UNITED STATES
SECURITIES AND EXCHANGE COMMISSION
Washington, D.C. 20549
FORMN-CSR
CERTIFIED SHAREHOLDER REPORT OF REGISTERED MANAGEMENT
INVESTMENT COMPANIES
Investment Company Act file number 811-08200
Bridgeway Funds, Inc.
(Exact name of registrant as specified in charter)
20 Greenway Plaza, Suite 450
Houston, Texas 77046
(Address of principal executive offices) (Zip code)
Tammira Philippe, President
Bridgeway Funds, Inc.
20 Greenway Plaza, Suite 450
Houston, Texas 77046
(Name and address of agent for service)
Registrant’s telephone number, including area code: (713) 661-3500
Date of fiscal year end: June 30
Date of reporting period: June 30, 2019
FormN-CSR is to be used by management investment companies to file reports with the Commission not later than 10 days after the transmission to stockholders of any report that is required to be transmitted to stockholders under Rule30e-1 under the Investment Company Act of 1940 (17 CFR270.30e-1). The Commission may use the information provided on FormN-CSR in its regulatory, disclosure review, inspection, and policymaking roles.
A registrant is required to disclose the information specified by FormN-CSR, and the Commission will make this information public. A registrant is not required to respond to the collection of information contained inForm N-CSR unless the Form displays a currently valid Office of Management and Budget (“OMB”) control number. Please direct comments concerning the accuracy of the information collection burden estimate and any suggestions for reducing the burden to Secretary, Securities and Exchange Commission, 450 Fifth Street, NW, Washington, DC 20549-0609. The OMB has reviewed this collection of information under the clearance requirements of 44 U.S.C. § 3507.
Item 1. Reports to Stockholders.
The Report to Shareholders is attached herewith.

Ano-load mutual fund family
| | | | |
| | Annual Report June 30, 2019 |
| | |
| | AGGRESSIVE INVESTORS 1 | | BRAGX |
| | ULTRA-SMALL COMPANY | | BRUSX |
| | (Open to Existing Investors — Direct Only) | | |
| | ULTRA-SMALL COMPANY MARKET | | BRSIX |
| | SMALL-CAP GROWTH | | BRSGX |
| | SMALL-CAP VALUE | | BRSVX |
| | BLUE CHIP (Formerly, Blue Chip 35 Index) | | BRLIX |
| | MANAGED VOLATILITY | | BRBPX |
|
Beginning on January 1, 2021, as permitted by regulations adopted by the U.S. Securities and Exchange Commission, paper copies of the Funds’ annual and semi-annual shareholder reports will no longer be sent by mail, unless you specifically request paper copies of the reports. Instead, the reports will be made available on the Funds’ website (www.bridgeway.com), and you will be notified by mail each time a report is posted and provided with a website link to access the report. If you already elected to receive shareholder reports electronically, you will not be affected by this change and you need not take any action. You may elect to receive shareholder reports and other communications from a Fund electronically anytime by contacting your financial intermediary (such as a broker-dealer or bank) or, if you are a direct investor, by calling800-661-3550. Beginning on January 1, 2019, you may elect to receive all future reports in paper free of charge. If you invest through a financial intermediary, you can contact your financial intermediary to request that you continue to receive paper copies of your shareholder reports. If you invest directly with a Fund, you can call800-661-3550 to let the Fund know you wish to continue receiving paper copies of your shareholder reports. Your election to receive reports in paper will apply to all Funds held in your account if you invest through your financial intermediary or to all Funds held with the fund complex if you invest directly with a Fund. |
| | |
| | | | |
| | www.bridgeway.com | | |
| | |
| TABLE OF CONTENTS | |  |
Bridgeway Funds Standardized Returns as of June 30, 2019* (Unaudited)
| | | | | | | | | | | | | | | | | | | | | | | | | | | | | | | | | | | | |
| | | | | | | | | Annualized | | | | | |
| Fund1 | | Quarter | | | Six Months | | | 1 Year | | | 5 Years | | | 10 Years | | | 15 Years | | | Inception
to Date | | | Inception
Date | | | Gross
Expense
Ratio2 | | Net
Expense
Ratio2 |
Aggressive Investors 1 | | | 4.13% | | | | 18.30% | | | | -6.67% | | | | 4.21% | | | | 11.36% | | | | 5.67% | | | | 12.00% | | | | 8/5/1994 | | | 0.96% | | 0.96% |
Ultra-Small Company | | | -5.22% | | | | 7.76% | | | | -14.48% | | | | -2.71% | | | | 8.32% | | | | 5.18% | | | | 12.32% | | | | 8/5/1994 | | | 2.03% | | 2.03% |
Ultra-Small Co Market | | | -2.66% | | | | 11.07% | | | | -16.98% | | | | 3.27% | | | | 11.23% | | | | 5.82% | | | | 9.71% | | | | 7/31/1997 | | | 0.86% | | 0.86% |
Small-Cap Growth | | | 0.92% | | | | 10.11% | | | | -10.81% | | | | 7.81% | | | | 12.50% | | | | 6.40% | | | | 6.66% | | | | 10/31/2003 | | | 1.08% | | 0.94% |
Small-Cap Value | | | -2.50% | | | | 6.36% | | | | -17.12% | | | | 2.17% | | | | 10.76% | | | | 6.59% | | | | 6.61% | | | | 10/31/2003 | | | 0.94% | | 0.94% |
Blue Chip | | | 5.19% | | | | 18.41% | | | | 16.26% | | | | 10.91% | | | | 14.14% | | | | 8.32% | | | | 7.56% | | | | 7/31/1997 | | | 0.22% | | 0.15% |
Managed Volatility | | | 1.90% | | | | 8.43% | | | | 1.74% | | | | 3.06% | | | | 5.11% | | | | 3.81% | | | | 3.97% | | | | 6/30/2001 | | | 1.21% | | 0.95% |
Bridgeway Funds Returns for Calendar Years 2003 through 2018* (Unaudited)
| | | | | | | | | | | | | | | | | | | | | | | | | | | | | | | | | | | | | | | | | | | | | | | | | | | | | | | | | | | | | | | | | | | | | | | | | | | | | | | | |
| | | 2003 | | 2004 | | 2005 | | 2006 | | 2007 | | 2008 | | 2009 | | 2010 | | 2011 | | 2012 | | 2013 | | 2014 | | 2015 | | 2016 | | 2017 | | 2018 |
Aggressive Investors 1 | | | | 53.98 | % | | | | 12.21 | % | | | | 14.93 | % | | | | 7.11 | % | | | | 25.80 | % | | | | -56.16 | % | | | | 23.98 | % | | | | 17.82 | % | | | | -10.31 | % | | | | 21.58 | % | | | | 42.21 | % | | | | 14.99 | % | | | | -9.82 | % | | | | 19.47 | % | | | | 18.44 | % | | | | -22.44 | % |
Ultra-Small Company | | | | 88.57 | % | | | | 23.34 | % | | | | 2.99 | % | | | | 21.55 | % | | | | -2.77 | % | | | | -46.24 | % | | | | 48.93 | % | | | | 23.55 | % | | | | -14.64 | % | | | | 24.49 | % | | | | 55.77 | % | | | | -0.56 | % | | | | -16.12 | % | | | | 14.06 | % | | | | 3.88 | % | | | | -15.68 | % |
Ultra-Small Co Market | | | | 79.43 | % | | | | 20.12 | % | | | | 4.08 | % | | | | 11.48 | % | | | | -5.40 | % | | | | -39.49 | % | | | | 25.96 | % | | | | 24.86 | % | | | | -7.86 | % | | | | 19.83 | % | | | | 50.91 | % | | | | 4.61 | % | | | | -8.28 | % | | | | 21.47 | % | | | | 12.47 | % | | | | -17.12 | % |
Small-Cap Growth | | | | | | | | | 11.59 | % | | | | 18.24 | % | | | | 5.31 | % | | | | 6.87 | % | | | | -43.48 | % | | | | 15.05 | % | | | | 11.77 | % | | | | -0.63 | % | | | | 11.05 | % | | | | 48.52 | % | | | | 6.13 | % | | | | 4.93 | % | | | | 16.10 | % | | | | 19.62 | % | | | | -11.21 | % |
Small-Cap Value | | | | | | | | | 17.33 | % | | | | 18.92 | % | | | | 12.77 | % | | | | 6.93 | % | | | | -45.57 | % | | | | 26.98 | % | | | | 16.56 | % | | | | 1.05 | % | | | | 20.99 | % | | | | 39.72 | % | | | | 0.79 | % | | | | -9.43 | % | | | | 26.79 | % | | | | 7.11 | % | | | | -13.06 | % |
Blue Chip | | | | 28.87 | % | | | | 4.79 | % | | | | 0.05 | % | | | | 15.42 | % | | | | 6.07 | % | | | | -33.30 | % | | | | 26.61 | % | | | | 10.60 | % | | | | 3.17 | % | | | | 15.20 | % | | | | 31.67 | % | | | | 11.51 | % | | | | 2.17 | % | | | | 13.18 | % | | | | 18.43 | % | | | | -1.48 | % |
Managed Volatility | | | | 17.82 | % | | | | 7.61 | % | | | | 6.96 | % | | | | 6.65 | % | | | | 6.58 | % | | | | -19.38 | % | | | | 12.39 | % | | | | 5.41 | % | | | | 1.94 | % | | | | 6.46 | % | | | | 9.25 | % | | | | 5.95 | % | | | | 0.17 | % | | | | 2.42 | % | | | | 8.18 | % | | | | -3.97 | % |
Performance figures quoted represent past performance and are no guarantee of future results. Current performance may be lower or higher than the performance data quoted. Investment return and principal value will fluctuate, so that an investor’s shares, when redeemed, may be worth more or less than original cost. To obtain performance current to the most recentmonth-end, please visit www.bridgeway.com or call1-800-661-3550. Total return figures include the reinvestment of dividends and capital gains. Periods of less than one year are not annualized.
| | 1 | Some of the Fund’s fees were waived or expenses reimbursed; otherwise, returns would have been lower. The Adviser is contractually obligated to waive fees and/or pay expenses. Any material change to this Fund policy would require a vote by shareholders. |
| | 2 | Expense ratios are as stated in the current prospectus. Please see financial highlights for expense ratios as of June 30, 2019. |
* Numbers highlighted indicate periods when the Fund outperformed its primary benchmark.
This report is submitted for the general information of the shareholders of each Fund. It is not authorized for distribution to prospective investors unless preceded or accompanied by an effective prospectus, which includes information regarding a Fund’s risks, objectives, fees and expenses, experience of its management, and other information. Investors should read the prospectus carefully before investing in a Fund. For questions or other Fund information, call1-800-661-3550 or visit the Funds’ website at www.bridgeway.com. Funds are available for purchase by residents of the United States, Puerto Rico, U.S. Virgin Islands and Guam only.
The views expressed here are exclusively those of Fund management. These views, including those relating to the market, sectors, or individual stocks, are not meant as investment advice and should not be considered predictive in nature.
Effective May 31, 2019, the name of the Blue Chip 35 Index Fund was changed to Blue Chip Fund. Effective July 31, 2019, the Fund’s principal strategies were modified, as indicated in the Supplement dated May 31, 2019 to the Prospectus dated October 31, 2018.
| | | | |
| LETTER FROM THE INVESTMENT MANAGEMENT TEAM (UNAUDITED) | | | | |
June 30, 2019
Dear Fellow Shareholders,
Performance across domestic equity markets was generally positive for the second quarter and the 12 months ended June 30, 2019. However, smaller stocks continued to lag larger stocks, resulting in negative returns forsmall-cap stocks this fiscal year. Growth stocks also continued to outperform value stocks across size categories. As a result,small-cap value stocks delivered the year’s worst performance. Market highlights appear on page 2. In this environment, the Bridgeway Funds performed within design expectations, guided by our statistically driven, evidence-based investment approach. Please see the enclosed letters for a detailed explanation of each Fund’s performance during the quarter and the fiscal year. We hope you find the letters helpful.
This August, Bridgeway is marking a major milestone: It’s been 25 years since the launch of the first Bridgeway Funds. To honor this anniversary, President and CEO Tammira Philippe describes the values and practices that have guided Bridgeway for the past 25 years — and that provide a strong foundation to position Bridgeway as an enduring firm for many years to come. Read her thoughts in “Celebrating the First 25 Years of the Bridgeway Funds” on page 2.
One of these foundational values is our commitment to transparency with our shareholders. That’s why we reserve space in our annual report to review a major challenge from the past 12 months. This year, we acknowledge the poor performance of our Select strategies during the quarter ended December 31, 2018. You can read about the market conditions that created headwinds for these strategies in “The Worst Thing of the Fiscal Year” on page 4.
Finally, Bridgeway is celebrating another milestone from the past year: Shannon Sedgwick Davis, President and CEO of the Bridgeway Foundation, recently published her first book,To Stop a Warlord: My Story of Justice, Grace, and the Fight for Peace.On page 4, read about Shannon’s inspiring transformative change work to foster a better world.
As always, we appreciate your feedback. We take your comments very seriously and regularly discuss them to help us manage our Funds and this company. Please keep your ideas coming — both favorable and critical. They provide us with a vital tool to serve you better.
Sincerely,
Your Investment Management Team
| | | | |

| | 
| | 
|
| John Montgomery | | Christine L. Wang | | Michael Whipple |

| | 
| | |
| | |
| Elena Khoziaeva | | Dick Cancelmo | | |
| | | | |
| LETTER FROM THE INVESTMENT MANAGEMENT TEAM (UNAUDITED)(continued) | | | | |
Market Review
Domestic equity markets rose during the quarter ended June 30, 2019, despite periods of volatility brought on by an escalating U.S.-China trade war and concerns about slowing economic growth. The S&P 500 returned +4.3% for the quarter, and the Dow Jones Industrial Average returned +3.2%. For the fiscal year, the S&P 500 and the DJIA returned +10.4% and +12.2%, respectively.
All U.S. equity style categories, as defined by Russell Indices, recorded positive returns for the quarter. However, larger stocks outperformed smaller stocks across style categories, and growth stocks continued to outperform value stocks in both thelarge-cap andsmall-cap spaces. For the quarter,large-cap growth stocks returned +4.64%, while small-value stocks returned +1.38%.
All sectors of the S&P 500 except Energy had positive returns for the quarter. The Financials sector led the gains, returning +8.0%, followed by Materials (+6.3%) and Information Technology (+6.1%). Among lagging sectors, Energy returned-2.8%, followed by Health Care (+1.4%).
Below are the stock market style box returns for the quarter and the fiscal year.
| | | | | | | | | | | | | | | | | | |
| | | June 2019 Quarter | | | | | | Fiscal Year Ended June 30, 2019 | | |
| | Value | | All | | Growth | | | | | | Value | | All | | Growth | | |
Large | |
3.84%
| |
4.25%
| |
4.64%
| | | | Large | |
8.46%
| |
10.02%
| |
11.56%
| | |
Mid | |
3.19%
| |
4.13%
| |
5.40%
| | | | Mid | |
3.68%
| |
7.83%
| |
13.94%
| | |
Small | |
1.38%
| |
2.10%
| |
2.75%
| | | | Small | |
-6.24%
| |
-3.31%
| |
-0.49%
| | |
Celebrating the First 25 Years of the Bridgeway Funds
By Tammira Philippe, President and CEO
What were you doing in August 1994? In August of that year, I was working as an intern at Andersen Consulting in Houston before the start of my senior year at Texas A&M University, where I would complete my undergraduate degree in Computer Science. At the same time, in the same city, and totally unknown to me, a visionary named John Montgomery had recently founded this great company called Bridgeway Capital Management — and was about to launch Bridgeway’s first mutual fund.
I couldn’t have predicted that our paths would cross in 2005, and today I’m thrilled to be working alongside John as President and CEO of a firm that’s grown to a team of 37 committed Partners, stewarding almost $8 billion for our clients.
I’ve been here for half of Bridgeway’s first 25 years, which means I’ve witnessed a large part of our changes first-hand. But it’s whathas notchanged about Bridgeway that has me even more excited for the next 25 years — and beyond.
From the beginning, we wanted Bridgeway to be a different kind of investment manager and mutual fund company — one focused on a purpose that would support and enhance every aspect of our firm. That mission has endured. People traditionally evaluate asset managers like Bridgeway by looking at the “4 Ps” —People, Process, Philosophy, and Performance. We believe it’s vital to consider a fifth “P” —Purpose,which in our experience over the last 25 years, is the source of excellence in the four other “Ps” that most people evaluate. Let’s examine Purpose, People, Philosophy, Process, and Performance further and look at what started 25 years ago, what’s evolved, and what we expect to endure.
| | |
| 2 | | Annual Report | June 30, 2019 |
| | | | |
| LETTER FROM THE INVESTMENT MANAGEMENT TEAM (UNAUDITED)(continued) | | | | |
Purpose
John founded Bridgeway to do more than just design excellent investment strategies. The firm’s purpose — then and now — was to create positive change for our clients, our Partners and the world at large. We manage our mutual funds and investment strategies to help our clients achieve their most important goals. We’ve created a company culture that helps our Partners make the best use of their unique talents. And we give back to the communities that sustain us, through volunteering and donations from the Bridgeway Foundation.
We define our mission and purpose in a simple but powerful way. Our vision is: “A world without genocide. Partnering to create an extraordinary future for our clients, community and world.”
People
One of John’s dreams for Bridgeway was that it would not be only his dream. He envisioned aBridgeway familysharing his vision and shaping the company as much or more than he would. Since 1993, he has invited others like you and me into this family, helping make Bridgeway a shared dream among clients, colleagues, and community.
We have built an incredible team to fulfill our commitment to clients like you. And we rely on our culture and processes to guide us as we continue striving toward our vision. Our diverse group of Partners come to Bridgeway for different reasons, but they all cite the importance of our purpose in their decisions to join and stay with our team. The average tenure at Bridgeway of our investment and risk professionals is more than a decade, and we intend to foster that stability and longevity to maintain an enduring culture in the years to come. One way that we do that is through our focus on servant leadership — a deep investment in ongoing professional development to “serve first” and improve our capabilities that keeps our team engaged and committed.
Philosophy, Process and Performance
From the beginning, Bridgeway’s steadfast commitment to our investment philosophy has driven both our process and our performance. The core of that philosophy — first articulated 25 years ago and maintained today — is that investment factors shape returns, and that data, evidence, and logic should guide investment decisions.
How we communicate and implement that philosophy has evolved since 1994 as the financial industry itself has evolved. Just consider the changes we’ve seen in the availability of data on factors such as small size and momentum, the rise of electronic trading, and the emergence of new investment vehicles like ETFs andfunds-of-funds. We’ve also expanded our outreach by developing strong relationships with like-minded financial advisors and consultants who serve retirement plans. But in all these conversations, our focus remains solely on caring for each client.
That commitment to stewardship has been in place since the beginning and will endure. I like to define stewardship as having the passion and discipline to care for an asset for the benefit of others. For Bridgeway, that means we strive to put your needs first and ask, “What is in the best long-term interest of our clients?” in every decision we make.
Another enduring feature is Bridgeway’s commitment to donate 50% of profits to support transformative change in communities. Nearly 15 years ago, John wrote a letter in Bridgeway’s semi-annual report that described the most important change he wants to help achieve: fostering world peace and stopping genocide. We’ve never wavered from that goal. You can turn to page 4 of this report to read how Shannon Sedgwick Davis, President and CEO of the Bridgeway Foundation, has chronicled our efforts to achieve this vision in her new book,To Stop a Warlord.
We are immensely proud of what we’ve achieved in the past 25 years, but a core practice from Bridgeway’s servant leadership development is to express gratitude and appreciation regularly. Whether you’ve been with us for one year or 25, we recognize the commitment you have made by investing with Bridgeway, and we appreciate the trust you have placed in us. In the next 25 years, Bridgeway will remain true to our vision while we raise our profile, diversify our client base, and broaden our capabilities.
| | | | |
| LETTER FROM THE INVESTMENT MANAGEMENT TEAM (UNAUDITED)(continued) | | | | |
We aspire to build an extraordinary future together as we honor the achievements of the past 25 years. Please celebrate this milestone with us by telling someone close to you how much you appreciate something special they have done for you — whether in the last 25 minutes, 25 hours or even 25 years.
Thank you!
The Worst Thing of the Fiscal Year
Our annual report is not just a place to highlight our achievements from the past 12 months (or the past 25 years, in this case). It is also an opportunity to acknowledge and review the challenges that our company and our shareholders experienced. For that reason, we have made it a tradition to include a discussion of the “worst thing” of the previous fiscal year.
The worst thing in Fiscal Year 2019 was the poor performance of our Select strategies during the fourth quarter of 2018. Many shareholders probably remember that turbulent quarter, when concerns about slowing economic growth and rising trade tensions drove down major stock indices and contributed to stocks recording their first calendar-year decline in nine years. Amid this volatility, all our Select strategies had negative absolute returns for the quarter. And three of these select strategies —Aggressive Investors 1,Small-Cap Value andSmall-Cap Growth— underperformed their respective benchmarks.
The fourth quarter of 2018 was an extreme“risk-off” environment, in which investors widely sold off stocks they perceived to be risky. Unfortunately, many of these stocks are the types that we target in our investment models, including smaller stocks and higher beta and higher momentum stocks. Riskier stocks weren’t the only types that suffered, though. The fourth quarter of 2018 was also a high correlation quarter — when stocks of all sizes and styles move in tandem. That fact meant our Funds’ diversifying model exposures largely failed to cushion declines elsewhere in the portfolios. For details on how these conditions affected specific Funds, please review the December 31, 2018 shareholder letters and the explanation of fiscal year performance in this report.
We understand how difficult it is to experience a poor quarter like we did in the fourth quarter of 2018 — and how difficult it is to remain patient while waiting for Fund performance to recover.Small-Cap Growth andSmall-Cap Value continued to lag their benchmarks in the second half of the 2019 fiscal year. And while strong, positive market performance over the past two quarters is helping Aggressive Investors 1 to catch up, the Fund still ended the fiscal year trailing the S&P 500 Index significantly.
Yet we encourage our shareholders to maintain a long-term perspective. As data-driven, statistical investors, Bridgeway believes that the historical premiums offered by investment factors such as small size and valuation, will continue to hold true in the future — even as we experience shorter periods of underperformance.
Our research-driven approach to designing investment strategies also means we continue to investigate ways to mitigate the effects of high-correlation markets, as we discussed in comments about the Aggressive Investors 1 Fund in our 2018 semi-annual report. We are committed to transparency with our shareholders, and we will update you on the outcomes of this research.
Inspiring Action to Create a Better World: Shannon Sedgwick Davis’ new book, To Stop a Warlord
Ten years ago, Shannon Sedgwick-Davis presented a major concern to the board of the Bridgeway Foundation, the charitable organization created and funded by Bridgeway Capital Management. Her appeal: The Foundation needed to do more to live up to its mission of stopping genocide.
As CEO of the Bridgeway Foundation, Shannon had been working in areas of Central Africa being terrorized by warlord Joseph Kony and his Lord’s Resistance Army (LRA). Amid mounting violence and the abduction of thousands of children to serve as LRA soldiers, she realized it was not enough to help communitiesrecoverfrom LRA attacks. The Bridgeway Foundation had to work topreventthese atrocities from continuing.
This insight sparked a multi-year campaign to help end the conflict in Central Africa — work that’s recounted in her new book,To Stop a Warlord: My Story of Grace, Justice, and the Fight for Peace.
| | |
| 4 | | Annual Report | June 30, 2019 |
| | | | |
| LETTER FROM THE INVESTMENT MANAGEMENT TEAM (UNAUDITED)(continued) | | | | |
Published this spring,To Stop a Warlorddescribes the unique collaboration between the Bridgeway Foundation and Central African people and organizations desiring change for their region. It is a story of innovative solutions, including the development of an early-warning radio network to alert villages of LRA activity and the creation of a program to train Ugandan soldiers to track and rescue LRA hostages. It is likewise a story of restorative justice, reflected in the efforts of LRA victims and former LRA soldiers to reconcile and move forward, together, for a safer future.
While the book celebrates many achievements —among them, a 90% reduction of LRA violence and the defection of more than 700 LRA soldiers— it also acknowledges the work that remains. As Tammira Philippe notes in her piece on Bridgeway’s 25th anniversary, our mission statement is, “A world without genocide. Partnering to create an extraordinary future for our clients, community, and world.” Yet, we know that this mission remains merely a goal until peopleact, which is why we work continually to effect transformative change in ways big and small.
To Stop a Warlordprovides examples of what action looks like, especially in the face of problems that seem unsolvable. The Bridgeway Foundation’s work in Central Africa could only happen through the dedication and commitment of hundreds of individuals — and each person’s contribution was essential. We hope you take a few moments to read Shannon’s book, feel our appreciation for what you helped make happen, and come away inspired in your service to others — finding your own ways to make a difference in the world.
| | |
| Aggressive Investors 1 Fund | |
|
MANAGER’S COMMENTARY (Unaudited) |
| | |
June 30, 2019
Dear Fellow Aggressive Investors 1 Fund Shareholder,
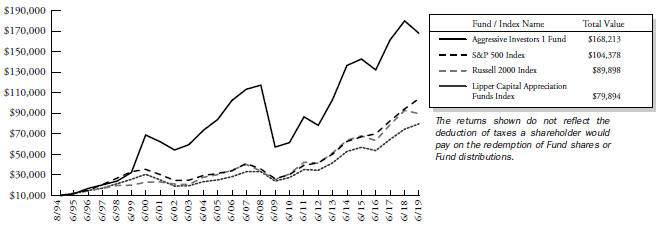
For the quarter ended June 30, 2019, our Fund returned +4.13%, slightly underperforming our primary market benchmark, the S&P 500 Index (+4.30%), and our peer benchmark, the Lipper Capital Appreciation Funds Index (+4.35%), but outperforming the Russell 2000 Index (+2.10%). It was a poor quarter on a relative basis.
For the fiscal year, our Fund returned-6.67%, underperforming our primary market benchmark, the S&P 500 Index (+10.42%), our peer benchmark, the Lipper Capital Appreciation Funds Index (+6.87%), and the Russell 2000 Index(-3.31%).
The table below presents our June quarter,one-year, five-year,10-year,15-year, andinception-to-date financial results. See the next page for a graph of performance since inception.
Standardized Returns as of June 30, 2019
| | | | | | | | | | | | | | | | | | | | | | | | | | | | | | |
| | | | | | | Annualized | | |
| | | Quarter | | 1 Year | | 5 Years | | 10 Years | | 15 Years | | Since Inception
(8/5/94) |
| | | | | | |
Aggressive Investors 1 Fund | | | | 4.13 | % | | | | -6.67 | % | | | | 4.21 | % | | | | 11.36 | % | | | | 5.67 | % | | | | 12.00 | % |
S&P 500 Index | | | | 4.30 | % | | | | 10.42 | % | | | | 10.71 | % | | | | 14.70 | % | | | | 8.75 | % | | | | 9.84 | % |
Russell 2000 Index | | | | 2.10 | % | | | | -3.31 | % | | | | 7.06 | % | | | | 13.45 | % | | | | 8.15 | % | | | | 9.19 | % |
Lipper Capital Appreciation Funds Index | | | | 4.35 | % | | | | 6.87 | % | | | | 8.56 | % | | | | 12.76 | % | | | | 8.46 | % | | | | 8.63 | % |
Performance figures quoted in the table above represent past performance and are no guarantee of future results. Total return figures in the table above include the reinvestment of dividends and capital gains. The table above does not reflect the deduction of taxes that a shareholder would pay on Fund distributions or on the redemption of Fund shares.
The S&P 500 Index is a broad-based, unmanaged measurement of changes in stock market conditions, based on the average of 500 widely held common stocks with dividends reinvested. The Russell 2000 Index is an unmanaged, market value weighted index that measures performance of the 2,000 companies that are between the 1,000th and 3,000th largest in the market with dividends reinvested. The Lipper Capital Appreciation Funds Index reflects the record of the 30 largest funds in the category of more aggressive domestic growth mutual funds, as reported by Lipper, Inc. It is not possible to invest directly in an index. Periods longer than one year are annualized.
| | |
| 6 | | Annual Report | June 30, 2019 |
| | |
| Aggressive Investors 1 Fund | | |
MANAGER’S COMMENTARY (Unaudited)(continued) | | |
| | |
Growth of a $10,000 Investment
from Inception August 5, 1994 to June 30, 2019
Detailed Explanation of Quarterly Performance
The Fund’s company financial health models underperformed the benchmark and detracted from relative results, as higher quality and stronger fundamentals stocks were not rewarded by the market during the quarter. However, outperformance by the Fund’s diversifying price momentum and value metrics models helped offset much of that negative impact, though not enough to outpace the benchmark overall. By design, the Fund tends to invest in higher beta and higher volatility stocks, and these holdings detracted from relative performance. The Fund’s investments in smaller stocks also reduced relative returns as smaller stocks underperformed larger stocks during the quarter.
From a sector perspective, the Fund’s allocation effect was slightly positive, with all sector positionings except an underweighting in Communication Services making small positive contributions to relative results. In contrast, the Fund’s stock selection effect was slightly negative. Holdings in the Energy, Information Technology, and Materials sectors detracted the most from relative performance.
Detailed Explanation of Fiscal Year Performance
The Fund significantly trailed the S&P 500 Index during the fiscal year. Most of this underperformance occurred during the first half of the12-month period, when market conditions — including a high-correlation,risk-off second fiscal quarter — created significant headwinds for the Fund.
The Fund’s company financial health and value metrics models underperformed the benchmark and detracted from relative results. Strong outperformance by the Fund’s price momentum model category did not offset this negative impact. The Fund’s investments in higher volatility stocks detracted significantly from relative results, while the Fund’s investments in smaller stocks and its overweighting in deeper value stocks hurt to a lesser degree.
From a sector perspective, the Fund’s allocation effect was slightly negative, with an underweighting in the Health Care sector and an overweighting in the Materials sector detracting somewhat from relative results. The Fund’s stock selection effect was significantly negative, largely driven by poor performance from holdings in the Information Technology, Consumer Discretionary, Industrials, Energy, and Health Care sectors.
| | |
| Aggressive Investors 1 Fund | |
|
MANAGER’S COMMENTARY (Unaudited)(continued) |
| | |
Top Ten Holdings as of June 30, 2019
| | | | | | | | | |
| Rank | | Description | | Industry | | % of Net
Assets |
| 1 | | HCA Healthcare, Inc. | | Health Care | | | | 2.5% | |
| 2 | | Applied Materials, Inc. | | Information Technology | | | | 2.5% | |
| 3 | | Church & Dwight Co., Inc. | | Consumer Staples | | | | 2.4% | |
| 4 | | Cadence Design Systems, Inc. | | Information Technology | | | | 2.3% | |
| 5 | | Merck & Co., Inc. | | Health Care | | | | 2.3% | |
| 6 | | Micron Technology, Inc. | | Information Technology | | | | 2.1% | |
| 7 | | Xilinx, Inc. | | Information Technology | | | | 2.0% | |
| 8 | | Ensign Group, Inc. (The) | | Health Care | | | | 2.0% | |
| 9 | | Lululemon Athletica, Inc. | | Consumer Discretionary | | | | 1.9% | |
| 10 | | Credit Acceptance Corp. | | Financials | | | | 1.8% | |
| | | |
| | Total | | | | | | 21.8% | |
Industry Sector Representation as of June 30, 2019
| | | | | | | | | | | | | | | |
| | | % of Net Assets | | % of S&P 500
Index | | Difference |
Communication Services | | | | 5.9% | | | | | 10.2% | | | | | -4.3% | |
Consumer Discretionary | | | | 14.5% | | | | | 10.2% | | | | | 4.3% | |
Consumer Staples | | | | 4.5% | | | | | 7.3% | | | | | -2.8% | |
Energy | | | | 3.6% | | | | | 5.0% | | | | | -1.4% | |
Financials | | | | 16.7% | | | | | 13.1% | | | | | 3.6% | |
Health Care | | | | 9.2% | | | | | 14.2% | | | | | -5.0% | |
Industrials | | | | 14.2% | | | | | 9.4% | | | | | 4.8% | |
Information Technology | | | | 22.4% | | | | | 21.5% | | | | | 0.9% | |
Materials | | | | 5.8% | | | | | 2.8% | | | | | 3.0% | |
Real Estate | | | | 2.2% | | | | | 3.1% | | | | | -0.9% | |
Utilities | | | | 0.0% | | | | | 3.3% | | | | | -3.3% | |
Cash & Other Assets | | | | 1.0% | | | | | -0.1% | | | | | 1.1% | |
| | | |
Total | | | | 100.0% | | | | | 100.0% | | | | | | |
Disclaimer
The views expressed here are exclusively those of Fund management. These views, including those related to market sectors or individual stocks, are not meant as investment advice and should not be considered predictive in nature. Any favorable (or unfavorable) description of a holding applies only as of the quarter end, June 30, 2019, unless otherwise stated. Security positions can and do change thereafter. Discussions of historical performance do not guarantee and may not be indicative of future performance.
Market volatility can significantly affect short-term performance. The Fund is not an appropriate investment for short-term investors. Investments in the small companies within thismulti-cap fund generally carry greater risk than is customarily associated with larger companies. This additional risk is attributable to a number of factors, including the relatively limited financial resources that are typically available to small companies and the fact that small companies often have comparatively limited product lines. In addition, the stock of small companies tends to be more volatile than the stock of large companies, particularly in the short term and particularly in the early stages of an economic or market downturn. The Fund’s use of options, futures, and leverage can magnify the risk of loss in an unfavorable market, and the Fund’s use of short-sale positions can, in theory, expose shareholders to unlimited loss. Finally, the Fund exposes shareholders to “focus risk,” which may add to Fund volatility through the possibility that a single company could significantly affect total return. Shareholders of the Fund, therefore, are taking on more risk than they would if they invested in the stock market as a whole.
| | |
| 8 | | Annual Report | June 30, 2019 |
| | |
| Aggressive Investors 1 Fund | | |
MANAGER’S COMMENTARY (Unaudited)(continued) | | |
| | |
Conclusion
Thank you for your continued investment in Aggressive Investors 1 Fund. We encourage your feedback; your reactions and concerns are important to us.
Sincerely,
The Investment Management Team
| | |
| Aggressive Investors 1 Fund | |
|
| SCHEDULE OF INVESTMENTS |
| Showing percentage of net assets as of June 30, 2019 | | |
| | | | | | | | | | | | | | | | |
| Industry Company | | Shares | | | Value | | | | | | | |
| | | | |
COMMON STOCKS - 99.00% | | | | | | | | | | | | | | | | |
Communication Services - 5.87% | | | | | | | | | |
Altice USA, Inc., Class A* | | | 88,300 | | | $ | 2,150,105 | | | | | | | | | |
AMC Networks, Inc., Class A* | | | 30,000 | | | | 1,634,700 | | | | | | | | | |
Charter Communications, Inc., Class A* | | | 7,000 | | | | 2,766,260 | | | | | | | | | |
DISH Network Corp., Class A* | | | 45,200 | | | | 1,736,132 | | | | | | | | | |
United States Cellular Corp.* | | | 33,300 | | | | 1,487,511 | | | | | | | | | |
WideOpenWest, Inc.* | | | 120,000 | | | | 871,200 | | | | | | | | | |
| | | | | | | | | | | | | | | | |
| | | | |
| | | | | | 10,645,908 | | | | | | | |
| | |
Consumer Discretionary - 14.48% | | | | | | | | | |
Abercrombie & Fitch Co., Class A | | | 89,300 | | | | 1,432,372 | | | | | | | | | |
Chipotle Mexican Grill, Inc.* | | | 2,700 | | | | 1,978,776 | | | | | | | | | |
Core-Mark Holding Co., Inc. | | | 50,000 | | | | 1,986,000 | | | | | | | | | |
Fiat Chrysler Automobiles NV | | | 215,000 | | | | 2,971,300 | | | | | | | | | |
Fossil Group, Inc.* | | | 50,000 | | | | 575,000 | | | | | | | | | |
K12, Inc.* | | | 53,700 | | | | 1,633,017 | | | | | | | | | |
Lear Corp. | | | 12,300 | | | | 1,713,021 | | | | | | | | | |
Lululemon Athletica, Inc.* | | | 19,300 | | | | 3,478,053 | | | | | | | | | |
RH* | | | 17,600 | | | | 2,034,560 | | | | | | | | | |
SeaWorld Entertainment, Inc.* | | | 74,500 | | | | 2,309,500 | | | | | | | | | |
Sonic Automotive, Inc., Class A | | | 58,000 | | | | 1,354,300 | | | | | | | | | |
Starbucks Corp. | | | 28,000 | | | | 2,347,240 | | | | | | | | | |
TopBuild Corp.* | | | 22,700 | | | | 1,878,652 | | | | | | | | | |
Vista Outdoor, Inc.* | | | 65,000 | | | | 577,200 | | | | | | | | | |
| | | | | | | | | | | | | | | | |
| | | | |
| | | | | | 26,268,991 | | | | | | | |
| | |
Consumer Staples - 4.51% | | | | | | | | | |
Church & Dwight Co., Inc. | | | 60,300 | | | | 4,405,518 | | | | | | | | | |
Coca-Cola Consolidated, Inc. | | | 6,000 | | | | 1,795,500 | | | | | | | | | |
Ingles Markets, Inc., Class A | | | 24,700 | | | | 768,911 | | | | | | | | | |
Tyson Foods, Inc., Class A | | | 15,000 | | | | 1,211,100 | | | | | | | | | |
| | | | | | | | | | | | | | | | |
| | | | |
| | | | | | 8,181,029 | | | | | | | |
| | |
Energy - 3.65% | | | | | | | | | |
CONSOL Energy, Inc.* | | | 37,000 | | | | 984,570 | | | | | | | | | |
Continental Resources, Inc.* | | | 42,000 | | | | 1,767,780 | | | | | | | | | |
Halliburton Co. | | | 60,000 | | | | 1,364,400 | | | | | | | | | |
ProPetro Holding Corp.* | | | 90,000 | | | | 1,863,000 | | | | | | | | | |
Renewable Energy Group, Inc.* | | | 40,000 | | | | 634,400 | | | | | | | | | |
| | | | | | | | | | | | | | | | |
| | | | |
| | | | | | | 6,614,150 | | | | | | | | | |
| | | | | | | | | | | | |
| Industry Company | | | Shares | | | | Value | | | | | |
| | | | | |
Financials - 16.72% | | | | | |
Aflac, Inc. | | | 41,800 | | | $ | 2,291,058 | | | | | |
Ameriprise Financial, Inc. | | | 15,500 | | | | 2,249,980 | | | | | |
Bank of Montreal | | | 12,000 | | | | 905,400 | | | | | |
Canadian Imperial Bank of Commerce+ | | | 21,000 | | | | 1,649,760 | | | | | |
Charles Schwab Corp. (The) | | | 40,500 | | | | 1,627,695 | | | | | |
Credit Acceptance Corp.* | | | 6,900 | | | | 3,338,427 | | | | | |
Enova International, Inc.* | | | 61,000 | | | | 1,406,050 | | | | | |
Erie Indemnity Co., Class A | | | 12,200 | | | | 3,102,216 | | | | | |
MarketAxess Holdings, Inc. | | | 6,700 | | | | 2,153,514 | | | | | |
Progressive Corp. (The) | | | 32,000 | | | | 2,557,760 | | | | | |
Prudential Financial, Inc. | | | 22,000 | | | | 2,222,000 | | | | | |
Santander Consumer USA Holdings, Inc. | | | 105,000 | | | | 2,515,800 | | | | | |
Synchrony Financial | | | 27,200 | | | | 943,024 | | | | | |
TD Ameritrade Holding Corp. | | | 33,500 | | | | 1,672,320 | | | | | |
Unum Group | | | 50,500 | | | | 1,694,275 | | | | | |
| | | | | | | | | | | | |
| | | |
| | | | | | 30,329,279 | | | | |
| |
Health Care - 9.21% | | | | | |
AmerisourceBergen Corp. | | | 20,900 | | | | 1,781,934 | | | | | |
Endo International PLC* | | | 142,800 | | | | 588,336 | | | | | |
Ensign Group, Inc. (The) | | | 62,000 | | | | 3,529,040 | | | | | |
HCA Healthcare, Inc. | | | 33,800 | | | | 4,568,746 | | | | | |
Incyte Corp.* | | | 25,000 | | | | 2,124,000 | | | | | |
Merck & Co., Inc. | | | 49,000 | | | | 4,108,650 | | | | | |
| | | | | | | | | | | | |
| | | |
| | | | | | 16,700,706 | | | | |
| |
Industrials - 14.22% | | | | | |
Allison Transmission Holdings, Inc. | | | 36,600 | | | | 1,696,410 | | | | | |
ArcBest Corp. | | | 38,000 | | | | 1,068,180 | | | | | |
BMC Stock Holdings, Inc.* | | | 72,000 | | | | 1,526,400 | | | | | |
Caterpillar, Inc. | | | 15,000 | | | | 2,044,350 | | | | | |
CNH Industrial NV | | | 175,000 | | | | 1,799,000 | | | | | |
CoStar Group, Inc.* | | | 3,300 | | | | 1,828,398 | | | | | |
CSX Corp. | | | 26,500 | | | | 2,050,305 | | | | | |
Insperity, Inc. | | | 25,900 | | | | 3,163,426 | | | | | |
Matson, Inc. | | | 26,300 | | | | 1,021,755 | | | | | |
NOW, Inc.* | | | 135,500 | | | | 1,999,980 | | | | | |
Spirit AeroSystems Holdings, Inc., Class A | | | 24,400 | | | | 1,985,428 | | | | | |
United Airlines Holdings, Inc.* | | | 20,400 | | | | 1,786,020 | | | | | |
United Rentals, Inc.* | | | 21,500 | | | | 2,851,545 | | | | | |
Wabash National Corp. | | | 60,000 | | | | 976,200 | | | | | |
| | | | | | | | | | | | |
| | | |
| | | | | | 25,797,397 | | | | |
| | |
| 10 | | Annual Report | June 30, 2019 |
| | |
| Aggressive Investors 1 Fund | | |
SCHEDULE OF INVESTMENTS(continued) | | |
| Showing percentage of net assets as of June 30, 2019 | | |
| | | | | | | | | | | | | | | | | | | | |
| Industry Company | | | | | Shares | | | Value | | | | | | | |
| | | | |
Common Stocks (continued) | | | | | | | | | | | | | | | | | |
Information Technology - 22.35% | | | | | | | | | |
Alliance Data Systems Corp. | | | | 11,300 | | | $ | 1,583,469 | | | | | | | | | |
Apple, Inc. | | | | 16,000 | | | | 3,166,720 | | | | | | | | | |
Applied Materials, Inc. | | | | 99,900 | | | | 4,486,509 | | | | | | | | | |
Cadence Design Systems, Inc.* | | | | 58,400 | | | | 4,135,304 | | | | | | | | | |
EPAM Systems, Inc.* | | | | 10,300 | | | | 1,782,930 | | | | | | | | | |
Intuit, Inc. | | | | 7,400 | | | | 1,933,842 | | | | | | | | | |
Lam Research Corp. | | | | 9,700 | | | | 1,822,048 | | | | | | | | | |
Micron Technology, Inc.* | | | | 100,000 | | | | 3,859,000 | | | | | | | | | |
OSI Systems, Inc.* | | | | 21,500 | | | | 2,421,545 | | | | | | | | | |
RingCentral, Inc., Class A* | | | | 14,600 | | | | 1,677,832 | | | | | | | | | |
Seagate Technology PLC | | | | 39,900 | | | | 1,880,088 | | | | | | | | | |
ServiceNow, Inc.* | | | | 6,600 | | | | 1,812,162 | | | | | | | | | |
Unisys Corp.* | | | | 96,000 | | | | 933,120 | | | | | | | | | |
VeriSign, Inc.* | | | | 10,500 | | | | 2,196,180 | | | | | | | | | |
Western Digital Corp. | | | | 27,000 | | | | 1,283,850 | | | | | | | | | |
Xilinx, Inc. | | | | 30,500 | | | | 3,596,560 | | | | | | | | | |
Zendesk, Inc.* | | | | 22,000 | | | | 1,958,660 | | | | | | | | | |
| | | | | | | | | | | | | | | | | | | | |
| | | | | |
| | | | | | | | | 40,529,819 | | | | | | | |
Materials - 5.77% | | | | | | | | | |
Ecolab, Inc. | | | | 9,400 | | | | 1,855,936 | | | | | | | | | |
Freeport-McMoRan, Inc. | | | | 164,800 | | | | 1,913,328 | | | | | | | | | |
Packaging Corp. of America | | | | 20,900 | | | | 1,992,188 | | | | | | | | | |
SunCoke Energy, Inc.* | | | | 201,300 | | | | 1,787,544 | | | | | | | | | |
Teck Resources, Ltd., Class B | | | | 95,000 | | | | 2,190,700 | | | | | | | | | |
Verso Corp., Class A* | | | | 38,000 | | | | 723,900 | | | | | | | | | |
| | | | | | | | | | | | | | | | | | | | |
| | | | | |
| | | | | | | | | 10,463,596 | | | | | | | |
Real Estate - 2.22% | | | | | | | | | | | | | |
American Tower Corp. | | | | 11,000 | | | | 2,248,950 | | | | | | | | | |
Lamar Advertising Co., Class A | | | | 22,000 | | | | 1,775,620 | | | | | | | | | |
| | | | | | | | | | | | | | | | | | | | |
| | | | | |
| | | | | | | | | 4,024,570 | | | | | | | |
| | | | | | | | | | | | | | | | | | | | |
| | | |
TOTAL COMMON STOCKS - 99.00% | | | | 179,555,445 | | | | | | | | | |
| | | | | | | | | | | | | | | | | | | | |
(Cost $170,835,476) | | | | | | | | | | | | | | | | | | | | |
| | | | | |
| | | Rate^ | | | Shares | | | Value | | | | | | | |
MONEY MARKET FUND - 1.02% | | | | | | | | | |
Fidelity Investments Money Market Government Portfolio Class I | | | 2.25 | % | | | 1,854,453 | | | | 1,854,453 | | | | | | | | | |
| | | | | | | | | | | | | | | | | | | | |
| | | |
TOTAL MONEY MARKET FUND - 1.02% | | | | 1,854,453 | | | | | | | | | |
| | | | | | | | | | | | | | | | | | | | |
(Cost $1,854,453) | | | | | | | | | | | | | |
| | | | | | | | | | | | | | | | |
| | | Rate^ | | | Shares | | | Value | | | | |
INVESTMENTS PURCHASED WITH CASH PROCEEDS FROM SECURITIES LENDING - 0.90% | | | | | |
Fidelity Investments Money Market Government Portfolio Class I** | | | 2.25 | % | | | 1,631,234 | | | | $1,631,234 | | | | | |
| | | | | | | | | | | | | | | | |
TOTAL INVESTMENTS PURCHASED WITH CASH PROCEEDS FROM SECURITIES LENDING - 0.90% | | | | 1,631,234 | | | | | |
| | | | | | | | | | | | | | | | |
(Cost $1,631,234) | | | | | | | | | | | | | | | | |
TOTAL INVESTMENTS - 100.92% | | | $ | 183,041,132 | | | | | |
(Cost $174,321,163) | | | | | | | | | |
Liabilities in Excess of Other Assets - (0.92%) | | | | (1,674,552 | ) | | | | |
| | | | | | | | | | | | | | | | |
| | |
NET ASSETS - 100.00% | | | $ | 181,366,580 | | | | | |
| | | | | | | | | | | | | | | | |
| * | Non-income producing security. |
| ** | This security represents the investment of the collateral received in connection with securities out on loan as of June 30, 2019. |
| ^ | Rate disclosed as of June 30, 2019. |
| + | This security or a portion of the security is out on loan as of June 30, 2019. Total loaned securities had a value of $1,612,837 as of June 30, 2019. |
PLC - Public Limited Company
Summary of inputs used to value the Fund’s investments as of 06/30/2019 (See Note 2 in Notes to Financial Statements):
| | | | | | | | | | | | | | | | |
| Valuation Inputs | |
| Investment in Securities (Value) | |
| | | Level 1 Quoted Prices | | | Level 2
Significant Observable Inputs | | | Level 3
Significant Unobservable
Inputs | | | Total | |
Common Stocks (a) | | $ | 179,555,445 | | | $ | — | | | $ | — | | | $ | 179,555,445 | |
Money Market Fund | | | — | | | | 1,854,453 | | | | — | | | | 1,854,453 | |
Investments Purchased with Cash Proceeds from Securities Lending | | | — | | | | 1,631,234 | | | | — | | | | 1,631,234 | |
| | | | | | | | | | | | | | | | |
TOTAL | | $ | 179,555,445 | | | $ | 3,485,687 | | | $ | — | | | $ | 183,041,132 | |
| | | | | | | | | | | | | | | | |
(a) - Please refer to the Schedule of Investments for the industry classifications of these portfolio holdings.
See Notes to Financial Statements.
| | |
| Ultra-Small Company Fund | |
|
MANAGER’S COMMENTARY (Unaudited) |
| | |
June 30, 2019
Dear Fellow Ultra-Small Company Fund Shareholder,
For the quarter ended June 30, 2019, our Fund returned-5.22%, lagging our primary market benchmark, the CRSPCap-Based Portfolio 10 Index(-4.00%), and our peer benchmark, the LipperMicro-Cap Stock Funds Index (+1.11%), as well as the Russell 2000 Index (+2.10%) and the Russell Microcap Index (+0.92%). It was a poor quarter.
For the fiscal year, our Fund returned-14.48%, performing in line with the CRSPCap-Based Portfolio 10 Index(-14.49%), but underperforming the LipperMicro-Cap Stock Funds Index(-7.23%), the Russell 2000 Index(-3.31%) and the Russell Microcap Index(-10.39%).
The table below presents our June quarter,one-year, five-year,10-year,15-year, andinception-to-date financial results. See the next page for a graph of performance since inception.
Standardized Returns as of June 30, 2019
| | | | | | | | | | | | | | | | | | | | | | | | | | | | | | |
| | | | | | | Annualized | | |
| | | Quarter | | 1 Year | | 5 Years | | 10 Years | | 15 Years | | Since Inception
(8/5/94) |
| | | | | | |
Ultra-Small Company Fund | | | | -5.22 | % | | | | -14.48 | % | | | | -2.71 | % | | | | 8.32 | % | | | | 5.18 | % | | | | 12.32 | % |
CRSPCap-Based Portfolio 10 Index | | | | -4.00 | % | | | | -14.49 | % | | | | 3.36 | % | | | | 12.24 | % | | | | 7.49 | % | | | | 11.24 | % |
Russell 2000 Index | | | | 2.10 | % | | | | -3.31 | % | | | | 7.06 | % | | | | 13.45 | % | | | | 8.15 | % | | | | 9.19 | % |
Russell Microcap Index | | | | 0.92 | % | | | | -10.39 | % | | | | 5.52 | % | | | | 12.54 | % | | | | 6.28 | % | | | | N/A | |
LipperMicro-Cap Stock Funds Index | | | | 1.11 | % | | | | -7.23 | % | | | | 5.82 | % | | | | 12.65 | % | | | | 7.15 | % | | | | N/A | |
Performance figures quoted in the table above represent past performance and are no guarantee of future results. Total return figures in the table above include the reinvestment of dividends and capital gains. The table above does not reflect the deduction of taxes that a shareholder would pay on Fund distributions or on the redemption of Fund shares.
The CRSPCap-Based Portfolio 10 Index is an unmanaged index of 699 of the smallest publicly traded U.S. stocks (with dividends reinvested), as reported by the Center for Research in Security Prices. The Russell Microcap Index is an unmanaged, market value weighted index that measures performance of 1,000 of the smallest securities in the Russell 2000 Index. The Russell 2000 Index is an unmanaged, market value weighted index that measures performance of the 2,000 companies that are between the 1,000th and 3,000th largest in the market (with dividends reinvested). The LipperMicro-Cap Stock Funds Index is an index ofmicro-cap funds compiled by Lipper, Inc. It is not possible to invest directly in an index. Periods longer than one year are annualized.
| | |
| 12 | | Annual Report | June 30, 2019 |
| | |
| Ultra-Small Company Fund | | |
MANAGER’S COMMENTARY (Unaudited)(continued) | | |
| | |
Growth of a $10,000 Investment
from Inception August 5, 1994 to June 30, 2019
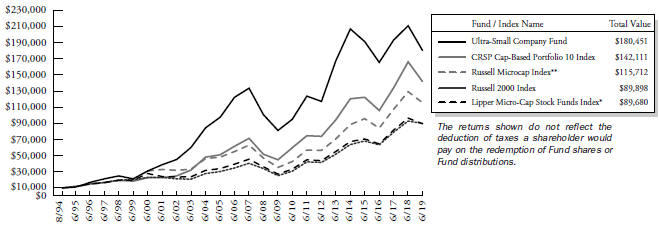
| * | The LipperMicro-Cap Stock Funds Index began on 12/31/1995, and the line graph for the Index begins at the same value as the Fund on that date. |
| ** | The Russell Microcap Index began on 6/30/2000, and the line graph for the Index begins at the same value as the Fund on that date. |
Detailed Explanation of Quarterly Performance
The Fund’s value metrics models lagged the benchmark and detracted from relative performance during the quarter. However, this negative impact was partially offset by outperformance from the Fund’s price momentum and company financial health model categories. The impact of the Fund’s tilt toward deeper value stocks across multiple valuation metrics was generally positive.
The Fund held approximately 18% of its assets, on average, outside of CRSP 10 during the quarter, including stocks that appreciated to CRSP 9. The Fund’s CRSP 9 holdings underperformed the benchmark and detracted from relative results. Interestingly, the Fund’s overweighting of CRSP 10’s smallest stocks also detracted from returns.
From a sector perspective, the Fund’s allocation effect was positive. An underweighting in the Energy sector and an overweighting in the Information Technology sector made the largest positive contributions to relative returns. However, the Fund’s stock selection effect was negative, largely driven by poor performance from holdings in the Health Care and Information Technology sectors.
| | |
| Ultra-Small Company Fund | |
|
MANAGER’S COMMENTARY (Unaudited)(continued) |
| | |
The table below presents index performance numbers for stocks in the different CRSP deciles during various time periods.
| | | | | | | | | | | | | | | | | | |
| | | | | | | | | Annualized | |
| CRSP Decile1 | | Quarter | | | 1 Year | | | 5 Years | | 10 Years | | | 93.5 Years | |
1 (ultra-large) | | | 4.21% | | | | 10.52% | | | 11.17% | | | 14.47% | | | | 9.44% | |
2 | | | 4.85% | | | | 11.33% | | | 9.83% | | | 15.44% | | | | 10.60% | |
3 | | | 4.51% | | | | 4.99% | | | 9.61% | | | 15.90% | | | | 11.06% | |
4 | | | 4.42% | | | | 7.21% | | | 7.29% | | | 14.83% | | | | 10.88% | |
5 | | | 2.17% | | | | -0.17% | | | 5.29% | | | 13.91% | | | | 11.33% | |
6 | | | 0.77% | | | | -4.65% | | | 5.51% | | | 13.98% | | | | 11.28% | |
7 | | | 2.82% | | | | 1.78% | | | 8.72% | | | 15.81% | | | | 11.57% | |
8 | | | -0.36% | | | | -8.65% | | | 4.98% | | | 13.33% | | | | 11.35% | |
9 | | | -0.66% | | | | -9.53% | | | 6.08% | | | 13.41% | | | | 11.40% | |
10 (ultra-small) | | | -4.00% | | | | -14.49% | | | 3.36% | | | 12.24% | | | | 13.04% | |
| 1 | Performance figures are as of the period ended June 30, 2019. The CRSPCap-Based Portfolio Indexes are unmanaged indexes of publicly traded U.S. stocks with dividends reinvested, grouped by market capitalization, as reported by the Center for Research in Security Prices. Past performance is no guarantee of future results. |
Detailed Explanation of Fiscal Year Performance
The Fund’s company financial health models slightly lagged the benchmark during the fiscal year, but its value metrics and price momentum models outperformed and helped offset this negative impact. The Fund’s tilt toward deeper value stocks across multiple valuation metrics hurt relative performance.
The Fund held approximately 18% of its assets, on average, outside of CRSP 10 during the year, including stocks that appreciated to CRSP 9. The Fund’s CRSP 9 holdings underperformed the benchmark and detracted from relative performance. As with the quarter, the Fund’s overweighting of CRSP 10’s smallest stocks also detracted from returns.
From a sector perspective, the Fund’s allocation effect was positive, with an overweighting in the Information Technology sector and an underweighting in the Energy sector improving relative results the most. The Fund’s stock selection effect was flat overall. Strong performance from holdings in the Health Care and Communication Services sectors was offset by the negative impact from holdings in the Information Technology and Energy sectors.
Top Ten Holdings as of June 30, 2019
| | | | | | | | | |
| Rank | | Description | | Industry | | % of Net
Assets |
| 1 | | Misonix, Inc. | | Health Care | | | | 2.5% | |
| 2 | | Lifevantage Corp. | | Consumer Staples | | | | 2.4% | |
| 3 | | Consumer Portfolio Services, Inc. | | Financials | | | | 2.2% | |
| 4 | | RF Industries, Ltd. | | Information Technology | | | | 2.2% | |
| 5 | | Genie Energy, Ltd., Class B | | Utilities | | | | 2.0% | |
| 6 | | Capitala Finance Corp. | | Financials | | | | 2.0% | |
| 7 | | Inseego Corp. | | Information Technology | | | | 2.0% | |
| 8 | | Rocky Brands, Inc. | | Consumer Discretionary | | | | 2.0% | |
| 9 | | Victory Capital Holdings, Inc., Class A | | Financials | | | | 1.9% | |
| 10 | | Ocwen Financial Corp. | | Financials | | | | 1.9% | |
| | Total | | | | | | 21.1% | |
| | |
| 14 | | Annual Report | June 30, 2019 |
| | |
| Ultra-Small Company Fund | | |
MANAGER’S COMMENTARY (Unaudited)(continued) | | |
| | |
Industry Sector Representation as of June 30, 2019
| | | | | | | | | | | | | | | |
| | | % of Net Assets | | % of CRSP 10 Index | | Difference |
Communication Services | | | | 4.8% | | | | | 6.5% | | | | | -1.7% | |
Consumer Discretionary | | | | 12.0% | | | | | 9.7% | | | | | 2.3% | |
Consumer Staples | | | | 3.9% | | | | | 2.5% | | | | | 1.4% | |
Energy | | | | 4.2% | | | | | 8.1% | | | | | -3.9% | |
Financials | | | | 21.6% | | | | | 24.5% | | | | | -2.9% | |
Health Care | | | | 22.4% | | | | | 21.5% | | | | | 0.9% | |
Industrials | | | | 10.1% | | | | | 10.3% | | | | | -0.2% | |
Information Technology | | | | 15.3% | | | | | 9.9% | | | | | 5.4% | |
Materials | | | | 3.4% | | | | | 3.6% | | | | | -0.2% | |
Real Estate | | | | 0.6% | | | | | 1.9% | | | | | -1.3% | |
Utilities | | | | 2.0% | | | | | 1.5% | | | | | 0.5% | |
Liabilities in Excess of Other Assets | | | | -0.3% | | | | | 0.0% | | | | | -0.3% | |
Total | | | | 100.0% | | | | | 100.0% | | | | | | |
Disclaimer
The views expressed here are exclusively those of Fund management. These views, including those related to market sectors or individual stocks, are not meant as investment advice and should not be considered predictive in nature. Any favorable (or unfavorable) description of a holding applies only as of the quarter end, June 30, 2019, unless otherwise stated. Security positions can and do change thereafter. Discussions of historical performance do not guarantee and may not be indicative of future performance.
The Fund is subject to very high, above market risk (volatility) and is not an appropriate investment for short-term investors. Investments in ultra-small companies generally carry greater risk than is customarily associated with larger companies and even “small companies” for various reasons, such as narrower markets (fewer investors), limited financial resources, and greater trading difficulty.
Conclusion
Ultra-Small Company Fund remains closed to new investors. We encourage your feedback; your reactions and concerns are important to us.
Sincerely,
The Investment Management Team
| | |
| Ultra-Small Company Fund | |
|
SCHEDULE OF INVESTMENTS |
| Showing percentage of net assets as of June 30, 2019 | | |
| | | | | | | | | | | | | | | | |
| Industry Company | | Shares | | | Value | | | | | | | |
| COMMON STOCKS - 100.28% | | | | | | | | | | |
Communication Services - 4.83% | | | | | |
Alaska Communications Systems Group, Inc.* | | | 381,200 | | | $ | 651,852 | | | | | | | | | |
Cinedigm Corp., Class A* | | | 32,000 | | | | 43,200 | | | | | | | | | |
Cumulus Media, Inc., Class A*+ | | | 25,700 | | | | 476,735 | | | | | | | | | |
DHI Group, Inc.* | | | 157,900 | | | | 563,703 | | | | | | | | | |
IDT Corp., Class B* | | | 25,000 | | | | 236,750 | | | | | | | | | |
Marchex, Inc., Class B* | | | 71,000 | | | | 333,700 | | | | | | | | | |
Travelzoo* | | | 82,300 | | | | 1,270,712 | | | | | | | | | |
| | | | | | | | | | | | | | | | |
| | | | |
| | | | | | | 3,576,652 | | | | | | | | | |
Consumer Discretionary - 11.96% | | | | | |
AMCON Distributing Co. | | | 2,100 | | | | 201,243 | | | | | | | | | |
Bassett Furniture Industries, Inc. | | | 8,700 | | | | 132,675 | | | | | | | | | |
Build-A-Bear Workshop, Inc.*+ | | | 71,500 | | | | 399,685 | | | | | | | | | |
Century Casinos, Inc.* | | | 21,000 | | | | 203,700 | | | | | | | | | |
Charles & Colvard, Ltd.* | | | 200,600 | | | | 316,948 | | | | | | | | | |
China XD Plastics Co., Ltd.*+ | | | 86,300 | | | | 181,230 | | | | | | | | | |
Comstock Holding Cos, Inc.*+ | | | 54,400 | | | | 144,160 | | | | | | | | | |
Delta Apparel, Inc.* | | | 18,200 | | | | 421,876 | | | | | | | | | |
Destination Maternity Corp.* | | | 31,900 | | | | 42,108 | | | | | | | | | |
Destination XL Group, Inc.* | | | 17,400 | | | | 30,624 | | | | | | | | | |
Educational Development Corp. | | | 62,000 | | | | 433,380 | | | | | | | | | |
J. Jill, Inc.+ | | | 231,800 | | | | 461,282 | | | | | | | | | |
Lakeland Industries, Inc.* | | | 47,000 | | | | 526,400 | | | | | | | | | |
Lincoln Educational Services Corp.*+ | | | 49,564 | | | | 114,493 | | | | | | | | | |
Live Ventures, Inc.*+ | | | 7,302 | | | | 50,749 | | | | | | | | | |
ONE Group Hospitality, Inc. (The)*+ | | | 27,400 | | | | 87,680 | | | | | | | | | |
Rocky Brands, Inc. | | | 53,700 | | | | 1,464,936 | | | | | | | | | |
RTW RetailWinds, Inc.* | | | 174,400 | | | | 296,480 | | | | | | | | | |
Rubicon Project, Inc. (The)* | | | 59,700 | | | | 379,692 | | | | | | | | | |
TravelCenters of America, LLC* | | | 349,600 | | | | 1,265,552 | | | | | | | | | |
Tuesday Morning Corp.*+ | | | 513,400 | | | | 867,646 | | | | | | | | | |
Vince Holding Corp.*+ | | | 47,100 | | | | 657,045 | | | | | | | | | |
Vitamin Shoppe, Inc.*+ | | | 43,800 | | | | 172,572 | | | | | | | | | |
| | | | | | | | | | | | | | | | |
| | | | |
| | | | | | | 8,852,156 | | | | | | | | | |
Consumer Staples - 3.93% | | | | | |
Alico, Inc. | | | 1,400 | | | | 42,476 | | | | | | | | | |
Lifevantage Corp.* | | | 136,600 | | | | 1,773,068 | | | | | | | | | |
Mannatech, Inc. | | | 13,809 | | | | 234,615 | | | | | | | | | |
Natural Alternatives International, Inc.* | | | 26,300 | | | | 306,658 | | | | | | | | | |
| | | | | | | | | | | | |
| Industry Company | | | Shares | | | | Value | | | | | |
| | | | | | | | | | | | |
Consumer Staples (continued) | |
Natural Grocers by Vitamin Cottage, Inc.* | | | 19,700 | | | $ | 197,985 | | | | | |
Reliv International, Inc.*+ | | | 26,939 | | | | 113,683 | | | | | |
Village Super Market, Inc., Class A+ | | | 9,100 | | | | 241,241 | | | | | |
| | | | | | | | | | | | |
| | | |
| | | | | | | 2,909,726 | | | | | |
Energy - 4.20% | |
Chaparral Energy, Inc., Class A*+ | | | 6,500 | | | | 30,615 | | | | | |
Earthstone Energy, Inc., Class A* | | | 16,000 | | | | 97,920 | | | | | |
Enservco Corp.* | | | 496,100 | | | | 186,583 | | | | | |
Lonestar Resources US, Inc., Class A* | | | 196,700 | | | | 450,443 | | | | | |
Midstates Petroleum Co., Inc.* | | | 48,100 | | | | 283,309 | | | | | |
Mitcham Industries, Inc.* | | | 93,000 | | | | 367,350 | | | | | |
NACCO Industries, Inc., Class A | | | 800 | | | | 41,552 | | | | | |
PrimeEnergy Resources Corp.* | | | 300 | | | | 39,939 | | | | | |
SilverBow Resources, Inc.* | | | 6,700 | | | | 92,795 | | | | | |
Superior Drilling Products, Inc.* | | | 122,800 | | | | 124,028 | | | | | |
Teekay Tankers, Ltd., Class A* | | | 299,300 | | | | 383,104 | | | | | |
TransAtlantic Petroleum, Ltd.* | | | 482,400 | | | | 347,376 | | | | | |
VAALCO Energy, Inc.* | | | 399,100 | | | | 666,497 | | | | | |
| | | | | | | | | | | | |
| | | |
| | | | | | | 3,111,511 | | | | | |
Financials - 21.56% | |
1347 Property Insurance Holdings, Inc.*+ | | | 7,800 | | | | 38,610 | | | | | |
A-Mark Precious Metals, Inc.*+ | | | 65,900 | | | | 859,995 | | | | | |
AmeriServ Financial, Inc. | | | 11,600 | | | | 48,140 | | | | | |
BCB Bancorp, Inc. | | | 8,200 | | | | 113,570 | | | | | |
C&F Financial Corp. | | | 13,652 | | | | 745,536 | | | | | |
Capitala Finance Corp. | | | 157,500 | | | | 1,488,375 | | | | | |
Central Federal Corp.* | | | 4,800 | | | | 57,792 | | | | | |
CM Finance, Inc. | | | 92,800 | | | | 706,208 | | | | | |
Codorus Valley Bancorp, Inc. | | | 2,672 | | | | 61,456 | | | | | |
Community West Bancshares | | | 5,000 | | | | 48,250 | | | | | |
Consumer Portfolio Services, Inc.* | | | 435,100 | | | | 1,653,380 | | | | | |
Elevate Credit, Inc.* | | | 59,200 | | | | 243,904 | | | | | |
FedNat Holding Co. | | | 87,300 | | | | 1,245,771 | | | | | |
| | |
| 16 | | Annual Report | June 30, 2019 |
| | |
| Ultra-Small Company Fund | | |
SCHEDULE OF INVESTMENTS(continued) | | |
| Showing percentage of net assets as of June 30, 2019 | | |
| | | | | | | | | | | | | | | | |
| Industry Company | | | Shares | | | | Value | | | | | | | | | |
Common Stocks (continued) | | | | | | | | | | | | | |
Financials (continued) | | | | | |
First Business Financial Services, Inc. | | | 2,500 | | | $ | 58,750 | | | | | | | | | |
First Savings Financial Group, Inc.+ | | | 1,100 | | | | 66,000 | | | | | | | | | |
First United Corp.+ | | | 9,800 | | | | 193,158 | | | | | | | | | |
GAMCO Investors, Inc., Class A | | | 1,900 | | | | 36,423 | | | | | | | | | |
Hallmark Financial Services, Inc.* | | | 13,700 | | | | 194,951 | | | | | | | | | |
Horizon Technology Finance Corp. | | | 51,300 | | | | 605,340 | | | | | | | | | |
Impac Mortgage Holdings, Inc.*+ | | | 68,381 | | | | 211,981 | | | | | | | | | |
Manning & Napier, Inc. | | | 134,900 | | | | 236,075 | | | | | | | | | |
Marlin Business Services Corp. | | | 3,200 | | | | 79,776 | | | | | | | | | |
Monroe Capital Corp.+ | | | 23,700 | | | | 273,498 | | | | | | | | | |
National Holdings Corp.* | | | 80,400 | | | | 217,884 | | | | | | | | | |
Northeast Bank | | | 41,200 | | | | 1,136,296 | | | | | | | | | |
Oaktree Strategic, Income Corp. | | | 7,300 | | | | 61,977 | | | | | | | | | |
Ocwen Financial Corp.* | | | 675,500 | | | | 1,398,285 | | | | | | | | | |
Orrstown Financial Services, Inc. | | | 1,800 | | | | 39,582 | | | | | | | | | |
Portman Ridge Finance Corp.+ | | | 380,600 | | | | 856,350 | | | | | | | | | |
Provident Financial Holdings, Inc. | | | 2,800 | | | | 58,772 | | | | | | | | | |
Pzena Investment Management, Inc., Class A | | | 64,300 | | | | 552,337 | | | | | | | | | |
Sachem Capital Corp.+ | | | 45,200 | | | | 240,012 | | | | | | | | | |
SB Financial Group, Inc.+ | | | 17,422 | | | | 286,766 | | | | | | | | | |
Security National Financial Corp., Class A* | | | 86,334 | | | | 433,397 | | | | | | | | | |
Victory Capital Holdings, Inc., Class A* | | | 81,700 | | | | 1,403,606 | | | | | | | | | |
| | | | | | | | | | | | | | | | |
| | | | |
| | | | | | | 15,952,203 | | | | | | | | | |
Health Care - 22.38% | | | | | |
Allied Healthcare Products, Inc.* | | | 66,481 | | | | 123,655 | | | | | | | | | |
Alphatec Holdings, Inc.*+ | | | 142,900 | | | | 648,766 | | | | | | | | | |
American Shared Hospital Services* | | | 101,400 | | | | 291,018 | | | | | | | | | |
Applied Genetic Technologies Corp.* | | | 42,600 | | | | 161,454 | | | | | | | | | |
Apyx Medical Corp.* | | | 25,000 | | | | 168,000 | | | | | | | | | |
Aquinox Pharmaceuticals, Inc.* | | | 17,800 | | | | 42,008 | | | | | | | | | |
Aravive, Inc.* | | | 22,000 | | | | 132,000 | | | | | | | | | |
| | | | | | | | | | | | | | | | |
| Industry Company | | | Shares | | | | Value | | | | | | | | | |
| | | | | | | | | | | | | | | | |
Health Care (continued) | | | | | |
Bioanalytical Systems, Inc.* | | | 121,110 | | | $ | 238,587 | | | | | | | | | |
Castlight Health, Inc., Class B* | | | 125,000 | | | | 403,750 | | | | | | | | | |
Celldex Therapeutics, Inc.*+ | | | 204,900 | | | | 549,132 | | | | | | | | | |
Cidara Therapeutics, Inc.* | | | 24,400 | | | | 40,992 | | | | | | | | | |
Community Health Systems, Inc.*+ | | | 76,300 | | | | 203,721 | | | | | | | | | |
Computer Programs & Systems, Inc. | | | 28,700 | | | | 797,573 | | | | | | | | | |
Conformis, Inc.*+ | | | 220,500 | | | | 961,380 | | | | | | | | | |
Cross Country Healthcare, Inc.* | | | 141,500 | | | | 1,327,270 | | | | | | | | | |
Cumberland Pharmaceuticals, Inc.* | | | 16,400 | | | | 104,468 | | | | | | | | | |
CynergisTek, Inc.*+ | | | 109,000 | | | | 527,560 | | | | | | | | | |
Daxor Corp.*+ | | | 4,400 | | | | 34,980 | | | | | | | | | |
Digirad Corp. | | | 44,090 | | | | 304,662 | | | | | | | | | |
ElectroCore, Inc.*+ | | | 45,800 | | | | 91,600 | | | | | | | | | |
Electromed, Inc.* | | | 207,638 | | | | 1,131,627 | | | | | | | | | |
Enzo Biochem, Inc.* | | | 214,300 | | | | 722,191 | | | | | | | | | |
Harvard Bioscience, Inc.* | | | 322,600 | | | | 645,200 | | | | | | | | | |
Infinity Pharmaceuticals, Inc.* | | | 147,900 | | | | 266,220 | | | | | | | | | |
InfuSystem Holdings, Inc.* | | | 273,798 | | | | 1,177,331 | | | | | | | | | |
IntriCon Corp.* | | | 12,000 | | | | 280,320 | | | | | | | | | |
InVivo Therapeutics Holdings Corp.* | | | 25,000 | | | | 18,500 | | | | | | | | | |
IRIDEX Corp.*+ | | | 20,900 | | | | 95,095 | | | | | | | | | |
IVERIC bio, Inc.* | | | 35,900 | | | | 46,670 | | | | | | | | | |
Jounce Therapeutics, Inc.* | | | 27,300 | | | | 135,135 | | | | | | | | | |
Kewaunee Scientific Corp. | | | 16,100 | | | | 308,154 | | | | | | | | | |
Lannett Co., Inc.*+ | | | 67,600 | | | | 409,656 | | | | | | | | | |
Misonix, Inc.* | | | 72,400 | | | | 1,840,408 | | | | | | | | | |
NantHealth, Inc.*+ | | | 60,900 | | | | 32,021 | | | | | | | | | |
Otonomy, Inc.* | | | 43,300 | | | | 119,075 | | | | | | | | | |
Pro-Dex, Inc.*+ | | | 28,200 | | | | 366,036 | | | | | | | | | |
RadNet, Inc.* | | | 15,000 | | | | 206,850 | | | | | | | | | |
RTI Surgical Holdings, Inc.* | | | 224,890 | | | | 955,782 | | | | | | | | | |
SeaSpine Holdings Corp.* | | | 33,900 | | | | 449,175 | | | | | | | | | |
SIGA Technologies, Inc.* | | | 34,100 | | | | 193,688 | | | | | | | | | |
SunLink Health Systems, Inc.* | | | 4,700 | | | | 6,909 | | | | | | | | | |
| | | | | | | | | | | | | | | | |
| | | | |
| | | | | | | 16,558,619 | | | | | | | | | |
Industrials - 10.12% | | | | | |
Acme United Corp.+ | | | 12,000 | | | | 270,960 | | | | | | | | | |
ARC Document Solutions, Inc.* | | | 130,600 | | | | 266,424 | | | | | | | | | |
Avalon Holdings Corp., Class A*+ | | | 14,700 | | | | 36,604 | | | | | | | | | |
| | |
| Ultra-Small Company Fund | |
|
SCHEDULE OF INVESTMENTS (continued) |
| Showing percentage of net assets as of June 30, 2019 | | |
| | | | | | | | | | | | |
| Industry Company | | Shares | | | Value | | | | |
| | | |
Common Stocks (continued) | | | | | | | | | | | | |
Industrials (continued) | | | | | |
BG Staffing, Inc. | | | 11,600 | | | $ | 219,008 | | | | | |
Chicago Rivet & Machine Co. | | | 1,900 | | | | 54,131 | | | | | |
Commercial Vehicle Group, Inc.* | | | 91,000 | | | | 729,820 | | | | | |
Construction Partners, Inc., Class A* | | | 4,300 | | | | 64,586 | | | | | |
Continental Materials Corp.* | | | 4,150 | | | | 66,400 | | | | | |
DLH Holdings Corp.* | | | 7,500 | | | | 38,100 | | | | | |
Eastern Co. (The) | | | 2,400 | | | | 67,248 | | | | | |
Ecology and Environment, Inc., Class A | | | 43,732 | | | | 476,679 | | | | | |
Fuel Tech, Inc.* | | | 203,500 | | | | 284,900 | | | | | |
Houston Wire & Cable Co.* | | | 7,400 | | | | 38,776 | | | | | |
Hudson Global, Inc.* | | | 2,019 | | | | 25,137 | | | | | |
Jason Industries, Inc.* | | | 234,900 | | | | 152,685 | | | | | |
LB Foster Co., Class A* | | | 2,100 | | | | 57,414 | | | | | |
Limbach Holdings, Inc.* | | | 22,500 | | | | 204,750 | | | | | |
LS Starrett Co. (The), Class A* | | | 32,300 | | | | 213,826 | | | | | |
LSI Industries, Inc. | | | 137,200 | | | | 500,780 | | | | | |
Miller Industries, Inc. | | | 3,200 | | | | 98,400 | | | | | |
Orion Energy Systems, Inc.* | | | 90,900 | | | | 269,973 | | | | | |
Preformed Line Products Co. | | | 1,200 | | | | 66,624 | | | | | |
Quest Resource Holding Corp.* | | | 22,000 | | | | 60,940 | | | | | |
Radiant Logistics, Inc.* | | | 217,600 | | | | 1,336,064 | | | | | |
Sterling Construction Co., Inc.* | | | 3,000 | | | | 40,260 | | | | | |
Sunworks, Inc.* | | | 119,600 | | | | 65,182 | | | | | |
Tel-Instrument Electronics Corp.* | | | 11,400 | | | | 26,904 | | | | | |
Transcat, Inc.* | | | 19,300 | | | | 493,887 | | | | | |
Virco Manufacturing Corp. | | | 17,600 | | | | 82,192 | | | | | |
Volt Information Sciences, Inc.* | | | 87,600 | | | | 393,324 | | | | | |
Willis Lease Finance Corp.* | | | 13,500 | | | | 787,320 | | | | | |
| | | | | | | | | | | | |
| | | |
| | | | | | | 7,489,298 | | | | | |
| |
Information Technology - 15.29% | | | | | |
AstroNova, Inc. | | | 8,800 | | | | 227,392 | | | | | |
Aviat Networks, Inc.* | | | 70,213 | | | | 961,918 | | | | | |
Blonder Tongue Laboratories, Inc.* | | | 290,100 | | | | 281,397 | | | | | |
Computer Task Group, Inc.* | | | 37,100 | | | | 148,771 | | | | | |
Digital Turbine, Inc.*+ | | | 90,000 | | | | 450,000 | | | | | |
Finjan Holdings, Inc.* | | | 334,100 | | | | 741,702 | | | | | |
Inseego Corp.*+ | | | 309,300 | | | | 1,481,547 | | | | | |
inTEST Corp.* | | | 220,100 | | | | 1,058,681 | | | | | |
Intevac, Inc.* | | | 6,700 | | | | 32,428 | | | | | |
Luna Innovations, Inc.* | | | 235,630 | | | | 1,060,335 | | | | | |
| | | | | | | | | | | | | | | | | | |
| Industry Company | | | | Shares | | | Value | | | | | | | |
| | |
Information Technology (continued) | | | | | | | | | |
NetSol Technologies, Inc.*+ | | | 47,600 | | | $ | 266,084 | | | | | | | | | |
PCM, Inc.* | | | 14,100 | | | | 494,064 | | | | | | | | | |
PC-Tel, Inc. | | | 77,800 | | | | 344,654 | | | | | | | | | |
PRGX Global, Inc.* | | | 20,000 | | | | 134,400 | | | | | | | | | |
RF Industries, Ltd.+ | | | 193,898 | | | | 1,636,499 | | | | | | | | | |
Richardson Electronics, Ltd. | | | 12,600 | | | | 70,560 | | | | | | | | | |
Schmitt Industries, Inc.*+ | | | 70,802 | | | | 164,969 | | | | | | | | | |
Synacor, Inc.* | | | 26,000 | | | | 40,560 | | | | | | | | | |
Taitron Components, Inc., Class A+ | | | 68,500 | | | | 219,200 | | | | | | | | | |
TESSCO Technologies, Inc. | | | 44,500 | | | | 794,770 | | | | | | | | | |
TransAct Technologies, Inc. | | | 62,800 | | | | 707,128 | | | | | | | | | |
| | | | | | | | | | | | | | | | | | |
| | | | | |
| | | | | | | | | 11,317,059 | | | | | | | | | |
| | |
Materials - 3.42% | | | | | | | | | |
China Advanced Construction Materials Group, Inc./Cayman*+ | | | 15,700 | | | | 56,363 | | | | | | | | | |
Flexible Solutions International, Inc.+ | | | 37,200 | | | | 167,772 | | | | | | | | | |
Friedman Industries, Inc. | | | 71,800 | | | | 499,728 | | | | | | | | | |
Gold Resource Corp. | | | 115,300 | | | | 389,714 | | | | | | | | | |
Gulf Resources, Inc.* | | | 536,800 | | | | 526,064 | | | | | | | | | |
Olympic Steel, Inc. | | | 29,700 | | | | 405,405 | | | | | | | | | |
UFP Technologies, Inc.* | | | 11,600 | | | | 482,676 | | | | | | | | | |
| | | | | | | | | | | | | | | | | | |
| | | | | |
| | | | | | | | | 2,527,722 | | | | | | | | | |
| | |
Real Estate - 0.56% | | | | | | | | | |
BRT Apartments Corp. | | | 8,900 | | | | 125,757 | | | | | | | | | |
Condor Hospitality Trust, Inc.+ | | | 4,800 | | | | 43,536 | | | | | | | | | |
Griffin Industrial Realty, Inc. | | | 7,000 | | | | 247,450 | | | | | | | | | |
| | | | | | | | | | | | | | | | | | |
| | | | | |
| | | | | | | | | 416,743 | | | | | | | | | |
| | |
Utilities - 2.03% | | | | | | | | | |
Genie Energy, Ltd., Class B | | | 140,800 | | | | 1,499,520 | | | | | | | | | |
| | | | | | | | | | | | | | | | | | |
| | | |
TOTAL COMMON STOCKS - 100.28% | | | | 74,211,209 | | | | | | | | | |
| | | | | | | | | | | | | | | | | | |
(Cost $80,619,609) | | | | | | | | | | | | | | | | | | |
| | | | | |
| | | Rate^ | | Shares | | | Value | | | | | | | |
MONEY MARKET FUND - 0.00% | | | | | | | | | |
Fidelity Investments Money Market Government Portfolio Class I | | 2.25% | | | 779 | | | | 779 | | | | | | | | | |
| | | | | | | | | | | | | | | | | | |
| | | |
TOTAL MONEY MARKET FUND - 0.00% | | | | 779 | | | | | | | | | |
| | | | | | | | | | | | | | | | | | |
(Cost $779) | | | | | | | | | | | | | | | | | | |
| | |
| 18 | | Annual Report | June 30, 2019 |
| | |
| Ultra-Small Company Fund | | |
SCHEDULE OF INVESTMENTS (continued) | | |
| Showing percentage of net assets as of June 30, 2019 | | |
| | | | | | | | | | | | | | | | |
| | | Rate^ | | | Shares | | | Value | | | | |
| |
| INVESTMENTS PURCHASED WITH CASH PROCEEDS FROM SECURITIES LENDING - 7.68% | | | | | |
Fidelity Investments Money Market Government Portfolio Class I** | | | 2.25 | % | | | 5,682,874 | | | | $5,682,874 | | | | | |
| | | | | | | | | | | | | | | | |
TOTAL INVESTMENTS PURCHASED WITH CASH PROCEEDS FROM SECURITIESLENDING - 7.68% | | | | 5,682,874 | | | | | |
| | | | | | | | | | | | | | | | |
(Cost $5,682,874) | | | | | | | | | | | | | |
| | |
TOTAL INVESTMENTS - 107.96% | | | | $79,894,862 | | | | | |
(Cost $86,303,262) | | | | | | | | | | | | | |
Liabilities in Excess of Other Assets - (7.96%) | | | | (5,889,450 | ) | | | | |
| | | | | | | | | | | | | | | | |
| | |
NET ASSETS - 100.00% | | | | $74,005,412 | | | | | |
| | | | | | | | | | | | | | | | |
* Non-income producing security. ** This security represents the investment of the collateral received in connection with securities out on loan as of June 30, 2019. ^ Rate disclosed as of June 30, 2019. + This security or a portion of the security is out on loan as of June 30, 2019. Total loaned securities had a value of $5,628,761 as of June 30, 2019. LLC - Limited Liability Company | |
Summary of inputs used to value the Fund’s investments as of 06/30/2019 (See Note 2 in Notes to Financial Statements):
| | | | | | | | | | | | | | | | |
| |
| | | Valuation Inputs | |
| | | Investment in Securities (Value) | |
| | | Level 1
Quoted
Prices | | | Level 2
Significant
Observable
Inputs | | | Level 3
Significant Unobservable
Inputs | | | Total | |
| | | | |
| Common Stocks (a) | | $ | 74,211,209 | | | $ | — | | | $ | — | | | $ | 74,211,209 | |
Money Market Fund | | | — | | | | 779 | | | | — | | | | 779 | |
Investments Purchased with Cash Proceeds from Securities Lending | | | — | | | | 5,682,874 | | | | — | | | | 5,682,874 | |
| | | | | | | | | | | | | | | | |
TOTAL | | $ | 74,211,209 | | | $ | 5,683,653 | | | $ | — | | | $ | 79,894,862 | |
| | | | | | | | | | | | | | | | |
(a) - Please refer to the Schedule of Investments for the industry classifications of these portfolio holdings.
See Notes to Financial Statements.
| | |
| Ultra-Small Company Market Fund | |
|
MANAGER’S COMMENTARY (Unaudited) |
| | |
June 30, 2019
Dear Fellow Ultra-Small Company Market Fund Shareholder,
For the quarter ended June 30, 2019, our Fund returned-2.66%, outperforming our primary market benchmark, the CRSPCap-Based Portfolio 10 Index(-4.00%), but underperforming our peer benchmark, the LipperMicro-Cap Stock Funds Index (+1.11%), the Russell 2000 Index (+2.10%) and the Russell Microcap Index (+0.92%). Results in the quarter were mixed.
For the fiscal year, our Fund returned-16.98%, underperforming the CRSPCap-Based Portfolio 10 Index(-14.49%) and the LipperMicro-Cap Stock Funds Index(-7.23%), as well as the Russell 2000 Index(-3.31%) and the Russell Microcap Index(-10.39%).
The table below presents our June quarter,one-year, five-year,10-year,15-year, andinception-to-date financial results. See the next page for a graph of performance since inception.
Standardized Returns as of June 30, 2019
| | | | | | | | | | | | | | | | | | | | | | | | | | | | | | |
| | | | | | | Annualized | | |
| | | Quarter | | 1 Year | | 5 Years | | 10 Years | | 15 Years | | Since Inception
(7/31/97) |
| | | | | | |
Ultra-Small Company Market Fund | | | | -2.66 | % | | | | -16.98 | % | | | | 3.27 | % | | | | 11.23 | % | | | | 5.82 | % | | | | 9.71 | % |
CRSPCap-Based Portfolio 10 Index | | | | -4.00 | % | | | | -14.49 | % | | | | 3.36 | % | | | | 12.24 | % | | | | 7.49 | % | | | | 10.06 | % |
Russell 2000 Index | | | | 2.10 | % | | | | -3.31 | % | | | | 7.06 | % | | | | 13.45 | % | | | | 8.15 | % | | | | 7.67 | % |
Russell Microcap Index | | | | 0.92 | % | | | | -10.39 | % | | | | 5.52 | % | | | | 12.54 | % | | | | 6.28 | % | | | | N/A | |
LipperMicro-Cap Stock Funds Index | | | | 1.11 | % | | | | -7.23 | % | | | | 5.82 | % | | | | 12.65 | % | | | | 7.15 | % | | | | 7.74 | % |
Performance figures quoted in the table above represent past performance and are no guarantee of future results. Total return figures in the table above include the reinvestment of dividends and capital gains. The table above does not reflect the deduction of taxes that a shareholder would pay on Fund distributions or on the redemption of Fund shares.
The CRSPCap-Based Portfolio 10 Index is an unmanaged index of 699 of the smallest publicly traded U.S. stocks with dividends reinvested, as reported by the Center for Research in Security Prices. The Russell Microcap Index is an unmanaged, market value weighted index that measures performance of 1,000 of the smallest securities in the Russell 2000 Index. The Russell 2000 Index is an unmanaged, market value weighted index that measures performance of the 2,000 companies that are between the 1,000th and 3,000th largest in the market with dividends reinvested. The LipperMicro-Cap Stock Funds Index is an index ofmicro-cap funds compiled by Lipper, Inc. It is not possible to invest directly in an index. Periods longer than one year are annualized.
| | |
| 20 | | Annual Report | June 30, 2019 |
| | |
| Ultra-Small Company Market Fund | | |
MANAGER’S COMMENTARY (Unaudited)(continued) | | |
| | |
Growth of a $10,000 Investment
from Inception July 31, 1997 to June 30, 2019
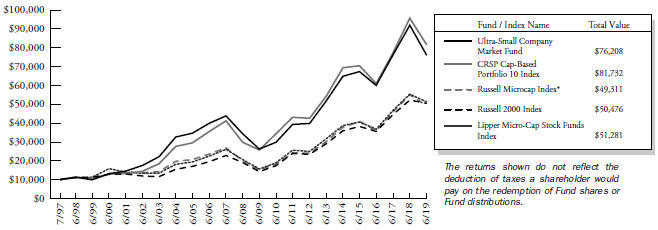
| * | The Russell Microcap Index began on 6/30/2000, and the line graph for the Index begins at the same value as the Fund on that date. |
Detailed Explanation of Quarterly Performance
The Fund’s sidestepping strategies, which eliminate exposure to stocks with high probability of a steep price decline, major financial distress or bankruptcy, helped performance against the benchmark during the quarter. The Fund held about 18% of its assets, on average, in stocks outside of CRSP 10. The Fund benefited slightly from holdings that had appreciated into CRSP 9, which outperformed the benchmark.
From a sector perspective, the Fund’s stock selection effect was positive, with holdings in the Consumer Discretionary, Health Care, and Energy sectors contributing the most to relative performance.
The table below presents index performance numbers for stocks in the different CRSP deciles during various time periods.
| | | | | | | | | | | | | | | | | | | | |
| | | | | | | | | Annualized | |
| CRSP Decile1 | | Quarter | | | 1 Year | | | 5 Years | | | 10 Years | | | 93.5 Years | |
| 1 (ultra-large) | | | 4.21% | | | | 10.52% | | | | 11.17% | | | | 14.47% | | | | 9.44% | |
| 2 | | | 4.85% | | | | 11.33% | | | | 9.83% | | | | 15.44% | | | | 10.60% | |
| 3 | | | 4.51% | | | | 4.99% | | | | 9.61% | | | | 15.90% | | | | 11.06% | |
| 4 | | | 4.42% | | | | 7.21% | | | | 7.29% | | | | 14.83% | | | | 10.88% | |
| 5 | | | 2.17% | | | | -0.17% | | | | 5.29% | | | | 13.91% | | | | 11.33% | |
| 6 | | | 0.77% | | | | -4.65% | | | | 5.51% | | | | 13.98% | | | | 11.28% | |
| 7 | | | 2.82% | | | | 1.78% | | | | 8.72% | | | | 15.81% | | | | 11.57% | |
| 8 | | | -0.36% | | | | -8.65% | | | | 4.98% | | | | 13.33% | | | | 11.35% | |
| 9 | | | -0.66% | | | | -9.53% | | | | 6.08% | | | | 13.41% | | | | 11.40% | |
| 10 (ultra-small) | | | -4.00% | | | | -14.49% | | | | 3.36% | | | | 12.24% | | | | 13.04% | |
| 1 | Performance figures are as of the period ended June 30, 2019. The CRSPCap-Based Portfolio Indexes are unmanaged indexes of publicly traded U.S. stocks with dividends reinvested, grouped by market capitalization, as reported by the Center for Research in Security Prices. Past performance is no guarantee of future results. |
| | |
| Ultra-Small Company Market Fund | | |
MANAGER’S COMMENTARY (Unaudited)(continued) | | |
| | |
Detailed Explanation of Fiscal Year Performance
The Fund held about 20% of its assets, on average, in stocks outside of CRSP 10 during the fiscal year. These larger stocks underperformed the benchmark and hurt the Fund’s relative returns. However, the Fund’s sidestepping strategies, which eliminate exposure to stocks with high probability of a steep price decline, major financial distress or bankruptcy, helped returns relative to the benchmark.
From a sector perspective, the Fund’s stock selection effect was negative. Holdings in the Information Technology sector detracted the most from relative results. Holdings in the Financials and Energy sectors also hurt relative performance.
Top Ten Holdings as of June 30, 2019
| | | | | | | | | |
| Rank | | Description | | Industry | | % of Net
Assets |
| 1 | | Pacific Biosciences of California, Inc. | | Health Care | | 0.7% |
| 2 | | Chiasma, Inc. | | Health Care | | 0.6% |
| 3 | | Mutualfirst Financial, Inc. | | Financials | | 0.6% |
| 4 | | Utah Medical Products, Inc. | | Health Care | | 0.5% |
| 5 | | CEL-SCI Corp. | | Health Care | | 0.5% |
| 6 | | Stratus Properties, Inc. | | Real Estate | | 0.5% |
| 7 | | Willis Lease Finance Corp. | | Industrials | | 0.5% |
| 8 | | Alphatec Holdings, Inc. | | Health Care | | 0.5% |
| 9 | | Synchronoss Technologies, Inc. | | Information Technology | | 0.5% |
| 10 | | Zynerba Pharmaceuticals, Inc. | | Health Care | | 0.5% |
| | Total | | | | 5.4% |
Industry Sector Representation as of June 30, 2019
| | | | | | | | | | | | | | | |
| | | % of Net Assets | | % of CRSP 10 Index | | Difference |
Communication Services | | | | 4.5% | | | | | 6.5% | | | | | -2.0% | |
Consumer Discretionary | | | | 11.3% | | | | | 9.7% | | | | | 1.6% | |
Consumer Staples | | | | 2.1% | | | | | 2.5% | | | | | -0.4% | |
Energy | | | | 8.2% | | | | | 8.1% | | | | | 0.1% | |
Financials | | | | 23.7% | | | | | 24.5% | | | | | -0.8% | |
Health Care | | | | 20.5% | | | | | 21.5% | | | | | -1.0% | |
Industrials | | | | 10.8% | | | | | 10.3% | | | | | 0.5% | |
Information Technology | | | | 10.5% | | | | | 9.9% | | | | | 0.6% | |
Materials | | | | 3.6% | | | | | 3.6% | | | | | 0.0% | |
Real Estate | | | | 1.8% | | | | | 1.9% | | | | | -0.1% | |
Utilities | | | | 1.6% | | | | | 1.5% | | | | | 0.1% | |
Cash & Other Assets | | | | 1.4% | | | | | 0.0% | | | | | 1.4% | |
Total | | | | 100.0% | | | | | 100.0% | | | | | | |
Disclaimer
The views expressed here are exclusively those of Fund management. These views, including those related to market sectors or individual stocks, are not meant as investment advice and should not be considered predictive in nature. Any favorable (or unfavorable) description of a holding applies only as of the quarter end, June 30, 2019, unless otherwise stated. Security positions can and do change thereafter. Discussions of historical performance do not guarantee and may not be indicative of future performance.
The Fund is subject to very high, above market risk (volatility) and is not an appropriate investment for short-term investors. Investments in ultra-small companies generally carry greater risk than is customarily associated with larger companies and
| | |
| 22 | | Annual Report | June 30, 2019 |
| | |
| Ultra-Small Company Market Fund | | |
MANAGER’S COMMENTARY (Unaudited)(continued) | | |
| | |
even “small companies” for various reasons, such as narrower markets (fewer investors), limited financial resources and greater trading difficulty.
Conclusion
Thank you for your continued investment in Ultra-Small Company Market Fund. We encourage your feedback; your reactions and concerns are important to us.
Sincerely,
The Investment Management Team
| | |
| Ultra-Small Company Market Fund | |
|
SCHEDULE OF INVESTMENTS |
| Showing percentage of net assets as of June 30, 2019 | | |
| | | | | | | | | | | | | | | | |
| Industry Company | | Shares | | | Value | | | | | | | |
| | | | |
COMMON STOCKS - 98.56% | | | | | | | | | | | | | | | | |
Communication Services - 4.45% | | | | | | | | | |
A.H. Belo Corp., Class A | | | 90,883 | | | $ | 335,358 | | | | | | | | | |
Alaska Communications Systems Group, Inc.* | | | 279,500 | | | | 477,945 | | | | | | | | | |
Ballantyne Strong, Inc.* | | | 92,020 | | | | 297,225 | | | | | | | | | |
Beasley Broadcast Group, Inc., Class A+ | | | 11,125 | | | | 35,822 | | | | | | | | | |
Chicken Soup For The Soul Entertainment, Inc.+ | | | 15,000 | | | | 112,500 | | | | | | | | | |
DHI Group, Inc.* | | | 182,200 | | | | 650,454 | | | | | | | | | |
Emmis Communications Corp., Class A* | | | 50,000 | | | | 237,500 | | | | | | | | | |
Entravision Communications Corp., Class A | | | 165,000 | | | | 514,800 | | | | | | | | | |
EverQuote, Inc., Class A* | | | 15,000 | | | | 195,000 | | | | | | | | | |
Fluent, Inc.* | | | 100,000 | | | | 538,000 | | | | | | | | | |
Frontier Communications Corp.*+ | | | 445,000 | | | | 778,750 | | | | | | | | | |
Harte-Hanks, Inc.* | | | 72,533 | | | | 159,573 | | | | | | | | | |
IDT Corp., Class B* | | | 78,600 | | | | 744,342 | | | | | | | | | |
Lee Enterprises, Inc.* | | | 232,700 | | | | 521,248 | | | | | | | | | |
Marchex, Inc., Class B* | | | 192,400 | | | | 904,280 | | | | | | | | | |
McClatchy Co. (The), Class A*+ | | | 45,011 | | | | 117,479 | | | | | | | | | |
NII Holdings, Inc.* | | | 228,500 | | | | 386,165 | | | | | | | | | |
Ooma, Inc.* | | | 65,800 | | | | 689,584 | | | | | | | | | |
Saga Communications, Inc., Class A | | | 13,016 | | | | 406,620 | | | | | | | | | |
Salem Media Group, Inc. | | | 100,000 | | | | 243,000 | | | | | | | | | |
Spok Holdings, Inc. | | | 60,000 | | | | 902,400 | | | | | | | | | |
Townsquare Media, Inc., Class A | | | 78,500 | | | | 422,330 | | | | | | | | | |
Travelzoo* | | | 45,000 | | | | 694,800 | | | | | | | | | |
Xcel Brands, Inc.* | | | 91,000 | | | | 131,950 | | | | | | | | | |
Zedge, Inc., Class B* | | | 16,855 | | | | 27,811 | | | | | | | | | |
| | | | | | | | | | | | | | | | |
| | | | |
| | | | | | | 10,524,936 | | | | | | | | | |
| | |
Consumer Discretionary - 11.33% | | | | | | | | | |
AMCON Distributing Co. | | | 3,900 | | | | 373,737 | | | | | | | | | |
Ark Restaurants Corp. | | | 17,900 | | | | 366,055 | | | | | | | | | |
Ascena Retail Group, Inc.* | | | 150,000 | | | | 91,500 | | | | | | | | | |
Barnes & Noble Education, Inc.* | | | 160,000 | | | | 537,600 | | | | | | | | | |
Bassett Furniture Industries, Inc. | | | 37,044 | | | | 564,921 | | | | | | | | | |
Build-A-Bear Workshop, Inc.* | | | 54,200 | | | | 302,978 | | | | | | | | | |
China XD Plastics Co., Ltd.* | | | 56,000 | | | | 117,600 | | | | | | | | | |
Citi Trends, Inc. | | | 40,800 | | | | 596,496 | | | | | | | | | |
Collectors Universe, Inc. | | | 36,760 | | | | 784,458 | | | | | | | | | |
Container Store Group, Inc.
(The)*+ | | | 78,300 | | | | 573,156 | | | | | | | | | |
CSS Industries, Inc. | | | 37,000 | | | | 180,560 | | | | | | | | | |
| | | | | | | | |
| Industry Company | | Shares | | | Value | |
|
Consumer Discretionary (continued) | |
Culp, Inc. | | | 40,000 | | | $ | 760,000 | |
Del Frisco’s Restaurant Group, Inc.*+ | | | 70,000 | | | | 557,200 | |
Delta Apparel, Inc.* | | | 32,988 | | | | 764,662 | |
Destination Maternity Corp.* | | | 27,200 | | | | 35,904 | |
Destination XL Group, Inc.*+ | | | 202,222 | | | | 355,911 | |
Dixie Group, Inc. (The)* | | | 93,200 | | | | 54,056 | |
Dover Motorsports, Inc. | | | 123,396 | | | | 256,664 | |
Educational Development Corp. | | | 41,400 | | | | 289,386 | |
Emerson Radio Corp.* | | | 187,100 | | | | 192,713 | |
Escalade, Inc. | | | 33,780 | | | | 387,457 | |
Famous Dave’s of America, Inc.*+ | | | 54,838 | | | | 241,836 | |
Flexsteel Industries, Inc. | | | 27,000 | | | | 460,620 | |
Fred’s, Inc., Class A*+ | | | 115,000 | | | | 56,534 | |
Gaia, Inc.*+ | | | 48,400 | | | | 366,872 | |
GNC Holdings, Inc., Class A*+ | | | 200,000 | | | | 300,000 | |
Habit Restaurants, Inc. (The), Class A* | | | 30,500 | | | | 319,945 | |
Hamilton Beach Brands Holding Co., Class A | | | 32,000 | | | | 609,600 | |
Horizon Global Corp.*+ | | | 115,000 | | | | 412,850 | |
J Alexander’s Holdings, Inc.* | | | 83,800 | | | | 941,074 | |
J. Jill, Inc.+ | | | 75,000 | | | | 149,250 | |
JAKKS Pacific, Inc.* | | | 143,600 | | | | 100,520 | |
Kandi Technologies Group, Inc.*+ | | | 70,100 | | | | 345,593 | |
Lakeland Industries, Inc.* | | | 31,557 | | | | 353,438 | |
Leaf Group, Ltd.* | | | 80,000 | | | | 592,800 | |
Libbey, Inc.*+ | | | 125,000 | | | | 232,500 | |
Lifetime Brands, Inc. | | | 66,500 | | | | 629,090 | |
Lincoln Educational Services Corp.* | | | 229,405 | | | | 529,926 | |
Liquidity Services, Inc.* | | | 82,000 | | | | 499,380 | |
Luby’s, Inc.* | | | 145,500 | | | | 157,140 | |
New Home Co., Inc.
(The)*+ | | | 68,400 | | | | 263,340 | |
P&F Industries, Inc., Class A | | | 10,500 | | | | 87,360 | |
Peak Resorts, Inc. | | | 71,000 | | | | 337,250 | |
Potbelly Corp.* | | | 97,000 | | | | 493,730 | |
Red Lion Hotels Corp.* | | | 74,900 | | | | 532,539 | |
Rocky Brands, Inc. | | | 34,600 | | | | 943,888 | |
RTW RetailWinds, Inc.* | | | 224,400 | | | | 381,480 | |
Shiloh Industries, Inc.* | | | 74,500 | | | | 362,815 | |
SORL Auto Parts, Inc.*+ | | | 106,058 | | | | 368,021 | |
Sportsman’s Warehouse Holdings, Inc.* | | | 164,015 | | | | 619,977 | |
Stage Stores, Inc.+ | | | 100,000 | | | | 77,000 | |
Stein Mart, Inc.*+ | | | 160,800 | | | | 138,288 | |
Strattec Security Corp. | | | 16,700 | | | | 402,470 | |
| | |
| 24 | | Annual Report | June 30, 2019 |
| | |
| Ultra-Small Company Market Fund | | |
SCHEDULE OF INVESTMENTS(continued) | | |
| Showing percentage of net assets as of June 30, 2019 | | |
| | | | | | | | | | | | | | | | |
| Industry Company | | Shares | | | Value | | | | | | | |
| | | | |
Common Stocks (continued) | | | | | | | | | | | | | | | | |
Consumer Discretionary (continued) | | | | | | | | | |
Superior Group of Cos, Inc. | | | 45,500 | | | $ | 779,415 | | | | | | | | | |
Superior Industries | | | | | | | | | | | | | | | | |
International, Inc. | | | 25,000 | | | | 86,500 | | | | | | | | | |
Sypris Solutions, Inc.* | | | 84,404 | | | | 65,413 | | | | | | | | | |
Tandy Leather Factory, Inc.* | | | 72,000 | | | | 396,000 | | | | | | | | | |
Town Sports International Holdings, Inc.* | | | 90,000 | | | | 195,300 | | | | | | | | | |
Trans World Entertainment Corp.* | | | 148,403 | | | | 37,101 | | | | | | | | | |
TravelCenters of America, LLC* | | | 166,500 | | | | 602,730 | | | | | | | | | |
Tuesday Morning Corp.* | | | 164,100 | | | | 277,329 | | | | | | | | | |
Turtle Beach Corp.*+ | | | 66,854 | | | | 772,832 | | | | | | | | | |
Unique Fabricating, Inc.+ | | | 50,000 | | | | 135,500 | | | | | | | | | |
Universal Technical Institute, Inc.* | | | 102,100 | | | | 350,203 | | | | | | | | | |
UQM Technologies, Inc.* | | | 94,000 | | | | 155,100 | | | | | | | | | |
US Auto Parts Network, Inc.* | | | 169,438 | | | | 211,798 | | | | | | | | | |
Vince Holding Corp.* | | | 39,600 | | | | 552,420 | | | | | | | | | |
Vitamin Shoppe, Inc.*+ | | | 159,500 | | | | 628,430 | | | | | | | | | |
VOXX International Corp.* | | | 94,500 | | | | 393,120 | | | | | | | | | |
Weyco Group, Inc. | | | 5,000 | | | | 133,550 | | | | | | | | | |
YogaWorks, Inc.* | | | 14,130 | | | | 8,478 | | | | | | | | | |
ZAGG, Inc.* | | | 79,900 | | | | 556,104 | | | | | | | | | |
| | | | | | | | | | | | | | | | |
| | | | |
| | | | | | | 26,787,463 | | | | | | | | | |
| | |
Consumer Staples - 2.05% | | | | | | | | | |
Alico, Inc. | | | 16,200 | | | | 491,508 | | | | | | | | | |
Bridgford Foods Corp.*+ | | | 1,300 | | | | 38,688 | | | | | | | | | |
Castle Brands, Inc.* | | | 213,987 | | | | 99,269 | | | | | | | | | |
Lifeway Foods, Inc.* | | | 55,152 | | | | 200,753 | | | | | | | | | |
Mannatech, Inc. | | | 13,600 | | | | 231,064 | | | | | | | | | |
Natural Alternatives International, Inc.* | | | 40,310 | | | | 470,015 | | | | | | | | | |
Natural Grocers by Vitamin Cottage, Inc.* | | | 69,400 | | | | 697,470 | | | | | | | | | |
Oil-Dri Corp. of America | | | 25,700 | | | | 874,828 | | | | | | | | | |
Reed’s, Inc.* | | | 103,700 | | | | 391,986 | | | | | | | | | |
Rocky Mountain Chocolate Factory, Inc. | | | 30,000 | | | | 252,000 | | | | | | | | | |
Seneca Foods Corp., Class A* | | | 26,500 | | | | 737,495 | | | | | | | | | |
United-Guardian, Inc. | | | 19,000 | | | | 357,200 | | | | | | | | | |
| | | | | | | | | | | | | | | | |
| | | | |
| | | | | | | 4,842,276 | | | | | | | | | |
| | |
Energy - 8.17% | | | | | | | | | |
Adams Resources & Energy, Inc. | | | 24,300 | | | | 833,004 | | | | | | | | | |
Aspen Aerogels, Inc.* | | | 117,100 | | | | 834,923 | | | | | | | | | |
Barnwell Industries, Inc.* | | | 54,320 | | | | 61,382 | | | | | | | | | |
CARBO Ceramics, Inc.*+ | | | 65,000 | | | | 87,750 | | | | | | | | | |
| | | | | | | | |
| Industry Company | | Shares | | | Value | |
|
Energy (continued) | |
Chaparral Energy, Inc., Class A*+ | | | 89,700 | | | $ | 422,487 | |
Clean Energy Fuels Corp.* | | | 180,000 | | | | 480,600 | |
Contango Oil & Gas Co.*+ | | | 208,730 | | | | 363,190 | |
Dawson Geophysical Co.* | | | 49,745 | | | | 124,362 | |
Earthstone Energy, Inc., Class A* | | | 64,302 | | | | 393,528 | |
Era Group, Inc.* | | | 97,350 | | | | 811,899 | |
Evolution Petroleum Corp. | | | 130,123 | | | | 930,379 | |
Geospace Technologies Corp.* | | | 55,663 | | | | 841,068 | |
Goodrich Petroleum Corp.* | | | 50,000 | | | | 649,500 | |
Gulf Island Fabrication, Inc.* | | | 63,400 | | | | 450,140 | |
Hornbeck Offshore Services, Inc.* | | | 215,000 | | | | 268,750 | |
Independence Contract Drilling, Inc.* | | | 284,100 | | | | 448,878 | |
ION Geophysical Corp.* | | | 127,816 | | | | 1,028,919 | |
Key Energy Services, Inc.*+ | | | 54,000 | | | | 121,500 | |
Lonestar Resources US, Inc., Class A* | | | 141,400 | | | | 323,806 | |
Mexco Energy Corp.*+ | | | 12,000 | | | | 47,400 | |
Midstates Petroleum Co., Inc.* | | | 125,000 | | | | 736,250 | |
Mitcham Industries, Inc.* | | | 119,545 | | | | 472,203 | |
NACCO Industries, Inc., Class A | | | 20,000 | | | | 1,038,800 | |
Natural Gas Services Group, Inc.* | | | 34,376 | | | | 567,204 | |
NCS Multistage Holdings, Inc.* | | | 199,200 | | | | 707,160 | |
New Concept Energy, Inc.*+ | | | 8,400 | | | | 15,456 | |
Nuverra Environmental Solutions, Inc.*+ | | | 2,689 | | | | 11,052 | |
Overseas Shipholding Group, Inc., Class A* | | | 464,700 | | | | 873,636 | |
Panhandle Oil and Gas, Inc., Class A | | | 35,594 | | | | 464,146 | |
PEDEVCO Corp.*+ | | | 40,000 | | | | 83,200 | |
Pioneer Energy Services Corp.* | | | 395,000 | | | | 99,896 | |
Quintana Energy Services, Inc.*+ | | | 183,514 | | | | 295,458 | |
Ranger Energy Services, Inc.*+ | | | 40,600 | | | | 326,830 | |
REX American Resources Corp.* | | | 6,249 | | | | 455,552 | |
RigNet, Inc.* | | | 71,309 | | | | 718,795 | |
SEACOR Marine Holdings, Inc.* | | | 45,440 | | | | 679,782 | |
SilverBow Resources, Inc.* | | | 21,148 | | | | 292,900 | |
Smart Sand, Inc.*+ | | | 155,000 | | | | 378,200 | |
| | |
| Ultra-Small Company Market Fund | |
|
SCHEDULE OF INVESTMENTS(continued) |
| Showing percentage of net assets as of June 30, 2019 | | |
| | | | | | | | | | | | | | | | |
| Industry Company | | Shares | | | Value | | | | | | | |
| | | | |
Common Stocks (continued) | | | | | | | | | | | | | | | | |
Energy (continued) | | | | | | | | | |
Superior Drilling Products, Inc.* | | | 166,100 | | | $ | 167,761 | | | | | | | | | |
Tengasco, Inc.* | | | 25,000 | | | | 20,875 | | | | | | | | | |
Uranium Energy Corp.* | | | 720,000 | | | | 986,400 | | | | | | | | | |
VAALCO Energy, Inc.* | | | 237,100 | | | | 395,957 | | | | | | | | | |
| | | | | | | | | | | | | | | | |
| | | | |
| | | | | | | 19,310,978 | | | | | | | | | |
| | |
Financials - 23.73% | | | | | | | | | |
1347 Property Insurance Holdings, Inc.* | | | 38,400 | | | | 190,080 | | | | | | | | | |
1st Constitution Bancorp | | | 18,733 | | | | 345,998 | | | | | | | | | |
A-Mark Precious Metals, Inc.*+ | | | 60,200 | | | | 785,610 | | | | | | | | | |
American River Bankshares | | | 56,000 | | | | 686,560 | | | | | | | | | |
AmeriServ Financial, Inc. | | | 135,671 | | | | 563,035 | | | | | | | | | |
Ashford, Inc.*+ | | | 5,200 | | | | 165,308 | | | | | | | | | |
Asta Funding, Inc.* | | | 68,400 | | | | 481,536 | | | | | | | | | |
Atlantic American Corp. | | | 74,856 | | | | 178,157 | | | | | | | | | |
Atlanticus Holdings Corp.* | | | 60,812 | | | | 246,289 | | | | | | | | | |
Auburn National Bancorporation, Inc.+ | | | 2,974 | | | | 99,629 | | | | | | | | | |
Bank of Commerce Holdings | | | 60,341 | | | | 645,045 | | | | | | | | | |
Bank of Princeton (The) | | | 13,910 | | | | 417,300 | | | | | | | | | |
Bank7 Corp.* | | | 24,010 | | | | 443,945 | | | | | | | | | |
BankFinancial Corp. | | | 47,000 | | | | 657,530 | | | | | | | | | |
Bankwell Financial Group, Inc. | | | 26,937 | | | | 773,092 | | | | | | | | | |
Baycom Corp.* | | | 35,000 | | | | 766,500 | | | | | | | | | |
BCB Bancorp, Inc. | | | 60,712 | | | | 840,861 | | | | | | | | | |
C&F Financial Corp. | | | 14,200 | | | | 775,462 | | | | | | | | | |
Capitala Finance Corp. | | | 62,880 | | | | 594,216 | | | | | | | | | |
CB Financial Services, Inc.+ | | | 13,700 | | | | 325,375 | | | | | | | | | |
Chemung Financial Corp. | | | 14,998 | | | | 725,003 | | | | | | | | | |
Citizens Community Bancorp, Inc. | | | 35,600 | | | | 385,904 | | | | | | | | | |
Citizens First Corp. | | | 2,633 | | | | 67,615 | | | | | | | | | |
Citizens Holding Co. | | | 20,670 | | | | 426,422 | | | | | | | | | |
CM Finance, Inc. | | | 46,800 | | | | 356,148 | | | | | | | | | |
Codorus Valley Bancorp, Inc. | | | 29,464 | | | | 677,672 | | | | | | | | | |
Cohen & Co., Inc.+ | | | 3,000 | | | | 13,800 | | | | | | | | | |
Colony Bankcorp, Inc.+ | | | 36,568 | | | | 619,828 | | | | | | | | | |
Community West Bancshares | | | 38,357 | | | | 370,145 | | | | | | | | | |
Conifer Holdings, Inc.*+ | | | 19,000 | | | | 75,810 | | | | | | | | | |
Consumer Portfolio Services, Inc.* | | | 138,100 | | | | 524,780 | | | | | | | | | |
Eagle Bancorp Montana, Inc. | | | 22,021 | | | | 365,549 | | | | | | | | | |
Elevate Credit, Inc.* | | | 143,600 | | | | 591,632 | | | | | | | | | |
| | | | | | | | |
| Industry Company | | Shares | | | Value | |
|
Financials (continued) | |
Entegra Financial Corp.* | | | 200 | | | $ | 6,024 | |
ESSA Bancorp, Inc. | | | 59,000 | | | | 899,750 | |
Evans Bancorp, Inc. | | | 24,701 | | | | 931,969 | |
FedNat Holding Co. | | | 20,412 | | | | 291,279 | |
Fidelity D&D Bancorp, Inc. | | | 1,000 | | | | 67,200 | |
First Bancorp, Inc.+ | | | 17,753 | | | | 476,668 | |
First Bank | | | 62,863 | | | | 738,012 | |
First Business Financial Services, Inc. | | | 22,308 | | | | 524,238 | |
First Financial Northwest, Inc. | | | 47,000 | | | | 665,050 | |
First Guaranty Bancshares, Inc. | | | 5,614 | | | | 117,052 | |
First Internet Bancorp | | | 33,000 | | | | 710,820 | |
First Northwest Bancorp | | | 42,500 | | | | 690,625 | |
First United Corp.+ | | | 24,192 | | | | 476,824 | |
GAIN Capital Holdings, Inc.+ | | | 86,800 | | | | 358,484 | |
GAMCO Investors, Inc., Class A | | | 10,000 | | | | 191,700 | |
Guaranty Federal Bancshares, Inc.+ | | | 20,856 | | | | 484,902 | |
Hallmark Financial Services, Inc.* | | | 45,700 | | | | 650,311 | |
Hawthorn Bancshares, Inc.+ | | | 28,121 | | | | 753,643 | |
HMN Financial, Inc.* | | | 25,000 | | | | 525,000 | |
HopFed Bancorp, Inc. | | | 32,988 | | | | 625,782 | |
Horizon Technology Finance Corp. | | | 53,600 | | | | 632,480 | |
Impac Mortgage Holdings, Inc.* | | | 16,600 | | | | 51,460 | |
Investar Holding Corp. | | | 21,000 | | | | 500,850 | |
JMP GROUP, LLC+ | | | 51,851 | | | | 203,256 | |
Lake Shore Bancorp, Inc. | | | 22,150 | | | | 331,142 | |
Landmark Bancorp, Inc. | | | 15,175 | | | | 363,441 | |
Level One Bancorp, Inc. | | | 25,000 | | | | 624,750 | |
Malvern Bancorp, Inc.* | | | 23,300 | | | | 512,833 | |
Manning & Napier, Inc. | | | 50,000 | | | | 87,500 | |
Marlin Business Services Corp. | | | 43,300 | | | | 1,079,469 | |
Medallion Financial Corp.*+ | | | 78,744 | | | | 530,735 | |
Medley Management, Inc., Class A+ | | | 10,000 | | | | 24,600 | |
Meridian Corp.* | | | 24,000 | | | | 405,600 | |
Mid Penn Bancorp, Inc. | | | 18,348 | | | | 457,783 | |
MidSouth Bancorp, Inc.+ | | | 36,750 | | | | 435,488 | |
Monroe Capital Corp.+ | | | 61,403 | | | | 708,591 | |
MSB Financial Corp./MD | | | 25,000 | | | | 382,750 | |
MutualFirst Financial, Inc. | | | 38,911 | | | | 1,324,530 | |
Northeast Bank | | | 35,300 | | | | 973,574 | |
Northrim BanCorp, Inc. | | | 26,750 | | | | 953,905 | |
| | |
| 26 | | Annual Report | June 30, 2019 |
| | |
| Ultra-Small Company Market Fund | | |
SCHEDULE OF INVESTMENTS(continued) | | |
| Showing percentage of net assets as of June 30, 2019 | | |
| | | | | | | | | | | | | | | | |
| Industry Company | | Shares | | | Value | | | | | | | |
| | | | |
Common Stocks (continued) | | | | | | | | | | | | | | | | |
Financials (continued) | | | | | | | | | |
Norwood Financial Corp. | | | 18,112 | | | $ | 630,479 | | | | | | | | | |
Oaktree Strategic, Income Corp. | | | 30,103 | | | | 255,574 | | | | | | | | | |
Ocwen Financial Corp.* | | | 225,000 | | | | 465,750 | | | | | | | | | |
Ohio Valley Banc Corp. | | | 19,500 | | | | 752,115 | | | | | | | | | |
OP Bancorp | | | 41,851 | | | | 453,665 | | | | | | | | | |
Pacific Mercantile Bancorp* | | | 83,319 | | | | 687,382 | | | | | | | | | |
Patriot National Bancorp, Inc. | | | 16,500 | | | | 246,345 | | | | | | | | | |
PCB Bancorp | | | 9,900 | | | | 168,696 | | | | | | | | | |
PDL Community Bancorp* | | | 23,000 | | | | 328,670 | | | | | | | | | |
Penns Woods Bancorp, Inc.+ | | | 16,400 | | | | 742,100 | | | | | | | | | |
Peoples Bancorp of North Carolina, Inc. | | | 24,830 | | | | 746,142 | | | | | | | | | |
Portman Ridge Finance Corp. | | | 201,300 | | | | 452,925 | | | | | | | | | |
Premier Financial Bancorp, Inc. | | | 60,275 | | | | 904,125 | | | | | | | | | |
Provident Financial Holdings, Inc. | | | 38,617 | | | | 810,571 | | | | | | | | | |
Prudential Bancorp, Inc. | | | 7,034 | | | | 133,083 | | | | | | | | | |
Pzena Investment Management, Inc., Class A | | | 52,800 | | | | 453,552 | | | | | | | | | |
Regional Management Corp.* | | | 20,000 | | | | 527,400 | | | | | | | | | |
Riverview Bancorp, Inc. | | | 91,226 | | | | 779,070 | | | | | | | | | |
Safeguard Scientifics, Inc.* | | | 35,000 | | | | 422,450 | | | | | | | | | |
SB One Bancorp | | | 35,000 | | | | 782,250 | | | | | | | | | |
Security National Financial Corp., Class A* | | | 58,480 | | | | 293,570 | | | | | | | | | |
Select Bancorp, Inc.* | | | 54,676 | | | | 625,493 | | | | | | | | | |
Shore Bancshares, Inc. | | | 38,700 | | | | 632,358 | | | | | | | | | |
Silvercrest Asset Management Group, Inc., Class A | | | 50,002 | | | | 701,528 | | | | | | | | | |
Southern First Bancshares, Inc.* | | | 21,215 | | | | 830,779 | | | | | | | | | |
Southern Missouri Bancorp, Inc. | | | 12,000 | | | | 417,960 | | | | | | | | | |
Spirit of Texas Bancshares, Inc.* | | | 30,989 | | | | 697,252 | | | | | | | | | |
Summit State Bank | | | 17,200 | | | | 189,200 | | | | | | | | | |
Territorial Bancorp, Inc. | | | 27,000 | | | | 834,300 | | | | | | | | | |
Timberland Bancorp, Inc. | | | 24,222 | | | | 723,753 | | | | | | | | | |
Two River Bancorp | | | 31,968 | | | | 459,060 | | | | | | | | | |
Union Bankshares, Inc./Morrisville VT | | | 7,419 | | | | 274,577 | | | | | | | | | |
United Bancshares, Inc.+ | | | 15,200 | | | | 306,584 | | | | | | | | | |
United Security Bancshares | | | 55,400 | | | | 631,006 | | | | | | | | | |
Unity Bancorp, Inc. | | | 46,500 | | | | 1,055,550 | | | | | | | | | |
| | | | | | | | |
| Industry Company | | Shares | | | Value | |
|
Financials (continued) | |
Western New England Bancorp, Inc. | | | 78,362 | | | $ | 731,901 | |
| | | | | | | | |
| | |
| | | | | | | 56,099,121 | |
|
Health Care - 20.55% | |
AcelRx Pharmaceuticals, Inc.*+ | | | 308,150 | | | | 779,619 | |
Aclaris Therapeutics, Inc.* | | | 80,000 | | | | 175,200 | |
Adamas Pharmaceuticals, Inc.*+ | | | 101,500 | | | | 629,300 | |
Aduro Biotech, Inc.* | | | 300,000 | | | | 462,000 | |
Aeglea BioTherapeutics, Inc.* | | | 75,000 | | | | 513,750 | |
AgeX Therapeutics, Inc.* | | | 23,499 | | | | 86,241 | |
Alimera Sciences, Inc.*+ | | | 460,000 | | | | 409,400 | |
Allena Pharmaceuticals, Inc.*+ | | | 48,000 | | | | 195,360 | |
Alphatec Holdings, Inc.*+ | | | 249,000 | | | | 1,130,460 | |
Alpine Immune Sciences, Inc.* | | | 200 | | | | 842 | |
Apollo Endosurgery, Inc.* | | | 80,000 | | | | 260,000 | |
Applied Genetic Technologies Corp.* | | | 36,400 | | | | 137,956 | |
Aptevo Therapeutics, Inc.* | | | 83,802 | | | | 74,290 | |
Apyx Medical Corp.* | | | 109,970 | | | | 738,998 | |
Aquestive Therapeutics, Inc.*+ | | | 60,000 | | | | 252,000 | |
Aquinox Pharmaceuticals, Inc.* | | | 80,000 | | | | 188,800 | |
Aratana Therapeutics, Inc.* | | | 46,983 | | | | 242,432 | |
Ardelyx, Inc.* | | | 226,100 | | | | 608,209 | |
Bellicum Pharmaceuticals, Inc.*+ | | | 71,700 | | | | 121,890 | |
BioScrip, Inc.* | | | 368,700 | | | | 958,620 | |
BioTime, Inc.* | | | 507,661 | | | | 558,427 | |
Calithera Biosciences, Inc.* | | | 132,600 | | | | 517,140 | |
Capital Senior Living Corp.* | | | 33,336 | | | | 167,680 | |
Castlight Health, Inc., Class B* | | | 57,400 | | | | 185,402 | |
Catabasis Pharmaceuticals, Inc.*+ | | | 20,900 | | | | 168,663 | |
Cellular Biomedicine Group, Inc.* | | | 30,800 | | | | 509,124 | |
CEL-SCI Corp.*+ | | | 152,000 | | | | 1,273,760 | |
Chiasma, Inc.* | | | 187,600 | | | | 1,401,372 | |
Chimerix, Inc.* | | | 150,000 | | | | 648,000 | |
Cidara Therapeutics, Inc.* | | | 69,982 | | | | 117,570 | |
Clearside Biomedical, Inc.*+ | | | 90,000 | | | | 87,462 | |
Conatus Pharmaceuticals, Inc.*+ | | | 60,000 | | | | 15,606 | |
Conformis, Inc.* | | | 250,000 | | | | 1,090,000 | |
| | |
| Ultra-Small Company Market Fund | |
|
SCHEDULE OF INVESTMENTS(continued) |
| Showing percentage of net assets as of June 30, 2019 | | |
| | | | | | | | | | | | | | | | |
| Industry Company | | Shares | | | Value | | | | | | | |
| | | | |
Common Stocks (continued) | | | | | | | | | | | | | | | | |
Health Care (continued) | | | | | | | | | |
Constellation Pharmaceuticals, Inc.*+ | | | 27,500 | | | $ | 337,700 | | | | | | | | | |
Corindus Vascular Robotics, Inc.*+ | | | 38,000 | | | | 113,240 | | | | | | | | | |
CorMedix, Inc.*+ | | | 66,000 | | | | 592,020 | | | | | | | | | |
Corvus Pharmaceuticals, Inc.* | | | 100 | | | | 374 | | | | | | | | | |
Cross Country Healthcare, Inc.* | | | 100,000 | | | | 938,000 | | | | | | | | | |
Cumberland Pharmaceuticals, Inc.* | | | 135,100 | | | | 860,587 | | | | | | | | | |
Curis, Inc.* | | | 100,000 | | | | 186,000 | | | | | | | | | |
CynergisTek, Inc.* | | | 55,000 | | | | 266,200 | | | | | | | | | |
Dova Pharmaceuticals, Inc.*+ | | | 70,156 | | | | 989,200 | | | | | | | | | |
Eiger BioPharmaceuticals, Inc.* | | | 71,000 | | | | 752,600 | | | | | | | | | |
ElectroCore, Inc.*+ | | | 36,200 | | | | 72,400 | | | | | | | | | |
Electromed, Inc.* | | | 45,000 | | | | 245,250 | | | | | | | | | |
Endologix, Inc.* | | | 10,000 | | | | 72,400 | | | | | | | | | |
Enzo Biochem, Inc.* | | | 170,000 | | | | 572,900 | | | | | | | | | |
EyePoint Pharmaceuticals, Inc.* | | | 330,000 | | | | 541,200 | | | | | | | | | |
Fulgent Genetics, Inc.*+ | | | 78,100 | | | | 521,708 | | | | | | | | | |
Gemphire Therapeutics, Inc.*+ | | | 25,000 | | | | 20,250 | | | | | | | | | |
Genesis Healthcare, Inc.* | | | 405,400 | | | | 502,696 | | | | | | | | | |
Geron Corp.*+ | | | 250,000 | | | | 352,500 | | | | | | | | | |
Harvard Bioscience, Inc.* | | | 166,717 | | | | 333,434 | | | | | | | | | |
Infinity Pharmaceuticals, Inc.* | | | 240,000 | | | | 432,000 | | | | | | | | | |
InfuSystem Holdings, Inc.* | | | 59,900 | | | | 257,570 | | | | | | | | | |
IntriCon Corp.* | | | 21,500 | | | | 502,240 | | | | | | | | | |
IRIDEX Corp.* | | | 50,400 | | | | 229,320 | | | | | | | | | |
Jounce Therapeutics, Inc.* | | | 95,000 | | | | 470,250 | | | | | | | | | |
Kala Pharmaceuticals, Inc.*+ | | | 134,400 | | | | 857,472 | | | | | | | | | |
KemPharm, Inc.*+ | | | 130,200 | | | | 227,850 | | | | | | | | | |
Kewaunee Scientific Corp. | | | 11,600 | | | | 222,024 | | | | | | | | | |
Kodiak Sciences, Inc.* | | | 12,500 | | | | 146,250 | | | | | | | | | |
Lannett Co., Inc.*+ | | | 85,000 | | | | 515,100 | | | | | | | | | |
Leap Therapeutics, Inc.*+ | | | 36,300 | | | | 64,977 | | | | | | | | | |
Magenta Therapeutics, Inc.*+ | | | 55,287 | | | | 815,483 | | | | | | | | | |
Marinus Pharmaceuticals, Inc.*+ | | | 181,500 | | | | 753,225 | | | | | | | | | |
Matinas BioPharma Holdings, Inc.* | | | 340,000 | | | | 291,244 | | | | | | | | | |
Menlo Therapeutics, Inc.* | | | 112,300 | | | | 672,677 | | | | | | | | | |
Mereo BioPharma Group PLC, ADR*+ | | | 15,961 | | | | 38,306 | | | | | | | | | |
Merrimack Pharmaceuticals, Inc.* | | | 55,000 | | | | 332,750 | | | | | | | | | |
Mersana Therapeutics, Inc.* | | | 49,800 | | | | 201,690 | | | | | | | | | |
| | | | | | | | |
| Industry Company | | Shares | | | Value | |
|
Health Care (continued) | |
Micron Solutions, Inc.*+ | | | 20,000 | | | $ | 49,000 | |
Millendo Therapeutics, Inc.* | | | 6,666 | | | | 77,059 | |
Minerva Neurosciences, Inc.* | | | 50,000 | | | | 281,500 | |
Misonix, Inc.* | | | 14,700 | | | | 373,674 | |
Myomo, Inc.* | | | 50,000 | | | | 35,000 | |
Neon Therapeutics, Inc.*+ | | | 132,400 | | | | 627,576 | |
Neos Therapeutics, Inc.*+ | | | 125,000 | | | | 161,250 | |
Novan, Inc.*+ | | | 60,000 | | | | 162,000 | |
Nuvectra Corp.* | | | 35,100 | | | | 117,585 | |
Oncocyte Corp.* | | | 115,000 | | | | 286,350 | |
Organovo Holdings, Inc.* | | | 348,600 | | | | 182,318 | |
Otonomy, Inc.* | | | 88,000 | | | | 242,000 | |
Owens & Minor, Inc. | | | 100,000 | | | | 320,000 | |
Pacific Biosciences of California, Inc.* | | | 275,200 | | | | 1,664,960 | |
Palatin Technologies, Inc.* | | | 696,000 | | | | 807,360 | |
Paratek Pharmaceuticals, Inc.*+ | | | 95,000 | | | | 379,050 | |
Pfenex, Inc.* | | | 94,500 | | | | 636,930 | |
Protagonist Therapeutics, Inc.* | | | 88,344 | | | | 1,069,846 | |
Protalix BioTherapeutics, Inc.* | | | 171,672 | | | | 80,514 | |
Quorum Health Corp.* | | | 51,400 | | | | 71,446 | |
resTORbio, Inc.*+ | | | 95,000 | | | | 969,000 | |
Rexahn Pharmaceuticals, Inc.*+ | | | 8,275 | | | | 42,699 | |
Rockwell Medical, Inc.*+ | | | 25,600 | | | | 77,056 | |
Savara, Inc.* | | | 40,000 | | | | 94,800 | |
scPharmaceuticals, Inc.*+ | | | 50,000 | | | | 159,500 | |
SCYNEXIS, Inc.* | | | 150,000 | | | | 196,500 | |
SeaSpine Holdings Corp.* | | | 58,613 | | | | 776,622 | |
Selecta Biosciences, Inc.* | | | 68,100 | | | | 121,899 | |
Seres Therapeutics, Inc.*+ | | | 145,500 | | | | 468,510 | |
Sesen Bio, Inc.*+ | | | 200,000 | | | | 300,000 | |
Sierra Oncology, Inc.* | | | 363,700 | | | | 203,672 | |
Spero Therapeutics, Inc.* | | | 46,379 | | | | 533,822 | |
Surface Oncology, Inc.* | | | 4,200 | | | | 11,844 | |
Sutro Biopharma, Inc.* | | | 48,800 | | | | 555,344 | |
Syndax Pharmaceuticals, Inc.* | | | 35,000 | | | | 325,850 | |
Synlogic, Inc.* | | | 93,000 | | | | 846,300 | |
Syros Pharmaceuticals, Inc.*+ | | | 10,000 | | | | 92,600 | |
T2 Biosystems, Inc.*+ | | | 125,000 | | | | 210,000 | |
Tocagen, Inc.* | | | 85,034 | | | | 568,027 | |
Tracon Pharmaceuticals, Inc.* | | | 60,000 | | | | 40,800 | |
Trevena, Inc.* | | | 150,000 | | | | 154,500 | |
Utah Medical Products, Inc. | | | 13,800 | | | | 1,320,660 | |
Verastem, Inc.*+ | | | 229,000 | | | | 345,790 | |
| | |
| 28 | | Annual Report | June 30, 2019 |
| | |
| Ultra-Small Company Market Fund | | |
| SCHEDULE OF INVESTMENTS(continued) | | |
| Showing percentage of net assets as of June 30, 2019 | | |
| | | | | | | | | | | | |
| Industry Company | | Shares | | | Value | | | | |
| |
Common Stocks (continued) | | | | | |
Health Care (continued) | | | | | |
VIVUS, Inc.*+ | | | 64,600 | | | | $ 246,772 | | | | | |
VolitionRX, Ltd.*+ | | | 195,000 | | | | 612,300 | | | | | |
vTv Therapeutics, Inc., Class A*+ | | | 68,800 | | | | 98,384 | | | | | |
XOMA Corp.*+ | | | 21,700 | | | | 322,462 | | | | | |
Xtant Medical Holdings, Inc.*+ | | | 50,000 | | | | 150,000 | | | | | |
Zynerba Pharmaceuticals, Inc.*+ | | | 80,500 | | | | 1,090,775 | | | | | |
| | | | | | | | | | | | |
| | | |
| | | | | | | 48,568,566 | | | | | |
| |
Industrials - 10.85% | | | | | |
Acacia Research Corp.* | | | 211,800 | | | | 626,928 | | | | | |
Acme United Corp. | | | 6,335 | | | | 143,044 | | | | | |
AeroCentury Corp.*+ | | | 10,900 | | | | 79,270 | | | | | |
Alpha Pro Tech, Ltd.*+ | | | 151,200 | | | | 515,592 | | | | | |
American Superconductor Corp.*+ | | | 45,100 | | | | 418,528 | | | | | |
AMREP Corp.* | | | 30,100 | | | | 206,486 | | | | | |
ARC Document Solutions, Inc.* | | | 164,000 | | | | 334,560 | | | | | |
Arotech Corp.* | | | 121,367 | | | | 241,520 | | | | | |
Avalon Holdings Corp., Class A* | | | 12,675 | | | | 31,562 | | | | | |
BG Staffing, Inc. | | | 37,500 | | | | 708,000 | | | | | |
BlueLinx Holdings, Inc.*+ | | | 35,600 | | | | 705,236 | | | | | |
CECO Environmental Corp.* | | | 69,710 | | | | 668,519 | | | | | |
Charah Solutions, Inc.* | | | 61,900 | | | | 340,450 | | | | | |
Chicago Rivet & Machine Co. | | | 10,000 | | | | 284,900 | | | | | |
Commercial Vehicle Group, Inc.* | | | 100,100 | | | | 802,802 | | | | | |
CompX International, Inc. | | | 3,200 | | | | 54,080 | | | | | |
CPI Aerostructures, Inc.* | | | 39,700 | | | | 333,877 | | | | | |
CRA International, Inc. | | | 13,500 | | | | 517,455 | | | | | |
Eastern Co. (The) | | | 21,200 | | | | 594,024 | | | | | |
Ecology and Environment, Inc., Class A | | | 13,000 | | | | 141,700 | | | | | |
Espey Manufacturing & Electronics Corp.+ | | | 10,700 | | | | 264,825 | | | | | |
ExOne Co. (The)*+ | | | 48,300 | | | | 450,156 | | | | | |
Fuel Tech, Inc.* | | | 49,228 | | | | 68,919 | | | | | |
Gencor Industries, Inc.* | | | 44,450 | | | | 577,850 | | | | | |
Goldfield Corp. (The)* | | | 108,080 | | | | 248,584 | | | | | |
GP Strategies Corp.* | | | 40,000 | | | | 603,200 | | | | | |
Graham Corp. | | | 35,900 | | | | 725,539 | | | | | |
Highpower International, Inc.*+ | | | 50,000 | | | | 212,000 | | | | | |
Hill International, Inc.* | | | 249,751 | | | | 674,328 | | | | | |
Houston Wire & Cable Co.* | | | 57,100 | | | | 299,204 | | | | | |
Hudson Global, Inc.* | | | 10,942 | | | | 136,228 | | | | | |
| | | | | | | | |
| Industry Company | | Shares | | | Value | |
|
| |
Industrials (continued) | | | | | |
Hurco Cos., Inc. | | | 23,734 | | | | $ 843,981 | |
InnerWorkings, Inc.* | | | 123,808 | | | | 472,947 | |
Innovative Solutions & Support, Inc.* | | | 80,400 | | | | 410,040 | |
LB Foster Co., Class A* | | | 32,600 | | | | 891,284 | |
LiqTech International, Inc.*+ | | | 6,249 | | | | 61,928 | |
LSI Industries, Inc. | | | 88,000 | | | | 321,200 | |
Mastech Digital, Inc.* | | | 18,500 | | | | 87,875 | |
Miller Industries, Inc. | | | 13,800 | | | | 424,350 | |
NL Industries, Inc.* | | | 48,100 | | | | 175,565 | |
Northwest Pipe Co.* | | | 21,200 | | | | 546,536 | |
PAM Transportation Services, Inc.* | | | 13,108 | | | | 812,696 | |
Patriot Transportation Holding, Inc.* | | | 30,871 | | | | 523,881 | |
Performant Financial Corp.* | | | 305,000 | | | | 320,250 | |
Perma-Pipe International Holdings, Inc.* | | | 66,100 | | | | 601,510 | |
PICO Holdings, Inc.* | | | 85,000 | | | | 987,700 | |
Radiant Logistics, Inc.* | | | 112,300 | | | | 689,522 | |
RCM Technologies, Inc.* | | | 180,710 | | | | 722,840 | |
Servotronics, Inc. | | | 15,653 | | | | 150,269 | |
SIFCO Industries, Inc.* | | | 16,024 | | | | 46,309 | |
Transcat, Inc.* | | | 24,800 | | | | 634,632 | |
Twin Disc, Inc.* | | | 49,600 | | | | 748,960 | |
Ultralife Corp.* | | | 52,400 | | | | 416,580 | |
USA Truck, Inc.* | | | 14,600 | | | | 147,606 | |
Virco Manufacturing Corp. | | | 16,800 | | | | 78,456 | |
Volt Information Sciences, Inc.* | | | 150,000 | | | | 673,500 | |
Willis Lease Finance Corp.* | | | 20,420 | | | | 1,190,894 | |
YRC Worldwide, Inc.* | | | 165,000 | | | | 664,950 | |
| | | | | | | | |
| | |
| | | | | | | 25,655,627 | |
Information Technology - 10.47% | | | | | |
Aerohive Networks, Inc.* | | | 110,000 | | | | 487,300 | |
Alithya Group, Inc., Class A* | | | 51,650 | | | | 135,323 | |
ALJ Regional Holdings, Inc.* | | | 78,000 | | | | 120,900 | |
Amtech Systems, Inc.* | | | 46,500 | | | | 255,750 | |
AstroNova, Inc. | | | 32,800 | | | | 847,552 | |
Aviat Networks, Inc.* | | | 22,086 | | | | 302,578 | |
Aware, Inc.* | | | 79,579 | | | | 264,202 | |
AXT, Inc.* | | | 208,006 | | | | 823,704 | |
Bel Fuse, Inc., Class B | | | 25,000 | | | | 429,250 | |
BK Technologies Corp. | | | 163,744 | | | | 704,099 | |
Blonder Tongue Laboratories, Inc.* | | | 20,000 | | | | 19,400 | |
BSQUARE Corp.* | | | 59,500 | | | | 69,020 | |
CBAK Energy Technology, Inc.* | | | 55,000 | | | | 51,425 | |
Clearfield, Inc.* | | | 41,600 | | | | 551,200 | |
| | |
| Ultra-Small Company Market Fund | |
|
SCHEDULE OF INVESTMENTS(continued) |
| Showing percentage of net assets as of June 30, 2019 | | |
| | | | | | | | | | | | |
| Industry Company | | Shares | | | Value | | | | |
| | |
Common Stocks (continued) | | | | | | | | | |
Information Technology (continued) | | | | | | | | | |
Communications Systems, Inc. | | | 25,000 | | | | $ 75,250 | | | | | |
Computer Task Group, Inc.* | | | 69,800 | | | | 279,898 | | | | | |
CSP, Inc. | | | 38,700 | | | | 590,175 | | | | | |
CyberOptics Corp.* | | | 17,550 | | | | 284,836 | | | | | |
EMCORE Corp.* | | | 49,702 | | | | 163,520 | | | | | |
Everspin Technologies, Inc.*+ | | | 41,400 | | | | 269,928 | | | | | |
Frequency Electronics, Inc.* | | | 16,000 | | | | 182,240 | | | | | |
GlobalSCAPE, Inc. | | | 91,180 | | | | 931,860 | | | | | |
GSE Systems, Inc.* | | | 140,125 | | | | 327,892 | | | | | |
GSI Technology, Inc.* | | | 111,417 | | | | 954,844 | | | | | |
ID Systems, Inc.* | | | 33,000 | | | | 194,040 | | | | | |
IEC Electronics Corp.* | | | 43,450 | | | | 272,866 | | | | | |
Information Services Group, Inc.* | | | 171,000 | | | | 540,360 | | | | | |
Innodata, Inc.* | | | 165,955 | | | | 149,359 | | | | | |
Inseego Corp.*+ | | | 21,900 | | | | 104,901 | | | | | |
Intellicheck, Inc.*+ | | | 49,700 | | | | 287,763 | | | | | |
Intelligent Systems Corp.*+ | | | 35,362 | | | | 1,018,072 | | | | | |
inTEST Corp.* | | | 55,600 | | | | 267,436 | | | | | |
Intevac, Inc.* | | | 65,000 | | | | 314,600 | | | | | |
Issuer Direct Corp.+ | | | 25,000 | | | | 280,000 | | | | | |
Key Tronic Corp.* | | | 57,100 | | | | 284,358 | | | | | |
KVH Industries, Inc.* | | | 75,510 | | | | 820,794 | | | | | |
MagnaChip Semiconductor Corp.*+ | | | 50,000 | | | | 517,500 | | | | | |
Majesco* | | | 6,000 | | | | 55,860 | | | | | |
Marin Software, Inc.* | | | 44,614 | | | | 109,750 | | | | | |
MicroVision, Inc.* | | | 100,000 | | | | 80,520 | | | | | |
Net 1 UEPS Technologies, Inc.* | | | 152,000 | | | | 608,000 | | | | | |
Network-1 Technologies, Inc. | | | 115,000 | | | | 287,500 | | | | | |
Optical Cable Corp.* | | | 20,100 | | | | 82,812 | | | | | |
PCM, Inc.* | | | 22,700 | | | | 795,408 | | | | | |
PC-Tel, Inc. | | | 78,100 | | | | 345,983 | | | | | |
Perceptron, Inc.* | | | 41,500 | | | | 184,675 | | | | | |
Pixelworks, Inc.* | | | 213,900 | | | | 631,005 | | | | | |
PRGX Global, Inc.* | | | 79,216 | | | | 532,332 | | | | | |
QAD, Inc., Class B | | | 6,250 | | | | 184,375 | | | | | |
QuickLogic Corp.* | | | 130,000 | | | | 74,815 | | | | | |
RealNetworks, Inc.* | | | 152,200 | | | | 289,180 | | | | | |
RF Industries, Ltd. | | | 14,100 | | | | 119,004 | | | | | |
Richardson Electronics, Ltd. | | | 99,011 | | | | 554,462 | | | | | |
Seachange International, Inc.* | | | 43,700 | | | | 62,491 | | | | | |
SMTC Corp.*+ | | | 102,434 | | | | 395,395 | | | | | |
StarTek, Inc.*+ | | | 113,800 | | | | 929,746 | | | | | |
Steel Connect, Inc.* | | | 249,500 | | | | 454,090 | | | | | |
| | | | | | | | |
| Industry Company | | Shares | | | Value | |
|
| |
Information Technology (continued) | | | | | |
Synacor, Inc.* | | | 242,400 | | | | $ 378,144 | |
Synchronoss Technologies, Inc.* | | | 140,900 | | | | 1,114,519 | |
Telaria, Inc.* | | | 111,900 | | | | 841,488 | |
TESSCO Technologies, Inc. | | | 42,800 | | | | 764,408 | |
TransAct Technologies, Inc. | | | 30,000 | | | | 337,800 | |
Trio-Tech International*+ | | | 26,800 | | | | 77,184 | |
Wayside Technology Group, Inc. | | | 10,298 | | | | 116,264 | |
Wireless Telecom Group, Inc.* | | | 113,100 | | | | 178,698 | |
| | | | | | | | |
| | |
| | | | | | | 24,760,103 | |
Materials - 3.62% | | | | | |
Advanced Emissions Solutions, Inc.+ | | | 77,075 | | | | 974,228 | |
AgroFresh Solutions, Inc.* | | | 157,200 | | | | 237,372 | |
Ampco-Pittsburgh Corp.* | | | 50,000 | | | | 201,500 | |
Amyris, Inc.*+ | | | 165,000 | | | | 587,400 | |
Core Molding Technologies, Inc.* | | | 45,100 | | | | 336,897 | |
Flexible Solutions International, Inc.+ | | | 45,707 | | | | 206,138 | |
Flotek Industries, Inc.*+ | | | 150,000 | | | | 496,500 | |
Friedman Industries, Inc. | | | 57,000 | | | | 396,720 | |
Gold Resource Corp. | | | 203,100 | | | | 686,478 | |
Gulf Resources, Inc.* | | | 362,900 | | | | 355,642 | |
Intrepid Potash, Inc.* | | | 105,000 | | | | 352,800 | |
LSB Industries, Inc.* | | | 107,500 | | | | 419,250 | |
Northern Technologies International Corp. | | | 13,950 | | | | 341,078 | |
Olympic Steel, Inc. | | | 48,300 | | | | 659,295 | |
Paramount Gold Nevada Corp.* | | | 40,000 | | | | 31,220 | |
Ramaco Resources, Inc.*+ | | | 150,800 | | | | 802,256 | |
Synalloy Corp. | | | 43,500 | | | | 679,470 | |
Trecora Resources* | | | 30,000 | | | | 287,100 | |
Universal Stainless & Alloy Products, Inc.*+ | | | 30,858 | | | | 493,728 | |
| | | | | | | | |
| | |
| | | | | | | 8,545,072 | |
Real Estate - 1.77% | | | | | |
American Realty Investors, Inc.* | | | 11,113 | | | | 151,581 | |
Consolidated-Tomoka Land Co. | | | 15,449 | | | | 922,305 | |
Griffin Industrial Realty, Inc. | | | 17,905 | | | | 632,942 | |
Maui Land & Pineapple Co., Inc.* | | | 80,700 | | | | 830,403 | |
Stratus Properties, Inc.* | | | 37,150 | | | | 1,204,774 | |
| | |
| 30 | | Annual Report | June 30, 2019 |
| | |
| Ultra-Small Company Market Fund | | |
SCHEDULE OF INVESTMENTS(continued) | | |
| Showing percentage of net assets as of June 30, 2019 | | |
| | | | | | | | | | | | | | | | |
| Industry Company | | | | | Shares | | | Value | | | | |
| | | |
Common Stocks (continued) | | | | | | | | | | | | | |
Real Estate (continued) | | | | | | | | | | | | | |
Transcontinental Realty Investors, Inc.*+ | | | | 3,097 | | | | $ 79,376 | | | | | |
Trinity Place Holdings, Inc.* | | | | 91,100 | | | | 359,845 | | | | | |
| | | | | | | | | | | | | | | | |
| | | | |
| | | | | | | | | | | 4,181,226 | | | | | |
Utilities - 1.57% | | | | | | | | | | | | | | | | |
Cadiz, Inc.*+ | | | | 71,700 | | | | 806,625 | | | | | |
Genie Energy, Ltd., Class B | | | | 98,667 | | | | 1,050,804 | | | | | |
Global Water Resources, Inc. | | | | 86,400 | | | | 902,016 | | | | | |
RGC Resources, Inc. | | | | 15,259 | | | | 465,705 | | | | | |
Spark Energy, Inc., Class A+ | | | | 43,000 | | | | 481,170 | | | | | |
| | | | | | | | | | | | | | | | |
| | | | |
| | | | | | | | | | | 3,706,320 | | | | | |
| | | | | | | | | | | | | | | | |
| | |
TOTAL COMMON STOCKS - 98.56% | | | | 232,981,688 | | | | | |
| | | | | | | | | | | | | | | | |
(Cost $208,743,902) | | | | | | | | | | | | | | | | |
| |
EXCHANGE TRADED FUND - 0.26% | | | | | |
iSharesMicro-Cap ETF+ | | | | 6,525 | | | | 608,065 | | | | | |
| | | | | | | | | | | | | | | | |
TOTAL EXCHANGE TRADED
FUND -0.26% | | | | | | | | 608,065 | | | | | |
| | | | | | | | | | | | | | | | |
(Cost $163,006) | | | | | | | | | | | | | | | | |
| | | | |
RIGHTS - 0.00% | | | | | | | | | | | | | | | | |
OncoMed Pharmaceuticals, Inc., CVR*D | | | | 125,000 | | | | — | | | | | |
OncoMed Pharmaceuticals, Inc., CVR*D | | | | 75,000 | | | | — | | | | | |
| | | | | | | | | | | | | | | | |
TOTAL RIGHTS - 0.00% | | | | | | | | | | | — | | | | | |
| | | | | | | | | | | | | | | | |
(Cost $35,063) | | | | | | | | | | | | | | | | |
| | | | |
WARRANTS - 0.00% | | | | | | | | | | | | | | | | |
SAExploration Series A,
expire 07/27/21*D | | | | 848 | | | | — | | | | | |
SAExploration Series B,
expire 07/27/21*D | | | | 848 | | | | — | | | | | |
| | | | | | | | | | | | | | | | |
TOTAL WARRANTS - 0.00% | | | | | | | | — | | | | | |
| | | | | | | | | | | | | | | | |
(Cost $ — ) | | | | | | | | | | | | | | | | |
| | | | |
| | | Rate^ | | | Shares | | | Value | | | | |
| |
MONEY MARKET FUND - 0.00% | | | | | |
Fidelity Investments Money Market Government Portfolio Class I | | | 2.25% | | | | 288 | | | | 288 | | | | | |
| | | | | | | | | | | | | | | | |
TOTAL MONEY MARKET FUND - 0.00% | | | | 288 | | | | | |
| | | | | | | | | | | | | | | | |
(Cost $288) | | | | | | | | | | | | | | | | |
| | | | | | | | | | |
| | | Rate^ | | Shares | | | Value | |
|
| INVESTMENTS PURCHASED WITH CASH PROCEEDS FROM SECURITIESLENDING - 10.38% | |
Fidelity Investments Money Market Government Portfolio Class I** | | 2.25% | | | 24,535,439 | | | | $24,535,439 | |
| | | | | | | | | | |
| |
TOTAL INVESTMENTS PURCHASED WITH CASH PROCEEDS FROM SECURITIES LENDING -10.38% | | | | 24,535,439 | |
| | | | | | | | | | |
(Cost $24,535,439) | | | | | | | | | | |
| |
TOTAL INVESTMENTS - 109.20% | | | | $258,125,480 | |
(Cost $233,477,698) | | | | | | | | | | |
Liabilities in Excess of Other Assets - (9.20%) | | | | (21,754,261) | |
| | | | | | | | | | |
| |
NET ASSETS - 100.00% | | | | $236,371,219 | |
| | | | | | | | | | |
| * | Non-income producing security. |
| ** | This security represents the investment of the collateral received in connection with securities out on loan as of June 30, 2019. |
| ^ | Rate disclosed as of June 30, 2019. |
| D | Security was fair valued using significant unobservable inputs (see Note 2). As such, the security is classified as Level 3 in the fair value hierarchy. |
| + | This security or a portion of the security is out on loan at June 30, 2019. Total loaned securities had a value of $24,435,122, which included loaned securities with value of $854,698 that have been sold and are pending settlement as of June 30, 2019. The total market value of loaned securities excluding these pending sales is $23,580,424. |
ADR - American Depositary Receipt
CVR - Contingent Value Rights
LLC - Limited Liability Company
PLC - Public Limited Company
| | |
| Ultra-Small Company Market Fund | |
|
| SCHEDULE OF INVESTMENTS(continued) |
| Showing percentage of net assets as of June 30, 2019 | | |
Summary of inputs used to value the Fund’s investments as of 06/30/2019 (See Note 2 in Notes to Financial Statements):
| | | | | | | | | | | | | | | | |
| | | Valuation Inputs | |
| | | Investment in Securities (Value) | |
| | | Level 1
Quoted Prices | | | Level 2
Significant
Observable
Inputs | | | Level 3
Significant
Unobservable
Inputs | | | Total | |
| | | | |
Common Stocks (a) | | $ | 232,981,688 | | | $ | — | | | $ | — | | | $ | 232,981,688 | |
Exchange Traded Fund | | | 608,065 | | | | — | | | | — | | | | 608,065 | |
Rights | | | — | | | | — | | | | 0 | | | | 0 | |
Warrants | | | — | | | | — | | | | 0 | | | | 0 | |
Money Market Fund | | | — | | | | 288 | | | | — | | | | 288 | |
Investments Purchased with Cash Proceeds from Securities Lending | | | — | | | | 24,535,439 | | | | — | | | | 24,535,439 | |
| | | | | | | | | | | | | | | | |
TOTAL | | $ | 233,589,753 | | | $ | 24,535,727 | | | $ | 0 | | | $ | 258,125,480 | |
| | | | | | | | | | | | | | | | |
| (a) | - Please refer to the Schedule of Investments for the industry classifications of these portfolio holdings. |
Following is a reconciliation of Level 3 investments for which significant unobservable inputs were used to determine fair value:
| | | | | | | | | | | | |
| | | Investment in Securities (Value) | |
| | | Rights | | | Warrants | | | Total | |
Balance as of 06/30/2018 | | $ | — | | | $ | 0 | | | $ | 0 | |
Purchases/Issuances | | | 35,063 | | | | — | | | | 35,063 | |
Sales/Expirations | | | — | | | | — | | | | — | |
Realized Gain/(Loss) | | | — | | | | — | | | | — | |
Change in Unrealized Appreciation/(Depreciation) | | | (35,063 | ) | | | — | | | | (35,063 | ) |
Transfers in | | | — | | | | — | | | | — | |
Transfers out | | | — | | | | — | | | | — | |
| | | | | | | | | | | | |
| | | |
Balance as of 06/30/2019 | | $ | 0 | | | $ | 0 | | | $ | 0 | |
| | | | | | | | | | | | |
Net Change in Unrealized Appreciation (Depreciation) from Investments Held as of 06/30/2019 | | $ | (35,063 | ) | | $ | — | | | $ | (35,063 | ) |
| | | | | | | | | | | | |
See Notes to Financial Statements.
| | |
32 | | Annual Report | June 30, 2019 |
| | |
| Small-Cap Growth Fund | | |
MANAGER’S COMMENTARY (Unaudited) | | |
| | |
June 30, 2019
Dear FellowSmall-Cap Growth Fund Shareholder,
For the quarter ended June 30, 2019, our Fund returned +0.92%, underperforming our primary market benchmark, the Russell 2000 Growth Index (+2.75%), and our peer benchmark, the LipperSmall-Cap Growth Funds Index (+5.18%). It was a poor quarter on a relative basis.
For the fiscal year, our Fund returned-10.81%, lagging both the Russell 2000 Growth Index(-0.49%) and the LipperSmall-Cap Growth Funds Index (+6.95%).
The table below presents our June quarter,one-year, five-year,10-year,15-year, andinception-to-date financial results. See the next page for a graph of performance since inception.
Standardized Returns as of June 30, 2019
| | | | | | | | | | | | | | | | | | | | | | | | | | | | | | |
| | | | | | | Annualized | | |
| | | Quarter | | 1 Year | | 5 Years | | 10 Years | | 15 Years | | Since Inception
(10/31/03) |
| | | | | | |
Small-Cap Growth Fund | | | | 0.92 | % | | | | -10.81 | % | | | | 7.81 | % | | | | 12.50 | % | | | | 6.40 | % | | | | 6.66 | % |
Russell 2000 Growth Index | | | | 2.75 | % | | | | -0.49 | % | | | | 8.63 | % | | | | 14.41 | % | | | | 8.90 | % | | | | 9.15 | % |
LipperSmall-Cap Growth Funds Index | | | | 5.18 | % | | | | 6.95 | % | | | | 10.33 | % | | | | 14.69 | % | | | | 8.71 | % | | | | 8.75 | % |
Performance figures quoted in the table above represent past performance and are no guarantee of future results. Total return figures in the table above include the reinvestment of dividends and capital gains. The table above does not reflect the deduction of taxes that a shareholder would pay on Fund distributions or on the redemption of Fund shares.
The Russell 2000 Growth Index is an unmanaged index that consists of stocks in the Russell 2000 Index with higherprice-to-book ratios and higher forecasted growth values with dividends reinvested. The LipperSmall-Cap Growth Funds Index is an index of small-company, growth-oriented funds compiled by Lipper, Inc. It is not possible to invest directly in an index. Periods longer than one year are annualized.
| | |
| Small-Cap Growth Fund | |
|
MANAGER’S COMMENTARY (Unaudited)(continued) |
| | |
Growth of a $10,000 Investment
from Inception October 31, 2003 to June 30, 2019
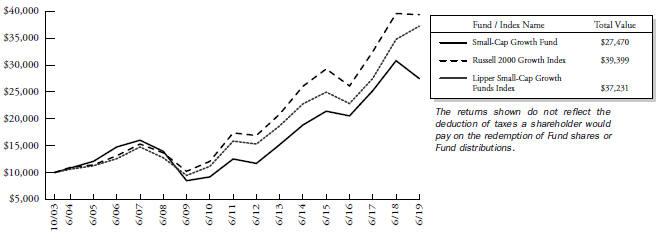
Detailed Explanation of Quarterly Performance
The Fund’s diversifying value metrics models significantly underperformed the benchmark and detracted from relative results during the quarter, while its core company financial health models slightly lagged the benchmark. However, the Fund’s diversifying price momentum models outperformed the benchmark, helping offset some of this negative impact. The Fund’s tilt toward smaller companies in thesmall-cap growth universe also detracted from relative performance. The impact of the Fund’s greater-than-benchmark core exposure (as measured by multiple value metrics) was mixed during the quarter.
From a sector perspective, the Fund’s allocation effect was negative. Overweightings in the Energy and Communication Services sectors particularly hurt relative results. The Fund’s stock selection effect was significantly negative. Holdings in the Information Technology, Health Care, and Industrials sectors detracted the most from relative performance.
Detailed Explanation of Fiscal Year Performance
The Fund’s diversifying value metrics models and primary company financial health models significantly lagged the benchmark during the12-month period and detracted from relative results. However, the Fund’s diversifying price momentum models improved relative performance and partially offset some of these losses. The Fund’s tilts toward smaller companies in thesmall-cap growth universe and to core stocks across multiple value metrics also detracted from relative performance.
From a sector perspective, the Fund’s allocation effect was negative. Overweightings in the Energy and Industrials sectors and an underweighting in the Real Estate sector detracted the most from relative results. The Fund’s stock selection effect was significantly negative, with holdings in the Information Technology, Health Care, Financials, and Industrials sectors weighing heavily on relative returns.
| | |
| 34 | | Annual Report | June 30, 2019 |
| | |
| Small-Cap Growth Fund | | |
MANAGER’S COMMENTARY (Unaudited)(continued) | | |
| | |
Top Ten Holdings as of June 30, 2019
| | | | | | | | | |
| Rank | | Description | | Industry | | % of Net
Assets |
| 1 | | TTEC Holdings, Inc. | | Information Technology | | 1.9% |
| 2 | | Avid Technology, Inc. | | Information Technology | | 1.9% |
| 3 | | Innoviva, Inc. | | Health Care | | 1.8% |
| 4 | | Haemonetics Corp. | | Health Care | | 1.7% |
| 5 | | Kronos Worldwide, Inc. | | Materials | | 1.7% |
| 6 | | Boot Barn Holdings, Inc. | | Consumer Discretionary | | 1.7% |
| 7 | | ProPetro Holding Corp. | | Energy | | 1.7% |
| 8 | | Emergent BioSolutions, Inc. | | Health Care | | 1.6% |
| 9 | | Insperity, Inc. | | Industrials | | 1.6% |
| 10 | | AMN Healthcare Services, Inc. | | Health Care | | 1.6% |
| | Total | | | | 17.2% |
Industry Sector Representation as of June 30, 2019
| | | | | | | | | | | | | | | |
| | | % of Net Assets | | % of Russell 2000
Growth Index | | Difference |
Communication Services | | | | 4.5% | | | | | 3.1% | | | | | 1.4% | |
Consumer Discretionary | | | | 14.3% | | | | | 14.6% | | | | | -0.3% | |
Consumer Staples | | | | 3.8% | | | | | 2.9% | | | | | 0.9% | |
Energy | | | | 5.2% | | | | | 1.7% | | | | | 3.5% | |
Financials | | | | 9.7% | | | | | 7.1% | | | | | 2.6% | |
Health Care | | | | 23.0% | | | | | 26.5% | | | | | -3.5% | |
Industrials | | | | 17.9% | | | | | 18.5% | | | | | -0.6% | |
Information Technology | | | | 15.2% | | | | | 18.5% | | | | | -3.3% | |
Materials | | | | 5.8% | | | | | 3.4% | | | | | 2.4% | |
Real Estate | | | | 0.9% | | | | | 3.2% | | | | | -2.3% | |
Utilities | | | | 0.0% | | | | | 0.5% | | | | | -0.5% | |
Liabilities in Excess of Other Assets | | | | -0.3% | | | | | 0.0% | | | | | -0.3% | |
Total | | | | 100.0% | | | | | 100.0% | | | | | | |
Disclaimer
The views expressed here are exclusively those of Fund management. These views, including those related to market sectors or individual stocks, are not meant as investment advice and should not be considered predictive in nature. Any favorable (or unfavorable) description of a holding applies only as of the quarter end, June 30, 2019, unless otherwise stated. Security positions can and do change thereafter. Discussions of historical performance do not guarantee and may not be indicative of future performance.
Market volatility can significantly impact short-term performance. The Fund is not an appropriate investment for short-term investors. Investments in small companies generally carry greater risk than is customarily associated with larger companies. This additional risk is attributable to a number of factors, including the relatively limited financial resources that are typically available to small companies and the fact that small companies often have comparatively limited product lines. In addition, the stock of small companies tends to be more volatile than the stock of large companies, particularly in the short term and particularly in the early stages of an economic or market downturn. Shareholders of the Fund, therefore, are taking on more risk than they would if they invested in the stock market as a whole.
| | |
| Small-Cap Growth Fund | |
|
MANAGER’S COMMENTARY (Unaudited) (continued) |
| | |
Conclusion
Thank you for your continued investment inSmall-Cap Growth Fund. We encourage your feedback; your reactions and concerns are important to us.
Sincerely,
The Investment Management Team
| | |
| 36 | | Annual Report | June 30, 2019 |
| | |
| Small-Cap Growth Fund | |
|
SCHEDULE OF INVESTMENTS |
| Showing percentage of net assets as of June 30, 2019 | | |
| | | | | | |
| Industry Company | | Shares | | Value | | |
| |
COMMON STOCKS - 100.31% | | |
Communication Services - 4.46% | | |
Entravision Communications Corp., Class A | | 154,700 | | $ 482,664 | | |
Liberty Media Corp.-Liberty Braves, Class C* | | 5,300 | | 148,241 | | |
Nexstar Media Group, Inc., Class A | | 5,700 | | 575,700 | | |
TechTarget, Inc.* | | 31,600 | | 671,500 | | |
| | | | | | |
| | | |
| | | | 1,878,105 | | |
| |
Consumer Discretionary - 14.32% | | |
America’sCar-Mart, Inc.* | | 5,400 | | 464,832 | | |
Asbury Automotive Group, Inc.* | | 7,800 | | 657,852 | | |
Bloomin’ Brands, Inc. | | 27,200 | | 514,352 | | |
Boot Barn Holdings, Inc.* | | 20,100 | | 716,364 | | |
Cheesecake Factory, Inc. (The) | | 7,400 | | 323,528 | | |
Children’s Place, Inc. (The)+ | | 4,900 | | 467,362 | | |
Crocs, Inc.* | | 25,300 | | 499,675 | | |
Dave & Buster’s Entertainment, Inc. | | 11,900 | | 481,593 | | |
LCI Industries | | 2,900 | | 261,000 | | |
LGI Homes, Inc.* | | 8,600 | | 614,298 | | |
M/I Homes, Inc.* | | 4,000 | | 114,160 | | |
Penn National Gaming, Inc.* | | 2,478 | | 47,726 | | |
RH* | | 5,400 | | 624,240 | | |
Stamps.com, Inc.* | | 2,900 | | 131,283 | | |
Tailored Brands, Inc.+ | | 18,900 | | 109,053 | | |
| | | | | | |
| | | |
| | | | 6,027,318 | | |
| |
Consumer Staples - 3.83% | | |
Chefs’ Warehouse, Inc. (The)* | | 13,000 | | 455,910 | | |
Coca-Cola Consolidated, Inc. | | 2,000 | | 598,500 | | |
Medifast, Inc. | | 3,500 | | 449,050 | | |
Performance Food Group Co.* | | 2,700 | | 108,081 | | |
| | | | | | |
| | | |
| | | | 1,611,541 | | |
| |
Energy - 5.17% | | |
Carrizo Oil & Gas, Inc.* | | 17,200 | | 172,344 | | |
CONSOL Energy, Inc.* | | 10,200 | | 271,422 | | |
DMC Global, Inc. | | 6,600 | | 418,110 | | |
Par Pacific Holdings, Inc.* | | 15,300 | | 313,956 | | |
ProPetro Holding Corp.* | | 34,000 | | 703,800 | | |
Rosehill Resources, Inc.* | | 79,600 | | 294,520 | | |
| | | | | | |
| | | |
| | | | 2,174,152 | | |
| |
Financials - 9.68% | | |
Diamond Hill Investment Group, Inc. | | 1,000 | | 141,720 | | |
| | | | |
| Industry Company | | Shares | | Value |
|
|
Financials (continued) |
Enova International, Inc.* | | 27,800 | | $ 640,790 |
FedNat Holding Co. | | 9,900 | | 141,273 |
FirstCash, Inc. | | 6,600 | | 660,132 |
Green Dot Corp., Class A* | | 2,600 | | 127,140 |
Moelis & Co., Class A | | 7,100 | | 248,145 |
Primerica, Inc. | | 2,100 | | 251,895 |
Seacoast Banking Corp of Florida* | | 23,500 | | 597,840 |
Universal Insurance Holdings, Inc. | | 22,300 | | 622,170 |
Walker & Dunlop, Inc. | | 12,100 | | 643,841 |
| | | | |
| | |
| | | | 4,074,946 |
Health Care - 23.03% |
AMN Healthcare Services, Inc.* | | 12,500 | | 678,125 |
AtriCure, Inc.* | | 11,400 | | 340,176 |
Axogen, Inc.* | | 3,800 | | 75,240 |
BioSpecifics Technologies Corp.* | | 9,500 | | 567,245 |
BioTelemetry, Inc.* | | 9,900 | | 476,685 |
Cutera, Inc.* | | 6,600 | | 137,148 |
Emergent BioSolutions, Inc.* | | 14,500 | | 700,495 |
Ensign Group, Inc. (The) | | 11,400 | | 648,888 |
Genesis Healthcare, Inc.* | | 479,600 | | 594,704 |
Haemonetics Corp.* | | 6,100 | | 734,074 |
Innoviva, Inc.* | | 50,600 | | 736,736 |
IntriCon Corp.* | | 4,800 | | 112,128 |
Jounce Therapeutics, Inc.* | | 121,300 | | 600,435 |
Ligand Pharmaceuticals, Inc.* | | 5,300 | | 604,995 |
Providence Service Corp. (The)* | | 9,900 | | 567,666 |
RTI Surgical Holdings, Inc.* | | 34,500 | | 146,625 |
Sientra, Inc.* | | 29,500 | | 181,720 |
Simulations Plus, Inc. | | 4,800 | | 137,088 |
Tactile Systems Technology, Inc.* | | 8,100 | | 461,052 |
Vericel Corp.* | | 30,000 | | 566,700 |
Vocera Communications, Inc.* | | 19,600 | | 625,632 |
| | | | |
| | |
| | | | 9,693,557 |
Industrials - 17.88% |
Allegiant Travel Co. | | 2,100 | | 301,350 |
ArcBest Corp. | | 11,000 | | 309,210 |
Atkore International Group, Inc.* | | 6,100 | | 157,807 |
Avis Budget Group, Inc.* | | 18,100 | | 636,396 |
Brink’s Co. (The) | | 3,200 | | 259,776 |
Comfort Systems USA, Inc. | | 11,500 | | 586,385 |
Covanta Holding Corp. | | 7,500 | | 134,325 |
| | |
| Small-Cap Growth Fund | |
|
SCHEDULE OF INVESTMENTS(continued) |
| Showing percentage of net assets as of June 30, 2019 | | |
| | | | | | |
| Industry Company | | Shares | | Value | | |
| |
Common Stocks (continued) | | |
Industrials (continued) | | |
Forward Air Corp. | | 4,200 | | $ 248,430 | | |
General Finance Corp.* | | 12,200 | | 102,114 | | |
Harsco Corp.* | | 23,500 | | 644,840 | | |
Herc Holdings, Inc.* | | 3,200 | | 146,656 | | |
Insperity, Inc. | | 5,600 | | 683,984 | | |
Kadant, Inc. | | 6,600 | | 599,346 | | |
Lindsay Corp. | | 2,200 | | 180,862 | | |
MasTec, Inc.* | | 3,700 | | 190,661 | | |
Meritor, Inc.* | | 18,600 | | 451,050 | | |
Miller Industries, Inc. | | 9,600 | | 295,200 | | |
PAM Transportation Services, Inc.* | | 6,800 | | 421,600 | | |
Patrick Industries, Inc.* | | 5,000 | | 245,950 | | |
Systemax, Inc. | | 9,900 | | 219,384 | | |
Tennant Co. | | 7,400 | | 452,880 | | |
Willis Lease Finance Corp.* | | 4,400 | | 256,608 | | |
| | | | | | |
| | | |
| | | | 7,524,814 | | |
| |
Information Technology - 15.25% | | |
ACI Worldwide, Inc.* | | 18,100 | | 621,554 | | |
Alarm.com Holdings, Inc.* | | 8,200 | | 438,700 | | |
Avid Technology, Inc.* | | 85,700 | | 781,584 | | |
Bottomline Technologies, Inc.* | | 13,400 | | 592,816 | | |
Calix, Inc.* | | 17,100 | | 112,176 | | |
Cirrus Logic, Inc.* | | 10,000 | | 437,000 | | |
Extreme Networks, Inc.* | | 55,600 | | 359,732 | | |
InterDigital, Inc. | | 9,700 | | 624,680 | | |
Limelight Networks, Inc.* | | 204,800 | | 552,960 | | |
QAD, Inc., Class A | | 12,400 | | 498,604 | | |
TTEC Holdings, Inc. | | 17,200 | | 801,348 | | |
Unisys Corp.* | | 61,400 | | 596,808 | | |
| | | | | | |
| | | |
| | | | 6,417,962 | | |
| |
Materials - 5.77% | | |
Forterra, Inc.*+ | | 123,500 | | 613,795 | | |
Kronos Worldwide, Inc. | | 47,000 | | 720,040 | | |
Ryerson Holding Corp.* | | 67,800 | | 564,774 | | |
Verso Corp., Class A* | | 27,700 | | 527,685 | | |
| | | | | | |
| | | |
| | | | 2,426,294 | | |
| |
Real Estate - 0.92% | | |
HFF, Inc., Class A | | 8,500 | | 386,580 | | |
| | | | | | |
| | |
TOTAL COMMON STOCKS - 100.31% | | 42,215,269 | | |
| | | | | | |
(Cost $39,873,431) | | | | | | |
| | | | | | | | |
| | | Rate^ | | Shares | | Value | |
|
| INVESTMENTS PURCHASED WITH CASH PROCEEDS FROM SECURITIES LENDING - 2.92% | |
Fidelity Investments Money Market Government Portfolio Class I** | | 2.25% | | 1,228,325 | | | $1,228,325 | |
| | | | | | | | |
| |
TOTAL INVESTMENTS PURCHASED WITH CASH PROCEEDS FROM SECURITIES LENDING - 2.92% | | | 1,228,325 | |
| | | | | | | | |
(Cost $ 1,228,325) | | | | | | | | |
| |
TOTAL INVESTMENTS - 103.23% | | | $43,443,594 | |
(Cost $ 41,101,756) | | | | | | | | |
Liabilities in Excess of Other Assets - (3.23%) | | | (1,358,348 | ) |
| | | | | | | | |
| |
NET ASSETS - 100.00% | | | $42,085,246 | |
| | | | | | | | |
| * | Non-income producing security. |
| ** | This security represents the investment of the collateral received in connection with securities out on loan as of June 30, 2019. |
| ^ | Rate disclosed as of June 30, 2019. |
| + | This security or a portion of the security is out on loan as of June 30, 2019. Total loaned securities had a value of $1,190,210 as of June 30, 2019. |
Summary of inputs used to value the Fund’s investments as of 06/30/2019 (See Note 2 in Notes to Financial Statements):
| | | | | | | | | | | | | | | | |
| | | Valuation Inputs | |
| | | Investment in Securities (Value) | |
| | | Level 1
Quoted
Prices | | | Level 2
Significant
Observable
Inputs | | | Level 3
Significant
Unobservable
Inputs | | | Total | |
| | | | |
Common Stocks (a) | | $ | 42,215,269 | | | $ | — | | | $ | — | | | $ | 42,215,269 | |
Investments Purchased with Cash Proceeds from Securities Lending | | | — | | | | 1,228,325 | | | | — | | | | 1,228,325 | |
| | | | | | | | | | | | | | | | |
TOTAL | | $ | 42,215,269 | | | $ | 1,228,325 | | | $ | — | | | $ | 43,443,594 | |
| | | | | | | | | | | | | | | | |
(a) - Please refer to the Schedule of Investments for the industry classifications of these portfolio holdings.
See Notes to Financial Statements.
| | |
| 38 | | Annual Report | June 30, 2019 |
| | |
| Small-Cap Value Fund | | |
MANAGER’S COMMENTARY (Unaudited) | | |
| | |
June 30, 2019
Dear FellowSmall-Cap Value Fund Shareholder,
For the quarter ended June 30, 2019, our Fund returned-2.50%, underperforming our primary market benchmark, the Russell 2000 Value Index (+1.38%), and our peer benchmark, the LipperSmall-Cap Value Funds Index (+0.83%). It was a poor quarter.
For the fiscal year, our Fund returned-17.12%, lagging the Russell 2000 Value Index(-6.24%) and the LipperSmall-Cap Value Funds Index(-7.41%).
The table below presents our June quarter,one-year, five-year,10-year,15-year, andinception-to-date financial results. See the next page for a graph of performance since inception.
Standardized Returns as of June 30, 2019
| | | | | | | | | | | | | | | | | | | | | | | | | | | | | | |
| | | | | | | Annualized |
| | | Quarter | | 1 Year | | 5 Years | | 10 Years | | 15 Years | | Since Inception
(10/31/03) |
| | | | | | |
Small-Cap Value Fund | | | | -2.50 | % | | | | -17.12 | % | | | | 2.17 | % | | | | 10.76 | % | | | | 6.59 | % | | | | 6.61 | % |
Russell 2000 Value Index | | | | 1.38 | % | | | | -6.24 | % | | | | 5.39 | % | | | | 12.40 | % | | | | 7.28 | % | | | | 7.98 | % |
LipperSmall-Cap Value Funds Index | | | | 0.83 | % | | | | -7.41 | % | | | | 3.97 | % | | | | 11.71 | % | | | | 7.26 | % | | | | 7.99 | % |
Performance figures quoted in the table above represent past performance and are no guarantee of future results. Total return figures in the table above include the reinvestment of dividends and capital gains. The table above does not reflect the deduction of taxes that a shareholder would pay on Fund distributions or on the redemption of Fund shares.
The Russell 2000 Value Index is an unmanaged index that consists of stocks in the Russell 2000 Index with lowerprice-to-book ratios and lower forecasted growth values with dividends reinvested. The LipperSmall-Cap Value Funds Index is an index of small-company, value-oriented funds compiled by Lipper, Inc. It is not possible to invest directly in an index. Periods longer than one year are annualized.
| | |
| Small-Cap Value Fund | |
|
MANAGER’S COMMENTARY (Unaudited)(continued) |
| | |
Growth of a $10,000 Investment
from Inception October 31, 2003 to June 30, 2019
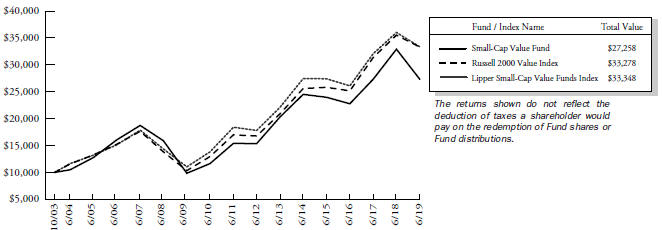
Detailed Explanation of Quarterly Performance
The Fund’s primary value metrics models and diversifying price momentum models lagged the benchmark and detracted from relative results during the quarter. The Fund’s company financial health models outperformed, however, helping offset some of this negative impact. The Fund’s tilt toward deeper value stocks weighed on relative results during a quarter in which value underperformed growth in thesmall-cap universe. Likewise, the Fund’s tilt toward smaller companies also detracted from results, as the benchmark’s largest companies generally outperformed its smaller companies.
From a sector perspective, the Fund’s allocation effect was flat during the quarter. However, the Fund’s stock selection effect was significantly negative. Holdings in the Consumer Discretionary, Financials, and Energy sectors detracted the most from relative results.
Detailed Explanation of Fiscal Year Performance
Our primary value metrics models and diversifying price momentum models lagged the benchmark significantly and detracted from relative results. However, the Fund’s diversifying company financial health models outperformed the benchmark. The Fund’s tilt toward deeper value stocks weighed on relative results for the12-month period, as did our tilt toward smaller companies in thesmall-cap value universe.
From a sector perspective, the Fund’s allocation effect was negative. Underweightings in the Utilities and Information Technology sectors and an overweighting in the Health Care sector detracted the most from relative results. The Fund’s stock selection effect was significantly negative, largely driven by poor performance from holdings in the Consumer Discretionary, Financials, and Real Estate sectors. Holdings in the Information Technology and Energy sectors also detracted significantly from relative results.
| | |
| 40 | | Annual Report | June 30, 2019 |
| | |
| Small-Cap Value Fund | | |
MANAGER’S COMMENTARY (Unaudited)(continued) | | |
| | |
Top Ten Holdings as of June 30, 2019
| | | | | | | | | |
| Rank | | Description | | Industry | | % of Net
Assets |
| 1 | | ArQule, Inc. | | Health Care | | | | 2.2 | % |
| 2 | | OFG Bancorp | | Financials | | | | 1.7 | % |
| 3 | | Harmonic, Inc. | | Information Technology | | | | 1.6 | % |
| 4 | | Callon Petroleum Co. | | Energy | | | | 1.5 | % |
| 5 | | SkyWest, Inc. | | Industrials | | | | 1.5 | % |
| 6 | | Argo Group International Holdings, Ltd. | | Financials | | | | 1.5 | % |
| 7 | | FTS International, Inc. | | Energy | | | | 1.5 | % |
| 8 | | Arch Coal, Inc., Class A | | Energy | | | | 1.5 | % |
| 9 | | Walker & Dunlop, Inc. | | Financials | | | | 1.5 | % |
| 10 | | Oppenheimer Holdings, Inc., Class A | | Financials | | | | 1.5 | % |
| | Total | | | | | | 16.0 | % |
Industry Sector Representation as of June 30, 2019
| | | | | | | | | | | | | | | |
| | | % of Net Assets | | % of Russell 2000
Value Index | | Difference |
Communication Services | | | | 3.2% | | | | | 2.9% | | | | | 0.3% | |
Consumer Discretionary | | | | 10.4% | | | | | 8.5% | | | | | 1.9% | |
Consumer Staples | | | | 2.1% | | | | | 2.4% | | | | | -0.3% | |
Energy | | | | 7.8% | | | | | 5.1% | | | | | 2.7% | |
Financials | | | | 26.1% | | | | | 29.4% | | | | | -3.3% | |
Health Care | | | | 6.9% | | | | | 4.1% | | | | | 2.8% | |
Industrials | | | | 15.3% | | | | | 11.6% | | | | | 3.7% | |
Information Technology | | | | 9.5% | | | | | 11.9% | | | | | -2.4% | |
Materials | | | | 5.4% | | | | | 4.2% | | | | | 1.2% | |
Real Estate | | | | 9.6% | | | | | 12.3% | | | | | -2.7% | |
Utilities | | | | 3.6% | | | | | 7.6% | | | | | -4.0% | |
Cash & Other Assets | | | | 0.1% | | | | | 0.0% | | | | | 0.1% | |
Total | | | | 100.0% | | | | | 100.0% | | | | | | |
Disclaimer
The views expressed here are exclusively those of Fund management. These views, including those related to market sectors or individual stocks, are not meant as investment advice and should not be considered predictive in nature. Any favorable (or unfavorable) description of a holding applies only as of the quarter end, June 30, 2019, unless otherwise stated. Security positions can and do change thereafter. Discussions of historical performance do not guarantee and may not be indicative of future performance.
Market volatility can significantly impact short-term performance. The Fund is not an appropriate investment for short-term investors. Investments in small companies generally carry greater risk than is customarily associated with larger companies. This additional risk is attributable to a number of factors, including the relatively limited financial resources that are typically available to small companies and the fact that small companies often have comparatively limited product lines. In addition, the stock of small companies tends to be more volatile than the stock of large companies, particularly in the short term and particularly in the early stages of an economic or market downturn. Shareholders of the Fund, therefore, are taking on more risk than they would if they invested in the stock market as a whole.
| | |
| Small-Cap Value Fund | | |
MANAGER’S COMMENTARY (Unaudited)(continued) | | |
| | |
Conclusion
Thank you for your continued investment inSmall-Cap Value Fund. We encourage your feedback; your reactions and concerns are important to us.
Sincerely,
The Investment Management Team
| | |
| 42 | | Annual Report | June 30, 2019 |
| | |
| Small-Cap Value Fund | | |
SCHEDULE OF INVESTMENTS | | |
Showing percentage of net assets as of June 30, 2019 | | |
| | | | | | | | | | | | |
| Industry Company | | | Shares | | | | Value | | | | | |
| |
COMMON STOCKS - 99.97% | | | | | |
| Communication Services - 3.23% | | | | |
Entravision Communications Corp., Class A | | | 184,100 | | | $ | 574,392 | | | | | |
Gannett Co., Inc. | | | 31,300 | | | | 255,408 | | | | | |
Marcus Corp. (The) | | | 19,500 | | | | 642,720 | | | | | |
NII Holdings, Inc.* | | | 77,000 | | | | 130,130 | | | | | |
| | | | | | | | | | | | |
| | | |
| | | | | | | 1,602,650 | | | | | |
| |
Consumer Discretionary - 10.41% | | | | | |
American Axle & Manufacturing Holdings, Inc.* | | | 35,900 | | | | 458,084 | | | | | |
Barnes & Noble Education, Inc.* | | | 67,900 | | | | 228,144 | | | | | |
Caleres, Inc. | | | 11,900 | | | | 237,048 | | | | | |
Chico’s FAS, Inc. | | | 153,000 | | | | 515,610 | | | | | |
Fossil Group, Inc.* | | | 34,200 | | | | 393,300 | | | | | |
GameStop Corp., Class A | | | 40,700 | | | | 222,629 | | | | | |
Hibbett Sports, Inc.* | | | 35,600 | | | | 647,920 | | | | | |
J. Jill, Inc.+ | | | 58,600 | | | | 116,614 | | | | | |
K12, Inc.* | | | 5,700 | | | | 173,337 | | | | | |
KB Home | | | 26,800 | | | | 689,564 | | | | | |
Meritage Homes Corp.* | | | 2,500 | | | | 128,350 | | | | | |
Office Depot, Inc. | | | 154,300 | | | | 317,858 | | | | | |
Shoe Carnival, Inc.+ | | | 21,100 | | | | 582,360 | | | | | |
Tower International, Inc. | | | 23,500 | | | | 458,250 | | | | | |
| | | | | | | | | | | | |
| | | |
| | | | | | | 5,169,068 | | | | | |
| |
Consumer Staples - 2.13% | | | | | |
Darling Ingredients, Inc.* | | | 32,700 | | | | 650,403 | | | | | |
Ingles Markets, Inc., Class A | | | 9,100 | | | | 283,283 | | | | | |
Tootsie Roll Industries, Inc. | | | 3,400 | | | | 125,562 | | | | | |
| | | | | | | | | | | | |
| | | |
| | | | | | | 1,059,248 | | | | | |
| |
Energy - 7.78% | | | | | |
Arch Coal, Inc., Class A | | | 7,900 | | | | 744,259 | | | | | |
California Resources Corp.*+ | | | 26,200 | | | | 515,616 | | | | | |
Callon Petroleum Co.* | | | 115,400 | | | | 760,486 | | | | | |
Denbury Resources, Inc.* | | | 112,200 | | | | 139,128 | | | | | |
FTS International, Inc.* | | | 133,800 | | | | 746,604 | | | | | |
Renewable Energy Group, Inc.* | | | 30,800 | | | | 488,488 | | | | | |
World Fuel Services Corp. | | | 13,000 | | | | 467,480 | | | | | |
| | | | | | | | | | | | |
| | | |
| | | | | | | 3,862,061 | | | | | |
| |
Financials - 26.08% | | | | | |
Argo Group International Holdings, Ltd. | | | 10,135 | | | | 750,497 | | | | | |
Arlington Asset Investment Corp., Class A+ | | | 93,100 | | | | 640,528 | | | | | |
Bancorp, Inc. (The)* | | | 66,600 | | | | 594,072 | | | | | |
| | | |
| | | | | | | | | | | | |
| | | | | | | | |
| Industry Company | | Shares | | | Value | |
|
| |
Financials (continued) | |
Banner Corp. | | | 11,700 | | | $ | 633,555 | |
Essent Group, Ltd.* | | | 14,100 | | | | 662,559 | |
FedNat Holding Co. | | | 16,900 | | | | 241,163 | |
First BanCorp Puerto Rico | | | 46,800 | | | | 516,672 | |
GAIN Capital Holdings, Inc.+ | | | 93,000 | | | | 384,090 | |
GAMCO Investors, Inc., Class A | | | 23,000 | | | | 440,910 | |
HomeStreet, Inc.* | | | 8,100 | | | | 240,084 | |
Independence Holding Co. | | | 18,900 | | | | 731,808 | |
James River Group Holdings, Ltd. | | | 14,600 | | | | 684,740 | |
MidSouth Bancorp, Inc. | | | 14,200 | | | | 168,270 | |
Mr Cooper Group, Inc.* | | | 2,978 | | | | 23,854 | |
National General Holdings Corp. | | | 29,400 | | | | 674,436 | |
National Western Life Group, Inc., Class A | | | 2,600 | | | | 668,200 | |
Ocwen Financial Corp.* | | | 225,100 | | | | 465,957 | |
OFG Bancorp | | | 35,200 | | | | 836,704 | |
Oppenheimer Holdings, Inc., Class A | | | 27,050 | | | | 736,301 | |
Piper Jaffray Cos | | | 9,600 | | | | 712,992 | |
Provident Financial Services, Inc. | | | 11,800 | | | | 286,150 | |
Republic First Bancorp, Inc.* | | | 40,600 | | | | 199,346 | |
Towne Bank | | | 10,600 | | | | 289,168 | |
TriCo Bancshares | | | 3,200 | | | | 120,960 | |
Walker & Dunlop, Inc. | | | 13,900 | | | | 739,619 | |
Waterstone Financial, Inc. | | | 8,300 | | | | 141,598 | |
Western New England Bancorp, Inc. | | | 39,000 | | | | 364,260 | |
| | | | | | | | |
| | |
| | | | | | | 12,948,493 | |
|
Health Care - 6.90% | |
Akorn, Inc.* | | | 120,200 | | | | 619,030 | |
AMAG Pharmaceuticals, Inc.* | | | 59,900 | | | | 598,401 | |
ArQule, Inc.* | | | 99,600 | | | | 1,096,596 | |
Castlight Health, Inc., Class B* | | | 47,200 | | | | 152,456 | |
Lannett Co., Inc.*+ | | | 29,700 | | | | 179,982 | |
Meridian Bioscience, Inc. | | | 34,000 | | | | 403,920 | |
National Research Corp. | | | 3,500 | | | | 201,565 | |
RTI Surgical Holdings, Inc.* | | | 40,700 | | | | 172,975 | |
| | | | | | | | |
| | |
| | | | | | | 3,424,925 | |
|
Industrials - 15.27% | |
Aircastle, Ltd. | | | 27,100 | | | | 576,146 | |
Apogee Enterprises, Inc. | | | 4,100 | | | | 178,104 | |
Echo Global Logistics, Inc.* | | | 6,000 | | | | 125,220 | |
| | |
| Small-Cap Value Fund | |
|
SCHEDULE OF INVESTMENTS(continued) |
Showing percentage of net assets as of June 30, 2019 | | |
| | | | | | | | | | | | |
| Industry Company | | | Shares | | | | Value | | | | | |
| |
Common Stocks (continued) | | | | | |
| Industrials (continued) | | | | |
Foundation Building Materials, Inc.* | | | 37,400 | | | $ | 664,972 | | | | | |
GATX Corp. | | | 9,100 | | | | 721,539 | | | | | |
Hawaiian Holdings, Inc. | | | 13,400 | | | | 367,562 | | | | | |
InnerWorkings, Inc.* | | | 94,300 | | | | 360,226 | | | | | |
Kimball International, Inc., Class B | | | 42,100 | | | | 733,803 | | | | | |
Mistras Group, Inc.* | | | 51,100 | | | | 734,307 | | | | | |
Quad/Graphics, Inc.+ | | | 56,000 | | | | 442,960 | | | | | |
Radiant Logistics, Inc.* | | | 101,900 | | | | 625,666 | | | | | |
SkyWest, Inc. | | | 12,500 | | | | 758,375 | | | | | |
Titan Machinery, Inc.* | | | 24,500 | | | | 504,210 | | | | | |
TriMas Corp.* | | | 6,200 | | | | 192,014 | | | | | |
Triton International, Ltd./Bermuda | | | 10,000 | | | | 327,600 | | | | | |
TrueBlue, Inc.* | | | 12,100 | | | | 266,926 | | | | | |
| | | | | | | | | | | | |
| | | |
| | | | | | | 7,579,630 | | | | | |
| |
Information Technology - 9.53% | | | | | |
Amkor Technology, Inc.* | | | 81,300 | | | | 606,498 | | | | | |
Cardtronics PLC, Class A* | | | 7,000 | | | | 191,240 | | | | | |
Control4 Corp.* | | | 25,700 | | | | 610,375 | | | | | |
Hackett Group, Inc. (The) | | | 12,000 | | | | 201,480 | | | | | |
Harmonic, Inc.* | | | 141,100 | | | | 783,105 | | | | | |
Information Services Group, Inc.* | | | 7,500 | | | | 23,700 | | | | | |
Perficient, Inc.* | | | 8,000 | | | | 274,560 | | | | | |
Sanmina Corp.* | | | 17,400 | | | | 526,872 | | | | | |
Tech Data Corp.* | | | 7,000 | | | | 732,200 | | | | | |
TTM Technologies, Inc.* | | | 36,100 | | | | 368,220 | | | | | |
Verint Systems, Inc.* | | | 7,700 | | | | 414,106 | | | | | |
| | | | | | | | | | | | |
| | | |
| | | | | | | 4,732,356 | | | | | |
| |
Materials - 5.43% | | | | | |
Gold Resource Corp. | | | 170,000 | | | | 574,600 | | | | | |
Innospec, Inc. | | | 4,800 | | | | 437,952 | | | | | |
SunCoke Energy, Inc.* | | | 74,700 | | | | 663,336 | | | | | |
Verso Corp., Class A* | | | 18,400 | | | | 350,520 | | | | | |
Warrior Met Coal, Inc. | | | 25,700 | | | | 671,284 | | | | | |
| | | | | | | | | | | | |
| | | |
| | | | | | | 2,697,692 | | | | | |
| |
Real Estate - 9.57% | | | | | |
Cousins Properties, Inc. | | | 6,475 | | | | 234,201 | | | | | |
Industrial Logistics Properties Trust | | | 19,597 | | | | 408,009 | | | | | |
Monmouth Real Estate Investment Corp. | | | 53,800 | | | | 728,990 | | | | | |
| | | | | | | | | | | | |
| | | | | | | | | | | | |
| Industry Company | | | | | Shares | | | Value | |
|
| |
| Real Estate (continued) | | | | |
National Health Investors, Inc. | | | | 8,400 | | | $ | 655,452 | |
National Storage Affiliates Trust | | | | 8,500 | | | | 245,990 | |
Piedmont Office Realty Trust, Inc., Class A | | | | 16,100 | | | | 320,873 | |
PS Business Parks, Inc. | | | | 4,100 | | | | 690,973 | |
STAG Industrial, Inc. | | | | 11,800 | | | | 356,832 | |
Washington Prime Group, Inc.+ | | | | 103,700 | | | | 396,134 | |
Whitestone REIT | | | | 56,500 | | | | 716,985 | |
| | | | | | | | | | | | |
| | | |
| | | | | | | | | | | 4,754,439 | |
| |
Utilities - 3.64% | | | | | |
Atlantic Power Corp.* | | | | 298,000 | | | | 721,160 | |
California Water Service Group | | | | 8,800 | | | | 445,544 | |
MGE Energy, Inc. | | | | 2,000 | | | | 146,160 | |
Portland General Electric Co. | | | | 4,000 | | | | 216,680 | |
Southwest Gas Holdings, Inc. | | | | 1,700 | | | | 152,354 | |
TerraForm Power, Inc., Class A | | | | 8,700 | | | | 124,410 | |
| | | | | | | | | | | | |
| | | |
| | | | | | | | | | | 1,806,308 | |
| | | | | | | | | | | | |
| |
TOTAL COMMON STOCKS - 99.97% | | | | 49,636,870 | |
| | | | | | | | | | | | |
(Cost $51,457,382) | | | | | |
| | | |
| | | Rate^ | | | Shares | | | Value | |
|
MONEY MARKET FUND - 0.10% | |
Fidelity Investments Money Market Government Portfolio Class I | | | 2.25% | | | | 52,931 | | | | 52,931 | |
| | | | | | | | | | | | |
| |
TOTAL MONEY MARKET FUND - 0.10% | | | | 52,931 | |
| | | | | | | | | | | | |
(Cost $52,931) | | | | | |
| | |
| 44 | | Annual Report | June 30, 2019 |
| | |
| Small-Cap Value Fund | | |
SCHEDULE OF INVESTMENTS(continued) | | |
Showing percentage of net assets as of June 30, 2019 | | |
| | | | | | | | | | |
| | | Rate^ | | Shares | | | Value | |
| INVESTMENTS PURCHASED WITH CASH PROCEEDS FROM SECURITIESLENDING - 6.33% | |
Fidelity Investments Money Market Government Portfolio Class I** | | 2.25% | | | 3,141,308 | | | | $3,141,308 | |
| | | | | | | | | | |
TOTAL INVESTMENTS PURCHASED WITH CASH PROCEEDS FROM SECURITIES LENDING - 6.33% | | | | 3,141,308 | |
| | | | | | | | | | |
(Cost $ 3,141,308) | | | | | |
| |
TOTAL INVESTMENTS - 106.40% | | | | $52,831,109 | |
(Cost $ 54,651,621) | | | | | |
Liabilities in Excess of Other Assets - (6.40%) | | | | (3,179,348 | ) |
| | | | | | | | | | |
| |
NET ASSETS - 100.00% | | | | $49,651,761 | |
| | | | | | | | | | |
| * | Non-income producing security. |
| ** | This security represents the investment of the collateral received in connection with securities out on loan as of June 30, 2019. |
| ^ | Rate disclosed as of June 30, 2019. |
| + | This security or a portion of the security is out on loan as of June 30, 2019. Total loaned securities had a value of $3,076,362 as of June 30, 2019. |
Summary of inputs used to value the Fund’s investments as of 06/30/2019 (See Note 2 in Notes to Financial Statements):
| | | | | | | | | | | | | | | | |
| | | Valuation Inputs | |
| | | Investment in Securities (Value) | |
| | | Level 1
Quoted
Prices | | | Level 2
Significant
Observable
Inputs | | | Level 3
Significant
Unobservable
Inputs | | | Total | |
| | | | |
Common Stocks | | $ | 49,636,870 | | | $ | — | | | $ | — | | | $ | 49,636,870 | |
Money Market Fund | | | — | | | | 52,931 | | | | — | | | | 52,931 | |
Investments Purchased with Cash Proceeds from Securities Lending | | | — | | | | 3,141,308 | | | | — | | | | 3,141,308 | |
| | | | | | | | | | | | | | | | |
TOTAL | | $ | 49,636,870 | | | $ | 3,194,239 | | | $ | — | | | $ | 52,831,109 | |
| | | | | | | | | | | | | | | | |
See Notes to Financial Statements.
| | |
| Blue Chip Fund (Formerly, Blue Chip 35 Index Fund) | |
|
MANAGER’S COMMENTARY (Unaudited) |
| | |
June 30, 2019
Dear Fellow Blue Chip Fund Shareholder,
For the quarter ended June 30, 2019, our Fund returned +5.19%, outperforming our primary market benchmark, the S&P 500 Index (+4.30%), our peer benchmark, the LipperLarge-Cap Core Funds Index (+4.06), and the Russell Top 50 Mega Cap Index (+4.22). It was a good quarter.
For the fiscal year, our Fund returned +16.26%, outperforming the S&P 500 Index (+10.42%), the LipperLarge-Cap Core Funds Index (+9.08%), and the Russell Top 50 Mega Cap Index (+12.25%).
The table below presents our June quarter,one-year, five-year,10-year,15-year, andinception-to-date financial results. See the next page for a graph of performance since inception.
Standardized Returns as of June 30, 2019
| | | | | | | | | | | | | | | | | | | | | | | | | | | | | | |
| | | | | | | Annualized |
| | | Quarter | | 1 Year | | 5 Years | | 10 Years | | 15 Years | | Since Inception
(7/31/97) |
| | | | | | |
Blue Chip Fund | | | | 5.19 | % | | | | 16.26 | % | | | | 10.91 | % | | | | 14.14 | % | | | | 8.32 | % | | | | 7.56 | % |
S&P 500 Index | | | | 4.30 | % | | | | 10.42 | % | | | | 10.71 | % | | | | 14.70 | % | | | | 8.75 | % | | | | 7.27 | % |
Russell Top 50 Mega Cap Index | | | | 4.22 | % | | | | 12.25 | % | | | | 11.54 | % | | | | 13.98 | % | | | | 8.14 | % | | | | 6.41 | % |
LipperLarge-Cap Core Funds Index | | | | 4.06 | % | | | | 9.08 | % | | | | 9.37 | % | | | | 13.28 | % | | | | 7.89 | % | | | | 6.41 | % |
Bridgeway Ultra-Large 35 Index | | | | 5.19 | % | | | | 16.47 | % | | | | 11.13 | % | | | | 14.39 | % | | | | 8.52 | % | | | | 7.72 | % |
Performance figures quoted in the table above represent past performance and are no guarantee of future results. Total return figures in the table above include the reinvestment of dividends and capital gains. The table above does not reflect the deduction of taxes that a shareholder would pay on Fund distributions or on the redemption of Fund shares.
The S&P 500 Index is a broad-based, unmanaged measurement of changes in stock market conditions, based on the average of 500 widely held common stocks with dividends reinvested. The Russell Top 50 Mega Cap Index measures the performance of the largest companies in the Russell 3000 Index. It includes 50 of the largest securities, based on a combination of their market cap and current index membership, and represents approximately 40% of the total market capitalization of the Russell 3000 Index. The Bridgeway Ultra-Large 35 Index is an index composed of very large, “blue chip” U.S. stocks, excluding tobacco; it is compiled by the adviser of the Fund. The LipperLarge-Cap Core Funds Index reflects the aggregate record of domesticlarge-cap core mutual funds as reported by Lipper, Inc. It is not possible to invest directly in an index. Periods longer than one year are annualized.
Effective May 31, 2019, the name of the Blue Chip 35 Index Fund was changed to Blue Chip Fund. Effective July 31, 2019, the Fund’s principal strategies were modified, as indicated in the Supplement dated May 31, 2019 to the Prospectus dated October 31, 2018.
| | |
| 46 | | Annual Report | June 30, 2019 |
| | |
| Blue Chip Fund (Formerly, Blue Chip 35 Index Fund) | | |
MANAGER’S COMMENTARY (Unaudited)(continued) | | |
| | |
Growth of a $10,000 Investment
from Inception July 31, 1997 to June 30, 2019
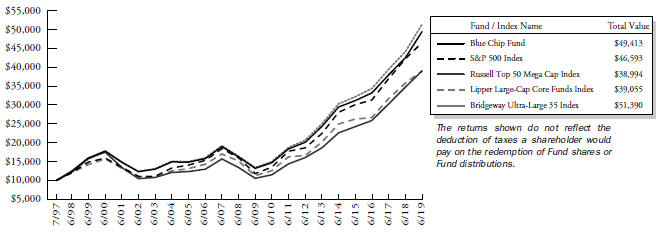
Detailed Explanation of Quarterly Performance
The Fund’smega-cap design boosted relative results by overweighting the benchmark’s largest stocks — which delivered the best returns during the quarter — while also avoiding the benchmark’s poor-performing smallest stocks. Investing in ultra-large stocks had another positive impact by creating an overweighting in lower-volatility stocks that outperformed during the quarter. The Fund’s roughly equal-weight design also improved relative performance.
From a sector perspective, the Fund’s allocation effect was positive, with an underweighting in the Financials sector contributing the most to relative results. The Fund’s stock selection effect was also positive. The Fund benefited from strong performance in the Information Technology, Consumer Staples, Consumer Discretionary, and Communication Services sectors, which more than offset poor returns from holdings in the Industrials sector.
Detailed Explanation of Fiscal Year Performance
The Fund’smega-cap design helped relative results during the fiscal year, as larger stocks outperformed smaller ones. Investing in ultra-large stocks also helped relative performance by creating an underweighting in higher-volatility stocks that performed poorly during the12-month period.
Disciplined rebalancing to maintain the Fund’s roughly equal-weight portfolio helped relative performance, as it requires the Fund to trim positions in holdings that have recently risen, while adding to names that have underperformed. This practice created an underweighting in poor-performing higher-momentum stocks.
From a sector perspective, the Fund’s allocation effect was slightly positive. Overweightings in the Information Technology and Consumer Staples sectors and underweighting in the Materials sector made the largest positive contributions to relative results. The Fund’s stock selection effect was significantly positive, largely driven by strong performance from holdings in the Communication Services, Health Care, and Information Technology sectors.
Note:The number of stocks was increased due to recomposition near the end of the fiscal year. Specifically, five were added (The Boeing Company, Citigroup Inc., Facebook, Inc., the Home Depot, Inc., and UnitedHealth Group Incorporated), and five were deleted (CVS Health Corp., ConocoPhillips, General Electric Company, Gilead Sciences, Inc., and Schlumberger Limited).
| | |
| Blue Chip Fund (Formerly, Blue Chip 35 Index Fund) | | |
MANAGER’S COMMENTARY (Unaudited)(continued) | | |
| | |
The table below presents index performance numbers for stocks in the different CRSP deciles during various time periods. The table is intended to provide a frame of reference for size.
| | | | | | | | | | | | | | | | | | | | |
| | | | | | | | | Annualized | |
| CRSP Decile1 | | Quarter | | | 1 Year | | | 5 Years | | | 10 Years | | | 93.5 Years | |
| 1 (ultra-large) | | | 4.21% | | | | 10.52% | | | | 11.17% | | | | 14.47% | | | | 9.44% | |
| 2 | | | 4.85% | | | | 11.33% | | | | 9.83% | | | | 15.44% | | | | 10.60% | |
| 3 | | | 4.51% | | | | 4.99% | | | | 9.61% | | | | 15.90% | | | | 11.06% | |
| 4 | | | 4.42% | | | | 7.21% | | | | 7.29% | | | | 14.83% | | | | 10.88% | |
| 5 | | | 2.17% | | | | -0.17% | | | | 5.29% | | | | 13.91% | | | | 11.33% | |
| 6 | | | 0.77% | | | | -4.65% | | | | 5.51% | | | | 13.98% | | | | 11.28% | |
| 7 | | | 2.82% | | | | 1.78% | | | | 8.72% | | | | 15.81% | | | | 11.57% | |
| 8 | | | -0.36% | | | | -8.65% | | | | 4.98% | | | | 13.33% | | | | 11.35% | |
| 9 | | | -0.66% | | | | -9.53% | | | | 6.08% | | | | 13.41% | | | | 11.40% | |
| 10 (ultra-small) | | | -4.00% | | | | -14.49% | | | | 3.36% | | | | 12.24% | | | | 13.04% | |
| 1 | Performance figures are as of the period ended June 30, 2019. The CRSPCap-Based Portfolio Indexes are unmanaged indexes of publicly traded U.S. stocks with dividends reinvested, grouped by market capitalization, as reported by the Center for Research in Security Prices. Past performance is no guarantee of future results. |
| | |
| 48 | | Annual Report | June 30, 2019 |
| | |
| Blue Chip Fund (Formerly, Blue Chip 35 Index Fund) | | |
MANAGER’S COMMENTARY (Unaudited)(continued) | | |
| | |
Contribution to Returns for Blue Chip Fund stocks for the fiscal year June 30, 2019:
| | | | | | | | | |
| Rank | | Company | | Industry | | % Contribution
to Return |
| 1 | | Microsoft Corp. | | Information Technology | | | | 1.4 | % |
| 2 | | Visa, Inc., Class A | | Information Technology | | | | 1.2 | % |
| 3 | | Procter & Gamble Co. (The) | | Consumer Staples | | | | 1.2 | % |
| 4 | | Merck & Co., Inc. | | Health Care | | | | 1.0 | % |
| 5 | | QUALCOMM, Inc. | | Information Technology | | | | 1.0 | % |
| 6 | | Walt Disney Co. (The) | | Communication Services | | | | 0.8 | % |
| 7 | | McDonald’s Corp. | | Consumer Discretionary | | | | 0.8 | % |
| 8 | | Oracle Corp. | | Information Technology | | | | 0.8 | % |
| 9 | | Comcast Corp., Class A | | Communication Services | | | | 0.8 | % |
| 10 | | Walmart, Inc. | | Consumer Staples | | | | 0.8 | % |
| 11 | | Cisco Systems, Inc. | | Information Technology | | | | 0.7 | % |
| 12 | | Facebook, Inc., Class A | | Communication Services | | | | 0.6 | % |
| 13 | | CVS Health Corp. | | Health Care | | | | 0.6 | % |
| 14 | | PepsiCo, Inc. | | Consumer Staples | | | | 0.6 | % |
| 15 | | Pfizer, Inc. | | Health Care | | | | 0.6 | % |
| 16 | | Coca-Cola Co. (The) | | Consumer Staples | | | | 0.5 | % |
| 17 | | Amazon.com, Inc. | | Consumer Discretionary | | | | 0.5 | % |
| 18 | | Verizon Communications, Inc. | | Communication Services | | | | 0.5 | % |
| 19 | | Johnson & Johnson | | Health Care | | | | 0.4 | % |
| 20 | | JPMorgan Chase & Co. | | Financials | | | | 0.4 | % |
| 21 | | Berkshire Hathaway, Inc., Class B | | Financials | | | | 0.3 | % |
| 22 | | Apple, Inc. | | Information Technology | | | | 0.3 | % |
| 23 | | ConocoPhillips | | Energy | | | | 0.3 | % |
| 24 | | Bank of America Corp. | | Financials | | | | 0.3 | % |
| 25 | | Gilead Sciences, Inc. | | Health Care | | | | 0.3 | % |
| 26 | | AT&T, Inc. | | Communication Services | | | | 0.3 | % |
| 27 | | United Technologies Corp. | | Industrials | | | | 0.2 | % |
| 28 | | International Business Machines Corp. | | Information Technology | | | | 0.2 | % |
| 29 | | Citigroup, Inc. | | Financials | | | | 0.1 | % |
| 30 | | Home Depot, Inc. (The) | | Consumer Discretionary | | | | 0.1 | % |
| 31 | | United Parcel Service, Inc., Class B | | Industrials | | | | 0.1 | % |
| 32 | | Intel Corp. | | Information Technology | | | | 0.1 | % |
| 33 | | Boeing Co. (The) | | Industrials | | | | 0.1 | % |
| 34 | | Chevron Corp. | | Energy | | | | 0.0 | % |
| 35 | | Alphabet, Inc., Class C | | Communication Services | | | | 0.0 | % |
| 36 | | Alphabet, Inc., Class A | | Communication Services | | | | 0.0 | % |
| 37 | | Exxon Mobil Corp. | | Energy | | | | -0.1 | % |
| 38 | | 3M Co. | | Industrials | | | | -0.2 | % |
| 39 | | Schlumberger, Ltd. | | Energy | | | | -0.2 | % |
| 40 | | UnitedHealth Group, Inc. | | Health Care | | | | -0.2 | % |
| 41 | | Wells Fargo & Co. | | Financials | | | | -0.3 | % |
| 42 | | General Electric Co. | | Industrials | | | | -0.4 | % |
| | |
| Blue Chip Fund (Formerly, Blue Chip 35 Index Fund) | |
|
MANAGER’S COMMENTARY (Unaudited)(continued) |
| | |
Industry Sector Representation as of June 30, 2019
| | | | | | | | | | | | | | | |
| | | % of Net Assets | | % of S&P 500 Index | | Difference |
Communication Services | | | | 16.8% | | | | | 10.2% | | | | | 6.6% | |
Consumer Discretionary | | | | 8.8% | | | | | 10.2% | | | | | -1.4% | |
Consumer Staples | | | | 10.7% | | | | | 7.3% | | | | | 3.4% | |
Energy | | | | 4.8% | | | | | 5.0% | | | | | -0.2% | |
Financials | | | | 14.8% | | | | | 13.1% | | | | | 1.7% | |
Health Care | | | | 10.2% | | | | | 14.2% | | | | | -4.0% | |
Industrials | | | | 9.8% | | | | | 9.4% | | | | | 0.4% | |
Information Technology | | | | 24.1% | | | | | 21.5% | | | | | 2.6% | |
Materials | | | | 0.0% | | | | | 2.8% | | | | | -2.8% | |
Real Estate | | | | 0.0% | | | | | 3.1% | | | | | -3.1% | |
Utilities | | | | 0.0% | | | | | 3.3% | | | | | -3.3% | |
Cash & Other Assets | | | | 0.0% | | | | | -0.1% | | | | | 0.1% | |
Total | | | | 100.0% | | | | | 100.0% | | | | | | |
Disclaimer
The views expressed here are exclusively those of Fund management. These views, including those concerning market sectors or individual stocks, are not meant as investment advice and should not be considered predictive in nature. Any favorable (or unfavorable) description of a holding applies only as of the quarter end, June 30, 2019, unless otherwise stated. Security positions can and do change thereafter. Discussions of historical performance do not guarantee and are not indicative of future performance.
The Fund is subject to significant market risk (volatility) and is not an appropriate investment for short-term investors.
Conclusion
Thank you for your continued investment in Blue Chip Fund. We encourage your feedback; your reactions and concerns are important to us.
Sincerely,
The Investment Management Team
| | |
| 50 | | Annual Report | June 30, 2019 |
| | |
| Blue Chip Fund | | |
| SCHEDULE OF INVESTMENTS | | |
Showing percentage of net assets as of June 30, 2019 | | |
| | | | | | | | | | | | |
| Industry Company | | Shares | | | Value | | | | |
COMMON STOCKS - 100.02% | | | | | |
| Communication Services - 16.79% | | | | |
Alphabet, Inc.,
Class A* | | | 8,730 | | | | $ 9,452,844 | | | | | |
Alphabet, Inc.,
Class C* | | | 8,709 | | | | 9,413,645 | | | | | |
AT&T, Inc. | | | 371,505 | | | | 12,449,133 | | | | | |
Comcast Corp.,
Class A | | | 283,250 | | | | 11,975,810 | | | | | |
Facebook, Inc.,
Class A* | | | 89,800 | | | | 17,331,400 | | | | | |
Verizon Communications, Inc. | | | 211,539 | | | | 12,085,223 | | | | | |
Walt Disney Co. (The) | | | 86,450 | | | | 12,071,878 | | | | | |
| | | | | | | | | | | | |
| | | |
| | | | | | | 84,779,933 | | | | | |
| |
Consumer Discretionary - 8.81% | | | | | |
Amazon.com, Inc.* | | | 10,550 | | | | 19,977,796 | | | | | |
Home Depot, Inc. (The) | | | 59,100 | | | | 12,291,027 | | | | | |
McDonald’s Corp. | | | 58,800 | | | | 12,210,408 | | | | | |
| | | | | | | | | | | | |
| | | |
| | | | | | | 44,479,231 | | | | | |
| |
Consumer Staples - 10.67% | | | | | |
Coca-Cola Co. (The) | | | 233,914 | | | | 11,910,901 | | | | | |
PepsiCo, Inc. | | | 90,475 | | | | 11,863,987 | | | | | |
Procter & Gamble Co. (The) | | | 163,906 | | | | 17,972,293 | | | | | |
Walmart, Inc. | | | 109,769 | | | | 12,128,377 | | | | | |
| | | | | | | | | | | | |
| | | |
| | | | | | | 53,875,558 | | | | | |
| |
Energy - 4.84% | | | | | |
Chevron Corp. | | | 97,895 | | | | 12,182,054 | | | | | |
Exxon Mobil Corp. | | | 160,187 | | | | 12,275,130 | | | | | |
| | | | | | | | | | | | |
| | | |
| | | | | | | 24,457,184 | | | | | |
| |
Financials - 14.84% | | | | | |
Bank of America Corp. | | | 656,108 | | | | 19,027,132 | | | | | |
Berkshire Hathaway, Inc., Class B* | | | 58,150 | | | | 12,395,835 | | | | | |
Citigroup, Inc. | | | 181,900 | | | | 12,738,457 | | | | | |
JPMorgan Chase & Co. | | | 164,295 | | | | 18,368,181 | | | | | |
Wells Fargo & Co. | | | 262,459 | | | | 12,419,560 | | | | | |
| | | | | | | | | | | | |
| | | |
| | | | | | | 74,949,165 | | | | | |
| |
Health Care - 10.22% | | | | | |
Johnson & Johnson | | | 83,952 | | | | 11,692,835 | | | | | |
Merck & Co., Inc. | | | 191,935 | | | | 16,093,750 | | | | | |
Pfizer, Inc. | | | 276,674 | | | | 11,985,518 | | | | | |
UnitedHealth Group, Inc. | | | 48,500 | | | | 11,834,485 | | | | | |
| | | | | | | | | | | | |
| | | |
| | | | | | | 51,606,588 | | | | | |
| |
Industrials - 9.78% | | | | | |
3M Co. | | | 71,100 | | | | 12,324,474 | | | | | |
Boeing Co. (The) | | | 32,950 | | | | 11,994,129 | | | | | |
United Parcel Service, Inc., Class B | | | 124,663 | | | | 12,873,948 | | | | | |
United Technologies Corp. | | | 93,810 | | | | 12,214,062 | | | | | |
| | | | | | | | | | | | |
| | | |
| | | | | | | 49,406,613 | | | | | |
| | | | | | | | | | | | |
| Industry Company | | Shares | | | Value | | | | |
| |
Information Technology - 24.07% | | | | | |
Apple, Inc. | | | 97,600 | | | $ | 19,316,992 | | | | | |
Cisco Systems, Inc. | | | 215,908 | | | | 11,816,645 | | | | | |
Intel Corp. | | | 258,493 | | | | 12,374,060 | | | | | |
International Business Machines Corp. | | | 87,117 | | | | 12,013,434 | | | | | |
Microsoft Corp. | | | 149,745 | | | | 20,059,840 | | | | | |
Oracle Corp. | | | 216,013 | | | | 12,306,261 | | | | | |
QUALCOMM, Inc. | | | 175,900 | | | | 13,380,713 | | | | | |
Visa, Inc., Class A | | | 116,850 | | | | 20,279,317 | | | | | |
| | | | | | | | | | | | |
| | | |
| | | | | | | 121,547,262 | | | | | |
| | | | | | | | | | | | |
| | |
TOTAL COMMON STOCKS - 100.02% | | | | 505,101,534 | | | | | |
| | | | | | | | | | | | |
(Cost $242,487,136) | | | | | | | | | | | | |
| | | | | | | | | | | | |
| | | |
| | | Rate^ | | | Shares | | | Value | |
|
MONEY MARKET FUND - 0.07% | |
Fidelity Investments Money Market Government Portfolio Class I | | | 2.25% | | | | 371,501 | | | | 371,501 | |
| | | | | | | | | | | | |
| |
TOTAL MONEY MARKET FUND - 0.07% | | | | 371,501 | |
| | | | | | | | | | | | |
(Cost $371,501) | | | | | | | | | | | | |
| | |
TOTAL INVESTMENTS - 100.09% | | | | | | | $ | 505,473,035 | |
(Cost $242,858,637) | | | | | | | | | | | | |
Liabilities in Excess of Other Assets - (0.09%) | | | | (444,463 | ) |
| | | | | | | | | | | | |
| |
NET ASSETS - 100.00% | | | $ | 505,028,572 | |
| | | | | | | | | | | | |
| * | Non-income producing security. |
| ^ | Rate disclosed as of June 30, 2019. |
Summary of inputs used to value the Fund’s investments as of
06/30/2019 (See Note 2 in Notes to Financial Statements):
| | | | | | | | | | | | | | | | |
| | | | | | Valuation Inputs | | | | |
| | | | | | Investment in Securities (Value) | |
| | | Level 1 Quoted Prices | | | Level 2
Significant
Observable
Inputs | | | Level 3
Significant
Unobservable
Inputs | | | Total | |
| | | | |
Common Stocks (a) | | $ | 505,101,534 | | | $ | — | | | $ | — | | | $ | 505,101,534 | |
Money Market Fund | | | — | | | | 371,501 | | | | — | | | | 371,501 | |
| | | | | | | | | | | | | | | | |
TOTAL | | $ | 505,101,534 | | | $ | 371,501 | | | $ | — | | | $ | 505,473,035 | |
| | | | | | | | | | | | | | | | |
(a) - Please refer to the Schedule of Investments for the industry classifications of these portfolio holdings.
See Notes to Financial Statements.
| | |
| Managed Volatility Fund | |
|
MANAGER’S COMMENTARY (Unaudited) |
| | |
June 30, 2019
Dear Fellow Managed Volatility Fund Shareholder,
For the quarter ended June 30, 2019, our Fund returned +1.90%, lagging our primary market benchmark, the S&P 500 Index (+4.30%), and our peer benchmark, the Lipper Balanced Funds Index (+3.39%). The Fund performed in line with its design during the quarter.
For the fiscal year, our Fund returned +1.74%, trailing the S&P 500 Index (+10.42%) and the Lipper Balanced Funds Index (+6.79%).
The table below presents our June quarter,one-year, five-year,10-year,15-year, andinception-to-date financial results. See the next page for a graph of performance since inception.
Standardized Returns as of June 30, 2019
| | | | | | | | | | | | | | | | | | | | | | | | | | | | | | |
| | | | | | | Annualized | | |
| | | Quarter | | 1 Year | | 5 Years | | 10 Years | | 15 Years | | Since Inception
(6/30/01) |
| | | | | | |
Managed Volatility Fund | | | | 1.90 | % | | | | 1.74 | % | | | | 3.06 | % | | | | 5.11 | % | | | | 3.81 | % | | | | 3.97 | % |
S&P 500 Index | | | | 4.30 | % | | | | 10.42 | % | | | | 10.71 | % | | | | 14.70 | % | | | | 8.75 | % | | | | 7.12 | % |
Lipper Balanced Funds Index | | | | 3.39 | % | | | | 6.79 | % | | | | 5.79 | % | | | | 9.09 | % | | | | 6.27 | % | | | | 5.64 | % |
Performance figures quoted in the table above represent past performance and are no guarantee of future results. Total return figures in the table above include the reinvestment of dividends and capital gains. The table above does not reflect the deduction of taxes that a shareholder would pay on Fund distributions or on the redemption of Fund shares.
The S&P 500 Index is a broad-based, unmanaged measurement of changes in stock market conditions, based on the average of 500 widely held common stocks with dividends reinvested. The Lipper Balanced Funds Index is an index of balanced funds compiled by Lipper, Inc. It is not possible to invest directly in an index. Periods longer than one year are annualized.
| | |
| 52 | | Annual Report | June 30, 2019 |
| | |
| Managed Volatility Fund | | |
MANAGER’S COMMENTARY (Unaudited)(continued) | | |
| | |
Growth of a $10,000 Investment
from Inception June 30, 2001 to June 30, 2019
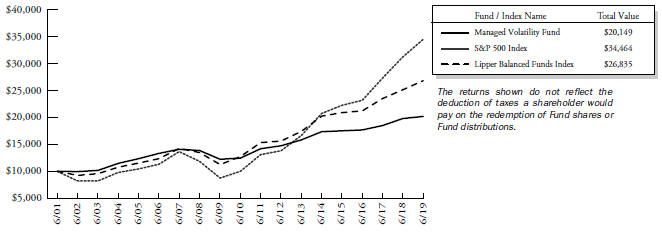
Detailed Explanation of Quarterly Performance
The Fund met its objective of capturing at least 40% of the S&P 500 Index’s return during the quarter. The Fund’s annualized standard deviation of 5.35% during the quarter was 54% lower than the S&P 500’s annualized standard deviation of 11.59% during the same period.
The portfolio’s equities component added the most to performance, contributing approximately +2.3% to the Fund’s return. The portfolio’s fixed income component also added modestly to performance, contributing +0.3% to the Fund’s return. However, the portfolio’s futures component detracted from performance, contributing approximately-0.8% to the Fund’s return. The performance of the portfolio’s options component was essentially flat during the quarter.
Detailed Explanation of Fiscal Year Performance
For the fiscal year, the Fund fell short of its goal of capturing at least 40% of the S&P 500 Index’s return. The Fund had an annualized standard deviation of 7.06%, which was 55% lower than the S&P 500’s annualized standard deviation of 15.62% during the12-month period.
The portfolio’s options and futures components detracted the most from performance, contributing approximately -1.3% and-1.2% to the Fund’s return, respectively. This performance was in line with expectations during a fiscal year characterized by a rising equity market. In contrast, the portfolio’s equities component helped results, contributing +3.2% to the Fund’s return. The portfolio’s fixed income component also helped performance, contributing approximately +0.9% to the Fund’s return.
The Fund has continued to perform as designed, particularly over longer time horizons. For the past 10 years and since inception, the Fund has captured roughly 35% and 56%, respectively, of the S&P 500 Index’s return. The Fund’s annualized standard deviation has been 55% lower than the index’s for the last 10 years and since inception.
| | |
| Managed Volatility Fund | |
|
MANAGER’S COMMENTARY (Unaudited)(continued) |
| | |
Top Ten Equity Holdings as of June 30, 2019
| | | | | | |
| Rank | | Description | | Industry | | % of Net
Assets |
| 1 | | Micron Technology, Inc. | | Information Technology | | 2.3% |
| 2 | | Amazon.com, Inc. | | Consumer Discretionary | | 1.9% |
| 3 | | Berkshire Hathaway, Inc., Class B | | Financials | | 1.4% |
| 4 | | ConocoPhillips | | Energy | | 1.3% |
| 5 | | Microsoft Corp. | | Information Technology | | 1.2% |
| 6 | | Apple, Inc. | | Information Technology | | 1.2% |
| 7 | | Charles Schwab Corp. (The) | | Financials | | 1.1% |
| 8 | | Xilinx, Inc. | | Information Technology | | 1.1% |
| 9 | | HCA Healthcare, Inc. | | Health Care | | 1.1% |
| 10 | | Prudential Financial, Inc. | | Financials | | 1.0% |
| | Total | | | | 13.6% |
Industry Sector Representation as of June 30, 2019
| | | | | |
| Asset Type | | % of Net
Assets |
Common Stock | | | | 60.8% | |
Communication Services | | | | 4.8% | |
Consumer Discretionary | | | | 6.1% | |
Consumer Staples | | | | 3.8% | |
Energy | | | | 4.1% | |
Financials | | | | 11.4% | |
Health Care | | | | 8.4% | |
Industrials | | | | 4.9% | |
Information Technology | | | | 12.9% | |
Materials | | | | 1.5% | |
Real Estate | | | | 1.3% | |
Utilities | | | | 1.6% | |
U.S. Government Obligations | | | | 29.3% | |
Call Options Written | | | | -1.2% | |
Put Options Written | | | | -0.5% | |
Money Market Fund | | | | 5.9% | |
Cash & Other Assets | | | | 5.7% | |
| Total | | | | 100% | |
Disclaimer
The views expressed here are exclusively those of Fund management. These views, including those related to market sectors or individual stocks, are not meant as investment advice and should not be considered predictive in nature. Any favorable (or unfavorable) description of a holding applies only as of the quarter end, June 30, 2019, unless otherwise stated. Security positions can and do change thereafter. Discussions of historical performance do not guarantee and may not be indicative of future performance.
Market volatility can significantly affect short-term performance. The Fund is not an appropriate investment for short-term investors. Investments in the small companies within thismulti-cap fund generally carry greater risk than is customarily associated with larger companies. This additional risk is attributable to a number of factors, including the relatively limited financial resources that are typically available to small companies and the fact that small companies often have comparatively limited product lines. In addition, the stock of small companies tends to be more volatile than the stock of large companies, particularly in the short term and particularly in the early stages of an economic or market downturn. The Fund’s use of options,
| | |
| 54 | | Annual Report | June 30, 2019 |
| | |
| Managed Volatility Fund | | |
MANAGER’S COMMENTARY (Unaudited)(continued) | | |
| | |
futures, and leverage can magnify the risk of loss in an unfavorable market, and the Fund’s use of short-sale positions can, in theory, expose shareholders to unlimited loss. Shareholders of the Fund, therefore, are taking on more risk than they would if they invested in the stock market as a whole. The Fund uses an option writing strategy in which the Fund may sell covered calls or secured put options. Options are subject to special risks and may not fully protect the Fund against declines in the value of its stocks. In addition, an option writing strategy limits the upside profit potential normally associated with stocks. Finally, the Fund’s fixed-income holdings are subject to three types of risk. Interest rate risk is the chance that bond prices overall will decline as interest rates rise. Credit risk is the chance that a bond issuer will fail to pay interest and principal. Prepayment risk is the chance that a mortgage-backed bond issuer will repay a higher yielding bond, resulting in a lower paying yield.
Conclusion
Thank you for your continued investment in Managed Volatility Fund. We encourage your feedback; your reactions and concerns are important to us.
Sincerely,
The Investment Management Team
| | |
| Managed Volatility Fund | |
|
SCHEDULE OF INVESTMENTS |
| |
| Showing percentage of net assets as of June 30, 2019 | | |
| | | | | | | | | | | | |
| Industry Company | | Shares | | | Value | | | | |
| |
COMMON STOCKS - 60.78% | |
Communication Services - 4.76% | |
Alphabet, Inc., Class A* | | | 260 | | | | $ 281,528 | | | | | |
Alphabet, Inc., Class C* | | | 260 | | | | 281,037 | | | | | |
AT&T, Inc.# | | | 4,540 | | | | 152,135 | | | | | |
CenturyLink, Inc. | | | 1,200 | | | | 14,112 | | | | | |
Comcast Corp., Class A# | | | 1,700 | | | | 71,876 | | | | | |
Discovery, Inc., Class C*# | | | 1,514 | | | | 43,073 | | | | | |
Electronic Arts, Inc.*# | | | 500 | | | | 50,630 | | | | | |
Facebook, Inc., Class A*# | | | 1,300 | | | | 250,900 | | | | | |
Fox Corp., Class A | | | 266 | | | | 9,746 | | | | | |
Omnicom Group, Inc.# | | | 600 | | | | 49,170 | | | | | |
Verizon Communications, Inc. | | | 1,600 | | | | 91,408 | | | | | |
Walt Disney Co. (The)# | | | 1,165 | | | | 162,681 | | | | | |
| | | | | | | | | | | | |
| | | |
| | | | | | | 1,458,296 | | | | | |
| |
Consumer Discretionary - 6.11% | | | | | |
Amazon.com, Inc.* | | | 300 | | | | 568,089 | | | | | |
AutoZone, Inc.*# | | | 200 | | | | 219,894 | | | | | |
Carnival Corp.# | | | 300 | | | | 13,965 | | | | | |
Delphi Technologies PLC | | | 166 | | | | 3,320 | | | | | |
Dollar General Corp. | | | 500 | | | | 67,580 | | | | | |
eBay, Inc.# | | | 700 | | | | 27,650 | | | | | |
Ford Motor Co.# | | | 2,900 | | | | 29,667 | | | | | |
Genuine Parts Co.# | | | 2,000 | | | | 207,160 | | | | | |
Hasbro, Inc.# | | | 700 | | | | 73,976 | | | | | |
Kohl’s Corp.# | | | 5,000 | | | | 237,750 | | | | | |
Macy’s, Inc.# | | | 1,000 | | | | 21,460 | | | | | |
McDonald’s Corp.# | | | 500 | | | | 103,830 | | | | | |
NIKE, Inc., Class B# | | | 1,100 | | | | 92,345 | | | | | |
Ross Stores, Inc.# | | | 500 | | | | 49,560 | | | | | |
Starbucks Corp.# | | | 400 | | | | 33,532 | | | | | |
Target Corp. | | | 500 | | | | 43,305 | | | | | |
Wynn Resorts, Ltd. | | | 200 | | | | 24,798 | | | | | |
Yum China Holdings, Inc. | | | 500 | | | | 23,100 | | | | | |
Yum! Brands, Inc. | | | 300 | | | | 33,201 | | | | | |
| | | | | | | | | | | | |
| | | |
| | | | | | | 1,874,182 | | | | | |
| | | |
Consumer Staples - 3.80% | | | | | | | | | | | | |
Archer-Daniels-Midland Co.# | | | 700 | | | | 28,560 | | | | | |
Bunge, Ltd.# | | | 1,500 | | | | 83,565 | | | | | |
Campbell Soup Co.# | | | 1,900 | | | | 76,133 | | | | | |
Coca-Cola Co. (The) | | | 900 | | | | 45,828 | | | | | |
Colgate-Palmolive Co. | | | 400 | | | | 28,668 | | | | | |
Constellation Brands, Inc., Class A | | | 500 | | | | 98,470 | | | | | |
Costco Wholesale Corp. | | | 500 | | | | 132,130 | | | | | |
General Mills, Inc.# | | | 1,600 | | | | 84,032 | | | | | |
JM Smucker Co. (The) | | | 400 | | | | 46,076 | | | | | |
Kimberly-Clark Corp.# | | | 800 | | | | 106,624 | | | | | |
Kroger Co. (The)# | | | 800 | | | | 17,368 | | | | | |
| | | | | | | | |
| Industry Company | | Shares | | | Value | |
|
Consumer Staples (continued) | |
Mondelez International, Inc., Class A | | | 1,700 | | | $ | 91,630 | |
PepsiCo, Inc.# | | | 900 | | | | 118,017 | |
Procter & Gamble Co.
(The)# | | | 800 | | | | 87,720 | |
Walmart, Inc.# | | | 1,100 | | | | 121,539 | |
| | | | | | | | |
| | |
| | | | | | | 1,166,360 | |
| | |
Energy - 4.15% | | | | | | | | |
Anadarko Petroleum Corp.# | | | 700 | | | | 49,392 | |
Chevron Corp.# | | | 1,278 | | | | 159,034 | |
ConocoPhillips# | | | 6,287 | | | | 383,507 | |
Continental Resources, Inc.*# | | | 1,000 | | | | 42,090 | |
EOG Resources, Inc.# | | | 500 | | | | 46,580 | |
Exxon Mobil Corp.# | | | 2,000 | | | | 153,260 | |
Halliburton Co.# | | | 10,700 | | | | 243,318 | |
Kinder Morgan, Inc. | | | 500 | | | | 10,440 | |
Marathon Petroleum Corp.# | | | 1,700 | | | | 94,996 | |
Phillips 66 | | | 593 | | | | 55,469 | |
Valero Energy Corp. | | | 400 | | | | 34,244 | |
| | | | | | | | |
| | |
| | | | | | | 1,272,330 | |
| | |
Financials - 11.38% | | | | | | | | |
Allstate Corp. (The) | | | 300 | | | | 30,507 | |
American Express Co.# | | | 600 | | | | 74,064 | |
Aon PLC# | | | 500 | | | | 96,490 | |
Athene Holding, Ltd., Class A*# | | | 5,700 | | | | 245,442 | |
Bank of America Corp.# | | | 1,600 | | | | 46,400 | |
BB&T Corp.# | | | 300 | | | | 14,739 | |
Berkshire Hathaway, Inc., Class B*# | | | 2,000 | | | | 426,340 | |
BlackRock, Inc. | | | 300 | | | | 140,790 | |
Capital One Financial Corp.# | | | 700 | | | | 63,518 | |
Charles Schwab Corp. (The)# | | | 8,800 | | | | 353,672 | |
Chubb, Ltd. | | | 461 | | | | 67,901 | |
Citigroup, Inc.# | | | 1,910 | | | | 133,757 | |
Comerica, Inc. | | | 300 | | | | 21,792 | |
Goldman Sachs Group, Inc. (The) | | | 500 | | | | 102,300 | |
Huntington Bancshares, Inc. | | | 3,200 | | | | 44,224 | |
JPMorgan Chase & Co.# | | | 700 | | | | 78,260 | |
KeyCorp. | | | 3,300 | | | | 58,575 | |
Marsh & McLennan Cos., Inc. | | | 700 | | | | 69,825 | |
MetLife, Inc.# | | | 6,000 | | | | 298,020 | |
Morgan Stanley# | | | 1,200 | | | | 52,572 | |
| | |
| 56 | | Annual Report | June 30, 2019 |
| | |
| Managed Volatility Fund | | |
SCHEDULE OF INVESTMENTS(continued) | | |
| |
| Showing percentage of net assets as of June 30, 2019 | | |
| | | | | | | | | | | | |
| Industry Company | | Shares | | | Value | | | | |
| |
Common Stocks (continued) | | | | | |
Financials (continued) | | | | | |
PNC Financial Services Group, Inc. (The) | | | 500 | | | | $ 68,640 | | | | | |
Progressive Corp.
(The)# | | | 1,220 | | | | 97,515 | | | | | |
Prudential Financial, Inc.# | | | 3,200 | | | | 323,200 | | | | | |
S&P Global, Inc. | | | 500 | | | | 113,895 | | | | | |
State Street Corp.# | | | 300 | | | | 16,818 | | | | | |
TD Ameritrade Holding Corp.# | | | 3,500 | | | | 174,720 | | | | | |
U.S. Bancorp | | | 1,900 | | | | 99,560 | | | | | |
Wells Fargo & Co.# | | | 3,671 | | | | 173,712 | | | | | |
| | | | | | | | | | | | |
| | | |
| | | | | | | 3,487,248 | | | | | |
| |
Health Care - 8.41% | | | | | |
Abbott Laboratories# | | | 1,400 | | | | 117,740 | | | | | |
AbbVie, Inc.# | | | 1,600 | | | | 116,352 | | | | | |
Allergan PLC | | | 300 | | | | 50,229 | | | | | |
Amgen, Inc.# | | | 500 | | | | 92,140 | | | | | |
Anthem, Inc. | | | 300 | | | | 84,663 | | | | | |
Baxter International, Inc.# | | | 600 | | | | 49,140 | | | | | |
Becton Dickinson & Co. | | | 473 | | | | 119,201 | | | | | |
Biogen, Inc.* | | | 400 | | | | 93,548 | | | | | |
Bristol-Myers Squibb Co.# | | | 1,479 | | | | 67,073 | | | | | |
Celgene Corp.*# | | | 1,100 | | | | 101,684 | | | | | |
Cigna Corp. | | | 299 | | | | 47,107 | | | | | |
CVS Health Corp.# | | | 700 | | | | 38,143 | | | | | |
Danaher Corp. | | | 500 | | | | 71,460 | | | | | |
DaVita, Inc.*# | | | 1,100 | | | | 61,886 | | | | | |
Eli Lilly & Co.# | | | 2,500 | | | | 276,975 | | | | | |
Gilead Sciences, Inc. | | | 400 | | | | 27,024 | | | | | |
HCA Healthcare, Inc.# | | | 2,500 | | | | 337,925 | | | | | |
Ionis Pharmaceuticals, Inc.*# | | | 800 | | | | 51,416 | | | | | |
Johnson & Johnson | | | 1,000 | | | | 139,280 | | | | | |
Merck & Co., Inc.# | | | 2,200 | | | | 184,470 | | | | | |
Pfizer, Inc.# | | | 2,500 | | | | 108,300 | | | | | |
Stryker Corp. | | | 360 | | | | 74,009 | | | | | |
Thermo Fisher Scientific, Inc. | | | 500 | | | | 146,840 | | | | | |
UnitedHealth Group, Inc. | | | 500 | | | | 122,005 | | | | | |
| | | | | | | | | | | | |
| | | |
| | | | | | | 2,578,610 | | | | | |
| |
Industrials - 4.88% | | | | | |
3M Co. | | | 500 | | | | 86,670 | | | | | |
Boeing Co. (The) | | | 300 | | | | 109,203 | | | | | |
Deere & Co. | | | 400 | | | | 66,284 | | | | | |
Delta Air Lines, Inc.# | | | 2,000 | | | | 113,500 | | | | | |
Emerson Electric Co.# | | | 1,000 | | | | 66,720 | | | | | |
FedEx Corp.# | | | 600 | | | | 98,514 | | | | | |
General Electric Co. | | | 900 | | | | 9,450 | | | | | |
HD Supply Holdings, Inc.*# | | | 1,500 | | | | 60,420 | | | | | |
Honeywell International, Inc.# | | | 800 | | | | 139,672 | | | | | |
Ingersoll-Rand PLC | | | 200 | | | | 25,334 | | | | | |
| | | | | | | | |
| Industry Company | | Shares | | | Value | |
|
| |
Industrials (continued) | |
Johnson Controls International PLC | | | 454 | | | $ | 18,755 | |
Lockheed Martin Corp. | | | 270 | | | | 98,156 | |
Northrop Grumman Corp.# | | | 700 | | | | 226,177 | |
Raytheon Co. | | | 300 | | | | 52,164 | |
Resideo Technologies, Inc.* | | | 133 | | | | 2,915 | |
Southwest Airlines Co.# | | | 1,400 | | | | 71,092 | |
Union Pacific Corp. | | | 500 | | | | 84,555 | |
United Technologies Corp.# | | | 840 | | | | 109,368 | |
Wabtec Corp. | | | 4 | | | | 287 | |
Waste Management, Inc. | | | 500 | | | | 57,685 | |
| | | | | | | | |
| | |
| | | | | | | 1,496,921 | |
Information Technology - 12.86% | | | | | |
Adobe, Inc.*# | | | 800 | | | | 235,720 | |
Apple, Inc.# | | | 1,800 | | | | 356,256 | |
Applied Materials, Inc.# | | | 1,100 | | | | 49,401 | |
Cisco Systems, Inc.# | | | 4,300 | | | | 235,339 | |
Citrix Systems, Inc.# | | | 500 | | | | 49,070 | |
Cognizant Technology Solutions Corp., Class A# | | | 700 | | | | 44,373 | |
Dell Technologies, Inc., Class C* | | | 143 | | | | 7,264 | |
DXC Technology Co. | | | 171 | | | | 9,431 | |
Hewlett Packard Enterprise Co. | | | 4,200 | | | | 62,790 | |
HP, Inc. | | | 2,000 | | | | 41,580 | |
Intel Corp.# | | | 2,300 | | | | 110,101 | |
International Business Machines Corp.# | | | 900 | | | | 124,110 | |
Intuit, Inc. | | | 400 | | | | 104,532 | |
Juniper Networks, Inc.# | | | 2,700 | | | | 71,901 | |
LogMeIn, Inc. | | | 189 | | | | 13,926 | |
Mastercard, Inc., Class A# | | | 800 | | | | 211,624 | |
Micro Focus International PLC, ADR | | | 162 | | | | 4,243 | |
Micron Technology, Inc.*# | | | 18,200 | | | | 702,338 | |
Microsoft Corp.# | | | 2,800 | | | | 375,088 | |
NetApp, Inc. | | | 400 | | | | 24,680 | |
Oracle Corp.# | | | 860 | | | | 48,994 | |
PayPal Holdings, Inc.*# | | | 1,100 | | | | 125,906 | |
QUALCOMM, Inc.# | | | 1,200 | | | | 91,284 | |
salesforce.com, Inc.*# | | | 1,300 | | | | 197,249 | |
Texas Instruments, Inc.# | | | 670 | | | | 76,889 | |
Visa, Inc., Class A# | | | 1,300 | | | | 225,615 | |
Xilinx, Inc.# | | | 2,900 | | | | 341,968 | |
| | | | | | | | |
| | |
| | | | | | | 3,941,672 | |
Materials - 1.51% | | | | | |
AdvanSix, Inc.* | | | 48 | | | | 1,173 | |
Corteva, Inc.*# | | | 833 | | | | 24,632 | |
Dow, Inc.# | | | 833 | | | | 41,075 | |
| | |
| Managed Volatility Fund | |
|
SCHEDULE OF INVESTMENTS(continued) |
| |
| Showing percentage of net assets as of June 30, 2019 | | |
| | | | | | | | | | | | |
Industry Company | | Shares | | | Value | | | | |
| | |
Common Stocks (continued) | | | | | | | | | |
Materials (continued) | | | | | | | | | |
DuPont de Nemours, Inc.# | | | 833 | | | | $ 62,533 | | | | | |
Ecolab, Inc. | | | 100 | | | | 19,744 | | | | | |
International Paper Co.# | | | 600 | | | | 25,992 | | | | | |
Linde PLC | | | 600 | | | | 120,480 | | | | | |
Sherwin-Williams Co. (The) | | | 200 | | | | 91,658 | | | | | |
Steel Dynamics, Inc.# | | | 2,500 | | | | 75,500 | | | | | |
| | | | | | | | | | | | |
| | | |
| | | | | | | 462,787 | | | | | |
Real Estate - 1.34% | | | | | | | | | |
American Tower Corp.# | | | 800 | | | | 163,560 | | | | | |
Crown Castle International Corp. | | | 500 | | | | 65,175 | | | | | |
Public Storage | | | 500 | | | | 119,085 | | | | | |
Simon Property Group, Inc.# | | | 400 | | | | 63,904 | | | | | |
| | | | | | | | | | | | |
| | | |
| | | | | | | 411,724 | | | | | |
Utilities - 1.58% | | | | | | | | | |
AES Corp. | | | 4,300 | | | | 72,068 | | | | | |
American Electric Power Co., Inc.# | | | 800 | | | | 70,408 | | | | | |
Dominion Energy, Inc.# | | | 720 | | | | 55,670 | | | | | |
Duke Energy Corp. | | | 783 | | | | 69,092 | | | | | |
Exelon Corp. | | | 700 | | | | 33,558 | | | | | |
NextEra Energy, Inc. | | | 300 | | | | 61,458 | | | | | |
Public Service Enterprise Group, Inc. | | | 900 | | | | 52,938 | | | | | |
Sempra Energy | | | 500 | | | | 68,720 | | | | | |
| | | | | | | | | | | | |
| | | |
| | | | | | | 483,912 | | | | | |
| | | | | | | | | | | | |
| | |
TOTAL COMMON STOCKS - 60.78% | | | | 18,634,042 | | | | | |
| | | | | | | | | | | | |
(Cost $12,063,422) | | | | | | | | | | | | |
| | | | | | | | | | | | |
| | | | | | | | | | | | |
| | | | | | | | | | | | |
| | | | | | | | | | | | |
| | | | | | | | | | | | |
| | | | | | | | | | | | |
| | | | | | | | | | | | |
| | | | | | | | | | | | |
| | | | | | | | | | | | |
| | | | | | | | | | |
| Due Date | | Discount Rate
or Coupon Rate | | Principal
Amount | | | Value | |
|
U.S. GOVERNMENT OBLIGATIONS - 29.26% | |
U.S. Treasury Bills - 29.26% | | | | | | | | |
07/11/2019 | | 2.338%(a) | | | $2,000,000 | | | | $1,998,929 | |
08/29/2019 | | 2.324%(a) | | | 3,000,000 | | | | 2,989,675 | |
09/19/2019 | | 2.182%(a) | | | 2,000,000 | | | | 1,990,766 | |
09/26/2019 | | 2.051%(a) | | | 2,000,000 | | | | 1,989,971 | |
| | | | | | | | | | |
| | | |
| | | | | | | | | 8,969,341 | |
| | | | | | | | | | |
TOTAL U.S. GOVERNMENT OBLIGATIONS -29.26% | | | | 8,969,341 | |
| | | | | | | | | | |
(Cost $8,967,601) | | | | | | | | | | |
| | | |
| | | Rate^ | | Shares | | | Value | |
|
MONEY MARKET FUND - 5.86% | |
Fidelity Investments Money Market Government Portfolio Class I | | 2.25% | | | 1,797,624 | | | | 1,797,624 | |
| | | | | | | | | | |
| |
TOTAL MONEY MARKET FUND – 5.86% | | | | 1,797,624 | |
| | | | | | | | | | |
(Cost $1,797,624) | | | | | | | | | | |
| |
TOTAL INVESTMENTS BEFORE OPTIONS WRITTEN - 95.90% | | | | $29,401,007 | |
| | | | | | | | | | |
(Cost $22,828,647) | | | | | |
|
WRITTEN OPTIONS - (1.66%) | |
TOTAL WRITTEN OPTIONS - (1.66%) | | | | $(510,915 | ) |
| | | | | | | | | | |
(Premiums Received $(426,413)) | | | | | |
| |
TOTAL INVESTMENTS - 94.24% | | | | $28,890,092 | |
| | | |
(Cost $22,402,234) | | | | | | | | | | |
Other Assets in Excess of Liabilities - 5.76% | | | | 1,766,898 | |
| | | | | | | | | | |
| |
NET ASSETS - 100.00% | | | | $30,656,990 | |
| | | | | | | | | | |
| * | Non-income producing security. |
| # | Security subject to call or put option written by the Fund. |
| ^ | Rate disclosed as of June 30, 2019. |
| (a) | Rate represents the effective yield at purchase. |
PLC - Public Limited Company
ADR - American Depositary Receipt
| | |
| 58 | | Annual Report | June 30, 2019 |
| | |
| Managed Volatility Fund | | |
SCHEDULE OF INVESTMENTS(continued) | | |
Showing percentage of net assets as of June 30, 2019 | | |
| | | | | | | | | | | | | | | | | | | | | | | | | |
| Description | | Number of
Contracts | | Notional
Amount | | Exercise
Price | | Expiration
Date | | Value |
EXCHANGE TRADED PUT OPTIONS WRITTEN - (0.49%) | | | | | | | | | | | | | | | | | | | | | | | | | |
| | | | | |
American Tower Corp. | | | | 10 | | | | $ | (204,450 | ) | | | $ | 210.00 | | | | | 08/02/19 | | | | $ | (8,400 | ) |
Ameriprise Financial, Inc. | | | | 21 | | | | | (304,836 | ) | | | | 145.00 | | | | | 09/20/19 | | | | | (14,700 | ) |
AutoZone, Inc. | | | | 3 | | | | | (329,841 | ) | | | | 1,080.00 | | | | | 09/20/19 | | | | | (11,187 | ) |
Cadence Design Systems, Inc. | | | | 50 | | | | | (354,050 | ) | | | | 65.00 | | | | | 08/16/19 | | | | | (6,550 | ) |
Cadence Design Systems, Inc. | | | | 5 | | | | | (35,405 | ) | | | | 70.00 | | | | | 08/16/19 | | | | | (1,515 | ) |
Capital One Financial Corp. | | | | 35 | | | | | (317,590 | ) | | | | 87.50 | | | | | 09/20/19 | | | | | (9,450 | ) |
Caterpillar, Inc. | | | | 20 | | | | | (272,580 | ) | | | | 125.00 | | | | | 09/20/19 | | | | | (5,640 | ) |
Chipotle Mexican Grill, Inc. | | | | 5 | | | | | (366,440 | ) | | | | 700.00 | | | | | 09/20/19 | | | | | (15,200 | ) |
CME Group, Inc. | | | | 6 | | | | | (116,466 | ) | | | | 185.00 | | | | | 09/20/19 | | | | | (2,250 | ) |
EOG Resources, Inc. | | | | 35 | | | | | (326,060 | ) | | | | 90.00 | | | | | 07/19/19 | | | | | (5,600 | ) |
Fair Isaac Corp. | | | | 5 | | | | | (157,010 | ) | | | | 270.00 | | | | | 07/19/19 | | | | | (425 | ) |
Fidelity National Information Services, Inc. | | | | 5 | | | | | (61,340 | ) | | | | 120.00 | | | | | 10/18/19 | | | | | (2,325 | ) |
Ford Motor Co. | | | | 70 | | | | | (71,610 | ) | | | | 10.00 | | | | | 09/20/19 | | | | | (3,080 | ) |
Hershey Co. (The) | | | | 21 | | | | | (281,463 | ) | | | | 135.00 | | | | | 09/20/19 | | | | | (12,600 | ) |
Intercontinental Exchange, Inc. | | | | 25 | | | | | (214,850 | ) | | | | 85.00 | | | | | 09/20/19 | | | | | (6,125 | ) |
Ionis Pharmaceuticals, Inc. | | | | 2 | | | | | (12,854 | ) | | | | 80.00 | | | | | 07/19/19 | | | | | (3,340 | ) |
Match Group, Inc. | | | | 25 | | | | | (168,175 | ) | | | | 65.00 | | | | | 09/20/19 | | | | | (11,500 | ) |
McDonald’s Corp. | | | | 15 | | | | | (311,490 | ) | | | | 200.00 | | | | | 09/20/19 | | | | | (5,475 | ) |
Morgan Stanley | | | | 25 | | | | | (109,525 | ) | | | | 42.00 | | | | | 08/02/19 | | | | | (1,825 | ) |
Procter & Gamble Co. (The) | | | | 25 | | | | | (274,125 | ) | | | | 105.00 | | | | | 09/20/19 | | | | | (5,875 | ) |
PulteGroup, Inc. | | | | 60 | | | | | (189,720 | ) | | | | 32.00 | | | | | 08/02/19 | | | | | (8,220 | ) |
Shopify, Inc. | | | | 5 | | | | | (150,075 | ) | | | | 210.00 | | | | | 07/19/19 | | | | | (175 | ) |
Starbucks Corp. | | | | 30 | | | | | (251,490 | ) | | | | 80.00 | | | | | 08/02/19 | | | | | (3,750 | ) |
Synchrony Financial | | | | 5 | | | | | (17,335 | ) | | | | 33.00 | | | | | 09/20/19 | | | | | (500 | ) |
Teck Resources, Ltd. | | | | 60 | | | | | (138,360 | ) | | | | 20.00 | | | | | 08/16/19 | | | | | (1,800 | ) |
Veeva Systems, Inc. | | | | 3 | | | | | (48,633 | ) | | | | 165.00 | | | | | 09/20/19 | | | | | (3,840 | ) |
| | | | | | | | | | | | | | | | | | | | | | | | | |
| | | | | |
Total Exchange Traded Put Options Written (Premiums received $(164,315)) | | | | | | | | | | | | | | | | | | | | | | | $ | (151,347 | ) |
| | | | | | | | | | | | | | | | | | | | | | | | | |
EXCHANGE TRADED CALL OPTIONSWRITTEN - (1.17%) | | | | | | | | | | | | | | | | | | | | | | | | | |
| | | | | |
Abbott Laboratories | | | | 4 | | | | $ | (33,640 | ) | | | $ | 85.00 | | | | | 09/20/19 | | | | $ | (956 | ) |
AbbVie, Inc. | | | | 5 | | | | | (36,360 | ) | | | | 80.00 | | | | | 09/20/19 | | | | | (490 | ) |
Adobe, Inc. | | | | 3 | | | | | (88,395 | ) | | | | 290.00 | | | | | 09/20/19 | | | | | (5,415 | ) |
American Electric Power Co., Inc. | | | | 3 | | | | | (26,403 | ) | | | | 92.50 | | | | | 09/20/19 | | | | | (285 | ) |
American Express Co. | | | | 3 | | | | | (37,032 | ) | | | | 115.00 | | | | | 07/19/19 | | | | | (2,640 | ) |
American Tower Corp. | | | | 3 | | | | | (61,335 | ) | | | | 200.00 | | | | | 07/19/19 | | | | | (1,860 | ) |
Amgen, Inc. | | | | 2 | | | | | (36,856 | ) | | | | 170.00 | | | | | 07/19/19 | | | | | (3,118 | ) |
Anadarko Petroleum Corp. | | | | 3 | | | | | (21,168 | ) | | | | 72.50 | | | | | 08/16/19 | | | | | (207 | ) |
Aon PLC | | | | 3 | | | | | (57,894 | ) | | | | 180.00 | | | | | 07/19/19 | | | | | (4,260 | ) |
Apple, Inc. | | | | 6 | | | | | (118,752 | ) | | | | 185.00 | | | | | 08/16/19 | | | | | (9,990 | ) |
Applied Materials, Inc. | | | | 4 | | | | | (17,964 | ) | | | | 40.00 | | | | | 07/19/19 | | | | | (2,060 | ) |
Archer-Daniels-Midland Co. | | | | 3 | | | | | (12,240 | ) | | | | 41.00 | | | | | 09/20/19 | | | | | (456 | ) |
AT&T, Inc. | | | | 14 | | | | | (46,914 | ) | | | | 33.00 | | | | | 09/20/19 | | | | | (1,750 | ) |
Athene Holding, Ltd., Class A | | | | 57 | | | | | (245,442 | ) | | | | 45.00 | | | | | 08/16/19 | | | | | (4,845 | ) |
Bank of America Corp. | | | | 5 | | | | | (14,500 | ) | | | | 29.00 | | | | | 09/20/19 | | | | | (685 | ) |
Baxter International, Inc. | | | | 3 | | | | | (24,570 | ) | | | | 77.50 | | | | | 08/16/19 | | | | | (1,755 | ) |
BB&T Corp. | | | | 3 | | | | | (14,739 | ) | | | | 50.00 | | | | | 09/20/19 | | | | | (420 | ) |
| | |
| Managed Volatility Fund | |
|
SCHEDULE OF INVESTMENTS(continued) |
Showing percentage of net assets as of June 30, 2019 | | |
| | | | | | | | | | | | | | | | | | | | | | | | | |
| Description | | Number of
Contracts | | Notional
Amount | | Exercise
Price | | Expiration
Date | | Value |
Exchange Traded Call Options Written (continued) | | | | | | | | | | | | | | | | | | | | | | | | | |
Berkshire Hathaway, Inc., Class B | | | | 15 | | | | $ | (319,755 | ) | | | $ | 210.00 | | | | | 08/16/19 | | | | $ | (10,125 | ) |
Bristol-Myers Squibb Co. | | | | 5 | | | | | (22,675 | ) | | | | 46.00 | | | | | 09/20/19 | | | | | (820 | ) |
Bunge, Ltd. | | | | 15 | | | | | (83,565 | ) | | | | 52.50 | | | | | 07/19/19 | | | | | (5,700 | ) |
Campbell Soup Co. | | | | 5 | | | | | (20,035 | ) | | | | 42.00 | | | | | 08/16/19 | | | | | (275 | ) |
Capital One Financial Corp. | | | | 3 | | | | | (27,222 | ) | | | | 92.50 | | | | | 09/20/19 | | | | | (990 | ) |
Carnival Corp. | | | | 3 | | | | | (13,965 | ) | | | | 55.00 | | | | | 07/19/19 | | | | | (12 | ) |
Celgene Corp. | | | | 3 | | | | | (27,732 | ) | | | | 95.00 | | | | | 07/19/19 | | | | | (90 | ) |
Charles Schwab Corp. (The) | | | | 70 | | | | | (281,330 | ) | | | | 41.00 | | | | | 09/20/19 | | | | | (12,600 | ) |
Charles Schwab Corp. (The) | | | | 6 | | | | | (24,114 | ) | | | | 42.00 | | | | | 09/20/19 | | | | | (960 | ) |
Chevron Corp. | | | | 5 | | | | | (62,220 | ) | | | | 125.00 | | | | | 07/19/19 | | | | | (875 | ) |
Cisco Systems, Inc. | | | | 13 | | | | | (71,149 | ) | | | | 55.00 | | | | | 07/19/19 | | | | | (1,183 | ) |
Citigroup, Inc. | | | | 6 | | | | | (42,018 | ) | | | | 70.00 | | | | | 09/20/19 | | | | | (1,860 | ) |
Citrix Systems, Inc. | | | | 3 | | | | | (29,442 | ) | | | | 97.50 | | | | | 07/19/19 | | | | | (735 | ) |
Cognizant Technology Solutions Corp., Class A | | | | 3 | | | | | (19,017 | ) | | | | 72.50 | | | | | 07/19/19 | | | | | (15 | ) |
Comcast Corp., Class A | | | | 5 | | | | | (21,140 | ) | | | | 42.50 | | | | | 09/20/19 | | | | | (700 | ) |
ConocoPhillips | | | | 50 | | | | | (305,000 | ) | | | | 60.00 | | | | | 08/16/19 | | | | | (14,200 | ) |
ConocoPhillips | | | | 4 | | | | | (24,400 | ) | | | | 61.00 | | | | | 08/02/19 | | | | | (856 | ) |
Continental Resources, Inc. | | | | 10 | | | | | (42,090 | ) | | | | 42.50 | | | | | 07/19/19 | | | | | (1,450 | ) |
Corteva, Inc. | | | | 3 | | | | | (8,871 | ) | | | | 30.00 | | | | | 09/20/19 | | | | | (435 | ) |
CVS Health Corp. | | | | 3 | | | | | (16,347 | ) | | | | 56.00 | | | | | 08/02/19 | | | | | (291 | ) |
DaVita, Inc. | | | | 4 | | | | | (22,504 | ) | | | | 55.00 | | | | | 07/19/19 | | | | | (920 | ) |
Delta Air Lines, Inc. | | | | 20 | | | | | (113,500 | ) | | | | 57.50 | | | | | 08/16/19 | | | | | (3,520 | ) |
Discovery, Inc., Class C | | | | 5 | | | | | (14,225 | ) | | | | 30.00 | | | | | 09/20/19 | | | | | (520 | ) |
Dominion Energy, Inc. | | | | 3 | | | | | (23,196 | ) | | | | 77.50 | | | | | 08/16/19 | | | | | (768 | ) |
Dow, Inc. | | | | 3 | | | | | (14,793 | ) | | | | 52.50 | | | | | 09/20/19 | | | | | (300 | ) |
DuPont de Nemours, Inc. | | | | 3 | | | | | (22,521 | ) | | | | 75.00 | | | | | 09/20/19 | | | | | (1,155 | ) |
eBay, Inc. | | | | 3 | | | | | (11,850 | ) | | | | 38.00 | | | | | 07/19/19 | | | | | (609 | ) |
Electronic Arts, Inc. | | | | 3 | | | | | (30,378 | ) | | | | 100.00 | | | | | 07/19/19 | | | | | (1,185 | ) |
Eli Lilly & Co. | | | | 25 | | | | | (276,975 | ) | | | | 120.00 | | | | | 08/16/19 | | | | | (2,050 | ) |
Emerson Electric Co. | | | | 3 | | | | | (20,016 | ) | | | | 65.00 | | | | | 09/20/19 | | | | | (1,140 | ) |
Exxon Mobil Corp. | | | | 7 | | | | | (53,641 | ) | | | | 77.50 | | | | | 07/19/19 | | | | | (574 | ) |
Facebook, Inc., Class A | | | | 5 | | | | | (96,500 | ) | | | | 175.00 | | | | | 09/20/19 | | | | | (11,385 | ) |
FedEx Corp. | | | | 3 | | | | | (49,257 | ) | | | | 175.00 | | | | | 07/19/19 | | | | | (225 | ) |
General Mills, Inc. | | | | 5 | | | | | (26,260 | ) | | | | 52.50 | | | | | 07/19/19 | | | | | (390 | ) |
Genuine Parts Co. | | | | 20 | | | | | (207,160 | ) | | | | 105.00 | | | | | 08/16/19 | | | | | (4,140 | ) |
Halliburton Co. | | | | 100 | | | | | (227,400 | ) | | | | 22.50 | | | | | 08/16/19 | | | | | (16,000 | ) |
Halliburton Co. | | | | 3 | | | | | (6,822 | ) | | | | 25.00 | | | | | 09/20/19 | | | | | (213 | ) |
Hasbro, Inc. | | | | 3 | | | | | (31,704 | ) | | | | 110.00 | | | | | 08/16/19 | | | | | (1,140 | ) |
HCA Healthcare, Inc. | | | | 25 | | | | | (337,925 | ) | | | | 135.00 | | | | | 09/20/19 | | | | | (18,250 | ) |
HD Supply Holdings, Inc. | | | | 15 | | | | | (60,420 | ) | | | | 40.00 | | | | | 09/20/19 | | | | | (3,225 | ) |
Honeywell International, Inc. | | | | 3 | | | | | (52,377 | ) | | | | 180.00 | | | | | 09/20/19 | | | | | (1,050 | ) |
Intel Corp. | | | | 7 | | | | | (33,509 | ) | | | | 45.00 | | | | | 08/16/19 | | | | | (2,730 | ) |
International Business Machines Corp. | | | | 3 | | | | | (41,370 | ) | | | | 135.00 | | | | | 08/16/19 | | | | | (2,022 | ) |
International Paper Co. | | | | 3 | | | | | (12,996 | ) | | | | 45.00 | | | | | 07/19/19 | | | | | (138 | ) |
Ionis Pharmaceuticals, Inc. | | | | 6 | | | | | (38,562 | ) | | | | 65.00 | | | | | 08/16/19 | | | | | (2,640 | ) |
JPMorgan Chase & Co. | | | | 3 | | | | | (33,540 | ) | | | | 110.00 | | | | | 07/19/19 | | | | | (900 | ) |
Juniper Networks, Inc. | | | | 8 | | | | | (21,304 | ) | | | | 28.00 | | | | | 07/19/19 | | | | | (168 | ) |
Kimberly-Clark Corp. | | | | 3 | | | | | (39,984 | ) | | | | 125.00 | | | | | 07/19/19 | | | | | (2,850 | ) |
Kohl’s Corp. | | | | 30 | | | | | (142,650 | ) | | | | 60.00 | | | | | 07/19/19 | | | | | (120 | ) |
| | |
| 60 | | Annual Report | June 30, 2019 |
| | |
| Managed Volatility Fund | | |
SCHEDULE OF INVESTMENTS(continued) | | |
Showing percentage of net assets as of June 30, 2019 | | |
| | | | | | | | | | | | | | | | | | | | | | | | | |
| Description | | Number of
Contracts | | Notional
Amount | | Exercise
Price | | Expiration
Date | | Value |
Exchange Traded Call Options Written (continued) | | | | | | | | | | | | | | | | | | | | | | | | | |
Kohl’s Corp. | | | | 20 | | | | $ | (95,100 | ) | | | $ | 65.00 | | | | | 07/19/19 | | | | $ | (60 | ) |
Kroger Co. (The) | | | | 3 | | | | | (6,513 | ) | | | | 26.00 | | | | | 07/19/19 | | | | | (3 | ) |
Macy’s, Inc. | | | | 10 | | | | | (21,460 | ) | | | | 22.00 | | | | | 08/16/19 | | | | | (1,060 | ) |
Marathon Petroleum Corp. | | | | 5 | | | | | (27,940 | ) | | | | 50.00 | | | | | 07/26/19 | | | | | (3,100 | ) |
Mastercard, Inc., Class A | | | | 3 | | | | | (79,359 | ) | | | | 240.00 | | | | | 07/19/19 | | | | | (6,930 | ) |
Merck & Co., Inc. | | | | 7 | | | | | (58,695 | ) | | | | 80.00 | | | | | 07/19/19 | | | | | (3,010 | ) |
MetLife, Inc. | | | | 60 | | | | | (298,020 | ) | | | | 45.00 | | | | | 07/19/19 | | | | | (28,800 | ) |
Micron Technology, Inc. | | | | 143 | | | | | (551,837 | ) | | | | 36.00 | | | | | 07/19/19 | | | | | (46,475 | ) |
Micron Technology, Inc. | | | | 12 | | | | | (46,308 | ) | | | | 35.00 | | | | | 09/20/19 | | | | | (6,660 | ) |
Microsoft Corp. | | | | 9 | | | | | (120,564 | ) | | | | 130.00 | | | | | 08/16/19 | | | | | (6,435 | ) |
Morgan Stanley | | | | 7 | | | | | (30,667 | ) | | | | 45.00 | | | | | 08/02/19 | | | | | (791 | ) |
NIKE, Inc., Class B | | | | 5 | | | | | (41,975 | ) | | | | 85.00 | | | | | 07/19/19 | | | | | (615 | ) |
Northrop Grumman Corp. | | | | 3 | | | | | (96,933 | ) | | | | 315.00 | | | | | 08/02/19 | | | | | (4,980 | ) |
Omnicom Group, Inc. | | | | 3 | | | | | (24,585 | ) | | | | 85.00 | | | | | 07/19/19 | | | | | (330 | ) |
Oracle Corp. | | | | 3 | | | | | (17,091 | ) | | | | 55.00 | | | | | 09/20/19 | | | | | (1,002 | ) |
PayPal Holdings, Inc. | | | | 3 | | | | | (34,338 | ) | | | | 115.00 | | | | | 07/19/19 | | | | | (801 | ) |
PepsiCo, Inc. | | | | 3 | | | | | (39,339 | ) | | | | 130.00 | | | | | 07/19/19 | | | | | (900 | ) |
Pfizer, Inc. | | | | 8 | | | | | (34,656 | ) | | | | 42.00 | | | | | 07/19/19 | | | | | (1,288 | ) |
Progressive Corp. (The) | | | | 4 | | | | | (31,972 | ) | | | | 80.00 | | | | | 08/16/19 | | | | | (1,080 | ) |
Prudential Financial, Inc. | | | | 32 | | | | | (323,200 | ) | | | | 100.00 | | | | | 09/20/19 | | | | | (14,944 | ) |
QUALCOMM, Inc. | | | | 4 | | | | | (30,428 | ) | | | | 80.00 | | | | | 07/19/19 | | | | | (340 | ) |
Ross Stores, Inc. | | | | 3 | | | | | (29,736 | ) | | | | 100.00 | | | | | 08/16/19 | | | | | (744 | ) |
salesforce.com, Inc. | | | | 4 | | | | | (60,692 | ) | | | | 160.00 | | | | | 08/16/19 | | | | | (1,096 | ) |
Simon Property Group, Inc. | | | | 3 | | | | | (47,928 | ) | | | | 180.00 | | | | | 07/19/19 | | | | | (21 | ) |
Southwest Airlines Co. | | | | 4 | | | | | (20,312 | ) | | | | 55.00 | | | | | 09/20/19 | | | | | (400 | ) |
State Street Corp. | | | | 3 | | | | | (16,818 | ) | | | | 65.00 | | | | | 08/16/19 | | | | | (69 | ) |
Steel Dynamics, Inc. | | | | 25 | | | | | (75,500 | ) | | | | 30.00 | | | | | 08/16/19 | | | | | (4,250 | ) |
TD Ameritrade Holding Corp. | | | | 35 | | | | | (174,720 | ) | | | | 55.00 | | | | | 08/16/19 | | | | | (1,050 | ) |
Texas Instruments, Inc. | | | | 3 | | | | | (34,428 | ) | | | | 114.00 | | | | | 08/02/19 | | | | | (1,560 | ) |
United Technologies Corp. | | | | 3 | | | | | (39,060 | ) | | | | 130.00 | | | | | 08/02/19 | | | | | (1,140 | ) |
Visa, Inc., Class A | | | | 4 | | | | | (69,420 | ) | | | | 165.00 | | | | | 07/19/19 | | | | | (3,380 | ) |
Walmart, Inc. | | | | 3 | | | | | (33,147 | ) | | | | 100.00 | | | | | 07/19/19 | | | | | (3,225 | ) |
Walt Disney Co. (The) | | | | 3 | | | | | (41,892 | ) | | | | 145.00 | | | | | 09/20/19 | | | | | (1,095 | ) |
Wells Fargo & Co. | | | | 12 | | | | | (56,784 | ) | | | | 50.00 | | | | | 07/19/19 | | | | | (312 | ) |
Xilinx, Inc. | | | | 29 | | | | | (341,968 | ) | | | | 105.00 | | | | | 07/19/19 | | | | | (35,931 | ) |
| | | | | | | | | | | | | | | | | | | | | | | | | |
| | | | | |
Total Exchange Traded Call Options Written (Premiums received $(262,098)) | | | | | | | | | | | | | | | | | | | | | | | $ | (359,568 | ) |
| | | | | | | | | | | | | | | | | | | | | | | | | |
| | |
| Managed Volatility Fund | | |
SCHEDULE OF INVESTMENTS(continued) | | |
| | |
Summary of inputs used to value the Fund’s investments as of 06/30/2019 (See Note 2 in Notes to Financial Statements):
| | | | | | | | | | | | | | | | |
| | | Assets Table | |
| | | Valuation Inputs | |
| | | Investment in Securities (Value) | |
| | | Level 1 Quoted Prices | | | Level 2
Significant
Observable
Inputs | | | Level 3 Significant
Unobservable Inputs | | | Total | |
| | | | |
Common Stocks | | $ | 18,634,042 | | | $ | — | | | $ | — | | | $ | 18,634,042 | |
U.S. Government Obligations | | | — | | | | 8,969,341 | | | | — | | | | 8,969,341 | |
Money Market Fund | | | — | | | | 1,797,624 | | | | — | | | | 1,797,624 | |
| | | | | | | | | | | | | | | | |
TOTAL | | $ | 18,634,042 | | | $ | 10,766,965 | | | $ | — | | | $ | 29,401,007 | |
| | | | | | | | | | | | | | | | |
| | | | | | | | | | | | | | | | |
| |
| | | Liabilities Table | |
| | | Valuation Inputs | |
| | | Investment in Securities (Value) | |
| | | Level 1
Quoted Prices | | | Level 2
Significant
Observable
Inputs | | | Level 3
Significant
Unobservable
Inputs | | | Total | |
| | | | |
Options Written | | $ | (442,924 | ) | | $ | (67,991) | | | $ | — | | | $ | (510,915 | ) |
| | | | | | | | | | | | | | | | |
TOTAL | | $ | (442,924 | ) | | $ | (67,991) | | | $ | — | | | $ | (510,915 | ) |
| | | | | | | | | | | | | | | | |
See Notes to Financial Statements.
| | |
| 62 | | Annual Report | June 30, 2019 |
THIS PAGE INTENTIONALLY LEFT BLANK
| | |
| STATEMENTS OF ASSETS AND LIABILITIES | | |
June 30, 2019
| | | | | | | | | | | | |
| ASSETS | | Aggressive
Investors 1 | | | | | Ultra-Small
Company | | | |
Investments at value | | $ | 183,041,132 | | | | | $ | 79,894,862 | | | |
Cash | | | - | | | | | | - | | | |
Receivables: | | | | | | | | | | | | |
Portfolio securities sold | | | - | | | | | | 22,622 | | | |
Fund shares sold | | | 1,356 | | | | | | 100 | | | |
Dividends and interest | | | 161,406 | | | | | | 51,399 | | | |
Receivable from investment adviser | | | - | | | | | | - | | | |
Deposits with brokers | | | - | | | | | | - | | | |
Prepaid expenses | | | 27,511 | | | | | | 9,895 | | | |
| | | | |
Total assets | | | 183,231,405 | | | | | | 79,978,878 | | | |
| | | | |
LIABILITIES | | | | | | | | | | | | |
Payables: | | | | | | | | | | | | |
Portfolio securities purchased | | | - | | | | | | - | | | |
Fund shares redeemed | | | 146,023 | | | | | | - | | | |
Due to custodian | | | - | | | | | | - | | | |
Loan payable | | | - | | | | | | 192,000 | | | |
Payable upon return of securities loaned | | | 1,631,234 | | | | | | 5,682,874 | | | |
Accrued Liabilities: | | | | | | | | | | | | |
Investment adviser fees | | | 1,111 | | | | | | 53,405 | | | |
Administration fees | | | 4,211 | | | | | | 1,718 | | | |
Directors’ fees | | | 496 | | | | | | 220 | | | |
Other | | | 81,750 | | | | | | 43,249 | | | |
Put options written at value | | | - | | | | | | - | | | |
Call options written at value | | | - | | | | | | - | | | |
| | | | |
Total liabilities | | | 1,864,825 | | | | | | 5,973,466 | | | |
| | | | |
NET ASSETS | | $ | 181,366,580 | | | | | $ | 74,005,412 | | | |
| | | | |
NET ASSETS REPRESENT | | | | | | | | | | | | |
Paid-in capital | | $ | 184,476,526 | | | | | $ | 80,105,809 | | | |
Distributable earnings(a) | | | (3,109,946 | ) | | | | | (6,100,397 | ) | | |
| | | | |
NET ASSETS | | $ | 181,366,580 | | | | | $ | 74,005,412 | | | |
| | | | |
Shares of common stock outstanding of $.001 par value(b) | | | 2,924,803 | | | | | | 3,062,542 | | | |
| | | | |
Net asset value, offering price and redemption price per share | | $ | 62.01 | | | | | $ | 24.16 | | | |
| | | | |
Total investments at cost | | $ | 174,321,163 | | | | | $ | 86,303,262 | | | |
Premiums received on put options written | | $ | - | | | | | $ | - | | | |
Premiums received on call options written | | $ | - | | | | | $ | - | | | |
| (a) | Effective December 31, 2018, the Fund has adopted disclosure requirements conforming to SEC Rule6-04.17 of RegulationS-X and discloses total distributable earnings. See Note 2 for further details. |
| (b) | See Note 1 - Organization in the Notes to Financial Statements for shares authorized for each Fund. |
| (c) | Redemption of shares held less than six months may be charged a 2% redemption fee. See Note 8. |
See Notes to Financial Statements.
| | |
| 64 | | Annual Report | June 30, 2019 |
| | |
| | | |
| | |
|
| | | | | | | | | | | | | | | | | | |
| | | | |
Ultra-Small
Company Market | | | Small-Cap Growth | | | Small-Cap Value | | | Blue Chip | | | Managed Volatility | �� |
| | $258,125,480 | | | $ | 43,443,594 | | | $ | 52,831,109 | | | $ | 505,473,035 | | | $ | 29,401,007 | |
| | - | | | | - | | | | 4,830 | | | | - | | | | - | |
| | | | |
| | | | | | | | | | | | | | | | | | |
| | 4,273,937 | | | | 124,807 | | | | - | | | | 222,847 | | | | 714,757 | |
| | 43,865 | | | | 3,560 | | | | 1,082 | | | | 168,744 | | | | - | |
| | 228,192 | | | | 7,657 | | | | 44,246 | | | | 230,738 | | | | 15,853 | |
| | - | | | | - | | | | - | | | | 88,980 | | | | - | |
| | - | | | | - | | | | - | | | | - | | | | 1,080,131 | |
| | 31,882 | | | | 10,062 | | | | 10,655 | | | | 60,181 | | | | 16,224 | |
| | | | |
| | 262,703,356 | | | | 43,589,680 | | | | 52,891,922 | | | | 506,244,525 | | | | 31,227,972 | |
| | | | |
| | | | | | | | | | | | | | | | | | |
| | | | |
| | | | | | | | | | | | | | | | | | |
| | 1,350,534 | | | | - | | | | - | | | | 684,675 | | | | - | |
| | 177,719 | | | | 21,556 | | | | 39,202 | | | | 389,422 | | | | 15,179 | |
| | - | | | | 8,913 | | | | - | | | | - | | | | - | |
| | 31,000 | | | | 193,000 | | | | - | | | | - | | | | - | |
| | 24,535,439 | | | | 1,228,325 | | | | 3,141,308 | | | | - | | | | - | |
| | 102,958 | | | | 12,486 | | | | 15,078 | | | | - | | | | 5,399 | |
| | 5,736 | | | | 977 | | | | 1,152 | | | | 13,536 | | | | 728 | |
| | 815 | | | | 125 | | | | 152 | | | | 1,466 | | | | 81 | |
| | 127,936 | | | | 39,052 | | | | 43,269 | | | | 126,854 | | | | 38,680 | |
| | - | | | | - | | | | - | | | | - | | | | 151,347 | |
| | - | | | | - | | | | - | | | | - | | | | 359,568 | |
| | | | |
| | 26,332,137 | | | | 1,504,434 | | | | 3,240,161 | | | | 1,215,953 | | | | 570,982 | |
| | | | |
| | $236,371,219 | | | $ | 42,085,246 | | | $ | 49,651,761 | | | $ | 505,028,572 | | | $ | 30,656,990 | |
| | | | |
| | | | | | | | | | | | | | | | | | |
| | $211,764,622 | | | $ | 41,511,133 | | | $ | 54,584,090 | | | $ | 198,013,094 | | | $ | 24,408,985 | |
| | 24,606,597 | | | | 574,113 | | | | (4,932,329 | ) | | | 307,015,478 | | | | 6,248,005 | |
| | | | |
| | $236,371,219 | | | $ | 42,085,246 | | | $ | 49,651,761 | | | $ | 505,028,572 | | | $ | 30,656,990 | |
| | | | |
| | 20,837,015 | | | | 1,733,014 | | | | 2,452,760 | | | | 33,702,074 | | | | 2,037,365 | |
| | $ 11.34(c) | | | $ | 24.28 | | | $ | 20.24 | | | $ | 14.99 | | | $ | 15.05 | |
| | | | |
| | $233,477,698 | | | $ | 41,101,756 | | | $ | 54,651,621 | | | $ | 242,858,637 | | | $ | 22,828,647 | |
| | | | |
| | $ - | | | $ | - | | | $ | - | | | $ | - | | | $ | 164,315 | |
| | | | |
| | $ - | | | $ | - | | | $ | - | | | $ | - | | | $ | 262,098 | |
Year Ended June 30, 2019
| | | | | | | | | | | | | | | | | | | | | | | | | |
| | | Aggressive
Investors 1 | | | | Ultra-Small
Company | | | | Ultra-Small
Company Market |
| | | | | |
INVESTMENT INCOME | | | | | | | | | | | | | | | | | | | | | | | | | |
Dividends | | | $ | 3,610,710 | | | | | | | | | $ | 1,503,521 | | | | | | | | | | $ 3,005,938 | |
Less: foreign taxes withheld | | | | (47,234 | ) | | | | | | | | | - | | | | | | | | | | (514 | ) |
Interest | | | | 18,900 | | | | | | | | | | 11,533 | | | | | | | | | | 15,854 | |
Securities lending | | | | 41,025 | | | | | | | | | | 384,395 | | | | | | | | | | 1,989,069 | |
| | | | | |
Total Investment Income | | | | 3,623,401 | | | | | | | | | | 1,899,449 | | | | | | | | | | 5,010,347 | |
| | | | | |
EXPENSES | | | | | | | | | | | | | | | | | | | | | | | | | |
Investment advisory fees - Base fees | | | | 1,745,086 | | | | | | | | | | 771,146 | | | | | | | | | | 1,578,055 | |
Investment advisory fees - Performance adjustment | | | | (1,610,301 | ) | | | | | | | | | - | | | | | | | | | | - | |
Administration fees | | | | 51,176 | | | | | | | | | | 22,601 | | | | | | | | | | 83,067 | |
Accounting fees | | | | 73,421 | | | | | | | | | | 64,168 | | | | | | | | | | 113,612 | |
Transfer agent fees | | | | 125,932 | | | | | | | | | | 59,714 | | | | | | | | | | 103,235 | |
Audit fees | | | | 23,033 | | | | | | | | | | 14,904 | | | | | | | | | | 29,930 | |
Legal fees | | | | 28,032 | | | | | | | | | | 12,512 | | | | | | | | | | 46,750 | |
Custody fees | | | | 6,698 | | | | | | | | | | 10,972 | | | | | | | | | | 21,562 | |
Blue sky fees | | | | 25,340 | | | | | | | | | | 10,896 | | | | | | | | | | 24,900 | |
Directors’ and officers’ fees | | | | 20,775 | | | | | | | | | | 8,867 | | | | | | | | | | 32,586 | |
Shareholder servicing fees | | | | 110,110 | | | | | | | | | | 23,700 | | | | | | | | | | 280,390 | |
Reports to shareholders | | | | 28,874 | | | | | | | | | | 19,832 | | | | | | | | | | 44,040 | |
Miscellaneous expenses | | | | 43,583 | | | | | | | | | | 19,709 | | | | | | | | | | 62,797 | |
| | | | | |
Total Expenses | | | | 671,759 | | | | | | | | | | 1,039,021 | | | | | | | | | | 2,420,924 | |
| | | | | |
Less investment advisory fees waived | | | | - | | | | | | | | | | - | | | | | | | | | | (53,790 | ) |
| | | | | |
Net Expenses | | | | 671,759 | | | | | | | | | | 1,039,021 | | | | | | | | | | 2,367,134 | |
| | | | | |
NET INVESTMENT INCOME (LOSS) | | | | 2,951,642 | | | | | | | | | | 860,428 | | | | | | | | | | 2,643,213 | |
| | | | | |
NET REALIZED AND UNREALIZED GAIN (LOSS) ON INVESTMENTS | | | | | | | | | | | | | | | | | | | | | | | | | |
Realized Gain (Loss) on: | | | | | | | | | | | | | | | | | | | | | | | | | |
Investments | | | | (11,831,532 | ) | | | | | | | | | (160,937 | ) | | | | | | | | | 10,012,500 | |
Written options | | | | - | | | | | | | | | | - | | | | | | | | | | - | |
Futures contracts | | | | - | | | | | | | | | | - | | | | | | | | | | - | |
Foreign Currency | | | | 5,660 | | | | | | | | | | - | | | | | | | | | | - | |
| | | | | |
Net Realized Gain (Loss) | | | | (11,825,872 | ) | | | | | | | | | (160,937 | ) | | | | | | | | | 10,012,500 | |
| | | | | |
Change in Unrealized Appreciation (Depreciation) on: | | | | | | | | | | | | | | | | | | | | | | | | | |
Investments | | | | (8,208,119 | ) | | | | | | | | | (14,307,616 | ) | | | | | | | | | (79,246,838 | ) |
Written options | | | | - | | | | | | | | | | - | | | | | | | | | | - | |
| | | | | |
Net Change in Unrealized Appreciation (Depreciation) | | | | (8,208,119 | ) | | | | | | | | | (14,307,616 | ) | | | | | | | | | (79,246,838 | ) |
| | | | | |
Net Realized and Unrealized Gain (Loss) on Investments | | | | (20,033,991 | ) | | | | | | | | | (14,468,553 | ) | | | | | | | | | (69,234,338 | ) |
| | | | | |
INCREASE (DECREASE) IN NET ASSETS RESULTING FROM OPERATIONS | | | $ | (17,082,349 | ) | | | | | | | | $ | (13,608,125 | ) | | | | | | | | | $(66,591,125 | ) |
See Notes to Financial Statements.
| | |
| 66 | | Annual Report | June 30, 2019 |
| | |
| | | |
| | |
|
| | | | | | | | | | | | | | |
| | | |
Small-Cap
Growth | | | Small-Cap
Value | | | Blue Chip | | | Managed
Volatility | |
| | | |
| | | | | | | | | | | | | | |
| | $ 358,293 | | | $ | 1,663,227 | | | $ | 13,966,039 | | | $ | 381,186 | |
| | - | | | | (1,178 | ) | | | - | | | | (212 | ) |
| | 4,823 | | | | 9,924 | | | | 1,989 | | | | 252,989 | |
| | 47,103 | | | | 46,068 | | | | - | | | | 87 | |
| | | |
| | 410,219 | | | | 1,718,041 | | | | 13,968,028 | | | | 634,050 | |
| | | |
| | | | | | | | | | | | | | |
| | 292,125 | | | | 354,149 | | | | 459,860 | | | | 190,274 | |
| | 4,352 | | | | (26,263 | ) | | | - | | | | - | |
| | 12,848 | | | | 15,562 | | | | 152,366 | | | | 8,413 | |
| | 55,716 | | | | 58,293 | | | | 121,138 | | | | 64,987 | |
| | 58,803 | | | | 64,567 | | | | 68,477 | | | | 36,898 | |
| | 12,296 | | | | 12,904 | | | | 42,319 | | | | 16,167 | |
| | 7,189 | | | | 8,727 | | | | 158,046 | | | | 4,545 | |
| | 5,613 | | | | 5,087 | | | | 11,791 | | | | 5,551 | |
| | 22,940 | | | | 22,568 | | | | 37,016 | | | | 22,667 | |
| | 5,041 | | | | 6,079 | | | | 62,626 | | | | 3,179 | |
| | 30,953 | | | | 33,467 | | | | 77,658 | | | | 20,190 | |
| | 19,253 | | | | 20,275 | | | | 121,547 | | | | 16,583 | |
| | 11,683 | | | | 15,120 | | | | 109,943 | | | | 4,557 | |
| | | |
| | 538,812 | | | | 590,535 | | | | 1,422,787 | | | | 394,011 | |
| | | |
| | (80,851 | ) | | | (35,202 | ) | | | (560,438 | ) | | | (95,984 | ) |
| | | |
| | 457,961 | | | | 555,333 | | | | 862,349 | | | | 298,027 | |
| | | |
| | (47,742 | ) | | | 1,162,708 | | | | 13,105,679 | | | | 336,023 | |
| | | |
| | | | | | | | | | | | | | |
| | | |
| | | | | | | | | | | | | | |
| | (218,258 | ) | | | (3,088,648 | ) | | | 68,602,183 | | | | 96,532 | |
| | - | | | | - | | | | - | | | | 891,998 | |
| | - | | | | - | | | | - | | | | (419,975 | ) |
| | - | | | | - | | | | - | | | | - | |
| | | |
| | (218,258 | ) | | | (3,088,648 | ) | | | 68,602,183 | | | | 568,555 | |
| | | | | | | | | | | | | | |
| | (5,797,297 | ) | | | (9,795,116 | ) | | | 1,846,454 | | | | (273,838 | ) |
| | - | | | | - | | | | - | | | | (90,015 | ) |
| | | |
| | (5,797,297 | ) | | | (9,795,116 | ) | | | 1,846,454 | | | | (363,853 | ) |
| | | |
| | (6,015,555 | ) | | | (12,883,764 | ) | | | 70,448,637 | | | | 204,702 | |
| | | |
| | $(6,063,297 | ) | | $ | (11,721,056 | ) | | $ | 83,554,316 | | | $ | 540,725 | |
| | |
| STATEMENTS OF CHANGES IN NET ASSETS | | |
| | | | | | | | | | | | | | | | |
| | | Aggressive Investors 1 | | | Ultra-Small Company | |
| | | Year Ended June 30, | | | Year Ended June 30, | |
| | | 2019 | | | 2018 | | | 2019 | | | 2018 | |
| | | | |
OPERATIONS | | | | | | | | | | | | | | | | |
Net investment income (loss) | | $ | 2,951,642 | | | $ | 732,685 | | | $ | 860,428 | | | $ | (135,877 | ) |
Net realized gain (loss) on investments | | | (11,825,872 | ) | | | 12,329,001 | | | | (160,937 | ) | | | 9,407,702 | |
Net change in unrealized appreciation (depreciation) on investments | | | (8,208,119 | ) | | | 12,741,483 | | | | (14,307,616 | ) | | | (881,449 | ) |
Net increase (decrease) in net assets resulting from operations | | | (17,082,349 | ) | | | 25,803,169 | | | | (13,608,125 | ) | | | 8,390,376 | |
| | | | |
DISTRIBUTIONS: | | | | | | | | | | | | | | | | |
From net investment income and net realized
gains(a) | | | (17,842,416 | ) | | | - | | | | (8,976,806 | ) | | | (1,914,548 | ) |
Net decrease in net assets from distributions(b) | | | (17,842,416 | ) | | | - | | | | (8,976,806 | ) | | | (1,914,548 | ) |
| | | | |
SHARE TRANSACTIONS: | | | | | | | | | | | | | | | | |
Proceeds from sale of shares | | | 2,826,662 | | | | 5,854,674 | | | | 1,238,828 | | | | 1,024,003 | |
Reinvestment of distributions | | | 17,139,212 | | | | - | | | | 8,375,017 | | | | 1,769,198 | |
Cost of shares redeemed | | | (31,236,846 | ) | | | (28,168,849 | ) | | | (9,777,274 | ) | | | (13,499,110 | ) |
Redemption fees | | | - | | | | - | | | | - | | | | - | |
Net increase (decrease) in net assets resulting from share transactions | | | (11,270,972 | ) | | | (22,314,175 | ) | | | (163,429 | ) | | | (10,705,909 | ) |
Net increase (decrease) in net assets | | | (46,195,737 | ) | | | 3,488,994 | | | | (22,748,360 | ) | | | (4,230,081 | ) |
| | | | |
NET ASSETS: | | | | | | | | | | | | | | | | |
Beginning of year | | | 227,562,317 | | | | 224,073,323 | | | | 96,753,772 | | | | 100,983,853 | |
End of year(c) | | $ | 181,366,580 | | | $ | 227,562,317 | | | $ | 74,005,412 | | | $ | 96,753,772 | |
| | | | |
SHARES ISSUED & REDEEMED | | | | | | | | | | | | | | | | |
Issued | | | 46,127 | | | | 79,909 | | | | 47,786 | | | | 33,925 | |
Distributions reinvested | | | 322,773 | | | | - | | | | 369,758 | | | | 59,509 | |
Redeemed | | | (517,228 | ) | | | (383,079 | ) | | | (366,637 | ) | | | (443,586 | ) |
Net increase (decrease) | | | (148,328 | ) | | | (303,170 | ) | | | 50,907 | | | | (350,152 | ) |
Outstanding at beginning of year | | | 3,073,131 | | | | 3,376,301 | | | | 3,011,635 | | | | 3,361,787 | |
Outstanding at end of year | | | 2,924,803 | | | | 3,073,131 | | | | 3,062,542 | | | | 3,011,635 | |
| (a) | For the year ended June 30, 2018, the distributions to shareholders from net investment income were $0, $1,299,999, $449,185, $98,928, and $547,906, and net realized gains were $0, $614,549, $43,056,482, $0, and $0 for Aggressive Investors 1, Ultra-Small Company, Ultra-Small Company Market, Small-Cap Growth and Small-Cap Value Funds, respectively. |
| (b) | Effective December 31, 2018, the Fund has adopted disclosure requirements conforming to SEC Rule 6-04.17 of Regulation S-X. See Note 2 for further details. |
| (c) | The balance as of June 30, 2018, includes $603,857, $(6,026), $1,740,562, $173,020, and $464,975 of undistributed net investment income (loss) for Aggressive Investors 1, Ultra-Small Company, Ultra-Small Company Market, Small-Cap Growth, and Small-Cap Value, respectively. |
See Notes to Financial Statements.
| | |
| 68 | | Annual Report | June 30, 2019 |
| | |
| | | |
| |
|
| | | | | | | | | | | | | | | | | | | | | | |
Ultra-Small Company Market | | | Small-Cap Growth | | | Small-Cap Value | |
Year Ended June 30, | | | Year Ended June 30, | | | Year Ended June 30, | |
| 2019 | | | 2018 | | | 2019 | | | 2018 | | | 2019 | | | 2018 | |
| | |
| | | | | | | | | | | | | | | | | | | | | | |
| | | | | | | | | | | | | | | | | | | | | | |
| $ | 2,643,213 | | | $ | 1,891,928 | | | $ | (47,742 | ) | | $ | 173,023 | | | $ | 1,162,708 | | | $ | 464,982 | |
| | 10,012,500 | | | | 42,623,829 | | | | (218,258 | ) | | | 7,272,557 | | | | (3,088,648 | ) | | | 10,753,725 | |
| | | | | | | | | | | | | | | | | | | | | | |
| | (79,246,838 | ) | | | 23,216,969 | | | | (5,797,297 | ) | | | 2,400,796 | | | | (9,795,116 | ) | | | 429,349 | |
| | |
| | | | | |
| | (66,591,125 | ) | | | 67,732,726 | | | | (6,063,297 | ) | | | 9,846,376 | | | | (11,721,056 | ) | | | 11,648,056 | |
| | |
| | | | | | | | | | | | | | | | | | | | | | |
| | | | | | | | | | | | | | | | | | | | | | |
| | (37,857,578 | ) | | | (43,505,667 | ) | | | (4,528,900 | ) | | | (98,928 | ) | | | (9,164,909 | ) | | | (547,906 | ) |
| | |
| | (37,857,578 | ) | | | (43,505,667 | ) | | | (4,528,900 | ) | | | (98,928 | ) | | | (9,164,909 | ) | | | (547,906 | ) |
| | |
| | | | | |
| | | | | | | | | | | | | | | | | | | | | | |
| | 36,606,492 | | | | 29,455,134 | | | | 3,609,014 | | | | 6,059,966 | | | | 4,577,457 | | | | 4,835,839 | |
| | 36,666,837 | | | | 41,869,482 | | | | 4,410,107 | | | | 95,874 | | | | 8,787,349 | | | | 525,341 | |
| | (110,698,074 | ) | | | (69,611,584 | ) | | | (10,814,122 | ) | | | (6,974,363 | ) | | | (12,143,617 | ) | | | (9,125,499 | ) |
| | 100,303 | | | | 14,360 | | | | - | | | | - | | | | - | | | | - | |
| | |
| | | | | |
| | | | | | | | | | | | | | | | | | | | | | |
| | (37,324,442 | ) | | | 1,727,392 | | | | (2,795,001 | ) | | | (818,523 | ) | | | 1,221,189 | | | | (3,764,319 | ) |
| | |
| | (141,773,145 | ) | | | 25,954,451 | | | | (13,387,198 | ) | | | 8,928,925 | | | | (19,664,776 | ) | | | 7,335,831 | |
| | | | | | | | | | | | | | | | | | | | | | |
| | 378,144,364 | | | | 352,189,913 | | | | 55,472,444 | | | | 46,543,519 | | | | 69,316,537 | | | | 61,980,706 | |
| | |
| $ | 236,371,219 | | | $ | 378,144,364 | | | $ | 42,085,246 | | | $ | 55,472,444 | | | $ | 49,651,761 | | | $ | 69,316,537 | |
| | |
| | | | | | | | | | | | | | | | | | | | | | |
| | 2,955,119 | | | | 1,963,750 | | | | 126,783 | | | | 216,113 | | | | 172,771 | | | | 170,722 | |
| | 3,508,788 | | | | 3,025,252 | | | | 194,879 | | | | 3,546 | | | | 453,658 | | | | 20,268 | |
| | (9,539,072 | ) | | | (4,661,379 | ) | | | (417,997 | ) | | | (257,898 | ) | | | (515,773 | ) | | | (346,128 | ) |
| | |
| | (3,075,165 | ) | | | 327,623 | | | | (96,335 | ) | | | (38,239 | ) | | | 110,656 | | | | (155,138 | ) |
| | 23,912,180 | | | | 23,584,557 | | | | 1,829,349 | | | | 1,867,588 | | | | 2,342,104 | | | | 2,497,242 | |
| | |
| | 20,837,015 | | | | 23,912,180 | | | | 1,733,014 | | | | 1,829,349 | | | | 2,452,760 | | | | 2,342,104 | |
| | |
| | |
| STATEMENTS OF CHANGES IN NET ASSETS | | |
| | | | | | | | | | | | | | | | |
| | | Blue Chip | | | Managed Volatility | |
| | | Year Ended June 30, | | | Year Ended June 30, | |
| | | 2019 | | | 2018 | | | 2019 | | | 2018 | |
| | | | |
OPERATIONS | | | | | | | | | | | | | | | | |
Net investment income | | $ | 13,105,679 | | | $ | 12,438,959 | | | $ | 336,023 | | | $ | 215,935 | |
Net realized gain on investments | | | 68,602,183 | | | | 37,821,971 | | | | 568,555 | | | | 1,879,183 | |
Net change in unrealized appreciation (depreciation) on investments | | | 1,846,454 | | | | 14,695,536 | | | | (363,853 | ) | | | 197,322 | |
Net increase in net assets resulting from operations | | | 83,554,316 | | | | 64,956,466 | | | | 540,725 | | | | 2,292,440 | |
| | | | |
DISTRIBUTIONS: | | | | | | | | | | | | | | | | |
From net investment income and net realized
gains(a) | | | (64,810,534 | ) | | | (27,402,645 | ) | | | (1,895,822 | ) | | | (194,557 | ) |
Net decrease in net assets from distributions(b) | | | (64,810,534 | ) | | | (27,402,645 | ) | | | (1,895,822 | ) | | | (194,557 | ) |
| | | | |
SHARE TRANSACTIONS: | | | | | | | | | | | | | | | | |
Proceeds from sale of shares | | | 77,791,859 | | | | 98,026,171 | | | | 3,893,273 | | | | 3,971,588 | |
Reinvestment of distributions | | | 59,566,051 | | | | 25,719,282 | | | | 1,794,927 | | | | 181,357 | |
Cost of shares redeemed | | | (218,586,219 | ) | | | (144,688,020 | ) | | | (6,492,503 | ) | | | (9,957,718 | ) |
Net decrease in net assets resulting from share transactions | | | (81,228,309 | ) | | | (20,942,567 | ) | | | (804,303 | ) | | | (5,804,773 | ) |
Net increase (decrease) in net assets | | | (62,484,527 | ) | | | 16,611,254 | | | | (2,159,400 | ) | | | (3,706,890 | ) |
NET ASSETS: | | | | | | | | | | | | | | | | |
Beginning of year | | | 567,513,099 | | | | 550,901,845 | | | | 32,816,390 | | | | 36,523,280 | |
End of year(c) | | $ | 505,028,572 | | | $ | 567,513,099 | | | $ | 30,656,990 | | | $ | 32,816,390 | |
| | | | |
SHARES ISSUED & REDEEMED | | | | | | | | | | | | | | | | |
Issued | | | 5,333,074 | | | | 6,741,303 | | | | 258,675 | | | | 256,503 | |
Distributions reinvested | | | 4,639,100 | | | | 1,779,881 | | | | 126,493 | | | | 11,807 | |
Redeemed | | | (15,099,653 | ) | | | (9,878,238 | ) | | | (431,848 | ) | | | (653,621 | ) |
Net decrease | | | (5,127,479 | ) | | | (1,357,054 | ) | | | (46,680 | ) | | | (385,311 | ) |
Outstanding at beginning of year | | | 38,829,553 | | | | 40,186,607 | | | | 2,084,045 | | | | 2,469,356 | |
Outstanding at end of year | | | 33,702,074 | | | | 38,829,553 | | | | 2,037,365 | | | | 2,084,045 | |
| (a) | For the year ended June 30, 2018, the distributions to shareholders from net investment income were $11,665,340 and $194,557, and net realized gains were $15,737,305 and $0 for Blue Chip and Managed Volatility Funds, respectively. |
| (b) | Effective December 31, 2018, the Fund has adopted disclosure requirements conforming to SEC Rule 6-04.17 of Regulation S-X. See Note 2 for further details. |
| (c) | The balance as of June 30, 2018, includes $4,947,291 and $201,988 of undistributed net investment income for Blue Chip and Managed Volatility, respectively. |
See Notes to Financial Statements.
| | |
| 70 | | Annual Report | June 30, 2019 |
FINANCIAL HIGHLIGHTS
(for a share outstanding throughout each year indicated)
AGGRESSIVE INVESTORS 1
| | | | | | | | | | |
| | | Year Ended June 30 |
| | | | | |
| | | 2019 | | 2018 | | 2017 | | 2016 | | 2015 |
| | | | | |
Net Asset Value, Beginning of Year | | $74.05 | | $66.37 | | $54.75 | | $59.15 | | $56.69 |
| | | | | |
| | | | | | | | | | |
| | | | | |
Income from Investment Operations: | | | | | | | | | | |
Net Investment Income (Loss)(a) | | 0.98 | | 0.23 | | (0.14) | | 0.31 | | 0.02 |
Net Realized and Unrealized Gain (Loss) | | (6.93) | | 7.45 | | 12.12 | | (4.69) | | 2.56 |
| | | | | |
| | | | | | | | | | |
| | | | | |
Total from Investment Operations | | (5.95) | | 7.68 | | 11.98 | | (4.38) | | 2.58 |
| | | | | |
| | | | | | | | | | |
| | | | | |
Less Distributions to Shareholders from: | | | | | | | | | | |
Net Investment Income | | (1.21) | | - | | (0.36) | | (0.02) | | (0.12) |
Net Realized Gain | | (4.88) | | - | | - | | - | | - |
| | | | | |
| | | | | | | | | | |
| | | | | |
Total Distributions | | (6.09) | | - | | (0.36) | | (0.02) | | (0.12) |
| | | | | |
| | | | | | | | | | |
| | | | | |
Net Asset Value, End of Year | | $62.01 | | $74.05 | | $66.37(b) | | $54.75 | | $59.15 |
| | | | | | | | | | |
| | | | | |
Total Return | | (6.67%) | | 11.57%(b) | | 21.90%(b) | | (7.40%) | | 4.57% |
| | | | | |
Ratios and Supplemental Data: | | | | | | | | | | |
Net Assets, End of Year (in 000’s) | | $181,367 | | $227,562 | | $224,073 | | $207,229 | | $248,046 |
Expenses Before Waivers and Reimbursements | | 0.35%(c) | | 0.96% | | 1.66% | | 0.63%(c) | | 1.32% |
Expenses After Waivers and Reimbursements | | 0.35% | | 0.96% | | 1.66% | | 0.63% | | 1.32% |
Net Investment Income (Loss) After Waivers and Reimbursements | | 1.52% | | 0.31% | | (0.23%) | | 0.58% | | 0.04% |
Portfolio Turnover Rate | | 102% | | 105% | | 153% | | 124% | | 107% |
| (a) | Per share amounts calculated based on the average daily shares outstanding during the year. |
| (b) | Includes adjustments in accordance with accounting principles generally accepted in the United States; consequently, the net asset value for financial reporting purposes and the returns based upon those net asset values may differ from the net asset values and returns for shareholder transactions. |
| (c) | For the year ended June 30, 2019 and June 30, 2016 the expense ratios were significantly lower than in other years, due to a negative performance adjustment to the investment advisory fee. Please refer to Note 3 of the Notes to Financial Statements for further information. The rate shown may not be indicative of the rate going forward. |
See Notes to Financial Statements.
FINANCIAL HIGHLIGHTS
(for a share outstanding throughout each year indicated)
ULTRA-SMALL COMPANY
| | | | | | | | | | |
| | | Year Ended June 30 |
| | | | | |
| | | 2019 | | 2018 | | 2017 | | 2016 | | 2015 |
| | | | | |
Net Asset Value, Beginning of Year | | $32.13 | | $30.04 | | $25.99 | | $30.37 | | $41.83 |
| | | | | |
| | | | | | | | | | |
| | | | | |
Income from Investment Operations: | | | | | | | | | | |
Net Investment Income (Loss)(a) | | 0.28 | | (0.04) | | 0.32 | | 0.28 | | 0.24 |
Net Realized and Unrealized Gain (Loss) | | (5.14) | | 2.73 | | 4.06 | | (4.39) | | (3.53) |
| | | | | |
| | | | | | | | | | |
| | | | | |
Total from Investment Operations | | (4.86) | | 2.69 | | 4.38 | | (4.11) | | (3.29) |
| | | | | |
| | | | | | | | | | |
| | | | | |
Less Distributions to Shareholders from: | | | | | | | | | | |
Net Investment Income | | (0.01) | | (0.41) | | (0.33) | | (0.27) | | (0.30) |
Net Realized Gain | | (3.10) | | (0.19) | | - | | - | | (7.87) |
| | | | | |
| | | | | | | | | | |
| | | | | |
Total Distributions | | (3.11) | | (0.60) | | (0.33) | | (0.27) | | (8.17) |
| | | | | |
| | | | | | | | | | |
| | | | | |
Net Asset Value, End of Year | | $24.16 | | $32.13 | | $30.04 | | $25.99 | | $30.37 |
| | | | | | | | | | |
| | | | | |
Total Return | | (14.48)% | | 9.13% | | 16.88% | | (13.53)% | | (7.60)% |
| | | | | |
Ratios and Supplemental Data: | | | | | | | | | | |
Net Assets, End of Year (in 000’s) | �� | $74,005 | | $96,754 | | $100,984 | | $101,451 | | $127,717 |
Expenses Before Waivers and Reimbursements | | 1.21% | | 1.18% | | 1.18% | | 1.17% | | 1.11% |
Expenses After Waivers and Reimbursements | | 1.21% | | 1.18% | | 1.18% | | 1.17% | | 1.11% |
Net Investment Income (Loss) After Waivers and Reimbursements | | 1.00% | | (0.14%) | | 1.14% | | 1.05% | | 0.68% |
Portfolio Turnover Rate | | 93% | | 89% | | 113% | | 101% | | 90% |
| (a) | Per share amounts calculated based on the average daily shares outstanding during the year. |
See Notes to Financial Statements.
| | |
| 72 | | Annual Report | June 30, 2019 |
FINANCIAL HIGHLIGHTS
(for a share outstanding throughout each year indicated)
ULTRA-SMALL COMPANY MARKET
| | | | | | | | | | |
| | | Year Ended June 30 |
| | | | | |
| | | 2019 | | 2018 | | 2017 | | 2016 | | 2015 |
| | | | | |
Net Asset Value, Beginning of Year | | $15.81 | | $14.93 | | $12.77 | | $16.18 | | $17.46 |
| | | | | |
| | | | | | | | | | |
| | | | | |
Income from Investment Operations: | | | | | | | | | | |
Net Investment Income(a) | | 0.11 | | 0.08 | | 0.17 | | 0.12 | | 0.12 |
Net Realized and Unrealized Gain (Loss) | | (2.93) | | 2.76 | | 3.18 | | (1.87) | | 0.38 |
| | | | | |
| | | | | | | | | | |
| | | | | |
Total from Investment Operations | | (2.82) | | 2.84 | | 3.35 | | (1.75) | | 0.50 |
| | | | | |
| | | | | | | | | | |
| | | | | |
Less Distributions to Shareholders from: | | | | | | | | | | |
Net Investment Income | | (0.08) | | (0.02) | | (0.15) | | (0.13) | | (0.14) |
Net Realized Gain | | (1.57) | | (1.94) | | (1.04) | | (1.53) | | (1.64) |
| | | | | |
| | | | | | | | | | |
| | | | | |
Total Distributions | | (1.65) | | (1.96) | | (1.19) | | (1.66) | | (1.78) |
| | | | | |
| | | | | | | | | | |
| | | | | |
Paid-in Capital from Redemption Fees(a) | | 0.00(b) | | 0.00(b) | | 0.00(b) | | 0.00(b) | | 0.00(b) |
| | | | | |
| | | | | | | | | | |
| | | | | |
Net Asset Value, End of Year | | $11.34 | | $15.81 | | $14.93 | | $12.77 | | $16.18 |
| | | | | | | | | | |
| | | | | |
Total Return | | (16.98%)(c) | | 20.86%(c) | | 26.61%(c) | | (10.83%)(c) | | 3.72% |
| | | | | |
Ratios and Supplemental Data: | | | | | | | | | | |
Net Assets, End of Year (in 000’s) | | $236,371 | | $378,144 | | $352,190 | | $331,535 | | $402,853 |
Expenses Before Waivers and Reimbursements | | 0.77% | | 0.75% | | 0.76% | | 0.75% | | 0.73% |
Expenses After Waivers and Reimbursements | | 0.75% | | 0.75% | | 0.75% | | 0.75% | | 0.73% |
Net Investment Income After Waivers and Reimbursements | | 0.84% | | 0.52% | | 1.21% | | 0.91% | | 0.74% |
Portfolio Turnover Rate | | 38% | | 35% | | 31% | | 41% | | 32% |
| (a) | Per share amounts calculated based on the average daily shares outstanding during the year. |
| (b) | Amount represents less than $0.005. |
| (c) | Total return would have been lower had various fees not been waived during the year. |
See Notes to Financial Statements.
FINANCIAL HIGHLIGHTS
(for a share outstanding throughout each year indicated)
SMALL-CAP GROWTH
| | | | | | | | | | |
| | | Year Ended June 30 |
| | | | | |
| | | 2019 | | 2018 | | 2017 | | 2016 | | 2015 |
| | | | | |
Net Asset Value, Beginning of Year | | $30.32 | | $24.92 | | $20.33 | | $21.17 | | $18.68 |
| | | | | |
| | | | | | | | | | |
| | | | | |
Income from Investment Operations: | | | | | | | | | | |
Net Investment Income (Loss)(a) | | (0.03) | | 0.09 | | 0.06 | | 0.07 | | (0.01) |
Net Realized and Unrealized Gain (Loss) | | (3.43) | | 5.36 | | 4.60 | | (0.91) | | 2.51 |
| | | | | |
| | | | | | | | | | |
| | | | | |
Total from Investment Operations | | (3.46) | | 5.45 | | 4.66 | | (0.84) | | 2.50 |
| | | | | |
| | | | | | | | | | |
| | | | | |
Less Distributions to Shareholders from: | | | | | | | | | | |
Net Investment Income | | (0.10) | | (0.05) | | (0.07) | | - | | (0.01) |
Net Realized Gain | | (2.48) | | - | | - | | - | | - |
| | | | | |
| | | | | | | | | | |
| | | | | |
Total Distributions | | (2.58) | | (0.05) | | (0.07) | | - | | (0.01) |
| | | | | |
| | | | | | | | | | |
| | | | | |
Net Asset Value, End of Year | | $24.28 | | $30.32 | | $24.92 | | $20.33 | | $21.17 |
| | | | | | | | | | |
| | | | | |
Total Return(b) | | (10.81%) | | 21.91% | | 22.97% | | (3.97%) | | 13.41% |
| | | | | |
Ratios and Supplemental Data: | | | | | | | | | | |
Net Assets, End of Year (in 000’s) | | $42,085 | | $55,472 | | $46,544 | | $36,394 | | $36,801 |
Expenses Before Waivers and Reimbursements | | 1.11% | | 1.08% | | 1.16% | | 1.20% | | 1.08% |
Expenses After Waivers and Reimbursements | | 0.94% | | 0.94% | | 0.94% | | 0.94% | | 0.94% |
Net Investment Income (Loss) After Waivers and Reimbursements | | (0.10%) | | 0.35% | | 0.24% | | 0.36% | | (0.07%) |
Portfolio Turnover Rate | | 102% | | 122% | | 136% | | 137% | | 123% |
| (a) | Per share amounts calculated based on the average daily shares outstanding during the year. |
| (b) | Total return would have been lower had various fees not been waived during the year. |
See Notes to Financial Statements.
| | |
| 74 | | Annual Report | June 30, 2019 |
FINANCIAL HIGHLIGHTS
(for a share outstanding throughout each year indicated)
SMALL-CAP VALUE
| | | | | | | | | | |
| | | Year Ended June 30 |
| | | | | |
| | | 2019 | | 2018 | | 2017 | | 2016 | | 2015 |
| | | | | |
Net Asset Value, Beginning of Year | | $29.60 | | $24.82 | | $20.87 | | $22.40 | | $23.06 |
| | | | | |
| | | | | | | | | | |
| | | | | |
Income from Investment Operations: | | | | | | | | | | |
Net Investment Income(a) | | 0.47 | | 0.20 | | 0.22 | | 0.29 | | 0.29 |
Net Realized and Unrealized Gain (Loss) | | (5.72) | | 4.81 | | 3.97 | | (1.43) | | (0.78) |
| | | | | |
| | | | | | | | | | |
| | | | | |
Total from Investment Operations | | (5.25) | | 5.01 | | 4.19 | | (1.14) | | (0.49) |
| | | | | |
| | | | | | | | | | |
| | | | | |
Less Distributions to Shareholders from: | | | | | | | | | | |
Net Investment Income | | (0.74) | | (0.23) | | (0.24) | | (0.39) | | (0.17) |
Net Realized Gain | | (3.37) | | - | | - | | - | | - |
| | | | | |
| | | | | | | | | | |
| | | | | |
Total Distributions | | (4.11) | | (0.23) | | (0.24) | | (0.39) | | (0.17) |
| | | | | |
| | | | | | | | | | |
| | | | | |
Net Asset Value, End of Year | | $20.24 | | $29.60 | | $24.82 | | $20.87 | | $22.40 |
| | | | | | | | | | |
| | | | | |
Total Return(b) | | (17.12%) | | 20.32% | | 20.08% | | (5.02%) | | (2.10%) |
| | | | | |
Ratios and Supplemental Data: | | | | | | | | | | |
Net Assets, End of Year (in 000’s) | | $49,652 | | $69,317 | | $61,981 | | $58,741 | | $73,241 |
Expenses Before Waivers and Reimbursements | | 1.00% | | 0.94% | | 0.98% | | 1.03% | | 0.98% |
Expenses After Waivers and Reimbursements | | 0.94% | | 0.94% | | 0.94% | | 0.94% | | 0.94% |
Net Investment Income After Waivers and Reimbursements | | 1.97% | | 0.74% | | 0.95% | | 1.41% | | 1.30% |
Portfolio Turnover Rate | | 84% | | 78% | | 77% | | 62% | | 74% |
| (a) | Per share amounts calculated based on the average daily shares outstanding during the year. |
| (b) | Total return would have been lower had various fees not been waived during the year. |
See Notes to Financial Statements.
FINANCIAL HIGHLIGHTS
(for a share outstanding throughout each year indicated)
BLUE CHIP
| | | | | | | | | | |
| | | Year Ended June 30 |
| | | | | |
| | | 2019 | | 2018 | | 2017 | | 2016 | | 2015 |
| | | | | |
Net Asset Value, Beginning of Year | | $14.62 | | $13.71 | | $12.28 | | $11.81 | | $11.39 |
| | | | | |
| | | | | | | | | | |
| | | | | |
Income from Investment Operations: | | | | | | | | | | |
Net Investment Income(a) | | 0.34 | | 0.31 | | 0.30 | | 0.28 | | 0.26 |
Net Realized and Unrealized Gain | | 1.75 | | 1.33 | | 1.44 | | 0.49 | | 0.39 |
| | | | | |
| | | | | | | | | | |
| | | | | |
Total from Investment Operations | | 2.09 | | 1.64 | | 1.74 | | 0.77 | | 0.65 |
| | | | | |
| | | | | | | | | | |
| | | | | |
Less Distributions to Shareholders from: | | | | | | | | | | |
Net Investment Income | | (0.31) | | (0.31) | | (0.31) | | (0.30) | | (0.23) |
Net Realized Gain | | (1.41) | | (0.42) | | - | | - | | - |
| | | | | |
| | | | | | | | | | |
| | | | | |
Total Distributions | | (1.72) | | (0.73) | | (0.31) | | (0.30) | | (0.23) |
| | | | | |
| | | | | | | | | | |
| | | | | |
Net Asset Value, End of Year | | $14.99 | | $14.62 | | $13.71 | | $12.28 | | $11.81 |
| | | | | | | | | | |
| | | | | |
Total Return(b) | | 16.26% | | 11.98% | | 14.33% | | 6.60% | | 5.77% |
| | | | | |
Ratios and Supplemental Data: | | | | | | | | | | |
Net Assets, End of Year (in 000’s) | | $505,029 | | $567,513 | | $550,902 | | $571,644 | | $600,823 |
Expenses Before Waivers and Reimbursements | | 0.25% | | 0.22% | | 0.25% | | 0.25% | | 0.23% |
Expenses After Waivers and Reimbursements | | 0.15% | | 0.15% | | 0.15% | | 0.15% | | 0.15% |
Net Investment Income After Waivers and Reimbursements | | 2.28% | | 2.17% | | 2.30% | | 2.42% | | 2.19% |
Portfolio Turnover Rate | | 20% | | 14% | | 17% | | 23% | | 19% |
| (a) | Per share amounts calculated based on the average daily shares outstanding during the year. |
| (b) | Total return would have been lower had various fees not been waived during the year. |
See Notes to Financial Statements.
| | |
| 76 | | Annual Report | June 30, 2019 |
FINANCIAL HIGHLIGHTS
(for a share outstanding throughout each year indicated)
MANAGED VOLATILITY
| | | | | | | | | | |
| | | Year Ended June 30 |
| | | | | |
| | | 2019 | | 2018 | | 2017 | | 2016 | | 2015 |
| | | | | |
Net Asset Value, Beginning of Year | | $15.75 | | $14.79 | | $14.20 | | $14.05 | | $13.94 |
| | | | | |
| | | | | | | | | | |
| | | | | |
Income from Investment Operations: | | | | | | | | | | |
Net Investment Income(a) | | 0.16 | | 0.10 | | 0.06 | | 0.04 | | 0.00(b) |
Net Realized and Unrealized Gain | | 0.06 | | 0.95 | | 0.59 | | 0.11 | | 0.13 |
| | | | | |
| | | | | | | | | | |
| | | | | |
Total from Investment Operations | | 0.22 | | 1.05 | | 0.65 | | 0.15 | | 0.13 |
| | | | | |
| | | | | | | | | | |
| | | | | |
Less Distributions to Shareholders from: | | | | | | | | | | |
Net Investment Income | | (0.31) | | (0.09) | | (0.06) | | 0.00(b) | | (0.02) |
Net Realized Gain | | (0.61) | | - | | - | | - | | - |
| | | | | |
| | | | | | | | | | |
| | | | | |
Total Distributions | | (0.92) | | (0.09) | | (0.06) | | 0.00(b) | | (0.02) |
| | | | | |
| | | | | | | | | | |
| | | | | |
Net Asset Value, End of Year | | $15.05 | | $15.75 | | $14.79 | | $14.20 | | $14.05 |
| | | | | | | | | | |
| | | | | |
Total Return(c) | | 1.74% | | 7.11% | | 4.59% | | 1.10% | | 0.92% |
| | | | | |
Ratios and Supplemental Data: | | | | | | | | | | |
Net Assets, End of Year (in 000’s) | | $30,657 | | $32,816 | | $36,523 | | $57,586 | | $59,008 |
Expenses Before Waivers and Reimbursements | | 1.24% | | 1.20% | | 1.12% | | 1.06% | | 1.04% |
Expenses After Waivers and Reimbursements | | 0.94% | | 0.94% | | 0.94% | | 0.94% | | 0.94% |
Net Investment Income After Waivers and Reimbursements | | 1.06% | | 0.64% | | 0.42% | | 0.31% | | 0.03% |
Portfolio Turnover Rate | | 69% | | 50% | | 50% | | 54% | | 38% |
| (a) | Per share amounts calculated based on the average daily shares outstanding during the year. |
| (b) | Amount represents less than $0.005. |
| (c) | Total return would have been lower had various fees not been waived during the year. |
See Notes to Financial Statements.
| | |
| NOTES TO FINANCIAL STATEMENTS | | |
June 30, 2019
1. Organization:
Bridgeway Funds, Inc. (“Bridgeway” or the “Company”) was organized as a Maryland corporation on October 19, 1993, and is registered under the Investment Company Act of 1940, as amended (the “1940 Act”), as an open-end management investment company.
Bridgeway is organized as a series fund, with nine investment funds as of June 30, 2019. Effective May 31, 2019, the name of the Blue Chip 35 Index Fund was changed to Blue Chip Fund. The Aggressive Investors 1, Ultra-Small Company, Ultra-Small Company Market, Small-Cap Growth, Small-Cap Value, Blue Chip and Managed Volatility Funds are presented in this report (each is referred to as a “Fund” and collectively, the “Funds”). The Omni Small-Cap Value and Omni Tax-Managed Small-Cap Value Funds are included in a separate report.
Bridgeway is authorized to issue 1,915,000,000 shares of common stock at $0.001 per share. As of June 30, 2019, 100,000,000 shares have been classified into the Aggressive Investors 1 Fund. 130,000,000 shares have been classified into the Blue Chip Fund. 15,000,000 shares have been classified into the Ultra-Small Company Fund. 100,000,000 shares each have been classified into the Ultra-Small Company Market, Omni Small-Cap Value, Omni Tax-Managed Small-Cap Value, Small-Cap Growth, and Small-Cap Value Funds. 50,000,000 shares have been classified into the Managed Volatility Fund.
The Ultra-Small Company Fund is open to existing investors (direct only).
All of the Funds are no-load, diversified funds.
The Aggressive Investors 1 Fund seeks to exceed the stock market total return (primarily through capital appreciation) at a level of total risk roughly equal to that of the stock market over longer periods of time (three year intervals or more).
The Ultra-Small Company, Ultra-Small Company Market, Small-Cap Growth and Small-Cap Value Funds seek to provide a long-term total return on capital, primarily through capital appreciation.
The Blue Chip Fund seeks to provide long-term total return on capital, primarily through capital appreciation, but also some income.
The Managed Volatility Fund seeks to provide a high current return with short-term risk less than or equal to 40% of the stock market.
Bridgeway Capital Management, Inc. (the “Adviser”) is the investment adviser for all of the Funds.
2. Significant Accounting Policies:
The following summary of significant accounting policies, followed in the preparation of the financial statements of the Funds, are in conformity with accounting principles generally accepted in the United States of America (“GAAP”). Each Fund is considered an investment company under GAAP and follows the accounting and reporting guidance applicable to investment companies.
New Accounting PronouncementsThe SEC recently adopted changes to Regulation S-X to simplify the reporting of information by registered investment companies in financial statements. The amendments require presentation of the total, rather than the components, of distributable earnings on the Statement of Assets and Liabilities and also require presentation of the total, rather than the components, of distributions to shareholders, except for tax return of capital distributions, if any, on the Statement of Changes in Net Assets. The amendments also removed the requirement for parenthetical disclosure of undistributed net investment income on the Statement of Changes in Net Assets. These Regulation S-X amendments are reflected in the Fund’s financial statements for the year ended June 30, 2019.
Securities, Options, Futures and Other Investments ValuationOther than options, securities for which market quotations are readily available are valued at the last sale price on the national exchange on which such securities are primarily traded. In the case of securities reported on the National Association of Securities Dealers Automated Quotation (“NASDAQ”) system,
| | |
| 78 | | Annual Report | June 30, 2019 |
| | |
| NOTES TO FINANCIAL STATEMENTS (continued) | | |
June 30, 2019
the securities are valued based on the NASDAQ Official Closing Price (“NOCP”). In the absence of recorded sales on their primary exchange, or NOCP, in the case of NASDAQ traded securities, the security will be valued as follows: bid prices for long positions and ask prices for short positions.
Fixed income securities are valued on the basis of current market quotations provided by a pricing service. Options are valued at the close if there is trading volume and, if there is no trading volume, the options are valued at the bid on long positions and the ask on the short positions.
Investments in open-end registered investment companies and closed-end registered investment companies that do not trade on an exchange are valued at the end of day net asset value (“NAV”) per share.
Investments in closed-end registered investment companies that trade on an exchange are valued at the last sales price as of the close of the customary trading session on the exchange where the security is principally traded.
When market quotations are not readily available or when events occur that make established valuation methods unreliable, securities of the Funds may be valued at fair value as determined in good faith by or under the direction of the Board of Directors. The valuation assigned to a fair valued security for purposes of calculating the Funds’ NAVs may differ from the security’s most recent closing market price and from the prices used by other mutual funds to calculate their NAVs.
The inputs and valuation techniques used to determine the value of a Fund’s investments are summarized into three levels as described in the hierarchy below:
| ● | | Level 1 — quoted prices in active markets for identical assets |
Investments whose values are based on quoted market prices in active markets, and whose values are therefore classified as Level 1 prices, include active listed equity securities. The Funds do not adjust the quoted price for such investments, even in situations where the Funds hold a large position and a sale could reasonably impact the quoted price.
| ● | | Level 2 — other significant observable inputs (including quoted prices for similar securities, interest rates, prepayment speeds, credit risk, etc.) |
Investments that trade in markets that are not considered to be active, but whose values are based on quoted market prices, dealer quotations or valuations provided by alternative pricing sources supported by observable inputs, are classified as Level 2 prices. These generally include certain U.S. Government and sovereign obligations, most government agency securities, investment-grade corporate bonds and less liquid listed equity securities. As investments whose values are classified as Level 2 prices include positions that are not traded in active markets and/or are subject to transfer restrictions, valuations may be adjusted to reflect illiquidity and/or non-transferability, which are generally based on available market information.
The Fidelity Investments Money Market Government Portfolio - Class I, which is held by each Fund, invests primarily in securities that are valued at amortized cost. Therefore, this investment is classified as a Level 2 investment.
| ● | | Level 3 — significant unobservable inputs (including the Fund’s own assumptions in determining the fair value of investments) |
Investments whose values are classified as Level 3 prices have significant unobservable inputs, as they may trade infrequently or not at all. When observable prices are not available for these securities, the Funds use one or more valuation techniques for which sufficient and reliable data is available. The inputs used by the Funds in estimating the value of Level 3 prices may include the original transaction price, quoted prices for similar securities or assets in active markets, completed or pending third-party transactions in the underlying investment or comparable issuers, and changes in financial ratios or cash flows. Level 3 prices may also be adjusted to reflect illiquidity and/or non-transferability, with the amount of such discount estimated by the Funds in the absence of market information. Assumptions used by the Funds due to the lack of observable inputs may significantly impact the resulting value and therefore the results of the Funds’ operations.
| | |
| NOTES TO FINANCIAL STATEMENTS (continued) | | |
June 30, 2019
The inputs or methodology used for valuing investments are not necessarily an indication of the risk associated with investing in those investments. A summary of the inputs used to value the Funds’ investments as of June 30, 2019 is included with each Fund’s Schedule of Investments.
Details regarding material transfers into, and material transfers out of, Level 3, if any, can be found at the end of each Schedule of Investments for Funds that held Level 3 securities.
Securities LendingUpon lending its securities to third parties, each participating Fund receives compensation in the form of fees. The loans are secured by collateral at least equal to the fair value of the securities loaned plus accrued interest. The remaining contractual maturity of all securities lending transactions is overnight and continuous. Each Fund has the right under the lending agreement to recover the securities from the borrower on demand. Additionally, a Fund does not have the right to sell or re-pledge collateral received in the form of securities unless the borrower goes into default. The risks to a Fund of securities lending are that the borrower may not provide additional collateral when required or return the securities when due, resulting in a loss. Under the terms of the Securities Lending Agreement, the Funds are indemnified for such losses by the securities lending agent.
While securities are on loan, the Fund continues to receive dividends on the securities loaned and recognizes any unrealized gain or loss in the fair value of the securities loaned.
Securities lending transactions are entered into by a Fund under a Securities Lending Agreement which provides the right, in the event of default (including bankruptcy or insolvency) for the non-defaulting party to liquidate the collateral or to offset the market value of the collateral received against the market value of the securities loaned. The value of the collateral is typically greater than that of the market value of the securities loaned, leaving the lender with a net amount payable to the defaulting party. However, bankruptcy or insolvency laws of a particular jurisdiction may impose restrictions on or prohibitions against such a right of offset in the event of a counterparty’s bankruptcy or insolvency.
The market value of securities on loan, all of which are classified as common stocks in the Funds’ Schedules of Investments, and the value of the related collateral are shown in the Statements of Assets and Liabilities as a component of Investments at value. During the year ended June 30, 2019 the Blue Chip Fund did not have any securities lending transactions.
| | |
| 80 | | Annual Report | June 30, 2019 |
| | |
| NOTES TO FINANCIAL STATEMENTS (continued) | | |
June 30, 2019
The following table is a summary of the Funds’ securities loaned and related collateral, which are subject to a netting agreement as of June 30, 2019:
| | | | | | | | | | | | | | | | | | | | | | |
| | | | | | | | | | | | Gross Amount Not
Offset in the Statement
of Assets and Liabilities | | | | |
| Fund | | Gross
Amounts of
Recognized
Assets1 | | | Gross Amounts Offset in the Statement of Assets and Liabilities | | | Net Amounts of
Assets Presented in the Statement of Assets and
Liabilities | | | Financial
Instruments | | Collateral
Received2 | | | Net
Amount | |
| |
| | | | | | |
Aggressive Investors 1 | | | | | | | | | | | | | | | | | | | | | | |
Securities lending | | $ | 1,612,837 | | | | - | | | | $ 1,612,837 | | | - | | $ | 1,612,837 | | | | - | |
| | | | | | |
Ultra-Small Company | | | | | | | | | | | | | | | | | | | | | | |
Securities lending | | $ | 5,628,761 | | | | - | | | | $ 5,628,761 | | | - | | $ | 5,628,761 | | | | - | |
| | | | | | |
Ultra-Small Company Market | | | | | | | | | | | | | | | | | | | | | | |
Securities lending | | $ | 24,435,122 | | | | - | | | | $24,435,122 | | | - | | $ | 24,435,122 | | | | - | |
| | | | | | |
Small-Cap Growth | | | | | | | | | | | | | | | | | | | | | | |
Securities lending | | $ | 1,190,210 | | | | - | | | | $ 1,190,210 | | | - | | $ | 1,190,210 | | | | - | |
| | | | | | |
Small-Cap Value | | | | | | | | | | | | | | | | | | | | | | |
Securities lending | | $ | 3,076,362 | | | | - | | | | $ 3,076,362 | | | - | | $ | 3,076,362 | | | | - | |
| 1 | Securities loaned with a value of $854,698 in Ultra-Small Company Market have been sold and are pending settlement on July 2, 2019. |
| 2 | Collateral with a value of $1,631,234, $5,682,874, $24,535,439, $1,228,325, and $3,141,308 has been received in connection with securities lending of Aggressive Investors 1, Ultra-Small Company, Ultra-Small Company Market, Small-Cap Growth, and Small-Cap Value, respectively. Excess of collateral received from an individual counterparty is not shown here for financial reporting purposes. |
It is each Fund’s policy to obtain additional collateral from, or return excess collateral to, the borrower by the end of the next business day following the valuation date of the securities loaned. Therefore, the value of the collateral held may be temporarily less than that required under the lending contract. As of June 30, 2019 the collateral consisted of an institutional government money market fund.
Use of Estimates in Financial StatementsIn preparing financial statements in conformity with GAAP, management makes estimates and assumptions that affect the reported amounts of assets and liabilities on the date of the financial statements and the disclosure of contingent assets and liabilities on the date of the financial statements, as well as the reported amounts of revenue and expenses during the reporting period. Actual results could differ from those estimates.
Concentrations of Credit RiskThe Funds maintain cash and securities in its custody account maintained by a high-credit, quality financial institution. Cash balances may, at times, exceed the FDIC insurance limit. Cash balances are generally invested in a short-term investment vehicle, which minimizes the risk of cash balances exceeding the FDIC insurance limit.
Risks and UncertaintiesThe Funds provide for various investment options, including stocks, bonds and call and put options. Such investments are exposed to risks, such as interest rate, market and credit risks. Due to the risks involved, it is at least reasonably possible that changes in risks in the near term would materially affect shareholders’ account values and the amounts reported in the financial statements.
Security Transactions, Investment Income and ExpensesSecurity transactions are accounted for as of the trade date, the date the order to buy or sell is executed. Realized gains and losses are computed on the identified cost basis. Dividend income is recorded on the ex-dividend date, and interest income is recorded on the accrual basis from settlement date. Particularly as related to the Managed Volatility Fund, discounts and premiums are accreted/amortized on the effective interest method.
Fund expenses that are not series-specific are allocated to each series based upon its relative proportion of net assets to the Funds’ total net assets or other appropriate basis.
| | |
| NOTES TO FINANCIAL STATEMENTS (continued) | | |
June 30, 2019
Distributions to ShareholdersThe Funds pay dividends from net investment income and distribute realized capital gains annually, usually in December.
Derivatives
The Funds’ use of derivatives for the year ended June 30, 2019 was limited to futures contracts, purchased options, and written options. The following is a summary of how these derivatives are treated in the financial statements and their impact on the Funds, categorized by primary underlying risk.
| | | | | | | | | | | | | | |
Primary Underlying Risk/Fund | | Derivative
Assets | | | | | | Derivative
Liabilities | | | Location on Statement of Assets and Liabilities |
|
Equity Risk | | | | | | | | | | | | | | |
Managed Volatility: | | | | | | | | | | | | | | |
Written Put Options | | | - | | | | | | | | $151,347 | | | Put options written at value |
Written Call Options | | | - | | | | | | | | 359,568 | | | Call options written at value |
| | | | | | | | | | | | | | | | | |
| | | | |
Primary Underlying Risk/Fund | | Amount of
Realized Gain
(Loss) on Derivatives | | | | Amount of
Unrealized Gain
(Loss) on Derivatives | | Location of Gain (Loss) in the Statement of Operations |
| | | | |
Equity Risk | | | | | | | | | | | | | | | | | |
Managed Volatility: | | | | | | | | | | | | | | | | | |
Written Options | | | | $ 891,998 | | | | | | | | | | | | | Realized Gain (Loss) on Written Options |
| | | | | | | | | | | | | | | | | Change in Unrealized Appreciation |
| | | | | | | | | | | | | | $(90,015) | | | (Depreciation) on Written Options |
| | | | |
Futures Contracts | | | | $(419,975) | | | | | | | | | | - | | | Realized Gain (Loss) on Futures Contracts |
The derivative instruments outstanding as of June 30, 2019, as disclosed in the Notes to the Financial Statements, and the amounts of realized and changes in unrealized gains and losses on derivative instruments during the period, as disclosed in the Statements of Operations, serve as indicators of the volume of derivatives activity for the Funds.
Futures ContractsThe Funds may purchase or sell financial futures contracts to hedge cash positions, manage market risk, and to dampen volatility in line with investment objectives. A futures contract is an agreement between two parties to buy or sell a financial instrument at a set price on a future date. Upon entering into such a contract, a Fund is required to pledge to the broker an amount of cash or U.S. Government securities equal to the minimum “initial margin” requirements of the exchange on which the futures contract is traded. The contract amount reflects the extent of a Fund’s exposure in these financial instruments. A Fund’s participation in the futures markets involves certain risks, including imperfect correlation between movements in the price of futures contracts and movements in the price of the securities hedged or used for cover. Pursuant to a contract, such Fund agrees to receive from, or pay to, the broker an amount of cash equal to the fluctuation in value of the contract. Such receipts or payments are known as “variation margin” and are recorded by a Fund as unrealized appreciation or depreciation. When a contract is closed, a Fund records a realized gain or loss equal to the difference between the value of the contract at the time it was opened and the value at the time it was closed. With futures, there is minimal counterparty risk to the Funds, since futures are exchange traded and the exchange’s clearinghouse, as counterparty to all exchange traded futures, guarantees the futures against default. As of June 30, 2019, the Funds had no open futures contracts.
OptionsThe Aggressive Investors 1 Fund may buy and sell calls and puts to increase or decrease the Fund’s exposure to stock market risk or for purposes of diversification of risk. The Managed Volatility Fund may buy and sell calls and puts to reduce the Fund’s volatility and provide some cash flow. An option is a contract conveying a right to buy or sell a financial instrument at a specified price during a stipulated period. The premium paid by a Fund for the purchase of a call or a put option is included in such Fund’s Schedule of Investments as an investment and subsequently marked-to-market to reflect the current market value of the option. When a Fund writes a call or a put option, an amount equal to the premium received by such Fund is included in its Statement of Assets and Liabilities as a liability and is subsequently marked-to-market to reflect the current market value of the option written. If an option that a Fund has written either expires on its stipulated expiration date,
| | |
| 82 | | Annual Report | June 30, 2019 |
| | |
| NOTES TO FINANCIAL STATEMENTS (continued) | | |
June 30, 2019
or if such Fund enters into a closing purchase transaction, that Fund realizes a gain (or a loss if the cost of a closing purchase transaction exceeds the premium received when the option was written) without regard to any unrealized gain or loss on the underlying security, and the liability related to such options is extinguished. If a call option that a Fund has written is assigned, such Fund realizes a gain or loss from the sale of the underlying security, and the proceeds from such sale are increased by the premium originally received. If a put option that a Fund has written is assigned, the amount of the premium originally received reduces the cost of the security that such Fund purchased upon exercise of the option. Buying calls increases a Fund’s exposure to the underlying security to the extent of any premium paid. Buying puts on a stock market index tends to limit a Fund’s exposure to a stock market decline. All options purchased by the Funds were listed on exchanges and considered liquid positions with readily available market quotes.
Covered Call Options and Secured PutsThe Aggressive Investors 1 and Managed Volatility Funds may write call options on a covered basis; that is, a Fund will own the underlying security, or a Fund may write secured puts. The principal reason for writing covered calls and secured puts on a security is to attempt to realize income through the receipt of premiums. The option writer has, in return for the premium, given up the opportunity for profit from a substantial price increase in the underlying security so long as the obligation as a writer continues, but has retained the risk of loss should the price of the security decline. All options were listed on exchanges and considered liquid positions with readily available market quotes.
Outstanding written options as of June 30, 2019 for the Managed Volatility Fund are included in the Schedule of Investments. The Aggressive Investors 1 Fund had no transactions in written options during the year ended June 30, 2019.
IndemnificationUnder the Company’s organizational documents, the Funds’ officers, directors, employees and agents are indemnified against certain liabilities that may arise out of the performance of their duties to the Funds. Additionally, in the normal course of business, the Funds enter into contracts that contain a variety of indemnification clauses. The Funds’ maximum exposure under these arrangements is unknown, as this would involve future claims that may be made against the Funds that have not yet occurred. However, the Funds have not had prior claims or losses pursuant to these contracts.
3. Advisory Fees, Other Related Party Transactions and Contingencies:
The Funds have entered into management agreements with the Adviser. As compensation for the advisory services rendered, facilities furnished, and expenses borne by the Adviser, the Funds pay the Adviser a fee pursuant to each Fund’s management agreement, as described below.
Aggressive Investors 1:A total advisory fee is paid by the Fund to the Adviser that is comprised of a Base Fee and a Performance Adjustment. The Base Fee equals the Base Fee Rate times the average daily net assets of the Fund. The Base Fee Rate is based on the following annual rates: 0.90% of the first $250 million of the Fund’s average daily net assets, 0.875% of the next $250 million, 0.85% of the next $500 million and 0.80% of any excess over $1 billion.
The Performance Adjustment equals 4.67% times the difference in cumulative total return between the Fund and the Standard and Poor’s 500 Composite Stock Price Index with dividends reinvested (hereinafter “Index”) over a rolling five-year performance period. The Performance Adjustment Rate varies from a minimum of -0.70% to a maximum of +0.70%. However, the Performance Adjustment Rate is zero if the difference between the cumulative Fund performance and the Index performance is less than or equal to 2%.
Ultra-Small Company:The Fund pays advisory fees based on the following annual rates: 0.90% of the first $250 million of the Fund’s average daily net assets, 0.875% of the next $250 million and 0.85% of any excess over $500 million. The management fees are computed daily and are payable monthly. However, during any period when the Fund’s net assets range from $27,500,000 to $55,000,000, the advisory fee will be determined as if the Fund had $55,000,000 under management. This is limited to a maximum annualized expense ratio of 1.49% of average net assets.
Ultra-Small Company Market:The Fund’s advisory fee is a flat 0.50% of the value of the Fund’s average daily net assets, computed daily and payable monthly.
| | |
| NOTES TO FINANCIAL STATEMENTS (continued) | | |
June 30, 2019
Small-Cap Growth and Small-Cap Value:A total advisory fee is paid by each Fund to the Adviser that is comprised of a Base Fee and a Performance Adjustment. The Base Fee equals the Base Fee Rate times the average daily net assets of the Fund. The Base Fee Rate is based on the annual rate of 0.60% of the value of each Fund’s average daily net assets.
The Performance Adjustment equals 0.33% times the difference in cumulative total return between the Fund and the Russell 2000 Growth Index for Small-Cap Growth Fund and the Russell 2000 Value Index for Small-Cap Value Fund, with dividends reinvested (hereinafter “Index”) over a rolling five-year performance period. The Performance Adjustment Rate varies from a minimum of -0.05% to a maximum of +0.05%. However, the Performance Adjustment Rate is zero if the difference between the cumulative Fund’s performance and the Index performance is less than or equal to 2%.
Blue Chip:The Fund’s advisory fee is a flat 0.08% of the value of the Fund’s average daily net assets, computed daily and payable monthly.
Managed Volatility:The Fund’s advisory fee is a flat 0.60% of the value of the Fund’s average daily net assets, computed daily and payable monthly.
Expense limitations:The Adviser has agreed to reimburse the Funds for operating expenses and management fees above the expense limitations shown in the table below, which are shown as a ratio of net expenses to average net assets, for each Fund, for the year ended June 30, 2019. Any material change to the expense limitation would require a vote by shareholders of the applicable Fund.
| | | | | | | | |
| Bridgeway Fund | | Expense
Limitation | | | Total Waivers and
Reimbursements
for Year Ended
06/30/19 | |
| |
| | | | | | | | |
Aggressive Investors 1 | | | 1.75% | | | | $ - | |
Ultra-Small Company | | | 1.85% | | | | - | |
Ultra-Small Company Market | | | 0.75% | | | | 53,790 | |
Small-Cap Growth | | | 0.94% | | | | 80,851 | |
Small-Cap Value | | | 0.94% | | | | 35,202 | |
Blue Chip | | | 0.15% | | | | 560,438 | |
Managed Volatility | | | 0.94% | | | | 95,984 | |
Other Related Party Transactions:The Funds will engage in inter-portfolio trades when it is to the benefit of both parties. The Board of Directors reviews these trades quarterly. Inter-portfolio purchases and sales during the year ended June 30, 2019 were as follows:
| | | | | | | | |
| Bridgeway Fund | | Inter-Portfolio
Purchases | | | Inter-Portfolio
Sales | |
| |
| | | | | | | | |
Aggressive Investors 1 | | $ | - | | | | $ 3,704,500 | |
Ultra-Small Company | | | 9,770,464 | | | | 12,704,573 | |
Ultra-Small Company Market | | | 15,027,353 | | | | 14,699,486 | |
Small-Cap Growth | | | 3,367,169 | | | | 1,325,439 | |
Small-Cap Value | | | 2,245,286 | | | | 2,518,884 | |
The Adviser entered into an Administrative Services Agreement with Bridgeway, pursuant to which the Adviser provides various administrative services to the Funds, including, but not limited to: (i) supervising and managing various aspects of the Funds’ business and affairs; (ii) selecting, overseeing and/or coordinating activities with other service providers to the Funds; (iii) providing reports to the Board of Directors as requested from time to time; (iv) assisting and/or reviewing amendments and updates to the Funds’ registration statement and other filings with the Securities and Exchange Commission (“SEC”); (v) providing certain shareholder services; (vi) providing administrative support in connection with meetings of the Board of Directors; and (vii) providing certain record-keeping services. For its services to all of the Bridgeway Funds, the Adviser is paid an
| | |
| 84 | | Annual Report | June 30, 2019 |
| | |
| NOTES TO FINANCIAL STATEMENTS (continued) | | |
June 30, 2019
aggregate annual fee of $775,000, payable in equal monthly installments. For the allocation of this expense to each of the Funds, please see the Statements of Operations.
Board of Directors CompensationEffective November 8, 2018, Independent Directors are paid an annual retainer of $20,000, with an additional retainer of $5,000 paid to the Independent Chairman of the Board and an additional retainer of $1,000 paid to the Nominating and Corporate Governance Committee Chair. The retainer is paid in quarterly installments. In addition, Independent Directors are paid $11,000 per meeting for meeting fees. Prior to November 8, 2018, Independent Directors were paid an annual retainer of $15,000, with an additional retainer of $5,000 paid to the Independent Chairman of the Board and an additional retainer of $1,000 paid to the Nominating and Corporate Governance Committee Chair, and $9,000 per meeting. Such compensation is the total compensation from all Bridgeway Funds and is allocated among the Bridgeway Funds.
Independent Directors are reimbursed for any expenses incurred in attending meetings and conferences, as well as expenses for subscriptions or printed materials. The amount of directors’ fees attributable to each Fund is disclosed in the Statements of Operations.
One director of Bridgeway, John Montgomery, is an owner and director of the Adviser. Under the 1940 Act definitions, he is considered to be an “affiliated person” of the Adviser and an “interested person” of the Adviser and of Bridgeway. Compensation for Mr. Montgomery is borne by the Adviser rather than the Funds.
4. Distribution Agreement:
Foreside Fund Services, LLC acts as distributor of the Funds’ shares, pursuant to a Distribution Agreement dated May 31, 2017. The Adviser pays all costs and expenses associated with distribution of the Funds’ shares, pursuant to a protective plan adopted by shareholders pursuant to Rule 12b-1.
5. Purchases and Sales of Investment Securities:
Purchases and sales of investments, other than short-term securities, for each Fund for the year ended June 30, 2019 were as follows:
| | | | | | | | | | | | |
| | | Purchases | | | Sales | |
| Bridgeway Fund | | U.S. Government | | Other | | | U.S. Government | | Other | |
| |
| | | | | | | | | | | | |
Aggressive Investors 1 | | $ - | | $ | 197,087,267 | | | $ - | | $ | 224,294,128 | |
Ultra-Small Company | | - | | | 79,287,762 | | | - | | | 86,764,882 | |
Ultra-Small Company Market | | - | | | 118,475,864 | | | - | | | 192,799,394 | |
Small-Cap Growth | | - | | | 49,154,028 | | | - | | | 55,888,010 | |
Small-Cap Value | | - | | | 49,105,436 | | | - | | | 53,701,075 | |
Blue Chip | | - | | | 114,928,340 | | | - | | | 247,411,136 | |
Managed Volatility | | - | | | 13,720,215 | | | - | | | 14,642,430 | |
6. Federal Income Taxes
It is the Funds’ policy to continue to comply with the provisions of the Internal Revenue Code of 1986, as amended (“Internal Revenue Code”), applicable to regulated investment companies, and to distribute income to the extent necessary so that the Funds are not subject to federal income tax. Therefore, no federal income tax provision is required.
| | |
| NOTES TO FINANCIAL STATEMENTS (continued) | | |
June 30, 2019
Unrealized Appreciation and Depreciation on Investments (Tax Basis)The amount of net unrealized appreciation/ depreciation and the cost of investment securities for tax purposes, including short-term securities as of June 30, 2019, were as follows:
| | | | | | | | | | | | | | | |
| | | Aggressive Investors 1 | | Ultra-Small
Company | | Ultra-Small
Company Market |
Gross appreciation (excess of value over tax cost) | | | | $ 20,035,434 | | | | $ | 7,665,317 | | | | | $ 57,196,891 | |
Gross depreciation (excess of tax cost over value) | | | | (11,315,465 | ) | | | | (14,211,476 | ) | | | | (32,679,978 | ) |
| | | |
Net unrealized appreciation (depreciation) | | | | $ 8,719,969 | | | | $ | (6,546,159 | ) | | | | $ 24,516,913 | |
| | | |
Cost of investments for income tax purposes | | | | $174,321,163 | | | | $ | 86,441,021 | | | | | $233,608,567 | |
| | | | | | | | | | | | | | | |
| | | |
| | | Small-Cap Growth | | | | Small-Cap Value |
Gross appreciation (excess of value over tax cost) | | | $ | 5,440,564 | | | | | | | | | $ | 4,910,867 | |
Gross depreciation (excess of tax cost over value) | | | | (3,142,203 | ) | | | | | | | | | (6,754,548 | ) |
| | | |
Net unrealized (depreciation) | | | $ | 2,298,361 | | | | | | | | | $ | (1,843,681 | ) |
| | | |
Cost of investments for income tax purposes | | | $ | 41,145,233 | | | | | | | | | $ | 54,674,790 | |
| | | | | | | | | | | | | | | |
| | | |
| | | Blue Chip | | | | Managed Volatility |
Gross appreciation (excess of value over tax cost) | | | $ | 263,752,599 | | | | | | | | | $ | 6,999,281 | |
Gross depreciation (excess of tax cost over value) | | | | (4,364,235 | ) | | | | | | | | | (529,008 | ) |
| | | |
Net unrealized appreciation | | | $ | 259,388,364 | | | | | | | | | $ | 6,470,273 | |
| | | |
Cost of investments for income tax purposes | | | $ | 246,084,671 | | | | | | | | | $ | 22,419,819 | |
The differences between book and tax net unrealized appreciation (depreciation) are primarily due to wash sale and straddle loss deferrals and basis adjustments on investments in business development companies, partnerships and passive foreign investment companies (PFICs).
Classifications of DistributionsNet investment income (loss) and net realized gain (loss) may differ for financial statement and tax purposes. The character of distributions made during the year from net investment income or net realized gains may differ from its ultimate characterization for federal income tax purposes.
The tax character of the distributions paid by the Funds during the last two fiscal years ended June 30, 2019 and June 30, 2018, respectively, are as follows:
| | | | | | | | | | | | | | | | | | | | | | | | | | | | | | | | | | | |
| | | Aggressive Investors 1 | | Ultra-Small Company |
| | | Year | | | | Year | | | | Year | | | | Year |
| | | Ended | | | | Ended | | | | Ended | | | | Ended |
| | | June 30, 2019 | | | | June 30, 2018 | | | | June 30, 2019 | | | | June 30, 2018 |
| | | | | | | |
Distributions paid from: | | | | | | | | | | | | | | | | | | | | | | | | | | | | | | | | | | | |
Ordinary Income | | | $ | 3,559,542 | | | | | | | | | | $ - | | | | | | | | | $ | 31,355 | | | | | | | | | $ | 1,299,999 | |
Long-Term Capital Gain | | | | 14,282,874 | | | | | | | | | | - | | | | | | | | | | 8,945,451 | | | | | | | | | | 614,549 | |
| | | | | | | |
Total | | | $ | 17,842,416 | | | | | | | | | | $ - | | | | | | | | | $ | 8,976,806 | | | | | | | | | $ | 1,914,548 | |
| | |
| | | Ultra-Small Company Market | | Small-Cap Growth |
| | | Year | | | | Year | | | | Year | | | | Year |
| | | Ended | | | | Ended | | | | Ended | | | | Ended |
| | | June 30, 2019 | | | | June 30, 2018 | | | | June 30, 2019 | | | | June 30, 2018 |
| | | | | | | |
Distributions paid from: | | | | | | | | | | | | | | | | | | | | | | | | | | | | | | | | | | | |
Ordinary Income | | | $ | 1,740,331 | | | | | | | | | $ | 449,185 | | | | | | | | | $ | 173,020 | | | | | | | | | $ | 98,928 | |
Long-Term Capital Gain | | | | 36,117,247 | | | | | | | | | | 43,056,482 | | | | | | | | | | 4,355,880 | | | | | | | | | | - | |
| | | | | | | |
Total | | | $ | 37,857,578 | | | | | | | | | $ | 43,505,667 | | | | | | | | | $ | 4,528,900 | | | | | | | | | $ | 98,928 | |
| | |
| 86 | | Annual Report | June 30, 2019 |
| | |
| NOTES TO FINANCIAL STATEMENTS (continued) | | |
June 30, 2019
| | | | | | | | | | | | | | | | | | | | | | | | | | | | |
| | | Small-Cap Value | | | Blue Chip | |
| | | Year
Ended
June 30, 2019 | | | | | | Year
Ended
June 30, 2018 | | | | | | Year
Ended
June 30, 2019 | | | | | | Year
Ended
June 30, 2018 | |
| | | | | | | |
Distributions paid from: | | | | | | | | | | | | | | | | | | | | | | | | | | | | |
Ordinary Income | | | $1,650,853 | | | | | | | | $547,906 | | | | | | | | $11,830,171 | | | | | | | | $11,665,340 | |
Long-Term Capital Gain | | | 7,514,056 | | | | | | | | - | | | | | | | | 52,980,363 | | | | | | | | 15,737,305 | |
| | | | | | | |
Total | | | $9,164,909 | | | | | | | | $547,906 | | | | | | | | $64,810,534 | | | | | | | | $27,402,645 | |
| | |
| | | Managed Volatility | | | | |
| | | Year
Ended
June 30, 2019 | | | | | | Year
Ended
June 30, 2018 | | | | | | | | | | | | | |
| | | | | | | |
Distributions paid from: | | | | | | | | | | | | | | | | | | | | | | | | | | | | |
Ordinary Income | | | $ 630,480 | | | | | | | | $194,557 | | | | | | | | | | | | | | | | | |
Long-Term Capital Gain | | | 1,265,342 | | | | | | | | - | | | | | | | | | | | | | | | | | |
| | | | | | | |
Total | | | $1,895,822 | | | | | | | | $194,557 | | | | | | | | | | | | | | | | | |
Under the Regulated Investment Company Modernization Act of 2010, capital losses incurred by the Funds after June 30, 2011 will not be subject to expiration and will retain their character as either short-term or long-term capital losses.
As of June 30, 2019, the following Funds had capital loss carryovers available to offset future realized capital gains which are not subject to expiration:
| | | | | | | | | | |
| | | Short-term | | | Long-Term | | Total | |
Aggressive Investors 1 | | | 42,262 | | | - | | | 42,262 | |
Small-Cap Value | | | 693,062 | | | - | | | 693,062 | |
Components of Accumulated EarningsAs of June 30, 2019, the components of accumulated earnings on a tax basis were:
| | | | | | | | | | | | | | | |
| | | Aggressive Investors 1 | | Ultra-Small Company | | Ultra-Small
Company Market |
Accumulated Net Investment Income | | | $ | - | | | | $ | 780,748 | | | | $ | 2,465,910 | |
Accumulated Net Realized Gain (Loss) on Investments* | | | | (11,829,915 | ) | | | | (334,986 | ) | | | | (2,376,226 | ) |
Net Unrealized Appreciation of Investments | | | | 8,719,969 | | | | | (6,546,159 | ) | | | | 24,516,913 | |
| | | |
Total | | | $ | (3,109,946 | ) | | | $ | (6,100,397 | ) | | | $ | 24,606,597 | |
| | | | | | | | | | |
| | | Small-Cap Growth | | Small-Cap Value |
Accumulated Net Investment Income | | | $ | - | | | | $ | - | |
Accumulated Net Realized Gain (Loss) on Investments* | | | | (1,724,248 | ) | | | | (3,088,648 | ) |
Net Unrealized Appreciation of Investments | | | | 2,298,361 | | | | | (1,843,681 | ) |
| | |
Total | | | $ | 574,113 | | | | $ | (4,932,329 | ) |
| | |
| NOTES TO FINANCIAL STATEMENTS (continued) | | |
June 30, 2019
| | | | | | | | | | |
| | | Blue Chip | | Managed Volatility |
Accumulated Net Investment Income | | | $ | 5,174,345 | | | | $ | - | |
Accumulated Net Realized Gain (Loss) on Investments* | | | | 42,452,769 | | | | | (222,268 | ) |
Net Unrealized Appreciation of Investments | | | | 259,388,364 | | | | | 6,470,273 | |
| | |
Total | | | $ | 307,015,478 | | | | $ | 6,248,005 | |
| * | Includes qualified late-year losses that the Funds have elected to defer to the beginning of their next fiscal year ending June 30, 2020. The Small-Cap Growth Fund has elected to defer qualified ordinary late year losses of ($43,278). The Aggressive Investors 1, Ultra-Small Company, Ultra-Small Company Market, Small-Cap Value, Blue Chip and Managed Volatility Funds have no deferred qualified ordinary late-year losses. The Aggressive Investors 1, Ultra-Small Company, Ultra-Small Company Market, Small-Cap Growth, Small-Cap Value and Managed Volatility Funds have elected to defer late-year short term capital losses of ($10,983,638), ($334,986), ($2,376,226), ($1,680,970), ($2,422,773) and ($401,870). The Blue Chip Fund has no deferred late-year short term capital losses. The Aggressive Investors 1, Small-Cap Value and Managed Volatility Funds have elected to defer late-year long term capital gains/(losses) of ($804,015), $27,187 and $179,602. The Ultra-Small Company, Ultra-Small Company Market, Small-Cap Growth and Blue Chip Funds have no deferred late-year long term capital losses. |
For the fiscal year June 30, 2019, the Funds recorded the following reclassifications to the accounts listed below:
| | | | | | | | | | | | | | | |
| | | Increase (Decrease) |
| | | Aggressive Investors 1 | | Ultra-Small Company | | Ultra-Small Company Market |
Paid-In Capital | | | $ | (14,282,874 | ) | | | $ | 67,893 | | | | $ | 214,427 | |
Distributable Earnings | | | | 14,282,874 | | | | | (67,893 | ) | | | | (214,427 | ) |
| | | | | | | | | | |
| | | Increase (Decrease) |
| | | Small-Cap Growth | | Small-Cap Value |
Paid-In Capital | | | $ | (2,198,309 | ) | | | $ | (7,514,056 | ) |
Distributable Earnings | | | | 2,198,309 | | | | | 7,514,056 | |
| |
| | | Increase (Decrease) |
| | | Blue Chip | | Managed Volatility |
Paid-In Capital | | | $ | 6,068,315 | | | | $ | (189,367 | ) |
Distributable Earnings | | | | (6,068,315 | ) | | | | 189,367 | |
The difference between book and tax components of net assets and the resulting reclassifications were primarily a result of the differing book/tax treatment of the deduction of equalization debits for tax purposes, excess distributions, the write-off of unused net operating loss, and redesignation of dividends paid and investments in PFICs.
Accounting for Uncertainty in Income Taxes sets forth a minimum threshold for financial statement recognition of the benefit of a tax position taken or expected to be taken in a tax return. Management has analyzed each Fund’s tax positions and has concluded that no provision for income tax is required in the individual Fund’s financial statements. The Funds are not aware of any tax position for which it is reasonably possible that the total amounts of unrecognized tax benefits will significantly change in the next twelve months. Each Fund’s federal tax returns for the prior three fiscal years remain subject to examination by the Internal Revenue Service.
7. Line of Credit
Bridgeway established a line of credit agreement (“Facility”) with The Bank of New York Mellon, effective November 5, 2010. The Facility is for temporary or emergency purposes, such as to provide liquidity for shareholder redemptions, and is cancellable by either party. Unless cancelled earlier, the Facility shall be held available until September 12, 2019. Advances under the Facility are limited to $15,000,000 in total for all Funds, and advances to each Fund shall not exceed certain limits set forth in the credit agreement, including, but not limited to, the maximum amount a Fund is permitted to borrow under the 1940 Act.
The Funds incur a commitment fee of 0.085% per annum on the unused portion of the Facility and interest expense to the extent of amounts borrowed under the Facility. Interest is based on the “Overnight Rate” plus 1.25%. The Overnight Rate means the higher of (a) the Federal Funds rate, (b) the Overnight Eurodollar Rate, or (c) the One-Month Eurodollar Rate. The
| | |
| 88 | | Annual Report | June 30, 2019 |
| | |
| NOTES TO FINANCIAL STATEMENTS (continued) | | |
June 30, 2019
commitment fees are payable quarterly in arrears and are allocated to all participating Funds. Interest expense is charged directly to a Fund based upon actual amounts borrowed by such Fund.
For the year ended June 30, 2019, borrowings by the Funds under this line of credit were as follows:
| | | | | | | | | | | | | | | | | | | | | | | | | |
| Bridgeway Fund | | Weighted
Average
Interest Rate | | Weighted
Average
Loan Balance | | Number of
Days
Outstanding | | Interest
Expense
Incurred1 | | Maximum Amount
Borrowed During
the Period |
| | | | | |
Aggressive Investors 1 | | | | 3.65 | % | | | $ | 1,230,885 | | | | | 52 | | | | $ | 6,494 | | | | $ | 7,380,000 | |
Ultra-Small Company | | | | 3.65 | % | | | | 435,659 | | | | | 82 | | | | | 3,620 | | | | | 1,413,000 | |
Ultra-Small Company Market | | | | 3.62 | % | | | | 654,500 | | | | | 110 | | | | | 7,238 | | | | | 2,928,000 | |
Small-Cap Growth | | | | 3.67 | % | | | | 264,644 | | | | | 45 | | | | | 1,215 | | | | | 1,440,000 | |
Small-Cap Value | | | | 3.62 | % | | | | 297,433 | | | | | 30 | | | | | 897 | | | | | 943,000 | |
Blue Chip | | | | 3.67 | % | | | | 778,934 | | | | | 183 | | | | | 14,551 | | | | | 9,083,000 | |
Managed Volatility | | | | 3.65 | % | | | | 255,000 | | | | | 1 | | | | | 26 | | | | | 255,000 | |
1 Interest expense is included on the Statements of Operations in Miscellaneous expenses.
On June 30, 2019, Ultra-Small Company, Ultra-Small Company Market and Small-Cap Growth had loans outstanding in the amounts of $192,000, $31,000 and $193,000, respectively, exclusive of interest payable on the loans.
8. Redemption Fees
In Ultra-Small Company Market Fund, a 2% redemption fee may be charged on shares held less than six months. The fee is charged for the benefit of the remaining shareholders and will be paid to the Fund to help offset transaction costs. The fee is accounted for as an addition to paid-in capital.
9. Subsequent Events
Management has evaluated the impact of all subsequent events on the Funds and has determined that there were no subsequent events requiring recognition or disclosure in the financial statements.
| | |
| REPORT OF INDEPENDENT REGISTERED PUBLIC ACCOUNTING FIRM | | |
To the Board of Directors of Bridgeway Funds, Inc.
and the Shareholders of Aggressive Investors 1 Fund, Ultra-Small Company Fund,
Ultra-Small Company Market Fund, Small-Cap Growth Fund, Small-Cap Value Fund,
Blue Chip Fund, and Managed Volatility Fund
Opinion on the Financial Statements
We have audited the accompanying statements of assets and liabilities of Aggressive Investors 1 Fund, Ultra-Small Company Fund, Ultra-Small Company Market Fund, Small-Cap Growth Fund, Small-Cap Value Fund, Blue Chip Fund (formerly, Blue Chip 35 Index Fund), and Managed Volatility Fund, each a series of shares of beneficial interest in Bridgeway Funds, Inc. (the “Funds”), including the schedules of investments, as of June 30, 2019, and the related statements of operations for the year then ended, the statements of changes in net assets for each of the years in the two-year period then ended and the financial highlights for each of the years in the five-year period then ended, and the related notes (collectively referred to as the “financial statements”). In our opinion, the financial statements present fairly, in all material respects, the financial position of the Funds as of June 30, 2019, and the results of their operations for the year then ended, the changes in their net assets for each of the years in the two-year period then ended and their financial highlights for each of the years in the five-year period then ended, in conformity with accounting principles generally accepted in the United States of America.
Basis for Opinion
These financial statements are the responsibility of the Funds’ management. Our responsibility is to express an opinion on the Funds’ financial statements based on our audits. We are a public accounting firm registered with the Public Company Accounting Oversight Board (United States) (“PCAOB”) and are required to be independent with respect to the Funds in accordance with the U.S. federal securities law and the applicable rules and regulations of the Securities and Exchange Commission and the PCAOB.
We conducted our audits in accordance with the standards of the PCAOB. Those standards require that we plan and perform the audits to obtain reasonable assurance about whether the financial statements are free of material misstatement, whether due to error or fraud. The Funds are not required to have, nor were we engaged to perform, an audit of their internal control over financial reporting. As part of our audits we are required to obtain an understanding of internal control over financial reporting but not for the purpose of expressing an opinion on the effectiveness of the Funds’ internal control over financial reporting. Accordingly, we express no such opinion.
Our audits included performing procedures to assess the risk of material misstatement of the financial statements, whether due to error or fraud, and performing procedures that respond to those risks. Such procedures included examining, on a test basis, evidence regarding the amounts and disclosures in the financial statements. Our procedures included confirmation of securities owned as of June 30, 2019 by correspondence with the custodian and brokers. Our audits also included evaluating the accounting principles used and significant estimates made by management, as well as evaluating the overall presentation of the financial statements. We believe that our audits provide a reasonable basis for our opinion.
|
 |
|
| BBD, LLP |
We have served as the auditor of one or more of the Funds in the Bridgeway Funds, Inc. since 2005.
Philadelphia, Pennsylvania
August 26, 2019
| | |
| 90 | | Annual Report | June 30, 2019 |
| | |
| OTHER INFORMATION (Unaudited) | | |
June 30, 2019
1. Shareholder Tax Information
Certain tax information regarding the Funds is required to be provided to shareholders, based upon each Fund’s income and distributions for the taxable year ended June 30, 2019. The information and distributions reported herein may differ from information and distributions taxable to the shareholders for the calendar year ended December 31, 2018.
The Funds report the following items with regard to distributions paid during the fiscal year ended June 30, 2019. All reportings are based on financial information available as of the date of this annual report and, accordingly, are subject to change. For each item, it is the intention of each Fund to report the maximum amount permitted under the Internal Revenue Code and the regulations there under.
| | | | | | | | | | | | | | | | |
| | | Aggressive
Investors 1 | | | | | Ultra-Small
Company | | | | | Ultra-Small
Company Market |
Corporate Dividends Received Deduction | | | 94.08% | | | | | | 99.97% | | | | | | 80.92% | |
Qualified Dividend Income | | | 96.39% | | | | | | 99.97% | | | | | | 80.14% | |
Qualified Interest Related Dividends | | | 0.58% | | | | | | 0.60% | | | | | | 0.15% | |
Qualified Short Term Capital Gain Dividends | | | 0.00% | | | | | | 0.00% | | | | | | 0.00% | |
U.S. Government Income | | | 0.00% | | | | | | 0.00% | | | | | | 0.00% | |
| | | | | |
| | | Small-Cap
Growth | | | | | Small-Cap
Value | | | | | |
Corporate Dividends Received Deduction | | | 100.00% | | | | | | 70.55% | | | | | | | |
Qualified Dividend Income | | | 100.00% | | | | | | 77.89% | | | | | | | |
Qualified Interest Related Dividends | | | 0.39% | | | | | | 0.98% | | | | | | | |
Qualified Short Term Capital Gain Dividends | | | 0.00% | | | | | | 0.00% | | | | | | | |
U.S. Government Income | | | 0.00% | | | | | | 0.00% | | | | | | | |
| | | | | |
| | | Blue Chip | | | | | Managed
Volatility | | | | | |
Corporate Dividends Received Deduction | | | 100.00% | | | | | | 84.59% | | | | | | | |
Qualified Dividend Income | | | 100.00% | | | | | | 86.00% | | | | | | | |
Qualified Interest Related Dividends | | | 0.02% | | | | | | 39.56% | | | | | | | |
Qualified Short Term Capital Gain Dividends | | | 0.00% | | | | | | 100.00% | | | | | | | |
U.S. Government Income | | | 0.00% | | | | | | 26.30% | | | | | | | |
U.S. Government Income represents the amount of interest that was derived from direct U.S. Government obligations. Generally, such interest is exempt from state income tax. However, for residents of California, New York and Connecticut, the statutory threshold requirements were not satisfied. Due to the diversity in state and local tax law, it is recommended you consult a tax adviser as to the applicability of the information provided for your specific situation.
During the fiscal year ended June 30, 2019, the Funds paid distributions from ordinary income and long-term capital gain that included equalization debits summarized below:
| | | | | | | | | | | | |
| | | Aggressive
Investors 1 | | | Ultra-Small
Company | | | Ultra-Small
Company Market |
Ordinary Income Distributions | | $ | 1,058,377 | | | $ | 31,355 | | | $ | 1,740,331 | |
Equalization Debits Included in Ordinary Income Distributions | | | - | | | | 67,893 | | | | 214,427 | |
Long-Term Capital Gain Distributions | | | 16,784,039 | | | | 8,945,451 | | | | 36,117,247 | |
Equalization Debits Included in Long-Term Capital Gain Distributions | | | - | | | | - | | | | - | |
| | |
| OTHER INFORMATION (Unaudited) (continued) | | |
June 30, 2019
| | | | | | | | | | | | | | | | | | | | |
| | | Small-Cap
Growth | | Small-Cap
Value | | Blue Chip | | Managed Volatility |
Ordinary Income Distributions | | | | $ 173,035 | | | | | $ 583,733 | | | | | $11,830,171 | | | | | $ 278,626 | |
Equalization Debits Included in Ordinary Income Distributions | | | | - | | | | | - | | | | | 1,048,454 | | | | | - | |
Long-Term Capital Gain Distributions | | | | 4,355,865 | | | | | 8,581,176 | | | | | 52,980,363 | | | | | 1,617,196 | |
Equalization Debits Included in Long-Term Capital Gain Distributions | | | | - | | | | | - | | | | | 5,019,861 | | | | | - | |
2. Proxy Voting
A description of the policies and procedures that the Funds use to determine how to vote proxies relating to the portfolio securities and a summary of proxies voted by the Funds for the period ended June 30, 2019 are available without charge, upon request, by contacting Bridgeway Funds at 1-800-661-3550 and on the SEC’s website at http://www.sec.gov.
3. Fund Holdings
The complete schedules of the Funds’ holdings for the second and fourth quarters of each fiscal year are contained in the Funds’ Semi-Annual and Annual Shareholder Reports, respectively.
The Bridgeway Funds file complete schedules of the Funds’ holdings with the SEC for the first and third quarters of each fiscal year as an exhibit to Form N-PORT within 60 days after the end of the period. Copies of the Funds’ Form N-PORT exhibit are available without charge, upon request, by contacting Bridgeway Funds at 1-800-661-3550 and on the SEC’s website at http://www.sec.gov. You may also review and copy the Funds’ Form N-PORT exhibit at the SEC’s Public Reference Room in Washington, D.C. For more information about the operation of the Public Reference Room, please call 1-800-SEC-0330.
4. Approval of Investment Management Agreement
Bridgeway Funds, Inc.’s (the “Company”) management agreement (the “Management Agreement”) with its investment adviser, Bridgeway Capital Management, Inc. (the “Adviser”), on behalf of each of the Company’s funds must be approved for an initial term no greater than two years and renewed at least annually thereafter by the Board of Directors of the Company (the “Board” or “Directors”) or a vote of a majority of the outstanding voting securities of each fund. In addition, the renewal must be approved by a majority of the Directors who are not parties to the Management Agreement or “interested persons” of any party thereto (the “Independent Directors”), cast in person at a meeting called specifically for the purpose of voting on such approval.
The Board has five regularly scheduled meetings each year and takes into account throughout the year matters bearing on the approval of the Management Agreement. For example, the Board or its standing committees consider at meetings during the year various factors that are relevant to the annual renewal of each Fund’s Management Agreement, including the quality of services and support provided to each Fund by the Adviser, the Adviser’s compliance program, including the effectiveness of its implementation, comparative performance information for each Fund, the risk assessment of the funds and “deep dives” on the strategy and performance of certain Funds on a periodic basis. Additionally, between regular Board meetings the Adviser provides the Board with updated financial information on the Adviser and strategic direction and marketing efforts.
On May 9, 2019, the Board, including a majority of the Independent Directors, met in person (the “Meeting”) with the Adviser, the Company’s outside legal counsel, independent legal counsel to the Independent Directors (“Independent Legal Counsel”) and others to consider information bearing on the continuation of the Management Agreement with respect to the following funds of the Company: Aggressive Investors 1 Fund, Ultra-Small Company Fund, Ultra-Small Company Market Fund, Small-Cap Growth Fund, Small-Cap Value Fund, Blue Chip 35 Index Fund (now known as Blue Chip Fund) and Managed Volatility Fund (each a “Fund” and together, the “Funds”).
In reaching its decisions regarding the renewal of the Management Agreement for each Fund, the Board considered the information furnished and discussed throughout the year at regularly scheduled Board and committee meetings, as applicable and
| | |
| 92 | | Annual Report | June 30, 2019 |
| | |
| OTHER INFORMATION (Unaudited) (continued) | | |
June 30, 2019
as described above, as well as the information provided to it specifically in relation to the annual consideration of the approval of the continuation of the Management Agreement for each Fund.
In preparation for the Meeting, the Independent Directors requested that the Adviser provide specific information relevant to the Board’s consideration of the renewal of the Management Agreement with respect to each Fund. In response to that request, the Board was furnished with a wide variety of information with respect to each Fund, including information regarding:
| | ● | | investment performance over various time periods and the fees and expenses of the Fund as compared to a comparable group of funds as determined and prepared by Broadridge Financial Solutions, Inc. (hereinafter “Broadridge”), an independent provider of investment company data; |
| | ● | | the nature, extent and quality of services provided by the Adviser to the Fund under the Management Agreement; |
| | ● | | actual management fees paid by the Fund to the Adviser and a comparison of those fees with the management fees charged to other advisory clients of the Adviser, as applicable; |
| | ● | | the Adviser’s costs of providing services to the Fund and the profitability of the Adviser from its relationship with the Fund; |
| | ● | | the extent to which economies of scale would be realized as the Fund’s assets increase and whether fee levels reflect these economies of scale for the benefit of Fund investors; and |
| | ● | | any potential “fall-out” or ancillary benefits accruing to the Adviser as a result of its relationship with the Fund. |
In addition to evaluating the written information provided by the Adviser, the Board also considered the answers to questions posed by the Board to representatives of the Adviser at the Meeting.
In considering the information and materials described above, the Independent Directors met telephonically with Independent Legal Counsel to review such information and materials prior to the Meeting. In addition, the Independent Directors met in executive session with Independent Legal Counsel to consider the continuation of the Management Agreement with respect to each Fund outside the presence of management during the Meeting.
The Board also was provided with a written description of its statutory responsibilities and the legal standards that are applicable to approval of the renewal of the Management Agreement.
Although the Management Agreement for all of the Funds was considered at the Meeting, the Directors considered the renewal of the Management Agreement with respect to each Fund separately.
In considering the aforementioned information, the Board took into account management style, investment strategies and prevailing market conditions as reported by the Adviser. Furthermore, in evaluating the Management Agreement, the Directors also considered information provided by the Adviser concerning the following:
| | ● | | the terms of the Management Agreement, including the services performed by the Adviser in managing each Fund’s assets in accordance with the Fund’s investment objectives, policies and restrictions and how those services and fees differ from those for other advisory clients of the Adviser, as applicable; |
| | ● | | information regarding the advisory fee rates and the expense limitation or fee waiver arrangements for each Fund; |
| | ● | | the Adviser’s personnel, staffing levels and the time and attention the Adviser’s personnel devote to the management of the Funds as compared to other advisory clients of the Adviser; |
| | ● | | the Adviser’s risk assessment and management process; |
| | |
| OTHER INFORMATION (Unaudited) (continued) | | |
June 30, 2019
| | ● | | the Adviser’s representation that it does not participate in any soft dollar arrangements and, although it receives unsolicited research from outside sources, the Adviser does not use that research in its investment decision-making process; and |
| | ● | | the financial condition and stability of the Adviser. |
In view of the broad scope and variety of factors and information considered by the Board, the Directors did not find it practicable to, and did not, assign relative weights to the specific factors considered in reaching their conclusions and determinations to approve the continuance of the Management Agreement for each Fund for an additional year. Rather, the Board’s determinations were made on the basis of each Director’s business judgment after consideration of all of the factors taken in their entirety. Although not meant to beall-inclusive, the following describes various factors that were considered by the Board in deciding to approve the continuance of the Management Agreement for each Fund.
Nature, Extent and Quality of Services
In examining the nature, extent and quality of the services provided by the Adviser, the Directors considered the services provided to each Fund and any expected changes thereto, the qualifications, experience and duties of the Adviser’s personnel, the approximate amount of time those personnel devote to the Funds, recent and expected personnel changes, portfolio manager compensation arrangements, business continuity and succession planning, and enterprise risk management (including as it relates to cybersecurity risk). In addition, the Directors considered information provided by the Adviser regarding its overall financial strength and considered the resources and staffing in place with respect to the services provided to the Funds.
Based on the totality of the information considered, the Directors concluded that they were satisfied with the nature, extent and quality of the services provided to each Fund by the Adviser, and that the Adviser has the ability to continue to provide these services based on its experience, operations and current resources.
Investment Performance
The Board considered performance information provided by the Adviser for similarly managed accounts (if any) over the most recent quarter,six-month,one-year, three-year, five-year,ten-year and fifteen-year periods ending December 31, 2018 (although certain Funds did not yet have a fifteen-year performance) as well as Fund performance compared with its benchmark forone-year, three-year, five-year,ten-year and since inception periods ending December 31, 2018 . The Board considered the Adviser’s representation that the differences in the performance of the similarly managed accounts (if any) and Fund performance were within ranges that the Adviser expects for the relevant accounts/Funds given, for example, differences in cash flows, investment restrictions, account size and tax management practices.
In addition, Broadridge provided a report (the “Broadridge Report”) of comparative data regarding fees, expenses and performance for each Fund as compared to a peer group selected by Broadridge (“Peer Group”). The performance periods included total return over the most recent calendar year(“one-year period”) and the annualized total returns over the most recent three calendar year period (“three-year period”), five calendar year period (“five-year period”) and ten calendar year period(“ten-year period”). With regard to the performance information provided in the Broadridge Report, the Board considered the performance of each Fund on a percentile and quintile basis as compared to its Peer Group. For purposes of the performance data provided, the first quintile is defined as 20% of the funds in the applicable Peer Group with the highest performance, and the fifth quintile is defined as 20% of the funds in the applicable Peer Group with the lowest performance.
In particular, the Board considered the following performance information as of December 31, 2018 provided by the Adviser and from Broadridge:
| | ● | | With regard to the Aggressive Investors 1 Fund, the Fund was in the fifth quintile relative to its Peer Group for theone-year, three-year, five-year andten-year periods. The Fund outperformed its primary benchmark for the since inception period, but underperformed its benchmark for theone-year, three-year, five-year andten-year periods. The Board considered the Adviser’s explanation that the Fund’s tilt toward smaller size, deeper value and more volatile stocks hurt relative returns for theone-year, three-year, five-year andten-year periods. The Board also took into |
| | |
| 94 | | Annual Report | June 30, 2019 |
| | |
| OTHER INFORMATION (Unaudited) (continued) | | |
June 30, 2019
| | account that the Adviser continued to engage in research that has the potential to positively impact the Fund and the Adviser’s continued monitoring of the Fund’s performance. Based on their review, the Directors concluded that the Fund’s performance was being addressed. |
| | ● | | With regard to the Ultra-Small Company Fund, the Fund had fourth quintile performance compared to its Peer Group for theone-year period, and was in the fifth quintile for the three-year, five-year andten-year periods. The Fund outperformed its primary benchmark forone-year and since-inception periods, but underperformed its benchmark for the three-year, five-year andten-year periods. The Board considered the Adviser’s explanation that the variability in the Fund’s relative performance was partly explained by the market capitalization differences between the ultra-small cap focus of the Fund and that of the othersmall-cap funds in its Peer Group. The Board also took into account efforts to reduce transaction costs and that the Fund’s recent performance was generally in line with its design although out of favor in the current market environment, and the Adviser’s continued monitoring of the Fund’s performance. Based on their review, the Directors concluded that the Fund’s performance was being addressed. |
| | ● | | With regard to the Ultra-Small Company Market Fund, the Fund ranked in the fifth quintile for theone-year and five-year periods, and the Fund ranked in the fourth quintile for the three-year andten-year periods. The Fund underperformed its primary benchmark over theone-year, three-year,ten-year and since-inception periods, but outperformed over the five-year period. The Board considered the Adviser’s explanation that the variability in the Fund’s relative performance was largely explained by the market capitalization differences between the ultra-small cap focus of the Fund and that of the othersmall-cap funds in its Peer Group. Based on their review, the Directors concluded that the Fund’s overall performance was satisfactory relative to the performance of the funds in its Peer Group and its primary benchmark. |
| | ● | | With regard to theSmall-Cap Growth Fund, the Fund ranked in the fifth quintile relative to its Peer Group for theone-year andten-year periods, in the fourth quintile for the three-year period and in the second quintile for the five-year period. The Fund underperformed its primary benchmark over theone-year, three-year,ten-year and since-inception periods, but outperformed over the five-year period. The Board noted that the Adviser had implemented some refinements to its investment process in 2013 and took into account the subsequent impact these refinements had had on the Fund’s relative performance. Based on their review, the Directors concluded that the Fund’s overall performance was satisfactory relative to the performance of the funds in its Peer Group and its primary benchmark. |
| | ● | | With regard to theSmall-Cap Value Fund, the Fund was in the second quintile for theone-year and three-year periods, in the fourth quintile for the five-year period, and in the third quintile for theten-year period, as compared with its Peer Group. The Fund underperformed its primary benchmark over theone-year, three-year, five-year and since-inception periods, but outperformed over theten-year period. The Board took into account the various design changes that had been implemented by the Adviser in the Fund inmid-2018, and the Adviser’s continued monitoring of the Fund’s performance. Based on their review, the Directors concluded that the Fund’s overall performance was satisfactory relative to the performance of the funds in its Peer Group and its primary benchmark. |
| | ● | | With regard to the Blue Chip 35 Index Fund, the Fund had performance in the first quintile of its Peer Group for theone-year, three-year, and five-year periods, and in the second quintile for theten-year period. The Fund outperformed its primary benchmark for all time periods, except theten-year period. Based on their review, the Directors concluded that the Fund’s overall performance was satisfactory relative to the performance of the funds in its Peer Group and its primary benchmark. |
| | ● | | With regard to the Managed Volatility Fund, the Fund had performance in the second quintile of its Peer Group for theone-year period, in the fourth quintile of its Peer Group for the three andten-year periods, and in the third quintile of its Peer Group for the five-year period. The Fund underperformed its primary benchmark for the three-year, five-year,ten-year and since-inception periods, but outperformed over theone-year period. The Board considered the Adviser’s explanation that the Fund is not designed to outperform the primary benchmark, but instead it is designed to capture market return while limiting volatility, which from inception to date the Fund has done. The Board also considered the Adviser’s statement that this performance is in line with the Fund’s design. Based on their review, the Directors |
| | |
| OTHER INFORMATION (Unaudited) (continued) | | |
June 30, 2019
| | concluded that the Fund’s overall performance was satisfactory relative to the performance of the funds in its Peer Group and its primary benchmark. |
Fund Fees and Expenses
The Board considered information provided by the Adviser regarding the advisory fees it charges to other advisory clients and the reasons for any material differences between those fees and the fees it charges to the Funds. The Board also considered the Adviser’s views that, given investment performance and overall expenses, the Adviser believes the management fees for each Fund appear reasonable and appropriate, given the distinctive features and design of each Fund, the disciplined implementation of the design by the Adviser, the relatively low management fees in most cases, the performance results in line with design and investor expectations, and the profitability to the Adviser of each Fund. More specifically, with regard to management fee differences among the Funds, the Board considered the Adviser’s view that fee differences stem from market factors as well as the estimated growth rate of the Fund at the time of launch; the potential asset capacity of the Fund; the risks associated with providing the advisory services to the Fund; and estimated costs of providing the advisory services driven by the design complexity of the Fund (e.g., more complex design is higher cost due to the research and portfolio management time required).
With respect to management fee differences between the Funds and other investment company clients of the Adviser, the Board considered that, unlike the Funds, the Adviser serves as asub-adviser to the other investment company clients, which generally requires the Adviser to furnish fewer services than the services it provides to the Funds. The Board also considered the fees charged to other investment company clients of the Adviser, as well as the Adviser’s representation that for certain Funds, that the Adviser did not manage comparable investment companies.
With respect to management fee differences between the Funds and othernon-investment company clients of the Adviser, the Board considered that: (i) the management fee charged to the Ultra-Small Company Market Fund is lower than that charged to comparable clients; (ii) the asset-based management fee charged to the Aggressive Investors 1 Fund is higher than that charged to comparable clients, while the Fund’s performance fee rate is significantly lower than the performance fee rate charged to comparable clients (and there are other differences in the performance fee calculations); and (iii) the Adviser had no advisory clients comparable to the other Funds.
The Board also considered information compiled by Broadridge comparing each Fund’s contractual management fee rate (excluding any performance fees and using an assumed common asset level for the Fund and the other funds in the Peer Group), actual management fee rate (which included the effect of any fee waivers and any performance fees, and was derived from annual reports) and actual total expense ratios (which also included the effect of any fee waivers and performance fees, and was derived from annual reports) as a percentage of average net assets as compared to other funds in its expense Peer Group. Broadridge’s contractual management fee data included both advisory fees and administrative services fees, except for the Funds. Broadridge excluded administrative services fees for the Funds from contractual management fee data because those fees are fixed (i.e., a stated dollar amount), as opposed to asset-based. More specifically, with respect to the Funds, the Adviser provides certain administrative services to the Funds pursuant to a separate contract, in exchange for an annual fixed fee (payable monthly) that the Adviser has represented approximates the cost of providing such services (which the Board considered in connection with profitability, as described below). Broadridge’s actual management fee data for the Funds and the other funds in the Peer Group included both advisory fees and administrative services fees. Thus, the contractual management fee rate in the Funds’ Broadridge comparisons did not reflect these administrative services fees, whereas the actual management fee rate in the Funds’ Broadridge comparisons included both advisory and administrative services fees.
With regard to the expense information provided in the Broadridge Report, the Board considered Fund expenses on a percentile and quintile basis as compared to each Fund’s Peer Group. For purposes of the expense data provided, Broadridge defines the first quintile as 20% of the funds in the applicable Peer Group with the lowest expenses and the fifth quintile as 20% of the funds in the applicable Peer Group with the highest expenses. In particular, the Board considered the following:
| | ● | | The Aggressive Investors 1 Fund’s contractual management fee was in the third quintile of its Peer Group (excluding the performance fee), and the Fund’s actual management fees and actual total expenses (factoring in the performance |
| | |
| 96 | | Annual Report | June 30, 2019 |
| | |
| OTHER INFORMATION (Unaudited) (continued) | | |
June 30, 2019
| | fee) were in the second and third quintiles of its Peer Group, respectively. The Board also considered the impact of the Fund’s performance fee on the fee comparisons. |
| | ● | | With respect to the Ultra-Small Company Fund, the Board considered that the Fund’s contractual management fees and actual total expense ratio were in the third and second quintiles of its Peer Group, respectively, and actual management fees were in the fourth quintile. The Board took into account that the Fund’s actual management fee, although in the fourth quintile, was only slightly above the median of its Peer Group. |
| | ● | | With respect to the Ultra-Small Company Market Fund, the Blue Chip 35 Index Fund, theSmall-Cap Growth Fund, the Managed Volatility Fund, and theSmall-Cap Value Fund, the Board considered that each Fund was in the first quintile of its applicable Peer Group for the contractual management fee, actual management fee and total expense ratio. The Board also considered the impact of the performance fee arrangement on actual management fees for theSmall-Cap Value andSmall-Cap Growth Funds. |
In addition, the Board considered that the Adviser agreed to contractual expense limitation agreements for each of the Funds to ensure that total expense levels do not increase above certain asset percentage levels.
The foregoing comparisons assisted the Board in determining to approve the continuance of the Management Agreement for each Fund by providing it with a basis for evaluating each Fund’s management fee and total expense ratio on a relative basis. Based on their review, the Directors concluded that each Fund’s management fee was reasonable in view of the services received by the Fund and the other factors considered.
Profitability
The Board reviewed the materials it received from the Adviser regarding its revenues and costs in providing investment management and certain administrative services to the Funds and the Company as a whole. In particular, the Board considered the analysis of the Adviser’s profitability with respect to each Fund, calculated for the years ended December 31, 2015, December 31, 2016, December 31, 2017 and December 31, 2018. The Board also considered the Adviser’s representations that it does not track expenses or maintain staff on a per Fund basis and accordingly the Adviser needed to make certain assumptions to allocate expenses on aFund-by-Fund basis in order to calculateFund-by-Fund profitability, making the process a subjective one. The Board also considered that the Adviser was operating some Funds at a loss but that the Adviser’s overall business is profitable. Based on their review, the Directors concluded that the Adviser’s profitability from its relationship with each Fund was reasonable.
Economies of Scale
The Board considered the effect of each Fund’s current size and its potential growth on its performance and fees. With respect to whether economies of scale are expected to be realized by the Adviser as a Fund’s assets increase and whether advisory fee levels reflect these economies of scale for the benefit of Fund investors, the Board considered, on aFund-by-Fund basis, the current level of advisory fees charged and fee structure and concluded that the Adviser’s fee structure with respect to each Fund was appropriate at this time. The Board considered that the Aggressive Investors 1 Fund and Ultra-Small Company Fund each have fee breakpoints in their management fee schedules although neither Fund is at a size currently to benefit from such breakpoints. With respect to Ultra-Small Company Market Fund and Managed Volatility Fund, the Board considered the Adviser’s representation that it believes that neither Fund will produce significant economies of scale because each Fund involves intensive and time-consuming portfolio and trading management. Finally, although theSmall-Cap Growth Fund,Small-Cap Value Fund, Blue Chip 35 Index Fund and Managed Volatility Fund do not have fee breakpoints in their management fee schedules, the Board considered the Adviser’s explanation that these Funds were priced low relative to their respective Peer Groups and ahead of the economies of scale curve at launch. The Board noted that if a Fund’s assets increased over time, the Fund might realize other economies of scale if assets increased proportionally more than certain other expenses.
| | |
| OTHER INFORMATION (Unaudited) (continued) | | |
June 30, 2019
“Fallout” or Ancillary Benefits
The Board considered whether there were any“fall-out” or ancillary benefits that may accrue to the Adviser as a result of its relationships with the Funds. In terms of potential“fall-out” or ancillary benefits to the Adviser due to its position as manager of the Funds, the Board considered benefits related to track record and reputation, and portfolio trading and execution. The Board also considered the Adviser’s representations that it does not participate in any soft dollar arrangements and that, although it receives unsolicited research from outside sources, the Adviser does not use that research in its investment decision-making process. In addition, the Board took into account that the Adviser receives administrative service fees from the Funds in exchange for providing certain administrative services to the Funds. The Board concluded that the benefits accruing to the Adviser by virtue of its relationship with the Funds appeared to be reasonable.
* * * * *
Based on all relevant information and factors discussed above, none of which was individually determinative of the outcome, the Board, including a majority of the Independent Directors, determined that the continuation of the Management Agreement for each Fund was in the best interests of the Fund. As a result, the Board, including a majority of the Independent Directors, approved the renewal of the Management Agreement for each Fund.
| | |
| 98 | | Annual Report | June 30, 2019 |
| | |
| DISCLOSURE OF FUND EXPENSES | | |
June 30, 2019 (Unaudited)
As a shareholder of a Fund, you will incur no transaction costs from such Fund, including sales charges (loads) on purchases, on reinvested dividends or on other distributions. There are no exchange fees. Shareholders are subject to redemption fees on the Ultra-Small Company Market Fund under certain circumstances. However, as a shareholder of a Fund, you will incur ongoing costs, including management fees and other Fund expenses. The following examples are intended to help you understand your ongoing costs (in dollars) of investing in a Fund and to compare these costs with ongoing costs of investing in other mutual funds. The examples are based on an investment of $1,000 invested on January 1, 2019 and held until June 30, 2019.
Actual Expenses.The first line of the table below provides information about actual account values and actual expenses. You may use the information in this line, together with the amount you invested, to estimate the expenses that you paid over the period. Simply divide your account value by $1,000 (for example, an $8,600 account value divided by $1,000 = 8.6), then multiply the result by the number in the first line under the heading “Expenses Paid During Period” to estimate the expenses you paid on your account during the period.
Hypothetical Example for Comparison Purposes.The second line of the table below provides information about hypothetical account values and hypothetical expenses based on the Fund’s actual expense ratio and an assumed rate of return of 5% per year before expenses, which is not the Fund’s actual return. The hypothetical account values and expenses may not be used to estimate the actual ending account balance or expenses you paid for the period. You may use this information to compare the ongoing costs of investing in a Fund and other mutual funds. To do so, compare this 5% hypothetical example with the 5% hypothetical examples that appear in the shareholder reports of other funds.
The expenses shown in the table are meant to highlight ongoing Fund costs only. Therefore, the second line of the table is useful in comparing ongoing costs only and will not help you determine the relative total costs of owning different funds, because other funds may also have transaction costs, such as sales charges, redemption fees or exchange fees.
| | | | | | | | | | | | | | | | | | | | |
| | | Beginning Account
Value at 1/1/19 | | Ending Account
Value at 6/30/19 | | Expense
Ratio | | Expenses Paid
During Period*
1/1/19 - 6/30/19 |
| | | | |
Bridgeway Aggressive Investors 1 Fund | | | | | | | | | | | | | | | | | | | | |
Actual Fund Return | | | $ | 1,000.00 | | | | $ | 1,183.00 | | | | | 0.30% | | | | $ | 1.62 | |
Hypothetical Fund Return | | | $ | 1,000.00 | | | | $ | 1,023.31 | | | | | 0.30% | | | | $ | 1.51 | |
| | | | |
Bridgeway Ultra-Small Company Fund | | | | | | | | | | | | | | | | | | | | |
Actual Fund Return | | | $ | 1,000.00 | | | | $ | 1,077.60 | | | | | 1.23% | | | | $ | 6.34 | |
Hypothetical Fund Return | | | $ | 1,000.00 | | | | $ | 1,018.70 | | | | | 1.23% | | | | $ | 6.16 | |
| | | | |
Bridgeway Ultra-Small Company Market Fund | | | | | | | | | | | | | | | | | | | | |
Actual Fund Return | | | $ | 1,000.00 | | | | $ | 1,110.70 | | | | | 0.75% | | | | $ | 3.93 | |
Hypothetical Fund Return | | | $ | 1,000.00 | | | | $ | 1,021.08 | | | | | 0.75% | | | | $ | 3.76 | |
| | | | |
BridgewaySmall-Cap Growth Fund | | | | | | | | | | | | | | | | | | | | |
Actual Fund Return | | | $ | 1,000.00 | | | | $ | 1,101.10 | | | | | 0.94% | | | | $ | 4.90 | |
Hypothetical Fund Return | | | $ | 1,000.00 | | | | $ | 1,020.13 | | | | | 0.94% | | | | $ | 4.71 | |
| | | | |
BridgewaySmall-Cap Value Fund | | | | | | | | | | | | | | | | | | | | |
Actual Fund Return | | | $ | 1,000.00 | | | | $ | 1,063.60 | | | | | 0.94% | | | | $ | 4.81 | |
Hypothetical Fund Return | | | $ | 1,000.00 | | | | $ | 1,020.13 | | | | | 0.94% | | | | $ | 4.71 | |
| | | | |
Bridgeway Blue Chip Fund | | | | | | | | | | | | | | | | | | | | |
Actual Fund Return | | | $ | 1,000.00 | | | | $ | 1,184.10 | | | | | 0.15% | | | | $ | 0.81 | |
Hypothetical Fund Return | | | $ | 1,000.00 | | | | $ | 1,024.05 | | | | | 0.15% | | | | $ | 0.75 | |
| | |
| DISCLOSURE OF FUND EXPENSES (continued) | | |
June 30, 2019 (Unaudited)
| | | | | | | | | | | | | | | | | | | | |
| | | Beginning Account
Value at 1/1/19 | | Ending Account
Value at 6/30/19 | | Expense
Ratio | | Expenses Paid
During Period*
1/1/19 - 6/30/19 |
| | | | |
Bridgeway Managed Volatility | | | | | | | | | | | | | | | | | | | | |
Actual Fund Return | | | $ | 1,000.00 | | | | $ | 1,084.30 | | | | | 0.94 | % | | | $ | 4.86 | |
Hypothetical Fund Return | | | $ | 1,000.00 | | | | $ | 1,020.13 | | | | | 0.94 | % | | | $ | 4.71 | |
| * | Expenses are equal to the average account value times the Fund’s annualized expense ratio multiplied by the number of days in the most recentsix-month period (181) divided by the number of days in the fiscal year (365). |
| | |
| 100 | | Annual Report | June 30, 2019 |
| | |
| DIRECTORS & OFFICERS | | |
June 30, 2019 (Unaudited)
Independent Directors
| | | | | | | | | | |
| | | | | | |
Name, Address
and Age1 | | Position Held with Bridgeway Funds | | Term of Office and Length of Time Served | | Principal Occupation(s)
During Past Five Years | | No. of Bridgeway
Funds Overseen
by Director | | Other Directorships
Held by Director |
| | | | | |
Karen S. Gerstner Age 64 | | Director | | Term: 1 Year
Length: 1994
to Present. | | Principal, Karen S. Gerstner & Associates, P.C., since 2004. | | Nine | | None |
| | | | | |
Miles Douglas Harper, III* Age 56 | | Director | | Term: 1 Year
Length: 1994
to Present. | | Partner, Carr, Riggs & Ingram, LLC, since 2013. | | Nine | | Calvert Funds (38 Portfolios) |
| | | | | |
Evan Harrel Age 58 | | Director | | Term: 1 Year
Length: 2006
to Present. | | Strategic Advisor, Small Steps Nurturing Center, since 2012. | | Nine | | None |
| | | | | |
| | | | | | | | | | | |
| | |
| DIRECTORS & OFFICERS(continued) | | |
June 30, 2019 (Unaudited)
| | | | | | | | | | |
| “Interested” or Affiliated Director and Officer |
| | | | | |
Name, Address and Age1 | | Position(s) Held with Bridgeway Funds | | Term of
Office and
Length of
Time Served | | Principal Occupation(s)
During Past Five Years | | No. of Bridgeway
Funds Overseen
by Director | | Other Directorships
Held by Director |
| | | | | |
John N. R. Montgomery2
Age 63 | | Director | | Term: 1 Year
Length: 1993
to Present. | | Chairman, Bridgeway Capital Management, Inc., since 2010; President, Bridgeway Capital Management, Inc., 1993 to 2010 and June 2015 to March 2016; President, Bridgeway Funds, June 2015 to June 2016; Vice President, Bridgeway Funds, 2005 to May 2015 and since June 2016. | | Nine | | None |
| | | | | | | | | | |
| | | | | | | | | | | |
| | |
| 102 | | Annual Report | June 30, 2019 |
| | |
| DIRECTORS & OFFICERS(continued) | | |
June 30, 2019 (Unaudited)
| | | | | | | | | | |
| Other Officers |
| | | | | |
Name, Address and Age1 | | Position Held with
Bridgeway
Funds | | Term of
Office and
Length of
Time Served | | Principal Occupation(s)
During Past Five Years | | No. of Bridgeway
Funds Overseen
by Officer | | Other Directorships
Held by Officer |
| | | | | |
Richard P. Cancelmo, Jr.
Age 61 | | Vice President | | Term: 1 Year
Length: 2004
to Present. | | Vice President, Bridgeway Funds, since 2004; Staff member, Bridgeway Capital Management, Inc., since 2000. | | N/A | | None |
| | | | | |
Linda G. Giuffré Age 57 | | Treasurer and
Chief
Compliance
Officer | | Term: 1 Year
Length: 2004
to Present. | | Chief Compliance Officer, Bridgeway Capital Management, Inc., since 2004; Staff member, Bridgeway Capital Management, Inc., since 2004. | | N/A | | None |
| | | | | |
Deborah L. Hanna Age 54 | | Secretary | | Term: 1 Year
Length: 2007
to Present. | | Self-employed, accounting and related projects for various organizations, since 2001. | | N/A | | None |
| | | | | |
Sharon Lester Age 64 | | Vice President | | Term: 1 Year
Length: 2011
to Present. | | Staff member, Bridgeway Capital Management, Inc., since 2010. | | N/A | | None |
| | | | | |
Tammira Philippe Age 45 | | President | | Term: 1 Year
Length: May
2016
to Present. | | President, Bridgeway Capital Management, Inc., since March 2016; Staff member, Bridgeway Capital Management, Inc., 2010 to March 2016. | | N/A | | None |
| 1 | The address of all of the Directors and Officers of Bridgeway Funds is 20 Greenway Plaza, Suite 450, Houston, Texas, 77046. |
| 2 | John Montgomery is chairman, director and majority shareholder of Bridgeway Capital Management, Inc., and therefore an interested person of Bridgeway Funds. |
The overall management of the business and affairs of Bridgeway Funds is vested with its Board of Directors (the “Board”). The Board approves all significant agreements between Bridgeway Funds and persons or companies furnishing services to it, including agreements with its Adviser and custodian. Theday-to-day operations of Bridgeway Funds are delegated to its officers, subject to its investment objectives and policies and general supervision by the Board.
The Funds’ Statement of Additional Information includes additional information about the Board and is available, without charge, upon request by calling1-800-661-3550.
BRIDGEWAY FUNDS, INC.
BNY Mellon Investment Servicing (US) Inc.
P.O. Box 9860
Providence, RI 02940-8060
CUSTODIAN
The Bank of New York Mellon
One Wall Street
New York, NY 10286
DISTRIBUTOR
Foreside Fund Services, LLC
Three Canal Plaza, Suite 100
Portland, ME 04101
| | | | |
| | You can review and copy information about our Funds (including the SAIs) at the SEC’s Public Reference Room in Washington, D.C. To find out more about this public service, call the SEC at800-SEC-0330. Reports and other information about the Funds are also available on the SEC’s website at www.sec.gov. You can receive copies of this information, for a fee, by writing the Public Reference Section, Securities and Exchange Commission, Washington, D.C. 20549-1520 or by sending an electronic request to the following email address: publicinfo@sec.gov. | | |

| | |
OMNI SMALL-CAP VALUE | | BOSVX |
| |
OMNI TAX-MANAGED SMALL-CAP VALUE | | BOTSX |
Beginning on January 1, 2021, as permitted by regulations adopted by the U.S. Securities and Exchange Commission, paper copies of the Funds’ annual and semi-annual shareholder reports will no longer be sent by mail, unless you specifically request paper copies of the reports. Instead, the reports will be made available on the Funds’ website (www.bridgeway.com), and you will be notified by mail each time a report is posted and provided with a website link to access the report.
If you already elected to receive shareholder reports electronically, you will not be affected by this change and you need not take any action. You may elect to receive shareholder reports and other communications from a Fund electronically anytime by contacting your financial intermediary (such as a broker-dealer or bank) or, if you are a direct investor, by calling 800-661-3550.
Beginning on January 1, 2019, you may elect to receive all future reports in paper free of charge. If you invest through a financial intermediary, you can contact your financial intermediary to request that you continue to receive paper copies of your shareholder reports. If you invest directly with a Fund, you can call 800-661-3550 to let the Fund know you wish to continue receiving paper copies of your shareholder reports. Your election to receive reports in paper will apply to all Funds held in your account if you invest through your financial intermediary or to all Funds held with the fund complex if you invest directly with a Fund.

| | |
| TABLE OF CONTENTS | |  |
|
|
Bridgeway Funds Standardized Returns as of June 30, 2019 (Unaudited)
| | | | | | | | | | | | | | | | |
| | | | | | | Annualized | | | | | | |
| | | | | | | | | | | Gross | | Net |
| Fund1 | | Quarter | | Six Months | | 1 Year | | 5 Years | | Inception
to Date | | Inception
Date | | Expense
Ratio2 | | Expense
Ratio2 |
Omni Small-Cap Value | | -3.04% | | 6.70% | | -16.82% | | 2.68% | | 9.93% | | 8/31/2011 | | 0.70% | | 0.60% |
Omni Tax-Managed Small-Cap Value | | -2.50% | | 6.18% | | -16.49% | | 2.90% | | 7.82% | | 12/31/2010 | | 0.70% | | 0.60% |
| | 1 | Some of the Fund’s fees were waived or expenses reimbursed; otherwise, returns would have been lower. The Adviser is contractually obligated to waive fees and/or reimburse expenses. Any material change to this Fund policy would require a vote by shareholders. |
| | 2 | Expense ratios are as stated in the current prospectus. Please see financial highlights for expense ratios as of June 30, 2019. |
Performance figures quoted represent past performance and are no guarantee of future results. Current performance may be lower or higher than the performance data quoted. Investment return and principal value will fluctuate, so that an investor’s shares, when redeemed, may be worth more or less than original cost. To obtain performance current to the most recent month-end, please visit our website at www.bridgeway.com or call 1-800-661-3550. Total return figures include the reinvestment of dividends and capital gains. Periods of less than one year are not annualized.
This report is submitted for the general information of the shareholders of each Fund. It is not authorized for distribution to prospective investors unless preceded or accompanied by an effective prospectus, which includes information regarding a Fund’s risks, objectives, fees and expenses, experience of its management, and other information. Investors should read the prospectus carefully before investing in a Fund. For questions or other Fund information, call 1-800-661-3550 or visit the Funds’ website at www.bridgeway.com. Funds are available for purchase by residents of the United States, Puerto Rico, U.S. Virgin Islands and Guam only.
The views expressed here are exclusively those of Fund management. These views, including those relating to the market, sectors or individual stocks, are not meant as investment advice and should not be considered predictive in nature.
| | |
| LETTER FROM THE INVESTMENT MANAGEMENT TEAM (UNAUDITED) | | |
|
|
June 30, 2019
Dear Fellow Shareholders,
At Bridgeway, we share a passion for applying logic, data and evidence to develop investment solutions. Our Omni Small-Cap Value and Omni Tax-Managed Small-Cap Value Funds are constructed based on fundamental academic research that relies on market efficiency to better capture risk premiums. We manage these Funds to provide broad diversification within the small-cap value universe and to keep transaction fees and expenses low. Bridgeway offers the Omni Small-Cap Value and Omni Tax-Managed Small-Cap Value Funds through a select group of advisers. We are committed to advisers and their clients who take a long-term perspective and whose investment goals fit our unique capabilities: delivering investment solutions that are statistically driven and grounded in academic theory.
Thank you for your investment in Bridgeway’s Omni Small-Cap Value and Omni Tax-Managed Small-Cap Value Funds.
Sincerely,
Your Investment Management Team
| | | | |
 | |  | |  |
| John Montgomery | | Christine L. Wang | | Michael Whipple |
| | |
 | | | | |
| Elena Khoziaeva | | | | |
| | |
| LETTER FROM THE INVESTMENT MANAGEMENT TEAM (UNAUDITED)(continued) | | |
|
|
Market Review
Performance across domestic equity markets was positive for the quarter ended June 30, 2019. Broad market returns, as represented by the Russell 3000 Index, were +4.10%.
For the fiscal year ended June 30, 2019, broad market stocks returned +8.98%, as represented by the Russell 3000 Index. Growth stocks outperformed value stocks across size categories, while mid-cap stocks outpaced both large-cap and small-cap stocks. As result, mid-cap growth stocks, as represented by the Russell Midcap Growth Index, performed the best, returning +13.94%. Small-cap value stocks, as represented by the Russell 2000 Value Index, performed the worst, returning -6.24%.
The following table presents returns for broad market, small-cap, mid-cap, and large-cap stocks, as represented by various style-based Russell Indexes. Size (market capitalization) and style (value/growth) are among the key factors that drive differences in returns among U.S. stock returns.
Russell Style-Based Indexes Ranked by Performance for the Quarter and Fiscal Year Ended June 30, 2019
| | | | |
| | | Quarter | | Fiscal Year |
Best Performing | | +5.40% RussellMidcap Growth Index | | +13.94% RussellMidcap Growth Index |
| | +4.64% Russell1000 Growth Index | | +11.56% Russell1000 Growth Index |
| | +4.50% Russell3000 Growth Index | | +10.61% Russell3000 Growth Index |
| | +3.84% Russell1000 Value Index | | +8.46% Russell1000 Value Index |
| | +3.68% Russell3000 Value Index | | +7.34% Russell3000 Value Index |
| | +3.19% RussellMidcap Value Index | | +3.68% RussellMidcap Value Index |
| | +2.75% Russell2000 Growth Index | | -0.49% Russell2000 Growth Index |
Worst Performing | | +1.38% Russell2000 Value Index | | -6.24% Russell2000 Value Index |
The Bridgeway Omni Funds are asset class exposure strategies that seek broad diversification and strive for risk premium exposure. These Funds were designed to capture the size and style benefits within the small-cap value asset class.
| | |
|
| |
| 2 | | Annual Report | June 30, 2019 |
| | |
Omni Small-Cap Value Fund MANAGER’S COMMENTARY (Unaudited) | | |
|
|
June 30, 2019
Dear Fellow Omni Small-Cap Value Fund Shareholder,
For the quarter ended June 30, 2019, our Fund returned -3.04%, underperforming our primary market benchmark, the Russell 2000 Value Index (+1.38%).
For the fiscal year, our Fund returned -16.82%, underperforming the Russell 2000 Value Index (-6.24%).
The table below presents our June quarter, one-year, five-year, and inception-to-date financial results. See the next page for a graph of performance since inception.
Standardized Returns as of June 30, 2019
| | | | | | | | |
| | | | | | | Annualized |
| | | Quarter | | 1 Year | | 5 Years | | Since Inception
(8/31/11) |
| | | | |
Omni Small-Cap Value Fund | | -3.04% | | -16.82% | | 2.68% | | 9.93% |
Russell 2000 Value Index | | 1.38% | | -6.24% | | 5.39% | | 10.73% |
Performance figures quoted in the table above and the graph on the next page represent past performance and are no guarantee of future results. Total return figures in the table above include the reinvestment of dividends and capital gains. The table above and the graph on the next page do not reflect the deduction of taxes that a shareholder would pay on Fund distributions or on the redemption of Fund shares.
The Russell 2000 Value Index is an unmanaged index that consists of stocks in the Russell 2000 Index with lower price-to-book ratios and lower forecasted growth values with dividends reinvested. It is not possible to invest directly in an index. Periods longer than one year are annualized.
| | |
Omni Small-Cap Value Fund MANAGER’S COMMENTARY (Unaudited) (continued) | | |
|
|
Growth of a $10,000 Investment
from Inception August 31, 2011 to June 30, 2019
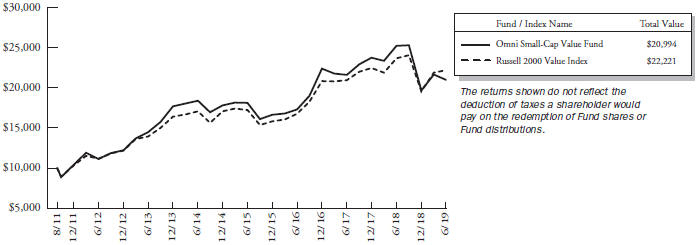
Detailed Explanation of Quarterly Performance
The Omni Small-Cap Value Fund is designed to capture the returns of the small-cap value asset class through broad diversification of small company and value stocks. This approach is sometimes referred to as “passive, asset class investing.” As of June 30, 2019, we held 655 such stocks in a market-cap weighted style. We make no attempt to track any particular index in either performance or statistics.
The Fund’s tilt toward deeper value stocks across multiple value metrics was a leading detractor from relative performance during the quarter. The Fund’s tilt toward smaller stocks in the small-cap value universe also hurt relative results, as smaller stocks underperformed their larger counterparts.
From a sector perspective, the Fund’s allocation effect was negative. By design, the Fund does not hold Real Estate Investment Trusts (REITs) or Utilities stocks. Avoiding REITs did not meaningfully affect the Fund’s relative performance during the quarter, but a lack of exposure to the Utilities sector detracted from relative results.
Detailed Explanation of Fiscal Year Performance
The Fund’s tilt toward smaller stocks in the small-cap value universe was the leading detractor from relative results, as smaller stocks dramatically underperformed their larger counterparts during the fiscal year. Likewise, the Fund’s tilt toward deeper value stocks across multiple value metrics also hurt relative results.
From a sector perspective, the Fund’s allocation effect was negative. By design, the Fund does not hold REITs or Utilities stocks. Both positionings detracted from relative performance.
| | |
|
| |
| 4 | | Annual Report | June 30, 2019 |
| | |
Omni Small-Cap Value Fund MANAGER’S COMMENTARY (Unaudited) (continued) | | |
|
|
Top Ten Holdings as of June 30, 2019
| | | | | | |
| Rank | | Description | | Industry | | % of Net
Assets |
1 | | Iridium Communications, Inc. | | Communication Services | | 0.9% |
2 | | Insight Enterprises, Inc. | | Information Technology | | 0.7% |
3 | | Group 1 Automotive, Inc. | | Consumer Discretionary | | 0.7% |
4 | | Warrior Met Coal, Inc. | | Materials | | 0.7% |
5 | | Meritage Homes Corp. | | Consumer Discretionary | | 0.6% |
6 | | First BanCorp Puerto Rico | | Financials | | 0.6% |
7 | | Cooper Tire & Rubber Co. | | Consumer Discretionary | | 0.6% |
8 | | Helix Energy Solutions Group, Inc. | | Energy | | 0.6% |
9 | | American Axle & Manufacturing Holdings, Inc. | | Consumer Discretionary | | 0.6% |
10 | | Arch Coal, Inc., Class A | | Energy | | 0.6% |
| | Total | | | | 6.6% |
Industry Sector Representation as of June 30, 2019
| | | | | | | | | | | | | | | | | | | | | | | | | |
| | | % of Net Assets | | | | % of Russell 2000
Value Index | | | | Difference |
Communication Services | | | | 4.7% | | | | | | | | | | 2.9% | | | | | | | | | | 1.8% | |
Consumer Discretionary | | | | 15.3% | | | | | | | | | | 8.5% | | | | | | | | | | 6.8% | |
Consumer Staples | | | | 2.4% | | | | | | | | | | 2.4% | | | | | | | | | | 0.0% | |
Energy | | | | 13.6% | | | | | | | | | | 5.1% | | | | | | | | | | 8.5% | |
Financials | | | | 30.3% | | | | | | | | | | 29.4% | | | | | | | | | | 0.9% | |
Health Care | | | | 3.4% | | | | | | | | | | 4.1% | | | | | | | | | | -0.7% | |
Industrials | | | | 16.2% | | | | | | | | | | 11.6% | | | | | | | | | | 4.6% | |
Information Technology | | | | 7.7% | | | | | | | | | | 11.9% | | | | | | | | | | -4.2% | |
Materials | | | | 5.3% | | | | | | | | | | 4.2% | | | | | | | | | | 1.1% | |
Real Estate | | | | 0.3% | | | | | | | | | | 12.3% | | | | | | | | | | -12.0% | |
Utilities | | | | 0.0% | | | | | | | | | | 7.6% | | | | | | | | | | -7.6% | |
Cash & Other Assets | | | | 0.8% | | | | | | | | | | 0.0% | | | | | | | | | | 0.8% | |
Total | | | | 100.0% | | | | | | | | | | 100.0% | | | | | | | | | | | |
Disclaimer
The views expressed here are exclusively those of Fund management. These views, including those related to market sectors or individual stocks, are not meant as investment advice and should not be considered predictive in nature. Any favorable (or unfavorable) description of a holding applies only as of the quarter end, June 30, 2019, unless otherwise stated. Security positions can and do change thereafter. Discussions of historical performance do not guarantee and may not be indicative of future performance.
Market volatility can significantly impact short-term performance. The Fund is not an appropriate investment for short-term investors. Investments in small companies generally carry greater risk than is customarily associated with larger companies. This additional risk is attributable to a number of factors, including the relatively limited financial resources that are typically available to small companies and the fact that small companies often have comparatively limited product lines. In addition, the stock of small companies tends to be more volatile than the stock of large companies, particularly in the short term and particularly in the early stages of an economic or market downturn. Shareholders of the Fund, therefore, are taking on more risk than they would if they invested in the stock market as a whole.
| | |
Omni Small-Cap Value Fund MANAGER’S COMMENTARY (Unaudited) (continued) | | |
|
|
Conclusion
Thank you for your continued investment in Omni Small-Cap Value Fund. We encourage your feedback; your reactions and concerns are important to us.
Sincerely,
The Investment Management Team
| | |
|
| |
| 6 | | Annual Report | June 30, 2019 |
| | |
Omni Small-Cap Value Fund SCHEDULE OF INVESTMENTS | | |
|
|
| |
| Showing percentage of net assets as of June 30, 2019 | | |
| | | | | | | | |
| Industry Company | | Shares | | | Value | |
|
COMMON STOCKS - 99.06% | |
Communication Services - 4.74% | |
A.H. Belo Corp., Class A | | | 65,500 | | | $ | 241,695 | |
Alaska Communications Systems Group, Inc.* | | | 377,100 | | | | 644,841 | |
AMC Entertainment Holdings, Inc.,
Class A+ | | | 306,900 | | | | 2,863,377 | |
ATN International, Inc. | | | 28,500 | | | | 1,645,305 | |
Cars.com, Inc.* | | | 210,000 | | | | 4,141,200 | |
Consolidated Communications Holdings, Inc. | | | 299,000 | | | | 1,474,070 | |
DHI Group, Inc.* | | | 231,900 | | | | 827,883 | |
Emmis Communications Corp., Class A* | | | 102,700 | | | | 487,825 | |
Entercom Communications Corp., Class A | | | 554,795 | | | | 3,217,811 | |
Entravision Communications Corp., Class A | | | 161,800 | | | | 504,816 | |
Eros International PLC*+ | | | 302,850 | | | | 408,848 | |
Gannett Co., Inc. | | | 464,000 | | | | 3,786,240 | |
Gray Television, Inc.* | | | 346,200 | | | | 5,674,218 | |
Iridium Communications, Inc.* | | | 391,325 | | | | 9,102,220 | |
Marcus Corp. (The) | | | 130,150 | | | | 4,289,744 | |
New Media Investment Group, Inc. | | | 180,900 | | | | 1,707,696 | |
Saga Communications, Inc., Class A | | | 8,761 | | | | 273,694 | |
Salem Media Group, Inc. | | | 89,800 | | | | 218,214 | |
Scholastic Corp. | | | 131,490 | | | | 4,370,728 | |
SPAR Group, Inc.* | | | 46,500 | | | | 29,760 | |
Townsquare Media, Inc., Class A | | | 120,000 | | | | 645,600 | |
Tribune Publishing Co. | | | 15,000 | | | | 119,550 | |
Urban One, Inc.* | | | 101,800 | | | | 199,528 | |
| | | | | | | | |
| | |
| | | | | | | 46,874,863 | |
| |
Consumer Discretionary - 15.24% | | | | | |
Abercrombie & Fitch Co., Class A | | | 210,000 | | | | 3,368,400 | |
AMCON Distributing Co. | | | 1,350 | | | | 129,370 | |
American Axle & Manufacturing Holdings, Inc.* | | | 452,200 | | | | 5,770,072 | |
American Outdoor Brands Corp.* | | | 154,327 | | | | 1,390,486 | |
American Public Education, Inc.* | | | 37,600 | | | | 1,112,208 | |
Ark Restaurants Corp. | | | 12,600 | | | | 257,670 | |
Ascena Retail Group, Inc.* | | | 982,500 | | | | 599,325 | |
Barnes & Noble Education, Inc.* | | | 236,824 | | | | 795,729 | |
Barnes & Noble, Inc. | | | 172,900 | | | | 1,156,701 | |
Bassett Furniture Industries, Inc. | | | 77,400 | | | | 1,180,350 | |
| | | | | | | | |
| Industry Company | | Shares | | | Value | |
|
Consumer Discretionary (continued) | |
BBX Capital Corp. | | | 351,039 | | | $ | 1,723,601 | |
Beazer Homes USA, Inc.* | | | 120,000 | | | | 1,153,200 | |
Big Lots, Inc. | | | 125,000 | | | | 3,576,250 | |
Build-A-Bear Workshop, Inc.* | | | 49,500 | | | | 276,705 | |
Caleres, Inc. | | | 168,500 | | | | 3,356,520 | |
Canterbury Park Holding Corp. | | | 3,900 | | | | 48,126 | |
Carriage Services, Inc. | | | 40,000 | | | | 760,400 | |
Carrols Restaurant Group, Inc.* | | | 120,000 | | | | 1,083,600 | |
Cato Corp. (The), Class A | | | 65,000 | | | | 800,800 | |
Century Casinos, Inc.* | | | 124,600 | | | | 1,208,620 | |
Chico’s FAS, Inc. | | | 316,200 | | | | 1,065,594 | |
China Automotive Systems, Inc.* | | | 77,500 | | | | 178,250 | |
China XD Plastics Co., Ltd.* | | | 160,000 | | | | 336,000 | |
Citi Trends, Inc. | | | 78,840 | | | | 1,152,641 | |
Conn’s, Inc.* | | | 90,500 | | | | 1,612,710 | |
Container Store Group, Inc. (The)* | | | 141,150 | | | | 1,033,218 | |
Cooper Tire & Rubber Co. | | | 185,050 | | | | 5,838,327 | |
Cooper-Standard Holdings, Inc.* | | | 51,000 | | | | 2,336,820 | |
Crown Crafts, Inc. | | | 13,050 | | | | 61,335 | |
CSS Industries, Inc. | | | 11,800 | | | | 57,584 | |
Del Taco Restaurants, Inc.* | | | 182,300 | | | | 2,337,086 | |
Delta Apparel, Inc.* | | | 29,900 | | | | 693,082 | |
Designer Brands, Inc., Class A | | | 55,000 | | | | 1,054,350 | |
Destination Maternity Corp.* | | | 9,800 | | | | 12,936 | |
Destination XL Group, Inc.* | | | 139,800 | | | | 246,048 | |
Dillard’s, Inc., Class A+ | | | 68,000 | | | | 4,235,040 | |
El Pollo Loco Holdings, Inc.* | | | 90,500 | | | | 964,730 | |
Escalade, Inc. | | | 3,600 | | | | 41,292 | |
Ethan Allen Interiors, Inc. | | | 82,500 | | | | 1,737,450 | |
Express, Inc.* | | | 197,000 | | | | 537,810 | |
Fiesta Restaurant Group, Inc.* | | | 60,000 | | | | 788,400 | |
Flanigan’s Enterprises, Inc. | | | 2,500 | | | | 57,450 | |
Flexsteel Industries, Inc. | | | 4,800 | | | | 81,888 | |
Fossil Group, Inc.* | | | 195,000 | | | | 2,242,500 | |
Full House Resorts, Inc.* | | | 71,000 | | | | 132,770 | |
GameStop Corp., Class A+ | | | 350,000 | | | | 1,914,500 | |
Genesco, Inc.* | | | 73,500 | | | | 3,108,315 | |
G-III Apparel Group, Ltd.* | | | 75,000 | | | | 2,206,500 | |
Golden Entertainment, Inc.* | | | 25,000 | | | | 350,000 | |
Good Times Restaurants, Inc.* | | | 106,000 | | | | 186,560 | |
Group 1 Automotive, Inc. | | | 84,000 | | | | 6,878,760 | |
Haverty Furniture Cos., Inc. | | | 98,400 | | | | 1,675,752 | |
Hibbett Sports, Inc.* | | | 76,900 | | | | 1,399,580 | |
| | |
Omni Small-Cap Value Fund SCHEDULE OF INVESTMENTS(continued) | | |
|
|
| |
| Showing percentage of net assets as of June 30, 2019 | | |
| | | | | | | | |
| Industry Company | | Shares | | | Value | |
|
Common Stocks (continued) | |
Consumer Discretionary (continued) | |
Houghton Mifflin Harcourt Co.* | | | 568,600 | | | $ | 3,275,136 | |
International Speedway Corp., Class A | | | 118,456 | | | | 5,317,490 | |
J Alexander’s Holdings, Inc.* | | | 49,950 | | | | 560,938 | |
J. Jill, Inc.+ | | | 145,000 | | | | 288,550 | |
JAKKS Pacific, Inc.* | | | 118,700 | | | | 83,090 | |
K12, Inc.* | | | 121,217 | | | | 3,686,209 | |
KB Home | | | 175,900 | | | | 4,525,907 | |
Lakeland Industries, Inc.* | | | 30,050 | | | | 336,560 | |
Lands’ End, Inc.* | | | 161,200 | | | | 1,969,864 | |
La-Z-Boy, Inc. | | | 9,500 | | | | 291,270 | |
Libbey, Inc.* | | | 30,000 | | | | 55,800 | |
Lifetime Brands, Inc. | | | 24,400 | | | | 230,824 | |
Live Ventures, Inc.*+ | | | 3,200 | | | | 22,240 | |
Luby’s, Inc.* | | | 75,800 | | | | 81,864 | |
MarineMax, Inc.* | | | 87,000 | | | | 1,430,280 | |
MDC Holdings, Inc. | | | 92,300 | | | | 3,025,594 | |
Meritage Homes Corp.* | | | 123,442 | | | | 6,337,512 | |
Modine Manufacturing Co.* | | | 187,900 | | | | 2,688,849 | |
Movado Group, Inc. | | | 75,000 | | | | 2,025,000 | |
Nautilus, Inc.* | | | 58,400 | | | | 129,064 | |
Office Depot, Inc. | | | 2,035,000 | | | | 4,192,100 | |
P&F Industries, Inc., Class A | | | 696 | | | | 5,791 | |
Party City Holdco, Inc.* | | | 258,200 | | | | 1,892,606 | |
Peak Resorts, Inc. | | | 114,000 | | | | 541,500 | |
Red Robin Gourmet Burgers, Inc.* | | | 17,000 | | | | 519,690 | |
Rent-A-Center, Inc.* | | | 65,500 | | | | 1,744,265 | |
Rocky Brands, Inc. | | | 28,300 | | | | 772,024 | |
RTW RetailWinds, Inc.* | | | 165,400 | | | | 281,180 | |
Sequential Brands Group, Inc.* | | | 155,000 | | | | 85,250 | |
Shiloh Industries, Inc.* | | | 71,500 | | | | 348,205 | |
Shoe Carnival, Inc.+ | | | 63,600 | | | | 1,755,360 | |
Signet Jewelers, Ltd. | | | 105,000 | | | | 1,877,400 | |
Sonic Automotive, Inc., Class A | | | 132,600 | | | | 3,096,210 | |
SORL Auto Parts, Inc.*+ | | | 129,900 | | | | 450,753 | |
Speedway Motorsports, Inc. | | | 145,700 | | | | 2,702,735 | |
Stage Stores, Inc.+ | | | 100,000 | | | | 77,000 | |
Stein Mart, Inc.* | | | 83,200 | | | | 71,552 | |
Strattec Security Corp. | | | 25,900 | | | | 624,190 | |
Superior Industries International, Inc. | | | 67,500 | | | | 233,550 | |
Tandy Leather Factory, Inc.* | | | 8,000 | | | | 44,000 | |
Tilly’s, Inc., Class A | | | 125,300 | | | | 956,039 | |
Tower International, Inc. | | | 87,000 | | | | 1,696,500 | |
TravelCenters of America, LLC* | | | 163,200 | | | | 590,784 | |
TRI Pointe Group, Inc.* | | | 266,000 | | | | 3,184,020 | |
Tuesday Morning Corp.* | | | 176,000 | | | | 297,440 | |
| | | | | | | | |
| Industry Company | | Shares | | | Value | |
|
Consumer Discretionary (continued) | |
Unifi, Inc.* | | | 31,900 | | | $ | 579,623 | |
US Auto Parts Network, Inc.* | | | 98,900 | | | | 123,625 | |
Vera Bradley, Inc.* | | | 149,200 | | | | 1,790,400 | |
Vista Outdoor, Inc.* | | | 214,087 | | | | 1,901,093 | |
Vitamin Shoppe, Inc.* | | | 50,000 | | | | 197,000 | |
VOXX International Corp.* | | | 75,100 | | | | 312,416 | |
William Lyon Homes,
Class A* | | | 80,500 | | | | 1,467,515 | |
ZAGG, Inc.* | | | 75,000 | | | | 522,000 | |
Zumiez, Inc.* | | | 119,400 | | | | 3,116,340 | |
| | | | | | | | |
| | |
| | | | | | | 150,715,608 | |
| | |
Consumer Staples - 2.39% | | | | | | | | |
Alico, Inc. | | | 10,461 | | | | 317,387 | |
Andersons, Inc. (The) | | | 88,100 | | | | 2,399,844 | |
Coffee Holding Co., Inc.* | | | 10,000 | | | | 40,900 | |
Edgewell Personal Care Co.* | | | 133,000 | | | | 3,584,350 | |
Hostess Brands, Inc.* | | | 367,300 | | | | 5,303,812 | |
Ingles Markets, Inc., Class A | | | 79,900 | | | | 2,487,287 | |
Mannatech, Inc. | | | 8,400 | | | | 142,716 | |
Natural Alternatives International, Inc.* | | | 18,100 | | | | 211,046 | |
Natural Grocers by Vitamin Cottage, Inc.* | | | 25,000 | | | | 251,250 | |
Nature’s Sunshine Products, Inc.* | | | 15,000 | | | | 139,350 | |
Seneca Foods Corp.,
Class A* | | | 40,100 | | | | 1,115,983 | |
SpartanNash Co. | | | 120,946 | | | | 1,411,440 | |
United Natural Foods, Inc.* | | | 78,300 | | | | 702,351 | |
Village Super Market, Inc., Class A | | | 74,009 | | | | 1,961,979 | |
Weis Markets, Inc. | | | 97,625 | | | | 3,554,526 | |
| | | | | | | | |
| | |
| | | | | | | 23,624,221 | |
| | |
Energy - 13.63% | | | | | | | | |
Adams Resources & Energy, Inc. | | | 23,100 | | | | 791,868 | |
Arch Coal, Inc., Class A | | | 61,000 | | | | 5,746,810 | |
Archrock, Inc. | | | 447,000 | | | | 4,738,200 | |
Ardmore Shipping Corp.* | | | 172,688 | | | | 1,407,407 | |
Berry Petroleum Corp. | | | 310,000 | | | | 3,286,000 | |
Bonanza Creek Energy, Inc.* | | | 90,000 | | | | 1,879,200 | |
Callon Petroleum Co.* | | | 401,000 | | | | 2,642,590 | |
Carrizo Oil & Gas, Inc.* | | | 338,300 | | | | 3,389,766 | |
Clean Energy Fuels Corp.* | | | 300,000 | | | | 801,000 | |
CONSOL Energy, Inc.* | | | 93,400 | | | | 2,485,374 | |
Contango Oil & Gas Co.* | | | 142,000 | | | | 247,080 | |
Contura Energy, Inc.* | | | 55,800 | | | | 2,896,020 | |
Dawson Geophysical Co.* | | | 45,600 | | | | 114,000 | |
| | |
|
| |
| 8 | | Annual Report | June 30, 2019 |
| | |
OmniSmall-Cap Value Fund SCHEDULE OF INVESTMENTS(continued) | | |
|
|
| |
| Showing percentage of net assets as of June 30, 2019 | | |
| | | | | | | | |
| Industry Company | | Shares | | | Value | |
|
Common Stocks (continued) | |
Energy (continued) | |
Delek US Holdings, Inc. | | | 32,080 | | | $ | 1,299,882 | |
Denbury Resources, Inc.* | | | 980,000 | | | | 1,215,200 | |
DHT Holdings, Inc. | | | 347,322 | | | | 2,052,673 | |
Diamond Offshore Drilling, Inc.*+ | | | 260,000 | | | | 2,306,200 | |
Dorian LPG, Ltd.* | | | 130,500 | | | | 1,177,110 | |
Earthstone Energy, Inc., Class A* | | | 187,000 | | | | 1,144,440 | |
Ensco Rowan PLC,
Class A+ | | | 204,931 | | | | 1,748,061 | |
Era Group, Inc.* | | | 144,800 | | | | 1,207,632 | |
Euronav NV | | | 125,442 | | | | 1,184,172 | |
Exterran Corp.* | | | 167,200 | | | | 2,377,584 | |
Extraction Oil & Gas, Inc.*+ | | | 640,400 | | | | 2,772,932 | |
Frontline, Ltd.*+ | | | 180,000 | | | | 1,440,000 | |
GasLog, Ltd. | | | 314,300 | | | | 4,525,920 | |
Gran Tierra Energy, Inc.* | | | 1,574,400 | | | | 2,503,296 | |
Green Plains, Inc. | | | 140,200 | | | | 1,511,356 | |
Gulf Island Fabrication, Inc.* | | | 15,000 | | | | 106,500 | |
Gulfport Energy Corp.* | | | 617,000 | | | | 3,029,470 | |
Hallador Energy Co. | | | 166,600 | | | | 937,958 | |
Helix Energy Solutions Group, Inc.* | | | 670,500 | | | | 5,786,415 | |
HighPoint Resources Corp.* | | | 800,546 | | | | 1,456,994 | |
Independence Contract Drilling, Inc.* | | | 183,319 | | | | 289,644 | |
International Seaways, Inc.* | | | 438 | | | | 8,322 | |
Keane Group, Inc.* | | | 200,000 | | | | 1,344,000 | |
Lonestar Resources US, Inc., Class A* | | | 109,250 | | | | 250,182 | |
Mammoth Energy Services, Inc. | | | 251,400 | | | | 1,729,632 | |
Matador Resources Co.* | | | 37,000 | | | | 735,560 | |
Matrix Service Co.* | | | 62,500 | | | | 1,266,250 | |
McDermott International, Inc.* | | | 250,131 | | | | 2,416,265 | |
Midstates Petroleum Co., Inc.* | | | 94,300 | | | | 555,427 | |
Mitcham Industries, Inc.* | | | 15,100 | | | | 59,645 | |
Montage Resources Corp.* | | | 69,213 | | | | 422,199 | |
Nabors Industries, Ltd. | | | 810,000 | | | | 2,349,000 | |
NACCO Industries, Inc., Class A | | | 37,245 | | | | 1,934,505 | |
Natural Gas Services Group, Inc.* | | | 68,800 | | | | 1,135,200 | |
Navigator Holdings, Ltd.* | | | 200,000 | | | | 1,872,000 | |
Newpark Resources, Inc.* | | | 245,000 | | | | 1,817,900 | |
Nine Energy Service, Inc.* | | | 55,000 | | | | 953,150 | |
Noble Corp. PLC* | | | 237,200 | | | | 443,564 | |
Northern Oil and Gas, Inc.*+ | | | 1,165,700 | | | | 2,249,801 | |
| | | | | | | | |
| Industry Company | | Shares | | | Value | |
| | |
Energy (continued) | | | | | | | | |
Oil States International, Inc.* | | | 121,000 | | | $ | 2,214,300 | |
Overseas Shipholding Group, Inc., Class A* | | | 455,916 | | | | 857,122 | |
Pacific Ethanol, Inc.* | | | 86,900 | | | | 66,478 | |
Par Pacific Holdings, Inc.* | | | 119,900 | | | | 2,460,348 | |
Penn Virginia Corp.* | | | 56,000 | | | | 1,718,080 | |
Pioneer Energy Services Corp.* | | | 143,100 | | | | 36,190 | |
ProPetro Holding Corp.* | | | 170,000 | | | | 3,519,000 | |
QEP Resources, Inc.* | | | 475,000 | | | | 3,434,250 | |
Ranger Energy Services, Inc.* | | | 3,000 | | | | 24,150 | |
Renewable Energy Group, Inc.* | | | 163,885 | | | | 2,599,216 | |
REX American Resources Corp.* | | | 33,920 | | | | 2,472,768 | |
Ring Energy, Inc.* | | | 50,000 | | | | 162,500 | |
SandRidge Energy, Inc.* | | | 34,550 | | | | 239,086 | |
SEACOR Holdings, Inc.* | | | 53,400 | | | | 2,537,034 | |
Select Energy Services, Inc., Class A* | | | 175,000 | | | | 2,031,750 | |
SemGroup Corp., Class A | | | 180,500 | | | | 2,166,000 | |
Ship Finance International, Ltd. | | | 434,400 | | | | 5,434,344 | |
SilverBow Resources, Inc.* | | | 15,000 | | | | 207,750 | |
SM Energy Co. | | | 257,000 | | | | 3,217,640 | |
SRC Energy, Inc.* | | | 608,500 | | | | 3,018,160 | |
Superior Energy Services, Inc.* | | | 220,000 | | | | 286,000 | |
Teekay Corp.+ | | | 340,000 | | | | 1,169,600 | |
TransAtlantic Petroleum, Ltd.* | | | 35,000 | | | | 25,204 | |
Unit Corp.* | | | 260,725 | | | | 2,317,845 | |
VAALCO Energy, Inc.* | | | 300,000 | | | | 501,000 | |
| | | | | | | | |
| | |
| | | | | | | 134,757,171 | |
| | |
Financials - 30.29% | | | | | | | | |
1347 Property Insurance Holdings, Inc.* | | | 24,300 | | | | 120,285 | |
1st Constitution Bancorp | | | 3,000 | | | | 55,410 | |
1st Source Corp. | | | 39,347 | | | | 1,825,701 | |
ACNB Corp. | | | 3,000 | | | | 118,710 | |
A-Mark Precious Metals, Inc.* | | | 5,000 | | | | 65,250 | |
American Equity Investment Life Holding Co. | | | 850 | | | | 23,086 | |
American National Bankshares, Inc. | | | 21,752 | | | | 842,890 | |
American River Bankshares | | | 21,300 | | | | 261,138 | |
AmeriServ Financial, Inc. | | | 138,000 | | | | 572,700 | |
| | |
OmniSmall-Cap Value Fund SCHEDULE OF INVESTMENTS(continued) | | |
|
|
| |
| Showing percentage of net assets as of June 30, 2019 | | |
| | | | | | | | |
| Industry Company | | Shares | | | Value | |
|
Common Stocks (continued) | |
Financials (continued) | |
Argo Group International Holdings, Ltd. | | | 71,884 | | | $ | 5,323,010 | |
Arlington Asset Investment Corp., Class A | | | 88,900 | | | | 611,632 | |
Atlantic Capital Bancshares, Inc.* | | | 109,800 | | | | 1,879,776 | |
B. Riley Financial, Inc. | | | 402 | | | | 8,386 | |
Banc of California, Inc. | | | 179,500 | | | | 2,507,615 | |
Banco Latinoamericano de Comercio Exterior SA, Class E | | | 117,000 | | | | 2,437,110 | |
Bancorp, Inc. (The)* | | | 169,500 | | | | 1,511,940 | |
Bankwell Financial Group, Inc. | | | 1,800 | | | | 51,660 | |
Banner Corp. | | | 32,000 | | | | 1,732,800 | |
Bar Harbor Bankshares | | | 61,966 | | | | 1,647,676 | |
BCB Bancorp, Inc. | | | 60,400 | | | | 836,540 | |
Berkshire Hills Bancorp, Inc. | | | 164,801 | | | | 5,173,103 | |
Blucora, Inc.* | | | 15,002 | | | | 455,611 | |
Blue Capital Reinsurance Holdings, Ltd.+ | | | 12,173 | | | | 80,220 | |
Boston Private Financial Holdings, Inc. | | | 200,000 | | | | 2,414,000 | |
Byline Bancorp, Inc.* | | | 100,000 | | | | 1,912,000 | |
C&F Financial Corp. | | | 10,500 | | | | 573,405 | |
Cadence BanCorp. | | | 166,000 | | | | 3,452,800 | |
Camden National Corp. | | | 30,100 | | | | 1,380,687 | |
Capital City Bank Group, Inc. | | | 83,150 | | | | 2,066,277 | |
Capstar Financial Holdings, Inc. | | | 29,000 | | | | 439,350 | |
CB Financial Services, Inc. | | | 14,000 | | | | 332,500 | |
Central Pacific Financial Corp. | | | 15,000 | | | | 449,400 | |
Central Valley Community Bancorp | | | 50,000 | | | | 1,073,500 | |
Century Bancorp, Inc., Class A | | | 15,200 | | | | 1,336,080 | |
Chemung Financial Corp. | | | 13,500 | | | | 652,590 | |
Citizens Community Bancorp, Inc. | | | 40,000 | | | | 433,600 | |
Citizens, Inc.*+ | | | 106,040 | | | | 774,092 | |
Civista Bancshares, Inc. | | | 57,523 | | | | 1,291,391 | |
CNB Financial Corp. | | | 73,800 | | | | 2,084,112 | |
Codorus Valley Bancorp, Inc. | | | 15,355 | | | | 353,165 | |
Colony Bankcorp, Inc. | | | 1,500 | | | | 25,425 | |
Community Bankers Trust Corp. | | | 40,800 | | | | 345,576 | |
Community Financial Corp. (The) | | | 12,500 | | | | 421,625 | |
Community Trust Bancorp, Inc. | | | 20,000 | | | | 845,800 | |
| | | | | | | | |
| Industry Company | | Shares | | | Value | |
| | |
Financials (continued) | | | | | | | | |
Community West Bancshares | | | 2,000 | | | $ | 19,300 | |
ConnectOne Bancorp, Inc. | | | 105,200 | | | | 2,383,832 | |
Consumer Portfolio Services, Inc.* | | | 191,650 | | | | 728,270 | |
County Bancorp, Inc.+ | | | 12,237 | | | | 209,130 | |
Cowen, Inc., Class A* | | | 154,100 | | | | 2,648,979 | |
Crawford & Co., Class A | | | 47,600 | | | | 501,228 | |
Crawford & Co., Class B | | | 16,400 | | | | 152,684 | |
Customers Bancorp, Inc.* | | | 81,700 | | | | 1,715,700 | |
Dime Community Bancshares, Inc. | | | 97,900 | | | | 1,859,121 | |
DNB Financial Corp. | | | 13,465 | | | | 598,789 | |
Donegal Group, Inc., Class A | | | 99,000 | | | | 1,511,730 | |
Eagle Bancorp Montana, Inc. | | | 29,000 | | | | 481,400 | |
Elevate Credit, Inc.* | | | 5,600 | | | | 23,072 | |
EMC Insurance Group, Inc. | | | 49,550 | | | | 1,785,286 | |
Emclaire Financial Corp.+ | | | 200 | | | | 6,252 | |
Employers Holdings, Inc. | | | 114,900 | | | | 4,856,823 | |
Encore Capital Group, Inc.* | | | 98,000 | | | | 3,319,260 | |
Enova International, Inc.* | | | 152,807 | | | | 3,522,201 | |
Entegra Financial Corp.* | | | 25,000 | | | | 753,000 | |
Enterprise Bancorp, Inc. | | | 33,275 | | | | 1,055,150 | |
Equity Bancshares, Inc.,
Class A* | | | 21,000 | | | | 559,860 | |
ESSA Bancorp, Inc. | | | 33,100 | | | | 504,775 | |
Evans Bancorp, Inc. | | | 12,808 | | | | 483,246 | |
EZCORP, Inc., Class A* | | | 194,169 | | | | 1,838,780 | |
Farmers National Banc Corp. | | | 150 | | | | 2,224 | |
FB Financial Corp. | | | 75,000 | | | | 2,745,000 | |
FBL Financial Group, Inc., Class A | | | 75,806 | | | | 4,836,423 | |
Federal Agricultural Mortgage Corp., Class C | | | 34,000 | | | | 2,470,440 | |
FedNat Holding Co. | | | 50,900 | | | | 726,343 | |
Fidelity Southern Corp. | | | 76,123 | | | | 2,357,529 | |
Financial Institutions, Inc. | | | 39,300 | | | | 1,145,595 | |
First BanCorp Puerto Rico | | | 566,400 | | | | 6,253,056 | |
First Bancorp, Inc. | | | 5,500 | | | | 147,675 | |
First Bank | | | 82,000 | | | | 962,680 | |
First Busey Corp. | | | 165,100 | | | | 4,360,291 | |
First Business Financial Services, Inc. | | | 42,400 | | | | 996,400 | |
First Capital, Inc. | | | 35 | | | | 1,769 | |
First Community Bankshares, Inc. | | | 30,000 | | | | 1,012,800 | |
First Community Corp. | | | 600 | | | | 11,106 | |
First Financial Corp. | | | 37,000 | | | | 1,485,920 | |
| | |
|
| |
| 10 | | Annual Report | June 30, 2019 |
| | |
OmniSmall-Cap Value Fund SCHEDULE OF INVESTMENTS(continued) | | |
|
|
| |
| Showing percentage of net assets as of June 30, 2019 | | |
| | | | | | | | |
| Industry Company | | Shares | | | Value | |
|
Common Stocks (continued) | |
Financials (continued) | |
First Financial Northwest, Inc. | | | 35,182 | | | $ | 497,825 | |
First Guaranty Bancshares, Inc. | | | 5,499 | | | | 114,654 | |
First Internet Bancorp | | | 14,500 | | | | 312,330 | |
First Northwest Bancorp | | | 2,000 | | | | 32,500 | |
First United Corp. | | | 14,876 | | | | 293,206 | |
First US Bancshares, Inc. | | | 4,368 | | | | 40,360 | |
Flushing Financial Corp. | | | 75,897 | | | | 1,684,913 | |
Franklin Financial Network, Inc. | | | 40,000 | | | | 1,114,400 | |
FS Bancorp, Inc. | | | 9,150 | | | | 474,610 | |
FS KKR Capital Corp. | | | 470,000 | | | | 2,801,200 | |
FSB Bancorp, Inc.* | | | 1,000 | | | | 18,000 | |
GAIN Capital Holdings, Inc.+ | | | 71,605 | | | | 295,729 | |
Global Indemnity, Ltd. | | | 44,100 | | | | 1,365,336 | |
Great Southern Bancorp, Inc. | | | 36,900 | | | | 2,208,465 | |
Great Western Bancorp, Inc. | | | 78,000 | | | | 2,786,160 | |
Hallmark Financial Services, Inc.* | | | 57,800 | | | | 822,494 | |
Hanmi Financial Corp. | | | 75,000 | | | | 1,670,250 | |
Hawthorn Bancshares, Inc. | | | 16,981 | | | | 455,091 | |
HCI Group, Inc. | | | 13,000 | | | | 526,110 | |
Heartland Financial USA, Inc. | | | 101,300 | | | | 4,531,149 | |
Hennessy Advisors, Inc. | | | 4,000 | | | | 38,800 | |
Heritage Insurance Holdings, Inc. | | | 90,000 | | | | 1,386,900 | |
Hilltop Holdings, Inc. | | | 221,100 | | | | 4,702,797 | |
Hingham Institution for Savings | | | 30 | | | | 5,940 | |
HMN Financial, Inc.* | | | 23,800 | | | | 499,800 | |
Home Bancorp, Inc. | | | 31,994 | | | | 1,231,129 | |
HomeStreet, Inc.* | | | 112,200 | | | | 3,325,608 | |
HomeTrust Bancshares, Inc. | | | 2,961 | | | | 74,440 | |
Hope Bancorp, Inc. | | | 325,000 | | | | 4,478,500 | |
HopFed Bancorp, Inc. | | | 18,100 | | | | 343,357 | |
Horace Mann Educators Corp. | | | 107,000 | | | | 4,311,030 | |
Horizon Bancorp, Inc. | | | 27,087 | | | | 442,602 | |
Howard Bancorp, Inc.* | | | 96,000 | | | | 1,456,320 | |
Independence Holding Co. | | | 15,050 | | | | 582,736 | |
INTL. FCStone, Inc.* | | | 18,500 | | | | 732,415 | |
James River Group Holdings, Ltd. | | | 110,600 | | | | 5,187,140 | |
Kingstone Cos., Inc. | | | 16,100 | | | | 139,265 | |
Ladenburg Thalmann Financial Services, Inc. | | | 354,000 | | | | 1,214,220 | |
| | | | | | | | |
| Industry Company | | Shares | | | Value | |
|
Financials (continued) | |
Lakeland Bancorp, Inc. | | | 125,250 | | | $ | 2,022,788 | |
Landmark Bancorp, Inc. | | | 1,214 | | | | 29,075 | |
LCNB Corp. | | | 18,000 | | | | 342,000 | |
Live Oak Bancshares, Inc. | | | 63,600 | | | | 1,090,740 | |
Luther Burbank Corp. | | | 188,000 | | | | 2,047,320 | |
Mackinac Financial Corp. | | | 40,800 | | | | 644,640 | |
Manning & Napier, Inc. | | | 209,000 | | | | 365,750 | |
Marlin Business Services Corp. | | | 51,280 | | | | 1,278,410 | |
Mercantile Bank Corp. | | | 2,200 | | | | 71,676 | |
Merchants Bancorp/IN | | | 55,000 | | | | 936,650 | |
Meta Financial Group, Inc. | | | 79,431 | | | | 2,228,040 | |
Metropolitan Bank Holding Corp.* | | | 26,400 | | | | 1,161,600 | |
Mid Penn Bancorp, Inc. | | | 12,300 | | | | 306,885 | |
Middlefield Banc Corp.+ | | | 17,000 | | | | 697,000 | |
Midland States Bancorp, Inc. | | | 78,658 | | | | 2,101,742 | |
MidSouth Bancorp, Inc.+ | | | 27,562 | | | | 326,610 | |
MidWestOne Financial Group, Inc. | | | 49,860 | | | | 1,394,086 | |
MMA Capital Holdings, Inc.*+ | | | 1,700 | | | | 56,899 | |
Mr Cooper Group, Inc.* | | | 262,066 | | | | 2,099,149 | |
MutualFirst Financial, Inc. | | | 18,900 | | | | 643,356 | |
MVB Financial Corp. | | | 42,718 | | | | 724,497 | |
National Holdings Corp.* | | | 2,000 | | | | 5,420 | |
National Security Group, Inc. (The) | | | 200 | | | | 2,400 | |
National Western Life Group, Inc., Class A | | | 12,714 | | | | 3,267,498 | |
Nelnet, Inc., Class A | | | 31,800 | | | | 1,883,196 | |
Nicholas Financial, Inc.*+ | | | 43,400 | | | | 407,960 | |
Nicolet Bankshares, Inc.* | | | 19,355 | | | | 1,201,171 | |
NMI Holdings, Inc., Class A* | | | 65,700 | | | | 1,865,223 | |
Northeast Bank | | | 37,500 | | | | 1,034,250 | |
Northrim BanCorp, Inc. | | | 30,445 | | | | 1,085,669 | |
Northwest Bancshares, Inc. | | | 236,000 | | | | 4,155,960 | |
Ocwen Financial Corp.* | | | 645,000 | | | | 1,335,150 | |
OFG Bancorp | | | 153,500 | | | | 3,648,695 | |
Old Point Financial Corp. | | | 1,000 | | | | 22,050 | |
Old Second Bancorp, Inc. | | | 79,750 | | | | 1,018,408 | |
On Deck Capital, Inc.* | | | 495,200 | | | | 2,055,080 | |
Oppenheimer Holdings, Inc., Class A | | | 49,093 | | | | 1,336,311 | |
Opus Bank | | | 133,000 | | | | 2,807,630 | |
Orrstown Financial Services, Inc. | | | 35,500 | | | | 780,645 | |
Ottawa Bancorp, Inc. | | | 1,000 | | | | 13,040 | |
Pacific Mercantile Bancorp* | | | 3,000 | | | | 24,750 | |
| | |
OmniSmall-Cap Value Fund SCHEDULE OF INVESTMENTS(continued) | | |
|
|
| |
| Showing percentage of net assets as of June 30, 2019 | | |
| | | | | | | | |
| Industry Company | | Shares | | | Value | |
|
Common Stocks (continued) | |
Financials (continued) | |
Pacific Premier Bancorp, Inc. | | | 55,800 | | | $ | 1,723,104 | |
Parke Bancorp, Inc. | | | 61,909 | | | | 1,482,721 | |
Pathfinder Bancorp, Inc.+ | | | 3,000 | | | | 43,650 | |
Patriot National Bancorp, Inc. | | | 13,000 | | | | 194,090 | |
PB Bancorp, Inc. | | | 15,500 | | | | 183,675 | |
Peapack Gladstone Financial Corp. | | | 60,894 | | | | 1,712,339 | |
Penns Woods Bancorp, Inc. | | | 2,023 | | | | 91,541 | |
PennyMac Financial Services, Inc. | | | 103,900 | | | | 2,304,502 | |
Peoples Bancorp of North Carolina, Inc. | | | 24,017 | | | | 721,711 | |
Peoples Bancorp, Inc. | | | 43,400 | | | | 1,400,084 | |
Peoples Financial Services Corp. | | | 22,900 | | | | 1,030,271 | |
People’s United Financial, Inc. | | | 20,022 | | | | 335,969 | |
Piper Jaffray Cos | | | 51,400 | | | | 3,817,478 | |
PRA Group, Inc.* | | | 67,000 | | | | 1,885,380 | |
Premier Financial Bancorp, Inc. | | | 79,650 | | | | 1,194,750 | |
Protective Insurance Corp., Class B+ | | | 75,300 | | | | 1,307,961 | |
Provident Financial Holdings, Inc. | | | 51,000 | | | | 1,070,490 | |
Provident Financial Services, Inc. | | | 118,900 | | | | 2,883,325 | |
Prudential Bancorp, Inc. | | | 4,600 | | | | 87,032 | |
QCR Holdings, Inc. | | | 16,500 | | | | 575,355 | |
Regional Management Corp.* | | | 55,000 | | | | 1,450,350 | |
Reliant Bancorp, Inc. | | | 45,000 | | | | 1,063,350 | |
Renasant Corp. | | | 2,300 | | | | 82,662 | |
Republic Bancorp, Inc., Class A | | | 66,142 | | | | 3,290,564 | |
Riverview Bancorp, Inc. | | | 87,000 | | | | 742,980 | |
S&T Bancorp, Inc. | | | 20,045 | | | | 751,287 | |
Safety Insurance Group, Inc. | | | 2,356 | | | | 224,126 | |
Salisbury Bancorp, Inc. | | | 2,183 | | | | 85,137 | |
Sandy Spring Bancorp, Inc. | | | 93,500 | | | | 3,261,280 | |
SB Financial Group, Inc. | | | 30,400 | | | | 500,384 | |
SB One Bancorp | | | 5,000 | | | | 111,750 | |
Security National Financial Corp., Class A* | | | 95,147 | | | | 477,638 | |
Severn Bancorp, Inc. | | | 35,000 | | | | 304,150 | |
Shore Bancshares, Inc. | | | 67,012 | | | | 1,094,976 | |
Sierra Bancorp | | | 53,600 | | | | 1,453,632 | |
Sound Financial Bancorp, Inc. | | | 1,000 | | | | 34,150 | |
Southern Missouri Bancorp, Inc. | | | 5,000 | | | | 174,150 | |
| | | | | | | | |
| Industry Company | | Shares | | | Value | |
| | |
Financials (continued) | | | | | | | | |
Southern National Bancorp of Virginia, Inc. | | | 56,958 | | | $ | 872,027 | |
Standard AVB Financial Corp.+ | | | 25,900 | | | | 710,696 | |
State Auto Financial Corp. | | | 83,550 | | | | 2,924,250 | |
Stewardship Financial Corp. | | | 1,000 | | | | 15,460 | |
Stewart Information Services Corp. | | | 87,150 | | | | 3,528,704 | |
Summit Financial Group, Inc. | | | 29,515 | | | | 792,478 | |
Territorial Bancorp, Inc. | | | 21,200 | | | | 655,080 | |
TheStreet, Inc. | | | 14,249 | | | | 87,346 | |
Timberland Bancorp, Inc. | | | 39,000 | | | | 1,165,320 | |
Tiptree, Inc. | | | 135,200 | | | | 851,760 | |
Towne Bank | | | 1,642 | | | | 44,794 | |
TriState Capital Holdings, Inc.* | | | 90,000 | | | | 1,920,600 | |
Triumph Bancorp, Inc.* | | | 16,500 | | | | 479,325 | |
Two River Bancorp | | | 36,205 | | | | 519,904 | |
United Bancshares, Inc. | | | 1,000 | | | | 20,170 | |
United Community Financial Corp. | | | 43,524 | | | | 416,525 | |
United Financial Bancorp, Inc. | | | 195,400 | | | | 2,770,772 | |
United Fire Group, Inc. | | | 78,800 | | | | 3,818,648 | |
United Insurance Holdings Corp. | | | 84,700 | | | | 1,207,822 | |
Unity Bancorp, Inc. | | | 8,000 | | | | 181,600 | |
Universal Insurance Holdings, Inc. | | | 111,316 | | | | 3,105,716 | |
Univest Financial Corp. | | | 74,979 | | | | 1,968,949 | |
Veritex Holdings, Inc. | | | 52,930 | | | | 1,373,534 | |
Waddell & Reed Financial, Inc., Class A | | | 247,000 | | | | 4,117,490 | |
Walker & Dunlop, Inc. | | | 84,475 | | | | 4,494,915 | |
Waterstone Financial, Inc. | | | 49,000 | | | | 835,940 | |
Wellesley Bank | | | 1,000 | | | | 32,610 | |
WesBanco, Inc. | | | 80,996 | | | | 3,122,396 | |
Western New England Bancorp, Inc. | | | 165,000 | | | | 1,541,100 | |
World Acceptance Corp.* | | | 26,100 | | | | 4,283,271 | |
| | | | | | | | |
| | |
| | | | | | | 299,557,139 | |
| | |
Health Care - 3.43% | | | | | | | | |
Acorda Therapeutics, Inc.* | | | 162,000 | | | | 1,242,540 | |
AMAG Pharmaceuticals, Inc.* | | | 50,000 | | | | 499,500 | |
AngioDynamics, Inc.* | | | 85,300 | | | | 1,679,557 | |
Assertio Therapeutics, Inc.* | | | 137,200 | | | | 473,340 | |
Brookdale Senior Living, Inc.* | | | 646,000 | | | | 4,657,660 | |
| | |
|
| |
| 12 | | Annual Report | June 30, 2019 |
| | |
OmniSmall-Cap Value Fund SCHEDULE OF INVESTMENTS(continued) | | |
|
|
| |
| Showing percentage of net assets as of June 30, 2019 | | |
| | | | | | | | |
| Industry Company | | Shares | | | Value | |
|
Common Stocks (continued) | |
Health Care (continued) | |
Concert Pharmaceuticals, Inc.* | | | 100,100 | | | $ | 1,201,200 | |
Cross Country Healthcare, Inc.* | | | 95,450 | | | | 895,321 | |
FONAR Corp.* | | | 30,400 | | | | 653,904 | |
InfuSystem Holdings, Inc.* | | | 71,100 | | | | 305,730 | |
Kewaunee Scientific Corp. | | | 3,000 | | | | 57,420 | |
Magellan Health, Inc.* | | | 71,300 | | | | 5,292,599 | |
Mallinckrodt PLC*+ | | | 409,000 | | | | 3,754,620 | |
National HealthCare Corp. | | | 25,500 | | | | 2,069,325 | |
PDL BioPharma, Inc.* | | | 591,000 | | | | 1,855,740 | |
Prestige Consumer Healthcare, Inc.* | | | 161,800 | | | | 5,125,824 | |
Surgery Partners, Inc.*+ | | | 152,241 | | | | 1,239,242 | |
Triple-S Management Corp., Class B* | | | 122,300 | | | | 2,916,855 | |
| | | | | | | | |
| | |
| | | | | | | 33,920,377 | |
| | |
Industrials - 16.14% | | | | | | | | |
Acacia Research Corp.* | | | 166,000 | | | | 491,360 | |
ACCO Brands Corp. | | | 364,300 | | | | 2,867,041 | |
Aegion Corp.* | | | 99,341 | | | | 1,827,874 | |
AeroCentury Corp.* | | | 4,300 | | | | 31,272 | |
Air T, Inc.* | | | 4,200 | | | | 73,458 | |
Aircastle, Ltd. | | | 261,100 | | | | 5,550,986 | |
Alpha Pro Tech, Ltd.* | | | 20,743 | | | | 70,734 | |
AMREP Corp.* | | | 25,500 | | | | 174,930 | |
Apogee Enterprises, Inc. | | | 84,300 | | | | 3,661,992 | |
ARC Document Solutions, Inc.* | | | 50,000 | | | | 102,000 | |
ArcBest Corp. | | | 104,500 | | | | 2,937,495 | |
Armstrong Flooring, Inc.* | | | 62,100 | | | | 611,685 | |
Arotech Corp.* | | | 94,300 | | | | 187,657 | |
Art’s-Way Manufacturing Co., Inc.* | | | 15,000 | | | | 30,300 | |
Atkore International Group, Inc.* | | | 85,000 | | | | 2,198,950 | |
Atlas Air Worldwide Holdings, Inc.* | | | 63,800 | | | | 2,848,032 | |
BMC Stock Holdings, Inc.* | | | 240,300 | | | | 5,094,360 | |
Briggs & Stratton Corp. | | | 119,300 | | | | 1,221,632 | |
Caesarstone, Ltd. | | | 110,600 | | | | 1,662,318 | |
CAI International, Inc.* | | | 104,600 | | | | 2,596,172 | |
Chicago Rivet & Machine Co. | | | 1,000 | | | | 28,490 | |
Civeo Corp.* | | | 519,830 | | | | 894,108 | |
Commercial Vehicle Group, Inc.* | | | 102,300 | | | | 820,446 | |
Costamare, Inc. | | | 402,500 | | | | 2,064,825 | |
Covenant Transportation Group, Inc., Class A* | | | 88,100 | | | | 1,295,951 | |
CRA International, Inc. | | | 34,800 | | | | 1,333,884 | |
| | | | | | | | |
| Industry Company | | Shares | | | Value | |
| | |
Industrials (continued) | | | | | | | | |
DLH Holdings Corp.* | | | 83,500 | | | $ | 424,180 | |
Ducommun, Inc.* | | | 50,550 | | | | 2,278,288 | |
Eagle Bulk Shipping, Inc.*+ | | | 305,000 | | | | 1,598,200 | |
Eastern Co. (The) | | | 18,401 | | | | 515,596 | |
Echo Global Logistics, Inc.* | | | 90,000 | | | | 1,878,300 | |
Ecology and Environment, Inc., Class A | | | 34,500 | | | | 376,050 | |
Ennis, Inc. | | | 136,892 | | | | 2,809,024 | |
EnPro Industries, Inc. | | | 64,800 | | | | 4,136,832 | |
Foundation Building Materials, Inc.* | | | 105,200 | | | | 1,870,456 | |
FTI Consulting, Inc.* | | | 68,500 | | | | 5,743,040 | |
Fuel Tech, Inc.* | | | 115,000 | | | | 161,000 | |
Genco Shipping & Trading, Ltd.* | | | 105,000 | | | | 886,200 | |
General Finance Corp.* | | | 115,764 | | | | 968,945 | |
Goldfield Corp. (The)* | | | 121,000 | | | | 278,300 | |
Great Lakes Dredge & Dock Corp.* | | | 220,550 | | | | 2,434,872 | |
Greenbrier Cos, Inc. (The) | | | 102,800 | | | | 3,125,120 | |
Griffon Corp. | | | 42,000 | | | | 710,640 | |
Hawaiian Holdings, Inc. | | | 133,000 | | | | 3,648,190 | |
HC2 Holdings, Inc.*+ | | | 100,600 | | | | 237,416 | |
Heidrick & Struggles International, Inc. | | | 6,250 | | | | 187,312 | |
Herc Holdings, Inc.* | | | 67,500 | | | | 3,093,525 | |
Hertz Global Holdings, Inc.* | | | 207,000 | | | | 3,303,720 | |
Highpower International, Inc.* | | | 55,923 | | | | 237,114 | |
Hub Group, Inc., Class A* | | | 90,000 | | | | 3,778,200 | |
Hurco Cos., Inc. | | | 27,857 | | | | 990,595 | |
Huron Consulting Group, Inc.* | | | 17,800 | | | | 896,764 | |
Hyster-Yale Materials Handling, Inc. | | | 5,000 | | | | 276,300 | |
ICF International, Inc. | | | 26,229 | | | | 1,909,471 | |
IES Holdings, Inc.* | | | 2,717 | | | | 51,215 | |
Kelly Services, Inc., Class A | | | 102,800 | | | | 2,692,332 | |
LB Foster Co., Class A* | | | 38,400 | | | | 1,049,856 | |
Limbach Holdings, Inc.* | | | 14,800 | | | | 134,680 | |
LS Starrett Co. (The),
Class A* | | | 15,000 | | | | 99,300 | |
Marten Transport, Ltd. | | | 162,561 | | | | 2,950,482 | |
Matson, Inc. | | | 137,100 | | | | 5,326,335 | |
Matthews International Corp., Class A | | | 100,000 | | | | 3,485,000 | |
Milacron Holdings Corp.* | | | 210,000 | | | | 2,898,000 | |
Miller Industries, Inc. | | | 7,300 | | | | 224,475 | |
MYR Group, Inc.* | | | 50,000 | | | | 1,867,500 | |
Navigant Consulting, Inc. | | | 202,028 | | | | 4,685,029 | |
NL Industries, Inc.* | | | 5,000 | | | | 18,250 | |
| | |
OmniSmall-Cap Value Fund SCHEDULE OF INVESTMENTS(continued) | | |
|
|
| |
| Showing percentage of net assets as of June 30, 2019 | | |
| | | | | | | | |
| Industry Company | | Shares | | | Value | |
|
Common Stocks (continued) | |
Industrials (continued) | |
Northwest Pipe Co.* | | | 21,800 | | | $ | 562,004 | |
Orion Group Holdings, Inc.* | | | 37,072 | | | | 99,353 | |
PAM Transportation Services, Inc.* | | | 20,905 | | | | 1,296,110 | |
Pangaea Logistics Solutions, Ltd.+ | | | 2,000 | | | | 6,700 | |
Park-Ohio Holdings Corp. | | | 51,000 | | | | 1,662,090 | |
Patriot Transportation Holding, Inc.* | | | 7,500 | | | | 127,275 | |
Preformed Line Products Co. | | | 6,535 | | | | 362,823 | |
Quad/Graphics, Inc. | | | 138,800 | | | | 1,097,908 | |
Quanex Building Products Corp. | | | 75,000 | | | | 1,416,750 | |
Rush Enterprises, Inc., Class A | | | 139,600 | | | | 5,098,192 | |
Rush Enterprises, Inc., Class B | | | 46,500 | | | | 1,716,315 | |
Safe Bulkers, Inc.* | | | 340,200 | | | | 530,712 | |
Scorpio Bulkers, Inc. | | | 265,000 | | | | 1,219,000 | |
Servotronics, Inc. | | | 1,000 | | | | 9,600 | |
SkyWest, Inc. | | | 30,291 | | | | 1,837,755 | |
Spartan Motors, Inc. | | | 10,000 | | | | 109,600 | |
SPX FLOW, Inc.* | | | 99,100 | | | | 4,148,326 | |
Steelcase, Inc., Class A | | | 274,000 | | | | 4,685,400 | |
Sterling Construction Co., Inc.* | | | 100,000 | | | | 1,342,000 | |
Textainer Group Holdings, Ltd.* | | | 200,300 | | | | 2,019,024 | |
Titan Machinery, Inc.* | | | 83,900 | | | | 1,726,662 | |
TrueBlue, Inc.* | | | 102,350 | | | | 2,257,841 | |
Tutor Perini Corp.* | | | 177,300 | | | | 2,459,151 | |
Ultralife Corp.* | | | 22,400 | | | | 178,080 | |
USA Truck, Inc.* | | | 23,800 | | | | 240,618 | |
Vectrus, Inc.* | | | 38,000 | | | | 1,541,280 | |
Veritiv Corp.* | | | 87,400 | | | | 1,697,308 | |
VSE Corp. | | | 23,600 | | | | 677,084 | |
Wabash National Corp. | | | 110,100 | | | | 1,791,327 | |
Willis Lease Finance Corp.* | | | 48,400 | | | | 2,822,688 | |
| | | | | | | | |
| | |
| | | | | | | 159,653,032 | |
|
Information Technology - 7.66% | |
Alpha & Omega Semiconductor, Ltd.* | | | 214,244 | | | | 2,001,039 | |
Amkor Technology, Inc.* | | | 527,291 | | | | 3,933,591 | |
Amtech Systems, Inc.* | | | 30,000 | | | | 165,000 | |
Avaya Holdings Corp.* | | | 350,500 | | | | 4,174,455 | |
Aviat Networks, Inc.* | | | 15,200 | | | | 208,240 | |
AXT, Inc.* | | | 30,700 | | | | 121,572 | |
| | | | | | | | |
| Industry Company | | Shares | | | Value | |
|
Information Technology (continued) | |
Benchmark Electronics, Inc. | | | 134,000 | | | $ | 3,366,080 | |
BK Technologies Corp. | | | 40,000 | | | | 172,000 | |
Cabot Microelectronics Corp. | | | 1,980 | | | | 217,958 | |
Communications Systems, Inc. | | | 12,500 | | | | 37,625 | |
Computer Task Group, Inc.* | | | 73,862 | | | | 296,187 | |
Comtech Telecommunications Corp. | | | 111,015 | | | | 3,120,632 | |
CSP, Inc. | | | 5,150 | | | | 78,537 | |
Data I/O Corp.* | | | 25,500 | | | | 114,750 | |
Diodes, Inc.* | | | 138,899 | | | | 5,051,757 | |
Fabrinet* | | | 30,000 | | | | 1,490,100 | |
Finjan Holdings, Inc.* | | | 193,200 | | | | 428,904 | |
Ichor Holdings, Ltd.* | | | 65,000 | | | | 1,536,600 | |
Innodata, Inc.* | | | 68,000 | | | | 61,200 | |
Insight Enterprises, Inc.* | | | 119,700 | | | | 6,966,540 | |
inTEST Corp.* | | | 55,000 | | | | 264,550 | |
KEMET Corp. | | | 63,750 | | | | 1,199,138 | |
Key Tronic Corp.* | | | 47,500 | | | | 236,550 | |
Kimball Electronics, Inc.* | | | 74,900 | | | | 1,216,376 | |
ManTech International Corp., Class A | | | 28,800 | | | | 1,896,480 | |
Methode Electronics, Inc. | | | 73,500 | | | | 2,099,895 | |
Mind CTI, Ltd. | | | 200 | | | | 446 | |
NeoPhotonics Corp.* | | | 160,000 | | | | 668,800 | |
Net 1 UEPS Technologies, Inc.* | | | 152,900 | | | | 611,600 | |
NetSol Technologies, Inc.* | | | 39,800 | | | | 222,482 | |
Network-1 Technologies, Inc. | | | 70,000 | | | | 175,000 | |
Nortech Systems, Inc.* | | | 1,500 | | | | 5,685 | |
PCM, Inc.* | | | 40,569 | | | | 1,421,538 | |
PC-Tel, Inc. | | | 72,650 | | | | 321,840 | |
Photronics, Inc.* | | | 271,050 | | | | 2,222,610 | |
Presidio, Inc. | | | 212,000 | | | | 2,898,040 | |
Rambus, Inc.* | | | 140,000 | | | | 1,685,600 | |
Sanmina Corp.* | | | 135,100 | | | | 4,090,828 | |
ScanSource, Inc.* | | | 108,500 | | | | 3,532,760 | |
Steel Connect, Inc.* | | | 170,600 | | | | 310,492 | |
SunPower Corp.*+ | | | 285,000 | | | | 3,046,650 | |
Sykes Enterprises, Inc.* | | | 104,534 | | | | 2,870,504 | |
Synaptics, Inc.* | | | 84,500 | | | | 2,462,330 | |
TiVo Corp. | | | 282,000 | | | | 2,078,340 | |
Trio-Tech International* | | | 21,800 | | | | 62,784 | |
TSR, Inc.* | | | 1,000 | | | | 4,550 | |
TTM Technologies, Inc.* | | | 520,153 | | | | 5,305,561 | |
Ultra Clean Holdings, Inc.* | | | 73,700 | | | | 1,025,904 | |
| | |
|
| |
| 14 | | Annual Report | June 30, 2019 |
| | |
OmniSmall-Cap Value Fund SCHEDULE OF INVESTMENTS(continued) | | |
|
|
| |
| Showing percentage of net assets as of June 30, 2019 | | |
| | | | | | | | |
| Industry Company | | Shares | | | Value | |
|
Common Stocks (continued) | |
Information Technology (continued) | |
Wayside Technology Group, Inc. | | | 16,400 | | | $ | 185,156 | |
Westell Technologies, Inc., Class A* | | | 66,100 | | | | 124,268 | |
| | | | | | | | |
| | |
| | | | | | | 75,789,524 | |
|
Materials - 5.28% | |
AdvanSix, Inc.* | | | 90,000 | | | | 2,198,700 | |
Boise Cascade Co. | | | 78,500 | | | | 2,206,635 | |
Carpenter Technology Corp. | | | 37,100 | | | | 1,780,058 | |
Clearwater Paper Corp.* | | | 50,000 | | | | 924,500 | |
Core Molding Technologies, Inc.* | | | 17,000 | | | | 126,990 | |
Forterra, Inc.*+ | | | 200,000 | | | | 994,000 | |
Friedman Industries, Inc. | | | 52,100 | | | | 362,616 | |
FutureFuel Corp. | | | 102,800 | | | | 1,201,732 | |
Gulf Resources, Inc.* | | | 81,200 | | | | 79,576 | |
Hecla Mining Co. | | | 1,272,000 | | | | 2,289,600 | |
Intrepid Potash, Inc.* | | | 318,500 | | | | 1,070,160 | |
Kaiser Aluminum Corp. | | | 22,630 | | | | 2,208,914 | |
Kraton Corp.* | | | 142,150 | | | | 4,416,600 | |
Kronos Worldwide, Inc. | | | 180,000 | | | | 2,757,600 | |
LSB Industries, Inc.* | | | 74,600 | | | | 290,940 | |
Materion Corp. | | | 18,600 | | | | 1,261,266 | |
Mercer International, Inc. | | | 276,250 | | | | 4,273,588 | |
PH Glatfelter Co. | | | 159,400 | | | | 2,690,672 | |
Ramaco Resources, Inc.* | | | 70,700 | | | | 376,124 | |
Rayonier Advanced Materials, Inc. | | | 52,200 | | | | 338,778 | |
Resolute Forest Products, Inc. | | | 512,000 | | | | 3,686,400 | |
Schnitzer Steel Industries, Inc., Class A | | | 79,700 | | | | 2,085,749 | |
Schweitzer-Mauduit International, Inc. | | | 56,000 | | | | 1,858,080 | |
SunCoke Energy, Inc.* | | | 234,700 | | | | 2,084,136 | |
Trecora Resources* | | | 25,602 | | | | 245,011 | |
Tredegar Corp. | | | 101,700 | | | | 1,690,254 | |
Universal Stainless & Alloy Products, Inc.* | | | 1,350 | | | | 21,600 | |
Verso Corp., Class A* | | | 115,700 | | | | 2,204,085 | |
Warrior Met Coal, Inc. | | | 250,000 | | | | 6,530,000 | |
| | | | | | | | |
| | |
| | | | | | | 52,254,364 | |
| | | | | | | | |
| Industry Company | | Shares | | | Value | |
| | |
Real Estate - 0.26% | | | | | | | | |
Altisource Portfolio Solutions SA* | | | 83,400 | | | $ | 1,639,644 | |
Consolidated-Tomoka Land Co. | | | 15,400 | | | | 919,380 | |
| | | | | | | | |
| | |
| | | | | | | 2,559,024 | |
| | | | | | | | |
| |
TOTAL COMMON STOCKS - 99.06% | | | | 979,705,323 | |
| | | | | |
(Cost $935,281,042) | | | | | |
| |
EXCHANGE TRADED FUND - 0.51% | | | | | |
iShares Russell 2000 Value ETF+ | | | 41,300 | | | | 4,976,650 | |
| | | | | | | | |
| |
TOTAL EXCHANGE TRADED FUND - 0.51% | | | | 4,976,650 | |
| | | | | |
(Cost $4,438,399) | | | | | |
| |
PREFERRED STOCK - 0.00% | | | | | |
Air T Funding, 8.00%*** | | | 2,218 | | | | 5,301 | |
| | | | | | | | |
| |
TOTAL PREFERRED STOCK - 0.00% | | | | 5,301 | |
| | | | | |
(Cost $4,613) | | | | | |
| | |
RIGHTS - 0.04% | | | | | | | | |
Hertz Global Holdings, Inc., expiring 07/12/19* | | | 207,000 | | | | 403,650 | |
Pan American Silver Corp., CVR, expiring 02/22/24*D | | | 150,000 | | | | — | |
Newstar Financial, Inc., expiring 12/26/19*D | | | 120,000 | | | | 8,400 | |
| | | | | | | | |
| |
TOTAL RIGHTS - 0.04% | | | | 412,050 | |
| | | | | |
(Cost $120,846) | | | | | |
| | |
WARRANTS - 0.00% | | | | | | | | |
Air T Funding, expiring 06/07/20* | | | 11,644 | | | | 815 | |
Eagle Bulk Shipping, Inc., expiring 10/15/21* | | | 3,317 | | | | 18 | |
| | | | | | | | |
| |
TOTAL WARRANTS - 0.00% | | | | 833 | |
| | | | | |
(Cost $106,728) | | | | | |
| | |
OmniSmall-Cap Value Fund SCHEDULE OF INVESTMENTS(continued) | | |
|
|
| |
| Showing percentage of net assets as of June 30, 2019 | | |
| | | | | | | | | | | | |
| | | Rate^ | | | Shares | | | Value | |
|
MONEY MARKET FUND - 0.00% | |
Fidelity Investments Money Market Government Portfolio Class I | | | 2.25% | | | | 752 | | | $ | 752 | |
| | | | | | | | | | | | |
| |
TOTAL MONEY MARKET FUND - 0.00% | | | | 752 | |
| | | | | | | | | | | | |
(Cost $752) | | | | | |
|
| INVESTMENTS PURCHASED WITH CASH PROCEEDS FROM SECURITIES LENDING - 2.77% | |
Fidelity Investments Money Market Government Portfolio
Class I** | | | 2.25% | | | | 27,405,876 | | | | 27,405,876 | |
| | | | | | | | | | | | |
TOTAL INVESTMENTS PURCHASED WITH CASH PROCEEDS FROM SECURITIES LENDING - 2.77% | | | | 27,405,876 | |
| | | | | | | | | | | | |
(Cost $27,405,876) | | | | | |
| |
TOTAL INVESTMENTS - 102.38% | | | $ | 1,012,506,785 | |
(Cost $967,358,256) | | | | | |
Liabilities in Excess of Other Assets - (2.38%) | | | | (23,491,439 | ) |
| | | | | | | | | | | | |
| |
NET ASSETS - 100.00% | | | $ | 989,015,346 | |
| | | | | | | | | | | | |
| * | Non-income producing security. |
| ** | This security represents the investment of the collateral received in connection with securities out on loan as of June 30, 2019. |
| *** | Security is perpetual and has no stated maturity date. |
| ^ | Rate disclosed as of June 30, 2019. |
| D | Security was fair valued using significant unobservable inputs (see Note 2). As such, the security is classified as Level 3 in the fair value hierarchy. |
| + | This security or a portion of the security is out on loan at June 30, 2019. Total loaned securities had a value of $26,788,784, which included loaned securities with a value of $27,156 that have been sold and are pending settlement as of June 30, 2019. The total market value of loaned securities excluding these pending sales is $26,761,628. |
CVR - Contingent Value Rights
LLC - Limited Liability Company
PLC - Public Limited Company
Summary of inputs used to value the Fund’s investments as of 06/30/2019 (See Note 2 in Notes to Financial Statements):
| | | | | | | | | | | | | | | | |
| | | Valuation Inputs | |
| | | Investment in Securities (Value) | |
| | | Level 1 Quoted Prices | | | Level 2
Significant
Observable
Inputs | | | Level 3
Significant Unobservable Inputs | | | Total | |
| | | | |
Common Stocks | | | | | | | | | | | | | | | | |
Consumer Discretionary | | $ | 150,658,158 | | | $ | 57,450 | | | $ | — | | | $ | 150,715,608 | |
Information Technology | | | 75,783,839 | | | | 5,685 | | | | — | | | | 75,789,524 | |
Other Industries (a) | | | 753,200,191 | | | | — | | | | — | | | | 753,200,191 | |
| | | | | | | | | | | | | | | | |
Total Common Stocks | | | 979,642,188 | | | | 63,135 | | | | — | | | | 979,705,323 | |
Exchange Traded Fund | | | 4,976,650 | | | | — | | | | — | | | | 4,976,650 | |
Preferred Stock | | | 5,301 | | | | — | | | | — | | | | 5,301 | |
Rights | | | 403,650 | | | | — | | | | 8,400 | | | | 412,050 | |
Warrants | | | 833 | | | | — | | | | — | | | | 833 | |
Money Market Fund | | | — | | | | 752 | | | | — | | | | 752 | |
Investments Purchased with Cash Proceeds from Securities Lending | | | — | | | | 27,405,876 | | | | — | | | | 27,405,876 | |
| | | | | | | | | | | | | | | | |
TOTAL | | $ | 985,028,622 | | | $ | 27,469,763 | | | $ | 8,400 | | | $ | 1,012,506,785 | |
| | | | | | | | | | | | | | | | |
(a) - please refer to the Schedule of Investments for the industry classifications of these portfolio holdings.
| | |
|
| |
| 16 | | Annual Report | June 30, 2019 |
| | |
OmniSmall-Cap Value Fund SCHEDULE OF INVESTMENTS(continued) | | |
|
|
| |
| Showing percentage of net assets as of June 30, 2019 | | |
Following is a reconciliation of Level 3 investments for which significant unobservable inputs were used to determine fair value:
| | | | | |
| | | Investment in Securities (Value) |
| | | Rights |
Balance as of 6/30/2018 | | | $ | 36,000 | |
Purchases | | | | 34,500 | |
Return of Capital | | | | (27,926 | ) |
Realized gain/(loss) | | | | — | |
Change in unrealized appreciation/(depreciation) | | | | (34,174 | ) |
Transfers in | | | | — | |
Transfers out | | | | — | |
| | | | | |
| |
Balance as of 06/30/2019 | | | $ | 8,400 | |
| | | | | |
Net change in unrealized appreciation (depreciation) from investments held as of 06/30/2019 | | | $ | (34,174 | ) |
| | | | | |
See Notes to Financial Statements.
| | |
Omni Tax-Managed Small-Cap Value Fund MANAGER’S COMMENTARY (Unaudited) | | |
|
|
June 30, 2019
Dear Fellow Omni Tax-Managed Small-Cap Value Fund Shareholder,
For the quarter ended June 30, 2019, our Fund returned -2.50%, underperforming our primary market benchmark, the Russell 2000 Value Index (+1.38%).
For the fiscal year, our Fund returned -16.49%, underperforming the Russell 2000 Value Index (-6.24%).
The table below presents our June quarter, one-year, five-year, and inception-to-date financial results. See the next page for a graph of performance since inception.
Standardized Returns as of June 30, 2019
| | | | | | | | |
| | | | | | | Annualized |
| | | Quarter | | 1 Year | | 5 Years | | Since Inception
(12/31/10) |
| | | | |
Omni Tax-Managed Small-Cap Value Fund | | -2.50% | | -16.49% | | 2.90% | | 7.82% |
Russell 2000 Value Index | | 1.38% | | -6.24% | | 5.39% | | 8.70% |
Performance figures quoted in the table above and the graph on the next page represent past performance and are no guarantee of future results. Total return figures in the table above include the reinvestment of dividends and capital gains. The table above and the graph on the next page do not reflect the deduction of taxes that a shareholder would pay on Fund distributions or on the redemption of Fund shares.
The Russell 2000 Value Index is an unmanaged index that consists of stocks in the Russell 2000 Index with lower price-to-book ratios and lower forecasted growth values with dividends reinvested. It is not possible to invest directly in an index. Periods longer than one year are annualized.
| | |
|
| |
| 18 | | Annual Report | June 30, 2019 |
| | |
Omni Tax-Managed Small-Cap Value Fund MANAGER’S COMMENTARY (Unaudited) (continued) | | |
|
|
Growth of a $10,000 Investment
from Inception December 31, 2010 to June 30, 2019
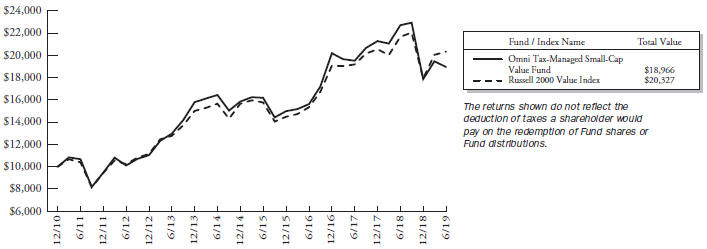
Detailed Explanation of Quarterly Performance
The Omni Tax-Managed Small-Cap Value Fund is designed to capture the returns of the small-cap value asset class through broad diversification of small company and value stocks. We also seek to minimize the distribution of capital gains within the constraints of the investment objective. This approach is sometimes referred to as “passive, asset class investing.” As of June 30, 2019, we held 616 such stocks in a market-cap weighted style. We make no attempt to track any particular index in either performance or statistics.
The Fund’s tilt toward smaller stocks in the small-cap value universe hurt relative results, as smaller stocks underperformed their larger counterparts during the quarter. The Fund’s tilt toward deeper value stocks across multiple value metrics also detracted from relative performance.
From a sector perspective, the Fund’s allocation effect was negative. By design, the Fund does not hold Real Estate Investment Trusts (REITs) or Utilities stocks. Lack of exposure to the Utilities sector detracted from relative performance, but avoiding REITs did not significantly impact results during the quarter.
Detailed Explanation of Fiscal Year Performance
The Fund’s tilt toward smaller stocks in the small-cap value universe detracted substantially from relative results during a year when smaller stocks dramatically underperformed their larger counterparts. Likewise, the Fund’s tilt toward deeper value stocks across multiple value metrics also hurt relative results.
From a sector perspective, the Fund’s allocation effect was negative. By design, the Fund does not hold REITs or Utilities stocks. Both positionings hurt relative performance.
| | |
Omni Tax-Managed Small-Cap Value Fund MANAGER’S COMMENTARY (Unaudited) (continued) | | |
|
|
Top Ten Holdings as of June 30, 2019
| | | | | | | | |
| Rank | | Description | | | | Industry | | % of Net
Assets |
1 | | Iridium Communications, Inc. | | | | Communication Services | | 1.0% |
2 | | First BanCorp Puerto Rico | | | | Financials | | 0.8% |
3 | | Insight Enterprises, Inc. | | | | Information Technology | | 0.7% |
4 | | Warrior Met Coal, Inc. | | | | Materials | | 0.7% |
5 | | Arch Coal, Inc., Class A | | | | Energy | | 0.7% |
6 | | Diodes, Inc. | | | | Information Technology | | 0.7% |
7 | | FTI Consulting, Inc. | | | | Industrials | | 0.7% |
8 | | Horace Mann Educators Corp. | | | | Financials | | 0.6% |
9 | | Prestige Consumer Healthcare, Inc. | | | | Health Care | | 0.6% |
10 | | Argo Group International Holdings, Ltd. | | | | Financials | | 0.6% |
| | Total | | | | | | 7.1% |
Industry Sector Representation as of June 30, 2019
| | | | | | | | | | | | | | | | | | | | | | | | | |
| | | % of Net Assets | | | | % of Russell 2000
Value Index | | | | Difference |
Communication Services | | | | 4.9% | | | | | | | | | | 2.9% | | | | | | | | | | 2.0% | |
Consumer Discretionary | | | | 14.8% | | | | | | | | | | 8.5% | | | | | | | | | | 6.3% | |
Consumer Staples | | | | 2.4% | | | | | | | | | | 2.4% | | | | | | | | | | 0.0% | |
Energy | | | | 13.4% | | | | | | | | | | 5.1% | | | | | | | | | | 8.3% | |
Financials | | | | 30.6% | | | | | | | | | | 29.4% | | | | | | | | | | 1.2% | |
Health Care | | | | 3.4% | | | | | | | | | | 4.1% | | | | | | | | | | -0.7% | |
Industrials | | | | 16.4% | | | | | | | | | | 11.6% | | | | | | | | | | 4.8% | |
Information Technology | | | | 8.1% | | | | | | | | | | 11.9% | | | | | | | | | | -3.8% | |
Materials | | | | 5.1% | | | | | | | | | | 4.2% | | | | | | | | | | 0.9% | |
Real Estate | | | | 0.3% | | | | | | | | | | 12.3% | | | | | | | | | | -12.0% | |
Utilities | | | | 0.0% | | | | | | | | | | 7.6% | | | | | | | | | | -7.6% | |
Cash & Other Assets | | | | 0.6% | | | | | | | | | | 0.0% | | | | | | | | | | 0.6% | |
Total | | | | 100.0% | | | | | | | | | | 100.0% | | | | | | | | | | | |
Disclaimer
The views expressed here are exclusively those of Fund management. These views, including those related to market sectors or individual stocks, are not meant as investment advice and should not be considered predictive in nature. Any favorable (or unfavorable) description of a holding applies only as of the quarter end, June 30, 2019, unless otherwise stated. Security positions can and do change thereafter. Discussions of historical performance do not guarantee and may not be indicative of future performance.
Market volatility can significantly impact short-term performance. The Fund is not an appropriate investment for short-term investors. Investments in small companies generally carry greater risk than is customarily associated with larger companies. This additional risk is attributable to a number of factors, including the relatively limited financial resources that are typically available to small companies and the fact that small companies often have comparatively limited product lines. In addition, the stock of small companies tends to be more volatile than the stock of large companies, particularly in the short term and particularly in the early stages of an economic or market downturn. Shareholders of the Fund, therefore, are taking on more risk than they would if they invested in the stock market as a whole.
| | |
|
| |
| 20 | | Annual Report | June 30, 2019 |
| | |
Omni Tax-Managed Small-Cap Value Fund MANAGER’S COMMENTARY (Unaudited) (continued) | | |
|
|
Conclusion
Thank you for your continued investment in Omni Tax-Managed Small-Cap Value Fund. We encourage your feedback; your reactions and concerns are important to us.
Sincerely,
The Investment Management Team
| | |
Omni Tax-Managed Small-Cap Value Fund SCHEDULE OF INVESTMENTS | | |
|
|
| |
| Showing percentage of net assets as of June 30, 2019 | | |
| | | | | | | | |
| Industry Company | | Shares | | | Value | |
|
COMMON STOCKS - 99.56% | |
Communication Services - 4.88% | |
A.H. Belo Corp., Class A | | | 39,000 | | | $ | 143,910 | |
Alaska Communications Systems Group, Inc.* | | | 314,187 | | | | 537,260 | |
AMC Entertainment Holdings, Inc.,
Class A+ | | | 207,763 | | | | 1,938,429 | |
ATN International, Inc. | | | 22,000 | | | | 1,270,060 | |
Cars.com, Inc.* | | | 133,100 | | | | 2,624,732 | |
Consolidated Communications Holdings, Inc. | | | 125,000 | | | | 616,250 | |
DHI Group, Inc.* | | | 147,000 | | | | 524,790 | |
Emmis Communications Corp., Class A* | | | 57,200 | | | | 271,700 | |
Entercom Communications Corp., Class A | | | 318,030 | | | | 1,844,574 | |
Entravision Communications Corp., Class A | | | 147,600 | | | | 460,512 | |
Eros International PLC*+ | | | 31,334 | | | | 42,301 | |
Gannett Co., Inc. | | | 231,000 | | | | 1,884,960 | |
Gray Television, Inc.* | | | 212,100 | | | | 3,476,319 | |
Iridium Communications, Inc.* | | | 273,625 | | | | 6,364,518 | |
Marcus Corp. (The) | | | 92,054 | | | | 3,034,100 | |
New Media Investment Group, Inc. | | | 64,800 | | | | 611,712 | |
Saga Communications, Inc., Class A | | | 11,100 | | | | 346,764 | |
Salem Media Group, Inc. | | | 4,352 | | | | 10,575 | |
Scholastic Corp. | | | 88,450 | | | | 2,940,078 | |
Townsquare Media, Inc., Class A | | | 100,100 | | | | 538,538 | |
Tribune Publishing Co. | | | 6,200 | | | | 49,414 | |
Urban One, Inc.* | | | 90,000 | | | | 176,400 | |
| | | | | | | | |
| | |
| | | | | | | 29,707,896 | |
| |
Consumer Discretionary - 14.78% | | | | | |
Abercrombie & Fitch Co.,
Class A | | | 139,600 | | | | 2,239,184 | |
AMCON Distributing Co. | | | 1,350 | | | | 129,370 | |
American Axle & Manufacturing Holdings, Inc.* | | | 199,850 | | | | 2,550,086 | |
American Outdoor Brands Corp.* | | | 144,000 | | | | 1,297,440 | |
American Public Education, Inc.* | | | 27,700 | | | | 819,366 | |
Ark Restaurants Corp. | | | 8,500 | | | | 173,825 | |
Ascena Retail Group, Inc.* | | | 200,000 | | | | 122,000 | |
Barnes & Noble Education, Inc.* | | | 178,760 | | | | 600,634 | |
Barnes & Noble, Inc. | | | 158,100 | | | | 1,057,689 | |
Bassett Furniture Industries, Inc. | | | 49,859 | | | | 760,350 | |
| | | | | | | | |
| Industry Company | | Shares | | | Value | |
|
Consumer Discretionary (continued) | |
BBX Capital Corp. | | | 193,018 | | | $ | 947,718 | |
Beazer Homes USA, Inc.* | | | 85,000 | | | | 816,850 | |
Big Lots, Inc. | | | 80,500 | | | | 2,303,105 | |
Build-A-Bear Workshop, Inc.* | | | 35,000 | | | | 195,650 | |
Caleres, Inc. | | | 80,000 | | | | 1,593,600 | |
Canterbury Park Holding Corp. | | | 511 | | | | 6,306 | |
Carriage Services, Inc. | | | 7,700 | | | | 146,377 | |
Carrols Restaurant Group, Inc.* | | | 105,000 | | | | 948,150 | |
Cato Corp. (The), Class A | | | 73,500 | | | | 905,520 | |
Century Casinos, Inc.* | | | 79,200 | | | | 768,240 | |
Chico’s FAS, Inc. | | | 216,200 | | | | 728,594 | |
China Automotive Systems, Inc.* | | | 29,200 | | | | 67,160 | |
China XD Plastics Co., Ltd.* | | | 48,400 | | | | 101,640 | |
Citi Trends, Inc. | | | 31,020 | | | | 453,512 | |
Conn’s, Inc.* | | | 84,000 | | | | 1,496,880 | |
Container Store Group, Inc. (The)* | | | 139,150 | | | | 1,018,578 | |
Cooper Tire & Rubber Co. | | | 114,650 | | | | 3,617,208 | |
Cooper-Standard Holdings, Inc.* | | | 32,000 | | | | 1,466,240 | |
Crown Crafts, Inc. | | | 13,050 | | | | 61,335 | |
CSS Industries, Inc. | | | 8,658 | | | | 42,251 | |
Del Taco Restaurants, Inc.* | | | 117,600 | | | | 1,507,632 | |
Delta Apparel, Inc.* | | | 23,700 | | | | 549,366 | |
Designer Brands, Inc., Class A | | | 40,000 | | | | 766,800 | |
Destination XL Group, Inc.* | | | 147,000 | | | | 258,720 | |
Dillard’s, Inc., Class A+ | | | 43,500 | | | | 2,709,180 | |
El Pollo Loco Holdings, Inc.* | | | 89,300 | | | | 951,938 | |
Escalade, Inc. | | | 4,000 | | | | 45,880 | |
Ethan Allen Interiors, Inc. | | | 58,100 | | | | 1,223,586 | |
Express, Inc.* | | | 144,000 | | | | 393,120 | |
Fiesta Restaurant Group, Inc.* | | | 40,000 | | | | 525,600 | |
Flanigan’s Enterprises, Inc.+ | | | 2,500 | | | | 57,450 | |
Flexsteel Industries, Inc. | | | 2,000 | | | | 34,120 | |
Fossil Group, Inc.* | | | 115,500 | | | | 1,328,250 | |
Full House Resorts, Inc.* | | | 70,000 | | | | 130,900 | |
GameStop Corp., Class A+ | | | 140,000 | | | | 765,800 | |
Genesco, Inc.* | | | 51,500 | | | | 2,177,935 | |
G-III Apparel Group, Ltd.* | | | 53,600 | | | | 1,576,912 | |
Good Times Restaurants, Inc.* | | | 4,300 | | | | 7,568 | |
Group 1 Automotive, Inc. | | | 38,000 | | | | 3,111,820 | |
Hamilton Beach Brands Holding Co., Class A | | | 3,500 | | | | 66,675 | |
Haverty Furniture Cos., Inc. | | | 69,659 | | | | 1,186,293 | |
| | |
|
| |
| 22 | | Annual Report | June 30, 2019 |
| | |
Omni Tax-Managed Small-Cap Value Fund SCHEDULE OF INVESTMENTS (continued) | | |
|
|
| |
| Showing percentage of net assets as of June 30, 2019 | | |
| | | | | | | | |
| Industry Company | | Shares | | | Value | |
|
Common Stocks (continued) | |
Consumer Discretionary (continued) | |
Hibbett Sports, Inc.* | | | 30,300 | | | $ | 551,460 | |
Houghton Mifflin Harcourt Co.* | | | 218,000 | | | | 1,255,680 | |
International Speedway Corp., Class A | | | 84,760 | | | | 3,804,876 | |
J Alexander’s Holdings, Inc.* | | | 45,250 | | | | 508,158 | |
J. Jill, Inc.+ | | | 257,500 | | | | 512,425 | |
JAKKS Pacific, Inc.* | | | 75,000 | | | | 52,500 | |
K12, Inc.* | | | 82,350 | | | | 2,504,264 | |
KB Home | | | 134,700 | | | | 3,465,831 | |
Lakeland Industries, Inc.* | | | 26,450 | | | | 296,240 | |
Lands’ End, Inc.* | | | 79,300 | | | | 969,046 | |
Lifetime Brands, Inc. | | | 74,199 | | | | 701,923 | |
Live Ventures, Inc.* | | | 3,200 | | | | 22,240 | |
Luby’s, Inc.* | | | 31,900 | | | | 34,452 | |
MarineMax, Inc.* | | | 54,000 | | | | 887,760 | |
MDC Holdings, Inc. | | | 41,904 | | | | 1,373,613 | |
Meritage Homes Corp.* | | | 72,100 | | | | 3,701,614 | |
Modine Manufacturing Co.* | | | 76,800 | | | | 1,099,008 | |
Movado Group, Inc. | | | 61,600 | | | | 1,663,200 | |
Nautilus, Inc.* | | | 76,000 | | | | 167,960 | |
Office Depot, Inc. | | | 610,000 | | | | 1,256,600 | |
P&F Industries, Inc., Class A | | | 492 | | | | 4,093 | |
Party City Holdco, Inc.*+ | | | 140,300 | | | | 1,028,399 | |
Peak Resorts, Inc. | | | 98,600 | | | | 468,350 | |
Red Robin Gourmet Burgers, Inc.* | | | 4,800 | | | | 146,736 | |
Rent-A-Center, Inc.* | | | 83,200 | | | | 2,215,616 | |
Rocky Brands, Inc. | | | 24,550 | | | | 669,724 | |
RTW RetailWinds, Inc.* | | | 145,700 | | | | 247,690 | |
Sequential Brands Group, Inc.* | | | 70,000 | | | | 38,500 | |
Shiloh Industries, Inc.* | | | 35,900 | | | | 174,833 | |
Shoe Carnival, Inc.+ | | | 33,800 | | | | 932,880 | |
Signet Jewelers, Ltd. | | | 25,000 | | | | 447,000 | |
Sonic Automotive, Inc., Class A | | | 70,000 | | | | 1,634,500 | |
SORL Auto Parts, Inc.*+ | | | 74,129 | | | | 257,228 | |
Speedway Motorsports, Inc. | | | 80,556 | | | | 1,494,314 | |
Sportsman’s Warehouse Holdings, Inc.* | | | 59,400 | | | | 224,532 | |
Stage Stores, Inc. | | | 42,100 | | | | 32,417 | |
Strattec Security Corp. | | | 17,300 | | | | 416,930 | |
Tandy Leather Factory, Inc.* | | | 2,000 | | | | 11,000 | |
Tilly’s, Inc., Class A | | | 79,800 | | | | 608,874 | |
Tower International, Inc. | | | 46,000 | | | | 897,000 | |
TravelCenters of America, LLC* | | | 143,650 | | | | 520,013 | |
TRI Pointe Group, Inc.* | | | 65,000 | | | | 778,050 | |
Tuesday Morning Corp.* | | | 74,000 | | | | 125,060 | |
Unifi, Inc.* | | | 10,800 | | | | 196,236 | |
Unique Fabricating, Inc. | | | 15,000 | | | | 40,650 | |
| | | | | | | | |
| Industry Company | | Shares | | | Value | |
|
Consumer Discretionary (continued) | |
Vera Bradley, Inc.* | | | 75,500 | | | $ | 906,000 | |
Vista Outdoor, Inc.* | | | 48,000 | | | | 426,240 | |
Vitamin Shoppe, Inc.* | | | 113,400 | | | | 446,796 | |
VOXX International Corp.* | | | 22,164 | | | | 92,202 | |
William Lyon Homes,
Class A* | | | 59,497 | | | | 1,084,630 | |
ZAGG, Inc.* | | | 50,000 | | | | 348,000 | |
Zumiez, Inc.* | | | 50,900 | | | | 1,328,490 | |
| | | | | | | | |
| | |
| | | | | | | 89,882,236 | |
|
Consumer Staples - 2.42% | |
Alico, Inc. | | | 16,600 | | | | 503,644 | |
Andersons, Inc. (The) | | | 82,216 | | | | 2,239,564 | |
Coffee Holding Co., Inc.* | | | 10,000 | | | | 40,900 | |
Edgewell Personal Care Co.* | | | 64,000 | | | | 1,724,800 | |
Hostess Brands, Inc.* | | | 230,000 | | | | 3,321,200 | |
Ingles Markets, Inc., Class A | | | 50,950 | | | | 1,586,074 | |
Mannatech, Inc. | | | 25,700 | | | | 436,643 | |
Natural Alternatives International, Inc.* | | | 16,800 | | | | 195,888 | |
Natural Grocers by Vitamin Cottage, Inc.* | | | 25,000 | | | | 251,250 | |
Nature’s Sunshine Products, Inc.* | | | 11,000 | | | | 102,190 | |
Seneca Foods Corp., Class A* | | | 23,150 | | | | 644,264 | |
SpartanNash Co. | | | 56,182 | | | | 655,644 | |
Village Super Market, Inc., Class A | | | 39,900 | | | | 1,057,749 | |
Weis Markets, Inc. | | | 54,100 | | | | 1,969,781 | |
| | | | | | | | |
| | |
| | | | | | | 14,729,591 | |
|
Energy - 13.44% | |
Adams Resources & Energy, Inc. | | | 10,600 | | | | 363,368 | |
Arch Coal, Inc., Class A | | | 44,400 | | | | 4,182,924 | |
Archrock, Inc. | | | 299,500 | | | | 3,174,700 | |
Ardmore Shipping Corp.* | | | 30,000 | | | | 244,500 | |
Berry Petroleum Corp. | | | 192,000 | | | | 2,035,200 | |
Bonanza Creek Energy, Inc.* | | | 56,800 | | | | 1,185,984 | |
Callon Petroleum Co.* | | | 236,300 | | | | 1,557,217 | |
Carrizo Oil & Gas, Inc.* | | | 105,000 | | | | 1,052,100 | |
CONSOL Energy, Inc.* | | | 77,500 | | | | 2,062,275 | |
Contango Oil & Gas Co.* | | | 195,000 | | | | 339,300 | |
Contura Energy, Inc.* | | | 36,700 | | | | 1,904,730 | |
Dawson Geophysical Co.* | | | 28,000 | | | | 70,000 | |
Denbury Resources, Inc.* | | | 1,638,000 | | | | 2,031,120 | |
DHT Holdings, Inc. | | | 291,800 | | | | 1,724,538 | |
Diamond Offshore Drilling, Inc.*+ | | | 259,700 | | | | 2,303,539 | |
Dorian LPG, Ltd.* | | | 104,029 | | | | 938,342 | |
| | |
Omni Tax-Managed Small-Cap Value Fund SCHEDULE OF INVESTMENTS(continued) | | |
|
|
| |
| Showing percentage of net assets as of June 30, 2019 | | |
| | | | | | | | |
| Industry Company | | Shares | | | Value | |
|
Common Stocks (continued) | |
Energy (continued) | |
Earthstone Energy, Inc.,
Class A* | | | 90,000 | | | $ | 550,800 | |
Era Group, Inc.* | | | 93,800 | | | | 782,292 | |
Euronav NV | | | 5,253 | | | | 49,588 | |
Extraction Oil & Gas, Inc.*+ | | | 101,400 | | | | 439,062 | |
Frontline, Ltd.*+ | | | 175,000 | | | | 1,400,000 | |
GasLog, Ltd. | | | 198,137 | | | | 2,853,173 | |
Gran Tierra Energy, Inc.* | | | 677,500 | | | | 1,077,225 | |
Green Plains, Inc. | | | 101,950 | | | | 1,099,021 | |
Gulf Island Fabrication, Inc.* | | | 15,000 | | | | 106,500 | |
Gulfport Energy Corp.* | | | 200,000 | | | | 982,000 | |
Hallador Energy Co. | | | 42,600 | | | | 239,838 | |
Helix Energy Solutions Group, Inc.* | | | 400,500 | | | | 3,456,315 | |
Independence Contract Drilling, Inc.* | | | 115,281 | | | | 182,144 | |
International Seaways, Inc.* | | | 399 | | | | 7,581 | |
Keane Group, Inc.* | | | 120,000 | | | | 806,400 | |
Lonestar Resources US, Inc., Class A* | | | 67,450 | | | | 154,460 | |
Matrix Service Co.* | | | 43,000 | | | | 871,180 | |
McDermott International, Inc.*+ | | | 215,001 | | | | 2,076,910 | |
Midstates Petroleum Co., Inc.* | | | 30,000 | | | | 176,700 | |
Mitcham Industries, Inc.* | | | 5,000 | | | | 19,750 | |
Montage Resources Corp.* | | | 25,053 | | | | 152,823 | |
Nabors Industries, Ltd. | | | 240,000 | | | | 696,000 | |
NACCO Industries, Inc., Class A | | | 31,450 | | | | 1,633,513 | |
Natural Gas Services Group, Inc.* | | | 58,888 | | | | 971,652 | |
Navigator Holdings, Ltd.* | | | 50,000 | | | | 468,000 | |
Newpark Resources, Inc.* | | | 40,000 | | | | 296,800 | |
Nine Energy Service, Inc.* | | | 57,700 | | | | 999,941 | |
Noble Corp. PLC* | | | 901,800 | | | | 1,686,366 | |
Northern Oil and Gas, Inc.* | | | 300,000 | | | | 579,000 | |
Oil States International, Inc.* | | | 78,000 | | | | 1,427,400 | |
Overseas Shipholding Group, Inc., Class A* | | | 253,300 | | | | 476,204 | |
Par Pacific Holdings, Inc.* | | | 110,300 | | | | 2,263,356 | |
Penn Virginia Corp.* | | | 36,000 | | | | 1,104,480 | |
Pioneer Energy Services Corp.* | | | 175,000 | | | | 44,258 | |
ProPetro Holding Corp.* | | | 118,500 | | | | 2,452,950 | |
QEP Resources, Inc.* | | | 307,000 | | | | 2,219,610 | |
Ranger Energy Services, Inc.* | | | 18,000 | | | | 144,900 | |
Renewable Energy Group, Inc.* | | | 236,319 | | | | 3,748,019 | |
REX American Resources Corp.* | | | 25,250 | | | | 1,840,725 | |
| | | | | | | | |
| Industry Company | | Shares | | | Value | |
|
Energy (continued) | |
Ring Energy, Inc.* | | | 28,300 | | | $ | 91,975 | |
SandRidge Energy, Inc.* | | | 35,550 | | | | 246,006 | |
SEACOR Holdings, Inc.* | | | 40,200 | | | | 1,909,902 | |
SEACOR Marine Holdings, Inc.* | | | 11,063 | | | | 165,502 | |
Select Energy Services, Inc., Class A* | | | 95,000 | | | | 1,102,950 | |
SemGroup Corp., Class A | | | 254,000 | | | | 3,048,000 | |
Ship Finance International, Ltd. | | | 275,500 | | | | 3,446,505 | |
SilverBow Resources, Inc.* | | | 65,500 | | | | 907,175 | |
SM Energy Co. | | | 22,000 | | | | 275,440 | |
Smart Sand, Inc.*+ | | | 40,000 | | | | 97,600 | |
SRC Energy, Inc.* | | | 397,000 | | | | 1,969,120 | |
Teekay Corp.+ | | | 145,000 | | | | 498,800 | |
TransAtlantic Petroleum, Ltd.* | | | 70,000 | | | | 50,407 | |
Unit Corp.* | | | 50,025 | | | | 444,722 | |
US Silica Holdings, Inc.+ | | | 119,500 | | | | 1,528,405 | |
VAALCO Energy, Inc.* | | | 155,000 | | | | 258,850 | |
| | | | | | | | |
| | |
| | | | | | | 81,748,132 | |
|
Financials - 30.66% | |
1347 Property Insurance Holdings, Inc.* | | | 17,500 | | | | 86,625 | |
1st Constitution Bancorp | | | 5,250 | | | | 96,968 | |
1st Source Corp. | | | 11,320 | | | | 525,248 | |
ACNB Corp. | | | 2,600 | | | | 102,882 | |
A-Mark Precious Metals, Inc.* | | | 1,500 | | | | 19,575 | |
American National Bankshares, Inc. | | | 4,565 | | | | 176,894 | |
American River Bankshares | | | 20,744 | | | | 254,321 | |
AmeriServ Financial, Inc. | | | 66,000 | | | | 273,900 | |
Argo Group International Holdings, Ltd. | | | 51,394 | | | | 3,805,726 | |
Arlington Asset Investment Corp., Class A+ | | | 72,600 | | | | 499,488 | |
Atlantic Capital Bancshares, Inc.* | | | 52,933 | | | | 906,213 | |
Banc of California, Inc. | | | 98,000 | | | | 1,369,060 | |
Banco Latinoamericano de Comercio Exterior SA, Class E | | | 52,000 | | | | 1,083,160 | |
Bancorp, Inc. (The)* | | | 151,800 | | | | 1,354,056 | |
Bank of Princeton (The) | | | 12,500 | | | | 375,000 | |
BankFinancial Corp. | | | 3,000 | | | | 41,970 | |
Bankwell Financial Group, Inc. | | | 1,500 | | | | 43,050 | |
Banner Corp. | | | 20,000 | | | | 1,083,000 | |
Bar Harbor Bankshares | | | 20,241 | | | | 538,208 | |
BCB Bancorp, Inc. | | | 26,300 | | | | 364,255 | |
| | |
|
| |
| 24 | | Annual Report | June 30, 2019 |
| | |
Omni Tax-Managed Small-Cap Value Fund SCHEDULE OF INVESTMENTS(continued) | | |
|
|
| |
| Showing percentage of net assets as of June 30, 2019 | | |
| | | | | | | | |
| Industry Company | | Shares | | | Value | |
|
Common Stocks (continued) | |
Financials (continued) | |
Berkshire Hills Bancorp, Inc. | | | 98,610 | | | $ | 3,095,368 | |
Blue Capital Reinsurance Holdings, Ltd.+ | | | 11,127 | | | | 73,327 | |
Boston Private Financial Holdings, Inc. | | | 130,000 | | | | 1,569,100 | |
Byline Bancorp, Inc.* | | | 65,000 | | | | 1,242,800 | |
C&F Financial Corp. | | | 7,400 | | | | 404,114 | |
Cadence BanCorp. | | | 60,000 | | | | 1,248,000 | |
Camden National Corp. | | | 33,779 | | | | 1,549,443 | |
Capital City Bank Group, Inc. | | | 55,750 | | | | 1,385,388 | |
Capstar Financial Holdings, Inc. | | | 29,900 | | | | 452,985 | |
CB Financial Services, Inc. | | | 13,500 | | | | 320,625 | |
Central Pacific Financial Corp. | | | 6,496 | | | | 194,620 | |
Central Valley Community Bancorp | | | 51,000 | | | | 1,094,970 | |
Century Bancorp, Inc., Class A | | | 6,800 | | | | 597,720 | |
Chemung Financial Corp. | | | 12,293 | | | | 594,244 | |
Citizens Community Bancorp, Inc. | | | 32,000 | | | | 346,880 | |
Citizens, Inc.*+ | | | 17,200 | | | | 125,560 | |
Civista Bancshares, Inc. | | | 31,921 | | | | 716,626 | |
CNB Financial Corp. | | | 60,800 | | | | 1,716,992 | |
Codorus Valley Bancorp, Inc. | | | 12,354 | | | | 284,142 | |
Colony Bankcorp, Inc. | | | 1,500 | | | | 25,425 | |
Community Bankers Trust Corp. | | | 48,000 | | | | 406,560 | |
Community Financial Corp. (The) | | | 3,840 | | | | 129,523 | |
Community West Bancshares | | | 1,000 | | | | 9,650 | |
ConnectOne Bancorp, Inc. | | | 58,000 | | | | 1,314,280 | |
Consumer Portfolio Services, Inc.* | | | 97,000 | | | | 368,600 | |
County Bancorp, Inc.+ | | | 8,700 | | | | 148,683 | |
Cowen, Inc., Class A* | | | 104,700 | | | | 1,799,793 | |
Crawford & Co., Class A+ | | | 44,000 | | | | 463,320 | |
Crawford & Co., Class B | | | 40,000 | | | | 372,400 | |
Customers Bancorp, Inc.* | | | 34,500 | | | | 724,500 | |
Dime Community Bancshares, Inc. | | | 67,000 | | | | 1,272,330 | |
DNB Financial Corp. | | | 12,000 | | | | 533,640 | |
Donegal Group, Inc., Class A | | | 74,100 | | | | 1,131,507 | |
Eagle Bancorp Montana, Inc. | | | 19,000 | | | | 315,400 | |
Elevate Credit, Inc.* | | | 20,000 | | | | 82,400 | |
EMC Insurance Group, Inc. | | | 44,025 | | | | 1,586,221 | |
| | | | | | | | |
| Industry Company | | Shares | | | Value | |
|
Financials (continued) | |
Emclaire Financial Corp.+ | | | 200 | | | $ | 6,252 | |
Employers Holdings, Inc. | | | 75,900 | | | | 3,208,293 | |
Encore Capital Group, Inc.*+ | | | 64,700 | | | | 2,191,389 | |
Enova International, Inc.* | | | 92,400 | | | | 2,129,820 | |
Entegra Financial Corp.* | | | 23,600 | | | | 710,832 | |
Enterprise Bancorp, Inc. | | | 27,475 | | | | 871,232 | |
Equity Bancshares, Inc., Class A* | | | 9,500 | | | | 253,270 | |
ESSA Bancorp, Inc. | | | 35,000 | | | | 533,750 | |
Evans Bancorp, Inc. | | | 7,000 | | | | 264,110 | |
EZCORP, Inc., Class A* | | | 150,100 | | | | 1,421,447 | |
Farmers National Banc Corp. | | | 150 | | | | 2,224 | |
FB Financial Corp. | | | 48,000 | | | | 1,756,800 | |
FBL Financial Group, Inc., Class A | | | 51,166 | | | | 3,264,391 | |
Federal Agricultural Mortgage Corp., Class C | | | 22,200 | | | | 1,613,052 | |
FedNat Holding Co. | | | 27,500 | | | | 392,425 | |
Fidelity Southern Corp. | | | 61,400 | | | | 1,901,558 | |
Financial Institutions, Inc. | | | 40,300 | | | | 1,174,745 | |
First BanCorp Puerto Rico | | | 450,000 | | | | 4,968,000 | |
First Bancorp, Inc. | | | 15,880 | | | | 426,378 | |
First Bank | | | 41,622 | | | | 488,642 | |
First Busey Corp. | | | 112,593 | | | | 2,973,581 | |
First Business Financial Services, Inc. | | | 19,100 | | | | 448,850 | |
First Capital, Inc. | | | 500 | | | | 25,270 | |
First Community Bankshares, Inc. | | | 11,000 | | | | 371,360 | |
First Financial Corp. | | | 27,520 | | | | 1,105,203 | |
First Financial Northwest, Inc. | | | 26,400 | | | | 373,560 | |
First Guaranty Bancshares, Inc. | | | 5,499 | | | | 114,654 | |
First Internet Bancorp | | | 13,800 | | | | 297,252 | |
First Northwest Bancorp | | | 16,590 | | | | 269,588 | |
First United Corp. | | | 12,225 | | | | 240,955 | |
First US Bancshares, Inc. | | | 5,000 | | | | 46,200 | |
Flushing Financial Corp. | | | 45,041 | | | | 999,910 | |
FNCB Bancorp, Inc.+ | | | 5,000 | | | | 38,700 | |
Franklin Financial Network, Inc. | | | 18,000 | | | | 501,480 | |
FS Bancorp, Inc. | | | 7,850 | | | | 407,180 | |
GAIN Capital Holdings, Inc.+ | | | 39,900 | | | | 164,787 | |
German American Bancorp, Inc. | | | 750 | | | | 22,590 | |
Global Indemnity, Ltd. | | | 24,443 | | | | 756,755 | |
| | |
Omni Tax-Managed Small-Cap Value Fund SCHEDULE OF INVESTMENTS(continued) | | |
|
|
| |
| Showing percentage of net assets as of June 30, 2019 | | |
| | | | | | | | |
| Industry Company | | Shares | | | Value | |
|
Common Stocks (continued) | |
Financials (continued) | |
Great Southern Bancorp, Inc. | | | 31,006 | | | $ | 1,855,709 | |
Hallmark Financial Services, Inc.* | | | 50,158 | | | | 713,748 | |
Hanmi Financial Corp. | | | 42,400 | | | | 944,248 | |
Hawthorn Bancshares, Inc. | | | 12,979 | | | | 347,837 | |
Heartland Financial USA, Inc. | | | 66,950 | | | | 2,994,674 | |
Hennessy Advisors, Inc. | | | 2,000 | | | | 19,400 | |
Heritage Insurance Holdings, Inc. | | | 38,200 | | | | 588,662 | |
Hilltop Holdings, Inc. | | | 156,600 | | | | 3,330,882 | |
HMN Financial, Inc.* | | | 1,000 | | | | 21,000 | |
Home Bancorp, Inc. | | | 15,597 | | | | 600,173 | |
HomeStreet, Inc.* | | | 64,900 | | | | 1,923,636 | |
Hope Bancorp, Inc. | | | 135,000 | | | | 1,860,300 | |
HopFed Bancorp, Inc. | | | 23,500 | | | | 445,795 | |
Horace Mann Educators Corp. | | | 94,950 | | | | 3,825,536 | |
Horizon Bancorp, Inc. | | | 53,542 | | | | 874,876 | |
Howard Bancorp, Inc.* | | | 53,100 | | | | 805,527 | |
Independence Holding Co. | | | 14,950 | | | | 578,864 | |
James River Group Holdings, Ltd. | | | 79,100 | | | | 3,709,790 | |
Kingstone Cos., Inc. | | | 21,700 | | | | 187,705 | |
Ladenburg Thalmann Financial Services, Inc. | | | 276,100 | | | | 947,023 | |
Lakeland Bancorp, Inc. | | | 70,040 | | | | 1,131,146 | |
Landmark Bancorp, Inc. | | | 2,430 | | | | 58,198 | |
LCNB Corp. | | | 27,700 | | | | 526,300 | |
Limestone Bancorp, Inc.* | | | 1,000 | | | | 15,250 | |
Luther Burbank Corp. | | | 139,600 | | | | 1,520,244 | |
Mackinac Financial Corp.+ | | | 13,400 | | | | 211,720 | |
Manning & Napier, Inc. | | | 131,000 | | | | 229,250 | |
Marlin Business Services Corp. | | | 28,875 | | | | 719,854 | |
Mercantile Bank Corp. | | | 2,000 | | | | 65,160 | |
Merchants Bancorp/IN | | | 51,300 | | | | 873,639 | |
Meta Financial Group, Inc. | | | 60,234 | | | | 1,689,564 | |
Metropolitan Bank Holding Corp.* | | | 15,100 | | | | 664,400 | |
Mid Penn Bancorp, Inc. | | | 11,200 | | | | 279,440 | |
Middlefield Banc Corp.+ | | | 2,000 | | | | 82,000 | |
Midland States Bancorp, Inc. | | | 45,117 | | | | 1,205,526 | |
MidSouth Bancorp, Inc.+ | | | 41,000 | | | | 485,850 | |
MidWestOne Financial Group, Inc. | | | 48,300 | | | | 1,350,468 | |
MMA Capital Holdings, Inc.*+ | | | 1,500 | | | | 50,205 | |
Mr Cooper Group, Inc.* | | | 141,703 | | | | 1,135,041 | |
| | | | | | | | |
| Industry Company | | Shares | | | Value | |
|
Financials (continued) | |
MutualFirst Financial, Inc. | | | 700 | | | $ | 23,828 | |
MVB Financial Corp. | | | 40,300 | | | | 683,488 | |
National Bankshares, Inc. | | | 1,000 | | | | 38,930 | |
National Holdings Corp.* | | | 2,000 | | | | 5,420 | |
National Security Group, Inc. (The)+ | | | 200 | | | | 2,400 | |
National Western Life Group, Inc., Class A | | | 7,350 | | | | 1,888,950 | |
Nelnet, Inc., Class A | | | 16,900 | | | | 1,000,818 | |
Nicholas Financial, Inc.*+ | | | 19,400 | | | | 182,360 | |
Nicolet Bankshares, Inc.* | | | 16,900 | | | | 1,048,814 | |
Northeast Bank | | | 22,300 | | | | 615,034 | |
Northrim BanCorp, Inc. | | | 24,073 | | | | 858,443 | |
Northwest Bancshares, Inc. | | | 115,000 | | | | 2,025,150 | |
Ocwen Financial Corp.* | | | 71,400 | | | | 147,798 | |
OFG Bancorp | | | 118,800 | | | | 2,823,876 | |
On Deck Capital, Inc.* | | | 310,700 | | | | 1,289,405 | |
Oppenheimer Holdings, Inc., Class A | | | 27,519 | | | | 749,067 | |
Opus Bank | | | 75,000 | | | | 1,583,250 | |
Orrstown Financial Services, Inc. | | | 28,000 | | | | 615,720 | |
Parke Bancorp, Inc. | | | 17,327 | | | | 414,982 | |
Patriot National Bancorp, Inc. | | | 11,000 | | | | 164,230 | |
PB Bancorp, Inc. | | | 14,500 | | | | 171,825 | |
Peapack Gladstone Financial Corp. | | | 34,968 | | | | 983,300 | |
Penns Woods Bancorp, Inc. | | | 1,000 | | | | 45,250 | |
PennyMac Financial Services, Inc. | | | 30,000 | | | | 665,400 | |
Peoples Bancorp of North Carolina, Inc. | | | 27,380 | | | | 822,769 | |
Peoples Bancorp, Inc. | | | 39,550 | | | | 1,275,883 | |
Peoples Financial Services Corp.+ | | | 17,600 | | | | 791,824 | |
People’s United Financial, Inc. | | | 8,000 | | | | 134,240 | |
Piper Jaffray Cos | | | 30,100 | | | | 2,235,527 | |
Premier Financial Bancorp, Inc. | | | 50,240 | | | | 753,600 | |
Protective Insurance Corp., Class B | | | 43,700 | | | | 759,069 | |
Provident Financial Holdings, Inc. | | | 53,710 | | | | 1,127,373 | |
Provident Financial Services, Inc. | | | 82,500 | | | | 2,000,625 | |
Prudential Bancorp, Inc. | | | 2,457 | | | | 46,486 | |
QCR Holdings, Inc. | | | 3,000 | | | | 104,610 | |
Regional Management Corp.* | | | 52,100 | | | | 1,373,877 | |
| | |
|
| |
| 26 | | Annual Report | June 30, 2019 |
| | |
Omni Tax-Managed Small-Cap Value Fund SCHEDULE OF INVESTMENTS(continued) | | |
|
|
| |
| Showing percentage of net assets as of June 30, 2019 | | |
| | | | | | | | |
| Industry Company | | Shares | | | Value | |
|
Common Stocks (continued) | |
Financials (continued) | |
Reliant Bancorp, Inc. | | | 31,000 | | | $ | 732,530 | |
Republic Bancorp, Inc., Class A | | | 37,700 | | | | 1,875,575 | |
Riverview Bancorp, Inc. | | | 66,478 | | | | 567,722 | |
Safety Insurance Group, Inc. | | | 7,149 | | | | 680,084 | |
Salisbury Bancorp, Inc. | | | 1,183 | | | | 46,137 | |
Sandy Spring Bancorp, Inc. | | | 58,300 | | | | 2,033,504 | |
SB Financial Group, Inc. | | | 30,952 | | | | 509,470 | |
SB One Bancorp | | | 5,000 | | | | 111,750 | |
Security National Financial Corp., Class A* | | | 15,827 | | | | 79,452 | |
Severn Bancorp, Inc.+ | | | 30,000 | | | | 260,700 | |
Shore Bancshares, Inc. | | | 60,400 | | | | 986,936 | |
Sierra Bancorp | | | 15,939 | | | | 432,266 | |
Sound Financial Bancorp, Inc.+ | | | 1,000 | | | | 34,150 | |
Southern Missouri Bancorp, Inc. | | | 1,300 | | | | 45,279 | |
Southern National Bancorp of Virginia, Inc. | | | 57,500 | | | | 880,325 | |
State Auto Financial Corp. | | | 81,836 | | | | 2,864,260 | |
Stewart Information Services Corp. | | | 22,750 | | | | 921,148 | |
Summit Financial Group, Inc. | | | 25,100 | | | | 673,935 | |
Summit State Bank | | | 6,250 | | | | 68,750 | |
Territorial Bancorp, Inc. | | | 21,900 | | | | 676,710 | |
TheStreet, Inc. | | | 7,000 | | | | 42,910 | |
Tiptree, Inc. | | | 94,200 | | | | 593,460 | |
Towne Bank | | | 743 | | | | 20,269 | |
TriState Capital Holdings, Inc.* | | | 15,000 | | | | 320,100 | |
Triumph Bancorp, Inc.* | | | 5,000 | | | | 145,250 | |
Two River Bancorp | | | 36,015 | | | | 517,175 | |
United Community Financial Corp. | | | 10,163 | | | | 97,260 | |
United Financial Bancorp, Inc. | | | 118,100 | | | | 1,674,658 | |
United Fire Group, Inc. | | | 50,200 | | | | 2,432,692 | |
United Insurance Holdings Corp. | | | 43,400 | | | | 618,884 | |
Unity Bancorp, Inc. | | | 3,500 | | | | 79,450 | |
Universal Insurance Holdings, Inc. | | | 71,495 | | | | 1,994,710 | |
Univest Financial Corp. | | | 45,000 | | | | 1,181,700 | |
Veritex Holdings, Inc. | | | 79,000 | | | | 2,050,050 | |
Waddell & Reed Financial, Inc., Class A | | | 187,800 | | | | 3,130,626 | |
Walker & Dunlop, Inc. | | | 67,275 | | | | 3,579,703 | |
Waterstone Financial, Inc. | | | 43,900 | | | | 748,934 | |
Wellesley Bank+ | | | 1,000 | | | | 32,610 | |
| | | | | | | | |
| Industry Company | | Shares | | | Value | |
|
Financials (continued) | |
WesBanco, Inc. | | | 23,200 | | | $ | 894,360 | |
Westbury Bancorp, Inc.* | | | 2,750 | | | | 69,025 | |
Western New England Bancorp, Inc. | | | 100,000 | | | | 934,000 | |
World Acceptance Corp.* | | | 22,500 | | | | 3,692,475 | |
WSFS Financial Corp. | | | 35,191 | | | | 1,453,388 | |
| | | | | | | | |
| | |
| | | | | | | 186,539,853 | |
|
Health Care - 3.38% | |
Acorda Therapeutics, Inc.* | | | 35,000 | | | | 268,450 | |
AMAG Pharmaceuticals, Inc.* | | | 100,000 | | | | 999,000 | |
AngioDynamics, Inc.* | | | 47,000 | | | | 925,430 | |
Assertio Therapeutics, Inc.* | | | 92,200 | | | | 318,090 | |
Brookdale Senior Living, Inc.* | | | 410,500 | | | | 2,959,705 | |
Concert Pharmaceuticals, Inc.* | | | 45,000 | | | | 540,000 | |
Cross Country Healthcare, Inc.* | | | 46,050 | | | | 431,949 | |
Electromed, Inc.* | | | 10,000 | | | | 54,500 | |
FONAR Corp.* | | | 23,400 | | | | 503,334 | |
InfuSystem Holdings, Inc.* | | | 118,378 | | | | 509,025 | |
Kewaunee Scientific Corp. | | | 2,500 | | | | 47,850 | |
Magellan Health, Inc.* | | | 39,500 | | | | 2,932,085 | |
Mallinckrodt PLC*+ | | | 119,900 | | | | 1,100,682 | |
National HealthCare Corp. | | | 22,982 | | | | 1,864,989 | |
PDL BioPharma, Inc.* | | | 380,800 | | | | 1,195,712 | |
Prestige Consumer Healthcare, Inc.* | | | 120,600 | | | | 3,820,608 | |
Surgery Partners, Inc.* | | | 95,000 | | | | 773,300 | |
Triple-S Management Corp., Class B* | | | 56,100 | | | | 1,337,985 | |
| | | | | | | | |
| | |
| | | | | | | 20,582,694 | |
|
Industrials - 16.39% | |
Acacia Research Corp.* | | | 101,500 | | | | 300,440 | |
ACCO Brands Corp. | | | 239,800 | | | | 1,887,226 | |
Aegion Corp.* | | | 72,100 | | | | 1,326,640 | |
AeroCentury Corp.* | | | 4,300 | | | | 31,272 | |
Air T, Inc.* | | | 10,050 | | | | 175,774 | |
Aircastle, Ltd. | | | 170,900 | | | | 3,633,334 | |
Alpha Pro Tech, Ltd.* | | | 30,500 | | | | 104,005 | |
AMREP Corp.* | | | 8,100 | | | | 55,566 | |
Apogee Enterprises, Inc. | | | 27,600 | | | | 1,198,944 | |
ARC Document Solutions, Inc.* | | | 224,600 | | | | 458,184 | |
ArcBest Corp. | | | 50,400 | | | | 1,416,744 | |
Armstrong Flooring, Inc.* | | | 65,000 | | | | 640,250 | |
Arotech Corp.* | | | 35,596 | | | | 70,836 | |
| | |
Omni Tax-Managed Small-Cap Value Fund SCHEDULE OF INVESTMENTS(continued) | | |
|
|
| |
| Showing percentage of net assets as of June 30, 2019 | | |
| | | | | | | | |
| Industry Company | | Shares | | | Value | |
|
Common Stocks (continued) | |
Industrials (continued) | |
Art’s-Way Manufacturing Co., Inc.* | | | 15,000 | | | $ | 30,300 | |
Atkore International Group, Inc.* | | | 75,000 | | | | 1,940,250 | |
Atlas Air Worldwide Holdings, Inc.* | | | 54,800 | | | | 2,446,272 | |
BMC Stock Holdings, Inc.* | | | 158,800 | | | | 3,366,560 | |
Briggs & Stratton Corp. | | | 60,700 | | | | 621,568 | |
Caesarstone, Ltd. | | | 31,000 | | | | 465,930 | |
CAI International, Inc.* | | | 64,500 | | | | 1,600,890 | |
Chicago Rivet & Machine Co. | | | 1,000 | | | | 28,490 | |
Civeo Corp.* | | | 113,700 | | | | 195,564 | |
Commercial Vehicle Group, Inc.* | | | 73,600 | | | | 590,272 | |
Costamare, Inc. | | | 255,000 | | | | 1,308,150 | |
Covenant Transportation Group, Inc., Class A* | | | 42,550 | | | | 625,910 | |
CRA International, Inc. | | | 22,000 | | | | 843,260 | |
DLH Holdings Corp.* | | | 52,500 | | | | 266,700 | |
Ducommun, Inc.* | | | 34,300 | | | | 1,545,901 | |
Eagle Bulk Shipping, Inc.* | | | 230,000 | | | | 1,205,200 | |
Eastern Co. (The) | | | 20,104 | | | | 563,314 | |
Echo Global Logistics, Inc.* | | | 60,000 | | | | 1,252,200 | |
Ecology and Environment, Inc., Class A | | | 18,536 | | | | 202,042 | |
Ennis, Inc. | | | 124,265 | | | | 2,549,918 | |
EnPro Industries, Inc. | | | 42,600 | | | | 2,719,584 | |
Foundation Building Materials, Inc.* | | | 59,800 | | | | 1,063,244 | |
FTI Consulting, Inc.* | | | 47,500 | | | | 3,982,400 | |
Genco Shipping & Trading, Ltd.* | | | 95,000 | | | | 801,800 | |
General Finance Corp.* | | | 50,000 | | | | 418,500 | |
Goldfield Corp. (The)* | | | 114,000 | | | | 262,200 | |
Great Lakes Dredge & Dock Corp.* | | | 144,800 | | | | 1,598,592 | |
Greenbrier Cos, Inc. (The) | | | 34,100 | | | | 1,036,640 | |
Hawaiian Holdings, Inc. | | | 62,300 | | | | 1,708,889 | |
Herc Holdings, Inc.* | | | 55,000 | | | | 2,520,650 | |
Hertz Global Holdings, Inc.* | | | 103,400 | | | | 1,650,264 | |
Highpower International, Inc.* | | | 25,922 | | | | 109,909 | |
Hub Group, Inc., Class A* | | | 60,700 | | | | 2,548,186 | |
Hurco Cos., Inc. | | | 17,615 | | | | 626,389 | |
IES Holdings, Inc.* | | | 3,600 | | | | 67,860 | |
Innovative Solutions & Support, Inc.* | | | 23,300 | | | | 118,830 | |
Kelly Services, Inc., Class A | | | 78,400 | | | | 2,053,296 | |
LB Foster Co., Class A* | | | 32,500 | | | | 888,550 | |
| | | | | | | | |
| Industry Company | | Shares | | | Value | |
|
Industrials (continued) | |
Limbach Holdings, Inc.* | | | 25,000 | | | $ | 227,500 | |
LS Starrett Co. (The),
Class A* | | | 9,400 | | | | 62,228 | |
Marten Transport, Ltd. | | | 100,776 | | | | 1,829,084 | |
Matson, Inc. | | | 90,590 | | | | 3,519,422 | |
Matthews International Corp., Class A | | | 58,500 | | | | 2,038,725 | |
Milacron Holdings Corp.* | | | 135,000 | | | | 1,863,000 | |
Miller Industries, Inc. | | | 22,700 | | | | 698,025 | |
MYR Group, Inc.* | | | 40,000 | | | | 1,494,000 | |
Navigant Consulting, Inc. | | | 125,900 | | | | 2,919,621 | |
NL Industries, Inc.* | | | 5,000 | | | | 18,250 | |
Northwest Pipe Co.* | | | 20,100 | | | | 518,178 | |
Orion Group Holdings, Inc.* | | | 52,672 | | | | 141,161 | |
PAM Transportation Services, Inc.* | | | 16,000 | | | | 992,000 | |
Pangaea Logistics Solutions, Ltd.+ | | | 4,800 | | | | 16,080 | |
Park-Ohio Holdings Corp. | | | 24,000 | | | | 782,160 | |
Patriot Transportation Holding, Inc.* | | | 7,500 | | | | 127,275 | |
Powell Industries, Inc. | | | 20,400 | | | | 775,200 | |
Preformed Line Products Co. | | | 4,600 | | | | 255,392 | |
Quad/Graphics, Inc.+ | | | 87,600 | | | | 692,916 | |
Quanex Building Products Corp. | | | 70,000 | | | | 1,322,300 | |
Rush Enterprises, Inc., Class A | | | 48,600 | | | | 1,774,872 | |
Rush Enterprises, Inc.,
Class B | | | 34,700 | | | | 1,280,777 | |
Safe Bulkers, Inc.* | | | 197,100 | | | | 307,476 | |
Scorpio Bulkers, Inc. | | | 108,700 | | | | 500,020 | |
Servotronics, Inc. | | | 1,000 | | | | 9,600 | |
SkyWest, Inc. | | | 25,200 | | | | 1,528,884 | |
Spartan Motors, Inc. | | | 10,000 | | | | 109,600 | |
SPX FLOW, Inc.* | | | 74,700 | | | | 3,126,942 | |
Steelcase, Inc., Class A | | | 202,600 | | | | 3,464,460 | |
Sterling Construction Co., Inc.* | | | 15,800 | | | | 212,036 | |
Textainer Group Holdings, Ltd.* | | | 80,500 | | | | 811,440 | |
Titan Machinery, Inc.* | | | 47,800 | | | | 983,724 | |
TrueBlue, Inc.* | | | 44,250 | | | | 976,155 | |
Tutor Perini Corp.* | | | 96,200 | | | | 1,334,294 | |
USA Truck, Inc.* | | | 17,700 | | | | 178,947 | |
Vectrus, Inc.* | | | 11,900 | | | | 482,664 | |
Veritiv Corp.* | | | 14,633 | | | | 284,173 | |
VSE Corp. | | | 25,560 | | | | 733,316 | |
| | |
|
| |
| 28 | | Annual Report | June 30, 2019 |
| | |
Omni Tax-Managed Small-Cap Value Fund SCHEDULE OF INVESTMENTS(continued) | | |
|
|
| |
| Showing percentage of net assets as of June 30, 2019 | | |
| | | | | | | | |
| Industry Company | | Shares | | | Value | |
|
Common Stocks (continued) | |
Industrials (continued) | |
Wabash National Corp. | | | 87,000 | | | $ | 1,415,490 | |
Willis Lease Finance Corp.* | | | 47,634 | | | | 2,778,015 | |
| | | | | | | | |
| | |
| | | | | | | 99,709,091 | |
|
Information Technology - 8.14% | |
Alpha & Omega | | | | | | | | |
Semiconductor, Ltd.* | | | 61,905 | | | | 578,193 | |
Amkor Technology, Inc.* | | | 408,000 | | | | 3,043,680 | |
Applied Optoelectronics, Inc.*+ | | | 27,800 | | | | 285,784 | |
Avaya Holdings Corp.* | | | 169,300 | | | | 2,016,363 | |
Aviat Networks, Inc.* | | | 13,800 | | | | 189,060 | |
Bel Fuse, Inc., Class B | | | 33,300 | | | | 571,761 | |
Benchmark Electronics, Inc. | | | 94,300 | | | | 2,368,816 | |
BK Technologies Corp. | | | 35,000 | | | | 150,500 | |
Communications Systems, Inc. | | | 5,800 | | | | 17,458 | |
Computer Task Group, Inc.* | | | 81,000 | | | | 324,810 | |
Comtech Telecommunications Corp. | | | 61,785 | | | | 1,736,776 | |
CSP, Inc. | | | 5,150 | | | | 78,538 | |
Diodes, Inc.* | | | 112,600 | | | | 4,095,262 | |
Finjan Holdings, Inc.* | | | 88,700 | | | | 196,914 | |
GSE Systems, Inc.* | | | 22,500 | | | | 52,650 | |
Ichor Holdings, Ltd.* | | | 40,500 | | | | 957,420 | |
Innodata, Inc.* | | | 43,000 | | | | 38,700 | |
Insight Enterprises, Inc.* | | | 74,600 | | | | 4,341,720 | |
inTEST Corp.* | | | 54,500 | | | | 262,145 | |
KEMET Corp. | | | 126,750 | | | | 2,384,168 | |
Key Tronic Corp.* | | | 18,600 | | | | 92,628 | |
Kimball Electronics, Inc.* | | | 59,100 | | | | 959,784 | |
KVH Industries, Inc.* | | | 13,600 | | | | 147,832 | |
Mind CTI, Ltd. | | | 500 | | | | 1,115 | |
NeoPhotonics Corp.* | | | 71,000 | | | | 296,780 | |
Net 1 UEPS Technologies, Inc.* | | | 51,400 | | | | 205,600 | |
NetSol Technologies, Inc.* | | | 15,700 | | | | 87,763 | |
Network-1 Technologies, Inc. | | | 50,000 | | | | 125,000 | |
Nortech Systems, Inc.* | | | 1,500 | | | | 5,685 | |
PCM, Inc.* | | | 35,500 | | | | 1,243,920 | |
PC-Tel, Inc. | | | 37,950 | | | | 168,118 | |
Perceptron, Inc.* | | | 13,500 | | | | 60,075 | |
Photronics, Inc.* | | | 171,470 | | | | 1,406,054 | |
Presidio, Inc. | | | 167,300 | | | | 2,286,991 | |
Rambus, Inc.* | | | 110,000 | | | | 1,324,400 | |
RF Industries, Ltd. | | | 35,000 | | | | 295,400 | |
Sanmina Corp.* | | | 90,900 | | | | 2,752,452 | |
ScanSource, Inc.* | | | 64,500 | | | | 2,100,120 | |
Steel Connect, Inc.* | | | 135,000 | | | | 245,700 | |
Stratasys, Ltd.* | | | 80,000 | | | | 2,349,600 | |
| | | | | | | | |
| Industry Company | | Shares | | | Value | |
|
Information Technology (continued) | |
SunPower Corp.*+ | | | 268,900 | | | $ | 2,874,541 | |
Sykes Enterprises, Inc.* | | | 92,750 | | | | 2,546,915 | |
Synaptics, Inc.* | | | 20,000 | | | | 582,800 | |
TiVo Corp. | | | 136,400 | | | | 1,005,268 | |
Trio-Tech International* | | | 13,000 | | | | 37,440 | |
TSR, Inc.* | | | 1,385 | | | | 6,302 | |
TTM Technologies, Inc.* | | | 219,402 | | | | 2,237,900 | |
Ultra Clean Holdings, Inc.* | | | 7,000 | | | | 97,440 | |
Wayside Technology Group, Inc. | | | 15,700 | | | | 177,253 | |
Westell Technologies, Inc., Class A* | | | 59,900 | | | | 112,612 | |
| | | | | | | | |
| | |
| | | | | | | 49,524,206 | |
|
Materials - 5.13% | |
AdvanSix, Inc.* | | | 58,900 | | | | 1,438,927 | |
American Vanguard Corp. | | | 4,800 | | | | 73,968 | |
Boise Cascade Co. | | | 68,400 | | | | 1,922,724 | |
Clearwater Paper Corp.* | | | 46,000 | | | | 850,540 | |
Forterra, Inc.*+ | | | 170,000 | | | | 844,900 | |
Friedman Industries, Inc. | | | 32,900 | | | | 228,984 | |
FutureFuel Corp. | | | 79,500 | | | | 929,355 | |
Gulf Resources, Inc.* | | | 18,150 | | | | 17,787 | |
Hecla Mining Co. | | | 749,000 | | | | 1,348,200 | |
Intrepid Potash, Inc.* | | | 185,000 | | | | 621,600 | |
Kraton Corp.* | | | 110,477 | | | | 3,432,520 | |
Kronos Worldwide, Inc. | | | 35,000 | | | | 536,200 | |
LSB Industries, Inc.* | | | 103,500 | | | | 403,650 | |
Materion Corp. | | | 21,400 | | | | 1,451,134 | |
Mercer International, Inc. | | | 164,850 | | | | 2,550,230 | |
PH Glatfelter Co. | | | 50,000 | | | | 844,000 | |
Rayonier Advanced Materials, Inc. | | | 180,500 | | | | 1,171,445 | |
Resolute Forest Products, Inc. | | | 202,500 | | | | 1,458,000 | |
Schnitzer Steel Industries, Inc., Class A | | | 77,600 | | | | 2,030,792 | |
SunCoke Energy, Inc.* | | | 181,200 | | | | 1,609,056 | |
Synalloy Corp. | | | 2,200 | | | | 34,364 | |
Trecora Resources* | | | 18,600 | | | | 178,002 | |
Tredegar Corp. | | | 77,600 | | | | 1,289,712 | |
Universal Stainless & Alloy Products, Inc.* | | | 1,350 | | | | 21,600 | |
Verso Corp., Class A* | | | 85,301 | | | | 1,624,984 | |
Warrior Met Coal, Inc. | | | 163,000 | | | | 4,257,560 | |
| | | | | | | | |
| | |
| | | | | | | 31,170,234 | |
|
Real Estate - 0.34% | |
Altisource Portfolio Solutions SA* | | | 72,000 | | | | 1,415,520 | |
| | |
Omni Tax-Managed Small-Cap Value Fund SCHEDULE OF INVESTMENTS(continued) | | |
|
|
| |
| Showing percentage of net assets as of June 30, 2019 | | |
| | | | | | | | |
| Industry Company | | Shares | | | Value | |
|
Common Stocks (continued) | |
Real Estate (continued) | |
Consolidated-Tomoka Land Co. | | | 11,000 | | | $ | 656,700 | |
Forestar Group, Inc.* | | | 1 | | | | 20 | |
| | | | | | | | |
| | | | | | | 2,072,240 | |
| | | | | | | | |
| |
TOTAL COMMON STOCKS - 99.56% | | | | 605,666,173 | |
| | | | | |
(Cost $551,611,745) | | | | | |
|
PREFERRED STOCK - 0.00% | |
Air T Funding,
8.00%***+ | | | 5,307 | | | | 12,684 | |
| | | | | | | | |
| |
TOTAL PREFERRED STOCK - 0.00% | | | | 12,684 | |
| | | | | | | | |
(Cost $11,039) | | | | | |
|
RIGHTS - 0.03% | |
Hertz Global Holdings, Inc., expiring 07/12/19* | | | 103,400 | | | | 201,630 | |
Newstar Financial, Inc., expiring 12/26/19*D | | | 105,100 | | | | 7,357 | |
| | | | | | | | |
| | |
TOTAL RIGHTS - 0.03% | | | | | | | 208,987 | |
| | | | | | | | |
(Cost $75,625) | | | | | | | | |
|
WARRANTS - 0.00% | |
Air T Funding, expiring 06/07/20* | | | 27,864 | | | | 1,950 | |
Eagle Bulk Shipping, Inc., expiring 10/15/21* | | | 8,501 | | | | 47 | |
| | | | | | | | |
| | |
TOTAL WARRANTS - 0.00% | | | | | | | 1,997 | |
| | | | | | | | |
(Cost $73,557) | | | | | | | | |
| | | | | | | | | | | | |
| | | Rate^ | | | Shares | | | Value | |
|
MONEY MARKET FUND - 0.52% | |
Fidelity Investments Money Market Government Portfolio Class I | | | 2.25% | | | | 3,162,366 | | | | $3,162,366 | |
| | | | | | | | | | | | |
| |
TOTAL MONEY MARKET FUND - 0.52% | | | | 3,162,366 | |
| | | | | | | | | | | | |
(Cost $3,162,366) | | | | | |
|
| INVESTMENTS PURCHASED WITH CASH PROCEEDS FROM SECURITIES LENDING - 2.68% | |
Fidelity Investments Money Market Government Portfolio
Class I** | | | 2.25% | | | | 16,314,418 | | | | 16,314,418 | |
| | | | | | | | | | | | |
TOTAL INVESTMENTS PURCHASED WITH CASH PROCEEDS FROM SECURITIES LENDING - 2.68% | | | | 16,314,418 | |
| | | | | | | | | | | | |
(Cost $16,314,418) | | | | | |
| |
TOTAL INVESTMENTS - 102.79% | | | | $625,366,625 | |
(Cost $571,248,750) | | | | | |
Liabilities in Excess of Other Assets - (2.79%) | | | | (16,998,603 | ) |
| | | | | | | | | | | | |
| |
NET ASSETS - 100.00% | | | | $608,368,022 | |
| | | | | | | | | | | | |
| * | Non-income producing security. |
| ** | This security represents the investment of the collateral received in connection with securities out on loan as of June 30, 2019. |
| *** | Security is perpetual and has no stated maturity date. |
| ^ | Rate disclosed as of June 30, 2019. |
| D | Security was fair valued using significant unobservable inputs (see Note 2). As such, the security is classified as Level 3 in the fair value hierarchy. |
| + | This security or a portion of the security is out on loan at June 30, 2019. Total loaned securities had a value of $15,732,909, which included loaned securities with a value of $459,737 that have been sold and are pending settlement as of June 30, 2019. The total market value of loaned securities excluding these pending sales is $15,273,172. |
LLC - Limited Liability Company
PLC - Public Limited Company
| | |
|
| |
| 30 | | Annual Report | June 30, 2019 |
| | |
Omni Tax-Managed Small-Cap Value Fund SCHEDULE OF INVESTMENTS(continued) | | |
|
|
| |
| Showing percentage of net assets as of June 30, 2019 | | |
Summary of inputs used to value the Fund’s investments as of 06/30/2019 (See Note 2 in Notes to Financial Statements):
| | | | | | | | | | | | | | | | |
| | | Valuation Inputs | |
| | | Investment in Securities (Value) | |
| | | Level 1 Quoted Prices | | | Level 2
Significant
Observable
Inputs | | | Level 3
Significant
Unobservable
Inputs | | | Total | |
| | | | |
Common Stocks | | | | | | | | | | | | | | | | |
Consumer Discretionary | | $ | 89,824,786 | | | $ | 57,450 | | | $ | — | | | $ | 89,882,236 | |
Information Technology | | | 49,518,521 | | | | 5,685 | | | | — | | | | 49,524,206 | |
Other Industries (a) | | | 466,259,731 | | | | — | | | | — | | | | 466,259,731 | |
| | | | | | | | | | | | | | | | |
Total Common Stocks | | | 605,603,038 | | | | 63,135 | | | | — | | | | 605,666,173 | |
Preferred Stock | | | 12,684 | | | | | | | | | | | | 12,684 | |
Rights | | | 201,630 | | | | — | | | | 7,357 | | | | 208,987 | |
Warrants | | | 1,997 | | | | — | | | | — | | | | 1,997 | |
Money Market Fund | | | — | | | | 3,162,366 | | | | — | | | | 3,162,366 | |
Investments Purchased with Cash Proceeds from Securities Lending | | | — | | | | 16,314,418 | | | | — | | | | 16,314,418 | |
| | | | | | | | | | | | | | | | |
TOTAL | | $ | 605,819,349 | | | $ | 19,539,919 | | | $ | 7,357 | | | $ | 625,366,625 | |
| | | | | | | | | | | | | | | | |
(a) - please refer to the Schedule of Investments for the industry classifications of these portfolio holdings
Following is a reconciliation of Level 3 investments for which significant unobservable inputs were used to determine fair value:
| | | | | |
| | | Investment in Securities (Value) |
| | | Rights |
Balance as of 06/30/2018 | | | $ | 31,530 | |
Purchases | | | | — | |
Return of Capital | | | | (24,459 | ) |
Realized gain/(loss) | | | | — | |
Change in unrealized appreciation/ (depreciation) | | | | 286 | |
Transfers in | | | | — | |
Transfers out | | | | — | |
| | | | | |
| |
Balance as of 06/30/2019 | | | $ | 7,357 | |
| | | | | |
Net change in unrealized appreciation (depreciation) from investments held as of 06/30/2019 | | | $ | 286 | |
| | | | | |
See Notes to Financial Statements.
| | |
| STATEMENTS OF ASSETS AND LIABILITIES | | |
|
|
June 30, 2019
| | | | | | | | | | | | | | | | | |
| ASSETS | | Omni Small-Cap Value | | | | Omni Tax-Managed Small-Cap Value | | |
| | | | |
Investments at value | | | $ | 1,012,506,785 | | | | | | | | | $ | 625,366,625 | | | |
| | | | |
Receivables: | | | | | | | | | | | | | | | | | |
| | | | |
Portfolio securities sold | | | | 3,903,147 | | | | | | | | | | 3,280,798 | | | |
| | | | |
Fund shares sold | | | | 1,389,962 | | | | | | | | | | 663,337 | | | |
| | | | |
Dividends and interest | | | | 660,116 | | | | | | | | | | 350,852 | | | |
| | | | |
Prepaid expenses | | | | 110,130 | | | | | | | | | | 80,316 | | | |
| | | | |
Total assets | | | | 1,018,570,140 | | | | | | | | | | 629,741,928 | | | |
| | | | |
LIABILITIES | | | | | | | | | | | | | | | | | |
| | | | |
Payables: | | | | | | | | | | | | | | | | | |
| | | | |
Portfolio securities purchased | | | | 1,083,199 | | | | | | | | | | 3,497,017 | | | |
| | | | |
Fund shares redeemed | | | | 195,722 | | | | | | | | | | 1,154,495 | | | |
| | | | |
Loan payable | | | | 306,000 | | | | | | | | | | - | | | |
| | | | |
Payable upon return of securities loaned | | | | 27,405,876 | | | | | | | | | | 16,314,418 | | | |
| | | | |
Accrued Liabilities: | | | | | | | | | | | | | | | | | |
| | | | |
Investment advisory fees | | | | 263,460 | | | | | | | | | | 180,202 | | | |
| | | | |
Administration fees | | | | 22,430 | | | | | | | | | | 13,830 | | | |
| | | | |
Directors’ fees | | | | 2,365 | | | | | | | | | | 1,780 | | | |
| | | | |
Other | | | | 275,742 | | | | | | | | | | 212,164 | | | |
| | | | |
Total liabilities | | | | 29,554,794 | | | | | | | | | | 21,373,906 | | | |
| | | | |
NET ASSETS | | | $ | 989,015,346 | | | | | | | | | $ | 608,368,022 | | | |
| | | | |
NET ASSETS REPRESENT | | | | | | | | | | | | | | | | | |
| | | | |
Paid-in capital | | | $ | 933,772,807 | | | | | | | | | $ | 551,222,282 | | | |
| | | | |
Distributable earnings* | | | | 55,242,539 | | | | | | | | | | 57,145,740 | | | |
| | | | |
NET ASSETS | | | $ | 989,015,346 | | | | | | | | | $ | 608,368,022 | | | |
| | | | |
Shares of common stock outstanding of $.001 par value** | | | | 66,083,436 | | | | | | | | | | 42,152,928 | | | |
| | | | |
Net asset value, offering price and redemption price per share | | | $ | 14.97 | | | | | | | | | $ | 14.43 | | | |
| | | | |
Total investments at cost | | | $ | 967,358,256 | | | | | | | | | $ | 571,248,750 | | | |
| * | Effective December 31, 2018, the Fund has adopted disclosure requirements conforming to SEC Rule 6-04.17 of Regulation S-X and discloses total distributable earnings. See Note 2 for further details. |
| ** | See Note 1 - Organization in the Notes to Financial Statements for shares authorized for each Fund. |
See Notes to Financial Statements.
| | |
|
| |
| 32 | | Annual Report | June 30, 2019 |
| | |
| STATEMENTS OF OPERATIONS | | |
| Year Ended June 30, 2019 | | |
| | | | | | | | | | | | | | | | | |
| | | Omni Small-Cap Value | | | | Omni Tax-Managed
Small-Cap Value | | |
| | | | |
INVESTMENT INCOME | | | | | | | | | | | | | | | | | |
| | | | |
Dividends | | | $ | 15,914,908 | | | | | | | | | $ | 11,641,252 | | | |
| | | | |
Less: foreign taxes withheld | | | | (16,788 | ) | | | | | | | | | (8,098 | ) | | |
| | | | |
Interest | | | | 90,620 | | | | | | | | | | 39,638 | | | |
| | | | |
Securities lending | | | | 873,168 | | | | | | | | | | 680,677 | | | |
| | | | |
Total Investment Income | | | | 16,861,908 | | | | | | | | | | 12,353,469 | | | |
| | | | |
EXPENSES | | | | | | | | | | | | | | | | | |
| | | | |
Investment advisory fees | | | | 4,647,553 | | | | | | | | | | 3,464,321 | | | |
| | | | |
Administration fees | | | | 246,701 | | | | | | | | | | 182,268 | | | |
| | | | |
Accounting fees | | | | 197,918 | | | | | | | | | | 169,133 | | | |
| | | | |
Transfer agent fees | | | | 10,735 | | | | | | | | | | 10,916 | | | |
| | | | |
Professional fees | | | | 194,124 | | | | | | | | | | 150,615 | | | |
| | | | |
Custody fees | | | | 28,343 | | | | | | | | | | 45,607 | | | |
| | | | |
Blue sky fees | | | | 65,312 | | | | | | | | | | 61,271 | | | |
| | | | |
Directors’ and officers’ fees | | | | 98,372 | | | | | | | | | | 71,915 | | | |
| | | | |
Shareholder servicing fees | | | | 811,067 | | | | | | | | | | 623,664 | | | |
| | | | |
Reports to shareholders | | | | 52,231 | | | | | | | | | | 39,814 | | | |
| | | | |
Miscellaneous expenses | | | | 162,682 | | | | | | | | | | 163,747 | | | |
| | | | |
Total Expenses | | | | 6,515,038 | | | | | | | | | | 4,983,271 | | | |
| | | | |
Less investment advisory fees waived | | | | (937,974 | ) | | | | | | | | | (826,118 | ) | | |
| | | | |
Net Expenses | | | | 5,577,064 | | | | | | | | | | 4,157,153 | | | |
| | | | |
NET INVESTMENT INCOME | | | | 11,284,844 | | | | | | | | | | 8,196,316 | | | |
| | | | |
NET REALIZED AND UNREALIZED GAIN (LOSS) ON INVESTMENTS | | | | | | | | | | | | | | | | | |
| | | | |
Realized Gain on: | | | | | | | | | | | | | | | | | |
| | | | |
Investments | | | | 33,634,476 | | | | | | | | | | 16,849,423 | | | |
| | | | |
Change in Unrealized Appreciation (Depreciation) on: | | | | | | | | | | | | | | | | | |
| | | | |
Investments | | | | (192,113,168 | ) | | | | | | | | | (167,424,940 | ) | | |
| | | | |
Net Realized and Unrealized Loss on Investments | | | | (158,478,692 | ) | | | | | | | | | (150,575,517 | ) | | |
| | | | |
NET DECREASE IN NET ASSETS RESULTING FROM OPERATIONS | | | $ | (147,193,848 | ) | | | | | | | | $ | (142,379,201 | ) | | |
See Notes to Financial Statements.
| | |
| STATEMENTS OF CHANGES IN NET ASSETS | | |
|
|
| | | | | | | | | | | | | | | | | | |
| | | Omni Small-Cap Value | | | Omni Tax-Managed Small-Cap Value | | | |
| | | Year Ended June 30, | | | Year Ended June 30, | | | |
| | | 2019 | | | 2018 | | | 2019 | | | 2018 | | | |
| | | | | |
OPERATIONS | | | | | | | | | | | | | | | | | | |
| | | | | |
Net investment income | | $ | 11,284,844 | | | $ | 6,995,943 | | | $ | 8,196,316 | | | $ | 6,345,885 | | | |
| | | | | |
Net realized gain on investments | | | 33,634,476 | | | | 54,647,102 | | | | 16,849,423 | | | | 46,319,987 | | | |
| | | | | |
Net change in unrealized appreciation (depreciation) on investments | | | (192,113,168 | ) | | | 63,773,834 | | | | (167,424,940 | ) | | | 55,911,577 | | | |
| | | | | |
Net increase (decrease) in net assets resulting from operations | | | (147,193,848 | ) | | | 125,416,879 | | | | (142,379,201 | ) | | | 108,577,449 | | | |
| | | | | |
DISTRIBUTIONS: | | | | | | | | | | | | | | | | | | |
| | | | | |
From net investment income and net realized gains* | | | (68,537,520 | ) | | | (50,546,932 | ) | | | (51,987,352 | ) | | | (40,512,145 | ) | | |
| | | | | |
Net decrease in net assets from distributions** | | | (68,537,520 | ) | | | (50,546,932 | ) | | | (51,987,352 | ) | | | (40,512,145 | ) | | |
| | | | | |
SHARE TRANSACTIONS: | | | | | | | | | | | | | | | | | | |
| | | | | |
Proceeds from sale of shares | | | 446,724,382 | | | | 203,730,487 | | | | 326,663,113 | | | | 168,009,722 | | | |
| | | | | |
Reinvestment of distributions | | | 68,487,234 | | | | 50,537,299 | | | | 51,833,228 | | | | 40,413,658 | | | |
| | | | | |
Cost of shares redeemed | | | (223,662,871 | ) | | | (126,296,700 | ) | | | (380,949,961 | ) | | | (114,515,838 | ) | | |
| | | | | |
Net increase (decrease) in net assets resulting from share transactions | | | 291,548,745 | | | | 127,971,086 | | | | (2,453,620 | ) | | | 93,907,542 | | | |
| | | | | |
Net increase (decrease) in net assets | | | 75,817,377 | | | | 202,841,033 | | | | (196,820,173 | ) | | | 161,972,846 | | | |
| | | | | |
NET ASSETS: | | | | | | | | | | | | | | | | | | |
| | | | | |
Beginning of year | | | 913,197,969 | | | | 710,356,936 | | | | 805,188,195 | | | | 643,215,349 | | | |
| | | | | |
End of year*** | | $ | 989,015,346 | | | $ | 913,197,969 | | | $ | 608,368,022 | | | $ | 805,188,195 | | | |
| | | | | |
SHARES ISSUED & REDEEMED | | | | | | | | | | | | | | | | | | |
| | | | | |
Issued | | | 29,158,856 | | | | 10,867,100 | | | | 21,486,464 | | | | 9,329,371 | | | |
| | | | | |
Distributions reinvested | | | 4,802,751 | | | | 2,766,136 | | | | 3,753,311 | | | | 2,304,085 | | | |
| | | | | |
Redeemed | | | (13,930,780 | ) | | | (6,729,805 | ) | | | (25,251,515 | ) | | | (6,460,884 | ) | | |
| | | | | |
Net increase (decrease) in shares | | | 20,030,827 | | | | 6,903,431 | | | | (11,740 | ) | | | 5,172,572 | | | |
| | | | | |
Outstanding at beginning of year | | | 46,052,609 | | | | 39,149,178 | | | | 42,164,668 | | | | 36,992,096 | | | |
| | | | | |
Outstanding at end of year | | | 66,083,436 | | | | 46,052,609 | | | | 42,152,928 | | | | 42,164,668 | | | |
| * | For the year ended June 30, 2018, the distributions to shareholders from net investment income were $ 6,405,244 and $8,820,586, and net realized gains were $44,141,688 and $31,691,559 for Omni Small-Cap Value Fund and Omni Tax-Managed Small-Cap Value Fund, respectively. |
| ** | Effective December 31, 2018, the Fund has adopted disclosure requirements conforming to SEC Rule 6-04.17 of Regulation S-X. See Note 2 for further details. |
| *** | The balance as of June 30, 2018, includes $2,782,031 and $2,718,400 of undistributed net investment income for Omni Small-Cap Value Fund and Omni Tax-Managed Small-Cap Value Fund, respectively. |
See Notes to Financial Statements.
| | |
|
| |
| 34 | | Annual Report | June 30, 2019 |
| | |
FINANCIAL HIGHLIGHTS | | |
| (for a share outstanding throughout each year indicated) | | |
OMNI SMALL-CAP VALUE
| | | | | | | | | | |
| | | Year Ended June 30 |
| | | | | |
| | | 2019 | | 2018 | | 2017 | | 2016 | | 2015 |
Net Asset Value, Beginning of Year | | $19.83 | | $18.14 | | $14.66 | | $15.49 | | $16.63 |
| | | | | | | | | | |
| | | | | |
Income from Investment Operations: | | | | | | | | | | |
Net Investment Income(a) | | 0.20 | | 0.17 | | 0.17 | | 0.17 | | 0.14 |
Net Realized and Unrealized Gain (Loss) | | (3.61) | | 2.77 | | 3.48 | | (0.86) | | (0.46) |
| | | | | | | | | | |
Total from Investment Operations | | (3.41) | | 2.94 | | 3.65 | | (0.69) | | (0.32) |
| | | | | | | | | | |
| | | | | |
Less Distributions to Shareholders from: | | | | | | | | | | |
Net Investment Income | | (0.17) | | (0.16) | | (0.17) | | (0.14) | | (0.09) |
Net Realized Gain | | (1.28) | | (1.09) | | - | | - | | (0.73) |
| | | | | | | | | | |
| | | | | | | | | | |
Total Distributions | | (1.45) | | (1.25) | | (0.17) | | (0.14) | | (0.82) |
| | | | | | | | | | |
| | | | | |
Net Asset Value, End of Year | | $14.97 | | $19.83 | | $18.14 | | $14.66 | | $15.49 |
| | | | | | | | | | |
| | | | | |
Total Return(b) | | (16.82%) | | 16.75% | | 24.83% | | (4.42%) | | (1.48%) |
| | | | | |
Ratios and Supplemental Data: | | | | | | | | | | |
Net Assets, End of Year (in 000’s) | | $989,015 | | $913,198 | | $710,357 | | $558,286 | | $459,367 |
Expenses Before Waivers and Reimbursements | | 0.70% | | 0.70% | | 0.71% | | 0.71% | | 0.71% |
Expenses After Waivers and Reimbursements | | 0.60% | | 0.60% | | 0.60% | | 0.60% | | 0.60% |
Net Investment Income After Waivers and Reimbursements | | 1.21% | | 0.88% | | 1.00% | | 1.17% | | 0.88% |
Portfolio Turnover Rate | | 29% | | 24% | | 23% | | 24% | | 25% |
| (a) | Per share amounts calculated based on the average daily shares outstanding during the year. |
| (b) | Total return would have been lower had various fees not been waived during the year. |
See Notes to Financial Statements.
| | |
FINANCIAL HIGHLIGHTS | | |
| (for a share outstanding throughout each year indicated) | | |
OMNI TAX-MANAGED SMALL-CAP VALUE
| | | | | | | | | | |
| | | Year Ended June 30 |
| | | | | |
| | | 2019 | | 2018 | | 2017 | | 2016 | | 2015 |
Net Asset Value, Beginning of Year | | $19.10 | | $17.39 | | $14.04 | | $14.65 | | $15.54 |
| | | | | | | | | | |
| | | | | |
Income from Investment Operations: | | | | | | | | | | |
Net Investment Income(a) | | 0.20 | | 0.16 | | 0.17 | | 0.16 | | 0.12 |
Net Realized and Unrealized Gain (Loss) | | (3.42) | | 2.61 | | 3.32 | | (0.66) | | (0.42) |
| | | | | | | | | | |
Total from Investment Operations | | (3.22) | | 2.77 | | 3.49 | | (0.50) | | (0.30) |
| | | | | | | | | | |
| | | | | |
Less Distributions to Shareholders from: | | | | | | | | | | |
Net Investment Income | | (0.20) | | (0.23) | | (0.14) | | (0.11) | | (0.03) |
Net Realized Gain | | (1.25) | | (0.83) | | - | | - | | (0.56) |
| | | | | | | | | | |
| | | | | | | | | | |
Total Distributions | | (1.45) | | (1.06) | | (0.14) | | (0.11) | | (0.59) |
| | | | | | | | | | |
| | | | | |
Net Asset Value, End of Year | | $14.43 | | $19.10 | | $17.39 | | $14.04 | | $14.65 |
| | | | | | | | | | |
| | | | | |
Total Return(b) | | (16.49%) | | 16.48% | | 24.83% | | (3.42%) | | (1.62%) |
| | | | | |
Ratios and Supplemental Data: | | | | | | | | | | |
Net Assets, End of Year (in 000’s) | | $608,368 | | $805,188 | | $643,215 | | $505,995 | | $461,101 |
Expenses Before Waivers and Reimbursements | | 0.72% | | 0.70% | | 0.71% | | 0.72% | | 0.71% |
Expenses After Waivers and Reimbursements | | 0.60% | | 0.60% | | 0.60% | | 0.60% | | 0.60% |
Net Investment Income After Waivers and Reimbursements | | 1.18% | | 0.89% | | 1.04% | | 1.20% | | 0.84% |
Portfolio Turnover Rate | | 42% | | 27% | | 23% | | 29% | | 30% |
| (a) | Per share amounts calculated based on the average daily shares outstanding during the year. |
| (b) | Total return would have been lower had various fees not been waived during the year. |
See Notes to Financial Statements.
| | |
|
| |
| 36 | | Annual Report | June 30, 2019 |
| | |
| NOTES TO FINANCIAL STATEMENTS | | |
|
|
| June 30, 2019 | | |
1. Organization:
Bridgeway Funds, Inc. (“Bridgeway” or the “Company”) was organized as a Maryland corporation on October 19, 1993, and is registered under the Investment Company Act of 1940, as amended (the “1940 Act”), as an open-end management investment company.
Bridgeway is organized as a series fund, with 9 investment funds as of June 30, 2019 (each is referred to as a “Bridgeway Fund” and collectively, the “Bridgeway Funds”). The Aggressive Investors 1, Ultra-Small Company, Ultra-Small Company Market, Small-Cap Growth, Small-Cap Value, Blue Chip (formerly, Blue Chip 35 Index) and Managed Volatility Funds are presented in a separate report. The Omni Small-Cap Value Fund and the Omni Tax-Managed Small-Cap Value Fund (each a “Fund” and together, the “Funds”) are presented in this report.
Bridgeway is authorized to issue 1,915,000,000 shares of common stock at $0.001 per share. As of June 30, 2019, 100,000,000 shares have been classified into the Aggressive Investors 1 Fund. 130,000,000 shares have been classified into the Blue Chip Fund. 15,000,000 shares have been classified into the Ultra-Small Company Fund. 100,000,000 shares each have been classified into the Ultra-Small Company Market, Omni Small-Cap Value, Omni Tax-Managed Small-Cap Value, Small-Cap Growth and Small-Cap Value Funds. 50,000,000 shares have been classified into the Managed Volatility Fund.
All of the Bridgeway Funds are no-load, diversified funds.
The Funds seek to provide long-term total return on capital, primarily through capital appreciation.
Bridgeway Capital Management, Inc. (the “Adviser”) is the investment adviser for all of the Bridgeway Funds.
2. Significant Accounting Policies:
The following summary of significant accounting policies, followed in the preparation of the financial statements of the Funds, are in conformity with accounting principles generally accepted in the United States of America (“GAAP”). Each Fund is considered an investment company under GAAP and follows the accounting and reporting guidance applicable to investment companies.
New Accounting PronouncementsThe SEC recently adopted changes to Regulation S-X to simplify the reporting of information by registered investment companies in financial statements. The amendments require presentation of the total, rather than the components, of distributable earnings on the Statement of Assets and Liabilities and also require presentation of the total, rather than the components, of distributions to shareholders, except for tax return of capital distributions, if any, on the Statement of Changes in Net Assets. The amendments also removed the requirement for parenthetical disclosure of undistributed net investment income on the Statement of Changes in Net Assets. These Regulation S-X amendments are reflected in the Funds’ financial statements for the year ended June 30, 2019.
Securities and Other Investments ValuationSecurities for which market quotations are readily available are valued at the last sale price on the national exchange on which such securities are primarily traded. In the case of securities reported on the National Association of Securities Dealers Automated Quotation (“NASDAQ”) system, the securities are valued based on the NASDAQ Official Closing Price (“NOCP”). In the absence of recorded sales on their home exchange, or NOCP, in the case of NASDAQ traded securities, the security will be valued as follows: bid prices for long positions and ask prices for short positions.
Investments in open-end registered investment companies and closed-end registered investment companies that do not trade on an exchange are valued at the end of day net asset value (“NAV”) per share.
Investments in closed-end registered investment companies that trade on an exchange are valued at the last sales price as of the close of the customary trading session on the exchange where the security is principally traded.
| | |
| NOTES TO FINANCIAL STATEMENTS(continued) | | |
|
|
| June 30, 2019 | | |
When market quotations are not readily available or when events occur that make established valuation methods unreliable, securities of the Funds may be valued at fair value as determined in good faith by or under the direction of the Board of Directors. The valuation assigned to a fair valued security for purposes of calculating the Funds’ NAV may differ from the security’s most recent closing market price and from the prices used by other mutual funds to calculate their NAVs.
The inputs and valuation techniques used to determine the value of a Fund’s investments are summarized into three levels as described in the hierarchy below:
| • | | Level 1 — quoted prices in active markets for identical assets |
Investments whose values are based on quoted market prices in active markets, and whose values are therefore classified as Level 1 prices, include active listed equity securities. The Funds do not adjust the quoted price for such investments, even in situations where the Funds hold a large position and a sale could reasonably impact the quoted price.
| • | | Level 2 — other significant observable inputs (including quoted prices for similar securities, interest rates, prepayment speeds, credit risk, etc.) |
Investments that trade in markets that are not considered to be active, but whose values are based on quoted market prices, dealer quotations or valuations provided by alternative pricing sources supported by observable inputs, are classified as Level 2 prices. These generally include certain U.S. Government and sovereign obligations, most government agency securities, investment-grade corporate bonds and less liquid listed equity securities. As investments whose values are classified as Level 2 prices include positions that are not traded in active markets and/or are subject to transfer restrictions, valuations may be adjusted to reflect illiquidity and/or non-transferability, which are generally based on available market information.
The Fidelity Investments Money Market Government Portfolio - Class I, which is held by the Funds, invests primarily in securities that are valued at amortized cost. Therefore, this investment is classified as a Level 2 investment.
| • | | Level 3 — significant unobservable inputs (including the Funds’ own assumptions in determining the fair value of investments) |
Investments whose values are classified as Level 3 prices have significant unobservable inputs, as they may trade infrequently or not at all. When observable prices are not available for these securities, the Funds use one or more valuation techniques for which sufficient and reliable data is available. The inputs used by the Funds in estimating the value of Level 3 prices may include the original transaction price, quoted prices for similar securities or assets in active markets, completed or pending third-party transactions in the underlying investment or comparable issuers, and changes in financial ratios or cash flows. Level 3 prices may also be adjusted to reflect illiquidity and/or non-transferability, with the amount of such discount estimated by the Funds in the absence of market information. Assumptions used by the Funds due to the lack of observable inputs may significantly impact the resulting value and therefore the results of the Funds’ operations.
The inputs or methodology used for valuing investments are not necessarily an indication of the risk associated with investing in those investments. A summary of the inputs used to value the Funds’ investments as of June 30, 2019 is included with each Fund’s Schedule of Investments.
Details regarding material transfers into, and material transfers out of, Level 3, if any, can be found at the end of each Schedule of Investments for Funds that held Level 3 securities.
Securities LendingUpon lending its securities to third parties, each Fund receives compensation in the form of fees. The loans are secured by collateral at least equal to the fair value of the securities loaned plus accrued interest. The remaining contractual maturity of all securities lending transactions is overnight and continuous. Each Fund has the right under the lending agreement to recover the securities from the borrower on demand. Additionally, a Fund does not have the right to sell or repledge collateral received in the form of securities unless the borrower goes into default. The risks to a Fund of securities lending are that the borrower may not provide additional collateral when required or return the securities when due, resulting in a loss. Under the terms of the Securities Lending Agreement, the Funds are indemnified for such losses by the securities lending agent.
| | |
|
| |
| 38 | | Annual Report | June 30, 2019 |
| | |
| NOTES TO FINANCIAL STATEMENTS(continued) | | |
|
|
| June 30, 2019 | | |
While securities are on loan, the Fund continues to receive dividends on the securities loaned and recognizes any unrealized gain or loss in the fair value of the securities loaned.
Securities lending transactions are entered into by a Fund under a Securities Lending Agreement that provides the right, in the event of default (including bankruptcy or insolvency) for the non-defaulting party to liquidate the collateral or to offset the market value of the collateral received against the market value of the securities loaned. The value of the collateral is typically greater than that of the market value of the securities loaned, leaving the lender with a net amount payable to the defaulting party. However, bankruptcy or insolvency laws of a particular jurisdiction may impose restrictions on or prohibitions against such a right of offset in the event of a counterparty’s bankruptcy or insolvency.
The market value of securities on loan, all of which are classified as common stocks in the Funds’ Schedules of Investments, and the value of the related collateral are shown in the Statements of Assets and Liabilities as a component of Investments at value.
The following table is a summary of the Funds’ securities loaned and related collateral, which are subject to a netting agreement as of June 30, 2019:
| | | | | | | | | | | | | | | | | | | | | | | | | | | | | | |
| | | | | | | | | Gross Amount Not
Offset in the Statement
of Assets and Liabilities | | |
| Fund | | Gross
Amounts of
Recognized
Assets1 | | Gross Amounts
Offset in the
Statement of
Assets and
Liabilities | | Net Amounts of
Assets Presented
in the Statement
of Assets and
Liabilities | | Financial
Instruments | | Collateral
Received2 | | Net
Amount |
| | | | | | |
Omni Small-Cap Value | | | | | | | | | | | | | | | | | | | | | | | | | | | | | | |
Securities lending | | | | $26,788,784 | | | | | - | | | | | $26,788,784 | | | | | - | | | | | $26,788,784 | | | | | - | |
| | | | | | |
Omni Tax-Managed Small-Cap Value | | | | | | | | | | | | | | | | | | | | | | | | | | | | | | |
Securities lending | | | | $15,732,909 | | | | | - | | | | | $15,732,909 | | | | | - | | | | | $15,732,909 | | | | | - | |
| 1 | Securities loaned with a value of $27,156 and $459,737 in Omni Small-Cap Value Fund and Omni Tax-Managed Small-Cap Value Fund have been sold and are pending settlement on July 2, 2019, respectively. |
| 2 | Collateral with a value of $27,405,876 and $16,314,418 has been received in connection with securities lending of Omni Small-Cap Value Fund and Omni Tax-Managed Small-Cap Value Fund, respectively. Excess of collateral received from an individual counterparty is not shown here for financial reporting purposes. |
It is each Fund’s policy to obtain additional collateral from or return excess collateral to the borrower by the end of the next business day following the valuation date of the securities loaned. Therefore, the value of the collateral held may be temporarily less than that required under the lending contract. As of June 30, 2019, the collateral consisted of an institutional government money market fund.
Use of Estimates in Financial StatementsIn preparing financial statements in conformity with GAAP, management makes estimates and assumptions that affect the reported amounts of assets and liabilities on the date of the financial statements and the disclosure of contingent assets and liabilities on the date of the financial statements, as well as the reported amounts of revenue and expenses during the reporting period. Actual results could differ from those estimates.
Concentrations of Credit RiskThe Funds maintain cash and securities in its custody account maintained by a high-credit, quality financial institution. Cash balances may, at times, exceed the FDIC insurance limit. Cash balances are generally invested in a short-term investment vehicle, which minimizes the risk of cash balances exceeding the FDIC insurance limit.
Risks and UncertaintiesThe Funds provide for various investment options, including stocks. Such investments are exposed to various risks, such as interest rate, market and credit risks. Due to the risks involved, it is at least reasonably possible that changes in risks in the near term would materially affect shareholders’ account values and the amounts reported in the financial statements.
| | |
| NOTES TO FINANCIAL STATEMENTS(continued) | | |
|
|
| June 30, 2019 | | |
Security Transactions, Investment Income and ExpensesSecurity transactions are accounted for as of the trade date, the date the order to buy or sell is executed. Realized gains and losses are computed on the identified cost basis. Dividend income is recorded on the ex-dividend date, and interest income is recorded on the accrual basis from settlement date.
Bridgeway Funds’ expenses that are not series-specific are allocated to each series based upon its relative proportion of net assets to the Bridgeway Funds’ total net assets or other appropriate basis.
Distributions to ShareholdersThe Funds pay dividends from net investment income and distribute realized capital gains annually, usually in December and are recorded on ex-date.
IndemnificationUnder the Company’s organizational documents, the Funds’ officers, directors, employees and agents are indemnified against certain liabilities that may arise out of the performance of their duties to the Funds. Additionally, in the normal course of business, the Funds enter into contracts that contain a variety of indemnification clauses. The Funds’ maximum exposure under these arrangements is unknown, as this would involve future claims that may be made against the Funds that have not yet occurred. However, the Funds have not had prior claims or losses pursuant to these contracts.
3. Advisory Fees, Other Related Party Transactions and Contingencies:
The Funds have entered into a management agreement with the Adviser. As compensation for the advisory services rendered, facilities furnished, and expenses borne by the Adviser, the Funds pay the Adviser a fee of 0.50% of the value of each Fund’s average daily net assets, computed daily and payable monthly.
Expense limitations:The Adviser has agreed to reimburse the Funds for operating expenses and advisory fees above the expense limitations presented in the table below, which are shown as a ratio of net expenses to average net assets, for each Fund, for the year ended June 30, 2019. Any material change to the expense limitation would require a vote by shareholders of the applicable Fund.
| | | | | | | | | | |
| Bridgeway Fund | | Expense
Limitation | | Total Waivers
for Year Ended
6/30/19 |
| | | | | | | | | | |
Omni Small-Cap Value* | | | | 0.60 | % | | | | $937,974 | |
Omni Tax-Managed Small-Cap Value* | | | | 0.60 | % | | | | 826,118 | |
| | | | | | | | | | |
* The Funds are authorized to reimburse the Adviser for management fees previously waived and/or for expenses previously paid by the Adviser, provided, however, that any reimbursements must be paid at a date not more than three years after the Adviser waived the fees or reimbursed the expenses and that the reimbursements do not cause the Funds to exceed the expense limitation in effect at the time of the waiver or the current expense limitation, if different. The Omni Small-Cap Value Fund has recoupable expenses of $716,803, $759,479, and $937,974, which expire no later than June 30, 2020, June 30, 2021 and June 30, 2022, respectively. The Omni Tax-Managed Small-Cap Value Fund has recoupable expenses of $674,880, $691,272, and $826,118, which expire no later than June 30, 2020, June 30, 2021, and June 30, 2022, respectively.
Other Related Party Transactions:The Bridgeway Funds will engage in inter-portfolio trades with other Bridgeway Funds when it is to the benefit of both parties. The Board of Directors reviews these trades quarterly. Inter-portfolio purchases and sales for the Funds during the year ended June 30, 2019 were as follows:
| | | | | | | | |
| Bridgeway Fund | | Inter-Portfolio
Purchases | | | Inter-Portfolio
Sales | |
| | | | | | | | |
Omni Small-Cap Value | | | $50,505,114 | | | | $28,113,884 | |
Omni Tax-Managed Small-Cap Value | | | 30,537,805 | | | | 48,386,425 | |
| | |
|
| |
| 40 | | Annual Report | June 30, 2019 |
| | |
| NOTES TO FINANCIAL STATEMENTS(continued) | | |
|
|
| June 30, 2019 | | |
The Adviser entered into an Administrative Services Agreement with Bridgeway Funds, pursuant to which the Adviser provides various administrative services to the Funds including, but not limited to: (i) supervising and managing various aspects of the Funds’ business and affairs; (ii) selecting, overseeing and/or coordinating activities with other service providers to the Funds; (iii) providing reports to the Board of Directors as requested from time to time; (iv) assisting and/or reviewing amendments and updates to the Funds’ registration statement and other filings with the Securities and Exchange Commission (“SEC”); (v) providing certain shareholder services; (vi) providing administrative support in connection with meetings of the Board of Directors; and (vii) providing certain record-keeping services. For its services to all of the Bridgeway Funds, the Adviser is paid an aggregate annual fee of $775,000, payable in equal monthly installments. During the year ended June 30, 2019, the allocation of this expense to the Omni Small-Cap Value and Omni Tax-Managed Small-Cap Value Funds was $246,701 and $182,268, respectively.
Board of Directors CompensationEffective November 8, 2018, Independent Directors are paid an annual retainer of $20,000, with an additional retainer of $5,000 paid to the Independent Chairman of the Board and an additional retainer of $1,000 paid to the Nominating and Corporate Governance Committee Chair. The retainer is paid in quarterly installments. In addition, Independent Directors are paid $11,000 per meeting for meeting fees. Prior to November 8, 2018, Independent Directors were paid an annual retainer of $15,000, with an additional retainer of $5,000 paid to the Independent Chairman of the Board and an additional retainer of $1,000 paid to the Nominating and Corporate Governance Committee Chair, and $9,000 per meeting. Such compensation is the total compensation from all Bridgeway Funds and is allocated among the Bridgeway Funds.
Independent Directors are reimbursed for any expenses incurred in attending meetings and conferences, as well as expenses for subscriptions or printed materials. The amount of Directors’ fees attributable to each Fund is disclosed in the Statements of Operations.
One director of Bridgeway, John Montgomery, is an owner and director of the Adviser. Under the 1940 Act definitions, he is considered to be an “affiliated person” of the Adviser and an “interested person” of the Adviser and of Bridgeway. Compensation for Mr. Montgomery is borne by the Adviser rather than the Bridgeway Funds.
4. Distribution Agreement:
Foreside Fund Services, LLC acts as distributor of the Funds’ shares, pursuant to a Distribution Agreement dated May 31, 2017. The Adviser pays all costs and expenses associated with distribution of the Funds’ shares, pursuant to a protective plan adopted by shareholders pursuant to Rule 12b-1.
5. Purchases and Sales of Investment Securities:
Purchases and sales of investments, other than short-term securities, for each Fund for the year ended June 30, 2019 were as follows:
| | | | | | | | | | | | | | | | | | | | |
| | | Purchases | | Sales |
| | | U.S. Government | | Other | | U.S. Government | | Other |
| | | | | | | | | | | | | | | | | | | | |
Omni Small-Cap Value | | | | $ - | | | | | $508,779,150 | | | | | $ - | | | | | $272,714,673 | |
Omni Tax-Managed Small-Cap Value | | | | - | | | | | 292,403,478 | | | | | - | | | | | 338,563,245 | |
6. Federal Income Taxes
It is the Funds’ policy to continue to comply with the provisions of the Internal Revenue Code of 1986, as amended (“Internal Revenue Code”), applicable to regulated investment companies, and to distribute income to the extent necessary so that such Fund is not subject to federal income tax. Therefore, no federal income tax provision is required.
| | |
| NOTES TO FINANCIAL STATEMENTS(continued) | | |
|
|
| June 30, 2019 | | |
Unrealized Appreciation and Depreciation on Investments (Tax Basis)The amount of net unrealized appreciation/depreciation and the cost of investment securities for tax purposes, including short-term securities at June 30, 2019, were as follows:
| | | | | | | | | | |
| | | Omni Small-Cap Value | | Omni Tax-Managed Small-Cap Value |
Gross appreciation (excess of value over tax cost) | | | $ | 156,690,727 | | | | $ | 109,441,996 | |
Gross depreciation (excess of tax cost over value) | | | | (111,681,886 | ) | | | | (55,464,875 | ) |
Net unrealized appreciation (depreciation) | | | $ | 45,008,841 | | | | $ | 53,977,121 | |
Cost of investments for income tax purposes | | | $ | 967,497,944 | | | | $ | 571,389,504 | |
The differences between book and tax net unrealized appreciation (depreciation) are due to wash sale loss deferrals and basis adjustments on passive foreign investment companies (PFICs).
Classifications of DistributionsNet investment income (loss) and net realized gain (loss) may differ for financial statement and tax purposes. The character of distributions made during the year from net investment income or net realized gains may differ from its ultimate characterization for federal income tax purposes.
The tax character of the distributions paid by the Funds during the fiscal years ended June 30, 2019 and 2018, is as follows:
| | | | | | | | | | | | | | | | | | | | |
| | | Omni Small-Cap Value | | Omni Tax-Managed Small-Cap Value |
| | | Year Ended
June 30, 2019 | | Year Ended
June 30, 2018 | | Year Ended
June 30, 2019 | | Year Ended
June 30, 2018 |
Distributions paid from: | | | | | | | | | | | | | | | | | | | | |
Ordinary Income | | | $ | 7,943,782 | | | | $ | 6,405,244 | | | | $ | 7,212,071 | | | | $ | 8,820,586 | |
Long-Term Capital Gain | | | | 60,593,738 | | | | | 44,141,688 | | | | | 44,775,281 | | | | | 31,691,559 | |
| | | | |
Total | | | $ | 68,537,520 | | | | $ | 50,546,932 | | | | $ | 51,987,352 | | | | $ | 40,512,145 | |
Components of Accumulated EarningsAs of June 30, 2019, the components of accumulated earnings on a tax basis were:
| | | | | | | | | | |
| | | Omni
Small-Cap Value | | Omni Tax-Managed
Small-Cap Value |
Undistributed Net Investment Income | | | $ | 5,305,674 | | | | $ | 3,168,619 | |
Undistributed Net Realized Gain on Investments | | | | 4,928,024 | | | | | - | |
Net Unrealized Appreciation of Investments | | | | 45,008,841 | | | | | 53,977,121 | |
| | |
Total | | | $ | 55,242,539 | | | | $ | 57,145,740 | |
|
For the fiscal year June 30, 2019, the Funds recorded the following reclassifications to the accounts listed below: | |
| |
| | | Increase (Decrease) |
| | | Omni
Small-Cap Value | | Omni Tax-Managed
Small-Cap Value |
Paid-in Capital | | | $ | 5,549,815 | | | | $ | 5,941,844 | |
Distributable Earnings | | | | (5,549,815 | ) | | | | (5,941,844 | ) |
The difference between book and tax components of net assets and the resulting reclassifications were primarily a result of the differing book/tax treatment of the deduction of equalization debits for tax purposes and investments in PFICs and partnerships.
| | |
|
| |
| 42 | | Annual Report | June 30, 2019 |
| | |
| NOTES TO FINANCIAL STATEMENTS(continued) | | |
|
|
| June 30, 2019 | | |
Accounting for Uncertainty in Income Taxes sets forth a minimum threshold for financial statement recognition of the benefit of a tax position taken or expected to be taken in a tax return. Management has analyzed each Fund’s tax positions and has concluded that no provision for income tax is required in any Fund’s financial statements. The Funds are not aware of any tax position for which it is reasonably possible that the total amounts of unrecognized tax benefits will significantly change in the next twelve months. Each Fund’s federal tax returns for the prior three fiscal years remain subject to examination by the Internal Revenue Service.
7. Line of Credit
Bridgeway established a line of credit agreement (“Facility”) with The Bank of New York Mellon, effective November 5, 2010. The Facility is for temporary or emergency purposes, such as to provide liquidity for shareholder redemptions, and is cancellable by either party. Unless cancelled earlier, the Facility shall be held available until September 12, 2019. Advances under the Facility are limited to $15,000,000 in total for all Bridgeway Funds, and advances to each Bridgeway Fund shall not exceed certain limits set forth in the credit agreement, including, but not limited to, the maximum amount a Bridgeway Fund is permitted to borrow under the 1940 Act.
The Bridgeway Funds incur a commitment fee of 0.085% per annum on the unused portion of the Facility and interest expense to the extent of amounts borrowed under the Facility. Interest is based on the “Overnight Rate” plus 1.25%. The Overnight Rate means the higher of (a) the Federal Funds rate, (b) the Overnight Eurodollar Rate, or (c) the One-Month Euro-dollar Rate. The commitment fees are payable quarterly in arrears and are allocated to all participating Bridgeway Funds. Interest expense is charged directly to each Bridgeway Fund, based upon actual amounts borrowed by such Bridgeway Fund.
For the year ended June 30, 2019, borrowings by the Funds under this line of credit were as follows:
| | | | | | | | | | | | | | | | | | | | | | | | | |
| Bridgeway Fund | | Weighted
Average
Interest Rate | | Weighted
Average
Loan Balance | | Number of
Days
Outstanding | | Interest
Expense
Incurred1 | | Maximum Amount
Borrowed During
the Period |
| | | | | | | | | | | | | | | | | | | | | | | | | |
Omni Small-Cap Value | | | | 3.54 | % | | | $ | 1,887,800 | | | | | 65 | | | | $ | 12,070 | | | | $ | 9,763,000 | |
Omni Tax-Managed Small-Cap Value | | | | 3.67 | % | | | | 5,033,451 | | | | | 71 | | | | | 36,439 | | | | | 15,000,000 | |
| 1Interest expense is included on the Statements of Operations in Miscellaneous expenses. | |
On June 30, 2019, Omni Small-Cap Value had loans outstanding in the amount of $306,000, exclusive of interest payable on the loan.
8. Subsequent Events
Management has evaluated the impact of all subsequent events on the Funds and has determined that there were no subsequent events requiring recognition or disclosure in the financial statements.
| | |
| REPORT OF INDEPENDENT REGISTERED PUBLIC ACCOUNTING FIRM | | |
|
|
To the Board of Directors of Bridgeway Funds, Inc.
and the Shareholders of Omni Small-Cap Value Fund
and Omni Tax-Managed Small-Cap Value Fund
Opinion on the Financial Statements
We have audited the accompanying statements of assets and liabilities of Omni Small-Cap Value Fund and Omni Tax-Managed Small-Cap Value Fund, each a series of shares of beneficial interest in Bridgeway Funds, Inc. (the “Funds”), including the schedules of investments, as of June 30, 2019, and the related statements of operations for the year then ended, the statements of changes in net assets for each of the years in the two-year period then ended and the financial highlights for each of the years in the five-year period then ended, and the related notes (collectively referred to as the“financialstatements”). In our opinion, the financial statements present fairly, in all material respects, the financial position of the Funds as of June 30, 2019, and the results of their operations for the year then ended, the changes in their net assets for each of the years in the two-year period then ended and their financial highlights for each of the years in the five-year period then ended, in conformity with accounting principles generally accepted in the United States of America.
Basis for Opinion
These financial statements are the responsibility of the Funds’ management. Our responsibility is to express an opinion on the Funds’ financial statements based on our audits. We are a public accounting firm registered with the Public Company Accounting Oversight Board (United States) (“PCAOB”) and are required to be independent with respect to the Funds in accordance with the U.S. federal securities law and the applicable rules and regulations of the Securities and Exchange Commission and the PCAOB.
We conducted our audits in accordance with the standards of the PCAOB. Those standards require that we plan and perform the audits to obtain reasonable assurance about whether the financial statements are free of material misstatement, whether due to error or fraud. The Funds are not required to have, nor were we engaged to perform, an audit of their internal control over financial reporting. As part of our audits we are required to obtain an understanding of internal control over financial reporting but not for the purpose of expressing an opinion on the effectiveness of the Funds’ internal control over financial reporting. Accordingly, we express no such opinion.
Our audits included performing procedures to assess the risk of material misstatement of the financial statements, whether due to error or fraud, and performing procedures that respond to those risks. Such procedures included examining, on a test basis, evidence regarding the amounts and disclosures in the financial statements. Our procedures included confirmation of securities owned as of June 30, 2019 by correspondence with the custodian and brokers. Our audits also included evaluating the accounting principles used and significant estimates made by management, as well as evaluating the overall presentation of the financial statements. We believe that our audits provide a reasonable basis for our opinion.
| | |
| |  |
| |
| | BBD, LLP |
We have served as the auditor of one or more of the Funds in the Bridgeway Funds, Inc. since 2005.
Philadelphia, Pennsylvania
August 26, 2019
| | |
|
| |
| 44 | | Annual Report | June 30, 2019 |
| | |
| OTHER INFORMATION (Unaudited) | | |
|
|
| June 30, 2019 | | |
1. Shareholder Tax Information
Certain tax information regarding the Funds is required to be provided to shareholders based upon each Fund’s income and distributions for the taxable year ended June 30, 2019. The information and distributions reported herein may differ from information and distributions taxable to the shareholders for the calendar year ended December 31, 2018.
The Funds report the following items with regard to distributions paid during the fiscal year ended June 30, 2019. All reportings are based on financial information available as of the date of this annual report and, accordingly, are subject to change. For each item, it is the intention of each Fund to report the maximum amount permitted under the Internal Revenue Code and the regulations thereunder.
| | | | | | | | | | | | | | | |
| | | Omni Small-Cap
Value | | Omni Tax-Managed
Small Cap Value | | |
Corporate Dividends Received Deduction | | | | 100.00 | % | | | | 100.00 | % | | | | | |
Qualified Dividend Income | | | | 100.00 | % | | | | 100.00 | % | | | | | |
Qualified Interest Related Dividends | | | | 0.44 | % | | | | 0.33 | % | | | | | |
Qualified Short Term Capital Gain Dividends | | | | 0.00 | % | | | | 0.00 | % | | | | | |
During the fiscal year ended June 30, 2019, the Funds paid distributions from ordinary income and long-term capital gain which included equalization debits summarized below:
| | | | | | | | | | | | | | | |
| | | Omni Small-Cap
Value | | Omni Tax-Managed
Small-Cap Value | | |
Ordinary Income Distributions | | | $ | 7,943,782 | | | | $ | 7,212,071 | | | | | | |
Equalization Debits Included in Ordinary Income Distributions | | | | 910,211 | | | | | 664,818 | | | | | | |
Long-Term Capital Gain Distributions | | | | 60,593,738 | | | | | 44,775,281 | | | | | | |
Equalization Debits Included in Long-Term Capital Gain Distributions | | | | 4,639,604 | | | | | 5,277,026 | | | | | | |
2. Proxy Voting
A description of the policies and procedures that the Funds use to determine how to vote proxies relating to the portfolio securities and a summary of proxies voted by the Funds for the period ended June 30, 2019 are available without a charge, upon request, by contacting Bridgeway Funds at 1-800-661-3550 and on the SEC’s website at http://www.sec.gov.
3. Fund Holdings
The complete schedule of the Funds’ holdings for the second and fourth quarters of each fiscal year are contained in the Funds’ Semi-Annual and Annual Shareholder Reports, respectively.
The Bridgeway Funds file complete schedules of the Funds’ holdings with the SEC for the first and third quarters of each fiscal year as an exhibit to Form N-PORT within 60 days after the end of the period. Copies of the Funds’ Form N-PORT exhibit are available without charge, upon request, by contacting Bridgeway Funds at 1-800-661-3550 and on the SEC’s website at http://www.sec.gov. You may also review and copy the Funds’ Form N-PORT exhibit at the SEC’s Public Reference Room in Washington, D.C. For more information about the operation of the Public Reference Room, please call 1-800-SEC-0330.
4. Approval of Investment Management Agreement
Bridgeway Funds, Inc.’s (the “Company”) management agreement (the “Management Agreement”) with its investment adviser, Bridgeway Capital Management, Inc. (the “Adviser”), on behalf of each of the Company’s funds must be approved for an initial term no greater than two years and renewed at least annually thereafter by the board of directors of the Company (the “Board” or “Directors”) or a vote of a majority of the outstanding voting securities of each fund. In addition, the renewal
| | |
| OTHER INFORMATION (Unaudited)(continued) | | |
|
|
| June 30, 2019 | | |
must be approved by a majority of the Directors who are not parties to the Management Agreement or “interested persons” of any party thereto (the “Independent Directors”), cast in person at a meeting called specifically for the purpose of voting on such approval.
The Board has five regularly scheduled meetings each year and takes into account throughout the year matters bearing on the approval of the Management Agreement. For example, the Board or its standing committees consider at meetings during the year various factors that are relevant to the annual renewal of each fund’s Management Agreement, including the quality of services and support provided to each fund by the Adviser, the Adviser’s compliance program, including the effectiveness of its implementation, comparative performance information for each fund, the risk assessment of the funds and “deep dives” on the strategy and performance of certain funds on a periodic basis. Additionally, between regular Board meetings the Adviser provides the Board with updated financial information on the Adviser and strategic direction and marketing efforts.
On May 9, 2019, the Board, including a majority of the Independent Directors, met in person (the “Meeting”) with the Adviser, the Company’s outside legal counsel, independent legal counsel to the Independent Directors (“Independent Legal Counsel”) and others to consider information bearing on the continuation of the Management Agreement with respect to the Omni Tax-Managed Small-Cap Value Fund and Omni Small-Cap Value Fund (each a “Fund” and together, the “Funds”).
In reaching its decisions regarding the renewal of the Management Agreement for each Fund, the Board considered the information furnished and discussed throughout the year at regularly scheduled Board and committee meetings, as applicable and as described above, as well as the information provided to it specifically in relation to the annual consideration of the approval of the continuation of the Management Agreement for each Fund.
In preparation for the Meeting, the Independent Directors requested that the Adviser provide specific information relevant to the Board’s consideration of the renewal of the Management Agreement with respect to each Fund. In response to that request, the Board was furnished with a wide variety of information with respect to each Fund, including information regarding:
| | ● | | investment performance over various time periods and the fees and expenses of the Fund as compared to a comparable group of funds as determined and prepared by Broadridge Financial Solutions, Inc. (hereinafter “Broadridge”), an independent provider of investment company data; |
| | ● | | the nature, extent and quality of services provided by the Adviser to the Fund under the Management Agreement; |
| | ● | | actual management fees paid by the Fund to the Adviser and a comparison of those fees with the management fees charged to other advisory clients of the Adviser, as applicable; |
| | ● | | the Adviser’s costs of providing services to the Fund and the profitability of the Adviser from its relationship with the Fund; |
| | ● | | the extent to which economies of scale would be realized as the Fund’s assets increase and whether fee levels reflect these economies of scale for the benefit of Fund investors; and |
| | ● | | any potential “fall-out” or ancillary benefits accruing to the Adviser as a result of its relationship with the Fund. |
In addition to evaluating the written information provided by the Adviser, the Board also considered the answers to questions posed by the Board to representatives of the Adviser at the Meeting.
In considering the information and materials described above, the Independent Directors met telephonically with Independent Legal Counsel to review such information and materials prior to the Meeting. In addition, the Independent Directors met in executive session with Independent Legal Counsel to consider the continuation of the Management Agreement with respect to each Fund outside the presence of management during the Meeting.
The Board also was provided with a written description of its statutory responsibilities and the legal standards that are applicable to approval of the renewal of the Management Agreement.
| | |
|
| |
| 46 | | Annual Report | June 30, 2019 |
| | |
| OTHER INFORMATION (Unaudited)(continued) | | |
|
|
| June 30, 2019 | | |
Although the Management Agreement for both Funds was considered at the Meeting, the Directors considered the renewal of the Management Agreement with respect to each Fund separately.
In considering the aforementioned information, the Board took into account management style, investment strategies and prevailing market conditions as reported by the Adviser. Furthermore, in evaluating the Management Agreement, the Directors also considered information provided by the Adviser concerning the following:
| | ● | | the terms of the Management Agreement, including the services performed by the Adviser in managing each Fund’s assets in accordance with the Fund’s investment objectives, policies and restrictions and how those services and fees differ from those for other advisory clients of the Adviser, as applicable; |
| | ● | | information regarding the advisory fee rates and the expense limitation or fee waiver arrangements for each Fund; |
| | ● | | the Adviser’s personnel, staffing levels and the time and attention the Adviser’s personnel devote to the management of the Funds as compared to other advisory clients of the Adviser; |
| | ● | | the Adviser’s risk assessment and management process; |
| | ● | | the Adviser’s representation that it does not participate in any soft dollar arrangements and, that although it receives unsolicited research from outside sources, the Adviser does not use that research in its investment decision-making process; and |
| | ● | | the financial condition and stability of the Adviser. |
In view of the broad scope and variety of factors and information considered by the Board, the Directors did not find it practicable to, and did not, assign relative weights to the specific factors considered in reaching their conclusions and determinations to approve the continuance of the Management Agreement for each Fund for an additional year. Rather, the Board’s determinations were made on the basis of each Director’s business judgment after consideration of all of the factors taken in their entirety. Although not meant to be all-inclusive, the following describes various factors that were considered by the Board in deciding to approve the continuance of the Management Agreement for each Fund.
Nature, Extent and Quality of Services
In examining the nature, extent and quality of the services provided by the Adviser, the Directors considered the services provided to each Fund and any expected changes thereto, the qualifications, experience and duties of the Adviser’s personnel, the approximate amount of time those personnel devote to the Funds, recent and expected personnel changes, portfolio manager compensation arrangements, business continuity and succession planning, and enterprise risk management (including as it relates to cybersecurity risk). In addition, the Directors considered information provided by the Adviser regarding its overall financial strength and considered the resources and staffing in place with respect to the services provided to the Funds.
Based on the totality of the information considered, the Directors concluded that they were satisfied with the nature, extent and quality of the services provided to each Fund by the Adviser, and that the Adviser has the ability to continue to provide these services based on its experience, operations and current resources.
Investment Performance
The Board considered performance information provided by the Adviser for similarly managed accounts (if any) over the most recent quarter, six-month, one-year, three-year and five-year periods ending December 31, 2018 as well as Fund performance compared with its benchmark for one-year, three-year, five-year and since-inception periods ending December 31, 2018. The Board considered the Adviser’s representation that the differences in the performance of other small cap accounts and Fund performance were expected by the Adviser given differences in investment strategy and tax management practices.
| | |
| OTHER INFORMATION (Unaudited)(continued) | | |
|
|
| June 30, 2019 | | |
In addition, Broadridge provided a report (the “Broadridge Report”) of comparative data regarding fees, expenses and performance for each Fund as compared to a peer group selected by Broadridge (“Peer Group”). The performance periods included total return over the most recent calendar year (“one-year period”) and the annualized total returns over the most recent three calendar year period (“three-year period”), five calendar year period (“five-year period”) and ten calendar year period (“ten-year period”), although neither of these Funds yet have a ten year performance period. With regard to the performance information provided in the Broadridge Report, the Board considered the performance of each Fund on a percentile and quintile basis as compared to its Peer Group. For purposes of the performance data provided, the first quintile is defined as 20% of the funds in the applicable Peer Group with the highest performance, and the fifth quintile is defined as 20% of the funds in the applicable Peer Group with the lowest performance.
In particular, the Board considered the following performance information as of December 31, 2018, provided by the Adviser and from Broadridge:
| | ● | | With regard to the Omni Tax-Managed Small-Cap Value Fund, the Fund’s performance for the one-year and five-year periods was in the third quintile relative to its Peer Group, and in the second quintile for the three-year period. The Fund underperformed its primary benchmark over the one-year, three-year, five-year and since-inception periods. The Board considered the Adviser’s explanation that the Fund’s relative performance is generally attributable to its broader exposure to smaller capitalization and deeper value stocks relative to its Peer Group. Based on their review, the Directors concluded that the Fund’s overall performance was satisfactory relative to the performance of the funds in its Peer Group and its primary benchmark. |
| | ● | | With regard to the Omni Small-Cap Value Fund, the Fund’s performance for the one-year and five-year periods was in the third quintile relative to its Peer Group and in the second quintile for the three-year period. The Fund underperformed its primary benchmark over the one-year, three-year and five-year periods, but outperformed over the since-inception period. The Board considered the Adviser’s explanation that the Fund’s relative performance is generally attributable to its broader exposure to smaller capitalization and deeper value stocks relative to its Peer Group. Based on their review, the Directors concluded that the Fund’s overall performance was satisfactory relative to the performance of the funds in its Peer Group and its primary benchmark. |
Fund Fees and Expenses
The Board considered information provided by the Adviser regarding the advisory fees it charges to other advisory clients and the reasons for any material differences between those fees and the fees it charges to the Funds. The Board also considered the Adviser’s views that, given investment performance and overall expenses, the Adviser believes the management fees for each Fund appear reasonable and appropriate given the distinctive features and design of each Fund, the disciplined implementation of the design by the Adviser, the relatively low management fees in each case, the performance results in line with design and investor expectations, and the profitability to the Adviser of each Fund. More specifically, with regard to management fee differences among the Funds and other small-cap funds advised by the Adviser, the Board considered the Adviser’s view that fee differences stem from market factors as well as the estimated growth rate of the Fund at the time of launch; the potential asset capacity of the Fund; the risks associated with providing the advisory services to the Fund; and estimated costs of providing the advisory services driven by the design complexity of the Fund (e.g., more complex design is higher cost due to the research and portfolio management time required).
The Board also considered the fees charged to other investment company and non-investment company clients of the Adviser, as well as the Adviser’s representation that the Adviser did not manage other clients comparable to these Funds.
The Board also considered information compiled by Broadridge comparing each Fund’s contractual management fee rate (using an assumed common asset level for the Fund and the other funds in the Peer Group), actual management fee rate (which included the effect of any fee waivers and was derived from annual reports) and actual total expense ratios (which also included the effect of any fee waivers and was derived from annual reports) as a percentage of average net assets as compared to other funds in its expense Peer Group. Broadridge’s contractual management fee data included both advisory fees and administrative services fees, except for the Funds. Broadridge excluded administrative services fees for the Funds from contractual management fee data because those fees are fixed (i.e., a stated dollar amount), as opposed to asset-based. More
| | |
|
| |
| 48 | | Annual Report | June 30, 2019 |
| | |
| OTHER INFORMATION (Unaudited)(continued) | | |
|
|
| June 30, 2019 | | |
specifically, with respect to the Funds, the Adviser provides certain administrative services to the Funds pursuant to a separate contract, in exchange for an annual fixed fee (payable monthly) that the Adviser has represented approximates the cost of providing such services (which the Board considered in connection with profitability, as described below). Broadridge’s actual management fee data for the Funds and the other funds in the Peer Group included both advisory fees and administrative services fees. Thus, the contractual management fee rate in the Funds’ Broadridge comparisons did not reflect these administrative services fees, whereas the actual management fee rate in the Funds’ Broadridge comparisons included both advisory and administrative services fees.
With regard to the expense information provided in the Broadridge Report, the Board considered Fund expenses on a percentile and quintile basis as compared to each Fund’s Peer Group. For purposes of the expense data provided, Broadridge defines the first quintile as 20% of the funds in the applicable Peer Group with the lowest expenses and the fifth quintile as 20% of the funds in the applicable Peer Group with the highest expenses.
With respect to the Funds, the Board considered that each Fund’s contractual management fee, actual management fee and actual total expense ratio were in the first quintile of its applicable Peer Group.
In addition, the Board considered that the Adviser agreed to contractual expense limitation agreements for each Fund to ensure that total expense levels do not increase above certain asset percentage levels.
The foregoing comparisons assisted the Board in determining to approve the continuance of the Management Agreement for each Fund by providing it with a basis for evaluating each Fund’s management fee and total expense ratio on a relative basis. Based on their review, the Directors concluded that each Fund’s management fee was reasonable in view of the services received by the Fund and the other factors considered.
Profitability
The Board reviewed the materials it received from the Adviser regarding its revenues and costs in providing investment management and certain administrative services to the Funds and the Company as a whole. In particular, the Board considered the analysis of the Adviser’s profitability with respect to each Fund, calculated for the years ended December 31, 2015, December 31, 2016, December 31, 2017 and December 31, 2018. The Board also considered the Adviser’s representations that it does not track expenses or maintain staff on a per Fund basis, and accordingly, the Adviser needed to make certain assumptions to allocate expenses on a Fund-by-Fund basis in order to calculate Fund-by-Fund profitability, making the process a subjective one. The Board also considered that the Adviser was operating some lines of business at a loss but that the Adviser’s overall business is profitable. Based on their review, the Directors concluded that the Adviser’s profitability from its relationship with each Fund was reasonable.
Economies of Scale
The Board considered the effect of each Fund’s current size and its potential growth on its performance and fees. With respect to whether economies of scale are expected to be realized by the Adviser as a Fund’s assets increase and whether advisory fee levels reflect these economies of scale for the benefit of Fund investors, the Board considered, for each Fund, the current level of advisory fees charged and fee structure and concluded that the Adviser’s fee structure with respect to each Fund was appropriate at this time. The Board considered the Adviser’s explanation that although neither Fund has fee break-points in its management fee schedules, each Fund was priced low relative to peers and ahead of the economies of scale curve at launch. The Board noted that if a Fund’s assets increased over time, the Fund might realize other economies of scale if assets increased proportionally more than certain other expenses.
“Fall-out” or Ancillary Benefits
The Board considered whether there were any “fall-out” or ancillary benefits that may accrue to the Adviser as a result of its relationships with the Funds. In terms of potential “fall-out” or ancillary benefits to the Adviser due to its position as manager of the Funds, the Board considered benefits related to track record and reputation, and portfolio trading and execution. The Board also considered the Adviser’s representations that it does not participate in any soft dollar arrangements and that, although it receives unsolicited research from outside sources, the Adviser does not use that research in its investment
| | |
| OTHER INFORMATION (Unaudited)(continued) | | |
|
|
| June 30, 2019 | | |
decision-making process. In addition, the Board took into account that the Adviser receives administrative service fees from the Funds in exchange for providing certain administrative services to the Funds. The Board concluded that the benefits accruing to Adviser by virtue of its relationship with the Funds appeared to be reasonable.
* * * * *
Based on all relevant information and factors discussed above, none of which was individually determinative of the outcome, the Board, including a majority of the Independent Directors, determined that the continuation of the Management Agreement for each Fund was in the best interests of the Fund. As a result, the Board, including a majority of the Independent Directors, approved the renewal of the Management Agreement for each Fund.
| | |
|
| |
| 50 | | Annual Report | June 30, 2019 |
| | |
| DISCLOSURE OF FUND EXPENSES | | |
|
|
| June 30, 2019 (Unaudited) | | |
As a shareholder of a Fund, you will incur no transaction costs from such Fund, including sales charges (loads) on purchases, on reinvested dividends, or on other distributions. There are no exchange fees. However, as a shareholder of a Fund, you will incur ongoing costs, including management fees and other Fund expenses. The following examples are intended to help you understand your ongoing costs (in dollars) of investing in a Fund and to compare these costs with ongoing costs of investing in other mutual funds. The examples are based on an investment of $1,000 invested on January 1, 2019 and held until June 30, 2019.
Actual Expenses.The first line of the table below provides information about actual account values and actual expenses. You may use the information in this line, together with the amount you invested, to estimate the expenses that you paid over the period. Simply divide your account value by $1,000 (for example, an $8,600 account value divided by $1,000 = 8.6), then multiply the result by the number in the first line under the heading “Expenses Paid During Period” to estimate the expenses you paid on your account during the period.
Hypothetical Example for Comparison Purposes.The second line of the table below provides information about hypothetical account values and hypothetical expenses, based on the Fund’s actual expense ratio and an assumed rate of return of 5% per year before expenses, which is not the Fund’s actual return. The hypothetical account values and expenses may not be used to estimate the actual ending account balance or expenses you paid for the period. You may use this information to compare the ongoing costs of investing in a Fund and other mutual funds. To do so, compare this 5% hypothetical example with the 5% hypothetical examples that appear in the shareholder reports of other funds.
The expenses shown in the table are meant to highlight ongoing Fund costs only. Therefore, the second line of the table is useful in comparing ongoing costs only and will not help you determine the relative total costs of owning different funds, because other funds may also have transaction costs, such as sales charges, redemption fees or exchange fees.
| | | | | | | | |
| | | Beginning Account
Value at 1/1/19 | | Ending Account
Value at 6/30/19 | | Expense
Ratio | | Expenses Paid
During Period*
1/1/19 - 6/30/19 |
| | | | |
Bridgeway Omni Small-Cap Value | | | | | | | | |
| | | | |
Actual Fund Return | | $1,000.00 | | $1,067.00 | | 0.60% | | $3.08 |
Hypothetical Fund Return | | $1,000.00 | | $1,021.82 | | 0.60% | | $3.01 |
|
Bridgeway Omni Tax-Managed Small-Cap Value |
| | | | |
Actual Fund Return | | $1,000.00 | | $1,061.80 | | 0.60% | | $3.07 |
Hypothetical Fund Return | | $1,000.00 | | $1,021.82 | | 0.60% | | $3.01 |
| * | Expenses are equal to the average account value times the Fund’s annualized expense ratio multiplied by the number of days in the most recent six-month period (181) divided by the number of days in the fiscal year (365). |
| | |
| DIRECTORS & OFFICERS | | |
|
|
| June 30, 2019 (Unaudited) | | |
Independent Directors
| | | | | | | | | | |
Name, Address and Age1 | | Position
Held with
Bridgeway
Funds | | Term of
Office and
Length of
Time Served | | Principal Occupation(s)
During Past Five Years | | No. of Bridgeway
Funds Overseen
by Director | | Other Directorships
Held by Director |
| | | | | |
Karen S. Gerstner Age 64 | | Director | | Term: 1 Year Length: 1994 to Present. | | Principal, Karen S. Gerstner & Associates, P.C., since 2004. | | Nine | | None |
| | | | | |
Miles Douglas Harper, III* Age 56 | | Director | | Term: 1 Year Length: 1994 to Present. | | Partner, Carr, Riggs & Ingram, LLC, since 2013. | | Nine | | Calvert Funds (38 Portfolios) |
| | | | | |
Evan Harrel Age 58 | | Director | | Term: 1 Year Length: 2006 to Present. | | Strategic Advisor, Small Steps Nurturing Center, since 2012. | | Nine | | None |
| | | | | |
| | | | | | | | | | | |
| | |
|
| |
| 52 | | Annual Report | June 30, 2019 |
| | |
| DIRECTORS & OFFICERS(continued) | | |
|
|
| June 30, 2019 (Unaudited) | | |
“Interested” or Affiliated Director and Officer
| | | | | | | | | | |
Name, Address and Age1 | | Position(s)
Held with
Bridgeway
Funds | | Term of
Office and
Length of
Time Served | | Principal Occupation(s) During Past Five Years | | No. of Bridgeway
Funds Overseen
by Director | | Other Directorships
Held by Director |
| | | | | |
John N. R. Montgomery2 Age 63 | | Director | | Term: 1 Year Length: 1993 to Present. | | Chairman, Bridgeway Capital Management, Inc., since 2010; President, Bridgeway Capital Management, Inc., 1993 to 2010 and June 2015 to March 2016; President, Bridgeway Funds, June 2015 to June 2016; Vice President, Bridgeway Funds, 2005 to May 2015 and since June 2016. | | Nine | | None |
| | | | | |
| | | | | | | | | | | |
| | |
| DIRECTORS & OFFICERS(continued) | | |
|
|
| June 30, 2019 (Unaudited) | | |
Other Officers
| | | | | | | | | | |
Name, Address and Age1 | | Position Held with
Bridgeway
Funds | | Term of
Office and
Length of
Time Served | | Principal Occupation(s)
During Past Five Years | | No. of Bridgeway
Funds Overseen
by Officer | | Other Directorships
Held by Officer |
| | | | | |
Richard P. Cancelmo, Jr. Age 61 | | Vice President | | Term: 1 Year Length: 2004 to Present. | | Vice President, Bridgeway Funds, since 2004; Staff member, Bridgeway Capital Management, Inc., since 2000. | | N/A | | None |
| | | | | |
Linda G. Giuffré Age 57 | | Treasurer and Chief Compliance Officer | | Term: 1 Year Length: 2004 to Present. | | Chief Compliance Officer, Bridgeway Capital Management, Inc., since 2004; Staff member, Bridgeway Capital Management, Inc., since 2004. | | N/A | | None |
| | | | | |
Deborah L. Hanna Age 54 | | Secretary | | Term: 1 Year Length: 2007 to Present. | | Self-employed, accounting and related projects for various organizations, since 2001. | | N/A | | None |
| | | | | |
Sharon Lester Age 64 | | Vice President | | Term: 1 Year Length: 2011 to Present. | | Staff member, Bridgeway Capital Management, Inc., since 2010. | | N/A | | None |
| | | | | |
Tammira Philippe Age 45 | | President | | Term: 1 Year Length: May 2016 to Present. | | President, Bridgeway Capital Management, Inc., since March 2016; Staff member, Bridgeway Capital Management, Inc., 2010 to March 2016. | | N/A | | None |
| 1 | The address of all of the Directors and Officers of Bridgeway Funds is 20 Greenway Plaza, Suite 450, Houston, Texas, 77046. |
| 2 | John Montgomery is chairman, director and majority shareholder of Bridgeway Capital Management, Inc., and therefore an interested person of Bridgeway Funds. |
The overall management of the business and affairs of Bridgeway Funds is vested with its Board of Directors (the “Board”). The Board approves all significant agreements between Bridgeway Funds and persons or companies furnishing services to it, including agreements with its Adviser and custodian. The day-to-day operations of Bridgeway Funds are delegated to its officers, subject to its investment objectives and policies and general supervision by the Board.
The Funds’ Statement of Additional Information includes additional information about the Board and is available, without charge, upon request by calling 1-800-661-3550.
| | |
|
| |
| 54 | | Annual Report | June 30, 2019 |

| | | | |
| | BRIDGEWAY FUNDS, INC. BNY Mellon Investment Servicing (US) Inc. P.O. Box 9860 Providence, RI 02940-8060 CUSTODIAN The Bank of New York Mellon One Wall Street New York, NY 10286 DISTRIBUTOR Foreside Fund Services, LLC Three Canal Plaza, Suite 100 Portland, ME 04101 | | |

Item 2. Code of Ethics.
| | (a) | The registrant, as of the end of the period covered by this report, has adopted a code of ethics that applies to the registrant’s principal executive officer, principal financial officer, principal accounting officer or controller, or persons performing similar functions, regardless of whether these individuals are employed by the registrant or a third party. |
| | (c) | There have been no substantive amendments, during the period covered by this report, to a provision of the code of ethics that applies to the registrant’s principal executive officer, principal financial officer, principal accounting officer or controller, or persons performing similar functions, regardless of whether these individuals are employed by the registrant or a third party, and that relates to any element of the code of ethics description. |
| | (d) | The registrant has not granted any waivers, including an implicit waiver, from a provision of the code of ethics that applies to the registrant’s principal executive officer, principal financial officer, principal accounting officer or controller, or persons performing similar functions, regardless of whether these individuals are employed by the registrant or a third party, that relates to one or more of the items set forth in paragraph (b) of this item’s instructions. |
Item 3. Audit Committee Financial Expert.
3(a)(1) The Registrant’s board of directors has determined that the registrant has at least one audit committee financial expert serving on its audit committee.
3(a)(2) The audit committee financial expert is Miles Douglas Harper III, who is “independent” for purposes of this Item 3 of FormN-CSR.
Item 4. Principal Accountant Fees and Services.
Audit Fees
| | (a) | The aggregate fees billed for each of the last two fiscal years for professional services rendered by the principal accountant for the audit of the registrant’s annual financial statements or services that are normally provided by the accountant in connection with statutory and regulatory filings or engagements were $216,400 for the fiscal year ended June 30, 2019 and $221,200 for the fiscal year ended June 30, 2018. |
Audit-Related Fees
| | (b) | The aggregate fees billed in each of the last two fiscal years for assurance and related services by the principal accountant that are reasonably related to the performance of the audit of the |
| | registrant’s financial statements and are not reported under paragraph (a) of this Item were $0 for the fiscal year ended June 30, 2019 and $0 for the fiscal year ended June 30, 2018. |
Tax Fees
| | (c) | The aggregate fees billed in each of the last two fiscal years for professional services rendered by the principal accountant for tax compliance, tax advice, and tax planning were $20,000 for the fiscal year ended June 30, 2019 and $20,000 for the fiscal year ended June 30, 2018. Tax services include the review of the Funds’ federal income tax returns, the review of the Funds’ federal excise tax returns and the review of required distributions by the Funds. |
All Other Fees
| | (d) | The aggregate fees billed in each of the last two fiscal years for products and services provided by the principal accountant, other than the services reported in paragraphs (a) through (c) of this Item were $0 for the fiscal year ended June 30, 2019 and $0 for the fiscal year ended June 30, 2018. |
| | (e)(1) | Disclose the audit committee’spre-approval policies and procedures described in paragraph (c)(7) of Rule2-01 of RegulationS-X. |
The Registrant’s Audit Committee has adopted an Audit Committee Charter that provides that the Audit Committee shall approve, prior to appointment, the engagement of the auditor to provide audit services to the Registrant andnon-audit services to the Registrant, its investment advisor or any entity controlling, controlled by or under common control with the investment adviser that provideson-going services to the Registrant if the engagement relates directly to the operations and financial reporting of the Registrant.
| | (e)(2) | The percentage of services described in each of paragraphs (b) through (d) of this Item that were approved by the audit committee pursuant to paragraph (c)(7)(i)(C) of Rule2-01 of RegulationS-X are as follows: |
No services described in paragraphs (b) through (d) above were approved pursuant to paragraph (c)(7)(i)(C) ofRule 2-01 of RegulationS-X.
| | (g) | The aggregatenon-audit fees billed by the registrant’s accountant for services rendered to the registrant, and rendered to the registrant’s investment adviser (not including anysub-adviser whose role is primarily portfolio management and is subcontracted with or overseen by another investment adviser), and any entity controlling, controlled by, or under common control with the adviser that provides ongoing services to the registrant for each of the last two fiscal years of the registrant was $0 for the fiscal year ended June 30, 2019 and $0 for the fiscal year ended June 30, 2018. |
| Item 5. | Audit Committee of Listed Registrants. |
Not applicable.
| (a) | Schedule of Investments in securities of unaffiliated issuers as of the close of the reporting period is included as part of the report to shareholders filed under Item 1 of this form. |
| Item 7. | Disclosure of Proxy Voting Policies and Procedures forClosed-End Management Investment Companies. |
Not applicable.
| Item 8. | Portfolio Managers ofClosed-End Management Investment Companies. |
Not applicable.
| Item 9. | Purchases of Equity Securities byClosed-End Management Investment Company and Affiliated Purchasers. |
Not applicable.
| Item 10. | Submission of Matters to a Vote of Security Holders. |
There have been no material changes to the procedures by which the shareholders may recommend nominees to the Registrant’s Board of Directors, where those changes were implemented after the registrant last provided disclosure in response to the requirements of Item 407(c)(2)(iv) of RegulationS-K (17 CFR 229.407) (as required by Item 22(b)(15) of Schedule 14A (17 CFR240.14a-101)), or this Item.
| Item 11. | Controls and Procedures. |
| | (a) | The registrant’s principal executive officer and principal financial officer, or persons performing similar functions, have concluded that the registrant’s disclosure controls and procedures (as defined in Rule30a-3(c) under the Investment Company Act of 1940, as amended (the “1940 Act”) (17 CFR270.30a-3(c))) are effectively designed, as of a date within 90 days of the filing date of the report that includes the disclosure required by this paragraph, based on their evaluation of these controls and procedures required by Rule30a-3(b) under the 1940 Act (17 CFR270.30a-3(b)) and Rules13a-15(b) or15d-15(b) under the Securities Exchange Act of 1934, as amended (17 CFR240.13a-15(b) or240.15d-15(b)). |
| | (b) | There were no changes in the registrant’s internal control over financial reporting (as defined in Rule30a-3(d) under the Act (17 CFR270.30a-3(d))) that occurred during the period covered by this report that have materially affected or are reasonably likely to materially affect, the registrant’s internal control over financial reporting. |
| Item 12. | Disclosure of Securities Lending Activities forClosed-End Management Investment Companies. |
Not applicable.
| | (a)(1) | Code of ethics, or any amendment thereto, that is the subject of disclosure required by Item 2 is attached hereto. |
| | (a)(2) | Certifications pursuant to Rule30a-2(a) under the 1940 Act and Section 302 of the Sarbanes-Oxley Act of 2002 are attached hereto. |
| | (b) | Certifications pursuant to Rule30a-2(b) under the 1940 Act and Section 906 of the Sarbanes-Oxley Act of 2002 are attached hereto. |
SIGNATURES
Pursuant to the requirements of the Securities Exchange Act of 1934 and the Investment Company Act of 1940, the registrant has duly caused this report to be signed on its behalf by the undersigned, thereunto duly authorized.
(Registrant) Bridgeway Funds, Inc.
| | |
| |
| By (Signature and Title)* | | /s/ Tammira Philippe |
| | Tammira Philippe, President and Principal Executive Officer (principal executive officer) |
Pursuant to the requirements of the Securities Exchange Act of 1934 and the Investment Company Act of 1940, this report has been signed below by the following persons on behalf of the registrant and in the capacities and on the dates indicated.
| | |
| By (Signature and Title)* | | /s/ Tammira Philippe |
| | Tammira Philippe, President and Principal Executive Officer (principal executive officer) |
| | |
| By (Signature and Title)* | | /s/ Linda G. Giuffré |
| | Linda G. Giuffré, Treasurer and Principal Financial Officer (principal financial officer) |
* Print the name and title of each signing officer under his or her signature.