UNITED STATES
SECURITIES AND EXCHANGE COMMISSION
Washington, D.C. 20549
FORM N-CSR
CERTIFIED SHAREHOLDER REPORT OF REGISTERED MANAGEMENT
INVESTMENT COMPANIES
Investment Company Act file number 811-08200
Bridgeway Funds, Inc.
(Exact name of registrant as specified in charter)
20 Greenway Plaza, Suite 450
Houston, Texas 77046
(Address of principal executive offices) (Zip code)
Tammira Philippe, President
Bridgeway Funds, Inc.
20 Greenway Plaza, Suite 450
Houston, Texas 77046
(Name and address of agent for service)
Registrant’s telephone number, including area code: (713) 661-3500
Date of fiscal year end: June 30
Date of reporting period: June 30, 2018
Form N-CSR is to be used by management investment companies to file reports with the Commission not later than 10 days after the transmission to stockholders of any report that is required to be transmitted to stockholders under Rule 30e-1 under the Investment Company Act of 1940 (17 CFR 270.30e-1). The Commission may use the information provided on Form N-CSR in its regulatory, disclosure review, inspection, and policymaking roles.
A registrant is required to disclose the information specified by Form N-CSR, and the Commission will make this information public. A registrant is not required to respond to the collection of information contained in Form N-CSR unless the Form displays a currently valid Office of Management and Budget (“OMB”) control number. Please direct comments concerning the accuracy of the information collection burden estimate and any suggestions for reducing the burden to Secretary, Securities and Exchange Commission, 450 Fifth Street, NW, Washington, DC 20549-0609. The OMB has reviewed this collection of information under the clearance requirements of 44 U.S.C. § 3507.
Item 1. Reports to Stockholders.
The Report to Shareholders is attached herewith.

A no-load mutual fund family
| | | | |
| | Annual Report June 30, 2018 |
| | |
| | AGGRESSIVE INVESTORS 1 | | BRAGX |
| | |
| | ULTRA-SMALL COMPANY | | BRUSX |
| | (Open to Existing Investors — Direct Only) | | |
| | |
| | ULTRA-SMALL COMPANY MARKET | | BRSIX |
| | |
| | SMALL-CAP GROWTH | | BRSGX |
| | |
| | SMALL-CAP VALUE | | BRSVX |
| | |
| | BLUE CHIP 35 INDEX | | BRLIX |
| | |
| | MANAGED VOLATILITY | | BRBPX |
| | www.bridgeway.com | | |
| | |
| TABLE OF CONTENTS | |  |
Bridgeway Funds Standardized Returns as of June 30, 2018* (Unaudited)
| | | | | | | | | | | | | | | | | | | | | | | | | | | | | | | | | | | | | | | |
| | | | | | | Annualized | | | | | | |
| Fund | | Quarter | | Six Months | | 1 Year | | 5 Years | | 10 Years | | Inception
to Date | | Inception
Date | | Gross
Expense
Ratio2 | | Net
Expense
Ratio2 |
Aggressive Investors 1 | | | | 0.09 | % | | | | -1.70 | % | | | | 11.59 | % | | | | 11.72 | % | | | | 4.35 | % | | | | 12.86 | % | | | | 8/5/1994 | | | 1.66% | | 1.66% |
Ultra-Small Company | | | | 6.39 | % | | | | 6.25 | % | | | | 9.13 | % | | | | 4.75 | % | | | | 7.67 | % | | | | 13.61 | % | | | | 8/5/1994 | | | 1.48% | | 1.48% |
Ultra-Small Co Market | | | | 9.87 | % | | | | 10.87 | % | | | | 20.86 | % | | | | 12.17 | % | | | | 10.33 | % | | | | 11.18 | % | | | | 7/31/1997 | | | 0.88%1 | | 0.87%1 |
Small-Cap Growth | | | | 10.86 | % | | | | 9.62 | % | | | | 21.91 | % | | | | 15.17 | % | | | | 8.24 | % | | | | 7.97 | % | | | | 10/31/2003 | | | 1.16%1 | | 0.94%1 |
Small-Cap Value | | | | 14.86 | % | | | | 11.57 | % | | | | 20.32 | % | | | | 10.14 | % | | | | 7.57 | % | | | | 8.46 | % | | | | 10/31/2003 | | | 0.98%1 | | 0.94%1 |
Blue Chip 35 Index | | | | 2.74 | % | | | | 0.34 | % | | | | 11.98 | % | | | | 11.82 | % | | | | 10.12 | % | | | | 7.16 | % | | | | 7/31/1997 | | | 0.25%1 | | 0.15%1 |
Managed Volatility | | | | 1.88 | % | | | | 2.34 | % | | | | 7.11 | % | | | | 4.61 | % | | | | 3.63 | % | | | | 4.10 | % | | | | 6/30/2001 | | | 1.12%1 | | 0.94%1 |
Bridgeway Funds Returns for Calendar Years 2003 through 2017* (Unaudited)
| | | | | | | | | | | | | | | | | | | | | | | | | | | | | | | | | | | | | | | | | | | | | | | | | | | | | | | | | | | | | | | | | | | | | | | | | | | |
| | | 2003 | | 2004 | | 2005 | | 2006 | | 2007 | | 2008 | | 2009 | | 2010 | | 2011 | | 2012 | | 2013 | | 2014 | | 2015 | | 2016 | | 2017 |
Aggressive Investors 1 | | | | 53.98 | % | | | | 12.21 | % | | | | 14.93 | % | | | | 7.11 | % | | | | 25.80 | % | | | | -56.16 | % | | | | 23.98 | % | | | | 17.82 | % | | | | -10.31 | % | | | | 21.58 | % | | | | 42.21 | % | | | | 14.99 | % | | | | -9.82 | % | | | | 19.47 | % | | | | 18.44 | % |
Ultra-Small Company | | | | 88.57 | % | | | | 23.34 | % | | | | 2.99 | % | | | | 21.55 | % | | | | -2.77 | % | | | | -46.24 | % | | | | 48.93 | % | | | | 23.55 | % | | | | -14.64 | % | | | | 24.49 | % | | | | 55.77 | % | | | | -0.56 | % | | | | -16.12 | % | | | | 14.06 | % | | | | 3.88 | % |
Ultra-Small Co Market | | | | 79.43 | % | | | | 20.12 | % | | | | 4.08 | % | | | | 11.48 | % | | | | -5.40 | % | | | | -39.49 | % | | | | 25.96 | % | | | | 24.86 | % | | | | -7.86 | % | | | | 19.83 | % | | | | 50.91 | % | | | | 4.61 | % | | | | -8.28 | % | | | | 21.47 | % | | | | 12.47 | % |
Small-Cap Growth | | | | | | | | | 11.59 | % | | | | 18.24 | % | | | | 5.31 | % | | | | 6.87 | % | | | | -43.48 | % | | | | 15.05 | % | | | | 11.77 | % | | | | -0.63 | % | | | | 11.05 | % | | | | 48.52 | % | | | | 6.13 | % | | | | 4.93 | % | | | | 16.10 | % | | | | 19.62 | % |
Small-Cap Value | | | | | | | | | 17.33 | % | | | | 18.92 | % | | | | 12.77 | % | | | | 6.93 | % | | | | -45.57 | % | | | | 26.98 | % | | | | 16.56 | % | | | | 1.05 | % | | | | 20.99 | % | | | | 39.72 | % | | | | 0.79 | % | | | | -9.43 | % | | | | 26.79 | % | | | | 7.11 | % |
Blue Chip 35 Index | | | | 28.87 | % | | | | 4.79 | % | | | | 0.05 | % | | | | 15.42 | % | | | | 6.07 | % | | | | -33.30 | % | | | | 26.61 | % | | | | 10.60 | % | | | | 3.17 | % | | | | 15.20 | % | | | | 31.67 | % | | | | 11.51 | % | | | | 2.17 | % | | | | 13.18 | % | | | | 18.43 | % |
Managed Volatility | | | | 17.82 | % | | | | 7.61 | % | | | | 6.96 | % | | | | 6.65 | % | | | | 6.58 | % | | | | -19.38 | % | | | | 12.39 | % | | | | 5.41 | % | | | | 1.94 | % | | | | 6.46 | % | | | | 9.25 | % | | | | 5.95 | % | | | | 0.17 | % | | | | 2.42 | % | | | | 8.18 | % |
Performance figures quoted represent past performance and are no guarantee of future results. Current performance may be lower or higher than the performance data quoted. Investment return and principal value will fluctuate, so that an investor’s shares, when redeemed, may be worth more or less than original cost. To obtain performance current to the most recent month-end, please visit www.bridgeway.com or call 1-800-661-3550. Total return figures include the reinvestment of dividends and capital gains.
| | 1 | Some of the Fund’s fees were waived or expenses reimbursed; otherwise, returns would have been lower. The Adviser has contractually agreed to waive fees and/or reimburse expenses. Any material change to this Fund policy would require a vote by shareholders. |
| | 2 | Expense ratios are as stated in the current prospectus. Please see financial highlights for expense ratios as of June 30, 2018. |
* Numbers highlighted indicate periods when the Fund outperformed its primary benchmark.
This report is submitted for the general information of the shareholders of each Fund. It is not authorized for distribution to prospective investors unless preceded or accompanied by an effective prospectus, which includes information regarding a Fund’s risks, objectives, fees and expenses, experience of its management, and other information. Investors should read the prospectus carefully before investing in a Fund. For questions or other Fund information, call 1-800-661-3550 or visit the Funds’ website at www.bridgeway.com. Funds are available for purchase by residents of the United States, Puerto Rico, U.S. Virgin Islands and Guam only. Foreside Fund Services, LLC, Distributor.
The views expressed here are exclusively those of Fund management. These views, including those relating to the market, sectors, or individual stocks, are not meant as investment advice and should not be considered predictive in nature.
| | | | |
| LETTER FROM THE INVESTMENT MANAGEMENT TEAM | | | | |
June 30, 2018
Dear Fellow Shareholders,
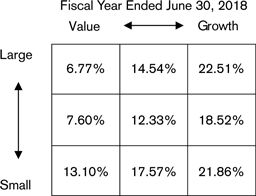
Performance across all segments of the domestic equity markets was positive for the June quarter and for the 12 months ended June 30, 2018. Growth stocks outperformed value stocks across market size categories for the fiscal year, and large-growth stocks delivered the highest one-year returns. Market highlights appear on page 2. In this environment, the Bridgeway Funds performed within design expectations, guided by our statistically driven, evidence-based investment approach. Please see the enclosed letters for a detailed explanation of each Fund’s performance during the quarter and fiscal year. We hope you find the letters helpful.
The recent trend of growth stocks outperforming value stocks has led to a historically pronounced gap between value and growth returns — particularly among large-cap stocks. As a result, investors might be overlooking a risk in their portfolios: An overweighting in growth stocks that could cause portfolios to suffer when growth and value returns begin a reversion to the mean. Bridgeway Founder and Chief Investment Officer John Montgomery and Portfolio Manager Christine Wang examine this threat and describe how investors can address it in “The Growth Risk Lurking in Equity Portfolios,” on page 2.
Rising interest rates are another recent trend that some investors find concerning. Conventional wisdom holds that rising rates are bad for stock returns. But Andrew L. Berkin, Bridgeway’s Director of Research, has examined historical data and found that stock returns have been quite strong, on average, whether interest rates are rising or falling. Read his analysis, including a closer look at the effect of rising interest rates on particular segments of the stock market, in “What Happens to Stocks When Interest Rates Rise?” on page 4.
As is our tradition in annual reports, we have identified “The Worst Thing of the Fiscal Year.” For 2018, we are highlighting closure and liquidation of the Bridgeway Small-Cap Momentum Fund. You can read how we came to this decision on page 6.
Finally, Bridgeway Partner Mark Sullivan shares his recent experience volunteering with the Prison Entrepreneurship Program (PEP), which helps prison inmates understand the business development process and gain business skills needed to become productive citizens upon their release. In “Transformative Change: Erasing the Line Between ‘Them’ and ‘Us’” on page 6, Mark describes the positive impact that PEP has on its participants, as well as its executive coaches.
As always, we appreciate your feedback. We take your comments very seriously and regularly discuss them to help us manage our Funds and this company. Please keep your ideas coming — both favorable and critical. They provide us with a vital tool to serve you better.
Sincerely,
Your Investment Management Team
| | | | |
 | |  | |  |
| John Montgomery | | Christine L. Wang | | Michael Whipple |

| | 
| | |
| | |
| Elena Khoziaeva | | Dick Cancelmo | | |
| | | | |
| LETTER FROM THE INVESTMENT MANAGEMENT TEAM (continued) | | | | |
Market Review
Domestic equity markets continued their positive performance during the quarter ended June 30, 2018, benefiting from strong consumer confidence, rising corporate earnings, and falling unemployment. The S&P 500 returned 3.43% for the quarter, and the Dow Jones Industrial Average rose 1.26%. For the fiscal year, the S&P 500 and the DJIA were up 14.37% and 16.31%, respectively.
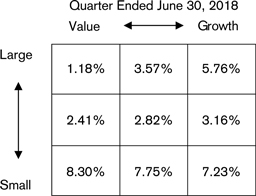
All U.S. equity style categories, as defined by Russell Indices, recorded positive returns for the quarter. However, smaller stocks outperformed larger stocks across style categories. Value versus growth performance was mixed, with value stocks outperforming growth in the small-cap space but underperforming among large-cap stocks. As a result, small value stocks delivered the quarter’s best performance (+8.30%), while large value stocks produced the lowest returns (+1.18%).
Most of the S&P 500 sectors recorded positive returns for the quarter. The Energy sector led the gains, up 13.5% amid rising oil prices. Consumer Discretionary (+8.2%), Information Technology (+7.1%), and Real Estate (+6.1%) also recorded strong returns. Among lagging sectors, Industrials and Financials were the worst performers, both returning -3.2%.
Below are the stock market style box returns for the quarter and the fiscal year.
The Growth Risk Lurking in Equity Portfolios
John Montgomery, CIO and Portfolio Manager and Christine Wang, CFA, CPA, Portfolio Manager
As evidence-based investors, we know from decades of market data that value stocks have outperformed growth stocks over the long run. But value doesn’t always beat growth over shorter time periods — and we clearly were in one of those periods as of the end of June 2018.
Value stocks have significantly lagged growth stocks during the recent bull market, resulting in a historically pronounced gap between growth and value returns that could have important implications for asset allocations: Equity portfolios that are designed to be balanced between value and growth are likely to be overweight in growth stocks right now.
Based on our research, this overweight position could cause portfolios to suffer when growth and value returns begin a reversion to the mean. However, investors also have an opportunity to rebalance portfolios between growth and value, better positioning them to capture the expected long-term value premium.
Just how big is this risk (and opportunity)?
We examined large growth and large value stocks, as represented by the Russell 1000 Growth and Russell 1000 Value Indexes. For the 10 years through 2017, the Russell 1000 Value Index trailed the Russell 1000 Growth Index by nearly three percentage points per year on average. The performance gap was especially wide in 2017, when the Russell 1000 Value Index trailed the Russell 1000 Growth Index by 16.55 percentage points.
| | |
| 2 | | Annual Report | June 30, 2018 |
| | | | |
| LETTER FROM THE INVESTMENT MANAGEMENT TEAM (continued) | | | | |
Adding in the effect of the first half of 2018, where the Russell 1000 Growth Index trounced the Russell 1000 Value Index by another 8.94 percentage points, the gap is now well above three percentage points on a trailing 10-year basis.
Large Growth vs. Large Value Returns (as of December 31, 2017)
| | | | | | | | | | | | | | | | | | | | | | | | | | | | |
| | | One Year | | | | | | 5 Years* | | | | | | 10 Years* | | | | | | Inception (1/1/87) to Date* | |
Russell 1000 Growth | | | 30.21% | | | | | | | | 17.33% | | | | | | | | 10.00% | | | | | | | | 8.08% | |
Russell 1000 Value | | | 13.66% | | | | | | | | 14.04% | | | | | | | | 7.10% | | | | | | | | 8.26% | |
Difference | | | 16.55% | | | | | | | | 3.29% | | | | | | | | 2.90% | | | | | | | | -0.18% | |
Source: Russell, Bridgeway
* Annualized
Given that large value has outpaced large growth for the 31 years since inception of the Russell Indexes, the current rolling period gaps are big numbers on both an absolute and on a relative basis. As of December 31, 2017, we were in roughly the 95th percentile of relative trailing performance for rolling one-year periods — meaning that the Russell 1000 Value Index’s relative performance was better than its recent relative performance 95% of the time over the 31 years of published Russell data. We were in the 89th percentile of relative trailing performance for 10-year periods. In other words, we are well into the worst quintile of relative returns for large value for both one-year and 10-year periods.
However, we also know that over longer time periods asset returns typically revert to the mean, which means that large value’s relative performance is likely to improve at some point in the future. To examine what mean reversion might look like, we’ve examined how large value stocks performed following similar rolling monthly periods of 10-year performance.
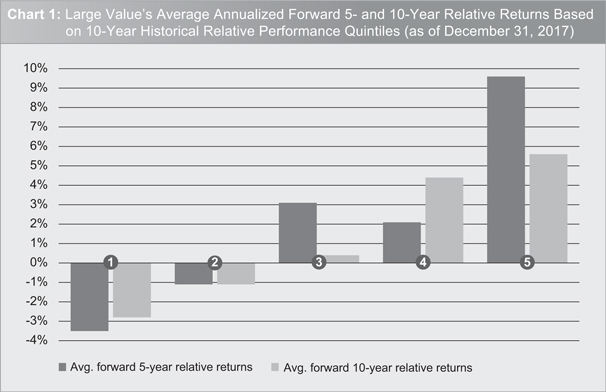
Source: Russell, Bridgeway
| | | | |
| LETTER FROM THE INVESTMENT MANAGEMENT TEAM (continued) | | | | |
This chart illustrates reversion to the mean in action: large value’s five- and 10-year forward relative performance is weakest following periods when the asset class had the best returns relative to large growth (Quintile 1), but strongest following periods of the weakest relative performance (Quintile 5). Because we are currently deep into the fifth quintile of relative returns, historical analysis tells us — based on this data — it is likely that large value stocks would outperform large growth stocks at some time over the coming five- to 10-year period.
What the chart doesn’t tell us is exactly when that reversion to the mean will take place. Large growth’s dominance could continue for some period of time, and we caution investors against trying to time the market. Fortunately, there’s a relatively simple strategy to help investors avoid the risk of ending up on the wrong side of an asset class’s long-term average performance: Rebalancing.
For portfolios that have stakes in both large growth and large value stocks and have not been rebalanced — and this includes passive index investors — chances are good that they have become overweight to large growth and underweight to large value. This carries the dual risk of being overweight to large growth at a time when future returns may be muted and underweight to large value when and if returns revert to the mean.
As a result, you might consider adding to value assets when investing new money, or trimming growth stocks in non-taxable accounts. In either case, you’ll be taking advantage of a rebalancing opportunity we seldom see so clearly presented in market data.
This approach may help reduce potential growth risk that might be “hidden” in equity portfolios following a near decade-long positive run for large growth stocks. Examining market data and using it to make objective decisions about asset allocation and rebalancing is always important, but it’s especially critical when we find ourselves in a situation as unusual as the current environment for value stocks.
What Happens to Stocks When Interest Rates Rise?
Andrew L. Berkin, Director of Research
This Spring, the Federal Reserve raised interest rates for the seventh time since 2015. While announcing that rate hike, the Fed also said it might pursue even steeper rate increases in the coming few years. This trend of rising rates — and the potential for further acceleration — has some investors worried anew about the potential for poor stock market returns going forward.
The idea that higher interest rates are bad for stocks is conventional wisdom for many investors. Here’s how an Investment News columnist articulated this theory in an article from February 5, 2018: “The problem with higher rates is that they may ultimately hit the stock market harder than the bond market. Higher interest rates slow the economy and the stock market.”
But conventional wisdom and investor theories are no match for market data, which is why we first explored the potential link between interest rates and stock returns in a 2014 shareholder letter. Given recent interest rate increases, we decided to take another look at this question and to dig deeper into the potential impact of rising rates on particular areas of the stock market.
First, let’s address the idea that rising rates are bad for stocks in general. Consider data from the past 90 years, which includes 44 years that featured declining bond yields, as represented by 10-Year Treasury Bonds, and 46 years that featured rising bond yields. Whether yields were up or down, however, stocks did quite well, on average — generating a mean 10.81% return, as represented by the S&P 500 Index, during years when yields declined and a mean 12.22% return when yields rose, as seen in the two left columns of the table below.
What about when rates rise sharply? The table’s rightmost five columns show the same data for stocks and bonds when we divide the change in rates into quintiles. The “Down Most” column gives results for the 20% of years when bond yields fell the most, while the “Up Most” column is for the 20% of years when bond yields rose the most. Intermediate cases are in the middle three columns.
Again, we see little difference in stock returns with the magnitude of rate changes. In all cases stock returns are on average quite strong, although with a high deviation and wide dispersion.
| | |
| 4 | | Annual Report | June 30, 2018 |
| | | | |
| LETTER FROM THE INVESTMENT MANAGEMENT TEAM (continued) | | | | |
Return of the S&P 500 According to Direction of 10-Year Bond Yield
| | | | | | | | | | | | | | | | | | | | | | | | | | | | |
| | | Yield Down or Up | | | | | | Quintile by Magnitude of Yield Change | | | | |
| | | Down | | | Up | | | Down Most | | | Down | | | Mid | | | Up | | | Up Most | |
Mean | | | 10.81% | | | | 12.22% | | | | 10.00% | | | | 10.84% | | | | 11.25% | | | | 16.52% | | | | 9.03% | |
Standard Deviation | | | 19.68% | | | | 19.76% | | | | 20.14% | | | | 19.35% | | | | 20.88% | | | | 17.09% | | | | 21.71% | |
Count | | | 44 | | | | 46 | | | | 18 | | | | 18 | | | | 18 | | | | 18 | | | | 18 | |
Minimum | | | -36.55% | | | | -43.84% | | | | -36.55% | | | | -25.12% | | | | -35.34% | | | | -14.31% | | | | -43.84% | |
Maximum | | | 52.56% | | | | 49.98% | | | | 37.20% | | | | 46.74% | | | | 52.56% | | | | 43.81% | | | | 43.72% | |
Source: Aswath Damodaran, http://www.stern.nyu.edu/~adamodar/New_Home_Page/data.html. Data from 1928 – 2017.
This lack of consistent relationship between stock returns and interest rate movements held true even when we looked at short-term Treasury Bills, the spread between long- and short-term yields, and real (inflation-adjusted) yields. Longer-term stock returns of three, five and 10 years also showed no effect.
In short, whatever way we choose to measure rates, the main conclusion still holds: Stock returns in the U.S. are quite strong on average — with lots of variation — whether rates are rising or falling.
However, we wanted to see if the same trend held for specific segments of the stock market, particularly ones that might be more affected by rising rates than the stock market as a whole: high dividend yield stocks and small stocks.
High Dividend Yield
When bond yields decline, more investors seek the income potential from stocks that paid high dividends. The data supports this pattern: Higher dividend stocks have historically outperformed the broader stock by an average of 3.91% in years when interest rates fall. But in years when rates rise, this segment lagged the overall market modestly by 0.19%.
Interestingly, this pattern reversed when looking at returns in the year following a rate increase. High dividend stocks did quite well (+3.13% vs. the broader market) the year after a rate increase. Taken together, these data points tell us that investors in high dividend yield stocks need to be wary of rising interest rates. But for some of these stocks, they have tended to recover.
Small Stocks
There is an argument that smaller stocks should suffer when rates rise, as they are more susceptible to economic slowing and higher borrowing costs. And yet, in years when bond yields fell, smaller stocks had lower, though still positive, average relative returns (+1.94% vs. large stocks); and very strong relative returns (+4.51% vs. large stocks) in years when yields rose.
Furthermore, there is no distinct pattern of returns in the year after bond yields change, and there is no clear trend in the same year that short term-rates change (although small stocks do lag in the year following a sharp rise in short-term rates). Thus, while there is some evidence that yield changes impact smaller stocks, results are quite mixed and often do not conform to the theory that higher rates hurt small stocks.
While bond investors have plenty of reasons to be cautious in a rising rate environment, the data tells us that the same is not necessarily true for stock investors. Stocks have performed well overall despite rising rates in the past — although certain segments of the market, such as higher dividend paying stocks, are more susceptible to changes in interest rates. Ultimately, equities remain an important driver of potential growth even as the market appears poised for a transition away from the low interest rate environment that has held sway over the past few decades.
| | | | |
| LETTER FROM THE INVESTMENT MANAGEMENT TEAM (continued) | | | | |
The Worst Thing of the Fiscal Year
For years, Bridgeway has dedicated a portion of our annual report to reviewing the worst thing that’s happened during the past fiscal year. As part of our commitment to transparency with our shareholders, we readily identified one such event: In May 2018, Bridgeway Funds liquidated and dissolved the Small-Cap Momentum Fund — a process also known as a full closure.
This is the first full closure of any Bridgeway Fund in our company’s history, and it’s a decision that we did not take lightly because of its impact on shareholders. First, a full closure creates a taxable event for the minority of shareholders who hold the fund in a taxable account. Those shareholders must then spend time reallocating the proceeds from the liquidation into other investments. Finally, closing the fund eliminates the investment opportunity that we and some shareholders still feel is promising: Offering a risk-adjusted approach to capturing rising prices in small-cap stocks with the goal of outperforming the Russell 2000 Index when the momentum factor is in favor in the small-cap space.
As designed, the Fund outperformed when the momentum factor was in favor and underperformed when momentum was out of favor. So, if the Fund performed as expected, why did we opt to close it now? We based our decision on two major challenges: low investor interest and high operating costs.
Since the Fund’s inception in 2010, there has been little market demand for this type of strategy. Few funds or strategies exist in the small-cap momentum space, as investors typically do not include this category in their asset allocation. As a result, our Small-Cap Momentum Fund struggled to gain traction in the market, only reaching $5.75 million in assets under management as of December 31, 2017.
Likewise, its small size hurt the Fund’s economic viability. Actual expenses for the Fund listed in the current prospectus were 3.84% and have exceeded that amount at times. But Bridgeway Capital Management, the Funds’ adviser, absorbed most of these costs to limit shareholder net expenses to 0.90%. This was the eighth year that this expense disparity had occurred.
Given the lack of demand from investors and the low economic viability for this type of strategy, we believed there was little realistic opportunity for the Bridgeway Small-Cap Momentum Fund to gather additional assets to provide its shareholders with meaningful economies of scale.
Because of the impact to the Fund’s shareholders, we considered options other than liquidation, including a potential merger of the Small-Cap Momentum Fund with another Bridgeway Fund. However, the costs of merging with another fund would have been high and the benefit to shareholders unclear. What’s more, because there is not another Bridgeway Fund with a similar objective, shareholders might have ended up selling their shares after the merger and incurring capital gains.
Ultimately, we have a fiduciary responsibility to the investors in our Funds. After careful consideration, Bridgeway Capital Management and the Funds’ Board of Directors determined that it was no longer economically viable to continue operating the Small-Cap Momentum Fund.
Transformative Change: Erasing the Line Between “Them” and “Us”
Mark Sullivan, Head of Client Service and Marketing
For several months, I’ve been fortunate to join several of my Bridgeway peers as a volunteer for the Prison Entrepreneurship Program (PEP) here in Texas. The mission of PEP is to help soon-to-be released inmates gain the skills needed to be productive members of society upon their release. PEP is a competitive program within the Texas Department of Criminal Justice: Of the 10,000 inmates who typically receive invitations each year, about 3,000 respond. In 2017, nearly one thousand were ultimately selected to participate in five units (four male and one female) throughout Texas. The inmates participating in this program serve an average of an eight-year sentence, but of course, some are much longer. Their crimes range from murder, aggravated assault and kidnapping to drugs and repeat offenses for driving under the influence.
I became familiar with PEP through our firm’s President and Chief Executive Officer, Tammira Philippe, as well as several other Bridgeway Partners. PEP employs a Servant Leader approach, which is a core belief of Bridgeway’s, too. In May 2018, eight of my colleagues and I attended “Pitch Day” — a Shark Tank-like experience — where we listened to PEP program members
| | |
| 6 | | Annual Report | June 30, 2018 |
| | | | |
| LETTER FROM THE INVESTMENT MANAGEMENT TEAM (continued) | | | | |
pitch their business plans and offered feedback. Separately, I have had the opportunity to teach a presentation skills training class for 75 program members.
By helping inmates improve their personal circumstances, PEP has a huge positive societal impact. For starters, the recidivism rate (inmates who return to prison) in Texas is 30% — but among PEP graduates it is only 7.5%. And there is a 100% employment rate within 90 days of release for seven consecutive years. In 2017, 291 inmates graduated from PEP. These participants have formed more than 350 businesses and launched 62 new businesses upon release. PEP participants realize they have been given a lifeline, and they certainly make the most of it.
One of the most powerful events I had the privilege to experience was the PEP 2018 Graduation — a day I will not soon forget. Some inmates had not seen their families for years. The overwhelming emotion that day was one of hope.
Before the graduation ceremony began, PEP’s CEO (himself formerly incarcerated) asked the inmates and volunteers/ executive coaches to stand if they could answer one of several questions in the affirmative. The questions started out easy with ones like, “Have you ever jaywalked?” They then built in intensity, culminating with questions like “Have you ever driven under the influence...have you ever used illegal drugs...have you committed a violent act against another person?” It was telling to see the number of inmates and volunteers/executive coaches (many of them successful, retired executives in their 60s and 70s) who answered in the affirmative by standing.
Despite the varied and troubled backgrounds of the PEP participants, I never felt uncomfortable or threatened by a single inmate. Quite the opposite: I felt very much at ease around them. PEP has made me realize there is a very thin line between them and us, which gave me a new perspective. My wife summed up the transformative change I experienced perfectly when she said, “A person’s life should not be defined by their worst day.”
Many of these inmates grew up in difficult circumstances: underserved by the education system, without a two-parent home, drugs, alcohol, gangs, violence...you name it. The list is endless. Yet the optimism that PEP members exude is palpable. I believe that because of PEP and its support system, and the commitment of these men and women to a new future, their best days are ahead of them.
| | |
| Aggressive Investors 1 Fund | |
|
| MANAGER’S COMMENTARY (Unaudited) |
| | |
June 30, 2018
Dear Fellow Aggressive Investors 1 Fund Shareholder,
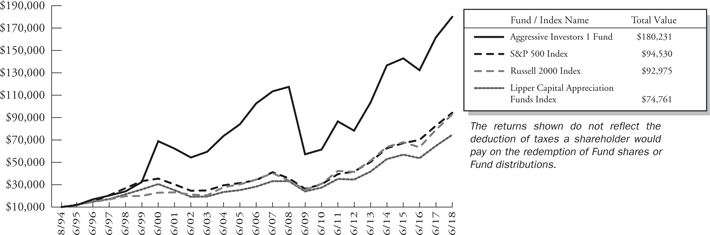
For the quarter ended June 30, 2018, our Fund returned +0.09%, underperforming our primary market benchmark, the S&P 500 Index (+3.43%), our peer benchmark, the Lipper Capital Appreciation Funds Index (+3.62%), and the Russell 2000 Index (+7.75%). It was a poor quarter.
For the fiscal year, our Fund returned +11.59%, underperforming our primary market benchmark, the S&P 500 Index (+14.37%), and our peer benchmark, the Lipper Capital Appreciation Funds Index (+15.37%) and the Russell 2000 Index (+17.57%).
The table below presents our June quarter, one-year, five-year, 10-year, 15-year, and inception-to-date financial results. See the next page for a graph of performance since inception.
Standardized Returns as of June 30, 2018
| | | | | | | | | | | | | | | | | | | | | | | | |
| | | | | | | | | | | | Annualized | | | | | | | |
| | | Quarter | | | 1 Year | | | 5 Years | | | 10 Years | | | 15 Years | | | Since Inception
(8/5/94) | |
| | | | | | |
Aggressive Investors 1 Fund | | | 0.09% | | | | 11.59% | | | | 11.72% | | | | 4.35% | | | | 7.67% | | | | 12.86% | |
S&P 500 Index | | | 3.43% | | | | 14.37% | | | | 13.42% | | | | 10.17% | | | | 9.30% | | | | 9.82% | |
Russell 2000 Index | | | 7.75% | | | | 17.57% | | | | 12.46% | | | | 10.60% | | | | 10.50% | | | | 9.74% | |
Lipper Capital Appreciation Funds Index | | | 3.62% | | | | 15.37% | | | | 12.37% | | | | 8.40% | | | | 9.33% | | | | 8.70% | |
Performance figures quoted in the table above represent past performance and are no guarantee of future results. Total return figures in the table above include the reinvestment of dividends and capital gains. The table above does not reflect the deduction of taxes that a shareholder would pay on Fund distributions or on the redemption of Fund shares.
The S&P 500 Index is a broad-based, unmanaged measurement of changes in stock market conditions, based on the average of 500 widely held common stocks with dividends reinvested. The Russell 2000 Index is an unmanaged, market value weighted index that measures performance of the 2,000 companies that are between the 1,000th and 3,000th largest in the market with dividends reinvested. The Lipper Capital Appreciation Funds Index reflects the record of the 30 largest funds in the category of more aggressive domestic growth mutual funds, as reported by Lipper, Inc. It is not possible to invest directly in an index. Periods longer than one year are annualized.
| | |
| 8 | | Annual Report | June 30, 2018 |
| | |
| Aggressive Investors 1 Fund | | |
| MANAGER’S COMMENTARY (Unaudited) (continued) | | |
| | |
Growth of a $10,000 Investment
from Inception August 5, 1994 to June 30, 2018
Detailed Explanation of Quarterly Performance
The Fund’s price momentum and company financial health models underperformed the benchmark during the quarter and detracted from relative results. However, these losses were partly offset by outperformance from the Fund’s value metrics models. The Fund’s tilt toward deeper value stocks also detracted from relative performance, as did our lack of exposure to or underweighting in several of the index’s largest technology stocks. By design, the Fund invests in higher beta stocks, which also hurt relative returns during the quarter. However, our tilt toward higher momentum stocks across all model categories boosted relative performance.
From a sector perspective, the Fund’s allocation effect was essentially neutral. However, the Fund’s stock selection effect was significantly negative, with holdings in the Information Technology and Consumer Discretionary sectors detracting the most from relative results.
Detailed Explanation of Fiscal Year Performance
For the fiscal year, the Fund’s company financial health models underperformed the benchmark and detracted from relative results. This negative impact was partly offset by outperformance from our value metrics and price momentum models. The Fund’s tilt toward smaller companies and deeper value shares also detracted from relative performance, as did our emphasis on higher beta stocks. However, an overweighting in higher momentum stocks across all model categories helped relative performance.
During the year, losses from the Fund’s investment in the Velocity Shares Inverse VIX Short-Term ETN (XIV) detracted from relative returns. The XIV investment was chosen to implement the modeled strategy, rather than using volatility futures contracts, primarily because XIV’s potential losses were limited to 100%, whereas volatility futures’ potential losses are infinite. XIV made a small negative contribution to the Fund’s return in 2015, followed by a positive 1.0% contribution in 2016 and positive 2.0% contribution in 2017. But when daily volatility spiked in February 2018, XIV lost more than 80% of its value, and Credit Suisse announced the investment’s liquidation. As a result, XIV contributed -1.64% to the Fund’s performance for the fiscal year.
From a sector perspective, the Fund’s allocation effect was slightly negative, with an overweighting in the Industrials sector detracting the most from relative performance. The Fund’s selection effect also was negative, with holdings in the Information Technology and Consumer Discretionary sectors particularly hurting relative results.
| | |
| Aggressive Investors 1 Fund | |
|
| MANAGER’S COMMENTARY (Unaudited) (continued) |
| | |
Top Ten Holdings as of June 30, 2018
| | | | | | | | |
| Rank | | Description | | Industry | | % of Net Assets | |
| 1 | | Micron Technology, Inc. | | Information Technology | | | 2.7% | |
| 2 | | Lam Research Corp. | | Information Technology | | | 2.1% | |
| 3 | | ON Semiconductor Corp. | | Information Technology | | | 2.1% | |
| 4 | | XPO Logistics, Inc. | | Industrials | | | 2.1% | |
| 5 | | Westlake Chemical Corp. | | Materials | | | 2.1% | |
| 6 | | Applied Materials, Inc. | | Information Technology | | | 2.0% | |
| 7 | | Zebra Technologies Corp., Class A | | Information Technology | | | 2.0% | |
| 8 | | Boeing Co. (The) | | Industrials | | | 2.0% | |
| 9 | | Fiat Chrysler Automobiles NV | | Consumer Discretionary | | | 1.8% | |
| 10 | | Abbvie, Inc. | | Health Care | | | 1.7% | |
| | | |
| | Total | | | | | 20.6% | |
Industry Sector Representation as of June 30, 2018
| | | | | | | | | | | | | | | |
| | | % of Net Assets | | % of S&P 500
Index | | Difference |
Consumer Discretionary | | | | 15.2% | | | | | 12.9% | | | | | 2.3% | |
Consumer Staples | | | | 4.1% | | | | | 7.0% | | | | | -2.9% | |
Energy | | | | 9.2% | | | | | 6.3% | | | | | 2.9% | |
Financials | | | | 13.4% | | | | | 13.8% | | | | | -0.4% | |
Health Care | | | | 7.8% | | | | | 14.1% | | | | | -6.3% | |
Industrials | | | | 13.4% | | | | | 9.5% | | | | | 3.9% | |
Information Technology | | | | 23.7% | | | | | 26.0% | | | | | -2.3% | |
Materials | | | | 10.0% | | | | | 2.6% | | | | | 7.4% | |
Real Estate | | | | 0.0% | | | | | 2.9% | | | | | -2.9% | |
Telecommunication Services | | | | 1.4% | | | | | 2.0% | | | | | -0.6% | |
Utilities | | | | 1.5% | | | | | 2.9% | | | | | -1.4% | |
Cash & Other Assets | | | | 0.3% | | | | | 0.0% | | | | | 0.3% | |
| | | |
Total | | | | 100.0% | | | | | 100.0% | | | | | | |
Disclaimer
The views expressed here are exclusively those of Fund management. These views, including those related to market sectors or individual stocks, are not meant as investment advice and should not be considered predictive in nature. Any favorable (or unfavorable) description of a holding applies only as of the quarter end, June 30, 2018, unless otherwise stated. Security positions can and do change thereafter. Discussions of historical performance do not guarantee and may not be indicative of future performance.
Market volatility can significantly affect short-term performance. The Fund is not an appropriate investment for short-term investors. Investments in the small companies within this multi-cap fund generally carry greater risk than is customarily associated with larger companies. This additional risk is attributable to a number of factors, including the relatively limited financial resources that are typically available to small companies and the fact that small companies often have comparatively limited product lines. In addition, the stock of small companies tends to be more volatile than the stock of large companies, particularly in the short term and particularly in the early stages of an economic or market downturn. The Fund’s use of options, futures, and leverage can magnify the risk of loss in an unfavorable market, and the Fund’s use of short-sale positions can, in theory, expose shareholders to unlimited loss. Finally, the Fund exposes shareholders to “focus risk,” which may add to Fund volatility through the possibility that a single company could significantly affect total return. Shareholders of the Fund, therefore, are taking on more risk than they would if they invested in the stock market as a whole.
| | |
| 10 | | Annual Report | June 30, 2018 |
| | |
| Aggressive Investors 1 Fund | | |
| MANAGER’S COMMENTARY (Unaudited) (continued) | | |
| | |
Conclusion
Thank you for your continued investment in Aggressive Investors 1 Fund. We encourage your feedback; your reactions and concerns are important to us.
Sincerely,
The Investment Management Team
| | |
| Aggressive Investors 1 Fund | |
|
| SCHEDULE OF INVESTMENTS |
| Showing percentage of net assets as of June 30, 2018 | | |
| | | | | | | | | | | | | | | | |
| Industry Company | | Shares | | | Value | | | | | | | |
| | | | |
COMMON STOCKS - 99.71% | | | | | | | | | | | | | | | | |
Consumer Discretionary - 15.15% | | | | | | | | | |
Abercrombie & Fitch Co., Class A | | | 89,300 | | | $ | 2,186,064 | | | | | | | | | |
Best Buy Co., Inc. | | | 38,000 | | | | 2,834,040 | | | | | | | | | |
Bloomin’ Brands, Inc. | | | 100,000 | | | | 2,010,000 | | | | | | | | | |
Express, Inc.* | | | 130,000 | | | | 1,189,500 | | | | | | | | | |
Fiat Chrysler Automobiles NV* | | | 215,000 | | | | 4,061,350 | | | | | | | | | |
Ford Motor Co. | | | 200,000 | | | | 2,214,000 | | | | | | | | | |
Hanesbrands, Inc. | | | 102,000 | | | | 2,246,040 | | | | | | | | | |
Lear Corp. | | | 16,000 | | | | 2,972,960 | | | | | | | | | |
LGI Homes, Inc.*+ | | | 41,400 | | | | 2,390,022 | | | | | | | | | |
LKQ Corp.* | | | 59,000 | | | | 1,882,100 | | | | | | | | | |
Marriott International, Inc., Class A | | | 18,300 | | | | 2,316,780 | | | | | | | | | |
Sonic Automotive, Inc., Class A | | | 58,000 | | | | 1,194,800 | | | | | | | | | |
Tailored Brands, Inc. | | | 75,000 | | | | 1,914,000 | | | | | | | | | |
William Lyon Homes, Class A* | | | 94,000 | | | | 2,180,800 | | | | | | | | | |
Winnebago Industries, Inc. | | | 71,200 | | | | 2,890,720 | | | | | | | | | |
| | | | | | | | | | | | | | | | |
| | | | | | | 34,483,176 | | | | | | | | | |
| | |
Consumer Staples - 4.12% | | | | | | | | | |
Adecoagro SA* | | | 150,000 | | | | 1,192,500 | | | | | | | | | |
Brown-Forman Corp., Class B | | | 43,000 | | | | 2,107,430 | | | | | | | | | |
Constellation Brands, Inc., Class A | | | 11,500 | | | | 2,517,005 | | | | | | | | | |
SpartanNash Co. | | | 38,000 | | | | 969,760 | | | | | | | | | |
Sysco Corp. | | | 38,000 | | | | 2,595,020 | | | | | | | | | |
| | | | | | | | | | | | | | | | |
| | | | | | | 9,381,715 | | | | | | | | | |
| | |
Energy - 9.15% | | | | | | | | | |
Archrock, Inc. | | | 108,300 | | | | 1,299,600 | | | | | | | | | |
Cimarex Energy Co. | | | 24,700 | | | | 2,512,978 | | | | | | | | | |
CONSOL Energy, Inc.* | | | 37,000 | | | | 1,418,950 | | | | | | | | | |
CVR Energy, Inc.+ | | | 56,000 | | | | 2,071,440 | | | | | | | | | |
Delek US Holdings, Inc. | | | 49,000 | | | | 2,458,330 | | | | | | | | | |
Denbury Resources, Inc.* | | | 700,000 | | | | 3,367,000 | | | | | | | | | |
Devon Energy Corp. | | | 70,000 | | | | 3,077,200 | | | | | | | | | |
Mammoth Energy Services, Inc.*+ | | | 38,603 | | | | 1,310,958 | | | | | | | | | |
Newfield Exploration Co.* | | | 72,000 | | | | 2,178,000 | | | | | | | | | |
Par Pacific Holdings, Inc.* | | | 65,000 | | | | 1,129,700 | | | | | | | | | |
| | | | | | | | | | | | | | | | |
| | | | | | | 20,824,156 | | | | | | | | | |
| | |
Financials - 13.42% | | | | | | | | | |
Aflac, Inc. | | | 59,800 | | | | 2,572,596 | | | | | | | | | |
Ally Financial, Inc. | | | 73,400 | | | | 1,928,218 | | | | | | | | | |
American Financial Group, Inc. | | | 24,300 | | | | 2,608,119 | | | | | | | | | |
Ameriprise Financial, Inc. | | | 15,500 | | | | 2,168,140 | | | | | | | | | |
| | | | | | | | | | | | | | | | |
| | | | | | | | | | | | | | | | |
| | | | | | | | | | | | | | | | |
| | | | | | | | | | | | | | | | |
| | | | | | | | | | | | | | | | |
| | | | | | | | | | | | |
| Industry Company | | Shares | | | Value | | | | |
| |
Financials (continued) | | | | | |
Credit Acceptance Corp.*+ | | | 6,900 | | | $ | 2,438,460 | | | | | |
Enova International, Inc.* | | | 38,000 | | | | 1,388,900 | | | | | |
Progressive Corp. (The) | | | 52,000 | | | | 3,075,800 | | | | | |
Prudential Financial, Inc. | | | 22,000 | | | | 2,057,220 | | | | | |
Royal Bank of Canada+ | | | 34,300 | | | | 2,582,790 | | | | | |
SEI Investments Co. | | | 37,000 | | | | 2,313,240 | | | | | |
Synchrony Financial | | | 80,000 | | | | 2,670,400 | | | | | |
Toronto-Dominion Bank (The) | | | 42,000 | | | | 2,430,120 | | | | | |
Unum Group | | | 62,500 | | | | 2,311,875 | | | | | |
| | | | | | | | | | | | |
| | | | | | | 30,545,878 | | | | | |
| |
Health Care - 7.85% | | | | | |
AbbVie, Inc. | | | 42,000 | | | | 3,891,300 | | | | | |
AmerisourceBergen Corp. | | | 39,900 | | | | 3,402,273 | | | | | |
Centene Corp.* | | | 20,500 | | | | 2,525,805 | | | | | |
Express Scripts Holding Co.* | | | 40,000 | | | | 3,088,400 | | | | | |
Gilead Sciences, Inc. | | | 34,000 | | | | 2,408,560 | | | | | |
Hill-Rom Holdings, Inc. | | | 29,100 | | | | 2,541,594 | | | | | |
| | | | | | | | | | | | |
| | | | | | | 17,857,932 | | | | | |
| |
Industrials - 13.40% | | | | | |
ArcBest Corp. | | | 38,000 | | | | 1,736,600 | | | | | |
Avis Budget Group, Inc.* | | | 56,000 | | | | 1,820,000 | | | | | |
Boeing Co. (The) | | | 13,300 | | | | 4,462,283 | | | | | |
Briggs & Stratton Corp. | | | 48,000 | | | | 845,280 | | | | | |
Caterpillar, Inc. | | | 16,000 | | | | 2,170,720 | | | | | |
H&E Equipment Services, Inc. | | | 65,000 | | | | 2,444,650 | | | | | |
Insperity, Inc. | | | 35,600 | | | | 3,390,900 | | | | | |
Patrick Industries, Inc.* | | | 18,700 | | | | 1,063,095 | | | | | |
Saia, Inc.* | | | 31,600 | | | | 2,554,860 | | | | | |
United Continental Holdings, Inc.* | | | 30,000 | | | | 2,091,900 | | | | | |
United Rentals, Inc.* | | | 21,500 | | | | 3,173,830 | | | | | |
XPO Logistics, Inc.* | | | 47,300 | | | | 4,738,514 | | | | | |
| | | | | | | | | | | | |
| | | | | | | 30,492,632 | | | | | |
| |
Information Technology - 23.66% | | | | | |
Accenture PLC, Class A | | | 16,100 | | | | 2,633,799 | | | | | |
Alliance Data Systems Corp. | | | 11,300 | | | | 2,635,160 | | | | | |
Apple, Inc. | | | 16,000 | | | | 2,961,760 | | | | | |
Applied Materials, Inc. | | | 99,900 | | | | 4,614,381 | | | | | |
Cardtronics PLC, Class A* | | | 46,500 | | | | 1,124,370 | | | | | |
IPG Photonics Corp.* | | | 10,700 | | | | 2,360,741 | | | | | |
Juniper Networks, Inc. | | | 100,000 | | | | 2,742,000 | | | | | |
Lam Research Corp. | | | 28,600 | | | | 4,943,510 | | | | | |
Match Group, Inc.*+ | | | 64,000 | | | | 2,479,360 | | | | | |
Micron Technology, Inc.* | | | 116,000 | | | | 6,083,040 | | | | | |
ON Semiconductor Corp.* | | | 220,000 | | | | 4,891,700 | | | | | |
| | |
| 12 | | Annual Report | June 30, 2018 |
| | |
| Aggressive Investors 1 Fund | | |
| SCHEDULE OF INVESTMENTS (continued) | | |
| Showing percentage of net assets as of June 30, 2018 | | |
| | | | | | | | | | | | | | | | | | | | |
| Industry Company | | | | | Shares | | | Value | | | | | | | |
| | | | |
Common Stocks (continued) | | | | | | | | | | | | | | | | | |
Information Technology (continued) | | | | | | | | | |
Science Applications International Corp. | | | | | | | 28,700 | | | $ | 2,322,691 | | | | | | | | | |
Seagate Technology PLC | | | | | | | 52,900 | | | | 2,987,263 | | | | | | | | | |
SYNNEX Corp. | | | | | | | 19,000 | | | | 1,833,690 | | | | | | | | | |
Total System Services, Inc. | | | | | | | 31,400 | | | | 2,653,928 | | | | | | | | | |
Western Digital Corp. | | | | | | | 27,000 | | | | 2,090,070 | | | | | | | | | |
Zebra Technologies Corp., Class A* | | | | | | | 31,300 | | | | 4,483,725 | | | | | | | | | |
| | | | | | | | | | | | | | | | | | | | |
| | | | | | | | | | | 53,841,188 | | | | | | | | | |
| | |
Materials - 10.05% | | | | | | | | | |
Chemours Co. (The) | | | | | | | 48,200 | | | | 2,138,152 | | | | | | | | | |
Freeport-McMoRan, Inc. | | | | | | | 164,800 | | | | 2,844,448 | | | | | | | | | |
Packaging Corp. of America | | | | | | | 20,900 | | | | 2,336,411 | | | | | | | | | |
Southern Copper Corp. | | | | | | | 53,300 | | | | 2,498,171 | | | | | | | | | |
SunCoke Energy, Inc.* | | | | | | | 201,300 | | | | 2,697,420 | | | | | | | | | |
Teck Resources, Ltd., Class B | | | | | | | 120,000 | | | | 3,054,000 | | | | | | | | | |
Warrior Met Coal, Inc. | | | | | | | 95,000 | | | | 2,619,150 | | | | | | | | | |
Westlake Chemical Corp. | | | | | | | 43,400 | | | | 4,671,142 | | | | | | | | | |
| | | | | | | | | | | | | | | | | | | | |
| | | | | | | | | | | 22,858,894 | | | | | | | | | |
| | |
Telecommunication Services - 1.40% | | | | | | | | | |
T-Mobile US, Inc.* | | | | | | | 53,200 | | | | 3,178,700 | | | | | | | | | |
| | |
Utilities - 1.51% | | | | | | | | | |
CenterPoint Energy, Inc. | | | | | | | 91,200 | | | | 2,527,152 | | | | | | | | | |
Just Energy Group, Inc.+ | | | | | | | 250,167 | | | | 905,604 | | | | | | | | | |
| | | | | | | | | | | | | | | | | | | | |
| | | | | | | | | | | 3,432,756 | | | | | | | | | |
| | | | | | | | | | | | | | | | | | | | |
| | | |
TOTAL COMMON STOCKS - 99.71% | | | | 226,897,027 | | | | | | | | | |
| | | | | | | | | | | | | | | | | | | | |
(Cost $209,968,939) | | | | | | | | | | | | | | | | | | | | |
| | | | | | | | | | | | | | | | | | | | |
| | | | | |
| | | Rate^ | | | Shares | | | Value | | | | | | | |
| | |
MONEY MARKET FUND - 0.30% | | | | | | | | | |
Fidelity Investments Money Market Government Portfolio Class I | | | 1.77 | % | | | 685,771 | | | | 685,771 | | | | | | | | | |
| | | | | | | | | | | | | | | | | | | | |
TOTAL MONEY MARKET FUND - 0.30% | | | | 685,771 | | | | | | | | | |
| | | | | | | | | | | | | | | | | | | | |
(Cost $685,771) | | | | | | | | | | | | | |
| | | | | | | | | | | | | | | | |
| | | Rate^ | | | Shares | | | Value | | | | |
| |
| INVESTMENTS PURCHASED WITH CASH PROCEEDS FROM SECURITIES LENDING - 5.50% | | | | | |
Fidelity Investments Money Market Government Portfolio Class I** | | | 1.77 | % | | | 12,524,485 | | | | $12,524,485 | | | | | |
| | | | | | | | | | | | | | | | |
TOTAL INVESTMENTS PURCHASED WITH CASH PROCEEDS FROM SECURITIES LENDING - 5.50% | | | | 12,524,485 | | | | | |
| | | | | | | | | | | | | | | | |
(Cost $12,524,485) | | | | | | | | | |
TOTAL INVESTMENTS - 105.51% | | | | $240,107,283 | | | | | |
(Cost $223,179,195) | | | | | | | | | |
Liabilities in Excess of Other Assets - (5.51%) | | | | (12,544,966 | ) | | | | |
| | | | | | | | | | | | | | | | |
NET ASSETS - 100.00% | | | | $227,562,317 | | | | | |
| | | | | | | | | | | | | | | | |
| * | Non-income producing security. |
| ** | This security represents the investment of the collateral received in connection with securities out on loan as of June 30, 2018. |
| ^ | Rate disclosed as of June 30, 2018. |
| + | This security or a portion of the security is out on loan as of June 30, 2018. Total loaned securities had a value of $12,260,164 as of June 30, 2018. |
PLC - Public Limited Company
Summary of inputs used to value the Fund’s investments as of 06/30/2018
(See Note 2 in Notes to Financial Statements):
| | | | | | | | | | | | | | | | |
| |
| | | Valuation Inputs | |
| | | Investment in Securities (Value) | |
| | | Level 1
Quoted
Prices | | | Level 2
Significant
Observable
Inputs | | | Level 3
Significant Unobservable
Inputs | | | Total | |
| | | | |
Common Stocks (a) | | $ | 226,897,027 | | | $ | — | | | $ | — | | | $ | 226,897,027 | |
Money Market Fund | | | — | | | | 685,771 | | | | — | | | | 685,771 | |
Investments Purchased with Cash Proceeds from Securities Lending | | | — | | | | 12,524,485 | | | | — | | | | 12,524,485 | |
| | | | | | | | | | | | | | | | |
TOTAL | | $ | 226,897,027 | | | $ | 13,210,256 | | | $ | — | | | $ | 240,107,283 | |
| | | | | | | | | | | | | | | | |
(a) - Please refer to the Schedule of Investments for the industry classifications of these portfolio holdings.
See Notes to Financial Statements.
| | |
| Ultra-Small Company Fund | |
|
| MANAGER’S COMMENTARY (Unaudited) |
June 30, 2018 | | |
Dear Fellow Ultra-Small Company Fund Shareholder,
For the quarter ended June 30, 2018, our Fund returned +6.39%, lagging our primary market benchmark, the CRSP Cap-Based Portfolio 10 Index (+11.57%), and our peer benchmark, the Lipper Micro-Cap Stock Funds Index (+9.34%), as well as the Russell 2000 Index (+7.75%) and the Russell Microcap Index (+9.97%). It was a poor quarter on a relative basis.
For the fiscal year, our Fund returned +9.13%, underperforming the CRSP Cap-Based Portfolio 10 Index (+24.18%), the Lipper Micro-Cap Stock Funds Index (+18.49%), the Russell 2000 Index (+17.57%) and the Russell Microcap Index (+20.21%).
The table below presents our June quarter, one-year, five-year, 10-year, 15-year, and inception-to-date financial results. See the next page for a graph of performance since inception.
Standardized Returns as of June 30, 2018
| | | | | | | | | | | | | | | | | | | | | | |
| | | | | | | | | Annualized | | | |
| | | Quarter | | | 1 Year | | | 5 Years | | | 10 Years | | | 15 Years | | | Since Inception
(8/5/94) |
| | | | | | |
Ultra-Small Company Fund | | | 6.39% | | | | 9.13% | | | | 4.75% | | | | 7.67% | | | | 8.74% | | | 13.61% |
CRSP Cap-Based Portfolio 10 Index | | | 11.57% | | | | 24.18% | | | | 11.92% | | | | 12.33% | | | | 11.55% | | | 12.45% |
Russell 2000 Index | | | 7.75% | | | | 17.57% | | | | 12.46% | | | | 10.60% | | | | 10.50% | | | 9.74% |
Russell Microcap Index | | | 9.97% | | | | 20.21% | | | | 12.78% | | | | 10.63% | | | | 9.44% | | | N/A |
Lipper Micro-Cap Stock Funds Index | | | 9.34% | | | | 18.49% | | | | 11.83% | | | | 10.32% | | | | 9.83% | | | N/A |
Performance figures quoted in the table above represent past performance and are no guarantee of future results. Total return figures in the table above include the reinvestment of dividends and capital gains. The table above does not reflect the deduction of taxes that a shareholder would pay on Fund distributions or on the redemption of Fund shares.
The CRSP Cap-Based Portfolio 10 Index is an unmanaged index of 753 of the smallest publicly traded U.S. stocks (with dividends reinvested), as reported by the Center for Research in Security Prices. The Russell Microcap Index is an unmanaged, market value weighted index that measures performance of 1,000 of the smallest securities in the Russell 2000 Index. The Russell 2000 Index is an unmanaged, market value weighted index that measures performance of the 2,000 companies that are between the 1,000th and 3,000th largest in the market (with dividends reinvested). The Lipper Micro-Cap Stock Funds Index is an index of micro-cap funds compiled by Lipper, Inc. It is not possible to invest directly in an index. Periods longer than one year are annualized.
| | |
| 14 | | Annual Report | June 30, 2018 |
| | |
| Ultra-Small Company Fund | | |
| MANAGER’S COMMENTARY (Unaudited) (continued) | | |
| | |
Growth of a $10,000 Investment
from Inception August 5, 1994 to June 30, 2018
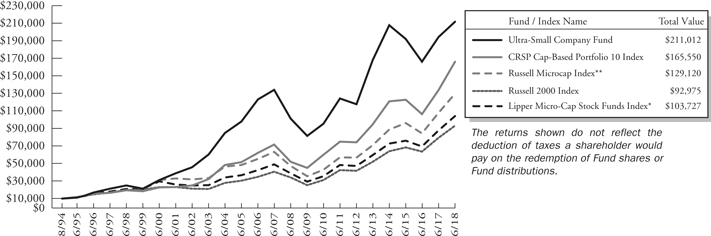
| * | The Lipper Micro-Cap Stock Funds Index began on 12/31/1995, and the line graph for the Index begins at the same value as the Fund on that date. |
| ** | The Russell Microcap Index began on 6/30/2000, and the line graph for the Index begins at the same value as the Fund on that date. |
Detailed Explanation of Quarterly Performance
The Fund’s value metrics and company financial health models lagged the benchmark during the quarter and detracted from relative performance. The Fund’s tilt toward deeper value stocks across multiple value metrics also hurt relative results, as did an overweighting in higher momentum stocks.
During the quarter, the Fund held approximately 11% of its assets, on average, in stocks that had appreciated into CRSP 9. The Fund’s holdings in CRSP 9 outperformed the CRSP 10 benchmark modestly, adding to relative results.
The Fund’s sector allocation effect was essentially neutral. However, the Fund’s selection effect was significantly negative, with holdings in the Information Technology, Consumer Discretionary, and Energy sectors detracting the most from relative results.
| | |
| Ultra-Small Company Fund | |
|
| MANAGER’S COMMENTARY (Unaudited) (continued) |
| | |
The table below presents index performance numbers for stocks in the different CRSP deciles during various time periods.
| | | | | | | | | | | | | | | | | | |
| | | | | | | | | Annualized | |
| CRSP Decile1 | | Quarter | | | 1 Year | | | 5 Years | | 10 Years | | | 92.5 Years | |
1 (ultra-large) | | | 3.87% | | | | 16.05% | | | 13.73% | | | 10.11% | | | | 9.43% | |
2 | | | 1.58% | | | | 10.94% | | | 12.95% | | | 10.67% | | | | 10.59% | |
3 | | | 3.93% | | | | 17.86% | | | 13.49% | | | 11.15% | | | | 11.13% | |
4 | | | 4.01% | | | | 16.59% | | | 11.51% | | | 11.11% | | | | 10.92% | |
5 | | | 5.82% | | | | 13.83% | | | 10.74% | | | 11.16% | | | | 11.47% | |
6 | | | 7.68% | | | | 19.11% | | | 11.74% | | | 11.29% | | | | 11.48% | |
7 | | | 8.29% | | | | 19.21% | | | 13.44% | | | 13.28% | | | | 11.67% | |
8 | | | 10.29% | | | | 20.50% | | | 11.38% | | | 12.55% | | | | 11.58% | |
9 | | | 12.39% | | | | 23.17% | | | 13.72% | | | 13.38% | | | | 11.66% | |
10 (ultra-small) | | | 11.57% | | | | 24.18% | | | 11.92% | | | 12.33% | | | | 13.38% | |
| 1 | Performance figures are as of the period ended June 30, 2018. The CRSP Cap-Based Portfolio Indexes are unmanaged indexes of publicly traded U.S. stocks with dividends reinvested, grouped by market capitalization, as reported by the Center for Research in Security Prices. Past performance is no guarantee of future results. |
Detailed Explanation of Fiscal Year Performance
The Fund’s value metrics and company financial health models both underperformed the benchmark during the 12-month period, hurting relative results. Our tilt toward deeper value stocks also reduced relative performance, as did an overweighting in higher momentum stocks. Transaction costs were also unusually high for the fiscal year.
During the fiscal year, the Fund held an average of approximately 12% of its assets in stocks that had appreciated above the CRSP 10 cutoff. These larger holdings outperformed the CRSP 10 benchmark and added to relative results.
The Fund’s sector allocation effect was negative, with an underweighting in the Materials sector and overweightings in the Information Technology and Consumer Discretionary sectors detracting the most from relative results. The Fund’s selection effect was significantly negative overall, with holdings in the Information Technology, Financials, Materials, and Industrials sectors detracting the most from relative performance.
Top Ten Holdings as of June 30, 2018
| | | | | | | | |
| Rank | | Description | | Industry | | % of Net
Assets | |
| 1 | | NII Holdings, Inc. | | Telecommunication Services | | | 3.1% | |
| 2 | | IntriCon Corp. | | Health Care | | | 2.7% | |
| 3 | | Enphase Energy, Inc. | | Industrials | | | 2.4% | |
| 4 | | Ooma, Inc. | | Telecommunication Services | | | 2.3% | |
| 5 | | VAALCO Energy, Inc. | | Energy | | | 2.3% | |
| 6 | | ION Geophysical Corp. | | Energy | | | 2.3% | |
| 7 | | Harvard Bioscience, Inc. | | Health Care | | | 2.2% | |
| 8 | | SeaSpine Holdings Corp. | | Health Care | | | 2.2% | |
| 9 | | Lonestar Resources US, Inc., Class A | | Energy | | | 2.2% | |
| 10 | | Veracyte, Inc. | | Health Care | | | 2.1% | |
| | Total | | | | | 23.8% | |
| | |
| 16 | | Annual Report | June 30, 2018 |
| | |
| Ultra-Small Company Fund | | |
| MANAGER’S COMMENTARY (Unaudited) (continued) | | |
| | |
Industry Sector Representation as of June 30, 2018
| | | | | | | | | | | | | | | |
| | | % of Net Assets | | % of CRSP 10 Index | | Difference |
Consumer Discretionary | | | | 13.8% | | | | | 16.1% | | | | | -2.3% | |
Consumer Staples | | | | 1.0% | | | | | 2.3% | | | | | -1.3% | |
Energy | | | | 9.4% | | | | | 11.2% | | | | | -1.8% | |
Financials | | | | 17.3% | | | | | 18.8% | | | | | -1.5% | |
Health Care | | | | 20.9% | | | | | 22.2% | | | | | -1.3% | |
Industrials | | | | 10.7% | | | | | 9.7% | | | | | 1.0% | |
Information Technology | | | | 17.0% | | | | | 13.2% | | | | | 3.8% | |
Materials | | | | 2.2% | | | | | 2.4% | | | | | -0.2% | |
Real Estate | | | | 0.7% | | | | | 1.3% | | | | | -0.6% | |
Telecommunication Services | | | | 6.7% | | | | | 1.5% | | | | | 5.2% | |
Utilities | | | | 0.0% | | | | | 1.3% | | | | | -1.3% | |
Cash & Other Assets | | | | 0.3% | | | | | 0.0% | | | | | 0.3% | |
Total | | | | 100.0% | | | | | 100.0% | | | | | | |
Disclaimer
The views expressed here are exclusively those of Fund management. These views, including those related to market sectors or individual stocks, are not meant as investment advice and should not be considered predictive in nature. Any favorable (or unfavorable) description of a holding applies only as of the quarter end, June 30, 2018, unless otherwise stated. Security positions can and do change thereafter. Discussions of historical performance do not guarantee and may not be indicative of future performance.
The Fund is subject to very high, above market risk (volatility) and is not an appropriate investment for short-term investors. Investments in ultra-small companies generally carry greater risk than is customarily associated with larger companies and even “small companies” for various reasons, such as narrower markets (fewer investors), limited financial resources, and greater trading difficulty.
Conclusion
Ultra-Small Company Fund remains closed to new investors. We encourage your feedback; your reactions and concerns are important to us.
Sincerely,
The Investment Management Team
| | |
| Ultra-Small Company Fund | |
|
| SCHEDULE OF INVESTMENTS |
| Showing percentage of net assets as of June 30, 2018 | | |
| | | | | | | | | | | | | | | | |
| Industry Company | | Shares | | | Value | | | | | | | |
COMMON STOCKS - 99.54% | | | | | | | | | |
Consumer Discretionary - 13.77% | | | | | | | | | |
AMCON Distributing Co. | | | 2,100 | | | $ | 184,800 | | | | | | | | | |
Century Casinos, Inc.* | | | 183,900 | | | | 1,609,125 | | | | | | | | | |
Charles & Colvard, Ltd.*+ | | | 144,300 | | | | 154,401 | | | | | | | | | |
China XD Plastics Co., Ltd.* | | | 86,300 | | | | 280,475 | | | | | | | | | |
Christopher & Banks Corp.* | | | 75,300 | | | | 70,782 | | | | | | | | | |
Comstock Holding Cos, Inc.*+ | | | 54,400 | | | | 142,528 | | | | | | | | | |
Destination Maternity Corp.* | | | 62,800 | | | | 365,496 | | | | | | | | | |
Educational Development Corp.+ | | | 74,400 | | | | 1,395,000 | | | | | | | | | |
Gaming Partners International Corp. | | | 13,300 | | | | 113,848 | | | | | | | | | |
Lakeland Industries, Inc.* | | | 76,100 | | | | 1,076,815 | | | | | | | | | |
Lee Enterprises, Inc.*+ | | | 20,200 | | | | 57,570 | | | | | | | | | |
Lincoln Educational Services Corp.*+ | | | 49,564 | | | | 86,241 | | | | | | | | | |
Live Ventures, Inc.*+ | | | 7,302 | | | | 91,859 | | | | | | | | | |
MCBC Holdings, Inc.* | | | 53,500 | | | | 1,548,825 | | | | | | | | | |
New York & Co., Inc.*+ | | | 136,500 | | | | 698,880 | | | | | | | | | |
ONE Group Hospitality, Inc. (The)*+ | | | 27,400 | | | | 66,582 | | | | | | | | | |
RLJ Entertainment, Inc.*+ | | | 58,600 | | | | 271,318 | | | | | | | | | |
Rocky Brands, Inc.+ | | | 25,700 | | | | 771,000 | | | | | | | | | |
Stage Stores, Inc.+ | | | 36,400 | | | | 87,724 | | | | | | | | | |
Tilly’s, Inc., Class A | | | 54,800 | | | | 830,220 | | | | | | | | | |
TravelCenters of America LLC* | | | 530,200 | | | | 1,855,700 | | | | | | | | | |
Tuesday Morning Corp.*+ | | | 490,800 | | | | 1,496,940 | | | | | | | | | |
US Auto Parts Network, Inc.* | | | 46,000 | | | | 69,000 | | | | | | | | | |
| | | | | | | | | | | | | | | | |
| | | | | | | 13,325,129 | | | | | | | | | |
| | | | |
Consumer Staples - 0.97% | | | | | | | | | | | | | | | | |
Mannatech, Inc. | | | 13,809 | | | | 283,084 | | | | | | | | | |
Natural Alternatives International, Inc.* | | | 42,000 | | | | 426,300 | | | | | | | | | |
Reliv International, Inc.*+ | | | 26,939 | | | | 132,540 | | | | | | | | | |
Village Super Market, Inc., Class A | | | 3,400 | | | | 100,164 | | | | | | | | | |
| | | | | | | | | | | | | | | | |
| | | | | | | 942,088 | | | | | | | | | |
| | | | |
Energy - 9.40% | | | | | | | | | | | | | | | | |
Aspen Aerogels, Inc.* | | | 14,100 | | | | 69,090 | | | | | | | | | |
Comstock Resources, Inc.*+ | | | 11,200 | | | | 117,712 | | | | | | | | | |
Dawson Geophysical Co.* | | | 28,900 | | | | 228,310 | | | | | | | | | |
Enservco Corp.* | | | 354,000 | | | | 410,640 | | | | | | | | | |
Independence Contract Drilling, Inc.*+ | | | 121,800 | | | | 501,816 | | | | | | | | | |
ION Geophysical Corp.* | | | 89,989 | | | | 2,186,733 | | | | | | | | | |
Lonestar Resources US, Inc., Class A*+ | | | 249,300 | | | | 2,104,092 | | | | | | | | | |
| | | | | | | | |
| Industry Company | | Shares | | | Value | |
| | |
Energy (continued) | | | | | | | | |
Mitcham Industries, Inc.* | | | 145,900 | | | $ | 586,518 | |
TransAtlantic Petroleum, Ltd.* | | | 482,400 | | | | 665,712 | |
VAALCO Energy, Inc.* | | | 816,600 | | | | 2,229,318 | |
| | | | | | | | |
| | | | | | | 9,099,941 | |
Financials - 17.31% | | | | | | | | |
1347 Property Insurance Holdings, Inc.*+ | | | 7,800 | | | | 55,380 | |
ACNB Corp. | | | 2,700 | | | | 91,935 | |
A-Mark Precious Metals, Inc.+ | | | 74,600 | | | | 990,688 | |
C&F Financial Corp. | | | 6,852 | | | | 428,593 | |
Capitala Finance Corp.+ | | | 222,200 | | | | 1,844,260 | |
Central Federal Corp.* | | | 26,400 | | | | 63,360 | |
CM Finance, Inc.+ | | | 195,000 | | | | 1,735,500 | |
Codorus Valley Bancorp, Inc.+ | | | 13,307 | | | | 408,259 | |
Community West Bancshares | | | 5,000 | | | | 59,000 | |
Consumer Portfolio Services, Inc.* | | | 452,500 | | | | 1,841,675 | |
First United Corp. | | | 10,100 | | | | 206,545 | |
FS Bancorp, Inc. | | | 4,700 | | | | 297,275 | |
Horizon Technology Finance Corp. | | | 174,200 | | | | 1,755,936 | |
Impac Mortgage Holdings, Inc.*+ | | | 119,381 | | | | 1,137,701 | |
KCAP Financial, Inc.+ | | | 581,500 | | | | 1,889,875 | |
Kingstone Cos., Inc. | | | 27,400 | | | | 463,060 | |
Manning & Napier, Inc.+ | | | 106,100 | | | | 328,910 | |
National Holdings Corp.*+ | | | 80,400 | | | | 264,516 | |
Northeast Bancorp | | | 39,100 | | | | 852,380 | |
SB Financial Group, Inc. | | | 17,422 | | | | 354,015 | |
Security National Financial Corp., Class A* | | | 82,223 | | | | 427,560 | |
Shore Bancshares, Inc. | | | 65,700 | | | | 1,249,614 | |
| | | | | | | | |
| | | | | | | 16,746,037 | |
Health Care - 20.87% | | | | | | | | |
Allied Healthcare Products, Inc.* | | | 66,481 | | | | 160,884 | |
Alphatec Holdings, Inc.*+ | | | 117,600 | | | | 350,448 | |
American Shared Hospital Services* | | | 101,400 | | | | 278,850 | |
Bioanalytical Systems, Inc.*+ | | | 121,110 | | | | 199,832 | |
Chembio Diagnostics, Inc.*+ | | | 13,900 | | | | 154,290 | |
Cumberland Pharmaceuticals, Inc.* | | | 16,400 | | | | 100,532 | |
CynergisTek, Inc.*+ | | | 109,000 | | | | 429,460 | |
Digirad Corp. | | | 604,500 | | | | 936,975 | |
Electromed, Inc.*+ | | | 191,938 | | | | 1,040,304 | |
| | |
| 18 | | Annual Report | June 30, 2018 |
| | |
| Ultra-Small Company Fund | | |
| SCHEDULE OF INVESTMENTS (continued) | | |
| Showing percentage of net assets as of June 30, 2018 | | |
| | | | | | | | | | | | |
| Industry Company | | Shares | | | Value | | | | |
| |
Common Stocks (continued) | | | | | |
Health Care (continued) | | | | | |
Five Star Senior Living, Inc.* | | | 45,228 | | | $ | 67,842 | | | | | |
Harvard Bioscience, Inc.* | | | 400,900 | | | | 2,144,815 | | | | | |
HTG Molecular Diagnostics, Inc.*+ | | | 52,500 | | | | 171,150 | | | | | |
InfuSystem Holdings, Inc.*+ | | | 273,798 | | | | 971,983 | | | | | |
IntriCon Corp.*+ | | | 63,800 | | | | 2,571,140 | | | | | |
Juniper Pharmaceuticals, Inc.*+ | | | 177,600 | | | | 1,545,120 | | | | | |
Kewaunee Scientific Corp. | | | 10,200 | | | | 366,690 | | | | | |
Misonix, Inc.*+ | | | 28,100 | | | | 348,440 | | | | | |
Nuvectra Corp.*+ | | | 64,300 | | | | 1,320,079 | | | | | |
Pro-Dex, Inc.* | | | 68,500 | | | | 458,950 | | | | | |
RTI Surgical, Inc.* | | | 397,290 | | | | 1,827,534 | | | | | |
SeaSpine Holdings Corp.* | | | 169,500 | | | | 2,139,090 | | | | | |
Sorrento Therapeutics, Inc.*+ | | | 31,500 | | | | 226,800 | | | | | |
Strata Skin Sciences, Inc.* | | | 85,000 | | | | 174,250 | | | | | |
SunLink Health Systems, Inc.* | | | 4,700 | | | | 6,063 | | | | | |
Synlogic, Inc.*+ | | | 2,114 | | | | 20,781 | | | | | |
Veracyte, Inc.*+ | | | 222,600 | | | | 2,079,084 | | | | | |
Vical, Inc.*+ | | | 87,496 | | | | 100,620 | | | | | |
| | | | | | | | | | | | |
| | | | | | | 20,192,006 | | | | | |
| | | |
Industrials - 10.70% | | | | | | | | | | | | |
Acme United Corp. | | | 5,200 | | | | 107,900 | | | | | |
Capstone Turbine Corp.* | | | 686,359 | | | | 981,493 | | | | | |
Chicago Rivet & Machine Co. | | | 1,900 | | | | 61,275 | | | | | |
CompX International, Inc. | | | 1,620 | | | | 21,384 | | | | | |
Continental Materials Corp.*+ | | | 4,150 | | | | 66,815 | | | | | |
DMC Global, Inc.+ | | | 8,300 | | | | 372,670 | | | | | |
Ecology & Environment, Inc., Class A | | | 43,732 | | | | 544,463 | | | | | |
Enphase Energy, Inc.*+ | | | 341,000 | | | | 2,294,930 | | | | | |
Fuel Tech, Inc.* | | | 49,500 | | | | 53,460 | | | | | |
General Finance Corp.*+ | | | 41,100 | | | | 556,905 | | | | | |
Goldfield Corp. (The)* | | | 24,800 | | | | 105,400 | | | | | |
Hudson Global, Inc.* | | | 39,600 | | | | 64,152 | | | | | |
Jason Industries, Inc.* | | | 336,700 | | | | 781,144 | | | | | |
L.B. Foster Co., Class A* | | | 55,000 | | | | 1,262,250 | | | | | |
L.S. Starrett Co. (The), Class A | | | 32,300 | | | | 206,720 | | | | | |
Quest Resource Holding Corp.*+ | | | 22,000 | | | | 42,680 | | | | | |
Radiant Logistics, Inc.* | | | 306,600 | | | | 1,198,806 | | | | | |
RCM Technologies, Inc. | | | 16,100 | | | | 79,534 | | | | | |
Safe Bulkers, Inc.* | | | 226,500 | | | | 770,100 | | | | | |
Virco Manufacturing Corp. | | | 17,600 | | | | 78,320 | | | | | |
| | | | | | | | | | | | |
| | | | | | | | |
| Industry Company | | Shares | | | Value | |
|
| |
Industrials (continued) | | | | | | | | |
Volt Information Sciences, Inc.* | | | 87,600 | | | $ | 297,840 | |
Willdan Group, Inc.*+ | | | 4,700 | | | | 145,559 | |
Willis Lease Finance Corp.* | | | 8,200 | | | | 259,038 | |
| | | | | | | | |
| | | | | | | 10,352,838 | |
| | |
Information Technology - 16.99% | | | | | | | | |
Amtech Systems, Inc.*+ | | | 106,200 | | | | 642,510 | |
Aviat Networks, Inc.* | | | 72,913 | | | | 1,193,586 | |
Blonder Tongue Laboratories, Inc.*+ | | | 137,500 | | | | 155,375 | |
Communications Systems, Inc. | | | 13,500 | | | | 51,435 | |
Computer Task Group, Inc.*+ | | | 57,800 | | | | 447,372 | |
Echelon Corp.* | | | 4,158 | | | | 34,262 | |
Fusion Connect, Inc.*+ | | | 260,611 | | | | 1,026,807 | |
Intermolecular, Inc.* | | | 113,100 | | | | 188,877 | |
inTEST Corp.* | | | 249,400 | | | | 1,820,620 | |
Iteris, Inc.*+ | | | 235,502 | | | | 1,139,830 | |
Luna Innovations, Inc.* | | | 306,430 | | | | 913,161 | |
Marin Software, Inc.*+ | | | 72,300 | | | | 419,340 | |
MoSys, Inc.*+ | | | 376,700 | | | | 659,225 | |
Napco Security Technologies, Inc.* | | | 21,400 | | | | 313,510 | |
PC-Tel, Inc. | | | 106,800 | | | | 666,432 | |
PRGX Global, Inc.* | | | 31,500 | | | | 305,550 | |
QuinStreet, Inc.* | | | 103,300 | | | | 1,311,910 | |
RF Industries, Ltd.+ | | | 160,298 | | | | 1,162,160 | |
Richardson Electronics, Ltd. | | | 23,400 | | | | 227,916 | |
Schmitt Industries, Inc.* | | | 70,802 | | | | 172,757 | |
Smith Micro Software, Inc.*+ | | | 190,000 | | | | 435,100 | |
Synacor, Inc.* | | | 26,000 | | | | 52,000 | |
TESSCO Technologies, Inc. | | | 73,800 | | | | 1,276,740 | |
TransAct Technologies, Inc.+ | | | 58,200 | | | | 727,500 | |
Travelzoo*+ | | | 29,600 | | | | 506,160 | |
Trio-Tech International* | | | 39,600 | | | | 177,012 | |
Xplore Technologies Corp.* | | | 106,300 | | | | 408,192 | |
| | | | | | | | |
| | | | | | | 16,435,339 | |
| | |
Materials - 2.19% | | | | | | | | |
China Advanced Construction Materials Group, Inc.*+ | | | 15,700 | | | | 88,705 | |
China Green Agriculture, Inc.* | | | 349,600 | | | | 402,040 | |
Gulf Resources, Inc.* | | | 536,800 | | | | 740,784 | |
| | |
| Ultra-Small Company Fund | |
|
| SCHEDULE OF INVESTMENTS (continued) |
| Showing percentage of net assets as of June 30, 2018 | | |
| | | | | | | | | | | | | | | | |
| Industry Company | | | | | Shares | | | Value | | | | |
| | | |
Common Stocks (continued) | | | | | | | | | | | | | |
Materials (continued) | | | | | | | | | |
Universal Stainless & Alloy Products, Inc.* | | | | 37,600 | | | $ | 889,992 | | | | | |
| | | | | | | | | | | | | | | | |
| | | | | | | | | | | 2,121,521 | | | | | |
| |
Real Estate - 0.66% | | | | | |
American Realty Investors, Inc.*+ | | | | 7,100 | | | | 112,251 | | | | | |
Griffin Industrial Realty, Inc. | | | | 7,000 | | | | 307,930 | | | | | |
Nam Tai Property, Inc.+ | | | | 5,900 | | | | 64,900 | | | | | |
Sotherly Hotels, Inc. | | | | 8,570 | | | | 59,819 | | | | | |
Wheeler Real Estate Investment Trust, Inc.+ | | | | 22,800 | | | | 92,112 | | | | | |
| | | | | | | | | | | | | | | | |
| | | | | | | | | | | 637,012 | | | | | |
| | |
Telecommunication Services - 6.68% | | | | | | | | | |
Alaska Communications Systems Group, Inc.* | | | | 655,800 | | | | 1,160,766 | | | | | |
NII Holdings, Inc.*+ | | | | 780,700 | | | | 3,044,730 | | | | | |
Ooma, Inc.*+ | | | | 159,300 | | | | 2,254,095 | | | | | |
| | | | | | | | | | | | | | | | |
| | | | | | | | | | | 6,459,591 | | | | | |
| | | | | | | | | | | | | | | | |
| | |
TOTAL COMMON STOCKS - 99.54% | | | | 96,311,502 | | | | | |
| | | | | | | | | | | | | | | | |
(Cost $88,412,286) | | | | | | | | | | | | | | | | |
| | |
WARRANTS - 0.00% | | | | | | | | | |
Novelion Therapeutics, Inc. Class Action expire 12/31/21*D | | | | 34,500 | | | | — | | | | | |
Novelion Therapeutics, Inc. DOJ/SEC expire 12/31/21*D | | | | 34,500 | | | | — | | | | | |
| | | | | | | | | | | | | | | | |
TOTAL WARRANTS - 0.00% | | | | — | | | | | |
| | | | | | | | | | | | | | | | |
(Cost $ — ) | | | | | | | | | | | | | | | | |
| | | | |
| | | Rate^ | | | Shares | | | Value | | | | |
| |
MONEY MARKET FUND - 0.10% | | | | | |
Fidelity Investments Money Market Government Portfolio Class I | | | 1.77 | % | | | 94,838 | | | | 94,838 | | | | | |
| | | | | | | | | | | | | | | | |
TOTAL MONEY MARKET FUND - 0.10% | | | | 94,838 | | | | | |
| | | | | | | | | | | | | | | | |
(Cost $94,838) | | | | | | | | | |
| | | | | | | | | | | | |
| | | Rate^ | | | Shares | | | Value | |
|
| INVESTMENTS PURCHASED WITH CASH PROCEEDS FROM SECURITIES LENDING - 13.08% | |
Fidelity Investments Money Market Government Portfolio Class I** | | | 1.77 | % | | | 12,653,438 | | | | $12,653,438 | |
| | | | | | | | | | | | |
| |
TOTAL INVESTMENTS PURCHASED WITH CASH PROCEEDS FROM SECURITIES LENDING - 13.08% | | | | 12,653,438 | |
| | | | | | | | | | | | |
(Cost $12,653,438) | | | | | |
| |
TOTAL INVESTMENTS - 112.72% | | | $ | 109,059,778 | |
(Cost $101,160,562) | | | | | |
Liabilities in Excess of Other Assets - (12.72%) | | | | (12,306,006 | ) |
| | | | | | | | | | | | |
NET ASSETS - 100.00% | | | $ | 96,753,772 | |
| | | | | | | | | | | | |
| * | Non-income producing security. |
| ** | This security represents the investment of the collateral received in connection with securities out on loan as of June 30, 2018. |
| ^ | Rate disclosed as of June 30, 2018. |
| D | Security was fair valued under procedures adopted by the Board of Directors (see Note 2). As such, the security is classified as Level 3 in the fair value hierarchy. |
| + | This security or a portion of the security is out on loan as of June 30, 2018. Total loaned securities had a value of $ 12,123,079 as of June 30, 2018. |
LLC - Limited Liability Company
Summary of inputs used to value the Fund’s investments as of 06/30/2018 (See Note 2 in Notes to Financial Statements):
| | | | | | | | | | | | | | | | |
| | | |
| | | | | | Valuation Inputs | | | | |
| | | | | | Investment in Securities (Value) | |
| | | Level 1
Quoted
Prices | | | Level 2
Significant
Observable
Inputs | | | Level 3
Significant
Unobservable
Inputs | | | Total | |
Common Stocks (a) | | $ | 96,311,502 | | | $ | — | | | $ | — | | | $ | 96,311,502 | |
Warrants | | | — | | | | — | | | | 0 | | | | 0 | |
Money Market Fund | | | — | | | | 94,838 | | | | — | | | | 94,838 | |
Investments Purchased with Cash Proceeds from Securities Lending | | | — | | | | 12,653,438 | | | | — | | | | 12,653,438 | |
| | | | | | | | | | | | | | | | |
TOTAL | | $ | 96,311,502 | | | $ | 12,748,276 | | | $ | 0 | | | $ | 109,059,778 | |
| | | | | | | | | | | | | | | | |
(a) - Please refer to the Schedule of Investments for the industry classifications of these portfolio holdings.
See Notes to Financial Statements.
| | |
| 20 | | Annual Report | June 30, 2018 |
| | |
| Ultra-Small Company Market Fund | | |
| MANAGER’S COMMENTARY (Unaudited) | | |
| | |
June 30, 2018
Dear Fellow Ultra-Small Company Market Fund Shareholder,
For the quarter ended June 30, 2018, our Fund returned +9.87%, underperforming our primary market benchmark, the CRSP Cap-Based Portfolio 10 Index (+11.57%), as well as the Russell Microcap Index (+9.97%). However, our Fund outperformed our peer benchmark, the Lipper Micro-Cap Stock Funds Index (+9.34%), as well as the Russell 2000 Index (+7.75%). Results in this quarter were mixed.
For the fiscal year, our Fund returned +20.86%, underperforming the CRSP Cap-Based Portfolio 10 Index (+24.18%), but outperforming the Lipper Micro-Cap Stock Funds Index (+18.49%), the Russell 2000 Index (+17.57%) and the Russell Microcap Index (+20.21%).
The table below presents our June quarter, one-year, five-year, 10-year, 15-year, and inception-to-date financial results. See the next page for a graph of performance since inception.
Standardized Returns as of June 30, 2018
| | | | | | | | | | | | | | | | | | | | | | | | |
| | | | | | | | | Annualized | |
| | | Quarter | | | 1 Year | | | 5 Years | | | 10 Years | | | 15 Years | | | Since Inception
(7/31/97) | |
| | | | | | |
Ultra-Small Company Market Fund | | | 9.87% | | | | 20.86% | | | | 12.17% | | | | 10.33% | | | | 9.94% | | | | 11.18% | |
CRSP Cap-Based Portfolio 10 Index | | | 11.57% | | | | 24.18% | | | | 11.92% | | | | 12.33% | | | | 11.55% | | | | 11.38% | |
Russell 2000 Index | | | 7.75% | | | | 17.57% | | | | 12.46% | | | | 10.60% | | | | 10.50% | | | | 8.22% | |
Russell Microcap Index | | | 9.97% | | | | 20.21% | | | | 12.78% | | | | 10.63% | | | | 9.44% | | | | N/A | |
Lipper Micro-Cap Stock Funds Index | | | 9.34% | | | | 18.49% | | | | 11.83% | | | | 10.32% | | | | 9.83% | | | | 8.52% | |
Performance figures quoted in the table above represent past performance and are no guarantee of future results. Total return figures in the table above include the reinvestment of dividends and capital gains. The table above does not reflect the deduction of taxes that a shareholder would pay on Fund distributions or on the redemption of Fund shares.
The CRSP Cap-Based Portfolio 10 Index is an unmanaged index of 753 of the smallest publicly traded U.S. stocks with dividends reinvested, as reported by the Center for Research in Security Prices. The Russell Microcap Index is an unmanaged, market value weighted index that measures performance of 1,000 of the smallest securities in the Russell 2000 Index. The Russell 2000 Index is an unmanaged, market value weighted index that measures performance of the 2,000 companies that are between the 1,000th and 3,000th largest in the market with dividends reinvested. The Lipper Micro-Cap Stock Funds Index is an index of micro-cap funds compiled by Lipper, Inc. It is not possible to invest directly in an index. Periods longer than one year are annualized.
| | |
| Ultra-Small Company Market Fund | |
|
| MANAGER’S COMMENTARY (Unaudited) (continued) |
| | |
Growth of a $10,000 Investment
from Inception July 31, 1997 to June 30, 2018
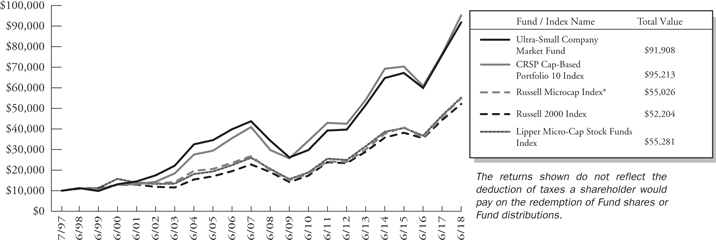
| * | The Russell Microcap Index began on 6/30/2000, and the line graph for the Index begins at the same value as the Fund on that date. |
Detailed Explanation of Quarterly Performance
The Fund held about 16% of its assets, on average, in stocks larger than CRSP 10 during the quarter. As a group these larger stocks trailed the benchmark, hurting the Fund’s relative performance. The Fund’s sidestepping strategies, which eliminate exposure to stocks with high probability of steep price decline, major financial distress or bankruptcy, helped performance against the benchmark.
The Fund’s security selection effect was negative, with holdings in the Health Care sector detracting the most from relative return.
The table below presents index performance numbers for stocks in the different CRSP deciles during various time periods.
| | | | | | | | | | | | | | | | | | | | |
| | | | | | | | | Annualized | |
| CRSP Decile1 | | Quarter | | | 1 Year | | | 5 Years | | | 10 Years | | | 92.5 Years | |
| 1 (ultra-large) | | | 3.87% | | | | 16.05% | | | | 13.73% | | | | 10.11% | | | | 9.43% | |
| 2 | | | 1.58% | | | | 10.94% | | | | 12.95% | | | | 10.67% | | | | 10.59% | |
| 3 | | | 3.93% | | | | 17.86% | | | | 13.49% | | | | 11.15% | | | | 11.13% | |
| 4 | | | 4.01% | | | | 16.59% | | | | 11.51% | | | | 11.11% | | | | 10.92% | |
| 5 | | | 5.82% | | | | 13.83% | | | | 10.74% | | | | 11.16% | | | | 11.47% | |
| 6 | | | 7.68% | | | | 19.11% | | | | 11.74% | | | | 11.29% | | | | 11.48% | |
| 7 | | | 8.29% | | | | 19.21% | | | | 13.44% | | | | 13.28% | | | | 11.67% | |
| 8 | | | 10.29% | | | | 20.50% | | | | 11.38% | | | | 12.55% | | | | 11.58% | |
| 9 | | | 12.39% | | | | 23.17% | | | | 13.72% | | | | 13.38% | | | | 11.66% | |
| 10 (ultra-small) | | | 11.57% | | | | 24.18% | | | | 11.92% | | | | 12.33% | | | | 13.38% | |
| 1 | Performance figures are as of the period ended June 30, 2018. The CRSP Cap-Based Portfolio Indexes are unmanaged indexes of publicly traded U.S. stocks with dividends reinvested, grouped by market capitalization, as reported by the Center for Research in Security Prices. Past performance is no guarantee of future results. |
Detailed Explanation of Fiscal Year Performance
The Fund held about 16% of its assets, on average, in stocks larger than CRSP 10 during the year; these larger stocks underperformed the benchmark and hurt the Fund’s relative return. The Fund’s sidestepping strategies, which eliminate exposure to stocks with high probability of steep price decline, major financial distress or bankruptcy, helped returns relative to the benchmark.
| | |
| 22 | | Annual Report | June 30, 2018 |
| | |
| Ultra-Small Company Market Fund | | |
| MANAGER’S COMMENTARY (Unaudited) (continued) | | |
| | |
The Fund’s security selection effect was negative. Holdings in the Health Care sector detracted the most from relative results during the fiscal year. Holdings in the Materials and Real Estate sectors also detracted from relative performance.
Top Ten Holdings as of June 30, 2018
| | | | | | |
| Rank | | Description | | Industry | | % of Net
Assets |
| 1 | | ION Geophysical Corp. | | Energy | | 0.8% |
| 2 | | Town Sports International Holdings, Inc. | | Consumer Discretionary | | 0.7% |
| 3 | | Utah Medical Products, Inc. | | Health Care | | 0.7% |
| 4 | | Pioneer Energy Services Corp. | | Energy | | 0.6% |
| 5 | | Rocky Brands, Inc. | | Consumer Discretionary | | 0.6% |
| 6 | | Evolution Petroleum Corp. | | Energy | | 0.6% |
| 7 | | Clean Energy Fuels Corp. | | Energy | | 0.5% |
| 8 | | Marlin Business Services Corp. | | Financials | | 0.5% |
| 9 | | Container Store Group, Inc. (The) | | Consumer Discretionary | | 0.5% |
| 10 | | Noodles & Co. | | Consumer Discretionary | | 0.4% |
| | Total | | | | 5.9% |
Industry Sector Representation as of June 30, 2018
| | | | | | | | | | | | |
| | | % of Net Assets | | | % of CRSP 10 Index | | | Difference | |
Consumer Discretionary | | | 15.7% | | | | 16.1% | | | | -0.4% | |
Consumer Staples | | | 1.8% | | | | 2.3% | | | | -0.5% | |
Energy | | | 10.9% | | | | 11.2% | | | | -0.3% | |
Financials | | | 19.3% | | | | 18.8% | | | | 0.5% | |
Health Care | | | 21.3% | | | | 22.2% | | | | -0.9% | |
Industrials | | | 10.3% | | | | 9.7% | | | | 0.6% | |
Information Technology | | | 13.9% | | | | 13.2% | | | | 0.7% | |
Materials | | | 2.8% | | | | 2.4% | | | | 0.4% | |
Real Estate | | | 1.1% | | | | 1.3% | | | | -0.2% | |
Telecommunication Services | | | 1.4% | | | | 1.5% | | | | -0.1% | |
Utilities | | | 1.1% | | | | 1.3% | | | | -0.2% | |
Cash & Other Assets | | | 0.4% | | | | 0.0% | | | | 0.4% | |
Total | | | 100.0% | | | | 100.0% | | | | | |
Disclaimer
The views expressed here are exclusively those of Fund management. These views, including those related to market sectors or individual stocks, are not meant as investment advice and should not be considered predictive in nature. Any favorable (or unfavorable) description of a holding applies only as of the quarter end, June 30, 2018, unless otherwise stated. Security positions can and do change thereafter. Discussions of historical performance do not guarantee and may not be indicative of future performance.
The Fund is subject to very high, above market risk (volatility) and is not an appropriate investment for short-term investors. Investments in ultra-small companies generally carry greater risk than is customarily associated with larger companies and even “small companies” for various reasons, such as narrower markets (fewer investors), limited financial resources and greater trading difficulty.
| | |
| Ultra-Small Company Market Fund | |
|
| MANAGER’S COMMENTARY (Unaudited) (continued) |
| | |
Conclusion
Thank you for your continued investment in Ultra-Small Company Market Fund. We encourage your feedback; your reactions and concerns are important to us.
Sincerely,
The Investment Management Team
| | |
| 24 | | Annual Report | June 30, 2018 |
| | |
| Ultra-Small Company Market Fund | | |
| SCHEDULE OF INVESTMENTS | | |
Showing percentage of net assets as of June 30, 2018 | | |
| | | | | | | | | | | | |
| Industry Company | | Shares | | | Value | | | | |
| | |
COMMON STOCKS - 99.62% | | | | | | | | | |
Consumer Discretionary - 15.76% | | | | | | | | | |
A.H. Belo Corp., Class A | | | 46,383 | | | | $ 218,000 | | | | | |
AMCON Distributing Co. | | | 3,900 | | | | 343,200 | | | | | |
America’s Car-Mart, Inc.*+ | | | 26,800 | | | | 1,658,920 | | | | | |
Ark Restaurants Corp. | | | 17,900 | | | | 455,734 | | | | | |
Ascent Capital Group, Inc., Class A*+ | | | 76,900 | | | | 216,089 | | | | | |
Ballantyne Strong, Inc.* | | | 92,020 | | | | 446,297 | | | | | |
Beasley Broadcast Group, Inc., Class A+ | | | 28,125 | | | | 315,000 | | | | | |
Big 5 Sporting Goods Corp.+ | | | 80,748 | | | | 613,685 | | | | | |
Boot Barn Holdings, Inc.* | | | 38,000 | | | | 788,500 | | | | | |
Bridgepoint Education, Inc.* | | | 99,500 | | | | 649,735 | | | | | |
Build-A-Bear Workshop, Inc.* | | | 78,900 | | | | 599,640 | | | | | |
CafePress, Inc.*+ | | | 92,588 | | | | 108,328 | | | | | |
Chicken Soup For The Soul Entertainment, Inc.* | | | 15,000 | | | | 143,700 | | | | | |
China XD Plastics Co., Ltd.* | | | 56,000 | | | | 182,000 | | | | | |
Christopher & Banks Corp.* | | | 197,800 | | | | 185,932 | | | | | |
Citi Trends, Inc. | | | 50,800 | | | | 1,393,952 | | | | | |
Clarus Corp.* | | | 97,500 | | | | 804,375 | | | | | |
Collectors Universe, Inc.+ | | | 51,760 | | | | 762,942 | | | | | |
Container Store Group, Inc. (The)* | | | 213,300 | | | | 1,793,853 | | | | | |
CSS Industries, Inc.+ | | | 40,550 | | | | 685,295 | | | | | |
Del Frisco’s Restaurant Group, Inc.* | | | 29,500 | | | | 371,700 | | | | | |
Delta Apparel, Inc.*+ | | | 32,988 | | | | 638,318 | | | | | |
Destination Maternity Corp.* | | | 27,200 | | | | 158,304 | | | | | |
Destination XL Group, Inc.*+ | | | 169,622 | | | | 381,650 | | | | | |
Dixie Group, Inc. (The)* | | | 100,600 | | | | 231,380 | | | | | |
Dover Downs Gaming & Entertainment, Inc.* | | | 50,000 | | | | 89,000 | | | | | |
Dover Motorsports, Inc. | | | 123,396 | | | | 277,641 | | | | | |
Drive Shack, Inc.* | | | 105,000 | | | | 810,600 | | | | | |
Educational Development Corp. | | | 20,700 | | | | 388,125 | | | | | |
Emerson Radio Corp.* | | | 198,100 | | | | 289,226 | | | | | |
Emmis Communications Corp., Class A* | | | 17,300 | | | | 91,517 | | | | | |
Entravision Communications Corp., Class A | | | 90,000 | | | | 450,000 | | | | | |
Escalade, Inc. | | | 39,780 | | | | 560,898 | | | | | |
EVINE Live, Inc.* | | | 420,810 | | | | 517,596 | | | | | |
Famous Dave’s of America, Inc.*+ | | | 54,838 | | | | 370,156 | | | | | |
Flexsteel Industries, Inc. | | | 11,300 | | | | 450,870 | | | | | |
Fluent, Inc.* | | | 250,000 | | | | 612,500 | | | | | |
Francesca’s Holdings Corp.* | | | 121,500 | | | | 917,325 | | | | | |
FTD Cos., Inc.* | | | 118,680 | | | | 550,675 | | | | | |
| | | | |
| Industry Company | | Shares | | Value |
|
|
| |
Consumer Discretionary (continued) | | |
Gaia, Inc.* | | 48,400 | | $ 980,100 |
Gaming Partners International Corp. | | 56,300 | | 481,928 |
Habit Restaurants, Inc. (The), Class A*+ | | 70,000 | | 700,000 |
Hamilton Beach Brands Holding Co., Class A | | 32,000 | | 929,600 |
Harte-Hanks, Inc.*+ | | 48,340 | | 536,574 |
Hemisphere Media Group, Inc.* | | 20,000 | | 262,000 |
Horizon Global Corp.*+ | | 89,800 | | 535,208 |
Hovnanian Enterprises, Inc., Class A* | | 250,000 | | 407,500 |
J Alexander’s Holdings, Inc.* | | 83,800 | | 934,370 |
JAKKS Pacific, Inc.* | | 140,600 | | 460,465 |
Jamba, Inc.*+ | | 91,462 | | 974,070 |
Kandi Technologies Group, Inc.*+ | | 70,100 | | 297,925 |
Kirkland’s, Inc.* | | 91,900 | | 1,069,716 |
Kona Grill, Inc.*+ | | 102,500 | | 240,875 |
Lakeland Industries, Inc.* | | 51,557 | | 729,532 |
Lee Enterprises, Inc.*+ | | 232,700 | | 663,195 |
Libbey, Inc.+ | | 70,000 | | 569,100 |
Liberty Tax, Inc.+ | | 70,300 | | 567,672 |
Lifetime Brands, Inc. | | 57,700 | | 729,905 |
Lincoln Educational Services Corp.* | | 140,900 | | 245,166 |
Luby’s, Inc.* | | 98,900 | | 256,151 |
McClatchy Co. (The), Class A*+ | | 20,011 | | 199,109 |
Nathan’s Famous, Inc. | | 7,691 | | 723,723 |
National American University Holdings, Inc. | | 275,000 | | 260,948 |
Nevada Gold & Casinos, Inc.* | | 120,000 | | 240,000 |
New Home Co. Inc., (The)* | | 73,400 | | 731,798 |
New York & Co., Inc.* | | 308,500 | | 1,579,520 |
Noodles & Co.*+ | | 144,000 | | 1,771,200 |
P&F Industries, Inc., Class A+ | | 10,500 | | 91,455 |
Papa Murphy’s Holdings, Inc.*+ | | 78,900 | | 437,895 |
Peak Resorts, Inc.+ | | 76,000 | | 380,000 |
Perry Ellis International, Inc.* | | 10,000 | | 271,700 |
PICO Holdings, Inc. | | 85,000 | | 990,250 |
Potbelly Corp.* | | 55,000 | | 712,250 |
Red Lion Hotels Corp.* | | 87,000 | | 1,013,550 |
Rocky Brands, Inc. | | 72,200 | | 2,166,000 |
Saga Communications, Inc., Class A | | 16,866 | | 649,341 |
Salem Media Group, Inc. | | 100,000 | | 515,000 |
Shiloh Industries, Inc.* | | 84,293 | | 733,349 |
| | |
| Ultra-Small Company Market Fund | |
|
| SCHEDULE OF INVESTMENTS (continued) |
Showing percentage of net assets as of June 30, 2018 | | |
| | | | | | | | |
| Industry Company | | Shares | | Value | | | |
| | |
Common Stocks (continued) | | | | | | |
Consumer Discretionary (continued) | | | | | | |
SORL Auto Parts, Inc.*+ | | 106,058 | | $ 495,291 | | | | |
Sportsman’s Warehouse Holdings, Inc.*+ | | 164,015 | | 839,757 | | | | |
Stage Stores, Inc.+ | | 100,000 | | 241,000 | | | | |
Stein Mart, Inc.*+ | | 60,800 | | 148,960 | | | | |
Strattec Security Corp. | | 16,700 | | 510,185 | | | | |
Superior Group of Cos, Inc.+ | | 7,500 | | 155,325 | | | | |
Sypris Solutions, Inc.* | | 39,404 | | 64,623 | | | | |
Tandy Leather Factory, Inc.* | | 72,000 | | 561,600 | | | | |
Tilly’s, Inc., Class A | | 102,175 | | 1,547,951 | | | | |
Town Sports International Holdings, Inc.*+ | | 173,571 | | 2,525,458 | | | | |
Townsquare Media, Inc., Class A | | 60,000 | | 388,200 | | | | |
Trans World Entertainment Corp.* | | 188,258 | | 163,784 | | | | |
TravelCenters of America LLC* | | 116,500 | | 407,750 | | | | |
Tuesday Morning Corp.*+ | | 175,000 | | 533,750 | | | | |
Turtle Beach Corp.*+ | | 66,854 | | 1,358,473 | | | | |
Unique Fabricating, Inc.+ | | 50,000 | | 437,000 | | | | |
Universal Technical Institute, Inc.* | | 120,000 | | 378,000 | | | | |
UQM Technologies, Inc.* | | 94,000 | | 94,000 | | | | |
US Auto Parts Network, Inc.* | | 189,751 | | 284,626 | | | | |
VOXX International Corp.* | | 129,500 | | 699,300 | | | | |
Weyco Group, Inc.+ | | 10,000 | | 364,000 | | | | |
Xcel Brands, Inc.* | | 91,000 | | 213,850 | | | | |
YogaWorks, Inc.*+ | | 70,000 | | 126,000 | | | | |
Zoe’s Kitchen, Inc.*+ | | 50,000 | | 488,000 | | | | |
| | | | | | | | |
| | | | 59,587,681 | | | | |
Consumer Staples - 1.84% | | | | | | | | |
Alico, Inc. | | 12,200 | | 386,740 | | | | |
Bridgford Foods Corp.*+ | | 1,000 | | 13,600 | | | | |
Castle Brands, Inc.*+ | | 899,187 | | 1,070,033 | | | | |
CCA Industries, Inc.*+ | | 1,652 | | 4,791 | | | | |
Lifeway Foods, Inc.*+ | | 80,152 | | 403,165 | | | | |
Limoneira Co. | | 2,596 | | 63,888 | | | | |
Mannatech, Inc. | | 13,600 | | 278,800 | | | | |
Natural Alternatives International, Inc.* | | 34,910 | | 354,336 | | | | |
Natural Grocers by Vitamin Cottage, Inc.*+ | | 136,000 | | 1,732,640 | | | | |
Oil-Dri Corp. of America | | 27,500 | | 1,158,850 | | | | |
Orchids Paper Products Co.*+ | | 24,600 | | 97,908 | | | | |
Reed’s, Inc.*+ | | 53,700 | | 153,045 | | | | |
Rocky Mountain Chocolate Factory, Inc.+ | | 30,000 | | 343,200 | | | | |
| | | | | | | | |
| | | | | | | | |
| | | | | | | | |
| | | | | | | | |
| | | | | | | | |
| | | | | | | | |
| | | | | | | | |
| | | | | | | | |
| | | | | | | | |
| Industry Company | | Shares | | | Value | |
|
| |
| |
Consumer Staples (continued) | | | | | |
Seneca Foods Corp., Class A* | | | 26,500 | | | | $ 715,500 | |
United-Guardian, Inc.+ | | | 10,000 | | | | 191,500 | |
| | | | | | | | |
| | | | | | | 6,967,996 | |
Energy - 10.90% | | | | | |
Adams Resources & Energy, Inc. | | | 24,300 | | | | 1,044,900 | |
Aemetis, Inc.* | | | 160,439 | | | | 242,263 | |
Amyris, Inc.*+ | | | 165,000 | | | | 1,054,350 | |
Approach Resources, Inc.*+ | | | 389,900 | | | | 951,356 | |
Aspen Aerogels, Inc.*+ | | | 135,500 | | | | 663,950 | |
Barnwell Industries, Inc.* | | | 9,320 | | | | 19,572 | |
Bristow Group, Inc.*+ | | | 100,000 | | | | 1,411,000 | |
CARBO Ceramics, Inc.*+ | | | 50,500 | | | | 463,085 | |
Clean Energy Fuels Corp.*+ | | | 555,000 | | | | 2,047,950 | |
Cloud Peak Energy, Inc.* | | | 250,000 | | | | 872,500 | |
Comstock Resources, Inc.* | | | 122,680 | | | | 1,289,367 | |
Contango Oil & Gas Co.* | | | 40,000 | | | | 227,200 | |
Dawson Geophysical Co.* | | | 134,545 | | | | 1,062,905 | |
Earthstone Energy, Inc., Class A* | | | 44,002 | | | | 389,418 | |
Era Group, Inc.* | | | 97,350 | | | | 1,260,682 | |
Evolution Petroleum Corp.+ | | | 217,123 | | | | 2,138,662 | |
Gastar Exploration, Inc.*+ | | | 600,000 | | | | 336,000 | |
Geospace Technologies Corp.* | | | 26,663 | | | | 374,882 | |
Goodrich Petroleum Corp.*+ | | | 50,000 | | | | 618,500 | |
Gulf Island Fabrication, Inc. | | | 63,400 | | | | 570,600 | |
Hornbeck Offshore Services, Inc.* | | | 3,900 | | | | 15,444 | |
Independence Contract Drilling, Inc.* | | | 273,000 | | | | 1,124,760 | |
ION Geophysical Corp.* | | | 127,816 | | | | 3,105,929 | |
Key Energy Services, Inc.* | | | 89,000 | | | | 1,445,360 | |
Lilis Energy, Inc.*+ | | | 170,000 | | | | 884,000 | |
Lonestar Resources US, Inc., Class A* | | | 113,500 | | | | 957,940 | |
Matrix Service Co.* | | | 65,000 | | | | 1,192,750 | |
Mexco Energy Corp.* | | | 12,000 | | | | 71,880 | |
Mitcham Industries, Inc.* | | | 119,545 | | | | 480,571 | |
NACCO Industries, Inc., Class A | | | 20,000 | | | | 675,000 | |
Natural Gas Services Group, Inc.* | | | 47,185 | | | | 1,113,566 | |
New Concept Energy, Inc.*+ | | | 8,400 | | | | 35,448 | |
Northern Oil and Gas, Inc.* | | | 326,000 | | | | 1,026,900 | |
Nuverra Environmental Solutions, Inc.* | | | 39,200 | | | | 470,400 | |
Overseas Shipholding Group, Inc., Class A*+ | | | 335,000 | | | | 1,299,800 | |
| | |
| 26 | | Annual Report | June 30, 2018 |
| | |
| Ultra-Small Company Market Fund | | |
| SCHEDULE OF INVESTMENTS (continued) | | |
| Showing percentage of net assets as of June 30, 2018 | | |
| | | | | | |
| Industry Company | | Shares | | Value | | |
| | |
Common Stocks (continued) | | | | |
Energy (continued) | | | | |
Panhandle Oil & Gas, Inc., | | | | | | |
Class A | | 23,594 | | $ 450,645 | | |
Parker Drilling Co.* | | 379,630 | | 144,259 | | |
PHI, Inc.* | | 104,550 | | 1,063,274 | | |
Pioneer Energy Services Corp.* | | 395,000 | | 2,310,750 | | |
Ranger Energy Services, Inc.*+ | | 40,600 | | 372,302 | | |
REX American Resources Corp.* | | 6,249 | | 505,982 | | |
RigNet, Inc.*+ | | 11,309 | | 116,483 | | |
SEACOR Marine Holdings, Inc.* | | 45,440 | | 1,049,210 | | |
SilverBow Resources, Inc.* | | 15,000 | | 433,200 | | |
Smart Sand, Inc.*+ | | 110,000 | | 584,100 | | |
Uranium Energy Corp.*+ | | 395,000 | | 635,950 | | |
VAALCO Energy, Inc.* | | 237,100 | | 647,283 | | |
W&T Offshore, Inc.* | | 185,000 | | 1,322,750 | | |
Zion Oil & Gas, Inc.*+ | | 157,285 | | 637,791 | | |
| | | | | | |
| | | | 41,212,869 | | |
| | |
Financials - 19.31% | | | | |
1347 Property Insurance Holdings, Inc.*+ | | 38,400 | | 272,640 | | |
1st Constitution Bancorp+ | | 38,733 | | 886,986 | | |
A-Mark Precious Metals, Inc. | | 56,500 | | 750,320 | | |
American National Bankshares, Inc. | | 29,746 | | 1,189,840 | | |
American River Bankshares | | 56,000 | | 887,600 | | |
Ameris Bancorp | | 9,714 | | 518,242 | | |
AmeriServ Financial, Inc. | | 155,671 | | 638,251 | | |
Anchor Bancorp, Inc.*+ | | 22,000 | | 577,500 | | |
Ashford, Inc.*+ | | 4,000 | | 259,200 | | |
Asta Funding, Inc.+ | | 68,400 | | 235,980 | | |
Atlantic American Corp. | | 74,856 | | 190,883 | | |
Atlanticus Holdings Corp.* | | 60,812 | | 125,881 | | |
Auburn National Bancorporation, Inc.+ | | 2,974 | | 147,540 | | |
Bank of Commerce Holdings | | 87,441 | | 1,114,873 | | |
Bankwell Financial Group, Inc. | | 20,937 | | 673,125 | | |
BCB Bancorp, Inc. | | 55,212 | | 828,180 | | |
C&F Financial Corp. | | 15,400 | | 963,270 | | |
Capitala Finance Corp.+ | | 77,180 | | 640,594 | | |
Capstar Financial Holdings, Inc.* | | 40,000 | | 741,200 | | |
CB Financial Services, Inc.+ | | 21,700 | | 746,480 | | |
Chemung Financial Corp. | | 14,998 | | 751,550 | | |
Citizens Community Bancorp, Inc. | | 35,600 | | 503,740 | | |
| | | | | | | | |
| Industry Company | | Shares | | | Value | |
|
| |
| |
Financials (continued) | | | | | |
Citizens First Corp.+ | | | 2,633 | | | | $ 69,906 | |
Citizens Holding Co.+ | | | 20,670 | | | | 490,912 | |
CM Finance, Inc. | | | 78,000 | | | | 694,200 | |
Codorus Valley Bancorp, Inc. | | | 28,061 | | | | 860,911 | |
Cohen & Co., Inc.+ | | | 3,000 | | | | 31,800 | |
Colony Bankcorp, Inc. | | | 22,868 | | | | 386,469 | |
Community West Bancshares | | | 38,357 | | | | 452,613 | |
Conifer Holdings, Inc.*+ | | | 19,000 | | | | 119,700 | |
Consumer Portfolio Services, Inc.* | | | 138,100 | | | | 562,067 | |
County Bancorp, Inc. | | | 24,000 | | | | 660,000 | |
Eagle Bancorp Montana, Inc. | | | 6,289 | | | | 121,378 | |
eHealth, Inc.* | | | 57,700 | | | | 1,275,170 | |
Elevate Credit, Inc.*+ | | | 100,000 | | | | 846,000 | |
Entegra Financial Corp.* | | | 26,800 | | | | 785,240 | |
ESSA Bancorp, Inc.+ | | | 59,000 | | | | 933,970 | |
Evans Bancorp, Inc.+ | | | 18,701 | | | | 862,116 | |
Farmers Capital Bank Corp. | | | 27,058 | | | | 1,409,722 | |
FedNat Holding Co. | | | 49,012 | | | | 1,130,707 | |
First Acceptance Corp.* | | | 394,700 | | | | 449,958 | |
First Bancorp, Inc.+ | | | 20,800 | | | | 586,976 | |
First Bancshares, Inc. (The) | | | 23,094 | | | | 830,229 | |
First Bank+ | | | 55,463 | | | | 770,936 | |
First Business Financial Services, Inc. | | | 42,308 | | | | 1,100,008 | |
First Financial Northwest, Inc. | | | 47,000 | | | | 917,440 | |
First Guaranty Bancshares, Inc. | | | 3,411 | | | | 88,754 | |
First Internet Bancorp | | | 25,000 | | | | 852,500 | |
First Northwest Bancorp*+ | | | 42,500 | | | | 678,725 | |
First United Corp. | | | 16,192 | | | | 331,126 | |
GAIN Capital Holdings, Inc.+ | | | 54,400 | | | | 410,720 | |
GAMCO Investors, Inc., Class A+ | | | 10,000 | | | | 267,600 | |
Great Elm Capital Group, Inc.* | | | 56,219 | | | | 202,388 | |
Guaranty Federal Bancshares, Inc.+ | | | 20,856 | | | | 509,929 | |
Hallmark Financial Services, Inc.* | | | 80,400 | | | | 802,392 | |
Hawthorn Bancshares, Inc. | | | 27,040 | | | | 592,176 | |
Health Insurance Innovations, Inc., Class A* | | | 30,300 | | | | 980,205 | |
HMN Financial, Inc.* | | | 30,000 | | | | 603,000 | |
Home Bancorp, Inc. | | | 16,500 | | | | 768,075 | |
HopFed Bancorp, Inc. | | | 32,988 | | | | 546,941 | |
| | |
| Ultra-Small Company Market Fund | |
|
| SCHEDULE OF INVESTMENTS (continued) |
| Showing percentage of net assets as of June 30, 2018 | | |
| | | | | | | | | | | | |
| Industry Company | | Shares | | | Value | | | | |
| |
Common Stocks (continued) | | | | | |
Financials (continued) | | | | | |
Horizon Technology Finance Corp. | | | 33,600 | | | $ | 338,688 | | | | | |
Impac Mortgage Holdings, Inc.*+ | | | 76,800 | | | | 731,904 | | | | | |
Independence Holding Co.+ | | | 8,443 | | | | 280,730 | | | | | |
Investar Holding Corp.+ | | | 5,000 | | | | 138,250 | | | | | |
Investors Title Co.+ | | | 2,028 | | | | 374,490 | | | | | |
JMP Group LLC+ | | | 96,851 | | | | 520,090 | | | | | |
KCAP Financial, Inc.+ | | | 156,600 | | | | 508,950 | | | | | |
Lake Shore Bancorp, Inc.+ | | | 22,150 | | | | 386,518 | | | | | |
Landmark Bancorp, Inc. | | | 14,453 | | | | 411,910 | | | | | |
Malvern Bancorp, Inc.* | | | 33,300 | | | | 810,855 | | | | | |
Marlin Business Services Corp. | | | 64,500 | | | | 1,925,325 | | | | | |
MBT Financial Corp. | | | 114,185 | | | | 1,216,070 | | | | | |
Medallion Financial Corp.*+ | | | 95,411 | | | | 522,852 | | | | | |
Medley Management, Inc., Class A+ | | | 10,000 | | | | 35,500 | | | | | |
Mid Penn Bancorp, Inc.+ | | | 14,348 | | | | 500,745 | | | | | |
MidSouth Bancorp, Inc.+ | | | 24,700 | | | | 327,275 | | | | | |
Monroe Capital Corp.+ | | | 61,403 | | | | 827,712 | | | | | |
MSB Financial Corp./MD | | | 25,000 | | | | 537,500 | | | | | |
MutualFirst Financial, Inc. | | | 38,911 | | | | 1,468,890 | | | | | |
Northeast Bancorp | | | 35,000 | | | | 763,000 | | | | | |
Northrim BanCorp, Inc. | | | 24,250 | | | | 959,088 | | | | | |
Norwood Financial Corp.+ | | | 12,749 | | | | 459,219 | | | | | |
Oaktree Strategic Income Corp. | | | 103 | | | | 876 | | | | | |
Ohio Valley Banc Corp.+ | | | 19,500 | | | | 1,022,775 | | | | | |
OP Bancorp* | | | 50,000 | | | | 636,000 | | | | | |
Pacific Mercantile Bancorp* | | | 83,319 | | | | 812,360 | | | | | |
Penns Woods Bancorp, Inc.+ | | | 16,400 | | | | 734,392 | | | | | |
Peoples Bancorp of North | | | | | | | | | | | | |
Carolina, Inc. | | | 27,830 | | | | 891,395 | | | | | |
Premier Financial Bancorp, Inc. | | | 60,275 | | | | 1,125,334 | | | | | |
Provident Financial Holdings, Inc. | | | 38,617 | | | | 736,812 | | | | | |
Prudential Bancorp, Inc. | | | 6,836 | | | | 131,935 | | | | | |
Pzena Investment Management, Inc., Class A | | | 52,800 | | | | 486,288 | | | | | |
Regional Management Corp.* | | | 47,000 | | | | 1,645,940 | | | | | |
Riverview Bancorp, Inc. | | | 82,206 | | | | 693,819 | | | | | |
Safeguard Scientifics, Inc.* | | | 19,500 | | | | 249,600 | | | | | |
SB One Bancorp+ | | | 23,000 | | | | 683,100 | | | | | |
Security National Financial Corp., Class A* | | | 55,695 | | | | 289,614 | | | | | |
Select Bancorp, Inc.*+ | | | 54,676 | | | | 736,486 | | | | | |
Shore Bancshares, Inc. | | | 42,500 | | | | 808,350 | | | | | |
| | | | | | | | |
| Industry Company | | Shares | | | Value | |
|
| |
Financials (continued) | |
SI Financial Group, Inc. | | | 47,676 | | | $ | 703,221 | |
Silvercrest Asset Management Group Inc., Class A | | | 50,002 | | | | 815,033 | |
Southern First Bancshares, Inc.* | | | 21,215 | | | | 937,703 | |
Southern Missouri Bancorp, Inc. | | | 30,000 | | | | 1,170,600 | |
Summit State Bank | | | 17,200 | | | | 265,740 | |
Territorial Bancorp, Inc. | | | 30,000 | | | | 930,000 | |
Timberland Bancorp, Inc. | | | 34,222 | | | | 1,277,849 | |
Two River Bancorp+ | | | 39,968 | | | | 764,588 | |
Union Bankshares, Inc./Morrisville VT | | | 1,934 | | | | 100,375 | |
United Community Bancorp | | | 26,200 | | | | 712,640 | |
United Security Bancshares+ | | | 5,400 | | | | 60,480 | |
Unity Bancorp, Inc. | | | 46,500 | | | | 1,057,875 | |
Western New England Bancorp, Inc. | | | 78,362 | | | | 861,982 | |
| | | | | | | | |
| | | | | | | 73,015,557 | |
|
Health Care - 21.30% | |
AAC Holdings, Inc.*+ | | | 98,000 | | | | 918,260 | |
AcelRx Pharmaceuticals, Inc.*+ | | | 208,150 | | | | 702,506 | |
Actinium Pharmaceuticals, Inc.* | | | 140,200 | | | | 89,728 | |
Adverum Biotechnologies, Inc.*+ | | | 183,900 | | | | 974,670 | |
Aeglea BioTherapeutics, Inc.*+ | | | 75,000 | | | | 793,500 | |
Agile Therapeutics, Inc.* | | | 122,000 | | | | 60,268 | |
Aileron Therapeutics, Inc.* | | | 63,600 | | | | 344,712 | |
Alimera Sciences, Inc.*+ | | | 360,000 | | | | 352,188 | |
Allena Pharmaceuticals, Inc.*+ | | | 68,000 | | | | 886,040 | |
Alphatec Holdings, Inc.*+ | | | 69,800 | | | | 208,004 | |
Alpine Immune Sciences, Inc.*+ | | | 35,000 | | | | 264,950 | |
Ampio Pharmaceuticals, Inc.*+ | | | 100,000 | | | | 220,000 | |
Apollo Endosurgery, Inc.* | | | 79,000 | | | | 551,420 | |
Applied Genetic Technologies Corp.* | | | 147,400 | | | | 545,380 | |
Aptevo Therapeutics, Inc.* | | | 83,802 | | | | 418,172 | |
Aquinox Pharmaceuticals, Inc.*+ | | | 50,000 | | | | 132,500 | |
Aratana Therapeutics, Inc.*+ | | | 156,983 | | | | 667,178 | |
Ardelyx, Inc.*+ | | | 117,500 | | | | 434,750 | |
ArQule, Inc.*+ | | | 312,599 | | | | 1,728,672 | |
Arsanis, Inc.*+ | | | 38,600 | | | | 140,118 | |
| | |
| 28 | | Annual Report | June 30, 2018 |
| | |
| Ultra-Small Company Market Fund | | |
| SCHEDULE OF INVESTMENTS (continued) | | |
| Showing percentage of net assets as of June 30, 2018 | | |
| | | | | | | | |
| Industry Company | | Shares | | Value | | | |
| | |
Common Stocks (continued) | | | | | | |
Health Care (continued) | | | | | | |
Asterias Biotherapeutics, Inc.*+ | | 172,763 | | $ 233,230 | | | | |
aTyr Pharma, Inc.* | | 102,697 | | 93,454 | | | | |
AVEO Pharmaceuticals, Inc.*+ | | 280,000 | | 632,800 | | | | |
Axsome Therapeutics, Inc.* | | 88,000 | | 281,600 | | | | |
Bellerophon Therapeutics, Inc.*+ | | 123,000 | | 297,660 | | | | |
Bellicum Pharmaceuticals, Inc.* | | 46,700 | | 344,646 | | | | |
BioScrip, Inc.* | | 200,000 | | 586,000 | | | | |
BioSpecifics Technologies Corp.* | | 25,200 | | 1,130,472 | | | | |
Bovie Medical Corp.* | | 124,970 | | 543,619 | | | | |
Calithera Biosciences, Inc.* | | 122,000 | | 610,000 | | | | |
Cara Therapeutics, Inc.* | | 20,000 | | 383,000 | | | | |
CareDx, Inc.*+ | | 103,598 | | 1,268,040 | | | | |
Castlight Health, Inc., Class B*+ | | 45,500 | | 193,375 | | | | |
Catabasis Pharmaceuticals, Inc.* | | 90,300 | | 86,598 | | | | |
Cellular Biomedicine Group, Inc.*+ | | 67,800 | | 1,325,490 | | | | |
CEL-SCI Corp.*+ | | 40,000 | | 36,800 | | | | |
ChemoCentryx, Inc.* | | 32,896 | | 433,240 | | | | |
Chiasma, Inc.* | | 307,600 | | 461,400 | | | | |
Chimerix, Inc.* | | 204,100 | | 971,516 | | | | |
Cidara Therapeutics, Inc.*+ | | 94,000 | | 488,800 | | | | |
Clearside Biomedical, Inc.*+ | | 74,200 | | 793,198 | | | | |
Conatus Pharmaceuticals, Inc.*+ | | 113,000 | | 483,640 | | | | |
Conformis, Inc.* | | 250,000 | | 312,500 | | | | |
Corindus Vascular Robotics, Inc.*+ | | 458,683 | | 378,735 | | | | |
Corvus Pharmaceuticals, Inc.*+ | | 85,000 | | 933,300 | | | | |
Cumberland Pharmaceuticals, Inc.* | | 157,500 | | 965,475 | | | | |
Curis, Inc.*+ | | 178,900 | | 309,497 | | | | |
Dicerna Pharmaceuticals, Inc.*+ | | 60,000 | | 735,000 | | | | |
Digirad Corp. | | 75,000 | | 116,250 | | | | |
Durect Corp.*+ | | 708,600 | | 1,105,416 | | | | |
Eiger BioPharmaceuticals, Inc.*+ | | 71,000 | | 866,200 | | | | |
Electromed, Inc.* | | 70,000 | | 379,400 | | | | |
Enzo Biochem, Inc.* | | 125,000 | | 648,750 | | | | |
EyePoint Pharmaceuticals, Inc.*+ | | 100,000 | | 208,000 | | | | |
Flex Pharma, Inc.*+ | | 49,839 | | 46,849 | | | | |
Fluidigm Corp.*+ | | 138,772 | | 827,081 | | | | |
Fulgent Genetics, Inc.*+ | | 78,100 | | 323,334 | | | | |
| | | | |
| Industry Company | | Shares | | Value |
|
|
Health Care (continued) | | |
Gemphire Therapeutics, Inc.*+ | | 46,000 | | $ 468,740 |
Genesis Healthcare, Inc.* | | 330,000 | | 755,700 |
GenMark Diagnostics, Inc.*+ | | 179,900 | | 1,147,762 |
Harvard Bioscience, Inc.* | | 317,017 | | 1,696,041 |
Histogenics Corp.*+ | | 100,000 | | 250,000 |
Immune Design Corp.*+ | | 81,292 | | 369,879 |
Infinity Pharmaceuticals, Inc.*+ | | 350,000 | | 668,500 |
InfuSystem Holdings, Inc.* | | 124,900 | | 443,395 |
IntriCon Corp.*+ | | 21,500 | | 866,450 |
Invitae Corp.*+ | | 13,195 | | 96,983 |
Invuity, Inc.*+ | | 75,000 | | 292,500 |
IRIDEX Corp.*+ | | 71,300 | | 483,414 |
IsoRay, Inc.* | | 168,700 | | 75,915 |
Juniper Pharmaceuticals, Inc.*+ | | 87,051 | | 757,344 |
Kadmon Holdings, Inc.*+ | | 308,000 | | 1,228,920 |
KalVista Pharmaceuticals, Inc.*+ | | 41,000 | | 332,920 |
Kewaunee Scientific Corp. | | 14,000 | | 503,300 |
Leap Therapeutics, Inc.*+ | | 36,300 | | 326,700 |
MannKind Corp.*+ | | 387,000 | | 735,300 |
Marinus Pharmaceuticals, Inc.* | | 57,606 | | 407,274 |
MediciNova, Inc.*+ | | 97,710 | | 777,772 |
Melinta Therapeutics, Inc.* | | 90,100 | | 572,135 |
Merrimack Pharmaceuticals, Inc.*+ | | 45,100 | | 221,441 |
Micron Solutions, Inc.* | | 20,000 | | 68,580 |
Minerva Neurosciences, Inc.* | | 120,700 | | 995,775 |
Misonix, Inc.* | | 25,000 | | 310,000 |
Mustang Bio, Inc.*+ | | 62,500 | | 430,625 |
NanoString Technologies, Inc.* | | 87,400 | | 1,195,632 |
NantKwest, Inc.* | | 100,000 | | 306,000 |
Neos Therapeutics, Inc.*+ | | 105,100 | | 656,875 |
NewLink Genetics Corp.* | | 100,000 | | 476,000 |
NovaBay Pharmaceuticals, Inc.*+ | | 2,000 | | 5,000 |
Novan, Inc.*+ | | 82,688 | | 243,103 |
Nuvectra Corp.* | | 44,400 | | 911,532 |
Ocular Therapeutix, Inc.*+ | | 100,000 | | 675,000 |
Oncocyte Corp.*+ | | 250,000 | | 637,500 |
OncoMed Pharmaceuticals, Inc.* | | 125,000 | | 288,750 |
Ophthotech Corp.* | | 108,000 | | 294,840 |
Organovo Holdings, Inc.*+ | | 273,600 | | 383,040 |
OrthoPediatrics Corp.*+ | | 43,500 | | 1,158,840 |
| | |
| Ultra-Small Company Market Fund | |
|
| SCHEDULE OF INVESTMENTS (continued) |
| Showing percentage of net assets as of June 30, 2018 | | |
| | | | | | | | |
| Industry Company | | Shares | | Value | | | |
| | |
Common Stocks (continued) | | | | | | |
Health Care (continued) | | | | | | |
Otonomy, Inc.* | | 145,000 | | $ 558,250 | | | | |
OvaScience, Inc.*+ | | 350,000 | | 317,590 | | | | |
Ovid Therapeutics, Inc.*+ | | 94,440 | | 736,632 | | | | |
Pacific Biosciences of California, Inc.*+ | | 320,200 | | 1,136,710 | | | | |
Pain Therapeutics, Inc.*+ | | 15,765 | | 32,476 | | | | |
Palatin Technologies, Inc.* | | 696,000 | | 674,981 | | | | |
Pfenex, Inc.* | | 94,500 | | 511,245 | | | | |
Protagonist Therapeutics, Inc.*+ | | 50,600 | | 340,032 | | | | |
Protalix BioTherapeutics, Inc.* | | 171,672 | | 73,819 | | | | |
Proteostasis Therapeutics, Inc.*+ | | 138,845 | | 387,378 | | | | |
Quorum Health Corp.* | | 165,000 | | 825,000 | | | | |
Ra Pharmaceuticals, Inc.*+ | | 41,000 | | 407,950 | | | | |
Restoration Robotics, Inc.*+ | | 140,200 | | 486,494 | | | | |
resTORbio, Inc.*+ | | 95,000 | | 869,250 | | | | |
Rexahn Pharmaceuticals, Inc.*+ | | 50,100 | | 70,641 | | | | |
Rockwell Medical, Inc.*+ | | 35,000 | | 172,550 | | | | |
RTI Surgical, Inc.* | | 191,900 | | 882,740 | | | | |
Savara, Inc.* | | 40,000 | | 452,800 | | | | |
scPharmaceuticals, Inc.*+ | | 58,000 | | 328,280 | | | | |
SCYNEXIS, Inc.*+ | | 100,000 | | 164,000 | | | | |
SeaSpine Holdings Corp.* | | 71,400 | | 901,068 | | | | |
Selecta Biosciences, Inc.*+ | | 75,000 | | 993,750 | | | | |
Senseonics Holdings, Inc.*+ | | 69,880 | | 287,207 | | | | |
Sientra, Inc.* | | 40,100 | | 782,351 | | | | |
Sierra Oncology, Inc.* | | 164,300 | | 486,328 | | | | |
Spero Therapeutics, Inc.*+ | | 48,500 | | 711,495 | | | | |
Syndax Pharmaceuticals, Inc.*+ | | 50,500 | | 354,510 | | | | |
Synlogic, Inc.*+ | | 56,428 | | 554,687 | | | | |
Syros Pharmaceuticals, Inc.* | | 85,900 | | 877,039 | | | | |
T2 Biosystems, Inc.*+ | | 125,000 | | 967,500 | | | | |
Teligent, Inc.*+ | | 100,981 | | 349,394 | | | | |
Tetraphase Pharmaceuticals, Inc.*+ | | 75,000 | | 267,750 | | | | |
Tocagen, Inc.*+ | | 100,000 | | 934,000 | | | | |
Tracon Pharmaceuticals, Inc.* | | 50,000 | | 135,000 | | | | |
Utah Medical Products, Inc. | | 22,400 | | 2,467,360 | | | | |
Veracyte, Inc.*+ | | 112,400 | | 1,049,816 | | | | |
Verastem, Inc.*+ | | 133,900 | | 921,232 | | | | |
Versartis, Inc.* | | 85,100 | | 172,328 | | | | |
Vital Therapies, Inc.*+ | | 160,000 | | 1,096,000 | | | | |
VolitionRX, Ltd.* | | 170,000 | | 340,000 | | | | |
Voyager Therapeutics, Inc.*+ | | 70,000 | | 1,367,800 | | | | |
vTv Therapeutics, Inc. Class A* | | 68,800 | | 105,952 | | | | |
| | | | |
| Industry Company | | Shares | | Value |
|
|
Health Care (continued) | | | | |
XOMA Corp.* | | 24,900 | | $ 519,912 |
Xtant Medical Holdings, Inc.* | | 50,000 | | 277,500 |
Zafgen, Inc.* | | 85,434 | | 873,990 |
Zynerba Pharmaceuticals, Inc.*+ | | 55,500 | | 540,570 |
| | | | |
| | | | 80,546,215 |
Industrials - 10.29% | | | | |
Acacia Research Corp.* | | 161,800 | | 671,470 |
Acme United Corp. | | 7,735 | | 160,501 |
AeroCentury Corp.* | | 10,900 | | 172,765 |
Air Industries Group* | | 400 | | 720 |
Allied Motion Technologies, Inc.+ | | 9,150 | | 438,102 |
Alpha Pro Tech, Ltd.*+ | | 181,200 | | 607,020 |
American Superconductor Corp.*+ | | 70,100 | | 490,700 |
AMREP Corp.* | | 30,100 | | 212,807 |
ARC Document Solutions, Inc.* | | 150,000 | | 265,500 |
Arotech Corp.* | | 121,367 | | 455,126 |
BG Staffing, Inc. | | 37,500 | | 871,875 |
BlueLinx Holdings, Inc.*+ | | 35,600 | | 1,336,068 |
Chicago Rivet & Machine Co. | | 10,000 | | 322,500 |
Command Security Corp.*+ | | 44,600 | | 69,130 |
Commercial Vehicle Group, Inc.* | | 52,100 | | 382,414 |
CompX International, Inc. | | 3,200 | | 42,240 |
CPI Aerostructures, Inc.* | | 31,300 | | 328,650 |
CRA International, Inc. | | 23,500 | | 1,195,915 |
Ducommun, Inc.*+ | | 14,500 | | 479,805 |
Eastern Co. (The) | | 33,600 | | 942,480 |
Ecology & Environment, Inc., Class A | | 7,000 | | 87,150 |
Enphase Energy, Inc.*+ | | 246,000 | | 1,655,580 |
EnviroStar, Inc.+ | | 12,800 | | 515,840 |
Espey Manufacturing & Electronics Corp. | | 10,700 | | 287,094 |
ExOne Co. (The)*+ | | 48,300 | | 341,964 |
FreightCar America, Inc. | | 20,000 | | 335,800 |
Fuel Tech, Inc.* | | 118,628 | | 128,118 |
FuelCell Energy, Inc.*+ | | 149,800 | | 197,736 |
Gencor Industries, Inc.* | | 66,450 | | 1,073,168 |
General Finance Corp.*+ | | 76,723 | | 1,039,597 |
Goldfield Corp. (The)* | | 158,080 | | 671,840 |
Graham Corp.+ | | 35,900 | | 926,579 |
Granite Construction, Inc. | | 12,150 | | 676,269 |
Great Lakes Dredge & Dock Corp.* | | 205,100 | | 1,076,775 |
| | |
| 30 | | Annual Report | June 30, 2018 |
| | |
| Ultra-Small Company Market Fund | | |
| SCHEDULE OF INVESTMENTS (continued) | | |
| Showing percentage of net assets as of June 30, 2018 | | |
| | | | | | | | |
| Industry Company | | Shares | | Value | | | |
| |
Common Stocks (continued) | | | | |
Industrials (continued) | | | | |
HC2 Holdings, Inc.*+ | | 104,000 | | $ 608,400 | | | | |
Highpower International, Inc.*+ | | 50,000 | | 155,000 | | | | |
Hill International, Inc.* | | 201,551 | | 1,189,151 | | | | |
Houston Wire & Cable Co.*+ | | 83,300 | | 708,050 | | | | |
Hudson Global, Inc.* | | 40,000 | | 64,800 | | | | |
Hurco Cos., Inc. | | 36,334 | | 1,625,946 | | | | |
Innovative Solutions & Support, Inc.* | | 125,054 | | 363,907 | | | | |
L.B. Foster Co., Class A* L.S. Starrett Co. (The), | | 44,000 | | 1,009,800 | | | | |
Class A | | 20,236 | | 129,510 | | | | |
Lawson Products, Inc.* | | 32,400 | | 788,940 | | | | |
LSI Industries, Inc. | | 100,000 | | 534,000 | | | | |
Mastech Digital, Inc.* | | 6,250 | | 100,625 | | | | |
Miller Industries, Inc. | | 29,800 | | 761,390 | | | | |
Orion Group Holdings, Inc.* | | 108,200 | | 893,732 | | | | |
PAM Transportation Services, Inc.* | | 29,400 | | 1,380,918 | | | | |
Patriot Transportation Holding, Inc.* | | 30,871 | | 663,726 | | | | |
Performant Financial Corp.* | | 305,000 | | 655,750 | | | | |
Perma-Pipe International Holdings, Inc.* | | 66,100 | | 618,035 | | | | |
Radiant Logistics, Inc.* | | 171,300 | | 669,783 | | | | |
RCM Technologies, Inc. | | 111,510 | | 550,859 | | | | |
Red Violet, Inc.*+ | | 9,813 | | 84,392 | | | | |
Servotronics, Inc. | | 15,653 | | 143,381 | | | | |
SIFCO Industries, Inc.* | | 16,024 | | 84,927 | | | | |
Sparton Corp.* | | 48,300 | | 917,217 | | | | |
Tel-Instrument Electronics Corp.*+ | | 15,000 | | 50,250 | | | | |
Transcat, Inc.* | | 5,200 | | 98,280 | | | | |
Twin Disc, Inc.*+ | | 49,600 | | 1,231,072 | | | | |
Ultralife Corp.* | | 112,400 | | 1,079,040 | | | | |
USA Truck, Inc.* | | 14,600 | | 342,662 | | | | |
Virco Manufacturing Corp. | | 14,600 | | 64,970 | | | | |
Volt Information Sciences, Inc.* | | 100,000 | | 340,000 | | | | |
Willdan Group, Inc.* | | 45,000 | | 1,393,650 | | | | |
Willis Lease Finance Corp.* | | 36,000 | | 1,137,240 | | | | |
| | | | | | | | |
| | | |
| | | | 38,898,701 | | | | |
| |
Information Technology - 13.86% | | | | |
Aerohive Networks, Inc.*+ | | 210,000 | | 833,700 | | | | |
Agilysys, Inc.* | | 75,000 | | 1,162,500 | | | | |
ALJ Regional Holdings, Inc.* | | 88,000 | | 167,200 | | | | |
Amber Road, Inc.*+ | | 123,300 | | 1,160,253 | | | | |
Amtech Systems, Inc.* | | 57,500 | | 347,875 | | | | |
AstroNova, Inc. | | 32,800 | | 618,280 | | | | |
| | | | | | | | |
| Industry Company | | Shares | | | Value | |
|
| |
Information Technology (continued) | |
Aviat Networks, Inc.* | | | 22,086 | | | $ | 361,548 | |
Avid Technology, Inc.* | | | 150,000 | | | | 780,000 | |
Aware, Inc.* | | | 24,979 | | | | 101,165 | |
AXT, Inc.* | | | 131,006 | | | | 923,592 | |
BK Technologies, Inc. | | | 168,744 | | | | 624,353 | |
Black Box Corp.+ | | | 55,594 | | | | 112,578 | |
Blonder Tongue Laboratories, Inc.* | | | 20,000 | | | | 22,600 | |
Brightcove, Inc.* | | | 143,300 | | | | 1,382,845 | |
BSQUARE Corp.*+ | | | 59,500 | | | | 160,650 | |
Clearfield, Inc.*+ | | | 58,000 | | | | 640,900 | |
Communications Systems, Inc. | | | 22,100 | | | | 84,201 | |
Computer Task Group, Inc.* | | | 58,800 | | | | 455,112 | |
CSP, Inc. | | | 38,700 | | | | 381,195 | |
CyberOptics Corp.*+ | | | 42,550 | | | | 740,370 | |
DHI Group, Inc.* | | | 150,100 | | | | 352,735 | |
Digi International, Inc.* | | | 105,000 | | | | 1,386,000 | |
DSP Group, Inc.* | | | 83,500 | | | | 1,039,575 | |
Echelon Corp.* | | | 30,000 | | | | 247,200 | |
Edgewater Technology, Inc.* | | | 91,212 | | | | 494,369 | |
EMCORE Corp.* | | | 98,702 | | | | 498,445 | |
Frequency Electronics, Inc.* | | | 41,000 | | | | 330,460 | |
GlobalSCAPE, Inc.+ | | | 176,600 | | | | 683,442 | |
GSE Systems, Inc.* | | | 195,125 | | | | 634,156 | |
GSI Technology, Inc.* | | | 161,417 | | | | 1,213,856 | |
Harmonic, Inc.* | | | 1,300 | | | | 5,525 | |
ID Systems, Inc.*+ | | | 83,000 | | | | 513,770 | |
IEC Electronics Corp.*+ | | | 73,450 | | | | 428,214 | |
Impinj, Inc.*+ | | | 58,000 | | | | 1,282,380 | |
Information Services Group, Inc.* | | | 183,300 | | | | 751,530 | |
Innodata, Inc.*+ | | | 294,955 | | | | 294,955 | |
Inseego Corp.* | | | 46,900 | | | | 94,269 | |
Intellicheck, Inc.*+ | | | 49,700 | | | | 114,310 | |
Intelligent Systems Corp.*+ | | | 35,362 | | | | 306,589 | |
Intermolecular, Inc.* | | | 167,600 | | | | 279,892 | |
Internap Corp.*+ | | | 66,800 | | | | 696,056 | |
inTEST Corp.* | | | 49,500 | | | | 361,350 | |
Intevac, Inc.* | | | 82,933 | | | | 402,225 | |
iPass, Inc.* | | | 45,400 | | | | 15,645 | |
Issuer Direct Corp.+ | | | 25,000 | | | | 497,242 | |
Iteris, Inc.*+ | | | 60,520 | | | | 292,917 | |
Key Tronic Corp.* | | | 57,100 | | | | 432,818 | |
KVH Industries, Inc.* | | | 80,510 | | | | 1,078,834 | |
Leaf Group, Ltd.*+ | | | 80,000 | | | | 868,000 | |
Liquidity Services, Inc.* | | | 132,000 | | | | 864,600 | |
Majesco* | | | 3,000 | | | | 18,450 | |
Marchex, Inc., Class B | | | 222,400 | | | | 680,544 | |
Marin Software, Inc.* | | | 23,914 | | | | 138,701 | |
| | |
| Ultra-Small Company Market Fund | | |
| SCHEDULE OF INVESTMENTS (continued) | | |
| Showing percentage of net assets as of June 30, 2018 | | |
| | | | | | | | |
| Industry Company | | Shares | | Value | | | |
| | |
Common Stocks (continued) | | | | | | |
Information Technology (continued) | | | | | | |
Mattersight Corp.*+ | | 149,896 | | $ 400,972 | | | | |
Maxwell Technologies, Inc.*+ | | 80,000 | | 416,000 | | | | |
Napco Security Technologies Inc.* | | 100,176 | | 1,467,578 | | | | |
NeoPhotonics Corp.*+ | | 105,000 | | 654,150 | | | | |
Network-1 Technologies, Inc. | | 130,000 | | 403,000 | | | | |
PAR Technology Corp.*+ | | 94,750 | | 1,675,180 | | | | |
PCM, Inc.*+ | | 39,100 | | 592,365 | | | | |
PC-Tel, Inc. | | 91,100 | | 568,464 | | | | |
Perceptron, Inc.* | | 70,000 | | 738,500 | | | | |
Pixelworks, Inc.*+ | | 113,900 | | 411,179 | | | | |
PRGX Global, Inc.* | | 143,100 | | 1,388,070 | | | | |
QAD, Inc., Class B | | 8,250 | | 334,125 | | | | |
Quantum Corp.* | | 165,000 | | 363,000 | | | | |
QuickLogic Corp.*+ | | 100,000 | | 115,000 | | | | |
QuinStreet, Inc.* | | 45,000 | | 571,500 | | | | |
Qumu Corp.* | | 30,000 | | 66,000 | | | | |
RealNetworks, Inc.* | | 213,500 | | 789,950 | | | | |
Reis, Inc.+ | | 54,800 | | 1,194,640 | | | | |
Richardson Electronics, Ltd. | | 99,011 | | 964,367 | | | | |
Rosetta Stone, Inc.* | | 103,160 | | 1,653,655 | | | | |
Rubicon Project, Inc. (The)* | | 200,000 | | 570,000 | | | | |
Seachange International, Inc.* | | 119,300 | | 408,006 | | | | |
ServiceSource International, Inc.* | | 225,000 | | 886,500 | | | | |
SMTC Corp.* | | 105,000 | | 308,700 | | | | |
StarTek, Inc.*+ | | 65,000 | | 408,850 | | | | |
Synacor, Inc.* | | 132,400 | | 264,800 | | | | |
Telaria, Inc.*+ | | 341,900 | | 1,381,276 | | | | |
Telenav, Inc.*+ | | 214,100 | | 1,198,960 | | | | |
TESSCO Technologies, Inc. | | 44,500 | | 769,850 | | | | |
TransAct Technologies, Inc. | | 50,000 | | 625,000 | | | | |
Travelzoo* | | 45,000 | | 769,500 | | | | |
Trio-Tech International* | | 6,000 | | 26,820 | | | | |
Wayside Technology Group, Inc. | | 32,298 | | 453,787 | | | | |
Wireless Telecom Group, | | | | | | | | |
Inc.* | | 113,100 | | 248,820 | | | | |
Zedge, Inc., Class B*+ | | 16,855 | | 63,375 | | | | |
Zix Corp.* | | 164,582 | | 887,097 | | | | |
| | | | | | | | |
| | | | 52,399,007 | | | | |
Materials - 2.78% | | | | | | |
Advanced Emissions | | | | | | | | |
Solutions, Inc.+ | | 77,075 | | 875,572 | | | | |
Ampco-Pittsburgh Corp.* | | 45,983 | | 471,326 | | | | |
| | | | |
| Industry Company | | Shares | | Value |
|
|
Materials (continued) | | |
Core Molding Technologies, Inc. | | 45,100 | | $ 644,028 |
Flexible Solutions International, Inc.* | | 45,707 | | 73,588 |
Friedman Industries, Inc. | | 57,000 | | 461,700 |
Gold Resource Corp. | | 203,100 | | 1,338,429 |
Gulf Resources, Inc.* | | 205,900 | | 284,142 |
Intrepid Potash, Inc.* | | 215,000 | | 881,500 |
LSB Industries, Inc.* | | 107,500 | | 569,750 |
Northern Technologies International Corp. | | 13,950 | | 499,410 |
Olympic Steel, Inc. | | 43,200 | | 881,712 |
Orient Paper, Inc.* | | 78,811 | | 78,811 |
Paramount Gold Nevada Corp.* | | 25,000 | | 31,500 |
Pershing Gold Corp.*+ | | 65,000 | | 118,950 |
Ramaco Resources, Inc.*+ | | 122,800 | | 854,688 |
Synalloy Corp.+ | | 54,400 | | 1,085,280 |
Trecora Resources* | | 30,000 | | 445,500 |
Universal Stainless & Alloy Products, Inc.* | | 39,586 | | 937,001 |
| | | | |
| | | | 10,532,887 |
Real Estate -1.10% | | |
American Realty Investors, Inc.*+ | | 4,000 | | 63,240 |
Consolidated-Tomoka Land Co. | | 15,449 | | 950,268 |
Griffin Industrial Realty, Inc. | | 17,905 | | 787,641 |
Maui Land & Pineapple Co., Inc.*+ | | 53,000 | | 593,600 |
Stratus Properties, Inc.*+ | | 37,150 | | 1,134,932 |
Transcontinental Realty Investors, Inc.*+ | | 2,300 | | 76,935 |
Trinity Place Holdings, Inc.*+ | | 85,100 | | 557,405 |
| | | | |
| | | | 4,164,021 |
Telecommunication Services - 1.38% | | |
Alaska Communications | | | | |
Systems Group, Inc.* | | 243,000 | | 430,110 |
Hawaiian Telcom Holdco, Inc.* | | 45,642 | | 1,319,967 |
NII Holdings, Inc.*+ | | 265,000 | | 1,033,500 |
Ooma, Inc.*+ | | 72,500 | | 1,025,875 |
Spok Holdings, Inc. | | 60,000 | | 903,000 |
Windstream Holdings, Inc.+ | | 99,200 | | 522,784 |
| | | | |
| | | | 5,235,236 |
| | |
| 32 | | Annual Report | June 30, 2018 |
| | |
| Ultra-Small Company Market Fund | | |
| SCHEDULE OF INVESTMENTS (continued) | | |
| Showing percentage of net assets as of June 30, 2018 | | |
| | | | | | | | |
| Industry Company | | Shares | | Value | | | |
| | |
Common Stocks (continued) | | | | | | |
Utilities - 1.10% | | | | | | |
Artesian Resources Corp., | | | | | | | | |
Class A | | 19,500 | | $ 756,015 | | | | |
Cadiz, Inc.*+ | | 71,700 | | 939,270 | | | | |
Genie Energy, Ltd., Class B+ | | 98,667 | | 489,388 | | | | |
Global Water Resources, Inc.+ | | 42,500 | | 399,500 | | | | |
RGC Resources, Inc.+ | | 14,000 | | 408,520 | | | | |
Spark Energy, Inc., Class A+ | | 43,000 | | 419,250 | | | | |
York Water Co., (The)+ | | 23,714 | | 754,105 | | | | |
| | | | | | | | |
| | | | 4,166,048 | | | | |
| | | | | | | | |
TOTAL COMMON STOCKS - 99.62% | | 376,726,218 | | | | |
| | | | | | | | |
(Cost $ 273,343,138) | | | | | | | | |
| |
EXCHANGE TRADED FUND - 0.18% | | | | |
iShares Micro-Cap ETF+ | | 6,525 | | 689,170 | | | | |
| | | | | | | | |
TOTAL EXCHANGE TRADED FUND - 0.18% | | 689,170 | | | | |
| | | | | | | | |
(Cost $ 163,006) | | | | | | | | |
| |
WARRANTS - 0.00% | | | | |
BioTime, Inc.,
expire 10/01/18*+ | | 16,058 | | 965 | | | | |
SAExploration Series A, expire 07/27/21*D | | 848 | | — | | | | |
SAExploration Series B, expire 07/27/21*D | | 848 | | — | | | | |
| | | | | | | | |
TOTAL WARRANTS - 0.00% | | | | 965 | | | | |
| | | | | | | | |
(Cost $ 15,589) | | | | | | | | |
| | | | | | | | |
| | | | | | | | |
| | | | | | | | |
| | | | | | | | |
| | | Rate^ | | Shares | | Value | |
|
MONEY MARKET FUND - 0.00% | |
Fidelity Investments Money Market Government Portfolio Class I | | 1.77% | | 277 | | | $277 | |
| | | | | | | | |
TOTAL MONEY MARKET FUND - 0.00% | | | 277 | |
| | | | | | | | |
(Cost $277) | | | | | | | | |
|
INVESTMENTS PURCHASED WITH CASH PROCEEDS FROM SECURITIES LENDING - 13.83% | |
Fidelity Investments Money Market Government Portfolio Class I** | | 1.77% | | 52,284,023 | | | 52,284,023 | |
| | | | | | | | |
| |
TOTAL INVESTMENTS PURCHASED WITH CASH PROCEEDS FROM SECURITIES LENDING - 13.83% | | | 52,284,023 | |
| | | | | | | | |
(Cost $52,284,023) | | | | | | | | |
| |
TOTAL INVESTMENTS - 113.63% | | | $429,700,653 | |
(Cost $325,806,033) | | | | | | | | |
Liabilities in Excess of Other Assets - (13.63%) | | | (51,556,289 | ) |
| | | | | | | | |
NET ASSETS - 100.00% | | | $378,144,364 | |
| | | | | | | | |
| * | Non-income producing security. |
| ** | This security represents the investment of the collateral received in connection with securities out on loan as of June 30, 2018. |
| ^ | Rate disclosed as of June 30, 2018. |
| D | Security was fair valued under procedures adopted by the Board of Directors (see Note 2). As such, the security is classified as Level 3 in the fair value hierarchy. |
| + | This security or a portion of the security is out on loan as of June 30, 2018. Total loaned securities had a value of $50,620,082 as of June 30, 2018. |
LLC - Limited Liability Company
| | |
| Ultra-Small Company Market Fund | | |
| SCHEDULE OF INVESTMENTS (continued) | | |
Showing percentage of net assets as of June 30, 2018 | | |
| | | | | | | | | | | | | | | | |
Summary of inputs used to value the Fund’s investments as of 06/30/2018 (See Note 2 in Notes to Financial Statements): | |
| | | |
| | | | | | Valuation Inputs | | | | |
| | | Investment in Securities (Value) | |
| | | Level 1 Quoted Prices | | | Level 2
Significant
Observable
Inputs | | | Level 3 Significant Unobservable
Inputs | | | Total | |
Common Stocks (a) | | $ | 376,726,218 | | | $ | — | | | $ | — | | | $ | 376,726,218 | |
Exchange Traded | | | | | | | | | | | | | | | | |
Fund | | | 689,170 | | | | — | | | | — | | | | 689,170 | |
Warrants | | | 965 | | | | — | | | | 0 | | | | 965 | |
Money Market Fund | | | — | | | | 277 | | | | — | | | | 277 | |
Investments Purchased with Cash Proceeds from Securities Lending | | | — | | | | 52,284,023 | | | | — | | | | 52,284,023 | |
| | | | | | | | | | | | | | | | |
TOTAL | | $ | 377,416,353 | | | $ | 52,284,300 | | | $ | 0 | | | $ | 429,700,653 | |
| | | | | | | | | | | | | | | | |
(a) - Please refer to the Schedule of Investments for the industry classifications of these portfolio holdings. | |
| | | | | | | | | | | | |
Following is a reconciliation of Level 3 investments for which significant unobservable inputs were used to determine fair value: | |
| |
| | | Investment in Securities (Value) | |
| | | Common Stock | | | Warrants | | | Total | |
Balance as of 06/30/2017 | | $ | 28,062 | | | $ | 0 | | | $ | 28,062 | |
Purchases | | | — | | | | — | | | | 0 | |
Sales | | | — | | | | — | | | | — | |
Realized Gain/(Loss) | | | (437,810 | ) | | | — | | | | (437,810 | ) |
Change in Unrealized Appreciation/ (Depreciation) | | | 409,748 | | | | — | | | | 409,748 | |
Transfers in | | | — | | | | — | | | | — | |
Transfers out | | | — | | | | — | | | | — | |
| | | | | | | | | | | | |
Balance as of 06/30/2018 | | $ | — | | | $ | 0 | | | $ | — | |
| | | | | | | | | | | | |
Net Change in Unrealized Appreciation (Depreciation) from Investments Held as of 06/30/2018 | | $ | — | | | $ | 0 | | | $ | — | |
| | | | | | | | | | | | |
See Notes to Financial Statements.
| | |
34 | | Annual Report | June 30, 2018 |
| | |
| Small-Cap Growth Fund | | |
| MANAGER’S COMMENTARY (Unaudited) | | |
| | |
June 30, 2018
Dear Fellow Small-Cap Growth Fund Shareholder,
For the quarter ended June 30, 2018, our Fund returned +10.86%, outperforming our primary market benchmark, the Russell 2000 Growth Index (+7.23%), and our peer benchmark, the Lipper Small-Cap Growth Funds Index (+7.90%). It was a good quarter.
For the fiscal year, our Fund returned +21.91%, slightly leading the Russell 2000 Growth Index (+21.86%), but lagging the Lipper Small-Cap Growth Funds Index (+26.33%). The Fund leads our benchmarks in the longer five-year period, but lags in the 10-year and inception-to-date periods.
The table below presents our June quarter, one-year, five-year, 10-year, and inception-to-date financial results. See the next page for a graph of performance since inception.
Standardized Returns as of June 30, 2018
| | | | | | | | | | | | | | | | | | | | |
| | | | | | | | | Annualized | |
| | | Quarter | | | 1 Year | | | 5 Years | | | 10 Years | | | Since Inception
(10/31/03) | |
| | | | | |
Small-Cap Growth Fund | | | 10.86% | | | | 21.91% | | | | 15.17% | | | | 8.24% | | | | 7.97% | |
Russell 2000 Growth Index | | | 7.23% | | | | 21.86% | | | | 13.65% | | | | 11.24% | | | | 9.84% | |
Lipper Small-Cap Growth Funds Index | | | 7.90% | | | | 26.33% | | | | 13.22% | | | | 10.58% | | | | 8.88% | |
Performance figures quoted in the table above represent past performance and are no guarantee of future results. Total return figures in the table above include the reinvestment of dividends and capital gains. The table above does not reflect the deduction of taxes that a shareholder would pay on Fund distributions or on the redemption of Fund shares.
The Russell 2000 Growth Index is an unmanaged index that consists of stocks in the Russell 2000 Index with higher price-to-book ratios and higher forecasted growth values with dividends reinvested. The Lipper Small-Cap Growth Funds Index is an index of small-company, growth-oriented funds compiled by Lipper, Inc. It is not possible to invest directly in an index. Periods longer than one year are annualized.
| | |
| Small-Cap Growth Fund | |
|
| MANAGER’S COMMENTARY (Unaudited) (continued) |
| | |
Growth of a $10,000 Investment
from Inception October 31, 2003 to June 30, 2018
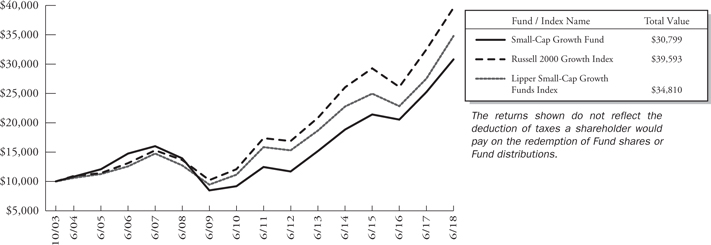
Detailed Explanation of Quarterly Performance
All three of the Fund’s model categories outperformed the benchmark during the quarter, with our core company financial health models delivering the best performance. The Fund’s tilt toward smaller stocks in the small-cap growth universe also helped relative results, as they outperformed their larger counterparts. However, the Fund’s increased core exposure (as measured by multiple value metrics) detracted from relative performance.
From a sector perspective, the Fund’s allocation effect was neutral. However, the Fund’s stock selection effect was significantly positive, with nearly all sectors boosting relative results. Holdings in the Health Care sector made the largest positive contribution, and holdings in the Materials, Consumer Staples, and Financials sectors also helped relative performance.
Detailed Explanation of Fiscal Year Performance
The Fund’s diversifying value metrics models outperformed the benchmark and boosted relative returns for the year. However, our diversifying price momentum models lagged the benchmark, while our core company financial health models underperformed slightly. The Fund’s exposure to higher momentum stocks also helped relative results, as those stocks outperformed their lower momentum counterparts during the year. In contrast, the Fund’s increased core exposure (as measured by multiple value metrics) hurt relative performance. A tilt toward smaller stocks in the small-cap growth universe also detracted from relative results.
From a sector perspective, the Fund’s allocation effect was neutral. However, the Fund’s stock selection effect was significantly positive, with holdings in the Consumer Discretionary and Consumer Staples sectors adding the most to relative results. These gains more than offset the negative impact of holdings in the Information Technology and Health Care sectors.
| | |
| 36 | | Annual Report | June 30, 2018 |
| | |
| Small-Cap Growth Fund | | |
| MANAGER’S COMMENTARY (Unaudited) (continued) | | |
| | |
Top Ten Holdings as of June 30, 2018
| | | | | | |
| Rank | | Description | | Industry | | % of Net
Assets |
| 1 | | Insperity, Inc. | | Industrials | | 1.6% |
| 2 | | Supernus Pharmaceuticals, Inc. | | Health Care | | 1.6% |
| 3 | | Enova International, Inc. | | Financials | | 1.6% |
| 4 | | Spartan Motors, Inc. | | Industrials | | 1.6% |
| 5 | | LGI Homes, Inc. | | Consumer Discretionary | | 1.5% |
| 6 | | LHC Group, Inc. | | Health Care | | 1.5% |
| 7 | | Cirrus Logic, Inc. | | Information Technology | | 1.5% |
| 8 | | AMN Healthcare Services, Inc. | | Health Care | | 1.5% |
| 9 | | BioTelemetry, Inc. | | Health Care | | 1.5% |
| 10 | | Chefs’ Warehouse, Inc. (The) | | Consumer Staples | | 1.5% |
| | Total | | | | 15.4% |
Industry Sector Representation as of June 30, 2018
| | | | | | | | | | | | |
| | | % of Net Assets | | | % of Russell 2000
Growth Index | | | Difference | |
Consumer Discretionary | | | 17.8% | | | | 15.3% | | | | 2.5% | |
Consumer Staples | | | 4.1% | | | | 2.9% | | | | 1.2% | |
Energy | | | 1.4% | | | | 2.4% | | | | -1.0% | |
Financials | | | 8.8% | | | | 7.7% | | | | 1.1% | |
Health Care | | | 23.3% | | | | 26.4% | | | | -3.1% | |
Industrials | | | 20.7% | | | | 18.2% | | | | 2.5% | |
Information Technology | | | 16.9% | | | | 19.1% | | | | -2.2% | |
Materials | | | 1.4% | | | | 4.3% | | | | -2.9% | |
Real Estate | | | 3.7% | | | | 2.5% | | | | 1.2% | |
Telecommunication Services | | | 0.0% | | | | 0.8% | | | | -0.8% | |
Utilities | | | 0.5% | | | | 0.4% | | | | 0.1% | |
Cash & Other Assets | | | 1.4% | | | | 0.0% | | | | 1.4% | |
Total | | | 100.0% | | | | 100.0% | | | | | |
Disclaimer
The views expressed here are exclusively those of Fund management. These views, including those related to market sectors or individual stocks, are not meant as investment advice and should not be considered predictive in nature. Any favorable (or unfavorable) description of a holding applies only as of the quarter end, June 30, 2018, unless otherwise stated. Security positions can and do change thereafter. Discussions of historical performance do not guarantee and may not be indicative of future performance.
Market volatility can significantly impact short-term performance. The Fund is not an appropriate investment for short-term investors. Investments in small companies generally carry greater risk than is customarily associated with larger companies. This additional risk is attributable to a number of factors, including the relatively limited financial resources that are typically available to small companies and the fact that small companies often have comparatively limited product lines. In addition, the stock of small companies tends to be more volatile than the stock of large companies, particularly in the short term and particularly in the early stages of an economic or market downturn. Shareholders of the Fund, therefore, are taking on more risk than they would if they invested in the stock market as a whole.
| | |
| Small-Cap Growth Fund | |
|
| MANAGER’S COMMENTARY (Unaudited) (continued) |
| | |
Conclusion
Thank you for your continued investment in Small-Cap Growth Fund. We encourage your feedback; your reactions and concerns are important to us.
Sincerely,
The Investment Management Team
| | |
| 38 | | Annual Report | June 30, 2018 |
| | | | |
Small-Cap Growth Fund SCHEDULE OF INVESTMENTS | | | | |
Showing percentage of net assets as of June 30, 2018
| | | | | | |
| Industry Company | | Shares | | Value | | |
| |
COMMON STOCKS - 98.60% | | |
Consumer Discretionary - 17.78% | | |
Asbury Automotive Group, Inc.* | | 2,400 | | $ 164,520 | | |
Big Lots, Inc.+ | | 9,300 | | 388,554 | | |
BJ’s Restaurants, Inc. | | 9,000 | | 540,000 | | |
Boot Barn Holdings, Inc.* | | 38,100 | | 790,575 | | |
Children’s Place, Inc. (The) | | 4,900 | | 591,920 | | |
Crocs, Inc.* | | 46,900 | | 825,909 | | |
Dave & Buster’s Entertainment, Inc.* | | 16,400 | | 780,640 | | |
Entravision Communications Corp., Class A | | 154,700 | | 773,500 | | |
LGI Homes, Inc.*+ | | 14,700 | | 848,631 | | |
MDC Partners, Inc., Class A*+ | | 123,400 | | 567,640 | | |
Noodles & Co.*+ | | 24,300 | | 298,890 | | |
Pinnacle Entertainment, Inc.* | | 5,900 | | 199,007 | | |
RH*+ | | 5,700 | | 796,290 | | |
Sinclair Broadcast Group, Inc., Class A+ | | 15,100 | | 485,465 | | |
Sleep Number Corp.* | | 3,800 | | 110,276 | | |
Sturm Ruger & Co., Inc.+ | | 5,600 | | 313,600 | | |
Tailored Brands, Inc. | | 29,900 | | 763,048 | | |
tronc, Inc.* | | 36,300 | | 627,264 | | |
| | | | | | |
| | | |
| | | | 9,865,729 | | |
| |
Consumer Staples - 4.11% | | |
Chefs’ Warehouse, Inc. (The)* | | 29,000 | | 826,500 | | |
Medifast, Inc. | | 5,000 | | 800,800 | | |
Performance Food Group Co.* | | 17,800 | | 653,260 | | |
| | | | | | |
| | | | 2,280,560 | | |
| |
Energy - 1.44% | | |
Carrizo Oil & Gas, Inc.*+ | | 17,200 | | 479,020 | | |
Matador Resources Co.* | | 10,600 | | 318,530 | | |
| | | | | | |
| | | | 797,550 | | |
| |
Financials - 8.77% | | |
Artisan Partners Asset Management, Inc., Class A | | 8,300 | | 250,245 | | |
BrightSphere Investment Group, PLC | | 51,700 | | 737,242 | | |
Diamond Hill Investment Group, Inc. | | 3,800 | | 738,834 | | |
Enova International, Inc.* | | 24,100 | | 880,855 | | |
Evercore, Inc., Class A | | 7,300 | | 769,785 | | |
Houlihan Lokey, Inc. | | 15,900 | | 814,398 | | |
Walker & Dunlop, Inc. | | 12,100 | | 673,365 | | |
| | | | | | |
| | | | 4,864,724 | | |
| | | | |
| Industry Company | | Shares | | Value |
|
|
Health Care - 23.34% |
Abaxis, Inc. | | 6,100 | | $ 506,361 |
AMN Healthcare Services, Inc.* | | 14,300 | | 837,980 |
BioSpecifics Technologies Corp.* | | 12,900 | | 578,694 |
BioTelemetry, Inc.* | | 18,600 | | 837,000 |
Chemed Corp. | | 2,300 | | 740,163 |
Corcept Therapeutics, Inc.*+ | | 31,000 | | 487,320 |
Cutera, Inc.* | | 20,300 | | 818,090 |
Eagle Pharmaceuticals, Inc.*+ | | 6,600 | | 499,356 |
Emergent BioSolutions, Inc.* | | 13,000 | | 656,370 |
Enanta Pharmaceuticals, Inc.* | | 6,500 | | 753,350 |
Encompass Health Corp. | | 11,100 | | 751,692 |
Genesis Healthcare, Inc.* | | 320,200 | | 733,258 |
Insys Therapeutics, Inc.* | | 76,200 | | 551,688 |
LHC Group, Inc.* | | 9,900 | | 847,341 |
Masimo Corp.* | | 8,200 | | 800,730 |
MiMedx Group, Inc.*+ | | 12,800 | | 81,792 |
Sientra, Inc.* | | 39,100 | | 762,841 |
Supernus Pharmaceuticals, Inc.* | | 14,800 | | 885,780 |
Vocera Communications, Inc.* | | 27,300 | | 815,997 |
| | | | |
| | | | 12,945,803 |
|
Industrials - 20.68% |
Advanced Drainage Systems, Inc. | | 8,300 | | 236,965 |
Allegiant Travel Co. | | 4,400 | | 611,380 |
ArcBest Corp. | | 11,000 | | 502,700 |
Avis Budget Group, Inc.* | | 17,900 | | 581,750 |
Brink’s Co. (The) | | 3,200 | | 255,200 |
Builders FirstSource, Inc.* | | 33,500 | | 612,715 |
Commercial Vehicle Group, Inc.* | | 94,600 | | 694,364 |
H&E Equipment Services, Inc. | | 11,000 | | 413,710 |
Harsco Corp.* | | 34,400 | | 760,240 |
Insperity, Inc. | | 9,300 | | 885,825 |
Kadant, Inc. | | 7,300 | | 701,895 |
Lindsay Corp. | | 8,500 | | 824,415 |
MasTec, Inc.* | | 5,600 | | 284,200 |
Meritor, Inc.* | | 39,000 | | 802,230 |
Patrick Industries, Inc.* | | 14,000 | | 795,900 |
Radiant Logistics, Inc.* | | 102,500 | | 400,775 |
Saia, Inc.* | | 5,500 | | 444,675 |
Spartan Motors, Inc. | | 57,400 | | 866,740 |
| | |
| Small-Cap Growth Fund | |
|
| SCHEDULE OF INVESTMENTS (continued) |
| Showing percentage of net assets as of June 30, 2018 | | |
| | | | | | |
| Industry Company | | Shares | | Value | | |
| |
Common Stocks (continued) | | |
Industrials (continued) | | |
TriNet Group, Inc.* | | 14,200 | | $ 794,348 | | |
| | | | | | |
| | | | 11,470,027 | | |
| |
Information Technology - 16.91% | | |
3D Systems Corp.*+ | | 57,400 | | 792,694 | | |
ACI Worldwide, Inc.* | | 18,100 | | 446,527 | | |
Advanced Energy Industries, Inc.* | | 9,300 | | 540,237 | | |
Alarm.com Holdings, Inc.*+ | | 8,000 | | 323,040 | | |
Cirrus Logic, Inc.* | | 21,900 | | 839,427 | | |
Extreme Networks, Inc.* | | 88,000 | | 700,480 | | |
Five9, Inc.* | | 18,800 | | 649,916 | | |
InterDigital, Inc. | | 9,700 | | 784,730 | | |
MAXIMUS, Inc. | | 10,100 | | 627,311 | | |
Monolithic Power Systems, Inc. | | 1,400 | | 187,138 | | |
NIC, Inc. | | 52,100 | | 810,155 | | |
Plantronics, Inc. | | 7,800 | | 594,750 | | |
Synaptics, Inc.* | | 16,200 | | 815,994 | | |
Systemax, Inc. | | 20,200 | | 693,466 | | |
TTEC Holdings, Inc. | | 11,500 | | 397,325 | | |
Unisys Corp.*+ | | 14,000 | | 180,600 | | |
| | | | | | |
| | | | 9,383,790 | | |
| |
Materials - 1.39% | | |
Kronos Worldwide, Inc. | | 11,900 | | 268,107 | | |
Verso Corp., Class A* | | 23,100 | | 502,656 | | |
| | | | | | |
| | | | 770,763 | | |
| |
Real Estate - 3.70% | | |
Altisource Portfolio Solutions SA*+ | | 25,100 | | 732,167 | | |
HFF, Inc., Class A | | 13,900 | | 477,465 | | |
National Health Investors, Inc. | | 6,400 | | 471,552 | | |
Urban Edge Properties | | 16,199 | | 370,471 | | |
| | | | | | |
| | | | 2,051,655 | | |
| |
Utilities - 0.48% | | |
Atlantic Power Corp.*+ | | 120,950 | | 266,090 | | |
| | | | | | |
TOTAL COMMON STOCKS - 98.60% | | 54,696,691 | | |
| | | | | | |
(Cost $ 46,557,549) | | | | | | |
| | |
EXCHANGE TRADED FUND - 0.51% | | | | |
iShares Russell 2000 Growth ETF | | 1,400 | | 286,062 | | |
| | | | | | |
TOTAL EXCHANGE TRADED FUND - 0.51% | | 286,062 | | |
| | | | | | |
(Cost $ 286,069) | | | | | | |
| | | | | | |
| | | Rate^ | | Shares | | Value |
|
MONEY MARKET FUND - 0.00% |
Fidelity Investments Money Market Government Portfolio Class I | | 1.77% | | 707 | | $707 |
| | | | | | |
| |
TOTAL MONEY MARKET FUND - 0.00% | | 707 |
| | | | | | |
(Cost $707) | | | | | | |
|
| INVESTMENTS PURCHASED WITH CASH PROCEEDS FROM SECURITIES LENDING - 9.02% |
Fidelity Investments Money Market Government Portfolio Class I** | | 1.77% | | 5,001,434 | | 5,001,434 |
| | | | | | |
| |
TOTAL INVESTMENTS PURCHASED WITH CASH PROCEEDS FROM SECURITIES LENDING - 9.02% | | 5,001,434 |
| | | | | | |
(Cost $5,001,434) | | | | | | |
| |
TOTAL INVESTMENTS - 108.13% | | $59,984,894 |
(Cost $51,845,759) | | | | | | |
Liabilities in Excess of Other Assets - (8.13%) | | (4,512,450) |
| | | | | | |
| |
NET ASSETS - 100.00% | | $55,472,444 |
| | | | | | |
| * | Non-income producing security. |
| ** | This security represents the investment of the collateral received in connection with securities out on loan as of June 30, 2018. |
| ^ | Rate disclosed as of June 30, 2018. |
| + | This security or a portion of the security is out on loan as of June 30, 2018. Total loaned securities had a value of $4,834,998 as of June 30, 2018. |
| | |
| 40 | | Annual Report | June 30, 2018 |
| | |
| Small-Cap Growth Fund | | |
| SCHEDULE OF INVESTMENTS (continued) | | |
| Showing percentage of net assets as of June 30, 2018 | | |
| | | | | | | | | | | | | | | | |
| Summary of inputs used to value the Fund’s investments as of 06/30/2018 (See Note 2 in Notes to Financial Statements): | |
| |
| | | Valuation Inputs | |
| | | Investment in Securities (Value) | |
| | | Level 1
Quoted
Prices | | | Level 2
Significant
Observable
Inputs | | | Level 3
Significant
Unobservable
Inputs | | | Total | |
Common Stocks | | $ | 54,696,691 | | | $ | — | | | $ | — | | | $ | 54,696,691 | |
Exchange Traded Fund | | | 286,062 | | | | — | | | | — | | | | 286,062 | |
Money Market Fund | | | — | | | | 707 | | | | — | | | | 707 | |
Investments Purchased with Cash Proceeds from Securities Lending | | | — | | | | 5,001,434 | | | | — | | | | 5,001,434 | |
| | | | | | | | | | | | | | | | |
TOTAL | | $ | 54,982,753 | | | $ | 5,002,141 | | | $ | — | | | $ | 59,984,894 | |
| | | | | | | | | | | | | | | | |
See Notes to Financial Statements.
| | |
| Small-Cap Value Fund | | |
| MANAGER’S COMMENTARY (Unaudited) | | |
June 30, 2018
Dear Fellow Small-Cap Value Fund Shareholder,
For the quarter ended June 30, 2018, our Fund returned +14.86%, outperforming our primary market benchmark, the Russell 2000 Value Index (+8.30%), and our peer benchmark, the Lipper Small-Cap Value Funds Index (+5.74%). It was a good quarter.
For the fiscal year, our Fund returned +20.32%, leading the Russell 2000 Value Index (+13.10%) and the Lipper Small-Cap Value Funds Index (+12.22%). However, we are lagging our primary market and peer benchmarks in the five-year, 10-year and inception-to-date periods.
The table below presents our June quarter, one-year, five-year, 10-year, and inception-to-date financial results. See the next page for a graph of performance since inception.
Standardized Returns as of June 30, 2018
| | | | | | | | | | | | | | | | | | |
| | | | | | | | | Annualized | | | |
| | | Quarter | | | 1 Year | | | 5 Years | | | 10 Years | | | Since Inception
(10/31/03) |
| | | | | |
Small-Cap Value Fund | | | 14.86% | | | | 20.32 | % | | | 10.14 | % | | | 7.57% | | | 8.46% |
Russell 2000 Value Index | | | 8.30% | | | | 13.10 | % | | | 11.18 | % | | | 9.88% | | | 9.02% |
Lipper Small-Cap Value Funds Index | | | 5.74% | | | | 12.22 | % | | | 10.26 | % | | | 9.61% | | | 9.13% |
Performance figures quoted in the table above represent past performance and are no guarantee of future results. Total return figures in the table above include the reinvestment of dividends and capital gains. The table above does not reflect the deduction of taxes that a shareholder would pay on Fund distributions or on the redemption of Fund shares.
The Russell 2000 Value Index is an unmanaged index that consists of stocks in the Russell 2000 Index with lower price-to-book ratios and lower forecasted growth values with dividends reinvested. The Lipper Small-Cap Value Funds Index is an index of small-company, value-oriented funds compiled by Lipper, Inc. It is not possible to invest directly in an index. Periods longer than one year are annualized.
| | |
| 42 | | Annual Report | June 30, 2018 |
| | |
| Small-Cap Value Fund | | |
| MANAGER’S COMMENTARY (Unaudited) (continued) | | |
| | |
Growth of a $10,000 Investment
from Inception October 31, 2003 to June 30, 2018
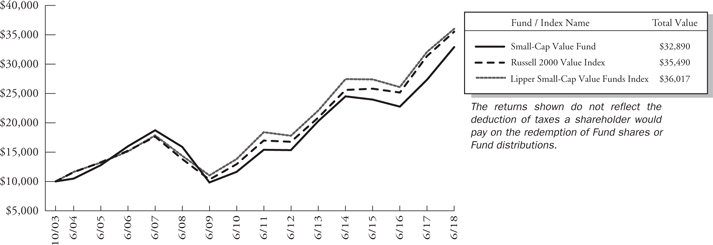
Detailed Explanation of Quarterly Performance
All three of the Fund’s model categories outperformed the benchmark during the quarter, with our core value metrics models and diversifying price momentum models delivering the best results. The Fund’s tilt toward deeper value stocks across multiple value metrics also benefited the Fund’s results, as did our tilt toward smaller stocks in the small-cap value universe.
From a sector perspective, the Fund’s allocation effect was modestly positive, with an underweighting in the Financials sector and a slight overweighting in the Energy sector boosting relative results. The Fund’s stock selection effect was significantly positive, with holdings in the Energy sector making the largest positive contribution to relative performance amid rising oil prices. Holdings in the Materials, Consumer Discretionary, and Telecommunication Services sectors also boosted relative results.
Detailed Explanation of Fiscal Year Performance
The Fund’s diversifying company financial health models and core value metrics models significantly outperformed the benchmark and boosted relative results. However, our diversifying price momentum models lagged the benchmark during the fiscal year. The Fund’s tilts toward deeper value stocks across multiple value metrics and to smaller stocks in the small-cap value universe also benefited results, as did its exposure to higher momentum stocks.
From a sector perspective, the Fund’s allocation effect was positive, with an underweighting in the Real Estate sector and overweightings in the Industrials and Consumer Discretionary sectors boosting relative results. The Fund’s stock selection effect was significantly positive, with holdings in the Energy sector boosting relative results the most. Holdings in the Materials and Telecommunication Services sectors also helped relative performance.
| | |
| Small-Cap Value Fund | |
|
| MANAGER’S COMMENTARY (Unaudited) (continued) |
Top Ten Holdings as of June 30, 2018
| | | | | | | | |
| | | |
| Rank | | Description | | Industry | | % of Net
Assets | |
| 1 | | California Resources Corp. | | Energy | | | 1.9% | |
| 2 | | Abraxas Petroleum Corp. | | Energy | | | 1.7% | |
| 3 | | Entravision Communications Corp., Class A | | Consumer Discretionary | | | 1.6% | |
| 4 | | J. Jill, Inc. | | Consumer Discretionary | | | 1.6% | |
| 5 | | Ardmore Shipping Corp. | | Energy | | | 1.6% | |
| 6 | | Natural Health Trends Corp. | | Consumer Staples | | | 1.6% | |
| 7 | | Monmouth Real Estate Investment Corp. | | Real Estate | | | 1.6% | |
| 8 | | Weight Watchers International, Inc. | | Consumer Discretionary | | | 1.5% | |
| 9 | | ACCO Brands Corp. | | Industrials | | | 1.5% | |
| 10 | | Greenbrier Companies., Inc. (The) | | Industrials | | | 1.5% | |
| | Total | | | | | 16.1% | |
Industry Sector Representation as of June 30, 2018
| | | | | | | | | | | | |
| | | % of Russell 2000 | |
| | | | % of Net Assets | | | | Value Index | | | | Difference | |
Consumer Discretionary | | | 14.8% | | | | 11.4% | | | | 3.4% | |
Consumer Staples | | | 5.2% | | | | 2.7% | | | | 2.5% | |
Energy | | | 11.7% | | | | 7.6% | | | | 4.1% | |
Financials | | | 22.8% | | | | 28.3% | | | | -5.5% | |
Health Care | | | 5.0% | | | | 4.7% | | | | 0.3% | |
Industrials | | | 12.7% | | | | 11.5% | | | | 1.2% | |
Information Technology | | | 8.8% | | | | 10.6% | | | | -1.8% | |
Materials | | | 2.9% | | | | 4.4% | | | | -1.5% | |
Real Estate | | | 9.4% | | | | 12.1% | | | | -2.7% | |
Telecommunication Services | | | 1.5% | | | | 0.5% | | | | 1.0% | |
Utilities | | | 2.1% | | | | 6.2% | | | | -4.1% | |
Cash & Other Assets | | | 3.1% | | | | 0.0% | | | | 3.1% | |
Total | | | 100.0% | | | | 100.0% | | | | | |
Disclaimer
The views expressed here are exclusively those of Fund management. These views, including those related to market sectors or individual stocks, are not meant as investment advice and should not be considered predictive in nature. Any favorable (or unfavorable) description of a holding applies only as of the quarter end, June 30, 2018, unless otherwise stated. Security positions can and do change thereafter. Discussions of historical performance do not guarantee and may not be indicative of future performance.
Market volatility can significantly impact short-term performance. The Fund is not an appropriate investment for short-term investors. Investments in small companies generally carry greater risk than is customarily associated with larger companies. This additional risk is attributable to a number of factors, including the relatively limited financial resources that are typically available to small companies and the fact that small companies often have comparatively limited product lines. In addition, the stock of small companies tends to be more volatile than the stock of large companies, particularly in the short term and particularly in the early stages of an economic or market downturn. Shareholders of the Fund, therefore, are taking on more risk than they would if they invested in the stock market as a whole.
| | |
| 44 | | Annual Report | June 30, 2018 |
| | |
| Small-Cap Value Fund | | |
| MANAGER’S COMMENTARY (Unaudited) (continued) | | |
Conclusion
Thank you for your continued investment in Small-Cap Value Fund. We encourage your feedback; your reactions and concerns are important to us.
Sincerely,
The Investment Management Team
| | |
| Small-Cap Value Fund | |
|
| SCHEDULE OF INVESTMENTS |
| Showing percentage of net assets as of June 30, 2018 | | |
| | | | | | | | | | | | |
| Industry Company | | Shares | | | Value | | | | |
| |
COMMON STOCKS - 96.93% | | | | | |
Consumer Discretionary - 14.83% | | | | | |
American Axle & Manufacturing Holdings, Inc.* | | | 42,100 | | | $ | 655,076 | | | | | |
Caleres, Inc. | | | 11,900 | | | | 409,241 | | | | | |
Conn’s, Inc.*+ | | | 21,200 | | | | 699,600 | | | | | |
Dana, Inc. | | | 28,900 | | | | 583,491 | | | | | |
Entravision Communications Corp., Class A | | | 224,500 | | | | 1,122,500 | | | | | |
Fossil Group, Inc.*+ | | | 34,200 | | | | 918,954 | | | | | |
J. Jill, Inc.* | | | 119,100 | | | | 1,112,394 | | | | | |
KB Home | | | 26,800 | | | | 730,032 | | | | | |
Modine Manufacturing Co.* | | | 13,000 | | | | 237,250 | | | | | |
Office Depot, Inc. | | | 191,400 | | | | 488,070 | | | | | |
Sonic Corp.+ | | | 29,900 | | | | 1,029,158 | | | | | |
Tenneco, Inc. | | | 11,000 | | | | 483,560 | | | | | |
Tower International, Inc. | | | 23,500 | | | | 747,300 | | | | | |
Weight Watchers | | | | | | | | | | | | |
International, Inc.*+ | | | 10,500 | | | | 1,061,550 | | | | | |
| | | | | | | | | | | | |
| | | | | | | 10,278,176 | | | | | |
| |
Consumer Staples - 5.20% | | | | | |
Darling Ingredients, Inc.* | | | 32,700 | | | | 650,076 | | | | | |
Dean Foods Co. | | | 47,200 | | | | 496,072 | | | | | |
Natural Health Trends Corp. | | | 44,300 | | | | 1,108,386 | | | | | |
Sanderson Farms, Inc. | | | 9,600 | | | | 1,009,440 | | | | | |
SUPERVALU, Inc.*+ | | | 16,785 | | | | 344,428 | | | | | |
| | | | | | | | | | | | |
| | | | | | | 3,608,402 | | | | | |
| |
Energy - 11.68% | | | | | |
Abraxas Petroleum Corp.* | | | 412,300 | | | | 1,191,547 | | | | | |
Arch Coal, Inc., Class A+ | | | 7,900 | | | | 619,597 | | | | | |
Ardmore Shipping Corp.* | | | 135,600 | | | | 1,111,920 | | | | | |
California Resources Corp.*+ | | | 28,800 | | | | 1,308,672 | | | | | |
Cloud Peak Energy, Inc.* | | | 127,100 | | | | 443,579 | | | | | |
Denbury Resources, Inc.* | | | 112,200 | | | | 539,682 | | | | | |
Par Pacific Holdings, Inc.* | | | 16,700 | | | | 290,246 | | | | | |
Renewable Energy Group, Inc.* | | | 57,100 | | | | 1,019,235 | | | | | |
Rowan Cos. PLC, Class A* | | | 61,700 | | | | 1,000,774 | | | | | |
W&T Offshore, Inc.* | | | 79,700 | | | | 569,855 | | | | | |
| | | | | | | | | | | | |
| | | | | | | 8,095,107 | | | | | |
| |
Financials - 22.81% | | | | | |
American Equity Investment Life Holding Co. | | | 28,600 | | | | 1,029,600 | | | | | |
Argo Group International Holdings, Ltd. | | | 14,835 | | | | 862,655 | | | | | |
Banco Latinoamericano de Comercio Exterior SA, Class E | | | 27,700 | | | | 681,697 | | | | | |
Banner Corp. | | | 11,700 | | | | 703,521 | | | | | |
| | | | | | | | |
| Industry Company | | Shares | | | Value | |
|
| |
Financials (continued) | | | | | | | | |
CNO Financial Group, Inc. | | | 19,400 | | | $ | 369,376 | |
Enstar Group, Ltd.* | | | 2,900 | | | | 601,170 | |
EZCORP, Inc., Class A*+ | | | 80,200 | | | | 966,410 | |
First BanCorp Puerto Rico* | | | 129,500 | | | | 990,675 | |
Flagstar Bancorp, Inc.* | | | 8,500 | | | | 291,210 | |
GAMCO Investors, Inc., Class A | | | 25,589 | | | | 684,762 | |
Independence Holding Co. | | | 20,800 | | | | 691,600 | |
Investors Bancorp, Inc. | | | 63,000 | | | | 805,770 | |
National General Holdings Corp. | | | 36,800 | | | | 968,944 | |
National Western Life Group, Inc., Class A | | | 2,600 | | | | 798,876 | |
Nationstar Mortgage Holdings, Inc.*+ | | | 46,500 | | | | 815,145 | |
Ocwen Financial Corp.*+ | | | 161,900 | | | | 641,124 | |
Oppenheimer Holdings, Inc., Class A | | | 22,250 | | | | 623,000 | |
Opus Bank | | | 34,500 | | | | 990,150 | |
Provident Financial Services, Inc. | | | 11,800 | | | | 324,854 | |
Selective Insurance Group, Inc. | | | 6,100 | | | | 335,500 | |
Walker & Dunlop, Inc. | | | 17,400 | | | | 968,310 | |
Western New England Bancorp, Inc. | | | 60,500 | | | | 665,500 | |
| | | | | | | | |
| | | | | | | 15,809,849 | |
|
Health Care - 4.97% | |
Civitas Solutions, Inc.* | | | 45,200 | | | | 741,280 | |
Community Health Systems, Inc.*+ | | | 47,900 | | | | 159,028 | |
Computer Programs & Systems, Inc.+ | | | 21,200 | | | | 697,480 | |
Concert Pharmaceuticals, Inc.* | | | 51,300 | | | | 863,379 | |
Triple-S Management Corp., Class B* | | | 25,200 | | | | 984,312 | |
| | | | | | | | |
| | | | | | | 3,445,479 | |
|
Industrials - 12.69% | |
ACCO Brands Corp. | | | 76,500 | | | | 1,059,525 | |
Aircastle, Ltd. | | | 27,100 | | | | 555,550 | |
EMCOR Group, Inc. | | | 10,100 | | | | 769,418 | |
Federal Signal Corp. | | | 31,700 | | | | 738,293 | |
GATX Corp. | | | 13,100 | | | | 972,413 | |
Greenbrier Companies., Inc. (The) | | | 19,700 | | | | 1,039,175 | |
Interface, Inc. | | | 42,500 | | | | 975,375 | |
Moog, Inc., Class A | | | 3,700 | | | | 288,452 | |
Radiant Logistics, Inc.* | | | 115,100 | | | | 450,041 | |
SkyWest, Inc. | | | 17,600 | | | | 913,440 | |
| | |
| 46 | | Annual Report | June 30, 2018 |
| | |
| Small-Cap Value Fund | | |
| SCHEDULE OF INVESTMENTS (continued) | | |
| Showing percentage of net assets as of June 30, 2018 | | |
| | | | | | | | | | | | |
| Industry Company | | Shares | | | Value | | | | |
| |
Common Stocks (continued) | | | | | |
Industrials (continued) | | | | | |
Sterling Construction Co., Inc.* | | | 55,737 | | | $ | 726,253 | | | | | |
Triton International, Ltd./Bermuda | | | 10,000 | | | | 306,600 | | | | | |
| | | | | | | | | | | | |
| | | | | | | 8,794,535 | | | | | |
| |
Information Technology - 8.83% | | | | | |
AVX Corp. | | | 41,100 | | | | 644,037 | | | | | |
CTS Corp. | | | 10,800 | | | | 388,800 | | | | | |
Diodes, Inc.* | | | 27,600 | | | | 951,372 | | | | | |
Rosetta Stone, Inc.* | | | 28,400 | | | | 455,252 | | | | | |
Systemax, Inc. | | | 22,200 | | | | 762,126 | | | | | |
Tech Data Corp.* | | | 7,700 | | | | 632,324 | | | | | |
TTM Technologies, Inc.* | | | 36,100 | | | | 636,443 | | | | | |
Unisys Corp.*+ | | | 55,800 | | | | 719,820 | | | | | |
Vishay Intertechnology, Inc. | | | 40,000 | | | | 928,000 | | | | | |
| | | | | | | | | | | | |
| | | | | | | 6,118,174 | | | | | |
| |
Materials - 2.95% | | | | | |
SunCoke Energy, Inc.* | | | 74,700 | | | | 1,000,980 | | | | | |
Verso Corp., Class A* | | | 18,400 | | | | 400,384 | | | | | |
Warrior Met Coal, Inc.+ | | | 23,500 | | | | 647,895 | | | | | |
| | | | | | | | | | | | |
| | | | | | | 2,049,259 | | | | | |
| |
Real Estate - 9.37% | | | | | |
CBL & Associates Properties, Inc.+ | | | 87,600 | | | | 487,932 | | | | | |
Cousins Properties, Inc. | | | 90,600 | | | | 877,914 | | | | | |
Education Realty Trust, Inc. | | | 17,600 | | | | 730,400 | | | | | |
Global Net Lease, Inc. | | | 29,700 | | | | 606,771 | | | | | |
Healthcare Realty Trust, Inc. | | | 21,500 | | | | 625,220 | | | | | |
Monmouth Real Estate Investment Corp. | | | 65,600 | | | | 1,084,368 | | | | | |
Select Income REIT | | | 39,000 | | | | 876,330 | | | | | |
Sunstone Hotel Investors, Inc. | | | 38,500 | | | | 639,870 | | | | | |
Washington Prime Group, Inc. | | | 69,800 | | | | 566,078 | | | | | |
| | | | | | | | | | | | |
| | | | | | | 6,494,883 | | | | | |
| |
Telecommunication Services - 1.53% | | | | | |
Intelsat SA*+ | | | 57,400 | | | | 956,284 | | | | | |
Windstream Holdings, Inc.+ | | | 20,620 | | | | 108,667 | | | | | |
| | | | | | | | | | | | |
| | | | | | | 1,064,951 | | | | | |
| |
Utilities - 2.07% | | | | | |
ALLETE, Inc. | | | 8,500 | | | | 657,985 | | | | | |
Atlantic Power Corp.* | | | 352,000 | | | | 774,400 | | | | | |
| | | | | | | | | | | | |
| | | | | | | 1,432,385 | | | | | |
| | | | | | | | | | | | |
TOTAL COMMON STOCKS - 96.93% | | | | 67,191,200 | | | | | |
| | | | | | | | | | | | |
(Cost $59,216,596) | | | | | | | | | | | | |
| | | | | | | | | | | | |
| | | Rate^ | | | Shares | | | Value | |
|
MONEY MARKET FUND - 3.66% | |
Fidelity Investments Money Market Government Portfolio Class I | | | 1.77 | % | | | 2,535,304 | | | | $2,535,304 | |
| | | | | | | | | | | | |
TOTAL MONEY MARKET FUND - 3.66% | | | | 2,535,304 | |
| | | | | | | | | | | | |
(Cost $2,535,304) | | | | | | | | | | | | |
|
| INVESTMENTS PURCHASED WITH CASH PROCEEDS FROM SECURITIES LENDING - 8.44% | |
Fidelity Investments Money Market Government Portfolio Class I** | | | 1.77 | % | | | 5,852,464 | | | | 5,852,464 | |
| | | | | | | | | | | | |
TOTAL INVESTMENTS PURCHASED WITH CASH PROCEEDS FROM SECURITIES LENDING -8.44% | | | | 5,852,464 | |
| | | | | | | | | | | | |
(Cost $5,852,464) | | | | | | | | | | | | |
| |
TOTAL INVESTMENTS - 109.03% | | | | $75,578,968 | |
(Cost $67,604,364) | | | | | | | | | | | | |
Liabilities in Excess of Other Assets - (9.03%) | | | | (6,262,431 | ) |
| | | | | | | | | | | | |
NET ASSETS - 100.00% | | | | $69,316,537 | |
| | | | | | | | | | | | |
| * | Non-income producing security. |
| ** | This security represents the investment of the collateral received in connection with securities out on loan as of June 30, 2018. |
| ^ | Rate disclosed as of June 30, 2018. |
| + | This security or a portion of the security is out on loan as of June 30, 2018. Total loaned securities had a value of $5,565,727 as of June 30, 2018. |
| | |
| Small-Cap Value Fund | |
|
| SCHEDULE OF INVESTMENTS (continued) |
| Showing percentage of net assets as of June 30, 2018 | | |
| | | | | | | | | | | | | | | | | | | | |
| Summary of inputs used to value the Fund’s investments as of 06/30/2018 (See Note 2 in Notes to Financial Statements): | | | | | |
| | |
| | | Valuation Inputs | | | | |
| | | | | |
| | | Investment in Securities (Value) | | | | |
| | | | | |
| | | | | | Level 2 | | | Level 3 | | | | | | | |
| | | Level 1 | | | Significant | | | Significant | | | | | | | |
| | | Quoted | | | Observable | | | Unobservable | | | | | | | |
| | | Prices | | | Inputs | | | Inputs | | | Total | | | | |
| | | | | |
| | | | | |
Common Stocks | | $ | 67,191,200 | | | $ | — | | | $ | — | | | $ | 67,191,200 | | | | | |
Money Market Fund | | | — | | | | 2,535,304 | | | | — | | | | 2,535,304 | | | | | |
Investments Purchased with Cash Proceeds from Securities Lending | | | — | | | | 5,852,464 | | | | — | | | | 5,852,464 | | | | | |
| | | | | | | | | | | | | | | | | | | | |
TOTAL | | $ | 67,191,200 | | | $ | 8,387,768 | | | $ | — | | | $ | 75,578,968 | | | | | |
| | | | | | | | | | | | | | | | | | | | |
| |
| See Notes to Financial Statements. | | | | | |
| | |
48 | | Annual Report | June 30, 2018 |
| | |
| Blue Chip 35 Index Fund | | |
| MANAGER’S COMMENTARY (Unaudited) | | |
June 30, 2018
Dear Fellow Blue Chip 35 Index Fund Shareholder,
For the quarter ended June 30, 2018, our Fund returned +2.74%, underperforming our primary market benchmark, the S&P 500 Index (+3.43%), our peer benchmark, the Lipper Large-Cap Core Funds Index (+3.09), and the Russell Top 50 Mega Cap Index (+4.16). It was a poor quarter on a relative basis.
For the fiscal year, our Fund returned +11.98%, trailing the S&P 500 Index (+14.37%), the Lipper Large-Cap Core Funds Index (+13.07%), and the Russell Top 50 Mega Cap Index (+14.85%).
The table below presents our June quarter, one-year, five-year, 10-year, 15-year, and inception-to-date financial results. See the next page for a graph of performance since inception.
Standardized Returns as of June 30, 2018
| | | | | | | | | | | | | | | | | | | | | | | | | | | | | | | | | | | |
| | | | | | | | | Annualized | | | | |
| | | Quarter | | 1 Year | | 5 Years | | 10 Years | | 15 Years | | Since Inception (7/31/97) | | |
| | | | | | | |
Blue Chip 35 Index Fund | | | | 2.74 | % | | | | 11.98 | % | | | | 11.82 | % | | | | 10.12 | % | | | | 8.26 | % | | | | 7.16 | % | | | | | |
S&P 500 Index | | | | 3.43 | % | | | | 14.37 | % | | | | 13.42 | % | | | | 10.17 | % | | | | 9.30 | % | | | | 7.13 | % | | | | | |
Russell Top 50 Mega Cap Index | | | | 4.16 | % | | | | 14.85 | % | | | | 13.26 | % | | | | 9.97 | % | | | | 8.12 | % | | | | 6.13 | % | | | | | |
Lipper Large-Cap Core Funds Index | | | | 3.09 | % | | | | 13.07 | % | | | | 12.10 | % | | | | 9.02 | % | | | | 8.32 | % | | | | 6.29 | % | | | | | |
Bridgeway Ultra-Large 35 Index | | | | 2.75 | % | | | | 12.03 | % | | | | 12.03 | % | | | | 10.43 | % | | | | 8.43 | % | | | | 7.35 | % | | | | | |
Performance figures quoted in the table above represent past performance and are no guarantee of future results. Total return figures in the table above include the reinvestment of dividends and capital gains. The table above does not reflect the deduction of taxes that a shareholder would pay on Fund distributions or on the redemption of Fund shares.
The S&P 500 Index is a broad-based, unmanaged measurement of changes in stock market conditions, based on the average of 500 widely held common stocks with dividends reinvested. The Russell Top 50 Mega Cap Index measures the performance of the largest companies in the Russell 3000 Index. It includes 50 of the largest securities, based on a combination of their market cap and current index membership, and represents approximately 40% of the total market capitalization of the Russell 3000 Index. The Bridgeway Ultra-Large 35 Index is an index composed of very large, “blue chip” U.S. stocks, excluding tobacco; it is compiled by the adviser of the Fund. The Lipper Large-Cap Core Funds Index reflects the aggregate record of domestic large-cap core mutual funds as reported by Lipper, Inc. It is not possible to invest directly in an index. Periods longer than one year are annualized.
| | |
| Blue Chip 35 Index Fund | |
|
| MANAGER’S COMMENTARY (Unaudited) (continued) |
| | |
Growth of a $10,000 Investment
from Inception July 31, 1997 to June 30, 2018
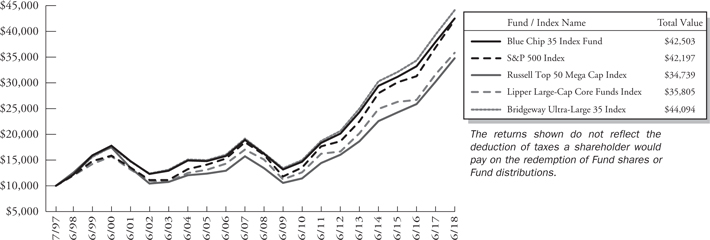
Detailed Explanation of Quarterly Performance
The Fund’s underweighting in higher momentum stocks compared to the benchmark dragged on relative returns during a quarter in which the momentum factor was in favor. However, the Fund’s mega-cap design boosted relative performance versus the benchmark.
From a sector perspective, the Fund’s allocation effect was positive, with an overweighting in the Energy sector making the largest contribution to relative returns. Stock selection effect was negative, with poor returns from holdings in the Information Technology and Consumer Discretionary sectors hurting relative performance the most.
Detailed Explanation of Fiscal Year Performance
An underweighting in higher momentum stocks compared to the benchmark dragged on relative returns during the 12-month period. The Fund’s equal weight design and disciplined rebalancing to maintain equal weighting requires us to trim positions that have performed well in recent months and add to names that recently have underperformed. However, the Fund’s mega-cap design helped relative performance as some of the largest market cap technology stocks significantly outperformed the index.
From a sector perspective, the Fund’s allocation effect was positive, with overweightings in the Information Technology and Energy sectors boosting relative returns the most. An underweighting in the Real Estate sector also helped relative performance. Stock selection effect was significantly negative, with holdings in the Industrials, Health Care, and Information Technology sectors detracting the most from relative returns.
| | |
| 50 | | Annual Report | June 30, 2018 |
| | |
| Blue Chip 35 Index Fund | | |
| MANAGER’S COMMENTARY (Unaudited) (continued) | | |
| | |
The table below presents index performance numbers for stocks in the different CRSP deciles during various time periods. The table is intended to provide a frame of reference for size.
| | | | | | | | | | | | | | | | | | | | |
| | | | | | | | | Annualized | |
| CRSP Decile1 | | Quarter | | | 1 Year | | | 5 Years | | | 10 Years | | | 92.5 Years | |
| 1 (ultra-large) | | | 3.87% | | | | 16.05% | | | | 13.73% | | | | 10.11% | | | | 9.43% | |
| 2 | | | 1.58% | | | | 10.94% | | | | 12.95% | | | | 10.67% | | | | 10.59% | |
| 3 | | | 3.93% | | | | 17.86% | | | | 13.49% | | | | 11.15% | | | | 11.13% | |
| 4 | | | 4.01% | | | | 16.59% | | | | 11.51% | | | | 11.11% | | | | 10.92% | |
| 5 | | | 5.82% | | | | 13.83% | | | | 10.74% | | | | 11.16% | | | | 11.47% | |
| 6 | | | 7.68% | | | | 19.11% | | | | 11.74% | | | | 11.29% | | | | 11.48% | |
| 7 | | | 8.29% | | | | 19.21% | | | | 13.44% | | | | 13.28% | | | | 11.67% | |
| 8 | | | 10.29% | | | | 20.50% | | | | 11.38% | | | | 12.55% | | | | 11.58% | |
| 9 | | | 12.39% | | | | 23.17% | | | | 13.72% | | | | 13.38% | | | | 11.66% | |
| 10 (ultra-small) | | | 11.57% | | | | 24.18% | | | | 11.92% | | | | 12.33% | | | | 13.38% | |
| 1 | Performance figures are as of the period ended June 30, 2018. The CRSP Cap-Based Portfolio Indexes are unmanaged indexes of publicly traded U.S. stocks with dividends reinvested, grouped by market capitalization, as reported by the Center for Research in Security Prices. Past performance is no guarantee of future results. |
| | |
| Blue Chip 35 Index Fund | |
|
| MANAGER’S COMMENTARY (Unaudited) (continued) |
| | |
Contribution to Returns for Blue Chip 35 Index Fund stocks for the fiscal year June 30, 2018:
| | | | | | | | | |
| Rank | | Company | | Industry | | % Contribution
to Return |
| 1 | | Amazon.com, Inc. | | Consumer Discretionary | | | | 2.4 | % |
| 2 | | Microsoft Corp. | | Information Technology | | | | 1.6 | % |
| 3 | | Visa, Inc., Class A | | Information Technology | | | | 1.5 | % |
| 4 | | ConocoPhillips | | Energy | | | | 1.3 | % |
| 5 | | Apple, Inc. | | Information Technology | | | | 1.3 | % |
| 6 | | Intel Corp. | | Information Technology | | | | 1.1 | % |
| 7 | | Cisco Systems, Inc. | | Information Technology | | | | 0.9 | % |
| 8 | | Bank of America Corp. | | Financials | | | | 0.7 | % |
| 9 | | Chevron Corp. | | Energy | | | | 0.7 | % |
| 10 | | JPMorgan Chase & Co. | | Financials | | | | 0.5 | % |
| 11 | | Verizon Communications, Inc. | | Telecommunication Services | | | | 0.5 | % |
| 12 | | Alphabet, Inc., Class C | | Information Technology | | | | 0.4 | % |
| 13 | | Walmart, Inc. | | Consumer Staples | | | | 0.4 | % |
| 14 | | Alphabet, Inc., Class A | | Information Technology | | | | 0.4 | % |
| 15 | | Pfizer, Inc. | | Health Care | | | | 0.3 | % |
| 16 | | Berkshire Hathaway, Inc., Class B | | Financials | | | | 0.3 | % |
| 17 | | QUALCOMM, Inc. | | Information Technology | | | | 0.3 | % |
| 18 | | Exxon Mobil Corp. | | Energy | | | | 0.2 | % |
| 19 | | McDonald’s Corp. | | Consumer Discretionary | | | | 0.2 | % |
| 20 | | Schlumberger, Ltd. | | Energy | | | | 0.1 | % |
| 21 | | Gilead Sciences, Inc. | | Health Care | | | | 0.1 | % |
| 22 | | United Technologies Corp. | | Industrials | | | | 0.1 | % |
| 23 | | Wells Fargo & Co. | | Financials | | | | 0.1 | % |
| 24 | | United Parcel Service, Inc., Class B | | Industrials | | | | 0.1 | % |
| 25 | | Coca-Cola Co. (The) | | Consumer Staples | | | | 0.0 | % |
| 26 | | Walt Disney Co. (The) | | Consumer Discretionary | | | | 0.0 | % |
| 27 | | Merck & Co., Inc. | | Health Care | | | | 0.0 | % |
| 28 | | 3M Co. | | Industrials | | | | 0.0 | % |
| 29 | | PepsiCo, Inc. | | Consumer Staples | | | | -0.1 | % |
| 30 | | Johnson & Johnson | | Health Care | | | | -0.1 | % |
| 31 | | International Business Machines Corp. | | Information Technology | | | | -0.1 | % |
| 32 | | Procter & Gamble Co. (The) | | Consumer Staples | | | | -0.1 | % |
| 33 | | AT&T, Inc. | | Telecommunication Services | | | | -0.3 | % |
| 34 | | Oracle Corp. | | Information Technology | | | | -0.3 | % |
| 35 | | Comcast Corp., Class A | | Consumer Discretionary | | | | -0.4 | % |
| 36 | | CVS Health Corp. | | Health Care | | | | -0.5 | % |
| 37 | | General Electric Co. | | Industrials | | | | -1.4 | % |
| | |
| 52 | | Annual Report | June 30, 2018 |
| | |
| Blue Chip 35 Index Fund | | |
| MANAGER’S COMMENTARY (Unaudited) (continued) | | |
| | |
Industry Sector Representation as of June 30, 2018
| | | | | | | | | | | | | | | |
| | | % of Net Assets | | % of S&P 500 Index | | Difference |
Consumer Discretionary | | | | 11.7 | % | | | | 12.9 | % | | | | -1.2 | % |
Consumer Staples | | | | 9.9 | % | | | | 7.0 | % | | | | 2.9 | % |
Energy | | | | 10.2 | % | | | | 6.3 | % | | | | 3.9 | % |
Financials | | | | 12.1 | % | | | | 13.8 | % | | | | -1.7 | % |
Health Care | | | | 12.3 | % | | | | 14.1 | % | | | | -1.8 | % |
Industrials | | | | 9.9 | % | | | | 9.5 | % | | | | 0.4 | % |
Information Technology | | | | 28.9 | % | | | | 26.0 | % | | | | 2.9 | % |
Materials | | | | 0.0 | % | | | | 2.6 | % | | | | -2.6 | % |
Real Estate | | | | 0.0 | % | | | | 2.9 | % | | | | -2.9 | % |
Telecommunication Services | | | | 4.9 | % | | | | 2.0 | % | | | | 2.9 | % |
Utilities | | | | 0.0 | % | | | | 2.9 | % | | | | -2.9 | % |
Cash & Other Assets | | | | 0.1 | % | | | | 0.0 | % | | | | 0.1 | % |
Total | | | | 100.0 | % | | | | 100.0 | % | | | | | |
Disclaimer
The views expressed here are exclusively those of Fund management. These views, including those concerning market sectors or individual stocks, are not meant as investment advice and should not be considered predictive in nature. Any favorable (or unfavorable) description of a holding applies only as of the quarter end, June 30, 2018, unless otherwise stated. Security positions can and do change thereafter. Discussions of historical performance do not guarantee and are not indicative of future performance.
The Fund is subject to significant market risk (volatility) and is not an appropriate investment for short-term investors.
Conclusion
Thank you for your continued investment in Blue Chip 35 Index Fund. We encourage your feedback; your reactions and concerns are important to us.
Sincerely,
The Investment Management Team
| | |
| Blue Chip 35 Index Fund | |
|
| SCHEDULE OF INVESTMENTS |
| Showing percentage of net assets as of June 30, 2018 | | |
| | | | | | |
| Industry Company | | Shares | | Value | | |
| |
COMMON STOCKS - 99.94% | | |
| Consumer Discretionary - 11.72% | | |
Amazon.com, Inc.* | | 13,350 | | $ 22,692,330 | | |
Comcast Corp., Class A | | 430,750 | | 14,132,907 | | |
McDonald’s Corp. | | 99,700 | | 15,621,993 | | |
Walt Disney Co. (The) | | 134,200 | | 14,065,502 | | |
| | | | | | |
| | | | 66,512,732 | | |
| Consumer Staples - 9.92% | | |
Coca-Cola Co. (The) | | 323,314 | | 14,180,552 | | |
PepsiCo, Inc. | | 129,375 | | 14,085,056 | | |
Procter & Gamble Co. (The) | | 179,806 | | 14,035,656 | | |
Walmart, Inc. | | 163,669 | | 14,018,250 | | |
| | | | | | |
| | | | 56,319,514 | | |
| Energy - 10.23% | | |
Chevron Corp. | | 111,795 | | 14,134,242 | | |
ConocoPhillips | | 229,350 | | 15,967,347 | | |
Exxon Mobil Corp. | | 170,037 | | 14,067,161 | | |
Schlumberger, Ltd. | | 207,250 | | 13,891,968 | | |
| | | | | | |
| | | | 58,060,718 | | |
| Financials - 12.11% | | |
Bank of America Corp. | | 748,408 | | 21,097,622 | | |
Berkshire Hathaway, Inc., | | | | | | |
Class B* | | 75,150 | | 14,026,747 | | |
JPMorgan Chase & Co. | | 184,395 | | 19,213,959 | | |
Wells Fargo & Co. | | 259,059 | | 14,362,231 | | |
| | | | | | |
| | | | 68,700,559 | | |
| Health Care - 12.30% | | |
CVS Health Corp. | | 211,150 | | 13,587,502 | | |
Gilead Sciences, Inc. | | 199,850 | | 14,157,374 | | |
Johnson & Johnson | | 115,202 | | 13,978,611 | | |
Merck & Co., Inc. | | 233,135 | | 14,151,294 | | |
Pfizer, Inc. | | 384,274 | | 13,941,461 | | |
| | | | | | |
| | | | 69,816,242 | | |
| Industrials - 9.91% | | |
3M Co. | | 71,700 | | 14,104,824 | | |
General Electric Co. | | 1,024,543 | | 13,944,030 | | |
United Parcel Service, Inc., Class B | | 132,763 | | 14,103,413 | | |
United Technologies Corp. | | 112,730 | | 14,094,632 | | |
| | | | | | |
| | | | 56,246,899 | | |
| Information Technology - 28.83% | | |
Alphabet, Inc., Class A* | | 10,030 | | 11,325,776 | | |
Alphabet, Inc., Class C* | | 10,159 | | 11,333,888 | | |
Apple, Inc. | | 123,600 | | 22,879,596 | | |
Cisco Systems, Inc. | | 366,558 | | 15,772,991 | | |
Intel Corp. | | 285,693 | | 14,201,799 | | |
| | | | | | |
| | | | | | |
| | | | | | |
| | | | | | |
| | | | | | | | |
| Industry Company | | Shares | | | Value | |
|
| |
Information Technology (continued) | |
International Business | | | | | | | | |
Machines Corp. | | | 100,317 | | | $ | 14,014,285 | |
Microsoft Corp. | | | 232,695 | | | | 22,946,054 | |
Oracle Corp. | | | 320,613 | | | | 14,126,209 | |
QUALCOMM, Inc. | | | 251,100 | | | | 14,091,732 | |
Visa, Inc., Class A | | | 172,900 | | | | 22,900,605 | |
| | | | | | | | |
| | | | | | | 163,592,935 | |
|
Telecommunication Services - 4.92% | |
AT&T, Inc. | | | 436,505 | | | | 14,016,176 | |
Verizon Communications, Inc. | | | 276,289 | | | | 13,900,100 | |
| | | | | | | | |
| | | | | | | 27,916,276 | |
| | | | | | | | |
TOTAL COMMON STOCKS - 99.94% | | | | 567,165,875 | |
| | | | | | | | |
(Cost $306,397,931) | | | | | | | | |
| | | | | | | | | | | | |
| | | |
| | | Rate^ | | | Shares | | | Value | |
|
MONEY MARKET FUND - 0.04% | |
Fidelity Investments Money Market Government Portfolio Class I | | | 1.77 | % | | | 246,690 | | | | 246,690 | |
| | | | | | | | | | | | |
| |
TOTAL MONEY MARKET FUND - 0.04% | | | | 246,690 | |
| | | | | | | | | | | | |
(Cost $246,690) | | | | | |
| |
TOTAL INVESTMENTS - 99.98% | | | $ | 567,412,565 | |
(Cost $306,644,621) | | | | | |
Other Assets in Excess of Liabilities - 0.02% | | | | 100,534 | |
| | | | | | | | | | | | |
NET ASSETS - 100.00% | | | $ | 567,513,099 | |
| | | | | | | | | | | | |
| * | Non-income producing security. |
| ^ | Rate disclosed as of June 30, 2018. |
Summary of inputs used to value the Fund’s investments as of 06/30/2018 (See Note 2 in Notes to Financial Statements):
| | | | | | | | | | | | | | | | |
| | | Valuation Inputs | |
| | | Investment in Securities (Value) | |
| | | Level 1 Quoted Prices | | | Level 2
Significant
Observable
Inputs | | | Level 3
Significant
Unobservable
Inputs | | | Total | |
| | | | |
Common Stocks | | $ | 567,165,875 | | | $ | — | | | $ | — | | | $ | 567,165,875 | |
| | | | |
Money Market Fund | | | — | | | | 246,690 | | | | — | | | | 246,690 | |
| | | | | | | | | | | | | | | | |
| | | | |
TOTAL | | $ | 567,165,875 | | | $ | 246,690 | | | $ | — | | | $ | 567,412,565 | |
| | | | | | | | | | | | | | | | |
See Notes to Financial Statements.
| | |
| 54 | | Annual Report | June 30, 2018 |
| | |
| Managed Volatility Fund | | |
| MANAGER’S COMMENTARY (Unaudited) | | |
June 30, 2018
Dear Fellow Managed Volatility Fund Shareholder,
For the quarter ended June 30, 2018, our Fund returned +1.88%, underperforming our primary market benchmark, the S&P 500 Index (+3.43%), but outperforming our peer benchmark, the Lipper Balanced Funds Index (+1.13%). The Fund performed in line with its design during the quarter.
For the fiscal year, our Fund returned +7.11%, trailing the S&P 500 Index (+14.37%), but slightly outperforming the Lipper Balanced Funds Index (+7.01%).
The table below presents our June quarter, one-year, five-year, 10-year, 15-year, and inception-to-date financial results. See the next page for a graph of performance since inception.
Standardized Returns as of June 30, 2018
| | | | | | | | | | | | | | | | | | | | | | | | | | | | | | |
| | | | | | | Annualized | | |
| | | Quarter | | 1 Year | | 5 Years | | 10 Years | | 15 Years | | Since Inception
(6/30/01) |
| | | | | | |
Managed Volatility Fund | | | | 1.88% | | | | | 7.11% | | | | | 4.61% | | | | | 3.63% | | | | | 4.54% | | | | | 4.10% | |
S&P 500 Index | | | | 3.43% | | | | | 14.37% | | | | | 13.42% | | | | | 10.17% | | | | | 9.30% | | | | | 6.92% | |
Lipper Balanced Funds Index | | | | 1.13% | | | | | 7.01% | | | | | 7.60% | | | | | 6.44% | | | | | 6.65% | | | | | 5.57% | |
Performance figures quoted in the table above represent past performance and are no guarantee of future results. Total return figures in the table above include the reinvestment of dividends and capital gains. The table above does not reflect the deduction of taxes that a shareholder would pay on Fund distributions or on the redemption of Fund shares.
The S&P 500 Index is a broad-based, unmanaged measurement of changes in stock market conditions, based on the average of 500 widely held common stocks with dividends reinvested. The Lipper Balanced Funds Index is an index of balanced funds compiled by Lipper, Inc. It is not possible to invest directly in an index. Periods longer than one year are annualized.
| | |
| Managed Volatility Fund | |
|
| MANAGER’S COMMENTARY (Unaudited) (continued) |
| | |
Growth of a $10,000 Investment
from Inception June 30, 2001 to June 30, 2018
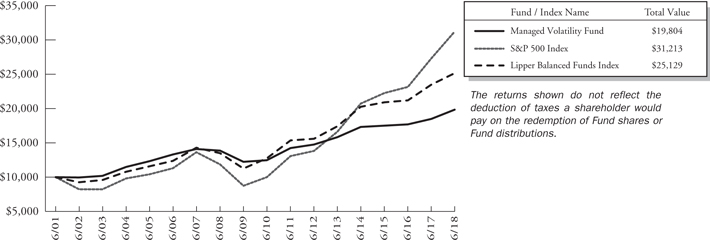
Detailed Explanation of Quarterly Performance
The Fund exceeded our objective of capturing 40% of the S&P 500 Index’s quarterly return. The Fund’s standard deviation of 0.37% was 53% lower than the S&P 500’s standard deviation of 0.78% during the quarter.
The portfolio’s equities component had the largest positive impact on performance, contributing about 1.92% to the Fund’s return. The portfolio’s futures and fixed income components also had a small positive impact on performance. In contrast, the portfolio’s options component detracted from relative performance, contributing -0.15% to the Fund’s return.
Detailed Explanation of Fiscal Year Performance
For the fiscal year, the Fund exceeded our objective of capturing 40% of the S&P 500’s return. The Fund’s 5.66% standard deviation was 55% lower than the S&P 500’s standard deviation of 12.60% during the 12-month period.
The portfolio’s equities component delivered positive absolute performance, contributing 8.75% to the Fund’s return. The portfolio’s futures component was the largest detractor from relative performance, contributing -0.74% to the Fund’s return. This performance was in line with expectations during a fiscal year characterized by a rising equity market. The portfolio’s options and fixed income components net of fees also detracted from relative performance, contributing about -0.72% and -0.12% to the Fund’s return, respectively.
The Fund continues to perform as designed, particularly over longer time horizons. For 10 years and since inception, the Fund has captured roughly 36% and 59%, respectively, of the S&P 500 Index’s return with a standard deviation roughly 56% lower than the index’s.
| | |
| 56 | | Annual Report | June 30, 2018 |
| | |
| Managed Volatility Fund | | |
| MANAGER’S COMMENTARY (Unaudited) (continued) | | |
Top Ten Equity Holdings as of June 30, 2018
| | | | | | | | |
| Rank | | Description | | Industry | | % of Net
Assets |
| 1 | | Micron Technology, Inc. | | Information Technology | | | 2.5 | % |
| 2 | | Apple, Inc. | | Information Technology | | | 2.2 | % |
| 3 | | United Rentals, Inc. | | Industrials | | | 1.6 | % |
| 4 | | Amazon.com, Inc. | | Consumer Discretionary | | | 1.6 | % |
| 5 | | Allstate Corp. (The) | | Financials | | | 1.1 | % |
| 6 | | Alliance Data Systems Corp. | | Information Technology | | | 1.1 | % |
| 7 | | Westlake Chemical Corp. | | Materials | | | 1.0 | % |
| 8 | | Alphabet, Inc., Class A | | Information Technology | | | 0.9 | % |
| 9 | | Facebook, Inc., Class A | | Information Technology | | | 0.9 | % |
| 10 | | Alphabet, Inc., Class C | | Information Technology | | | 0.9 | % |
| | Total | | | | | 13.8 | % |
Industry Sector Representation as of June 30, 2018
| | | | |
| Asset Type | | % of Net
Assets | |
Common Stock | | | 60.1% | |
Consumer Discretionary | | | 6.7% | |
Consumer Staples | | | 3.2% | |
Energy | | | 2.9% | |
Financials | | | 10.8% | |
Health Care | | | 6.4% | |
Industrials | | | 7.2% | |
Information Technology | | | 16.6% | |
Materials | | | 2.8% | |
Real Estate | | | 1.3% | |
Telecommunication Services | | | 0.9% | |
Utilities | | | 1.3% | |
U.S. Government Obligations | | | 33.4% | |
Call Options Written | | | -0.6% | |
Put Options Written | | | -1.0% | |
Money Market Fund | | | 8.6% | |
Liabilities in Excess of Other Assets | | | -0.5% | |
Total | | | 100% | |
Disclaimer
The views expressed here are exclusively those of Fund management. These views, including those related to market sectors or individual stocks, are not meant as investment advice and should not be considered predictive in nature. Any favorable (or unfavorable) description of a holding applies only as of the quarter end, June 30, 2018, unless otherwise stated. Security positions can and do change thereafter. Discussions of historical performance do not guarantee and may not be indicative of future performance.
Market volatility can significantly affect short-term performance. The Fund is not an appropriate investment for short-term investors. Investments in the small companies within this multi-cap fund generally carry greater risk than is customarily associated with larger companies. This additional risk is attributable to a number of factors, including the relatively limited financial resources that are typically available to small companies and the fact that small companies often have comparatively limited product lines. In addition, the stock of small companies tends to be more volatile than the stock of large companies, particularly in the short term and particularly in the early stages of an economic or market downturn. The Fund’s use of options,
| | |
| Managed Volatility Fund | |
|
| MANAGER’S COMMENTARY (Unaudited) (continued) |
futures, and leverage can magnify the risk of loss in an unfavorable market, and the Fund’s use of short-sale positions can, in theory, expose shareholders to unlimited loss. Shareholders of the Fund, therefore, are taking on more risk than they would if they invested in the stock market as a whole. The Fund uses an option writing strategy in which the Fund may sell covered calls or secured put options. Options are subject to special risks and may not fully protect the Fund against declines in the value of its stocks. In addition, an option writing strategy limits the upside profit potential normally associated with stocks. Finally, the Fund’s fixed-income holdings are subject to three types of risk. Interest rate risk is the chance that bond prices overall will decline as interest rates rise. Credit risk is the chance that a bond issuer will fail to pay interest and principal. Prepayment risk is the chance that a mortgage-backed bond issuer will repay a higher yielding bond, resulting in a lower paying yield.
Conclusion
Thank you for your continued investment in Managed Volatility Fund. We encourage your feedback; your reactions and concerns are important to us.
Sincerely,
The Investment Management Team
| | |
| 58 | | Annual Report | June 30, 2018 |
| | |
| Managed Volatility Fund | | |
| SCHEDULE OF INVESTMENTS | | |
| Showing percentage of net assets as of June 30, 2018 | | |
| | | | | | | | | | | | |
| Industry Company | | | Shares | | | | Value | | | | | |
| |
COMMON STOCKS - 60.14% | | | | | |
| Consumer Discretionary - 6.70% | | | | |
Adient PLC | | | 495 | | | $ | 24,349 | | | | | |
Amazon.com, Inc.* | | | 300 | | | | 509,940 | | | | | |
Aptiv PLC | | | 500 | | | | 45,815 | | | | | |
AutoZone, Inc.* | | | 200 | | | | 134,186 | | | | | |
Booking Holdings, Inc.* | | | 100 | | | | 202,709 | | | | | |
Carnival Corp. | | | 600 | | | | 34,386 | | | | | |
Comcast Corp., Class A# | | | 2,500 | | | | 82,025 | | | | | |
Delphi Technologies PLC | | | 166 | | | | 7,546 | | | | | |
Discovery, Inc., Class C*# | | | 2,214 | | | | 56,457 | | | | | |
Dollar General Corp. | | | 500 | | | | 49,300 | | | | | |
Ford Motor Co.# | | | 2,900 | | | | 32,103 | | | | | |
General Motors Co.# | | | 100 | | | | 3,940 | | | | | |
Goodyear Tire & Rubber Co. (The) | | | 200 | | | | 4,658 | | | | | |
Hasbro, Inc.# | | | 700 | | | | 64,617 | | | | | |
McDonald’s Corp. | | | 500 | | | | 78,345 | | | | | |
NIKE, Inc., Class B# | | | 1,500 | | | | 119,520 | | | | | |
Omnicom Group, Inc.#+ | | | 1,200 | | | | 91,524 | | | | | |
PulteGroup, Inc.# | | | 10,000 | | | | 287,500 | | | | | |
Ross Stores, Inc.# | | | 500 | | | | 42,375 | | | | | |
Starbucks Corp.# | | | 1,000 | | | | 48,850 | | | | | |
Target Corp. | | | 500 | | | | 38,060 | | | | | |
Twenty-First Century Fox, | | | | | | | | | | | | |
Inc., Class A | | | 1,200 | | | | 59,628 | | | | | |
Walt Disney Co. (The)# | | | 900 | | | | 94,329 | | | | | |
Wynn Resorts, Ltd. | | | 200 | | | | 33,468 | | | | | |
Yum China Holdings, Inc.# | | | 800 | | | | 30,768 | | | | | |
Yum! Brands, Inc. | | | 300 | | | | 23,466 | | | | | |
| | | | | | | | | | | | |
| | | | | | | 2,199,864 | | | | | |
| |
Consumer Staples - 3.23% | | | | | |
Archer-Daniels-Midland Co.# | | | 1,000 | | | | 45,830 | | | | | |
Campbell Soup Co.#+ | | | 1,900 | | | | 77,026 | | | | | |
Coca-Cola Co. (The) | | | 900 | | | | 39,474 | | | | | |
Colgate-Palmolive Co.# | | | 700 | | | | 45,367 | | | | | |
Constellation Brands, Inc., Class A | | | 500 | | | | 109,435 | | | | | |
Costco Wholesale Corp. | | | 300 | | | | 62,694 | | | | | |
General Mills, Inc.# | | | 1,600 | | | | 70,816 | | | | | |
JM Smucker Co. (The) | | | 400 | | | | 42,992 | | | | | |
Kimberly-Clark Corp.# | | | 1,100 | | | | 115,874 | | | | | |
Kroger Co. (The)# | | | 800 | | | | 22,760 | | | | | |
Mondelez International, Inc. Class A# | | | 3,600 | | | | 147,600 | | | | | |
PepsiCo, Inc.# | | | 1,300 | | | | 141,531 | | | | | |
Procter & Gamble Co. (The)# | | | 1,100 | | | | 85,866 | | | | | |
Walmart, Inc. | | | 600 | | | | 51,390 | | | | | |
| | | | | | | | | | | | |
| | | | | | | 1,058,655 | | | | | |
| |
Energy - 2.87% | | | | | |
Anadarko Petroleum Corp.# | | | 700 | | | | 51,275 | | | | | |
| | | | | | | | |
| Industry Company | | Shares | | | Value | |
|
| |
Energy (continued) | |
Chevron Corp.# | | | 1,778 | | | $ | 224,793 | |
ConocoPhillips# | | | 1,287 | | | | 89,601 | |
EOG Resources, Inc. | | | 500 | | | | 62,215 | |
Exxon Mobil Corp.# | | | 1,900 | | | | 157,187 | |
Halliburton Co.# | | | 700 | | | | 31,542 | |
Helmerich & Payne, Inc.# | | | 1,000 | | | | 63,760 | |
Kinder Morgan, Inc. | | | 1,800 | | | | 31,806 | |
Marathon Petroleum Corp.# | | | 1,700 | | | | 119,272 | |
Phillips 66 | | | 593 | | | | 66,600 | |
Valero Energy Corp. | | | 400 | | | | 44,332 | |
| | | | | | | | |
| | | | | | | 942,383 | |
|
Financials - 10.76% | |
Allstate Corp. (The)# | | | 4,100 | | | | 374,207 | |
Ally Financial, Inc.# | | | 7,500 | | | | 197,025 | |
American Express Co.# | | | 900 | | | | 88,200 | |
Aon PLC# | | | 800 | | | | 109,736 | |
Athene Holding, Ltd., Class A*# | | | 5,700 | | | | 249,888 | |
Bank of America Corp.# | | | 2,300 | | | | 64,837 | |
BB&T Corp.# | | | 800 | | | | 40,352 | |
Berkshire Hathaway, Inc., Class B* | | | 500 | | | | 93,325 | |
BlackRock, Inc. | | | 300 | | | | 149,712 | |
Capital One Financial Corp.# | | | 700 | | | | 64,330 | |
Charles Schwab Corp. (The)# | | | 1,800 | | | | 91,980 | |
Chubb, Ltd. | | | 361 | | | | 45,854 | |
Citigroup, Inc.# | | | 2,810 | | | | 188,045 | |
Comerica, Inc. | | | 300 | | | | 27,276 | |
Goldman Sachs Group, Inc. (The) | | | 500 | | | | 110,285 | |
Huntington Bancshares, Inc. | | | 3,200 | | | | 47,232 | |
Jefferies Financial Group, Inc.# | | | 2,000 | | | | 45,480 | |
JPMorgan Chase & Co.# | | | 1,000 | | | | 104,200 | |
KeyCorp | | | 4,800 | | | | 93,792 | |
Marsh & McLennan Cos., Inc. | | | 300 | | | | 24,591 | |
Morgan Stanley# | | | 2,300 | | | | 109,020 | |
PNC Financial Services | | | | | | | | |
Group, Inc. (The) | | | 500 | | | | 67,550 | |
Progressive Corp. (The)# | | | 1,220 | | | | 72,163 | |
Prudential Financial, Inc.# | | | 3,000 | | | | 280,530 | |
S&P Global, Inc. | | | 500 | | | | 101,945 | |
State Street Corp.# | | | 700 | | | | 65,163 | |
T Rowe Price Group, Inc. | | | 1,000 | | | | 116,090 | |
Travelers Cos., Inc. (The)# | | | 1,700 | | | | 207,978 | |
U.S. Bancorp# | | | 1,900 | | | | 95,038 | |
Wells Fargo & Co.# | | | 3,671 | | | | 203,520 | |
| | | | | | | | |
| | | | | | | 3,529,344 | |
| | |
| Managed Volatility Fund | |
|
| SCHEDULE OF INVESTMENTS (continued) |
| Showing percentage of net assets as of June 30, 2018 | | |
| | | | | | |
| Industry Company | | Shares | | Value | | |
| |
Common Stocks (continued) | | |
| Health Care - 6.48% | | |
Abbott Laboratories# | | 1,900 | | $ 115,881 | | |
AbbVie, Inc.# | | 1,600 | | 148,240 | | |
Allergan PLC | | 300 | | 50,016 | | |
Amgen, Inc.# | | 800 | | 147,672 | | |
Anthem, Inc. | | 300 | | 71,409 | | |
Baxter International, Inc. | | 600 | | 44,304 | | |
Becton Dickinson & Co.# | | 773 | | 185,180 | | |
Biogen, Inc.* | | 400 | | 116,096 | | |
Bristol-Myers Squibb Co.# | | 1,479 | | 81,848 | | |
Celgene Corp.*# | | 1,100 | | 87,362 | | |
CVS Health Corp.# | | 700 | | 45,045 | | |
Danaher Corp.# | | 800 | | 78,944 | | |
DaVita, Inc.*# | | 1,100 | | 76,384 | | |
Express Scripts Holding Co.* | | 1,234 | | 95,277 | | |
Gilead Sciences, Inc.# | | 700 | | 49,588 | | |
Johnson & Johnson# | | 1,400 | | 169,876 | | |
Merck & Co., Inc.# | | 2,200 | | 133,540 | | |
Pfizer, Inc.# | | 2,500 | | 90,700 | | |
Stryker Corp.# | | 660 | | 111,448 | | |
Thermo Fisher Scientific, Inc. | | 500 | | 103,570 | | |
UnitedHealth Group, Inc. | | 500 | | 122,670 | | |
| | | | | | |
| | | | 2,125,050 | | |
| |
Industrials - 7.20% | | |
3M Co.# | | 800 | | 157,376 | | |
AerCap Holdings NV*# | | 1,100 | | 59,565 | | |
Boeing Co. (The) | | 300 | | 100,653 | | |
Deere & Co. | | 400 | | 55,920 | | |
Emerson Electric Co.# | | 1,500 | | 103,710 | | |
FedEx Corp.# | | 600 | | 136,236 | | |
General Electric Co. | | 2,900 | | 39,469 | | |
Honeywell International, Inc.# | | 1,000 | | 144,050 | | |
JetBlue Airways Corp.*# | | 10,700 | | 203,086 | | |
Johnson Controls International PLC# | | 754 | | 25,221 | | |
Lockheed Martin Corp. | | 270 | | 79,766 | | |
Northrop Grumman Corp.# | | 700 | | 215,390 | | |
NOW, Inc.*+ | | 200 | | 2,666 | | |
Raytheon Co. | | 300 | | 57,954 | | |
Southwest Airlines Co.# | | 3,400 | | 172,992 | | |
Union Pacific Corp. | | 500 | | 70,840 | | |
United Rentals, Inc.*# | | 3,600 | | 531,432 | | |
United Technologies Corp.# | | 1,140 | | 142,534 | | |
Waste Management, Inc.# | | 800 | | 65,072 | | |
| | | | | | |
| | | | 2,363,932 | | |
| |
Information Technology - 16.56% | | |
Adobe Systems, Inc.*# | | 800 | | 195,048 | | |
| | | | | | | | |
| Industry Company | | Shares | | | Value | |
|
Information Technology (continued) | |
Alliance Data Systems Corp.# | | | 1,600 | | | $ | 373,120 | |
Alphabet, Inc., Class A* | | | 260 | | | | 293,589 | |
Alphabet, Inc., Class C* | | | 260 | | | | 290,069 | |
Apple, Inc.# | | | 3,900 | | | | 721,929 | |
Applied Materials, Inc.# | | | 1,600 | | | | 73,904 | |
Cisco Systems, Inc.# | | | 5,900 | | | | 253,877 | |
Citrix Systems, Inc.*# | | | 500 | | | | 52,420 | |
Cognex Corp.# | | | 2,500 | | | | 111,525 | |
Cognizant Technology Solutions Corp., Class A# | | | 700 | | | | 55,293 | |
Dell Technologies, Inc., | | | | | | | | |
Class V* | | | 222 | | | | 18,777 | |
DXC Technology Co. | | | 171 | | | | 13,784 | |
eBay, Inc.*# | | | 700 | | | | 25,382 | |
Electronic Arts, Inc.*# | | | 800 | | | | 112,816 | |
Facebook, Inc., Class A*# | | | 1,500 | | | | 291,480 | |
Hewlett Packard Enterprise Co. | | | 1,400 | | | | 20,454 | |
HP, Inc. | | | 2,000 | | | | 45,380 | |
Intel Corp.# | | | 2,400 | | | | 119,304 | |
International Business Machines Corp.# | | | 1,300 | | | | 181,610 | |
Intuit, Inc. | | | 400 | | | | 81,722 | |
Juniper Networks, Inc.# | | | 3,900 | | | | 106,938 | |
LogMeIn, Inc. | | | 189 | | | | 19,514 | |
Mastercard, Inc., Class A# | | | 800 | | | | 157,216 | |
Micro Focus International PLC, ADR | | | 196 | | | | 3,385 | |
Micron Technology, Inc.*# | | | 15,700 | | | | 823,308 | |
Microsoft Corp.# | | | 800 | | | | 78,888 | |
Oracle Corp.# | | | 1,260 | | | | 55,516 | |
PayPal Holdings, Inc.* | | | 400 | | | | 33,308 | |
Perspecta, Inc. | | | 85 | | | | 1,747 | |
QUALCOMM, Inc.# | | | 1,000 | | | | 56,120 | |
salesforce.com, Inc.*# | | | 1,300 | | | | 177,320 | |
Texas Instruments, Inc.# | | | 970 | | | | 106,942 | |
Total System Services, Inc.# | | | 1,800 | | | | 152,136 | |
Visa, Inc., Class A | | | 1,900 | | | | 251,655 | |
Western Digital Corp.# | | | 1,010 | | | | 78,184 | |
| | | | | | | | |
| | | | | | | 5,433,660 | |
|
Materials - 2.78% | |
AdvanSix, Inc.* | | | 48 | | | | 1,758 | |
DowDuPont, Inc. | | | 900 | | | | 59,328 | |
Eastman Chemical Co.# | | | 2,100 | | | | 209,916 | |
International Paper Co.# | | | 700 | | | | 36,456 | |
LyondellBasell Industries NV, Class A | | | 500 | | | | 54,925 | |
Praxair, Inc.# | | | 600 | | | | 94,890 | |
Sherwin-Williams Co. (The) | | | 300 | | | | 122,271 | |
| | |
| 60 | | Annual Report | June 30, 2018 |
| | |
| Managed Volatility Fund | | |
| SCHEDULE OF INVESTMENTS (continued) | | |
| Showing percentage of net assets as of June 30, 2018 | | |
| | | | | | |
| Industry Company | | Shares | | Value | | |
| | | |
Common Stocks (continued) | | | | | | |
Materials (continued) | | |
Westlake Chemical Corp.# | | 3,100 | | $ 333,653 | | |
| | | | | | |
| | | | 913,197 | | |
| |
Real Estate - 1.33% | | |
American Tower Corp.# | | 800 | | 115,336 | | |
Crown Castle International Corp. | | 500 | | 53,910 | | |
Public Storage | | 500 | | 113,430 | | |
Simon Property Group, Inc.# | | 900 | | 153,171 | | |
| | | | | | |
| | | | 435,847 | | |
| |
Telecommunication Services - 0.94% | | |
AT&T, Inc.# | | 6,441 | | 206,812 | | |
CenturyLink, Inc.# | | 1,200 | | 22,368 | | |
Verizon Communications, Inc.# | | 1,600 | | 80,496 | | |
| | | | | | |
| | | | 309,676 | | |
| |
Utilities - 1.29% | | |
AES Corp. | | 4,300 | | 57,663 | | |
American Electric Power Co., Inc. | | 1,000 | | 69,250 | | |
Dominion Energy, Inc.# | | 1,020 | | 69,544 | | |
Duke Energy Corp. | | 783 | | 61,920 | | |
Exelon Corp.# | | 1,400 | | 59,640 | | |
Public Service Enterprise Group, Inc. | | 900 | | 48,726 | | |
Sempra Energy | | 500 | | 58,055 | | |
| | | | | | |
| | | | 424,798 | | |
| | | | | | |
TOTAL COMMON STOCKS - 60.14% | | | | 19,736,406 | | |
| | | | | | |
(Cost $12,890,763) | | | | | | |
| | | | | | | | | | | | | | | | |
| | | | |
| Due Date | | Discount Rate
or Coupon Rate | | | Principal
Amount | | | Value | | | | |
| |
U.S. GOVERNMENT OBLIGATIONS - 33.43% | | | | | |
U.S. Treasury Bills - 33.43% | | | | | | | | | | | | | |
07/05/2018 | | | 1.710%(a) | | | $ | 2,000,000 | | | | 1,999,723 | | | | | |
07/12/2018 | | | 1.722%(a) | | | | 2,000,000 | | | | 1,999,069 | | | | | |
08/30/2018 | | | 1.904%(a) | | | | 3,000,000 | | | | 2,990,855 | | | | | |
09/27/2018 | | | 1.876%(a) | | | | 4,000,000 | | | | 3,981,778 | | | | | |
| | | | | | | | | | | | | | | | |
| | | | | | | | | | | 10,971,425 | | | | | |
| | | | | | | | | | | | | | | | |
TOTAL U.S. GOVERNMENT OBLIGATIONS - 33.43% | | | | 10,971,425 | | | | | |
| | | | | | | | | | | | | | | | |
(Cost $10,970,870) | | | | | | | | | |
| | | | | | | | | | | | |
| | | Rate^ | | | Shares | | | Value | |
|
MONEY MARKET FUND - 8.63% | |
Fidelity Investments Money Market Government Portfolio Class I | | | 1.77 | % | | | 2,832,835 | | | | $2,832,835 | |
| | | | | | | | | | | | |
TOTAL MONEY MARKET FUND – 8.63% | | | | 2,832,835 | |
| | | | | | | | | | | | |
(Cost $2,832,835) | | | | | |
|
| INVESTMENTS PURCHASED WITH CASH PROCEEDS FROM SECURITIES LENDING - 0.11% | |
Fidelity Investments Money Market Government Portfolio Class I** | | | 1.77 | % | | | 35,460 | | | | 35,460 | |
| | | | | | | | | | | | |
TOTAL INVESTMENTS PURCHASED WITH CASH PROCEEDS FROM SECURITIES LENDING -0.11% | | | | 35,460 | |
| | | | | | | | | | | | |
(Cost $35,460) | | | | | |
| |
TOTAL INVESTMENTS BEFORE OPTIONS WRITTEN - 102.31% | | | | $33,576,126 | |
| | | | | | | | | | | | |
(Cost $26,729,928) | | | | | |
|
| WRITTEN OPTIONS - (1.55%) | |
TOTAL WRITTEN OPTIONS - (1.55%) | | | | $ (509,335) | |
| | | | | | | | | | | | |
(Premiums Received $(514,848)) | | | | | |
| |
TOTAL INVESTMENTS - 100.76% | | | | $33,066,791 | |
(Cost $26,215,080) | | | | | |
Liabilities in Excess of Other Assets - (0.76%) | | | | (250,401 | ) |
| | | | | | | | | | | | |
NET ASSETS - 100.00% | | | | $32,816,390 | |
| | | | | | | | | | | | |
| * | Non-income producing security. |
| ** | This security represents the investment of the collateral received in connection with securities out on loan as of June 30, 2018. |
| # | Security subject to call or put option written by the Fund. |
| ^ | Rate disclosed as of June 30, 2018. |
| + | This security or a portion of the security is out on loan as of June 30, 2018. Total loaned securities had a value of $34,617 as of June 30, 2018. |
| (a) | Rate represents the effective yield at purchase. |
| PLC - Public | Limited Company |
| ADR - American | Depositary Receipt |
| | |
| Managed Volatility Fund | |
|
| SCHEDULE OF INVESTMENTS (continued) |
| Showing percentage of net assets as of June 30, 2018 | | |
| | | | | | | | | | | | | | | | | | | | |
| Description | | Number of
Contracts | | | Notional
Amount | | | Exercise
Price | | | Expiration
Date | | | Value | |
EXCHANGE TRADED PUT OPTIONS WRITTEN - (0.96%) | | | | | | | | | | | | | |
| | | | | |
AerCap Holdings NV | | | 40 | | | $ | (216,600 | ) | | $ | 55.00 | | | | 08/17/18 | | | $ | (8,000 | ) |
Air Products & Chemicals, Inc. | | | 20 | | | | (311,460 | ) | | | 165.00 | | | | 09/21/18 | | | | (22,000 | ) |
Centene Corp. | | | 12 | | | | (147,852 | ) | | | 120.00 | | | | 09/21/18 | | | | (5,160 | ) |
Chemours Co. (The) | | | 19 | | | | (84,284 | ) | | | 50.00 | | | | 07/27/18 | | | | (11,400 | ) |
Chemours Co. (The) | | | 10 | | | | (44,360 | ) | | | 50.00 | | | | 07/20/18 | | | | (5,400 | ) |
Cimarex Energy Co. | | | 38 | | | | (386,612 | ) | | | 85.00 | | | | 09/21/18 | | | | (5,130 | ) |
Extra Space Storage, Inc. | | | 35 | | | | (349,335 | ) | | | 95.00 | | | | 09/21/18 | | | | (9,800 | ) |
Ford Motor Co. | | | 270 | | | | (298,890 | ) | | | 12.00 | | | | 08/17/18 | | | | (30,780 | ) |
Huntsman Corp. | | | 100 | | | | (292,000 | ) | | | 32.00 | | | | 08/17/18 | | | | (33,000 | ) |
Lam Research Corp. | | | 16 | | | | (276,560 | ) | | | 200.00 | | | | 07/20/18 | | | | (42,320 | ) |
Lear Corp. | | | 15 | | | | (278,715 | ) | | | 195.00 | | | | 07/20/18 | | | | (10,950 | ) |
Magna International, Inc. | | | 30 | | | | (174,390 | ) | | | 57.50 | | | | 09/21/18 | | | | (7,050 | ) |
Magna International, Inc. | | | 12 | | | | (69,756 | ) | | | 62.50 | | | | 09/21/18 | | | | (6,720 | ) |
MetLife, Inc. | | | 70 | | | | (305,200 | ) | | | 45.00 | | | | 08/17/18 | | | | (15,540 | ) |
Netflix, Inc. | | | 10 | | | | (391,430 | ) | | | 320.00 | | | | 07/20/18 | | | | (3,000 | ) |
ON Semiconductor Corp. | | | 130 | | | | (289,055 | ) | | | 25.00 | | | | 07/20/18 | | | | (37,050 | ) |
Pfizer, Inc. | | | 90 | | | | (326,520 | ) | | | 36.00 | | | | 08/17/18 | | | | (6,570 | ) |
Seagate Technology PLC | | | 40 | | | | (225,880 | ) | | | 55.00 | | | | 09/21/18 | | | | (13,400 | ) |
Waste Connections, Inc. | | | 5 | | | | (37,640 | ) | | | 75.00 | | | | 09/21/18 | | | | (1,275 | ) |
XPO Logistics, Inc. | | | 32 | | | | (320,576 | ) | | | 100.00 | | | | 08/17/18 | | | | (17,856 | ) |
Zebra Technologies Corp. | | | 22 | | | | (315,150 | ) | | | 150.00 | | | | 08/17/18 | | | | (22,220 | ) |
| | | | | | | | | | | | | | | | | | | | |
Total Exchange Traded Put Options Written (Premiums received $(226,621)) | | | | | | | | | | | | | | | | | | $ | (314,621 | ) |
| | | | | | | | | | | | | | | | | | | | |
EXCHANGE TRADED CALL OPTIONS WRITTEN - (0.59%) | | | | | | | | | | | | | | | | | |
3M Co. | | | 3 | | | $ | (59,016 | ) | | $ | 210.00 | | | | 09/21/18 | | | $ | (957 | ) |
Abbott Laboratories | | | 3 | | | | (18,297 | ) | | | 65.00 | | | | 08/17/18 | | | | (108 | ) |
AbbVie, Inc. | | | 3 | | | | (27,795 | ) | | | 110.00 | | | | 08/17/18 | | | | (81 | ) |
Adobe Systems, Inc. | | | 3 | | | | (73,143 | ) | | | 230.00 | | | | 07/20/18 | | | | (4,860 | ) |
AerCap Holdings NV | | | 11 | | | | (59,565 | ) | | | 52.50 | | | | 07/20/18 | | | | (2,475 | ) |
Alliance Data Systems Corp. | | | 16 | | | | (373,120 | ) | | | 220.00 | | | | 07/20/18 | | | | (28,800 | ) |
Allstate Corp. (The) | | | 35 | | | | (319,445 | ) | | | 95.00 | | | | 08/17/18 | | | | (4,760 | ) |
Allstate Corp. (The) | | | 3 | | | | (27,381 | ) | | | 95.00 | | | | 10/19/18 | | | | (597 | ) |
Ally Financial, Inc. | | | 75 | | | | (197,025 | ) | | | 27.00 | | | | 09/21/18 | | | | (8,550 | ) |
American Express Co. | | | 3 | | | | (29,400 | ) | | | 105.00 | | | | 08/17/18 | | | | (234 | ) |
American Tower Corp. | | | 3 | | | | (43,251 | ) | | | 145.00 | | | | 08/17/18 | | | | (1,080 | ) |
Amgen, Inc. | | | 3 | | | | (55,377 | ) | | | 185.00 | | | | 08/17/18 | | | | (1,800 | ) |
Anadarko Petroleum Corp. | | | 3 | | | | (21,975 | ) | | | 75.00 | | | | 10/19/18 | | | | (1,290 | ) |
Aon PLC | | | 3 | | | | (41,151 | ) | | | 150.00 | | | | 07/20/18 | | | | (30 | ) |
Apple, Inc. | | | 20 | | | | (370,220 | ) | | | 190.00 | | | | 09/21/18 | | | | (11,960 | ) |
Applied Materials, Inc. | | | 5 | | | | (23,095 | ) | | | 52.50 | | | | 08/17/18 | | | | (310 | ) |
Archer-Daniels-Midland Co. | | | 3 | | | | (13,749 | ) | | | 46.00 | | | | 09/21/18 | | | | (495 | ) |
AT&T, Inc. | | | 15 | | | | (48,165 | ) | | | 37.00 | | | | 07/20/18 | | | | (30 | ) |
Athene Holding, Ltd. | | | 37 | | | | (162,208 | ) | | | 50.00 | | | | 08/17/18 | | | | (1,110 | ) |
Athene Holding, Ltd., Class A | | | 20 | | | | (87,680 | ) | | | 45.00 | | | | 08/17/18 | | | | (3,000 | ) |
Bank of America Corp. | | | 7 | | | | (19,733 | ) | | | 31.00 | | | | 09/21/18 | | | | (245 | ) |
BB&T Corp. | | | 3 | | | | (15,132 | ) | | | 55.00 | | | | 09/21/18 | | | | (129 | ) |
| | |
| 62 | | Annual Report | June 30, 2018 |
| | |
| Managed Volatility Fund | | |
| SCHEDULE OF INVESTMENTS (continued) | | |
| Showing percentage of net assets as of June 30, 2018 | | |
| | | | | | | | | | | | | | | | | | | | |
| Description | | Number of
Contracts | | | Notional
Amount | | | Exercise
Price | | | Expiration
Date | | | Value | |
Exchange Traded Call Options Written (continued) | | | | | | | | | | | | | | | | | | | | |
Becton Dickinson and Co. | | | 3 | | | $ | (71,868 | ) | | $ | 240.00 | | | | 09/21/18 | | | | $ (2,970) | |
Bristol-Myers Squibb Co. | | | 5 | | | | (27,670 | ) | | | 55.00 | | | | 09/21/18 | | | | (1,450) | |
Campbell Soup Co. | | | 6 | | | | (24,324 | ) | | | 38.00 | | | | 08/17/18 | | | | (2,160) | |
Capital One Financial Corp. | | | 3 | | | | (27,570 | ) | | | 100.00 | | | | 09/21/18 | | | | (387) | |
Celgene Corp. | | | 4 | | | | (31,768 | ) | | | 80.00 | | | | 09/21/18 | | | | (1,820) | |
CenturyLink, Inc. | | | 4 | | | | (7,456 | ) | | | 18.00 | | | | 07/20/18 | | | | (420) | |
Charles Schwab Corp. (The) | | | 6 | | | | (30,660 | ) | | | 60.00 | | | | 09/21/18 | | | | (180) | |
Chevron Corp. | | | 6 | | | | (75,858 | ) | | | 130.00 | | | | 07/20/18 | | | | (612) | |
Cisco Systems, Inc. | | | 13 | | | | (55,939 | ) | | | 44.00 | | | | 08/17/18 | | | | (1,469) | |
Citigroup, Inc. | | | 8 | | | | (53,536 | ) | | | 72.50 | | | | 07/20/18 | | | | (144) | |
Citrix Systems, Inc. | | | 3 | | | | (31,452 | ) | | | 110.00 | | | | 09/21/18 | | | | (870) | |
Cognex Corp. | | | 25 | | | | (111,525 | ) | | | 50.00 | | | | 08/17/18 | | | | (2,000) | |
Cognizant Technology Solutions Corp., Class A | | | 3 | | | | (23,697 | ) | | | 79.00 | | | | 07/27/18 | | | | (540) | |
Colgate-Palmolive Co. | | | 3 | | | | (19,443 | ) | | | 62.50 | | | | 08/17/18 | | | | (1,050) | |
Comcast Corp., Class A | | | 8 | | | | (26,248 | ) | | | 35.00 | | | | 09/21/18 | | | | (856) | |
ConocoPhillips | | | 4 | | | | (27,848 | ) | | | 70.00 | | | | 08/17/18 | | | | (1,056) | |
CVS Health Corp. | | | 3 | | | | (19,305 | ) | | | 67.50 | | | | 08/17/18 | | | | (444) | |
Danaher Corp. | | | 3 | | | | (29,604 | ) | | | 105.00 | | | | 09/21/18 | | | | (360) | |
DaVita, Inc. | | | 3 | | | | (20,832 | ) | | | 65.00 | | | | 07/20/18 | | | | (1,560) | |
Discovery, Inc., Class C | | | 7 | | | | (17,850 | ) | | | 27.50 | | | | 09/21/18 | | | | (770) | |
Dominion Energy, Inc. | | | 3 | | | | (20,454 | ) | | | 65.00 | | | | 07/20/18 | | | | (1,110) | |
Eastman Chemical Co. | | | 21 | | | | (209,916 | ) | | | 110.00 | | | | 09/21/18 | | | | (2,772) | |
eBay, Inc. | | | 3 | | | | (10,878 | ) | | | 39.00 | | | | 07/20/18 | | | | (36) | |
Electronic Arts, Inc. | | | 3 | | | | (42,306 | ) | | | 140.00 | | | | 09/21/18 | | | | (2,865) | |
Emerson Electric Co. | | | 5 | | | | (34,570 | ) | | | 75.00 | | | | 09/21/18 | | | | (400) | |
Exelon Corp. | | | 4 | | | | (17,040 | ) | | | 39.00 | | | | 07/20/18 | | | | (1,316) | |
Exxon Mobil Corp. | | | 6 | | | | (49,638 | ) | | | 85.00 | | | | 09/21/18 | | | | (1,140) | |
Facebook, Inc., Class A | | | 5 | | | | (97,160 | ) | | | 200.00 | | | | 10/19/18 | | | | (5,075) | |
FedEx Corp. | | | 3 | | | | (68,118 | ) | | | 270.00 | | | | 08/17/18 | | | | (111) | |
General Mills, Inc. | | | 5 | | | | (22,130 | ) | | | 47.50 | | | | 07/20/18 | | | | (50) | |
General Motors Co. | | | 1 | | | | (3,940 | ) | | | 38.00 | | | | 07/20/18 | | | | (280) | |
Gilead Sciences, Inc. | | | 3 | | | | (21,252 | ) | | | 70.00 | | | | 07/20/18 | | | | (618) | |
Halliburton Co. | | | 3 | | | | (13,518 | ) | | | 50.00 | | | | 08/17/18 | | | | (156) | |
Hasbro, Inc. | | | 3 | | | | (27,693 | ) | | | 90.00 | | | | 07/20/18 | | | | (1,050) | |
Helmerich & Payne, Inc. | | | 3 | | | | (19,128 | ) | | | 67.50 | | | | 09/21/18 | | | | (690) | |
Honeywell International, Inc. | | | 3 | | | | (43,215 | ) | | | 155.00 | | | | 09/21/18 | | | | (342) | |
Honeywell International, Inc. | | | 2 | | | | (28,810 | ) | | | 150.00 | | | | 09/21/18 | | | | (516) | |
Intel Corp. | | | 8 | | | | (39,768 | ) | | | 55.00 | | | | 07/20/18 | | | | (56) | |
International Business Machines Corp. | | | 4 | | | | (55,880 | ) | | | 155.00 | | | | 07/20/18 | | | | (52) | |
International Paper Co. | | | 3 | | | | (15,624 | ) | | | 55.00 | | | | 07/20/18 | | | | (90) | |
Jefferies Financial Group, Inc. | | | 20 | | | | (45,480 | ) | | | 23.00 | | | | 09/21/18 | | | | (1,800) | |
JetBlue Airways Corp. | | | 107 | | | | (203,086 | ) | | | 20.00 | | | | 09/21/18 | | | | (6,955) | |
Johnson & Johnson | | | 3 | | | | (36,402 | ) | | | 125.00 | | | | 08/17/18 | | | | (546) | |
Johnson Controls International PLC | | | 3 | | | | (10,035 | ) | | | 35.00 | | | | 07/20/18 | | | | (72) | |
JPMorgan Chase & Co. | | | 3 | | | | (31,260 | ) | | | 112.00 | | | | 07/27/18 | | | | (138) | |
Juniper Networks, Inc. | | | 12 | | | | (32,904 | ) | | | 27.00 | | | | 07/20/18 | | | | (1,284) | |
Kimberly-Clark Corp. | | | 3 | | | | (31,602 | ) | | | 105.00 | | | | 07/20/18 | | | | (810) | |
Kroger Co. (The) | | | 3 | | | | (8,535 | ) | | | 25.00 | | | | 07/20/18 | | | | (1,116) | |
Marathon Petroleum Corp. | | | 5 | | | | (35,080 | ) | | | 80.00 | | | | 07/20/18 | | | | (40) | |
| | |
| Managed Volatility Fund | |
|
| SCHEDULE OF INVESTMENTS (continued) |
| Showing percentage of net assets as of June 30, 2018 | | |
| | | | | | | | | | | | | | | | | | | | |
| Description | | Number of
Contracts | | | Notional
Amount | | | Exercise
Price | | | Expiration
Date | | | Value | |
Exchange Traded Call Options Written (continued) | | | | | | | | | | | | | | | | | | | | |
Mastercard, Inc., Class A | | | 3 | | | $ | (58,956 | ) | | $ | 180.00 | | | | 07/20/18 | | | $ | (5,415 | ) |
Merck & Co., Inc. | | | 7 | | | | (42,490 | ) | | | 60.00 | | | | 08/17/18 | | | | (1,757 | ) |
Micron Technology, Inc. | | | 75 | | | | (393,300 | ) | | | 62.50 | | | | 08/17/18 | | | | (5,100 | ) |
Micron Technology, Inc. | | | 40 | | | | (209,760 | ) | | | 57.50 | | | | 07/20/18 | | | | (2,320 | ) |
Micron Technology, Inc. | | | 15 | | | | (78,660 | ) | | | 60.00 | | | | 07/20/18 | | | | (405 | ) |
Microsoft Corp. | | | 3 | | | | (29,583 | ) | | | 100.00 | | | | 07/20/18 | | | | (618 | ) |
Mondelez International, Inc. Class A | | | 11 | | | | (45,100 | ) | | | 42.00 | | | | 09/21/18 | | | | (1,375 | ) |
Morgan Stanley | | | 7 | | | | (33,180 | ) | | | 52.50 | | | | 08/17/18 | | | | (231 | ) |
NIKE, Inc., Class B | | | 5 | | | | (39,840 | ) | | | 72.50 | | | | 07/20/18 | | | | (3,875 | ) |
Northrop Grumman Corp. | | | 3 | | | | (92,310 | ) | | | 335.00 | | | | 08/17/18 | | | | (780 | ) |
Omnicom Group, Inc. | | | 3 | | | | (22,881 | ) | | | 75.00 | | | | 07/20/18 | | | | (840 | ) |
Oracle Corp. | | | 4 | | | | (17,624 | ) | | | 48.00 | | | | 08/17/18 | | | | (52 | ) |
PepsiCo, Inc. | | | 4 | | | | (43,548 | ) | | | 105.00 | | | | 07/27/18 | | | | (2,020 | ) |
Praxair, Inc. | | | 3 | | | | (47,445 | ) | | | 160.00 | | | | 08/17/18 | | | | (1,590 | ) |
Procter & Gamble Co. (The) | | | 3 | | | | (23,418 | ) | | | 80.00 | | | | 09/21/18 | | | | (489 | ) |
Progressive Corp. (The) | | | 4 | | | | (23,660 | ) | | | 62.50 | | | | 08/17/18 | | | | (332 | ) |
Prudential Financial, Inc. | | | 30 | | | | (280,530 | ) | | | 100.00 | | | | 07/20/18 | | | | (780 | ) |
PulteGroup, Inc. | | | 100 | | | | (287,500 | ) | | | 30.00 | | | | 07/20/18 | | | | (3,700 | ) |
QUALCOMM, Inc. | | | 3 | | | | (16,836 | ) | | | 60.00 | | | | 07/20/18 | | | | (135 | ) |
Ross Stores, Inc. | | | 3 | | �� | | (25,425 | ) | | | 90.00 | | | | 08/17/18 | | | | (330 | ) |
salesforce.com, Inc. | | | 4 | | | | (54,560 | ) | | | 140.00 | | | | 08/17/18 | | | | (1,596 | ) |
Simon Property Group, Inc. | | | 3 | | | | (51,057 | ) | | | 155.00 | | | | 07/20/18 | | | | (4,905 | ) |
Southwest Airlines Co. | | | 20 | | | | (101,760 | ) | | | 52.50 | | | | 07/20/18 | | | | (1,300 | ) |
Starbucks Corp. | | | 3 | | | | (14,655 | ) | | | 52.50 | | | | 09/21/18 | | | | (237 | ) |
State Street Corp. | | | 3 | | | | (27,927 | ) | | | 105.00 | | | | 08/17/18 | | | | (96 | ) |
Stryker Corp. | | | 3 | | | | (50,658 | ) | | | 175.00 | | | | 09/21/18 | | | | (1,470 | ) |
Texas Instruments, Inc. | | | 3 | | | | (33,075 | ) | | | 115.00 | | | | 07/20/18 | | | | (240 | ) |
Total System Services, Inc. | | | 18 | | | | (152,136 | ) | | | 85.00 | | | | 07/20/18 | | | | (2,970 | ) |
Travelers Cos, Inc. (The) | | | 17 | | | | (207,978 | ) | | | 140.00 | | | | 07/20/18 | | | | (510 | ) |
United Rentals, Inc. | | | 36 | | | | (531,432 | ) | | | 165.00 | | | | 09/21/18 | | | | (15,120 | ) |
United Technologies Corp. | | | 3 | | | | (37,509 | ) | | | 130.00 | | | | 09/21/18 | | | | (759 | ) |
US Bancorp | | | 6 | | | | (30,012 | ) | | | 50.00 | | | | 08/17/18 | | | | (966 | ) |
Verizon Communications, Inc. | | | 5 | | | | (25,155 | ) | | | 49.00 | | | | 08/17/18 | | | | (1,050 | ) |
Walt Disney Co. (The) | | | 3 | | | | (31,443 | ) | | | 105.00 | | | | 09/21/18 | | | | (1,290 | ) |
Waste Management, Inc. | | | 3 | | | | (24,402 | ) | | | 85.00 | | | | 07/20/18 | | | | (45 | ) |
Wells Fargo & Co. | | | 11 | | | | (60,984 | ) | | | 57.50 | | | | 09/21/18 | | | | (1,551 | ) |
Western Digital Corp. | | | 3 | | | | (23,223 | ) | | | 85.00 | | | | 10/19/18 | | | | (915 | ) |
Westlake Chemical Corp. | | | 31 | | | | (333,653 | ) | | | 115.00 | | | | 07/20/18 | | | | (2,015 | ) |
Yum China Holdings, Inc. | | | 3 | | | | (11,538 | ) | | | 42.50 | | | | 07/20/18 | | | | (30 | ) |
| | | | | | | | | | | | | | | | | | | | |
| | | | | |
Total Exchange Traded Call Options Written (Premiums received $(288,227)) | | | | | | | | | | | | | | | | | | $ | (194,714 | ) |
| | | | | | | | | | | | | | | | | | | | |
| | |
| 64 | | Annual Report | June 30, 2018 |
| | |
| Managed Volatility Fund | | |
| SCHEDULE OF INVESTMENTS (continued) | | |
| | |
Summary of inputs used to value the Fund’s investments as of 06/30/2018 (See Note 2 in Notes to Financial Statements):
| | | | | | | | | | | | | | | | |
| | | | | | Assets Table | | | | | | | |
| | | | | | Valuation Inputs | | | | | | | |
| | | Investment in Securities (Value) | | | | |
| | | | | | Level 2 | | | Level 3 | | | | |
| | | Level 1 | | | Significant | | | Significant | | | | |
| | | Quoted | | | Observable | | | Unobservable | | | | |
| | | Prices | | | Inputs | | | Inputs | | | Total | |
Common Stocks | | | $19,736,406 | | | $ | – | | | $ | – | | | $ | 19,736,406 | |
U.S. Government Obligations | | | – | | | | 10,971,425 | | | | – | | | | 10,971,425 | |
Money Market Fund | | | – | | | | 2,832,835 | | | | – | | | | 2,832,835 | |
Investments Purchased with Cash Proceeds from Securities Lending | | | – | | | | 35,460 | | | | – | | | | 35,460 | |
| | | | | | | | | | | | | | | | |
TOTAL | | $ | 19,736,406 | | | $ | 13,839,720 | | | $ | – | | | $ | 33,576,126 | |
| | | | | | | | | | | | | | | | |
| | | | | | | | | | | | | | | | |
| |
| | | Liabilities Table | |
| | | Valuation Inputs | |
| | | Investment in Securities (Value) | |
| | | | | | Level 2 | | | Level 3 | | | | |
| | | Level 1 | | | Significant | | | Significant | | | | |
| | | Quoted | | | Observable | | | Unobservable | | | | |
| | | Prices | | | Inputs | | | Inputs | | | Total | |
Options Written | | $ | (329,902 | ) | | $ | (179,433 | ) | | $ | – | | | $ | (509,335 | ) |
| | | | | | | | | | | | | | | | |
TOTAL | | $ | (329,902 | ) | | $ | (179,433 | ) | | $ | – | | | $ | (509,335 | ) |
| | | | | | | | | | | | | | | | |
See Notes to Financial Statements.
| | |
STATEMENTS OF ASSETS AND LIABILITIES |
June 30, 2018
| | | | | | | | | | | | | | | | | | | | |
| ASSETS | | Aggressive
Investors 1 | | | | Ultra-Small
Company | | | | | | Ultra-Small Company Market |
Investments at value | | $ | 240,107,283 | | | | | | | $ | 109,059,778 | | | | | | | $ | 429,700,653 | |
Cash | | | - | | | | | | | | - | | | | | | | | 108,517 | |
Receivables: | | | | | | | | | | | | | | | | | | | | |
Portfolio securities sold | | | - | | | | | | | | 428,005 | | | | | | | | 4,043,083 | |
Fund shares sold | | | 1,050 | | | | | | | | 131 | | | | | | | | 138,254 | |
Dividends and interest | | | 112,328 | | | | | | | | 137,742 | | | | | | | | 286,449 | |
Receivable from investment adviser | | | 57,857 | | | | | | | | - | | | | | | | | - | |
Deposits with brokers | | | - | | | | | | | | - | | | | | | | | - | |
Prepaid expenses | | | 32,280 | | | | | | | | 10,492 | | | | | | | | 35,330 | |
Total assets | | | 240,310,798 | | | | | | | | 109,636,148 | | | | | | | | 434,312,286 | |
| | | | | |
LIABILITIES | | | | | | | | | | | | | | | | | | | | |
Payables: | | | | | | | | | | | | | | | | | | | | |
Portfolio securities purchased | | | - | | | | | | | | - | | | | | | | | 1,694,626 | |
Fund shares redeemed | | | 117,374 | | | | | | | | 2,921 | | | | | | | | 54,696 | |
Loan payable | | | - | | | | | | | | 108,000 | | | | | | | | 1,814,000 | |
Payable upon return of securities loaned | | | 12,524,485 | | | | | | | | 12,653,438 | | | | | | | | 52,284,023 | |
Accrued Liabilities: | | | | | | | | | | | | | | | | | | | | |
Investment adviser fees | | | - | | | | | | | | 71,405 | | | | | | | | 164,704 | |
Administration fees | | | 4,791 | | | | | | | | 1,946 | | | | | | | | 7,706 | |
Directors’ fees | | | - | | | | | | | | 344 | | | | | | | | 1,500 | |
Other | | | 101,831 | | | | | | | | 44,322 | | | | | | | | 146,667 | |
Put options written at value | | | - | | | | | | | | - | | | | | | | | - | |
Call options written at value | | | - | | | | | | | | - | | | | | | | | - | |
| | | | | |
Total liabilities | | | 12,748,481 | | | | | | | | 12,882,376 | | | | | | | | 56,167,922 | |
| | | | | |
NET ASSETS | | $ | 227,562,317 | | | | | | | $ | 96,753,772 | | | | | | | $ | 378,144,364 | |
NET ASSETS REPRESENT | | | | | | | | | | | | | | | | | | | | |
Paid-in capital | | $ | 210,030,372 | | | | | | | $ | 80,201,345 | | | | | | | $ | 248,874,637 | |
Undistributed net investment income (loss) | | | 603,857 | | | | | | | | (6,026 | ) | | | | | | | 1,740,562 | |
Accumulated net realized gain on investments | | | - | | | | | | | | 8,659,237 | | | | | | | | 23,634,545 | |
Net unrealized appreciation on investments | | | 16,928,088 | | | | | | | | 7,899,216 | | | | | | | | 103,894,620 | |
| | | | | |
NET ASSETS | | $ | 227,562,317 | | | | | | | $ | 96,753,772 | | | | | | | $ | 378,144,364 | |
| | | | | |
Shares of common stock outstanding of $.001 par value* | | | 3,073,131 | | | | | | | | 3,011,635 | | | | | | | | 23,912,180 | |
| | | | | |
Net asset value, offering price and redemption price per share | | $ | 74.05 | | | | | | | $ | 32.13 | | | | | | | $ | 15.81 | (a) |
Total investments at cost | | $ | 223,179,195 | | | | | | | $ | 101,160,562 | | | | | | | $ | 325,806,033 | |
Premiums received on put options written | | $ | - | | | | | | | $ | - | | | | | | | $ | - | |
Premiums received on call options written | | $ | - | | | | | | | $ | - | | | | | | | $ | - | |
| * | See Note 1 - Organization in the Notes to Financial Statements for shares authorized for each Fund. |
(a) Redemption of shares held less than six months may be charged a 2% redemption fee. See Note 8.
See Notes to Financial Statements.
| | |
| 66 | | Annual Report | June 30, 2018 |
| | |
| | |
| | |
|
| | | | | | | | | | | | | | |
| | | |
| Small-Cap
Growth |
| |
| Small-Cap
Value |
| |
| Blue Chip 35
Index |
| |
| Managed
Volatility |
|
| $ | 59,984,894 | | | $ | 75,578,968 | | | $ | 567,412,565 | | | $ | 33,576,126 | |
| | - | | | | 5,764 | | | | - | | | | 111,207 | |
| | | |
| | 1,562,394 | | | | - | | | | 10,293,231 | | | | 27,715 | |
| | 48,896 | | | | 1,377 | | | | 484,572 | | | | - | |
| | 41,157 | | | | 51,498 | | | | 463,941 | | | | 14,544 | |
| | - | | | | - | | | | - | | | | - | |
| | - | | | | - | | | | - | | | | 306,625 | |
| | 9,271 | | | | 10,109 | | | | 56,372 | | | | 14,415 | |
| | 61,646,612 | | | | 75,647,716 | | | | 578,710,681 | | | | 34,050,632 | |
| | | |
| | 812,963 | | | | 391,541 | | | | 10,672,734 | | | | 624,396 | |
| | 1,856 | | | | 7,147 | | | | 354,987 | | | | 11,088 | |
| | 290,000 | | | | - | | | | - | | | | - | |
| | 5,001,434 | | | | 5,852,464 | | | | - | | | | 35,460 | |
| | | |
| | 28,161 | | | | 35,940 | | | | 22,870 | | | | 12,302 | |
| | 1,136 | | | | 1,385 | | | | 11,665 | | | | 654 | |
| | 170 | | | | 268 | | | | 2,467 | | | | 214 | |
| | 38,448 | | | | 42,434 | | | | 132,859 | | | | 40,793 | |
| | - | | | | - | | | | - | | | | 314,621 | |
| | - | | | | - | | | | - | | | | 194,714 | |
| | 6,174,168 | | | | 6,331,179 | | | | 11,197,582 | | | | 1,234,242 | |
| $ | 55,472,444 | | | $ | 69,316,537 | | | $ | 567,513,099 | | | $ | 32,816,390 | |
| | | |
| $ | 46,504,443 | | | $ | 60,876,957 | | | $ | 273,173,088 | | | $ | 25,402,655 | |
| | 173,020 | | | | 464,975 | | | | 4,947,291 | | | | 201,988 | |
| | 655,846 | | | | 1 | | | | 28,624,776 | | | | 360,036 | |
| | 8,139,135 | | | | 7,974,604 | | | | 260,767,944 | | | | 6,851,711 | |
| | | | |
| $ | 55,472,444 | | | $ | 69,316,537 | | | $ | 567,513,099 | | | $ | 32,816,390 | |
| | 1,829,349 | | | | 2,342,104 | | | | 38,829,553 | | | | 2,084,045 | |
| $ | 30.32 | | | $ | 29.60 | | | $ | 14.62 | | | $ | 15.75 | |
| $ | 51,845,759 | | | $ | 67,604,364 | | | $ | 306,644,621 | | | $ | 26,729,928 | |
| $ | - | | | $ | - | | | $ | - | | | $ | 226,621 | |
| $ | - | | | $ | - | | | $ | - | | | $ | 288,227 | |
STATEMENTS OF OPERATIONS
Year Ended June 30, 2018
| | | | | | | | | | | | |
| | | Aggressive
Investors 1 | | | Ultra-Small
Company | | | Ultra-Small
Company Market | |
| |
INVESTMENT INCOME | | | | | | | | | | | | |
Dividends | | | $ 2,901,917 | | | | $ 403,071 | | | | $ 2,000,255 | |
Less: foreign taxes withheld | | | (58,893 | ) | | | - | | | | - | |
Interest | | | - | | | | - | | | | - | |
Securities lending | | | 147,288 | | | | 600,571 | | | | 2,563,117 | |
| |
Total Investment Income | | | 2,990,312 | | | | 1,003,642 | | | | 4,563,372 | |
| |
EXPENSES | | | | | | | | | | | | |
Investment advisory fees - Base fees | | | 2,121,370 | | | | 870,782 | | | | 1,781,074 | |
Investment advisory fees - Performance adjustment | | | (441,785 | ) | | | - | | | | - | |
Administration fees | | | 62,715 | | | | 25,762 | | | | 94,661 | |
Accounting fees | | | 71,350 | | | | 63,862 | | | | 117,224 | |
Transfer agent fees | | | 125,151 | | | | 59,401 | | | | 111,430 | |
Audit fees | | | 18,862 | | | | 12,974 | | | | 23,616 | |
Legal fees | | | 36,029 | | | | 14,962 | | | | 53,946 | |
Custody fees | | | 7,287 | | | | 11,037 | | | | 20,388 | |
Blue sky fees | | | 28,063 | | | | 11,133 | | | | 40,496 | |
Directors’ and officers’ fees | | | 25,894 | | | | 11,071 | | | | 39,578 | |
Shareholder servicing fees | | | 140,510 | | | | 26,040 | | | | 304,089 | |
Reports to shareholders | | | 26,525 | | | | 11,243 | | | | 38,439 | |
Miscellaneous expenses | | | 35,656 | | | | 21,252 | | | | 57,629 | |
| |
| | | |
Total Expenses | | | 2,257,627 | | | | 1,139,519 | | | | 2,682,570 | |
| |
| | | |
Less investment advisory fees waived | | | - | | | | - | | | | (11,126) | |
| |
| | | |
Net Expenses | | | 2,257,627 | | | | 1,139,519 | | | | 2,671,444 | |
| |
| | | |
NET INVESTMENT INCOME (LOSS) | | | 732,685 | | | | (135,877 | ) | | | 1,891,928 | |
| |
| | | |
NET REALIZED AND UNREALIZED GAIN (LOSS) ON INVESTMENTS | | | | | | | | | | | | |
Realized Gain (Loss) on: | | | | | | | | | | | | |
Investments | | | 12,329,001 | | | | 9,407,702 | | | | 42,623,829 | |
Written options | | | - | | | | - | | | | - | |
Futures contracts | | | - | | | | - | | | | - | |
| |
Net Realized Gain | | | 12,329,001 | | | | 9,407,702 | | | | 42,623,829 | |
| |
Change in Unrealized Appreciation (Depreciation) on: | | | | | | | | | | | | |
Investments | | | 12,741,483 | | | | (881,449 | ) | | | 23,216,969 | |
Written options | | | - | | | | - | | | | - | |
| |
Net Change in Unrealized Appreciation (Depreciation) | | | 12,741,483 | | | | (881,449 | ) | | | 23,216,969 | |
| |
Net Realized and Unrealized Gain on Investments | | | 25,070,484 | | | | 8,526,253 | | | | 65,840,798 | |
| |
INCREASE IN NET ASSETS RESULTING FROM OPERATIONS | | | $25,803,169 | | | | $8,390,376 | | | | $67,732,726 | |
| |
See Notes to Financial Statements.
| | |
| 68 | | Annual Report | June 30, 2018 |
| | | | | | | | | | | | | | |
| | | |
| Small-Cap
Growth |
| |
| Small-Cap
Value |
| |
| Blue Chip 35
Index |
| |
| Managed
Volatility |
|
| | |
| | | |
| $ | 323,921 | | | $ | 994,065 | | | $ | 13,299,766 | | | $ | 395,146 | |
| | - | | | | - | | | | - | | | | (646) | |
| | - | | | | - | | | | - | | | | 140,376 | |
| | 315,564 | | | | 58,305 | | | | - | | | | 315 | |
| | |
| | | |
| | 639,485 | | | | 1,052,370 | | | | 13,299,766 | | | | 535,191 | |
| | |
| | 297,877 | | | | 375,026 | | | | 459,157 | | | | 201,524 | |
| | 16,878 | | | | (27,836 | ) | | | - | | | | - | |
| | 13,171 | | | | 16,609 | | | | 152,631 | | | | 8,940 | |
| | 53,552 | | | | 55,200 | | | | 118,566 | | | | 60,956 | |
| | 58,100 | | | | 62,855 | | | | 57,997 | | | | 38,624 | |
| | 11,071 | | | | 11,513 | | | | 32,819 | | | | 15,223 | |
| | 7,460 | | | | 9,415 | | | | 92,810 | | | | 5,320 | |
| | 4,373 | | | | 3,472 | | | | 9,203 | | | | 6,152 | |
| | 21,323 | | | | 20,801 | | | | 15,381 | | | | 24,572 | |
| | 5,671 | | | | 7,036 | | | | 64,836 | | | | 3,563 | |
| | 29,307 | | | | 34,346 | | | | 86,132 | | | | 20,838 | |
| | 7,763 | | | | 8,944 | | | | 96,410 | | | | 5,427 | |
| | 7,808 | | | | 10,201 | | | | 91,166 | | | | 10,365 | |
| | |
| | | |
| | 534,354 | | | | 587,582 | | | | 1,277,108 | | | | 401,504 | |
| | |
| | | |
| | (67,892 | ) | | | (194 | ) | | | (416,301 | ) | | | (82,248) | |
| | |
| | | |
| | 466,462 | | | | 587,388 | | | | 860,807 | | | | 319,256 | |
| | |
| | | |
| | 173,023 | | | | 464,982 | | | | 12,438,959 | | | | 215,935 | |
| | |
| |
| | | | | | | |
| | | | | | | |
| | 7,272,557 | | | | 10,753,725 | | | | 37,821,971 | | | | 1,899,837 | |
| | - | | | | - | | | | - | | | | 623,106 | |
| | - | | | | - | | | | - | | | | (643,760) | |
| | |
| | 7,272,557 | | | | 10,753,725 | | | | 37,821,971 | | | | 1,879,183 | |
| | |
| | | |
| | 2,400,796 | | | | 429,349 | | | | 14,695,536 | | | | 246,789 | |
| | - | | | | - | | | | - | | | | (49,467) | |
| | |
| | | |
| | 2,400,796 | | | | 429,349 | | | | 14,695,536 | | | | 197,322 | |
| | |
| | | |
| | 9,673,353 | | | | 11,183,074 | | | | 52,517,507 | | | | 2,076,505 | |
| | |
| | | |
| $ | 9,846,376 | | | $ | 11,648,056 | | | $ | 64,956,466 | | | $ | 2,292,440 | |
| | |
STATEMENTS OF CHANGES IN NET ASSETS
| | | | | | | | | | | | | | | | | | | | |
| | | Aggressive Investors 1 | | | Ultra-Small Company | | | | |
| | | Year Ended June 30, | | | Year Ended June 30, | | | | |
| | | 2018 | | | 2017 | | | 2018 | | | 2017 | | | | |
| | | | | |
OPERATIONS | | | | | | | | | | | | | | | | | | | | |
Net investment income (loss) | | $ | 732,685 | | | $ | (512,747 | ) | | $ | (135,877 | ) | | $ | 1,168,356 | | | | | |
Net realized gain on investments | | | 12,329,001 | | | | 52,731,300 | | | | 9,407,702 | | | | 9,710,185 | | | | | |
Net change in unrealized appreciation | | | | | | | | | | | | | | | | | | | | |
(depreciation) on investments | | | 12,741,483 | | | | (9,290,204 | ) | | | (881,449 | ) | | | 5,136,677 | | | | | |
| |
| | | | | |
Net increase in net assets resulting from operations | | | 25,803,169 | | | | 42,928,349 | | | | 8,390,376 | | | | 16,015,218 | | | | | |
| |
| | | | | |
DISTRIBUTIONS: | | | | | | | | | | | | | | | | | | | | |
From net investment income | | | - | | | | (1,255,319 | ) | | | (1,299,999 | ) | | | (1,212,208 | ) | | | | |
From net realized gains | | | - | | | | - | | | | (614,549 | ) | | | - | | | | | |
| |
| | | | | |
Net decrease in net assets from distributions | | | - | | | | (1,255,319 | ) | | | (1,914,548 | ) | | | (1,212,208 | ) | | | | |
| |
| | | | | |
SHARE TRANSACTIONS: | | | | | | | | | | | | | | | | | | | | |
Proceeds from sale of shares | | | 5,854,674 | | | | 8,479,231 | | | | 1,024,003 | | | | 1,300,515 | | | | | |
Reinvestment of distributions | | | - | | | | 1,210,679 | | | | 1,769,198 | | | | 1,132,706 | | | | | |
Cost of shares redeemed | | | (28,168,849 | ) | | | (34,518,694 | ) | | | (13,499,110 | ) | | | (17,703,091 | ) | | | | |
Redemption fees | | | - | | | | - | | | | - | | | | - | | | | | |
| |
| | | | | |
Net increase (decrease) in net assets resulting from share transactions | | | (22,314,175 | ) | | | (24,828,784 | ) | | | (10,705,909 | ) | | | (15,269,870 | ) | | | | |
| |
| | | | | |
Net increase (decrease) in net assets | | | 3,488,994 | | | | 16,844,246 | | | | (4,230,081 | ) | | | (466,860 | ) | | | | |
| | | | | |
NET ASSETS: | | | | | | | | | | | | | | | | | | | | |
Beginning of year | | | 224,073,323 | | | | 207,229,077 | | | | 100,983,853 | | | | 101,450,713 | | | | | |
| |
End of year** | | $ | 227,562,317 | | | $ | 224,073,323 | | | $ | 96,753,772 | | | $ | 100,983,853 | | | | | |
| |
| | | | | |
SHARES ISSUED & REDEEMED | | | | | | | | | | | | | | | | | | | | |
Issued | | | 79,909 | | | | 133,731 | | | | 33,925 | | | | 45,001 | | | | | |
Distributions reinvested | | | - | | | | 18,811 | | | | 59,509 | | | | 38,177 | | | | | |
Redeemed | | | (383,079 | ) | | | (561,401 | ) | | | (443,586 | ) | | | (624,860 | ) | | | | |
| |
| | | | | |
Net increase (decrease) | | | (303,170 | ) | | | (408,859 | ) | | | (350,152 | ) | | | (541,682 | ) | | | | |
Outstanding at beginning of year | | | 3,376,301 | | | | 3,785,160 | | | | 3,361,787 | | | | 3,903,469 | | | | | |
| |
| | | | | |
Outstanding at end of year | | | 3,073,131 | | | | 3,376,301 | | | | 3,011,635 | | | | 3,361,787 | | | | | |
| |
** Including undistributed net investment income (loss) of: | | $ | 603,857 | | | $ | (128,827 | ) | | $ | (6,026 | ) | | $ | 1,140,178 | | | | | |
See Notes to Financial Statements.
| | |
| 70 | | Annual Report | June 30, 2018 |
| | |
| | | |
| | |
|
| | | | | | | | | | | | | | | | | | | | | | | | | | | | | | | | | | | | | | | | | | |
| | | | |
Ultra-Small Company Market | | | | | | Small-Cap Growth | | | | | | Small-Cap Value | |
| | | | Year Ended June 30, | | | | | | | | | | | | Year Ended June 30, | | | | | | | | | | | | Year Ended June 30, | | | | |
| | | | | | | | | | | | | | | | | | | | | | | |
| 2018 | | | | | | 2017 | | | | | | 2018 | | | | | | 2017 | | | | | | 2018 | | | | | | 2017 | |
| $ | 1,891,928 | | | | | | | $ | 4,216,600 | | | | | | | $ | 173,023 | | | | | | | $ | 98,933 | | | | | | | $ | 464,982 | | | | | | | $ | 589,999 | |
| | 42,623,829 | | | | | | | | 37,591,817 | | | | | | | | 7,272,557 | | | | | | | | 6,078,273 | | | | | | | | 10,753,725 | | | | | | | | 3,054,674 | |
| | | | | | | | | | |
| | 23,216,969 | | | | | | | | 40,759,414 | | | | | | | | 2,400,796 | | | | | | | | 2,032,306 | | | | | | | | 429,349 | | | | | | | | 7,518,282 | |
| | 67,732,726 | | | | | | | | 82,567,831 | | | | | | | | 9,846,376 | | | | | | | | 8,209,512 | | | | | | | | 11,648,056 | | | | | | | | 11,162,955 | |
| | | | | | | | | | |
| | (449,185 | ) | | | | | | | (3,465,525 | ) | | | | | | | (98,928 | ) | | | | | | | (128,436 | ) | | | | | | | (547,906 | ) | | | | | | | (644,905 | ) |
| | (43,056,482 | ) | | | | | | | (24,304,051 | ) | | | | | | | - | | | | | | | | - | | | | | | | | - | | | | | | | | - | |
| | (43,505,667 | ) | | | | | | | (27,769,576 | ) | | | | | | | (98,928 | ) | | | | | | | (128,436 | ) | | | | | | | (547,906 | ) | | | | | | | (644,905 | ) |
| | | | | | | | | | |
| | 29,455,134 | | | | | | | | 33,169,406 | | | | | | | | 6,059,966 | | | | | | | | 10,067,573 | | | | | | | | 4,835,839 | | | | | | | | 3,643,910 | |
| | 41,869,482 | | | | | | | | 26,765,299 | | | | | | | | 95,874 | | | | | | | | 124,435 | | | | | | | | 525,341 | | | | | | | | 621,803 | |
| | (69,611,584 | ) | | | | | | | (94,110,373 | ) | | | | | | | (6,974,363 | ) | | | | | | | (8,123,208 | ) | | | | | | | (9,125,499 | ) | | | | | | | (11,543,562 | ) |
| | 14,360 | | | | | | | | 31,936 | | | | | | | | - | | | | | | | | - | | | | | | | | - | | | | | | | | - | |
| | | | | | | | | | |
| | 1,727,392 | | | | | | | | (34,143,732 | ) | | | | | | | (818,523 | ) | | | | | | | 2,068,800 | | | | | | | | (3,764,319 | ) | | | | | | | (7,277,849 | ) |
| | 25,954,451 | | | | | | | | 20,654,523 | | | | | | | | 8,928,925 | | | | | | | | 10,149,876 | | | | | | | | 7,335,831 | | | | | | | | 3,240,201 | |
| | 352,189,913 | | | | | | | | 331,535,390 | | | | | | | | 46,543,519 | | | | | | | | 36,393,643 | | | | | | | | 61,980,706 | | | | | | | | 58,740,505 | |
| $ | 378,144,364 | | | | | | | $ | 352,189,913 | | | | | | | $ | 55,472,444 | | | | | | | $ | 46,543,519 | | | | | | | $ | 69,316,537 | | | | | | | $ | 61,980,706 | |
| | | | | | | | | | |
| | 1,963,750 | | | | | | | | 2,305,325 | | | | | | | | 216,113 | | | | | | | | 435,958 | | | | | | | | 170,722 | | | | | | | | 150,968 | |
| | 3,025,252 | | | | | | | | 1,858,701 | | | | | | | | 3,546 | | | | | | | | 5,311 | | | | | | | | 20,268 | | | | | | | | 24,714 | |
| | (4,661,379 | ) | | | | | | | (6,546,492 | ) | | | | | | | (257,898 | ) | | | | | | | (364,034 | ) | | | | | | | (346,128 | ) | | | | | | | (492,525 | ) |
| | 327,623 | | | | | | | | (2,382,466 | ) | | | | | | | (38,239 | ) | | | | | | | 77,235 | | | | | | | | (155,138 | ) | | | | | | | (316,843 | ) |
| | 23,584,557 | | | | | | | | 25,967,023 | | | | | | | | 1,867,588 | | | | | | | | 1,790,353 | | | | | | | | 2,497,242 | | | | | | | | 2,814,085 | |
| | 23,912,180 | | | | | | | | 23,584,557 | | | | | | | | 1,829,349 | | | | | | | | 1,867,588 | | | | | | | | 2,342,104 | | | | | | | | 2,497,242 | |
| $ | 1,740,562 | | | | | | | $ | 449,165 | | | | | | | $ | 173,020 | | | | | | | $ | 98,925 | | | | | | | $ | 464,975 | | | | | | | $ | 547,899 | |
STATEMENTS OF CHANGES IN NET ASSETS
| | | | | | | | | | | | | | | | | | | | |
| | | Blue Chip 35 Index | | | Managed Volatility | | | | |
| | | |
| | | Year Ended
June 30, | | | Year Ended
June 30, | | | | |
| | | 2018 | | | 2017 | | | 2018 | | | 2017 | | | | |
| | | | | |
OPERATIONS | | | | | | | | | | | | | | | | | | | | |
Net investment income | | $ | 12,438,959 | | | $ | 12,971,148 | | | $ | 215,935 | | | $ | 204,871 | | | | | |
Net realized gain on investments | | | 37,821,971 | | | | 17,816,996 | | | | 1,879,183 | | | | 2,076,155 | | | | | |
Net change in unrealized appreciation (depreciation) on investments | | | 14,695,536 | | | | 44,258,705 | | | | 197,322 | | | | (180,364 | ) | | | | |
| |
Net increase in net assets resulting from operations | | | 64,956,466 | | | | 75,046,849 | | | | 2,292,440 | | | | 2,100,662 | | | | | |
| |
| | | | | |
DISTRIBUTIONS: | | | | | | | | | | | | | | | | | | | | |
From net investment income | | | (11,665,340 | ) | | | (13,425,245 | ) | | | (194,557 | ) | | | (195,475 | ) | | | | |
From net realized gains | | | (15,737,305 | ) | | | - | | | | - | | | | - | | | | | |
| |
Net decrease in net assets from distributions | | | (27,402,645 | ) | | | (13,425,245 | ) | | | (194,557 | ) | | | (195,475 | ) | | | | |
| |
| | | | | |
SHARE TRANSACTIONS: | | | | | | | | | | | | | | | | | | | | |
Proceeds from sale of shares | | | 98,026,171 | | | | 141,781,165 | | | | 3,971,588 | | | | 5,629,461 | | | | | |
Reinvestment of distributions | | | 25,719,282 | | | | 12,574,239 | | | | 181,357 | | | | 183,367 | | | | | |
Cost of shares redeemed | | | (144,688,020 | ) | | | (236,718,752 | ) | | | (9,957,718 | ) | | | (28,780,897 | ) | | | | |
| |
Net decrease in net assets resulting from share transactions | | | (20,942,567 | ) | | | (82,363,348 | ) | | | (5,804,773 | ) | | | (22,968,069 | ) | | | | |
| |
Net increase (decrease) in net assets | | | 16,611,254 | | | | (20,741,744 | ) | | | (3,706,890 | ) | | | (21,062,882 | ) | | | | |
| | | | | |
NET ASSETS: | | | | | | | | | | | | | | | | | | | | |
Beginning of year | | | 550,901,845 | | | | 571,643,589 | | | | 36,523,280 | | | | 57,586,162 | | | | | |
| |
End of year* | | $ | 567,513,099 | | | $ | 550,901,845 | | | $ | 32,816,390 | | | $ | 36,523,280 | | | | | |
| |
| | | | | |
SHARES ISSUED & REDEEMED | | | | | | | | | | | | | | | | | | | | |
Issued | | | 6,741,303 | | | | 10,843,864 | | | | 256,503 | | | | 390,649 | | | | | |
Distributions reinvested | | | 1,779,881 | | | | 962,069 | | | | 11,807 | | | | 12,814 | | | | | |
Redeemed | | | (9,878,238 | ) | | | (18,162,153 | ) | | | (653,621 | ) | | | (1,988,231 | ) | | | | |
| |
Net decrease | | | (1,357,054 | ) | | | (6,356,220 | ) | | | (385,311 | ) | | | (1,584,768 | ) | | | | |
Outstanding at beginning of year | | | 40,186,607 | | | | 46,542,827 | | | | 2,469,356 | | | | 4,054,124 | | | | | |
| |
Outstanding at end of year | | | 38,829,553 | | | | 40,186,607 | | | | 2,084,045 | | | | 2,469,356 | | | | | |
| |
| | | | | |
* Including undistributed net investment income of: | | $ | 4,947,291 | | | $ | 5,168,789 | | | $ | 201,988 | | | $ | 180,610 | | | | | |
See Notes to Financial Statements.
| | |
| 72 | | Annual Report | June 30, 2018 |
FINANCIAL HIGHLIGHTS
(for a share outstanding throughout each year indicated)
AGGRESSIVE INVESTORS 1
| | | | | | | | | | | | | | | | | | | | |
| | | Year Ended June 30 | |
| | | | | |
| | | 2018 | | | 2017 | | | 2016 | | | 2015 | | | 2014 | |
| | | | | |
Net Asset Value, Beginning of Year | | | $66.37 | | | | $54.75 | | | | $59.15 | | | | $56.69 | | | | $43.21 | |
| | | | | |
| | | | | | | | | | | | | | | | | | | | |
| | | | | |
Income from Investment Operations: | | | | | | | | | | | | | | | | | | | | |
Net Investment Income (Loss)(a) | | | 0.23 | | | | (0.14) | | | | 0.31 | | | | 0.02 | | | | 0.11 | |
Net Realized and Unrealized Gain (Loss) | | | 7.45 | | | | 12.12 | | | | (4.69) | | | | 2.56 | | | | 13.73 | |
| | | | | |
| | | | | | | | | | | | | | | | | | | | |
| | | | | |
Total from Investment Operations | | | 7.68 | | | | 11.98 | | | | (4.38) | | | | 2.58 | | | | 13.84 | |
| | | | | |
| | | | | | | | | | | | | | | | | | | | |
| | | | | |
Less Distributions to Shareholders from: | | | | | | | | | | | | | | | | | | | | |
Net Investment Income | | | - | | | | (0.36) | | | | (0.02) | | | | (0.12) | | | | (0.36) | |
| | | | | |
| | | | | | | | | | | | | | | | | | | | |
| | | | | |
Total Distributions | | | - | | | | (0.36) | | | | (0.02) | | | | (0.12) | | | | (0.36) | |
| | | | | |
| | | | | | | | | | | | | | | | | | | | |
| | | | | |
Net Asset Value, End of Year | | | $74.05 | | | | $66.37(b) | | | | $54.75 | | | | $59.15 | | | | $56.69 | |
| | | | | | | | | | | | | | | | | | | | |
| | | | | |
Total Return | | | 11.57%(b) | | | | 21.90%(b) | | | | (7.40%) | | | | 4.57% | | | | 32.14% | |
| | | | | |
Ratios and Supplemental Data: | | | | | | | | | | | | | | | | | | | | |
Net Assets, End of Year (in 000’s) | | | $227,562 | | | | $224,073 | | | | $207,229 | | | | $248,046 | | | | $259,402 | |
Expenses Before Waivers and Reimbursements | | | 0.96% | | | | 1.66% | | | | 0.63%(c) | | | | 1.32% | | | | 1.01% | |
Expenses After Waivers and Reimbursements . | | | 0.96% | | | | 1.66% | | | | 0.63% | | | | 1.32% | | | | 1.01% | |
Net Investment Income (Loss) After Waivers and Reimbursements | | | 0.31% | | | | (0.23%) | | | | 0.58% | | | | 0.04% | | | | 0.22% | |
Portfolio Turnover Rate | | | 105% | | | | 153% | | | | 124% | | | | 107% | | | | 125% | |
| (a) | Per share amounts calculated based on the average daily shares outstanding during the year. |
| (b) | Includes adjustments in accordance with accounting principles generally accepted in the United States and, consequently, the net asset value for financial reporting purposes and the returns based upon those net asset values may differ from the net asset values and returns for shareholder transactions. |
| (c) | For the year ended June 30, 2016 the expense ratio was significantly lower than in other years, due to a negative performance adjustment to the investment advisory fee. Please refer to Note 3 of the Notes to Financial Statements for further information. The rate shown may not be indicative of the rate going forward. |
See Notes to Financial Statements.
FINANCIAL HIGHLIGHTS
(for a share outstanding throughout each year indicated)
ULTRA-SMALL COMPANY
| | | | | | | | | | |
| | | Year Ended June 30 |
| | | | | |
| | | 2018 | | 2017 | | 2016 | | 2015 | | 2014 |
| | | | | |
Net Asset Value, Beginning of Year | | $30.04 | | $25.99 | | $30.37 | | $41.83 | | $39.36 |
| | | | | |
| | | | | | | | | | |
| | | | | |
Income from Investment Operations: | | | | | | | | | | |
Net Investment Income (Loss)(a) | | (0.04) | | 0.32 | | 0.28 | | 0.24 | | 0.41 |
Net Realized and Unrealized Gain (Loss) | | 2.73 | | 4.06 | | (4.39) | | (3.53) | | 8.33 |
| | | | | |
| | | | | | | | | | |
| | | | | |
Total from Investment Operations | | 2.69 | | 4.38 | | (4.11) | | (3.29) | | 8.74 |
| | | | | |
| | | | | | | | | | |
| | | | | |
Less Distributions to Shareholders from: | | | | | | | | | | |
Net Investment Income | | (0.41) | | (0.33) | | (0.27) | | (0.30) | | (0.76) |
Net Realized Gain | | (0.19) | | - | | - | | (7.87) | | (5.51) |
| | | | | |
| | | | | | | | | | |
| | | | | |
Total Distributions | | (0.60) | | (0.33) | | (0.27) | | (8.17) | | (6.27) |
| | | | | |
| | | | | | | | | | |
| | | | | |
Net Asset Value, End of Year | | $32.13 | | $30.04 | | $25.99 | | $30.37 | | $41.83 |
| | | | | | | | | | |
| | | | | |
Total Return | | 9.13% | | 16.88% | | (13.53)% | | (7.60)% | | 23.72% |
| | | | | |
Ratios and Supplemental Data: | | | | | | | | | | |
Net Assets, End of Year (in 000’s) | | $96,754 | | $100,984 | | $101,451 | | $127,717 | | $152,331 |
Expenses Before Waivers and Reimbursements | | 1.18% | | 1.18% | | 1.17% | | 1.11% | | 1.10% |
Expenses After Waivers and Reimbursements | | 1.18% | | 1.18% | | 1.17% | | 1.11% | | 1.10% |
Net Investment Income (Loss) After Waivers and Reimbursements | | (0.14%) | | 1.14% | | 1.05% | | 0.68% | | 0.98% |
Portfolio Turnover Rate | | 89% | | 113% | | 101% | | 90% | | 99% |
| (a) | Per share amounts calculated based on the average daily shares outstanding during the year. |
See Notes to Financial Statements.
| | |
| 74 | | Annual Report | June 30, 2018 |
FINANCIAL HIGHLIGHTS
(for a share outstanding throughout each year indicated)
ULTRA-SMALL COMPANY MARKET
| | | | | | | | | | |
| | | Year Ended June 30 |
| | | | | |
| | | 2018 | | 2017 | | 2016 | | 2015 | | 2014 |
| | | | | |
Net Asset Value, Beginning of Year | | $14.93 | | $12.77 | | $16.18 | | $17.46 | | $15.44 |
| | | | | |
| | | | | | | | | | |
| | | | | |
Income from Investment Operations: | | | | | | | | | | |
Net Investment Income(a) | | 0.08 | | 0.17 | | 0.12 | | 0.12 | | 0.12 |
Net Realized and Unrealized Gain (Loss) | | 2.76 | | 3.18 | | (1.87) | | 0.38 | | 3.66 |
| | | | | |
| | | | | | | | | | |
| | | | | |
Total from Investment Operations | | 2.84 | | 3.35 | | (1.75) | | 0.50 | | 3.78 |
| | | | | |
| | | | | | | | | | |
| | | | | |
Less Distributions to Shareholders from: | | | | | | | | | | |
Net Investment Income | | (0.02) | | (0.15) | | (0.13) | | (0.14) | | (0.18) |
Net Realized Gain | | (1.94) | | (1.04) | | (1.53) | | (1.64) | | (1.59) |
| | | | | |
| | | | | | | | | | |
| | | | | |
Total Distributions | | (1.96) | | (1.19) | | (1.66) | | (1.78) | | (1.77) |
| | | | | |
| | | | | | | | | | |
| | | | | |
Paid in Capital from Redemption Fees(a) | | 0.00(b) | | 0.00(b) | | 0.00(b) | | 0.00(b) | | 0.01 |
| | | | | |
| | | | | | | | | | |
| | | | | |
Net Asset Value, End of Year | | $15.81 | | $14.93 | | $12.77 | | $16.18 | | $17.46 |
| | | | | | | | | | |
| | | | | |
Total Return | | 20.86%(c) | | 26.61%(c) | | (10.83%)(c) | | 3.72% | | 25.48% |
| | | | | |
Ratios and Supplemental Data: | | | | | | | | | | |
Net Assets, End of Year (in 000’s) | | $378,144 | | $352,190 | | $331,535 | | $402,853 | | $424,096 |
Expenses Before Waivers and Reimbursements | | 0.75% | | 0.76% | | 0.75% | | 0.73% | | 0.72% |
Expenses After Waivers and Reimbursements | | 0.75% | | 0.75% | | 0.75% | | 0.73% | | 0.72% |
Net Investment Income After Waivers and Reimbursements | | 0.52% | | 1.21% | | 0.91% | | 0.74% | | 0.73% |
Portfolio Turnover Rate | | 35% | | 31% | | 41% | | 32% | | 29% |
| (a) | Per share amounts calculated based on the average daily shares outstanding during the year. |
| (b) | Amount represents less than $0.005. |
| (c) | Total return would have been lower had various fees not been waived during the year. |
See Notes to Financial Statements.
FINANCIAL HIGHLIGHTS
(for a share outstanding throughout each year indicated)
SMALL-CAP GROWTH
| | | | | | | | | | |
| | | Year Ended June 30 |
| | | | | |
| | | 2018 | | 2017 | | 2016 | | 2015 | | 2014 |
| | | | | |
Net Asset Value, Beginning of Year | | $24.92 | | $20.33 | | $21.17 | | $18.68 | | $15.11 |
| | | | | |
| | | | | | | | | | |
| | | | | |
Income from Investment Operations: | | | | | | | | | | |
Net Investment Income (Loss)(a) | | 0.09 | | 0.06 | | 0.07 | | (0.01) | | 0.01 |
Net Realized and Unrealized Gain (Loss) | | 5.36 | | 4.60 | | (0.91) | | 2.51 | | 3.63 |
| | | | | |
| | | | | | | | | | |
| | | | | |
Total from Investment Operations | | 5.45 | | 4.66 | | (0.84) | | 2.50 | | 3.64 |
| | | | | |
| | | | | | | | | | |
| | | | | |
Less Distributions to Shareholders from: | | | | | | | | | | |
Net Investment Income | | (0.05) | | (0.07) | | - | | (0.01) | | (0.07) |
| | | | | |
| | | | | | | | | | |
| | | | | |
Total Distributions | | (0.05) | | (0.07) | | - | | (0.01) | | (0.07) |
| | | | | |
| | | | | | | | | | |
| | | | | |
Net Asset Value, End of Year | | $30.32 | | $24.92 | | $20.33 | | $21.17 | | $18.68 |
| | | | | | | | | | |
| | | | | |
Total Return(b) | | 21.91% | | 22.97% | | (3.97%) | | 13.41% | | 24.11% |
| | | | | |
Ratios and Supplemental Data: | | | | | | | | | | |
Net Assets, End of Year (in 000’s) | | $55,472 | | $46,544 | | $36,394 | | $36,801 | | $33,419 |
Expenses Before Waivers and Reimbursements | | 1.08% | | 1.16% | | 1.20% | | 1.08% | | 1.07% |
Expenses After Waivers and Reimbursements | | 0.94% | | 0.94% | | 0.94% | | 0.94% | | 0.94% |
Net Investment Income (Loss) After Waivers and Reimbursements | | 0.35% | | 0.24% | | 0.36% | | (0.07%) | | 0.06% |
Portfolio Turnover Rate | | 122% | | 136% | | 137% | | 123% | | 121% |
| (a) | Per share amounts calculated based on the average daily shares outstanding during the year. |
| (b) | Total return would have been lower had various fees not been waived during the year. |
See Notes to Financial Statements.
| | |
| 76 | | Annual Report | June 30, 2018 |
FINANCIAL HIGHLIGHTS
(for a share outstanding throughout each year indicated)
SMALL-CAP VALUE
| | | | | | | | | | |
| | | Year Ended June 30 |
| | | | | |
| | | 2018 | | 2017 | | 2016 | | 2015 | | 2014 |
| | | | | |
Net Asset Value, Beginning of Year | | $24.82 | | $20.87 | | $22.40 | | $23.06 | | $19.21 |
| | | | | |
| | | | | | | | | | |
| | | | | |
Income from Investment Operations: | | | | | | | | | | |
Net Investment Income(a) | | 0.20 | | 0.22 | | 0.29 | | 0.29 | | 0.15 |
Net Realized and Unrealized Gain (Loss) | | 4.81 | | 3.97 | | (1.43) | | (0.78) | | 3.80 |
| | | | | |
| | | | | | | | | | |
| | | | | |
Total from Investment Operations | | 5.01 | | 4.19 | | (1.14) | | (0.49) | | 3.95 |
| | | | | |
| | | | | | | | | | |
| | | | | |
Less Distributions to Shareholders from: | | | | | | | | | | |
Net Investment Income | | (0.23) | | (0.24) | | (0.39) | | (0.17) | | (0.10) |
| | | | | |
| | | | | | | | | | |
| | | | | |
Total Distributions | | (0.23) | | (0.24) | | (0.39) | | (0.17) | | (0.10) |
| | | | | |
| | | | | | | | | | |
| | | | | |
Net Asset Value, End of Year | | $29.60 | | $24.82 | | $20.87 | | $22.40 | | $23.06 |
| | | | | | | | | | |
| | | | | |
Total Return(b) | | 20.32% | | 20.08% | | (5.02%) | | (2.10%) | | 20.63% |
| | | | | |
Ratios and Supplemental Data: | | | | | | | | | | |
Net Assets, End of Year (in 000’s) | | $69,317 | | $61,981 | | $58,741 | | $73,241 | | $85,782 |
Expenses Before Waivers and Reimbursements | | 0.94% | | 0.98% | | 1.03% | | 0.98% | | 0.97% |
Expenses After Waivers and Reimbursements | | 0.94% | | 0.94% | | 0.94% | | 0.94% | | 0.94% |
Net Investment Income After Waivers and Reimbursements | | 0.74% | | 0.95% | | 1.41% | | 1.30% | | 0.71% |
Portfolio Turnover Rate | | 78% | | 77% | | 62% | | 74% | | 83% |
| (a) | Per share amounts calculated based on the average daily shares outstanding during the year. |
| (b) | Total return would have been lower had various fees not been waived during the year. |
See Notes to Financial Statements.
FINANCIAL HIGHLIGHTS
(for a share outstanding throughout each year indicated)
BLUE CHIP 35 INDEX
| | | | | | | | | | |
| | | Year Ended June 30 |
| | | | | |
| | | 2018 | | 2017 | | 2016 | | 2015 | | 2014 |
| | | | | |
Net Asset Value, Beginning of Year | | $13.71 | | $12.28 | | $11.81 | | $11.39 | | $9.59 |
| | | | | |
| | | | | | | | | | |
| | | | | |
Income from Investment Operations: | | | | | | | | | | |
Net Investment Income(a) | | 0.31 | | 0.30 | | 0.28 | | 0.26 | | 0.23 |
Net Realized and Unrealized Gain | | 1.33 | | 1.44 | | 0.49 | | 0.39 | | 1.77 |
| | | | | |
| | | | | | | | | | |
| | | | | |
Total from Investment Operations | | 1.64 | | 1.74 | | 0.77 | | 0.65 | | 2.00 |
| | | | | |
| | | | | | | | | | |
| | | | | |
Less Distributions to Shareholders from: | | | | | | | | | | |
Net Investment Income | | (0.31) | | (0.31) | | (0.30) | | (0.23) | | (0.20) |
Net Realized Gain | | (0.42) | | - | | - | | - | | - |
| | | | | |
| | | | | | | | | | |
| | | | | |
Total Distributions | | (0.73) | | (0.31) | | (0.30) | | (0.23) | | (0.20) |
| | | | | |
| | | | | | | | | | |
| | | | | |
Net Asset Value, End of Year | | $14.62 | | $13.71 | | $12.28 | | $11.81 | | $11.39 |
| | | | | | | | | | |
| | | | | |
Total Return(b) | | 11.98% | | 14.33% | | 6.60% | | 5.77% | | 21.11% |
| | | | | |
Ratios and Supplemental Data: | | | | | | | | | | |
Net Assets, End of Year (in 000’s) | | $567,513 | | $550,902 | | $571,644 | | $600,823 | | $556,985 |
Expenses Before Waivers and Reimbursements | | 0.22% | | 0.25% | | 0.25% | | 0.23% | | 0.25% |
Expenses After Waivers and Reimbursements | | 0.15% | | 0.15% | | 0.15% | | 0.15% | | 0.15% |
Net Investment Income After Waivers and Reimbursements | | 2.17% | | 2.30% | | 2.42% | | 2.19% | | 2.20% |
Portfolio Turnover Rate | | 14% | | 17% | | 23% | | 19% | | 28% |
| (a) | Per share amounts calculated based on the average daily shares outstanding during the year. |
| (b) | Total return would have been lower had various fees not been waived during the year. |
See Notes to Financial Statements.
| | |
| 78 | | Annual Report | June 30, 2018 |
FINANCIAL HIGHLIGHTS
(for a share outstanding throughout each year indicated)
MANAGED VOLATILITY
| | | | | | | | | | |
| | | Year Ended June 30 |
| | | | | |
| | | 2018 | | 2017 | | 2016 | | 2015 | | 2014 |
| | | | | |
Net Asset Value, Beginning of Year | | $14.79 | | $14.20 | | $14.05 | | $13.94 | | $12.75 |
| | | | | |
| | | | | | | | | | |
| | | | | |
Income from Investment Operations: | | | | | | | | | | |
Net Investment Income(a) | | 0.10 | | 0.06 | | 0.04 | | 0.00(b) | | 0.02 |
Net Realized and Unrealized Gain | | 0.95 | | 0.59 | | 0.11 | | 0.13 | | 1.20 |
| | | | | |
| | | | | | | | | | |
| | | | | |
Total from Investment Operations | | 1.05 | | 0.65 | | 0.15 | | 0.13 | | 1.22 |
| | | | | |
| | | | | | | | | | |
| | | | | |
Less Distributions to Shareholders from: | | | | | | | | | | |
Net Investment Income | | (0.09) | | (0.06) | | 0.00(b) | | (0.02) | | (0.03) |
| | | | | |
| | | | | | | | | | |
| | | | | |
Total Distributions | | (0.09) | | (0.06) | | 0.00(b) | | (0.02) | | (0.03) |
| | | | | |
| | | | | | | | | | |
| | | | | |
Net Asset Value, End of Year | | $15.75 | | $14.79 | | $14.20 | | $14.05 | | $13.94 |
| | | | | | | | | | |
| | | | | |
Total Return(c) | | 7.11% | | 4.59% | | 1.10% | | 0.92% | | 9.61% |
| | | | | |
Ratios and Supplemental Data: | | | | | | | | | | |
Net Assets, End of Year (in 000’s) | | $32,816 | | $36,523 | | $57,586 | | $59,008 | | $46,908 |
Expenses Before Waivers and Reimbursements | | 1.20% | | 1.12% | | 1.06% | | 1.04% | | 1.14% |
Expenses After Waivers and Reimbursements | | 0.94% | | 0.94% | | 0.94% | | 0.94% | | 0.94% |
Net Investment Income After Waivers and Reimbursements | | 0.64% | | 0.42% | | 0.31% | | 0.03% | | 0.17% |
Portfolio Turnover Rate | | 50% | | 50% | | 54% | | 38% | | 39% |
| (a) | Per share amounts calculated based on the average daily shares outstanding during the year. |
| (b) | Amount represents less than $0.005. |
| (c) | Total return would have been lower had various fees not been waived during the year. |
See Notes to Financial Statements.
| | |
| NOTES TO FINANCIAL STATEMENTS | | |
June 30, 2018
1. Organization:
Bridgeway Funds, Inc. (“Bridgeway” or the “Company”) was organized as a Maryland corporation on October 19, 1993, and is registered under the Investment Company Act of 1940, as amended (the “1940 Act”), as an open-end management investment company.
Bridgeway is organized as a series fund, with nine investment funds as of June 30, 2018. The Aggressive Investors 1, Ultra-Small Company, Ultra-Small Company Market, Small-Cap Growth, Small-Cap Value, Blue Chip 35 Index and Managed Volatility Funds are presented in this report (each is referred to as a “Fund” and collectively, the “Funds”). The Omni Small-Cap Value and Omni Tax-Managed Small-Cap Value Funds are included in a separate report.
Bridgeway is authorized to issue 1,915,000,000 shares of common stock at $0.001 per share. As of June 30, 2018,
100,000,000 shares have been classified into the Aggressive Investors 1 Fund. 130,000,000 shares have been classified into the Blue Chip 35 Index Fund. 15,000,000 shares have been classified into the Ultra-Small Company Fund. 100,000,000 shares each have been classified into the Ultra-Small Company Market, Omni Small-Cap Value, Omni Tax-Managed Small-Cap Value, Small-Cap Growth, and Small-Cap Value Funds. 50,000,000 shares have been classified into the Managed Volatility Fund.
The Ultra-Small Company Fund is open to existing investors (direct only).
All of the Funds are no-load, diversified funds.
The Aggressive Investors 1 Fund seeks to exceed the stock market total return (primarily through capital appreciation) at a level of total risk roughly equal to that of the stock market over longer periods of time (three year intervals or more).
The Ultra-Small Company, Ultra-Small Company Market, Small-Cap Growth and Small-Cap Value Funds seek to provide a long-term total return on capital, primarily through capital appreciation.
The Blue Chip 35 Index Fund seeks to provide long-term total return on capital, primarily through capital appreciation, but also some income.
The Managed Volatility Fund seeks to provide a high current return with short-term risk less than or equal to 40% of the stock market.
Bridgeway Capital Management, Inc. (the “Adviser”) is the investment adviser for all of the Funds.
2. Significant Accounting Policies:
The following summary of significant accounting policies, followed in the preparation of the financial statements of the Funds, are in conformity with accounting principles generally accepted in the United States of America (“GAAP”). Each Fund is considered an investment company under GAAP and follows the accounting and reporting guidance applicable to investment companies.
Securities, Options, Futures and Other Investments Valuation Other than options, securities for which market quotations are readily available are valued at the last sale price on the national exchange on which such securities are primarily traded. In the case of securities reported on the National Association of Securities Dealers Automated Quotation (“NASDAQ”) system, the securities are valued based on the NASDAQ Official Closing Price (“NOCP”). In the absence of recorded sales on their primary exchange, or NOCP, in the case of NASDAQ traded securities, the security will be valued as follows: bid prices for long positions and ask prices for short positions.
Fixed income securities are valued on the basis of current market quotations provided by a pricing service. Options are valued at the close if there is trading volume and, if there is no trading volume, the options are valued at the bid on long positions and the ask on the short positions.
| | |
| 80 | | Annual Report | June 30, 2018 |
| | |
| NOTES TO FINANCIAL STATEMENTS (continued) | | |
June 30, 2018
Investments in open-end registered investment companies and closed-end registered investment companies that do not trade on an exchange are valued at the end of day net asset value (“NAV”) per share.
Investments in closed-end registered investment companies that trade on an exchange are valued at the last sales price as of the close of the customary trading session on the exchange where the security is principally traded.
When market quotations are not readily available or when events occur that make established valuation methods unreliable, securities of the Funds may be valued at fair value as determined in good faith by or under the direction of the Board of Directors. The valuation assigned to a fair valued security for purposes of calculating the Funds’ NAVs may differ from the security’s most recent closing market price and from the prices used by other mutual funds to calculate their NAVs.
The inputs and valuation techniques used to determine the value of a Fund’s investments are summarized into three levels as described in the hierarchy below:
| ● | | Level 1 – quoted prices in active markets for identical assets |
Investments whose values are based on quoted market prices in active markets, and whose values are therefore classified as Level 1 prices, include active listed equity securities. The Funds do not adjust the quoted price for such investments, even in situations where the Funds hold a large position and a sale could reasonably impact the quoted price.
| ● | | Level 2 – other significant observable inputs (including quoted prices for similar securities, interest rates, prepayment speeds, credit risk, etc.) |
Investments that trade in markets that are not considered to be active, but whose values are based on quoted market prices, dealer quotations or valuations provided by alternative pricing sources supported by observable inputs, are classified as Level 2 prices. These generally include certain U.S. Government and sovereign obligations, most government agency securities, investment-grade corporate bonds and less liquid listed equity securities. As investments whose values are classified as Level 2 prices include positions that are not traded in active markets and/or are subject to transfer restrictions, valuations may be adjusted to reflect illiquidity and/or non-transferability, which are generally based on available market information.
The Fidelity Investments Money Market Government Portfolio - Class I, which is held by each Fund, invests primarily in securities that are valued at amortized cost. Therefore, this investment is classified as a Level 2 investment.
| ● | | Level 3 – significant unobservable inputs (including the Fund’s own assumptions in determining the fair value of investments) |
Investments whose values are classified as Level 3 prices have significant unobservable inputs, as they may trade infrequently or not at all. When observable prices are not available for these securities, the Funds use one or more valuation techniques for which sufficient and reliable data is available. The inputs used by the Funds in estimating the value of Level 3 prices may include the original transaction price, quoted prices for similar securities or assets in active markets, completed or pending third-party transactions in the underlying investment or comparable issuers, and changes in financial ratios or cash flows. Level 3 prices may also be adjusted to reflect illiquidity and/or non-transferability, with the amount of such discount estimated by the Funds in the absence of market information. Assumptions used by the Funds due to the lack of observable inputs may significantly impact the resulting value and therefore the results of the Funds’ operations.
The inputs or methodology used for valuing investments are not necessarily an indication of the risk associated with investing in those investments. A summary of the inputs used to value the Funds’ investments as of June 30, 2018 is included with each Fund’s Schedule of Investments.
The Funds’ policy is to recognize transfers into, and transfers out of, each level of hierarchy as of the beginning of the reporting period. For the year ended June 30, 2018, there were no transfers between Level 1 and Level 2 in any of the Funds. Details regarding material transfers into, and material transfers out of, Level 3, if any, can be found at the end of each Schedule of Investments for Funds that held Level 3 securities.
| | |
| NOTES TO FINANCIAL STATEMENTS (continued) | | |
June 30, 2018
Securities Lending Upon lending its securities to third parties, each participating Fund receives compensation in the form of fees. The loans are secured by collateral at least equal to the fair value of the securities loaned plus accrued interest. The remaining contractual maturity of all securities lending transactions is overnight and continuous. Each Fund has the right under the lending agreement to recover the securities from the borrower on demand. Additionally, a Fund does not have the right to sell or re-pledge collateral received in the form of securities unless the borrower goes into default. The risks to a Fund of securities lending are that the borrower may not provide additional collateral when required or return the securities when due, resulting in a loss. Under the terms of the Securities Lending Agreement, the Funds are indemnified for such losses by the securities lending agent.
While securities are on loan, the Fund continues to receive dividends on the securities loaned and recognizes any gain or loss in the fair value of the securities loaned.
Securities lending transactions are entered into by a Fund under a Securities Lending Agreement which provides the right, in the event of default (including bankruptcy or insolvency) for the non-defaulting party to liquidate the collateral or to offset the market value of the collateral received against the market value of the securities loaned. The value of the collateral is typically greater than that of the market value of the securities loaned, leaving the lender with a net amount payable to the defaulting party. However, bankruptcy or insolvency laws of a particular jurisdiction may impose restrictions on or prohibitions against such a right of offset in the event of a counterparty’s bankruptcy or insolvency.
The market value of securities on loan, all of which are classified as common stocks in the Funds’ Schedules of Investments, and the value of the related collateral are shown in the Statements of Assets and Liabilities as a component of Investments at value. During the year ended June 30, 2018 the Blue Chip 35 Index Fund did not have any securities lending transactions.
The following table is a summary of the Funds’ securities loaned and related collateral, which are subject to a netting agreement as of June 30, 2018:
| | | | | | | | | | | | | | | | | | | | | | |
| | | | | | | | | | | | Gross Amount Not
Offset in the Statement
of Assets and Liabilities | | | | |
| Fund | | Gross
Amounts of
Recognized
Assets1 | | | Gross Amounts
Offset in the
Statement of
Assets and
Liabilities | | | Net Amounts of
Assets Presented
in the Statement
of Assets and
Liabilities | | | Financial
Instruments | | Collateral
Received2 | | | Net
Amount | |
| |
| | | | | | |
Aggressive Investors 1 | | | | | | | | | | | | | | | | | | | | | | |
Securities lending | | $ | 12,260,164 | | | | - | | | | $12,260,164 | | | - | | $ | 12,260,164 | | | | - | |
| | | | | | |
Ultra-Small Company | | | | | | | | | | | | | | | | | | | | | | |
Securities lending | | $ | 12,123,079 | | | | - | | | | $12,123,079 | | | - | | $ | 12,123,079 | | | | - | |
| | | | | | |
Ultra-Small Company Market | | | | | | | | | | | | | | | | | | | | | | |
Securities lending | | $ | 50,620,082 | | | | - | | | | $50,620,082 | | | - | | $ | 50,620,082 | | | | - | |
| | | | | | |
Small-Cap Growth | | | | | | | | | | | | | | | | | | | | | | |
Securities lending | | $ | 4,834,998 | | | | - | | | | $ 4,834,998 | | | - | | $ | 4,834,998 | | | | - | |
| | | | | | |
Small-Cap Value | | | | | | | | | | | | | | | | | | | | | | |
Securities lending | | $ | 5,565,727 | | | | - | | | | $ 5,565,727 | | | - | | $ | 5,565,727 | | | | - | |
| | | | | | |
Managed Volatility | | | | | | | | | | | | | | | | | | | | | | |
Securities lending | | $ | 34,617 | | | | - | | | | $ 34,617 | | | - | | $ | 34,617 | | | | - | |
| 1 | Securities loaned with a value of $678,818 in Ultra-Small Company Market have been sold and are pending settlement on July 2, 2018. |
| 2 | Collateral with a value of $12,524,485, $12,653,438, $52,284,023, $5,001,434, $5,852,464, and $35,460 has been received in connection with securities lending of Aggressive Investors 1, Ultra-Small Company, Ultra-Small Company Market, Small-Cap Growth, Small-Cap Value, and Managed Volatility Funds, respectively. Excess of collateral received from an individual counterparty is not shown here for financial reporting purposes. |
It is each Fund’s policy to obtain additional collateral from, or return excess collateral to, the borrower by the end of the next business day following the valuation date of the securities loaned. Therefore, the value of the collateral held may be temporarily less than that required under the lending contract. As of June 30, 2018 the collateral consisted of an institutional government money market fund.
| | |
| 82 | | Annual Report | June 30, 2018 |
| | |
| NOTES TO FINANCIAL STATEMENTS (continued) | | |
June 30, 2018
Use of Estimates in Financial Statements In preparing financial statements in conformity with GAAP, management makes estimates and assumptions that affect the reported amounts of assets and liabilities on the date of the financial statements and the disclosure of contingent assets and liabilities on the date of the financial statements, as well as the reported amounts of revenue and expenses during the reporting period. Actual results could differ from those estimates.
Concentrations of Credit Risk The Funds maintain cash and securities in its custody account maintained by a high-credit, quality financial institution. Cash balances may, at times, exceed the FDIC insurance limit. Cash balances are generally invested in a short-term investment vehicle, which minimizes the risk of cash balances exceeding the FDIC insurance limit.
Risks and Uncertainties The Funds provide for various investment options, including stocks, bonds and call and put options. Such investments are exposed to risks, such as interest rate, market and credit risks. Due to the risks involved, it is at least reasonably possible that changes in risks in the near term would materially affect shareholders’ account values and the amounts reported in the financial statements.
Security Transactions, Investment Income and Expenses Security transactions are accounted for as of the trade date, the date the order to buy or sell is executed. Realized gains and losses are computed on the identified cost basis. Dividend income is recorded on the ex-dividend date, and interest income is recorded on the accrual basis from settlement date. Particularly related to the Managed Volatility Fund, discounts and premiums are accreted/amortized on the effective interest method.
Fund expenses that are not series-specific are allocated to each series based upon its relative proportion of net assets to the Funds’ total net assets or other appropriate basis.
Distributions to Shareholders The Funds pay dividends from net investment income and distribute realized capital gains annually, usually in December.
Derivatives
The Funds’ use of derivatives for the year ended June 30, 2018 was limited to futures contracts, purchased options, and written options. The following is a summary of how these derivatives are treated in the financial statements and their impact on the Funds, categorized by primary underlying risk.
| | | | | | | | | | | | | | |
Primary Underlying Risk/Fund | | Derivative
Assets | | | | | | Derivative
Liabilities | | | Location on Statement of Assets and Liabilities |
|
Equity Risk | | | | | | | | | | | | | | |
Managed Volatility: | | | | | | | | | | | | | | |
Written Put Options | | | - | | | | | | | | $314,621 | | | Put options written at value |
Written Call Options | | | - | | | | | | | | 194,714 | | | Call options written at value |
| | | | | | | | | | | | |
| | | |
Primary Underlying Risk/Fund | | Amount of
Realized Gain
(Loss) on Derivatives | | Amount of
Unrealized Gain
(Loss) on Derivatives | | Location of Gain (Loss) in the Statement of Operations |
| | | |
Equity Risk | | | | | | | | | | | | |
Managed Volatility: | | | | | | | | | | | | |
Written Options | | | | $623,106 | | | | | | | | Realized Gain (Loss) on Written Options |
| | | | | | | | | | | | Change in Unrealized Appreciation |
| | | | | | | | | $(49,467) | | | (Depreciation) on Written Options |
Futures Contracts | | | | $(643,760) | | | | | - | | | Realized Gain (Loss) on Futures Contracts |
The derivative instruments outstanding as of June 30, 2018, as disclosed in the Notes to the Financial Statements, and the amounts of realized and changes in unrealized gains and losses on derivative instruments during the period, as disclosed in the Statements of Operations, serve as indicators of the volume of derivatives activity for the Funds.
| | |
| NOTES TO FINANCIAL STATEMENTS (continued) | | |
June 30, 2018
Futures Contracts The Funds may purchase or sell financial futures contracts to hedge cash positions, manage market risk, and to dampen volatility in line with investment objectives. A futures contract is an agreement between two parties to buy or sell a financial instrument at a set price on a future date. Upon entering into such a contract, a Fund is required to pledge to the broker an amount of cash or U.S. Government securities equal to the minimum “initial margin” requirements of the exchange on which the futures contract is traded. The contract amount reflects the extent of a Fund’s exposure in these financial instruments. A Fund’s participation in the futures markets involves certain risks, including imperfect correlation between movements in the price of futures contracts and movements in the price of the securities hedged or used for cover. Pursuant to a contract, such Fund agrees to receive from, or pay to, the broker an amount of cash equal to the fluctuation in value of the contract. Such receipts or payments are known as “variation margin” and are recorded by a Fund as unrealized appreciation or depreciation. When a contract is closed, a Fund records a realized gain or loss equal to the difference between the value of the contract at the time it was opened and the value at the time it was closed. With futures, there is minimal counterparty risk to the Funds, since futures are exchange traded and the exchange’s clearinghouse, as counterparty to all exchange traded futures, guarantees the futures against default. As of June 30, 2018, the Funds had no open futures contracts.
Options The Aggressive Investors 1 Fund may buy and sell calls and puts to increase or decrease the Fund’s exposure to stock market risk or for purposes of diversification of risk. The Managed Volatility Fund may buy and sell calls and puts to reduce the Fund’s volatility and provide some cash flow. An option is a contract conveying a right to buy or sell a financial instrument at a specified price during a stipulated period. The premium paid by a Fund for the purchase of a call or a put option is included in such Fund’s Schedule of Investments as an investment and subsequently marked-to-market to reflect the current market value of the option. When a Fund writes a call or a put option, an amount equal to the premium received by such Fund is included in its Statement of Assets and Liabilities as a liability and is subsequently marked-to-market to reflect the current market value of the option written. If an option that a Fund has written either expires on its stipulated expiration date, or if such Fund enters into a closing purchase transaction, that Fund realizes a gain (or a loss if the cost of a closing purchase transaction exceeds the premium received when the option was written) without regard to any unrealized gain or loss on the underlying security, and the liability related to such options is extinguished. If a call option that a Fund has written is assigned, such Fund realizes a gain or loss from the sale of the underlying security, and the proceeds from such sale are increased by the premium originally received. If a put option that a Fund has written is assigned, the amount of the premium originally received reduces the cost of the security that such Fund purchased upon exercise of the option. Buying calls increases a Fund’s exposure to the underlying security to the extent of any premium paid. Buying puts on a stock market index tends to limit a Fund’s exposure to a stock market decline. All options purchased by the Funds were listed on exchanges and considered liquid positions with readily available market quotes.
Covered Call Options and Secured Puts The Aggressive Investors 1 and Managed Volatility Funds may write call options on a covered basis; that is, a Fund will own the underlying security, or a Fund may write secured puts. The principal reason for writing covered calls and secured puts on a security is to attempt to realize income through the receipt of premiums. The option writer has, in return for the premium, given up the opportunity for profit from a substantial price increase in the underlying security so long as the obligation as a writer continues, but has retained the risk of loss should the price of the security decline. All options were listed on exchanges and considered liquid positions with readily available market quotes.
Outstanding written options as of June 30, 2018 for the Managed Volatility Fund are included in the Schedule of Investments. The Aggressive Investors 1 Fund had no transactions in written options during the year ended June 30, 2018.
Indemnification Under the Company’s organizational documents, the Funds’ officers, directors, employees and agents are indemnified against certain liabilities that may arise out of the performance of their duties to the Funds. Additionally, in the normal course of business, the Funds enter into contracts that contain a variety of indemnification clauses. The Funds’ maximum exposure under these arrangements is unknown, as this would involve future claims that may be made against the Funds that have not yet occurred. However, the Funds have not had prior claims or losses pursuant to these contracts.
3. Advisory Fees, Other Related Party Transactions and Contingencies:
The Funds have entered into management agreements with the Adviser. As compensation for the advisory services rendered, facilities furnished, and expenses borne by the Adviser, the Funds pay the Adviser a fee pursuant to each Fund’s management agreement, as described below.
| | |
| 84 | | Annual Report | June 30, 2018 |
| | |
| NOTES TO FINANCIAL STATEMENTS (continued) | | |
June 30, 2018
Aggressive Investors 1: A total advisory fee is paid by the Fund to the Adviser that is comprised of a Base Fee and a Performance Adjustment. The Base Fee equals the Base Fee Rate times the average daily net assets of the Fund. The Base Fee Rate is based on the following annual rates: 0.90% of the first $250 million of the Fund’s average daily net assets, 0.875% of the next $250 million, 0.85% of the next $500 million and 0.80% of any excess over $1 billion.
The Performance Adjustment equals 4.67% times the difference in cumulative total return between the Fund and the Standard and Poor’s 500 Composite Stock Price Index with dividends reinvested (hereinafter “Index”) over a rolling five-year performance period. The Performance Adjustment Rate varies from a minimum of -0.70% to a maximum of +0.70%. However, the Performance Adjustment Rate is zero if the difference between the cumulative Fund performance and the Index performance is less than or equal to 2%.
Ultra-Small Company: The Fund pays advisory fees based on the following annual rates: 0.90% of the first $250 million of the Fund’s average daily net assets, 0.875% of the next $250 million and 0.85% of any excess over $500 million. The management fees are computed daily and are payable monthly. However, during any period when the Fund’s net assets range from $27,500,000 to $55,000,000, the advisory fee will be determined as if the Fund had $55,000,000 under management. This is limited to a maximum annualized expense ratio of 1.49% of average net assets.
Ultra-Small Company Market: The Fund’s advisory fee is a flat 0.50% of the value of the Fund’s average daily net assets, computed daily and payable monthly.
Small-Cap Growth and Small-Cap Value: A total advisory fee is paid by each Fund to the Adviser that is comprised of a Base Fee and a Performance Adjustment. The Base Fee equals the Base Fee Rate times the average daily net assets of the Fund. The Base Fee Rate is based on the annual rate of 0.60% of the value of each Fund’s average daily net assets.
The Performance Adjustment equals 0.33% times the difference in cumulative total return between the Fund and the Russell 2000 Growth Index for Small-Cap Growth Fund and the Russell 2000 Value Index for Small-Cap Value Fund, with dividends reinvested (hereinafter “Index”) over a rolling five-year performance period. The Performance Adjustment Rate varies from a minimum of -0.05% to a maximum of +0.05%. However, the Performance Adjustment Rate is zero if the difference between the cumulative Fund’s performance and the Index performance is less than or equal to 2%.
Blue Chip 35 Index: The Fund’s advisory fee is a flat 0.08% of the value of the Fund’s average daily net assets, computed daily and payable monthly.
Managed Volatility: The Fund’s advisory fee is a flat 0.60% of the value of the Fund’s average daily net assets, computed daily and payable monthly.
Expense limitations: The Adviser has agreed to reimburse the Funds for operating expenses and management fees above the expense limitations shown in the table below, which are shown as a ratio of net expenses to average net assets, for each Fund, for the year ended June 30, 2018. Any material change to the expense limitation would require a vote by shareholders of the applicable Fund.
| | | | | | | | |
| Bridgeway Fund | | Expense
Limitation | | | Total Waivers and
Reimbursements
for Year Ended
06/30/18 | |
| |
| | | | | | | | |
Aggressive Investors 1 | | | 1.75% | | | | $ - | |
Ultra-Small Company | | | 1.85% | | | | - | |
Ultra-Small Company Market | | | 0.75% | | | | 11,126 | |
Small-Cap Growth | | | 0.94% | | | | 67,892 | |
Small-Cap Value | | | 0.94% | | | | 194 | |
Blue Chip 35 Index | | | 0.15% | | | | 416,301 | |
Managed Volatility | | | 0.94% | | | | 82,248 | |
| | |
| NOTES TO FINANCIAL STATEMENTS (continued) | | |
June 30, 2018
Other Related Party Transactions: The Funds will engage in inter-portfolio trades when it is to the benefit of both parties. The Board of Directors reviews and approves these trades quarterly. Inter-portfolio purchases and sales during the year ended June 30, 2018 were as follows:
| | | | | | | | |
| Bridgeway Fund | | Inter-Portfolio
Purchases | | | Inter-Portfolio
Sales | |
| |
| | | | | | | | |
Aggressive Investors 1 | | $ | 438,280 | | | $ | 3,587,805 | |
Ultra-Small Company | | | 1,205,173 | | | | 7,559,701 | |
Ultra-Small Company Market | | | 10,161,481 | | | | 12,431,435 | |
Small-Cap Growth | | | 1,941,182 | | | | 1,183,331 | |
Small-Cap Value | | | 1,954,217 | | | | 5,237,433 | |
The Adviser entered into an Administrative Services Agreement with Bridgeway, pursuant to which the Adviser provides various administrative services to the Funds including, but not limited to: (i) supervising and managing various aspects of the Funds’ business and affairs; (ii) selecting, overseeing and/or coordinating activities with other service providers to the Funds; (iii) providing reports to the Board of Directors as requested from time to time; (iv) assisting and/or reviewing amendments and updates to the Funds’ registration statement and other filings with the Securities and Exchange Commission (“SEC”); (v) providing certain shareholder services; (vi) providing administrative support in connection with meetings of the Board of Directors; and (vii) providing certain record-keeping services. For its services to all of the Bridgeway Funds, the Adviser is paid an aggregate annual fee of $775,000, payable in equal monthly installments. For the allocation of this expense to each of the Funds, please see the Statements of Operations.
Board of Directors Compensation Independent Directors are paid an annual retainer of $15,000, with an additional retainer of $5,000 paid to the Independent Chairman of the Board and an additional retainer of $1,000 paid to the Nominating and Corporate Governance Committee Chair. The retainer is paid in quarterly installments. In addition, effective November 9, 2017, Independent Directors are paid $9,000 per meeting for meeting fees. Prior to November 9, 2017, Independent Directors were paid $8,500 per meeting. Such compensation is the total compensation from all Bridgeway Funds and is allocated among the Bridgeway Funds.
Each Independent Director receives this compensation in the form of shares of the Bridgeway Funds, credited to his or her account. Such Directors are reimbursed for any expenses incurred in attending meetings and conferences, as well as expenses for subscriptions or printed materials. The amount of directors’ fees attributable to each Fund is disclosed in the Statements of Operations.
One director of Bridgeway, John Montgomery, is an owner and director of the Adviser. Under the 1940 Act definitions, he is considered to be an “affiliated person” of the Adviser and an “interested person” of the Adviser and of Bridgeway. Compensation for Mr. Montgomery is borne by the Adviser rather than the Funds.
4. Distribution Agreement:
Foreside Fund Services, LLC acts as distributor of the Funds’ shares, pursuant to a Distribution Agreement dated May 31, 2017. The Adviser pays all costs and expenses associated with distribution of the Funds’ shares, pursuant to a protective plan adopted by shareholders pursuant to Rule 12b-1.
| | |
| 86 | | Annual Report | June 30, 2018 |
| | |
| NOTES TO FINANCIAL STATEMENTS (continued) | | |
June 30, 2018
5. Purchases and Sales of Investment Securities:
Purchases and sales of investments, other than short-term securities, for each Fund for the year ended June 30, 2018 were as follows:
| | | | | | | | | | | | |
| | | Purchases | | | Sales | |
| Bridgeway Fund | | U.S. Government | | Other | | | U.S. Government | | Other | |
| |
| | | | | | | | | | | | |
Aggressive Investors 1 | | $ - | | $ | 244,827,981 | | | $ - | | $ | 261,259,385 | |
Ultra-Small Company | | - | | | 85,914,234 | | | - | | | 98,168,323 | |
Ultra-Small Company Market | | - | | | 125,482,418 | | | - | | | 162,546,194 | |
Small-Cap Growth | | - | | | 60,094,729 | | | - | | | 61,266,528 | |
Small-Cap Value | | - | | | 48,248,378 | | | - | | | 53,371,037 | |
Blue Chip 35 Index | | - | | | 79,637,980 | | | - | | | 117,631,803 | |
Managed Volatility | | - | | | 10,700,713 | | | - | | | 15,012,383 | |
During the year ended June 30, 2018, the Blue Chip 35 Index Fund permitted an in-kind purchase of its shares, accepting payment for such shares in the form of securities that are permissible investments of the Fund and cash. The purchase in-kind occurred on May 3, 2018 and totaled $2,837,689, of which $516,669 was in cash.
6. Federal Income Taxes
It is the Funds’ policy to continue to comply with the provisions of the Internal Revenue Code of 1986, as amended (“Internal Revenue Code”), applicable to regulated investment companies, and to distribute income to the extent necessary so that the Funds are not subject to federal income tax. Therefore, no federal income tax provision is required.
Unrealized Appreciation and Depreciation on Investments (Tax Basis) The amount of net unrealized appreciation/ depreciation and the cost of investment securities for tax purposes, including short-term securities as of June 30, 2018, were as follows:
| | | | | | | | | | | | | | | |
| | | Aggressive Investors 1 | | Ultra-Small
Company | | Ultra-Small
Company Market |
Gross appreciation (excess of value over tax cost) | | | $ | 26,764,307 | | | | $ | 16,225,074 | | | | $ | 125,282,916 | |
Gross depreciation (excess of tax cost over value) | | | | (9,836,219 | ) | | | | (8,649,402 | ) | | | | (21,332,913 | ) |
Net unrealized appreciation | | | $ | 16,928,088 | | | | $ | 7,575,672 | | | | $ | 103,950,003 | |
| | | |
Cost of investments for income tax purposes | | | $ | 223,179,195 | | | | $ | 101,484,106 | | | | $ | 325,750,650 | |
| | | | | | | | | | | | | | | |
| | | |
| | | Small-Cap Growth | | | | Small-Cap Value |
Gross appreciation (excess of value over tax cost) | | | $ | 9,727,704 | | | | | | | | | $ | 11,086,815 | |
Gross depreciation (excess of tax cost over value) | | | | (1,642,370 | ) | | | | | | | | | (3,115,302 | ) |
Net unrealized appreciation | | | $ | 8,085,334 | | | | | | | | | $ | 7,971,513 | |
| | | |
Cost of investments for income tax purposes | | | $ | 51,899,560 | | | | | | | | | $ | 67,607,455 | |
| | | |
| | | Blue Chip 35 Index | | | | Managed Volatility |
Gross appreciation (excess of value over tax cost) | | | $ | 264,249,287 | | | | | | | | | $ | 7,318,657 | |
Gross depreciation (excess of tax cost over value) | | | | (6,661,517 | ) | | | | | | | | | (483,634 | ) |
Net unrealized appreciation | | | $ | 257,587,770 | | | | | | | | | $ | 6,835,023 | |
| | | |
Cost of investments for income tax purposes | | | $ | 309,824,795 | | | | | | | | | $ | 26,231,768 | |
The differences between book and tax net unrealized appreciation (depreciation) are primarily due to wash sale and straddle loss deferrals and basis adjustments on investments in business development companies, partnerships and passive foreign investment companies (PFICs).
| | |
| NOTES TO FINANCIAL STATEMENTS (continued) | | |
June 30, 2018
Classifications of Distributions Net investment income (loss) and net realized gain (loss) may differ for financial statement and tax purposes. The character of distributions made during the year from net investment income or net realized gains may differ from its ultimate characterization for federal income tax purposes.
The tax character of the distributions paid by the Funds during the last two fiscal years ended June 30, 2018 and June 30, 2017 respectively, are as follows:
| | | | | | | | | | | | | | | | | | | | | | | | | | | | |
| | | Aggressive Investors 1 | | | Ultra-Small Company | |
| | | Year | | | | | | Year | | | | | | Year | | | | | | Year | |
| | | Ended | | | | | | Ended | | | | | | Ended | | | | | | Ended | |
| | | June 30, 2018 | | | | | | June 30, 2017 | | | | | | June 30, 2018 | | | | | | June 30, 2017 | |
| | | | | | | |
Distributions paid from: | | | | | | | | | | | | | | | | | | | | | | | | | | | | |
Ordinary Income | | | $ - | | | | | | | | $1,255,319 | | | | | | | | $1,299,999 | | | | | | | | $1,212,208 | |
Long-Term Capital Gain | | | - | | | | | | | | - | | | | | | | | 614,549 | | | | | | | | - | |
Total | | | $ - | | | | | | | | $1,255,319 | | | | | | | | $1,914,548 | | | | | | | | $1,212,208 | |
| | |
| | | Ultra-Small Company Market | | | Small-Cap Growth | |
| | | Year | | | | | | Year | | | | | | Year | | | | | | Year | |
| | | Ended | | | | | | Ended | | | | | | Ended | | | | | | Ended | |
| | | June 30, 2018 | | | | | | June 30, 2017 | | | | | | June 30, 2018 | | | | | | June 30, 2017 | |
| | | | | | | |
Distributions paid from: | | | | | | | | | | | | | | | | | | | | | | | | | | | | |
Ordinary Income | | $ | 449,185 | | | | | | | $ | 3,465,525 | | | | | | | $ | 98,928 | | | | | | | $ | 128,436 | |
Long-Term Capital Gain | | | 43,056,482 | | | | | | | | 24,304,051 | | | | | | | | - | | | | | | | | - | |
Total | | $ | 43,505,667 | | | | | | | $ | 27,769,576 | | | | | | | $ | 98,928 | | | | | | | $ | 128,436 | |
| | |
| | | Small-Cap Value | | | Blue Chip 35 Index | |
| | | Year | | | | | | Year | | | | | | Year | | | | | | Year | |
| | | Ended | | | | | | Ended | | | | | | Ended | | | | | | Ended | |
| | | June 30, 2018 | | | | | | June 30, 2017 | | | | | | June 30, 2018 | | | | | | June 30, 2017 | |
| | | | | | | |
Distributions paid from: | | | | | | | | | | | | | | | | | | | | | | | | | | | | |
Ordinary Income | | $ | 547,906 | | | | | | | $ | 644,905 | | | | | | | $ | 11,665,340 | | | | | | | $ | 13,425,245 | |
Long-Term Capital Gain | | | - | | | | | | | | - | | | | | | | | 15,737,305 | | | | | | | | - | |
Total | | $ | 547,906 | | | | | | | $ | 644,905 | | | | | | | $ | 27,402,645 | | | | | | | $ | 13,425,245 | |
| | |
| | | Managed Volatility | | | | |
| | | Year | | | | | | Year | | | | | | | | | | | | | |
| | | Ended | | | | | | Ended | | | | | | | | | | | | | |
| | | June 30, 2018 | | | | | | June 30, 2017 | | | | | | | | | | | | | |
| | | | | | | |
Distributions paid from: | | | | | | | | | | | | | | | | | | | | | | | | | | | | |
Ordinary Income | | $ | 194,557 | | | | | | | $ | 195,475 | | | | | | | | | | | | | | | | | |
Total | | $ | 194,557 | | | | | | | $ | 195,475 | | | | | | | | | | | | | | | | | |
Under the Regulated Investment Company Modernization Act of 2010, capital losses incurred by the Funds after June 30, 2011 will not be subject to expiration and will retain their character as either short-term or long-term capital losses.
As of June 30, 2018, the Funds had no remaining capital loss carryovers.
| | |
| 88 | | Annual Report | June 30, 2018 |
| | |
| NOTES TO FINANCIAL STATEMENTS (continued) | | |
June 30, 2018
Capital loss carryovers utilized during the year ended June 30, 2018 were as follows:
| | | | |
| | | Capital Loss | |
| Bridgeway Fund | | Carryover Utilized | |
| | | | |
Aggressive Investors 1 | | | $12,329,001 | |
Small-Cap Growth | | | 6,535,338 | |
Small-Cap Value | | | 10,753,725 | |
Managed Volatility | | | 1,499,825 | |
During the year ended June 30, 2018, Aggressive Investors 1 and Small-Cap Value Funds had capital loss carryforwards expire in the amounts of $3,765,316 and $9,257,491, respectively.
Components of Accumulated Earnings As of June 30, 2018, the components of accumulated earnings on a tax basis were:
| | | | | | | | | | | | |
| | | | | | | | | Ultra-Small | |
| | | Aggressive Investors 1 | | | Ultra-Small Company | | | Company Market | |
| |
Accumulated Net Investment Income | | | $ 603,857 | | | | $ 31,332 | | | | $ 1,740,460 | |
Accumulated Net Realized Gain (Loss) on Investments | | | — | | | | 8,945,423 | | | | 23,579,264 | |
Net Unrealized Appreciation of Investments | | | 16,928,088 | | | | 7,575,672 | | | | 103,950,003 | |
| |
Total | | | $17,531,945 | | | | $16,552,427 | | | | $129,269,727 | |
| |
| | | | | | | | | | | | |
| | | |
| | | Small-Cap Growth | | | | | | Small-Cap Value | |
Accumulated Net Investment Income | | | $ 173,020 | | | | | | | | $ 468,066 | |
Accumulated Net Realized Gain (Loss) on Investments | | | 709,647 | | | | | | | | - | |
Net Unrealized Appreciation of Investments | | | 8,085,334 | | | | | | | | 7,971,513 | |
| |
Total | | | $8,968,001 | | | | | | | | $8,439,579 | |
| |
| | | |
| | | Blue Chip 35 Index | | | | | | Managed Volatility | |
| |
Accumulated Net Investment Income | | | $ 4,947,291 | | | | | | | | $ 201,988 | |
Accumulated Net Realized Gain (Loss) on Investments | | | 31,804,950 | | | | | | | | 376,724 | |
Net Unrealized Appreciation of Investments | | | 257,587,770 | | | | | | | | 6,835,023 | |
| |
Total | | | $294,340,011 | | | | | | | | $7,413,735 | |
| |
For the fiscal year June 30, 2018, the Funds recorded the following reclassifications to the accounts listed below:
| | | | | | | | | | | | |
| | | Increase (Decrease) | |
| |
| | | Aggressive Investors 1 | | | Ultra-Small Company | | | Ultra-Small Company Market | |
| |
Paid-in-Capital | | | $(3,765,316) | | | | $ 320,784 | | | | $ 2,721,756 | |
Undistributed Net Investment Income | | | (1) | | | | 289,672 | | | | (151,346) | |
Accumulated Net Realized Gain (Loss) on Investments | | | 3,765,317 | | | | (610,456) | | | | (2,570,410) | |
| |
| | | | | | |
| |
| | | Increase (Decrease) | |
| | | Small-Cap Growth | | Small-Cap Value | |
Paid-in-Capital | | $ - | | | $(9,257,491) | |
Undistributed Net Investment Income | | - | | | - | |
Accumulated Net Realized Gain (Loss) on Investments | | - | | | 9,257,491 | |
| | |
| NOTES TO FINANCIAL STATEMENTS (continued) | | |
June 30, 2018
| | | | | | | | |
| | | Increase (Decrease) |
| | | Blue Chip 35 Index | | | | | Managed Volatility |
Paid-in-Capital | | $ | 3,143,030 | | | | | $ - |
Undistributed Net Investment Income | | | (995,117) | | | | | - |
Accumulated Net Realized Gain (Loss) on Investments | | | (2,147,913) | | | | | - |
The difference between book and tax components of net assets and the resulting reclassifications were primarily a result of the differing book/tax treatment of the deduction of equalization debits for tax purposes, redesignation of dividends paid and investments in real estate investment trusts, business development companies, partnerships and passive foreign investment companies (PFICs).
Accounting for Uncertainty in Income Taxes sets forth a minimum threshold for financial statement recognition of the benefit of a tax position taken or expected to be taken in a tax return. Management has analyzed each Fund’s tax positions and has concluded that no provision for income tax is required in each Fund’s financial statements. The Funds are not aware of any tax position for which it is reasonably possible that the total amounts of unrecognized tax benefits will significantly change in the next twelve months. Each Fund’s federal tax returns for the prior three fiscal years remain subject to examination by the Internal Revenue Service.
7. Line of Credit
Bridgeway established a line of credit agreement (“Facility”) with The Bank of New York Mellon, effective November 5, 2010. The Facility is for temporary or emergency purposes, such as to provide liquidity for shareholder redemptions, and is cancellable by either party. Unless cancelled earlier, the Facility shall be held available until September 13, 2018. Advances under the Facility are limited to $15,000,000 in total for all Funds, and advances to each Fund shall not exceed certain limits set forth in the credit agreement, including, but not limited to, the maximum amount a Fund is permitted to borrow under the 1940 Act.
The Funds incur a commitment fee of 0.085% per annum on the unused portion of the Facility and interest expense to the extent of amounts borrowed under the Facility. Interest is based on the “Overnight Rate” plus 1.25%. The Overnight Rate means the higher of (a) the Federal Funds rate, (b) the Overnight Eurodollar Rate, or (c) the One-Month Eurodollar Rate. The commitment fees are payable quarterly in arrears and are allocated to all participating Funds. Interest expense is charged directly to a Fund based upon actual amounts borrowed by such Fund.
For the year ended June 30, 2018, borrowings by the Funds under this line of credit were as follows:
| | | | | | | | | | | | | | | | | | | | | | | | | |
| Bridgeway Fund | | Weighted
Average
Interest Rate | | Weighted
Average
Loan Balance | | Number of
Days
Outstanding | | Interest
Expense
Incurred1 | | Maximum Amount
Borrowed During
the Period |
| | | | | | | | | | | | | | | | | | | | | | | | | |
Aggressive Investors 1 | | | | 2.82 | % | | | $ | 602,311 | | | | | 45 | | | | $ | 2,095 | | | | $ | 1,682,000 | |
Ultra-Small Company | | | | 2.75 | % | | | | 654,879 | | | | | 124 | | | | | 6,124 | | | | | 1,370,000 | |
Ultra-Small Company Market | | | | 2.77 | % | | | | 940,009 | | | | | 113 | | | | | 8,073 | | | | | 4,527,000 | |
Small-Cap Growth | | | | 2.85 | % | | | | 484,100 | | | | | 10 | | | | | 378 | | | | | 2,021,000 | |
Small-Cap Value | | | | 2.59 | % | | | | 302,526 | | | | | 19 | | | | | 408 | | | | | 1,304,000 | |
Blue Chip 35 Index | | | | 2.81 | % | | | | 1,224,459 | | | | | 111 | | | | | 10,481 | | | | | 12,930,000 | |
Managed Volatility | | | | 2.59 | % | | | | 341,000 | | | | | 7 | | | | | 170 | | | | | 701,000 | |
1Interest expense is included on the Statements of Operations in Miscellaneous expenses.
On June 30, 2018, Ultra-Small Company, Ultra-Small Company Market and Small-Cap Growth Funds had loans outstanding in the amounts of $108,000, $1,814,000, and $290,000, respectively, exclusive of interest payable on the loans.
| | |
| 90 | | Annual Report | June 30, 2018 |
| | |
| NOTES TO FINANCIAL STATEMENTS (continued) | | |
June 30, 2018
8. Redemption Fees
In Ultra-Small Company Market Fund, a 2% redemption fee may be charged on shares held less than six months. The fee is charged for the benefit of the remaining shareholders and will be paid to the Fund to help offset transaction costs. The fee is accounted for as an addition to paid-in capital.
9. Subsequent Events
Management has evaluated the impact of all subsequent events on the Funds and has determined that there were no subsequent events requiring recognition or disclosure in the financial statements.
| | |
| REPORT OF INDEPENDENT REGISTERED PUBLIC ACCOUNTING FIRM | | |
To the Board of Directors of Bridgeway Funds, Inc.
and the Shareholders of Aggressive Investors 1 Fund, Ultra-Small Company Fund,
Ultra-Small Company Market Fund, Small-Cap Growth Fund, Small-Cap Value Fund,
Blue Chip 35 Index Fund, and Managed Volatility Fund
Opinion on the Financial Statements
We have audited the accompanying statements of assets and liabilities of Aggressive Investors 1 Fund, Ultra-Small Company Fund, Ultra-Small Company Market Fund, Small-Cap Growth Fund, Small-Cap Value Fund, Blue Chip 35 Index Fund, and Managed Volatility Fund, each a series of shares of beneficial interest in Bridgeway Funds, Inc. (the “Funds”), including the schedules of investments, as of June 30, 2018, and the related statements of operations for the year then ended, the statements of changes in net assets for each of the years in the two-year period then ended and the financial highlights for each of the years in the five-year period then ended, and the related notes (collectively referred to as the “financial statements”). In our opinion, the financial statements present fairly, in all material respects, the financial position of the Funds as of June 30, 2018, and the results of their operations for the year then ended, the changes in their net assets for each of the years in the two-year period then ended and their financial highlights for each of the years in the five-year period then ended, in conformity with accounting principles generally accepted in the United States of America.
Basis for Opinion
These financial statements are the responsibility of the Funds’ management. Our responsibility is to express an opinion on the Funds’ financial statements based on our audits. We are a public accounting firm registered with the Public Company Accounting Oversight Board (United States) “PCAOB” and are required to be independent with respect to the Funds in accordance with the U.S. federal securities law and the applicable rules and regulations of the Securities and Exchange Commission and the PCAOB.
We conducted our audits in accordance with the standards of the PCAOB. Those standards require that we plan and perform the audits to obtain reasonable assurance about whether the financial statements are free of material misstatement, whether due to error or fraud. The Funds are not required to have, nor were we engaged to perform, an audit of their internal control over financial reporting. As part of our audits we are required to obtain an understanding of internal control over financial reporting but not for the purpose of expressing an opinion on the effectiveness of the Funds’ internal control over financial reporting. Accordingly, we express no such opinion.
Our audits included performing procedures to assess the risk of material misstatement of those financial statements, whether due to error or fraud, and performing procedures that respond to those risks. Such procedures included examining, on a test basis, evidence regarding the amounts and disclosures in the financial statements. Our procedures included confirmation of securities owned as of June 30, 2018 by correspondence with the custodian and brokers. Our audits also included evaluating the accounting principles used and significant estimates made by management, as well as evaluating the overall presentation of the financial statements. We believe that our audits provide a reasonable basis for our opinion.
|
 |
|
| BBD, LLP |
We have served as the auditor of one or more of the Funds in the Bridgeway Funds, Inc. since 2005.
Philadelphia, Pennsylvania
August 27, 2018
| | |
| 92 | | Annual Report | June 30, 2018 |
| | |
| OTHER INFORMATION (Unaudited) | | |
June 30, 2018
1. Shareholder Tax Information
Certain tax information regarding the Funds is required to be provided to shareholders based upon each Fund’s income and distributions for the taxable year ended June 30, 2018. The information and distributions reported herein may differ from information and distributions taxable to the shareholders for the calendar year ended December 31, 2017.
The Funds report the following items with regard to distributions paid during the fiscal year ended June 30, 2018. All reportings are based on financial information available as of the date of this annual report and, accordingly, are subject to change. For each item, it is the intention of each Fund to report the maximum amount permitted under the Internal Revenue Code and the regulations there-under.
| | | | | | | | | | | | | | | | |
| | | Aggressive
Investors 1 | | | | | Ultra-Small
Company | | | | | Ultra-Small
Company Market |
Corporate Dividends Received Deduction | | | 0.00% | | | | | | 81.14% | | | | | | 92.28% | |
Qualified Dividend Income | | | 0.00% | | | | | | 76.49% | | | | | | 92.07% | |
Qualified Interest Related Dividends | | | 0.00% | | | | | | 0.12% | | | | | | 0.04% | |
Qualified Short Term Capital Gain Dividends | | | 0.00% | | | | | | 0.00% | | | | | | 0.00% | |
U.S. Government Income | | | 0.00% | | | | | | 0.00% | | | | | | 0.00% | |
| | | | | |
| | | Small-Cap
Growth | | | | | Small-Cap
Value | | | | | |
Corporate Dividends Received Deduction | | | 100.00% | | | | | | 64.75% | | | | | | | |
Qualified Dividend Income | | | 100.00% | | | | | | 63.20% | | | | | | | |
Qualified Interest Related Dividends | | | 0.31% | | | | | | 0.33% | | | | | | | |
Qualified Short Term Capital Gain Dividends | | | 0.00% | | | | | | 0.00% | | | | | | | |
U.S. Government Income | | | 0.00% | | | | | | 0.00% | | | | | | | |
| | | | | |
| | | Blue Chip
35 Index | | | | | Managed
Volatility | | | | | |
Corporate Dividends Received Deduction | | | 100.00% | | | | | | 100.00% | | | | | | | |
Qualified Dividend Income | | | 100.00% | | | | | | 100.00% | | | | | | | |
Qualified Interest Related Dividends | | | 0.02% | | | | | | 15.71% | | | | | | | |
Qualified Short Term Capital Gain Dividends | | | 0.00% | | | | | | 0.00% | | | | | | | |
U.S. Government Income | | | 0.00% | | | | | | 14.66% | | | | | | | |
U.S. Government Income represents the amount of interest that was derived from direct U.S. Government obligations. Generally, such interest is exempt from state income tax. However, for residents of California, New York and Connecticut, the statutory threshold requirements were not satisfied. Due to the diversity in state and local tax law, it is recommended you consult a tax adviser as to the applicability of the information provided for your specific situation.
During the fiscal year ended June 30, 2018, the Funds paid distributions from ordinary income and long-term capital gain which included equalization debits summarized below:
| | | | | | | | | | |
| | | Aggressive
Investors 1 | | Ultra-Small
Company | | | Ultra-Small
Company Market |
Ordinary Income Distributions | | $ - | | $ | 1,299,999 | | | $ | 449,185 | |
Equalization Debits Included in Ordinary Income Distributions | | - | | | 2,727 | | | | 151,346 | |
Long-Term Capital Gain Distributions | | - | | | 614,549 | | | | 43,056,482 | |
Equalization Debits Included in Long-Term Capital Gain Distributions | | - | | | 318,057 | | | | 2,570,410 | |
| | |
| OTHER INFORMATION (Unaudited) (continued) | | |
June 30, 2018
| | | | | | | | | | | | | | | | |
| | | Small-Cap
Growth | | | Small-Cap
Value | | | Blue Chip 35 Index | | | Managed Volatility |
Ordinary Income Distributions | | | $98,928 | | | | $547,906 | | | | $11,665,340 | | | | $194,557 | |
Equalization Debits Included in Ordinary Income Distributions | | | - | | | | - | | | | 995,472 | | | | - | |
Long-Term Capital Gain Distributions | | | - | | | | - | | | | 15,737,305 | | | | - | |
Equalization Debits Included in Long-Term Capital Gain Distributions | | | - | | | | - | | | | 2,147,913 | | | | - | |
2. Proxy Voting
A description of the policies and procedures that the Funds use to determine how to vote proxies relating to the portfolio securities and a summary of proxies voted by the Funds for the period ended June 30, 2018 are available without a charge, upon request, by contacting Bridgeway Funds at 1-800-661-3550 and on the SEC’s website at http://www.sec.gov.
3. Fund Holdings
The complete schedules of the Funds’ holdings for the second and fourth quarters of each fiscal year are contained in the Funds’ Semi-Annual and Annual Shareholder Reports, respectively.
The Bridgeway Funds file complete schedules of the Funds’ holdings with the SEC for the first and third quarters of each fiscal year on Form N-Q within 60 days after the end of the period. Copies of the Funds’ Form N-Q are available without charge, upon request, by contacting Bridgeway Funds at 1-800-661-3550 and on the SEC’s website at http://www.sec.gov. You may also review and copy Form N-Q at the SEC’s Public Reference Room in Washington, D.C. For more information about the operation of the Public Reference Room, please call 1-800-SEC-0330.
4. Approval of Investment Management Agreement
Bridgeway Funds, Inc.’s (the “Company”) management agreement (the “Management Agreement”) with its investment adviser, Bridgeway Capital Management, Inc. (the “Adviser”), on behalf of each of the Company’s funds must be approved for an initial term no greater than two years and renewed at least annually thereafter by the board of directors of the Company (the “Board”) or a vote of a majority of the outstanding voting securities of each fund. In addition, the renewal must be approved by a majority of the Directors who are not parties to the Management Agreement or “interested persons” of any party thereto (the “Independent Directors”), cast in person at a meeting called specifically for the purpose of voting on such approval.
The Board has five regularly scheduled meetings each year and takes into account throughout the year matters bearing on the approval of the Management Agreement. For example, the Board or its standing committees consider at meetings during the year various factors that are relevant to the annual renewal of each fund’s Management Agreement, including the quality of services and support provided to each fund by the Adviser, the Adviser’s compliance program, including the effectiveness of its implementation, comparative performance information for each fund, the risk assessment of the funds and “deep dives” on the strategy and performance of certain funds on a periodic basis. Additionally, between regular Board meetings the Adviser provides the Board with updated financial information on the Adviser and strategic direction and marketing efforts.
On May 10, 2018, the Board, including a majority of the Independent Directors, met in person (the “Meeting”) with the Adviser, the Company’s outside legal counsel, independent legal counsel (“Independent Legal Counsel”) to the Independent Directors and others to consider information bearing on the continuation of the Management Agreement with respect to the following funds of the Company: Aggressive Investors 1 Fund, Ultra-Small Company Fund, Ultra-Small Company Market Fund, Small-Cap Growth Fund, Small-Cap Value Fund, Blue Chip 35 Index Fund and Managed Volatility Fund (each a “Fund” and together, the “Funds”).
In reaching its decisions regarding the Management Agreement for each Fund, the Board considered the information furnished and discussed throughout the year at regularly scheduled Board and committee meetings, as applicable and as
| | |
| 94 | | Annual Report | June 30, 2018 |
| | |
| OTHER INFORMATION (Unaudited) (continued) | | |
June 30, 2018
described above, as well as the information provided to it specifically in relation to the annual consideration of the approval of the continuation of the Management Agreement for each Fund.
In preparation for the Meeting, the Independent Directors requested that the Adviser provide specific information relevant to the Board’s consideration of the renewal of the Management Agreement with respect to each Fund. In response to that request, the Board was furnished with a wide variety of information with respect to each Fund, including information regarding:
| | ● | | investment performance over various time periods and the fees and expenses of the Fund as compared to a comparable group of funds as determined and prepared by Broadridge Financial Solutions, Inc. (hereinafter “Broadridge”), an independent provider of investment company data; |
| | ● | | the nature, extent and quality of services provided by the Adviser to the Fund under the Management Agreement; |
| | ● | | actual management fees paid by the Fund to the Adviser and a comparison of those fees with the management fees charged to other advisory clients of the Adviser, as applicable; |
| | ● | | the Adviser’s costs of providing services to the Fund and the profitability of the Adviser from its relationship with the Fund; |
| | ● | | the extent to which economies of scale would be realized as the Fund’s assets increase and whether fee levels reflect these economies of scale for the benefit of Fund investors; and |
| | ● | | any potential “fall out” or ancillary benefits accruing to the Adviser as a result of its relationship with the Fund. |
In addition to evaluating the written information provided by the Adviser, the Board also considered the answers to questions posed by the Board to representatives of the Adviser at the Meeting.
In considering the information and materials described above, the Independent Directors received assistance from, and also had the opportunity to consult with, Independent Legal Counsel prior to the Meeting. In addition, the Independent Directors met in executive session with Independent Legal Counsel to consider the continuation of the Management Agreement with respect to each Fund outside the presence of management during the Meeting.
The Board also was provided with a written description of its statutory responsibilities and the legal standards that are applicable to approval of the renewal of the Management Agreement.
Although the Management Agreement for all of the Funds was considered at the Meeting, the Directors considered the renewal of the Management Agreement with respect to each Fund separately.
In considering the aforementioned information, the Board took into account management style, investment strategies and prevailing market conditions as reported by the Adviser. Furthermore, in evaluating the Management Agreement, the Directors also considered information provided by the Adviser concerning the following:
| | ● | | the terms of the Management Agreement, including the services performed by the Adviser in managing each Fund’s assets in accordance with the Fund’s investment objectives, policies and restrictions and how those services and fees differ from those for other advisory clients of the Adviser, as applicable; |
| | ● | | information regarding the advisory fee rates and the expense limitation or fee waiver arrangements for each Fund; |
| | ● | | the Adviser’s personnel, staffing levels and the time and attention the Adviser’s personnel devote to the management of the Funds as compared to other advisory clients of the Adviser; |
| | ● | | the Adviser’s risk assessment and management process; |
| | |
| OTHER INFORMATION (Unaudited) (continued) | | |
June 30, 2018
| | ● | | the Adviser’s representation that it does not participate in any soft dollar arrangements and, although it receives unsolicited research from outside sources, the Adviser does not use that research in its investment decision-making process; and |
| | ● | | the financial condition and stability of the Adviser. |
In view of the broad scope and variety of factors and information considered by the Board, the Directors did not find it practicable to, and did not, assign relative weights to the specific factors considered in reaching their conclusions and determinations to approve the continuance of the Management Agreement for each Fund for an additional year. Rather, the Board’s determinations were made on the basis of each Director’s business judgment after consideration of all of the factors taken in their entirety. Although not meant to be all-inclusive, the following describes various factors that were considered by the Board in deciding to approve the continuance of the Management Agreement for each Fund.
Nature, Extent and Quality of Services
In examining the nature, extent and quality of the services provided by the Adviser, the Directors considered the services provided to each Fund and any expected changes thereto, the qualifications, experience and duties of the Adviser’s personnel, the approximate amount of time those personnel devote to the Funds, recent and expected personnel changes, portfolio manager compensation arrangements, business continuity and succession planning, and enterprise risk management (including as it relates to cybersecurity risk). In addition, the Directors considered information provided by the Adviser regarding its overall financial strength and considered the resources and staffing in place with respect to the services provided to the Funds.
Based on the totality of the information considered, the Directors concluded that they were satisfied with the nature, extent and quality of the services provided to each Fund by the Adviser, and that the Adviser has the ability to continue to provide these services based on its experience, operations and current resources.
Investment Performance
The Board considered performance information provided by the Adviser for similarly managed accounts (if any) over the most recent quarter, six month, one year, three year and five year periods ending December 31, 2017 as well as Fund performance compared with its benchmark for one, three, five, ten, fifteen year and since inception periods ending December 31, 2017 (although certain Funds did not yet have a fifteen year performance.) The Board considered the Adviser’s representation that the differences in the performance of the similarly managed accounts (if any) and Fund performance were within ranges that the Adviser expects for the relevant accounts/Funds given, for example, differences in cash flows, investment restrictions, account size and tax management practices.
In addition, Broadridge provided a report (the “Broadridge Report”) of comparative data regarding fees, expenses and performance for each Fund as compared to a peer group selected by Broadridge (“Peer Group”). The performance periods included total return over the most recent calendar year (“one year period”) and the annualized total returns over the most recent three calendar year period (“three year period”), five calendar year period (“five year period”) and ten calendar year period (“ten year period”). With regard to the performance information provided in the Broadridge Report, the Board considered the performance of each Fund on a percentile and quintile basis as compared to its Peer Group. For purposes of the performance data provided, the first quintile is defined as 20% of the funds in the applicable Peer Group with the highest performance and the fifth quintile is defined as 20% of the funds in the applicable Peer Group with the lowest performance.
In particular, the Board considered the following performance information as of December 31, 2017 provided by the Adviser and from Broadridge:
| | ● | | With regard to the Aggressive Investors 1 Fund, the Fund was in the fourth quintile relative to its Peer Group for the one and three year periods, in the first quintile for the five year period and in the fifth quintile for the ten year period. The Fund outperformed its primary benchmark for the five year and since inception periods, but underperformed its benchmark for the one, three, ten and fifteen year periods. The Board considered the Adviser’s explanation that the Fund’s smaller size tilt hurt relative returns for the one and three year periods. The Board also considered the |
| | |
| 96 | | Annual Report | June 30, 2018 |
| | |
| OTHER INFORMATION (Unaudited) (continued) | | |
June 30, 2018
| | Adviser’s representation that it had engaged in significant research over 2016 and early 2017 for this Fund, and had made certain modifications intended to make the Fund less susceptible to underperformance during spikes in stock correlations, which had contributed to the Fund’s relative underperformance over longer periods. Based on their review, the Directors concluded that the Fund’s overall performance was satisfactory relative to the performance of the funds in its Peer Group and its primary benchmark. |
| | ● | | With regard to the Ultra-Small Company Fund, the Fund had fifth quintile performance compared to its Peer Group for the one, three, five and ten year periods. The Fund underperformed its primary benchmark for all performance periods, except the since inception period. The Board considered the Adviser’s explanation that the variability in the Fund’s relative performance was partly explained by the market capitalization differences between the ultra-small cap focus of the Fund and that of the other small-cap funds in its Peer Group. The Board also took into account the portfolio updates that the Adviser recently had implemented and that the Fund’s recent performance was generally in line with its design although out of favor in the current market environment, and the Adviser’s continued monitoring of the Fund’s performance. Based on their review, the Directors concluded that the Fund’s performance was being addressed. |
| | ● | | With regard to the Ultra-Small Company Market Fund, the Fund ranked in the third, fourth, first and fourth quintiles for the one, three, five and ten year periods, respectively. The Fund underperformed its primary benchmark over the one, ten, fifteen year and since inception periods, but outperformed over the three and five year periods. The Board considered the Adviser’s explanation that the variability in the Fund’s relative performance was largely explained by the market capitalization differences between the ultra-small cap focus of the Fund and that of the other small-cap funds in its Peer Group. Based on their review, the Directors concluded that the Fund’s overall performance was satisfactory relative to the performance of the funds in its Peer Group and its primary benchmark. |
| | ● | | With regard to the Small-Cap Growth Fund, the Fund is in the fourth quintile relative to its Peer Group for the one year period, in the first quintile for the three and five year periods and in the fifth quintile for the ten year period. The Fund outperformed its primary benchmark for the three and five year periods, but underperformed for the one and ten year and since inception periods. The Board noted that the Adviser had implemented some refinements to its investment process in 2013 and that the Fund’s performance had improved since these refinements had been made. Based on their review, the Directors concluded that the Fund’s overall performance was satisfactory relative to the performance of the funds in its Peer Group and its primary benchmark. |
| | ● | | With regard to the Small-Cap Value Fund, the Fund was in the fourth quintile for the one, three and five year periods and in the fifth quintile for the ten year period, as compared with its Peer Group. The Fund underperformed its primary benchmark across all time periods. The Board took into account the various design changes to be implemented by the Adviser in the Fund in mid-2018, and the Adviser’s continued monitoring of the Fund’s performance. Based on their review, the Directors concluded that the Fund’s performance was being addressed. |
| | ● | | With regard to the Blue Chip 35 Index Fund, the Fund had performance in the fifth quintile of its Peer Group for the one year period, in the third quintile for the three and five year periods and in the second quintile for the ten year period. The Fund underperformed its primary benchmark for all time periods, except the since inception period. The Board considered the Adviser’s explanation that the variability in the Fund’s relative performance was partly explained by the market capitalization differences between the ultra-large cap focus of the Fund and that of the benchmark and other funds in its Peer Group. The Board also took into account the Adviser’s explanation for the Fund’s recent underperformance. Based on their review, the Directors concluded that the Fund’s overall performance was satisfactory relative to the performance of the funds in its Peer Group and its primary benchmark. |
| | ● | | With regard to the Managed Volatility Fund, the Fund had performance in the fourth quintile of its Peer Group for all periods and underperformed its primary benchmark for all periods. The Board considered the Adviser’s explanation that the Fund is not designed to outperform the primary benchmark, but instead it is designed to capture market return while limiting volatility, which from inception to date the Fund has done. The Board also considered the Adviser’s statement that this performance is in line with the Fund’s design. Based on their review, the Directors |
| | |
| OTHER INFORMATION (Unaudited) (continued) | | |
June 30, 2018
| | concluded that the Fund’s overall performance was satisfactory relative to the performance of the funds in its Peer Group and its primary benchmark. |
Fund Fees and Expenses
The Board considered information provided by the Adviser regarding the advisory fees it charges to other advisory clients and the reasons for any material differences between those fees and the fees it charges to the Funds. The Board also considered the Adviser’s views that, given investment performance and overall expenses, the Adviser believes the management fees for each Fund appear reasonable and appropriate given the distinctive features and design of each Fund, the disciplined implementation of the design by the Adviser, the relatively low management fees in most cases, the performance results in line with design and investor expectations, and the profitability to the Adviser of each Fund. More specifically, with regard to management fee differences among the Funds, the Board considered the Adviser’s view that fee differences stem from market factors as well as the estimated growth rate of the Fund at the time of launch; the potential asset capacity of the Fund; the risks associated with providing the advisory services to the Fund; and estimated costs of providing the advisory services driven by the design complexity of the Fund (e.g., more complex design is higher cost due to the research and portfolio management time required).
With respect to management fee differences between the Funds and other investment company clients of the Adviser, the Board considered that, unlike the Funds, the Adviser serves as a sub-adviser to the other investment company clients, which generally requires the Adviser to furnish fewer services than the services it provides to the Funds. The Board also considered the fees charged to other investment company clients of the Adviser, as well as the Adviser’s representation that for certain Funds, that the Adviser did not manage comparable investment companies.
With respect to management fee differences between the Funds and other non-investment company clients of the Adviser, the Board considered that: (i) the management fees charged to the Blue Chip 35 Index Fund and the Ultra-Small Company Market Fund are lower than those charged to comparable clients; (ii) the asset-based management fee charged to the Aggressive Investors 1 Fund is higher than that charged to comparable clients, while the Fund’s performance fee rate is significantly lower than the performance fee rate charged to comparable clients (and there are other differences in the performance fee calculations); and (iii) the Adviser had no advisory clients comparable to the other Funds.
The Board also considered information compiled by Broadridge comparing each Fund’s contractual management fee rate (excluding any performance fees and using an assumed common asset level for the Fund and the other funds in the Peer Group), actual management fee rate (which included the effect of any fee waivers and any performance fees, and was derived from annual reports) and actual total expense ratios (which also included the effect of any fee waivers and performance fees, and was derived from annual reports) as a percentage of average net assets as compared to other funds in its expense Peer Group. Broadridge’s contractual management fee data included both advisory fees and administrative services fees, except for the Funds. Broadridge excluded administrative services fees for the Funds from contractual management fee data because those fees are fixed (i.e., a stated dollar amount), as opposed to asset-based. More specifically, with respect to the Funds, the Adviser provides certain administrative services to the Funds pursuant to a separate contract, in exchange for an annual fixed fee (payable monthly) that the Adviser has represented approximates the cost of providing such services (which the Board considered in connection with profitability, as described below). Broadridge’s actual management fee data for the Funds and the other funds in the Peer Group included both advisory fees and administrative services fees. Thus, the contractual management fee rate in the Funds’ Broadridge comparisons did not reflect these administrative services fees, whereas the actual management fee rate in the Funds’ Broadridge comparisons included both advisory and administrative services fees.
With regard to the expense information provided in the Broadridge Report, the Board considered Fund expenses on a percentile and quintile basis as compared to each Fund’s Peer Group. For purposes of the expense data provided, Broadridge defines the first quintile as 20% of the funds in the applicable Peer Group with the lowest expenses and the fifth quintile as 20% of the funds in the applicable Peer Group with the highest expenses. In particular, the Board considered the following:
| | ● | | The Aggressive Investors 1 Fund’s contractual management fee was in the fourth quintile of its Peer Group (excluding the performance fee) and the Fund’s actual management fees and actual total expenses (factoring in the performance |
| | |
| 98 | | Annual Report | June 30, 2018 |
| | |
| OTHER INFORMATION (Unaudited) (continued) | | |
June 30, 2018
| | fee) were in the fifth quintile of its Peer Group. The Board also considered the impact of the Fund’s performance fee on the fee comparisons. |
| | ● | | With respect to the Ultra-Small Company Fund, the Board considered that the Fund’s contractual management fees and actual total expense ratio were in the third and second quintile of its Peer Group, respectively, and actual management fees were in the fourth quintile. The Board took into account that the Fund’s actual management fee, although in the fourth quintile, was only slightly above the median of its Peer Group. |
| | ● | | With respect to the Ultra-Small Company Market Fund, the Blue Chip 35 Index Fund, the Small-Cap Growth Fund, the Managed Volatility Fund, and the Small-Cap Value Fund, the Board considered that each Fund was in the first quintile of its applicable Peer Group for the contractual management fee, actual management fee and total expense ratio. The Board also considered the impact of the performance fee arrangement on contractual management fees for the Small-Cap Value and Small-Cap Growth Funds. |
In addition, the Board considered that the Adviser agreed to contractual expense limitation agreements for each of the Funds to ensure that total expense levels do not increase above certain asset percentage levels.
The foregoing comparisons assisted the Board in determining to approve the Management Agreement for each Fund by providing it with a basis for evaluating each Fund’s management fee and total expense ratio on a relative basis. Based on their review, the Directors concluded that each Fund’s management fee was reasonable in view of the services received by the Fund and the other factors considered.
Profitability
The Board reviewed the materials it received from the Adviser regarding its revenues and costs in providing investment management and certain administrative services to the Funds and the Company as a whole. In particular, the Board considered the analysis of the Adviser’s profitability with respect to each Fund, calculated for the years ended December 31, 2014, December 31, 2015, December 31, 2016 and December 31, 2017. The Board also considered the Adviser’s representations that it does not track expenses or maintain staff on a per Fund basis and accordingly the Adviser needed to make certain assumptions to allocate expenses on a Fund-by-Fund basis in order to calculate Fund-by-Fund profitability, making the process a subjective one. The Board also considered that the Adviser was operating some Funds at a loss but that the Adviser’s overall business is profitable. Based on their review, the Directors concluded that the Adviser’s profitability from its relationship with each Fund was reasonable.
Economies of Scale
The Board considered the effect of each Fund’s current size and its potential growth on its performance and fees. With respect to whether economies of scale are expected to be realized by the Adviser as a Fund’s assets increase and whether advisory fee levels reflect these economies of scale for the benefit of Fund investors, the Board considered, on a Fund-by-Fund basis, the current level of advisory fees charged and fee structure and concluded that the Adviser’s fee structure with respect to each Fund was appropriate at this time. The Board considered that the Aggressive Investors 1 Fund and Ultra-Small Company Fund each have fee breakpoints in their management fee schedules although neither Fund is at a size currently to benefit from such breakpoints. With respect to Ultra-Small Company Market Fund and Managed Volatility Fund, the Board considered the Adviser’s representation that it believes that neither Fund will produce significant economies of scale because each Fund involves intensive and time-consuming portfolio and trading management. Finally, although the Small-Cap Growth Fund, Small-Cap Value Fund, Blue Chip 35 Index Fund and Managed Volatility Fund do not have fee breakpoints in their management fee schedules, the Board considered the Adviser’s explanation that these Funds were priced low relative to their respective Peer Groups and ahead of the economies of scale curve at launch. The Board noted that if a Fund’s assets increased over time, the Fund might realize other economies of scale if assets increased proportionally more than certain other expenses.
| | |
| OTHER INFORMATION (Unaudited) (continued) | | |
June 30, 2018
“Fallout” or Ancillary Benefits
The Board considered whether there were any “fall-out” or ancillary benefits that may accrue to the Adviser as a result of its relationships with the Funds. In terms of potential “fall out” or ancillary benefits to the Adviser due to its position as manager of the Funds, the Board considered benefits related to track record and reputation, and portfolio trading and execution. The Board also considered the Adviser’s representations that it does not participate in any soft dollar arrangements and that, although it receives unsolicited research from outside sources, the Adviser does not use that research in its investment decision-making process. The Board concluded that the benefits accruing to Adviser by virtue of its relationship with the Funds appeared to be reasonable.
* * * * *
Based on all relevant information and factors discussed above, none of which was individually determinative of the outcome, the Board, including a majority of the Independent Directors, determined that the continuation of the Management Agreement for each Fund was in the best interests of the Fund. As a result, the Board, including a majority of the Independent Directors, approved the renewal of the Management Agreement for each Fund.
| | |
| 100 | | Annual Report | June 30, 2018 |
| | |
| DISCLOSURE OF FUND EXPENSES | | |
June 30, 2018 (Unaudited)
As a shareholder of a Fund, you will incur no transaction costs from such Fund, including sales charges (loads) on purchases, on reinvested dividends or on other distributions. There are no exchange fees. Shareholders are subject to redemption fees on the Ultra-Small Company Market Fund under certain circumstances. However, as a shareholder of a Fund, you will incur ongoing costs, including management fees and other Fund expenses. The following examples are intended to help you understand your ongoing costs (in dollars) of investing in a Fund and to compare these costs with ongoing costs of investing in other mutual funds. The examples are based on an investment of $1,000 invested on January 1, 2018 and held until June 30, 2018.
Actual Expenses. The first line of the table below provides information about actual account values and actual expenses. You may use the information in this line, together with the amount you invested, to estimate the expenses that you paid over the period. Simply divide your account value by $1,000 (for example, an $8,600 account value divided by $1,000 = 8.6), then multiply the result by the number in the first line under the heading “Expenses Paid During Period” to estimate the expenses you paid on your account during the period.
Hypothetical Example for Comparison Purposes. The second line of the table below provides information about hypothetical account values and hypothetical expenses based on the Fund’s actual expense ratio and an assumed rate of return of 5% per year before expenses, which is not the Fund’s actual return. The hypothetical account values and expenses may not be used to estimate the actual ending account balance or expenses you paid for the period. You may use this information to compare the ongoing costs of investing in a Fund and other mutual funds. To do so, compare this 5% hypothetical example with the 5% hypothetical examples that appear in the shareholder reports of other funds.
The expenses shown in the table are meant to highlight ongoing Fund costs only. Therefore, the second line of the table is useful in comparing ongoing costs only and will not help you determine the relative total costs of owning different funds, because other funds may also have transaction costs, such as sales charges, redemption fees or exchange fees.
| | | | | | | | | | | | | | | | | | | | |
| | | Beginning Account
Value at 1/1/18 | | Ending Account
Value at 6/30/18 | | Expense
Ratio | | Expenses Paid
During Period*
1/1/18 - 6/30/18 |
| | | | |
Bridgeway Aggressive Investors 1 Fund | | | | | | | | | | | | | | | | | | | | |
Actual Fund Return | | | $ | 1,000.00 | | | | $ | 983.00 | | | | | 0.66% | | | | $ | 3.25 | |
Hypothetical Fund Return | | | $ | 1,000.00 | | | | $ | 1,021.52 | | | | | 0.66% | | | | $ | 3.31 | |
| | | | |
Bridgeway Ultra-Small Company Fund | | | | | | | | | | | | | | | | | | | | |
Actual Fund Return | | | $ | 1,000.00 | | | | $ | 1,062.50 | | | | | 1.17% | | | | $ | 5.98 | |
Hypothetical Fund Return | | | $ | 1,000.00 | | | | $ | 1,018.99 | | | | | 1.17% | | | | $ | 5.86 | |
| | | | |
Bridgeway Ultra-Small Company Market Fund | | | | | | | | | | | | | | | | | | | | |
Actual Fund Return | | | $ | 1,000.00 | | | | $ | 1,108.70 | | | | | 0.75% | | | | $ | 3.92 | |
Hypothetical Fund Return | | | $ | 1,000.00 | | | | $ | 1,021.08 | | | | | 0.75% | | | | $ | 3.76 | |
| | | | |
Bridgeway Small-Cap Growth Fund | | | | | | | | | | | | | | | | | | | | |
Actual Fund Return | | | $ | 1,000.00 | | | | $ | 1,096.20 | | | | | 0.94% | | | | $ | 4.89 | |
Hypothetical Fund Return | | | $ | 1,000.00 | | | | $ | 1,020.13 | | | | | 0.94% | | | | $ | 4.71 | |
| | | | |
Bridgeway Small-Cap Value Fund | | | | | | | | | | | | | | | | | | | | |
Actual Fund Return | | | $ | 1,000.00 | | | | $ | 1,115.70 | | | | | 0.94% | | | | $ | 4.93 | |
Hypothetical Fund Return | | | $ | 1,000.00 | | | | $ | 1,020.13 | | | | | 0.94% | | | | $ | 4.71 | |
| | | | |
Bridgeway Blue Chip 35 Index Fund | | | | | | | | | | | | | | | | | | | | |
Actual Fund Return | | | $ | 1,000.00 | | | | $ | 1,003.40 | | | | | 0.15% | | | | $ | 0.75 | |
Hypothetical Fund Return | | | $ | 1,000.00 | | | | $ | 1,024.05 | | | | | 0.15% | | | | $ | 0.75 | |
| | |
| DISCLOSURE OF FUND EXPENSES (continued) | | |
June 30, 2018 (Unaudited)
| | | | | | | | | | | | | | | | | | | | |
| | | Beginning Account
Value at 1/1/18 | | Ending Account
Value at 6/30/18 | | Expense
Ratio | | Expenses Paid
During Period*
1/1/18 - 6/30/18 |
| | | | |
Bridgeway Managed Volatility | | | | | | | | | | | | | | | | | | | | |
Actual Fund Return | | | $ | 1,000.00 | | | | $ | 1,023.40 | | | | | 0.94 | % | | | $ | 4.72 | |
Hypothetical Fund Return | | | $ | 1,000.00 | | | | $ | 1,020.13 | | | | | 0.94 | % | | | $ | 4.71 | |
| * | Expenses are equal to the average account value times the Fund’s annualized expense ratio multiplied by the number of days in the most recent six-month period (181) divided by the number of days in the fiscal year (365). |
| | |
| 102 | | Annual Report | June 30, 2018 |
| | |
| DIRECTORS & OFFICERS | | |
June 30, 2018 (Unaudited)
| | | | | | | | | | |
| Independent Directors |
| | | | | |
Name, Address
and Age1 | | Position Held with Bridgeway Funds | | Term of Office and Length of Time Served | | Principal Occupation(s)
During Past Five Years | | No. of Bridgeway
Funds Overseen
by Director | | Other Directorships
Held by Director |
| | | | | |
Karen S. Gerstner
Age 63 | | Director | | Term: 1 Year
Length: 1994 to
Present. | | Principal, Karen S. Gerstner & Associates, P.C., since 2004. | | Nine | | None |
| | | | | |
Miles Douglas Harper, III*
Age 55 | | Director | | Term: 1 Year
Length: 1994 to
Present. | | Partner, Carr, Riggs & Ingram, LLC, since 2013; Partner, Gainer Donnelly, LLP, 1998 to 2013 upon merger with Carr, Riggs & Ingram, LLC. | | Nine | | Calvert Funds (39 Portfolios) |
| | | | | |
Evan Harrel
Age 57 | | Director | | Term: 1 Year
Length: 2006 to
Present. | | Strategic Advisor, Small Steps Nurturing Center, since 2012. | | Nine | | None |
| | | | | |
| | | | | | | | | | | |
| | |
| DIRECTORS & OFFICERS (continued) | | |
June 30, 2018 (Unaudited)
| | | | | | | | | | |
| “Interested” or Affiliated Director and Officer |
| | | | | |
Name, Address and Age1 | | Position(s) Held with Bridgeway Funds | | Term of
Office and
Length of
Time Served | | Principal Occupation(s)
During Past Five Years | | No. of Bridgeway
Funds Overseen
by Director | | Other Directorships
Held by Director |
| | | | | |
John N. R. Montgomery2
Age 62 | | Director | | Term: 1 Year
Length: 1993
to Present. | | Chairman, Bridgeway Capital Management, Inc., since 2010; President, Bridgeway Capital Management, Inc., 1993 to 2010 and June 2015 to March 2016; President, Bridgeway Funds, June 2015 to June 2016; Vice President, Bridgeway Funds, 2005 to May 2015 and since June 2016. | | Nine | | None |
| | | | | | | | | | |
| | | | | | | | | | | |
| | |
| 104 | | Annual Report | June 30, 2018 |
| | |
| DIRECTORS & OFFICERS (continued) | | |
June 30, 2018 (Unaudited)
| | | | | | | | | | |
| Other Officers |
| | | | | |
Name, Address and Age1 | | Position
Held with
Bridgeway
Funds | | Term of
Office and
Length of
Time Served | | Principal Occupation(s)
During Past Five Years | | No. of Bridgeway
Funds Overseen
by Officer | | Other Directorships
Held by Officer |
| | | | | |
Richard P. Cancelmo, Jr.
Age 60 | | Vice
President | | Term: 1 Year
Length: 2004
to Present. | | Vice President, Bridgeway Funds, since 2004; Staff member, Bridgeway Capital Management, Inc., since 2000. | | N/A | | None |
| | | | | |
Linda G. Giuffré
Age 56 | | Treasurer
and Chief
Compliance
Officer | | Term: 1 Year
Length: 2004
to Present. | | Chief Compliance Officer, Bridgeway Capital Management, Inc., since 2004; Staff member, Bridgeway Capital Management, Inc., since 2004. | | N/A | | None |
| | | | | |
Deborah L. Hanna
Age 53 | | Secretary | | Term: 1 Year
Length: 2007
to Present. | | Self-employed, accounting and related projects for various organizations, since 2001. | | N/A | | None |
| | | | | |
Sharon Lester Age 63 | | Vice
President | | Term: 1 Year
Length: 2011
to Present. | | Staff member, Bridgeway Capital Management, Inc., since 2010. | | N/A | | None |
| | | | | |
Tammira Philippe Age 44 | | President | | Term: 1 Year
Length: May
2016
to Present. | | President, Bridgeway Capital Management, Inc., since March 2016; Staff member, Bridgeway Capital Management, Inc., 2010 to March 2016. | | N/A | | None |
| 1 | The address of all of the Directors and Officers of Bridgeway Funds is 20 Greenway Plaza, Suite 450, Houston, Texas, 77046. |
| 2 | John Montgomery is chairman, director and majority shareholder of Bridgeway Capital Management, Inc., and therefore an interested person of Bridgeway Funds. |
The overall management of the business and affairs of Bridgeway Funds is vested with its Board of Directors (the “Board”). The Board approves all significant agreements between Bridgeway Funds and persons or companies furnishing services to it, including agreements with its Adviser and custodian. The day-to-day operations of Bridgeway Funds are delegated to its officers, subject to its investment objectives and policies and general supervision by the Board.
The Funds’ Statement of Additional Information includes additional information about the Board and is available, without charge, upon request by calling 1-800-661-3550.
THIS PAGE INTENTIONALLY LEFT BLANK
THIS PAGE INTENTIONALLY LEFT BLANK
BRIDGEWAY FUNDS, INC.
BNY Mellon Investment Servicing (US) Inc.
P.O. Box 9860
Providence, RI 02940-8060
CUSTODIAN
The Bank of New York Mellon
One Wall Street
New York, NY 10286
DISTRIBUTOR
Foreside Fund Services, LLC
Three Canal Plaza, Suite 100
Portland, ME 04101
| | | | |
| | You can review and copy information about our Funds (including the SAIs) at the SEC’s Public Reference Room in Washington, D.C. To find out more about this public service, call the SEC at 800-SEC-0330. Reports and other information about the Funds are also available on the SEC’s website at www.sec.gov. You can receive copies of this information, for a fee, by writing the Public Reference Section, Securities and Exchange Commission, Washington, D.C. 20549-1520 or by sending an electronic request to the following email address: publicinfo@sec.gov. | | |
| | |
| TABLE OF CONTENTS | |  |
|
| | |
| | | |
| Bridgeway Funds Standardized Returns as of June 30, 2018 (Unaudited) | | |
| | | | | | | | | | | | | | | | |
| | | | | | | Annualized | | | | | | |
| | | | | | | | | | | Gross | | Net |
| Fund | | Quarter | | Six Months | | 1 Year | | 5 Years | | Inception
to Date | | Inception
Date | | Expense
Ratio2 | | Expense
Ratio2 |
Omni Small-Cap Value | | 7.89% | | 6.27% | | 16.75% | | 11.73% | | 14.51% | | 8/31/2011 | | 0.71%1 | | 0.60%1 |
Omni Tax-Managed Small-Cap Value | | 7.91% | | 6.70% | | 16.48% | | 11.85% | | 11.56% | | 12/31/2010 | | 0.71%1 | | 0.60%1 |
| | 1 | Some of the Fund’s fees were waived or expenses reimbursed; otherwise, returns would have been lower. The Adviser has contractually agreed to waive fees and/or reimburse expenses. Any material change to this Fund policy would require a vote by shareholders. |
| | 2 | Expense ratios are as stated in the current prospectus. Please see financial highlights for expense ratios as of June 30, 2018. |
Performance figures quoted represent past performance and are no guarantee of future results. Current performance may be lower or higher than the performance data quoted. Investment return and principal value will fluctuate, so that an investor’s shares, when redeemed, may be worth more or less than original cost. To obtain performance current to the most recent month-end, please visit our website at www.bridgeway.com or call 1-800-661-3550. Total return figures include the reinvestment of dividends and capital gains.
This report is submitted for the general information of the shareholders of each Fund. It is not authorized for distribution to prospective investors unless preceded or accompanied by an effective prospectus, which includes information regarding a Fund’s risks, objectives, fees and expenses, experience of its management, and other information. Investors should read the prospectus carefully before investing in a Fund. For questions or other Fund information, call 1-800-661-3550 or visit the Funds’ website at www.bridgeway.com. Funds are available for purchase by residents of the United States, Puerto Rico, U.S. Virgin Islands and Guam only. Foreside Fund Services, LLC, Distributor.
The views expressed here are exclusively those of Fund management. These views, including those relating to the market, sectors or individual stocks, are not meant as investment advice and should not be considered predictive in nature.
| | |
| LETTER FROM THE INVESTMENT MANAGEMENT TEAM | | |
June 30, 2018
Dear Fellow Shareholders,
At Bridgeway, we have a shared passion for applying logic, data and evidence to develop investment solutions. Our Omni Small-Cap Value and Omni Tax-Managed Small-Cap Value Funds are constructed based on fundamental academic research that relies on market efficiency to better capture risk premiums. We manage these Funds to provide broad diversification within the small-cap value universe and to keep transaction fees and expenses low. Bridgeway offers the Omni Small-Cap Value and Omni Tax-Managed Small-Cap Value Funds through a select group of advisers. We are committed to advisers and their clients who take a long-term perspective and whose investment goals fit our unique expertise: delivering investment solutions that are statistically driven and grounded in academic theory.
Thank you for your investment in Bridgeway’s Omni Small-Cap Value and Omni Tax-Managed Small-Cap Value Funds.
Sincerely,
Your Investment Management Team
| | | | |
 | |  | |  |
| John Montgomery | | Christine L. Wang | | Michael Whipple |
| | |
 | | | | |
| Elena Khoziaeva | | | | |
| | |
| LETTER FROM THE INVESTMENT MANAGEMENT TEAM (continued) | | |
Market Review
Performance across the domestic equity markets was positive for the June 2018 quarter. Broad market returns for the quarter were up +3.89%, as represented by the Russell 3000 Index.
For the fiscal year ended June 30, 2018, broad market stocks returned +14.78%, as represented by the Russell 3000 Index. Growth stocks outperformed value stocks across the market-cap spectrum. As a result, large-cap growth stocks, represented by the Russell 1000 Growth Index, had the highest returns (+22.51%), followed by broad-market growth stocks, represented by the Russell 3000 Growth Index (+22.47%).
The following table presents returns for broad market, small-cap, mid-cap, and large-cap stocks, as represented by various style-based Russell Indexes. Size (market capitalization) and style (value/growth) are among the key factors that drive differences in returns among U.S. stocks.
Russell Style-Based Indexes Ranked by Performance for the Quarter and Fiscal Year Ended June 30, 2018
| | | | |
| | | Quarter | | Fiscal Year |
Best Performing | | 8.30% Russell 2000 Value Index | | 22.51% Russell 1000 Growth Index |
| | |
| | 7.23% Russell 2000 Growth Index | | 22.47% Russell 3000 Growth Index |
| | |
| | 5.87% Russell 3000 Growth Index | | 21.86% Russell 2000 Growth Index |
| | |
| | 5.76% Russell 1000 Growth Index | | 18.52% Russell Midcap Growth Index |
| | |
| | 3.16% Russell Midcap Growth Index | | 13.10% Russell 2000 Value Index |
| | |
| | 2.41% Russell Midcap Value Index | | 7.60% Russell Midcap Value Index |
| | |
| | 1.71% Russell 3000 Value Index | | 7.25% Russell 3000 Value Index |
| | |
Worst Performing | | 1.18% Russell 1000 Value Index | | 6.77% Russell 1000 Value Index |
The Bridgeway Omni Funds in this annual report are asset class exposure strategies that seek broad diversification and risk premium exposure. These Funds were designed to capture the size and style benefits within the small-cap value asset class.
| | |
2 | | Annual Report | June 30, 2018 |
| | |
Omni Small-Cap Value Fund MANAGER’S COMMENTARY (Unaudited) | |
|
| | |
June 30, 2018
Dear Fellow Omni Small-Cap Value Fund Shareholder,
For the quarter ended June 30, 2018, our Fund returned +7.89%, underperforming our primary market benchmark, the Russell 2000 Value Index (+8.30%).
For the fiscal year, our Fund returned +16.75%, outperforming the Russell 2000 Value Index (+13.10%).
The table below presents our June quarter, one-year, five-year, and inception-to-date financial results. See the next page for a graph of performance since inception.
Standardized Returns as of June 30, 2018
| | | | | | | | |
| | | | | | | Annualized |
| | | Quarter | | 1 Year | | 5 Years | | Since Inception
(8/31/11) |
| | | | |
Omni Small-Cap Value Fund | | 7.89% | | 16.75% | | 11.73% | | 14.51% |
Russell 2000 Value Index | | 8.30% | | 13.10% | | 11.18% | | 13.46% |
Performance figures quoted in the table above and the graph on the next page represent past performance and are no guarantee of future results. Total return figures in the table above include the reinvestment of dividends and capital gains. The table above and the graph on the next page do not reflect the deduction of taxes that a shareholder would pay on Fund distributions or on the redemption of Fund shares.
The Russell 2000 Value Index is an unmanaged index that consists of stocks in the Russell 2000 Index with lower price-to-book ratios and lower forecasted growth values with dividends reinvested. It is not possible to invest directly in an index. Periods longer than one year are annualized.
| | |
Omni Small-Cap Value Fund MANAGER’S COMMENTARY (Unaudited) (continued) | |
|
| | |
Growth of a $10,000 Investment
from Inception August 31, 2011 to June 30, 2018
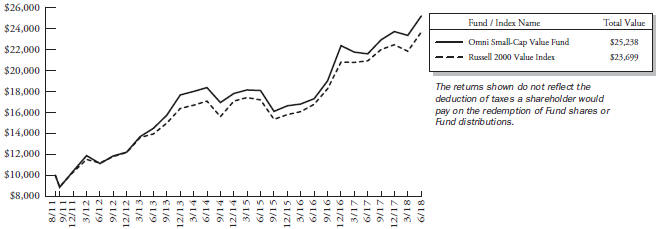
Detailed Explanation of Quarterly Performance
The Omni Small-Cap Value Fund is designed to capture the returns of the small-cap value asset class through broad diversification of small company and value stocks. This approach is sometimes referred to as “passive, asset class investing.” As of June 30, 2018, we held 673 such stocks in a market-cap weighted style. We make no attempt to track any particular index in either performance or statistics.
Above-benchmark exposure to higher momentum stocks detracted slightly from results during the quarter. On the positive side, the Fund’s tilt toward smaller stocks in the small-cap value universe was the leading contributor to relative results, as smaller stocks outperformed their larger counterparts. The Fund’s tilt toward deeper value stocks across multiple value metrics also benefited relative performance.
From a sector perspective, the Fund’s allocation effect was negative. By design, the Fund does not hold Real Estate Investment Trusts (REITs) or Utilities stocks. The lack of exposure to the Real Estate sector was the largest detractor to relative results. Lack of exposure to the Utilities sector had no meaningful impact on results during the quarter.
Detailed Explanation of Fiscal Year Performance
Smaller stocks outperformed their larger counterparts in the small-cap value universe during the 12-month period. As a result, the Fund’s tilt toward the benchmark’s smaller stocks made the largest positive contribution to relative results. Above-benchmark exposure to higher momentum stocks also benefited relative results, as the momentum factor was in favor during a volatile period for the stock market. In addition, the Fund’s tilt toward deeper value stocks across multiple value metrics added to relative results.
From a sector perspective, the Fund’s allocation effect was positive. By design, the Fund does not hold Real Estate Investment Trusts (REITs) or Utilities stocks. This positioning boosted relative results during the fiscal year.
| | |
|
| |
| 4 | | Annual Report | June 30, 2018 |
| | |
Omni Small-Cap Value Fund MANAGER’S COMMENTARY (Unaudited) (continued) | |
|
| | |
Top Ten Holdings as of June 30, 2018
| | | | | | |
| Rank | | Description | | Industry | | % of Net
Assets |
1 | | TTM Technologies, Inc. | | Information Technology | | 1.0% |
2 | | RH | | Consumer Discretionary | | 0.8% |
3 | | Delek US Holdings, Inc. | | Energy | | 0.8% |
4 | | Cooper-Standard Holdings, Inc. | | Consumer Discretionary | | 0.7% |
5 | | Kraton Corp. | | Materials | | 0.7% |
6 | | Iridium Communications, Inc. | | Telecommunication Services | | 0.7% |
7 | | Rush Enterprises, Inc., Class A | | Industrials | | 0.7% |
8 | | Marten Transport, Ltd. | | Industrials | | 0.7% |
9 | | ManTech International Corp., Class A | | Information Technology | | 0.6% |
10 | | SkyWest, Inc. | | Industrials | | 0.6% |
| | Total | | | | 7.3% |
Industry Sector Representation as of June 30, 2018
| | | | | | | | | | | | |
| | | % of Net Assets | | | % of Russell 2000
Value Index | | | Difference | |
Consumer Discretionary | | | 22.0% | | | | 11.4% | | | | 10.6% | |
Consumer Staples | | | 2.4% | | | | 2.7% | | | | -0.3% | |
Energy | | | 11.6% | | | | 7.6% | | | | 4.0% | |
Financials | | | 28.7% | | | | 28.3% | | | | 0.4% | |
Health Care | | | 2.5% | | | | 4.7% | | | | -2.2% | |
Industrials | | | 17.1% | | | | 11.5% | | | | 5.6% | |
Information Technology | | | 7.6% | | | | 10.6% | | | | -3.0% | |
Materials | | | 6.0% | | | | 4.4% | | | | 1.6% | |
Real Estate | | | 0.3% | | | | 12.1% | | | | -11.8% | |
Telecommunication Services | | | 1.3% | | | | 0.5% | | | | 0.8% | |
Utilities | | | 0.0% | | | | 6.2% | | | | -6.2% | |
Cash & Other Assets | | | 0.5% | | | | 0.0% | | | | 0.5% | |
Total | | | 100.0% | | | | 100.0% | | | | | |
Disclaimer
The views expressed here are exclusively those of Fund management. These views, including those related to market sectors or individual stocks, are not meant as investment advice and should not be considered predictive in nature. Any favorable (or unfavorable) description of a holding applies only as of the quarter end, June 30, 2018, unless otherwise stated. Security positions can and do change thereafter. Discussions of historical performance do not guarantee and may not be indicative of future performance.
Market volatility can significantly impact short-term performance. The Fund is not an appropriate investment for short-term investors. Investments in small companies generally carry greater risk than is customarily associated with larger companies. This additional risk is attributable to a number of factors, including the relatively limited financial resources that are typically available to small companies and the fact that small companies often have comparatively limited product lines. In addition, the stock of small companies tends to be more volatile than the stock of large companies, particularly in the short term and particularly in the early stages of an economic or market downturn. Shareholders of the Fund, therefore, are taking on more risk than they would if they invested in the stock market as a whole.
| | |
Omni Small-Cap Value Fund MANAGER’S COMMENTARY (Unaudited) (continued) | |
|
Conclusion
Thank you for your continued investment in Omni Small-Cap Value Fund. We encourage your feedback; your reactions and concerns are important to us.
Sincerely,
The Investment Management Team
| | |
|
| |
| 6 | | Annual Report | June 30, 2018 |
| | |
Omni Small-Cap Value Fund SCHEDULE OF INVESTMENTS | | |
|
| |
| Showing percentage of net assets as of June 30, 2018 | | |
| | | | | | | | |
| Industry Company | | Shares | | | Value | |
|
COMMON STOCKS - 99.48% | |
Consumer Discretionary - 21.95% | |
1-800-Flowers.com, Inc., Class A* | | | 60,000 | | | $ | 753,000 | |
Abercrombie & Fitch Co., Class A | | | 210,000 | | | | 5,140,800 | |
AMCON Distributing Co. | | | 1,350 | | | | 118,800 | |
American Axle & Manufacturing Holdings, Inc.* | | | 206,600 | | | | 3,214,696 | |
American Public Education, Inc.* | | | 37,600 | | | | 1,582,960 | |
Appliance Recycling Centers of America, Inc.* | | | 2,900 | | | | 2,001 | |
Ark Restaurants Corp. | | | 12,600 | | | | 320,796 | |
Ascena Retail Group, Inc.* | | | 150,000 | | | | 597,750 | |
AV Homes, Inc.*+ | | | 52,300 | | | | 1,119,220 | |
Barnes & Noble Education, Inc.* | | | 68,824 | | | | 388,167 | |
Barnes & Noble, Inc. | | | 42,900 | | | | 272,415 | |
Bassett Furniture Industries, Inc. | | | 80,500 | | | | 2,217,775 | |
BBX Capital Corp. | | | 351,039 | | | | 3,169,882 | |
Beasley Broadcast Group, Inc., Class A | | | 28,500 | | | | 319,200 | |
Beazer Homes USA, Inc.* | | | 120,000 | | | | 1,770,000 | |
Big 5 Sporting Goods Corp.+ | | | 117,600 | | | | 893,760 | |
Big Lots, Inc.+ | | | 50,000 | | | | 2,089,000 | |
Biglari Holdings, Inc., Class A* | | | 210 | | | | 199,500 | |
Biglari Holdings, Inc., Class B* | | | 2,100 | | | | 385,329 | |
BJ’s Restaurants, Inc. | | | 59,000 | | | | 3,540,000 | |
Bojangles’, Inc.* | | | 70,000 | | | | 1,008,000 | |
Boot Barn Holdings, Inc.* | | | 54,000 | | | | 1,120,500 | |
Buckle, Inc. (The)+ | | | 75,400 | | | | 2,028,260 | |
Build-A-Bear Workshop, Inc.* | | | 26,000 | | | | 197,600 | |
Caleres, Inc. | | | 98,500 | | | | 3,387,415 | |
Canterbury Park Holding Corp. | | | 3,900 | | | | 60,255 | |
Carrols Restaurant Group, Inc.* | | | 61,900 | | | | 919,215 | |
Century Casinos, Inc.* | | | 124,600 | | | | 1,090,250 | |
Century Communities, Inc.* | | | 4,202 | | | | 132,573 | |
Chico’s FAS, Inc. | | | 121,000 | | | | 984,940 | |
China Automotive Systems, Inc.*+ | | | 37,500 | | | | 163,500 | |
China XD Plastics Co., Ltd.* | | | 163,000 | | | | 529,750 | |
Christopher & Banks Corp.* | | | 27,700 | | | | 26,038 | |
Citi Trends, Inc. | | | 78,840 | | | | 2,163,370 | |
Clarus Corp.* | | | 23,300 | | | | 192,225 | |
Conn’s, Inc.* | | | 78,000 | | | | 2,574,000 | |
| | | | | | | | |
| Industry Company | | Shares | | | Value | |
|
Consumer Discretionary (continued) | |
Container Store Group, Inc. (The)* | | | 141,150 | | | $ | 1,187,072 | |
Cooper Tire & Rubber Co.+ | | | 54,550 | | | | 1,434,665 | |
Cooper-Standard Holdings, Inc.* | | | 51,000 | | | | 6,664,170 | |
Crown Crafts, Inc. | | | 13,050 | | | | 74,385 | |
CSS Industries, Inc. | | | 45,700 | | | | 772,330 | |
Del Frisco’s Restaurant Group, Inc.* | | | 49,700 | | | | 626,220 | |
Del Taco Restaurants, Inc.* | | | 102,300 | | | | 1,450,614 | |
Delta Apparel, Inc.*+ | | | 25,500 | | | | 493,425 | |
Destination Maternity Corp.* | | | 9,800 | | | | 57,036 | |
Destination XL Group, Inc.* | | | 90,000 | | | | 202,500 | |
Dillard’s, Inc., Class A+ | | | 50,000 | | | | 4,725,000 | |
Dixie Group, Inc. (The)* | | | 50,000 | | | | 115,000 | |
DSW, Inc., Class A | | | 186,500 | | | | 4,815,430 | |
E.W. Scripps Co., (The) Class A | | | 220,000 | | | | 2,945,800 | |
El Pollo Loco Holdings, Inc.* | | | 90,500 | | | | 1,031,700 | |
Emmis Communications Corp., Class A* | | | 35,000 | | | | 185,150 | |
Entercom Communications Corp., Class A+ | | | 320,225 | | | | 2,417,699 | |
Entravision Communications Corp., Class A | | | 130,000 | | | | 650,000 | |
Eros International PLC*+ | | | 121,100 | | | | 1,574,300 | |
Escalade, Inc. | | | 3,600 | | | | 50,760 | |
Ethan Allen Interiors, Inc. | | | 82,500 | | | | 2,021,250 | |
EVINE Live, Inc.* | | | 162,700 | | | | 200,121 | |
Express, Inc.* | | | 206,000 | | | | 1,884,900 | |
Fiesta Restaurant Group, Inc.*+ | | | 45,800 | | | | 1,314,460 | |
Flanigan’s Enterprises, Inc. | | | 2,500 | | | | 68,875 | |
Flexsteel Industries, Inc. | | | 17,000 | | | | 678,300 | |
Full House Resorts, Inc.* | | | 71,000 | | | | 236,430 | |
Gaming Partners International Corp. | | | 1,200 | | | | 10,272 | |
Gannett Co., Inc. | | | 316,700 | | | | 3,388,690 | |
Genesco, Inc.* | | | 40,000 | | | | 1,588,000 | |
Golden Entertainment, Inc.*+ | | | 40,000 | | | | 1,079,600 | |
Good Times Restaurants, Inc.* | | | 3,000 | | | | 11,250 | |
Gray Television, Inc.* | | | 256,200 | | | | 4,047,960 | |
Group 1 Automotive, Inc. | | | 59,000 | | | | 3,717,000 | |
Guess?, Inc. | | | 124,100 | | | | 2,655,740 | |
Hamilton Beach Brands Holding Co., Class A | | | 10,090 | | | | 293,114 | |
Haverty Furniture Cos., Inc. | | | 98,400 | | | | 2,125,440 | |
Hibbett Sports, Inc.* | | | 53,500 | | | | 1,225,150 | |
Hooker Furniture Corp. | | | 15,000 | | | | 703,500 | |
| | |
Omni Small-Cap Value Fund SCHEDULE OF INVESTMENTS (continued) | | |
|
| |
| Showing percentage of net assets as of June 30, 2018 | | |
| | | | | | | | |
| Industry Company | | Shares | | | Value | |
|
Common Stocks (continued) | |
Consumer Discretionary (continued) | |
Houghton Mifflin Harcourt Co.* | | | 275,000 | | | | $2,103,750 | |
International Speedway Corp., Class A | | | 118,456 | | | | 5,294,983 | |
J Alexander’s Holdings, Inc.* | | | 37,450 | | | | 417,568 | |
Johnson Outdoors, Inc., Class A | | | 32,779 | | | | 2,770,809 | |
K12, Inc.* | | | 121,217 | | | | 1,984,322 | |
KB Home | | | 175,900 | | | | 4,791,516 | |
Kirkland’s, Inc.* | | | 29,000 | | | | 337,560 | |
Lakeland Industries, Inc.* | | | 30,050 | | | | 425,208 | |
La-Z-Boy, Inc. | | | 29,500 | | | | 902,700 | |
Liberty Tax, Inc. | | | 34,500 | | | | 278,588 | |
Lifetime Brands, Inc. | | | 60,900 | | | | 770,385 | |
Lincoln Educational Services Corp.* | | | 91,900 | | | | 159,906 | |
Live Ventures, Inc.*+ | | | 3,200 | | | | 40,256 | |
Luby’s, Inc.* | | | 75,800 | | | | 196,322 | |
M/I Homes, Inc.* | | | 48,000 | | | | 1,271,040 | |
Marcus Corp. (The) | | | 130,150 | | | | 4,229,875 | |
MDC Holdings, Inc. | | | 156,760 | | | | 4,823,505 | |
Modine Manufacturing Co.* | | | 142,900 | | | | 2,607,925 | |
Movado Group, Inc. | | | 45,000 | | | | 2,173,500 | |
Nevada Gold & Casinos, Inc.*+ | | | 38,300 | | | | 76,600 | |
New Home Co. Inc., (The)* | | | 45,300 | | | | 451,641 | |
New Media Investment Group, Inc. | | | 173,500 | | | | 3,206,280 | |
New York & Co., Inc.*+ | | | 126,700 | | | | 648,704 | |
Office Depot, Inc. | | | 500,000 | | | | 1,275,000 | |
P&F Industries, Inc., Class A | | | 696 | | | | 6,062 | |
Papa Murphy’s Holdings, Inc.* | | | 65,000 | | | | 360,750 | |
Party City Holdco, Inc.*+ | | | 273,200 | | | | 4,166,300 | |
Peak Resorts, Inc. | | | 114,000 | | | | 570,000 | |
Perry Ellis International, Inc.* | | | 138,100 | | | | 3,752,177 | |
PICO Holdings, Inc. | | | 62,500 | | | | 728,125 | |
Pier 1 Imports, Inc. | | | 261,200 | | | | 621,656 | |
Reading International, Inc., Class A* | | | 17,848 | | | | 284,676 | |
Red Lion Hotels Corp.* | | | 34,405 | | | | 400,818 | |
Red Robin Gourmet Burgers, Inc.* | | | 38,500 | | | | 1,794,100 | |
Regis Corp.* | | | 153,150 | | | | 2,533,101 | |
Rent-A-Center, Inc. | | | 67,500 | | | | 993,600 | |
RH*+ | | | 55,200 | | | | 7,711,440 | |
Rocky Brands, Inc.+ | | | 24,300 | | | | 729,000 | |
Saga Communications, Inc., Class A | | | 8,761 | | | | 337,298 | |
Salem Media Group, Inc. | | | 24,800 | | | | 127,720 | |
Scholastic Corp. | | | 72,800 | | | | 3,225,768 | |
| | | | | | | | |
| Industry Company | | Shares | | | Value | |
|
Consumer Discretionary (continued) | |
Shiloh Industries, Inc.* | | | 51,000 | | | | $ 443,700 | |
Shoe Carnival, Inc. | | | 63,600 | | | | 2,063,820 | |
Sonic Automotive, Inc., Class A | | | 119,100 | | | | 2,453,460 | |
SORL Auto Parts, Inc.*+ | | | 129,900 | | | | 606,633 | |
SPAR Group, Inc.* | | | 46,500 | | | | 58,590 | |
Speedway Motorsports, Inc. | | | 145,700 | | | | 2,529,352 | |
Stage Stores, Inc.+ | | | 100,000 | | | | 241,000 | |
Stoneridge, Inc.* | | | 50,000 | | | | 1,757,000 | |
Strattec Security Corp.+ | | | 25,900 | | | | 791,245 | |
Superior Industries International, Inc. | | | 115,400 | | | | 2,065,660 | |
Tandy Leather Factory, Inc.* | | | 8,000 | | | | 62,400 | |
Tilly’s, Inc., Class A | | | 125,300 | | | | 1,898,295 | |
Tower International, Inc. | | | 47,000 | | | | 1,494,600 | |
Townsquare Media, Inc., Class A | | | 185,556 | | | | 1,200,547 | |
TravelCenters of America LLC* | | | 126,000 | | | | 441,000 | |
Tuesday Morning Corp.*+ | | | 133,000 | | | | 405,650 | |
Unifi, Inc.* | | | 11,900 | | | | 377,230 | |
Urban One, Inc.* | | | 800 | | | | 1,680 | |
US Auto Parts Network, Inc.* | | | 98,900 | | | | 148,350 | |
Vera Bradley, Inc.* | | | 78,500 | | | | 1,102,140 | |
Vista Outdoor, Inc.* | | | 5,500 | | | | 85,195 | |
VOXX International Corp.* | | | 73,000 | | | | 394,200 | |
Weyco Group, Inc. | | | 20,200 | | | | 735,280 | |
William Lyon Homes, Class A* | | | 100,500 | | | | 2,331,600 | |
ZAGG, Inc.* | | | 88,200 | | | | 1,525,860 | |
Zoe’s Kitchen, Inc.*+ | | | 25,000 | | | | 244,000 | |
Zumiez, Inc.* | | | 79,400 | | | | 1,988,970 | |
| | | | | | | | |
| | |
| | | | | | | 200,424,241 | |
|
Consumer Staples - 2.41% | |
Alico, Inc. | | | 10,461 | | | | 331,614 | |
Andersons, Inc. (The) | | | 88,100 | | | | 3,013,020 | |
Central Garden & Pet Co., Class A* | | | 59,603 | | | | 2,412,133 | |
Chefs’ Warehouse, Inc. (The)* | | | 50,000 | | | | 1,425,000 | |
Dean Foods Co. | | | 135,000 | | | | 1,418,850 | |
Hostess Brands, Inc.* | | | 211,000 | | | | 2,869,600 | |
Ingles Markets, Inc., Class A | | | 59,800 | | | | 1,901,640 | |
Landec Corp.* | | | 16,000 | | | | 238,400 | |
Mannatech, Inc. | | | 8,400 | | | | 172,200 | |
Natural Alternatives International, Inc.* | | | 18,100 | | | | 183,715 | |
Natural Health Trends Corp.+ | | | 3,000 | | | | 75,060 | |
| | |
|
| |
| 8 | | Annual Report | June 30, 2018 |
| | |
Omni Small-Cap Value Fund SCHEDULE OF INVESTMENTS (continued) | | |
|
| |
| Showing percentage of net assets as of June 30, 2018 | | |
| | | | | | | | |
| Industry Company | | Shares | | | Value | |
|
Common Stocks (continued) | |
Consumer Staples (continued) | |
S&W Seed Co.*+ | | | 7,000 | | | | $ 22,750 | |
Seneca Foods Corp., Class A* | | | 40,100 | | | | 1,082,700 | |
SpartanNash Co. | | | 145,946 | | | | 3,724,542 | |
Village Super Market, Inc., Class A | | | 35,709 | | | | 1,051,987 | |
Weis Markets, Inc. | | | 38,525 | | | | 2,054,924 | |
| | | | | | | | |
| | |
| | | | | | | 21,978,135 | |
|
Energy - 11.65% | |
Adams Resources & Energy, Inc. | | | 23,100 | | | | 993,300 | |
Approach Resources, Inc.*+ | | | 241,026 | | | | 588,103 | |
Arch Coal, Inc., Class A+ | | | 50,500 | | | | 3,960,715 | |
Archrock, Inc. | | | 160,000 | | | | 1,920,000 | |
Ardmore Shipping Corp.*+ | | | 148,688 | | | | 1,219,242 | |
Bristow Group, Inc.*+ | | | 65,500 | | | | 924,205 | |
Callon Petroleum Co.* | | | 60,000 | | | | 644,400 | |
Cloud Peak Energy, Inc.* | | | 316,100 | | | | 1,103,189 | |
CVR Energy, Inc.+ | | | 105,000 | | | | 3,883,950 | |
Dawson Geophysical Co.* | | | 47,250 | | | | 373,275 | |
Delek US Holdings, Inc. | | | 141,080 | | | | 7,077,984 | |
Denbury Resources, Inc.* | | | 940,000 | | | | 4,521,400 | |
DHT Holdings, Inc. | | | 253,422 | | | | 1,188,549 | |
Dorian LPG, Ltd.* | | | 110,169 | | | | 841,691 | |
Eclipse Resources Corp.* | | | 538,700 | | | | 861,920 | |
ENGlobal Corp.* | | | 60,422 | | | | 77,944 | |
Ensco PLC, Class A+ | | | 248,000 | | | | 1,800,480 | |
EP Energy Corp., Class A*+ | | | 250,000 | | | | 750,000 | |
Era Group, Inc.* | | | 45,800 | | | | 593,110 | |
Euronav NV | | | 125,442 | | | | 1,154,066 | |
Exterran Corp.* | | | 92,000 | | | | 2,303,680 | |
Forum Energy Technologies, Inc.* | | | 48,310 | | | | 596,629 | |
Frontline, Ltd.*+ | | | 180,000 | | | | 1,051,200 | |
GasLog Ltd.+ | | | 239,300 | | | | 4,570,630 | |
Gran Tierra Energy, Inc.* | | | 1,083,600 | | | | 3,738,420 | |
Green Plains, Inc. | | | 90,200 | | | | 1,650,660 | |
Gulf Island Fabrication, Inc. | | | 15,000 | | | | 135,000 | |
Halcon Resources Corp.*+ | | | 280,000 | | | | 1,229,200 | |
Hallador Energy Co. | | | 70,000 | | | | 499,800 | |
Helix Energy Solutions Group, Inc.* | | | 267,000 | | | | 2,224,110 | |
HighPoint Resources Corp.* | | | 140,900 | | | | 856,672 | |
Independence Contract Drilling, Inc.*+ | | | 83,319 | | | | 343,274 | |
International Seaways, Inc.* | | | 438 | | | | 10,135 | |
Matador Resources Co.* | | | 37,000 | | | | 1,111,850 | |
Matrix Service Co.* | | | 47,500 | | | | 871,625 | |
McDermott International, Inc.* | | | 179,466 | | | | 3,526,507 | |
| | | | | | | | |
| Industry Company | | Shares | | | Value | |
|
Energy (continued) | |
Mitcham Industries, Inc.* | | | 15,100 | | | | $ 60,702 | |
NACCO Industries, Inc., Class A | | | 34,445 | | | | 1,162,519 | |
Natural Gas Services Group, Inc.* | | | 68,800 | | | | 1,623,680 | |
Navios Maritime Acquisition Corp. | | | 158,400 | | | | 96,624 | |
Newpark Resources, Inc.* | | | 51,500 | | | | 558,775 | |
Noble Corp. PLC* | | | 316,000 | | | | 2,000,280 | |
Oasis Petroleum, Inc.* | | | 237,000 | | | | 3,073,890 | |
Oil States International, Inc.* | | | 10,000 | | | | 321,000 | |
Overseas Shipholding Group, Inc., Class A* | | | 185,016 | | | | 717,862 | |
Pacific Ethanol, Inc.* | | | 86,900 | | | | 225,940 | |
Par Pacific Holdings, Inc.* | | | 119,900 | | | | 2,083,862 | |
Penn Virginia Corp.* | | | 20,000 | | | | 1,697,800 | |
Pioneer Energy Services Corp.* | | | 58,100 | | | | 339,885 | |
Renewable Energy Group, Inc.* | | | 163,885 | | | | 2,925,347 | |
REX American Resources Corp.* | | | 33,920 | | | | 2,746,502 | |
Ring Energy, Inc.* | | | 50,000 | | | | 631,000 | |
Rowan Cos. PLC, Class A* | | | 205,000 | | | | 3,325,100 | |
SandRidge Energy, Inc.* | | | 68,500 | | | | 1,215,190 | |
Scorpio Tankers, Inc.+ | | | 100,000 | | | | 281,000 | |
SEACOR Holdings, Inc.* | | | 53,400 | | | | 3,058,218 | |
SEACOR Marine Holdings, Inc.* | | | 20,008 | | | | 461,985 | |
SemGroup Corp., Class A | | | 162,500 | | | | 4,127,500 | |
Ship Finance International, Ltd.+ | | | 264,400 | | | | 3,952,780 | |
SilverBow Resources, Inc.* | | | 30,600 | | | | 883,728 | |
SM Energy Co. | | | 12,000 | | | | 308,280 | |
SRC Energy, Inc.* | | | 110,000 | | | | 1,212,200 | |
Talos Energy, Inc.* | | | 20,000 | | | | 642,600 | |
Teekay Corp.+ | | | 260,000 | | | | 2,015,000 | |
TETRA Technologies, Inc.* | | | 200,000 | | | | 890,000 | |
TransAtlantic Petroleum, Ltd.* | | | 35,000 | | | | 48,300 | |
Unit Corp.* | | | 175,725 | | | | 4,491,531 | |
| | | | | | | | |
| | |
| | | | | | | 106,375,995 | |
|
Financials - 28.75% | |
1347 Property Insurance Holdings, Inc.* | | | 24,300 | | | | 172,530 | |
1st Constitution Bancorp+ | | | 3,000 | | | | 68,700 | |
1st Source Corp. | | | 59,347 | | | | 3,170,910 | |
Access National Corp. | | | 35,191 | | | | 1,006,463 | |
ACNB Corp. | | | 2,000 | | | | 68,100 | |
| | |
Omni Small-Cap Value Fund SCHEDULE OF INVESTMENTS (continued) | | |
|
| |
| Showing percentage of net assets as of June 30, 2018 | | |
| | | | | | | | |
| Industry Company | | Shares | | | Value | |
|
Common Stocks (continued) | |
Financials (continued) | |
American Equity Investment Life Holding Co. | | | 850 | | | $ | 30,600 | |
American National Bankshares, Inc. | | | 21,800 | | | | 872,000 | |
American River Bankshares | | | 21,300 | | | | 337,605 | |
Ameris Bancorp | | | 6,120 | | | | 326,502 | |
AmeriServ Financial, Inc. | | | 78,000 | | | | 319,800 | |
Argo Group International Holdings, Ltd.+ | | | 71,884 | | | | 4,180,055 | |
Arlington Asset Investment Corp., Class A+ | | | 45,300 | | | | 467,043 | |
Atlantic Capital Bancshares, Inc.* | | | 52,300 | | | | 1,027,695 | |
Atlas Financial Holdings, Inc.* | | | 13,850 | | | | 121,188 | |
B. Riley Financial, Inc. | | | 10,402 | | | | 234,565 | |
Baldwin & Lyons, Inc., Class B | | | 75,300 | | | | 1,837,320 | |
Banc of California, Inc.+ | | | 135,000 | | | | 2,639,250 | |
Banco Latinoamericano de Comercio Exterior SA, Class E | | | 117,000 | | | | 2,879,370 | |
Bank of Commerce Holdings+ | | | 83,450 | | | | 1,063,988 | |
Bankwell Financial Group, Inc. | | | 1,800 | | | | 57,870 | |
Banner Corp. | | | 32,000 | | | | 1,924,160 | |
Bar Harbor Bankshares+ | | | 21,366 | | | | 647,176 | |
BCB Bancorp, Inc. | | | 10,400 | | | | 156,000 | |
Beneficial Bancorp, Inc. | | | 125,000 | | | | 2,025,000 | |
Berkshire Hills Bancorp, Inc. | | | 108,065 | | | | 4,387,439 | |
Blue Capital Reinsurance Holdings, Ltd.+ | | | 12,173 | | | | 134,512 | |
BofI Holding, Inc.* | | | 70,000 | | | | 2,863,700 | |
BSB Bancorp, Inc.* | | | 7,400 | | | | 254,560 | |
C&F Financial Corp. | | | 2,200 | | | | 137,610 | |
California First National Bancorp | | | 33,500 | | | | 529,300 | |
Camden National Corp. | | | 30,100 | | | | 1,375,871 | |
Cannae Holdings, Inc.* | | | 126,700 | | | | 2,350,285 | |
Capital City Bank Group, Inc. | | | 83,150 | | | | 1,964,835 | |
Capstar Financial Holdings, Inc.* | | | 4,000 | | | | 74,120 | |
CB Financial Services, Inc.+ | | | 14,000 | | | | 481,600 | |
Central Valley Community Bancorp | | | 50,000 | | | | 1,058,000 | |
Century Bancorp, Inc., Class A | | | 15,200 | | | | 1,161,280 | |
Charter Financial Corp. | | | 17,500 | | | | 422,625 | |
Chemung Financial Corp. | | | 13,500 | | | | 676,485 | |
Citizens Community Bancorp, Inc. | | | 15,000 | | | | 212,250 | |
| | | | | | | | |
| Industry Company | | Shares | | | Value | |
|
Financials (continued) | |
Citizens, Inc.*+ | | | 106,040 | | | $ | 826,052 | |
Civista Bancshares, Inc.+ | | | 36,500 | | | | 884,760 | |
CNB Financial Corp. | | | 83,800 | | | | 2,519,028 | |
Coastway Bancorp, Inc.* | | | 2,013 | | | | 55,760 | |
Codorus Valley Bancorp, Inc.+ | | | 7,767 | | | | 238,292 | |
Colony Bankcorp, Inc. | | | 1,500 | | | | 25,350 | |
Community Bankers Trust Corp.* | | | 40,800 | | | | 365,160 | |
Community Financial Corp. (The) | | | 12,500 | | | | 442,000 | |
Community Trust Bancorp, Inc. | | | 17,500 | | | | 874,125 | |
ConnectOne Bancorp, Inc. | | | 85,200 | | | | 2,121,480 | |
Consumer Portfolio Services, Inc.* | | | 120,000 | | | | 488,400 | |
County Bancorp, Inc.+ | | | 15,237 | | | | 419,018 | |
Cowen, Inc.* | | | 31,000 | | | | 429,350 | |
Crawford & Co., Class A | | | 47,600 | | | | 409,836 | |
Crawford & Co., Class B | | | 16,400 | | | | 141,860 | |
Customers Bancorp, Inc.* | | | 56,700 | | | | 1,609,146 | |
Dime Community Bancshares, Inc. | | | 54,300 | | | | 1,058,850 | |
DNB Financial Corp. | | | 13,465 | | | | 471,948 | |
Donegal Group, Inc., Class A | | | 94,000 | | | | 1,279,340 | |
Eagle Bancorp Montana, Inc. | | | 3,000 | | | | 57,900 | |
EMC Insurance Group, Inc. | | | 46,550 | | | | 1,293,159 | |
Employers Holdings, Inc. | | | 103,900 | | | | 4,176,780 | |
Encore Capital Group, Inc.*+ | | | 73,000 | | | | 2,671,800 | |
Enova International, Inc.* | | | 132,307 | | | | 4,835,821 | |
Entegra Financial Corp.* | | | 25,000 | | | | 732,500 | |
Enterprise Bancorp, Inc. | | | 38,775 | | | | 1,567,673 | |
ESSA Bancorp, Inc.+ | | | 33,100 | | | | 523,973 | |
Evans Bancorp, Inc.+ | | | 4,000 | | | | 184,400 | |
EZCORP, Inc., Class A* | | | 147,169 | | | | 1,773,386 | |
Farmers Capital Bank Corp. | | | 34,400 | | | | 1,792,240 | |
Farmers National Banc Corp. | | | 150 | | | | 2,393 | |
FBL Financial Group, Inc., Class A | | | 50,806 | | | | 4,000,973 | |
Federal Agricultural Mortgage Corp., Class C | | | 29,000 | | | | 2,594,920 | |
FedNat Holding Co. | | | 59,988 | | | | 1,383,923 | |
Fidelity Southern Corp. | | | 76,123 | | | | 1,934,285 | |
Financial Institutions, Inc. | | | 39,300 | | | | 1,292,970 | |
First BanCorp Puerto Rico* | | | 476,500 | | | | 3,645,225 | |
First BanCorp Southern Pines NC | | | 99,988 | | | | 4,090,509 | |
First Bancorp, Inc. | | | 5,500 | | | | 155,210 | |
| | |
|
| |
| 10 | | Annual Report | June 30, 2018 |
| | |
Omni Small-Cap Value Fund SCHEDULE OF INVESTMENTS (continued) | | |
|
| |
| Showing percentage of net assets as of June 30, 2018 | | |
| | | | | | | | |
| Industry Company | | Shares | | | Value | |
|
Common Stocks (continued) | |
Financials (continued) | |
First Busey Corp. | | | 45,000 | | | | $1,427,400 | |
First Business Financial Services, Inc. | | | 16,000 | | | | 416,000 | |
First Capital, Inc. | | | 35 | | | | 1,454 | |
First Commonwealth Financial Corp. | | | 143,300 | | | | 2,222,583 | |
First Community Bancshares, Inc. | | | 44,000 | | | | 1,401,840 | |
First Community Corp. | | | 600 | | | | 15,060 | |
First Connecticut Bancorp, Inc. | | | 2,100 | | | | 64,260 | |
First Financial Bancorp | | | 93,808 | | | | 2,875,215 | |
First Financial Corp. | | | 37,000 | | | | 1,677,950 | |
First Financial Northwest, Inc. | | | 35,182 | | | | 686,753 | |
First Guaranty Bancshares, Inc. | | | 5,499 | | | | 143,084 | |
First Internet Bancorp+ | | | 14,500 | | | | 494,450 | |
First Mid-Illinois Bancshares, Inc. | | | 16,476 | | | | 647,507 | |
First Midwest Bancorp, Inc. | | | 78,700 | | | | 2,004,489 | |
First United Corp. | | | 14,876 | | | | 304,214 | |
First US Bancshares, Inc. | | | 4,368 | | | | 50,887 | |
Flushing Financial Corp. | | | 38,197 | | | | 996,942 | |
Franklin Financial Network, Inc.* | | | 3,000 | | | | 112,800 | |
FS Bancorp, Inc. | | | 2,250 | | | | 142,313 | |
FSB Bancorp, Inc./NY*+ | | | 1,000 | | | | 17,750 | |
GAIN Capital Holdings, Inc.+ | | | 139,805 | | | | 1,055,528 | |
Great Southern Bancorp, Inc. | | | 36,900 | | | | 2,110,680 | |
Green Bancorp, Inc. | | | 67,000 | | | | 1,447,200 | |
Greenhill & Co., Inc.+ | | | 60,000 | | | | 1,704,000 | |
Greenlight Capital Re, Ltd., Class A* | | | 68,000 | | | | 965,600 | |
Hallmark Financial Services, Inc.*+ | | | 57,800 | | | | 576,844 | |
Hawthorn Bancshares, Inc. | | | 16,328 | | | | 357,583 | |
HCI Group, Inc. | | | 40,400 | | | | 1,679,428 | |
Heartland Financial USA, Inc. | | | 64,600 | | | | 3,543,310 | |
Heritage Insurance Holdings, Inc.+ | | | 60,000 | | | | 1,000,200 | |
Hingham Institution for Savings+ | | | 30 | | | | 6,591 | |
HMN Financial, Inc.* | | | 23,800 | | | | 478,380 | |
Home Bancorp, Inc. | | | 31,994 | | | | 1,489,321 | |
HomeStreet, Inc.* | | | 73,100 | | | | 1,970,045 | |
HomeTrust Bancshares, Inc.* | | | 2,961 | | | | 83,352 | |
HopFed Bancorp, Inc. | | | 18,100 | | | | 300,098 | |
| | | | | | | | |
| Industry Company | | Shares | | | Value | |
|
Financials (continued) | |
Horace Mann Educators Corp. | | | 104,600 | | | | $4,665,160 | |
Horizon Bancorp, Inc. | | | 7,088 | | | | 146,640 | |
Independence Holding Co. | | | 15,050 | | | | 500,412 | |
Independent Bank Group, Inc. | | | 16,900 | | | | 1,128,920 | |
Infinity Property & Casualty Corp. | | | 22,400 | | | | 3,188,640 | |
International Bancshares Corp. | | | 65,687 | | | | 2,811,404 | |
INTL.FCStone, Inc.* | | | 28,500 | | | | 1,473,735 | |
Investar Holding Corp. | | | 22,000 | | | | 608,300 | |
Investment Technology Group, Inc. | | | 88,242 | | | | 1,846,023 | |
Investors Title Co. | | | 1,000 | | | | 184,660 | |
James River Group Holdings, Ltd. | | | 87,600 | | | | 3,441,804 | |
JMP Group LLC+ | | | 300 | | | | 1,611 | |
Kingstone Cos., Inc. | | | 16,100 | | | | 272,090 | |
Lakeland Bancorp, Inc. | | | 95,250 | | | | 1,890,712 | |
Landmark Bancorp, Inc. | | | 1,157 | | | | 32,974 | |
LCNB Corp. | | | 5,000 | | | | 98,500 | |
Mackinac Financial Corp. | | | 15,800 | | | | 261,964 | |
Maiden Holdings, Ltd. | | | 162,600 | | | | 1,260,150 | |
Marlin Business Services Corp.+ | | | 27,080 | | | | 808,338 | |
Mercantile Bank Corp. | | | 2,200 | | | | 81,312 | |
Meta Financial Group, Inc. | | | 16,477 | | | | 1,604,860 | |
Mid Penn Bancorp, Inc.+ | | | 12,300 | | | | 429,270 | |
Middlefield Banc Corp.+ | | | 1,000 | | | | 50,700 | |
Midland States Bancorp, Inc. | | | 57,658 | | | | 1,975,363 | |
MidSouth Bancorp, Inc.+ | | | 21,512 | | | | 285,034 | |
MidWestOne Financial Group, Inc. | | | 24,860 | | | | 839,771 | |
MMA Capital Management, LLC* | | | 500 | | | | 12,825 | |
MutualFirst Financial, Inc. | | | 18,900 | | | | 713,475 | |
MVB Financial Corp.+ | | | 40,500 | | | | 731,025 | |
National Commerce Corp.* | | | 5,000 | | | | 231,500 | |
National Holdings Corp.* | | | 2,000 | | | | 6,580 | |
National Security Group, Inc. (The) | | | 200 | | | | 3,330 | |
National Western Life Group, Inc., Class A | | | 8,614 | | | | 2,646,738 | |
Nationstar Mortgage Holdings, Inc.* | | | 195,000 | | | | 3,418,350 | |
Navigators Group, Inc. (The) | | | 74,700 | | | | 4,257,900 | |
Nelnet, Inc., Class A | | | 37,800 | | | | 2,207,898 | |
Nicholas Financial, Inc.*+ | | | 43,400 | | | | 399,280 | |
Nicolet Bankshares, Inc.* | | | 1,355 | | | | 74,674 | |
| | |
Omni Small-Cap Value Fund SCHEDULE OF INVESTMENTS (continued) | | |
|
| |
| Showing percentage of net assets as of June 30, 2018 | | |
| | | | | | | | |
| Industry Company | | Shares | | | Value | |
|
Common Stocks (continued) | |
Financials (continued) | |
NMI Holdings, Inc., Class A* | | | 250,000 | | | $ | 4,075,000 | |
Northeast Bancorp | | | 12,500 | | | | 272,500 | |
Northrim BanCorp, Inc. | | | 30,445 | | | | 1,204,100 | |
Northwest Bancshares, Inc. | | | 236,000 | | | | 4,104,040 | |
Ocwen Financial Corp.*+ | | | 355,000 | | | | 1,405,800 | |
OFG Bancorp | | | 112,200 | | | | 1,576,410 | |
Old Line Bancshares, Inc. | | | 10,220 | | | | 356,780 | |
Old Second Bancorp, Inc. | | | 79,750 | | | | 1,148,400 | |
On Deck Capital, Inc.* | | | 252,200 | | | | 1,765,400 | |
Oppenheimer Holdings, Inc., Class A+ | | | 31,093 | | | | 870,604 | |
Opus Bank | | | 110,500 | | | | 3,171,350 | |
Orrstown Financial Services, Inc. | | | 35,500 | | | | 923,000 | |
Ottawa Bancorp, Inc. | | | 1,000 | | | | 13,990 | |
Parke Bancorp, Inc. | | | 23,609 | | | | 558,353 | |
Pathfinder Bancorp, Inc. | | | 3,000 | | | | 47,910 | |
PB Bancorp, Inc. | | | 15,500 | | | | 175,925 | |
Peapack Gladstone Financial Corp. | | | 16,894 | | | | 584,363 | |
Penns Woods Bancorp, Inc. | | | 1,000 | | | | 44,780 | |
Peoples Bancorp of North Carolina, Inc. | | | 5,280 | | | | 169,118 | |
Peoples Bancorp, Inc. | | | 43,400 | | | | 1,639,652 | |
Peoples Financial Services Corp. | | | 2,900 | | | | 136,358 | |
Piper Jaffray Cos. | | | 51,400 | | | | 3,950,090 | |
Premier Financial Bancorp, Inc. | | | 34,650 | | | | 646,916 | |
Provident Financial Holdings, Inc. | | | 51,000 | | | | 973,080 | |
Provident Financial Services, Inc. | | | 20,900 | | | | 575,377 | |
Prudential Bancorp, Inc. | | | 4,600 | | | | 88,780 | |
Regional Management Corp.* | | | 43,100 | | | | 1,509,362 | |
Reliant Bancorp, Inc. | | | 2,500 | | | | 70,125 | |
Republic Bancorp, Inc., Class A | | | 42,642 | | | | 1,931,683 | |
Riverview Bancorp, Inc. | | | 87,000 | | | | 734,280 | |
S&T Bancorp, Inc. | | | 40,045 | | | | 1,731,546 | |
Safety Insurance Group, Inc. | | | 32,000 | | | | 2,732,800 | |
Salisbury Bancorp, Inc. | | | 1,183 | | | | 52,880 | |
Sandy Spring Bancorp, Inc. | | | 7,400 | | | | 303,474 | |
SB Financial Group, Inc. | | | 30,400 | | | | 617,728 | |
SB One Bancorp | | | 15,000 | | | | 445,500 | |
Security National Financial Corp., Class A* | | | 90,616 | | | | 471,203 | |
Severn Bancorp, Inc. | | | 35,000 | | | | 302,750 | |
Shore Bancshares, Inc. | | | 67,012 | | | | 1,274,568 | |
SI Financial Group, Inc. | | | 55,700 | | | | 821,575 | |
| | | | | | | | |
| Industry Company | | Shares | | | Value | |
|
Financials (continued) | |
Sierra Bancorp | | | 77,800 | | | | $ 2,197,072 | |
Sound Financial Bancorp, Inc. | | | 1,000 | | | | 38,950 | |
State Auto Financial Corp. | | | 83,550 | | | | 2,498,980 | |
Stewardship Financial Corp.+ | | | 1,000 | | | | 11,650 | |
Stewart Information Services Corp. | | | 87,150 | | | | 3,753,550 | |
Summit Financial Group, Inc. | | | 22,015 | | | | 590,883 | |
Territorial Bancorp, Inc. | | | 21,200 | | | | 657,200 | |
Timberland Bancorp, Inc. | | | 39,000 | | | | 1,456,260 | |
Tiptree, Inc. | | | 84,100 | | | | 571,880 | |
TowneBank | | | 1,642 | | | | 52,708 | |
TriCo Bancshares | | | 600 | | | | 22,470 | |
TriState Capital Holdings, Inc.* | | | 34,000 | | | | 887,400 | |
Triumph Bancorp, Inc.* | | | 10,700 | | | | 436,025 | |
Two River Bancorp+ | | | 29,505 | | | | 564,431 | |
Union Bankshares Corp. | | | 99,481 | | | | 3,867,821 | |
United Community Bancorp | | | 1,000 | | | | 27,200 | |
United Community Financial Corp. | | | 324 | | | | 3,561 | |
United Financial Bancorp, Inc. | | | 90,000 | | | | 1,576,800 | |
United Fire Group, Inc. | | | 78,800 | | | | 4,295,388 | |
United Insurance Holdings Corp. | | | 84,700 | | | | 1,658,426 | |
Universal Insurance Holdings, Inc. | | | 86,316 | | | | 3,029,692 | |
Univest Corp. of Pennsylvania | | | 63,379 | | | | 1,742,922 | |
Waddell & Reed Financial, Inc., Class A+ | | | 70,000 | | | | 1,257,900 | |
Walker & Dunlop, Inc. | | | 84,475 | | | | 4,701,034 | |
Waterstone Financial, Inc. | | | 49,000 | | | | 835,450 | |
Wellesley Bank+ | | | 1,000 | | | | 33,800 | |
WesBanco, Inc. | | | 70,273 | | | | 3,165,096 | |
Westbury Bancorp, Inc.* | | | 2,750 | | | | 60,912 | |
World Acceptance Corp.* | | | 26,100 | | | | 2,897,361 | |
| | | | | | | | |
| | |
| | | | | | | 262,521,562 | |
| | |
Health Care - 2.47% | | | | | | | | |
AMAG Pharmaceuticals, Inc.*+ | | | 29,900 | | | | 583,050 | |
AngioDynamics, Inc.* | | | 105,300 | | | | 2,341,872 | |
Bioanalytical Systems, Inc.* | | | 10,000 | | | | 16,500 | |
Community Health Systems, Inc.*+ | | | 303,500 | | | | 1,007,620 | |
Concert Pharmaceuticals, Inc.* | | | 85,700 | | | | 1,442,331 | |
| | |
|
| |
| 12 | | Annual Report | June 30, 2018 |
| | |
Omni Small-Cap Value Fund SCHEDULE OF INVESTMENTS (continued) | | |
|
| |
| Showing percentage of net assets as of June 30, 2018 | | |
| | | | | | | | |
| Industry Company | | Shares | | | Value | |
|
Common Stocks (continued) | |
Health Care (continued) | |
Cross Country Healthcare, Inc.* | | | 90,000 | | | | $ 1,012,500 | |
Digirad Corp. | | | 36,447 | | | | 56,493 | |
FONAR Corp.* | | | 30,400 | | | | 807,120 | |
InfuSystem Holdings, Inc.* | | | 71,100 | | | | 252,405 | |
Juniper Pharmaceuticals, Inc.* | | | 32,000 | | | | 278,400 | |
Kewaunee Scientific Corp. | | | 3,000 | | | | 107,850 | |
Kindred Healthcare, Inc.* | | | 21,000 | | | | 189,000 | |
Lannett Co., Inc.*+ | | | 85,000 | | | | 1,156,000 | |
LHC Group, Inc.* | | | 1,549 | | | | 132,579 | |
National HealthCare Corp. | | | 25,500 | | | | 1,794,690 | |
Nobilis Health Corp.* | | | 35,000 | | | | 42,000 | |
PDL BioPharma, Inc.* | | | 591,000 | | | | 1,382,940 | |
Quorum Health Corp.* | | | 25,000 | | | | 125,000 | |
Select Medical Holdings Corp.* | | | 185,000 | | | | 3,357,750 | |
Surgery Partners, Inc.* | | | 115,000 | | | | 1,713,500 | |
Triple-S Management Corp., Class B* | | | 122,300 | | | | 4,777,038 | |
| | | | | | | | |
| | |
| | | | | | | 22,576,638 | |
|
Industrials - 17.12% | |
Acacia Research Corp.* | | | 35,000 | | | | 145,250 | |
ACCO Brands Corp. | | | 364,300 | | | | 5,045,555 | |
Aegion Corp.* | | | 99,341 | | | | 2,558,031 | |
AeroCentury Corp.* | | | 4,300 | | | | 68,155 | |
Air T, Inc.* | | | 2,800 | | | | 93,800 | |
Aircastle, Ltd. | | | 132,000 | | | | 2,706,000 | |
Alpha Pro Tech, Ltd.* | | | 20,743 | | | | 69,489 | |
American Railcar Industries, Inc.+ | | | 36,900 | | | | 1,456,812 | |
AMREP Corp.* | | | 25,500 | | | | 180,285 | |
ARC Document Solutions, Inc.* | | | 118,000 | | | | 208,860 | |
ArcBest Corp. | | | 94,500 | | | | 4,318,650 | |
Argan, Inc. | | | 17,500 | | | | 716,625 | |
Armstrong Flooring, Inc.* | | | 65,000 | | | | 912,600 | |
Arotech Corp.* | | | 94,300 | | | | 353,625 | |
ASV Holdings, Inc.* | | | 53,000 | | | | 306,870 | |
Atkore International Group, Inc.* | | | 85,000 | | | | 1,765,450 | |
Atlas Air Worldwide Holdings, Inc.* | | | 57,700 | | | | 4,137,090 | |
BMC Stock Holdings, Inc.* | | | 120,700 | | | | 2,516,595 | |
Briggs & Stratton Corp. | | | 114,300 | | | | 2,012,823 | |
Broadwind Energy, Inc.* | | | 24,375 | | | | 57,525 | |
Caesarstone, Ltd.+ | | | 70,000 | | | | 1,057,000 | |
CAI International, Inc.* | | | 82,600 | | | | 1,919,624 | |
CBIZ, Inc.* | | | 192,600 | | | | 4,429,800 | |
Cemtrex, Inc.* | | | 21,000 | | | | 43,890 | |
| | | | | | | | |
| Industry Company | | Shares | | | Value | |
|
Industrials (continued) | |
Chart Industries, Inc.* | | | 67,575 | | | | $4,168,026 | |
Chicago Rivet & Machine Co. | | | 1,000 | | | | 32,250 | |
Civeo Corp.* | | | 531,500 | | | | 2,317,340 | |
Columbus McKinnon Corp. | | | 40,400 | | | | 1,751,744 | |
Commercial Vehicle Group, Inc.* | | | 67,300 | | | | 493,982 | |
Costamare, Inc. | | | 227,500 | | | | 1,815,450 | |
Covenant Transportation Group, Inc., Class A* | | | 93,900 | | | | 2,957,850 | |
CRA International, Inc. | | | 53,500 | | | | 2,722,615 | |
DLH Holdings Corp.* | | | 57,500 | | | | 315,100 | |
DMC Global, Inc.+ | | | 20,000 | | | | 898,000 | |
Ducommun, Inc.* | | | 43,300 | | | | 1,432,797 | |
Eastern Co. (The) | | | 18,401 | | | | 516,148 | |
Ecology & Environment, Inc., Class A | | | 3,500 | | | | 43,575 | |
Encore Wire Corp. | | | 16,500 | | | | 782,925 | |
Engility Holdings, Inc.* | | | 56,700 | | | | 1,737,288 | |
Ennis, Inc. | | | 136,892 | | | | 2,785,752 | |
Foundation Building Materials, Inc.* | | | 45,000 | | | | 692,100 | |
FreightCar America, Inc. | | | 35,881 | | | | 602,442 | |
FTI Consulting, Inc.* | | | 68,500 | | | | 4,142,880 | |
General Finance Corp.*+ | | | 115,764 | | | | 1,568,602 | |
Goldfield Corp. (The)* | | | 121,000 | | | | 514,250 | |
Great Lakes Dredge & Dock Corp.* | | | 220,550 | | | | 1,157,888 | |
Greenbrier Companies., Inc. (The) | | | 87,800 | | | | 4,631,450 | |
Griffon Corp. | | | 77,000 | | | | 1,370,600 | |
HC2 Holdings, Inc.*+ | | | 31,100 | | | | 181,935 | |
Heidrick & Struggles International, Inc. | | | 56,250 | | | | 1,968,750 | |
Heritage-Crystal Clean, Inc.*+ | | | 39,854 | | | | 801,065 | |
Hertz Global Holdings, Inc.*+ | | | 121,000 | | | | 1,856,140 | |
Highpower International, Inc.* | | | 60,923 | | | | 188,861 | |
Hurco Cos., Inc. | | | 17,857 | | | | 799,101 | |
Huron Consulting Group, Inc.* | | | 32,800 | | | | 1,341,520 | |
Hyster-Yale Materials Handling, Inc. | | | 5,000 | | | | 321,250 | |
ICF International, Inc. | | | 36,229 | | | | 2,574,070 | |
IES Holdings, Inc.*+ | | | 2,717 | | | | 45,510 | |
Innovative Solutions & Support, Inc.* | | | 25,000 | | | | 72,750 | |
Kelly Services, Inc., Class A | | | 95,000 | | | | 2,132,750 | |
L.B. Foster Co., Class A* | | | 38,400 | | | | 881,280 | |
| | |
Omni Small-Cap Value Fund SCHEDULE OF INVESTMENTS (continued) | | |
|
| |
| Showing percentage of net assets as of June 30, 2018 | | |
| | | | | | | | |
| Industry Company | | Shares | | | Value | |
|
Common Stocks (continued) | |
Industrials (continued) | |
L.S. Starrett Co. (The), Class A | | | 15,000 | | | | $ 96,000 | |
Limbach Holdings, Inc.* | | | 27,000 | | | | 319,140 | |
Manitowoc Co., Inc. (The)* | | | 35,000 | | | | 905,100 | |
Marten Transport, Ltd. | | | 254,970 | | | | 5,979,046 | |
Matson, Inc. | | | 15,000 | | | | 575,700 | |
McGrath RentCorp | | | 83,300 | | | | 5,270,391 | |
Miller Industries, Inc. | | | 7,300 | | | | 186,515 | |
Navigant Consulting, Inc.* | | | 239,600 | | | | 5,304,744 | |
Navios Maritime Holdings, Inc.* | | | 250,000 | | | | 212,975 | |
Nexeo Solutions, Inc.* | | | 155,000 | | | | 1,415,150 | |
NN, Inc. | | | 45,500 | | | | 859,950 | |
Northwest Pipe Co.* | | | 21,800 | | | | 422,266 | |
Orion Group Holdings, Inc.* | | | 119,466 | | | | 986,789 | |
PAM Transportation Services, Inc.* | | | 16,905 | | | | 794,028 | |
Pangaea Logistics Solutions, Ltd.* | | | 2,000 | | | | 6,020 | |
Park-Ohio Holdings Corp. | | | 15,000 | | | | 559,500 | |
Patriot Transportation Holding, Inc.* | | | 7,500 | | | | 161,250 | |
Performant Financial Corp.* | | | 97,367 | | | | 209,339 | |
Powell Industries, Inc. | | | 25,000 | | | | 870,750 | |
Preformed Line Products Co. | | | 5,135 | | | | 455,885 | |
Quad/Graphics, Inc. | | | 75,300 | | | | 1,568,499 | |
Quanex Building Products Corp. | | | 75,000 | | | | 1,346,250 | |
RCM Technologies, Inc. | | | 55,200 | | | | 272,688 | |
Rush Enterprises, Inc., Class A* | | | 139,600 | | | | 6,055,848 | |
Rush Enterprises, Inc., Class B* | | | 46,500 | | | | 2,041,350 | |
Safe Bulkers, Inc.* | | | 294,550 | | | | 1,001,470 | |
Scorpio Bulkers, Inc. | | | 205,000 | | | | 1,455,500 | |
Servotronics, Inc. | | | 1,000 | | | | 9,160 | |
SkyWest, Inc. | | | 108,291 | | | | 5,620,303 | |
SPX FLOW, Inc.* | | | 20,000 | | | | 875,400 | |
Steelcase, Inc., Class A | | | 245,000 | | | | 3,307,500 | |
Sterling Construction Co., Inc.* | | | 96,400 | | | | 1,256,092 | |
Textainer Group Holdings Ltd.* | | | 158,200 | | | | 2,515,380 | |
Titan Machinery, Inc.* | | | 83,900 | | | | 1,304,645 | |
Triumph Group, Inc. | | | 112,000 | | | | 2,195,200 | |
TrueBlue, Inc.* | | | 74,750 | | | | 2,014,512 | |
Tutor Perini Corp.*+ | | | 107,300 | | | | 1,979,685 | |
Ultralife Corp.* | | | 63,050 | | | | 605,280 | |
USA Truck, Inc.* | | | 9,636 | | | | 226,157 | |
Vectrus, Inc.* | | | 5,000 | | | | 154,100 | |
Veritiv Corp.* | | | 12,700 | | | | 506,095 | |
| | | | | | | | |
| Industry Company | | Shares | | | Value | |
|
Industrials (continued) | |
VSE Corp. | | | 23,600 | | | | $ 1,127,608 | |
Wabash National Corp.+ | | | 110,100 | | | | 2,054,466 | |
Willis Lease Finance Corp.* | | | 48,400 | | | | 1,528,956 | |
| | | | | | | | |
| | |
| | | | | | | 156,309,122 | |
|
Information Technology - 7.62% | |
Alpha & Omega Semiconductor, Ltd.*+ | | | 214,244 | | | | 3,050,835 | |
Amkor Technology, Inc.* | | | 202,291 | | | | 1,737,680 | |
Amtech Systems, Inc.* | | | 30,000 | | | | 181,500 | |
Applied Optoelectronics, Inc.* | | | 55,000 | | | | 2,469,500 | |
AutoWeb, Inc.* | | | 500 | | | | 2,260 | |
Aviat Networks, Inc.* | | | 15,200 | | | | 248,824 | |
Axcelis Technologies, Inc.* | | | 14,100 | | | | 279,180 | |
AXT, Inc.* | | | 30,700 | | | | 216,435 | |
Bel Fuse, Inc., Class B | | | 18,500 | | | | 386,650 | |
Benchmark Electronics, Inc. | | | 134,000 | | | | 3,906,100 | |
BK Technologies, Inc. | | | 40,000 | | | | 148,000 | |
Blucora, Inc.* | | | 89,297 | | | | 3,303,989 | |
Cars.com, Inc.* | | | 35,000 | | | | 993,650 | |
Communications Systems, Inc. | | | 12,500 | | | | 47,625 | |
Computer Task Group, Inc.* | | | 73,862 | | | | 571,692 | |
Comtech Telecommunications Corp. | | | 64,215 | | | | 2,047,174 | |
CSP, Inc. | | | 5,150 | | | | 50,728 | |
Data I/O Corp.* | | | 25,500 | | | | 161,925 | |
Digi International, Inc.* | | | 45,325 | | | | 598,290 | |
Diodes, Inc.* | | | 138,899 | | | | 4,787,849 | |
Fabrinet* | | | 30,000 | | | | 1,106,700 | |
Finjan Holdings, Inc.* | | | 50,000 | | | | 170,000 | |
GSE Systems, Inc.* | | | 22,500 | | | | 73,125 | |
inTEST Corp.* | | | 55,000 | | | | 401,500 | |
KEMET Corp.* | | | 63,750 | | | | 1,539,562 | |
Key Tronic Corp.* | | | 52,500 | | | | 397,950 | |
Kimball Electronics, Inc.* | | | 74,900 | | | | 1,370,670 | |
Knowles Corp.* | | | 198,200 | | | | 3,032,460 | |
ManTech International Corp., Class A | | | 108,800 | | | | 5,836,032 | |
Mind CTI Ltd. | | | 200 | | | | 436 | |
Net 1 UEPS Technologies, Inc.* | | | 252,900 | | | | 2,296,332 | |
Network-1 Technologies, Inc. | | | 60,000 | | | | 186,000 | |
Nortech Systems, Inc.*+ | | | 1,500 | | | | 5,160 | |
PCM, Inc.* | | | 8,769 | | | | 132,850 | |
PC-Tel, Inc. | | | 56,700 | | | | 353,808 | |
Photronics, Inc.* | | | 205,050 | | | | 1,635,274 | |
Presidio, Inc.* | | | 32,000 | | | | 419,200 | |
PRGX Global, Inc.* | | | 40,739 | | | | 395,168 | |
| | |
|
| |
| 14 | | Annual Report | June 30, 2018 |
| | |
Omni Small-Cap Value Fund SCHEDULE OF INVESTMENTS (continued) | | |
|
| |
| Showing percentage of net assets as of June 30, 2018 | | |
| | | | | | | | |
| Industry Company | | Shares | | | Value | |
|
Common Stocks (continued) | |
Information Technology (continued) | |
Sanmina Corp.* | | | 45,100 | | | | $ 1,321,430 | |
ScanSource, Inc.* | | | 88,500 | | | | 3,566,550 | |
SigmaTron International, Inc.* | | | 6,500 | | | | 45,630 | |
Stratasys, Ltd.*+ | | | 135,000 | | | | 2,583,900 | |
SunPower Corp.*+ | | | 285,000 | | | | 2,185,950 | |
Sykes Enterprises, Inc.* | | | 104,534 | | | | 3,008,489 | |
Synacor, Inc.* | | | 29,100 | | | | 58,200 | |
TESSCO Technologies, Inc. | | | 15,250 | | | | 263,825 | |
TiVo Corp. | | | 167,000 | | | | 2,246,150 | |
Trio-Tech International* | | | 3,000 | | | | 13,410 | |
TSR, Inc.*+ | | | 1,000 | | | | 6,800 | |
TTM Technologies, Inc.* | | | 520,153 | | | | 9,170,297 | |
Vishay Precision Group, Inc.* | | | 7,248 | | | | 276,511 | |
Wayside Technology Group, Inc. | | | 7,900 | | | | 110,995 | |
Westell Technologies, Inc., Class A* | | | 66,100 | | | | 188,385 | |
| | | | | | | | |
| | |
| | | | | | | 69,588,635 | |
|
Materials - 5.96% | |
AgroFresh Solutions, Inc.*+ | | | 132,500 | | | | 928,825 | |
American Vanguard Corp. | | | 14,100 | | | | 323,595 | |
Boise Cascade Co. | | | 78,500 | | | | 3,508,950 | |
Carpenter Technology Corp. | | | 51,600 | | | | 2,712,612 | |
China Green Agriculture, Inc.* | | | 169,800 | | | | 195,270 | |
Clearwater Paper Corp.* | | | 30,500 | | | | 704,550 | |
Coeur Mining, Inc.* | | | 110,000 | | | | 836,000 | |
Core Molding Technologies, Inc. | | | 17,000 | | | | 242,760 | |
Flexible Solutions International, Inc.* | | | 5,000 | | | | 8,050 | |
Friedman Industries, Inc.+ | | | 5,000 | | | | 40,500 | |
FutureFuel Corp. | | | 102,800 | | | | 1,440,228 | |
Gulf Resources, Inc.* | | | 178,200 | | | | 245,916 | |
Haynes International, Inc. | | | 25,200 | | | | 925,848 | |
Hecla Mining Co. | | | 557,000 | | | | 1,938,360 | |
Kaiser Aluminum Corp. | | | 22,630 | | | | 2,356,009 | |
KMG Chemicals, Inc. | | | 9,900 | | | | 730,422 | |
Kraton Corp.* | | | 142,150 | | | | 6,558,801 | |
Materion Corp. | | | 48,600 | | | | 2,631,690 | |
Mercer International, Inc. | | | 276,250 | | | | 4,834,375 | |
Olympic Steel, Inc. | | | 20,000 | | | | 408,200 | |
Orient Paper, Inc.* | | | 35,000 | | | | 35,000 | |
PH Glatfelter Co. | | | 95,500 | | | | 1,870,845 | |
Rayonier Advanced Materials, Inc. | | | 138,200 | | | | 2,361,838 | |
Resolute Forest Products, Inc.* | | | 244,000 | | | | 2,525,400 | |
| | | | | | | | |
| Industry Company | | Shares | | | Value | |
|
Materials (continued) | |
Schnitzer Steel Industries, Inc., Class A | | | 79,700 | | | | $ 2,685,890 | |
Stepan Co. | | | 37,000 | | | | 2,886,370 | |
SunCoke Energy, Inc.* | | | 234,700 | | | | 3,144,980 | |
Synalloy Corp.+ | | | 14,000 | | | | 279,300 | |
TimkenSteel Corp.* | | | 55,000 | | | | 899,250 | |
Trecora Resources* | | | 25,602 | | | | 380,190 | |
Tredegar Corp. | | | 76,700 | | | | 1,802,450 | |
Universal Stainless & Alloy Products, Inc.* | | | 16,250 | | | | 384,638 | |
Verso Corp., Class A* | | | 78,000 | | | | 1,697,280 | |
Warrior Met Coal, Inc. | | | 71,000 | | | | 1,957,470 | |
| | | | | | | | |
| | |
| | | | | | | 54,481,862 | |
|
Real Estate - 0.29% | |
Altisource Portfolio Solutions SA*+ | | | 53,850 | | | | 1,570,804 | |
Consolidated-Tomoka Land Co. | | | 5,900 | | | | 362,909 | |
Forestar Group, Inc.*+ | | | 8,776 | | | | 182,102 | |
RE/MAX Holdings, Inc., Class A | | | 6,168 | | | | 323,512 | |
St. Joe Co. (The)* | | | 15,000 | | | | 269,250 | |
| | | | | | | | |
| | |
| | | | | | | 2,708,577 | |
|
Telecommunication Services - 1.26% | |
Alaska Communications Systems Group, Inc.* | | | 347,100 | | | | 614,367 | |
ATN International, Inc. | | | 28,500 | | | | 1,503,945 | |
Hawaiian Telcom Holdco, Inc.* | | | 44,500 | | | | 1,286,940 | |
Iridium Communications, Inc.*+ | | | 391,325 | | | | 6,300,332 | |
Spok Holdings, Inc. | | | 118,864 | | | | 1,788,903 | |
| | | | | | | | |
| | |
| | | | | | | 11,494,487 | |
| | | | | | | | |
| |
TOTAL COMMON STOCKS - 99.48% | | | | 908,459,254 | |
| | | | | | | | |
(Cost $671,013,987) | | | | | |
|
RIGHTS - 0.01% | |
NewStar Financial, Inc., expiring 12/26/19*D | | | 120,000 | | | | 36,000 | |
| | | | | | | | |
| |
TOTAL RIGHTS - 0.01% | | | | 36,000 | |
| | | | | | | | |
(Cost $114,272) | | | | | |
|
WARRANTS - 0.00% | |
Eagle Bulk Shipping, Inc., expiring 10/15/21* | | | 3,317 | | | | 265 | |
| | | | | | | | |
| |
TOTAL WARRANTS - 0.00% | | | | 265 | |
| | | | | | | | |
(Cost $105,563) | | | | | |
| | |
Omni Small-Cap Value Fund SCHEDULE OF INVESTMENTS (continued) | | |
|
| |
| Showing percentage of net assets as of June 30, 2018 | | |
| | | | | | | | | | | | |
| | | Rate^ | | | Shares | | | Value | |
|
MONEY MARKET FUND - 0.45% | |
Fidelity Investments Money Market Government Portfolio Class I | | | 1.77 | % | | | 4,136,053 | | | | $ 4,136,053 | |
| | | | | | | | | | | | |
| |
TOTAL MONEY MARKET FUND - 0.45% | | | | 4,136,053 | |
| | | | | | | | | | | | |
(Cost $4,136,053) | | | | | |
|
| INVESTMENTS PURCHASED WITH CASH PROCEEDS FROM SECURITIES LENDING - 5.55% | |
Fidelity Investments Money Market Government Portfolio Class I** | | | 1.77 | % | | | 50,702,260 | | | | 50,702,260 | |
| | | | | | | | | | | | |
TOTAL INVESTMENTS PURCHASED WITH CASH PROCEEDS FROM SECURITIES LENDING - 5.55% | | | | 50,702,260 | |
| | | | | | | | | | | | |
(Cost $50,702,260) | | | | | |
| |
TOTAL INVESTMENTS - 105.49% | | | | $963,333,832 | |
| | | | | | | | | | | | |
(Cost $726,072,135) | | | | | |
Liabilities in Excess of Other Assets - (5.49%) | | | | (50,135,863 | ) |
| | | | | | | | | | | | |
NET ASSETS - 100.00% | | | | $913,197,969 | |
| | | | | | | | | | | | |
| * | Non-income producing security. |
| ** | This security represents the investment of the collateral received in connection with securities out on loan as of June 30, 2018. |
| ^ | Rate disclosed as of June 30, 2018. |
| D | Security was fair valued under procedures adopted by the Board of Directors (see Note 2). As such, the security is classified as Level 3 in the fair value hierarchy. |
| + | This security or a portion of the security is out on loan as of June 30, 2018. Total loaned securities had a value of $48,779,456 as of June 30, 2018. |
LLC - Limited Liability Company
PLC - Public Limited Company
Summary of inputs used to value the Fund’s investments as of 06/30/2018 (See Note 2 in Notes to Financial Statements):
| | | | | | | | | | | | | | | | |
| | | Valuation Inputs | |
| | | Investment in Securities (Value) | |
| | | Level 1 Quoted Prices | | | Level 2
Significant
Observable
Inputs | | | Level 3
Significant Unobservable Inputs | | | Total | |
| | | | |
Common
Stocks (a) | | $ | 908,459,254 | | | $ | — | | | $ | — | | | $ | 908,459,254 | |
Rights | | | — | | | | — | | | | 36,000 | | | | 36,000 | |
Warrants | | | 265 | | | | — | | | | — | | | | 265 | |
Money Market Fund | | | — | | | | 4,136,053 | | | | — | | | | 4,136,053 | |
Investments Purchased with Cash Proceeds from Securities Lending | | | — | | | | 50,702,260 | | | | — | | | | 50,702,260 | |
| | | | | | | | | | | | | | | | |
TOTAL | | $ | 908,459,519 | | | $ | 54,838,313 | | | $ | 36,000 | | | $ | 963,333,832 | |
| | | | | | | | | | | | | | | | |
(a) - please refer to the Schedule of Investments for the industry classifications of these portfolio holdings.
| | |
|
| |
| 16 | | Annual Report | June 30, 2018 |
| | |
Omni Small-Cap Value Fund SCHEDULE OF INVESTMENTS (continued) | | |
|
| |
| Showing percentage of net assets as of June 30, 2018 | | |
Following is a reconciliation of Level 3 investments for which significant unobservable inputs were used to determine fair value:
| | | | | | | | |
| | | Investment in Securities (Value) | |
| | | Rights | | | Total | |
| | |
Balance as of 06/30/2017 | | $ | — | | | $ | — | |
Purchases | | | 120,000 | | | | 120,000 | |
Return of Capital | | | (5,728) | | | | (5,728) | |
Realized gain/(loss) | | | — | | | | — | |
Change in unrealized appreciation/ (depreciation) | | | (78,272) | | | | (78,272) | |
Transfers in | | | — | | | | — | |
Transfers out | | | — | | | | — | |
| | | | | | | | |
Balance as of 06/30/2018 | | $ | 36,000 | | | $ | 36,000 | |
| | | | | | | | |
Net change in unrealized appreciation (depreciation) from investments held as of 06/30/2018 | | $ | (78,272) | | | $ | (78,272) | |
| | | | | | | | |
See Notes to Financial Statements.
| | |
Omni Tax-Managed Small-Cap Value Fund MANAGER’S COMMENTARY (Unaudited) | |
|
| | |
June 30, 2018
Dear Fellow Omni Tax-Managed Small-Cap Value Fund Shareholder,
For the quarter ended June 30, 2018, our Fund returned +7.91%, underperforming our primary market benchmark, the Russell 2000 Value Index (+8.30%).
For the fiscal year, our Fund returned +16.48%, outperforming the Russell 2000 Value Index (+13.10%).
The table below presents our June quarter, one-year, five-year, and inception-to-date financial results. See the next page for a graph of performance since inception.
Standardized Returns as of June 30, 2018
| | | | | | | | |
| | | | | | | Annualized |
| | | Quarter | | 1 Year | | 5 Years | | Since Inception
(12/31/10) |
| | | | |
Omni Tax-Managed Small-Cap Value Fund | | 7.91% | | 16.48% | | 11.85% | | 11.56% |
Russell 2000 Value Index | | 8.30% | | 13.10% | | 11.18% | | 10.87% |
Performance figures quoted in the table above and the graph on the next page represent past performance and are no guarantee of future results. Total return figures in the table above include the reinvestment of dividends and capital gains. The table above and the graph on the next page do not reflect the deduction of taxes that a shareholder would pay on Fund distributions or on the redemption of Fund shares.
The Russell 2000 Value Index is an unmanaged index that consists of stocks in the Russell 2000 Index with lower price-to-book ratios and lower forecasted growth values with dividends reinvested. It is not possible to invest directly in an index. Periods longer than one year are annualized.
| | |
|
| |
| 18 | | Annual Report | June 30, 2018 |
| | |
Omni Tax-Managed Small-Cap Value Fund MANAGER’S COMMENTARY (Unaudited) (continued) | |
|
| | |
Growth of a $10,000 Investment
from Inception December 31, 2010 to June 30, 2018
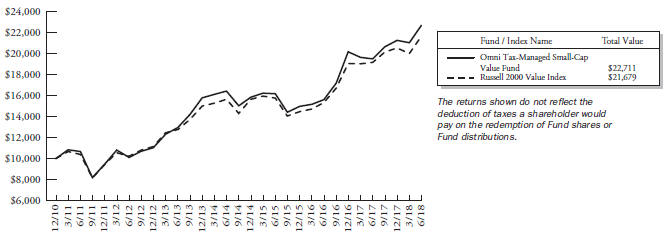
Detailed Explanation of Quarterly Performance
The Omni Tax-Managed Small-Cap Value Fund is designed to capture the returns of the small-cap value asset class through broad diversification of small company and value stocks. This approach is sometimes referred to as “passive, asset class investing.” We also seek to minimize the distribution of capital gains within the constraints of the investment objective. As of June 30, 2018, we held 673 such stocks in a market-cap weighted style. We make no attempt to track any particular index in either performance or statistics.
Above-benchmark exposure to higher momentum stocks detracted slightly from relative results during the quarter. On the positive side, the Fund’s tilt toward smaller stocks in the small-cap value universe made the largest contribution to relative results, as smaller stocks outperformed their larger counterparts. The Fund’s tilt toward deeper value stocks across multiple value metrics also benefited relative performance.
From a sector perspective, the Fund’s allocation effect was negative. By design, the Fund does not hold Real Estate Investment Trusts (REITs) or Utilities stocks. The lack of exposure to the Real Estate sector was the largest detractor to relative results. Lack of exposure to the Utilities sector had no meaningful impact on results during the quarter.
Detailed Explanation of Fiscal Year Performance
The Fund’s tilt toward smaller stocks in the small-cap value universe boosted relative results, as smaller stocks outperformed their larger counterparts during the 12-month period. Above-benchmark exposure to higher momentum stocks also benefited relative results, as the momentum factor was in favor during a volatile period for the stock market. In addition, the Fund’s tilt toward deeper value stocks across multiple value metrics added to relative results during the fiscal year.
From a sector perspective, the Fund’s allocation effect was positive. By design, the Fund does not hold Real Estate Investment Trusts (REITs) or Utilities stocks. This positioning boosted relative performance during the fiscal year.
| | |
Omni Tax-Managed Small-Cap Value Fund MANAGER’S COMMENTARY (Unaudited) (continued) | |
|
| | |
Top Ten Holdings as of June 30, 2018
| | | | | | |
| Rank | | Description | | Industry | | % of Net
Assets |
1 | | Delek US Holdings, Inc. | | Energy | | 1.1% |
2 | | Kraton Corp. | | Materials | | 1.0% |
3 | | Cooper-Standard Holdings, Inc. | | Consumer Discretionary | | 0.9% |
4 | | RH | | Consumer Discretionary | | 0.9% |
5 | | Iridium Communications, Inc. | | Telecommunication Services | | 0.8% |
6 | | Renewable Energy Group, Inc. | | Energy | | 0.8% |
7 | | McDermott International, Inc. | | Energy | | 0.7% |
8 | | Johnson Outdoors, Inc., Class A | | Consumer Discretionary | | 0.6% |
9 | | SkyWest, Inc. | | Industrials | | 0.6% |
10 | | McGrath RentCorp | | Industrials | | 0.6% |
| | Total | | | | 8.0% |
Industry Sector Representation as of June 30, 2018
| | | | | | | | | | | | |
| | | % of Net Assets | | | % of Russell 2000
Value Index | | | Difference | |
Consumer Discretionary | | | 22.4% | | | | 11.4% | | | | 11.0% | |
Consumer Staples | | | 2.1% | | | | 2.7% | | | | -0.6% | |
Energy | | | 12.0% | | | | 7.6% | | | | 4.4% | |
Financials | | | 28.5% | | | | 28.3% | | | | 0.2% | |
Health Care | | | 2.4% | | | | 4.7% | | | | -2.3% | |
Industrials | | | 16.7% | | | | 11.5% | | | | 5.2% | |
Information Technology | | | 7.8% | | | | 10.6% | | | | -2.8% | |
Materials | | | 6.2% | | | | 4.4% | | | | 1.8% | |
Real Estate | | | 0.4% | | | | 12.1% | | | | -11.7% | |
Telecommunication Services | | | 1.3% | | | | 0.5% | | | | 0.8% | |
Utilities | | | 0.0% | | | | 6.2% | | | | -6.2% | |
Cash & Other Assets | | | 0.2% | | | | 0.0% | | | | 0.2% | |
Total | | | 100.0% | | | | 100.0% | | | | | |
Disclaimer
The views expressed here are exclusively those of Fund management. These views, including those related to market sectors or individual stocks, are not meant as investment advice and should not be considered predictive in nature. Any favorable (or unfavorable) description of a holding applies only as of the quarter end, June 30, 2018, unless otherwise stated. Security positions can and do change thereafter. Discussions of historical performance do not guarantee and may not be indicative of future performance.
Market volatility can significantly impact short-term performance. The Fund is not an appropriate investment for short-term investors. Investments in small companies generally carry greater risk than is customarily associated with larger companies. This additional risk is attributable to a number of factors, including the relatively limited financial resources that are typically available to small companies and the fact that small companies often have comparatively limited product lines. In addition, the stock of small companies tends to be more volatile than the stock of large companies, particularly in the short term and particularly in the early stages of an economic or market downturn. Shareholders of the Fund, therefore, are taking on more risk than they would if they invested in the stock market as a whole.
| | |
|
| |
| 20 | | Annual Report | June 30, 2018 |
| | |
Omni Tax-Managed Small-Cap Value Fund MANAGER’S COMMENTARY (Unaudited) (continued) | |
|
Conclusion
Thank you for your continued investment in Omni Tax-Managed Small-Cap Value Fund. We encourage your feedback; your reactions and concerns are important to us.
Sincerely,
The Investment Management Team
| | |
Omni Tax-Managed Small-Cap Value Fund SCHEDULE OF INVESTMENTS | | |
|
| |
| Showing percentage of net assets as of June 30, 2018 | | |
| | | | | | | | |
| Industry Company | | Shares | | | Value | |
|
COMMON STOCKS - 99.79% | |
Consumer Discretionary - 22.40% | |
1-800-Flowers.com, Inc., Class A* | | | 60,000 | | | | $ 753,000 | |
Abercrombie & Fitch Co., Class A | | | 166,000 | | | | 4,063,680 | |
Adtalem Global Education, Inc.* | | | 39,000 | | | | 1,875,900 | |
AMCON Distributing Co. | | | 1,350 | | | | 118,800 | |
American Axle & Manufacturing Holdings, Inc.* | | | 181,750 | | | | 2,828,030 | |
American Public Education, Inc.* | | | 27,700 | | | | 1,166,170 | |
America’s Car-Mart, Inc.* | | | 10,000 | | | | 619,000 | |
Appliance Recycling Centers of America, Inc.* | | | 2,000 | | | | 1,380 | |
Ark Restaurants Corp. | | | 8,500 | | | | 216,410 | |
Ascena Retail Group, Inc.* | | | 150,000 | | | | 597,750 | |
AV Homes, Inc.*+ | | | 39,300 | | | | 841,020 | |
Barnes & Noble Education, Inc.* | | | 82,060 | | | | 462,818 | |
Barnes & Noble, Inc. | | | 23,000 | | | | 146,050 | |
Bassett Furniture Industries, Inc. | | | 52,959 | | | | 1,459,020 | |
BBX Capital Corp.+ | | | 311,200 | | | | 2,810,136 | |
Beasley Broadcast Group, Inc., Class A | | | 19,100 | | | | 213,920 | |
Beazer Homes USA, Inc.* | | | 105,000 | | | | 1,548,750 | |
Big 5 Sporting Goods Corp.+ | | | 103,600 | | | | 787,360 | |
Big Lots, Inc.+ | | | 31,500 | | | | 1,316,070 | |
Biglari Holdings, Inc., Class A* | | | 140 | | | | 133,000 | |
Biglari Holdings, Inc., Class B* | | | 1,400 | | | | 256,886 | |
BJ’s Restaurants, Inc. | | | 53,500 | | | | 3,210,000 | |
Bojangles’, Inc.* | | | 59,600 | | | | 858,240 | |
Boot Barn Holdings, Inc.* | | | 150,000 | | | | 3,112,500 | |
Buckle, Inc. (The)+ | | | 65,000 | | | | 1,748,500 | |
Build-A-Bear Workshop, Inc.* | | | 25,000 | | | | 190,000 | |
Caleres, Inc. | | | 90,000 | | | | 3,095,100 | |
Canterbury Park Holding Corp. | | | 511 | | | | 7,895 | |
Carrols Restaurant Group, Inc.*+ | | | 80,000 | | | | 1,188,000 | |
Century Casinos, Inc.* | | | 114,200 | | | | 999,250 | |
Chico’s FAS, Inc. | | | 115,000 | | | | 936,100 | |
China Automotive Systems, Inc.* | | | 69,200 | | | | 301,712 | |
China XD Plastics Co., Ltd.* | | | 48,400 | | | | 157,300 | |
Christopher & Banks Corp.* | | | 43,200 | | | | 40,608 | |
Citi Trends, Inc. | | | 76,150 | | | | 2,089,556 | |
| | | | | | | | |
| Industry Company | | Shares | | | Value | |
|
Consumer Discretionary (continued) | |
Clarus Corp.* | | | 10,000 | | | | $ 82,500 | |
Conn’s, Inc.*+ | | | 71,500 | | | | 2,359,500 | |
Container Store Group, Inc. (The)* | | | 139,150 | | | | 1,170,252 | |
Cooper Tire & Rubber Co.+ | | | 48,550 | | | | 1,276,865 | |
Cooper-Standard Holdings, Inc.* | | | 55,510 | | | | 7,253,492 | |
Crown Crafts, Inc.+ | | | 13,050 | | | | 74,385 | |
CSS Industries, Inc. | | | 75,958 | | | | 1,283,690 | |
Del Frisco’s Restaurant Group, Inc.* | | | 44,768 | | | | 564,077 | |
Del Taco Restaurants, Inc.* | | | 92,600 | | | | 1,313,068 | |
Delta Apparel, Inc.* | | | 23,700 | | | | 458,595 | |
Destination XL Group, Inc.* | | | 35,000 | | | | 78,750 | |
Dillard’s, Inc., Class A+ | | | 43,500 | | | | 4,110,750 | |
Dixie Group, Inc. (The)* | | | 27,600 | | | | 63,480 | |
DSW, Inc., Class A | | | 171,000 | | | | 4,415,220 | |
E.W. Scripps Co., (The) Class A+ | | | 133,500 | | | | 1,787,565 | |
El Pollo Loco Holdings, Inc.* | | | 89,300 | | | | 1,018,020 | |
Emmis Communications Corp., Class A* | | | 27,200 | | | | 143,888 | |
Entercom Communications Corp., Class A+ | | | 122,405 | | | | 924,158 | |
Entravision Communications Corp., Class A | | | 7,900 | | | | 39,500 | |
Eros International PLC*+ | | | 111,750 | | | | 1,452,750 | |
Escalade, Inc.+ | | | 4,000 | | | | 56,400 | |
Ethan Allen Interiors, Inc. | | | 72,500 | | | | 1,776,250 | |
EVINE Live, Inc.* | | | 147,300 | | | | 181,179 | |
Express, Inc.* | | | 115,000 | | | | 1,052,250 | |
Fiesta Restaurant Group, Inc.* | | | 32,853 | | | | 942,881 | |
Flanigan’s Enterprises, Inc.+ | | | 2,500 | | | | 68,875 | |
Flexsteel Industries, Inc. | | | 2,000 | | | | 79,800 | |
Full House Resorts, Inc.* | | | 70,000 | | | | 233,100 | |
Gaming Partners International Corp. | | | 1,000 | | | | 8,560 | |
Gannett Co., Inc. | | | 306,600 | | | | 3,280,620 | |
Genesco, Inc.* | | | 20,000 | | | | 794,000 | |
Golden Entertainment, Inc.* | | | 42,000 | | | | 1,133,580 | |
Good Times Restaurants, Inc.* | | | 4,300 | | | | 16,125 | |
Gray Television, Inc.* | | | 212,100 | | | | 3,351,180 | |
Group 1 Automotive, Inc. | | | 58,000 | | | | 3,654,000 | |
Guess?, Inc. | | | 112,000 | | | | 2,396,800 | |
Hamilton Beach Brands Holding Co., Class A | | | 16,900 | | | | 490,945 | |
Haverty Furniture Cos., Inc. | | | 69,659 | | | | 1,504,634 | |
Hibbett Sports, Inc.* | | | 47,000 | | | | 1,076,300 | |
| | |
|
| |
| 22 | | Annual Report | June 30, 2018 |
| | |
Omni Tax-Managed Small-Cap Value Fund SCHEDULE OF INVESTMENTS (continued) | | |
|
| |
| Showing percentage of net assets as of June 30, 2018 | | |
| | | | | | | | |
| Industry Company | | Shares | | | Value | |
|
Common Stocks (continued) | |
Consumer Discretionary (continued) | |
Houghton Mifflin Harcourt Co.* | | | 190,000 | | | | $1,453,500 | |
International Speedway Corp., Class A | | | 105,760 | | | | 4,727,472 | |
J Alexander’s Holdings, Inc.* | | | 34,250 | | | | 381,888 | |
JAKKS Pacific, Inc.* | | | 4,100 | | | | 13,428 | |
Johnson Outdoors, Inc., Class A | | | 63,850 | | | | 5,397,240 | |
K12, Inc.* | | | 107,850 | | | | 1,765,504 | |
KB Home | | | 134,700 | | | | 3,669,228 | |
Kirkland’s, Inc.* | | | 19,900 | | | | 231,636 | |
Lakeland Industries, Inc.* | | | 26,450 | | | | 374,268 | |
La-Z-Boy, Inc. | | | 51,000 | | | | 1,560,600 | |
Liberty Tax, Inc. | | | 5,000 | | | | 40,375 | |
Lifetime Brands, Inc. | | | 24,999 | | | | 316,237 | |
Lincoln Educational Services Corp.* | | | 39,605 | | | | 68,913 | |
Live Ventures, Inc.* | | | 3,200 | | | | 40,256 | |
Luby’s, Inc.* | | | 31,900 | | | | 82,621 | |
M/I Homes, Inc.* | | | 31,700 | | | | 839,416 | |
Marcus Corp. (The) | | | 136,454 | | | | 4,434,755 | |
MDC Holdings, Inc. | | | 117,504 | | | | 3,615,598 | |
Modine Manufacturing Co.* | | | 51,800 | | | | 945,350 | |
Movado Group, Inc. | | | 61,600 | | | | 2,975,280 | |
Nevada Gold & Casinos, Inc.*+ | | | 36,100 | | | | 72,200 | |
New Home Co. Inc., (The)* | | | 33,100 | | | | 330,007 | |
New Media Investment Group, Inc. | | | 153,800 | | | | 2,842,224 | |
New York & Co., Inc.* | | | 125,700 | | | | 643,584 | |
Office Depot, Inc. | | | 445,000 | | | | 1,134,750 | |
P&F Industries, Inc., Class A | | | 492 | | | | 4,285 | |
Papa Murphy’s Holdings, Inc.*+ | | | 45,000 | | | | 249,750 | |
Party City Holdco, Inc.*+ | | | 228,900 | | | | 3,490,725 | |
Peak Resorts, Inc.+ | | | 103,600 | | | | 518,000 | |
Perry Ellis International, Inc.* | | | 135,184 | | | | 3,672,949 | |
Pier 1 Imports, Inc. | | | 238,300 | | | | 567,154 | |
Reading International, Inc., Class A* | | | 55,500 | | | | 885,225 | |
Red Lion Hotels Corp.* | | | 42,795 | | | | 498,562 | |
Red Robin Gourmet Burgers, Inc.* | | | 31,000 | | | | 1,444,600 | |
Regis Corp.* | | | 148,350 | | | | 2,453,709 | |
Rent-A-Center, Inc.+ | | | 84,000 | | | | 1,236,480 | |
RH*+ | | | 49,300 | | | | 6,887,210 | |
Rocky Brands, Inc.+ | | | 16,050 | | | | 481,500 | |
Saga Communications, Inc., Class A | | | 7,250 | | | | 279,125 | |
Salem Media Group, Inc. | | | 69,352 | | | | 357,163 | |
Scholastic Corp. | | | 75,950 | | | | 3,365,344 | |
Shiloh Industries, Inc.* | | | 56,400 | | | | 490,680 | |
| | | | | | | | |
| Industry Company | | Shares | | | Value | |
|
Consumer Discretionary (continued) | |
Shoe Carnival, Inc. | | | 57,500 | | | | $ 1,865,875 | |
Sonic Automotive, Inc., Class A | | | 113,500 | | | | 2,338,100 | |
SORL Auto Parts, Inc.*+ | | | 74,129 | | | | 346,182 | |
SPAR Group, Inc.*+ | | | 16,500 | | | | 20,790 | |
Speedway Motorsports, Inc. | | | 118,963 | | | | 2,065,198 | |
Stage Stores, Inc.+ | | | 42,100 | | | | 101,461 | |
Stoneridge, Inc.* | | | 47,000 | | | | 1,651,580 | |
Strattec Security Corp. | | | 18,600 | | | | 568,230 | |
Summer Infant, Inc.* | | | 5,000 | | | | 6,950 | |
Superior Industries International, Inc.+ | | | 43,800 | | | | 784,020 | |
Tilly’s, Inc., Class A | | | 114,300 | | | | 1,731,645 | |
Tower International, Inc. | | | 51,000 | | | | 1,621,800 | |
Townsquare Media, Inc., Class A | | | 160,044 | | | | 1,035,485 | |
TravelCenters of America LLC* | | | 129,850 | | | | 454,475 | |
Tuesday Morning Corp.*+ | | | 117,000 | | | | 356,850 | |
Unifi, Inc.* | | | 10,800 | | | | 342,360 | |
US Auto Parts Network, Inc.* | | | 100,000 | | | | 150,000 | |
Vera Bradley, Inc.* | | | 55,500 | | | | 779,220 | |
Vista Outdoor, Inc.* | | | 11,587 | | | | 179,483 | |
VOXX International Corp.* | | | 83,064 | | | | 448,546 | |
Weyco Group, Inc. | | | 16,400 | | | | 596,960 | |
William Lyon Homes, Class A* | | | 89,497 | | | | 2,076,330 | |
ZAGG, Inc.* | | | 86,500 | | | | 1,496,450 | |
Zoe’s Kitchen, Inc.*+ | | | 25,000 | | | | 244,000 | |
Zumiez, Inc.* | | | 85,900 | | | | 2,151,795 | |
| | | | | | | | |
| | |
| | | | | | | 180,370,471 | |
|
Consumer Staples - 2.14% | |
Alico, Inc. | | | 14,600 | | | | 462,820 | |
Andersons, Inc. (The) | | | 94,700 | | | | 3,238,740 | |
Central Garden & Pet Co., Class A* | | | 6,200 | | | | 250,914 | |
Chefs’ Warehouse, Inc. (The)* | | | 25,000 | | | | 712,500 | |
Dean Foods Co. | | | 110,000 | | | | 1,156,100 | |
Hostess Brands, Inc.* | | | 215,000 | | | | 2,924,000 | |
Ingles Markets, Inc., Class A | | | 50,950 | | | | 1,620,210 | |
Landec Corp.* | | | 9,900 | | | | 147,510 | |
Mannatech, Inc. | | | 25,700 | | | | 526,850 | |
Natural Alternatives International, Inc.* | | | 16,800 | | | | 170,520 | |
Natural Health Trends Corp.+ | | | 3,000 | | | | 75,060 | |
Seneca Foods Corp., Class A* | | | 23,150 | | | | 625,050 | |
SpartanNash Co. | | | 78,682 | | | | 2,007,965 | |
| | |
Omni Tax-Managed Small-Cap Value Fund SCHEDULE OF INVESTMENTS (continued) | | |
|
| |
| Showing percentage of net assets as of June 30, 2018 | | |
| | | | | | | | |
| Industry Company | | Shares | | | Value | |
|
Common Stocks (continued) | |
Consumer Staples (continued) | |
Village Super Market, Inc., Class A | | | 29,500 | | | | $ 869,070 | |
Weis Markets, Inc.+ | | | 45,300 | | | | 2,416,302 | |
| | | | | | | | |
| | |
| | | | | | | 17,203,611 | |
|
Energy - 11.98% | |
Adams Resources & Energy, Inc. | | | 10,600 | | | | 455,800 | |
Approach Resources, Inc.*+ | | | 252,174 | | | | 615,305 | |
Arch Coal, Inc., Class A+ | | | 44,400 | | | | 3,482,292 | |
Archrock, Inc. | | | 123,000 | | | | 1,476,000 | |
Ardmore Shipping Corp.* | | | 75,000 | | | | 615,000 | |
Bristow Group, Inc.*+ | | | 20,000 | | | | 282,200 | |
Callon Petroleum Co.* | | | 56,300 | | | | 604,662 | |
Cloud Peak Energy, Inc.* | | | 123,700 | | | | 431,713 | |
CVR Energy, Inc.+ | | | 105,000 | | | | 3,883,950 | |
Dawson Geophysical Co.* | | | 47,250 | | | | 373,275 | |
Delek US Holdings, Inc. | | | 173,502 | | | | 8,704,595 | |
Denbury Resources, Inc.* | | | 828,000 | | | | 3,982,680 | |
DHT Holdings, Inc. | | | 291,800 | | | | 1,368,542 | |
Dorian LPG, Ltd.* | | | 93,860 | | | | 717,090 | |
Eclipse Resources Corp.* | | | 475,300 | | | | 760,480 | |
ENGlobal Corp.* | | | 55,878 | | | | 72,083 | |
Ensco PLC, Class A+ | | | 127,000 | | | | 922,020 | |
EP Energy Corp., Class A*+ | | | 140,000 | | | | 420,000 | |
Era Group, Inc.* | | | 32,800 | | | | 424,760 | |
Euronav NV | | | 98,390 | | | | 905,188 | |
Exterran Corp.* | | | 75,200 | | | | 1,883,008 | |
Frontline, Ltd.*+ | | | 175,000 | | | | 1,022,000 | |
GasLog Ltd. | | | 198,137 | | | | 3,784,417 | |
Gran Tierra Energy, Inc.* | | | 958,800 | | | | 3,307,860 | |
Green Plains, Inc. | | | 54,150 | | | | 990,945 | |
Gulf Island Fabrication, Inc. | | | 15,000 | | | | 135,000 | |
Halcon Resources Corp.*+ | | | 250,000 | | | | 1,097,500 | |
Hallador Energy Co. | | | 71,600 | | | | 511,224 | |
Helix Energy Solutions Group, Inc.* | | | 240,500 | | | | 2,003,365 | |
HighPoint Resources Corp.* | | | 90,000 | | | | 547,200 | |
Independence Contract Drilling, Inc.* | | | 115,281 | | | | 474,958 | |
International Seaways, Inc.* | | | 399 | | | | 9,233 | |
Matador Resources Co.* | | | 34,500 | | | | 1,036,725 | |
Matrix Service Co.* | | | 20,000 | | | | 367,000 | |
McDermott International, Inc.* | | | 285,666 | | | | 5,613,337 | |
Mitcham Industries, Inc.* | | | 5,000 | | | | 20,100 | |
NACCO Industries, Inc., Class A | | | 31,450 | | | | 1,061,438 | |
Natural Gas Services Group, Inc.* | | | 75,888 | | | | 1,790,957 | |
Navios Maritime Acquisition Corp. | | | 277,600 | | | | 169,336 | |
| | | | | | | | |
| Industry Company | | Shares | | | Value | |
|
Energy (continued) | |
Newpark Resources, Inc.* | | | 51,000 | | | | $ 553,350 | |
Noble Corp. PLC* | | | 146,000 | | | | 924,180 | |
Oasis Petroleum, Inc.* | | | 213,000 | | | | 2,762,610 | |
Oil States International, Inc.* | | | 18,000 | | | | 577,800 | |
Overseas Shipholding Group, Inc., Class A*+ | | | 111,800 | | | | 433,784 | |
Pacific Ethanol, Inc.* | | | 77,500 | | | | 201,500 | |
Par Pacific Holdings, Inc.* | | | 110,300 | | | | 1,917,014 | |
Penn Virginia Corp.* | | | 17,500 | | | | 1,485,575 | |
Pioneer Energy Services Corp.* | | | 100,000 | | | | 585,000 | |
Renewable Energy Group, Inc.*+ | | | 348,319 | | | | 6,217,494 | |
REX American Resources Corp.* | | | 25,250 | | | | 2,044,492 | |
Ring Energy, Inc.*+ | | | 28,300 | | | | 357,146 | |
Rowan Cos. PLC, Class A* | | | 175,500 | | | | 2,846,610 | |
SandRidge Energy, Inc.* | | | 69,500 | | | | 1,232,930 | |
Scorpio Tankers, Inc.+ | | | 100,000 | | | | 281,000 | |
SEACOR Holdings, Inc.* | | | 40,200 | | | | 2,302,254 | |
SEACOR Marine Holdings, Inc.* | | | 11,063 | | | | 255,445 | |
SemGroup Corp., Class A | | | 125,000 | | | | 3,175,000 | |
Ship Finance International, Ltd.+ | | | 230,500 | | | | 3,445,975 | |
SilverBow Resources, Inc.*+ | | | 17,900 | | | | 516,952 | |
SM Energy Co. | | | 22,000 | | | | 565,180 | |
SRC Energy, Inc.* | | | 100,000 | | | | 1,102,000 | |
Talos Energy, Inc.* | | | 20,000 | | | | 642,600 | |
Teekay Corp.+ | | | 225,000 | | | | 1,743,750 | |
TETRA Technologies, Inc.* | | | 100,000 | | | | 445,000 | |
TransAtlantic Petroleum, Ltd.* | | | 70,000 | | | | 96,600 | |
Unit Corp.* | | | 135,025 | | | | 3,451,239 | |
| | | | | | | | |
| | |
| | | | | | | 96,485,718 | |
|
Financials - 28.47% | |
1347 Property Insurance Holdings, Inc.* | | | 17,500 | | | | 124,250 | |
1st Constitution Bancorp+ | | | 5,250 | | | | 120,225 | |
1st Source Corp. | | | 57,750 | | | | 3,085,582 | |
Access National Corp. | | | 30,506 | | | | 872,472 | |
ACNB Corp. | | | 1,600 | | | | 54,480 | |
Ambac Financial Group, Inc.* | | | 3,400 | | | | 67,490 | |
American Equity Investment Life Holding Co. | | | 30,250 | | | | 1,089,000 | |
American National Bankshares, Inc. | | | 13,060 | | | | 522,400 | |
American River Bankshares | | | 20,744 | | | | 328,792 | |
Ameris Bancorp | | | 5,270 | | | | 281,155 | |
AmeriServ Financial, Inc. | | | 66,000 | | | | 270,600 | |
| | |
|
| |
| 24 | | Annual Report | June 30, 2018 |
| | |
Omni Tax-Managed Small-Cap Value Fund SCHEDULE OF INVESTMENTS (continued) | | |
|
| |
| Showing percentage of net assets as of June 30, 2018 | | |
| | | | | | | | |
| Industry Company | | Shares | | | Value | |
|
Common Stocks (continued) | |
Financials (continued) | |
Argo Group International Holdings, Ltd. | | | 51,394 | | | | $2,988,561 | |
Arlington Asset Investment Corp., Class A+ | | | 44,200 | | | | 455,702 | |
Atlantic Capital Bancshares, Inc.* | | | 47,200 | | | | 927,480 | |
Atlas Financial Holdings, Inc.* | | | 3,050 | | | | 26,688 | |
B. Riley Financial, Inc. | | | 10,520 | | | | 237,226 | |
Baldwin & Lyons, Inc., Class B | | | 43,700 | | | | 1,066,280 | |
Banc of California, Inc.+ | | | 98,000 | | | | 1,915,900 | |
Banco Latinoamericano de Comercio Exterior SA, Class E+ | | | 77,000 | | | | 1,894,970 | |
Bank of Commerce Holdings | | | 75,550 | | | | 963,263 | |
Bankwell Financial Group, Inc. | | | 1,500 | | | | 48,225 | |
Banner Corp. | | | 20,000 | | | | 1,202,600 | |
Bar Harbor Bankshares | | | 20,241 | | | | 613,100 | |
BCB Bancorp, Inc. | | | 11,300 | | | | 169,500 | |
Beneficial Bancorp, Inc. | | | 96,800 | | | | 1,568,160 | |
Berkshire Hills Bancorp, Inc. | | | 111,570 | | | | 4,529,742 | |
Blue Capital Reinsurance Holdings, Ltd.+ | | | 11,127 | | | | 122,953 | |
BofI Holding, Inc.* | | | 65,000 | | | | 2,659,150 | |
BSB Bancorp, Inc.* | | | 6,500 | | | | 223,600 | |
C&F Financial Corp. | | | 3,400 | | | | 212,670 | |
California First National Bancorp | | | 31,500 | | | | 497,700 | |
Camden National Corp. | | | 33,779 | | | | 1,544,038 | |
Cannae Holdings, Inc.* | | | 118,400 | | | | 2,196,320 | |
Capital City Bank Group, Inc. | | | 81,250 | | | | 1,919,938 | |
Capstar Financial Holdings, Inc.* | | | 4,900 | | | | 90,797 | |
CB Financial Services, Inc.+ | | | 13,500 | | | | 464,400 | |
Central Pacific Financial Corp. | | | 6,496 | | | | 186,110 | |
Central Valley Community Bancorp | | | 51,000 | | | | 1,079,160 | |
Century Bancorp, Inc., Class A | | | 14,300 | | | | 1,092,520 | |
Charter Financial Corp. | | | 12,500 | | | | 301,875 | |
Chemung Financial Corp.+ | | | 12,293 | | | | 616,002 | |
Citizens Community Bancorp, Inc. | | | 17,500 | | | | 247,625 | |
Citizens, Inc.*+ | | | 17,200 | | | | 133,988 | |
Civista Bancshares, Inc.+ | | | 31,921 | | | | 773,765 | |
CNB Financial Corp. | | | 70,800 | | | | 2,128,248 | |
| | | | | | | | |
| Industry Company | | Shares | | | Value | |
|
Financials (continued) | |
Coastway Bancorp, Inc.* | | | 500 | | | | $ 13,850 | |
Codorus Valley Bancorp, Inc. | | | 7,766 | | | | 238,261 | |
Colony Bankcorp, Inc. | | | 1,500 | | | | 25,350 | |
Community Bankers Trust Corp.* | | | 48,000 | | | | 429,600 | |
Community Financial Corp. (The)+ | | | 3,840 | | | | 135,782 | |
Community Trust Bancorp, Inc. | | | 32,500 | | | | 1,623,375 | |
ConnectOne Bancorp, Inc. | | | 78,000 | | | | 1,942,200 | |
Consumer Portfolio Services, Inc.* | | | 168,650 | | | | 686,406 | |
County Bancorp, Inc.+ | | | 8,700 | | | | 239,250 | |
Cowen, Inc.*+ | | | 65,800 | | | | 911,330 | |
Crawford & Co., Class A | | | 44,000 | | | | 378,840 | |
Crawford & Co., Class B | | | 40,000 | | | | 346,000 | |
Customers Bancorp, Inc.* | | | 34,500 | | | | 979,110 | |
Dime Community Bancshares, Inc. | | | 45,000 | | | | 877,500 | |
DNB Financial Corp. | | | 12,000 | | | | 420,600 | |
Donegal Group, Inc., Class A+ | | | 74,100 | | | | 1,008,501 | |
Eagle Bancorp Montana, Inc. | | | 3,000 | | | | 57,900 | |
EMC Insurance Group, Inc. | | | 39,025 | | | | 1,084,115 | |
Employers Holdings, Inc. | | | 99,400 | | | | 3,995,880 | |
Encore Capital Group, Inc.*+ | | | 64,700 | | | | 2,368,020 | |
Enova International, Inc.* | | | 92,400 | | | | 3,377,220 | |
Entegra Financial Corp.* | | | 23,600 | | | | 691,480 | |
Enterprise Bancorp, Inc. | | | 43,175 | | | | 1,745,565 | |
ESSA Bancorp, Inc. | | | 35,000 | | | | 554,050 | |
Evans Bancorp, Inc. | | | 9,000 | | | | 414,900 | |
EZCORP, Inc., Class A* | | | 170,300 | | | | 2,052,115 | |
Farmers Capital Bank Corp. | | | 30,400 | | | | 1,583,840 | |
Farmers National Banc Corp. | | | 150 | | | | 2,393 | |
FBL Financial Group, Inc., Class A | | | 45,666 | | | | 3,596,198 | |
Federal Agricultural Mortgage Corp., Class C | | | 23,200 | | | | 2,075,936 | |
FedNat Holding Co. | | | 33,900 | | | | 782,073 | |
Fidelity Southern Corp. | | | 61,400 | | | | 1,560,174 | |
Financial Institutions, Inc. | | | 40,300 | | | | 1,325,870 | |
First BanCorp Puerto Rico* | | | 469,100 | | | | 3,588,615 | |
First BanCorp Southern Pines NC | | | 62,856 | | | | 2,571,439 | |
First Bancorp, Inc. | | | 19,550 | | | | 551,701 | |
First Busey Corp. | | | 30,893 | | | | 979,926 | |
| | |
Omni Tax-Managed Small-Cap Value Fund SCHEDULE OF INVESTMENTS (continued) | | |
|
| |
| Showing percentage of net assets as of June 30, 2018 | | |
| | | | | | | | |
| Industry Company | | Shares | | | Value | |
|
Common Stocks (continued) | |
Financials (continued) | |
First Business Financial Services, Inc. | | | 14,100 | | | | $ 366,600 | |
First Capital, Inc. | | | 500 | | | | 20,775 | |
First Commonwealth Financial Corp. | | | 106,900 | | | | 1,658,019 | |
First Community Bancshares, Inc. | | | 61,300 | | | | 1,953,018 | |
First Financial Bancorp | | | 27,948 | | | | 856,606 | |
First Financial Corp. | | | 38,830 | | | | 1,760,941 | |
First Financial Northwest, Inc. | | | 26,400 | | | | 515,328 | |
First Guaranty Bancshares, Inc.+ | | | 5,499 | | | | 143,084 | |
First Internet Bancorp | | | 13,800 | | | | 470,580 | |
First Mid-Illinois Bancshares, Inc. | | | 36,500 | | | | 1,434,450 | |
First United Corp. | | | 12,225 | | | | 250,001 | |
First US Bancshares, Inc.+ | | | 5,000 | | | | 58,250 | |
Flushing Financial Corp. | | | 23,041 | | | | 601,370 | |
Franklin Financial Network, Inc.* | | | 3,000 | | | | 112,800 | |
FS Bancorp, Inc. | | | 4,250 | | | | 268,813 | |
GAIN Capital Holdings, Inc.+ | | | 146,000 | | | | 1,102,300 | |
German American Bancorp, Inc. | | | 750 | | | | 26,888 | |
Great Southern Bancorp, Inc. | | | 39,850 | | | | 2,279,420 | |
Green Bancorp, Inc. | | | 100,000 | | | | 2,160,000 | |
Greenhill & Co., Inc.+ | | | 55,000 | | | | 1,562,000 | |
Greenlight Capital Re, Ltd., Class A* | | | 61,000 | | | | 866,200 | |
Hallmark Financial Services, Inc.* | | | 50,158 | | | | 500,577 | |
Hawthorn Bancshares, Inc. | | | 12,480 | | | | 273,312 | |
HCI Group, Inc. | | | 25,000 | | | | 1,039,250 | |
Heartland Financial USA, Inc. | | | 61,950 | | | | 3,397,958 | |
Heritage Insurance Holdings, Inc. | | | 30,000 | | | | 500,100 | |
Home Bancorp, Inc. | | | 15,597 | | | | 726,040 | |
HomeStreet, Inc.* | | | 64,900 | | | | 1,749,055 | |
HomeTrust Bancshares, Inc.* | | | 35,000 | | | | 985,250 | |
HopFed Bancorp, Inc. | | | 23,500 | | | | 389,630 | |
Horace Mann Educators Corp. | | | 94,950 | | | | 4,234,770 | |
Horizon Bancorp, Inc. | | | 53,543 | | | | 1,107,794 | |
Independence Holding Co. | | | 14,950 | | | | 497,088 | |
Infinity Property & Casualty Corp. | | | 22,700 | | | | 3,231,345 | |
International Bancshares Corp. | | | 64,600 | | | | 2,764,880 | |
| | | | | | | | |
| Industry Company | | Shares | | | Value | |
|
Financials (continued) | |
INTL.FCStone, Inc.* | | | 11,900 | | | | $ 615,349 | |
Investar Holding Corp.+ | | | 19,524 | | | | 539,839 | |
Investment Technology Group, Inc. | | | 76,000 | | | | 1,589,920 | |
Investors Title Co. | | | 1,000 | | | | 184,660 | |
James River Group Holdings, Ltd. | | | 79,100 | | | | 3,107,839 | |
Kingstone Cos., Inc. | | | 21,700 | | | | 366,730 | |
Lakeland Bancorp, Inc. | | | 70,040 | | | | 1,390,294 | |
Landmark Bancorp, Inc. | | | 2,315 | | | | 65,978 | |
LCNB Corp.+ | | | 12,700 | | | | 250,190 | |
Mackinac Financial Corp. | | | 13,400 | | | | 222,172 | |
Maiden Holdings, Ltd. | | | 37,550 | | | | 291,012 | |
Marlin Business Services Corp. | | | 28,875 | | | | 861,919 | |
Mercantile Bank Corp. | | | 2,000 | | | | 73,920 | |
Meta Financial Group, Inc. | | | 20,078 | | | | 1,955,597 | |
Mid Penn Bancorp, Inc.+ | | | 11,200 | | | | 390,880 | |
Middlefield Banc Corp.+ | | | 1,000 | | | | 50,700 | |
Midland States Bancorp, Inc. | | | 55,417 | | | | 1,898,586 | |
MidSouth Bancorp, Inc.+ | | | 41,000 | | | | 543,250 | |
MidWestOne Financial Group, Inc. | | | 23,300 | | | | 787,074 | |
MMA Capital Management, LLC* | | | 500 | | | | 12,825 | |
MutualFirst Financial, Inc. | | | 700 | | | | 26,425 | |
MVB Financial Corp. | | | 40,300 | | | | 727,415 | |
National Bankshares, Inc. | | | 1,000 | | | | 46,400 | |
National Holdings Corp.* | | | 2,000 | | | | 6,580 | |
National Security Group, Inc. (The) | | | 200 | | | | 3,330 | |
National Western Life Group, Inc., Class A | | | 8,450 | | | | 2,596,347 | |
Nationstar Mortgage Holdings, Inc.*+ | | | 151,500 | | | | 2,655,795 | |
Navigators Group, Inc. (The) | | | 75,300 | | | | 4,292,100 | |
Nelnet, Inc., Class A | | | 36,900 | | | | 2,155,329 | |
Nicholas Financial, Inc.* | | | 18,400 | | | | 169,280 | |
NMI Holdings, Inc., Class A* | | | 185,000 | | | | 3,015,500 | |
Northeast Bancorp | | | 8,400 | | | | 183,120 | |
Northrim BanCorp, Inc. | | | 24,073 | | | | 952,087 | |
Northwest Bancshares, Inc. | | | 155,000 | | | | 2,695,450 | |
Norwood Financial Corp.+ | | | 1,500 | | | | 54,030 | |
Ocwen Financial Corp.*+ | | | 325,000 | | | | 1,287,000 | |
OFG Bancorp | | | 75,000 | | | | 1,053,750 | |
Old Line Bancshares, Inc. | | | 10,220 | | | | 356,780 | |
Old Second Bancorp, Inc. | | | 68,712 | | | | 989,453 | |
On Deck Capital, Inc.* | | | 208,000 | | | | 1,456,000 | |
Oppenheimer Holdings, Inc., Class A | | | 4,419 | | | | 123,732 | |
Opus Bank | | | 97,500 | | | | 2,798,250 | |
| | |
|
| |
| 26 | | Annual Report | June 30, 2018 |
| | |
Omni Tax-Managed Small-Cap Value Fund SCHEDULE OF INVESTMENTS (continued) | | |
|
| |
| Showing percentage of net assets as of June 30, 2018 | | |
| | | | | | | | |
| Industry Company | | Shares | | | Value | |
|
Common Stocks (continued) | |
Financials (continued) | |
Orrstown Financial Services, Inc. | | | 28,000 | | | | $ 728,000 | |
Oxbridge Re Holdings, Ltd. | | | 1,500 | | | | 2,625 | |
Parke Bancorp, Inc.+ | | | 17,327 | | | | 409,784 | |
PB Bancorp, Inc. | | | 14,500 | | | | 164,575 | |
Peapack Gladstone Financial Corp. | | | 19,968 | | | | 690,693 | |
Penns Woods Bancorp, Inc. | | | 1,000 | | | | 44,780 | |
Peoples Bancorp of North Carolina, Inc. | | | 5,280 | | | | 169,118 | |
Peoples Bancorp, Inc. | | | 39,550 | | | | 1,494,199 | |
Peoples Financial Services Corp.+ | | | 2,600 | | | | 122,252 | |
Piper Jaffray Cos. | | | 45,200 | | | | 3,473,620 | |
Premier Financial Bancorp, Inc. | | | 35,840 | | | | 669,133 | |
Provident Financial Holdings, Inc. | | | 53,710 | | | | 1,024,787 | |
Provident Financial Services, Inc. | | | 27,500 | | | | 757,075 | |
Prudential Bancorp, Inc. | | | 2,457 | | | | 47,420 | |
Regional Management Corp.* | | | 52,100 | | | | 1,824,542 | |
Reliant Bancorp, Inc.+ | | | 1,000 | | | | 28,050 | |
Republic Bancorp, Inc., Class A | | | 32,700 | | | | 1,481,310 | |
Riverview Bancorp, Inc. | | | 72,478 | | | | 611,714 | |
Safety Insurance Group, Inc. | | | 31,800 | | | | 2,715,720 | |
Salisbury Bancorp, Inc. | | | 1,183 | | | | 52,880 | |
Sandy Spring Bancorp, Inc. | | | 14,300 | | | | 586,443 | |
SB Financial Group, Inc. | | | 30,952 | | | | 628,945 | |
SB One Bancorp+ | | | 15,000 | | | | 445,500 | |
Security National Financial Corp., Class A* | | | 15,073 | | | | 78,380 | |
Severn Bancorp, Inc. | | | 30,000 | | | | 259,500 | |
Shore Bancshares, Inc. | | | 60,400 | | | | 1,148,808 | |
SI Financial Group, Inc. | | | 35,500 | | | | 523,625 | |
Sierra Bancorp | | | 59,400 | | | | 1,677,456 | |
Sound Financial Bancorp, Inc. | | | 1,000 | | | | 38,950 | |
State Auto Financial Corp. | | | 81,836 | | | | 2,447,715 | |
Stewart Information Services Corp. | | | 68,350 | | | | 2,943,834 | |
Summit Financial Group, Inc.+ | | | 20,600 | | | | 552,904 | |
Summit State Bank | | | 6,250 | | | | 96,562 | |
Territorial Bancorp, Inc. | | | 21,900 | | | | 678,900 | |
Timberland Bancorp, Inc. | | | 32,000 | | | | 1,194,880 | |
Tiptree, Inc.+ | | | 56,200 | | | | 382,160 | |
TowneBank | | | 743 | | | | 23,850 | |
TriCo Bancshares | | | 200 | | | | 7,490 | |
| | | | | | | | |
| Industry Company | | Shares | | | Value | |
|
Financials (continued) | |
TriState Capital Holdings, Inc.* | | | 36,760 | | | | $ 959,436 | |
Triumph Bancorp, Inc.* | | | 11,600 | | | | 472,700 | |
Two River Bancorp | | | 36,015 | | | | 688,967 | |
Union Bankshares Corp. | | | 108,956 | | | | 4,236,209 | |
United Community Financial Corp. | | | 163 | | | | 1,791 | |
United Financial Bancorp, Inc. | | | 75,000 | | | | 1,314,000 | |
United Fire Group, Inc. | | | 60,900 | | | | 3,319,659 | |
United Insurance Holdings Corp. | | | 78,400 | | | | 1,535,072 | |
Universal Insurance Holdings, Inc. | | | 81,795 | | | | 2,871,004 | |
Univest Corp. of Pennsylvania | | | 45,000 | | | | 1,237,500 | |
Waddell & Reed Financial, Inc., Class A+ | | | 63,000 | | | | 1,132,110 | |
Walker & Dunlop, Inc. | | | 76,175 | | | | 4,239,139 | |
Waterstone Financial, Inc. | | | 43,900 | | | | 748,495 | |
Wellesley Bank+ | | | 1,000 | | | | 33,800 | |
WesBanco, Inc. | | | 66,385 | | | | 2,989,980 | |
Westbury Bancorp, Inc.* | | | 2,750 | | | | 60,912 | |
World Acceptance Corp.*+ | | | 22,500 | | | | 2,497,725 | |
WSFS Financial Corp. | | | 15,600 | | | | 831,480 | |
| | | | | | | | |
| | |
| | | | | | | 229,235,604 | |
|
Health Care - 2.41% | |
AMAG Pharmaceuticals, Inc.*+ | | | 17,000 | | | | 331,500 | |
AngioDynamics, Inc.* | | | 102,300 | | | | 2,275,152 | |
Bioanalytical Systems, Inc.* | | | 4,000 | | | | 6,600 | |
Community Health Systems, Inc.*+ | | | 275,000 | | | | 913,000 | |
Concert Pharmaceuticals, Inc.* | | | 79,300 | | | | 1,334,619 | |
Cross Country Healthcare, Inc.* | | | 74,000 | | | | 832,500 | |
Digirad Corp. | | | 36,447 | | | | 56,493 | |
Electromed, Inc.* | | | 10,000 | | | | 54,200 | |
FONAR Corp.* | | | 23,400 | | | | 621,270 | |
InfuSystem Holdings, Inc.* | | | 118,378 | | | | 420,242 | |
Juniper Pharmaceuticals, Inc.* | | | 50,000 | | | | 435,000 | |
Kewaunee Scientific Corp. | | | 2,500 | | | | 89,875 | |
Lannett Co., Inc.*+ | | | 35,000 | | | | 476,000 | |
LHC Group, Inc.* | | | 500 | | | | 42,795 | |
National HealthCare Corp. | | | 22,982 | | | | 1,617,473 | |
Nobilis Health Corp.* | | | 20,000 | | | | 24,000 | |
PDL BioPharma, Inc.* | | | 480,800 | | | | 1,125,072 | |
| | |
Omni Tax-Managed Small-Cap Value Fund SCHEDULE OF INVESTMENTS (continued) | | |
|
| |
| Showing percentage of net assets as of June 30, 2018 | | |
| | | | | | | | |
| Industry Company | | Shares | | | Value | |
|
Common Stocks (continued) | |
Health Care (continued) | |
Quorum Health Corp.* | | | 26,700 | | | | $ 133,500 | |
Select Medical Holdings Corp.* | | | 170,000 | | | | 3,085,500 | |
Surgery Partners, Inc.* | | | 101,500 | | | | 1,512,350 | |
Triple-S Management Corp., Class B* | | | 102,100 | | | | 3,988,026 | |
| | | | | | | | |
| | |
| | | | | | | 19,375,167 | |
|
Industrials - 16.71% | |
Acacia Research Corp.* | | | 35,000 | | | | 145,250 | |
ACCO Brands Corp. | | | 339,800 | | | | 4,706,230 | |
Aegion Corp.* | | | 120,300 | | | | 3,097,725 | |
AeroCentury Corp.* | | | 4,300 | | | | 68,155 | |
Air T, Inc.* | | | 6,700 | | | | 224,450 | |
Aircastle, Ltd. | | | 162,400 | | | | 3,329,200 | |
Alpha Pro Tech, Ltd.*+ | | | 30,500 | | | | 102,175 | |
American Railcar Industries, Inc.+ | | | 30,500 | | | | 1,204,140 | |
AMREP Corp.* | | | 21,000 | | | | 148,470 | |
ARC Document Solutions, Inc.* | | | 56,300 | | | | 99,651 | |
ArcBest Corp. | | | 80,400 | | | | 3,674,280 | |
Argan, Inc. | | | 4,000 | | | | 163,800 | |
Armstrong Flooring, Inc.* | | | 45,000 | | | | 631,800 | |
Arotech Corp.* | | | 35,596 | | | | 133,485 | |
ASV Holdings, Inc.* | | | 53,000 | | | | 306,870 | |
Atkore International Group, Inc.* | | | 75,000 | | | | 1,557,750 | |
Atlas Air Worldwide Holdings, Inc.* | | | 54,900 | | | | 3,936,330 | |
BMC Stock Holdings, Inc.* | | | 106,300 | | | | 2,216,355 | |
Briggs & Stratton Corp. | | | 169,450 | | | | 2,984,015 | |
Broadwind Energy, Inc.* | | | 12,192 | | | | 28,773 | |
CAI International, Inc.*+ | | | 48,600 | | | | 1,129,464 | |
CBIZ, Inc.* | | | 170,033 | | | | 3,910,759 | |
Cemtrex, Inc.*+ | | | 19,000 | | | | 39,710 | |
Chart Industries, Inc.* | | | 63,175 | | | | 3,896,634 | |
Chicago Rivet & Machine Co. | | | 1,000 | | | | 32,250 | |
Civeo Corp.* | | | 443,200 | | | | 1,932,352 | |
Columbus McKinnon Corp. | | | 33,800 | | | | 1,465,568 | |
Commercial Vehicle Group, Inc.* | | | 60,000 | | | | 440,400 | |
Costamare, Inc. | | | 225,000 | | | | 1,795,500 | |
Covenant Transportation Group, Inc., Class A* | | | 80,650 | | | | 2,540,475 | |
CRA International, Inc. | | | 51,000 | | | | 2,595,390 | |
DLH Holdings Corp.* | | | 52,500 | | | | 287,700 | |
DMC Global, Inc. | | | 20,000 | | | | 898,000 | |
Ducommun, Inc.* | | | 39,750 | | | | 1,315,328 | |
| | | | | | | | |
| Industry Company | | Shares | | | Value | |
|
Industrials (continued) | |
Eastern Co. (The) | | | 20,104 | | | | $ 563,917 | |
Ecology & Environment, Inc., Class A | | | 2,811 | | | | 34,997 | |
Engility Holdings, Inc.* | | | 38,600 | | | | 1,182,704 | |
Ennis, Inc. | | | 149,265 | | | | 3,037,543 | |
Foundation Building Materials, Inc.* | | | 35,000 | | | | 538,300 | |
FreightCar America, Inc. | | | 16,200 | | | | 271,998 | |
FTI Consulting, Inc.* | | | 56,500 | | | | 3,417,120 | |
General Finance Corp.*+ | | | 50,000 | | | | 677,500 | |
Goldfield Corp. (The)* | | | 114,000 | | | | 484,500 | |
Great Lakes Dredge & Dock Corp.* | | | 239,800 | | | | 1,258,950 | |
Greenbrier Companies., Inc. (The) | | | 83,400 | | | | 4,399,350 | |
Griffon Corp. | | | 57,150 | | | | 1,017,270 | |
Hawaiian Holdings, Inc. | | | 12,000 | | | | 431,400 | |
HC2 Holdings, Inc.* | | | 33,900 | | | | 198,315 | |
Heidrick & Struggles International, Inc. | | | 54,190 | | | | 1,896,650 | |
Heritage-Crystal Clean, Inc.* | | | 14,246 | | | | 286,345 | |
Hertz Global Holdings, Inc.*+ | | | 148,800 | | | | 2,282,592 | |
Highpower International, Inc.* | | | 55,922 | | | | 173,358 | |
Hurco Cos., Inc. | | | 17,615 | | | | 788,271 | |
Huron Consulting Group, Inc.* | | | 10,300 | | | | 421,270 | |
Hyster-Yale Materials Handling, Inc. | | | 17,200 | | | | 1,105,100 | |
ICF International, Inc. | | | 35,000 | | | | 2,486,750 | |
IES Holdings, Inc.*+ | | | 3,600 | | | | 60,300 | |
Innovative Solutions & Support, Inc.*+ | | | 23,300 | | | | 67,803 | |
Kelly Services, Inc., Class A | | | 68,400 | | | | 1,535,580 | |
L.B. Foster Co., Class A* | | | 39,400 | | | | 904,230 | |
L.S. Starrett Co. (The), Class A | | | 23,800 | | | | 152,320 | |
Limbach Holdings, Inc.* | | | 27,000 | | | | 319,140 | |
Manitowoc Co., Inc. (The)* | | | 36,000 | | | | 930,960 | |
Marten Transport, Ltd. | | | 100,776 | | | | 2,363,197 | |
Matson, Inc. | | | 41,690 | | | | 1,600,062 | |
McGrath RentCorp | | | 78,000 | | | | 4,935,060 | |
Miller Industries, Inc. | | | 22,700 | | | | 579,985 | |
Navigant Consulting, Inc.* | | | 140,900 | | | | 3,119,526 | |
Nexeo Solutions, Inc.*+ | | | 116,100 | | | | 1,059,993 | |
NN, Inc. | | | 47,500 | | | | 897,750 | |
Northwest Pipe Co.* | | | 20,100 | | | | 389,337 | |
Orion Group Holdings, Inc.* | | | 66,278 | | | | 547,456 | |
| | |
|
| |
| 28 | | Annual Report | June 30, 2018 |
| | |
Omni Tax-Managed Small-Cap Value Fund SCHEDULE OF INVESTMENTS (continued) | | |
|
| |
| Showing percentage of net assets as of June 30, 2018 | | |
| | | | | | | | |
| Industry Company | | Shares | | | Value | |
|
Common Stocks (continued) | |
Industrials (continued) | |
PAM Transportation Services, Inc.* | | | 10,000 | | | | $ 469,700 | |
Pangaea Logistics Solutions, Ltd.*+ | | | 4,800 | | | | 14,448 | |
Park-Ohio Holdings Corp. | | | 10,000 | | | | 373,000 | |
Patriot Transportation Holding, Inc.* | | | 7,500 | | | | 161,250 | |
Performant Financial Corp.* | | | 93,833 | | | | 201,741 | |
Powell Industries, Inc. | | | 25,000 | | | | 870,750 | |
Preformed Line Products Co. | | | 2,200 | | | | 195,316 | |
Quad/Graphics, Inc. | | | 52,500 | | | | 1,093,575 | |
Quanex Building Products Corp. | | | 45,000 | | | | 807,750 | |
RCM Technologies, Inc. | | | 14,000 | | | | 69,160 | |
Rush Enterprises, Inc., Class A* | | | 48,600 | | | | 2,108,268 | |
Rush Enterprises, Inc., Class B* | | | 41,700 | | | | 1,830,630 | |
Safe Bulkers, Inc.* | | | 251,450 | | | | 854,930 | |
Scorpio Bulkers, Inc. | | | 195,000 | | | | 1,384,500 | |
Servotronics, Inc. | | | 1,000 | | | | 9,160 | |
Sino-Global Shipping America, Ltd.* | | | 22,300 | | | | 26,314 | |
SkyWest, Inc. | | | 95,200 | | | | 4,940,880 | |
Spartan Motors, Inc. | | | 50,200 | | | | 758,020 | |
SPX FLOW, Inc.* | | | 17,200 | | | | 752,844 | |
Steelcase, Inc., Class A | | | 223,000 | | | | 3,010,500 | |
Sterling Construction Co., Inc.* | | | 35,000 | | | | 456,050 | |
Textainer Group Holdings Ltd.* | | | 141,300 | | | | 2,246,670 | |
Titan International, Inc. | | | 46,700 | | | | 501,091 | |
Titan Machinery, Inc.* | | | 75,500 | | | | 1,174,025 | |
Triumph Group, Inc. | | | 99,500 | | | | 1,950,200 | |
TrueBlue, Inc.* | | | 77,550 | | | | 2,089,972 | |
Tutor Perini Corp.*+ | | | 96,200 | | | | 1,774,890 | |
Ultralife Corp.* | | | 57,350 | | | | 550,560 | |
USA Truck, Inc.* | | | 9,635 | | | | 226,133 | |
Vectrus, Inc.* | | | 5,000 | | | | 154,100 | |
Veritiv Corp.* | | | 11,133 | | | | 443,650 | |
Viad Corp. | | | 12,894 | | | | 699,500 | |
Virco Manufacturing Corp. | | | 200 | | | | 890 | |
VSE Corp. | | | 31,660 | | | | 1,512,715 | |
Wabash National Corp. | | | 96,000 | | | | 1,791,360 | |
Willis Lease Finance Corp.* | | | 50,950 | | | | 1,609,510 | |
| | | | | | | | |
| | |
| | | | | | | 134,569,385 | |
|
Information Technology - 7.83% | |
Alpha & Omega Semiconductor, Ltd.* | | | 161,905 | | | | 2,305,527 | |
Amkor Technology, Inc.* | | | 255,200 | | | | 2,192,168 | |
| | | | | | | | |
| Industry Company | | Shares | | | Value | |
|
Information Technology (continued) | |
Amtech Systems, Inc.* | | | 34,000 | | | | $ 205,700 | |
Applied Optoelectronics, Inc.*+ | | | 50,000 | | | | 2,245,000 | |
AutoWeb, Inc.* | | | 600 | | | | 2,712 | |
Aviat Networks, Inc.* | | | 13,800 | | | | 225,906 | |
Axcelis Technologies, Inc.* | | | 14,100 | | | | 279,180 | |
Bel Fuse, Inc., Class B | | | 63,600 | | | | 1,329,240 | |
Benchmark Electronics, Inc. | | | 121,800 | | | | 3,550,470 | |
BK Technologies, Inc. | | | 35,000 | | | | 129,500 | |
Blucora, Inc.* | | | 82,400 | | | | 3,048,800 | |
Cars.com, Inc.*+ | | | 55,000 | | | | 1,561,450 | |
ClearOne, Inc.+ | | | 5,000 | | | | 19,250 | |
Communications Systems, Inc. | | | 5,800 | | | | 22,098 | |
Computer Task Group, Inc.* | | | 84,900 | | | | 657,126 | |
Comtech Telecommunications Corp. | | | 61,785 | | | | 1,969,706 | |
CSP, Inc. | | | 5,150 | | | | 50,728 | |
CVD Equipment Corp.*+ | | | 1,500 | | | | 9,990 | |
Data I/O Corp.* | | | 22,500 | | | | 142,875 | |
Digi International, Inc.* | | | 58,325 | | | | 769,890 | |
Diodes, Inc.* | | | 112,600 | | | | 3,881,322 | |
Edgewater Technology, Inc.* | | | 9,810 | | | | 53,170 | |
Electro Scientific Industries, Inc.*+ | | | 15,000 | | | | 236,550 | |
Finjan Holdings, Inc.* | | | 20,700 | | | | 70,380 | |
GSE Systems, Inc.* | | | 22,500 | | | | 73,125 | |
IEC Electronics Corp.*+ | | | 17,700 | | | | 103,191 | |
inTEST Corp.* | | | 54,500 | | | | 397,850 | |
KEMET Corp.* | | | 126,750 | | | | 3,061,012 | |
Key Tronic Corp.* | | | 18,600 | | | | 140,988 | |
Kimball Electronics, Inc.* | | | 59,100 | | | | 1,081,530 | |
Knowles Corp.* | | | 156,800 | | | | 2,399,040 | |
Kulicke & Soffa Industries, Inc. | | | 26,232 | | | | 624,846 | |
KVH Industries, Inc.* | | | 18,200 | | | | 243,880 | |
LightPath Technologies, Inc., Class A*+ | | | 65,000 | | | | 149,500 | |
ManTech International Corp., Class A | | | 78,882 | | | | 4,231,230 | |
Meet Group, Inc. (The)* | | | 26,831 | | | | 120,203 | |
Mind CTI Ltd. | | | 500 | | | | 1,090 | |
Net 1 UEPS Technologies, Inc.* | | | 171,100 | | | | 1,553,588 | |
Network-1 Technologies, Inc. | | | 50,000 | | | | 155,000 | |
Nortech Systems, Inc.* | | | 1,500 | | | | 5,160 | |
PCM, Inc.*+ | | | 82,175 | | | | 1,244,951 | |
PC-Tel, Inc. | | | 56,000 | | | | 349,440 | |
Photronics, Inc.* | | | 171,470 | | | | 1,367,473 | |
Presidio, Inc.*+ | | | 37,300 | | | | 488,630 | |
| | |
Omni Tax-Managed Small-Cap Value Fund SCHEDULE OF INVESTMENTS (continued) | | |
|
| |
| Showing percentage of net assets as of June 30, 2018 | | |
| | | | | | | | |
| Industry Company | | Shares | | | Value | |
|
Common Stocks (continued) | |
Information Technology (continued) | |
PRGX Global, Inc.* | | | 16,377 | | | | $ 158,857 | |
RF Industries, Ltd. | | | 35,000 | | | | 253,750 | |
Sanmina Corp.* | | | 60,900 | | | | 1,784,370 | |
ScanSource, Inc.* | | | 45,500 | | | | 1,833,650 | |
SigmaTron International, Inc.* | | | 7,000 | | | | 49,140 | |
Stratasys, Ltd.* | | | 115,000 | | | | 2,201,100 | |
SunPower Corp.*+ | | | 300,000 | | | | 2,301,000 | |
Sykes Enterprises, Inc.* | | | 92,750 | | | | 2,669,345 | |
Synacor, Inc.* | | | 15,000 | | | | 30,000 | |
Systemax, Inc. | | | 21,000 | | | | 720,930 | |
TESSCO Technologies, Inc. | | | 15,250 | | | | 263,825 | |
TiVo Corp. | | | 186,400 | | | | 2,507,080 | |
Trio-Tech International* | | | 13,000 | | | | 58,110 | |
TSR, Inc.*+ | | | 1,385 | | | | 9,418 | |
TTM Technologies, Inc.* | | | 219,402 | | | | 3,868,057 | |
Ultra Clean Holdings, Inc.* | | | 7,000 | | | | 116,200 | |
Vishay Precision Group, Inc.* | | | 31,667 | | | | 1,208,096 | |
Wayside Technology Group, Inc. | | | 7,200 | | | | 101,160 | |
Westell Technologies, Inc., Class A* | | | 59,900 | | | | 170,715 | |
| | | | | | | | |
| | |
| | | | | | | 63,055,268 | |
|
Materials - 6.16% | |
AgroFresh Solutions, Inc.* | | | 51,700 | | | | 362,417 | |
American Vanguard Corp. | | | 4,800 | | | | 110,160 | |
Boise Cascade Co. | | | 65,000 | | | | 2,905,500 | |
Carpenter Technology Corp. | | | 50,400 | | | | 2,649,528 | |
China Green Agriculture, Inc.* | | | 43,500 | | | | 50,025 | |
Clearwater Paper Corp.* | | | 16,182 | | | | 373,804 | |
Coeur Mining, Inc.* | | | 197,500 | | | | 1,501,000 | |
Core Molding Technologies, Inc. | | | 11,900 | | | | 169,932 | |
Flexible Solutions International, Inc.* | | | 5,000 | | | | 8,050 | |
Friedman Industries, Inc. | | | 5,000 | | | | 40,500 | |
FutureFuel Corp. | | | 54,500 | | | | 763,545 | |
Gulf Resources, Inc.* | | | 78,150 | | | | 107,847 | |
Haynes International, Inc. | | | 22,200 | | | | 815,628 | |
Hecla Mining Co. | | | 749,000 | | | | 2,606,520 | |
Kaiser Aluminum Corp. | | | 23,350 | | | | 2,430,968 | |
Kraton Corp.* | | | 169,500 | | | | 7,820,730 | |
Materion Corp. | | | 71,700 | | | | 3,882,555 | |
Mercer International, Inc. | | | 129,950 | | | | 2,274,125 | |
Olympic Steel, Inc. | | | 22,300 | | | | 455,143 | |
Orient Paper, Inc.* | | | 35,000 | | | | 35,000 | |
PH Glatfelter Co. | | | 113,900 | | | | 2,231,301 | |
| | | | | | | | |
| Industry Company | | Shares | | | Value | |
|
Materials (continued) | |
Rayonier Advanced Materials, Inc. | | | 74,500 | | | | $ 1,273,205 | �� |
Resolute Forest Products, Inc.* | | | 157,500 | | | | 1,630,125 | |
Schnitzer Steel Industries, Inc., Class A | | | 77,600 | | | | 2,615,120 | |
Stepan Co. | | | 50,400 | | | | 3,931,704 | |
SunCoke Energy, Inc.* | | | 216,200 | | | | 2,897,080 | |
Synalloy Corp.+ | | | 5,000 | | | | 99,750 | |
TimkenSteel Corp.* | | | 20,000 | | | | 327,000 | |
Trecora Resources* | | | 18,600 | | | | 276,210 | |
Tredegar Corp. | | | 53,900 | | | | 1,266,650 | |
Universal Stainless & Alloy Products, Inc.* | | | 16,250 | | | | 384,638 | |
Verso Corp., Class A* | | | 83,000 | | | | 1,806,080 | |
Warrior Met Coal, Inc. | | | 55,000 | | | | 1,516,350 | |
| | | | | | | | |
| | |
| | | | | | | 49,618,190 | |
|
Real Estate - 0.41% | |
Altisource Portfolio Solutions SA*+ | | | 51,450 | | | | 1,500,796 | |
Consolidated-Tomoka Land Co. | | | 11,000 | | | | 676,610 | |
Forestar Group, Inc.*+ | | | 11,025 | | | | 228,769 | |
RE/MAX Holdings, Inc., Class A | | | 16,900 | | | | 886,405 | |
| | | | | | | | |
| | |
| | | | | | | 3,292,580 | |
|
Telecommunication Services - 1.28% | |
Alaska Communications Systems Group, Inc.* | | | 344,187 | | | | 609,211 | |
ATN International, Inc. | | | 22,000 | | | | 1,160,940 | |
Hawaiian Telcom Holdco, Inc.* | | | 17,600 | | | | 508,992 | |
Iridium Communications, Inc.* | | | 392,125 | | | | 6,313,212 | |
Spok Holdings, Inc. | | | 111,100 | | | | 1,672,055 | |
| | | | | | | | |
| |
| | | | 10,264,410 | |
| | | | | | | | |
| |
TOTAL COMMON STOCKS - 99.79% | | | | 803,470,404 | |
| | | | | | | | |
(Cost $ 581,788,945) | | | | | |
|
RIGHTS - 0.00% | |
NewStar Financial, Inc., expiring 12/26/19*D | | | 105,100 | | | | 31,530 | |
| | | | | | | | |
| |
TOTAL RIGHTS - 0.00% | | | | 31,530 | |
| | | | | | | | |
(Cost $ 100,084) | | | | | |
| | |
|
| |
| 30 | | Annual Report | June 30, 2018 |
| | |
Omni Tax-Managed Small-Cap Value Fund SCHEDULE OF INVESTMENTS (continued) | | |
|
| |
| Showing percentage of net assets as of June 30, 2018 | | |
| | | | | | | | | | | | |
| Industry Company | | | Shares | | | Value | |
WARRANTS - 0.00% | |
Eagle Bulk Shipping, Inc., expiring 10/15/21* | | | | 8,501 | | | | $680 | |
| | | | | | | | | | | | |
| |
TOTAL WARRANTS - 0.00% | | | | 680 | |
| | | | | | | | | | | | |
(Cost $70,770) | | | | | |
| | | |
| | | Rate^ | | | Shares | | | Value | |
|
MONEY MARKET FUND - 0.36% | |
Fidelity Investments Money Market Government Portfolio Class I | | | 1.77 | % | | | 2,905,278 | | | | 2,905,278 | |
| | | | | | | | | | | | |
| |
TOTAL MONEY MARKET FUND - 0.36% | | | | 2,905,278 | |
| | | | | | | | | | | | |
(Cost $2,905,278) | | | | | |
|
| INVESTMENTS PURCHASED WITH CASH PROCEEDS FROM SECURITIES LENDING - 7.04% | |
Fidelity Investments Money Market Government Portfolio Class I** | | | 1.77 | % | | | 56,667,798 | | | | 56,667,798 | |
| | | | | | | | | | | | |
| |
TOTAL INVESTMENTS PURCHASED WITH CASH PROCEEDS FROM SECURITIES LENDING - 7.04% | | | | 56,667,798 | |
| | | | | | | | | | | | |
(Cost $56,667,798) | | | | | |
| |
TOTAL INVESTMENTS - 107.19% | | | | $863,075,690 | |
(Cost $641,532,875) | | | | | |
Liabilities in Excess of Other Assets - (7.19%) | | | | (57,887,495 | ) |
| | | | | | | | | | | | |
| |
NET ASSETS - 100.00% | | | | $805,188,195 | |
| | | | | | | | | | | | |
| * | Non-income producing security. |
| ** | This security represents the investment of the collateral received in connection with securities out on loan as of June 30, 2018. |
| ^ | Rate disclosed as of June 30, 2018. |
| D | Security was fair valued under procedures adopted by the Board of Directors (see Note 2). As such, the security is classified as Level 3 in the fair value hierarchy. |
| + | This security or a portion of the security is out on loan as of June 30, 2018. Total loaned securities had a value of $54,658,065 as of June 30, 2018. |
LLC - Limited Liability Company
PLC - Public Limited Company
Summary of inputs used to value the Fund’s investments as of 06/30/2018 (See Note 2 in Notes to Financial Statements):
| | | | | | | | | | | | | | | | |
| | | Valuation Inputs | |
| | | Investment in Securities (Value) | |
| | | Level 1 Quoted Prices | | | Level 2
Significant
Observable
Inputs | | | Level 3
Significant
Unobservable
Inputs | | | Total | |
| | | | |
Common Stocks (a) | | $ | 803,470,404 | | | $ | — | | | $ | — | | | $ | 803,470,404 | |
Rights | | | — | | | | — | | | | 31,530 | | | | 31,530 | |
Warrants | | | 680 | | | | — | | | | — | | | | 680 | |
Money Market Fund | | | — | | | | 2,905,278 | | | | — | | | | 2,905,278 | |
Investments Purchased with Cash Proceeds from Securities Lending | | | — | | | | 56,667,798 | | | | — | | | | 56,667,798 | |
| | | | | | | | | | | | | | | | |
TOTAL | | $ | 803,471,084 | | | $ | 59,573,076 | | | $ | 31,530 | | | $ | 863,075,690 | |
| | | | | | | | | | | | | | | | |
(a) - please refer to the Schedule of Investments for the industry classifications of these portfolio holdings
| | |
Omni Tax-Managed Small-Cap Value Fund SCHEDULE OF INVESTMENTS (continued) | | |
|
| |
| Showing percentage of net assets as of June 30, 2018 | | |
Following is a reconciliation of Level 3 investments for which significant unobservable inputs were used to determine fair value:
| | | | | | | | |
| | | Investment in Securities (Value) | |
| | | Rights | | | Total | |
| | |
Balance as of 06/30/2017 | | $ | — | | | $ | — | |
Purchases | | | 105,100 | | | | 105,100 | |
Return of Capital | | | (5,016) | | | | (5,016) | |
Realized gain/(loss) | | | — | | | | — | |
Change in unrealized appreciation/ (depreciation) | | | (68,554) | | | | (68,554) | |
Transfers in | | | — | | | | — | |
Transfers out | | | — | | | | — | |
| | | | | | | | |
Balance as of 06/30/2018 | | $ | 31,530 | | | $ | 31,530 | |
| | | | | | | | |
Net change in unrealized appreciation (depreciation) from investments held as of 06/30/2018 | | $ | (68,554) | | | $ | (68,554) | |
| | | | | | | | |
See Notes to Financial Statements.
| | |
|
| |
| 32 | | Annual Report | June 30, 2018 |
| | |
| STATEMENTS OF ASSETS AND LIABILITIES | | |
| June 30, 2018 | | |
| | | | | | | | | | |
| ASSETS | | Omni Small-Cap Value | | | Omni Tax-Managed Small-Cap Value | | | |
Investments at value | | | $963,333,832 | | | | $863,075,690 | | | |
Receivables: | | | | | | | | | | |
Portfolio securities sold | | | 3,315,066 | | | | 392,025 | | | |
Fund shares sold | | | 389,657 | | | | 253,782 | | | |
Dividends and interest | | | 636,435 | | | | 573,133 | | | |
Prepaid expenses | | | 76,135 | | | | 76,046 | | | |
Total assets | | | 967,751,125 | | | | 864,370,676 | | | |
LIABILITIES | | | | | | | | | | |
Payables: | | | | | | | | | | |
Portfolio securities purchased | | | 3,076,314 | | | | 1,755,165 | | | |
Fund shares redeemed | | | 159,414 | | | | 198,207 | | | |
Due to custodian | | | 44,061 | | | | 38,140 | | | |
Payable upon return of securities loaned | | | 50,702,260 | | | | 56,667,798 | | | |
Accrued Liabilities: | | | | | | | | | | |
Investment advisory fees | | | 305,662 | | | | 280,215 | | | |
Administration fees | | | 18,605 | | | | 16,430 | | | |
Directors’ fees | | | 2,561 | | | | 2,342 | | | |
Other | | | 244,279 | | | | 224,184 | | | |
Total liabilities | | | 54,553,156 | | | | 59,182,481 | | | |
NET ASSETS | | | $913,197,969 | | | | $805,188,195 | | | |
NET ASSETS REPRESENT | | | | | | | | | | |
Paid-in capital | | | $636,674,247 | | | | $547,734,058 | | | |
Undistributed net investment income | | | 2,782,031 | | | | 2,718,400 | | | |
Undistributed net realized gain on investments | | | 36,479,994 | | | | 33,192,922 | | | |
Net unrealized appreciation on investments | | | 237,261,697 | | | | 221,542,815 | | | |
NET ASSETS | | | $913,197,969 | | | | $805,188,195 | | | |
Shares of common stock outstanding of $.001 par value* | | | 46,052,609 | | | | 42,164,668 | | | |
Net asset value, offering price and redemption price per share | | | $ 19.83 | | | | $ 19.10 | | | |
Total investments at cost | | | $726,072,135 | | | | $641,532,875 | | | |
* See Note 1 - Organization in the Notes to Financial Statements for shares authorized for each Fund.
See Notes to Financial Statements.
| | |
| STATEMENTS OF OPERATIONS | | |
| Year Ended June 30, 2018 | | |
| | | | | | | | | | |
| | | Omni Small-Cap Value | | | Omni Tax-Managed Small-Cap Value | | | |
INVESTMENT INCOME | | | | | | | | | | |
Dividends | | | $ 9,997,612 | | | | $ 9,161,897 | | | |
Less: foreign taxes withheld | | | (6,609) | | | | (5,466) | | | |
Securities lending | | | 1,793,399 | | | | 1,471,446 | | | |
Total Investment Income | | | 11,784,402 | | | | 10,627,877 | | | |
EXPENSES | | | | | | | | | | |
Investment advisory fees | | | 3,990,501 | | | | 3,568,622 | | | |
Administration fees | | | 211,285 | | | | 189,312 | | | |
Accounting fees | | | 180,013 | | | | 166,164 | | | |
Transfer agent fees | | | 10,544 | | | | 10,741 | | | |
Professional fees | | | 160,195 | | | | 144,168 | | | |
Custody fees | | | 24,296 | | | | 23,914 | | | |
Blue sky fees | | | 37,728 | | | | 23,318 | | | |
Directors’ and officers’ fees | | | 88,910 | | | | 79,790 | | | |
Shareholder servicing fees | | | 697,103 | | | | 631,478 | | | |
Reports to shareholders | | | 39,570 | | | | 32,854 | | | |
Miscellaneous expenses | | | 107,793 | | | | 102,903 | | | |
Total Expenses | | | 5,547,938 | | | | 4,973,264 | | | |
Less investment advisory fees waived | | | (759,479) | | | | (691,272) | | | |
Net Expenses | | | 4,788,459 | | | | 4,281,992 | | | |
NET INVESTMENT INCOME | | | 6,995,943 | | | | 6,345,885 | | | |
| | | |
NET REALIZED AND UNREALIZED GAIN ON INVESTMENTS | | | | | | | | | | |
Realized Gain on: | | | | | | | | | | |
Investments | | | 54,647,102 | | | | 46,319,987 | | | |
Change in Unrealized Appreciation on: | | | | | | | | | | |
Investments | | | 63,773,834 | | | | 55,911,577 | | | |
Net Realized and Unrealized Gain on Investments | | | 118,420,936 | | | | 102,231,564 | | | |
NET INCREASE IN NET ASSETS RESULTING FROM OPERATIONS | | | $125,416,879 | | | | $108,577,449 | | | |
See Notes to Financial Statements.
| | |
|
| |
| 34 | | Annual Report | June 30, 2018 |
| | |
| STATEMENTS OF CHANGES IN NET ASSETS | | |
| | | | | | | | | | | | | | | | | | |
| | | Omni Small-Cap Value | | | Omni Tax-Managed Small-Cap Value | | | |
| | | Year Ended June 30, | | | Year Ended June 30, | | | |
| | | 2018 | | | 2017 | | | 2018 | | | 2017 | | | |
OPERATIONS | | | | | | | | | | | | | | | | | | |
Net investment income | | | $ 6,995,943 | | | | $ 6,528,404 | | | | $ 6,345,885 | | | | $ 6,198,317 | | | |
Net realized gain on investments | | | 54,647,102 | | | | 39,014,429 | | | | 46,319,987 | | | | 30,306,951 | | | |
Net change in unrealized appreciation on investments | | | 63,773,834 | | | | 93,770,758 | | | | 55,911,577 | | | | 89,592,888 | | | |
Net increase in net assets resulting from operations | | | 125,416,879 | | | | 139,313,591 | | | | 108,577,449 | | | | 126,098,156 | | | |
| | | | | |
DISTRIBUTIONS: | | | | | | | | | | | | | | | | | | |
From net investment income | | | (6,405,244 | ) | | | (6,191,149 | ) | | | (8,820,586 | ) | | | (4,983,381 | ) | | |
From net realized gains | | | (44,141,688 | ) | | | - | | | | (31,691,559 | ) | | | - | | | |
Net decrease in net assets resulting from distributions | | | (50,546,932 | ) | | | (6,191,149 | ) | | | (40,512,145 | ) | | | (4,983,381 | ) | | |
| | | | | |
SHARE TRANSACTIONS: | | | | | | | | | | | | | | | | | | |
Proceeds from sale of shares | | | 203,730,487 | | | | 137,957,334 | | | | 168,009,722 | | | | 115,240,335 | | | |
Reinvestment of distributions | | | 50,537,299 | | | | 6,188,289 | | | | 40,413,658 | | | | 4,967,931 | | | |
Cost of shares redeemed | | | (126,296,700 | ) | | | (125,196,672 | ) | | | (114,515,838 | ) | | | (104,102,649 | ) | | |
Net increase in net assets resulting from share transactions | | | 127,971,086 | | | | 18,948,951 | | | | 93,907,542 | | | | 16,105,617 | | | |
Net increase in net assets | | | 202,841,033 | | | | 152,071,393 | | | | 161,972,846 | | | | 137,220,392 | | | |
NET ASSETS: | | | | | | | | | | | | | | | | | | |
Beginning of year | | | 710,356,936 | | | | 558,285,543 | | | | 643,215,349 | | | | 505,994,957 | | | |
End of year* | | | $913,197,969 | | | | $710,356,936 | | | | $805,188,195 | | | | $643,215,349 | | | |
| | | | | |
SHARES ISSUED & REDEEMED | | | | | | | | | | | | | | | | | | |
Issued | | | 10,867,100 | | | | 7,807,866 | | | | 9,329,371 | | �� | | 6,888,395 | | | |
Distributions reinvested | | | 2,766,136 | | | | 328,117 | | | | 2,304,085 | | | | 275,079 | | | |
Redeemed | | | (6,729,805 | ) | | | (7,074,972 | ) | | | (6,460,884 | ) | | | (6,209,008 | ) | | |
Net increase in shares | | | 6,903,431 | | | | 1,061,011 | | | | 5,172,572 | | | | 954,466 | | | |
Outstanding at beginning of year | | | 39,149,178 | | | | 38,088,167 | | | | 36,992,096 | | | | 36,037,630 | | | |
Outstanding at end of year | | | 46,052,609 | | | | 39,149,178 | | | | 42,164,668 | | | | 36,992,096 | | | |
| | | | | |
* Including undistributed net investment income of: | | | $ 2,782,031 | | | | $ 2,734,016 | | | | $ 2,718,400 | | | | $ 5,702,122 | | | |
See Notes to Financial Statements.
| | |
FINANCIAL HIGHLIGHTS | | |
| (for a share outstanding throughout each year indicated) | | |
OMNI SMALL-CAP VALUE
| | | | | | | | | | |
| | | Year Ended June 30 |
| | | | | |
| | | 2018 | | 2017 | | 2016 | | 2015 | | 2014 |
Net Asset Value, Beginning of Year | | $18.14 | | $14.66 | | $15.49 | | $16.63 | | $14.11 |
| | | | | | | | | | |
| | | | | |
Income from Investment Operations: | | | | | | | | | | |
Net Investment Income(a) | | 0.17 | | 0.17 | | 0.17 | | 0.14 | | 0.11 |
Net Realized and Unrealized Gain (Loss) | | 2.77 | | 3.48 | | (0.86) | | (0.46) | | 3.58 |
| | | | | | | | | | |
Total from Investment Operations | | 2.94 | | 3.65 | | (0.69) | | (0.32) | | 3.69 |
| | | | | | | | | | |
| | | | | |
Less Distributions to Shareholders from: | | | | | | | | | | |
Net Investment Income | | (0.16) | | (0.17) | | (0.14) | | (0.09) | | (0.08) |
Net Realized Gain | | (1.09) | | - | | - | | (0.73) | | (1.09) |
| | | | | | | | | | |
Total Distributions | | (1.25) | | (0.17) | | (0.14) | | (0.82) | | (1.17) |
| | | | | | | | | | |
| | | | | |
Net Asset Value, End of Year | | $19.83 | | $18.14 | | $14.66 | | $15.49 | | $16.63 |
| | | | | | | | | | |
| | | | | |
Total Return(b) | | 16.75% | | 24.83% | | (4.42%) | | (1.48%) | | 26.89% |
| | | | | |
Ratios and Supplemental Data: | | | | | | | | | | |
Net Assets, End of Year (in 000’s) | | $913,198 | | $710,357 | | $558,286 | | $459,367 | | $407,192 |
Expenses Before Waivers and Reimbursements | | 0.70% | | 0.71% | | 0.71% | | 0.71% | | 0.71% |
Expenses After Waivers and Reimbursements | | 0.60% | | 0.60% | | 0.60% | | 0.60% | | 0.60% |
Net Investment Income After Waivers and Reimbursements | | 0.88% | | 1.00% | | 1.17% | | 0.88% | | 0.70% |
Portfolio Turnover Rate | | 24% | | 23% | | 24% | | 25% | | 31% |
| (a) | Per share amounts calculated based on the average daily shares outstanding during the year. |
| (b) | Total return would have been lower had various fees not been waived during the year. |
See Notes to Financial Statements.
| | |
|
| |
| 36 | | Annual Report | June 30, 2018 |
| | |
FINANCIAL HIGHLIGHTS | | |
| (for a share outstanding throughout each year indicated) | | |
OMNI TAX-MANAGED SMALL-CAP VALUE
| | | | | | | | | | |
| | | Year Ended June 30 |
| | | | | |
| | | 2018 | | 2017 | | 2016 | | 2015 | | 2014 |
Net Asset Value, Beginning of Year | | $17.39 | | $14.04 | | $14.65 | | $15.54 | | $12.75 |
| | | | | | | | | | |
| | | | | |
Income from Investment Operations: | | | | | | | | | | |
Net Investment Income(a) | | 0.16 | | 0.17 | | 0.16 | | 0.12 | | 0.09 |
Net Realized and Unrealized Gain (Loss) | | 2.61 | | 3.32 | | (0.66) | | (0.42) | | 3.26 |
| | | | | | | | | | |
Total from Investment Operations | | 2.77 | | 3.49 | | (0.50) | | (0.30) | | 3.35 |
| | | | | | | | | | |
| | | | | |
Less Distributions to Shareholders from: | | | | | | | | | | |
Net Investment Income | | (0.23) | | (0.14) | | (0.11) | | (0.03) | | (0.08) |
Net Realized Gain | | (0.83) | | - | | - | | (0.56) | | (0.48) |
| | | | | | | | | | |
Total Distributions | | (1.06) | | (0.14) | | (0.11) | | (0.59) | | (0.56) |
| | | | | | | | | | |
| | | | | |
Net Asset Value, End of Year | | $19.10 | | $17.39 | | $14.04 | | $14.65 | | $15.54 |
| | | | | | | | | | |
| | | | | |
Total Return(b) | | 16.48% | | 24.83% | | (3.42%) | | (1.62%) | | 26.71% |
| | | | | |
Ratios and Supplemental Data: | | | | | | | | | | |
Net Assets, End of Year (in 000’s) | | $805,188 | | $643,215 | | $505,995 | | $461,101 | | $425,330 |
Expenses Before Waivers and Reimbursements | | 0.70% | | 0.71% | | 0.72% | | 0.71% | | 0.71% |
Expenses After Waivers and Reimbursements | | 0.60% | | 0.60% | | 0.60% | | 0.60% | | 0.60% |
Net Investment Income After Waivers and Reimbursements | | 0.89% | | 1.04% | | 1.20% | | 0.84% | | 0.65% |
Portfolio Turnover Rate | | 27% | | 23% | | 29% | | 30% | | 25% |
| (a) | Per share amounts calculated based on the average daily shares outstanding during the year. |
| (b) | Total return would have been lower had various fees not been waived during the year. |
See Notes to Financial Statements.
| | |
| NOTES TO FINANCIAL STATEMENTS | | |
|
| June 30, 2018 | | |
1. Organization:
Bridgeway Funds, Inc. (“Bridgeway” or the “Company”) was organized as a Maryland corporation on October 19, 1993, and is registered under the Investment Company Act of 1940, as amended (the “1940 Act”), as an open-end management investment company.
Bridgeway is organized as a series fund, with 9 investment funds as of June 30, 2018 (each is referred to as a “Bridgeway Fund” and collectively, the “Bridgeway Funds”). The Aggressive Investors 1, Ultra-Small Company, Ultra-Small Company Market, Small-Cap Growth, Small-Cap Value, Blue Chip 35 Index and Managed Volatility Funds are presented in a separate report. The Omni Small-Cap Value Fund and the Omni Tax-Managed Small-Cap Value Fund (each a “Fund” and together, the “Funds”) are presented in this report.
Bridgeway is authorized to issue 1,915,000,000 shares of common stock at $0.001 per share. As of June 30, 2018, 100,000,000 shares have been classified into the Aggressive Investors 1 Fund. 130,000,000 shares have been classified into the Blue Chip 35 Index Fund. 15,000,000 shares have been classified into the Ultra-Small Company Fund. 100,000,000 shares each have been classified into the Ultra-Small Company Market, Omni Small-Cap Value, Omni Tax-Managed Small-Cap Value, Small-Cap Growth and Small-Cap Value Funds. 50,000,000 shares have been classified into the Managed Volatility Fund.
All of the Bridgeway Funds are no-load, diversified funds.
The Funds seek to provide long-term total return on capital, primarily through capital appreciation.
Bridgeway Capital Management, Inc. (the “Adviser”) is the investment adviser for all of the Bridgeway Funds.
2. Significant Accounting Policies:
The following summary of significant accounting policies, followed in the preparation of the financial statements of the Funds, are in conformity with accounting principles generally accepted in the United States of America (“GAAP”). Each Fund is considered an investment company under GAAP and follows the accounting and reporting guidance applicable to investment companies.
Securities and Other Investments Valuation Securities for which market quotations are readily available are valued at the last sale price on the national exchange on which such securities are primarily traded. In the case of securities reported on the National Association of Securities Dealers Automated Quotation (“NASDAQ”) system, the securities are valued based on the NASDAQ Official Closing Price (“NOCP”). In the absence of recorded sales on their home exchange, or NOCP, in the case of NASDAQ traded securities, the security will be valued as follows: bid prices for long positions and ask prices for short positions.
Investments in open-end registered investment companies and closed-end registered investment companies that do not trade on an exchange are valued at the end of day net asset value (“NAV”) per share.
Investments in closed-end registered investment companies that trade on an exchange are valued at the last sales price as of the close of the customary trading session on the exchange where the security is principally traded.
When market quotations are not readily available or when events occur that make established valuation methods unreliable, securities of the Funds may be valued at fair value as determined in good faith by or under the direction of the Board of Directors. The valuation assigned to a fair valued security for purposes of calculating the Funds’ NAV may differ from the security’s most recent closing market price and from the prices used by other mutual funds to calculate their NAVs.
| | |
|
| |
| 38 | | Annual Report | June 30, 2018 |
| | |
| NOTES TO FINANCIAL STATEMENTS (continued) | | |
|
| June 30, 2018 | | |
The inputs and valuation techniques used to determine the value of a Fund’s investments are summarized into three levels as described in the hierarchy below:
| • | | Level 1 — quoted prices in active markets for identical assets |
Investments whose values are based on quoted market prices in active markets, and whose values are therefore classified as Level 1 prices, include active listed equity securities. The Funds do not adjust the quoted price for such investments, even in situations where the Funds hold a large position and a sale could reasonably impact the quoted price.
| • | | Level 2 — other significant observable inputs (including quoted prices for similar securities, interest rates, prepayment speeds, credit risk, etc.) |
Investments that trade in markets that are not considered to be active, but whose values are based on quoted market prices, dealer quotations or valuations provided by alternative pricing sources supported by observable inputs, are classified as Level 2 prices. These generally include certain U.S. Government and sovereign obligations, most government agency securities, investment-grade corporate bonds and less liquid listed equity securities. As investments whose values are classified as Level 2 prices include positions that are not traded in active markets and/or are subject to transfer restrictions, valuations may be adjusted to reflect illiquidity and/or non-transferability, which are generally based on available market information.
The Fidelity Investments Money Market Government Portfolio - Class I, which is held by the Funds, invests primarily in securities that are valued at amortized cost. Therefore, this investment is classified as a Level 2 investment.
| • | | Level 3 — significant unobservable inputs (including the Funds’ own assumptions in determining the fair value of investments) |
Investments whose values are classified as Level 3 prices have significant unobservable inputs, as they may trade infrequently or not at all. When observable prices are not available for these securities, the Funds use one or more valuation techniques for which sufficient and reliable data is available. The inputs used by the Funds in estimating the value of Level 3 prices may include the original transaction price, quoted prices for similar securities or assets in active markets, completed or pending third-party transactions in the underlying investment or comparable issuers, and changes in financial ratios or cash flows. Level 3 prices may also be adjusted to reflect illiquidity and/or non-transferability, with the amount of such discount estimated by the Funds in the absence of market information. Assumptions used by the Funds due to the lack of observable inputs may significantly impact the resulting value and therefore the results of the Funds’ operations.
The inputs or methodology used for valuing investments are not necessarily an indication of the risk associated with investing in those investments. A summary of the inputs used to value the Funds’ investments as of June 30, 2018 is included with each Fund’s Schedule of Investments.
The Funds’ policy is to recognize transfers into, and transfers out of, each level of hierarchy as of the beginning of the reporting period. For the year ended June 30, 2018, there were no transfers from Level 1 to Level 2 or from Level 2 to Level 1 in any of the Funds. Details regarding material transfers into, and material transfers out of, Level 3, if any, can be found at the end of each Schedule of Investments for Funds that held Level 3 securities.
Securities Lending Upon lending its securities to third parties, each Fund receives compensation in the form of fees. The loans are secured by collateral at least equal to the fair value of the securities loaned plus accrued interest. The remaining contractual maturity of all securities lending transactions is overnight and continuous. Each Fund has the right under the lending agreement to recover the securities from the borrower on demand. Additionally, a Fund does not have the right to sell or repledge collateral received in the form of securities unless the borrower goes into default. The risks to a Fund of securities lending are that the borrower may not provide additional collateral when required or return the securities when due, resulting in a loss. Under the terms of the Securities Lending Agreement, the Funds are indemnified for such losses by the securities lending agent.
While securities are on loan, the Fund continues to receive dividends on the securities loaned and recognizes any gain or loss in the fair value of the securities loaned.
| | |
| NOTES TO FINANCIAL STATEMENTS (continued) | | |
|
| June 30, 2018 | | |
Securities lending transactions are entered into by a Fund under a Securities Lending Agreement that provides the right, in the event of default (including bankruptcy or insolvency) for the non-defaulting party to liquidate the collateral or to offset the market value of the collateral received against the market value of the securities loaned. The value of the collateral is typically greater than that of the market value of the securities loaned, leaving the lender with a net amount payable to the defaulting party. However, bankruptcy or insolvency laws of a particular jurisdiction may impose restrictions on or prohibitions against such a right of offset in the event of a counterparty’s bankruptcy or insolvency.
The market value of securities on loan, all of which are classified as common stocks in the Funds’ Schedules of Investments, and the value of the related collateral are shown in the Statements of Assets and Liabilities as a component of Investments at value.
The following table is a summary of the Funds’ securities loaned and related collateral, which are subject to a netting agreement as of June 30, 2018:
| | | | | | | | | | | | | | | | | | | | | | | | | | | | | | |
| | | | | | | | | Gross Amount Not
Offset in the Statement
of Assets and Liabilities | | |
| Fund | | Gross Amounts of
Recognized
Assets1 | | Gross Amounts
Offset in the
Statement of
Assets and
Liabilities | | Net Amounts of
Assets Presented
in the Statement
of Assets and
Liabilities | | Financial
Instruments | | Collateral
Received2 | | Net
Amount |
| | | | | | |
Omni Small-Cap Value | | | | | | | | | | | | | | | | | | | | | | | | | | | | | | |
Securities lending | | | | $48,779,456 | | | | | - | | | | | $48,779,456 | | | | | - | | | | | $48,779,456 | | | | | - | |
| | | | | | |
Omni Tax-Managed Small-Cap Value | | | | | | | | | | | | | | | | | | | | | | | | | | | | | | |
Securities lending | | | | $54,658,065 | | | | | - | | | | | $54,658,065 | | | | | - | | | | | $54,658,065 | | | | | - | |
| 1 | Securities loaned with a value of $77,735 and $1,979 in Omni Small-Cap Value and Omni Tax-Managed Small-Cap Value, respectively, have been sold and are pending settlement on July 2, 2018. |
| 2 | Collateral with a value of $50,702,260 and $56,667,798 has been received in connection with securities lending of Omni Small-Cap Value Fund and Omni Tax-Managed Small-Cap Value Fund, respectively. Excess of collateral received from an individual counterparty is not shown here for financial reporting purposes. |
It is each Fund’s policy to obtain additional collateral from or return excess collateral to the borrower by the end of the next business day following the valuation date of the securities loaned. Therefore, the value of the collateral held may be temporarily less than that required under the lending contract. As of June 30, 2018, the collateral consisted of an institutional government money market fund.
Use of Estimates in Financial Statements In preparing financial statements in conformity with GAAP, management makes estimates and assumptions that affect the reported amounts of assets and liabilities on the date of the financial statements and the disclosure of contingent assets and liabilities on the date of the financial statements, as well as the reported amounts of revenue and expenses during the reporting period. Actual results could differ from those estimates.
Risks and Uncertainties The Funds provide for various investment options, including stocks. Such investments are exposed to various risks, such as interest rate, market and credit risks. Due to the risks involved, it is at least reasonably possible that changes in risks in the near term would materially affect shareholders’ account values and the amounts reported in the financial statements.
Security Transactions, Investment Income and Expenses Security transactions are accounted for as of the trade date, the date the order to buy or sell is executed. Realized gains and losses are computed on the identified cost basis. Dividend income is recorded on the ex-dividend date, and interest income is recorded on the accrual basis from settlement date.
Bridgeway Funds’ expenses that are not series-specific are allocated to each series based upon its relative proportion of net assets to the Bridgeway Funds’ total net assets or other appropriate basis.
| | |
|
| |
| 40 | | Annual Report | June 30, 2018 |
| | |
| NOTES TO FINANCIAL STATEMENTS (continued) | | |
|
| June 30, 2018 | | |
Distributions to Shareholders The Funds pay dividends from net investment income and distribute realized capital gains annually, usually in December.
Indemnification Under the Company’s organizational documents, the Funds’ officers, directors, employees and agents are indemnified against certain liabilities that may arise out of the performance of their duties to the Funds. Additionally, in the normal course of business, the Funds enter into contracts that contain a variety of indemnification clauses. The Funds’ maximum exposure under these arrangements is unknown, as this would involve future claims that may be made against the Funds that have not yet occurred. However, the Funds have not had prior claims or losses pursuant to these contracts.
3. Advisory Fees, Other Related Party Transactions and Contingencies:
The Funds have entered into a management agreement with the Adviser. As compensation for the advisory services rendered, facilities furnished, and expenses borne by the Adviser, the Funds pay the Adviser a fee of 0.50% of the value of each Fund’s average daily net assets, computed daily and payable monthly.
Expense limitations: The Adviser has agreed to reimburse the Funds for operating expenses and advisory fees above the expense limitations presented in the table below, which are shown as a ratio of net expenses to average net assets, for each Fund, for the year ended June 30, 2018. Any material change to the expense limitation would require a vote by shareholders of the applicable Fund.
| | | | | | | | | | |
| Bridgeway Fund | | Expense
Limitation | | Total Waivers
for Year Ended
6/30/18 |
| | | | | | | | | | |
Omni Small-Cap Value* | | | | 0.60 | % | | | | $759,479 | |
Omni Tax-Managed Small-Cap Value* | | | | 0.60 | % | | | | 691,272 | |
| | | | | | | | | | |
*The Funds are authorized to reimburse the Adviser for management fees previously waived and/or for expenses previously paid by the Adviser, provided, however, that any reimbursements must be paid at a date not more than three years after the Adviser waived the fees or reimbursed the expenses and that the reimbursements do not cause the Funds to exceed the expense limitation in effect at the time of the waiver or the current expense limitation, if different. The Omni Small-Cap Value Fund has recoupable expenses of $561,512, $716,803, and $759,479, which expire no later than June 30, 2019, June 30, 2020, and June 30, 2021, respectively. The Omni Tax-Managed Small-Cap Value Fund has recoupable expenses of $547,245, $674,880, and $691,272, which expire no later than June 30, 2019, June 30, 2020, and June 30, 2021, respectively.
Other Related Party Transactions: The Bridgeway Funds will engage in inter-portfolio trades with other Bridgeway Funds when it is to the benefit of both parties. The Board of Directors reviews and approves these trades quarterly. Inter-portfolio purchases and sales for the Funds during the year ended June 30, 2018 were as follows:
| | | | | | | | |
| Bridgeway Fund | | Inter-Portfolio
Purchases | | | Inter-Portfolio
Sales | |
| | | | | | | | |
Omni Small-Cap Value | | | $22,023,335 | | | | $8,685,659 | |
Omni Tax-Managed Small-Cap Value | | | 15,461,167 | | | | 14,494,663 | |
The Adviser entered into an Administrative Services Agreement with Bridgeway Funds, pursuant to which the Adviser provides various administrative services to the Funds including, but not limited to: (i) supervising and managing various aspects of the Funds’ business and affairs; (ii) selecting, overseeing and/or coordinating activities with other service providers to the Funds; (iii) providing reports to the Board of Directors as requested from time to time; (iv) assisting and/or reviewing amendments and updates to the Funds’ registration statement and other filings with the Securities and Exchange Commission (“SEC”); (v) providing certain shareholder services; (vi) providing administrative support in connection with meetings of the Board of Directors; and (vii) providing certain record-keeping services. For its services to all of the Bridgeway Funds, the Adviser is paid an aggregate annual fee of $775,000, payable in equal monthly installments. During the year ended June 30,
| | |
| NOTES TO FINANCIAL STATEMENTS (continued) | | |
|
| June 30, 2018 | | |
2018, the allocation of this expense to the Omni Small-Cap Value and Omni Tax-Managed Small-Cap Value Funds was $211,285 and $189,312, respectively.
Board of Directors Compensation Independent Directors are paid an annual retainer of $15,000, with an additional retainer of $5,000 paid to the Independent Chairman of the Board and an additional retainer of $1,000 paid to the Nominating and Corporate Governance Committee Chair. The retainer is paid in quarterly installments. In addition, effective November 9, 2017, Independent Directors are paid $9,000 per meeting for meeting fees. Prior to November 9, 2017, Independent Directors were paid $8,500 per meeting. Such compensation is the total compensation from all Bridgeway Funds and is allocated among the Bridgeway Funds.
Each Independent Director receives this compensation in the form of shares of the Bridgeway Funds, credited to his or her account. Such Directors are reimbursed for any expenses incurred in attending meetings and conferences, as well as expenses for subscriptions or printed materials. The amount of Directors’ fees attributable to each Fund is disclosed in the Statements of Operations.
One director of Bridgeway, John Montgomery, is an owner and director of the Adviser. Under the 1940 Act definitions, he is considered to be an “affiliated person” of the Adviser and an “interested person” of the Adviser and of Bridgeway. Compensation for Mr. Montgomery is borne by the Adviser rather than the Bridgeway Funds.
4. Distribution Agreement:
Foreside Fund Services, LLC acts as distributor of the Funds’ shares pursuant to a Distribution Agreement dated May 31, 2017. The Adviser pays all costs and expenses associated with distribution of the Funds’ shares, pursuant to a protective plan adopted by shareholders pursuant to Rule 12b-1.
5. Purchases and Sales of Investment Securities:
Purchases and sales of investments, other than short-term securities, for each Fund for the year ended June 30, 2018 were as follows:
| | | | | | | | | | | | | | | | | | | | |
| | | Purchases | | Sales |
| | | U.S. Government | | Other | | U.S. Government | | Other |
| | | | | | | | | | | | | | | | | | | | |
Omni Small-Cap Value | | | | $ - | | | | | $276,031,278 | | | | | $ - | | | | | $190,049,218 | |
Omni Tax-Managed Small-Cap Value | | | | - | | | | | 258,466,132 | | | | | - | | | | | 195,569,641 | |
6. Federal Income Taxes
It is the Funds’ policy to continue to comply with the provisions of the Internal Revenue Code of 1986, as amended (“Internal Revenue Code”), applicable to regulated investment companies, and to distribute income to the extent necessary so that such Fund is not subject to federal income tax. Therefore, no federal income tax provision is required.
Unrealized Appreciation and Depreciation on Investments (Tax Basis) The amount of net unrealized appreciation/ depreciation and the cost of investment securities for tax purposes, including short-term securities at June 30, 2018, were as follows:
| | | | |
| | | Omni Small-Cap Value | | Omni Tax-Managed
Small-Cap Value |
Gross appreciation (excess of value over tax cost) | | $263,513,444 | | $240,865,548 |
Gross depreciation (excess of tax cost over value) | | (26,298,801) | | (19,351,976) |
Net unrealized appreciation | | $237,214,643 | | $221,513,572 |
Cost of investments for income tax purposes | | $726,119,189 | | $641,562,118 |
The differences between book and tax net unrealized appreciation (depreciation) are due to wash sale loss deferrals and basis adjustments on passive foreign investment companies (PFICs) and partnerships.
| | |
|
| |
| 42 | | Annual Report | June 30, 2018 |
| | |
| NOTES TO FINANCIAL STATEMENTS (continued) | | |
|
| June 30, 2018 | | |
Classifications of Distributions Net investment income (loss) and net realized gain (loss) may differ for financial statement and tax purposes. The character of distributions made during the year from net investment income or net realized gains may differ from its ultimate characterization for federal income tax purposes.
The tax character of the distributions paid by the Funds during the fiscal years ended June 30, 2018 and 2017, is as follows:
| | | | | | | | | | | | | | | | | | | | |
| | | Omni Small-Cap Value | | Omni Tax-Managed Small-Cap Value |
| | | Year Ended June 30, 2018 | | Year Ended June 30, 2017 | | Year Ended June 30, 2018 | | Year Ended
June 30, 2017 |
Distributions paid from: | | | | | | | | | | | | | | | | | | | | |
Ordinary Income | | | | $ 6,405,244 | | | | | $6,191,149 | | | | | $ 8,820,586 | | | | | $4,983,381 | |
Long-Term Capital Gain | | | | 44,141,688 | | | | | - | | | | | 31,691,559 | | | | | - | |
| | | | |
Total | | | | $50,546,932 | | | | | $6,191,149 | | | | | $40,512,145 | | | | | $4,983,381 | |
Components of Accumulated Earnings As of June 30, 2018, the components of accumulated earnings on a tax basis were:
| | | | | | | | | | |
| | | Omni
Small-Cap Value | | Omni Tax-Managed
Small-Cap Value |
Undistributed Net Investment Income | | | | $ 2,782,031 | | | | | $ 2,735,279 | |
Undistributed Net Realized Gain on Investments | | | | 36,527,048 | | | | | 33,205,286 | |
Net Unrealized Appreciation of Investments | | | | 237,214,643 | | | | | 221,513,572 | |
| | |
Total | | | | $276,523,722 | | | | | $257,454,137 | |
For the fiscal year June 30, 2018, the Funds recorded the following reclassifications to the accounts listed below:
| | | | | | | | |
| | | Increase (Decrease) | |
| | | Omni Small-Cap Value | | | Omni Tax-Managed Small-Cap Value | |
Paid-in Capital | | | $ 3,056,072 | | | | $ 2,924,911 | |
Undistributed Net Investment Income | | | (542,684 | ) | | | (509,021) | |
Undistributed Net Realized Gain on Investments | | | (2,513,388 | ) | | | (2,415,890) | |
The difference between book and tax components of net assets and the resulting reclassifications were primarily a result of the differing book/tax treatment of the deduction of equalization debits for tax purposes and investments in passive foreign investment companies (PFICs), partnerships and business development companies.
Accounting for Uncertainty in Income Taxes sets forth a minimum threshold for financial statement recognition of the benefit of a tax position taken or expected to be taken in a tax return. Management has analyzed each Fund’s tax positions and has concluded that no provision for income tax is required in any Fund’s financial statements. The Funds are not aware of any tax position for which it is reasonably possible that the total amounts of unrecognized tax benefits will significantly change in the next twelve months. Each Fund’s federal tax returns for the prior three fiscal years remain subject to examination by the Internal Revenue Service.
7. Line of Credit
Bridgeway established a line of credit agreement (“Facility”) with The Bank of New York Mellon effective November 5, 2010. The Facility is for temporary or emergency purposes, such as to provide liquidity for shareholder redemptions, and is cancellable by either party. Unless cancelled earlier, the Facility shall be held available until September 13, 2018. Advances under the Facility are limited to $15,000,000 in total for all Bridgeway Funds, and advances to each Bridgeway Fund shall not exceed certain limits set forth in the credit agreement, including, but not limited to, the maximum amount a Bridgeway Fund is permitted to borrow under the 1940 Act.
| | |
| NOTES TO FINANCIAL STATEMENTS (continued) | | |
|
| June 30, 2018 | | |
The Bridgeway Funds incur a commitment fee of 0.085% per annum on the unused portion of the Facility and interest expense to the extent of amounts borrowed under the Facility. Interest is based on the “Overnight Rate” plus 1.25%. The Overnight Rate means the higher of (a) the Federal Funds rate, (b) the Overnight Eurodollar Rate, or (c) the One-Month Euro-dollar Rate. The commitment fees are payable quarterly in arrears and are allocated to all participating Bridgeway Funds. Interest expense is charged directly to each Bridgeway Fund, based upon actual amounts borrowed by such Bridgeway Fund.
For the year ended June 30, 2018, borrowings by the Funds under this line of credit were as follows:
| | | | | | | | | | |
| Bridgeway Fund | | Weighted
Average
Interest Rate | | Weighted
Average
Loan Balance | | Number of
Days
Outstanding | | Interest
Expense
Incurred1 | | Maximum Amount
Borrowed During
the Period |
| | | | | | | | | | |
Omni Small-Cap Value | | 2.80% | | $ 825,705 | | 44 | | $2,790 | | $2,917,000 |
Omni Tax-Managed Small-Cap Value | | 2.81% | | 1,773,357 | | 56 | | 7,633 | | 6,155,000 |
| 1Interest expense is included on the Statements of Operations in Miscellaneous expenses. |
8. Subsequent Events
Management has evaluated the impact of all subsequent events on the Funds and has determined that there were no subsequent events requiring recognition or disclosure in the financial statements.
| | |
|
| |
| 44 | | Annual Report | June 30, 2018 |
| | |
| REPORT OF INDEPENDENT REGISTERED PUBLIC ACCOUNTING FIRM | | |
|
To the Board of Directors of Bridgeway Funds, Inc.
and the Shareholders of Omni Small-Cap Value Fund
and Omni Tax-Managed Small-Cap Value Fund
Opinion on the Financial Statements
We have audited the accompanying statements of assets and liabilities of Omni Small-Cap Value Fund and Omni Tax-Managed Small-Cap Value Fund, each a series of shares of beneficial interest in Bridgeway Funds, Inc. (the “Funds”), including the schedules of investments, as of June 30, 2018, and the related statements of operations for the year then ended, the statements of changes in net assets for each of the years in the two-year period then ended and the financial highlights for each of the years in the five-year period then ended, and the related notes (collectively referred to as the “financial statements”). In our opinion, the financial statements present fairly, in all material respects, the financial position of the Funds as of June 30, 2018, and the results of their operations for the year then ended, the changes in their net assets for each of the years in the two-year period then ended and their financial highlights for each of the years in the five-year period then ended, in conformity with accounting principles generally accepted in the United States of America.
Basis for Opinion
These financial statements are the responsibility of the Funds’ management. Our responsibility is to express an opinion on the Funds’ financial statements based on our audits. We are a public accounting firm registered with the Public Company Accounting Oversight Board (United States) “PCAOB” and are required to be independent with respect to the Funds in accordance with the U.S. federal securities law and the applicable rules and regulations of the Securities and Exchange Commission and the PCAOB.
We conducted our audits in accordance with the standards of the PCAOB. Those standards require that we plan and perform the audits to obtain reasonable assurance about whether the financial statements are free of material misstatement, whether due to error or fraud. The Funds are not required to have, nor were we engaged to perform, an audit of their internal control over financial reporting. As part of our audits we are required to obtain an understanding of internal control over financial reporting but not for the purpose of expressing an opinion on the effectiveness of the Funds’ internal control over financial reporting. Accordingly, we express no such opinion.
Our audits included performing procedures to assess the risk of material misstatement of those financial statements, whether due to error or fraud, and performing procedures that respond to those risks. Such procedures included examining, on a test basis, evidence regarding the amounts and disclosures in the financial statements. Our procedures included confirmation of securities owned as of June 30, 2018 by correspondence with the custodian and brokers. Our audits also included evaluating the accounting principles used and significant estimates made by management, as well as evaluating the overall presentation of the financial statements. We believe that our audits provide a reasonable basis for our opinion.
| | |
| |  |
| |
| | BBD, LLP |
We have served as the auditor of one or more of the Funds in the Bridgeway Funds, Inc. since 2005.
Philadelphia, Pennsylvania
August 27, 2018
| | |
| OTHER INFORMATION (Unaudited) | | |
|
| June 30, 2018 | | |
1. Shareholder Tax Information
Certain tax information regarding the Funds is required to be provided to shareholders based upon each Fund’s income and distributions for the taxable year ended June 30, 2018. The information and distributions reported herein may differ from information and distributions taxable to the shareholders for the calendar year ended December 31, 2017.
The Funds report the following items with regard to distributions paid during the fiscal year ended June 30, 2018. All reportings are based on financial information available as of the date of this annual report and, accordingly, are subject to change. For each item, it is the intention of each Fund to report the maximum amount permitted under the Internal Revenue Code and the regulations thereunder.
| | | | | | | | | | |
| | | Omni Small-Cap
Value | | Omni Tax-Managed
Small Cap Value |
Corporate Dividends Received Deduction | | | | 100.00 | % | | | | 100.00 | % |
Qualified Dividend Income | | | | 100.00 | % | | | | 100.00 | % |
Qualified Interest Related Dividends | | | | 0.16 | % | | | | 0.14 | % |
Qualified Short Term Capital Gain Dividends | | | | 0.00 | % | | | | 0.00 | % |
During the fiscal year ended June 30, 2018, the Funds paid distributions from ordinary income and long-term capital gain which included equalization debits summarized below:
| | | | | | | | | | |
| | | Omni Small-Cap
Value | | Omni Tax-Managed
Small-Cap Value |
Ordinary Income Distributions | | | $ | 6,405,244 | | | | $ | 8,820,586 | |
Equalization Debits Included in Ordinary Income Distributions | | | | 561,153 | | | | | 509,021 | |
Long-Term Capital Gain Distributions | | | | 44,141,688 | | | | | 31,691,559 | |
Equalization Debits Included in Long-Term Capital Gain Distributions | | | | 2,494,919 | | | | | 2,415,890 | |
2. Proxy Voting
A description of the policies and procedures that the Funds use to determine how to vote proxies relating to the portfolio securities and a summary of proxies voted by the Funds for the period ended June 30, 2018 are available without a charge, upon request, by contacting Bridgeway Funds at 1-800-661-3550 and on the SEC’s website at http://www.sec.gov.
3. Fund Holdings
The complete schedule of the Funds’ holdings for the second and fourth quarters of each fiscal year are contained in the Funds’ Semi-Annual and Annual Shareholder Reports, respectively.
The Bridgeway Funds file complete schedules of the Funds’ holdings with the SEC for the first and third quarters of each fiscal year on Form N-Q within 60 days after the end of the period. Copies of the Funds’ Form N-Q are available without charge, upon request, by contacting Bridgeway Funds at 1-800-661-3550 and on the SEC’s website at http://www.sec.gov. You may also review and copy Form N-Q at the SEC’s Public Reference Room in Washington, D.C. For more information about the operation of the Public Reference Room, please call 1-800-SEC-0330.
4. Approval of Investment Management Agreement
Bridgeway Funds, Inc.’s (the “Company”) management agreement (the “Management Agreement”) with its investment adviser, Bridgeway Capital Management, Inc. (the “Adviser”), on behalf of each of the Company’s funds must be approved for an initial term no greater than two years and renewed at least annually thereafter by the board of directors of the Company (the “Board”) or a vote of a majority of the outstanding voting securities of each fund. In addition, the renewal must be
| | |
|
| |
| 46 | | Annual Report | June 30, 2018 |
| | |
| OTHER INFORMATION (Unaudited) (continued) | | |
|
| June 30, 2018 | | |
approved by a majority of the Directors who are not parties to the Management Agreement or “interested persons” of any party thereto (the “Independent Directors”), cast in person at a meeting called specifically for the purpose of voting on such approval.
The Board has five regularly scheduled meetings each year and takes into account throughout the year matters bearing on the approval of the Management Agreement. For example, the Board or its standing committees consider at meetings during the year various factors that are relevant to the annual renewal of each fund’s Management Agreement, including the quality of services and support provided to each fund by the Adviser, the Adviser’s compliance program, including the effectiveness of its implementation, comparative performance information for each fund, the risk assessment of the funds and “deep dives” on the strategy and performance of certain funds on a periodic basis. Additionally, between regular Board meetings the Adviser provides the Board with updated financial information on the Adviser and strategic direction and marketing efforts.
On May 10, 2018, the Board, including a majority of the Independent Directors, met in person (the “Meeting”) with the Adviser, the Company’s outside legal counsel, independent legal counsel (“Independent Legal Counsel”) to the Independent Directors and others to consider information bearing on the continuation of the Management Agreement with respect to the Omni Tax-Managed Small-Cap Value Fund and Omni Small-Cap Value Fund (each a “Fund” and together, the “Funds”).
In reaching its decisions regarding the Management Agreement for each Fund, the Board considered the information furnished and discussed throughout the year at regularly scheduled Board and committee meetings, as applicable and as described above, as well as the information provided to it specifically in relation to the annual consideration of the approval of the continuation of the Management Agreement for each Fund.
In preparation for the Meeting, the Independent Directors requested that the Adviser provide specific information relevant to the Board’s consideration of the renewal of the Management Agreement with respect to each Fund. In response to that request, the Board was furnished with a wide variety of information with respect to each Fund, including information regarding:
| | ● | | investment performance over various time periods and the fees and expenses of the Fund as compared to a comparable group of funds as determined and prepared by Broadridge Financial Solutions, Inc. (hereinafter “Broadridge”), an independent provider of investment company data; |
| | ● | | the nature, extent and quality of services provided by the Adviser to the Fund under the Management Agreement; |
| | ● | | actual management fees paid by the Fund to the Adviser and a comparison of those fees with the management fees charged to other advisory clients of the Adviser, as applicable; |
| | ● | | the Adviser’s costs of providing services to the Fund and the profitability of the Adviser from its relationship with the Fund; |
| | ● | | the extent to which economies of scale would be realized as the Fund’s assets increase and whether fee levels reflect these economies of scale for the benefit of Fund investors; and |
| | ● | | any potential “fall out” or ancillary benefits accruing to the Adviser as a result of its relationship with the Fund. |
In addition to evaluating the written information provided by the Adviser, the Board also considered the answers to questions posed by the Board to representatives of the Adviser at the Meeting.
In considering the information and materials described above, the Independent Directors received assistance from, and also had the opportunity to consult with, Independent Legal Counsel prior to the Meeting. In addition, the Independent Directors met in executive session with Independent Legal Counsel to consider the continuation of the Management Agreement with respect to each Fund outside the presence of management during the Meeting.
The Board also was provided with a written description of its statutory responsibilities and the legal standards that are applicable to approval of the renewal of the Management Agreement.
| | |
| OTHER INFORMATION (Unaudited) (continued) | | |
|
| June 30, 2018 | | |
Although the Management Agreement for both Funds was considered at the Meeting, the Directors considered the renewal of the Management Agreement with respect to each Fund separately.
In considering the aforementioned information, the Board took into account management style, investment strategies and prevailing market conditions as reported by the Adviser. Furthermore, in evaluating the Management Agreement, the Directors also considered information provided by the Adviser concerning the following:
| | ● | | the terms of the Management Agreement, including the services performed by the Adviser in managing each Fund’s assets in accordance with the Fund’s investment objectives, policies and restrictions and how those services and fees differ from those for other advisory clients of the Adviser, as applicable; |
| | ● | | information regarding the advisory fee rates and the expense limitation or fee waiver arrangements for each Fund; |
| | ● | | the Adviser’s personnel, staffing levels and the time and attention the Adviser’s personnel devote to the management of the Funds as compared to other advisory clients of the Adviser; |
| | ● | | the Adviser’s risk assessment and management process; |
| | ● | | the Adviser’s representation that it does not participate in any soft dollar arrangements and, although it receives unsolicited research from outside sources, the Adviser does not use that research in its investment decision-making process; and |
| | ● | | the financial condition and stability of the Adviser. |
In view of the broad scope and variety of factors and information considered by the Board, the Directors did not find it practicable to, and did not, assign relative weights to the specific factors considered in reaching their conclusions and determinations to approve the continuance of the Management Agreement for each Fund for an additional year. Rather, the Board’s determinations were made on the basis of each Director’s business judgment after consideration of all of the factors taken in their entirety. Although not meant to be all-inclusive, the following describes various factors that were considered by the Board in deciding to approve the continuance of the Management Agreement for each Fund.
Nature, Extent and Quality of Services
In examining the nature, extent and quality of the services provided by the Adviser, the Directors considered the services provided to each Fund and any expected changes thereto, the qualifications, experience and duties of the Adviser’s personnel, the approximate amount of time those personnel devote to the Funds, recent and expected personnel changes, portfolio manager compensation arrangements, business continuity and succession planning, and enterprise risk management (including as it relates to cybersecurity risk). In addition, the Directors considered information provided by the Adviser regarding its overall financial strength and considered the resources and staffing in place with respect to the services provided to the Funds.
Based on the totality of the information considered, the Directors concluded that they were satisfied with the nature, extent and quality of the services provided to each Fund by the Adviser, and that the Adviser has the ability to continue to provide these services based on its experience, operations and current resources.
Investment Performance
The Board considered performance information provided by the Adviser for similarly managed accounts (if any) over the most recent quarter, six month, one year, three year and five year periods ending December 31, 2017 as well as Fund performance compared with its benchmark for one year, three year, five year, and since inception periods ending December 31, 2017. The Board considered the Adviser’s representation that the differences in the performance of other small cap accounts and Fund performance were expected by the Adviser given differences in investment strategy and tax management practices.
| | |
|
| |
| 48 | | Annual Report | June 30, 2018 |
| | |
| OTHER INFORMATION (Unaudited) (continued) | | |
|
| June 30, 2018 | | |
In addition, Broadridge provided a report (the “Broadridge Report”) of comparative data regarding fees, expenses and performance for each Fund as compared to a peer group selected by Broadridge (“Peer Group”). The performance periods included total return over the most recent calendar year (“one year period”) and the annualized total returns over the most recent three calendar year period (“three year period”), five calendar year period (“five year period”) and ten calendar year period (“ten year period”), although neither of these Funds yet have a ten year performance period. With regard to the performance information provided in the Broadridge Report, the Board considered the performance of each Fund on a percentile and quintile basis as compared to its Peer Group. For purposes of the performance data provided, the first quintile is defined as 20% of the funds in the applicable Peer Group with the highest performance and the fifth quintile is defined as 20% of the funds in the applicable Peer Group with the lowest performance.
In particular, the Board considered the following performance information as of December 31, 2017 provided by the Adviser and from Broadridge:
| | ● | | With regard to the Omni Tax-Managed Small-Cap Value Fund, the Fund’s performance for the one year period was in the fourth quintile relative to its Peer Group, in the first quintile for the three year period and in the second quintile for the five year period. The Fund also outperformed its primary benchmark for all performance periods, except the one year period. The Board considered the Adviser’s explanation that the Fund’s relative performance is generally attributable to its broader exposure to smaller capitalization and deeper value stocks relative to its Peer Group. Based on their review, the Directors concluded that the Fund’s overall performance was satisfactory relative to the performance of the funds in its Peer Group and its primary benchmark. |
| | ● | | With regard to the Omni Small-Cap Value Fund, the Fund’s performance for the one year period was in the fourth quintile relative to its Peer Group and in the second quintile for the three and five year periods. The Fund also outperformed its primary benchmark for all performance periods, except the one year period. The Board considered the Adviser’s explanation that the Fund’s relative performance is generally attributable to its broader exposure to smaller capitalization and deeper value stocks relative to its Peer Group. Based on their review, the Directors concluded that the Fund’s overall performance was satisfactory relative to the performance of the funds in its Peer Group and its primary benchmark. |
Fund Fees and Expenses
The Board considered information provided by the Adviser regarding the advisory fees it charges to other advisory clients and the reasons for any material differences between those fees and the fees it charges to the Funds. The Board also considered the Adviser’s views that, given investment performance and overall expenses, the Adviser believes the management fees for each Fund appear reasonable and appropriate given the distinctive features and design of each Fund, the disciplined implementation of the design by the Adviser, the relatively low management fees in most cases, the performance results in line with design and investor expectations, and the profitability to the Adviser of each Fund. More specifically, with regard to management fee differences among the Funds and other small-cap funds advised by the Adviser, the Board considered the Adviser’s view that fee differences stem from market factors as well as the estimated growth rate of the Fund at the time of launch; the potential asset capacity of the Fund; the risks associated with providing the advisory services to the Fund; and estimated costs of providing the advisory services driven by the design complexity of the Fund (e.g., more complex design is higher cost due to the research and portfolio management time required).
The Board also considered the fees charged to other investment company and non-investment company clients of the Adviser, as well as the Adviser’s representation that the Adviser did not manage other clients comparable to these Funds.
The Board also considered information compiled by Broadridge comparing each Fund’s contractual management fee rate (using an assumed common asset level for the Fund and the other funds in the Peer Group), actual management fee rate (which included the effect of any fee waivers, and was derived from annual reports) and actual total expense ratios (which also included the effect of any fee waivers, and was derived from annual reports) as a percentage of average net assets as compared to other funds in its expense Peer Group. Broadridge’s contractual management fee data included both advisory fees and administrative services fees, except for the Funds. Broadridge excluded administrative services fees for the Funds from contractual management fee data because those fees are fixed (i.e., a stated dollar amount), as opposed to asset-based. More
| | |
| OTHER INFORMATION (Unaudited) (continued) | | |
|
| June 30, 2018 | | |
specifically, with respect to the Funds, the Adviser provides certain administrative services to the Funds pursuant to a separate contract, in exchange for an annual fixed fee (payable monthly) that the Adviser has represented approximates the cost of providing such services (which the Board considered in connection with profitability, as described below). Broadridge’s actual management fee data for the Funds and the other funds in the Peer Group included both advisory fees and administrative services fees. Thus, the contractual management fee rate in the Funds’ Broadridge comparisons did not reflect these administrative services fees, whereas the actual management fee rate in the Funds’ Broadridge comparisons included both advisory and administrative services fees.
With regard to the expense information provided in the Broadridge Report, the Board considered Fund expenses on a percentile and quintile basis as compared to each Fund’s Peer Group. For purposes of the expense data provided, Broadridge defines the first quintile as 20% of the funds in the applicable Peer Group with the lowest expenses and the fifth quintile as 20% of the funds in the applicable Peer Group with the highest expenses.
With respect to the Funds, the Board considered that each Fund’s contractual management fee, actual management fee and actual total expense ratio were in the first quintile of its applicable Peer Group.
In addition, the Board considered that the Adviser agreed to contractual expense limitation agreements for each Fund to ensure that total expense levels do not increase above certain asset percentage levels.
The foregoing comparisons assisted the Board in determining to approve the Management Agreement for each Fund by providing it with a basis for evaluating each Fund’s management fee and total expense ratio on a relative basis. Based on their review, the Directors concluded that each Fund’s management fee was reasonable in view of the services received by the Fund and the other factors considered.
Profitability
The Board reviewed the materials it received from the Adviser regarding its revenues and costs in providing investment management and certain administrative services to the Funds and the Company as a whole. In particular, the Board considered the analysis of the Adviser’s profitability with respect to each Fund, calculated for the years ended December 31, 2014, December 31, 2015, December 31, 2016 and December 31, 2017. The Board also considered the Adviser’s representations that it does not track expenses or maintain staff on a per Fund basis and accordingly the Adviser needed to make certain assumptions to allocate expenses on a Fund-by-Fund basis in order to calculate Fund-by-Fund profitability, making the process a subjective one. The Board also considered that the Adviser was operating some lines of business at a loss but that the Adviser’s overall business is profitable. Based on their review, the Directors concluded that the Adviser’s profitability from its relationship with each Fund was reasonable.
Economies of Scale
The Board considered the effect of each Fund’s current size and its potential growth on its performance and fees. With respect to whether economies of scale are expected to be realized by the Adviser as a Fund’s assets increase and whether advisory fee levels reflect these economies of scale for the benefit of Fund investors, the Board considered, for each Fund, the current level of advisory fees charged and fee structure and concluded that the Adviser’s fee structure with respect to each Fund was appropriate at this time. The Board considered the Adviser’s explanation that although neither Fund has fee breakpoints in its management fee schedules, each Fund was priced low relative to peers and ahead of the economies of scale curve at launch. The Board noted that if a Fund’s assets increased over time, the Fund might realize other economies of scale if assets increased proportionally more than certain other expenses.
“Fallout” or Ancillary Benefits
The Board considered whether there were any “fall-out” or ancillary benefits that may accrue to the Adviser as a result of its relationships with the Funds. In terms of potential “fall out” or ancillary benefits to the Adviser due to its position as manager of the Funds, the Board considered benefits related to track record and reputation, and portfolio trading and execution. The Board also considered the Adviser’s representations that it does not participate in any soft dollar arrangements and that, although it receives unsolicited research from outside sources, the Adviser does not use that research in its investment
| | |
|
| |
| 50 | | Annual Report | June 30, 2018 |
| | |
| OTHER INFORMATION (Unaudited) (continued) | | |
|
| June 30, 2018 | | |
decision-making process. The Board concluded that the benefits accruing to Adviser by virtue of its relationship with the Funds appeared to be reasonable.
* * * * *
Based on all relevant information and factors discussed above, none of which was individually determinative of the outcome, the Board, including a majority of the Independent Directors, determined that the continuation of the Management Agreement for each Fund was in the best interests of the Fund. As a result, the Board, including a majority of the Independent Directors, approved the renewal of the Management Agreement for each Fund.
| | |
| DISCLOSURE OF FUND EXPENSES | | |
|
| June 30, 2018 (Unaudited) | | |
As a shareholder of a Fund, you will incur no transaction costs from such Fund, including sales charges (loads) on purchases, on reinvested dividends, or on other distributions. There are no exchange fees. However, as a shareholder of a Fund, you will incur ongoing costs, including management fees and other Fund expenses. The following examples are intended to help you understand your ongoing costs (in dollars) of investing in a Fund and to compare these costs with ongoing costs of investing in other mutual funds. The examples are based on an investment of $1,000 invested on January 1, 2018 and held until June 30, 2018.
Actual Expenses. The first line of the table below provides information about actual account values and actual expenses. You may use the information in this line, together with the amount you invested, to estimate the expenses that you paid over the period. Simply divide your account value by $1,000 (for example, an $8,600 account value divided by $1,000 = 8.6), then multiply the result by the number in the first line under the heading “Expenses Paid During Period” to estimate the expenses you paid on your account during the period.
Hypothetical Example for Comparison Purposes. The second line of the table below provides information about hypothetical account values and hypothetical expenses based on the Fund’s actual expense ratio and an assumed rate of return of 5% per year before expenses, which is not the Fund’s actual return. The hypothetical account values and expenses may not be used to estimate the actual ending account balance or expenses you paid for the period. You may use this information to compare the ongoing costs of investing in a Fund and other mutual funds. To do so, compare this 5% hypothetical example with the 5% hypothetical examples that appear in the shareholder reports of other funds.
The expenses shown in the table are meant to highlight ongoing Fund costs only. Therefore, the second line of the table is useful in comparing ongoing costs only and will not help you determine the relative total costs of owning different funds, because other funds may also have transaction costs, such as sales charges, redemption fees or exchange fees.
| | | | | | | | |
| | | Beginning Account
Value at 1/1/18 | | Ending Account
Value at 6/30/18 | | Expense
Ratio | | Expenses Paid
During Period*
1/1/18 - 6/30/18 |
| | | | |
Bridgeway Omni Small-Cap Value | | | | | | | | |
| | | | |
Actual Fund Return | | $1,000.00 | | $1,062.70 | | 0.60% | | $3.07 |
Hypothetical Fund Return | | $1,000.00 | | $1,021.82 | | 0.60% | | $3.01 |
|
Bridgeway Omni Tax-Managed Small-Cap Value |
| | | | |
Actual Fund Return | | $1,000.00 | | $1,067.00 | | 0.60% | | $3.08 |
Hypothetical Fund Return | | $1,000.00 | | $1,021.82 | | 0.60% | | $3.01 |
| * | Expenses are equal to the average account value times the Fund’s annualized expense ratio multiplied by the number of days in the most recent six-month period (181) divided by the number of days in the fiscal year (365). |
| | |
|
| |
| 52 | | Annual Report | June 30, 2018 |
| | |
| DIRECTORS & OFFICERS | | |
|
| June 30, 2018 (Unaudited) | | |
Independent Directors
| | | | | | | | | | |
Name, Address and Age1 | | Position
Held with
Bridgeway
Funds | | Term of Office and Length of Time Served | | Principal Occupation(s)
During Past Five Years | | No. of Bridgeway
Funds Overseen
by Director | | Other Directorships
Held by Director |
| | | | | |
Karen S. Gerstner Age 63 | | Director | | Term: 1 Year Length: 1994 to Present. | | Principal, Karen S. Gerstner & Associates, P.C., since 2004. | | Nine | | None |
| | | | | |
Miles Douglas Harper, III* Age 55 | | Director | | Term: 1 Year Length: 1994 to Present. | | Partner, Carr, Riggs & Ingram, LLC, since 2013; Partner, Gainer Donnelly, LLP, 1998 to 2013 upon merger with Carr, Riggs & Ingram, LLC. | | Nine | | Calvert Funds (39 Portfolios) |
| | | | | |
Evan Harrel Age 57 | | Director | | Term: 1 Year Length: 2006 to Present. | | Strategic Advisor, Small Steps Nurturing Center, since 2012. | | Nine | | None |
| | | | | |
| | | | | | | | | | | |
| | |
| DIRECTORS & OFFICERS (continued) | | |
|
| June 30, 2018 (Unaudited) | | |
“Interested” or Affiliated Director and Officer
| | | | | | | | | | |
| | | | | |
Name, Address and Age1 | | Position(s)
Held with
Bridgeway
Funds | | Term of Office and Length of Time Served | | Principal Occupation(s)
During Past Five Years | | No. of Bridgeway
Funds Overseen
by Director | | Other Directorships
Held by Director |
| | | | | |
John N. R. Montgomery2 Age 62 | | Director | | Term: 1 Year Length: 1993 to Present. | | Chairman, Bridgeway Capital Management, Inc., since 2010; President, Bridgeway Capital Management, Inc., 1993 to 2010 and June 2015 to March 2016; President, Bridgeway Funds, June 2015 to June 2016; Vice President, Bridgeway Funds, 2005 to May 2015 and since June 2016. | | Nine | | None |
| | | | | |
| | | | | | | | | | | |
| | |
|
| |
| 54 | | Annual Report | June 30, 2018 |
| | |
| DIRECTORS & OFFICERS (continued) | | |
|
| June 30, 2018 (Unaudited) | | |
Other Officers
| | | | | | | | | | |
| | | | | |
Name, Address and Age1 | | Position Held with Bridgeway Funds | | Term of Office and Length of Time Served | | Principal Occupation(s)
During Past Five Years | | No. of Bridgeway
Funds Overseen
by Officer | | Other Directorships
Held by Officer |
| | | | | |
Richard P. Cancelmo, Jr. Age 60 | | Vice President | | Term: 1 Year Length: 2004 to Present. | | Vice President, Bridgeway Funds, since 2004; Staff member, Bridgeway Capital Management, Inc., since 2000. | | N/A | | None |
| | | | | |
Linda G. Giuffré Age 56 | | Treasurer and Chief Compliance Officer | | Term: 1 Year Length: 2004 to Present. | | Chief Compliance Officer, Bridgeway Capital Management, Inc., since 2004; Staff member, Bridgeway Capital Management, Inc., since 2004. | | N/A | | None |
| | | | | |
Deborah L. Hanna Age 53 | | Secretary | | Term: 1 Year Length: 2007 to Present. | | Self-employed, accounting and related projects for various organizations, since 2001. | | N/A | | None |
| | | | | |
Sharon Lester Age 63 | | Vice President | | Term: 1 Year Length: 2011 to Present. | | Staff member, Bridgeway Capital Management, Inc., since 2010. | | N/A | | None |
| | | | | |
Tammira Philippe Age 44 | | President | | Term: 1 Year Length: May 2016 to Present. | | President, Bridgeway Capital Management, Inc., since March 2016; Staff member, Bridgeway Capital Management, Inc., 2010 to March 2016. | | N/A | | None |
| 1 | The address of all of the Directors and Officers of Bridgeway Funds is 20 Greenway Plaza, Suite 450, Houston, Texas, 77046. |
| 2 | John Montgomery is chairman, director and majority shareholder of Bridgeway Capital Management, Inc., and therefore an interested person of Bridgeway Funds. |
The overall management of the business and affairs of Bridgeway Funds is vested with its Board of Directors (the “Board”). The Board approves all significant agreements between Bridgeway Funds and persons or companies furnishing services to it, including agreements with its Adviser and custodian. The day-to-day operations of Bridgeway Funds are delegated to its officers, subject to its investment objectives and policies and general supervision by the Board.
The Funds’ Statement of Additional Information includes additional information about the Board and is available, without charge, upon request by calling 1-800-661-3550.
Item 2. Code of Ethics.
| | (a) | The registrant, as of the end of the period covered by this report, has adopted a code of ethics that applies to the registrant’s principal executive officer, principal financial officer, principal accounting officer or controller, or persons performing similar functions, regardless of whether these individuals are employed by the registrant or a third party. |
| | (c) | There have been no substantive amendments, during the period covered by this report, to a provision of the code of ethics that applies to the registrant’s principal executive officer, principal financial officer, principal accounting officer or controller, or persons performing similar functions, regardless of whether these individuals are employed by the registrant or a third party, and that relates to any element of the code of ethics description. |
| | (d) | The registrant has not granted any waivers, including an implicit waiver, from a provision of the code of ethics that applies to the registrant’s principal executive officer, principal financial officer, principal accounting officer or controller, or persons performing similar functions, regardless of whether these individuals are employed by the registrant or a third party, that relates to one or more of the items set forth in paragraph (b) of this item’s instructions. |
Item 3. Audit Committee Financial Expert.
3(a)(1) The Registrant’s board of directors has determined that the registrant has at least one audit committee financial expert serving on its audit committee.
3(a)(2) The audit committee financial expert is Miles Douglas Harper III, who is “independent” for purposes of this Item 3 of Form N-CSR.
Item 4. Principal Accountant Fees and Services.
Audit Fees
| | (a) | The aggregate fees billed for each of the last two fiscal years for professional services rendered by the principal accountant for the audit of the registrant’s annual financial statements or services that are normally provided by the accountant in connection with statutory and regulatory filings or engagements were $221,200 for the fiscal year ended June 30, 2018 and $221,200 for the fiscal year ended June 30, 2017. |
Audit-Related Fees
| | (b) | The aggregate fees billed in each of the last two fiscal years for assurance and related services by the principal accountant that are reasonably related to the performance of the audit of the registrant’s financial statements and are not reported under paragraph (a) of this Item were $0 for the fiscal year ended June 30, 2018 and $0 for the fiscal year ended June 30, 2017. |
Tax Fees
| | (c) | The aggregate fees billed in each of the last two fiscal years for professional services rendered by the principal accountant for tax compliance, tax advice, and tax planning were $20,000 for the fiscal year ended June 30, 2018 and $20,000 for the fiscal year ended June 30, 2017. Tax services include the review of the Funds’ federal income tax returns, the review of the Funds’ federal excise tax returns and the review of required distributions by the Funds. |
All Other Fees
| | (d) | The aggregate fees billed in each of the last two fiscal years for products and services provided by the principal accountant, other than the services reported in paragraphs (a) through (c) of this Item were $0 for the fiscal year ended June 30, 2018 and $0 for the fiscal year ended June 30, 2017. |
| | (e)(1) | Disclose the audit committee’s pre-approval policies and procedures described in paragraph (c)(7) of Rule 2-01 of Regulation S-X. |
The Registrant’s Audit Committee has adopted an Audit Committee Charter that provides that the Audit Committee shall approve, prior to appointment, the engagement of the auditor to provide audit services to the Registrant and non-audit services to the Registrant, its investment advisor or any entity controlling, controlled by or under common control with the investment adviser that provides on-going services to the Registrant if the engagement relates directly to the operations and financial reporting of the Registrant.
| | (e)(2) | The percentage of services described in each of paragraphs (b) through (d) of this Item that were approved by the audit committee pursuant to paragraph (c)(7)(i)(C) of Rule 2-01 of Regulation S-X are as follows: |
No services described in paragraphs (b) through (d) above were approved pursuant to paragraph (c)(7)(i)(C) of Rule 2-01 of Regulation S-X
| | (g) | The aggregate non-audit fees billed by the registrant’s accountant for services rendered to the registrant, and rendered to the registrant’s investment adviser (not including any sub-adviser whose role is primarily portfolio management and is subcontracted with or overseen by another investment adviser), and any entity controlling, controlled by, or under common control with the adviser that provides ongoing services to the registrant for each of the last two fiscal years of the registrant was $0 for the fiscal year ended June 30, 2018 and $0 for the fiscal year ended June 30, 2017. |
Item 5. Audit Committee of Listed Registrants.
Not applicable.
Item 6. Investments.
| (a) | Schedule of Investments in securities of unaffiliated issuers as of the close of the reporting period is included as part of the report to shareholders filed under Item 1 of this form. |
(b) Not applicable.
Item 7. Disclosure of Proxy Voting Policies and Procedures for Closed-End Management Investment Companies.
Not applicable.
Item 8. Portfolio Managers of Closed-End Management Investment Companies.
Not applicable.
Item 9. Purchases of Equity Securities by Closed-End Management Investment Company and Affiliated Purchasers.
Not applicable.
Item 10. Submission of Matters to a Vote of Security Holders.
There have been no material changes to the procedures by which the shareholders may recommend nominees to the Registrant’s Board of Directors, where those changes were implemented after the registrant last provided disclosure in response to the requirements of Item 407(c)(2)(iv) of Regulation S-K (17 CFR 229.407) (as required by Item 22(b)(15) of Schedule 14A (17 CFR 240.14a-101)), or this Item.
Item 11. Controls and Procedures.
| | (a) | The registrant’s principal executive officer and principal financial officer, or persons performing similar functions, have concluded that the registrant’s disclosure controls and procedures (as defined in Rule 30a-3(c) under the Investment Company Act of 1940, as amended (the “1940 Act”) (17 CFR 270.30a-3(c))) are effectively designed, as of a date within 90 days of the filing date of the report that includes the disclosure required by this paragraph, based on their evaluation of these controls and procedures required by Rule 30a-3(b) under the 1940 Act (17 |
| | CFR 270.30a-3(b)) and Rules 13a-15(b) or 15d-15(b) under the Securities Exchange Act of 1934, as amended (17 CFR 240.13a-15(b) or 240.15d-15(b)). |
| | (b) | There were no changes in the registrant’s internal control over financial reporting (as defined in Rule 30a-3(d) under the Act (17 CFR 270.30a-3(d))) that occurred during the last fiscal quarter that have materially affected or are reasonably likely to materially affect, the registrant’s internal control over financial reporting. |
Item 12. Disclosure of Securities Lending Activities for Closed-End Management Investment Companies.
Not applicable.
Item 13. Exhibits.
| | (a)(1) | Code of ethics, or any amendment thereto, that is the subject of disclosure required by Item 2 is attached hereto. |
| | (a)(2) | Certifications pursuant to Rule 30a-2(a) under the 1940 Act and Section 302 of the Sarbanes-Oxley Act of 2002 are attached hereto. |
| | (b) | Certifications pursuant to Rule 30a-2(b) under the 1940 Act and Section 906 of the Sarbanes-Oxley Act of 2002 are attached hereto. |
SIGNATURES
Pursuant to the requirements of the Securities Exchange Act of 1934 and the Investment Company Act of 1940, the registrant has duly caused this report to be signed on its behalf by the undersigned, thereunto duly authorized.
(Registrant) Bridgeway Funds, Inc.
| | |
| |
| By (Signature and Title)* | | /s/ Tammira Philippe |
| | Tammira Philippe, President and Principal Executive Officer (principal executive officer) |
Pursuant to the requirements of the Securities Exchange Act of 1934 and the Investment Company Act of 1940, this report has been signed below by the following persons on behalf of the registrant and in the capacities and on the dates indicated.
| | |
| By (Signature and Title)* | | /s/ Tammira Philippe |
| | Tammira Philippe, President and Principal Executive Officer (principal executive officer) |
| | |
| By (Signature and Title)* | | /s/ Linda G. Giuffré |
| | Linda G. Giuffré, Treasurer and Principal Financial Officer (principal financial officer) |
* Print the name and title of each signing officer under his or her signature.