UNITED STATES
SECURITIES AND EXCHANGE COMMISSION
Washington, D.C. 20549
FORM N-CSR
CERTIFIED SHAREHOLDER REPORT OF REGISTERED MANAGEMENT
INVESTMENT COMPANIES
Investment Company Act file number 811-08200
Bridgeway Funds, Inc.
(Exact name of registrant as specified in charter)
20 Greenway Plaza, Suite 450
Houston, Texas 77046
(Address of principal executive offices) (Zip code)
John Montgomery, President
Bridgeway Funds, Inc.
20 Greenway Plaza, Suite 450
Houston, Texas 77046
(Name and address of agent for service)
Registrant’s telephone number, including area code: (713) 661-3500
Date of fiscal year end: June 30
Date of reporting period: July 1, 2014 through June 30, 2015
Form N-CSR is to be used by management investment companies to file reports with the Commission not later than 10 days after the transmission to stockholders of any report that is required to be transmitted to stockholders under Rule 30e-1 under the Investment Company Act of 1940 (17 CFR 270.30e-1). The Commission may use the information provided on Form N-CSR in its regulatory, disclosure review, inspection, and policymaking roles.
A registrant is required to disclose the information specified by Form N-CSR, and the Commission will make this information public. A registrant is not required to respond to the collection of information contained in Form N-CSR unless the Form displays a currently valid Office of Management and Budget (“OMB”) control number. Please direct comments concerning the accuracy of the information collection burden estimate and any suggestions for reducing the burden to Secretary, Securities and Exchange Commission, 100 F Street, NE, Washington, DC 20549. The OMB has reviewed this collection of information under the clearance requirements of 44 U.S.C. § 3507.
Item 1. Reports to Stockholders.
The Report to Shareholders is attached herewith.

A no-load mutual fund family of domestic funds
| | | | |
| | |
| | Annual Report | | |
| | |
| | June 30, 2015 | | |
| | |
| | | | |
| | |
| |
| AGGRESSIVE INVESTORS 1 | | BRAGX |
| |
| ULTRA-SMALL COMPANY | | BRUSX |
| (Open to Existing Investors — Direct Only) | | |
| |
| ULTRA-SMALL COMPANY MARKET | | BRSIX |
| |
| SMALL-CAP MOMENTUM | | BRSMX |
| |
| SMALL-CAP GROWTH | | BRSGX |
| |
| SMALL-CAP VALUE | | BRSVX |
| |
| LARGE-CAP GROWTH | | BRLGX |
| |
| BLUE CHIP 35 INDEX | | BRLIX |
| |
| MANAGED VOLATILITY | | BRBPX |
| | |
| TABLE OF CONTENTS | |  |
| | |
| | |
Bridgeway Funds Standardized Returns as of June 30, 2015* (Unaudited)
| | | | | | | | | | | | | | | | | | | | | | | | | | | | | | | | | | | | |
| | | | | | | | | Annualized | | | | | | | | | | |
| Fund | | Quarter | | | Six Months | | | 1 Year | | | 5 Years | | | 10 Years | | | Inception to Date | | | Inception Date | | | Gross
Expense Ratio2 | | | Net
Expense
Ratio2 | |
Aggressive Investors 1 | | | -1.63% | | | | -0.40% | | | | 4.57% | | | | 18.34% | | | | 5.44% | | | | 13.58% | | | | 8/5/1994 | | | | 1.01% | | | | 1.01% | |
Ultra-Small Company | | | -6.12% | | | | -4.26% | | | | -7.60% | | | | 14.98% | | | | 6.97% | | | | 15.17% | | | | 8/5/1994 | | | | 1.13% | | | | 1.13% | |
Ultra-Small Co Market | | | -0.06% | | | | 1.83% | | | | 3.72% | | | | 17.71% | | | | 6.86% | | | | 11.23% | | | | 7/31/1997 | | | | 0.83% | | | | 0.83% | |
Small-Cap Momentum | | | 1.07% | | | | 5.77% | | | | 4.54% | | | | 15.67% | | | | NA | | | | 13.81% | | | | 5/28/2010 | | | | 3.13%1 | | | | 0.95%1 | |
Small-Cap Growth | | | 3.67% | | | | 10.95% | | | | 13.41% | | | | 18.45% | | | | 5.89% | | | | 6.74% | | | | 10/31/2003 | | | | 1.07%1 | | | | 0.94%1 | |
Small-Cap Value | | | -1.02% | | | | 0.00% | | | | -2.10% | | | | 15.60% | | | | 6.48% | | | | 7.78% | | | | 10/31/2003 | | | | 1.06%1 | | | | 1.03%1 | |
Large-Cap Growth | | | -0.84% | | | | 4.87% | | | | 16.19% | | | | 19.32% | | | | 8.60% | | | | 8.21% | | | | 10/31/2003 | | | | 0.87%1 | | | | 0.84%1 | |
Blue Chip 35 Index | | | 1.11% | | | | 0.68% | | | | 5.77% | | | | 16.28% | | | | 7.72% | | | | 6.55% | | | | 7/31/1997 | | | | 0.25%1 | | | | 0.15%1 | |
Managed Volatility | | | -1.27% | | | | 0.29% | | | | 0.92% | | | | 7.03% | | | | 3.55% | | | | 4.07% | | | | 6/30/2001 | | | | 1.15%1 | | | | 0.95%1 | |
Bridgeway Funds Returns for Calendar Years 2001 through 2014* (Unaudited)
| | | | | | | | | | | | | | | | | | | | | | | | | | | | | | | | | | | | | | | | | | | | | | | | | | | | | | | | |
| | | 2001 | | | 2002 | | | 2003 | | | 2004 | | | 2005 | | | 2006 | | | 2007 | | | 2008 | | | 2009 | | | 2010 | | | 2011 | | | 2012 | | | 2013 | | | 2014 | |
Aggressive Investors 1 | | | -11.20% | | | | -18.01% | | | | 53.97% | | | | 12.21% | | | | 14.93% | | | | 7.11% | | | | 25.80% | | | | -56.16% | | | | 23.98% | | | | 17.82% | | | | -10.31% | | | | 21.58% | | | | 42.21% | | | | 14.99% | |
Ultra-Small Company | | | 34.00% | | | | 3.98% | | | | 88.57% | | | | 23.33% | | | | 2.99% | | | | 21.55% | | | | -2.77% | | | | -46.24% | | | | 48.93% | | | | 23.55% | | | | -14.64% | | | | 24.49% | | | | 55.77% | | | | -0.56% | |
Ultra-Small Co Market | | | 23.98% | | | | 4.90% | | | | 79.43% | | | | 20.12% | | | | 4.08% | | | | 11.48% | | | | -5.40% | | | | -39.49% | | | | 25.95% | | | | 24.86% | | | | -7.86% | | | | 19.83% | | | | 50.91% | | | | 4.61% | |
Small-Cap Momentum | | | | | | | | | | | | | | | | | | | | | | | | | | | | | | | | | | | | | | | | | | | -0.92% | | | | 14.18% | | | | 37.07% | | | | -0.94% | |
Small-Cap Growth | | | | | | | | | | | | | | | 11.59% | | | | 18.24% | | | | 5.31% | | | | 6.87% | | | | -43.48% | | | | 15.04% | | | | 11.77% | | | | -0.63% | | | | 11.05% | | | | 48.52% | | | | 6.13% | |
Small-Cap Value | | | | | | | | | | | | | | | 17.33% | | | | 18.92% | | | | 12.77% | | | | 6.93% | | | | -45.57% | | | | 26.98% | | | | 16.55% | | | | 1.05% | | | | 20.99% | | | | 39.72% | | | | 0.79% | |
Large-Cap Growth | | | | | | | | | | | | | | | 6.77% | | | | 9.33% | | | | 4.99% | | | | 19.01% | | | | -45.42% | | | | 36.66% | | | | 13.34% | | | | -0.71% | | | | 16.21% | | | | 37.19% | | | | 18.66% | |
Blue Chip 35 Index | | | -9.06% | | | | -18.02% | | | | 28.87% | | | | 4.79% | | | | 0.05% | | | | 15.42% | | | | 6.07% | | | | -33.30% | | | | 26.61% | | | | 10.60% | | | | 3.17% | | | | 15.20% | | | | 31.67% | | | | 11.51% | |
Managed Volatility | | | | | | | -3.51% | | | | 17.82% | | | | 7.61% | | | | 6.96% | | | | 6.65% | | | | 6.58% | | | | -19.38% | | | | 12.39% | | | | 5.41% | | | | 1.94% | | | | 6.46% | | | | 9.25% | | | | 5.95% | |
Performance figures quoted represent past performance and are no guarantee of future results. Current performance may be lower or higher than the performance data quoted. Investment return and principal value will fluctuate, so that an investor’s shares, when redeemed, may be worth more or less than original cost. To obtain performance current to the most recent month-end, please visit www.bridgeway.com or call 1-800-661-3550. Total return figures include the reinvestment of dividends and capital gains.
| | 1 | Some of the Funds’ fees were waived or expenses reimbursed; otherwise, returns would have been lower. The Adviser has contractually agreed to waive fees and/or reimburse expenses. Any material change to this Fund policy would require a vote by shareholders. |
| | 2 | Expense ratios are as stated in the current prospectus. Please see financial highlights for expense ratios as of June 30, 2015. |
* Numbers highlighted indicate periods when the Fund outperformed its primary benchmark.
This report is submitted for the general information of the shareholders of each Fund. It is not authorized for distribution to prospective investors unless preceded or accompanied by an effective prospectus, which includes information regarding a Fund’s risks, objectives, fees and expenses, experience of its management, and other information. Investors should read the prospectus carefully before investing in a Fund. For questions or other Fund information, call 1-800-661-3550 or visit the Funds’ website at www.bridgeway.com. Funds are available for purchase by residents of the United States, Puerto Rico, U.S. Virgin Islands and Guam only. Foreside Fund Services, LLC, Distributor.
The views expressed here are exclusively those of Fund management. These views, including those relating to the market, sectors, or individual stocks, are not meant as investment advice and should not be considered predictive in nature.
THIS PAGE INTENTIONALLY LEFT BLANK
| | |
LETTER FROM THE INVESTMENT MANAGEMENT TEAM | | |
June 30, 2015
Dear Fellow Shareholders,
Performance was mixed across domestic equity markets during the June quarter and the twelve months ended June 30, 2015. Market highlights appear on page 2. The Bridgeway Funds performed within design expectations, guided by our statistically driven, evidence-based investment approach. Please see the enclosed letters for a detailed explanation of each Fund’s performance during the quarter and fiscal year. We hope you find the letters helpful.
“Is Investing a Science?” On page 2, Dr. Andrew L. Berkin, Bridgeway’s Director of Research, and noted evidence-based investor Larry Swedroe answer that question and share the application of the scientific method to our investment process.
In our December 2014 semi-annual report, we kicked off a series on factors that drive the risk and returns of stocks. Continuing the series, this report examines an important individual factor. Turn to page 3 to read about “The Dangers of Data Mining and the Small-Cap Effect.”
Each fiscal year we commit to reporting to shareholders what we think is the worst thing that we experienced at Bridgeway during the year. As a shareholder, you are an owner, and we think we owe it to you to tell you not only the good stuff, but also when things do not go well. After a long period of consideration, we decided that discontinuing IRA fee waivers for direct accounts was the worst thing from the past year. Details are on page 5.
One of the strongest parts of our culture is a commitment to community and world change. On page 5, Bridgeway’s Chief Compliance Officer, Linda Giuffré, inspires you to recognize and live into your individual giftedness.
On May 31, 2015, Bridgeway announced the departure of Michael D. Mulcahy, President of Bridgeway Capital Management and Bridgeway Funds. See page 6 for more information on the transition.
As always, we appreciate your feedback. We take your comments seriously and regularly discuss them to help us manage our Funds and this company. Please keep your ideas coming — both favorable and critical. They provide us with a vital tool to serve you better.
Sincerely,
Your Investment Management Team
| | |
| 1 | | Annual Report | June 30, 2015 |
| | |
LETTER FROM THE INVESTMENT MANAGEMENT TEAM (continued) | | |
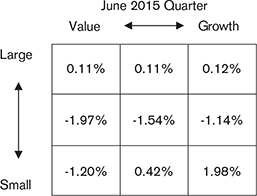
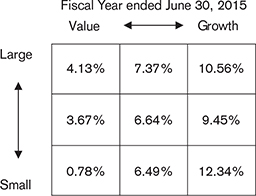
Market Review
Performance across the domestic equity markets was mixed for the June 2015 quarter, with smaller and more growth-oriented companies leading the way. The quarter ended with the S&P 500 up 0.28% and the Dow down 0.29%. For the fiscal year, the S&P and Dow were up 7.42% and 7.21%, respectively.
Returns across U.S. equity style boxes, as defined by Morningstar, were mixed for the quarter. Small-cap growth stocks led the way, up 1.98%, while small-cap value stocks lagged, down 1.20%. Growth outperformed value, and investors favored small-cap stocks over large-cap stocks.
Sector performance for the S&P 500 Index was positive in the second quarter. Information Technology led the way, gaining more than 19%, followed by Financials, up more than 16%, and Health Care, up more than 15%. The laggards, relatively speaking, were Materials, Utilities and Telecommunication Services (up 2%).
Following are the stock market style box returns from Morningstar for the quarter and fiscal year.
Is Investing a Science?
by Dr. Andrew L. Berkin, Director of Research, and Larry E. Swedroe, Director of Research, The BAM Alliance
You’re probably familiar with the phrase, “Past performance does not guarantee future results.” This statement, or one like it, is found on almost all mutual fund materials given out to individual investors. And for good reason: Returns of asset classes can vary dramatically from quarter to quarter and year to year. Yet, investors are tempted to read too much into past performance because they’re looking for greater certainty about the results of their investing strategy. Wouldn’t it be great if investing could be distilled into a set of laws that govern results in a predictable fashion, similar to what happens in the hard sciences such as chemistry or physics?
Unfortunately, investing is not a science — at least not in the sense of the natural or physical sciences. Scientific phenomena are governed by the rules of nature (think Newton’s Universal Law of Gravity), which don’t change. Investing is contaminated by the complicated interactions of investors. This is why science has laws, while investing has hypotheses and models.
However, even if investing isn’t a science, we can address some of its uncertainty by applying the scientific method to our investment approach. The scientific method is a system for answering questions about the world through careful observations and rigorous experiments. The basic steps of the scientific method include asking a question, doing background research, constructing a hypothesis, testing that hypothesis, analyzing the data and then sharing the results.
Scientists conduct research in this fashion in order to reach objective conclusions based on the evidence. While scientists may follow their intuition when first developing a hypothesis, the framework for testing those hypotheses is entirely objective. In a similar fashion, going by your gut instinct isn’t enough when analyzing investments; you need objective testing and analysis to gain confidence that your hypothesis is correct.
| | |
LETTER FROM THE INVESTMENT MANAGEMENT TEAM (continued) | | |
For instance, we might start our scientific investigation by asking which investment strategy has the highest odds of successfully achieving our goals with the least amount of risk. Our next step would be to research the current thinking around the question and develop a hypothesis about what helps drive investment results. That hypothesis then needs to be tested, which we can do through careful analysis of existing financial data. Ultimately, this research will generate a conclusion that we can communicate to our peers for review and criticism. If the result holds up to this scrutiny, we now have a model that can give us greater confidence in our investing decisions.
Value investing is a great example of how the scientific method influenced investment strategy. Investing legend Benjamin Graham touted the benefits of value investing as far back as the 1930s, but there was no evidence to explain the value effect. Even the development of the Capital Asset Pricing Model (CAPM) in the 1960s could not explain this effect. But in the early 1990s, economists Eugene Fama and Kenneth French used a systematic approach to show that the value effect existed in U.S. market data dating back to the 1960s. Further, they proposed that the higher returns offered by value stocks were a reward for bearing risk.
Their work received much interest — and much criticism. So the authors, together with Jim Davis, analyzed data going back even further and found that the same effect persisted all the way back to 1927. What’s more, the value effect held true even when they looked internationally across different stock markets. This rigorous and continued application of the scientific method has shown the value premium to be both persistent and pervasive, and the Fama-French model has continued to hold up more than 20 years after its initial publication.
Of course, there are no guarantees in investing. But applying the scientific method has helped us move investing away from the anecdotal and into the realm of evidence-based analysis. We may never be able to predict the future of financial markets, but we can continue to conduct research that increases our understanding of likely results and their potential variability. That, in turn, can give us the greatest possible confidence in the outcome of our investments.
Understanding Factors: The Dangers of Data Mining and the Small-Cap Effect
by John Montgomery, Founder and Chief Investment Officer
In our 2014 semi-annual report, we began a series of articles to explore the phenomenon of investment factors, the underlying characteristics or attributes that drive the returns of a group of stocks. Given Bridgeway’s commitment to evidence-based and statistically driven investing, factors are a key piece of our investing strategy.
In this article, we begin examining some of the most important individual factors. But before we do that, we want to explain how researchers identify a factor — and why we believe factors can play a key role when designing investment portfolios.
Researchers investigating factors perform sophisticated analysis of financial data to identify underlying causes of market behavior. Data is wonderful. It helps us take the subjective and — this is huge — the emotional component out of investing. But there’s also a risk in doing this research: If you have enough data with enough potential variables, you’ll always find something that seems to explain outcomes, no matter how spurious the connection.
Given the huge amounts of market data available, you can find some pretty wild examples of these bogus correlations. A famous study by financial researcher and quantitative money manager David Leinweber might be the most absurd: He was able to show how annual butter production in Bangladesh, cheese production in the United States, and the sheep population of both countries almost completely explained the returns of the S&P 500 over an historical period.
Is there really any relationship between those factors and the market’s returns? Of course not! That’s the risk of this kind of hyper-selective data analysis, which is called data mining. While the study was meant as a humorous example of the dangers of data mining (its title is “Stupid Data Miner Tricks: Overfitting the S&P 500”), it was nonetheless taken seriously by some.
One way we guard against data mining is by making sure there is an underlying economic reason that potentially explains the performance of a factor. In many cases, these reasons are related to the risk of the asset — as is the case with one of the most well-established factors, small size.
| | |
| 3 | | Annual Report | June 30, 2015 |
| | |
LETTER FROM THE INVESTMENT MANAGEMENT TEAM (continued) | | |
The small-size factor, also known as the small-cap effect, refers to the historically strong returns offered by shares of small companies. Since 1926, small-cap stocks have generated an average annual return of 12.2%, compared to a 10.1% average annual return for large-cap stocks.
What’s more, the small-cap effect becomes more pronounced as the size of the company decreases. The Center for Research in Security Prices (CRSP) divides all stocks traded on the New York Stock Exchange into 10 deciles based on company market capitalization. Decile 1 includes the largest of all companies, while decile 10 represents the smallest of small-cap stocks, known as ultra-small companies. Looking back to 1926 again, we find that the ultra-small stocks in CRSP decile 10 have delivered a 13.5% average annual return.
So, historical data shows that small-cap stocks outperform large cap stocks, and ultra-small stocks outperform both. But next we have to ask ourselves whether the data makes sense — or whether we happen to have stumbled into a spurious relationship that is unlikely to be repeated in the future.
In this case, we can find a good reason to explain performance. Small companies tend to be riskier than larger companies. They often are less established, with smaller product lines and fewer economic resources than larger companies. Their management teams may be untested. For investors to assume the risk of investing in these companies, they naturally would expect a higher potential return. After all, if I could get the same returns from a company like Apple or Procter & Gamble — one that is almost certainly not going out of business in the next 12 months — I’d have no reason to invest in these untested, riskier shares. Looking at it another way, a significantly higher percentage of smaller companies go bankrupt. Wouldn’t most investors demand a higher return for a company with a higher chance of going out of business and losing all of the capital invested?
I believe strongly that smaller companies are riskier and therefore, as a group, should give investors a higher potential return, which makes me much more confident in the data behind the small-cap effect. But this supposition is also another potential weakness: Once I’ve formed an opinion, I run the risk of paying attention only to data that supports what I already believe. This phenomenon is well documented in the book, The Honest Truth About Dishonesty by Dan Ariely. People tend to filter out information that contradicts their beliefs.
To protect against this natural and widespread kind of human bias, Bridgeway plays the skeptic in our own research efforts. When someone on our research team reaches a conclusion, the rest of us ask ourselves how we might have blown it by not looking hard enough for contradictory data. This question usually sends us deeper into the data in order to corroborate our findings. We apply the same research to market data from a different time period than the first sample, or to data from multiple countries, to confirm that the factor we’ve identified shows up in every case. We look at the consistency of the statistical relationship over time. We expend significant research resources to guard against the potential problems of data mining.
Besides building our confidence in the validity of a factor, this additional research gives us a deeper understanding of how that factor works and how it can fit in an investment strategy. For example, we know from researching the persistence of the small-cap effect that the premium doesn’t always show up over short-term cycles. In some years, larger stocks beat small caps, and small caps can even lag larger company stocks over the course of an entire decade, as shown in the table below. The highest return for each period is highlighted.
| | |
LETTER FROM THE INVESTMENT MANAGEMENT TEAM (continued) | | |
Average Annual Returns for Ultra-Large Stocks, Small-Cap Stocks and Ultra-Small Stocks
| | | | | | |
| Decade | | Ultra-Large (CRSP-1) | | Small-Cap (CRSP 6-8) | | Ultra-Small (CRSP-10) |
1926-1930 | | 17.50% | | 0.99% | | -1.20% |
1930-1939 | | -0.47% | | 3.57% | | 12.43% |
1940-1949 | | 7.98% | | 14.79% | | 24.17% |
1950-1959 | | 18.43% | | 18.17% | | 18.08% |
1960-1969 | | 7.08% | | 11.74% | | 15.32% |
1970-1979 | | 4.81% | | 10.44% | | 9.56% |
1980-1989 | | 16.82% | | 16.16% | | 10.68% |
1990-1999 | | 19.19% | | 15.88% | | 13.39% |
2000-2009 | | -2.37% | | 4.88% | | 10.74% |
2010-2015(June) | | 13.62% | | 16.60% | | 14.60% |
Entire Period:1926-2015 (June) | | 9.33% | | 11.62% | | 13.50% |
Source: The Center for Research in Security Prices
This data tells us two things. First, investors seeking the higher returns of small-cap stocks should have a long investing time horizon — preferably one lasting multiple decades. If they do, their probability of reaping the benefits of this single factor increases.
Second, to achieve even more consistency in an investment portfolio, we need to look for other factors that might work at different times. The process of constructing portfolios with strong factor exposure and diversification is where our research team spends a significant amount of its time and efforts.
We’ll examine this process in future articles in this series, while also looking at the characteristics of additional factors. The key to successful factor investing is not just identifying individual factors. You also must understand how different factors interact, so that you can combine them into an investment model that offers better odds of achieving your objectives.
Worst Thing of the Fiscal Year
Bridgeway is committed to transparency with our shareholders. That’s why we set aside a portion of each annual report to discuss the worst thing that happened during the fiscal year. In the past, these “worst things” have included problems with our Funds, market factors beyond our control, operational mistakes and even the loss of a partner.
Fortunately, we didn’t experience major setbacks like those during this fiscal year. However, we did have to make a difficult business decision that will impact our shareholders: Bridgeway Capital Management will no longer be absorbing an IRA account maintenance fee for direct shareholders who hold funds in their retirement accounts. Instead, our IRA account holders now will pay this annual $15 maintenance fee themselves. This increase in costs for some shareholders is the worst thing of the past year, because...we just don’t like the thought of any rising costs.
A little background: IRA account maintenance fees are standard in the industry. BNY Mellon, Bridgeway’s transfer agent and custodian for our Funds, charges this fee on all other IRA accounts. But when we launched Bridgeway Funds in 1994, our goal was to minimize the barriers that prevented people from investing toward their long-term goals. In that spirit, we decided to cover IRA account maintenance fees, rather than passing them along to our shareholders. Our change of plan is due to the following; we believe there are more powerful ways to devote adviser resources to keep costs lean: transaction costs (cost of buying and selling shares), selective Fund reimbursements, income to offset expenses (such as securities lending), and managing Fund operating expenses. We hope you understand and agree. As always, we appreciate your feedback and want to hear from you.
Transformative Change
Leading Through Your Genius, by Linda Giuffré
At Bridgeway we believe that providing ongoing training to improve our personal skills is essential to delivering quality service and becoming a stronger organization. Staying on top of the changes in our constantly evolving industry requires a commitment to continuing education and training. But change is not limited to the tools we use and the regulations we face.
| | |
| 5 | | Annual Report | June 30, 2015 |
| | |
LETTER FROM THE INVESTMENT MANAGEMENT TEAM (continued) | | |
During the annual Bridgeway retreat in November of last year, we participated in an all-day leadership session led by Ann McGee-Cooper and Associates, focused on their book titled “Leading Through Your Genius: The Amazing and Extraordinary Me.” The session was based on the idea that we all have natural gifts, such as the ability to lead or a particular aptitude for creativity. But harnessing these gifts and living up to our potential takes courage.
These gifts come naturally to us, as opposed to the skills that we must work hard to develop. And because they come naturally to us, we often don’t recognize them as gifts — they simply aren’t noteworthy to us. Yet, we owe it to ourselves and others to recognize and accept our gifts. Then we can find opportunities to use our gifts constructively.
If your gifts align with the job you’ve chosen, embracing them will probably make you happier and more effective — which will likely translate into more positive energy for the people around you. If your gifts fall outside of your workplace duties, then look for ways to incorporate those gifts into other activities in your life. This might be a personal pursuit, or it could involve volunteering with an organization whose needs align with your gifts.
As leaders we can provide a supportive environment that encourages others to embrace their gifts. It takes courage to recognize and accept your gifts, but doing so can help you achieve greater satisfaction in your life, while helping you improve the lives of those around you.
Leadership Transition
We consider it a privilege to serve our shareholders, and we seek to keep you abreast of changes at Bridgeway. Effective May 31, 2015, Michael D. Mulcahy left Bridgeway Capital Management and his role as president of Bridgeway Capital Management and Bridgeway Funds to pursue an entrepreneurial aspiration to serve families in wealth management and philanthropy at his newly created firm.
In 2008, the Board of each of Bridgeway Capital Management and Bridgeway Funds developed a succession plan that has since been reviewed. Per our succession plan, John Montgomery stepped back into the role of President of Bridgeway Capital Management and Bridgeway Funds effective, May 31. John and other members of our senior leadership team will be assuming Mike’s responsibilities in the short-term, while we take this opportunity to consider our long-term needs.
Bridgeway has a strong, experienced team, and business functions and client relationships will continue and thrive. We wish Mike the best in his new venture. We look forward to continuing to provide a high level of service for our clients, and to the great opportunities ahead for Bridgeway.
| | |
Aggressive Investors 1 Fund MANAGER’S COMMENTARY (Unaudited) | | |
June 30, 2015
Dear Fellow Aggressive Investors 1 Fund Shareholder,
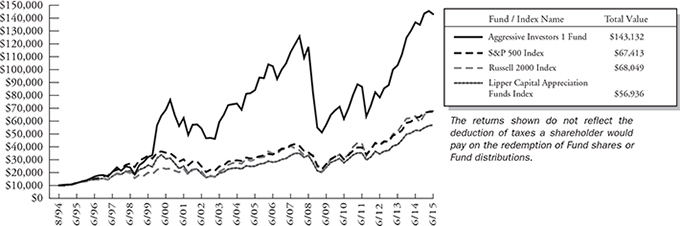
For the quarter ended June 30, 2015, our Fund declined 1.63%, underperforming our primary market benchmark, the S&P 500 Index (+0.28%), our peer benchmark, the Lipper Capital Appreciation Funds Index (+0.59%), and the Russell 2000 Index (+0.42%). It was a poor quarter.
For the fiscal year, our Fund returned 4.57%, underperforming our primary market benchmark, the S&P 500 Index (+7.42%), our peer benchmark, the Lipper Capital Appreciation Funds Index (+7.47%), and the Russell 2000 Index (+6.49%).
The table below presents our June quarter, one-year, five-year, 10-year, 15-year, and inception-to-date financial results. See the next page for a graph of performance since inception.
Standardized Returns as of June 30, 2015
| | | | | | | | | | | | | | | | | | | | | | |
| | | | | | | | | Annualized |
| | | | | | | | | | | |
| | | Quarter | | | | 1 Year | | | | 5 Years | | | | 10 Years | | | | 15 Years | | | Since Inception
(8/5/94) |
|
| | | | | | |
Aggressive Investors 1 Fund | | | -1.63% | | | | 4.57 | % | | | 18.34% | | | | 5.44% | | | | 4.99% | | | 13.58% |
S&P 500 Index | | | 0.28% | | | | 7.42 | % | | | 17.34% | | | | 7.89% | | | | 4.36% | | | 9.54% |
Russell 2000 Index | | | 0.42% | | | | 6.49 | % | | | 17.08% | | | | 8.40% | | | | 7.50% | | | 9.61% |
Lipper Capital Appreciation Funds Index | | | 0.59% | | | | 7.47 | % | | | 15.57% | | | | 8.49% | | | | 4.20% | | | 8.67% |
Performance figures quoted in the table above represent past performance and are no guarantee of future results. Total return figures in the table above include the reinvestment of dividends and capital gains. The table above does not reflect the deduction of taxes that a shareholder would pay on Fund distributions or on the redemption of Fund shares.
The S&P 500 Index is a broad-based, unmanaged measurement of changes in stock market conditions, based on the average of 500 widely held common stocks with dividends reinvested. The Russell 2000 Index is an unmanaged, market value-weighted index that measures performance of the 2,000 companies that are between the 1,000th and 3,000th largest in the market with dividends reinvested. The Lipper Capital Appreciation Funds Index reflects the record of the largest funds in the category of more aggressive domestic growth mutual funds, as reported by Lipper, Inc. It is not possible to invest directly in an index. Periods longer than one year are annualized.
According to data from Lipper, Inc. as of June 30, 2015, Aggressive Investors 1 Fund ranked 186th of 263 capital appreciation funds for the 12 months ending June 30, 2015, 67th of 226 over the last five years, 135th of 158 over the last 10 years, and 2nd of 46 since inception in August 1994. Lipper, Inc. is an independent mutual fund rating service that ranks funds in various fund categories by making comparative calculations using total returns.
| | |
| 7 | | Annual Report | June 30, 2015 |
| | |
Aggressive Investors 1 Fund MANAGER’S COMMENTARY (Unaudited) (continued) | | |
Aggressive Investors 1 Fund vs. S&P 500 Index, Russell 2000 Index & Lipper Capital Appreciation Funds Index
from Inception 8/5/94 to 6/30/15
Detailed Explanation of Quarterly Performance
In a quarter when ultra-large and small-cap stocks outperformed large- and mid-cap stocks, our Fund’s “all-cap” design was a primary factor impacting the relative performance versus its larger primary benchmark, the S&P 500 Index. Additionally, the company financial health category of models lagged the market, detracting from the Fund’s relative performance.
The Fund’s sector allocation, which is an outcome of statistical analysis of company-level fundamentals and not any macroeconomic or sector view, contributed slightly to our relative returns. Health Care sector holdings contributed the most to relative performance, while the holdings in the Industrials sector detracted from relative performance.
Detailed Explanation of Fiscal Year Performance
For the fiscal year, large-cap stocks outperformed small- and mid-cap stocks. As a result, our Fund’s “all-cap” design had a negative impact on our relative performance versus the larger S&P 500 Index. Additionally, holdings selected by our diversifying value metrics models lagged the index.
Overall, the Fund’s sector allocation versus its primary benchmark index slightly diminished relative performance. Overweighting in the lagging Energy, Industrials and Materials sectors detracted from performance. However, despite being underweighted in the best performing Health Care sector during a portion of the year, the Fund’s holdings in this sector outperformed the index, contributing to relative performance.
In the 2015 fiscal year, the Fund’s use of derivatives, options specifically, had an insignificant impact on Fund performance.
| | |
Aggressive Investors 1 Fund MANAGER’S COMMENTARY (Unaudited) (continued) | | |
Top Ten Holdings as of June 30, 2015
| | | | | | | | | |
| Rank | | Description | | Industry | | % of Net
Assets |
| 1 | | Allergan PLC | | Pharmaceuticals | | | | 2.5% | |
| 2 | | United Continental Holdings, Inc. | | Airlines | | | | 2.3% | |
| 3 | | Skechers U.S.A., Inc., Class A | | Textiles, Apparel & Luxury Goods | | | | 2.1% | |
| 4 | | Kroger Co. (The) | | Food & Staples Retailing | | | | 2.0% | |
| 5 | | Rite Aid Corp. | | Food & Staples Retailing | | | | 2.0% | |
| 6 | | Southwest Airlines Co. | | Airlines | | | | 2.0% | |
| 7 | | Apple, Inc. | | Computers & Peripherals | | | | 1.7% | |
| 8 | | Cigna Corp. | | Health Care Providers & Services | | | | 1.6% | |
| 9 | | Edwards Lifesciences Corp. | | Health Care Equipment & Supplies | | | | 1.6% | |
| 10 | | Delta Airlines Inc. | | Airlines | | | | 1.5% | |
| | Total | | | | | | 19.3% | |
Industry Sector Representation as of June 30, 2015
| | | | | | | | | | |
| | | % of Net Assets | | | | % of S&P 500 Index | | | | Difference |
Consumer Discretionary | | 20.6% | | | | 12.8% | | | | 7.8% |
Consumer Staples | | 6.9% | | | | 9.4% | | | | -2.5% |
Energy | | 9.9% | | | | 7.9% | | | | 2.0% |
Financials | | 10.3% | | | | 16.6% | | | | -6.3% |
Health Care | | 18.1% | | | | 15.4% | | | | 2.7% |
Industrials | | 18.1% | | | | 10.1% | | | | 8.0% |
Information Technology | | 10.0% | | | | 19.6% | | | | -9.6% |
Materials | | 4.3% | | | | 3.1% | | | | 1.2% |
Telecommunication Services | | 1.0% | | | | 2.3% | | | | -1.3% |
Utilities | | 0.0% | | | | 2.8% | | | | -2.8% |
Cash & Other Assets | | 0.8% | | | | 0.0% | | | | 0.8% |
Total | | 100.0% | | | | 100.0% | | | | |
Disclaimer
The views expressed here are exclusively those of Fund management. These views, including those related to market sectors or individual stocks, are not meant as investment advice and should not be considered predictive in nature. Any favorable (or unfavorable) description of a holding applies only as of the quarter end, June 30, 2015, unless otherwise stated. Security positions can and do change thereafter. Discussions of historical performance do not guarantee and may not be indicative of future performance.
Market volatility can significantly affect short-term performance. The Fund is not an appropriate investment for short-term investors. Investments in the small companies within this multi-cap fund generally carry greater risk than is customarily associated with larger companies. This additional risk is attributable to a number of factors, including the relatively limited financial resources that are typically available to small companies and the fact that small companies often have comparatively limited product lines. In addition, the stock of small companies tends to be more volatile than the stock of large companies, particularly in the short term and particularly in the early stages of an economic or market downturn. The Fund’s use of options, futures, and leverage can magnify the risk of loss in an unfavorable market. Finally, the Fund exposes shareholders to “focus risk,” which may add to Fund volatility through the possibility that a single company could significantly affect total return. Shareholders of the Fund, therefore, are taking on more risk than they would if they invested in the stock market as a whole.
| | |
| 9 | | Annual Report | June 30, 2015 |
| | |
Aggressive Investors 1 Fund MANAGER’S COMMENTARY (Unaudited) (continued) | | |
Conclusion
Thank you for your continued investment in Aggressive Investors 1 Fund. We encourage your feedback; your reactions and concerns are important to us.
Sincerely,
The Investment Management Team
| | |
Aggressive Investors 1 Fund SCHEDULE OF INVESTMENTS | | |
Showing percentage of net assets as of June 30, 2015
| | | | | | | | | | |
| Industry Company | | Shares | | | Value | | | |
COMMON STOCKS - 99.68% | | | |
Aerospace & Defense - 1.05% | | | |
Lockheed Martin Corp. | | | 14,000 | | | | $ 2,602,600 | | | |
| |
Airlines - 6.85% | | | |
Alaska Air Group, Inc. | | | 40,200 | | | | 2,590,086 | | | |
Delta Air Lines, Inc. | | | 89,300 | | | | 3,668,444 | | | |
Southwest Airlines Co. | | | 151,300 | | | | 5,006,517 | | | |
United Continental Holdings, Inc.* | | | 108,200 | | | | 5,735,682 | | | |
| | | | | | | | | | |
| | | | | | | 17,000,729 | | | |
| |
Auto Components - 3.69% | | | |
Goodyear Tire & Rubber Co. (The) | | | 83,600 | | | | 2,520,540 | | | |
Lear Corp. | | | 24,200 | | | | 2,716,692 | | | |
Magna International, Inc. | | | 50,800 | | | | 2,849,372 | | | |
Modine Manufacturing Co.* | | | 100,200 | | | | 1,075,146 | | | |
| | | | | | | | | | |
| | | | | | | 9,161,750 | | | |
| |
Automobiles - 0.96% | | | |
General Motors Co. | | | 71,500 | | | | 2,383,095 | | | |
| |
Beverages - 1.31% | | | |
Constellation Brands, Inc., Class A | | | 28,100 | | | | 3,260,162 | | | |
| |
Biotechnology - 2.42% | | | |
BioMarin Pharmaceutical, Inc.* | | | 21,700 | | | | 2,968,126 | | | |
Gilead Sciences, Inc. | | | 26,000 | | | | 3,044,080 | | | |
| | | | | | | | | | |
| | | | | | | 6,012,206 | | | |
| |
Capital Markets - 1.65% | | | |
Affiliated Managers Group, Inc.* | | | 13,000 | | | | 2,841,800 | | | |
Charles Schwab Corp. (The) | | | 37,900 | | | | 1,237,435 | | | |
| | | | | | | | | | |
| | | | | | | 4,079,235 | | | |
| |
Chemicals - 2.67% | | | |
Celanese Corp., Class A | | | 29,700 | | | | 2,134,836 | | | |
LyondellBasell Industries NV, Class A | | | 25,500 | | | | 2,639,760 | | | |
Stepan Co. | | | 34,000 | | | | 1,839,740 | | | |
| | | | | | | | | | |
| | | | | | | 6,614,336 | | | |
| |
Commercial Services & Supplies - 2.38% | | | |
ACCO Brands Corp.* | | | 296,800 | | | | 2,306,136 | | | |
Multi-Color Corp. | | | 19,600 | | | | 1,252,048 | | | |
Waste Management, Inc. | | | 50,600 | | | | 2,345,310 | | | |
| | | | | | | 5,903,494 | | | |
| |
Computers & Peripherals - 3.65% | | | |
Apple, Inc. | | | 33,600 | | | | 4,214,280 | | | |
| | | | | | | | | | |
| Industry Company | | Shares | | | Value | | | |
| | | |
Computers & Peripherals (continued) |
Seagate Technology PLC | | | 38,500 | | | | $ 1,828,750 | | | |
Super Micro Computer, Inc.* | | | 50,700 | | | | 1,499,706 | | | |
Western Digital Corp. | | | 19,100 | | | | 1,497,822 | | | |
| | | | | | | | | | |
| | | | | | | 9,040,558 | | | |
|
Consumer Finance - 2.91% |
Capital One Financial Corp. | | | 31,500 | | | | 2,771,055 | | | |
Cash America International, Inc. | | | 50,000 | | | | 1,309,500 | | | |
Navient Corp. | | | 96,000 | | | | 1,748,160 | | | |
Santander Consumer USA Holdings, Inc.* | | | 53,900 | | | | 1,378,223 | | | |
| | | | | | | | | | |
| | | | | | | 7,206,938 | | | |
|
Containers & Packaging - 1.17% |
Crown Holdings, Inc.* | | | 54,800 | | | | 2,899,468 | | | |
|
Distributors - 0.94% |
Core-Mark Holding Co., Inc. | | | 39,300 | | | | 2,328,525 | | | |
|
Diversified Financial Services - 1.39% |
Voya Financial, Inc. | | | 73,900 | | | | 3,434,133 | | | |
|
Diversified Telecommunication Services - 1.02% |
Verizon Communications, Inc. | | | 54,500 | | | | 2,540,245 | | | |
|
Electronic Equipment, Instruments & Components - 0.59% |
TTM Technologies, Inc.* | | | 147,300 | | | | 1,471,527 | | | |
|
Energy Equipment & Services - 2.50% |
Halliburton Co. | | | 40,700 | | | | 1,752,949 | | | |
Matrix Service Co.* | | | 56,000 | | | | 1,023,680 | | | |
Noble Corp. PLC+ | | | 78,500 | | | | 1,208,115 | | | |
Seadrill, Ltd.+ | | | 213,500 | | | | 2,207,590 | | | |
| | | | | | | | | | |
| | | | | | | 6,192,334 | | | |
|
Food & Staples Retailing - 4.83% |
Ingles Markets, Inc., Class A | | | 40,500 | | | | 1,934,685 | | | |
Kroger Co. (The) | | | 69,300 | | | | 5,024,943 | | | |
Rite Aid Corp.* | | | 600,100 | | | | 5,010,835 | | | |
| | | | | | | | | | |
| | | | | | | 11,970,463 | | | |
|
Food Products - 0.76% |
Pilgrim’s Pride Corp.+ | | | 82,400 | | | | 1,892,728 | | | |
|
Health Care Equipment & Supplies - 2.75% |
C.R. Bard, Inc. | | | 17,000 | | | | 2,901,900 | | | |
Edwards Lifesciences Corp.* | | | 27,500 | | | | 3,916,825 | | | |
| | | | | | | | | | |
| | | | | | | 6,818,725 | | | |
| | |
| 11 | | Annual Report | June 30, 2015 |
| | |
Aggressive Investors 1 Fund SCHEDULE OF INVESTMENTS (continued) | | |
Showing percentage of net assets as of June 30, 2015
| | | | | | | | | | |
| Industry Company | | Shares | | | Value | | | |
Common Stocks (continued) | | | |
Health Care Providers & Services - 10.23% | | | |
Aetna, Inc. | | | 24,000 | | | | $ 3,059,040 | | | |
AMN Healthcare Services, Inc.* | | | 85,000 | | | | 2,685,150 | | | |
Centene Corp.* | | | 39,000 | | | | 3,135,600 | | | |
Cigna Corp. | | | 24,300 | | | | 3,936,600 | | | |
HCA Holdings, Inc.* | | | 40,100 | | | | 3,637,872 | | | |
Molina Healthcare, Inc.* | | | 42,900 | | | | 3,015,870 | | | |
UnitedHealth Group, Inc. | | | 21,000 | | | | 2,562,000 | | | |
Universal Health Services, Inc., Class B | | | 23,600 | | | | 3,353,560 | | | |
| | | | | | | | | | |
| | | | | | | 25,385,692 | | | |
| |
Hotels, Restaurants & Leisure - 5.45% |
BJ’s Restaurants, Inc.* | | | 54,100 | | | | 2,621,145 | | | |
Cheesecake Factory, Inc. (The) | | | 50,500 | | | | 2,754,018 | | | |
Isle of Capri Casinos, Inc.* | | | 137,000 | | | | 2,486,550 | | | |
Penn National Gaming, Inc.* | | | 160,000 | | | | 2,936,000 | | | |
Pinnacle Entertainment, Inc.* | | | 73,000 | | | | 2,721,440 | | | |
| | | | | | | | | | |
| | | | | | | 13,519,153 | | | |
| |
Household Durables - 1.13% | | | |
Jarden Corp.* | | | 54,000 | | | | 2,794,500 | | | |
| | | |
Insurance - 3.90% | | | | | | | | | | |
Aflac, Inc. | | | 43,000 | | | | 2,674,600 | | | |
Allstate Corp. (The) | | | 35,000 | | | | 2,270,450 | | | |
Employers Holdings, Inc. | | | 63,800 | | | | 1,453,364 | | | |
Genworth Financial, Inc., Class A* | | | 143,600 | | | | 1,087,052 | | | |
Infinity Property & Casualty Corp. | | | 5,260 | | | | 398,918 | | | |
Maiden Holdings, Ltd. | | | 113,200 | | | | 1,786,296 | | | |
| | | | | | | | | | |
| | | | | | | 9,670,680 | | | |
|
Internet & Catalog Retail - 0.68% |
1-800-Flowers.com, Inc., Class A* | | | 161,300 | | | | 1,687,198 | | | |
|
Internet Software & Services - 1.18% |
Facebook, Inc., Class A* | | | 34,000 | | | | 2,916,010 | | | |
| | | |
Machinery - 2.27% | | | | | | | | | | |
Greenbrier Companies., Inc. (The)+ | | | 39,500 | | | | 1,850,575 | | | |
John Bean Technologies Corp. | | | 68,600 | | | | 2,578,674 | | | |
Wabash National Corp.* | | | 96,000 | | | | 1,203,840 | | | |
| | | | | | | | | | |
| | | | | | | 5,633,089 | | | |
| | | | | | | |
| | | | | | | |
| | | | | | | |
| | | | | | | |
| | | | | | | | | | |
| Industry Company | | Shares | | | Value | | | |
| | | | | | | | | | |
Marine - 1.61% | | | | | | | | | | |
DryShips, Inc.* | | | 1,289,200 | | | | $ 775,067 | | | |
Matson, Inc. | | | 76,800 | | | | 3,228,672 | | | |
| | | | | | | | | | |
| | | | | | | 4,003,739 | | | |
|
Metals & Mining - 0.49% |
Century Aluminum Co.* | | | 117,000 | | | | 1,220,310 | | | |
|
Multiline Retail - 0.92% |
Burlington Stores, Inc.* | | | 44,500 | | | | 2,278,400 | | | |
|
Oil, Gas & Consumable Fuels - 7.77% |
Encana Corp. | | | 195,000 | | | | 2,148,900 | | | |
Green Plains, Inc. | | | 87,900 | | | | 2,421,645 | | | |
Hess Corp. | | | 38,900 | | | | 2,601,632 | | | |
Marathon Petroleum Corp. | | | 58,000 | | | | 3,033,980 | | | |
Range Resources Corp.+ | | | 48,600 | | | | 2,399,868 | | | |
SandRidge Energy, Inc.*+ | | | 886,100 | | | | 777,110 | | | |
Tesoro Corp. | | | 35,900 | | | | 3,030,319 | | | |
Valero Energy Corp. | | | 45,600 | | | | 2,854,560 | | | |
| | | | | | | | | | |
| | | | | | | 19,268,014 | | | |
|
Pharmaceuticals - 2.48% |
Allergan PLC* | | | 20,300 | | | | 6,160,238 | | | |
|
Real Estate Management & Development - 0.54% |
Altisource Portfolio Solutions SA*+ | | | 43,400 | | | | 1,336,286 | | | |
|
Road & Rail - 0.80% |
Avis Budget Group, Inc.* | | | 45,000 | | | | 1,983,600 | | | |
|
Semiconductors & Semiconductor Equipment - 2.25% |
Micron Technology, Inc.* | | | 162,400 | | | | 3,059,616 | | | |
Skyworks Solutions, Inc. | | | 24,300 | | | | 2,529,630 | | | |
| | | | | | | | | | |
| | | | | | | 5,589,246 | | | |
|
Software - 2.34% |
Red Hat, Inc.* | | | 38,400 | | | | 2,915,712 | | | |
ServiceNow, Inc.* | | | 38,900 | | | | 2,890,659 | | | |
| | | | | | | | | | |
| | | | | | | 5,806,371 | | | |
|
Specialty Retail - 4.81% |
CarMax, Inc.* | | | 46,900 | | | | 3,105,249 | | | |
Gap, Inc. (The) | | | 62,800 | | | | 2,397,076 | | | |
Murphy USA, Inc.* | | | 38,600 | | | | 2,154,652 | | | |
Select Comfort Corp.* | | | 104,000 | | | | 3,127,280 | | | |
TravelCenters of America LLC* | | | 76,700 | | | | 1,138,995 | | | |
| | | | | | | | | | |
| | | | | | | 11,923,252 | | | |
| | |
Aggressive Investors 1 Fund SCHEDULE OF INVESTMENTS (continued) | | |
Showing percentage of net assets as of June 30, 2015
| | | | | | | | | | |
| Industry Company | | | | Shares | | Value | | | |
Common Stocks (continued) | | | |
| Textiles, Apparel & Luxury Goods - 2.13% | | | |
Skechers U.S.A., Inc., Class A* | | 48,200 | | | $ 5,291,878 | | | |
| |
| Trading Companies & Distributors - 3.21% | | | |
Rush Enterprises, Inc., Class A* | | 75,700 | | | 1,984,097 | | | |
United Rentals, Inc.* | | 38,700 | | | 3,390,894 | | | |
Veritiv Corp.* | | 992 | | | 36,168 | | | |
Watsco, Inc. | | 20,700 | | | 2,561,418 | | | |
| | | | | | | | | | |
| | | | | | | 7,972,577 | | | |
| | | | | | | | | | |
TOTAL COMMON STOCKS - 99.68% | | | 247,253,484 | | | |
| | | | | | | | | | |
(Cost $216,359,795) | | | | | | |
| | | | |
| | | Rate^ | | Shares | | Value | | | |
MONEY MARKET FUND - 1.76% | | | |
Dreyfus Cash Management Fund | | 0.04% | | 4,373,125 | | | 4,373,125 | | | |
| | | | | | | | | | |
TOTAL MONEY MARKET FUND - 1.76% | | | 4,373,125 | | | |
| | | | | | | | | | |
(Cost $4,373,125) | | | | | | | | | | |
INVESTMENTS PURCHASED WITH CASH PROCEEDS FROM SECURITIES LENDING - 4.07% | | | |
Dreyfus Cash Management Fund** | | 0.04% | | 10,088,121 | | | 10,088,121 | | | |
| | | | | | | | | | |
TOTAL INVESTMENTS PURCHASED WITH CASH PROCEEDS FROM SECURITIES LENDING - 4.07% | | | 10,088,121 | | | |
| | | | | | | | | | |
(Cost $10,088,121) | | | | | | |
| | | | | | | | | | |
| | | | | | | | | | |
| | | | | | | | | | |
| | | | | | | | | | |
| | | | | | | | | | |
| | | | | | | | | | |
| | | | | | | | | | |
| | | | | | | | | | |
| | | | | | | | | | |
| | | | | | | | | | |
| | | | | | | | | | |
| | | | | | | | | | |
| | | | | | | | | | |
| | | | | | | | | | |
| | | | | | | | | | |
| | | | | | | | | | |
| | | | | | | | | | |
| | | | | | | | | | |
| | | | | | | | | | |
| | | | | | |
| | | | | Value | |
TOTAL INVESTMENTS - 105.51% | | | | | $261,714,730 | |
(Cost $230,821,041) | | | | | | |
Liabilities in Excess of Other Assets - (5.51%) | | | | | (13,668,663 | ) |
| | | | | | |
NET ASSETS - 100.00% | | | | | $248,046,067 | |
| | | | | | |
| * | Non-income producing security. |
| ** | This security represents the investment of the collateral received in connection with securities out on loan as of June 30, 2015. |
| ^ | Rate disclosed as of June 30, 2015. |
| + | This security or a portion of the security is out on loan as of June 30, 2015. Total loaned securities had a value of $9,752,348 as of June 30, 2015. |
PLC - Public Limited Company
Summary of inputs used to value the Fund’s investments as of 06/30/2015 (See Note 2 in Notes to Financial Statements):
| | | | | | | | | | | | | | | | |
| | | Valuation Inputs | |
| | | Investment in Securities (Value) | |
| | | Level 1
Quoted Prices | | | Level 2
Significant
Observable
Inputs | | | Level 3
Significant Unobservable
Inputs | | | Total | |
| | | | |
Common Stocks | | $ | 247,253,484 | | | $ | — | | | $ | — | | | $ | 247,253,484 | |
Money Market Fund | | | — | | | | 4,373,125 | | | | — | | | | 4,373,125 | |
Investments Purchased with Cash Proceeds from Securities Lending | | | — | | | | 10,088,121 | | | | — | | | | 10,088,121 | |
| | | | | | | | | | | | | | | | |
TOTAL | | $ | 247,253,484 | | | $ | 14,461,246 | | | $ | — | | | $ | 261,714,730 | |
| | | | | | | | | | | | | | | | |
See Notes to Financial Statements.
| | |
| 13 | | Annual Report | June 30, 2015 |
| | |
Ultra-Small Company Fund MANAGER’S COMMENTARY (Unaudited) | | |
June 30, 2015
Dear Fellow Ultra-Small Company Fund Shareholder,
For the quarter ended June 30, 2015, our Fund declined 6.12%, underperforming our primary market benchmark, the CRSP Cap-Based Portfolio 10 Index (+0.51%), our peer benchmark, the Lipper Micro-Cap Stock Funds Index (+1.36%), the Russell 2000 Index (+0.42%) and the Russell Microcap Index (+2.80%). It was a poor quarter.
For the fiscal year, our Fund declined 7.60%, underperforming our primary market benchmark, the CRSP Cap-Based Portfolio 10 Index (+1.45%), our peer benchmark, the Lipper Micro-Cap Stock Funds Index (+4.73%), the Russell 2000 Index (+6.49%) and the Russell Microcap Index (+8.21%).
The table below presents our June quarter, one-year, five-year, 10-year, 15-year, and inception-to-date financial results. See the next page for a graph of performance since inception.
Standardized Returns as of June 30, 2015
| | | | | | | | | | | | | | | | |
| | | | | | | | Annualized |
| | | Quarter | | | 1 Year | | | | 5 Years | | 10 Years | | 15 Years | | Since Inception (8/5/94) |
| | | | | | | |
Ultra-Small Company Fund | | | -6.12% | �� | | -7.60% | | | | 14.98% | | 6.97% | | 12.88% | | 15.17% |
CRSP Cap-Based Portfolio 10 Index | | | 0.51% | | | 1.45% | | | | 15.43% | | 9.19% | | 11.99% | | 12.74% |
Russell 2000 Index | | | 0.42% | | | 6.49% | | | | 17.08% | | 8.40% | | 7.50% | | 9.61% |
Russell Microcap Index | | | 2.80% | | | 8.21% | | | | 17.48% | | 7.07% | | 7.79% | | N/A |
Lipper Micro-Cap Stock Funds Index | | | 1.36% | | | 4.73% | | | | 16.39% | | 7.64% | | 6.44% | | N/A |
Performance figures quoted in the table above represent past performance and are no guarantee of future results. Total return figures in the table above include the reinvestment of dividends and capital gains. The table above does not reflect the deduction of taxes that a shareholder would pay on Fund distributions or on the redemption of Fund shares.
The CRSP Cap-Based Portfolio 10 Index is an unmanaged index of 848 of the smallest publicly traded U.S. stocks (with dividends reinvested), as reported by the Center for Research on Security Prices. The Russell Microcap Index is an unmanaged, market value-weighted index that measures performance of 1,000 of the smallest securities in the Russell 2000 Index. The Russell 2000 Index is an unmanaged, market value-weighted index that measures performance of the 2,000 companies that are between the 1,000th and 3,000th largest in the market with dividends reinvested. The Lipper Micro-Cap Stock Funds Index is an index of micro-cap funds compiled by Lipper, Inc. It is not possible to invest directly in an index. Periods longer than one year are annualized.
According to data from Lipper, Inc. as of June 30, 2015, Ultra-Small Company Fund ranked 67th of 68 micro-cap funds for the 12 months ending June 30, 2015, 37th of 53 over the last five years, 24th of 36 over the last 10 years, and 1st of 8 since inception in August 1994. Lipper, Inc. is an independent mutual fund rating service that ranks funds in various fund categories by making comparative calculations using total returns.
| | |
Ultra-Small Company Fund MANAGER’S COMMENTARY (Unaudited) (continued) | | |
Ultra-Small Company Fund vs. CRSP Cap-Based Portfolio 10 Index, Russell Microcap Index**, Russell 2000 Index & Lipper Micro-Cap Stock Funds Index* from Inception 8/5/94 to 6/30/15
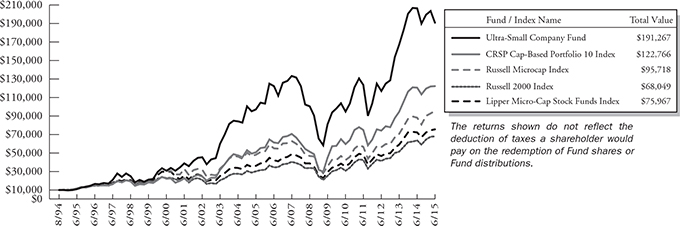
| * | The Lipper Micro-Cap Stock Funds Index began on 12/31/1995, and the line graph for the Index begins at the same value as the Fund on that date. |
| ** | The Russell Microcap Index began on 6/30/2000, and the line graph for the Index begins at the same value as the Fund on that date. |
Detailed Explanation of Quarterly Performance
Our Fund underperformed the CRSP Cap-Based Portfolio 10 Index for the quarter. Higher relative exposure to stocks that have outgrown the CRSP 10 size cutoff — ones that we don’t sell immediately in order to keep Fund turnover low — detracted from the Fund’s relative performance, as these holdings did not perform as well as the overall market for such market caps.
Our company financial health and value metrics categories of models underperformed versus the benchmark, which hurt our performance. With regard to sectors, holdings within the Energy and Industrials sectors detracted the most from our relative performance.
The table below presents index performance numbers of stocks in the different deciles for various time periods.
| | | | | | | | | | | | | | | | | | | | |
| CRSP Decile1 | | Quarter | | | 1 Year | | | 5 Years | | | 10 Years | | | 89.5 Years | |
1 (ultra-large) | | | 0.79% | | | | 7.21% | | | | 16.89% | | | | 7.66% | | | | 9.33% | |
2 | | | -1.61% | | | | 7.54% | | | | 18.68% | | | | 9.45% | | | | 10.60% | |
3 | | | -0.77% | | | | 8.75% | | | | 18.76% | | | | 9.49% | | | | 11.12% | |
4 | | | 0.09% | | | | 4.06% | | | | 18.90% | | | | 10.13% | | | | 11.00% | |
5 | | | -0.38% | | | | 4.62% | | | | 18.71% | | | | 11.46% | | | | 11.65% | |
6 | | | 1.33% | | | | 3.47% | | | | 18.67% | | | | 9.45% | | | | 11.50% | |
7 | | | 0.92% | | | | 5.86% | | | | 18.84% | | | | 10.25% | | | | 11.64% | |
8 | | | 1.79% | | | | 5.13% | | | | 17.89% | | | | 10.40% | | | | 11.68% | |
9 | | | 0.95% | | | | 2.31% | | | | 16.85% | | | | 8.97% | | | | 11.59% | |
10 (ultra-small) | | | 0.51% | | | | 1.45% | | | | 15.43% | | | | 9.19% | | | | 13.49% | |
| 1 | Performance figures are as of the period ended June 30, 2015. The CRSP Cap-Based Portfolio Indexes are unmanaged indexes of publicly traded U.S. stocks with dividends reinvested, grouped by market capitalization, as reported by the Center for Research in Security Prices. Past performance is no guarantee of future results. |
| | |
| 15 | | Annual Report | June 30, 2015 |
| | |
Ultra-Small Company Fund MANAGER’S COMMENTARY (Unaudited) (continued) | | |
Detailed Explanation of Fiscal Year Performance
For the fiscal year, the Fund underperformed the CRSP Cap-Based Portfolio 10 Index, the Fund’s primary benchmark. While the Fund had strong exposure to some of the smallest stocks in the CRSP 10 universe of stocks, Fund holdings that have outgrown the CRSP 10 size cutoff — ones that we don’t sell immediately in order to keep Fund turnover low — contributed to underperformance. Additionally, ultra-small stocks with highest liquidity hurt the Fund’s relative returns for the year.
Our diversifying value metrics models lagged the benchmark the most, while company financial health and momentum categories also underperformed. With regard to sectors, holdings within the Energy, Health Care and Industrials sectors contributed the most to the Fund’s underperformance.
Top Ten Holdings as of June 30, 2015
| | | | | | | | | |
| Rank | | Description | | Industry | | % of Net
Assets |
| 1 | | Sigma Designs, Inc. | | Semiconductors & Semiconductor Equipment | | | | 2.0% | |
| 2 | | NeoPhotonics Corp. | | Semiconductors & Semiconductor Equipment | | | | 1.9% | |
| 3 | | ZAGG, Inc. | | Household Durables | | | | 1.9% | |
| 4 | | Isle of Capri Casinos, Inc. | | Hotels, Restaurants & Leisure | | | | 1.8% | |
| 5 | | Mattson Technology, Inc. | | Semiconductors & Semiconductor Equipment | | | | 1.7% | |
| 6 | | P.A.M. Transportation Services, Inc. | | Road & Rail | | | | 1.7% | |
| 7 | | RadNet, Inc. | | Health Care Providers & Services | | | | 1.7% | |
| 8 | | Core Molding Technologies, Inc. | | Chemicals | | | | 1.7% | |
| 9 | | Allied Motion Technologies, Inc. | | Electrical Equipment | | | | 1.7% | |
| 10 | | Hooker Furniture Corp. | | Household Durables | | | | 1.6% | |
| | Total | | | | | | 17.7% | |
Industry Sector Representation as of June 30, 2015
| | | | | | | | | | |
| | | % of Net Assets | | | | % of CRSP 10 Index | | | | Difference |
Consumer Discretionary | | 18.3% | | | | 12.2% | | | | 6.1% |
Consumer Staples | | 1.7% | | | | 2.8% | | | | -1.1% |
Energy | | 6.7% | | | | 8.9% | | | | -2.2% |
Financials | | 14.4% | | | | 21.8% | | | | -7.4% |
Health Care | | 6.7% | | | | 17.3% | | | | -10.6% |
Industrials | | 17.9% | | | | 11.6% | | | | 6.3% |
Information Technology | | 27.5% | | | | 19.8% | | | | 7.7% |
Materials | | 3.6% | | | | 3.8% | | | | -0.2% |
Telecommunication Services | | 0.7% | | | | 0.9% | | | | -0.2% |
Utilities | | 1.6% | | | | 1.0% | | | | 0.6% |
Cash & Other Assets | | 0.9% | | | | 0.0% | | | | 0.9% |
Total | | 100.0% | | | | 100.0% | | | | |
Disclaimer
The views expressed here are exclusively those of Fund management. These views, including those related to market sectors or individual stocks, are not meant as investment advice and should not be considered predictive in nature. Any favorable (or unfavorable) description of a holding applies only as of the quarter end, June 30, 2015, unless otherwise stated. Security positions can and do change thereafter. Discussions of historical performance do not guarantee and may not be indicative of future performance.
| | |
Ultra-Small Company Fund MANAGER’S COMMENTARY (Unaudited) (continued) | | |
The Fund is subject to very high, above market risk (volatility) and is not an appropriate investment for short-term investors. Investments in ultra-small companies generally carry greater risk than is customarily associated with larger companies and even “small companies” for various reasons, such as narrower markets (fewer investors), limited financial resources and greater trading difficulty.
Conclusion
Ultra-Small Company Fund remains closed to new investors. We encourage your feedback; your reactions and concerns are important to us.
Sincerely,
The Investment Management Team
| | |
| 17 | | Annual Report | June 30, 2015 |
| | |
Ultra-Small Company Fund SCHEDULE OF INVESTMENTS | | |
Showing percentage of net assets as of June 30, 2015
| | | | | | | | | | |
| Industry Company | | Shares | | | Value | | | |
COMMON STOCKS - 99.10% | | | |
Aerospace & Defense - 0.55% |
Vectrus, Inc.* | | | 28,200 | | | | $ 701,334 | | | |
| |
Air Freight & Logistics - 1.04% | | | |
Air T, Inc.* | | | 20,400 | | | | 427,584 | | | |
Radiant Logistics, Inc.* | | | 122,900 | | | | 898,399 | | | |
| | | | | | | | | | |
| | | | | | | 1,325,983 | | | |
| |
Auto Components - 2.08% | | | |
China XD Plastics Co., Ltd.*+ | | | 69,700 | | | | 420,291 | | | |
Jason Industries, Inc.* | | | 80,000 | | | | 544,800 | | | |
SORL Auto Parts, Inc.*+ | | | 56,700 | | | | 184,842 | | | |
Strattec Security Corp. | | | 22,000 | | | | 1,511,400 | | | |
| | | | | | | | | | |
| | | | | | | 2,661,333 | | | |
| |
Beverages - 1.22% | | | |
MGP Ingredients, Inc. | | | 72,000 | | | | 1,211,040 | | | |
Primo Water Corp.* | | | 60,000 | | | | 343,200 | | | |
| | | | | | | | | | |
| | | | | | | 1,554,240 | | | |
| |
Biotechnology - 0.92% | | | |
Biota Pharmaceuticals, Inc.* | | | 65,000 | | | | 134,550 | | | |
Celladon Corp.* | | | 157,300 | | | | 198,198 | | | |
MEI Pharma, Inc.* | | | 197,300 | | | | 337,383 | | | |
OncoGenex Pharmaceutical, Inc.*+ | | | 215,500 | | | | 502,115 | | | |
| | | | | | | | | | |
| | | | | | | 1,172,246 | | | |
| |
Capital Markets - 0.76% | | | |
Capitala Finance Corp.+ | | | 46,400 | | | | 723,840 | | | |
Pzena Investment Management, Inc., Class A+ | | | 22,000 | | | | 243,100 | | | |
| | | | | | | | | | |
| | | | | | | 966,940 | | | |
| |
Chemicals - 2.92% | | | |
Chase Corp.+ | | | 17,400 | | | | 691,650 | | | |
China Green Agriculture, Inc. | | | 158,500 | | | | 336,020 | | | |
Core Molding Technologies, Inc.* | | | 95,000 | | | | 2,169,800 | | | |
Gulf Resources, Inc.*+ | | | 259,000 | | | | 534,835 | | | |
| | | | | | | | | | |
| | | | | | | 3,732,305 | | | |
| |
Commercial Banks - 5.30% | | | |
Bar Harbor Bankshares | | | 22,000 | | | | 779,460 | | | |
Century Bancorp, Inc., Class A | | | 3,600 | | | | 146,376 | | | |
Citizens & Northern Corp. | | | 33,500 | | | | 688,425 | | | |
Community Bank Shares of Indiana, Inc. | | | 4,900 | | | | 134,113 | | | |
| | | | | | | | | | |
| | | | | | | | | | |
| | | | | | | | | | |
| Industry Company | | Shares | | | Value | | | |
| | | | | | | | | | |
Commercial Banks (continued) | | | |
CU Bancorp* | | | 14,600 | | | | $ 323,536 | | | |
Farmers Capital Bank Corp.* | | | 42,800 | | | | 1,216,804 | | | |
First Bancorp, Inc. | | | 15,500 | | | | 301,320 | | | |
Heritage Commerce Corp. | | | 26,950 | | | | 258,990 | | | |
Heritage Oaks Bancorp | | | 38,800 | | | | 305,356 | | | |
Independent Bank Corp., MI | | | 112,400 | | | | 1,524,144 | | | |
Monarch Financial Holdings, Inc. | | | 11,300 | | | | 141,815 | | | |
Old Second Bancorp, Inc.* | | | 53,400 | | | | 352,440 | | | |
Pacific Mercantile Bancorp* | | | 40,000 | | | | 303,600 | | | |
Unity Bancorp, Inc. | | | 15,000 | | | | 146,850 | | | |
Westbury Bancorp, Inc.*+ | | | 8,300 | | | | 143,839 | | | |
| | | | | | | | | | |
| | | | | | | 6,767,068 | | | |
| |
Commercial Services & Supplies - 1.25% | | | |
ARC Document Solutions, Inc.* | | | 166,600 | | | | 1,267,826 | | | |
RR Donnelley & Sons Co. | | | 9,814 | | | | 171,058 | | | |
Versar, Inc.* | | | 40,400 | | | | 159,176 | | | |
| | | | | | | | | | |
| | | | | | | 1,598,060 | | | |
| |
Communications Equipment - 4.03% | | | |
Bel Fuse, Inc., Class B | | | 65,000 | | | | 1,333,800 | | | |
Ceragon Networks Ltd.*+ | | | 169,600 | | | | 195,040 | | | |
Digi International, Inc.* | | | 60,650 | | | | 579,207 | | | |
EMCORE Corp.* | | | 315,000 | | | | 1,896,300 | | | |
Infosonics Corp.*+ | | | 217,500 | | | | 578,550 | | | |
Oclaro, Inc.* | | | 248,000 | | | | 560,480 | | | |
| | | | | | | | | | |
| | | | | | | 5,143,377 | | | |
| |
Computers & Peripherals - 3.16% | | | |
Concurrent Computer Corp. | | | 75,700 | | | | 469,340 | | | |
Dot Hill Systems Corp.* | | | 199,900 | | | | 1,223,388 | | | |
Hutchinson Technology, Inc.*+ | | | 157,500 | | | | 269,325 | | | |
Novatel Wireless, Inc.*+ | | | 579,000 | | | | 1,881,750 | | | |
Smart Technologies, Inc., Class A* | | | 194,300 | | | | 185,770 | | | |
| | | | | | | | | | |
| | | | | | | 4,029,573 | | | |
| |
Construction & Engineering - 0.77% | | | |
Willdan Group, Inc.* | | | 87,800 | | | | 981,604 | | | |
| |
Distributors - 0.48% | | | |
AMCON Distributing Co. | | | 2,700 | | | | 210,087 | | | |
VOXX International Corp.* | | | 48,900 | | | | 404,892 | | | |
| | | | | | | | | | |
| | | | | | | 614,979 | | | |
| | |
Ultra-Small Company Fund SCHEDULE OF INVESTMENTS (continued) | | |
| Showing percentage of net assets as of June 30, 2015 | | |
| | | | | | | | | | |
| Industry Company | | Shares | | | Value | | | |
Common Stocks (continued) | | | | | | | | | | |
Diversified Consumer Services - 0.50% | | | |
Cambium Learning Group, Inc.* | | | 130,000 | | | | $ 555,100 | | | |
Lincoln Educational Services Corp. | | | 42,700 | | | | 86,254 | | | |
| | | | | | | | | | |
| | | | | | | 641,354 | | | |
| |
Diversified Financial Services - 0.30% | | | |
Resource America, Inc., Class A+ | | | 46,300 | | | | 389,383 | | | |
| |
Diversified Telecommunication Services - 0.69% | | | |
Alaska Communications | | | | | | | | | | |
Systems Group, Inc.* | | | 368,213 | | | | 883,711 | | | |
| |
Electrical Equipment - 3.42% | | | |
Allied Motion Technologies, Inc. | | | 96,509 | | | | 2,167,592 | | | |
Highpower International, Inc.*+ | | | 183,200 | | | | 701,656 | | | |
LSI Industries, Inc. | | | 74,600 | | | | 696,764 | | | |
Magnetek, Inc.* | | | 18,500 | | | | 636,585 | | | |
Ultralife Corp.* | | | 38,500 | | | | 161,315 | | | |
| | | | | | | | | | |
| | | | | | | 4,363,912 | | | |
| |
Electronic Equipment, Instruments & Components - 2.96% | | | |
IntriCon Corp.* | | | 21,500 | | | | 157,380 | | | |
Nam Tai Property, Inc.+ | | | 113,100 | | | | 545,142 | | | |
PCM, Inc.* | | | 33,700 | | | | 338,011 | | | |
Perceptron, Inc.*+ | | | 111,700 | | | | 1,179,552 | | | |
Planar Systems, Inc.* | | | 183,900 | | | | 801,804 | | | |
Wayside Technology Group, Inc. | | | 38,200 | | | | 757,124 | | | |
| | | | | | | | | | |
| | | | | | | 3,779,013 | | | |
| |
Energy Equipment & Services - 3.32% | | | |
Key Energy Services, Inc.* | | | 743,400 | | | | 1,338,120 | | | |
North American Energy Partners, Inc. | | | 73,900 | | | | 179,577 | | | |
Paragon Offshore PLC+ | | | 648,700 | | | | 707,083 | | | |
Pioneer Energy Services Corp.* | | | 100,500 | | | | 637,170 | | | |
Seventy Seven Energy, Inc.* | | | 322,100 | | | | 1,381,809 | | | |
| | | | | | | | | | |
| | | | | | | 4,243,759 | | | |
| |
Health Care Equipment & Supplies - 0.81% | | | |
RTI Surgical, Inc.* | | | 161,000 | | | | 1,040,060 | | | |
| |
Health Care Providers & Services - 4.72% | | | |
Almost Family, Inc.* | | | 41,600 | | | | 1,660,256 | | | |
Chembio Diagnostics, Inc.*+ | | | 107,500 | | | | 527,825 | | | |
Diversicare Healthcare Services, Inc. | | | 22,400 | | | | 288,960 | | | |
| | | | | | | | | | |
| | | | | | | | | | |
| | | | | | | | | | |
| Industry Company | | Shares | | | Value | | | |
| | | | | | | | | | |
Health Care Providers & Services (continued) | | | |
Five Star Quality Care, Inc.* | | | 286,200 | | | | $ 1,373,760 | | | |
RadNet, Inc.* | | | 326,400 | | | | 2,183,616 | | | |
| | | | | | | | | | |
| | | | | | | 6,034,417 | | | |
| |
Hotels, Restaurants & Leisure - 4.06% | | | |
Bravo Brio Restaurant Group, Inc.* | | | 109,700 | | | | 1,486,435 | | | |
Frisch’s Restaurants, Inc. | | | 5,900 | | | | 198,063 | | | |
Isle of Capri Casinos, Inc.* | | | 128,700 | | | | 2,335,905 | | | |
Luby’s, Inc.* | | | 49,700 | | | | 241,045 | | | |
Red Lion Hotels Corp.* | | | 51,700 | | | | 396,022 | | | |
Town Sports International Holdings, Inc.* | | | 180,000 | | | | 522,000 | | | |
| | | | | | | | | | |
| | | | | | | 5,179,470 | | | |
| |
Household Durables - 5.98% | | | |
Bassett Furniture Industries, Inc. | | | 41,000 | | | | 1,164,810 | | | |
CSS Industries, Inc. | | | 19,200 | | | | 580,800 | | | |
Flexsteel Industries, Inc. | | | 7,374 | | | | 317,746 | | | |
Hooker Furniture Corp. | | | 81,400 | | | | 2,043,954 | | | |
Skullcandy, Inc.* | | | 145,500 | | | | 1,115,985 | | | |
ZAGG, Inc.* | | | 304,100 | | | | 2,408,472 | | | |
| | | | | | | | | | |
| | | | | | | 7,631,767 | | | |
| |
Household Products - 0.16% | | | |
Oil-Dri Corp. of America+ | | | 6,700 | | | | 203,546 | | | |
| |
Independent Power Producers & Energy Traders - 1.56% | | | |
Atlantic Power Corp.+ | | | 645,300 | | | | 1,987,524 | | | |
| | | |
Insurance - 2.44% | | | | | | | | | | |
Blue Capital Reinsurance Holdings Ltd. | | | 15,500 | | | | 278,535 | | | |
CNinsure, Inc. - ADR* | | | 162,800 | | | | 1,437,524 | | | |
First Acceptance Corp.* | | | 43,500 | | | | 139,200 | | | |
Hallmark Financial Services, Inc.* | | | 99,500 | | | | 1,132,310 | | | |
Kingstone Cos., Inc. | | | 17,400 | | | | 132,240 | | | |
| | | | | | | | | | |
| | | | | | | 3,119,809 | | | |
| |
Internet & Catalog Retail - 0.08% | | | |
CafePress, Inc.* | | | 23,665 | | | | 106,492 | | | |
| |
Internet Software & Services - 4.37% | | | |
Autobytel, Inc.* | | | 115,400 | | | | 1,845,246 | | | |
BroadVision, Inc.*+ | | | 72,749 | | | | 437,221 | | | |
Inuvo, Inc.*+ | | | 105,000 | | | | 321,300 | | | |
Tucows, Inc., Class A*+ | | | 47,000 | | | | 1,308,950 | | | |
United Online, Inc.* | | | 106,400 | | | | 1,667,288 | | | |
| | | | | | | | | | |
| | | | | | | 5,580,005 | | | |
| | |
| 19 | | Annual Report | June 30, 2015 |
| | |
Ultra-Small Company Fund SCHEDULE OF INVESTMENTS (continued) | | |
| Showing percentage of net assets as of June 30, 2015 | | |
| | | | | | | | | | |
| Industry Company | | Shares | | | Value | | | |
Common Stocks (continued) | | | | | | | | | | |
IT Services - 4.29% | | | |
Edgewater Technology, Inc.* | | | 38,300 | | | | $ 279,590 | | | |
Hackett Group, Inc. (The) | | | 51,400 | | | | 690,302 | | | |
Information Services Group, Inc. | | | 30,238 | | | | 144,538 | | | |
Mattersight Corp.*+ | | | 74,600 | | | | 440,140 | | | |
NCI, Inc., Class A | | | 85,000 | | | | 878,050 | | | |
Newtek Business Services Corp.+ | | | 61,800 | | | | 1,095,096 | | | |
PFSweb, Inc.* | | | 140,500 | | | | 1,947,330 | | | |
| | | | | | | | | | |
| | | | | | | 5,475,046 | | | |
| |
Leisure Equipment & Products - 0.85% | | | |
Escalade, Inc.+ | | | 46,800 | | | | 860,652 | | | |
JAKKS Pacific, Inc.* | | | 22,229 | | | | 219,845 | | | |
| | | | | | | | | | |
| | | | | | | 1,080,497 | | | |
| |
Machinery - 4.16% | | | |
Accuride Corp.* | | | 304,300 | | | | 1,171,555 | | | |
Commercial Vehicle Group, Inc.* | | | 94,300 | | | | 679,903 | | | |
Hurco Companies, Inc. | | | 29,200 | | | | 1,010,904 | | | |
L.S. Starrett Co., Class A (The) | | | 18,200 | | | | 273,000 | | | |
Miller Industries, Inc. | | | 32,700 | | | | 652,365 | | | |
Twin Disc, Inc. | | | 38,800 | | | | 723,232 | | | |
Xerium Technologies, Inc.* | | | 43,800 | | | | 797,160 | | | |
| | | | | | | | | | |
| | | | | | | 5,308,119 | | | |
| |
Marine - 0.16% | | | |
Diana Containerships, Inc. | | | 100,000 | | | | 210,500 | | | |
| |
Media - 1.15% | | | |
Reading International, Inc., Class A* | | | 106,500 | | | | 1,475,025 | | | |
| |
Metals & Mining - 0.69% | | | |
Richmont Mines, Inc.* | | | 230,000 | | | | 729,100 | | | |
Synalloy Corp. | | | 11,497 | | | | 157,509 | | | |
| | | | | | | | | | |
| | | | | | | 886,609 | | | |
| |
Multiline Retail - 0.84% | | | |
Gordmans Stores, Inc.*+ | | | 175,900 | | | | 1,078,267 | | | |
| |
Oil, Gas & Consumable Fuels - 3.40% | | | |
Adams Resources & Energy, Inc. | | | 4,900 | | | | 218,540 | | | |
Energy XXI, Ltd.+ | | | 472,600 | | | | 1,242,938 | | | |
Geopark Ltd*+ | | | 43,900 | | | | 207,208 | | | |
Green Brick Partners, Inc.* | | | 60,400 | | | | 661,380 | | | |
Pacific Ethanol, Inc.*+ | | | 170,700 | | | | 1,761,624 | | | |
PrimeEnergy Corp.* | | | 4,300 | | | | 244,670 | | | |
| | | | | | | | | | |
| | | | | | | 4,336,360 | | | |
| | | | | | | | | | |
| | | | | | | | | | |
| | | | | | | | | | |
| Industry Company | | Shares | | | Value | | | |
| | | | | | | | | | |
Personal Products - 0.28% | | | |
Synutra International, Inc.*+ | | | 50,000 | | | | $ 357,500 | | | |
| |
Pharmaceuticals - 0.25% | | | |
Dipexium Pharmaceuticals, Inc.* | | | 24,600 | | | | 312,912 | | | |
| |
Professional Services - 1.69% | | | |
CRA International, Inc.* | | | 48,300 | | | | 1,346,121 | | | |
VSE Corp. | | | 15,200 | | | | 813,352 | | | |
| | | | | | | | | | |
| | | | | | | 2,159,473 | | | |
| |
Real Estate Investment Trusts (REITs) - 0.94% | | | |
Armada Hoffler Properties, Inc. | | | 90,000 | | | | 899,100 | | | |
Gyrodyne Special Distribution, LLCD | | | 5,100 | | | | 15,300 | | | |
Sotherly Hotels, Inc. | | | 40,800 | | | | 288,456 | | | |
| | | | | | | | | | |
| | | | | | | 1,202,856 | | | |
| |
Road & Rail - 4.46% | | | |
Covenant Transportation Group, Inc., Class A* | | | 74,700 | | | | 1,871,982 | | | |
P.A.M. Transportation Services, Inc.* | | | 37,700 | | | | 2,188,485 | | | |
USA Truck, Inc.* | | | 77,000 | | | | 1,634,710 | | | |
| | | | | | | | | | |
| | | | | | | 5,695,177 | | | |
| |
Semiconductors & Semiconductor Equipment - 7.12% | | | |
Alpha & Omega Semiconductor, Ltd.* | | | 50,000 | | | | 437,000 | | | |
ANADIGICS, Inc.* | | | 207,300 | | | | 151,329 | | | |
AXT, Inc.* | | | 98,000 | | | | 246,960 | | | |
Cascade Microtech, Inc.* | | | 54,203 | | | | 825,241 | | | |
CyberOptics Corp.* | | | 18,600 | | | | 188,046 | | | |
Mattson Technology, Inc.* | | | 658,000 | | | | 2,204,300 | | | |
NeoPhotonics Corp.*+ | | | 270,200 | | | | 2,466,926 | | | |
Sigma Designs, Inc.* | | | 216,000 | | | | 2,576,880 | | | |
| | | | | | | | | | |
| | | | | | | 9,096,682 | | | |
| |
Software - 1.46% | | | |
Bsquare Corp.* | | | 108,000 | | | | 732,240 | | | |
Envivio, Inc.* | | | 80,000 | | | | 152,000 | | | |
Evolving Systems, Inc. | | | 23,300 | | | | 208,768 | | | |
TeleCommunication Systems, Inc., Class A* | | | 234,200 | | | | 775,202 | | | |
| | | | | | | | | | |
| | | | | | | 1,868,210 | | | |
| |
Specialty Retail - 0.44% | | | |
Build-A-Bear Workshop, Inc.* | | | 35,000 | | | | 559,650 | | | |
| | |
Ultra-Small Company Fund SCHEDULE OF INVESTMENTS (continued) | | |
Showing percentage of net assets as of June 30, 2015
| | | | | | | | | | |
| Industry Company | | Shares | | | Value | | | |
Common Stocks (continued) | | | | | | | |
Textiles, Apparel & Luxury Goods - 1.87% | | | |
Lakeland Industries, Inc.* | | | 16,700 | | | | $ 191,048 | | | |
Rocky Brands, Inc. | | | 65,900 | | | | 1,232,330 | | | |
Superior Uniform Group, Inc. | | | 58,100 | | | | 960,974 | | | |
| | | | | | | | | | |
| | | | | | | 2,384,352 | | | |
| | | |
Thrifts & Mortgage Finance - 4.71% | | | | | | | | | | |
BankFinancial Corp. | | | 42,700 | | | | 503,006 | | | |
Charter Financial Corp. | | | 101,000 | | | | 1,253,410 | | | |
Citizens Community Bancorp, Inc. | | | 15,600 | | | | 142,896 | | | |
ESSA Bancorp, Inc. | | | 12,400 | | | | 159,464 | | | |
Home Bancorp, Inc.+ | | | 35,000 | | | | 883,400 | | | |
Impac Mortgage Holdings, Inc.*+ | | | 65,000 | | | | 1,244,100 | | | |
Malvern Bancorp, Inc.* | | | 11,200 | | | | 166,208 | | | |
Ocean Shore Holding Co. | | | 19,600 | | | | 290,766 | | | |
Provident Financial Holdings, Inc. | | | 12,100 | | | | 202,554 | | | |
Pulaski Financial Corp. | | | 11,500 | | | | 148,580 | | | |
Riverview Bancorp, Inc.+ | | | 70,600 | | | | 302,168 | | | |
Security National Financial Corp., Class A* | | | 19,600 | | | | 131,908 | | | |
Southern Missouri Bancorp, Inc.+ | | | 5,700 | | | | 107,445 | | | |
Territorial Bancorp, Inc. | | | 19,700 | | | | 477,922 | | | |
| | | | | | | | | | |
| | | | | | | 6,013,827 | | | |
| |
Trading Companies & Distributors - 0.49% | | | |
Lawson Products, Inc.* | | | 26,900 | | | | 631,612 | | | |
| | | | | | | | | | |
TOTAL COMMON STOCKS - 99.10% | | | | 126,565,938 | | | |
| | | | | | | | | | |
(Cost $109,557,468) | | | | | | | | | | |
| |
DIVIDEND NOTE - 0.01% | | | |
Gyrodyne Dividend Notes, 5%*D | | | 5,100 | | | | 8,007 | | | |
| | | | | | | | | | |
TOTAL DIVIDEND NOTE - 0.01% | | | | 8,007 | | | |
| | | | | | | | | | |
(Cost $ — ) | | | | | | | | | | |
| | | |
| Rate^ | | Shares | | | Value | | | |
MONEY MARKET FUND - 0.01% | | | | | | | | | | |
Dreyfus Cash Management
Fund 0.04% | | | 19,779 | | | | 19,779 | | | |
| | | | | | | | | | |
TOTAL MONEY MARKET
FUND - 0.01% | | | | | | | 19,779 | | | |
| | | | | | | | | | |
(Cost $19,779) | | | | | | | | | | |
| | | | | | | | | | | | |
| | | Rate^ | | | Shares | | | Value | |
INVESTMENTS PURCHASED WITH CASH PROCEEDS FROM SECURITIES LENDING - 8.85% | |
Dreyfus Cash Management Fund** | | | 0.04% | | | | 11,304,787 | | | | $ 11,304,787 | |
| | | | | | | | | | | | |
TOTAL INVESTMENTS PURCHASED WITH CASH PROCEEDS FROM SECURITIES LENDING - 8.85% | | | | | | | | | | | 11,304,787 | |
| | | | | | | | | | | | |
(Cost $11,304,787) | | | | | | | | | | | | |
| |
TOTAL INVESTMENTS - 107.97% | | | | 137,898,511 | |
(Cost $120,882,034) | | | | | | | | | | | | |
Liabilities in Excess of Other Assets - (7.97%) | | | | (10,181,846 | ) |
| | | | | | | | | | | | |
NET ASSETS - 100.00% | | | | $127,716,665 | |
| | | | | | | | | | | | |
| * | Non-income producing security. |
| ** | This security represents the investment of the collateral received in connection with securities out on loan as of June 30, 2015. |
| ^ | Rate disclosed as of June 30, 2015. |
| D | Security was fair valued under procedures adopted by the Board of Directors (see Note 2). |
| + | This security or a portion of the security is out on loan as of June 30, 2015. Total loaned securities had a value of $ 10,970,434 as of June 30, 2015. |
ADR - American Depositary Receipt
PLC - Public Limited Company
Summary of inputs used to value the Fund’s investments as of 06/30/2015 (See Note 2 in Notes to Financial Statements):
| | | | | | | | | | | | | | | | |
| | | Valuation Inputs | |
| | | Investment in Securities (Value) | |
| | | Level 1 Quoted Prices | | | Level 2 Significant Observable
Inputs | | | Level 3 Significant Unobservable
Inputs | | | Total | |
Common Stocks | | $ | 126,550,638 | | | $ | — | | | $ | 15,300 | | | $ | 126,565,938 | |
Dividend Note | | | — | | | | — | | | | 8,007 | | | | 8,007 | |
Money Market Fund | | | — | | | | 19,779 | | | | — | | | | 19,779 | |
Investments Purchased with Cash Proceeds from Securities Lending | | | — | | | | 11,304,787 | | | | — | | | | 11,304,787 | |
| | | | | | | | | | | | | | | | |
TOTAL | | $ | 126,550,638 | | | $ | 11,324,566 | | | $ | 23,307 | | | $ | 137,898,511 | |
| | | | | | | | | | | | | | | | |
| | |
| 21 | | Annual Report | June 30, 2015 |
| | |
Ultra-Small Company Fund SCHEDULE OF INVESTMENTS (continued) | | |
Showing percentage of net assets as of June 30, 2015 | | |
| | | | | | | | | | | | | | |
Following is a reconciliation of Level 3 investments for which significant unobservable inputs were used to determine fair value: | | | |
| | | Investment in Securities (Value) | | | |
| | | Common Stocks | | | Dividend Note | | | Total | | | |
Balance as of 06/30/2014 | | | $ 272,250 | | | | $ — | | | | $ 272,250 | | | |
Purchases | | | — | | | | — | | | | — | | | |
Sales | | | — | | | | — | | | | — | | | |
Realized gain/(loss) | | | — | | | | — | | | | — | | | |
Change in
unrealized
appreciation/
(depreciation)1 | | | — | | | | 8,007 | | | | 8,007 | | | |
Transfers in | | | — | | | | — | | | | — | | | |
Transfers out2,3 | | | (256,950) | | | | — | | | | (256,950) | | | |
| | | | | | | | | | | | | | |
Balance as of 06/30/2015 | | | $ 15,300 | | | | $8,007 | | | | $ 23,307 | | | |
| | | | | | | | | | | | | | |
Net change in unrealized appreciation (depreciation) from investments held as of 06/30/2015 | | | $ — | | | | $8,007 | | | | $ 8,007 | | | |
| | | | | | | | | | | | | | |
1 Change in unrealized appreciation/(depreciation) for Level 3 securities is included on the Statements of Operations in the Change in Unrealized Appreciation (Depreciation) on Investments. 2 Transfers out represent the value as of the beginning of the reporting period, for any investment security where significant transfers in the pricing level occurred during the period. The security transferred from level 3 to level 1. 3 Transfer took place as a result of the availability of a quoted price in active market. See Notes to Financial Statements. | | | |
| | |
Ultra-Small Company Market Fund MANAGER’S COMMENTARY (Unaudited) | | |
June 30, 2015
Dear Fellow Ultra-Small Company Market Fund Shareholder,
For the quarter ended June 30, 2015, our Fund declined 0.06%, underperforming our primary market benchmark, the CRSP Cap-Based Portfolio 10 Index (+0.51%), our peer benchmark, the Lipper Micro-Cap Stock Funds Index (+1.36%), the Russell Microcap Index (+2.80%) and the Russell 2000 Index (+0.42%). It was a poor quarter.
For the fiscal year, our Fund returned 3.72%, outperforming our primary market benchmark, the CRSP Cap-Based Portfolio 10 Index (+1.45%). However, the Fund trailed our peer benchmark, the Lipper Micro-Cap Stock Funds Index (+4.73%), the Russell Microcap Index (+8.21%) and the Russell 2000 Index (+6.49%).
The table below presents our June quarter, one-year, five-year, 10-year, 15-year, and inception-to-date financial results. See the next page for a graph of performance since inception.
Standardized Returns as of June 30, 2015
| | | | | | | | | | | | |
| | | | | | | Annualized |
| | | Quarter | | 1 Year | | 5 Years | | 10 Years | | 15 Years | | Since Inception
(7/31/97) |
| | | | | | |
Ultra-Small Company Market Fund | | -0.06% | | 3.72% | | 17.71% | | 6.86% | | 11.45% | | 11.23% |
CRSP Cap-Based Portfolio 10 Index | | 0.51% | | 1.45% | | 15.43% | | 9.19% | | 11.99% | | 11.55% |
Russell 2000 Index | | 0.42% | | 6.49% | | 17.08% | | 8.40% | | 7.50% | | 7.77% |
Russell Microcap Index | | 2.80% | | 8.21% | | 17.48% | | 7.07% | | 7.79% | | N/A |
Lipper Micro-Cap Stock Funds Index | | 1.36% | | 4.73% | | 16.39% | | 7.64% | | 6.44% | | 8.12% |
Performance figures quoted in the table above represent past performance and are no guarantee of future results. Total return figures in the table above include the reinvestment of dividends and capital gains. The table above does not reflect the deduction of taxes that a shareholder would pay on Fund distributions or on the redemption of Fund shares.
The CRSP Cap-Based Portfolio 10 Index is an unmanaged index of 848 of the smallest publicly traded U.S. stocks (with dividends reinvested), as reported by the Center for Research on Security Prices. The Russell Microcap Index is an unmanaged, market value-weighted index that measures performance of 1,000 of the smallest securities in the Russell 2000 Index. The Russell 2000 Index is an unmanaged, market value-weighted index that measures performance of the 2,000 companies that are between the 1,000th and 3,000th largest in the market with dividends reinvested. The Lipper Micro-Cap Stock Funds Index is an index of micro-cap funds compiled by Lipper, Inc. It is not possible to invest directly in an index. Periods longer than one year are annualized.
According to data from Lipper, Inc. as of June 30, 2015, Ultra-Small Company Market Fund ranked 46th of 68 micro-cap funds for the 12 months ending June 30, 2015, 17th of 53 over the last five years, 25th of 36 over the last 10 years, and 3rd of 17 since inception in July 1997. Lipper, Inc. is an independent mutual fund rating service that ranks funds in various fund categories by making comparative calculations using total returns.
| | |
| 23 | | Annual Report | June 30, 2015 |
| | |
Ultra-Small Company Market Fund MANAGER’S COMMENTARY (Unaudited) (continued) | | |
Ultra-Small Company Market Fund vs. CRSP Cap-Based Portfolio 10 Index, Russell Microcap Index*, Russell 2000 Index & Lipper Micro-Cap Stock Funds Index from Inception 7/31/97 to 6/30/15
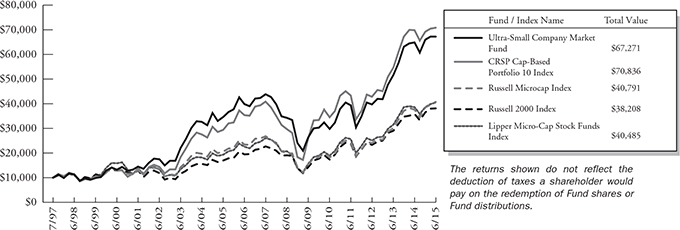
| * | The Russell Microcap Index began on 6/30/2000, and the line graph for the Index begins at the same value as the Fund on that date. |
Detailed Explanation of Quarterly Performance
Our Fund lagged its primary benchmark, the CRSP Cap-Based Portfolio 10 Index, for the quarter. Our investment strategy is to approximate the long-term returns of the CRSP Cap-Based Portfolio 10 Index of ultra-small companies by investing in a representative sample of ultra-small company stocks. In order to keep the Fund’s turnover low, the Fund’s adviser does not sell a stock immediately when it outgrows the CRSP 10 (ultra-small) size threshold. While a majority of the Fund’s assets are ultra-small, holdings in slightly larger-cap stocks detracted from the Fund’s relative performance, as these holdings did not perform as well as the overall market for such market caps.
On a positive note, our sidestepping models, which seek to avoid up to ten percent of the universe of ultra-small stocks that may go bankrupt or plummet precipitously, performed favorably this quarter. Additionally, an underweighted position in the lagging Energy sector compared to our benchmark helped the Fund’s relative performance.
The table below presents index performance numbers of stocks in the different deciles for various time periods.
| | | | | | | | | | | | | | | | | | | | |
| CRSP Decile1 | | Quarter | | | 1 Year | | | 5 Years | | | 10 Years | | | 89.5 Years | |
1 (ultra-large) | | | 0.79% | | | | 7.21% | | | | 16.89% | | | | 7.66% | | | | 9.33% | |
2 | | | -1.61% | | | | 7.54% | | | | 18.68% | | | | 9.45% | | | | 10.60% | |
3 | | | -0.77% | | | | 8.75% | | | | 18.76% | | | | 9.49% | | | | 11.12% | |
4 | | | 0.09% | | | | 4.06% | | | | 18.90% | | | | 10.13% | | | | 11.00% | |
5 | | | -0.38% | | | | 4.62% | | | | 18.71% | | | | 11.46% | | | | 11.65% | |
6 | | | 1.33% | | | | 3.47% | | | | 18.67% | | | | 9.45% | | | | 11.50% | |
7 | | | 0.92% | | | | 5.86% | | | | 18.84% | | | | 10.25% | | | | 11.64% | |
8 | | | 1.79% | | | | 5.13% | | | | 17.89% | | | | 10.40% | | | | 11.68% | |
9 | | | 0.95% | | | | 2.31% | | | | 16.85% | | | | 8.97% | | | | 11.59% | |
10 (ultra-small) | | | 0.51% | | | | 1.45% | | | | 15.43% | | | | 9.19% | | | | 13.49% | |
| 1 | Performance figures are as of the period ended June 30, 2015. The CRSP Cap-Based Portfolio Indexes are unmanaged indexes of publicly traded U.S. stocks with dividends reinvested, grouped by market capitalization, as reported by the Center for Research in Security Prices. Past performance is no guarantee of future results. |
| | |
Ultra-Small Company Market Fund MANAGER’S COMMENTARY (Unaudited) (continued) | | |
Detailed Explanation of Fiscal Year Performance
Our Fund outperformed its primary benchmark, the CRSP Cap-Based Portfolio 10 Index, for the fiscal year. Our strategy of avoiding a relatively small percentage of stocks that can be very damaging in downturns, as well as our strategy of not immediately selling stocks that outgrow the CRSP 10 size of ultra-small stocks, added to our relative performance for the fiscal year. Additionally, the Fund benefited from an underweighted position in the Energy sector, one of the worst performing sectors. We are pleased with the Fund’s performance in line with Fund design.
Top Ten Holdings as of June 30, 2015
| | | | | | | | | |
| Rank | | Description | | Industry | | % of Net
Assets |
| 1 | | Eagle Pharmaceuticals, Inc. | | Biotechnology | | | | 0.6% | |
| 2 | | Utah Medical Products, Inc. | | Health Care Equipment & Supplies | | | | 0.5% | |
| 3 | | Bassett Furniture Industries, Inc. | | Household Durables | | | | 0.5% | |
| 4 | | Isle of Capri Casinos, Inc. | | Hotels, Restaurants & Leisure | | | | 0.5% | |
| 5 | | Tucows, Inc., Class A | | Internet Software & Services | | | | 0.5% | |
| 6 | | Nautilus, Inc. | | Leisure Equipment & Products | | | | 0.5% | |
| 7 | | Retrophin, Inc. | | Biotechnology | | | | 0.5% | |
| 8 | | HomeStreet, Inc. | | Thrifts & Mortgage Finance | | | | 0.4% | |
| 9 | | Hurco Companies, Inc. | | Machinery | | | | 0.4% | |
| 10 | | Lifeway Foods, Inc. | | Food Products | | | | 0.4% | |
| | Total | | | | | | 4.8% | |
Industry Sector Representation as of June 30, 2015
| | | | | | | | | | |
| | | % of Net Assets | | | | % of CRSP 10 Index | | | | Difference |
Consumer Discretionary | | 13.1% | | | | 12.2% | | | | 0.9% |
Consumer Staples | | 3.4% | | | | 2.8% | | | | 0.6% |
Energy | | 7.3% | | | | 8.9% | | | | -1.6% |
Financials | | 20.8% | | | | 21.8% | | | | -1.0% |
Health Care | | 17.3% | | | | 17.3% | | | | 0.0% |
Industrials | | 11.2% | | | | 11.6% | | | | -0.4% |
Information Technology | | 20.3% | | | | 19.8% | | | | 0.5% |
Materials | | 3.4% | | | | 3.8% | | | | -0.4% |
Telecommunication Services | | 1.4% | | | | 0.9% | | | | 0.5% |
Utilities | | 0.9% | | | | 0.9% | | | | 0.0% |
Cash & Other Assets | | 0.9% | | | | 0.0% | | | | 0.9% |
Total | | 100.0% | | | | 100.0% | | | | |
Disclaimer
The views expressed here are exclusively those of Fund management. These views, including those related to market sectors or individual stocks, are not meant as investment advice and should not be considered predictive in nature. Any favorable (or unfavorable) description of a holding applies only as of the quarter end, June 30, 2015, unless otherwise stated. Security positions can and do change thereafter. Discussions of historical performance do not guarantee and may not be indicative of future performance.
The Fund is subject to very high, above market risk (volatility) and is not an appropriate investment for short-term investors. Investments in ultra-small companies generally carry greater risk than is customarily associated with larger companies and even “small companies,” for various reasons, such as narrower markets (fewer investors), limited financial resources and greater trading difficulty.
| | |
| 25 | | Annual Report | June 30, 2015 |
| | |
Ultra-Small Company Market Fund MANAGER’S COMMENTARY (Unaudited) (continued) | | |
Conclusion
Thank you for your continued investment in Ultra-Small Company Market Fund. We encourage your feedback; your reactions and concerns are important to us.
Sincerely,
The Investment Management Team
| | |
Ultra-Small Company Market Fund SCHEDULE OF INVESTMENTS | | |
Showing percentage of net assets as of June 30, 2015
| | | | | | | | | | |
| Industry Company | | Shares | | | Value | | | |
COMMON STOCKS - 99.09% | | | |
Aerospace & Defense - 0.98% | | | |
Air Industries Group+ | | | 1,500 | | | | $ 15,225 | | | |
Arotech Corp.*+ | | | 82,163 | | | | 198,013 | | | |
Breeze-Eastern Corp.* | | | 4,000 | | | | 46,000 | | | |
CPI Aerostructures, Inc.* | | | 31,479 | | | | 315,105 | | | |
Ducommun, Inc.* | | | 25,300 | | | | 649,451 | | | |
Erickson, Inc.* | | | 31,443 | | | | 136,463 | | | |
Innovative Solutions & Support, Inc.* | | | 132,354 | | | | 436,768 | | | |
LMI Aerospace, Inc.*+ | | | 44,558 | | | | 446,026 | | | |
SIFCO Industries, Inc. | | | 19,222 | | | | 286,408 | | | |
Sparton Corp.* | | | 48,300 | | | | 1,319,556 | | | |
Sypris Solutions, Inc. | | | 25,000 | | | | 36,250 | | | |
Tel-Instrument Electronics Corp.*+ | | | 15,000 | | | | 73,500 | | | |
| | | | | | | | | | |
| | | | | | | 3,958,765 | | | |
| |
Air Freight & Logistics - 0.23% | | | |
Radiant Logistics, Inc.* | | | 125,000 | | | | 913,750 | | | |
| |
Auto Components - 1.03% | | | |
China XD Plastics Co., Ltd.* | | | 91,000 | | | | 548,730 | | | |
Fuel Systems Solutions, Inc.* | | | 18,000 | | | | 134,640 | | | |
Shiloh Industries, Inc.*+ | | | 53,350 | | | | 690,882 | | | |
SORL Auto Parts, Inc.*+ | | | 109,900 | | | | 358,274 | | | |
Spartan Motors, Inc. | | | 169,800 | | | | 777,684 | | | |
Stoneridge, Inc.* | | | 28,547 | | | | 334,285 | | | |
Strattec Security Corp. | | | 19,100 | | | | 1,312,170 | | | |
| | | | | | | | | | |
| | | | | | | 4,156,665 | | | |
| |
Beverages - 0.78% | | | |
Castle Brands, Inc.* | | | 149,187 | | | | 207,370 | | | |
Craft Brew Alliance, Inc.* | | | 92,200 | | | | 1,019,732 | | | |
MGP Ingredients, Inc. | | | 75,862 | | | | 1,275,999 | | | |
Primo Water Corp.* | | | 112,930 | | | | 645,960 | | | |
| | | | | | | | | | |
| | | | | | | 3,149,061 | | | |
| |
Biotechnology - 7.87% | | | |
Achillion Pharmaceuticals, Inc.* | | | 100,000 | | | | 886,000 | | | |
Actinium Pharmaceuticals, Inc.* | | | 114,043 | | | | 302,214 | | | |
Akebia Therapeutics, Inc.*+ | | | 85,250 | | | | 877,223 | | | |
Applied Genetic Technologies Corp.* | | | 655 | | | | 10,048 | | | |
Aquinox Pharmaceuticals, Inc.*+ | | | 15,000 | | | | 104,100 | | | |
Ardelyx, Inc.*+ | | | 30,000 | | | | 479,100 | | | |
Argos Therapeutics, Inc.*+ | | | 40,000 | | | | 274,000 | | | |
Arqule, Inc.* | | | 191,493 | | | | 306,389 | | | |
| | | | | | | | | | |
| | | | | | | | | | |
| | | | | | | | | | |
| | | | | | | | | | |
| Industry Company | | Shares | | | Value | | | |
| | | |
Biotechnology (continued) | | | |
Asterias Biotherapeutics, Inc.*+ | | | 13,125 | | | | $ 60,375 | | | |
AVEO Pharmaceuticals, Inc.* | | | 180,000 | | | | 313,200 | | | |
BIND Therapeutics, Inc.*+ | | | 35,000 | | | | 195,650 | | | |
BioSpecifics Technologies Corp.* | | | 22,314 | | | | 1,151,402 | | | |
Biota Pharmaceuticals, Inc.* | | | 48,234 | | | | 99,844 | | | |
Cara Therapeutics, Inc.* | | | 58,867 | | | | 715,234 | | | |
CareDx, Inc.*+ | | | 10,000 | | | | 65,000 | | | |
Celladon Corp.*+ | | | 55,900 | | | | 70,434 | | | |
Cerulean Pharma, Inc.* | | | 86,200 | | | | 396,520 | | | |
ChemoCentryx, Inc.*+ | | | 50,000 | | | | 411,500 | | | |
Codexis, Inc.* | | | 150,500 | | | | 585,445 | | | |
Conatus Pharmaceuticals, Inc.*+ | | | 65,000 | | | | 334,750 | | | |
Concert Pharmaceuticals, Inc.*+ | | | 43,500 | | | | 647,715 | | | |
CorMedix, Inc.*+ | | | 55,000 | | | | 213,400 | | | |
Curis, Inc.* | | | 220,000 | | | | 728,200 | | | |
Dicerna Pharmaceuticals, Inc.* | | | 45,000 | | | | 627,750 | | | |
Eagle Pharmaceuticals, Inc.* | | | 31,968 | | | | 2,584,932 | | | |
Eleven Biotherapeutics, Inc.*+ | | | 50,000 | | | | 141,000 | | | |
Fate Therapeutics, Inc.*+ | | | 37,000 | | | | 239,390 | | | |
Five Prime Therapeutics, Inc.* | | | 35,000 | | | | 869,400 | | | |
Flexion Therapeutics, Inc.* | | | 30,000 | | | | 656,700 | | | |
Genocea Biosciences, Inc.*+ | | | 25,000 | | | | 343,250 | | | |
Geron Corp.*+ | | | 315,000 | | | | 1,348,200 | | | |
GlycoMimetics, Inc.* | | | 60,264 | | | | 479,099 | | | |
Harvard Apparatus Regenerative Technology, Inc.* | | | 20,000 | | | | 28,600 | | | |
Immunomedics, Inc.*+ | | | 222,900 | | | | 904,974 | | | |
IsoRay, Inc.*+ | | | 155,000 | | | | 229,400 | | | |
Loxo Oncology, Inc.*+ | | | 30,000 | | | | 540,900 | | | |
Medgenics, Inc.* | | | 100,000 | | | | 613,000 | | | |
MediciNova, Inc.*+ | | | 63,792 | | | | 251,978 | | | |
Minerva Neurosciences, Inc.* | | | 20,000 | | | | 116,000 | | | |
NanoViricides, Inc.* | | | 137,163 | | | | 237,292 | | | |
Neuralstem, Inc.*+ | | | 133,983 | | | | 259,927 | | | |
Ocata Therapeutics, Inc.*+ | | | 71,282 | | | | 375,656 | | | |
Oncothyreon, Inc.* | | | 424,988 | | | | 1,589,455 | | | |
OvaScience, Inc.*+ | | | 25,000 | | | | 723,250 | | | |
Pfenex, Inc.*+ | | | 2,000 | | | | 38,800 | | | |
PharmAthene, Inc.*+ | | | 188,826 | | | | 339,887 | | | |
| | |
| 27 | | Annual Report | June 30, 2015 |
| | |
Ultra-Small Company Market Fund SCHEDULE OF INVESTMENTS (continued) | | |
Showing percentage of net assets as of June 30, 2015
| | | | | | | | | | |
| Industry Company | | Shares | | | Value | | | |
| |
Common Stocks (continued) | | | |
Biotechnology (continued) | | | |
Protalix BioTherapeutics, Inc.* | | | 296,428 | | | | $ 578,035 | | | |
Proteon Therapeutics, Inc.*+ | | | 11,835 | | | | 211,373 | | | |
Regulus Therapeutics, Inc.*+ | | | 50,000 | | | | 548,000 | | | |
Repligen Corp.* | | | 30,000 | | | | 1,238,100 | | | |
Retrophin, Inc.* | | | 54,900 | | | | 1,819,935 | | | |
Rexahn Pharmaceuticals, Inc.* | | | 180,000 | | | | 109,386 | | | |
Rigel Pharmaceuticals, Inc.* | | | 150,000 | | | | 481,500 | | | |
Synergy Pharmaceuticals, Inc.*+ | | | 61,674 | | | | 511,894 | | | |
Synthetic Biologics, Inc.* | | | 50,000 | | | | 142,500 | | | |
TetraLogic Pharmaceuticals Corp.*+ | | | 10,050 | | | | 23,517 | | | |
Tetraphase Pharmaceuticals, Inc.* | | | 25,000 | | | | 1,186,000 | | | |
Tokai Pharmaceuticals, Inc.*+ | | | 10,000 | | | | 133,000 | | | |
Trevena, Inc.* | | | 37,337 | | | | 233,730 | | | |
Vanda Pharmaceuticals, Inc.*+ | | | 59,300 | | | | 752,517 | | | |
Verastem, Inc.*+ | | | 75,000 | | | | 565,500 | | | |
Vical, Inc.* | | | 200,000 | | | | 140,000 | | | |
Vitae Pharmaceuticals, Inc.* | | | 10,100 | | | | 145,440 | | | |
XOMA Corp.*+ | | | 29,000 | | | | 112,520 | | | |
| | | | | | | | | | |
| | | | | | | 31,699,530 | | | |
| |
Building Products - 0.11% | | | |
Alpha Pro Tech, Ltd.* | | | 106,700 | | | | 239,008 | | | |
Ameresco, Inc., Class A* | | | 24,548 | | | | 187,792 | | | |
| | | | | | | | | | |
| | | | | | | 426,800 | | | |
| |
Capital Markets - 1.69% | | | |
Calamos Asset Management, Inc., Class A | | | 53,500 | | | | 655,375 | | | |
FBR & Co.* | | | 43,575 | | | | 1,008,326 | | | |
Institutional Financial Markets, Inc. | | | 30,000 | | | | 42,000 | | | |
JMP Group LLC | | | 96,851 | | | | 755,438 | | | |
KCAP Financial, Inc.+ | | | 93,900 | | | | 561,522 | | | |
Manning & Napier, Inc. | | | 61,100 | | | | 609,167 | | | |
Medallion Financial Corp.+ | | | 86,711 | | | | 724,037 | | | |
OFS Capital Corp.+ | | | 39,700 | | | | 476,400 | | | |
Oppenheimer Holdings, Inc., Class A | | | 31,550 | | | | 829,134 | | | |
Pzena Investment Management, Inc., Class A | | | 52,800 | | | | 583,440 | | | |
| | | | | | | | | | |
| | | | | | | | | | |
| | | | | | | | | | |
| | | | | | | | | | |
| Industry Company | | Shares | | | Value | | | |
| | | |
Capital Markets (continued) | | | |
Silvercrest Asset Management Group LLC,
Class A+ | | | 39,258 | | | | $ 551,967 | | | |
| | | | | | | | | | |
| | | | | | | 6,796,806 | | | |
| |
Chemicals - 1.66% | | | |
BioAmber, Inc.*+ | | | 11,480 | | | | 98,728 | | | |
Chase Corp. | | | 27,800 | | | | 1,105,050 | | | |
Core Molding Technologies, Inc.* | | | 45,100 | | | | 1,030,084 | | | |
Flexible Solutions International, Inc.* | | | 1,200 | | | | 2,460 | | | |
Gulf Resources, Inc.* | | | 212,900 | | | | 439,638 | | | |
KMG Chemicals, Inc. | | | 40,100 | | | | 1,020,144 | | | |
Landec Corp.* | | | 69,200 | | | | 998,556 | | | |
Marrone Bio Innovations, Inc.* | | | 80,600 | | | | 159,588 | | | |
Northern Technologies International Corp.* | | | 13,950 | | | | 224,595 | | | |
OMNOVA Solutions, Inc.* | | | 66,000 | | | | 494,340 | | | |
Trecora Resources* | | | 74,649 | | | | 1,127,200 | | | |
| | | | | | | | | | |
| | | | | | | 6,700,383 | | | |
| |
Commercial Banks - 10.55% | | | |
1st Constitution Bancorp*+ | | | 12,127 | | | | 139,339 | | | |
Access National Corp. | | | 33,500 | | | | 651,240 | | | |
American National Bankshares, Inc. | | | 22,100 | | | | 526,201 | | | |
American River Bankshares* | | | 56,000 | | | | 521,920 | | | |
AmeriServ Financial, Inc. | | | 155,671 | | | | 518,384 | | | |
Anchor Bancorp, Inc.*+ | | | 10,000 | | | | 224,900 | | | |
Bank of Commerce Holdings | | | 87,441 | | | | 501,037 | | | |
Bar Harbor Bankshares | | | 18,000 | | | | 637,740 | | | |
BB&T Corp. | | | 16,302 | | | | 657,134 | | | |
BCB Bancorp, Inc. | | | 23,500 | | | | 287,170 | | | |
C&F Financial Corp. | | | 6,300 | | | | 233,415 | | | |
Camden National Corp. | | | 11,800 | | | | 456,660 | | | |
Capital City Bank Group, Inc. | | | 50,390 | | | | 769,455 | | | |
Carolina Bank Holdings, Inc.* | | | 27,000 | | | | 327,105 | | | |
Century Bancorp, Inc., Class A | | | 23,272 | | | | 946,240 | | | |
Citizens Holding Co.+ | | | 20,670 | | | | 429,523 | | | |
CNB Financial Corp. | | | 42,200 | | | | 776,480 | | | |
Codorus Valley Bancorp, Inc. | | | 13,230 | | | | 267,643 | | | |
Colony Bankcorp, Inc.* | | | 16,668 | | | | 150,012 | | | |
| | |
Ultra-Small Company Market Fund SCHEDULE OF INVESTMENTS (continued) | | |
Showing percentage of net assets as of June 30, 2015
| | | | | | | | | | |
| Industry Company | | Shares | | | Value | | | |
| |
Common Stocks (continued) | | | |
Commercial Banks (continued) | | | |
Community West Bancshares | | | 19,266 | | | | $ 127,156 | | | |
Eastern Virginia Bankshares, Inc. | | | 48,536 | | | | 306,262 | | | |
Enterprise Bancorp, Inc. | | | 9,502 | | | | 222,727 | | | |
Evans Bancorp, Inc. | | | 16,701 | | | | 404,999 | | | |
Farmers Capital Bank Corp.* | | | 57,149 | | | | 1,624,746 | | | |
Fidelity Southern Corp. | | | 36,074 | | | | 629,131 | | | |
Financial Institutions, Inc. | | | 31,900 | | | | 792,396 | | | |
First Bancorp | | | 33,200 | | | | 553,776 | | | |
First Bancorp, Inc. | | | 33,300 | | | | 647,352 | | | |
First Bancshares, Inc.+ | | | 12,794 | | | | 213,020 | | | |
First Business Financial Services, Inc. | | | 18,354 | | | | 860,436 | | | |
First Community Bancshares, Inc. | | | 15,000 | | | | 273,300 | | | |
First South Bancorp, Inc.+ | | | 33,322 | | | | 263,244 | | | |
First United Corp.* | | | 9,200 | | | | 79,672 | | | |
First West Virginia Bancorp+ | | | 8,100 | | | | 178,767 | | | |
German American Bancorp, Inc. | | | 17,500 | | | | 515,375 | | | |
Guaranty Bancorp | | | 61,440 | | | | 1,014,374 | | | |
Heritage Commerce Corp. | | | 74,300 | | | | 714,023 | | | |
Horizon Bancorp | | | 23,500 | | | | 586,560 | | | |
Independent Bank Corp., MI | | | 70,000 | | | | 949,200 | | | |
Landmark Bancorp, Inc. | | | 11,035 | | | | 267,709 | | | |
LNB Bancorp, Inc. | | | 36,700 | | | | 678,950 | | | |
Macatawa Bank Corp.+ | | | 51,500 | | | | 272,950 | | | |
MBT Financial Corp.* | | | 57,485 | | | | 329,964 | | | |
Mercantile Bank Corp. | | | 29,892 | | | | 639,988 | | | |
Merchants Bancshares, Inc. | | | 28,700 | | | | 949,109 | | | |
Metro Bancorp, Inc. | | | 40,600 | | | | 1,061,284 | | | |
MidSouth Bancorp, Inc. | | | 35,900 | | | | 547,834 | | | |
MidWestOne Financial Group, Inc. | | | 31,300 | | | | 1,030,396 | | | |
MutualFirst Financial, Inc.+ | | | 9,849 | | | | 228,792 | | | |
NewBridge Bancorp | | | 86,806 | | | | 775,178 | | | |
Northeast Bancorp | | | 35,000 | | | | 348,250 | | | |
Northrim BanCorp, Inc. | | | 34,700 | | | | 889,361 | | | |
Ohio Valley Banc Corp. | | | 19,500 | | | | 441,285 | | | |
Old Second Bancorp, Inc.* | | | 95,000 | | | | 627,000 | | | |
Pacific Continental Corp. | | | 53,611 | | | | 725,357 | | | |
Pacific Mercantile Bancorp* | | | 48,521 | | | | 368,274 | | | |
Pacific Premier Bancorp, Inc.* | | | 23,500 | | | | 398,560 | | | |
Park Sterling Corp. | | | 120,700 | | | | 869,040 | | | |
Peapack Gladstone Financial Corp. | | | 39,777 | | | | 883,845 | | | |
Penns Woods Bancorp, Inc. | | | 16,400 | | | | 723,076 | | | |
Peoples Bancorp of North Carolina, Inc. | | | 34,901 | | | | 640,084 | | | |
| | | | | | | | | | |
| | | | | | | | | | |
| | | | | | | | | | |
| | | | | | | | | | |
| Industry Company | | Shares | | | Value | | | |
| | | |
Commercial Banks (continued) | | | |
Preferred Bank | | | 33,680 | | | | $ 1,012,084 | | | |
Premier Financial Bancorp, Inc. | | | 43,837 | | | | 677,282 | | | |
QCR Holdings, Inc. | | | 33,900 | | | | 737,664 | | | |
Republic First Bancorp, Inc.*+ | | | 23,000 | | | | 79,810 | | | |
Royal Bancshares of Pennsylvania, Inc., Class A* | | | 78,195 | | | | 156,390 | | | |
SB Financial Group, Inc.+ | | | 9,641 | | | | 102,098 | | | |
Select Bancorp, Inc.* | | | 10,076 | | | | 71,540 | | | |
Shore Bancshares, Inc.* | | | 25,000 | | | | 235,750 | | | |
Sierra Bancorp | | | 42,900 | | | | 742,599 | | | |
Southcoast Financial Corp.*+ | | | 49,500 | | | | 399,960 | | | |
Southern First Bancshares, Inc.*+ | | | 32,215 | | | | 576,648 | | | |
Southern National Bancorp of Virginia, Inc.+ | | | 70,892 | | | | 785,483 | | | |
Southwest Bancorp, Inc. | | | 73,100 | | | | 1,360,391 | | | |
Suffolk Bancorp | | | 37,000 | | | | 949,420 | | | |
West Bancorporation, Inc. | | | 48,200 | | | | 956,288 | | | |
Yadkin Financial Corp.* | | | 1 | | | | 21 | | | |
| | | | | | | | | | |
| | | | | | | 42,517,828 | | | |
| |
Commercial Services & Supplies - 0.96% | | | |
Acme United Corp. | | | 3,000 | | | | 54,300 | | | |
AMREP Corp.*+ | | | 17,000 | | | | 86,700 | | | |
Casella Waste Systems, Inc., Class A* | | | 167,656 | | | | 940,550 | | | |
Cenveo, Inc.*+ | | | 282,098 | | | | 598,048 | | | |
CompX International, Inc. | | | 3,200 | | | | 36,480 | | | |
Ecology & Environment, Inc., Class A | | | 3,000 | | | | 31,260 | | | |
Fuel Tech, Inc.* | | | 69,400 | | | | 151,986 | | | |
Heritage-Crystal Clean, Inc.* | | | 23,000 | | | | 338,100 | | | |
Intersections, Inc.*+ | | | 85,300 | | | | 261,871 | | | |
Performant Financial Corp.* | | | 81,000 | | | | 262,440 | | | |
TRC Cos., Inc.* | | | 94,275 | | | | 956,891 | | | |
Versar, Inc.* | | | 33,000 | | | | 130,020 | | | |
| | | | | | | | | | |
| | | | | | | 3,848,646 | | | |
| |
Communications Equipment - 2.42% | | | |
Alliance Fiber Optic Products, Inc.+ | | | 45,000 | | | | 834,750 | | | |
Applied Optoelectronics, Inc.*+ | | | 30,000 | | | | 520,800 | | | |
Aviat Networks, Inc.* | | | 350,239 | | | | 441,301 | | | |
Bel Fuse, Inc., Class B | | | 44,700 | | | | 917,244 | | | |
Clearfield, Inc.*+ | | | 48,300 | | | | 768,453 | | | |
Communications Systems, Inc. | | | 36,000 | | | | 378,360 | | | |
| | |
| 29 | | Annual Report | June 30, 2015 |
| | |
Ultra-Small Company Market Fund SCHEDULE OF INVESTMENTS (continued) | | |
Showing percentage of net assets as of June 30, 2015
| | | | | | | | | | |
| Industry Company | | Shares | | | Value | | | |
| |
Common Stocks (continued) | | | |
Communications Equipment (continued) | | | |
Digi International, Inc.* | | | 70,000 | | | | $ 668,500 | | | |
EMCORE Corp.* | | | 118,580 | | | | 713,852 | | | |
KVH Industries, Inc.* | | | 60,410 | | | | 812,514 | | | |
Numerex Corp., Class A*+ | | | 70,408 | | | | 601,284 | | | |
Oclaro, Inc.* | | | 66,103 | | | | 149,393 | | | |
PC-Tel, Inc. | | | 87,800 | | | | 630,404 | | | |
RELM Wireless Corp.* | | | 78,900 | | | | 388,977 | | | |
ShoreTel, Inc.* | | | 137,000 | | | | 928,860 | | | |
Tessco Technologies, Inc. | | | 39,500 | | | | 782,495 | | | |
Westell Technologies, Inc., Class A* | | | 195,000 | | | | 193,050 | | | |
| | | | | | | | | | |
| | | | | | | 9,730,237 | | | |
| |
Computers & Peripherals - 1.73% | | | |
Astro-Med, Inc. | | | 32,800 | | | | 469,368 | | | |
Concurrent Computer Corp. | | | 55,600 | | | | 344,720 | | | |
Datalink Corp.* | | | 57,700 | | | | 515,838 | | | |
Dot Hill Systems Corp.* | | | 269,400 | | | | 1,648,728 | | | |
Hutchinson Technology, Inc.* | | | 131,350 | | | | 224,608 | | | |
Imation Corp.*+ | | | 195,100 | | | | 792,106 | | | |
Immersion Corp.* | | | 62,900 | | | | 796,943 | | | |
Intevac, Inc.* | | | 42,933 | | | | 251,158 | | | |
Novatel Wireless, Inc.*+ | | | 78,800 | | | | 256,100 | | | |
Quantum Corp.* | | | 350,100 | | | | 588,168 | | | |
Qumu Corp.* | | | 36,400 | | | | 299,936 | | | |
Transact Technologies, Inc. | | | 70,000 | | | | 467,600 | | | |
USA Technologies, Inc.*+ | | | 111,400 | | | | 300,780 | | | |
| | | | | | | | | | |
| | | | | | | 6,956,053 | | | |
| |
Construction & Engineering - 1.05% | | | |
Furmanite Corp.* | | | 125,500 | | | | 1,019,060 | | | |
Goldfield Corp.
(The)* | | | 63,480 | | | | 105,377 | | | |
Integrated Electrical Services, Inc.* | | | 109,312 | | | | 776,115 | | | |
Layne Christensen Co.*+ | | | 6,430 | | | | 57,548 | | | |
Northwest Pipe Co.* | | | 41,500 | | | | 845,355 | | | |
Orion Marine Group, Inc.* | | | 119,044 | | | | 859,498 | | | |
Sterling Construction Co., Inc.*+ | | | 81,712 | | | | 326,848 | | | |
Willdan Group, Inc.* | | | 20,000 | �� | | | 223,600 | | | |
| | | | | | | | | | |
| | | | | | | 4,213,401 | | | |
| |
Construction Materials - 0.26% | | | |
United States Lime & Minerals, Inc. | | | 17,663 | | | | 1,026,574 | | | |
| |
Consumer Finance - 0.74% | | | |
Asta Funding, Inc.* | | | 122,300 | | | | 1,024,874 | | | |
Atlanticus Holdings Corp.* | | | 58,961 | | | | 208,132 | | | |
| | | | | | | | | | |
| | | | | | | | | | |
| | | | | | | | | | |
| | | | | | | | | | |
| Industry Company | | Shares | | | Value | | | |
| | | |
Consumer Finance (continued) | | | |
Consumer Portfolio Services, Inc.* | | | 110,000 | | | | $ 687,500 | | | |
QC Holdings, Inc. | | | 56,600 | | | | 105,842 | | | |
Regional Management Corp.* | | | 52,600 | | | | 939,436 | | | |
| | | | | | | | | | |
| | | | | | | 2,965,784 | | | |
| |
Containers & Packaging - 0.15% | | | |
AEP Industries, Inc.* | | | 10,900 | | | | 601,680 | | | |
| |
Distributors - 0.32% | | | |
AMCON Distributing Co. | | | 2,300 | | | | 178,963 | | | |
VOXX International Corp.* | | | 94,001 | | | | 778,328 | | | |
Weyco Group, Inc. | | | 10,883 | | | | 324,531 | | | |
| | | | | | | | | | |
| | | | | | | 1,281,822 | | | |
| |
Diversified Consumer Services - 0.53% | | | |
Cambium Learning Group, Inc.* | | | 37,250 | | | | 159,058 | | | |
Career Education Corp.* | | | 92,550 | | | | 305,415 | | | |
Collectors Universe, Inc. | | | 26,360 | | | | 525,618 | | | |
Learning Tree International, Inc.* | | | 25,400 | | | | 32,766 | | | |
Lincoln Educational Services Corp. | | | 78,400 | | | | 158,368 | | | |
National American University Holdings, Inc.+ | | | 70,988 | | | | 206,575 | | | |
Universal Technical Institute, Inc. | | | 88,400 | | | | 760,240 | | | |
| | | | | | | | | | |
| | | | | | | 2,148,040 | | | |
| |
Diversified Financial Services - 0.83% | | | |
California First National Bancorp | | | 54,257 | | | | 731,927 | | | |
Gain Capital Holdings, Inc. | | | 94,400 | | | | 902,464 | | | |
JG Wentworth Co.*+ | | | 17,652 | | | | 162,398 | | | |
Marlin Business Services Corp. | | | 49,500 | | | | 835,560 | | | |
Resource America, Inc., Class A | | | 83,600 | | | | 703,076 | | | |
| | | | | | | | | | |
| | | | | | | 3,335,425 | | | |
| |
Diversified Telecommunication Services - 1.01% | | | |
Alaska Communications | | | | | | | | | | |
Systems Group, Inc.* | | | 243,000 | | | | 583,200 | | | |
Hawaiian Telcom Holdco, Inc.* | | | 24,686 | | | | 644,305 | | | |
IDT Corp., Class B | | | 50,567 | | | | 914,251 | | | |
Lumos Networks Corp. | | | 35,000 | | | | 517,650 | | | |
| | |
Ultra-Small Company Market Fund SCHEDULE OF INVESTMENTS (continued) | | |
Showing percentage of net assets as of June 30, 2015
| | | | | | | | | | |
| Industry Company | | Shares | | | Value | | | |
| |
Common Stocks (continued) | | | |
Diversified Telecommunication Services (continued) | | | |
Straight Path Communications, Inc., Class B*+ | | | 42,470 | | | | $1,392,591 | | | |
| | | | | | | | | | |
| | | | | | | 4,051,997 | | | |
| |
Electrical Equipment - 1.60% | | | |
Allied Motion Technologies, Inc. | | | 53,650 | | | | 1,204,979 | | | |
Espey Manufacturing & Electronics Corp. | | | 10,700 | | | | 278,200 | | | |
Global Power Equipment Group, Inc. | | | 67,272 | | | | 522,031 | | | |
Highpower International, Inc.*+ | | | 50,000 | | | | 191,500 | | | |
LSI Industries, Inc. | | | 84,000 | | | | 784,560 | | | |
Magnetek, Inc.* | | | 13,000 | | | | 447,330 | | | |
Orion Energy Systems, Inc.* | | | 35,000 | | | | 87,850 | | | |
PowerSecure International, Inc.* | | | 88,500 | | | | 1,306,260 | | | |
Preformed Line Products Co. | | | 8,489 | | | | 320,205 | | | |
SL Industries, Inc.* | | | 20,250 | | | | 781,852 | | | |
Ultralife Corp.* | | | 112,400 | | | | 470,956 | | | |
Vicor Corp.* | | | 3,600 | | | | 43,884 | | | |
| | | | | | | | | | |
| | | | | | | 6,439,607 | | | |
| |
| Electronic Equipment, Instruments & Components - 2.90% | | | |
Agilysys, Inc.* | | | 82,700 | | | | 759,186 | | | |
Echelon Corp.* | | | 95,062 | | | | 76,050 | | | |
Electro Rent Corp. | | | 33,100 | | | | 359,466 | | | |
Electro Scientific Industries, Inc. | | | 38,500 | | | | 202,895 | | | |
Frequency Electronics, Inc.* | | | 41,000 | | | | 462,480 | | | |
ID Systems, Inc.*+ | | | 83,000 | | | | 506,300 | | | |
IEC Electronics Corp.*+ | | | 73,450 | | | | 330,525 | | | |
Iteris, Inc.* | | | 272,520 | | | | 482,360 | | | |
Kemet Corp.* | | | 130,858 | | | | 376,871 | | | |
Key Tronic Corp.* | | | 37,200 | | | | 404,364 | | | |
LoJack Corp.* | | | 77,150 | | | | 266,168 | | | |
Maxwell Technologies, Inc.*+ | | | 61,500 | | | | 367,155 | | | |
Mesa Laboratories, Inc.+ | | | 9,830 | | | | 873,887 | | | |
MOCON, Inc. | | | 12,800 | | | | 204,160 | | | |
Multi-Fineline Electronix, Inc.* | | | 55,300 | | | | 1,208,858 | | | |
NAPCO Security Technologies, Inc.* | | | 51,576 | | | | 295,530 | | | |
PAR Technology Corp.* | | | 104,750 | | | | 514,322 | | | |
PCM, Inc.* | | | 74,200 | | | | 744,226 | | | |
Perceptron, Inc.* | | | 23,000 | | | | 242,880 | | | |
Planar Systems, Inc.* | | | 75,000 | | | | 327,000 | | | |
Radisys Corp.* | | | 195,300 | | | | 499,968 | | | |
| | | | | | | | | | |
| Industry Company | | Shares | | | Value | | | |
| | | |
Electronic Equipment, Instruments & Components (continued) | | | |
RF Industries, Ltd.+ | | | 35,000 | | | | $ 148,750 | | | |
Richardson Electronics, Ltd. | | | 52,011 | | | | 420,249 | | | |
SMTC Corp.* | | | 149,000 | | | | 247,340 | | | |
Vicon Industries, Inc. | | | 29,900 | | | | 39,767 | | | |
Vishay Precision Group, Inc.* | | | 71,900 | | | | 1,082,814 | | | |
Wayside Technology Group, Inc. | | | 12,198 | | | | 241,764 | | | |
| | | | | | | | | | |
| | | | | | | 11,685,335 | | | |
| |
Energy Equipment & Services - 2.44% | | | |
Dawson Geophysical Co.* | | | 150,139 | | | | 705,653 | | | |
Enservco Corp.*+ | | | 241,298 | | | | 361,947 | | | |
Forbes Energy Services, Ltd.* | | | 152,000 | | | | 209,760 | | | |
Geospace Technologies Corp.* | | | 46,663 | | | | 1,075,582 | | | |
GreenHunter Resources, Inc.*+ | | | 199,000 | | | | 137,111 | | | |
Gulf Island Fabrication, Inc. | | | 117,800 | | | | 1,315,826 | | | |
Key Energy Services, Inc.* | | | 557,200 | | | | 1,002,960 | | | |
Mitcham Industries, Inc.* | | | 173,400 | | | | 726,546 | | | |
Natural Gas Services Group, Inc.* | | | 68,600 | | | | 1,565,452 | | | |
Nuverra Environmental Solutions, Inc.*+ | | | 195,000 | | | | 1,222,650 | | | |
SAExploration Holdings, Inc.*+ | | | 10,815 | | | | 36,230 | | | |
Seventy Seven Energy, Inc.* | | | 200,000 | | | | 858,000 | | | |
Superior Drilling Products, Inc.*+ | | | 22,187 | | | | 61,236 | | | |
Willbros Group, Inc.* | | | 425,000 | | | | 544,000 | | | |
| | | | | | | | | | |
| | | | | | | 9,822,953 | | | |
| |
Food & Staples Retailing - 0.32% | | | |
Ingles Markets, Inc., Class A | | | 10,000 | | | | 477,700 | | | |
Roundy’s, Inc.*+ | | | 246,478 | | | | 798,589 | | | |
| | | | | | | | | | |
| | | | | | | 1,276,289 | | | |
| |
Food Products - 1.52% | | | |
Griffin Industrial Realty, Inc. | | | 13,300 | | | | 426,132 | | | |
Inventure Foods, Inc.* | | | 44,000 | | | | 446,600 | | | |
John B. Sanfilippo & Son, Inc. | | | 25,900 | | | | 1,344,210 | | | |
Liberator Medical Holdings, Inc. | | | 233,200 | | | | 529,364 | | | |
Lifeway Foods, Inc.*+ | | | 90,152 | | | | 1,730,017 | | | |
Omega Protein Corp.* | | | 69,800 | | | | 959,750 | | | |
| | |
| 31 | | Annual Report | June 30, 2015 |
| | |
Ultra-Small Company Market Fund SCHEDULE OF INVESTMENTS (continued) | | |
Showing percentage of net assets as of June 30, 2015
| | | | | | | | | | |
| Industry Company | | Shares | | | Value | | | |
| |
Common Stocks (continued) | | | |
Food Products (continued) | | | |
Seneca Foods Corp., Class A* | | | 25,000 | | | | $ 694,250 | | | |
| | | | | | | | | | |
| | | | | | | 6,130,323 | | | |
| |
Gas Utilities - 0.25% | | | |
Delta Natural Gas Co., Inc. | | | 20,000 | | | | 402,000 | | | |
Gas Natural, Inc. | | | 58,000 | | | | 597,400 | | | |
| | | | | | | | | | |
| | | | | | | 999,400 | | | |
| |
Health Care Equipment & Supplies - 2.77% | | | |
AdCare Health Systems, Inc.+ | | | 25,000 | | | | 86,500 | | | |
Alphatec Holdings, Inc.* | | | 614,731 | | | | 848,329 | | | |
CryoLife, Inc. | | | 107,270 | | | | 1,210,006 | | | |
Cutera, Inc.* | | | 60,200 | | | | 931,896 | | | |
Digirad Corp. | | | 100,000 | | | | 434,000 | | | |
ERBA Diagnostics, Inc.*+ | | | 19,096 | | | | 41,820 | | | |
Hansen Medical, Inc.* | | | 170,000 | | | | 155,550 | | | |
Kewaunee Scientific Corp. | | | 14,000 | | | | 230,160 | | | |
LeMaitre Vascular, Inc. | | | 50,000 | | | | 603,000 | | | |
Navidea Biopharmaceuticals, Inc.*+ | | | 548,580 | | | | 883,214 | | | |
PhotoMedex, Inc.* | | | 94,000 | | | | 127,840 | | | |
Retractable Technologies, Inc.* | | | 29,000 | | | | 110,200 | | | |
Roka Bioscience, Inc.* | | | 30,000 | | | | 78,000 | | | |
RTI Surgical, Inc.* | | | 148,600 | | | | 959,956 | | | |
SurModics, Inc.* | | | 7,400 | | | | 173,308 | | | |
TransEnterix, Inc.*+ | | | 214,942 | | | | 644,826 | | | |
TriVascular Technologies, Inc.*+ | | | 67,200 | | | | 359,520 | | | |
Unilife Corp.*+ | | | 318,836 | | | | 685,497 | | | |
Utah Medical Products, Inc. | | | 35,900 | | | | 2,140,717 | | | |
Veracyte, Inc.*+ | | | 41,000 | | | | 456,740 | | | |
| | | | | | | | | | |
| | | | | | | 11,161,079 | | | |
| |
Health Care Providers & Services - 2.00% | | | |
Addus HomeCare Corp.* | | | 48,600 | | | | 1,353,996 | | | |
Alliance HealthCare Services, Inc.* | | | 40,900 | | | | 764,421 | | | |
Almost Family, Inc.* | | | 24,400 | | | | 973,804 | | | |
BioTelemetry, Inc.* | | | 137,700 | | | | 1,298,511 | | | |
Cross Country Healthcare, Inc.* | | | 71,000 | | | | 900,280 | | | |
Five Star Quality Care, Inc.* | | | 228,800 | | | | 1,098,240 | | | |
Genesis Healthcare, Inc.* | | | 71,350 | | | | 470,910 | | | |
InfuSystems Holdings, Inc.* | | | 100,000 | | | | 319,000 | | | |
PDI, Inc.* | | | 25,000 | | | | 35,750 | | | |
RadNet, Inc.* | | | 89,800 | | | | 600,762 | | | |
Trupanion, Inc.*+ | | | 30,000 | | | | 247,200 | | | |
| | | | | | | | | | |
| | | | | | | 8,062,874 | | | |
| | | | | | | | | | |
| | | | | | | | |
| Industry Company | | Shares | | | Value | |
| |
Health Care Technology - 0.41% | |
Merge Healthcare, Inc.* | | | 150,000 | | | | $ 720,000 | |
Vocera Communications, Inc.* | | | 82,000 | | | | 938,900 | |
| | | | | | | | |
| | | | | | | 1,658,900 | |
|
Hotels, Restaurants & Leisure - 3.25% | |
Ark Restaurants Corp. | | | 9,900 | | | | 247,797 | |
Bravo Brio Restaurant Group, Inc.* | | | 64,429 | | | | 873,013 | |
Carrols Restaurant Group, Inc.* | | | 94,100 | | | | 978,640 | |
Dover Downs Gaming & Entertainment, Inc.* | | | 92,580 | | | | 86,099 | |
Empire Resorts, Inc.*+ | | | 50,000 | | | | 254,500 | |
Famous Dave’s of America, Inc.*+ | | | 45,200 | | | | 906,260 | |
Frisch’s Restaurants, Inc. | | | 26,100 | | | | 876,177 | |
Gaming Partners International Corp.* | | | 56,300 | | | | 569,193 | |
Ignite Restaurant Group, Inc.*+ | | | 81,300 | | | | 399,996 | |
Isle of Capri Casinos, Inc.* | | | 114,000 | | | | 2,069,100 | |
Jamba, Inc.*+ | | | 30,662 | | | | 474,954 | |
Kona Grill, Inc.* | | | 67,500 | | | | 1,310,175 | |
Lakes Entertainment, Inc.* | | | 42,300 | | | | 384,084 | |
Luby’s, Inc.* | | | 135,600 | | | | 657,660 | |
Monarch Casino & Resort, Inc.* | | | 34,485 | | | | 709,012 | |
Morgans Hotel Group Co.* | | | 84,300 | | | | 568,182 | |
Nathan’s Famous, Inc. | | | 12,000 | | | | 444,720 | |
Nevada Gold & Casinos, Inc.* | | | 120,000 | | | | 198,000 | |
Papa Murphy’s Holdings, Inc.*+ | | | 15,000 | | | | 310,800 | |
Red Lion Hotels Corp.* | | | 74,900 | | | | 573,734 | |
Town Sports International Holdings, Inc.* | | | 70,864 | | | | 205,506 | |
| | | | | | | | |
| | | | | | | 13,097,602 | |
|
Household Durables - 2.13% | |
Bassett Furniture Industries, Inc. | | | 74,200 | | | | 2,108,022 | |
Blyth, Inc.* | | | 15,200 | | | | 96,520 | |
CSS Industries, Inc. | | | 32,700 | | | | 989,175 | |
Dixie Group, Inc. (The)* | | | 30,000 | | | | 315,000 | |
Emerson Radio Corp. | | | 198,100 | | | | 229,796 | |
Flexsteel Industries, Inc. | | | 27,050 | | | | 1,165,584 | |
Hooker Furniture Corp. | | | 53,300 | | | | 1,338,363 | |
Lifetime Brands, Inc. | | | 65,000 | | | | 960,050 | |
P&F Industries, Inc., Class A*+ | | | 10,500 | | | | 89,670 | |
| | |
Ultra-Small Company Market Fund SCHEDULE OF INVESTMENTS (continued) | | |
Showing percentage of net assets as of June 30, 2015
| | | | | | | | | | |
| Industry Company | | Shares | | | Value | | | |
Common Stocks (continued) | | | |
Household Durables (continued) | | | |
Skullcandy, Inc.* | | | 25,850 | | | | $ 198,270 | | | |
Stanley Furniture Co., Inc.* | | | 67,783 | | | | 201,316 | | | |
Turtle Beach Corp.* | | | 47,300 | | | | 107,844 | | | |
ZAGG, Inc.* | | | 100,000 | | | | 792,000 | | | |
| | | | | | | | | | |
| | | | | | | 8,591,610 | | | |
| |
Household Products - 0.28% | | | |
Oil-Dri Corp. of America | | | 20,800 | | | | 631,904 | | | |
Orchids Paper Products Co. | | | 20,000 | | | | 481,400 | | | |
| | | | | | | | | | |
| | | | | | | 1,113,304 | | | |
| |
Independent Power Producers & Energy Traders - 0.13% | | | |
Genie Energy, Ltd., Class B | | | 48,667 | | | | 509,543 | | | |
Synthesis Energy Systems, Inc.* | | | 11,464 | | | | 16,394 | | | |
| | | | | | | | | | |
| | | | | | | 525,937 | | | |
| |
Insurance - 1.07% | | | |
American Independence Corp.*+ | | | 7,500 | | | | 70,650 | | | |
Atlantic American Corp. | | | 14,056 | | | | 50,883 | | | |
Federated National Holding Co. | | | 38,000 | | | | 919,600 | | | |
First Acceptance Corp.* | | | 266,700 | | | | 853,440 | | | |
Hallmark Financial Services, Inc.* | | | 80,400 | | | | 914,952 | | | |
Health Insurance Innovations, Inc., Class A*+ | | | 14,116 | | | | 70,157 | | | |
Independence Holding Co. | | | 69,190 | | | | 912,616 | | | |
Investors Title Co. | | | 3,500 | | | | 248,115 | | | |
Phoenix Cos., Inc.
(The)*+ | | | 14,200 | | | | 259,008 | | | |
| | | | | | | | | | |
| | | | | | | 4,299,421 | | | |
| |
Internet & Catalog Retail - 0.59% | | | |
1-800-Flowers.com, Inc., Class A* | | | 60,000 | | | | 627,600 | | | |
CafePress, Inc.*+ | | | 87,588 | | | | 394,146 | | | |
EVINE Live, Inc.* | | | 121,286 | | | | 326,259 | | | |
Gaiam, Inc., Class A*+ | | | 45,300 | | | | 296,262 | | | |
Geeknet, Inc.* | | | 1,870 | | | | 37,288 | | | |
PetMed Express, Inc.+ | | | 19,647 | | | | 339,304 | | | |
US Auto Parts Network, Inc.* | | | 164,751 | | | | 362,452 | | | |
| | | | | | | | | | |
| | | | | | | 2,383,311 | | | |
| |
Internet Software & Services - 3.96% | | | |
Aerohive Networks, Inc.*+ | | | 98,500 | | | | 687,530 | | | |
Amber Road, Inc.*+ | | | 40,000 | | | | 280,800 | | | |
Brightcove, Inc.* | | | 39,387 | | | | 270,195 | | | |
Carbonite, Inc.* | | | 58,060 | | | | 685,689 | | | |
| | | | | | | | | | |
| | | | | | | | | | |
| | | | | | | | |
| Industry Company | | Shares | | | Value | |
| |
Internet Software & Services (continued) | |
Care.com, Inc.*+ | | | 25,831 | | | | $ 152,920 | |
Demand Media, Inc.* | | | 54,500 | | | | 346,620 | |
Five9, Inc.* | | | 98,500 | | | | 515,155 | |
Limelight Networks, Inc.* | | | 359,837 | | | | 1,417,758 | |
Liquidity Services, Inc.* | | | 52,000 | | | | 500,760 | |
Marchex, Inc., Class B | | | 109,000 | | | | 539,550 | |
Millennial Media, Inc.*+ | | | 276,200 | | | | 447,444 | |
QuinStreet, Inc.* | | | 111,547 | | | | 719,478 | |
RealNetworks, Inc.*+ | | | 123,600 | | | | 668,676 | |
Reis, Inc. | | | 42,100 | | | | 933,778 | |
Rightside Group Ltd*+ | | | 37,056 | | | | 250,869 | |
Spark Networks, Inc.*+ | | | 64,800 | | | | 198,936 | |
Support.com, Inc.* | | | 189,545 | | | | 267,258 | |
Synacor, Inc.* | | | 50,000 | | | | 80,500 | |
TechTarget, Inc.* | | | 145,900 | | | | 1,302,887 | |
TheStreet, Inc. | | | 136,900 | | | | 247,789 | |
Travelzoo, Inc.* | | | 32,500 | | | | 366,600 | |
Tremor Video, Inc.*+ | | | 121,400 | | | | 353,274 | |
Tucows, Inc., Class A* | | | 71,150 | | | | 1,981,528 | |
United Online, Inc.* | | | 46,900 | | | | 734,923 | |
XO Group, Inc.* | | | 54,813 | | | | 896,193 | |
YuMe, Inc.*+ | | | 26,900 | | | | 145,798 | |
Zix Corp.* | | | 187,582 | | | | 969,799 | |
| | | | | | | | |
| | | | | | | 15,962,707 | |
|
IT Services - 2.41% | |
CIBER, Inc.* | | | 215,000 | | | | 741,750 | |
Computer Task Group, Inc. | | | 64,830 | | | | 500,488 | |
CSP, Inc.+ | | | 38,700 | | | | 268,772 | |
Edgewater Technology, Inc.* | | | 52,912 | | | | 386,258 | |
Hackett Group, Inc. (The) | | | 119,928 | | | | 1,610,633 | |
Higher One Holdings, Inc.* | | | 133,528 | | | | 399,249 | |
Information Services Group, Inc. | | | 196,600 | | | | 939,748 | |
Innodata, Inc.* | | | 148,955 | | | | 391,752 | |
Lionbridge Technologies, Inc.* | | | 193,995 | | | | 1,196,949 | |
Mattersight Corp.* | | | 77,877 | | | | 459,474 | |
ModusLink Global Solutions, Inc.* | | | 93,455 | | | | 317,747 | |
NCI, Inc., Class A | | | 38,430 | | | | 396,982 | |
PRGX Global, Inc.* | | | 94,300 | | | | 413,977 | |
ServiceSource International, Inc.* | | | 215,000 | | | | 1,176,050 | |
StarTek, Inc.* | | | 65,000 | | | | 383,500 | |
WidePoint Corp.* | | | 70,447 | | | | 117,646 | |
| | | | | | | | |
| | | | | | | 9,700,975 | |
|
Leisure Equipment & Products - 1.03% | |
Escalade, Inc. | | | 39,780 | | | | 731,554 | |
| | |
| 33 | | Annual Report | June 30, 2015 |
| | |
Ultra-Small Company Market Fund SCHEDULE OF INVESTMENTS (continued) | | |
Showing percentage of net assets as of June 30, 2015
| | | | | | | | | | |
| Industry Company | | Shares | | | Value | | | |
Common Stocks (continued) | | | |
Leisure Equipment & Products (continued) | | | |
JAKKS Pacific, Inc.*+ | | | 61,000 | | | | $ 603,290 | | | |
Johnson Outdoors, Inc., Class A | | | 37,400 | | | | 880,770 | | | |
Marine Products Corp. | | | 2,400 | | | | 14,976 | | | |
Nautilus, Inc.* | | | 89,986 | | | | 1,935,599 | | | |
| | | | | | | | | | |
| | | | | | | 4,166,189 | | | |
| |
Life Sciences Tools & Services - 0.88% | | | |
Enzo Biochem, Inc.* | | | 235,800 | | | | 714,474 | | | |
Harvard Bioscience, Inc.* | | | 167,017 | | | | 951,997 | | | |
NanoString Technologies, Inc.* | | | 63,700 | | | | 982,254 | | | |
pSivida Corp.*+ | | | 168,000 | | | | 633,360 | | | |
Sequenom, Inc.*+ | | | 90,000 | | | | 273,600 | | | |
| | | | | | | | | | |
| | | | | | | 3,555,685 | | | |
| |
Machinery - 3.34% | | | |
Accuride Corp.* | | | 159,312 | | | | 613,351 | | | |
Ampco-Pittsburgh Corp. | | | 57,999 | | | | 876,945 | | | |
Chicago Rivet & Machine Co. | | | 10,000 | | | | 280,000 | | | |
Commercial Vehicle Group, Inc.* | | | 160,000 | | | | 1,153,600 | | | |
Dynamic Materials Corp. | | | 42,500 | | | | 467,500 | | | |
Eastern Co. (The) | | | 33,600 | | | | 622,272 | | | |
Energy Recovery, Inc.*+ | | | 66,700 | | | | 182,758 | | | |
FreightCar America, Inc. | | | 24,675 | | | | 515,214 | | | |
Gencor Industries, Inc.* | | | 23,500 | | | | 227,245 | | | |
Global Brass & Copper Holdings, Inc. | | | 50,000 | | | | 850,500 | | | |
Graham Corp. | | | 35,900 | | | | 735,591 | | | |
Hardinge, Inc. | | | 53,300 | | | | 525,005 | | | |
Hurco Companies, Inc. | | | 51,334 | | | | 1,777,183 | | | |
Intelligent Systems Corp.* | | | 35,362 | | | | 105,025 | | | |
Key Technology, Inc.* | | | 23,900 | | | | 315,480 | | | |
L.S. Starrett Co., Class A (The) | | | 26,136 | | | | 392,040 | | | |
MFRI, Inc.* | | | 10,000 | | | | 60,500 | | | |
Miller Industries, Inc. | | | 49,800 | | | | 993,510 | | | |
PMFG, Inc.* | | | 41,600 | | | | 267,488 | | | |
Supreme Industries, Inc., Class A | | | 58,993 | | | | 505,570 | | | |
Tecumseh Products Co.* | | | 58,090 | | | | 143,482 | | | |
Twin Disc, Inc. | | | 39,600 | | | | 738,144 | | | |
Xerium Technologies, Inc.* | | | 59,550 | | | | 1,083,810 | | | |
| | | | | | | | | | |
| | | | | | | 13,432,213 | | | |
| |
Marine - 0.07% | | | |
International Shipholding Corp.+ | | | 45,843 | | | | 292,478 | | | |
| | | | | | | | | | |
| | | | | | | | | | |
| | | | | | | | | | |
| | | | | | | | |
| Industry Company | | Shares | | | Value | |
| |
Media - 1.39% | |
A.H. Belo Corp.,
Class A+ | | | 46,400 | | | | $ 259,840 | |
Ballantyne Strong, Inc.* | | | 45,500 | | | | 213,395 | |
Beasley Broadcast Group, Inc., Class A | | | 17,000 | | | | 78,710 | |
Emmis Communications Corp., Class A* | | | 236,500 | | | | 236,500 | |
Entercom Communications Corp., Class A* | | | 80,000 | | | | 913,600 | |
Entravision Communications Corp., Class A | | | 108,800 | | | | 895,424 | |
Lee Enterprises, Inc.*+ | | | 246,860 | | | | 822,044 | |
Martha Stewart Living Omnimedia, Inc., Class A* | | | 90,200 | | | | 562,848 | |
McClatchy Co. (The), Class A* | | | 308,650 | | | | 333,342 | |
ReachLocal, Inc.* | | | 43,900 | | | | 138,285 | |
Saga Communications, Inc., Class A | | | 13,005 | | | | 492,239 | |
Salem Media Group, Inc. | | | 59,500 | | | | 376,635 | |
Sizmek, Inc.* | | | 40,210 | | | | 285,491 | |
| | | | | | | | |
| | | | | | | 5,608,353 | |
|
Metals & Mining - 1.30% | |
A.M. Castle & Co.* | | | 37,601 | | | | 231,998 | |
Comstock Mining, Inc.* | | | 155,376 | | | | 90,895 | |
Energy Fuels, Inc.*+ | | | 131,274 | | | | 584,169 | |
Friedman Industries, Inc. | | | 68,300 | | | | 426,875 | |
Gold Resource Corp. | | | 233,600 | | | | 644,736 | |
Noranda Aluminum Holding Corp. | | | 211,650 | | | | 179,902 | |
Olympic Steel, Inc. | | | 69,300 | | | | 1,208,592 | |
Ryerson Holding Corp.*+ | | | 25,000 | | | | 227,500 | |
Synalloy Corp. | | | 35,400 | | | | 484,980 | |
United States Antimony Corp.* | | | 269,221 | | | | 183,070 | |
Universal Stainless & Alloy Products, Inc.* | | | 49,928 | | | | 981,085 | |
| | | | | | | | |
| | | | | | | 5,243,802 | |
|
Multiline Retail - 0.17% | |
Bon-Ton Stores, Inc. (The)+ | | | 45,439 | | | | 209,928 | |
Gordmans Stores, Inc.* | | | 80,000 | | | | 490,400 | |
| | | | | | | | |
| | | | | | | 700,328 | |
|
Oil, Gas & Consumable Fuels - 4.84% | |
Adams Resources & Energy, Inc. | | | 22,300 | | | | 994,580 | |
Aemetis, Inc.*+ | | | 153,239 | | | | 551,660 | |
Amyris, Inc.*+ | | | 270,000 | | | | 526,500 | |
Approach Resources, Inc.*+ | | | 151,500 | | | | 1,037,775 | |
| | |
Ultra-Small Company Market Fund SCHEDULE OF INVESTMENTS (continued) | | |
Showing percentage of net assets as of June 30, 2015
| | | | | | | | | | |
| Industry Company | | Shares | | | Value | | | |
Common Stocks (continued) | | | |
Oil, Gas & Consumable Fuels (continued) | | | |
Arch Coal, Inc.* | | | 118,488 | | | | $ 40,286 | | | |
Aspen Aerogels, Inc.* | | | 124,172 | | | | 822,019 | | | |
Callon Petroleum Co.* | | | 182,800 | | | | 1,520,896 | | | |
Comstock Resources, Inc.+ | | | 157,175 | | | | 523,393 | | | |
Dakota Plains Holdings, Inc.* | | | 298,900 | | | | 355,691 | | | |
Earthstone Energy, Inc.* | | | 8,000 | | | | 156,240 | | | |
Emerald Oil, Inc.*+ | | | 13,475 | | | | 57,269 | | | |
Escalera Resources Co.* | | | 97,100 | | | | 26,722 | | | |
Evolution Petroleum Corp.+ | | | 135,123 | | | | 890,461 | | | |
FieldPoint Petroleum Corp.* | | | 30,000 | | | | 33,900 | | | |
FX Energy, Inc.*+ | | | 534,001 | | | | 469,974 | | | |
Gastar Exploration, Inc.* | | | 145,200 | | | | 448,668 | | | |
Goodrich Petroleum Corp.*+ | | | 230,000 | | | | 427,800 | | | |
Harvest Natural Resources, Inc.*+ | | | 369,500 | | | | 646,625 | | | |
Independence Contract Drilling, Inc.*+ | | | 115,000 | | | | 1,020,050 | | | |
Jones Energy, Inc., Class A*+ | | | 81,742 | | | | 739,765 | | | |
Midstates Petroleum Co., Inc.*+ | | | 200,000 | | | | 186,000 | | | |
Miller Energy Resources, Inc.*+ | | | 261,418 | | | | 95,418 | | | |
Panhandle Oil & Gas, Inc., Class A | | | 23,594 | | | | 488,160 | | | |
Penn Virginia Corp.*+ | | | 91,000 | | | | 398,580 | | | |
PetroQuest Energy, Inc.* | | | 593,300 | | | | 1,174,734 | | | |
PostRock Energy Corp.*+ | | | 4,360 | | | | 11,990 | | | |
Resolute Energy Corp.* | | | 219,300 | | | | 211,953 | | | |
REX American Resources Corp.* | | | 20,249 | | | | 1,288,646 | | | |
Rex Energy Corp.*+ | | | 225,000 | | | | 1,257,750 | | | |
Ring Energy, Inc.*+ | | | 95,353 | | | | 1,067,000 | | | |
Swift Energy Co.*+ | | | 288,400 | | | | 585,452 | | | |
VAALCO Energy, Inc.* | | | 400,000 | | | | 856,000 | | | |
Warren Resources, Inc.* | | | 698,600 | | | | 321,356 | | | |
Yuma Energy, Inc.* | | | 144,800 | | | | 73,848 | | | |
Zion Oil & Gas, Inc.* | | | 101,200 | | | | 193,292 | | | |
| | | | | | | | | | |
| | | | | | | 19,500,453 | | | |
| |
Paper & Forest Products - 0.08% | | | |
Orient Paper, Inc.* | | | 87,811 | | | | 141,376 | | | |
Verso Corp.* | | | 251,926 | | | | 166,271 | | | |
| | | | | | | | | | |
| | | | | | | 307,647 | | | |
| |
Personal Products - 0.54% | | | |
CCA Industries, Inc.*+ | | | 15,752 | | | | 49,619 | | | |
IGI Laboratories, Inc.*+ | | | 88,211 | | | | 555,729 | | | |
Mannatech, Inc.* | | | 13,600 | | | | 243,440 | | | |
| | | | | | | | | | |
| | | | | | | | | | |
| | | | | | | | |
| Industry Company | | Shares | | | Value | |
| |
Personal Products (continued) | |
Natural Alternatives International, Inc.* | | | 19,910 | | | | $ 112,790 | |
Nutraceutical International Corp.* | | | 37,000 | | | | 915,380 | |
Synutra International, Inc.*+ | | | 13,100 | | | | 93,665 | |
United-Guardian, Inc. | | | 10,000 | | | | 191,000 | |
| | | | | | | | |
| | | | | | | 2,161,623 | |
|
Pharmaceuticals - 3.33% | |
AcelRx Pharmaceuticals, Inc.*+ | | | 98,000 | | | | 415,520 | |
Achaogen, Inc.*+ | | | 88,029 | | | | 530,815 | |
Agile Therapeutics, Inc.*+ | | | 48,966 | | | | 420,618 | |
Alimera Sciences, Inc.*+ | | | 121,600 | | | | 560,576 | |
Ampio Pharmaceuticals, Inc.*+ | | | 100,750 | | | | 238,778 | |
Cempra, Inc.* | | | 17,500 | | | | 601,300 | |
Corium International, Inc.* | | | 30,000 | | | | 410,700 | |
Cumberland Pharmaceuticals, Inc.* | | | 67,500 | | | | 482,625 | |
Durect Corp.* | | | 283,600 | | | | 677,804 | |
Egalet Corp.*+ | | | 74,700 | | | | 1,077,921 | |
Endocyte, Inc.*+ | | | 155,000 | | | | 804,450 | |
Marinus Pharmaceuticals, Inc.*+ | | | 30,000 | | | | 348,000 | |
Ocera Therapeutics, Inc.* | | | 59,800 | | | | 227,240 | |
Omeros Corp.*+ | | | 16,095 | | | | 289,549 | |
Pain Therapeutics, Inc.* | | | 213,953 | | | | 370,139 | |
Pernix Therapeutics Holdings, Inc.*+ | | | 26,056 | | | | 154,252 | |
Pozen, Inc.*+ | | | 93,200 | | | | 960,892 | |
Sciclone Pharmaceuticals, Inc.* | | | 161,750 | | | | 1,588,385 | |
Sucampo Pharmaceuticals, Inc., Class A* | | | 40,000 | | | | 657,200 | |
Tonix Pharmaceuticals Holding Corp.*+ | | | 64,401 | | | | 577,677 | |
VIVUS, Inc.*+ | | | 155,000 | | | | 365,800 | |
XenoPort, Inc.* | | | 135,600 | | | | 831,228 | |
Zogenix, Inc.* | | | 486,630 | | | | 817,538 | |
| | | | | | | | |
| | | | | | | 13,409,007 | |
|
Professional Services - 1.58% | |
CDI Corp. | | | 27,000 | | | | 351,000 | |
CRA International, Inc.* | | | 54,500 | | | | 1,518,915 | |
CTPartners Executive Search, Inc.*D | | | 27,400 | | | | 2,740 | |
Franklin Covey Co.* | | | 33,334 | | | | 676,347 | |
Heidrick & Struggles International, Inc. | | | 50,000 | | | | 1,304,000 | |
Hill International, Inc.* | | | 131,971 | | | | 694,167 | |
| | |
| 35 | | Annual Report | June 30, 2015 |
| | |
Ultra-Small Company Market Fund SCHEDULE OF INVESTMENTS (continued) | | |
Showing percentage of net assets as of June 30, 2015
| | | | | | | | | | |
| Industry Company | | Shares | | | Value | | | |
Common Stocks (continued) | | | |
Professional Services (continued) | | | |
Hudson Global, Inc.* | | | 89,346 | | | | $ 204,602 | | | |
Mastech Holdings, Inc.* | | | 6,250 | | | | 55,688 | | | |
RCM Technologies, Inc. | | | 32,700 | | | | 185,082 | | | |
Volt Information Sciences, Inc.* | | | 31,676 | | | | 307,574 | | | |
VSE Corp. | | | 20,200 | | | | 1,080,902 | | | |
| | | | | | | | | | |
| | | | | | | 6,381,017 | | | |
| |
Real Estate Management & Development - 0.67% | | | |
AV Homes, Inc.* | | | 54,600 | | | | 784,602 | | | |
Consolidated-Tomoka Land Co. | | | 21,249 | | | | 1,224,792 | | | |
Maui Land & Pineapple Co., Inc.*+ | | | 30,000 | | | | 170,400 | | | |
Stratus Properties, Inc.* | | | 37,150 | | | | 531,988 | | | |
| | | | | | | | | | |
| | | | | | | 2,711,782 | | | |
| |
Road & Rail - 0.47% | | | |
Covenant Transportation Group, Inc.,
Class A* | | | 30,700 | | | | 769,342 | | | |
Providence & Worcester Railroad Co. | | | 5,000 | | | | 86,700 | | | |
Quality Distribution, Inc.* | | | 20,000 | | | | 309,200 | | | |
USA Truck, Inc.* | | | 35,000 | | | | 743,050 | | | |
| | | | | | | | | | |
| | | | | | | 1,908,292 | | | |
| |
Semiconductors & Semiconductor Equipment - 3.76% | | | |
Amtech Systems, Inc.* | | | 57,500 | | | | 597,425 | | | |
Axcelis Technologies, Inc.* | | | 225,000 | | | | 666,000 | | | |
Cascade Microtech, Inc.* | | | 69,700 | | | | 1,061,182 | | | |
CEVA, Inc.* | | | 29,000 | | | | 563,470 | | | |
Cohu, Inc. | | | 81,850 | | | | 1,082,876 | | | |
CyberOptics Corp.* | | | 26,400 | | | | 266,904 | | | |
DSP Group, Inc.* | | | 131,300 | | | | 1,356,329 | | | |
GigOptix, Inc.* | | | 100,000 | | | | 170,000 | | | |
GSI Technology, Inc.* | | | 161,417 | | | | 840,983 | | | |
Integrated Silicon Solution, Inc. | | | 22,641 | | | | 501,272 | | | |
Intermolecular, Inc.* | | | 140,000 | | | | 275,800 | | | |
inTEST Corp.*+ | | | 49,500 | | | | 215,820 | | | |
Kopin Corp.* | | | 90,000 | | | | 310,500 | | | |
Mattson Technology, Inc.* | | | 191,300 | | | | 640,855 | | | |
MaxLinear, Inc., Class A* | | | 93,700 | | | | 1,133,770 | | | |
NeoPhotonics Corp.*+ | | | 125,000 | | | | 1,141,250 | | | |
Pericom Semiconductor Corp. | | | 75,000 | | | | 986,250 | | | |
Pixelworks, Inc.*+ | | | 122,500 | | | | 720,300 | | | |
Rudolph Technologies, Inc.* | | | 35,929 | | | | 431,507 | | | |
Sigma Designs, Inc.* | | | 122,313 | | | | 1,459,194 | | | |
Ultra Clean Holdings, Inc.* | | | 118,377 | | | | 737,489 | | | |
| | | | | | | | | | |
| | | | | | | 15,159,176 | | | |
| | | | | | | | | | |
| | | | | | | | |
| Industry Company | | Shares | | | Value | |
| |
Software - 3.08% | |
American Software, Inc., Class A | | | 72,400 | | | | $ 687,800 | |
Bsquare Corp.* | | | 79,500 | | | | 539,010 | |
Callidus Software, Inc.* | | | 63,100 | | | | 983,098 | |
Cinedigm Corp.,
Class A* | | | 354,897 | | | | 250,167 | |
Covisint Corp.*+ | | | 90,600 | | | | 296,262 | |
Cyan, Inc.* | | | 60,100 | | | | 314,924 | |
Digimarc Corp.*+ | | | 23,100 | | | | 1,042,734 | |
Envivio, Inc.* | | | 90,626 | | | | 172,189 | |
Exa Corp.* | | | 54,000 | | | | 602,100 | |
FalconStor Software, Inc.* | | | 135,000 | | | | 214,650 | |
Globalscape, Inc. | | | 81,700 | | | | 268,793 | |
Glu Mobile, Inc.* | | | 150,000 | | | | 931,500 | |
GSE Systems, Inc.* | | | 109,525 | | | | 169,764 | |
Guidance Software, Inc.*+ | | | 102,857 | | | | 871,199 | |
Model N, Inc.* | | | 50,252 | | | | 598,501 | |
QAD, Inc., Class A+ | | | 33,000 | | | | 872,190 | |
QAD, Inc., Class B+ | | | 8,250 | | | | 177,952 | |
Rally Software Development Corp.* | | | 20,000 | | | | 389,000 | |
Rosetta Stone, Inc.*+ | | | 73,600 | | | | 587,328 | |
Seachange International, Inc.* | | | 55,500 | | | | 389,055 | |
Smith Micro Software, Inc.* | | | 75,400 | | | | 86,710 | |
TeleCommunication Systems, Inc.,
Class A* | | | 180,834 | | | | 598,561 | |
Telenav, Inc.* | | | 153,000 | | | | 1,231,650 | |
Upland Software, Inc.*+ | | | 15,000 | | | | 138,300 | |
| | | | | | | | |
| | | | | | | 12,413,437 | |
|
Specialty Retail - 1.67% | |
Aeropostale, Inc.*+ | | | 158,600 | | | | 256,932 | |
America’s Car-Mart, Inc.* | | | 963 | | | | 47,495 | |
bebe stores, inc. | | | 100,000 | | | | 200,000 | |
Big 5 Sporting Goods Corp. | | | 49,200 | | | | 699,132 | |
Books-A-Million, Inc.* | | | 40,000 | | | | 114,400 | |
Build-A-Bear Workshop, Inc.* | | | 29,500 | | | | 471,705 | |
Christopher & Banks Corp.* | | | 33,300 | | | | 133,533 | |
Destination Maternity Corp. | | | 31,000 | | | | 361,460 | |
Destination XL Group, Inc.* | | | 174,100 | | | | 872,241 | |
hhgregg, Inc.*+ | | | 111,700 | | | | 373,078 | |
Kirkland’s, Inc. | | | 19,500 | | | | 543,465 | |
New York & Co., Inc.* | | | 142,100 | | | | 380,828 | |
Pacific Sunwear of California, Inc.*+ | | | 238,549 | | | | 271,946 | |
Sportsman’s Warehouse Holdings, Inc.* | | | 55,000 | | | | 625,350 | |
Tandy Leather Factory, Inc.*+ | | | 10,000 | | | | 86,000 | |
Tilly’s, Inc., Class A* | | | 55,000 | | | | 531,850 | |
| | |
Ultra-Small Company Market Fund SCHEDULE OF INVESTMENTS (continued) | | |
Showing percentage of net assets as of June 30, 2015
| | | | | | | | | | |
| Industry Company | | Shares | | | Value | | | |
Common Stocks (continued) | | | |
Specialty Retail (continued) | | | |
Trans World Entertainment Corp.* | | | 98,403 | | | | $ 360,155 | | | |
West Marine, Inc.* | | | 42,200 | | | | 406,808 | | | |
| | | | | | | | | | |
| | | | | | | 6,736,378 | | | |
| |
Textiles, Apparel & Luxury Goods - 0.95% | | | |
Charles & Colvard, Ltd.* | | | 50,521 | | | | 76,287 | | | |
Cherokee, Inc. | | | 1,100 | | | | 30,998 | | | |
Culp, Inc. | | | 36,016 | | | | 1,116,496 | | | |
Delta Apparel, Inc.*+ | | | 29,988 | | | | 428,828 | | | |
Ever-Glory International Group, Inc.* | | | 10,000 | | | | 51,000 | | | |
Lakeland Industries, Inc.*+ | | | 13,300 | | | | 152,152 | | | |
Perry Ellis International, Inc.* | | | 35,000 | | | | 831,950 | | | |
Rocky Brands, Inc. | | | 52,200 | | | | 976,140 | | | |
Superior Uniform Group, Inc. | | | 10,000 | | | | 165,400 | | | |
| | | | | | | | | | |
| | | | | | | 3,829,251 | | | |
| |
Thrifts & Mortgage Finance - 5.25% | | | |
Alliance Bancorp, Inc. of Pennsylvania | | | 22,000 | | | | 501,380 | | | |
ASB Bancorp, Inc.*+ | | | 21,000 | | | | 454,860 | | | |
Bank Mutual Corp. | | | 129,000 | | | | 989,430 | | | |
BankFinancial Corp. | | | 76,279 | | | | 898,567 | | | |
Cape Bancorp, Inc. | | | 42,102 | | | | 398,285 | | | |
Chicopee Bancorp, Inc. | | | 26,500 | | | | 436,985 | | | |
Citizens Community Bancorp, Inc. | | | 20,000 | | | | 183,200 | | | |
Eagle Bancorp Montana, Inc. | | | 6,289 | | | | 67,795 | | | |
ESSA Bancorp, Inc. | | | 37,400 | | | | 480,964 | | | |
Federal Agricultural Mortgage Corp.,
Class C | | | 24,200 | | | | 703,252 | | | |
First Defiance Financial Corp. | | | 44,900 | | | | 1,685,097 | | | |
First Financial Northwest, Inc. | | | 61,600 | | | | 767,536 | | | |
Fox Chase Bancorp, Inc. | | | 14,133 | | | | 239,130 | | | |
Guaranty Federal Bancshares, Inc. | | | 20,856 | | | | 307,000 | | | |
Heritage Financial Group, Inc. | | | 21,900 | | | | 660,942 | | | |
HF Financial Corp. | | | 12,000 | | | | 182,040 | | | |
Hingham Institution for Savings | | | 2,500 | | | | 287,775 | | | |
HMN Financial, Inc.* | | | 25,000 | | | | 294,750 | | | |
Home Bancorp, Inc. | | | 48,000 | | | | 1,211,520 | | | |
HomeStreet, Inc.* | | | 78,555 | | | | 1,792,625 | | | |
| | | | | | | | | | |
| | | | | | | | | | |
| | | | | | | | | | |
| | | | | | | | | | |
| | | | | | | | |
| Industry Company | | Shares | | | Value | |
| |
Thrifts & Mortgage Finance (continued) | |
HopFed Bancorp, Inc. | | | 13,088 | | | | $ 154,831 | |
Lake Shore Bancorp, Inc.+ | | | 22,150 | | | | 297,474 | |
Lake Sunapee Bank Group | | | 18,250 | | | | 263,348 | |
Meta Financial Group, Inc. | | | 17,155 | | | | 736,293 | |
Northeast Community Bancorp, Inc. | | | 55,658 | | | | 415,209 | |
Ocean Shore Holding Co. | | | 51,837 | | | | 769,002 | |
OceanFirst Financial Corp. | | | 29,200 | | | | 544,580 | |
Oneida Financial Corp.+ | | | 20,000 | | | | 409,000 | |
Provident Financial Holdings, Inc. | | | 63,617 | | | | 1,064,949 | |
Pulaski Financial Corp. | | | 43,500 | | | | 562,020 | |
Riverview Bancorp, Inc. | | | 67,406 | | | | 288,498 | |
Security National Financial Corp., Class A* | | | 38,588 | | | | 259,697 | |
SI Financial Group, Inc. | | | 34,276 | | | | 398,973 | |
Southern Missouri Bancorp, Inc. | | | 100 | | | | 1,885 | |
Territorial Bancorp, Inc. | | | 22,300 | | | | 540,998 | |
Timberland Bancorp, Inc. | | | 24,222 | | | | 242,704 | |
United Community Bancorp+ | | | 26,200 | | | | 361,822 | |
United Community Financial Corp. | | | 137,800 | | | | 737,230 | |
Wayne Savings Bancshares, Inc.+ | | | 7,800 | | | | 104,442 | |
Westfield Financial, Inc. | | | 64,100 | | | | 468,571 | |
| | | | | | | | |
| | | | | | | 21,164,659 | |
|
Trading Companies & Distributors - 0.84% | |
AeroCentury Corp.*+ | | | 10,900 | | | | 89,489 | |
BlueLinx Holdings, Inc.* | | | 97,724 | | | | 93,815 | |
EnviroStar, Inc.+ | | | 35,000 | | | | 156,450 | |
General Finance Corp.*+ | | | 100,600 | | | | 525,132 | |
Houston Wire & Cable Co. | | | 86,934 | | | | 862,385 | |
Lawson Products, Inc.* | | | 32,400 | | | | 760,752 | |
Titan Machinery, Inc.*+ | | | 18,000 | | | | 265,140 | |
Transcat, Inc.*+ | | | 5,000 | | | | 47,250 | |
Willis Lease Finance Corp.* | | | 31,000 | | | | 569,470 | |
| | | | | | | | |
| | | | | | | 3,369,883 | |
|
Water Utilities - 0.55% | |
Artesian Resources Corp., Class A | | | 21,500 | | | | 453,435 | |
Cadiz, Inc.*+ | | | 36,700 | | | | 318,923 | |
York Water Co., (The)+ | | | 69,850 | | | | 1,457,071 | |
| | | | | | | | |
| | | | | | | 2,229,429 | |
| | |
| 37 | | Annual Report | June 30, 2015 |
| | |
Ultra-Small Company Market Fund SCHEDULE OF INVESTMENTS (continued) | | |
Showing percentage of net assets as of June 30, 2015
| | | | | | | | | | |
| Industry Company | | | | Shares | | Value | | | |
Common Stocks (continued) | | | | | | |
Wireless Telecommunication Services - 0.37% | | | |
Boingo Wireless, Inc.* | | 120,000 | | $ | 991,200 | | | |
Spok Holdings, Inc. | | 30,000 | | | 505,200 | | | |
| | | | | | | | | | |
| | | | | | | 1,496,400 | | | |
| | | | | | | | | | |
TOTAL COMMON STOCKS - 99.09% | | | 399,168,356 | | | |
| | | | | | | | | | |
(Cost $284,922,040) | | | | | | | | |
| |
EXCHANGE TRADED FUND - 0.33% | | | |
iShares Micro-Cap ETF+ | | 16,525 | | | 1,347,283 | | | |
| | | | | | | | | | |
TOTAL EXCHANGE TRADED FUND - 0.33% | | | 1,347,283 | | | |
| | | | | | | | | | |
(Cost $442,002) | | | | | | |
| |
WARRANTS - 0.00% | | | |
Biotime, Inc.,
expire 10/01/18+ | | 16,058 | | | 17,824 | | | |
| | | | | | | | | | |
TOTAL WARRANTS - 0.00% | | | 17,824 | | | |
| | | | | | | | | | |
(Cost $15,589) | | | | | | |
| | | | |
| | | Rate^ | | Shares | | Value | | | |
MONEY MARKET FUND - 1.18% | | | |
Dreyfus Cash Management Fund | | 0.04% | | 4,736,924 | | | 4,736,924 | | | |
| | | | | | | | | | |
TOTAL MONEY MARKET FUND - 1.18% | | | 4,736,924 | | | |
| | | | | | | | | | |
(Cost $4,736,924) | | | | | | |
| | | | | | |
| INVESTMENTS PURCHASED WITH CASH PROCEEDS FROM SECURITIES LENDING - 10.98% | | | |
Dreyfus Cash Management Fund** | | 0.04% | | 44,237,825 | | | 44,237,825 | | | |
| | | | | | | | | | |
TOTAL INVESTMENTS PURCHASED WITH CASH PROCEEDS FROM SECURITIES LENDING - 10.98% | | | 44,237,825 | | | |
| | | | | | | | | | |
(Cost $44,237,825) | | | | | | |
TOTAL INVESTMENTS - 111.58% | | | 449,508,212 | | | |
(Cost $334,354,380) | | | | | | |
Liabilities in Excess of Other Assets - (11.58%) | | | (46,655,208 | ) | | |
| | | | | | | | | | |
NET ASSETS - 100.00% | | $ | 402,853,004 | | | |
| | | | | | | | | | |
| | | | |
| |
| * | | Non-income producing security. |
| ** | | This security represents the investment of the collateral received in connection with securities out on loan as of June 30, 2015. |
| ^ | | Rate disclosed as of June 30, 2015. |
| D | | Security was fair valued under procedures adopted by the Board of Directors (see Note 2). |
| + | | This security or a portion of the security is out on loan as of June 30, 2015. Total loaned securities had a value of $43,006,223 as of June 30, 2015. |
| LLC - Limited Liability Company | | |
Summary of inputs used to value the Fund’s investments as of 06/30/2015 (See Note 2 in Notes to Financial Statements):
| | | | | | | | | | | | | | | | |
| | | Valuation Inputs | |
| | | Investment in Securities (Value) | |
| | | Level 1 Quoted Prices | | | Level 2 Significant Observable Inputs | | | Level 3 Significant Unobservable Inputs | | | Total | |
Common Stocks | | $ | 398,728,631 | | | $ | 436,985 | | | $ | 2,740 | | | $ | 399,168,356 | |
Exchange Traded | | | | | | | | | | | | | | | | |
Fund | | | 1,347,283 | | | | — | | | | — | | | | 1,347,283 | |
Warrants | | | 17,824 | | | | — | | | | — | | | | 17,824 | |
Money Market Fund | | | — | | | | 4,736,924 | | | | — | | | | 4,736,924 | |
Investments Purchased with Cash Proceeds from Securities Lending | | | — | | | | 44,237,825 | | | | — | | | | 44,237,825 | |
| | | | | | | | | | | | | | | | |
TOTAL | | $ | 400,093,738 | | | $ | 49,411,734 | | | $ | 2,740 | | | $ | 449,508,212 | |
| | | | | | | | | | | | | | | | |
| | |
Ultra-Small Company Market Fund SCHEDULE OF INVESTMENTS (continued) | | |
Showing percentage of net assets as of June 30, 2015
| | | | | | | | | | | | |
Following is a reconciliation of Level 3 investments for which significant unobservable inputs were used to determine fair value: | | |
| | | Investment in Securities (Value) | | |
| | | Common Stocks | | | Total | | | | | |
Balance as of 06/30/2014 | | $ | — | | | $ | — | | | | | |
Purchases | | | — | �� | | | — | | | | | |
Sales | | | — | | | | — | | | | | |
Realized gain/(loss) | | | — | | | | — | | | | | |
Change in unrealized appreciation/ (depreciation)1 | | | (253,450 | ) | | | (253,450 | ) | | | | |
Transfers in2,3 | | | 256,190 | | | | 256,190 | | | | | |
Transfers out | | | — | | | | — | | | | | |
| | | | | | | | | | | | |
Balance as of 06/30/2015 | | $ | 2,740 | | | $ | 2,740 | | | | | |
| | | | | | | | | | | | |
Net change in unrealized appreciation (depreciation) from investments held as of 06/30/20152 | | $ | (253,450 | ) | | $ | (253,450 | ) | | | | |
| | | | | | | | | | | | |
| | | | | | | | | | | | |
1 Change in unrealized appreciation/(depreciation) for Level 3 securities is included on the Statements of Operations in the Change in Unrealized Appreciation (Depreciation) on Investments. | | |
| |
2 Transfers in represent the value as of the beginning of the reporting period, for any investment security where significant transfers in the pricing level occurred during the period. The purchase value is used in situations where the investment was not held as of the beginning of the period. The security transferred from level 1 to level 3. | | |
| |
3 Transfer took place as a result of a trading halt. | | |
| |
| See Notes to Financial Statements. | | |
| | |
| | |
| 39 | | Annual Report | June 30, 2015 |
| | |
Small-Cap Momentum Fund MANAGER’S COMMENTARY (Unaudited) | | |
June 30, 2015
Dear Fellow Small-Cap Momentum Fund Shareholder,
For the quarter ended June 30, 2015, our Fund appreciated 1.07%, outperforming our primary market benchmark, the Russell 2000 Index (+0.42%). It was a good quarter.
For the fiscal year, our Fund appreciated 4.54%, underperforming the Russell 2000 Index (+6.49%).
The table below presents our June quarter, one-year, five-year, and inception-to-date financial results. See the next page for a graph of performance since inception.
Standardized Returns as of June 30, 2015
| | | | | | | | | | | | | | | | | | | | | | | | |
| | | | | | | | | | | | | | | Annualized | | | | | Annualized | |
| | | Quarter | | | | | 1 Year | | | | | | | 5 Year | | | | | Since Inception
(5/28/10) | |
| | | | | | | | |
Small-Cap Momentum Fund | | | 1.07% | | | | | | 4.54% | | | | | | | | 15.67% | | | | | | 13.81% | |
Russell 2000 Index | | | 0.42% | | | | | | 6.49% | | | | | | | | 17.08% | | | | | | 14.91% | |
Performance figures quoted in the table above represent past performance and are no guarantee of future results. Total return figures in the table above include the reinvestment of dividends and capital gains. The table above does not reflect the deduction of taxes that a shareholder would pay on Fund distributions or on the redemption of Fund shares.
The Russell 2000 Index is an unmanaged, market value-weighted index that measures performance of the 2,000 companies that are between the 1,000th and 3,000th largest in the market with dividends reinvested. It is not possible to invest directly in an index. Periods longer than one year are annualized.
According to data from Lipper, Inc. as of June 30, 2015, Small-Cap Momentum Fund ranked 442nd of 792 small-cap core funds for the 12 months ending June 30, 2015, 354th of 616 over the last five years, and 344th of 609 such funds since inception in May 2010. Lipper, Inc. is an independent mutual fund rating service that ranks funds in various fund categories by making comparative calculations using total returns.
| | |
Small-Cap Momentum Fund MANAGER’S COMMENTARY (Unaudited) (continued) | | |
Small-Cap Momentum Fund vs. Russell 2000 Index
from Inception 5/28/10 to 6/30/15
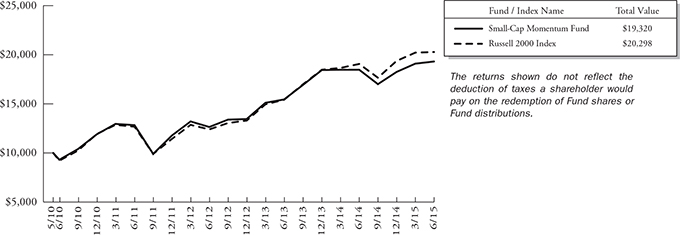
Detailed Explanation of Quarterly Performance
Our Fund outperformed its primary benchmark, the Russell 2000 Index. Price momentum was a favorable factor for the quarter, contributing positively to our Fund. Additionally, the Fund’s risk-adjustment overlay feature worked well this quarter. We are pleased with the Fund’s performance in line with Fund design.
Detailed Explanation of Fiscal Year Performance
For the fiscal year, the momentum factor did not perform well for small-cap stocks, and momentum holdings lagged the Russell 2000 Index. Additionally, the risk-adjustment overlay feature further diminished our performance.
Top Ten Holdings as of June 30, 2015
| | | | | | | | | |
| Rank | | Description | | Industry | | % of Net
Assets |
| 1 | | LifePoint Health, Inc. | | Health Care Providers & Services | | | | 0.8% | |
| 2 | | Bright Horizons Family Solutions, Inc. | | Diversified Consumer Services | | | | 0.8% | |
| 3 | | First Horizon National Corp. | | Commercial Banks | | | | 0.8% | |
| 4 | | Radian Group, Inc. | | Thrifts & Mortgage Finance | | | | 0.8% | |
| 5 | | EPAM Systems, Inc. | | IT Services | | | | 0.8% | |
| 6 | | Anacor Pharmaceuticals, Inc. | | Biotechnology | | | | 0.8% | |
| 7 | | Amsurg Corp. | | Health Care Providers & Services | | | | 0.8% | |
| 8 | | MarketAxess Holdings, Inc. | | Diversified Financial Services | | | | 0.7% | |
| 9 | | j2 Global, Inc. | | Internet Software & Services | | | | 0.7% | |
| 10 | | Sun Communities, Inc. | | Real Estate Investment Trusts (REITs) | | | | 0.7% | |
| | Total | | | | | | 7.7% | |
| | |
| 41 | | Annual Report | June 30, 2015 |
| | |
Small-Cap Momentum Fund MANAGER’S COMMENTARY (Unaudited) (continued) | | |
Industry Sector Representation as of June 30, 2015
| | | | | | | | | | | | | | | |
| | | % of Net Assets | | % of Russell 2000
Index | | Difference |
Consumer Discretionary | | | | 14.6% | | | | | 14.6% | | | | | 0.0% | |
Consumer Staples | | | | 3.2% | | | | | 3.1% | | | | | 0.1% | |
Energy | | | | 0.4% | | | | | 3.9% | | | | | -3.5% | |
Financials | | | | 28.6% | | | | | 24.3% | | | | | 4.3% | |
Health Care | | | | 19.0% | | | | | 16.0% | | | | | 3.0% | |
Industrials | | | | 9.7% | | | | | 12.8% | | | | | -3.1% | |
Information Technology | | | | 16.8% | | | | | 17.2% | | | | | -0.4% | |
Materials | | | | 1.7% | | | | | 4.0% | | | | | -2.3% | |
Telecommunication Services | | | | 1.7% | | | | | 0.8% | | | | | 0.9% | |
Utilities | | | | 4.2% | | | | | 3.3% | | | | | 0.9% | |
Cash & Other Assets | | | | 0.0% | | | | | 0.0% | | | | | 0.0% | |
Total | | | | 100.0% | | | | | 100.0% | | | | | | |
Disclaimer
The views expressed here are exclusively those of Fund management. These views, including those related to market sectors or individual stocks, are not meant as investment advice and should not be considered predictive in nature. Any favorable (or unfavorable) description of a holding applies only as of the quarter end, June 30, 2015, unless otherwise stated. Security positions can and do change thereafter. Discussions of historical performance do not guarantee and are not indicative of future performance.
Market volatility can significantly impact short-term performance. The Fund is not an appropriate investment for short-term investors. Investments in small companies generally carry greater risk than is customarily associated with larger companies. This additional risk is attributable to a number of factors, including the relatively limited financial resources that are typically available to small companies and the fact that small companies often have comparatively limited product lines. In addition, the stock of small companies tends to be more volatile than the stock of large companies, particularly in the short term and particularly in the early stages of an economic or market downturn. Shareholders of the Fund, therefore, are taking on more risk than they would if they invested in the stock market as a whole.
Conclusion
Thank you for your continued investment in Small-Cap Momentum Fund. We encourage your feedback; your reactions and concerns are important to us.
|
| Sincerely, |
|
| The Investment Management Team |
| | |
Small-Cap Momentum Fund SCHEDULE OF INVESTMENTS | | |
| Showing percentage of net assets as of June 30, 2015 | | |
| | | | | | | | | | |
| Industry Company | | Shares | | | Value | | | |
COMMON STOCKS - 99.96% | | | | | | | |
Aerospace & Defense - 1.63% | | | |
AAR Corp. | | | 450 | | | | $14,342 | | | |
Astronics Corp.* | | | 200 | | | | 14,178 | | | |
Elbit Systems, Ltd.+ | | | 450 | | | | 35,217 | | | |
Taser International, Inc.* | | | 600 | | | | 19,986 | | | |
| | | | | | | | | | |
| | | | | | | 83,723 | | | |
| | |
Air Freight & Logistics - 0.25% | | | | | | | |
Echo Global Logistics, Inc.* | | | 300 | | | | 9,798 | | | |
Radiant Logistics, Inc.* | | | 450 | | | | 3,290 | | | |
| | | | | | | | | | |
| | | | | | | 13,088 | | | |
| | |
Airlines - 0.62% | | | | | | | |
Allegiant Travel Co. | | | 180 | | | | 32,018 | | | |
| | | | | | | | | | |
| | |
Auto Components - 0.88% | | | | | | | |
American Axle & Manufacturing Holdings, Inc.* | | | 850 | | | | 17,774 | | | |
Cooper Tire & Rubber Co. | | | 615 | | | | 20,805 | | | |
Fox Factory Holding Corp.* | | | 400 | | | | 6,432 | | | |
| | | | | | | | | | |
| | | | | | | 45,011 | | | |
| | |
Beverages - 0.71% | | | | | | | |
Boston Beer Co.,
Inc., Class A
(The)*+ | | | 105 | | | | 24,359 | | | |
Coca-Cola Bottling
Co. Consolidated | | | 80 | | | | 12,086 | | | |
| | | | | | | | | | |
| | | | | | | 36,445 | | | |
| | |
Biotechnology - 6.91% | | | | | | | |
Advaxis, Inc.* | | | 350 | | | | 7,116 | | | |
Agenus, Inc.*+ | | | 800 | | | | 6,904 | | | |
AMAG Pharmaceuticals, Inc.* | | | 350 | | | | 24,171 | | | |
Amicus Therapeutics, Inc.* | | | 1,000 | | | | 14,150 | | | |
Anacor Pharmaceuticals, Inc.* | | | 500 | | | | 38,715 | | | |
BioSpecifics Technologies Corp.* | | | 50 | | | | 2,580 | | | |
BioTime, Inc.*+ | | | 900 | | | | 3,267 | | | |
Chimerix, Inc.* | | | 440 | | | | 20,328 | | | |
China Biologic Products, Inc.* | | | 275 | | | | 31,669 | | | |
CorMedix, Inc.*+ | | | 350 | | | | 1,358 | | | |
Dynavax
Technologies Corp.* | | | 300 | | | | 7,028 | | | |
Eagle Pharmaceuticals, Inc.* | | | 150 | | | | 12,129 | | | |
Emergent BioSolutions, Inc.* | | | 400 | | | | 13,180 | | | |
Esperion Therapeutics, Inc.*+ | | | 250 | | | | 20,440 | | | |
Insys Therapeutics, Inc.*+ | | | 800 | | | | 28,736 | | | |
| | | | | | | | | | |
| | | | | | | | | | |
| | | | | | | | | | |
| Industry Company | | Shares | | | Value | | | |
| | | | | | | | | | |
Biotechnology (continued) | | | | | | | | | | |
Momenta Pharmaceuticals, Inc.* | | | 650 | | | | $ 14,826 | | | |
NewLink Genetics Corp.* | | | 300 | | | | 13,281 | | | |
Portola Pharmaceuticals, Inc.* | | | 550 | | | | 25,052 | | | |
PTC Therapeutics, Inc.* | | | 350 | | | | 16,846 | | | |
TESARO, Inc.* | | | 450 | | | | 26,456 | | | |
Tetraphase Pharmaceuticals, Inc.* | | | 400 | | | | 18,976 | | | |
uniQure NV* | | | 250 | | | | 6,750 | | | |
| | | | | | | | | | |
| | | | | | | 353,958 | | | |
| | | |
Building Products - 1.51% | | | | | | | | | | |
AAON, Inc. | | | 600 | | | | 13,512 | | | |
American Woodmark Corp.* | | | 150 | | | | 8,228 | | | |
Apogee Enterprises, Inc. | | | 300 | | | | 15,792 | | | |
Gibraltar Industries, Inc.* | | | 350 | | | | 7,130 | | | |
Griffon Corp. | | | 550 | | | | 8,756 | | | |
New Home Co. Inc.,
(The)*+ | | | 150 | | | | 2,584 | | | |
Patrick Industries, Inc.* | | | 100 | | | | 3,805 | | | |
PGT, Inc.* | | | 500 | | | | 7,255 | | | |
Universal Forest Products, Inc. | | | 200 | | | | 10,406 | | | |
| | | | | | | | | | |
| | | | | | | 77,468 | | | |
| | | |
Capital Markets - 2.14% | | | | | | | | | | |
BGC Partners, Inc.,
Class A | | | 2,300 | | | | 20,125 | | | |
Cowen Group, Inc.,
Class A* | | | 1,200 | | | | 7,680 | | | |
Diamond Hill Investment Group, Inc. | | | 35 | | | | 6,988 | | | |
HFF, Inc., Class A | | | 400 | | | | 16,692 | | | |
INTL FCStone, Inc.* | | | 200 | | | | 6,648 | | | |
Marcus & Millichap, Inc.* | | | 400 | | | | 18,456 | | | |
WisdomTree Investments, Inc.+ | | | 1,500 | | | | 32,948 | | | |
| | | | | | | | | | |
| | | | | | | 109,537 | | | |
| | | |
Chemicals - 0.64% | | | | | | | | | | |
Core Molding Technologies, Inc.* | | | 100 | | | | 2,284 | | | |
Innophos Holdings, Inc. | | | 250 | | | | 13,160 | | | |
KMG Chemicals, Inc. | | | 150 | | | | 3,816 | | | |
Quaker Chemical Corp. | | | 150 | | | | 13,326 | | | |
| | | | | | | | | | |
| | | | | | | 32,586 | | | |
| | | |
Commercial Banks - 9.19% | | | | | | | | | | |
Access National Corp. | | | 100 | | | | 1,944 | | | |
Ames National Corp. | | | 100 | | | | 2,510 | | | |
Banner Corp. | | | 250 | | | | 11,982 | | | |
| | |
| 43 | | Annual Report | June 30, 2015 |
| | |
Small-Cap Momentum Fund SCHEDULE OF INVESTMENTS (continued) | | |
| Showing percentage of net assets as of June 30, 2015 | | |
| | | | | | | | | | |
| Industry Company | | Shares | | | Value | | | |
Common Stocks (continued) | | | |
Commercial Banks (continued) | | | |
Bar Harbor Bankshares | | | 50 | | | | $ 1,772 | | | |
Bridge Capital Holdings | | | 150 | | | | 4,470 | | | |
BSB Bancorp, Inc.* | | | 100 | | | | 2,211 | | | |
Camden National Corp. | | | 100 | | | | 3,870 | | | |
Cardinal Financial Corp. | | | 350 | | | | 7,626 | | | |
Cathay General Bancorp | | | 850 | | | | 27,582 | | | |
CenterState Banks, Inc. | | | 500 | | | | 6,755 | | | |
Central Pacific Financial Corp. | | | 350 | | | | 8,312 | | | |
Citizens & Northern Corp. | | | 150 | | | | 3,082 | | | |
CoBiz Financial, Inc. | | | 450 | | | | 5,882 | | | |
Columbia Banking System, Inc. | | | 650 | | | | 21,151 | | | |
CU Bancorp* | | | 200 | | | | 4,432 | | | |
Customers Bancorp, Inc.* | | | 284 | | | | 7,637 | | | |
Enterprise Financial Services Corp. | | | 200 | | | | 4,554 | | | |
Farmers Capital Bank Corp.* | | | 100 | | | | 2,843 | | | |
Fidelity Southern Corp. | | | 250 | | | | 4,360 | | | |
First Community Bancshares, Inc. | | | 200 | | | | 3,644 | | | |
First Horizon National Corp. | | | 2,530 | | | | 39,645 | | | |
First Merchants Corp. | | | 400 | | | | 9,880 | | | |
Great Southern Bancorp, Inc. | | | 150 | | | | 6,321 | | | |
Hampton Roads Bankshares, Inc.*+ | | | 1,850 | | | | 3,848 | | | |
Hanmi Financial Corp. | | | 350 | | | | 8,694 | | | |
Heartland Financial USA, Inc. | | | 200 | | | | 7,444 | | | |
Heritage Commerce Corp. | | | 300 | | | | 2,883 | | | |
Heritage Oaks Bancorp | | | 350 | | | | 2,754 | | | |
Horizon Bancorp | | | 100 | | | | 2,496 | | | |
Independent Bank Corp., MA | | | 300 | | | | 14,067 | | | |
International Bancshares Corp. | | | 700 | | | | 18,809 | | | |
MainSource Financial Group, Inc. | | | 250 | | | | 5,488 | | | |
Metro Bancorp, Inc. | | | 150 | | | | 3,921 | | | |
MidWestOne Financial Group, Inc. | | | 100 | | | | 3,292 | | | |
NewBridge Bancorp | | | 350 | | | | 3,126 | | | |
Old Second Bancorp, Inc.* | | | 300 | | | | 1,980 | | | |
Palmetto Bancshares, Inc.+ | | | 150 | | | | 2,966 | | | |
Pinnacle Financial Partners, Inc. | | | 375 | | | | 20,389 | | | |
Preferred Bank | | | 150 | | | | 4,508 | | | |
PrivateBancorp, Inc. | | | 875 | | | | 34,842 | | | |
Republic Bancorp, Inc., Class A | | | 200 | | | | 5,140 | | | |
| | | | | | | | | | |
| | | | | | | | | | |
| | | | | | | | | | |
| Industry Company | | Shares | | | Value | | | |
| | | | | | | | | | |
Commercial Banks (continued) | | | |
Sandy Spring Bancorp, Inc. | | | 250 | | | | $ 6,995 | | | |
Seacoast Banking Corp. of Florida* | | | 350 | | | | 5,530 | | | |
Square 1 Financial, Inc.,
Class A* | | | 300 | | | | 8,205 | | | |
Stock Yards Bancorp, Inc. | | | 150 | | | | 5,668 | | | |
Suffolk Bancorp | | | 150 | | | | 3,849 | | | |
Tompkins Financial Corp. | | | 150 | | | | 8,058 | | | |
TowneBank+ | | | 350 | | | | 5,702 | | | |
United Bankshares, Inc. | | | 775 | | | | 31,178 | | | |
United Community Banks, Inc. | | | 650 | | | | 13,566 | | | |
Washington Trust Bancorp, Inc. | | | 200 | | | | 7,896 | | | |
West Bancorporation, Inc. | | | 150 | | | | 2,976 | | | |
Western Alliance Bancorp* | | | 950 | | | | 32,072 | | | |
| | | | | | | | | | |
| | | | | | | 470,807 | | | |
| |
Commercial Services & Supplies - 2.10% | | | |
ABM Industries, Inc. | | | 600 | | | | 19,722 | | | |
Ennis, Inc. | | | 300 | | | | 5,577 | | | |
G&K Services, Inc., Class A | | | 200 | | | | 13,828 | | | |
HNI Corp. | | | 500 | | | | 25,575 | | | |
Knoll, Inc. | | | 550 | | | | 13,766 | | | |
Multi-Color Corp. | | | 200 | | | | 12,776 | | | |
Sykes Enterprises, Inc.* | | | 450 | | | | 10,912 | | | |
Viad Corp. | | | 200 | | | | 5,422 | | | |
| | | | | | | | | | |
| | | | | | | 107,578 | | | |
| |
Communications Equipment - 1.26% | | | |
Infinera Corp.* | | | 1,400 | | | | 29,372 | | | |
InterDigital, Inc. | | | 400 | | | | 22,756 | | | |
Radware, Ltd.* | | | 550 | | | | 12,210 | | | |
| | | | | | | | | | |
| | | | | | | 64,338 | | | |
| |
Computers & Peripherals - 0.39% | | | |
Novatel Wireless, Inc.*+ | | | 550 | | | | 1,788 | | | |
QLogic Corp.* | | | 950 | | | | 13,480 | | | |
Quantum Corp.* | | | 2,750 | | | | 4,620 | | | |
| | | | | | | | | | |
| | | | | | | 19,888 | | | |
| |
Construction & Engineering - 0.33% | | | |
Comfort Systems USA, Inc. | | | 400 | | | | 9,180 | | | |
MYR Group, Inc.* | | | 250 | | | | 7,740 | | | |
| | | | | | | | | | |
| | | | | | | 16,920 | | | |
| |
Construction Materials - 0.11% | | | |
U.S. Concrete, Inc.* | | | 150 | | | | 5,684 | | | |
| |
Distributors - 0.04% | | | |
VOXX International Corp.* | | | 250 | | | | 2,070 | | | |
| | |
Small-Cap Momentum Fund SCHEDULE OF INVESTMENTS (continued) | | |
| Showing percentage of net assets as of June 30, 2015 | | |
| | | | | | | | | | |
| Industry Company | | Shares | | | Value | | | |
Common Stocks (continued) | | | | | | | | | | |
Diversified Consumer Services - 2.22% | | | |
2U, Inc.* | | | 450 | | | | $ 14,486 | | | |
Bright Horizons Family Solutions, Inc.* | | | 700 | | | | 40,460 | | | |
Carriage Services, Inc. | | | 200 | | | | 4,776 | | | |
Matthews International Corp., Class A | | | 350 | | | | 18,599 | | | |
Nord Anglia Education, Inc.* | | | 1,050 | | | | 25,746 | | | |
Regis Corp.* | | | 600 | | | | 9,456 | | | |
| | | | | | | | | | |
| | | | | | | 113,523 | | | |
| |
Diversified Financial Services - 1.88% | | | |
Capitol Acquisition Corp. II* | | | 250 | | | | 2,638 | | | |
Janus Capital Group, Inc. | | | 2,050 | | | | 35,096 | | | |
Levy Acquisition Corp.* | | | 200 | | | | 3,044 | | | |
MarketAxess Holdings, Inc. | | | 410 | | | | 38,036 | | | |
PennyMac Financial Services, Inc., Class A* | | | 200 | | | | 3,624 | | | |
Sterling Bancorp | | | 950 | | | | 13,965 | | | |
| | | | | | | | | | |
| | | | | | | 96,403 | | | |
| |
Diversified Telecommunication Services - 0.86% | | | |
8X8, Inc.* | | | 1,000 | | | | 8,960 | | | |
Atlantic Tele-Network, Inc. | | | 175 | | | | 12,089 | | | |
FairPoint Communications, Inc.* | | | 300 | | | | 5,466 | | | |
General Communication, Inc., Class A* | | | 400 | | | | 6,804 | | | |
Vonage Holdings Corp.* | | | 2,200 | | | | 10,802 | | | |
| | | | | | | | | | |
| | | | | | | 44,121 | | | |
| |
Electric Utilities - 1.15% | | | |
IDACORP, Inc. | | | 560 | | | | 31,438 | | | |
UIL Holdings Corp. | | | 600 | | | | 27,492 | | | |
| | | | | | | | | | |
| | | | | | | 58,930 | | | |
| |
Electrical Equipment - 0.57% | | | |
II-VI, Inc.* | | | 650 | | | | 12,337 | | | |
Orbotech, Ltd.* | | | 450 | | | | 9,360 | | | |
PowerSecure International, Inc.* | | | 250 | | | | 3,690 | | | |
Vicor Corp.* | | | 300 | | | | 3,657 | | | |
| | | | | | | | | | |
| | | | | | | 29,044 | | | |
| |
Electronic Equipment, Instruments & Components - 1.69% | | | |
Badger Meter, Inc. | | | 150 | | | | 9,524 | | | |
DTS, Inc.* | | | 200 | | | | 6,098 | | | |
GSI Group, Inc.* | | | 350 | | | | 5,260 | | | |
IMAX Corp.* | | | 750 | | | | 30,202 | | | |
Multi-Fineline Electronix, Inc.* | | | 250 | | | | 5,465 | | | |
| | | | | | | | | | |
| | | | | | | | | | |
| | | | | | | | | | |
| | | | | | | | | | |
| Industry Company | | Shares | | | Value | | | |
| | | |
Electronic Equipment, Instruments & Components (continued) | | | |
WGL Holdings, Inc. | | | 550 | | | | $29,860 | | | |
| | | | | | | | | | |
| | | | | | | 86,409 | | | |
| |
Food & Staples Retailing - 0.20% | | | |
Ingles Markets, Inc., Class A | | | 150 | | | | 7,166 | | | |
Village Super Market, Inc., Class A | | | 100 | | | | 3,169 | | | |
| | | | | | | | | | |
| | | | | | | 10,335 | | | |
| |
Food Products - 1.28% | | | |
Calavo Growers, Inc. | | | 200 | | | | 10,386 | | | |
Cal-Maine Foods, Inc. | | | 500 | | | | 26,100 | | | |
Fresh Del Monte Produce, Inc. | | | 550 | | | | 21,263 | | | |
John B. Sanfilippo & Son, Inc. | | | 100 | | | | 5,190 | | | |
Lifeway Foods, Inc.* | | | 150 | | | | 2,878 | | | |
| | | | | | | | | | |
| | | | | | | 65,817 | | | |
| |
Gas Utilities - 1.16% | | | |
Chesapeake Utilities Corp. | | | 187 | | | | 10,070 | | | |
Laclede Group, Inc. (The) | | | 450 | | | | 23,427 | | | |
New Jersey Resources Corp. | | | 950 | | | | 26,172 | | | |
| | | | | | | | | | |
| | | | | | | 59,669 | | | |
| |
Health Care Equipment & Supplies - 5.60% | | | |
Abaxis, Inc. | | | 260 | | | | 13,385 | | | |
ABIOMED, Inc.* | | | 425 | | | | 27,935 | | | |
Analogic Corp. | | | 125 | | | | 9,862 | | | |
AtriCure, Inc.* | | | 300 | | | | 7,392 | | | |
CryoLife, Inc. | | | 300 | | | | 3,384 | | | |
Cutera, Inc.* | | | 150 | | | | 2,322 | | | |
Cynosure, Inc.,
Class A* | | | 250 | | | | 9,645 | | | |
Greatbatch, Inc.* | | | 300 | | | | 16,176 | | | |
Hill-Rom Holdings, Inc. | | | 600 | | | | 32,598 | | | |
Inogen, Inc.* | | | 200 | | | | 8,920 | | | |
Integra LifeSciences Holdings Corp.* | | | 350 | | | | 23,580 | | | |
Invacare Corp. | | | 350 | | | | 7,570 | | | |
LDR Holding Corp.* | | | 300 | | | | 12,975 | | | |
LeMaitre Vascular, Inc. | | | 200 | | | | 2,412 | | | |
Masimo Corp.* | | | 550 | | | | 21,307 | | | |
Merit Medical Systems, Inc.* | | | 500 | | | | 10,770 | | | |
Natus Medical, Inc.* | | | 350 | | | | 14,896 | | | |
NuVasive, Inc.* | | | 550 | | | | 26,059 | | | |
NxStage Medical, Inc.* | | | 650 | | | | 9,285 | | | |
RTI Surgical, Inc.* | | | 650 | | | | 4,199 | | | |
| | |
| 45 | | Annual Report | June 30, 2015 |
| | |
Small-Cap Momentum Fund SCHEDULE OF INVESTMENTS (continued) | | |
| Showing percentage of net assets as of June 30, 2015 | | |
| | | | | | | | | | |
| Industry Company | | Shares | | | Value | | | |
Common Stocks (continued) | | | |
Health Care Equipment & Supplies (continued) | | | |
SurModics, Inc.* | | | 150 | | | | $ 3,513 | | | |
Vascular Solutions, Inc.* | | | 200 | | | | 6,944 | | | |
Zeltiq Aesthetics, Inc.* | | | 400 | | | | 11,788 | | | |
| | | | | | | | | | |
| | | | | | | 286,917 | | | |
| |
Health Care Providers & Services - 4.20% | | | |
Almost Family, Inc.* | | | 100 | | | | 3,991 | | | |
Amedisys, Inc.* | | | 350 | | | | 13,906 | | | |
AMN Healthcare Services, Inc.* | | | 500 | | | | 15,795 | | | |
Amsurg Corp.* | | | 550 | | | | 38,473 | | | |
Bio-Reference Laboratories, Inc.* | | | 300 | | | | 12,375 | | | |
Cross Country Healthcare, Inc.* | | | 350 | | | | 4,438 | | | |
Ensign Group, Inc. (The) | | | 275 | | | | 14,042 | | | |
ExamWorks Group, Inc.*+ | | | 450 | | | | 17,595 | | | |
LHC Group, Inc.* | | | 200 | | | | 7,650 | | | |
LifePoint Health, Inc.* | | | 500 | | | | 43,475 | | | |
National Healthcare Corp. | | | 140 | | | | 9,099 | | | |
Surgical Care Affiliates, Inc.* | | | 450 | | | | 17,271 | | | |
U.S. Physical Therapy, Inc. | | | 150 | | | | 8,214 | | | |
Universal American Corp.* | | | 850 | | | | 8,602 | | | |
| | | | | | | | | | |
| | | | | | | 214,926 | | | |
| |
Health Care Technology - 1.01% | | | |
Medidata Solutions, Inc.* | | | 600 | | | | 32,592 | | | |
Merge Healthcare, Inc.* | | | 1,000 | | | | 4,800 | | | |
Omnicell, Inc.* | | | 380 | | | | 14,330 | | | |
| | | | | | | | | | |
| | | | | | | 51,722 | | | |
| |
Hotels, Restaurants & Leisure - 5.03% | | | |
Carrols Restaurant Group, Inc.* | | | 350 | | | | 3,640 | | | |
Churchill Downs, Inc. | | | 200 | | | | 25,010 | | | |
ClubCorp Holdings, Inc. | | | 700 | | | | 16,716 | | | |
Denny’s Corp.* | | | 850 | | | | 9,868 | | | |
Diamond Resorts | | | | | | | | | | |
International, Inc.* | | | 775 | | | | 24,451 | | | |
Isle of Capri Casinos, Inc.* | | | 450 | | | | 8,168 | | | |
Jack in the Box, Inc. | | | 400 | | | | 35,264 | | | |
La Quinta Holdings, Inc.* | | | 1,450 | | | | 33,132 | | | |
Marcus Corp. (The) | | | 200 | | | | 3,836 | | | |
Marriott Vacations | | | | | | | | | | |
Worldwide Corp. | | | 350 | | | | 32,112 | | | |
Papa John’s International, Inc. | | | 445 | | | | 33,646 | | | |
Ruth’s Hospitality
Group, Inc. | | | 350 | | | | 5,642 | | | |
Sonic Corp. | | | 550 | | | | 15,840 | | | |
Speedway Motorsports, Inc. | | | 450 | | | | 10,192 | | | |
| | | | | | | | | | |
| | | | | | | 257,517 | | | |
| | | | | | | | | | |
| Industry Company | | Shares | | | Value | | | |
| | | |
Household Durables - 0.91% | | | |
Bassett Furniture Industries, Inc. | | | 100 | | | | $ 2,841 | | | |
Helen of Troy, Ltd.* | | | 300 | | | | 29,247 | | | |
Hooker Furniture Corp. | | | 100 | | | | 2,511 | | | |
Libbey, Inc. | | | 225 | | | | 9,299 | | | |
ZAGG, Inc.* | | | 350 | | | | 2,772 | | | |
| | | | | | | | | | |
| | | | | | | 46,670 | | | |
| |
Household Products - 0.37% | | | |
Central Garden & Pet Co., Class A* | | | 500 | | | | 5,705 | | | |
WD-40 Co. | | | 150 | | | | 13,074 | | | |
| | | | | | | | | | |
| | | | | | | 18,779 | | | |
| |
Insurance - 3.99% | | | |
AMERISAFE, Inc. | | | 200 | | | | 9,412 | | | |
Atlas Financial Holdings, Inc.* | | | 150 | | | | 2,975 | | | |
EMC Insurance Group, Inc. | | | 225 | | | | 5,641 | | | |
FBL Financial Group, Inc., Class A | | | 250 | | | | 14,430 | | | |
Heritage Insurance Holdings, Inc.* | | | 350 | | | | 8,046 | | | |
Horace Mann Educators Corp. | | | 450 | | | | 16,371 | | | |
Mercury General Corp. | | | 600 | | | | 33,390 | | | |
Montpelier Re Holdings, Ltd. | | | 500 | | | | 19,750 | | | |
RLI Corp. | | | 450 | | | | 23,126 | | | |
Safety Insurance Group, Inc. | | | 150 | | | | 8,656 | | | |
StanCorp Financial Group, Inc. | | | 450 | | | | 34,024 | | | |
State Auto Financial Corp. | | | 450 | | | | 10,778 | | | |
United Fire Group, Inc. | | | 250 | | | | 8,190 | | | |
Universal Insurance Holdings, Inc. | | | 400 | | | | 9,680 | | | |
| | | | | | | | | | |
| | | | | | | 204,469 | | | |
| |
Internet & Catalog Retail - 0.37% | | | |
EVINE Live, Inc.* | | | 600 | | | | 1,614 | | | |
Orbitz Worldwide, Inc.*+ | | | 1,200 | | | | 13,704 | | | |
PetMed Express, Inc. | | | 200 | | | | 3,454 | | | |
| | | | | | | | | | |
| | | | | | | 18,772 | | | |
| |
Internet Software & Services - 2.78% | | | |
Cimpress NV* | | | 375 | | | | 31,560 | | | |
comScore, Inc.* | | | 450 | | | | 23,967 | | | |
GTT Communications, Inc.* | | | 400 | | | | 9,548 | | | |
Internap Corp.* | | | 600 | | | | 5,550 | | | |
j2 Global, Inc. | | | 550 | | | | 37,367 | | | |
LogMeIn, Inc.* | | | 250 | | | | 16,122 | | | |
Stamps.com, Inc.* | | | 200 | | | | 14,714 | | | |
| | |
Small-Cap Momentum Fund SCHEDULE OF INVESTMENTS (continued) | | |
| Showing percentage of net assets as of June 30, 2015 | | |
| | | | | | | | | | |
| Industry Company | | Shares | | | Value | | | |
Common Stocks (continued) | | | |
Internet Software & Services (continued) | | | |
Zix Corp.* | | | 650 | | | | $ 3,360 | | | |
| | | | | | | | | | |
| | | | | | | 142,188 | | | |
| |
IT Services - 2.02% | | | |
Blackhawk Network Holdings, Inc.* | | | 600 | | | | 24,720 | | | |
EPAM Systems, Inc.* | | | 550 | | | | 39,176 | | | |
Hackett Group, Inc. (The) | | | 300 | | | | 4,029 | | | |
Heartland Payment Systems, Inc. | | | 400 | | | | 21,620 | | | |
Luxoft Holding, Inc.* | | | 200 | | | | 11,310 | | | |
PFSweb, Inc.* | | | 200 | | | | 2,772 | | | |
| | | | | | | | | | |
| | | | | | | 103,627 | | | |
| |
Leisure Equipment & Products - 0.29% | | | |
Callaway Golf Co. | | | 850 | | | | 7,599 | | | |
Nautilus, Inc.* | | | 350 | | | | 7,528 | | | |
| | | | | | | | | | |
| | | | | | | 15,127 | | | |
| |
Life Sciences Tools & Services - 0.43% | | | |
Affymetrix, Inc.*+ | | | 850 | | | | 9,282 | | | |
Fluidigm Corp.* | | | 300 | | | | 7,260 | | | |
Harvard Bioscience, Inc.* | | | 350 | | | | 1,995 | | | |
Sequenom, Inc.*+ | | | 1,200 | | | | 3,648 | | | |
| | | | | | | | | | |
| | | | | | | 22,185 | | | |
| |
Machinery - 0.52% | | | |
Blue Bird Corp.*+ | | | 250 | | | | 3,248 | | | |
Hurco Companies, Inc. | | | 75 | | | | 2,596 | | | |
John Bean Technologies Corp. | | | 300 | | | | 11,277 | | | |
Kadant, Inc. | | | 100 | | | | 4,720 | | | |
Miller Industries, Inc.+ | | | 100 | | | | 1,995 | | | |
Xerium Technologies, Inc.* | | | 150 | | | | 2,730 | | | |
| | | | | | | | | | |
| | | | | | | 26,566 | | | |
| |
Marine - 0.43% | | | |
Global Ship Lease, Inc., Class A* | | | 500 | | | | 2,895 | | | |
Matson, Inc. | | | 450 | | | | 18,918 | | | |
| | | | | | | | | | |
| | | | | | | 21,813 | | | |
| |
Media - 0.58% | | | |
Hemisphere Media Group, Inc.*+ | | | 150 | | | | 1,785 | | | |
New Media Investment Group, Inc. | | | 500 | | | | 8,965 | | | |
Reading International, Inc., Class A*+ | | | 250 | | | | 3,462 | | | |
Scholastic Corp. | | | 350 | | | | 15,446 | | | |
| | | | | | | | | | |
| | | | | | | 29,658 | | | |
| | | | | | | | | | |
| | | | | | | | | | |
| | | | | | | | | | |
| | | | | | | | | | |
| Industry Company | | Shares | | | Value | | | |
| | | | | | | | | | |
Metals & Mining - 0.40% | | | |
Dominion Diamond Corp. | | | 950 | | | | $13,310 | | | |
Materion Corp. | | | 200 | | | | 7,050 | | | |
| | | | | | | | | | |
| | | | | | | 20,360 | | | |
| |
Multi-Utilities - 0.49% | | | |
NorthWestern Corp.+ | | | 515 | | | | 25,106 | | | |
| |
Oil, Gas & Consumable Fuels - 0.87% | | | |
Nordic American Tankers, Ltd.+ | | | 900 | | | | 12,807 | | | |
ONE Gas, Inc. | | | 550 | | | | 23,408 | | | |
Teekay Tankers, Ltd., Class A | | | 1,250 | | | | 8,263 | | | |
| | | | | | | | | | |
| | | | | | | 44,478 | | | |
| |
Paper & Forest Products - 0.73% | | | |
Boise Cascade Co.* | | | 425 | | | | 15,589 | | | |
Mercer International, Inc.* | | | 700 | | | | 9,576 | | | |
Neenah Paper, Inc. | | | 205 | | | | 12,087 | | | |
| | | | | | | | | | |
| | | | | | | 37,252 | | | |
| |
Personal Products - 0.39% | | | |
Revlon, Inc., Class A* | | | 550 | | | | 20,190 | | | |
| |
Pharmaceuticals - 1.61% | | | |
Assembly Biosciences, Inc.* | | | 200 | | | | 3,852 | | | |
Cempra, Inc.* | | | 500 | | | | 17,180 | | | |
Corcept Therapeutics, Inc.* | | | 1,200 | | | | 7,212 | | | |
Heska Corp.* | | | 50 | | | | 1,484 | | | |
Impax Laboratories, Inc.* | | | 800 | | | | 36,736 | | | |
Phibro Animal Health Corp., Class A | | | 200 | | | | 7,788 | | | |
Sucampo Pharmaceuticals, Inc., Class A* | | | 500 | | | | 8,215 | | | |
| | | | | | | | | | |
| | | | | | | 82,467 | | | |
| |
Professional Services - 1.42% | | | |
CRA International, Inc.* | | | 100 | | | | 2,787 | | | |
Exponent, Inc. | | | 250 | | | | 11,195 | | | |
FTI Consulting, Inc.* | | | 450 | | | | 18,558 | | | |
Heidrick & Struggles International, Inc. | | | 200 | | | | 5,216 | | | |
Insperity, Inc. | | | 300 | | | | 15,270 | | | |
Resources Connection, Inc. | | | 400 | | | | 6,436 | | | |
TrueBlue, Inc.* | | | 450 | | | | 13,455 | | | |
| | | | | | | | | | |
| | | | | | | 72,917 | | | |
| |
Real Estate Investment Trusts (REITs) - 7.33% | | | |
Alexander’s, Inc. | | | 60 | | | | 24,600 | | | |
American Assets Trust, Inc. | | | 500 | | | | 19,605 | | | |
Cedar Realty Trust, Inc. | | | 850 | | | | 5,440 | | | |
| | |
| 47 | | Annual Report | June 30, 2015 |
| | |
Small-Cap Momentum Fund SCHEDULE OF INVESTMENTS (continued) | | |
| Showing percentage of net assets as of June 30, 2015 | | |
| | | | | | | | | | |
| Industry Company | | Shares | | | Value | | | |
Common Stocks (continued) | | | |
Real Estate Investment Trusts (REITs) (continued) | | | |
CoreSite Realty Corp. | | | 260 | | | | $ 11,814 | | | |
CyrusOne, Inc. | | | 600 | | | | 17,670 | | | |
DuPont Fabros Technology, Inc. | | | 875 | | | | 25,769 | | | |
FelCor Lodging Trust, Inc. | | | 1,550 | | | | 15,314 | | | |
Gramercy Property Trust, Inc. | | | 637 | | | | 14,887 | | | |
Hannon Armstrong Sustainable Infrastructure Capital, Inc. | | | 350 | | | | 7,018 | | | |
Healthcare Trust of America, Inc., Class A | | | 1,350 | | | | 32,332 | | | |
Hudson Pacific Properties, Inc. | | | 950 | | | | 26,952 | | | |
LTC Properties, Inc. | | | 375 | | | | 15,600 | | | |
Post Properties, Inc. | | | 600 | | | | 32,622 | | | |
Preferred Apartment Communities, Inc., Class A | | | 200 | | | | 1,990 | | | |
QTS Realty Trust, Inc., Class A | | | 400 | | | | 14,580 | | | |
Retail Opportunity Investments Corp. | | | 950 | | | | 14,839 | | | |
Rouse Properties, Inc.+ | | | 650 | | | | 10,628 | | | |
Sovran Self Storage, Inc. | | | 395 | | | | 34,329 | | | |
Summit Hotel Properties, Inc. | | | 950 | | | | 12,360 | | | |
Sun Communities, Inc. | | | 600 | | | | 37,098 | | | |
| | | | | | | | | | |
| | | | | | | 375,447 | | | |
| |
Real Estate Management & Development - 0.68% | | | |
Colliers International Group, Inc. | | | 400 | | | | 15,392 | | | |
FirstService Corp. | | | 400 | | | | 11,108 | | | |
FRP Holdings, Inc.* | | | 100 | | | | 3,243 | | | |
RE/MAX Holdings, Inc., Class A | | | 150 | | | | 5,326 | | | |
| | | | | | | | | | |
| | | | | | | 35,069 | | | |
| |
Road & Rail - 0.19% | | | |
Covenant Transportation Group, Inc., Class A* | | | 150 | | | | 3,759 | | | |
P.A.M. Transportation Services, Inc.* | | | 100 | | | | 5,805 | | | |
| | | | | | | | | | |
| | | | | | | 9,564 | | | |
| |
Semiconductors & Semiconductor Equipment - 3.30% | | | |
Ambarella, Inc.*+ | | | 350 | | | | 35,942 | | | |
Axcelis Technologies, Inc.* | | | 1,250 | | | | 3,700 | | | |
Brooks Automation, Inc. | | | 700 | | | | 8,015 | | | |
CEVA, Inc.* | | | 200 | | | | 3,886 | | | |
DSP Group, Inc.* | | | 200 | | | | 2,066 | | | |
| | | | | | | | | | |
| | | | | | | | | | |
| | | | | | | | | | |
| | | | | | | | | | |
| Industry Company | | Shares | | | Value | | | |
| | | |
| | | | | | | | | | |
Semiconductors & Semiconductor Equipment (continued) | | | |
Inphi Corp.* | | | 400 | | | | $ 9,144 | | | |
Integrated Silicon Solution, Inc. | | | 365 | | | | 8,081 | | | |
M/A-COM Technology Solutions Holdings, Inc.* | | | 550 | | | | 21,038 | | | |
Mellanox Technologies, Ltd.* | | | 500 | | | | 24,295 | | | |
MKS Instruments, Inc. | | | 600 | | | | 22,764 | | | |
NVE Corp.+ | | | 50 | | | | 3,920 | | | |
Rudolph Technologies, Inc.* | | | 350 | | | | 4,204 | | | |
Tessera Technologies, Inc. | | | 575 | | | | 21,838 | | | |
| | | | | | | | | | |
| | | | | | | 168,893 | | | |
| | | |
Software - 6.43% | | | | | | | | | | |
ACI Worldwide, Inc.* | | | 1,250 | | | | 30,713 | | | |
Blackbaud, Inc. | | | 500 | | | | 28,475 | | | |
BroadSoft, Inc.* | | | 300 | | | | 10,371 | | | |
Ellie Mae, Inc.* | | | 300 | | | | 20,937 | | | |
Epiq Systems, Inc. | | | 400 | | | | 6,752 | | | |
ePlus, Inc.* | | | 100 | | | | 7,665 | | | |
Fair Isaac Corp. | | | 325 | | | | 29,504 | | | |
Fleetmatics Group PLC* | | | 400 | | | | 18,732 | | | |
Imperva, Inc.* | | | 350 | | | | 23,695 | | | |
Infoblox, Inc.* | | | 600 | | | | 15,726 | | | |
Monotype Imaging Holdings, Inc. | | | 450 | | | | 10,850 | | | |
Progress Software Corp.* | | | 550 | | | | 15,125 | | | |
Proofpoint, Inc.* | | | 450 | | | | 28,652 | | | |
Qlik Technologies, Inc.* | | | 1,000 | | | | 34,960 | | | |
Qualys, Inc.* | | | 350 | | | | 14,122 | | | |
Synchronoss Technologies, Inc.* | | | 450 | | | | 20,578 | | | |
VASCO Data Security International, Inc.*+ | | | 415 | | | | 12,529 | | | |
| | | | | | | | | | |
| | | | | | | 329,386 | | | |
| | | |
Specialty Retail - 2.17% | | | | | | | | | | |
America’s Car-Mart, Inc.* | | | 100 | | | | 4,932 | | | |
Asbury Automotive Group, Inc.* | | | 300 | | | | 27,186 | | | |
Children’s Place, Inc. (The) | | | 250 | | | | 16,352 | | | |
Lithia Motors, Inc., Class A | | | 250 | | | | 28,290 | | | |
MarineMax, Inc.* | | | 300 | | | | 7,053 | | | |
Select Comfort Corp.* | | | 550 | | | | 16,538 | | | |
TravelCenters of America LLC* | | | 400 | | | | 5,940 | | | |
Winmark Corp. | | | 50 | | | | 4,925 | | | |
| | | | | | | | | | |
| | | | | | | 111,216 | | | |
| |
Textiles, Apparel & Luxury Goods - 1.31% | | | |
Cherokee, Inc. | | | 100 | | | | 2,818 | | | |
Culp, Inc. | | | 150 | | | | 4,650 | | | |
| | |
Small-Cap Momentum Fund SCHEDULE OF INVESTMENTS (continued) | | |
| Showing percentage of net assets as of June 30, 2015 | | |
| | | | | | | | |
| Industry Company | | Shares | | Value | | | |
Common Stocks (continued) | | | |
Textiles, Apparel & Luxury Goods (continued) | | | |
G-III Apparel Group, Ltd.* | | 510 | | | $ 35,878 | | | |
Superior Uniform Group, Inc. | | 100 | | | 1,654 | | | |
Tumi Holdings, Inc.* | | 750 | | | 15,390 | | | |
Unifi, Inc.* | | 200 | | | 6,700 | | | |
| | | | | | | | |
| | | | | 67,090 | | | |
| |
Thrifts & Mortgage Finance - 3.17% | | | |
Banc of California, Inc. | | 400 | | | 5,500 | | | |
BankFinancial Corp. | | 250 | | | 2,945 | | | |
Berkshire Hills Bancorp, Inc. | | 300 | | | 8,544 | | | |
Brookline Bancorp, Inc. | | 700 | | | 7,903 | | | |
Clifton Bancorp, Inc. | | 300 | | | 4,197 | | | |
Essent Group, Ltd.* | | 1,000 | | | 27,350 | | | |
First Defiance Financial Corp. | | 100 | | | 3,753 | | | |
Flagstar Bancorp, Inc.* | | 600 | | | 11,088 | | | |
Hingham Institution for Savings | | 20 | | | 2,302 | | | |
HomeStreet, Inc.* | | 250 | | | 5,705 | | | |
Impac Mortgage Holdings, Inc.*+ | | 100 | | | 1,914 | | | |
LendingTree, Inc.* | | 130 | | | 10,219 | | | |
Meridian Bancorp, Inc.* | | 606 | | | 8,126 | | | |
Meta Financial Group, Inc. | | 100 | | | 4,292 | | | |
Radian Group, Inc. | | 2,100 | | | 39,396 | | | |
Territorial Bancorp, Inc. | | 100 | | | 2,426 | | | |
United Community Financial Corp. | | 550 | | | 2,942 | | | |
Walker & Dunlop, Inc.* | | 350 | | | 9,359 | | | |
Waterstone Financial, Inc. | | 350 | | | 4,620 | | | |
| | | | | | | | |
| | | | | 162,581 | | | |
| |
Trading Companies & Distributors - 0.40% | | | |
Aircastle, Ltd. | | 900 | | | 20,403 | | | |
| |
Water Utilities - 0.35% | | | |
American States Water Co. | | 400 | | | 14,956 | | | |
York Water Co., (The) | | 150 | | | 3,129 | | | |
| | | | | | | | |
| | | | | 18,085 | | | |
| |
Wireless Telecommunication Services - 0.47% | | | |
RingCentral, Inc.,
Class A*+ | | 600 | | | 11,094 | | | |
Shenandoah
Telecommunications Co. | | 250 | | | 8,558 | | | |
Spok Holdings, Inc. | | 250 | | | 4,210 | | | |
| | | | | | | | |
| | | | | 23,862 | | | |
| | | | | | | | |
TOTAL COMMON STOCKS - 99.96% | | | 5,120,672 | | | |
| | | | | | | | |
(Cost $4,683,935) | | | | | | | | |
| | | | | | | | |
| | | | | | | | |
| | | | | | | | |
| | | | | | | | |
| | | | | | | | | | |
| Industry Company | | | | Shares | | Value | | | |
| | | | | | | | | | |
EXCHANGE TRADED FUND - 0.25% | | | |
iShares Russell 2000 ETF+ | | 100 | | | $12,486 | | | |
| | | | | | | | | | |
TOTAL EXCHANGE TRADED FUND - 0.25% | | | 12,486 | | | |
| | | | | | | | | | |
(Cost $12,380) | | | | | | | | |
| | | | |
| | | Rate^ | | Shares | | Value | | | |
| |
INVESTMENTS PURCHASED WITH CASH PROCEEDS FROM SECURITIES
LENDING - 6.00% | | | |
Dreyfus Cash Management Fund** | | 0.04% | | 307,286 | | | 307,286 | | | |
| | | | | | | | | | |
TOTAL INVESTMENTS PURCHASED WITH CASH PROCEEDS FROM SECURITIES LENDING - 6.00% | | | 307,286 | | | |
| | | | | | | | | | |
(Cost $307,286) | | | | | | |
| | |
TOTAL INVESTMENTS - 106.21% | | | $5,440,444 | | | |
(Cost $5,003,601) | | | | | | | | | | |
Liabilities in Excess of Other Assets - (6.21%) | | | (317,891 | ) | | |
| | | | | | | | | | |
NET ASSETS - 100.00% | | | $5,122,553 | | | |
| | | | | | | | | | |
| | |
| * | | Non-income producing security. |
| ** | | This security represents the investment of the collateral received in connection with securities out on loan as of June 30, 2015. |
| ^ | | Rate disclosed as of June 30, 2015. |
| + | | This security or a portion of the security is out on loan as of June 30, 2015. Total loaned securities had a value of $303,096 as of June 30, 2015. |
LLC - Limited Liability Company
PLC - Public Limited Company
| | |
| 49 | | Annual Report | June 30, 2015 |
| | |
Small-Cap Momentum Fund SCHEDULE OF INVESTMENTS (continued) | | |
| | | | | | | | | | | | | | |
| | | |
Summary of inputs used to value the Fund’s investments as of 06/30/2015 (See Note 2 in Notes to Financial Statements): | | |
| | | Valuation Inputs | | |
| | |
| | | Investment in Securities (Value) | | |
| | |
| | | Level 1
Quoted
Prices | | Level 2
Significant
Observable
Inputs | | | Level 3
Significant
Unobservable
Inputs | | | Total | | |
| | |
| | | | | |
Common Stocks | | $5,120,672 | | $ | — | | | $ | — | | | $5,120,672 | | |
Exchange Traded Fund | | 12,486 | | | — | | | | — | | | 12,486 | | |
Investments Purchased with Cash Proceeds from Securities Lending | | — | | | 307,286 | | | | — | | | 307,286 | | |
TOTAL | | $5,133,158 | | $ | 307,286 | | | $ | — | | | $5,440,444 | | |
See Notes to Financial Statements. | | |
| | |
Small-Cap Growth Fund MANAGER’S COMMENTARY (Unaudited) | | |
June 30, 2015
Dear Fellow Small-Cap Growth Fund Shareholder,
For the quarter ended June 30, 2015, our Fund appreciated 3.67%, outperforming our primary market benchmark, the Russell 2000 Growth Index (+1.98%), and our peer benchmark, the Lipper Small-Cap Growth Funds Index (+1.71%). It was a good quarter.
For the fiscal year, our Fund appreciated 13.41%, beating the Russell 2000 Growth Index (+12.34%), and the Lipper Small-Cap Growth Funds Index (+9.63%). It was a good year for the Fund, but we are still lagging in the longer five-year, 10-year, and inception-to-date periods.
The table below presents our June quarter, one-year, five-year, 10-year, and inception-to-date financial results. See the next page for a graph of performance since inception.
Standardized Returns as of June 30, 2015
| | | | | | | | | | | | | | | | | | | | | | |
| |
| | | | | | | | | | | Annualized | | | | |
| | | | | | | | | | | |
| | | Quarter | | | 1 Year | | | | | 5 Years | | | 10 Years | | | Since Inception (10/31/03) | |
| |
| | | | | | |
Small-Cap Growth Fund | | | 3.67% | | | | 13.41% | | | | | | 18.45% | | | | 5.89% | | | | 6.74% | |
Russell 2000 Growth Index | | | 1.98% | | | | 12.34% | | | | | | 19.33% | | | | 9.86% | | | | 9.64% | |
Lipper Small-Cap Growth Funds Index | | | 1.71% | | | | 9.63% | | | | | | 17.44% | | | | 8.30% | | | | 8.16% | |
Performance figures quoted in the table above represent past performance and are no guarantee of future results. Total return figures in the table above include the reinvestment of dividends and capital gains. The table above does not reflect the deduction of taxes that a shareholder would pay on Fund distributions or on the redemption of Fund shares.
The Russell 2000 Growth Index is an unmanaged index that consists of stocks in the Russell 2000 Index with higher price-to-book ratios and higher forecasted growth values with dividends reinvested. The Lipper Small-Cap Growth Funds Index is an index of small-company, growth-oriented funds compiled by Lipper, Inc. It is not possible to invest directly in an index. Periods longer than one year are annualized.
According to data from Lipper, Inc. as of June 30, 2015, Small-Cap Growth Fund ranked 122nd of 544 small-cap growth funds for the 12 months ending June 30, 2015, 198th of 416 over the last five years, 289th of 300 over the last 10 years, and 228th of 250 such funds since inception in October 2003. Lipper, Inc. is an independent mutual fund rating service that ranks funds in various fund categories by making comparative calculations using total returns.
| | |
| 51 | | Annual Report | June 30, 2015 |
| | |
Small-Cap Growth Fund MANAGER’S COMMENTARY (Unaudited) (continued) | | |
Small-Cap Growth Fund vs. Russell 2000 Growth Index & Lipper Small-Cap Growth Funds Index
from Inception 10/31/03 to 6/30/15
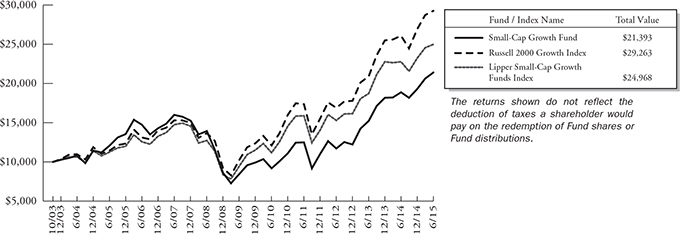
Detailed Explanation of Quarterly Performance
Our Fund outperformed its primary benchmark for the quarter. Positioning toward smaller market cap stocks helped our Fund, as did our diversifying value metrics and momentum models. Holdings in the Consumer Discretionary and Consumer Staples sectors contributed nicely to our relative performance.
Detailed Explanation of Fiscal Year Performance
Our core company financial health models performed quite well relative to our primary index, while our diversifying value metrics and momentum models lagged the index.
Top Ten Holdings as of June 30, 2015
| | | | | | | | | |
| Rank | | Description | | Industry | | % of Net
Assets |
| 1 | | Altisource Portfolio Solutions SA | | Real Estate Management & Development | | | | 1.6% | |
| 2 | | Papa John’s International, Inc. | | Hotels, Restaurants & Leisure | | | | 1.6% | |
| 3 | | Insys Therapeutics, Inc. | | Biotechnology | | | | 1.6% | |
| 4 | | Cambrex Corp. | | Life Sciences Tools & Services | | | | 1.6% | |
| 5 | | AMN Healthcare Services, Inc. | | Health Care Providers & Services | | | | 1.6% | |
| 6 | | Kaiser Aluminum Corp. | | Metals & Mining | | | | 1.6% | |
| 7 | | Texas Roadhouse, Inc. | | Hotels, Restaurants & Leisure | | | | 1.5% | |
| 8 | | Universal Insurance Holdings, Inc. | | Insurance | | | | 1.5% | |
| 9 | | Molina Healthcare, Inc. | | Health Care Providers & Services | | | | 1.5% | |
| 10 | | Luxoft Holding, Inc. | | IT Services | | | | 1.5% | |
| | Total | | | | | | 15.6% | |
| | |
Small-Cap Growth Fund MANAGER’S COMMENTARY (Unaudited) (continued) | | |
Industry Sector Representation as of June 30, 2015
| | | | | | | | | | | | | | | |
| | | % of Net Assets | | % of Russell 2000
Growth Index | | Difference |
Consumer Discretionary | | | | 18.1% | | | | | 18.3% | | | | | -0.2% | |
Consumer Staples | | | | 4.3% | | | | | 3.3% | | | | | 1.0% | |
Energy | | | | 2.1% | | | | | 1.5% | | | | | 0.6% | |
Financials | | | | 7.5% | | | | | 7.1% | | | | | 0.4% | |
Health Care | | | | 24.9% | | | | | 27.5% | | | | | -2.6% | |
Industrials | | | | 14.0% | | | | | 13.2% | | | | | 0.8% | |
Information Technology | | | | 21.8% | | | | | 23.9% | | | | | -2.1% | |
Materials | | | | 4.2% | | | | | 4.2% | | | | | 0.0% | |
Telecommunication Services | | | | 1.1% | | | | | 0.8% | | | | | 0.3% | |
Utilities | | | | 0.0% | | | | | 0.1% | | | | | -0.1% | |
Cash & Other Assets | | | | 2.0% | | | | | 0.0% | | | | | 2.0% | |
Total | | | | 100.0% | | | | | 100.0% | | | | | | |
Disclaimer
The views expressed here are exclusively those of Fund management. These views, including those related to market sectors or individual stocks, are not meant as investment advice and should not be considered predictive in nature. Any favorable (or unfavorable) description of a holding applies only as of the quarter end, June 30, 2015, unless otherwise stated. Security positions can and do change thereafter. Discussions of historical performance do not guarantee and may not be indicative of future performance.
Market volatility can significantly impact short-term performance. The Fund is not an appropriate investment for short-term investors. Investments in small companies generally carry greater risk than is customarily associated with larger companies. This additional risk is attributable to a number of factors, including the relatively limited financial resources that are typically available to small companies and the fact that small companies often have comparatively limited product lines. In addition, the stock of small companies tends to be more volatile than the stock of large companies, particularly in the short term and particularly in the early stages of an economic or market downturn. Shareholders of the Fund, therefore, are taking on more risk than they would if they invested in the stock market as a whole.
Conclusion
Thank you for your continued investment in Small-Cap Growth Fund. We encourage your feedback; your reactions and concerns are important to us.
Sincerely,
The Investment Management Team
| | |
| 53 | | Annual Report | June 30, 2015 |
| | |
Small-Cap Growth Fund SCHEDULE OF INVESTMENTS | | |
Showing percentage of net assets as of June 30, 2015
| | | | | | | | | | |
| Industry Company | | Shares | | | Value | | | |
COMMON STOCKS - 98.15% | | | |
Air Freight & Logistics - 0.30% | | | |
Park-Ohio Holdings Corp. | | | 2,300 | | | | $ 111,458 | | | |
| |
Airlines - 1.47% | | | |
Hawaiian Holdings, Inc.* | | | 22,800 | | | | 541,500 | | | |
| |
Auto Components - 3.68% | | | |
Drew Industries, Inc. | | | 7,700 | | | | 446,754 | | | |
Tenneco, Inc.* | | | 9,200 | | | | 528,448 | | | |
Tower International, Inc.* | | | 14,600 | | | | 380,330 | | | |
| | | | | | | | | | |
| | | | | | | 1,355,532 | | | |
| |
Biotechnology - 4.83% | | | |
CTI BioPharma Corp.*+ | | | 73,500 | | | | 143,325 | | | |
Dynavax Technologies Corp.* | | | 7,870 | | | | 184,355 | | | |
Insys Therapeutics, Inc.*+ | | | 16,200 | | | | 581,904 | | | |
MiMedx Group, Inc.*+ | | | 36,000 | | | | 417,240 | | | |
PDL BioPharma, Inc.+ | | | 69,900 | | | | 449,457 | | | |
| | | | | | | | | | |
| | | | | | | 1,776,281 | | | |
| |
Building Products - 0.69% | | | |
NCI Building Systems, Inc.* | | | 16,900 | | | | 254,683 | | | |
| |
Communications Equipment - 1.47% | | | |
InterDigital, Inc. | | | 9,500 | | | | 540,455 | | | |
| |
Computers & Peripherals - 2.31% | | | |
Dot Hill Systems Corp.* | | | 78,100 | | | | 477,972 | | | |
Quantum Corp.* | | | 220,800 | | | | 370,944 | | | |
| | | | | | | | | | |
| | | | | | | 848,916 | | | |
| |
Containers & Packaging - 1.24% | | | |
Graphic Packaging Holding Co. | | | 32,800 | | | | 456,904 | | | |
| |
Diversified Consumer Services - 1.51% | | | |
Grand Canyon Education, Inc.* | | | 10,100 | | | | 428,240 | | | |
K12, Inc.* | | | 10,000 | | | | 126,500 | | | |
| | | | | | | | | | |
| | | | | | | 554,740 | | | |
| |
Diversified Financial Services - 1.44% | | | |
MarketAxess Holdings, Inc. | | | 5,700 | | | | 528,789 | | | |
| |
Diversified Telecommunication Services - 1.06% | | | |
Inteliquent, Inc. | | | 21,300 | | | | 391,920 | | | |
| |
Electronic Equipment, Instruments & Components - 1.10% | | | |
Methode Electronics, Inc. | | | 11,800 | | | | 323,910 | | | |
MTS Systems Corp. | | | 1,200 | | | | 82,740 | | | |
| | | | | | | | | | |
| | | | | | | 406,650 | | | |
| |
Food Products - 2.84% | | | |
Cal-Maine Foods, Inc. | | | 9,800 | | | | 511,560 | | | |
| | | | | | | | |
| Industry Company | | Shares | | | Value | |
| |
| |
Food Products (continued) | | | | | |
Fresh Del Monte Produce, Inc. | | | 13,800 | | | | $ 533,508 | |
| | | | | | | | |
| | | | | | | 1,045,068 | |
|
Health Care Equipment & Supplies - 5.90% | |
ABIOMED, Inc.* | | | 8,100 | | | | 532,413 | |
LDR Holding Corp.* | | | 2,300 | | | | 99,475 | |
Masimo Corp.* | | | 13,800 | | | | 534,612 | |
Thoratec Corp.* | | | 12,300 | | | | 548,211 | |
Vascular Solutions, Inc.* | | | 3,300 | | | | 114,576 | |
Zeltiq Aesthetics, Inc.* | | | 11,600 | | | | 341,852 | |
| | | | | | | | |
| | | | | | | 2,171,139 | |
|
Health Care Providers & Services - 10.46% | |
Air Methods Corp.*+ | | | 12,400 | | | | 512,616 | |
AMN Healthcare Services, Inc.* | | | 18,300 | | | | 578,097 | |
Chemed Corp. | | | 4,100 | | | | 537,510 | |
Five Star Quality Care, Inc.* | | | 43,600 | | | | 209,280 | |
Genesis Healthcare, Inc.* | | | 19,200 | | | | 126,720 | |
HealthSouth Corp. | | | 5,700 | | | | 262,542 | |
Molina Healthcare, Inc.* | | | 7,900 | | | | 555,370 | |
RadNet, Inc.* | | | 82,400 | | | | 551,256 | |
Triple-S Management Corp., Class B* | | | 20,100 | | | | 515,766 | |
| | | | | | | | |
| | | | | | | 3,849,157 | |
|
Hotels, Restaurants & Leisure - 5.49% | |
Fiesta Restaurant Group, Inc.* | | | 6,800 | | | | 340,000 | |
Papa John’s International, Inc. | | | 7,700 | | | | 582,197 | |
Red Robin Gourmet Burgers, Inc.* | | | 6,200 | | | | 532,084 | |
Texas Roadhouse, Inc. | | | 15,100 | | | | 565,193 | |
| | | | | | | | |
| | | | | | | 2,019,474 | |
|
Insurance - 1.51% | |
Universal Insurance Holdings, Inc. | | | 23,000 | | | | 556,600 | |
| |
Internet & Catalog Retail - 1.34% | | | | | |
1-800-Flowers.com, Inc., Class A* | | | 47,000 | | | | 491,620 | |
|
Internet Software & Services - 4.20% | |
Cimpress NV*+ | | | 6,100 | | | | 513,376 | |
Constant Contact, Inc.* | | | 9,400 | | | | 270,344 | |
EarthLink Holdings Corp. | | | 10,700 | | | | 80,143 | |
Envestnet, Inc.* | | | 2,300 | | | | 92,989 | |
Marchex, Inc., Class B | | | 26,500 | | | | 131,175 | |
| | |
Small-Cap Growth Fund SCHEDULE OF INVESTMENTS (continued) | | |
Showing percentage of net assets as of June 30, 2015
| | | | | | | | | | |
| Industry Company | | Shares | | | Value | | | |
Common Stocks (continued) | | | |
Internet Software & Services (continued) | | | |
RetailMeNot, Inc.* | | | 25,700 | | | | $ 458,231 | | | |
| | | | | | | | | | |
| | | | | | | 1,546,258 | | | |
| |
IT Services - 5.30% | | | |
Hackett Group, Inc. (The) | | | 10,602 | | | | 142,385 | | | |
Lionbridge Technologies, Inc.* | | | 45,300 | | | | 279,501 | | | |
Luxoft Holding, Inc.* | | | 9,800 | | | | 554,190 | | | |
MAXIMUS, Inc. | | | 8,400 | | | | 552,132 | | | |
Science Applications International Corp. | | | 8,000 | | | | 422,800 | | | |
| | | | | | | | | | |
| | | | | | | 1,951,008 | | | |
| |
Leisure Equipment & Products - 0.91% | | | |
Smith & Wesson Holding Corp.*+ | | | 20,200 | | | | 335,118 | | | |
| |
Life Sciences Tools & Services - 2.97% | | | |
Cambrex Corp.* | | | 13,200 | | | | 580,008 | | | |
PAREXEL International Corp.* | | | 8,000 | | | | 514,480 | | | |
| | | | | | | | | | |
| | | | | | | 1,094,488 | | | |
| |
Machinery - 4.52% | | | |
Greenbrier Companies., Inc. (The) | | | 8,600 | | | | 402,910 | | | |
John Bean Technologies Corp. | | | 14,600 | | | | 548,814 | | | |
Wabash National Corp.* | | | 15,300 | | | | 191,862 | | | |
Xerium Technologies, Inc.* | | | 28,600 | | | | 520,520 | | | |
| | | | | | | | | | |
| | | | | | | 1,664,106 | | | |
| |
Metals & Mining - 3.65% | | | |
Commercial Metals Co. | | | 32,500 | | | | 522,600 | | | |
Kaiser Aluminum Corp. | | | 6,900 | | | | 573,252 | | | |
U.S. Silica Holdings, Inc.+ | | | 8,400 | | | | 246,624 | | | |
| | | | | | | | | | |
| | | | | | | 1,342,476 | | | |
| |
Oil, Gas & Consumable Fuels - 1.43% | | | |
Western Refining, Inc. | | | 12,100 | | | | 527,802 | | | |
| |
Personal Products - 1.49% | | | |
USANA Health Sciences, Inc.*+ | | | 4,000 | | | | 546,640 | | | |
| |
Pharmaceuticals - 0.78% | | | |
Lannett Co., Inc.*+ | | | 4,800 | | | | 285,312 | | | |
| |
Professional Services - 2.95% | | | |
Barrett Business Services, Inc.+ | | | 15,100 | | | | 548,432 | | | |
TrueBlue, Inc.* | | | 18,000 | | | | 538,200 | | | |
| | | | | | | | | | |
| | | | | | | 1,086,632 | | | |
| | | | | | | | |
| Industry Company | | Shares | | | Value | |
| | | | | | | | |
Real Estate Investment Trusts (REITs) - 0.39% | |
Saul Centers, Inc.+ | | | 2,900 | | | | $ 142,651 | |
|
Real Estate Management & Development - 1.61% | |
Altisource Portfolio Solutions SA*+ | | | 19,200 | | | | 591,168 | |
|
Road & Rail - 2.65% | |
Knight Transportation, Inc. | | | 13,700 | | | | 366,338 | |
P.A.M. Transportation Services, Inc.* | | | 4,402 | | | | 255,536 | |
Saia, Inc.* | | | 8,950 | | | | 351,645 | |
| | | | | | | | |
| | | | | | | 973,519 | |
|
Semiconductors & Semiconductor Equipment - 1.44% | |
Cascade Microtech, Inc.* | | | 34,800 | | | | 529,830 | |
|
Software - 6.00% | |
ACI Worldwide, Inc.* | | | 4,300 | | | | 105,651 | |
Aspen Technology, Inc.* | | | 4,700 | | | | 214,085 | |
ePlus, Inc.* | | | 5,500 | | | | 421,575 | |
Fair Isaac Corp. | | | 6,100 | | | | 553,758 | |
Manhattan Associates, Inc.* | | | 9,200 | | | | 548,780 | |
Pegasystems, Inc. | | | 5,200 | | | | 119,028 | |
Take-Two Interactive Software, Inc.* | | | 8,900 | | | | 245,373 | |
| | | | | | | | |
| | | | | | | 2,208,250 | |
|
Specialty Retail - 3.75% | |
Lithia Motors, Inc., Class A | | | 4,700 | | | | 531,852 | |
Outerwall, Inc.+ | | | 3,900 | | | | 296,829 | |
Pier 1 Imports, Inc.+ | | | 4,200 | | | | 53,046 | |
Select Comfort Corp.* | | | 16,600 | | | | 499,162 | |
| | | | | | | | |
| | | | | | | 1,380,889 | |
|
Textiles, Apparel & Luxury Goods - 1.43% | |
G-III Apparel Group, Ltd.* | | | 7,500 | | | | 527,625 | |
|
Thrifts & Mortgage Finance - 2.56% | |
BofI Holding, Inc.* | | | 5,200 | | | | 549,692 | |
Meridian Bancorp, Inc.* | | | 29,200 | | | | 391,572 | |
| | | | | | | | |
| | | | | | | 941,264 | |
|
Trading Companies & Distributors - 1.48% | |
Watsco, Inc. | | | 4,400 | | | | 544,456 | |
| | | | | | | | |
TOTAL COMMON STOCKS - 98.15% | | | | 36,120,378 | |
| | | | | | | | |
(Cost $30,374,590) | | | | | | | | |
| | |
| 55 | | Annual Report | June 30, 2015 |
| | |
Small-Cap Growth Fund SCHEDULE OF INVESTMENTS (continued) | | |
Showing percentage of net assets as of June 30, 2015
| | | | | | | | | | | | |
| | | Rate^ | | | | Shares | | Value | | | |
MONEY MARKET FUND - 0.53% | | | |
Dreyfus Cash Management Fund | | 0.04% | | | | 195,266 | | | $195,266 | | | |
| | | | | | |
TOTAL MONEY MARKET FUND - 0.53% | | | 195,266 | | | |
| | | | | | |
(Cost $195,266) | | | | | | |
| |
| INVESTMENTS PURCHASED WITH CASH PROCEEDS FROM SECURITIES LENDING - 14.74% | | | |
Dreyfus Cash Management Fund** | | 0.04% | | | | 5,424,205 | | | 5,424,205 | | | |
| | | | | | |
TOTAL INVESTMENTS PURCHASED WITH CASH PROCEEDS FROM SECURITIES LENDING - 14.74% | | | 5,424,205 | | | |
| | | | | | |
(Cost $5,424,205) | | | | | | |
| | |
TOTAL INVESTMENTS - 113.42% | | | $41,739,849 | | | |
(Cost $35,994,061) | | | | | | |
Liabilities in Excess of Other Assets - (13.42%) | | | (4,938,554 | ) | | |
| | | | | | |
NET ASSETS - 100.00% | | | $36,801,295 | | | |
| | | | | | | | | | | | |
* Non-income producing security. | | | |
** This security represents the investment of the collateral received in connection with securities out on loan as of June 30, 2015. | | | |
^ Rate disclosed as of June 30, 2015. | | | |
+ This security or a portion of the security is out on loan as of June 30, 2015. Total loaned securities had a value of $5,333,433 as of June 30, 2015. | | | |
Summary of inputs used to value the Fund’s investments as of 06/30/2015 (See Note 2 in Notes to Financial Statements):
| | | | | | | | | | | | | | | | |
| | | Valuation Inputs | |
| | | Investment in Securities (Value) | |
| | | Level 1
Quoted
Prices | | | Level 2
Significant
Observable
Inputs | | | Level 3
Significant
Unobservable
Inputs | | | Total | |
| | | | |
Common Stocks | | $ | 36,120,378 | | | $ | — | | | $ | — | | | $ | 36,120,378 | |
Money Market Fund | | | — | | | | 195,266 | | | | — | | | | 195,266 | |
Investments Purchased with Cash Proceeds from Securities Lending | | | — | | | | 5,424,205 | | | | — | | | | 5,424,205 | |
| | | | | | | | | | | | | | | | |
TOTAL | | $ | 36,120,378 | | | $ | 5,619,471 | | | $ | — | | | $ | 41,739,849 | |
| | | | | | | | | | | | | | | | |
See Notes to Financial Statements.
| | |
Small-Cap Value Fund MANAGER’S COMMENTARY (Unaudited) | | |
June 30, 2015
Dear Fellow Small-Cap Value Fund Shareholder,
For the quarter ended June 30, 2015, our Fund declined 1.02%, outperforming our primary market benchmark, the Russell 2000 Value Index (-1.20%), but underperforming our peer benchmark, the Lipper Small-Cap Value Funds Index (-0.46%). This was a mixed quarter on a relative basis.
For the fiscal year, our Fund declined 2.10%, trailing both of our benchmarks. We are leading our primary market benchmark and peer benchmark in the longer five-year period, but we are still lagging our primary and peer benchmarks in the 10-year and inception-to-date periods.
The table below presents our June quarter, one-year, five-year, 10-year, and inception-to-date financial results. See the next page for a graph of performance since inception.
Standardized Returns as of June 30, 2015
| | | | | | | | | | | | |
| | | | | | | Annualized | | | | |
| | | | | | |
| | | Quarter | | 1 Year | | 5 Years | | 10 Years | | Since Inception
(10/31/03) | | |
| |
Small-Cap Value Fund | | -1.02% | | -2.10% | | 15.60% | | 6.48% | | 7.78% | |
Russell 2000 Value Index | | -1.20% | | 0.78% | | 14.81% | | 6.87% | | 8.46% | |
Lipper Small-Cap Value Funds Index | | -0.46% | | -0.22% | | 14.64% | | 7.55% | | 9.02% | |
Performance figures quoted in the table above represent past performance and are no guarantee of future results. Total return figures in the table above include the reinvestment of dividends and capital gains. The table above does not reflect the deduction of taxes that a shareholder would pay on Fund distributions or on the redemption of Fund shares.
The Russell 2000 Value Index is an unmanaged index that consists of stocks in the Russell 2000 Index with lower price-to-book ratios and lower forecasted growth values with dividends reinvested. The Lipper Small-Cap Value Funds Index is an index of small-company, value-oriented funds compiled by Lipper, Inc. It is not possible to invest directly in an index. Periods longer than one year are annualized.
According to data from Lipper, Inc. as of June 30, 2015, Small-Cap Value Fund ranked 249th of 312 small-cap value funds for the 12 months ending June 30, 2015, 94th of 217 over the last five years, 120th of 150 over the last 10 years, and 95th of 111 such funds since inception in October 2003. Lipper, Inc. is an independent mutual fund rating service that ranks funds in various fund categories by making comparative calculations using total returns.
| | |
| 57 | | Annual Report | June 30, 2015 |
| | |
Small-Cap Value Fund MANAGER’S COMMENTARY (Unaudited) (continued) | | |
Small-Cap Value Fund vs. Russell 2000 Value Index & Lipper Small-Cap Value Funds Index
from Inception 10/31/03 to 6/30/15
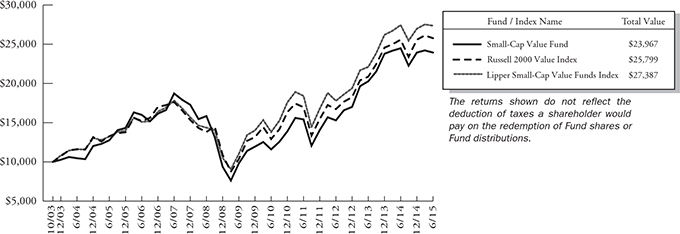
Detailed Explanation of Quarterly Performance
The Fund’s exposure to smaller market cap stocks and investment in deeper value stocks across multiple value metrics worked well this quarter, adding to relative performance versus our benchmark. Our company financial health models also performed well, while our overall value metrics and momentum models lagged. The Consumer Discretionary sector had the best relative performance.
Detailed Explanation of Fiscal Year Performance
The Fund’s exposure to deeper value and more volatile stocks contributed to the Fund’s underperformance for the fiscal year. Our company financial health models significantly lagged the primary benchmark performance, while our diversifying momentum models did well versus the benchmark. Our Energy sector holdings were hit hard during the year and detracted the most from our Fund’s absolute return. Overweighting in the Energy sector during a portion of the year and holdings in the Energy and Health Care sectors hurt the Fund’s relative performance.
Top Ten Holdings as of June 30, 2015
| | | | | | | | | |
| Rank | | Description | | Industry | | % of Net
Assets |
| 1 | | Skechers U.S.A., Inc., Class A | | Textiles, Apparel & Luxury Goods | | | | 2.7% | |
| 2 | | JetBlue Airways Corp. | | Airlines | | | | 1.9% | |
| 3 | | Magellan Health, Inc. | | Health Care Providers & Services | | | | 1.7% | |
| 4 | | Sanmina Corp. | | Electronic Equipment, Instruments & Components | | | | 1.6% | |
| 5 | | Isle of Capri Casinos, Inc. | | Hotels, Restaurants & Leisure | | | | 1.6% | |
| 6 | | Symetra Financial Corp. | | Insurance | | | | 1.5% | |
| 7 | | Maiden Holdings, Ltd. | | Insurance | | | | 1.5% | |
| 8 | | Multi-Color Corp. | | Commercial Services & Supplies | | | | 1.4% | |
| 9 | | TTM Technologies, Inc. | | Electronic Equipment, Instruments & Components | | | | 1.4% | |
| 10 | | EarthLink Holdings Corp. | | Internet Software & Services | | | | 1.3% | |
| | Total | | | | | | 16.6% | |
| | |
Small-Cap Value Fund MANAGER’S COMMENTARY (Unaudited) (continued) | | |
Industry Sector Representation as of June 30, 2015
| | | | | | | | | | | | |
| | | % of Net Assets | | | % of
Russell 2000
Value Index | | | Difference | |
Consumer Discretionary | | | 17.5% | | | | 10.8% | | | | 6.7% | |
Consumer Staples | | | 2.6% | | | | 3.0% | | | | -0.4% | |
Energy | | | 5.6% | | | | 6.3% | | | | -0.7% | |
Financials | | | 32.7% | | | | 41.7% | | | | -9.0% | |
Health Care | | | 6.8% | | | | 4.2% | | | | 2.6% | |
Industrials | | | 18.6% | | | | 12.4% | | | | 6.2% | |
Information Technology | | | 9.1% | | | | 10.3% | | | | -1.2% | |
Materials | | | 4.0% | | | | 3.9% | | | | 0.1% | |
Telecommunication Services | | | 0.6% | | | | 0.9% | | | | -0.3% | |
Utilities | | | 3.5% | | | | 6.5% | | | | -3.0% | |
Cash & Other Assets | | | -1.0% | | | | 0.0% | | | | -1.0% | |
Total | | | 100.0% | | | | 100.0% | | | | | |
Disclaimer
The views expressed here are exclusively those of Fund management. These views, including those related to market sectors or individual stocks, are not meant as investment advice and should not be considered predictive in nature. Any favorable (or unfavorable) description of a holding applies only as of the quarter end, June 30, 2015, unless otherwise stated. Security positions can and do change thereafter. Discussions of historical performance do not guarantee and may not be indicative of future performance.
Market volatility can significantly impact short-term performance. The Fund is not an appropriate investment for short-term investors. Investments in small companies generally carry greater risk than is customarily associated with larger companies. This additional risk is attributable to a number of factors, including the relatively limited financial resources that are typically available to small companies and the fact that small companies often have comparatively limited product lines. In addition, the stock of small companies tends to be more volatile than the stock of large companies, particularly in the short term and particularly in the early stages of an economic or market downturn. Shareholders of the Fund, therefore, are taking on more risk than they would if they invested in the stock market as a whole.
Conclusion
Thank you for your continued investment in Small-Cap Value Fund. We encourage your feedback; your reactions and concerns are important to us.
Sincerely,
The Investment Management Team
| | |
| 59 | | Annual Report | June 30, 2015 |
| | |
Small-Cap Value Fund SCHEDULE OF INVESTMENTS | | |
Showing percentage of net assets as of June 30, 2015
| | | | | | | | | | |
| Industry Company | | Shares | | | Value | | | |
COMMON STOCKS - 101.01% | | | |
Air Freight & Logistics - 2.48% | | | |
Atlas Air Worldwide Holdings, Inc.* | | | 16,200 | | | | $ 890,352 | | | |
XPO Logistics, Inc.*+ | | | 20,500 | | | | 926,190 | | | |
| | | | | | | | | | |
| | | | | | | 1,816,542 | | | |
| |
Airlines - 4.66% | | | |
Hawaiian Holdings, Inc.* | | | 41,100 | | | | 976,125 | | | |
JetBlue Airways Corp.* | | | 67,400 | | | | 1,399,224 | | | |
Republic Airways Holdings, Inc.* | | | 60,900 | | | | 559,062 | | | |
SkyWest, Inc. | | | 31,700 | | | | 476,768 | | | |
| | | | | | | | | | |
| | | | | | | 3,411,179 | | | |
| |
Auto Components - 0.92% | | | |
Strattec Security Corp. | | | 9,800 | | | | 673,260 | | | |
| |
Biotechnology - 0.83% | | | |
PDL BioPharma, Inc.+ | | | 94,400 | | | | 606,992 | | | |
| |
Building Products - 1.07% | | | |
Advanced Drainage Systems, Inc. | | | 26,700 | | | | 783,111 | | | |
| |
Capital Markets - 2.12% | | | |
Calamos Asset Management, Inc., Class A | | | 56,500 | | | | 692,125 | | | |
INTL FCStone, Inc.* | | | 25,800 | | | | 857,592 | | | |
| | | | | | | | | | |
| | | | | | | 1,549,717 | | | |
| |
Commercial Banks - 6.13% | | | |
First BanCorp.* | | | 118,000 | | | | 568,760 | | | |
FNB Corp. | | | 53,100 | | | | 760,392 | | | |
Independent Bank Corp., MA | | | 17,200 | | | | 806,508 | | | |
Talmer Bancorp, Inc., Class A | | | 54,900 | | | | 919,575 | | | |
Valley National Bancorp | | | 58,000 | | | | 597,980 | | | |
Wilshire Bancorp, Inc. | | | 66,100 | | | | 834,843 | | | |
| | | | | | | | | | |
| | | | | | | 4,488,058 | | | |
| |
Commercial Services & Supplies - 3.13% | | | |
ABM Industries, Inc. | | | 18,500 | | | | 608,095 | | | |
ACCO Brands Corp.* | | | 85,600 | | | | 665,112 | | | |
Multi-Color Corp. | | | 15,900 | | | | 1,015,692 | | | |
| | | | | | | | | | |
| | | | | | | 2,288,899 | | | |
| |
Consumer Finance - 1.70% | | | |
Cash America International, Inc. | | | 22,200 | | | | 581,418 | | | |
Nelnet, Inc., Class A | | | 15,400 | | | | 666,974 | | | |
| | | | | | | | | | |
| | | | | | | 1,248,392 | | | |
| | | | | | | | | | |
| | | | | | | | |
| Industry Company | | Shares | | | Value | |
| |
|
Containers & Packaging - 0.95% | |
Graphic Packaging Holding Co. | | | 50,100 | | | | $ 697,893 | |
|
Distributors - 1.30% | |
Core-Mark Holding Co., Inc. | | | 16,100 | | | | 953,925 | |
|
Diversified Consumer Services - 1.09% | |
Matthews International Corp., Class A | | | 15,000 | | | | 797,100 | |
|
Diversified Financial Services - 1.50% | |
Enova International, Inc.* | | | 20,313 | | | | 379,447 | |
Ladder Capital Corp. | | | 41,500 | | | | 720,025 | |
| | | | | | | | |
| | | | | | | 1,099,472 | |
|
Diversified Telecommunication Services - 0.59% | |
Intelsat SA*+ | | | 43,200 | | | | 428,544 | |
|
Electric Utilities - 0.62% | |
Empire District Electric Co. (The)+ | | | 21,000 | | | | 457,800 | |
|
Electrical Equipment - 1.09% | |
General Cable Corp. | | | 40,600 | | | | 801,038 | |
|
Electronic Equipment, Instruments & Components - 3.00% | |
Sanmina Corp.* | | | 58,700 | | | | 1,183,392 | |
TTM Technologies, Inc.* | | | 101,500 | | | | 1,013,985 | |
| | | | | | | | |
| | | | | | | 2,197,377 | |
|
Food & Staples Retailing - 1.12% | |
Ingles Markets, Inc., Class A | | | 17,100 | | | | 816,867 | |
|
Food Products - 1.48% | |
Cal-Maine Foods, Inc. | | | 10,300 | | | | 537,660 | |
Sanderson Farms, Inc.+ | | | 7,300 | | | | 548,668 | |
| | | | | | | | |
| | | | | | | 1,086,328 | |
|
Gas Utilities - 0.87% | |
Chesapeake Utilities Corp. | | | 11,900 | | | | 640,815 | |
|
Health Care Providers & Services - 5.98% | |
AMN Healthcare Services, Inc.* | | | 23,600 | | | | 745,524 | |
Bio-Reference Laboratories, Inc.*+ | | | 23,500 | | | | 969,375 | |
Magellan Health, Inc.* | | | 18,200 | | | | 1,275,274 | |
Owens & Minor, Inc. | | | 23,500 | | | | 799,000 | |
RadNet, Inc.* | | | 88,500 | | | | 592,065 | |
| | | | | | | | |
| | | | | | | 4,381,238 | |
|
Hotels, Restaurants & Leisure - 5.98% | |
BJ’s Restaurants, Inc.* | | | 15,000 | | | | 726,750 | |
| | |
Small-Cap Value Fund SCHEDULE OF INVESTMENTS (continued) | | |
Showing percentage of net assets as of June 30, 2015
| | | | | | | | | | |
| Industry Company | | Shares | | | Value | | | |
Common Stocks (continued) | | | |
Hotels, Restaurants & Leisure (continued) | | | |
Cracker Barrel Old Country Store, Inc.+ | | | 5,400 | | | | $ 805,464 | | | |
Isle of Capri Casinos, Inc.* | | | 62,700 | | | | 1,138,005 | | | |
Marriott Vacations Worldwide Corp. | | | 8,800 | | | | 807,400 | | | |
Penn National Gaming, Inc.* | | | 49,100 | | | | 900,985 | | | |
| | | | | | | | | | |
| | | | | | | 4,378,604 | | | |
Insurance - 9.31% | | | |
American Equity Investment Life Holding Co. | | | 28,600 | | | | 771,628 | | | |
AmTrust Financial Services, Inc.+ | | | 13,600 | | | | 890,936 | | | |
Fidelity & Guaranty Life | | | 34,000 | | | | 803,420 | | | |
Maiden Holdings, Ltd. | | | 67,500 | | | | 1,065,150 | | | |
Navigators Group, Inc. (The)* | | | 6,700 | | | | 519,652 | | | |
OneBeacon Insurance Group, Ltd., Class A | | | 60,220 | | | | 873,792 | | | |
Selective Insurance Group, Inc. | | | 27,500 | | | | 771,375 | | | |
Symetra Financial Corp. | | | 46,500 | | | | 1,123,905 | | | |
| | | | | | | | | | |
| | | | | | | 6,819,858 | | | |
Internet & Catalog Retail - 1.72% | | | |
1-800-Flowers.com, Inc., Class A* | | | 78,900 | | | | 825,294 | | | |
Lands’ End, Inc.*+ | | | 17,600 | | | | 437,008 | | | |
| | | | | | | | | | |
| | | | | | | 1,262,302 | | | |
Internet Software & Services - 1.35% | | | |
EarthLink Holdings Corp. | | | 132,000 | | | | 988,680 | | | |
| |
IT Services - 2.27% | | | |
Convergys Corp.+ | | | 31,700 | | | | 808,033 | | | |
Unisys Corp.* | | | 42,900 | | | | 857,571 | | | |
| | | | | | | | | | |
| | | | | | | 1,665,604 | | | |
Machinery - 4.08% | | | |
Global Brass & Copper Holdings, Inc. | | | 38,200 | | | | 649,782 | | | |
Greenbrier Companies., Inc. (The) | | | 11,700 | | | | 548,145 | | | |
Lydall, Inc.* | | | 31,000 | | | | 916,360 | | | |
Meritor, Inc.* | | | 66,400 | | | | 871,168 | | | |
| | | | | | | | | | |
| | | | | | | 2,985,455 | | | |
Marine - 1.31% | | | |
Matson, Inc. | | | 22,800 | | | | 958,512 | | | |
| |
Metals & Mining - 1.97% | | | |
Century Aluminum Co.* | | | 69,600 | | | | 725,928 | | | |
| | | | | | | | |
| Industry Company | | Shares | | | Value | |
| | | | | | | | |
Metals & Mining (continued) | |
Kaiser Aluminum Corp. | | | 8,600 | | | | $ 714,488 | |
| | | | | | | | |
| | | | | | | 1,440,416 | |
|
Multi-Utilities - 0.96% | |
Black Hills Corp. | | | 16,100 | | | | 702,765 | |
|
Oil, Gas & Consumable Fuels - 5.55% | |
Alon USA Energy, Inc. | | | 48,600 | | | | 918,540 | |
Energy XXI, Ltd.+ | | | 31,100 | | | | 81,793 | |
Green Plains, Inc. | | | 23,500 | | | | 647,425 | |
Pacific Ethanol, Inc.*+ | | | 36,800 | | | | 379,776 | |
Renewable Energy Group, Inc.* | | | 77,000 | | | | 890,120 | |
Ship Finance International, Ltd.+ | | | 44,900 | | | | 732,768 | |
Stone Energy Corp.* | | | 32,966 | | | | 415,042 | |
| | | | | | | | |
| | | | | | | 4,065,464 | |
|
Paper & Forest Products - 1.10% | |
Neenah Paper, Inc. | | | 13,700 | | | | 807,752 | |
|
Real Estate Investment Trusts (REITs) - 10.23% | |
Chambers Street Properties | | | 103,000 | | | | 818,850 | |
Education Realty Trust, Inc. | | | 26,233 | | | | 822,667 | |
EPR Properties | | | 15,700 | | | | 860,046 | |
FelCor Lodging Trust, Inc. | | | 81,000 | | | | 800,280 | |
Geo Group, Inc. (The) | | | 17,400 | | | | 594,384 | |
Government Properties Income Trust+ | | | 34,300 | | | | 636,265 | |
Hudson Pacific Properties, Inc. | | | 32,300 | | | | 916,351 | |
Inland Real Estate Corp. | | | 75,500 | | | | 711,210 | |
Ramco-Gershenson Properties Trust | | | 45,400 | | | | 740,928 | |
Summit Hotel Properties, Inc. | | | 45,400 | | | | 590,654 | |
| | | | | | | | |
| | | | | | | 7,491,635 | |
|
Semiconductors & Semiconductor Equipment - 1.21% | |
Amkor Technology, Inc.* | | | 148,000 | | | | 885,040 | |
|
Software - 1.26% | |
Mentor Graphics Corp. | | | 35,000 | | | | 925,050 | |
|
Specialty Retail - 2.82% | |
Build-A-Bear Workshop, Inc.* | | | 29,750 | | | | 475,702 | |
Outerwall, Inc.+ | | | 12,600 | | | | 958,986 | |
Stage Stores, Inc. | | | 35,800 | | | | 627,574 | |
| | | | | | | | |
| | | | | | | 2,062,262 | |
| | |
| 61 | | Annual Report | June 30, 2015 |
| | |
Small-Cap Value Fund SCHEDULE OF INVESTMENTS (continued) | | |
Showing percentage of net assets as of June 30, 2015
| | | | | | | | | | | | |
| Industry Company | | Shares | | Value | | | | | |
Common Stocks (continued) | | | | | |
Textiles, Apparel & Luxury Goods - 3.71% | | | | |
Perry Ellis International, Inc.* | | 29,800 | | $ | 708,346 | | | | | |
Skechers U.S.A., Inc., Class A* | | 18,300 | | | 2,009,157 | | | | | |
| | | | | | | | |
| | | | | | | 2,717,503 | | | | | |
Thrifts & Mortgage Finance - 1.73% | | | | | |
Capitol Federal Financial, Inc. | | 71,900 | | | 865,676 | | | | | |
Clifton Bancorp, Inc. | | 28,900 | | | 404,311 | | | | | |
| | | | | | | | |
| | | | | | | 1,269,987 | | | | | |
Trading Companies & Distributors - 0.79% | | | | | |
Rush Enterprises, Inc., Class A* | | 22,100 | | | 579,241 | | | | | |
| | |
Water Utilities - 1.03% | | | | | |
California Water Service Group | | 33,000 | | | 754,050 | | | | | |
| | | | | | | | |
TOTAL COMMON STOCKS - 101.01% | | | 73,984,727 | | | | | |
| | | | | | | | |
(Cost $71,094,094) | | | | | |
| | | | | | | | | | |
| | | | |
| | | Rate^ | | Shares | | Value | | | |
| |
INVESTMENTS PURCHASED WITH CASH PROCEEDS FROM SECURITIES LENDING - 11.10% | | | |
Dreyfus Cash Management Fund** | | 0.04% | | 8,128,231 | | | 8,128,231 | | | |
| | | | | | |
TOTAL INVESTMENTS PURCHASED WITH CASH PROCEEDS FROM SECURITIES LENDING - 11.10% | | | 8,128,231 | | | |
| | | | | | |
(Cost $8,128,231) | | | | | | |
| | |
Total Investments - 112.11% | | $ | 82,112,958 | | | |
(Cost $79,222,325) | | | |
Liabilities in Excess of Other Assets - (12.11%) | | | (8,871,720 | ) | | |
| | | | | | |
NET ASSETS - 100.00% | | $ | 73,241,238 | | | |
| | | | | | |
| | | | | | | | |
| |
* Non-income producing security. | | |
** This security represents the investment of the collateral received in connection with securities out on loan as of June 30, 2015. | | |
^ Rate disclosed as of June 30, 2015. | | |
+ This security or a portion of the security is out on loan as of June 30, 2015. Total loaned securities had a value of $8,060,854 as of June 30, 2015. | | |
| | | | | | | | |
| | | | | | | | |
Summary of inputs used to value the Fund’s investments as of 06/30/2015 (See Note 2 in Notes to Financial Statements):
| | | | | | | | | | | | | | | | |
| | | Valuation Inputs | |
| |
| | | Investment in Securities (Value) | |
| |
| | | Level 1
Quoted
Prices | | | Level 2
Significant
Observable
Inputs | | | Level 3
Significant
Unobservable
Inputs | | | Total | |
| |
| | | | |
Common Stocks | | $ | 73,984,727 | | | $ | — | | | $ | — | | | $ | 73,984,727 | |
Investments Purchased with Cash Proceeds from Securities Lending | | | — | | | | 8,128,231 | | | | — | | | | 8,128,231 | |
| | | | | | | | | | | | | | | | |
TOTAL | | $ | 73,984,727 | | | $ | 8,128,231 | | | $ | — | | | $ | 82,112,958 | |
| | | | | | | | | | | | | | | | |
See Notes to Financial Statements
| | |
Large-Cap Growth Fund MANAGER’S COMMENTARY (Unaudited) | | |
June 30, 2015
Dear Fellow Large-Cap Growth Fund Shareholder,
For the quarter ended June 30, 2015, our Fund declined 0.84%, underperforming our primary market benchmark, the Russell 1000 Growth Index (+0.12%), and our peer benchmark, the Lipper Large-Cap Growth Funds Index (+0.94%). It was a poor quarter.
For the fiscal year, our Fund was up 16.19%, beating our primary market benchmark, the Russell 1000 Growth Index (+10.56%), and our peer benchmark, the Lipper Large-Cap Growth Funds Index (+10.56%). It was a good year for the Fund on an absolute and relative basis. We are now leading our benchmarks in the five-year period but, we are slightly lagging our primary benchmark in the longer 10-year and inception-to-date periods.
The table below presents our June quarter, one-year, five-year, 10-year, and inception-to-date financial results. See the next page for a graph of performance since inception.
Standardized Returns as of June 30, 2015
| | | | | | | | | | | | |
| | | | | | | Annualized | | | | |
| | | | | | |
| | | Quarter | | 1 Year | | 5 Years | | 10 Years | | Since Inception (10/31/03) | | |
| |
Large-Cap Growth Fund | | -0.84% | | 16.19% | | 19.32% | | 8.60% | | 8.21% | |
Russell 1000 Growth Index | | 0.12% | | 10.56% | | 18.59% | | 9.10% | | 8.57% | |
Lipper Large-Cap Growth Funds Index | | 0.94% | | 10.56% | | 17.23% | | 7.97% | | 7.68% | |
Performance figures quoted in the table above represent past performance and are no guarantee of future results. The table above does not reflect the deduction of taxes that a shareholder would pay on Fund distributions or on the redemption of Fund shares.
The Russell 1000 Growth Index is an unmanaged index that consists of stocks in the Russell 1000 Index with higher price-to-book ratios and higher forecasted growth values with dividends reinvested. The Lipper Large-Cap Growth Funds Index is an index of large-company, growth-oriented funds compiled by Lipper, Inc. It is not possible to invest directly in an index. Periods longer than one year are annualized.
According to data from Lipper, Inc. as of June 30, 2015, Large-Cap Growth Fund ranked 21st of 566 multi-cap growth funds for the 12 months ending June 30, 2015, 58th of 409 over the last five years, 142nd of 276 over the last 10 years, and 151st of 251 such funds since inception in October 2003. Lipper, Inc. is an independent mutual fund rating service that ranks funds in various fund categories by making comparative calculations using total returns.
| | |
| 63 | | Annual Report | June 30, 2015 |
| | |
Large-Cap Growth Fund MANAGER’S COMMENTARY (Unaudited) (continued) | | |
Large-Cap Growth Fund vs. Russell 1000 Growth Index & Lipper Large-Cap Growth Funds Index
from Inception 10/31/03 to 6/30/15
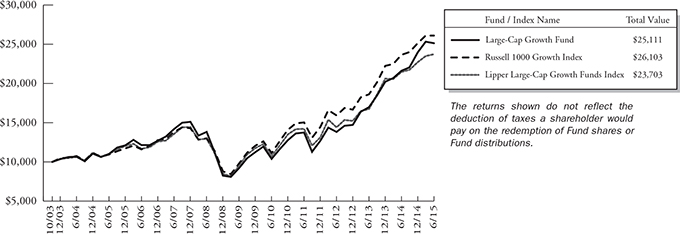
Detailed Explanation of Quarterly Performance
Stocks at the very largest end of the size spectrum performed the best within the large-cap universe for the quarter. The Fund’s non-market-cap weighted design, which gives us more exposure to smaller companies within the large-cap universe of stocks, hurt relative returns versus the Russell 1000 Growth Index. With respect to our models, our company financial health models performance was mixed, our diversifying value metrics models generally lagged for the quarter, while our diversifying momentum models performed well.
Detailed Explanation of Fiscal Year Performance
The Fund outperformed its primary benchmark, the Russell 1000 Growth Index, for the fiscal year. Although the Fund’s non-market-cap weighted design hurt relative returns, performance was boosted by strong performance by our company financial health and diversifying momentum models. Strong stock selection in the Health Care, Industrials and Information Technology sectors also contributed to the Fund’s outperformance.
Top Ten Holdings as of June 30, 2015
| | | | | | | | | |
| Rank | | Description | | Industry | | % of Net
Assets |
| 1 | | HCA Holdings, Inc. | | Health Care Providers & Services | | | | 2.3% | |
| 2 | | Aetna, Inc. | | Health Care Providers & Services | | | | 2.2% | |
| 3 | | Foot Locker, Inc. | | Specialty Retail | | | | 2.1% | |
| 4 | | Kroger Co. (The) | | Food & Staples Retailing | | | | 2.0% | |
| 5 | | Tesoro Corp. | | Oil, Gas & Consumable Fuels | | | | 1.8% | |
| 6 | | Apple, Inc. | | Computers & Peripherals | | | | 1.7% | |
| 7 | | Lear Corp. | | Auto Components | | | | 1.7% | |
| 8 | | Under Armour, Inc., Class A | | Textiles, Apparel & Luxury Goods | | | | 1.4% | |
| 9 | | United Continental Holdings, Inc. | | Airlines | | | | 1.3% | |
| 10 | | BioMarin Pharmaceutical, Inc. | | Biotechnology | | | | 1.3% | |
| | Total | | | | | | 17.8% | |
| | |
Large-Cap Growth Fund MANAGER’S COMMENTARY (Unaudited) (continued) | | |
Industry Sector Representation as of June 30, 2015
| | | | | | | | | | | | |
| | | % of Net Assets | | | % of Russell 1000 Growth Index | | | Difference | |
Consumer Discretionary | | | 19.4% | | | | 21.0% | | | | -1.6% | |
Consumer Staples | | | 9.6% | | | | 10.5% | | | | -0.9% | |
Energy | | | 5.5% | | | | 1.0% | | | | 4.5% | |
Financials | | | 8.6% | | | | 5.2% | | | | 3.4% | |
Health Care | | | 16.8% | | | | 18.3% | | | | -1.5% | |
Industrials | | | 10.9% | | | | 11.1% | | | | -0.2% | |
Information Technology | | | 23.6% | | | | 27.1% | | | | -3.5% | |
Materials | | | 4.1% | | | | 3.9% | | | | 0.2% | |
Telecommunication Services | | | 0.5% | | | | 1.8% | | | | -1.3% | |
Utilities | | | 0.0% | | | | 0.0% | | | | 0.0% | |
Cash & Other Assets | | | 1.1% | | | | 0.0% | | | | 1.1% | |
Total | | | 100.0% | | | | 100.0% | | | | | |
Disclaimer
The views expressed here are exclusively those of Fund management. These views, including those related to market sectors or individual stocks, are not meant as investment advice and should not be considered predictive in nature. Any favorable (or unfavorable) description of a holding applies only as of the quarter end, June 30, 2015, unless otherwise stated. Security positions can and do change thereafter. Discussions of historical performance do not guarantee and may not be indicative of future performance.
The Fund is subject to market risk (volatility) and is not an appropriate investment for short-term investors.
Conclusion
Thank you for your continued investment in Large-Cap Growth Fund. We encourage your feedback; your reactions and concerns are important to us.
Sincerely,
The Investment Management Team
| | |
| 65 | | Annual Report | June 30, 2015 |
| | |
Large-Cap Growth Fund SCHEDULE OF INVESTMENTS | | |
Showing percentage of net assets as of June 30, 2015
| | | | | | | | | | |
| Industry Company | | Shares | | | Value | | | |
COMMON STOCKS - 98.66% | | | |
Aerospace & Defense - 3.03% | | | |
Honeywell International, Inc. | | | 13,400 | | | | $1,366,398 | | | |
Huntington Ingalls Industries, Inc. | | | 15,100 | | | | 1,700,109 | | | |
Lockheed Martin Corp. | | | 9,000 | | | | 1,673,100 | | | |
| | | | | | | | | | |
| | | | | | | 4,739,607 | | | |
| |
Airlines - 4.12% | | | |
Alaska Air Group, Inc. | | | 22,900 | | | | 1,475,447 | | | |
Delta Air Lines, Inc. | | | 38,900 | | | | 1,598,012 | | | |
Southwest Airlines Co. | | | 39,700 | | | | 1,313,673 | | | |
United Continental Holdings, Inc.* | | | 38,800 | | | | 2,056,788 | | | |
| | | | | | | | | | |
| | | | | | | 6,443,920 | | | |
| |
Auto Components - 1.68% | | | |
Lear Corp. | | | 23,500 | | | | 2,638,110 | | | |
| |
Beverages - 2.47% | | | |
Constellation Brands, Inc., Class A | | | 6,700 | | | | 777,334 | | | |
Monster Beverage Corp.* | | | 15,000 | | | | 2,010,300 | | | |
PepsiCo, Inc. | | | 11,600 | | | | 1,082,744 | | | |
| | | | | | | | | | |
| | | | | | | 3,870,378 | | | |
| |
Biotechnology - 5.89% | | | |
Amgen, Inc. | | | 3,800 | | | | 583,376 | | | |
BioMarin Pharmaceutical, Inc.* | | | 14,900 | | | | 2,038,022 | | | |
Gilead Sciences, Inc. | | | 15,500 | | | | 1,814,740 | | | |
Incyte Corp. Ltd* | | | 11,300 | | | | 1,177,573 | | | |
Regeneron Pharmaceuticals, Inc.* | | | 3,700 | | | | 1,887,481 | | | |
United Therapeutics Corp.* | | | 9,900 | | | | 1,722,105 | | | |
| | | | | | | | | | |
| | | | | | | 9,223,297 | | | |
| |
Chemicals - 4.12% | | | |
Airgas, Inc. | | | 9,400 | | | | 994,332 | | | |
Celanese Corp., Class A | | | 10,500 | | | | 754,740 | | | |
Dow Chemical Co. (The) | | | 18,500 | | | | 946,645 | | | |
LyondellBasell Industries NV, Class A | | | 15,100 | | | | 1,563,152 | | | |
Praxair, Inc. | | | 6,400 | | | | 765,120 | | | |
Sherwin-Williams Co. (The) | | | 5,200 | | | | 1,430,104 | | | |
| | | | | | | | | | |
| | | | | | | 6,454,093 | | | |
| |
Commercial Services & Supplies - 1.86% | | | |
Cintas Corp. | | | 15,400 | | | | 1,302,686 | | | |
Waste Management, Inc. | | | 34,700 | | | | 1,608,345 | | | |
| | | | | | | | | | |
| | | | | | | 2,911,031 | | | |
| |
Communications Equipment - 0.39% | | | |
F5 Networks, Inc.* | | | 5,100 | | | | 613,785 | | | |
| | | | | | | | |
| Industry Company | | Shares | | | Value | |
| | | | | | | | |
Computers & Peripherals - 1.74% | |
Apple, Inc. | | | 21,700 | | | | $ 2,721,723 | |
|
Consumer Finance - 3.90% | |
Ally Financial, Inc.* | | | 70,900 | | | | 1,590,287 | |
Navient Corp. | | | 75,100 | | | | 1,367,571 | |
Santander Consumer USA Holdings, Inc.* | | | 62,400 | | | | 1,595,568 | |
Synchrony Financial* | | | 47,000 | | | | 1,547,710 | |
| | | | | | | | |
| | | | | | | 6,101,136 | |
|
Diversified Financial Services - 0.70% | |
Voya Financial, Inc. | | | 23,600 | | | | 1,096,692 | |
|
Diversified Telecommunication Services - 0.53% | |
Verizon Communications, Inc. | | | 17,900 | | | | 834,319 | |
|
Electronic Equipment, Instruments & Components - 1.07% | |
Amphenol Corp., Class A | | | 28,800 | | | | 1,669,536 | |
|
Energy Equipment & Services - 0.59% | |
Halliburton Co. | | | 21,300 | | | | 917,391 | |
|
Food & Staples Retailing - 6.48% | |
Costco Wholesale Corp. | | | 11,500 | | | | 1,553,190 | |
CVS Health Corp. | | | 15,400 | | | | 1,615,152 | |
Kroger Co. (The) | | | 43,100 | | | | 3,125,181 | |
Rite Aid Corp.* | | | 208,500 | | | | 1,740,975 | |
Sysco Corp. | | | 35,500 | | | | 1,281,550 | |
Walgreens Boots Alliance, Inc. | | | 9,700 | | | | 819,068 | |
| | | | | | | | |
| | | | | | | 10,135,116 | |
|
Food Products - 0.62% | |
Pilgrim’s Pride Corp.+ | | | 42,000 | | | | 964,740 | |
|
Gas Utilities - 0.22% | |
ONEOK, Inc. | | | 8,700 | | | | 343,476 | |
|
Health Care Equipment & Supplies - 0.45% | |
C.R. Bard, Inc. | | | 4,100 | | | | 699,870 | |
|
Health Care Providers & Services - 8.66% | |
Aetna, Inc. | | | 27,500 | | | | 3,505,150 | |
Cardinal Health, Inc. | | | 19,100 | | | | 1,597,715 | |
Centene Corp.* | | | 24,400 | | | | 1,961,760 | |
Cigna Corp. | | | 10,500 | | | | 1,701,000 | |
Envision Healthcare Holdings, Inc.* | | | 31,300 | | | | 1,235,724 | |
HCA Holdings, Inc.* | | | 39,100 | | | | 3,547,152 | |
| | | | | | | | |
| | | | | | | 13,548,501 | |
|
Hotels, Restaurants & Leisure - 1.64% | |
Chipotle Mexican Grill, Inc.* | | | 1,000 | | | | 604,990 | |
| | |
Large-Cap Growth Fund SCHEDULE OF INVESTMENTS (continued) | | |
Showing percentage of net assets as of June 30, 2015
| | | | | | | | | | |
| Industry Company | | Shares | | | Value | | | |
Common Stocks (continued) | | | |
Hotels, Restaurants & Leisure (continued) | | | |
Hilton Worldwide Holdings, Inc.* | | | 48,000 | | | | $1,322,400 | | | |
Marriott International, Inc., Class A | | | 8,700 | | | | 647,193 | | | |
| | | | | | | | | | |
| | | | | | | 2,574,583 | | | |
| |
Household Durables - 0.87% | | | |
Jarden Corp.* | | | 26,300 | | | | 1,361,025 | | | |
| |
Insurance - 3.53% | | | |
Arch Capital Group, Ltd.* | | | 25,200 | | | | 1,687,392 | | | |
Marsh & McLennan Cos., Inc. | | | 14,400 | | | | 816,480 | | | |
Reinsurance Group of America, Inc. | | | 18,400 | | | | 1,745,608 | | | |
Travelers Cos., Inc. (The) | | | 13,200 | | | | 1,275,912 | | | |
| | | | | | | | | | |
| | | | | | | 5,525,392 | | | |
| |
Internet & Catalog Retail - 0.37% | | | |
Priceline Group, Inc. (The)* | | | 500 | | | | 575,685 | | | |
| |
Internet Software & Services - 2.94% | | | |
Facebook, Inc.,
Class A* | | | 22,000 | | | | 1,886,830 | | | |
Google, Inc.,
Class C* | | | 3,300 | | | | 1,717,683 | | | |
Rackspace Hosting, Inc.* | | | 26,700 | | | | 992,973 | | | |
| | | | | | | | | | |
| | | | | | | 4,597,486 | | | |
| |
IT Services - 5.67% | | | |
Accenture PLC, Class A | | | 7,100 | | | | 687,138 | | | |
Automatic Data Processing, Inc. | | | 7,000 | | | | 561,610 | | | |
Broadridge Financial Solutions, Inc. | | | 32,300 | | | | 1,615,323 | | | |
Cognizant Technology Solutions Corp., Class A* | | | 11,800 | | | | 720,862 | | | |
Fidelity National Information Services, Inc. | | | 24,000 | | | | 1,483,200 | | | |
Fiserv, Inc.* | | | 18,600 | | | | 1,540,638 | | | |
Paychex, Inc. | | | 33,600 | | | | 1,575,168 | | | |
Visa, Inc., Class A | | | 10,400 | | | | 698,360 | | | |
| | | | | | | | | | |
| | | | | | | 8,882,299 | | | |
| |
Leisure Equipment & Products - 0.42% | | | |
Polaris Industries, Inc. | | | 4,400 | | | | 651,684 | | | |
| |
Life Sciences Tools & Services - 0.77% | | | |
Illumina, Inc.* | | | 5,500 | | | | 1,200,980 | | | |
| |
Media - 1.83% | | | |
Comcast Corp., Class A | | | 15,800 | | | | 950,212 | | | |
FactSet Research Systems, Inc. | | | 11,800 | | | | 1,917,618 | | | |
| | | | | | | | | | |
| | | | | | | 2,867,830 | | | |
| | | | | | | | |
| Industry Company | | Shares | | | Value | |
| | | | | | | | |
Oil, Gas & Consumable Fuels - 4.67% | |
Chesapeake Energy Corp.+ | | | 104,500 | | | | $1,167,265 | |
Marathon Petroleum Corp. | | | 33,400 | | | | 1,747,154 | |
Tesoro Corp. | | | 33,000 | | | | 2,785,530 | |
Valero Energy Corp. | | | 25,600 | | | | 1,602,560 | |
| | | | | | | | |
| | | | | | | 7,302,509 | |
|
Pharmaceuticals - 0.97% | |
Allergan PLC* | | | 5,000 | | | | 1,517,300 | |
|
Professional Services - 0.74% | |
Robert Half International, Inc. | | | 20,800 | | | | 1,154,400 | |
|
Real Estate Investment Trusts (REITs) - 0.41% | |
Federal Realty Investment Trust | | | 5,000 | | | | 640,450 | |
|
Road & Rail - 1.10% | |
Avis Budget Group, Inc.* | | | 10,000 | | | | 440,800 | |
Union Pacific Corp. | | | 13,400 | | | | 1,277,958 | |
| | | | | | | | |
| | | | | | | 1,718,758 | |
|
Semiconductors & Semiconductor Equipment - 5.17% | |
Avago Technologies Ltd. | | | 13,100 | | | | 1,741,383 | |
Freescale Semiconductor Ltd.* | | | 28,200 | | | | 1,127,154 | |
Intel Corp. | | | 17,200 | | | | 523,138 | |
Microchip Technology, Inc.+ | | | 11,800 | | | | 559,615 | |
Micron Technology, Inc.* | | | 40,500 | | | | 763,020 | |
QUALCOMM, Inc. | | | 24,400 | | | | 1,528,172 | |
Skyworks Solutions, Inc. | | | 17,700 | | | | 1,842,570 | |
| | | | | | | | |
| | | | | | | 8,085,052 | |
|
Software - 6.43% | |
Electronic Arts, Inc.* | | | 21,200 | | | | 1,409,800 | |
Fortinet, Inc.* | | | 39,700 | | | | 1,640,801 | |
Intuit, Inc. | | | 7,200 | | | | 725,544 | |
Microsoft Corp. | | | 28,000 | | | | 1,236,200 | |
Oracle Corp. | | | 14,700 | | | | 592,410 | |
Red Hat, Inc.* | | | 25,400 | | | | 1,928,622 | |
salesforce.com, inc.* | | | 10,300 | | | | 717,189 | |
ServiceNow, Inc.* | | | 24,500 | | | | 1,820,595 | |
| | | | | | | | |
| | | | | | | 10,071,161 | |
|
Specialty Retail - 11.26% | |
Best Buy Co., Inc. | | | 47,600 | | | | 1,552,236 | |
CarMax, Inc.* | | | 26,900 | | | | 1,781,049 | |
Foot Locker, Inc. | | | 49,300 | | | | 3,303,593 | |
Home Depot, Inc. (The) | | | 13,600 | | | | 1,511,368 | |
L Brands, Inc. | | | 17,200 | | | | 1,474,556 | |
Lowe’s Companies, Inc. | | | 28,100 | | | | 1,881,857 | |
O’Reilly Automotive, Inc.* | | | 8,800 | | | | 1,988,624 | |
| | |
| 67 | | Annual Report | June 30, 2015 |
| | |
Large-Cap Growth Fund SCHEDULE OF INVESTMENTS (continued) | | |
Showing percentage of net assets as of June 30, 2015
| | | | | | | | | | | | |
| Industry Company | | | | Shares | | | Value | | | |
Common Stocks (continued) | | | |
Specialty Retail (continued) | | | |
Ross Stores, Inc. | | | 21,600 | | | | $1,049,976 | | | |
Ulta Salon Cosmetics & Fragrance, Inc.* | | | 13,000 | | | | 2,007,850 | | | |
Williams-Sonoma, Inc. | | | 13,100 | | | | 1,077,737 | | | |
| | | | | | | |
| | | | 17,628,846 | | | |
| |
Textiles, Apparel & Luxury Goods - 1.35% | | | |
Under Armour, Inc., Class A*+ | | | 25,300 | | | | 2,111,032 | | | |
| | | | | | | |
TOTAL COMMON STOCKS - 98.66% | | | | 154,393,193 | | | |
| | | | | | | |
(Cost $139,336,461) | | | | | | | |
| | | | | | | |
| | | Rate^ | | Shares | | | Value | | | |
| | | | | |
| |
MONEY MARKET FUND - 2.17% | | | |
Dreyfus Cash Management Fund | | 0.04% | | | 3,392,947 | | | | 3,392,947 | | | |
| | | | | | | |
| | |
TOTAL MONEY MARKET FUND - 2.17% | | | | 3,392,947 | | | |
| | | | | | | |
(Cost $3,392,947) | | | | | | | |
| |
| INVESTMENTS PURCHASED WITH CASH PROCEEDS FROM SECURITIES LENDING - 3.14% | | | |
Dreyfus Cash Management Fund** | | 0.04% | | | 4,920,115 | | | | 4,920,115 | | | |
| | | | | | | |
TOTAL INVESTMENTS PURCHASED WITH CASH PROCEEDS FROM SECURITIES LENDING - 3.14% | | | | 4,920,115 | | | |
| | | | | | | |
(Cost $4,920,115) | | | | | | | | | | | | |
| | |
TOTAL INVESTMENTS - 103.97% | | | | $162,706,255 | | | |
(Cost $147,649,523) | | | | | | | |
Liabilities in Excess of Other Assets - (3.97%) | | | | (6,212,950 | ) | | |
| | | | | | | |
NET ASSETS - 100.00% | | | | $156,493,305 | | | |
| | | | | | | |
| | | | |
* | | Non-income producing security. | | |
** | | This security represents the investment of the collateral received in connection with securities out on loan as of June 30, 2015. | | |
^ | | Rate disclosed as of June 30, 2015. | | |
+ | | This security or a portion of the security is out on loan as of June 30, 2015. Total loaned securities had a value of $4,802,652 as of June 30, 2015. | | |
PLC - Public Limited Company
Summary of inputs used to value the Fund’s investments as of 06/30/2015 (See Note 2 in Notes to Financial Statements):
| | | | | | | | | | | | | | | | |
| | | Valuation Inputs | |
| |
| | | Investment in Securities (Value) | |
| |
| | | Level 1
Quoted
Prices | | | Level 2
Significant
Observable
Inputs | | | Level 3
Significant
Unobservable
Inputs | | | Total | |
| |
| | | | |
Common Stocks | | $ | 154,393,193 | | | $ | — | | | $ | — | | | $ | 154,393,193 | |
Money Market Fund | | | — | | | | 3,392,947 | | | | — | | | | 3,392,947 | |
Investments Purchased with Cash Proceeds from Securities Lending | | | — | | | | 4,920,115 | | | | — | | | | 4,920,115 | |
| | | | | | | | | | | | | | | | |
TOTAL | | $ | 154,393,193 | | | $ | 8,313,062 | | | $ | — | | | $ | 162,706,255 | |
| | | | | | | | | | | | | | | | |
See Notes to Financial Statements.
| | |
Blue Chip 35 Index Fund MANAGER’S COMMENTARY (Unaudited) | | |
June 30, 2015
Dear Fellow Blue Chip 35 Index Fund Shareholder,
For the quarter ended June 30, 2015, our Fund appreciated 1.11%, outperforming our primary market benchmark, the S&P 500 Index (+0.28%), and our peer benchmark, the Lipper Large-Cap Core Funds Index (-0.07%), but trailing the Russell Top
50 Mega Cap Index (+1.47%). It was a good quarter on a relative basis.
For the fiscal year, our Fund was up 5.77%, trailing our primary benchmark, the S&P 500 Index (+7.42%), and the Russell Top 50 Mega Cap Index (+7.37%). Our Fund beat our peer benchmark, the Lipper Large-Cap Core Funds Index (+5.25%).
The table below presents our June quarter, one-year, five-year, 10-year, 15-year, and inception-to-date financial results. See the next page for a graph of performance since inception.
Standardized Returns as of June 30, 2015
| | | | | | | | | | | | | | | | | | | | | | |
| | | | | | | | | Annualized |
| | | Quarter | | | 1 Year | | | 5 Years | | | 10 Years | | | 15 Years | | | Since Inception (7/31/97) |
|
| | | | | | |
Blue Chip 35 Index Fund | | | 1.11% | | | | 5.77% | | | | 16.28% | | | | 7.72% | | | | 3.81% | | | 6.55% |
S&P 500 Index | | | 0.28% | | | | 7.42% | | | | 17.34% | | | | 7.89% | | | | 4.36% | | | 6.34% |
Russell Top 50 Mega Cap Index | | | 1.47% | | | | 7.37% | | | | 16.19% | | | | 6.99% | | | | 2.21% | | | 5.07% |
Lipper Large-Cap Core Funds Index | | | -0.07% | | | | 5.25% | | | | 15.82% | | | | 7.20% | | | | 3.49% | | | 5.54% |
Bridgeway Ultra-Large 35 Index | | | 1.22% | | | | 5.96% | | | | 16.50% | | | | 7.95% | | | | 4.10% | | | 6.73% |
Performance figures quoted in the table above represent past performance and are no guarantee of future results. Total return figures in the table above include the reinvestment of dividends and capital gains. The table above does not reflect the deduction of taxes that a shareholder would pay on Fund distributions or on the redemption of Fund shares.
The S&P 500 Index is a broad-based, unmanaged measurement of changes in stock market conditions, based on the average of 500 widely held common stocks with dividends reinvested. The Russell Top 50 Mega Cap Index measures the performance of the largest companies in the Russell 3000 Index. It includes 50 of the largest securities, based on a combination of their market cap and current index membership, and represents approximately 40% of the total market capitalization of the Russell 3000 Index. The Bridgeway Ultra-Large 35 Index is an index comprising very large, “blue chip” U.S. stocks, excluding tobacco companies; it is compiled by the adviser of the Fund. The Lipper Large-Cap Core Funds Index reflects the aggregate record of domestic large-cap core mutual funds as reported by Lipper, Inc. It is not possible to invest directly in an index. Periods longer than one year are annualized.
According to data from Lipper, Inc. as of June 30, 2015, Blue Chip 35 Index Fund ranked 484th of 845 large-cap core funds for the 12 months ending June 30, 2015, 300th of 690 over the last five years, 153rd of 492 over the last 10 years, and 47th of 175 since inception in July 1997. Lipper, Inc. is an independent mutual fund rating service that ranks funds in various fund categories by making comparative calculations using total returns.
| | |
| 69 | | Annual Report | June 30, 2015 |
| | |
Blue Chip 35 Index Fund MANAGER’S COMMENTARY (Unaudited) (continued) | | |
Blue Chip 35 Index Fund vs. S&P 500 Index, Russell Top 50 Mega Cap Index, Bridgeway Ultra-Large 35 Index & Lipper Large-Cap Core Funds Index from Inception 7/31/97 to 6/30/15
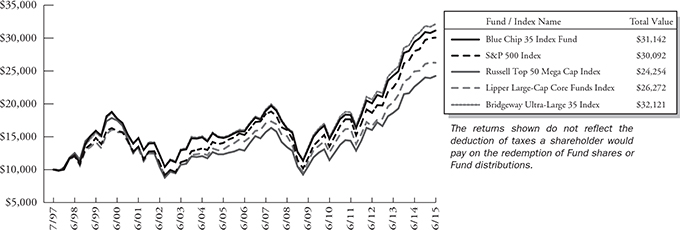
Quarterly and Fiscal Year Performance by Company Size:
As demonstrated in the table below, ultra-large stocks (decile 1), the substance of our Fund, performed better than other large-cap stocks for the quarter. This provided a considerable advantage over the S&P 500 Index, which includes smaller sized large-cap stocks.
Momentum was a strong factor for the fiscal year, which hurt our Fund’s performance relative to its market-cap weighted benchmark. By design, the Fund is “roughly equally weighted.” In order to achieve a roughly equal weighting, additional weight is given to the stocks with the greatest decline in price. By contrast, a market-cap weighted index gives more weight to stocks that have appreciated the most in price (i.e., experienced positive momentum). Thus, the market-cap weighted S&P 500 Index had an advantage in this fiscal year’s market environment.
While sector allocation was not a significant contributor to performance for the year, the Fund was overweighted in the lagging Energy sector and underweighted in the strongly performing Health Care sector.
The table below presents index performance numbers of stocks in the different deciles for various time periods.
| | | | | | | | | | | | | | | | | | | | |
| CRSP Decile1 | | Quarter | | | 1 Year | | | 5 Years | | | 10 Years | | | 89.5 Years | |
| |
| 1 (ultra-large) | | | 0.79% | | | | 7.21% | | | | 16.89% | | | | 7.66% | | | | 9.33% | |
| 2 | | | -1.61% | | | | 7.54% | | | | 18.68% | | | | 9.45% | | | | 10.60% | |
| 3 | | | -0.77% | | | | 8.75% | | | | 18.76% | | | | 9.49% | | | | 11.12% | |
| 4 | | | 0.09% | | | | 4.06% | | | | 18.90% | | | | 10.13% | | | | 11.00% | |
| 5 | | | -0.38% | | | | 4.62% | | | | 18.71% | | | | 11.46% | | | | 11.65% | |
| 6 | | | 1.33% | | | | 3.47% | | | | 18.67% | | | | 9.45% | | | | 11.50% | |
| 7 | | | 0.92% | | | | 5.86% | | | | 18.84% | | | | 10.25% | | | | 11.64% | |
| 8 | | | 1.79% | | | | 5.13% | | | | 17.89% | | | | 10.40% | | | | 11.68% | |
| 9 | | | 0.95% | | | | 2.31% | | | | 16.85% | | | | 8.97% | | | | 11.59% | |
| 10 (ultra-small) | | | 0.51% | | | | 1.45% | | | | 15.43% | | | | 9.19% | | | | 13.49% | |
| 1 | Performance figures are as of the period ended June 30, 2015. The CRSP Cap-Based Portfolio Indexes are unmanaged indexes of publicly traded U.S. stocks with dividends reinvested, grouped by market capitalization, as reported by the Center for Research in Security Prices. Past performance is no guarantee of future results. |
| | |
Blue Chip 35 Index Fund MANAGER’S COMMENTARY (Unaudited) (continued) | | |
Contribution to Returns for Blue Chip 35 Index Fund stocks for the fiscal year June 30, 2015:
| | | | | | | | | |
| Rank | | Company | | Industry | | % Contribution
to Return |
| 1 | | Apple Inc. | | Information Technology | | | | 1.3% | |
| 2 | | CVS Health Corporation | | Consumer Staples | | | | 1.2% | |
| 3 | | Gilead Sciences, Inc. | | Health Care | | | | 1.1% | |
| 4 | | Amazon.com, Inc. | | Consumer Discretionary | | | | 0.9% | |
| 5 | | Visa Inc. Class A | | Information Technology | | | | 0.8% | |
| 6 | | Walt Disney Company | | Consumer Discretionary | | | | 0.8% | |
| 7 | | JPMorgan Chase & Co. | | Financials | | | | 0.5% | |
| 8 | | Pfizer Inc. | | Health Care | | | | 0.4% | |
| 9 | | Cisco Systems, Inc. | | Information Technology | | | | 0.4% | |
| 10 | | Comcast Corporation Class A | | Consumer Discretionary | | | | 0.3% | |
| 11 | | 3M Company | | Industrials | | | | 0.3% | |
| 12 | | Bank of America Corporation | | Financials | | | | 0.3% | |
| 13 | | Wells Fargo & Company | | Financials | | | | 0.3% | |
| 14 | | Microsoft Corporation | | Information Technology | | | | 0.2% | |
| 15 | | Berkshire Hathaway Inc. Class B | | Financials | | | | 0.2% | |
| 16 | | PepsiCo, Inc. | | Consumer Staples | | | | 0.2% | |
| 17 | | AT&T Inc. | | Telecommunication Services | | | | 0.2% | |
| 18 | | General Electric Company | | Industrials | | | | 0.1% | |
| 19 | | Procter & Gamble Company | | Consumer Staples | | | | 0.1% | |
| 20 | | Intel Corporation | | Information Technology | | | | 0.1% | |
| 21 | | Oracle Corporation | | Information Technology | | | | 0.0% | |
| 22 | | Merck & Co., Inc. | | Health Care | | | | 0.0% | |
| 23 | | Verizon Communications Inc. | | Telecommunication Services | | | | 0.0% | |
| 24 | | United Technologies Corporation | | Industrials | | | | 0.0% | |
| 25 | | United Parcel Service, Inc. Class B | | Industrials | | | | 0.0% | |
| 26 | | Wal-Mart Stores, Inc. | | Consumer Staples | | | | -0.1% | |
| 27 | | McDonald’s Corporation | | Consumer Discretionary | | | | -0.1% | |
| 28 | | Johnson & Johnson | | Health Care | | | | -0.1% | |
| 29 | | Google Inc. Class A | | Information Technology | | | | -0.1% | |
| 30 | | Coca-Cola Company | | Consumer Staples | | | | -0.1% | |
| 31 | | Google Inc. Class C | | Information Technology | | | | -0.1% | |
| 32 | | International Business Machines Corporation | | Information Technology | | | | -0.2% | |
| 33 | | Exxon Mobil Corporation | | Energy | | | | -0.4% | |
| 34 | | QUALCOMM Incorporated | | Information Technology | | | | -0.5% | |
| 35 | | Chevron Corporation | | Energy | | | | -0.7% | |
| 36 | | ConocoPhillips | | Energy | | | | -0.8% | |
| 37 | | Schlumberger NV | | Energy | | | | -0.9% | |
| | |
| 71 | | Annual Report | June 30, 2015 |
| | |
Blue Chip 35 Index Fund MANAGER’S COMMENTARY (Unaudited) (continued) | | |
Industry Sector Representation as of June 30, 2015
| | | | | | |
| | | % of Net Assets | | % of S&P 500 Index | | Difference |
Consumer Discretionary | | 11.6% | | 12.8% | | -1.2% |
Consumer Staples | | 14.0% | | 9.4% | | 4.6% |
Energy | | 10.3% | | 7.9% | | 2.4% |
Financials | | 11.3% | | 16.6% | | -5.3% |
Health Care | | 11.3% | | 15.4% | | -4.1% |
Industrials | | 10.4% | | 10.1% | | 0.3% |
Information Technology | | 25.8% | | 19.6% | | 6.2% |
Materials | | 0.0% | | 3.1% | | -3.1% |
Telecommunication Services | | 5.4% | | 2.3% | | 3.1% |
Utilities | | 0.0% | | 2.8% | | -2.8% |
Cash & Other Assets | | 0.1% | | 0.0% | | 0.1% |
Total | | 100.0% | | 100.0% | | |
Disclaimer
The views expressed here are exclusively those of Fund management. These views, including those concerning market sectors or individual stocks, are not meant as investment advice and should not be considered predictive in nature. Any favorable (or unfavorable) description of a holding applies only as of the quarter end, June 30, 2015, unless otherwise stated. Security positions can and do change thereafter. Discussions of historical performance do not guarantee and are not indicative of future performance.
The Fund is subject to significant market risk (volatility) and is not an appropriate investment for short-term investors.
Conclusion
Thank you for your continued investment in Blue Chip 35 Index Fund. We encourage your feedback; your reactions and concerns are important to us.
Sincerely,
The Investment Management Team
| | |
Blue Chip 35 Index Fund SCHEDULE OF INVESTMENTS | | |
Showing percentage of net assets as of June 30, 2015
| | | | | | | | | | |
| Industry Company | | Shares | | | Value | | | |
COMMON STOCKS - 99.87% | | | |
Aerospace & Defense - 2.55% | | | |
United Technologies Corp. | | | 137,780 | | | | $15,283,935 | | | |
| |
Air Freight & Logistics - 2.56% | | | |
United Parcel Service, Inc., Class B | | | 158,863 | | | | 15,395,413 | | | |
| |
Beverages - 5.11% | | | |
Coca-Cola Co. (The) | | | 391,014 | | | | 15,339,479 | | | |
PepsiCo, Inc. | | | 164,505 | | | | 15,354,897 | | | |
| | | | | | | | | | |
| | | | | | | 30,694,376 | | | |
| |
Biotechnology - 3.55% | | | |
Gilead Sciences, Inc. | | | 182,300 | | | | 21,343,684 | | | |
| |
Commercial Banks - 2.60% | | | |
Wells Fargo & Co. | | | 277,659 | | | | 15,615,542 | | | |
| |
Communications Equipment - 2.60% | | | |
Cisco Systems, Inc. | | | 568,508 | | | | 15,611,230 | | | |
| |
Computers & Peripherals - 3.93% | | | |
Apple, Inc. | | | 188,350 | | | | 23,623,799 | | | |
| |
Diversified Financial Services - 8.67% | | | |
Bank of America Corp. | | | 1,064,708 | | | | 18,121,330 | | | |
Berkshire Hathaway, Inc., Class B* | | | 112,250 | | | | 15,278,348 | | | |
JPMorgan Chase & Co. | | | 275,995 | | | | 18,701,421 | | | |
| | | | | | | | | | |
| | | | | | | 52,101,099 | | | |
| |
Diversified Telecommunication Services - 5.35% | | | |
AT&T, Inc. | | | 471,725 | | | | 16,755,672 | | | |
Verizon Communications, Inc. | | | 330,389 | | | | 15,399,431 | | | |
| | | | | | | | | | |
| | | | | | | 32,155,103 | | | |
| |
Energy Equipment & Services - 2.60% | | | |
Schlumberger, Ltd. | | | 181,500 | | | | 15,643,485 | | | |
| |
Food & Staples Retailing - 6.29% | | | |
CVS Health Corp. | | | 212,700 | | | | 22,307,976 | | | |
Wal-Mart Stores, Inc. | | | 218,019 | | | | 15,464,088 | | | |
| | | | | | | | | | |
| | | | | | | 37,772,064 | | | |
| |
Hotels, Restaurants & Leisure - 2.58% | | | |
McDonald’s Corp. | | | 163,200 | | | | 15,515,424 | | | |
| |
Household Products - 2.58% | | | |
Procter & Gamble Co. (The) | | | 197,926 | | | | 15,485,730 | | | |
| |
Industrial Conglomerates - 5.24% | | | |
3M Co. | | | 99,350 | | | | 15,329,705 | | | |
| | | | | | | | |
| Industry Company | | Shares | | | Value | |
|
| |
Industrial Conglomerates (continued) | |
General Electric Co. | | | 608,143 | | | | $ 16,158,360 | |
| | | | | | | | |
| | | | | | | 31,488,065 | |
|
Internet & Catalog Retail - 3.23% | |
Amazon.com, Inc.* | | | 44,700 | | | | 19,403,823 | |
|
Internet Software & Services - 2.51% | |
Google, Inc., Class A* | | | 13,970 | | | | 7,544,359 | |
Google, Inc., Class C* | | | 14,514 | | | | 7,554,682 | |
| | | | | | | | |
| | | | | | | 15,099,041 | |
|
IT Services - 6.07% | |
International Business Machines Corp. | | | 94,167 | | | | 15,317,204 | |
Visa, Inc., Class A | | | 314,500 | | | | 21,118,675 | |
| | | | | | | | |
| | | | | | | 36,435,879 | |
|
Media - 5.74% | |
Comcast Corp., Class A | | | 255,200 | | | | 15,347,728 | |
Walt Disney Co. (The) | | | 167,600 | | | | 19,129,864 | |
| | | | | | | | |
| | | | | | | 34,477,592 | |
|
Oil, Gas & Consumable Fuels - 7.73% | |
Chevron Corp. | | | 158,795 | | | | 15,318,954 | |
ConocoPhillips | | | 255,435 | | | | 15,686,263 | |
Exxon Mobil Corp. | | | 185,787 | | | | 15,457,478 | |
| | | | | | | | |
| | | | | | | 46,462,695 | |
|
Pharmaceuticals - 7.70% | |
Johnson & Johnson | | | 159,352 | | | | 15,530,446 | |
Merck & Co., Inc. | | | 270,635 | | | | 15,407,251 | |
Pfizer, Inc. | | | 457,244 | | | | 15,331,391 | |
| | | | | | | | |
| | | | | | | 46,269,088 | |
|
Semiconductors & Semiconductor Equipment - 5.17% | |
Intel Corp. | | | 509,843 | | | | 15,506,875 | |
QUALCOMM, Inc. | | | 248,400 | | | | 15,557,292 | |
| | | | | | | | |
| | | | | | | 31,064,167 | |
|
Software - 5.51% | |
Microsoft Corp. | | | 401,245 | | | | 17,714,967 | |
Oracle Corp. | | | 382,113 | | | | 15,399,154 | |
| | | | | | | | |
| | | | | | | 33,114,121 | |
| | | | | | | | |
TOTAL COMMON STOCKS - 99.87% | | | | 600,055,355 | |
| | | | | | | | |
(Cost $405,201,281) | | | | | | | | |
| | |
| 73 | | Annual Report | June 30, 2015 |
| | |
Blue Chip 35 Index Fund SCHEDULE OF INVESTMENTS (continued) | | |
Showing percentage of net assets as of June 30, 2015
| | | | | | | | | | |
| | | Rate^ | | Shares | | Value | | | |
MONEY MARKET FUND - 0.00% | | | |
Dreyfus Cash Management Fund | | 0.04% | | 618 | | | $618 | | | |
| | | | | | | | | | |
TOTAL MONEY MARKET FUND - 0.00% | | | 618 | | | |
| | | | | | | | | | |
(Cost $618) | | | | | | | | | | |
| | |
TOTAL INVESTMENTS - 99.87% | | | $600,055,973 | | | |
(Cost $405,201,899) | | | | | | | | | | |
Other Assets in Excess of
Liabilities - 0.13% | | | 767,132 | | | |
| | | | | | | | | | |
NET ASSETS - 100.00% | | | $600,823,105 | | | |
| | | | | | | | | | |
* Non-income producing security. ^ Rate disclosed as of June 30, 2015. | | | | | | |
| | | | | | | | | | |
| | | | | | | | | | |
| | | | | | | | | | |
| | | | | | | | | | |
| | | | | | | | | | |
| | | | | | | | | | |
Summary of inputs used to value the Fund’s investments as of 06/30/2015 (See Note 2 in Notes to Financial Statements):
| | | | | | | | | | | | | | | | |
| | | Valuation Inputs | |
| |
| | | Investment in Securities (Value) | |
| |
| | | Level 1
Quoted
Prices | | | Level 2
Significant
Observable
Inputs | | | Level 3
Significant
Unobservable
Inputs | | | Total | |
| |
| | | | |
Common Stocks | | $ | 600,055,355 | | | $ | — | | | $ | — | | | $ | 600,055,355 | |
Money Market Fund | | | — | | | | 618 | | | | — | | | | 618 | |
| | | | | | | | | | | | | | | | |
TOTAL | | $ | 600,055,355 | | | $ | 618 | | | $ | — | | | $ | 600,055,973 | |
| | | | | | | | | | | | | | | | |
See Notes to Financial Statements.
| | |
Managed Volatility Fund MANAGER’S COMMENTARY (Unaudited) | | |
June 30, 2015
Dear Fellow Managed Volatility Fund Shareholder,
For the quarter ended June 30, 2015, our Fund declined 1.27%, lagging our primary market benchmark, the S&P 500 Index (+0.28%), our peer benchmark, the Lipper Balanced Funds Index (-0.41%), and the fixed income-only Bloomberg/EFFAS U.S. Government 1-3 Year Total Return Bond Index (+0.13%). Performance for the quarter was poor. This was only the third quarter in our 14-year history that the Fund’s performance was negative while the S&P 500 Index was positive. Fortunately, the decline was small, and as always, we caution against focusing on short-term performance – good or bad.
For the fiscal year, our Fund returned 0.92%, trailing the S&P 500 Index (+7.42%) and the Lipper Balanced Funds Index (+3.11%), but outperforming the fixed income-only Bloomberg/ EFFAS U.S. Government 1-3 Year Total Return Bond Index (+0.88%). The fiscal year return was also poor, relative to the S&P 500 Index. This was only the second time in our 14-year history that we captured so little (12.46%) of the S&P 500’s return in an up market; the other was the 2010 fiscal year, when we captured only 11.59% of the upside.
The table below presents our June quarter, one-year, five-year, 10-year, and inception-to-date financial results. See the next page for a graph of performance since inception.
Standardized Returns as of June 30, 2015
| | | | | | | | | | | | | | | | | | | | |
| | | Quarter | | | 1 Year | | | 5 Years | | | 10 Years | | | Since Inception
(6/30/01) | |
| |
| | | | | |
Managed Volatility Fund | | | -1.27% | | | | 0.92% | | | | 7.03% | | | | 3.55% | | | | 4.07% | |
S&P 500 Index | | | 0.28% | | | | 7.42% | | | | 17.34% | | | | 7.89% | | | | 5.88% | |
Bloomberg/EFFAS U.S. Government 1-3 Year Total Return Bond Index | | | 0.13% | | | | 0.88% | | | | 0.88% | | | | 2.56% | | | | 2.81% | |
Lipper Balanced Funds Index | | | -0.41% | | | | 3.11% | | | | 10.39% | | | | 6.10% | | | | 5.40% | |
Performance figures quoted in the table above represent past performance and are no guarantee of future results. Total return figures in the table above include the reinvestment of dividends and capital gains. The table above does not reflect the deduction of taxes that a shareholder would pay on Fund distributions or on the redemption of Fund shares.
The S&P 500 Index is a broad-based, unmanaged measurement of changes in stock market conditions, based on the average of 500 widely held common stocks with dividends reinvested. The Bloomberg/EFFAS U.S. Government 1-3 year Total Return Bond Index is a transparent benchmark for the total return of the 1-3 year U.S. Government bond market. The Lipper Balanced Funds Index is an index of balanced funds compiled by Lipper, Inc. It is not possible to invest directly in an index. Periods longer than one year are annualized.
According to data from Lipper, Inc. as of June 30, 2015, the Managed Volatility Fund ranked 174th of 289 Alternative Long/ Short equity funds for the 12-months ending June 30, 2015, 42nd of 89 over the last five years, 18th of 33 over the last ten years, and 5th of 15 funds since inception in June 2001. Lipper, Inc. is an independent mutual fund rating service that ranks funds in various fund categories by making comparative calculations using total returns.
According to data from Morningstar as of June 30, 2015, the Managed Volatility Fund ranked 206th of 372 Long-Short funds for the 12-months ending June 30, 2015, 47th out of 96 funds over the last five years, and 22nd out of 33 funds over the last 10 years. Morningstar ranks funds in various fund categories by making comparative calculations using total returns.
| | |
| 75 | | Annual Report | June 30, 2015 |
| | |
Managed Volatility Fund MANAGER’S COMMENTARY (Unaudited) (continued) | | |
Managed Volatility Fund vs. S&P 500 Index, Bloomberg/EFFAS Bond Index & Lipper Balanced Funds Index
from Inception 6/30/01 to 6/30/15
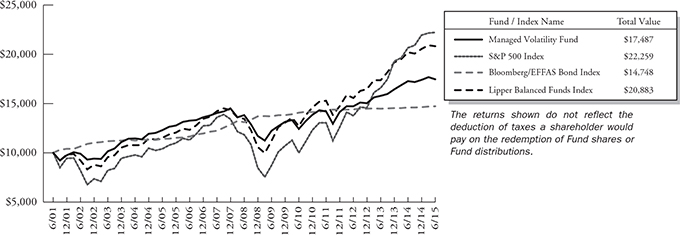
Detailed Explanation of Quarterly Performance
For the quarter, the Managed Volatility Fund had a negative return of 1.27%, underperforming the S&P 500 Index’s positive return of 0.28%. Each of the Fund’s components generated a negative return this quarter. The primary drivers of performance were the equities and futures components, contributing approximately -1.0% and -0.2%, respectively. The options and fixed-income components generated approximately -0.1% combined.
Detailed Explanation of Fiscal Year Performance
For the fiscal year, the Managed Volatility Fund had a positive return of 0.92%, underperforming the S&P 500 Index’s return of 7.42%. The primary drivers of performance were the equities, options and futures components, contributing approximately 2.15%, 1.6% and -2.89%, respectively. Fixed income generated approximately 0.05%. While short-term performance is out-side the desired 40% performance band (relative to the S&P 500), the Fund continues to perform as designed, particularly over longer time horizons. For 10 years and since inception, the Fund has captured 45% and 69%, respectively, of the S&P 500 Index’s return, with a standard deviation of approximately 55% less than that of the Index.
Top Ten Holdings as of June 30, 2015
| | | | | | | | | |
| Rank | | Description | | Industry | | % of Net
Assets |
| 1 | | Marathon Petroleum Corp. | | Oil, Gas & Consumable Fuels | | | | 1.2% | |
| 2 | | Micron Technology, Inc. | | Semiconductors & Semiconductor Equipment | | | | 1.2% | |
| 3 | | Apple, Inc. | | Computers & Peripherals | | | | 1.0% | |
| 4 | | United Continental Holdings, Inc. | | Airlines | | | | 0.9% | |
| 5 | | Avis Budget Group, Inc. | | Road & Rail | | | | 0.7% | |
| 6 | | Motorola Solutions, Inc. | | Communications Equipment | | | | 0.7% | |
| 7 | | Exxon Mobil Corp. | | Oil, Gas & Consumable Fuels | | | | 0.7% | |
| 8 | | Phillips 66 | | Oil, Gas & Consumable Fuels | | | | 0.7% | |
| 9 | | Northrop Grumman Corp. | | Aerospace & Defense | | | | 0.7% | |
| 10 | | AutoZone, Inc. | | Specialty Retail | | | | 0.7% | |
| | Total | | | | | | 8.5% | |
| | |
Managed Volatility Fund MANAGER’S COMMENTARY (Unaudited) (continued) | | |
Industry Sector Representation as of June 30, 2015
| | | | |
| Asset Type | | % of Net
Assets | |
Common Stock | | | 52.9% | |
Consumer Discretionary | | | 10.8% | |
Consumer Staples | | | 8.0% | |
Energy | | | 12.0% | |
Financials | | | 14.3% | |
Health Care | | | 12.8% | |
Industrials | | | 13.7% | |
Information Technology | | | 19.3% | |
Materials | | | 4.6% | |
Telecommunication Services | | | 2.2% | |
Utilities | | | 2.3% | |
U.S. Government Obligations | | | 50.8% | |
Call Options Written | | | -0.8% | |
Put Options Written | | | -0.3% | |
Money Market Funds | | | 4.9% | |
Liabilities in Excess of Other Assets | | | -7.5% | |
Total | | | 100% | |
Disclaimer
The views expressed here are exclusively those of Fund management. These views, including those related to market sectors or individual stocks, are not meant as investment advice and should not be considered predictive in nature. Any favorable (or unfavorable) description of a holding applies only as of the quarter end, June 30, 2015, unless otherwise stated. Security positions can and do change thereafter. Discussions of historical performance do not guarantee and may not be indicative of future performance.
Market volatility can significantly affect short-term performance. The Fund is not an appropriate investment for short-term investors. Investments in the small companies within this multi-cap fund generally carry greater risk than is customarily associated with larger companies. This additional risk is attributable to a number of factors, including the relatively limited financial resources that are typically available to small companies and the fact that small companies often have comparatively limited product lines. In addition, the stock of small companies tends to be more volatile than the stock of large companies, particularly in the short term and particularly in the early stages of an economic or market downturn. The Fund’s use of options, futures, and leverage can magnify the risk of loss in an unfavorable market, and the Fund’s use of short-sale positions can, in theory, expose shareholders to unlimited loss. Shareholders of the Fund, therefore, are taking on more risk than they would if they invested in the stock market as a whole. The Fund uses an option writing strategy in which the Fund may sell covered calls or secured put options. Options are subject to special risks and may not fully protect the Fund against declines in the value of its stocks. In addition, an option writing strategy limits the upside profit potential normally associated with stocks. Finally, the Fund’s fixed-income holdings are subject to three types of risk. Interest rate risk is the chance that bond prices overall will decline as interest rates rise. Credit risk is the chance that a bond issuer will fail to pay interest and principal. Prepayment risk is the chance that a mortgage-backed bond issuer will repay a higher yielding bond, resulting in a lower paying yield.
Conclusion
Thank you for your continued investment in Managed Volatility Fund. We encourage your feedback; your reactions and concerns are important to us.
Sincerely,
The Investment Management Team
| | |
| 77 | | Annual Report | June 30, 2015 |
| | |
Managed Volatility Fund SCHEDULE OF INVESTMENTS | | |
Showing percentage of net assets as of June 30, 2015
| | | | | | | | | | |
| Industry Company | | Shares | | | Value | | | |
COMMON STOCKS - 52.94% | | | | | | | |
Aerospace & Defense - 1.77% | | | | | | | | | | |
Honeywell International, Inc. | | | 1,700 | | | | $ 173,349 | | | |
Lockheed Martin Corp. | | | 870 | | | | 161,733 | | | |
Northrop Grumman Corp.# | | | 2,600 | | | | 412,438 | | | |
Raytheon Co.# | | | 1,800 | | | | 172,224 | | | |
United Technologies Corp.# | | | 1,140 | | | | 126,460 | | | |
| | | | | | | | | | |
| | | | | | | 1,046,204 | | | |
| | |
Air Freight & Logistics - 0.35% | | | | | | | |
FedEx Corp. | | | 1,200 | | | | 204,480 | | | |
| | |
Airlines - 1.13% | | | | | | | |
Southwest Airlines Co.# | | | 4,200 | | | | 138,978 | | | |
United Continental Holdings, Inc.*# | | | 10,000 | | | | 530,100 | | | |
| | | | | | | | | | |
| | | | | | | 669,078 | | | |
| | |
Auto Components - 0.45% | | | | | | | |
Delphi Automotive PLC# | | | 900 | | | | 76,581 | | | |
Goodyear Tire & Rubber Co. (The)# | | | 4,700 | | | | 141,705 | | | |
Johnson Controls, Inc. | | | 900 | | | | 44,577 | | | |
| | | | | | | | | | |
| | | | | | | 262,863 | | | |
| | |
Automobiles - 0.39% | | | | | | | |
Ford Motor Co.# | | | 9,900 | | | | 148,599 | | | |
General Motors Co.# | | | 2,500 | | | | 83,325 | | | |
| | | | | | | | | | |
| | | | | | | 231,924 | | | |
| | |
Beverages - 1.26% | | | | | | | |
Brown-Forman Corp., Class B | | | 2,425 | | | | 242,937 | | | |
Coca-Cola Co. (The) | | | 2,500 | | | | 98,075 | | | |
Constellation Brands, Inc.,
Class A# | | | 2,100 | | | | 243,642 | | | |
PepsiCo, Inc.# | | | 1,700 | | | | 158,678 | | | |
| | | | | | | | | | |
| | | | | | | 743,332 | | | |
| | |
Biotechnology - 1.92% | | | | | | | |
Alexion Pharmaceuticals, Inc,* | | | 500 | | | | 90,385 | | | |
Amgen, Inc.# | | | 1,600 | | | | 245,632 | | | |
Biogen, Inc.*# | | | 900 | | | | 363,546 | | | |
Celgene Corp.* | | | 1,100 | | | | 127,309 | | | |
Gilead Sciences, Inc.# | | | 2,600 | | | | 304,408 | | | |
| | | | | | | | | | |
| | | | | | | 1,131,280 | | | |
| | |
Capital Markets - 1.30% | | | | | | | |
Ameriprise Financial, Inc. | | | 680 | | | | 84,952 | | | |
BlackRock, Inc. | | | 200 | | | | 69,196 | | | |
| | | | | | | | | | |
| Industry Company | | Shares | | | Value | | | |
| | |
Capital Markets (continued) | | | | | | | |
Charles Schwab Corp. (The) | | | 7,100 | | | | $ 231,815 | | | |
Goldman Sachs Group, Inc. (The) | | | 700 | | | | 146,153 | | | |
Morgan Stanley | | | 3,300 | | | | 128,007 | | | |
State Street Corp. | | | 1,400 | | | | 107,800 | | | |
| | | | | | | | | | |
| | | | | | | 767,923 | | | |
| | |
Chemicals - 1.36% | | | | | | | |
Dow Chemical Co. (The)# | | | 2,700 | | | | 138,159 | | | |
LyondellBasell Industries NV, Class A# | | | 1,200 | | | | 124,224 | | | |
Monsanto Co. | | | 900 | | | | 95,931 | | | |
PPG Industries, Inc. | | | 800 | | | | 91,776 | | | |
Praxair, Inc.# | | | 1,200 | | | | 143,460 | | | |
Sherwin-Williams Co. (The) | | | 400 | | | | 110,008 | | | |
Sigma-Aldrich Corp. | | | 700 | | | | 97,545 | | | |
| | | | | | | | | | |
| | | | | | | 801,103 | | | |
| | |
Commercial Banks - 1.64% | | | | | | | |
BB&T Corp. | | | 1,500 | | | | 60,465 | | | |
Comerica, Inc. | | | 1,100 | | | | 56,452 | | | |
Huntington Bancshares, Inc. | | | 7,700 | | | | 87,087 | | | |
KeyCorp | | | 4,800 | | | | 72,096 | | | |
PNC Financial Services Group, Inc. (The)# | | | 2,100 | | | | 200,865 | | | |
U.S. Bancorp | | | 4,100 | | | | 177,940 | | | |
Wells Fargo & Co.# | | | 5,571 | | | | 313,313 | | | |
| | | | | | | | | | |
| | | | | | | 968,218 | | | |
| | |
Commercial Services & Supplies - 0.47% | | | | | | | |
Tyco International PLC# | | | 4,400 | | | | 169,312 | | | |
Waste Management, Inc. | | | 2,300 | | | | 106,605 | | | |
| | | | | | | | | | |
| | | | | | | 275,917 | | | |
| | |
Communications Equipment - 1.57% | | | | | | | |
Cisco Systems, Inc. | | | 12,500 | | | | 343,250 | | | |
Juniper Networks, Inc.# | | | 5,900 | | | | 153,223 | | | |
Motorola Solutions, Inc.# | | | 7,500 | | | | 430,050 | | | |
| | | | | | | | | | |
| | | | | | | 926,523 | | | |
| | |
Computers & Peripherals - 1.88% | | | | | | | |
Apple, Inc.# | | | 4,700 | | | | 589,498 | | | |
EMC Corp.# | | | 6,600 | | | | 174,174 | | | |
Hewlett-Packard Co.# | | | 5,900 | | | | 177,059 | | | |
SanDisk Corp.# | | | 1,300 | | | | 75,686 | | | |
Western Digital Corp.# | | | 1,200 | | | | 94,104 | | | |
| | | | | | | | | | |
| | | | | | | 1,110,521 | | | |
| | |
Managed Volatility Fund SCHEDULE OF INVESTMENTS (continued) | | |
Showing percentage of net assets as of June 30, 2015
| | | | | | | | | | |
| Industry Company | | Shares | | | Value | | | |
Common Stocks (continued) | | | | | | | | | | |
Consumer Finance - 0.47% | | | |
American Express Co.# | | | 1,300 | | | | $ 101,036 | | | |
Capital One Financial Corp.# | | | 2,000 | | | | 175,940 | | | |
| | | | | | | | | | |
| | | | | | | 276,976 | | | |
| |
Containers & Packaging - 0.05% | | | |
Ball Corp. | | | 400 | | | | 28,060 | | | |
| |
Diversified Financial Services - 1.75% | | | |
Bank of America Corp. | | | 7,800 | | | | 132,756 | | | |
Berkshire Hathaway, Inc., Class B* | | | 1,600 | | | | 217,776 | | | |
Citigroup, Inc.# | | | 5,110 | | | | 282,276 | | | |
JPMorgan Chase & Co.# | | | 4,400 | | | | 298,144 | | | |
McGraw Hill Financial, Inc.# | | | 1,000 | | | | 100,450 | | | |
| | | | | | | | | | |
| | | | | | | 1,031,402 | | | |
| |
Diversified Telecommunication Services - 1.23% | | | |
AT&T, Inc. | | | 6,700 | | | | 237,984 | | | |
CenturyLink, Inc. | | | 6,000 | | | | 176,280 | | | |
Frontier Communications Corp.#+ | | | 11,272 | | | | 55,796 | | | |
Verizon Communications, Inc.# | | | 5,500 | | | | 256,355 | | | |
| | | | | | | | | | |
| | | | | | | 726,415 | | | |
| |
Electric Utilities - 0.56% | | | |
American Electric Power Co., Inc. | | | 1,900 | | | | 100,643 | | | |
Duke Energy Corp. Exelon Corp.# | |
| 1,383
4,300 |
| |
| 97,667
135,106 |
| | |
| | | | | | | | | | |
| | | | | | | 333,416 | | | |
| |
Electrical Equipment - 0.26% | | | |
Eaton Corp. PLC | | | 1,000 | | | | 67,490 | | | |
Emerson Electric Co. | | | 1,500 | | | | 83,145 | | | |
| | | | | | | | | | |
| | | | | | | 150,635 | | | |
| |
Energy Equipment & Services - 0.53% | | | |
Baker Hughes, Inc.# | | | 2,100 | | | | 129,570 | | | |
Halliburton Co.# | | | 1,700 | | | | 73,219 | | | |
Helmerich & Payne, Inc.+ | | | 1,000 | | | | 70,420 | | | |
National Oilwell Varco, Inc.# | | | 800 | | | | 38,624 | | | |
| | | | | | | | | | |
| | | | | | | 311,833 | | | |
| |
Food & Staples Retailing - 1.10% | | | |
CVS Health Corp.# | | | 1,800 | | | | 188,784 | | | |
Kroger Co. (The)# | | | 4,000 | | | | 290,040 | | | |
Wal-Mart Stores, Inc. | | | 2,400 | | | | 170,232 | | | |
| | | | | | | | | | |
| | | | | | | 649,056 | | | |
| | | | | | | | | | |
| Industry Company | | Shares | | | Value | | | |
| |
Food Products - 1.06% | | | |
Archer-Daniels-Midland Co.# | | | 2,900 | | | | $139,838 | | | |
General Mills, Inc.# | | | 3,200 | | | | 178,304 | | | |
JM Smucker Co. (The)# | | | 1,400 | | | | 151,774 | | | |
Keurig Green Mountain, Inc.# | | | 1,300 | | | | 99,619 | | | |
Mead Johnson Nutrition Co. | | | 616 | | | | 55,576 | | | |
| | | | | | | | | | |
| | | | | | | 625,111 | | | |
| |
Health Care Equipment & Supplies - 1.05% | | | |
Abbott Laboratories# | | | 1,800 | | | | 88,344 | | | |
Baxter International, Inc. | | | 1,300 | | | | 90,909 | | | |
Becton Dickinson & Co. | | | 920 | | | | 130,318 | | | |
C.R. Bard, Inc. | | | 1,100 | | | | 187,770 | | | |
Stryker Corp.# | | | 1,260 | | | | 120,418 | | | |
| | | | | | | | | | |
| | | | | | | 617,759 | | | |
| |
Health Care Providers & Services - 1.15% | | | |
AmerisourceBergen Corp. | | | 500 | | | | 53,170 | | | |
Express Scripts Holding Co.*# | | | 1,934 | | | | 172,010 | | | |
Laboratory Corp. of America Holdings* | | | 900 | | | | 109,098 | | | |
UnitedHealth Group, Inc. | | | 2,800 | | | | 341,600 | | | |
| | | | | | | | | | |
| | | | | | | 675,878 | | | |
| |
Hotels, Restaurants & Leisure - 0.73% | | | |
McDonald’s Corp. | | | 900 | | | | 85,563 | | | |
Starbucks Corp.# | | | 2,700 | | | | 144,760 | | | |
Wynn Resorts, Ltd. | | | 500 | | | | 49,335 | | | |
Yum! Brands, Inc.# | | | 1,700 | | | | 153,136 | | | |
| | | | | | | | | | |
| | | | | | | 432,794 | | | |
| |
Household Products - 0.81% | | | |
Colgate-Palmolive Co. | | | 2,500 | | | | 163,525 | | | |
Kimberly-Clark Corp. | | | 1,400 | | | | 148,358 | | | |
Procter & Gamble Co. (The) | | | 2,100 | | | | 164,304 | | | |
| | | | | | | | | | |
| | | | | | | 476,187 | | | |
| |
Independent Power Producers & Energy
Traders - 0.15% | | | |
AES Corp.# | | | 6,800 | | | | 90,168 | | | |
| |
Industrial Conglomerates - 0.92% | | | |
3M Co. | | | 1,400 | | | | 216,020 | | | |
Danaher Corp. | | | 2,400 | | | | 205,416 | | | |
General Electric Co. | | | 4,600 | | | | 122,222 | | | |
| | | | | | | | | | |
| | | | | | | 543,658 | | | |
| |
Insurance - 1.16% | | | |
Aon PLC# | | | 1,700 | | | | 169,456 | | | |
Chubb Corp. (The) | | | 1,100 | | | | 104,654 | | | |
| | |
| 79 | | Annual Report | June 30, 2015 |
| | |
Managed Volatility Fund SCHEDULE OF INVESTMENTS (continued) | | |
Showing percentage of net assets as of June 30, 2015
| | | | | | | | | | |
| Industry Company | | Shares | | | Value | | | |
Common Stocks (continued) | | | |
Insurance (continued) | | | | | | | |
Progressive Corp. (The) | | | 820 | | | | $ 22,821 | | | |
Travelers Cos., Inc. (The)# | | | 4,000 | | | | 386,640 | | | |
| | | | | | | | | | |
| | | | | | | 683,571 | | | |
| |
Internet & Catalog Retail - 0.49% | | | |
Amazon.com, Inc.*# | | | 400 | | | | 173,636 | | | |
Priceline Group, Inc. (The)* | | | 100 | | | | 115,137 | | | |
| | | | | | | | | | |
| | | | | | | 288,773 | | | |
| |
Internet Software & Services - 1.08% | | | |
eBay, Inc.*# | | | 1,300 | | | | 78,312 | | | |
Facebook, Inc., Class A* | | | 3,300 | | | | 283,024 | | | |
Google, Inc.,
Class A* | | | 260 | | | | 140,410 | | | |
Google, Inc.,
Class C* | | | 260 | | | | 135,333 | | | |
| | | | | | | | | | |
| | | | | | | 637,079 | | | |
| |
IT Services - 1.76% | | | |
Automatic Data Processing, Inc. | | | 1,300 | | | | 104,299 | | | |
Cognizant Technology | | | | | | | | | | |
Solutions Corp., Class A*# | | | 4,100 | | | | 250,469 | | | |
International Business Machines Corp. | | | 1,200 | | | | 195,192 | | | |
MasterCard, Inc., Class A | | | 1,000 | | | | 93,480 | | | |
Teradata Corp.*+ | | | 400 | | | | 14,800 | | | |
Visa, Inc., Class A | | | 5,200 | | | | 349,180 | | | |
Western Union Co. (The)#+ | | | 1,500 | | | | 30,495 | | | |
| | | | | | | | | | |
| | | | | | | 1,037,915 | | | |
| |
Leisure Equipment & Products - 0.19% | | | |
Hasbro, Inc.#+ | | | 1,500 | | | | 112,185 | | | |
| |
Life Sciences Tools & Services - 0.15% | | | |
Thermo Fisher Scientific, Inc. | | | 700 | | | | 90,832 | | | |
| |
Machinery - 0.44% | | | |
Deere & Co.+ | | | 2,700 | | | | 262,035 | | | |
| |
Media - 1.61% | | | |
Comcast Corp., Class A# | | | 3,850 | | | | 231,539 | | | |
News Corp.,
Class A*# | | | 2,300 | | | | 33,557 | | | |
Omnicom Group, Inc. | | | 1,000 | | | | 69,490 | | | |
Scripps Networks Interactive, Inc., Class A | | | 1,200 | | | | 78,444 | | | |
Time Warner, Inc.# | | | 1,333 | | | | 116,518 | | | |
Twenty-First Century Fox, Inc., Class A# | | | 3,300 | | | | 107,398 | | | |
Viacom, Inc., Class B | | | 1,000 | | | | 64,640 | | | |
Walt Disney Co. (The)# | | | 2,200 | | | | 251,108 | | | |
| | | | | | | | | | |
| | | | | | | 952,694 | | | |
| | | | | | | | | | |
| Industry Company | | Shares | | | Value | | | |
| |
Metals & Mining - 0.88% | | | |
Alcoa, Inc.# | | | 25,000 | | | | $ 278,750 | | | |
Freeport-McMoRan, Inc.# | | | 13,000 | | | | 242,060 | | | |
| | | | | | | | | | |
| | | | | | | 520,810 | | | |
| |
Multiline Retail - 0.61% | | | |
Big Lots, Inc. | | | 500 | | | | 22,495 | | | |
Dollar General Corp.# | | | 2,100 | | | | 163,254 | | | |
Target Corp.# | | | 2,100 | | | | 171,423 | | | |
| | | | | | | | | | |
| | | | | | | 357,172 | | | |
| |
Multi-Utilities - 0.50% | | | |
Dominion Resources, Inc. | | | 1,920 | | | | 128,390 | | | |
Public Service Enterprise Group, Inc. | | | 1,800 | | | | 70,704 | | | |
Sempra Energy | | | 1,000 | | | | 98,940 | | | |
| | | | | | | | | | |
| | | | | | | 298,034 | | | |
| |
Oil, Gas & Consumable Fuels - 5.81% | | | |
Anadarko Petroleum Corp.# | | | 1,000 | | | | 78,060 | | | |
Apache Corp. | | | 500 | | | | 28,815 | | | |
California Resources Corp. | | | 480 | | | | 2,899 | | | |
Chesapeake Energy Corp.#+ | | | 2,100 | | | | 23,457 | | | |
Chevron Corp. | | | 2,078 | | | | 200,465 | | | |
ConocoPhillips# | | | 1,787 | | | | 109,740 | | | |
EOG Resources, Inc. | | | 1,000 | | | | 87,550 | | | |
Exxon Mobil Corp.# | | | 5,100 | | | | 424,320 | | | |
Hess Corp. | | | 5,000 | | | | 334,400 | | | |
Kinder Morgan, Inc. | | | 2,000 | | | | 76,780 | | | |
Marathon Petroleum Corp.# | | | 14,000 | | | | 732,340 | | | |
Murphy Oil Corp.# | | | 4,300 | | | | 178,751 | | | |
Occidental Petroleum Corp. | | | 1,200 | | | | 93,324 | | | |
Phillips 66# | | | 5,193 | | | | 418,348 | | | |
Southwestern Energy Co.*# | | | 13,000 | | | | 295,490 | | | |
Valero Energy Corp.# | | | 4,100 | | | | 256,660 | | | |
Williams Cos., Inc.
(The)# | | | 1,500 | | | | 86,085 | | | |
| | | | | | | | | | |
| | | | | | | 3,427,484 | | | |
| |
Paper & Forest Products - 0.17% | | | |
International Paper Co.# | | | 2,100 | | | | 99,939 | | | |
| |
Pharmaceuticals - 2.50% | | | |
AbbVie, Inc.# | | | 4,000 | | | | 268,760 | | | |
Allergan PLC* | | | 1,041 | | | | 315,902 | | | |
Bristol-Myers Squibb Co. | | | 2,279 | | | | 151,645 | | | |
Johnson & Johnson# | | | 3,300 | | | | 321,618 | | | |
Merck & Co., Inc. | | | 3,400 | | | | 193,562 | | | |
Pfizer, Inc. | | | 6,600 | | | | 221,298 | | | |
| | | | | | | | | | |
| | | | | | | 1,472,785 | | | |
| | |
Managed Volatility Fund SCHEDULE OF INVESTMENTS (continued) | | |
Showing percentage of net assets as of June 30, 2015
| | | | | | | | | | | | |
| | | | | | | | | | | | |
| | | | | | | | | | | | |
| Industry Company | | Shares | | | Value | | | |
| |
Common Stocks (continued) | | | |
Professional Services - 0.17% | | | |
Nielsen NV# | | | 2,200 | | | | $ 98,494 | | | |
| |
Real Estate Investment Trusts (REITs) - 1.05% | | | |
American Tower Corp. | | | 1,200 | | | | 111,948 | | | |
Crown Castle International Corp.# | | | 1,200 | | | | 96,360 | | | |
Public Storage | | | 1,100 | | | | 202,807 | | | |
Simon Property Group, Inc. | | | 1,200 | | | | 207,624 | | | |
| | | | | | | |
| | | | | | | 618,739 | | | |
| |
Road & Rail - 0.94% | | | |
Avis Budget Group, Inc.*# | | | 10,000 | | | | 440,800 | | | |
Union Pacific Corp. | | | 1,200 | | | | 114,444 | | | |
| | | | | | | |
| | | | | | | 555,244 | | | |
| |
Semiconductors & Semiconductor Equipment - 2.08% | | | |
Applied Materials, Inc.# | | | 8,200 | | | | 157,604 | | | |
Broadcom Corp., Class A# | | | 900 | | | | 46,341 | | | |
Intel Corp. | | | 2,300 | | | | 69,954 | | | |
Micron Technology, Inc.*# | | | 38,000 | | | | 715,920 | | | |
QUALCOMM, Inc.# | | | 2,800 | | | | 175,364 | | | |
Texas Instruments, Inc. | | | 1,170 | | | | 60,267 | | | |
| | | | | | | |
| | | | | | | 1,225,450 | | | |
| |
Software - 1.83% | | | |
Adobe Systems, Inc.*# | | | 1,100 | | | | 89,111 | | | |
Citrix Systems, Inc.*# | | | 1,000 | | | | 70,160 | | | |
Electronic Arts, Inc.*# | | | 2,000 | | | | 133,000 | | | |
Intuit, Inc.# | | | 1,300 | | | | 131,001 | | | |
Microsoft Corp.# | | | 8,300 | | | | 366,445 | | | |
Oracle Corp. | | | 5,460 | | | | 220,038 | | | |
salesforce.com, inc.*# | | | 1,000 | | | | 69,630 | | | |
| | | | | | | |
| | | | | | | 1,079,385 | | | |
| |
Specialty Retail - 1.03% | | | |
AutoZone, Inc.* | | | 600 | | | | 400,140 | | | |
Gap, Inc. (The) | | | 2,700 | | | | 103,059 | | | |
Ross Stores, Inc.# | | | 2,200 | | | | 106,942 | | | |
| | | | | | | |
| | | | | | | 610,141 | | | |
| |
Textiles, Apparel & Luxury Goods - 0.38% | | | |
NIKE, Inc., Class B# | | | 2,100 | | | | 226,842 | | | |
| |
Trading Companies & Distributors - 0.80% | | | |
NOW, Inc.*+ | | | 200 | | | | 3,982 | | | |
United Rentals, Inc.*# | | | 4,000 | | | | 350,480 | | | |
Veritiv Corp.* | | | 28 | | | | 1,021 | | | |
W.W. Grainger, Inc. | | | 500 | | | | 118,325 | | | |
| | | | | | | |
| | | | | | | 473,808 | | | |
| | | | | | | |
TOTAL COMMON STOCKS - 52.94% | | | | 31,238,125 | | | |
| | | | | | | |
(Cost $24,436,209) | | | | | | | |
| | | | | | | | | | | | | | |
| | | | |
| Due Date | | Discount Rate
or Coupon Rate | | | Principal
Amount | | | Value | | | |
| |
U.S. GOVERNMENT OBLIGATIONS - 50.84% | | | |
U.S. Treasury Bills - 50.84% | | | |
07/02/2015 | | | 0.035%(a) | | | | $4,000,000 | | | | $ 3,999,996 | | | |
07/16/2015 | | | 0.015%(a) | | | | 3,000,000 | | | | 2,999,969 | | | |
08/06/2015 | | | 0.020%(a) | | | | 2,000,000 | | | | 1,999,970 | | | |
08/27/2015 | | | 0.015%(a) | | | | 5,000,000 | | | | 4,999,880 | | | |
09/03/2015 | | | 0.020%(a) | | | | 5,000,000 | | | | 5,000,000 | | | |
09/17/2015 | | | 0.010%(a) | | | | 2,000,000 | | | | 2,000,000 | | | |
09/24/2015 | | | 0.010%(a) | | | | 5,000,000 | | | | 4,999,940 | | | |
10/01/2015 | | | 0.015%(a) | | | | 4,000,000 | | | | 3,999,820 | | | |
| | | | | | | |
| | | | | | | | | | | 29,999,575 | | | |
| | | | | | | |
TOTAL U.S. GOVERNMENT OBLIGATIONS - 50.84% | | | | | | | | 29,999,575 | | | |
| | | | | | | |
(Cost $29,999,413) | | | | | | | |
| | | | |
| | | Rate^ | | | Shares | | | Value | | | |
| |
MONEY MARKET FUND - 4.92% | | | |
Dreyfus Cash Management Fund | | | 0.04 | % | | | 2,905,476 | | | | 2,905,476 | | | |
| | | | | | | |
TOTAL MONEY MARKET FUND - 4.92% | | | | 2,905,476 | | | |
| | | | | | | |
(Cost $2,905,476) | | | | | | | | | | | |
| |
INVESTMENTS PURCHASED WITH CASH PROCEEDS FROM SECURITIES
LENDING - 0.42% | | | |
Dreyfus Cash Management Fund** | | | 0.04 | % | | | 245,163 | | | | 245,163 | | | |
| | | | | | | |
TOTAL INVESTMENTS PURCHASED WITH CASH PROCEEDS FROM SECURITIES LENDING - 0.42% | | | | 245,163 | | | |
| | | | | | | |
(Cost $245,163) | | | | | | | | | | | |
| | |
TOTAL INVESTMENTS - 109.12% | | | | $64,388,339 | | | |
(Cost $57,586,261) | | | | | | | | | | | |
Liabilities in Excess of Other Assets - (9.12%) | | | | (5,379,974 | ) | | |
| | | | | | | |
NET ASSETS - 100.00% | | | | $59,008,365 | | | |
| | | | | | | |
| * | Non-income producing security. |
| ** | This security represents the investment of the collateral received in connection with securities out on loan as of June 30, 2015. |
| # | Security subject to call or put option written by the Fund. |
| ^ | Rate disclosed as of June 30, 2015. |
| + | This security or a portion of the security is out on loan as of June 30, 2015. Total loaned securities had a value of $230,804 as of June 30, 2015. |
| (a) | Rate represents the effective yield at purchase. |
PLC - Public Limited Company
See Notes to Financial Statements.
| | |
| 81 | | Annual Report | June 30, 2015 |
| | |
Managed Volatility Fund SCHEDULE OF OPTIONS WRITTEN | | |
Showing percentage of net assets as of June 30, 2015
| | | | | | | | | | |
| Company | | Number
of Contracts | | | Value | | | |
| |
CALL OPTIONS WRITTEN - (0.32%) | | | |
| | | |
Abbott Laboratories | | | | | | | | | | |
Expiring August, 2015 at $48.00 | | | 5 | | | | $(1,015 | ) | | |
AbbVie, Inc. | | | | | | | | | | |
Expiring August, 2015 at $67.50 | | | 13 | | | | (2,730 | ) | | |
Actavis PLC | | | | | | | | | | |
Expiring August, 2015 at $310.00 | | | 3 | | | | (2,610 | ) | | |
Adobe Systems, Inc. | | | | | | | | | | |
Expiring July, 2015 at $80.00 | | | 3 | | | | (690 | ) | | |
AES Corp. | | | | | | | | | | |
Expiring August, 2015 at $14.00 | | | 20 | | | | (400 | ) | | |
Alcoa, Inc. | | | | | | | | | | |
Expiring July, 2015 at $14.00 | | | 250 | | | | (250 | ) | | |
Amazon.com, Inc. | | | | | | | | | | |
Expiring July, 2015 at $400.00 | | | 2 | | | | (7,340 | ) | | |
American Express Co. | | | | | | | | | | |
Expiring July, 2015 at $80.00 | | | 4 | | | | (180 | ) | | |
Amgen, Inc. | | | | | | | | | | |
Expiring July, 2015 at $170.00 | | | 4 | | | | (40 | ) | | |
Anadarko Petroleum Corp. | | | | | | | | | | |
Expiring August, 2015 at $85.00 | | | 3 | | | | (288 | ) | | |
Aon PLC | | | | | | | | | | |
Expiring July, 2015 at $100.00 | | | 5 | | | | (725 | ) | | |
Apple, Inc. | | | | | | | | | | |
Expiring July, 2015 at $130.00 | | | 13 | | | | (702 | ) | | |
Applied Materials, Inc. | | | | | | | | | | |
Expiring July, 2015 at $21.00 | | | 10 | | | | (70 | ) | | |
Expiring July, 2015 at $23.00 | | | 20 | | | | (100 | ) | | |
| | | | | | | | | | |
| | | | | | | (170 | ) | | |
Archer-Daniels-Midland Co. | | | | | | | | | | |
Expiring September, 2015 at $55.00 | | | 5 | | | | (85 | ) | | |
Avis Budget Group, Inc. | | | | | | | | | | |
Expiring August, 2015 at $50.00 | | | 40 | | | | (3,400 | ) | | |
Expiring July, 2015 at $55.00 | | | 40 | | | | (400 | ) | | |
| | | | | | | | | | |
| | | | | | | (3,800 | ) | | |
Baker Hughes, Inc. | | | | | | | | | | |
Expiring July, 2015 at $70.00 | | | 6 | | | | (150 | ) | | |
Biogen, Inc. | | | | | | | | | | |
Expiring July, 2015 at $440.00 | | | 3 | | | | (270 | ) | | |
Broadcom Corp., Class A | | | | | | | | | | |
Expiring August, 2015 at $48.00 | | | 3 | | | | (1,200 | ) | | |
Capital One Financial Corp. | | | | | | | | | | |
Expiring September, 2015 at $90.00 | | | 7 | | | | (1,400 | ) | | |
Centurytel, Inc. | | | | | | | | | | |
Expiring July, 2015 at $37.00 | | | 11 | | | | (55 | ) | | |
Chesapeake Energy Corp. | | | | | | | | | | |
Expiring July, 2015 at $15.00 | | | 6 | | | | (18 | ) | | |
| | | | | | | | | | |
| Company | | Number
of Contracts | | | Value | | | |
Citigroup, Inc. | | | | | | | | | | |
Expiring September, 2015 at $57.50 | | | 11 | | | | $(1,276 | ) | | |
Citrix Systems, Inc. | | | | | | | | | | |
Expiring September, 2015 at $72.50 | | | 4 | | | | (1,076 | ) | | |
Cognizant Technology Solutions Corp., Class A | | | | | | | | | | |
Expiring July, 2015 at $65.00 | | | 14 | | | | (350 | ) | | |
Comcast Corp., Class A | | | | | | | | | | |
Expiring July, 2015 at $60.00 | | | 6 | | | | (624 | ) | | |
ConocoPhillips | | | | | | | | | | |
Expiring August, 2015 at $65.00 | | | 5 | | | | (235 | ) | | |
Constellation Brands, Inc., Class A | | | | | | | | | | |
Expiring July, 2015 at $120.00 | | | 6 | | | | (738 | ) | | |
Crown Castle International Corp. | | | | | | | | | | |
Expiring July, 2015 at $90.00 | | | 3 | | | | (75 | ) | | |
CVS Health Corp. | | | | | | | | | | |
Expiring August, 2015 at $105.00 | | | 5 | | | | (1,280 | ) | | |
Delphi Automotive PLC | | | | | | | | | | |
Expiring August, 2015 at $87.50 | | | 3 | | | | (540 | ) | | |
Dollar General Corp. | | | | | | | | | | |
Expiring August, 2015 at $77.50 | | | 5 | | | | (1,200 | ) | | |
Dow Chemical Co. (The) | | | | | | | | | | |
Expiring September, 2015 at $55.00 | | | 8 | | | | (536 | ) | | |
eBay, Inc. | | | | | | | | | | |
Expiring July, 2015 at $62.50 | | | 4 | | | | (284 | ) | | |
Electronic Arts, Inc. | | | | | | | | | | |
Expiring September, 2015 at $70.00 | | | 7 | | | | (1,610 | ) | | |
EMC Corp. | | | | | | | | | | |
Expiring July, 2015 at $27.00 | | | 15 | | | | (405 | ) | | |
Exelon Corp. | | | | | | | | | | |
Expiring July, 2015 at $35.00 | | | 11 | | | | (44 | ) | | |
Express Scripts Holding Co. | | | | | | | | | | |
Expiring July, 2015 at $90.00 | | | 6 | | | | (912 | ) | | |
Exxon Mobil Corp. | | | | | | | | | | |
Expiring July, 2015 at $90.00 | | | 17 | | | | (17 | ) | | |
Ford Motor Co. | | | | | | | | | | |
Expiring July, 2015 at $16.00 | | | 40 | | | | (120 | ) | | |
Freeport-McMoRan, Inc. | | | | | | | | | | |
Expiring August, 2015 at $20.00 | | | 70 | | | | (3,710 | ) | | |
Expiring August, 2015 at $21.00 | | | 51 | | | | (1,581 | ) | | |
| | | | | | | | | | |
| | | | | | | (5,291 | ) | | |
Frontier Communications Corp. | | | | | | | | | | |
Expiring August, 2015 at $8.00 | | | 10 | | | | (50 | ) | | |
General Mills, Inc. | | | | | | | | | | |
Expiring July, 2015 at $57.50 | | | 8 | | | | (256 | ) | | |
| | |
Managed Volatility Fund SCHEDULE OF OPTIONS WRITTEN (continued) | | |
Showing percentage of net assets as of June 30, 2015
| | | | | | | | | | |
| Company | | Number
of Contracts | | | Value | | | |
| |
Call Options Written (continued) | | | |
General Motors Co. | | | | | | | | | | |
Expiring September, 2015 at $37.00 | | | 25 | | | | $ (600 | ) | | |
Gilead Sciences, Inc. | | | | | | | | | | |
Expiring August, 2015 at $115.00 | | | 8 | | | | (5,152 | ) | | |
Goodyear Tire & Rubber Co. (The) | | | | | | | | | | |
Expiring July, 2015 at $28.00 | | | 15 | | | | (3,600 | ) | | |
Halliburton Co. | | | | | | | | | | |
Expiring July, 2015 at $50.00 | | | 5 | | | | (10 | ) | | |
Hasbro, Inc. | | | | | | | | | | |
Expiring July, 2015 at $65.00 | | | 7 | | | | (6,580 | ) | | |
Hertz Corp. (The) | | | | | | | | | | |
Expiring August, 2015 at $70.00 | | | 50 | | | | (7,600 | ) | | |
Hewlett-Packard Co. | | | | | | | | | | |
Expiring July, 2015 at $36.00 | | | 15 | | | | (30 | ) | | |
International Paper Co. | | | | | | | | | | |
Expiring July, 2015 at $55.00 | | | 5 | | | | (10 | ) | | |
Intuit, Inc. | | | | | | | | | | |
Expiring July, 2015 at $100.00 | | | 4 | | | | (920 | ) | | |
JM Smucker Co. (The) | | | | | | | | | | |
Expiring July, 2015 at $120.00 | | | 4 | | | | (20 | ) | | |
Johnson & Johnson | | | | | | | | | | |
Expiring August, 2015 at $105.00 | | | 10 | | | | (240 | ) | | |
JPMorgan Chase & Co. | | | | | | | | | | |
Expiring September, 2015 at $70.00 | | | 15 | | | | (1,845 | ) | | |
Juniper Networks, Inc. | | | | | | | | | | |
Expiring July, 2015 at $27.00 | | | 12 | | | | (348 | ) | | |
Keurig Green Mountain, Inc. | | | | | | | | | | |
Expiring July, 2015 at $120.00 | | | 4 | | | | (4 | ) | | |
Kroger Co. (The) | | | | | | | | | | |
Expiring July, 2015 at $75.00 | | | 15 | | | | (450 | ) | | |
LyondellBasell Industries NV, Class A | | | | | | | | | | |
Expiring September, 2015 at $105.00 | | | 4 | | | | (1,760 | ) | | |
Marathon Petroleum Corp. | | | | | | | | | | |
Expiring July, 2015 at $52.50 | | | 124 | | | | (14,260 | ) | | |
McGraw Hill Financial, Inc. | | | | | | | | | | |
Expiring August, 2015 at $105.00 | | | 3 | | | | (510 | ) | | |
Micron Technology, Inc. | | | | | | | | | | |
Expiring July, 2015 at $25.00 | | | 100 | | | | (400 | ) | | |
Expiring July, 2015 at $27.00 | | | 200 | | | | (200 | ) | | |
Expiring July, 2015 at $30.00 | | | 20 | | | | (40 | ) | | |
| | | | | | | | | | |
| | | | | | | (640 | ) | | |
Microsoft Corp. | | | | | | | | | | |
Expiring August, 2015 at $50.00 | | | 25 | | | | (350 | ) | | |
| | | | | | | | | | |
| Company | | Number
of Contracts | | | Value | | | |
| | | |
Motorola Solutions, Inc. | | | | | | | | | | |
Expiring October, 2015 at $60.00 | | | 55 | | | | $ (8,360 | ) | | |
Murphy Oil Corp. | | | | | | | | | | |
Expiring July, 2015 at $52.50 | | | 43 | | | | (215 | ) | | |
National Oilwell Varco, Inc. | | | | | | | | | | |
Expiring August, 2015 at $57.50 | | | 3 | | | | (42 | ) | | |
News Corp., Class A | | | | | | | | | | |
Expiring July, 2015 at $16.00 | | | 8 | | | | (200 | ) | | |
Nielsen NV | | | | | | | | | | |
Expiring August, 2015 at $46.00 | | | 6 | | | | (630 | ) | | |
NIKE, Inc., Class B | | | | | | | | | | |
Expiring July, 2015 at $105.00 | | | 5 | | | | (1,780 | ) | | |
Northrop Grumman Corp. | | | | | | | | | | |
Expiring August, 2015 at $160.00 | | | 15 | | | | (6,150 | ) | | |
Expiring August, 2015 at $165.00 | | | 4 | | | | (944 | ) | | |
| | | | | | | | | | |
| | | | | | | (7,094 | ) | | |
PepsiCo, Inc. | | | | | | | | | | |
Expiring July, 2015 at $100.00 | | | 5 | | | | (35 | ) | | |
Phillips 66 | | | | | | | | | | |
Expiring August, 2015 at $82.50 | | | 35 | | | | (6,475 | ) | | |
Expiring August, 2015 at $85.00 | | | 5 | | | | (510 | ) | | |
| | | | | | | | | | |
| | | | | | | (6,985 | ) | | |
PNC Financial Services Group, Inc. (The) | | | | | | | | | | |
Expiring August, 2015 at $100.00 | | | 5 | | | | (400 | ) | | |
Praxair, Inc. | | | | | | | | | | |
Expiring July, 2015 at $125.00 | | | 4 | | | | (100 | ) | | |
QUALCOMM, Inc. | | | | | | | | | | |
Expiring July, 2015 at $70.00 | | | 6 | | | | (12 | ) | | |
Raytheon Co. | | | | | | | | | | |
Expiring August, 2015 at $115.00 | | | 4 | | | | (20 | ) | | |
Ross Stores, Inc. | | | | | | | | | | |
Expiring August, 2015 at $55.00 | | | 6 | | | | (120 | ) | | |
Salesforce.com, inc. | | | | | | | | | | |
Expiring August, 2015 at $75.00 | | | 3 | | | | (549 | ) | | |
SanDisk Corp. | | | | | | | | | | |
Expiring July, 2015 at $70.00 | | | 4 | | | | (20 | ) | | |
Southwest Airlines Co. | | | | | | | | | | |
Expiring July, 2015 at $39.00 | | | 7 | | | | (35 | ) | | |
Southwestern Energy Co. | | | | | | | | | | |
Expiring September, 2015 at $24.00 | | | 130 | | | | (13,780 | ) | | |
Starbucks Corp. | | | | | | | | | | |
Expiring July, 2015 at $50.00 | | | 7 | | | | (2,695 | ) | | |
| | |
| 83 | | Annual Report | June 30, 2015 |
| | |
Managed Volatility Fund SCHEDULE OF OPTIONS WRITTEN (continued) | | |
Showing percentage of net assets as of June 30, 2015
| | | | | | | | | | |
| Company | | Number of Contracts | | | Value | | | |
| |
Call Options Written (continued) | | | |
Stryker Corp. | | | | | | | | | | |
Expiring September, 2015 at $100.00 | | | 4 | | | | $ (680 | ) | | |
Target Corp. | | | | | | | | | | |
Expiring July, 2015 at $85.00 | | | 5 | | | | (140 | ) | | |
Time Warner, Inc. | | | | | | | | | | |
Expiring July, 2015 at $87.50 | | | 4 | | | | (604 | ) | | |
Travelers Cos., Inc. (The) | | | | | | | | | | |
Expiring July, 2015 at $105.00 | | | 10 | | | | (50 | ) | | |
Twenty-First Century Fox, Inc., Class A | | | | | | | | | | |
Expiring July, 2015 at $35.00 | | | 8 | | | | (40 | ) | | |
Tyco International PLC | | | | | | | | | | |
Expiring July, 2015 at $42.00 | | | 10 | | | | (50 | ) | | |
United Continental Holdings, Inc. | | | | | | | | | | |
Expiring September, 2015 at $52.50 | | | 25 | | | | (11,500 | ) | | |
Expiring September, 2015 at $55.00 | | | 75 | | | | (23,625 | ) | | |
| | | | | | | | | | |
| | | | | | | (35,125 | ) | | |
United Rentals, Inc. | | | | | | | | | | |
Expiring September, 2015 at $95.00 | | | 40 | | | | (10,160 | ) | | |
United Technologies Corp. | | | | | | | | | | |
Expiring August, 2015 at $120.00 | | | 3 | | | | (78 | ) | | |
Valero Energy Corp. | | | | | | | | | | |
Expiring September, 2015 at $60.00 | | | 10 | | | | (4,670 | ) | | |
Verizon Communications, Inc. | | | | | | | | | | |
Expiring August, 2015 at $50.00 | | | 5 | | | | (40 | ) | | |
Expiring July, 2015 at $50.00 | | | 10 | | | | (30 | ) | | |
| | | | | | | | | | |
| | | | | | | (70 | ) | | |
Walt Disney Co. (The) | | | | | | | | | | |
Expiring September, 2015 at $115.00 | | | 8 | | | | (2,568 | ) | | |
Wells Fargo & Co. | | | | | | | | | | |
Expiring July, 2015 at $55.00 | | | 10 | | | | (1,830 | ) | | |
Western Digital Corp. | | | | | | | | | | |
Expiring July, 2015 at $100.00 | | | 4 | | | | (12 | ) | | |
Western Union Co. (The) | | | | | | | | | | |
Expiring August, 2015 at $22.00 | | | 5 | | | | (125 | ) | | |
Williams Cos., Inc. (The) | | | | | | | | | | |
Expiring August, 2015 at $55.00 | | | 5 | | | | (2,250 | ) | | |
Yum! Brands, Inc. | | | | | | | | | | |
Expiring July, 2015 at $97.50 | | | 6 | | | | (204 | ) | | |
| | | | | | | | | | |
TOTAL CALL OPTIONS WRITTEN - (0.32%) | | | | (187,694 | ) | | |
| | | | | | | | | | |
(Premiums received $(334,365)) | | | | | | | | | | |
| |
PUT OPTIONS WRITTEN - (0.75%) | | | |
| | | |
Aetna, Inc. | | | | | | | | | | |
Expiring July, 2015 at $105.00 | | | 75 | | | | (3,675 | ) | | |
| | | | | | | | | | |
| Company | | Number
of Contracts | | | Value | | | |
| |
| | | |
Alaska Air Group, Inc. | | | | | | | | | | |
Expiring July, 2015 at $65.00 | | | 50 | | | | $(10,250 | ) | | |
American Airlines Group, Inc. | | | | | | | | | | |
Expiring August, 2015 at $46.00 | | | 50 | | | | (32,750 | ) | | |
American International Group, Inc. | | | | | | | | | | |
Expiring August, 2015 at $60.00 | | | 60 | | | | (7,560 | ) | | |
Apple, Inc. | | | | | | | | | | |
Expiring July, 2015 at $125.00 | | | 45 | | | | (8,325 | ) | | |
Ashland, Inc. | | | | | | | | | | |
Expiring July, 2015 at $125.00 | | | 45 | | | | (17,100 | ) | | |
Centurytel, Inc. | | | | | | | | | | |
Expiring July, 2015 at $34.00 | | | 48 | | | | (22,560 | ) | | |
CF Industries Holdings, Inc. | | | | | | | | | | |
Expiring August, 2015 at $57.00 | | | 100 | | | | (5,200 | ) | | |
Cit Group | | | | | | | | | | |
Expiring July, 2015 at $45.00 | | | 100 | | | | (2,600 | ) | | |
Delphi Automotive PLC | | | | | | | | | | |
Expiring August, 2015 at $82.50 | | | 15 | | | | (3,225 | ) | | |
Foot Locker, Inc. | | | | | | | | | | |
Expiring August, 2015 at $60.00 | | | 110 | | | | (7,150 | ) | | |
Gilead Sciences, Inc. | | | | | | | | | | |
Expiring August, 2015 at $110.00 | | | 50 | | | | (11,900 | ) | | |
Goodyear Tire & Rubber Co. (The) | | | | | | | | | | |
Expiring October, 2015 at $30.00 | | | 150 | | | | (27,000 | ) | | |
HCA Holdings, Inc. | | | | | | | | | | |
Expiring September, 2015 at $80.00 | | | 30 | | | | (3,150 | ) | | |
Expiring September, 2015 at $82.50 | | | 45 | | | | (6,300 | ) | | |
| | | | | | | | | | |
| | | | | | | (9,450 | ) | | |
Hertz Corp. (The) | | | | | | | | | | |
Expiring August, 2015 at $80.00 | | | 68 | | | | (21,760 | ) | | |
Expiring July, 2015 at $67.50 | | | 30 | | | | (5,310 | ) | | |
| | | | | | | | | | |
| | | | | | | (27,070 | ) | | |
Juniper Networks, Inc. | | | | | | | | | | |
Expiring July, 2015 at $23.00 | | | 180 | | | | (900 | ) | | |
Expiring October, 2015 at $27.00 | | | 70 | | | | (16,030 | ) | | |
| | | | | | | | | | |
| | | | | | | (16,930 | ) | | |
Kroger Co. (The) | | | | | | | | | | |
Expiring July, 2015 at $70.00 | | | 70 | | | | (2,800 | ) | | |
Expiring July, 2015 at $75.00 | | | 40 | | | | (10,600 | ) | | |
| | | | | | | | | | |
| | | | | | | (13,400 | ) | | |
Motorola Solutions, Inc. | | | | | | | | | | |
Expiring July, 2015 at $57.50 | | | 25 | | | | (2,925 | ) | | |
Murphy Oil Corp. | | | | | | | | | | |
Expiring July, 2015 at $47.50 | | | 70 | | | | (44,100 | ) | | |
National Oilwell Varco, Inc. | | | | | | | | | | |
Expiring August, 2015 at $47.50 | | | 60 | | | | (11,400 | ) | | |
| | |
Managed Volatility Fund SCHEDULE OF OPTIONS WRITTEN (continued) | | |
| | | | | | | | | | |
| Company | | Number
of Contracts | | | Value | | | |
| |
Put Options Written (continued) | | | |
Northrop Grumman Corp. | | | | | | | | | | |
Expiring August, 2015 at $150.00 | | | 20 | | | | $ (4,000 | ) | | |
Reinsurance Group of America, Inc. | | | | | | | | | | |
Expiring August, 2015 at $95.00 | | | 10 | | | | (3,100 | ) | | |
Tesoro Corp. | | | | | | | | | | |
Expiring August, 2015 at $85.00 | | | 60 | | | | (30,600 | ) | | |
Travelers Cos., Inc. (The) | | | | | | | | | | |
Expiring July, 2015 at $105.00 | | | 40 | | | | (34,160 | ) | | |
Expiring October, 2015 at $97.50 | | | 20 | | | | (7,800 | ) | | |
| | | | | | | | | | |
| | | | | | | (41,960 | ) | | |
Tyco International PLC | | | | | | | | | | |
Expiring July, 2015 at $43.00 | | | 120 | | | | (55,800 | ) | | |
United Rentals, Inc. | | | | | | | | | | |
Expiring September, 2015 at $90.00 | | | 30 | | | | (20,100 | ) | | |
Universal Health Services, Inc., Class B | | | | | | | | | | |
Expiring July, 2015 at $115.00 | | | 30 | | | | (150 | ) | | |
Expiring July, 2015 at $125.00 | | | 40 | | | | (800 | ) | | |
| | | | | | | | | | |
| | | | | | | (950 | ) | | |
Voya Financial, Inc. | | | | | | | | | | |
Expiring August, 2015 at $42.00 | | | 60 | | | | (3,000 | ) | | |
| | | | | | | | | | |
TOTAL PUT OPTIONS WRITTEN - (0.75%) | | | | (444,080 | ) | | |
| | | | | | | | | | |
(Premiums received $(448,204)) | | | | | | | | | | |
| | | |
TOTAL OPTIONS
WRITTEN — (1.07%) | | | | | | | $(631,774 | ) | | |
| | | | | | | | | | |
(Premiums received $(782,569)) | | | | | | | | | | |
| | | | | | | | | | | | | | | | | | |
Summary of inputs used to value the Fund’s investments as of
06/30/2015 (See Note 2 in Notes to Financial Statements): |
| | |
| | | Assets Table | | | |
| | | Valuation Inputs | | | |
| | | Investment in Securities (Value) | | | |
| | | Level 1 Quoted Prices | | | Level 2
Significant
Observable
Inputs | | | Level 3
Significant Unobservable
Inputs | | | Total | | | |
| | | | | |
Common Stocks | | $ | 31,238,125 | | | $ | — | | | $ | — | | | $ | 31,238,125 | | | |
U.S. Government Obligations | | | — | | | | 29,999,575 | | | | — | | | | 29,999,575 | | | |
Money Market Fund | | | — | | | | 2,905,476 | | | | — | | | | 2,905,476 | | | |
Investments Purchased with Cash Proceeds from Securities Lending | | | — | | | | 245,163 | | | | — | | | | 245,163 | | | |
| | | | | | | | | | | | | | | | | | |
TOTAL | | $ | 31,238,125 | | | $ | 33,150,214 | | | $ | — | | | $ | 64,388,339 | | | |
| | | | | | | | | | | | | | | | | | |
| | | | | |
| | | | | | | | | | | | | | | | | | |
| | | Liabilities Table | | | |
| | | Valuation Inputs | | | |
| | | Investment in Securities (Value) | | | |
| | | Level 1
Quoted
Prices | | | Level 2
Significant
Observable
Inputs | | | Level 3
Significant
Unobservable
Inputs | | | Total | | | |
| | | | | |
Options Written | | $ | (393,290 | ) | | $ | (238,484 | ) | | $ | — | | | $ | (631,774 | ) | | |
| | | | | | | | | | | | | | | | | | |
TOTAL | | $ | (393,290 | ) | | $ | (238,484 | ) | | $ | — | | | $ | (631,774 | ) | | |
| | | | | | | | | | | | | | | | | | |
See Notes to Financial Statements. | | | |
| | |
| 85 | | Annual Report | June 30, 2015 |
THIS PAGE INTENTIONALLY LEFT BLANK
| | |
STATEMENTS OF ASSETS AND LIABILITIES | | |
June 30, 2015
| | | | | | | | | | | | | | | | | | |
ASSETS | |
| Aggressive
Investors 1 |
| |
| Ultra-Small
Company |
| |
| Ultra-Small
Company Market |
| |
| Small-Cap
Momentum |
| | |
Investments at value | | $ | 261,714,730 | | | $ | 137,898,511 | | | | $449,508,212 | | | | $5,440,444 | | | |
Receivables: | | | | | | | | | | | | | | | | | | |
Portfolio securities sold | | | 3,199,459 | | | | 2,692,715 | | | | 6,670,927 | | | | - | | | |
Fund shares sold | | | 4,132 | | | | 2,200 | | | | 194,501 | | | | - | | | |
Dividends and interest | | | 77,231 | | | | 142,601 | | | | 272,713 | | | | 4,788 | | | |
Receivable from investment adviser | | | - | | | | - | | | | - | | | | 8,190 | | | |
Deposits with brokers | | | - | | | | - | | | | - | | | | - | | | |
Prepaid expenses. | | | 35,645 | | | | 15,719 | | | | 45,383 | | | | 11,779 | | | |
Total assets | | | 265,031,197 | | | | 140,751,746 | | | | 456,691,736 | | | | 5,465,201 | | | |
| | | | | |
LIABILITIES | | | | | | | | | | | | | | | | | | |
Payables: | | | | | | | | | | | | | | | | | | |
Portfolio securities purchased | | | 5,222,740 | | | | 1,441,720 | | | | 9,199,434 | | | | - | | | |
Fund shares redeemed | | | 1,177,807 | | | | 12,696 | | | | 75,492 | | | | - | | | |
Due to custodian | | | - | | | | - | | | | - | | | | 8,575 | | | |
Loan payable | | | - | | | | 128,323 | | | | - | | | | - | | | |
Payable upon return of securities loaned | | | 10,088,121 | | | | 11,304,787 | | | | 44,237,825 | | | | 307,286 | | | |
Accrued Liabilities: | | | | | | | | | | | | | | | | | | |
Investment adviser fees | | | 391,964 | | | | 98,368 | | | | 167,460 | | | | - | | | |
Administration fees | | | 4,169 | | | | 2,175 | | | | 6,688 | | | | 84 | | | |
Directors’ fees | | | 386 | | | | 209 | | | | 596 | | | | 8 | | | |
Other | | | 99,943 | | | | 46,803 | | | | 151,237 | | | | 26,695 | | | |
Call options written at value | | | - | | | | - | | | | - | | | | - | | | |
Put options written at value | | | - | | | | - | | | | - | | | | - | | | |
Total liabilities | | | 16,985,130 | | | | 13,035,081 | | | | 53,838,732 | | | | 342,648 | | | |
NET ASSETS | | $ | 248,046,067 | | | $ | 127,716,665 | | | | $402,853,004 | | | | $5,122,553 | | | |
| | | | | |
NET ASSETS REPRESENT | | | | | | | | | | | | | | | | | | |
Paid-in capital | | $ | 316,820,618 | | | $ | 113,609,454 | | | | $261,198,553 | | | | $4,560,980 | | | |
Undistributed (distributions in excess of) net investment income | | | 99,002 | | | | 596,067 | | | | 3 | | | | 9,442 | | | |
Accumulated net realized gain (loss) on investments | | | (99,767,242 | ) | | | (3,505,333 | ) | | | 26,500,616 | | | | 115,288 | | | |
Net unrealized appreciation on investments | | | 30,893,689 | | | | 17,016,477 | | | | 115,153,832 | | | | 436,843 | | | |
| | | | | |
NET ASSETS | | $ | 248,046,067 | | | $ | 127,716,665 | | | | $402,853,004 | | | | $5,122,553 | | | |
| | | | | |
Shares of common stock outstanding of $.001 par value* | | | 4,193,709 | | | | 4,205,214 | | | | 24,894,478 | | | | 416,889 | | | |
| | | | | |
Net asset value, offering price and redemption price per share | | $ | 59.15 | | | $ | 30.37 | | | | $16.18(a) | | | | $12.29(a) | | | |
Total investments at cost | | $ | 230,821,041 | | | $ | 120,882,034 | | | | $334,354,380 | | | | $5,003,601 | | | |
Premiums received on call options written | | $ | - | | | $ | - | | | | $ - | | | | $ - | | | |
Premiums received on put options written | | $ | - | | | $ | - | | | | $ - | | | | $ - | | | |
| * | See Note 1 - Organization in the Notes to Financial Statements for shares authorized for each Fund. |
| (a) | Redemption of shares held less than six months may be charged a 2% redemption fee. See Note 8. |
See Notes to Financial Statements.
| | |
| 87 | | Annual Report | June 30, 2015 |
| | |
| | |
|
| | | | | | | | | | | | | | | | | | |
| | | | |
| Small-Cap
Growth |
| |
| Small-Cap
Value |
| |
| Large-Cap
Growth |
| |
| Blue Chip 35
Index |
| |
| Managed
Volatility |
|
| $ | 41,739,849 | | | $ | 82,112,958 | | | $ | 162,706,255 | | | $ | 600,055,973 | | | $ | 64,388,339 | |
| | | | | | | | | | | | | | | | | | |
| | 2,949,655 | | | | - | | | | - | | | | 4,940,020 | | | | 3,193 | |
| | 50 | | | | 8,083 | | | | 443,881 | | | | 475,440 | | | | 277,193 | |
| | 19,062 | | | | 93,509 | | | | 66,489 | | | | 606,813 | | | | 25,711 | |
| | - | | | | - | | | | - | | | | 3,498 | | | | - | |
| | - | | | | - | | | | - | | | | - | | | | 50 | |
| | 10,223 | | | | 13,696 | | | | 27,861 | | | | 86,901 | | | | 18,961 | |
| | 44,718,839 | | | | 82,228,246 | | | | 163,244,486 | | | | 606,168,645 | | | | 64,713,447 | |
| | | | |
| | | | | | | | | | | | | | | | | | |
| | | | |
| | | | | | | | | | | | | | | | | | |
| | | | | | | | | | | | | | | | | | |
| | 2,405,532 | | | | - | | | | 1,614,591 | | | | 2,817,789 | | | | 4,659,406 | |
| | 41,519 | | | | 32,853 | | | | 96,760 | | | | 184,363 | | | | 101,917 | |
| | - | | | | 123,167 | | | | - | | | | - | | | | - | |
| | - | | | | 613,221 | | | | - | | | | 2,189,520 | | | | - | |
| | 5,424,205 | | | | 8,128,231 | | | | 4,920,115 | | | | - | | | | 245,163 | |
| | 12,768 | | | | 42,330 | | | | 68,343 | | | | - | | | | 23,873 | |
| | 607 | | | | 1,222 | | | | 2,581 | | | | 10,865 | | | | 978 | |
| | 51 | | | | 116 | | | | 125 | | | | 915 | | | | 74 | |
| | 32,862 | | | | 45,868 | | | | 48,666 | | | | 142,088 | | | | 41,897 | |
| | - | | | | - | | | | - | | | | - | | | | 187,694 | |
| | - | | | | - | | | | - | | | | - | | | | 444,080 | |
| | 7,917,544 | | | | 8,987,008 | | | | 6,751,181 | | | | 5,345,540 | | | | 5,705,082 | |
| $ | 36,801,295 | | | $ | 73,241,238 | | | $ | 156,493,305 | | | $ | 600,823,105 | | | $ | 59,008,365 | |
| | | | |
$ | 44,222,895 | | | $ | 90,326,420 | | | $ | 153,663,309 | | | $ | 418,660,637 | | | $ | 56,209,776 | |
| | | | | | | | | | | | | | | | | | |
| | - | | | | 941,370 | | | | 538,934 | | | | 7,344,268 | | | | 15,835 | |
| | (13,167,388 | ) | | | (20,917,185 | ) | | | (12,765,670 | ) | | | (20,035,874 | ) | | | (4,170,119 | ) |
| | 5,745,788 | | | | 2,890,633 | | | | 15,056,732 | | | | 194,854,074 | | | | 6,952,873 | |
| $ | 36,801,295 | | | $ | 73,241,238 | | | $ | 156,493,305 | | | $ | 600,823,105 | | | $ | 59,008,365 | |
| | | | |
| | 1,738,412 | | | | 3,270,335 | | | | 6,599,459 | | | | 50,878,978 | | | | 4,200,630 | |
| | | | |
| $ | 21.17 | | | $ | 22.40 | | | $ | 23.71 | | | $ | 11.81 | | | $ | 14.05 | |
| | | | |
| $ | 35,994,061 | | | $ | 79,222,325 | | | $ | 147,649,523 | | | $ | 405,201,899 | | | $ | 57,586,261 | |
| $ | - | | | $ | - | | | $ | - | | | $ | - | | | $ | 334,365 | |
| $ | - | | | $ | - | | | $ | - | | | $ | - | | | $ | 448,204 | |
Fiscal Year Ended June 30, 2015
| | | | | | | | | | | | | | | | | | |
| | |
| Aggressive
Investors 1 |
| |
| Ultra-Small
Company |
| |
| Ultra-Small
Company Market |
| |
| Small-Cap
Momentum |
| | |
INVESTMENT INCOME | | | | | | | | | | | | | | | | | | |
Dividends | | $ | 3,242,202 | | | $ | 1,317,323 | | | | $ 4,151,745 | | | | $ 78,565 | | | |
Less: foreign taxes withheld | | | (16,449 | ) | | | (6,732 | ) | | | - | | | | (346 | ) | | |
Interest | | | - | | | | - | | | | - | | | | - | | | |
Securities lending. | | | 290,430 | | | | 1,191,244 | | | | 1,727,768 | | | | 8,893 | | | |
Total Investment Income | | | 3,516,183 | | | | 2,501,835 | | | | 5,879,513 | | | | 87,112 | | | |
| | | | | |
EXPENSES | | | | | | | | | | | | | | | | | | |
Investment advisory fees - Base fees | | | 2,324,578 | | | | 1,258,150 | | | | 2,001,780 | | | | 28,684 | | | |
Investment advisory fees - Performance adjustment | | | 458,358 | | | | - | | | | - | | | | - | | | |
Administration fees. | | | 54,683 | | | | 29,582 | | | | 84,656 | | | | 1,104 | | | |
Accounting fees | | | 77,910 | | | | 66,993 | | | | 123,474 | | | | 58,762 | | | |
Transfer agent fees | | | 155,115 | | | | 56,195 | | | | 111,221 | | | | 32,981 | | | |
Audit fees | | | 24,366 | | | | 16,877 | | | | 31,887 | | | | 9,339 | | | |
Legal fees | | | 24,900 | | | | 13,771 | | | | 38,902 | | | | 513 | | | |
Custody fees | | | 8,483 | | | | 15,937 | | | | 26,525 | | | | 12,052 | | | |
Blue sky fees | | | 23,543 | | | | 10,916 | | | | 26,470 | | | | 22,030 | | | |
Directors’ and officers’ fees | | | 22,977 | | | | 13,045 | | | | 36,853 | | | | 486 | | | |
Shareholder servicing fees | | | 165,019 | | | | 39,090 | | | | 317,235 | | | | 4,130 | | | |
Reports to shareholders | | | 29,680 | | | | 5,988 | | | | 37,018 | | | | 270 | | | |
Miscellaneous expenses | | | 47,565 | | | | 30,286 | | | | 75,092 | | | | 4,699 | | | |
Total Expenses | | | 3,417,177 | | | | 1,556,830 | | | | 2,911,113 | | | | 175,050 | | | |
Less investment advisory fees waived | | | - | | | | - | | | | - | | | | (28,684 | ) | | |
Less expenses reimbursed by investment adviser | | | - | | | | - | | | | - | | | | (99,426 | ) | | |
Net Expenses | | | 3,417,177 | | | | 1,556,830 | | | | 2,911,113 | | | | 46,940 | | | |
NET INVESTMENT INCOME (LOSS) | | | 99,006 | | | | 945,005 | | | | 2,968,400 | | | | 40,172 | | | |
| | | | | |
NET REALIZED AND UNREALIZED GAIN (LOSS) ON INVESTMENTS | | | | | | | | | | | | | | | | | | |
Realized Gain (Loss) on: | | | | | | | | | | | | | | | | | | |
Investments | | | 25,307,168 | | | | (1,713,902 | ) | | | 33,400,024 | | | | 142,632 | | | |
Written options | | | - | | | | - | | | | - | | | | - | | | |
Futures contracts | | | - | | | | - | | | | - | | | | - | | | |
Net Realized Gain (Loss) | | | 25,307,168 | | | | (1,713,902 | ) | | | 33,400,024 | | | | 142,632 | | | |
Change in Unrealized Appreciation (Depreciation) on: | | | | | | | | | | | | | | | | | | |
Investments | | | (13,663,556 | ) | | | (10,407,890 | ) | | | (23,058,470 | ) | | | 11,922 | | | |
Written options | | | - | | | | - | | | | - | | | | - | | | |
Net Change in Unrealized Appreciation (Depreciation) | | | (13,663,556 | ) | | | (10,407,890 | ) | | | (23,058,470 | ) | | | 11,922 | | | |
Net Realized and Unrealized Gain (Loss) on Investments | | | 11,643,612 | | | | (12,121,792 | ) | | | 10,341,554 | | | | 154,554 | | | |
INCREASE (DECREASE) IN NET ASSETS RESULTING FROM OPERATIONS | | $ | 11,742,618 | | | $ | (11,176,787 | ) | | | $ 13,309,954 | | | | $194,726 | | | |
See Notes to Financial Statements.
| | |
| 89 | | Annual Report | June 30, 2015 |
| | |
| | |
|
| | | | | | | | | | | | | | | | | | |
| | | | |
| Small-Cap
Growth |
| |
| Small-Cap
Value |
| |
| Large-Cap
Growth |
| |
| Blue Chip 35
Index |
| |
| Managed
Volatility |
|
| | | | | | | | | | | | | | | | | | |
| $ | 174,521 | | | $ | 1,634,319 | | | $ | 1,381,270 | | | $ | 14,471,423 | | | $ | 477,466 | |
| | - | | | | - | | | | - | | | | - | | | | (340 | ) |
| | - | | | | - | | | | - | | | | - | | | | 10,946 | |
| | 124,866 | | | | 102,754 | | | | 31,188 | | | | - | | | | 651 | |
| | 299,387 | | | | 1,737,073 | | | | 1,412,458 | | | | 14,471,423 | | | | 488,723 | |
| | | | |
| | | | | | | | | | | | | | | | | | |
| | 206,500 | | | | 465,925 | | | | 453,171 | | | | 494,937 | | | | 301,848 | |
| | (17,760 | ) | | | 25,899 | | | | 6,626 | | | | - | | | | - | |
| | 7,262 | | | | 16,447 | | | | 18,772 | | | | 130,584 | | | | 10,609 | |
| | 49,904 | | | | 55,210 | | | | 56,909 | | | | 120,005 | | | | 62,173 | |
| | 49,639 | | | | 65,054 | | | | 57,004 | | | | 55,582 | | | | 42,125 | |
| | 10,763 | | | | 13,228 | | | | 13,958 | | | | 45,889 | | | | 17,652 | |
| | 3,184 | | | | 7,678 | | | | 6,722 | | | | 57,529 | | | | 4,715 | |
| | 3,529 | | | | 3,427 | | | | 3,439 | | | | 9,841 | | | | 8,682 | |
| | 21,013 | | | | 21,241 | | | | 22,586 | | | | 37,822 | | | | 23,253 | |
| | 3,120 | | | | 7,223 | | | | 7,457 | | | | 53,441 | | | | 4,284 | |
| | 21,102 | | | | 52,747 | | | | 68,086 | | | | 197,717 | | | | 33,867 | |
| | 4,896 | | | | 11,651 | | | | 7,851 | | | | 115,837 | | | | 5,051 | |
| | 6,926 | | | | 17,496 | | | | 11,647 | | | | 105,593 | | | | 8,929 | |
| | 370,078 | | | | 763,226 | | | | 734,228 | | | | 1,424,777 | | | | 523,188 | |
| | (47,099 | ) | | | (32,524 | ) | | | - | | | | (494,937 | ) | | | (50,322 | ) |
| | - | | | | - | | | | - | | | | (1,900 | ) | | | - | |
| | 322,979 | | | | 730,702 | | | | 734,228 | | | | 927,940 | | | | 472,866 | |
| | (23,592 | ) | | | 1,006,371 | | | | 678,230 | | | | 13,543,483 | | | | 15,857 | |
| | | | |
| | | | | | | | | | | | | | | | | | |
| | | | | | | | | | | | | | | | | | |
| | 4,000,306 | | | | 5,855,994 | | | | 7,237,893 | | | | 4,936,744 | | | | 2,152,234 | |
| | - | | | | - | | | | - | | | | - | | | | 117,574 | |
| | - | | | | - | | | | - | | | | - | | | | (1,318,939 | ) |
| | 4,000,306 | | | | 5,855,994 | | | | 7,237,893 | | | | 4,936,744 | | | | 950,869 | |
| | | | |
| | 481,668 | | | | (8,924,705 | ) | | | 1,817,428 | | | | 16,801,251 | | | | (1,031,945 | ) |
| | - | | | | - | | | | - | | | | - | | | | 315,098 | |
| | 481,668 | | | | (8,924,705 | ) | | | 1,817,428 | | | | 16,801,251 | | | | (716,847 | ) |
| | 4,481,974 | | | | (3,068,711 | ) | | | 9,055,321 | | | | 21,737,995 | | | | 234,022 | |
| $ | 4,458,382 | | | $ | (2,062,340 | ) | | $ | 9,733,551 | | | $ | 35,281,478 | | | $ | 249,879 | |
| | |
STATEMENTS OF CHANGES IN NET ASSETS | | |
| | | | | | | | | | | | | | | | | | |
| | | |
| | | Aggressive Investors 1 | | | Ultra-Small Company | | | |
| | | Year Ended
June 30, | | | Year Ended
June 30, | | | |
| | | 2015 | | | 2014 | | | 2015 | | | 2014 | | | |
| | | | | |
OPERATIONS | | | | | | | | | | | | | | | | | | |
Net investment income | | $ | 99,006 | | | $ | 540,870 | | | $ | 945,005 | | | $ | 1,433,179 | | | |
Net realized gain (loss) on investments | | | 25,307,168 | | | | 51,574,990 | | | | (1,713,902 | ) | | | 36,865,808 | | | |
Net change in unrealized appreciation (depreciation) on investments | | | (13,663,556 | ) | | | 14,508,239 | | | | (10,407,890 | ) | | | (7,816,828 | ) | | |
Net increase (decrease) in net assets resulting from operations | | | 11,742,618 | | | | 66,624,099 | | | | (11,176,787 | ) | | | 30,482,159 | | | |
| | | | | |
DISTRIBUTIONS: | | | | | | | | | | | | | | | | | | |
From net investment income. | | | (540,861 | ) | | | (1,735,698 | ) | | | (1,052,434 | ) | | | (2,464,929 | ) | | |
From net realized gains | | | - | | | | - | | | | (27,750,353 | ) | | | (17,948,088 | ) | | |
Net decrease in net assets from distributions | | | (540,861 | ) | | | (1,735,698 | ) | | | (28,802,787 | ) | | | (20,413,017 | ) | | |
| | | | | |
SHARE TRANSACTIONS: | | | | | | | | | | | | | | | | | | |
Proceeds from sale of shares | | | 9,973,079 | | | | 10,038,899 | | | | 1,395,869 | | | | 1,662,726 | | | |
Reinvestment of distributions | | | 511,322 | | | | 1,660,793 | | | | 27,164,352 | | | | 19,320,983 | | | |
Cost of shares redeemed | | | (33,042,204 | ) | | | (38,522,785 | ) | | | (13,194,608 | ) | | | (10,786,724 | ) | | |
Redemption fees | | | - | | | | - | | | | - | | | | - | | | |
Net increase (decrease) in net assets resulting from share transactions | | | (22,557,803 | ) | | | (26,823,093 | ) | | | 15,365,613 | | | | 10,196,985 | | | |
Net increase (decrease) in net assets | | | (11,356,046 | ) | | | 38,065,308 | | | | (24,613,961 | ) | | | 20,266,127 | | | |
| | | | | |
NET ASSETS: | | | | | | | | | | | | | | | | | | |
Beginning of year | | | 259,402,113 | | | | 221,336,805 | | | | 152,330,626 | | | | 132,064,499 | | | |
End of year** | | $ | 248,046,067 | | | $ | 259,402,113 | | | $ | 127,716,665 | | | $ | 152,330,626 | | | |
| | | | | |
SHARES ISSUED & REDEEMED | | | | | | | | | | | | | | | | | | |
Issued | | | 172,109 | | | | 195,178 | | | | 41,473 | | | | 39,966 | | | |
Distributions reinvested | | | 9,139 | | | | 33,024 | | | | 906,990 | | | | 505,785 | | | |
Redeemed | | | (563,075 | ) | | | (775,190 | ) | | | (384,777 | ) | | | (259,111 | ) | | |
Net increase (decrease) | | | (381,827 | ) | | | (546,988 | ) | | | 563,686 | | | | 286,640 | | | |
Outstanding at beginning of year | | | 4,575,536 | | | | 5,122,524 | | | | 3,641,528 | | | | 3,354,888 | | | |
Outstanding at end of year | | | 4,193,709 | | | | 4,575,536 | | | | 4,205,214 | | | | 3,641,528 | | | |
| | | | | |
** Including undistributed net investment income of: | | $ | 99,002 | | | $ | 540,857 | | | $ | 596,067 | | | $ | 717,553 | | | |
See Notes to Financial Statements.
| | |
| 91 | | Annual Report | June 30, 2015 |
| | | | | | | | | | | | | | |
| |
Ultra-Small Company Market | | | Small-Cap Momentum | |
Year Ended
June 30, | | | Year Ended
June 30, | |
| 2015 | | | 2014 | | | 2015 | | | 2014 | |
| | | |
| | | | | | | | | | | | | | |
| $ | 2,968,400 | | | $ | 2,924,214 | | | $ | 40,172 | | | $ | 3,930 | |
| | 33,400,024 | | | | 45,200,727 | | | | 142,632 | | | | 726,074 | |
| | | |
| | (23,058,470 | ) | | | 38,820,181 | | | | 11,922 | | | | 210,124 | |
| 13,309,954 | | | | 86,945,122 | | | | 194,726 | | | | 940,128 | |
| | | |
| | | | | | | | | | | | | | |
| | (3,294,374 | ) | | | (4,139,584 | ) | | | (27,463 | ) | | | (10,130 | ) |
| | (37,828,878 | ) | | | (35,854,743 | ) | | | (442,934 | ) | | | (611,659 | ) |
| (41,123,252 | ) | | | (39,994,327 | ) | | | (470,397 | ) | | | (621,789 | ) |
| | | |
| | | | | | | | | | | | | | |
| | 46,724,160 | | | | 88,398,227 | | | | 181,242 | | | | 1,714,550 | |
| | 39,489,770 | | | | 36,966,829 | | | | 467,987 | | | | 621,509 | |
| | (79,731,098 | ) | | | (90,103,055 | ) | | | (1,145,289 | ) | | | (1,197,763 | ) |
| | 87,151 | | | | 236,586 | | | | 28 | | | | 831 | |
| | | |
| 6,569,983 | | | | 35,498,587 | | | | (496,032 | ) | | | 1,139,127 | |
| (21,243,315 | ) | | | 82,449,382 | | | | (771,703 | ) | | | 1,457,466 | |
| | | |
| | | | | | | | | | | | | | |
| | 424,096,319 | | | | 341,646,937 | | | | 5,894,256 | | | | 4,436,790 | |
$ | 402,853,004 | | | $ | 424,096,319 | | | $ | 5,122,553 | | | $ | 5,894,256 | |
| | | |
| | | | | | | | | | | | | | |
| | 2,862,947 | | | | 5,175,660 | | | | 14,977 | | | | 133,880 | |
| | 2,643,224 | | | | 2,277,685 | | | | 42,390 | | | | 49,921 | |
| | (4,894,380 | ) | | | (5,302,510 | ) | | | (93,856 | ) | | | (94,408 | ) |
| 611,791 | | | | 2,150,835 | | | | (36,489 | ) | | | 89,393 | |
| | 24,282,687 | | | | 22,131,852 | | | | 453,378 | | | | 363,985 | |
| 24,894,478 | | | | 24,282,687 | | | | 416,889 | | | | 453,378 | |
| | | |
| $ | 3 | | | $ | 103,540 | | | $ | 9,442 | | | $ | - | |
| | |
STATEMENTS OF CHANGES IN NET ASSETS (continued) | | |
| | | | | | | | | | | | | | | | | | |
| | | |
| | | Small-Cap Growth | | | Small-Cap Value | | | |
| | | Year Ended
June 30, | | | Year Ended
June 30, | | | |
| | | 2015 | | | 2014 | | | 2015 | | | 2014 | | | |
| | | | | |
OPERATIONS | | | | | | | | | | | | | | | | | | |
Net investment income (loss) | | $ | (23,592 | ) | | $ | 21,893 | | | $ | 1,006,371 | | | $ | 600,775 | | | |
Net realized gain on investments | | | 4,000,306 | | | | 8,176,246 | | | | 5,855,994 | | | | 19,073,482 | | | |
Net change in unrealized appreciation (depreciation) on
investments | | | 481,668 | | | | (944,872 | ) | | | (8,924,705 | ) | | | (4,096,067 | ) | | |
Net increase (decrease) in net assets resulting from
operations | | | 4,458,382 | | | | 7,253,267 | | | | (2,062,340 | ) | | | 15,578,190 | | | |
| | | | | |
DISTRIBUTIONS: | | | | | | | | | | | | | | | | | | |
From net investment income. | | | (21,907 | ) | | | (134,922 | ) | | | (581,377 | ) | | | (411,510 | ) | | |
Net decrease in net assets from distributions | | | (21,907 | ) | | | (134,922 | ) | | | (581,377 | ) | | | (411,510 | ) | | |
| | | | | |
SHARE TRANSACTIONS: | | | | | | | | | | | | | | | | | | |
Proceeds from sale of shares | | | 4,488,921 | | | | 4,396,650 | | | | 5,477,606 | | | | 8,350,818 | | | |
Reinvestment of distributions | | | 20,925 | | | | 128,745 | | | | 548,083 | | | | 390,564 | | | |
Cost of shares redeemed | | | (5,563,663 | ) | | | (8,829,944 | ) | | | (15,922,282 | ) | | | (17,374,484 | ) | | |
Net increase (decrease) in net assets resulting from share
transactions | | | (1,053,817 | ) | | | (4,304,549 | ) | | | (9,896,593 | ) | | | (8,633,102 | ) | | |
| | | | | |
Net increase (decrease) in net assets | | | 3,382,658 | | | | 2,813,796 | | | | (12,540,310 | ) | | | 6,533,578 | | | |
| | | | | |
NET ASSETS: | | | | | | | | | | | | | | | | | | |
Beginning of year | | | 33,418,637 | | | | 30,604,841 | | | | 85,781,548 | | | | 79,247,970 | | | |
End of year* | | $ | 36,801,295 | | | $ | 33,418,637 | | | $ | 73,241,238 | | | $ | 85,781,548 | | | |
| | | | | |
SHARES ISSUED & REDEEMED | | | | | | | | | | | | | | | | | | |
Issued | | | 228,708 | | | | 260,853 | | | | 248,054 | | | | 392,653 | | | |
Distributions reinvested | | | 1,168 | | | | 7,459 | | | | 26,087 | | | | 18,174 | | | |
Redeemed | | | (280,771 | ) | | | (504,578 | ) | | | (723,093 | ) | | | (816,636 | ) | | |
Net increase (decrease) | | | (50,895 | ) | | | (236,266 | ) | | | (448,952 | ) | | | (405,809 | ) | | |
Outstanding at beginning of year | | | 1,789,307 | | | | 2,025,573 | | | | 3,719,287 | | | | 4,125,096 | | | |
Outstanding at end of year | | | 1,738,412 | | | | 1,789,307 | | | | 3,270,335 | | | | 3,719,287 | | | |
| | | | | |
* Including undistributed net investment income of: | | $ | - | | | $ | 21,889 | | | $ | 941,370 | | | $ | 510,944 | | | |
See Notes to Financial Statements.
| | |
| 93 | | Annual Report | June 30, 2015 |
| | |
| | |
|
| | | | | | | | | | | | | | | | | | | | | | |
| | |
Large-Cap Growth | | | Blue Chip 35 Index | | | Managed Volatility | |
Year Ended
June 30, | | | Year Ended
June 30, | | | Year Ended
June 30, | |
| 2015 | | | 2014 | | | 2015 | | | 2014 | | | 2015 | | | 2014 | |
| | | | | |
| | | | | | | | | | | | | | | | | | | | | | | |
| $ | 678,230 | | | $ | 371,342 | | | $ | 13,543,483 | | | $ | 11,231,549 | | | $ | 15,857 | | | $ | 59,672 | |
| | 7,237,893 | | | | 10,053,322 | | | | 4,936,744 | | | | 25,571,189 | | | | 950,869 | | | | 289,994 | |
�� |
1,817,428 |
| | | 2,238,082 | | | | 16,801,251 | | | | 61,288,676 | | | | (716,847 | ) | | | 2,995,432 | |
| 9,733,551 | | | | 12,662,746 | | | | 35,281,478 | | | | 98,091,414 | | | | 249,879 | | | | 3,345,098 | |
| | | | | |
| | | | | | | | | | | | | | | | | | | | | | | |
| | (330,018 | ) | | | (269,798 | ) | | | (11,713,217 | ) | | | (9,822,019 | ) | | | (59,691 | ) | | | (90,423 | ) |
| (330,018 | ) | | | (269,798 | ) | | | (11,713,217 | ) | | | (9,822,019 | ) | | | (59,691 | ) | | | (90,423 | ) |
| | | | | |
| | 101,191,213 | | | | 2,603,682 | | | | 187,796,541 | | | | 122,237,919 | | | | 24,595,261 | | | | 27,943,007 | |
| | 316,957 | | | | 257,823 | | | | 11,360,966 | | | | 9,492,007 | | | | 55,735 | | | | 84,811 | |
| | (10,761,992 | ) | | | (6,877,425 | ) | | | (178,887,373 | ) | | | (126,160,896 | ) | | | (12,740,758 | ) | | | (11,077,782 | ) |
|
90,746,178 |
| | | (4,015,920 | ) | | | 20,270,134 | | | | 5,569,030 | | | | 11,910,238 | | | | 16,950,036 | |
| | | | | |
| | 100,149,711 | | | | 8,377,028 | | | | 43,838,395 | | | | 93,838,425 | | | | 12,100,426 | | | | 20,204,711 | |
| | | | | |
| | | | | | | | | | | | | | | | | | | | | | | |
| | 56,343,594 | | | | 47,966,566 | | | | 556,984,710 | | | | 463,146,285 | | | | 46,907,939 | | | | 26,703,228 | |
$ | 156,493,305 | | | $ | 56,343,594 | | | $ | 600,823,105 | | | $ | 556,984,710 | | | $ | 59,008,365 | | | $ | 46,907,939 | |
| | | | | |
| | 4,302,332 | | | | 136,923 | | | | 16,033,306 | | | | 11,688,219 | | | | 1,745,954 | | | | 2,098,652 | |
| | 14,681 | | | | 13,944 | | | | 1,007,178 | | | | 921,554 | | | | 4,036 | | | | 6,489 | |
| | (464,212 | ) | | | (368,472 | ) | | | (15,052,751 | ) | | | (12,014,968 | ) | | | (913,317 | ) | | | (835,656 | ) |
| 3,852,801 | | | | (217,605 | ) | | | 1,987,733 | | | | 594,805 | | | | 836,673 | | | | 1,269,485 | |
| | 2,746,658 | | | | 2,964,263 | | | | 48,891,245 | | | | 48,296,440 | | | | 3,363,957 | | | | 2,094,472 | |
| 6,599,459 | | | | 2,746,658 | | | | 50,878,978 | | | | 48,891,245 | | | | 4,200,630 | | | | 3,363,957 | |
| | | | | |
| $ | 538,934 | | | $ | 190,722 | | | $ | 7,344,268 | | | $ | 5,514,002 | | | $ | 15,835 | | | $ | 59,669 | |
(for a share outstanding throughout each year indicated)
AGGRESSIVE INVESTORS 1
| | | | | | | | | | |
| | | Year Ended June 30 |
| | | | | |
| | | 2015 | | 2014 | | 2013 | | 2012 | | 2011 |
| | | | | |
Net Asset Value, Beginning of Year | | $56.69 | | $43.21 | | $33.13 | | $38.19 | | $27.67 |
| | | | | | | | | | |
| | | | | |
Income from Investment Operations: | | | | | | | | | | |
Net Investment Income(a) | | 0.02 | | 0.11 | | 0.65 | | 0.62 | | 0.51 |
Net Realized and Unrealized Gain (Loss) | | 2.56 | | 13.73 | | 9.84 | | (4.37) | | 10.72 |
| | | | | | | | | | |
Total from Investment Operations | | 2.58 | | 13.84 | | 10.49 | | (3.75) | | 11.23 |
| | | | | | | | | | |
| | | | | |
Less Distributions to Shareholders from: | | | | | | | | | | |
Net Investment Income | | (0.12) | | (0.36) | | (0.41) | | (1.31) | | (0.71) |
| | | | | | | | | | |
Total Distributions | | (0.12) | | (0.36) | | (0.41) | | (1.31) | | (0.71) |
| | | | | | | | | | |
| | | | | |
Net Asset Value, End of Year | | $59.15 | | $56.69 | | $43.21 | | $33.13 | | $38.19 |
| | | | | | | | | | |
| | | | | |
Total Return | | 4.57% | | 32.14% | | 31.92% | | (9.57%) | | 40.81% |
| | | | | |
Ratios and Supplemental Data: | | | | | | | | | | |
Net Assets, End of Year (in 000’s) | | $248,046 | | $259,402 | | $221,337 | | $206,010 | | $106,757 |
Expenses Before Waivers and Reimbursements | | 1.32% | | 1.01% | | 0.74%(b) | | (0.04%)(b) | | (0.41%)(b) |
Expenses After Waivers and Reimbursements | | 1.32% | | 1.01% | | 0.74% | | (0.04%) | | (0.41%) |
Net Investment Income After Waivers and Reimbursements | | 0.04% | | 0.22% | | 1.69% | | 1.86% | | 1.49% |
Portfolio Turnover Rate | | 107% | | 125% | | 149% | | 125% | | 107% |
| (a) | Per share amounts calculated based on the average daily shares outstanding during the period. |
| (b) | For the years ended June 30, 2011, June 30, 2012 and June 30, 2013, the expense ratio was significantly lower than in past years, due to a negative performance adjustment to the investment advisory fee. Please refer to Note 3 of the Notes to Financial Statements for further information. The rate shown may not be indicative of the rate going forward. |
See Notes to Financial Statements.
| | |
| 95 | | Annual Report | June 30, 2015 |
(for a share outstanding throughout each year indicated)
ULTRA-SMALL COMPANY
| | | | | | | | | | |
| | | Year Ended June 30 |
| | | 2015 | | 2014 | | 2013 | | 2012 | | 2011 |
Net Asset Value, Beginning of Year | | $41.83 | | $39.36 | | $27.57 | | $29.65 | | $22.94 |
| | | | | |
| | | | | | | | | | |
| | | | | |
Income from Investment Operations: | | | | | | | | | | |
Net Investment Income(a) | | 0.24 | | 0.41 | | 0.43 | | 0.13 | | 0.07 |
Net Realized and Unrealized Gain (Loss) | | (3.53) | | 8.33 | | 11.38 | | (1.79) | | 6.83 |
| | | | | | | | | | |
Total from Investment Operations | | (3.29) | | 8.74 | | 11.81 | | (1.66) | | 6.90 |
| | | | | | | | | | |
| | | | | |
Less Distributions to Shareholders from: | | | | | | | | | | |
Net Investment Income | | (0.30) | | (0.76) | | (0.02) | | (0.42) | | (0.19) |
Net Realized Gain | | (7.87) | | (5.51) | | - | | - | | - |
| | | | | | | | | | |
Total Distributions | | (8.17) | | (6.27) | | (0.02) | | (0.42) | | (0.19) |
| | | | | | | | | | |
| | | | | |
Net Asset Value, End of Year | | $30.37 | | $41.83 | | $39.36 | | $27.57 | | $29.65 |
| | | | | | | | | | |
| | | | | |
Total Return | | (7.60)% | | 23.72% | | 42.85% | | (5.41%) | | 30.12% |
| | | | | |
Ratios and Supplemental Data: | | | | | | | | | | |
Net Assets, End of Year (in 000’s) | | $127,717 | | $152,331 | | $132,064 | | $102,110 | | $94,434 |
Expenses Before Waivers and Reimbursements | | 1.11% | | 1.10% | | 1.17% | | 1.22% | | 1.18% |
Expenses After Waivers and Reimbursements | | 1.11% | | 1.10% | | 1.17% | | 1.22% | | 1.18% |
Net Investment Income After Waivers and Reimbursements | | 0.68% | | 0.98% | | 1.33% | | 0.49% | | 0.27% |
Portfolio Turnover Rate | | 90% | | 99% | | 89% | | 93% | | 110% |
| (a) | Per share amounts calculated based on the average daily shares outstanding during the period. |
See Notes to Financial Statements.
(for a share outstanding throughout each year indicated)
ULTRA-SMALL COMPANY MARKET
| | | | | | | | | | |
| | | Year Ended June 30 |
| | | | | |
| | | 2015 | | 2014 | | 2013 | | 2012 | | 2011 |
| | | | | |
Net Asset Value, Beginning of Year | | $17.46 | | $15.44 | | $14.67 | | $15.34 | | $11.72 |
| | | | | | | | | | |
| | | | | |
Income from Investment Operations: | | | | | | | | | | |
Net Investment Income(a) | | 0.12 | | 0.12 | | 0.22 | | 0.12 | | 0.12 |
Net Realized and Unrealized Gain (Loss) | | 0.38 | | 3.66 | | 3.49 | | (0.09) | | 3.65 |
| | | | | | | | | | |
Total from Investment Operations | | 0.50 | | 3.78 | | 3.71 | | 0.03 | | 3.77 |
| | | | | | | | | | |
| | | | | |
Less Distributions to Shareholders from: | | | | | | | | | | |
Net Investment Income | | (0.14) | | (0.18) | | (0.40) | | (0.14) | | (0.15) |
Net Realized Gain | | (1.64) | | (1.59) | | (2.54) | | (0.56) | | - |
| | | | | | | | | | |
Total Distributions | | (1.78) | | (1.77) | | (2.94) | | (0.70) | | (0.15) |
| | | | | | | | | | |
| | | | | |
Paid in Capital from Redemption Fees(a) | | 0.00(b) | | 0.01 | | 0.00(b) | | 0.00(b) | | 0.00(b) |
| | | | | | | | | | |
Net Asset Value, End of Year | | $16.18 | | $17.46 | | $15.44 | | $14.67 | | $15.34 |
| | | | | | | | | | |
| | | | | |
Total Return | | 3.72% | | 25.48% | | 29.95%(c) | | 1.05%(c) | | 32.22%(c) |
| | | | | |
Ratios and Supplemental Data: | | | | | | | | | | |
Net Assets, End of Year (in 000’s) | | $402,853 | | $424,096 | | $341,647 | | $302,432 | | $393,883 |
Expenses Before Waivers and Reimbursements | | 0.73% | | 0.72% | | 0.79% | | 0.83% | | 0.79% |
Expenses After Waivers and Reimbursements | | 0.73% | | 0.72% | | 0.75% | | 0.75% | | 0.75% |
Net Investment Income After Waivers and Reimbursements | | 0.74% | | 0.73% | | 1.52% | | 0.86% | | 0.82% |
Portfolio Turnover Rate | | 32% | | 29% | | 41% | | 31% | | 42% |
| (a) | Per share amounts calculated based on the average daily shares outstanding during the period. |
| (b) | Amount represents less than $0.005. |
| (c) | Total return would have been lower had various fees not been waived during the period. |
See Notes to Financial Statements.
| | |
| 97 | | Annual Report | June 30, 2015 |
(for a share outstanding throughout each year indicated)
SMALL-CAP MOMENTUM
| | | | | | | | | | |
| | | Year Ended June 30 |
| | | 2015 | | 2014 | | 2013 | | 2012 | | 2011 |
Net Asset Value, Beginning of Year | | $13.00 | | $12.19 | | $11.25 | | $12.74 | | $9.33 |
| | | | | | | | | | |
| | | | | |
Income from Investment Operations: | | | | | | | | | | |
Net Investment Income(a) | | 0.09 | | 0.01 | | 0.10 | | 0.04 | | 0.09 |
Net Realized and Unrealized Gain (Loss) | | 0.37 | | 2.29 | | 2.20 | | (0.35) | | 3.40 |
| | | | | | | | | | |
Total from Investment Operations | | 0.46 | | 2.30 | | 2.30 | | (0.31) | | 3.49 |
| | | | | | | | | | |
| | | | | |
Less Distributions to Shareholders from: | | | | | | | | | | |
Net Investment Income | | (0.07) | | (0.02) | | (0.19) | | (0.01) | | (0.08) |
Net Realized Gain | | (1.10) | | (1.47) | | (1.17) | | (1.18) | | - |
| | | | | | | | | | |
Total Distributions | | (1.17) | | (1.49) | | (1.36) | | (1.19) | | (0.08) |
| | | | | | | | | | |
| | | | | |
Paid in Capital from Redemption Fees(a) | | 0.00(b) | | 0.00(b) | | 0.00(b) | | 0.01 | | 0.00(b) |
| | | | | | | | | | |
Net Asset Value, End of Year | | $12.29 | | $13.00 | | $12.19 | | $11.25 | | $12.74 |
| | | | | | | | | | |
| | | | | |
Total Return | | 4.54%(c) | | 19.46%(c) | | 22.31%(c) | | (1.40%)(c) | | 37.49%(c) |
| | | | | |
Ratios and Supplemental Data: | | | | | | | | | | |
Net Assets, End of Year (in 000’s) | | $5,123 | | $5,894 | | $4,437 | | $2,070 | | $3,002 |
Expenses Before Waivers and Reimbursements | | 3.36% | | 3.08% | | 5.42% | | 5.73% | | 5.43% |
Expenses After Waivers and Reimbursements | | 0.90% | | 0.90% | | 0.90% | | 0.90% | | 0.90% |
Net Investment Income After Waivers and Reimbursements | | 0.77% | | 0.07% | | 0.89% | | 0.38% | | 0.79% |
Portfolio Turnover Rate | | 198% | | 242% | | 264% | | 230% | | 272% |
| (a) | Per share amounts calculated based on the average daily shares outstanding during the period. |
| (b) | Amount represents less than $0.005. |
| (c) | Total return would have been lower had various fees not been waived during the period. |
See Notes to Financial Statements.
(for a share outstanding throughout each year indicated)
SMALL-CAP GROWTH
| | | | | | | | | | | | | | | | | | | | |
| | | Year Ended June 30 | |
| | | 2015 | | | 2014 | | | 2013 | | | 2012 | | | 2011 | |
Net Asset Value, Beginning of Year | | $ | 18.68 | | | $ | 15.11 | | | $ | 11.63 | | | $ | 12.42 | | | $ | 9.14 | |
| | | | | | | | | | | | | | | | | | | | |
| | | | | |
Income from Investment Operations: | | | | | | | | | | | | | | | | | | | | |
Net Investment Income (Loss)(a) | | | (0.01) | | | | 0.01 | | | | 0.08 | | | | (0.02) | | | | (0.01) | |
Net Realized and Unrealized Gain (Loss) | | | 2.51 | | | | 3.63 | | | | 3.40 | | | | (0.77) | | | | 3.31 | |
| | | | | | | | | | | | | | | | | | | | |
Total from Investment Operations | | | 2.50 | | | | 3.64 | | | | 3.48 | | | | (0.79) | | | | 3.30 | |
| | | | | | | | | | | | | | | | | | | | |
| | | | | |
Less Distributions to Shareholders from: | | | | | | | | | | | | | | | | | | | | |
Net Investment Income | | | (0.01) | | | | (0.07) | | | | - | | | | 0.00(b) | | | | (0.02) | |
| | | | | | | | | | | | | | | | | | | | |
Total Distributions | | | (0.01) | | | | (0.07) | | | | - | | | | 0.00(b) | | | | (0.02) | |
| | | | | | | | | | | | | | | | | | | | |
| | | | | |
Net Asset Value, End of Year | | | $21.17 | | | | $18.68 | | | | $15.11 | | | | $11.63 | | | | $12.42 | |
| | | | | | | | | | | | | | | | | | | | |
| | | | | |
Total Return | | | 13.41%(c) | | | | 24.11%(c) | | | | 29.92%(c) | | | | (6.35%)(c) | | | | 36.17%(c) | |
| | | | | |
Ratios and Supplemental Data: | | | | | | | | | | | | | | | | | | | | |
Net Assets, End of Year (in 000’s) | | | $36,801 | | | | $33,419 | | | | $30,605 | | | | $31,778 | | | | $46,717 | |
Expenses Before Waivers and | | | | | | | | | | | | | | | | | | | | |
Reimbursements | | | 1.08% | | | | 1.07% | | | | 1.13% | | | | 1.08% | | | | 0.98% | |
Expenses After Waivers and Reimbursements | | | 0.94% | | | | 0.94% | | | | 0.94% | | | | 0.94% | | | | 0.94% | |
Net Investment Income (Loss) After Waivers and Reimbursements | | | (0.07%) | | | | 0.06% | | | | 0.60% | | | | (0.14%) | | | | (0.12%) | |
Portfolio Turnover Rate | | | 123% | | | | 121% | | | | 78% | | | | 63% | | | | 87% | |
| (a) | Per share amounts calculated based on the average daily shares outstanding during the period. |
| (b) | Amount represents less than $0.005. |
| (c) | Total return would have been lower had various fees not been waived during the period. |
See Notes to Financial Statements.
| | |
| 99 | | Annual Report | June 30, 2015 |
(for a share outstanding throughout each year indicated)
SMALL-CAP VALUE
| | | | | | | | | | |
| | | Year Ended June 30 |
| | | | | |
| | | 2015 | | 2014 | | 2013 | | 2012 | | 2011 |
| | | | | |
| | | | | | | | | | |
| | | | | | | | | | |
Net Asset Value, Beginning of Year | | $23.06 | | $19.21 | | $14.82 | | $15.12 | | $11.45 |
| | | | | |
| | | | | | | | | | |
| | | | | |
Income from Investment Operations: | | | | | | | | | | |
Net Investment Income(a) | | 0.29 | | 0.15 | | 0.29 | | 0.15 | | 0.14 |
Net Realized and Unrealized Gain (Loss) | | (0.78) | | 3.80 | | 4.46 | | (0.26) | | 3.60 |
| | | | | |
| | | | | | | | | | |
| | | | | | | | | | |
Total from Investment Operations | | (0.49) | | 3.95 | | 4.75 | | (0.11) | | 3.74 |
| | | | | |
| | | | | | | | | | |
| | | | | |
Less Distributions to Shareholders from: | | | | | | | | | | |
Net Investment Income | | (0.17) | | (0.10) | | (0.36) | | (0.19) | | (0.07) |
| | | | | |
| | | | | | | | | | |
| | | | | | | | | | |
Total Distributions | | (0.17) | | (0.10) | | (0.36) | | (0.19) | | (0.07) |
| | | | | |
| | | | | | | | | | |
| | | | | |
Net Asset Value, End of Year | | $22.40 | | $23.06 | | $19.21 | | $14.82 | | $15.12 |
| | | | | | | | | | |
| | | | | |
Total Return | | (2.10%)(b) | | 20.63%(b) | | 32.49% | | (0.59%)(b) | | 32.73% |
| | | | | |
Ratios and Supplemental Data: | | | | | | | | | | |
Net Assets, End of Year (in 000’s) | | $73,241 | | $85,782 | | $79,248 | | $67,610 | | $93,714 |
Expenses Before Waivers and Reimbursements | | 0.98% | | 0.97% | | 0.91% | | 0.99% | | 0.87% |
Expenses After Waivers and Reimbursements | | 0.94% | | 0.94% | | 0.91% | | 0.94% | | 0.87% |
Net Investment Income After Waivers and Reimbursements | | 1.30% | | 0.71% | | 1.71% | | 1.10% | | 1.03% |
Portfolio Turnover Rate | | 74% | | 83% | | 64% | | 49% | | 84% |
| (a) | Per share amounts calculated based on the average daily shares outstanding during the period. |
| (b) | Total return would have been lower had various fees not been waived during the period. |
See Notes to Financial Statements.
(for a share outstanding throughout each year indicated)
LARGE-CAP GROWTH
| | | | | | | | | | |
| | | Year Ended June 30 |
| | | | | |
| | | 2015 | | 2014 | | 2013 | | 2012 | | 2011 |
| | | | | |
| | | | | | | | | | |
| | | | | |
Net Asset Value, Beginning of Year | | $20.51 | | $16.18 | | $13.33 | | $13.38 | | $10.17 |
| | | | | |
| | | | | | | | | | |
| | | | | |
Income from Investment Operations: | | | | | | | | | | |
Net Investment Income(a) | | 0.17 | | 0.13 | | 0.16 | | 0.09 | | 0.06 |
Net Realized and Unrealized Gain (Loss) | | 3.14 | | 4.29 | | 2.88 | | (0.05) | | 3.22 |
| | | | | |
| | | | | | | | | | |
| | | | | |
Total from Investment Operations | | 3.31 | | 4.42 | | 3.04 | | 0.04 | | 3.28 |
| | | | | |
| | | | | | | | | | |
| | | | | |
Less Distributions to Shareholders from: | | | | | | | | | | |
Net Investment Income | | (0.11) | | (0.09) | | (0.19) | | (0.09) | | (0.07) |
| | | | | |
| | | | | | | | | | |
| | | | | |
Total Distributions | | (0.11) | | (0.09) | | (0.19) | | (0.09) | | (0.07) |
| | | | | |
| | | | | | | | | | |
| | | | | |
Net Asset Value, End of Year | | $23.71 | | $20.51 | | $16.18 | | $13.33 | | $13.38 |
| | | | | | | | | | |
| | | | | |
Total Return | | 16.19% | | 27.41%(b) | | 23.06%(b) | | 0.37%(b) | | 32.31%(b) |
| | | | | |
Ratios and Supplemental Data: | | | | | | | | | | |
Net Assets, End of Year (in 000’s) | | $156,493 | | $56,344 | | $47,967 | | $48,444 | | $58,478 |
Expenses Before Waivers and Reimbursements | | 0.81% | | 0.87% | | 0.90% | | 0.92% | | 0.86% |
Expenses After Waivers and Reimbursements | | 0.81% | | 0.84% | | 0.84% | | 0.84% | | 0.84% |
Net Investment Income After Waivers and Reimbursements | | 0.75% | | 0.70% | | 1.10% | | 0.74% | | 0.47% |
Portfolio Turnover Rate | | 48% | | 74% | | 49% | | 55% | | 65% |
| (a) | Per share amounts calculated based on the average daily shares outstanding during the period. |
| (b) | Total return would have been lower had various fees not been waived during the period. |
See Notes to Financial Statements.
| | |
| 101 | | Annual Report | June 30, 2015 |
(for a share outstanding throughout each year indicated)
BLUE CHIP 35 INDEX
| | | | | | | | | | |
| | | Year Ended June 30 |
| | | | | |
| | | 2015 | | 2014 | | 2013 | | 2012 | | 2011 |
| | | | | |
Net Asset Value, Beginning of Year | | $11.39 | | $9.59 | | $8.16 | | $7.60 | | $6.18 |
| | | | | |
| | | | | | | | | | |
| | | | | |
Income from Investment Operations: | | | | | | | | | | |
Net Investment Income(a) | | 0.26 | | 0.23 | | 0.21 | | 0.17 | | 0.15 |
Net Realized and Unrealized Gain | | 0.39 | | 1.77 | | 1.46 | | 0.55 | | 1.39 |
| | | | | |
| | | | | | | | | | |
Total from Investment Operations | | 0.65 | | 2.00 | | 1.67 | | 0.72 | | 1.54 |
| | | | | |
| | | | | | | | | | |
| | | | | |
Less Distributions to Shareholders from: | | | | | | | | | | |
Net Investment Income | | (0.23) | | (0.20) | | (0.24) | | (0.16) | | (0.12) |
| | | | | |
| | | | | | | | | | |
Total Distributions | | (0.23) | | (0.20) | | (0.24) | | (0.16) | | (0.12) |
| | | | | |
| | | | | | | | | | |
| | | | | |
Net Asset Value, End of Year | | $11.81 | | $11.39 | | $9.59 | | $8.16 | | $7.60 |
| | | | | | | | | | |
| | | | | |
Total Return | | 5.77%(b) | | 21.11%(b) | | 20.89%(b) | | 9.72%(b) | | 25.10%(b) |
| | | | | |
Ratios and Supplemental Data: | | | | | | | | | | |
Net Assets, End of Year (in 000’s) | | $600,823 | | $556,985 | | $463,146 | | $264,161 | | $331,565 |
Expenses Before Waivers and Reimbursements | | 0.23% | | 0.25% | | 0.27% | | 0.29% | | 0.27% |
Expenses After Waivers and Reimbursements | | 0.15% | | 0.15% | | 0.15% | | 0.15% | | 0.15% |
Net Investment Income After Waivers and Reimbursements | | 2.19% | | 2.20% | | 2.36% | | 2.28% | | 2.09% |
Portfolio Turnover Rate | | 19% | | 28% | | 28% | | 33% | | 19% |
| (a) | Per share amounts calculated based on the average daily shares outstanding during the period. |
| (b) | Total return would have been lower had various fees not been waived during the period. |
See Notes to Financial Statements.
(for a share outstanding throughout each year indicated)
MANAGED VOLATILITY
| | | | | | | | | | |
| | | Year Ended June 30 |
| | | | | |
| | | 2015 | | 2014 | | 2013 | | 2012 | | 2011 |
| | | | | |
Net Asset Value, Beginning of Year | | $13.94 | | $12.75 | | $11.94 | | $11.58 | | $10.23 |
| | | | | |
| | | | | | | | | | |
| | | | | |
Income from Investment Operations: | | | | | | | | | | |
Net Investment Income(a) | | 0.00(b) | | 0.02 | | 0.05 | | 0.04 | | 0.07 |
Net Realized and Unrealized Gain | | 0.13 | | 1.20 | | 0.81 | | 0.39 | | 1.37 |
| | | | | |
| | | | | | | | | | |
Total from Investment Operations | | 0.13 | | 1.22 | | 0.86 | | 0.43 | | 1.44 |
| | | | | |
| | | | | | | | | | |
| | | | | |
Less Distributions to Shareholders from: | | | | | | | | | | |
Net Investment Income | | (0.02) | | (0.03) | | (0.05) | | (0.07) | | (0.09) |
| | | | | |
| | | | | | | | | | |
Total Distributions | | (0.02) | | (0.03) | | (0.05) | | (0.07) | | (0.09) |
| | | | | |
| | | | | | | | | | |
| | | | | |
Net Asset Value, End of Year | | $14.05 | | $13.94 | | $12.75 | | $11.94 | | $11.58 |
| | | | | | | | | | |
| | | | | |
Total Return | | 0.92%(c) | | 9.61%(c) | | 7.23%(c) | | 3.74%(c) | | 14.15%(c) |
| | | | | |
Ratios and Supplemental Data: | | | | | | | | | | |
Net Assets, End of Year (in 000’s) | | $59,008 | | $46,908 | | $26,703 | | $23,705 | | $29,246 |
Expenses Before Waivers and Reimbursements | | 1.04% | | 1.14% | | 1.35% | | 1.43% | | 1.22% |
Expenses After Waivers and Reimbursements | | 0.94% | | 0.94% | | 0.94% | | 0.94% | | 0.94% |
Net Investment Income After Waivers and Reimbursements | | 0.03% | | 0.17% | | 0.37% | | 0.39% | | 0.63% |
Portfolio Turnover Rate | | 38% | | 39% | | 45% | | 41% | | 34% |
| (a) | Per share amounts calculated based on the average daily shares outstanding during the period. |
| (b) | Amount represents less than $0.005. |
| (c) | Total return would have been lower had various fees not been waived during the period. |
See Notes to Financial Statements.
| | |
| 103 | | Annual Report | June 30, 2015 |
| | |
NOTES TO FINANCIAL STATEMENTS | | |
June 30, 2015
1. Organization:
Bridgeway Funds, Inc. (“Bridgeway” or the “Company”) was organized as a Maryland corporation on October 19, 1993, and is registered under the Investment Company Act of 1940, as amended (the “1940 Act”), as an open-end management investment company.
Bridgeway is organized as a series fund, with 11 investment funds as of June 30, 2015 (each is referred to as a “Fund” and collectively, the “Funds”). The Aggressive Investors 1, Ultra-Small Company, Ultra-Small Company Market, Small-Cap Momentum, Small-Cap Growth, Small-Cap Value, Large-Cap Growth, Blue Chip 35 Index and Managed Volatility Funds are presented in this report. The Omni Small-Cap Value and Omni Tax-Managed Small-Cap Value Funds are included in a separate report.
Bridgeway is authorized to issue 1,915,000,000 shares of common stock at $0.001 per share. As of June 30, 2015, 100,000,000 shares have been classified into the Aggressive Investors 1 Fund. 130,000,000 shares have been classified into the Blue Chip 35 Index Fund. 15,000,000 shares have been classified into the Ultra-Small Company Fund. 100,000,000 shares each have been classified into the Ultra-Small Company Market, Omni Small-Cap Value, Omni Tax-Managed Small-Cap Value, Small-Cap Momentum, Small-Cap Growth, Small-Cap Value and Large-Cap Growth Funds. 50,000,000 shares have been classified into the Managed Volatility Fund.
The Ultra-Small Company Fund is open to existing investors (direct only).
All of the Funds are no-load, diversified funds.
The Aggressive Investors 1 Fund seeks to exceed the stock market total return (primarily through capital appreciation) at a level of total risk roughly equal to that of the stock market over longer periods of time (three year intervals or more).
The Ultra-Small Company, Ultra-Small Company Market, Small-Cap Momentum, Small-Cap Growth, Small-Cap Value and Large-Cap Growth Funds seek to provide a long-term total return on capital, primarily through capital appreciation.
The Blue Chip 35 Index Fund seeks to provide long-term total return on capital, primarily through capital appreciation, but also some income.
The Managed Volatility Fund seeks to provide a high current return with short-term risk less than or equal to 40% of the stock market.
Bridgeway Capital Management, Inc. (the “Adviser”) is the investment adviser for all of the Funds.
2. Significant Accounting Policies:
The following summary of significant accounting policies, followed in the preparation of the financial statements of the Funds, are in conformity with accounting principles generally accepted in the United States of America (“GAAP”). Each Fund is considered an investment company under GAAP and follows the accounting and reporting guidance applicable to investment companies.
Securities, Options, Futures and Other Investments Valuation Other than options, securities for which market quotations are readily available are valued at the last sale price on the national exchange on which such securities are primarily traded. In the case of securities reported on the National Association of Securities Dealers Automated Quotation (“NASDAQ”) system, the securities are valued based on the NASDAQ Official Closing Price (“NOCP”). In the absence of recorded sales on their primary exchange, or NOCP, in the case of NASDAQ traded securities, the security will be valued as follows: bid prices for long positions and ask prices for short positions.
Fixed income securities are valued on the basis of current market quotations provided by a pricing service. Options are valued at the close if there is trading volume and, if there is no trading volume, the options are valued at the bid on long positions and the ask on the short positions.
| | |
NOTES TO FINANCIAL STATEMENTS (continued) | | |
June 30, 2015
Investments in open-end registered investment companies and closed-end registered investment companies that do not trade on an exchange are valued at the end of day net asset value (“NAV”) per share.
Investments in closed-end registered investment companies that trade on an exchange are valued at the last sales price as of the close of the customary trading session on the exchange where the security is principally traded.
When market quotations are not readily available or when events occur that make established valuation methods unreliable, securities of the Funds may be valued at fair value as determined in good faith by or under the direction of the Board of Directors. The valuation assigned to a fair valued security for purposes of calculating the Funds’ NAVs may differ from the security’s most recent closing market price and from the prices used by other mutual funds to calculate their NAVs.
The inputs and valuation techniques used to determine the value of a Fund’s investments are summarized into three levels as described in the hierarchy below:
| • | | Level 1 — quoted prices in active markets for identical assets |
Investments whose values are based on quoted market prices in active markets, and whose values are therefore classified as Level 1 prices, include active listed equity securities. The Funds do not adjust the quoted price for such investments, even in situations where the Funds hold a large position and a sale could reasonably impact the quoted price.
| • | | Level 2 — other significant observable inputs (including quoted prices for similar securities, interest rates, prepayment speeds, credit risk, etc.) |
Investments that trade in markets that are not considered to be active, but whose values are based on quoted market prices, dealer quotations or valuations provided by alternative pricing sources supported by observable inputs, are classified as Level 2 prices. These generally include certain U.S. Government and sovereign obligations, most government agency securities, investment-grade corporate bonds and less liquid listed equity securities. As investments whose values are classified as Level 2 prices include positions that are not traded in active markets and/or are subject to transfer restrictions, valuations may be adjusted to reflect illiquidity and/or non-transferability, which are generally based on available market information.
The Dreyfus Cash Management Fund, which is held by each Fund, invests primarily in securities that are valued at cost or amortized cost. Therefore, these investments are classified as Level 2 investments.
| • | | Level 3 — significant unobservable inputs (including the Fund’s own assumptions in determining the fair value of investments) |
Investments whose values are classified as Level 3 prices have significant unobservable inputs, as they may trade infrequently or not at all. When observable prices are not available for these securities, the Funds use one or more valuation techniques for which sufficient and reliable data is available. The inputs used by the Funds in estimating the value of Level 3 prices may include the original transaction price, quoted prices for similar securities or assets in active markets, completed or pending third-party transactions in the underlying investment or comparable issuers, and changes in financial ratios or cash flows. Level 3 prices may also be adjusted to reflect illiquidity and/or non-transferability, with the amount of such discount estimated by the Funds in the absence of market information. Assumptions used by the Funds due to the lack of observable inputs may significantly impact the resulting value and therefore the results of the Funds’ operations.
The inputs or methodology used for valuing investments are not necessarily an indication of the risk associated with investing in those investments. A summary of the inputs used to value the Funds’ investments as of June 30, 2015 is included with each Fund’s Schedule of Investments.
The Funds’ policy is to recognize transfers into, and transfers out of, each level of hierarchy as of the beginning of the reporting period. For the year ended June 30, 2015, the Ultra-Small Company Market Fund transferred a security with a value of $436,985 from Level 1 to Level 2 as of the end of the period due to the market becoming inactive. There were no transfers between Level 1 and Level 2 in any of the other Funds. Details regarding transfers into, and transfers out of, Level 3 can be found at the end of each Schedule of Investments for Funds that held Level 3 securities.
| | |
| 105 | | Annual Report | June 30, 2015 |
| | |
NOTES TO FINANCIAL STATEMENTS (continued) | | |
June 30, 2015
Securities Lending Upon lending its securities to third parties, each Fund receives compensation in the form of fees. The loans are secured by collateral at least equal to the fair value of the securities loaned plus accrued interest. Each Fund has the right under the lending agreement to recover the securities from the borrower on demand. Additionally, a Fund does not have the right to sell or re-pledge collateral received in the form of securities unless the borrower goes into default. The risks to a Fund of securities lending are that the borrower may not provide additional collateral when required or return the securities when due, resulting in a loss. Under the terms of the Securities Lending Agreement, the Funds are indemnified for such losses by the securities lending agent.
While securities are on loan, the Fund continues to receive dividends on the securities loaned and recognizes any gain or loss in the fair value of the securities loaned.
Securities lending transactions are entered into by a Fund under a Securities Lending Agreement which provides the right, in the event of default (including bankruptcy or insolvency) for the non-defaulting party to liquidate the collateral or to offset the market value of the collateral received against the market value of the securities loaned. The value of the collateral is typically greater than that of the market value of the securities loaned, leaving the lender with a net amount payable to the defaulting party. However, bankruptcy or insolvency laws of a particular jurisdiction may impose restrictions on or prohibitions against such a right of offset in the event of a counterparty’s bankruptcy or insolvency.
The following table is a summary of the Funds’ securities loaned and related collateral which are subject to a netting agreement as of June 30, 2015:
| | | | | | | | | | | | | | | | | | | | |
| | | | | | | | | | | Gross Amount Not
Offset in the Statement
of Assets and Liabilities | | | | |
| Fund | | Gross
Amounts of
Recognized
Assets1 | | | Gross Amounts
Offset in the
Statement of
Assets and
Liabilities | | Net Amounts of
Assets Presented
in the Statement
of Assets and
Liabilities | | | Financial
Instruments | | Cash
Collateral
Received2 | | | Net
Amount | |
| |
| | | | | | |
Aggressive Investors 1 | | | | | | | | | | | | | | | | | | | | |
Securities lending | | $ | 9,752,348 | | | - | | $ | 9,752,348 | | | - | | $ | 9,752,348 | | | | - | |
| | | | | | |
Ultra-Small Company | | | | | | | | | | | | | | | | | | | | |
Securities lending | | $ | 10,970,434 | | | - | | $ | 10,970,434 | | | - | | $ | 10,970,434 | | | | - | |
| | | | | | |
Ultra-Small Company Market | | | | | | | | | | | | | | | | | | | | |
Securities lending | | $ | 43,006,223 | | | - | | $ | 43,006,223 | | | - | | $ | 43,006,223 | | | | - | |
| | | | | | |
Small-Cap Momentum | | | | | | | | | | | | | | | | | | | | |
Securities lending | | $ | 303,096 | | | - | | $ | 303,096 | | | - | | $ | 303,096 | | | | - | |
| | | | | | |
Small-Cap Growth | | | | | | | | | | | | | | | | | | | | |
Securities lending | | $ | 5,333,433 | | | - | | $ | 5,333,433 | | | - | | $ | 5,333,433 | | | | - | |
| | | | | | |
Small-Cap Value | | | | | | | | | | | | | | | | | | | | |
Securities lending | | $ | 8,060,854 | | | - | | $ | 8,060,854 | | | - | | $ | 8,060,854 | | | | - | |
| | | | | | |
Large-Cap Growth | | | | | | | | | | | | | | | | | | | | |
Securities lending | | $ | 4,802,652 | | | - | | $ | 4,802,652 | | | - | | $ | 4,802,652 | | | | - | |
| | | | | | |
Managed Volatility | | | | | | | | | | | | | | | | | | | | |
Securities lending | | $ | 230,804 | | | - | | $ | 230,804 | | | - | | $ | 230,804 | | | | - | |
| 1 | Securities loaned with a value of $62,400 and $969,527 in Ultra-Small Company Market and Small-Cap Growth, respectively, have been sold and are pending settlement on July 1, 2015. |
| 2 | Collateral with a value of $10,088,121, $11,304,787, $44,237,825, $307,286, $5,424,205, $8,128,231, $4,920,115, and $245,163 has been received in connection with securities lending of Aggressive Investors 1, Ultra-Small Company, Ultra-Small Company Market, Small-Cap Momentum, Small-Cap Growth, Small-Cap Value, Large-Cap Growth, and Managed Volatility Funds, respectively. Excess of collateral received from an individual counterparty is not shown here for financial reporting purposes. |
| | |
NOTES TO FINANCIAL STATEMENTS (continued) | | |
June 30, 2015
It is each Fund’s policy to obtain additional collateral from, or return excess collateral to, the borrower by the end of the next business day following the valuation date of the securities loaned. Therefore, the value of the collateral held may be temporarily less than that required under the lending contract. As of June 30, 2015 the collateral consisted of an institutional money market fund.
Use of Estimates in Financial Statements In preparing financial statements in conformity with GAAP, management makes estimates and assumptions that affect the reported amounts of assets and liabilities on the date of the financial statements and the disclosure of contingent assets and liabilities on the date of the financial statements, as well as the reported amounts of revenue and expenses during the reporting period. Actual results could differ from those estimates.
Risks and Uncertainties The Funds provide for various investment options, including stocks, bonds and call and put options. Such investments are exposed to various risks, such as interest rate, market and credit risks. Due to the risks involved, it is at least reasonably possible that changes in risks in the near term would materially affect shareholders’ account values and the amounts reported in the financial statements.
Security Transactions, Investment Income and Expenses Security transactions are accounted for as of the trade date, the date the order to buy or sell is executed. Realized gains and losses are computed on the identified cost basis. Dividend income is recorded on the ex-dividend date, and interest income is recorded on the accrual basis from settlement date. Particularly related to the Managed Volatility Fund, discounts and premiums are accreted/amortized on the effective interest method.
Fund expenses that are not series-specific are allocated to each series based upon its relative proportion of net assets to the Funds’ total net assets or other appropriate basis.
Distributions to Shareholders The Funds pay dividends from net investment income and distribute realized capital gains annually, usually in December.
Derivatives
The Funds’ use of derivatives for the year ended June 30, 2015 was limited to futures contracts, purchased options, and written options. The following is a summary of how these derivatives are treated in the financial statements and their impact on the Funds, categorized by primary underlying risk.
| | | | | | | | | | | | | | |
| | | | | Asset Derivatives | | | Liability Derivatives | |
Primary Underlying
Risk/Fund | | Type of
Derivative | | Location on
Statement of
Assets and
Liabilities | | Value | | | Location on
Statement of
Assets and
Liabilities | | Value | |
| |
| | | | | |
Equity | | | | | | | | | | | | | | |
Managed Volatility | | Written Option | | | | $ | - | | | Call Options Written at Value | | $ | 187,694 | |
| | | | | | | | | | Put Options Written at Value | | | 444,080 | |
| | | | | | | | | | | | |
Fund/Financial
Instrument Type | | Type of
Derivative | | Location of Gain (Loss)
on Derivatives | | Amount of
Realized Gain
(Loss) | | | Amount of
Unrealized
Gain (Loss) | |
| |
| | | | |
Equity | | | | | | | | | | | | |
Managed Volatility | | Written Option | | Realized Gain (Loss) on Written Options | | $ | 117,574 | | | | | |
| | | | Change in Unrealized Appreciation (Depreciation) on Written Options | | | | | | $ | 315,098 | |
| | Futures Contract | | Realized Gain (Loss) on Futures Contracts | | $ | (1,318,939 | ) | | | | |
The derivative instruments outstanding as of June 30, 2015, as disclosed in the Notes to the Financial Statements, and the amounts of realized and changes in unrealized gains and losses on derivative instruments during the period, as disclosed in the Statements of Operations, serve as indicators of the volume of derivatives activity for the Funds.
| | |
| 107 | | Annual Report | June 30, 2015 |
| | |
NOTES TO FINANCIAL STATEMENTS (continued) | | |
June 30, 2015
Futures Contracts The Funds may purchase or sell financial futures contracts to hedge cash positions, manage market risk, and to dampen volatility in line with investment objectives. A futures contract is an agreement between two parties to buy or sell a financial instrument at a set price on a future date. Upon entering into such a contract, a Fund is required to pledge to the broker an amount of cash or U.S. Government securities equal to the minimum “initial margin” requirements of the exchange on which the futures contract is traded. The contract amount reflects the extent of a Fund’s exposure in these financial instruments. A Fund’s participation in the futures markets involves certain risks, including imperfect correlation between movements in the price of futures contracts and movements in the price of the securities hedged or used for cover. Pursuant to a contract, such Fund agrees to receive from, or pay to, the broker an amount of cash equal to the fluctuation in value of the contract. Such receipts or payments are known as “variation margin” and are recorded by a Fund as unrealized appreciation or depreciation. When a contract is closed, a Fund records a realized gain or loss equal to the difference between the value of the contract at the time it was opened and the value at the time it was closed. With futures, there is minimal counterparty risk to the Funds, since futures are exchange traded and the exchange’s clearinghouse, as counterparty to all exchange traded futures, guarantees the futures against default. As of June 30, 2015, the Funds had no open futures contracts.
Options The Aggressive Investors 1 Fund may buy and sell calls and puts to increase or decrease the Fund’s exposure to stock market risk or for purposes of diversification of risk. The Managed Volatility Fund may buy and sell calls and puts to reduce the Fund’s volatility and provide some cash flow. An option is a contract conveying a right to buy or sell a financial instrument at a specified price during a stipulated period. The premium paid by a Fund for the purchase of a call or a put option is included in such Fund’s Schedule of Investments as an investment and subsequently marked-to-market to reflect the current market value of the option. When a Fund writes a call or a put option, an amount equal to the premium received by such Fund is included in its Statement of Assets and Liabilities as a liability and is subsequently marked-to-market to reflect the current market value of the option written. If an option that a Fund has written either expires on its stipulated expiration date, or if such Fund enters into a closing purchase transaction, that Fund realizes a gain (or a loss if the cost of a closing purchase transaction exceeds the premium received when the option was written) without regard to any unrealized gain or loss on the underlying security, and the liability related to such options is extinguished. If a call option that a Fund has written is assigned, such Fund realizes a gain or loss from the sale of the underlying security, and the proceeds from such sale are increased by the premium originally received. If a put option that a Fund has written is assigned, the amount of the premium originally received reduces the cost of the security that such Fund purchased upon exercise of the option. Buying calls increases a Fund’s exposure to the underlying security to the extent of any premium paid. Buying puts on a stock market index tends to limit a Fund’s exposure to a stock market decline. All options purchased by the Funds were listed on exchanges and considered liquid positions with readily available market quotes.
Covered Call Options and Secured Puts The Aggressive Investors 1 and Managed Volatility Funds may write call options on a covered basis; that is, a Fund will own the underlying security, or a Fund may write secured puts. The principal reason for writing covered calls and secured puts on a security is to attempt to realize income through the receipt of premiums. The option writer has, in return for the premium, given up the opportunity for profit from a substantial price increase in the underlying security so long as the obligation as a writer continues, but has retained the risk of loss should the price of the security decline. All options were listed on exchanges and considered liquid positions with readily available market quotes. Transactions in options written during the year ended June 30, 2015 are as follows:
| | | | | | | | | | | | | | | | |
| | | Managed Volatility Fund
Written Call Options | | | Managed Volatility Fund
Written Put Options | |
| | | Contracts | | | Premiums | | | Contracts | | | Premiums | |
| |
| | | | | | | | | | | | | | | | |
Outstanding, June 30, 2014 | | | 1,510 | | | | $ 241,740 | | | | 2,029 | | | | $ 397,134 | |
Positions Opened | | | 9,592 | | | | 1,739,800 | | | | 7,511 | | | | 1,595,204 | |
Exercised | | | (2,119) | | | | (375,290) | | | | (2,537) | | | | (458,894) | |
Splits | | | 68 | | | | - | | | | 80 | | | | - | |
Expired | | | (4,597) | | | | (771,373) | | | | (4,800) | | | | (1,004,434) | |
Closed | | | (2,392) | | | | (500,512) | | | | (267) | | | | (80,806) | |
| |
| | | | |
Outstanding, June 30, 2015 | | | 2,062 | | | | $ 334,365 | | | | 2,016 | | | | $ 448,204 | |
|
| |
| | | | |
Value, June 30, 2015 | | | | | | | $ (187,694) | | | | | | | | $ (444,080) | |
|
| |
| | |
NOTES TO FINANCIAL STATEMENTS (continued) | | |
June 30, 2015
The Aggressive Investors 1 Fund had no transactions in written options during the year ended June 30, 2015.
Indemnification Under the Company’s organizational documents, the Funds’ officers, directors, employees and agents are indemnified against certain liabilities that may arise out of the performance of their duties to the Funds. Additionally, in the normal course of business, the Funds enter into contracts that contain a variety of indemnification clauses. The Funds’ maximum exposure under these arrangements is unknown, as this would involve future claims that may be made against the Funds that have not yet occurred. However, the Funds have not had prior claims or losses pursuant to these contracts.
3. Advisory Fees, Other Related Party Transactions and Contingencies:
The Funds have entered into management agreements with the Adviser. As compensation for the advisory services rendered, facilities furnished, and expenses borne by the Adviser, the Funds pay the Adviser a fee pursuant to each Fund’s management agreement, as described below.
Aggressive Investors 1: A total advisory fee is paid by the Fund to the Adviser that is comprised of a Base Fee and a Performance Adjustment. The Base Fee equals the Base Fee Rate times the average daily net assets of the Fund. The Base Fee Rate is based on the following annual rates: 0.90% of the first $250 million of the Fund’s average daily net assets, 0.875% of the next $250 million, 0.85% of the next $500 million and 0.80% of any excess over $1 billion.
The Performance Adjustment equals 4.67% times the difference in cumulative total return between the Fund and the Standard and Poor’s 500 Composite Stock Price Index with dividends reinvested (hereinafter “Index”) over a rolling five-year performance period. The Performance Adjustment Rate varies from a minimum of -0.70% to a maximum of +0.70%. However, the Performance Adjustment Rate is zero if the difference between the cumulative Fund performance and the Index performance is less than or equal to 2%.
Ultra-Small Company: The Fund pays advisory fees based on the following annual rates: 0.90% of the first $250 million of the Fund’s average daily net assets, 0.875% of the next $250 million and 0.85% of any excess over $500 million. The management fees are computed daily and are payable monthly. However, during any period when the Fund’s net assets range from $27,500,000 to $55,000,000, the advisory fee will be determined as if the Fund had $55,000,000 under management. This is limited to a maximum annualized expense ratio of 1.49% of average net assets.
Ultra-Small Company Market: The Fund’s advisory fee is a flat 0.50% of the value of the Fund’s average daily net assets, computed daily and payable monthly.
Small-Cap Momentum: The Fund’s advisory fee is a flat 0.55% of the value of the Fund’s average daily net assets, computed daily and payable monthly.
Small-Cap Growth and Small-Cap Value: A total advisory fee is paid by each Fund to the Adviser that is comprised of a Base Fee and a Performance Adjustment. The Base Fee equals the Base Fee Rate times the average daily net assets of the Fund. The Base Fee Rate is based on the annual rate of 0.60% of the value of the Fund’s average daily net assets.
The Performance Adjustment equals 0.33% times the difference in cumulative total return between the Fund and the Russell 2000 Growth Index for Small-Cap Growth Fund and the Russell 2000 Value Index for Small-Cap Value Fund, with dividends reinvested (hereinafter “Index”) over a rolling five-year performance period. The Performance Adjustment Rate varies from a minimum of -0.05% to a maximum of +0.05%. However, the Performance Adjustment Rate is zero if the difference between the cumulative Fund’s performance and the Index performance is less than or equal to 2%.
Large-Cap Growth: A total advisory fee is paid by the Fund to the Adviser that is comprised of a Base Fee and a Performance Adjustment. The Base Fee equals the Base Fee Rate times the average daily net assets of the Fund. The Base Fee Rate is based on the annual rate of 0.50% of the value of the Fund’s average daily net assets.
| | |
| 109 | | Annual Report | June 30, 2015 |
| | |
NOTES TO FINANCIAL STATEMENTS (continued) | | |
June 30, 2015
The Performance Adjustment equals 0.33% times the difference in cumulative total return between the Fund and the Russell 1000 Growth Index, with dividends reinvested (hereinafter “Index”) over a rolling five-year performance period. The Performance Adjustment Rate varies from a minimum of -0.05% to a maximum of +0.05%. However, the Performance Adjustment Rate is zero if the difference between the cumulative Fund’s performance and the Index performance is less than or equal to 2%.
Blue Chip 35 Index: The Fund’s advisory fee is a flat 0.08% of the value of the Fund’s average daily net assets, computed daily and payable monthly.
Managed Volatility: The Fund’s advisory fee is a flat 0.60% of the value of the Fund’s average daily net assets, computed daily and payable monthly.
Expense limitations: The Adviser has agreed to reimburse the Funds for operating expenses and management fees above the expense limitations shown in the table below, which are shown as a ratio of net expenses to average net assets, for each Fund, for the year ended June 30, 2015. Any material change to the expense limitation would require a vote by shareholders of the applicable Fund.
| | | | | | | | | | | | | | | |
| Bridgeway Fund | | Expense
Limitation | | Total Waivers and
Reimbursements
for Year Ending
06/30/15 | | |
|
| | | | | | | | | | | | | | | |
Aggressive Investors 1 | | | | 1.75% | | | | | $ - | | | |
Ultra-Small Company | | | | 1.85% | | | | | - | | | |
Ultra-Small Company Market | | | | 0.75% | | | | | - | | | |
Small-Cap Momentum* | | | | 0.90% | | | | | 128,110 | | | |
Small-Cap Growth | | | | 0.94% | | | | | 47,099 | | | |
Small-Cap Value | | | | 0.94% | | | | | 32,524 | | | |
Large-Cap Growth | | | | 0.84% | | | | | - | | | |
Blue Chip 35 Index | | | | 0.15% | | | | | 496,837 | | | |
Managed Volatility | | | | 0.94% | | | | | 50,322 | | | |
| | | | | | | | | | | | | |
| *The Fund is authorized to reimburse the Adviser for management fees previously waived and/or for expenses previously paid by the Adviser, provided, however, that any reimbursements must be paid at a date not more than three years after the fiscal year in which the Adviser waived the fees or reimbursed the expenses and the reimbursements do not cause the Fund to exceed the expense limitation in the agreement. The Fund has recoupable expenses of $128,493, $121,419 and $128,110, which expire June 30, 2016, June 30, 2017 and June 30, 2018, respectively. |
Other Related Party Transactions: The Funds will engage in inter-portfolio trades when it is to the benefit of both parties. The Board of Directors reviews these trades quarterly. Inter-portfolio purchases and sales during the year ended June 30, 2015 were as follows:
| | | | | | | | |
| Bridgeway Fund | | Inter-Portfolio
Purchases | | | Inter-Portfolio
Sales | |
| |
| | | | | | | | |
Aggressive Investors 1 | | | $ 2,260,311 | | | | $ 9,296,127 | |
Ultra-Small Company | | | 992,246 | | | | 18,541,930 | |
Ultra-Small Company Market | | | 19,340,422 | | | | 8,602,903 | |
Small-Cap Momentum | | | 5,117 | | | | 71,446 | |
Small-Cap Growth | | | 254,664 | | | | 1,162,840 | |
Small-Cap Value | | | 1,116,270 | | | | 6,293,412 | |
The Adviser entered into an Administrative Services Agreement with Bridgeway, pursuant to which the Adviser provides various administrative services to the Funds including, but not limited to: (i) supervising and managing various aspects of the
| | |
NOTES TO FINANCIAL STATEMENTS (continued) | | |
June 30, 2015
Funds’ business and affairs; (ii) selecting, overseeing and/or coordinating activities with other service providers to the Funds; (iii) providing reports to the Board of Directors as requested from time to time; (iv) assisting and/or reviewing amendments and updates to the Funds’ registration statement and other filings with the Securities and Exchange Commission (“SEC”); (v) providing certain shareholder services; (vi) providing administrative support in connection with meetings of the Board of Directors; and (vii) providing certain record-keeping services. Prior to July 1, 2015 for its services to all of the Bridgeway Funds, the Adviser was paid an aggregate annual fee of $535,000, payable in equal monthly installments. Effective July 1, 2015, the Adviser will be paid an aggregate annual fee of $590,000, payable in equal monthly installments.
Board of Directors Compensation Independent Directors are paid an annual retainer of $15,000, with an additional retainer of $5,000 paid to the Independent Chairman of the Board and an additional retainer of $1,000 paid to the Nominating and Corporate Governance Committee Chair. The retainer is paid in quarterly installments. Independent Directors are paid $6,250 per meeting for meeting fees. Such compensation is the total compensation from all Funds and is allocated among the Funds.
The Independent Directors each receive this compensation in the form of shares of the Bridgeway Funds, credited to his or her account. Such Directors are reimbursed for any expenses incurred in attending meetings and conferences, as well as expenses for subscriptions or printed materials. The amount of directors’ fees attributable to each Fund is disclosed in the Statements of Operations.
One director of Bridgeway, John Montgomery, is an owner and director of the Adviser. Under the 1940 Act definitions, he is considered to be an “affiliated person” of the Adviser and an “interested person” of the Adviser and of Bridgeway. Compensation for Mr. Montgomery is borne by the Adviser rather than the Funds.
4. Distribution and Shareholder Servicing Fees:
Foreside Fund Services, LLC acts as distributor of the Funds’ shares, pursuant to a Distribution Agreement dated November 12, 2010. The Adviser pays all costs and expenses associated with distribution of the Funds’ shares, pursuant to a protective plan adopted by shareholders pursuant to Rule 12b-1.
5. Purchases and Sales of Investment Securities:
Purchases and sales of investments, other than short-term securities, for each Fund for the year ended June 30, 2015 were as follows:
| | | | | | | | | | | | | | | | |
| | | Purchases | | | Sales | |
| Bridgeway Fund | | U.S. Government | | | Other | | | U.S. Government | | | Other | |
| |
| | | | | | | | | | | | | | | | |
Aggressive Investors 1 | | $ | - | | | $ | 273,191,835 | | | $ | - | | | $ | 292,847,364 | |
Ultra-Small Company | | | - | | | | 124,906,478 | | | | - | | | | 135,337,696 | |
Ultra-Small Company Market | | | - | | | | 126,768,842 | | | | - | | | | 157,126,678 | |
Small-Cap Momentum | | | - | | | | 10,363,278 | | | | - | | | | 11,276,324 | |
Small-Cap Growth | | | - | | | | 42,212,376 | | | | - | | | | 44,105,150 | |
Small-Cap Value | | | - | | | | 57,083,711 | | | | - | | | | 65,615,458 | |
Large-Cap Growth | | | - | | | | 132,420,742 | | | | - | | | | 43,442,573 | |
Blue Chip 35 Index | | | - | | | | 136,520,125 | | | | - | | | | 114,767,299 | |
Managed Volatility | | | - | | | | 17,729,508 | | | | - | | | | 10,474,314 | |
6. Federal Income Taxes
It is the Funds’ policy to continue to comply with the provisions of the Internal Revenue Code of 1986, as amended, applicable to regulated investment companies, and to distribute income to the extent necessary so that the Funds are not subject to federal income tax. Therefore, no federal income tax provision is required.
| | |
| 111 | | Annual Report | June 30, 2015 |
| | |
| NOTES TO FINANCIAL STATEMENTS (continued) | | |
June 30, 2015
Unrealized Appreciation and Depreciation on Investments (Tax Basis) The amount of net unrealized appreciation/ depreciation and the cost of investment securities for tax purposes, including short-term securities as of June 30, 2015, were as follows:
| | | | | | | | | | | | |
| | | Aggressive Investors 1 | | | Ultra-Small Company | | | Ultra-Small
Company Market | |
Gross appreciation (excess of value over tax cost) | | | $ 40,532,678 | | | | $ 22,237,161 | | | | $140,020,138 | |
Gross depreciation (excess of tax cost over value) | | | (9,638,989) | | | | (5,737,397) | | | | (24,835,499) | |
Net unrealized appreciation (depreciation) | | | $ 30,893,689 | | | | $ 16,499,764 | | | | $115,184,639 | |
Cost of investments for income tax purposes | | | $230,821,041 | | | | $121,398,747 | | | | $334,323,573 | |
| | | |
| | | Small-Cap Momentum | | | Small-Cap Growth | | | Small-Cap Value | |
Gross appreciation (excess of value over tax cost) | | | $ 524,636 | | | | $ 6,753,646 | | | | $ 8,656,132 | |
Gross depreciation (excess of tax cost over value) | | | (87,793) | | | | (1,064,829) | | | | (5,765,499) | |
Net unrealized appreciation (depreciation) | | | $ 436,843 | | | | $ 5,688,817 | | | | $ 2,890,633 | |
Cost of investments for income tax purposes | | | $5,003,601 | | | | $36,051,032 | | | | $79,222,325 | |
| | | |
| | | Large-Cap Growth | | | Blue Chip 35 Index | | | Managed Volatility | |
Gross appreciation (excess of value over tax cost) | | | $ 20,182,585 | | | | $197,379,176 | | | | $ 8,383,828 | |
Gross depreciation (excess of tax cost over value) | | | (5,125,853) | | | | (6,036,239) | | | | (1,442,514) | |
Net unrealized appreciation (depreciation) | | | $ 15,056,732 | | | | $191,342,937 | | | | $ 6,941,314 | |
Cost of investments for income tax purposes | | | $147,649,523 | | | | $408,713,036 | | | | $56,815,251 | |
The differences between book and tax net unrealized appreciation (depreciation) are primarily due to wash sale and straddle loss deferrals and basis adjustments on investments in business development companies, partnerships and passive foreign investment companies (PFICs).
Classifications of Distributions Net investment income (loss) and net realized gain (loss) may differ for financial statement and tax purposes. The character of distributions made during the year from net investment income or net realized gains may differ from its ultimate characterization for federal income tax purposes.
The tax character of the distributions paid by the Funds during the last two fiscal years ended June 30, 2015 and June 30, 2014, respectively, are as follows:
| | | | | | | | | | | | | | | | |
| | | Aggressive Investors 1 | | | Ultra-Small Company | |
| | | Year | | | Year | | | Year | | | Year | |
| | | Ended | | | Ended | | | Ended | | | Ended | |
| | | June 30, 2015 | | | June 30, 2014 | | | June 30, 2015 | | | June 30, 2014 | |
Distributions paid from: | | | | | | | | | | | | | | | | |
Ordinary Income | | | $540,861 | | | | $1,735,698 | | | | $ 1,052,434 | | | | $ 2,464,929 | |
Long-Term Capital Gain | | | - | | | | - | | | | 27,750,353 | | | | 17,948,088 | |
Total | | | $540,861 | | | | $1,735,698 | | | | $28,802,787 | | | | $20,413,017 | |
| | |
| | | Ultra-Small Company Market | | | Small-Cap Momentum | |
| | | Year | | | Year | | | Year | | | Year | |
| | | Ended | | | Ended | | | Ended | | | Ended | |
| | | June 30, 2015 | | | June 30, 2014 | | | June 30, 2015 | | | June 30, 2014 | |
Distributions paid from: | | | | | | | | | | | | | | | | |
Ordinary Income | | | $ 2,780,087 | | | | $ 2,799,151 | | | | $282,147 | | | | $490,538 | |
Long-Term Capital Gain | | | 38,343,165 | | | | 37,195,176 | | | | 188,250 | | | | 131,251 | |
Total | | | $41,123,252 | | | | $39,994,327 | | | | $470,397 | | | | $621,789 | |
| | |
NOTES TO FINANCIAL STATEMENTS (continued) | | |
June 30, 2015
| | | | | | | | | | | | |
| | | Small-Cap Growth | | | Small-Cap Value |
|
| | | Year
Ended
June 30, 2015 | | | Year Ended June 30, 2014 | | | Year
Ended
June 30, 2015 | | Year
Ended
June 30, 2014 |
|
Distributions paid from: | | | | | | | | | | | | |
Ordinary Income | | | $ 21,907 | | | | $134,922 | | | $ 581,377 | | $411,510 |
|
| | | | |
Total | | | $ 21,907 | | | | $134,922 | | | $ 581,377 | | $411,510 |
|
| | |
| | | Large-Cap Growth | | | Blue Chip 35 Index |
|
| | | Year
Ended
June 30, 2015 | | | Year Ended June 30, 2014 | | | Year
Ended
June 30, 2015 | | Year
Ended
June 30, 2014 |
|
Distributions paid from: | | | | | | | | | | | | |
Ordinary Income | | | $330,018 | | | | $269,798 | | | $11,713,217 | | $9,822,019 |
|
| | | | |
Total | | | $330,018 | | | | $269,798 | | | $11,713,217 | | $9,822,019 |
|
| | |
| | | Managed Volatility | | | |
| | | | | |
| | | Year
Ended
June 30, 2015 | | | Year Ended June 30, 2014 | | | | | |
| | | | | |
Distributions paid from: | | | | | | | | | | | | |
Ordinary Income | | | $ 59,691 | | | | $ 90,423 | | | | | |
| | | | | |
| | | | |
Total | | | $ 59,691 | | | | $ 90,423 | | | | | |
| | | | | |
As of June 30, 2015, the Funds had available for tax purposes, capital loss carryovers as follows:
| | | | | | | | |
| | | Aggressive Investors 1 | | | Ultra-Small Company | |
Expiring 6/30/2017 | | | $83,672,925 | | | | $1,203,654 | |
6/30/2018 | | | 16,094,317 | | | | - | |
| | |
| | | Small-Cap Growth | | | Small-Cap Value | |
Expiring 6/30/2018 | | | $13,110,417 | | | | $20,917,185 | |
| | | | | | | | | | | | | | |
| | | Large-Cap Growth | | | Blue Chip 35 Index | | | Managed Volatility | | | |
|
Expiring 6/30/2018 | | | $12,765,670 | | | | $13,868,547 | | | | $4,158,560 | | | |
6/30/2019 | | | - | | | | 2,656,190 | | | | - | | | |
Under the Regulated Investment Company Modernization Act of 2010, capital losses incurred by these Funds after June 30, 2011 will not be subject to expiration and will retain their character as either short-term or long-term capital losses. In addition, such losses must be utilized prior to the losses incurred in the years preceding enactment. For Aggressive Investors 1 and Ultra-Small Company Funds, capital losses related to prior year reorganizations are subject to limitations under Internal Revenue Code Section 381-384. As of the date of the reorganizations, Aggressive Investors 1 and Ultra-Small Company had accumulated capital losses of $99,767,242 and $1,203,654, respectively, which are subject to limitation.
There are no capital loss carryovers for Ultra-Small Company Market Fund and Small-Cap Momentum Fund as of June 30, 2015.
| | |
| 113 | | Annual Report | June 30, 2015 |
| | |
NOTES TO FINANCIAL STATEMENTS (continued) | | |
June 30, 2015
Capital loss carryovers utilized during the year ended June 30, 2015 were as follows:
| | |
| Bridgeway Fund | | Capital Loss
Carryover Utilized |
|
| | |
Aggressive Investors 1 | | $25,307,168 |
Ultra-Small Company | | 601,827 |
Small-Cap Growth | | 4,041,588 |
Small-Cap Value | | 5,688,882 |
Large-Cap Growth | | 7,237,893 |
Blue Chip 35 Index | | 5,687,442 |
Managed Volatility | | 927,552 |
Components of Accumulated Earnings (Deficit) As of June 30, 2015, the components of accumulated earnings (deficit) on a tax basis were:
| | | | | | | | | | | | |
| | | Aggressive Investors 1 | | | Ultra-Small Company | | | Ultra-Small
Company Market | |
| |
Accumulated Net Investment Income (Loss) | | | $ 99,002 | | | | $ 1,116,193 | | | | $ - | |
Accumulated Net Realized Gain (Loss) on Investments* | | | (99,767,242) | | | | (3,508,746) | | | | 26,469,812 | |
Net Unrealized Appreciation/Depreciation of Investments | | | 30,893,689 | | | | 16,499,764 | | | | 115,184,639 | |
| |
| | | |
Total | | | $(68,774,551) | | | | $14,107,211 | | | | $141,654,451 | |
| |
| | | |
| | | Small-Cap Momentum | | | Small-Cap Growth | | | Small-Cap Value | |
| |
Accumulated Net Investment Income (Loss) | | | $ 9,442 | | | | $ - | | | | $ 941,370 | |
Accumulated Net Realized Gain (Loss) on Investments* | | | 115,288 | | | | (13,110,417) | | | | (20,917,185) | |
Net Unrealized Appreciation/Depreciation of Investments | | | 436,843 | | | | 5,688,817 | | | | 2,890,633 | |
| |
| | | |
Total | | | $561,573 | | | | $ (7,421,600) | | | | $(17,085,182) | |
| |
| | | |
| | | Large-Cap Growth | | | Blue Chip 35 Index | | | Managed Volatility | |
| |
Accumulated Net Investment Income (Loss) | | | $ 538,934 | | | | $ 7,344,268 | | | | $ 15,835 | |
Accumulated Net Realized Gain (Loss) on Investments* | | | (12,765,670) | | | | (16,524,737) | | | | (4,158,560) | |
Net Unrealized Appreciation/Depreciation of Investments | | | 15,056,732 | | | | 191,342,937 | | | | 6,941,314 | |
| |
Total | | | $ 2,829,996 | | | | $182,162,468 | | | | $ 2,798,589 | |
| |
| * | Includes qualified late-year losses that the Funds have elected to defer to the beginning of their next fiscal year ending June 30, 2016. The Ultra-Small Company Fund has elected to defer qualified short-term late-year losses of ($2,305,092). The Aggressive Investors 1, Ultra-Small Company Market, Small-Cap Momentum, Small-Cap Growth, Small-Cap Value, Large-Cap Growth, Blue Chip 35 Index Fund, and Managed Volatility Funds have no deferred qualified late-year losses. |
| | |
NOTES TO FINANCIAL STATEMENTS (continued) | | |
June 30, 2015
For the fiscal year June 30, 2015, the Funds recorded the following reclassifications to the accounts listed below:
| | | | | | | | | | | | |
| | | Increase (Decrease) | |
| |
| | | Aggressive Investors 1 | | | Ultra-Small Company | | | Ultra-Small Company Market | |
| |
Paid-in-Capital | | $ | - | | | $ | - | | | $ | 2,099,239 | |
Undistributed Net Investment Income | | | - | | | | (14,057) | | | | 222,437 | |
Accumulated Net Realized Gain (Loss) on Investments | | | - | | | | 14,057 | | | | (2,321,676) | |
| |
| | | |
| | | Small-Cap Momentum | | | Small-Cap Growth | | | Small-Cap Value | |
| |
Paid-in-Capital | | $ | 10,366 | | | $ | (23,610) | | | $ | - | |
Undistributed Net Investment Income | | | (3,267) | | | | 23,610 | | | | 5,432 | |
Accumulated Net Realized Gain (Loss) on Investments | | | (7,099) | | | | - | | | | (5,432) | |
| |
| | | |
| | | Large-Cap Growth | | | Blue Chip 35 Index | | | Managed Volatility | |
| |
Paid-in-Capital | | $ | - | | | $ | - | | | $ | - | |
Undistributed Net Investment Income | | | - | | | | - | | | | - | |
Accumulated Net Realized Gain (Loss) on Investments | | | - | | | | - | | | | - | |
| |
The difference between book and tax components of net assets and the resulting reclassifications were primarily a result of the differing book/tax treatment of the deduction of equalization debits for tax purposes, redesignation of dividends paid, net operating loss, distributions in excess of profits and investments in real estate investment trusts, business development companies, grantor trusts, partnerships and passive foreign investment companies (PFICs).
Accounting for Uncertainty in Income Taxes sets forth a minimum threshold for financial statement recognition of the benefit of a tax position taken or expected to be taken in a tax return. Management has analyzed each Fund’s tax positions and has concluded that no provision for income tax is required in each Fund’s financial statements. The Funds are not aware of any tax position for which it is reasonably possible that the total amounts of unrecognized tax benefits will significantly change in the next twelve months. Each Fund’s federal tax returns for the prior three fiscal years remain subject to examination by the Internal Revenue Service.
7. Line of Credit
Bridgeway established a line of credit agreement (“Facility”) with The Bank of New York Mellon, effective November 5, 2010. The Facility is for temporary or emergency purposes, such as to provide liquidity for shareholder redemptions, and is cancellable by either party. Unless cancelled earlier, the Facility shall be held available until September 17, 2015. Advances under the Facility are limited to $15,000,000 in total for all Funds, and advances to each Fund shall not exceed certain limits set forth in the credit agreement, including, but not limited to, the maximum amount a Fund is permitted to borrow under the 1940 Act.
The Funds incur a commitment fee of 0.05% per annum on the unused portion of the Facility and interest expense to the extent of amounts borrowed under the Facility. Interest is based on the “Overnight Rate” plus 1.25%. The Overnight Rate means the higher of (a) the Federal Funds rate, (b) the Overnight Eurodollar Rate, or (c) the One-Month Eurodollar Rate. The commitment fees are payable quarterly in arrears and are allocated to all participating Funds. Interest expense is charged directly to a Fund based upon actual amounts borrowed by such Fund.
| | |
| 115 | | Annual Report | June 30, 2015 |
| | |
NOTES TO FINANCIAL STATEMENTS (continued) | | |
June 30, 2015
For the year ended June 30, 2015, borrowings by the Funds under this line of credit were as follows:
| | | | | | | | | | | | | | | | | | |
| Bridgeway Fund | | Weighted
Average
Interest Rate | | | Weighted
Average
Loan Balance | | | Number of
Days
Outstanding | | Interest
Expense
Incurred1 | | | Maximum Amount
Borrowed During
the Period | |
| |
| | | | | | | | | | | | | | | | | | |
Aggressive Investors 1 | | | 1.42% | | | | $ 886,776 | | | 49 | | | $1,688 | | | | $3,193,000 | |
Ultra-Small Company | | | 1.42% | | | | 897,115 | | | 113 | | | 3,944 | | | | 3,973,000 | |
Ultra-Small Company Market | | | 1.41% | | | | 981,843 | | | 83 | | | 3,146 | | | | 3,362,000 | |
Small-Cap Growth | | | 1.42% | | | | 354,579 | | | 38 | | | 525 | | | | 809,000 | |
Small-Cap Value | | | 1.42% | | | | 438,449 | | | 78 | | | 1,326 | | | | 1,156,000 | |
Blue Chip 35 Index | | | 1.42% | | | | 1,741,593 | | | 59 | | | 4,009 | | | | 6,218,000 | |
Managed Volatility | | | 1.40% | | | | 1,565,000 | | | 1 | | | 60 | | | | 1,565,000 | |
Small Cap Momentum | | | 1.42% | | | | 238,000 | | | 2 | | | 19 | | | | 238,000 | |
| 1 Interest expense is included on the Statements of Operations in Miscellaneous expenses. | |
On June 30, 2015, Ultra-Small Company, Small-Cap Value, and Blue Chip 35 Index had loans outstanding in the amounts of $128,000, $613,000 and $2,189,000, respectively, exclusive of interest payable on the loans.
8. Redemption Fees
In Ultra-Small Company Market and Small-Cap Momentum Funds, a 2% redemption fee may be charged on shares held less than six months. The fee is charged for the benefit of the remaining shareholders and will be paid to the appropriate Fund to help offset transaction costs. The fee is accounted for as an addition to paid-in capital.
9. Subsequent Events
Management has evaluated the impact of all subsequent events on the Funds and has determined that there were no subsequent events requiring recognition or disclosure in the financial statements.
| | |
REPORT OF INDEPENDENT REGISTERED PUBLIC ACCOUNTING FIRM | | |
To the Shareholders and Board of Directors of Bridgeway Funds, Inc.
We have audited the accompanying statements of assets and liabilities of the Aggressive Investors 1 Fund, Ultra-Small Company Fund, Ultra-Small Company Market Fund, Small-Cap Momentum Fund, Small-Cap Growth Fund, Small-Cap Value Fund, Large-Cap Growth Fund, Blue Chip 35 Index Fund and Managed Volatility Fund (the “Funds”), each a series of Bridgeway Funds, Inc., including the schedules of investments, as of June 30, 2015, and the related statements of operations for the year then ended, the statements of changes in net assets for each of the years in the two-year period then ended and the financial highlights for each of the years in the five-year period then ended. These financial statements and financial highlights are the responsibility of the Funds’ management. Our responsibility is to express an opinion on these financial statements and financial highlights based on our audits.
We conducted our audits in accordance with the standards of the Public Company Accounting Oversight Board (United States). Those standards require that we plan and perform the audits to obtain reasonable assurance about whether the financial statements and financial highlights are free of material misstatement. An audit includes examining, on a test basis, evidence supporting the amounts and disclosures in the financial statements. Our procedures included confirmation of securities owned as of June 30, 2015 by correspondence with the custodian and brokers. An audit also includes assessing the accounting principles used and significant estimates made by management, as well as evaluating the overall financial statement presentation. We believe that our audits provide a reasonable basis for our opinion.
In our opinion, the financial statements and financial highlights referred to above present fairly, in all material respects, the financial position of Aggressive Investors 1 Fund, Ultra-Small Company Fund, Ultra-Small Company Market Fund, Small-Cap Momentum Fund, Small-Cap Growth Fund, Small-Cap Value Fund, Large-Cap Growth Fund, Blue Chip 35 Index Fund and Managed Volatility Fund as of June 30, 2015, the results of their operations for the year then ended, the changes in their net assets for each of the years in the two-year period then ended, and their financial highlights for each of the years in the five-year period then ended, in conformity with accounting principles generally accepted in the United States of America.

BBD, LLP
Philadelphia, Pennsylvania
August 27, 2015
| | |
| 117 | | Annual Report | June 30, 2015 |
| | |
OTHER INFORMATION | | |
June 30, 2015 (Unaudited)
1. Shareholder Tax Information
Certain tax information regarding the Funds is required to be provided to shareholders based upon each Fund’s income and distributions for the taxable year ended June 30, 2015. The information and distributions reported herein may differ from information and distributions taxable to the shareholders for the calendar year ended December 31, 2014.
The Funds report the following items with regard to distributions paid during the fiscal year ended June 30, 2015. All reportings are based on financial information available as of the date of this annual report and, accordingly, are subject to change. For each item, it is the intention of each Fund to report the maximum amount permitted under the Internal Revenue Code of 1986, as amended, and the regulations there-under.
| | | | | | | | | | | | |
| | | Aggressive | | | Ultra-Small | | | Ultra-Small | |
| | | Investors 1 | | | Company | | | Company Market | |
Corporate Dividends Received Deduction | | | 100.00% | | | | 56.91% | | | | 100.00% | |
Qualified Dividend Income | | | 100.00% | | | | 57.74% | | | | 100.00% | |
Qualified Interest Related Dividends | | | 0.00% | | | | 0.00% | | | | 0.01% | |
Qualified Short Term Capital Gain Dividends | | | 0.00% | | | | 0.00% | | | | 0.00% | |
U.S. Government Income | | | 0.00% | | | | 0.00% | | | | 0.00% | |
| | | Small-Cap | | | | Small-Cap | | | | Small-Cap | |
| | | | Momentum | | | | Growth | | | | Value | |
Corporate Dividends Received Deduction | | | 16.31% | | | | 99.92% | | | | 98.68% | |
Qualified Dividend Income | | | 16.80% | | | | 99.92% | | | | 100.00% | |
Qualified Interest Related Dividends | | | 0.00% | | | | 0.00% | | | | 0.00% | |
Qualified Short Term Capital Gain Dividends | | | 100.00% | | | | 0.00% | | | | 0.00% | |
U.S. Government Income | | | 0.00% | | | | 0.00% | | | | 0.00% | |
| | | Large-Cap | | | | Blue Chip | | | | Managed | |
| | | | Growth | | | | 35 Index | | | | Volatility | |
Corporate Dividends Received Deduction | | | 100.00% | | | | 100.00% | | | | 100.00% | |
Qualified Dividend Income | | | 100.00% | | | | 100.00% | | | | 100.00% | |
Qualified Interest Related Dividends | | | 0.02% | | | | 0.00% | | | | 5.50% | |
Qualified Short Term Capital Gain Dividends | | | 0.00% | | | | 0.00% | | | | 0.00% | |
U.S. Government Income | | | 0.00% | | | | 0.00% | | | | 5.45% | |
U.S. Government Income represents the amount of interest that was derived from direct U.S. Government obligations. Generally, such interest is exempt from state income tax. However, for residents of California, New York and Connecticut, the statutory threshold requirements were not satisfied. Due to the diversity in state and local tax law, it is recommended you consult a tax adviser as to the applicability of the information provided for your specific situation.
During the fiscal year ended June 30, 2015, the Funds paid distributions from ordinary income and long-term capital gain which included equalization debits summarized below:
| | | | | | | | | | | | | | | | | | |
| | | Aggressive | | | Ultra-Small | | | Ultra-Small | | | Small-Cap | | | |
| | | Investors 1 | | | Company | | | Company Market | | | Momentum | | | |
Ordinary Income Distributions | | $ | 540,861 | | | $ | 1,052,434 | | | $ | 2,780,087 | | | $ | 282,147 | | | |
Equalization Debits Included in Ordinary Income Distributions | | | - | | | | - | | | | 12,590 | | | | 3,209 | | | |
Equalization Debits Included in Long-Term Capital Gain Distributions | | | - | | | | - | | | | 2,086,649 | | | | 7,157 | | | |
Long-Term Capital Gain Distributions | | | - | | | | 27,750,353 | | | | 38,343,165 | | | | 188,250 | | | |
| | | | | |
| | | Small-Cap | | | Small-Cap | | | Large-Cap | | | Blue Chip | | | |
| | | Growth | | | Value | | | Growth | | | 35 Index | | | Managed Volatility |
Ordinary Income Distributions | | $ | 21,907 | | | $ | 581,377 | | | $ | 330,018 | | | $ | 11,713,217 | | | $59,691 |
| | |
OTHER INFORMATION (continued) | | |
June 30, 2015 (Unaudited)
2. Proxy Voting
Fund policies and procedures used in determining how to vote proxies relating to the Funds’ securities and a summary of proxies voted by the Funds for the period ended June 30, 2015 are available without a charge, upon request, by contacting Bridgeway Funds at 1-800-661-3550 and on the SEC’s website at http://www.sec.gov.
3. Fund Holdings
The complete schedules of the Funds’ holdings for the second and fourth quarters of each fiscal year are contained in the Funds’ Semi-Annual and Annual Shareholder Reports, respectively.
The Bridgeway Funds file complete schedules of the Funds’ holdings with the SEC for the first and third quarters of each fiscal year on Form N-Q within 60 days after the end of the period. Copies of the Funds’ Form N-Q are available without charge, upon request, by contacting Bridgeway Funds at 1-800-661-3550 and on the SEC’s website at http://www.sec.gov. You may also review and copy Form N-Q at the SEC’s Public Reference Room in Washington, D.C. For more information about the operation of the Public Reference Room, please call 1-800-SEC-0330.
4. Approval of Investment Management Agreement
The Bridgeway Funds, Inc.’s (the “Company”) management agreement (the “Management Agreement”) with its investment adviser, Bridgeway Capital Management, Inc. (the “Adviser”), on behalf of each of the Company’s funds must be approved for an initial term no greater than two years and renewed at least annually thereafter (i) by the vote of the Directors or by a vote of the shareholders of each fund and (ii) by the vote of a majority of the Directors who are not parties to the Management Agreement or “interested persons” of any party thereto (the “Independent Directors”), cast in person at a meeting called specifically for the purpose of voting on such approval.
The Board of Directors (the “Board”) has five regularly scheduled meetings each year and takes into account throughout the year matters bearing on the approval of the Management Agreement. For example, the Board and its standing committees also consider at each meeting factors that are relevant to the annual renewal of each fund’s Management Agreement, including the services and support provided to each fund by the Adviser, the Adviser’s compliance program, comparative performance information for each fund, the risk assessment of the funds and “deep dives” on the strategy and performance of certain funds on a periodic basis. In addition, the Board receives updated financial information on the Adviser and updates related to strategic direction and marketing efforts between meetings from the Adviser.
On May 15, 2015, the Board, including a majority of the Independent Directors, met in person (the “Meeting”) with the Adviser, Company counsel, independent legal counsel (“Independent Legal Counsel”) to the Independent Directors and others to give consideration to information bearing on the continuation of the Management Agreement with respect to the following funds: Aggressive Investors 1 Fund, Ultra-Small Company Fund, Ultra-Small Company Market Fund, Small-Cap Growth Fund, Small-Cap Value Fund, Large-Cap Growth Fund, Blue Chip 35 Index Fund, Managed Volatility Fund and Small-Cap Momentum Fund (each a “Fund” and collectively, the “Funds”). In preparation for the Meeting, the Independent Directors requested that the Adviser provide specific information relevant to their consideration of the renewal of each Fund’s Management Agreement. In response to that request, the Independent Directors were furnished with a wide variety of information with respect to each Fund, including:
| | • | | investment performance over various time periods and the fees and expenses of each Fund as compared to a comparable group of funds (the “peer funds”); |
| | • | | the nature, extent and quality of services provided by the Adviser to each Fund, including investment advisory and administrative services; |
| | • | | actual management fees paid by each Fund to the Adviser; |
| | • | | the Adviser’s costs of providing services to each Fund and the profitability of the Adviser derived from its relationship with each Fund; |
| | |
| 119 | | Annual Report | June 30, 2015 |
| | |
OTHER INFORMATION (continued) | | |
June 30, 2015 (Unaudited)
| | • | | the extent to which economies of scale may be present and if so, the degree to which they would be shared with the Fund’s shareholders; |
| | • | | any “fall out” or ancillary benefits accruing to the Adviser as a result of its relationship with each Fund; and |
| | • | | information regarding the structure of the advisory fees, the method of computing fees and the frequency of payment of fees and any expense limitation or fee waiver arrangements for each Fund. |
The Independent Directors also met telephonically with Independent Legal Counsel prior to the Meeting to review and discuss the information provided by the Adviser. Moreover, the Independent Directors also met in executive session with Independent Legal Counsel to consider the continuation of the Management Agreement outside the presence of management during the Meeting.
In considering the aforementioned information, the Independent Directors took into account management style, investment strategies and prevailing market conditions. Furthermore, in evaluating the Management Agreement, the Directors also reviewed information provided by the Adviser concerning the following:
| | • | | the terms of the Management Agreement, including the services performed by the Adviser in managing each Fund in accordance with each Fund’s investment objectives, policies and restrictions and how those services and fees differ from the Adviser’s services to non-mutual fund accounts, to the extent applicable; |
| | • | | the services provided by the Adviser under a separate Administrative Services Agreement and the fact that those services were provided at approximately cost to the Funds, although it was noted the annual fee under the Administrative Services Agreement was proposed to be increased at the Meeting; |
| | • | | the Adviser’s specialized skills and experience in statistical analysis and investment management and trading; |
| | • | | the Adviser’s personnel, staffing levels and the time and attention the Adviser’s personnel devote to the management of the Funds as compared to other Adviser clients; |
| | • | | the Adviser’s risk assessment and risk management capabilities; |
| | • | | the fact that the Adviser continues to use no soft dollars; and |
| | • | | the financial condition and stability of the Adviser, including supplemental financial information provided upon the request of the Independent Directors periodically during the year. |
In examining the nature, extent and quality of the services provided by the Adviser, the Independent Directors were pleased that the Funds continue to have access to the Adviser’s specialized skills and experience in statistical analysis and investment management and trading, and viewed those skills as relatively unique within the investment management industry. The Independent Directors were satisfied that staffing levels at the Adviser were adequate and appropriate in view of the Funds’ operations.
In examining investment performance, the Independent Directors reviewed performance information as of December 31, 2014 for each Fund and considered the following:
| | • | | With regard to the Aggressive Investors 1 Fund, the Independent Directors noted that the Fund has outperformed its peer funds and benchmark index for the past three-year and five-year periods and has significantly outperformed its benchmark index since inception. |
| | • | | With regard to the Ultra-Small Company Fund, the Independent Directors noted that the Fund has outperformed its peer funds and benchmark index for the past three-year period, outperformed its peers but lagged its benchmark index for the past five-year period and has significantly outperformed its benchmark index since inception. The |
| | |
OTHER INFORMATION (continued) | | |
June 30, 2015 (Unaudited)
Independent Directors also considered that the Fund’s performance has been negatively impacted by macro-driven markets but has performed well in the recent more favorable market environment.
| | • | | With regard to the Ultra-Small Company Market Fund, the Independent Directors noted that the Fund has outperformed its peer funds and its benchmark index for the past three-year and five-year periods and slightly lagged its benchmark index since inception (although by less than the Fund’s expense ratio). |
| | • | | With regard to the Small-Cap Growth Fund, the Independent Directors noted that: (i) the Fund has lagged its peer funds and benchmark index for the past five-year period and lagged its benchmark index since inception; and (ii) the Fund has outperformed its peers and benchmark index for the past three-year period. However, the Independent Directors also considered that the Fund’s performance has been negatively impacted by macro-driven markets and noted that the Adviser made some refinements to its investment process approximately three years ago and that the Adviser believes these refinements are having a positive impact on the Fund. |
| | • | | With regard to the Small-Cap Value Fund, the Independent Directors noted that the Fund has outperformed its peer funds and benchmark index for the past three-year and five-year periods and has slightly lagged its benchmark index since inception. |
| | • | | With regard to the Large-Cap Growth Fund, the Independent Directors noted that the Fund has outperformed its peer funds and benchmark index for the past three-year and five-year periods and has slightly lagged its benchmark index since inception. |
| | • | | With regard to the Blue Chip 35 Index Fund, the Independent Directors noted that the Fund has lagged its peer funds and benchmark index for the past three-year and five-year periods and outperformed its benchmark index since inception. The Independent Directors also considered that the Blue Chip 35 Index Fund is a passively managed fund whose peer funds have a significantly lower average market capitalization and that this difference in average capitalization was the primary reason for the difference in performance compared to peer funds as well as its benchmark index. |
| | • | | With regard to the Managed Volatility Fund, the Independent Directors noted that the Fund has lagged its peer funds and benchmark index for the three-year and five-year periods and lagged its benchmark index since inception. However, the Independent Directors also considered that in 10 out of 13 years since inception, the fund has captured at least 40% of the S&P 500 return in up years and 40% or less of the S&P 500 return in down years, which is consistent with the design of the Fund. |
| | • | | With regard to the Small-Cap Momentum Fund, the Independent Directors noted that, during this Fund’s relatively short operating history, it has lagged its peer funds and benchmark index for the past one-year and three-year periods and has lagged its benchmark index since inception. The Independent Directors also considered that analysis performed by the Adviser indicates that performance is in line with the design of the fund but that it has been an extended unfavorable period for the risk-adjusted momentum approach used by this Fund. |
In examining fees and expenses, the Independent Directors considered the following:
| | • | | With respect to the Aggressive Investors 1 Fund, the management fee is performance-based and adjusts higher or lower in a range in response to investment results. The Aggressive Investors 1 Fund’s management fee is higher than peer funds, partially due to the performance based portion. However, total expenses are significantly lower than peer funds. |
| | • | | With respect to the Ultra-Small Company Fund, the management fee and total expenses are significantly lower than peer funds. |
| | • | | With respect to the Ultra-Small Company Market Fund, the management fee and total expenses are significantly lower than peer funds. |
| | |
| 121 | | Annual Report | June 30, 2015 |
| | |
OTHER INFORMATION (continued) | | |
June 30, 2015 (Unaudited)
| | • | | With respect to each of the Small-Cap Growth Fund, Small-Cap Value Fund and Large-Cap Growth Fund, the management fee is performance-based and adjusts higher or lower in a range in response to investment results. Each such Fund’s management fee and overall expenses were significantly lower than its respective peer funds. |
| | • | | With respect to each of the Blue Chip 35 Index Fund, Managed Volatility Fund and Small-Cap Momentum Fund, the management fee and total expenses are significantly lower than their respective peer funds. |
In addition, the Independent Directors considered that the Adviser agreed to contractual expense limitation agreements for each of the Funds to ensure that total expense levels do not increase above certain levels. The Independent Directors also reviewed the fees the Adviser charged to other funds (for which the Adviser serves as subadviser) and separately managed accounts, as applicable, and evaluated the differences in fees and services provided to the Funds and such other separately managed accounts.
In examining profitability, the Independent Directors considered that the Adviser was operating some Funds at a loss, which negatively impacted the Adviser’s overall financial results. However, the Independent Directors also considered that the Adviser has significant financial resources to support ongoing operations and future growth despite currently operating some of the Funds at a loss and that the Adviser had experienced improved overall financial performance results in 2014 as compared to 2013.
With regard to economies of scale, the Independent Directors noted that the Aggressive Investors 1 Fund and Ultra-Small Company Fund each have fee breakpoints in their management fee schedules and that the Aggressive Investors 1 Fund is at a size currently to benefit from such breakpoints. The Independent Directors noted that although the Ultra-Small Company Fund is not currently at an asset level at which it can take advantage of the breakpoints contained in its fee schedule, the fee schedules is structured so that when the assets of the Fund increase, economies of scale may be shared for the benefit of shareholders. Although the Ultra-Small Company Market Fund does not have fee breakpoints in its management fee schedule, the Adviser represented that it believes that the Fund does not exhibit significant economies of scale because it involves intensive and time-consuming portfolio and trading management because trades are small and oftentimes less liquid, so they may take longer to execute. As a result, the Adviser indicated that an increase in assets of the Ultra-Small Company Market Fund does not necessarily lead to economies of scale. Although the Small-Cap Growth Fund, Small-Cap Value Fund, Large-Cap Growth Fund, Blue Chip 35 Index Fund, Managed Volatility Fund and Small-Cap Momentum Fund do not have fee breakpoints in their management fee schedules, the Adviser indicated that these Funds were priced low relative to peers and ahead of the economies of scale curve at launch. In view of asset sizes and fee structures, the Independent Directors were satisfied that shareholders were not missing the opportunity to benefit from economies of scale if they were available.
In terms of potential “fall out” or ancillary benefits to the Adviser due to its position as manager of the Funds, the Independent Directors noted that the Adviser continues to use no soft dollars and that its administrative services to the Funds are structured to approximate an at-cost relationship.
After extensive discussion and consideration among themselves, and with the Adviser, Company counsel and Independent Legal Counsel, including during an executive session with Independent Legal Counsel outside the presence of management, the Independent Directors concluded the following:
| | • | | the nature, extent and quality of the Adviser’s services were appropriate and consistent with the terms of the Management Agreement and mutual fund industry norms; |
| | • | | the investment performance of each Fund was either acceptable or better or subject to reasonable steps by the Adviser to monitor or address underperformance; |
| | • | | the management fees and overall expense levels, after taking into account any applicable management fee and expense waivers, were reasonable; |
| | • | | the costs of services provided by the Adviser to each Fund were fair and reasonable in relation to the services and benefits provided to each Fund; and |
| | |
OTHER INFORMATION (continued) | | |
June 30, 2015 (Unaudited)
| | • | | the shareholders of each Fund have appropriately benefitted from economies of scale, either directly through expense caps, fee waivers and/or breakpoints, or were not missing the opportunity to benefit from economies of scale in view of asset sizes and fee structures. |
Based on all relevant information and factors, the Board, including a majority of its Independent Directors, unanimously approved the renewal of the Management Agreement with respect to each Fund. In view of the broad scope and variety of factors and information, the Directors did not identify any single factor as being of paramount importance in reaching their conclusions and determinations to approve the continuance of the Management Agreement for each Fund. Rather, the approval determinations were made on the basis of each Director’s business judgment after consideration of all of the factors taken in their entirety.
| | |
| 123 | | Annual Report | June 30, 2015 |
| | |
DISCLOSURE OF FUND EXPENSES | | |
June 30, 2015 (Unaudited)
As a shareholder of a Fund, you will incur no transaction costs from such Fund, including sales charges (loads) on purchases, on reinvested dividends or on other distributions. There are no exchange fees. Shareholders are subject to redemption fees on the Ultra-Small Company Market and Small-Cap Momentum Funds under certain circumstances. However, as a shareholder of a Fund, you will incur ongoing costs, including management fees and other Fund expenses. The following examples are intended to help you understand your ongoing costs (in dollars) of investing in a Fund and to compare these costs with ongoing costs of investing in other mutual funds. The examples are based on an investment of $1,000 invested on January 1, 2015 and held until June 30, 2015.
Actual Expenses. The first line of the table below provides information about actual account values and actual expenses. You may use the information in this line, together with the amount you invested, to estimate the expenses that you paid over the period. Simply divide your account value by $1,000 (for example, an $8,600 account value divided by $1,000 = 8.6), then multiply the result by the number in the first line under the heading “Expenses Paid During Period” to estimate the expenses you paid on your account during the period.
Hypothetical Example for Comparison Purposes. The second line of the table below provides information about hypothetical account values and hypothetical expenses based on the Fund’s actual expense ratio and an assumed rate of return of 5% per year before expenses, which is not the Fund’s actual return. The hypothetical account values and expenses may not be used to estimate the actual ending account balance or expenses you paid for the period. You may use this information to compare the ongoing costs of investing in a Fund and other mutual funds. To do so, compare this 5% hypothetical example with the 5% hypothetical examples that appear in the shareholder reports of other funds.
The expenses shown in the table are meant to highlight ongoing Fund costs only. Therefore, the second line of the table is useful in comparing ongoing costs only and will not help you determine the relative total costs of owning different funds, because other funds may also have transaction costs, such as sales charges, redemption fees or exchange fees.
| | | | | | | | |
| | | Beginning Account Value at 1/1/15 | | Ending Account Value at 6/30/15 | | Expense Ratio | | Expenses Paid During Period* 1/1/15 - 6/30/15 |
| | | | |
Bridgeway Aggressive Investors 1 Fund | | | | | | | | |
Actual Fund Return | | $1,000.00 | | $ 996.00 | | 1.42% | | $7.03 |
Hypothetical Fund Return | | $1,000.00 | | $1,017.75 | | 1.42% | | $7.10 |
| | | | |
Bridgeway Ultra-Small Company Fund | | | | | | | | |
Actual Fund Return | | $1,000.00 | | $ 957.40 | | 1.12% | | $5.44 |
Hypothetical Fund Return | | $1,000.00 | | $1,019.24 | | 1.12% | | $5.61 |
| | | | |
Bridgeway Ultra-Small Company Market Fund | | | | | | | | |
Actual Fund Return | | $1,000.00 | | $1,018.30 | | 0.73% | | $3.65 |
Hypothetical Fund Return | | $1,000.00 | | $1,021.17 | | 0.73% | | $3.66 |
| | | | |
Bridgeway Small-Cap Momentum Fund | | | | | | | | |
Actual Fund Return | | $1,000.00 | | $1,057.70 | | 0.90% | | $4.59 |
Hypothetical Fund Return | | $1,000.00 | | $1,020.33 | | 0.90% | | $4.51 |
| | | | |
Bridgeway Small-Cap Growth Fund | | | | | | | | |
Actual Fund Return | | $1,000.00 | | $1,109.50 | | 0.94% | | $4.92 |
Hypothetical Fund Return | | $1,000.00 | | $1,020.13 | | 0.94% | | $4.71 |
| | | | |
Bridgeway Small-Cap Value Fund | | | | | | | | |
Actual Fund Return | | $1,000.00 | | $1,000.00 | | 0.94% | | $4.66 |
Hypothetical Fund Return | | $1,000.00 | | $1,020.13 | | 0.94% | | $4.71 |
| | |
DISCLOSURE OF FUND EXPENSES (continued) | | |
June 30, 2015 (Unaudited)
| | | | | | | | |
| | | Beginning Account Value at 1/1/15 | | Ending Account Value at 6/30/15 | | Expense Ratio | | Expenses Paid During Period* 1/1/15 - 6/30/15 |
| | | | |
Bridgeway Large-Cap Growth Fund | | | | | | | | |
Actual Fund Return | | $1,000.00 | | $1,048.70 | | 0.80% | | $4.06 |
Hypothetical Fund Return | | $1,000.00 | | $1,020.83 | | 0.80% | | $4.01 |
| | | | |
Bridgeway Blue Chip 35 Index Fund | | | | | | | | |
Actual Fund Return | | $1,000.00 | | $1,006.80 | | 0.15% | | $0.75 |
Hypothetical Fund Return | | $1,000.00 | | $1,024.05 | | 0.15% | | $0.75 |
| | | | |
Bridgeway Managed Volatility | | | | | | | | |
Actual Fund Return | | $1,000.00 | | $1,002.90 | | 0.94% | | $4.67 |
Hypothetical Fund Return | | $1,000.00 | | $1,020.13 | | 0.94% | | $4.71 |
| * | Expenses are equal to the average account value times the Fund’s annualized expense ratio multiplied by the number of days in the most recent six-month period (181) divided by the number of days in the fiscal year (365). |
| | |
| 125 | | Annual Report | June 30, 2015 |
| | |
DIRECTORS & OFFICERS | | |
June 30, 2015
| | | | | | | | | | |
Independent Directors | | | | | | | | | | |
| | | | | |
Name, Address and Age1 | | Position
Held with
Bridgeway
Funds | | Term of
Office and
Length of
Time Served | | Principal Occupation(s)
During Past Five Years | | No. of Bridgeway
Funds Overseen
by Director | | Other Directorships
Held by Director |
| | | | | |
Kirbyjon Caldwell Age 61 | | Director | | Term: 1 Year
Length: 2001
to Present. | | Senior Pastor of Windsor Village United Methodist Church, since 1982. | | Eleven | | American Church
Mortgage Company,
NRG Energy, Inc.,
Amegy Bancshares
Advisory Board |
| | | | | |
Karen S. Gerstner Age 60 | | Director | | Term: 1 Year
Length: 1994
to Present. | | Principal, Karen S. Gerstner & Associates, P.C., since 2004. | | Eleven | | None |
| | | | | |
Miles Douglas Harper, III* Age 52 | | Director | | Term: 1 Year
Length: 1994
to Present. | | Partner, Carr, Riggs & Ingram, LLC, since 2013; Partner, Gainer Donnelly, LLP, 1998 to 2013 upon merger with Carr, Riggs & Ingram, LLC. | | Eleven | | Calvert Social
Investment Fund (8
Portfolios), Calvert
Social Index Series,
Inc. (1 Portfolio),
Calvert Impact Fund
(4 Portfolios),
Calvert World
Values Fund (3
Portfolios) |
| | | | | |
Evan Harrel Age 54 | | Director | | Term: 1 Year
Length: 2006
to Present. | | Strategic Advisor, Small Steps Nurturing Center, since 2012; Executive Director, Small Steps Nurturing Center, 2004 to 2012. | | Eleven | | None |
| | | | | |
| | | | | | | | | | | |
| | |
DIRECTORS & OFFICERS (continued) | | |
June 30, 2015
| | | | | | | | | | |
“Interested” or Affiliated Director and Officer | | | | |
| | | | | |
Name,
Address and Age1 | | Position(s)
Held with
Bridgeway
Funds | | Term of
Office and
Length of
Time Served | | Principal Occupation(s)
During Past Five Years | | No. of Bridgeway
Funds Overseen
by Director | | Other Directorships
Held by Director |
| | | | | |
| John N. R. Montgomery2 Age 59 | | President and
Director | | Term: 1 Year
Length: 1993
to Present. | | Chairman, Bridgeway Capital Management, Inc., since 2010; President, Bridgeway Capital Management, Inc., 1993 to 2010 and since June 2015; President, Bridgeway Funds, since June 2015; Vice President, Bridgeway Funds, 2005 to May 2015. | | Eleven | | None |
| | | | | |
| | | | | | | | | | | |
| | |
| 127 | | Annual Report | June 30, 2015 |
| | |
DIRECTORS & OFFICERS (continued) | | |
June 30, 2015
| | | | | | | | | | |
Other Officers | | | | | | | | | | |
| | | | | |
Name, Address and Age1 | | Position
Held with
Bridgeway
Funds | | Term of
Office and
Length of
Time Served | | Principal Occupation(s)
During Past Five Years | | No. of Bridgeway
Funds Overseen
by Officer | | Other Directorships
Held by Officer |
| | | | | |
Richard P. Cancelmo, Jr. Age 57 | | Vice President | | Term: 1 Year
Length: 2004
to Present. | | Vice President, Bridgeway Funds, since 2004; Staff member, Bridgeway Capital Management, Inc., since 2000. | | N/A | | None |
| | | | | |
Linda G. Giuffré Age 53 | | Treasurer and
Chief
Compliance
Officer | | Term: 1 Year
Length: 2004
to Present. | | Chief Compliance Officer, Bridgeway Capital Management, Inc., since 2004; Staff member, Bridgeway Capital Management, Inc., since 2004. | | N/A | | None |
| | | | | |
Deborah L. Hanna Age 50 | | Secretary | | Term: 1 Year
Length: 2007
to Present. | | Self-employed, accounting and related projects for various organizations, since 2001. | | N/A | | None |
| | | | | |
Sharon Lester Age 60 | | Vice President | | Term: 1 Year
Length: 2011
to Present. | | Staff member, Bridgeway Capital Management, Inc., since 2010; Prior to 2010, Director of Portfolio Operations, Invesco. | | N/A | | None |
| 1 | The address of all of the Directors and Officers of Bridgeway Funds is 20 Greenway Plaza, Suite 450, Houston, Texas, 77046. |
| 2 | John Montgomery is chairman, president, director and majority shareholder of Bridgeway Capital Management, Inc., and therefore an interested person of Bridgeway Funds. |
The overall management of the business and affairs of Bridgeway Funds is vested with its Board of Directors (the “Board”). The Board approves all significant agreements between Bridgeway Funds and persons or companies furnishing services to it, including agreements with its Adviser and Custodian. The day-to-day operations of Bridgeway Funds are delegated to its officers, subject to its investment objectives and policies and general supervision by the Board.
The Funds’ Statement of Additional Information includes additional information about the Board and is available, without charge, upon request by calling 1-800-661-3550.
THIS PAGE INTENTIONALLY LEFT BLANK
|
BRIDGEWAY FUNDS, INC. BNY Mellon Investment Servicing (US) Inc. P.O. Box 9860 Providence, RI 02940-8060 CUSTODIAN The Bank of New York Mellon One Wall Street New York, NY 10286 DISTRIBUTOR Foreside Fund Services, LLC Three Canal Plaza, Suite 100 Portland, ME 04101 |
| | | | |
| | |
| | You can review and copy information about our Funds (including the SAIs) at the SEC’s Public Reference Room in Washington, D.C. To find out more about this public service, call the SEC at 800-SEC-0330. Reports and other information about the Funds are also available on the SEC’s website at www.sec.gov. You can receive copies of this information, for a fee, by writing the Public Reference Section, Securities and Exchange Commission, Washington, D.C. 20549-1520 or by sending an electronic request to the following email address: publicinfo@sec.gov. | | |
| | |
| | | | |
A no-load mutual fund family of domestic funds
| | | | |
| | |
| | Annual Report | | |
| | |
| | June 30, 2015 | | |
| | |
| | | | |
| | |
OMNI SMALL-CAP VALUE | | BOSVX |
| |
OMNI TAX-MANAGED SMALL-CAP
VALUE | | BOTSX |
| | |
TABLE OF CONTENTS | |
|
Bridgeway Funds Standardized Returns as of June 30, 2015 (Unaudited)
| | | | | | | | | | | | | | | | | | | | | | | | | | | | | | | | | | | |
| | | | | | | Annualized | | | | | | |
| Fund | | Quarter | | Six Months | | 1 Year | | Inception
to Date | | Inception
Date | | Gross
Expense
Ratio2 | | Net
Expense
Ratio2 |
Omni Small-Cap Value | | | | -0.32 | % | | | | 1.57 | % | | | | -1.48 | % | | | | 16.77 | % | | | | 8/31/2011 | | | | | 0.73 | %1 | | | | 0.62 | %1 |
Omni Tax-Managed Small-Cap Value | | | | -0.41 | % | | | | 2.02 | % | | | | -1.62 | % | | | | 11.29 | % | | | | 12/31/2010 | | | | | 0.72 | %1 | | | | 0.61 | %1 |
| | 1 | Some of the Funds’ fees were waived or expenses reimbursed; otherwise, returns would have been lower. The Adviser has contractually agreed to waive fees and/or reimburse expenses. Any material change to this Fund policy would require a vote by shareholders. |
| | 2 | Expense ratios are as stated in the current prospectus. Please see financial highlights for expense ratios as of June 30, 2015. |
Performance figures quoted represent past performance and are no guarantee of future results. Current performance may be lower or higher than the performance data quoted. Investment return and principal value will fluctuate, so that an investor’s shares, when redeemed, may be worth more or less than original cost. To obtain performance current to the most recent month-end, please visit our website at www.bridgeway.com or call 1-800-661-3550. Total return figures include the reinvestment of dividends and capital gains.
This report is submitted for the general information of the shareholders of each Fund. It is not authorized for distribution to prospective investors unless preceded or accompanied by an effective prospectus, which includes information regarding a Fund’s risks, objectives, fees and expenses, experience of its management, and other information. Investors should read the prospectus carefully before investing in a Fund. For questions or other Fund information, call 1-800-661-3550 or visit the Funds’ website at www.bridgeway.com. Funds are available for purchase by residents of the United States, Puerto Rico, U.S. Virgin Islands and Guam only. Foreside Fund Services, LLC, Distributor.
The views expressed here are exclusively those of Fund management. These views, including those relating to the market, sectors or individual stocks are not meant as investment advice and should not be considered predictive in nature.
| | |
| LETTER FROM THE INVESTMENT MANAGEMENT TEAM | | |
June 30, 2015
Dear Fellow Shareholders,
At Bridgeway, we have a shared passion for applying logic, data and evidence to develop investment solutions. The construction of our Omni Small-Cap Value and Omni Tax-Managed Small-Cap Value Funds is based on fundamental academic research that relies on market efficiency to better capture risk premiums. We manage these Funds to provide broad diversification within the small-cap value universe and to keep transaction fees and expenses low. Bridgeway offers the Omni Small-Cap Value and Omni Tax-Managed Small-Cap Value Funds through a select group of advisers. We are committed to advisers and their clients who take a long-term perspective and whose investment goals fit our unique expertise: delivering investment solutions that are statistically driven and grounded in academic theory.
Thank you for your investment in Bridgeway’s Omni Small-Cap Value and Omni Tax-Managed Small-Cap Value Funds.
Sincerely,
Your Investment Management Team
| | | | |
 | |  | |  |
| | |
| John Montgomery | | Christine L. Wang | | Michael Whipple |
| | |
 | | | | |
| | |
| Elena Khoziaeva | | | | |
| | |
| LETTER FROM THE INVESTMENT MANAGEMENT TEAM (continued) | | |
Market Review
Performance across domestic equity markets was mixed for the June 2015 quarter. Broad market returns for the quarter were up slightly, 0.14% as represented by the Russell 3000 Index.
For the fiscal year ended June 30, 2015, broad market stocks were up 7.29%, as represented by the Russell 3000 Index. Returns among growth stocks outperformed value stocks across the market cap spectrum. Small-cap growth stocks led the way, up 12.34%, followed by large-cap growth stocks, up 10.56%.
The following table presents returns for broad market, small-cap, mid-cap, and large-cap stocks, as represented by various style-based Russell Indexes. Size (market capitalization) and style (value/growth) are among the key factors that drive differences in returns among U.S. stocks.
Russell Style-Based Indexes Ranked by Performance for the Quarter and Fiscal Year Ended June 30, 2015
| | | | | | |
| | Quarter | | Fiscal Year | | |
Best Performing | | 1.98% Russell 2000 Growth Index | | 12.34% Russell 2000 Growth Index | | |
| | 0.27% Russell 3000 Growth Index | | 10.69% Russell 3000 Growth Index | | |
| | 0.12% Russell 1000 Growth Index | | 10.56% Russell 1000 Growth Index | | |
| | 0.11% Russell 1000 Value Index | | 9.45% Russell Midcap Growth Index | | |
| | 0.00% Russell 3000 Value Index | | 4.13% Russell 1000 Value Index | | |
| | -1.14% Russell Midcap Growth Index | | 3.86% Russell 3000 Value Index | | |
| | -1.20% Russell 2000 Value Index | | 3.67% Russell Midcap Value Index | | |
Worst Performing | | -1.97% Russell Midcap Value Index | | 0.78% Russell 2000 Value Index | | |
The Bridgeway Omni Funds in this annual report are asset class exposure strategies that seek broad diversification and risk premium exposure with low tracking error. These Funds were designed to capture the size and style benefits within the small-cap value asset class.
| | |
| 2 | | Annual Report | June 30, 2015 |
| | |
Omni Small-Cap Value Fund MANAGER’S COMMENTARY (Unaudited) | | |
June 30, 2015
Dear Fellow Omni Small-Cap Value Fund Shareholder,
For the quarter ended June 30, 2015, our Fund declined 0.32%, outperforming our primary market benchmark, the Russell 2000 Value Index (-1.20%).
For the fiscal year, our Fund declined 1.48%, underperforming our primary benchmark, the Russell 2000 Value Index (+0.78%).
The table below presents our June quarter, one-year, and inception-to-date financial results. See the next page for a graph of performance since inception.
Standardized Returns as of June 30, 2015
| | | | | | | | | | |
| | | | | | | | | Annualized |
| | | Quarter | | | 1 Year | | | Since Inception
(8/31/11) |
| | | |
Omni Small-Cap Value Fund | | | -0.32 | % | | | -1.48 | % | | 16.77% |
Russell 2000 Value Index | | | -1.20 | % | | | 0.78 | % | | 15.24% |
Performance figures quoted in the table above and the graph on the next page represent past performance and are no guarantee of future results. Total return figures in the table above include the reinvestment of dividends and capital gains. The table above and the graph on the next page do not reflect the deduction of taxes that a shareholder would pay on Fund distributions or on the redemption of Fund shares.
The Russell 2000 Value Index is an unmanaged index that consists of stocks in the Russell 2000 Index with lower price-to-book ratios and lower forecasted growth values with dividends reinvested. It is not possible to invest directly in an index. Periods longer than one year are annualized.
According to data from Lipper, Inc. as of June 30, 2015, Omni Small-Cap Value Fund ranked 243rd of 312 small-cap value funds for the 12 months ended June 30, 2015 and 81st of 249 such funds since inception in August, 2011. Lipper, Inc. is an independent mutual fund rating service that ranks funds in various fund categories by making comparative calculations using total returns.
| | |
Omni Small-Cap Value Fund MANAGER’S COMMENTARY (Unaudited) (continued) | | |
Omni Small-Cap Value Fund vs. Russell 2000 Value Index
from Inception 8/31/11 to 6/30/15
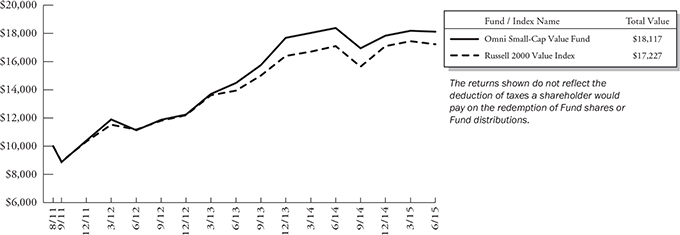
Detailed Explanation of Quarterly Performance
The Omni Small-Cap Value Fund is designed to capture the returns of the small-cap value asset class through broad diversification of small company and value stocks. This approach is sometimes referred to as “passive, asset class investing.” As of June 30, 2015, we held 614 such stocks in a market-cap weighted style. We make no attempt to track any particular index in either performance or statistics.
Our design tilt toward deeper value and smaller stocks contributed positively to relative performance. By design, the Fund does not hold Utility sector stocks or Real Estate Investment Trusts (REITs). Those assets had weak relative returns during the quarter, which helped the Fund’s relative performance. Our Fund’s higher weighting in Financial sector stocks other than REITs contributed to relative returns, while holdings in the Energy sector had a negative effect.
Detailed Explanation of Fiscal Year Performance
Our Fund’s investment in deeper value stocks versus the Index detracted from our relative performance for the fiscal year. Our Fund’s overweighted position in the Energy sector also hurt performance, as Energy was the worst performing sector for the year.
Top Ten Holdings as of June 30, 2015
| | | | | | | | |
Rank | | Description | | Industry | |
| % of Net
Assets |
|
1 | | Amedisys, Inc. | | Health Care Providers & Services | | | 0.8% | |
2 | | OM Group, Inc. | | Chemicals | | | 0.8% | |
3 | | Ebix, Inc. | | Software | | | 0.8% | |
4 | | Fresh Del Monte Produce, Inc. | | Food Products | | | 0.7% | |
5 | | Post Holdings, Inc. | | Food Products | | | 0.7% | |
6 | | Perry Ellis International, Inc. | | Textiles, Apparel & Luxury Goods | | | 0.7% | |
7 | | TravelCenters of America LLC | | Specialty Retail | | | 0.7% | |
8 | | Hawaiian Holdings, Inc. | | Airlines | | | 0.7% | |
9 | | Scholastic Corp. | | Media | | | 0.7% | |
10 | | Cooper-Standard Holding, Inc. | | Auto Components | | | 0.7% | |
| | Total | | | | | 7.3% | |
| | |
| 4 | | Annual Report | June 30, 2015 |
| | |
Omni Small-Cap Value Fund MANAGER’S COMMENTARY (Unaudited) (continued) | | |
Industry Sector Representation as of June 30, 2015
| | | | | | |
| | | % of Portfolio | | % of Russell 2000
Value Index | | Difference |
Consumer Discretionary | | 14.5% | | 10.8% | | 3.7% |
Consumer Staples | | 4.6% | | 3.0% | | 1.6% |
Energy | | 8.3% | | 6.3% | | 2.0% |
Financials | | 34.9% | | 41.7% | | -6.8% |
Health Care | | 5.0% | | 4.2% | | 0.8% |
Industrials | | 15.6% | | 12.4% | | 3.2% |
Information Technology | | 11.6% | | 10.3% | | 1.3% |
Materials | | 3.9% | | 3.9% | | 0.0% |
Telecommunication Services | | 1.6% | | 0.9% | | 0.7% |
Utilities | | 0.0% | | 6.5% | | -6.5% |
Cash & Other Assets | | 0.1% | | 0.0% | | 0.1% |
Total | | 100.0% | | 100.0% | | |
Disclaimer
The views expressed here are exclusively those of Fund management. These views, including those related to market sectors or individual stocks, are not meant as investment advice and should not be considered predictive in nature. Any favorable (or unfavorable) description of a holding applies only as of the quarter end, June 30, 2015, unless otherwise stated. Security positions can and do change thereafter. Discussions of historical performance do not guarantee and may not be indicative of future performance.
Market volatility can significantly impact short-term performance. The Fund is not an appropriate investment for short-term investors. Investments in small companies generally carry greater risk than is customarily associated with larger companies. This additional risk is attributable to a number of factors, including the relatively limited financial resources that are typically available to small companies and the fact that small companies often have comparatively limited product lines. In addition, the stock of small companies tends to be more volatile than the stock of large companies, particularly in the short term and particularly in the early stages of an economic or market downturn. Shareholders of the Fund, therefore, are taking on more risk than they would if they invested in the stock market as a whole.
Conclusion
Thank you for your continued investment in Omni Small-Cap Value Fund. We encourage your feedback; your reactions and concerns are important to us.
Sincerely,
The Investment Management Team
| | |
Omni Small-Cap Value Fund SCHEDULE OF INVESTMENTS | | |
Showing percentage of net assets as of June 30, 2015
| | | | | | | | | | |
| Industry Company | | Shares | | | Value | | | |
COMMON STOCKS - 99.80% | | | |
Aerospace & Defense - 1.30% | | | |
AAR Corp.+ | | | 92,600 | | | | $2,951,162 | | | |
Arotech Corp.*+ | | | 162,800 | | | | 392,348 | | | |
Breeze-Eastern Corp.* | | | 625 | | | | 7,188 | | | |
Cubic Corp. | | | 5,000 | | | | 237,900 | | | |
Ducommun, Inc.* | | | 62,770 | | | | 1,611,306 | | | |
Erickson, Inc.*+ | | | 1,417 | | | | 6,150 | | | |
LMI Aerospace, Inc.*+ | | | 35,000 | | | | 350,350 | | | |
National Presto Industries, Inc.+ | | | 5,020 | | | | 403,206 | | | |
Sypris Solutions, Inc. | | | 6,400 | | | | 9,280 | | | |
| | | | | | | | | | |
| | | | | | | 5,968,890 | | | |
| |
Air Freight & Logistics - 0.83% | | | |
Air T, Inc.* | | | 2,800 | | | | 58,688 | | | |
Air Transport Services Group, Inc.* | | | 260,200 | | | | 2,729,498 | | | |
Atlas Air Worldwide Holdings, Inc.* | | | 18,800 | | | | 1,033,248 | | | |
| | | | | | | | | | |
| | | | | | | 3,821,434 | | | |
| |
Airlines - 1.26% | | | |
Hawaiian Holdings, Inc.* | | | 135,634 | | | | 3,221,308 | | | |
Republic Airways Holdings, Inc.* | | | 130,550 | | | | 1,198,449 | | | |
SkyWest, Inc. | | | 91,800 | | | | 1,380,672 | | | |
| | | | | | | | | | |
| | | | | | | 5,800,429 | | | |
| |
Auto Components - 2.15% | | | |
China Automotive Systems, Inc.*+ | | | 28,200 | | | | 237,444 | | | |
China XD Plastics Co., Ltd.*+ | | | 100,900 | | | | 608,427 | | | |
Cooper Tire & Rubber Co. | | | 14,000 | | | | 473,620 | | | |
Cooper-Standard Holding, Inc.* | | | 51,000 | | | | 3,134,970 | | | |
Fuel Systems Solutions, Inc.*+ | | | 60,122 | | | | 449,713 | | | |
Modine Manufacturing Co.* | | | 84,000 | | | | 901,320 | | | |
Remy International, Inc. | | | 21,600 | | | | 477,576 | | | |
Shiloh Industries, Inc.*+ | | | 15,000 | | | | 194,250 | | | |
SORL Auto Parts, Inc.*+ | | | 129,900 | | | | 423,474 | | | |
Spartan Motors, Inc.+ | | | 22,000 | | | | 100,760 | | | |
Stoneridge, Inc.* | | | 55,900 | | | | 654,589 | | | |
Strattec Security Corp. | | | 1,300 | | | | 89,310 | | | |
Superior Industries International, Inc. | | | 115,400 | | | | 2,112,974 | | | |
| | | | | | | | | | |
| | | | | | | 9,858,427 | | | |
| |
Beverages - 0.04% | | | |
MGP Ingredients, Inc. | | | 11,318 | | | | 190,369 | | | |
| | | | | | | | | | |
| Industry Company | | Shares | | | Value | | | |
| | | |
Building Products - 0.98% | | | | | | | | | | |
Alpha Pro Tech, Ltd.* | | | 26,743 | | | | $ 59,904 | | | |
Gibraltar Industries, Inc.* | | | 81,850 | | | | 1,667,284 | | | |
Griffon Corp. | | | 140,900 | | | | 2,243,128 | | | |
Universal Forest Products, Inc. | | | 10,000 | | | | 520,300 | | | |
| | | | | | | | | | |
| | | | | | | 4,490,616 | | | |
| |
Capital Markets - 1.59% | | | |
Arlington Asset Investment Corp., Class A+ | | | 13,700 | | | | 267,972 | | | |
BlackRock Capital Investment Corp. | | | 35,000 | | | | 319,900 | | | |
Calamos Asset Management, Inc., Class A | | | 64,300 | | | | 787,675 | | | |
Cowen Group, Inc., Class A* | | | 105,900 | | | | 677,760 | | | |
FBR & Co.*+ | | | 21,600 | | | | 499,824 | | | |
Gladstone Capital Corp.+ | | | 31,900 | | | | 252,010 | | | |
INTL FCStone, Inc.* | | | 2,200 | | | | 73,128 | | | |
Investment Technology Group, Inc. | | | 57,050 | | | | 1,414,840 | | | |
JMP Group LLC+ | | | 87,300 | | | | 680,940 | | | |
KCG Holdings, Inc., Class A* | | | 35,000 | | | | 431,550 | | | |
MCG Capital Corp. | | | 50,000 | | | | 228,000 | | | |
OFS Capital Corp. | | | 28,708 | | | | 344,496 | | | |
Oppenheimer Holdings, Inc., Class A | | | 31,093 | | | | 817,124 | | | |
Piper Jaffray Cos.* | | | 11,400 | | | | 497,496 | | | |
| | | | | | | | | | |
| | | | | | | 7,292,715 | | | |
| |
Chemicals - 1.96% | | | |
Core Molding Technologies, Inc.* | | | 17,000 | | | | 388,280 | | | |
Gulf Resources, Inc.* | | | 153,200 | | | | 316,358 | | | |
Intrepid Potash, Inc.* | | | 93,600 | | | | 1,117,584 | | | |
KMG Chemicals, Inc. | | | 58,200 | | | | 1,480,608 | | | |
Kraton Performance Polymers, Inc.* | | | 85,750 | | | | 2,047,710 | | | |
OM Group, Inc. | | | 108,300 | | | | 3,638,880 | | | |
| | | | | | | | | | |
| | | | | | | 8,989,420 | | | |
| |
Commercial Banks - 17.79% | | | |
1st Source Corp. | | | 78,952 | | | | 2,693,842 | | | |
Access National Corp. | | | 2,700 | | | | 52,488 | | | |
American National Bankshares, Inc. | | | 21,800 | | | | 519,058 | | | |
American River Bankshares* | | | 21,300 | | | | 198,516 | | | |
AmeriServ Financial, Inc. | | | 5,000 | | | | 16,650 | | | |
| | |
| 6 | | Annual Report | June 30, 2015 |
| | |
Omni Small-Cap Value Fund SCHEDULE OF INVESTMENTS (continued) | | |
Showing percentage of net assets as of June 30, 2015
| | | | | | | | | | |
| Industry Company | | Shares | | | Value | | | |
Common Stocks (continued) | | | | | | | |
Commercial Banks (continued) | | | | | | | |
Bank of Commerce
Holdings | | | 45,300 | | | | $ 259,569 | | | |
Bank of the Ozarks, Inc. | | | 17,812 | | | | 814,899 | | | |
Banner Corp. | | | 11,450 | | | | 548,798 | | | |
Bar Harbor Bankshares+ | | | 11,250 | | | | 398,588 | | | |
Baylake Corp.+ | | | 3,000 | | | | 37,950 | | | |
BBCN Bancorp, Inc. | | | 15,000 | | | | 221,850 | | | |
BCB Bancorp, Inc. | | | 10,400 | | | | 127,088 | | | |
BNC Bancorp | | | 73,844 | | | | 1,427,405 | | | |
Boston Private Financial Holdings, Inc. | | | 10,000 | | | | 134,100 | | | |
BSB Bancorp, Inc.* | | | 31,633 | | | | 699,406 | | | |
C&F Financial Corp. | | | 1,200 | | | | 44,460 | | | |
Camden National Corp. | | | 9,500 | | | | 367,650 | | | |
Capital City Bank Group, Inc. | | | 48,750 | | | | 744,412 | | | |
Cardinal Financial Corp. | | | 25,000 | | | | 544,750 | | | |
Carolina Bank Holdings, Inc.*+ | | | 11,500 | | | | 139,322 | | | |
Central Pacific Financial Corp. | | | 25,000 | | | | 593,750 | | | |
Central Valley Community Bancorp | | | 20,000 | | | | 236,600 | | | |
Century Bancorp, Inc., Class A | | | 15,200 | | | | 618,032 | | | |
Chemical Financial Corp. | | | 61,500 | | | | 2,033,190 | | | |
Chemung Financial Corp.+ | | | 13,500 | | | | 357,480 | | | |
Citizens & Northern Corp. | | | 15,000 | | | | 308,250 | | | |
Civista Bancshares, Inc. | | | 2,000 | | | | 21,600 | | | |
CNB Financial Corp. | | | 29,000 | | | | 533,600 | | | |
Codorus Valley Bancorp, Inc. | | | 3,990 | | | | 80,718 | | | |
Community Bankers Trust Corp.*+ | | | 5,000 | | | | 24,850 | | | |
Community Trust Bancorp, Inc. | | | 17,500 | | | | 610,225 | | | |
Customers Bancorp, Inc.* | | | 20,000 | | | | 537,800 | | | |
Enterprise Bancorp, Inc.+ | | | 11,775 | | | | 276,006 | | | |
Enterprise Financial Services Corp. | | | 27,700 | | | | 630,729 | | | |
Farmers Capital Bank Corp.* | | | 18,400 | | | | 523,112 | | | |
Farmers National Banc Corp.+ | | | 150 | | | | 1,238 | | | |
Fidelity Southern Corp.+ | | | 55,723 | | | | 971,809 | | | |
Financial Institutions, Inc. | | | 39,300 | | | | 976,212 | | | |
First Bancorp | | | 49,571 | | | | 826,844 | | | |
First Bancorp, Inc.+ | | | 1,295 | | | | 25,175 | | | |
First BanCorp.* | | | 327,800 | | | | 1,579,996 | | | |
First Busey Corp. | | | 55,710 | | | | 366,015 | | | |
First Business Financial Services, Inc. | | | 2,800 | | | | 131,264 | | | |
| | | | | | | | | | |
| Industry Company | | Shares | | | Value | | | |
| | | |
Commercial Banks (continued) | | | | | | | |
First Commonwealth
Financial Corp. | | | 158,300 | | | | $1,518,097 | | | |
First Community
Bancshares, Inc. | | | 44,000 | | | | 801,680 | | | |
First Connecticut Bancorp, Inc. | | | 16,100 | | | | 255,507 | | | |
First Financial Bancorp | | | 66,600 | | | | 1,194,804 | | | |
First Financial Corp. | | | 37,000 | | | | 1,323,120 | | | |
First Internet Bancorp+ | | | 1,500 | | | | 36,750 | | | |
First Interstate BancSystem, Inc., Class A | | | 95,200 | | | | 2,640,848 | | | |
First Merchants Corp. | | | 79,311 | | | | 1,958,982 | | | |
First Midwest Bancorp, Inc. | | | 129,000 | | | | 2,447,130 | | | |
First of Long Island Corp. (The) | | | 12,000 | | | | 332,640 | | | |
First United Corp.* | | | 5,000 | | | | 43,300 | | | |
Flushing Financial Corp. | | | 44,297 | | | | 930,680 | | | |
German American Bancorp, Inc. | | | 13,000 | | | | 382,850 | | | |
Great Southern Bancorp, Inc. | | | 26,900 | | | | 1,133,566 | | | |
Hampton Roads
Bankshares, Inc.*+ | | | 386,754 | | | | 804,448 | | | |
Heartland Financial USA, Inc. | | | 41,600 | | | | 1,548,352 | | | |
Heritage Commerce Corp. | | | 28,100 | | | | 270,041 | | | |
Heritage Financial Corp. | | | 60,260 | | | | 1,076,846 | | | |
Heritage Oaks Bancorp | | | 200 | | | | 1,574 | | | |
HomeTrust Bancshares, Inc.* | | | 2,961 | | | | 49,626 | | | |
Horizon Bancorp+ | | | 3,150 | | | | 78,624 | | | |
Hudson Valley Holding Corp. | | | 25,200 | | | | 710,892 | | | |
Independent Bank Corp., MA+ | | | 6,500 | | | | 304,785 | | | |
Independent Bank Corp., MI | | | 75,625 | | | | 1,025,475 | | | |
International Bancshares Corp. | | | 90,687 | | | | 2,436,760 | | | |
Lakeland Bancorp, Inc. | | | 102,050 | | | | 1,213,374 | | | |
Landmark Bancorp, Inc. | | | 1,000 | | | | 24,260 | | | |
LNB Bancorp, Inc. | | | 26,672 | | | | 493,432 | | | |
Macatawa Bank Corp.+ | | | 13,200 | | | | 69,960 | | | |
MainSource Financial
Group, Inc. | | | 67,400 | | | | 1,479,430 | | | |
MB Financial, Inc. | | | 17,400 | | | | 599,256 | | | |
MBT Financial Corp.* | | | 60,322 | | | | 346,248 | | | |
Mercantile Bank Corp. | | | 31,600 | | | | 676,556 | | | |
Merchants Bancshares, Inc. | | | 5,000 | | | | 165,350 | | | |
Metro Bancorp, Inc. | | | 27,300 | | | | 713,622 | | | |
Middleburg Financial Corp. | | | 21,400 | | | | 385,200 | | | |
MidSouth Bancorp, Inc. | | | 22,500 | | | | 343,350 | | | |
MidWestOne Financial Group, Inc. | | | 15,000 | | | | 493,800 | | | |
| | |
Omni Small-Cap Value Fund SCHEDULE OF INVESTMENTS (continued) | | |
Showing percentage of net assets as of June 30, 2015
| | | | | | | | | | |
| Industry Company | | Shares | | | Value | | | |
Common Stocks (continued) | | | |
Commercial Banks (continued) | | | |
Monarch Financial Holdings, Inc. | | | 13,662 | | | | $ 171,458 | | | |
MutualFirst Financial, Inc. | | | 10,900 | | | | 253,207 | | | |
National Bankshares, Inc.+ | | | 2,500 | | | | 73,150 | | | |
National Penn Bancshares, Inc. | | | 25,000 | | | | 282,000 | | | |
NBT Bancorp, Inc. | | | 13,000 | | | | 340,210 | | | |
NewBridge Bancorp | | | 96,700 | | | | 863,531 | | | |
Northrim BanCorp, Inc.+ | | | 30,445 | | | | 780,305 | | | |
OFG Bancorp+ | | | 92,600 | | | | 988,042 | | | |
Old Line Bancshares, Inc.+ | | | 50 | | | | 794 | | | |
Old National Bancorp | | | 20,000 | | | | 289,200 | | | |
Old Second Bancorp, Inc.* | | | 54,750 | | | | 361,350 | | | |
Orrstown Financial Services, Inc. | | | 16,800 | | | | 271,824 | | | |
Pacific Continental Corp. | | | 55,500 | | | | 750,915 | | | |
Pacific Mercantile Bancorp* | | | 20,000 | | | | 151,800 | | | |
Park Sterling Corp. | | | 48,852 | | | | 351,734 | | | |
Parke Bancorp, Inc.+ | | | 300 | | | | 3,849 | | | |
Peapack Gladstone Financial Corp. | | | 6,894 | | | | 153,185 | | | |
Peoples Bancorp, Inc. | | | 29,200 | | | | 681,528 | | | |
Pinnacle Financial Partners, Inc. | | | 18,700 | | | | 1,016,719 | | | |
Preferred Bank | | | 35,700 | | | | 1,072,785 | | | |
Premier Financial Bancorp, Inc. | | | 25,200 | | | | 389,340 | | | |
QCR Holdings, Inc. | | | 2,000 | | | | 43,520 | | | |
Renasant Corp.+ | | | 47,946 | | | | 1,563,040 | | | |
Republic Bancorp, Inc., Class A | | | 21,550 | | | | 553,835 | | | |
Republic First Bancorp, Inc.*+ | | | 37,000 | | | | 128,390 | | | |
S&T Bancorp, Inc. | | | 49,300 | | | | 1,458,787 | | | |
Salisbury Bancorp, Inc. | | | 1,183 | | | | 36,910 | | | |
Sandy Spring Bancorp, Inc. | | | 24,000 | | | | 671,520 | | | |
SB Financial Group, Inc.+ | | | 400 | | | | 4,236 | | | |
Shore Bancshares, Inc.* | | | 11,112 | | | | 104,786 | | | |
Sierra Bancorp | | | 45,000 | | | | 778,950 | | | |
South State Corp. | | | 14,506 | | | | 1,102,311 | | | |
Southern National Bancorp of Virginia, Inc. | | | 20,000 | | | | 221,600 | | | |
Southwest Bancorp, Inc. | | | 32,900 | | | | 612,269 | | | |
State Bank Financial Corp. | | | 97,384 | | | | 2,113,233 | | | |
Sun Bancorp, Inc.* | | | 10,000 | | | | 192,500 | | | |
Tompkins Financial Corp. | | | 12,808 | | | | 688,046 | | | |
TowneBank+ | | | 10,000 | | | | 162,900 | | | |
Trico Bancshares | | | 37,400 | | | | 899,470 | | | |
TriState Capital Holdings, Inc.* | | | 50,000 | | | | 646,500 | | | |
| | | | | | | | | | |
| Industry Company | | Shares | | | Value | | | |
| | | |
Commercial Banks (continued) | | | |
Trustmark Corp. | | | 32,100 | | | | $ 801,858 | | | |
Union Bankshares Corp. | | | 60,966 | | | | 1,416,850 | | | |
United Community Banks, Inc. | | | 35,650 | | | | 744,016 | | | |
Univest Corp. of Pennsylvania | | | 62,600 | | | | 1,274,536 | | | |
WesBanco, Inc. | | | 70,273 | | | | 2,390,687 | | | |
Wilshire Bancorp, Inc. | | | 40,000 | | | | 505,200 | | | |
Yadkin Financial Corp.* | | | 38,452 | | | | 805,569 | | | |
| | | | | | | | | | |
| | | | | | | 81,734,956 | | | |
| |
Commercial Services & Supplies - 2.71% | | | |
ACCO Brands Corp.* | | | 333,000 | | | | 2,587,410 | | | |
Acme United Corp. | | | 735 | | | | 13,304 | | | |
Brink’s Co. (The) | | | 22,000 | | | | 647,460 | | | |
Command Security Corp.* | | | 26,800 | | | | 54,404 | | | |
Ecology & Environment, Inc., Class A+ | | | 3,500 | | | | 36,470 | | | |
EnerNOC, Inc.* | | | 124,100 | | | | 1,203,770 | | | |
Ennis, Inc. | | | 136,892 | | | | 2,544,822 | | | |
Heritage-Crystal Clean, Inc.* | | | 13,954 | | | | 205,124 | | | |
Kimball International, Inc., Class B | | | 107,200 | | | | 1,303,552 | | | |
McGrath RentCorp | | | 2,300 | | | | 69,989 | | | |
Multi-Color Corp. | | | 22,400 | | | | 1,430,912 | | | |
Quad/Graphics, Inc. | | | 70,000 | | | | 1,295,700 | | | |
RR Donnelley & Sons Co. | | | 24,597 | | | | 428,726 | | | |
TRC Cos., Inc.* | | | 10,600 | | | | 107,590 | | | |
Versar, Inc.* | | | 8,600 | | | | 33,884 | | | |
Viad Corp. | | | 17,400 | | | | 471,714 | | | |
| | | | | | | | | | |
| | | | | | | 12,434,831 | | | |
| |
Communications Equipment - 0.55% | | | |
Bel Fuse, Inc., Class B | | | 18,500 | | | | 379,620 | | | |
Black Box Corp. | | | 51,561 | | | | 1,031,220 | | | |
Blonder Tongue Laboratories* | | | 10,000 | | | | 7,700 | | | |
ClearOne, Inc. | | | 27,500 | | | | 354,888 | | | |
Communications Systems, Inc. | | | 4,150 | | | | 43,616 | | | |
Harmonic, Inc.* | | | 28,700 | | | | 196,021 | | | |
NETGEAR, Inc.* | | | 10,000 | | | | 300,200 | | | |
Polycom, Inc.* | | | 20,700 | | | | 236,808 | | | |
| | | | | | | | | | |
| | | | | | | 2,550,073 | | | |
| |
Computers & Peripherals - 0.06% | | | |
Concurrent Computer Corp. | | | 3,600 | | | | 22,320 | | | |
Hutchinson Technology, Inc.*+ | | | 100,900 | | | | 172,539 | | | |
| | |
| 8 | | Annual Report | June 30, 2015 |
| | |
Omni Small-Cap Value Fund SCHEDULE OF INVESTMENTS (continued) | | |
Showing percentage of net assets as of June 30, 2015
| | | | | | | | | | |
| Industry Company | | Shares | | | Value | | | |
Common Stocks (continued) | | | |
Computers & Peripherals (continued) | | | |
USA Technologies, Inc.*+ | | | 25,000 | | | | $ 67,500 | | | |
| | | | | | | | | | |
| | | | | | | 262,359 | | | |
| |
Construction & Engineering - 0.97% | | | |
Aegion Corp.* | | | 71,800 | | | | 1,359,892 | | | |
Goldfield Corp. (The)* | | | 121,000 | | | | 200,860 | | | |
Great Lakes Dredge & Dock Corp.* | | | 255,000 | | | | 1,519,800 | | | |
Integrated Electrical Services, Inc.* | | | 2,717 | | | | 19,291 | | | |
MYR Group, Inc.* | | | 12,100 | | | | 374,616 | | | |
Northwest Pipe Co.* | | | 33,295 | | | | 678,219 | | | |
Orion Marine Group, Inc.* | | | 43,920 | | | | 317,102 | | | |
| | | | | | | | | | |
| | | | | | | 4,469,780 | | | |
| |
Consumer Finance - 1.07% | | | |
Asta Funding, Inc.* | | | 37,900 | | | | 317,602 | | | |
Cash America International, Inc. | | | 10,200 | | | | 267,138 | | | |
Consumer Portfolio Services, Inc.*+ | | | 97,000 | | | | 606,250 | | | |
Encore Capital Group, Inc.*+ | | | 10,000 | | | | 427,400 | | | |
Ezcorp, Inc., Class A* | | | 33,900 | | | | 251,877 | | | |
Green Dot Corp., Class A* | | | 72,000 | | | | 1,376,640 | | | |
Nelnet, Inc., Class A | | | 25,800 | | | | 1,117,398 | | | |
Nicholas Financial, Inc.*+ | | | 25,000 | | | | 318,000 | | | |
Regional Management Corp.* | | | 12,700 | | | | 226,822 | | | |
| | | | | | | | | | |
| | | | | | | 4,909,127 | | | |
| |
Distributors - 0.15% | | | |
AMCON Distributing Co. | | | 800 | | | | 62,248 | | | |
VOXX International Corp.* | | | 56,500 | | | | 467,820 | | | |
Weyco Group, Inc. | | | 5,000 | | | | 149,100 | | | |
| | | | | | | | | | |
| | | | | | | 679,168 | | | |
| |
Diversified Consumer Services - 0.62% | | | |
K12, Inc.* | | | 70,600 | | | | 893,090 | | | |
Lincoln Educational Services Corp. | | | 5,000 | | | | 10,100 | | | |
Regis Corp.* | | | 121,750 | | | | 1,918,780 | | | |
Universal Technical Institute, Inc. | | | 5,000 | | | | 43,000 | | | |
| | | | | | | | | | |
| | | | | | | 2,864,970 | | | |
| |
Diversified Financial Services - 1.04% | | | |
Enova International, Inc.* | | | 9,333 | | | | 174,340 | | | |
Gain Capital Holdings, Inc. | | | 47,599 | | | | 455,046 | | | |
Interactive Brokers Group, Inc., Class A | | | 51,150 | | | | 2,125,794 | | | |
| | | | | | | | | | |
| Industry Company | | Shares | | | Value | | | |
| | | |
Diversified Financial Services (continued) | | | |
Marlin Business Services Corp. | | | 2,100 | | | | $ 35,448 | | | |
PHH Corp.* | | | 69,550 | | | | 1,810,386 | | | |
Resource America, Inc., Class A+ | | | 291 | | | | 2,447 | | | |
Sterling Bancorp+ | | | 10,000 | | | | 147,000 | | | |
Summit Financial Group, Inc. | | | 2,115 | | | | 23,709 | | | |
| | | | | | | | | | |
| | | | | | | 4,774,170 | | | |
| |
Diversified Telecommunication Services - 1.26% | | | |
Alaska Communications Systems Group, Inc.* | | | 178,400 | | | | 428,160 | | | |
Atlantic Tele-Network, Inc. | | | 11,300 | | | | 780,604 | | | |
General Communication, Inc., Class A* | | | 82,650 | | | | 1,405,876 | | | |
Hawaiian Telcom Holdco, Inc.* | | | 29,500 | | | | 769,950 | | | |
Iridium Communications, Inc.*+ | | | 241,325 | | | | 2,193,644 | | | |
Premiere Global Services, Inc.* | | | 20,700 | | | | 213,003 | | | |
| | | | | | | | | | |
| | | | | | | 5,791,237 | | | |
| |
Electrical Equipment - 0.32% | | | |
Broadwind Energy, Inc.* | | | 75,000 | | | | 318,000 | | | |
GrafTech International, Ltd.* | | | 80,500 | | | | 399,280 | | | |
Highpower International, Inc.*+ | | | 25,923 | | | | 99,285 | | | |
II-VI, Inc.* | | | 13,000 | | | | 246,740 | | | |
LSI Industries, Inc. | | | 15,000 | | | | 140,100 | | | |
Orion Energy Systems, Inc.* | | | 74,300 | | | | 186,493 | | | |
Preformed Line Products Co. | | | 1,000 | | | | 37,720 | | | |
Ultralife Corp.* | | | 7,350 | | | | 30,796 | | | |
| | | | | | | | | | |
| | | | | | | 1,458,414 | | | |
| |
Electronic Equipment, Instruments &
Components - 2.59% | | | |
Benchmark Electronics, Inc.* | | | 79,700 | | | | 1,735,866 | | | |
Fabrinet* | | | 30,050 | | | | 562,837 | | | |
GSI Group, Inc.* | | | 9,600 | | | | 144,288 | | | |
Insight Enterprises, Inc.* | | | 29,800 | | | | 891,318 | | | |
Iteris, Inc.* | | | 87,000 | | | | 153,990 | | | |
Key Tronic Corp.* | | | 22,000 | | | | 239,140 | | | |
Kimball Electronics, Inc.* | | | 50,400 | | | | 735,336 | | | |
PAR Technology Corp.* | | | 101,800 | | | | 499,838 | | | |
PCM, Inc.* | | | 8,769 | | | | 87,953 | | | |
Planar Systems, Inc.*+ | | | 10,000 | | | | 43,600 | | | |
Rofin-Sinar Technologies, Inc.* | | | 5,000 | | | | 138,000 | | | |
| | |
Omni Small-Cap Value Fund SCHEDULE OF INVESTMENTS (continued) | | |
Showing percentage of net assets as of June 30, 2015
| | | | | | | | | | |
| Industry Company | | Shares | | | Value | | | |
Common Stocks (continued) | | | |
Electronic Equipment, Instruments & Components (continued) | | | |
Sanmina Corp.* | | | 142,700 | | | | $ 2,876,832 | | | |
ScanSource, Inc.* | | | 16,000 | | | | 608,960 | | | |
Sigmatron International, Inc.*+ | | | 13,000 | | | | 118,300 | | | |
SMTC Corp.* | | | 7,500 | | | | 12,450 | | | |
TTM Technologies, Inc.* | | | 151,538 | | | | 1,513,865 | | | |
Vishay Precision Group, Inc.* | | | 101,448 | | | | 1,527,807 | | | |
Wireless Telecom Group, Inc.* | | | 10,000 | | | | 21,700 | | | |
| | | | | | | | | | |
| | | | | | | 11,912,080 | | | |
| |
Energy Equipment & Services - 2.99% | | | |
Basic Energy Services, Inc.* | | | 70,100 | | | | 529,255 | | | |
C&J Energy Services, Ltd.* | | | 81,300 | | | | 1,073,160 | | | |
CARBO Ceramics, Inc.+ | | | 16,820 | | | | 700,217 | | | |
Checkpoint Systems, Inc. | | | 17,000 | | | | 173,060 | | | |
ENGlobal Corp.* | | | 83,200 | | | | 112,320 | | | |
Era Group, Inc.* | | | 11,000 | | | | 225,280 | | | |
Gulf Island Fabrication, Inc. | | | 13,503 | | | | 150,829 | | | |
Gulfmark Offshore, Inc., Class A+ | | | 13,000 | | | | 150,800 | | | |
Helix Energy Solutions Group, Inc.* | | | 15,000 | | | | 189,450 | | | |
ION Geophysical Corp.* | | | 50,000 | | | | 53,500 | | | |
Natural Gas Services Group, Inc.* | | | 29,800 | | | | 680,036 | | | |
Newpark Resources, Inc.* | | | 85,000 | | | | 691,050 | | | |
Parker Drilling Co.* | | | 221,250 | | | | 734,550 | | | |
PHI, Inc.* | | | 90,200 | | | | 2,707,804 | | | |
Pioneer Energy Services Corp.* | | | 329,940 | | | | 2,091,820 | | | |
SEACOR Holdings, Inc.* | | | 26,000 | | | | 1,844,440 | | | |
Tesco Corp. | | | 94,505 | | | | 1,030,104 | | | |
Unit Corp.* | | | 22,000 | | | | 596,640 | | | |
| | | | | | | | | | |
| | | | | | | 13,734,315 | | | |
| |
Food & Staples Retailing - 1.58% | | | |
Andersons, Inc. (The) | | | 58,100 | | | | 2,265,900 | | | |
Ingles Markets, Inc., Class A | | | 49,800 | | | | 2,378,946 | | | |
SpartanNash Co. | | | 56,146 | | | | 1,826,991 | | | |
| | | | | | | | | | |
| | | | | | | | | | |
Village Super Market, Inc., Class A | | | 1,709 | | | | 54,158 | | | |
Weis Markets, Inc. | | | 17,500 | | | | 737,625 | | | |
| | | | | | | | | | |
| | | | | | | 7,263,620 | | | |
| |
Food Products - 2.19% | | | |
Fresh Del Monte Produce, Inc. | | | 88,000 | | | | 3,402,080 | | | |
John B. Sanfilippo & Son, Inc. | | | 9,200 | | | | 477,480 | | | |
| | | | | | | | | | |
| Industry Company | | Shares | | | Value | | | |
| | | |
Food Products (continued) | | | |
Omega Protein Corp.* | | | 123,750 | | | | $ 1,701,562 | | | |
Post Holdings, Inc.*+ | | | 62,000 | | | | 3,343,660 | | | |
Seneca Foods Corp., Class A* | | | 40,100 | | | | 1,113,577 | | | |
| | | | | | | | | | |
| | | | | | | 10,038,359 | | | |
| |
Health Care Equipment & Supplies - 0.73% | | | |
AngioDynamics, Inc.* | | | 74,400 | | | | 1,220,160 | | | |
Exactech, Inc.* | | | 17,500 | | | | 364,525 | | | |
Invacare Corp. | | | 47,900 | | | | 1,036,077 | | | |
Kewaunee Scientific Corp. | | | 3,000 | | | | 49,320 | | | |
Merit Medical Systems, Inc.* | | | 20,000 | | | | 430,800 | | | |
Symmetry Surgical, Inc.* | | | 31,250 | | | | 272,500 | | | |
| | | | | | | | | | |
| | | | | | | 3,373,382 | | | |
| |
Health Care Providers & Services - 4.28% | | | |
Almost Family, Inc.* | | | 24,600 | | | | 981,786 | | | |
Amedisys, Inc.* | | | 93,950 | | | | 3,732,634 | | | |
Amsurg Corp.* | | | 28,550 | | | | 1,997,073 | | | |
Five Star Quality Care, Inc.* | | | 146,300 | | | | 702,240 | | | |
InfuSystems Holdings, Inc.*+ | | | 36,100 | | | | 115,159 | | | |
Kindred Healthcare, Inc. | | | 81,350 | | | | 1,650,592 | | | |
LHC Group, Inc.* | | | 38,000 | | | | 1,453,500 | | | |
Magellan Health, Inc.* | | | 26,225 | | | | 1,837,586 | | | |
Molina Healthcare, Inc.* | | | 30,950 | | | | 2,175,785 | | | |
National Healthcare Corp. | | | 13,000 | | | | 844,870 | | | |
PharMerica Corp.* | | | 72,050 | | | | 2,399,265 | | | |
Premier, Inc., Class A* | | | 12,500 | | | | 480,750 | | | |
Triple-S Management Corp., Class B* | | | 50,800 | | | | 1,303,528 | | | |
| | | | | | | | | | |
| | | | | | | 19,674,768 | | | |
| |
Hotels, Restaurants & Leisure - 3.80% | | | |
Ambassadors Group, Inc.* | | | 500 | | | | 1,220 | | | |
Boyd Gaming Corp.* | | | 136,100 | | | | 2,034,695 | | | |
Flanigan’s Enterprises, Inc.+ | | | 2,500 | | | | 61,750 | | | |
Frisch’s Restaurants, Inc.+ | | | 10,900 | | | | 365,913 | | | |
International Speedway Corp., Class A | | | 64,829 | | | | 2,377,279 | | | |
Intrawest Resorts Holdings, Inc.* | | | 10,500 | | | | 122,010 | | | |
Isle of Capri Casinos, Inc.* | | | 96,200 | | | | 1,746,030 | | | |
Luby’s, Inc.* | | | 207,600 | | | | 1,006,860 | | | |
Marcus Corp. (The) | | | 130,150 | | | | 2,496,277 | | | |
| | | | | | | | | | |
| | | | | �� | | | | | |
Monarch Casino & Resort, Inc.* | | | 29,400 | | | | 604,464 | | | |
Nevada Gold & Casinos, Inc.* | | | 300 | | | | 495 | | | |
Penn National Gaming, Inc.*+ | | | 133,800 | | | | 2,455,230 | | | |
| | |
| 10 | | Annual Report | June 30, 2015 |
| | |
Omni Small-Cap Value Fund SCHEDULE OF INVESTMENTS (continued) | | |
Showing percentage of net assets as of June 30, 2015
| | | | | | | | | | |
| Industry Company | | Shares | | | Value | | | |
Common Stocks (continued) | | | |
Hotels, Restaurants & Leisure (continued) | | | |
Red Lion Hotels Corp.* | | | 43,905 | | | | $ 336,312 | | | |
Ruby Tuesday, Inc.* | | | 249,900 | | | | 1,566,873 | | | |
Speedway Motorsports, Inc. | | | 99,900 | | | | 2,262,735 | | | |
| | | | | | | | | | |
| | | | | | | 17,438,143 | | | |
| |
Household Durables - 1.41% | | | |
Bassett Furniture Industries, Inc. | | | 80,500 | | | | 2,287,005 | | | |
CSS Industries, Inc. | | | 44,900 | | | | 1,358,225 | | | |
Hooker Furniture Corp.+ | | | 15,000 | | | | 376,650 | | | |
Lifetime Brands, Inc. | | | 24,400 | | | | 360,388 | | | |
NACCO Industries, Inc., Class A | | | 9,250 | | | | 562,030 | | | |
P&F Industries, Inc., Class A* | | | 696 | | | | 5,944 | | | |
Skullcandy, Inc.* | | | 13,000 | | | | 99,710 | | | |
William Lyon Homes, Class A* | | | 10,000 | | | | 256,700 | | | |
ZAGG, Inc.* | | | 145,700 | | | | 1,153,944 | | | |
| | | | | | | | | | |
| | | | | | | 6,460,596 | | | |
| |
Household Products - 0.61% | | | |
Central Garden & Pet Co., Class A* | | | 245,003 | | | | 2,795,484 | | | |
| |
Insurance - 8.86% | | | |
Ambac Financial Group, Inc.* | | | 68,000 | | | | 1,131,520 | | | |
American Equity Investment Life Holding Co. | | | 94,850 | | | | 2,559,053 | | | |
American Independence Corp.*+ | | | 1,800 | | | | 16,956 | | | |
AMERISAFE, Inc. | | | 26,800 | | | | 1,261,208 | | | |
Argo Group International Holdings, Ltd. | | | 8,800 | | | | 490,160 | | | |
Baldwin & Lyons, Inc., Class B | | | 25,900 | | | | 596,218 | | | |
Citizens, Inc.*+ | | | 13,040 | | | | 97,278 | | | |
Donegal Group, Inc., Class A | | | 26,900 | | | | 409,687 | | | |
EMC Insurance Group, Inc. | | | 20,550 | | | | 515,188 | | | |
Employers Holdings, Inc. | | | 38,500 | | | | 877,030 | | | |
FBL Financial Group, Inc., Class A | | | 35,806 | | | | 2,066,722 | | | |
Federated National Holding Co. | | | 37,288 | | | | 902,370 | | | |
Fidelity & Guaranty Life | | | 30,800 | | | | 727,804 | | | |
First Acceptance Corp.* | | | 140,000 | | | | 448,000 | | | |
Hallmark Financial Services, Inc.* | | | 57,800 | | | | 657,764 | | | |
HCI Group, Inc. | | | 8,000 | | | | 353,680 | | | |
Heritage Insurance Holdings, Inc.* | | | 15,000 | | | | 344,850 | | | |
| | | | | | | | | | |
| Industry Company | | Shares | | | Value | | | |
| | | | | | | | | | |
Insurance (continued) | | | |
Hilltop Holdings, Inc.* | | | 20,000 | | | | $ 481,800 | | | |
Horace Mann Educators Corp. | | | 60,800 | | | | 2,211,904 | | | |
Independence Holding Co. | | | 15,050 | | | | 198,510 | | | |
Infinity Property & Casualty Corp. | | | 15,640 | | | | 1,186,138 | | | |
Investors Title Co.+ | | | 1,000 | | | | 70,890 | | | |
Kansas City Life Insurance Co. | | | 7,000 | | | | 319,970 | | | |
Kingstone Cos., Inc. | | | 4,300 | | | | 32,680 | | | |
Maiden Holdings, Ltd. | | | 162,600 | | | | 2,565,828 | | | |
MBIA, Inc.* | | | 42,100 | | | | 253,021 | | | |
Meadowbrook Insurance Group, Inc. | | | 86,000 | | | | 739,600 | | | |
Montpelier Re Holdings, Ltd. | | | 46,400 | | | | 1,832,800 | | | |
National Interstate Corp. | | | 8,000 | | | | 218,560 | | | |
National Western Life Insurance Co., Class A | | | 5,614 | | | | 1,344,497 | | | |
Navigators Group, Inc. (The)* | | | 37,200 | | | | 2,885,232 | | | |
OneBeacon Insurance Group, Ltd., Class A | | | 41,000 | | | | 594,910 | | | |
Safety Insurance Group, Inc. | | | 24,000 | | | | 1,385,040 | | | |
Selective Insurance Group, Inc. | | | 90,950 | | | | 2,551,148 | | | |
State Auto Financial Corp. | | | 18,400 | | | | 440,680 | | | |
Stewart Information Services Corp. | | | 62,150 | | | | 2,473,570 | | | |
Third Point Reinsurance, Ltd.*+ | | | 35,000 | | | | 516,250 | | | |
United Fire Group, Inc. | | | 58,800 | | | | 1,926,288 | | | |
United Insurance Holdings Corp. | | | 60,000 | | | | 932,400 | | | |
Universal Insurance Holdings, Inc. | | | 86,316 | | | | 2,088,847 | | | |
| | | | | | | | | | |
| | | | | | | 40,706,051 | | | |
| |
Internet & Catalog Retail - 0.23% | | | |
CafePress, Inc.*+ | | | 25,000 | | | | 112,500 | | | |
FTD Cos., Inc.* | | | 25,380 | | | | 715,462 | | | |
Lands’ End, Inc.*+ | | | 10,000 | | | | 248,300 | | | |
| | | | | | | | | | |
| | | | | | | 1,076,262 | | | |
| |
Internet Software & Services - 0.92% | | | |
Autobytel, Inc.* | | | 11,000 | | | | 175,890 | | | |
Blucora, Inc.* | | | 65,500 | | | | 1,057,825 | | | |
Demand Media, Inc.*+ | | | 40,000 | | | | 254,400 | | | |
Marchex, Inc., Class B | | | 70,000 | | | | 346,500 | | | |
Monster Worldwide, Inc.* | | | 264,200 | | | | 1,727,868 | | | |
United Online, Inc.* | | | 41,429 | | | | 649,192 | | | |
Unwired Planet, Inc.* | | | 10,000 | | | | 6,200 | | | |
| | | | | | | | | | |
| | | | | | | 4,217,875 | | | |
| | |
Omni Small-Cap Value Fund SCHEDULE OF INVESTMENTS (continued) | | |
Showing percentage of net assets as of June 30, 2015
| | | | | | | | | | |
| Industry Company | | Shares | | | Value | | | |
Common Stocks (continued) | | | |
IT Services - 2.14% | | | |
CACI International, Inc.,
Class A* | | | 30,924 | | | | $2,501,442 | | | |
CIBER, Inc.* | | | 82,350 | | | | 284,108 | | | |
Edgewater Technology, Inc.* | | | 51,100 | | | | 373,030 | | | |
Engility Holdings, Inc. | | | 51,400 | | | | 1,293,224 | | | |
Global Cash Access Holdings, Inc.* | | | 85,000 | | | | 657,900 | | | |
ManTech International Corp., Class A | | | 88,800 | | | | 2,575,200 | | | |
ModusLink Global Solutions, Inc.* | | | 20,000 | | | | 68,000 | | | |
NCI, Inc., Class A | | | 62,804 | | | | 648,765 | | | |
Newtek Business Services Corp.+ | | | 2,318 | | | | 41,075 | | | |
Sykes Enterprises, Inc.* | | | 58,134 | | | | 1,409,750 | | | |
| | | | | | | | | | |
| | | | | | | 9,852,494 | | | |
| |
Leisure Equipment & Products - 0.19% | | | |
Johnson Outdoors, Inc.,
Class A | | | 32,779 | | | | 771,945 | | | |
Summer Infant, Inc.* | | | 41,400 | | | | 83,628 | | | |
| | | | | | | | | | |
| | | | | | | 855,573 | | | |
| |
Machinery - 1.60% | | | |
Ampco-Pittsburgh Corp. | | | 41,200 | | | | 622,944 | | | |
Briggs & Stratton Corp. | | | 99,300 | | | | 1,912,518 | | | |
Chicago Rivet & Machine Co.+ | | | 1,000 | | | | 28,000 | | | |
Cleantech Solutions International, Inc.*+ | | | 11,500 | | | | 34,270 | | | |
Dynamic Materials Corp. | | | 20,100 | | | | 221,100 | | | |
Eastern Co. (The) | | | 18,401 | | | | 340,787 | | | |
FreightCar America, Inc. | | | 14,200 | | | | 296,496 | | | |
Hardinge, Inc. | | | 75,000 | | | | 738,750 | | | |
Hurco Companies, Inc. | | | 6,090 | | | | 210,836 | | | |
L.B. Foster Co., Class A | | | 18,600 | | | | 643,746 | | | |
L.S. Starrett Co., Class A (The) | | | 22,500 | | | | 337,500 | | | |
MFRI, Inc.* | | | 29,900 | | | | 180,895 | | | |
Supreme Industries, Inc.,
Class A | | | 35,805 | | | | 306,849 | | | |
THT Heat Transfer Technology, Inc.* | | | 15,000 | | | | 13,800 | | | |
Titan International, Inc.+ | | | 136,000 | | | | 1,460,640 | | | |
WSI Industries, Inc. | | | 1,300 | | | | 8,359 | | | |
| | | | | | | | | | |
| | | | | | | 7,357,490 | | | |
| |
Marine - 0.05% | | | |
Navios Maritime Holdings, Inc.+ | | | 43,500 | | | | 161,820 | | | |
Rand Logistics, Inc.*+ | | | 9,000 | | | | 29,160 | | | |
| | | | | | | | | | |
| Industry Company | | Shares | | | Value | | | |
| | | | | | | | | | |
Marine (continued) | | | |
Ultrapetrol Bahamas, Ltd.* | | | 15,000 | | | | $ 16,950 | | | |
| | | | | | | | | | |
| | | | | | | 207,930 | | | |
| |
Media - 1.92% | | | |
Ballantyne Strong, Inc.* | | | 43,481 | | | | 203,926 | | | |
CTC Media, Inc. | | | 3,800 | | | | 8,626 | | | |
Entercom Communications Corp., Class A* | | | 117,425 | | | | 1,340,994 | | | |
Eros International PLC*+ | | | 24,700 | | | | 620,464 | | | |
Global Sources, Ltd.*+ | | | 4,200 | | | | 29,190 | | | |
Harte-Hanks, Inc. | | | 300,300 | | | | 1,789,788 | | | |
Insignia Systems, Inc.* | | | 4,900 | | | | 13,377 | | | |
New Media Investment Group, Inc. | | | 12,800 | | | | 229,504 | | | |
Radio One, Inc., Class D*+ | | | 123,800 | | | | 392,446 | | | |
Reading International, Inc., Class A* | | | 31,209 | | | | 432,245 | | | |
Salem Media Group, Inc.+ | | | 83,452 | | | | 528,251 | | | |
Scholastic Corp. | | | 72,800 | | | | 3,212,664 | | | |
| | | | | | | | | | |
| | | | | | | 8,801,475 | | | |
| |
Metals & Mining - 1.32% | | | |
Century Aluminum Co.* | | | 147,100 | | | | 1,534,253 | | | |
Handy & Harman, Ltd.* | | | 800 | | | | 27,720 | | | |
Hecla Mining Co. | | | 327,000 | | | | 860,010 | | | |
Kaiser Aluminum Corp. | | | 21,980 | | | | 1,826,098 | | | |
Materion Corp. | | | 33,400 | | | | 1,177,350 | | | |
Noranda Aluminum Holding Corp. | | | 23,500 | | | | 19,975 | | | |
Stillwater Mining Co.* | | | 20,000 | | | | 231,800 | | | |
Synalloy Corp. | | | 7,000 | | | | 95,900 | | | |
Thompson Creek Metals Co., Inc.* | | | 3,500 | | | | 2,870 | | | |
Universal Stainless & Alloy Products, Inc.*+ | | | 14,658 | | | | 288,030 | | | |
| | | | | | | | | | |
| | | | | | | 6,064,006 | | | |
| |
Multiline Retail - 0.19% | | | |
Fred’s, Inc., Class A | | | 46,200 | | | | 891,198 | | | |
| |
Oil, Gas & Consumable Fuels - 5.32% | | | |
Abraxas Petroleum Corp.* | | | 180,200 | | | | 531,590 | | | |
Adams Resources & Energy, Inc. | | | 19,100 | | | | 851,860 | | | |
Alon USA Energy, Inc. | | | 70,850 | | | | 1,339,065 | | | |
Bill Barrett Corp.*+ | | | 15,000 | | | | 128,850 | | | |
Bonanza Creek Energy, Inc.* | | | 46,000 | | | | 839,500 | | | |
Callon Petroleum Co.* | | | 293,900 | | | | 2,445,248 | | | |
Carrizo Oil & Gas, Inc.* | | | 25,000 | | | | 1,231,000 | | | |
Clayton Williams Energy, Inc.* | | | 16,000 | | | | 1,052,000 | | | |
| | |
| 12 | | Annual Report | June 30, 2015 |
| | |
Omni Small-Cap Value Fund SCHEDULE OF INVESTMENTS (continued) | | |
Showing percentage of net assets as of June 30, 2015
| | | | | | | | | | |
| Industry Company | | Shares | | | Value | | | |
Common Stocks (continued) | | | |
Oil, Gas & Consumable Fuels (continued) | | | |
Cloud Peak Energy, Inc.*+ | | | 31,800 | | | | $ 148,188 | | | |
Contango Oil & Gas Co.* | | | 5,000 | | | | 61,350 | | | |
DHT Holdings, Inc. | | | 36,722 | | | | 285,330 | | | |
Earthstone Energy, Inc.* | | | 3,202 | | | | 62,535 | | | |
Gastar Exploration, Inc.* | | | 162,540 | | | | 502,249 | | | |
Golden Ocean Group Ltd.+ | | | 27,000 | | | | 103,950 | | | |
Gran Tierra Energy, Inc.* | | | 100,000 | | | | 298,000 | | | |
Green Plains, Inc. | | | 90,200 | | | | 2,485,010 | | | |
Halcon Resources Corp.*+ | | | 98,000 | | | | 113,680 | | | |
Hallador Energy Co. | | | 70,000 | | | | 583,800 | | | |
LinnCo LLC+ | | | 40,000 | | | | 378,000 | | | |
Matador Resources Co.* | | | 55,000 | | | | 1,375,000 | | | |
Mexco Energy Corp.*+ | | | 6,000 | | | | 27,960 | | | |
Navios Maritime Acquisition Corp.+ | | | 65,000 | | | | 233,350 | | | |
New Concept Energy, Inc.* | | | 4,800 | | | | 7,200 | | | |
Northern Oil and Gas, Inc.*+ | | | 90,000 | | | | 609,300 | �� | | |
Pacific Ethanol, Inc.*+ | | | 25,000 | | | | 258,000 | | | |
PDC Energy, Inc.* | | | 10,000 | | | | 536,400 | | | |
Penn Virginia Corp.*+ | | | 184,300 | | | | 807,234 | | | |
PetroQuest Energy, Inc.*+ | | | 46,250 | | | | 91,575 | | | |
Renewable Energy Group, Inc.* | | | 181,341 | | | | 2,096,302 | | | |
REX American Resources Corp.* | | | 33,920 | | | | 2,158,669 | | | |
Sanchez Energy Corp.*+ | | | 30,000 | | | | 294,000 | | | |
Ship Finance International, Ltd.+ | | | 50,000 | | | | 816,000 | | | |
Stone Energy Corp.* | | | 12,400 | | | | 156,116 | | | |
Swift Energy Co.*+ | | | 10,000 | | | | 20,300 | | | |
TransAtlantic Petroleum, Ltd.*+ | | | 68,500 | | | | 350,035 | | | |
Triangle Petroleum Corp.*+ | | | 185,000 | | | | 928,700 | | | |
VAALCO Energy, Inc.* | | | 26,500 | | | | 56,710 | | | |
W&T Offshore, Inc.+ | | | 28,800 | | | | 157,824 | | | |
Warren Resources, Inc.* | | | 79,600 | | | | 36,616 | | | |
| | | | | | | | | | |
| | | | | | | 24,458,496 | | | |
| |
Paper & Forest Products - 0.64% | | | |
Mercer International, Inc.* | | | 79,150 | | | | 1,082,772 | | | |
Orient Paper, Inc.* | | | 76,593 | | | | 123,315 | | | |
PH Glatfelter Co. | | | 20,500 | | | | 450,795 | | | |
| | | | | | | | | | |
Resolute Forest
Products, Inc.*+
| | | 112,800 | | | | 1,269,000 | | | |
| | | | | | | | | | |
| | | | | | | 2,925,882 | | | |
| |
Personal Products - 0.20% | | | |
Mannatech, Inc.* | | | 8,400 | | | | 150,360 | | | |
Natural Alternatives International, Inc.*+ | | | 6,400 | | | | 36,256 | | | |
| | | | | | | | | | |
| Industry Company | | Shares | | | Value | | | |
| | | | | | | | | | |
Personal Products (continued) | | | |
Nutraceutical International Corp.* | | | 28,700 | | | | $ 710,038 | | | |
| | | | | | | | | | |
| | | | | | | 896,654 | | | |
| |
Professional Services - 2.59% | | | |
CBIZ, Inc.* | | | 13,000 | | | | 125,320 | | | |
CDI Corp. | | | 104,600 | | | | 1,359,800 | | | |
CRA International, Inc.* | | | 54,700 | | | | 1,524,489 | | | |
FTI Consulting, Inc.* | | | 47,800 | | | | 1,971,272 | | | |
Heidrick & Struggles International, Inc. | | | 55,000 | | | | 1,434,400 | | | |
Hill International, Inc.* | | | 50,100 | | | | 263,526 | | | |
ICF International, Inc.* | | | 6,000 | | | | 209,160 | | | |
Kelly Services, Inc., Class A | | | 17,816 | | | | 273,476 | | | |
Navigant Consulting, Inc.* | | | 124,600 | | | | 1,852,802 | | | |
RPX Corp.* | | | 132,700 | | | | 2,242,630 | | | |
VSE Corp. | | | 11,800 | | | | 631,418 | | | |
| | | | | | | | | | |
| | | | | | | 11,888,293 | | | |
| |
Real Estate Management & Development - 0.10% | | | |
Forestar Group, Inc.* | | | 15,000 | | | | 197,400 | | | |
RE/MAX Holdings, Inc., Class A | | | 1,168 | | | | 41,476 | | | |
St. Joe Co. (The)* | | | 15,000 | | | | 232,950 | | | |
| | | | | | | | | | |
| | | | | | | 471,826 | | | |
| |
Road & Rail - 1.37% | | | |
ArcBest Corp. | | | 45,700 | | | | 1,453,260 | | | |
Celadon Group, Inc. | | | 22,400 | | | | 463,232 | | | |
Covenant Transportation Group, Inc., Class A*+ | | | 45,300 | | | | 1,135,218 | | | |
Marten Transport, Ltd. | | | 55,482 | | | | 1,203,959 | | | |
P.A.M. Transportation Services, Inc.*+ | | | 26,819 | | | | 1,556,843 | | | |
Providence & Worcester Railroad Co. | | | 531 | | | | 9,208 | | | |
USA Truck, Inc.* | | | 21,836 | | | | 463,578 | | | |
| | | | | | | | | | |
| | | | | | | 6,285,298 | | | |
| |
Semiconductors & Semiconductor
Equipment - 3.86% | | | |
Advanced Energy Industries, Inc.* | | | 44,400 | | | | 1,220,556 | | | |
Alpha & Omega Semiconductor, Ltd.* | | | 114,500 | | | | 1,000,730 | | | |
Amkor Technology, Inc.* | | | 162,600 | | | | 972,348 | | | |
AXT, Inc.* | | | 100,000 | | | | 252,000 | | | |
Brooks Automation, Inc. | | | 73,400 | | | | 840,430 | | | |
Cirrus Logic, Inc.* | | | 29,800 | | | | 1,014,094 | | | |
| | | | | | | | | | |
Cohu, Inc. | | | 5,000 | | | | 66,150 | | | |
Diodes, Inc.* | | | 35,799 | | | | 863,114 | | | |
| | |
Omni Small-Cap Value Fund SCHEDULE OF INVESTMENTS (continued) | | |
Showing percentage of net assets as of June 30, 2015
| | | | | | | | | | |
| Industry Company | | Shares | | | Value | | | |
Common Stocks (continued) | | | |
Semiconductors & Semiconductor Equipment (continued) | | | |
Fairchild Semiconductor International, Inc.* | | | 128,000 | | | | $ 2,224,640 | | | |
GigOptix, Inc.* | | | 60,000 | | | | 102,000 | | | |
Integrated Silicon Solution, Inc. | | | 68,200 | | | | 1,509,948 | | | |
inTEST Corp.*+ | | | 55,000 | | | | 239,800 | | | |
IXYS Corp. | | | 57,500 | | | | 879,750 | | | |
Kulicke & Soffa Industries, Inc.* | | | 123,632 | | | | 1,447,731 | | | |
OmniVision Technologies, Inc.* | | | 79,100 | | | | 2,072,024 | | | |
Pericom Semiconductor Corp. | | | 40,000 | | | | 526,000 | | | |
Photronics, Inc.* | | | 168,550 | | | | 1,602,910 | | | |
Rudolph Technologies, Inc.* | | | 39,600 | | | | 475,596 | | | |
Ultra Clean Holdings, Inc.* | | | 39,300 | | | | 244,839 | | | |
Xcerra Corp.* | | | 25,000 | | | | 189,250 | | | |
| | | | | | | | | | |
| | | | | | | 17,743,910 | | | |
| |
Software - 1.09% | | | |
Ebix, Inc.+ | | | 110,000 | | | | 3,587,100 | | | |
Epiq Systems, Inc. | | | 30,000 | | | | 506,400 | | | |
GSE Systems, Inc.* | | | 22,500 | | | | 34,875 | | | |
Mind CTI, Ltd. | | | 20,000 | | | | 52,000 | | | |
Net 1 UEPS Technologies, Inc.* | | | 3,400 | | | | 62,152 | | | |
NetSol Technologies, Inc.* | | | 31,000 | | | | 159,650 | | | |
TeleCommunication Systems, Inc., Class A* | | | 180,743 | | | | 598,259 | | | |
| | | | | | | | | | |
| | | | | | | 5,000,436 | | | |
| |
Specialty Retail - 2.62% | | | |
Barnes & Noble, Inc.* | | | 82,000 | | | | 2,128,720 | | | |
Big 5 Sporting Goods Corp. | | | 14,745 | | | | 209,526 | | | |
Children’s Place, Inc. (The) | | | 10,500 | | | | 686,805 | | | |
Citi Trends, Inc.* | | | 28,900 | | | | 699,380 | | | |
Genesco, Inc.* | | | 7,000 | | | | 462,210 | | | |
Haverty Furniture Cos., Inc. | | | 12,700 | | | | 274,574 | | | |
hhgregg, Inc.*+ | | | 15,000 | | | | 50,100 | | | |
Pep Boys-Manny, Moe & Jack (The)* | | | 52,900 | | | | 649,083 | | | |
Rent-A-Center, Inc. | | | 5,000 | | | | 141,750 | | | |
Shoe Carnival, Inc. | | | 16,500 | | | | 476,190 | | | |
Sonic Automotive, Inc., Class A | | | 30,000 | | | | 714,900 | | | |
Stage Stores, Inc. | | | 67,800 | | | | 1,188,534 | | | |
Systemax, Inc.* | | | 12,500 | | | | 108,000 | | | |
Tilly’s, Inc., Class A* | | | 42,700 | | | | 412,909 | | | |
Trans World Entertainment Corp.* | | | 70,000 | | | | 256,200 | | | |
TravelCenters of America LLC* | | | 219,400 | | | | 3,258,090 | | | |
| | | | | | | | | | |
| | | | | | | | | | |
| | | | | | | | | | |
| Industry Company | | Shares | | | Value | | | |
| | | |
Specialty Retail (continued) | | | |
West Marine, Inc.* | | | 35,300 | | | | $ 340,292 | | | |
| | | | | | | | | | |
| | | | | | | 12,057,263 | | | |
| |
Textiles, Apparel & Luxury Goods - 1.23% | | | |
Delta Apparel, Inc.*+ | | | 10,000 | | | | 143,000 | | | |
Iconix Brand Group, Inc.* | | | 14,000 | | | | 349,580 | | | |
Perry Ellis International, Inc.* | | | 138,100 | | | | 3,282,637 | | | |
Rocky Brands, Inc. | | | 20,800 | | | | 388,960 | | | |
Unifi, Inc.* | | | 44,300 | | | | 1,484,050 | | | |
| | | | | | | | | | |
| | | | | | | 5,648,227 | | | |
| |
Thrifts & Mortgage Finance - 4.37% | | | |
Astoria Financial Corp. | | | 112,100 | | | | 1,545,859 | | | |
Bank Mutual Corp. | | | 124,700 | | | | 956,449 | | | |
Berkshire Hills Bancorp, Inc. | | | 50,565 | | | | 1,440,091 | | | |
Brookline Bancorp, Inc. | | | 45,000 | | | | 508,050 | | | |
Cape Bancorp, Inc. | | | 29,300 | | | | 277,178 | | | |
Cheviot Financial Corp. | | | 3,893 | | | | 57,227 | | | |
Chicopee Bancorp, Inc. | | | 12,500 | | | | 206,125 | | | |
Dime Community Bancshares, Inc. | | | 42,100 | | | | 713,174 | | | |
ESSA Bancorp, Inc. | | | 33,100 | | | | 425,666 | | | |
Federal Agricultural Mortgage Corp., Class C | | | 21,500 | | | | 624,790 | | | |
First Defiance Financial Corp. | | | 19,400 | | | | 728,082 | | | |
First Financial Northwest, Inc.+ | | | 35,182 | | | | 438,368 | | | |
Flagstar Bancorp, Inc.* | | | 57,100 | | | | 1,055,208 | | | |
Fox Chase Bancorp, Inc. | | | 31,000 | | | | 524,520 | | | |
Hingham Institution for Savings | | | 30 | | | | 3,453 | | | |
HMN Financial, Inc.*+ | | | 23,800 | | | | 280,602 | | | |
Home Bancorp, Inc. | | | 17,311 | | | | 436,930 | | | |
HomeStreet, Inc.* | | | 22,000 | | | | 502,040 | | | |
HopFed Bancorp, Inc.+ | | | 18,100 | | | | 214,123 | | | |
Lake Sunapee Bank Group+ | | | 2,000 | | | | 28,860 | | | |
Meta Financial Group, Inc. | | | 7,900 | | | | 339,068 | | | |
NASB Financial, Inc.+ | | | 4,600 | | | | 121,900 | | | |
Northwest Bancshares, Inc. | | | 68,300 | | | | 875,606 | | | |
Ocean Shore Holding Co. | | | 14,200 | | | | 210,657 | | | |
OceanFirst Financial Corp. | | | 39,900 | | | | 744,135 | | | |
Oritani Financial Corp. | | | 74,400 | | | | 1,194,120 | | | |
| | | | | | | | | | |
Provident Financial Holdings, Inc. | | | 26,600 | | | | 445,284 | | | |
Provident Financial Services, Inc. | | | 69,700 | | | | 1,323,603 | | | |
Pulaski Financial Corp. | | | 29,900 | | | | 386,308 | | | |
Riverview Bancorp, Inc. | | | 87,000 | | | | 372,360 | | | |
Security National Financial Corp., Class A*+ | | | 78,278 | | | | 526,811 | | | |
| | |
| 14 | | Annual Report | June 30, 2015 |
| | |
Omni Small-Cap Value Fund SCHEDULE OF INVESTMENTS (continued) | | |
Showing percentage of net assets as of June 30, 2015
| | | | | | | | | | |
| Industry Company | | Shares | | | Value | | | |
Common Stocks (continued) | | | |
Thrifts & Mortgage Finance (continued) | | | |
SI Financial Group, Inc. | | | 31,000 | | | | $ 360,840 | | | |
Territorial Bancorp, Inc. | | | 21,200 | | | | 514,312 | | | |
Timberland Bancorp, Inc. | | | 9,000 | | | | 90,180 | | | |
TrustCo Bank Corp. - NY | | | 55,000 | | | | 386,650 | | | |
United Community Bancorp+ | | | 11,800 | | | | 162,958 | | | |
United Community Financial Corp. | | | 61,324 | | | | 328,083 | | | |
Westfield Financial, Inc. | | | 53,081 | | | | 388,022 | | | |
WSFS Financial Corp. | | | 12,000 | | | | 328,200 | | | |
| | | | | | | | | | |
| | | | | | | 20,065,892 | | | |
| |
Trading Companies & Distributors - 1.88% | | | |
Aircastle, Ltd. | | | 130,700 | | | | 2,962,969 | | | |
CAI International, Inc.* | | | 63,500 | | | | 1,307,465 | | | |
General Finance Corp.*+ | | | 168,500 | | | | 879,570 | | | |
Rush Enterprises, Inc., Class A* | | | 58,500 | | | | 1,533,285 | | | |
TAL International Group, Inc.+ | | | 17,250 | | | | 545,100 | | | |
Textainer Group Holdings, Ltd.+ | | | 15,000 | | | | 390,150 | | | |
Titan Machinery, Inc.*+ | | | 9,500 | | | | 139,935 | | | |
Willis Lease Finance Corp.* | | | 48,400 | | | | 889,108 | | | |
| | | | | | | | | | |
| | | | | | | 8,647,582 | | | |
| |
Wireless Telecommunication Services - 0.28% | | | |
Shenandoah Telecommunications Co. | | | 5,600 | | | | 191,688 | | | |
Spok Holdings, Inc. | | | 64,764 | | | | 1,090,626 | | | |
| | | | | | | | | | |
| | | | | | | 1,282,314 | | | |
| | | | | | | | | | |
TOTAL COMMON STOCKS - 99.80% | | | | 458,434,559 | | | |
| | | | | | | | | | |
(Cost $366,657,321) | | | | | | | | | | |
| |
RIGHTS - 0.01% | | | |
Leap Wireless CVR*D | | | 32,900 | | | | 41,454 | | | |
| | | | | | | | | | |
TOTAL RIGHTS - 0.01% | | | | | | | 41,454 | | | |
| | | | | | | | | | |
(Cost $80,276) | | | | | | | | | | |
| |
WARRANTS - 0.00% | | | |
Eagle Bulk Shipping, Inc.* | | | 3,317 | | | | 1,260 | | | |
| | | | | | | | | | |
TOTAL WARRANTS - 0.00% | | | | | | | 1,260 | | | |
| | | | | | | | | | |
(Cost $105,563) | | | | | | | | | | |
| | | | | | | | | | | | | | |
| | | Rate^ | | | Shares | | | Value | | | |
MONEY MARKET FUND - 0.15% | | | | | | | |
Dreyfus Cash Management Fund | | | 0.04 | % | | | 702,231 | | | $ | 702,231 | | | |
| | | | | | | |
TOTAL MONEY MARKET FUND - 0.15% | | | | 702,231 | | | |
| | | | | | | |
(Cost $702,231) | | | | | | | | | | | | | | |
| |
| INVESTMENTS PURCHASED WITH CASH PROCEEDS FROM SECURITIES LENDING - 3.59% | | | |
Dreyfus Cash Management Fund** | | | 0.04 | % | | | 16,484,499 | | | | 16,484,499 | | | |
| | | | | | | |
TOTAL INVESTMENTS PURCHASED WITH CASH PROCEEDS FROM SECURITIES LENDING - 3.59% | | | | 16,484,499 | | | |
| | | | | | | |
(Cost $16,484,499) | | | | | | | |
| | |
TOTAL INVESTMENTS - 103.55% | | | $ | 475,664,003 | | | |
(Cost $384,029,890) | | | | | | | |
Liabilities in Excess of Other
Assets - (3.55%) | | | | (16,296,868 | ) | | |
| | | | | | | |
NET ASSETS - 100.00% | | | $ | 459,367,135 | | | |
| | | | | | | | | | | | | | |
| | | | |
| |
| * | | Non-income producing security. |
| ** | | This security represents the investment of the collateral received in connection with securities out on loan as of June 30, 2015. | | |
| ^ | | Rate disclosed as of June 30, 2015. | | |
| D | | Security was fair valued under procedures adopted by the Board of Directors (see Note 2). | | |
| + | | This security or a portion of the security is out on loan as of June 30, 2015. Total loaned securities had a value of $15,806,395 as of June 30, 2015. | | |
CVR - Contingent Value Right
LLC - Limited Liability Company
PLC - Public Limited Company
| | |
Omni Small-Cap Value Fund SCHEDULE OF INVESTMENTS (continued) | | |
| | | | | | | | | | | | | | | | | | |
Summary of inputs used to value the Fund’s investments as of
06/30/2015 (See Note 2 in Notes to Financial Statements): | | | |
| | | Valuation Inputs | | | |
| | | Investment in Securities (Value) | | | |
| | | Level 1 Quoted
Prices | | | Level 2
Significant
Observable
Inputs | | | Level 3 Significant Unobservable
Inputs | | | Total | | | |
| | | | | |
Common Stocks | | $ | 458,228,434 | | | $ | 206,125 | | | | $ — | | | $ | 458,434,559 | | | |
Rights | | | — | | | | — | | | | 41,454 | | | | 41,454 | | | |
Warrants | | | 1,260 | | | | — | | | | — | | | | 1,260 | | | |
Money Market Fund | | | — | | | | 702,231 | | | | — | | | | 702,231 | | | |
Investments Purchased with Cash Proceeds from Securities Lending | | | — | | | | 16,484,499 | | | | — | | | | 16,484,499 | | | |
| | | | | | | | | | | | | | | | | | |
TOTAL | | $ | 458,229,694 | | | $ | 17,392,855 | | | | $ 41,454 | | | $ | 475,664,003 | | | |
| | | | | | | | | | | | | | | | | | |
| | | | | | | | |
Following is a reconciliation of Level 3 investments for which significant
unobservable inputs were used to determine fair value: | |
| | | Investment in Securities (Value) | |
| | | Rights | | | Total | |
| | |
Balance as of 06/30/2014 | | | $41,454 | | | | $41,454 | |
Purchases | | | — | | | | — | |
Sales | | | — | | | | — | |
Realized gain/(loss) | | | — | | | | — | |
Change in unrealized
appreciation/
(depreciation) | | | — | | | | — | |
Transfers in | | | — | | | | — | |
Transfers out | | | — | | | | — | |
| | | | | | | | |
Balance as of 06/30/2015 | | | $41,454 | | | | $41,454 | |
| | | | | | | | |
Net change in
unrealized appreciation
(depreciation) from
investments held
as of 06/30/2015 | | | $ — | | | | $ — | |
| | | | | | | | |
See Notes to Financial Statements.
| | |
| 16 | | Annual Report | June 30, 2015 |
| | |
Omni Tax-Managed Small-Cap Value Fund MANAGER’S COMMENTARY (Unaudited) | | |
June 30, 2015
Dear Fellow Omni Tax-Managed Small-Cap Value Fund Shareholder,
For the quarter ended June 30, 2015, our Fund declined 0.41%, outperforming our primary market benchmark, the Russell 2000 Value Index (-1.20%).
For the fiscal year, our Fund declined 1.62%, underperforming our primary market benchmark, the Russell 2000 Value Index (+0.78%).
The table below presents our June quarter, one-year and inception-to-date financial results. See the next page for a graph of performance since inception.
Standardized Returns as of June 30, 2015
| | | | | | | | | | |
| | | | | | | | | Annualized |
| | | Quarter | | | 1 Year | | | Since Inception (12/31/10) |
| | | |
Omni Tax-Managed Small-Cap Value Fund | | | -0.41 | % | | | -1.62 | % | | 11.29% |
Russell 2000 Value Index | | | -1.20 | % | | | 0.78 | % | | 10.64% |
Performance figures quoted in the table above and the graph on the next page represent past performance and are no guarantee of future results. Total return figures in the table above include the reinvestment of dividends and capital gains. The table above and the graph on the next page do not reflect the deduction of taxes that a shareholder would pay on Fund distributions or on the redemption of Fund shares.
The Russell 2000 Value Index is an unmanaged index that consists of stocks in the Russell 2000 Index with lower price-to-book ratios and lower forecasted growth values with dividends reinvested. It is not possible to invest directly in an index. Periods longer than one year are annualized.
According to data from Lipper, Inc. as of June 30, 2015, Omni Tax-Managed Small-Cap Value Fund ranked 247th of 312 small-cap value funds for the 12 months ending June 30, 2015 and 110th of 233 such funds since inception in December 2010. Lipper, Inc. is an independent mutual fund rating service that ranks funds in various fund categories by making comparative calculations using total returns.
| | |
Omni Tax-Managed Small-Cap Value Fund MANAGER’S COMMENTARY (Unaudited) (continued) | | |
Omni Tax-Managed Small-Cap Value Fund vs. Russell 2000 Value Index
from Inception 12/31/10 to 6/30/15
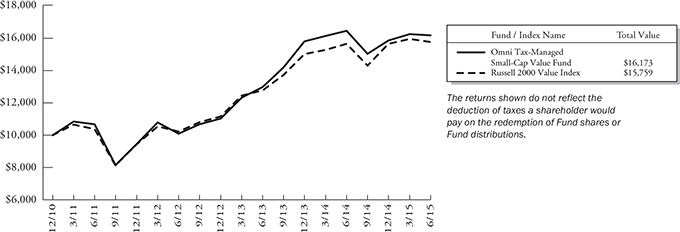
Detailed Explanation of Quarterly Performance
The Omni Tax-Managed Small-Cap Value Fund is designed to capture the returns of the small-cap value asset class through broad diversification of small company and value stocks. We also seek to minimize the distribution of capital gains within the constraints of the investment objective. This approach is sometimes referred to as “passive, asset class investing.” As of June 30, 2015, we held 637 such stocks in a market-cap weighted style. We make no attempt to track any particular index in either performance or statistics.
Our design tilt toward deeper value and smaller stocks contributed positively to relative performance. By design, the Fund does not hold Utility sector stocks or Real Estate Investment Trusts (REITs). Those assets had weak relative returns during the quarter, which helped the Fund’s relative performance. Our Fund’s higher weighting in Financial sector stocks other than REITs contributed to relative returns, while holdings in the Energy sector had a negative effect.
Detailed Explanation of Fiscal Year Performance
Our Fund’s investment in deeper value stocks versus the Index detracted from our relative performance for the fiscal year. Our Fund’s overweight position in the Energy sector also hurt performance, as Energy was the worst performing sector for the year.
| | |
| 18 | | Annual Report | June 30, 2015 |
| | |
Omni Tax-Managed Small-Cap Value Fund MANAGER’S COMMENTARY (Unaudited) (continued) | | |
Top Ten Holdings as of June 30, 2015
| | | | | | | | |
| Rank | | Description | | Industry | | % of Net
Assets | |
1 | | Interactive Brokers Group, Inc., Class A | | Diversified Financial Services | | | 0.8% | |
2 | | AAR Corp. | | Aerospace & Defense | | | 0.8% | |
3 | | Fresh Del Monte Produce, Inc. | | Food Products | | | 0.8% | |
4 | | Cooper-Standard Holding, Inc. | | Auto Components | | | 0.7% | |
5 | | Scholastic Corp. | | Media | | | 0.7% | |
6 | | Briggs & Stratton Corp. | | Machinery | | | 0.7% | |
7 | | Hawaiian Holdings, Inc. | | Airlines | | | 0.7% | |
8 | | Perry Ellis International, Inc. | | Textiles, Apparel & Luxury Goods | | | 0.7% | |
9 | | Aircastle, Ltd. | | Trading Companies & Distributors | | | 0.7% | |
10 | | Sanmina Corp. | | Electronic Equipment, Instruments & Components | | | 0.7% | |
| | Total | | | | | 7.3% | |
Industry Sector Representation as of June 30, 2015
| | | | | | |
| | | % of Net Assets | | % of Russell 2000
Value Index | | Difference |
Consumer Discretionary | | 15.7% | | 10.8% | | 4.9% |
Consumer Staples | | 4.0% | | 3.0% | | 1.0% |
Energy | | 8.0% | | 6.3% | | 1.7% |
Financials | | 34.8% | | 41.7% | | -6.9% |
Health Care | | 4.2% | | 4.2% | | 0.0% |
Industrials | | 16.5% | | 12.4% | | 4.1% |
Information Technology | | 10.6% | | 10.3% | | 0.3% |
Materials | | 4.1% | | 3.9% | | 0.2% |
Telecommunication Services | | 1.4% | | 0.9% | | 0.5% |
Utilities | | 0.0% | | 6.5% | | -6.5% |
Cash & Other Assets | | 0.6% | | 0.0% | | 0.6% |
Total | | 100.0% | | 100.0% | | |
Disclaimer
The views expressed here are exclusively those of Fund management. These views, including those related to market sectors or individual stocks, are not meant as investment advice and should not be considered predictive in nature. Any favorable (or unfavorable) description of a holding applies only as of the quarter end, June 30, 2015, unless otherwise stated. Security positions can and do change thereafter. Discussions of historical performance do not guarantee and may not be indicative of future performance.
Market volatility can significantly impact short-term performance. The Fund is not an appropriate investment for short-term investors. Investments in small companies generally carry greater risk than is customarily associated with larger companies. This additional risk is attributable to a number of factors, including the relatively limited financial resources that are typically available to small companies and the fact that small companies often have comparatively limited product lines. In addition, the stock of small companies tends to be more volatile than the stock of large companies, particularly in the short-term and particularly in the early stages of an economic or market downturn. Shareholders of the Fund, therefore, are taking on more risk than they would if they invested in the stock market as a whole.
Conclusion
Thank you for your continued investment in Omni Tax-Managed Small-Cap Value Fund. We encourage your feedback; your reactions and concerns are important to us.
Sincerely,
The Investment Management Team
| | |
Omni Tax-Managed Small-Cap Value Fund SCHEDULE OF INVESTMENTS | | |
Showing percentage of net assets as of June 30, 2015
| | | | | | | | | | |
| Industry Company | | Shares | | | Value | | | |
COMMON STOCKS - 99.46% | | | |
Aerospace & Defense - 1.69% | | | |
AAR Corp. | | | 114,560 | | | | $ 3,651,027 | | | |
Arotech Corp.*+ | | | 136,300 | | | | 328,483 | | | |
Breeze-Eastern Corp.* | | | 2,500 | | | | 28,750 | | | |
Cubic Corp. | | | 10,000 | | | | 475,800 | | | |
Ducommun, Inc.* | | | 69,220 | | | | 1,776,877 | | | |
Erickson, Inc.*+ | | | 1,500 | | | | 6,510 | | | |
LMI Aerospace, Inc.* | | | 77,600 | | | | 776,776 | | | |
National Presto Industries, Inc.+ | | | 9,435 | | | | 757,819 | | | |
Sypris Solutions, Inc. | | | 8,004 | | | | 11,606 | | | |
| | | | | | | | | | |
| | | | | | | 7,813,648 | | | |
| |
Air Freight & Logistics - 0.74% | | | |
Air T, Inc.* | | | 6,700 | | | | 140,432 | | | |
Air Transport Services Group, Inc.* | | | 215,950 | | | | 2,265,316 | | | |
Atlas Air Worldwide Holdings, Inc.* | | | 18,291 | | | | 1,005,273 | | | |
| | | | | | | | | | |
| | | | | | | 3,411,021 | | | |
| |
Airlines - 1.44% | | | |
Hawaiian Holdings, Inc.* | | | 135,600 | | | | 3,220,500 | | | |
Republic Airways Holdings, Inc.* | | | 191,354 | | | | 1,756,630 | | | |
SkyWest, Inc. | | | 110,600 | | | | 1,663,424 | | | |
| | | | | | | | | | |
| | | | | | | 6,640,554 | | | |
| |
Auto Components - 2.26% | | | |
China Automotive Systems, Inc.*+ | | | 28,500 | | | | 239,970 | | | |
China XD Plastics Co., Ltd.* | | | 79,500 | | | | 479,385 | | | |
Cooper Tire & Rubber Co. | | | 14,500 | | | | 490,535 | | | |
Cooper-Standard Holding, Inc.* | | | 55,510 | | | | 3,412,200 | | | |
Fuel Systems Solutions, Inc.* | | | 56,402 | | | | 421,887 | | | |
Modine Manufacturing Co.* | | | 149,000 | | | | 1,598,770 | | | |
Remy International, Inc. | | | 9,100 | | | | 201,201 | | | |
Shiloh Industries, Inc.*+ | | | 15,000 | | | | 194,250 | | | |
SORL Auto Parts, Inc.*+ | | | 48,000 | | | | 156,480 | | | |
Spartan Motors, Inc. | | | 88,600 | | | | 405,788 | | | |
Stoneridge, Inc.* | | | 33,400 | | | | 391,114 | | | |
Strattec Security Corp. | | | 3,600 | | | | 247,320 | | | |
Superior Industries International, Inc. | | | 118,700 | | | | 2,173,397 | | | |
| | | | | | | | | | |
| | | | | | | 10,412,297 | | | |
| |
Beverages - 0.05% | | | |
MGP Ingredients, Inc. | | | 12,300 | | | | 206,886 | | | |
| | | |
Biotechnology - 0.01% | | | | | | | | | | |
Enzon Pharmaceuticals, Inc. | | | 41,400 | | | | 49,680 | | | |
| | | | | | | | | | |
| Industry Company | | Shares | | | Value | | | |
| | | |
Building Products - 1.00% | | | | | | | | | | |
Alpha Pro Tech, Ltd.* | | | 54,000 | | | | $ 120,960 | | | |
Gibraltar Industries, Inc.* | | | 84,706 | | | | 1,725,461 | | | |
Griffon Corp. | | | 140,250 | | | | 2,232,780 | | | |
Universal Forest Products, Inc. | | | 10,000 | | | | 520,300 | | | |
| | | | | | | | | | |
| | | | | | | 4,599,501 | | | |
| |
Capital Markets - 1.42% | | | |
Arlington Asset Investment Corp., Class A+ | | | 13,700 | | | | 267,972 | | | |
Calamos Asset Management, Inc., Class A | | | 49,700 | | | | 608,825 | | | |
Cowen Group, Inc.,
Class A* | | | 157,300 | | | | 1,006,720 | | | |
FBR & Co.*+ | | | 11,775 | | | | 272,474 | | | |
INTL FCStone, Inc.* | | | 14,000 | | | | 465,360 | | | |
Investment Technology Group, Inc. | | | 61,000 | | | | 1,512,800 | | | |
JMP Group LLC | | | 50,000 | | | | 390,000 | | | |
KCG Holdings, Inc.,
Class A* | | | 35,000 | | | | 431,550 | | | |
Oppenheimer Holdings, Inc., Class A | | | 34,419 | | | | 904,531 | | | |
Piper Jaffray Cos.* | | | 16,100 | | | | 702,604 | | | |
| | | | | | | | | | |
| | | | | | | 6,562,836 | | | |
| |
Chemicals - 1.31% | | | |
China Green Agriculture, Inc.+ | | | 36,800 | | | | 78,016 | | | |
Core Molding Technologies, Inc.* | | | 22,425 | | | | 512,187 | | | |
Gulf Resources, Inc.* | | | 60,750 | | | | 125,449 | | | |
Intrepid Potash, Inc.* | | | 140,000 | | | | 1,671,600 | | | |
KMG Chemicals, Inc. | | | 38,200 | | | | 971,808 | | | |
Kraton Performance Polymers, Inc.* | | | 16,075 | | | | 383,871 | | | |
OM Group, Inc. | | | 69,000 | | | | 2,318,400 | | | |
| | | | | | | | | | |
| | | | | | | 6,061,331 | | | |
| |
Commercial Banks - 17.72% | | | |
1st Constitution Bancorp*+ | | | 5,000 | | | | 57,450 | | | |
1st Source Corp. | | | 52,500 | | | | 1,791,300 | | | |
Access National Corp. | | | 5,600 | | | | 108,864 | | | |
American National Bankshares, Inc. | | | 13,060 | | | | 310,959 | | | |
American River Bankshares* | | | 20,744 | | | | 193,334 | | | |
AmeriServ Financial, Inc. | | | 5,000 | | | | 16,650 | | | |
Bank of Commerce Holdings | | | 47,900 | | | | 274,467 | | | |
Bank of the Ozarks, Inc. | | | 13,622 | | | | 623,206 | | | |
Banner Corp. | | | 25,057 | | | | 1,200,982 | | | |
| | |
| 20 | | Annual Report | June 30, 2015 |
| | |
Omni Tax-Managed Small-Cap Value Fund SCHEDULE OF INVESTMENTS (continued) | | |
Showing percentage of net assets as of June 30, 2015
| | | | | | | | | | |
| Industry Company | | Shares | | | Value | | | |
Common Stocks (continued) | | | | | | | |
Commercial Banks (continued) | | | | | | | |
Bar Harbor Bankshares | | | 10,500 | | | | $ 372,015 | | | |
Baylake Corp.+ | | | 5,600 | | | | 70,840 | | | |
BB&T Corp. | | | 4,455 | | | | 179,581 | | | |
BBCN Bancorp, Inc. | | | 2,600 | | | | 38,454 | | | |
BCB Bancorp, Inc.+ | | | 11,300 | | | | 138,086 | | | |
Beneficial Bancorp, Inc.* | | | 20,000 | | | | 249,800 | | | |
BNC Bancorp | | | 74,956 | | | | 1,448,899 | | | |
Boston Private Financial Holdings, Inc. | | | 10,000 | | | | 134,100 | | | |
BSB Bancorp, Inc.* | | | 23,800 | | | | 526,218 | | | |
C&F Financial Corp. | | | 2,400 | | | | 88,920 | | | |
Camden National Corp. | | | 5,853 | | | | 226,511 | | | |
Capital City Bank Group, Inc. | | | 47,950 | | | | 732,196 | | | |
Cardinal Financial Corp. | | | 24,478 | | | | 533,376 | | | |
Carolina Bank Holdings, Inc.*+ | | | 11,500 | | | | 139,322 | | | |
Central Pacific Financial Corp. | | | 30,400 | | | | 722,000 | | | |
Central Valley Community Bancorp+ | | | 21,000 | | | | 248,430 | | | |
Century Bancorp, Inc., Class A | | | 14,300 | | | | 581,438 | | | |
Chemical Financial Corp. | | | 60,300 | | | | 1,993,518 | | | |
Chemung Financial Corp.+ | | | 10,998 | | | | 291,227 | | | |
Citizens & Northern Corp. | | | 10,000 | | | | 205,500 | | | |
Civista Bancshares, Inc. | | | 2,000 | | | | 21,600 | | | |
CNB Financial Corp. | | | 31,900 | | | | 586,960 | | | |
Codorus Valley Bancorp, Inc. | | | 3,989 | | | | 80,697 | | | |
Community Bankers Trust Corp.* | | | 25,000 | | | | 124,250 | | | |
Community Trust Bancorp, Inc. | | | 32,500 | | | | 1,133,275 | | | |
Customers Bancorp, Inc.* | | | 20,000 | | | | 537,800 | | | |
Eastern Virginia Bankshares, Inc. | | | 7,051 | | | | 44,492 | | | |
Enterprise Bancorp, Inc. | | | 175 | | | | 4,102 | | | |
Farmers Capital Bank Corp.* | | | 13,400 | | | | 380,962 | | | |
Farmers National Banc Corp.+ | | | 150 | | | | 1,238 | | | |
Fidelity Southern Corp. | | | 58,900 | | | | 1,027,216 | | | |
Financial Institutions, Inc. | | | 40,300 | | | | 1,001,052 | | | |
First Bancorp | | | 51,600 | | | | 860,688 | | | |
First Bancorp, Inc. | | | 11,800 | | | | 229,392 | | | |
First BanCorp.* | | | 254,700 | | | | 1,227,654 | | | |
First Busey Corp. | | | 111,500 | | | | 732,555 | | | |
First Commonwealth Financial Corp. | | | 121,200 | | | | 1,162,308 | | | |
First Community Bancshares, Inc. | | | 44,100 | | | | 803,502 | | | |
| | | | | | | | | | |
| | | | | | | | | | |
| | | | | | | | | | |
| | | | | | | | | | |
| Industry Company | | Shares | | | Value | | | |
| | | |
Commercial Banks (continued) | | | | | | | |
First Connecticut Bancorp, Inc. | | | 4,800 | | | | $ 76,176 | | | |
First Financial Bancorp | | | 68,337 | | | | 1,225,966 | | | |
First Financial Corp. | | | 38,830 | | | | 1,388,561 | | | |
First Internet Bancorp+ | | | 1,200 | | | | 29,400 | | | |
First Interstate BancSystem, Inc., Class A | | | 94,600 | | | | 2,624,204 | | | |
First Merchants Corp. | | | 71,000 | | | | 1,753,700 | | | |
First Midwest Bancorp, Inc. | | | 115,900 | | | | 2,198,623 | | | |
First of Long Island Corp. (The) | | | 18,000 | | | | 498,960 | | | |
Flushing Financial Corp. | | | 43,300 | | | | 909,733 | | | |
German American Bancorp, Inc. | | | 12,500 | | | | 368,125 | | | |
Great Southern Bancorp, Inc. | | | 39,850 | | | | 1,679,279 | | | |
Hampton Roads Bankshares, Inc.*+ | | | 500,725 | | | | 1,041,508 | | | |
Heartland Financial USA, Inc. | | | 10,950 | | | | 407,559 | | | |
Heritage Commerce Corp. | | | 30,000 | | | | 288,300 | | | |
Heritage Financial Corp. | | | 40,502 | | | | 723,771 | | | |
Heritage Oaks Bancorp | | | 200 | | | | 1,574 | | | |
HomeTrust Bancshares, Inc.* | | | 50,000 | | | | 838,000 | | | |
Horizon Bancorp | | | 20,363 | | | | 508,260 | | | |
Hudson Valley Holding Corp. | | | 37,800 | | | | 1,066,338 | | | |
Huntington Bancshares, Inc. | | | 17,709 | | | | 200,289 | | | |
Independent Bank Corp., MA | | | 11,000 | | | | 515,790 | | | |
Independent Bank Corp., MI | | | 80,500 | | | | 1,091,580 | | | |
International Bancshares Corp. | | | 89,200 | | | | 2,396,804 | | | |
Lakeland Bancorp, Inc. | | | 104,940 | | | | 1,247,737 | | | |
Landmark Bancorp, Inc. | | | 2,000 | | | | 48,520 | | | |
LCNB Corp. | | | 1,500 | | | | 24,308 | | | |
LNB Bancorp, Inc. | | | 17,000 | | | | 314,500 | | | |
Macatawa Bank Corp.+ | | | 12,550 | | | | 66,515 | | | |
MainSource Financial Group, Inc. | | | 41,500 | | | | 910,925 | | | |
MB Financial, Inc. | | | 8,700 | | | | 299,628 | | | |
MBT Financial Corp.* | | | 62,011 | | | | 355,943 | | | |
Mercantile Bank Corp. | | | 2,000 | | | | 42,820 | | | |
Merchants Bancshares, Inc. | | | 5,000 | | | | 165,350 | | | |
Metro Bancorp, Inc. | | | 26,250 | | | | 686,175 | | | |
Middleburg Financial Corp. | | | 22,463 | | | | 404,334 | | | |
MidSouth Bancorp, Inc. | | | 23,300 | | | | 355,558 | | | |
MidWestOne Financial Group, Inc. | | | 12,000 | | | | 395,040 | | | |
Monarch Financial Holdings, Inc. | | | 12,538 | | | | 157,352 | | | |
| | |
Omni Tax-Managed Small-Cap Value Fund SCHEDULE OF INVESTMENTS (continued) | | |
Showing percentage of net assets as of June 30, 2015
| | | | | | | | | | |
| Industry Company | | Shares | | | Value | | | |
Common Stocks (continued) | | | | | | | |
Commercial Banks (continued) | | | | | | | |
MutualFirst Financial, Inc. | | | 8,700 | | | | $ 202,101 | | | |
National Bankshares, Inc.+ | | | 1,000 | | | | 29,260 | | | |
National Penn Bancshares, Inc. | | | 20,000 | | | | 225,600 | | | |
NBT Bancorp, Inc. | | | 20,932 | | | | 547,790 | | | |
NewBridge Bancorp | | | 99,388 | | | | 887,535 | | | |
Northrim BanCorp, Inc. | | | 32,000 | | | | 820,160 | | | |
Norwood Financial Corp. | | | 1,000 | | | | 29,320 | | | |
OFG Bancorp+ | | | 50,000 | | | | 533,500 | | | |
Old Line Bancshares, Inc.+ | | | 50 | | | | 794 | | | |
Old National Bancorp | | | 30,600 | | | | 442,476 | | | |
Old Second Bancorp, Inc.* | | | 30,050 | | | | 198,330 | | | |
Orrstown Financial Services, Inc. | | | 16,700 | | | | 270,206 | | | |
Pacific Continental Corp. | | | 56,600 | | | | 765,798 | | | |
Pacific Mercantile Bancorp* | | | 20,000 | | | | 151,800 | | | |
Park Sterling Corp. | | | 50,298 | | | | 362,146 | | | |
Parke Bancorp, Inc.+ | | | 1,200 | | | | 15,396 | | | |
Peapack Gladstone Financial Corp. | | | 468 | | | | 10,399 | | | |
Peoples Bancorp of North Carolina, Inc. | | | 14,500 | | | | 265,930 | | | |
Peoples Bancorp, Inc. | | | 28,550 | | | | 666,357 | | | |
Pinnacle Financial Partners, Inc. | | | 45,750 | | | | 2,487,428 | | | |
Preferred Bank | | | 36,000 | | | | 1,081,800 | | | |
Premier Financial Bancorp, Inc. | | | 26,066 | | | | 402,720 | | | |
QCR Holdings, Inc. | | | 27,300 | | | | 594,048 | | | |
Renasant Corp.+ | | | 58,700 | | | | 1,913,620 | | | |
Republic Bancorp, Inc., Class A | | | 25,700 | | | | 660,490 | | | |
S&T Bancorp, Inc. | | | 30,700 | | | | 908,413 | | | |
Salisbury Bancorp, Inc. | | | 1,183 | | | | 36,910 | | | |
Sandy Spring Bancorp, Inc. | | | 14,300 | | | | 400,114 | | | |
Shore Bancshares, Inc.* | | | 30,000 | | | | 282,900 | | | |
Sierra Bancorp | | | 42,200 | | | | 730,482 | | | |
South State Corp. | | | 16,911 | | | | 1,285,067 | | | |
Southern National Bancorp of Virginia, Inc. | | | 35,000 | | | | 387,800 | | | |
Southside Bancshares, Inc.+ | | | 12,736 | | | | 372,273 | | | |
Southwest Bancorp, Inc. | | | 23,900 | | | | 444,779 | | | |
State Bank Financial Corp. | | | 95,800 | | | | 2,078,860 | | | |
Summit State Bank+ | | | 5,000 | | | | 65,575 | | | |
Sun Bancorp, Inc.* | | | 10,000 | | | | 192,500 | | | |
Tompkins Financial Corp. | | | 8,400 | | | | 451,248 | | | |
TowneBank+ | | | 32,222 | | | | 524,896 | | | |
Trico Bancshares | | | 38,900 | | | | 935,545 | | | |
TriState Capital Holdings, Inc.* | | | 50,000 | | | | 646,500 | | | |
Trustmark Corp. | | | 20,800 | | | | 519,584 | | | |
| | | | | | | | | | |
| Industry Company | | Shares | | | Value | | | |
| | | |
Commercial Banks (continued) | | | | | | | |
Union Bankshares Corp. | | | 58,628 | | | | $ 1,362,515 | | | |
United Community Banks, Inc. | | | 57,770 | | | | 1,205,660 | | | |
Univest Corp. of Pennsylvania | | | 39,200 | | | | 798,112 | | | |
WesBanco, Inc. | | | 66,385 | | | | 2,258,418 | | | |
Wilshire Bancorp, Inc. | | | 25,000 | | | | 315,750 | | | |
Wintrust Financial Corp. | | | 7,000 | | | | 373,660 | | | |
Yadkin Financial Corp.* | | | 38,000 | | | | 796,100 | | | |
| | | | | | | | | | |
| | | | | | | 81,703,256 | | | |
| |
Commercial Services & Supplies - 2.93% | | | |
ACCO Brands Corp.* | | | 339,800 | | | | 2,640,246 | | | |
Acme United Corp. | | | 2,000 | | | | 36,200 | | | |
Brink’s Co. (The) | | | 22,500 | | | | 662,175 | | | |
Command Security Corp.* | | | 17,800 | | | | 36,134 | | | |
Ecology & Environment, Inc., Class A | | | 2,811 | | | | 29,291 | | | |
EnerNOC, Inc.* | | | 148,100 | | | | 1,436,570 | | | |
Ennis, Inc. | | | 125,900 | | | | 2,340,481 | | | |
Heritage-Crystal Clean, Inc.* | | | 14,246 | | | | 209,416 | | | |
Kimball International, Inc., Class B | | | 103,800 | | | | 1,262,208 | | | |
McGrath RentCorp | | | 17,000 | | | | 517,310 | | | |
Metalico, Inc.* | | | 1,200 | | | | 612 | | | |
Multi-Color Corp. | | | 5,750 | | | | 367,310 | | | |
Quad/Graphics, Inc. | | | 71,000 | | | | 1,314,210 | | | |
RR Donnelley & Sons Co. | | | 23,927 | | | | 417,048 | | | |
TRC Cos., Inc.* | | | 51,400 | | | | 521,710 | | | |
Versar, Inc.* | | | 35,000 | | | | 137,900 | | | |
Viad Corp. | | | 57,894 | | | | 1,569,506 | | | |
| | | | | | | | | | |
| | | | | | | 13,498,327 | | | |
| |
Communications Equipment - 0.96% | | | |
Bel Fuse, Inc., Class B | | | 63,600 | | | | 1,305,072 | | | |
Black Box Corp. | | | 67,664 | | | | 1,353,280 | | | |
Blonder Tongue Laboratories* | | | 27,859 | | | | 21,451 | | | |
ClearOne, Inc. | | | 26,500 | | | | 341,982 | | | |
Communications Systems, Inc. | | | 4,950 | | | | 52,024 | | | |
Harmonic, Inc.* | | | 99,100 | | | | 676,853 | | | |
NETGEAR, Inc.* | | | 15,000 | | | | 450,300 | | | |
Polycom, Inc.* | | | 20,800 | | | | 237,952 | | | |
| | | | | | | | | | |
| | | | | | | 4,438,914 | | | |
| |
Computers & Peripherals - 0.06% | | | |
Concurrent Computer Corp. | | | 3,400 | | | | 21,080 | | | |
Datalink Corp.* | | | 500 | | | | 4,470 | | | |
Hutchinson Technology, Inc.* | | | 105,500 | | | | 180,405 | | | |
| | |
| 22 | | Annual Report | June 30, 2015 |
| | |
Omni Tax-Managed Small-Cap Value Fund SCHEDULE OF INVESTMENTS (continued) | | |
Showing percentage of net assets as of June 30, 2015
| | | | | | | | | | |
| Industry Company | | Shares | | | Value | | | |
Common Stocks (continued) | | | | | | | |
Computers & Peripherals (continued) | | | |
USA Technologies, Inc.* | | | 30,000 | | | | $ 81,000 | | | |
| | | | | | | | | | |
| | | | | | | 286,955 | | | |
| |
Construction & Engineering - 1.16% | | | |
Aegion Corp.* | | | 120,300 | | | | 2,278,482 | | | |
Goldfield Corp. (The)* | | | 114,000 | | | | 189,240 | | | |
Great Lakes Dredge & Dock Corp.* | | | 196,750 | | | | 1,172,630 | | | |
Integrated Electrical Services, Inc.* | | | 3,600 | | | | 25,560 | | | |
MYR Group, Inc.* | | | 15,000 | | | | 464,400 | | | |
Northwest Pipe Co.* | | | 38,800 | | | | 790,356 | | | |
Orion Marine Group, Inc.* | | | 58,000 | | | | 418,760 | | | |
| | | | | | | | | | |
| | | | | | | 5,339,428 | | | |
| |
Consumer Finance - 1.25% | | | |
Asta Funding, Inc.* | | | 10,350 | | | | 86,733 | | | |
Cash America International, Inc. | | | 24,900 | | | | 652,131 | | | |
Consumer Portfolio Services, Inc.* | | | 116,650 | | | | 729,062 | | | |
Encore Capital Group, Inc.*+ | | | 10,000 | | | | 427,400 | | | |
Ezcorp, Inc., Class A* | | | 40,000 | | | | 297,200 | | | |
Green Dot Corp., Class A* | | | 21,800 | | | | 416,816 | | | |
Nelnet, Inc., Class A | | | 25,900 | | | | 1,121,729 | | | |
Nicholas Financial, Inc.*+ | | | 25,000 | | | | 318,000 | | | |
Regional Management Corp.* | | | 52,100 | | | | 930,506 | | | |
World Acceptance Corp.*+ | | | 13,100 | | | | 805,781 | | | |
| | | | | | | | | | |
| | | | | | | 5,785,358 | | | |
| |
Distributors - 0.11% | | | |
AMCON Distributing Co. | | | 800 | | | | 62,248 | | | |
VOXX International Corp.* | | | 34,364 | | | | 284,534 | | | |
Weyco Group, Inc. | | | 5,000 | | | | 149,100 | | | |
| | | | | | | | | | |
| | | | | | | 495,882 | | | |
| |
Diversified Consumer Services - 0.82% | | | |
Ascent Capital Group, Inc., Class A* | | | 7,000 | | | | 299,180 | | | |
K12, Inc.* | | | 63,500 | | | | 803,275 | | | |
Lincoln Educational Services Corp. | | | 91,300 | | | | 184,426 | | | |
Regis Corp.* | | | 129,050 | | | | 2,033,828 | | | |
Steiner Leisure, Ltd.* | | | 8,000 | | | | 430,240 | | | |
Universal Technical Institute, Inc. | | | 5,000 | | | | 43,000 | | | |
| | | | | | | | | | |
| | | | | | | 3,793,949 | | | |
| |
Diversified Financial Services - 1.39% | | | |
Enova International, Inc.* | | | 22,783 | | | | 425,586 | | | |
| | | | | | | | | | |
| | | | | | | | | | |
| | | | | | | | | | |
| | | | | | | | | | |
| | | | | | | | | | |
| | | | | | | | | | |
| Industry Company | | Shares | | | Value | | | |
| | | |
Diversified Financial Services (continued) | | | |
Gain Capital Holdings, Inc. | | | 39,900 | | | | $ 381,444 | | | |
Interactive Brokers Group, Inc., Class A | | | 90,750 | | | | 3,771,570 | | | |
Marlin Business Services Corp. | | | 5,775 | | | | 97,482 | | | |
PHH Corp.* | | | 46,000 | | | | 1,197,380 | | | |
Resource America, Inc., Class A | | | 35,900 | | | | 301,919 | | | |
Sterling Bancorp | | | 15,000 | | | | 220,500 | | | |
| | | | | | | | | | |
| | | | | | | 6,395,881 | | | |
| |
Diversified Telecommunication Services - 1.13% | | | |
Alaska Communications
Systems Group, Inc.* | | | 313,487 | | | | 752,369 | | | |
Atlantic Tele-Network, Inc. | | | 17,500 | | | | 1,208,900 | | | |
General Communication, Inc., Class A* | | | 10,000 | | | | 170,100 | | | |
Hawaiian Telcom Holdco, Inc.* | | | 35,400 | | | | 923,940 | | | |
Iridium Communications, Inc.*+ | | | 217,125 | | | | 1,973,666 | | | |
Premiere Global Services, Inc.* | | | 15,800 | | | | 162,582 | | | |
| | | | | | | | | | |
| | | | | | | 5,191,557 | | | |
| |
Electrical Equipment - 0.28% | | | |
Broadwind Energy, Inc.* | | | 25,000 | | | | 106,000 | | | |
GrafTech International, Ltd.* | | | 3,050 | | | | 15,128 | | | |
Highpower International, Inc.*+ | | | 25,922 | | | | 99,281 | | | |
II-VI, Inc.* | | | 43,104 | | | | 818,114 | | | |
LSI Industries, Inc. | | | 15,000 | | | | 140,100 | | | |
Orion Energy Systems, Inc.* | | | 17,224 | | | | 43,232 | | | |
Preformed Line Products Co. | | | 1,200 | | | | 45,264 | | | |
Ultralife Corp.* | | | 8,350 | | | | 34,986 | | | |
| | | | | | | | | | |
| | | | | | | 1,302,105 | | | |
| |
Electronic Equipment, Instruments & Components - 3.19% | | | |
Benchmark Electronics, Inc.* | | | 105,500 | | | | 2,297,790 | | | |
Electro Rent Corp. | | | 10,103 | | | | 109,719 | | | |
Fabrinet* | | | 60,150 | | | | 1,126,610 | | | |
GSI Group, Inc.* | | | 11,000 | | | | 165,330 | | | |
Insight Enterprises, Inc.* | | | 44,883 | | | | 1,342,451 | | | |
Iteris, Inc.* | | | 65,000 | | | | 115,050 | | | |
Key Tronic Corp.* | | | 11,900 | | | | 129,353 | | | |
Kimball Electronics, Inc.* | | | 59,100 | | | | 862,269 | | | |
PAR Technology Corp.* | | | 98,400 | | | | 483,144 | | | |
PCM, Inc.* | | | 82,175 | | | | 824,215 | | | |
Planar Systems, Inc.* | | | 2,100 | | | | 9,156 | | | |
Plexus Corp.* | | | 9,500 | | | | 416,860 | | | |
| | |
Omni Tax-Managed Small-Cap Value Fund SCHEDULE OF INVESTMENTS (continued) | | |
Showing percentage of net assets as of June 30, 2015
| | | | | | | | | | |
| Industry Company | | Shares | | | Value | | | |
Common Stocks (continued) | | | | | | | |
Electronic Equipment, Instruments
& Components (continued) | | | |
Sanmina Corp.* | | | 149,100 | | | | $ 3,005,856 | | | |
ScanSource, Inc.* | | | 14,000 | | | | 532,840 | | | |
Sigmatron International, Inc.*+ | | | 20,000 | | | | 182,000 | | | |
SMTC Corp.* | | | 13,500 | | | | 22,410 | | | |
TTM Technologies, Inc.* | | | 158,615 | | | | 1,584,564 | | | |
Vishay Precision Group, Inc.* | | | 96,667 | | | | 1,455,805 | | | |
Wireless Telecom Group, Inc.* | | | 10,000 | | | | 21,700 | | | |
| | | | | | | | | | |
| | | | | | | 14,687,122 | | | |
| |
Energy Equipment & Services - 2.63% | | | |
Basic Energy Services, Inc.* | | | 86,300 | | | | 651,565 | | | |
C&J Energy Services, Ltd.*+ | | | 63,700 | | | | 840,840 | | | |
CARBO Ceramics, Inc.+ | | | 7,000 | | | | 291,410 | | | |
Checkpoint Systems, Inc. | | | 24,500 | | | | 249,410 | | | |
ENGlobal Corp.* | | | 86,300 | | | | 116,505 | | | |
Era Group, Inc.* | | | 11,500 | | | | 235,520 | | | |
Forum Energy Technologies, Inc.* | | | 25,000 | | | | 507,000 | | | |
Gulf Island Fabrication, Inc. | | | 10,100 | | | | 112,817 | | | |
Gulfmark Offshore, Inc., Class A+ | | | 21,500 | | | | 249,400 | | | |
Helix Energy Solutions Group, Inc.* | | | 30,000 | | | | 378,900 | | | |
ION Geophysical Corp.* | | | 140,000 | | | | 149,800 | | | |
Natural Gas Services Group, Inc.* | | | 26,305 | | | | 600,280 | | | |
Newpark Resources, Inc.* | | | 85,000 | | | | 691,050 | | | |
Parker Drilling Co.* | | | 239,400 | | | | 794,808 | | | |
PHI, Inc.* | | | 78,150 | | | | 2,346,063 | | | |
Pioneer Energy Services Corp.* | | | 127,300 | | | | 807,082 | | | |
SEACOR Holdings, Inc.* | | | 25,000 | | | | 1,773,500 | | | |
Tesco Corp. | | | 70,500 | | | | 768,450 | | | |
Unit Corp.* | | | 21,200 | | | | 574,944 | | | |
| | | | | | | | | | |
| | | | | | | 12,139,344 | | | |
| |
Food & Staples Retailing - 1.64% | | | |
Andersons, Inc. (The) | | | 57,350 | | | | 2,236,650 | | | |
Ingles Markets, Inc., Class A | | | 50,950 | | | | 2,433,882 | | | |
SpartanNash Co. | | | 60,860 | | | | 1,980,384 | | | |
Village Super Market, Inc., Class A | | | 1,100 | | | | 34,859 | | | |
Weis Markets, Inc. | | | 20,700 | | | | 872,505 | | | |
| | | | | | | | | | |
| | | | | | | 7,558,280 | | | |
| |
Food Products - 1.56% | | | |
Fresh Del Monte Produce, Inc. | | | 90,800 | | | | 3,510,328 | | | |
| | | | | | | | | | |
| Industry Company | | Shares | | | Value | | | |
| | | |
Food Products (continued) | | | | | | | |
John B. Sanfilippo & Son, Inc. | | | 9,600 | | | | $ 498,240 | | | |
Omega Protein Corp.* | | | 123,650 | | | | 1,700,188 | | | |
Post Holdings, Inc.*+ | | | 23,700 | | | | 1,278,141 | | | |
Seneca Foods Corp.,
Class A* | | | 6,650 | | | | 184,670 | | | |
| | | | | | | | | | |
| | | | | | | 7,171,567 | | | |
| |
Health Care Equipment & Supplies - 0.69% | | | |
AngioDynamics, Inc.* | | | 77,500 | | | | 1,271,000 | | | |
Electromed, Inc.* | | | 10,000 | | | | 18,500 | | | |
Exactech, Inc.* | | | 17,500 | | | | 364,525 | | | |
Fonar Corp.* | | | 2,000 | | | | 21,150 | | | |
Invacare Corp. | | | 35,000 | | | | 757,050 | | | |
Kewaunee Scientific Corp. | | | 2,500 | | | | 41,100 | | | |
Merit Medical Systems, Inc.* | | | 28,100 | | | | 605,274 | | | |
Symmetry Surgical, Inc.* | | | 13,200 | | | | 115,104 | | | |
| | | | | | | | | | |
| | | | | | | 3,193,703 | | | |
| |
Health Care Providers & Services - 3.81% | | | |
Almost Family, Inc.* | | | 27,600 | | | | 1,101,516 | | | |
Amedisys, Inc.* | | | 73,710 | | | | 2,928,498 | | | |
Amsurg Corp.* | | | 31,100 | | | | 2,175,445 | | | |
Five Star Quality Care, Inc.* | | | 76,400 | | | | 366,720 | | | |
Healthways, Inc.* | | | 24,500 | | | | 293,510 | | | |
InfuSystems Holdings, Inc.* | | | 35,178 | | | | 112,218 | | | |
Kindred Healthcare, Inc. | | | 101,700 | | | | 2,063,493 | | | |
LHC Group, Inc.* | | | 16,500 | | | | 631,125 | | | |
Magellan Health, Inc.* | | | 27,125 | | | | 1,900,649 | | | |
Molina Healthcare, Inc.* | | | 28,600 | | | | 2,010,580 | | | |
National Healthcare Corp. | | | 8,920 | | | | 579,711 | | | |
PharMerica Corp.* | | | 74,800 | | | | 2,490,840 | | | |
Premier, Inc., Class A* | | | 13,000 | | | | 499,980 | | | |
Skystar Bio-Pharmaceutical Co., Ltd.*+ | | | 24,300 | | | | 64,638 | | | |
Triple-S Management Corp.,
Class B* | | | 14,000 | | | | 359,240 | | | |
| | | | | | | | | | |
| | | | | | | 17,578,163 | | | |
| |
Hotels, Restaurants & Leisure - 3.75% | | | |
Ambassadors Group, Inc.* | | | 200 | | | | 488 | | | |
Boyd Gaming Corp.* | | | 70,900 | | | | 1,059,955 | | | |
Flanigan’s Enterprises, Inc. | | | 2,500 | | | | 61,750 | | | |
Frisch’s Restaurants, Inc. | | | 15,473 | | | | 519,429 | | | |
International Speedway Corp., Class A | | | 75,760 | | | | 2,778,119 | | | |
Intrawest Resorts Holdings, Inc.* | | | 25,000 | | | | 290,500 | | | |
Isle of Capri Casinos, Inc.* | | | 100,150 | | | | 1,817,722 | | | |
Luby’s, Inc.* | | | 179,100 | | | | 868,635 | | | |
Marcus Corp. (The) | | | 136,454 | | | | 2,617,188 | | | |
| | |
| 24 | | Annual Report | June 30, 2015 |
| | |
Omni Tax-Managed Small-Cap Value Fund SCHEDULE OF INVESTMENTS (continued) | | |
Showing percentage of net assets as of June 30, 2015
| | | | | | | | | | |
| Industry Company | | Shares | | | Value | | | |
Common Stocks (continued) | | | | | | | |
Hotels, Restaurants & Leisure (continued) | | | |
Monarch Casino & Resort, Inc.* | | | 38,900 | | | | $ 799,784 | | | |
Nevada Gold & Casinos, Inc.* | | | 10,000 | | | | 16,500 | | | |
Penn National Gaming, Inc.*+ | | | 125,500 | | | | 2,302,925 | | | |
Red Lion Hotels Corp.* | | | 80,695 | | | | 618,124 | | | |
Ruby Tuesday, Inc.* | | | 232,200 | | | | 1,455,894 | | | |
Speedway Motorsports, Inc. | | | 92,863 | | | | 2,103,347 | | | |
| | | | | | | | | | |
| | | | | | | 17,310,360 | | | |
| |
Household Durables - 1.24% | | | |
Bassett Furniture Industries, Inc. | | | 52,959 | | | | 1,504,565 | | | |
CSS Industries, Inc. | | | 40,558 | | | | 1,226,880 | | | |
Hooker Furniture Corp. | | | 15,000 | | | | 376,650 | | | |
Lifetime Brands, Inc. | | | 24,999 | | | | 369,235 | | | |
NACCO Industries,
Inc., Class A | | | 11,450 | | | | 695,702 | | | |
P&F Industries, Inc.,
Class A*+ | | | 492 | | | | 4,202 | | | |
William Lyon Homes,
Class A* | | | 15,000 | | | | 385,050 | | | |
ZAGG, Inc.* | | | 144,000 | | | | 1,140,480 | | | |
| | | | | | | | | | |
| | | | | | | 5,702,764 | | | |
| |
Household Products - 0.55% | | | |
Central Garden &
Pet Co., Class A* | | | 221,400 | | | | 2,526,174 | | | |
| |
Insurance - 9.05% | | | |
Ambac Financial Group, Inc.* | | | 56,000 | | | | 931,840 | | | |
American Equity Investment Life Holding Co. | | | 78,550 | | | | 2,119,279 | | | |
American Independence Corp.* | | | 16,900 | | | | 159,198 | | | |
AMERISAFE, Inc. | | | 56,500 | | | | 2,658,890 | | | |
Argo Group International Holdings, Ltd. | | | 9,187 | | | | 511,716 | | | |
Baldwin & Lyons,
Inc., Class B | | | 32,200 | | | | 741,244 | | | |
Citizens, Inc.*+ | | | 14,800 | | | | 110,408 | | | |
Donegal Group, Inc.,
Class A | | | 57,100 | | | | 869,633 | | | |
EMC Insurance Group, Inc. | | | 26,025 | | | | 652,447 | | | |
Employers Holdings, Inc. | | | 30,000 | | | | 683,400 | | | |
FBL Financial Group, Inc.,
Class A | | | 45,666 | | | | 2,635,842 | | | |
Federated National Holding Co. | | | 38,012 | | | | 919,890 | | | |
Fidelity & Guaranty Life | | | 45,000 | | | | 1,063,350 | | | |
First Acceptance Corp.* | | | 145,000 | | | | 464,000 | | | |
| | | | | | | | | | |
| Industry Company | | Shares | | | Value | | | |
| | | | | | | | | | |
Insurance (continued) | | | | | | | | | | |
Hallmark Financial Services, Inc.* | | | 50,158 | | | | $ 570,798 | | | |
HCI Group, Inc. | | | 10,000 | | | | 442,100 | | | |
Heritage Insurance Holdings, Inc.* | | | 20,000 | | | | 459,800 | | | |
Hilltop Holdings, Inc.* | | | 14,100 | | | | 339,669 | | | |
Horace Mann Educators Corp. | | | 74,950 | | | | 2,726,681 | | | |
Independence Holding Co. | | | 14,950 | | | | 197,190 | | | |
Infinity Property & Casualty Corp. | | | 9,200 | | | | 697,728 | | | |
Investors Title Co. | | | 1,000 | | | | 70,890 | | | |
Kansas City Life Insurance Co. | | | 24,900 | | | | 1,138,179 | | | |
Kingstone Cos., Inc. | | | 4,000 | | | | 30,400 | | | |
Maiden Holdings, Ltd. | | | 167,450 | | | | 2,642,361 | | | |
Montpelier Re Holdings, Ltd. | | | 43,950 | | | | 1,736,025 | | | |
National Interstate Corp. | | | 16,000 | | | | 437,120 | | | |
National Western Life Insurance Co., Class A | | | 5,350 | | | | 1,281,272 | | | |
Navigators Group, Inc. (The)* | | | 37,650 | | | | 2,920,134 | | | |
OneBeacon Insurance Group, Ltd., Class A | | | 15,000 | | | | 217,650 | | | |
Safety Insurance Group, Inc. | | | 31,800 | | | | 1,835,178 | | | |
Selective Insurance Group, Inc. | | | 50,100 | | | | 1,405,305 | | | |
State Auto Financial Corp. | | | 15,000 | | | | 359,250 | | | |
Stewart Information Services Corp. | | | 45,950 | | | | 1,828,810 | | | |
Third Point Reinsurance, Ltd.* | | | 45,500 | | | | 671,125 | | | |
United Fire Group, Inc. | | | 60,900 | | | | 1,995,084 | | | |
United Insurance Holdings Corp. | | | 53,400 | | | | 829,836 | | | |
Universal Insurance Holdings, Inc. | | | 98,641 | | | | 2,387,112 | | | |
| | | | | | | | | | |
| | | | | | | 41,740,834 | | | |
| |
Internet & Catalog Retail - 0.28% | | | |
CafePress, Inc.* | | | 30,000 | | | | 135,000 | | | |
FTD Cos., Inc.* | | | 27,160 | | | | 765,640 | | | |
Lands’ End, Inc.*+ | | | 16,000 | | | | 397,280 | | | |
| | | | | | | | | | |
| | | | | | | 1,297,920 | | | |
| |
Internet Software & Services - 0.62% | | | |
Autobytel, Inc.* | | | 10,600 | | | | 169,494 | | | |
Blucora, Inc.* | | | 17,597 | | | | 284,192 | | | |
Demand Media, Inc.* | | | 15,000 | | | | 95,400 | | | |
Marchex, Inc., Class B | | | 88,000 | | | | 435,600 | | | |
Monster Worldwide, Inc.* | | | 185,000 | | | | 1,209,900 | | | |
United Online, Inc.* | | | 42,399 | | | | 664,392 | | | |
| | |
Omni Tax-Managed Small-Cap Value Fund SCHEDULE OF INVESTMENTS (continued) | | |
Showing percentage of net assets as of June 30, 2015
| | | | | | | | | | |
| Industry Company | | Shares | | | Value | | | |
Common Stocks (continued) | | | | | | | | | | |
Internet Software & Services (continued) | | | |
Unwired Planet, Inc.* | | | 10,000 | | | | $ 6,200 | | | |
| | | | | | | | | | |
| | | | | | | 2,865,178 | | | |
| |
IT Services - 1.81% | | | |
CACI International,
Inc., Class A* | | | 28,951 | | | | 2,341,846 | | | |
CIBER, Inc.* | | | 157,501 | | | | 543,378 | | | |
Edgewater Technology, Inc.* | | | 11,710 | | | | 85,483 | | | |
Engility Holdings, Inc. | | | 36,950 | | | | 929,662 | | | |
Global Cash Access Holdings, Inc.* | | | 60,000 | | | | 464,400 | | | |
ManTech International
Corp., Class A | | | 78,882 | | | | 2,287,578 | | | |
ModusLink Global Solutions, Inc.* | | | 55,300 | | | | 188,020 | | | |
NCI, Inc., Class A | | | 60,700 | | | | 627,031 | | | |
Newtek Business Services Corp. | | | 2,400 | | | | 42,528 | | | |
Sykes Enterprises, Inc.* | | | 33,550 | | | | 813,588 | | | |
| | | | | | | | | | |
| | | | | | | 8,323,514 | | | |
| |
Leisure Equipment & Products - 0.35% | | | |
Johnson Outdoors,
Inc., Class A | | | 63,850 | | | | 1,503,668 | | | |
Summer Infant, Inc.*+ | | | 43,200 | | | | 87,264 | | | |
| | | | | | | | | | |
| | | | | | | 1,590,932 | | | |
| |
Life Sciences Tools & Services - 0.09% | | | |
Albany Molecular Research, Inc.*+ | | | 21,028 | | | | 425,186 | | | |
| | | |
Machinery - 1.68% | | | | | | | | | | |
American Railcar Industries, Inc.+ | | | 10,000 | | | | 486,400 | | | |
Ampco-Pittsburgh Corp. | | | 17,905 | | | | 270,724 | | | |
Art’s-Way Manufacturing Co. Inc. | | | 5,000 | | | | 23,400 | | | |
Briggs & Stratton Corp. | | | 169,450 | | | | 3,263,607 | | | |
Chicago Rivet & Machine Co. | | | 1,000 | | | | 28,000 | | | |
Cleantech Solutions International, Inc.*+ | | | 12,000 | | | | 35,760 | | | |
Dynamic Materials Corp. | | | 100 | | | | 1,100 | | | |
Eastern Co. (The) | | | 20,104 | | | | 372,326 | | | |
FreightCar America, Inc. | | | 15,000 | | | | 313,200 | | | |
Hardinge, Inc. | | | 71,200 | | | | 701,320 | | | |
Hurco Companies, Inc. | | | 3,765 | | | | 130,344 | | | |
Hyster-Yale Materials Handling, Inc. | | | 2,700 | | | | 187,056 | | | |
L.B. Foster Co., Class A | | | 31,900 | | | | 1,104,059 | | | |
L.S. Starrett Co., Class A (The) | | | 22,700 | | | | 340,500 | | | |
| | | | | | | | | | |
| Industry Company | | Shares | | | Value | | | |
| | | | | | | | | | |
Machinery (continued) | | | | | | | | | | |
MFRI, Inc.* | | | 31,200 | | | | $ 188,760 | | | |
Supreme Industries,
Inc., Class A | | | 30,450 | | | | 260,956 | | | |
THT Heat Transfer Technology, Inc.* | | | 15,000 | | | | 13,800 | | | |
Wabash National Corp.* | | | 1,200 | | | | 15,048 | | | |
WSI Industries, Inc.+ | | | 1,000 | | | | 6,430 | | | |
| | | | | | | | | | |
| | | | | | | 7,742,790 | | | |
| |
Marine - 0.03% | | | |
International Shipholding Corp.+ | | | 9,250 | | | | 59,015 | | | |
Rand Logistics, Inc.* | | | 6,600 | | | | 21,384 | | | |
Ultrapetrol Bahamas, Ltd.* | | | 39,900 | | | | 45,087 | | | |
| | | | | | | | | | |
| | | | | | | 125,486 | | | |
| |
Media - 2.04% | | | |
Ballantyne Strong, Inc.* | | | 27,939 | | | | 131,034 | | | |
CTC Media, Inc. | | | 3,200 | | | | 7,264 | | | |
E.W. Scripps Co., (The)
Class A | | | 23,375 | | | | 534,119 | | | |
Entercom Communications Corp., Class A* | | | 55,405 | | | | 632,725 | | | |
Eros International PLC* | | | 19,300 | | | | 484,816 | | | |
Global Sources, Ltd.*+ | | | 5,000 | | | | 34,750 | | | |
Harte-Hanks, Inc. | | | 287,500 | | | | 1,713,500 | | | |
Journal Media Group, Inc. | | | 14,683 | | | | 121,722 | | | |
McClatchy Co. (The),
Class A* | | | 225,025 | | | | 243,027 | | | |
New Media Investment Group, Inc. | | | 13,000 | | | | 233,090 | | | |
Radio One, Inc., Class D*+ | | | 120,450 | | | | 381,826 | | | |
Reading International, Inc.,
Class A* | | | 70,400 | | | | 975,040 | | | |
Salem Media Group, Inc. | | | 91,300 | | | | 577,929 | | | |
Scholastic Corp. | | | 75,950 | | | | 3,351,674 | | | |
| | | | | | | | | | |
| | | | | | | 9,422,516 | | | |
| |
Metals & Mining - 1.99% | | | |
Century Aluminum Co.* | | | 187,900 | | | | 1,959,797 | | | |
Handy & Harman, Ltd.* | | | 200 | | | | 6,930 | | | |
Hecla Mining Co. | | | 299,000 | | | | 786,370 | | | |
Kaiser Aluminum Corp. | | | 26,700 | | | | 2,218,236 | | | |
Materion Corp. | | | 34,500 | | | | 1,216,125 | | | |
Noranda Aluminum Holding Corp. | | | 103,600 | | | | 88,060 | | | |
Olympic Steel, Inc. | | | 18,000 | | | | 313,920 | | | |
Schnitzer Steel Industries, Inc., Class A | | | 101,200 | | | | 1,767,964 | | | |
Stillwater Mining Co.* | | | 24,465 | | | | 283,549 | | | |
Synalloy Corp. | | | 7,000 | | | | 95,900 | | | |
| | |
| 26 | | Annual Report | June 30, 2015 |
| | |
Omni Tax-Managed Small-Cap Value Fund SCHEDULE OF INVESTMENTS (continued) | | |
Showing percentage of net assets as of June 30, 2015
| | | | | | | | | | |
| Industry Company | | Shares | | | Value | | | |
Common Stocks (continued) | | | | | | | |
Metals & Mining (continued) | | | | | | | |
Thompson Creek Metals Co., Inc.* | | | 140,000 | | | | $ 114,800 | | | |
Universal Stainless & Alloy Products, Inc.* | | | 16,200 | | | | 318,330 | | | |
| | | | | | | | | | |
| | | | | | | 9,169,981 | | | |
| |
Multiline Retail - 0.21% | | | |
Fred’s, Inc., Class A | | | 51,250 | | | | 988,612 | | | |
| |
Oil, Gas & Consumable Fuels - 5.47% | | | |
Abraxas Petroleum Corp.* | | | 267,800 | | | | 790,010 | | | |
Adams Resources & Energy, Inc. | | | 8,600 | | | | 383,560 | | | |
Alon USA Energy, Inc. | | | 115,000 | | | | 2,173,500 | | | |
Bill Barrett Corp.*+ | | | 34,000 | | | | 292,060 | | | |
Bonanza Creek Energy, Inc.* | | | 63,500 | | | | 1,158,875 | | | |
Callon Petroleum Co.* | | | 56,300 | | | | 468,416 | | | |
Carrizo Oil & Gas, Inc.* | | | 32,500 | | | | 1,600,300 | | | |
Clayton Williams Energy, Inc.* | | | 13,100 | | | | 861,325 | | | |
Cloud Peak Energy, Inc.*+ | | | 51,450 | | | | 239,757 | | | |
Contango Oil & Gas Co.* | | | 15,955 | | | | 195,768 | | | |
DHT Holdings, Inc. | | | 39,000 | | | | 303,030 | | | |
Earthstone Energy, Inc.* | | | 4,000 | | | | 78,120 | | | |
Escalera Resources Co.* | | | 12,050 | | | | 3,316 | | | |
GasLog, Ltd.+ | | | 34,500 | | | | 688,275 | | | |
Gastar Exploration, Inc.* | | | 70,000 | | | | 216,300 | | | |
Golden Ocean Group Ltd.+ | | | 31,000 | | | | 119,350 | | | |
Gran Tierra Energy, Inc.* | | | 60,200 | | | | 179,396 | | | |
Green Brick Partners, Inc.* | | | 20,900 | | | | 228,855 | | | |
Green Plains, Inc. | | | 96,450 | | | | 2,657,198 | | | |
Halcon Resources Corp.*+ | | | 100,000 | | | | 116,000 | | | |
Hallador Energy Co. | | | 71,600 | | | | 597,144 | | | |
LinnCo LLC+ | | | 35,000 | | | | 330,750 | | | |
Matador Resources Co.* | | | 59,500 | | | | 1,487,500 | | | |
Mexco Energy Corp.*+ | | | 6,000 | | | | 27,960 | | | |
Midstates Petroleum Co., Inc.*+ | | | 46,200 | | | | 42,966 | | | |
New Concept Energy, Inc.* | | | 3,600 | | | | 5,400 | | | |
Northern Oil and Gas, Inc.*+ | | | 54,100 | | | | 366,257 | | | |
Pacific Ethanol, Inc.*+ | | | 109,900 | | | | 1,134,168 | | | |
PDC Energy, Inc.* | | | 13,100 | | | | 702,684 | | | |
Penn Virginia Corp.*+ | | | 65,700 | | | | 287,766 | | | |
PetroQuest Energy, Inc.* | | | 104,250 | | | | 206,415 | | | |
Renewable Energy Group, Inc.* | | | 140,053 | | | | 1,619,013 | | | |
REX American Resources Corp.* | | | 39,350 | | | | 2,504,234 | | | |
Sanchez Energy Corp.*+ | | | 34,000 | | | | 333,200 | | | |
Ship Finance International, Ltd.+ | | | 54,900 | | | | 895,968 | | | |
Stone Energy Corp.* | | | 64,600 | | | | 813,314 | | | |
| | | | | | | | | | |
| Industry Company | | Shares | | | Value | | | |
| | | | | | | | | | |
Oil, Gas & Consumable Fuels (continued) | | | |
Swift Energy Co.*+ | | | 10,000 | | | | $ 20,300 | | | |
TransAtlantic Petroleum, Ltd.*+ | | | 10,000 | | | | 51,100 | | | |
Triangle Petroleum Corp.*+ | | | 150,000 | | | | 753,000 | | | |
VAALCO Energy, Inc.* | | | 30,500 | | | | 65,270 | | | |
W&T Offshore, Inc.+ | | | 33,600 | | | | 184,128 | | | |
Warren Resources, Inc.* | | | 120,780 | | | | 55,559 | | | |
| | | | | | | | | | |
| | | | | | | 25,237,507 | | | |
| |
Paper & Forest Products - 0.81% | | | |
Mercer International, Inc.* | | | 64,950 | | | | 888,516 | | | |
Orient Paper, Inc.* | | | 200 | | | | 322 | | | |
PH Glatfelter Co. | | | 40,000 | | | | 879,600 | | | |
Resolute Forest Products, Inc.*+ | | | 174,700 | | | | 1,965,375 | | | |
| | | | | | | | | | |
| | | | | | | 3,733,813 | | | |
| |
Personal Products - 0.23% | | | |
Mannatech, Inc.*+ | | | 25,700 | | | | 460,030 | | | |
Natural Alternatives International, Inc.*+ | | | 6,000 | | | | 33,990 | | | |
Nutraceutical International Corp.* | | | 23,250 | | | | 575,205 | | | |
| | | | | | | | | | |
| | | | | | | 1,069,225 | | | |
| |
Professional Services - 2.75% | | | |
CBIZ, Inc.* | | | 47,000 | | | | 453,080 | | | |
CDI Corp. | | | 87,389 | | | | 1,136,057 | | | |
CRA International, Inc.* | | | 49,800 | | | | 1,387,926 | | | |
FTI Consulting, Inc.* | | | 36,500 | | | | 1,505,260 | | | |
Heidrick & Struggles International, Inc. | | | 55,440 | | | | 1,445,875 | | | |
Hill International, Inc.* | | | 100,300 | | | | 527,578 | | | |
ICF International, Inc.* | | | 15,000 | | | | 522,900 | | | |
Kelly Services, Inc., Class A | | | 6,000 | | | | 92,100 | | | |
Navigant Consulting, Inc.* | | | 170,900 | | | | 2,541,283 | | | |
RPX Corp.* | | | 130,596 | | | | 2,207,072 | | | |
VSE Corp. | | | 15,830 | | | | 847,063 | | | |
| | | | | | | | | | |
| | | | | | | 12,666,194 | | | |
| |
Real Estate Management & Development - 0.16% | | | |
Farmland Partners, Inc.+ | | | 3,800 | | | | 45,220 | | | |
Forestar Group, Inc.*+ | | | 18,000 | | | | 236,880 | | | |
RE/MAX Holdings, Inc.,
Class A | | | 6,500 | | | | 230,815 | | | |
St. Joe Co. (The)*+ | | | 15,000 | | | | 232,950 | | | |
| | | | | | | | | | |
| | | | | | | 745,865 | | | |
| |
Road & Rail - 1.15% | | | |
ArcBest Corp. | | | 40,400 | | | | 1,284,720 | | | |
Celadon Group, Inc. | | | 4,400 | | | | 90,992 | | | |
| | |
Omni Tax-Managed Small-Cap Value Fund SCHEDULE OF INVESTMENTS (continued) | | |
Showing percentage of net assets as of June 30, 2015
| | | | | | | | | | | | |
| Industry Company | | Shares | | Value | | |
Common Stocks (continued) | | | | | | | | | | | | |
Road & Rail (continued) | | | | | | | | | | | | |
Covenant Transportation Group, Inc., Class A* | | | | 42,550 | | | | | $ 1,066,303 | | | |
Marten Transport, Ltd. | | | | 37,966 | | | | | 823,862 | | | |
P.A.M. Transportation Services, Inc.* | | | | 27,527 | | | | | 1,597,942 | | | |
USA Truck, Inc.* | | | | 21,435 | | | | | 455,065 | | | |
| | | | | | | | | | | | |
| | | | | | | | | 5,318,884 | | | |
| | | |
Semiconductors & Semiconductor
Equipment - 2.88% | | | | | | | | | | | | |
Advanced Energy Industries, Inc.* | | | | 23,000 | | | | | 632,270 | | | |
Alpha & Omega Semiconductor, Ltd.* | | | | 11,905 | | | | | 104,050 | | | |
Amkor Technology, Inc.* | | | | 165,200 | | | | | 987,896 | | | |
AXT, Inc.* | | | | 25,000 | | | | | 63,000 | | | |
Brooks Automation, Inc. | | | | 60,000 | | | | | 687,000 | | | |
Cirrus Logic, Inc.* | | | | 30,500 | | | | | 1,037,915 | | | |
Cohu, Inc. | | | | 30,000 | | | | | 396,900 | | | |
Diodes, Inc.* | | | | 17,200 | | | | | 414,692 | | | |
Fairchild Semiconductor International, Inc.* | | | | 52,400 | | | | | 910,712 | | | |
GigOptix, Inc.* | | | | 65,000 | | | | | 110,500 | | | |
Integrated Silicon Solution, Inc. | | | | 26,800 | | | | | 593,352 | | | |
inTEST Corp.*+ | | | | 54,500 | | | | | 237,620 | | | |
IXYS Corp. | | | | 39,000 | | | | | 596,700 | | | |
Kulicke & Soffa Industries, Inc.* | | | | 100,300 | | | | | 1,174,513 | | | |
OmniVision Technologies, Inc.* | | | | 81,800 | | | | | 2,142,751 | | | |
Pericom Semiconductor Corp. | | | | 41,500 | | | | | 545,725 | | | |
Photronics, Inc.* | | | | 171,470 | | | | | 1,630,680 | | | |
Rudolph Technologies, Inc.* | | | | 31,100 | | | | | 373,511 | | | |
Sigma Designs, Inc.* | | | | 3,800 | | | | | 45,334 | | | |
Ultra Clean Holdings, Inc.* | | | | 57,000 | | | | | 355,110 | | | |
Xcerra Corp.* | | | | 30,000 | | | | | 227,100 | | | |
| | | | | | | | | | | | |
| | | | | | | | | 13,267,331 | | | |
| | | |
Software - 0.53% | | | | | | | | | | | | |
Ebix, Inc.+ | | | | 40,000 | | | | | 1,304,400 | | | |
Epiq Systems, Inc. | | | | 30,000 | | | | | 506,400 | | | |
GSE Systems, Inc.* | | | | 22,500 | | | | | 34,875 | | | |
Mind CTI, Ltd. | | | | 25,000 | | | | | 65,000 | | | |
Net 1 UEPS Technologies, Inc.* | | | | 15,700 | | | | | 286,996 | | | |
NetSol Technologies, Inc.* | | | | 11,680 | | | | | 60,152 | | | |
TeleCommunication Systems, Inc.,
Class A* | | | | 57,900 | | | | | 191,649 | | | |
| | | | | | | | | | | | |
| | | | | | | | | 2,449,472 | | | |
| | | | | | | | | | | | |
| Industry Company | | Shares | | Value | | |
| | | | | | | | | | | | |
Specialty Retail - 2.98% | | | |
Barnes & Noble, Inc.* | | | | 80,000 | | | | | $ 2,076,800 | | | |
Big 5 Sporting Goods Corp. | | | | 16,003 | | | | | 227,403 | | | |
Children’s Place, Inc. (The) | | | | 14,500 | | | | | 948,445 | | | |
Christopher & Banks Corp.* | | | | 89,200 | | | | | 357,692 | | | |
Citi Trends, Inc.* | | | | 51,150 | | | | | 1,237,830 | | | |
Genesco, Inc.* | | | | 5,000 | | | | | 330,150 | | | |
Haverty Furniture Cos., Inc. | | | | 30,300 | | | | | 655,086 | | | |
hhgregg, Inc.*+ | | | | 20,000 | | | | | 66,800 | | | |
Pep Boys-Manny, Moe & Jack (The)* | | | | 50,500 | | | | | 619,635 | | | |
Rent-A-Center, Inc. | | | | 15,000 | | | | | 425,250 | | | |
Shoe Carnival, Inc. | | | | 20,000 | | | | | 577,200 | | | |
Sonic Automotive, Inc.,
Class A | | | | 40,000 | | | | | 953,200 | | | |
Stage Stores, Inc. | | | | 67,500 | | | | | 1,183,275 | | | |
Systemax, Inc.* | | | | 3,000 | | | | | 25,920 | | | |
Tilly’s, Inc., Class A* | | | | 41,500 | | | | | 401,305 | | | |
Trans World Entertainment Corp.* | | | | 30,000 | | | | | 109,800 | | | |
TravelCenters of America LLC* | | | | 197,050 | | | | | 2,926,192 | | | |
West Marine, Inc.* | | | | 61,900 | | | | | 596,716 | | | |
| | | | | | | | | | | | |
| | | | | | | | | 13,718,699 | | | |
| |
Textiles, Apparel & Luxury Goods - 1.22% | | | |
Delta Apparel, Inc.* | | | | 13,200 | | | | | 188,760 | | | |
Ever-Glory International Group, Inc.* | | | | 20,000 | | | | | 102,000 | | | |
Iconix Brand Group, Inc.* | | | | 12,000 | | | | | 299,640 | | | |
Perry Ellis International, Inc.* | | | | 135,184 | | | | | 3,213,324 | | | |
Rocky Brands, Inc. | | | | 19,550 | | | | | 365,585 | | | |
Unifi, Inc.* | | | | 43,600 | | | | | 1,460,600 | | | |
| | | | | | | | | | | | |
| | | | | | | | | 5,629,909 | | | |
| |
Thrifts & Mortgage Finance - 3.88% | | | |
Astoria Financial Corp. | | | | 120,900 | | | | | 1,667,211 | | | |
Bank Mutual Corp. | | | | 121,800 | | | | | 934,206 | | | |
Berkshire Hills Bancorp, Inc. | | | | 30,970 | | | | | 882,026 | | | |
Brookline Bancorp, Inc. | | | | 30,000 | | | | | 338,700 | | | |
Cape Bancorp, Inc. | | | | 26,100 | | | | | 246,906 | | | |
Cheviot Financial Corp. | | | | 1,200 | | | | | 17,640 | | | |
Chicopee Bancorp, Inc. | | | | 12,500 | | | | | 206,125 | | | |
Dime Community Bancshares, Inc. | | | | 15,000 | | | | | 254,100 | | | |
ESSA Bancorp, Inc. | | | | 35,000 | | | | | 450,100 | | | |
Federal Agricultural Mortgage Corp., Class C | | | | 16,500 | | | | | 479,490 | | | |
First Defiance Financial Corp. | | | | 20,750 | | | | | 778,748 | | | |
| | |
| 28 | | Annual Report | June 30, 2015 |
| | |
Omni Tax-Managed Small-Cap Value Fund SCHEDULE OF INVESTMENTS (continued) | | |
Showing percentage of net assets as of June 30, 2015
| | | | | | | | | | |
| Industry Company | | Shares | | | Value | | | |
Common Stocks (continued) | | | | | | | |
Thrifts & Mortgage Finance (continued) | | | |
First Financial Northwest, Inc. | | | 26,400 | | | | $ 328,944 | | | |
Flagstar Bancorp, Inc.* | | | 59,500 | | | | 1,099,560 | | | |
Fox Chase Bancorp, Inc. | | | 10,500 | | | | 177,660 | | | |
Heritage Financial Group, Inc. | | | 12,200 | | | | 368,196 | | | |
Hingham Institution for Savings+ | | | 1,143 | | | | 131,571 | | | |
Home Bancorp, Inc. | | | 15,597 | | | | 393,668 | | | |
HomeStreet, Inc.* | | | 17,766 | | | | 405,420 | | | |
HopFed Bancorp, Inc. | | | 23,500 | | | | 278,005 | | | |
Lake Sunapee Bank Group | | | 2,000 | | | | 28,860 | | | |
Laporte Bancorp, Inc.+ | | | 11,000 | | | | 149,050 | | | |
Meta Financial Group, Inc. | | | 11,500 | | | | 493,580 | | | |
Northwest Bancshares, Inc. | | | 20,000 | | | | 256,400 | | | |
Ocean Shore Holding Co. | | | 14,800 | | | | 219,558 | | | |
OceanFirst Financial Corp. | | | 50,488 | | | | 941,601 | | | |
Oritani Financial Corp. | | | 50,000 | | | | 802,500 | | | |
Provident Financial Holdings, Inc. | | | 26,600 | | | | 445,284 | | | |
Provident Financial Services, Inc. | | | 67,400 | | | | 1,279,926 | | | |
Prudential Bancorp, Inc. | | | 957 | | | | 13,876 | | | |
Pulaski Financial Corp. | | | 800 | | | | 10,336 | | | |
Riverview Bancorp, Inc. | | | 72,478 | | | | 310,206 | | | |
Security National Financial Corp., Class A* | | | 13,020 | | | | 87,625 | | | |
SI Financial Group, Inc. | | | 30,000 | | | | 349,200 | | | |
Territorial Bancorp, Inc. | | | 21,900 | | | | 531,294 | | | |
Timberland Bancorp, Inc. | | | 7,000 | | | | 70,140 | | | |
United Community Bancorp | | | 10,000 | | | | 138,100 | | | |
United Community Financial Corp. | | | 39,163 | | | | 209,522 | | | |
Westfield Financial, Inc. | | | 53,000 | | | | 387,430 | | | |
WSFS Financial Corp. | | | 63,000 | | | | 1,723,050 | | | |
| | | | | | | | | | |
| | | | | | | 17,885,814 | | | |
| |
Trading Companies & Distributors - 2.16% | | | |
Aircastle, Ltd. | | | 135,600 | | | | 3,074,052 | | | |
CAI International, Inc.* | | | 81,000 | | | | 1,667,790 | | | |
General Finance Corp.*+ | | | 158,064 | | | | 825,094 | | | |
Rush Enterprises, Inc., Class A* | | | 73,600 | | | | 1,929,056 | | | |
TAL International Group, Inc. | | | 37,199 | | | | 1,175,488 | | | |
Titan Machinery, Inc.*+ | | | 20,000 | | | | 294,600 | | | |
Veritiv Corp.* | | | 2,194 | | | | 79,993 | | | |
| | | | | | | | | | |
| Industry Company | | Shares | | | Value | | | |
| | | | | | | | | | |
Trading Companies & Distributors (continued) | | | |
Willis Lease Finance Corp.* | | | 50,950 | | | | $ 935,952 | | | |
| | | | | | | | | | |
| | | | | | | 9,982,025 | | | |
| | | |
Wireless Telecommunication Services - 0.30% | | | | | | | | | | |
Spok Holdings, Inc. | | | 81,100 | | | | 1,365,724 | | | |
| | | | | | | | | | |
TOTAL COMMON STOCKS - 99.46% | | | | 458,620,254 | | | |
| | | | | | | | | | |
(Cost $370,031,231) | | | | | | | | | | |
| | | | | | | | | | |
| | | |
WARRANTS - 0.00% | | | | | | | | | | |
Eagle Bulk Shipping, Inc.* | | | 8,501 | | | | 3,230 | | | |
| | | | | | | | | | |
TOTAL WARRANTS - 0.00% | | | | | | | 3,230 | | | |
| | | | | | | | | | |
(Cost $70,770) | | | | | | | | | | |
| | | | | | | | | | | | |
| | | | | | | | | | | | |
| | | Rate^ | | | Shares | | | Value | | |
| | |
MONEY MARKET FUND - 0.74% | | | | | |
Dreyfus Cash Management Fund | | | 0.04 | % | | | 3,415,796 | | | 3,415,796 | | |
| | | | | | | | | | | | |
TOTAL MONEY
MARKET FUND - 0.74% | | | 3,415,796 | | |
| | | | | | | | | | | | |
(Cost $3,415,796) | | | | | | | | | | | | |
| | | | | | | | | | | | |
|
INVESTMENTS PURCHASED WITH CASH PROCEEDS
FROM SECURITIES LENDING - 4.10% |
Dreyfus Cash Management Fund** | | | 0.04 | % | | | 18,869,835 | | | 18,869,835 | | |
| | | | | | | | | | | | |
TOTAL INVESTMENTS PURCHASED WITH CASH PROCEEDS FROM SECURITIES LENDING - 4.10% | | | | | | | | | | 18,869,835 | | |
| | | | | | | | | | | | |
(Cost $18,869,835) | | | | | | | | | | | | |
| | | | |
TOTAL INVESTMENTS - 104.30% | | | | | | | | | | $480,909,115 | | |
(Cost $392,387,632) | | | | | | | | | | | | |
Liabilities in Excess of Other Assets - (4.30%) | | | (19,808,262) | | |
| | | | | | | | | | | | |
NET ASSETS - 100.00% | | | | | | | | | | $461,100,853 | | |
| | | | | | | | | | | | |
| | |
| * | | Non-income producing security. |
| ** | | This security represents the investment of the collateral received in connection with securities out on loan as of June 30, 2015. |
| ^ | | Rate disclosed as of June 30, 2015. |
| + | | This security or a portion of the security is out on loan as of June 30, 2015. Total loaned securities had a value of $18,211,431 as of June 30, 2015. |
| LLC - Limited Liability Company |
| PLC - Public Limited Company |
| | |
Omni Tax-Managed Small-Cap Value Fund SCHEDULE OF INVESTMENTS (continued) | | |
Showing percentage of net assets as of June 30, 2015
| | | | | | | | | | | | | | | | |
Summary of inputs used to value the Fund’s investments as of 06/30/2015 (See Note 2 in Notes to Financial Statements): | | | |
| | | Valuation Inputs | | | |
| | | Investment in Securities (Value) | | | |
| | | Level 1
Quoted
Prices | | | Level 2
Significant
Observable
Inputs | | | Level 3
Significant
Unobservable
Inputs | | Total | | | |
Common Stocks | | $ | 458,414,129 | | | $ | 206,125 | | | $ — | | $ | 458,620,254 | | | |
Warrants | | | 3,230 | | | | — | | | — | | | 3,230 | | | |
Money Market Fund | | | — | | | | 3,415,796 | | | — | | | 3,415,796 | | | |
Investments Purchased with Cash Proceeds from Securities Lending | | | — | | | | 18,869,835 | | | — | | | 18,869,835 | | | |
| | | | | | | | | | | | | | | | |
TOTAL | | $ | 458,417,359 | | | $ | 22,491,756 | | | $ — | | $ | 480,909,115 | | | |
| | | | | | | | | | | | | | | | |
See Notes to Financial Statements.
| | |
| 30 | | Annual Report | June 30, 2015 |
| | |
| STATEMENTS OF ASSETS AND LIABILITIES | | |
June 30, 2015
| | | | | | | | | | | | |
| ASSETS | | Omni Small-Cap Value | | Omni Tax-Managed
Small-Cap Value |
Investments at value | | | $475,664,003 | | | | | | $480,909,115 | | | |
Receivables: | | | | | | | | | | | | |
Portfolio securities sold | | | - | | | | | | 1,163,344 | | | |
Fund shares sold | | | 1,321,438 | | | | | | 588,510 | | | |
Dividends and interest | | | 281,402 | | | | | | 284,051 | | | |
Prepaid expenses | | | 68,029 | | | | | | 57,982 | | | |
| | | | |
Total assets | | | 477,334,872 | | | | | | 483,003,002 | | | |
| | | | |
LIABILITIES | | | | | | | | | | | | |
Payables: | | | | | | | | | | | | |
Portfolio securities purchased | | | 255,698 | | | | | | 1,671,262 | | | |
Fund shares redeemed | | | 921,226 | | | | | | 1,059,594 | | | |
Payable upon return of securities loaned | | | 16,484,499 | | | | | | 18,869,835 | | | |
Accrued Liabilities: | | | | | | | | | | | | |
Investment advisory fees | | | 141,330 | | | | | | 143,367 | | | |
Administration fees | | | 7,614 | | | | | | 7,593 | | | |
Directors’ fees | | | 650 | | | | | | 620 | | | |
Other | | | 156,720 | | | | | | 149,878 | | | |
| | | | |
Total liabilities | | | 17,967,737 | | | | | | 21,902,149 | | | |
| | | | |
NET ASSETS | | | $459,367,135 | | | | | | $461,100,853 | | | |
| | | | |
NET ASSETS REPRESENT | | | | | | | | | | | | |
Paid-in capital | | | $369,624,328 | | | | | | $371,975,338 | | | |
Undistributed net investment income | | | 2,027,126 | | | | | | 3,271,865 | | | |
Accumulated net realized loss on investments | | | (3,918,432 | ) | | | | | (2,667,833 | ) | | |
Net unrealized appreciation on investments | | | 91,634,113 | | | | | | 88,521,483 | | | |
| | | | |
NET ASSETS | | | $459,367,135 | | | | | | $461,100,853 | | | |
| | | | |
Shares of common stock outstanding of $.001 par value* | | | 29,651,823 | | | | | | 31,476,957 | | | |
| | | | |
Net asset value, offering price and redemption price per share | | | $15.49 | | | | | | $14.65 | | | |
| | | | |
Total investments at cost | | | $384,029,890 | | | | | | $392,387,632 | | | |
* See Note 1 - Organization in the Notes to Financial Statements for shares authorized for each Fund.
See Notes to Financial Statements.
| | |
| STATEMENTS OF OPERATIONS | | |
Fiscal Year Ended June 30, 2015
| | | | | | | | | | | | |
| | | Omni
Small-Cap Value | | Omni Tax-Managed
Small-Cap Value |
| | | | |
INVESTMENT INCOME | | | | | | | | | | | | |
Dividends | | | $6,005,884 | | | | | | $5,726,848 | | | |
Less: foreign taxes withheld | | | (6,141 | ) | | | | | (4,871 | ) | | |
Securities lending | | | 482,354 | | | | | | 347,089 | | | |
| | | | |
Total Investment Income | | | 6,482,097 | | | | | | 6,069,066 | | | |
| | | | |
EXPENSES | | | | | | | | | | | | |
Investment advisory fees | | | 2,192,412 | | | | | | 2,101,135 | | | |
Administration fees | | | 92,581 | | | | | | 88,720 | | | |
Accounting fees | | | 122,110 | | | | | | 119,435 | | | |
Transfer agent fees | | | 13,056 | | | | | | 13,058 | | | |
Professional fees | | | 79,468 | | | | | | 77,752 | | | |
Custody fees | | | 18,070 | | | | | | 19,080 | | | |
Blue sky fees | | | 68,215 | | | | | | 70,982 | | | |
Directors’ and officers’ fees | | | 37,455 | | | | | | 36,728 | | | |
Shareholder servicing fees | | | 386,398 | | | | | | 371,948 | | | |
Reports to shareholders | | | 25,982 | | | | | | 21,584 | | | |
Miscellaneous expenses | | | 75,458 | | | | | | 80,553 | | | |
| | | | |
Total Expenses | | | 3,111,205 | | | | | | 3,000,975 | | | |
| | | | |
Less investment advisory fees waived | | | (480,284 | ) | | | | | (479,218 | ) | | |
| | | | |
Net Expenses | | | 2,630,921 | | | | | | 2,521,757 | | | |
| | | | |
NET INVESTMENT INCOME | | | 3,851,176 | | | | | | 3,547,309 | | | |
| | | | |
NET REALIZED AND UNREALIZED LOSS ON INVESTMENTS | | | | | | | | | | | | |
Realized Loss on: | | | | | | | | | | | | |
Investments | | | (1,654,820 | ) | | | | | (2,599,989 | ) | | |
| | | | |
Change in Unrealized Appreciation on: | | | | | | | | | | | | |
Investments | | | (4,763,662 | ) | | | | | (10,832,450 | ) | | |
| | | | |
Net Realized and Unrealized Loss on Investments | | | (6,418,482 | ) | | | | | (13,432,439 | ) | | |
| | | | |
NET DECREASE IN NET ASSETS RESULTING FROM OPERATIONS | | | $(2,567,306 | ) | | | | | $(9,885,130 | ) | | |
See Notes to Financial Statements.
| | |
| 32 | | Annual Report | June 30, 2015 |
| | |
| STATEMENTS OF CHANGES IN NET ASSETS | | |
| | | | | | | | | | | | | | | | | | |
| | | Omni Small-Cap Value | | | Omni Tax-Managed Small-Cap Value | | | |
| | | Year Ended June 30, | | | Year Ended June 30, | | | |
| | | 2015 | | | 2014 | | | 2015 | | | 2014 | | | |
| | | | | |
OPERATIONS | | | | | | | | | | | | | | | | | | |
Net investment income | | $ | 3,851,176 | | | $ | 2,327,679 | | | $ | 3,547,309 | | | $ | 2,217,693 | | | |
Net realized gain (loss) on investments | | | (1,654,820 | ) | | | 32,913,857 | | | | (2,599,989 | ) | | | 21,562,969 | | | |
Net change in unrealized appreciation (depreciation) on investments | | | (4,763,662 | ) | | | 40,739,787 | | | | (10,832,450 | ) | | | 53,648,014 | | | |
| | | | | |
Net increase (decrease) in net assets resulting from operations | | | (2,567,306 | ) | | | 75,981,323 | | | | (9,885,130 | ) | | | 77,428,676 | | | |
| | | | | |
DISTRIBUTIONS: | | | | | | | | | | | | | | | | | | |
From net investment income | | | (2,478,657 | ) | | | (1,694,743 | ) | | | (767,401 | ) | | | (1,891,418 | ) | | |
From net realized gains | | | (20,389,241 | ) | | | (21,789,088 | ) | | | (14,502,076 | ) | | | (10,989,498 | ) | | |
| | | | | |
Net decrease in net assets resulting from distributions | | | (22,867,898 | ) | | | (23,483,831 | ) | | | (15,269,477 | ) | | | (12,880,916 | ) | | |
| | | | | |
SHARE TRANSACTIONS: | | | | | | | | | | | | | | | | | | |
Proceeds from sale of shares | | | 150,345,339 | | | | 134,502,593 | | | | 153,736,050 | | | | 137,813,044 | | | |
Reinvestment of distributions | | | 22,867,898 | | | | 23,483,831 | | | | 15,267,233 | | | | 12,880,497 | | | |
Cost of shares redeemed | | | (95,602,458 | ) | | | (64,201,515 | ) | | | (108,078,029 | ) | | | (51,998,913 | ) | | |
| | | | | |
Net increase in net assets resulting from share transactions | | | 77,610,779 | | | | 93,784,909 | | | | 60,925,254 | | | | 98,694,628 | | | |
Net increase in net assets | | | 52,175,575 | | | | 146,282,401 | | | | 35,770,647 | | | | 163,242,388 | | | |
| | | | | |
NET ASSETS: | | | | | | | | | | | | | | | | | | |
| | | | | |
Beginning of year | | | 407,191,560 | | | | 260,909,159 | | | | 425,330,206 | | | | 262,087,818 | | | |
| | | | | |
End of year* | | $ | 459,367,135 | | | $ | 407,191,560 | | | $ | 461,100,853 | | | $ | 425,330,206 | | | |
| | | | | |
SHARES ISSUED & REDEEMED | | | | | | | | | | | | | | | | | | |
Issued | | | 9,811,973 | | | | 8,558,069 | | | | 10,661,864 | | | | 9,510,227 | | | |
Distributions reinvested | | | 1,604,765 | | | | 1,534,891 | | | | 1,131,744 | | | | 901,364 | | | |
Redeemed | | | (6,248,268 | ) | | | (4,100,860 | ) | | | (7,678,666 | ) | | | (3,605,976 | ) | | |
| | | | | |
Net increase in shares | | | 5,168,470 | | | | 5,992,100 | | | | 4,114,942 | | | | 6,805,615 | | | |
Outstanding at beginning of year | | | 24,483,353 | | | | 18,491,253 | | | | 27,362,015 | | | | 20,556,400 | | | |
| | | | | |
Outstanding at end of year | | | 29,651,823 | | | | 24,483,353 | | | | 31,476,957 | | | | 27,362,015 | | | |
| | | | | |
* Including undistributed net investment income of: | | $ | 2,027,126 | | | $ | 885,528 | | | $ | 3,271,865 | | | $ | 767,355 | | | |
See Notes to Financial Statements.
(for a share outstanding throughout each period indicated)
OMNI SMALL-CAP VALUE
| | | | | | | | | | |
| | | Year Ended June 30 | | | | |
| | | 2015 | | 2014 | | 2013 | | For the
Period Ended
06/30/2012(a) | | |
| | | | | |
Net Asset Value, Beginning of Period | | $16.63 | | $14.11 | | $11.11 | | $10.00 | | |
| | | | | | | | | | |
| | | | | |
Income from Investment Operations: | | | | | | | | | | |
Net Investment Income(b) | | 0.14 | | 0.11 | | 0.17 | | 0.08 | | |
Net Realized and Unrealized Gain (Loss) | | (0.46) | | 3.58 | | 3.12 | | 1.06 | | |
| | | | | | | | | | |
Total from Investment Operations | | (0.32) | | 3.69 | | 3.29 | | 1.14 | | |
| | | | | | | | | | |
| | | | | |
Less Distributions to Shareholders from: | | | | | | | | | | |
Net Investment Income | | (0.09) | | (0.08) | | (0.16) | | (0.03) | | |
Net Realized Gain | | (0.73) | | (1.09) | | (0.13) | | - | | |
| | | | | | | | | | |
Total Distributions | | (0.82) | | (1.17) | | (0.29) | | (0.03) | | |
| | | | | | | | | | |
| | | | | |
Net Asset Value, End of Period | | $15.49 | | $16.63 | | $14.11 | | $11.11 | | |
| | | | | | | | | | |
| | | | | |
Total Return | | (1.48%)(c) | | 26.89%(c) | | 30.08%(c) | | 11.41%(c)(d) | | |
| | | | | |
Ratios and Supplemental Data: | | | | | | | | | | |
Net Assets, End of Period (in 000’s) | | $459,367 | | $407,192 | | $260,909 | | $179,553 | | |
Expenses Before Waivers and Reimbursements | | 0.71% | | 0.71% | | 0.78% | | 0.84%(e) | | |
Expenses After Waivers and Reimbursements | | 0.60% | | 0.60% | | 0.60% | | 0.60%(e) | | |
Net Investment Income After Waivers and Reimbursements | | 0.88% | | 0.70% | | 1.36% | | 0.92%(e) | | |
Portfolio Turnover Rate | | 25% | | 31% | | 34% | | 8%(d) | | |
| (a) | Commenced operations on August 31, 2011. |
| (b) | Per share amounts calculated based on the average daily shares outstanding during the period. |
| (c) | Total return would have been lower had various fees not been waived during the period. |
| (e) | Annualized for periods less than one year. |
See Notes to Financial Statements.
| | |
| 34 | | Annual Report | June 30, 2015 |
(for a share outstanding throughout each period indicated)
OMNI TAX-MANAGED SMALL-CAP VALUE
| | | | | | | | | | | | |
| | | Year Ended June 30 | | | | |
| | | 2015 | | 2014 | | 2013 | | 2012 | | For the
Period Ended
06/30/2011(a) | | |
| | | | | | |
Net Asset Value, Beginning of Period | | $15.54 | | $12.75 | | $10.05 | | $10.68 | | $10.00 | | |
| | | | | | | | | | | | |
| | | | | | |
Income from Investment Operations: | | | | | | | | | | | | |
Net Investment Income(b) | | 0.12 | | 0.09 | | 0.15 | | 0.09 | | 0.03 | | |
Net Realized and Unrealized Gain (Loss) | | (0.42) | | 3.26 | | 2.68 | | (0.67)(c) | | 0.65 | | |
| | | | | | | | | | | | |
Total from Investment Operations | | (0.30) | | 3.35 | | 2.83 | | (0.58) | | 0.68 | | |
| | | | | | | | | | | | |
| | | | | | |
Less Distributions to Shareholders from: | | | | | | | | | | | | |
Net Investment Income | | (0.03) | | (0.08) | | (0.13) | | (0.05) | | - | | |
Net Realized Gain | | (0.56) | | (0.48) | | - | | - | | - | | |
| | | | | | | | | | | | |
Total Distributions | | (0.59) | | (0.56) | | (0.13) | | (0.05) | | - | | |
| | | | | | | | | | | | |
| | | | | | |
Net Asset Value, End of Period | | $14.65 | | $15.54 | | $12.75 | | $10.05 | | $10.68 | | |
| | | | | | | | | | | | |
| | | | | | |
Total Return | | (1.62%)(d) | | 26.71%(d) | | 28.43%(d) | | (5.41%)(d) | | 6.80%(d)(e) | | |
| | | | | | |
Ratios and Supplemental Data: | | | | | | | | | | | | |
Net Assets, End of Period (in 000’s) | | $461,101 | | $425,330 | | $262,088 | | $127,216 | | $37,945 | | |
Expenses Before Waivers and Reimbursements | | 0.71% | | 0.71% | | 0.77% | | 0.90% | | 1.56%(f) | | |
Expenses After Waivers and Reimbursements | | 0.60% | | 0.60% | | 0.60% | | 0.60% | | 0.60%(f) | | |
Net Investment Income After Waivers and Reimbursements | | 0.84% | | 0.65% | | 1.34% | | 0.95% | | 0.57%(f) | | |
Portfolio Turnover Rate | | 30% | | 25% | | 34% | | 26% | | 7%(e) | | |
| (a) | Commenced operations on December 31, 2010. |
| (b) | Per share amounts calculated based on the average daily shares outstanding during the period. |
| (c) | Realized and unrealized gain (loss) per share do not correlate to the aggregate of the net unrealized and realized gain in the Statements of Changes in Net Assets for the year ended June 30, 2012, primarily due to the timing of the sales and repurchases of the Fund’s shares in relation to fluctuating market values for the Fund’s portfolio. |
| (d) | Total return would have been lower had various fees not been waived during the period. |
| (f) | Annualized for periods less than one year. |
See Notes to Financial Statements.
| | |
| NOTES TO FINANCIAL STATEMENTS | | |
June 30, 2015
1. Organization:
Bridgeway Funds, Inc. (“Bridgeway” or the “Company”) was organized as a Maryland corporation on October 19, 1993, and is registered under the Investment Company Act of 1940, as amended (the “1940 Act”), as an open-end management investment company.
Bridgeway is organized as a series fund, with 11 investment funds as of June 30, 2015 (each is referred to as a “Bridgeway Fund” and collectively, the “Bridgeway Funds”). The Aggressive Investors 1, Ultra-Small Company, Ultra-Small Company Market, Small-Cap Momentum, Small-Cap Growth, Small-Cap Value, Large-Cap Growth, Blue Chip 35 Index and Managed Volatility Funds are presented in a separate report. The Omni Small-Cap Value Fund and the Omni Tax-Managed Small-Cap Value Fund (each a “Fund” and together, the “Funds”) are presented in this report.
Bridgeway is authorized to issue 1,915,000,000 shares of common stock at $0.001 per share. As of June 30, 2015, 100,000,000 shares have been classified into the Aggressive Investors 1 Fund. 130,000,000 shares have been classified into the Blue Chip 35 Index Fund. 15,000,000 shares have been classified into the Ultra-Small Company Fund. 100,000,000 shares each have been classified into the Ultra-Small Company Market, Omni Small-Cap Value, Omni Tax-Managed Small-Cap Value, Small-Cap Momentum, Small-Cap Growth, Small-Cap Value and Large-Cap Growth Funds. 50,000,000 shares have been classified into the Managed Volatility Fund.
All of the Bridgeway Funds are no-load, diversified funds.
The Funds seek to provide long-term total return on capital, primarily through capital appreciation.
Bridgeway Capital Management, Inc. (the “Adviser”) is the investment adviser for all of the Bridgeway Funds.
2. Significant Accounting Policies:
The following summary of significant accounting policies, followed in the preparation of the financial statements of the Funds, are in conformity with accounting principles generally accepted in the United States of America (“GAAP”). Each Fund is considered an investment company under GAAP and follows the accounting and reporting guidance applicable to investment companies.
Securities and Other Investments Valuation Securities for which market quotations are readily available are valued at the last sale price on the national exchange on which such securities are primarily traded. In the case of securities reported on the National Association of Securities Dealers Automated Quotation (“NASDAQ”) system, the securities are valued based on the NASDAQ Official Closing Price (“NOCP”). In the absence of recorded sales on their home exchange, or NOCP, in the case of NASDAQ traded securities, the security will be valued as follows: bid prices for long positions and ask prices for short positions.
Investments in open-end registered investment companies and closed-end registered investment companies that do not trade on an exchange are valued at the end of day net asset value (“NAV”) per share.
Investments in closed-end registered investment companies that trade on an exchange are valued at the last sales price as of the close of the customary trading session on the exchange where the security is principally traded.
When market quotations are not readily available or when events occur that make established valuation methods unreliable, securities of the Funds may be valued at fair value as determined in good faith by or under the direction of the Board of Directors. The valuation assigned to a fair valued security for purposes of calculating the Funds’ NAV may differ from the security’s most recent closing market price and from the prices used by other mutual funds to calculate their NAVs.
| | |
| 36 | | Annual Report | June 30, 2015 |
| | |
| NOTES TO FINANCIAL STATEMENTS (continued) | | |
June 30, 2015
The inputs and valuation techniques used to determine the value of a fund’s investments are summarized into three levels as described in the hierarchy below:
| • | | Level 1 — quoted prices in active markets for identical assets |
Investments whose values are based on quoted market prices in active markets, and whose values are therefore classified as Level 1 prices, include active listed equity securities. The Funds do not adjust the quoted price for such investments, even in situations where the Funds hold a large position and a sale could reasonably impact the quoted price.
| • | | Level 2 — other significant observable inputs (including quoted prices for similar securities, interest rates, prepayment speeds, credit risk, etc.) |
Investments that trade in markets that are not considered to be active, but whose values are based on quoted market prices, dealer quotations or valuations provided by alternative pricing sources supported by observable inputs, are classified as Level 2 prices. These generally include certain U.S. Government and sovereign obligations, most government agency securities, investment-grade corporate bonds and less liquid listed equity securities. As investments whose values are classified as Level 2 prices include positions that are not traded in active markets and/or are subject to transfer restrictions, valuations may be adjusted to reflect illiquidity and/or non-transferability, which are generally based on available market information.
The Dreyfus Cash Management Fund, which is held by the Funds, invests primarily in securities that are valued at cost or amortized cost. Therefore, these investments are classified as Level 2 investments.
| • | | Level 3 — significant unobservable inputs (including the Funds’ own assumptions in determining the fair value of investments) |
Investments whose values are classified as Level 3 prices have significant unobservable inputs, as they may trade infrequently or not at all. When observable prices are not available for these securities, the Funds use one or more valuation techniques for which sufficient and reliable data is available. The inputs used by the Funds in estimating the value of Level 3 prices may include the original transaction price, quoted prices for similar securities or assets in active markets, completed or pending third-party transactions in the underlying investment or comparable issuers, and changes in financial ratios or cash flows. Level 3 prices may also be adjusted to reflect illiquidity and/or non-transferability, with the amount of such discount estimated by the Funds in the absence of market information. Assumptions used by the Funds due to the lack of observable inputs may significantly impact the resulting value and therefore the results of the Funds’ operations.
The inputs or methodology used for valuing investments are not necessarily an indication of the risk associated with investing in those investments. A summary of the inputs used to value the Funds’ investments as of June 30, 2015 is included with each Fund’s Schedule of Investments.
The Funds’ policy is to recognize transfers into, and transfers out of, each level of hierarchy as of the beginning of the reporting period. For the year ended June 30, 2015, there were no transfers between Level 1 and Level 2 in any of the Funds. Details regarding transfers into, and transfers out of, Level 3 can be found at the end of each Schedule of Investments for Funds that hold Level 3 securities.
Securities Lending Upon lending its securities to third parties, each Fund receives compensation in the form of fees. The loans are secured by collateral at least equal to the fair value of the securities loaned plus accrued interest. Each Fund has the right under the lending agreement to recover the securities from the borrower on demand. Additionally, a Fund does not have the right to sell or repledge collateral received in the form of securities unless the borrower goes into default. The risks to a Fund of securities lending are that the borrower may not provide additional collateral when required or return the securities when due, resulting in a loss. Under the terms of the Securities Lending Agreement, the Funds are indemnified for such losses by the securities lending agent.
While securities are on loan, the Fund continues to receive dividends on the securities loaned and recognizes any gain or loss in the fair value of the securities loaned.
| | |
| NOTES TO FINANCIAL STATEMENTS (continued) | | |
June 30, 2015
Securities lending transactions are entered into by a Fund under a Securities Lending Agreement which provides the right, in the event of default (including bankruptcy or insolvency) for the non-defaulting party to liquidate the collateral or to offset the market value of the collateral received against the market value of the securities loaned. The value of the collateral is typically greater than that of the market value of the securities loaned, leaving the lender with a net amount payable to the defaulting party. However, bankruptcy or insolvency laws of a particular jurisdiction may impose restrictions on or prohibitions against such a right of offset in the event of a counterparty’s bankruptcy or insolvency.
The following table is a summary of the Funds’ securities loaned and related collateral which are subject to a netting agreement as of June 30, 2015:
| | | | | | | | | | | | | | |
| | | | | | | | | Gross Amount Not
Offset in the Statement
of Assets and Liabilities | | | |
| Fund | | Gross
Amounts of
Recognized
Assets1 | | Gross Amounts
Offset in the
Statement of
Assets and
Liabilities | | Net Amounts of
Assets Presented
in the Statement
of Assets and
Liabilities | | Financial
Instruments | | Cash
Collateral
Received2 | | Net
Amount | |
| | | | | | |
Omni Small-Cap Value | | | | | | | | | | | | | | |
Securities lending | | $15,806,395 | | - | | $15,806,395 | | - | | $15,806,395 | | | - | |
| | | | | | |
Omni Tax-Managed Small-Cap Value | | | | | | | | | | | | | | |
Securities lending | | $18,211,431 | | - | | $18,211,431 | | - | | $18,211,431 | | | - | |
| 1 | Securities loaned with a value of $252,614 in Omni Tax-Managed Small Cap Value have been sold and are pending settlement on July 1, 2015. |
| 2 | Collateral with a value of $16,484,499 and $18,869,835 has been received in connection with securities lending of Omni Small-Cap Value Fund and Omni Tax-Managed Small Cap Value Fund, respectively. Excess of collateral received from individual counterparty is not shown here for financial reporting purposes. |
It is each Fund’s policy to obtain additional collateral from or return excess collateral to the borrower by the end of the next business day following the valuation date of the securities loaned. Therefore, the value of the collateral held may be temporarily less than that required under the lending contract. As of June 30, 2015, the collateral consisted of an institutional money market fund.
Use of Estimates in Financial Statements In preparing financial statements in conformity with GAAP, management makes estimates and assumptions that affect the reported amounts of assets and liabilities on the date of the financial statements and the disclosure of contingent assets and liabilities on the date of the financial statements, as well as the reported amounts of revenue and expenses during the reporting period. Actual results could differ from those estimates.
Risks and Uncertainties The Funds provide for various investment options, including stocks. Such investments are exposed to various risks, such as interest rate, market and credit risks. Due to the risks involved, it is at least reasonably possible that changes in risks in the near term would materially affect shareholders’ account values and the amounts reported in the financial statements.
Security Transactions, Investment Income and Expenses Security transactions are accounted for as of the trade date, the date the order to buy or sell is executed. Realized gains and losses are computed on the identified cost basis. Dividend income is recorded on the ex-dividend date, and interest income is recorded on the accrual basis from settlement date.
Bridgeway Funds’ expenses that are not series-specific are allocated to each series based upon its relative proportion of net assets to the Bridgeway Funds’ total net assets or other appropriate basis.
Distributions to Shareholders The Funds pay dividends from net investment income and distribute realized capital gains annually, usually in December.
| | |
| 38 | | Annual Report | June 30, 2015 |
| | |
| NOTES TO FINANCIAL STATEMENTS (continued) | | |
June 30, 2015
Indemnification Under the Company’s organizational documents, the Funds’ officers, directors, employees and agents are indemnified against certain liabilities that may arise out of the performance of their duties to the Funds. Additionally, in the normal course of business, the Funds enter into contracts that contain a variety of indemnification clauses. The Funds’ maximum exposure under these arrangements is unknown, as this would involve future claims that may be made against the Funds that have not yet occurred. However, the Funds have not had prior claims or losses pursuant to these contracts.
3. Advisory Fees, Other Related Party Transactions and Contingencies:
The Funds have entered into a management agreement with the Adviser. As compensation for the advisory services rendered, facilities furnished, and expenses borne by the Adviser, the Funds pay the Adviser a fee of 0.50% of the value of each Fund’s average daily net assets, computed daily and payable monthly.
Expense limitations: The Adviser has agreed to reimburse the Funds for operating expenses and advisory fees above the expense limitations shown in the table below, which are shown as a ratio of net expenses to average net assets, for each Fund, for the year ended June 30, 2015. Any material change to the expense limitation would require a vote by shareholders of the applicable Fund.
| | | | |
| | | | | Total Waivers and |
| | | | | Reimbursements |
| | | Expense | | for Year Ending |
| Bridgeway Fund | | Limitation | | 06/30/15 |
| | | | | |
Omni Small-Cap Value* | | 0.60% | | $480,284 |
Omni Tax-Managed Small-Cap Value* | | 0.60% | | 479,218 |
| | | | |
*The Funds are authorized to reimburse the Adviser for management fees previously waived and/or for expenses previously paid by the Adviser, provided, however, that any reimbursements must be paid at a date not more than three years after the fiscal year in which the Adviser waived the fees or reimbursed the expenses and that the reimbursements do not cause the Funds to exceed the expense limitation in the agreement. The Omni Small-Cap Value Fund has recoupable expenses of $384,005, $367,842, and $480,284, which expire on June 30, 2016, June 30, 2017, and June 30, 2018, respectively. The Omni Tax-Managed Small-Cap Value Fund has recoupable expenses of $328,970, $382,335, and $479,218, which expire June 30, 2016, June 30, 2017, and June 30, 2018, respectively.
Other Related Party Transactions: The Bridgeway Funds will engage in inter-portfolio trades with other Bridgeway Funds when it is to the benefit of both parties. The Board of Directors reviews these trades quarterly. Inter-portfolio purchases and sales for the Funds during the year ended June 30, 2015 were as follows:
| | | | | | |
| | | Inter-Portfolio | | Inter-Portfolio | |
| Bridgeway Fund | | Purchases | | Sales | |
| | | | | | |
Omni Small-Cap Value | | $32,677,174 | | | $14,939,500 | |
Omni Tax-Managed Small-Cap Value | | 23,518,001 | | | 21,256,027 | |
The Adviser entered into an Administrative Services Agreement with Bridgeway, pursuant to which the Adviser provides various administrative services to the Funds including, but not limited to: (i) supervising and managing various aspects of the Funds’ business and affairs; (ii) selecting, overseeing and/or coordinating activities with other service providers to the Funds; (iii) providing reports to the Board of Directors as requested from time to time; (iv) assisting and/or reviewing amendments and updates to the Funds’ registration statement and other filings with the Securities and Exchange Commission (“SEC”); (v) providing certain shareholder services; (vi) providing administrative support in connection with meetings of the Board of Directors; and (vii) providing certain record-keeping services. Prior to July 1, 2015 for its services to all of the Bridgeway Funds, the Adviser was paid an aggregate annual fee of $535,000, payable in equal monthly installments. Effective July 1, 2015, the Adviser will be paid an aggregate annual fee of $590,000, payable in monthly installments. During the year ended June 30, 2015, the allocation of this expense to the Omni Small-Cap Value and Omni Tax-Managed Small-Cap Value Funds was $92,581 and $88,720, respectively.
| | |
| NOTES TO FINANCIAL STATEMENTS (continued) | | |
June 30, 2015
Board of Directors Compensation Independent Directors are paid an annual retainer of $15,000, with an additional retainer of $5,000 paid to the Independent Chairman of the Board and an additional retainer of $1,000 paid to the Nominating and Corporate Governance Committee Chair. The retainer is paid in quarterly installments. Independent Directors are paid $6,250 per meeting for meeting fees. Such compensation is the total compensation from all Bridgeway Funds and is allocated among the Bridgeway Funds.
The Independent Directors each receive this compensation in the form of shares of the Bridgeway Funds, credited to his or her account. Such Directors are reimbursed for any expenses incurred in attending meetings and conferences, as well as expenses for subscriptions or printed materials. The amount of Directors’ fees attributable to each Fund is disclosed in the Statement of Operations.
One director of Bridgeway, John Montgomery, is an owner and director of the Adviser. Under the 1940 Act definitions, he is considered to be an “affiliated person” of the Adviser and an “interested person” of the Adviser and of Bridgeway. Compensation for Mr. Montgomery is borne by the Adviser rather than the Bridgeway Funds.
4. Distribution and Shareholder Servicing Fees:
Foreside Fund Services, LLC acts as distributor of the Funds’ shares pursuant to a Distribution Agreement dated November 12, 2010. The Adviser pays all costs and expenses associated with distribution of the Funds’ shares, pursuant to a protective plan adopted by shareholders pursuant to Rule 12b-1.
5. Purchases and Sales of Investment Securities:
Purchases and sales of investments, other than short-term securities, for each Fund for the year ended June 30, 2015 were as follows:
| | | | | | | | | | | | |
| | | Purchases | | | Sales | |
| | | U.S. Government | | Other | | | U.S. Government | | Other | |
| | | | | | | | | | | |
Omni Small-Cap Value | | $ - | | $ | 169,544,959 | | | $ - | | $ | 110,189,519 | |
Omni Tax-Managed Small-Cap Value | | - | | | 171,740,227 | | | - | | | 125,241,674 | |
6. Federal Income Taxes
It is the Funds’ policy to continue to comply with the provisions of the Internal Revenue Code of 1986, as amended (“Internal Revenue Code”), applicable to regulated investment companies, and to distribute income to the extent necessary so that such Fund is not subject to federal income tax. Therefore, no federal income tax provision is required.
Unrealized Appreciation and Depreciation on Investments (Tax Basis) The amount of net unrealized appreciation/ depreciation and the cost of investment securities for tax purposes, including short-term securities at June 30, 2015, were as follows:
| | | | | | | | | | |
| | | Omni Small-Cap Value | | Omni Tax-Managed Small-Cap Value |
Gross appreciation (excess of value over tax cost) | | | | $109,840,066 | | | | | $107,348,649 | |
Gross depreciation (excess of tax cost over value) | | | | (18,289,186) | | | | | (18,841,742) | |
Net unrealized appreciation | | | | $ 91,550,880 | | | | | $ 88,506,907 | |
Cost of investments for income tax purposes | | | | $384,113,123 | | | | | $392,402,208 | |
The differences between book and tax net unrealized appreciation (depreciation) are due to wash sale loss deferrals and basis adjustments on passive foreign investment companies (PFICs), partnerships and business development companies.
Classifications of Distributions Net investment income (loss) and net realized gain (loss) may differ for financial statement and tax purposes. The character of distributions made during the year from net investment income or net realized gains may differ from its ultimate characterization for federal income tax purposes.
| | |
| 40 | | Annual Report | June 30, 2015 |
| | |
| NOTES TO FINANCIAL STATEMENTS (continued) | | |
June 30, 2015
The tax character of the distributions paid by the Funds during the fiscal years ended June 30, 2015 and 2014, is as follows:
| | | | | | | | | | | | | | | | |
| | | Omni | | | Omni Tax-Managed | |
| | | Small-Cap Value | | | Small-Cap Value | |
| | | Year | | | Year | | | Year | | | Year | |
| | | Ended | | | Ended | | | Ended | | | Ended | |
| | | June 30, 2015 | | | June 30, 2014 | | | June 30, 2015 | | | June 30, 2014 | |
Distributions paid from: | | | | | | | | | | | | | | | | |
Ordinary Income | | | $ 2,478,657 | | | | $ 1,694,743 | | | | $ 767,401 | | | | $ 1,891,418 | |
Long-Term Capital Gain | | | 20,389,241 | | | | 21,789,088 | | | | 14,502,076 | | | | 10,989,498 | |
Total | | | $22,867,898 | | | | $23,483,831 | | | | $15,269,477 | | | | $12,880,916 | |
Components of Accumulated Earnings As of June 30, 2015, the components of accumulated earnings on a tax basis were:
| | | | | | | | | | | | | | | |
| | | Omni | | | | Omni Tax-Managed |
| | | Small-Cap Value | | | | Small-Cap Value |
Undistributed Net Investment Income | | | | $ 2,027,126 | | | | | | | $ 3,274,274 | |
Accumulated Net Realized Loss on Investments* | | | | (3,835,199 | ) | | | | | | (2,655,666 | ) |
Net Unrealized Appreciation of Investments | | | | 91,550,880 | | | | | | | 88,506,907 | |
Total | | | | $89,742,807 | | | | | | | $89,125,515 | |
| * | Includes qualified late-year losses that the Funds have elected to defer to the beginning of their next fiscal year ending June 30, 2016. The Omni Small-Cap Value Fund and Omni Tax-Managed Small-Cap Value Fund have elected to defer late-year short term capital losses of $(3,835,199) and $(2,655,666), respectively. |
For the fiscal year June 30, 2015, the Funds recorded the following reclassifications to the accounts listed below:
| | | | | | | | | | |
| |
| | | Increase (Decrease) | |
| | | Omni | | | | | Omni Tax-Managed | |
| | | Small-Cap Value | | | | | Small-Cap Value | |
Paid-in-Capital | | | $171,816 | | | | | | $284,723 | |
Undistributed Net Investment Income | | | (230,921) | | | | | | (275,398) | |
Accumulated Net Realized Gain (Loss) on Investments | | | 59,105 | | | | | | (9,325) | |
The difference between book and tax components of net assets and the resulting reclassifications were primarily a result of the differing book/tax treatment of the deduction of equalization debits for tax purposes and investments in passive foreign investment companies (PFICs), partnerships and business development companies.
Accounting for Uncertainty in Income Taxes sets forth a minimum threshold for financial statement recognition of the benefit of a tax position taken or expected to be taken in a tax return. Management has analyzed each Fund’s tax positions and has concluded that no provision for income tax is required in each Fund’s financial statements. The Funds are not aware of any tax position for which it is reasonably possible that the total amounts of unrecognized tax benefits will significantly change in the next twelve months. Each Fund’s federal tax returns for the prior three fiscal years remain subject to examination by the Internal Revenue Service.
7. Line of Credit
Bridgeway established a line of credit agreement (“Facility”) with The Bank of New York Mellon, effective November 5, 2010. The Facility is for temporary or emergency purposes, such as to provide liquidity for shareholder redemptions, and is cancellable by either party. Unless cancelled earlier, the Facility shall be held available until September 17, 2015. Advances under the Facility are limited to $15,000,000 in total for all Bridgeway Funds, and advances to each Bridgeway Fund shall not exceed certain limits set forth in the credit agreement, including, but not limited to, the maximum amount a Bridgeway Fund is permitted to borrow under the 1940 Act.
| | |
| NOTES TO FINANCIAL STATEMENTS (continued) | | |
June 30, 2015
The Bridgeway Funds incur a commitment fee of 0.05% per annum on the unused portion of the Facility and interest expense to the extent of amounts borrowed under the Facility. Interest is based on the “Overnight Rate” plus 1.25%. The Overnight Rate means the higher of (a) the Federal Funds rate, (b) the Overnight Eurodollar Rate, or (c) the One-month Eurodollar Rate. The commitment fees are payable quarterly in arrears and are allocated to all participating Bridgeway Funds. Interest expense is charged directly to each Bridgeway Fund, based upon actual amounts borrowed by such Bridgeway Fund.
For the year ended June 30, 2015, borrowings by the Funds under this line of credit were as follows:
| | | | | | | | | | | | | | | | | | |
| | | Weighted | | | Weighted | | | Number of | | Interest | | | Maximum Amount | |
| | | Average | | | Average | | | Days | | Expense | | | Borrowed During | |
| Bridgeway Fund | | Interest Rate | | | Loan Balance | | | Outstanding | | Incurred1 | | | the Period | |
| | | | | | | | | | | | | | | |
Omni Small-Cap Value | | | 1.42% | | | | $1,237,155 | | | 58 | | | $2,797 | | | | $4,553,000 | |
Omni Tax-Managed Small-Cap Value | | | 1.41% | | | | 4,831,952 | | | 42 | | | 7,834 | | | | 15,000,000 | |
1 Interest expense is included on the Statements of Operations in Miscellaneous expenses. | |
There were no outstanding borrowings by the Funds under this line of credit as of June 30, 2015.
8. Subsequent Events
Management has evaluated the impact of all subsequent events on the Funds and has determined that there were no subsequent events requiring recognition or disclosure in the financial statements.
| | |
| 42 | | Annual Report | June 30, 2015 |
| | |
| REPORT OF INDEPENDENT REGISTERED PUBLIC ACCOUNTING FIRM | | |
To the Shareholders and Board of Directors of Bridgeway Funds, Inc.
We have audited the accompanying statements of assets and liabilities of the Omni Small-Cap Value Fund and Omni Tax-Managed Small-Cap Value Fund (the “Funds”), each a series of Bridgeway Funds, Inc., including the schedules of investments, as of June 30, 2015, and the related statements of operations for the year then ended, the statements of changes in net assets for each of the years in the two-year period then ended and the financial highlights for each of the years or periods presented. These financial statements and financial highlights are the responsibility of the Funds’ management. Our responsibility is to express an opinion on these financial statements and financial highlights based on our audits.
We conducted our audits in accordance with the standards of the Public Company Accounting Oversight Board (United States). Those standards require that we plan and perform the audits to obtain reasonable assurance about whether the financial statements and financial highlights are free of material misstatement. An audit includes examining, on a test basis, evidence supporting the amounts and disclosures in the financial statements. Our procedures included confirmation of securities owned as of June 30, 2015 by correspondence with the custodian and brokers. An audit also includes assessing the accounting principles used and significant estimates made by management, as well as evaluating the overall financial statement presentation. We believe that our audits provide a reasonable basis for our opinion.
In our opinion, the financial statements and financial highlights referred to above present fairly, in all material respects, the financial position of the Omni Small-Cap Value Fund and Omni Tax-Managed Small-Cap Value Fund as of June 30, 2015, and the results of their operations for the year then ended, the changes in their net assets for each of the years in the two-year period then ended, and their financial highlights for each of the years or periods presented, in conformity with accounting principles generally accepted in the United States of America.
BBD, LLP
Philadelphia, Pennsylvania
August 27, 2015
| | |
| OTHER INFORMATION | | |
June 30, 2015 (unaudited)
1. Shareholder Tax Information
Certain tax information regarding the Funds is required to be provided to shareholders based upon each Fund’s income and distributions for the taxable year ended June 30, 2015. The information and distributions reported herein may differ from information and distributions taxable to the shareholders for the calendar year ended December 31, 2014.
The Funds report the following items with regard to distributions paid during the fiscal year ended June 30, 2015. All reportings are based on financial information available as of the date of this annual report and, accordingly, are subject to change. For each item, it is the intention of each Fund to report the maximum amount permitted under the Internal Revenue Code of 1986, as amended, and the regulations thereunder.
| | | | |
| | | Omni Small-Cap
Value | | Omni Tax-Managed
Small Cap Value |
Corporate Dividends Received Deduction | | 100.00% | | 100.00% |
Qualified Dividend Income | | 100.00% | | 100.00% |
Qualified Interest Related Dividends | | 0.01% | | 0.00% |
Qualified Short Term Capital Gain Dividends | | 0.00% | | 0.00% |
During the fiscal year ended June 30, 2015, the Funds paid distributions from ordinary income and long-term capital gain which included equalization debits summarized below:
| | | | |
| | | Omni Small-Cap Value | | Omni Tax-Managed
Small-Cap Value |
Ordinary Income Distributions | | $ 2,478,657 | | $ 767,401 |
Equalization Debits Included in Ordinary Income Distributions | | 171,816 | | 284,723 |
Long-Term Capital Gain Distributions | | 20,389,241 | | 14,502,076 |
Equalization Debits Included in Long-Term Capital Gain Distributions | | - | | - |
2. Proxy Voting
Fund policies and procedures used in determining how to vote proxies relating to the Funds’ securities and a summary of proxies voted by the Funds for the period ended June 30, 2015 are available without a charge, upon request, by contacting Bridgeway Funds at 1-800-661-3550 and on the SEC’s website at http://www.sec.gov.
3. Fund Holdings
The complete schedule of the Funds’ holdings for the second and fourth quarters of each fiscal year are contained in the Funds’ Semi-Annual and Annual Shareholder Reports, respectively.
The Bridgeway Funds file complete schedules of the Funds’ holdings with the SEC for the first and third quarters of each fiscal year on Form N-Q within 60 days after the end of the period. Copies of the Funds’ Form N-Q are available without charge, upon request, by contacting Bridgeway Funds at 1-800-661-3550 and on the SEC’s website at http://www.sec.gov. You may also review and copy Form N-Q at the SEC’s Public Reference Room in Washington, D.C. For more information about the operation of the Public Reference Room, please call 1-800-SEC-0330.
4. Approval of Investment Management Agreement
The Bridgeway Funds, Inc.’s (the “Company”) management agreement (the “Management Agreement”) with its investment adviser, Bridgeway Capital Management, Inc. (the “Adviser”), on behalf of each of the Company’s funds must be approved for an initial term no greater than two years and renewed at least annually thereafter (i) by the vote of the Directors or by a vote of
| | |
| 44 | | Annual Report | June 30, 2015 |
| | |
| OTHER INFORMATION (continued) | | |
June 30, 2015 (unaudited)
the shareholders of each fund and (ii) by the vote of a majority of the Directors who are not parties to the Management Agreement or “interested persons” of any party thereto (the “Independent Directors”), cast in person at a meeting called specifically for the purpose of voting on such approval.
The Board of Directors (the “Board”) has five regularly scheduled meetings each year and takes into account throughout the year matters bearing on the approval of the Management Agreement. For example, the Board and its standing committees also consider at each meeting factors that are relevant to the annual renewal of each fund’s Management Agreement, including the services and support provided to each fund by the Adviser, the Adviser’s compliance program, comparative performance information for each fund, the risk assessment of the funds and “deep dives” on the strategy and performance of certain funds on a periodic basis. In addition, the Board receives updated financial information on the Adviser and updates related to strategic direction and marketing efforts between meetings from the Adviser.
On May 15, 2015, the Board, including a majority of the Independent Directors, met in person (the “Meeting”) with the Adviser, Company counsel, independent legal counsel (“Independent Legal Counsel”) to the Independent Directors and others to give consideration to information bearing on the continuation of the Management Agreement with respect to the following funds: Omni Tax-Managed Small-Cap Value Fund and Omni Small-Cap Value Fund (each a “Fund” and collectively, the “Funds”). In preparation for the Meeting, the Independent Directors requested that the Adviser provide specific information relevant to their consideration of the renewal of each Fund’s Management Agreement. In response to that request, the Independent Directors were furnished with a wide variety of information with respect to each Fund, including:
| | • | | investment performance over various time periods and the fees and expenses of each Fund as compared to a comparable group of funds (the “peer funds”); |
| | • | | the nature, extent and quality of services provided by the Adviser to each Fund, including investment advisory and administrative services; |
| | • | | actual management fees paid by each Fund to the Adviser; |
| | • | | the Adviser’s costs of providing services to each Fund and the profitability of the Adviser derived from its relationship with each Fund; |
| | • | | the extent to which economies of scale may be present and if so, the degree to which they would be shared with the Fund’s shareholders; |
| | • | | any “fall out” or ancillary benefits accruing to the Adviser as a result of its relationship with each Fund; and |
| | • | | information regarding the structure of the advisory fees, the method of computing fees and the frequency of payment of fees and any expense limitation or fee waiver arrangements for each Fund. |
The Independent Directors also met telephonically with Independent Legal Counsel prior to the Meeting to review and discuss the information provided by the Adviser. Moreover, the Independent Directors also met in executive session with Independent Legal Counsel to consider the continuation of the Management Agreement outside the presence of management during the Meeting.
In considering the aforementioned information, the Independent Directors took into account management style, investment strategies and prevailing market conditions. Furthermore, in evaluating the Management Agreement, the Directors also reviewed information provided by the Adviser concerning the following:
| | • | | the terms of the Management Agreement, including the services performed by the Adviser in managing each Fund in accordance with each Fund’s investment objectives, policies and restrictions and how those services and fees differ from the Adviser’s services to non-mutual fund accounts, to the extent applicable; |
| | |
| OTHER INFORMATION (continued) | | |
June 30, 2015 (unaudited)
| | • | | the services provided by the Adviser under a separate Administrative Services Agreement and the fact that those services were provided at approximately cost to the Funds, although it was noted the annual fee under the Administrative Services Agreement was proposed to be increased at the Meeting; |
| | • | | the Adviser’s specialized skills and experience in statistical analysis and investment management and trading; |
| | • | | the Adviser’s personnel, staffing levels and the time and attention the Adviser’s personnel devote to the management of the Funds as compared to other Adviser clients; |
| | • | | the Adviser’s risk assessment and risk management capabilities; |
| | • | | the fact that the Adviser continues to use no soft dollars; and |
| | • | | the financial condition and stability of the Adviser, including supplemental financial information provided upon the request of the Independent Directors periodically during the year. |
In examining the nature, extent and quality of the services provided by the Adviser, the Independent Directors were pleased that the Funds continue to have access to the Adviser’s specialized skills and experience in statistical analysis and investment management and trading, and viewed those skills as relatively unique within the investment management industry. The Independent Directors were satisfied that staffing levels at the Adviser were adequate and appropriate in view of the Funds’ operations.
In examining investment performance, the Independent Directors reviewed performance information as of December 31, 2014 for each Fund and considered the following:
| | • | | With regard to the Omni Tax-Managed Small-Cap Value Fund, the Independent Directors noted that, during this Fund’s relatively short operating history, the Fund has outperformed its peer funds and benchmark index for the past three-year period, lagged its peer funds and benchmark index for the one-year period, and has outperformed its benchmark index since inception. |
| | • | | With regard to the Omni Small-Cap Value Fund, the Independent Directors noted that, during this Fund’s short operating history, the Fund has outperformed its peer funds and benchmark index for the past three-year period, lagged its peer funds and benchmark index for the one-year period, and outperformed its benchmark index by a significant margin since inception. |
In examining fees and expenses, the Independent Directors considered that each Fund’s management fee and total expenses are significantly lower than their respective peer funds. In addition, the Independent Directors considered that the Adviser agreed to contractual expense limitation agreements for each Fund to ensure that total expense levels do not increase above certain levels.
In examining profitability, the Independent Directors considered that the Adviser was operating each Fund at a relatively low profit margin. However, the Independent Directors also considered that the Adviser has significant financial resources to support ongoing operations and future growth and that the Adviser had experienced improved overall financial performance results in 2014 as compared to 2013.
With regard to economies of scale, the Independent Directors noted that although there are no fee breakpoints in each Fund’s management fee schedules, the Adviser indicated that these Funds were priced low relative to peers and ahead of the economies of scale curve at launch. In view of asset sizes and fee structures, the Independent Directors were satisfied that shareholders were not missing the opportunity to benefit from economies of scale if they were available.
In terms of potential “fall out” or ancillary benefits to the Adviser due to its position as manager of the Funds, the Independent Directors noted that the Adviser continues to use no soft dollars and that its administrative services to the Funds are structured to approximate an at-cost relationship.
| | |
| 46 | | Annual Report | June 30, 2015 |
| | |
| OTHER INFORMATION (continued) | | |
June 30, 2015 (unaudited)
After extensive discussion and consideration among themselves, and with the Adviser, Company counsel and Independent Legal Counsel, including during an executive session with Independent Legal Counsel outside the presence of management, the Independent Directors concluded the following:
| | • | | the nature, extent and quality of the Adviser’s services were appropriate and consistent with the terms of the Management Agreement and mutual fund industry norms; |
| | • | | the investment performance of each Fund was acceptable or better over the relatively short operating history of each Fund; |
| | • | | the management fees and overall expense levels, after taking into account any applicable management fee and expense waivers, were reasonable and significantly lower than peer funds; |
| | • | | the costs of services provided by the Adviser to each Fund were fair and reasonable in relation to the services and benefits provided to each Fund; and |
| | • | | although there are no breakpoints in each Fund’s fee schedule, shareholders of each Fund were not missing the opportunity to benefit from economies of scale in view of the fact that each Fund was priced low in anticipation of future growth. |
Based on all relevant information and factors, the Board, including a majority of its Independent Directors, unanimously approved the renewal of the Management Agreement with respect to each Fund. In view of the broad scope and variety of factors and information, the Directors did not identify any single factor as being of paramount importance in reaching their conclusions and determinations to approve the continuance of the Management Agreement for each Fund. Rather, the approval determinations were made on the basis of each Director’s business judgment after consideration of all of the factors taken in their entirety.
| | |
| DISCLOSURE OF FUND EXPENSES | | |
June 30, 2015 (unaudited)
As a shareholder of a Fund, you will incur no transaction costs from such Fund, including sales charges (loads) on purchases, on reinvested dividends, or on other distributions. There are no exchange fees. However, as a shareholder of a Fund, you will incur ongoing costs, including management fees and other Fund expenses. The following examples are intended to help you understand your ongoing costs (in dollars) of investing in a Fund and to compare these costs with ongoing costs of investing in other mutual funds. The examples are based on an investment of $1,000 invested on January 1, 2015 and held until June 30, 2015.
Actual Expenses. The first line of the table below provides information about actual account values and actual expenses. You may use the information in this line, together with the amount you invested, to estimate the expenses that you paid over the period. Simply divide your account value by $1,000 (for example, an $8,600 account value divided by $1,000 = 8.6), then multiply the result by the number in the first line under the heading “Expenses Paid During Period” to estimate the expenses you paid on your account during the period.
Hypothetical Example for Comparison Purposes. The second line of the table below provides information about hypothetical account values and hypothetical expenses based on the Fund’s actual expense ratio and an assumed rate of return of 5% per year before expenses, which is not the Fund’s actual return. The hypothetical account values and expenses may not be used to estimate the actual ending account balance or expenses you paid for the period. You may use this information to compare the ongoing costs of investing in a Fund and other mutual funds. To do so, compare this 5% hypothetical example with the 5% hypothetical examples that appear in the shareholder reports of other funds.
The expenses shown in the table are meant to highlight ongoing Fund costs only. Therefore, the second line of the table is useful in comparing ongoing costs only and will not help you determine the relative total costs of owning different funds, because other funds may also have transaction costs, such as sales charges, redemption fees or exchange fees.
| | | | | | | | | | | | | | | | | | | | |
| | | Beginning Account
Value at 1/1/15 | | Ending Account
Value at 6/30/15 | | Expense
Ratio | | Expenses Paid
During Period*
1/1/15 - 6/30/15 |
| | | | |
Bridgeway Omni Small-Cap Value | | | | | | | | | | | | | | | | | | | | |
Actual Fund Return | | | $ | 1,000.00 | | | | $ | 1,015.70 | | | | | 0.60 | % | | | $ | 3.00 | |
Hypothetical Fund Return | | | $ | 1,000.00 | | | | $ | 1,021.82 | | | | | 0.60 | % | | | $ | 3.01 | |
| | | | |
Bridgeway Omni Tax-Managed Small-Cap Value | | | | | | | | | | | | | | | | | | | | |
Actual Fund Return | | | $ | 1,000.00 | | | | $ | 1,020.20 | | | | | 0.60 | % | | | $ | 3.01 | |
Hypothetical Fund Return | | | $ | 1,000.00 | | | | $ | 1,021.82 | | | | | 0.60 | % | | | $ | 3.01 | |
| * | Expenses are equal to the average account value times the Fund’s annualized expense ratio multiplied by the number of days in the most recent six-month period (181) divided by the number of days in the fiscal year (365). |
| | |
| 48 | | Annual Report | June 30, 2015 |
| | |
| DIRECTORS & OFFICERS | | |
Independent Directors
| | | | | | | | | | |
Name, Address and Age1 | | Position Held with
Bridgeway Funds | | Term of Office and Length of Time Served | | Principal Occupation(s)
During Past Five Years | | No. of Bridgeway
Funds Overseen
by Director | | Other Directorships
Held by Director |
| | | | | |
Kirbyjon Caldwell Age 61 | | Director | | Term: 1 Year
Length: 2001
to Present. | | Senior Pastor of
Windsor Village United
Methodist Church,
since 1982. | | Eleven | | American Church
Mortgage Company,
NRG Energy, Inc.,
Amegy Bancshares
Advisory Board |
| | | | | |
Karen S. Gerstner Age 60 | | Director | | Term: 1 Year
Length: 1994
to Present. | | Principal, Karen S.
Gerstner & Associates,
P.C., since 2004. | | Eleven | | None |
| | | | | |
Miles Douglas Harper, III* Age 52 | | Director | | Term: 1 Year
Length: 1994
to Present. | | Partner, Carr, Riggs &
Ingram, LLC, since
2013; Partner, Gainer
Donnelly, LLP, 1998 to
2013 upon merger with
Carr, Riggs & Ingram,
LLC. | | Eleven | | Calvert Social Investment
Fund (8 Portfolios),
Calvert Social Index
Series, Inc. (1 Portfolio),
Calvert Impact Fund
(4 Portfolios), Calvert
World Values Fund
(3 Portfolios) |
| | | | | |
Evan Harrel Age 54 | | Director | | Term: 1 Year
Length: 2006
to Present. | | Strategic Advisor, Small
Steps Nurturing Center,
since 2012;
Executive Director,
Small Steps Nurturing
Center, 2004 to 2012. | | Eleven | | None |
| | | | | |
| | | | | | | | | | | |
| | |
| DIRECTORS & OFFICERS (continued) | | |
June 30, 2015
“Interested” or Affiliated Director and Officer
| | | | | | | | | | |
Name, Address and Age1 | | Position(s) Held with
Bridgeway Funds | | Term of Office and
Length of Time Served | | Principal Occupation(s)
During Past Five Years | | No. of Bridgeway
Funds Overseen
by Director | | Other Directorships
Held by Director |
| | | | | |
John N. R. Montgomery2 Age 59 | | President and
Director | | Term: 1 Year
Length: 1993
to Present. | | Chairman, Bridgeway
Capital Management,
Inc., since 2010;
President, Bridgeway
Capital Management,
Inc., 1993 to 2010
and since June 2015;
President, Bridgeway
Funds, since June
2015; Vice President,
Bridgeway Funds,
2005 to May 2015. | | Eleven | | None |
| | | | | |
| | | | | | | | | | | |
| | |
| 50 | | Annual Report | June 30, 2015 |
| | |
| DIRECTORS & OFFICERS (continued) | | |
June 30, 2015
Other Officers
| | | | | | | | | | |
Name, Address and Age1 | | Position
Held with
Bridgeway
Funds | | Term of
Office and
Length of
Time Served | | Principal Occupation(s)
During Past Five Years | | No. of Bridgeway
Funds Overseen
by Officer | | Other Directorships
Held by Officer |
| | | | | |
Richard P. Cancelmo, Jr. Age 57 | | Vice President | | Term: 1 Year
Length: 2004
to Present. | | Vice President,
Bridgeway Funds,
since 2004; Staff
member, Bridgeway
Capital Management,
Inc., since 2000. | | N/A | | None |
| | | | | |
Linda G. Giuffré Age 53 | | Treasurer and
Chief
Compliance
Officer | | Term: 1 Year
Length: 2004
to Present. | | Chief Compliance
Officer, Bridgeway
Capital Management,
Inc., since 2004; Staff
member, Bridgeway
Capital Management,
Inc., since 2004. | | N/A | | None |
| | | | | |
Deborah L. Hanna Age 50 | | Secretary | | Term: 1 Year
Length: 2007
to Present. | | Self-employed,
accounting and related
projects for various
organizations, since
2001. | | N/A | | None |
| | | | | |
Sharon Lester Age 60 | | Vice President | | Term: 1 Year
Length: 2011
to Present. | | Staff member,
Bridgeway Capital
Management, Inc.,
since 2010; Prior to
2010, Director of
Portfolio Operations,
Invesco. | | N/A | | None |
| 1 | The address of all of the Directors and Officers of Bridgeway Funds is 20 Greenway Plaza, Suite 450, Houston, Texas, 77046. |
| 2 | John Montgomery is chairman, president, director and majority shareholder of Bridgeway Capital Management, Inc., and therefore an interested person of Bridgeway Funds. |
The overall management of the business and affairs of Bridgeway Funds is vested with its Board of Directors (the “Board”). The Board approves all significant agreements between Bridgeway Funds and persons or companies furnishing services to it, including agreements with its Adviser and Custodian. The day-to-day operations of Bridgeway Funds are delegated to its officers, subject to its investment objectives and policies and general supervision by the Board.
The Funds’ Statement of Additional Information includes additional information about the Board and is available, without charge, upon request by calling 1-800-661-3550.
| | |
| |
BRIDGEWAY FUNDS, INC. BNY Mellon Investment Servicing (US) Inc. P.O. Box 9860 Providence, RI 02940-8060 CUSTODIAN The Bank of New York Mellon One Wall Street New York, NY 10286 DISTRIBUTOR Foreside Fund Services, LLC Three Canal Plaza, Suite 100 Portland, ME 04101 | | |
| | | | |
| | |
| | You can review and copy information about our Funds (including the SAI) at the SEC’s Public Reference Room in Washington, D.C. To find out more about this public service, call the SEC at 800-SEC-0330. Reports and other information about the Funds are also available on the SEC’s website at www.sec.gov. You can receive copies of this information, for a fee, by writing the Public Reference Section, Securities and Exchange Commission, Washington, D.C. 20549-1520 or by sending an electronic request to the following email address: publicinfo@sec.gov. | | |
| | |
| | | | |
Item 2. Code of Ethics.
| | (a) | The registrant, as of the end of the period covered by this report, has adopted a code of ethics that applies to the registrant’s principal executive officer, principal financial officer, principal accounting officer or controller, or persons performing similar functions, regardless of whether these individuals are employed by the registrant or a third party. |
| | (c) | There have been no substantive amendments, during the period covered by this report, to a provision of the code of ethics that applies to the registrant’s principal executive officer, principal financial officer, principal accounting officer or controller, or persons performing similar functions, regardless of whether these individuals are employed by the registrant or a third party, and that relates to any element of the code of ethics description. |
| | (d) | The registrant has not granted any waivers, including an implicit waiver, from a provision of the code of ethics that applies to the registrant’s principal executive officer, principal financial officer, principal accounting officer or controller, or persons performing similar functions, regardless of whether these individuals are employed by the registrant or a third party, that relates to one or more of the items set forth in paragraph (b) of this item’s instructions. |
Item 3. Audit Committee Financial Expert.
3(a)(1) The Registrant’s board of directors has determined that the registrant has at least one audit committee financial expert serving on its audit committee.
3(a)(2) The audit committee financial expert is Miles Douglas Harper III, who is “independent” for purposes of this Item 3 of Form N-CSR.
Item 4. Principal Accountant Fees and Services.
Audit Fees
| | (a) | The aggregate fees billed for each of the last two fiscal years for professional services rendered by the principal accountant for the audit of the registrant’s annual financial statements or services that are normally provided by the accountant in connection with statutory and regulatory filings or engagements were $232,000 for the fiscal year ended June 30, 2015 and $232,000 for the fiscal year ended June 30, 2014. |
Audit-Related Fees
| | (b) | The aggregate fees billed in each of the last two fiscal years for assurance and related services by the principal accountant that are reasonably related to the performance of the audit of the registrant’s financial statements and are not reported under paragraph (a) of this Item were $0 for the fiscal year ended June 30, 2015 and $0 for the fiscal year ended June 30, 2014. |
Tax Fees
| | (c) | The aggregate fees billed in each of the last two fiscal years for professional services rendered by the principal accountant for tax compliance, tax advice, and tax planning were $22,000 for the fiscal year ended June 30, 2015 and $22,000 for the fiscal year ended June 30, 2014. Tax services include the review of the Funds’ federal income tax returns, the review of the Funds’ federal excise tax returns and the review of required distributions by the Funds. |
All Other Fees
| | (d) | The aggregate fees billed in each of the last two fiscal years for products and services provided by the principal accountant, other than the services reported in paragraphs (a) through (c) of this Item were $0 for the fiscal year ended June 30, 2015 and $0 for the fiscal year ended June 30, 2014. |
| | (e)(1) | Disclose the audit committee’s pre-approval policies and procedures described in paragraph (c)(7) of Rule 2-01 of Regulation S-X. |
The Registrant’s Audit Committee has adopted an Audit Committee Charter that provides that the Audit Committee shall approve, prior to appointment, the engagement of the auditor to provide audit services to the Registrant and non-audit services to the Registrant, its investment advisor or any entity controlling, controlled by or under common control with the investment adviser that provides on-going services to the Registrant if the engagement relates directly to the operations and financial reporting of the Registrant.
| | (e)(2) | No services described in paragraphs (b) through (d) above were approved pursuant to paragraph (c)(7)(i)(C) of Rule 2-01 of Regulation S-X |
| | (g) | The aggregate non-audit fees billed by the registrant’s accountant for services rendered to the registrant, and rendered to the registrant’s investment adviser (not including any sub-adviser whose role is primarily portfolio management and is subcontracted with or overseen by another investment adviser), and any entity controlling, controlled by, or under common control with the adviser that provides ongoing services to the registrant for each of the last two fiscal years of the registrant was $0 for the fiscal year ended June 30, 2015 and $0 for the fiscal year ended June 30, 2014. |
| Item 5. | Audit Committee of Listed Registrants. |
Not applicable.
| (a) | Schedule of Investments in securities of unaffiliated issuers as of the close of the reporting period is included as part of the report to shareholders filed under Item 1 of this form. |
| (b) | The Registrant made no divestments of securities in accordance with section 13(c) of the Investment Company Act of 1940. |
| Item 7. | Disclosure of Proxy Voting Policies and Procedures for Closed-End Management Investment Companies. |
Not applicable.
| Item 8. | Portfolio Managers of Closed-End Management Investment Companies. |
Not applicable.
| Item 9. | Purchases of Equity Securities by Closed-End Management Investment Company and Affiliated Purchasers. |
Not applicable.
| Item 10. | Submission of Matters to a Vote of Security Holders. |
There have been no material changes to the procedures by which the shareholders may recommend nominees to the Registrant’s Board of Directors, where those changes were implemented after the registrant last provided disclosure in response to the requirements of Item 407(c)(2)(iv) of Regulation S-K (17 CFR 229.407) (as required by Item 22(b)(15) of Schedule 14A (17 CFR 240.14a-101)), or this Item.
| Item 11. | Controls and Procedures. |
| | (a) | The registrant’s principal executive officer and principal financial officer, or persons performing similar functions, have concluded that the registrant’s disclosure controls and procedures (as defined in Rule 30a-3(c) under the Investment Company Act of 1940, as amended (the “1940 Act”) (17 CFR 270.30a-3(c))) are effectively designed, as of a date within 90 days of the filing date of the report that includes the disclosure required by this paragraph, based on their evaluation of these controls and procedures required by Rule 30a-3(b) under the 1940 Act (17 CFR 270.30a-3(b)) and Rules 13a-15(b) or 15d-15(b) under the Securities Exchange Act of 1934, as amended (17 CFR 240.13a-15(b) or 240.15d-15(b)). |
| | (b) | There were no changes in the registrant’s internal control over financial reporting (as defined in Rule 30a-3(d) under the Act (17 CFR 270.30a-3(d)) that occurred during the second fiscal quarter of the period covered by this report that have materially affected or are reasonably likely to materially affect, the registrant’s internal control over financial reporting. |
Item 12. Exhibits.
| | (a)(1) | Code of ethics, or any amendment thereto, that is the subject of disclosure required by Item 2 is attached hereto. |
| | (a)(2) | Certifications pursuant to Rule 30a-2(a) under the 1940 Act and Section 302 of the Sarbanes-Oxley Act of 2002 are attached hereto. |
| | (b) | Certifications pursuant to Rule 30a-2(b) under the 1940 Act and Section 906 of the Sarbanes-Oxley Act of 2002 are attached hereto. |
(12.other) Not applicable.
SIGNATURES
Pursuant to the requirements of the Securities Exchange Act of 1934 and the Investment Company Act of 1940, the registrant has duly caused this report to be signed on its behalf by the undersigned, thereunto duly authorized.
(Registrant) Bridgeway Funds, Inc.
By (Signature and Title)* /s/ John Montgomery
John Montgomery, President and Principal Executive Officer
(principal executive officer)
Date 08/28/15
Pursuant to the requirements of the Securities Exchange Act of 1934 and the Investment Company Act of 1940, this report has been signed below by the following persons on behalf of the registrant and in the capacities and on the dates indicated.
By (Signature and Title)* /s/ John Montgomery
John Montgomery, President and Principal Executive Officer
(principal executive officer)
Date 08/28/15
By (Signature and Title)* /s/ Linda G. Giuffré
Linda G. Giuffré, Treasurer and Principal Financial Officer
(principal financial officer)
Date 08/28/15
* Print the name and title of each signing officer under his or her signature.