UNITED STATES
SECURITIES AND EXCHANGE COMMISSION
Washington, D.C. 20549
FORM N-CSR
CERTIFIED SHAREHOLDER REPORT OF REGISTERED MANAGEMENT
INVESTMENT COMPANIES
Investment Company Act file number 811-08200
Bridgeway Funds, Inc.
(Exact name of registrant as specified in charter)
20 Greenway Plaza, Suite 450
Houston, Texas 77046
(Address of principal executive offices) (Zip code)
Tammira Philippe, President
Bridgeway Funds, Inc.
20 Greenway Plaza, Suite 450
Houston, Texas 77046
(Name and address of agent for service)
Registrant’s telephone number, including area code: (713) 661-3500
Date of fiscal year end: June 30
Date of reporting period: June 30, 2017
Form N-CSR is to be used by management investment companies to file reports with the Commission not later than 10 days after the transmission to stockholders of any report that is required to be transmitted to stockholders under Rule 30e-1 under the Investment Company Act of 1940 (17 CFR 270.30e-1). The Commission may use the information provided on Form N-CSR in its regulatory, disclosure review, inspection, and policymaking roles.
A registrant is required to disclose the information specified by Form N-CSR, and the Commission will make this information public. A registrant is not required to respond to the collection of information contained in Form N-CSR unless the Form displays a currently valid Office of Management and Budget (“OMB”) control number. Please direct comments concerning the accuracy of the information collection burden estimate and any suggestions for reducing the burden to Secretary, Securities and Exchange Commission, 450 Fifth Street, NW, Washington, DC 20549-0609. The OMB has reviewed this collection of information under the clearance requirements of 44 U.S.C. § 3507.
Item 1. Reports to Stockholders.
The Report to Shareholders is attached herewith.

A no-load mutual fund family of domestic funds
| | | | |
| | Annual Report June 30, 2017 |
| | |
| | AGGRESSIVE INVESTORS 1 | | BRAGX |
| | |
| | ULTRA-SMALL COMPANY | | BRUSX |
| | (Open to Existing Investors — Direct Only) | | |
| | |
| | ULTRA-SMALL COMPANY MARKET | | BRSIX |
| | |
| | SMALL-CAP MOMENTUM | | BRSMX |
| | |
| | SMALL-CAP GROWTH | | BRSGX |
| | |
| | SMALL-CAP VALUE | | BRSVX |
| | |
| | BLUE CHIP 35 INDEX | | BRLIX |
| | |
| | MANAGED VOLATILITY | | BRBPX |
| | www.bridgeway.com | | |
| | |
| TABLE OF CONTENTS | |  |
| | | | |
| | | | |
Bridgeway Funds Standardized Returns as of June 30, 2017* (Unaudited)
| | | | | | | | | | | | | | | | | | | | | | | | | | | | | | | | |
| | | | | | | | Annualized | | | | | | | |
| Fund | | Quarter | | | Six Months | | 1 Year | | 5 Years | | 10 Years | | Inception
to Date | | Inception
Date | | | Gross
Expense
Ratio2 | | Net
Expense
Ratio2 |
Aggressive Investors 1 | | | -0.91% | | | | 4.34 | % | | | 21.88 | % | | | 15.52 | % | | | 3.57 | % | | | 12.92 | % | | | 8/5/1994 | | | 0.63% | | 0.63% |
Ultra-Small Company | | | 0.74% | | | | 1.15 | % | | | 16.88 | % | | | 10.54 | % | | | 3.76 | % | | | 13.81 | % | | | 8/5/1994 | | | 1.27% | | 1.27% |
Ultra-Small Co Market | | | 1.50% | | | | 3.18 | % | | | 26.61 | % | | | 13.81 | % | | | 5.64 | % | | | 10.72 | % | | | 7/31/1997 | | | 0.84% | | 0.84% |
Small-Cap Momentum | | | 2.28% | | | | 5.85 | % | | | 18.08 | % | | | 11.73 | % | | | N | A | | | 11.78 | % | | | 5/28/2010 | | | 3.96%1 | | 0.91%1 |
Small-Cap Growth | | | 3.71% | | | | 7.55 | % | | | 22.97 | % | | | 16.65 | % | | | 4.67 | % | | | 7.02 | % | | | 10/31/2003 | | | 1.20%1 | | 0.94%1 |
Small-Cap Value | | | -0.40% | | | | -0.68 | % | | | 20.08 | % | | | 12.28 | % | | | 3.85 | % | | | 7.64 | % | | | 10/31/2003 | | | 1.03%1 | | 0.94%1 |
Blue Chip 35 Index | | | 1.56% | | | | 6.11 | % | | | 14.33 | % | | | 13.54 | % | | | 7.21 | % | | | 6.93 | % | | | 7/31/1997 | | | 0.25%1 | | 0.15%1 |
Managed Volatility | | | 0.89% | | | | 3.35 | % | | | 4.59 | % | | | 4.63 | % | | | 2.76 | % | | | 3.92 | % | | | 6/30/2001 | | | 1.07%1 | | 0.95%1 |
Bridgeway Funds Returns for Calendar Years 2003 through 2016* (Unaudited)
| | | | | | | | | | | | | | | | | | | | | | | | | | | | | | | | | | | | | | | | | | | | | | | | | | | | | | | | |
| | | 2003 | | | 2004 | | | 2005 | | | 2006 | | | 2007 | | | 2008 | | | 2009 | | | 2010 | | | 2011 | | | 2012 | | | 2013 | | | 2014 | | | 2015 | | | 2016 | |
Aggressive Investors 1 | | | 53.97 | % | | | 12.21 | % | | | 14.93 | % | | | 7.11 | % | | | 25.80 | % | | | -56.16 | % | | | 23.98 | % | | | 17.82 | % | | | -10.31 | % | | | 21.58 | % | | | 42.21 | % | | | 14.99 | % | | | -9.83 | % | | | 19.47 | % |
Ultra-Small Company | | | 88.57 | % | | | 23.33 | % | | | 2.99 | % | | | 21.55 | % | | | -2.77 | % | | | -46.24 | % | | | 48.93 | % | | | 23.55 | % | | | -14.64 | % | | | 24.49 | % | | | 55.77 | % | | | -0.56 | % | | | -16.12 | % | | | 14.06 | % |
Ultra-Small Co Market | | | 79.43 | % | | | 20.12 | % | | | 4.08 | % | | | 11.48 | % | | | -5.40 | % | | | -39.49 | % | | | 25.95 | % | | | 24.86 | % | | | -7.86 | % | | | 19.83 | % | | | 50.91 | % | | | 4.61 | % | | | -8.28 | % | | | 21.47 | % |
Small-Cap Momentum | | | | | | | | | | | | | | | | | | | | | | | | | | | | | | | | | | | -0.92 | % | | | 14.18 | % | | | 37.07 | % | | | -0.94 | % | | | 0.14 | % | | | 13.73 | % |
Small-Cap Growth | | | | | | | 11.59 | % | | | 18.24 | % | | | 5.31 | % | | | 6.87 | % | | | -43.48 | % | | | 15.04 | % | | | 11.77 | % | | | -0.63 | % | | | 11.05 | % | | | 48.52 | % | | | 6.13 | % | | | 4.93 | % | | | 16.10 | % |
Small-Cap Value | | | | | | | 17.33 | % | | | 18.92 | % | | | 12.77 | % | | | 6.93 | % | | | -45.57 | % | | | 26.98 | % | | | 16.55 | % | | | 1.05 | % | | | 20.99 | % | | | 39.72 | % | | | 0.79 | % | | | -9.43 | % | | | 26.79 | % |
Blue Chip 35 Index | | | 28.87 | % | | | 4.79 | % | | | 0.05 | % | | | 15.42 | % | | | 6.07 | % | | | -33.30 | % | | | 26.61 | % | | | 10.60 | % | | | 3.17 | % | | | 15.20 | % | | | 31.67 | % | | | 11.51 | % | | | 2.17 | % | | | 13.18 | % |
Managed Volatility | | | 17.82 | % | | | 7.61 | % | | | 6.96 | % | | | 6.65 | % | | | 6.58 | % | | | -19.38 | % | | | 12.39 | % | | | 5.41 | % | | | 1.94 | % | | | 6.46 | % | | | 9.25 | % | | | 5.95 | % | | | 0.17 | % | | | 2.42 | % |
Performance figures quoted represent past performance and are no guarantee of future results. Current performance may be lower or higher than the performance data quoted. Investment return and principal value will fluctuate, so that an investor’s shares, when redeemed, may be worth more or less than original cost. To obtain performance current to the most recent month-end, please visit www.bridgeway.com or call 1-800-661-3550. Total return figures include the reinvestment of dividends and capital gains.
| | 1 | Some of the Fund’s fees were waived or expenses reimbursed; otherwise, returns would have been lower. The Adviser has contractually agreed to waive fees and/or reimburse expenses. Any material change to this Fund policy would require a vote by shareholders. |
| | 2 | Expense ratios are as stated in the current prospectus. Please see financial highlights for expense ratios as of June 30, 2017. |
* Numbers highlighted indicate periods when the Fund outperformed its primary benchmark.
This report is submitted for the general information of the shareholders of each Fund. It is not authorized for distribution to prospective investors unless preceded or accompanied by an effective prospectus, which includes information regarding a Fund’s risks, objectives, fees and expenses, experience of its management, and other information. Investors should read the prospectus carefully before investing in a Fund. For questions or other Fund information, call 1-800-661-3550 or visit the Funds’ website at www.bridgeway.com. Funds are available for purchase by residents of the United States, Puerto Rico, U.S. Virgin Islands and Guam only. Foreside Fund Services, LLC, Distributor.
The views expressed here are exclusively those of Fund management. These views, including those relating to the market, sectors, or individual stocks, are not meant as investment advice and should not be considered predictive in nature.
| | | | |
| LETTER FROM THE INVESTMENT MANAGEMENT TEAM | | | | |
June 30, 2017
Dear Fellow Shareholders,
Performance across all segments of the domestic equity market was positive for the June quarter and for the 12 months ended June 30, 2017. Although small size and value factors were out of favor in the final quarter of the fiscal year, small-cap stocks outperformed larger stocks for the 12-month period, and small-value stocks delivered the highest one-year returns. Market highlights appear on page 2. In this environment, the Bridgeway Funds performed within design expectations, guided by our statistically driven, evidence-based investment approach. Please see the enclosed letters for a detailed explanation of each Fund’s performance during the quarter and fiscal year. We hope you find the letters helpful.
Due to the long-term historical premium offered by small-cap stocks, many investors are including small-cap exposure in a diversified portfolio. But fewer investors have diversified further within the small-cap space by targeting ultra-small stocks —in part because of the perceived risks associated with these shares. Bridgeway Portfolio Manager Christine L. Wang explains why investors with the right risk tolerance and time horizon might want to take another look at the ultra-small asset class, in “Boosting Exposure to the Small-Size Premium with Ultra-Small Stocks” on page 2.
As part of our fiscal-year performance review, we dedicate a portion of each annual report to a discussion of something that’s gone wrong during the past 12 months, and what we’ve learned from that experience. While this year we found nothing worthy of highlighting at Bridgeway, we did see a broader industry trend that could have negative implications for all investors. Read about our concerns regarding the ongoing debate over the Department of Labor’s so-called “fiduciary rule” in “The Worst Thing of the Fiscal Year” on page 3.
Moving on to good news, we’re proud to report that Tammira Philippe, Bridgeway’s President, was named one of 2017’s “Top Women in Asset Management” by Money Management Executive magazine. You can learn more about this award on page 4.
Finally, Bridgeway Partner Melissa Garrison recently returned from a life-changing trip to Africa, where she visited some of the programs supported by Bridgeway. She shares insights from this experience in “Transformative Change: The Power of Reconciliation,” found on page 4.
As always, we appreciate your feedback. We take your comments very seriously and regularly discuss them to help us manage our Funds and this company. Please keep your ideas coming — both favorable and critical. They provide us with a vital tool to serve you better.
Sincerely,
Your Investment Management Team
| | | | |
 | |  | |  |
| John Montgomery | | Christine L. Wang | | Michael Whipple |

| | 
| | |
| | |
| Elena Khoziaeva | | Dick Cancelmo | | |
| | | | |
| LETTER FROM THE INVESTMENT MANAGEMENT TEAM (continued) | | | | |
Market Review
Domestic equity markets rose steadily during the quarter ended June 30, 2017 recording small positive gains in each of the three months. The S&P 500 returned +3.09% for the quarter, and the Dow Jones Industrial Average (DJIA) rose 3.95%. For the fiscal year, the S&P 500 and the DJIA were up 17.90% and 22.12%, respectively.
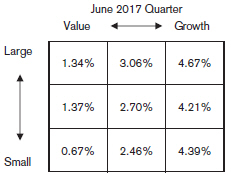
All U.S. equity style categories, as defined by Russell Indices, recorded positive returns for the quarter. Growth outperformed value, and large stocks outperformed small stocks across style categories. As a result, large growth stocks delivered the best performance in the quarter (+4.67%), while small value stocks produced the lowest returns (+0.67%).
All but two of the S&P 500 sectors (Telecommunication Services and Energy) recorded positive returns for the quarter. The Health Care sector led the gains, up 7.1%, followed by Industrials (+4.7%), Financials (+4.3%) and Information Technology (+4.1%). Telecommunication Services was the worst performer, returning -7.1%, while the Energy sector recorded the only other quarterly loss (-6.4%).
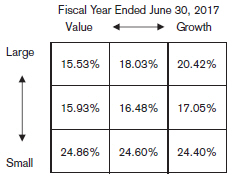
Below are the stock market style box returns for the quarter and the fiscal year.
Boosting Exposure to the Small-Size Premium with Ultra-Small Stocks
By Christine L. Wang, CFA, CPA, Portfolio Manager
As factor-based investing has entered the mainstream over the past 20 years, many investors have included small-cap stocks in a diversified portfolio to gain exposure to the small-size premium — the tendency for stocks of companies with smaller market capitalization to outperform stocks of companies with larger market capitalization. Yet fewer investors have taken an additional step that could capture an even greater long-term size premium: Diversifying further within the small-cap universe by targeting ultra-small stocks.
One potential reason is that ultra-small stocks are unfamiliar territory to many investors. Often unfairly generalized as “penny stocks” or junk stocks, ultra-small stocks have been mischaracterized as scary investments. Ultra-small stocks do indeed carry risk, but for investors with the right risk tolerance, ultra-small stocks not only have outpaced the market historically (as explained below), but have delivered even stronger returns than small-cap stocks. What’s more, current valuation levels for ultra-small stocks compared to historical averages suggest conditions may be especially favorable for this asset class.
To examine the evidence, we use the Center for Research in Security Prices’ (CRSP) sized-based portfolios, which divide the entire stock market into 10 groups based on market capitalization. Between 1926 and December 31, 2016, ultra-small stocks (represented by CRSP 10) generated the highest average annualized returns, at +13.31%. That’s nearly two percentage points higher than small-cap stocks, and four percentage points higher than the +9.31% average annualized return for the largest stocks, represented by CRSP 1.
However, ultra-small stocks’ higher returns came with a trade-off: higher volatility. Annualized standard deviation (a measure of risk) for CRSP 10 is 35.71%, compared to 17.44% for CRSP 1. Such volatility is understandable, since ultra-small stocks carry more inherent risk than ultra-large stocks. Compared to larger companies, ultra-small companies may only have one
| | |
| 2 | | Annual Report | June 30, 2017 |
| | | | |
| LETTER FROM THE INVESTMENT MANAGEMENT TEAM (continued) | | | | |
product, or rely on a few customers. Ultra-small companies also may have less access to capital and ability to withstand downturns. This additional risk may explain why ultra-small stocks have historically outperformed. It also gives clues as to why they may continue to outperform, as these barriers are not easily removed.
Because of this volatility, though, ultra-small stocks do not always outperform the market — especially over shorter time periods. For example, ultra-small stock portfolios underperformed the market during roughly half of one-year and three-year holding periods since 1926. However, the likelihood of beating the market generally increases with longer holding periods. As a result, ultra-small stocks have outperformed the market during nearly 80% of 20-year holding periods since 1926.
While this historical data reveals compelling evidence for the long-term potential returns of ultra-small stocks, we also must acknowledge that the market has changed considerably since 1926. What hasn’t changed is that shares of ultra-small companies continue to be inherently riskier than shares of ultra-large companies, and thus have the potential to deliver considerably higher returns. But with many investors and market-watchers pondering the current valuation levels of the overall market, it’s worth considering whether ultra-small stocks are relatively cheap or expensive compared to the total market — and how valuation historically has affected their performance.
We examined the historical ratio of median book-to-market (BtM) for ultra-small stocks to the median BtM for the overall market since 1972 (the earliest period for which our data provider has sufficient coverage). This analysis revealed that as of December 31, 2016, the current ratio was in the 90th percentile of historical data — meaning that ultra-small stocks are quite cheap.
Not surprisingly, cheaper ultra-small stocks historically have translated into stronger subsequent results: Following periods when ultra-small stocks have been cheapest, the asset class’s 10-year average annualized relative returns have been +6.39% over the market. That compares to 10-year average annualized relative returns of -4.94% following periods when ultra-small stocks have been most expensive.
Given their current low valuation, combined with historical evidence of ultra-small stocks’ long-term return premium, we believe there’s a strong and compelling case for adding ultra-small exposure to a diversified portfolio. Ultra-small stocks may underperform the market over shorter periods, but the longer you hold them, the more likely you are to enjoy significant outperformance. For investors with the right risk tolerance and time horizon, history has shown that while the stocks may be ultra-small, the potential rewards have been anything but insignificant.
The Worst Thing of the Fiscal Year
Longtime Bridgeway shareholders probably remember that we dedicate a portion of each annual report to discussing the “worst thing of the fiscal year.” The goal of this process is to have an open discussion about a recent challenge we’ve faced, and what we have learned from it, as part of our commitment to transparency with our shareholders.
While reviewing the past year, however, we found nothing worthy of “worst thing” status inside Bridgeway. This is good news, but it doesn’t mean that everything is perfect for our shareholders. In fact, as we expanded our thinking to consider all the major developments in the financial world over the past 12 months, we found a troubling trend that warrants discussion here because of its potential impact on all investors. To us, the worst thing of the fiscal year was the confusion and contentious debate surrounding the Department of Labor’s (DOL) so called “fiduciary rule.”
This well-intentioned rule, proposed in 2015 and originally scheduled for implementation in mid-2017, is meant to ensure that any financial professional or institution that handles investors’ retirement assets act as a “fiduciary” — which means putting the investor’s interests above their own in all decisions. This is a worthy goal, as much of the investing process is fraught with potential conflicts of interest that have led some investors to bad advice and overly expensive or inappropriate investment products. But the DOL regulations designed to achieve this outcome have raised serious questions about implementation and potentially harmful implications for the very investors the rule is meant to protect.
The resulting fight has included lawsuits, delays, and the introduction of legislation designed to repeal the rule — all of which has made the future even murkier for investors. Worse, these arguments threaten to obscure the key question at the heart of the rule: Whose interests should a financial institution serve?
| | | | |
| LETTER FROM THE INVESTMENT MANAGEMENT TEAM (continued) | | | | |
We want to make one thing clear: Bridgeway is committed to the spirit of the fiduciary standard. Putting our investors’ interests first is the foundation of our corporate culture, and making sure we’re doing the right thing for our shareholders guides all of our decisions. Yet for 20 years, we’ve been surprised and disappointed that many other companies haven’t been able to uphold this simple principle. That’s one reason we find ourselves watching a bitter fight in 2017 over complex rules and regulations. And when this fight is finally concluded, we’re not sure that the outcome will actually solve the real problems facing investors.
Bridgeway is closely monitoring developments around the DOL fiduciary rule. But whatever the outcome, it won’t change our commitment to serving our clients’ interests first. We are building a new model for a financial services firm and hope someday to see the entire industry protecting the interests of their clients because it’s the right thing to do. Were that to happen, investors would see a lot less of the kind of regulatory confusion and battles that have consumed the financial industry for the past year, while experiencing better service and better potential outcomes.
Tammira Philippe Recognized as One of the Top Women In Asset Management
It’s our honor to report that Tammira Philippe, President of Bridgeway Capital Management, has been recognized for her leadership in Money Management Executive’s 2017 “Top Women in Asset Management Awards.” The annual awards celebrate women who are making a substantial impact on their organizations and the asset management industry as a whole, and who are committed to helping other women rise to key roles in the field.
Although Tammira has made many contributions to Bridgeway since joining the firm in 2005, after becoming President in 2016 she has overseen substantial growth in the number of our investors and assets under management, and she has led efforts to attract important new personnel, such as a dedicated institutional sales professional and a head of technology. At the same time, she has focused on strengthening Bridgeway’s client-centered culture and commitment to expertly designed, evidence-based investing strategies.
In fact, she credits Bridgeway’s unique culture with helping her achieve this industry recognition. “The fact that I’m in the position to be considered for this award is a testament to the culture that Bridgeway has created — a workplace where individuals from diverse backgrounds can thrive and are encouraged to make use of their greatest gifts, so we can deliver at the highest level for our clients, our communities, and each other,” she says.
Every day, Tammira inspires us to continue building an enduring firm that not only serves our clients, but provides a new model for the financial services industry. We are proud to have her as our leader.
Transformative Change: The Power of Reconciliation
By Melissa Garrison, Corporate Administration Team
Recently, I had the privilege of taking my first trip to Africa to visit several programs that Bridgeway has supported for many years. It was an amazing opportunity to see the countryside, meet the people and immerse myself in different cultures. But it also allowed me to see powerful examples of Bridgeway’s commitment to transformative change in action. And by participating side-by-side with other Bridgeway colleagues, it helped strengthen our connections with each other and to our shared mission and values. Not surprisingly, it was an overwhelmingly emotional experience, filled with highs and lows, but it was the chance of a lifetime.
Visiting the Kigali Genocide Memorial and genocide sites in Rwanda had the biggest impact on me. I felt like I was walking on hallowed ground. We learned the history of the Rwandan genocide and saw the amazing turnaround and reconciliation that has occurred across the community since those terrible events. I was surprised to meet so many genocide survivors who were willing to share their personal experiences and articulate how their time at the memorials helps them honor and feel closer to family members who were killed.
I was in high school when the genocide in Rwanda took place, and I was completely unaware of it until college. Learning that the conflict started with individuals intentionally highlighting differences between cultures caused me to reflect on my own experiences, and I realized that sometimes I do the same. I began to reframe my point of view so that I look for similarities, rather
| | |
| 4 | | Annual Report | June 30, 2017 |
| | | | |
| LETTER FROM THE INVESTMENT MANAGEMENT TEAM (continued) | | | | |
than differences, among people. I now see the importance of recognizing and honoring diversity within a framework that highlights the many similarities we share — specifically our shared desire to have our basic physiological needs met, and to live with a sense of hope, peace and security.
The Kigali Genocide Memorial is leading many outstanding initiatives to share a message of peace and reconciliation, while honoring victims of the Rwandan genocide. By recording their stories for future generations — as well as the stories of other genocides around the world — I believe these efforts will help create change in people similar to the change I experienced after my visit.
Participating in the trip with work colleagues also brought about other changes. Most importantly, it significantly strengthened our relationships and deepened our trust. You really get to know and depend on someone after 10 days of air travel, car travel and being roomies. We shared early breakfasts, late night dinners and, occasionally, socks!
My time in Africa was truly transforming for me and my travel mates. I returned from the trip re-energized in my role at
Bridgeway and more deeply committed to my colleagues, our investors and our communities. We now have an important story to tell, and my hope is that these stories will be passed along well beyond the group of travelers, creating greater change in our world. It was an experience that I will never forget, and that will connect us for a lifetime.
| | |
| Aggressive Investors 1 Fund | |
|
| MANAGER’S COMMENTARY (Unaudited) | |
| | |
June 30, 2017
Dear Fellow Aggressive Investors 1 Fund Shareholder,
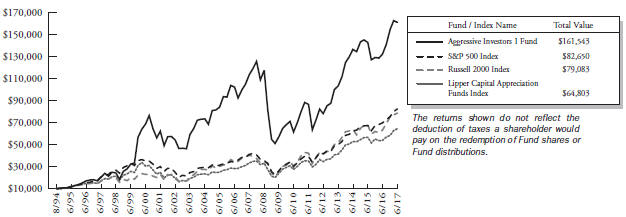
For the quarter ended June 30, 2017, our Fund returned -0.91%, underperforming our primary market benchmark, the S&P 500 Index (+3.09%), our peer benchmark, the Lipper Capital Appreciation Funds Index (+3.14%), and the Russell 2000 Index (+2.46%). It was a poor quarter.
For the fiscal year, our Fund returned +21.88%, outperforming our primary market benchmark, the S&P 500 Index
(+17.90%), and our peer benchmark, the Lipper Capital Appreciation Funds Index (+20.10%), but underperforming the Russell 2000 Index (+24.60%).
The table below presents our June quarter, one-year, five-year, 10-year, 15-year, and inception-to-date financial results. See the next page for a graph of performance since inception.
Standardized Returns as of June 30, 2017
| | | | | | | | | | | | | | | | | | | | | | | | |
| | | | | | | | | | Annualized | | | | |
| | | Quarter | | | 1 Year | | 5 Years | | 10 Years | | 15 Years | | Since Inception
(8/5/94) |
| | | | | | |
Aggressive Investors 1 Fund | | | -0.91 | % | | | 21.88 | % | | | 15.52 | % | | | 3.57 | % | | | 7.53 | % | | | 12.92 | % |
S&P 500 Index | | | 3.09 | % | | | 17.90 | % | | | 14.63 | % | | | 7.18 | % | | | 8.34 | % | | | 9.65 | % |
Russell 2000 Index | | | 2.46 | % | | | 24.60 | % | | | 13.70 | % | | | 6.92 | % | | | 9.19 | % | | | 9.45 | % |
Lipper Capital Appreciation Funds Index | | | 3.14 | % | | | 20.10 | % | | | 13.27 | % | | | 6.85 | % | | | 8.38 | % | | | 8.50 | % |
Performance figures quoted in the table above represent past performance and are no guarantee of future results. Total return figures in the table above include the reinvestment of dividends and capital gains. The table above does not reflect the deduction of taxes that a shareholder would pay on Fund distributions or on the redemption of Fund shares.
The S&P 500 Index is a broad-based, unmanaged measurement of changes in stock market conditions, based on the average of 500 widely held common stocks with dividends reinvested. The Russell 2000 Index is an unmanaged, market value weighted index that measures performance of the 2,000 companies that are between the 1,000th and 3,000th largest in the market with dividends reinvested. The Lipper Capital Appreciation Funds Index reflects the record of the 30 largest funds in the category of more aggressive domestic growth mutual funds, as reported by Lipper, Inc. It is not possible to invest directly in an index. Periods longer than one year are annualized.
According to data from Lipper, Inc. as of June 30, 2017, Aggressive Investors 1 Fund ranked 59th of 240 capital appreciation funds for the 12 months ended June 30, 2017, 24th of 211 over the last five years, 140th of 160 over the last 10 years, and 3rd of 34 since inception in August 1994. Lipper, Inc. is an independent mutual fund rating service that ranks funds in various fund categories by making comparative calculations using total returns.
| | |
| 6 | | Annual Report | June 30, 2017 |
| | |
| Aggressive Investors 1 Fund | | |
| MANAGER’S COMMENTARY (Unaudited) (continued) | | |
| | |
Growth of a $10,000 Investment
from Inception August 5, 1994 to June 30, 2017
Detailed Explanation of Quarterly Performance
Several of the Fund’s primary design features — size, value, and higher beta — created a strong headwind and detracted from relative performance during the quarter. The Fund’s tilt toward smaller stocks hurt relative results, as these stocks underperformed the benchmark’s larger stocks during the quarter. The Fund’s deeper value tilt also detracted from relative returns. Exposure to stocks with relatively higher beta and higher volatility hurt relative results because it led to overweight exposure to poorer-performing higher volatility stocks and underweight exposure to some strong-performing lower volatility stocks.
The Fund’s company financial health, value metrics and price momentum exposure detracted from relative results. However, the Fund’s tilt toward higher momentum stocks was a positive contributor to relative performance and partially offset negative contributions from the other design elements.
Among sectors, an underweight position and holdings in the Information Technology sector detracted from relative performance. Holdings in the Consumer Staples, Financials and Utilities sectors also contributed negatively. By contrast, an underweight position and holdings in the Energy sector boosted relative performance.
Detailed Explanation of Fiscal Year Performance
The Fund’s company financial health and value metrics exposure strongly outperformed the benchmark and boosted relative results during the fiscal year. However, the Fund’s price momentum exposure lagged the benchmark and detracted slightly from relative performance.
Among other design features, the Fund’s deeper value tilt helped relative results. The Fund’s overweighting of higher beta stocks compared to the benchmark also made a large positive contribution to relative results, as higher beta stocks posted strong returns during the fiscal year. By contrast, the Fund’s tilt toward smaller stocks detracted, as these stocks generally underperformed the benchmark’s larger stocks during the year. Exposure to higher momentum stocks also hurt relative results, as higher momentum stocks underperformed during the fiscal year.
While an underweight position in the IT sector detracted, holdings in the Information Technology sector more than offset the losses and made significant positive contributions to relative results. An underweight position and holdings in the Energy sector also lifted relative performance, as did holdings in the Consumer Discretionary sector. However, an underweight position
| | |
| Aggressive Investors 1 Fund | |
|
| MANAGER’S COMMENTARY (Unaudited) (continued) | |
| | |
and holdings in the Financials sector — in particular, among stocks of large banks that delivered strong returns — detracted from relative performance. Holdings in the Health Care sector also detracted.
Top Ten Holdings as of June 30, 2017
| | | | | | | | |
| Rank | | Description | | Industry | | % of Net
Assets | |
| 1 | | MercadoLibre, Inc. | | Information Technology | | | 1.8% | |
| 2 | | AmerisourceBergen Corp. | | Health Care | | | 1.7% | |
| 3 | | VelocityShares Daily Inverse VIX Short Term ETN | | Exchange Traded Notes | | | 1.5% | |
| 4 | | Applied Materials, Inc. | | Information Technology | | | 1.5% | |
| 5 | | Crown Holdings, Inc. | | Materials | | | 1.5% | |
| 6 | | T-Mobile US, Inc. | | Telecommunication Services | | | 1.4% | |
| 7 | | ON Semiconductor Corp. | | Information Technology | | | 1.4% | |
| 8 | | WellCare Health Plans, Inc. | | Health Care | | | 1.4% | |
| 9 | | Brink’s Co. (The) | | Industrials | | | 1.3% | |
| 10 | | Delphi Automotive PLC | | Consumer Discretionary | | | 1.3% | |
| | | |
| | Total | | | | | 14.8% | |
Industry Sector Representation as of June 30, 2017
| | | | | | | | | | | | |
| | | % of Net Assets | | | % of S&P 500
Index | | | Difference | |
Consumer Discretionary | | | 18.2% | | | | 12.3% | | | | 5.9% | |
Consumer Staples | | | 3.8% | | | | 9.0% | | | | -5.2% | |
Energy | | | 2.2% | | | | 6.0% | | | | -3.8% | |
Financials | | | 13.1% | | | | 14.5% | | | | -1.4% | |
Health Care | | | 13.0% | | | | 14.5% | | | | -1.5% | |
Industrials | | | 10.8% | | | | 10.3% | | | | 0.5% | |
Information Technology | | | 24.3% | | | | 22.4% | | | | 1.9% | |
Materials | | | 6.6% | | | | 2.8% | | | | 3.8% | |
Real Estate | | | 1.1% | | | | 2.9% | | | | -1.8% | |
Telecommunication Services | | | 2.9% | | | | 2.1% | | | | 0.8% | |
Utilities | | | 0.2% | | | | 3.2% | | | | -3.0% | |
Cash & Other Assets | | | 3.8% | | | | 0.0% | | | | 3.8% | |
| | | |
Total | | | 100.0% | | | | 100.0% | | | | | |
Disclaimer
The views expressed here are exclusively those of Fund management. These views, including those related to market sectors or individual stocks, are not meant as investment advice and should not be considered predictive in nature. Any favorable (or unfavorable) description of a holding applies only as of the quarter end, June 30, 2017, unless otherwise stated. Security positions can and do change thereafter. Discussions of historical performance do not guarantee and may not be indicative of future performance.
Market volatility can significantly affect short-term performance. The Fund is not an appropriate investment for short-term investors. Investments in the small companies within this multi-cap fund generally carry greater risk than is customarily associated with larger companies. This additional risk is attributable to a number of factors, including the relatively limited financial resources that are typically available to small companies and the fact that small companies often have comparatively limited product lines. In addition, the stock of small companies tends to be more volatile than the stock of large companies, particularly in the short term and particularly in the early stages of an economic or market downturn. The Fund’s use of options, futures, and leverage can magnify the risk of loss in an unfavorable market, and the Fund’s use of short-sale positions can, in theory, expose shareholders to unlimited loss. Finally, the Fund exposes shareholders to “focus risk,” which may add to Fund volatility through the possibility that a single company could significantly affect total return. Shareholders of the Fund, therefore, are taking on more risk than they would if they invested in the stock market as a whole.
| | |
| 8 | | Annual Report | June 30, 2017 |
| | |
| Aggressive Investors 1 Fund | |
|
| MANAGER’S COMMENTARY (Unaudited) (continued) | |
| | |
Conclusion
Thank you for your continued investment in Aggressive Investors 1 Fund. We encourage your feedback; your reactions and concerns are important to us.
Sincerely,
The Investment Management Team
| | |
| Aggressive Investors 1 Fund | | |
| SCHEDULE OF INVESTMENTS | | |
| Showing percentage of net assets as of June 30, 2017 | | |
| | | | | | |
| Industry Company | | Shares | | Value | | |
| |
COMMON STOCKS - 95.96% | | |
| Consumer Discretionary -18.15% | | |
Best Buy Co., Inc. | | 38,000 | | $ 2,178,540 | | |
Burlington Stores, Inc.* | | 25,000 | | 2,299,750 | | |
CalAtlantic Group, Inc. | | 62,500 | | 2,209,375 | | |
Children’s Place, Inc. (The) | | 28,000 | | 2,858,800 | | |
Darden Restaurants, Inc. | | 26,000 | | 2,351,440 | | |
Delphi Automotive PLC | | 33,800 | | 2,962,570 | | |
Discovery Communications, Inc., Class A*+ | | 79,600 | | 2,056,068 | | |
Fiat Chrysler Automobiles NV*+ | | 215,000 | | 2,285,450 | | |
General Motors Co. | | 71,500 | | 2,497,495 | | |
Honda Motor Co., Ltd., ADR+ | | 76,000 | | 2,081,640 | | |
Interpublic Group of Cos, Inc. (The) | | 100,000 | | 2,460,000 | | |
Lear Corp. | | 16,000 | | 2,273,280 | | |
Netflix, Inc.* | | 16,100 | | 2,405,501 | | |
Pier 1 Imports, Inc. | | 131,100 | | 680,409 | | |
Pinnacle Entertainment, Inc.* | | 65,760 | | 1,299,418 | | |
Polaris Industries, Inc.+ | | 21,500 | | 1,982,945 | | |
Tailored Brands, Inc.+ | | 64,000 | | 714,240 | | |
Tupperware Brands Corp. | | 38,400 | | 2,696,832 | | |
Wyndham Worldwide Corp. | | 23,700 | | 2,379,717 | | |
| | | | | | |
| | | |
| | | | 40,673,470 | | |
| |
Consumer Staples - 3.81% | | |
Andersons, Inc. (The) | | 30,500 | | 1,041,575 | | |
Central Garden & Pet Co., Class A* | | 92,700 | | 2,782,854 | | |
Ingredion, Inc. | | 20,000 | | 2,384,200 | | |
Spectrum Brands Holdings, Inc.+ | | 18,600 | | 2,325,744 | | |
| | | | | | |
| | | |
| | | | 8,534,373 | | |
| |
Energy - 2.17% | | |
Archrock, Inc. | | 99,300 | | 1,132,020 | | |
BP PLC, ADR | | 62,000 | | 2,148,300 | | |
Exterran Corp.* | | 38,200 | | 1,019,940 | | |
McDermott International, Inc.* | | 80,200 | | 575,034 | | |
| | | | | | |
| | | |
| | | | 4,875,294 | | |
| |
Financials - 13.13% | | |
Aflac, Inc. | | 29,900 | | 2,322,632 | | |
Ally Financial, Inc. | | 107,900 | | 2,255,110 | | |
American Financial Group, Inc. | | 24,300 | | 2,414,691 | | |
Bank of America Corp. | | 97,000 | | 2,353,220 | | |
Canadian Imperial Bank of Commerce/Canada+ | | 27,000 | | 2,191,320 | | |
Citigroup, Inc. | | 42,000 | | 2,808,960 | | |
Leucadia National Corp. | | 90,000 | | 2,354,400 | | |
| | | | | | | | |
| Industry Company | | Shares | | | Value | |
|
| |
Financials (continued) | |
Morgan Stanley | | | 53,100 | | | $ | 2,366,136 | |
Ocwen Financial Corp.*+ | | | 225,000 | | | | 605,250 | |
Prudential Financial, Inc. | | | 22,000 | | | | 2,379,080 | |
Regions Financial Corp. | | | 170,000 | | | | 2,488,800 | |
Royal Bank of Canada+ | | | 34,300 | | | | 2,487,436 | |
Synchrony Financial | | | 80,000 | | | | 2,385,600 | |
| | | | | | | | |
| | |
| | | | | | | 29,412,635 | |
|
Health Care - 12.95% | |
AmerisourceBergen Corp. | | | 39,900 | | | | 3,771,747 | |
Baxter International, Inc. | | | 45,700 | | | | 2,766,678 | |
Express Scripts Holding Co.* | | | 40,000 | | | | 2,553,600 | |
Gilead Sciences, Inc. | | | 34,000 | | | | 2,406,520 | |
HCA Healthcare, Inc.* | | | 27,500 | | | | 2,398,000 | |
Hill-Rom Holdings, Inc. | | | 29,100 | | | | 2,316,651 | |
Kindred Healthcare, Inc. | | | 145,000 | | | | 1,689,250 | |
LHC Group, Inc.* | | | 14,586 | | | | 990,243 | |
Mallinckrodt PLC* | | | 29,000 | | | | 1,299,490 | |
Surgery Partners, Inc.* | | | 50,000 | | | | 1,137,500 | |
United Therapeutics Corp.* | | | 15,500 | | | | 2,010,815 | |
UnitedHealth Group, Inc. | | | 14,200 | | | | 2,632,964 | |
WellCare Health Plans, Inc.* | | | 17,000 | | | | 3,052,520 | |
| | | | | | | | |
| | |
| | | | | | | 29,025,978 | |
|
Industrials - 10.82% | |
AerCap Holdings NV* | | | 26,800 | | | | 1,244,324 | |
ArcBest Corp. | | | 41,000 | | | | 844,600 | |
Boeing Co. (The) | | | 13,300 | | | | 2,630,075 | |
Brink’s Co. (The) | | | 45,000 | | | | 3,015,000 | |
Builders FirstSource, Inc.* | | | 152,000 | | | | 2,328,640 | |
Essendant, Inc. | | | 66,000 | | | | 978,780 | |
H&E Equipment Services, Inc. | | | 48,500 | | | | 989,885 | |
HD Supply Holdings, Inc.* | | | 53,600 | | | | 1,641,768 | |
Insperity, Inc. | | | 29,900 | | | | 2,122,900 | |
Tetra Tech, Inc. | | | 57,000 | | | | 2,607,750 | |
TrueBlue, Inc.* | | | 44,000 | | | | 1,166,000 | |
United Continental Holdings, Inc.* | | | 30,000 | | | | 2,257,500 | |
United Rentals, Inc.* | | | 21,500 | | | | 2,423,265 | |
| | | | | | | | |
| | |
| | | | | | | 24,250,487 | |
|
Information Technology - 24.25% | |
Activision Blizzard, Inc. | | | 38,000 | | | | 2,187,660 | |
Adobe Systems, Inc.* | | | 17,300 | | | | 2,446,912 | |
Akamai Technologies, Inc.* | | | 38,000 | | | | 1,892,780 | |
Alliance Data Systems Corp. | | | 10,900 | | | | 2,797,921 | |
Amphenol Corp., Class A | | | 31,300 | | | | 2,310,566 | |
Apple, Inc. | | | 16,000 | | | | 2,304,320 | |
Applied Materials, Inc. | | | 79,900 | | | | 3,300,669 | |
| | |
| 10 | | Annual Report | June 30, 2017 |
| | |
| Aggressive Investors 1 Fund | | |
| SCHEDULE OF INVESTMENTS (continued) | | |
| Showing percentage of net assets as of June 30, 2017 | | |
| | | | | | | | | | | | | | | | |
| Industry Company | | Shares | | | Value | | | | | | | |
| | | | |
Common Stocks (continued) | | | | | | | | | | | | | | | | |
Information Technology (continued) | | | | | | | | | |
Cirrus Logic, Inc.* | | | 35,600 | | | $ | 2,232,832 | | | | | | | | | |
Itron, Inc.* | | | 18,000 | | | | 1,219,500 | | | | | | | | | |
Lam Research Corp. | | | 18,100 | | | | 2,559,883 | | | | | | | | | |
Mastercard, Inc., Class A | | | 19,300 | | | | 2,343,985 | | | | | | | | | |
MercadoLibre, Inc. | | | 16,200 | | | | 4,064,256 | | | | | | | | | |
Microchip Technology, Inc.+ | | | 28,500 | | | | 2,199,630 | | | | | | | | | |
Microsoft Corp. | | | 31,900 | | | | 2,198,867 | | | | | | | | | |
NVIDIA Corp. | | | 9,700 | | | | 1,402,232 | | | | | | | | | |
ON Semiconductor Corp.* | | | 220,000 | | | | 3,088,800 | | | | | | | | | |
QUALCOMM, Inc. | | | 35,400 | | | | 1,954,788 | | | | | | | | | |
ScanSource, Inc.* | | | 30,000 | | | | 1,209,000 | | | | | | | | | |
Seagate Technology PLC | | | 52,900 | | | | 2,049,875 | | | | | | | | | |
TTM Technologies, Inc.* | | | 124,466 | | | | 2,160,730 | | | | | | | | | |
Unisys Corp.*+ | | | 83,200 | | | | 1,064,960 | | | | | | | | | |
VeriSign, Inc.* | | | 26,300 | | | | 2,444,848 | | | | | | | | | |
Xerox Corp. | | | 79,475 | | | | 2,283,317 | | | | | | | | | |
Zebra Technologies Corp., Class A* | | | 26,000 | | | | 2,613,520 | | | | | | | | | |
| | | | | | | | | | | | | | | | |
| | | | |
| | | | | | | 54,331,851 | | | | | | | | | |
| | |
Materials - 6.58% | | | | | | | | | |
Barrick Gold Corp. | | | 133,000 | | | | 2,116,030 | | | | | | | | | |
Boise Cascade Co.* | | | 45,000 | | | | 1,368,000 | | | | | | | | | |
Cemex SAB de CV, ADR* | | | 260,000 | | | | 2,449,200 | | | | | | | | | |
Constellium NV, Class A* | | | 154,700 | | | | 1,067,430 | | | | | | | | | |
Crown Holdings, Inc.* | | | 54,800 | | | | 3,269,368 | | | | | | | | | |
Packaging Corp. of America | | | 20,900 | | | | 2,328,051 | | | | | | | | | |
Schulman (A.), Inc. | | | 35,000 | | | | 1,120,000 | | | | | | | | | |
SunCoke Energy, Inc.* | | | 94,000 | | | | 1,024,600 | | | | | | | | | |
| | | | | | | | | | | | | | | | |
| | | | |
| | | | | | | 14,742,679 | | | | | | | | | |
| | |
Real Estate - 1.06% | | | | | | | | | |
CBRE Group, Inc., Class A* | | | 65,000 | | | | 2,366,000 | | | | | | | | | |
| | |
Telecommunication Services - 2.89% | | | | | | | | | |
Cincinnati Bell, Inc.* | | | 61,200 | | | | 1,196,460 | | | | | | | | | |
T-Mobile US, Inc.* | | | 53,200 | | | | 3,224,984 | | | | | | | | | |
Windstream Holdings, Inc.+ | | | 529,278 | | | | 2,053,599 | | | | | | | | | |
| | | | | | | | | | | | | | | | |
| | | | |
| | | | | | | 6,475,043 | | | | | | | | | |
| | |
Utilities - 0.15% | | | | | | | | | |
Just Energy Group, Inc.+ | | | 65,167 | | | | 341,475 | | | | | | | | | |
| | | | | | | | | | | | | | | | |
| | | | |
TOTAL COMMON STOCKS - 95.96% | | | | | | | 215,029,285 | | | | | | | | | |
| | | | | | | | | | | | | | | | |
(Cost $211,442,467) | | | | | | | | | | | | | | | | |
| | | | | | | | |
| Industry Company | | Shares | | | Value | |
|
EXCHANGE TRADED NOTE - 1.52% | |
Exchange Traded Note - 1.52% | | | | | | | | |
VelocityShares Daily Inverse VIX Short Term ETN*+ | | | 40,800 | | | $ | 3,405,168 | |
| | | | | | | | |
TOTAL EXCHANGE TRADED NOTE - 1.52% | | | | | | | 3,405,168 | |
| | | | | | | | |
(Cost $2,805,381) | | | | | | | | |
| | | | | | | | | | | | |
| | | |
| | | Rate^ | | | Shares | | | Value | |
|
MONEY MARKET FUND - 0.80% | |
Fidelity Investments Money Market Government Portfolio Class I | | | 0.81 | % | | | 1,779,367 | | | | 1,779,367 | |
| | | | | | | | | | | | |
TOTAL MONEY MARKET FUND - 0.80% | | | | 1,779,367 | |
| | | | | | | | | | | | |
(Cost $1,779,367) | | | | | |
|
| INVESTMENTS PURCHASED WITH CASH PROCEEDS FROM SECURITIES LENDING - 10.35% | |
Fidelity Investments Money Market Government Portfolio Class I** | | | 0.81 | % | | | 23,185,880 | | | | 23,185,880 | |
| | | | | | | | | | | | |
TOTAL INVESTMENTS PURCHASED WITH CASH PROCEEDS FROM SECURITIES LENDING -10.35% | | | | 23,185,880 | |
(Cost $23,185,880) | | | | | |
TOTAL INVESTMENTS - 108.63% | | | $ | 243,399,700 | |
(Cost $239,213,095) | | | | | |
Liabilities in Excess of Other Assets - (8.63%) | | | | (19,326,377 | ) |
| | | | | | | | | | | | |
NET ASSETS - 100.00% | | | $ | 224,073,323 | |
| | | | | | | | | | | | |
| * | Non-income producing security. |
| ** | This security represents the investment of the collateral received in connection with securities out on loan as of June 30, 2017. |
| ^ | Rate disclosed as of June 30, 2017. |
| + | This security or a portion of the security is out on loan as of June 30, 2017. Total loaned securities had a value of $22,451,665 as of June 30, 2017. |
| ETN | - Exchange Traded Note |
PLC - Public Limited Company
ADR - American Depositary Receipt
| | |
| Aggressive Investors 1 Fund | | |
| SCHEDULE OF INVESTMENTS (continued) | | |
| Showing percentage of net assets as of June 30, 2017 | | |
| | | | | | | | | | | | | | | | | | | | |
Summary of inputs used to value the Fund’s investments as of 06/30/2017 (See Note 2 in Notes to Financial Statements): | | | | | |
| |
| | | Valuation Inputs | |
| | | Investment in Securities (Value) | |
| | | Level 1
Quoted
Prices | | | Level 2
Significant
Observable
Inputs | | | Level 3
Significant Unobservable
Inputs | | | Total | | | | |
| | | | | |
Common Stocks (a) | | $ | 215,029,285 | | | $ | — | | | $ | — | | | $ | 215,029,285 | | | | | |
Exchange Traded Note | | | 3,405,168 | | | | — | | | | — | | | | 3,405,168 | | | | | |
Money Market Fund | | | — | | | | 1,779,367 | | | | — | | | | 1,779,367 | | | | | |
Investments Purchased with Cash Proceeds from Securities Lending | | | — | | | | 23,185,880 | | | | — | | | | 23,185,880 | | | | | |
| | | | | | | | | | | | | | | | |
TOTAL | | $ | 218,434,453 | | | $ | 24,965,247 | | | $ | — | | | $ | 243,399,700 | | | | | |
| | | | | | | | | | | | | | | | |
(a) - Please refer to the Schedule of Investments for the industry classifications of these portfolio holdings. See Notes to Financial Statements. | | | | | |
| | |
| 12 | | Annual Report | June 30, 2017 |
| | |
| Ultra-Small Company Fund | |
|
| MANAGER’S COMMENTARY (Unaudited) | |
June 30, 2017 | | |
Dear Fellow Ultra-Small Company Fund Shareholder,
For the quarter ended June 30, 2017, our Fund returned +0.74%, lagging our primary market benchmark, the CRSP Cap-Based Portfolio 10 Index (+1.28%), and our peer benchmark, the Lipper Micro-Cap Stock Funds Index (+4.30%), as well as the Russell 2000 Index (+2.46%) and the Russell Microcap Index (+3.83%). It was a poor quarter.
For the fiscal year, our Fund gained 16.88%, underperforming the CRSP Cap-Based Portfolio 10 Index (+25.94%), the Lipper Micro-Cap Stock Funds Index (+26.54%), the Russell 2000 Index (+24.60%), and the Russell Microcap Index (+27.60%).
The table below presents our June quarter, one-year, five-year, 10-year, 15-year, and inception-to-date financial results. See the next page for a graph of performance since inception.
Standardized Returns as of June 30, 2017
| | | | | | | | | | | | | | | | | | | | | | | | | | | | | | |
| | | | | | | Annualized | | |
| | | Quarter | | 1 Year | | 5 Years | | 10 Years | | 15 Years | | Since Inception
(8/5/94) |
| | | | | | |
Ultra-Small Company Fund | | | | 0.74% | | | | | 16.88% | | | | | 10.54% | | | | | 3.76% | | | | | 10.13% | | | | | 13.81% | |
CRSP Cap-Based Portfolio 10 Index | | | | 1.28% | | | | | 25.94% | | | | | 12.47% | | | | | 6.45% | | | | | 11.80% | | | | | 11.94% | |
Russell 2000 Index | | | | 2.46% | | | | | 24.60% | | | | | 13.70% | | | | | 6.92% | | | | | 9.19% | | | | | 9.45% | |
Russell Microcap Index | | | | 3.83% | | | | | 27.60% | | | | | 13.73% | | | | | 5.47% | | | | | 8.44% | | | | | N/A | |
Lipper Micro-Cap Stock Funds Index | | | | 4.30% | | | | | 26.54% | | | | | 13.26% | | | | | 6.01% | | | | | 8.69% | | | | | N/A | |
Performance figures quoted in the table above represent past performance and are no guarantee of future results. Total return figures in the table above include the reinvestment of dividends and capital gains. The table above does not reflect the deduction of taxes that a shareholder would pay on Fund distributions or on the redemption of Fund shares.
The CRSP Cap-Based Portfolio 10 Index is an unmanaged index of 799 of the smallest publicly traded U.S. stocks (with dividends reinvested), as reported by the Center for Research in Security Prices. The Russell Microcap Index is an unmanaged, market value weighted index that measures performance of 1,000 of the smallest securities in the Russell 2000 Index. The Russell 2000 Index is an unmanaged, market value weighted index that measures performance of the 2,000 companies that are between the 1,000th and 3,000th largest in the market (with dividends reinvested). The Lipper Micro-Cap Stock Funds Index is an index of micro-cap funds compiled by Lipper, Inc. It is not possible to invest directly in an index. Periods longer than one year are annualized.
According to data from Lipper, Inc. as of June 30, 2017, Ultra-Small Company Fund ranked 64th of 68 micro-cap funds for the 12 months ended June 30, 2017, 48th of 58 over the last five years, 31st of 39 over the last 10 years, and 1st of 8 since inception in August 1994. Lipper, Inc. is an independent mutual fund rating service that ranks funds in various fund categories by making comparative calculations using total returns.
| | |
| Ultra-Small Company Fund | |
|
| MANAGER’S COMMENTARY (Unaudited) (continued) | |
| | |
Growth of a $10,000 Investment
from Inception August 5, 1994 to June 30, 2017
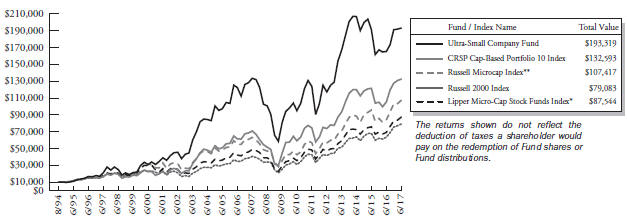
| * | The Lipper Micro-Cap Stock Funds Index began on 12/31/1995, and the line graph for the Index begins at the same value as the Fund on that date. |
| ** | The Russell Microcap Index began on 6/30/2000, and the line graph for the Index begins at the same value as the Fund on that date. |
Detailed Explanation of Quarterly Performance
The Fund’s company financial health, value metrics and price momentum exposure also lagged the benchmark and hurt relative performance. Exposure to the slightly larger stocks in CRSP’s 9th decile also detracted from relative returns. The Fund held an average of about 10% of its assets outside of the 10th CRSP decile during the quarter because of appreciation above the CRSP 10 cutoff, and these holdings underperformed the benchmark. However, the Fund’s tilt toward deeper-value stocks in the CRSP 10 universe helped relative performance.
Holdings in the Information Technology sector had a large negative impact on the Fund’s relative returns, with particular weakness in the Internet Software and Services industry group. Holdings in the Consumer Discretionary, Energy, and Consumer Staples sectors also detracted. Holdings within the Health Care sector helped relative performance, as did underweight positions in the Health Care and Energy sectors.
The table below presents index performance numbers for stocks in the different CRSP deciles during various time periods.
| | | | | | | | | | | | | | | | | | | | |
| | | | | | | | | Annualized | |
| CRSP Decile1 | | Quarter | | | 1 Year | | | 5 Years | | | 10 Years | | | 91.5 Years | |
1 (ultra-large) | | | 3.48% | | | | 19.07% | | | | 14.37% | | | | 7.20% | | | | 9.36% | |
2 | | | 2.30% | | | | 18.81% | | | | 15.96% | | | | 8.00% | | | | 10.58% | |
3 | | | 2.17% | | | | 19.93% | | | | 15.19% | | | | 7.88% | | | | 11.07% | |
4 | | | 1.56% | | | | 17.73% | | | | 14.07% | | | | 7.83% | | | | 10.85% | |
5 | | | 2.02% | | | | 21.73% | | | | 13.71% | | | | 8.22% | | | | 11.48% | |
6 | | | 2.02% | | | | 22.75% | | | | 13.69% | | | | 7.60% | | | | 11.38% | |
7 | | | 2.59% | | | | 27.16% | | | | 14.97% | | | | 8.78% | | | | 11.57% | |
8 | | | 2.06% | | | | 23.90% | | | | 13.14% | | | | 7.97% | | | | 11.51% | |
9 | | | 3.32% | | | | 33.89% | | | | 14.57% | | | | 7.86% | | | | 11.53% | |
10 (ultra-small) | | | 1.28% | | | | 25.94% | | | | 12.47% | | | | 6.45% | | | | 13.26% | |
| 1 | Performance figures are as of the period ended June 30, 2017. The CRSP Cap-Based Portfolio Indexes are unmanaged indexes of publicly traded U.S. stocks with dividends reinvested, grouped by market capitalization, as reported by the Center for Research in Security Prices. Past performance is no guarantee of future results. |
| | |
| 14 | | Annual Report | June 30, 2017 |
| | |
| Ultra-Small Company Fund | | |
| MANAGER’S COMMENTARY (Unaudited) (continued) | | |
| | |
Detailed Explanation of Fiscal Year Performance
The Fund held an average of roughly 15% of its assets in stocks outside of the CRSP 10 index during the fiscal year. These holdings underperformed the benchmark, hurting relative results. The Fund’s three model categories also trailed the benchmark for the fiscal year, detracting from relative performance. However, the Fund’s tilt toward deeper-value stocks helped relative returns.
The Fund’s holdings in the Information Technology, Consumer Discretionary, Materials, and Energy sectors hurt returns against the index. Underweight positions in the Energy and Health Care sectors during the fiscal year helped relative performance, as did holdings in the Financials sector.
Top Ten Holdings as of June 30, 2017
| | | | | | | | |
| Rank | | Description | | Industry | | % of Net
Assets |
| 1 | | Sterling Construction Co., Inc. | | Industrials | | | 3.0 | % |
| 2 | | Health Insurance Innovations, Inc., Class A | | Financials | | | 2.6 | % |
| 3 | | Iteris, Inc. | | Information Technology | | | 2.2 | % |
| 4 | | Cutera, Inc. | | Health Care | | | 2.2 | % |
| 5 | | Nuvectra Corp. | | Health Care | | | 2.2 | % |
| 6 | | RTI Surgical, Inc. | | Health Care | | | 2.1 | % |
| 7 | | America’s Car-Mart, Inc. | | Consumer Discretionary | | | 2.0 | % |
| 8 | | Horizon Technology Finance Corp. | | Financials | | | 2.0 | % |
| 9 | | Willdan Group, Inc. | | Industrials | | | 1.9 | % |
| 10 | | Shore Bancshares, Inc. | | Financials | | | 1.9 | % |
| | Total | | | | | 22.1 | % |
Industry Sector Representation as of June 30, 2017
| | | | | | | | | | | | |
| | | % of Net Assets | | | % of CRSP 10 Index | | | Difference | |
Consumer Discretionary | | | 15.0% | | | | 14.0% | | | | 1.0% | |
Consumer Staples | | | 0.8% | | | | 3.6% | | | | -2.8% | |
Energy | | | 6.0% | | | | 8.2% | | | | -2.2% | |
Financials | | | 22.4% | | | | 19.4% | | | | 3.0% | |
Health Care | | | 18.3% | | | | 18.3% | | | | 0.0% | |
Industrials | | | 14.1% | | | | 11.5% | | | | 2.6% | |
Information Technology | | | 19.2% | | | | 16.9% | | | | 2.3% | |
Materials | | | 2.2% | | | | 3.7% | | | | -1.5% | |
Real Estate | | | 1.4% | | | | 2.0% | | | | -0.6% | |
Telecommunication Services | | | 0.7% | | | | 0.9% | | | | -0.2% | |
Utilities | | | 0.0% | | | | 1.5% | | | | -1.5% | |
Liabilities in Excess of Other Assets | | | -0.1% | | | | 0.0% | | | | -0.1% | |
Total | | | 100.0% | | | | 100.0% | | | | | |
Disclaimer
The views expressed here are exclusively those of Fund management. These views, including those related to market sectors or individual stocks, are not meant as investment advice and should not be considered predictive in nature. Any favorable (or unfavorable) description of a holding applies only as of the quarter end, June 30, 2017, unless otherwise stated. Security positions can and do change thereafter. Discussions of historical performance do not guarantee and may not be indicative of future performance.
| | |
| Ultra-Small Company Fund | |
|
| MANAGER’S COMMENTARY (Unaudited) (continued) | |
| | |
The Fund is subject to very high, above market risk (volatility) and is not an appropriate investment for short-term investors. Investments in ultra-small companies generally carry greater risk than is customarily associated with larger companies and even “small companies” for various reasons, such as narrower markets (fewer investors), limited financial resources, and greater trading difficulty.
Conclusion
Ultra-Small Company Fund remains closed to new investors. We encourage your feedback; your reactions and concerns are important to us.
Sincerely,
The Investment Management Team
| | |
| 16 | | Annual Report | June 30, 2017 |
| | |
| Ultra-Small Company Fund | | |
| SCHEDULE OF INVESTMENTS | | |
| Showing percentage of net assets as of June 30, 2017 | | |
| | | | | | | | | | | | |
| Industry Company | | Shares | | | Value | | | | |
| |
COMMON STOCKS - 100.01% | | | | | |
Consumer Discretionary - 14.98% | | | | | |
AMCON Distributing Co. | | | 2,100 | | | $ | 218,610 | | | | | |
America’s Car-Mart, Inc.*+ | | | 52,100 | | | | 2,026,690 | | | | | |
Beasley Broadcast Group, Inc., Class A+ | | | 31,600 | | | | 309,680 | | | | | |
bebe stores, Inc.*+ | | | 10,500 | | | | 62,370 | | | | | |
Black Diamond, Inc.* | | | 90,519 | | | | 601,951 | | | | | |
Bon-Ton Stores, Inc. (The)* | | | 102,000 | | | | 44,625 | | | | | |
Boot Barn Holdings, Inc.*+ | | | 90,800 | | | | 642,864 | | | | | |
Cambium Learning Group, Inc.* | | | 20,450 | | | | 103,682 | | | | | |
China Automotive Systems, Inc.* | | | 60,000 | | | | 290,400 | | | | | |
China XD Plastics Co., Ltd.* | | | 86,300 | | | | 405,610 | | | | | |
Christopher & Banks Corp.* | | | 473,000 | | | | 619,630 | | | | | |
Container Store Group, Inc. (The)*+ | | | 100,000 | | | | 592,000 | | | | | |
Diversified Restaurant Holdings, Inc.* | | | 290,000 | | | | 754,000 | | | | | |
Educational Development Corp.+ | | | 16,400 | | | | 173,840 | | | | | |
Gaming Partners International Corp.+ | | | 13,300 | | | | 159,467 | | | | | |
Kingold Jewelry, Inc.*+ | | | 85,700 | | | | 142,262 | | | | | |
Lee Enterprises, Inc.*+ | | | 303,500 | | | | 576,650 | | | | | |
Lincoln Educational Services Corp.* | | | 107,364 | | | | 332,828 | | | | | |
Live Ventures, Inc.*+ | | | 26,002 | | | | 275,101 | | | | | |
MCBC Holdings, Inc.* | | | 71,800 | | | | 1,403,690 | | | | | |
McClatchy Co. (The), Class A*+ | | | 20,011 | | | | 186,903 | | | | | |
New York & Co., Inc.* | | | 23,600 | | | | 32,568 | | | | | |
ONE Group Hospitality, Inc. (The)* | | | 53,700 | | | | 116,529 | | | | | |
Shiloh Industries, Inc.* | | | 10,900 | | | | 127,966 | | | | | |
SORL Auto Parts, Inc.*+ | | | 143,100 | | | | 955,908 | | | | | |
Superior Uniform Group, Inc. | | | 18,457 | | | | 412,514 | | | | | |
Tilly’s, Inc., Class A | | | 50,000 | | | | 507,500 | | | | | |
Town Sports International Holdings, Inc.* | | | 217,500 | | | | 1,022,250 | | | | | |
TravelCenters of America LLC* | | | 459,200 | | | | 1,882,720 | | | | | |
US Auto Parts Network, Inc.* | | | 46,000 | | | | 148,580 | | | | | |
| | | | | | | | | | | | |
| | | |
| | | | | | | 15,129,388 | | | | | |
| | | |
Consumer Staples - 0.75% | | | | | | | | | | | | |
Mannatech, Inc. | | | 13,809 | | | | 219,563 | | | | | |
Natural Alternatives International, Inc.* | | | 42,000 | | | | 420,000 | | | | | |
Reliv International, Inc.*+ | | | 13,755 | | | | 120,906 | | | | | |
| | | | | | | | | | | | |
| | | |
| | | | | | | 760,469 | | | | | |
| | | | | | | | |
| Industry Company | | Shares | | | Value | |
| | |
| | | | | | | | |
Energy - 6.01% | | | | | | | | |
Aemetis, Inc.* | | | 1,300 | | | $ | 1,742 | |
Aspen Aerogels, Inc.* | | | 77,700 | | | | 345,765 | |
Comstock Resources, Inc.*+ | | | 35,900 | | | | 253,813 | |
Contango Oil & Gas Co.* | | | 240,700 | | | | 1,598,248 | |
ENGlobal Corp.* | | | 30,081 | | | | 39,105 | |
Gulf Island Fabrication, Inc.+ | | | 89,000 | | | | 1,032,400 | |
Independence Contract Drilling, Inc.*+ | | | 332,700 | | | | 1,294,203 | |
ION Geophysical Corp.*+ | | | 28,389 | | | | 123,492 | |
Jones Energy, Inc., Class A*+ | | | 26,100 | | | | 41,760 | |
Mitcham Industries, Inc.* | | | 131,600 | | | | 523,768 | |
W&T Offshore, Inc.*+ | | | 233,000 | | | | 456,680 | |
Willbros Group, Inc.* | | | 143,309 | | | | 353,973 | |
| | | | | | | | |
| | |
| | | | | | | 6,064,949 | |
Financials - 22.42% | | | | | | | | |
ACNB Corp. | | | 5,200 | | | | 158,600 | |
A-Mark Precious Metals, Inc. | | | 94,100 | | | | 1,547,004 | |
Asta Funding, Inc.* | | | 15,400 | | | | 126,280 | |
C&F Financial Corp. | | | 6,852 | | | | 321,359 | |
Capitala Finance Corp.+ | | | 146,600 | | | | 1,907,266 | |
Central Federal Corp.* | | | 47,800 | | | | 99,424 | |
Chemung Financial Corp. | | | 1,300 | | | | 53,144 | |
Citizens First Corp.+ | | | 52 | | | | 1,170 | |
CM Finance, Inc. | | | 172,500 | | | | 1,725,000 | |
Codorus Valley Bancorp, Inc. | | | 31,579 | | | | 896,844 | |
Community West Bancshares | | | 5,000 | | | | 52,000 | |
Consumer Portfolio Services, Inc.* | | | 420,100 | | | | 1,911,455 | |
Evans Bancorp, Inc.+ | | | 3,750 | | | | 149,813 | |
First South Bancorp, Inc. | | | 5,193 | | | | 85,892 | |
First United Corp.* | | | 30,600 | | | | 457,470 | |
FS Bancorp, Inc.+ | | | 16,400 | | | | 731,932 | |
Health Insurance Innovations, Inc., Class A*+ | | | 112,600 | | | | 2,646,100 | |
Horizon Technology Finance Corp.+ | | | 178,200 | | | | 2,019,006 | |
KCAP Financial, Inc.+ | | | 506,800 | | | | 1,789,004 | |
Kingstone Cos., Inc.+ | | | 71,700 | | | | 1,097,010 | |
Landmark Bancorp, Inc. | | | 1,600 | | | | 49,280 | |
Mackinac Financial Corp. | | | 1,632 | | | | 22,848 | |
Medley Management, Inc., Class A+ | | | 13,600 | | | | 88,400 | |
MFC Industrial, Ltd.* | | | 26,900 | | | | 47,882 | |
Monroe Capital Corp.+ | | | 12,060 | | | | 183,674 | |
MutualFirst Financial, Inc. | | | 2,155 | | | | 76,934 | |
| | |
| Ultra-Small Company Fund | | |
| SCHEDULE OF INVESTMENTS (continued) | | |
| Showing percentage of net assets as of June 30, 2017 | | |
| | | | | | | | | | | | |
| Industry Company | | Shares | | | Value | | | | |
| |
Common Stocks (continued) | | | | | |
Financials (continued) | | | | | |
Northeast Bancorp+ | | | 39,100 | | | $ | 795,685 | | | | | |
Peoples Bancorp of North Carolina, Inc. | | | 402 | | | | 12,703 | | | | | |
Provident Bancorp, Inc.* | | | 2,600 | | | | 58,500 | | | | | |
Regional Management Corp.* | | | 10,500 | | | | 248,115 | | | | | |
SB Financial Group, Inc. | | | 36,822 | | | | 625,606 | | | | | |
Security National Financial Corp., Class A* | | | 78,308 | | | | 501,171 | | | | | |
Shore Bancshares, Inc. | | | 117,400 | | | | 1,931,230 | | | | | |
TriplePoint Venture Growth BDC Corp.+ | | | 16,900 | | | | 224,939 | | | | | |
| | | | | | | | | | | | |
| | | |
| | | | | | | 22,642,740 | | | | | |
| |
Health Care - 18.29% | | | | | |
American Shared Hospital Services* | | | 100 | | | | 385 | | | | | |
Auxilio, Inc.* | | | 171,000 | | | | 779,760 | | | | | |
Bioanalytical Systems, Inc.* | | | 24,610 | | | | 41,591 | | | | | |
Chembio Diagnostics, Inc.*+ | | | 98,300 | | | | 594,715 | | | | | |
Chiasma, Inc.* | | | 59,300 | | | | 85,985 | | | | | |
CombiMatrix Corp.*+ | | | 39,800 | | | | 210,940 | | | | | |
Cumberland Pharmaceuticals, Inc.* | | | 16,400 | | | | 115,948 | | | | | |
Cutera, Inc.* | | | 86,600 | | | | 2,242,940 | | | | | |
Digirad Corp. | | | 91,900 | | | | 372,195 | | | | | |
Electromed, Inc.* | | | 191,938 | | | | 1,061,417 | | | | | |
Five Star Senior Living, Inc.* | | | 45,228 | | | | 67,842 | | | | | |
FONAR Corp.*+ | | | 59,192 | | | | 1,642,578 | | | | | |
Harvard Bioscience, Inc.* | | | 337,200 | | | | 859,860 | | | | | |
InfuSystems Holdings, Inc.* | | | 273,798 | | | | 492,836 | | | | | |
Juniper Pharmaceuticals, Inc.* | | | 133,400 | | | | 673,670 | | | | | |
Kewaunee Scientific Corp. | | | 10,200 | | | | 254,490 | | | | | |
Kindred Biosciences, Inc.* | | | 13,900 | | | | 119,540 | | | | | |
Leap Therapeutics, Inc.*+ | | | 29,800 | | | | 193,998 | | | | | |
Mirna Therapeutics, Inc.* | | | 14,800 | | | | 25,012 | | | | | |
Misonix, Inc.*+ | | | 28,100 | | | | 271,165 | | | | | |
Novelion Therapeutics, Inc.*+ | | | 18,600 | | | | 171,678 | | | | | |
Nuvectra Corp.* | | | 165,500 | | | | 2,197,840 | | | | | |
Onconova Therapeutics, Inc.*+ | | | 16,700 | | | | 36,072 | | | | | |
Proteon Therapeutics, Inc.* | | | 47,200 | | | | 73,160 | | | | | |
Retractable Technologies, Inc.* | | | 2,677 | | | | 3,427 | | | | | |
RTI Surgical, Inc.* | | | 358,490 | | | | 2,097,167 | | | | | |
Sientra, Inc.*+ | | | 152,300 | | | | 1,480,356 | | | | | |
Strata Skin Sciences, Inc.* | | | 85,000 | | | | 206,550 | | | | | |
SunLink Health Systems, Inc.* | | | 4,700 | | | | 7,802 | | | | | |
Veracyte, Inc.* | | | 222,600 | | | | 1,854,258 | | | | | |
| | | | | | | | |
| Industry Company | | Shares | | | Value | |
|
| |
Health Care (continued) | |
Vical, Inc.* | | | 87,496 | | | $ | 237,114 | |
| | | | | | | | |
| | | | | | | 18,472,291 | |
|
Industrials - 14.07% | |
Acme United Corp. | | | 300 | | | | 8,580 | |
CDI Corp.* | | | 73,000 | | | | 427,050 | |
Cenveo, Inc.*+ | | | 7,675 | | | | 46,741 | |
Chicago Rivet & Machine Co. | | | 1,900 | | | | 68,400 | |
CompX International, Inc. | | | 1,620 | | | | 24,705 | |
Continental Materials Corp.* | | | 4,150 | | | | 79,265 | |
Ecology & Environment, Inc., Class A | | | 8,092 | | | | 102,364 | |
Fuel Tech, Inc.* | | | 51,200 | | | | 43,008 | |
Goldfield Corp. (The)* | | | 308,200 | | | | 1,695,100 | |
Highpower International, Inc.*+ | | | 100 | | | | 365 | |
Huttig Building Products, Inc.*+ | | | 9,800 | | | | 68,698 | |
LSI Industries, Inc. | | | 54,900 | | | | 496,845 | |
Orion Group Holdings, Inc.* | | | 89,600 | | | | 669,312 | |
Preformed Line Products Co. | | | 623 | | | | 28,920 | |
Radiant Logistics, Inc.* | | | 306,600 | | | | 1,649,508 | |
RCM Technologies, Inc.* | | | 16,100 | | | | 81,305 | |
Safe Bulkers, Inc.* | | | 617,100 | | | | 1,413,159 | |
Sterling Construction Co., Inc.* | | | 229,900 | | | | 3,004,793 | |
Supreme Industries, Inc., Class A | | | 43,000 | | | | 707,350 | |
Titan Machinery, Inc.* | | | 86,800 | | | | 1,560,664 | |
Transcat, Inc.* | | | 200 | | | | 2,430 | |
Virco Manufacturing Corp.* | | | 17,600 | | | | 94,160 | |
Willdan Group, Inc.*+ | | | 63,429 | | | | 1,937,756 | |
| | | | | | | | |
| | |
| | | | | | | 14,210,478 | |
|
Information Technology - 19.18% | |
Aviat Networks, Inc.* | | | 25,013 | | | | 435,226 | |
Control4 Corp.* | | | 33,300 | | | | 653,013 | |
Data I/O Corp.* | | | 65,600 | | | | 521,520 | |
Determine, Inc.* | | | 81,733 | | | | 217,410 | |
Document Security Systems, Inc.* | | | 20,000 | | | | 15,400 | |
Echelon Corp.* | | | 4,158 | | | | 21,746 | |
Everi Holdings, Inc.* | | | 50,000 | | | | 364,000 | |
Global Sources, Ltd.* | | | 5,800 | | | | 116,000 | |
GlobalSCAPE, Inc. | | | 98,500 | | | | 521,065 | |
GSE Systems, Inc.* | | | 8,200 | | | | 24,190 | |
Inseego Corp.*+ | | | 93,800 | | | | 117,250 | |
inTEST Corp.* | | | 6,000 | | | | 40,200 | |
Inuvo, Inc.* | | | 2,600 | | | | 2,652 | |
| | |
| 18 | | Annual Report | June 30, 2017 |
| | |
| Ultra-Small Company Fund | |
|
| SCHEDULE OF INVESTMENTS (continued) | |
| Showing percentage of net assets as of June 30, 2017 | | |
| | | | | | | | | | | | |
| Industry Company | | Shares | | | Value | | | | |
| |
Common Stocks (continued) | | | | | |
Information Technology (continued) | | | | | |
Iteris, Inc.*+ | | | 362,102 | | | $ | 2,252,274 | | | | | |
KEMET Corp.* | | | 18,000 | | | | 230,400 | | | | | |
Lantronix, Inc.* | | | 188,476 | | | | 459,881 | | | | | |
Marin Software, Inc.* | | | 361,200 | | | | 469,560 | | | | | |
Napco Security Technologies, Inc.*+ | | | 109,900 | | | | 1,033,060 | | | | | |
NCI, Inc., Class A* | | | 50,800 | | | | 1,071,880 | | | | | |
Network-1 Technologies, Inc. | | | 312,400 | | | | 1,327,700 | | | | | |
Optical Cable Corp.* | | | 14,200 | | | | 34,790 | | | | | |
PAR Technology Corp.* | | | 5,800 | | | | 49,474 | | | | | |
PCM, Inc.*+ | | | 82,380 | | | | 1,544,625 | | | | | |
PC-Tel, Inc. | | | 52,100 | | | | 368,868 | | | | | |
Planet Payment, Inc.*+ | | | 7,300 | | | | 24,090 | | | | | |
PRGX Global, Inc.* | | | 84,400 | | | | 548,600 | | | | | |
Professional Diversity Network, Inc.*+ | | | 51,475 | | | | 354,148 | | | | | |
Rocket Fuel, Inc.*+ | | | 611,900 | | | | 1,682,725 | | | | | |
Schmitt Industries, Inc.* | | | 2,980 | | | | 5,304 | | | | | |
Sigma Designs, Inc.* | | | 310,200 | | | | 1,814,670 | | | | | |
Socket Mobile, Inc.*+ | | | 27,700 | | | | 113,293 | | | | | |
StarTek, Inc.* | | | 78,600 | | | | 962,064 | | | | | |
TESSCO Technologies, Inc. | | | 16,200 | | | | 215,460 | | | | | |
TransAct Technologies, Inc. | | | 23,600 | | | | 200,600 | | | | | |
Travelzoo*+ | | | 29,600 | | | | 324,120 | | | | | |
UTStarcom Holdings Corp.* | | | 48,600 | | | | 113,724 | | | | | |
Xplore Technologies Corp.* | | | 1,200 | | | | 2,340 | | | | | |
YuMe, Inc. | | | 236,200 | | | | 1,110,140 | | | | | |
| | | | | | | | | | | | |
| | | |
| | | | | | | 19,363,462 | | | | | |
| |
Materials - 2.24% | | | | | |
China Green Agriculture, Inc.* | | | 277,400 | | | | 349,524 | | | | | |
Core Molding Technologies, Inc.* | | | 300 | | | | 6,483 | | | | | |
Flexible Solutions International, Inc.* | | | 4,507 | | | | 8,158 | | | | | |
Gulf Resources, Inc.* | | | 330,400 | | | | 525,336 | | | | | |
Olympic Steel, Inc. | | | 70,600 | | | | 1,375,288 | | | | | |
| | | | | | | | | | | | |
| | | |
| | | | | | | 2,264,789 | | | | | |
| |
Real Estate - 1.35% | | | | | |
American Realty Investors, Inc.*+ | | | 7,100 | | | | 60,776 | | | | | |
BRT Apartments Corp.* | | | 23,100 | | | | 181,566 | | | | | |
Maui Land & Pineapple Co., Inc.*+ | | | 35,800 | | | | 726,740 | | | | | |
Nam Tai Property, Inc.+ | | | 48,700 | | | | 389,600 | | | | | |
| | | | | | | | | | | | |
| | | |
| | | | | | | 1,358,682 | | | | | |
| | | | | | | | | | |
| Industry Company | | | | Shares | | | Value | |
| | | |
| | | | | | | | | | |
|
Telecommunication Services - 0.72% | |
Alaska Communications | | | | | | | | |
Systems Group, Inc.* | | | 305,300 | | | $ | 671,660 | |
Hawaiian Telcom Holdco, Inc.* | | | 2,100 | | | | 52,479 | |
| | | | | | | | | | |
| |
| | | | 724,139 | |
| |
TOTAL COMMON STOCKS - 100.01% | | | | 100,991,387 | |
(Cost $92,210,722) | |
| |
WARRANTS - 0.00% | | | | | |
Novelion Therapeutics, Inc. Class Action expire 12/31/21*D | | | 34,500 | | | | — | |
Novelion Therapeutics, Inc. DOJ/SEC expire 12/31/21*D | | | 34,500 | | | | — | |
| | | | | | | | | | |
| |
TOTAL WARRANTS - 0.00% | | | | — | |
| | | | | | | | | | |
(Cost $ - ) | |
| | | | | | | | | | | | |
| | | |
| | | Rate^ | | | Shares | | | Value | |
| |
MONEY MARKET FUND - 0.00% | | | | | |
Fidelity Investments Money Market Government Portfolio Class I | | | 0.81 | % | | | 494 | | | | 494 | |
| | | | | | | | | | | | |
TOTAL MONEY MARKET FUND - 0.00% | | | | | | | | 494 | |
| | | | | | | | | | | | |
(Cost $494) | |
| |
INVESTMENTS PURCHASED WITH CASH PROCEEDS FROM SECURITIES LENDING - 16.63% | | | | | |
Fidelity Investments Money | | | | | | | | | | | | |
Market Government Portfolio Class I** | | | 0.81 | % | | | 16,790,737 | | | | 16,790,737 | |
| | | | | | | | | | | | |
TOTAL INVESTMENTS PURCHASED WITH CASH PROCEEDS FROM SECURITIES LENDING -16.63% | | | | 16,790,737 | |
| | | | | | | | | | | | |
(Cost $16,790,737) | | | | | | | | | | | | |
| | |
TOTAL INVESTMENTS - 116.64% | | | | | | | $ | 117,782,618 | |
(Cost $109,001,953) | | | | | | | | | | | | |
Liabilities in Excess of Other Assets - (16.64%) | | | | (16,798,765 | ) |
| | | | | | | | | | | | |
NET ASSETS - 100.00% | | | | | | | | | | $ | 100,983,853 | |
| | | | | | | | | | | | |
| * | Non-income producing security. |
| ** | This security represents the investment of the collateral received in connection with securities out on loan as of June 30, 2017. |
| ^ | Rate disclosed as of June 30, 2017. |
| D | Security was fair valued under procedures adopted by the Board of Directors (see Note 2). |
| + | This security or a portion of the security is out on loan as of June 30, 2017. Total loaned securities had a value of $16,108,711 as of June 30, 2017. |
| | |
| Ultra-Small Company Fund | |
|
| SCHEDULE OF INVESTMENTS (continued) | |
| Showing percentage of net assets as of June 30, 2017 | | |
| | | | | | | | | | | | | | | | | | |
| Summary of inputs used to value the Fund’s investments as of 06/30/2017 (See Note 2 in Notes to Financial Statements): | | | |
| | | | |
| | | | | | Valuation Inputs | | | | | | |
| | | | | | Investment in Securities (Value) | | | |
| | | Level 1
Quoted
Prices | | | Level 2
Significant
Observable Inputs | | | Level 3
Significant Unobservable
Inputs | | | Total | | | |
Common Stocks (a) | | $ | 100,991,387 | | | $ | — | | | $ | — | | | $ | 100,991,387 | | | |
Warrants | | | — | | | | — | | | | 0 | | | | 0 | | | |
Money Market Fund | | | — | | | | 494 | | | | — | | | | 494 | | | |
Investments Purchased with Cash Proceeds from Securities Lending | | | — | | | | 16,790,737 | | | | — | | | | 16,790,737 | | | |
| | | | | | | | | | | | | | | | | | |
TOTAL | | $ | 100,991,387 | | | $ | 16,791,231 | | | $ | 0 | | | $ | 117,782,618 | | | |
| | | | | | | | | | | | | | | | | | |
(a) - Please refer to the Schedule of Investments for the industry classifications of these portfolio holdings. See Notes to Financial Statements. | | | |
| | |
| 20 | | Annual Report | June 30, 2017 |
| | |
| Ultra-Small Company Market Fund | | |
| MANAGER’S COMMENTARY (Unaudited) | | |
| | |
June 30, 2017
Dear Fellow Ultra-Small Company Market Fund Shareholder,
For the quarter ended June 30, 2017, our Fund returned +1.50%, outperforming our primary market benchmark, the CRSP Cap-Based Portfolio 10 Index (+1.28%). However, the Fund underperformed our peer benchmark, the Lipper Micro-Cap Stock Funds Index (+4.30%), as well as the Russell 2000 Index (+2.46%) and the Russell Microcap Index (+3.83%). Results in this quarter were mixed.
For the fiscal year, our Fund returned +26.61%, outperforming the CRSP Cap-Based Portfolio 10 Index (+25.94%), the Lipper Micro-Cap Stock Funds Index (+26.54%) and the Russell 2000 Index (+24.60%). The Fund trailed the Russell Microcap Index (+27.60%).
The table below presents our June quarter, one-year, five-year, 10-year, 15-year, and inception-to-date financial results. See the next page for a graph of performance since inception.
Standardized Returns as of June 30, 2017
| | | | | | | | | | | | | | | | | | | | | | | | |
| | | | | | | | | Annualized | |
| | | Quarter | | | 1 Year | | | 5 Years | | | 10 Years | | | 15 Years | | | Since Inception
(7/31/97) | |
| | | | | | |
Ultra-Small Company Market Fund | | | 1.50% | | | | 26.61% | | | | 13.81% | | | | 5.64% | | | | 10.26% | | | | 10.72% | |
CRSP Cap-Based Portfolio 10 Index | | | 1.28% | | | | 25.94% | | | | 12.47% | | | | 6.45% | | | | 11.80% | | | | 10.76% | |
Russell 2000 Index | | | 2.46% | | | | 24.60% | | | | 13.70% | | | | 6.92% | | | | 9.19% | | | | 7.77% | |
Russell Microcap Index | | | 3.83% | | | | 27.60% | | | | 13.73% | | | | 5.47% | | | | 8.44% | | | | N/A | |
Lipper Micro-Cap Stock Funds Index | | | 4.30% | | | | 26.54% | | | | 13.26% | | | | 6.01% | | | | 8.69% | | | | 8.04% | |
Performance figures quoted in the table above represent past performance and are no guarantee of future results. Total return figures in the table above include the reinvestment of dividends and capital gains. The table above does not reflect the deduction of taxes that a shareholder would pay on Fund distributions or on the redemption of Fund shares.
The CRSP Cap-Based Portfolio 10 Index is an unmanaged index of 799 of the smallest publicly traded U.S. stocks with dividends reinvested, as reported by the Center for Research in Security Prices. The Russell Microcap Index is an unmanaged, market value weighted index that measures performance of 1,000 of the smallest securities in the Russell 2000 Index. The Russell 2000 Index is an unmanaged, market value weighted index that measures performance of the 2,000 companies that are between the 1,000th and 3,000th largest in the market with dividends reinvested. The Lipper Micro-Cap Stock Funds Index is an index of micro-cap funds compiled by Lipper, Inc. It is not possible to invest directly in an index. Periods longer than one year are annualized.
According to data from Lipper, Inc. as of June 30, 2017, Ultra-Small Company Market Fund ranked 23rd of 68 micro-cap funds for the 12 months ended June 30, 2017, 25th of 58 over the last five years, 23rd of 39 over the last 10 years, and 4th of 17 since inception in July 1997. Lipper, Inc. is an independent mutual fund rating service that ranks funds in various fund categories by making comparative calculations using total returns.
| | |
| Ultra-Small Company Market Fund | |
|
| MANAGER’S COMMENTARY (Unaudited) (continued) | |
| | |
Growth of a $10,000 Investment
from Inception July 31, 1997 to June 30, 2017
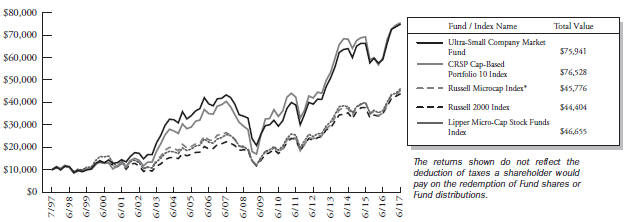
| * | The Russell Microcap Index began on 6/30/2000, and the line graph for the Index begins at the same value as the Fund on that date. |
Detailed Explanation of Quarterly Performance
The Fund outperformed its primary benchmark largely because of our sidestepping strategies, which reduce exposure to stocks with high probability of steep price decline, major financial distress or bankruptcy. These strategies boosted relative performance by helping the Fund avoid certain stocks that posted large losses.
The Fund held an average of about 16% of its assets outside of CRSP’s 10th decile during the quarter, as certain stocks appreciated above the CRSP 10 cutoff. Performance from the Fund’s non-CRSP 10 stocks had a positive impact on relative return. Underweight exposure to the lowest-momentum stocks in the benchmark also improved the Fund’s relative performance, as that group of stocks generated a negative return.
Holdings in the Health Care and Telecommunication Services sectors helped the Fund’s relative performance, while holdings in the Information Technology sector hurt.
The table below presents index performance numbers for stocks in the different CRSP deciles during various time periods.
| | | | | | | | | | | | | | | | | | | | |
| | | | | | | | | Annualized | |
| CRSP Decile1 | | Quarter | | | 1 Year | | | 5 Years | | | 10 Years | | | 91.5 Years | |
| 1 (ultra-large) | | | 3.48% | | | | 19.07% | | | | 14.37% | | | | 7.20% | | | | 9.36% | |
| 2 | | | 2.30% | | | | 18.81% | | | | 15.96% | | | | 8.00% | | | | 10.58% | |
| 3 | | | 2.17% | | | | 19.93% | | | | 15.19% | | | | 7.88% | | | | 11.07% | |
| 4 | | | 1.56% | | | | 17.73% | | | | 14.07% | | | | 7.83% | | | | 10.85% | |
| 5 | | | 2.02% | | | | 21.73% | | | | 13.71% | | | | 8.22% | | | | 11.48% | |
| 6 | | | 2.02% | | | | 22.75% | | | | 13.69% | | | | 7.60% | | | | 11.38% | |
| 7 | | | 2.59% | | | | 27.16% | | | | 14.97% | | | | 8.78% | | | | 11.57% | |
| 8 | | | 2.06% | | | | 23.90% | | | | 13.14% | | | | 7.97% | | | | 11.51% | |
| 9 | | | 3.32% | | | | 33.89% | | | | 14.57% | | | | 7.86% | | | | 11.53% | |
| 10 (ultra-small) | | | 1.28% | | | | 25.94% | | | | 12.47% | | | | 6.45% | | | | 13.26% | |
| 1 | Performance figures are as of the period ended June 30, 2017. The CRSP Cap-Based Portfolio Indexes are unmanaged indexes of publicly traded U.S. stocks with dividends reinvested, grouped by market capitalization, as reported by the Center for Research in Security Prices. Past performance is no guarantee of future results. |
| | |
| 22 | | Annual Report | June 30, 2017 |
| | |
| Ultra-Small Company Market Fund | | |
| MANAGER’S COMMENTARY (Unaudited) (continued) | | |
| | |
Detailed Explanation of Fiscal Year Performance
The Fund’s sidestepping strategies helped it outperform its primary benchmark for the fiscal year. During the 12-month period, the Fund held an average of roughly 18% of its assets outside of CRSP’s 10th decile. These holdings boosted relative performance. Underweight positions in the lowest-momentum stocks in the benchmark also helped relative returns.
Holdings in the Health Care, Telecommunication Services, and Energy sectors improved the Fund’s relative performance, while holdings in the Information Technology and Materials sectors detracted.
Top Ten Holdings as of June 30, 2017
| | | | | | |
| Rank | | Description | | Industry | | % of Net
Assets |
| 1 | | Utah Medical Products, Inc. | | Health Care | | 0.7% |
| 2 | | Straight Path Communications, Inc., Class B | | Telecommunication Services | | 0.6% |
| 3 | | Calithera Biosciences, Inc. | | Health Care | | 0.6% |
| 4 | | Home Bancorp, Inc. | | Financials | | 0.5% |
| 5 | | Evolution Petroleum Corp. | | Energy | | 0.5% |
| 6 | | Marlin Business Services Corp. | | Financials | | 0.5% |
| 7 | | Cutera, Inc. | | Health Care | | 0.5% |
| 8 | | Castle Brands, Inc. | | Consumer Staples | | 0.4% |
| 9 | | Zogenix, Inc. | | Health Care | | 0.4% |
| 10 | | Southern National Bancorp of Virginia, Inc. | | Financials | | 0.4% |
| | Total | | | | 5.1% |
Industry Sector Representation as of June 30, 2017
| | | | | | | | | | | | |
| | | % of Net Assets | | | % of CRSP 10 Index | | | Difference | |
Consumer Discretionary | | | 13.4% | | | | 14.0% | | | | -0.6% | |
Consumer Staples | | | 2.7% | | | | 3.6% | | | | -0.9% | |
Energy | | | 7.1% | | | | 8.2% | | | | -1.1% | |
Financials | | | 20.5% | | | | 19.4% | | | | 1.1% | |
Health Care | | | 18.5% | | | | 18.3% | | | | 0.2% | |
Industrials | | | 12.4% | | | | 11.5% | | | | 0.9% | |
Information Technology | | | 17.0% | | | | 16.9% | | | | 0.1% | |
Materials | | | 3.4% | | | | 3.7% | | | | -0.3% | |
Real Estate | | | 1.1% | | | | 2.0% | | | | -0.9% | |
Telecommunication Services | | | 1.3% | | | | 0.9% | | | | 0.4% | |
Utilities | | | 1.8% | | | | 1.5% | | | | 0.3% | |
Cash & Other Assets | | | 0.8% | | | | 0.0% | | | | 0.8% | |
Total | | | 100.0% | | | | 100.0% | | | | | |
Disclaimer
The views expressed here are exclusively those of Fund management. These views, including those related to market sectors or individual stocks, are not meant as investment advice and should not be considered predictive in nature. Any favorable (or unfavorable) description of a holding applies only as of the quarter end, June 30, 2017, unless otherwise stated. Security positions can and do change thereafter. Discussions of historical performance do not guarantee and may not be indicative of future performance.
| | |
| Ultra-Small Company Market Fund | |
|
| MANAGER’S COMMENTARY (Unaudited) (continued) | |
| | |
The Fund is subject to very high, above market risk (volatility) and is not an appropriate investment for short-term investors. Investments in ultra-small companies generally carry greater risk than is customarily associated with larger companies and even “small companies” for various reasons, such as narrower markets (fewer investors), limited financial resources and greater trading difficulty.
Conclusion
Thank you for your continued investment in Ultra-Small Company Market Fund. We encourage your feedback; your reactions and concerns are important to us.
Sincerely,
The Investment Management Team
| | |
| 24 | | Annual Report | June 30, 2017 |
| | |
| Ultra-Small Company Market Fund | | |
| SCHEDULE OF INVESTMENTS | | |
| Showing percentage of net assets as of June 30, 2017 | | |
| | | | | | | | |
| Industry Company | | Shares | | Value | | | |
| | |
COMMON STOCKS - 99.22% | | | | | | |
Consumer Discretionary - 13.44% | | | | | | |
A.H. Belo Corp., Class A | | 34,900 | | $ 191,950 | | | | |
AMCON Distributing Co. | | 3,900 | | 405,990 | | | | |
Ark Restaurants Corp. | | 9,900 | | 241,164 | | | | |
Ascent Capital Group, Inc., Class A* | | 61,400 | | 943,104 | | | | |
AV Homes, Inc.*+ | | 9,800 | | 196,490 | | | | |
Ballantyne Strong, Inc.* | | 117,020 | | 784,034 | | | | |
Bassett Furniture Industries, Inc. | | 12,234 | | 464,280 | | | | |
Beasley Broadcast Group, Inc., Class A+ | | 28,125 | | 275,625 | | | | |
Black Diamond, Inc.* | | 69,600 | | 462,840 | | | | |
Boot Barn Holdings, Inc.*+ | | 70,000 | | 495,600 | | | | |
Bravo Brio Restaurant Group, Inc.* | | 59,394 | | 273,212 | | | | |
Build-A-Bear Workshop, Inc.* | | 55,500 | | 579,975 | | | | |
CafePress, Inc.* | | 80,188 | | 207,687 | | | | |
Charles & Colvard, Ltd.* | | 50,521 | | 46,479 | | | | |
Cherokee, Inc.*+ | | 16,100 | | 111,895 | | | | |
China XD Plastics Co., Ltd.* | | 56,000 | | 263,200 | | | | |
Christopher & Banks Corp.* | | 230,000 | | 301,300 | | | | |
Citi Trends, Inc. | | 18,000 | | 381,960 | | | | |
Collectors Universe, Inc. | | 36,960 | | 918,456 | | | | |
Container Store Group, Inc. (The)*+ | | 150,000 | | 888,000 | | | | |
CSS Industries, Inc. | | 29,150 | | 762,564 | | | | |
Culp, Inc. | | 13,016 | | 423,020 | | | | |
Delta Apparel, Inc.* | | 32,988 | | 731,674 | | | | |
Destination Maternity Corp.* | | 69,155 | | 224,062 | | | | |
Destination XL Group, Inc.* | | 241,822 | | 568,282 | | | | |
DGSE Cos., Inc.* | | 935 | | 1,561 | | | | |
Dixie Group, Inc. (The)* | | 100,600 | | 452,700 | | | | |
Dover Downs Gaming & Entertainment,Inc.* | | 92,580 | | 102,764 | | | | |
Dover Motorsports, Inc. | | 123,396 | | 259,132 | | | | |
Drive Shack, Inc. | | 105,000 | | 330,750 | | | | |
Educational Development Corp.+ | | 34,000 | | 360,400 | | | | |
Emerson Radio Corp.* | | 198,100 | | 277,340 | | | | |
Escalade, Inc. | | 39,780 | | 521,118 | | | | |
EVINE Live, Inc.* | | 346,286 | | 346,286 | | | | |
Famous Dave’s of America, Inc.*+ | | 45,200 | | 164,980 | | | | |
Gaia, Inc.* | | 48,400 | | 542,080 | | | | |
Gaming Partners International Corp.+ | | 56,300 | | 675,037 | | | | |
Golden Entertainment, Inc.* | | 51,100 | | 1,058,281 | | | | |
Harte-Hanks, Inc.* | | 213,900 | | 220,317 | | | | |
Hemisphere Media Group, Inc.*+ | | 20,000 | | 237,000 | | | | |
Hooker Furniture Corp. | | 12,227 | | 503,141 | | | | |
| | | | |
| Industry Company | | Shares | | Value |
|
|
Consumer Discretionary (continued) | | |
Horizon Global Corp.*+ | | 10,700 | | $ 153,652 |
J Alexander’s Holdings, Inc.* | | 83,800 | | 1,026,550 |
JAKKS Pacific, Inc.* | | 121,400 | | 485,600 |
Jamba, Inc.*+ | | 74,462 | | 580,059 |
Johnson Outdoors, Inc., Class A | | 24,800 | | 1,195,608 |
Kirkland’s, Inc.* | | 82,400 | | 847,072 |
Kona Grill, Inc.*+ | | 52,500 | | 194,250 |
Lakeland Industries, Inc.*+ | | 51,557 | | 747,576 |
Lee Enterprises, Inc.*+ | | 220,000 | | 418,000 |
Liberty Tax, Inc.+ | | 52,800 | | 683,760 |
Lifetime Brands, Inc. | | 45,000 | | 816,750 |
Lincoln Educational Services Corp.* | | 103,400 | | 320,540 |
Luby’s, Inc.* | | 164,500 | | 462,245 |
MCBC Holdings, Inc.* | | 55,000 | | 1,075,250 |
McClatchy Co. (The), Class A*+ | | 19,435 | | 181,523 |
Nathan’s Famous, Inc.* | | 12,000 | | 756,000 |
National American University Holdings, Inc.+ | | 350,988 | | 888,000 |
Nevada Gold & Casinos, Inc.*+ | | 120,000 | | 268,800 |
New Home Co. Inc., (The)* | | 10,000 | | 114,700 |
New York & Co., Inc.* | | 308,500 | | 425,730 |
Noodles & Co.*+ | | 111,800 | | 436,020 |
P&F Industries, Inc., Class A | | 10,500 | | 64,155 |
Papa Murphy’s Holdings, Inc.*+ | | 10,000 | | 43,700 |
Peak Resorts, Inc.+ | | 96,000 | | 393,600 |
Perry Ellis International, Inc.* | | 35,000 | | 681,100 |
Red Lion Hotels Corp.* | | 112,000 | | 823,200 |
Rocky Brands, Inc. | | 72,200 | | 971,090 |
Ruby Tuesday, Inc.* | | 150,000 | | 301,500 |
Saga Communications, Inc., Class A | | 16,866 | | 771,620 |
Salem Media Group, Inc. | | 145,100 | | 1,030,210 |
Shiloh Industries, Inc.* | | 124,293 | | 1,459,200 |
Skyline Corp.* | | 20,100 | | 121,002 |
SORL Auto Parts, Inc.*+ | | 79,900 | | 533,732 |
Stanley Furniture Co., Inc. | | 129,383 | | 146,203 |
Stein Mart, Inc.+ | | 160,800 | | 271,752 |
Strattec Security Corp. | | 16,700 | | 591,180 |
Superior Uniform Group, Inc. | | 25,000 | | 558,750 |
Sypris Solutions, Inc.* | | 39,404 | | 65,017 |
Tandy Leather Factory, Inc.* | | 82,000 | | 729,800 |
Tilly’s, Inc., Class A | | 102,175 | | 1,037,076 |
Town Sports International Holdings, Inc.* | | 173,571 | | 815,784 |
Townsquare Media, Inc., Class A* | | 74,357 | | 761,416 |
| | |
| Ultra-Small Company Market Fund | |
|
| SCHEDULE OF INVESTMENTS (continued) | |
| Showing percentage of net assets as of June 30, 2017 | | |
| | | | | | |
| Industry Company | | Shares | | Value | | |
| | |
Common Stocks (continued) | | | | |
Consumer Discretionary (continued) | | | | |
Trans World Entertainment Corp.* | | 198,403 | | $ 327,365 | | |
TravelCenters of America LLC* | | 241,800 | | 991,380 | | |
Tuesday Morning Corp.*+ | | 200,000 | | 380,000 | | |
Turtle Beach Corp.* | | 267,416 | | 187,191 | | |
Unique Fabricating, Inc.+ | | 18,400 | | 175,168 | | |
Universal Technical Institute, Inc.*+ | | 75,000 | | 267,750 | | |
US Auto Parts Network, Inc.* | | 164,751 | | 532,146 | | |
VOXX International Corp.* | | 134,500 | | 1,102,900 | | |
West Marine, Inc. | | 85,432 | | 1,097,801 | | |
Xcel Brands, Inc.* | | 44,000 | | 134,200 | | |
ZAGG, Inc.* | | 80,000 | | 692,000 | | |
| | | | | | |
| | | | 47,332,403 | | |
| | |
Consumer Staples - 2.71% | | | | |
Alico, Inc. | | 6,700 | | 209,710 | | |
Arcadia Biosciences, Inc.* | | 40,000 | | 18,000 | | |
Castle Brands, Inc.*+ | | 899,187 | | 1,546,602 | | |
CCA Industries, Inc.*+ | | 15,752 | | 53,557 | | |
Craft Brew Alliance, Inc.* | | 81,840 | | 1,379,004 | | |
Inventure Foods, Inc.*+ | | 115,613 | | 498,292 | | |
Lifeway Foods, Inc.* | | 90,152 | | 842,020 | | |
Limoneira Co.+ | | 2,596 | | 61,343 | | |
Mannatech, Inc. | | 13,600 | | 216,240 | | |
Natural Alternatives International, Inc.* | | 29,910 | | 299,100 | | |
Natural Grocers by Vitamin Cottage, Inc.*+ | | 86,000 | | 711,220 | | |
Nutraceutical International Corp. | | 30,000 | | 1,249,500 | | |
Oil-Dri Corp. of America | | 27,500 | | 1,155,275 | | |
Orchids Paper Products Co.+ | | 35,000 | | 453,250 | | |
Reed’s, Inc.* | | 53,700 | | 131,565 | | |
Rocky Mountain Chocolate Factory, Inc. | | 30,000 | | 354,000 | | |
Seneca Foods Corp., Class A* | | 7,000 | | 217,350 | | |
United-Guardian, Inc. | | 10,000 | | 154,500 | | |
| | | | | | |
| | | | 9,550,528 | | |
Energy - 7.05% | | | | |
Adams Resources & Energy, Inc. | | 24,300 | | 998,244 | | |
Aemetis, Inc.* | | 224,139 | | 300,346 | | |
Approach Resources, Inc.*+ | | 274,900 | | 926,413 | | |
Aspen Aerogels, Inc.*+ | | 215,130 | | 957,328 | | |
Cloud Peak Energy, Inc.* | | 160,000 | | 564,800 | | |
| | | | |
| Industry Company | | Shares | | Value |
|
|
Energy (continued) | | |
Cobalt International Energy, Inc.* | | 186,700 | | $ 461,149 |
Comstock Resources, Inc.*+ | | 85,480 | | 604,344 |
Contango Oil & Gas Co.* | | 75,000 | | 498,000 |
Dawson Geophysical Co.* | | 128,139 | | 502,305 |
Earthstone Energy, Inc., Class A*+ | | 62,002 | | 620,640 |
Era Group, Inc.* | | 97,350 | | 920,931 |
Evolution Petroleum Corp.+ | | 217,123 | | 1,758,696 |
EXCO Resources, Inc.*+ | | 135,000 | | 357,750 |
Gastar Exploration, Inc.*+ | | 780,200 | | 722,465 |
Geospace Technologies Corp.* | | 46,663 | | 645,349 |
Gulf Island Fabrication, Inc.+ | | 54,700 | | 634,520 |
Harvest Natural Resources, Inc.D+ | | 56,125 | | 28,062 |
Hornbeck Offshore Services, Inc.*+ | | 50,000 | | 141,500 |
Independence Contract Drilling, Inc.* | | 148,000 | | 575,720 |
ION Geophysical Corp.*+ | | 127,816 | | 556,000 |
Jones Energy, Inc., Class A*+ | | 217,858 | | 348,573 |
Lonestar Resources US, Inc., Class A*+ | | 80,000 | | 344,000 |
Mexco Energy Corp.*+ | | 12,000 | | 50,760 |
Mitcham Industries, Inc.* | | 141,900 | | 564,762 |
Natural Gas Services Group, Inc.* | | 47,185 | | 1,172,547 |
Northern Oil and Gas, Inc.*+ | | 326,000 | | 456,400 |
Overseas Shipholding Group, Inc., Class A* | | 205,000 | | 545,300 |
Panhandle Oil & Gas, Inc., Class A | | 23,594 | | 545,021 |
Parker Drilling Co.* | | 679,630 | | 917,500 |
PetroQuest Energy, Inc.* | | 168,457 | | 333,545 |
PHI, Inc.* | | 54,550 | | 532,408 |
Pioneer Energy Services Corp.* | | 280,000 | | 574,000 |
Resolute Energy Corp.*+ | | 48,000 | | 1,428,960 |
REX American Resources Corp.* | | 9,249 | | 893,083 |
Ring Energy, Inc.*+ | | 16,958 | | 220,454 |
SAExploration Holdings, Inc.* | | — | | — |
Superior Drilling Products, Inc.* | | 166,187 | | 104,698 |
Uranium Energy Corp.*+ | | 395,000 | | 628,050 |
VAALCO Energy, Inc.* | | 237,100 | | 221,688 |
| | |
| 26 | | Annual Report | June 30, 2017 |
| | |
| Ultra-Small Company Market Fund | | |
| SCHEDULE OF INVESTMENTS (continued) | | |
| Showing percentage of net assets as of June 30, 2017 | | |
| | | | | | |
| Industry Company | | Shares | | Value | | |
| | |
Common Stocks (continued) | | | | |
Energy (continued) | | | | |
W&T Offshore, Inc.*+ | | 150,000 | | $ 294,000 | | |
Westmoreland Coal Co.* | | 77,660 | | 378,204 | | |
Willbros Group, Inc.* | | 425,000 | | 1,049,750 | | |
Zion Oil & Gas, Inc.*+ | | 132,285 | | 453,738 | | |
| | | | | | |
| | | | 24,832,003 | | |
Financials - 20.53% | | | | |
1347 Property Insurance | | | | | | |
Holdings, Inc.* | | 38,400 | | 307,200 | | |
1st Constitution Bancorp | | 38,733 | | 687,511 | | |
A-Mark Precious Metals, Inc. | | 44,500 | | 731,580 | | |
American National Bankshares, Inc. | | 31,746 | | 1,173,015 | | |
American River Bankshares | | 56,000 | | 812,560 | | |
AmeriServ Financial, Inc. | | 155,671 | | 646,035 | | |
Anchor Bancorp, Inc.* | | 22,000 | | 555,500 | | |
ASB Bancorp, Inc.*+ | | 21,000 | | 922,950 | | |
Ashford, Inc.* | | 4,000 | | 196,920 | | |
Asta Funding, Inc.* | | 68,400 | | 560,880 | | |
Atlantic American Corp. | | 21,056 | | 77,907 | | |
Atlantic Coast Financial Corp.*+ | | 57,150 | | 456,628 | | |
Atlanticus Holdings Corp.* | | 60,812 | | 161,760 | | |
Auburn National Bancorporation, Inc.+ | | 2,974 | | 111,198 | | |
B. Riley Financial, Inc. | | 25,212 | | 467,683 | | |
Bank of Commerce Holdings+ | | 87,441 | | 966,223 | | |
Bankwell Financial Group, Inc. | | 8,000 | | 249,840 | | |
BCB Bancorp, Inc.+ | | 55,212 | | 844,744 | | |
C&F Financial Corp. | | 15,400 | | 722,260 | | |
California First National Bancorp+ | | 71,257 | | 1,343,194 | | |
Capitala Finance Corp.+ | | 81,280 | | 1,057,453 | | |
Capstar Financial Holdings, Inc.*+ | | 40,000 | | 709,600 | | |
CB Financial Services, Inc. | | 21,700 | | 566,370 | | |
Chemung Financial Corp. | | 29,998 | | 1,226,318 | | |
Citizens Community Bancorp, Inc. | | 35,600 | | 497,688 | | |
Citizens First Corp. | | 2,581 | | 58,072 | | |
Citizens Holding Co.+ | | 20,670 | | 537,420 | | |
CM Finance, Inc.+ | | 35,000 | | 350,000 | | |
Codorus Valley Bancorp, Inc. | | 21,726 | | 617,006 | | |
Colony Bankcorp, Inc. | | 22,868 | | 313,292 | | |
Community West Bancshares | | 38,357 | | 398,913 | | |
Consumer Portfolio Services, Inc.* | | 155,100 | | 705,705 | | |
County Bancorp, Inc. | | 16,000 | | 384,000 | | |
| | | | |
| Industry Company | | Shares | | Value |
|
|
Financials (continued) | | |
Eagle Bancorp Montana, Inc. | | 6,289 | | $ 113,831 |
eHealth, Inc.* | | 70,000 | | 1,316,000 |
Entegra Financial Corp.*+ | | 26,800 | | 609,700 |
ESSA Bancorp, Inc. | | 59,000 | | 868,480 |
Evans Bancorp, Inc.+ | | 18,701 | | 747,105 |
Farmers Capital Bank Corp. | | 27,058 | | 1,043,086 |
Federated National Holding Co. | | 49,012 | | 784,192 |
Fifth Street Senior Floating Rate Corp. | | 103 | | 839 |
First Acceptance Corp.* | | 394,700 | | 449,958 |
First Bancorp, Inc. | | 20,800 | | 562,848 |
First Bancshares, Inc. (The)+ | | 30,094 | | 830,594 |
First Bank+ | | 19,345 | | 225,369 |
First Business Financial Services, Inc. | | 42,308 | | 976,469 |
First Financial Northwest, Inc. | | 47,000 | | 758,110 |
First Internet Bancorp | | 25,000 | | 701,250 |
First Northwest Bancorp* | | 15,000 | | 236,550 |
First South Bancorp, Inc. | | 56,980 | | 942,449 |
First United Corp.* | | 12,192 | | 182,270 |
GAIN Capital Holdings, Inc. | | 94,400 | | 588,112 |
Global Brokerage, Inc.*+ | | 26,000 | | 52,000 |
Great Elm Capital Group, Inc.*+ | | 1,666 | | 5,664 |
Guaranty Federal Bancshares, Inc.+ | | 20,856 | | 442,147 |
Hallmark Financial Services, Inc.* | | 80,400 | | 906,108 |
Hawthorn Bancshares, Inc.+ | | 26,000 | | 540,800 |
Health Insurance Innovations, Inc., Class A*+ | | 30,300 | | 712,050 |
HMN Financial, Inc.* | | 30,000 | | 538,500 |
Home Bancorp, Inc. | | 42,300 | | 1,798,596 |
HopFed Bancorp, Inc. | | 32,988 | | 485,253 |
Horizon Technology Finance Corp.+ | | 20,000 | | 226,600 |
Impac Mortgage Holdings, Inc.*+ | | 60,600 | | 916,878 |
Independence Holding Co. | | 45,743 | | 935,444 |
Institutional Financial Markets, Inc.+ | | 30,000 | | 35,400 |
Investar Holding Corp.+ | | 5,000 | | 114,500 |
Investors Title Co. | | 6,800 | | 1,315,392 |
JMP Group LLC+ | | 96,851 | | 528,806 |
KCAP Financial, Inc.+ | | 143,900 | | 507,967 |
Lake Shore Bancorp, Inc.+ | | 22,150 | | 351,964 |
Landmark Bancorp, Inc. | | 12,165 | | 374,682 |
| | |
| Ultra-Small Company Market Fund | | |
| SCHEDULE OF INVESTMENTS (continued) | | |
| Showing percentage of net assets as of June 30, 2017 | | |
| | | | | | | | |
| Industry Company | | Shares | | Value | | | |
| | |
Common Stocks (continued) | | | | | | |
Financials (continued) | | | | | | |
Malvern Bancorp, Inc.*+ | | 37,800 | | $ 905,310 | | | | |
Marlin Business Services Corp. | | 64,500 | | 1,622,175 | | | | |
MBT Financial Corp. | | 119,185 | | 1,156,094 | | | | |
Medallion Financial Corp.+ | | 95,411 | | 228,032 | | | | |
Medley Management, Inc., Class A+ | | 48,800 | | 317,200 | | | | |
Mid Penn Bancorp, Inc. | | 14,348 | | 393,853 | | | | |
MidSouth Bancorp, Inc.+ | | 24,700 | | 290,225 | | | | |
Monroe Capital Corp.+ | | 61,403 | | 935,168 | | | | |
MSB Financial Corp./MD* | | 25,000 | | 438,750 | | | | |
MutualFirst Financial, Inc. | | 38,911 | | 1,389,123 | | | | |
Newtek Business Services Corp.+ | | 18,200 | | 296,478 | | | | |
Northeast Bancorp | | 35,000 | | 712,250 | | | | |
Northrim BanCorp, Inc. | | 34,750 | | 1,056,400 | | | | |
Norwood Financial Corp.+ | | 8,500 | | 359,125 | | | | |
Ohio Valley Banc Corp.+ | | 19,500 | | 702,975 | | | | |
Oppenheimer Holdings, Inc., Class A | | 46,550 | | 763,420 | | | | |
Pacific Mercantile Bancorp*+ | | 83,319 | | 733,207 | | | | |
Patriot National, Inc.*+ | | 105,000 | | 222,600 | | | | |
Penns Woods Bancorp, Inc.+ | | 16,400 | | 675,352 | | | | |
Peoples Bancorp of North Carolina, Inc.+ | | 25,301 | | 799,512 | | | | |
Premier Financial Bancorp, Inc. | | 48,220 | | 993,814 | | | | |
Provident Financial Holdings, Inc. | | 38,617 | | 743,377 | | | | |
Pzena Investment Management, Inc., Class A | | 52,800 | | 536,448 | | | | |
Regional Management Corp.* | | 47,000 | | 1,110,610 | | | | |
Riverview Bancorp, Inc. | | 82,206 | | 545,848 | | | | |
Royal Bancshares of Pennsylvania, Inc., Class A* | | 78,195 | | 330,765 | | | | |
Safeguard Scientifics, Inc.* | | 19,500 | | 232,050 | | | | |
Security National Financial Corp., Class A*+ | | 53,043 | | 339,475 | | | | |
Select Bancorp, Inc.* | | 54,676 | | 668,141 | | | | |
Shore Bancshares, Inc. | | 42,500 | | 699,125 | | | | |
SI Financial Group, Inc. | | 40,176 | | 646,834 | | | | |
Silvercrest Asset Management Group Inc., Class A+ | | 50,002 | | 672,527 | | | | |
Southern First Bancshares, Inc.* | | 21,215 | | 786,016 | | | | |
Southern Missouri Bancorp, Inc. | | 30,000 | | 967,800 | | | | |
| | | | |
| Industry Company | | Shares | | Value |
|
|
Financials (continued) |
Southern National Bancorp of Virginia, Inc. | | 86,194 | | $ 1,517,021 |
Summit State Bank | | 17,200 | | 223,600 |
Sussex Bancorp+ | | 23,000 | | 569,250 |
TheStreet, Inc.* | | 313,634 | | 260,316 |
Timberland Bancorp, Inc.+ | | 34,222 | | 864,790 |
Two River Bancorp+ | | 39,968 | | 743,010 |
Union Bankshares, Inc./Morrisville VT+ | | 1,473 | | 69,968 |
United Community Bancorp | | 26,200 | | 513,520 |
Unity Bancorp, Inc.+ | | 41,500 | | 713,800 |
Wayne Savings Bancshares, Inc. | | 19,900 | | 347,852 |
Western New England Bancorp, Inc. | | 103,362 | | 1,049,124 |
| | | | |
| | | | 72,285,718 |
| |
Health Care - 18.51% | | |
AAC Holdings, Inc.*+ | | 98,000 | | 679,140 |
AcelRx Pharmaceuticals, Inc.*+ | | 281,150 | | 604,472 |
Actinium Pharmaceuticals, Inc.*+ | | 290,200 | | 354,044 |
AdCare Health Systems, Inc.*+ | | 129,601 | | 124,417 |
Adverum Biotechnologies, Inc.*+ | | 183,900 | | 459,750 |
Aeglea BioTherapeutics, Inc.* | | 75,000 | | 288,000 |
Agile Therapeutics, Inc.*+ | | 122,000 | | 457,500 |
Alimera Sciences, Inc.* | | 260,000 | | 361,400 |
Alliance HealthCare Services, Inc.* | | 44,936 | | 597,649 |
Almost Family, Inc.* | | 2,400 | | 147,960 |
Alphatec Holdings, Inc.*+ | | 19,800 | | 37,224 |
Altimmune, Inc. | | 53,002 | | 169,606 |
Apollo Endosurgery, Inc.*+ | | 20,000 | | 160,200 |
Applied Genetic Technologies Corp.* | | 92,400 | | 471,240 |
Aptevo Therapeutics, Inc.* | | 45,802 | | 94,810 |
Aquinox Pharmaceuticals, Inc.*+ | | 50,000 | | 703,500 |
Aratana Therapeutics, Inc.*+ | | 131,983 | | 954,237 |
ArQule, Inc.* | | 439,393 | | 544,847 |
Arrowhead Pharmaceuticals, Inc.*+ | | 200,000 | | 324,000 |
Asterias Biotherapeutics, Inc.*+ | | 138,363 | | 491,189 |
aTyr Pharma, Inc.*+ | | 102,697 | | 354,305 |
AVEO Pharmaceuticals, Inc.* | | 380,000 | | 843,600 |
Aviragen Therapeutics, Inc.* | | 158,470 | | 106,096 |
| | |
| 28 | | Annual Report | June 30, 2017 |
| | |
| Ultra-Small Company Market Fund | |
|
| SCHEDULE OF INVESTMENTS (continued) | |
| Showing percentage of net assets as of June 30, 2017 | | |
| | | | | | | | |
| Industry Company | | Shares | | Value | | | |
| | |
Common Stocks (continued) | | | | | | |
Health Care (continued) | | | | | | |
BioScrip, Inc.*+ | | 423,338 | | $1,149,363 | | | | |
Bovie Medical Corp.* | | 59,970 | | 148,126 | | | | |
Calithera Biosciences, Inc.*+ | | 127,600 | | 1,894,860 | | | | |
Cara Therapeutics, Inc.*+ | | 80,000 | | 1,231,200 | | | | |
CareDx, Inc.* | | 117,598 | | 130,534 | | | | |
Cascadian Therapeutics, Inc.*+ | | 247,700 | | 920,206 | | | | |
Castlight Health, Inc., Class B*+ | | 115,500 | | 479,325 | | | | |
Cellular Biomedicine Group, Inc.*+ | | 67,800 | | 593,250 | | | | |
Cempra, Inc.*+ | | 150,000 | | 690,000 | | | | |
ChemoCentryx, Inc.*+ | | 48,496 | | 453,923 | | | | |
Chiasma, Inc.* | | 172,389 | | 249,964 | | | | |
Chimerix, Inc.* | | 80,000 | | 436,000 | | | | |
Cidara Therapeutics, Inc.* | | 44,000 | | 330,000 | | | | |
Clearside Biomedical, Inc.*+ | | 99,200 | | 903,712 | | | | |
Conatus Pharmaceuticals, Inc.*+ | | 113,000 | | 650,880 | | | | |
Concert Pharmaceuticals, Inc.* | | 40,000 | | 558,000 | | | | |
ConforMIS, Inc.* | | 159,200 | | 682,968 | | | | |
Connecture, Inc.*+ | | 205,000 | | 126,670 | | | | |
Corindus Vascular Robotics, Inc.*+ | | 500,483 | | 930,898 | | | | |
Corium International, Inc.*+ | | 152,000 | | 1,133,920 | | | | |
CorMedix, Inc.*+ | | 177,701 | | 76,127 | | | | |
Cumberland Pharmaceuticals, Inc.* | | 202,500 | | 1,431,675 | | | | |
Curis, Inc.* | | 80,960 | | 153,014 | | | | |
Cutera, Inc.* | | 60,200 | | 1,559,180 | | | | |
Dicerna Pharmaceuticals, Inc.*+ | | 85,000 | | 269,450 | | | | |
Digirad Corp.+ | | 100,000 | | 405,000 | | | | |
Dimension Therapeutics, Inc.* | | 50,800 | | 73,660 | | | | |
Durect Corp.*+ | | 458,600 | | 715,416 | | | | |
Egalet Corp.*+ | | 166,350 | | 394,250 | | | | |
Eiger BioPharmaceuticals, Inc.*+ | | 50,000 | | 395,000 | | | | |
Electromed, Inc.* | | 50,000 | | 276,500 | | | | |
Eleven Biotherapeutics, Inc.*+ | | 65,000 | | 102,050 | | | | |
Endocyte, Inc.*+ | | 249,000 | | 373,500 | | | | |
Fate Therapeutics, Inc.*+ | | 180,000 | | 583,200 | | | | |
Flex Pharma, Inc.*+ | | 48,189 | | 185,528 | | | | |
Flexion Therapeutics, Inc.*+ | | 22,000 | | 444,840 | | | | |
Fluidigm Corp.* | | 113,772 | | 459,639 | | | | |
Fulgent Genetics, Inc.*+ | | 3,100 | | 19,809 | | | | |
Genocea Biosciences, Inc.*+ | | 119,000 | | 621,180 | | | | |
| | | | | | | | |
| Industry Company | | Shares | | | Value | |
| |
| | | | | |
Health Care (continued) | |
GlycoMimetics, Inc.*+ | | | 66,764 | | | | $ 745,086 | |
Harvard Bioscience, Inc.* | | | 317,017 | | | | 808,393 | |
Histogenics Corp.* | | | 100,000 | | | | 180,000 | |
Immune Design Corp.*+ | | | 115,000 | | | | 1,121,250 | |
Infinity Pharmaceuticals, Inc.* | | | 200,000 | | | | 314,000 | |
InfuSystems Holdings, Inc.* | | | 259,900 | | | | 467,820 | |
InVivo Therapeutics Holdings Corp.*+ | | | 121,350 | | | | 327,645 | |
Invuity, Inc.*+ | | | 75,000 | | | | 543,750 | |
IRIDEX Corp.*+ | | | 56,900 | | | | 562,741 | |
IsoRay, Inc.* | | | 218,700 | | | | 136,688 | |
Juniper Pharmaceuticals, Inc.*+ | | | 59,200 | | | | 298,960 | |
Kadmon Holdings, Inc.*+ | | | 193,000 | | | | 750,770 | |
Kewaunee Scientific Corp. | | | 14,000 | | | | 349,300 | |
Kura Oncology, Inc.*+ | | | 92,200 | | | | 857,460 | |
Lantheus Holdings, Inc.* | | | 59,802 | | | | 1,055,505 | |
Leap Therapeutics, Inc.*+ | | | 6,500 | | | | 42,315 | |
Matinas BioPharma Holdings, Inc.*+ | | | 125,000 | | | | 211,250 | |
MediciNova, Inc.*+ | | | 107,710 | | | | 566,555 | |
Minerva Neurosciences, Inc.*+ | | | 120,700 | | | | 1,068,195 | |
Mirna Therapeutics, Inc.* | | | 45,000 | | | | 76,050 | |
Misonix, Inc.*+ | | | 25,000 | | | | 241,250 | |
NanoViricides, Inc.*+ | | | 225,000 | | | | 303,750 | |
Navidea Biopharmaceuticals, Inc.*+ | | | 548,580 | | | | 279,776 | |
Neos Therapeutics, Inc.*+ | | | 40,100 | | | | 292,730 | |
Nivalis Therapeutics, Inc.* | | | 60,000 | | | | 144,600 | |
Novan, Inc.* | | | 22,688 | | | | 91,433 | |
Nuvectra Corp.* | | | 26,000 | | | | 345,280 | |
Obalon Therapeutics, Inc.*+ | | | 25,000 | | | | 247,750 | |
Ocera Therapeutics, Inc.* | | | 56,205 | | | | 65,198 | |
Ocular Therapeutix, Inc.*+ | | | 100,000 | | | | 927,000 | |
Oncobiologics, Inc.* | | | 113,000 | | | | 114,130 | |
Oncocyte Corp.*+ | | | 130,000 | | | | 676,000 | |
OncoMed Pharmaceuticals, Inc.*+ | | | 8,000 | | | | 26,640 | |
Oragenics, Inc.* | | | 45,696 | | | | 16,908 | |
Pain Therapeutics, Inc.*+ | | | 40,765 | | | | 167,952 | |
Protalix BioTherapeutics, Inc.*+ | | | 271,672 | | | | 227,525 | |
Proteostasis Therapeutics, Inc.*+ | | | 59,500 | | | | 278,460 | |
pSivida Corp.*+ | | | 100,000 | | | | 171,000 | |
RadNet, Inc.* | | | 139,800 | | | | 1,083,450 | |
REGENXBIO, Inc.*+ | | | 27,852 | | | | 550,077 | |
Retractable Technologies, Inc.* | | | 34,000 | | | | 43,520 | |
| | |
| Ultra-Small Company Market Fund | | |
| SCHEDULE OF INVESTMENTS (continued) | | |
| Showing percentage of net assets as of June 30, 2017 | | |
| | | | | | | | |
| Industry Company | | Shares | | Value | | | |
| | |
Common Stocks (continued) | | | | | | |
Health Care (continued) | | | | | | |
Rigel Pharmaceuticals, Inc.* | | 150,000 | | $ 409,500 | | | | |
Roka Bioscience, Inc.* | | 16,950 | | 45,087 | | | | |
RTI Surgical, Inc.* | | 191,900 | | 1,122,615 | | | | |
SCYNEXIS, Inc.*+ | | 50,000 | | 89,500 | | | | |
SeaSpine Holdings Corp.*+ | | 93,600 | | 1,078,272 | | | | |
Selecta Biosciences, Inc.*+ | | 25,000 | | 496,500 | | | | |
Senseonics Holdings, Inc.*+ | | 353,400 | | 636,120 | | | | |
Sientra, Inc.*+ | | 134,200 | | 1,304,424 | | | | |
Sierra Oncology, Inc.* | | 134,300 | | 157,131 | | | | |
Syndax Pharmaceuticals, Inc.* | | 50,500 | | 705,485 | | | | |
T2 Biosystems, Inc.*+ | | 110,900 | | 355,989 | | | | |
Tabula Rasa HealthCare, Inc.* | | 61,800 | | 930,090 | | | | |
Tactile Systems Technology, Inc.*+ | | 35,000 | | 1,000,300 | | | | |
Tetraphase Pharmaceuticals, Inc.*+ | | 75,000 | | 534,750 | | | | |
Tracon Pharmaceuticals, Inc.*+ | | 54,135 | | 129,924 | | | | |
Utah Medical Products, Inc. | | 33,900 | | 2,454,360 | | | | |
Veracyte, Inc.* | | 112,400 | | 936,292 | | | | |
Verastem, Inc.* | | 153,900 | | 335,502 | | | | |
Vital Therapies, Inc.*+ | | 140,000 | | 406,000 | | | | |
VIVUS, Inc.* | | 547,100 | | 667,462 | | | | |
vTv Therapeutics, Inc. Class A*+ | | 60,000 | | 298,200 | | | | |
Zafgen, Inc.*+ | | 159,785 | | 560,845 | | | | |
Zogenix, Inc.*+ | | 105,540 | | 1,530,330 | | | | |
Zynerba Pharmaceuticals, Inc.*+ | | 40,000 | | 678,800 | | | | |
| | | | | | | | |
| | | | 65,203,643 | | | | |
| | |
Industrials - 12.37% | | | | | | |
Acacia Research Corp.* | | 15,000 | | 61,500 | | | | |
Acme United Corp. | | 5,000 | | 143,000 | | | | |
AeroCentury Corp.*+ | | 10,900 | | 135,160 | | | | |
Air Industries Group*+ | | 80,000 | | 143,200 | | | | |
Allied Motion Technologies, Inc. | | 35,650 | | 970,393 | | | | |
Alpha Pro Tech, Ltd.* | | 211,200 | | 623,040 | | | | |
American Superconductor Corp.* | | 45,100 | | 208,362 | | | | |
AMREP Corp.* | | 30,100 | | 204,078 | | | | |
ARC Document Solutions, Inc.* | | 100,000 | | 416,000 | | | | |
Arotech Corp.*+ | | 121,367 | | 430,853 | | | | |
BG Staffing, Inc.+ | | 37,500 | | 651,750 | | | | |
CAI International, Inc.* | | 48,500 | | 1,144,600 | | | | |
CDI Corp.* | | 74,600 | | 436,410 | | | | |
Celadon Group, Inc.+ | | 55,700 | | 175,455 | | | | |
| | | | | | | | |
| Industry Company | | Shares | | | Value | |
|
| |
Industrials (continued) | | | | | | | | |
Cenveo, Inc.*+ | | | 57,662 | | | | $ 351,162 | |
Chicago Rivet & Machine Co. | | | 10,000 | | | | 360,000 | |
Command Security Corp.*+ | | | 44,600 | | | | 140,490 | |
Commercial Vehicle Group, Inc.* | | | 131,000 | | | | 1,106,950 | |
CompX International, Inc. | | | 3,200 | | | | 48,800 | |
Covenant Transportation Group, Inc., Class A*+ | | | 20,700 | | | | 362,871 | |
CPI Aerostructures, Inc.*+ | | | 31,300 | | | | 294,220 | |
CRA International, Inc. | | | 39,500 | | | | 1,434,640 | |
DMC Global, Inc. | | | 69,100 | | | | 905,210 | |
Ducommun, Inc.* | | | 27,100 | | | | 855,818 | |
Eastern Co. (The)+ | | | 33,600 | | | | 1,009,680 | |
Ecology & Environment, Inc., Class A | | | 3,000 | | | | 37,950 | |
EnviroStar, Inc.+ | | | 35,000 | | | | 946,750 | |
Espey Manufacturing & Electronics Corp. | | | 10,700 | | | | 239,894 | |
Franklin Covey Co.* | | | 33,334 | | | | 643,346 | |
FreightCar America, Inc. | | | 20,000 | | | | 347,800 | |
Fuel Tech, Inc.* | | | 118,628 | | | | 99,648 | |
Gencor Industries, Inc.* | | | 71,450 | | | | 1,157,490 | |
General Finance Corp.*+ | | | 136,723 | | | | 704,123 | |
Goldfield Corp. (The)* | | | 63,480 | | | | 349,140 | |
Graham Corp.+ | | | 35,900 | | | | 705,794 | |
Great Lakes Dredge & Dock Corp.* | | | 65,000 | | | | 279,500 | |
Hardinge, Inc. | | | 53,300 | | | | 661,986 | |
HC2 Holdings, Inc.* | | | 188,600 | | | | 1,108,968 | |
Highpower International, Inc.*+ | | | 50,000 | | | | 182,500 | |
Hill International, Inc.* | | | 286,551 | | | | 1,490,065 | |
Houston Wire & Cable Co.+ | | | 59,300 | | | | 311,325 | |
Hudson Global, Inc. | | | 304,760 | | | | 408,378 | |
Hurco Cos., Inc. | | | 41,334 | | | | 1,436,356 | |
Innovative Solutions & Support, Inc.* | | | 172,054 | | | | 757,038 | |
Intersections, Inc.*+ | | | 85,300 | | | | 400,910 | |
Key Technology, Inc.* | | | 43,900 | | | | 603,625 | |
L.B. Foster Co., Class A+ | | | 39,000 | | | | 836,550 | |
L.S. Starrett Co. (The), Class A | | | 38,136 | | | | 327,970 | |
Lawson Products, Inc.* | | | 32,400 | | | | 717,660 | |
Layne Christensen Co.*+ | | | 36,430 | | | | 320,220 | |
LSI Industries, Inc. | | | 20,100 | | | | 181,905 | |
Mastech Digital, Inc.*+ | | | 6,250 | | | | 40,500 | |
Miller Industries, Inc. | | | 29,800 | | | | 740,530 | |
Northwest Pipe Co.*+ | | | 32,295 | | | | 525,117 | |
Orion Group Holdings, Inc.* | | | 108,200 | | | | 808,254 | |
| | |
| 30 | | Annual Report | June 30, 2017 |
| | |
| Ultra-Small Company Market Fund | | |
| SCHEDULE OF INVESTMENTS (continued) | | |
| Showing percentage of net assets as of June 30, 2017 | | |
| | | | | | |
| Industry Company | | Shares | | Value | | |
| |
Common Stocks (continued) | | |
Industrials (continued) | | |
PAM Transportation Services, Inc.* | | 21,400 | | $ 405,530 | | |
Patriot Transportation Holding, Inc.* | | 15,000 | | 268,050 | | |
Performant Financial Corp.*+ | | 310,000 | | 647,900 | | |
Perma-Pipe International Holdings, Inc.* | | 71,100 | | 568,800 | | |
Preformed Line Products Co. | | 8,489 | | 394,059 | | |
Radiant Logistics, Inc.*+ | | 125,000 | | 672,500 | | |
RCM Technologies, Inc.* | | 111,510 | | 563,126 | | |
SIFCO Industries, Inc.* | | 53,046 | | 352,756 | | |
Spartan Motors, Inc. | | 148,200 | | 1,311,570 | | |
Sparton Corp.* | | 48,300 | | 1,062,117 | | |
Sterling Construction Co., Inc.* | | 64,736 | | 846,100 | | |
Supreme Industries, Inc., Class A | | 56,800 | | 934,360 | | |
Tel-Instrument Electronics Corp.*+ | | 15,000 | | 48,000 | | |
Transcat, Inc.*+ | | 5,000 | | 60,750 | | |
Twin Disc, Inc.*+ | | 56,600 | | 913,524 | | |
Ultralife Corp.* | | 112,400 | | 809,280 | | |
Versar, Inc.* | | 173,538 | | 253,365 | | |
Virco Manufacturing Corp.* | | 14,600 | | 78,110 | | |
Volt Information Sciences, Inc.* | | 181,576 | | 717,225 | | |
Willdan Group, Inc.*+ | | 45,000 | | 1,374,750 | | |
Willis Lease Finance Corp.* | | 39,000 | | 1,042,470 | | |
Xerium Technologies, Inc.* | | 33,550 | | 241,224 | | |
| | | | | | |
| | | | 43,550,500 | | |
Information Technology - 16.99% | | |
Aerohive Networks, Inc.*+ | | 50,000 | | 250,000 | | |
Agilysys, Inc.* | | 75,000 | | 759,000 | | |
ALJ Regional Holdings, Inc.*+ | | 88,000 | | 281,600 | | |
Amber Road, Inc.* | | 92,800 | | 795,296 | | |
American Software, Inc., Class A | | 35,700 | | 367,353 | | |
Amtech Systems, Inc.* | | 57,500 | | 485,300 | | |
AstroNova, Inc. | | 32,800 | | 429,680 | | |
Aviat Networks, Inc.*+ | | 6,186 | | 107,636 | | |
Aware, Inc.* | | 6,023 | | 31,018 | | |
AXT, Inc.* | | 201,006 | | 1,276,388 | | |
Black Box Corp. | | 53,764 | | 459,682 | | |
Brightcove, Inc.* | | 143,300 | | 888,460 | | |
BroadVision, Inc.*+ | | 72,749 | | 320,096 | | |
BSQUARE Corp.* | | 79,500 | | 445,200 | | |
Care.com, Inc.* | | 100,000 | | 1,510,000 | | |
| | | | |
| Industry Company | | Shares | | Value |
| | |
| | | | |
Information Technology (continued) |
Clearfield, Inc.*+ | | 26,000 | | $ 343,200 |
Communications Systems, Inc. | | 103,800 | | 449,454 |
Computer Task Group, Inc. | | 105,762 | | 591,210 |
Concurrent Computer Corp. | | 75,700 | | 510,218 |
Covisint Corp.* | | 187,200 | | 458,640 |
CSP, Inc. | | 38,700 | | 416,025 |
CyberOptics Corp.*+ | | 42,550 | | 878,658 |
DHI Group, Inc.* | | 15,664 | | 44,642 |
Echelon Corp.*+ | | 30,000 | | 156,900 |
Edgewater Technology, Inc.* | | 91,212 | | 622,978 |
Electro Scientific Industries, Inc.* | | 126,700 | | 1,044,008 |
EMCORE Corp. | | 98,702 | | 1,051,176 |
EnerNOC, Inc.*+ | | 179,100 | | 1,388,025 |
Everi Holdings, Inc.* | | 13,500 | | 98,280 |
Exa Corp.* | | 74,150 | | 1,023,270 |
Frequency Electronics, Inc.*+ | | 41,000 | | 391,140 |
GlobalSCAPE, Inc. | | 176,600 | | 934,214 |
GSE Systems, Inc.* | | 195,125 | | 575,619 |
GSI Technology, Inc.*+ | | 161,417 | | 1,268,738 |
Guidance Software, Inc.* | | 134,481 | | 888,919 |
ID Systems, Inc.* | | 83,000 | | 508,790 |
IEC Electronics Corp.* | | 73,450 | | 264,420 |
Information Services Group, Inc.* | | 150,000 | | 616,500 |
Innodata, Inc.* | | 294,955 | | 516,171 |
Inseego Corp.*+ | | 225,000 | | 281,250 |
Intelligent Systems Corp.* | | 35,362 | | 123,060 |
Intermolecular, Inc.* | | 247,600 | | 230,268 |
Internap Corp.*+ | | 233,600 | | 857,312 |
inTEST Corp.* | | 49,500 | | 331,650 |
Intevac, Inc.* | | 82,933 | | 920,556 |
IntriCon Corp.* | | 21,500 | | 172,000 |
Inuvo, Inc.* | | 265,600 | | 270,912 |
iPass, Inc.* | | 50,000 | | 66,000 |
Issuer Direct Corp. | | 25,000 | | 323,750 |
Iteris, Inc.*+ | | 82,520 | | 513,274 |
KEMET Corp.* | | 6,921 | | 88,589 |
Key Tronic Corp.* | | 57,100 | | 404,268 |
KVH Industries, Inc.* | | 84,510 | | 802,845 |
Leaf Group, Ltd.*+ | | 107,905 | | 841,659 |
Limelight Networks, Inc.* | | 276,537 | | 799,192 |
Liquidity Services, Inc.* | | 102,000 | | 647,700 |
Marchex, Inc., Class B* | | 37,400 | | 111,452 |
Marin Software, Inc.* | | 314,000 | | 408,200 |
Mattersight Corp.*+ | | 164,896 | | 420,485 |
MaxPoint Interactive, Inc.*+ | | 30,000 | | 221,700 |
| | |
| Ultra-Small Company Market Fund | |
|
| SCHEDULE OF INVESTMENTS (continued) | |
| Showing percentage of net assets as of June 30, 2017 | | |
| | | | | | |
| Industry Company | | Shares | | Value | | |
| | |
Common Stocks (continued) | | | | |
Information Technology (continued) | | | | |
Maxwell Technologies, Inc.*+ | | 80,000 | | $ 479,200 | | |
Napco Security Technologies Inc.* | | 81,576 | | 766,814 | | |
NCI, Inc., Class A* | | 38,430 | | 810,873 | | |
Network-1 Technologies, Inc. | | 50,000 | | 212,500 | | |
Numerex Corp., Class A*+ | | 36,008 | | 177,519 | | |
PAR Technology Corp.* | | 104,750 | | 893,518 | | |
PCM, Inc.*+ | | 54,200 | | 1,016,250 | | |
PC-Tel, Inc. | | 91,100 | | 644,988 | | |
Perceptron, Inc.* | | 80,000 | | 582,400 | | |
Pixelworks, Inc.*+ | | 58,900 | | 270,351 | | |
PRGX Global, Inc.* | | 143,100 | | 930,150 | | |
QAD, Inc., Class B | | 8,250 | | 221,512 | | |
Quantum Corp.* | | 31,250 | | 244,062 | | |
QuinStreet, Inc.* | | 151,547 | | 631,951 | | |
Qumu Corp.* | | 77,700 | | 226,884 | | |
Radisys Corp.* | | 259,300 | | 974,968 | | |
RealNetworks, Inc.* | | 153,800 | | 665,954 | | |
Reis, Inc. | | 54,800 | | 1,164,500 | | |
RELM Wireless Corp.+ | | 243,744 | | 926,227 | | |
RF Industries, Ltd. | | 35,000 | | 64,750 | | |
Richardson Electronics, Ltd. | | 102,011 | | 609,006 | | |
Rightside Group Ltd* | | 87,056 | | 924,535 | | |
Rocket Fuel, Inc.*+ | | 229,112 | | 630,058 | | |
Rosetta Stone, Inc.* | | 103,160 | | 1,112,065 | | |
Seachange International, Inc.* | | 184,000 | | 489,440 | | |
Sigma Designs, Inc.* | | 128,800 | | 753,480 | | |
SMTC Corp.* | | 149,000 | | 193,700 | | |
Spark Networks, Inc.* | | 249,500 | | 239,520 | | |
StarTek, Inc.* | | 65,000 | | 795,600 | | |
Synacor, Inc.* | | 172,800 | | 630,720 | | |
TechTarget, Inc.* | | 16,392 | | 169,985 | | |
TESSCO Technologies, Inc. | | 44,500 | | 591,850 | | |
TransAct Technologies, Inc. | | 80,688 | | 685,848 | | |
Travelzoo*+ | | 70,000 | | 766,500 | | |
Tremor Video, Inc.* | | 460,200 | | 1,145,898 | | |
Trio-Tech International* | | 6,000 | | 29,880 | | |
Ultra Clean Holdings, Inc.* | | 20,000 | | 375,000 | | |
Upland Software, Inc.*+ | | 49,000 | | 1,077,510 | | |
USA Technologies, Inc.*+ | | 171,400 | | 891,280 | | |
Vishay Precision Group, Inc.* | | 56,900 | | 984,370 | | |
Wayside Technology Group, Inc. | | 35,298 | | 683,016 | | |
Wireless Telecom Group, Inc.* | | 113,100 | | 180,960 | | |
YuMe, Inc. | | 121,726 | | 572,112 | | |
| | | | |
| Industry Company | | Shares | | Value |
| | |
| | | | |
Information Technology (continued) |
Zedge, Inc., Class B* | | 16,855 | | $ 37,250 |
Zix Corp.* | | 187,582 | | 1,067,342 |
| | | | |
| | | | 59,826,322 |
Materials - 3.38% | | | | |
Advanced Emissions | | | | |
Solutions, Inc.+ | | 77,075 | | 706,007 |
Ampco-Pittsburgh Corp. | | 76,499 | | 1,128,360 |
BioAmber, Inc.*+ | | 166,700 | | 428,419 |
Codexis, Inc.* | | 232,500 | | 1,267,125 |
Core Molding Technologies, Inc.*+ | | 45,100 | | 974,611 |
Flexible Solutions International, Inc.* | | 41,200 | | 74,572 |
Friedman Industries, Inc. | | 57,000 | | 323,760 |
Gold Resource Corp. | | 108,100 | | 441,048 |
Gulf Resources, Inc.* | | 285,900 | | 454,581 |
Intrepid Potash, Inc.*+ | | 250,000 | | 565,000 |
LSB Industries, Inc.*+ | | 80,000 | | 826,400 |
Marrone Bio Innovations, Inc.*+ | | 154,908 | | 199,831 |
Northern Technologies International Corp.* | | 13,950 | | 222,502 |
Olympic Steel, Inc. | | 43,200 | | 841,536 |
Orient Paper, Inc.* | | 163,811 | | 167,087 |
Ryerson Holding Corp.* | | 37,036 | | 366,656 |
Synalloy Corp.* | | 77,400 | | 878,490 |
Trecora Resources* | | 30,000 | | 337,500 |
Universal Stainless & Alloy Products, Inc.*+ | | 48,286 | | 941,577 |
Verso Corp., Class A*+ | | 161,000 | | 755,090 |
| | | | |
| | | | 11,900,152 |
Real Estate - 1.14% | | | | |
Consolidated-Tomoka Land Co. | | 21,249 | | 1,210,131 |
Griffin Industrial Realty, Inc. | | 13,905 | | 436,200 |
Maui Land & Pineapple Co., Inc.*+ | | 30,000 | | 609,000 |
Stratus Properties, Inc.+ | | 37,150 | | 1,092,210 |
Transcontinental Realty Investors, Inc.*+ | | 2,300 | | 61,847 |
Trinity Place Holdings, Inc.* | | 85,100 | | 605,061 |
| | | | |
| | | | 4,014,449 |
Telecommunication Services - 1.26% |
Alaska Communications | | | | |
Systems Group, Inc.* | | 243,000 | | 534,600 |
Hawaiian Telcom Holdco, Inc.* | | 45,642 | | 1,140,594 |
| | |
| 32 | | Annual Report | June 30, 2017 |
| | |
| Ultra-Small Company Market Fund | |
|
| SCHEDULE OF INVESTMENTS (continued) | |
| Showing percentage of net assets as of June 30, 2017 | | |
| | | | | | | | |
| Industry Company | | Shares | | Value | | | |
| |
Common Stocks (continued) | | | | |
Telecommunication Services (continued) | | | | |
Ooma, Inc.*+ | | 72,500 | | $ 580,000 | | | | |
Straight Path Communi- cations, Inc., Class B*+ | | 12,143 | | 2,181,490 | | | | |
| | | | | | | | |
| | | | 4,436,684 | | | | |
| |
Utilities - 1.84% | | | | |
Artesian Resources Corp., Class A | | 21,500 | | 809,260 | | | | |
Cadiz, Inc.*+ | | 71,700 | | 967,950 | | | | |
Delta Natural Gas Co., Inc. | | 40,000 | | 1,218,800 | | | | |
Gas Natural, Inc. | | 48,800 | | 629,520 | | | | |
Genie Energy, Ltd., Class B | | 98,667 | | 751,843 | | | | |
Global Water Resources, Inc.+ | | 3,000 | | 29,700 | | | | |
RGC Resources, Inc.+ | | 8,000 | | 226,640 | | | | |
Spark Energy, Inc., Class A+ | | 43,000 | | 808,400 | | | | |
York Water Co., (The)+ | | 30,214 | | 1,052,958 | | | | |
| | | | | | | | |
| | | | 6,495,071 | | | | |
| | | | | | | | |
TOTAL COMMON STOCKS - 99.22% | | 349,427,473 | | | | |
| | | | | | | | |
| (Cost $269,271,937) | | | | | | | | |
| |
EXCHANGE TRADED FUND - 0.21% | | | | |
iShares Micro-Cap ETF+ | | 8,525 | | 758,128 | | | | |
| | | | | | | | |
TOTAL EXCHANGE TRADED
FUND - 0.21% | | 758,128 | | | | |
| | | | | | | | |
(Cost $218,805) | | | | | | | | |
| |
WARRANTS - 0.00% | | | | |
Asterias Biotherapeutics, Inc.,
expire 09/29/17*+ | | 27,672 | | 13,836 | | | | |
BioTime, Inc.,
expire 10/01/18*+ | | 16,058 | | 5,299 | | | | |
SAExploration Series A, expire 07/27/21*D | | 848 | | — | | | | |
SAExploration Series B, expire 07/27/21*D | | 848 | | — | | | | |
| | | | | | | | |
TOTAL WARRANTS - 0.00% | | 19,135 | | | | |
| | | | | | | | |
(Cost $36,343) | | | | | | | | |
| | | | | | | | |
| | | Rate^ | | Shares | | Value | |
|
MONEY MARKET FUND - 0.27% | |
Fidelity Investments Money Market Government Portfolio Class I | | 0.81% | | 936,056 | | | $ 936,056 | |
| | | | | | | | |
TOTAL MONEY MARKET FUND - 0.27% | | | | | 936,056 | |
| | | | | | | | |
(Cost $936,056) | | | | | | | | |
|
| INVESTMENTS PURCHASED WITH CASH PROCEEDS FROM SECURITIES LENDING - 18.03% | |
Fidelity Investments Money Market Government Portfolio Class I** | | 0.81% | | 63,491,698 | | | 63,491,698 | |
| | | | | | | | |
TOTAL INVESTMENTS PURCHASED WITH CASH PROCEEDS FROM SECURITIES LENDING - 18.03% | | | 63,491,698 | |
| | | | | | | | |
(Cost $63,491,698) | | | | | | | | |
| |
TOTAL INVESTMENTS - 117.73% | | | $ 414,632,490 | |
(Cost $333,954,839) | | | | | | | | |
Liabilities in Excess of Other
Assets - (17.73%) | | | (62,442,577) | |
| | | | | | | | |
NET ASSETS - 100.00% | | | $ 352,189,913 | |
| | | | | | | | |
| * | Non-income producing security. |
| ** | This security represents the investment of the collateral received in connection with securities out on loan as of June 30, 2017. |
| ^ | Rate disclosed as of June 30, 2017. |
| D | Security was fair valued under procedures adopted by the Board of Directors (see Note 2). |
| + | This security or a portion of the security is out on loan as of June 30, 2017. Total loaned securities had a value of $59,690,789 as of June 30, 2017. |
LLC - Limited Liability Company
| | |
| Ultra-Small Company Market Fund | | |
| SCHEDULE OF INVESTMENTS (continued) | | |
| Showing percentage of net assets as of June 30, 2017 | | |
| | | | | | | | | | | | | | | | |
| Summary of inputs used to value the Fund’s investments as of 06/30/2017 (See Note 2 in Notes to Financial Statements): | |
| |
| | | Valuation Inputs | |
| |
| | | Investment in Securities (Value) | |
| |
| | | | | | Level 2 | | | Level 3 | | | | |
| | | Level 1 | | | Significant | | | Significant | | | | |
| | | Quoted | | | Observable | | | Unobservable | | | | |
| | | Prices | | | Inputs | | | Inputs | | | Total | |
| |
| | | | |
Common Stocks (a) | | $ | 349,399,411 | | | $ | — | | | $ | 28,062 | | | $ | 349,427,473 | |
Exchange Traded Fund | | | 758,128 | | | | — | | | | — | | | | 758,128 | |
Warrants | | | 19,135 | | | | — | | | | 0 | | | | 19,135 | |
Money Market Fund | | | — | | | | 936,056 | | | | — | | | | 936,056 | |
Investments Purchased with Cash Proceeds from Securities Lending | | | — | | | | 63,491,698 | | | | — | | | | 63,491,698 | |
| | | | | | | | | | | | | | | | |
TOTAL | | $ | 350,176,674 | | | $ | 64,427,754 | | | $ | 28,062 | | | $ | 414,632,490 | |
| | | | | | | | | | | | | | | | |
| (a) | - Please refer to the Schedule of Investments for the industry classifications of these portfolio holdings. |
See Notes to Financial Statements.
| | |
| 34 | | Annual Report | June 30, 2017 |
| | |
| Small-Cap Momentum Fund | |
|
| MANAGER’S COMMENTARY (Unaudited) | |
| | |
June 30, 2017
Dear Fellow Small-Cap Momentum Fund Shareholder,
For the quarter ended June 30, 2017, our Fund returned +2.28%, underperforming our primary market benchmark, the Russell 2000 Index (+2.46%).
For the fiscal year, our Fund returned +18.08%, trailing the Russell 2000 Index (+24.60%). It was a poor year on a relative basis.
The table below presents our June quarter, one-year, five-year, and inception-to-date financial results. See the next page for a graph of performance since inception.
Standardized Returns as of June 30, 2017
| | | | | | | | | | | | | | | | | | |
| | | | | | | | | | | | Annualized | | | |
| | | Quarter | | | 1 Year | | | 5 Years | | | Since Inception
(5/28/10) | | | |
| | | | | |
Small-Cap Momentum Fund | | | 2.28% | | | | 18.08% | | | | 11.73% | | | 11.78% | | | | |
Russell 2000 Index | | | 2.46% | | | | 24.60% | | | | 13.70% | | | 12.82% | | | | |
Performance figures quoted in the table above represent past performance and are no guarantee of future results. Total return figures in the table above include the reinvestment of dividends and capital gains. The table above does not reflect the deduction of taxes that a shareholder would pay on Fund distributions or on the redemption of Fund shares.
The Russell 2000 Index is an unmanaged, market value weighted index that measures performance of the 2,000 companies that are between the 1,000th and 3,000th largest in the market with dividends reinvested. It is not possible to invest directly in an index. Periods longer than one year are annualized.
According to data from Lipper, Inc. as of June 30, 2017, Small-Cap Momentum Fund ranked 770th of 949 small-cap core funds for the 12 months ended June 30, 2017, 521st of 680 over the last five years, and 345th of 597 such funds since inception in May 2010. Lipper, Inc. is an independent mutual fund rating service that ranks funds in various fund categories by making comparative calculations using total returns.
| | |
| Small-Cap Momentum Fund | |
|
| MANAGER’S COMMENTARY (Unaudited) (continued) | |
| | |
Growth of a $10,000 Investment
from Inception May 28, 2010 to June 30, 2017
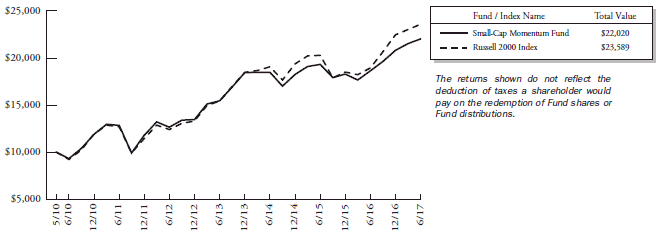
Detailed Explanation of Quarterly Performance
The Fund’s tilt toward higher-momentum stocks detracted from relative results, as lower-momentum small-cap stocks outperformed higher-momentum small-cap stocks for the quarter. Our risk-adjustment feature, which avoids some of the higher-volatility stocks in the momentum factor, helped offset some of the Fund’s underperformance. The Fund’s tilt toward shares of higher-quality companies (as measured by lower debt-to-equity ratios) also contributed positively to relative results.
Detailed Explanation of Fiscal Year Performance
The Fund’s tilt toward higher-momentum stocks weighed significantly on relative results, as higher-momentum small-cap stocks underperformed lower-momentum small-cap names for the fiscal year. The Fund’s risk-adjustment feature, which avoids some higher-volatility stocks, also detracted from relative performance for the 12-month period.
Top Ten Holdings as of June 30, 2017
| | | | | | |
| Rank | | Description | | Industry | | % of Net Assets |
| 1 | | MasTec, Inc. | | Industrials | | 0.9% |
| 2 | | PS Business Parks, Inc. | | Real Estate | | 0.9% |
| 3 | | Chimera Investment Corp. | | Financials | | 0.9% |
| 4 | | Essent Group, Ltd. | | Financials | | 0.9% |
| 5 | | Silgan Holdings, Inc. | | Materials | | 0.9% |
| 6 | | Nu Skin Enterprises, Inc., Class A | | Consumer Staples | | 0.9% |
| 7 | | ILG, Inc. | | Consumer Discretionary | | 0.9% |
| 8 | | Brink’s Co. (The) | | Industrials | | 0.9% |
| 9 | | ICU Medical, Inc. | | Health Care | | 0.8% |
| 10 | | Cabot Corp. | | Materials | | 0.8% |
| | Total | | | | 8.8% |
| | |
| 36 | | Annual Report | June 30, 2017 |
| | |
| Small-Cap Momentum Fund | | |
| MANAGER’S COMMENTARY (Unaudited) (continued) | | |
| | |
Industry Sector Representation as of June 30, 2017
| | | | | | | | | | | | | | | |
| | | % of Net Assets | | % of Russell
2000 Index | | Difference |
Consumer Discretionary | | | | 13.1 | % | | | | 12.5 | % | | | | 0.6% | |
Consumer Staples | | | | 3.8 | % | | | | 2.7 | % | | | | 1.1% | |
Energy | | | | 2.4 | % | | | | 3.6 | % | | | | -1.2% | |
Financials | | | | 15.6 | % | | | | 18.1 | % | | | | -2.5% | |
Health Care | | | | 11.0 | % | | | | 15.0 | % | | | | -4.0% | |
Industrials | | | | 16.7 | % | | | | 14.6 | % | | | | 2.1% | |
Information Technology | | | | 20.8 | % | | | | 17.0 | % | | | | 3.8% | |
Materials | | | | 8.6 | % | | | | 4.4 | % | | | | 4.2% | |
Real Estate | | | | 4.2 | % | | | | 7.5 | % | | | | -3.3% | |
Telecommunication Services | | | | 0.2 | % | | | | 0.9 | % | | | | -0.7% | |
Utilities | | | | 3.4 | % | | | | 3.7 | % | | | | -0.3% | |
Cash & Other Assets | | | | 0.2 | % | | | | 0.0 | % | | | | 0.2% | |
Total | | | | 100.0 | % | | | | 100.0 | % | | | | | |
Disclaimer
The views expressed here are exclusively those of Fund management. These views, including those related to market sectors or individual stocks, are not meant as investment advice and should not be considered predictive in nature. Any favorable (or unfavorable) description of a holding applies only as of June 30, 2017, unless otherwise stated. Security positions can and do change thereafter. Discussions of historical performance do not guarantee and are not indicative of future performance.
Market volatility can significantly impact short-term performance. The Fund is not an appropriate investment for short-term investors. Investments in small companies generally carry greater risk than is customarily associated with larger companies. This additional risk is attributable to a number of factors, including the relatively limited financial resources that are typically available to small companies and the fact that small companies often have comparatively limited product lines. In addition, the stock of small companies tends to be more volatile than the stock of large companies, particularly in the short term and particularly in the early stages of an economic or market downturn. Shareholders of the Fund, therefore, are taking on more risk than they would if they invested in the stock market as a whole.
Conclusion
Thank you for your continued investment in Small-Cap Momentum Fund. We encourage your feedback; your reactions and concerns are important to us.
Sincerely,
The Investment Management Team
| | |
| Small-Cap Momentum Fund | |
|
| SCHEDULE OF INVESTMENTS | |
| Showing percentage of net assets as of June 30, 2017 | | |
| | | | | | |
| Industry Company | | Shares | | Value | | |
COMMON STOCKS - 99.59% | | |
Consumer Discretionary - 13.07% | | |
1-800-Flowers.com, Inc., Class A* | | 450 | | $ 4,388 | | |
Aaron’s, Inc. | | 900 | | 35,010 | | |
Adtalem Global Education, Inc. | | 800 | | 30,360 | | |
Arcos Dorados Holdings, Inc., Class A* | | 1,650 | | 12,292 | | |
AV Homes, Inc.* | | 300 | | 6,015 | | |
Beazer Homes USA, Inc.* | | 450 | | 6,174 | | |
Belmond, Ltd., Class A* | | 1,250 | | 16,625 | | |
Big 5 Sporting Goods Corp.+ | | 300 | | 3,915 | | |
Bob Evans Farms, Inc. | | 250 | | 17,958 | | |
Capella Education Co. | | 150 | | 12,840 | | |
Career Education Corp.* | | 900 | | 8,640 | | |
Century Casinos, Inc.* | | 300 | | 2,211 | | |
Century Communities, Inc.* | | 300 | | 7,440 | | |
Chegg, Inc.*+ | | 1,200 | | 14,748 | | |
Dana, Inc. | | 1,850 | | 41,310 | | |
Dave & Buster’s Entertainment, Inc.* | | 550 | | 36,580 | | |
Del Taco Restaurants, Inc.* | | 500 | | 6,875 | | |
Fox Factory Holding Corp.* | | 450 | | 16,020 | | |
Francesca’s Holdings Corp.* | | 450 | | 4,923 | | |
Green Brick Partners, Inc.* | | 650 | | 7,442 | | |
ILG, Inc. | | 1,600 | | 43,984 | | |
iRobot Corp.*+ | | 350 | | 29,449 | | |
Jack in the Box, Inc. | | 375 | | 36,938 | | |
Johnson Outdoors, Inc., Class A | | 100 | | 4,821 | | |
KB Home | | 1,100 | | 26,367 | | |
Lumber Liquidators Holdings, Inc.* | | 350 | | 8,771 | | |
M/I Homes, Inc.* | | 300 | | 8,565 | | |
MakeMyTrip, Ltd.*+ | | 650 | | 21,808 | | |
Marcus Corp. (The) | | 250 | | 7,550 | | |
Monarch Casino & Resort, Inc.* | | 200 | | 6,050 | | |
MSG Networks, Inc., Class A* | | 800 | | 17,960 | | |
NACCO Industries, Inc., Class A | | 50 | | 3,542 | | |
Nathan’s Famous, Inc.* | | 50 | | 3,150 | | |
Ollie’s Bargain Outlet Holdings, Inc.* | | 800 | | 34,080 | | |
PICO Holdings, Inc.* | | 300 | | 5,250 | | |
Pinnacle Entertainment, Inc.* | | 750 | | 14,820 | | |
Red Rock Resorts, Inc., Class A | | 850 | | 20,018 | | |
SodaStream International, Ltd.* | | 275 | | 14,718 | | |
| | | | |
| Industry Company | | Shares | | Value |
|
|
Consumer Discretionary (continued) | | | | |
Standard Motor Products, Inc. | | 300 | | $ 15,666 |
Strayer Education, Inc. | | 150 | | 13,983 |
Taylor Morrison Home Corp., Class A* | | 650 | | 15,606 |
William Lyon Homes, Class A* | | 400 | | 9,656 |
Winmark Corp. | | 50 | | 6,448 |
ZAGG, Inc.* | | 350 | | 3,028 |
| | | | |
| | | | 663,994 |
| |
Consumer Staples - 3.75% | | |
Central Garden & Pet Co., Class A* | | 650 | | 19,513 |
Coca-Cola Bottling Co. Consolidated | | 100 | | 22,887 |
Farmer Brothers Co.* | | 200 | | 6,050 |
Fresh Del Monte Produce, Inc. | | 650 | | 33,092 |
Hostess Brands, Inc.*+ | | 1,200 | | 19,320 |
J&J Snack Foods Corp. | | 250 | | 33,018 |
John B. Sanfilippo & Son, Inc. | | 100 | | 6,311 |
Medifast, Inc. | | 150 | | 6,220 |
Nu Skin Enterprises, Inc., Class A | | 700 | | 43,988 |
| | | | |
| | | | 190,399 |
| |
Energy - 2.44% | | |
Abraxas Petroleum Corp.* | | 1,950 | | 3,159 |
Centennial Resource | | | | |
Development, Inc., Class A*+ | | 2,650 | | 41,923 |
Cosan, Ltd., Class A | | 2,200 | | 14,102 |
Evolution Petroleum Corp. | | 400 | | 3,240 |
Exterran Corp.* | | 450 | | 12,015 |
GasLog Ltd.+ | | 1,000 | | 15,250 |
Geopark, Ltd.* | | 750 | | 5,662 |
Isramco, Inc.*+ | | 35 | | 4,004 |
Newpark Resources, Inc.* | | 1,050 | | 7,718 |
Resolute Energy Corp.*+ | | 300 | | 8,931 |
REX American Resources Corp.* | | 80 | | 7,725 |
| | | | |
| | | | 123,729 |
| |
Financials - 15.56% | | |
ACNB Corp. | | 100 | | 3,050 |
AG Mortgage Investment Trust, Inc. | | 350 | | 6,405 |
Anworth Mortgage Asset Corp. | | 1,200 | | 7,212 |
| | |
| 38 | | Annual Report | June 30, 2017 |
| | |
| Small-Cap Momentum Fund | | |
| SCHEDULE OF INVESTMENTS (continued) | | |
| Showing percentage of net assets as of June 30, 2017 | | |
| | | | | | |
| Industry Company | | Shares | | Value | | |
| | | |
Common Stocks (continued) | | | | | | |
Financials (continued) | | | | |
Apollo Commercial Real Estate Finance, Inc. | | 1,150 | | $ 21,332 | | |
Arbor Realty Trust, Inc. | | 800 | | 6,672 | | |
Ares Commercial Real Estate Corp. | | 350 | | 4,582 | | |
ARMOUR Residential REIT, Inc.+ | | 450 | | 11,250 | | |
Atlantic Capital Bancshares, Inc.* | | 350 | | 6,650 | | |
BancFirst Corp. | | 200 | | 19,320 | | |
Bank of Commerce Holdings | | 200 | | 2,210 | | |
Bankwell Financial Group, Inc. | | 100 | | 3,123 | | |
Bar Harbor Bankshares | | 200 | | 6,164 | | |
BCB Bancorp, Inc. | | 150 | | 2,295 | | |
Berkshire Hills Bancorp, Inc. | | 450 | | 15,818 | | |
Blue Hills Bancorp, Inc. | | 350 | | 6,265 | | |
Bryn Mawr Bank Corp. | | 200 | | 8,500 | | |
Camden National Corp. | | 200 | | 8,582 | | |
Carolina Financial Corp. | | 200 | | 6,464 | | |
CenterState Banks, Inc. | | 700 | | 17,402 | | |
Central Valley Community Bancorp | | 150 | | 3,324 | | |
Chimera Investment Corp. | | 2,400 | | 44,712 | | |
City Holding Co. | | 200 | | 13,174 | | |
Civista Bancshares, Inc. | | 100 | | 2,088 | | |
Codorus Valley Bancorp, Inc. | | 100 | | 2,840 | | |
Commerce Union Bancshares, Inc.+ | | 100 | | 2,387 | | |
Community Bankers Trust Corp.*+ | | 250 | | 2,062 | | |
Community Financial Corp. (The)+ | | 50 | | 1,925 | | |
CYS Investments, Inc. | | 1,950 | | 16,400 | | |
Employers Holdings, Inc. | | 400 | | 16,920 | | |
Enova International, Inc.* | | 400 | | 5,940 | | |
Enterprise Bancorp, Inc. | | 150 | | 5,331 | | |
Essent Group, Ltd.* | | 1,200 | | 44,568 | | |
Farmers Capital Bank Corp. | | 100 | | 3,855 | | |
First Bancorp, Inc. | | 150 | | 4,059 | | |
First Bancshares,
Inc. (The)+ | | 100 | | 2,760 | | |
First Connecticut Bancorp, Inc. | | 200 | | 5,130 | | |
First Financial Corp. | | 150 | | 7,095 | | |
First Guaranty Bancshares, Inc.+ | | 100 | | 2,724 | | |
German American Bancorp, Inc. | | 300 | | 10,227 | | |
Green Bancorp, Inc.* | | 450 | | 8,730 | | |
Green Dot Corp., Class A* | | 650 | | 25,044 | | |
| | | | |
| Industry Company | | Shares | | Value |
|
|
Financials (continued) | | |
Guaranty Bancorp | | 350 | | $ 9,520 |
Hannon Armstrong Sustainable Infrastructure Capital, Inc. | | 650 | | 14,866 |
Hilltop Holdings, Inc. | | 1,250 | | 32,762 |
Horizon Bancorp | | 300 | | 7,905 |
Howard Bancorp, Inc.*+ | | 100 | | 1,925 |
Independence Holding Co. | | 200 | | 4,090 |
Independent Bank Corp. | | 250 | | 5,438 |
Independent Bank Group, Inc. | | 350 | | 20,825 |
INTL.FCStone, Inc.* | | 250 | | 9,440 |
Investar Holding Corp.+ | | 100 | | 2,290 |
Lakeland Bancorp, Inc. | | 550 | | 10,368 |
Live Oak Bancshares, Inc.+ | | 450 | | 10,890 |
Marlin Business Services Corp. | | 150 | | 3,772 |
MBT Financial Corp. | | 250 | | 2,425 |
Mercury General Corp.+ | | 700 | | 37,800 |
Meta Financial Group, Inc. | | 100 | | 8,900 |
Middlefield Banc Corp.+ | | 50 | | 2,520 |
MTGE Investment Corp. | | 600 | | 11,280 |
National Bank Holdings Corp., Class A | | 350 | | 11,588 |
National Commerce Corp.* | | 150 | | 5,932 |
Newtek Business Services Corp.+ | | 200 | | 3,258 |
NMI Holdings, Inc., Class A* | | 750 | | 8,588 |
Oconee Federal Financial Corp. | | 100 | | 2,779 |
Old Line Bancshares, Inc. | | 150 | | 4,227 |
Old Point Financial Corp.+ | | 50 | | 1,644 |
Old Second Bancorp, Inc. | | 400 | | 4,620 |
Orchid Island Capital, Inc.+ | | 450 | | 4,437 |
Owens Realty Mortgage, Inc. | | 150 | | 2,544 |
PennantPark Investment Corp. | | 900 | | 6,651 |
Peoples Bancorp, Inc. | | 250 | | 8,032 |
Peoples Financial Services Corp.+ | | 100 | | 4,373 |
Premier Financial Bancorp, Inc. | | 150 | | 3,092 |
Provident Bancorp, Inc.* | | 100 | | 2,250 |
QCR Holdings, Inc. | | 150 | | 7,110 |
S&T Bancorp, Inc. | | 450 | | 16,137 |
Safety Insurance Group, Inc. | | 200 | | 13,660 |
Shore Bancshares, Inc. | | 150 | | 2,468 |
SmartFinancial, Inc.*+ | | 100 | | 2,388 |
Stewart Information Services Corp. | | 300 | | 13,614 |
Sunshine Bancorp, Inc.*+ | | 100 | | 2,131 |
| | |
| Small-Cap Momentum Fund | |
|
| SCHEDULE OF INVESTMENTS (continued) | |
| Showing percentage of net assets as of June 30, 2017 | | |
| | | | | | |
| Industry Company | | Shares | | Value | | |
| | | |
Common Stocks (continued) | | | | | | |
Financials (continued) | | | | |
Timberland Bancorp, Inc.+ | | 100 | | $ 2,527 | | |
Tiptree, Inc. | | 350 | | 2,468 | | |
TriState Capital Holdings, Inc.* | | 350 | | 8,820 | | |
United Community Financial Corp. | | 650 | | 5,402 | | |
United Security Bancshares+ | | 200 | | 1,850 | | |
Unity Bancorp, Inc. | | 150 | | 2,580 | | |
Univest Corp. of Pennsylvania | | 350 | | 10,482 | | |
Veritex Holdings, Inc.* | | 200 | | 5,266 | | |
Washington Trust Bancorp, Inc. | | 200 | | 10,310 | | |
Waterstone Financial, Inc. | | 400 | | 7,540 | | |
Western Asset Mortgage Capital Corp. | | 550 | | 5,665 | | |
Western New England Bancorp, Inc. | | 400 | | 4,060 | | |
| | | | | | |
| | | | 790,100 | | |
| | |
Health Care - 11.03% | | | | |
Accelerate Diagnostics, Inc.*+ | | 700 | | 19,145 | | |
Achaogen, Inc.*+ | | 450 | | 9,778 | | |
Addus HomeCare Corp.* | | 150 | | 5,580 | | |
Assembly Biosciences, Inc.* | | 200 | | 4,130 | | |
AtriCure, Inc.*+ | | 450 | | 10,912 | | |
AxoGen, Inc.* | | 400 | | 6,700 | | |
BioTelemetry, Inc.* | | 350 | | 11,708 | | |
Blueprint Medicines Corp.* | | 500 | | 25,335 | | |
Cardiovascular Systems, Inc.* | | 400 | | 12,892 | | |
Chemed Corp. | | 200 | | 40,906 | | |
CryoLife, Inc.* | | 350 | | 6,982 | | |
Cutera, Inc.* | | 200 | | 5,180 | | |
Foundation Medicine, Inc.*+ | | 450 | | 17,888 | | |
Glaukos Corp.*+ | | 450 | | 18,662 | | |
Haemonetics Corp.* | | 650 | | 25,668 | | |
Heska Corp.* | | 100 | | 10,207 | | |
HMS Holdings Corp.* | | 1,050 | | 19,425 | | |
ICU Medical, Inc.* | | 250 | | 43,125 | | |
Inogen, Inc.* | | 250 | | 23,855 | | |
Insmed, Inc.* | | 800 | | 13,728 | | |
K2M Group Holdings, Inc.* | | 550 | | 13,398 | | |
Kamada, Ltd.* | | 450 | | 2,700 | | |
Kura Oncology, Inc.* | | 250 | | 2,325 | | |
LeMaitre Vascular, Inc. | | 250 | | 7,805 | | |
National Research Corp., Class A | | 150 | | 4,035 | | |
| | | | |
| Industry Company | | Shares | | Value |
|
|
Health Care (continued) | | |
NxStage Medical, Inc.* | | 850 | | $ 21,310 |
Oxford Immunotec Global PLC* | | 300 | | 5,046 |
Penumbra, Inc.*+ | | 450 | | 39,488 |
Phibro Animal Health Corp., Class A | | 250 | | 9,262 |
Pulse Biosciences, Inc.*+ | | 200 | | 6,906 |
Repligen Corp.* | | 450 | | 18,648 |
Simulations Plus, Inc.+ | | 200 | | 2,470 |
STAAR Surgical Co.* | | 500 | | 5,400 |
Supernus Pharmaceuticals, Inc.* | | 650 | | 28,015 |
Teladoc, Inc.*+ | | 700 | | 24,290 |
Theravance Biopharma, Inc.*+ | | 700 | | 27,888 |
Vocera Communications, Inc.* | | 350 | | 9,247 |
| | | | |
| | | | 560,039 |
| |
Industrials - 16.68% | | |
AAON, Inc. | | 650 | | 23,952 |
ABM Industries, Inc. | | 700 | | 29,064 |
ACCO Brands Corp.* | | 1,400 | | 16,310 |
Altra Industrial Motion Corp. | | 350 | | 13,930 |
Argan, Inc. | | 200 | | 12,000 |
Barnes Group, Inc. | | 700 | | 40,971 |
Blue Bird Corp.*+ | | 300 | | 5,100 |
Brink’s Co. (The) | | 650 | | 43,550 |
Casella Waste Systems, Inc., Class A* | | 500 | | 8,205 |
CBIZ, Inc.* | | 700 | | 10,500 |
China Yuchai International, Ltd. | | 500 | | 9,105 |
Columbus McKinnon Corp. | | 300 | | 7,626 |
CRA International, Inc. | | 100 | | 3,632 |
Douglas Dynamics, Inc. | | 300 | | 9,870 |
Dycom Industries, Inc.*+ | | 400 | | 35,808 |
Eastern Co. (The) | | 100 | | 3,005 |
EnPro Industries, Inc. | | 275 | | 19,627 |
EnviroStar, Inc.+ | | 150 | | 4,058 |
ESCO Technologies, Inc. | | 350 | | 20,878 |
Exponent, Inc. | | 350 | | 20,405 |
Franklin Covey Co.* | | 150 | | 2,895 |
Gencor Industries, Inc.* | | 150 | | 2,430 |
Gibraltar Industries, Inc.* | | 400 | | 14,260 |
Global Brass & Copper Holdings, Inc. | | 300 | | 9,165 |
GP Strategies Corp.* | | 200 | | 5,280 |
Hudson Technologies, Inc.* | | 450 | | 3,802 |
| | |
| 40 | | Annual Report | June 30, 2017 |
| | |
| Small-Cap Momentum Fund | | |
| SCHEDULE OF INVESTMENTS (continued) | | |
| Showing percentage of net assets as of June 30, 2017 | | |
| | | | | | |
| Industry Company | | Shares | | Value | | |
| | | |
Common Stocks (continued) | | | | | | |
Industrials (continued) | | | | |
Huttig Building Products, Inc.* | | 300 | | $ 2,103 | | |
ICF International, Inc.* | | 250 | | 11,775 | | |
Insperity, Inc. | | 250 | | 17,750 | | |
John Bean Technologies Corp. | | 400 | | 39,200 | | |
Kennametal, Inc. | | 1,050 | | 39,291 | | |
Kimball International, Inc., Class B | | 450 | | 7,510 | | |
Kornit Digital, Ltd.*+ | | 450 | | 8,708 | | |
Lindsay Corp.+ | | 150 | | 13,388 | | |
Lydall, Inc.* | | 200 | | 10,340 | | |
MasTec, Inc.* | | 1,050 | | 47,408 | | |
Mercury Systems, Inc.* | | 600 | | 25,254 | | |
Meritor, Inc.* | | 1,150 | | 19,102 | | |
MSA Safety, Inc. | | 500 | | 40,585 | | |
MYR Group, Inc.* | | 200 | | 6,204 | | |
Navigant Consulting, Inc.* | | 600 | | 11,856 | | |
Rush Enterprises, Inc., Class A* | | 500 | | 18,590 | | |
Saia, Inc.* | | 300 | | 15,390 | | |
SiteOne Landscape Supply, Inc.* | | 500 | | 26,030 | | |
SkyWest, Inc. | | 650 | | 22,815 | | |
Sterling Construction Co., Inc.* | | 300 | | 3,921 | | |
Student Transportation, Inc.+ | | 1,150 | | 6,980 | | |
Tetra Tech, Inc. | | 750 | | 34,312 | | |
Trex Co., Inc.* | | 375 | | 25,372 | | |
Viad Corp. | | 250 | | 11,812 | | |
Vicor Corp.* | | 350 | | 6,265 | | |
| | | | | | |
| | | | 847,389 | | |
| | |
Information Technology - 20.75% | | | | |
2U, Inc.*+ | | 600 | | 28,152 | | |
Actua Corp.* | | 500 | | 7,025 | | |
Advanced Energy Industries, Inc.* | | 500 | | 32,345 | | |
Alarm.com Holdings, Inc.* | | 600 | | 22,578 | | |
Appfolio, Inc., Class A* | | 150 | | 4,890 | | |
Applied Optoelectronics, Inc.*+ | | 250 | | 15,447 | | |
AudioCodes, Ltd.* | | 400 | | 2,396 | | |
AVX Corp. | | 2,150 | | 35,131 | | |
Axcelis Technologies, Inc.* | | 400 | | 8,380 | | |
Bel Fuse, Inc., Class B | | 150 | | 3,705 | | |
Benchmark Electronics, Inc.* | | 650 | | 20,995 | | |
Blucora, Inc.* | | 550 | | 11,660 | | |
Brooks Automation, Inc. | | 900 | | 19,521 | | |
| | | | |
| Industry Company | | Shares | | Value |
|
|
Information Technology (continued) | | |
Cabot Microelectronics Corp. | | 300 | | $ 22,149 |
Callidus Software, Inc.* | | 850 | | 20,570 |
Camtek, Ltd.*+ | | 450 | | 2,174 |
Carbonite, Inc.* | | 350 | | 7,630 |
CEVA, Inc.* | | 250 | | 11,362 |
Control4 Corp.* | | 300 | | 5,883 |
EMCORE Corp. | | 300 | | 3,195 |
Everi Holdings, Inc.* | | 850 | | 6,188 |
Extreme Networks, Inc.* | | 1,300 | | 11,986 |
Five9, Inc.* | | 700 | | 15,064 |
GSI Technology, Inc.* | | 250 | | 1,965 |
Instructure, Inc.* | | 350 | | 10,325 |
InterDigital, Inc. | | 450 | | 34,785 |
Intevac, Inc.* | | 250 | | 2,775 |
Iteris, Inc.* | | 400 | | 2,488 |
Itron, Inc.* | | 500 | | 33,875 |
Ituran Location And Control, Ltd. | | 300 | | 9,390 |
Kimball Electronics, Inc.* | | 300 | | 5,415 |
Kopin Corp.*+ | | 950 | | 3,524 |
Kulicke & Soffa Industries, Inc.* | | 900 | | 17,118 |
Limelight Networks, Inc.* | | 1,400 | | 4,046 |
Mesa Laboratories, Inc. | | 50 | | 7,166 |
Methode Electronics, Inc. | | 450 | | 18,540 |
Mimecast, Ltd.* | | 700 | | 18,746 |
MINDBODY, Inc., Class A* | | 500 | | 13,600 |
Nanometrics, Inc.* | | 300 | | 7,587 |
Napco Security Technologies, Inc.* | | 250 | | 2,350 |
Nova Measuring | | | | |
Instruments, Ltd.* | | 350 | | 7,732 |
Novanta, Inc.* | | 450 | | 16,200 |
NVE Corp. | | 50 | | 3,850 |
OSI Systems, Inc.* | | 250 | | 18,788 |
Paylocity Holding Corp.* | | 650 | | 29,367 |
PCM, Inc.* | | 150 | | 2,812 |
Pixelworks, Inc.*+ | | 400 | | 1,836 |
Plantronics, Inc. | | 450 | | 23,540 |
Power Integrations, Inc. | | 400 | | 29,160 |
PROS Holdings, Inc.* | | 400 | | 10,956 |
Q2 Holdings, Inc.* | | 500 | | 18,475 |
QAD, Inc., Class A | | 250 | | 8,012 |
Qualys, Inc.* | | 450 | | 18,360 |
Radware, Ltd.* | | 550 | | 9,647 |
RealPage, Inc.* | | 1,050 | | 37,748 |
Rudolph Technologies, Inc.* | | 400 | | 9,140 |
Sanmina Corp.* | | 950 | | 36,195 |
Silicom, Ltd. | | 100 | | 4,436 |
| | |
| Small-Cap Momentum Fund | |
|
| SCHEDULE OF INVESTMENTS (continued) | |
| Showing percentage of net assets as of June 30, 2017 | | |
| | | | | | |
| Industry Company | | Shares | | Value | | |
| | | |
Common Stocks (continued) | | | | | | |
Information Technology (continued) | | | | |
Silicon Laboratories, Inc.* | | 525 | | $ 35,884 | | |
SPS Commerce, Inc.* | | 200 | | 12,752 | | |
StarTek, Inc.* | | 200 | | 2,448 | | |
Telenav, Inc.* | | 550 | | 4,455 | | |
TrueCar, Inc.*+ | | 1,200 | | 23,916 | | |
TTM Technologies, Inc.* | | 1,250 | | 21,700 | | |
Tucows, Inc., Class A*+ | | 150 | | 8,025 | | |
Ultra Clean Holdings, Inc.* | | 450 | | 8,438 | | |
Upland Software, Inc.* | | 250 | | 5,498 | | |
USA Technologies, Inc.* | | 500 | | 2,600 | | |
Varonis Systems, Inc.* | | 350 | | 13,020 | | |
Veeco Instruments, Inc.* | | 500 | | 13,925 | | |
Verint Systems, Inc.* | | 800 | | 32,560 | | |
Vishay Intertechnology, Inc. | | 1,650 | | 27,390 | | |
Vishay Precision Group, Inc.* | | 150 | | 2,595 | | |
Wix.com, Ltd.* | | 580 | | 40,368 | | |
| | | | | | |
| | | | 1,053,949 | | |
| | |
Materials - 8.58% | | | | |
American Vanguard Corp. | | 400 | | 6,900 | | |
Balchem Corp. | | 400 | | 31,084 | | |
Cabot Corp. | | 800 | | 42,744 | | |
Chase Corp. | | 125 | | 13,338 | | |
Core Molding Technologies, Inc.* | | 100 | | 2,161 | | |
Ferro Corp.* | | 1,050 | | 19,204 | | |
GCP Applied Technologies, Inc.* | | 900 | | 27,450 | | |
Greif, Inc., Class A | | 650 | | 36,257 | | |
Hawkins, Inc. | | 150 | | 6,952 | | |
Ingevity Corp.* | | 550 | | 31,570 | | |
Innospec, Inc. | | 300 | | 19,665 | | |
KMG Chemicals, Inc. | | 150 | | 7,300 | | |
Koppers Holdings, Inc.* | | 250 | | 9,038 | | |
Kronos Worldwide, Inc. | | 1,500 | | 27,330 | | |
Materion Corp. | | 250 | | 9,350 | | |
Neenah Paper, Inc. | | 200 | | 16,050 | | |
Orion Engineered Carbons SA | | 700 | | 13,965 | | |
Quaker Chemical Corp. | | 175 | | 25,415 | | |
Silgan Holdings, Inc. | | 1,400 | | 44,492 | | |
Stepan Co. | | 300 | | 26,142 | | |
Tronox, Ltd., Class A | | 850 | | 12,852 | | |
UFP Technologies, Inc.* | | 100 | | 2,830 | | |
United States Lime & Minerals, Inc. | | 50 | | 3,924 | | |
| | | | | | |
| | | | 436,013 | | |
| | |
Real Estate - 4.19% | | | | |
Agree Realty Corp. | | 350 | | 16,054 | | |
CareTrust REIT, Inc. | | 900 | | 16,686 | | |
| | | | |
| Industry Company | | Shares | | Value |
|
|
Real Estate (continued) | | |
Community Healthcare Trust, Inc. | | 150 | | $ 3,838 |
CorEnergy Infrastructure Trust, Inc. | | 150 | | 5,038 |
Four Corners Property Trust, Inc. | | 750 | | 18,832 |
FRP Holdings, Inc.* | | 150 | | 6,922 |
Gladstone Commercial Corp. | | 300 | | 6,537 |
InfraREIT, Inc.* | | 550 | | 10,532 |
Jernigan Capital, Inc. | | 100 | | 2,200 |
Maui Land & Pineapple Co., Inc.* | | 250 | | 5,075 |
Monmouth Real Estate Investment Corp. | | 850 | | 12,792 |
NexPoint Residential Trust, Inc. | | 250 | | 6,222 |
PS Business Parks, Inc. | | 350 | | 46,336 |
Summit Hotel Properties, Inc. | | 1,300 | | 24,245 |
Terreno Realty Corp. | | 650 | | 21,879 |
Transcontinental Realty Investors, Inc.*+ | | 100 | | 2,689 |
UMH Properties, Inc. | | 400 | | 6,820 |
| | | | |
| | | | 212,697 |
| |
Telecommunication Services - 0.18% | | |
Boingo Wireless, Inc.* | | 500 | | 7,480 |
Ooma, Inc.* | | 200 | | 1,600 |
| | | | |
| | | | 9,080 |
| |
Utilities - 3.36% | | |
Cadiz, Inc.*+ | | 250 | | 3,375 |
Chesapeake Utilities Corp. | | 200 | | 14,990 |
MGE Energy, Inc. | | 450 | | 28,958 |
Ormat Technologies, Inc. | | 650 | | 38,142 |
Otter Tail Corp. | | 500 | | 19,800 |
PNM Resources, Inc. | | 1,000 | | 38,250 |
Pure Cycle Corp.*+ | | 300 | | 2,325 |
RGC Resources, Inc.+ | | 100 | | 2,833 |
SJW Corp. | | 250 | | 12,295 |
Unitil Corp. | | 200 | | 9,662 |
| | | | |
| | | | 170,630 |
| | | | |
TOTAL COMMON STOCKS - 99.59% | | 5,058,019 |
| | | | |
(Cost $4,598,123) | | | | |
| |
EXCHANGE TRADED FUND - 0.50% | | |
iShares Russell 2000 ETF | | 180 | | 25,366 |
| | | | |
TOTAL EXCHANGE TRADED
FUND - 0.50% | | | | 25,366 |
| | | | |
(Cost $24,465) | | | | |
| | |
| 42 | | Annual Report | June 30, 2017 |
| | |
| Small-Cap Momentum Fund | | |
| SCHEDULE OF INVESTMENTS (continued) | | |
| | |
| | | | | | | | | | | | |
| | | |
| | | Rate^ | | | Shares | | | Value | |
INVESTMENTS PURCHASED WITH CASH PROCEEDS FROM SECURITIES
LENDING - 10.49% | |
Fidelity Investments Money Market Government Portfolio Class I** | | | 0.81 | % | | | 532,593 | | | $ | 532,593 | |
| | | | | | | | | | | | |
TOTAL INVESTMENTS PURCHASED WITH CASH PROCEEDS FROM SECURITIES LENDING -10.49% | | | | 532,593 | |
| | | | | | | | | | | | |
(Cost $ 532,593) | | | | | |
| |
TOTAL INVESTMENTS - 110.58% | | | $ | 5,615,978 | |
(Cost $ 5,155,181) | | | | | | | | | | | | |
Liabilities in Excess of Other
Assets - (10.58%) | | | | (537,369 | ) |
| | | | | | | | | | | | |
NET ASSETS - 100.00% | | | | | | | $ | 5,078,609 | |
| | | | | | | | | | | | |
| * | Non-income producing security. |
| ** | This security represents the investment of the collateral received in connection with securities out on loan as of June 30, 2017. |
| ^ | Rate disclosed as of June 30, 2017. |
| + | This security or a portion of the security is out on loan as of June 30, 2017. Total loaned securities had a value of $519,253 as of June 30, 2017. |
PLC - Public Limited Company
Summary of inputs used to value the Fund’s investments as of 06/30/2017 (See Note 2 in Notes to Financial Statements):
| | | | | | | | | | | | | | | | |
| | | Valuation Inputs | |
| | | Investment in Securities (Value) | |
| | | Level 1
Quoted
Prices | | | Level 2
Significant
Observable
Inputs | | | Level 3
Significant
Unobservable
Inputs | | | Total | |
Common Stocks | | $ | 5,058,019 | | | $ | — | | | $ | — | | | $ | 5,058,019 | |
Exchange Traded Fund | | | 25,366 | | | | — | | | | — | | | | 25,366 | |
Investments Purchased with Cash Proceeds from Securities Lending | | | — | | | | 532,593 | | | | — | | | | 532,593 | |
| | | | | | | | | | | | | | | | |
TOTAL | | $ | 5,083,385 | | | $ | 532,593 | | | $ | — | | | $ | 5,615,978 | |
| | | | | | | | | | | | | | | | |
See Notes to Financial Statements.
| | |
| Small-Cap Growth Fund | |
|
| MANAGER’S COMMENTARY (Unaudited) | |
| | |
June 30, 2017
Dear Fellow Small-Cap Growth Fund Shareholder,
For the quarter ended June 30, 2017, our Fund gained 3.71%, underperforming our primary market benchmark, the Russell 2000 Growth Index (+4.39%), and our peer benchmark, the Lipper Small-Cap Growth Funds Index (+4.20%). It was a weak quarter on a relative basis.
For the fiscal year, our Fund appreciated 22.97%, lagging the Russell 2000 Growth Index (+24.40%), but beating the Lipper Small-Cap Growth Funds Index (+20.55%).
The table below presents our June quarter, one-year, five-year, 10-year, and inception-to-date financial results. See the next page for a graph of performance since inception.
Standardized Returns as of June 30, 2017
| | | | | | | | | | | | | | | | | | |
| | | | | | | | | Annualized | | | |
| | | Quarter | | | 1 Year | | | 5 Years | | | 10 Years | | | Since Inception
(10/31/03) |
| | | | | |
Small-Cap Growth Fund | | | 3.71% | | | | 22.97 | % | | | 16.65 | % | | | 4.67% | | | 7.02% |
Russell 2000 Growth Index | | | 4.39% | | | | 24.40 | % | | | 13.98 | % | | | 7.82% | | | 9.00% |
Lipper Small-Cap Growth Funds Index | | | 4.20% | | | | 20.55 | % | | | 12.48 | % | | | 6.46% | | | 7.70% |
Performance figures quoted in the table above represent past performance and are no guarantee of future results. Total return figures in the table above include the reinvestment of dividends and capital gains. The table above does not reflect the deduction of taxes that a shareholder would pay on Fund distributions or on the redemption of Fund shares.
The Russell 2000 Growth Index is an unmanaged index that consists of stocks in the Russell 2000 Index with higher price-to-book ratios and higher forecasted growth values with dividends reinvested. The Lipper Small-Cap Growth Funds Index is an index of small-company, growth-oriented funds compiled by Lipper, Inc. It is not possible to invest directly in an index. Periods longer than one year are annualized.
According to data from Lipper, Inc. as of June 30, 2017, Small-Cap Growth Fund ranked 254th of 545 small-cap growth funds for the 12 months ended June 30, 2017, 16th of 436 over the last five years, 297th of 324 over the last 10 years, and 196th of 225 such funds since inception in October 2003. Lipper, Inc. is an independent mutual fund rating service that ranks funds in various fund categories by making comparative calculations using total returns.
| | |
| 44 | | Annual Report | June 30, 2017 |
| | |
| Small-Cap Growth Fund | |
|
| MANAGER’S COMMENTARY (Unaudited) (continued) | |
| | |
Growth of a $10,000 Investment
from Inception October 31, 2003 to June 30, 2017
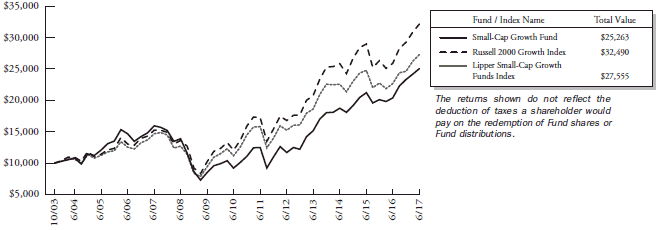
Detailed Explanation of Quarterly Performance
The Fund’s diversifying value metrics and price momentum exposure significantly underperformed the benchmark and detracted from relative results. The Fund’s tilt toward deeper value stocks across multiple value metrics also hurt relative results during a period when value stocks underperformed their growth counterparts. These losses were partly offset by our high-performing company financial health exposure, and by the Fund’s exposure to smaller stocks within the small-cap growth universe. Smaller companies in the benchmark generally delivered stronger returns for the quarter.
Holdings in the Real Estate and Financials sectors dragged down relative results, particularly investments in the Banking subsector. Holdings in the Telecommunication Services sector also had a negative impact, although an overweight allocation to the sector — the strongest performing sector of the benchmark — helped offset some of those losses. Holdings in the Health Care sector, particularly among Pharmaceutical and Biotechnology companies, added to relative results.
Detailed Explanation of Fiscal Year Performance
The Fund’s value metrics and price momentum exposure underperformed the benchmark during the 12-month period, detracting from relative results. These losses were partly offset by our company financial health exposure, which outperformed the benchmark. Relative performance also benefited from the Fund’s tilt toward deeper value stocks, as well as from exposure to smaller stocks within the small-cap growth universe. Smaller companies in the benchmark were among the strongest performers during the fiscal year.
Holdings in the Financials sector, most notably among diversified financial companies and insurers, dragged on relative performance, as did holdings in the Information Technology and Telecommunication Services sectors. Holdings in the Industrials sector added to relative results, along with holdings in the Consumer Discretionary sector, particularly among retailing companies.
| | |
| Small-Cap Growth Fund | |
|
| MANAGER’S COMMENTARY (Unaudited) (continued) | |
| | |
Top Ten Holdings as of June 30, 2017
| | | | | | |
| Rank | | Description | | Industry | | % of Net
Assets |
| 1 | | Select Comfort Corp. | | Consumer Discretionary | | 1.7% |
| 2 | | Worthington Industries, Inc. | | Materials | | 1.7% |
| 3 | | Fabrinet | | Information Technology | | 1.6% |
| 4 | | Integrated Device Technology, Inc. | | Information Technology | | 1.6% |
| 5 | | Commercial Vehicle Group, Inc. | | Industrials | | 1.5% |
| 6 | | Trinseo SA | | Materials | | 1.5% |
| 7 | | Cempra, Inc. | | Health Care | | 1.5% |
| 8 | | Supernus Pharmaceuticals, Inc. | | Health Care | | 1.5% |
| 9 | | Radiant Logistics, Inc. | | Industrials | | 1.5% |
| 10 | | ePlus, Inc. | | Information Technology | | 1.5% |
| | Total | | | | 15.6% |
Industry Sector Representation as of June 30, 2017
| | | | | | | | | | | | | | | | |
| | | % of Net Assets | | | % of Russell 2000
Growth Index | | | Difference | |
Consumer Discretionary | | | 17.2% | | | | | | | | 14.2% | | | | 3.0% | |
Consumer Staples | | | 1.7% | | | | | | | | 2.6% | | | | -0.9% | |
Energy | | | 0.0% | | | | | | | | 1.2% | | | | -1.2% | |
Financials | | | 4.0% | | | | | | | | 6.0% | | | | -2.0% | |
Health Care | | | 22.1% | | | | | | | | 24.3% | | | | -2.2% | |
Industrials | | | 17.0% | | | | | | | | 17.4% | | | | -0.4% | |
Information Technology | | | 28.3% | | | | | | | | 24.4% | | | | 3.9% | |
Materials | | | 4.1% | | | | | | | | 4.7% | | | | -0.6% | |
Real Estate | | | 4.8% | | | | | | | | 3.5% | | | | 1.3% | |
Telecommunication Services | | | 0.0% | | | | | | | | 1.0% | | | | -1.0% | |
Utilities | | | 0.0% | | | | | | | | 0.7% | | | | -0.7% | |
Cash & Other Assets | | | 0.8% | | | | | | | | 0.0% | | | | 0.8% | |
Total | | | 100.0% | | | | | | | | 100.0% | | | | | |
Disclaimer
The views expressed here are exclusively those of Fund management. These views, including those related to market sectors or individual stocks, are not meant as investment advice and should not be considered predictive in nature. Any favorable (or unfavorable) description of a holding applies only as of the quarter end, June 30, 2017, unless otherwise stated. Security positions can and do change thereafter. Discussions of historical performance do not guarantee and may not be indicative of future performance.
Market volatility can significantly impact short-term performance. The Fund is not an appropriate investment for short-term investors. Investments in small companies generally carry greater risk than is customarily associated with larger companies. This additional risk is attributable to a number of factors, including the relatively limited financial resources that are typically available to small companies and the fact that small companies often have comparatively limited product lines. In addition, the stock of small companies tends to be more volatile than the stock of large companies, particularly in the short term and particularly in the early stages of an economic or market downturn. Shareholders of the Fund, therefore, are taking on more risk than they would if they invested in the stock market as a whole.
| | |
| 46 | | Annual Report | June 30, 2017 |
| | |
| Small-Cap Growth Fund | |
|
| MANAGER’S COMMENTARY (Unaudited) (continued) | |
| | |
Conclusion
Thank you for your continued investment in Small-Cap Growth Fund. We encourage your feedback; your reactions and concerns are important to us.
Sincerely,
The Investment Management Team
| | |
| Small-Cap Growth Fund | |
|
| SCHEDULE OF INVESTMENTS | |
| Showing percentage of net assets as of June 30, 2017 | | |
| | | | | | |
| Industry Company | | Shares | | Value | | |
| |
COMMON STOCKS - 99.19% | | |
Consumer Discretionary - 17.20% | | |
Big Lots, Inc.+ | | 5,900 | | $ 284,970 | | |
Boyd Gaming Corp.+ | | 26,100 | | 647,541 | | |
Children’s Place, Inc. (The) | | 6,300 | | 643,230 | | |
Dave & Buster’s Entertainment, Inc.* | | 9,600 | | 638,496 | | |
Hooker Furniture Corp. | | 2,600 | | 106,990 | | |
Installed Building Products, Inc.* | | 12,300 | | 651,285 | | |
LCI Industries | | 5,300 | | 542,720 | | |
LGI Homes, Inc.*+ | | 11,300 | | 454,034 | | |
Nautilus, Inc.* | | 19,700 | | 377,255 | | |
Noodles & Co.*+ | | 88,400 | | 344,760 | | |
Papa John’s International, Inc. | | 6,600 | | 473,616 | | |
Pinnacle Entertainment, Inc.* | | 5,900 | | 116,584 | | |
RH* | | 4,500 | | 290,340 | | |
Select Comfort Corp.* | | 22,500 | | 798,525 | | |
Shutterfly, Inc.* | | 12,700 | | 603,250 | | |
Tailored Brands, Inc. | | 10,500 | | 117,180 | | |
Tile Shop Holdings, Inc. | | 29,900 | | 617,435 | | |
ZAGG, Inc.* | | 34,600 | | 299,290 | | |
| | | | | | |
| | | | 8,007,501 | | |
| |
Consumer Staples - 1.69% | | |
Medifast, Inc. | | 5,000 | | 207,350 | | |
Tootsie Roll Industries, Inc.+ | | 16,583 | | 577,918 | | |
| | | | | | |
| | | | 785,268 | | |
| |
Financials - 4.00% | | |
Capital Bank Financial Corp., Class A | | 14,900 | | 567,690 | | |
Crawford & Co., Class B | | 9,300 | | 86,490 | | |
Evercore Partners, Inc., Class A | | 5,500 | | 387,750 | | |
Financial Engines, Inc.+ | | 5,300 | | 193,980 | | |
Meridian Bancorp, Inc. | | 11,900 | | 201,110 | | |
WMIH Corp.* | | 338,900 | | 423,625 | | |
| | | | | | |
| | | | 1,860,645 | | |
| |
Health Care - 22.11% | | |
Abaxis, Inc. | | 2,200 | | 116,644 | | |
BioTelemetry, Inc.* | | 6,000 | | 200,700 | | |
Cambrex Corp.* | | 11,500 | | 687,125 | | |
Cempra, Inc.*+ | | 152,800 | | 702,880 | | |
Corcept Therapeutics, Inc.* | | 51,700 | | 610,060 | | |
Eagle Pharmaceuticals, Inc.*+ | | 6,600 | | 520,674 | | |
Emergent BioSolutions, Inc.* | | 19,900 | | 674,809 | | |
Globus Medical, Inc., Class A* | | 18,000 | | 596,700 | | |
HealthSouth Corp. | | 13,800 | | 667,920 | | |
Landauer, Inc. | | 5,700 | | 298,110 | | |
| | | | | | |
| | | | | | |
| | | | | | |
| | | | | | |
| | | | | | |
| | | | | | |
| | | | | | |
| | | | |
| Industry Company | | Shares | | Value |
|
|
Health Care (continued) |
LHC Group, Inc.* | | 8,800 | | $ 597,432 |
Luminex Corp. | | 12,100 | | 255,552 |
Masimo Corp.* | | 7,500 | | 683,850 |
PRA Health Sciences, Inc.* | | 9,100 | | 682,591 |
Quality Systems, Inc.* | | 12,100 | | 208,241 |
RadNet, Inc.* | | 87,100 | | 675,025 |
SciClone Pharmaceuticals, Inc.* | | 52,400 | | 576,400 |
Supernus Pharmaceuticals, Inc.* | | 16,300 | | 702,530 |
Surmodics, Inc.* | | 9,600 | | 270,240 |
Vocera Communications, Inc.* | | 21,300 | | 562,746 |
| | | | |
| | | | 10,290,229 |
|
Industrials - 16.97% |
Brink’s Co. (The) | | 10,100 | | 676,700 |
Builders FirstSource, Inc.* | | 11,800 | | 180,776 |
Commercial Vehicle Group, Inc.* | | 84,400 | | 713,180 |
Dycom Industries, Inc.*+ | | 1,900 | | 170,088 |
GMS, Inc.* | | 21,000 | | 590,100 |
Hawaiian Holdings, Inc.* | | 2,200 | | 103,290 |
HC2 Holdings, Inc.* | | 58,000 | | 341,040 |
Healthcare Services Group, Inc. | | 14,600 | | 683,718 |
HNI Corp. | | 12,200 | | 486,414 |
Insperity, Inc. | | 2,700 | | 191,700 |
Kimball International, Inc., Class B | | 19,300 | | 322,117 |
MasTec, Inc.* | | 15,000 | | 677,250 |
Mistras Group, Inc.* | | 9,400 | | 206,518 |
NN, Inc. | | 5,300 | | 145,485 |
Orion Group Holdings, Inc.* | | 43,300 | | 323,451 |
Ply Gem Holdings, Inc.* | | 6,500 | | 116,675 |
Radiant Logistics, Inc.* | | 129,200 | | 695,096 |
TriNet Group, Inc.* | | 20,500 | | 671,170 |
Wabash National Corp.+ | | 27,500 | | 604,450 |
| | | | |
| | | | 7,899,218 |
|
Information Technology - 28.33% |
A10 Networks, Inc.* | | 22,800 | | 192,432 |
Acacia Communications, Inc.* | | 5,900 | | 244,673 |
Alarm.com Holdings, Inc.* | | 8,000 | | 301,040 |
Axcelis Technologies, Inc.* | | 29,300 | | 613,835 |
Blucora, Inc.* | | 16,800 | | 356,160 |
Brightcove, Inc.* | | 43,100 | | 267,220 |
Brooks Automation, Inc. | | 27,600 | | 598,644 |
CEVA, Inc.* | | 14,100 | | 640,845 |
Cimpress NV*+ | | 5,600 | | 529,368 |
Cirrus Logic, Inc.* | | 3,900 | | 244,608 |
| | |
| 48 | | Annual Report | June 30, 2017 |
| | |
| Small-Cap Growth Fund | | |
| SCHEDULE OF INVESTMENTS (continued) | | |
| Showing percentage of net assets as of June 30, 2017 | | |
| | | | | | |
| Industry Company | | Shares | | Value | | |
| |
Common Stocks (continued) | | |
Information Technology (continued) | | |
CommVault Systems, Inc.* | | 4,100 | | $ 231,445 | | |
Eastman Kodak Co.*+ | | 57,200 | | 520,520 | | |
ePlus, Inc.* | | 9,300 | | 689,130 | | |
Extreme Networks, Inc.* | | 64,400 | | 593,768 | | |
Fabrinet* | | 17,400 | | 742,284 | | |
Fair Isaac Corp. | | 4,500 | | 627,345 | | |
Five9, Inc.* | | 18,800 | | 404,576 | | |
Integrated Device Technology, Inc.* | | 28,100 | | 724,699 | | |
Itron, Inc.* | | 9,700 | | 657,175 | | |
MAXIMUS, Inc. | | 10,100 | | 632,563 | | |
MaxLinear, Inc.* | | 8,500 | | 237,065 | | |
Monolithic Power Systems, Inc. | | 3,000 | | 289,200 | | |
Novanta, Inc.* | | 7,000 | | 252,000 | | |
RealPage, Inc.* | | 12,800 | | 460,160 | | |
Rosetta Stone, Inc.* | | 15,900 | | 171,402 | | |
TeleTech Holdings, Inc. | | 11,500 | | 469,200 | | |
Unisys Corp.*+ | | 45,000 | | 576,000 | | |
Varonis Systems, Inc.* | | 10,100 | | 375,720 | | |
WebMD Health Corp.* | | 9,300 | | 545,445 | | |
| | | | | | |
| | | | 13,188,522 | | |
| |
Materials - 4.12% | | |
Koppers Holdings, Inc.* | | 12,200 | | 441,030 | | |
Trinseo SA | | 10,300 | | 707,610 | | |
Worthington Industries, Inc. | | 15,300 | | 768,366 | | |
| | | | | | |
| | | | 1,917,006 | | |
| |
Real Estate - 4.77% | | |
Altisource Portfolio Solutions SA*+ | | 30,600 | | 667,692 | | |
HFF, Inc., Class A | | 3,700 | | 128,649 | | |
LTC Properties, Inc. | | 3,600 | | 185,004 | | |
National Health Investors, Inc. | | 6,400 | | 506,880 | | |
Potlatch Corp. | | 7,600 | | 347,320 | | |
Urban Edge Properties | | 16,199 | | 384,402 | | |
| | | | | | |
| | | | 2,219,947 | | |
| | | | | | |
TOTAL COMMON STOCKS - 99.19% | | 46,168,336 | | |
| | | | | | |
(Cost $40,456,689) | | | | | | |
| | | | | | |
| Industry Company | | | | Shares | | Value |
|
EXCHANGE TRADED FUND - 0.73% |
iShares Russell 2000 Growth ETF+ | | 2,000 | | $ 337,540 |
| | | | | | |
TOTAL EXCHANGE TRADED FUND - 0.73% | | 337,540 |
| | | | | | |
(Cost $310,848) |
| | | |
| | | Rate^ | | Shares | | Value |
|
MONEY MARKET FUND - 0.00% |
Fidelity Investments Money Market Government Portfolio Class I | | 0.81% | | 564 | | 564 |
| | | | | | |
TOTAL MONEY MARKET FUND - 0.00% | | 564 |
| | | | | | |
(Cost $564) | | | | | | |
|
| INVESTMENTS PURCHASED WITH CASH PROCEEDS FROM SECURITIES LENDING - 9.76% |
Fidelity Investments Money | | | | | | |
Market Government Portfolio Class I** | | 0.81% | | 4,544,311 | | 4,544,311 |
| | | | | | |
TOTAL INVESTMENTS PURCHASED WITH CASH PROCEEDS FROM SECURITIES LENDING - 9.76% | | 4,544,311 |
| | | | | | |
(Cost $4,544,311) | | | | | | |
| |
TOTAL INVESTMENTS - 109.68% | | $ 51,050,751 |
(Cost $45,312,412) | | | | | | |
Liabilities in Excess of Other Assets - (9.68%) | | (4,507,232) |
| | | | | | |
NET ASSETS - 100.00% | | $ 46,543,519 |
| | | | | | |
| * | Non-income producing security. |
| ** | This security represents the investment of the collateral received in connection with securities out on loan as of June 30, 2017. |
| ^ | Rate disclosed as of June 30, 2017. |
| + | This security or a portion of the security is out on loan as of June 30, 2017. Total loaned securities had a value of $4,441,280 as of June 30, 2017. |
| | |
| Small-Cap Growth Fund | | |
| SCHEDULE OF INVESTMENTS (continued) | | |
| Showing percentage of net assets as of June 30, 2017 | | |
| | | | | | | | | | | | | | | | |
| Summary of inputs used to value the Fund’s investments as of 06/30/2017 (See Note 2 in Notes to Financial Statements): | |
| |
| | | Valuation Inputs | |
| | | Investment in Securities (Value) | |
| | | Level 1
Quoted
Prices | | | Level 2 Significant Observable
Inputs | | | Level 3 Significant Unobservable
Inputs | | | Total | |
| | | | |
Common Stocks | | $ | 46,168,336 | | | $ | — | | | $ | — | | | $ | 46,168,336 | |
Exchange Traded Fund | | | 337,540 | | | | — | | | | — | | | | 337,540 | |
Money Market Fund | | | — | | | | 564 | | | | — | | | | 564 | |
Investments Purchased with Cash Proceeds from Securities Lending | | | — | | | | 4,544,311 | | | | — | | | | 4,544,311 | |
| | | | | | | | | | | | | | | | |
TOTAL | | $ | 46,505,876 | | | $ | 4,544,875 | | | $ | — | | | $ | 51,050,751 | |
| | | | | | | | | | | | | | | | |
See Notes to Financial Statements.
| | |
| 50 | | Annual Report | June 30, 2017 |
| | |
| Small-Cap Value Fund | | |
| MANAGER’S COMMENTARY (Unaudited) | | |
| | |
June 30, 2017
Dear Fellow Small-Cap Value Fund Shareholder,
For the quarter ended June 30, 2017, our Fund returned -0.40%, underperforming our primary market benchmark, the Russell 2000 Value Index (+0.67%), and our peer benchmark, the Lipper Small-Cap Value Funds Index (+0.57%). It was a poor quarter.
For the fiscal year, our Fund returned +20.08%, trailing the Russell 2000 Value Index (+24.86%) and the Lipper Small-Cap Value Funds Index (+22.99%).
The table below presents our June quarter, one-year, five-year, 10-year, and inception-to-date financial results. See the next page for a graph of performance since inception.
Standardized Returns as of June 30, 2017
| | | | | | | | | | | | | | | | | | |
| | | | | | | | | Annualized | | | |
| | | Quarter | | | 1 Year | | | 5 Years | | | 10 Years | | | Since Inception
(10/31/03) |
| | | | | |
Small-Cap Value Fund | | | -0.40% | | | | 20.08 | % | | | 12.28 | % | | | 3.85% | | | 7.64% |
Russell 2000 Value Index | | | 0.67% | | | | 24.86 | % | | | 13.39 | % | | | 5.92% | | | 8.73% |
Lipper Small-Cap Value Funds Index | | | 0.57% | | | | 22.99 | % | | | 12.53 | % | | | 6.05% | | | 8.91% |
Performance figures quoted in the table above represent past performance and are no guarantee of future results. Total return figures in the table above include the reinvestment of dividends and capital gains. The table above does not reflect the deduction of taxes that a shareholder would pay on Fund distributions or on the redemption of Fund shares.
The Russell 2000 Value Index is an unmanaged index that consists of stocks in the Russell 2000 Index with lower price-to-book ratios and lower forecasted growth values with dividends reinvested. The Lipper Small-Cap Value Funds Index is an index of small-company, value-oriented funds compiled by Lipper, Inc. It is not possible to invest directly in an index. Periods longer than one year are annualized.
According to data from Lipper, Inc. as of June 30, 2017, Small-Cap Value Fund ranked 191st of 295 small-cap value funds for the 12 months ended June 30, 2017, 135th of 222 over the last five years, 128th of 141 over the last 10 years, and 78th of 94 such funds since inception in October 2003. Lipper, Inc. is an independent mutual fund rating service that ranks funds in various fund categories by making comparative calculations using total returns.
| | |
| Small-Cap Value Fund | | |
| MANAGER’S COMMENTARY (Unaudited) (continued) | | |
| | |
Growth of a $10,000 Investment
from Inception October 31, 2003 to June 30, 2017
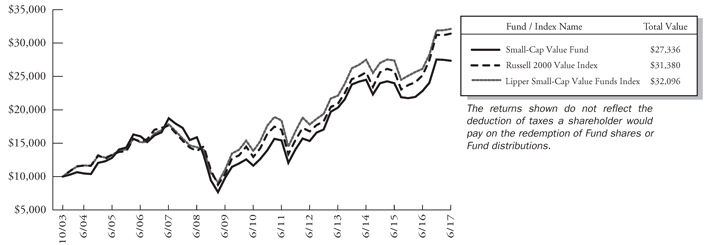
Detailed Explanation of Quarterly Performance
The Fund’s diversifying company financial health and price momentum exposure weighed heavily on relative results for the quarter, which contributed to our underperformance. Exposure to deeper value stocks across multiple value metrics also detracted from relative returns during a period when growth stocks outperformed their value counterparts. These losses were partially offset by outperformance from the Fund’s heavily weighted value metrics exposure. Our focus on smaller stocks within the small-cap value universe also had a slightly positive impact on relative performance.
Holdings in the Consumer Discretionary sector weighed on relative returns, while holdings in the Information Technology sector, particularly investments in semiconductor companies, also detracted. An underweight position and holdings in the Energy sector added to relative results, as did holdings in the Health Care sector.
Detailed Explanation of Fiscal Year Performance
The Fund’s company financial health and price momentum exposure underperformed the benchmark during the year, detracting from relative results. Exposure to deeper value stocks across multiple value metrics also hurt relative performance. However, our heavily weighted value metrics exposure made positive contributions to relative performance, as did the Fund’s tilt toward smaller stocks in the small-cap value universe. The benchmark’s smaller stocks generally outperformed larger stocks in the benchmark during the fiscal year.
An underweight position and holdings in the Financials sector, particularly among banks, detracted from relative results. Holdings in the Consumer Discretionary sector also detracted. Underweight positions and holdings in the Energy and Real Estate sectors added to relative performance, as did an overweight position and holdings in the Information Technology sector; the latter was the benchmark’s best-performing sector during the 12-month period.
| | |
| 52 | | Annual Report | June 30, 2017 |
| | |
| Small-Cap Value Fund | | |
| MANAGER’S COMMENTARY (Unaudited) (continued) | | |
| | |
Top Ten Holdings as of June 30, 2017
| | | | | | |
| Rank | | Description | | Industry | | % of Net
Assets |
| 1 | | Selective Insurance Group, Inc. | | Financials | | 2.2% |
| 2 | | Sanmina Corp. | | Information Technology | | 2.2% |
| 3 | | Central Garden & Pet Co., Class A | | Consumer Staples | | 2.0% |
| 4 | | Summit Hotel Properties, Inc. | | Real Estate | | 1.9% |
| 5 | | Walker & Dunlop, Inc. | | Financials | | 1.8% |
| 6 | | SkyWest, Inc. | | Industrials | | 1.8% |
| 7 | | Sanderson Farms, Inc. | | Consumer Staples | | 1.8% |
| 8 | | OneBeacon Insurance Group Ltd., Class A | | Financials | | 1.8% |
| 9 | | Kindred Healthcare, Inc. | | Health Care | | 1.7% |
| 10 | | ACCO Brands Corp. | | Industrials | | 1.6% |
| | Total | | | | 18.8% |
Industry Sector Representation as of June 30, 2017
| | | | | | | | | | | | |
| | | % of Net Assets | | | % of Russell 2000
Value Index | | | Difference | |
Consumer Discretionary | | | 11.7% | | | | 10.6% | | | | 1.1% | |
Consumer Staples | | | 4.4% | | | | 2.8% | | | | 1.6% | |
Energy | | | 1.6% | | | | 6.1% | | | | -4.5% | |
Financials | | | 26.4% | | | | 30.6% | | | | -4.2% | |
Health Care | | | 3.9% | | | | 5.6% | | | | -1.7% | |
Industrials | | | 16.8% | | | | 11.7% | | | | 5.1% | |
Information Technology | | | 14.3% | | | | 9.5% | | | | 4.8% | |
Materials | | | 8.1% | | | | 4.1% | | | | 4.0% | |
Real Estate | | | 7.5% | | | | 11.6% | | | | -4.1% | |
Telecommunication Services | | | 2.2% | | | | 0.7% | | | | 1.5% | |
Utilities | | | 2.0% | | | | 6.7% | | | | -4.7% | |
Cash & Other Assets | | | 1.1% | | | | 0.0% | | | | 1.1% | |
Total | | | 100.0% | | | | 100.0% | | | | | |
Disclaimer
The views expressed here are exclusively those of Fund management. These views, including those related to market sectors or individual stocks, are not meant as investment advice and should not be considered predictive in nature. Any favorable (or unfavorable) description of a holding applies only as of the quarter end, June 30, 2017, unless otherwise stated. Security positions can and do change thereafter. Discussions of historical performance do not guarantee and may not be indicative of future performance.
Market volatility can significantly impact short-term performance. The Fund is not an appropriate investment for short-term investors. Investments in small companies generally carry greater risk than is customarily associated with larger companies. This additional risk is attributable to a number of factors, including the relatively limited financial resources that are typically available to small companies and the fact that small companies often have comparatively limited product lines. In addition, the stock of small companies tends to be more volatile than the stock of large companies, particularly in the short term and particularly in the early stages of an economic or market downturn. Shareholders of the Fund, therefore, are taking on more risk than they would if they invested in the stock market as a whole.
| | |
| Small-Cap Value Fund | | |
| MANAGER’S COMMENTARY (Unaudited) (continued) | | |
| | |
Conclusion
Thank you for your continued investment in Small-Cap Value Fund. We encourage your feedback; your reactions and concerns are important to us.
Sincerely,
The Investment Management Team
| | |
| 54 | | Annual Report | June 30, 2017 |
| | |
| Small-Cap Value Fund | | |
| SCHEDULE OF INVESTMENTS | | |
| Showing percentage of net assets as of June 30, 2017 | | |
| | | | | | |
| Industry Company | | Shares | | Value | | |
| |
COMMON STOCKS - 98.68% | | |
Consumer Discretionary - 11.68% | | |
American Axle & Manufacturing Holdings, Inc.* | | 26,900 | | $ 419,640 | | |
Big 5 Sporting Goods Corp.+ | | 39,200 | | 511,560 | | |
Bridgepoint Education, Inc.* | | 45,900 | | 677,484 | | |
Container Store Group, Inc. (The)* | | 58,300 | | 345,136 | | |
Cooper Tire & Rubber Co. | | 15,100 | | 545,110 | | |
Cooper-Standard Holding, Inc.* | | 5,800 | | 585,046 | | |
Dana, Inc. | | 32,300 | | 721,259 | | |
Fossil Group, Inc.*+ | | 21,500 | | 222,525 | | |
Office Depot, Inc. | | 155,800 | | 878,712 | | |
Standard Motor Products, Inc. | | 12,400 | | 647,528 | | |
Tailored Brands, Inc.+ | | 35,100 | | 391,716 | | |
Tower International, Inc. | | 23,500 | | 527,575 | | |
Weight Watchers International, Inc.*+ | | 22,900 | | 765,318 | | |
| | | | | | |
| | | | 7,238,609 | | |
| |
Consumer Staples - 4.38% | | |
Central Garden & Pet Co., Class A* | | 40,600 | | 1,218,812 | | |
Sanderson Farms, Inc. | | 9,600 | | 1,110,240 | | |
SUPERVALU, Inc.* | | 117,500 | | 386,575 | | |
| | | | | | |
| | | | 2,715,627 | | |
| |
Energy - 1.56% | | |
Sanchez Energy Corp.*+ | | 49,600 | | 356,128 | | |
Ship Finance International, Ltd.+ | | 44,900 | | 610,640 | | |
Tesoro Corp. | | 1 | | 84 | | |
| | | | | | |
| | | | 966,852 | | |
| |
Financials - 26.39% | | |
American Equity Investment Life Holding Co. | | 28,600 | | 751,608 | | |
Argo Group International Holdings Ltd. | | 11,110 | | 673,266 | | |
Banco Latinoamericano de Comercio Exterior SA, Class E | | 27,700 | | 758,426 | | |
Banner Corp. | | 11,700 | | 661,167 | | |
Capitol Federal Financial, Inc. | | 45,200 | | 642,292 | | |
Employers Holdings, Inc. | | 18,500 | | 782,550 | | |
Enstar Group, Ltd.* | | 2,900 | | 576,085 | | |
First BanCorp Puerto Rico* | | 129,500 | | 749,805 | | |
Heartland Financial USA, Inc. | | 12,400 | | 584,040 | | |
| | | | | | |
| | | | |
| Industry Company | | Shares | | Value |
|
|
Financials (continued) |
Investors Bancorp, Inc. | | 60,800 | | $ 812,288 |
Kearny Financial Corp. | | 55,400 | | 822,690 |
National Western Life Group, Inc., Class A | | 2,600 | | 831,012 |
Nationstar Mortgage Holdings, Inc.* | | 26,700 | | 477,663 |
Nelnet, Inc., Class A | | 19,700 | | 926,097 |
Northwest Bancshares, Inc. | | 49,300 | | 769,573 |
Ocwen Financial Corp.*+ | | 132,000 | | 355,080 |
OneBeacon Insurance Group Ltd., Class A | | 60,220 | | 1,097,810 |
Safety Insurance Group, Inc. | | 9,800 | | 669,340 |
Selective Insurance Group, Inc. | | 27,500 | | 1,376,375 |
TriState Capital Holdings, Inc.* | | 35,600 | | 897,120 |
Walker & Dunlop, Inc.* | | 23,400 | | 1,142,622 |
| | | | |
| | | | 16,356,909 |
|
Health Care - 3.87% |
Community Health Systems, Inc.* | | 47,900 | | 477,084 |
Kindred Healthcare, Inc. | | 87,800 | | 1,022,870 |
LHC Group, Inc.* | | 13,200 | | 896,148 |
| | | | |
| | | | 2,396,102 |
|
Industrials - 16.80% |
ABM Industries, Inc. | | 18,500 | | 768,120 |
ACCO Brands Corp.* | | 85,600 | | 997,240 |
Aircastle, Ltd. | | 27,100 | | 589,425 |
EMCOR Group, Inc. | | 10,100 | | 660,338 |
GATX Corp.+ | | 13,100 | | 841,937 |
Greenbrier Companies., Inc. (The)+ | | 19,700 | | 911,125 |
Kratos Defense & Security Solutions, Inc.* | | 72,200 | | 857,014 |
MasTec, Inc.* | | 11,200 | | 505,680 |
Meritor, Inc.* | | 41,600 | | 690,976 |
Radiant Logistics, Inc.* | | 96,300 | | 518,094 |
Rush Enterprises, Inc., Class A* | | 12,600 | | 468,468 |
SkyWest, Inc. | | 31,700 | | 1,112,670 |
Tetra Tech, Inc. | | 16,600 | | 759,450 |
UniFirst Corp. | | 5,200 | | 731,640 |
| | | | |
| | | | 10,412,177 |
|
Information Technology - 14.31% |
AVX Corp. | | 41,100 | | 671,574 |
Benchmark Electronics, Inc.* | | 25,100 | | 810,730 |
Cirrus Logic, Inc.* | | 9,600 | | 602,112 |
| | |
| Small-Cap Value Fund | | |
| SCHEDULE OF INVESTMENTS (continued) | | |
| Showing percentage of net assets as of June 30, 2017 | | |
| | | | | | | | | | |
| Industry Company | | Shares | | | Value | | | |
| |
Common Stocks (continued) | | | | |
Information Technology (continued) | | | | |
ePlus, Inc.* | | | 10,200 | | | $ 755,820 | | | | |
Extreme Networks, Inc.* | | | 67,000 | | | 617,740 | | | | |
NETGEAR, Inc.* | | | 9,300 | | | 400,830 | | | | |
Rosetta Stone, Inc.* | | | 28,400 | | | 306,152 | | | | |
Sanmina Corp.* | | | 35,900 | | | 1,367,790 | | | | |
Sykes Enterprises, Inc.* | | | 14,400 | | | 482,832 | | | | |
Systemax, Inc. | | | 300 | | | 5,640 | | | | |
Tech Data Corp.* | | | 7,700 | | | 777,700 | | | | |
TTM Technologies, Inc.* | | | 36,100 | | | 626,696 | | | | |
Unisys Corp.*+ | | | 55,800 | | | 714,240 | | | | |
Vishay Intertechnology, Inc. | | | 44,100 | | | 732,060 | | | | |
| | | | | | | | | | |
| | | | | | 8,871,916 | | | | |
| |
Materials - 8.05% | | | | |
Cliffs Natural Resources, Inc.*+ | | | 101,100 | | | 699,612 | | | | |
Materion Corp. | | | 20,000 | | | 748,000 | | | | |
Rayonier Advanced Materials, Inc.+ | | | 62,800 | | | 987,216 | | | | |
Ryerson Holding Corp.* | | | 63,900 | | | 632,610 | | | | |
Schnitzer Steel Industries, Inc., Class A | | | 31,100 | | | 783,720 | | | | |
Stepan Co. | | | 3,700 | | | 322,418 | | | | |
SunCoke Energy, Inc.* | | | 74,700 | | | 814,230 | | | | |
| | | | | | | | | | |
| | | | | | 4,987,806 | | | | |
| |
Real Estate - 7.48% | | | | |
CBL & Associates Properties, Inc.+ | | | 87,600 | | | 738,468 | | | | |
Cousins Properties, Inc. | | | 90,600 | | | 796,374 | | | | |
Farmland Partners, Inc.+ | | | 23,100 | | | 206,514 | | | | |
Healthcare Realty Trust, Inc. | | | 24,200 | | | 826,430 | | | | |
Monogram Residential Trust, Inc. | | | 92,500 | | | 898,175 | | | | |
Summit Hotel Properties, Inc. | | | 62,800 | | | 1,171,220 | | | | |
| | | | | | | | | | |
| | | | | | 4,637,181 | | | | |
| |
Telecommunication Services - 2.20% | | | | |
ATN International, Inc. | | | 9,000 | | | 615,960 | | | | |
Intelsat SA*+ | | | 113,400 | | | 347,004 | | | | |
Windstream Holdings, Inc.+ | | | 103,100 | | | 400,028 | | | | |
| | | | | | | | | | |
| | | | | | 1,362,992 | | | | |
| |
Utilities - 1.96% | | | | |
ALLETE, Inc. | | | 8,500 | | | 609,280 | | | | |
NorthWestern Corp. | | | 9,900 | | | 604,098 | | | | |
| | | | | | | | | | |
| | | | | | 1,213,378 | | | | |
| | | | | | | | | | |
TOTAL COMMON STOCKS - 98.68% | | | 61,159,549 | | | | |
| | | | | | | | | | |
(Cost $53,614,294) | | | | | | | | | | |
| | | | | | | | | | | | | | |
| | | Rate^ | | | Shares | | | Value | | | |
| |
| INVESTMENTS PURCHASED WITH CASH PROCEEDS FROM SECURITIES LENDING - 11.04% | | | |
Fidelity Investments Money Market Government Portfolio Class I** | | | 0.81 | % | | | 6,844,975 | | | | $ 6,844,975 | | | |
| | | | | | | | | | | | | | |
TOTAL INVESTMENTS PURCHASED WITH CASH PROCEEDS FROM SECURITIES LENDING - 11.04% | | | | 6,844,975 | | | |
| | | | | | | | | | | | | | |
(Cost $6,844,975) | | | | | | | |
| | |
TOTAL INVESTMENTS - 109.72% | | | | $ 68,004,524 | | | |
(Cost $60,459,269) | | | | | | | |
Liabilities in Excess of Other Assets - (9.72%) | | | | (6,023,818 | ) | | |
| | | | | | | | | | | | | | |
NET ASSETS - 100.00% | | | | $ 61,980,706 | | | |
| | | | | | | | | | | | | | |
| * | Non-income producing security. |
| ** | This security represents the investment of the collateral received in connection with securities out on loan as of June 30, 2017. |
| ^ | Rate disclosed as of June 30, 2017. |
| + | This security or a portion of the security is out on loan as of June 30, 2017. Total loaned securities had a value of $6,536,979 as of June 30, 2017. |
| | |
| 56 | | Annual Report | June 30, 2017 |
| | |
| Small-Cap Value Fund | | |
| SCHEDULE OF INVESTMENTS (continued) | | |
| Showing percentage of net assets as of June 30, 2017 | | |
| | | | | | | | | | | | | | | | |
| Summary of inputs used to value the Fund’s investments as of 06/30/2017 (See Note 2 in Notes to Financial Statements): | |
| |
| | | Valuation Inputs | |
| | | Investment in Securities (Value) | |
| | | Level 1 Quoted Prices | | | Level 2 Significant Observable Inputs | | | Level 3 Significant Unobservable Inputs | | | Total | |
| | | | |
Common Stocks | | $ | 61,159,549 | | | $ | — | | | | $ — | | | $ | 61,159,549 | |
Investments Purchased with Cash Proceeds from Securities Lending | | | — | | | | 6,844,975 | | | | — | | | | 6,844,975 | |
| | | | | | | | | | | | | | | | |
TOTAL | | $ | 61,159,549 | | | $ | 6,844,975 | | | | $ — | | | $ | 68,004,524 | |
| | | | | | | | | | | | | | | | |
See Notes to Financial Statements
| | |
| Blue Chip 35 Index Fund | | |
| MANAGER’S COMMENTARY (Unaudited) | | |
| | |
June 30, 2017
Dear Fellow Blue Chip 35 Index Fund Shareholder,
For the quarter ended June 30, 2017, our Fund returned +1.56%, underperforming our primary market benchmark, the S&P 500 Index (+3.09%), our peer benchmark, the Lipper Large-Cap Core Funds Index (+2.97), and the Russell Top 50 Mega Cap Index (+2.56). It was a poor quarter on a relative basis.
For the fiscal year, our Fund was up 14.33%, trailing the S&P 500 Index (+17.90%), the Lipper Large-Cap Core Funds Index (+18.73%), and the Russell Top 50 Mega Cap Index (+16.90%).
The table below presents our June quarter, one-year, five-year, 10-year, 15-year, and inception-to-date financial results. See the next page for a graph of performance since inception.
Standardized Returns as of June 30, 2017
| | | | | | | | | | | | | | | | | | | | | | |
| | | | | | | | | Annualized |
| | | Quarter | | | 1 Year | | | 5 Years | | | 10 Years | | | 15 Years | | | Since Inception
(7/31/97) |
| | | | | | |
Blue Chip 35 Index Fund | | | 1.56% | | | | 14.33 | % | | | 13.54 | % | | | 7.21% | | | | 7.80% | | | 6.93% |
S&P 500 Index | | | 3.09% | | | | 17.90 | % | | | 14.63 | % | | | 7.18% | | | | 8.34% | | | 6.77% |
Russell Top 50 Mega Cap Index | | | 2.56% | | | | 16.90 | % | | | 13.53 | % | | | 6.78% | | | | 7.35% | | | 5.71% |
Lipper Large-Cap Core Funds Index | | | 2.97% | | | | 18.73 | % | | | 13.73 | % | | | 6.39% | | | | 7.37% | | | 5.96% |
Bridgeway Ultra-Large 35 Index | | | 1.62% | | | | 14.65 | % | | | 13.77 | % | | | 7.47% | | | | 8.03% | | | 7.12% |
Performance figures quoted in the table above represent past performance and are no guarantee of future results. Total return figures in the table above include the reinvestment of dividends and capital gains. The table above does not reflect the deduction of taxes that a shareholder would pay on Fund distributions or on the redemption of Fund shares.
The S&P 500 Index is a broad-based, unmanaged measurement of changes in stock market conditions, based on the average of 500 widely held common stocks with dividends reinvested. The Russell Top 50 Mega Cap Index measures the performance of the largest companies in the Russell 3000 Index. It includes 50 of the largest securities, based on a combination of their market cap and current index membership, and represents approximately 40% of the total market capitalization of the Russell 3000 Index. The Bridgeway Ultra-Large 35 Index is an index composed of very large, “blue chip” U.S. stocks, excluding tobacco; it is compiled by the adviser of the Fund. The Lipper Large-Cap Core Funds Index reflects the aggregate record of domestic large-cap core mutual funds as reported by Lipper, Inc. It is not possible to invest directly in an index. Periods longer than one year are annualized.
According to data from Lipper, Inc. as of June 30, 2017, Blue Chip 35 Index Fund ranked 636th of 834 large-cap core funds for the 12 months ended June 30, 2017, 353rd of 675 over the last five years, 99th of 526 over the last 10 years, and 43rd of 156 since inception in July 1997. Lipper, Inc. is an independent mutual fund rating service that ranks funds in various fund categories by making comparative calculations using total returns.
| | |
| 58 | | Annual Report | June 30, 2017 |
| | |
| Blue Chip 35 Index Fund | | |
| MANAGER’S COMMENTARY (Unaudited) (continued) | | |
| | |
Growth of a $10,000 Investment
from Inception July 31, 1997 to June 30, 2017
Detailed Explanation of Quarterly Performance
The Fund’s size tilt detracted from results relative to the S&P 500 when measuring by market cap deciles. Our equal weight design and discipline of rebalancing to maintain equal weighting also detracted from relative performance. Rebalancing entails trimming positions that have performed well in recent months and adding names that recently have underperformed.
Holdings in the Health Care and Information Technology sectors detracted from relative performance, as did overweight positions in the Energy and Telecommunication Services sectors. Holdings in the Consumer Discretionary sector boosted relative returns.
The table below presents index performance numbers for stocks in the different CRSP deciles during various time periods.
| | | | | | | | | | | | | | | | | | | | | | | | |
| | | | | | | | | | | | Annualized | |
| CRSP Decile1 | | Quarter | | | 6 Months | | | 1 Year | | | 5 Years | | | 10 Years | | | 91.5 Years | |
| 1 (ultra-large) | | | 3.48% | | | | 9.97% | | | | 19.07% | | | | 14.37% | | | | 7.20% | | | | 9.36% | |
| 2 | | | 2.30% | | | | 8.18% | | | | 18.81% | | | | 15.96% | | | | 8.00% | | | | 10.58% | |
| 3 | | | 2.17% | | | | 8.62% | | | | 19.93% | | | | 15.19% | | | | 7.88% | | | | 11.07% | |
| 4 | | | 1.56% | | | | 6.17% | | | | 17.73% | | | | 14.07% | | | | 7.83% | | | | 10.85% | |
| 5 | | | 2.02% | | | | 6.37% | | | | 21.73% | | | | 13.71% | | | | 8.22% | | | | 11.48% | |
| 6 | | | 2.02% | | | | 6.11% | | | | 22.75% | | | | 13.69% | | | | 7.60% | | | | 11.38% | |
| 7 | | | 2.59% | | | | 5.20% | | | | 27.16% | | | | 14.97% | | | | 8.78% | | | | 11.57% | |
| 8 | | | 2.06% | | | | 2.38% | | | | 23.90% | | | | 13.14% | | | | 7.97% | | | | 11.51% | |
| 9 | | | 3.32% | | | | 4.09% | | | | 33.89% | | | | 14.57% | | | | 7.86% | | | | 11.53% | |
| 10 (ultra-small) | | | 1.28% | | | | 3.90% | | | | 25.94% | | | | 12.47% | | | | 6.45% | | | | 13.26% | |
1 Performance figures are as of the period ended June 30, 2017. The CRSP Cap-Based Portfolio Indexes are unmanaged indexes of publicly traded U.S. stocks with dividends reinvested, grouped by market capitalization, as reported by the Center for Research in Security Prices. Past performance is no guarantee of future results.
| | |
| Blue Chip 35 Index Fund | | |
| MANAGER’S COMMENTARY (Unaudited) (continued) | | |
| | |
Detailed Explanation of Fiscal Year Performance
The Fund’s size tilt detracted from results relative to the S&P 500 when measuring by market cap deciles. Exposure to less risky, lower beta stocks also hurt relative performance, as the benchmark’s higher beta stocks outperformed during the year. Our equal weight design and discipline of rebalancing to maintain equal weighting detracted from relative returns for the fiscal year.
Holdings in the Industrials, Health Care, and Information Technology sectors detracted from relative performance. Overweight positions in the lagging Telecommunication Services and Energy sectors also hurt relative performance. Holdings in the Consumer Discretionary and Financials sectors helped relative performance.
| | |
| 60 | | Annual Report | June 30, 2017 |
| | |
| Blue Chip 35 Index Fund | | |
| MANAGER’S COMMENTARY (Unaudited) (continued) | | |
| | |
Contribution to Returns for Blue Chip 35 Index Fund stocks for the fiscal year June 30, 2017:
| | | | | | | | | |
| Rank | | Company | | Industry | | % Contribution
to Return |
| 1 | | Bank of America Corp. | | Financials | | | | 2.4 | % |
| 2 | | Apple, Inc. | | Information Technology | | | | 1.6 | % |
| 3 | | Microsoft Corp. | | Information Technology | | | | 1.3 | % |
| 4 | | JPMorgan Chase & Co. | | Financials | | | | 1.3 | % |
| 5 | | Amazon.com, Inc. | | Consumer Discretionary | | | | 1.2 | % |
| 6 | | Visa Inc., Class A | | Information Technology | | | | 1.0 | % |
| 7 | | McDonald’s Corp. | | Consumer Discretionary | | | | 0.7 | % |
| 8 | | Oracle Corp. | | Information Technology | | | | 0.6 | % |
| 9 | | Wells Fargo & Co. | | Financials | | | | 0.6 | % |
| 10 | | Comcast Corp., Class A | | Consumer Discretionary | | | | 0.6 | % |
| 11 | | Alphabet Inc., Class A | | Information Technology | | | | 0.6 | % |
| 12 | | United Technologies Corp. | | Industrials | | | | 0.5 | % |
| 13 | | Alphabet Inc., Class C | | Information Technology | | | | 0.5 | % |
| 14 | | 3M Co. | | Industrials | | | | 0.5 | % |
| 15 | | Berkshire Hathaway, Inc., Class B | | Financials | | | | 0.5 | % |
| 16 | | Merck & Co., Inc. | | Health Care | | | | 0.4 | % |
| 17 | | Cisco Systems, Inc. | | Information Technology | | | | 0.4 | % |
| 18 | | Walt Disney Co. (The) | | Consumer Discretionary | | | | 0.3 | % |
| 19 | | PepsiCo, Inc. | | Consumer Staples | | | | 0.3 | % |
| 20 | | Johnson & Johnson | | Health Care | | | | 0.3 | % |
| 21 | | QUALCOMM, Inc. | | Information Technology | | | | 0.3 | % |
| 22 | | International Business Machines Corp. | | Information Technology | | | | 0.2 | % |
| 23 | | Intel Corp. | | Information Technology | | | | 0.2 | % |
| 24 | | United Parcel Service Inc., Class B | | Industrials | | | | 0.2 | % |
| 25 | | Proctor & Gamble Co. (The) | | Consumer Staples | | | | 0.2 | % |
| 26 | | Wal-Mart Stores, Inc. | | Consumer Staples | | | | 0.2 | % |
| 27 | | Chevron Corp. | | Energy | | | | 0.2 | % |
| 28 | | ConocoPhillips | | Energy | | | | 0.1 | % |
| 29 | | Coca-Cola Co. (The) | | Consumer Staples | | | | 0.0 | % |
| 30 | | Pfizer, Inc. | | Health Care | | | | -0.1 | % |
| 31 | | AT&T, Inc. | | Telecommunication Services | | | | -0.2 | % |
| 32 | | General Electric Co. | | Industrials | | | | -0.3 | % |
| 33 | | Exxon Mobil Corp. | | Energy | | | | -0.3 | % |
| 34 | | Schlumberger, Ltd. | | Energy | | | | -0.3 | % |
| 35 | | Gilead Sciences, Inc. | | Health Care | | | | -0.4 | % |
| 36 | | Verizon Communications, Inc. | | Telecommunication Services | | | | -0.5 | % |
| 37 | | CVS Health Corp. | | Consumer Staples | | | | -0.5 | % |
| | |
| Blue Chip 35 Index Fund | | |
| MANAGER’S COMMENTARY (Unaudited) (continued) | | |
| | |
Industry Sector Representation as of June 30, 2017
| | | | | | | | | | | | | | | |
| | | % of Net Assets | | % of S&P 500 Index | | Difference |
Consumer Discretionary | | | | 11.8% | | | | | 12.3% | | | | | -0.5% | |
Consumer Staples | | | | 12.2% | | | | | 9.0% | | | | | 3.2% | |
Energy | | | | 9.9% | | | | | 6.0% | | | | | 3.9% | |
Financials | | | | 12.4% | | | | | 14.5% | | | | | -2.1% | |
Health Care | | | | 9.8% | | | | | 14.5% | | | | | -4.7% | |
Industrials | | | | 10.0% | | | | | 10.3% | | | | | -0.3% | |
Information Technology | | | | 28.9% | | | | | 22.4% | | | | | 6.5% | |
Materials | | | | 0.0% | | | | | 2.8% | | | | | -2.8% | |
Real Estate | | | | 0.0% | | | | | 2.9% | | | | | -2.9% | |
Telecommunication Services | | | | 4.9% | | | | | 2.1% | | | | | 2.8% | |
Utilities | | | | 0.0% | | | | | 3.2% | | | | | -3.2% | |
Cash & Other Assets | | | | 0.1% | | | | | 0.0% | | | | | 0.1% | |
Total | | | | 100.0% | | | | | 100.0% | | | | | | |
Disclaimer
The views expressed here are exclusively those of Fund management. These views, including those concerning market sectors or individual stocks, are not meant as investment advice and should not be considered predictive in nature. Any favorable (or unfavorable) description of a holding applies only as of the quarter end, June 30, 2017, unless otherwise stated. Security positions can and do change thereafter. Discussions of historical performance do not guarantee and are not indicative of future performance.
The Fund is subject to significant market risk (volatility) and is not an appropriate investment for short-term investors.
Conclusion
Thank you for your continued investment in Blue Chip 35 Index Fund. We encourage your feedback; your reactions and concerns are important to us.
Sincerely,
The Investment Management Team
| | |
| 62 | | Annual Report | June 30, 2017 |
| | |
| Blue Chip 35 Index Fund | | |
| SCHEDULE OF INVESTMENTS | | |
| Showing percentage of net assets as of June 30, 2017 | | |
| | | | | | |
| Industry Company | | Shares | | Value | | |
| |
COMMON STOCKS - 99.97% | | |
Consumer Discretionary - 11.82% | | |
Amazon.com, Inc.* | | 22,900 | | $ 22,167,200 | | |
Comcast Corp., Class A | | 350,250 | | 13,631,730 | | |
McDonald’s Corp. | | 104,100 | | 15,943,956 | | |
Walt Disney Co. (The) | | 125,500 | | 13,334,375 | | |
| | | | | | |
| | | | 65,077,261 | | |
| |
Consumer Staples - 12.24% | | |
Coca-Cola Co. (The) | | 298,514 | | 13,388,353 | | |
CVS Health Corp. | | 168,350 | | 13,545,441 | | |
PepsiCo, Inc. | | 118,305 | | 13,663,045 | | |
Procter & Gamble Co. (The) | | 153,326 | | 13,362,361 | | |
Wal-Mart Stores, Inc. | | 178,069 | | 13,476,262 | | |
| | | | | | |
| | | | 67,435,462 | | |
| |
Energy - 9.90% | | |
Chevron Corp. | | 128,295 | | 13,385,017 | | |
ConocoPhillips | | 312,865 | | 13,753,545 | | |
Exxon Mobil Corp. | | 167,237 | | 13,501,043 | | |
Schlumberger, Ltd. | | 211,300 | | 13,911,992 | | |
| | | | | | |
| | | | 54,551,597 | | |
| |
Financials - 12.42% | | |
Bank of America Corp. | | 918,808 | | 22,290,282 | | |
Berkshire Hathaway, Inc., Class B* | | 79,350 | | 13,439,510 | | |
JPMorgan Chase & Co. | | 192,895 | | 17,630,603 | | |
Wells Fargo & Co. | | 271,559 | | 15,047,084 | | |
| | | | | | |
| | | | 68,407,479 | | |
| |
Health Care - 9.79% | | |
Gilead Sciences, Inc. | | 188,850 | | 13,366,803 | | |
Johnson & Johnson | | 102,402 | | 13,546,761 | | |
Merck & Co., Inc. | | 205,835 | | 13,191,965 | | |
Pfizer, Inc. | | 411,644 | | 13,827,122 | | |
| | | | | | |
| | | | 53,932,651 | | |
| |
Industrials - 9.96% | | |
3M Co. | | 66,100 | | 13,761,359 | | |
General Electric Co. | | 511,943 | | 13,827,580 | | |
United Parcel Service, Inc., Class B | | 125,163 | | 13,841,776 | | |
United Technologies Corp. | | 110,130 | | 13,447,974 | | |
| | | | | | |
| | | | 54,878,689 | | |
| |
Information Technology - 28.91% | | |
Alphabet, Inc., Class A* | | 11,870 | | 11,035,302 | | |
Alphabet, Inc., Class C* | | 12,059 | | 10,958,375 | | |
Apple, Inc. | | 154,950 | | 22,315,899 | | |
Cisco Systems, Inc. | | 428,958 | | 13,426,385 | | |
Intel Corp. | | 395,343 | | 13,338,873 | | |
| | | | | | |
| | | | | | |
| | | | | | |
| | | | | | | | |
| Industry Company | | Shares | | | Value | |
|
| |
Information Technology (continued) | |
International Business Machines Corp. | | | 86,067 | | | $ | 13,239,687 | |
Microsoft Corp. | | | 322,695 | | | | 22,243,366 | |
Oracle Corp. | | | 347,213 | | | | 17,409,260 | |
QUALCOMM, Inc. | | | 239,400 | | | | 13,219,668 | |
Visa, Inc., Class A | | | 235,300 | | | | 22,066,434 | |
| | | | | | | | |
| | | | | | | 159,253,249 | |
|
Telecommunication Services - 4.93% | |
AT&T, Inc. | | | 353,725 | | | | 13,346,044 | |
Verizon Communications, Inc. | | | 309,589 | | | | 13,826,245 | |
| | | | | | | | |
| | | | | | | 27,172,289 | |
| | | | | | | | |
TOTAL COMMON STOCKS - 99.97% | | | | 550,708,677 | |
| | | | | | | | |
(Cost $304,636,269) | | | | | | | | |
| | | | | | | | | | | | | | |
| | | | |
| | | Rate^ | | | Shares | | | Value | | | |
| |
| MONEY MARKET FUND - 0.00% | | | |
Fidelity Investments Money Market Government Portfolio Class I | | | 0.81 | % | | | 952 | | | | 952 | | | |
| | | | | | | | | | | | | | |
TOTAL MONEY MARKET FUND - 0.00% | | | | 952 | | | |
| | | | | | | | | | | | | | |
(Cost $952) | | | | | | | |
| | |
TOTAL INVESTMENTS - 99.97% | | | | $ 550,709,629 | | | |
(Cost $304,637,221) | | | | | | | |
Other Assets in Excess of Liabilities - 0.03% | | | | 192,216 | | | |
| | | | | | | | | | | | | | |
NET ASSETS - 100.00% | | | | $ 550,901,845 | | | |
| | | | | | | | | | | | | | |
| * | Non-income producing security. |
| ^ | Rate disclosed as of June 30, 2017. |
Summary of inputs used to value the Fund’s investments as of 06/30/2017 (See Note 2 in Notes to Financial Statements):
| | | | | | | | | | | | | | | | |
| | | Valuation Inputs | |
| | | Investment in Securities (Value) | |
| | | Level 1 Quoted Prices | | | Level 2 Significant Observable Inputs | | | Level 3 Significant Unobservable Inputs | | | Total | |
| | | | |
Common Stocks | | $ | 550,708,677 | | | $ | — | | | | $ — | | | $ | 550,708,677 | |
Money Market Fund | | | — | | | | 952 | | | | — | | | | 952 | |
| | | | | | | | | | | | | | | | |
TOTAL | | $ | 550,708,677 | | | $ | 952 | | | | $ — | | | $ | 550,709,629 | |
| | | | | | | | | | | | | | | | |
See Notes to Financial Statements.
| | |
| Managed Volatility Fund | | |
| MANAGER’S COMMENTARY (Unaudited) | | |
| | |
June 30, 2017
Dear Fellow Managed Volatility Fund Shareholder,
For the quarter ended June 30, 2017, our Fund returned +0.89%, underperforming our primary market benchmark, the S&P 500 Index (+3.09%) and our peer benchmark, the Lipper Balanced Funds Index (+2.52%). In the second quarter of 2017, Bloomberg discontinued the Bloomberg/EFFAS U.S. Government 1-3 Year Total Return Bond Index, and that index will no longer appear as a performance benchmark. The Fund performed in line with its design during the quarter, as discussed in Detailed Explanation of Quarterly Performance on page 65.
For the fiscal year, our Fund returned +4.59%, trailing the S&P 500 Index (+17.90%) and the Lipper Balanced Funds Index (+10.80%).
The table below presents our June quarter, one-year, five-year, 10-year, 15-year, and inception-to-date financial results. See the next page for a graph of performance since inception.
Standardized Returns as of June 30, 2017
| | | | | | | | | | | | | | | | | | | | | | |
| | | | | | | | | Annualized |
| | | Quarter | | | 1 Year | | | 5 Years | | | 10 Years | | | 15 Years | | | Since Inception
(6/30/01) |
| | | | | | |
Managed Volatility Fund | | | 0.89% | | | | 4.59% | | | | 4.63% | | | | 2.76% | | | | 4.24% | | | 3.92% |
S&P 500 Index | | | 3.09% | | | | 17.90% | | | | 14.63% | | | | 7.18% | | | | 8.34% | | | 6.48% |
Lipper Balanced Funds Index | | | 2.52% | | | | 10.80% | | | | 8.53% | | | | 5.11% | | | | 6.41% | | | 5.48% |
Performance figures quoted in the table above represent past performance and are no guarantee of future results. Total return figures in the table above include the reinvestment of dividends and capital gains. The table above does not reflect the deduction of taxes that a shareholder would pay on Fund distributions or on the redemption of Fund shares.
The S&P 500 Index is a broad-based, unmanaged measurement of changes in stock market conditions, based on the average of 500 widely held common stocks with dividends reinvested. The Lipper Balanced Funds Index is an index of balanced funds compiled by Lipper, Inc. It is not possible to invest directly in an index. Periods longer than one year are annualized.
According to data from Lipper, Inc. as of June 30, 2017, the Managed Volatility Fund ranked 252nd of 323 Alternative Long/ Short Equity funds for the 12 months ended June 30, 2017, 68th of 108 over the past five years, 17th of 38 over the last 10 years, and 5th of 12 funds since inception on June 30, 2001. Lipper, Inc. is an independent mutual fund rating service that ranks funds in various fund categories by making comparative calculations using total returns.
According to data from Morningstar as of June 30, 2017, Managed Volatility Fund ranked 93rd of 114 Option Writing funds for the 12 months ended June 30, 2017, 23rd of 27 over the past five years, and 2nd of 6 over the last 10 years. Morningstar ranks funds in various fund categories by making comparative calculations using total returns.
| | |
| 64 | | Annual Report | June 30, 2017 |
| | |
| Managed Volatility Fund | | |
| MANAGER’S COMMENTARY (Unaudited) (continued) | | |
| | |
Growth of a $10,000 Investment
from Inception June 30, 2001 to June 30, 2017
Detailed Explanation of Quarterly Performance
The Fund failed to capture 40% of the S&P 500’s return during the quarter. The portfolio’s futures component was the largest detractor from relative performance, contributing about -0.7% to the Fund’s return. However, this performance was in line with expectations during a quarter characterized by a rising equity market.
The portfolio’s equities component delivered positive absolute performance, but underperformed the benchmark and contributed about 1.1% to the Fund’s return. The portfolio’s options component contributed roughly 0.5% to the Fund’s return, while the portfolio’s fixed income component was essentially flat for the quarter.
For the quarter, the Fund had a standard deviation of 0.18, which was 39% of the index’s 0.46 standard deviation during the same period.
Detailed Explanation of Fiscal Year Performance
The Fund failed to capture 40% of the S&P 500’s return for the 12-month period. The portfolio’s futures component was the largest detractor from relative performance, contributing about -3.2% to the Fund’s return. This performance was in line with expectations during a fiscal year characterized by a rising equity market, low interest rates, and low levels of volatility.
The portfolio’s fixed income and options components also detracted from relative performance, contributing roughly -0.2% and -0.1% to the Fund’s return, respectively. The portfolio’s equities component delivered positive absolute performance, but underperformed the benchmark and contributed about 8.4% to the Fund’s return.
For the 12-month period, the Fund had a standard deviation of 2.99, which was 36% of the index’s 8.29 standard deviation during the same period. The Fund continues to perform as designed, particularly over longer time horizons. For the 10 year and since inception periods, the Fund has captured roughly 38% and 60%, respectively, of the S&P 500 Index’s returns, with standard deviations roughly 44% of the index’s for the respective periods.
| | |
| Managed Volatility Fund | | |
| MANAGER’S COMMENTARY (Unaudited) (continued) | | |
| | |
Top Ten Equity Holdings as of June 30, 2017
| | | | | | | | |
| Rank | | Description | | Industry | | % of Net
Assets | |
| 1 | | Procter & Gamble Co.(The) | | Consumer Staples | | | 1.6% | |
| 2 | | Kellogg Co. | | Consumer Staples | | | 1.4% | |
| 3 | | Amazon.com, Inc. | | Consumer Discretionary | | | 1.3% | |
| 4 | | HCA Healthcare, Inc. | | Health Care | | | 1.3% | |
| 5 | | Fiat Chrysler Automobiles NV | | Consumer Discretionary | | | 1.2% | |
| 6 | | General Motors Co. | | Consumer Discretionary | | | 1.1% | |
| 7 | | United Rentals, Inc. | | Industrials | | | 1.1% | |
| 8 | | Gilead Sciences, Inc. | | Health Care | | | 1.1% | |
| 9 | | Occidental Petroleum Corp. | | Energy | | | 1.1% | |
| 10 | | Goldcorp, Inc. | | Materials | | | 1.0% | |
| | Total | | | | | 12.2% | |
Industry Sector Representation as of June 30, 2017
| | | | |
| Asset Type | | % of Net
Assets | |
Common Stock | | | 59.6% | |
Consumer Discretionary | | | 9.1% | |
Consumer Staples | | | 6.7% | |
Energy | | | 4.7% | |
Financials | | | 7.1% | |
Health Care | | | 8.8% | |
Industrials | | | 6.7% | |
Information Technology | | | 10.2% | |
Materials | | | 2.3% | |
Real Estate | | | 1.4% | |
Telecommunication Services | | | 1.3% | |
Utilities | | | 1.3% | |
U.S. Government Obligations | | | 38.3% | |
Call Options Written | | | -0.7% | |
Put Options Written | | | -0.5% | |
Money Market Fund | | | 4.4% | |
Liabilities in Excess of Other Assets | | | -1.1% | |
Total | | | 100% | |
Disclaimer
The views expressed here are exclusively those of Fund management. These views, including those related to market sectors or individual stocks, are not meant as investment advice and should not be considered predictive in nature. Any favorable (or unfavorable) description of a holding applies only as of the quarter end, June 30, 2017, unless otherwise stated. Security positions can and do change thereafter. Discussions of historical performance do not guarantee and may not be indicative of future performance.
Market volatility can significantly affect short-term performance. The Fund is not an appropriate investment for short-term investors. Investments in the small companies within this multi-cap fund generally carry greater risk than is customarily associated with larger companies. This additional risk is attributable to a number of factors, including the relatively limited financial resources that are typically available to small companies and the fact that small companies often have comparatively limited product lines. In addition, the stock of small companies tends to be more volatile than the stock of large companies, particularly in the short term and particularly in the early stages of an economic or market downturn. The Fund’s use of options,
| | |
| 66 | | Annual Report | June 30, 2017 |
| | |
| Managed Volatility Fund | | |
| MANAGER’S COMMENTARY (Unaudited) (continued) | | |
| | |
futures, and leverage can magnify the risk of loss in an unfavorable market, and the Fund’s use of short-sale positions can, in theory, expose shareholders to unlimited loss. Shareholders of the Fund, therefore, are taking on more risk than they would if they invested in the stock market as a whole. The Fund uses an option writing strategy in which the Fund may sell covered calls or secured put options. Options are subject to special risks and may not fully protect the Fund against declines in the value of its stocks. In addition, an option writing strategy limits the upside profit potential normally associated with stocks. Finally, the Fund’s fixed-income holdings are subject to three types of risk. Interest rate risk is the chance that bond prices overall will decline as interest rates rise. Credit risk is the chance that a bond issuer will fail to pay interest and principal. Prepayment risk is the chance that a mortgage-backed bond issuer will repay a higher yielding bond, resulting in a lower paying yield.
Conclusion
Thank you for your continued investment in Managed Volatility Fund. We encourage your feedback; your reactions and concerns are important to us.
Sincerely,
The Investment Management Team
| | |
| Managed Volatility Fund | | |
| SCHEDULE OF INVESTMENTS | | |
| Showing percentage of net assets as of June 30, 2017 | | |
| | | | | | |
| Industry Company | | Shares | | Value | | |
| |
COMMON STOCKS - 59.61% | | |
Consumer Discretionary - 9.11% | | |
Adient PLC | | 495 | | $32,363 | | |
Amazon.com, Inc.* | | 500 | | 484,000 | | |
AutoZone, Inc.* | | 300 | | 171,138 | | |
Carnival Corp. | | 600 | | 39,342 | | |
Comcast Corp., Class A# | | 2,500 | | 97,300 | | |
Delphi Automotive PLC# | | 500 | | 43,825 | | |
Dollar General Corp. | | 500 | | 36,045 | | |
Fiat Chrysler Automobiles NV*# | | 40,000 | | 425,200 | | |
Ford Motor Co. | | 2,900 | | 32,451 | | |
General Motors Co.# | | 12,000 | | 419,160 | | |
Goodyear Tire & Rubber Co. (The) | | 200 | | 6,992 | | |
Hasbro, Inc.# | | 1,000 | | 111,510 | | |
Lear Corp.# | | 1,100 | | 156,288 | | |
McDonald’s Corp. | | 500 | | 76,580 | | |
NIKE, Inc., Class B# | | 1,500 | | 88,500 | | |
Nordstrom, Inc.# | | 2,000 | | 95,660 | | |
Omnicom Group, Inc.# | | 1,200 | | 99,480 | | |
Priceline Group, Inc.
(The)* | | 100 | | 187,052 | | |
Ross Stores, Inc.# | | 1,100 | | 63,503 | | |
Scripps Networks Interactive, Inc., Class A# | | 1,000 | | 68,310 | | |
Starbucks Corp.# | | 1,400 | | 81,634 | | |
Target Corp.# | | 1,200 | | 62,748 | | |
Time Warner, Inc.# | | 933 | | 93,683 | | |
Twenty-First Century Fox, Inc., Class A# | | 1,200 | | 34,008 | | |
Viacom, Inc., Class B# | | 4,000 | | 134,280 | | |
Walt Disney Co. (The)# | | 900 | | 95,625 | | |
Wynn Resorts, Ltd. | | 200 | | 26,824 | | |
Yum China Holdings, Inc.*# | | 1,100 | | 43,373 | | |
Yum! Brands, Inc. | | 300 | | 22,128 | | |
| | | | | | |
| | | | 3,329,002 | | |
| | | |
Consumer Staples - 6.74% | | | | | | |
Archer-Daniels-Midland Co.# | | 2,000 | | 82,760 | | |
Campbell Soup Co.# | | 1,900 | | 99,085 | | |
Coca-Cola Co. (The) | | 900 | | 40,365 | | |
Colgate-Palmolive Co. | | 700 | | 51,891 | | |
Constellation Brands, Inc., Class A | | 500 | | 96,865 | | |
Costco Wholesale Corp. | | 700 | | 111,951 | | |
CVS Health Corp.# | | 900 | | 72,414 | | |
General Mills, Inc.# | | 1,600 | | 88,640 | | |
JM Smucker Co. (The)# | | 1,000 | | 118,330 | | |
Kellogg Co.# | | 7,500 | | 520,950 | | |
Kimberly-Clark Corp.# | | 1,100 | | 142,021 | | |
Kroger Co. (The)# | | 1,200 | | 27,984 | | |
Mondelez International, Inc. Class A# | | 3,600 | | 155,484 | | |
PepsiCo, Inc.# | | 1,300 | | 150,137 | | |
| | | | | | | | |
| Industry Company | | Shares | | | Value | |
|
| |
| | |
Consumer Staples (continued) | | | | | | | | |
Procter & Gamble Co. (The)# | | | 6,600 | | | $ | 575,190 | |
Wal-Mart Stores, Inc.# | | | 1,700 | | | | 128,656 | |
| | | | | | | | |
| | | | | | | 2,462,723 | |
| | |
Energy - 4.67% | | | | | | | | |
Anadarko Petroleum Corp.# | | | 1,000 | | | | 45,340 | |
Chesapeake Energy Corp.*# | | | 20,000 | | | | 99,400 | |
Chevron Corp.# | | | 1,778 | | | | 185,499 | |
ConocoPhillips# | | | 1,287 | | | | 56,576 | |
EOG Resources, Inc.# | | | 800 | | | | 72,416 | |
Exxon Mobil Corp.# | | | 2,700 | | | | 217,971 | |
Halliburton Co. | | | 1,000 | | | | 42,710 | |
Helmerich & Payne, Inc.#+ | | | 1,000 | | | | 54,340 | |
Kinder Morgan, Inc.# | | | 2,600 | | | | 49,816 | |
Marathon Petroleum Corp.# | | | 1,700 | | | | 88,961 | |
Occidental Petroleum Corp.# | | | 6,700 | | | | 401,129 | |
Phillips 66 | | | 593 | | | | 49,035 | |
Transocean, Ltd.*# | | | 30,000 | | | | 246,900 | |
Valero Energy Corp.# | | | 1,400 | | | | 94,444 | |
| | | | | | | | |
| | | | | | | 1,704,537 | |
| | |
Financials - 7.07% | | | | | | | | |
Allstate Corp. (The)# | | | 900 | | | | 79,596 | |
American Express Co.# | | | 1,800 | | | | 151,632 | |
Aon PLC# | | | 1,100 | | | | 146,245 | |
Bank of America Corp.# | | | 3,900 | | | | 94,614 | |
BB&T Corp.# | | | 1,100 | | | | 49,951 | |
Berkshire Hathaway, Inc., Class B*# | | | 800 | | | | 135,496 | |
BlackRock, Inc. | | | 300 | | | | 126,723 | |
Capital One Financial Corp. | | | 700 | | | | 57,834 | |
Charles Schwab Corp. (The)# | | | 1,800 | | | | 77,328 | |
Chubb, Ltd.# | | | 361 | | | | 52,482 | |
Citigroup, Inc.# | | | 2,810 | | | | 187,933 | |
Comerica, Inc.# | | | 1,100 | | | | 80,564 | |
Goldman Sachs Group, Inc. (The) | | | 500 | | | | 110,950 | |
Huntington Bancshares, Inc. | | | 3,200 | | | | 43,264 | |
JPMorgan Chase & Co.# | | | 1,800 | | | | 164,520 | |
KeyCorp | | | 4,800 | | | | 89,952 | |
Marsh & McLennan Cos., Inc. | | | 300 | | | | 23,388 | |
Morgan Stanley# | | | 3,300 | | | | 147,048 | |
PNC Financial Services Group, Inc. (The)# | | | 1,000 | | | | 124,870 | |
Progressive Corp. (The)# | | | 2,220 | | | | 97,880 | |
S&P Global, Inc. | | | 500 | | | | 72,995 | |
State Street Corp.# | | | 1,000 | | | | 89,730 | |
U.S. Bancorp# | | | 1,900 | | | | 98,648 | |
| | |
| 68 | | Annual Report | June 30, 2017 |
| | |
| Managed Volatility Fund | | |
| SCHEDULE OF INVESTMENTS (continued) | | |
| Showing percentage of net assets as of June 30, 2017 | | |
| | | | | | | | | | | | |
| Industry Company | | Shares | | | Value | | | | |
| |
Common Stocks (continued) | | | | | |
Financials (continued) | | | | | | | | | | | | |
Unum Group# | | | 1,600 | | | $ | 74,608 | | | | | |
Wells Fargo & Co.# | | | 3,671 | | | | 203,410 | | | | | |
| | | | | | | | | | | | |
| | | | | | | 2,581,661 | | | | | |
| | | |
Health Care - 8.82% | | | | | | | | | | | | |
Abbott Laboratories# | | | 1,300 | | | | 63,193 | | | | | |
AbbVie, Inc.# | | | 2,000 | | | | 145,020 | | | | | |
Allergan PLC | | | 300 | | | | 72,927 | | | | | |
Amgen, Inc.# | | | 1,100 | | | | 189,453 | | | | | |
Baxter International, Inc.# | | | 900 | | | | 54,486 | | | | | |
Becton Dickinson & Co. | | | 520 | | | | 101,457 | | | | | |
Biogen, Inc.* | | | 600 | | | | 162,816 | | | | | |
Bioverativ, Inc.* | | | 300 | | | | 18,051 | | | | | |
Bristol-Myers Squibb Co.# | | | 2,179 | | | | 121,414 | | | | | |
C.R. Bard, Inc. | | | 700 | | | | 221,277 | | | | | |
Celgene Corp.*# | | | 1,100 | | | | 142,857 | | | | | |
Danaher Corp.# | | | 1,700 | | | | 143,463 | | | | | |
DaVita, Inc.*# | | | 1,100 | | | | 71,236 | | | | | |
Express Scripts Holding Co.*# | | | 1,734 | | | | 110,699 | | | | | |
Gilead Sciences, Inc.# | | | 5,700 | | | | 403,446 | | | | | |
HCA Healthcare, Inc.*# | | | 5,300 | | | | 462,160 | | | | | |
Johnson & Johnson# | | | 1,300 | | | | 171,977 | | | | | |
Merck & Co., Inc.# | | | 2,200 | | | | 140,998 | | | | | |
Pfizer, Inc.# | | | 3,600 | | | | 120,924 | | | | | |
Shire PLC, ADR | | | 192 | | | | 31,732 | | | | | |
Stryker Corp. | | | 660 | | | | 91,595 | | | | | |
Thermo Fisher Scientific, Inc. | | | 500 | | | | 87,235 | | | | | |
UnitedHealth Group, Inc. | | | 500 | | | | 92,710 | | | | | |
| | | | | | | | | | | | |
| | | | | | | 3,221,126 | | | | | |
| | | |
Industrials - 6.74% | | | | | | | | | | | | |
3M Co. | | | 800 | | | | 166,552 | | | | | |
AerCap Holdings NV*# | | | 1,100 | | | | 51,073 | | | | | |
Deere & Co. | | | 400 | | | | 49,436 | | | | | |
Emerson Electric Co.# | | | 1,500 | | | | 89,430 | | | | | |
FedEx Corp.# | | | 1,000 | | | | 217,330 | | | | | |
General Electric Co. | | | 2,900 | | | | 78,329 | | | | | |
Honeywell International, Inc. | | | 800 | | | | 106,632 | | | | | |
Johnson Controls International PLC# | | | 1,454 | | | | 63,045 | | | | | |
Lockheed Martin Corp. | | | 570 | | | | 158,238 | | | | | |
Northrop Grumman Corp.# | | | 1,100 | | | | 282,381 | | | | | |
NOW, Inc.* | | | 200 | | | | 3,216 | | | | | |
Raytheon Co. | | | 600 | | | | 96,888 | | | | | |
Southwest Airlines Co.# | | | 1,400 | | | | 86,996 | | | | | |
Union Pacific Corp.# | | | 800 | | | | 87,128 | | | | | |
United Continental Holdings, Inc.*# | | | 4,000 | | | | 301,000 | | | | | |
United Rentals, Inc.*# | | | 3,600 | | | | 405,756 | | | | | |
United Technologies Corp.# | | | 1,140 | | | | 139,205 | | | | | |
| | | | | | | | |
| Industry Company | | Shares | | | Value | |
|
| |
Industrials (continued) | | | | | | | | |
Waste Management, Inc.# | | | 1,100 | | | $ | 80,685 | |
| | | | | | | | |
| | | | | | | 2,463,320 | |
| | |
Information Technology - 10.23% | | | | | | | | |
Adobe Systems, Inc.*# | | | 800 | | | | 113,152 | |
Alphabet, Inc., Class A* | | | 260 | | | | 241,717 | |
Alphabet, Inc., Class C* | | | 260 | | | | 236,270 | |
Apple, Inc.# | | | 2,100 | | | | 302,442 | |
Applied Materials, Inc.# | | | 1,600 | | | | 66,096 | |
Automatic Data Processing, Inc. | | | 600 | | | | 61,476 | |
Cisco Systems, Inc.# | | | 6,000 | | | | 187,800 | |
Citrix Systems, Inc.*# | | | 1,100 | | | | 87,538 | |
Cognizant Technology Solutions Corp., Class A# | | | 1,600 | | | | 106,240 | |
Cree, Inc.*# | | | 2,000 | | | | 49,300 | |
Dell Technologies, Inc. - VMware Inc.* | | | 222 | | | | 13,566 | |
DXC Technology Co. | | | 172 | | | | 13,181 | |
eBay, Inc.*# | | | 1,000 | | | | 34,920 | |
Electronic Arts, Inc.*# | | | 800 | | | | 84,576 | |
Facebook, Inc., Class A* | | | 2,000 | | | | 301,960 | |
Hewlett Packard Enterprise Co.# | | | 2,000 | | | | 33,180 | |
HP, Inc.# | | | 2,900 | | | | 50,692 | |
Intel Corp.# | | | 3,400 | | | | 114,716 | |
International Business Machines Corp.# | | | 1,300 | | | | 199,979 | |
Intuit, Inc. | | | 400 | | | | 53,124 | |
Juniper Networks, Inc.# | | | 3,900 | | | | 108,732 | |
LogMeIn, Inc. | | | 189 | | | | 19,753 | |
Mastercard, Inc., Class A# | | | 800 | | | | 97,160 | |
Micron Technology, Inc.*# | | | 3,900 | | | | 116,454 | |
Microsoft Corp.# | | | 2,600 | | | | 179,218 | |
Oracle Corp. | | | 1,260 | | | | 63,176 | |
PayPal Holdings, Inc.* | | | 700 | | | | 37,569 | |
QUALCOMM, Inc.# | | | 1,000 | | | | 55,220 | |
salesforce.com, Inc.* | | | 1,900 | | | | 164,540 | |
Texas Instruments, Inc.# | | | 1,370 | | | | 105,394 | |
Visa, Inc., Class A# | | | 3,700 | | | | 346,986 | |
Western Digital Corp.# | | | 1,010 | | | | 89,486 | |
| | | | | | | | |
| | | | | | | 3,735,613 | |
| | |
Materials - 2.29% | | | | | | | | |
AdvanSix, Inc.* | | | 48 | | | | 1,500 | |
Dow Chemical Co.
(The)# | | | 1,300 | | | | 81,991 | |
Goldcorp, Inc.# | | | 28,000 | | | | 361,480 | |
International Paper Co.# | | | 1,000 | | | | 56,610 | |
LyondellBasell Industries NV, Class A | | | 500 | | | | 42,195 | |
Monsanto Co. | | | 600 | | | | 71,016 | |
Praxair, Inc. | | | 600 | | | | 79,530 | |
| | |
| Managed Volatility Fund | | |
| SCHEDULE OF INVESTMENTS (continued) | | |
| Showing percentage of net assets as of June 30, 2017 | | |
| | | | | | |
| Industry Company | | Shares | | Value | | |
| | | |
Common Stocks (continued) | �� | | | | | |
Materials (continued) | | | | | | |
Sherwin-Williams Co. (The) | | 400 | | $140,384 | | |
| | | | | | |
| | | | 834,706 | | |
| | | |
Real Estate - 1.39% | | | | | | |
American Tower Corp.# | | 800 | | 105,856 | | |
Crown Castle International Corp.# | | 800 | | 80,144 | | |
Public Storage# | | 1,000 | | 208,530 | | |
Simon Property Group, Inc. | | 700 | | 113,232 | | |
| | | | | | |
| | | | 507,762 | | |
| |
Telecommunication Services - 1.30% | | |
AT&T, Inc.# | | 6,700 | | 252,791 | | |
CenturyLink, Inc.#+ | | 1,800 | | 42,984 | | |
T-Mobile US, Inc.*# | | 1,200 | | 72,744 | | |
Verizon Communications, Inc.# | | 2,400 | | 107,184 | | |
| | | | | | |
| | | | 475,703 | | |
| | | |
Utilities - 1.25% | | | | | | |
AES Corp. | | 4,300 | | 47,773 | | |
American Electric Power Co., Inc. | | 1,000 | | 69,470 | | |
Dominion Resources, Inc.# | | 1,020 | | 78,163 | | |
Duke Energy Corp. | | 783 | | 65,451 | | |
Exelon Corp.# | | 2,800 | | 100,996 | | |
Public Service Enterprise Group, Inc. | | 900 | | 38,709 | | |
Sempra Energy | | 500 | | 56,375 | | |
| | | | | | |
| | | | 456,937 | | |
| | | | | | |
TOTAL COMMON STOCKS - 59.61% | | 21,773,090 | | |
| | | | | | |
(Cost $15,174,850) | | | | | | |
| | | | | | | | | | |
| | | | |
| Due Date | | Discount Rate
or Coupon Rate | | Principal
Amount | | Value | | | |
| |
U.S. GOVERNMENT OBLIGATIONS - 38.27% | | | |
U.S. Treasury Bills - 38.27% | | | | | | |
07/13/2017 | | 0.000%(a) | | $3,000,000 | | | 2,999,355 | | | |
08/24/2017 | | 0.000%(a) | | 2,000,000 | | | 1,997,348 | | | |
08/31/2017 | | 0.000%(a) | | 2,000,000 | | | 1,996,976 | | | |
09/14/2017 | | 0.000%(a) | | 2,000,000 | | | 1,996,158 | | | |
09/21/2017 | | 0.000%(a) | | 2,000,000 | | | 1,995,674 | | | |
09/28/2017 | | 0.000%(a) | | 3,000,000 | | | 2,992,677 | | | |
| | | | | | | | | | |
| | | | | | | 13,978,188 | | | |
| | | | | | | | | | |
TOTAL U.S. GOVERNMENT OBLIGATIONS - 38.27% | | | | | 13,978,188 | | | |
| | | | | | | | | | |
(Cost $13,977,019) | | | | | | | | |
| | | | | | | | | | | | |
| | | Rate^ | | | Shares | | | Value | |
| |
MONEY MARKET FUND - 4.37% | | | | | |
Fidelity Investments Money Market Government Portfolio Class I | | | 0.81 | % | | | 1,595,167 | | | $ | 1,595,167 | |
| | | | | | | | | | | | |
TOTAL MONEY MARKET FUND - 4.37% | | | | 1,595,167 | |
| | | | | | | | | | | | |
(Cost $1,595,167) | | | | | | | | | | | | |
|
| INVESTMENTS PURCHASED WITH CASH PROCEEDS FROM SECURITIES LENDING - 0.20% | |
Fidelity Investments Money Market Government Portfolio Class I** | | | 0.81 | % | | | 71,025 | | | | 71,025 | |
| | | | | | | | | | | | |
TOTAL INVESTMENTS PURCHASED WITH CASH PROCEEDS FROM SECURITIES LENDING -0.20% | | | | 71,025 | |
| | | | | | | | | | | | |
(Cost $71,025) | | | | | | | | | | | | |
| |
TOTAL INVESTMENTS - 102.45% | | | $ | 37,417,470 | |
(Cost $30,818,061) | | | | | | | | | | | | |
Liabilities in Excess of Other Assets - (2.45%) | | | | (894,190 | ) |
| | | | | | | | | | | | |
NET ASSETS - 100.00% | | | $ | 36,523,280 | |
| | | | | | | | | | | | |
| * | Non-income producing security. |
| ** | This security represents the investment of the collateral received in connection with securities out on loan as of June 30, 2017. |
| # | Security subject to call or put option written by the Fund. |
| ^ | Rate disclosed as of June 30, 2017. |
| + | This security or a portion of the security is out on loan as of June 30, 2017. Total loaned securities had a value of $69,082 as of June 30, 2017. |
| (a) | Rate represents the effective yield at purchase. |
PLC - Public Limited Company
ADR - American Depositary Receipt
See Notes to Financial Statements.
| | |
| 70 | | Annual Report | June 30, 2017 |
| | |
| Managed Volatility Fund | | |
| SCHEDULE OF OPTIONS WRITTEN | | |
| Showing percentage of net assets as of June 30, 2017 | | |
| | | | | | | | | | | | | | | | |
| Company | | Number
of Contracts | | | Value | | | | |
| |
CALL OPTIONS WRITTEN - (0.67%) | | | | | |
Abbott Laboratories | | | | | | | | | | | | | | | | |
Expiring August, 2017 at $45.00 | | | 3 | | | | | | | | $(1,170) | | | | | |
AbbVie, Inc. | | | | | | | | | | | | | | | | |
Expiring August, 2017 at $67.50 | | | 6 | | | | | | | | (3,102) | | | | | |
Adobe Systems, Inc. | | | | | | | | | | | | | | | | |
Expiring July, 2017 at $145.00 | | | 3 | | | | | | | | (465) | | | | | |
AerCap Holdings NV | | | | | | | | | | | | | | | | |
Expiring July, 2017 at $45.00 | | | 11 | | | | | | | | (2,365) | | | | | |
Allstate Corp. (The) | | | | | | | | | | | | | | | | |
Expiring August, 2017 at $90.00 | | | 3 | | | | | | | | (480) | | | | | |
American Express Co. | | | | | | | | | | | | | | | | |
Expiring July, 2017 at $82.50 | | | 5 | | | | | | | | (1,385) | | | | | |
American Tower Corp. | | | | | | | | | | | | | | | | |
Expiring August, 2017 at $135.00 | | | 3 | | | | | | | | (630) | | | | | |
Amgen, Inc. | | | | | | | | | | | | | | | | |
Expiring July, 2017 at $167.50 | | | 3 | | | | | | | | (2,250) | | | | | |
Anadarko Petroleum Corp. | | | | | | | | | | | | | | | | |
Expiring August, 2017 at $55.00 | | | 3 | | | | | | | | (30) | | | | | |
Aon PLC | | | | | | | | | | | | | | | | |
Expiring July, 2017 at $125.00 | | | 3 | | | | | | | | (2,550) | | | | | |
Apple, Inc. | | | | | | | | | | | | | | | | |
Expiring July, 2017 at $155.00 | | | 6 | | | | | | | | (126) | | | | | |
Applied Materials, Inc. | | | | | | | | | | | | | | | | |
Expiring August, 2017 at $45.00 | | | 5 | | | | | | | | (390) | | | | | |
Archer-Daniels-Midland Co. | | | | | | | | | | | | | | | | |
Expiring July, 2017 at $43.00 | | | 7 | | | | | | | | (112) | | | | | |
AT&T, Inc. | | | | | | | | | | | | | | | | |
Expiring September, 2017 at $39.00 | | | 20 | | | | | | | | (860) | | | | | |
Bank of America Corp. | | | | | | | | | | | | | | | | |
Expiring July, 2017 at $24.00 | | | 12 | | | | | | | | (864) | | | | | |
Baxter International, Inc. | | | | | | | | | | | | | | | | |
Expiring August, 2017 at $60.00 | | | 3 | | | | | | | | (570) | | | | | |
BB&T Corp. | | | | | | | | | | | | | | | | |
Expiring September, 2017 at $44.00 | | | 3 | | | | | | | | (687) | | | | | |
Berkshire Hathaway, Inc. | | | | | | | | | | | | | | | | |
Expiring September, 2017 at $170.00 | | | 3 | | | | | | | | (1,380) | | | | | |
Bristol-Myers Squibb Co. | | | | | | | | | | | | | | | | |
Expiring July, 2017 at $55.00 | | | 7 | | | | | | | | (1,225) | | | | | |
Campbell Soup Co. | | | | | | | | | | | | | | | | |
Expiring August, 2017 at $60.00 | | | 6 | | | | | | | | (36) | | | | | |
Celgene Corp. | | | | | | | | | | | | | | | | |
Expiring September, 2017 at $125.00 | | | 3 | | | | | | | | (2,613) | | | | | |
CenturyLink, Inc. | | | | | | | | | | | | | | | | |
Expiring July, 2017 at $25.00 | | | 5 | | | | | | | | (100) | | | | | |
Charles Schwab Corp., (The) | | | | | | | | | | | | | | | | |
Expiring September, 2017 at $45.00 | | | 6 | | | | | | | | (690) | | | | | |
| | | | | | | | | | | | |
| Company | | Number
of Contracts | | | Value | |
|
| |
Chesapeake Energy Corp. | | | | | | | | | | | | |
Expiring July, 2017 at $6.00 | | | 200 | | | | | | | | $ (400) | |
Chevron Corp. | | | | | | | | | | | | |
Expiring August, 2017 at $110.00 | | | 5 | | | | | | | | (275) | |
Cisco Systems, Inc. | | | | | | | | | | | | |
Expiring August, 2017 at $32.00 | | | 18 | | | | | | | | (1,008) | |
Citigroup, Inc. | | | | | | | | | | | | |
Expiring August, 2017 at $65.00 | | | 9 | | | | | | | | (2,754) | |
Citrix Systems, Inc. | | | | | | | | | | | | |
Expiring September, 2017 at $82.50 | | | 3 | | | | | | | | (1,050) | |
Cognizant Technology Solutions Corp. | | | | | | | | | | | | |
Expiring July, 2017 at $65.00 | | | 5 | | | | | | | | (1,045) | |
Comcast Corp. | | | | | | | | | | | | |
Expiring July, 2017 at $40.00 | | | 8 | | | | | | | | (264) | |
Comerica, Inc. | | | | | | | | | | | | |
Expiring July, 2017 at $72.50 | | | 3 | | | | | | | | (738) | |
ConocoPhillips | | | | | | | | | | | | |
Expiring August, 2017 at $47.00 | | | 4 | | | | | | | | (192) | |
Cree, Inc. | | | | | | | | | | | | |
Expiring August, 2017 at $25.00 | | | 20 | | | | | | | | (1,800) | |
Crown Castle International Corp. | | | | | | | | | | | | |
Expiring August, 2017 at $105.00 | | | 3 | | | | | | | | (210) | |
CVS Health Corp. | | | | | | | | | | | | |
Expiring August, 2017 at $80.00 | | | 3 | | | | | | | | (738) | |
Danaher Corp. | | | | | | | | | | | | |
Expiring September, 2017 at $87.50 | | | 5 | | | | | | | | (485) | |
DaVita, Inc. | | | | | | | | | | | | |
Expiring July, 2017 at $70.00 | | | 3 | | | | | | | | (33) | |
Dominion Resources, Inc. | | | | | | | | | | | | |
Expiring July, 2017 at $80.00 | | | 3 | | | | | | | | (45) | |
Dow Chemical Co. (The) | | | | | | | | | | | | |
Expiring September, 2017 at $65.00 | | | 4 | | | | | | | | (600) | |
eBay, Inc. | | | | | | | | | | | | |
Expiring July, 2017 at $35.00 | | | 3 | | | | | | | | (333) | |
Electronic Arts, Inc. | | | | | | | | | | | | |
Expiring July, 2017 at $115.00 | | | 3 | | | | | | | | (51) | |
Emerson Electric Co. | | | | | | | | | | | | |
Expiring September, 2017 at $62.50 | | | 5 | | | | | | | | (465) | |
EOG Resources, Inc. | | | | | | | | | | | | |
Expiring July, 2017 at $90.00 | | | 3 | | | | | | | | (558) | |
Exelon Corp. | | | | | | | | | | | | |
Expiring July, 2017 at $35.00 | | | 8 | | | | | | | | (1,160) | |
Express Scripts Holding Co. | | | | | | | | | | | | |
Expiring August, 2017 at $62.50 | | | 5 | | | | | | | | (1,650) | |
Exxon Mobil Corp. | | | | | | | | | | | | |
Expiring August, 2017 at $85.00 | | | 8 | | | | | | | | (224) | |
| | |
| Managed Volatility Fund | | |
| SCHEDULE OF OPTIONS WRITTEN (continued) | | |
| Showing percentage of net assets as of June 30, 2017 | | |
| | | | | | | | | | | | | | | | |
| Company | | Number
of Contracts | | | Value | | | | |
| |
Call Options Written (continued) | | | | | |
FedEx Corp. | | | | | | | | | | | | | | | | |
Expiring August, 2017 at $220.00 | | | 3 | | | | | | | | $ (1,458) | | | | | |
Fiat Chrysler Automobiles NV | | | | | | | | | | | | | | | | |
Expiring September, 2017 at $11.00 | | | 400 | | | | | | | | (23,200) | | | | | |
General Mills, Inc. | | | | | | | | | | | | | | | | |
Expiring July, 2017 at $60.00 | | | 5 | | | | | | | | (50) | | | | | |
General Motors Co. | | | | | | | | | | | | | | | | |
Expiring August, 2017 at $35.00 | | | 120 | | | | | | | | (12,960) | | | | | |
Gilead Sciences, Inc. | | | | | | | | | | | | | | | | |
Expiring September, 2017 at $65.00 | | | 50 | | | | | | | | (34,250) | | | | | |
Goldcorp, Inc. | | | | | | | | | | | | | | | | |
Expiring July, 2017 at $15.00 | | | 280 | | | | | | | | (560) | | | | | |
Hasbro, Inc. | | | | | | | | | | | | | | | | |
Expiring July, 2017 at $105.00 | | | 3 | | | | | | | | (2,220) | | | | | |
HCA Healthcare, Inc. | | | | | | | | | | | | | | | | |
Expiring September, 2017 at $85.00 | | | 53 | | | | | | | | (25,440) | | | | | |
Helmerich & Payne, Inc. | | | | | | | | | | | | | | | | |
Expiring September, 2017 at $55.00 | | | 3 | | | | | | | | (900) | | | | | |
HP, Inc. | | | | | | | | | | | | | | | | |
Expiring August, 2017 at $19.00 | | | 9 | | | | | | | | (126) | | | | | |
Intel Corp. | | | | | | | | | | | | | | | | |
Expiring September, 2017 at $36.00 | | | 10 | | | | | | | | (410) | | | | | |
International Business Machines Corp. | | | | | | | | | | | | | | | | |
Expiring July, 2017 at $165.00 | | | 4 | | | | | | | | (116) | | | | | |
International Paper Co. | | | | | | | | | | | | | | | | |
Expiring July, 2017 at $52.50 | | | 3 | | | | | | | | (1,311) | | | | | |
JM Smucker Co. (The) | | | | | | | | | | | | | | | | |
Expiring July, 2017 at $130.00 | | | 3 | | | | | | | | (9) | | | | | |
Johnson & Johnson | | | | | | | | | | | | | | | | |
Expiring August, 2017 at $140.00 | | | 5 | | | | | | | | (195) | | | | | |
Johnson Controls International PLC | | | | | | | | | | | | | | | | |
Expiring July, 2017 at $43.00 | | | 4 | | | | | | | | (420) | | | | | |
JPMorgan Chase & Co. | | | | | | | | | | | | | | | | |
Expiring August, 2017 at $87.50 | | | 6 | | | | | | | | (2,814) | | | | | |
Juniper Networks, Inc. | | | | | | | | | | | | | | | | |
Expiring July, 2017 at $31.00 | | | 12 | | | | | | | | (84) | | | | | |
Kellogg Co. | | | | | | | | | | | | | | | | |
Expiring September, 2017 at $72.50 | | | 75 | | | | | | | | (9,075) | | | | | |
Kimberly-Clark Corp. | | | | | | | | | | | | | | | | |
Expiring July, 2017 at $130.00 | | | 3 | | | | | | | | (540) | | | | | |
Kinder Morgan, Inc. | | | | | | | | | | | | | | | | |
Expiring September, 2017 at $19.00 | | | 8 | | | | | | | | (672) | | | | | |
Kroger Co. (The) | | | | | | | | | | | | | | | | |
Expiring July, 2017 at $31.00 | | | 4 | | | | | | | | (12) | | | | | |
| | | | | | | | | | | | |
| Company | | Number
of Contracts | | | Value | |
| |
| | | | | |
Lear Corp. | | | | | | | | | | | | |
Expiring September, 2017 at $140.00 | | | 11 | | | | | | | | $ (8,030) | |
Marathon Petroleum Corp. | | | | | | | | | | | | |
Expiring August, 2017 at $55.00 | | | 5 | | | | | | | | (470) | |
Mastercard, Inc. | | | | | | | | | | | | |
Expiring September, 2017 at $125.00 | | | 3 | | | | | | | | (798) | |
Merck & Co, Inc. | | | | | | | | | | | | |
Expiring September, 2017 at $65.00 | | | 7 | | | | | | | | (1,134) | |
Micron Technology, Inc. | | | | | | | | | | | | |
Expiring July, 2017 at $30.00 | | | 12 | | | | | | | | (1,440) | |
Microsoft Corp. | | | | | | | | | | | | |
Expiring July, 2017 at $70.00 | | | 8 | | | | | | | | (904) | |
Mondelez International, Inc. | | | | | | | | | | | | |
Expiring July, 2017 at $46.00 | | | 11 | | | | | | | | (154) | |
Morgan Stanley | | | | | | | | | | | | |
Expiring July, 2017 at $45.00 | | | 10 | | | | | | | | (830) | |
NIKE, Inc. | | | | | | | | | | | | |
Expiring July, 2017 at $57.50 | | | 5 | | | | | | | | (1,050) | |
Nordstrom, Inc. | | | | | | | | | | | | |
Expiring July, 2017 at $47.50 | | | 20 | | | | | | | | (3,660) | |
Northrop Grumman Corp. | | | | | | | | | | | | |
Expiring August, 2017 at $265.00 | | | 3 | | | | | | | | (870) | |
Occidental Petroleum Corp. | | | | | | | | | | | | |
Expiring August, 2017 at $62.50 | | | 4 | | | | | | | | (388) | |
Omnicom Group, Inc. | | | | | | | | | | | | |
Expiring July, 2017 at $85.00 | | | 3 | | | | | | | | (225) | |
PepsiCo, Inc. | | | | | | | | | | | | |
Expiring July, 2017 at $120.00 | | | 4 | | | | | | | | (116) | |
Pfizer, Inc. | | | | | | | | | | | | |
Expiring July, 2017 at $34.00 | | | 10 | | | | | | | | (230) | |
PNC Financial Services Group, Inc. (The) | | | | | | | | | | | | |
Expiring August, 2017 at $125.00 | | | 3 | | | | | | | | (1,035) | |
Procter & Gamble Co. (The) | | | | | | | | | | | | |
Expiring September, 2017 at $90.00 | | | 50 | | | | | | | | (3,650) | |
Progressive Corp. (The) | | | | | | | | | | | | |
Expiring August, 2017 at $42.00 | | | 6 | | | | | | | | (1,620) | |
Public Storage | | | | | | | | | | | | |
Expiring September, 2017 at $220.00 | | | 3 | | | | | | | | (660) | |
QUALCOMM, Inc. | | | | | | | | | | | | |
Expiring September, 2017 at $60.00 | | | 3 | | | | | | | | (261) | |
Ross Stores, Inc. | | | | | | | | | | | | |
Expiring August, 2017 at $65.00 | | | 3 | | | | | | | | (42) | |
Scripps Networks Interactive, Inc. | | | | | | | | | | | | |
Expiring September, 2017 at $70.00 | | | 3 | | | | | | | | (795) | |
| | |
| 72 | | Annual Report | June 30, 2017 |
| | |
| Managed Volatility Fund | | |
| SCHEDULE OF OPTIONS WRITTEN (continued) | | |
| Showing percentage of net assets as of June 30, 2017 | | |
| | | | | | | | | | | | | | | | |
| Company | | Number
of Contracts | | | Value | | | | |
| |
Call Options Written (continued) | | | | | |
Southwest Airlines Co. | | | | | | | | | | | | | | | | |
Expiring July, 2017 at $61.50 | | | 4 | | | | | | | | $ (640) | | | | | |
Starbucks Corp. | | | | | | | | | | | | | | | | |
Expiring July, 2017 at $62.50 | | | 4 | | | | | | | | (16) | | | | | |
State Street Corp. | | | | | | | | | | | | | | | | |
Expiring July, 2017 at $85.00 | | | 3 | | | | | | | | (1,500) | | | | | |
Target Corp. | | | | | | | | | | | | | | | | |
Expiring July, 2017 at $57.50 | | | 3 | | | | | | | | (12) | | | | | |
Texas Instruments, Inc. | | | | | | | | | | | | | | | | |
Expiring July, 2017 at $82.50 | | | 4 | | | | | | | | (68) | | | | | |
Time Warner, Inc. | | | | | | | | | | | | | | | | |
Expiring August, 2017 at $100.00 | | | 3 | | | | | | | | (663) | | | | | |
T-Mobile US, Inc. | | | | | | | | | | | | | | | | |
Expiring August, 2017 at $62.00 | | | 12 | | | | | | | | (1,800) | | | | | |
Transocean, Ltd. | | | | | | | | | | | | | | | | |
Expiring August, 2017 at $11.00 | | | 300 | | | | | | | | (1,200) | | | | | |
Twenty-First Century Fox, Inc. | | | | | | | | | | | | | | | | |
Expiring July, 2017 at $31.00 | | | 4 | | | | | | | | (40) | | | | | |
Union Pacific Corp. | | | | | | | | | | | | | | | | |
Expiring July, 2017 at $110.00 | | | 3 | | | | | | | | (288) | | | | | |
United Continental Holdings, Inc. | | | | | | | | | | | | | | | | |
Expiring July, 2017 at $78.00 | | | 40 | | | | | | | | (6,400) | | | | | |
United Rentals, Inc. | | | | | | | | | | | | | | | | |
Expiring August, 2017 at $110.00 | | | 36 | | | | | | | | (30,168) | | | | | |
United Technologies Corp. | | | | | | | | | | | | | | | | |
Expiring August, 2017 at $125.00 | | | 3 | | | | | | | | (399) | | | | | |
Unum Group | | | | | | | | | | | | | | | | |
Expiring July, 2017 at $45.00 | | | 16 | | | | | | | | (3,840) | | | | | |
US Bancorp | | | | | | | | | | | | | | | | |
Expiring July, 2017 at $52.50 | | | 6 | | | | | | | | (426) | | | | | |
Valero Energy Corp. | | | | | | | | | | | | | | | | |
Expiring July, 2017 at $65.00 | | | 4 | | | | | | | | (1,208) | | | | | |
Verizon Communications, Inc. | | | | | | | | | | | | | | | | |
Expiring July, 2017 at $48.00 | | | 7 | | | | | | | | (14) | | | | | |
Viacom, Inc. | | | | | | | | | | | | | | | | |
Expiring September, 2017 at $37.50 | | | 40 | | | | | | | | (2,200) | | | | | |
Visa, Inc. | | | | | | | | | | | | | | | | |
Expiring July, 2017 at $92.50 | | | 11 | | | | | | | | (2,860) | | | | | |
Wal-Mart Stores, Inc. | | | | | | | | | | | | | | | | |
Expiring July, 2017 at $77.50 | | | 5 | | | | | | | | (185) | | | | | |
Walt Disney Co. (The) | | | | | | | | | | | | | | | | |
Expiring August, 2017 at $105.00 | | | 3 | | | | | | | | (990) | | | | | |
Waste Management, Inc. | | | | | | | | | | | | | | | | |
Expiring August, 2017 at $75.00 | | | 3 | | | | | | | | (240) | | | | | |
Wells Fargo & Co. | | | | | | | | | | | | | | | | |
Expiring July, 2017 at $55.00 | | | 11 | | | | | | | | (1,474) | | | | | |
Western Digital Corp. | | | | | | | | | | | | | | | | |
Expiring July, 2017 at $92.50 | | | 3 | | | | | | | | (351) | | | | | |
| | | | | | | | | | | | |
| Company | | Number
of Contracts | | | Value | |
|
| |
Yum China Holdings, Inc. | | | | | | | | | | | | |
Expiring July, 2017 at $35.00 | | | 3 | | | | | | | | $ (1,380) | |
| | | | | | | | | | | | |
TOTAL CALL OPTIONS WRITTEN - (0.67%) | | | | (243,704) | |
| | | | | | | | | | | | |
(Premiums received $(258,278)) | | | | | |
|
PUT OPTIONS WRITTEN - (0.50%) | |
Aflac, Inc. | | | | | | | | | | | | |
Expiring August, 2017 at $75.00 | | | 50 | | | | | | | | (3,950) | |
Amdocs, Ltd. | | | | | | | | | | | | |
Expiring July, 2017 at $60.00 | | | 20 | | | | | | | | (300) | |
American Airlines Group, Inc. | | | | | | | | | | | | |
Expiring August, 2017 at $46.00 | | | 50 | | | | | | | | (4,200) | |
Apple, Inc. | | | | | | | | | | | | |
Expiring July, 2017 at $142.00 | | | 30 | | | | | | | | (5,940) | |
Applied Materials, Inc. | | | | | | | | | | | | |
Expiring August, 2017 at $40.00 | | | 50 | | | | | | | | (6,700) | |
Best Buy Co., Inc. | | | | | | | | | | | | |
Expiring July, 2017 at $55.00 | | | 30 | | | | | | | | (1,650) | |
Expiring July, 2017 at $59.00 | | | 20 | | | | | | | | (4,100) | |
| | | | | | | | | | | | |
| | | | | | | | | | | (5,750) | |
Boeing Co. (The) | | | | | | | | | | | | |
Expiring July, 2017 at $175.00 | | | 20 | | | | | | | | (260) | |
Cemex SAB de CV | | | | | | | | | | | | |
Expiring July, 2017 at $8.65 | | | 170 | | | | | | | | (2,475) | |
Chubb, Ltd. | | | | | | | | | | | | |
Expiring August, 2017 at $135.00 | | | 20 | | | | | | | | (1,400) | |
Cirrus Logic, Inc. | | | | | | | | | | | | |
Expiring July, 2017 at $62.00 | | | 50 | | | | | | | | (6,750) | |
Citigroup, Inc. | | | | | | | | | | | | |
Expiring July, 2017 at $55.00 | | | 70 | | | | | | | | (140) | |
Delphi Automotive PLC | | | | | | | | | | | | |
Expiring August, 2017 at $85.00 | | | 35 | | | | | | | | (8,050) | |
Hanesbrands,. Inc | | | | | | | | | | | | |
Expiring July, 2017 at $20.00 | | | 20 | | | | | | | | (60) | |
Magna International, Inc. | | | | | | | | | | | | |
Expiring July, 2017 at $45.00 | | | 20 | | | | | | | | (960) | |
MasTec, Inc. | | | | | | | | | | | | |
Expiring July, 2017 at $43.00 | | | 35 | | | | | | | | (2,275) | |
MercadoLibre, Inc. | | | | | | | | | | | | |
Expiring July, 2017 at $270.00 | | | 10 | | | | | | | | (22,540) | |
Microchip Technology, Inc. | | | | | | | | | | | | |
Expiring July, 2017 at $80.00 | | | 35 | | | | | | | | (10,850) | |
Netflix, Inc. | | | | | | | | | | | | |
Expiring August, 2017 at $150.00 | | | 25 | | | | | | | | (21,100) | |
Nordstrom, Inc. | | | | | | | | | | | | |
Expiring July, 2017 at $45.00 | | | 40 | | | | | | | | (2,280) | |
Seagate Technology PLC | | | | | | | | | | | | |
Expiring July, 2017 at $42.00 | | | 90 | | | | | | | | (32,850) | |
| | |
| Managed Volatility Fund | | |
| SCHEDULE OF OPTIONS WRITTEN (continued) | | |
| | |
| | | | | | | | | | | | |
| Company | | Number of
Contracts | | | Value | | | | |
| |
Put Options Written (continued) | | | | | |
Snap-on, Inc. | | | | | | | | | | | | |
Expiring July, 2017 at $150.00 | | | 25 | | | $ | (3,625 | ) | | | | |
Steel Dynamics, Inc. | | | | | | | | | | | | |
Expiring August, 2017 at $32.00 | | | 110 | | | | (6,050 | ) | | | | |
Target Corp. | | | | | | | | | | | | |
Expiring July, 2017 at $48.00 | | | 60 | | | | (1,440 | ) | | | | |
Expiring July, 2017 at $55.00 | | | 20 | | | | (5,880 | ) | | | | |
| | | | | | | | | | | | |
| | | | | | | (7,320 | ) | | | | |
T-Mobile US, Inc. | | | | | | | | | | | | |
Expiring July, 2017 at $67.50 | | | 18 | | | | (12,276 | ) | | | | |
United Continental Holdings, Inc. | | | | | | | | | | | | |
Expiring July, 2017 at $75.00 | | | 15 | | | | (3,825 | ) | | | | |
United Technologies Corp. | | | | | | | | | | | | |
Expiring August, 2017 at $120.00 | | | 30 | | | | (5,400 | ) | | | | |
Zebra Technologies Corp. | | | | | | | | | | | | |
Expiring August, 2017 at $95.00 | | | 25 | | | | (7,250 | ) | | | | |
| | | | | | | | | | | | |
TOTAL PUT OPTIONS WRITTEN - (0.50%) | | | | (184,576 | ) | | | | |
| | | | | | | | | | | | |
(Premiums received $(224,982)) | | | | | | | | | |
TOTAL OPTIONS WRITTEN - (1.17%) | | | $ | (428,280 | ) | | | | |
| | | | | | | | | | | | |
(Premiums received $(483,260)) | | | | | | | | | |
| | | | | | | | | |
| | | | | | | | | |
| | | | | | | | | |
| | | | | | | | | |
| | | | | | | | | |
| | | | | | | | | |
| | | | | | | | | |
| | | | | | | | | |
| | | | | | | | | | | | | | | | |
| Summary of inputs used to value the Fund’s investments as of 06/30/2017 (See Note 2 in Notes to Financial Statements): | |
| |
| | | Assets Table | |
| | | Valuation Inputs | |
| | | Investment in Securities (Value) | |
| | | Level 1
Quoted
Prices | | | Level 2
Significant
Observable
Inputs | | | Level 3
Significant
Unobservable
Inputs | | | Total | |
Common Stocks | | | $21,773,090 | | | | $ — | | | | $ — | | | | $21,773,090 | |
U.S. Government Obligations | | | — | | | | 13,978,188 | | | | — | | | | 13,978,188 | |
Money Market Fund | | | — | | | | 1,595,167 | | | | — | | | | 1,595,167 | |
Investments Purchased with Cash Proceeds from Securities Lending | | | — | | | | 71,025 | | | | — | | | | 71,025 | |
| | | | | | | | | | | | | | | | |
TOTAL | | | $21,773,090 | | | | $15,644,380 | | | | $ — | | | | $37,417,470 | |
| | | | | | | | | | | | | | | | |
| | | | | | | | | | | | | | | | |
| | | Liabilities Table | |
| | | Valuation Inputs | |
| | | Investment in Securities (Value) | |
| | | Level 1
Quoted
Prices | | | Level 2
Significant
Observable
Inputs | | | Level 3
Significant
Unobservable
Inputs | | | Total | |
Options Written | | | $(354,954) | | | | $(73,326) | | | | $ — | | | | $(428,280) | |
| | | | | | | | | | | | | | | | |
TOTAL | | | $(354,954) | | | | $(73,326) | | | | $ — | | | | $(428,280) | |
| | | | | | | | | | | | | | | | |
See Notes to Financial Statements.
| | |
| 74 | | Annual Report | June 30, 2017 |
THIS PAGE INTENTIONALLY LEFT BLANK
STATEMENTS OF ASSETS AND LIABILITIES
June 30, 2017
| | | | | | | | | | | | |
| ASSETS | | Aggressive
Investors 1 | | Ultra-Small
Company | | | Ultra-Small
Company Market |
Investments at value | | $ | 243,399,700 | | | $ | 117,782,618 | | | $ | 414,632,490 | |
Cash | | | - | | | | - | | | | - | |
Receivables: | | | | | | | | | | | | |
Portfolio securities sold | | | 13,056,786 | | | | - | | | | 2,755,076 | |
Fund shares sold | | | 1,352 | | | | 158 | | | | 3,231 | |
Dividends and interest | | | 263,351 | | | | 353,905 | | | | 710,487 | |
Receivable from investment adviser | | | - | | | | - | | | | - | |
Deposits with brokers | | | - | | | | - | | | | - | |
Prepaid expenses. | | | 36,768 | | | | 12,823 | | | | 51,821 | |
Total assets | | | 256,757,957 | | | | 118,149,504 | | | | 418,153,105 | |
| | | |
LIABILITIES | | | | | | | | | | | | |
Payables: | | | | | | | | | | | | |
Portfolio securities purchased | | | 8,950,647 | | | | - | | | | 1,903,060 | |
Fund shares redeemed | | | 44,196 | | | | 243,000 | | | | 47,058 | |
Due to custodian | | | - | | | | - | | | | - | |
Loan payable | | | - | | | | - | | | | - | |
Payable upon return of securities loaned | | | 23,185,880 | | | | 16,790,737 | | | | 63,491,698 | |
Due to securities lending agent | | | - | | | | - | | | | 213,885 | |
Accrued Liabilities: | | | | | | | | | | | | |
Investment adviser fees | | | 375,588 | | | | 73,251 | | | | 131,723 | |
Administration fees | | | 4,387 | | | | 1,944 | | | | 6,864 | |
Other | | | 123,936 | | | | 56,719 | | | | 168,904 | |
Call options written at value | | | - | | | | - | | | | - | |
Put options written at value | | | - | | | | - | | | | - | |
Total liabilities | | | 32,684,634 | | | | 17,165,651 | | | | 65,963,192 | |
NET ASSETS | | $ | 224,073,323 | | | $ | 100,983,853 | | | $ | 352,189,913 | |
NET ASSETS REPRESENT | | | | | | | | | | | | |
Paid-in capital | | $ | 236,109,863 | | | $ | 90,586,470 | | | $ | 244,425,489 | |
Undistributed net investment income (loss) | | | (128,827 | ) | | | 1,140,178 | | | | 449,165 | |
Accumulated net realized gain (loss) on investments | | | (16,094,318 | ) | | | 476,540 | | | | 26,637,608 | |
Net unrealized appreciation on investments | | | 4,186,605 | | | | 8,780,665 | | | | 80,677,651 | |
NET ASSETS | | $ | 224,073,323 | | | $ | 100,983,853 | | | $ | 352,189,913 | |
Shares of common stock outstanding of $.001 par value* | | | 3,376,301 | | | | 3,361,787 | | | | 23,584,557 | |
Net asset value, offering price and redemption price per share | | $ | 66.37 | | | $ | 30.04 | | | $ | 14.93 | (a) |
Total investments at cost | | $ | 239,213,095 | | | $ | 109,001,953 | | | $ | 333,954,839 | |
Premiums received on call options written | | $ | - | | | $ | - | | | $ | - | |
Premiums received on put options written | | $ | - | | | $ | - | | | $ | - | |
| * | See Note 1 - Organization in the Notes to Financial Statements for shares authorized for each Fund. |
| (a) | Redemption of shares held less than six months may be charged a 2% redemption fee. See Note 8. |
See Notes to Financial Statements.
| | |
| 76 | | Annual Report | June 30, 2017 |
| | |
| | | |
| | | |
| | | | | | | | | | | | | | | | | | |
| Small-Cap
Momentum |
| |
| Small-Cap
Growth |
| |
| Small-Cap
Value |
| |
| Blue Chip 35
Index |
| |
| Managed
Volatility |
|
| | |
| $ | 5,615,978 | | | $ | 51,050,751 | | | $ | 68,004,524 | | | $ | 550,709,629 | | | $ | 37,417,470 | |
| | - | | | | 283,022 | | | | - | | | | - | | | | - | |
| | - | | | | 1,147,264 | | | | 863,246 | | | | 6,667,066 | | | | 50,524 | |
| | - | | | | 6,363 | | | | 100,125 | | | | 338,950 | | | | - | |
| | 6,204 | | | | 37,386 | | | | 72,575 | | | | 474,589 | | | | 13,814 | |
| | 9,557 | | | | - | | | | - | | | | 2,498 | | | | - | |
| | - | | | | - | | | | - | | | | - | | | | 145 | |
| | 13,573 | | | | 10,284 | | | | 10,960 | | | | 35,383 | | | | 19,646 | |
| | |
| | 5,645,312 | | | | 52,535,070 | | | | 69,051,430 | | | | 558,228,115 | | | | 37,501,599 | |
| | |
| | - | | | | 1,119,273 | | | | 5,636 | | | | 6,044,163 | | | | 411,040 | |
| | - | | | | 500 | | | | - | | | | 361,890 | | | | 2,842 | |
| | 817 | | | | - | | | | 142,789 | | | | - | | | | - | |
| | - | | | | 265,000 | | | | - | | | | 731,977 | | | | - | |
| | 532,593 | | | | 4,544,311 | | | | 6,844,975 | | | | - | | | | 71,025 | |
| | - | | | | - | | | | - | | | | - | | | | - | |
| | - | | | | 19,243 | | | | 25,244 | | | | - | | | | 11,134 | |
| | 100 | | | | 913 | | | | 1,213 | | | | 11,156 | | | | 740 | |
| | 33,193 | | | | 42,311 | | | | 50,867 | | | | 177,084 | | | | 53,258 | |
| | - | | | | - | | | | - | | | | - | | | | 243,704 | |
| | - | | | | - | | | | - | | | | - | | | | 184,576 | |
| | |
| | 566,703 | | | | 5,991,551 | | | | 7,070,724 | | | | 7,326,270 | | | | 978,319 | |
| | |
| $ | 5,078,609 | | | $ | 46,543,519 | | | $ | 61,980,706 | | | $ | 550,901,845 | | | $ | 36,523,280 | |
| | |
| $ | 4,239,671 | | | $ | 47,322,966 | | | $ | 73,898,767 | | | $ | 290,972,625 | | | $ | 31,207,428 | |
| | 7,719 | | | | 98,925 | | | | 547,899 | | | | 5,168,789 | | | | 180,610 | |
| | 370,422 | | | | (6,616,711 | ) | | | (20,011,215 | ) | | | 8,688,023 | | | | (1,519,147 | ) |
| | 460,797 | | | | 5,738,339 | | | | 7,545,255 | | | | 246,072,408 | | | | 6,654,389 | |
| | |
| $ | 5,078,609 | | | $ | 46,543,519 | | | $ | 61,980,706 | | | $ | 550,901,845 | | | $ | 36,523,280 | |
| | |
| | 389,674 | | | | 1,867,588 | | | | 2,497,242 | | | | 40,186,607 | | | | 2,469,356 | |
| | |
| $ | 13.03 | (a) | | $ | 24.92 | | | $ | 24.82 | | | $ | 13.71 | | | $ | 14.79 | |
| | |
| $ | 5,155,181 | | | $ | 45,312,412 | | | $ | 60,459,269 | | | $ | 304,637,221 | | | $ | 30,818,061 | |
| $ | - | | | $ | - | | | $ | - | | | $ | - | | | $ | 258,278 | |
| $ | - | | | $ | - | | | $ | - | | | $ | - | | | $ | 224,982 | |
STATEMENTS OF OPERATIONS
Year Ended June 30, 2017
| | | | | | | | | | | | |
| | | Aggressive
Investors 1 | | | Ultra-Small
Company | | | Ultra-Small
Company Market | |
| |
INVESTMENT INCOME | | | | | | | | | | | | |
Dividends | | $ | 2,956,183 | | | $ | 1,713,701 | | | $ | 5,040,281 | |
Less: foreign taxes withheld | | | (59,747 | ) | | | (268 | ) | | | - | |
Interest | | | - | | | | - | | | | - | |
Securities lending | | | 251,711 | | | | 665,843 | | | | 1,787,402 | |
| |
Total Investment Income | | | 3,148,147 | | | | 2,379,276 | | | | 6,827,683 | |
| |
EXPENSES | | | | | | | | | | | | |
Investment advisory fees -Base fees | | | 1,988,272 | | | | 925,434 | | | | 1,740,946 | |
Investment advisory fees - Performance adjustment | | | 1,086,197 | | | | - | | | | - | |
Administration fees. | | | 55,458 | | | | 25,827 | | | | 87,492 | |
Accounting fees | | | 95,538 | | | | 66,652 | | | | 117,193 | |
Transfer agent fees | | | 120,512 | | | | 61,658 | | | | 102,907 | |
Audit fees | | | 19,994 | | | | 13,954 | | | | 26,186 | |
Legal fees | | | 30,673 | | | | 14,448 | | | | 49,272 | |
Custody fees | | | 7,281 | | | | 12,616 | | | | 23,237 | |
Blue sky fees | | | 24,986 | | | | 11,407 | | | | 26,213 | |
Directors’ and officers’ fees | | | 23,228 | | | | 10,856 | | | | 37,399 | |
Shareholder servicing fees | | | 130,042 | | | | 30,702 | | | | 302,681 | |
Reports to shareholders | | | 30,177 | | | | 12,988 | | | | 44,842 | |
Miscellaneous expenses | | | 48,536 | | | | 24,378 | | | | 80,700 | |
| |
Total Expenses | | | 3,660,894 | | | | 1,210,920 | | | | 2,639,068 | |
| |
Less investment advisory fees waived | | | - | | | | - | | | | (27,985 | ) |
Less expenses reimbursed by investment adviser | | | - | | | | - | | | | - | |
| |
Net Expenses | | | 3,660,894 | | | | 1,210,920 | | | | 2,611,083 | |
| |
NET INVESTMENT INCOME (LOSS) | | | (512,747 | ) | | | 1,168,356 | | | | 4,216,600 | |
| |
NET REALIZED AND UNREALIZED GAIN (LOSS) ON INVESTMENTS | | | | | | | | | | | | |
Realized Gain (Loss) on: | | | | | | | | | | | | |
Investments | | | 52,731,300 | | | | 9,710,185 | | | | 37,591,817 | |
Written options | | | - | | | | - | | | | - | |
Futures contracts | | | - | | | | - | | | | - | |
| |
Net Realized Gain | | | 52,731,300 | | | | 9,710,185 | | | | 37,591,817 | |
| |
Change in Unrealized Appreciation (Depreciation) on: | | | | | | | | | | | | |
Investments | | | (9,290,204 | ) | | | 5,136,677 | | | | 40,759,414 | |
Written options | | | - | | | | - | | | | - | |
| |
Net Change in Unrealized Appreciation (Depreciation) | | | (9,290,204 | ) | | | 5,136,677 | | | | 40,759,414 | |
| |
Net Realized and Unrealized Gain on Investments | | | 43,441,096 | | | | 14,846,862 | | | | 78,351,231 | |
| |
INCREASE IN NET ASSETS RESULTING FROM OPERATIONS | | $ | 42,928,349 | | | $ | 16,015,218 | | | $ | 82,567,831 | |
| |
See Notes to Financial Statements.
| | |
| 78 | | Annual Report | June 30, 2017 |
| | |
| | | |
| | | |
| | | | | | | | | | | | | | | | | | |
| Small-Cap
Momentum |
| |
| Small-Cap
Growth |
| |
| Small-Cap
Value |
| |
| Blue Chip 35
Index |
| |
| Managed
Volatility |
|
| | |
| $ | 65,911 | | | $ | 334,753 | | | $ | 1,068,782 | | | | $13,816,761 | | | | $572,383 | |
| | (204 | ) | | | - | | | | - | | | | - | | | | (359) | |
| | - | | | | - | | | | - | | | | - | | | | 91,518 | |
| | 5,607 | | | | 146,252 | | | | 104,867 | | | | - | | | | 654 | |
| | |
| | 71,314 | | | | 481,005 | | | | 1,173,649 | | | | 13,816,761 | | | | 664,196 | |
| | |
| | 25,787 | | | | 243,506 | | | | 373,108 | | | | 450,993 | | | | 291,351 | |
| | - | | | | 17,200 | | | | (16,090 | ) | | | - | | | | - | |
| | 1,177 | | | | 10,176 | | | | 15,607 | | | | 141,692 | | | | 12,250 | |
| | 62,965 | | | | 52,569 | | | | 55,321 | | | | 118,945 | | | | 63,761 | |
| | 35,260 | | | | 55,860 | | | | 64,749 | | | | 57,091 | | | | 52,780 | |
| | 9,264 | | | | 11,117 | | | | 11,986 | | | | 38,525 | | | | 16,655 | |
| | 642 | | | | 5,523 | | | | 8,617 | | | | 80,760 | | | | 7,788 | |
| | 10,890 | | | | 5,517 | | | | 3,771 | | | | 10,027 | | | | 8,339 | |
| | 20,951 | | | | 22,434 | | | | 23,887 | | | | 54,946 | | | | 24,298 | |
| | 486 | | | | 4,119 | | | | 6,583 | | | | 60,271 | | | | 5,610 | |
| | 3,564 | | | | 23,648 | | | | 37,625 | | | | 162,003 | | | | 35,373 | |
| | 4,053 | | | | 9,073 | | | | 11,555 | | | | 127,560 | | | | 10,643 | |
| | 3,693 | | | | 8,907 | | | | 13,410 | | | | 131,402 | | | | 16,750 | |
| | |
| | 178,732 | | | | 469,649 | | | | 610,129 | | | | 1,434,215 | | | | 545,598 | |
| | |
| | (25,787 | ) | | | (87,577 | ) | | | (26,479 | ) | | | (450,993 | ) | | | (86,273) | |
| | (110,748 | ) | | | - | | | | - | | | | (137,609 | ) | | | - | |
| | |
| | 42,197 | | | | 382,072 | | | | 583,650 | | | | 845,613 | | | | 459,325 | |
| | |
| | 29,117 | | | | 98,933 | | | | 589,999 | | | | 12,971,148 | | | | 204,871 | |
| | |
| | 535,990 | | | | 6,078,273 | | | | 3,054,674 | | | | 17,816,996 | | | | 3,142,461 | |
| | - | | | | - | | | | - | | | | - | | | | 1,462,340 | |
| | - | | | | - | | | | - | | | | - | | | | (2,528,646) | |
| | |
| | 535,990 | | | | 6,078,273 | | | | 3,054,674 | | | | 17,816,996 | | | | 2,076,155 | |
| | |
| | 203,270 | | | | 2,032,306 | | | | 7,518,282 | | | | 44,258,705 | | | | (270,843) | |
| | - | | | | - | | | | - | | | | - | | | | 90,479 | |
| | |
| | 203,270 | | | | 2,032,306 | | | | 7,518,282 | | | | 44,258,705 | | | | (180,364) | |
| | |
| | 739,260 | | | | 8,110,579 | | | | 10,572,956 | | | | 62,075,701 | | | | 1,895,791 | |
| | |
| $ | 768,377 | | | $ | 8,209,512 | | | $ | 11,162,955 | | | | $75,046,849 | | | | $2,100,662 | |
| | |
STATEMENTS OF CHANGES IN NET ASSETS
| | | | | | | | | | | | | | | | |
| | | Aggressive Investors 1 | | | Ultra-Small Company | |
| | | Year Ended June 30, | | | Year Ended June 30, | |
| | | 2017 | | | 2016 | | | 2017 | | | 2016 | |
| | | | |
OPERATIONS | | | | | | | | | | | | | | | | |
Net investment income (loss) | | $ | (512,747 | ) | | $ | 1,255,312 | | | $ | 1,168,356 | | | $ | 1,137,071 | |
Net realized gain (loss) on investments | | | 52,731,300 | | | | (2,615,832 | ) | | | 9,710,185 | | | | (5,021,149 | ) |
Net change in unrealized appreciation (depreciation) on investments | | | (9,290,204 | ) | | | (17,416,880 | ) | | | 5,136,677 | | | | (13,372,489 | ) |
| |
Net increase (decrease) in net assets resulting from operations | | | 42,928,349 | | | | (18,777,400 | ) | | | 16,015,218 | | | | (17,256,567 | ) |
| |
DISTRIBUTIONS: | | | | | | | | | | | | | | | | |
From net investment income | | | (1,255,319 | ) | | | (99,024 | ) | | | (1,212,208 | ) | | | (1,116,218 | ) |
From net realized gains | | | - | | | | - | | | | - | | | | - | |
| |
Net decrease in net assets from distributions | | | (1,255,319 | ) | | | (99,024 | ) | | | (1,212,208 | ) | | | (1,116,218 | ) |
| |
SHARE TRANSACTIONS: | | | | | | | | | | | | | | | | |
Proceeds from sale of shares | | | 8,479,231 | | | | 12,201,386 | | | | 1,300,515 | | | | 1,946,202 | |
Reinvestment of distributions | | | 1,210,679 | | | | 95,200 | | | | 1,132,706 | | | | 1,038,194 | |
Cost of shares redeemed | | | (34,518,694 | ) | | | (34,237,152 | ) | | | (17,703,091 | ) | | | (10,877,563 | ) |
Redemption fees | | | - | | | | - | | | | - | | | | - | |
| |
Net increase (decrease) in net assets resulting from share transactions | | | (24,828,784 | ) | | | (21,940,566 | ) | | | (15,269,870 | ) | | | (7,893,167 | ) |
| |
Net increase (decrease) in net assets | | | 16,844,246 | | | | (40,816,990 | ) | | | (466,860 | ) | | | (26,265,952 | ) |
NET ASSETS: | | | | | | | | | | | | | | | | |
Beginning of year | | | 207,229,077 | | | | 248,046,067 | | | | 101,450,713 | | | | 127,716,665 | |
| |
End of year** | | $ | 224,073,323 | | | $ | 207,229,077 | | | $ | 100,983,853 | | | $ | 101,450,713 | |
| |
SHARES ISSUED & REDEEMED | | | | | | | | | | | | | | | | |
Issued | | | 133,731 | | | | 226,120 | | | | 45,001 | | | | 71,929 | |
Distributions reinvested | | | 18,811 | | | | 1,751 | | | | 38,177 | | | | 39,808 | |
Redeemed | | | (561,401 | ) | | | (636,420 | ) | | | (624,860 | ) | | | (413,482 | ) |
| |
Net increase (decrease) | | | (408,859 | ) | | | (408,549 | ) | | | (541,682 | ) | | | (301,745 | ) |
Outstanding at beginning of year | | | 3,785,160 | | | | 4,193,709 | | | | 3,903,469 | | | | 4,205,214 | |
| |
Outstanding at end of year | | | 3,376,301 | | | | 3,785,160 | | | | 3,361,787 | | | | 3,903,469 | |
| |
** Including undistributed net investment income (loss) of: | | $ | (128,827 | ) | | $ | 1,255,290 | | | $ | 1,140,178 | | | $ | 1,155,911 | |
See Notes to Financial Statements.
| | |
80 | | Annual Report | June 30, 2017 |
| | |
| | | |
| | | |
| | | | | | | | | | | | | | | | | | | | | | | | | | |
Ultra-Small Company Market | | | | | | Small-Cap Momentum | |
| | | | Year Ended
June 30, | | | | | | | | | | | | Year Ended
June 30, | | | | |
| 2017 | | | | | | 2016 | | | | | | 2017 | | | | | | 2016 | |
| | | | | | |
| $ | 4,216,600 | | | | | | | $ | 3,169,017 | | | | | | | $ | 29,117 | | | | | | | $ | 26,619 | |
| | 37,591,817 | | | | | | | | 28,557,753 | | | | | | | | 535,990 | | | | | | | | (11,415 | ) |
| | 40,759,414 | | | | | | | | (75,235,595 | ) | | | | | | | 203,270 | | | | | | | | (179,316 | ) |
| | 82,567,831 | | | | | | | | (43,508,825 | ) | | | | | | | 768,377 | | | | | | | | (164,112 | ) |
| | (3,465,525 | ) | | | | | | | (3,152,924 | ) | | | | | | | (48,202 | ) | | | | | | | (9,442 | ) |
| | (24,304,051 | ) | | | | | | | (37,504,226 | ) | | | | | | | (147,252 | ) | | | | | | | (115,288 | ) |
| | (27,769,576 | ) | | | | | | | (40,657,150 | ) | | | | | | | (195,454 | ) | | | | | | | (124,730 | ) |
| | 33,169,406 | | | | | | | | 52,017,890 | | | | | | | | 272,512 | | | | | | | | 261,156 | |
| | 26,765,299 | | | | | | | | 39,249,741 | | | | | | | | 194,812 | | | | | | | | 124,006 | |
| | (94,110,373 | ) | | | | | | | (78,477,718 | ) | | | | | | | (137,445 | ) | | | | | | | (1,043,587 | ) |
| | 31,936 | | | | | | | | 58,448 | | | | | | | | 218 | | | | | | | | 303 | |
| | (34,143,732 | ) | | | | | | | 12,848,361 | | | | | | | | 330,097 | | | | | | | | (658,122 | ) |
| | 20,654,523 | | | | | | | | (71,317,614 | ) | | | | | | | 903,020 | | | | | | | | (946,964 | ) |
| | 331,535,390 | | | | | | | | 402,853,004 | | | | | | | | 4,175,589 | | | | | | | | 5,122,553 | |
| $ | 352,189,913 | | | | | | | $ | 331,535,390 | | | | | | | $ | 5,078,609 | | | | | | | $ | 4,175,589 | |
| | 2,305,325 | | | | | | | | 3,904,938 | | | | | | | | 23,323 | | | | | | | | 22,889 | |
| | 1,858,701 | | | | | | | | 3,073,590 | | | | | | | | 15,787 | | | | | | | | 10,802 | |
| | (6,546,492 | ) | | | | | | | (5,905,983 | ) | | | | | | | (12,284 | ) | | | | | | | (87,732 | ) |
| | (2,382,466 | ) | | | | | | | 1,072,545 | | | | | | | | 26,826 | | | | | | | | (54,041 | ) |
| | 25,967,023 | | | | | | | | 24,894,478 | | | | | | | | 362,848 | | | | | | | | 416,889 | |
| | 23,584,557 | | | | | | | | 25,967,023 | | | | | | | | 389,674 | | | | | | | | 362,848 | |
| $ | 449,165 | | | | | | | $ | 3 | | | | | | | $ | 7,719 | | | | | | | $ | 24,077 | |
STATEMENTS OF CHANGES IN NET ASSETS (continued)
| | | | | | | | | | | | | | | | | | | | |
| | | Small-Cap Growth | | | Small-Cap Value | | | | |
| | | Year Ended June 30, | | | Year Ended June 30, | | | | |
| | | 2017 | | | 2016 | | | 2017 | | | 2016 | | | | |
| | | | | |
OPERATIONS | | | | | | | | | | | | | | | | | | | | |
Net investment income | | $ | 98,933 | | | $ | 129,866 | | | $ | 589,999 | | | $ | 877,190 | | | | | |
Net realized gain (loss) on investments | | | 6,078,273 | | | | 470,966 | | | | 3,054,674 | | | | (2,163,966 | ) | | | | |
Net change in unrealized appreciation (depreciation) on investments | | | 2,032,306 | | | | (2,039,755 | ) | | | 7,518,282 | | | | (2,863,660 | ) | | | | |
| |
Net increase (decrease) in net assets resulting from operations | | | 8,209,512 | | | | (1,438,923 | ) | | | 11,162,955 | | | | (4,150,436 | ) | | | | |
| |
DISTRIBUTIONS: | | | | | | | | | | | | | | | | | | | | |
From net investment income | | | (128,436 | ) | | | - | | | | (644,905 | ) | | | (1,200,493 | ) | | | | |
| |
Net decrease in net assets from distributions | | | (128,436 | ) | | | - | | | | (644,905 | ) | | | (1,200,493 | ) | | | | |
| |
SHARE TRANSACTIONS: | | | | | | | | | | | | | | | | | | | | |
Proceeds from sale of shares | | | 10,067,573 | | | | 8,174,017 | | | | 3,643,910 | | | | 2,974,064 | | | | | |
Reinvestment of distributions. | | | 124,435 | | | | - | | | | 621,803 | | | | 1,160,995 | | | | | |
Cost of shares redeemed | | | (8,123,208 | ) | | | (7,142,746 | ) | | | (11,543,562 | ) | | | (13,284,863 | ) | | | | |
| |
Net increase (decrease) in net assets resulting from share transactions | | | 2,068,800 | | | | 1,031,271 | | | | (7,277,849 | ) | | | (9,149,804 | ) | | | | |
| |
Net increase (decrease) in net assets | | | 10,149,876 | | | | (407,652 | ) | | | 3,240,201 | | | | (14,500,733 | ) | | | | |
NET ASSETS: | | | | | | | | | | | | | | | | | | | | |
Beginning of year | | | 36,393,643 | | | | 36,801,295 | | | | 58,740,505 | | | | 73,241,238 | | | | | |
| |
End of year* | | $ | 46,543,519 | | | $ | 36,393,643 | | | $ | 61,980,706 | | | $ | 58,740,505 | | | | | |
| |
SHARES ISSUED & REDEEMED | | | | | | | | | | | | | | | | | | | | |
Issued | | | 435,958 | | | | 417,698 | | | | 150,968 | | | | 146,711 | | | | | |
Distributions reinvested | | | 5,311 | | | | - | | | | 24,714 | | | | 57,532 | | | | | |
Redeemed | | | (364,034 | ) | | | (365,757 | ) | | | (492,525 | ) | | | (660,493 | ) | | | | |
| |
Net increase (decrease) | | | 77,235 | | | | 51,941 | | | | (316,843 | ) | | | (456,250 | ) | | | | |
Outstanding at beginning of year | | | 1,790,353 | | | | 1,738,412 | | | | 2,814,085 | | | | 3,270,335 | | | | | |
| |
Outstanding at end of year | | | 1,867,588 | | | | 1,790,353 | | | | 2,497,242 | | | | 2,814,085 | | | | | |
| |
* Including undistributed net investment income of: | | $ | 98,925 | | | $ | 128,428 | | | $ | 547,899 | | | $ | 602,805 | | | | | |
See Notes to Financial Statements.
| | |
| 82 | | Annual Report | June 30, 2017 |
| | |
| | | |
| | | |
| | | | | | | | | | | | | | | | | | | | | | | | | | |
Blue Chip 35 Index | | | | | | Managed Volatility | |
| | | | Year Ended
June 30, | | | | | | | | | | | | Year Ended
June 30, | | | | |
| 2017 | | | | | | 2016 | | | | | | 2017 | | | | | | 2016 | |
| $ | 12,971,148 | | | | | | | $ | 13,796,994 | | | | | | | $ | 204,871 | | | | | | | $ | 174,794 | |
| | 17,816,996 | | | | | | | | 11,244,582 | | | | | | | | 2,076,155 | | | | | | | | 571,246 | |
| | 44,258,705 | | | | | | | | 6,959,629 | | | | | | | | (180,364 | ) | | | | | | | (118,120 | ) |
| | 75,046,849 | | | | | | | | 32,001,205 | | | | | | | | 2,100,662 | | | | | | | | 627,920 | |
| | (13,425,245 | ) | | | | | | | (14,480,684 | ) | | | | | | | (195,475 | ) | | | | | | | (15,844 | ) |
| | (13,425,245 | ) | | | | | | | (14,480,684 | ) | | | | | | | (195,475 | ) | | | | | | | (15,844 | ) |
| | 141,781,165 | | | | | | | | 197,709,355 | | | | | | | | 5,629,461 | | | | | | | | 13,489,567 | |
| | 12,574,239 | | | | | | | | 13,464,160 | | | | | | | | 183,367 | | | | | | | | 15,001 | |
| | (236,718,752 | ) | | | | | | | (257,873,552 | ) | | | | | | | (28,780,897 | ) | | | | | | | (15,538,847 | ) |
| | (82,363,348 | ) | | | | | | | (46,700,037 | ) | | | | | | | (22,968,069 | ) | | | | | | | (2,034,279 | ) |
| | (20,741,744 | ) | | | | | | | (29,179,516 | ) | | | | | | | (21,062,882 | ) | | | | | | | (1,422,203 | ) |
| | 571,643,589 | | | | | | | | 600,823,105 | | | | | | | | 57,586,162 | | | | | | | | 59,008,365 | |
| $ | 550,901,845 | | | | | | | $ | 571,643,589 | | | | | | | $ | 36,523,280 | | | | | | | $ | 57,586,162 | |
| | 10,843,864 | | | | | | | | 16,712,171 | | | | | | | | 390,649 | | | | | | | | 970,595 | |
| | 962,069 | | | | | | | | 1,130,492 | | | | | | | | 12,814 | | | | | | | | 1,078 | |
| | (18,162,153 | ) | | | | | | | (22,178,814 | ) | | | | | | | (1,988,231 | ) | | | | | | | (1,118,179 | ) |
| | (6,356,220 | ) | | | | | | | (4,336,151 | ) | | | | | | | (1,584,768 | ) | | | | | | | (146,506 | ) |
| | 46,542,827 | | | | | | | | 50,878,978 | | | | | | | | 4,054,124 | | | | | | | | 4,200,630 | |
| | 40,186,607 | | | | | | | | 46,542,827 | | | | | | | | 2,469,356 | | | | | | | | 4,054,124 | |
| $ | 5,168,789 | | | | | | | $ | 6,660,578 | | | | | | | $ | 180,610 | | | | | | | $ | 171,214 | |
FINANCIAL HIGHLIGHTS
(for a share outstanding throughout each year indicated)
AGGRESSIVE INVESTORS 1
| | | | | | | | | | | | | | | | | | | | |
| | | Year Ended June 30 | |
| | | | | |
| | | 2017 | | | 2016 | | | 2015 | | | 2014 | | | 2013 | |
| | | | | |
Net Asset Value, Beginning of Year | | | $54.75 | | | | $59.15 | | | | $56.69 | | | | $43.21 | | | | $33.13 | |
| | | | | |
| | | | | | | | | | | | | | | | | | | | |
| | | | | |
Income from Investment Operations: | | | | | | | | | | | | | | | | | | | | |
Net Investment Income (Loss)(a) | | | (0.14) | | | | 0.31 | | | | 0.02 | | | | 0.11 | | | | 0.65 | |
Net Realized and Unrealized Gain (Loss) | | | 12.12 | | | | (4.69) | | | | 2.56 | | | | 13.73 | | | | 9.84 | |
| | | | | |
| | | | | | | | | | | | | | | | | | | | |
| | | | | |
Total from Investment Operations | | | 11.98 | | | | (4.38) | | | | 2.58 | | | | 13.84 | | | | 10.49 | |
| | | | | |
| | | | | | | | | | | | | | | | | | | | |
| | | | | |
Less Distributions to Shareholders from: | | | | | | | | | | | | | | | | | | | | |
Net Investment Income | | | (0.36) | | | | (0.02) | | | | (0.12) | | | | (0.36) | | | | (0.41) | |
| | | | | |
| | | | | | | | | | | | | | | | | | | | |
| | | | | |
Total Distributions | | | (0.36) | | | | (0.02) | | | | (0.12) | | | | (0.36) | | | | (0.41) | |
| | | | | |
| | | | | | | | | | | | | | | | | | | | |
| | | | | |
Net Asset Value, End of Year | | | $66.37(b) | | | | $54.75 | | | | $59.15 | | | | $56.69 | | | | $43.21 | |
| | | | | | | | | | | | | | | | | | | | |
| | | | | |
Total Return | | | 21.90%(b) | | | | (7.40%) | | | | 4.57% | | | | 32.14% | | | | 31.92% | |
| | | | | |
Ratios and Supplemental Data: | | | | | | | | | | | | | | | | | | | | |
Net Assets, End of Year (in 000’s) | | | $224,073 | | | | $207,229 | | | | $248,046 | | | | $259,402 | | | | $221,337 | |
Expenses Before Waivers and Reimbursements | | | 1.66% | | | | 0.63%(c) | | | | 1.32% | | | | 1.01% | | | | 0.74%(c) | |
Expenses After Waivers and Reimbursements . | | | 1.66% | | | | 0.63% | | | | 1.32% | | | | 1.01% | | | | 0.74% | |
Net Investment Income (Loss) After Waivers and Reimbursements | | | (0.23%) | | | | 0.58% | | | | 0.04% | | | | 0.22% | | | | 1.69% | |
Portfolio Turnover Rate | | | 153% | | | | 124% | | | | 107% | | | | 125% | | | | 149% | |
| (a) | Per share amounts calculated based on the average daily shares outstanding during the period. |
| (b) | Includes adjustments in accordance with accounting principles generally accepted in the United States and, consequently, the net asset value for financial reporting purposes and the returns based upon those net asset values may differ from the net asset values and returns for shareholder transactions. |
| (c) | For the years ended June 30, 2013 and June 30, 2016 the expense ratio was significantly lower than in other years, due to a negative performance adjustment to the investment advisory fee. Please refer to Note 3 of the Notes to Financial Statements for further information. The rate shown may not be indicative of the rate going forward. |
See Notes to Financial Statements.
| | |
84 | | Annual Report | June 30, 2017 |
FINANCIAL HIGHLIGHTS
(for a share outstanding throughout each year indicated)
ULTRA-SMALL COMPANY
| | | | | | | | | | |
| | | Year Ended June 30 |
| | | | | |
| | | 2017 | | 2016 | | 2015 | | 2014 | | 2013 |
| | | | | |
Net Asset Value, Beginning of Year | | $25.99 | | $30.37 | | $41.83 | | $39.36 | | $27.57 |
| | | | | |
| | | | | | | | | | |
| | | | | |
Income from Investment Operations: | | | | | | | | | | |
Net Investment Income(a) | | 0.32 | | 0.28 | | 0.24 | | 0.41 | | 0.43 |
| | | | | |
Net Realized and Unrealized Gain (Loss) | | 4.06 | | (4.39) | | (3.53) | | 8.33 | | 11.38 |
| | | | | |
| | | | | | | | | | |
| | | | | |
Total from Investment Operations | | 4.38 | | (4.11) | | (3.29) | | 8.74 | | 11.81 |
| | | | | |
| | | | | | | | | | |
| | | | | |
Less Distributions to Shareholders from: | | | | | | | | | | |
Net Investment Income | | (0.33) | | (0.27) | | (0.30) | | (0.76) | | (0.02) |
Net Realized Gain | | - | | - | | (7.87) | | (5.51) | | - |
| | | | | |
| | | | | | | | | | |
| | | | | |
Total Distributions | | (0.33) | | (0.27) | | (8.17) | | (6.27) | | (0.02) |
| | | | | |
| | | | | | | | | | |
| | | | | |
Net Asset Value, End of Year | | $30.04 | | $25.99 | | $30.37 | | $41.83 | | $39.36 |
| | | | | | | | | | |
| | | | | |
Total Return | | 16.88% | | (13.53)% | | (7.60)% | | 23.72% | | 42.85% |
| | | | | |
Ratios and Supplemental Data: | | | | | | | | | | |
Net Assets, End of Year (in 000’s) | | $100,984 | | $101,451 | | $127,717 | | $152,331 | | $132,064 |
Expenses Before Waivers and Reimbursements | | 1.18% | | 1.17% | | 1.11% | | 1.10% | | 1.17% |
Expenses After Waivers and Reimbursements . | | 1.18% | | 1.17% | | 1.11% | | 1.10% | | 1.17% |
Net Investment Income After Waivers and Reimbursements | | 1.14% | | 1.05% | | 0.68% | | 0.98% | | 1.33% |
Portfolio Turnover Rate | | 113% | | 101% | | 90% | | 99% | | 89% |
| (a) | Per share amounts calculated based on the average daily shares outstanding during the period. |
See Notes to Financial Statements.
FINANCIAL HIGHLIGHTS
(for a share outstanding throughout each year indicated)
ULTRA-SMALL COMPANY MARKET
| | | | | | | | | | |
| | | Year Ended June 30 |
| | | | | |
| | | 2017 | | 2016 | | 2015 | | 2014 | | 2013 |
| | | | | |
Net Asset Value, Beginning of Year | | $12.77 | | $16.18 | | $17.46 | | $15.44 | | $14.67 |
| | | | | |
| | | | | | | | | | |
| | | | | |
Income from Investment Operations: | | | | | | | | | | |
Net Investment Income(a) | | 0.17 | | 0.12 | | 0.12 | | 0.12 | | 0.22 |
Net Realized and Unrealized Gain (Loss) | | 3.18 | | (1.87) | | 0.38 | | 3.66 | | 3.49 |
| | | | | |
| | | | | | | | | | |
| | | | | |
Total from Investment Operations | | 3.35 | | (1.75) | | 0.50 | | 3.78 | | 3.71 |
| | | | | |
| | | | | | | | | | |
| | | | | |
Less Distributions to Shareholders from: | | | | | | | | | | |
Net Investment Income | | (0.15) | | (0.13) | | (0.14) | | (0.18) | | (0.40) |
Net Realized Gain | | (1.04) | | (1.53) | | (1.64) | | (1.59) | | (2.54) |
| | | | | |
| | | | | | | | | | |
| | | | | |
Total Distributions | | (1.19) | | (1.66) | | (1.78) | | (1.77) | | (2.94) |
| | | | | |
| | | | | | | | | | |
| | | | | |
Paid in Capital from Redemption Fees(a) | | 0.00(b) | | 0.00(b) | | 0.00(b) | | 0.01 | | 0.00(b) |
| | | | | |
| | | | | | | | | | |
| | | | | |
Net Asset Value, End of Year | | $14.93 | | $12.77 | | $16.18 | | $17.46 | | $15.44 |
| | | | | | | | | | |
| | | | | |
Total Return | | 26.61%(c) | | (10.83%)(c) | | 3.72% | | 25.48% | | 29.95%(c) |
| | | | | |
Ratios and Supplemental Data: | | | | | | | | | | |
Net Assets, End of Year (in 000’s) | | $352,190 | | $331,535 | | $402,853 | | $424,096 | | $341,647 |
Expenses Before Waivers and Reimbursements | | 0.76% | | 0.75% | | 0.73% | | 0.72% | | 0.79% |
Expenses After Waivers and Reimbursements . | | 0.75% | | 0.75% | | 0.73% | | 0.72% | | 0.75% |
Net Investment Income After Waivers and Reimbursements | | 1.21% | | 0.91% | | 0.74% | | 0.73% | | 1.52% |
Portfolio Turnover Rate | | 31% | | 41% | | 32% | | 29% | | 41% |
| (a) | Per share amounts calculated based on the average daily shares outstanding during the period. |
| (b) | Amount represents less than $0.005. |
| (c) | Total return would have been lower had various fees not been waived during the period. |
See Notes to Financial Statements.
| | |
| 86 | | Annual Report | June 30, 2017 |
FINANCIAL HIGHLIGHTS
(for a share outstanding throughout each year indicated)
SMALL-CAP MOMENTUM
| | | | | | | | | | |
| | | Year Ended June 30 |
| | | | | |
| | | 2017 | | 2016 | | 2015 | | 2014 | | 2013 |
| | | | | |
Net Asset Value, Beginning of Year | | $11.51 | | $12.29 | | $13.00 | | $12.19 | | $11.25 |
| | | | | |
| | | | | | | | | | |
| | | | | |
Income from Investment Operations: | | | | | | | | | | |
Net Investment Income(a) | | 0.08 | | 0.07 | | 0.09 | | 0.01 | | 0.10 |
Net Realized and Unrealized Gain (Loss) | | 1.97 | | (0.50) | | 0.37 | | 2.29 | | 2.20 |
| | | | | |
| | | | | | | | | | |
| | | | | |
Total from Investment Operations | | 2.05 | | (0.43) | | 0.46 | | 2.30 | | 2.30 |
| | | | | |
| | | | | | | | | | |
| | | | | |
Less Distributions to Shareholders from: | | | | | | | | | | |
Net Investment Income | | (0.13) | | (0.03) | | (0.07) | | (0.02) | | (0.19) |
Net Realized Gain | | (0.40) | | (0.32) | | (1.10) | | (1.47) | | (1.17) |
| | | | | |
| | | | | | | | | | |
| | | | | |
Total Distributions | | (0.53) | | (0.35) | | (1.17) | | (1.49) | | (1.36) |
| | | | | |
| | | | | | | | | | |
| | | | | |
Paid in Capital from Redemption Fees(a) | | 0.00(b) | | 0.00(b) | | 0.00(b) | | 0.00(b) | | 0.00(b) |
| | | | | |
| | | | | | | | | | |
| | | | | |
Net Asset Value, End of Year | | $13.03 | | $11.51 | | $12.29 | | $13.00 | | $12.19 |
| | | | | | | | | | |
| | | | | |
Total Return(c) | | 18.08% | | (3.48%) | | 4.54% | | 19.46% | | 22.31% |
| | | | | |
Ratios and Supplemental Data: | | | | | | | | | | |
Net Assets, End of Year (in 000’s) | | $5,079 | | $4,176 | | $5,123 | | $5,894 | | $4,437 |
Expenses Before Waivers and Reimbursements | | 3.81% | | 3.95% | | 3.36% | | 3.08% | | 5.42% |
Expenses After Waivers and Reimbursements . | | 0.90% | | 0.90% | | 0.90% | | 0.90% | | 0.90% |
Net Investment Income After Waivers and Reimbursements | | 0.62% | | 0.62% | | 0.77% | | 0.07% | | 0.89% |
Portfolio Turnover Rate | | 208% | | 184% | | 198% | | 242% | | 264% |
| (a) | Per share amounts calculated based on the average daily shares outstanding during the period. |
| (b) | Amount represents less than $0.005. |
| (c) | Total return would have been lower had various fees not been waived during the period. |
See Notes to Financial Statements.
FINANCIAL HIGHLIGHTS
(for a share outstanding throughout each year indicated)
SMALL-CAP GROWTH
| | | | | | | | | | |
| | | Year Ended June 30 |
| | | 2017 | | 2016 | | 2015 | | 2014 | | 2013 |
| | | | | |
Net Asset Value, Beginning of Year | | $20.33 | | $21.17 | | $18.68 | | $15.11 | | $11.63 |
| | | | | |
| | | | | | | | | | |
| | | | | |
Income from Investment Operations: | | | | | | | | | | |
Net Investment Income (Loss)(a) | | 0.06 | | 0.07 | | (0.01) | | 0.01 | | 0.08 |
Net Realized and Unrealized Gain (Loss) | | 4.60 | | (0.91) | | 2.51 | | 3.63 | | 3.40 |
| | | | | |
| | | | | | | | | | |
| | | | | |
Total from Investment Operations | | 4.66 | | (0.84) | | 2.50 | | 3.64 | | 3.48 |
| | | | | |
| | | | | | | | | | |
| | | | | |
Less Distributions to Shareholders from: | | | | | | | | | | |
Net Investment Income | | (0.07) | | - | | (0.01) | | (0.07) | | - |
| | | | | |
| | | | | | | | | | |
Total Distributions | | (0.07) | | - | | (0.01) | | (0.07) | | - |
| | | | | |
| | | | | | | | | | |
| | | | | |
Net Asset Value, End of Year | | $24.92 | | $20.33 | | $21.17 | | $18.68 | | $15.11 |
| | | | | | | | | | |
| | | | | |
Total Return(b) | | 22.97% | | (3.97%) | | 13.41% | | 24.11% | | 29.92% |
| | | | | |
Ratios and Supplemental Data: | | | | | | | | | | |
Net Assets, End of Year (in 000’s) | | $46,544 | | $36,394 | | $36,801 | | $33,419 | | $30,605 |
Expenses Before Waivers and Reimbursements | | 1.16% | | 1.20% | | 1.08% | | 1.07% | | 1.13% |
Expenses After Waivers and Reimbursements . | | 0.94% | | 0.94% | | 0.94% | | 0.94% | | 0.94% |
Net Investment Income (Loss) After Waivers and Reimbursements | | 0.24% | | 0.36% | | (0.07%) | | 0.06% | | 0.60% |
Portfolio Turnover Rate | | 136% | | 137% | | 123% | | 121% | | 78% |
| (a) | Per share amounts calculated based on the average daily shares outstanding during the period. |
| (b) | Total return would have been lower had various fees not been waived during the period. |
See Notes to Financial Statements.
| | |
88 | | Annual Report | June 30, 2017 |
FINANCIAL HIGHLIGHTS
(for a share outstanding throughout each year indicated)
SMALL-CAP VALUE
| | | | | | | | | | |
| | | Year Ended June 30 |
| | | | | |
| | | 2017 | | 2016 | | 2015 | | 2014 | | 2013 |
| | | | | |
Net Asset Value, Beginning of Year | | $20.87 | | $22.40 | | $23.06 | | $19.21 | | $14.82 |
| | | | | |
| | | | | | | | | | |
| | | | | |
Income from Investment Operations: | | | | | | | | | | |
Net Investment Income(a) | | 0.22 | | 0.29 | | 0.29 | | 0.15 | | 0.29 |
Net Realized and Unrealized Gain (Loss) | | 3.97 | | (1.43) | | (0.78) | | 3.80 | | 4.46 |
| | | | | |
| | | | | | | | | | |
| | | | | |
Total from Investment Operations | | 4.19 | | (1.14) | | (0.49) | | 3.95 | | 4.75 |
| | | | | |
| | | | | | | | | | |
| | | | | |
Less Distributions to Shareholders from: | | | | | | | | | | |
Net Investment Income | | (0.24) | | (0.39) | | (0.17) | | (0.10) | | (0.36) |
| | | | | |
| | | | | | | | | | |
| | | | | |
Total Distributions | | (0.24) | | (0.39) | | (0.17) | | (0.10) | | (0.36) |
| | | | | |
| | | | | | | | | | |
| | | | | |
Net Asset Value, End of Year | | $24.82 | | $20.87 | | $22.40 | | $23.06 | | $19.21 |
| | | | | | | | | | |
| | | | | |
Total Return | | 20.08%(b) | | (5.02%)(b) | | (2.10%)(b) | | 20.63%(b) | | 32.49% |
Ratios and Supplemental Data: | | | | | | | | | | |
Net Assets, End of Year (in 000’s) | | $61,981 | | $58,741 | | $73,241 | | $85,782 | | $79,248 |
Expenses Before Waivers and Reimbursements | | 0.98% | | 1.03% | | 0.98% | | 0.97% | | 0.91% |
Expenses After Waivers and Reimbursements . | | 0.94% | | 0.94% | | 0.94% | | 0.94% | | 0.91% |
Net Investment Income After Waivers and Reimbursements | | 0.95% | | 1.41% | | 1.30% | | 0.71% | | 1.71% |
Portfolio Turnover Rate | | 77% | | 62% | | 74% | | 83% | | 64% |
| (a) | Per share amounts calculated based on the average daily shares outstanding during the period. |
| (b) | Total return would have been lower had various fees not been waived during the period. |
See Notes to Financial Statements.
FINANCIAL HIGHLIGHTS
(for a share outstanding throughout each year indicated)
BLUE CHIP 35 INDEX
| | | | | | | | | | |
| | | Year Ended June 30 |
| | | | | |
| | | 2017 | | 2016 | | 2015 | | 2014 | | 2013 |
| | | | | |
Net Asset Value, Beginning of Year | | $12.28 | | $11.81 | | $11.39 | | $9.59 | | $8.16 |
| | | | | |
| | | | | | | | | | |
| | | | | |
Income from Investment Operations: | | | | | | | | | | |
Net Investment Income(a) | | 0.30 | | 0.28 | | 0.26 | | 0.23 | | 0.21 |
Net Realized and Unrealized Gain | | 1.44 | | 0.49 | | 0.39 | | 1.77 | | 1.46 |
| | | | | |
| | | | | | | | | | |
| | | | | |
Total from Investment Operations | | 1.74 | | 0.77 | | 0.65 | | 2.00 | | 1.67 |
| | | | | |
| | | | | | | | | | |
| | | | | |
Less Distributions to Shareholders from: | | | | | | | | | | |
Net Investment Income | | (0.31) | | (0.30) | | (0.23) | | (0.20) | | (0.24) |
| | | | | |
| | | | | | | | | | |
| | | | | |
Total Distributions | | (0.31) | | (0.30) | | (0.23) | | (0.20) | | (0.24) |
| | | | | |
| | | | | | | | | | |
| | | | | |
Net Asset Value, End of Year | | $13.71 | | $12.28 | | $11.81 | | $11.39 | | $9.59 |
| | | | | | | | | | |
| | | | | |
Total Return(b) | | 14.33% | | 6.60% | | 5.77% | | 21.11% | | 20.89% |
| | | | | |
Ratios and Supplemental Data: | | | | | | | | | | |
Net Assets, End of Year (in 000’s) | | $550,902 | | $571,644 | | $600,823 | | $556,985 | | $463,146 |
Expenses Before Waivers and Reimbursements | | 0.25% | | 0.25% | | 0.23% | | 0.25% | | 0.27% |
Expenses After Waivers and Reimbursements | | 0.15% | | 0.15% | | 0.15% | | 0.15% | | 0.15% |
Net Investment Income After Waivers and Reimbursements | | 2.30% | | 2.42% | | 2.19% | | 2.20% | | 2.36% |
Portfolio Turnover Rate | | 17% | | 23% | | 19% | | 28% | | 28% |
| (a) | Per share amounts calculated based on the average daily shares outstanding during the period. |
| (b) | Total return would have been lower had various fees not been waived during the period. |
See Notes to Financial Statements.
| | |
| 90 | | Annual Report | June 30, 2017 |
FINANCIAL HIGHLIGHTS
(for a share outstanding throughout each year indicated)
MANAGED VOLATILITY
| | | | | | | | | | |
| | | Year Ended June 30 |
| | | | | |
| | | 2017 | | 2016 | | 2015 | | 2014 | | 2013 |
| | | | | |
Net Asset Value, Beginning of Year | | $14.20 | | $14.05 | | $13.94 | | $12.75 | | $11.94 |
| | | | | |
| | | | | | | | | | |
| | | | | |
Income from Investment Operations: | | | | | | | | | | |
Net Investment Income(a) | | 0.06 | | 0.04 | | 0.00(b) | | 0.02 | | 0.05 |
Net Realized and Unrealized Gain | | 0.59 | | 0.11 | | 0.13 | | 1.20 | | 0.81 |
| | | | | |
| | | | | | | | | | |
| | | | | |
Total from Investment Operations | | 0.65 | | 0.15 | | 0.13 | | 1.22 | | 0.86 |
| | | | | |
| | | | | | | | | | |
| | | | | |
Less Distributions to Shareholders from: | | | | | | | | | | |
Net Investment Income | | (0.06) | | 0.00(b) | | (0.02) | | (0.03) | | (0.05) |
| | | | | |
| | | | | | | | | | |
| | | | | |
Total Distributions | | (0.06) | | 0.00(b) | | (0.02) | | (0.03) | | (0.05) |
| | | | | |
| | | | | | | | | | |
| | | | | |
Net Asset Value, End of Year | | $14.79 | | $14.20 | | $14.05 | | $13.94 | | $12.75 |
| | | | | | | | | | |
| | | | | |
Total Return(c) | | 4.59% | | 1.10% | | 0.92% | | 9.61% | | 7.23% |
| | | | | |
Ratios and Supplemental Data: | | | | | | | | | | |
Net Assets, End of Year (in 000’s) | | $36,523 | | $57,586 | | $59,008 | | $46,908 | | $26,703 |
Expenses Before Waivers and Reimbursements | | 1.12% | | 1.06% | | 1.04% | | 1.14% | | 1.35% |
Expenses After Waivers and Reimbursements | | 0.95% | | 0.94% | | 0.94% | | 0.94% | | 0.94% |
Net Investment Income After Waivers and Reimbursements | | 0.42% | | 0.31% | | 0.03% | | 0.17% | | 0.37% |
Portfolio Turnover Rate | | 50% | | 54% | | 38% | | 39% | | 45% |
| (a) | Per share amounts calculated based on the average daily shares outstanding during the period. |
| (b) | Amount represents less than $0.005. |
| (c) | Total return would have been lower had various fees not been waived during the period. |
See Notes to Financial Statements.
| | |
| NOTES TO FINANCIAL STATEMENTS | | |
June 30, 2017
1. Organization:
Bridgeway Funds, Inc. (“Bridgeway” or the “Company”) was organized as a Maryland corporation on October 19, 1993, and is registered under the Investment Company Act of 1940, as amended (the “1940 Act”), as an open-end management investment company.
Bridgeway is organized as a series fund, with 10 investment funds as of June 30, 2017. The Aggressive Investors 1, Ultra-Small Company, Ultra-Small Company Market, Small-Cap Momentum, Small-Cap Growth, Small-Cap Value, Blue Chip 35 Index and Managed Volatility Funds are presented in this report (each is referred to as a “Fund” and collectively, the “Funds”). The Omni Small-Cap Value and Omni Tax-Managed Small-Cap Value Funds are included in a separate report.
Bridgeway is authorized to issue 1,915,000,000 shares of common stock at $0.001 per share. As of June 30, 2017,
100,000,000 shares have been classified into the Aggressive Investors 1 Fund. 130,000,000 shares have been classified into the Blue Chip 35 Index Fund. 15,000,000 shares have been classified into the Ultra-Small Company Fund. 100,000,000 shares each have been classified into the Ultra-Small Company Market, Omni Small-Cap Value, Omni Tax-Managed Small-Cap Value, Small-Cap Momentum, Small-Cap Growth, and Small-Cap Value Funds. 50,000,000 shares have been classified into the Managed Volatility Fund.
The Ultra-Small Company Fund is open to existing investors (direct only).
All of the Funds are no-load, diversified funds.
The Aggressive Investors 1 Fund seeks to exceed the stock market total return (primarily through capital appreciation) at a level of total risk roughly equal to that of the stock market over longer periods of time (three year intervals or more).
The Ultra-Small Company, Ultra-Small Company Market, Small-Cap Momentum, Small-Cap Growth, and Small-Cap Value Funds seek to provide a long-term total return on capital, primarily through capital appreciation.
The Blue Chip 35 Index Fund seeks to provide long-term total return on capital, primarily through capital appreciation, but also some income.
The Managed Volatility Fund seeks to provide a high current return with short-term risk less than or equal to 40% of the stock market.
Bridgeway Capital Management, Inc. (the “Adviser”) is the investment adviser for all of the Funds.
2. Significant Accounting Policies:
The following summary of significant accounting policies, followed in the preparation of the financial statements of the Funds, are in conformity with accounting principles generally accepted in the United States of America (“GAAP”). Each Fund is considered an investment company under GAAP and follows the accounting and reporting guidance applicable to investment companies.
Securities, Options, Futures and Other Investments Valuation Other than options, securities for which market quotations are readily available are valued at the last sale price on the national exchange on which such securities are primarily traded. In the case of securities reported on the National Association of Securities Dealers Automated Quotation (“NASDAQ”) system, the securities are valued based on the NASDAQ Official Closing Price (“NOCP”). In the absence of recorded sales on their primary exchange, or NOCP, in the case of NASDAQ traded securities, the security will be valued as follows: bid prices for long positions and ask prices for short positions.
Fixed income securities are valued on the basis of current market quotations provided by a pricing service. Options are valued at the close if there is trading volume and, if there is no trading volume, the options are valued at the bid on long positions and the ask on the short positions.
| | |
| 92 | | Annual Report | June 30, 2017 |
| | |
| NOTES TO FINANCIAL STATEMENTS (continued) | | |
June 30, 2017
Investments in open-end registered investment companies and closed-end registered investment companies that do not trade on an exchange are valued at the end of day net asset value (“NAV”) per share.
Investments in closed-end registered investment companies that trade on an exchange are valued at the last sales price as of the close of the customary trading session on the exchange where the security is principally traded.
When market quotations are not readily available or when events occur that make established valuation methods unreliable, securities of the Funds may be valued at fair value as determined in good faith by or under the direction of the Board of Directors. The valuation assigned to a fair valued security for purposes of calculating the Funds’ NAVs may differ from the security’s most recent closing market price and from the prices used by other mutual funds to calculate their NAVs.
The inputs and valuation techniques used to determine the value of a Fund’s investments are summarized into three levels as described in the hierarchy below:
| ● | | Level 1 – quoted prices in active markets for identical assets |
Investments whose values are based on quoted market prices in active markets, and whose values are therefore classified as Level 1 prices, include active listed equity securities. The Funds do not adjust the quoted price for such investments, even in situations where the Funds hold a large position and a sale could reasonably impact the quoted price.
| ● | | Level 2 – other significant observable inputs (including quoted prices for similar securities, interest rates, prepayment speeds, credit risk, etc.) |
Investments that trade in markets that are not considered to be active, but whose values are based on quoted market prices, dealer quotations or valuations provided by alternative pricing sources supported by observable inputs, are classified as Level 2 prices. These generally include certain U.S. Government and sovereign obligations, most government agency securities, investment-grade corporate bonds and less liquid listed equity securities. As investments whose values are classified as Level 2 prices include positions that are not traded in active markets and/or are subject to transfer restrictions, valuations may be adjusted to reflect illiquidity and/or non-transferability, which are generally based on available market information.
The Fidelity Investments Money Market Government Portfolio - Class I, which is held by each Fund, invests primarily in securities that are valued at amortized cost. Therefore, this investment is classified as a Level 2 investment.
| ● | | Level 3 – significant unobservable inputs (including the Fund’s own assumptions in determining the fair value of investments) |
Investments whose values are classified as Level 3 prices have significant unobservable inputs, as they may trade infrequently or not at all. When observable prices are not available for these securities, the Funds use one or more valuation techniques for which sufficient and reliable data is available. The inputs used by the Funds in estimating the value of Level 3 prices may include the original transaction price, quoted prices for similar securities or assets in active markets, completed or pending third-party transactions in the underlying investment or comparable issuers, and changes in financial ratios or cash flows. Level 3 prices may also be adjusted to reflect illiquidity and/or non-transferability, with the amount of such discount estimated by the Funds in the absence of market information. Assumptions used by the Funds due to the lack of observable inputs may significantly impact the resulting value and therefore the results of the Funds’ operations.
The inputs or methodology used for valuing investments are not necessarily an indication of the risk associated with investing in those investments. A summary of the inputs used to value the Funds’ investments as of June 30, 2017 is included with each Fund’s Schedule of Investments.
The Funds’ policy is to recognize transfers into, and transfers out of, each level of hierarchy as of the beginning of the reporting period. For the year ended June 30, 2017, there were no transfers between Level 1 and Level 2 in any of the Funds. Details regarding material transfers into, and material transfers out of, Level 3, if any, can be found at the end of each Schedule of Investments for Funds that held Level 3 securities.
| | |
| NOTES TO FINANCIAL STATEMENTS (continued) | | |
June 30, 2017
Securities Lending Upon lending its securities to third parties, each participating Fund receives compensation in the form of fees. During the year ended June 30, 2017 the Blue Chip 35 Index Fund did not have any securities lending transactions. The loans are secured by collateral at least equal to the fair value of the securities loaned plus accrued interest. Each Fund has the right under the lending agreement to recover the securities from the borrower on demand. Additionally, a Fund does not have the right to sell or re-pledge collateral received in the form of securities unless the borrower goes into default. The risks to a Fund of securities lending are that the borrower may not provide additional collateral when required or return the securities when due, resulting in a loss. Under the terms of the Securities Lending Agreement, the Funds are indemnified for such losses by the securities lending agent.
While securities are on loan, the Fund continues to receive dividends on the securities loaned and recognizes any gain or loss in the fair value of the securities loaned.
Securities lending transactions are entered into by a Fund under a Securities Lending Agreement which provides the right, in the event of default (including bankruptcy or insolvency) for the non-defaulting party to liquidate the collateral or to offset the market value of the collateral received against the market value of the securities loaned. The value of the collateral is typically greater than that of the market value of the securities loaned, leaving the lender with a net amount payable to the defaulting party. However, bankruptcy or insolvency laws of a particular jurisdiction may impose restrictions on or prohibitions against such a right of offset in the event of a counterparty’s bankruptcy or insolvency.
The market value of securities on loan, all of which are classified as common stocks in the Funds’ Schedules of Investments, and the value of the related collateral are shown in the Statements of Assets and Liabilities as a component of Investments at value.
The following table is a summary of the Funds’ securities loaned and related collateral, which are subject to a netting agreement as of June 30, 2017:
| | | | | | | | | | | | | | | | | | | | | | |
| | | | | | | | | | | | Gross Amount Not
Offset in the Statement
of Assets and Liabilities | | | | |
| Fund | | Gross
Amounts of
Recognized
Assets1 | | | Gross Amounts
Offset in the
Statement of
Assets and
Liabilities | | | Net Amounts of
Assets Presented
in the Statement
of Assets and
Liabilities | | | Financial
Instruments | | Cash
Collateral
Received2 | | | Net
Amount | |
| |
| | | | | | |
Aggressive Investors 1 | | | | | | | | | | | | | | | | | | | | | | |
Securities lending | | | $22,451,665 | | | | - | | | | $22,451,665 | | | - | | | $22,451,665 | | | | - | |
| | | | | | |
Ultra-Small Company | | | | | | | | | | | | | | | | | | | | | | |
Securities lending | | | $16,108,711 | | | | - | | | | $16,108,711 | | | - | | | $16,108,711 | | | | - | |
| | | | | | |
Ultra-Small Company Market | | | | | | | | | | | | | | | | | | | | | | |
Securities lending | | | $59,690,789 | | | | - | | | | $59,690,789 | | | - | | | $59,690,789 | | | | - | |
| | | | | | |
Small-Cap Momentum | | | | | | | | | | | | | | | | | | | | | | |
Securities lending | | | $ 519,253 | | | | - | | | | $ 519,253 | | | - | | | $ 519,253 | | | | - | |
| | | | | | |
Small-Cap Growth | | | | | | | | | | | | | | | | | | | | | | |
Securities lending | | | $ 4,441,280 | | | | - | | | | $ 4,441,280 | | | - | | | $4,441,280 | | | | - | |
| | | | | | |
Small-Cap Value | | | | | | | | | | | | | | | | | | | | | | |
Securities lending | | | $ 6,536,979 | | | | - | | | | $ 6,536,979 | | | - | | | $6,536,979 | | | | - | |
| | | | | | |
Managed Volatility | | | | | | | | | | | | | | | | | | | | | | |
Securities lending | | | $ 69,082 | | | | - | | | | $ 69,082 | | | - | | | $ 69,082 | | | | - | |
| 1 | Securities loaned with a value of $264,839 in Ultra-Small Company Market have been sold and are pending settlement on July 1, 2017. |
| 2 | Collateral with a value of $23,185,880, $16,790,737, $63,491,698, $532,593, $4,544,311, $6,844,975, and $71,025 has been received in connection with securities lending of Aggressive Investors 1, Ultra-Small Company, Ultra-Small Company Market, Small-Cap Momentum, Small-Cap Growth, Small- Cap Value, and Managed Volatility Funds, respectively. Excess of collateral received from an individual counterparty is not shown here for financial reporting purposes. |
| | |
| 94 | | Annual Report | June 30, 2017 |
| | |
| NOTES TO FINANCIAL STATEMENTS (continued) | | |
June 30, 2017
It is each Fund’s policy to obtain additional collateral from, or return excess collateral to, the borrower by the end of the next business day following the valuation date of the securities loaned. Therefore, the value of the collateral held may be temporarily less than that required under the lending contract. As of June 30, 2017 the collateral consisted of an institutional government money market fund.
Use of Estimates in Financial Statements In preparing financial statements in conformity with GAAP, management makes estimates and assumptions that affect the reported amounts of assets and liabilities on the date of the financial statements and the disclosure of contingent assets and liabilities on the date of the financial statements, as well as the reported amounts of revenue and expenses during the reporting period. Actual results could differ from those estimates.
Concentrations of Credit Risk The Funds maintain cash and securities in its custody account maintained by a high-credit, quality financial institution. Cash balances may, at times, exceed the FDIC insurance limit. Cash balances are generally invested in a short-term investment vehicle which minimizes the risk of cash balances exceeding the FDIC insurance limit.
Risks and Uncertainties The Funds provide for various investment options, including stocks, bonds and call and put options. Such investments are exposed to various risks, such as interest rate, market and credit risks. Due to the risks involved, it is at least reasonably possible that changes in risks in the near term would materially affect shareholders’ account values and the amounts reported in the financial statements.
Security Transactions, Investment Income and Expenses Security transactions are accounted for as of the trade date, the date the order to buy or sell is executed. Realized gains and losses are computed on the identified cost basis. Dividend income is recorded on the ex-dividend date, and interest income is recorded on the accrual basis from settlement date. Particularly related to the Managed Volatility Fund, discounts and premiums are accreted/amortized on the effective interest method.
Fund expenses that are not series-specific are allocated to each series based upon its relative proportion of net assets to the Funds’ total net assets or other appropriate basis.
Distributions to Shareholders The Funds pay dividends from net investment income and distribute realized capital gains annually, usually in December.
Derivatives
The Funds’ use of derivatives for the year ended June 30, 2017 was limited to futures contracts, purchased options, and written options. The following is a summary of how these derivatives are treated in the financial statements and their impact on the Funds, categorized by primary underlying risk.
| | | | | | | | | | | | | | |
Primary Underlying Risk/Fund | | Derivative
Assets | | | | | | Derivative
Liabilities | | | Location on Statement of Assets and Liabilities |
|
Equity Risk | | | | | | | | | | | | | | |
Managed Volatility: | | | | | | | | | | | | | | |
Written Call Options | | | - | | | | | | | $ | 243,704 | | | Call options written at value |
Written Put Options | | | - | | | | | | | | 184,576 | | | Put options written at value |
| | | | | | | | | | |
| | | |
Primary Underlying Risk/Fund | | Amount of
Realized Gain
(Loss) on Derivatives | | | Amount of
Unrealized Gain
(Loss) on Derivatives | | | Location of Gain (Loss) in the Statement of Operations |
| | | |
Equity Risk | | | | | | | | | | |
Managed Volatility: | | | | | | | | | | |
Written Options | | | $ 1,462,340 | | | | | | | Realized Gain (Loss) on Written Options |
| | | | | | | $90,479 | | | Change in Unrealized Depreciation (Depreciation) on Written Options |
Futures Contracts | | | $(2,528,646) | | | | $ - | | | Realized Gain (Loss) on Futures Contracts |
| | |
| NOTES TO FINANCIAL STATEMENTS (continued) | | |
June 30, 2017
The derivative instruments outstanding as of June 30, 2017, as disclosed in the Notes to the Financial Statements, and the amounts of realized and changes in unrealized gains and losses on derivative instruments during the period, as disclosed in the Statements of Operations, serve as indicators of the volume of derivatives activity for the Funds.
Futures Contracts The Funds may purchase or sell financial futures contracts to hedge cash positions, manage market risk, and to dampen volatility in line with investment objectives. A futures contract is an agreement between two parties to buy or sell a financial instrument at a set price on a future date. Upon entering into such a contract, a Fund is required to pledge to the broker an amount of cash or U.S. Government securities equal to the minimum “initial margin” requirements of the exchange on which the futures contract is traded. The contract amount reflects the extent of a Fund’s exposure in these financial instruments. A Fund’s participation in the futures markets involves certain risks, including imperfect correlation between movements in the price of futures contracts and movements in the price of the securities hedged or used for cover. Pursuant to a contract, such Fund agrees to receive from, or pay to, the broker an amount of cash equal to the fluctuation in value of the contract. Such receipts or payments are known as “variation margin” and are recorded by a Fund as unrealized appreciation or depreciation. When a contract is closed, a Fund records a realized gain or loss equal to the difference between the value of the contract at the time it was opened and the value at the time it was closed. With futures, there is minimal counterparty risk to the Funds, since futures are exchange traded and the exchange’s clearinghouse, as counterparty to all exchange traded futures, guarantees the futures against default. As of June 30, 2017, the Funds had no open futures contracts.
Options The Aggressive Investors 1 Fund may buy and sell calls and puts to increase or decrease the Fund’s exposure to stock market risk or for purposes of diversification of risk. The Managed Volatility Fund may buy and sell calls and puts to reduce the Fund’s volatility and provide some cash flow. An option is a contract conveying a right to buy or sell a financial instrument at a specified price during a stipulated period. The premium paid by a Fund for the purchase of a call or a put option is included in such Fund’s Schedule of Investments as an investment and subsequently marked-to-market to reflect the current market value of the option. When a Fund writes a call or a put option, an amount equal to the premium received by such Fund is included in its Statement of Assets and Liabilities as a liability and is subsequently marked-to-market to reflect the current market value of the option written. If an option that a Fund has written either expires on its stipulated expiration date, or if such Fund enters into a closing purchase transaction, that Fund realizes a gain (or a loss if the cost of a closing purchase transaction exceeds the premium received when the option was written) without regard to any unrealized gain or loss on the underlying security, and the liability related to such options is extinguished. If a call option that a Fund has written is assigned, such Fund realizes a gain or loss from the sale of the underlying security, and the proceeds from such sale are increased by the premium originally received. If a put option that a Fund has written is assigned, the amount of the premium originally received reduces the cost of the security that such Fund purchased upon exercise of the option. Buying calls increases a Fund’s exposure to the underlying security to the extent of any premium paid. Buying puts on a stock market index tends to limit a Fund’s exposure to a stock market decline. All options purchased by the Funds were listed on exchanges and considered liquid positions with readily available market quotes.
Covered Call Options and Secured Puts The Aggressive Investors 1 and Managed Volatility Funds may write call options on a covered basis; that is, a Fund will own the underlying security, or a Fund may write secured puts. The principal reason for writing covered calls and secured puts on a security is to attempt to realize income through the receipt of premiums. The option writer has, in return for the premium, given up the opportunity for profit from a substantial price increase in the underlying security so long as the obligation as a writer continues, but has retained the risk of loss should the price of the security decline. All options were listed on exchanges and considered liquid positions with readily available market quotes. Transactions in options written during the year ended June 30, 2017 are as follows:
| | | | | | | | | | | | | | | | |
| | | Managed Volatility Fund | | Managed Volatility Fund |
| | | Written Call Options | | Written Put Options |
| | | Contracts | | Premiums | | | Contracts | | Premiums | |
| |
| | | | | | | | | | | | | | | | |
Outstanding, June 30, 2016 | | | 2,218 | | | | $388,392 | | | | 2,502 | | | | $491,574 | |
Positions Opened | | | 11,029 | | | | 1,375,645 | | | | 10,044 | | | | 1,728,460 | |
Exercised | | | (4,966) | | | | (651,975) | | | | (4,743) | | | | (671,409) | |
Splits | | | 8 | | | | - | | | | - | | | | - | |
Expired | | | (4,416) | | | | (600,388) | | | | (5,130) | | | | (1,038,015) | |
Closed | | | (1,632) | | | | (253,396) | | | | (1,480) | | | | (285,628) | |
| |
| | | | |
Outstanding, June 30, 2017 | | | 2,241 | | | | $258,278 | | | | 1,193 | | | | $224,982 | |
| |
| | | | |
Market Value, June 30, 2017 | | | | | | | $(243,704) | | | | | | | | $(184,576 | ) |
| |
| | |
| 96 | | Annual Report | June 30, 2017 |
| | |
| NOTES TO FINANCIAL STATEMENTS (continued) | | |
June 30, 2017
The Aggressive Investors 1 Fund had no transactions in written options during the year ended June 30, 2017.
Indemnification Under the Company’s organizational documents, the Funds’ officers, directors, employees and agents are indemnified against certain liabilities that may arise out of the performance of their duties to the Funds. Additionally, in the normal course of business, the Funds enter into contracts that contain a variety of indemnification clauses. The Funds’ maximum exposure under these arrangements is unknown, as this would involve future claims that may be made against the Funds that have not yet occurred. However, the Funds have not had prior claims or losses pursuant to these contracts.
3. Advisory Fees, Other Related Party Transactions and Contingencies:
The Funds have entered into management agreements with the Adviser. As compensation for the advisory services rendered, facilities furnished, and expenses borne by the Adviser, the Funds pay the Adviser a fee pursuant to each Fund’s management agreement, as described below.
Aggressive Investors 1: A total advisory fee is paid by the Fund to the Adviser that is comprised of a Base Fee and a Performance Adjustment. The Base Fee equals the Base Fee Rate times the average daily net assets of the Fund. The Base Fee Rate is based on the following annual rates: 0.90% of the first $250 million of the Fund’s average daily net assets, 0.875% of the next $250 million, 0.85% of the next $500 million and 0.80% of any excess over $1 billion.
The Performance Adjustment equals 4.67% times the difference in cumulative total return between the Fund and the Standard and Poor’s 500 Composite Stock Price Index with dividends reinvested (hereinafter “Index”) over a rolling five-year performance period. The Performance Adjustment Rate varies from a minimum of -0.70% to a maximum of +0.70%. However, the Performance Adjustment Rate is zero if the difference between the cumulative Fund performance and the Index performance is less than or equal to 2%.
Ultra-Small Company: The Fund pays advisory fees based on the following annual rates: 0.90% of the first $250 million of the Fund’s average daily net assets, 0.875% of the next $250 million and 0.85% of any excess over $500 million. The management fees are computed daily and are payable monthly. However, during any period when the Fund’s net assets range from $27,500,000 to $55,000,000, the advisory fee will be determined as if the Fund had $55,000,000 under management. This is limited to a maximum annualized expense ratio of 1.49% of average net assets.
Ultra-Small Company Market: The Fund’s advisory fee is a flat 0.50% of the value of the Fund’s average daily net assets, computed daily and payable monthly.
Small-Cap Momentum: The Fund’s advisory fee is a flat 0.55% of the value of the Fund’s average daily net assets, computed daily and payable monthly.
Small-Cap Growth and Small-Cap Value: A total advisory fee is paid by each Fund to the Adviser that is comprised of a Base Fee and a Performance Adjustment. The Base Fee equals the Base Fee Rate times the average daily net assets of the Fund. The Base Fee Rate is based on the annual rate of 0.60% of the value of each Fund’s average daily net assets.
The Performance Adjustment equals 0.33% times the difference in cumulative total return between the Fund and the Russell 2000 Growth Index for Small-Cap Growth Fund and the Russell 2000 Value Index for Small-Cap Value Fund, with dividends reinvested (hereinafter “Index”) over a rolling five-year performance period. The Performance Adjustment Rate varies from a minimum of -0.05% to a maximum of +0.05%. However, the Performance Adjustment Rate is zero if the difference between the cumulative Fund’s performance and the Index performance is less than or equal to 2%.
| | |
| NOTES TO FINANCIAL STATEMENTS (continued) | | |
June 30, 2017
Blue Chip 35 Index: The Fund’s advisory fee is a flat 0.08% of the value of the Fund’s average daily net assets, computed daily and payable monthly.
Managed Volatility: The Fund’s advisory fee is a flat 0.60% of the value of the Fund’s average daily net assets, computed daily and payable monthly.
Expense limitations: The Adviser has agreed to reimburse the Funds for operating expenses and management fees above the expense limitations shown in the table below, which are shown as a ratio of net expenses to average net assets, for each Fund, for the year ended June 30, 2017. Any material change to the expense limitation would require a vote by shareholders of the applicable Fund.
| | | | | | | | |
| Bridgeway Fund | | Expense
Limitation | | | Total Waivers and
Reimbursements
for Year Ending
06/30/17 | |
| |
| | | | | | | | |
Aggressive Investors 1 | | | 1.75% | | | | $ - | |
Ultra-Small Company | | | 1.85% | | | | - | |
Ultra-Small Company Market | | | 0.75% | | | | 27,985 | |
Small-Cap Momentum* | | | 0.90% | | | | 136,535 | |
Small-Cap Growth | | | 0.94% | | | | 87,577 | |
Small-Cap Value | | | 0.94% | | | | 26,479 | |
Blue Chip 35 Index | | | 0.15% | | | | 588,602 | |
Managed Volatility | | | 0.94% | | | | 86,273 | |
| | | | | | | | |
*The Fund is authorized to reimburse the Adviser for management fees previously waived and/or for expenses previously reimbursed by the Adviser, provided, however, that any reimbursements must be paid at a date not more than three years after the Adviser waived the fees or reimbursed the expenses and the reimbursements do not cause the Fund to exceed the expense limitation in effect at the time of the waiver or the current expense limitation if different. The Fund has recoupable expenses of $128,110, $131,006 and $136,535 which expire no later than June 30, 2018, June 30, 2019, and June 30, 2020, respectively. | |
Other Related Party Transactions: The Funds will engage in inter-portfolio trades when it is to the benefit of both parties. The Board of Directors reviews and approves these trades quarterly. Inter-portfolio purchases and sales during the year ended June 30, 2017 were as follows:
| | | | | | | | |
| Bridgeway Fund | | Inter-Portfolio
Purchases | | | Inter-Portfolio
Sales | |
| |
| | | | | | | | |
Aggressive Investors 1 | | | $ 447,590 | | | | $ 4,062,740 | |
Ultra-Small Company | | | 2,975,375 | | | | 17,269,789 | |
Ultra-Small Company Market | | | 15,699,766 | | | | 12,857,841 | |
Small-Cap Momentum | | | 23,888 | | | | 56,826 | |
Small-Cap Growth | | | 283,823 | | | | 1,925,387 | |
Small-Cap Value | | | 815,760 | | | | 1,798,417 | |
The Adviser entered into an Administrative Services Agreement with Bridgeway, pursuant to which the Adviser provides various administrative services to the Funds including, but not limited to: (i) supervising and managing various aspects of the Funds’ business and affairs; (ii) selecting, overseeing and/or coordinating activities with other service providers to the Funds; (iii) providing reports to the Board of Directors as requested from time to time; (iv) assisting and/or reviewing amendments and updates to the Funds’ registration statement and other filings with the Securities and Exchange Commission (“SEC”); (v) providing certain shareholder services; (vi) providing administrative support in connection with meetings of the Board of Directors; and (vii) providing certain record-keeping services. Prior to July 1, 2017, for its services to all of the Bridgeway Funds, the Adviser was paid an aggregate annual fee of $665,000, payable in equal monthly installments. Effective July 1, 2017, the Adviser will be paid an aggregate annual fee of $775,000, payable in equal monthly installments. For the allocation of this expense to each of the Funds, please see the Statement of Operations.
| | |
| 98 | | Annual Report | June 30, 2017 |
| | |
| NOTES TO FINANCIAL STATEMENTS (continued) | | |
June 30, 2017
Board of Directors Compensation Independent Directors are paid an annual retainer of $15,000, with an additional retainer of $5,000 paid to the Independent Chairman of the Board and an additional retainer of $1,000 paid to the Nominating and Corporate Governance Committee Chair. The retainer is paid in quarterly installments. Effective November 11, 2016, Independent Directors are paid $8,500 per meeting for meeting fees. Prior to November 11, 2016, Independent Directors were paid $7,500 per meeting. Such compensation is the total compensation from all Funds and is allocated among the Funds.
Each Independent Director receives this compensation in the form of shares of the Bridgeway Funds, credited to his or her account. Such Directors are reimbursed for any expenses incurred in attending meetings and conferences, as well as expenses for subscriptions or printed materials. The amount of directors’ fees attributable to each Fund is disclosed in the Statements of Operations.
One director of Bridgeway, John Montgomery, is an owner and director of the Adviser. Under the 1940 Act definitions, he is considered to be an “affiliated person” of the Adviser and an “interested person” of the Adviser and of Bridgeway. Compensation for Mr. Montgomery is borne by the Adviser rather than the Funds.
4. Distribution Agreement:
Foreside Fund Services, LLC acts as distributor of the Funds’ shares, pursuant to a Distribution Agreement dated May 31, 2017. The Adviser pays all costs and expenses associated with distribution of the Funds’ shares, pursuant to a protective plan adopted by shareholders pursuant to Rule 12b-1.
5. Purchases and Sales of Investment Securities:
Purchases and sales of investments, other than short-term securities, for each Fund for the year ended June 30, 2017 were as follows:
| | | | | | | | | | | | |
| | | Purchases | | | Sales | |
| Bridgeway Fund | | U.S. Government | | Other | | | U.S. Government | | Other | |
| |
| | | | | | | | | | | | |
Aggressive Investors 1 | | $ - | | | $334,021,602 | | | $ - | | | $365,866,245 | |
Ultra-Small Company | | - | | | 114,962,096 | | | - | | | 130,303,670 | |
Ultra-Small Company Market | | - | | | 108,368,776 | | | - | | | 167,475,816 | |
Small-Cap Momentum | | - | | | 9,920,952 | | | - | | | 9,747,787 | |
Small-Cap Growth | | - | | | 57,444,496 | | | - | | | 54,792,995 | |
Small-Cap Value | | - | | | 47,307,073 | | | - | | | 54,961,664 | |
Blue Chip 35 Index | | - | | | 94,478,198 | | | - | | | 176,733,353 | |
Managed Volatility | | - | | | 13,804,949 | | | - | | | 26,808,877 | |
6. Federal Income Taxes
It is the Funds’ policy to continue to comply with the provisions of the Internal Revenue Code of 1986, as amended (“Internal Revenue Code”), applicable to regulated investment companies, and to distribute income to the extent necessary so that the Funds are not subject to federal income tax. Therefore, no federal income tax provision is required.
| | |
| NOTES TO FINANCIAL STATEMENTS (continued) | | |
June 30, 2017
Unrealized Appreciation and Depreciation on Investments (Tax Basis) The amount of net unrealized appreciation/ depreciation and the cost of investment securities for tax purposes, including short-term securities as of June 30, 2017, were as follows:
| | | | | | | | | | | | |
| | | Aggressive Investors 1 | | Ultra-Small
Company | | Ultra-Small
Company Market |
Gross appreciation (excess of value over tax cost) | | $ | 14,714,854 | | | $ | 15,996,146 | | | $ | 111,367,568 | |
Gross depreciation (excess of tax cost over value) | | | (10,528,249 | ) | | | (7,465,158 | ) | | | (30,667,699 | ) |
Net unrealized appreciation | | $ | 4,186,605 | | | $ | 8,530,988 | | | $ | 80,699,869 | |
| | | |
Cost of investments for income tax purposes | | $ | 239,213,095 | | | $ | 109,251,630 | | | $ | 333,932,621 | |
| | | | | | | | | | | | | | | |
| | | |
| | | Small-Cap Momentum | | Small-Cap Growth | | Small-Cap Value |
Gross appreciation (excess of value over tax cost) | | | $ | 523,480 | | | | $ | 7,038,394 | | | | $ | 10,167,515 | |
Gross depreciation (excess of tax cost over value) | | | | (62,683 | ) | | | | (1,381,428 | ) | | | | (2,622,260 | ) |
Net unrealized appreciation | | | $ | 460,797 | | | | $ | 5,656,966 | | | | $ | 7,545,255 | |
| | | |
Cost of investments for income tax purposes | | | $ | 5,155,181 | | | | $ | 45,393,785 | | | | $ | 60,459,269 | |
| | | | | | | | | | | | | | | |
| | | |
| | | Blue Chip 35 Index | | | | Managed Volatility |
Gross appreciation (excess of value over tax cost) | | | $ | 247,731,195 | | | | | | | | | $ | 7,392,088 | |
Gross depreciation (excess of tax cost over value) | | | | (5,104,277 | ) | | | | | | | | | (812,001 | ) |
Net unrealized appreciation | | | $ | 242,626,918 | | | | | | | | | $ | 6,580,087 | |
| | | |
Cost of investments for income tax purposes | | | $ | 308,082,711 | | | | | | | | | $ | 30,837,383 | |
The differences between book and tax net unrealized appreciation (depreciation) are primarily due to wash sale and straddle loss deferrals and basis adjustments on investments in business development companies, partnerships and passive foreign investment companies (PFICs).
Classifications of Distributions Net investment income (loss) and net realized gain (loss) may differ for financial statement and tax purposes. The character of distributions made during the year from net investment income or net realized gains may differ from its ultimate characterization for federal income tax purposes.
The tax character of the distributions paid by the Funds during the last two fiscal years ended June 30, 2017 and June 30, 2016 respectively, are as follows:
| | | | | | | | | | | | | | | | |
| | | Aggressive Investors 1 | | | Ultra-Small Company | |
| | | Year | | | Year | | Year | | | Year | |
| | | Ended | | | Ended | | Ended | | | Ended | |
| | | June 30, 2017 | | | June 30, 2016 | | June 30, 2017 | | | June 30, 2016 | |
| | | | |
Distributions paid from: | | | | | | | | | | | | | | | | |
Ordinary Income | | | $1,255,319 | | | | $99,024 | | | | $1,212,208 | | | | $ 1,116,218 | |
Long-Term Capital Gain | | | - | | | | - | | | | - | | | | - | |
Total | | | $1,255,319 | | | | $99,024 | | | | $1,212,208 | | | | $ 1,116,218 | |
| | |
| | | Ultra-Small Company Market | | | Small-Cap Momentum | |
| | | Year | | | Year | | Year | | | Year | |
| | | Ended | | | Ended | | Ended | | | Ended | |
| | | June 30, 2017 | | | June 30, 2016 | | June 30, 2017 | | | June 30, 2016 | |
| | | | |
Distributions paid from: | | | | | | | | | | | | | | | | |
Ordinary Income | | | $ 3,465,525 | | | | $ 3,152,924 | | | | $ 147,281 | | | | $ 9,442 | |
Long-Term Capital Gain | | | 24,304,051 | | | | 37,504,226 | | | | 48,173 | | | | 115,288 | |
Total | | | $27,769,576 | | | | $40,657,150 | | | | $ 195,454 | | | | $ 124,730 | |
| | |
| 100 | | Annual Report | June 30, 2017 |
| | |
| NOTES TO FINANCIAL STATEMENTS (continued) | | |
June 30, 2017
| | | | | | | | | | | | | | | | |
| | | Small-Cap Growth | | | Small-Cap Value | |
| | | Year | | | Year | | | Year | | | Year | |
| | | Ended | | | Ended | | | Ended | | | Ended | |
| | | June 30, 2017 | | | June 30, 2016 | | | June 30, 2017 | | | June 30, 2016 | |
| | | | |
Distributions paid from: | | | | | | | | | | | | | | | | |
Ordinary Income | | $ | 128,436 | | | $ | - | | | $ | 644,905 | | | $ | 1,200,493 | |
| | | | |
Total | | $ | 128,436 | | | $ | - | | | $ | 644,905 | | | $ | 1,200,493 | |
| | |
| | | Blue Chip 35 Index | | | Managed Volatility | |
| | | Year | | | Year | | | Year | | | Year | |
| | | Ended | | | Ended | | | Ended | | | Ended | |
| | | June 30, 2017 | | | June 30, 2016 | | | June 30, 2017 | | | June 30, 2016 | |
| | | | |
Distributions paid from: | | | | | | | | | | | | | | | | |
Ordinary Income | | $ | 13,425,245 | | | $ | 14,480,684 | | | $ | 195,475 | | | $ | 15,844 | |
| | | | |
Total | | $ | 13,425,245 | | | $ | 14,480,684 | | | $ | 195,475 | | | $ | 15,844 | |
As of June 30, 2017, the Funds had available for tax purposes expiring capital loss carryovers as follows:
| | | | |
| | | Aggressive Investors 1 | | Small-Cap Growth |
Expiring 6/30/2018 | | $16,094,317 | | $6,535,338 |
| | |
| | | Small-Cap Value | | Managed Volatility |
Expiring 6/30/2018 | | $20,011,215 | | $1,499,825 |
For Aggressive Investors 1, capital losses related to prior year reorganizations are subject to limitations under Internal Revenue Code Section 381-384. Aggressive Investors 1, has capital losses of $16,094,317 subject to limitation.
Under the Regulated Investment Company Modernization Act of 2010, capital losses incurred by these Funds after June 30, 2011 will not be subject to expiration and will retain their character as either short-term or long-term capital losses. In addition, such losses must be utilized prior to the losses incurred in the years preceding enactment.
There are no capital loss carryovers for Ultra-Small Company Fund, Ultra-Small Company Market Fund, Small-Cap Momentum Fund, and Blue Chip 35 Index Fund as of June 30, 2017.
Capital loss carryovers utilized during the year ended June 30, 2017 were as follows:
| | | | |
| | | Capital Loss | |
| Bridgeway Fund | | Carryover Utilized | |
| | | | |
Aggressive Investors 1 | | | $46,629,631 | |
Ultra-Small Company | | | 9,063,579 | |
Small-Cap Momentum | | | 10,440 | |
Small-Cap Growth | | | 4,279,188 | |
Small-Cap Value | | | 3,054,674 | |
Blue Chip 35 Index | | | 2,100,878 | |
Managed Volatility | | | 1,270,304 | |
During the year ended June 30, 2017, $33,557,457 of the capital loss carryforwards for Aggressive Investor 1 expired.
| | |
| NOTES TO FINANCIAL STATEMENTS (continued) | | |
June 30, 2017
Components of Accumulated Earnings (Deficit) As of June 30, 2017, the components of accumulated earnings (deficit) on a tax basis were:
| | | | | | | | | | | | |
| | | | | | | | | Ultra-Small | |
| | | Aggressive Investors 1 | | | Ultra-Small Company | | | Company Market | |
| |
Accumulated Net Investment Income | | | $ - | | | | $ 1,299,976 | | | | $ 449,162 | |
Accumulated Net Realized Gain (Loss) on Investments* | | | (16,223,145) | | | | 566,419 | | | | 26,615,393 | |
Net Unrealized Appreciation of Investments | | | 4,186,605 | | | | 8,530,988 | | | | 80,699,869 | |
| |
Total | | | $(12,036,540) | | | | $10,397,383 | | | | $107,764,424 | |
| |
| | | |
| | | Small-Cap Momentum | | | Small-Cap Growth | | | Small-Cap Value | |
Accumulated Net Investment Income | | | $ 218,377 | | | | $ 98,925 | | | | $ 547,899 | |
Accumulated Net Realized Gain (Loss) on Investments* | | | 159,764 | | | | (6,535,338) | | | | (20,011,215) | |
Net Unrealized Appreciation of Investments | | | 460,797 | | | | 5,656,966 | | | | 7,545,255 | |
| |
Total | | | $ 838,938 | | | | $ (779,447) | | | | $(11,918,061) | |
| |
| | | | | | | | | | | | |
| | | Blue Chip 35 Index | | | | | | Managed Volatility | |
| |
Accumulated Net Investment Income | | $ | 5,169,144 | | | | | | | $ | 180,610 | |
Accumulated Net Realized Gain (Loss) on Investments* | | | 12,133,158 | | | | | | | | (1,499,825) | |
Net Unrealized Appreciation of Investments | | | 242,626,918 | | | | | | | | 6,635,067 | |
| |
Total | | $ | 259,929,220 | | | | | | | $ | 5,315,852 | |
| |
| * | Includes qualified late-year losses that the Funds have elected to defer to the beginning of their next fiscal year ending June 30, 2018. The Aggressive Investors I Fund has elected to defer qualified short-term late-year losses of ($128,827). The Ultra-Small Company, Ultra-Small Company Market, Small-Cap Momentum, Small-Cap Growth, Small-Cap Value, Blue Chip 35 Index and Managed Volatility Funds have no deferred qualified late-year losses. |
For the fiscal year June 30, 2017, the Funds recorded the following reclassifications to the accounts listed below:
| | | | | | | | | | | | |
| | | Increase (Decrease) | |
| |
| | | Aggressive Investors 1 | | | Ultra-Small Company | | | Ultra-Small Company Market | |
| |
Paid-in-Capital | | | $(33,941,405) | | | | $ 140,052 | | | | $ 3,173,738 | |
Undistributed Net Investment Income | | | 383,949 | | | | 28,119 | | | | (301,913) | |
Accumulated Net Realized Gain (Loss) on Investments | | | 33,557,456 | | | | (168,171) | | | | (2,871,825) | |
| |
| | | |
| | | Small-Cap Momentum | | | Small-Cap Growth | | | Small-Cap Value | |
| |
Paid-in-Capital | | | $ 5,148 | | | | $ - | | | | $ - | |
Undistributed Net Investment Income | | | 2,727 | | | | - | | | | - | |
Accumulated Net Realized Gain (Loss) on Investments | | | (7,875) | | | | - | | | | - | |
| |
| | | |
| | | Blue Chip 35 Index | | | Managed Volatility | | | | |
Paid-in-Capital | | | $ 1,375,373 | | | | $ - | | | | | |
Undistributed Net Investment Income | | | (1,037,692 | ) | | | - | | | | | |
Accumulated Net Realized Gain (Loss) on Investments | | | (337,681 | ) | | | - | | | | | |
| | | | | |
The difference between book and tax components of net assets and the resulting reclassifications were primarily a result of the differing book/tax treatment of the deduction of equalization debits for tax purposes, redesignation of dividends paid and investments in real estate investment trusts, business development companies, partnerships and passive foreign investment companies (PFICs).
Accounting for Uncertainty in Income Taxes sets forth a minimum threshold for financial statement recognition of the benefit of a tax position taken or expected to be taken in a tax return. Management has analyzed each Fund’s tax positions and has concluded that no provision for income tax is required in each Fund’s financial statements. The Funds are not aware of any tax position for which it is reasonably possible that the total amounts of unrecognized tax benefits will significantly change in the next twelve months. Each Fund’s federal tax returns for the prior three fiscal years remain subject to examination by the Internal Revenue Service.
| | |
| 102 | | Annual Report | June 30, 2017 |
| | |
| NOTES TO FINANCIAL STATEMENTS (continued) | | |
June 30, 2017
7. Line of Credit
Bridgeway established a line of credit agreement (“Facility”) with The Bank of New York Mellon, effective November 5, 2010. The Facility is for temporary or emergency purposes, such as to provide liquidity for shareholder redemptions, and is cancellable by either party. Unless cancelled earlier, the Facility shall be held available until September 14, 2017. Advances under the Facility are limited to $15,000,000 in total for all Funds, and advances to each Fund shall not exceed certain limits set forth in the credit agreement, including, but not limited to, the maximum amount a Fund is permitted to borrow under the 1940 Act.
The Funds incur a commitment fee of 0.085% per annum on the unused portion of the Facility and interest expense to the extent of amounts borrowed under the Facility. Interest is based on the “Overnight Rate” plus 1.25%. The Overnight Rate means the higher of (a) the Federal Funds rate, (b) the Overnight Eurodollar Rate, or (c) the One-Month Eurodollar Rate. The commitment fees are payable quarterly in arrears and are allocated to all participating Funds. Interest expense is charged directly to a Fund based upon actual amounts borrowed by such Fund.
For the year ended June 30, 2017, borrowings by the Funds under this line of credit were as follows:
| | | | | | | | | | | | | | | | | | | | |
| Bridgeway Fund | | Weighted
Average
Interest Rate | | | Weighted
Average
Loan Balance | | Number of
Days
Outstanding | | | Interest
Expense
Incurred1 | | Maximum Amount
Borrowed During
the Period |
| | | | | | | | | | | | | | | | | | | | |
Aggressive Investors 1 | | | 1.90% | | | $ | 858,374 | | | | 107 | | | $ | 4,787 | | | $ | 2,512,000 | |
Ultra-Small Company | | | 2.06% | | | | 631,781 | | | | 64 | | | | 2,279 | | | | 2,208,000 | |
Ultra-Small Company Market | | | 1.97% | | | | 1,288,559 | | | | 186 | | | | 12,944 | | | | 7,789,000 | |
Small-Cap Growth | | | 2.03% | | | | 629,300 | | | | 20 | | | | 699 | | | | 1,056,000 | |
Small-Cap Value | | | 1.82% | | | | 313,615 | | | | 26 | | | | 406 | | | | 469,000 | |
Blue Chip 35 Index | | | 2.10% | | | | 2,877,355 | | | | 93 | | | | 15,396 | | | | 13,421,000 | |
Managed Volatility | | | 2.08% | | | | 997,711 | | | | 45 | | | | 2,553 | | | | 2,201,000 | |
1Interest expense is included on the Statements of Operations in Miscellaneous expenses.
On June 30, 2017, Small-Cap Growth and Blue Chip 35 Index Funds had loans outstanding in the amounts of $265,000 and $728,000, respectively, exclusive of interest payable on the loans.
8. Redemption Fees
In Ultra-Small Company Market and Small-Cap Momentum Funds, a 2% redemption fee may be charged on shares held less than six months. The fee is charged for the benefit of the remaining shareholders and will be paid to the appropriate Fund to help offset transaction costs. The fee is accounted for as an addition to paid-in capital.
9. Subsequent Events
Management has evaluated the impact of all subsequent events on the Funds and has determined that there were no subsequent events requiring recognition or disclosure in the financial statements.
| | |
| REPORT OF INDEPENDENT REGISTERED PUBLIC ACCOUNTING FIRM | | |
To the Shareholders and Board of Directors of Bridgeway Funds, Inc.
We have audited the accompanying statements of assets and liabilities of the Aggressive Investors 1 Fund, Ultra-Small Company Fund, Ultra-Small Company Market Fund, Small-Cap Momentum Fund, Small-Cap Growth Fund, Small-Cap Value Fund, Blue Chip 35 Index Fund, and Managed Volatility Fund (the “Funds”), each a series of Bridgeway Funds, Inc., including the schedules of investments, as of June 30, 2017 and the related statements of operations for the year then ended, the statements of changes in net assets for each of the years in the two-year period then ended and the financial highlights for each of the years in the five-year period then ended. These financial statements and financial highlights are the responsibility of the Funds’ management. Our responsibility is to express an opinion on these financial statements and financial highlights based on our audits.
We conducted our audits in accordance with the standards of the Public Company Accounting Oversight Board (United States). Those standards require that we plan and perform the audits to obtain reasonable assurance about whether the financial statements and financial highlights are free of material misstatement. An audit includes examining, on a test basis, evidence supporting the amounts and disclosures in the financial statements. Our procedures included confirmation of securities owned as of June 30, 2017 by correspondence with the custodian and brokers. An audit also includes assessing the accounting principles used and significant estimates made by management, as well as evaluating the overall financial statement presentation. We believe that our audits provide a reasonable basis for our opinion.
In our opinion, the financial statements and financial highlights referred to above present fairly, in all material respects, the financial position of the Aggressive Investors 1 Fund, Ultra-Small Company Fund, Ultra-Small Company Market Fund, Small-Cap Momentum Fund, Small-Cap Growth Fund, Small-Cap Value Fund, Blue Chip 35 Index Fund, and Managed Volatility Fund as of June 30, 2017 and the results of their operations for the year then ended, the changes in their net assets for each of the years in the two-year period then ended and their financial highlights for each of the years in the five-year period then ended, in conformity with accounting principles generally accepted in the United States of America.
|
 |
|
| BBD, LLP |
Philadelphia, Pennsylvania
August 25, 2017
| | |
| 104 | | Annual Report | June 30, 2017 |
| | |
| OTHER INFORMATION | | |
June 30, 2017 (Unaudited)
1. Shareholder Tax Information
Certain tax information regarding the Funds is required to be provided to shareholders based upon each Fund’s income and distributions for the taxable year ended June 30, 2017. The information and distributions reported herein may differ from information and distributions taxable to the shareholders for the calendar year ended December 31, 2016.
The Funds report the following items with regard to distributions paid during the fiscal year ended June 30, 2017. All reportings are based on financial information available as of the date of this annual report and, accordingly, are subject to change. For each item, it is the intention of each Fund to report the maximum amount permitted under the Internal Revenue Code and the regulations there-under.
| | | | | | | | | | | | | | | | |
| | | Aggressive
Investors 1 | | | | | Ultra-Small
Company | | | | | Ultra-Small
Company Market |
Corporate Dividends Received Deduction | | | 100.00% | | | | | | 46.43% | | | | | | 92.28% | |
Qualified Dividend Income | | | 100.00% | | | | | | 46.03% | | | | | | 92.07% | |
Qualified Interest Related Dividends | | | 0.05% | | | | | | 0.09% | | | | | | 0.04% | |
Qualified Short Term Capital Gain Dividends | | | 0.00% | | | | | | 0.00% | | | | | | 0.00% | |
U.S. Government Income | | | 0.00% | | | | | | 0.00% | | | | | | 0.00% | |
| | | | | |
| | | Small-Cap
Momentum | | | | | Small-Cap
Growth | | | | | Small-Cap Value |
Corporate Dividends Received Deduction | | | 24.89% | | | | | | 100.00% | | | | | | 86.14% | |
Qualified Dividend Income | | | 24.27% | | | | | | 100.00% | | | | | | 86.04% | |
Qualified Interest Related Dividends | | | 0.01% | | | | | | 0.09% | | | | | | 0.08% | |
Qualified Short Term Capital Gain Dividends | | | 100.00% | | | | | | 0.00% | | | | | | 0.00% | |
U.S. Government Income | | | 0.00% | | | | | | 0.00% | | | | | | 0.00% | |
| | | | | |
| | | Blue Chip
35 Index | | | | | Managed
Volatility | | | | | |
Corporate Dividends Received Deduction | | | 100.00% | | | | | | 100.00% | | | | | | | |
Qualified Dividend Income | | | 100.00% | | | | | | 100.00% | | | | | | | |
Qualified Interest Related Dividends | | | 0.02% | | | | | | 6.35% | | | | | | | |
Qualified Short Term Capital Gain Dividends | | | 0.00% | | | | | | 0.00% | | | | | | | |
U.S. Government Income | | | 0.00% | | | | | | 5.84% | | | | | | | |
U.S. Government Income represents the amount of interest that was derived from direct U.S. Government obligations. Generally, such interest is exempt from state income tax. However, for residents of California, New York and Connecticut, the statutory threshold requirements were not satisfied. Due to the diversity in state and local tax law, it is recommended you consult a tax adviser as to the applicability of the information provided for your specific situation.
During the fiscal year ended June 30, 2017, the Funds paid distributions from ordinary income and long-term capital gain which included equalization debits summarized below:
| | | | | | | | | | | | | | | | |
| | | Aggressive
Investors 1 | | | Ultra-Small
Company | | | Ultra-Small
Company Market | | Small-Cap
Momentum |
Ordinary Income Distributions | | $ | 1,255,319 | | | $ | 1,212,208 | | | $ | 3,465,525 | | | $ | 147,281 | |
Equalization Debits Included in Ordinary Income Distributions | | | - | | | | 113,042 | | | | 340,408 | | | | 2,469 | |
Equalization Debits Included in Long-Term Capital Gain Distributions | | | - | | | | 27,011 | | | | 2,833,330 | | | | 2,679 | |
Long-Term Capital Gain Distributions | | | - | | | | - | | | | 24,304,051 | | | | 48,173 | |
| | |
| OTHER INFORMATION (continued) | | |
June 30, 2017 (Unaudited)
| | | | | | | | | | | | | | | | |
| | | Small-Cap
Growth | | | Small-Cap
Value | | | Blue Chip 35 Index | | | Managed Volatility |
Ordinary Income Distributions | | | $128,436 | | | | $644,905 | | | | $13,425,245 | | | | $195,475 | |
Equalization Debits Included in Ordinary Income Distributions | | | - | | | | - | | | | 1,037,692 | | | | - | |
| Equalization Debits Included in Long-Term Capital Gain Distributions | | | - | | | | - | | | | 337,681 | | | | - | |
2. Proxy Voting
A description of the policies and procedures that the Funds use to determine how to vote proxies relating to the portfolio securities and a summary of proxies voted by the Funds for the period ended June 30, 2017 are available without a charge, upon request, by contacting Bridgeway Funds at 1-800-661-3550 and on the SEC’s website at http://www.sec.gov.
3. Fund Holdings
The complete schedules of the Funds’ holdings for the second and fourth quarters of each fiscal year are contained in the Funds’ Semi-Annual and Annual Shareholder Reports, respectively.
The Bridgeway Funds file complete schedules of the Funds’ holdings with the SEC for the first and third quarters of each fiscal year on Form N-Q within 60 days after the end of the period. Copies of the Funds’ Form N-Q are available without charge, upon request, by contacting Bridgeway Funds at 1-800-661-3550 and on the SEC’s website at http://www.sec.gov. You may also review and copy Form N-Q at the SEC’s Public Reference Room in Washington, D.C. For more information about the operation of the Public Reference Room, please call 1-800-SEC-0330.
4. Approval of Investment Management Agreement
Bridgeway Funds, Inc.’s (the “Company”) management agreement (the “Management Agreement”) with its investment adviser, Bridgeway Capital Management, Inc. (the “Adviser”), on behalf of each of the Company’s funds must be approved for an initial term no greater than two years and renewed at least annually thereafter by the board of directors of the Company (the “Board”) or a vote of a majority of the outstanding voting securities of each fund. In addition, the renewal must be approved by a majority of the Directors who are not parties to the Management Agreement or “interested persons” of any party thereto (the “Independent Directors”), cast in person at a meeting called specifically for the purpose of voting on such approval.
The Board has five regularly scheduled meetings each year and takes into account throughout the year matters bearing on the approval of the Management Agreement. For example, the Board or its standing committees consider at meetings during the year various factors that are relevant to the annual renewal of each fund’s Management Agreement, including the services and support provided to each fund by the Adviser, the Adviser’s compliance program, comparative performance information for each fund, the risk assessment of the funds and “deep dives” on the strategy and performance of certain funds on a periodic basis. In addition, the Board receives updated financial information on the Adviser and updates related to strategic direction and marketing efforts between meetings from the Adviser.
On May 11, 2017, the Board, including a majority of the Independent Directors, met in person (the “Meeting”) with the Adviser, the Company’s outside legal counsel, independent legal counsel (“Independent Legal Counsel”) to the Independent Directors and others to consider information bearing on the continuation of the Management Agreement with respect to the following funds of the Company: Aggressive Investors 1 Fund, Ultra-Small Company Fund, Ultra-Small Company Market Fund, Small-Cap Growth Fund, Small-Cap Value Fund, Blue Chip 35 Index Fund, Managed Volatility Fund and Small-Cap Momentum Fund (each a “Fund” and collectively, the “Funds”).
In reaching its decisions regarding the Management Agreement for each Fund, the Board considered the information furnished and discussed throughout the year at regularly scheduled Board or committee meetings, as applicable and as described above, as well as the information provided to it specifically in relation to the annual consideration of the approval of the Management Agreement for each Fund.
| | |
| 106 | | Annual Report | June 30, 2017 |
| | |
| OTHER INFORMATION (continued) | | |
June 30, 2017 (Unaudited)
In preparation for the Meeting, the Independent Directors requested that the Adviser provide specific information relevant to the Board’s consideration of the renewal of the Management Agreement with respect to each Fund. In response to that request, the Board was furnished with a wide variety of information with respect to each Fund, including information regarding:
| | ● | | investment performance over various time periods and the fees and expenses of each Fund as compared to a comparable group of funds as determined and prepared by Broadridge Financial Solutions, Inc. (formerly, Lipper, Inc.) (hereinafter “Lipper”), an independent provider of investment company data; |
| | ● | | the nature, extent and quality of services provided by the Adviser to each Fund under the Management Agreement; |
| | ● | | actual management fees paid by each Fund to the Adviser and a comparison of those fees with the management fees charged to other clients of the Adviser, as applicable; |
| | ● | | the Adviser’s costs of providing services to each Fund and the profitability of the Adviser derived from the Management Agreement with each Fund; |
| | ● | | the extent to which economies of scale may be present and if so, how and to what extent they could be shared with the Fund’s shareholders; and |
| | ● | | any potential “fall out” or ancillary benefits accruing to the Adviser as a result of its relationship with each Fund. |
In addition to evaluating the written information provided by the Adviser, the Board also considered the answers to questions posed by the Board to representatives of the Adviser at the Meeting.
In considering the information and materials described above, the Independent Directors received assistance from, and also had the opportunity to consult with, Independent Legal Counsel prior to the Meeting. In addition, the Independent Directors met in executive session with Independent Legal Counsel to consider the continuation of the Management Agreement with respect to each Fund outside the presence of management during the Meeting.
The Board also was provided with a written description of its statutory responsibilities and the legal standards that are applicable to approvals of the Management Agreement.
Although the Management Agreement for all of the Funds was considered at the same Board meeting, the Directors considered each Fund separately.
In considering the aforementioned information, the Board took into account management style, investment strategies and prevailing market conditions as reported by the Adviser. Furthermore, in evaluating the Management Agreement, the Directors also considered information provided by the Adviser concerning the following:
| | ● | | the terms of the Management Agreement, including the services performed by the Adviser in managing each Fund’s assets in accordance with the Fund’s investment objectives, policies and restrictions and how those services and fees differ from those for other advisory clients of the Adviser, as applicable; |
| | ● | | information regarding the advisory fee rates and the expense limitation or fee waiver arrangements for each Fund; |
| | ● | | the Adviser’s personnel, staffing levels and the time and attention the Adviser’s personnel devote to the management of the Funds as compared to other clients of the Adviser; |
| | ● | | the Adviser’s risk assessment and management process; |
| | ● | | the Adviser’s representation that it does not participate in any soft dollar arrangements and, although it receives unsolicited research from outside sources, the Adviser does not consider the receipt of that research in the decision- making process; and |
| | |
| OTHER INFORMATION (continued) | | |
June 30, 2017 (Unaudited)
| | ● | | the financial condition and stability of the Adviser. |
In view of the broad scope and variety of factors and information, the Directors did not find it practicable to, and did not, assign relative weights to the specific factors considered in reaching their conclusions and determinations to approve the continuance of the Management Agreement for each Fund for an additional year. Rather, the Board’s determinations were made on the basis of each Director’s business judgment after consideration of all of the factors taken in their entirety. Although not meant to be all-inclusive, the following describes some of the factors that were considered by the Board in deciding to approve the continuance of the Management Agreement for each Fund.
Nature, Extent and Quality of Services
In examining the nature, extent and quality of the services provided by the Adviser, the Directors considered the services provided to each Fund and any expected changes thereto, the qualifications, experience and duties of the Adviser’s personnel, the approximate amount of time those personnel devote to the Funds, recent and expected personnel changes, portfolio manager compensation arrangements, business continuity and succession planning, and enterprise risk management (including cybersecurity). In addition, the Directors considered information provided by the Adviser regarding its overall financial strength and considered the resources and staffing in place with respect to the services provided to the Funds.
Based on the totality of the information considered, the Directors concluded that each Fund is likely to benefit from the nature, extent and quality of the Adviser’s services, and that the Adviser has the ability to continue to provide these services based on its experience, operations and current resources.
Investment Performance
The Board considered performance information provided by the Adviser for similarly managed accounts (if any) over the most recent quarter, six month, one year, three year and five year periods ending December 31, 2016 as well as Fund performance compared with its benchmark for one, three, five, ten, fifteen year and since inception periods ending December 31, 2016 (although certain Funds did not yet have ten or fifteen year performance). The Board considered the Adviser’s representation that the differences in the performance of the similarly managed accounts (if any) and Fund performance were within ranges that the Adviser expects for the relevant accounts/Funds given, for example, differences in cash flows, investment restrictions, account size and tax management practices.
In addition, Lipper provided a report (the “Lipper Report”) of comparative data regarding fees, expenses and performance for each Fund as compared to a peer group selected by Lipper (“Peer Group”) as of December 31, 2016. The performance periods included total return over the most recent calendar year (“one year period”) and the annualized total returns over the most recent three calendar year period (“three year period”), five calendar year period (“five year period”) and ten calendar year period (“ten year period”), although some Funds did not yet have a ten year performance period. With regard to the performance information provided in the Lipper Report, the Board considered the performance of each Fund on a percentile and quintile basis as compared to its Peer Group. For purposes of the performance data provided, the first quintile is defined as 20% of the funds in the applicable Peer Group with the highest performance and the fifth quintile is defined as 20% of the funds in the applicable Peer Group with the lowest performance.
In particular, the Board considered the following performance information provided by the Adviser and from Lipper:
| | ● | | With regard to the Aggressive Investors 1 Fund, the Fund was in the top quintile relative to its Peer Group for the one and five year periods, in the second quintile for the three year period, and in the lowest quintile for the ten year period. The Fund outperformed its primary benchmark for the one, five, and fifteen year, and since inception, periods, but lagged its benchmark for the three and ten year periods. The Board considered the Adviser’s explanation that the underperformance of this Fund during certain of the above periods can be partially explained by spikes in stock correlations. The Board also considered the Adviser’s representation that it has engaged in significant research over 2016 and early 2017 for this Fund, and had made certain modifications intended to make the Fund less susceptible to underperformance during spikes in stock correlations. |
| | |
| 108 | | Annual Report | June 30, 2017 |
| | |
| OTHER INFORMATION (continued) | | |
June 30, 2017 (Unaudited)
| | ● | | With regard to the Ultra-Small Company Fund, the Fund had bottom quintile performance compared to its Peer Group for the one, three and ten year periods, with five year performance in the fourth quintile. The Fund underperformed its primary benchmark for all performance periods, except the since inception period. The Board considered the portfolio updates that the Adviser is in the process of implementing for this Fund, the Fund’s recent quarter end performance, and the Adviser’s explanation that this Fund’s holdings in larger capitalization stocks account for much of the underperformance relative to its primary benchmark, and that this Fund has outperformed its benchmark since inception. |
| | ● | | With regard to the Ultra-Small Company Market Fund, the Fund ranked in the third, fourth, first and fourth quintiles for the one, three, five and ten year periods respectively. The Fund underperformed its primary benchmark over the one, ten and fifteen year periods, but outperformed over the three and five year periods. The Board considered the Adviser’s view that it expects this kind of performance variability against its Peer Group, which can largely be explained by the market capitalization differences between the Fund and other funds in the Peer Group (with the Fund’s holdings in extremely small market capitalization stocks relative to its Peer Group accounting for much of the underperformance) and the Adviser’s statement that it has brought a larger percentage of Fund assets into the market capitalization of the benchmark universe. |
| | ● | | With regard to the Small-Cap Growth Fund, the Fund is in the top quintile relative to its Peer Group for the one, three and five year periods, but is in the bottom quintile for the ten year period. The Fund outperformed its primary benchmark for the one, three and five year periods, but lagged for the ten year and since inception periods. The Board considered the Adviser’s explanation that it made some refinements to its investment process approximately five years ago and that the Adviser believes these refinements are having a positive impact on the Fund. |
| | ● | | With regard to the Small-Cap Value Fund, the Fund was in the third quintile for the one and five year periods and in the fourth quintile for the three and ten year periods, as compared with its Peer Group. The Fund lagged its primary benchmark across all time periods. The Board considered the Adviser’s explanation that the Fund’s underperformance relative to its Peer Group and benchmark is attributed to the Fund’s design of stronger exposure to capitalization and value factors that have been through a particularly long period of being out of favor. In addition, the Board considered the Adviser’s view that a deeper value exposure as compared to similar funds managed by the Adviser attributed to underperformance relative to such funds and the Adviser’s representation that it intends to focus research on this Fund in 2017. |
| | ● | | With regard to the Blue Chip 35 Index Fund, the Fund had performance in the top quintile of its Peer Group for the one, three and ten year periods, with performance for the five year period in the second quintile. The Fund outperformed its primary benchmark for the one year, ten year and since inception periods, and underperformed the benchmark for the three, five and fifteen year periods. The Board also considered the Adviser’s explanation that the primary reason for the differences in performance was the larger market capitalization of the Fund’s holdings. |
| | ● | | With regard to the Managed Volatility Fund, the Fund had performance in the third quintile relative to the Peer Group for all periods and underperformed its primary benchmark for all periods. The Board considered the Adviser’s explanation that the Fund is not designed to outperform the primary benchmark, but instead it is designed to capture market return while limiting volatility, which from inception to date the Fund has done. The Board also considered the Adviser’s statement that this performance is in line with the Fund’s design. |
| | ● | | With regard to the Small-Cap Momentum Fund, the Fund had performance in the bottom quintile for the one and three year periods, and in the fourth quintile for the five year period, relative to its Peer Group. The Fund lagged its primary benchmark over all performance periods. The Board considered the Adviser’s view that the Fund’s intended design regarding momentum exposure and risk adjustment, lagging price-momentum factors, and growth factors in the small-cap space are the primary reasons for this performance and that the funds in the Peer Group do not have a design similar to that of the Fund. The Board also considered the Adviser’s representation that its research indicated that the intended design of stronger momentum exposure would be expected to provide stronger long-term outcomes than those of its Peer Group and benchmark and that the intended design would lag in the environments experienced over the relevant periods. |
| | |
| OTHER INFORMATION (continued) | | |
June 30, 2017 (Unaudited)
Fund Fees and Expenses
The Board considered information provided by the Adviser regarding the advisory fees it charges to other advisory clients and the reasons for any material differences between those fees and the fees it charges to any comparable client accounts. The Board also considered the Adviser’s views that, given investment performance and overall expenses, the Adviser believes the management fees for each Fund appear reasonable and appropriate given the distinctive features and design of each Fund, the disciplined implementation of the design by the Adviser, the relatively low management fees in most cases, the performance results in line with design and investor expectations, and the profitability to the Adviser of each Fund. More specifically, with regard to management fee differences among the Funds, the Board considered the Adviser’s view that fee differences stem from market factors as well as the estimated growth rate of the Fund at the time of launch; the potential asset capacity of the Fund; the risks associated with providing the advisory services to the Fund; and estimated costs of providing the advisory services driven by the design complexity of the Fund (e.g., more complex design is higher cost due to the research and portfolio management time required).
With respect to management fee differences between the Funds and other investment company clients of the Adviser, the Board considered that, unlike the Funds, the Adviser serves as a sub-adviser to the other investment company clients. The Board also considered the fees charged to other investment company clients of the Adviser, as well as the Adviser’s representation that for certain Funds, that the Adviser did not manage comparable investment companies.
With respect to management fee differences between the Funds and other non-investment company clients of the Adviser, the Board considered that: (i) the management fees charged to the Blue Chip 35 Fund and the Ultra-Small Company Market Fund are lower than those charged to comparable clients; (ii) the asset based management fee charged to the Aggressive Investors 1 Fund is higher than that charged to comparable clients, while the Fund’s performance fee rate is significantly lower than the performance fee rate charged to comparable clients (and there are other differences in the performance fee calculations); and (iii) the Adviser had no advisory clients comparable to the other Funds.
The Board also considered information compiled by Lipper comparing each Fund’s contractual management fee rate (excluding any performance fees and using an assumed common asset level for the Fund and the other funds in the Peer Group), actual management fee rate (which included the effect of any fee waivers and any performance fees, and was derived from annual reports) and actual total expense ratios (which also included the effect of any fee waivers and performance fees, and was derived from annual reports) as a percentage of average net assets as compared to other funds in its expense Peer Group. Lipper’s contractual management fee data included both advisory fees and administrative services fees, except for the Funds. Lipper excluded administrative services fees for the Funds from contractual management fee data because those fees are fixed (i.e., a stated dollar amount), as opposed to asset-based. More specifically, with respect to the Funds, the Adviser provides certain administrative services to the Funds pursuant to a separate contract, in exchange for an annual fixed fee (payable monthly) that the Adviser has represented approximates the cost of providing such services (which the Board considered in connection with profitability, as described below). Lipper’s actual management fee data for the Funds and the other funds in the Peer Group included both advisory fees and administrative services fees. Thus, the contractual management fee rate in the Funds’ Lipper comparisons did not reflect these administrative services fees, whereas the actual management fee rate in the Funds’ Lipper comparisons included both advisory and administration fees.
With regard to the expense information provided in the Lipper Report, the Board considered Fund expenses on a percentile and quintile basis as compared to each Fund’s Peer Group. For purposes of the expense data provided, Lipper defines the first quintile as 20% of the funds in the applicable Peer Group with the lowest expenses and the fifth quintile as 20% of the funds in the applicable Peer Group with the highest expenses. In particular, the Board considered the following:
| | ● | | The Aggressive Investors 1 Fund’s contractual management fee was higher than most of the other funds in its Peer Group (excluding the performance fee), but that Fund’s actual management fees and actual total expenses were the lowest in its Peer Group. The Board also considered the impact of the performance fee for this Fund on the contractual management fee comparison. |
| | ● | | With respect to the Ultra-Small Company Fund, the Board considered that the Fund’s contractual management fees and actual total expense ratio were in the second quintile in its Peer Group, and actual management fees were in the |
| | |
| 110 | | Annual Report | June 30, 2017 |
| | |
| OTHER INFORMATION (continued) | | |
June 30, 2017 (Unaudited)
| | fourth quintile. The Board considered the Adviser’s belief that the Fund’s management fee is reasonable and appropriate due to the smaller-capitalization and other distinctive design features of the Fund relative to its Peer Group, which place the fees and performance in line with what the Adviser believes current investors expect. |
| | ● | | With respect to the Ultra-Small Company Market Fund, the Blue Chip 35 Index Fund, the Small-Cap Growth Fund, the Small-Cap Momentum Fund, and the Small-Cap Value Fund, the Board considered that each Fund was in the top quintile for all three fee categories. The Board also considered the impact of the performance fee arrangement on contractual management fees for the Small-Cap Value and Small-Cap Growth Funds. |
| | ● | | With respect to the Managed Volatility Fund, the Board considered that the Fund was in the first quintile for contractual management fees and actual total expense ratio, and in the second quintile (but below the median) for actual management fees. |
In addition, the Board considered that the Adviser agreed to contractual expense limitation agreements for each of the Funds to ensure that total expense levels do not increase above certain levels.
The foregoing comparisons assisted the Board in determining to approve the Management Agreement for each Fund by providing it with a basis for evaluating each Fund’s management fee and expense ratio on a relative basis.
Profitability
The Board reviewed the materials it received from the Adviser regarding its revenues and costs in providing investment management and certain administrative services to the Funds and the Company as a whole. In particular, the Board considered the analysis of the Adviser’s profitability with respect to each Fund, calculated for the years ended December 31, 2013, December 31, 2014, December 31, 2015 and December 31, 2016. The Board also considered the Adviser’s representations that it does not track expenses or maintain staff on a per Fund basis and accordingly the Adviser needed to make certain assumptions to allocate expenses on a Fund-by-Fund basis in order to calculate Fund-by-Fund profitability, making the process somewhat arbitrary. The Board also considered that the Adviser was operating some Funds at a loss but that the Adviser’s overall business is profitable. Additionally, the Board considered the Adviser’s representation that the Adviser continued to improve its financial position over the last year.
Economies of Scale
With respect to whether economies of scale are expected to be realized by the Adviser as a Fund’s assets increase and whether advisory fee levels reflect these economies of scale for the benefit of Fund investors, the Board considered, on a Fund-by-Fund basis, the current level of advisory fees charged and fee structure and concluded that the Adviser’s fee structure with respect to each Fund was appropriate at this time. The Board considered that the Aggressive Investors 1 Fund and Ultra-Small Company Fund each have fee breakpoints in their management fee schedules although neither Fund is at a size currently to benefit from such breakpoints. With respect to Ultra-Small Company Market Fund and Managed Volatility Fund, the Board considered the Adviser’s representation that it believes that neither Fund will produce significant economies of scale because each Fund involves intensive and time-consuming portfolio and trading management. Finally, although the Small-Cap Growth Fund, Small-Cap Value Fund, Blue Chip 35 Index Fund, Managed Volatility Fund and Small-Cap Momentum Fund do not have fee breakpoints in their management fee schedules, the Board considered the Adviser’s explanation that these Funds were priced low relative to their respective Peer Groups and ahead of the economies of scale curve at launch.
“Fallout” or Ancillary Benefits
The Board considered whether there were any “fall-out” or ancillary benefits that may accrue to the Adviser as a result of its relationships with the Funds. In terms of potential “fall out” or ancillary benefits to the Adviser due to its position as manager of the Funds, the Board considered benefits related to track record and reputation, and portfolio trading and execution. The Board also considered the Adviser’s representations that it does not participate in any soft dollar arrangements and that, although it receives unsolicited research from outside sources, the Adviser does not consider the receipt of this information in the decision-making process. The Board concluded that the benefits accruing to Adviser by virtue of its relationship to the
| | |
| OTHER INFORMATION (continued) | | |
June 30, 2017 (Unaudited)
Funds appeared to be reasonable.
* * * * *
After evaluation of the information regarding management services, investment performance, management fees, profitability, economies of scale and ancillary benefits, as described above, as well as other considerations (such as the Adviser’s compliance program, regulatory history, insurance coverage, privacy and cybersecurity controls and brokerage practices), and in light of the nature, extent and quality of services provided by the Adviser, the Board, including a majority of the Independent Directors, concluded that the level of management fees to be paid to the Adviser with respect to each Fund under the Management Agreement is reasonable.
In summary, based on all relevant information and factors discussed above, none of which was individually determinative of the outcome, the Board, including a majority of the Independent Directors, determined that the approval of the Management Agreement for each Fund was in the best interests of each such Fund. As a result, the Board, including a majority of the Independent Directors, approved the renewal of the Management Agreement for each Fund.
| | |
| 112 | | Annual Report | June 30, 2017 |
| | |
| DISCLOSURE OF FUND EXPENSES | | |
June 30, 2017 (Unaudited)
As a shareholder of a Fund, you will incur no transaction costs from such Fund, including sales charges (loads) on purchases, on reinvested dividends or on other distributions. There are no exchange fees. Shareholders are subject to redemption fees on the Ultra-Small Company Market and Small-Cap Momentum Funds under certain circumstances. However, as a shareholder of a Fund, you will incur ongoing costs, including management fees and other Fund expenses. The following examples are intended to help you understand your ongoing costs (in dollars) of investing in a Fund and to compare these costs with ongoing costs of investing in other mutual funds. The examples are based on an investment of $1,000 invested on January 1, 2017 and held until June 30, 2017.
Actual Expenses. The first line of the table below provides information about actual account values and actual expenses. You may use the information in this line, together with the amount you invested, to estimate the expenses that you paid over the period. Simply divide your account value by $1,000 (for example, an $8,600 account value divided by $1,000 = 8.6), then multiply the result by the number in the first line under the heading “Expenses Paid During Period” to estimate the expenses you paid on your account during the period.
Hypothetical Example for Comparison Purposes. The second line of the table below provides information about hypothetical account values and hypothetical expenses based on the Fund’s actual expense ratio and an assumed rate of return of 5% per year before expenses, which is not the Fund’s actual return. The hypothetical account values and expenses may not be used to estimate the actual ending account balance or expenses you paid for the period. You may use this information to compare the ongoing costs of investing in a Fund and other mutual funds. To do so, compare this 5% hypothetical example with the 5% hypothetical examples that appear in the shareholder reports of other funds.
The expenses shown in the table are meant to highlight ongoing Fund costs only. Therefore, the second line of the table is useful in comparing ongoing costs only and will not help you determine the relative total costs of owning different funds, because other funds may also have transaction costs, such as sales charges, redemption fees or exchange fees.
| | | | | | | | | | | | | | | | |
| | | Beginning Account
Value at 1/1/17 | | | Ending Account
Value at 6/30/17 | | | Expense
Ratio | | | Expenses Paid
During Period*
1/1/17 - 6/30/17 |
| | | | |
Bridgeway Aggressive Investors 1 Fund | | | | | | | | | | | | | | | | |
Actual Fund Return | | | $1,000.00 | | | | $1,043.40 | | | | 1.60% | | | | $8.11 | |
Hypothetical Fund Return | | | $1,000.00 | | | | $1,016.86 | | | | 1.60% | | | | $8.00 | |
| | | | |
Bridgeway Ultra-Small Company Fund | | | | | | | | | | | | | | | | |
Actual Fund Return | | | $1,000.00 | | | | $1,011.50 | | | | 1.18% | | | | $5.89 | |
Hypothetical Fund Return | | | $1,000.00 | | | | $1,018.94 | | | | 1.18% | | | | $5.91 | |
| | | | |
Bridgeway Ultra-Small Company Market Fund | | | | | | | | | | | | | | | | |
Actual Fund Return | | | $1,000.00 | | | | $1,031.80 | | | | 0.75% | | | | $3.78 | |
Hypothetical Fund Return | | | $1,000.00 | | | | $1,021.08 | | | | 0.75% | | | | $3.76 | |
| | | | |
Bridgeway Small-Cap Momentum Fund | | | | | | | | | | | | | | | | |
Actual Fund Return | | | $1,000.00 | | | | $1,058.50 | | | | 0.90% | | | | $4.59 | |
Hypothetical Fund Return | | | $1,000.00 | | | | $1,020.33 | | | | 0.90% | | | | $4.51 | |
| | | | |
Bridgeway Small-Cap Growth Fund | | | | | | | | | | | | | | | | |
Actual Fund Return | | | $1,000.00 | | | | $1,075.50 | | | | 0.94% | | | | $4.84 | |
Hypothetical Fund Return | | | $1,000.00 | | | | $1,020.13 | | | | 0.94% | | | | $4.71 | |
| | | | |
Bridgeway Small-Cap Value Fund | | | | | | | | | | | | | | | | |
Actual Fund Return | | | $1,000.00 | | | | $993.20 | | | | 0.94% | | | | $4.65 | |
Hypothetical Fund Return | | | $1,000.00 | | | | $1,020.13 | | | | 0.94% | | | | $4.71 | |
| | |
| DISCLOSURE OF FUND EXPENSES (continued) | | |
June 30, 2017 (Unaudited)
| | | | | | | | | | | | | | | | |
| | | Beginning Account
Value at 1/1/17 | | Ending Account
Value at 6/30/17 | | Expense
Ratio | | | Expenses Paid
During Period*
1/1/17 - 6/30/17 |
| | | | |
Bridgeway Blue Chip 35 Index Fund | | | | | | | | | | | | | | | | |
Actual Fund Return | | | $1,000.00 | | | | $1,061.10 | | | | 0.15 | % | | | $0.77 | |
Hypothetical Fund Return | | | $1,000.00 | | | | $1,024.05 | | | | 0.15 | % | | | $0.75 | |
| | | | |
Bridgeway Managed Volatility | | | | | | | | | | | | | | | | |
Actual Fund Return | | | $1,000.00 | | | | $1,033.50 | | | | 0.95 | % | | | $4.79 | |
Hypothetical Fund Return | | | $1,000.00 | | | | $1,020.08 | | | | 0.95 | % | | | $4.76 | |
| * | Expenses are equal to the average account value times the Fund’s annualized expense ratio multiplied by the number of days in the most recent six- month period (181) divided by the number of days in the fiscal year (365). |
| | |
| 114 | | Annual Report | June 30, 2017 |
| | |
DIRECTORS & OFFICERS | |
|
| June 30, 2017 (Unaudited) | | |
| | | | | | | | | | |
| Independent Directors |
| | | | | |
Name, Address and Age1 | | Position
Held with
Bridgeway
Funds | | Term of
Office and
Length of
Time Served | | Principal Occupation(s)
During Past Five Years | | No. of Bridgeway
Funds Overseen
by Director | | Other Directorships
Held by Director |
| | | | | |
Kirbyjon Caldwell
Age 63 | | Director | | Term: 1 Year
Length: 2001
to Present. | | Senior Pastor of Windsor Village United Methodist Church, since 1982. | | Ten | | American Church Mortgage Company, NRG Energy, Inc., Amegy Bancshares Advisory Board |
| | | | | |
Karen S. Gerstner
Age 62 | | Director | | Term: 1 Year
Length: 1994
to Present. | | Principal, Karen S. Gerstner & Associates, P.C., since 2004. | | Ten | | None |
| | | | | |
Miles Douglas Harper, III* Age 54 | | Director | | Term: 1 Year
Length: 1994
to Present. | | Partner, Carr, Riggs & Ingram, LLC, since 2013; Partner, Gainer Donnelly, LLP, 1998 to 2013 upon merger with Carr, Riggs & Ingram, LLC. | | Ten | | Calvert Funds (37 Portfolios) |
| | | | | |
Evan Harrel
Age 56 | | Director | | Term: 1 Year
Length: 2006
to Present. | | Strategic Advisor, Small Steps Nurturing Center, since 2012; Executive Director, Small Steps Nurturing Center, 2004 to 2012. | | Ten | | None |
| | |
DIRECTORS & OFFICERS (continued) | |
|
| June 30, 2017 (Unaudited) | | |
| | | | | | | | | | |
| “Interested” or Affiliated Director and Officer |
| | | | | |
Name, Address and Age1 | | Position(s)
Held with
Bridgeway
Funds | | Term of
Office and
Length of
Time Served | | Principal Occupation(s)
During Past Five Years | | No. of Bridgeway
Funds Overseen by Director | | Other Directorships
Held by Director |
| | | | | |
John N. R. Montgomery2
Age 61 | | Director | | Term: 1 Year
Length: 1993
to Present. | | Chairman, Bridgeway Capital Management, Inc., since 2010; President, Bridgeway Capital Management, Inc., 1993 to 2010 and June 2015 to March 2016; President, Bridgeway Funds, June 2015 to June 2016; Vice President, Bridgeway Funds, 2005 to May 2015 and since June 2016. | | Ten | | None |
| | |
| 116 | | Annual Report | June 30, 2017 |
| | |
DIRECTORS & OFFICERS (continued) | |
|
| June 30, 2017 (Unaudited) | | |
| | | | | | | | | | |
| Other Officers |
| | | | | |
| Name, Address and Age1 | | Position
Held with
Bridgeway
Funds | | Term of
Office and
Length of
Time Served | | Principal Occupation(s)
During Past Five Years | | No. of Bridgeway
Funds Overseen by Officer | | Other Directorships
Held by Officer |
| | | | | |
Richard P. Cancelmo, Jr.
Age 59 | | Vice
President | | Term: 1 Year
Length: 2004
to Present. | | Vice President, Bridgeway Funds, since 2004; Staff member, Bridgeway Capital Management, Inc., since 2000. | | N/A | | None |
| | | | | |
Linda G. Giuffré
Age 55 | | Treasurer
and Chief
Compliance
Officer | | Term: 1 Year
Length: 2004
to Present. | | Chief Compliance Officer, Bridgeway Capital Management, Inc., since 2004; Staff member, Bridgeway Capital Management, Inc., since 2004. | | N/A | | None |
| | | | | |
Deborah L. Hanna Age 52 | | Secretary | | Term: 1 Year
Length: 2007
to Present. | | Self-employed, accounting and related projects for various organizations, since 2001. | | N/A | | None |
| | | | | |
Sharon Lester Age 62 | | Vice
President | | Term: 1 Year
Length: 2011
to Present. | | Staff member, Bridgeway Capital Management, Inc., since 2010. | | N/A | | None |
| | | | | |
Tammira Philippe Age 43 | | President | | Term: 1 Year
Length: May
2016 to
Present. | | Staff member, Bridgeway Capital Management, Inc., 2010 to March 2016; President, Bridgeway Capital Management, Inc., since March 2016. | | N/A | | None |
| 1 | The address of all of the Directors and Officers of Bridgeway Funds is 20 Greenway Plaza, Suite 450, Houston, Texas, 77046. |
| 2 | John Montgomery is chairman, director and majority shareholder of Bridgeway Capital Management, Inc., and therefore an interested person of Bridgeway Funds. |
The overall management of the business and affairs of Bridgeway Funds is vested with its Board of Directors (the “Board”). The Board approves all significant agreements between Bridgeway Funds and persons or companies furnishing services to it, including agreements with its Adviser and custodian. The day-to-day operations of Bridgeway Funds are delegated to its officers, subject to its investment objectives and policies and general supervision by the Board.
The Funds’ Statement of Additional Information includes additional information about the Board and is available, without charge, upon request by calling 1-800-661-3550.
THIS PAGE INTENTIONALLY LEFT BLANK
THIS PAGE INTENTIONALLY LEFT BLANK
BRIDGEWAY FUNDS, INC.
BNY Mellon Investment Servicing (US) Inc.
P.O. Box 9860
Providence, RI 02940-8060
CUSTODIAN
The Bank of New York Mellon
One Wall Street
New York, NY 10286
DISTRIBUTOR
Foreside Fund Services, LLC
Three Canal Plaza, Suite 100
Portland, ME 04101
| | | | |
| | You can review and copy information about our Funds (including the SAIs) at the SEC’s Public Reference Room in Washington, D.C. To find out more about this public service, call the SEC at 800-SEC-0330. Reports and other information about the Funds are also available on the SEC’s website at www.sec.gov. You can receive copies of this information, for a fee, by writing the Public Reference Section, Securities and Exchange Commission, Washington, D.C. 20549-1520 or by sending an electronic request to the following email address: publicinfo@sec.gov. | | |

A no-load mutual fund family of domestic funds
| | | | |
| | Annual Report | | |
| | June 30, 2017 | | |
| | OMNI SMALL-CAP VALUE | | BOSVX |
| | OMNI TAX-MANAGED SMALL-CAP VALUE | | BOTSX |
| | www.bridgeway.com | | |
| | |
TABLE OF CONTENTS | |  |
Bridgeway Funds Standardized Returns as of June 30, 2017 (Unaudited)
| | | | | | | | | | | | | | | | | | | | | | | | | | | | | | | | | | | | | | | | |
| | | | | | | Annualized | | | | | | |
| Fund | | Quarter | | Six Months | | 1 Year | | 5 Years | | Inception
to Date | | Inception
Date | | Gross
Expense
Ratio2 | | Net
Expense
Ratio2 |
Omni Small-Cap Value | | -0.77% | | -3.51% | | 24.83% | | 14.17% | | 14.13% | | 8/31/2011 | | 0.71%1 | | 0.61%1 |
Omni Tax-Managed Small-Cap Value | | -0.74% | | -3.34% | | 24.83% | | 14.05% | | 10.83% | | 12/31/2010 | | 0.72%1 | | 0.60%1 |
| | 1 | Some of the Fund’s fees were waived or expenses reimbursed; otherwise, returns would have been lower. The Adviser has contractually agreed to waive fees and/or reimburse expenses. Any material change to this Fund policy would require a vote by shareholders. |
| | 2 | Expense ratios are as stated in the current prospectus. Please see financial highlights for expense ratios as of June 30, 2017. |
Performance figures quoted represent past performance and are no guarantee of future results. Current performance may be lower or higher than the performance data quoted. Investment return and principal value will fluctuate, so that an investor’s shares, when redeemed, may be worth more or less than original cost. To obtain performance current to the most recent month-end, please visit our website at www.bridgeway.com or call 1-800-661-3550. Total return figures include the reinvestment of dividends and capital gains.
This report is submitted for the general information of the shareholders of each Fund. It is not authorized for distribution to prospective investors unless preceded or accompanied by an effective prospectus, which includes information regarding a Fund’s risks, objectives, fees and expenses, experience of its management, and other information. Investors should read the prospectus carefully before investing in a Fund. For questions or other Fund information, call 1-800-661-3550 or visit the Funds’ website at www.bridgeway.com. Funds are available for purchase by residents of the United States, Puerto Rico, U.S. Virgin Islands and Guam only. Foreside Fund Services, LLC, Distributor.
The views expressed here are exclusively those of Fund management. These views, including those relating to the market, sectors or individual stocks, are not meant as investment advice and should not be considered predictive in nature.
| | |
LETTER FROM THE INVESTMENT MANAGEMENT TEAM | | |
June 30, 2017
Dear Fellow Shareholders,
At Bridgeway, we have a shared passion for applying logic, data and evidence to develop investment solutions. Our Omni Small-Cap Value and Omni Tax-Managed Small-Cap Value Funds are constructed based on fundamental academic research that relies on market efficiency to better capture risk premiums. We manage these Funds to provide broad diversification within the small-cap value universe and to keep transaction fees and expenses low. Bridgeway offers the Omni Small-Cap Value and Omni Tax-Managed Small-Cap Value Funds through a select group of advisers. We are committed to advisers and their clients who take a long-term perspective and whose investment goals fit our unique expertise: delivering investment solutions that are statistically driven and grounded in academic theory.
Thank you for your investment in Bridgeway’s Omni Small-Cap Value and Omni Tax-Managed Small-Cap Value Funds.
Sincerely,
Your Investment Management Team
| | | | |
 | |  | | 
|
| John Montgomery | | Christine L. Wang | | Michael Whipple |
 | | | | |
Elena Khoziaeva | | | | |
| | |
LETTER FROM THE INVESTMENT MANAGEMENT TEAM (continued) | | |
Market Review
Performance across domestic equity markets was positive for the June 2017 quarter. Broad market returns for the quarter were up 3.02%, as represented by the Russell 3000 Index.
For the fiscal year ended June 30, 2017, broad market stocks were up 18.51%, as represented by the Russell 3000 Index. Growth stocks outperformed value stocks in the large and mid-cap size groups, but value stocks slightly outperformed growth among small caps. As a result, small-cap value stocks had the highest returns, up 24.86%, followed by small-cap growth stocks, up 24.40%, as represented by the Russell 2000 Value Index and Russell 2000 Growth Index, respectively.
The following table presents returns for broad market, small-cap, mid-cap, and large-cap stocks, as represented by various style-based Russell Indexes. Size (market capitalization) and style (value/growth) are among the key factors that drive differences in returns among U.S. stocks.
Russell Style-Based Indexes Ranked by Performance for the Quarter and Fiscal Year Ended June 30, 2017
| | | | |
| | | Quarter | | Fiscal Year |
| Best | | 4.67% | | 24.86% |
| Performing | | Russell 1000 Growth Index | | Russell 2000 Value Index |
| | 4.65% | | 24.40% |
| | Russell 3000 Growth Index | | Russell 2000 Growth Index |
| | 4.39% | | 20.72% |
| | Russell 2000 Growth Index | | Russell 3000 Growth Index |
| | 4.21% | | 20.42% |
| | Russell Midcap Growth Index | | Russell 1000 Growth Index |
| | 1.37% | | 17.05% |
| | Russell Midcap Value Index | | Russell Midcap Growth Index |
| | 1.34% | | 16.21% |
| | Russell 1000 Value Index | | Russell 3000 Value Index |
| | 1.29% | | 15.93% |
| | Russell 3000 Value Index | | Russell Midcap Value Index |
| Worst | | 0.67% | | 15.53% |
| Performing | | Russell 2000 Value Index | | Russell 1000 Value Index |
The Bridgeway Omni Funds in this annual report are asset class exposure strategies that seek broad diversification and risk premium exposure. These Funds were designed to capture the size and style benefits within the small-cap asset class.
| | |
| 2 | | Annual Report | June 30, 2017 |
| | |
Omni Small-Cap Value Fund MANAGER’S COMMENTARY (Unaudited) | |
|
June 30, 2017
Dear Fellow Omni Small-Cap Value Fund Shareholder,
For the quarter ended June 30, 2017, our Fund returned -0.77%, underperforming our primary market benchmark, the Russell 2000 Value Index (+0.67%).
For the fiscal year, our Fund returned +24.83%, slightly underperforming the Russell 2000 Value Index (+24.86%).
The table below presents our June quarter, one-year, five-year, and inception-to-date financial results. See the next page for a graph of performance since inception.
Standardized Returns as of June 30, 2017
| | | | | | | | | | | | | | | | |
| | | | | | | | | Annualized | |
| | | Quarter | | | 1 Year | | | 5 Years | | | Since Inception
(8/31/11) | |
| | | | |
Omni Small-Cap Value Fund | | | -0.77% | | | | 24.83% | | | | 14.17% | | | | 14.13% | |
Russell 2000 Value Index | | | 0.67% | | | | 24.86% | | | | 13.39% | | | | 13.52% | |
Performance figures quoted in the table above and the graph on the next page represent past performance and are no guarantee of future results. Total return figures in the table above include the reinvestment of dividends and capital gains. The table above and the graph on the next page do not reflect the deduction of taxes that a shareholder would pay on Fund distributions or on the redemption of Fund shares.
The Russell 2000 Value Index is an unmanaged index that consists of stocks in the Russell 2000 Index with lower price-to-book ratios and lower forecasted growth values with dividends reinvested. It is not possible to invest directly in an index. Periods longer than one year are annualized.
According to data from Lipper, Inc. as of June 30, 2017, Omni Small-Cap Value Fund ranked 58th of 295 small-cap value funds for the 12 months ended June 30, 2017, 50th of 222 over the last five years and 45th of 214 such funds since inception in August 2011. Lipper, Inc. is an independent mutual fund rating service that ranks funds in various fund categories by making comparative calculations using total returns.
| | |
Omni Small-Cap Value Fund MANAGER’S COMMENTARY (Unaudited) (continued) | |
|
Growth of a $10,000 Investment
from Inception August 31, 2011 to June 30, 2017
Detailed Explanation of Quarterly Performance
The Omni Small-Cap Value Fund is designed to capture the returns of the small-cap value asset class through broad diversification of small company and value stocks. This approach is sometimes referred to as “passive, asset class investing.” As of June 30, 2017, we held 665 such stocks in a market-cap weighted style. We make no attempt to track any particular index in either performance or statistics.
The Fund’s tilt toward deeper value stocks across multiple value metrics detracted from relative performance, as the deepest-value stocks, according to some metrics, significantly lagged the benchmark. The Fund’s tilt toward smaller stocks within the small-cap value universe helped relative returns, but not enough to offset the impact of the deeper value tilt.
By design, the Fund does not hold Utilities sector stocks and Real Estate Investment Trusts (REITs). This positioning hurt relative performance, as REITs and Utilities make up roughly 17% of the benchmark and outperformed the benchmark’s total returns. Our Fund’s higher weighting in Energy sector stocks also detracted from relative returns, as oil prices moved lower during the quarter amid oversupply concerns.
Detailed Explanation of Fiscal Year Performance
The Fund benefited from its focus on smaller stocks within the small-cap value universe, as smaller stocks were among the benchmark’s best performers during the fiscal year. A tilt toward deeper value stocks across multiple value metrics did not have a significant impact on relative performance.
A lack of exposure to Utilities sector stocks and REITs boosted relative results because Utilities stocks and REITs underperformed the benchmark during the fiscal year. The Fund’s higher weighting in Energy stocks detracted from relative performance.
| | |
| 4 | | Annual Report | June 30, 2017 |
| | |
Omni Small-Cap Value Fund MANAGER’S COMMENTARY (Unaudited) (continued) | |
|
Top Ten Holdings as of June 30, 2017
| | | | | | | | | |
| Rank | | Description | | Industry | | % of Net
Assets |
| 1 | | TTM Technologies, Inc. | | Information Technology | | 1.3% |
| 2 | | Stepan Co. | | Materials | | 1.0% |
| 3 | | Rush Enterprises, Inc., Class A | | Industrials | | 0.9% |
| 4 | | Central Garden & Pet Co., Class A | | Consumer Staples | | 0.9% |
| 5 | | Air Transport Services Group, Inc. | | Industrials | | 0.9% |
| 6 | | SkyWest, Inc. | | Industrials | | 0.7% |
| 7 | | Cooper-Standard Holding, Inc. | | Consumer Discretionary | | 0.7% |
| 8 | | Kraton Corp. | | Materials | | 0.7% |
| 9 | | Navigant Consulting, Inc. | | Industrials | | 0.7% |
| 10 | | ManTech International Corp., Class A | | Information Technology | | 0.6% |
| | Total | | | | 8.4% |
Industry Sector Representation as of June 30, 2017
| | | | | | | | | | | | | | | |
| | | % of Net Assets | | % of Russell 2000
Value Index | | Difference |
| Consumer Discretionary | | | | 17.2% | | | | | 10.7% | | | | | 6.5% | |
| Consumer Staples | | | | 3.2% | | | | | 2.8% | | | | | 0.4% | |
| Energy | | | | 8.1% | | | | | 6.1% | | | | | 2.0% | |
| Financials | | | | 32.5% | | | | | 30.6% | | | | | 1.9% | |
| Health Care | | | | 2.3% | | | | | 5.6% | | | | | -3.3% | |
| Industrials | | | | 19.2% | | | | | 11.7% | | | | | 7.5% | |
| Information Technology | | | | 9.1% | | | | | 9.5% | | | | | -0.4% | |
| Materials | | | | 6.2% | | | | | 4.1% | | | | | 2.1% | |
| Real Estate | | | | 0.3% | | | | | 11.6% | | | | | -11.3% | |
| Telecommunication Services | | | | 1.2% | | | | | 0.7% | | | | | 0.5% | |
| Utilities | | | | 0.0% | | | | | 6.6% | | | | | -6.6% | |
| Cash & Other Assets | | | | 0.7% | | | | | 0.0% | | | | | 0.7% | |
Total | | | | 100.0% | | | | | 100.0% | | | | | | |
Disclaimer
The views expressed here are exclusively those of Fund management. These views, including those related to market sectors or individual stocks, are not meant as investment advice and should not be considered predictive in nature. Any favorable (or unfavorable) description of a holding applies only as of the quarter end, June 30, 2017, unless otherwise stated. Security positions can and do change thereafter. Discussions of historical performance do not guarantee and may not be indicative of future performance.
Market volatility can significantly impact short-term performance. The Fund is not an appropriate investment for short-term investors. Investments in small companies generally carry greater risk than is customarily associated with larger companies. This additional risk is attributable to a number of factors, including the relatively limited financial resources that are typically available to small companies and the fact that small companies often have comparatively limited product lines. In addition, the stock of small companies tends to be more volatile than the stock of large companies, particularly in the short term and particularly in the early stages of an economic or market downturn. Shareholders of the Fund, therefore, are taking on more risk than they would if they invested in the stock market as a whole.
| | |
Omni Small-Cap Value Fund MANAGER’S COMMENTARY (Unaudited) (continued) | |
|
Conclusion
Thank you for your continued investment in Omni Small-Cap Value Fund. We encourage your feedback; your reactions and concerns are important to us.
Sincerely,
The Investment Management Team
| | |
| 6 | | Annual Report | June 30, 2017 |
| | |
Omni Small-Cap Value Fund SCHEDULE OF INVESTMENTS | |
|
Showing percentage of net assets as of June 30, 2017
| | | | | | | | |
| Industry Company | | | Shares | | | | Value | |
| |
| COMMON STOCKS - 99.31% | | | | | |
Consumer Discretionary - 17.17% | | | | | |
A.H. Belo Corp., Class A | | | 37,983 | | | $ | 208,907 | |
Abercrombie & Fitch Co., Class A+ | | | 124,000 | | | | 1,542,560 | |
Adtalem Global Education, Inc.+ | | | 22,900 | | | | 869,055 | |
AMCON Distributing Co. | | | 1,350 | | | | 140,535 | |
American Axle & Manufacturing Holdings, Inc.*+ | | | 105,000 | | | | 1,638,000 | |
American Public Education, Inc.* | | | 32,800 | | | | 775,720 | |
Appliance Recycling Centers of America, Inc.* | | | 2,900 | | | | 2,320 | |
Ascent Capital Group, Inc., Class A*+ | | | 17,000 | | | | 261,120 | |
AV Homes, Inc.*+ | | | 52,300 | | | | 1,048,615 | |
Barnes & Noble Education, Inc.* | | | 64,824 | | | | 689,079 | |
Barnes & Noble, Inc. | | | 112,000 | | | | 851,200 | |
Bassett Furniture Industries, Inc. | | | 80,500 | | | | 3,054,975 | |
Beasley Broadcast Group, Inc., Class A+ | | | 2,500 | | | | 24,500 | |
Beazer Homes USA, Inc.* | | | 70,000 | | | | 960,400 | |
Big 5 Sporting Goods Corp.+ | | | 132,345 | | | | 1,727,102 | |
Biglari Holdings, Inc.* | | | 1,600 | | | | 639,584 | |
Black Diamond, Inc.*+ | | | 23,300 | | | | 154,945 | |
Boot Barn Holdings, Inc.*+ | | | 54,000 | | | | 382,320 | |
Caesars Entertainment Corp.*+ | | | 126,600 | | | | 1,519,200 | |
CafePress, Inc.* | | | 43,400 | | | | 112,406 | |
Caleres, Inc. | | | 88,500 | | | | 2,458,530 | |
Century Casinos, Inc.* | | | 59,600 | | | | 439,252 | |
Chico’s FAS, Inc. | | | 121,000 | | | | 1,139,820 | |
Children’s Place, Inc. (The)+ | | | 20,200 | | | | 2,062,420 | |
China Automotive Systems, Inc.*+ | | | 20,400 | | | | 98,736 | |
China XD Plastics Co., Ltd.*+ | | | 163,000 | | | | 766,100 | |
Christopher & Banks Corp.* | | | 27,700 | | | | 36,287 | |
Citi Trends, Inc.+ | | | 53,900 | | | | 1,143,758 | |
Conn’s, Inc.*+ | | | 30,000 | | | | 573,000 | |
Container Store Group, Inc. (The)*+ | | | 12,000 | | | | 71,040 | |
Cooper-Standard Holding, Inc.* | | | 51,000 | | | | 5,144,370 | |
Crown Crafts, Inc.+ | | | 13,050 | | | | 90,045 | |
CSS Industries, Inc. | | | 53,100 | | | | 1,389,096 | |
Del Frisco’s Restaurant Group, Inc.* | | | 49,700 | | | | 800,170 | |
Del Taco Restaurants, Inc.*+ | | | 102,300 | | | | 1,406,625 | |
| | | | | | | | |
| Industry Company | | | Shares | | | | Value | |
| | | | | | | | |
Consumer Discretionary (continued) | | | | | |
Delta Apparel, Inc.*+ | | | 25,500 | | | $ | 565,590 | |
Destination Maternity Corp.* | | | 9,800 | | | | 31,752 | |
DSW, Inc., Class A+ | | | 55,000 | | | | 973,500 | |
E.W. Scripps Co., Class A (The)* | | | 80,000 | | | | 1,424,800 | |
El Pollo Loco Holdings, Inc.*+ | | | 35,000 | | | | 484,750 | |
Eldorado Resorts, Inc.*+ | | | 15,000 | | | | 300,000 | |
Entercom Communications Corp., Class A+ | | | 220,225 | | | | 2,279,329 | |
Eros International PLC*+ | | | 51,300 | | | | 587,385 | |
EVINE Live, Inc.* | | | 162,700 | | | | 162,700 | |
Express, Inc.* | | | 60,000 | | | | 405,000 | |
Finish Line, Inc. (The), Class A+ | | | 53,600 | | | | 759,512 | |
Flanigan’s Enterprises, Inc. | | | 2,500 | | | | 72,500 | |
Flexsteel Industries, Inc. | | | 17,000 | | | | 919,870 | |
Fogo De Chao, Inc.*+ | | | 45,000 | | | | 625,500 | |
Fossil Group, Inc.*+ | | | 20,000 | | | | 207,000 | |
Fred’s, Inc., Class A+ | | | 133,600 | | | | 1,233,128 | |
FTD Cos., Inc.* | | | 25,380 | | | | 507,600 | |
Full House Resorts, Inc.* | | | 56,000 | | | | 136,640 | |
Gannett Co., Inc. | | | 160,000 | | | | 1,395,200 | |
Genesco, Inc.* | | | 27,200 | | | | 922,080 | |
Golden Entertainment, Inc.*+ | | | 40,000 | | | | 828,400 | |
Good Times Restaurants, Inc.*+ | | | 1,500 | | | | 5,325 | |
Gray Television, Inc.* | | | 148,700 | | | | 2,037,190 | |
Group 1 Automotive, Inc. | | | 44,000 | | | | 2,786,080 | |
Guess?, Inc.+ | | | 99,100 | | | | 1,266,498 | |
Haverty Furniture Cos., Inc. | | | 73,400 | | | | 1,842,340 | |
Hooker Furniture Corp. | | | 15,000 | | | | 617,250 | |
Iconix Brand Group, Inc.* | | | 70,000 | | | | 483,700 | |
International Speedway Corp., Class A | | | 76,456 | | | | 2,870,923 | |
Intrawest Resorts Holdings, Inc.*+ | | | 79,300 | | | | 1,882,582 | |
J Alexander’s Holdings, Inc.* | | | 10,000 | | | | 122,500 | |
Johnson Outdoors, Inc., Class A | | | 32,779 | | | | 1,580,276 | |
K12, Inc.* | | | 91,350 | | | | 1,636,992 | |
KB Home+ | | | 175,900 | | | | 4,216,323 | |
Lakeland Industries, Inc.* | | | 16,000 | | | | 232,000 | |
Libbey, Inc. | | | 15,000 | | | | 120,900 | |
Liberty Tax, Inc.+ | | | 9,500 | | | | 123,025 | |
Lifetime Brands, Inc.+ | | | 60,900 | | | | 1,105,335 | |
Lincoln Educational Services Corp.*+ | | | 91,900 | | | | 284,890 | |
Luby’s, Inc.* | | | 156,900 | | | | 440,889 | |
M/I Homes, Inc.* | | | 48,000 | | | | 1,370,400 | |
| | |
Omni Small-Cap Value Fund SCHEDULE OF INVESTMENTS (continued) | |
|
Showing percentage of net assets as of June 30, 2017
| | | | | | | | |
| Industry Company | | | Shares | | | | Value | |
| Common Stocks (continued) | |
Consumer Discretionary (continued) | |
Marcus Corp. (The) | | | 130,150 | | | $ | 3,930,530 | |
McClatchy Co. (The), Class A*+ | | | 15,432 | | | | 144,135 | |
MDC Holdings, Inc. | | | 75,000 | | | | 2,649,750 | |
Modine Manufacturing Co.* | | | 142,900 | | | | 2,364,995 | |
Movado Group, Inc. | | | 30,000 | | | | 757,500 | |
NACCO Industries, Inc., Class A | | | 13,045 | | | | 924,238 | |
Nevada Gold & Casinos, Inc.*+ | | | 35,300 | | | | 79,072 | |
New Home Co. Inc., (The)* | | | 10,000 | | | | 114,700 | |
New Media Investment Group, Inc. | | | 93,300 | | | | 1,257,684 | |
New York & Co., Inc.*+ | | | 126,700 | | | | 174,846 | |
P&F Industries, Inc., Class A | | | 696 | | | | 4,253 | |
Party City Holdco, Inc.*+ | | | 180,200 | | | | 2,820,130 | |
Peak Resorts, Inc.+ | | | 104,000 | | | | 426,400 | |
Perry Ellis International, Inc.* | | | 138,100 | | | | 2,687,426 | |
PICO Holdings, Inc.* | | | 25,000 | | | | 437,500 | |
Pier 1 Imports, Inc. | | | 196,200 | | | | 1,018,278 | |
Reading International, Inc., Class A* | | | 31,209 | | | | 503,401 | |
Red Lion Hotels Corp.* | | | 43,905 | | | | 322,702 | |
Regis Corp.*+ | | | 168,150 | | | | 1,726,900 | |
Rent-A-Center, Inc.+ | | | 2,000 | | | | 23,440 | |
Rocky Brands, Inc. | | | 24,300 | | | | 326,835 | |
Ruby Tuesday, Inc.* | | | 125,300 | | | | 251,853 | |
Saga Communications, Inc., Class A | | | 6,765 | | | | 309,499 | |
Salem Media Group, Inc.+ | | | 83,452 | | | | 592,509 | |
Scholastic Corp. | | | 72,800 | | | | 3,173,352 | |
Shiloh Industries, Inc.*+ | | | 36,500 | | | | 428,510 | |
Shoe Carnival, Inc.+ | | | 63,600 | | | | 1,327,968 | |
Sonic Automotive, Inc., Class A | | | 74,500 | | | | 1,449,025 | |
SORL Auto Parts, Inc.*+ | | | 129,900 | | | | 867,732 | |
SPAR Group, Inc.* | | | 1,500 | | | | 1,500 | |
Speedway Motorsports, Inc. | | | 120,800 | | | | 2,207,016 | |
Stein Mart, Inc.+ | | | 53,000 | | | | 89,570 | |
Stoneridge, Inc.* | | | 25,000 | | | | 385,250 | |
Strattec Security Corp.+ | | | 1,300 | | | | 46,020 | |
Superior Industries International, Inc. | | | 115,400 | | | | 2,371,470 | |
Tandy Leather Factory, Inc.*+ | | | 8,000 | | | | 71,200 | |
Tilly’s, Inc., Class A | | | 88,300 | | | | 896,245 | |
Time, Inc. | | | 114,350 | | | | 1,640,922 | |
Tower International, Inc. | | | 47,000 | | | | 1,055,150 | |
Townsquare Media, Inc., Class A* | | | 185,556 | | | | 1,900,093 | |
TravelCenters of America LLC* | | | 179,400 | | | | 735,540 | |
| | | | | | | | |
| Industry Company | | | Shares | | | | Value | |
Consumer Discretionary (continued) | |
UCP, Inc., Class A*+ | | | 18,200 | | | $ | 199,290 | |
Unifi, Inc.* | | | 11,900 | | | | 366,520 | |
Urban One, Inc.*+ | | | 800 | | | | 1,800 | |
Vera Bradley, Inc.* | | | 20,000 | | | | 195,600 | |
Vitamin Shoppe, Inc.* | | | 35,000 | | | | 407,750 | |
VOXX International Corp.*+ | | | 67,100 | | | | 550,220 | |
West Marine, Inc.+ | | | 42,400 | | | | 544,840 | |
Weyco Group, Inc. | | | 10,200 | | | | 284,376 | |
William Lyon Homes, Class A*+ | | | 30,000 | | | | 724,200 | |
ZAGG, Inc.* | | | 145,700 | | | | 1,260,305 | |
Zumiez, Inc.* | | | 69,000 | | | | 852,150 | |
| | | | | | | | |
| | | | | | 121,951,636 | |
Consumer Staples - 3.15% | |
Alico, Inc. | | | 6,800 | | | | 212,840 | |
Andersons, Inc. (The) | | | 88,100 | | | | 3,008,615 | |
Central Garden & Pet Co., Class A* | | | 220,003 | | | | 6,604,490 | |
Dean Foods Co.+ | | | 10,000 | | | | 170,000 | |
Ingles Markets, Inc., Class A | | | 59,800 | | | | 1,991,340 | |
Landec Corp.* | | | 9,000 | | | | 133,650 | |
Mannatech, Inc.+ | | | 8,400 | | | | 133,560 | |
Natural Alternatives International, Inc.* | | | 18,100 | | | | 181,000 | |
Nutraceutical International Corp. | | | 28,700 | | | | 1,195,355 | |
Omega Protein Corp. | | | 123,750 | | | | 2,215,125 | |
S&W Seed Co.*+ | | | 20,000 | | | | 83,000 | |
Seneca Foods Corp., Class A*+ | | | 40,100 | | | | 1,245,105 | |
SpartanNash Co. | | | 145,946 | | | | 3,788,758 | |
Village Super Market, Inc., Class A | | | 1,709 | | | | 44,297 | |
Weis Markets, Inc. | | | 28,525 | | | | 1,389,738 | |
| | | | | | | | |
| | | | | | 22,396,873 | |
Energy - 8.09% | |
Adams Resources & Energy, Inc.+ | | | 23,100 | | | | 948,948 | |
Alon USA Energy, Inc. | | | 101,350 | | | | 1,349,982 | |
Approach Resources, Inc.*+ | | | 120,726 | | | | 406,847 | |
Archrock, Inc. | | | 100,000 | | | | 1,140,000 | |
Ardmore Shipping Corp.+ | | | 99,700 | | | | 812,555 | |
Atwood Oceanics, Inc.*+ | | | 230,000 | | | | 1,874,500 | |
Bill Barrett Corp.* | | | 180,500 | | | | 554,135 | |
Bristow Group, Inc.+ | | | 65,500 | | | | 501,075 | |
Callon Petroleum Co.* | | | 215,000 | | | | 2,281,150 | |
Clean Energy Fuels Corp.*+ | | | 115,000 | | | | 292,100 | |
Cloud Peak Energy, Inc.* | | | 47,300 | | | | 166,969 | |
Dawson Geophysical Co.*+ | | | 45,000 | | | | 176,400 | |
| | |
| 8 | | Annual Report | June 30, 2017 |
| | |
Omni Small-Cap Value Fund SCHEDULE OF INVESTMENTS (continued) | |
|
Showing percentage of net assets as of June 30, 2017
| | | | | | | | |
Industry Company | | | Shares | | | | Value | |
| |
| Common Stocks (continued) | | | | | |
Energy (continued) | | | | | |
Delek US Holdings, Inc.+ | | | 90,000 | | | $ | 2,379,600 | |
Denbury Resources, Inc.* | | | 479,500 | | | | 733,635 | |
DHT Holdings, Inc.+ | | | 221,722 | | | | 920,146 | |
Dorian LPG, Ltd.*+ | | | 183,500 | | | | 1,501,030 | |
ENGlobal Corp.* | | | 60,422 | | | | 78,549 | |
EP Energy Corp., Class A*+ | | | 350,000 | | | | 1,281,000 | |
Era Group, Inc.*+ | | | 45,800 | | | | 433,268 | |
Exterran Corp.* | | | 35,000 | | | | 934,500 | |
Forum Energy Technologies, Inc.* | | | 148,310 | | | | 2,313,636 | |
GasLog Ltd.+ | | | 199,300 | | | | 3,039,325 | |
Gran Tierra Energy, Inc.*+ | | | 147,100 | | | | 329,504 | |
Green Plains, Inc. | | | 90,200 | | | | 1,853,610 | |
Gulf Island Fabrication, Inc.+ | | | 30,403 | | | | 352,675 | |
Hallador Energy Co.+ | | | 70,000 | | | | 543,900 | |
Helix Energy Solutions Group, Inc.* | | | 40,000 | | | | 225,600 | |
Independence Contract Drilling, Inc.*+ | | | 83,319 | | | | 324,111 | |
International Seaways, Inc.* | | | 438 | | | | 9,491 | |
Matador Resources Co.*+ | | | 95,000 | | | | 2,030,150 | |
McDermott International, Inc.* | | | 538,400 | | | | 3,860,328 | |
Mitcham Industries, Inc.*+ | | | 28,700 | | | | 114,226 | |
Natural Gas Services Group, Inc.* | | | 68,800 | | | | 1,709,680 | |
Navios Maritime Acquisition Corp. | | | 387,400 | | | | 569,478 | |
New Concept Energy, Inc.*+ | | | 4,800 | | | | 6,528 | |
Newpark Resources, Inc.* | | | 101,500 | | | | 746,025 | |
North Atlantic Drilling, Ltd.*+ | | | 100,000 | | | | 133,000 | |
Oasis Petroleum, Inc.* | | | 237,000 | | | | 1,907,850 | |
Oil States International, Inc.* | | | 18,000 | | | | 488,700 | |
Overseas Shipholding Group, Inc., Class A* | | | 16 | | | | 43 | |
Pacific Drilling SA*+ | | | 73,700 | | | | 126,027 | |
Parker Drilling Co.* | | | 490,500 | | | | 662,175 | |
Pioneer Energy Services Corp.* | | | 198,300 | | | | 406,515 | |
Renewable Energy Group, Inc.* | | | 163,885 | | | | 2,122,311 | |
REX American Resources Corp.* | | | 33,920 | | | | 3,275,315 | |
Ring Energy, Inc.*+ | | | 50,000 | | | | 650,000 | |
Scorpio Tankers, Inc.+ | | | 200,000 | | | | 794,000 | |
SEACOR Holdings, Inc.* | | | 45,900 | | | | 1,574,370 | |
SEACOR Marine Holdings, Inc.* | | | 46,148 | | | | 939,573 | |
Ship Finance International, Ltd.+ | | | 185,000 | | | | 2,516,000 | |
| | | | | | | | |
Industry Company | | | Shares | | | | Value | |
| | | | | | | | |
Energy (continued) | | | | | | | | |
SM Energy Co.+ | | | 12,000 | | | $ | 198,360 | |
SRC Energy, Inc.*+ | | | 110,000 | | | | 740,300 | |
Teekay Corp.+ | | | 165,000 | | | | 1,100,550 | |
Teekay Tankers, Ltd., Class A+ | | | 304,800 | | | | 573,024 | |
TransAtlantic Petroleum, Ltd.* | | | 15,000 | | | | 18,000 | |
Unit Corp.* | | | 132,625 | | | | 2,484,066 | |
| | | | | | | | |
| | | | | | | 57,504,835 | |
| | |
Financials - 32.53% | | | | | | | | |
1347 Property Insurance Holdings, Inc.*+ | | | 24,300 | | | | 194,400 | |
1st Constitution Bancorp+ | | | 3,000 | | | | 53,250 | |
1st Source Corp. | | | 59,347 | | | | 2,845,095 | |
Access National Corp.+ | | | 31,191 | | | | 827,185 | |
ACNB Corp.+ | | | 1,000 | | | | 30,500 | |
Ambac Financial Group, Inc.* | | | 69,000 | | | | 1,197,150 | |
American Equity Investment Life Holding Co. | | | 850 | | | | 22,338 | |
American National Bankshares, Inc. | | | 21,800 | | | | 805,510 | |
American River Bankshares | | | 21,300 | | | | 309,063 | |
AMERISAFE, Inc. | | | 1,800 | | | | 102,510 | |
AmeriServ Financial, Inc.+ | | | 5,000 | | | | 20,750 | |
Argo Group International Holdings Ltd. | | | 39,160 | | | | 2,373,096 | |
Arlington Asset Investment Corp., Class A+ | | | 45,300 | | | | 619,251 | |
Asta Funding, Inc.*+ | | | 20,000 | | | | 164,000 | |
Atlantic Capital Bancshares, Inc.* | | | 52,300 | �� | | | 993,700 | |
Atlantic Coast Financial Corp.* | | | 1,000 | | | | 7,990 | |
B. Riley Financial, Inc. | | | 10,402 | | | | 192,957 | |
Baldwin & Lyons, Inc., Class B | | | 75,300 | | | | 1,844,850 | |
Banc of California, Inc.+ | | | 70,000 | | | | 1,505,000 | |
Banco Latinoamericano de Comercio Exterior SA, Class E | | | 70,000 | | | | 1,916,600 | |
Bank of Commerce Holdings+ | | | 83,450 | | | | 922,123 | |
Bankwell Financial Group, Inc. | | | 13,300 | | | | 415,359 | |
Bar Harbor Bankshares+ | | | 18,366 | | | | 566,040 | |
Bay Bancorp, Inc.*+ | | | 25,000 | | | | 191,250 | |
BCB Bancorp, Inc.+ | | | 10,400 | | | | 159,120 | |
Bear State Financial, Inc.+ | | | 5,000 | | | | 47,300 | |
Berkshire Hills Bancorp, Inc. | | | 80,565 | | | | 2,831,860 | |
| | |
Omni Small-Cap Value Fund SCHEDULE OF INVESTMENTS (continued) | |
|
Showing percentage of net assets as of June 30, 2017
| | | | | | | | |
| Industry Company | | | Shares | | | | Value | |
| | |
Common Stocks (continued) | | | | | | | | |
Financials (continued) | | | | | | | | |
Blue Capital Reinsurance Holdings, Ltd.+ | | | 12,173 | | | $ | 222,766 | |
BofI Holding, Inc.*+ | | | 70,000 | | | | 1,660,400 | |
C&F Financial Corp.+ | | | 2,200 | | | | 103,180 | |
Camden National Corp. | | | 20,100 | | | | 862,491 | |
Capital City Bank Group, Inc. | | | 83,150 | | | | 1,697,923 | |
CB Financial Services, Inc. | | | 14,000 | | | | 365,400 | |
Central Pacific Financial Corp. | | | 25,000 | | | | 786,750 | |
Central Valley Community Bancorp | | | 50,000 | | | | 1,108,000 | |
Century Bancorp, Inc., Class A | | | 15,200 | | | | 966,720 | |
Charter Financial Corp. | | | 17,500 | | | | 315,000 | |
Chemung Financial Corp.+ | | | 13,500 | | | | 551,880 | |
Citizens Community Bancorp, Inc.+ | | | 15,000 | | | | 209,700 | |
Citizens, Inc.*+ | | | 106,040 | | | | 782,575 | |
Civista Bancshares, Inc.+ | | | 21,500 | | | | 448,920 | |
CNB Financial Corp. | | | 83,800 | | | | 2,008,686 | |
Coastway Bancorp, Inc.*+ | | | 1,513 | | | | 31,168 | |
Codorus Valley Bancorp, Inc.+ | | | 7,398 | | | | 210,116 | |
Commerce Union Bancshares, Inc.+ | | | 2,500 | | | | 59,675 | |
Community Bankers Trust Corp.*+ | | | 40,800 | | | | 336,600 | |
Community Financial Corp. (The)+ | | | 12,500 | | | | 481,250 | |
Community Trust Bancorp, Inc. | | | 17,500 | | | | 765,625 | |
ConnectOne Bancorp, Inc. | | | 43,000 | | | | 969,650 | |
Consumer Portfolio Services, Inc.* | | | 142,000 | | | | 646,100 | |
County Bancorp, Inc. | | | 8,237 | | | | 197,688 | |
Crawford & Co., Class A+ | | | 11,600 | | | | 90,248 | |
Customers Bancorp, Inc.* | | | 36,500 | | | | 1,032,220 | |
DNB Financial Corp.+ | | | 465 | | | | 15,950 | |
Donegal Group, Inc., Class A | | | 64,000 | | | | 1,017,600 | |
Eagle Bancorp Montana, Inc. | | | 3,000 | | | | 54,300 | |
eHealth, Inc.* | | | 15,000 | | | | 282,000 | |
EMC Insurance Group, Inc. | | | 46,550 | | | | 1,293,159 | |
Employers Holdings, Inc.+ | | | 91,300 | | | | 3,861,990 | |
Encore Capital Group, Inc.*+ | | | 48,500 | | | | 1,947,275 | |
Enova International, Inc.* | | | 66,307 | | | | 984,659 | |
Entegra Financial Corp.*+ | | | 13,200 | | | | 300,300 | |
Enterprise Bancorp, Inc.+ | | | 38,775 | | | | 1,378,064 | |
Enterprise Financial Services Corp. | | | 27,700 | | | | 1,130,160 | |
| | | | | | | | |
Industry Company | | | Shares | | | | Value | |
| | | | | | | | |
Financials (continued) | | | | | | | | |
ESSA Bancorp, Inc.+ | | | 33,100 | | | $ | 487,232 | |
Evans Bancorp, Inc.+ | | | 4,000 | | | | 159,800 | |
EZCORP, Inc., Class A* | | | 102,169 | | | | 786,701 | |
Farmers Capital Bank Corp. | | | 34,400 | | | | 1,326,120 | |
Farmers National Banc Corp. | | | 150 | | | | 2,175 | |
FBL Financial Group, Inc., Class A+ | | | 50,806 | | | | 3,124,569 | |
Federal Agricultural Mortgage Corp., Class C | | | 24,000 | | | | 1,552,800 | |
Federated National Holding Co.+ | | | 37,288 | | | | 596,608 | |
Fidelity & Guaranty Life+ | | | 60,800 | | | | 1,887,840 | |
Fidelity Southern Corp. | | | 57,623 | | | | 1,317,262 | |
Financial Institutions, Inc. | | | 39,300 | | | | 1,171,140 | |
First BanCorp Puerto Rico* | | | 476,500 | | | | 2,758,935 | |
First BanCorp Southern Pines NC+ | | | 114,988 | | | | 3,594,525 | |
First Bancorp, Inc.+ | | | 9,045 | | | | 244,758 | |
First Bancshares, Inc. (The)+ | | | 14,900 | | | | 411,240 | |
First Business Financial Services, Inc.+ | | | 16,000 | | | | 369,280 | |
First Commonwealth Financial Corp. | | | 158,300 | | | | 2,007,244 | |
First Community Bancshares, Inc. | | | 44,000 | | | | 1,203,400 | |
First Community Corp.+ | | | 600 | | | | 12,600 | |
First Connecticut Bancorp, Inc.+ | | | 2,100 | | | | 53,865 | |
First Financial Corp. | | | 37,000 | | | | 1,750,100 | |
First Financial Northwest, Inc. | | | 35,182 | | | | 567,486 | |
First Guaranty Bancshares, Inc.+ | | | 5,000 | | | | 136,200 | |
First Internet Bancorp+ | | | 14,500 | | | | 406,725 | |
First Interstate BancSystem, Inc., Class A | | | 2,633 | | | | 97,948 | |
First Midwest Bancorp, Inc. | | | 129,000 | | | | 3,006,990 | |
First of Long Island Corp. (The) | | | 18,000 | | | | 514,800 | |
First South Bancorp, Inc.+ | | | 25,000 | | | | 413,500 | |
First United Corp.* | | | 6,626 | | | | 99,059 | |
First US Bancshares, Inc. | | | 4,368 | | | | 49,009 | |
FirstCash, Inc. | | | 42,788 | | | | 2,494,540 | |
Flushing Financial Corp. | | | 44,297 | | | | 1,248,732 | |
FNFV Group* | | | 126,700 | | | | 2,001,860 | |
GAIN Capital Holdings, Inc.+ | | | 139,805 | | | | 870,985 | |
GAMCO Investors, Inc., Class A+ | | | 10,000 | | | | 296,000 | |
Great Southern Bancorp, Inc. | | | 26,900 | | | | 1,439,150 | |
| | |
| 10 | | Annual Report | June 30, 2017 |
| | |
Omni Small-Cap Value Fund SCHEDULE OF INVESTMENTS (continued) | |
|
Showing percentage of net assets as of June 30, 2017
| | | | | | | | |
| Industry Company | | | Shares | | | | Value | |
| | |
Common Stocks (continued) | | | | | | | | |
Financials (continued) | | | | | | | | |
Green Bancorp, Inc.*+ | | | 52,000 | | | $ | 1,008,800 | |
Green Dot Corp., Class A* | | | 84,600 | | | | 3,259,638 | |
Hallmark Financial Services, Inc.* | | | 57,800 | | | | 651,406 | |
HCI Group, Inc.+ | | | 40,400 | | | | 1,897,992 | |
Heartland Financial USA, Inc. | | | 64,600 | | | | 3,042,660 | |
Heritage Financial Corp.+ | | | 69,860 | | | | 1,851,290 | |
Heritage Insurance Holdings, Inc.+ | | | 35,000 | | | | 455,700 | |
Hingham Institution for Savings+ | | | 30 | | | | 5,458 | |
HMN Financial, Inc.* | | | 23,800 | | | | 427,210 | |
Home Bancorp, Inc. | | | 31,994 | | | | 1,360,385 | |
HomeStreet, Inc.* | | | 57,000 | | | | 1,577,475 | |
HomeTrust Bancshares, Inc.* | | | 2,961 | | | | 72,248 | |
HopFed Bancorp, Inc.+ | | | 18,100 | | | | 266,251 | |
Horace Mann Educators Corp. | | | 93,600 | | | | 3,538,080 | |
Horizon Bancorp | | | 4,725 | | | | 124,504 | |
Independence Holding Co.+ | | | 15,050 | | | | 307,772 | |
Independent Bank Group, Inc. | | | 16,900 | | | | 1,005,550 | |
Infinity Property & Casualty Corp. | | | 20,900 | | | | 1,964,600 | |
International Bancshares Corp. | | | 65,687 | | | | 2,302,329 | |
Investar Holding Corp.+ | | | 22,000 | | | | 503,800 | |
Investment Technology Group, Inc. | | | 57,050 | | | | 1,211,742 | |
Investors Title Co.+ | | | 1,000 | | | | 193,440 | |
James River Group Holdings, Ltd. | | | 70,600 | | | | 2,804,938 | |
JMP Group LLC+ | | | 300 | | | | 1,638 | |
Kansas City Life Insurance Co.+ | | | 7,000 | | | | 346,500 | |
KCG Holdings, Inc., Class A* | | | 159,500 | | | | 3,180,430 | |
Kingstone Cos., Inc.+ | | | 12,100 | | | | 185,130 | |
Lakeland Bancorp, Inc. | | | 102,050 | | | | 1,923,642 | |
Landmark Bancorp, Inc.+ | | | 1,102 | | | | 33,942 | |
LegacyTexas Financial Group, Inc. | | | 10,000 | | | | 381,300 | |
Mackinac Financial Corp.+ | | | 15,800 | | | | 221,200 | |
Maiden Holdings, Ltd. | | | 219,500 | | | | 2,436,450 | |
MainSource Financial Group, Inc. | | | 67,610 | | | | 2,265,611 | |
Marlin Business Services Corp.+ | | | 10,580 | | | | 266,087 | |
MBT Financial Corp. | | | 60,322 | | | | 585,123 | |
Mercantile Bank Corp. | | | 44,100 | | | | 1,388,268 | |
Meta Financial Group, Inc. | | | 16,477 | | | | 1,466,453 | |
| | | | | | | | |
| Industry Company | | | Shares | | | | Value | |
| | | | | | | | |
Financials (continued) | | | | | | | | |
Mid Penn Bancorp, Inc.+ | | | 12,300 | | | $ | 337,635 | |
Midland States Bancorp, Inc. | | | 22,658 | | | | 759,496 | |
MidSouth Bancorp, Inc.+ | | | 17,000 | | | | 199,750 | |
MidWestOne Financial Group, Inc. | | | 24,860 | | | | 842,505 | |
MMA Capital Management, LLC* | | | 500 | | | | 11,050 | |
MutualFirst Financial, Inc. | | | 18,900 | | | | 674,730 | |
National Bankshares, Inc.+ | | | 2,500 | | | | 102,000 | |
National Commerce Corp.*+ | | | 5,400 | | | | 213,570 | |
National Security Group, Inc. (The)+ | | | 200 | | | | 2,852 | |
National Western Life Group, Inc., Class A+ | | | 7,614 | | | | 2,433,587 | |
Nationstar Mortgage Holdings, Inc.*+ | | | 170,000 | | | | 3,041,300 | |
Navigators Group, Inc. (The) | | | 74,700 | | | | 4,101,030 | |
NBT Bancorp, Inc. | | | 10,000 | | | | 369,500 | |
Nelnet, Inc., Class A | | | 37,800 | | | | 1,776,978 | |
NewStar Financial, Inc. | | | 40,000 | | | | 420,000 | |
Nicholas Financial, Inc.*+ | | | 43,400 | | | | 400,582 | |
Nicolet Bankshares, Inc.* | | | 1,355 | | | | 74,132 | |
NMI Holdings, Inc., Class A* | | | 250,000 | | | | 2,862,500 | |
Northeast Bancorp+ | | | 12,500 | | | | 254,375 | |
Northrim BanCorp, Inc. | | | 30,445 | | | | 925,528 | |
Ocwen Financial Corp.*+ | | | 61,500 | | | | 165,435 | |
OFG Bancorp | | | 99,200 | | | | 992,000 | |
Old Line Bancshares, Inc. | | | 50 | | | | 1,409 | |
Old Second Bancorp, Inc. | | | 54,750 | | | | 632,362 | |
OneBeacon Insurance Group Ltd., Class A | | | 163,900 | | | | 2,987,897 | |
Oppenheimer Holdings, Inc., Class A | | | 31,093 | | | | 509,925 | |
Opus Bank+ | | | 1,500 | | | | 36,300 | |
Orrstown Financial Services, Inc. | | | 35,500 | | | | 811,175 | |
Pacific Continental Corp. | | | 55,500 | | | | 1,418,025 | |
Pacific Premier Bancorp, Inc.* | | | 28,524 | | | | 1,052,536 | |
Park Sterling Corp. | | | 248,817 | | | | 2,955,946 | |
Parke Bancorp, Inc.+ | | | 7,863 | | | | 176,131 | |
Pathfinder Bancorp, Inc. | | | 3,000 | | | | 47,250 | |
Peapack Gladstone Financial Corp. | | | 6,894 | | | | 215,713 | |
Penns Woods Bancorp, Inc.+ | | | 1,000 | | | | 41,180 | |
Peoples Bancorp of North Carolina, Inc.+ | | | 4,800 | | | | 151,680 | |
Peoples Bancorp, Inc. | | | 43,400 | | | | 1,394,442 | |
PHH Corp.* | | | 105,050 | | | | 1,446,538 | |
Piper Jaffray Cos. | | | 35,500 | | | | 2,128,225 | |
| | |
Omni Small-Cap Value Fund SCHEDULE OF INVESTMENTS (continued) | |
|
Showing percentage of net assets as of June 30, 2017
| | | | | | | | |
| Industry Company | | | Shares | | | | Value | |
| Common Stocks (continued) | |
Financials (continued) | |
Premier Financial Bancorp, Inc.+ | | | 27,720 | | | $ | 571,309 | |
Provident Financial Holdings, Inc. | | | 51,000 | | | | 981,750 | |
Provident Financial Services, Inc. | | | 69,700 | | | | 1,768,986 | |
QCR Holdings, Inc. | | | 2,000 | | | | 94,800 | |
Regional Management Corp.*+ | | | 43,100 | | | | 1,018,453 | |
Renasant Corp. | | | 97,046 | | | | 4,244,792 | |
Republic Bancorp, Inc., Class A | | | 38,642 | | | | 1,379,519 | |
Riverview Bancorp, Inc.+ | | | 87,000 | | | | 577,680 | |
S&T Bancorp, Inc. | | | 40,045 | | | | 1,436,014 | |
Safety Insurance Group, Inc. | | | 32,000 | | | | 2,185,600 | |
Salisbury Bancorp, Inc. | | | 1,183 | | | | 49,035 | |
Sandy Spring Bancorp, Inc. | | | 7,400 | | | | 300,884 | |
SB Financial Group, Inc.+ | | | 28,400 | | | | 482,516 | |
Security National Financial Corp., Class A* | | | 86,301 | | | | 552,326 | |
Selective Insurance Group, Inc. | | | 65,950 | | | | 3,300,798 | |
Shore Bancshares, Inc. | | | 67,012 | | | | 1,102,347 | |
SI Financial Group, Inc. | | | 55,700 | | | | 896,770 | |
Sierra Bancorp | | | 77,800 | | | | 1,909,990 | |
Southern National Bancorp of Virginia, Inc.+ | | | 47,866 | | | | 842,438 | |
State Auto Financial Corp. | | | 80,550 | | | | 2,072,552 | |
State National Cos, Inc. | | | 25,000 | | | | 459,500 | |
Stewart Information Services Corp. | | | 87,150 | | | | 3,954,867 | |
Stonegate Bank | | | 44,100 | | | | 2,036,538 | |
Summit Financial Group, Inc.+ | | | 22,015 | | | | 484,330 | |
Sussex Bancorp+ | | | 15,000 | | | | 371,250 | |
Territorial Bancorp, Inc. | | | 21,200 | | | | 661,228 | |
Third Point Reinsurance Ltd.*+ | | | 70,000 | | | | 973,000 | |
Timberland Bancorp, Inc.+ | | | 39,000 | | | | 985,530 | |
Tiptree, Inc.+ | | | 10,000 | | | | 70,500 | |
TowneBank | | | 1,642 | | | | 50,574 | |
TriCo Bancshares | | | 600 | | | | 21,090 | |
TriState Capital Holdings, Inc.* | | | 61,900 | | | | 1,559,880 | |
Triumph Bancorp, Inc.* | | | 20,000 | | | | 491,000 | |
TrustCo Bank Corp. | | | 5,000 | | | | 38,750 | |
Two River Bancorp+ | | | 29,505 | | | | 548,498 | |
Union Bankshares Corp. | | | 60,966 | | | | 2,066,747 | |
United Bankshares, Inc.+ | | | 17,750 | | | | 695,800 | |
| | | | | | | | |
| Industry Company | | | Shares | | | | Value | |
|
Financials (continued) | |
United Community Bancorp+ | | | 11,800 | | | $ | 231,280 | |
United Community Financial Corp. | | | 324 | | | | 2,692 | |
United Fire Group, Inc. | | | 78,800 | | | | 3,471,928 | |
United Insurance Holdings Corp. | | | 60,000 | | | | 943,800 | |
Universal Insurance Holdings, Inc.+ | | | 86,316 | | | | 2,175,163 | |
Univest Corp. of Pennsylvania | | | 92,764 | | | | 2,778,282 | |
Veritex Holdings, Inc.* | | | 30,400 | | | | 800,432 | |
Walker & Dunlop, Inc.* | | | 70,475 | | | | 3,441,294 | |
Waterstone Financial, Inc. | | | 8,000 | | | | 150,800 | |
WesBanco, Inc. | | | 70,273 | | | | 2,778,594 | |
Westbury Bancorp, Inc.*+ | | | 3,750 | | | | 76,350 | |
Western New England Bancorp, Inc. | | | 83,393 | | | | 846,439 | |
World Acceptance Corp.*+ | | | 7,700 | | | | 576,807 | |
Xenith Bankshares, Inc.* | | | 41,175 | | | | 1,278,896 | |
| | | | | | | | |
| | |
| | | | | | 231,068,322 | |
|
Health Care - 2.34% | |
Almost Family, Inc.* | | | 600 | | | | 36,990 | |
Altimmune, Inc. | | | 13,778 | | | | 44,090 | |
AMAG Pharmaceuticals, Inc.*+ | | | 58,500 | | | | 1,076,400 | |
AngioDynamics, Inc.* | | | 67,400 | | | | 1,092,554 | |
Cumberland Pharmaceuticals, Inc.* | | | 23,000 | | | | 162,610 | |
Digirad Corp.+ | | | 36,447 | | | | 147,610 | |
Enanta Pharmaceuticals, Inc.* | | | 20,000 | | | | 719,600 | |
Exactech, Inc.* | | | 17,500 | | | | 521,500 | |
FONAR Corp.*+ | | | 30,400 | | | | 843,600 | |
Halyard Health, Inc.* | | | 17,800 | | | | 699,184 | |
InfuSystems Holdings, Inc.* | | | 21,100 | | | | 37,980 | |
Kewaunee Scientific Corp. | | | 3,000 | | | | 74,850 | |
Kindred Healthcare, Inc. | | | 116,350 | | | | 1,355,478 | |
Lannett Co., Inc.*+ | | | 60,000 | | | | 1,224,000 | |
LHC Group, Inc.* | | | 1,000 | | | | 67,890 | |
Magellan Health, Inc.* | | | 26,225 | | | | 1,911,802 | |
Nobilis Health Corp.*+ | | | 20,000 | | | | 38,000 | |
PDL BioPharma, Inc. | | | 25,000 | | | | 61,750 | |
PharMerica Corp.* | | | 36,750 | | | | 964,688 | |
Select Medical Holdings Corp.* | | | 200,000 | | | | 3,070,000 | |
Tivity Health, Inc.* | | | 10,000 | | | | 398,500 | |
| | |
| 12 | | Annual Report | June 30, 2017 |
| | |
Omni Small-Cap Value Fund SCHEDULE OF INVESTMENTS (continued) | |
|
Showing percentage of net assets as of June 30, 2017
| | | | | | | | |
| Industry Company | | | Shares | | | | Value | |
| |
Common Stocks (continued) | |
Health Care (continued) | |
Triple-S Management Corp., Class B* | | | 122,300 | | | $ | 2,068,093 | |
| | | | | | | | |
| | |
| | | | | | 16,617,169 | |
| | |
Industrials - 19.23% | | | | | | | | |
AAR Corp. | | | 92,600 | | | | 3,218,776 | |
Acacia Research Corp.* | | | 35,000 | | | | 143,500 | |
ACCO Brands Corp.* | | | 364,300 | | | | 4,244,095 | |
Acme United Corp. | | | 735 | | | | 21,021 | |
Aegion Corp.* | | | 99,341 | | | | 2,173,581 | |
AeroCentury Corp.*+ | | | 4,300 | | | | 53,320 | |
Air T, Inc.*+ | | | 2,800 | | | | 59,360 | |
Air Transport Services Group, Inc.* | | | 291,924 | | | | 6,358,105 | |
Aircastle, Ltd. | | | 62,100 | | | | 1,350,675 | |
Alpha Pro Tech, Ltd.*+ | | | 20,743 | | | | 61,192 | |
American Railcar Industries, Inc.+ | | | 31,900 | | | | 1,221,770 | |
AMREP Corp.*+ | | | 25,500 | | | | 172,890 | |
ARC Document Solutions, Inc.* | | | 80,000 | | | | 332,800 | |
ArcBest Corp. | | | 94,500 | | | | 1,946,700 | |
Armstrong Flooring, Inc.* | | | 65,000 | | | | 1,168,050 | |
Arotech Corp.*+ | | | 94,300 | | | | 334,765 | |
Atlas Air Worldwide Holdings, Inc.* | | | 57,700 | | | | 3,009,055 | |
Babcock & Wilcox Enterprises, Inc.* | | | 35,000 | | | | 411,600 | |
Briggs & Stratton Corp. | | | 114,300 | | | | 2,754,630 | |
Broadwind Energy, Inc.* | | | 25,000 | | | | 126,000 | |
CAI International, Inc.* | | | 52,600 | | | | 1,241,360 | |
CBIZ, Inc.* | | | 142,600 | | | | 2,139,000 | |
CECO Environmental Corp. | | | 81,000 | | | | 743,580 | |
Chart Industries, Inc.* | | | 67,575 | | | | 2,346,880 | |
Chicago Rivet & Machine Co.+ | | | 1,000 | | | | 36,000 | |
Civeo Corp.* | | | 366,500 | | | | 769,650 | |
Columbus McKinnon Corp. | | | 40,400 | | | | 1,026,968 | |
Commercial Vehicle Group, Inc.*+ | | | 67,300 | | | | 568,685 | |
Covenant Transportation Group, Inc., Class A*+ | | | 93,900 | | | | 1,646,067 | |
CRA International, Inc.+ | | | 53,500 | | | | 1,943,120 | |
Cubic Corp. | | | 24,500 | | | | 1,134,350 | |
DigitalGlobe, Inc.* | | | 29,800 | | | | 992,340 | |
DMC Global, Inc. | | | 20,000 | | | | 262,000 | |
Ducommun, Inc.* | | | 43,300 | | | | 1,367,414 | |
Eastern Co. (The)+ | | | 18,401 | | | | 552,950 | |
Ecology & Environment, Inc., Class A+ | | | 3,500 | | | | 44,275 | |
Encore Wire Corp. | | | 16,500 | | | | 704,550 | |
Engility Holdings, Inc.* | | | 56,700 | | | | 1,610,280 | |
| | | | | | | | |
| Industry Company | | | Shares | | | | Value | |
|
| |
Industrials (continued) | |
Ennis, Inc. | | | 136,892 | | | $ | 2,614,637 | |
Essendant, Inc. | | | 27,300 | | | | 404,859 | |
FreightCar America, Inc. | | | 22,381 | | | | 389,206 | |
FTI Consulting, Inc.* | | | 56,700 | | | | 1,982,232 | |
General Finance Corp.*+ | | | 46,500 | | | | 239,475 | |
Gibraltar Industries, Inc.* | | | 28,350 | | | | 1,010,678 | |
Goldfield Corp. (The)* | | | 121,000 | | | | 665,500 | |
Great Lakes Dredge & Dock Corp.* | | | 187,550 | | | | 806,465 | |
Greenbrier Companies., Inc. (The)+ | | | 62,800 | | | | 2,904,500 | |
Griffon Corp. | | | 115,900 | | | | 2,544,005 | |
Hardinge, Inc.+ | | | 86,400 | | | | 1,073,088 | |
Hawaiian Holdings, Inc.* | | | 15,634 | | | | 734,016 | |
HC2 Holdings, Inc.*+ | | | 81,100 | | | | 476,868 | |
Heidrick & Struggles International, Inc. | | | 55,000 | | | | 1,196,250 | |
Heritage-Crystal Clean, Inc.*+ | | | 39,854 | | | | 633,679 | |
Highpower International, Inc.*+ | | | 25,923 | | | | 94,619 | |
Houston Wire & Cable Co. | | | 46,100 | | | | 242,025 | |
Hurco Cos., Inc. | | | 17,857 | | | | 620,531 | |
Huron Consulting Group, Inc.* | | | 32,800 | | | | 1,416,960 | |
ICF International, Inc.* | | | 36,229 | | | | 1,706,386 | |
IES Holdings, Inc.*+ | | | 2,717 | | | | 49,314 | |
Kaman Corp. | | | 6,600 | | | | 329,142 | |
Kelly Services, Inc., Class A | | | 35,500 | | | | 796,975 | |
Kratos Defense & Security Solutions, Inc.* | | | 25,000 | | | | 296,750 | |
L.B. Foster Co., Class A | | | 19,900 | | | | 426,855 | |
L.S. Starrett Co. (The), Class A | | | 27,500 | | | | 236,500 | |
Marten Transport, Ltd. | | | 152,982 | | | | 4,191,707 | |
MasTec, Inc.* | | | 78,700 | | | | 3,553,305 | |
McGrath RentCorp+ | | | 83,300 | | | | 2,884,679 | |
Miller Industries, Inc. | | | 4,000 | | | | 99,400 | |
Mistras Group, Inc.*+ | | | 15,000 | | | | 329,550 | |
MRC Global, Inc.* | | | 195,500 | | | | 3,229,660 | |
MYR Group, Inc.* | | | 12,100 | | | | 375,342 | |
National Presto Industries, Inc.+ | | | 5,020 | | | | 554,710 | |
Navigant Consulting, Inc.* | | | 239,600 | | | | 4,734,496 | |
Navios Maritime Holdings, Inc.* | | | 556,786 | | | | 762,797 | |
NN, Inc. | | | 45,500 | | | | 1,248,975 | |
Northwest Pipe Co.*+ | | | 21,800 | | | | 354,468 | |
Orion Group Holdings, Inc.* | | | 109,986 | | | | 821,595 | |
PAM Transportation Services, Inc.*+ | | | 16,905 | | | | 320,350 | |
Park-Ohio Holdings Corp. | | | 15,000 | | | | 571,500 | |
| | |
Omni Small-Cap Value Fund SCHEDULE OF INVESTMENTS (continued) | |
|
Showing percentage of net assets as of June 30, 2017
| | | | | | | | |
| Industry Company | | Shares | | | Value | |
| |
Common Stocks (continued) | |
Industrials (continued) | |
Pendrell Corp.*+ | | | 56,900 | | | $ | 411,387 | |
Performant Financial Corp.* | | | 97,367 | | | | 203,497 | |
Powell Industries, Inc. | | | 25,000 | | | | 799,750 | |
Preformed Line Products Co. | | | 1,135 | | | | 52,687 | |
Quad/Graphics, Inc. | | | 75,300 | | | | 1,725,876 | |
Quanex Building Products Corp. | | | 35,000 | | | | 740,250 | |
Radiant Logistics, Inc.*+ | | | 69,000 | | | | 371,220 | |
RCM Technologies, Inc.*+ | | | 55,200 | | | | 278,760 | |
RPX Corp.* | | | 212,600 | | | | 2,965,770 | |
RR Donnelley & Sons Co.+ | | | 38,500 | | | | 482,790 | |
Rush Enterprises, Inc., Class A* | | | 177,700 | | | | 6,606,886 | |
Rush Enterprises, Inc., Class B* | | | 46,500 | | | | 1,693,065 | |
SkyWest, Inc. | | | 148,791 | | | | 5,222,564 | |
Spartan Motors, Inc. | | | 22,000 | | | | 194,700 | |
SPX FLOW, Inc.* | | | 20,000 | | | | 737,600 | |
Sterling Construction Co., Inc.* | | | 96,400 | | | | 1,259,948 | |
Supreme Industries, Inc., Class A | | | 35,805 | | | | 588,992 | |
Textainer Group Holdings Ltd.+ | | | 90,000 | | | | 1,305,000 | |
Titan International, Inc. | | | 25,000 | | | | 300,250 | |
Titan Machinery, Inc.*+ | | | 43,900 | | | | 789,322 | |
TriMas Corp.* | | | 20,000 | | | | 417,000 | |
Triumph Group, Inc. | | | 20,000 | | | | 632,000 | |
TrueBlue, Inc.* | | | 32,750 | | | | 867,875 | |
Tutor Perini Corp.*+ | | | 107,300 | | | | 3,084,875 | |
Ultralife Corp.*+ | | | 32,050 | | | | 230,760 | |
USA Truck, Inc.*+ | | | 9,636 | | | | 83,448 | |
Vectrus, Inc.* | | | 5,000 | | | | 161,600 | |
Veritiv Corp.* | | | 45,200 | | | | 2,034,000 | |
Viad Corp. | | | 17,400 | | | | 822,150 | |
VSE Corp. | | | 23,600 | | | | 1,061,528 | |
Wabash National Corp.+ | | | 110,100 | | | | 2,419,998 | |
Wesco Aircraft Holdings, Inc.* | | | 38,800 | | | | 420,980 | |
Westport Fuel Systems, Inc.* | | | 302 | | | | 710 | |
Willdan Group, Inc.*+ | | | 3,900 | | | | 119,145 | |
Willis Lease Finance Corp.*+ | | | 48,400 | | | | 1,293,732 | |
| | | | | | | | |
| | | | | | | 136,595,518 | |
| |
Information Technology - 9.07% | |
Alpha & Omega Semiconductor, Ltd.* | | | 214,244 | | | | 3,571,447 | |
Amkor Technology, Inc.* | | | 202,291 | | | | 1,976,383 | |
Autobytel, Inc.* | | | 500 | | | | 6,305 | |
| | | | | | | | |
| Industry Company | | Shares | | | Value | |
| | | | | | | | |
Information Technology (continued) | |
AXT, Inc.*+ | | | 100,000 | | | $ | 635,000 | |
Bel Fuse, Inc., Class B | | | 18,500 | | | | 456,950 | |
Benchmark Electronics, Inc.* | | | 134,000 | | | | 4,328,200 | |
Black Box Corp. | | | 40,000 | | | | 342,000 | |
Blucora, Inc.* | | | 89,297 | | | | 1,893,096 | |
Computer Task Group, Inc. | | | 4,400 | | | | 24,596 | |
Concurrent Computer Corp.+ | | | 53,600 | | | | 361,264 | |
CSP, Inc.+ | | | 5,150 | | | | 55,362 | |
DASAN Zhone Solutions, Inc.*+ | | | 7,620 | | | | 45,720 | |
Digi International, Inc.* | | | 45,325 | | | | 460,049 | |
Diodes, Inc.* | | | 105,399 | | | | 2,532,738 | |
Ebix, Inc.+ | | | 40,000 | | | | 2,156,000 | |
Edgewater Technology, Inc.* | | | 36,100 | | | | 246,563 | |
Electro Scientific Industries, Inc.*+ | | | 15,000 | | | | 123,600 | |
FORM Holdings Corp.* | | | 30,000 | | | | 49,500 | |
Global Sources, Ltd.*+ | | | 4,200 | | | | 84,000 | |
GSE Systems, Inc.* | | | 22,500 | | | | 66,375 | |
Harmonic, Inc.*+ | | | 700 | | | | 3,675 | |
IEC Electronics Corp.* | | | 19,000 | | | | 68,400 | |
II-VI, Inc.* | | | 79,250 | | | | 2,718,275 | |
Insight Enterprises, Inc.* | | | 64,800 | | | | 2,591,352 | |
inTEST Corp.* | | | 55,000 | | | | 368,500 | |
IXYS Corp. | | | 57,500 | | | | 945,875 | |
KEMET Corp.* | | | 57,500 | | | | 736,000 | |
Key Tronic Corp.*+ | | | 40,600 | | | | 287,448 | |
Kimball Electronics, Inc.* | | | 50,400 | | | | 909,720 | |
Kulicke & Soffa Industries, Inc.* | | | 123,632 | | | | 2,351,481 | |
Liquidity Services, Inc.* | | | 43,550 | | | | 276,542 | |
ManTech International Corp., Class A | | | 108,800 | | | | 4,502,144 | |
Mind CTI Ltd. | | | 200 | | | | 500 | |
ModusLink Global Solutions, Inc.* | | | 105,300 | | | | 180,063 | |
NCI, Inc., Class A* | | | 62,804 | | | | 1,325,164 | |
Net 1 UEPS Technologies, Inc.* | | | 252,900 | | | | 2,493,594 | |
NetSol Technologies, Inc.*+ | | | 31,000 | | | | 122,450 | |
Network-1 Technologies, Inc. | | | 50,000 | | | | 212,500 | |
NeuStar, Inc., Class A*+ | | | 64,881 | | | | 2,163,781 | |
PCM, Inc.*+ | | | 26,769 | | | | 501,919 | |
PC-Tel, Inc.+ | | | 56,700 | | | | 401,436 | |
Photronics, Inc.* | | | 205,050 | | | | 1,927,470 | |
PRGX Global, Inc.* | | | 40,739 | | | | 264,804 | |
Rocket Fuel, Inc.*+ | | | 115,000 | | | | 316,250 | |
Sanmina Corp.* | | | 52,600 | | | | 2,004,060 | |
| | |
| 14 | | Annual Report June 30, 2017 |
| | |
Omni Small-Cap Value Fund SCHEDULE OF INVESTMENTS (continued) | |
|
Showing percentage of net assets as of June 30, 2017
| | | | | | | | |
| Industry Company | | Shares | | | Value | |
| |
| Common Stocks (continued) | |
Information Technology (continued) | | | | | |
ScanSource, Inc.* | | | 36,500 | | | $ | 1,470,950 | |
SigmaTron International, Inc.* | | | 2,500 | | | | 16,450 | |
SMTC Corp.* | | | 7,500 | | | | 9,750 | |
Sohu.com, Inc.*+ | | | 10,000 | | | | 450,600 | |
Sykes Enterprises, Inc.* | | | 75,134 | | | | 2,519,243 | |
Synacor, Inc.*+ | | | 64,000 | | | | 233,600 | |
Systemax, Inc. | | | 8,500 | | | | 159,800 | |
TESSCO Technologies, Inc. | | | 15,250 | | | | 202,825 | |
Trio-Tech International* | | | 3,000 | | | | 14,940 | |
TTM Technologies, Inc.* | | | 520,153 | | | | 9,029,856 | |
Vishay Precision Group, Inc.* | | | 166,448 | | | | 2,879,550 | |
Wayside Technology Group, Inc. | | | 7,900 | | | | 152,865 | |
YuMe, Inc.+ | | | 35,700 | | | | 167,790 | |
| | | | | | | | |
| | | | | | | 64,396,770 | |
| | |
Materials - 6.22% | | | | | | | | |
American Vanguard Corp. | | | 20,000 | | | | 345,000 | |
Ampco-Pittsburgh Corp.+ | | | 24,047 | | | | 354,693 | |
Boise Cascade Co.* | | | 66,000 | | | | 2,006,400 | |
Carpenter Technology Corp. | | | 51,600 | | | | 1,931,388 | |
China Green Agriculture, Inc.* | | | 169,800 | | | | 213,948 | |
Clearwater Paper Corp.* | | | 30,500 | | | | 1,425,875 | |
Coeur Mining, Inc.* | | | 91,800 | | | | 787,644 | |
Core Molding Technologies, Inc.*+ | | | 17,000 | | | | 367,370 | |
Flexible Solutions International, Inc.* | | | 5,000 | | | | 9,050 | |
Friedman Industries, Inc. | | | 5,000 | | | | 28,400 | |
FutureFuel Corp. | | | 72,800 | | | | 1,098,552 | |
Gulf Resources, Inc.* | | | 178,200 | | | | 283,338 | |
Handy & Harman, Ltd.* | | | 8,150 | | | | 255,910 | |
Haynes International, Inc.+ | | | 25,200 | | | | 915,012 | |
Hecla Mining Co.+ | | | 557,000 | | | | 2,840,700 | |
Kaiser Aluminum Corp. | | | 22,630 | | | | 2,003,208 | |
KMG Chemicals, Inc.+ | | | 26,400 | | | | 1,284,888 | |
Kraton Corp.* | | | 142,150 | | | | 4,895,646 | |
Materion Corp.+ | | | 48,600 | | | | 1,817,640 | |
Mercer International, Inc. | | | 276,250 | | | | 3,176,875 | |
Olympic Steel, Inc. | | | 20,000 | | | | 389,600 | |
PH Glatfelter Co. | | | 95,500 | | | | 1,866,070 | |
Rayonier Advanced Materials, Inc.+ | | | 26,700 | | | | 419,724 | |
Resolute Forest Products, Inc.*+ | | | 15,000 | | | | 66,000 | |
| | | | | | | | |
| Industry Company | | Shares | | | Value | |
|
Materials (continued) | |
Schnitzer Steel Industries, Inc., Class A | | | 59,700 | | | $ | 1,504,440 | |
Schulman (A.), Inc. | | | 20,000 | | | | 640,000 | |
Stepan Co. | | | 82,000 | | | | 7,145,480 | |
SunCoke Energy, Inc.* | | | 234,700 | | | | 2,558,230 | |
Synalloy Corp.*+ | | | 14,000 | | | | 158,900 | |
TimkenSteel Corp.*+ | | | 55,000 | | | | 845,350 | |
Trecora Resources*+ | | | 7,000 | | | | 78,750 | |
Tredegar Corp. | | | 76,700 | | | | 1,169,675 | |
Tronox, Ltd., Class A | | | 65,000 | | | | 982,800 | |
Universal Stainless & Alloy Products, Inc.*+ | | | 16,250 | | | | 316,875 | |
| | | | | | | | |
| | | | | | | 44,183,431 | |
| | |
Real Estate - 0.28% | | | | | | | | |
Forestar Group, Inc.* | | | 80,000 | | | | 1,372,000 | |
RE/MAX Holdings, Inc., Class A | | | 6,168 | | | | 345,716 | |
St. Joe Co. (The)*+ | | | 15,000 | | | | 281,250 | |
| | | | | | | | |
| | | | | | | 1,998,966 | |
|
Telecommunication Services - 1.23% | |
Alaska Communications Systems Group, Inc.* | | | 347,100 | | | | 763,620 | |
Hawaiian Telcom Holdco, Inc.* | | | 44,500 | | | | 1,112,055 | |
Iridium Communications, Inc.*+ | | | 391,325 | | | | 4,324,141 | |
Lumos Networks Corp.* | | | 5,000 | | | | 89,350 | |
Spok Holdings, Inc. | | | 118,864 | | | | 2,103,893 | |
Windstream Holdings, Inc.+ | | | 95,000 | | | | 368,600 | |
| | | | | | | | |
| | | | | | | 8,761,659 | |
| | | | | | | | |
TOTAL COMMON STOCKS - 99.31% (Cost $531,882,052) | | | | 705,475,179 | |
| | | | | | | | |
| | |
WARRANTS - 0.00% | | | | | | | | |
Eagle Bulk Shipping, Inc., expiring 10/15/21* | | | 3,317 | | | | 299 | |
| | | | | | | | |
TOTAL WARRANTS - 0.00% (Cost $105,563) | | | | 299 | |
| | | | | | | | |
| | |
Omni Small-Cap Value Fund SCHEDULE OF INVESTMENTS (continued) | |
|
| | | | | | | | | | | | |
| | | Rate^ | | | Shares | | | Value | |
| |
MONEY MARKET FUND - 0.38% | | | | | |
Fidelity Investments Money Market Government Portfolio Class I | | | 0.81 | % | | | 2,690,419 | | | $ | 2,690,419 | |
| | | | | | | | | | | | |
TOTAL MONEY MARKET FUND - 0.38% (Cost $2,690,419) | | | | 2,690,419 | |
| | | | | | | | | | | | |
| |
INVESTMENTS PURCHASED WITH CASH PROCEEDS FROM SECURITIES LENDING - 10.98% | |
Fidelity Investments Money Market Government Portfolio Class I** | | | 0.81 | % | | | 77,965,296 | | | | 77,965,296 | |
| | | | | | | | | | | | |
TOTAL INVESTMENTS PURCHASED WITH CASH PROCEEDS FROM SECURITIES LENDING -10.98% (Cost $77,965,296) | | | | 77,965,296 | |
| | | | | | | | | | | | |
| |
TOTAL INVESTMENTS - 110.67% (Cost $612,643,330) | | | $ | 786,131,193 | |
| Liabilities in Excess of Other Assets - (10.67%) | | | | (75,774,257 | ) |
| | | | | | | | | | | | |
NET ASSETS - 100.00% | | | $ | 710,356,936 | |
| | | | | | | | | | | | |
| * | Non-income producing security. |
| ** | This security represents the investment of the collateral received in connection with securities out on loan as of June 30, 2017. |
| ^ | Rate disclosed as of June 30, 2017. |
| + | This security or a portion of the security is out on loan as of June 30, 2017. Total loaned securities had a value of $75,323,710 as of June 30, 2017. |
| LLC | - Limited Liability Company |
| PLC | - Public Limited Company |
| | |
| |
| |
Summary of inputs used to value the Fund’s investments as of
06/30/2017 (See Note 2 in Notes to Financial Statements): |
| | | | | | | | | | | | | | | | |
| | | Valuation Inputs | |
| | | Investment in Securities (Value) | |
| | | Level 1 Quoted Prices | | | Level 2 Significant Observable Inputs | | | Level 3
Significant
Unobservable
Inputs | | | Total | |
Common Stocks (a) | | $ | 705,475,179 | | | $ | — | | | $ | — | | | $ | 705,475,179 | |
Warrants | | | 299 | | | | — | | | | — | | | | 299 | |
Money Market Fund | | | — | | | | 2,690,419 | | | | — | | | | 2,690,419 | |
Investments Purchased with Cash Proceeds from Securities Lending | | | — | | | | 77,965,296 | | | | — | | | | 77,965,296 | |
| | | | | | | | | | | | | | | | |
TOTAL | | $ | 705,475,478 | | | $ | 80,655,715 | | | $ | — | | | $ | 786,131,193 | |
| | | | | | | | | | | | | | | | |
(a) - please refer to the Schedule of Investments for the industry classifications of these portfolio holdings.
See Notes to Financial Statements.
| | |
| 16 | | Annual Report | June 30, 2017 (Unaudited) |
| | |
Omni Tax-Managed Small-Cap Value Fund MANAGER’S COMMENTARY (Unaudited) | | |
June 30, 2017
Dear Fellow Omni Tax-Managed Small-Cap Value Fund Shareholder,
For the quarter ended June 30, 2017, our Fund returned -0.74%, underperforming our primary market benchmark, the Russell 2000 Value Index (+0.67%).
For the fiscal year, our Fund returned +24.83%, slightly underperforming the Russell 2000 Value Index (+24.86%).
The table below presents our June quarter, one-year, five-year, and inception-to-date financial results. See the next page for a graph of performance since inception.
Standardized Returns as of June 30, 2017
| | | | | | | | | | | | | | | | | | | | |
| | | | | | | Annualized |
| | | Quarter | | 1 Year | | 5 Years | | Since Inception
(12/31/10) |
| | | | |
Omni Tax-Managed Small-Cap Value Fund | | | | -0.74% | | | | | 24.83% | | | | | 14.05% | | | | | 10.83% | |
Russell 2000 Value Index | | | | 0.67% | | | | | 24.86% | | | | | 13.39% | | | | | 10.53% | |
Performance figures quoted in the table above and the graph on the next page represent past performance and are no guarantee of future results. Total return figures in the table above include the reinvestment of dividends and capital gains. The table above and the graph on the next page do not reflect the deduction of taxes that a shareholder would pay on Fund distributions or on the redemption of Fund shares.
The Russell 2000 Value Index is an unmanaged index that consists of stocks in the Russell 2000 Index with lower price-to-book ratios and lower forecasted growth values with dividends reinvested. It is not possible to invest directly in an index. Periods longer than one year are annualized.
According to data from Lipper, Inc. as of June 30, 2017, Omni Tax-Managed Small-Cap Value Fund ranked 58th of 295 small-cap value funds for the 12 months ended June 30, 2017, 52nd of 222 over the last five years, and 53rd of 199 such funds since inception in December 2010. Lipper, Inc. is an independent mutual fund rating service that ranks funds in various fund categories by making comparative calculations using total returns.
| | |
Omni Tax-Managed Small-Cap Value Fund MANAGER’S COMMENTARY (Unaudited) (continued) | | |
Growth of a $10,000 Investment
from Inception December 31, 2010 to June 30, 2017
Detailed Explanation of Quarterly Performance
The Omni Tax-Managed Small-Cap Value Fund is designed to capture the returns of the small-cap value asset class through broad diversification of small company and value stocks. We also seek to minimize the distribution of capital gains within the constraints of the investment objective. This approach is sometimes referred to as “passive, asset class investing.” As of June 30, 2017, we held 656 such stocks in a market-cap weighted style. We make no attempt to track any particular index in either performance or statistics.
The Fund’s tilt toward deeper value stocks across multiple value metrics detracted slightly from relative results because the deepest value stocks, according to some measurements, lagged the benchmark. The Fund’s tilt toward smaller stocks contributed positively to relative performance, but not enough to offset the impact of the deeper value tilt.
By design, the Fund does not hold Utilities sector stocks and Real Estate Investment Trusts (REITs). This positioning hurt relative performance, as REITs and Utilities make up roughly 17% of the benchmark and outperformed the benchmark’s total return. Our Fund’s higher weighting in Energy sector stocks also detracted from relative performance. Energy stocks suffered during the quarter as oil prices moved lower amid oversupply concerns.
Detailed Explanation of Fiscal Year Performance
The Fund benefited from its focus on smaller stocks within the small-cap value universe, as smaller stocks were among the benchmark’s best performers during the fiscal year. A tilt toward deeper value stocks across multiple value metrics did not have a significant impact on relative performance.
The Fund’s higher weighting in Energy sector stocks detracted from relative performance. A lack of exposure to Utilities sector stocks and REITs boosted relative results, because Utilities stocks and REITs underperformed the benchmark during the fiscal year.
| | |
| 18 | | Annual Report | June 30, 2017 |
| | |
Omni Tax-Managed Small-Cap Value Fund MANAGER’S COMMENTARY (Unaudited) (continued) | | |
Top Ten Holdings as of June 30, 2017
| | | | | | |
| Rank | | Description | | Industry | | % of Net
Assets |
| 1 | | McDermott International, Inc. | | Energy | | 1.0% |
| 2 | | Kraton Corp. | | Materials | | 0.9% |
| 3 | | Air Transport Services Group, Inc. | | Industrials | | 0.9% |
| 4 | | Central Garden & Pet Co., Class A | | Consumer Staples | | 0.9% |
| 5 | | Stepan Co. | | Materials | | 0.9% |
| 6 | | Cooper-Standard Holding, Inc. | | Consumer Discretionary | | 0.9% |
| 7 | | SkyWest, Inc. | | Industrials | | 0.8% |
| 8 | | Renewable Energy Group, Inc. | | Energy | | 0.7% |
| 9 | | Iridium Communications, Inc. | | Telecommunication Services | | 0.7% |
| 10 | | Navigant Consulting, Inc. | | Industrials | | 0.7% |
| | Total | | | | 8.4% |
Industry Sector Representation as of June 30, 2017
| | | | | | | | |
| | | % of Net Assets | | % of Russell 2000
Value Index | | Difference | |
| Consumer Discretionary | | 17.3% | | 10.7% | | | 6.6% | |
| Consumer Staples | | 3.3% | | 2.8% | | | 0.5% | |
| Energy | | 8.1% | | 6.1% | | | 2.0% | |
| Financials | | 32.6% | | 30.6% | | | 2.0% | |
| Health Care | | 2.1% | | 5.6% | | | -3.5% | |
| Industrials | | 18.7% | | 11.7% | | | 7.0% | |
| Information Technology | | 8.6% | | 9.5% | | | -0.9% | |
| Materials | | 6.9% | | 4.1% | | | 2.8% | |
| Real Estate | | 0.5% | | 11.6% | | | -11.1% | |
| Telecommunication Services | | 1.2% | | 0.7% | | | 0.5% | |
| Utilities | | 0.0% | | 6.6% | | | -6.6% | |
| Cash & Other Assets | | 0.7% | | 0.0% | | | 0.7% | |
Total | | 100.0% | | 100.0% | | | | |
Disclaimer
The views expressed here are exclusively those of Fund management. These views, including those related to market sectors or individual stocks, are not meant as investment advice and should not be considered predictive in nature. Any favorable (or unfavorable) description of a holding applies only as of the quarter end, June 30, 2017, unless otherwise stated. Security positions can and do change thereafter. Discussions of historical performance do not guarantee and may not be indicative of future performance.
Market volatility can significantly impact short-term performance. The Fund is not an appropriate investment for short-term investors. Investments in small companies generally carry greater risk than is customarily associated with larger companies. This additional risk is attributable to a number of factors, including the relatively limited financial resources that are typically available to small companies and the fact that small companies often have comparatively limited product lines. In addition, the stock of small companies tends to be more volatile than the stock of large companies, particularly in the short term and particularly in the early stages of an economic or market downturn. Shareholders of the Fund, therefore, are taking on more risk than they would if they invested in the stock market as a whole.
| | |
Omni Tax-Managed Small-Cap Value Fund MANAGER’S COMMENTARY (Unaudited) (continued) | | |
Conclusion
Thank you for your continued investment in Omni Tax-Managed Small-Cap Value Fund. We encourage your feedback; your reactions and concerns are important to us.
Sincerely,
The Investment Management Team
| | |
| 20 | | Annual Report | June 30, 2017 |
| | |
Omni Tax-Managed Small-Cap Value Fund SCHEDULE OF INVESTMENTS | | |
Showing percentage of net assets as of June 30, 2017
| | | | | | | | | | |
| Industry | | Company | | Shares | | | Value | |
| |
COMMON STOCKS - 99.40% | |
Consumer Discretionary - 17.34% | |
| | A.H. Belo Corp., Class A | | | 35,000 | | | $ | 192,500 | |
| | Abercrombie & Fitch Co., Class A+ | | | 63,000 | | | | 783,720 | |
| | Adtalem Global Education, Inc. | | | 39,000 | | | | 1,480,050 | |
| | AMCON Distributing Co. | | | 1,350 | | | | 140,535 | |
| | American Axle & Manufacturing Holdings, Inc.* | | | 105,450 | | | | 1,645,020 | |
| | American Public Education, Inc.* | | | 27,700 | | | | 655,105 | |
| | Appliance Recycling Centers of America, Inc.* | | | 2,000 | | | | 1,600 | |
| | Ascent Capital Group, Inc., Class A* | | | 25,400 | | | | 390,144 | |
| | AV Homes, Inc.* | | | 19,500 | | | | 390,975 | |
| | Barnes & Noble Education, Inc.* | | | 50,560 | | | | 537,453 | |
| | Barnes & Noble, Inc. | | | 141,500 | | | | 1,075,400 | |
| | Bassett Furniture Industries, Inc. | | | 52,959 | | | | 2,009,794 | |
| | Beasley Broadcast Group, Inc., Class A | | | 2,500 | | | | 24,500 | |
| | Beazer Homes USA, Inc.* | | | 50,000 | | | | 686,000 | |
| | Big 5 Sporting Goods Corp.+ | | | 119,603 | | | | 1,560,819 | |
| | Biglari Holdings, Inc.* | | | 1,600 | | | | 639,584 | |
| | Black Diamond, Inc.* | | | 10,000 | | | | 66,500 | |
| | Boot Barn Holdings, Inc.*+ | | | 150,000 | | | | 1,062,000 | |
| | Caesars Entertainment Corp.*+ | | | 95,000 | | | | 1,140,000 | |
| | CafePress, Inc.* | | | 32,400 | | | | 83,916 | |
| | Caleres, Inc. | | | 60,000 | | | | 1,666,800 | |
| | Century Casinos, Inc.* | | | 79,200 | | | | 583,704 | |
| | Chico’s FAS, Inc. | | | 115,000 | | | | 1,083,300 | |
| | Children’s Place, Inc. (The) | | | 17,900 | | | | 1,827,590 | |
| | China Automotive Systems, Inc.*+ | | | 36,300 | | | | 175,692 | |
| | China XD Plastics Co., Ltd.* | | | 48,400 | | | | 227,480 | |
| | Christopher & Banks Corp.* | | | 43,200 | | | | 56,592 | |
| | Citi Trends, Inc. | | | 76,150 | | | | 1,615,903 | |
| | Conn’s, Inc.*+ | | | 15,000 | | | | 286,500 | |
| | Container Store Group, Inc. (The)*+ | | | 12,000 | | | | 71,040 | |
| | Cooper-Standard Holding, Inc.* | | | 55,510 | | | | 5,599,294 | |
| | Crown Crafts, Inc.+ | | | 13,050 | | | | 90,045 | |
| | CSS Industries, Inc. | | | 68,558 | | | | 1,793,477 | |
| | Del Frisco’s Restaurant Group, Inc.* | | | 44,768 | | | | 720,765 | |
| | Del Taco Restaurants, Inc.* | | | 92,600 | | | | 1,273,250 | |
| | Delta Apparel, Inc.* | | | 23,700 | | | | 525,666 | |
| | Destination Maternity Corp.* | | | 2,200 | | | | 7,128 | |
| | | | | | | | | | |
| Industry | | Company | | Shares | | | Value | |
| | | |
| | | | | | | | | | |
Consumer Discretionary (continued) | |
| | DSW, Inc., Class A | | | 40,000 | | | $ | 708,000 | |
| | E.W. Scripps Co., Class A (The)* | | | 65,000 | | | | 1,157,650 | |
| | El Pollo Loco Holdings, Inc.*+ | | | 35,000 | | | | 484,750 | |
| | Eldorado Resorts, Inc.* | | | 15,000 | | | | 300,000 | |
| | Entercom Communications Corp., Class A+ | | | 122,405 | | | | 1,266,892 | |
| | Eros International PLC*+ | | | 111,750 | | | | 1,279,538 | |
| | EVINE Live, Inc.* | | | 147,300 | | | | 147,300 | |
| | Express, Inc.* | | | 20,000 | | | | 135,000 | |
| | Finish Line, Inc. (The), Class A | | | 103,000 | | | | 1,459,510 | |
| | Flanigan’s Enterprises, Inc. | | | 2,500 | | | | 72,500 | |
| | Flexsteel Industries, Inc. | | | 10,500 | | | | 568,155 | |
| | Fogo De Chao, Inc.* | | | 32,000 | | | | 444,800 | |
| | Fred’s, Inc., Class A+ | | | 108,450 | | | | 1,000,994 | |
| | FTD Cos., Inc.* | | | 27,160 | | | | 543,200 | |
| | Full House Resorts, Inc.* | | | 55,000 | | | | 134,200 | |
| | Gannett Co., Inc. | | | 45,000 | | | | 392,400 | |
| | Genesco, Inc.* | | | 30,000 | | | | 1,017,000 | |
| | Golden Entertainment, Inc.* | | | 42,000 | | | | 869,820 | |
| | Good Times Restaurants, Inc.* | | | 1,500 | | | | 5,325 | |
| | Gray Television, Inc.* | | | 140,000 | | | | 1,918,000 | |
| | Group 1 Automotive, Inc. | | | 33,000 | | | | 2,089,560 | |
| �� | Guess?, Inc.+ | | | 87,000 | | | | 1,111,860 | |
| | Haverty Furniture Cos., Inc. | | | 69,659 | | | | 1,748,441 | |
| | Hooker Furniture Corp. | | | 15,000 | | | | 617,250 | |
| | Iconix Brand Group, Inc.* | | | 80,000 | | | | 552,800 | |
| | International Speedway Corp., Class A | | | 75,760 | | | | 2,844,788 | |
| | Intrawest Resorts Holdings, Inc.* | | | 25,000 | | | | 593,500 | |
| | J Alexander’s Holdings, Inc.* | | | 9,700 | | | | 118,825 | |
| | JAKKS Pacific, Inc.*+ | | | 104,100 | | | | 416,400 | |
| | Johnson Outdoors, Inc., Class A | | | 63,850 | | | | 3,078,208 | |
| | K12, Inc.* | | | 84,850 | | | | 1,520,512 | |
| | KB Home | | | 134,700 | | | | 3,228,759 | |
| | Liberty Tax, Inc. | | | 9,500 | | | | 123,025 | |
| | Lifetime Brands, Inc. | | | 51,499 | | | | 934,707 | |
| | Lincoln Educational Services Corp.* | | | 134,605 | | | | 417,276 | |
| | Luby’s, Inc.*+ | | | 130,800 | | | | 367,548 | |
| | M/I Homes, Inc.* | | | 31,700 | | | | 905,035 | |
| | Marcus Corp. (The) | | | 136,454 | | | | 4,120,911 | |
| | McClatchy Co. (The), Class A* | | | 15,432 | | | | 144,135 | |
| | MDC Holdings, Inc. | | | 74,800 | | | | 2,642,684 | |
| | Modine Manufacturing Co.* | | | 28,900 | | | | 478,295 | |
| | Movado Group, Inc. | | | 40,600 | | | | 1,025,150 | |
| | |
Omni Tax-Managed Small-Cap Value Fund SCHEDULE OF INVESTMENTS (continued) | | |
Showing percentage of net assets as of June 30, 2017
| | | | | | | | | | |
| Industry | | Company | | Shares | | | Value | |
| |
Common Stocks (continued) | |
Consumer Discretionary (continued) | |
| | NACCO Industries, Inc., Class A | | | 16,450 | | | $ | 1,165,482 | |
| | Nevada Gold & Casinos, Inc.* | | | 35,000 | | | | 78,400 | |
| | New Home Co. Inc., (The)* | | | 10,000 | | | | 114,700 | |
| | New Media Investment Group, Inc. | | | 78,600 | | | | 1,059,528 | |
| | New York & Co., Inc.* | | | 125,700 | | | | 173,466 | |
| | P&F Industries, Inc., Class A | | | 492 | | | | 3,006 | |
| | Party City Holdco, Inc.*+ | | | 175,400 | | | | 2,745,010 | |
| | Peak Resorts, Inc. | | | 93,600 | | | | 383,760 | |
| | Perry Ellis International, Inc.* | | | 135,184 | | | | 2,630,681 | |
| | PICO Holdings, Inc.* | | | 25,000 | | | | 437,500 | |
| | Pier 1 Imports, Inc. | | | 172,200 | | | | 893,718 | |
| | Reading International, Inc., Class A* | | | 55,500 | | | | 895,215 | |
| | Red Lion Hotels Corp.* | | | 80,695 | | | | 593,108 | |
| | Regis Corp.* | | | 83,250 | | | | 854,978 | |
| | Rent-A-Center, Inc.+ | | | 800 | | | | 9,376 | |
| | Rocky Brands, Inc. | | | 16,050 | | | | 215,872 | |
| | Ruby Tuesday, Inc.* | | | 258,800 | | | | 520,188 | |
| | Saga Communications, Inc., Class A | | | 2,250 | | | | 102,938 | |
| | Salem Media Group, Inc. | | | 81,200 | | | | 576,520 | |
| | Scholastic Corp. | | | 75,950 | | | | 3,310,660 | |
| | Shiloh Industries, Inc.* | | | 25,500 | | | | 299,370 | |
| | Shoe Carnival, Inc. | | | 57,500 | | | | 1,200,600 | |
| | Sonic Automotive, Inc., Class A | | | 73,500 | | | | 1,429,575 | |
| | SORL Auto Parts, Inc.*+ | | | 74,129 | | | | 495,182 | |
| | SPAR Group, Inc.* | | | 1,500 | | | | 1,500 | |
| | Speedway Motorsports, Inc. | | | 93,963 | | | | 1,716,704 | |
| | Stoneridge, Inc.* | | | 25,000 | | | | 385,250 | |
| | Strattec Security Corp. | | | 3,600 | | | | 127,440 | |
| | Superior Industries International, Inc. | | | 118,700 | | | | 2,439,285 | |
| | Tilly’s, Inc., Class A | | | 79,900 | | | | 810,985 | |
| | Time, Inc. | | | 105,350 | | | | 1,511,772 | |
| | Tower International, Inc. | | | 46,000 | | | | 1,032,700 | |
| | Townsquare Media, Inc., Class A* | | | 160,044 | | | | 1,638,851 | |
| | TravelCenters of America LLC* | | | 149,850 | | | | 614,385 | |
| | UCP, Inc., Class A* | | | 16,700 | | | | 182,865 | |
| | Unifi, Inc.* | | | 10,800 | | | | 332,640 | |
| | Vitamin Shoppe, Inc.* | | | 25,000 | | | | 291,250 | |
| | VOXX International Corp.* | | | 83,064 | | | | 681,125 | |
| | West Marine, Inc. | | | 86,000 | | | | 1,105,100 | |
| | Weyco Group, Inc. | | | 9,900 | | | | 276,012 | |
| | William Lyon Homes, Class A* | | | 49,497 | | | | 1,194,858 | |
| | ZAGG, Inc.* | | | 144,000 | | | | 1,245,600 | |
| | | | | | | | | | |
| Industry | | Company | | Shares | | | Value | |
| | | |
| | | | | | | | | | |
Consumer Discretionary (continued) | |
| | Zumiez, Inc.* | | | 50,900 | | | $ | 628,615 | |
| | | | | | | | | | |
| | | | | | | | | 111,560,314 | |
|
Consumer Staples - 3.31% | |
| | Alico, Inc. | | | 8,100 | | | | 253,530 | |
| | Andersons, Inc. (The) | | | 94,700 | | | | 3,234,005 | |
| | Central Garden & Pet Co., Class A* | | | 191,400 | | | | 5,745,828 | |
| | Dean Foods Co. | | | 16,600 | | | | 282,200 | |
| | Ingles Markets, Inc., Class A | | | 92,805 | | | | 3,090,406 | |
| | Mannatech, Inc. | | | 25,700 | | | | 408,630 | |
| | Natural Alternatives International, Inc.* | | | 16,800 | | | | 168,000 | |
| | Nutraceutical International Corp. | | | 23,250 | | | | 968,362 | |
| | Omega Protein Corp. | | | 123,650 | | | | 2,213,335 | |
| | S&W Seed Co.*+ | | | 10,000 | | | | 41,500 | |
| | Seneca Foods Corp., Class A* | | | 23,150 | | | | 718,808 | |
| | SpartanNash Co. | | | 78,682 | | | | 2,042,585 | |
| | Village Super Market, Inc., Class A | | | 24,500 | | | | 635,040 | |
| | Weis Markets, Inc. | | | 30,700 | | | | 1,495,704 | |
| | | | | | | | | | |
| | | | | | | | | 21,297,933 | |
|
Energy - 8.13% | |
| | Adams Resources & Energy, Inc. | | | 9,600 | | | | 394,368 | |
| | Alon USA Energy, Inc. | | | 175,600 | | | | 2,338,992 | |
| | Approach Resources, Inc.*+ | | | 72,174 | | | | 243,226 | |
| | Archrock, Inc. | | | 85,000 | | | | 969,000 | |
| | Ardmore Shipping Corp.+ | | | 123,988 | | | | 1,010,502 | |
| | Atwood Oceanics, Inc.*+ | | | 120,000 | | | | 978,000 | |
| | Bill Barrett Corp.* | | | 100,000 | | | | 307,000 | |
| | Bristow Group, Inc.+ | | | 20,000 | | | | 153,000 | |
| | Callon Petroleum Co.* | | | 56,300 | | | | 597,343 | |
| | Clean Energy Fuels Corp.* | | | 100,000 | | | | 254,000 | |
| | Cloud Peak Energy, Inc.* | | | 268,700 | | | | 948,511 | |
| | Dawson Geophysical Co.* | | | 45,000 | | | | 176,400 | |
| | Delek US Holdings, Inc. | | | 85,000 | | | | 2,247,400 | |
| | Denbury Resources, Inc.* | | | 263,000 | | | | 402,390 | |
| | DHT Holdings, Inc. | | | 261,800 | | | | 1,086,470 | |
| | Dorian LPG, Ltd.*+ | | | 131,454 | | | | 1,075,294 | |
| | ENGlobal Corp.* | | | 55,878 | | | | 72,641 | |
| | EP Energy Corp., Class A*+ | | | 290,000 | | | | 1,061,400 | |
| | Era Group, Inc.* | | | 32,800 | | | | 310,288 | |
| | Exterran Corp.* | | | 12,000 | | | | 320,400 | |
| | Forum Energy Technologies, Inc.* | | | 75,000 | | | | 1,170,000 | |
| | GasLog Ltd.+ | | | 48,137 | | | | 734,089 | |
| | Gran Tierra Energy, Inc.* | | | 527,700 | | | | 1,182,048 | |
| | |
22 | | Annual Report | June 30, 2017 |
| | |
Omni Tax-Managed Small-Cap Value Fund SCHEDULE OF INVESTMENTS (continued) | | |
Showing percentage of net assets as of June 30, 2017
| | | | | | | | | | |
| Industry | | Company | | Shares | | | Value | |
| |
Common Stocks (continued) | |
Energy (continued) | | | | | | | | |
| | Green Plains, Inc. | | | 64,250 | | | $ | 1,320,338 | |
| | Gulf Island Fabrication, Inc. | | | 28,200 | | | | 327,120 | |
| | Hallador Energy Co. | | | 71,600 | | | | 556,332 | |
| | Helix Energy Solutions Group, Inc.* | | | 75,500 | | | | 425,820 | |
| | Independence Contract Drilling, Inc.* | | | 140,281 | | | | 545,693 | |
| | International Seaways, Inc.* | | | 400 | | | | 8,667 | |
| | Matador Resources Co.*+ | | | 59,500 | | | | 1,271,515 | |
| | McDermott International, Inc.* | | | 857,000 | | | | 6,144,690 | |
| | Mitcham Industries, Inc.* | | | 27,400 | | | | 109,052 | |
| | Natural Gas Services Group, Inc.* | | | 75,888 | | | | 1,885,817 | |
| | Navios Maritime Acquisition Corp. | | | 337,600 | | | | 496,272 | |
| | New Concept Energy, Inc.*+ | | | 3,600 | | | | 4,896 | |
| | Newpark Resources, Inc.* | | | 51,000 | | | | 374,850 | |
| | North Atlantic Drilling, Ltd.*+ | | | 94,500 | | | | 125,685 | |
| | Oasis Petroleum, Inc.* | | | 213,000 | | | | 1,714,650 | |
| | Oil States International, Inc.* | | | 18,000 | | | | 488,700 | |
| | Overseas Shipholding Group, Inc., Class A* | | | 2,500 | | | | 6,650 | |
| | Pacific Drilling SA*+ | | | 73,700 | | | | 126,027 | |
| | Parker Drilling Co.* | | | 89,550 | | | | 120,892 | |
| | Pioneer Energy Services Corp.* | | | 163,700 | | | | 335,585 | |
| | Renewable Energy Group, Inc.* | | | 348,319 | | | | 4,510,731 | |
| | REX American Resources Corp.* | | | 25,250 | | | | 2,438,140 | |
| | Ring Energy, Inc.* | | | 28,300 | | | | 367,900 | |
| | Scorpio Tankers, Inc.+ | | | 530,000 | | | | 2,104,100 | |
| | SEACOR Holdings, Inc.* | | | 30,200 | | | | 1,035,860 | |
| | SEACOR Marine Holdings, Inc.* | | | 30,363 | | | | 618,191 | |
| | Ship Finance International, Ltd.+ | | | 140,500 | | | | 1,910,800 | |
| | SM Energy Co.+ | | | 22,000 | | | | 363,660 | |
| | SRC Energy, Inc.*+ | | | 100,000 | | | | 673,000 | |
| | Teekay Corp.+ | | | 150,000 | | | | 1,000,500 | |
| | Teekay Tankers, Ltd., Class A | | | 310,010 | | | | 582,819 | |
| | TransAtlantic Petroleum, Ltd.* | | | 15,000 | | | | 18,000 | |
| | Unit Corp.* | | | 119,025 | | | | 2,229,338 | |
| | | | | | | | | | |
| | | | | | | | | 52,275,052 | |
Financials - 32.60% | | | | | | | | |
| | 1347 Property Insurance Holdings, Inc.* | | | 17,500 | | | | 140,000 | |
| | 1st Constitution Bancorp | | | 5,250 | | | | 93,188 | |
| | | | | | | | | | |
| Industry | | Company | | Shares | | | Value | |
| | | |
| | | | | | | | | | |
Financials (continued) | |
| | 1st Source Corp. | | | 57,750 | | | $ | 2,768,535 | |
| | Access National Corp. | | | 30,506 | | | | 809,019 | |
| | ACNB Corp. | | | 600 | | | | 18,300 | |
| | Ambac Financial Group, Inc.* | | | 76,500 | | | | 1,327,275 | |
| | American Equity Investment Life Holding Co. | | | 30,250 | | | | 794,970 | |
| | American National Bankshares, Inc. | | | 13,060 | | | | 482,567 | |
| | American River Bankshares | | | 20,744 | | | | 300,995 | |
| | AMERISAFE, Inc. | | | 21,500 | | | | 1,224,425 | |
| | AmeriServ Financial, Inc. | | | 5,000 | | | | 20,750 | |
| | Argo Group International Holdings Ltd. | | | 22,865 | | | | 1,385,619 | |
| | Arlington Asset Investment Corp., Class A+ | | | 13,700 | | | | 187,279 | |
| | Asta Funding, Inc.* | | | 18,500 | | | | 151,700 | |
| | Atlantic Capital Bancshares, Inc.* | | | 47,200 | | | | 896,800 | |
| | Atlantic Coast Financial Corp.* | | | 1,000 | | | | 7,990 | |
| | B. Riley Financial, Inc. | | | 10,520 | | | | 195,146 | |
| | Baldwin & Lyons, Inc., Class B | | | 43,700 | | | | 1,070,650 | |
| | Banc of California, Inc.+ | | | 33,000 | | | | 709,500 | |
| | Banco Latinoamericano de Comercio Exterior SA, Class E+ | | | 60,500 | | | | 1,656,490 | |
| | Bank of Commerce Holdings | | | 75,550 | | | | 834,828 | |
| | Bankwell Financial Group, Inc. | | | 1,000 | | | | 31,230 | |
| | Bar Harbor Bankshares | | | 17,241 | | | | 531,368 | |
| | Bay Bancorp, Inc.* | | | 25,000 | | | | 191,250 | |
| | BCB Bancorp, Inc. | | | 11,300 | | | | 172,890 | |
| | Bear State Financial, Inc. | | | 5,000 | | | | 47,300 | |
| | Berkshire Hills Bancorp, Inc. | | | 55,570 | | | | 1,953,286 | |
| | Blue Capital Reinsurance Holdings, Ltd. | | | 11,127 | | | | 203,624 | |
| | BofI Holding, Inc.*+ | | | 40,000 | | | | 948,800 | |
| | C&F Financial Corp. | | | 3,400 | | | | 159,460 | |
| | Camden National Corp. | | | 33,779 | | | | 1,449,457 | |
| | Capital City Bank Group, Inc. | | | 81,250 | | | | 1,659,125 | |
| | CB Financial Services, Inc. | | | 13,500 | | | | 352,350 | |
| | Central Pacific Financial Corp. | | | 47,100 | | | | 1,482,237 | |
| | Central Valley Community Bancorp | | | 51,000 | | | | 1,130,160 | |
| | Century Bancorp, Inc., Class A | | | 14,300 | | | | 909,480 | |
| | Charter Financial Corp. | | | 12,500 | | | | 225,000 | |
| | |
Omni Tax-Managed Small-Cap Value Fund SCHEDULE OF INVESTMENTS (continued) | | |
Showing percentage of net assets as of June 30, 2017
| | | | | | | | | | |
| Industry | | Company | | Shares | | | Value | |
| |
Common Stocks (continued) | |
Financials (continued) | |
| | Chemung Financial Corp. | | | 3,000 | | | $ | 122,640 | |
| | Citizens Community Bancorp, Inc. | | | 17,500 | | | | 244,650 | |
| | Citizens, Inc.*+ | | | 17,200 | | | | 126,936 | |
| | Civista Bancshares, Inc. | | | 19,921 | | | | 415,950 | |
| | CNB Financial Corp. | | | 70,800 | | | | 1,697,076 | |
| | Codorus Valley Bancorp, Inc. | | | 7,397 | | | | 210,086 | |
| | Commerce Union Bancshares, Inc.+ | | | 1,000 | | | | 23,870 | |
| | Community Bankers Trust Corp.*+ | | | 25,000 | | | | 206,250 | |
| | Community Financial Corp. (The)+ | | | 3,840 | | | | 147,840 | |
| | Community Trust Bancorp, Inc. | | | 32,500 | | | | 1,421,875 | |
| | ConnectOne Bancorp, Inc. | | | 40,000 | | | | 902,000 | |
| | Consumer Portfolio Services, Inc.* | | | 71,650 | | | | 326,008 | |
| | County Bancorp, Inc. | | | 1,500 | | | | 36,000 | |
| | Customers Bancorp, Inc.* | | | 24,500 | | | | 692,860 | |
| | Donegal Group, Inc., Class A | | | 74,100 | | | | 1,178,190 | |
| | Eagle Bancorp Montana, Inc. | | | 1,500 | | | | 27,150 | |
| | eHealth, Inc.* | | | 15,000 | | | | 282,000 | |
| | EMC Insurance Group, Inc. | | | 39,025 | | | | 1,084,114 | |
| | Employers Holdings, Inc. | | | 75,900 | | | | 3,210,570 | |
| | Encore Capital Group, Inc.*+ | | | 26,000 | | | | 1,043,900 | |
| | Enova International, Inc.* | | | 45,000 | | | | 668,250 | |
| | Entegra Financial Corp.* | | | 12,000 | | | | 273,000 | |
| | Enterprise Bancorp, Inc. | | | 53,175 | | | | 1,889,840 | |
| | ESSA Bancorp, Inc. | | | 35,000 | | | | 515,200 | |
| | Evans Bancorp, Inc. | | | 9,000 | | | | 359,550 | |
| | EZCORP, Inc., Class A* | | | 96,100 | | | | 739,970 | |
| | Farmers Capital Bank Corp. | | | 30,400 | | | | 1,171,920 | |
| | Farmers National Banc Corp. | | | 150 | | | | 2,175 | |
| | FBL Financial Group, Inc., Class A | | | 45,666 | | | | 2,808,459 | |
| | Federal Agricultural Mortgage Corp., Class C | | | 13,200 | | | | 854,040 | |
| | Federated National Holding Co. | | | 27,000 | | | | 432,000 | |
| | Fidelity & Guaranty Life+ | | | 65,000 | | | | 2,018,250 | |
| | Fidelity Southern Corp. | | | 61,400 | | | | 1,403,604 | |
| | Financial Institutions, Inc. | | | 40,300 | | | | 1,200,940 | |
| | First BanCorp Puerto Rico* | | | 469,100 | | | | 2,716,089 | |
| | First BanCorp Southern Pines NC | | | 102,856 | | | | 3,215,279 | |
| | | | | | | | | | |
| Industry | | Company | | Shares | | | Value | |
| | | |
| | | | | | | | | | |
Financials (continued) | |
| | First Bancorp, Inc. | | | 19,550 | | | $ | 529,023 | |
| | First Bancshares, Inc. (The)+ | | | 14,715 | | | | 406,134 | |
| | First Business Financial Services, Inc. | | | 14,100 | | | | 325,428 | |
| | First Commonwealth Financial Corp. | | | 121,200 | | | | 1,536,816 | |
| | First Community Bancshares, Inc. | | | 61,300 | | | | 1,676,555 | |
| | First Financial Corp. | | | 38,830 | | | | 1,836,659 | |
| | First Financial Northwest, Inc. | | | 26,400 | | | | 425,832 | |
| | First Guaranty Bancshares, Inc.+ | | | 5,000 | | | | 136,200 | |
| | First Internet Bancorp | | | 12,800 | | | | 359,040 | |
| | First Midwest Bancorp, Inc. | | | 115,900 | | | | 2,701,629 | |
| | First of Long Island Corp. (The) | | | 27,000 | | | | 772,200 | |
| | First South Bancorp, Inc. | | | 21,600 | | | | 357,264 | |
| | First United Corp.* | | | 3,975 | | | | 59,426 | |
| | First US Bancshares, Inc. | | | 5,000 | | | | 56,100 | |
| | FirstCash, Inc. | | | 46,484 | | | | 2,710,017 | |
| | Flushing Financial Corp. | | | 43,300 | | | | 1,220,627 | |
| | FNFV Group* | | | 118,400 | | | | 1,870,720 | |
| | GAIN Capital Holdings, Inc. | | | 146,000 | | | | 909,580 | |
| | German American Bancorp, Inc. | | | 750 | | | | 25,568 | |
| | Great Southern Bancorp, Inc. | | | 39,850 | | | | 2,131,975 | |
| | Green Bancorp, Inc.*+ | | | 100,000 | | | | 1,940,000 | |
| | Green Dot Corp., Class A* | | | 56,900 | | | | 2,192,357 | |
| | Hallmark Financial Services, Inc.* | | | 50,158 | | | | 565,281 | |
| | HCI Group, Inc.+ | | | 20,000 | | | | 939,600 | |
| | Heartland Financial USA, Inc. | | | 61,950 | | | | 2,917,845 | |
| | Heritage Financial Corp. | | | 60,102 | | | | 1,592,703 | |
| | Heritage Insurance Holdings, Inc. | | | 20,000 | | | | 260,400 | |
| | Hingham Institution for Savings | | | 1,143 | | | | 207,946 | |
| | Home Bancorp, Inc. | | | 15,597 | | | | 663,184 | |
| | HomeStreet, Inc.* | | | 54,000 | | | | 1,494,450 | |
| | HomeTrust Bancshares, Inc.* | | | 50,000 | | | | 1,220,000 | |
| | HopFed Bancorp, Inc. | | | 23,500 | | | | 345,685 | |
| | Horace Mann Educators Corp. | | | 74,950 | | | | 2,833,110 | |
| | Horizon Bancorp | | | 35,695 | | | | 940,563 | |
| | Independence Holding Co. | | | 14,950 | | | | 305,728 | |
| | |
| 24 | | Annual Report | June 30, 2017 |
| | |
Omni Tax-Managed Small-Cap Value Fund SCHEDULE OF INVESTMENTS (continued) | | |
Showing percentage of net assets as of June 30, 2017
| | | | | | | | | | |
| Industry | | Company | | Shares | | | Value | |
| |
Common Stocks (continued) | |
Financials (continued) | |
| | Independent Bank Group, Inc. | | | 17,787 | | | $ | 1,058,326 | |
| | Infinity Property & Casualty Corp. | | | 19,700 | | | | 1,851,800 | |
| | International Bancshares Corp. | | | 64,600 | | | | 2,264,230 | |
| | Investar Holding Corp.+ | | | 19,524 | | | | 447,100 | |
| | Investment Technology Group, Inc. | | | 76,000 | | | | 1,614,240 | |
| | Investors Title Co. | | | 1,000 | | | | 193,440 | |
| | James River Group Holdings, Ltd. | | | 65,600 | | | | 2,606,288 | |
| | Kansas City Life Insurance Co. | | | 24,900 | | | | 1,232,550 | |
| | KCG Holdings, Inc., Class A* | | | 149,900 | | | | 2,989,006 | |
| | Kingstone Cos., Inc. | | | 11,200 | | | | 171,360 | |
| | Lakeland Bancorp, Inc. | | | 104,940 | | | | 1,978,119 | |
| | Landmark Bancorp, Inc. | | | 2,205 | | | | 67,914 | |
| | LCNB Corp.+ | | | 1,500 | | | | 30,000 | |
| | LegacyTexas Financial Group, Inc. | | | 20,000 | | | | 762,600 | |
| | Mackinac Financial Corp.+ | | | 13,400 | | | | 187,600 | |
| | Maiden Holdings, Ltd. | | | 167,450 | | | | 1,858,695 | |
| | MainSource Financial Group, Inc. | | | 41,765 | | | | 1,399,545 | |
| | Marlin Business Services Corp. | | | 15,775 | | | | 396,741 | |
| | MBT Financial Corp. | | | 62,011 | | | | 601,507 | |
| | Mercantile Bank Corp. | | | 2,000 | | | | 62,960 | |
| | Meta Financial Group, Inc. | | | 20,078 | | | | 1,786,942 | |
| | Mid Penn Bancorp, Inc. | | | 11,200 | | | | 307,440 | |
| | Midland States Bancorp, Inc. | | | 20,418 | | | | 684,398 | |
| | MidSouth Bancorp, Inc.+ | | | 16,000 | | | | 188,000 | |
| | MidWestOne Financial Group, Inc. | | | 23,300 | | | | 789,637 | |
| | MMA Capital Management, LLC* | | | 500 | | | | 11,050 | |
| | MutualFirst Financial, Inc. | | | 700 | | | | 24,990 | |
| | National Bankshares, Inc.+ | | | 1,000 | | | | 40,800 | |
| | National Commerce Corp.* | | | 10,000 | | | | 395,500 | |
| | National Security Group, Inc. (The)+ | | | 200 | | | | 2,852 | |
| | National Western Life Group, Inc., Class A | | | 7,350 | | | | 2,349,207 | |
| | Nationstar Mortgage Holdings, Inc.*+ | | | 126,500 | | | | 2,263,085 | |
| | Navigators Group, Inc. (The) | | | 75,300 | | | | 4,133,970 | |
| | NBT Bancorp, Inc. | | | 11,434 | | | | 422,486 | |
| | Nelnet, Inc., Class A | | | 36,900 | | | | 1,734,669 | |
| | NewStar Financial, Inc. | | | 15,000 | | | | 157,500 | |
| | | | | | | | | | |
| Industry | | Company | | Shares | | | Value | |
| | | |
| | | | | | | | | | |
Financials (continued) | |
| | Nicholas Financial, Inc.*+ | | | 50,200 | | | $ | 463,346 | |
| | NMI Holdings, Inc., Class A* | | | 185,000 | | | | 2,118,250 | |
| | Northeast Bancorp | | | 8,400 | | | | 170,940 | |
| | Northrim BanCorp, Inc. | | | 24,073 | | | | 731,819 | |
| | Norwood Financial Corp.+ | | | 1,000 | | | | 42,250 | |
| | Ocwen Financial Corp.*+ | | | 420,000 | | | | 1,129,800 | |
| | OFG Bancorp | | | 88,000 | | | | 880,000 | |
| | Old Line Bancshares, Inc. | | | 8,050 | | | | 226,849 | |
| | Old Second Bancorp, Inc. | | | 30,050 | | | | 347,078 | |
| | OneBeacon Insurance Group Ltd., Class A | | | 151,400 | | | | 2,760,022 | |
| | Oppenheimer Holdings, Inc., Class A | | | 4,419 | | | | 72,472 | |
| | Opus Bank | | | 5,000 | | | | 121,000 | |
| | Orrstown Financial Services, Inc. | | | 28,000 | | | | 639,800 | |
| | Pacific Continental Corp. | | | 56,600 | | | | 1,446,130 | |
| | Pacific Premier Bancorp, Inc.* | | | 44,289 | | | | 1,634,264 | |
| | Park Sterling Corp. | | | 50,298 | | | | 597,540 | |
| | Parke Bancorp, Inc.+ | | | 15,752 | | | | 352,845 | |
| | Peapack Gladstone Financial Corp. | | | 4,968 | | | | 155,449 | |
| | Penns Woods Bancorp, Inc. | | | 1,000 | | | | 41,180 | |
| | Peoples Bancorp of North Carolina, Inc.+ | | | 4,800 | | | | 151,680 | |
| | Peoples Bancorp, Inc. | | | 39,550 | | | | 1,270,742 | |
| | Peoples Financial Services Corp.+ | | | 2,600 | | | | 113,698 | |
| | PHH Corp.* | | | 73,300 | | | | 1,009,341 | |
| | Piper Jaffray Cos. | | | 28,700 | | | | 1,720,565 | |
| | Premier Financial Bancorp, Inc. | | | 28,672 | | | | 590,930 | |
| | Provident Financial Holdings, Inc. | | | 53,710 | | | | 1,033,918 | |
| | Provident Financial Services, Inc. | | | 67,400 | | | | 1,710,612 | |
| | Prudential Bancorp, Inc.+ | | | 957 | | | | 17,379 | |
| | QCR Holdings, Inc. | | | 27,300 | | | | 1,294,020 | |
| | Regional Management Corp.* | | | 52,100 | | | | 1,231,123 | |
| | Renasant Corp. | | | 88,004 | | | | 3,849,295 | |
| | Republic Bancorp, Inc., Class A | | | 25,700 | | | | 917,490 | |
| | Riverview Bancorp, Inc. | | | 72,478 | | | | 481,254 | |
| | S&T Bancorp, Inc. | | | 20,700 | | | | 742,302 | |
| | Safety Insurance Group, Inc. | | | 31,800 | | | | 2,171,940 | |
| | Salisbury Bancorp, Inc. | | | 1,183 | | | | 49,035 | |
| | Sandy Spring Bancorp, Inc. | | | 14,300 | | | | 581,438 | |
| | SB Financial Group, Inc. | | | 28,952 | | | | 491,894 | |
| | |
Omni Tax-Managed Small-Cap Value Fund SCHEDULE OF INVESTMENTS (continued) | | |
Showing percentage of net assets as of June 30, 2017
| | | | | | | | | | |
| Industry | | Company | | Shares | | | Value | |
| |
Common Stocks (continued) | |
Financials (continued) | |
| | Security National Financial Corp., Class A* | | | 14,355 | | | $ | 91,872 | |
| | Selective Insurance Group, Inc. | | | 50,100 | | | | 2,507,505 | |
| | Shore Bancshares, Inc. | | | 60,400 | | | | 993,580 | |
| | SI Financial Group, Inc. | | | 30,000 | | | | 483,000 | |
| | Sierra Bancorp | | | 59,400 | | | | 1,458,270 | |
| | Southern National Bancorp of Virginia, Inc. | | | 51,257 | | | | 902,116 | |
| | State Auto Financial Corp. | | | 72,836 | | | | 1,874,070 | |
| | State National Cos, Inc. | | | 50,500 | | | | 928,190 | |
| | Stewart Information Services Corp. | | | 68,350 | | | | 3,101,723 | |
| | Stonegate Bank | | | 29,000 | | | | 1,339,220 | |
| | Summit Financial Group, Inc.+ | | | 20,600 | | | | 453,200 | |
| | Summit State Bank+ | | | 6,250 | | | | 81,250 | |
| | Sussex Bancorp+ | | | 15,000 | | | | 371,250 | |
| | Territorial Bancorp, Inc. | | | 21,900 | | | | 683,061 | |
| | Third Point Reinsurance Ltd.*+ | | | 100,500 | | | | 1,396,950 | |
| | Timberland Bancorp, Inc.+ | | | 32,000 | | | | 808,640 | |
| | Tiptree, Inc. | | | 56,200 | | | | 396,210 | |
| | TowneBank | | | 743 | | | | 22,884 | |
| | TriCo Bancshares | | | 200 | | | | 7,030 | |
| | TriState Capital Holdings, Inc.* | | | 51,760 | | | | 1,304,352 | |
| | Triumph Bancorp, Inc.* | | | 11,600 | | | | 284,780 | |
| | TrustCo Bank Corp. | | | 20,000 | | | | 155,000 | |
| | Trustmark Corp. | | | 20,800 | | | | 668,928 | |
| | Two River Bancorp+ | | | 36,015 | | | | 669,519 | |
| | Union Bankshares Corp. | | | 84,148 | | | | 2,852,617 | |
| | United Bankshares, Inc.+ | | | 17,379 | | | | 681,257 | |
| | United Community Bancorp | | | 10,000 | | | | 196,000 | |
| | United Community Financial Corp. | | | 163 | | | | 1,355 | |
| | United Financial Bancorp, Inc. | | | 10,000 | | | | 166,900 | |
| | United Fire Group, Inc. | | | 60,900 | | | | 2,683,254 | |
| | United Insurance Holdings Corp. | | | 53,400 | | | | 839,982 | |
| | Universal Insurance Holdings, Inc.+ | | | 49,795 | | | | 1,254,834 | |
| | Univest Corp. of Pennsylvania | | | 49,415 | | | | 1,479,979 | |
| | Walker & Dunlop, Inc.* | | | 58,175 | | | | 2,840,685 | |
| | Waterstone Financial, Inc. | | | 15,000 | | | | 282,750 | |
| | WesBanco, Inc. | | | 66,385 | | | | 2,624,863 | |
| | Westbury Bancorp, Inc.*+ | | | 3,750 | | | | 76,350 | |
| | Western New England Bancorp, Inc. | | | 83,312 | | | | 845,617 | |
| | World Acceptance Corp.*+ | | | 12,000 | | | | 898,920 | |
| | | | | | | | | | |
| Industry | | Company | | Shares | | | Value | |
| | | |
| | | | | | | | | | |
Financials (continued) | |
| | WSFS Financial Corp. | | | 23,000 | | | $ | 1,043,050 | |
| | Xenith Bankshares, Inc.* | | | 26,522 | | | | 823,773 | |
| | | | | | | | | | |
| | | | | | | | | 209,658,242 | |
|
Health Care - 2.13% | |
| | Altimmune, Inc. | | | 12,547 | | | | 40,150 | |
| | AMAG Pharmaceuticals, Inc.*+ | | | 17,000 | | | | 312,800 | |
| | AngioDynamics, Inc.* | | | 62,300 | | | | 1,009,883 | |
| | Cumberland Pharmaceuticals, Inc.* | | | 20,300 | | | | 143,521 | |
| | Digirad Corp. | | | 36,447 | | | | 147,610 | |
| | Electromed, Inc.* | | | 10,000 | | | | 55,300 | |
| | Exactech, Inc.* | | | 17,500 | | | | 521,500 | |
| | FONAR Corp.* | | | 23,400 | | | | 649,350 | |
| | Halyard Health, Inc.* | | | 27,000 | | | | 1,060,560 | |
| | InfuSystems Holdings, Inc.* | | | 70,178 | | | | 126,320 | |
| | Kewaunee Scientific Corp. | | | 2,500 | | | | 62,375 | |
| | Kindred Healthcare, Inc. | | | 106,700 | | | | 1,243,055 | |
| | Lannett Co., Inc.*+ | | | 35,000 | | | | 714,000 | |
| | LHC Group, Inc.* | | | 500 | | | | 33,945 | |
| | Magellan Health, Inc.* | | | 27,125 | | | | 1,977,412 | |
| | National Healthcare Corp. | | | 5,982 | | | | 419,577 | |
| | Nobilis Health Corp.*+ | | | 20,000 | | | | 38,000 | |
| | PDL BioPharma, Inc. | | | 25,000 | | | | 61,750 | |
| | PharMerica Corp.* | | | 5,300 | | | | 139,125 | |
| | Select Medical Holdings Corp.* | | | 185,000 | | | | 2,839,750 | |
| | Tivity Health, Inc.* | | | 9,500 | | | | 378,575 | |
| | Triple-S Management Corp., Class B* | | | 102,100 | | | | 1,726,511 | |
| | | | | | | | | | |
| | | | | | | | | 13,701,069 | |
|
Industrials - 18.67% | |
| | AAR Corp. | | | 89,560 | | | | 3,113,106 | |
| | Acacia Research Corp.* | | | 35,000 | | | | 143,500 | |
| | ACCO Brands Corp.* | | | 339,800 | | | | 3,958,670 | |
| | Acme United Corp. | | | 2,000 | | | | 57,200 | |
| | Aegion Corp.* | | | 120,300 | | | | 2,632,164 | |
| | AeroCentury Corp.* | | | 4,300 | | | | 53,320 | |
| | Air T, Inc.* | | | 6,700 | | | | 142,040 | |
| | Air Transport Services Group, Inc.* | | | 266,526 | | | | 5,804,936 | |
| | Aircastle, Ltd. | | | 55,400 | | | | 1,204,950 | |
| | Alpha Pro Tech, Ltd.* | | | 500 | | | | 1,475 | |
| | American Railcar Industries, Inc.+ | | | 5,000 | | | | 191,500 | |
| | AMREP Corp.* | | | 21,000 | | | | 142,380 | |
| | ArcBest Corp. | | | 40,400 | | | | 832,240 | |
| | Armstrong Flooring, Inc.* | | | 45,000 | | | | 808,650 | |
| | Arotech Corp.*+ | | | 35,596 | | | | 126,366 | |
| | |
| 26 | | Annual Report | June 30, 2017 |
| | |
Omni Tax-Managed Small-Cap Value Fund SCHEDULE OF INVESTMENTS (continued) | | |
Showing percentage of net assets as of June 30, 2017
| | | | | | | | | | |
| Industry | | Company | | Shares | | | Value | |
| |
Common Stocks (continued) | |
Industrials (continued) | |
| | Atlas Air Worldwide Holdings, Inc.* | | | 41,900 | | | $ | 2,185,085 | |
| | Babcock & Wilcox Enterprises, Inc.* | | | 10,000 | | | | 117,600 | |
| | Briggs & Stratton Corp. | | | 169,450 | | | | 4,083,745 | |
| | Broadwind Energy, Inc.* | | | 26,075 | | | | 131,418 | |
| | CAI International, Inc.* | | | 48,600 | | | | 1,146,960 | |
| | CBIZ, Inc.* | | | 128,300 | | | | 1,924,500 | |
| | CECO Environmental Corp. | | | 52,022 | | | | 477,562 | |
| | Chart Industries, Inc.* | | | 63,175 | | | | 2,194,068 | |
| | Chicago Rivet & Machine Co. | | | 1,000 | | | | 36,000 | |
| | Civeo Corp.*+ | | | 79,500 | | | | 166,950 | |
| | Columbus McKinnon Corp. | | | 33,800 | | | | 859,196 | |
| | Commercial Vehicle Group, Inc.* | | | 60,000 | | | | 507,000 | |
| | Covenant Transportation Group, Inc., Class A* | | | 80,650 | | | | 1,413,795 | |
| | CRA International, Inc. | | | 51,000 | | | | 1,852,320 | |
| | Cubic Corp. | | | 10,000 | | | | 463,000 | |
| | DigitalGlobe, Inc.* | | | 29,800 | | | | 992,340 | |
| | DMC Global, Inc. | | | 20,000 | | | | 262,000 | |
| | Ducommun, Inc.* | | | 34,750 | | | | 1,097,405 | |
| | Eastern Co. (The) | | | 20,104 | | | | 604,125 | |
| | Ecology & Environment, Inc., Class A | | | 2,811 | | | | 35,559 | |
| | Encore Wire Corp. | | | 6,500 | | | | 277,550 | |
| | Engility Holdings, Inc.* | | | 31,650 | | | | 898,860 | |
| | Ennis, Inc. | | | 149,265 | | | | 2,850,962 | |
| | Essendant, Inc. | | | 2,500 | | | | 37,075 | |
| | FreightCar America, Inc. | | | 700 | | | | 12,173 | |
| | FTI Consulting, Inc.* | | | 56,500 | | | | 1,975,240 | |
| | General Cable Corp. | | | 16,500 | | | | 269,775 | |
| | General Finance Corp.* | | | 119,264 | | | | 614,210 | |
| | Gibraltar Industries, Inc.* | | | 15,706 | | | | 559,919 | |
| | Goldfield Corp. (The)* | | | 114,000 | | | | 627,000 | |
| | Great Lakes Dredge & Dock Corp.* | | | 167,000 | | | | 718,100 | |
| | Greenbrier Companies., Inc. (The)+ | | | 58,400 | | | | 2,701,000 | |
| | Griffon Corp. | | | 115,250 | | | | 2,529,738 | |
| | Hardinge, Inc. | | | 82,600 | | | | 1,025,892 | |
| | Hawaiian Holdings, Inc.* | | | 54,000 | | | | 2,535,300 | |
| | HC2 Holdings, Inc.* | | | 83,900 | | | | 493,332 | |
| | Heidrick & Struggles International, Inc. | | | 55,440 | | | | 1,205,820 | |
| | Heritage-Crystal Clean, Inc.* | | | 14,246 | | | | 226,511 | |
| | Highpower International, Inc.*+ | | | 25,922 | | | | 94,615 | |
| | Houston Wire & Cable Co. | | | 46,100 | | | | 242,025 | |
| | | | | | | | | | |
| Industry | | Company | | Shares | | | Value | |
| | | |
| | | | | | | | | | |
Industrials (continued) | |
| | Hurco Cos., Inc. | | | 11,015 | | | $ | 382,771 | |
| | Huron Consulting Group, Inc.* | | | 30,300 | | | | 1,308,960 | |
| | Hyster-Yale Materials Handling, Inc. | | | 2,700 | | | | 189,675 | |
| | ICF International, Inc.* | | | 35,000 | | | | 1,648,500 | |
| | IES Holdings, Inc.*+ | | | 3,600 | | | | 65,340 | |
| | Kaman Corp. | | | 16,500 | | | | 822,855 | |
| | Kelly Services, Inc., Class A | | | 68,400 | | | | 1,535,580 | |
| | Kratos Defense & Security Solutions, Inc.* | | | 10,000 | | | | 118,700 | |
| | L.B. Foster Co., Class A | | | 18,600 | | | | 398,970 | |
| | L.S. Starrett Co. (The), Class A | | | 23,900 | | | | 205,540 | |
| | Marten Transport, Ltd. | | | 60,466 | | | | 1,656,768 | |
| | MasTec, Inc.* | | | 63,500 | | | | 2,867,025 | |
| | McGrath RentCorp | | | 93,000 | | | | 3,220,590 | |
| | Miller Industries, Inc. | | | 1,200 | | | | 29,820 | |
| | MRC Global, Inc.* | | | 138,020 | | | | 2,280,090 | |
| | MYR Group, Inc.* | | | 25,000 | | | | 775,500 | |
| | National Presto Industries, Inc.+ | | | 9,435 | | | | 1,042,568 | |
| | Navigant Consulting, Inc.* | | | 215,900 | | | | 4,266,184 | |
| | Navios Maritime Holdings, Inc.* | | | 51,914 | | | | 71,122 | |
| | NN, Inc. | | | 47,500 | | | | 1,303,875 | |
| | Northwest Pipe Co.*+ | | | 20,100 | | | | 326,826 | |
| | Orion Group Holdings, Inc.* | | | 93,078 | | | | 695,293 | |
| | Park-Ohio Holdings Corp. | | | 10,000 | | | | 381,000 | |
| | Pendrell Corp.* | | | 52,000 | | | | 375,960 | |
| | Performant Financial Corp.* | | | 93,833 | | | | 196,111 | |
| | Powell Industries, Inc. | | | 25,000 | | | | 799,750 | |
| | Preformed Line Products Co. | | | 1,200 | | | | 55,704 | |
| | Quad/Graphics, Inc. | | | 52,500 | | | | 1,203,300 | |
| | Quanex Building Products Corp. | | | 35,000 | | | | 740,250 | |
| | Radiant Logistics, Inc.* | | | 53,200 | | | | 286,216 | |
| | RCM Technologies, Inc.* | | | 14,000 | | | | 70,700 | |
| | RPX Corp.* | | | 105,596 | | | | 1,473,064 | |
| | Rush Enterprises, Inc., Class A* | | | 48,600 | | | | 1,806,948 | |
| | Rush Enterprises, Inc., Class B* | | | 41,700 | | | | 1,518,297 | |
| | SkyWest, Inc. | | | 145,600 | | | �� | 5,110,560 | |
| | Spartan Motors, Inc. | | | 88,600 | | | | 784,110 | |
| | SPX FLOW, Inc.* | | | 20,000 | | | | 737,600 | |
| | Sterling Construction Co., Inc.* | | | 35,000 | | | | 457,450 | |
| | |
Omni Tax-Managed Small-Cap Value Fund SCHEDULE OF INVESTMENTS (continued) | | |
Showing percentage of net assets as of June 30, 2017
| | | | | | | | | | |
| Industry | | Company | | Shares | | | Value | |
| |
Common Stocks (continued) | |
Industrials (continued) | |
| | Supreme Industries, Inc., Class A | | | 30,450 | | | $ | 500,902 | |
| | Textainer Group Holdings Ltd. | | | 70,800 | | | | 1,026,600 | |
| | Titan International, Inc. | | | 136,000 | | | | 1,633,360 | |
| | Titan Machinery, Inc.* | | | 75,500 | | | | 1,357,490 | |
| | TriMas Corp.* | | | 19,500 | | | | 406,575 | |
| | Triumph Group, Inc. | | | 20,000 | | | | 632,000 | |
| | TrueBlue, Inc.* | | | 12,850 | | | | 340,525 | |
| | Tutor Perini Corp.* | | | 96,200 | | | | 2,765,750 | |
| | Ultralife Corp.* | | | 57,350 | | | | 412,920 | |
| | USA Truck, Inc.* | | | 9,635 | | | | 83,439 | |
| | Vectrus, Inc.* | | | 5,000 | | | | 161,600 | |
| | Veritiv Corp.* | | | 46,133 | | | | 2,075,985 | |
| | Viad Corp. | | | 57,894 | | | | 2,735,492 | |
| | VSE Corp. | | | 31,660 | | | | 1,424,067 | |
| | Wabash National Corp.+ | | | 96,000 | | | | 2,110,080 | |
| | Wesco Aircraft Holdings, Inc.* | | | 14,200 | | | | 154,070 | |
| | Westport Fuel Systems, Inc.*+ | | | 995 | | | | 2,338 | |
| | Willdan Group, Inc.* | | | 1,600 | | | | 48,880 | |
| | Willis Lease Finance Corp.* | | | 50,950 | | | | 1,361,894 | |
| | | | | | | | | | |
| | | |
| | | | | | | | | 120,101,761 | |
Information Technology - 8.64% | |
| | Alpha & Omega | | | | | | | | |
| | Semiconductor, Ltd.* | | | 161,905 | | | | 2,698,956 | |
| | Amkor Technology, Inc.* | | | 255,200 | | | | 2,493,304 | |
| | Autobytel, Inc.* | | | 600 | | | | 7,566 | |
| | AXT, Inc.* | | | 25,000 | | | | 158,750 | |
| | Bel Fuse, Inc., Class B | | | 63,600 | | | | 1,570,920 | |
| | Benchmark Electronics, Inc.* | | | 121,800 | | | | 3,934,140 | |
| | Black Box Corp. | | | 23,775 | | | | 203,276 | |
| | Blucora, Inc.* | | | 82,400 | | | | 1,746,880 | |
| | Brooks Automation, Inc. | | | 500 | | | | 10,845 | |
| | ClearOne, Inc. | | | 5,000 | | | | 47,250 | |
| | Computer Task Group, Inc. | | | 72,400 | | | | 404,716 | |
| | Comtech Telecommunications Corp. | | | 40,000 | | | | 758,800 | |
| | Concurrent Computer Corp. | | | 3,400 | | | | 22,916 | |
| | CSP, Inc. | | | 5,150 | | | | 55,363 | |
| | DASAN Zhone Solutions, Inc.* | | | 6,800 | | | | 40,800 | |
| | Digi International, Inc.* | | | 58,325 | | | | 591,999 | |
| | Diodes, Inc.* | | | 69,400 | | | | 1,667,682 | |
| | Ebix, Inc.+ | | | 40,000 | | | | 2,156,000 | |
| | Edgewater Technology, Inc.* | | | 11,710 | | | | 79,979 | |
| | Electro Scientific Industries, Inc.* | | | 15,000 | | | | 123,600 | |
| | | | | | | | | | |
| Industry | | Company | | Shares | | | Value | |
| | | |
| | | | | | | | | | |
Information Technology (continued) | |
| | FORM Holdings Corp.* | | | 30,000 | | | $ | 49,500 | |
| | Global Sources, Ltd.* | | | 5,000 | | | | 100,000 | |
| | GSE Systems, Inc.* | | | 22,500 | | | | 66,375 | |
| | Harmonic, Inc.* | | | 600 | | | | 3,150 | |
| | IEC Electronics Corp.* | | | 17,700 | | | | 63,720 | |
| | II-VI, Inc.* | | | 63,404 | | | | 2,174,757 | |
| | Insight Enterprises, Inc.* | | | 44,883 | | | | 1,794,871 | |
| | inTEST Corp.* | | | 54,500 | | | | 365,150 | |
| | IXYS Corp. | | | 39,000 | | | | 641,550 | |
| | KEMET Corp.* | | | 81,500 | | | | 1,043,200 | |
| | Key Tronic Corp.* | | | 30,500 | | | | 215,940 | |
| | Kimball Electronics, Inc.* | | | 59,100 | | | | 1,066,755 | |
| | Kulicke & Soffa Industries, Inc.* | | | 100,300 | | | | 1,907,706 | |
| | KVH Industries, Inc.* | | | 18,200 | | | | 172,900 | |
| | Liquidity Services, Inc.* | | | 37,350 | | | | 237,172 | |
| | ManTech International Corp., Class A | | | 78,882 | | | | 3,264,137 | |
| | Meet Group Inc. (The)*+ | | | 26,831 | | | | 135,497 | |
| | Mind CTI Ltd. | | | 500 | | | | 1,250 | |
| | NCI, Inc., Class A* | | | 60,700 | | | | 1,280,770 | |
| | Net 1 UEPS Technologies, Inc.* | | | 171,100 | | | | 1,687,046 | |
| | NETGEAR, Inc.* | | | 34,930 | | | | 1,505,483 | |
| | NetSol Technologies, Inc.* | | | 16,680 | | | | 65,886 | |
| | Network-1 Technologies, Inc. | | | 50,000 | | | | 212,500 | |
| | NeuStar, Inc., Class A* | | | 61,481 | | | | 2,050,391 | |
| | PCM, Inc.* | | | 82,175 | | | | 1,540,781 | |
| | PC-Tel, Inc. | | | 56,000 | | | | 396,480 | |
| | Photronics, Inc.* | | | 171,470 | | | | 1,611,818 | |
| | Plexus Corp.* | | | 500 | | | | 26,285 | |
| | PRGX Global, Inc.* | | | 16,377 | | | | 106,450 | |
| | Rocket Fuel, Inc.* | | | 110,000 | | | | 302,500 | |
| | Sanmina Corp.* | | | 68,800 | | | | 2,621,280 | |
| | ScanSource, Inc.* | | | 39,500 | | | | 1,591,850 | |
| | SMTC Corp.* | | | 13,500 | | | | 17,550 | |
| | Sohu.com, Inc.* | | | 17,500 | | | | 788,550 | |
| | Sykes Enterprises, Inc.* | | | 56,750 | | | | 1,902,828 | |
| | Synacor, Inc.* | | | 15,000 | | | | 54,750 | |
| | Systemax, Inc. | | | 21,000 | | | | 394,800 | |
| | TESSCO Technologies, Inc. | | | 15,250 | | | | 202,825 | |
| | Trio-Tech International* | | | 3,000 | | | | 14,940 | |
| | TTM Technologies, Inc.* | | | 219,402 | | | | 3,808,819 | |
| | Ultra Clean Holdings, Inc.* | | | 32,000 | | | | 600,000 | |
| | Vishay Precision Group, Inc.* | | | 31,667 | | | | 547,839 | |
| | Wayside Technology Group, Inc. | | | 7,200 | | | | 139,320 | |
| | | | | | | | | | |
| | | |
| | | | | | | | | 55,549,113 | |
| | |
| 28 | | Annual Report | June 30, 2017 |
| | |
Omni Tax-Managed Small-Cap Value Fund SCHEDULE OF INVESTMENTS (continued) | |
|
Showing percentage of net assets as of June 30, 2017
| | | | | | | | | | |
| Industry Company | | Shares | | | Value | |
| |
Common Stocks (continued) | |
Materials - 6.88% | |
| | American Vanguard Corp. | | | 34,200 | | | $ | 589,950 | |
| | Ampco-Pittsburgh Corp. | | | 64,005 | | | | 944,074 | |
| | Boise Cascade Co.* | | | 65,000 | | | | 1,976,000 | |
| | Carpenter Technology Corp. | | | 50,400 | | | | 1,886,472 | |
| | China Green Agriculture, Inc.* | | | 43,500 | | | | 54,810 | |
| | Clearwater Paper Corp.* | | | 16,182 | | | | 756,509 | |
| | Coeur Mining, Inc.* | | | 179,700 | | | | 1,541,826 | |
| | Core Molding Technologies, Inc.* | | | 11,900 | | | | 257,159 | |
| | Flexible Solutions | | | | | | | | |
| | International, Inc.* | | | 5,000 | | | | 9,050 | |
| | Friedman Industries, Inc. | | | 5,000 | | | | 28,400 | |
| | FutureFuel Corp. | | | 54,500 | | | | 822,405 | |
| | Gold Resource Corp. | | | 20,000 | | | | 81,600 | |
| | Gulf Resources, Inc.* | | | 85,750 | | | | 136,342 | |
| | Handy & Harman, Ltd.* | | | 30,300 | | | | 951,420 | |
| | Haynes International, Inc. | | | 22,200 | | | | 806,082 | |
| | Hecla Mining Co. | | | 749,000 | | | | 3,819,900 | |
| | Kaiser Aluminum Corp. | | | 17,850 | | | | 1,580,082 | |
| | Kraton Corp.* | | | 169,500 | | | | 5,837,580 | |
| | Materion Corp. | | | 71,700 | | | | 2,681,580 | |
| | Mercer International, Inc. | | | 109,950 | | | | 1,264,425 | |
| | Olympic Steel, Inc. | | | 22,300 | | | | 434,404 | |
| | PH Glatfelter Co. | | | 113,900 | | | | 2,225,606 | |
| | Rayonier Advanced | | | | | | | | |
| | Materials, Inc.+ | | | 26,700 | | | | 419,724 | |
| | Resolute Forest Products, Inc.* | | | 15,000 | | | | 66,000 | |
| | Schnitzer Steel Industries, Inc., Class A | | | 66,500 | | | | 1,675,800 | |
| | Schulman (A.), Inc. | | | 57,900 | | | | 1,852,800 | |
| | Stepan Co. | | | 65,400 | | | | 5,698,956 | |
| | SunCoke Energy, Inc.* | | | 216,200 | | | | 2,356,580 | |
| | Synalloy Corp.* | | | 5,000 | | | | 56,750 | |
| | TimkenSteel Corp.* | | | 45,000 | | | | 691,650 | |
| | Trecora Resources* | | | 8,600 | | | | 96,750 | |
| | Tredegar Corp. | | | 28,900 | | | | 440,725 | |
| | Tronox, Ltd., Class A | | | 124,000 | | | | 1,874,880 | |
| | Universal Stainless & Alloy Products, Inc.* | | | 16,250 | | | | 316,875 | |
| | | | | | | | | | |
| | | |
| | | | | | | | | 44,233,166 | |
| |
Real Estate - 0.52% | |
| | Forestar Group, Inc.* | | | 100,500 | | | | 1,723,575 | |
| | Griffin Industrial Realty, Inc. | | | 4,000 | | | | 125,480 | |
| | RE/MAX Holdings, Inc., Class A | | | 26,900 | | | | 1,507,745 | |
| | | | | | | | | | |
| | | |
| | | | | | | | | 3,356,800 | |
| | | | | | | | | | | | | | |
| Industry Company | | | | | Shares | | | Value | |
|
Telecommunication Services - 1.18% | |
| | Alaska Communications Systems Group, Inc.* | | | | 344,187 | | | $ | 757,211 | |
| | Hawaiian Telcom Holdco, Inc.* | | | | 17,600 | | | | 439,824 | |
| | Iridium Communications, Inc.*+ | | | | 392,125 | | | | 4,332,981 | |
| | Spok Holdings, Inc. | | | | 111,100 | | | | 1,966,470 | |
| | Windstream Holdings, Inc.+ | | | | 32,000 | | | | 124,160 | |
| | | | | | | | | | | | | | |
| | | | 7,620,646 | |
| | | | | | | | | | | | | | |
TOTAL COMMON STOCKS - 99.40% | | | | 639,354,096 | |
| | | | | | | | | | | | | | |
(Cost $473,652,853) | |
|
WARRANTS - 0.00% | |
| | Eagle Bulk Shipping, Inc., expiring 10/15/21* | | | | 8,501 | | | | 765 | |
| | | | | | | | | | | | | | |
TOTAL WARRANTS - 0.00% | | | | 765 | |
| | | | | | | | | | | | | | |
(Cost $70,770) | | | | | |
| | | | |
| | | | | Rate^ | | | Shares | | | Value | |
|
MONEY MARKET FUND - 0.28% | |
Fidelity Investments Money Market Government Portfolio Class I | | | 0.81 | % | | | 1,820,660 | | | | 1,820,660 | |
| | | | | | | | | | | | | | |
TOTAL MONEY MARKET FUND - 0.28% | | | | 1,820,660 | |
| | | | | | | | | | | | | | |
(Cost $1,820,660) | | | | | |
|
INVESTMENTS PURCHASED WITH CASH PROCEEDS FROM SECURITIES LENDING - 7.48% | |
Fidelity Investments Money Market Government Portfolio Class I** | | | 0.81 | % | | | 48,103,897 | | | | 48,103,897 | |
| | | | | | | | | | | | | | |
TOTAL INVESTMENTS PURCHASED WITH CASH PROCEEDS FROM SECURITIES LENDING -7.48% | | | | 48,103,897 | |
| | | | | | | | | | | | | | |
(Cost $48,103,897) | | | | | | | | | | | | |
| |
TOTAL INVESTMENTS - 107.16% | | | $ | 689,279,418 | |
(Cost $523,648,180) | | | | | | | | | | | | |
Liabilities in Excess of Other Assets - (7.16%) | | | | (46,064,069 | ) |
| | | | | | | | | | | | | | |
NET ASSETS - 100.00% | | | $ | 643,215,349 | |
| | | | | | | | | | | | | | |
| * | Non-income producing security. |
| ** | This security represents the investment of the collateral received in connection with securities out on loan as of June 30, 2017. |
| ^ | Rate disclosed as of June 30, 2017. |
| + | This security or a portion of the security is out on loan as of June 30, 2017. Total loaned securities had a value of $46,331,748 as of June 30, 2017. |
LLC - Limited Liability Company
PLC - Public Limited Company
| | |
Omni Tax-Managed Small-Cap Value Fund SCHEDULE OF INVESTMENTS (continued) | |
|
Showing percentage of net assets as of June 30, 2017
| | | | | | | | | | | | | | | | |
| Summary of inputs used to value the Fund’s investments as of 06/30/2017 (See Note 2 in Notes to Financial Statements): | |
| |
| | | Valuation Inputs | |
| | | Investment in Securities (Value) | |
| | | Level 1 Quoted Prices | | | Level 2
Significant
Observable
Inputs | | | Level 3
Significant
Unobservable
Inputs | | | Total | |
Common Stocks (a) | | $ | 639,354,096 | | | $ | — | | | $ | — | | | $ | 639,354,096 | |
Warrants | | | 765 | | | | — | | | | — | | | | 765 | |
Money Market Fund | | | — | | | | 1,820,660 | | | | — | | | | 1,820,660 | |
Investments Purchased with Cash Proceeds from Securities Lending | | | — | | | | 48,103,897 | | | | — | | | | 48,103,897 | |
| | | | | | | | | | | | | | | | |
TOTAL | | $ | 639,354,861 | | | $ | 49,924,557 | | | $ | — | | | $ | 689,279,418 | |
| | | | | | | | | | | | | | | | |
(a) - please refer to the Schedule of Investments for the industry classifications of these portfolio holdings See Notes to Financial Statements. | |
| | |
| 30 | | Annual Report | June 30, 2017 |
| | |
| STATEMENTS OF ASSETS AND LIABILITIES | |
|
June 30, 2017
| | | | | | | | | | | | | | | | | | | | | | | | |
| ASSETS | | Omni Small-Cap Value | | | | | | Omni Tax-Managed Small-Cap Value | | | | |
| | | | | | |
Investments at value | | | $786,131,193 | | | | | | | | | | | | $689,279,418 | | | | | | | | | |
| | | | | | |
Receivables: | | | | | | | | | | | | | | | | | | | | | | | | |
Portfolio securities sold | | | 5,412,765 | | | | | | | | | | | | 4,911,021 | | | | | | | | | |
Fund shares sold | | | 1,432,272 | | | | | | | | | | | | 874,900 | | | | | | | | | |
Dividends and interest | | | 506,380 | | | | | | | | | | | | 372,703 | | | | | | | | | |
Prepaid expenses. | | | 72,688 | | | | | | | | | | | | 44,213 | | | | | | | | | |
Total assets | | | 793,555,298 | | | | | | | | | | | | 695,482,255 | | | | | | | | | |
| | | | | | |
LIABILITIES | | | | | | | | | | | | | | | | | | | | | | | | |
Payables: | | | | | | | | | | | | | | | | | | | | | | | | |
Portfolio securities purchased | | | 4,679,192 | | | | | | | | | | | | 3,595,371 | | | | | | | | | |
Fund shares redeemed | | | 99,520 | | | | | | | | | | | | 158,680 | | | | | | | | | |
Payable upon return of securities loaned | | | 77,965,296 | | | | | | | | | | | | 48,103,897 | | | | | | | | | |
Accrued Liabilities: | | | | | | | | | | | | | | | | | | | | | | | | |
Investment advisory fees. | | | 201,164 | | | | | | | | | | | | 173,350 | | | | | | | | | |
Administration fees | | | 14,169 | | | | | | | | | | | | 12,509 | | | | | | | | | |
Other | | | 239,021 | | | | | | | | | | | | 223,099 | | | | | | | | | |
Total liabilities | | | 83,198,362 | | | | | | | | | | | | 52,266,906 | | | | | | | | | |
NET ASSETS | | | $710,356,936 | | | | | | | | | | | | $643,215,349 | | | | | | | | | |
| | | | | | |
NET ASSETS REPRESENT | | | | | | | | | | | | | | | | | | | | | | | | |
Paid-in capital | | | $505,647,089 | | | | | | | | | | | | $450,901,605 | | | | | | | | | |
Undistributed net investment income | | | 2,734,016 | | | | | | | | | | | | 5,702,122 | | | | | | | | | |
Undistributed net realized gain on investments | | | 28,487,968 | | | | | | | | | | | | 20,980,384 | | | | | | | | | |
Net unrealized appreciation on investments | | | 173,487,863 | | | | | | | | | | | | 165,631,238 | | | | | | | | | |
NET ASSETS | | | $710,356,936 | | | | | | | | | | | | $643,215,349 | | | | | | | | | |
Shares of common stock outstanding of $.001 par value* | | | 39,149,178 | | | | | | | | | | | | 36,992,096 | | | | | | | | | |
Net asset value, offering price and redemption price per share | | | $ 18.14 | | | | | | | | | | | | $ 17.39 | | | | | | | | | |
Total investments at cost | | | $612,643,330 | | | | | | | | | | | | $523,648,180 | | | | | | | | | |
| *See | Note 1 - Organization in the Notes to Financial Statements for shares authorized for each Fund. |
See Notes to Financial Statements.
| | |
STATEMENTS OF OPERATIONS | | |
Year Ended June 30, 2017
| | | | | | | | | | | | | | | | |
| | | Omni Small-Cap Value | | | | | | Omni Tax-Managed Small-Cap Value | | | | |
| | | | |
INVESTMENT INCOME | | | | | | | | | | | | | | | | |
| | | | |
Dividends | | | $ 9,898,201 | | | | | | | | $ 9,042,490 | | | | | |
| | | | |
Less: foreign taxes withheld | | | (2,051 | ) | | | | | | | (1,440 | ) | | | | |
| | | | |
Securities lending | | | 554,515 | | | | | | | | 739,238 | | | | | |
| | | | | |
Total Investment Income | | | 10,450,665 | | | | | | | | 9,780,288 | | | | | |
| | | | |
EXPENSES | | | | | | | | | | | | | | | | |
| | | | |
Investment advisory fees | | | 3,268,550 | | | | | | | | 2,984,976 | | | | | |
| | | | |
Administration fees | | | 164,219 | | | | | | | | 149,747 | | | | | |
| | | | |
Accounting fees | | | 162,719 | | | | | | | | 154,304 | | | | | |
| | | | |
Transfer agent fees | | | 14,125 | | | | | | | | 14,101 | | | | | |
| | | | |
Professional fees | | | 138,772 | | | | | | | | 128,114 | | | | | |
| | | | |
Custody fees | | | 22,148 | | | | | | | | 20,749 | | | | | |
| | | | |
Blue sky fees | | | 55,043 | | | | | | | | 66,637 | | | | | |
| | | | |
Directors’ and officers’ fees | | | 67,439 | | | | | | | | 61,696 | | | | | |
| | | | |
Shareholder servicing fees | | | 588,745 | | | | | | | | 537,428 | | | | | |
| | | | |
Reports to shareholders | | | 30,902 | | | | | | | | 23,669 | | | | | |
| | | | |
Miscellaneous expenses | | | 126,402 | | | | | | | | 115,430 | | | | | |
| | | | | |
Total Expenses | | | 4,639,064 | | | | | | | | 4,256,851 | | | | | |
| | | | |
Less investment advisory fees waived | | | (716,803 | ) | | | | | | | (674,880 | ) | | | | |
| | | | |
Net Expenses | | | 3,922,261 | | | | | | | | 3,581,971 | | | | | |
| | | | |
NET INVESTMENT INCOME | | | 6,528,404 | | | | | | | | 6,198,317 | | | | | |
| | | | |
NET REALIZED AND UNREALIZED GAIN ON INVESTMENTS | | | | | | | | | | | | | | | | |
| | | | |
Realized Gain on:
Investments | | | 39,014,429 | | | | | | | | 30,306,951 | | | | | |
| | | | |
Change in Unrealized Appreciation on: | | | | | | | | | | | | | | | | |
| | | | |
Investments | | | 93,770,758 | | | | | | | | 89,592,888 | | | | | |
| | | | |
Net Realized and Unrealized Gain on Investments | | | 132,785,187 | | | | | | | | 119,899,839 | | | | | |
| | | | |
NET INCREASE IN NET ASSETS RESULTING FROM OPERATIONS | | | $139,313,591 | | | | | | | | $126,098,156 | | | | | |
See Notes to Financial Statements.
| | |
| 32 | | Semi-Annual Report | June 30, 2017 |
| | |
| STATEMENTS OF CHANGES IN NET ASSETS | |
|
| | | | | | | | | | | | | | | | |
| | | Omni Small-Cap Value | | | Omni Tax-Managed Small-Cap Value | |
| | | Year Ended June 30, | | | Year Ended June 30, | |
| | | 2017 | | | 2016 | | | 2017 | | | 2016 | |
| | | | |
OPERATIONS | | | | | | | | | | | | | | | | |
| | | | |
Net investment income | | $ | 6,528,404 | | | $ | 5,760,972 | | | $ | 6,198,317 | | | $ | 5,292,328 | |
| | | | |
Net realized gain (loss) on investments | | | 39,014,429 | | | | (5,156,734 | ) | | | 30,306,951 | | | | (5,787,803 | ) |
| | | | |
Net change in unrealized appreciation (depreciation) on investments | | | 93,770,758 | | | | (11,917,008 | ) | | | 89,592,888 | | | | (12,483,133 | ) |
| | | | |
Net increase (decrease) in net assets resulting from operations | | | 139,313,591 | | | | (11,312,770 | ) | | | 126,098,156 | | | | (12,978,608 | ) |
| | | | |
DISTRIBUTIONS: | | | | | | | | | | | | | | | | |
| | | | |
From net investment income | | | (6,191,149 | ) | | | (4,704,613 | ) | | | (4,983,381 | ) | | | (3,274,284 | ) |
| | | | |
Net decrease in net assets resulting from distributions | | | (6,191,149 | ) | | | (4,704,613 | ) | | | (4,983,381 | ) | | | (3,274,284 | ) |
| | | | |
SHARE TRANSACTIONS: | | | | | | | | | | | | | | | | |
| | | | |
Proceeds from sale of shares | | | 137,957,334 | | | | 267,382,250 | | | | 115,240,335 | | | | 280,799,281 | |
| | | | |
Reinvestment of distributions | | | 6,188,289 | | | | 4,704,241 | | | | 4,967,931 | | | | 3,264,234 | |
| | | | |
Cost of shares redeemed | | | (125,196,672 | ) | | | (157,150,700 | ) | | | (104,102,649 | ) | | | (222,916,519 | ) |
| | | | |
Net increase in net assets resulting from share transactions | | | 18,948,951 | | | | 114,935,791 | | | | 16,105,617 | | | | 61,146,996 | |
| | | | |
Net increase in net assets | | | 152,071,393 | | | | 98,918,408 | | | | 137,220,392 | | | | 44,894,104 | |
| | | | |
NET ASSETS: | | | | | | | | | | | | | | | | |
| | | | |
Beginning of year | | | 558,285,543 | | | | 459,367,135 | | | | 505,994,957 | | | | 461,100,853 | |
| | | | |
End of year* | | $ | 710,356,936 | | | $ | 558,285,543 | | | $ | 643,215,349 | | | $ | 505,994,957 | |
| | | | |
SHARES ISSUED & REDEEMED | | | | | | | | | | | | | | | | |
| | | | |
Issued | | | 7,807,866 | | | | 19,594,288 | | | | 6,888,395 | | | | 21,596,228 | |
| | | | |
Distributions reinvested | | | 328,117 | | | | 330,354 | | | | 275,079 | | | | 240,017 | |
| | | | |
Redeemed | | | (7,074,972 | ) | | | (11,488,298 | ) | | | (6,209,008 | ) | | | (17,275,572 | ) |
| | | | |
Net increase in shares | | | 1,061,011 | | | | 8,436,344 | | | | 954,466 | | | | 4,560,673 | |
| | | | |
Outstanding at beginning of year | | | 38,088,167 | | | | 29,651,823 | | | | 36,037,630 | | | | 31,476,957 | |
| | | | |
Outstanding at end of year | | | 39,149,178 | | | | 38,088,167 | | | | 36,992,096 | | | | 36,037,630 | |
| | | | |
* Including undistributed net investment income of: | | $ | 2,734,016 | | | $ | 2,918,574 | | | $ | 5,702,122 | | | $ | 4,983,051 | |
See Notes to Financial Statements.
(for a share outstanding throughout each year indicated)
| | | | | | | | | | | | | | | | | | | | |
| OMNI SMALL-CAP VALUE | | | | | | | | | | | | | | | | | | | | |
| | | Year Ended June 30 | |
| | | | | |
| | | 2017 | | | 2016 | | | 2015 | | | 2014 | | | 2013 | |
| | | | | | | | | | | | | | | | | | | | |
| | | | | |
Net Asset Value, Beginning of Year | | | $14.66 | | | | $15.49 | | | | $16.63 | | | | $14.11 | | | | $11.11 | |
| | | | | |
| | | | | | | | | | | | | | | | | | | | |
| | | | | |
Income from Investment Operations: | | | | | | | | | | | | | | | | | | | | |
| | | | | |
Net Investment Income(a) | | | 0.17 | | | | 0.17 | | | | 0.14 | | | | 0.11 | | | | 0.17 | |
| | | | | |
Net Realized and Unrealized Gain (Loss) | | | 3.48 | | | | (0.86) | | | | (0.46) | | | | 3.58 | | | | 3.12 | |
| | | | | | | | | | | | | | | | | | | | |
| | | | | |
Total from Investment Operations | | | 3.65 | | | | (0.69) | | | | (0.32) | | | | 3.69 | | | | 3.29 | |
| | | | | | | | | | | | | | | | | | | | |
| | | | | |
Less Distributions to Shareholders from: | | | | | | | | | | | | | | | | | | | | |
| | | | | |
Net Investment Income | | | (0.17) | | | | (0.14) | | | | (0.09) | | | | (0.08) | | | | (0.16) | |
| | | | | |
Net Realized Gain | | | - | | | | - | | | | (0.73) | | | | (1.09) | | | | (0.13) | |
| | | | | | | | | | | | | | | | | | | | |
| | | | | |
Total Distributions | | | (0.17) | | | | (0.14) | | | | (0.82) | | | | (1.17) | | | | (0.29) | |
| | | | | | | | | | | | | | | | | | | | |
| | | | | |
Net Asset Value, End of Year | | | $18.14 | | | | $14.66 | | | | $15.49 | | | | $16.63 | | | | $14.11 | |
| | | | | | | | | | | | | | | | | | | | |
| | | | | |
Total Return(b) | | | 24.83% | | | | (4.42%) | | | | (1.48%) | | | | 26.89% | | | | 30.08% | |
| | | | | |
Ratios and Supplemental Data: | | | | | | | | | | | | | | | | | | | | |
| | | | | |
Net Assets, End of Year (in 000’s) | | | $710,357 | | | | $558,286 | | | | $459,367 | | | | $407,192 | | | | $260,909 | |
| | | | | |
Expenses Before Waivers and Reimbursements | | | 0.71% | | | | 0.71% | | | | 0.71% | | | | 0.71% | | | | 0.78% | |
| | | | | |
Expenses After Waivers and Reimbursements | | | 0.60% | | | | 0.60% | | | | 0.60% | | | | 0.60% | | | | 0.60% | |
| | | | | |
Net Investment Income After Waivers and Reimbursements | | | 1.00% | | | | 1.17% | | | | 0.88% | | | | 0.70% | | | | 1.36% | |
| | | | | |
Portfolio Turnover Rate | | | 23% | | | | 24% | | | | 25% | | | | 31% | | | | 34% | |
| (a) | Per share amounts calculated based on the average daily shares outstanding during the period. |
| (b) | Total return would have been lower had various fees not been waived during the period. |
See Notes to Financial Statements.
| | |
| 34 | | Annual Report | June 30, 2017 |
(for a share outstanding throughout each year indicated)
OMNI TAX-MANAGED SMALL-CAP VALUE
| | | | | | | | | | |
| | | Year Ended June 30 |
| | | | | |
| | | 2017 | | 2016 | | 2015 | | 2014 | | 2013 |
| | | | | |
| | | | | | | | | | |
| | | | | |
Net Asset Value, Beginning of Year | | $14.04 | | $14.65 | | $15.54 | | $12.75 | | $10.05 |
| | | | | |
| | | | | | | | | | |
| | | | | |
Income from Investment Operations: | | | | | | | | | | |
| | | | | |
Net Investment Income(a) | | 0.17 | | 0.16 | | 0.12 | | 0.09 | | 0.15 |
| | | | | |
Net Realized and Unrealized Gain (Loss) | | 3.32 | | (0.66) | | (0.42) | | 3.26 | | 2.68 |
| | | | | |
| | | | | | | | | | |
| | | | | |
Total from Investment Operations | | 3.49 | | (0.50) | | (0.30) | | 3.35 | | 2.83 |
| | | | | |
| | | | | | | | | | |
| | | | | |
Less Distributions to Shareholders from: | | | | | | | | | | |
| | | | | |
Net Investment Income | | (0.14) | | (0.11) | | (0.03) | | (0.08) | | (0.13) |
| | | | | |
Net Realized Gain | | - | | - | | (0.56) | | (0.48) | | - |
| | | | | |
| | | | | | | | | | |
| | | | | |
Total Distributions | | (0.14) | | (0.11) | | (0.59) | | (0.56) | | (0.13) |
| | | | | |
| | | | | | | | | | |
| | | | | |
Net Asset Value, End of Year | | $17.39 | | $14.04 | | $14.65 | | $15.54 | | $12.75 |
| | | | | | | | | | |
| | | | | |
Total Return(b) | | 24.83% | | (3.42%) | | (1.62%) | | 26.71% | | 28.43% |
| | | | | |
Ratios and Supplemental Data: | | | | | | | | | | |
| | | | | |
Net Assets, End of Year (in 000’s) | | $643,215 | | $505,995 | | $461,101 | | $425,330 | | $262,088 |
| | | | | |
Expenses Before Waivers and Reimbursements | | 0.71% | | 0.72% | | 0.71% | | 0.71% | | 0.77% |
| | | | | |
Expenses After Waivers and Reimbursements | | 0.60% | | 0.60% | | 0.60% | | 0.60% | | 0.60% |
| | | | | |
Net Investment Income After Waivers and Reimbursements | | 1.04% | | 1.20% | | 0.84% | | 0.65% | | 1.34% |
| | | | | |
Portfolio Turnover Rate | | 23% | | 29% | | 30% | | 25% | | 34% |
| (a) | Per share amounts calculated based on the average daily shares outstanding during the period. |
| (b) | Total return would have been lower had various fees not been waived during the period. |
See Notes to Financial Statements.
| | |
NOTES TO FINANCIAL STATEMENTS | | |
June 30, 2017
1. Organization:
Bridgeway Funds, Inc. (“Bridgeway” or the “Company”) was organized as a Maryland corporation on October 19, 1993, and is registered under the Investment Company Act of 1940, as amended (the “1940 Act”), as an open-end management investment company.
Bridgeway is organized as a series fund, with 10 investment funds as of June 30, 2017 (each is referred to as a “Bridgeway Fund” and collectively, the “Bridgeway Funds”). The Aggressive Investors 1, Ultra-Small Company, Ultra-Small Company Market, Small-Cap Momentum, Small-Cap Growth, Small-Cap Value, Blue Chip 35 Index and Managed Volatility Funds are presented in a separate report. The Omni Small-Cap Value Fund and the Omni Tax-Managed Small-Cap Value Fund (each a “Fund” and together, the “Funds”) are presented in this report.
Bridgeway is authorized to issue 1,915,000,000 shares of common stock at $0.001 per share. As of June 30, 2017,
100,000,000 shares have been classified into the Aggressive Investors 1 Fund. 130,000,000 shares have been classified into the Blue Chip 35 Index Fund. 15,000,000 shares have been classified into the Ultra-Small Company Fund. 100,000,000 shares each have been classified into the Ultra-Small Company Market, Omni Small-Cap Value, Omni Tax-Managed Small-Cap Value, Small-Cap Momentum, Small-Cap Growth and Small-Cap Value Funds. 50,000,000 shares have been classified into the Managed Volatility Fund.
All of the Bridgeway Funds are no-load, diversified funds.
The Funds seek to provide long-term total return on capital, primarily through capital appreciation.
Bridgeway Capital Management, Inc. (the “Adviser”) is the investment adviser for all of the Bridgeway Funds.
2. Significant Accounting Policies:
The following summary of significant accounting policies, followed in the preparation of the financial statements of the Funds, are in conformity with accounting principles generally accepted in the United States of America (“GAAP”). Each Fund is considered an investment company under GAAP and follows the accounting and reporting guidance applicable to investment companies.
Securities and Other Investments Valuation Securities for which market quotations are readily available are valued at the last sale price on the national exchange on which such securities are primarily traded. In the case of securities reported on the National Association of Securities Dealers Automated Quotation (“NASDAQ”) system, the securities are valued based on the NASDAQ Official Closing Price (“NOCP”). In the absence of recorded sales on their home exchange, or NOCP, in the case of NASDAQ traded securities, the security will be valued as follows: bid prices for long positions and ask prices for short positions.
Investments in open-end registered investment companies and closed-end registered investment companies that do not trade on an exchange are valued at the end of day net asset value (“NAV”) per share.
Investments in closed-end registered investment companies that trade on an exchange are valued at the last sales price as of the close of the customary trading session on the exchange where the security is principally traded.
When market quotations are not readily available or when events occur that make established valuation methods unreliable, securities of the Funds may be valued at fair value as determined in good faith by or under the direction of the Board of Directors. The valuation assigned to a fair valued security for purposes of calculating the Funds’ NAV may differ from the security’s most recent closing market price and from the prices used by other mutual funds to calculate their NAVs.
| | |
| 36 | | Annual Report | June 30, 2017 |
| | |
NOTES TO FINANCIAL STATEMENTS (continued) | | |
June 30, 2017
The inputs and valuation techniques used to determine the value of a Fund’s investments are summarized into three levels as described in the hierarchy below:
| ● | | Level 1 – quoted prices in active markets for identical assets |
Investments whose values are based on quoted market prices in active markets, and whose values are therefore classified as Level 1 prices, include active listed equity securities. The Funds do not adjust the quoted price for such investments, even in situations where the Funds hold a large position and a sale could reasonably impact the quoted price.
| ● | | Level 2 – other significant observable inputs (including quoted prices for similar securities, interest rates, prepayment speeds, credit risk, etc.) |
Investments that trade in markets that are not considered to be active, but whose values are based on quoted market prices, dealer quotations or valuations provided by alternative pricing sources supported by observable inputs, are classified as Level 2 prices. These generally include certain U.S. Government and sovereign obligations, most government agency securities, investment-grade corporate bonds and less liquid listed equity securities. As investments whose values are classified as Level 2 prices include positions that are not traded in active markets and/or are subject to transfer restrictions, valuations may be adjusted to reflect illiquidity and/or non-transferability, which are generally based on available market information.
The Fidelity Investments Money Market Government Portfolio – Class I, which is held by the Funds, invests primarily in securities that are valued at amortized cost. Therefore, this investment is classified as a Level 2 investment.
| ● | | Level 3 – significant unobservable inputs (including the Funds’ own assumptions in determining the fair value of investments) |
Investments whose values are classified as Level 3 prices have significant unobservable inputs, as they may trade infrequently or not at all. When observable prices are not available for these securities, the Funds use one or more valuation techniques for which sufficient and reliable data is available. The inputs used by the Funds in estimating the value of Level 3 prices may include the original transaction price, quoted prices for similar securities or assets in active markets, completed or pending third-party transactions in the underlying investment or comparable issuers, and changes in financial ratios or cash flows. Level 3 prices may also be adjusted to reflect illiquidity and/or non-transferability, with the amount of such discount estimated by the Funds in the absence of market information. Assumptions used by the Funds due to the lack of observable inputs may significantly impact the resulting value and therefore the results of the Funds’ operations.
The inputs or methodology used for valuing investments are not necessarily an indication of the risk associated with investing in those investments. A summary of the inputs used to value the Funds’ investments as of June 30, 2017 is included with each Fund’s Schedule of Investments.
The Funds’ policy is to recognize transfers into, and transfers out of, each level of hierarchy as of the beginning of the reporting period. For the year ended June 30, 2017, there were no transfers from Level 1 to Level 2 or from Level 2 to Level 1 in any of the Funds.
Securities Lending Upon lending its securities to third parties, each Fund receives compensation in the form of fees. The loans are secured by collateral at least equal to the fair value of the securities loaned plus accrued interest. Each Fund has the right under the lending agreement to recover the securities from the borrower on demand. Additionally, a Fund does not have the right to sell or repledge collateral received in the form of securities unless the borrower goes into default. The risks to a Fund of securities lending are that the borrower may not provide additional collateral when required or return the securities when due, resulting in a loss. Under the terms of the Securities Lending Agreement, the Funds are indemnified for such losses by the securities lending agent.
While securities are on loan, the Fund continues to receive dividends on the securities loaned and recognizes any gain or loss in the fair value of the securities loaned.
| | |
| NOTES TO FINANCIAL STATEMENTS (continued) | | |
June 30, 2017
Securities lending transactions are entered into by a Fund under a Securities Lending Agreement which provides the right, in the event of default (including bankruptcy or insolvency) for the non-defaulting party to liquidate the collateral or to offset the market value of the collateral received against the market value of the securities loaned. The value of the collateral is typically greater than that of the market value of the securities loaned, leaving the lender with a net amount payable to the defaulting party. However, bankruptcy or insolvency laws of a particular jurisdiction may impose restrictions on or prohibitions against such a right of offset in the event of a counterparty’s bankruptcy or insolvency.
The market value of securities on loan, all of which are classified as common stocks in the Funds’ Schedules of Investments, and the value of the related collateral are shown in the Statements of Assets and Liabilities as a component of Investments at value.
The following table is a summary of the Funds’ securities loaned and related collateral, which are subject to a netting agreement as of June 30, 2017:
| | | | | | | | | | | | | | | | | | | | | | | | |
| | | | | | | | | | | | Gross Amount Not
Offset in the Statement
of Assets and Liabilities | | | | |
| Fund | | Gross
Amounts of
Recognized
Assets1 | | | Gross Amounts
Offset in the
Statement of
Assets and
Liabilities | | | Net Amounts of
Assets Presented
in the Statement
of Assets and
Liabilities | | | Financial
Instruments | | | Cash
Collateral
Received2 | | | Net
Amount | |
| | | | | | |
| Omni Small-Cap Value | | | | | | | | | | | | | | | | | | | | | | | | |
Securities lending | | | $75,323,710 | | | | - | | | | $75,323,710 | | | | - | | | | $75,323,710 | | | | - | |
| | | | | | |
Omni Tax-Managed Small-Cap Value | | | | | | | | | | | | | | | | | | | | | | | | |
Securities lending | | | $46,331,748 | | | | - | | | | $46,331,748 | | | | - | | | | $46,331,748 | | | | - | |
| 1 | Securities loaned with a value of $336,225 and $859,771 in Omni Small-Cap Value and Omni Tax-Managed Small-Cap Value, respectively, have been sold and are pending settlement on July 1, 2017. |
| 2 | Collateral with a value of $77,965,296 and $48,103,897 has been received in connection with securities lending of Omni Small-Cap Value Fund and Omni Tax-Managed Small-Cap Value Fund, respectively. Excess of collateral received from an individual counterparty is not shown here for financial reporting purposes. |
It is each Fund’s policy to obtain additional collateral from or return excess collateral to the borrower by the end of the next business day following the valuation date of the securities loaned. Therefore, the value of the collateral held may be temporarily less than that required under the lending contract. As of June 30, 2017, the collateral consisted of an institutional government money market fund.
Use of Estimates in Financial Statements In preparing financial statements in conformity with GAAP, management makes estimates and assumptions that affect the reported amounts of assets and liabilities on the date of the financial statements and the disclosure of contingent assets and liabilities on the date of the financial statements, as well as the reported amounts of revenue and expenses during the reporting period. Actual results could differ from those estimates.
Risks and Uncertainties The Funds provide for various investment options, including stocks. Such investments are exposed to various risks, such as interest rate, market and credit risks. Due to the risks involved, it is at least reasonably possible that changes in risks in the near term would materially affect shareholders’ account values and the amounts reported in the financial statements.
Security Transactions, Investment Income and Expenses Security transactions are accounted for as of the trade date, the date the order to buy or sell is executed. Realized gains and losses are computed on the identified cost basis. Dividend income is recorded on the ex-dividend date, and interest income is recorded on the accrual basis from settlement date.
Bridgeway Funds’ expenses that are not series-specific are allocated to each series based upon its relative proportion of net assets to the Bridgeway Funds’ total net assets or other appropriate basis.
| | |
| 38 | | Annual Report | June 30, 2017 |
| | |
| NOTES TO FINANCIAL STATEMENTS (continued) | | |
June 30, 2017
Distributions to Shareholders The Funds pay dividends from net investment income and distribute realized capital gains annually, usually in December.
Indemnification Under the Company’s organizational documents, the Funds’ officers, directors, employees and agents are indemnified against certain liabilities that may arise out of the performance of their duties to the Funds. Additionally, in the normal course of business, the Funds enter into contracts that contain a variety of indemnification clauses. The Funds’ maximum exposure under these arrangements is unknown, as this would involve future claims that may be made against the Funds that have not yet occurred. However, the Funds have not had prior claims or losses pursuant to these contracts.
3. Advisory Fees, Other Related Party Transactions and Contingencies:
The Funds have entered into a management agreement with the Adviser. As compensation for the advisory services rendered, facilities furnished, and expenses borne by the Adviser, the Funds pay the Adviser a fee of 0.50% of the value of each Fund’s average daily net assets, computed daily and payable monthly.
Expense limitations: The Adviser has agreed to reimburse the Funds for operating expenses and advisory fees above the expense limitations shown in the table below, which are shown as a ratio of net expenses to average net assets, for each Fund, for the year ended June 30, 2017. Any material change to the expense limitation would require a vote by shareholders of the applicable Fund.
| | | | | | | | |
| Bridgeway Fund | | Expense Limitation | | | Total Waivers for Period Ending 6/30/17 | |
| | | | | | | | |
| Omni Small-Cap Value* | | | 0.60% | | | | $716,803 | |
| Omni Tax-Managed Small-Cap Value* | | | 0.60% | | | | 674,880 | |
| | | | | | | | |
*The Funds are authorized to reimburse the Adviser for management fees previously waived and/or for expenses previously reimbursed by the Adviser, provided, however, that any reimbursements must be paid at a date not more than three years after the Adviser waived the fees or reimbursed the expenses and that the reimbursements do not cause the Funds to exceed the expense limitation in effect at the time of the waiver or the current expense limitation if different. The Omni Small-Cap Value Fund has recoupable expenses of $480,284, $561,512, and $716,803, which expire no later than June 30, 2018, June 30, 2019, and June 30, 2020, respectively. The Omni Tax-Managed Small-Cap Value Fund has recoupable expenses of $479,218, $547,245 and $674,880, which expire no later than June 30, 2018, June 30, 2019 and June 30, 2020, respectively.
Other Related Party Transactions: The Bridgeway Funds will engage in inter-portfolio trades with other Bridgeway Funds when it is to the benefit of both parties. The Board of Directors reviews and approves these trades quarterly. Inter-portfolio purchases and sales for the Funds during the year ended June 30, 2017 were as follows:
| | | | | | | | |
| Bridgeway Fund | | Inter-Portfolio
Purchases | | | Inter-Portfolio
Sales | |
| | | | | | | | |
| Omni Small-Cap Value | | | $18,482,380 | | | | $7,162,859 | |
| Omni Tax-Managed Small-Cap Value | | | 16,308,021 | | | | 9,902,745 | |
The Adviser entered into an Administrative Services Agreement with Bridgeway Funds, pursuant to which the Adviser provides various administrative services to the Funds including, but not limited to: (i) supervising and managing various aspects of the Funds’ business and affairs; (ii) selecting, overseeing and/or coordinating activities with other service providers to the Funds; (iii) providing reports to the Board of Directors as requested from time to time; (iv) assisting and/or reviewing amendments and updates to the Funds’ registration statement and other filings with the Securities and Exchange Commission (“SEC”); (v) providing certain shareholder services; (vi) providing administrative support in connection with meetings of the Board of Directors; and (vii) providing certain record-keeping services. Prior to July 1, 2017, for its services to all of the Bridgeway Funds, the Adviser was paid an aggregate annual fee of $665,000, payable in equal monthly installments. Effective
| | |
| NOTES TO FINANCIAL STATEMENTS (continued) | | |
June 30, 2017
July 1, 2017, the Adviser will be paid an aggregate annual fee of $775,000, payable in equal monthly installments. During the year ended June 30, 2017, the allocation of this expense to the Omni Small-Cap Value and Omni Tax-Managed Small-Cap Value Funds was $164,219 and $149,747, respectively.
Board of Directors Compensation Independent Directors are paid an annual retainer of $15,000, with an additional retainer of $5,000 paid to the Independent Chairman of the Board and an additional retainer of $1,000 paid to the Nominating and Corporate Governance Committee Chair. The retainer is paid in quarterly installments. Effective November 11, 2016, Independent Directors are paid $8,500 per meeting for meeting fees. Prior to November 11, 2016, Independent Directors were paid $7,500 per meeting. Such compensation is the total compensation from all Bridgeway Funds and is allocated among the Bridgeway Funds.
Each Independent Director receives this compensation in the form of shares of the Bridgeway Funds, credited to his or her account. Such Directors are reimbursed for any expenses incurred in attending meetings and conferences, as well as expenses for subscriptions or printed materials. The amount of Directors’ fees attributable to each Fund is disclosed in the Statement of Operations.
One director of Bridgeway, John Montgomery, is an owner and director of the Adviser. Under the 1940 Act definitions, he is considered to be an “affiliated person” of the Adviser and an “interested person” of the Adviser and of Bridgeway. Compensation for Mr. Montgomery is borne by the Adviser rather than the Bridgeway Funds.
4. Distribution Agreement:
Foreside Fund Services, LLC acts as distributor of the Funds’ shares pursuant to a Distribution Agreement dated May 31, 2017. The Adviser pays all costs and expenses associated with distribution of the Funds’ shares, pursuant to a protective plan adopted by shareholders pursuant to Rule 12b-1.
5. Purchases and Sales of Investment Securities:
Purchases and sales of investments, other than short-term securities, for each Fund for the year ended June 30, 2017 were as follows:
| | | | | | | | | | | | |
| | | Purchases | | | Sales | |
| | | U.S. Government | | Other | | | U.S. Government | | Other | |
| | | | |
| Omni Small-Cap Value | | $ - | | $ | 165,978,522 | | | $ - | | $ | 147,870,199 | |
| Omni Tax-Managed Small-Cap Value | | - | | | 145,364,640 | | | - | | | 133,744,565 | |
6. Federal Income Taxes
It is the Funds’ policy to continue to comply with the provisions of the Internal Revenue Code of 1986, as amended (“Internal Revenue Code”), applicable to regulated investment companies, and to distribute income to the extent necessary so that such Fund is not subject to federal income tax. Therefore, no federal income tax provision is required.
Unrealized Appreciation and Depreciation on Investments (Tax Basis) The amount of net unrealized appreciation/ depreciation and the cost of investment securities for tax purposes, including short-term securities at June 30, 2017, were as follows:
| | | | |
| | | Omni Small-Cap Value | | Omni Tax-Managed Small-Cap Value |
| Gross appreciation (excess of value over tax cost) | | $200,247,439 | | $188,355,529 |
| Gross depreciation (excess of tax cost over value) | | (26,788,244) | | (22,733,094) |
| Net unrealized appreciation | | $173,459,195 | | $165,622,435 |
| Cost of investments for income tax purposes | | $612,671,998 | | $523,656,983 |
The differences between book and tax net unrealized appreciation (depreciation) are due to wash sale loss deferrals and basis adjustments on passive foreign investment companies (PFICs) and partnerships.
| | |
| 40 | | Annual Report | June 30, 2017 |
| | |
| NOTES TO FINANCIAL STATEMENTS (continued) | | |
June 30, 2017
Classifications of Distributions Net investment income (loss) and net realized gain (loss) may differ for financial statement and tax purposes. The character of distributions made during the year from net investment income or net realized gains may differ from its ultimate characterization for federal income tax purposes.
The tax character of the distributions paid by the Funds during the fiscal years ended June 30, 2017 and 2016, is as follows:
| | | | | | | | | | | | | | | | | | | | |
| | | Omni Small-Cap Value | | Omni Tax-Managed Small-Cap Value |
| | | Year Ended June 30, 2017 | | Year Ended June 30, 2016 | | Year Ended June 30, 2017 | | Year Ended June 30, 2016 |
Distributions paid from: | | | | | | | | | | | | | | | | | | | | |
Ordinary Income | | | | $6,191,149 | | | | | $4,704,613 | | | | | $4,983,381 | | | | | $3,274,284 | |
Total | | | | $6,191,149 | | | | | $4,704,613 | | | | | $4,983,381 | | | | | $3,274,284 | |
Components of Accumulated Earnings As of June 30, 2017, the components of accumulated earnings on a tax basis were:
| | | | |
| | | Omni Small-Cap Value | | Omni Tax-Managed Small-Cap Value |
| Undistributed Net Investment Income | | $ 2,734,016 | | $ 5,702,122 |
| Undistributed Net Realized Gain on Investments | | 28,516,636 | | 20,989,187 |
| Net Unrealized Appreciation of Investments | | 173,459,195 | | 165,622,435 |
| Total | | $204,709,847 | | $192,313,744 |
For the fiscal year June 30, 2017, the Funds recorded the following reclassifications to the accounts listed below:
| | | | | | |
| | | Increase (Decrease) |
| | | Omni Small-Cap Value | | | Omni Tax-Managed Small-Cap Value |
Paid-in Capital | | | $ 1,844,385 | | | $ 1,240,344 |
Undistributed Net Investment Income | | | (521,813 | ) | | (495,865) |
Undistributed Net Realized Gain on Investments | | | (1,322,572 | ) | | (744,479) |
The difference between book and tax components of net assets and the resulting reclassifications were primarily a result of the differing book/tax treatment of the deduction of equalization debits for tax purposes and investments in passive foreign investment companies (PFICs), partnerships and business development companies.
Accounting for Uncertainty in Income Taxes sets forth a minimum threshold for financial statement recognition of the benefit of a tax position taken or expected to be taken in a tax return. Management has analyzed each Fund’s tax positions and has concluded that no provision for income tax is required in any Fund’s financial statements. The Funds are not aware of any tax position for which it is reasonably possible that the total amounts of unrecognized tax benefits will significantly change in the next twelve months. Each Fund’s federal tax returns for the prior three fiscal years remain subject to examination by the Internal Revenue Service.
7. Line of Credit
Bridgeway established a line of credit agreement (“Facility”) with The Bank of New York Mellon, effective November 5, 2010. The Facility is for temporary or emergency purposes, such as to provide liquidity for shareholder redemptions, and is cancellable by either party. Unless cancelled earlier, the Facility shall be held available until September 14, 2017. Advances under the Facility are limited to $15,000,000 in total for all Bridgeway Funds, and advances to each Bridgeway Fund shall not exceed certain limits set forth in the credit agreement, including, but not limited to, the maximum amount a Bridgeway Fund is permitted to borrow under the 1940 Act.
| | |
| NOTES TO FINANCIAL STATEMENTS (continued) | | |
June 30, 2017 (Unaudited)
The Bridgeway Funds incur a commitment fee of 0.085% per annum on the unused portion of the Facility and interest expense to the extent of amounts borrowed under the Facility. Interest is based on the “Overnight Rate” plus 1.25%. The Overnight Rate means the higher of (a) the Federal Funds rate, (b) the Overnight Eurodollar Rate, or (c) the One-month Euro-dollar Rate. The commitment fees are payable quarterly in arrears and are allocated to all participating Bridgeway Funds. Interest expense is charged directly to each Bridgeway Fund, based upon actual amounts borrowed by such Bridgeway Fund.
For the year ended June 30, 2017, borrowings by the Funds under this line of credit were as follows:
| | | | | | | | | | | | | | | | | | | | |
| Bridgeway Fund | | Weighted
Average
Interest Rate | | | Weighted
Average
Loan Balance | | | Number of
Days
Outstanding | | | Interest
Expense
Incurred1 | | | Maximum Amount
Borrowed During
the Period | |
| | | | | | | | | | | | | | | | | | | | |
| Omni Small-Cap Value | | | 1.96% | | | | $1,380,135 | | | | 96 | | | | $7,110 | | | | $4,723,000 | |
Omni Tax-Managed Small-Cap Value | | | 1.86% | | | | 1,458,988 | | | | 85 | | | | 6,316 | | | | 6,406,000 | |
| 1 Interest expense is included on the Statements of Operations in Miscellaneous expenses. | |
8. Subsequent Events
Management has evaluated the impact of all subsequent events on the Funds and has determined that there were no subsequent events requiring recognition or disclosure in the financial statements.
| | |
| 42 | | Annual Report | June 30, 2017 |
| | |
| REPORT OF INDEPENDENT REGISTERED PUBLIC ACCOUNTING FIRM | | |
To the Board of Directors and the Shareholders of Bridgeway Funds, Inc.
We have audited the accompanying statements of assets and liabilities of the Omni Small-Cap Value Fund and the Omni Tax-Managed Small-Cap Value Fund (the “Funds”), each a series of Bridgeway Funds, Inc., including the schedules of investments, as of June 30, 2017, and the related statements of operations for the year then ended, the statements of changes in net assets for each of the years in the two-year period then ended and the financial highlights for each of the years in the five-year period then ended. These financial statements and financial highlights are the responsibility of the Funds’ management. Our responsibility is to express an opinion on these financial statements and financial highlights based on our audits.
We conducted our audits in accordance with the standards of the Public Company Accounting Oversight Board (United States). Those standards require that we plan and perform the audits to obtain reasonable assurance about whether the financial statements and financial highlights are free of material misstatement. An audit includes examining, on a test basis, evidence supporting the amounts and disclosures in the financial statements. Our procedures included confirmation of securities owned as of June 30, 2017 by correspondence with the custodian and brokers. An audit also includes assessing the accounting principles used and significant estimates made by management, as well as evaluating the overall financial statement presentation. We believe that our audits provide a reasonable basis for our opinion.
In our opinion, the financial statements and financial highlights referred to above present fairly, in all material respects, the financial position of the Omni Small-Cap Value Fund and the Omni Tax-Managed Small-Cap Value Fund as of June 30, 2017 and the results of their operations for the year then ended, the changes in their net assets for each of the years in the two-year period then ended and their financial highlights for each of the years in the five-year period then ended, in conformity with accounting principles generally accepted in the United States of America.
| | | | | | |
| | | | | | |
| | | |
| | | | 
BBD, LLP | | |
Philadelphia, Pennsylvania
August 25, 2017
| | |
OTHER INFORMATION | | |
June 30, 2017 (unaudited)
1. Shareholder Tax Information
Certain tax information regarding the Funds is required to be provided to shareholders based upon each Fund’s income and distributions for the taxable year ended June 30, 2017. The information and distributions reported herein may differ from information and distributions taxable to the shareholders for the calendar year ended December 31, 2016.
The Funds report the following items with regard to distributions paid during the fiscal year ended June 30, 2017. All reportings are based on financial information available as of the date of this annual report and, accordingly, are subject to change. For each item, it is the intention of each Fund to report the maximum amount permitted under the Internal Revenue Code and the regulations thereunder.
| | | | | | | | |
| | | Omni Small-Cap Value | | | Omni Tax-Managed Small Cap Value | |
Corporate Dividends Received Deduction | | | 100.00% | | | | 100.00% | |
Qualified Dividend Income | | | 100.00% | | | | 100.00% | |
Qualified Interest Related Dividends | | | 0.07% | | | | 0.05% | |
Qualified Short Term Capital Gain Dividends | | | 0.00% | | | | 0.00% | |
During the fiscal year ended June 30, 2017, the Funds paid distributions from ordinary income and long-term capital gain which included equalization debits summarized below:
| | | | | | | | |
| | | Omni Small-Cap Value | | | Omni Tax-Managed Small-Cap Value | |
Ordinary Income Distributions | | $ | 6,191,149 | | | $ | 4,983,381 | |
Equalization Debits Included in Ordinary Income Distributions | | | 522,312 | | | | 495,865 | |
Long-Term Capital Gain Distributions | | | - | | | | - | |
Equalization Debits Included in Long-Term Capital Gain Distributions | | | 1,322,073 | | | | 744,479 | |
2. Proxy Voting
A description of the policies and procedures that the Funds use to determine how to vote proxies relating to the portfolio securities and a summary of proxies voted by the Funds for the period ended June 30, 2017 are available without a charge, upon request, by contacting Bridgeway Funds at 1-800-661-3550 and on the SEC’s website at http://www.sec.gov.
3. Fund Holdings
The complete schedule of the Funds’ holdings for the second and fourth quarters of each fiscal year are contained in the Funds’ Semi-Annual and Annual Shareholder Reports, respectively.
The Bridgeway Funds file complete schedules of the Funds’ holdings with the SEC for the first and third quarters of each fiscal year on Form N-Q within 60 days after the end of the period. Copies of the Funds’ Form N-Q are available without charge, upon request, by contacting Bridgeway Funds at 1-800-661-3550 and on the SEC’s website at http://www.sec.gov. You may also review and copy Form N-Q at the SEC’s Public Reference Room in Washington, D.C. For more information about the operation of the Public Reference Room, please call 1-800-SEC-0330.
4. Approval of Investment Management Agreement
Bridgeway Funds, Inc.’s (the “Company”) management agreement (the “Management Agreement”) with its investment adviser, Bridgeway Capital Management, Inc. (the “Adviser”), on behalf of each of the Company’s funds must be approved for an initial term no greater than two years and renewed at least annually thereafter by the board of directors of the Company (the “Board”) or a vote of a majority of the outstanding voting securities of each fund. In addition, the renewal must be
| | |
| 44 | | Annual Report | June 30, 2017 |
| | |
OTHER INFORMATION (continued) | | |
June 30, 2017 (unaudited)
approved by a majority of the Directors who are not parties to the Management Agreement or “interested persons” of any party thereto (the “Independent Directors”), cast in person at a meeting called specifically for the purpose of voting on such approval.
The Board has five regularly scheduled meetings each year and takes into account throughout the year matters bearing on the approval of the Management Agreement. For example, the Board or its standing committees consider at meetings during the year various factors that are relevant to the annual renewal of each fund’s Management Agreement, including the services and support provided to each fund by the Adviser, the Adviser’s compliance program, comparative performance information for each fund, the risk assessment of the funds and “deep dives” on the strategy and performance of certain funds on a periodic basis. In addition, the Board receives updated financial information on the Adviser and updates related to strategic direction and marketing efforts between meetings from the Adviser.
On May 11, 2017, the Board, including a majority of the Independent Directors, met in person (the “Meeting”) with the Adviser, the Company’s outside legal counsel, independent legal counsel (“Independent Legal Counsel”) to the Independent Directors and others to consider information bearing on the continuation of the Management Agreement with respect to the Omni Tax-Managed Small-Cap Value Fund and Omni Small-Cap Value Fund (each a “Fund” and collectively, the “Funds”).
In reaching its decisions regarding the Management Agreement for each Fund, the Board considered the information furnished and discussed throughout the year at regularly scheduled Board or committee meetings, as applicable and as described above, as well as the information provided to it specifically in relation to the annual consideration of the approval of the Management Agreement for each Fund.
In preparation for the Meeting, the Independent Directors requested that the Adviser provide specific information relevant to the Board’s consideration of the renewal of the Management Agreement with respect to each Fund. In response to that request, the Board was furnished with a wide variety of information with respect to each Fund, including information regarding:
| | ● | | investment performance over various time periods and the fees and expenses of each Fund as compared to a comparable group of funds as determined and prepared by Broadridge Financial Solutions, Inc. (formerly, Lipper, Inc.) (hereinafter “Lipper”), an independent provider of investment company data; |
| | ● | | the nature, extent and quality of services provided by the Adviser to each Fund under the Management Agreement; |
| | ● | | actual management fees paid by each Fund to the Adviser and a comparison of those fees with the management fees charged to other clients of the Adviser, as applicable; |
| | ● | | the Adviser’s costs of providing services to each Fund and the profitability of the Adviser derived from the Management Agreement with each Fund; |
| | ● | | the extent to which economies of scale may be present and if so, how and to what extent they could be shared with the Fund’s shareholders; and |
| | ● | | any potential “fall out” or ancillary benefits accruing to the Adviser as a result of its relationship with each Fund. |
In addition to evaluating the written information provided by the Adviser, the Board also considered the answers to questions posed by the Board to representatives of the Adviser at the Meeting.
In considering the information and materials described above, the Independent Directors received assistance from, and also had the opportunity to consult with, Independent Legal Counsel prior to the Meeting. In addition, the Independent Directors met in executive session with Independent Legal Counsel to consider the continuation of the Management Agreement with respect to each Fund outside the presence of management during the Meeting.
The Board also was provided with a written description of its statutory responsibilities and the legal standards that are applicable to approvals of the Management Agreement.
| | |
OTHER INFORMATION (continued) | | |
June 30, 2017 (unaudited)
Although the Management Agreement for the Funds was considered at the same Board meeting, the Directors considered each Fund separately.
In considering the aforementioned information, the Board took into account management style, investment strategies and prevailing market conditions as reported by the Adviser. Furthermore, in evaluating the Management Agreement, the Directors also considered information provided by the Adviser concerning the following:
| | ● | | the terms of the Management Agreement, including the services performed by the Adviser in managing each Fund’s assets in accordance with the Fund’s investment objectives, policies and restrictions and how those services and fees differ from those for other advisory clients of the Adviser, as applicable; |
| | ● | | information regarding the advisory fee rates and the expense limitation or fee waiver arrangements for each Fund; |
| | ● | | the Adviser’s personnel, staffing levels and the time and attention the Adviser’s personnel devote to the management of the Funds as compared to other clients of the Adviser; |
| | ● | | the Adviser’s risk assessment and management process; |
| | ● | | the Adviser’s representation that it does not participate in any soft dollar arrangements and, although it receives unsolicited research from outside sources, the Adviser does not consider the receipt of that research in the decision-making process; and |
| | ● | | the financial condition and stability of the Adviser. |
In view of the broad scope and variety of factors and information, the Directors did not find it practicable to, and did not, assign relative weights to the specific factors considered in reaching their conclusions and determinations to approve the continuance of the Management Agreement for each Fund for an additional year. Rather, the Board’s determinations were made on the basis of each Director’s business judgment after consideration of all of the factors taken in their entirety. Although not meant to be all-inclusive, the following describes some of the factors that were considered by the Board in deciding to approve the continuance of the Management Agreement for each Fund.
Nature, Extent and Quality of Services
In examining the nature, extent and quality of the services provided by the Adviser, the Directors considered the services provided to each Fund and any expected changes thereto, the qualifications, experience and duties of the Adviser’s personnel, the approximate amount of time those personnel devote to the Funds, recent and expected personnel changes, portfolio manager compensation arrangements, business continuity and succession planning, and enterprise risk management (including cybersecurity). In addition, the Directors considered information provided by the Adviser regarding its overall financial strength and considered the resources and staffing in place with respect to the services provided to the Funds.
Based on the totality of the information considered, the Directors concluded that each Fund is likely to benefit from the nature, extent and quality of the Adviser’s services, and that the Adviser has the ability to continue to provide these services based on its experience, operations and current resources.
Investment Performance
The Board considered performance information provided by the Adviser for similarly managed accounts (if any) over the most recent quarter, six month, one year, three year and five year periods ending December 31, 2016 as well as Fund performance compared with its benchmark for one year, three year, five year, and since inception periods ending December 31, 2016. The Board considered the Adviser’s representation that the differences in the performance of other small cap accounts and Fund performance were expected by the Adviser given differences in investment strategy and tax management practices.
| | |
| 46 | | Annual Report | June 30, 2017 |
| | |
OTHER INFORMATION (continued) | | |
June 30, 2017 (unaudited)
In addition, Lipper provided a report (the “Lipper Report”) of comparative data regarding fees, expenses and performance for each Fund as compared to a peer group selected by Lipper (“Peer Group”) as of December 31, 2016. The performance periods included total return over the most recent calendar year (“one year period”) and the annualized total returns over the most recent three calendar year period (“three year period”), five calendar year period (“five year period”) and ten calendar year period (“ten year period”), although these Funds did not yet have a ten year performance period. With regard to the performance information provided in the Lipper Report, the Board considered the performance of each Fund on a percentile and quintile basis as compared to its Peer Group. For purposes of the performance data provided, the first quintile is defined as 20% of the funds in the applicable Peer Group with the highest performance and the fifth quintile is defined as 20% of the funds in the applicable Peer Group with the lowest performance.
In particular, the Board considered the following performance information provided by the Adviser and from Lipper:
| | ● | | With regard to the Omni Tax-Managed Small-Cap Value Fund, the Fund’s performance for the one year and five year periods was in the first quintile relative to its Peer Group, and in the second quintile for the three year period. The Fund also outperformed its primary benchmark in all performance periods (one year, three year, five year, and since inception). |
| | ● | | With regard to the Omni Small-Cap Value Fund, the Fund’s performance for the one year and five year periods was in the first quintile relative to its Peer Group, and in the second quintile for the three year period. The Fund also outperformed its primary benchmark in all performance periods (one year, five year, and since inception), except the three year period. |
Fund Fees and Expenses
The Board considered information provided by the Adviser regarding the advisory fees it charges to other advisory clients and the reasons for any material differences between those fees and the fees it charges to comparable client accounts. The Board also considered the Adviser’s views that, given investment performance and overall expenses, the Adviser believes the management fees for each Fund appear reasonable and appropriate given the distinctive features and design of each Fund, the disciplined implementation of the design by the Adviser, the relatively low management fees in most cases, the performance results in line with design and investor expectations, and the profitability to the Adviser of each Fund. More specifically, with regard to management fee differences among the Funds and other small-cap funds advised by the Adviser, the Board considered the Adviser’s view that fee differences stem from market factors as well as the estimated growth rate of the fund at the time of launch; the potential asset capacity of the fund; the risks associated with providing the advisory services to the fund; and estimated costs of providing the advisory services driven by the design complexity of the fund (e.g., more complex design is higher cost due to the research and portfolio management time required).
The Board also considered the fees charged to other investment company and non-investment company clients of the Adviser, as well as the Adviser’s representation that the Adviser did not manage other clients comparable to these Funds.
The Board also considered information compiled by Lipper comparing each Fund’s contractual management fee rate (using an assumed common asset level for the Fund and the other funds in the Peer Group), actual management fee rate (which included the effect of any fee waivers, and was derived from annual reports) and actual total expense ratios (which also included the effect of any fee waivers, and was derived from annual reports) as a percentage of average net assets as compared to other funds in its expense Peer Group. Lipper’s contractual management fee data included both advisory fees and administrative services fees, except for the Funds. Lipper excluded administrative services fees for the Funds from contractual management fee data because those fees are fixed (i.e., a stated dollar amount), as opposed to asset-based. More specifically, with respect to the Funds, the Adviser provides certain administrative services to the Funds pursuant to a separate contract, in exchange for an annual fixed fee (payable monthly) that the Adviser has represented approximates the cost of providing such services (which the Board considered in connection with profitability, as described below). Lipper’s actual management fee data for the Funds and the other funds in the Peer Group included both advisory fees and administrative services fees. Thus, the contractual management fee rate in the Funds’ Lipper comparisons did not reflect these administrative services fees, whereas the actual management fee rate in the Funds’ Lipper comparisons included both advisory and administration fees.
| | |
OTHER INFORMATION (continued) | | |
June 30, 2017 (unaudited)
With regard to the expense information provided in the Lipper Report, the Board considered Fund expenses on a percentile and quintile basis as compared to each Fund’s Peer Group. For purposes of the expense data provided, Lipper defines the first quintile as 20% of the funds in the applicable Peer Group with the lowest expenses and the fifth quintile as 20% of the funds in the applicable Peer Group with the highest expenses.
With respect to the Funds, the Board considered that each Fund’s contractual management fee, actual management fee and actual total expense ratio were in the 1st quintile of its respective Peer Group.
In addition, the Board considered that the Adviser agreed to contractual expense limitation agreements for each Fund to ensure that total expense levels do not increase above certain levels.
The foregoing comparisons assisted the Board in determining to approve the Management Agreement for each Fund by providing it with a basis for evaluating each Fund’s management fee and expense ratio on a relative basis.
| | |
| 48 | | Annual Report | June 30, 2017 |
| | |
OTHER INFORMATION (continued) | | |
June 30, 2017 (unaudited)
Profitability
The Board reviewed the materials it received from the Adviser regarding its revenues and costs in providing investment management and certain administrative services to the Funds and the Company as a whole. In particular, the Board considered the analysis of the Adviser’s profitability with respect to each Fund, calculated for the years ended December 31, 2013, December 31, 2014, December 31, 2015 and December 31, 2016. The Board also considered the Adviser’s representations that it does not track expenses or maintain staff on a per Fund basis and accordingly the Adviser needed to make certain assumptions to allocate expenses on a Fund-by-Fund basis in order to calculate Fund-by-Fund profitability, making the process somewhat arbitrary. The Board also considered that the Adviser was operating some lines of business at a loss but that the Adviser’s overall business is profitable. Additionally, the Board considered the Adviser’s representation that the Adviser continued to improve its financial position over the last year.
Economies of Scale
With respect to whether economies of scale are expected to be realized by the Adviser as a Fund’s assets increase and whether advisory fee levels reflect these economies of scale for the benefit of Fund investors, the Board considered, for each Fund, the current level of advisory fees charged and fee structure and concluded that the Adviser’s fee structure with respect to each Fund was appropriate at this time. The Board considered the Adviser’s explanation that although neither Fund has fee breakpoints in its management fee schedules, each Fund was priced low relative to peers and ahead of the economies of scale curve at launch.
“Fallout” or Ancillary Benefits
The Board considered whether there were any “fall-out” or ancillary benefits that may accrue to the Adviser as a result of its relationships with the Funds. In terms of potential “fall out” or ancillary benefits to the Adviser due to its position as manager of the Funds, the Board considered benefits related to track record and reputation, and portfolio trading and execution. The Board also considered the Adviser’s representations that it does not participate in any soft dollar arrangements and that, although it receives unsolicited research from outside sources, the Adviser does not consider the receipt of this information in the decision-making process. The Board concluded that the benefits accruing to Adviser by virtue of its relationship to the Funds appeared to be reasonable.
* * * * *
After evaluation of the information regarding management services, investment performance, management fees, profitability, economies of scale and ancillary benefits, as described above, as well as other considerations (such as the Adviser’s compliance program, regulatory history, insurance coverage, privacy and cybersecurity controls and brokerage practices), and in light of the nature, extent and quality of services provided by the Adviser, the Board, including a majority of the Independent Directors, concluded that the level of management fees to be paid to the Adviser with respect to each Fund under the Management Agreement is reasonable.
In summary, based on all relevant information and factors discussed above, none of which was individually determinative of the outcome, the Board, including a majority of the Independent Directors, determined that the approval of the Management Agreement for each Fund was in the best interests of each such Fund. As a result, the Board, including a majority of the Independent Directors, approved the renewal of the Management Agreement for each Fund.
| | |
| DISCLOSURE OF FUND EXPENSES | | |
June 30, 2017 (Unaudited)
As a shareholder of a Fund, you will incur no transaction costs from such Fund, including sales charges (loads) on purchases, on reinvested dividends, or on other distributions. There are no exchange fees. However, as a shareholder of a Fund, you will incur ongoing costs, including management fees and other Fund expenses. The following examples are intended to help you understand your ongoing costs (in dollars) of investing in a Fund and to compare these costs with ongoing costs of investing in other mutual funds. The examples are based on an investment of $1,000 invested on January 1, 2017 and held until June 30, 2017.
Actual Expenses. The first line of the table below provides information about actual account values and actual expenses. You may use the information in this line, together with the amount you invested, to estimate the expenses that you paid over the period. Simply divide your account value by $1,000 (for example, an $8,600 account value divided by $1,000 = 8.6), then multiply the result by the number in the first line under the heading “Expenses Paid During Period” to estimate the expenses you paid on your account during the period.
Hypothetical Example for Comparison Purposes. The second line of the table below provides information about hypothetical account values and hypothetical expenses based on the Fund’s actual expense ratio and an assumed rate of return of 5% per year before expenses, which is not the Fund’s actual return. The hypothetical account values and expenses may not be used to estimate the actual ending account balance or expenses you paid for the period. You may use this information to compare the ongoing costs of investing in a Fund and other mutual funds. To do so, compare this 5% hypothetical example with the 5% hypothetical examples that appear in the shareholder reports of other funds.
The expenses shown in the table are meant to highlight ongoing Fund costs only. Therefore, the second line of the table is useful in comparing ongoing costs only and will not help you determine the relative total costs of owning different funds, because other funds may also have transaction costs, such as sales charges, redemption fees or exchange fees.
| | | | | | | | | | | | | | | | |
| | | Beginning Account
Value at 1/1/17 | | | Ending Account
Value at 6/30/17 | | | Expense Ratio | | | Expenses Paid During Period*
1/1/17 - 6/30/17 | |
| | | | |
| Bridgeway Omni Small-Cap Value | | | | | | | | | | | | | | | | |
| Actual Fund Return | | | $1,000.00 | | | | $ 964.90 | | | | 0.60 | % | | | $2.92 | |
Hypothetical Fund Return | | | $1,000.00 | | | | $1,021.82 | | | | 0.60 | % | | | $3.01 | |
| | | | |
| Bridgeway Omni Tax-Managed Small-Cap Value | | | | | | | | | | | | | | | | |
| Actual Fund Return | | | $1,000.00 | | | | $ 966.60 | | | | 0.60 | % | | | $2.93 | |
Hypothetical Fund Return | | | $1,000.00 | | | | $1,021.82 | | | | 0.60 | % | | | $3.01 | |
| * | Expenses are equal to the average account value times the Fund’s annualized expense ratio multiplied by the number of days in the most recent six-month period (181) divided by the number of days in the fiscal year (365). |
| | |
| 50 | | Annual Report | June 30, 2017 |
| | |
| DIRECTORS & OFFICERS | | |
June 30, 2017 (Unaudited)
| | | | | | | | | | |
| Independent Directors |
| | | | | |
Name, Address and Age1 | | Position Held with Bridgeway Funds | | Term of Office and Length of Time Served | | Principal Occupatio (s) During Past Five Years | | No. of Bridgeway Funds Overseen by Director | | Other Directorships Held by Director |
| | | | | |
Kirbyjon Caldwell Age 63 | | Director | | Term: 1 Year
Length: 2001
to Present. | | Senior Pastor of Windsor Village United Methodist Church, since 1982. | | Ten | | American Church Mortgage Company, NRG Energy, Inc., Amegy Bancshares Advisory Board |
| | | | | |
Karen S. Gerstner Age 62 | | Director | | Term: 1 Year
Length:
1994
to Present. | | Principal, Karen S. Gerstner & Associates, P.C., since 2004. | | Ten | | None |
| | | | | |
Miles Douglas Harper, III* Age 54 | | Director | | Term: 1 Year
Length:
1994
to Present. | | Partner, Carr, Riggs & Ingram, LLC, since 2013; Partner, Gainer Donnelly, LLP, 1998 to 2013 upon merger with Carr, Riggs & Ingram, LLC. | | Ten | | Calvert Funds (37 Portfolios) |
| | | | | |
Evan Harrel Age 56 | | Director | | Term: 1 Year
Length:
2006
to Present. | | Strategic Advisor, Small Steps Nurturing Center, since 2012; Executive Director, Small Steps Nurturing Center, 2004 to 2012. | | Ten | | None |
| | |
| DIRECTORS & OFFICERS (continued) | | |
June 30, 2017 (Unaudited)
| | | | | | | | | | |
| “Interested” or Affiliated Director and Officer |
| | | | | |
Name, Address and Age1 | | Position (s) Held with Bridgeway Funds | | Term of Office and Length of Time Served | | Principal Occupation (s) During Past Five Years | | No. of Bridgeway Funds Overseen by Director | | Other Directorships Held by Director |
| | | | | |
John N. R. Montgomery2
Age 61 | | Director | | Term: 1 Year
Length: 1993
to Present. | | Chairman, Bridgeway Capital Management, Inc., since 2010; President, Bridgeway Capital Management, Inc., 1993 to 2010 and June 2015 to March 2016; President, Bridgeway Funds, June 2015 to June 2016; Vice President, Bridgeway Funds, 2005 to May 2015 and since June 2016. | | Ten | | None |
| | |
| 52 | | Annual Report | June 30, 2017 |
| | |
| DIRECTORS & OFFICERS (continued) | | |
June 30, 2017 (Unaudited)
| | | | | | | | | | |
| Other Officers |
| | | | | |
Name, Address and Age1 | | Position Held with Bridgeway Funds | | Term of Office and Length of Time Served | | Principal Occupation (s) During Past Five Years | | No. of Bridgeway Funds Overseen by Officer | | Other Directorships Held by Officer |
| | | | | |
| Richard P. Cancelmo, Jr. Age 59 | | Vice
President | | Term: 1 Year
Length: 2004
to Present. | | Vice President, Bridgeway Funds, since 2004; Staff member, Bridgeway Capital Management, Inc., since 2000. | | N/A | | None |
| | | | | |
Linda G. Giuffré Age 55 | | Treasurer
and Chief
Compliance
Officer | | Term: 1 Year
Length: 2004
to Present. | | Chief Compliance Officer, Bridgeway Capital Management, Inc., since 2004; Staff member, Bridgeway Capital Management, Inc., since 2004. | | N/A | | None |
| | | | | |
Deborah L. Hanna Age 52 | | Secretary | | Term: 1 Year
Length: 2007
to Present. | | Self-employed, accounting and related projects for various organizations, since 2001. | | N/A | | None |
| | | | | |
Sharon Lester Age 62 | | Vice
President | | Term: 1 Year
Length: 2011
to Present. | | Staff member, Bridgeway Capital Management, Inc., since 2010. | | N/A | | None |
| | | | | |
Tammira Philippe Age 43 | | President | | Term: 1 Year
Length: May
2016 to
Present. | | Staff member, Bridgeway Capital Management, Inc., 2010 to March 2016; President, Bridgeway Capital Management, Inc., since March 2016. | | N/A | | None |
| 1 | The address of all of the Directors and Officers of Bridgeway Funds is 20 Greenway Plaza, Suite 450, Houston, Texas, 77046. |
| 2 | John Montgomery is chairman, director and majority shareholder of Bridgeway Capital Management, Inc., and therefore an interested person of Bridgeway Funds. |
The overall management of the business and affairs of Bridgeway Funds is vested with its Board of Directors (the “Board”). The Board approves all significant agreements between Bridgeway Funds and persons or companies furnishing services to it, including agreements with its Adviser and custodian. The day-to-day operations of Bridgeway Funds are delegated to its officers, subject to its investment objectives and policies and general supervision by the Board.
The Funds’ Statement of Additional Information includes additional information about the Board and is available, without charge, upon request by calling 1-800-661-3550.
THIS PAGE INTENTIONALLY LEFT BLANK
THIS PAGE INTENTIONALLY LEFT BLANK
| | | | |
| | | | |
| | | | |
| | | | |
| | | | |
| | | | |
| | BRIDGEWAY FUNDS, INC. | | |
| | |
| | BNY Mellon Investment Servicing (US) Inc. | | |
| | P.O. Box 9860 | | |
| | Providence, RI 02940-8060 | | |
| | |
| | CUSTODIAN | | |
| | |
| | The Bank of New York Mellon | | |
| | One Wall Street | | |
| | New York, NY 10286 | | |
| | |
| | DISTRIBUTOR | | |
| | |
| | Foreside Fund Services, LLC | | |
| | Three Canal Plaza, Suite 100 | | |
| | Portland, ME 04101 | | |
| | You can review and copy information about our Funds (including the SAI) at the SEC’s Public Reference Room in Washington, D.C. To find out more about this public service, call the SEC at 800-SEC-0330. Reports and other information about the Funds are also available on the SEC’s website at www.sec.gov. You can receive copies of this information, for a fee, by writing the Public Reference Section, Securities and Exchange Commission, Washington, D.C. 20549-1520 or by sending an electronic request to the following email address: publicinfo@sec.gov. | | |
Item 2. Code of Ethics.
| | (a) | The registrant, as of the end of the period covered by this report, has adopted a code of ethics that applies to the registrant’s principal executive officer, principal financial officer, principal accounting officer or controller, or persons performing similar functions, regardless of whether these individuals are employed by the registrant or a third party. |
| | (c) | There have been no substantive amendments, during the period covered by this report, to a provision of the code of ethics that applies to the registrant’s principal executive officer, principal financial officer, principal accounting officer or controller, or persons performing similar functions, regardless of whether these individuals are employed by the registrant or a third party, and that relates to any element of the code of ethics description. |
| | (d) | The registrant has not granted any waivers, including an implicit waiver, from a provision of the code of ethics that applies to the registrant’s principal executive officer, principal financial officer, principal accounting officer or controller, or persons performing similar functions, regardless of whether these individuals are employed by the registrant or a third party, that relates to one or more of the items set forth in paragraph (b) of this item’s instructions. |
Item 3. Audit Committee Financial Expert.
3(a)(1) The Registrant’s board of directors has determined that the registrant has at least one audit committee financial expert serving on its audit committee.
3(a)(2) The audit committee financial expert is Miles Douglas Harper III, who is “independent” for purposes of this Item 3 of Form N-CSR.
Item 4. Principal Accountant Fees and Services.
Audit Fees
| | (a) | The aggregate fees billed for each of the last two fiscal years for professional services rendered by the principal accountant for the audit of the registrant’s annual financial statements or services that are normally provided by the accountant in connection with statutory and regulatory filings or engagements were $221,200 for the fiscal year ended June 30, 2017 and $237,500 for the fiscal year ended June 30, 2016. |
Audit-Related Fees
| | (b) | The aggregate fees billed in each of the last two fiscal years for assurance and related services by the principal accountant that are reasonably related to the performance of the audit of the registrant’s financial statements and are not reported under paragraph (a) of this Item were $0 for the fiscal year ended June 30, 2017 and $0 for the fiscal year ended June 30, 2016. |
Tax Fees
| | (c) | The aggregate fees billed in each of the last two fiscal years for professional services rendered by the principal accountant for tax compliance, tax advice, and tax planning were $20,000 for the fiscal year ended June 30, 2017 and $22,000 for the fiscal year ended June 30, 2016. Tax services include the review of the Funds’ federal income tax returns, the review of the Funds’ federal excise tax returns and the review of required distributions by the Funds. |
All Other Fees
| | (d) | The aggregate fees billed in each of the last two fiscal years for products and services provided by the principal accountant, other than the services reported in paragraphs (a) through (c) of this Item were $0 for the fiscal year ended June 30, 2017 and $0 for the fiscal year ended June 30, 2016. |
| | (e)(1) | Disclose the audit committee’s pre-approval policies and procedures described in paragraph (c)(7) of Rule 2-01 of Regulation S-X. |
The Registrant’s Audit Committee has adopted an Audit Committee Charter that provides that the Audit Committee shall approve, prior to appointment, the engagement of the auditor to provide audit services to the Registrant and non-audit services to the Registrant, its investment advisor or any entity controlling, controlled by or under common control with the investment adviser that provides on-going services to the Registrant if the engagement relates directly to the operations and financial reporting of the Registrant.
| | (e)(2) | The percentage of services described in each of paragraphs (b) through (d) of this Item that were approved by the audit committee pursuant to paragraph (c)(7)(i)(C) of Rule 2-01 of Regulation S-X are as follows: |
No services described in paragraphs (b) through (d) above were approved pursuant to paragraph (c)(7)(i)(C) of Rule 2-01 of Regulation S-X
| | (g) | The aggregate non-audit fees billed by the registrant’s accountant for services rendered to the registrant, and rendered to the registrant’s investment adviser (not including any sub-adviser whose role is primarily portfolio management and is subcontracted with or overseen by another investment adviser), and any entity controlling, controlled by, or under common control with the adviser that provides ongoing services to the registrant for each of the last two fiscal years of the registrant was $0 for the fiscal year ended June 30, 2017 and $0 for the fiscal year ended June 30, 2016. |
Item 5. Audit Committee of Listed Registrants.
Not applicable.
Item 6. Investments.
| (a) | Schedule of Investments in securities of unaffiliated issuers as of the close of the reporting period is included as part of the report to shareholders filed under Item 1 of this form. |
Item 7. Disclosure of Proxy Voting Policies and Procedures for Closed-End Management Investment
Companies.
Not applicable.
Item 8. Portfolio Managers of Closed-End Management Investment Companies.
Not applicable.
Item 9. Purchases of Equity Securities by Closed-End Management Investment Company and Affiliated
Purchasers.
Not applicable.
Item 10. Submission of Matters to a Vote of Security Holders.
There have been no material changes to the procedures by which the shareholders may recommend nominees to the Registrant’s Board of Directors, where those changes were implemented after the registrant last provided disclosure in response to the requirements of Item 407(c)(2)(iv) of Regulation S-K (17 CFR 229.407) (as required by Item 22(b)(15) of Schedule 14A (17 CFR 240.14a-101)), or this Item.
Item 11. Controls and Procedures.
| | (a) | The registrant’s principal executive officer and principal financial officer, or persons performing similar functions, have concluded that the registrant’s disclosure controls and procedures (as defined in Rule 30a-3(c) under the Investment Company Act of 1940, as amended (the “1940 Act”) (17 CFR 270.30a-3(c))) are effectively designed, as of a date within 90 days of the filing date of the report that includes the disclosure required by this paragraph, based on their evaluation of these controls and procedures required by Rule 30a-3(b) under the 1940 Act (17 CFR 270.30a-3(b)) and Rules 13a-15(b) or 15d-15(b) under the Securities Exchange Act of 1934, as amended (17 CFR 240.13a-15(b) or 240.15d-15(b)). |
| | (b) | There were no changes in the registrant’s internal control over financial reporting (as defined in Rule 30a-3(d) under the Act (17 CFR 270.30a-3(d))) that occurred during the second fiscal quarter of the period covered by this report that have materially affected or are reasonably likely to materially affect, the registrant’s internal control over financial reporting. |
Item 12. Exhibits.
| | (a)(1) | Code of ethics, or any amendment thereto, that is the subject of disclosure required by Item 2 is attached hereto. |
| | (a)(2) | Certifications pursuant to Rule 30a-2(a) under the 1940 Act and Section 302 of the Sarbanes-Oxley Act of 2002 are attached hereto. |
| | (b) | Certifications pursuant to Rule 30a-2(b) under the 1940 Act and Section 906 of the Sarbanes-Oxley Act of 2002 are attached hereto. |
(12.other) Not applicable.
SIGNATURES
Pursuant to the requirements of the Securities Exchange Act of 1934 and the Investment Company Act of 1940, the registrant has duly caused this report to be signed on its behalf by the undersigned, thereunto duly authorized.
| | | | |
| | |
| (Registrant) | | Bridgeway Funds, Inc. | | |
| | | | |
| | |
| By (Signature and Title)* | | /s/ Tammira Philippe | | |
| | Tammira Philippe, President and Principal Executive Officer (principal executive officer) | | |
Pursuant to the requirements of the Securities Exchange Act of 1934 and the Investment Company Act of 1940, this report has been signed below by the following persons on behalf of the registrant and in the capacities and on the dates indicated.
| | | | |
| | |
| By (Signature and Title)* | | /s/ Tammira Philippe | | |
| | Tammira Philippe, President and Principal Executive Officer (principal executive officer) | | |
| | | | |
| | |
| By (Signature and Title)* | | /s/ Linda G. Giuffré | | |
| | Linda G. Giuffré, Treasurer and Principal Financial Officer (principal financial officer) | | |
* Print the name and title of each signing officer under his or her signature.