UNITED STATES
SECURITIES AND EXCHANGE COMMISSION
Washington, D.C. 20549
FORM N-CSR
CERTIFIED SHAREHOLDER REPORT OF REGISTERED MANAGEMENT INVESTMENT COMPANIES
Investment Company Act file number 811-08200
Bridgeway Funds, Inc.
(Exact name of registrant as specified in charter)
20 Greenway Plaza, Suite 450
Houston, Texas 77046
(Address of principal executive offices) (Zip code)
Tammira Philippe, President
Bridgeway Funds, Inc.
20 Greenway Plaza, Suite 450
Houston, Texas 77046
(Name and address of agent for service)
Registrant’s telephone number, including area code: (713) 661-3500
Date of fiscal year end: June 30
Date of reporting period: June 30, 2016
Form N-CSR is to be used by management investment companies to file reports with the Commission not later than 10 days after the transmission to stockholders of any report that is required to be transmitted to stockholders under Rule 30e-1 under the Investment Company Act of 1940 (17 CFR 270.30e-1). The Commission may use the information provided on Form N-CSR in its regulatory, disclosure review, inspection, and policymaking roles.
A registrant is required to disclose the information specified by Form N-CSR, and the Commission will make this information public. A registrant is not required to respond to the collection of information contained in Form N-CSR unless the Form displays a currently valid Office of Management and Budget (“OMB”) control number. Please direct comments concerning the accuracy of the information collection burden estimate and any suggestions for reducing the burden to Secretary, Securities and Exchange Commission, 100 F Street, NE, Washington, DC 20549. The OMB has reviewed this collection of information under the clearance requirements of 44 U.S.C. § 3507.
Item 1. Reports to Stockholders.
The Report to Shareholders is attached herewith.

A no-load mutual fund family of domestic funds
| | | | |
| | |
| | Annual Report | | |
| | |
| | June 30, 2016 | | |
| | |
| | | | |
| | |
| |
| AGGRESSIVE INVESTORS 1 | | BRAGX |
| |
| ULTRA-SMALL COMPANY | | BRUSX |
| (Open to Existing Investors — Direct Only) | | |
| |
| ULTRA-SMALL COMPANY MARKET | | BRSIX |
| |
| SMALL-CAP MOMENTUM | | BRSMX |
| |
| SMALL-CAP GROWTH | | BRSGX |
| |
| SMALL-CAP VALUE | | BRSVX |
| |
| BLUE CHIP 35 INDEX | | BRLIX |
| |
| MANAGED VOLATILITY | | BRBPX |
| | |
| TABLE OF CONTENTS | |  |
| | |
| | |
Bridgeway Funds Standardized Returns as of June 30, 2016* (Unaudited)
| | | | | | | | | | | | | | | | | | | | | | | | | | | | | | | | | | | | | | | | | | | | | |
| | | | | | | Annualized | | | | | | |
| Fund | | Quarter | | Six Months | | 1 Year | | 5 Years | | 10 Years | | Inception
to Date | | Inception
Date | | Gross
Expense
Ratio2 | | Net
Expense
Ratio2 |
Aggressive Investors 1 | | | | 2.68% | | | | | 2.28% | | | | | -7.40% | | | | | 8.82% | | | | | 2.59% | | | | | 12.52% | | | | | 8/5/1994 | | | | | 1.32% | | | | | 1.32% | |
Ultra-Small Company | | | | 0.35% | | | | | -1.29% | | | | | -13.53% | | | | | 5.96% | | | | | 3.05% | | | | | 13.67% | | | | | 8/5/1994 | | | | | 1.15% | | | | | 1.15% | |
Ultra-Small Co Market | | | | 2.90% | | | | | -1.01% | | | | | -10.83% | | | | | 8.79% | | | | | 4.17% | | | | | 9.93% | | | | | 7/31/1997 | | | | | 0.78% | | | | | 0.78% | |
Small-Cap Momentum | | | | 5.60% | | | | | 1.95% | | | | | -3.48% | | | | | 7.77% | | | | | NA | | | | | 10.77% | | | | | 5/28/2010 | | | | | 3.36% | 1 | | | | 0.90% | 1 |
Small-Cap Growth | | | | 3.04% | | | | | 1.55% | | | | | -3.97% | | | | | 10.46% | | | | | 3.37% | | | | | 5.85% | | | | | 10/31/2003 | | | | | 1.08% | 1 | | | | 0.94% | 1 |
Small-Cap Value | | | | 3.94% | | | | | 4.87% | | | | | -5.02% | | | | | 8.12% | | | | | 3.58% | | | | | 6.71% | | | | | 10/31/2003 | | | | | 0.98% | 1 | | | | 0.94% | 1 |
Blue Chip 35 Index | | | | 2.85% | | | | | 5.05% | | | | | 6.60% | | | | | 12.61% | | | | | 7.72% | | | | | 6.55% | | | | | 7/31/1997 | | | | | 0.23% | 1 | | | | 0.15% | 1 |
Managed Volatility | | | | 0.57% | | | | | 1.21% | | | | | 1.10% | | | | | 4.46% | | | | | 2.89% | | | | | 3.87% | | | | | 6/30/2001 | | | | | 1.05% | 1 | | | | 0.95% | 1 |
Bridgeway Funds Returns for Calendar Years 2002 through 2015* (Unaudited)
| | | | | | | | | | | | | | | | | | | | | | | | | | | | | | | | | | | | | | | | | | | | | | | | | | | | | | | | |
| | | 2002 | | | 2003 | | | 2004 | | | 2005 | | | 2006 | | | 2007 | | | 2008 | | | 2009 | | | 2010 | | | 2011 | | | 2012 | | | 2013 | | | 2014 | | | 2015 | |
Aggressive Investors 1 | | | -18.01% | | | | 53.97% | | | | 12.21% | | | | 14.93% | | | | 7.11% | | | | 25.80% | | | | -56.16% | | | | 23.98% | | | | 17.82% | | | | -10.31% | | | | 21.58% | | | | 42.21% | | | | 14.99% | | | | -9.83% | |
Ultra-Small Company | | | 3.98% | | | | 88.57% | | | | 23.33% | | | | 2.99% | | | | 21.55% | | | | -2.77% | | | | -46.24% | | | | 48.93% | | | | 23.55% | | | | -14.64% | | | | 24.49% | | | | 55.77% | | | | -0.56% | | | | -16.12% | |
Ultra-Small Co Market | | | 4.90% | | | | 79.43% | | | | 20.12% | | | | 4.08% | | | | 11.48% | | | | -5.40% | | | | -39.49% | | | | 25.95% | | | | 24.86% | | | | -7.86% | | | | 19.83% | | | | 50.91% | | | | 4.61% | | | | -8.28% | |
Small-Cap Momentum | | | | | | | | | | | | | | | | | | | | | | | | | | | | | | | | | | | | | | | -0.92% | | | | 14.18% | | | | 37.07% | | | | -0.94% | | | | 0.14% | |
Small-Cap Growth | | | | | | | | | | | 11.59% | | | | 18.24% | | | | 5.31% | | | | 6.87% | | | | -43.48% | | | | 15.04% | | | | 11.77% | | | | -0.63% | | | | 11.05% | | | | 48.52% | | | | 6.13% | | | | 4.93% | |
Small-Cap Value | | | | | | | | | | | 17.33% | | | | 18.92% | | | | 12.77% | | | | 6.93% | | | | -45.57% | | | | 26.98% | | | | 16.55% | | | | 1.05% | | | | 20.99% | | | | 39.72% | | | | 0.79% | | | | -9.43% | |
Blue Chip 35 Index | | | -18.02% | | | | 28.87% | | | | 4.79% | | | | 0.05% | | | | 15.42% | | | | 6.07% | | | | -33.30% | | | | 26.61% | | | | 10.60% | | | | 3.17% | | | | 15.20% | | | | 31.67% | | | | 11.51% | | | | 2.17% | |
Managed Volatility | | | -3.51% | | | | 17.82% | | | | 7.61% | | | | 6.96% | | | | 6.65% | | | | 6.58% | | | | -19.38% | | | | 12.39% | | | | 5.41% | | | | 1.94% | | | | 6.46% | | | | 9.25% | | | | 5.95% | | | | 0.17% | |
Performance figures quoted represent past performance and are no guarantee of future results. Current performance may be lower or higher than the performance data quoted. Investment return and principal value will fluctuate, so that an investor’s shares, when redeemed, may be worth more or less than original cost. To obtain performance current to the most recent month-end, please visit www.bridgeway.com or call 1-800-661-3550. Total return figures include the reinvestment of dividends and capital gains.
| | 1 | Some of the Fund’s fees were waived or expenses reimbursed; otherwise, returns would have been lower. The Adviser has contractually agreed to waive fees and/or reimburse expenses. Any material change to this Fund policy would require a vote by shareholders. |
| | 2 | Expense ratios are as stated in the current prospectus. Please see financial highlights for expense ratios as of June 30, 2016. |
* Numbers highlighted indicate periods when the Fund outperformed its primary benchmark.
This report is submitted for the general information of the shareholders of each Fund. It is not authorized for distribution to prospective investors unless preceded or accompanied by an effective prospectus, which includes information regarding a Fund’s risks, objectives, fees and expenses, experience of its management, and other information. Investors should read the prospectus carefully before investing in a Fund. For questions or other Fund information, call 1-800-661-3550 or visit the Funds’ website at www.bridgeway.com. Funds are available for purchase by residents of the United States, Puerto Rico, U.S. Virgin Islands and Guam only. Foreside Fund Services, LLC, Distributor.
The views expressed here are exclusively those of Fund management. These views, including those relating to the market, sectors, or individual stocks, are not meant as investment advice and should not be considered predictive in nature.
| | |
LETTER FROM THE INVESTMENT MANAGEMENT TEAM | | |
June 30, 2016
Dear Fellow Shareholders,
Performance across the domestic equity markets was positive for the June quarter, and most segments of the market also posted gains for the 12 months ended June 30, 2016. Only small-cap stocks and mid-cap growth stocks recorded losses for the fiscal year. Market highlights appear on page 2. In this environment, the Bridgeway Funds performed within design expectations, guided by our statistically driven, evidence-based investment approach. Please see the enclosed letters for a detailed explanation of each Fund’s performance during the quarter and fiscal year. We hope you find the letters helpful.
The start of the June quarter marked an important milestone for Bridgeway: Tammira Philippe stepped into her new role as President of Bridgeway Capital Management. On page 2, she reflects on her first 90 days as President, and shares her vision for Bridgeway’s future.
The June quarter also saw a turnaround for small-cap value stocks, although the gains were not enough to offset the asset class’s poor performance from earlier in the fiscal year. In fact, small-cap value stocks have lagged the market for several years, which might be causing some investors to wonder whether these stocks still offer a long-term premium. Yet our research indicates that the small-cap value premium isn’t dead, and we explain our reasons for optimism on page 3.
The end of the fiscal year is also the time when we look back on what went well for Bridgeway during the past 12 months, and what didn’t. This year, we’re highlighting the poor performance of our Aggressive Investors 1 Fund as the “worst thing” of the past fiscal year. You can read our breakdown of what went wrong on page 4.
Finally, on page 5, we share one Partner’s very personal approach to creating transformative change in our communities. Tami Groce describes her work supporting two groups of people going through life changes that she’s experienced first hand.
As always, we appreciate your feedback. We take your comments very seriously and regularly discuss them to help us manage our Funds and this company. Please keep your ideas coming — both favorable and critical. They provide us with a vital tool to serve you better.
Sincerely,
Your Investment Management Team
| | |
LETTER FROM THE INVESTMENT MANAGEMENT TEAM (continued) | | |
Market Review
Domestic equity markets rose during the June quarter, despite late-period volatility sparked by the U.K. referendum vote to leave the European Union. Although global stock markets plunged immediately following the June 23 vote, they quickly rebounded in subsequent days. The S&P 500 returned 2.46% for the quarter, and the Dow Jones Industrial Average rose 2.07%. For the fiscal year, the S&P 500 and the DJIA were up 3.99% and 4.50%, respectively, with most of those gains coming during the second half of the 12-month period.
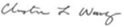
U.S. equity styles, as defined by Russell Indices, recorded positive returns for the quarter. Value stocks outperformed growth stocks, with the largest difference among large-cap stocks. Small-cap stocks generally outperformed larger stocks, with the exception of the value category. As a result, mid-cap value stocks delivered the best performance (4.77%), while large growth stocks produced the lowest return (0.61%).
Six of the 10 S&P 500 sectors posted positive returns for the quarter. The Energy sector led the gains, up 11.6%, followed by Telecommunications (7.1%), Utilities (6.8%) and Health Care (6.3%). Information Technology was the worst performer, returning -2.8%, while the Consumer Discretionary sector recorded the only other quarterly loss (-0.9%).
Below are the stock market style box returns for the quarter and the fiscal year.
Message from the President: Reflections on my First 90 Days
by Tammira Philippe, CFA
Although I have worked at Bridgeway for 11 years, I started my day on March 30 determined to look at our firm from a new perspective.
It was my first day as President of Bridgeway Capital Management — a position I was thrilled to accept after being chosen from among several finalists during a nationwide search — and I was eager to begin leading our firm. I knew that we had a talented team and enjoyed strong momentum thanks to our evidence-based investing philosophy and unique culture. I also knew that my top priority as President would be to build on this foundation and help create an organization that has an even larger positive impact on investors and the world at large.
Before I could take any steps toward accomplishing that goal, though, I needed to be sure my colleagues shared my vision for Bridgeway.
So beginning March 30, I began talking with my colleagues to articulate my ideas to help Bridgeway’s success continue long into the future. I emphasized the importance of our firm’s values, starting with putting our investors’ interests first at all times. I described how our team-based approach is helping to build a stronger, more adaptable company, one in which Partners can learn new skills that help them take on new responsibilities — much as my Bridgeway career gave me experience in strategy, operations and client relationships.
| | |
| 2 | | Annual Report | June 30, 2016 |
| | |
LETTER FROM THE INVESTMENT MANAGEMENT TEAM (continued) | | |
To my great excitement, I found even more alignment among my Partners than I expected. Everyone at Bridgeway knows that we have created something special in the financial world, and they are just as committed as I am to seeing the firm thrive beyond their own careers.
In addition, I listened to advisers, institutional clients and shareholders we serve. I knew from past conversations that some wondered whether the values and approach established by our founder, John Montgomery, would continue to drive Bridgeway in the future. I wanted to assure them, as I assure you today, that John’s values have been thoroughly absorbed into Bridgeway’s DNA, and by all of us. You can see them in our commitment to maintaining a disciplined investment strategy and relentless focus on controlling costs that can help investors achieve their long-term goals — and in our pledge to use our own success to help make the world a better place.
I hope that my appointment as President is a compelling example of how Bridgeway’s culture and values are bigger than any one person. We know there will be challenges along the way. We face increasing competition, shifting regulations and evolving investor needs that will require us to change and adapt. But what will not change is our commitment to our investors and our values. In fact, I believe that the forces changing our industry have made Bridgeway’s culture an even greater asset as we strive to build an enduring firm. I am honored to be the person with the responsibility to protect that legacy and to guide our Partners toward our shared vision for the future.
Is Small-Cap Value Dead?
by Christine Wang, CFA, CPA, Portfolio Manager
Value investors have had a tough few years. At the end of 2015, value stocks had again lagged growth stocks. Even worse, value also underperformed growth during the most recent 3-year, 5-year and 10-year periods.
Results also have been bad for small-cap investors, with large-cap stocks outperforming small-cap growth stocks on a 1-year, 3-year and 5-year basis through the end of 2015. Considering that small-cap value stocks historically have provided a return premium, these trends might leave some investors scratching their heads, wondering if small-cap value still has a place in their portfolios.
While we share the frustration with recent results, our research into historical market data offers reason for optimism. In fact, we believe that small-cap value remains an important part of a diversified investment portfolio, and that abandoning the asset class now could diminish the potential positive impact of the small-cap value premium on your long-term results.
Since 1926, small-cap value stocks have outperformed small-cap growth stocks by 6.07% annually. However, the short-term relative performance of small-cap value stocks often is not for the faint of heart — as we’ve recently experienced. Small-cap value underperformed the market for 21 consecutive months spanning May, 2014 to February, 2016.
But how unusual is that down trend? Looking at market data going back to 1926, we found that the duration of the recent 21-month slump is above average, but not unprecedented. When small-cap value underperformed, the average length of its consecutive monthly underperformance was 11 months, while the longest stretch was 3.5 years, occurring between 1929 and 1932. More recently, small-cap value underperformed for 26 consecutive months between July 1989 and August 1991.
What’s more, although small-cap value stocks frequently underperform the market from year to year, the odds of underperformance greatly decline over longer holding periods: Between 1926 and 2015, there has not been a single 20-year period during which small-cap value lagged the market.
While 21 months can feel like an eternity, it is a relatively short period within an investor’s lifetime and any reasonable equity investment time horizon. And based on our examination of long-term market returns, it’s unlikely that small-cap value stocks will continue to lag the market for a period of more than a decade.
Another important insight from our research: Small-cap value typically rebounds strongly from prolonged slumps, which supports the argument for not giving up now. For example, after small-cap value stocks underperformed the market for 42 consecutive months starting in 1929, they went on to outperform the market by an astonishing 231% during the 42 months after they recovered. After the 26-month period of underperformance starting in 1989, small-cap value posted a 44% cumulative outperformance over the 26 months following its recovery. In these and other periods, the eventual rebound in small-cap value more than wiped out the early losses — rewarding those investors who stuck to their strategy.
| | |
LETTER FROM THE INVESTMENT MANAGEMENT TEAM (continued) | | |
There’s no doubt that recent performance has been difficult for small-cap value investors, but we may already have seen a potential change in that trend: Small-cap value stocks outperformed broad-market Russell 3000 index by 2.17 percentage points during the most recent quarter. Of course, one quarter does not make a trend, but we will continue to monitor small-cap value’s performance for signs of a turnaround.
In the meantime, our analysis shows that the recent stretch of underperformance is within the historic norm for the small-cap value premium. To abandon the asset class based on the past few years of performance alone would just be another version of chasing hot returns by buying high and selling low — the exact opposite of a recipe for success. Instead, recent volatility in small-cap value stocks is a perfect opportunity to rebalance portfolios and remain committed to a well-diversified asset allocation that takes advantage of the historical premiums the market offers.
The Worst Thing of the Fiscal Year
by John Montgomery, Founder and Chief Investment Officer
While we like to celebrate our successes as much as anyone, we also believe that getting the hard stuff on the table is a key ingredient to learning and growing — as individuals and as a corporation.
Additionally, Bridgeway is committed to transparency with you, our shareholders, who are the owners of the Fund. That’s why we have set aside a portion of each annual report to discuss the worst thing that happened during the fiscal year.
This year, we’ve chosen the results for Aggressive Investors 1 — our poorest performing Fund. Although the Fund achieved relatively impressive return rankings for calendar years 2014, 2013 and 2012, and leads its primary market benchmark by more than 3% per year since inception, this year’s -7.40% return and low peer ranking is very disappointing.
Why did it happen? Thanks to a confluence of trends, none of the Fund’s major categories of factors helped performance, and several hurt it significantly.
For example, by design the Fund invests in some small- and mid-cap stocks, deeper value stocks, and certain riskier (high-beta) stocks that our models project are statistically likely to outperform their peers on an economic basis. All of those types of stocks underperformed the market during the past fiscal year. Or stated a different way, our specific approach to diversification in the Fund’s portfolio did not help during this period.
Normally, our company financial health models would have helped offset losses from deeper value’s underperformance. However, stocks in the company financial health category tend not to perform well when markets experience a correlation spike — periods in which stocks of all sizes and styles move in tandem, largely due to macro-trends and not company- or asset-specific factors. We had a high correlation spike in the September 2015 quarter, which meant we got little help from this diversifying category.
Another diversifying factor that has been successful in the long term is price momentum. However, the Fund’s exposure to high momentum stocks also hurt because these stocks declined in the fiscal year.
Finally, our models do not weight holdings by company size — giving more weight in the portfolio to the largest companies — as does our primary market benchmark, the S&P 500 Index. As a result, we had lower exposure to larger stocks. These stocks performed well relative to smaller cap stocks during the fiscal year and contributed to our Fund’s 11% underperformance of the S&P 500. By contrast, our fiscal year results were within one percentage point of our secondary market benchmark, the Russell 2000 Index of smaller companies.
In short, it was a perfect storm of diversifying factors not going our way. However, we gave the Fund the factor exposures we intended, based on analysis of long-term market data. We do not consider that anything is “broken,” and we are staying the course. In fact, performance of these factors tends to revert back to their expected long-term returns, which we believe would be beneficial to our Fund in the future.
| | |
| 4 | | Annual Report | June 30, 2016 |
| | |
LETTER FROM THE INVESTMENT MANAGEMENT TEAM (continued) | | |
That said, we continue to conduct research on all of our Funds and models, looking for small, incremental improvements. We will be studying Aggressive Investors 1 in the coming fiscal year, specifically examining model performance in high correlation markets to see if we can further reduce their negative impact.
In summary, it was a poor year for Aggressive Investors 1. We know the reasons why, and we are studying ways to improve the models, but we are not changing our investment process. And as a fellow shareholder, I want to express my personal confidence in the Fund’s research and portfolio management teams. I continue to use Bridgeway-managed portfolios for 100% of my stock market investing needs and Aggressive Investors 1 plays a significant role in that allocation.
Transformative Change: Where I Live
by Tami Groce, Partner, Marketing and Client Service
When we think about transformative change, it is often with an eye toward addressing the needs that seem most significant or universal. Helping the poor and disenfranchised is certainly vital to making the world a better place, and it is a worthwhile endeavor for us all. I find, however, that we often overlook the needs where we live — and by “where we live” I mean both our physical locality and our experiences.
While I am involved in numerous charitable activities, most recently my experience has been informed by two issues that have led me to administer healing to those who often suffer in silence and to those who seek guidance in unchartered waters. The first group consists of couples on the infertility journey, which can be a painful path to parenthood with little spiritual or emotional support. I know the sorrow of infertility firsthand. Though my journey ended with the blessing of two beautiful little boys, I am connected to those still on their own journeys, because that is where I lived for quite a while. As a result, I founded The Waiting Room Infertility Ministry at Wheeler Avenue Baptist Church in Houston. We meet monthly and provide spiritual, educational and financial direction for those who for too long have felt forsaken by others who do not share their experience.
As an ordained, seminary-trained minister, the second group that I have dedicated myself to is seminary students. I lead small groups aimed at equipping seminarians with the tools necessary to their vocation. Additionally, I mentor seminarians at the Fuller Theological Seminary through a structured program that allows for a six-month relationship. Whether they are my mentee or a small group member, each individual will directly intersect with the lives of hundreds (if not thousands) of church members over the course of their ministry. It is important that they understand the lifestyle that comes with that role, and are prepared to handle the responsibilities. For example, burnout is common among ministers, so I urge them to find their own Sabbath day to take time for themselves and recharge, as Sundays are typically busy work days. We also discuss the feelings of isolation and loneliness that many ministers feel as leaders of a church, and I urge them to develop a community of peers with whom they can share their concerns and feel heard.
Beyond that, their personal spiritual care must be a priority. There is a reason that flight attendants ask you to put your oxygen mask on first before assisting others. As ministers, they have to have discernment around their particular calling. I remind them to examine and reconcile the potential hurt and brokenness in their own backgrounds, as well as their limitations, so they are better prepared to help others deal with their issues. I believe I am uniquely equipped to help others understand this process and to move from passion to purpose, because that is also where I live.
| | |
Aggressive Investors 1 Fund MANAGER’S COMMENTARY (Unaudited) | | |
June 30, 2016
Dear Fellow Aggressive Investors 1 Fund Shareholder,
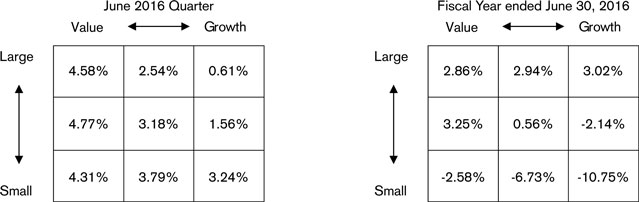
For the quarter ended June 30, 2016, our Fund returned 2.68%, outperforming our primary market benchmark, the S&P 500 Index (2.46%), and our peer benchmark, the Lipper Capital Appreciation Funds Index (0.40%), but underperforming the Russell 2000 Index (3.79%). It was a good quarter.
For the fiscal year, our Fund returned -7.40%, underperforming our primary market benchmark, the S&P 500 Index (3.99%), our peer benchmark, the Lipper Capital Appreciation Funds Index (-5.23%), and the Russell 2000 Index (-6.73%).
The table below presents our June quarter, one-year, five-year, 10-year, 15-year, and inception-to-date financial results. See the next page for a graph of performance since inception.
Standardized Returns as of June 30, 2016
| | | | | | | | | | | | |
| | | | | | | Annualized | | |
| | | | | | |
| | | Quarter | | 1 Year | | 5 Years | | 10 Years | | 15 Years | | Since Inception (8/5/94) |
| | | | | | |
Aggressive Investors 1 Fund | | 2.68% | | -7.40% | | 8.82% | | 2.59% | | 5.15% | | 12.52% |
S&P 500 Index | | 2.46% | | 3.99% | | 12.10% | | 7.42% | | 5.75% | | 9.28% |
Russell 2000 Index | | 3.79% | | -6.73% | | 8.35% | | 6.20% | | 6.96% | | 8.80% |
Lipper Capital Appreciation Funds Index | | 0.40% | | -5.23% | | 8.83% | | 6.66% | | 5.22% | | 7.99% |
Performance figures quoted in the table above represent past performance and are no guarantee of future results. Total return figures in the table above include the reinvestment of dividends and capital gains. The table above does not reflect the deduction of taxes that a shareholder would pay on Fund distributions or on the redemption of Fund shares.
The S&P 500 Index is a broad-based, unmanaged measurement of changes in stock market conditions, based on the average of 500 widely held common stocks with dividends reinvested. The Russell 2000 Index is an unmanaged, market value weighted index that measures performance of the 2,000 companies that are between the 1,000th and 3,000th largest in the market with dividends reinvested. The Lipper Capital Appreciation Funds Index reflects the record of the 30 largest funds in the category of more aggressive domestic growth mutual funds, as reported by Lipper, an independent fund research firm owned by Broadridge Financial Solutions, Inc. It is not possible to invest directly in an index. Periods longer than one year are annualized.
According to data from Lipper as of June 30, 2016, Aggressive Investors 1 Fund ranked 177th of 254 capital appreciation funds for the 12 months ended June 30, 2016, 122nd of 224 over the last five years, 147th of 157 over the last 10 years, and 3rd of 43 since inception in August 1994. Lipper is an independent mutual fund rating service owned by Broadridge Financial Solutions, Inc. that ranks funds in various fund categories by making comparative calculations using total returns.
| | |
| 6 | | Annual Report | June 30, 2016 |
| | |
Aggressive Investors 1 Fund MANAGER’S COMMENTARY (Unaudited) (continued) | | |
Aggressive Investors 1 Fund vs. S&P 500 Index, Russell 2000 Index & Lipper Capital Appreciation Funds Index
from Inception 8/5/94 to 6/30/16
Detailed Explanation of Quarterly Performance
The Fund’s investment in mid-cap and small-cap stocks boosted relative returns during a quarter in which those shares outpaced large-company stocks. In addition, all our model categories made positive contributions to the Fund’s relative performance.
An underweight position in the lagging Information Technology sector boosted relative performance, as did select holdings within that sector. Holdings in the Materials sector also helped relative results. By contrast, an overweight position and holdings in the lagging Industrials sector detracted from relative performance.
Detailed Explanation of Fiscal Year Performance
The Fund’s bias toward smaller stocks detracted from relative results during the 12-month period, as small company shares significantly underperformed larger stocks in the first half of the fiscal year. Although small-cap stocks rebounded in the second half of the year, it was not enough to overcome previous losses. In addition, all three model categories contributed to the Fund’s fiscal-year underperformance. Our value metrics category was the largest detractor, as these models targeted deeper-value stocks that lagged the Index during the period. The price momentum category also detracted from results, as the stocks selected by this model underperformed. Our company financial health category of stocks underperformed in the market context of a high correlation spike (stocks moving in tandem irrespective of their underlying economic health) in the September quarter. Diversification across these three categories did not help in the market environment of the fiscal year.
Sector allocation did not have a significant impact on performance. Instead, individual stock holdings detracted from results.
| | |
Aggressive Investors 1 Fund MANAGER’S COMMENTARY (Unaudited) (continued) | | |
Top Ten Holdings as of June 30, 2016
| | | | | | | | | |
| Rank Description | | Industry | | |
| % of Net
Assets |
|
| 1 | | AMN Healthcare Services, Inc. | | Health Care Providers & Service | | | | 2.3% | |
| 2 | | Global Payments, Inc. | | Financials | | | | 2.2% | |
| 3 | | John Bean Technologies Corp. | | Machinery | | | | 2.0% | |
| 4 | | Edwards Lifesciences Corp. | | Health Care Equipment & Supplies | | | | 2.0% | |
| 5 | | Windstream Holdings, Inc. | | Diversified Telecommunications Services | | | | 1.8% | |
| 6 | | Aflac, Inc. | | Insurance | | | | 1.5% | |
| 7 | | Equinix, Inc. | | Real Estate Investment Trusts | | | | 1.4% | |
| 8 | | Acuity Brands, Inc. | | Electrical Equipment & Services | | | | 1.4% | |
| 9 | | Ulta Salon Cosmetics & Fragrance, Inc. | | Specialty Retail | | | | 1.4% | |
| 10 | | Antero Resources Corp. | | Oil, Gas & Consumable Fuels | | | | 1.4% | |
| | | |
| | Total | | | | | | 17.4% | |
Industry Sector Representation as of June 30, 2016
| | | | | | | | | | |
| | | % of Net Assets | | | | % of S&P 500
Index | | | | Difference |
Consumer Discretionary | | 15.1% | | | | 12.3% | | | | 2.8% |
Consumer Staples | | 10.5% | | | | 10.6% | | | | -0.1% |
Energy | | 7.7% | | | | 7.4% | | | | 0.3% |
Financials | | 14.7% | | | | 15.7% | | | | -1.0% |
Health Care | | 9.9% | | | | 14.7% | | | | -4.8% |
Industrials | | 17.2% | | | | 10.2% | | | | 7.0% |
Information Technology | | 14.0% | | | | 19.8% | | | | -5.8% |
Materials | | 6.7% | | | | 2.8% | | | | 3.9% |
Telecommunication Services | | 1.8% | | | | 2.9% | | | | -1.1% |
Utilities | | 1.1% | | | | 3.6% | | | | -2.5% |
Cash & Other Assets | | 1.3% | | | | 0.0% | | | | 1.3% |
| | | | | |
Total | | 100.0% | | | | 100.0% | | | | |
Disclaimer
The views expressed here are exclusively those of Fund management. These views, including those related to market sectors or individual stocks, are not meant as investment advice and should not be considered predictive in nature. Any favorable (or unfavorable) description of a holding applies only as of the quarter end, June 30, 2016, unless otherwise stated. Security positions can and do change thereafter. Discussions of historical performance do not guarantee and may not be indicative of future performance.
Market volatility can significantly affect short-term performance. The Fund is not an appropriate investment for short-term investors. Investments in the small companies within this multi-cap fund generally carry greater risk than is customarily associated with larger companies. This additional risk is attributable to a number of factors, including the relatively limited financial resources that are typically available to small companies and the fact that small companies often have comparatively limited product lines. In addition, the stock of small companies tends to be more volatile than the stock of large companies, particularly in the short term and particularly in the early stages of an economic or market downturn. The Fund’s use of options, futures, and leverage can magnify the risk of loss in an unfavorable market, and the Fund’s use of short-sale positions can, in theory, expose shareholders to unlimited loss. Finally, the Fund exposes shareholders to “focus risk,” which may add to Fund volatility through the possibility that a single company could significantly affect total return. Shareholders of the Fund, therefore, are taking on more risk than they would if they invested in the stock market as a whole.
| | |
| 8 | | Annual Report | June 30, 2016 |
| | |
Aggressive Investors 1 Fund MANAGER’S COMMENTARY (Unaudited) (continued) | | |
Conclusion
Thank you for your continued investment in Aggressive Investors 1 Fund. We encourage your feedback; your reactions and concerns are important to us.
Sincerely,
The Investment Management Team
| | |
Aggressive Investors 1 Fund SCHEDULE OF INVESTMENTS | | |
Showing percentage of net assets as of June 30, 2016
| | | | | | | | | | | | |
| Industry Company | | Shares | | | Value | | | | |
| |
COMMON STOCKS - 98.72% | | | | | |
Aerospace & Defense - 0.83% | | | | | |
Spirit Aerosystems Holdings, Inc., Class A* | | | 40,000 | | | | $ 1,720,000 | | | | | |
| |
Airlines - 5.07% | | | | | |
Alaska Air Group, Inc. | | | 40,200 | | | | 2,343,258 | | | | | |
Delta Air Lines, Inc. | | | 46,500 | | | | 1,693,995 | | | | | |
JetBlue Airways Corp.* | | | 95,300 | | | | 1,578,168 | | | | | |
Southwest Airlines Co. | | | 69,800 | | | | 2,736,858 | | | | | |
United Continental Holdings, Inc.* | | | 52,500 | | | | 2,154,600 | | | | | |
| | | | | | | | | | | | |
| | | |
| | | | | | | 10,506,879 | | | | | |
| |
Auto Components - 3.78% | | | | | |
Cooper-Standard Holding, Inc.* | | | 28,300 | | | | 2,235,417 | | | | | |
Drew Industries, Inc. | | | 17,000 | | | | 1,442,280 | | | | | |
Goodyear Tire & Rubber Co. (The) | | | 66,400 | | | | 1,703,824 | | | | | |
Lear Corp. | | | 24,200 | | | | 2,462,592 | | | | | |
| | | | | | | | | | | | |
| | | |
| | | | | | | 7,844,113 | | | | | |
| |
Automobiles - 0.98% | | | | | |
General Motors Co. | | | 71,500 | | | | 2,023,450 | | | | | |
| | | |
Beverages - 1.04% | | | | | | | | | | | | |
Constellation Brands, Inc., Class A | | | 13,000 | | | | 2,150,200 | | | | | |
| |
Biotechnology - 1.05% | | | | | |
Gilead Sciences, Inc. | | | 26,000 | | | | 2,168,920 | | | | | |
| |
Building Products - 2.03% | | | | | |
American Woodmark Corp.* | | | 15,000 | | | | 995,700 | | | | | |
Gibraltar Industries, Inc.* | | | 39,000 | | | | 1,231,230 | | | | | |
U.S. Concrete, Inc.*+ | | | 32,500 | | | | 1,979,575 | | | | | |
| | | | | | | | | | | | |
| | | |
| | | | | | | 4,206,505 | | | | | |
| |
Chemicals - 0.85% | | | | | |
Kraton Performance Polymers, Inc.* | | | 63,000 | | | | 1,759,590 | | | | | |
| |
Commercial Banks - 3.24% | | | | | |
Bank of Nova Scotia (The)+ | | | 43,000 | | | | 2,107,430 | | | | | |
Canadian Imperial Bank of Commerce/Canada+ | | | 27,000 | | | | 2,026,890 | | | | | |
Royal Bank of Canada+ | | | 43,700 | | | | 2,582,233 | | | | | |
| | | | | | | | | | | | |
| | | |
| | | | | | | 6,716,553 | | | | | |
| |
Commercial Services & Supplies - 1.15% | | | | | |
Equifax, Inc. | | | 18,600 | | | | 2,388,240 | | | | | |
| |
Computers & Peripherals - 1.19% | | | | | |
HP, Inc. | | | 196,100 | | | | 2,461,055 | | | | | |
| | | | | | | | | | | | |
| Industry Company | | Shares | | | Value | | | | |
| | | | | |
Construction & Engineering - 1.21% | | | | | |
Comfort Systems USA, Inc. | | | 77,000 | | | | $2,507,890 | | | | | |
|
Consumer Finance - 2.42% | |
Alliance Data Systems Corp.* | | | 10,900 | | | | 2,135,528 | | | | | |
Santander Consumer USA Holdings, Inc.* | | | 101,900 | | | | 1,052,627 | | | | | |
Synchrony Financial* | | | 72,500 | | | | 1,832,800 | | | | | |
| | | | | | | | | | | | |
| | | |
| | | | | | | 5,020,955 | | | | | |
|
Containers & Packaging - 2.35% | |
Berry Plastics Group, Inc.* | | | 54,000 | | | | 2,097,900 | | | | | |
Crown Holdings, Inc.* | | | 54,800 | | | | 2,776,716 | | | | | |
| | | | | | | | | | | | |
| | | |
| | | | | | | 4,874,616 | | | | | |
|
Diversified Financial Services - 2.35% | |
Berkshire Hathaway, Inc., Class B* | | | 8,700 | | | | 1,259,673 | | | | | |
Citigroup, Inc. | | | 42,000 | | | | 1,780,380 | | | | | |
Voya Financial, Inc. | | | 73,900 | | | | 1,829,764 | | | | | |
| | | | | | | | | | | | |
| | | |
| | | | | | | 4,869,817 | | | | | |
|
Diversified Telecommunication Services - 1.75% | |
Windstream Holdings, Inc.+ | | | 392,100 | | | | 3,634,767 | | | | | |
| |
Electronic Equipment, Instruments &
Components - 4.67% | | | | | |
Acuity Brands, Inc. | | | 12,000 | | | | 2,975,520 | | | | | |
Fabrinet* | | | 29,000 | | | | 1,076,480 | | | | | |
Flextronics International, Ltd.* | | | 207,700 | | | | 2,450,860 | | | | | |
Mettler-Toledo International, Inc.* | | | 5,500 | | | | 2,007,060 | | | | | |
TTM Technologies, Inc.* | | | 155,000 | | | | 1,167,150 | | | | | |
| | | | | | | | | | | | |
| | | |
| | | | | | | 9,677,070 | | | | | |
| |
Energy Equipment & Services - 1.37% | | | | | |
Teekay Corp.+ | | | 110,000 | | | | 784,300 | | | | | |
Tidewater, Inc.+ | | | 115,000 | | | | 507,150 | | | | | |
Unit Corp.* | | | 100,000 | | | | 1,556,000 | | | | | |
| | | | | | | | | | | | |
| | | |
| | | | | | | 2,847,450 | | | | | |
|
Financials - 2.18% | |
Global Payments, Inc. | | | 63,345 | | | | 4,521,566 | | | | | |
|
Food & Staples Retailing - 1.04% | |
Kroger Co. (The) | | | 58,600 | | | | 2,155,894 | | | | | |
| |
Food Products - 7.19% | | | | | |
Campbell Soup Co. | | | 32,500 | | | | 2,162,225 | | | | | |
Dean Foods Co.+ | | | 94,000 | | | | 1,700,460 | | | | | |
Hormel Foods Corp. | | | 55,400 | | | | 2,027,640 | | | | | |
Ingredion, Inc. | | | 20,000 | | | | 2,588,200 | | | | | |
| | |
| 10 | | Annual Report | June 30, 2016 |
| | |
Aggressive Investors 1 Fund SCHEDULE OF INVESTMENTS (continued) | | |
Showing percentage of net assets as of June 30, 2016
| | | | | | | | | | |
| Industry Company | | Shares | | | Value | | | |
| |
Common Stocks (continued) | | | |
Food Products (continued) | | | |
Kellogg Co. | | | 28,000 | | | | $ 2,286,200 | | | |
Pilgrim’s Pride Corp.+ | | | 83,700 | | | | 2,132,676 | | | |
Tyson Foods, Inc., Class A | | | 30,000 | | | | 2,003,700 | | | |
| | | | | | | | | | |
| | | |
| | | | | | | 14,901,101 | | | |
| |
Health Care Equipment & Supplies - 3.00% | | | |
Edwards Lifesciences Corp.* | | | 41,000 | | | | 4,088,930 | | | |
Henry Schein, Inc.* | | | 12,000 | | | | 2,121,600 | | | |
| | | | | | | | | | |
| | | |
| | | | | | | 6,210,530 | | | |
| |
Health Care Providers & Services - 4.91% | | | |
AmerisourceBergen Corp. | | | 28,000 | | | | 2,220,960 | | | |
AMN Healthcare Services, Inc.* | | | 121,500 | | | | 4,856,355 | | | |
Cardinal Health, Inc. | | | 26,600 | | | | 2,075,066 | | | |
Triple-S Management Corp., Class B* | | | 42,000 | | | | 1,026,060 | | | |
| | | | | | | | | | |
| | | |
| | | | | | | 10,178,441 | | | |
| |
Hotels, Restaurants & Leisure - 1.54% | | | |
Boyd Gaming Corp.* | | | 120,000 | | | | 2,208,000 | | | |
Scientific Games Corp., Class A* | | | 106,000 | | | | 974,140 | | | |
| | | | | | | | | | |
| | | |
| | | | | | | 3,182,140 | | | |
| |
Household Products - 1.19% | | | |
Kimberly-Clark Corp. | | | 18,000 | | | | 2,474,640 | | | |
| |
Insurance - 3.04% | | | |
Aflac, Inc. | | | 43,000 | | | | 3,102,880 | | | |
Employers Holdings, Inc. | | | 36,400 | | | | 1,056,328 | | | |
Prudential Financial, Inc. | | | 30,000 | | | | 2,140,200 | | | |
| | | | | | | | | | |
| | | |
| | | | | | | 6,299,408 | | | |
| |
Internet & Catalog Retail - 1.17% | | | |
Amazon.com, Inc.* | | | 3,400 | | | | 2,433,108 | | | |
| |
Internet Software & Services - 1.73% | | | |
EarthLink Holdings Corp. | | | 232,600 | | | | 1,488,640 | | | |
VeriSign, Inc.*+ | | | 24,300 | | | | 2,100,978 | | | |
| | | | | | | | | | |
| | | |
| | | | | | | 3,589,618 | | | |
| |
IT Services - 1.07% | | | |
CSG Systems International, Inc. | | | 55,000 | | | | 2,217,050 | | | |
| |
Leisure Equipment & Products - 0.85% | | | |
Polaris Industries, Inc.+ | | | 21,500 | | | | 1,757,840 | | | |
| |
Machinery - 3.61% | | | |
John Bean Technologies Corp. | | | 68,600 | | | | 4,199,692 | | | |
| | | | | | | | | | |
| Industry Company | | Shares | | | Value | | | |
| | | |
Machinery (continued) |
Wabash National Corp.* | | | 96,000 | | | | $ 1,219,200 | | | |
Xylem, Inc. | | | 46,000 | | | | 2,053,900 | | | |
| | | | | | | | | | |
| | | |
| | | | | | | 7,472,792 | | | |
|
Materials - 1.21% |
Trinseo SA | | | 58,400 | | | | 2,507,112 | | | |
|
Media - 0.95% |
Scripps Networks Interactive, Inc., Class A | | | 31,600 | | | | 1,967,732 | | | |
|
Metals & Mining - 0.96% |
AK Steel Holding Corp.* | | | 426,100 | | | | 1,985,626 | | | |
| |
Oil, Gas & Consumable Fuels - 6.38% | | | |
Antero Resources Corp.* | | | 111,400 | | | | 2,894,172 | | | |
Baytex Energy Corp.+ | | | 302,800 | | | | 1,753,212 | | | |
Encana Corp. | | | 195,000 | | | | 1,519,050 | | | |
McDermott International, Inc.*+ | | | 411,100 | | | | 2,030,834 | | | |
Tesoro Corp. | | | 35,900 | | | | 2,689,628 | | | |
Valero Energy Corp. | | | 45,600 | | | | 2,325,600 | | | |
| | | | | | | | | | |
| | | |
| | | | | | | 13,212,496 | | | |
| |
Paper & Forest Products - 0.41% | | | |
Resolute Forest Products, Inc.*+ | | | 161,199 | | | | 852,743 | | | |
| |
Real Estate Investment Trusts (REITs) - 3.56% | | | |
Digital Realty Trust, Inc.+ | | | 22,300 | | | | 2,430,477 | | | |
Equinix, Inc.+ | | | 7,700 | | | | 2,985,521 | | | |
Public Storage | | | 7,700 | | | | 1,968,043 | | | |
| | | | | | | | | | |
| | | |
| | | | | | | 7,384,041 | | | |
| |
Semiconductors & Semiconductor
Equipment - 3.58% | | | |
Lam Research Corp.+ | | | 30,000 | | | | 2,521,800 | | | |
Micron Technology, Inc.* | | | 197,900 | | | | 2,723,104 | | | |
NVIDIA Corp. | | | 46,100 | | | | 2,167,161 | | | |
| | | | | | | | | | |
| | | |
| | | | | | | 7,412,065 | | | |
| |
Software - 2.06% | | | |
Autodesk, Inc.* | | | 36,000 | | | | 1,949,040 | | | |
MSCI, Inc. | | | 30,000 | | | | 2,313,600 | | | |
| | | | | | | | | | |
| | | |
| | | | | | | 4,262,640 | | | |
| |
Specialty Retail - 4.73% | | | |
Children’s Place, Inc. (The) | | | 28,000 | | | | 2,245,040 | | | |
Home Depot, Inc. (The) | | | 16,400 | | | | 2,094,116 | | | |
Lithia Motors, Inc., Class A | | | 20,800 | | | | 1,478,256 | | | |
Rent-A-Center, Inc. | | | 83,000 | | | | 1,019,240 | | | |
| | |
Aggressive Investors 1 Fund SCHEDULE OF INVESTMENTS (continued) | | |
Showing percentage of net assets as of June 30, 2016
| | | | | | | | | | |
| Industry Company | | | | Shares | | Value | | | |
| |
Common Stocks (continued) | | | |
Specialty Retail (continued) | | | |
Ulta Salon Cosmetics & Fragrance, Inc.* | | 12,200 | | | $ 2,972,408 | | | |
| | | | | | | | | | |
| | | | |
| | | | | | | 9,809,060 | | | |
| |
Trading Companies & Distributors - 3.94% |
AerCap Holdings NV* | | 26,800 | | | 900,212 | | | |
Beacon Roofing Supply, Inc.* | | 50,000 | | | 2,273,500 | | | |
Pool Corp. | | 25,000 | | | 2,350,750 | | | |
United Rentals, Inc.* | | 38,700 | | | 2,596,770 | | | |
Veritiv Corp.* | | 992 | | | 37,279 | | | |
| | | | | | | | | | |
| | | | |
| | | | | | | 8,158,511 | | | |
| |
Water Utilities - 1.09% |
American Water Works Co., Inc. | | | | 26,700 | | | 2,256,417 | | | |
| | | | | | | | | | |
| | |
TOTAL COMMON STOCKS - 98.72% | | | 204,580,641 | | | |
| | | | | | | | | | |
(Cost $191,226,879) | | | | | | |
| |
EXCHANGE TRADED NOTE - 1.13% | | | |
Exchange Traded Note - 1.13% | | | |
VelocityShares Daily Inverse ETN*+ | | 93,200 | | | 2,329,068 | | | |
| | | | | | | | | | |
TOTAL EXCHANGE TRADED
NOTE - 1.13% | | | 2,329,068 | | | |
| | | | | | | | | | |
(Cost $2,206,021) | | | | | | |
| | | | |
| | | Rate^ | | Shares | | Value | | | |
MONEY MARKET FUND - 0.16% | | | |
Dreyfus Cash Management Fund | | 0.30% | | 338,006 | | | 338,006 | | | |
| | | | | | | | | | |
| | |
TOTAL MONEY MARKET
FUND - 0.16% | | | 338,006 | | | |
| | | | | | | | | | |
(Cost $338,006) | | | | | | | | | | |
| |
INVESTMENTS PURCHASED WITH CASH
PROCEEDS FROM SECURITIES
LENDING - 13.34% | | | |
Dreyfus Cash Management Fund** | | 0.30% | | 27,647,275 | | | 27,647,275 | | | |
| | | | | | | | | | |
| | |
TOTAL INVESTMENTS PURCHASED WITH CASH PROCEEDS FROM SECURITIES LENDING - 13.34% | | | 27,647,275 | | | |
| | | | | | | | | | |
(Cost $27,647,275) | | | | | | |
| | | | | | | | |
| | | Value | | | | |
| | |
TOTAL INVESTMENTS - 113.35% | | $ | 234,894,990 | | | | | |
(Cost $221,418,181) | | | | | | | | |
Liabilities in Excess of Other
Assets - (13.35%) | | | (27,665,913 | ) | | | | |
| | | | | | | | |
| | |
NET ASSETS - 100.00% | | $ | 207,229,077 | | | | | |
| | | | | | | | |
| * | Non-income producing security. |
| ** | This security represents the investment of the collateral received in connection with securities out on loan as of June 30, 2016. |
| ^ | Rate disclosed as of June 30, 2016. |
| + | This security or a portion of the security is out on loan as of June 30, 2016. Total loaned securities had a value of $27,172,480 as of June 30, 2016. |
ETN - Exchange Traded Note
Summary of inputs used to value the Fund’s investments as of 06/30/2016 (See Note 2 in Notes to Financial Statements):
| | | | | | | | | | | | | | | | |
| | | Valuation Inputs | |
| | | Investment in Securities (Value) | |
| | | Level 1
Quoted
Prices | | | Level 2
Significant
Observable
Inputs | | | Level 3
Significant Unobservable Inputs | | | Total | |
| | | | |
Common Stocks | | $ | 204,580,641 | | | $ | — | | | $ | — | | | $ | 204,580,641 | |
Exchange Traded Note | | | 2,329,068 | | | | — | | | | — | | | | 2,329,068 | |
Money Market Fund | | | — | | | | 338,006 | | | | — | | | | 338,006 | |
Investments Purchased with Cash Proceeds from Securities Lending | | | — | | | | 27,647,275 | | | | — | | | | 27,647,275 | |
| | | | | | | | | | | | | | | | |
| | | | |
TOTAL | | $ | 206,909,709 | | | $ | 27,985,281 | | | $ | — | | | $ | 234,894,990 | |
| | | | | | | | | | | | | | | | |
See Notes to Financial Statements.
| | |
| 12 | | Annual Report | June 30, 2016 |
| | |
Ultra-Small Company Fund MANAGER’S COMMENTARY (Unaudited) | | |
June 30, 2016
Dear Fellow Ultra-Small Company Fund Shareholder,
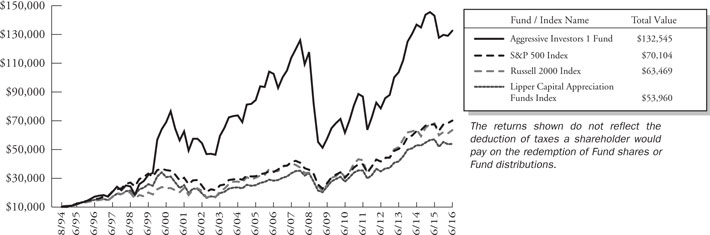
For the quarter ended June 30, 2016, our Fund returned 0.35%, underperforming our primary market benchmark, the CRSP Cap-Based Portfolio 10 Index (5.45%), and our peer benchmark, the Lipper Micro-Cap Stock Funds Index (3.05%). Our Fund also underperformed the Russell 2000 Index (3.79%) and the Russell Microcap Index (3.97%). It was a poor quarter.
For the fiscal year, our Fund returned -13.53%, slightly underperforming the CRSP Cap-Based Portfolio 10 Index (-13.49%). However, our Fund trailed the Russell Microcap Index (-12.06%), the Lipper Micro-Cap Stock Funds Index (-8.93%) and the Russell 2000 Index (-6.73%).
The table below presents our June quarter, one-year, five-year, 10-year, 15-year and inception-to-date financial results. See the next page for a graph of performance since inception.
Standardized Returns as of June 30, 2016
| | | | | | | | | | | | | | | | |
| | | | | | | | Annualized |
| | | Quarter | | | 1 Year | | | | 5 Years | | 10 Years | | 15 Years | | Since Inception (8/5/94) |
| | | | | | | |
Ultra-Small Company Fund | | | 0.35% | | | -13.53% | | | | 5.96% | | 3.05% | | 10.14% | | 13.67% |
CRSP Cap-Based Portfolio 10 Index | | | 5.45% | | | -13.49% | | | | 7.17% | | 5.52% | | 10.74% | | 11.33% |
Russell 2000 Index | | | 3.79% | | | -6.73% | | | | 8.35% | | 6.20% | | 6.96% | | 8.80% |
Russell Microcap Index | | | 3.97% | | | -12.06% | | | | 8.20% | | 4.31% | | 6.46% | | N/A |
Lipper Micro-Cap Stock Funds Index | | | 3.05% | | | -8.93% | | | | 7.50% | | 5.03% | | 6.71% | | N/A |
Performance figures quoted in the table above represent past performance and are no guarantee of future results. Total return figures in the table above include the reinvestment of dividends and capital gains. The table above does not reflect the deduction of taxes that a shareholder would pay on Fund distributions or on the redemption of Fund shares.
The CRSP Cap-Based Portfolio 10 Index is an unmanaged index of 783 of the smallest publicly traded U.S. stocks (with dividends reinvested), as reported by the Center for Research on Security Prices. The Russell Microcap Index is an unmanaged, market value weighted index that measures performance of 1,000 of the smallest securities in the Russell 2000 Index. The Russell 2000 Index is an unmanaged, market value weighted index that measures performance of the 2,000 companies that are between the 1,000th and 3,000th largest in the market (with dividends reinvested). The Lipper Micro-Cap Stock Funds Index is an index of micro-cap funds compiled by Lipper, an independent fund research firm owned by Broadridge Financial Solutions, Inc. It is not possible to invest directly in an index. Periods longer than one year are annualized.
According to data from Lipper as of June 30, 2016, Ultra-Small Company Fund ranked 51st of 71 micro-cap funds for the 12 months ended June 30, 2016, 42nd of 55 over the last five years, 32nd of 39 over the last 10 years, and 1st of 8 since inception in August 1994. Lipper is an independent mutual fund rating service owned by Broadridge Financial Solutions, Inc. that ranks funds in various fund categories by making comparative calculations using total returns.
| | |
Ultra-Small Company Fund MANAGER’S COMMENTARY (Unaudited) (continued) | | |
Ultra-Small Company Fund vs. CRSP Cap-Based Portfolio 10 Index, Russell Microcap Index**, Russell 2000 Index & Lipper Micro-Cap Stock Funds Index* from Inception 8/5/94 to 6/30/16
| * | The Lipper Micro-Cap Stock Funds Index began on 12/31/1995, and the line graph for the Index begins at the same value as the Fund on that date. |
| ** | The Russell Microcap Index began on 6/30/2000, and the line graph for the Index begins at the same value as the Fund on that date. |
Detailed Explanation of Quarterly Performance
All model categories detracted from the Fund’s relative performance during the quarter. Our company financial health models weighed most heavily on relative returns, while our price momentum models detracted the least. Although the Fund held nearly 80% of its assets in CRSP’s 10th decile, which, on average, had positive returns, those holdings still underperformed the primary benchmark. In addition, the Fund’s holdings that were larger than CRSP 10 posted negative returns, on average, for the quarter and detracted from relative performance.
An underweight position and holdings in the Energy sector detracted from relative returns. Holdings in the Financials sector also hurt relative performance. However, an underweight allocation to the Health Care sector boosted relative performance because Health Care was one of the worst-performing sectors in CRSP 10.
The table below presents index performance numbers for stocks in the different deciles during various time periods.
| | | | | | | | | | | | | | | | | | | | |
| CRSP Decile1 | | Quarter | | | 1 Year | | | 5 Years | | | 10 Years | | | 90.5 Years | |
1 (ultra-large) | | | 2.37% | | | | 3.63% | | | | 12.09% | | | | 7.28% | | | | 9.26% | |
2 | | | 4.82% | | | | 1.56% | | | | 12.00% | | | | 8.27% | | | | 10.50% | |
3 | | | 3.60% | | | | -1.78% | | | | 10.11% | | | | 8.09% | | | | 10.97% | |
4 | | | 2.36% | | | | -7.53% | | | | 9.47% | | | | 8.18% | | | | 10.78% | |
5 | | | 2.22% | | | | -9.77% | | | | 7.92% | | | | 8.63% | | | | 11.38% | |
6 | | | 3.48% | | | | -8.86% | | | | 8.87% | | | | 7.41% | | | | 11.25% | |
7 | | | 5.86% | | | | -7.63% | | | | 9.11% | | | | 7.79% | | | | 11.41% | |
8 | | | 4.18% | | | | -11.46% | | | | 8.08% | | | | 7.46% | | | | 11.39% | |
9 | | | 6.02% | | | | -11.64% | | | | 7.40% | | | | 6.40% | | | | 11.31% | |
10 (ultra-small) | | | 5.45% | | | | -13.49% | | | | 7.17% | | | | 5.52% | | | | 13.13% | |
| 1 | Performance figures are as of the period ended June 30, 2016. The CRSP Cap-Based Portfolio Indexes are unmanaged indexes of publicly traded U.S. stocks with dividends reinvested, grouped by market capitalization, as reported by the Center for Research in Security Prices. Past performance is no guarantee of future results. |
| | |
| 14 | | Annual Report | June 30, 2016 |
| | |
Ultra-Small Company Fund MANAGER’S COMMENTARY (Unaudited) (continued) | | |
Detailed Explanation of Fiscal Year Performance
Our value metrics models lagged the benchmark for the fiscal year, detracting from relative results. However, our company financial health and price momentum models added to the Fund’s relative returns and helped offset some of those losses. A higher weighting in larger stocks also detracted from relative results when these stocks underperformed.
Holdings in the Energy, Industrials and Financials sectors weighed most heavily on relative performance. Meanwhile, holdings in the Information Technology sector added to relative performance. The Fund’s lower-than-benchmark exposure to the Health Care sector also helped.
Top Ten Holdings as of June 30, 2016
| | | | | | | | | |
| Rank | | Description | | Industry | | % of Net
Assets |
| 1 | | Olympic Steel, Inc. | | Metals & Mining | | | | 2.8% | |
| 2 | | Supreme Industries, Inc. | | Machinery | | | | 2.4% | |
| 3 | | Ryerson Holding Corp. | | Metals & Mining | | | | 2.2% | |
| 4 | | Oclaro, Inc. | | Communications Equipment | | | | 2.1% | |
| 5 | | Radisys Corp. | | Electronic Equip., Instruments & Components | | | | 2.0% | |
| 6 | | A-Mark Precious Metals, Inc. | | Metals & Mining | | | | 1.8% | |
| 7 | | LSB Industries, Inc. | | Chemicals | | | | 1.8% | |
| 8 | | NV5 Global, Inc. | | Commercial Banks | | | | 1.7% | |
| 9 | | Brightcove, Inc. | | Internet Software & Services | | | | 1.5% | |
| 10 | | Armada Hoffler Properties, Inc. | | Real Estate Investment Trusts | | | | 1.5% | |
| | Total | | | | | | 19.8% | |
Industry Sector Representation as of June 30, 2016
| | | | | | | | | | |
| | | % of Net Assets | | | | % of CRSP 10 Index | | | | Difference |
Consumer Discretionary | | 13.1% | | | | 10.8% | | | | 2.3% |
Consumer Staples | | 3.5% | | | | 2.4% | | | | 1.1% |
Energy | | 8.1% | | | | 11.6% | | | | -3.5% |
Financials | | 23.9% | | | | 22.1% | | | | 1.8% |
Health Care | | 10.0% | | | | 18.6% | | | | -8.6% |
Industrials | | 15.5% | | | | 11.2% | | | | 4.3% |
Information Technology | | 18.0% | | | | 17.0% | | | | 1.0% |
Materials | | 7.5% | | | | 4.6% | | | | 2.9% |
Telecommunication Services | | 0.0% | | | | 0.3% | | | | -0.3% |
Utilities | | 0.6% | | | | 1.4% | | | | -0.8% |
Cash & Other Assets | | -0.2% | | | | 0.0% | | | | -0.2% |
Total | | 100.0% | | | | 100.0% | | | | |
Disclaimer
The views expressed here are exclusively those of Fund management. These views, including those related to market sectors or individual stocks, are not meant as investment advice and should not be considered predictive in nature. Any favorable (or unfavorable) description of a holding applies only as of the quarter end, June 30, 2016, unless otherwise stated. Security positions can and do change thereafter. Discussions of historical performance do not guarantee and may not be indicative of future performance.
| | |
Ultra-Small Company Fund MANAGER’S COMMENTARY (Unaudited) (continued) | | |
The Fund is subject to very high, above market risk (volatility) and is not an appropriate investment for short-term investors. Investments in ultra-small companies generally carry greater risk than is customarily associated with larger companies and even “small companies” for various reasons, such as narrower markets (fewer investors), limited financial resources and greater trading difficulty.
Conclusion
Ultra-Small Company Fund remains closed to new investors. We encourage your feedback; your reactions and concerns are important to us.
Sincerely,
The Investment Management Team
| | |
| 16 | | Annual Report | June 30, 2016 |
| | |
Ultra-Small Company Fund SCHEDULE OF INVESTMENTS | | |
Showing percentage of net assets as of June 30, 2016
| | | | | | | | | | |
| Industry Company | | Shares | | | Value | | | |
| |
COMMON STOCKS - 100.23% | | | |
Aerospace & Defense - 1.02% | | | |
Ducommun, Inc.* | | | 52,300 | | | | $ 1,034,494 | | | |
| |
Air Freight & Logistics - 0.26% | | | |
Air T, Inc.* | | | 12,463 | | | | 267,954 | | | |
| |
Auto Components - 1.22% | | | |
China XD Plastics Co., Ltd.* | | | 69,700 | | | | 224,434 | | | |
Horizon Global Corp.* | | | 89,200 | | | | 1,012,420 | | | |
| | | | | | | | | | |
| | | |
| | | | | | | 1,236,854 | | | |
| |
Beverages - 0.70% | | | |
Primo Water Corp.* | | | 60,000 | | | | 708,600 | | | |
| |
Biotechnology - 3.15% | | | |
Adverum Biotechnologies, Inc.* | | | 132,200 | | | | 417,752 | | | |
CoLucid Pharmaceuticals, Inc.*+ | | | 50,000 | | | | 408,500 | | | |
MacroCure, Ltd.* | | | 200,000 | | | | 284,000 | | | |
MEI Pharma, Inc.* | | | 427,500 | | | | 581,400 | | | |
Nexvet Biopharma PLC* | | | 44,400 | | | | 206,460 | | | |
PharmAthene, Inc.*+ | | | 191,700 | | | | 467,748 | | | |
QLT, Inc.* | | | 172,500 | | | | 244,950 | | | |
Vericel Corp.* | | | 258,000 | | | | 580,500 | | | |
| | | | | | | | | | |
| | | |
| | | | | | | 3,191,310 | | | |
| |
Chemicals - 2.15% | | | |
Gulf Resources, Inc.* | | | 259,000 | | | | 398,860 | | | |
LSB Industries, Inc.*+ | | | 147,700 | | | | 1,784,216 | | | |
| | | | | | | | | | |
| | | |
| | | | | | | 2,183,076 | | | |
| |
Commercial Banks - 11.35% | | | |
American National Bankshares, Inc. | | | 19,000 | | | | 478,420 | | | |
Bankwell Financial Group, Inc.+ | | | 26,200 | | | | 577,972 | | | |
Bar Harbor Bankshares+ | | | 33,000 | | | | 1,158,300 | | | |
C&F Financial Corp.+ | | | 5,200 | | | | 232,752 | | | |
Civista Bancshares, Inc.+ | | | 15,100 | | | | 197,810 | | | |
Coastway Bancorp, Inc.*+ | | | 8,700 | | | | 108,315 | | | |
Codorus Valley Bancorp, Inc.+ | | | 30,500 | | | | 621,285 | | | |
Farmers National Banc Corp.+ | | | 22,400 | | | | 197,120 | | | |
First Business Financial Services, Inc. | | | 28,100 | | | | 659,507 | | | |
First United Corp.* | | | 12,000 | | | | 118,080 | | | |
FS Bancorp, Inc. | | | 5,000 | | | | 126,750 | | | |
Northrim BanCorp, Inc. | | | 16,600 | | | | 436,414 | | | |
NV5 Global, Inc.* | | | 59,600 | | | | 1,695,024 | | | |
Old Line Bancshares, Inc.+ | | | 71,213 | | | | 1,281,834 | | | |
| | | | | | | | | | |
| Industry Company | | Shares | | | Value | | | |
| | | |
| | | | | | | | | | |
Commercial Banks (continued) | | | |
Old Second Bancorp, Inc. | | | 88,400 | | | | $ 603,772 | | | |
Pacific Mercantile Bancorp*+ | | | 72,100 | | | | 511,910 | | | |
Shore Bancshares, Inc. | | | 82,600 | | | | 970,550 | | | |
Southern First Bancshares, Inc.*+ | | | 16,100 | | | | 388,010 | | | |
Westbury Bancorp, Inc.*+ | | | 5,500 | | | | 107,250 | | | |
Your Community Bankshares, Inc.+ | | | 28,100 | | | | 1,044,196 | | | |
| | | | | | | | | | |
| | | |
| | | | | | | 11,515,271 | | | |
| |
Commercial Services & Supplies - 2.36% | | | |
Ascent Capital Group, Inc., Class A* | | | 63,500 | | | | 977,265 | | | |
Cenveo, Inc.* | | | 413,400 | | | | 337,293 | | | |
Civeo Corp.* | | | 350,000 | | | | 630,000 | | | |
Performant Financial Corp.* | | | 191,200 | | | | 309,744 | | | |
Virco Manufacturing Corp.* | | | 32,200 | | | | 140,070 | | | |
| | | | | | | | | | |
| | | |
| | | | | | | 2,394,372 | | | |
| |
Communications Equipment - 2.74% | | | |
Ceragon Networks, Ltd.* | | | 283,900 | | | | 459,918 | | | |
Oclaro, Inc.*+ | | | 440,500 | | | | 2,149,640 | | | |
UTStarcom Holdings Corp.* | | | 90,200 | | | | 172,733 | | | |
| | | | | | | | | | |
| | | |
| | | | | | | 2,782,291 | | | |
| |
Computers & Peripherals - 0.32% | | | |
TransAct Technologies, Inc. | | | 40,200 | | | | 322,404 | | | |
|
Construction & Engineering - 0.10% |
IES Holdings, Inc.*+ | | | 8,200 | | | | 101,844 | | | |
| |
Consumer Finance - 1.02% | | | |
Consumer Portfolio Services, Inc.* | | | 174,300 | | | | 657,111 | | | |
Nicholas Financial, Inc.* | | | 36,800 | | | | 378,304 | | | |
| | | | | | | | | | |
| | | |
| | | | | | | 1,035,415 | | | |
| |
Diversified Consumer Services - 1.82% | | | |
Cambium Learning Group, Inc.* | | | 167,250 | | | | 754,297 | | | |
ITT Educational Services, Inc.*+ | | | 427,300 | | | | 820,416 | | | |
Lincoln Educational Services Corp.* | | | 180,000 | | | | 270,000 | | | |
| | | | | | | | | | |
| | | |
| | | | | | | 1,844,713 | | | |
| |
Diversified Financial Services - 1.14% | | | |
Impac Mortgage Holdings, Inc.*+ | | | 74,000 | | | | 1,160,320 | | | |
| | |
Ultra-Small Company Fund SCHEDULE OF INVESTMENTS (continued) | | |
Showing percentage of net assets as of June 30, 2016
| | | | | | | | | | |
| Industry Company | | Shares | | | Value | | | |
| |
Common Stocks (continued) | | | |
Diversified Telecommunication Services - 0.76% | | | |
HC2 Holdings, Inc.*+ | | | 178,700 | | | | $ 768,410 | | | |
| |
Electrical Equipment - 1.37% | | | |
LSI Industries, Inc. | | | 104,800 | | | | 1,160,136 | | | |
Ultralife Corp.* | | | 46,700 | | | | 233,967 | | | |
| | | | | | | | | | |
| | | |
| | | | | | | 1,394,103 | | | |
| |
Electronic Equipment, Instruments &
Components - 7.05% | | | |
American Superconductor Corp.*+ | | | 128,000 | | | | 1,080,320 | | | |
Electro Scientific Industries, Inc.* | | | 151,600 | | | | 885,344 | | | |
IEC Electronics Corp.* | | | 36,700 | | | | 152,305 | | | |
Kemet Corp.*+ | | | 210,000 | | | | 615,300 | | | |
Key Tronic Corp.*+ | | | 37,100 | | | | 279,363 | | | |
Maxwell Technologies, Inc.*+ | | | 264,500 | | | | 1,396,560 | | | |
NAPCO Security Technologies, Inc.*+ | | | 110,000 | | | | 699,600 | | | |
Radisys Corp.* | | | 456,800 | | | | 2,046,464 | | | |
| | | | | | | | | | |
| | | |
| | | | | | | 7,155,256 | | | |
| |
Energy Equipment & Services - 4.46% | | | |
Basic Energy Services, Inc.*+ | | | 190,300 | | | | 319,704 | | | |
Hercules Offshore, Inc.* | | | 77,900 | | | | 108,281 | | | |
North American Energy Partners, Inc. | | | 58,800 | | | | 165,816 | | | |
North Atlantic Drilling, Ltd.*+ | | | 75,900 | | | | 511,566 | | | |
Ocean Rig UDW, Inc.*+ | | | 451,400 | | | | 1,119,472 | | | |
Parker Drilling Co.* | | | 402,406 | | | | 921,510 | | | |
Willbros Group, Inc.* | | | 545,900 | | | | 1,381,127 | | | |
| | | | | | | | | | |
| | | |
| | | | | | | 4,527,476 | | | |
| |
Food Products - 0.25% | | | |
S&W Seed Co.*+ | | | 57,100 | | | | 248,956 | | | |
| |
Gas Utilities - 0.64% | | | |
Delta Natural Gas Co., Inc.+ | | | 23,900 | | | | 643,866 | | | |
| |
Health Care Equipment & Supplies - 3.28% | | | |
AxoGen, Inc.*+ | | | 180,000 | | | | 1,238,400 | | | |
Digirad Corp. | | | 40,600 | | | | 209,090 | | | |
Electromed, Inc.* | | | 80,000 | | | | 308,800 | | | |
FONAR Corp.* | | | 64,100 | | | | 1,305,076 | | | |
Symmetry Surgical, Inc.* | | | 20,000 | | | | 262,600 | | | |
| | | | | | | | | | |
| | | |
| | | | | | | 3,323,966 | | | |
| |
Health Care Providers & Services - 0.99% | | | |
Chembio Diagnostics, Inc.*+ | | | 107,500 | | | | 880,425 | | | |
InfuSystems Holdings, Inc.* | | | 48,700 | | | | 126,620 | | | |
| | | | | | | | | | |
| | | |
| | | | | | | 1,007,045 | | | |
| | | | | | | | | | |
| Industry Company | | Shares | | | Value | | | |
| | | |
| | | | | | | | | | |
Hotels, Restaurants & Leisure - 3.17% | | | |
Century Casinos, Inc.* | | | 106,400 | | | | $ 662,872 | | | |
Gaming Partners International Corp.* | | | 13,300 | | | | 123,690 | | | |
Golden Entertainment, Inc.+ | | | 35,300 | | | | 412,657 | | | |
Luby’s, Inc.*+ | | | 63,200 | | | | 317,264 | | | |
MCBC Holdings, Inc. | | | 46,100 | | | | 509,405 | | | |
Red Lion Hotels Corp.*+ | | | 82,300 | | | | 597,498 | | | |
Town Sports International Holdings, Inc.* | | | 217,800 | | | | 592,416 | | | |
| | | | | | | | | | |
| | | |
| | | | | | | 3,215,802 | | | |
| |
Household Durables - 0.40% | | | |
Skyline Corp.*+ | | | 20,100 | | | | 188,940 | | | |
UCP, Inc., Class A* | | | 27,200 | | | | 218,144 | | | |
| | | | | | | | | | |
| | | |
| | | | | | | 407,084 | | | |
| |
Insurance - 1.53% | | | |
Blue Capital Reinsurance Holdings, Ltd.+ | | | 23,300 | | | | 431,283 | | | |
eHealth, Inc.* | | | 43,000 | | | | 602,860 | | | |
Health Insurance Innovations, Inc., Class A*+ | | | 132,000 | | | | 518,760 | | | |
| | | | | | | | | | |
| | | |
| | | | | | | 1,552,903 | | | |
| | | |
Internet & Catalog Retail - 1.13% | | | | | | | | | | |
CafePress, Inc.* | | | 64,800 | | | | 200,880 | | | |
Gaiam, Inc., Class A* | | | 58,000 | | | | 448,920 | | | |
US Auto Parts Network, Inc.* | | | 124,800 | | | | 492,960 | | | |
| | | | | | | | | | |
| | | |
| | | | | | | 1,142,760 | | | |
| |
Internet Software & Services - 4.44% | | | |
Autobytel, Inc.* | | | 58,200 | | | | 807,234 | | | |
Brightcove, Inc.* | | | 175,100 | | | | 1,540,880 | | | |
Care.com, Inc.* | | | 91,300 | | | | 1,066,384 | | | |
Demand Media, Inc.* | | | 101,000 | | | | 522,170 | | | |
Marchex, Inc., Class B* | | | 103,200 | | | | 328,176 | | | |
Support.com, Inc.* | | | 285,800 | | | | 240,358 | | | |
| | | | | | | | | | |
| | | |
| | | | | | | 4,505,202 | | | |
| |
IT Services - 2.38% | | | |
BG Staffing, Inc. | | | 18,700 | | | | 353,804 | | | |
Edgewater Technology, Inc.* | | | 27,499 | | | | 237,591 | | | |
Information Services Group, Inc.*+ | | | 60,100 | | | | 225,375 | | | |
NCI, Inc., Class A | | | 87,000 | | | | 1,222,350 | | | |
PRGX Global, Inc.* | | | 71,300 | | | | 372,186 | | | |
| | | | | | | | | | |
| | | |
| | | | | | | 2,411,306 | | | |
| | |
| 18 | | Annual Report | June 30, 2016 |
| | |
Ultra-Small Company Fund SCHEDULE OF INVESTMENTS (continued) | | |
Showing percentage of net assets as of June 30, 2016
| | | | | | | | | | |
| Industry Company | | Shares | | | Value | | | |
| |
Common Stocks (continued) | | | |
Machinery - 3.85% | | | |
Ampco-Pittsburgh Corp. | | | 31,000 | | | | $ 350,610 | | | |
Commercial Vehicle Group, Inc.* | | | 92,900 | | | | 483,080 | | | |
Gencor Industries, Inc.* | | | 36,200 | | | | 561,824 | | | |
Key Technology, Inc.* | | | 11,200 | | | | 103,152 | | | |
Supreme Industries, Inc., Class A | | | 175,400 | | | | 2,402,980 | | | |
| | | | | | | | | | |
| | | |
| | | | | | | 3,901,646 | | | |
| |
Marine - 0.54% | | | |
DryShips, Inc.* | | | 241,600 | | | | 136,021 | | | |
Global Ship Lease, Inc., Class A | | | 321,600 | | | | 408,432 | | | |
| | | | | | | | | | |
| | | |
| | | | | | | 544,453 | | | |
| |
Media - 1.21% | | | |
Global Sources, Ltd.*+ | | | 18,900 | | | | 173,313 | | | |
Lee Enterprises, Inc.*+ | | | 360,200 | | | | 687,982 | | | |
Salem Media Group, Inc. | | | 50,700 | | | | 366,054 | | | |
| | | | | | | | | | |
| | | |
| | | | | | | 1,227,349 | | | |
| |
Metals & Mining - 6.79% | | | |
A-Mark Precious Metals, Inc. | | | 112,700 | | | | 1,823,486 | | | |
Olympic Steel, Inc. | | | 102,800 | | | | 2,807,468 | | | |
Ryerson Holding Corp.* | | | 129,000 | | | | 2,257,500 | | | |
| | | | | | | | | | |
| | | |
| | | | | | | 6,888,454 | | | |
| |
Multiline Retail - 0.41% | | | |
Bon-Ton Stores, Inc. (The) | | | 297,200 | | | | 419,052 | | | |
| |
Oil, Gas & Consumable Fuels - 3.51% | | | |
Adams Resources & Energy, Inc. | | | 4,900 | | | | 188,650 | | | |
Cloud Peak Energy, Inc.*+ | | | 389,900 | | | | 803,194 | | | |
Comstock Resources, Inc.* | | | 429,600 | | | | 360,993 | | | |
Geopark, Ltd.*+ | | | 43,900 | | | | 142,675 | | | |
PrimeEnergy Corp.*+ | | | 4,300 | | | | 259,075 | | | |
W&T Offshore, Inc.*+ | | | 418,700 | | | | 971,384 | | | |
Westmoreland Coal Co.* | | | 87,700 | | | | 834,904 | | | |
| | | | | | | | | | |
| | | |
| | | | | | | 3,560,875 | | | |
| |
Personal Products - 2.53% | | | |
Lifevantage Corp.*+ | | | 80,200 | | | | 1,090,720 | | | |
Mannatech, Inc.*+ | | | 9,500 | | | | 192,280 | | | |
Natural Alternatives International, Inc.* | | | 74,500 | | | | 822,480 | | | |
Nutraceutical International Corp.* | | | 20,000 | | | | 463,000 | | | |
| | | | | | | | | | |
| | | |
| | | | | | | 2,568,480 | | | |
| | | | | | | | | | |
| Industry Company | | Shares | | | Value | | | |
| | | |
| | | | | | | | | | |
Pharmaceuticals - 2.58% | | | |
Aralez Pharmaceuticals, Inc.* | | | 17,486 | | | | $ 57,704 | | | |
Dipexium Pharmaceuticals, Inc.*+ | | | 24,600 | | | | 243,786 | | | |
Juniper Pharmaceuticals, Inc.* | | | 100,900 | | | | 707,309 | | | |
Kindred Biosciences, Inc.* | | | 80,300 | | | | 284,262 | | | |
Tetraphase Pharmaceuticals, Inc.* | | | 126,100 | | | | 542,230 | | | |
Zafgen, Inc.*+ | | | 131,300 | | | | 786,487 | | | |
| | | | | | | | | | |
| | | |
| | | | | | | 2,621,778 | | | |
| |
Real Estate Investment Trusts (REITs) - 1.69% | | | |
Armada Hoffler Properties, Inc. | | | 111,900 | | | | 1,537,506 | | | |
BRT Realty Trust* | | | 24,200 | | | | 173,030 | | | |
| | | | | | | | | | |
| | | |
| | | | | | | 1,710,536 | | | |
| |
Real Estate Management & Development - 0.64% | | | |
Nam Tai Property, Inc.+ | | | 121,100 | | | | 650,307 | | | |
| | | |
Road & Rail - 1.33% | | | | | | | | | | |
USA Truck, Inc.* | | | 77,000 | | | | 1,348,270 | | | |
| |
Semiconductors & Semiconductor Equipment - 0.07% | | | |
Intermolecular, Inc.* | | | 44,900 | | | | 66,452 | | | |
| |
Software - 2.25% | | | |
BSQUARE Corp.*+ | | | 155,700 | | | | 868,806 | | | |
Covisint Corp.* | | | 115,500 | | | | 251,790 | | | |
GlobalSCAPE, Inc. | | | 41,400 | | | | 152,766 | | | |
Planet Payment, Inc.*+ | | | 225,000 | | | | 1,010,250 | | | |
| | | | | | | | | | |
| | | |
| | | | | | | 2,283,612 | | | |
| |
Specialty Retail - 1.46% | | | |
Kingold Jewelry, Inc.* | | | 201,900 | | | | 363,420 | | | |
New York & Co., Inc.* | | | 137,000 | | | | 204,130 | | | |
Sears Hometown & Outlet Stores, Inc.*+ | | | 135,500 | | | | 913,270 | | | |
| | | | | | | | | | |
| | | |
| | | | | | | 1,480,820 | | | |
| |
Textiles, Apparel & Luxury Goods - 1.53% | | | |
Crown Crafts, Inc.+ | | | 26,100 | | | | 246,906 | | | |
Delta Apparel, Inc.* | | | 53,400 | | | | 1,204,170 | | | |
Lakeland Industries, Inc.*+ | | | 12,162 | | | | 105,445 | | | |
| | | | | | | | | | |
| | | |
| | | | | | | 1,556,521 | | | |
| |
Thrifts & Mortgage Finance - 6.40% | | | |
BSB Bancorp, Inc.*+ | | | 14,500 | | | | 328,425 | | | |
Charter Financial Corp. | | | 101,000 | | | | 1,341,280 | | | |
| | |
Ultra-Small Company Fund SCHEDULE OF INVESTMENTS (continued) | | |
Showing percentage of net assets as of June 30, 2016
| | | | | | | | | | | | | | |
| Industry Company | | | | Shares | | Value | | | | | | |
| | |
Common Stocks (continued) | | | | | | | |
Thrifts & Mortgage Finance (continued) | | | | | | | |
Entegra Financial Corp.* | | 12,100 | | | $ 211,629 | | | | | | | |
ESSA Bancorp, Inc. | | 38,100 | | | 510,540 | | | | | | | |
First Financial Northwest, Inc. | | 47,400 | | | 629,472 | | | | | | | |
Fox Chase Bancorp, Inc. | | 7,000 | | | 142,380 | | | | | | | |
Hingham Institution for Savings | | 4,631 | | | 569,242 | | | | | | | |
MMA Capital Management, LLC* | | 20,700 | | | 373,014 | | | | | | | |
Ocean Shore Holding Co.+ | | 19,600 | | | 332,416 | | | | | | | |
Provident Financial Holdings, Inc. | | 47,000 | | | 860,100 | | | | | | | |
Security National Financial Corp., Class A* | | 41,055 | | | 200,759 | | | | | | | |
SI Financial Group, Inc. | | 59,500 | | | 787,780 | | | | | | | |
Westfield Financial, Inc. | | 27,000 | | | 207,900 | | | | | | | |
| | | | | | | | | | | | | | |
| | | | | | | 6,494,937 | | | | | | | |
| | |
Trading Companies & Distributors - 2.24% | | | | | | | |
General Finance Corp.*+ | | 68,300 | | | 290,275 | | | | | | | |
Huttig Building Products, Inc.* | | 28,600 | | | 150,150 | | | | | | | |
MFC Industrial, Ltd.*+ | | 155,900 | | | 341,421 | | | | | | | |
Titan Machinery, Inc.* | | 86,800 | | | 967,820 | | | | | | | |
Willis Lease Finance Corp.* | | 23,700 | | | 526,851 | | | | | | | |
| | | | | | | | | | | | | | |
| | | | | | | 2,276,517 | | | | | | | |
| | | | | | | | | | | | | | |
TOTAL COMMON STOCKS - 100.23% | | | 101,683,112 | | | | | | | |
| | | | | | | | | | | | | | |
(Cost $98,039,124) | | | | | | | | | | |
| | | | | |
| | | Rate^ | | Shares | | Value | | | | | | |
| | |
MONEY MARKET FUND - 0.00% | | | | | | | |
Dreyfus Cash Management Fund | | 0.30% | | 99 | | | 99 | | | | | | | |
| | | | | | | | | | | | | | |
| | | |
TOTAL MONEY MARKET FUND - 0.00% | | | 99 | | | | | | | |
| | | | | | | | | | | | | | |
(Cost $99) | | | | | | | | | | | | | | |
| | |
| INVESTMENTS PURCHASED WITH CASH PROCEEDS FROM SECURITIES LENDING - 20.95% | | | | | | | |
Dreyfus Cash Management Fund** | | 0.30% | | 21,256,738 | | | 21,256,738 | | | | | | | |
| | | | | | | | | | | | | | |
| | | |
TOTAL INVESTMENTS PURCHASED WITH CASH PROCEEDS FROM SECURITIES LENDING - 20.95% | | | 21,256,738 | | | | | | | |
| | | | | | | | | | | | | | |
(Cost $21,256,738) | | | | | | | | | | |
| | | | | | | | |
| | | | | | Value | |
| | |
TOTAL INVESTMENTS - 121.18% | | | | | | | $122,939,949 | |
(Cost $119,295,961) | | | | | | | | |
Liabilities in Excess of Other Assets - (21.18%) | | | | | | | (21,489,236 | ) |
| | | | | | | | |
| | |
NET ASSETS - 100.00% | | | | | | | $101,450,713 | |
| | | | | | | | |
| * | Non-income producing security. |
| ** | This security represents the investment of the collateral received in connection with securities out on loan as of June 30, 2016. |
| ^ | Rate disclosed as of June 30, 2016. |
| + | This security or a portion of the security is out on loan as of June 30, 2016. Total loaned securities had a value of $20,728,150 as of June 30, 2016. |
LLC - Limited Liability Company
PLC - Public Limited Company
Summary of inputs used to value the Fund’s investments as of 06/30/2016 (See Note 2 in Notes to Financial Statements):
| | | | | | | | | | | | | | | | |
| | | Valuation Inputs | |
| | | Investment in Securities (Value) | |
| | | Level 1
Quoted Prices | | | Level 2
Significant
Observable
Inputs | | | Level 3
Significant Unobservable Inputs | | | Total | |
| | | | |
Common Stocks | | $ | 101,683,112 | | | $ | — | | | | — | | | $ | 101,683,112 | |
Money Market Fund | | | — | | | | 99 | | | | — | | | | 99 | |
Investments Purchased with Cash Proceeds from Securities Lending | | | — | | | | 21,256,738 | | | | — | | | | 21,256,738 | |
| | | | | | | | | | | | | | | | |
TOTAL | | $ | 101,683,112 | | | $ | 21,256,837 | | | $ | — | | | $ | 122,939,949 | |
| | | | | | | | | | | | | | | | |
See Notes to Financial Statements.
| | |
| 20 | | Annual Report | June 30, 2016 |
| | |
Ultra-Small Company Market Fund MANAGER’S COMMENTARY (Unaudited) | | |
June 30, 2016
Dear Fellow Ultra-Small Company Market Fund Shareholder,
For the quarter ended June 30, 2016, our Fund returned 2.90%, underperforming our primary market benchmark, the CRSP Cap-Based Portfolio 10 Index (5.45%), our peer benchmark, the Lipper Micro-Cap Stock Funds Index (3.05%), the Russell 2000 Index (3.79%) and the Russell Microcap Index (3.97%). It was a poor quarter on a relative basis.
For the fiscal year, our Fund returned -10.83%, outperforming the CRSP Cap-Based Portfolio 10 Index (-13.49%) and the Russell Microcap Index (-12.06%), but trailing the Lipper Micro-Cap Stock Funds Index (-8.93%) and the Russell 2000 Index (-6.73%).
The table below presents our June quarter, one-year, five-year, 10-year, 15-year and inception-to-date financial results. See the next page for a graph of performance since inception.
Standardized Returns as of June 30, 2016
| | | | | | | | | | | | | | | | |
| | | | | | | | Annualized |
| | | Quarter | | | 1 Year | | | | 5 Years | | 10 Years | | 15 Years | | Since Inception
(7/31/97) |
| | | | | | | |
Ultra-Small Company Market Fund | | | 2.90% | | | -10.83% | | | | 8.79% | | 4.17% | | 9.91% | | 9.93% |
CRSP Cap-Based Portfolio 10 Index | | | 5.45% | | | -13.49% | | | | 7.17% | | 5.52% | | 10.74% | | 10.00% |
Russell 2000 Index | | | 3.79% | | | -6.73% | | | | 8.35% | | 6.20% | | 6.96% | | 6.95% |
Russell Microcap Index | | | 3.97% | | | -12.06% | | | | 8.20% | | 4.31% | | 6.46% | | N/A |
Lipper Micro-Cap Stock Funds Index | | | 3.05% | | | -8.93% | | | | 7.50% | | 5.03% | | 6.71% | | 7.14% |
Performance figures quoted in the table above represent past performance and are no guarantee of future results. Total return figures in the table above include the reinvestment of dividends and capital gains. The table above does not reflect the deduction of taxes that a shareholder would pay on Fund distributions or on the redemption of Fund shares.
The CRSP Cap-Based Portfolio 10 Index is an unmanaged index of 783 of the smallest publicly traded U.S. stocks with dividends reinvested, as reported by the Center for Research on Security Prices. The Russell Microcap Index is an unmanaged, market value weighted index that measures performance of 1,000 of the smallest securities in the Russell 2000 Index. The Russell 2000 Index is an unmanaged, market value weighted index that measures performance of the 2,000 companies that are between the 1,000th and 3,000th largest in the market with dividends reinvested. The Lipper Micro-Cap Stock Funds Index is an index of micro-cap funds compiled by Lipper, an independent fund research firm owned by Broadridge Financial Solutions, Inc. It is not possible to invest directly in an index. Periods longer than one year are annualized.
According to data from Lipper as of June 30, 2016, Ultra-Small Company Market Fund ranked 37th of 71 micro-cap funds for the 12 months ended June 30, 2016, 18th of 55 over the last five years, 26th of 39 over the last 10 years, and 3rd of 17 since inception in July 1997. Lipper is an independent mutual fund rating service owned by Broadridge Financial Solutions, Inc. that ranks funds in various fund categories by making comparative calculations using total returns.
| | |
Ultra-Small Company Market Fund MANAGER’S COMMENTARY (Unaudited) (continued) | | |
Ultra-Small Company Market Fund vs. CRSP Cap-Based Portfolio 10 Index, Russell Microcap Index*, Russell 2000 Index & Lipper Micro-Cap Stock Funds Index from Inception 7/31/97 to 6/30/16
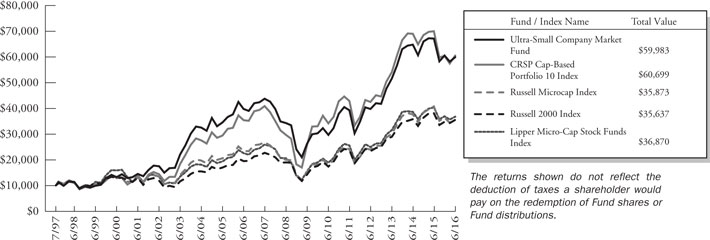
| * | The Russell Microcap Index began on 6/30/2000, and the line graph for the Index begins at the same value as the Fund on that date. |
Detailed Explanation of Quarterly Performance
The Fund lagged its primary benchmark largely because of holdings that had appreciated out of CRSP’s 10th decile. The Fund held approximately 75% of assets in CRSP 10 stocks — higher than in recent quarters, due to a rise in the cutoff for the 10th decile and our efforts to increase the Fund’s weight in CRSP 10 shares — but holdings of stocks with market caps above the CRSP 10 breakpoint detracted from relative performance when those shares lagged CRSP 10 stocks. Our “sidestepping” strategy — which eliminates exposure to stocks with a high probability of a precipitous price decline, major financial distress or bankruptcy — helped relative results, but not enough to offset the drag from non-CRSP 10 stocks.
An underweight position in the Energy sector hurt relative performance, as Energy was one of the best performing sectors during the period. The Fund doesn’t invest in shares of master limited partnerships or royalty trusts, two structures used primarily as Energy sector investment vehicles. By contrast, the benchmark includes a roughly 5% allocation to these investments.
The table below presents index performance numbers for stocks in the different CRSP deciles during various time periods.
| | | | | | | | | | | | | | | | | | | | |
| CRSP Decile1 | | Quarter | | | 1 Year | | | 5 Years | | | 10 Years | | | 90.5 Years | |
1 (ultra-large) | | | 2.37% | | | | 3.63% | | | | 12.09% | | | | 7.28% | | | | 9.26% | |
2 | | | 4.82% | | | | 1.56% | | | | 12.00% | | | | 8.27% | | | | 10.50% | |
3 | | | 3.60% | | | | -1.78% | | | | 10.11% | | | | 8.09% | | | | 10.97% | |
4 | | | 2.36% | | | | -7.53% | | | | 9.47% | | | | 8.18% | | | | 10.78% | |
5 | | | 2.22% | | | | -9.77% | | | | 7.92% | | | | 8.63% | | | | 11.38% | |
6 | | | 3.48% | | | | -8.86% | | | | 8.87% | | | | 7.41% | | | | 11.25% | |
7 | | | 5.86% | | | | -7.63% | | | | 9.11% | | | | 7.79% | | | | 11.41% | |
8 | | | 4.18% | | | | -11.46% | | | | 8.08% | | | | 7.46% | | | | 11.39% | |
9 | | | 6.02% | | | | -11.64% | | | | 7.40% | | | | 6.40% | | | | 11.31% | |
10 (ultra-small) | | | 5.45% | | | | -13.49% | | | | 7.17% | | | | 5.52% | | | | 13.13% | |
| 1 | Performance figures are as of the period ended June 30, 2016. The CRSP Cap-Based Portfolio Indexes are unmanaged indexes of publicly traded U.S. stocks with dividends reinvested, grouped by market capitalization, as reported by the Center for Research in Security Prices. Past performance is no guarantee of future results. |
| | |
| 22 | | Annual Report | June 30, 2016 |
| | |
Ultra-Small Company Market Fund MANAGER’S COMMENTARY (Unaudited) (continued) | | |
Detailed Explanation of Fiscal Year Performance
Our Fund outperformed its primary benchmark, the CRSP Cap-Based Portfolio 10 Index, for the fiscal year, primarily due to holdings that had appreciated out of CRSP’s 10th decile. The Fund held an average of approximately one-third of its assets in stocks with market caps above the CRSP 10 breakpoint during the 12-month period, and those larger shares significantly outperformed CRSP 10 names. The Fund’s “sidestepping” strategy was effective as well. It is important to note that the adviser has been consistently trimming stocks that have outgrown the CRSP 10 size threshold to increase exposure to the ultra-small 10th decile.
Top Ten Holdings as of June 30, 2016
| | | | | | | | | |
| Rank | | Description | | Industry | | % of Net
Assets |
| 1 | | Ryerson Holding Corp. | | Metals & Mining | | | | 0.7% | |
| 2 | | Utah Medical Products, Inc. | | Health Care Equipment & Supplies | | | | 0.7% | |
| 3 | | BioTelemetry, Inc. | | Health Care Providers & Service | | | | 0.7% | |
| 4 | | Supreme Industries, Inc. | | Machinery | | | | 0.6% | |
| 5 | | Olympic Steel, Inc. | | Metals & Mining | | | | 0.6% | |
| 6 | | Dawson Geophysical Co. | | Energy Equipment & Services | | | | 0.6% | |
| 7 | | York Water Co. (The) | | Water Utilities | | | | 0.6% | |
| 8 | | Enzo Biochem, Inc. | | Life Sciences Tools & Services | | | | 0.5% | |
| 9 | | Natural Gas Services Group, Inc. | | Energy Equipment & Services | | | | 0.5% | |
| 10 | | Farmers Capital Bank Corp. | | Commercial Banks | | | | 0.5% | |
| | Total | | | | | | 6.0% | |
Industry Sector Representation as of June 30, 2016
| | | | | | | | | | |
| | | % of Net Assets | | | | % of CRSP 10 Index | | | | Difference |
Consumer Discretionary | | 12.1% | | | | 10.8% | | | | 1.3% |
Consumer Staples | | 2.8% | | | | 2.4% | | | | 0.4% |
Energy | | 8.4% | | | | 11.6% | | | | -3.2% |
Financials | | 23.3% | | | | 22.1% | | | | 1.2% |
Health Care | | 16.5% | | | | 18.6% | | | | -2.1% |
Industrials | | 11.9% | | | | 11.2% | | | | 0.7% |
Information Technology | | 17.6% | | | | 17.0% | | | | 0.6% |
Materials | | 4.2% | | | | 4.6% | | | | -0.4% |
Telecommunication Services | | 1.1% | | | | 0.3% | | | | 0.8% |
Utilities | | 1.7% | | | | 1.4% | | | | 0.3% |
Cash & Other Assets | | 0.4% | | | | 0.0% | | | | 0.4% |
Total | | 100.0% | | | | 100.0% | | | | |
Disclaimer
The views expressed here are exclusively those of Fund management. These views, including those related to market sectors or individual stocks, are not meant as investment advice and should not be considered predictive in nature. Any favorable (or unfavorable) description of a holding applies only as of the quarter end, June 30, 2016, unless otherwise stated. Security positions can and do change thereafter. Discussions of historical performance do not guarantee and may not be indicative of future performance.
The Fund is subject to very high, above market risk (volatility) and is not an appropriate investment for short-term investors. Investments in ultra-small companies generally carry greater risk than is customarily associated with larger companies and even “small companies” for various reasons, such as narrower markets (fewer investors), limited financial resources and greater trading difficulty.
| | |
Ultra-Small Company Market Fund MANAGER’S COMMENTARY (Unaudited) (continued) | | |
Conclusion
Thank you for your continued investment in Ultra-Small Company Market Fund. We encourage your feedback; your reactions and concerns are important to us.
Sincerely,
The Investment Management Team
| | |
| 24 | | Annual Report | June 30, 2016 |
| | |
Ultra-Small Company Market Fund SCHEDULE OF INVESTMENTS | | |
Showing percentage of net assets as of June 30, 2016
| | | | | | | | | | |
| Industry Company | | Shares | | | Value | | | |
COMMON STOCKS - 99.61% | | | |
Aerospace & Defense - 1.70% | | | |
Air Industries Group+ | | | 83,000 | | | | $ 394,250 | | | |
Arotech Corp.*+ | | | 234,163 | | | | 657,998 | | | |
CPI Aerostructures, Inc.* | | | 58,079 | | | | 357,186 | | | |
Ducommun, Inc.* | | | 63,000 | | | | 1,246,140 | | | |
Erickson, Inc.*+ | | | 110,945 | | | | 67,676 | | | |
Innovative Solutions & Support, Inc.* | | | 132,354 | | | | 373,238 | | | |
LMI Aerospace, Inc.*+ | | | 104,558 | | | | 840,646 | | | |
SIFCO Industries, Inc.* | | | 55,046 | | | | 543,304 | | | |
Sparton Corp.* | | | 48,300 | | | | 1,051,491 | | | |
Sypris Solutions, Inc.* | | | 25,000 | | | | 21,250 | | | |
Tel-Instrument Electronics Corp.*+ | | | 15,000 | | | | 64,500 | | | |
| | | | | | | | | | |
| | | |
| | | | | | | 5,617,679 | | | |
| |
Air Freight & Logistics - 0.22% | | | |
Radiant Logistics, Inc.* | | | 247,200 | | | | 741,600 | | | |
| |
Auto Components - 1.18% | | | |
China XD Plastics Co., Ltd.*+ | | | 56,000 | | | | 180,320 | | | |
Horizon Global Corp.* | | | 50,000 | | | | 567,500 | | | |
Shiloh Industries, Inc.*+ | | | 137,168 | | | | 999,955 | | | |
SORL Auto Parts, Inc.* | | | 109,900 | | | | 195,622 | | | |
Spartan Motors, Inc. | | | 191,500 | | | | 1,198,790 | | | |
Strattec Security Corp. | | | 19,100 | | | | 778,707 | | | |
| | | | | | | | | | |
| | | |
| | | | | | | 3,920,894 | | | |
| |
Beverages - 0.96% | | | |
Castle Brands, Inc.* | | | 899,187 | | | | 658,654 | | | |
Craft Brew Alliance, Inc.* | | | 92,200 | | | | 1,062,144 | | | |
Primo Water Corp.* | | | 112,930 | | | | 1,333,703 | | | |
Reed’s, Inc.* | | | 45,000 | | | | 111,150 | | | |
| | | | | | | | | | |
| | | |
| | | | | | | 3,165,651 | | | |
| |
Biotechnology - 7.69% | | | |
Actinium Pharmaceuticals, Inc.* | | | 240,200 | | | | 425,154 | | | |
Akebia Therapeutics, Inc.*+ | | | 65,000 | | | | 486,200 | | | |
Aquinox Pharmaceuticals, Inc.*+ | | | 62,000 | | | | 410,440 | | | |
Aratana Therapeutics, Inc.*+ | | | 86,983 | | | | 549,733 | | | |
Argos Therapeutics, Inc.*+ | | | 116,424 | | | | 713,679 | | | |
Arqule, Inc.* | | | 291,493 | | | | 553,837 | | | |
Asterias Biotherapeutics, Inc.*+ | | | 138,363 | | | | 332,071 | | | |
aTyr Pharma, Inc.* | | | 47,697 | | | | 132,598 | | | |
AVEO Pharmaceuticals, Inc.* | | | 433,087 | | | | 416,240 | | | |
Aviragen Therapeutics, Inc.* | | | 168,470 | | | | 235,858 | | | |
BioSpecifics Technologies Corp.* | | | 22,314 | | | | 891,221 | | | |
| | | | | | | | |
| Industry Company | | Shares | | | Value | |
|
Biotechnology (continued) | |
Calithera Biosciences, Inc.*+ | | | 157,850 | | | | $ 585,624 | |
Cara Therapeutics, Inc.*+ | | | 131,646 | | | | 633,217 | |
CareDx, Inc.*+ | | | 90,750 | | | | 392,040 | |
Catabasis Pharmaceuticals, Inc.*+ | | | 27,700 | | | | 102,490 | |
Cerulean Pharma, Inc.*+ | | | 202,623 | | | | 429,561 | |
ChemoCentryx, Inc.* | | | 58,496 | | | | 262,647 | |
Cidara Therapeutics, Inc.* | | | 80,000 | | | | 824,800 | |
Codexis, Inc.*+ | | | 232,500 | | | | 936,975 | |
Conatus Pharmaceuticals, Inc.* | | | 103,000 | | | | 212,180 | |
Concert Pharmaceuticals, Inc.*+ | | | 28,200 | | | | 316,686 | |
CorMedix, Inc.*+ | | | 232,701 | | | | 463,075 | |
Curis, Inc.*+ | | | 220,000 | | | | 343,200 | |
Dimension Therapeutics, Inc.*+ | | | 21,400 | | | | 128,400 | |
Eiger BioPharmaceuticals, Inc.*+ | | | 15,000 | | | | 297,300 | |
Fate Therapeutics, Inc.* | | | 324,537 | | | | 551,713 | |
Flexion Therapeutics, Inc.*+ | | | 39,000 | | | | 583,635 | |
Genocea Biosciences, Inc.*+ | | | 89,000 | | | | 364,900 | |
GlycoMimetics, Inc.*+ | | | 109,764 | | | | 797,984 | |
Immunomedics, Inc.*+ | | | 288,900 | | | | 670,248 | |
Invivo Therapeutics Holdings Corp.*+ | | | 66,350 | | | | 383,503 | |
IsoRay, Inc.*+ | | | 265,300 | | | | 230,811 | |
Kura Oncology, Inc.* | | | 63,000 | | | | 170,730 | |
Loxo Oncology, Inc.*+ | | | 30,000 | | | | 695,400 | |
Medgenics, Inc.* | | | 135,000 | | | | 749,250 | |
MediciNova, Inc.*+ | | | 77,710 | | | | 586,710 | |
Minerva Neurosciences, Inc.* | | | 151,097 | | | | 1,542,700 | |
NanoViricides, Inc.*+ | | | 225,000 | | | | 360,000 | |
Neos Therapeutics, Inc.*+ | | | 65,000 | | | | 603,200 | |
Nivalis Therapeutics, Inc.*+ | | | 60,000 | | | | 276,000 | |
Oncocyte Corp.* | | | 100,000 | | | | 356,000 | |
Oragenics, Inc.* | | | 189,200 | | | | 96,492 | |
OvaScience, Inc.*+ | | | 25,000 | | | | 130,250 | |
PharmAthene, Inc.*+ | | | 513,244 | | | | 1,252,315 | |
Pronai Therapeutics, Inc.*+ | | | 55,000 | | | | 109,450 | |
Protalix BioTherapeutics, Inc.* | | | 271,672 | | | | 173,870 | |
Proteon Therapeutics, Inc.*+ | | | 36,835 | | | | 295,785 | |
Rigel Pharmaceuticals, Inc.* | | | 150,000 | | | | 334,500 | |
Synthetic Biologics, Inc.*+ | | | 484,905 | | | | 872,829 | |
Tetraphase Pharmaceuticals, Inc.*+ | | | 150,000 | | | | 645,000 | |
Tokai Pharmaceuticals, Inc.*+ | | | 100,000 | | | | 551,000 | |
| | |
Ultra-Small Company Market Fund SCHEDULE OF INVESTMENTS (continued) | | |
Showing percentage of net assets as of June 30, 2016
| | | | | | | | | | |
| Industry Company | | Shares | | | Value | | | |
| |
Common Stocks (continued) | | | |
Biotechnology (continued) | | | |
Vanda Pharmaceuticals, Inc.* | | | 35,000 | | | | $ 391,650 | | | |
Vitae Pharmaceuticals, Inc.*+ | | | 60,350 | | | | 651,176 | | | |
| | | | | | | | | | |
| | | |
| | | | | | | 25,502,327 | | | |
| |
Building Products - 0.15% | | | |
Alpha Pro Tech, Ltd.* | | | 211,200 | | | | 479,424 | | | |
| |
Capital Markets - 2.10% | | | |
Calamos Asset Management, Inc., Class A | | | 98,500 | | | | 720,035 | | | |
Capitala Finance Corp.+ | | | 81,280 | | | | 1,137,920 | | | |
FBR & Co.+ | | | 53,575 | | | | 799,875 | | | |
Institutional Financial Markets, Inc. | | | 30,000 | | | | 24,504 | | | |
JMP Group LLC+ | | | 96,851 | | | | 525,901 | | | |
KCAP Financial, Inc.+ | | | 93,900 | | | | 368,088 | | | |
Medallion Financial Corp.+ | | | 86,711 | | | | 639,927 | | | |
Monroe Capital Corp.+ | | | 61,403 | | | | 910,606 | | | |
OFS Capital Corp.+ | | | 26,446 | | | | 339,831 | | | |
Oppenheimer Holdings, Inc., Class A+ | | | 31,550 | | | | 487,763 | | | |
Pzena Investment Management, Inc., Class A | | | 52,800 | | | | 401,808 | | | |
Silvercrest Asset Management Group LLC, Class A | | | 50,002 | | | | 612,024 | | | |
| | | | | | | | | | |
| | | |
| | | | | | | 6,968,282 | | | |
| |
Chemicals - 1.12% | | | |
Arcadia Biosciences, Inc.*+ | | | 75,000 | | | | 194,250 | | | |
BioAmber, Inc.*+ | | | 76,700 | | | | 228,566 | | | |
Chase Corp.+ | | | 10,000 | | | | 590,700 | | | |
China Green Agriculture, Inc.* | | | 197,000 | | | | 262,010 | | | |
Core Molding Technologies, Inc.*+ | | | 45,100 | | | | 615,615 | | | |
Flexible Solutions International, Inc.* | | | 1,200 | | | | 1,680 | | | |
Gulf Resources, Inc.* | | | 285,900 | | | | 440,286 | | | |
KMG Chemicals, Inc. | | | 29,000 | | | | 753,710 | | | |
Marrone Bio Innovations, Inc.*+ | | | 181,200 | | | | 148,584 | | | |
Northern Technologies International Corp.* | | | 13,950 | | | | 154,008 | | | |
OMNOVA Solutions, Inc.* | | | 44,600 | | | | 323,350 | | | |
| | | | | | | | | | |
| | | |
| | | | | | | 3,712,759 | | | |
| |
Commercial Banks - 11.20% | | | |
1st Constitution Bancorp*+ | | | 18,733 | | | | 225,171 | | | |
| | | | | | | | |
| Industry Company | | Shares | | | Value | |
|
Commercial Banks (continued) | |
Access National Corp. | | | 33,500 | | | | $ 653,585 | |
American National Bankshares, Inc. | | | 31,746 | | | | 799,364 | |
American River Bankshares* | | | 56,000 | | | | 568,400 | |
AmeriServ Financial, Inc. | | | 155,671 | | | | 470,126 | |
Anchor Bancorp, Inc.*+ | | | 22,000 | | | | 519,860 | |
Auburn National Bancorporation, Inc.+ | | | 2,974 | | | | 84,729 | |
Bank of Commerce Holdings | | | 87,441 | | | | 577,111 | |
Bankwell Financial Group, Inc.+ | | | 8,000 | | | | 176,480 | |
Bar Harbor Bankshares | | | 18,050 | | | | 633,555 | |
BCB Bancorp, Inc. | | | 55,212 | | | | 565,371 | |
C&F Financial Corp.+ | | | 15,400 | | | | 689,304 | |
Carolina Bank Holdings, Inc.*+ | | | 27,000 | | | | 471,960 | |
Century Bancorp, Inc., Class A | | | 23,272 | | | | 985,104 | |
Chemung Financial Corp.+ | | | 29,998 | | | | 880,441 | |
Citizens Holding Co.+ | | | 20,670 | | | | 453,293 | |
CNB Financial Corp. | | | 52,100 | | | | 927,380 | |
Codorus Valley Bancorp, Inc.+ | | | 20,691 | | | | 421,476 | |
Colony Bankcorp, Inc.* | | | 16,668 | | | | 158,513 | |
Community West Bancshares | | | 38,357 | | | | 281,157 | |
Enterprise Bancorp, Inc.+ | | | 12,602 | | | | 302,322 | |
Evans Bancorp, Inc. | | | 16,701 | | | | 411,513 | |
Farmers Capital Bank Corp. | | | 57,149 | | | | 1,563,025 | |
First BanCorp Puerto Rico+ | | | 32,000 | | | | 562,560 | |
First Bancorp, Inc. | | | 43,300 | | | | 932,682 | |
First Bancshares, Inc.+ | | | 40,194 | | | | 694,150 | |
First Business Financial Services, Inc. | | | 42,308 | | | | 992,969 | |
First Northwest Bancorp* | | | 15,000 | | | | 191,100 | |
First South Bancorp, Inc.+ | | | 56,980 | | | | 532,193 | |
First United Corp.* | | | 9,200 | | | | 90,528 | |
Guaranty Bancorp | | | 24,640 | | | | 411,488 | |
Heritage Commerce Corp. | | | 49,300 | | | | 519,129 | |
Higher One Holdings, Inc.* | | | 233,528 | | | | 1,193,328 | |
Landmark Bancorp, Inc.+ | | | 11,586 | | | | 293,473 | |
Macatawa Bank Corp. | | | 71,500 | | | | 530,530 | |
MBT Financial Corp.+ | | | 119,185 | | | | 953,480 | |
Medley Management, Inc., Class A+ | | | 20,000 | | | | 117,600 | |
Merchants Bancshares, Inc. | | | 28,700 | | | | 874,776 | |
MidSouth Bancorp, Inc. | | | 93,600 | | | | 939,744 | |
MSB Financial Corp./MD*+ | | | 25,000 | | | | 344,750 | |
MutualFirst Financial, Inc. | | | 38,911 | | | | 1,064,216 | |
Northeast Bancorp | | | 35,000 | | | | 393,750 | |
Northrim BanCorp, Inc. | | | 34,750 | | | | 913,578 | |
| | |
| 26 | | Annual Report | June 30, 2016 |
| | |
Ultra-Small Company Market Fund SCHEDULE OF INVESTMENTS (continued) | | |
Showing percentage of net assets as of June 30, 2016
| | | | | | | | | | |
| Industry Company | | Shares | | | Value | | | |
| |
Common Stocks (continued) | | | |
Commercial Banks (continued) | | | |
Ohio Valley Banc Corp.+ | | | 19,500 | | | | $ 426,270 | | | |
Old Second Bancorp, Inc. | | | 118,690 | | | | 810,653 | | | |
Pacific Mercantile Bancorp*+ | | | 103,319 | | | | 733,565 | | | |
Peapack Gladstone Financial Corp. | | | 39,777 | | | | 736,272 | | | |
Penns Woods Bancorp, Inc.+ | | | 16,400 | | | | 688,636 | | | |
Peoples Bancorp of North Carolina, Inc. | | | 34,901 | | | | 684,409 | | | |
Premier Financial Bancorp, Inc.+ | | | 43,837 | | | | 738,653 | | | |
QCR Holdings, Inc. | | | 20,700 | | | | 562,833 | | | |
Republic First Bancorp, Inc.*+ | | | 23,000 | | | | 99,130 | | | |
Royal Bancshares of Pennsylvania, Inc., Class A* | | | 78,195 | | | | 176,721 | | | |
Select Bancorp, Inc.* | | | 10,076 | | | | 81,414 | | | |
Shore Bancshares, Inc.+ | | | 83,400 | | | | 979,950 | | | |
Sierra Bancorp | | | 42,900 | | | | 716,001 | | | |
Southern First Bancshares, Inc.*+ | | | 32,215 | | | | 776,382 | | | |
Southern National Bancorp of Virginia, Inc. | | | 70,892 | | | | 861,338 | | | |
Suffolk Bancorp | | | 37,000 | | | | 1,158,470 | | | |
Sussex Bancorp+ | | | 23,000 | | | | 307,280 | | | |
Two River Bancorp+ | | | 15,565 | | | | 169,036 | | | |
Union Bankshares, Inc./Morrisville VT+ | | | 1,473 | | | | 53,558 | | | |
Unity Bancorp, Inc.+ | | | 15,000 | | | | 190,650 | | | |
Veritex Holdings, Inc.*+ | | | 20,000 | | | | 320,400 | | | |
West Bancorporation, Inc.+ | | | 27,100 | | | | 503,789 | | | |
| | | | | | | | | | |
| | | |
| | | | | | | 37,140,674 | | | |
| |
Commercial Services & Supplies - 0.98% | | | |
Acme United Corp. | | | 3,000 | | | | 54,900 | | | |
AMREP Corp.* | | | 17,000 | | | | 82,620 | | | |
Ascent Capital Group, Inc., Class A* | | | 20,000 | | | | 307,800 | | | |
Cenveo, Inc.* | | | 382,098 | | | | 311,754 | | | |
CompX International, Inc. | | | 3,200 | | | | 36,800 | | | |
Ecology & Environment, Inc., Class A+ | | | 3,000 | | | | 30,660 | | | |
Fuel Tech, Inc.* | | | 69,400 | | | | 102,712 | | | |
Intersections, Inc.*+ | | | 85,300 | | | | 182,542 | | | |
Patriot National, Inc.*+ | | | 105,000 | | | | 858,900 | | | |
Performant Financial Corp.* | | | 310,000 | | | | 502,200 | | | |
TRC Cos., Inc.* | | | 94,275 | | | | 595,818 | | | |
Versar, Inc.* | | | 171,800 | | | | 185,544 | | | |
| | | | | | | | | | |
| | | |
| | | | | | | 3,252,250 | | | |
| | | | | | | | |
| Industry Company | | Shares | | | Value | |
| | |
| | | | | | | | |
Communications Equipment - 1.72% | |
Bel Fuse, Inc., Class B | | | 35,100 | | | | $ 624,078 | |
Black Box Corp. | | | 31,764 | | | | 415,473 | |
Communications Systems, Inc.+ | | | 54,700 | | | | 381,259 | |
EMCORE Corp.* | | | 118,580 | | | | 704,365 | |
KVH Industries, Inc.* | | | 60,410 | | | | 465,157 | |
Numerex Corp., Class A*+ | | | 50,008 | | | | 374,560 | |
PC-Tel, Inc.+ | | | 131,100 | | | | 617,481 | |
RELM Wireless Corp.+ | | | 245,900 | | | | 1,251,631 | |
Tessco Technologies, Inc. | | | 44,500 | | | | 618,105 | |
Westell Technologies, Inc., Class A* | | | 362,000 | | | | 253,400 | |
| | | | | | | | |
| | |
| | | | | | | 5,705,509 | |
|
Computers & Peripherals - 1.43% | |
AstroNova, Inc.+ | | | 32,800 | | | | 499,216 | |
Concurrent Computer Corp.+ | | | 81,300 | | | | 424,386 | |
Datalink Corp.* | | | 123,700 | | | | 927,750 | |
Imation Corp.* | | | 145,100 | | | | 181,375 | |
Intevac, Inc.* | | | 107,933 | | | | 613,059 | |
Novatel Wireless, Inc.*+ | | | 225,000 | | | | 342,000 | |
Qumu Corp.* | | | 85,200 | | | | 378,288 | |
TransAct Technologies, Inc. | | | 80,688 | | | | 647,118 | |
USA Technologies, Inc.*+ | | | 171,400 | | | | 731,878 | |
| | | | | | | | |
| | |
| | | | | | | 4,745,070 | |
|
Construction & Engineering - 1.04% | |
Goldfield Corp. (The)* | | | 63,480 | | | | 208,214 | |
Layne Christensen Co.*+ | | | 36,430 | | | | 295,083 | |
Northwest Pipe Co.*+ | | | 50,295 | | | | 542,180 | |
Orion Marine Group, Inc.* | | | 168,200 | | | | 893,142 | |
Sterling Construction Co., Inc.* | | | 207,736 | | | | 1,019,984 | |
Willdan Group, Inc.* | | | 45,000 | | | | 477,900 | |
| | | | | | | | |
| | |
| | | | | | | 3,436,503 | |
|
Construction Materials - 0.09% | |
United States Lime & Minerals, Inc.+ | | | 5,300 | | | | 312,647 | |
|
Consumer Finance - 0.80% | |
Asta Funding, Inc.*+ | | | 122,300 | | | | 1,292,711 | |
Atlanticus Holdings Corp.* | | | 60,812 | | | | 176,963 | |
Consumer Portfolio Services, Inc.*+ | | | 155,100 | | | | 584,727 | |
Regional Management Corp.* | | | 40,000 | | | | 586,400 | |
| | | | | | | | |
| | |
| | | | | | | 2,640,801 | |
| | |
Ultra-Small Company Market Fund SCHEDULE OF INVESTMENTS (continued) | | |
Showing percentage of net assets as of June 30, 2016
| | | | | | | | | | |
| Industry Company | | Shares | | | Value | | | |
Common Stocks (continued) | | | |
Containers & Packaging - 0.27% | | | |
AEP Industries, Inc. | | | 10,900 | | | | $ 877,014 | | | |
| |
Distributors - 0.19% | | | |
AMCON Distributing Co.+ | | | 3,900 | | | | 339,300 | | | |
VOXX International Corp.* | | | 104,500 | | | | 291,555 | | | |
| | | | | | | | | | |
| | | |
| | | | | | | 630,855 | | | |
| |
Diversified Consumer Services - 0.69% | | | |
Career Education Corp.* | | | 94,850 | | | | 564,358 | | | |
Collectors Universe, Inc. | | | 36,960 | | | | 729,960 | | | |
ITT Educational Services, Inc.*+ | | | 37,500 | | | | 72,000 | | | |
Lincoln Educational Services Corp.* | | | 153,400 | | | | 230,100 | | | |
National American University Holdings, Inc. | | | 350,988 | | | | 694,956 | | | |
| | | | | | | | | | |
| | | |
| | | | | | | 2,291,374 | | | |
| |
Diversified Financial Services - 1.65% | | | |
Ashford, Inc.*+ | | | 4,000 | | | | 200,000 | | | |
California First National Bancorp+ | | | 74,257 | | | | 1,096,776 | | | |
FXCM, Inc., Class A*+ | | | 26,000 | | | | 224,900 | | | |
GAIN Capital Holdings, Inc. | | | 94,400 | | | | 596,608 | | | |
Impac Mortgage Holdings, Inc.*+ | | | 40,600 | | | | 636,608 | | | |
Marlin Business Services Corp. | | | 64,500 | | | | 1,051,350 | | | |
Resource America, Inc., Class A+ | | | 130,700 | | | | 1,270,404 | | | |
Stonegate Mortgage Corp.*+ | | | 115,000 | | | | 386,400 | | | |
| | | | | | | | | | |
| | | |
| | | | | | | 5,463,046 | | | |
| |
Diversified Telecommunication Services - 1.38% | | | |
Alaska Communications Systems Group, Inc.* | | | 243,000 | | | | 413,100 | | | |
Aviat Networks, Inc.* | | | 29,186 | | | | 227,067 | | | |
Hawaiian Telcom Holdco, Inc.* | | | 24,686 | | | | 523,096 | | | |
HC2 Holdings, Inc.*+ | | | 188,600 | | | | 810,980 | | | |
IDT Corp., Class B | | | 50,567 | | | | 717,546 | | | |
Lumos Networks Corp.* | | | 35,000 | | | | 423,500 | | | |
Ooma, Inc.*+ | | | 50,000 | | | | 409,500 | | | |
Straight Path Communications, Inc., Class B*+ | | | 37,470 | | | | 1,036,795 | | | |
| | | | | | | | | | |
| | | |
| | | | | | | 4,561,584 | | | |
| |
Electric Utilities - 0.21% | | | |
Spark Energy, Inc., Class A+ | | | 21,500 | | | | 710,575 | | | |
| | | | | | | | |
| Industry Company | | Shares | | | Value | |
| | | | | | | | |
Electrical Equipment - 0.64% | |
Allied Motion Technologies, Inc.+ | | | 35,650 | | | | $ 829,219 | |
Espey Manufacturing & Electronics Corp. | | | 10,700 | | | | 278,307 | |
Highpower International, Inc.* | | | 50,000 | | | | 94,500 | |
Preformed Line Products Co. | | | 8,489 | | | | 342,871 | |
Ultralife Corp.* | | | 112,400 | | | | 563,124 | |
| | | | | | | | |
| | |
| | | | | | | 2,108,021 | |
|
Electronic Equipment, Instruments & Components - 3.95% | |
Agilysys, Inc.* | | | 2,107 | | | | 22,060 | |
American Superconductor Corp.*+ | | | 37,025 | | | | 312,491 | |
Control4 Corp.*+ | | | 80,000 | | | | 652,800 | |
Electro Rent Corp. | | | 44,200 | | | | 681,122 | |
Electro Scientific Industries, Inc.* | | | 143,500 | | | | 838,040 | |
Frequency Electronics, Inc.* | | | 41,000 | | | | 381,300 | |
ID Systems, Inc.* | | | 83,000 | | | | 399,230 | |
IEC Electronics Corp.* | | | 73,450 | | | | 304,818 | |
IntriCon Corp.* | | | 21,500 | | | | 114,810 | |
Iteris, Inc.* | | | 272,520 | | | | 779,407 | |
Kemet Corp.* | | | 292,800 | | | | 857,904 | |
Key Tronic Corp.* | | | 57,200 | | | | 430,716 | |
Maxwell Technologies, Inc.*+ | | | 91,500 | | | | 483,120 | |
MOCON, Inc. | | | 12,800 | | | | 181,248 | |
NAPCO Security Technologies, Inc.*+ | | | 81,576 | | | | 518,823 | |
PAR Technology Corp.* | | | 104,750 | | | | 501,752 | |
PCM, Inc.* | | | 74,200 | | | | 826,588 | |
Perceptron, Inc.* | | | 100,000 | | | | 468,000 | |
Radisys Corp.*+ | | | 329,300 | | | | 1,475,264 | |
RF Industries, Ltd.+ | | | 35,000 | | | | 76,650 | |
Richardson Electronics, Ltd.+ | | | 102,011 | | | | 537,598 | |
SMTC Corp.* | | | 149,000 | | | | 224,990 | |
Vicon Industries, Inc.* | | | 29,900 | | | | 14,800 | |
Vishay Precision Group, Inc.*+ | | | 71,900 | | | | 964,898 | |
Wayside Technology Group, Inc. | | | 50,398 | | | | 910,188 | |
Wireless Telecom Group, Inc.* | | | 93,100 | | | | 124,754 | |
| | | | | | | | |
| | |
| | | | | | | 13,083,371 | |
|
Energy - 0.11% | |
FuelCell Energy, Inc.*+ | | | 60,000 | | | | 373,200 | |
| | |
| 28 | | Annual Report | June 30, 2016 |
| | |
Ultra-Small Company Market Fund SCHEDULE OF INVESTMENTS (continued) | | |
Showing percentage of net assets as of June 30, 2016
| | | | | | | | | | |
| Industry Company | | Shares | | | Value | | | |
Common Stocks (continued) | | | |
Energy Equipment & Services - 2.98% | | | |
Basic Energy Services, Inc.*+ | | | 160,400 | | | | $ 269,472 | | | |
Dawson Geophysical Co.* | | | 232,139 | | | | 1,891,933 | | | |
Enservco Corp.* | | | 271,298 | | | | 168,205 | | | |
Era Group, Inc.* | | | 36,750 | | | | 345,450 | | | |
Forbes Energy Services, Ltd.* | | | 62,449 | | | | 11,553 | | | |
Geospace Technologies Corp.*+ | | | 46,663 | | | | 763,873 | | | |
Gulf Island Fabrication, Inc. | | | 130,400 | | | | 904,976 | | | |
Gulfmark Offshore, Inc., Class A*+ | | | 115,800 | | | | 362,454 | | | |
Key Energy Services, Inc.* | | | 557,200 | | | | 129,215 | | | |
Mitcham Industries, Inc.* | | | 193,400 | | | | 725,250 | | | |
Natural Gas Services Group, Inc.* | | | 68,600 | | | | 1,570,940 | | | |
Pioneer Energy Services Corp.* | | | 280,000 | | | | 1,288,000 | | | |
SAExploration Holdings, Inc.* | | | 97,015 | | | | 11,884 | | | |
Superior Drilling Products, Inc.* | | | 166,187 | | | | 355,640 | | | |
Willbros Group, Inc.* | | | 425,000 | | | | 1,075,250 | | | |
| | | | | | | | | | |
| | | |
| | | | | | | 9,874,095 | | | |
| |
Food Products - 1.14% | | | |
Griffin Industrial Realty, Inc. | | | 13,300 | | | | 407,645 | | | |
Inventure Foods, Inc.*+ | | | 44,000 | | | | 343,640 | | | |
John B. Sanfilippo & Son, Inc. | | | 12,000 | | | | 511,560 | | | |
Lifeway Foods, Inc.* | | | 90,152 | | | | 871,770 | | | |
Rocky Mountain Chocolate Factory, Inc.+ | | | 10,000 | | | | 101,500 | | | |
Seneca Foods Corp.,
Class A* | | | 25,000 | | | | 905,250 | | | |
TerraVia Holdings, Inc.*+ | | | 247,396 | | | | 648,178 | | | |
| | | | | | | | | | |
| | | |
| | | | | | | 3,789,543 | | | |
| |
Gas Utilities - 0.43% | | | |
Delta Natural Gas Co., Inc.+ | | | 40,000 | | | | 1,077,600 | | | |
Gas Natural, Inc. | | | 48,800 | | | | 341,112 | | | |
| | | | | | | | | | |
| | | |
| | | | | | | 1,418,712 | | | |
| |
Health Care Equipment & Supplies - 3.03% | | | |
AdCare Health Systems, Inc. | | | 153,900 | | | | 283,176 | | | |
Avinger, Inc.*+ | | | 15,000 | | | | 178,950 | | | |
CryoLife, Inc. | | | 107,270 | | | | 1,266,859 | | | |
Cutera, Inc.* | | | 60,200 | | | | 674,842 | | | |
Digirad Corp. | | | 172,894 | | | | 890,404 | | | |
EndoChoice Holdings, Inc.*+ | | | 75,000 | | | | 367,500 | | | |
| | | | | | | | |
| Industry Company | | Shares | | | Value | |
| | | | | | | | |
Health Care Equipment & Supplies (continued) | |
ERBA Diagnostics, Inc.* | | | 19,096 | | | | $ 15,277 | |
Iridex Corp.* | | | 25,000 | | | | 369,750 | |
Kewaunee Scientific Corp.+ | | | 14,000 | | | | 264,320 | |
Lantheus Holdings, Inc.* | | | 84,802 | | | | 311,223 | |
LeMaitre Vascular, Inc. | | | 50,000 | | | | 713,500 | |
Navidea Biopharmaceuticals, Inc.*+ | | | 548,580 | | | | 291,022 | |
Retractable Technologies, Inc.* | | | 34,000 | | | | 85,680 | |
Roka Bioscience, Inc.* | | | 207,500 | | | | 118,690 | |
Seaspine Holdings Corp.*+ | | | 22,200 | | | | 232,656 | |
Sientra, Inc.*+ | | | 109,200 | | | | 718,536 | |
Symmetry Surgical, Inc.*+ | | | 20,000 | | | | 262,600 | |
TransEnterix, Inc.*+ | | | 75,000 | | | | 91,500 | |
Utah Medical Products, Inc. | | | 35,900 | | | | 2,261,700 | |
Veracyte, Inc.*+ | | | 129,200 | | | | 649,876 | |
| | | | | | | | |
| | |
| | | | | | | 10,048,061 | |
|
Health Care Providers & Services - 2.37% | |
Addus HomeCare Corp.* | | | 28,600 | | | | 498,498 | |
Alliance HealthCare Services, Inc.* | | | 20,000 | | | | 124,800 | |
Almost Family, Inc.* | | | 2,400 | | | | 102,264 | |
BioScrip, Inc.*+ | | | 305,000 | | | | 777,750 | |
BioTelemetry, Inc.* | | | 137,700 | | | | 2,244,510 | |
Everyday Health, Inc.* | | | 160,000 | | | | 1,260,800 | |
Five Star Quality Care, Inc.* | | | 200,300 | | | | 468,702 | |
InfuSystems Holdings, Inc.* | | | 174,900 | | | | 454,740 | |
Juniper Pharmaceuticals, Inc.*+ | | | 59,200 | | | | 414,992 | |
RadNet, Inc.*+ | | | 89,800 | | | | 479,532 | |
Trupanion, Inc.*+ | | | 78,700 | | | | 1,042,775 | |
| | | | | | | | |
| | |
| | | | | | | 7,869,363 | |
|
Hotels, Restaurants & Leisure - 2.71% | |
Ark Restaurants Corp. | | | 9,900 | | | | 220,968 | |
Bravo Brio Restaurant Group, Inc.* | | | 58,500 | | | | 479,115 | |
Carrols Restaurant Group, Inc.* | | | 43,100 | | | | 512,890 | |
Dover Downs Gaming & Entertainment, Inc.* | | | 92,580 | | | | 98,135 | |
Dover Motorsports, Inc. | | | 22,896 | | | | 49,684 | |
Famous Dave’s of America, Inc.*+ | | | 45,200 | | | | 227,356 | |
Gaming Partners International Corp.* | | | 56,300 | | | | 523,590 | |
Golden Entertainment, Inc.+ | | | 42,300 | | | | 494,487 | |
Ignite Restaurant Group, Inc.*+ | | | 173,100 | | | | 270,036 | |
J Alexander’s Holdings, Inc.* | | | 83,800 | | | | 832,134 | |
| | |
Ultra-Small Company Market Fund SCHEDULE OF INVESTMENTS (continued) | | |
Showing percentage of net assets as of June 30, 2016
| | | | | | | | | | |
| Industry Company | | Shares | | | Value | | | |
| |
Common Stocks (continued) | | | |
Hotels, Restaurants & Leisure (continued) | | | |
Jamba, Inc.*+ | | | 65,662 | | | | $ 675,662 | | | |
Kona Grill, Inc.*+ | | | 67,500 | | | | 723,600 | | | |
Luby’s, Inc.*+ | | | 135,600 | | | | 680,712 | | | |
Monarch Casino & Resort, Inc.* | | | 34,485 | | | | 757,635 | | | |
Morgans Hotel Group Co.* | | | 209,300 | | | | 447,902 | | | |
Nathan’s Famous, Inc.*+ | | | 12,000 | | | | 534,000 | | | |
Nevada Gold & Casinos, Inc.*+ | | | 120,000 | | | | 231,600 | | | |
Papa Murphy’s Holdings, Inc.*+ | | | 10,000 | | | | 66,350 | | | |
Peak Resorts, Inc.+ | | | 31,900 | | | | 145,464 | | | |
Red Lion Hotels Corp.*+ | | | 74,900 | | | | 543,774 | | | |
Town Sports International Holdings, Inc.* | | | 173,571 | | | | 472,113 | | | |
| | | | | | | | | | |
| | | |
| | | | | | | 8,987,207 | | | |
| |
Household Durables - 1.43% | | | |
Bassett Furniture Industries, Inc. | | | 12,234 | | | | 292,882 | | | |
CSS Industries, Inc. | | | 15,700 | | | | 420,917 | | | |
Dixie Group, Inc.
(The)*+ | | | 100,600 | | | | 358,136 | | | |
Emerson Radio Corp.* | | | 198,100 | | | | 113,908 | | | |
Flexsteel Industries, Inc. | | | 22,000 | | | | 871,640 | | | |
Hooker Furniture Corp. | | | 32,227 | | | | 692,558 | | | |
Lifetime Brands, Inc. | | | 45,000 | | | | 656,550 | | | |
P&F Industries, Inc., Class A | | | 10,500 | | | | 98,175 | | | |
Skullcandy, Inc.*+ | | | 35,666 | | | | 218,989 | | | |
Stanley Furniture Co., Inc.* | | | 129,383 | | | | 316,988 | | | |
Turtle Beach Corp.*+ | | | 286,500 | | | | 277,905 | | | |
ZAGG, Inc.* | | | 80,000 | | | | 420,000 | | | |
| | | | | | | | | | |
| | | |
| | | | | | | 4,738,648 | | | |
| |
Household Products - 0.50% | | | |
Oil-Dri Corp. of America | | | 27,500 | | | | 949,575 | | | |
Orchids Paper Products Co. | | | 20,000 | | | | 711,400 | | | |
| | | | | | | | | | |
| | | |
| | | | | | | 1,660,975 | | | |
| |
Independent Power Producers &
Energy Traders - 0.22% | | | |
Genie Energy, Ltd., Class B+ | | | 48,667 | | | | 329,476 | | | |
Synthesis Energy Systems, Inc.* | | | 394,064 | | | | 413,767 | | | |
| | | | | | | | | | |
| | | |
| | | | | | | 743,243 | | | |
| |
Insurance - 1.50% | | | |
1347 Property Insurance Holdings, Inc.*+ | | | 38,400 | | | | 245,376 | | | |
American Independence Corp.*+ | | | 7,500 | | | | 183,975 | | | |
Atlantic American Corp. | | | 21,056 | | | | 79,171 | | | |
| | | | | | | | |
| Industry Company | | Shares | | | Value | |
| | |
| | | | | | | | |
Insurance (continued) | |
eHealth, Inc.* | | | 45,000 | | | | $ 630,900 | |
Federated National Holding Co. | | | 23,000 | | | | 437,920 | |
First Acceptance Corp.* | | | 310,200 | | | | 434,280 | |
Hallmark Financial Services, Inc.* | | | 80,400 | | | | 931,836 | |
Health Insurance Innovations, Inc., Class A*+ | | | 61,900 | | | | 243,267 | |
Independence Holding Co. | | | 63,990 | | | | 1,149,900 | |
Investors Title Co.+ | | | 6,800 | | | | 647,700 | |
| | | | | | | | |
| | |
| | | | | | | 4,984,325 | |
|
Internet & Catalog Retail - 0.64% | |
CafePress, Inc.* | | | 69,188 | | | | 214,483 | |
EVINE Live, Inc.* | | | 331,286 | | | | 546,622 | |
Gaiam, Inc., Class A* | | | 93,400 | | | | 722,916 | |
US Auto Parts Network, Inc.* | | | 164,751 | | | | 650,766 | |
| | | | | | | | |
| | |
| | | | | | | 2,134,787 | |
|
Internet Software & Services - 4.32% | |
Amber Road, Inc.*+ | | | 92,800 | | | | 715,488 | |
Brightcove, Inc.* | | | 39,387 | | | | 346,606 | |
BroadVision, Inc.*+ | | | 72,749 | | | | 482,326 | |
Carbonite, Inc.* | | | 58,060 | | | | 564,924 | |
Connecture, Inc.* | | | 75,000 | | | | 169,500 | |
Demand Media, Inc.*+ | | | 212,500 | | | | 1,098,625 | |
Five9, Inc.* | | | 54,700 | | | | 650,930 | |
Inuvo, Inc.* | | | 219,000 | | | | 306,600 | |
Limelight Networks, Inc.* | | | 276,537 | | | | 412,040 | |
Liquidity Services, Inc.* | | | 104,000 | | | | 815,360 | |
Marchex, Inc., Class B* | | | 195,500 | | | | 621,690 | |
Marin Software, Inc.* | | | 96,600 | | | | 227,010 | |
MaxPoint Interactive, Inc.* | | | 30,000 | | | | 324,000 | |
QuinStreet, Inc.* | | | 196,547 | | | | 697,742 | |
RealNetworks, Inc.* | | | 105,700 | | | | 455,567 | |
Reis, Inc. | | | 17,100 | | | | 425,790 | |
Rightside Group Ltd*+ | | | 87,056 | | | | 926,276 | |
Rocket Fuel, Inc.*+ | | | 172,912 | | | | 383,865 | |
Spark Networks, Inc.*+ | | | 124,500 | | | | 196,710 | |
Support.com, Inc.* | | | 339,545 | | | | 285,557 | |
Synacor, Inc.*+ | | | 100,000 | | | | 308,000 | |
TheStreet, Inc. | | | 242,700 | | | | 274,251 | |
Travelzoo, Inc.*+ | | | 70,000 | | | | 561,400 | |
Tremor Video, Inc.* | | | 460,200 | | | | 846,768 | |
Tucows, Inc., Class A*+ | | | 22,500 | | | | 548,100 | |
United Online, Inc.* | | | 42,059 | | | | 462,649 | |
YuMe, Inc.*+ | | | 121,726 | | | | 447,952 | |
Zedge, Inc., Class B*+ | | | 16,855 | | | | 77,364 | |
| | |
| 30 | | Annual Report | June 30, 2016 |
| | |
Ultra-Small Company Market Fund SCHEDULE OF INVESTMENTS (continued) | | |
Showing percentage of net assets as of June 30, 2016
| | | | | | | | | | |
| Industry Company | | Shares | | | Value | | | |
| |
Common Stocks (continued) | | | |
Internet Software & Services (continued) | | | |
Zix Corp.* | | | 187,582 | | | | $ 703,432 | | | |
| | | | | | | | | | |
| | | |
| | | | | | | 14,336,522 | | | |
| |
IT Services - 1.90% | | | |
CIBER, Inc.* | | | 202,100 | | | | 303,150 | | | |
Computer Task Group, Inc.+ | | | 56,962 | | | | 283,101 | | | |
CSP, Inc. | | | 38,700 | | | | 314,244 | | | |
Edgewater Technology, Inc.*+ | | | 91,212 | | | | 788,072 | | | |
Information Services Group, Inc.*+ | | | 196,600 | | | | 737,250 | | | |
Innodata, Inc.* | | | 294,955 | | | | 722,640 | | | |
Lionbridge Technologies, Inc.* | | | 143,995 | | | | 568,780 | | | |
Mattersight Corp.*+ | | | 77,877 | | | | 301,384 | | | |
ModusLink Global Solutions, Inc.*+ | | | 190,000 | | | | 233,700 | | | |
NCI, Inc., Class A | | | 38,430 | | | | 539,942 | | | |
Newtek Business Services Corp.+ | | | 18,200 | | | | 231,504 | | | |
PRGX Global, Inc.*+ | | | 178,800 | | | | 933,336 | | | |
StarTek, Inc.*+ | | | 65,000 | | | | 284,050 | | | |
WidePoint Corp.* | | | 70,447 | | | | 41,564 | | | |
| | | | | | | | | | |
| | | |
| | | | | | | 6,282,717 | | | |
| |
Leisure Equipment & Products - 0.67% | | | |
Escalade, Inc.+ | | | 39,780 | | | | 407,347 | | | |
JAKKS Pacific, Inc.*+ | | | 106,000 | | | | 838,460 | | | |
Johnson Outdoors, Inc., Class A | | | 37,400 | | | | 961,180 | | | |
| | | | | | | | | | |
| | | |
| | | | | | | 2,206,987 | | | |
| | |
Life Sciences Tools & Services - 1.00% | | | | | | | |
Enzo Biochem, Inc.* | | | 268,800 | | | | 1,604,736 | | | |
Harvard Bioscience, Inc.* | | | 217,017 | | | | 620,669 | | | |
NanoString Technologies, Inc.*+ | | | 12,000 | | | | 151,200 | | | |
pSivida Corp.* | | | 168,000 | | | | 475,440 | | | |
Sequenom, Inc.*+ | | | 510,550 | | | | 466,490 | | | |
| | | | | | | | | | |
| | | |
| | | | | | | 3,318,535 | | | |
| |
Machinery - 3.75% | | | |
Accuride Corp.* | | | 197,200 | | | | 244,528 | | | |
Ampco-Pittsburgh Corp.+ | | | 57,999 | | | | 655,969 | | | |
Chicago Rivet & Machine Co. | | | 10,000 | | | | 272,200 | | | |
Commercial Vehicle Group, Inc.* | | | 131,000 | | | | 681,200 | | | |
Dynamic Materials Corp.+ | | | 68,900 | | | | 740,675 | | | |
Eastern Co. (The) | | | 33,600 | | | | 557,088 | | | |
Gencor Industries, Inc.* | | | 73,500 | | | | 1,140,720 | | | |
Graham Corp. | | | 45,900 | | | | 845,478 | | | |
| | | | | | | | |
| Industry Company | | Shares | | | Value | |
| | |
| | | | | | | | |
Machinery (continued) | |
Hardinge, Inc. | | | 53,300 | | | | $ 536,198 | |
Hurco Companies, Inc. | | | 46,334 | | | | 1,289,475 | |
Intelligent Systems Corp.+ | | | 35,362 | | | | 131,547 | |
Key Technology, Inc.* | | | 23,900 | | | | 220,119 | |
L.B. Foster Co., Class A+ | | | 29,000 | | | | 315,810 | |
L.S. Starrett Co. (The), Class A | | | 38,136 | | | | 454,200 | |
MFRI, Inc.* | | | 71,100 | | | | 530,406 | |
Miller Industries, Inc. | | | 29,800 | | | | 613,582 | |
Supreme Industries, Inc., Class A | | | 149,793 | | | | 2,052,164 | |
Twin Disc, Inc.+ | | | 86,730 | | | | 931,480 | |
Xerium Technologies, Inc.*+ | | | 33,550 | | | | 214,049 | |
| | | | | | | | |
| | |
| | | | | | | 12,426,888 | |
|
Media - 1.67% | |
A.H. Belo Corp., Class A | | | 81,300 | | | | 406,500 | |
Ballantyne Strong, Inc.* | | | 117,020 | | | | 612,015 | |
Beasley Broadcast Group, Inc., Class A | | | 28,125 | | | | 118,406 | |
Emmis Communications Corp., Class A* | | | 236,500 | | | | 172,054 | |
Harte-Hanks, Inc. | | | 175,000 | | | | 278,250 | |
Lee Enterprises, Inc.*+ | | | 330,000 | | | | 630,300 | |
McClatchy Co. (The), Class A*+ | | | 14,435 | | | | 211,040 | |
ReachLocal, Inc.* | | | 86,860 | | | | 395,213 | |
Saga Communications, Inc., Class A+ | | | 16,866 | | | | 666,882 | |
Salem Media Group, Inc.+ | | | 145,100 | | | | 1,047,622 | |
Sizmek, Inc.* | | | 110,210 | | | | 252,381 | |
Spanish Broadcasting System, Inc., Class A*+ | | | 13,629 | | | | 48,519 | |
Townsquare Media, Inc.,
Class A*+ | | | 89,852 | | | | 708,932 | |
| | | | | | | | |
| | |
| | | | | | | 5,548,114 | |
|
Metals & Mining - 2.31% | |
A.M. Castle & Co.*+ | | | 181,400 | | | | 297,496 | |
A-Mark Precious Metals, Inc. | | | 30,100 | | | | 487,018 | |
Energy Fuels, Inc.*+ | | | 131,274 | | | | 297,992 | |
Friedman Industries, Inc. | | | 68,300 | | | | 398,189 | |
Gold Resource Corp. | | | 129,100 | | | | 463,469 | |
Olympic Steel, Inc. | | | 69,300 | | | | 1,892,583 | |
Ryerson Holding Corp.*+ | | | 134,000 | | | | 2,345,000 | |
Synalloy Corp.+ | | | 77,400 | | | | 592,884 | |
Universal Stainless & Alloy Products, Inc.*+ | | | 80,786 | | | | 880,567 | |
| | | | | | | | |
| | |
| | | | | | | 7,655,198 | |
|
Multiline Retail - 0.26% | |
Bon-Ton Stores, Inc. (The) | | | 150,439 | | | | 212,119 | |
| | |
Ultra-Small Company Market Fund SCHEDULE OF INVESTMENTS (continued) | | |
Showing percentage of net assets as of June 30, 2016
| | | | | | | | | | |
| Industry Company | | Shares | | | Value | | | |
| |
Common Stocks (continued) | | | |
Multiline Retail (continued) | | | |
Flex Pharma, Inc.*+ | | | 31,000 | | | | $ 316,510 | | | |
Gordmans Stores, Inc.*+ | | | 255,100 | | | | 329,079 | | | |
| | | | | | | | | | |
| | | |
| | | | | | | 857,708 | | | |
| |
Oil, Gas & Consumable Fuels - 5.22% | | | |
Adams Resources & Energy, Inc. | | | 22,300 | | | | 858,550 | | | |
Aemetis, Inc.*+ | | | 204,139 | | | | 465,437 | | | |
Amyris, Inc.* | | | 277,748 | | | | 125,125 | | | |
Approach Resources, Inc.*+ | | | 426,400 | | | | 895,440 | | | |
Aspen Aerogels, Inc.*+ | | | 221,130 | | | | 1,099,016 | | | |
Bill Barrett Corp.*+ | | | 52,100 | | | | 332,919 | | | |
Bonanza Creek Energy, Inc.*+ | | | 115,000 | | | | 231,150 | | | |
Callon Petroleum Co.* | | | 132,800 | | | | 1,491,344 | | | |
Clayton Williams Energy, Inc.*+ | | | 11,500 | | | | 315,790 | | | |
Cloud Peak Energy, Inc.*+ | | | 160,000 | | | | 329,600 | | | |
Comstock Resources, Inc.*+ | | | 359,000 | | | | 301,668 | | | |
Contango Oil & Gas Co.* | | | 75,000 | | | | 918,000 | | | |
Earthstone Energy, Inc.*+ | | | 39,250 | | | | 423,115 | | | |
Evolution Petroleum Corp. | | | 232,123 | | | | 1,269,713 | | | |
FieldPoint Petroleum Corp.* | | | 30,000 | | | | 18,600 | | | |
Gastar Exploration, Inc.* | | | 345,200 | | | | 379,720 | | | |
Harvest Natural Resources, Inc.* | | | 224,500 | | | | 187,458 | | | |
Independence Contract Drilling, Inc.*+ | | | 148,000 | | | | 803,640 | | | |
ION Geophysical Corp.*+ | | | 96,484 | | | | 601,095 | | | |
Jones Energy, Inc., Class A*+ | | | 147,742 | | | | 608,697 | | | |
Panhandle Oil & Gas, Inc., Class A | | | 23,594 | | | | 393,312 | | | |
PetroQuest Energy, Inc.* | | | 153,254 | | | | 510,336 | | | |
Resolute Energy Corp.* | | | 91,860 | | | | 272,824 | | | |
REX American Resources Corp.* | | | 20,249 | | | | 1,211,498 | | | |
Rex Energy Corp.*+ | | | 465,300 | | | | 307,331 | | | |
Ring Energy, Inc.*+ | | | 83,711 | | | | 738,331 | | | |
Triangle Petroleum Corp.* | | | 271,000 | | | | 77,804 | | | |
Uranium Energy Corp.*+ | | | 145,000 | | | | 127,281 | | | |
VAALCO Energy, Inc.* | | | 307,000 | | | | 325,420 | | | |
W&T Offshore, Inc.*+ | | | 325,000 | | | | 754,000 | | | |
Westmoreland Coal Co.* | | | 75,000 | | | | 714,000 | | | |
Yuma Energy, Inc.* | | | 144,800 | | | | 42,238 | | | |
Zion Oil & Gas, Inc.* | | | 132,285 | | | | 183,876 | | | |
| | | | | | | | | | |
| | | |
| | | | | | | 17,314,328 | | | |
| |
Paper & Forest Products - 0.05% | | | |
Orient Paper, Inc.* | | | 163,811 | | | | 170,363 | | | |
| | | | | | | | | | |
| | | | | | | | | | |
| | | | | | | | | | | | |
| Industry Company | | Shares | | | Value | | | | | |
| | |
| | | | | |
Personal Products - 0.47% | | | | | |
CCA Industries, Inc.* | | | 15,752 | | | | $ 51,352 | | | | | |
Mannatech, Inc.* | | | 13,600 | | | | 275,264 | | | | | |
Natural Alternatives International, Inc.* | | | 19,910 | | | | 219,806 | | | | | |
Nutraceutical International Corp.* | | | 37,000 | | | | 856,550 | | | | | |
United-Guardian, Inc. | | | 10,000 | | | | 160,700 | | | | | |
| | | | | | | | | | | | |
| | | | |
| | | | | | | 1,563,672 | | | | | |
| | |
Pharmaceuticals - 2.96% | | | | | |
AcelRx Pharmaceuticals, Inc.*+ | | | 243,650 | | | | 655,419 | | | | | |
Achaogen, Inc.*+ | | | 125,400 | | | | 475,266 | | | | | |
Agile Therapeutics, Inc.*+ | | | 104,634 | | | | 796,265 | | | | | |
Alimera Sciences, Inc.* | | | 184,444 | | | | 226,866 | | | | | |
Ampio Pharmaceuticals, Inc.*+ | | | 273,400 | | | | 352,686 | | | | | |
Anthera Pharmaceuticals, Inc.*+ | | | 145,750 | | | | 450,368 | | | | | |
Aralez Pharmaceuticals, Inc.*+ | | | 38,200 | | | | 126,060 | | | | | |
Corium International, Inc.* | | | 140,000 | | | | 485,800 | | | | | |
Cumberland Pharmaceuticals, Inc.* | | | 202,500 | | | | 911,250 | | | | | |
Durect Corp.* | | | 433,600 | | | | 528,992 | | | | | |
Egalet Corp.*+ | | | 166,950 | | | | 828,072 | | | | | |
Endocyte, Inc.*+ | | | 174,000 | | | | 558,540 | | | | | |
Inotek Pharmaceuticals Corp.*+ | | | 20,713 | | | | 154,105 | | | | | |
Marinus Pharmaceuticals, Inc.*+ | | | 75,500 | | | | 95,885 | | | | | |
Ocera Therapeutics, Inc.* | | | 169,800 | | | | 322,620 | | | | | |
Pain Therapeutics, Inc.* | | | 368,253 | | | | 806,474 | | | | | |
Tonix Pharmaceuticals Holding Corp.*+ | | | 94,401 | | | | 187,858 | | | | | |
Tracon Pharmaceuticals, Inc.*+ | | | 37,135 | | | | 162,651 | | | | | |
VIVUS, Inc.* | | | 512,800 | | | | 574,336 | | | | | |
vTv Therapeutics, Inc. Class A* | | | 60,000 | | | | 348,000 | | | | | |
Zafgen, Inc.*+ | | | 130,000 | | | | 778,700 | | | | | |
| | | | | | | | | | | | |
| | | | |
| | | | | | | 9,826,213 | | | | | |
| | |
Professional Services - 2.03% | | | | | |
CDI Corp. | | | 104,600 | | | | 638,060 | | | | | |
CRA International, Inc.* | | | 54,500 | | | | 1,374,490 | | | | | |
Franklin Covey Co.* | | | 33,334 | | | | 511,010 | | | | | |
Hill International, Inc.* | | | 286,551 | | | | 1,166,263 | | | | | |
Hudson Global, Inc. | | | 264,760 | | | | 521,577 | | | | | |
Mastech Holdings, Inc.* | | | 6,250 | | | | 41,563 | | | | | |
RCM Technologies, Inc.+ | | | 111,510 | | | | 580,967 | | | | | |
| | |
| 32 | | Annual Report | June 30, 2016 |
| | |
Ultra-Small Company Market Fund SCHEDULE OF INVESTMENTS (continued) | | |
Showing percentage of net assets as of June 30, 2016
| | | | | | | | | | | | |
| Industry Company | | Shares | | | Value | | | | | |
| | |
Common Stocks (continued) | | | | | |
Professional Services (continued) | | | | | |
Volt Information Sciences, Inc.* | | | 90,676 | | | | $ 535,895 | | | | | |
VSE Corp. | | | 20,200 | | | | 1,349,360 | | | | | |
| | | | | | | | | | | | |
| | | | |
| | | | | | | 6,719,185 | | | | | |
| | |
Real Estate Management & Development - 0.77% | | | | | |
AV Homes, Inc.*+ | | | 52,800 | | | | 645,216 | | | | | |
Consolidated-Tomoka Land Co.+ | | | 21,249 | | | | 1,008,690 | | | | | |
Maui Land & Pineapple Co., Inc.* | | | 30,000 | | | | 216,600 | | | | | |
Stratus Properties, Inc.*+ | | | 37,150 | | | | 695,820 | | | | | |
| | | | | | | | | | | | |
| | | | |
| | | | | | | 2,566,326 | | | | | |
| | |
Road & Rail - 0.55% | | | | | |
Covenant Transportation Group, Inc., Class A* | | | 30,700 | | | | 554,749 | | | | | |
PAM Transportation Services, Inc.* | | | 23,400 | | | | 371,826 | | | | | |
Providence & Worcester Railroad Co. | | | 5,000 | | | | 81,500 | | | | | |
USA Truck, Inc.* | | | 46,800 | | | | 819,468 | | | | | |
| | | | | | | | | | | | |
| | | | |
| | | | | | | 1,827,543 | | | | | |
| | |
Semiconductors & Semiconductor
Equipment - 2.01% | | | | | |
Amtech Systems, Inc.* | | | 57,500 | | | | 343,275 | | | | | |
AXT, Inc.* | | | 201,006 | | | | 641,209 | | | | | |
CyberOptics Corp.* | | | 99,300 | | | | 1,487,514 | | | | | |
DSP Group, Inc.* | | | 81,300 | | | | 862,593 | | | | | |
GigPeak, Inc.* | | | 221,900 | | | | 434,924 | | | | | |
GSI Technology, Inc.* | | | 161,417 | | | | 673,109 | | | | | |
Intermolecular, Inc.* | | | 347,600 | | | | 514,448 | | | | | |
inTEST Corp.*+ | | | 49,500 | | | | 188,595 | | | | | |
Magnachip Semiconductor Corp.*+ | | | 132,000 | | | | 747,120 | | | | | |
Pixelworks, Inc.* | | | 58,900 | | | | 108,376 | | | | | |
Ultra Clean Holdings, Inc.* | | | 118,377 | | | | 673,565 | | | | | |
| | | | | | | | | | | | |
| | | | |
| | | | | | | 6,674,728 | | | | | |
| | |
Software - 1.63% | | | | | |
American Software, Inc., Class A | | | 35,700 | | | | 374,136 | | | | | |
BSQUARE Corp.*+ | | | 79,500 | | | | 443,610 | | | | | |
Covisint Corp.*+ | | | 90,600 | | | | 197,508 | | | | | |
Exa Corp.*+ | | | 74,150 | | | | 1,071,468 | | | | | |
FalconStor Software, Inc.* | | | 397,500 | | | | 417,375 | | | | | |
GlobalSCAPE, Inc. | | | 81,700 | | | | 301,473 | | | | | |
GSE Systems, Inc.* | | | 195,125 | | | | 435,129 | | | | | |
Guidance Software, Inc.*+ | | | 134,481 | | | | 832,437 | | | | | |
QAD, Inc., Class B+ | | | 8,250 | | | | 142,725 | | | | | |
| | | | | | | | | | |
| Industry Company | | Shares | | | Value | | | |
| |
| | | |
Software (continued) | | | |
Rosetta Stone, Inc.* | | | 103,160 | | | | $ 799,490 | | | |
Seachange International, Inc.* | | | 39,000 | | | | 124,410 | | | |
Upland Software, Inc.*+ | | | 34,000 | | | | 259,080 | | | |
| | | | | | | | | | |
| | | |
| | | | | | | 5,398,841 | | | |
| |
Specialty Retail - 1.53% | | | |
Big 5 Sporting Goods Corp. | | | 14,200 | | | | 131,634 | | | |
Build-A-Bear Workshop, Inc.* | | | 29,500 | | | | 395,890 | | | |
Christopher & Banks Corp.* | | | 132,200 | | | | 289,518 | | | |
Destination Maternity Corp.+ | | | 121,000 | | | | 711,480 | | | |
Destination XL Group, Inc.* | | | 149,100 | | | | 681,387 | | | |
hhgregg, Inc.*+ | | | 100,000 | | | | 177,000 | | | |
New York & Co., Inc.* | | | 283,300 | | | | 422,117 | | | |
Tandy Leather Factory, Inc.*+ | | | 62,000 | | | | 440,820 | | | |
Tilly’s, Inc., Class A*+ | | | 142,175 | | | | 823,193 | | | |
Trans World Entertainment Corp.*+ | | | 98,403 | | | | 369,011 | | | |
West Marine, Inc.* | | | 73,132 | | | | 613,577 | | | |
| | | | | | | | | | |
| | | |
| | | | | | | 5,055,627 | | | |
Textiles, Apparel & Luxury Goods - 1.15% | | | |
Charles & Colvard, Ltd.* | | | 50,521 | | | | 51,531 | | | |
Cherokee, Inc.*+ | | | 16,100 | | | | 178,871 | | | |
Culp, Inc. | | | 26,016 | | | | 718,822 | | | |
Delta Apparel, Inc.*+ | | | 32,988 | | | | 743,879 | | | |
Lakeland Industries, Inc.*+ | | | 67,557 | | | | 585,719 | | | |
Perry Ellis International, Inc.* | | | 35,000 | | | | 704,200 | | | |
Rocky Brands, Inc. | | | 72,200 | | | | 824,524 | | | |
| | | | | | | | | | |
| | | |
| | | | | | | 3,807,546 | | | |
Thrifts & Mortgage Finance - 5.07% | | | |
ASB Bancorp, Inc.*+ | | | 21,000 | | | | 515,130 | | | |
Atlantic Coast Financial Corp.*+ | | | 28,050 | | | | 167,739 | | | |
Bank Mutual Corp. | | | 99,000 | | | | 760,320 | | | |
Chicopee Bancorp, Inc. | | | 26,500 | | | | 483,890 | | | |
Citizens Community Bancorp, Inc. | | | 35,600 | | | | 368,816 | | | |
Eagle Bancorp Montana, Inc. | | | 6,289 | | | | 79,933 | | | |
ESSA Bancorp, Inc.+ | | | 59,000 | | | | 790,600 | | | |
First Defiance Financial Corp. | | | 26,900 | | | | 1,045,065 | | | |
First Financial Northwest, Inc.+ | | | 61,600 | | | | 818,048 | | | |
Fox Chase Bancorp, Inc. | | | 3,433 | | | | 69,827 | | | |
| | |
Ultra-Small Company Market Fund SCHEDULE OF INVESTMENTS (continued) | | |
Showing percentage of net assets as of June 30, 2016
| | | | | | | | | | |
| Industry Company | | | | Shares | | Value | | | |
| |
Common Stocks (continued) | | | |
Thrifts & Mortgage Finance (continued) | | | |
Guaranty Federal Bancshares, Inc.+ | | | | 20,856 | | $ | 333,070 | | | |
Hingham Institution for Savings+ | | | | 2,500 | | | 307,300 | | | |
HMN Financial, Inc.*+ | | | | 25,000 | | | 339,500 | | | |
Home Bancorp, Inc.+ | | | | 42,300 | | | 1,161,981 | | | |
HopFed Bancorp, Inc.+ | | | | 32,988 | | | 382,331 | | | |
Lake Shore Bancorp, Inc.+ | | | | 22,150 | | | 288,615 | | | |
Lake Sunapee Bank Group+ | | | | 20,250 | | | 346,478 | | | |
Malvern Bancorp, Inc.* | | | | 37,800 | | | 589,680 | | | |
Ocean Shore Holding Co. | | | | 51,837 | | | 879,156 | | | |
Provident Financial Holdings, Inc.+ | | | | 63,617 | | | 1,164,191 | | | |
Riverview Bancorp, Inc.+ | | | | 138,006 | | | 652,768 | | | |
Security National Financial Corp., Class A*+ | | | | 40,517 | | | 198,128 | | | |
SI Financial Group, Inc.+ | | | | 83,176 | | | 1,101,250 | | | |
Southern Missouri Bancorp, Inc.+ | | | | 45,800 | | | 1,077,674 | | | |
Territorial Bancorp, Inc. | | | | 22,300 | | | 590,281 | | | |
Timberland Bancorp, Inc. | | | | 49,022 | | | 735,330 | | | |
United Community Bancorp+ | | | | 26,200 | | | 368,634 | | | |
United Community Financial Corp. | | | | 62,800 | | | 381,824 | | | |
Wayne Savings Bancshares, Inc. | | | | 7,800 | | | 99,216 | | | |
Westfield Financial, Inc.+ | | | | 94,100 | | | 724,570 | | | |
| | | | | | | | | | |
| | | | |
| | | | | | | 16,821,345 | | | |
| |
Trading Companies & Distributors - 0.95% | | | |
AeroCentury Corp.*+ | | | | 10,900 | | | 99,408 | | | |
CAI International, Inc.* | | | | 43,000 | | | 322,500 | | | |
EnviroStar, Inc.+ | | | | 35,000 | | | 128,800 | | | |
General Finance Corp.*+ | | | | 170,900 | | | 726,325 | | | |
Houston Wire & Cable Co. | | | | 59,300 | | | 311,325 | | | |
Lawson Products, Inc.* | | | | 32,400 | | | 643,464 | | | |
Transcat, Inc.* | | | | 5,000 | | | 50,250 | | | |
Willis Lease Finance Corp.*+ | | | | 39,000 | | | 866,970 | | | |
| | | | | | | | | | |
| | | | |
| | | | | | | 3,149,042 | | | |
| |
Water Utilities - 0.92% | | | |
Artesian Resources Corp., Class A | | | | 21,500 | | | 729,280 | | | |
Cadiz, Inc.*+ | | | | 71,700 | | | 420,879 | | | |
York Water Co., (The)+ | | | | 58,750 | | | 1,882,350 | | | |
| | | | | | | | | | |
| | | | |
| | | | | | | 3,032,509 | | | |
| | | | | | | | | | |
| | |
TOTAL COMMON STOCKS - 99.61% | | | 330,250,006 | | | |
| | | | | | | | | | |
(Cost $291,035,159) | | | | | | | | |
| | | | | | | | |
| | | | | | | | | | |
| Industry Company | | | | Shares | | Value | | | |
| |
EXCHANGE TRADED FUND - 0.35% | | | |
iShares Micro-Cap ETF+ | | 16,525 | | | $1,168,648 | | | |
| | | | | | | | | | |
| | |
TOTAL EXCHANGE TRADED FUND - 0.35% | | | 1,168,648 | | | |
| | | | | | | | | | |
(Cost $442,002) | | | | | | |
| |
WARRANTS - 0.00% | | | |
Asterias Biotherapeutics, Inc.*+ | | 27,672 | | | 5,540 | | | |
Biotime, Inc.,
expire 10/01/18*+ | | 16,058 | | | 7,547 | | | |
| | | | | | | | | | |
| | |
TOTAL WARRANTS - 0.00% | | | 13,087 | | | |
| | | | | | | | | | |
(Cost $36,343) | | | | | | |
| | | | |
| | | Rate^ | | Shares | | Value | | | |
| |
MONEY MARKET FUND - 0.00% | | | |
Dreyfus Cash Management Fund | | 0.30% | | 277 | | | 277 | | | |
| | | | | | | | | | |
TOTAL MONEY MARKET FUND - 0.00% | | | 277 | | | |
| | | | | | | | | | |
(Cost $277) | | | | | | |
| |
| INVESTMENTS PURCHASED WITH CASH PROCEEDS FROM SECURITIES LENDING - 16.68% | | | |
Dreyfus Cash Management Fund** | | 0.30% | | 55,281,243 | | | 55,281,243 | | | |
| | | | | | | | | | |
| | |
TOTAL INVESTMENTS PURCHASED WITH CASH PROCEEDS FROM SECURITIES LENDING - 16.68% | | | 55,281,243 | | | |
| | | | | | | | | | |
(Cost $55,281,243) | | | | | | |
| | |
TOTAL INVESTMENTS - 116.64% | | | $386,713,261 | | | |
(Cost $346,795,024) | | | | | | |
Liabilities in Excess of Other Assets - (16.64%) | | | (55,177,871 | ) | | |
| | | | | | | | | | |
| | |
NET ASSETS - 100.00% | | | $331,535,390 | | | |
| | | | | | | | | | |
| | | | |
| |
| * | | Non-income producing security. |
| ** | | This security represents the investment of the collateral received in connection with securities out on loan as of June 30, 2016. |
| ^ | | Rate disclosed as of June 30, 2016. |
| + | | This security or a portion of the security is out on loan as of June 30, 2016. Total loaned securities had a value of $52,923,212 as of June 30, 2016. |
| |
| LLC - Limited Liability Company | | |
| | |
| 34 | | Annual Report | June 30, 2016 |
| | |
Ultra-Small Company Market Fund SCHEDULE OF INVESTMENTS (continued) | | |
Showing percentage of net assets as of June 30, 2016
| | | | | | | | | | | | | | | | | | |
Summary of inputs used to value the Fund’s investments
as of 06/30/2016 (See Note 2 in Notes to Financial Statements): |
| | | Valuation Inputs | | | |
| | | Investment in Securities (Value) | | | |
| | | Level 1 Quoted Prices | | | Level 2
Significant
Observable
Inputs | | | Level 3 Significant Unobservable Inputs | | | Total | | | |
Common Stocks | | $ | 330,250,006 | | | $ | — | | | $ | — | | | $ | 330,250,006 | | | |
Exchange Traded Fund | | | 1,168,648 | | | | — | | | | — | | | | 1,168,648 | | | |
Warrants | | | 13,087 | | | | — | | | | — | | | | 13,087 | | | |
Money Market Fund | | | — | | | | 277 | | | | — | | | | 277 | | | |
Investments Purchased with Cash Proceeds from Securities Lending | | | — | | | | 55,281,243 | | | | — | | | | 55,281,243 | | | |
| | | | | | | | | | | | | | | | | | |
TOTAL | | $ | 331,431,741 | | | $ | 55,281,520 | | | $ | — | | | $ | 386,713,261 | | | |
| | | | | | | | | | | | | | | | | | |
| | | | | | | | | | | | | | | | | | |
| | | | | | | | | | | | | | | | | | |
| | | | | | | | | | | | | | | | | | |
Following is a reconciliation of Level 3 investments for which significant unobservable inputs were used to determine fair value:
| | | | | | | | | | | | | | | | |
| | | Investment in Securities (Value) | | | | |
| | | Common Stocks | | | Total | | | | | | | |
Balance as of 06/30/2015 | | $ | 2,740 | | | $ | 2,740 | | | | | | | | | |
Purchases | | | — | | | | — | | | | | | | | | |
Sales | | | (27) | | | | (27 | ) | | | | | | | | |
Realized Gain/(Loss) | | | (118,341) | | | | (118,341 | ) | | | | | | | | |
Change in Unrealized Appreciation/ (Depreciation) | | | 115,628 | | | | 115,628 | | | | | | | | | |
Transfers in | | | — | | | | — | | | | | | | | | |
Transfers out | | | — | | | | — | | | | | | | | | |
| | | | | | | | | | | | | | | | |
Balance as of 06/30/2016 | | $ | — | | | $ | — | | | | | | | | | |
| | | | | | | | | | | | | | | | |
| |
| See Notes to Financial Statements. | | | | | |
| | |
Small-Cap Momentum Fund MANAGER’S COMMENTARY (Unaudited) | | |
June 30, 2016
Dear Fellow Small-Cap Momentum Fund Shareholder,
For the quarter ended June 30, 2016, our Fund returned 5.60%, outperforming our primary market benchmark, the Russell 2000 Index (3.79%). It was a good quarter.
For the fiscal year, our Fund returned -3.48%, outperforming the Russell 2000 Index (-6.73%).
The table below presents our June quarter, one-year, five-year and inception-to-date financial results. See the next page for a graph of performance since inception.
Standardized Returns as of June 30, 2016
| | | | | | | | | | | | | | | | | | | | | | | | | | | | | | | | |
| | | | | | | | | | | | | | | | | | | | | Annualized | | | | | | | |
| | | Quarter | | | | | 1 Year | | | | | | | 5 Year | | | | | | Since Inception
(5/28/10) | | | |
Small-Cap Momentum Fund | | | 5.60% | | | | | | -3.48% | | | | | | | | 7.77% | | | | | | | | 10.77% | | |
Russell 2000 Index | | | 3.79% | | | | | | -6.73% | | | | | | | | 8.35% | | | | | | | | 11.04% | | |
Performance figures quoted in the table above represent past performance and are no guarantee of future results. Total return figures in the table above include the reinvestment of dividends and capital gains. The table above does not reflect the deduction of taxes that a shareholder would pay on Fund distributions or on the redemption of Fund shares.
The Russell 2000 Index is an unmanaged, market value weighted index that measures performance of the 2,000 companies that are between the 1,000th and 3,000th largest in the market with dividends reinvested. It is not possible to invest directly in an index. Periods longer than one year are annualized.
According to data from Lipper as of June 30, 2016, Small-Cap Momentum Fund ranked 262nd of 821 small-cap core funds for the 12 months ended June 30, 2016, 339th of 607 over the last five years, and 277th of 566 such funds since inception in May 2010. Lipper is an independent mutual fund rating service owned by Broadridge Financial Solutions, Inc. that ranks funds in various fund categories by making comparative calculations using total returns.
| | |
| 36 | | Annual Report | June 30, 2016 |
| | |
Small-Cap Momentum Fund MANAGER’S COMMENTARY (Unaudited) (continued) | | |
Small-Cap Momentum Fund vs. Russell 2000 Index
from Inception 5/28/10 to 6/30/16
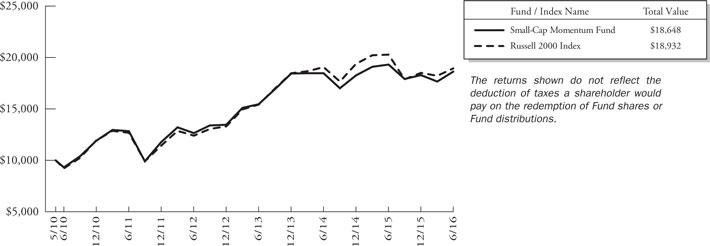
Detailed Explanation of Quarterly Performance
The price momentum factor had a strong quarter, boosting the Fund’s return relative to its benchmark. The Fund’s risk-adjustment feature, which steers it away from some of the higher-volatility stocks in the momentum factor, also helped relative performance.
Detailed Explanation of Fiscal Year Performance
Momentum holdings outperformed the Russell 2000 Index for the fiscal year, and the risk-adjustment overlay feature performed according to design, boosting relative returns.
Top Ten Holdings as of June 30, 2016
| | | | | | | | | |
| Rank | | Description | | Industry | | % of Net
Assets |
| 1 | | First Industrial Realty Trust, Inc. | | Real Estate Investment Trusts | | | | 0.8% | |
| 2 | | Blackbaud, Inc. | | Software | | | | 0.8% | |
| 3 | | Snyders-Lance, Inc. | | Food Products | | | | 0.8% | |
| 4 | | Piedmont Office Realty Trust, Inc. | | Real Estate Investment Trusts | | | | 0.8% | |
| 5 | | Integra LifeSciences Holdings Corp. | | Health Care Equipment & Supplies | | | | 0.8% | |
| 6 | | PS Business Parks, Inc. | | Real Estate Investment Trusts | | | | 0.8% | |
| 7 | | National Beverage Corp. | | Beverages | | | | 0.8% | |
| 8 | | Chimera Investment Corp. | | Real Estate Investment Trusts | | | | 0.8% | |
| 9 | | B&G Foods, Inc. | | Food Products | | | | 0.8% | |
| 10 | | Healthcare Services Group, Inc. | | Commercial Services & Supplies | | | | 0.7% | |
| | | |
| | Total | | | | | | 7.9% | |
| | |
Small-Cap Momentum Fund MANAGER’S COMMENTARY (Unaudited) (continued) | | |
Industry Sector Representation as of June 30, 2016
| | | | | | | | | | | | | | | |
| | | % of Net Assets | | % of Russell 2000
Index | | Difference |
Consumer Discretionary | | | | 9.4% | | | | | 13.4% | | | | | -4.0% | |
Consumer Staples | | | | 6.1% | | | | | 3.1% | | | | | 3.0% | |
Energy | | | | 1.1% | | | | | 3.1% | | | | | -2.0% | |
Financials | | | | 36.7% | | | | | 25.8% | | | | | 10.9% | |
Health Care | | | | 10.5% | | | | | 13.6% | | | | | -3.1% | |
Industrials | | | | 13.6% | | | | | 13.9% | | | | | -0.3% | |
Information Technology | | | | 12.2% | | | | | 17.3% | | | | | -5.1% | |
Materials | | | | 5.5% | | | | | 4.6% | | | | | 0.9% | |
Telecommunication Services | | | | 1.9% | | | | | 0.9% | | | | | 1.0% | |
Utilities | | | | 2.8% | | | | | 4.3% | | | | | -1.5% | |
Cash & Other Assets | | | | 0.2% | | | | | 0.0% | | | | | 0.2% | |
| | | |
Total | | | | 100.0% | | | | | 100.0% | | | | | | |
Disclaimer
The views expressed here are exclusively those of Fund management. These views, including those related to market sectors or individual stocks, are not meant as investment advice and should not be considered predictive in nature. Any favorable (or unfavorable) description of a holding applies only as of June 30, 2016, unless otherwise stated. Security positions can and do change thereafter. Discussions of historical performance do not guarantee and are not indicative of future performance.
Market volatility can significantly impact short-term performance. The Fund is not an appropriate investment for short-term investors. Investments in small companies generally carry greater risk than is customarily associated with larger companies. This additional risk is attributable to a number of factors, including the relatively limited financial resources that are typically available to small companies and the fact that small companies often have comparatively limited product lines. In addition, the stock of small companies tends to be more volatile than the stock of large companies, particularly in the short term and particularly in the early stages of an economic or market downturn. Shareholders of the Fund, therefore, are taking on more risk than they would if they invested in the stock market as a whole.
Conclusion
Thank you for your continued investment in Small-Cap Momentum Fund. We encourage your feedback; your reactions and concerns are important to us.
|
| Sincerely, |
|
| The Investment Management Team |
| | |
| 38 | | Annual Report | June 30, 2016 |
| | |
Small-Cap Momentum Fund SCHEDULE OF INVESTMENTS | | |
Showing percentage of net assets as of June 30, 2016
| | | | | | | | | | |
| Industry Company | | Shares | | | Value | | | |
| |
COMMON STOCKS - 99.81% | | | |
Aerospace & Defense - 0.35% | | | |
Aerovironment, Inc.* | | | 250 | | | | $ 6,950 | | | |
National Presto Industries, Inc.+ | | | 80 | | | | 7,548 | | | |
| | | | | | | | | | |
| | | |
| | | | | | | 14,498 | | | |
| |
Air Freight & Logistics - 0.22% | | | |
Air Transport Services Group, Inc.* | | | 700 | | | | 9,072 | | | |
| |
Airlines - 0.88% | | | |
Hawaiian Holdings, Inc.* | | | 550 | | | | 20,878 | | | |
SkyWest, Inc. | | | 600 | | | | 15,876 | | | |
| | | | | | | | | | |
| | | |
| | | | | | | 36,754 | | | |
| |
Auto Components - 1.68% | | | |
Cooper-Standard Holding, Inc.* | | | 200 | | | | 15,798 | | | |
Dorman Products, Inc.*+ | | | 350 | | | | 20,020 | | | |
Stoneridge, Inc.* | | | 300 | | | | 4,482 | | | |
Superior Industries International, Inc. | | | 250 | | | | 6,695 | | | |
Visteon Corp. | | | 350 | | | | 23,034 | | | |
| | | | | | | | | | |
| | | |
| | | | | | | 70,029 | | | |
| |
Automobiles - 0.16% | | | |
Winnebago Industries, Inc.+ | | | 300 | | | | 6,876 | | | |
| |
Beverages - 1.44% | | | |
Cott Corp. | | | 1,300 | | | | 18,148 | | | |
MGP Ingredients, Inc. | | | 200 | | | | 7,646 | | | |
National Beverage Corp.* | | | 500 | | | | 31,405 | | | |
Primo Water Corp.* | | | 250 | | | | 2,952 | | | |
| | | | | | | | | | |
| | | |
| | | | | | | 60,151 | | | |
| |
Biotechnology - 1.52% | | | |
Emergent BioSolutions, Inc.* | | | 400 | | | | 11,248 | | | |
Fortress Biotech, Inc.* | | | 500 | | | | 1,345 | | | |
Lexicon Pharmaceuticals, Inc.*+ | | | 1,100 | | | | 15,785 | | | |
Ligand Pharmaceuticals, Inc.*+ | | | 230 | | | | 27,432 | | | |
Loxo Oncology, Inc.*+ | | | 250 | | | | 5,795 | | | |
PharmAthene, Inc.*+ | | | 700 | | | | 1,708 | | | |
| | | | | | | | | | |
| | | |
| | | | | | | 63,313 | | | |
| |
Building Products - 2.22% | | | |
AAON, Inc. | | | 550 | | | | 15,131 | | | |
American Woodmark Corp.* | | | 200 | | | | 13,276 | | | |
Gibraltar Industries, Inc.* | | | 350 | | | | 11,050 | | | |
Insteel Industries, Inc. | | | 200 | | | | 5,718 | | | |
Masonite International Corp.* | | | 300 | | | | 19,842 | | | |
| | | | | | | | | | |
| Industry Company | | Shares | | | Value | | | |
| | | |
Building Products (continued) | | | |
U.S. Concrete, Inc.*+ | | | 150 | | | | $ 9,136 | | | |
Universal Forest Products, Inc. | | | 200 | | | | 18,538 | | | |
| | | | | | | | | | |
| | | |
| | | | | | | 92,691 | | | |
| |
Capital Markets - 0.94% | | | |
Diamond Hill Investment Group, Inc. | | | 35 | | | | 6,595 | | | |
Evercore Partners, Inc., Class A | | | 400 | | | | 17,676 | | | |
GAMCO Investors, Inc., Class A | | | 100 | | | | 3,277 | | | |
Golub Capital BDC, Inc.+ | | | 550 | | | | 9,938 | | | |
Hennessy Advisors, Inc. | | | 50 | | | | 1,674 | | | |
| | | | | | | | | | |
| | | |
| | | | | | | 39,160 | | | |
| |
Chemicals - 1.64% | | | |
American Vanguard Corp.+ | | | 300 | | | | 4,533 | | | |
Cabot Corp. | | | 650 | | | | 29,679 | | | |
Chase Corp. | | | 100 | | | | 5,907 | | | |
Quaker Chemical Corp. | | | 150 | | | | 13,380 | | | |
Stepan Co. | | | 250 | | | | 14,882 | | | |
| | | | | | | | | | |
| | | |
| | | | | | | 68,381 | | | |
| |
Commercial Banks - 18.48% | | | |
1st Source Corp. | | | 250 | | | | 8,098 | | | |
American National Bankshares, Inc. | | | 100 | | | | 2,518 | | �� | |
Ameris Bancorp | | | 350 | | | | 10,395 | | | |
BancFirst Corp. | | | 150 | | | | 9,048 | | | |
BBCN Bancorp, Inc. | | | 900 | | | | 13,428 | | | |
Blue Hills Bancorp, Inc. | | | 300 | | | | 4,428 | | | |
BNC Bancorp | | | 450 | | | | 10,220 | | | |
Bridge Bancorp, Inc. | | | 200 | | | | 5,680 | | | |
Camden National Corp. | | | 100 | | | | 4,200 | | | |
Cardinal Financial Corp. | | | 350 | | | | 7,679 | | | |
Carolina Financial Corp. | | | 150 | | | | 2,802 | | | |
Cascade Bancorp* | | | 750 | | | | 4,155 | | | |
Cathay General Bancorp | | | 850 | | | | 23,970 | | | |
CenterState Banks, Inc. | | | 500 | | | | 7,875 | | | |
Central Valley Community Bancorp+ | | | 100 | | | | 1,400 | | | |
Century Bancorp, Inc., Class A | | | 50 | | | | 2,116 | | | |
Chemical Financial Corp.+ | | | 400 | | | | 14,916 | | | |
City Holding Co. | | | 150 | | | | 6,820 | | | |
CoBiz Financial, Inc. | | | 450 | | | | 5,265 | | | |
Community Bank System, Inc. | | | 450 | | | | 18,490 | | | |
Community Trust Bancorp, Inc. | | | 200 | | | | 6,932 | | | |
| | |
Small-Cap Momentum Fund SCHEDULE OF INVESTMENTS (continued) | | |
Showing percentage of net assets as of June 30, 2016
| | | | | | | | | | |
| Industry Company | | Shares | | | Value | | | |
| |
Common Stocks (continued) | | | |
Commercial Banks (continued) | | | |
CU Bancorp* | | | 200 | | | | $ 4,546 | | | |
CVB Financial Corp.+ | | | 1,200 | | | | 19,668 | | | |
Eagle Bancorp, Inc.* | | | 350 | | | | 16,838 | | | |
Enterprise Bancorp, Inc.+ | | | 100 | | | | 2,399 | | | |
Enterprise Financial Services Corp. | | | 200 | | | | 5,578 | | | |
Farmers National Banc Corp.+ | | | 300 | | | | 2,640 | | | |
FCB Financial Holdings, Inc., Class A* | | | 400 | | | | 13,600 | | | |
Financial Institutions, Inc. | | | 150 | | | | 3,910 | | | |
First BanCorp Puerto Rico | | | 200 | | | | 3,516 | | | |
First Bancorp, Inc. | | | 100 | | | | 2,154 | | | |
First Busey Corp. | | | 468 | | | | 10,011 | | | |
First Business Financial Services, Inc. | | | 100 | | | | 2,347 | | | |
First Community Bancshares, Inc. | | | 200 | | | | 4,488 | | | |
First Connecticut Bancorp, Inc.+ | | | 150 | | | | 2,484 | | | |
First Financial Bancorp | | | 650 | | | | 12,642 | | | |
First Financial Bankshares, Inc.+ | | | 700 | | | | 22,953 | | | |
First Foundation, Inc.*+ | | | 200 | | | | 4,300 | | | |
First Merchants Corp. | | | 450 | | | | 11,218 | | | |
First Mid-Illinois Bancshares, Inc.+ | | | 100 | | | | 2,500 | | | |
First Midwest Bancorp, Inc. | | | 900 | | | | 15,804 | | | |
First of Long Island Corp. (The) | | | 150 | | | | 4,300 | | | |
Franklin Financial Network, Inc.* | | | 100 | | | | 3,136 | | | |
Fulton Financial Corp. | | | 1,850 | | | | 24,975 | | | |
German American Bancorp, Inc. | | | 150 | | | | 4,796 | | | |
Great Western Bancorp, Inc. | | | 600 | | | | 18,924 | | | |
Hanmi Financial Corp. | | | 350 | | | | 8,222 | | | |
Heritage Commerce Corp. | | | 350 | | | | 3,686 | | | |
Heritage Financial Corp. | | | 350 | | | | 6,153 | | | |
HomeTrust Bancshares, Inc.* | | | 200 | | | | 3,700 | | | |
Independent Bank Corp., MI | | | 250 | | | | 3,628 | | | |
International Bancshares Corp. | | | 700 | | | | 18,263 | | | |
Kearny Financial Corp. | | | 1,050 | | | | 13,209 | | | |
Lakeland Financial Corp. | | | 200 | | | | 9,402 | | | |
Macatawa Bank Corp. | | | 350 | | | | 2,597 | | | |
MainSource Financial Group, Inc. | | | 250 | | | | 5,512 | | | |
MB Financial, Inc. | | | 800 | | | | 29,024 | | | |
MBT Financial Corp.+ | | | 250 | | | | 2,000 | | | |
| | | | | | | | | | |
| Industry Company | | Shares | | | Value | | | |
| | | | | | | | | | |
Commercial Banks (continued) | | | |
Mercantile Bank Corp. | | | 150 | | | | $ 3,579 | | | |
Merchants Bancshares, Inc. | | | 50 | | | | 1,524 | | | |
Middleburg Financial Corp. | | | 100 | | | | 2,720 | | | |
MutualFirst Financial, Inc. | | | 100 | | | | 2,735 | | | |
National Bankshares, Inc.+ | | | 50 | | | | 1,746 | | | |
NBT Bancorp, Inc. | | | 450 | | | | 12,884 | | | |
Northrim BanCorp, Inc. | | | 50 | | | | 1,314 | | | |
Old Line Bancshares, Inc.+ | | | 100 | | | | 1,800 | | | |
Old Second Bancorp, Inc. | | | 300 | | | | 2,049 | | | |
Opus Bank+ | | | 350 | | | | 11,830 | | | |
Pacific Continental Corp. | | | 200 | | | | 3,142 | | | |
Pacific Premier Bancorp, Inc.* | | | 250 | | | | 6,000 | | | |
Park National Corp.+ | | | 150 | | | | 13,767 | | | |
Preferred Bank | | | 150 | | | | 4,331 | | | |
Premier Financial Bancorp, Inc.+ | | | 100 | | | | 1,685 | | | |
QCR Holdings, Inc. | | | 150 | | | | 4,078 | | | |
Renasant Corp. | | | 450 | | | | 14,548 | | | |
Republic Bancorp, Inc., Class A | | | 200 | | | | 5,526 | | | |
Republic First Bancorp, Inc.*+ | | | 450 | | | | 1,940 | | | |
Sandy Spring Bancorp, Inc. | | | 250 | | | | 7,265 | | | |
ServisFirst Bancshares, Inc.+ | | | 300 | | | | 14,817 | | | |
Shore Bancshares, Inc.+ | | | 150 | | | | 1,762 | | | |
Simmons First National Corp., Class A | | | 300 | | | | 13,856 | | | |
Southern First Bancshares, Inc.*+ | | | 50 | | | | 1,205 | | | |
Southside Bancshares, Inc. | | | 250 | | | | 7,730 | | | |
Stock Yards Bancorp, Inc. | | | 175 | | | | 4,940 | | | |
Tompkins Financial Corp. | | | 150 | | | | 9,750 | | | |
TowneBank+ | | | 300 | | | | 6,495 | | | |
TriCo Bancshares | | | 250 | | | | 6,900 | | | |
TriState Capital Holdings, Inc.* | | | 300 | | | | 4,119 | | | |
Triumph Bancorp, Inc.* | | | 200 | | | | 3,200 | | | |
UMB Financial Corp. | | | 500 | | | | 26,605 | | | |
Union Bankshares Corp. | | | 450 | | | | 11,120 | | | |
United Bankshares, Inc. | | | 750 | | | | 28,132 | | | |
Veritex Holdings, Inc.*+ | | | 100 | | | | 1,602 | | | |
WashingtonFirst Bankshares, Inc.+ | | | 150 | | | | 3,242 | | | |
Westamerica Bancorporation+ | | | 250 | | | | 12,315 | | | |
Yadkin Financial Corp. | | | 550 | | | | 13,800 | | | |
| | | | | | | | | | |
| | | |
| | | | | | | 771,611 | | | |
| | |
| 40 | | Annual Report | June 30, 2016 |
| | |
Small-Cap Momentum Fund SCHEDULE OF INVESTMENTS (continued) | | |
Showing percentage of net assets as of June 30, 2016
| | | | | | | | | | |
| Industry Company | | Shares | | | Value | | | |
| |
Common Stocks (continued) | | | |
Commercial Services & Supplies - 3.18% | | | |
ACCO Brands Corp.* | | | 1,150 | | | | $ 11,880 | | | |
Casella Waste Systems, Inc., Class A* | | | 400 | | | | 3,140 | | | |
Ennis, Inc. | | | 300 | | | | 5,754 | | | |
Healthcare Services Group, Inc. | | | 750 | | | | 31,035 | | | |
Herman Miller, Inc. | | | 650 | | | | 19,428 | | | |
INC Research Holdings, Inc., Class A* | | | 600 | | | | 22,878 | | | |
InnerWorkings, Inc.* | | | 550 | | | | 4,548 | | | |
MSA Safety, Inc. | | | 400 | | | | 21,012 | | | |
Sykes Enterprises, Inc.* | | | 450 | | | | 13,032 | | | |
| | | | | | | | | | |
| | | |
| | | | | | | 132,707 | | | |
| |
Communications Equipment - 0.54% | | | |
NETGEAR, Inc.* | | | 350 | | | | 16,639 | | | |
Oclaro, Inc.*+ | | | 1,250 | | | | 6,100 | | | |
| | | | | | | | | | |
| | | |
| | | | | | | 22,739 | | | |
| |
Construction & Engineering - 2.07% | | | |
Aegion Corp.* | | | 350 | | | | 6,829 | | | |
Argan, Inc. | | | 150 | | | | 6,258 | | | |
Comfort Systems USA, Inc. | | | 400 | | | | 13,028 | | | |
Granite Construction, Inc. | | | 400 | | | | 18,220 | | | |
Installed Building Products, Inc.* | | | 350 | | | | 12,702 | | | |
MasTec, Inc.* | | | 850 | | | | 18,972 | | | |
Primoris Services Corp.+ | | | 550 | | | | 10,412 | | | |
| | | | | | | | | | |
| | | |
| | | | | | | 86,421 | | | |
| |
Consumer Finance - 0.27% | | | |
Green Dot Corp., Class A* | | | 500 | | | | 11,495 | | | |
| |
Containers & Packaging - 0.05% | | | |
UFP Technologies, Inc.* | | | 100 | | | | 2,254 | | | |
| |
Distributors - 0.56% | | | |
Core-Mark Holding Co., Inc. | | | 500 | | | | 23,430 | | | |
| |
Diversified Consumer Services - 0.18% | | | |
Cambium Learning Group, Inc.* | | | 500 | | | | 2,255 | | | |
Capella Education Co.+ | | | 100 | | | | 5,264 | | | |
| | | | | | | | | | |
| | | |
| | | | | | | 7,519 | | | |
| |
Diversified Financial Services - 0.59% | | | |
Sterling Bancorp | | | 1,450 | | | | 22,765 | | | |
Summit Financial Group, Inc. | | | 100 | | | | 1,750 | | | |
| | | | | | | | | | |
| | | |
| | | | | | | 24,515 | | | |
| | | | | | | | | | |
| Industry Company | | Shares | | | Value | | | |
| | | |
Diversified Telecommunication Services - 1.03% | | | |
Cogent Communications Holdings, Inc. | | | 500 | | | | $20,030 | | | |
Consolidated Communications Holdings, Inc.+ | | | 550 | | | | 14,982 | | | |
ORBCOMM, Inc.* | | | 800 | | | | 7,960 | | | |
| | | | | | | | | | |
| | | |
| | | | | | | 42,972 | | | |
| |
Electric Utilities - 1.02% | | | |
El Paso Electric Co. | | | 450 | | | | 21,272 | | | |
MGE Energy, Inc. | | | 350 | | | | 19,780 | | | |
Spark Energy, Inc., Class A | | | 50 | | | | 1,652 | | | |
| | | | | | | | | | |
| | | |
| | | | | | | 42,704 | | | |
| |
Electrical Equipment - 0.44% | | | |
AZZ, Inc. | | | 250 | | | | 14,995 | | | |
LSI Industries, Inc. | | | 300 | | | | 3,321 | | | |
| | | | | | | | | | |
| | | |
| | | | | | | 18,316 | | | |
| |
Electronic Equipment, Instruments &
Components - 2.29% | | | |
Agilysys, Inc.* | | | 250 | | | | 2,618 | | | |
Badger Meter, Inc. | | | 150 | | | | 10,955 | | | |
Coherent, Inc.* | | | 250 | | | | 22,945 | | | |
Electro Scientific Industries, Inc.* | | | 350 | | | | 2,044 | | | |
Energous Corp.*+ | | | 200 | | | | 2,590 | | | |
Fabrinet* | | | 400 | | | | 14,848 | | | |
Littelfuse, Inc. | | | 250 | | | | 29,548 | | | |
Mercury Systems, Inc.* | | | 400 | | | | 9,944 | | | |
| | | | | | | | | | |
| | | |
| | | | | | | 95,492 | | | |
| |
Energy Equipment & Services - 0.12% | | | |
Matrix Service Co.* | | | 300 | | | | 4,947 | | | |
| |
Food & Staples Retailing - 0.97% | | | |
PriceSmart, Inc. | | | 300 | | | | 28,071 | | | |
Smart & Final Stores, Inc.* | | | 850 | | | | 12,656 | | | |
| | | | | | | | | | |
| | | |
| | | | | | | 40,727 | | | |
| |
Food Products - 2.17% | | | |
B&G Foods, Inc. | | | 650 | | | | 31,330 | | | |
Farmer Bros. Co.* | | | 200 | | | | 6,412 | | | |
Seneca Foods Corp., Class A* | | | 100 | | | | 3,621 | | | |
Snyders-Lance, Inc. | | | 1,000 | | | | 33,890 | | | |
Tootsie Roll Industries, Inc.+ | | | 400 | | | | 15,412 | | | |
| | | | | | | | | | |
| | | |
| | | | | | | 90,665 | | | |
| |
Gas Utilities - 0.06% | | | |
Delta Natural Gas Co., Inc.+ | | | 100 | | | | 2,694 | | | |
| | |
Small-Cap Momentum Fund SCHEDULE OF INVESTMENTS (continued) | | |
Showing percentage of net assets as of June 30, 2016
| | | | | | | | | | |
| Industry Company | | Shares | | | Value | | | |
| |
Common Stocks (continued) | | | |
Health Care Equipment & Supplies - 4.38% | | | |
Anika Therapeutics, Inc.* | | | 150 | | | | $ 8,048 | | | |
Atrion Corp. | | | 20 | | | | 8,557 | | | |
AxoGen, Inc.* | | | 350 | | | | 2,408 | | | |
Bio-Path Holdings, Inc.* | | | 950 | | | | 1,891 | | | |
Cantel Medical Corp. | | | 450 | | | | 30,928 | | | |
Cerus Corp.* | | | 1,100 | | | | 6,864 | | | |
CryoLife, Inc. | | | 350 | | | | 4,134 | | | |
Cynosure, Inc., Class A* | | | 250 | | | | 12,161 | | | |
Insulet Corp.*+ | | | 600 | | | | 18,144 | | | |
Integra LifeSciences Holdings Corp.*+ | | | 400 | | | | 31,912 | | | |
LeMaitre Vascular, Inc. | | | 200 | | | | 2,854 | | | |
Masimo Corp.* | | | 500 | | | | 26,258 | | | |
Meridian Bioscience, Inc. | | | 450 | | | | 8,775 | | | |
Orthofix International Nv* | | | 200 | | | | 8,480 | | | |
Utah Medical Products, Inc. | | | 50 | | | | 3,150 | | | |
Vascular Solutions, Inc.* | | | 200 | | | | 8,332 | | | |
| | | | | | | | | | |
| | | |
| | | | | | | 182,896 | | | |
| |
Health Care Providers & Services - 1.78% | | | |
Amedisys, Inc.* | | | 350 | | | | 17,668 | | | |
AMN Healthcare Services, Inc.* | | | 500 | | | | 19,985 | | | |
LHC Group, Inc.* | | | 200 | | | | 8,656 | | | |
MediWound, Ltd.* | | | 250 | | | | 1,960 | | | |
Owens & Minor, Inc. | | | 650 | | | | 24,297 | | | |
USMD Holdings, Inc.*+ | | | 100 | | | | 1,874 | | | |
| | | | | | | | | | |
| | | |
| | | | | | | 74,440 | | | |
| |
Hotels, Restaurants & Leisure - 2.05% | | | |
Boyd Gaming Corp.* | | | 1,250 | | | | 23,000 | | | |
Carrols Restaurant Group, Inc.* | | | 350 | | | | 4,165 | | | |
Chuy’s Holdings, Inc.* | | | 200 | | | | 6,922 | | | |
Dave & Buster’s Entertainment, Inc.* | | | 450 | | | | 21,056 | | | |
Eldorado Resorts, Inc.* | | | 550 | | | | 8,357 | | | |
Golden Entertainment, Inc.+ | | | 250 | | | | 2,922 | | | |
Ruth’s Hospitality Group, Inc. | | | 350 | | | | 5,582 | | | |
Sonic Corp.+ | | | 500 | | | | 13,525 | | | |
| | | | | | | | | | |
| | | |
| | | | | | | 85,529 | | | |
| |
Household Durables - 1.28% | | | |
Ethan Allen Interiors, Inc.+ | | | 300 | | | | 9,912 | | | |
iRobot Corp.* | | | 300 | | | | 10,524 | | | |
KB Home+ | | | 900 | | | | 13,689 | | | |
LGI Homes, Inc.*+ | | | 200 | | | | 6,388 | | | |
Lifetime Brands, Inc. | | | 150 | | | | 2,188 | | | |
Universal Electronics, Inc.* | | | 150 | | | | 10,842 | | | |
| | | | | | | | | | |
| | | |
| | | | | | | 53,543 | | | |
| | | | | | | | | | |
| Industry Company | | Shares | | | Value | | | |
| | | | | | | | | | |
Household Products - 2.21% | | | |
Central Garden & Pet Co., Class A* | | | 500 | | | | $ 10,855 | | | |
Helen Of Troy, Ltd.* | | | 300 | | | | 30,852 | | | |
HRG Group, Inc.* | | | 2,150 | | | | 29,520 | | | |
Orchids Paper Products Co. | | | 100 | | | | 3,557 | | | |
WD-40 Co. | | | 150 | | | | 17,618 | | | |
| | | | | | | | | | |
| | | |
| | | | | | | 92,402 | | | |
| |
Independent Power Producers & Energy Traders - 0.52% | | | |
Ormat Technologies, Inc. | | | 500 | | | | 21,880 | | | |
| |
Insurance - 4.09% | | | |
AMERISAFE, Inc. | | | 200 | | | | 12,244 | | | |
Argo Group International Holdings Ltd. | | | 30 | | | | 1,557 | | | |
EMC Insurance Group, Inc. | | | 225 | | | | 6,237 | | | |
Employers Holdings, Inc.+ | | | 350 | | | | 10,157 | | | |
Independence Holding Co. | | | 200 | | | | 3,594 | | | |
Infinity Property & Casualty Corp. | | | 100 | | | | 8,066 | | | |
Investors Title Co.+ | | | 20 | | | | 1,905 | | | |
James River Group Holdings, Ltd. | | | 300 | | | | 10,188 | | | |
National General Holdings Corp. | | | 1,100 | | | | 23,562 | | | |
Primerica, Inc. | | | 500 | | | | 28,620 | | | |
RLI Corp. | | | 450 | | | | 30,951 | | | |
Selective Insurance Group, Inc. | | | 600 | | | | 22,926 | | | |
United Fire Group, Inc. | | | 250 | | | | 10,608 | | | |
| | | | | | | | | | |
| | | |
| | | | | | | 170,615 | | | |
| |
Internet Software & Services - 1.91% | | | |
Care.com, Inc.* | | | 350 | | | | 4,088 | | | |
Cornerstone OnDemand, Inc.* | | | 600 | | | | 22,836 | | | |
Internet Gold-Golden Lines, Ltd.*+ | | | 200 | | | | 2,728 | | | |
MeetMe, Inc.*+ | | | 500 | | | | 2,665 | | | |
NIC, Inc. | | | 750 | | | | 16,455 | | | |
Reis, Inc. | | | 100 | | | | 2,490 | | | |
WebMD Health Corp.*+ | | | 400 | | | | 23,244 | | | |
XO Group, Inc.* | | | 300 | | | | 5,229 | | | |
| | | | | | | | | | |
| | | |
| | | | | | | 79,735 | | | |
| |
IT Services - 3.22% | | | |
Acxiom Corp.* | | | 800 | | | | 17,592 | | | |
Cardtronics, Inc.* | | | 500 | | | | 19,905 | | | |
CSG Systems International, Inc. | | | 350 | | | | 14,109 | | | |
ExlService Holdings, Inc.* | | | 350 | | | | 18,344 | | | |
Hackett Group, Inc. (The) | | | 300 | | | | 4,161 | | | |
| | |
| 42 | | Annual Report | June 30, 2016 |
| | |
Small-Cap Momentum Fund SCHEDULE OF INVESTMENTS (continued) | | |
Showing percentage of net assets as of June 30, 2016
| | | | | | | | | | |
| Industry Company | | Shares | | | Value | | | |
| |
Common Stocks (continued) | | | |
IT Services (continued) | | | |
ManTech International Corp., Class A | | | 250 | | | | $ 9,455 | | | |
Press Ganey Holdings, Inc.*+ | | | 550 | | | | 21,642 | | | |
Science Applications International Corp. | | | 500 | | | | 29,175 | | | |
| | | | | | | | | | |
| | | |
| | | | | | | 134,383 | | | |
| |
Leisure Equipment & Products - 0.78% | | | |
Marine Products Corp. | | | 400 | | | | 3,384 | | | |
Smith & Wesson Holding Corp.*+ | | | 600 | | | | 16,308 | | | |
Sturm Ruger & Co., Inc.+ | | | 200 | | | | 12,802 | | | |
| | | | | | | | | | |
| | | |
| | | | | | | 32,494 | | | |
| |
Life Sciences Tools & Services - 0.90% | | | |
Cambrex Corp.* | | | 350 | | | | 18,106 | | | |
Enzo Biochem, Inc.* | | | 500 | | | | 2,985 | | | |
Luminex Corp.* | | | 500 | | | | 10,115 | | | |
NeoGenomics, Inc.* | | | 800 | | | | 6,432 | | | |
| | | | | | | | | | |
| | | |
| | | | | | | 37,638 | | | |
| |
Machinery - 3.04% | | | |
Actuant Corp., Class A+ | | | 600 | | | | 13,566 | | | |
Altra Holdings, Inc. | | | 300 | | | | 8,094 | | | |
Astec Industries, Inc. | | | 250 | | | | 14,038 | | | |
CIRCOR International, Inc. | | | 150 | | | | 8,548 | | | |
Douglas Dynamics, Inc. | | | 250 | | | | 6,432 | | | |
Energy Recovery, Inc.*+ | | | 550 | | | | 4,890 | | | |
Global Brass & Copper Holdings, Inc. | | | 250 | | | | 6,822 | | | |
John Bean Technologies Corp. | | | 300 | | | | 18,366 | | | |
Lydall, Inc.* | | | 200 | | | | 7,712 | | | |
Manitowoc Co., Inc. (The)+ | | | 1,450 | | | | 7,902 | | | |
Mueller Water Products, Inc., Class A | | | 1,700 | | | | 19,414 | | | |
Sun Hydraulics Corp.+ | | | 300 | | | | 8,907 | | | |
Supreme Industries, Inc., Class A | | | 150 | | | | 2,055 | | | |
| | | | | | | | | | |
| | | |
| | | | | | | 126,746 | | | |
| |
Media - 0.13% | | | |
Central European Media Enterprises, Ltd., Class A* | | | 1,450 | | | | 3,060 | | | |
Global Sources, Ltd.* | | | 250 | | | | 2,292 | | | |
| | | | | | | | | | |
| | | |
| | | | | | | 5,352 | | | |
| |
Metals & Mining - 3.63% | | | |
Asanko Gold, Inc.* | | | 2,100 | | | | 8,001 | | | |
Commercial Metals Co. | | | 1,200 | | | | 20,280 | | | |
| | | | | | | | | | |
| Industry Company | | Shares | | | Value | | | |
| | | |
Metals & Mining (continued) | | | |
Endeavour Silver Corp.*+ | | | 1,200 | | | | $ 4,740 | | | |
First Majestic Silver Corp.* | | | 1,650 | | | | 22,407 | | | |
Kaiser Aluminum Corp. | | | 200 | | | | 18,082 | | | |
MAG Silver Corp.* | | | 850 | | | | 10,718 | | | |
Novagold Resources, Inc.*+ | | | 3,400 | | | | 20,808 | | | |
Richmont Mines, Inc.* | | | 600 | | | | 5,526 | | | |
Schnitzer Steel Industries, Inc., Class A | | | 300 | | | | 5,280 | | | |
Seabridge Gold, Inc.*+ | | | 550 | | | | 8,074 | | | |
Worthington Industries, Inc. | | | 650 | | | | 27,495 | | | |
| | | | | | | | | | |
| | | |
| | | | | | | 151,411 | | | |
| |
Multi-Utilities - 0.70% | | | |
Avista Corp. | | | 650 | | | | 29,120 | | | |
| |
Oil, Gas & Consumable Fuels - 0.93% | | | |
Nordic American Tankers Ltd.+ | | | 1,000 | | | | 13,890 | | | |
PBF Energy, Inc., Class A | | | 1,050 | | | | 24,969 | | | |
| | | | | | | | | | |
| | | |
| | | | | | | 38,859 | | | |
| |
Personal Products - 0.06% | | | |
Nutraceutical International Corp.* | | | 100 | | | | 2,315 | | | |
| |
Pharmaceuticals - 0.82% | | | |
PRA Health Sciences, Inc.* | | | 650 | | | | 27,144 | | | |
SciClone Pharmaceuticals, Inc.* | | | 550 | | | | 7,183 | | | |
| | | | | | | | | | |
| | | |
| | | | | | | 34,327 | | | |
| |
Professional Services - 1.14% | | | |
ICF International, Inc.* | | | 200 | | | | 8,180 | | | |
Kelly Services, Inc., Class A | | | 400 | | | | 7,588 | | | |
Navigant Consulting, Inc.* | | | 500 | | | | 8,075 | | | |
WageWorks, Inc.* | | | 400 | | | | 23,924 | | | |
| | | | | | | | | | |
| | | |
| | | | | | | 47,767 | | | |
| |
Real Estate Investment Trusts (REITs) - 8.48% | | | |
Agree Realty Corp. | | | 200 | | | | 9,648 | | | |
Ares Commercial Real Estate Corp. | | | 300 | | | | 3,687 | | | |
Chimera Investment Corp. | | | 2,000 | | | | 31,400 | | | |
CoreSite Realty Corp. | | | 310 | | | | 27,494 | | | |
Cousins Properties, Inc. | | | 2,250 | | | | 23,400 | | | |
Easterly Government Properties, Inc. | | | 250 | | | | 4,932 | | | |
EastGroup Properties, Inc.+ | | | 350 | | | | 24,122 | | | |
First Industrial Realty Trust, Inc. | | | 1,250 | | | | 34,775 | | | |
Getty Realty Corp. | | | 350 | | | | 7,508 | | | |
Mack-Cali Realty Corp. | | | 950 | | | | 25,650 | | | |
| | |
Small-Cap Momentum Fund SCHEDULE OF INVESTMENTS (continued) | | |
Showing percentage of net assets as of June 30, 2016 | | |
| | | | | | | | | | |
| Industry Company | | Shares | | | Value | | | |
| | | |
Common Stocks (continued) | | | | | | | | | | |
Real Estate Investment Trusts (REITs) (continued) | | | |
Monmouth Real Estate Investment Corp. | | | 700 | | | | $ 9,282 | | | |
New York, Inc. | | | 1,750 | | | | 16,188 | | | |
Owens Realty Mortgage, Inc. | | | 100 | | | | 1,664 | | | |
Piedmont Office Realty Trust, Inc., Class A | | | 1,550 | | | | 33,387 | | | |
Preferred Apartment Communities, Inc., Class A | | | 250 | | | | 3,680 | | | |
PS Business Parks, Inc. | | | 300 | | | | 31,824 | | | |
QTS Realty Trust, Inc., Class A | | | 500 | | | | 27,990 | | | |
Retail Opportunity Investments Corp. | | | 1,050 | | | | 22,754 | | | |
Rexford Industrial Realty, Inc. | | | 700 | | | | 14,763 | | | |
| | | | | | | | | | |
| | | |
| | | | | | | 354,148 | | | |
| |
Real Estate Management & Development - 0.17% | | | |
Farmland Partners, Inc.+ | | | 150 | | | | 1,698 | | | |
FRP Holdings, Inc.*+ | | | 100 | | | | 3,450 | | | |
Stratus Properties, Inc.*+ | | | 100 | | | | 1,873 | | | |
| | | | | | | | | | |
| | | |
| | | | | | | 7,021 | | | |
| |
Semiconductors & Semiconductor Equipment - 0.88% | | | |
Alpha & Omega Semiconductor, Ltd.* | | | 250 | | | | 3,482 | | | |
Applied Micro Circuits Corp.* | | | 900 | | | | 5,778 | | | |
GigPeak, Inc.* | | | 550 | | | | 1,078 | | | |
MaxLinear, Inc., Class A*+ | | | 650 | | | | 11,687 | | | |
Nanometrics, Inc.* | | | 250 | | | | 5,198 | | | |
NeoPhotonics Corp.*+ | | | 450 | | | | 4,288 | | | |
Rudolph Technologies, Inc.* | | | 350 | | | | 5,436 | | | |
| | | | | | | | | | |
| | | |
| | | | | | | 36,947 | | | |
| |
Software - 3.59% | | | |
Benefitfocus, Inc.*+ | | | 300 | | | | 11,436 | | | |
Blackbaud, Inc. | | | 500 | | | | 33,950 | | | |
Callidus Software, Inc.* | | | 600 | | | | 11,988 | | | |
Descartes Systems Group, Inc. (The)* | | | 850 | | | | 16,226 | | | |
Globant SA* | | | 350 | | | | 13,772 | | | |
Interactive Intelligence Group, Inc.* | | | 250 | | | | 10,248 | | | |
Mitek Systems, Inc.* | | | 350 | | | | 2,488 | | | |
Pegasystems, Inc. | | | 800 | | | | 21,560 | | | |
Planet Payment, Inc.*+ | | | 600 | | | | 2,694 | | | |
| | | | | | | | | | |
| | | | | | | | | | |
| | | | | | | | |
| Industry Company | | Shares | | | Value | |
|
| |
Software (continued) | | | | | | | | |
RealPage, Inc.* | | | 850 | | | | $ 18,980 | |
Sapiens International Corp. NV | | | 550 | | | | 6,440 | |
| | | | | | | | |
| | |
| | | | | | | 149,782 | |
|
Specialty Retail - 1.84% | |
Abercrombie & Fitch Co., Class A | | | 700 | | | | 12,467 | |
BMC Stock Holdings, Inc.* | | | 700 | | | | 12,474 | |
Guess?, Inc. | | | 900 | | | | 13,545 | |
Monro Muffler Brake, Inc. | | | 350 | | | | 22,246 | |
Sportsman’s Warehouse Holdings, Inc.* | | | 500 | | | | 4,030 | |
Tile Shop Holdings, Inc.*+ | | | 600 | | | | 11,928 | |
| | | | | | | | |
| | |
| | | | | | | 76,690 | |
|
Telecommunication Services - 0.17% | |
B Communications, Ltd. | | | 300 | | | | 7,158 | |
|
Textiles, Apparel & Luxury Goods - 0.10% | |
Movado Group, Inc. | | | 200 | | | | 4,336 | |
|
Thrifts & Mortgage Finance - 3.66% | |
Banc of California, Inc. | | | 400 | | | | 7,240 | |
Bank Mutual Corp. | | | 500 | | | | 3,840 | |
Capitol Federal Financial, Inc. | | | 1,450 | | | | 20,228 | |
Dime Community Bancshares, Inc. | | | 400 | | | | 6,804 | |
Federal Agricultural Mortgage Corp., Class C | | | 100 | | | | 3,482 | |
First Defiance Financial Corp. | | | 100 | | | | 3,885 | |
First Financial Northwest, Inc. | | | 150 | | | | 1,992 | |
Flagstar Bancorp, Inc.* | | | 600 | | | | 14,646 | |
Greene County Bancorp, Inc.+ | | | 100 | | | | 1,627 | |
Hingham Institution for Savings+ | | | 20 | | | | 2,458 | |
Home Bancorp, Inc.+ | | | 100 | | | | 2,747 | |
Meta Financial Group, Inc. | | | 100 | | | | 5,096 | |
Northwest Bancshares, Inc. | | | 1,150 | | | | 17,054 | |
OceanFirst Financial Corp. | | | 295 | | | | 5,360 | |
Oritani Financial Corp. | | | 500 | | | | 7,995 | |
Prudential Bancorp, Inc.+ | | | 100 | | | | 1,410 | |
SI Financial Group, Inc.+ | | | 150 | | | | 1,986 | |
Southern Missouri Bancorp, Inc.+ | | | 100 | | | | 2,353 | |
| | |
| 44 | | Annual Report | June 30, 2016 |
| | |
Small-Cap Momentum Fund SCHEDULE OF INVESTMENTS (continued) | | |
Showing percentage of net assets as of June 30, 2016 | | |
| | | | | | | | | | |
| Industry Company | | Shares | | | Value | | | |
| |
Common Stocks (continued) | | | |
Thrifts & Mortgage Finance (continued) | | | |
Territorial Bancorp, Inc. | | | 100 | | | | $ 2,647 | | | |
United Financial Bancorp, Inc. | | | 550 | | | | 7,139 | | | |
Washington Federal, Inc. | | | 950 | | | | 23,047 | | | |
WSFS Financial Corp. | | | 300 | | | | 9,657 | | | |
| | | | | | | | | | |
| | | |
| | | | | | | 152,693 | | | |
| |
Trading Companies & Distributors - 1.12% | | | |
Beacon Roofing Supply, Inc.* | | | 650 | | | | 29,556 | | | |
MRC Global, Inc.* | | | 1,050 | | | | 14,920 | | | |
Willis Lease Finance Corp.* | | | 100 | | | | 2,223 | | | |
| | | | | | | | | | |
| | | |
| | | | | | | 46,699 | | | |
| |
Water Utilities - 0.53% | | | |
Artesian Resources Corp., Class A | | | 100 | | | | 3,392 | | | |
Connecticut Water Service, Inc. | | | 100 | | | | 5,620 | | | |
Consolidated Water Co., Ltd. | | | 150 | | | | 1,959 | | | |
Middlesex Water Co. | | | 150 | | | | 6,507 | | | |
York Water Co., (The) | | | 150 | | | | 4,806 | | | |
| | | | | | | | | | |
| | | |
| | | | | | | 22,284 | | | |
| |
Wireless Telecommunication Services - 0.63% | | | |
Cellcom Israel, Ltd.* | | | 1,050 | | | | 6,898 | | | |
Shenandoah Telecommunications Co. | | | 500 | | | | 19,530 | | | |
| | | | | | | | | | |
| | | |
| | | | | | | 26,428 | | | |
| | | | | | | | | | |
| | |
TOTAL COMMON STOCKS - 99.81% | | | | 4,167,771 | | | |
| | | | | | | | | | |
(Cost $3,910,507) | | | | | | | | | | |
| |
EXCHANGE TRADED FUND - 0.39% |
iShares Russell 2000 Fund | | | 140 | | | | 16,096 | | | |
| | | | | | | | | | |
| | |
TOTAL EXCHANGE TRADED
FUND - 0.39% | | | | 16,096 | | | |
| | | | | | | | | | |
(Cost $15,833) | | | | | | | | | | |
| | | | | | | | | | |
| | | | | | | | | | |
| | | | | | | | | | |
| | | | | | | | | | |
| | | | | | | | | | |
| | | | | | | | | | | | |
| | | Rate^ | | | Shares | | | Value | |
|
MONEY MARKET FUND - 0.37% | |
Dreyfus Cash Management Fund | | | 0.30 | % | | | 15,516 | | | | $15,516 | |
| | | | | | | | | | | | |
| |
TOTAL MONEY MARKET FUND - 0.37% | | | | 15,516 | |
| | | | | | | | | | | | |
(Cost $15,516) | | | | | | | | | |
|
| INVESTMENTS PURCHASED WITH CASH PROCEEDS FROM SECURITIES LENDING - 13.91% | |
Dreyfus Cash Management Fund** | | | 0.30% | | | | 580,846 | | | | 580,846 | |
| | | | | | | | | | | | |
TOTAL INVESTMENTS PURCHASED WITH CASH PROCEEDS FROM SECURITIES LENDING - 13.91% | | | | 580,846 | |
| | | | | | | | | | | | |
(Cost $580,846) | | | | | |
| |
TOTAL INVESTMENTS - 114.48% | | | | $4,780,229 | |
(Cost $4,522,702) | | | | | | | | | | | | |
Liabilities in Excess of Other Assets - (14.48%) | | | | (604,640 | ) |
| | | | | | | | | | | | |
| |
NET ASSETS - 100.00% | | | | $4,175,589 | |
| | | | | | | | | | | | |
| | |
| * | | Non-income producing security. |
| ** | | This security represents the investment of the collateral received in connection with securities out on loan as of June 30, 2016. |
| ^ | | Rate disclosed as of June 30, 2016. |
| + | | This security or a portion of the security is out on loan as of June 30, 2016. Total loaned securities had a value of $573,566 as of June 30, 2016. |
| | |
Small-Cap Momentum Fund SCHEDULE OF INVESTMENTS (continued) | | |
| | |
| | | | | | | | | | | | | | | | | | |
| | | | |
Summary of inputs used to value the Fund’s investments as of 06/30/2016 (See Note 2 in Notes to Financial Statements): | | | |
| | | Valuation Inputs | | | |
| | | |
| | | Investment in Securities (Value) | | | |
| | | |
| | | Level 1 Quoted Prices | | | Level 2 Significant Observable Inputs | | | Level 3 Significant Unobservable Inputs | | | Total | | | |
| | | |
| | | | | |
Common Stocks | | $ | 4,167,771 | | | $ | — | | | $ | — | | | $ | 4,167,771 | | | |
Exchange Traded Fund | | | 16,096 | | | | — | | | | — | | | | 16,096 | | | |
Money Market Fund | | | — | | | | 15,516 | | | | — | | | | 15,516 | | | |
Investments Purchased with Cash Proceeds from Securities Lending | | | — | | | | 580,846 | | | | — | | | | 580,846 | | | |
TOTAL | | $ | 4,183,867 | | | $ | 596,362 | | | $ | — | | | $ | 4,780,229 | | | |
See Notes to Financial Statements.
| | |
| 46 | | Annual Report | June 30, 2016 |
| | |
Small-Cap Growth Fund MANAGER’S COMMENTARY (Unaudited) | | |
June 30, 2016
Dear Fellow Small-Cap Growth Fund Shareholder,
For the quarter ended June 30, 2016, our Fund returned 3.04%, underperforming our primary market benchmark, the Russell 2000 Growth Index (3.24%), and our peer benchmark, the Lipper Small-Cap Growth Funds Index (3.66%). It was a good quarter on an absolute basis, but a poor one on a relative basis.
For the fiscal year, our Fund returned -3.97%, significantly beating the Russell 2000 Growth Index (-10.75%), and the Lipper Small-Cap Growth Funds Index (-8.45%). It was a good year on a relative basis, but a poor one on an absolute basis. Our Fund now leads its benchmarks in the five-year period, but lags in the longer 10-year and inception-to-date periods.
The table below presents our June quarter, one-year, five-year, 10-year and inception-to-date financial results. See the next page for a graph of performance since inception.
Standardized Returns as of June 30, 2016
| | | | | | | | | | | | | | | | | | | | | | |
| |
| | | | | |
| | | | | | | | | | | Annualized | | | | |
| | | | | | | | | | | |
| | | Quarter | | | 1 Year | | | | | 5 Years | | | 10 Years | | | Since Inception (10/31/03) | |
| |
| | | | | | |
Small-Cap Growth Fund | | | 3.04% | | | | -3.97% | | | | | | 10.46% | | | | 3.37% | | | | 5.85% | |
Russell 2000 Growth Index | | | 3.24% | | | | -10.75% | | | | | | 8.51% | | | | 7.14% | | | | 7.87% | |
Lipper Small-Cap Growth Funds Index | | | 3.66% | | | | -8.45% | | | | | | 7.58% | | | | 6.17% | | | | 6.74% | |
Performance figures quoted in the table above represent past performance and are no guarantee of future results. Total return figures in the table above include the reinvestment of dividends and capital gains. The table above does not reflect the deduction of taxes that a shareholder would pay on Fund distributions or on the redemption of Fund shares.
The Russell 2000 Growth Index is an unmanaged index that consists of stocks in the Russell 2000 Index with higher price-to-book ratios and higher forecasted growth values with dividends reinvested. The Lipper Small-Cap Growth Funds Index is an index of small-company, growth-oriented funds compiled by Lipper, an independent fund research firm owned by Broadridge Financial Solutions, Inc. It is not possible to invest directly in an index. Periods longer than one year are annualized.
According to data from Lipper, Inc. as of June 30, 2016, Small-Cap Growth Fund ranked 87th of 556 small-cap growth funds for the 12 months ended June 30, 2016, 31st of 440 over the last five years, 301st of 311 over the last 10 years, and 215th of 241 such funds since inception in October 2003. Lipper, Inc. is an independent mutual fund rating service owned by Broadridge Financial Solutions, Inc. that ranks funds in various fund categories by making comparative calculations using total returns.
| | |
Small-Cap Growth Fund MANAGER’S COMMENTARY (Unaudited) (continued) | | |
Small-Cap Growth Fund vs. Russell 2000 Growth Index & Lipper Small-Cap Growth Funds Index
from Inception 10/31/03 to 6/30/16
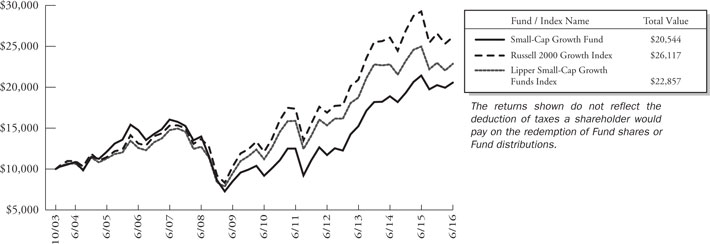
Detailed Explanation of Quarterly Performance
The Fund’s relative returns suffered due to underperformance of our company financial health models and our diversifying value metrics models. The Fund’s value metrics models detracted from relative results because they targeted deeper-value stocks that underperformed the Index during the quarter. Strong gains from our diversifying price momentum model helped offset some of the underperformance, as did the Fund’s bias toward smaller sized companies, which outperformed larger-company stocks during the quarter.
Holdings within the Industrials and Consumer Staples sectors dragged on relative results. Meanwhile, holdings in the Health Care, Materials and Consumer Discretionary sectors added to relative results.
Detailed Explanation of Fiscal Year Performance
All model categories helped the Fund outperform the Russell 2000 Growth Index for the year. Our diversifying price momentum model posted large gains for the 12-month period. Our company financial health and diversifying value metrics models generated negative returns for the period, but still outperformed the Index.
Holdings in the Health Care sector contributed positively to relative performance for the year. Holdings in the Materials sectors also added to results.
| | |
| 48 | | Annual Report | June 30, 2016 |
| | |
Small-Cap Growth Fund MANAGER’S COMMENTARY (Unaudited) (continued) | | |
Top Ten Holdings as of June 30, 2016
| | | | | | | | | |
| Rank | | Description | | Industry | | % of Net Assets |
| 1 | | Pool Corp. | | Trading Companies & Distributors | | | | 1.7% | |
| 2 | | MarketAxess Holdings, Inc. | | Diversified Financial Services | | | | 1.7% | |
| 3 | | Wolverine World Wide, Inc. | | Textiles, Apparel & Luxury Goods | | | | 1.6% | |
| 4 | | Comfort Systems USA, Inc. | | Construction & Engineering | | | | 1.6% | |
| 5 | | Plantronics, Inc. | | Communications Equipment | | | | 1.5% | |
| 6 | | Koppers Holdings, Inc. | | Chemicals | | | | 1.5% | |
| 7 | | Forrester Research, Inc. | | IT Services | | | | 1.5% | |
| 8 | | Insteel Industries, Inc. | | Building Products | | | | 1.5% | |
| 9 | | AMN Healthcare Services, Inc. | | Health Care Providers & Services | | | | 1.5% | |
| 10 | | Drew Industries, Inc. | | Auto Components | | | | 1.5% | |
| | Total | | | | | | 15.6% | |
Industry Sector Representation as of June 30, 2016
| | | | | | | | | | | | | | | |
| | | % of Net Assets | | % of Russell 2000 Growth Index | | Difference |
Consumer Discretionary | | | | 20.6% | | | | | 16.3% | | | | | 4.3% | |
Consumer Staples | | | | 2.0% | | | | | 3.3% | | | | | -1.3% | |
Energy | | | | 0.9% | | | | | 1.0% | | | | | -0.1% | |
Financials | | | | 8.4% | | | | | 10.5% | | | | | -2.1% | |
Health Care | | | | 21.7% | | | | | 22.5% | | | | | -0.8% | |
Industrials | | | | 13.4% | | | | | 15.5% | | | | | -2.1% | |
Information Technology | | | | 23.6% | | | | | 24.3% | | | | | -0.7% | |
Materials | | | | 6.2% | | | | | 4.6% | | | | | 1.6% | |
Telecommunication Services | | | | 1.4% | | | | | 1.1% | | | | | 0.3% | |
Utilities | | | | 0.0% | | | | | 0.9% | | | | | -0.9% | |
Cash & Other Assets | | | | 1.8% | | | | | 0.0% | | | | | 1.8% | |
Total | | | | 100.0% | | | | | 100.0% | | | | | | |
Disclaimer
The views expressed here are exclusively those of Fund management. These views, including those related to market sectors or individual stocks, are not meant as investment advice and should not be considered predictive in nature. Any favorable (or unfavorable) description of a holding applies only as of the quarter end, June 30, 2016, unless otherwise stated. Security positions can and do change thereafter. Discussions of historical performance do not guarantee and may not be indicative of future performance.
Market volatility can significantly impact short-term performance. The Fund is not an appropriate investment for short-term investors. Investments in small companies generally carry greater risk than is customarily associated with larger companies. This additional risk is attributable to a number of factors, including the relatively limited financial resources that are typically available to small companies and the fact that small companies often have comparatively limited product lines. In addition, the stock of small companies tends to be more volatile than the stock of large companies, particularly in the short term and particularly in the early stages of an economic or market downturn. Shareholders of the Fund, therefore, are taking on more risk than they would if they invested in the stock market as a whole.
| | |
Small-Cap Growth Fund MANAGER’S COMMENTARY (Unaudited) (continued) | | |
Conclusion
Thank you for your continued investment in Small-Cap Growth Fund. We encourage your feedback; your reactions and concerns are important to us.
Sincerely,
The Investment Management Team
| | |
| 50 | | Annual Report | June 30, 2016 |
| | |
Small-Cap Growth Fund SCHEDULE OF INVESTMENTS | | |
Showing percentage of net assets as of June 30, 2016 | | |
| | | | | | | | | | | | |
| Industry Company | | Shares | | | Value | | | | |
| |
COMMON STOCKS - 98.21% | | | | | |
Airlines - 1.68% | | | | | |
Allegiant Travel Co. | | | 1,200 | | | | $ 181,800 | | | | | |
Hawaiian Holdings, Inc.* | | | 11,300 | | | | 428,948 | | | | | |
| | | | | | | | | | | | |
| | | |
| | | | | | | 610,748 | | | | | |
| |
Auto Components - 2.69% | | | | | |
Drew Industries, Inc. | | | 6,500 | | | | 551,460 | | | | | |
Tenneco, Inc.* | | | 9,200 | | | | 428,812 | | | | | |
| | | | | | | | | | | | |
| | | |
| | | | | | | 980,272 | | | | | |
| |
Biotechnology - 1.79% | | | | | |
Adverum Biotechnologies, Inc.* | | | 6,839 | | | | 21,611 | | | | | |
Emergent BioSolutions, Inc.* | | | 3,300 | | | | 92,796 | | | | | |
Insys Therapeutics, Inc.*+ | | | 13,000 | | | | 168,220 | | | | | |
Tetraphase Pharmaceuticals, Inc.*+ | | | 85,617 | | | | 368,153 | | | | | |
| | | | | | | | | | | | |
| | | |
| | | | | | | 650,780 | | | | | |
| |
Building Products - 2.85% | | | | | |
American Woodmark Corp.* | | | 7,200 | | | | 477,936 | | | | | |
Insteel Industries, Inc. | | | 19,500 | | | | 557,505 | | | | | |
| | | | | | | | | | | | |
| | | |
| | | | | | | 1,035,441 | | | | | |
| |
Capital Markets - 0.35% | | | | | |
Evercore Partners, Inc., Class A | | | 2,900 | | | | 128,151 | | | | | |
| |
Chemicals - 4.49% | | | | | |
Ferro Corp.* | | | 39,500 | | | | 528,510 | | | | | |
KMG Chemicals, Inc. | | | 20,900 | | | | 543,191 | | | | | |
Koppers Holdings, Inc.* | | | 18,300 | | | | 562,359 | | | | | |
| | | | | | | | | | | | |
| | | |
| | | | | | | 1,634,060 | | | | | |
| |
Commercial Services & Supplies - 1.26% | | | | | |
Interface, Inc. | | | 5,600 | | | | 85,400 | | | | | |
Kimball International, Inc., Class B | | | 32,900 | | | | 374,402 | | | | | |
| | | | | | | | | | | | |
| | | |
| | | | | | | 459,802 | | | | | |
| |
Communications Equipment - 2.42% | | | | | |
Extreme Networks, Inc.* | | | 93,700 | | | | 317,643 | | | | | |
Plantronics, Inc. | | | 12,800 | | | | 563,200 | | | | | |
| | | | | | | | | | | | |
| | | |
| | | | | | | 880,843 | | | | | |
| |
Computers & Peripherals - 1.34% | | | | | |
Electronics for Imaging, Inc.*+ | | | 11,300 | | | | 486,352 | | | | | |
| |
Construction & Engineering - 3.06% | | | | | |
Comfort Systems USA, Inc. | | | 17,400 | | | | 566,718 | | | | | |
| | | | | | | | | | | | |
| | | | | | | | | | | | |
| | | | | | | | |
| Industry Company | | Shares | | | Value | |
|
Construction & Engineering (continued) | |
Installed Building Products, Inc.* | | | 15,100 | | | | $ 547,979 | |
| | | | | | | | |
| | |
| | | | | | | 1,114,697 | |
|
Consumer Finance - 2.16% | |
First Cash Financial Services, Inc. | | | 9,500 | | | | 487,635 | |
Regional Management Corp.* | | | 20,300 | | | | 297,598 | |
| | | | | | | | |
| | |
| | | | | | | 785,233 | |
|
Diversified Consumer Services - 0.65% | |
Weight Watchers | | | | | | | | |
International, Inc.*+ | | | 20,300 | | | | 236,089 | |
|
Diversified Financial Services - 2.23% | |
MarketAxess Holdings, Inc. | | | 4,200 | | | | 610,680 | |
OM Asset Management, PLC | | | 15,100 | | | | 201,585 | |
| | | | | | | | |
| | |
| | | | | | | 812,265 | |
|
Electrical Equipment - 1.25% | |
General Cable Corp. | | | 35,800 | | | | 455,018 | |
|
Electronic Equipment, Instruments &
Components - 3.17% | |
Badger Meter, Inc. | | | 3,000 | | | | 219,090 | |
Fabrinet* | | | 14,700 | | | | 545,664 | |
Littelfuse, Inc. | | | 3,300 | | | | 390,027 | |
| | | | | | | | |
| | |
| | | | | | | 1,154,781 | |
|
Food Products - 1.58% | |
Cal-Maine Foods, Inc.+ | | | 8,900 | | | | 394,448 | |
Tootsie Roll Industries, Inc. | | | 4,713 | | | | 181,592 | |
| | | | | | | | |
| | |
| | | | | | | 576,040 | |
|
Health Care Equipment & Supplies - 5.59% | |
ABIOMED, Inc.*+ | | | 4,900 | | | | 535,521 | |
LDR Holding Corp.* | | | 2,300 | | | | 84,985 | |
Masimo Corp.* | | | 10,200 | | | | 535,653 | |
Sientra, Inc.*+ | | | 64,300 | | | | 423,094 | |
Vascular Solutions, Inc.* | | | 3,300 | | | | 137,478 | |
Zeltiq Aesthetics, Inc.*+ | | | 11,600 | | | | 317,028 | |
| | | | | | | | |
| | | | | | | 2,033,759 | |
|
Health Care Providers & Services - 9.65% | |
Air Methods Corp.* | | | 7,100 | | | | 254,393 | |
AMN Healthcare Services, Inc.* | | | 13,900 | | | | 555,583 | |
BioTelemetry, Inc.* | | | 33,000 | | | | 537,900 | |
Chemed Corp. | | | 3,400 | | | | 463,454 | |
| | |
Small-Cap Growth Fund SCHEDULE OF INVESTMENTS (continued) | | |
Showing percentage of net assets as of June 30, 2016 | | |
| | | | | | | | | | | | |
| Industry Company | | Shares | | | Value | | | | |
| |
Common Stocks (continued) | | | | | |
Health Care Providers & Services (continued) | | | | | |
Everyday Health, Inc.* | | | 19,000 | | | | $ 149,720 | | | | | |
LHC Group, Inc.* | | | 12,600 | | | | 545,328 | | | | | |
Molina Healthcare, Inc.* | | | 10,500 | | | | 523,950 | | | | | |
WellCare Health Plans, Inc.* | | | 4,500 | | | | 482,760 | | | | | |
| | | | | | | | | | | | |
| | | |
| | | | | | | 3,513,088 | | | | | |
| |
Hotels, Restaurants & Leisure - 4.51% | | | | | |
Dave & Buster’s Entertainment, Inc.* | | | 2,400 | | | | 112,296 | | | | | |
Diamond Resorts International, Inc.*+ | | | 4,300 | | | | 128,828 | | | | | |
Isle of Capri Casinos, Inc.* | | | 27,600 | | | | 505,632 | | | | | |
Papa John’s International, Inc.+ | | | 6,600 | | | | 448,800 | | | | | |
SeaWorld Entertainment, Inc.+ | | | 4,300 | | | | 61,619 | | | | | |
Texas Roadhouse, Inc. | | | 8,400 | | | | 383,040 | | | | | |
| | | | | | | | | | | | |
| | | |
| | | | | | | 1,640,215 | | | | | |
| |
Household Durables - 0.73% | | | | | |
LGI Homes, Inc.*+ | | | 6,000 | | | | 191,640 | | | | | |
ZAGG, Inc.* | | | 14,300 | | | | 75,075 | | | | | |
| | | | | | | | | | | | |
| | | |
| | | | | | | 266,715 | | | | | |
| | | |
Insurance - 2.86% | | | | | | | | | | | | |
Essent Group, Ltd.* | | | 9,800 | | | | 213,738 | | | | | |
Primerica, Inc. | | | 9,400 | | | | 538,056 | | | | | |
Universal Insurance Holdings, Inc. | | | 15,600 | | | | 289,848 | | | | | |
| | | | | | | | | | | | |
| | | |
| | | | | | | 1,041,642 | | | | | |
| |
Internet & Catalog Retail - 1.43% | | | | | |
1-800-Flowers.com, Inc., Class A* | | | 57,800 | | | | 521,356 | | | | | |
| |
Internet Software & Services - 4.99% | | | | | |
Brightcove, Inc.* | | | 11,491 | | | | 101,122 | | | | | |
Cimpress NV*+ | | | 5,600 | | | | 517,888 | | | | | |
EarthLink Holdings Corp. | | | 83,800 | | | | 536,320 | | | | | |
Five9, Inc.* | | | 10,800 | | | | 128,520 | | | | | |
j2 Global, Inc. | | | 8,400 | | | | 530,628 | | | | | |
| | | | | | | | | | | | |
| | | |
| | | | | | | 1,814,478 | | | | | |
| | | |
IT Services - 5.06% | | | | | | | | | | | | |
CSG Systems International, Inc. | | | 12,200 | | | | 491,782 | | | | | |
Forrester Research, Inc. | | | 15,200 | | | | 560,272 | | | | | |
Luxoft Holding, Inc.*+ | | | 6,400 | | | | 332,928 | | | | | |
PFSweb, Inc.* | | | 36,400 | | | | 345,800 | | | | | |
TeleTech Holdings, Inc. | | | 4,087 | | | | 110,880 | | | | | |
| | | | | | | | | | | | |
| | | |
| | | | | | | 1,841,662 | | | | | |
| | | | | | | | |
| Industry Company | | Shares | | | Value | |
|
Leisure Equipment & Products - 0.97% | |
Nautilus, Inc.* | | | 19,700 | | | | $ 351,448 | |
|
Life Sciences Tools & Services - 1.46% | |
Cambrex Corp.* | | | 10,300 | | | | 532,819 | |
| | |
Machinery - 1.61% | | | | | | | | |
Global Brass & Copper Holdings, Inc. | | | 3,500 | | | | 95,515 | |
Wabash National Corp.* | | | 38,500 | | | | 488,950 | |
| | | | | | | | |
| | |
| | | | | | | 584,465 | |
| | |
Materials - 2.59% | | | | | | | | |
CLARCOR, Inc. | | | 7,300 | | | | 444,059 | |
Trinseo SA+ | | | 11,600 | | | | 497,988 | |
| | | | | | | | |
| | |
| | | | | | | 942,047 | |
| | |
Metals & Mining - 1.20% | | | | | | | | |
Kaiser Aluminum Corp. | | | 1,300 | | | | 117,533 | |
U.S. Silica Holdings, Inc. | | | 9,300 | | | | 320,571 | |
| | | | | | | | |
| | |
| | | | | | | 438,104 | |
| | |
Pharmaceuticals - 4.07% | | | | | | | | |
Diplomat Pharmacy, Inc.*+ | | | 15,400 | | | | 539,000 | |
SciClone Pharmaceuticals, Inc.* | | | 42,100 | | | | 549,826 | |
Sucampo Pharmaceuticals, Inc., Class A* | | | 20,000 | | | | 219,400 | |
Synutra International, Inc.* | | | 45,100 | | | | 171,831 | |
| | | | | | | | |
| | |
| | | | | | | 1,480,057 | |
| | |
Professional Services - 3.00% | | | | | | | | |
Mistras Group, Inc.* | | | 22,800 | | | | 544,236 | |
TrueBlue, Inc.* | | | 29,000 | | | | 548,680 | |
| | | | | | | | |
| | |
| | | | | | | 1,092,916 | |
| | |
Road & Rail - 0.25% | | | | | | | | |
YRC Worldwide, Inc.*+ | | | 10,200 | | | | 89,760 | |
|
Semiconductors & Semiconductor Equipment - 0.89% | |
Cavium, Inc.*+ | | | 2,800 | | | | 108,080 | |
Synaptics, Inc.* | | | 2,100 | | | | 112,875 | |
Xcerra Corp.*+ | | | 17,973 | | | | 103,345 | |
| | | | | | | | |
| | |
| | | | | | | 324,300 | |
| | |
Software - 5.30% | | | | | | | | |
Blackbaud, Inc. | | | 3,200 | | | | 217,280 | |
Ebix, Inc.+ | | | 11,400 | | | | 546,060 | |
Fair Isaac Corp. | | | 4,800 | | | | 542,448 | |
Manhattan Associates, Inc.* | | | 7,600 | | | | 487,388 | |
QAD, Inc., Class A+ | | | 7,072 | | | | 136,277 | |
| | | | | | | | |
| | |
| | | | | | | 1,929,453 | |
| | |
| 52 | | Annual Report | June 30, 2016 |
| | |
Small-Cap Growth Fund SCHEDULE OF INVESTMENTS (continued) | | |
Showing percentage of net assets as of June 30, 2016 | | |
| | | | | | | | | | |
| Industry Company | | | | Shares | | Value | | | |
| |
Common Stocks (continued) | | | |
Specialty Retail - 2.41% | | | |
Asbury Automotive Group, Inc.* | | 1,600 | | | $ 84,384 | | | |
Outerwall, Inc.+ | | 3,900 | | | 163,800 | | | |
Select Comfort Corp.* | | 22,500 | | | 481,050 | | | |
Sportsman’s Warehouse Holdings, Inc.* | | 18,400 | | | 148,304 | | | |
| | | | | | | | | | |
| | | | |
| | | | | | | 877,538 | | | |
| |
Telecommunication Services - 0.74% | | | |
General Communication, Inc., Class A* | | 5,400 | | | 85,320 | | | |
Windstream Holdings, Inc.+ | | 20,000 | | | 185,400 | | | |
| | | | | | | | | | |
| | | | |
| | | | | | | 270,720 | | | |
| |
Textiles, Apparel & Luxury Goods - 2.80% | | | |
Culp, Inc. | | 6,000 | | | 165,780 | | | |
G-III Apparel Group, Ltd.* | | 6,100 | | | 278,892 | | | |
Wolverine World Wide, Inc. | | 28,300 | | | 575,056 | | | |
| | | | | | | | | | |
| | | | |
| | | | | | | 1,019,728 | | | |
| |
Thrifts & Mortgage Finance - 0.82% | | | |
BofI Holding, Inc.*+ | | 16,800 | | | 297,528 | | | |
| |
Trading Companies & Distributors - 1.68% | | | |
Pool Corp. | | 6,500 | | | 611,195 | | | |
| |
Wireless Telecommunication Services - 0.63% | | | |
RingCentral, Inc.,
Class A* | | 11,600 | | | 228,752 | | | |
| | | | | | | | | | |
| | |
TOTAL COMMON STOCKS - 98.21% | | | 35,744,317 | | | |
| | | | | | | | | | |
(Cost $32,038,284) | | | | | | |
| | | | |
| | | Rate^ | | Shares | | Value | | | |
| | |
MONEY MARKET FUND - 0.10% | | | | | | |
Dreyfus Cash Management Fund | | 0.30% | | 35,390 | | | 35,390 | | | |
| | | | | | | | | | |
TOTAL MONEY MARKET
FUND - 0.10% | | | | | 35,390 | | | |
| | | | | | | | | | |
(Cost $35,390) | | | | | | | | | | |
| |
| INVESTMENTS PURCHASED WITH CASH PROCEEDS FROM SECURITIES LENDING - 21.54% | | | |
Dreyfus Cash Management Fund** | | 0.30% | | 7,838,131 | | | 7,838,131 | | | |
| | | | | | | | | | |
| | |
TOTAL INVESTMENTS PURCHASED WITH CASH PROCEEDS FROM SECURITIES LENDING - 21.54% | | | 7,838,131 | | | |
| | | | | | | | | | |
(Cost $7,838,131) | | | | | | | | | | |
| | | | | | | | | | |
| | | | | | | | | | |
| | | | |
| | | Value | |
| |
TOTAL INVESTMENTS - 119.85% | | | $43,617,838 | |
(Cost $39,911,805) | | | | |
Liabilities in Excess of Other Assets - (19.85%) | | | (7,224,195 | ) |
| | | | |
| |
NET ASSETS - 100.00% | | | $36,393,643 | |
| | | | |
| * | Non-income producing security. |
| ** | This security represents the investment of the collateral received in connection with securities out on loan as of June 30, 2016. |
| ^ | Rate disclosed as of June 30, 2016. |
| + | This security or a portion of the security is out on loan as of June 30, 2016. Total loaned securities had a value of $7,707,161 as of June 30, 2016. |
PLC - Public Limited Company
Summary of inputs used to value the Fund’s investments as of 06/30/2016 (See Note 2 in Notes to Financial Statements):
| | | | | | | | | | | | | | | | |
| | | Valuation Inputs | |
| |
| | | Investment in Securities (Value) | |
| |
| | | Level 1 Quoted Prices | | | Level 2
Significant
Observable Inputs | | | Level 3
Significant Unobservable
Inputs | | | Total | |
| |
| | | | |
Common Stocks | | $ | 35,744,317 | | | $ | — | | | $ | — | | | $ | 35,744,317 | |
Money Market Fund | | | — | | | | 35,390 | | | | — | | | | 35,390 | |
Investments Purchased with Cash Proceeds from Securities Lending | | | — | | | | 7,838,131 | | | | — | | | | 7,838,131 | |
TOTAL | | $ | 35,744,317 | | | $ | 7,873,521 | | | $ | — | | | $ | 43,617,838 | |
See Notes to Financial Statements.
| | |
Small-Cap Value Fund MANAGER’S COMMENTARY (Unaudited) | | |
June 30, 2016
Dear Fellow Small-Cap Value Fund Shareholder,
For the quarter ended June 30, 2016, our Fund returned 3.94%, underperforming our primary market benchmark, the Russell 2000 Value Index (4.31%), but outperforming our peer benchmark, the Lipper Small-Cap Value Funds Index (1.82%). It was a good quarter on an absolute basis, but a mixed one on a relative basis.
For the fiscal year, the Fund returned -5.02%, trailing the Russell 2000 Value Index (-2.58%) and the Lipper Small-Cap Value Funds Index (-4.71%). The Fund is lagging its primary benchmark but leading its peer benchmark in the five-year period. It lags both its primary and peer benchmarks in the 10-year and inception-to-date periods.
The table below presents our June quarter, one-year, five-year, 10-year and inception-to-date financial results. See the next page for a graph of performance since inception.
Standardized Returns as of June 30, 2016
| | | | | | | | | | | | | | | | | | | | | | | | | | | | | | | | |
|
| | | | | |
| | | | | | | | | Annualized | | |
| | | | | | | | | | | | |
| | | Quarter | | 1 Year | | | | 5 Years | | 10 Years | | Since Inception
(10/31/03) | | |
Small-Cap Value Fund | | | | 3.94% | | | | | -5.02% | | | | | | | 8.12% | | | | | 3.58% | | | | | 6.71% | | |
Russell 2000 Value Index | | | | 4.31% | | | | | -2.58% | | | | | | | 8.15% | | | | | 5.15% | | | | | 7.55% | | |
Lipper Small-Cap Value Funds Index | | | | 1.82% | | | | | -4.71% | | | | | | | 7.23% | | | | | 5.61% | | | | | 7.87% | | |
Performance figures quoted in the table above represent past performance and are no guarantee of future results. Total return figures in the table above include the reinvestment of dividends and capital gains. The table above does not reflect the deduction of taxes that a shareholder would pay on Fund distributions or on the redemption of Fund shares.
The Russell 2000 Value Index is an unmanaged index that consists of stocks in the Russell 2000 Index with lower price-to-book ratios and lower forecasted growth values with dividends reinvested. The Lipper Small-Cap Value Funds Index is an index of small-company, value-oriented funds compiled by Lipper, an independent fund research firm owned by Broadridge Financial Solutions, Inc. It is not possible to invest directly in an index. Periods longer than one year are annualized.
According to data from Lipper, Inc. as of June 30, 2016, Small-Cap Value Fund ranked 190th of 307 small-cap value funds for the 12 months ended June 30, 2016, 103rd of 235 over the last five years, 134th of 146 over the last 10 years, and 88th of 106 such funds since inception in October 2003. Lipper, Inc. is an independent mutual fund rating service owned by Broadridge Financial Solutions, Inc. that ranks funds in various fund categories by making comparative calculations using total returns.
| | |
| 54 | | Annual Report | June 30, 2016 |
| | |
Small-Cap Value Fund MANAGER’S COMMENTARY (Unaudited) (continued) | | |
Small-Cap Value Fund vs. Russell 2000 Value Index & Lipper Small-Cap Value Funds Index
from Inception 10/31/03 to 6/30/16
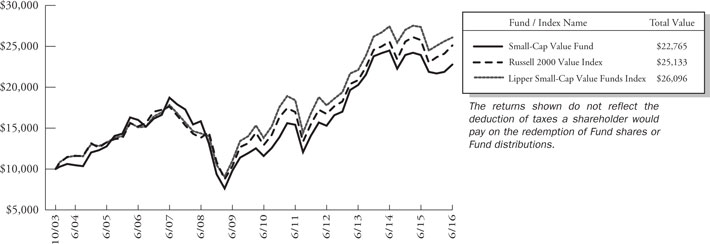
Detailed Explanation of Quarterly Performance
Our value metrics models detracted from the Fund’s relative returns, because they targeted deeper-value stocks that underperformed the index during the quarter. The Fund’s bias toward smaller companies also weighed somewhat on results as larger stocks in the Russell 2000 Value Index delivered the best returns. However, our diversifying price momentum and company financial health models helped offset some of the Fund’s relative underperformance for the quarter.
Holdings in the Energy and Financials sectors detracted most from relative returns, while holdings in the Consumer Discretionary, Utilities and Information Technology sectors added to results.
Detailed Explanation of Fiscal Year Performance
All three model categories underperformed for the year, with our core value metrics models detracting most from the Fund’s relative returns.
Holdings in the Health Care, Financials and Information Technology sectors weighed most heavily on the Fund’s relative returns for the year. The Fund’s underweight exposure to the Utilities sector also detracted from relative performance.
Top Ten Holdings as of June 30, 2016
| | | | | | | | | |
| Rank | | Description | | Industry | | % of Net
Assets |
| 1 | | Isle of Capri Casinos, Inc. | | Hotels, Restaurants & Leisure | | | | 2.0% | |
| 2 | | Talmer Bancorp, Inc. | | Commercial Banks | | | | 1.8% | |
| 3 | | Selective Insurance Group, Inc. | | Insurance | | | | 1.8% | |
| 4 | | Global Brass & Copper Holdings, Inc. | | Machinery | | | | 1.8% | |
| 5 | | Amkor Technology, Inc. | | Semiconductors & Semiconductor Equipment | | | | 1.7% | |
| 6 | | Sanmina Corp. | | Electronic Equip., Instruments & Components | | | | 1.6% | |
| 7 | | Windstream Holdings, Inc. | | Telecommunication Services | | | | 1.6% | |
| 8 | | Cash America International, Inc. | | Consumer Finance | | | | 1.6% | |
| 9 | | LGI Homes, Inc. | | Household Durables | | | | 1.6% | |
| 10 | | Spire, Inc. | | Electronic Equip., Instruments & Components | | | | 1.6% | |
| | Total | | | | | | 17.1% | |
| | |
Small-Cap Value Fund MANAGER’S COMMENTARY (Unaudited) (continued) | | |
Industry Sector Representation as of June 30, 2016
| | | | | | | | | | | | | | | |
| | | % of Net Assets | | % of
Russell 2000
Value Index | | Difference |
Consumer Discretionary | | | | 8.4% | | | | | 10.5% | | | | | -2.1% | |
Consumer Staples | | | | 4.5% | | | | | 3.0% | | | | | 1.5% | |
Energy | | | | 3.5% | | | | | 5.1% | | | | | -1.6% | |
Financials | | | | 37.2% | | | | | 41.3% | | | | | -4.1% | |
Health Care | | | | 6.2% | | | | | 4.7% | | | | | 1.5% | |
Industrials | | | | 16.6% | | | | | 12.1% | | | | | 4.5% | |
Information Technology | | | | 7.7% | | | | | 10.1% | | | | | -2.4% | |
Materials | | | | 5.9% | | | | | 4.6% | | | | | 1.3% | |
Telecommunication Services | | | | 2.8% | | | | | 0.8% | | | | | 2.0% | |
Utilities | | | | 6.4% | | | | | 7.8% | | | | | -1.4% | |
Cash & Other Assets | | | | 0.8% | | | | | 0.0% | | | | | 0.8% | |
Total | | | | 100.0% | | | | | 100.0% | | | | | | |
Disclaimer
The views expressed here are exclusively those of Fund management. These views, including those related to market sectors or individual stocks, are not meant as investment advice and should not be considered predictive in nature. Any favorable (or unfavorable) description of a holding applies only as of the quarter end, June 30, 2016, unless otherwise stated. Security positions can and do change thereafter. Discussions of historical performance do not guarantee and may not be indicative of future performance.
Market volatility can significantly impact short-term performance. The Fund is not an appropriate investment for short-term investors. Investments in small companies generally carry greater risk than is customarily associated with larger companies. This additional risk is attributable to a number of factors, including the relatively limited financial resources that are typically available to small companies and the fact that small companies often have comparatively limited product lines. In addition, the stock of small companies tends to be more volatile than the stock of large companies, particularly in the short term and particularly in the early stages of an economic or market downturn. Shareholders of the Fund, therefore, are taking on more risk than they would if they invested in the stock market as a whole.
| | |
| 56 | | Annual Report | June 30, 2016 |
| | |
Small-Cap Value Fund MANAGER’S COMMENTARY (Unaudited) (continued) | | |
Conclusion
Thank you for your continued investment in Small-Cap Value Fund. We encourage your feedback; your reactions and concerns are important to us.
Sincerely,
The Investment Management Team
| | |
Small-Cap Value Fund SCHEDULE OF INVESTMENTS | | |
Showing percentage of net assets as of June 30, 2016 | | |
| | | | | | | | | | | | |
| Industry Company | | Shares | | | Value | | | | |
| |
COMMON STOCKS - 99.19% | | | | | |
Aerospace & Defense - 1.11% | | | | | |
Cubic Corp. | | | 16,200 | | | | $ 650,592 | | | | | |
| |
Air Freight & Logistics - 1.14% | | | | | |
Atlas Air Worldwide Holdings, Inc.* | | | 16,200 | | | | 671,004 | | | | | |
| |
Airlines - 1.43% | | | | | |
SkyWest, Inc. | | | 31,700 | | | | 838,782 | | | | | |
| |
Auto Components - 0.78% | | | | | |
Cooper-Standard Holding, Inc.* | | | 5,800 | | | | 458,142 | | | | | |
| |
Beverages - 1.55% | | | | | |
National Beverage Corp.* | | | 14,500 | | | | 910,745 | | | | | |
| |
Biotechnology - 0.71% | | | | | |
PDL BioPharma, Inc. | | | 132,800 | | | | 416,992 | | | | | |
| |
Building Products - 1.01% | | | | | |
Insteel Industries, Inc. | | | 20,800 | | | | 594,672 | | | | | |
| |
Chemicals - 4.91% | | | | | |
American Vanguard Corp. | | | 43,900 | | | | 663,329 | | | | | |
Innospec, Inc. | | | 16,200 | | | | 745,038 | | | | | |
Rayonier Advanced Materials, Inc. | | | 62,800 | | | | 853,452 | | | | | |
Stepan Co. | | | 10,400 | | | | 619,112 | | | | | |
| | | | | | | | | | | | |
| | | |
| | | | | | | 2,880,931 | | | | | |
| |
Commercial Banks - 11.35% | | | | | |
Customers Bancorp, Inc.* | | | 27,000 | | | | 678,510 | | | | | |
FCB Financial Holdings, Inc., Class A* | | | 17,800 | | | | 605,200 | | | | | |
First BanCorp Puerto Rico* | | | 118,000 | | | | 468,460 | | | | | |
Investors Bancorp, Inc. | | | 60,800 | | | | 673,664 | | | | | |
Kearny Financial Corp. | | | 45,400 | | | | 571,132 | | | | | |
PrivateBancorp, Inc. | | | 17,700 | | | | 779,331 | | | | | |
Talmer Bancorp, Inc., Class A | | | 54,900 | | | | 1,052,433 | | | | | |
Valley National Bancorp | | | 58,000 | | | | 528,960 | | | | | |
Webster Financial Corp. | | | 18,300 | | | | 621,285 | | | | | |
Wilshire Bancorp, Inc. | | | 66,100 | | | | 688,762 | | | | | |
| | | | | | | | | | | | |
| | | |
| | | | | | | 6,667,737 | | | | | |
| |
Commercial Services & Supplies - 3.68% | | | | | |
ABM Industries, Inc. | | | 18,500 | | | | 674,880 | | | | | |
ACCO Brands Corp.* | | | 85,600 | | | | 884,248 | | | | | |
UniFirst Corp. | | | 5,200 | | | | 601,744 | | | | | |
| | | | | | | | | | | | |
| | | |
| | | | | | | 2,160,872 | | | | | |
| | | | | | | | | | | | |
| Industry Company | | Shares | | | Value | | | | |
| |
| | | | | |
Communications Equipment - 1.95% | | | | | |
ATN International, Inc.+ | | | 9,000 | | | | $ 700,290 | | | | | |
Extreme Networks, Inc.* | | | 131,100 | | | | 444,429 | | | | | |
| | | | | | | | | | | | |
| | | |
| | | | | | | 1,144,719 | | | | | |
| |
Construction & Engineering - 1.23% | | | | | |
Comfort Systems
USA, Inc. | | | 22,200 | | | | 723,054 | | | | | |
| |
Consumer Finance - 2.78% | | | | | |
Cash America International, Inc. | | | 22,200 | | | | 946,164 | | | | | |
Nelnet, Inc., Class A | | | 19,700 | | | | 684,575 | | | | | |
| | | | | | | | | | | | |
| | | |
| | | | | | | 1,630,739 | | | | | |
| |
Diversified Financial Services - 1.89% | | | | | |
Impac Mortgage Holdings, Inc.*+ | | | 35,500 | | | | 556,640 | | | | | |
Ladder Capital Corp. | | | 45,549 | | | | 555,698 | | | | | |
| | | | | | | | | | | | |
| | | |
| | | | | | | 1,112,338 | | | | | |
| |
Electric Utilities - 1.20% | | | | | |
Otter Tail Corp. | | | 21,100 | | | | 706,639 | | | | | |
| |
Electrical Equipment - 0.88% | | | | | |
General Cable Corp. | | | 40,600 | | | | 516,026 | | | | | |
| |
Electronic Equipment, Instruments &
Components - 6.40% | | | | | |
Sanmina Corp.* | | | 35,900 | | | | 962,479 | | | | | |
Spire, Inc. | | | 13,100 | | | | 928,004 | | | | | |
Tech Data Corp.* | | | 7,700 | | | | 553,245 | | | | | |
TTM Technologies, Inc.* | | | 101,500 | | | | 764,295 | | | | | |
WGL Holdings, Inc. | | | 7,800 | | | | 552,162 | | | | | |
| | | | | | | | | | | | |
| | | |
| | | | | | | 3,760,185 | | | | | |
| |
Food Products - 1.42% | | | | | |
Sanderson Farms, Inc.+ | | | 9,600 | | | | 831,744 | | | | | |
| |
Health Care Providers & Services - 5.47% | | | | | |
Amedisys, Inc.* | | | 11,500 | | | | 580,520 | | | | | |
AMN Healthcare Services, Inc.* | | | 16,500 | | | | 659,505 | | | | | |
LHC Group, Inc.* | | | 14,500 | | | | 627,560 | | | | | |
Owens & Minor, Inc. | | | 23,500 | | | | 878,430 | | | | | |
Triple-S Management Corp., Class B* | | | 19,200 | | | | 469,056 | | | | | |
| | | | | | | | | | | | |
| | | |
| | | | | | | 3,215,071 | | | | | |
| |
Hotels, Restaurants & Leisure - 1.96% | | | | | |
Isle of Capri Casinos, Inc.* | | | 62,700 | | | | 1,148,664 | | | | | |
| | |
| 58 | | Annual Report | June 30, 2016 |
| | |
Small-Cap Value Fund SCHEDULE OF INVESTMENTS (continued) | | |
Showing percentage of net assets as of June 30, 2016 | | |
| | | | | | | | | | |
| Industry Company | | Shares | | | Value | | | |
| |
Common Stocks (continued) | | | |
Household Durables - 2.52% | | | |
Bassett Furniture Industries, Inc. | | | 22,700 | | | | $ 543,438 | | | |
LGI Homes, Inc.*+ | | | 29,400 | | | | 939,036 | | | |
| | | | | | | | | | |
| | | |
| | | | | | | 1,482,474 | | | |
| |
Household Products - 1.50% |
Central Garden & Pet Co., Class A* | | | 40,600 | | | | 881,426 | | | |
| |
Independent Power Producers & Energy
Traders - 1.47% |
Talen Energy Corp.* | | | 63,500 | | | | 860,425 | | | |
| |
Insurance - 10.15% |
American Equity Investment Life Holding Co. | | | 28,600 | | | | 407,550 | | | |
Argo Group International Holdings Ltd. | | | 11,110 | | | | 576,609 | | | |
CNO Financial Group, Inc. | | | 30,500 | | | | 532,530 | | | |
FBL Financial Group, Inc., Class A | | | 12,800 | | | | 776,576 | | | |
Heritage Insurance Holdings, Inc.+ | | | 29,400 | | | | 351,918 | | | |
National Western Life Group, Inc., Class A | | | 2,600 | | | | 507,702 | | | |
Navigators Group, Inc. (The) | | | 6,700 | | | | 616,199 | | | |
OneBeacon Insurance Group Ltd., Class A | | | 60,220 | | | | 831,036 | | | |
Selective Insurance Group, Inc. | | | 27,500 | | | | 1,050,775 | | | |
State Auto Financial Corp. | | | 14,300 | | | | 313,313 | | | |
| | | | | | | | | | |
| | | |
| | | | | | | 5,964,208 | | | |
| |
Machinery - 3.62% |
Global Brass & Copper Holdings, Inc. | | | 38,200 | | | | 1,042,478 | | | |
Greenbrier Companies., Inc. (The)+ | | | 19,700 | | | | 573,861 | | | |
Titan International, Inc.+ | | | 82,000 | | | | 508,400 | | | |
| | | | | | | | | | |
| | | |
| | | | | | | 2,124,739 | | | |
| |
Media - 1.07% |
Time, Inc. | | | 38,300 | | | | 630,418 | | | |
| |
Metals & Mining - 0.93% |
Schnitzer Steel Industries, Inc., Class A | | | 31,100 | | | | 547,360 | | | |
| |
Oil, Gas & Consumable Fuels - 2.82% |
Alon USA Energy, Inc.+ | | | 48,600 | | | | 314,928 | | | |
Renewable Energy Group, Inc.*+ | | | 77,000 | | | | 679,910 | | | |
| | | | | | | | | | |
| Industry Company | | Shares | | | Value | | | |
| |
| | | |
Oil, Gas & Consumable Fuels (continued) | | | |
Ship Finance International, Ltd.+ | | | 44,900 | | | | $ 661,826 | | | |
| | | | | | | | | | |
| | | |
| | | | | | | 1,656,664 | | | |
|
Professional Services - 1.00% |
Mistras Group, Inc.* | | | 24,500 | | | | 584,815 | | | |
|
Real Estate Investment Trusts (REITs) - 5.97% |
Colony Starwood Homes+ | | | 25,800 | | | | 784,836 | | | |
Geo Group, Inc. (The) | | | 17,400 | | | | 594,732 | | | |
Healthcare Realty Trust, Inc. | | | 18,200 | | | | 636,818 | | | |
Ramco-Gershenson Properties Trust | | | 33,500 | | | | 656,935 | | | |
Summit Hotel Properties, Inc. | | | 62,800 | | | | 831,472 | | | |
| | | | | | | | | | |
| | | |
| | | | | | | 3,504,793 | | | |
|
Semiconductors & Semiconductor Equipment - 1.68% |
Amkor Technology, Inc.* | | | 171,500 | | | | 986,125 | | | |
|
Software - 1.40% |
Mentor Graphics Corp. | | | 26,100 | | | | 554,886 | | | |
Silver Spring Networks, Inc.* | | | 22,100 | | | | 268,515 | | | |
| | | | | | | | | | |
| | | |
| | | | | | | 823,401 | | | |
|
Specialty Retail - 1.06% |
Sportsman’s Warehouse Holdings, Inc.* | | | 55,900 | | | | 450,554 | | | |
Stage Stores, Inc.+ | | | 35,800 | | | | 174,704 | | | |
| | | | | | | | | | |
| | | |
| | | | | | | 625,258 | | | |
|
Telecommunication Services - 1.63% |
Windstream Holdings, Inc.+ | | | 103,100 | | | | 955,737 | | | |
|
Textiles, Apparel & Luxury Goods - 1.02% |
Perry Ellis International, Inc.* | | | 29,800 | | | | 599,576 | | | |
|
Thrifts & Mortgage Finance - 5.04% |
Beneficial Bancorp, Inc.* | | | 44,300 | | | | 563,496 | | | |
Capitol Federal Financial, Inc. | | | 45,200 | | | | 630,540 | | | |
Clifton Bancorp, Inc.+ | | | 28,900 | | | | 435,523 | | | |
Northwest Bancshares, Inc. | | | 49,300 | | | | 731,119 | | | |
Provident Financial Services, Inc. | | | 30,600 | | | | 600,984 | | | |
| | | | | | | | | | |
| | | |
| | | | | | | 2,961,662 | | | |
|
Trading Companies & Distributors - 1.52% |
Textainer Group Holdings, Ltd.+ | | | 40,800 | | | | 454,512 | | | |
| | |
Small-Cap Value Fund SCHEDULE OF INVESTMENTS (continued) | | |
Showing percentage of net assets as of June 30, 2016 | | |
| | | | | | | | | | |
| Industry Company | | | | Shares | | Value | | | |
| |
Common Stocks (continued) | | | |
| Trading Companies & Distributors (continued) | | | |
Titan Machinery, Inc.* | | 39,400 | | | $ 439,310 | | | |
| | | | | | | | | | |
| | | |
| | | | | 893,822 | | | |
| |
| Transportation Infrastructure - 0.71% | | | |
Scorpio Tankers, Inc. | | 99,500 | | | 417,900 | | | |
| |
| Water Utilities - 1.23% | | | |
Middlesex Water Co. | | 16,700 | | | 724,446 | | | |
| | | | | | | | | | |
| | |
TOTAL COMMON STOCKS - 99.19% | | | 58,264,897 | | | |
| | | | | | | | | | |
(Cost $58,237,924) | | | | | | |
| | | | |
| | | Rate^ | | Shares | | Value | | | |
MONEY MARKET FUND - 0.83% | | | |
Dreyfus Cash Management Fund | | 0.30% | | 485,900 | | | 485,900 | | | |
| | | | | | | | | | |
| | |
TOTAL MONEY MARKET FUND - 0.83% | | | 485,900 | | | |
| | | | | | | | | | |
(Cost $485,900) | | | | | | |
| |
INVESTMENTS PURCHASED WITH CASH PROCEEDS FROM SECURITIES
LENDING - 12.41% | | | |
Dreyfus Cash Management Fund** | | 0.30% | | 7,289,239 | | | 7,289,239 | | | |
| | | | | | |
TOTAL INVESTMENTS PURCHASED WITH CASH PROCEEDS FROM SECURITIES LENDING - 12.41% | | | 7,289,239 | | | |
| | | | | | |
(Cost $7,289,239) | | | | | | |
| | |
Total Investments - 112.43% | | | $66,040,036 | | | |
(Cost $66,013,063) | | | |
Liabilities in Excess of Other
Assets - (12.43%) | | | (7,299,531 | ) | | |
| | | | | | |
| | |
NET ASSETS - 100.00% | | | $58,740,505 | | | |
| | | | | | |
| | | | | | | | |
* Non-income producing security. | | |
** This security represents the investment of the collateral received in connection with securities out on loan as of June 30, 2016. | | |
^ Rate disclosed as of June 30, 2016. | | |
+ This security or a portion of the security is out on loan as of June 30, 2016. Total loaned securities had a value of $7,205,943 as of June 30, 2016. | | |
| | |
| | |
Summary of inputs used to value the Fund’s investments as of 06/30/2016 (See Note 2 in Notes to Financial Statements):
| | | | | | | | | | | | | | | | |
| | | Valuation Inputs | |
| | | Investment in Securities (Value) | |
| | | Level 1 Quoted Prices | | | Level 2 Significant
Observable Inputs | | | Level 3
Significant
Unobservable
Inputs | | | Total | |
| | | | |
Common Stocks | | $ | 58,264,897 | | | $ | — | | | $ | — | | | $ | 58,264,897 | |
Money Market Fund | | | — | | | | 485,900 | | | | — | | | | 485,900 | |
Investments Purchased with Cash Proceeds from Securities Lending | | | — | | | | 7,289,239 | | | | — | | | | 7,289,239 | |
| | | | | | | | | | | | | | | | |
TOTAL | | $ | 58,264,897 | | | $ | 7,775,139 | | | $ | — | | | $ | 66,040,036 | |
| | | | | | | | | | | | | | | | |
See Notes to Financial Statements
| | |
| 60 | | Annual Report | June 30, 2016 |
| | |
Blue Chip 35 Index Fund MANAGER’S COMMENTARY (Unaudited) | | |
June 30, 2016
Dear Fellow Blue Chip 35 Index Fund Shareholder,
For the quarter ended June 30, 2016, our Fund returned 2.85%, outperforming our primary market benchmark, the S&P 500 Index (2.46%), our peer benchmark, the Lipper Large-Cap Core Funds Index (2.14%), and the Russell Top 50 Mega Cap Index (2.24%). It was a good quarter.
For the fiscal year, our Fund was up 6.60%, beating the S&P 500 Index (3.99%) and the Lipper Large-Cap Core Funds Index (1.52%), but slightly trailing the Russell Top 50 Mega Cap Index (6.68%).
The table below presents our June quarter, one-year, five-year, 10-year, 15-year and inception-to-date financial results. See the next page for a graph of performance since inception.
Standardized Returns as of June 30, 2016
| | | | | | | | | | | | | | | | |
| | | | | | | | | | Annualized |
| | | Quarter | | | 1 Year | | | | 5 Years | | 10 Years | | 15 Years | | Since Inception
(7/31/97) |
| | | | | | | |
Blue Chip 35 Index Fund | | | 2.85% | | | 6.60% | | | | 12.61% | | 7.72% | | 5.53% | | 6.55% |
S&P 500 Index | | | 2.46% | | | 3.99% | | | | 12.10% | | 7.42% | | 5.75% | | 6.22% |
Russell Top 50 Mega Cap Index | | | 2.24% | | | 6.68% | | | | 12.45% | | 7.19% | | 4.46% | | 5.15% |
Lipper Large-Cap Core Funds Index | | | 2.14% | | | 1.52% | | | | 10.47% | | 6.43% | | 4.82% | | 5.32% |
Bridgeway Ultra-Large 35 Index | | | 2.89% | | | 6.87% | | | | 12.88% | | 7.93% | | 5.81% | | 6.74% |
Performance figures quoted in the table above represent past performance and are no guarantee of future results. Total return figures in the table above include the reinvestment of dividends and capital gains. The table above does not reflect the deduction of taxes that a shareholder would pay on Fund distributions or on the redemption of Fund shares.
The S&P 500 Index is a broad-based, unmanaged measurement of changes in stock market conditions, based on the average of 500 widely held common stocks with dividends reinvested. The Russell Top 50 Mega Cap Index measures the performance of the largest companies in the Russell 3000 Index. It includes 50 of the largest securities, based on a combination of their market cap and current index membership, and represents approximately 40% of the total market capitalization of the Russell 3000 Index. The Bridgeway Ultra-Large 35 Index is an index composed of very large, “blue chip” U.S. stocks, excluding tobacco; it is compiled by the adviser of the Fund. The Lipper Large-Cap Core Funds Index reflects the aggregate record of domestic large-cap core mutual funds as reported by Lipper, an independent fund research firm owned by Broadridge Financial Solutions, Inc. It is not possible to invest directly in an index. Periods longer than one year are annualized.
According to data from Lipper, Inc. as of June 30, 2016, Blue-Chip 35 Index Fund ranked 62nd of 861 large-cap core funds for the 12 months ended June 30, 2016, 22nd of 696 over the last five years, 66th of 524 over the last 10 years, and 29th of 163 since inception in July 1997. Lipper, Inc. is an independent mutual fund rating service owned by Broadridge Financial Solutions, Inc. that ranks funds in various fund categories by making comparative calculations using total returns.
| | |
Blue Chip 35 Index Fund MANAGER’S COMMENTARY (Unaudited) (continued) | | |
Blue Chip 35 Index Fund vs. S&P 500 Index, Russell Top 50 Mega Cap Index, Lipper Large-Cap Core Funds Index & Bridgeway Ultra-Large 35 Index from Inception 7/31/97 to 6/30/16
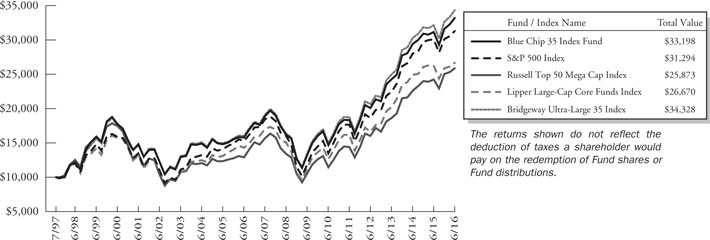
Detailed Explanation of Quarterly Performance
The Fund’s relative performance benefitted from our equal-weight design feature, which requires us to regularly reduce our stakes in stocks that have appreciated the most while increasing our stakes in shares that have lagged. This rebalancing helped the Fund benefit from strong growth among ultra-large stocks that recovered during the recent quarter. In addition, the Fund held fewer higher-volatility stocks than the S&P 500 Index, which helped performance because higher-volatility stocks underperformed during the quarter.
The Fund’s overweight position in the lagging Information Technology sector detracted slightly from relative performance during the quarter. An underweight position in the strongly performing Health Care sector also hurt relative returns.
Detailed Explanation of Fiscal Year Performance
The Fund’s mega-cap design boosted relative performance, as the largest stocks outperformed the rest of the market during the 12-month period.
Underweight positions in the poor-performing Financials and Health Care sectors helped relative returns. An overweight positions in Telecommunication Services boosted relative returns, as this sector delivered strong performance during the fiscal year.
| | |
| 62 | | Annual Report | June 30, 2016 |
| | |
Blue Chip 35 Index Fund MANAGER’S COMMENTARY (Unaudited) (continued) | | |
The table below presents index performance numbers for stocks in the different CRSP deciles during various time periods.
| | | | | | | | | | | | | | | | | | | | |
| CRSP Decile1 | | Quarter | | | 1 Year | | | 5 Years | | | 10 Years | | | 90.5 Years | |
| |
| 1 (ultra-large) | | | 2.37% | | | | 3.63% | | | | 12.09% | | | | 7.28% | | | | 9.26% | |
| 2 | | | 4.82% | | | | 1.56% | | | | 12.00% | | | | 8.27% | | | | 10.50% | |
| 3 | | | 3.60% | | | | -1.78% | | | | 10.11% | | | | 8.09% | | | | 10.97% | |
| 4 | | | 2.36% | | | | -7.53% | | | | 9.47% | | | | 8.18% | | | | 10.78% | |
| 5 | | | 2.22% | | | | -9.77% | | | | 7.92% | | | | 8.63% | | | | 11.38% | |
| 6 | | | 3.48% | | | | -8.86% | | | | 8.87% | | | | 7.41% | | | | 11.25% | |
| 7 | | | 5.86% | | | | -7.63% | | | | 9.11% | | | | 7.79% | | | | 11.41% | |
| 8 | | | 4.18% | | | | -11.46% | | | | 8.08% | | | | 7.46% | | | | 11.39% | |
| 9 | | | 6.02% | | | | -11.64% | | | | 7.40% | | | | 6.40% | | | | 11.31% | |
| 10 (ultra-small) | | | 5.45% | | | | -13.49% | | | | 7.17% | | | | 5.52% | | | | 13.13% | |
| 1 | Performance figures are as of the period ended June 30, 2016. The CRSP Cap-Based Portfolio Indexes are unmanaged indexes of publicly traded U.S. stocks with dividends reinvested, grouped by market capitalization, as reported by the Center for Research in Security Prices. Past performance is no guarantee of future results. |
| | |
Blue Chip 35 Index Fund MANAGER’S COMMENTARY (Unaudited) (continued) | | |
Contribution to Returns for Blue Chip 35 Index Fund stocks for the fiscal year June 30, 2016:
| | | | | | | | | |
| Rank | | Company | | Industry | | % Contribution
to Return |
| 1 | | Amazon.com, Inc. | | Consumer Discretionary | | | | 0.7% | |
| 2 | | Pfizer, Inc. | | Health Care | | | | 0.5% | |
| 3 | | Exxon Mobil Corp. | | Energy | | | | 0.3% | |
| 4 | | Johnson & Johnson | | Health Care | | | | 0.3% | |
| 5 | | AT&T, Inc. | | Telecommunication Services | | | | 0.3% | |
| 6 | | Chevron Corp. | | Energy | | | | 0.3% | |
| 7 | | Merck & Co., Inc. | | Health Care | | | | 0.2% | |
| 8 | | ConocoPhillips | | Energy | | | | 0.2% | |
| 9 | | Schlumberger, Ltd | | Energy | | | | 0.2% | |
| 10 | | Wal-Mart Stores, Inc. | | Consumer Discretionary | | | | 0.2% | |
| 11 | | Comcast Corp. | | Consumer Discretionary | | | | 0.2% | |
| 12 | | QUALCOMM, Inc. | | Information Technology | | | | 0.2% | |
| 13 | | 3M Co. | | Industrials | | | | 0.2% | |
| 14 | | JPMorgan Chase & Co. | | Financials | | | | 0.1% | |
| 15 | | Verizon Communications, Inc. | | Telecommunication Services | | | | 0.1% | |
| 16 | | PepsiCo, Inc. | | Consumer Staples | | | | 0.1% | |
| 17 | | Procter & Gamble Co. | | Consumer Staples | | | | 0.1% | |
| 18 | | United Technologies Corp. | | Industrials | | | | 0.1% | |
| 19 | | United Parcel Service, Inc. | | Industrials | | | | 0.1% | |
| 20 | | Intel Corp. | | Information Technology | | | | 0.1% | |
| 21 | | Cisco Systems, Inc. | | Information Technology | | | | 0.1% | |
| 22 | | Berkshire Hathaway, Inc. | | Industrials | | | | 0.1% | |
| 23 | | International Business Machines Corp. | | Information Technology | | | | 0.0% | |
| 24 | | Oracle Corp. | | Information Technology | | | | 0.0% | |
| 25 | | General Electric Co. | | Industrials | | | | 0.0% | |
| 26 | | Coca-Cola Co. | | Consumer Staples | | | | 0.0% | |
| 27 | | Wells Fargo & Co. | | Financials | | | | 0.0% | |
| 28 | | Walt Disney Co. | | Consumer Discretionary | | | | 0.0% | |
| 29 | | Bank of America Corp. | | Financials | | | | -0.1% | |
| 30 | | Visa, Inc. | | Financials | | | | -0.1% | |
| 31 | | McDonald’s Corp. | | Consumer Discretionary | | | | -0.1% | |
| 32 | | Alphabet, Inc., Class C | | Information Technology | | | | -0.1% | |
| 33 | | Alphabet, Inc., Class A | | Information Technology | | | | -0.1% | |
| 34 | | Gilead Sciences, Inc. | | Health Care | | | | -0.2% | |
| 35 | | Microsoft Corp. | | Information Technology | | | | -0.3% | |
| 36 | | CVS Health Corp. | | Consumer Staples | | | | -0.3% | |
| 37 | | Apple, Inc. | | Information Technology | | | | -0.4% | |
| | |
| 64 | | Annual Report | June 30, 2016 |
| | |
Blue Chip 35 Index Fund MANAGER’S COMMENTARY (Unaudited) (continued) | | |
Industry Sector Representation as of June 30, 2016
| | | | | | | | |
| | | % of Net Assets | | % of S&P 500 Index | | Difference | |
Consumer Discretionary | | 11.9% | | 12.3% | | | -0.4% | |
Consumer Staples | | 13.6% | | 10.6% | | | 3.0% | |
Energy | | 10.4% | | 7.4% | | | 3.0% | |
Financials | | 10.4% | | 15.7% | | | -5.3% | |
Health Care | | 11.0% | | 14.7% | | | -3.7% | |
Industrials | | 10.6% | | 10.2% | | | 0.4% | |
Information Technology | | 25.9% | | 19.8% | | | 6.1% | |
Materials | | 0.0% | | 2.8% | | | -2.8% | |
Telecommunication Services | | 6.1% | | 2.9% | | | 3.2% | |
Utilities | | 0.0% | | 3.6% | | | -3.6% | |
Cash & Other Assets | | 0.1% | | 0.0% | | | 0.1% | |
Total | | 100.0% | | 100.0% | | | | |
Disclaimer
The views expressed here are exclusively those of Fund management. These views, including those concerning market sectors or individual stocks, are not meant as investment advice and should not be considered predictive in nature. Any favorable (or unfavorable) description of a holding applies only as of the quarter end, June 30, 2016, unless otherwise stated. Security positions can and do change thereafter. Discussions of historical performance do not guarantee and are not indicative of future performance.
The Fund is subject to significant market risk (volatility) and is not an appropriate investment for short-term investors.
Conclusion
Thank you for your continued investment in Blue Chip 35 Index Fund. We encourage your feedback; your reactions and concerns are important to us.
Sincerely,
The Investment Management Team
| | |
Blue Chip 35 Index Fund SCHEDULE OF INVESTMENTS | | |
Showing percentage of net assets as of June 30, 2016
| | | | | | | | | | |
| Industry Company | | Shares | | | Value | | | |
| |
COMMON STOCKS - 99.87% | | | |
Aerospace & Defense - 2.61% | | | |
United Technologies Corp. | | | 145,380 | | | | $14,908,719 | | | |
| |
Air Freight & Logistics - 2.65% | | | |
United Parcel Service, Inc., Class B | | | 140,563 | | | | 15,141,446 | | | |
| |
Beverages - 5.26% | | | |
Coca-Cola Co. (The) | | | 334,914 | | | | 15,181,652 | | | |
PepsiCo, Inc. | | | 140,205 | | | | 14,853,318 | | | |
| | | | | | | | | | |
| | | |
| | | | | | | 30,034,970 | | | |
| |
Biotechnology - 2.61% | | | |
Gilead Sciences, Inc. | | | 178,600 | | | | 14,898,812 | | | |
| |
Commercial Banks - 2.59% | | | |
Wells Fargo & Co. | | | 312,359 | | | | 14,783,952 | | | |
| |
Communications Equipment - 2.60% | | | |
Cisco Systems, Inc. | | | 518,608 | | | | 14,878,864 | | | |
| |
Computers & Peripherals - 2.98% | | | |
Apple, Inc. | | | 178,350 | | | | 17,050,260 | | | |
| |
Diversified Financial Services - 7.86% | | | |
Bank of America Corp. | | | 1,127,908 | | | | 14,967,339 | | | |
Berkshire Hathaway, Inc., Class B* | | | 102,750 | | | | 14,877,173 | | | |
JPMorgan Chase & Co. | | | 242,995 | | | | 15,099,709 | | | |
| | | | | | | | | | |
| | | |
| | | | | | | 44,944,221 | | | |
| |
Diversified Telecommunication Services - 6.08% | | | |
AT&T, Inc. | | | 412,125 | | | | 17,807,921 | | | |
Verizon Communications, Inc. | | | 303,689 | | | | 16,957,994 | | | |
| | | | | | | | | | |
| | | |
| | | | | | | 34,765,915 | | | |
| |
Energy Equipment & Services - 2.59% | | | |
Schlumberger, Ltd. | | | 187,200 | | | | 14,803,776 | | | |
| |
Food & Staples Retailing - 5.75% | | | |
CVS Health Corp. | | | 185,200 | | | | 17,731,048 | | | |
Wal-Mart Stores, Inc. | | | 206,919 | | | | 15,109,225 | | | |
| | | | | | | | | | |
| | | |
| | | | | | | 32,840,273 | | | |
| |
Hotels, Restaurants & Leisure - 2.64% | | | |
McDonald’s Corp. | | | 125,400 | | | | 15,090,636 | | | |
| |
Household Products - 2.59% | | | |
Procter & Gamble Co. (The) | | | 174,826 | | | | 14,802,517 | | | |
| |
Industrial Conglomerates - 5.30% | | | |
3M Co. | | | 86,750 | | | | 15,191,660 | | | |
General Electric Co. | | | 480,243 | | | | 15,118,050 | | | |
| | | | | | | | | | |
| | | |
| | | | | | | 30,309,710 | | | |
| | | | | | | | |
| Industry Company | | Shares | | | Value | |
|
| |
Internet & Catalog Retail - 3.94% | |
Amazon.com, Inc.* | | | 31,500 | | | | $22,542,030 | |
|
Internet Software & Services - 3.29% | |
Alphabet, Inc., Class A* | | | 13,170 | | | | 9,265,490 | |
Alphabet, Inc., Class C* | | | 13,814 | | | | 9,560,669 | |
| | | | | | | | |
| | |
| | | | | | | 18,826,159 | |
|
IT Services - 5.96% | |
International Business Machines Corp. | | | 98,767 | | | | 14,990,855 | |
Visa, Inc., Class A | | | 257,300 | | | | 19,083,941 | |
| | | | | | | | |
| | |
| | | | | | | 34,074,796 | |
|
Media - 5.30% | |
Comcast Corp., Class A | | | 233,200 | | | | 15,202,308 | |
Walt Disney Co. (The) | | | 154,500 | | | | 15,113,190 | |
| | | | | | | | |
| | |
| | | | | | | 30,315,498 | |
|
Oil, Gas & Consumable Fuels - 7.79% | |
Chevron Corp. | | | 141,095 | | | | 14,790,989 | |
ConocoPhillips | | | 340,335 | | | | 14,838,606 | |
Exxon Mobil Corp. | | | 158,587 | | | | 14,865,945 | |
| | | | | | | | |
| | |
| | | | | | | 44,495,540 | |
|
Pharmaceuticals - 8.39% | |
Johnson & Johnson | | | 124,552 | | | | 15,108,158 | |
Merck & Co., Inc. | | | 257,135 | | | | 14,813,547 | |
Pfizer, Inc. | | | 512,744 | | | | 18,053,716 | |
| | | | | | | | |
| | |
| | | | | | | 47,975,421 | |
|
Semiconductors & Semiconductor Equipment - 5.20% | |
Intel Corp. | | | 459,443 | | | | 15,069,730 | |
QUALCOMM, Inc. | | | 273,900 | | | | 14,672,823 | |
| | | | | | | | |
| | |
| | | | | | | 29,742,553 | |
|
Software - 5.89% | |
Microsoft Corp. | | | 368,445 | | | | 18,853,331 | |
Oracle Corp. | | | 361,813 | | | | 14,809,006 | |
| | | | | | | | |
| | |
| | | | | | | 33,662,337 | |
| | | | | | | | |
| |
TOTAL COMMON STOCKS - 99.87% | | | | 570,888,405 | |
| | | | | | | | |
(Cost $ 369,074,702) | | | | | | | | |
| |
TOTAL INVESTMENTS - 99.87% | | | | $570,888,405 | |
(Cost $ 369,074,702) | | | | | | | | |
Other Assets in Excess of
Liabilities - 0.13% | | | | 755,184 | |
| | | | | | | | |
| |
NET ASSETS - 100.00% | | | | $571,643,589 | |
| | | | | | | | |
| * | Non-income producing security. |
| | |
| 66 | | Annual Report | June 30, 2016 |
| | |
Blue Chip 35 Index Fund SCHEDULE OF INVESTMENTS (continued) | | |
Showing percentage of net assets as of June 30, 2016
| | | | | | | | | | | | | | | | | | | | | | |
Summary of inputs used to value the Fund’s investments
as of 06/30/2016 (See Note 2 in Notes to Financial Statements): | | | | | | | | | |
| | | Valuation Inputs | | | | | | | | | |
| | | Investment in Securities (Value) | | | | | | | | | |
| | | Level 1
Quoted
Prices | | | Level 2
Significant
Observable
Inputs | | Level 3
Significant
Unobservable Inputs | | | Total | | | | | | | | | |
Common Stocks | | $ | 570,888,405 | | | $— | | $ | — | | | $ | 570,888,405 | | | | | | | | | |
| | | | | | | | | | | | | | | | | | | | | | |
TOTAL | | $ | 570,888,405 | | | $— | | $ | — | | | $ | 570,888,405 | | | | | | | | | |
| | | | | | | | | | | | | | | | | | | | | | |
See Notes to Financial Statements. | | | | | | | | | |
| | |
Managed Volatility Fund MANAGER’S COMMENTARY (Unaudited) | | |
June 30, 2016
Dear Fellow Managed Volatility Fund Shareholder,
For the quarter ended June 30, 2016, our Fund returned 0.57%, underperforming our primary market benchmark, the S&P 500 Index (2.46%), and our peer benchmark, the Lipper Balanced Funds Index (1.99%). The Fund’s performance was roughly in line with the fixed-income only Bloomberg/EFFAS U.S. Government 1-3 Year Total Return Bond Index (0.54%). It was a poor quarter relative to our goal of capturing at least 40% of the S&P 500 Index’s return.
For the fiscal year, our Fund returned 1.10%, trailing the S&P 500 Index (3.99%), the Lipper Balanced Funds Index (1.49%), and the Bloomberg/EFFAS U.S. Government 1-3 Year Total Return Bond Index (1.37%).
The table below presents our June quarter, one-year, five-year, 10-year, 15-year and inception-to-date financial results. See the next page for a graph of performance since inception.
Standardized Returns as of June 30, 2016
| | | | | | | | | | | | | | | | | | | | | | |
| | | |
| | | | | | | | | Annualized |
| | | Quarter | | | 1 Year | | | 5 Years | | | 10 Years | | | 15 Years | | | Since Inception (6/30/01) |
|
| | | | | | |
Managed Volatility Fund | | | 0.57% | | | | 1.10% | | | | 4.46% | | | | 2.89% | | | | 3.87% | | | 3.87% |
S&P 500 Index | | | 2.46% | | | | 3.99% | | | | 12.10% | | | | 7.42% | | | | 5.75% | | | 5.75% |
Bloomberg/EFFAS U.S. Government 1-3 Year Total Return Bond Index | | | 0.54% | | | | 1.37% | | | | 0.86% | | | | 2.52% | | | | 2.72% | | | 2.72% |
Lipper Balanced Funds Index | | | 1.99% | | | | 1.49% | | | | 6.70% | | | | 5.54% | | | | 5.14% | | | 5.14% |
Performance figures quoted in the table above represent past performance and are no guarantee of future results. Total return figures in the table above include the reinvestment of dividends and capital gains. The table above does not reflect the deduction of taxes that a shareholder would pay on Fund distributions or on the redemption of Fund shares.
The S&P 500 Index is a broad-based, unmanaged measurement of changes in stock market conditions, based on the average of 500 widely held common stocks with dividends reinvested. The Bloomberg/EFFAS U.S. Government 1-3 year Total Return Bond Index is a transparent benchmark for the total return of the 1-3 year U.S. Government bond market. The Lipper Balanced Funds Index is an index of balanced funds compiled by Lipper, an independent fund research firm owned by Broadridge Financial Solutions, Inc. It is not possible to invest directly in an index. Periods longer than one year are annualized.
According to data from Lipper as of June 30, 2016, Managed Volatility Fund ranked 63rd of 331 Alternative Long/Short Equity funds for the 12 months ended June 30, 2016, 45th of 103 over the past five years, 14th of 32 over the last 10 years, and 5th of 12 such funds since inception on June 30, 2001. Lipper is an independent mutual fund rating service owned by Broadridge Financial Solutions, Inc. that ranks funds in various fund categories by making comparative calculations using total returns.
According to data from Morningstar as of June 30, 2016, Managed Volatility Fund ranked 34th of 101 Option Writing funds for the 12 months ended June 30, 2016, 14th of 26 over the past five years, and 3rd of 8 over the last 10 years. Morningstar ranks funds in various fund categories by making comparative calculations using total returns. Please note that Morningstar changed the Managed Volatility Fund’s investment category to Option Writing from Long/Short Equity. This category change by Morningstar does not impact the Fund in any way. The Fund’s strategy and investment approach have not changed.
| | |
| 68 | | Annual Report | June 30, 2016 |
| | |
Managed Volatility Fund MANAGER’S COMMENTARY (Unaudited) (continued) | | |
Managed Volatility Fund vs. S&P 500 Index, Bloomberg/EFFAS U.S. Government 1-3 Year Total Return Bond Index & Lipper Balanced Funds Index
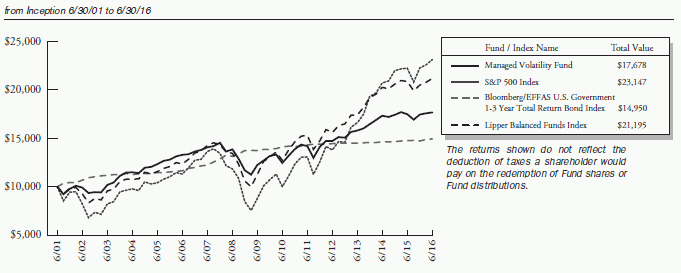
Detailed Explanation of Quarterly Performance
The Fund’s 0.57% return failed to capture 40% of the S&P 500 Index’s return of 2.46% for the quarter. The portfolio’s futures component was responsible for most of this underperformance, contributing -0.8% to the Fund’s return. However, this down performance is in line with our expectations for futures during a quarter characterized by a rising equity market. The options component also detracted from performance, contributing about -0.1% to return. By contrast, the equities and fixed-income components contributed about 1.4% and 0.1% to return, respectively.
Detailed Explanation of Fiscal Year Performance
For the fiscal year, the Fund’s 1.10% return failed to capture 40% of the S&P 500 Index’s 3.99% return. The futures component drove this underperformance, contributing about -0.7% to return. The Fund’s equities component contributed about 0.9% to return, while the options and fixed-income components contributed roughly 0.5% and 0.2%, respectively.
For the fiscal year, the Fund had a standard deviation of 7.49, which was 43% of the Index’s 17.41 standard deviation during the same period. While short-term performance failed to meet our target of capturing at least 40% of the market’s upside, the Fund continues to perform as designed, particularly over longer time periods. For 10 years and since inception, the Fund has captured 39% and 67%, respectively, of the S&P 500 Index’s return, with roughly 55% less volatility than the Index.
| | |
Managed Volatility Fund MANAGER’S COMMENTARY (Unaudited) (continued) | | |
Top Ten Holdings as of June 30, 2016
| | | | | | | | | |
| Rank | | Description | | Industry | | % of Net
Assets |
| 1 | | Apple, Inc. | | Computers & Peripherals | | | | 2.4% | |
| 2 | | Johnson & Johnson | | Pharmaceuticals | | | | 2.0% | |
| 3 | | Gilead Sciences, Inc. | | Biotechnology | | | | 1.2% | |
| 4 | | Scripps Networks Interactive, Inc. | | Media | | | | 1.1% | |
| 5 | | Valero Energy Corp. | | Oil, Gas & Consumable Fuels | | | | 1.1% | |
| 6 | | Exxon Mobil Corp. | | Oil, Gas & Consumable Fuels | | | | 0.9% | |
| 7 | | NIKE, Inc. | | Textiles, Apparel & Luxury Goods | | | | 0.9% | |
| 8 | | General Motors Co. | | Automobiles | | | | 0.9% | |
| 9 | | CME Group, Inc. | | Diversified Financial Services | | | | 0.8% | |
| 10 | | AutoZone, Inc. | | Specialty Retail | | | | 0.8% | |
| | Total | | | | | | 12.1% | |
Industry Sector Representation as of June 30, 2016
| | | | |
| Asset Type | | % of Net Assets | |
Common Stock | | | 57.9% | |
Consumer Discretionary | | | 9.0% | |
Consumer Staples | | | 5.9% | |
Energy | | | 3.9% | |
Financials | | | 8.5% | |
Health Care | | | 9.6% | |
Industrials | | | 5.5% | |
Information Technology | | | 11.4% | |
Materials | | | 1.3% | |
Telecommunication Services | | | 1.2% | |
Utilities | | | 1.6% | |
U.S. Government Obligations | | | 39.9% | |
Call Options Written | | | -0.8% | |
Put Options Written | | | -0.8% | |
Money Market Fund | | | 3.9% | |
Liabilities in Excess of Other Assets | | | -0.1% | |
Total | | | 100% | |
Disclaimer
The views expressed here are exclusively those of Fund management. These views, including those related to market sectors or individual stocks, are not meant as investment advice and should not be considered predictive in nature. Any favorable (or unfavorable) description of a holding applies only as of the quarter end, June 30, 2016, unless otherwise stated. Security positions can and do change thereafter. Discussions of historical performance do not guarantee and may not be indicative of future performance.
Market volatility can significantly affect short-term performance. The Fund is not an appropriate investment for short-term investors. Investments in the small companies within this multi-cap fund generally carry greater risk than is customarily associated with larger companies. This additional risk is attributable to a number of factors, including the relatively limited financial resources that are typically available to small companies and the fact that small companies often have comparatively limited product lines. In addition, the stock of small companies tends to be more volatile than the stock of large companies, particularly in the short term and particularly in the early stages of an economic or market downturn. The Fund’s use of options, futures, and leverage can magnify the risk of loss in an unfavorable market, and the Fund’s use of short-sale positions can, in
| | |
| 70 | | Annual Report | June 30, 2016 |
| | |
Managed Volatility Fund MANAGER’S COMMENTARY (Unaudited) (continued) | | |
theory, expose shareholders to unlimited loss. Shareholders of the Fund, therefore, are taking on more risk than they would if they invested in the stock market as a whole. The Fund uses an option writing strategy in which the Fund may sell covered calls or secured put options. Options are subject to special risks and may not fully protect the Fund against declines in the value of its stocks. In addition, an option writing strategy limits the upside profit potential normally associated with stocks. Finally, the Fund’s fixed-income holdings are subject to three types of risk. Interest rate risk is the chance that bond prices overall will decline as interest rates rise. Credit risk is the chance that a bond issuer will fail to pay interest and principal. Prepayment risk is the chance that a mortgage-backed bond issuer will repay a higher yielding bond, resulting in a lower paying yield.
Conclusion
Thank you for your continued investment in Managed Volatility Fund. We encourage your feedback; your reactions and concerns are important to us.
Sincerely,
The Investment Management Team
| | |
Managed Volatility Fund SCHEDULE OF INVESTMENTS | | |
Showing percentage of net assets as of June 30, 2016
| | | | | | | | | | |
| Industry Company | | Shares | | | Value | | | |
| |
COMMON STOCKS - 57.92% | | | |
Aerospace & Defense - 1.67% | | | |
Honeywell International, Inc.# | | | 1,200 | | | | $ 139,584 | | | |
Lockheed Martin Corp. | | | 870 | | | | 215,908 | | | |
Northrop Grumman Corp.# | | | 1,100 | | | | 244,508 | | | |
Raytheon Co.# | | | 1,800 | | | | 244,710 | | | |
United Technologies Corp. | | | 1,140 | | | | 116,907 | | | |
| | | | | | | | | | |
| | | |
| | | | | | | 961,617 | | | |
| | |
Air Freight & Logistics - 0.32% | | | | | | | |
FedEx Corp.# | | | 1,200 | | | | 182,136 | | | |
| | | |
Airlines - 0.94% | | | | | | | | | | |
JetBlue Airways Corp.*# | | | 16,000 | | | | 264,960 | | | |
Southwest Airlines Co.# | | | 7,000 | | | | 274,470 | | | |
| | | | | | | | | | |
| | | |
| | | | | | | 539,430 | | | |
| | |
Auto Components - 0.27% | | | | | | | |
Delphi Automotive PLC# | | | 900 | | | | 56,340 | | | |
Goodyear Tire & Rubber Co. (The)# | | | 2,400 | | | | 61,584 | | | |
Johnson Controls, Inc. | | | 900 | | | | 39,834 | | | |
| | | | | | | | | | |
| | | |
| | | | | | | 157,758 | | | |
| | | |
Automobiles - 1.02% | | | | | | | | | | |
Ford Motor Co.# | | | 7,400 | | | | 93,018 | | | |
General Motors Co.# | | | 17,500 | | | | 495,250 | | | |
| | | | | | | | | | |
| | | |
| | | | | | | 588,268 | | | |
| | | |
Beverages - 1.24% | | | | | | | | | | |
Coca-Cola Co. (The) | | | 4,100 | | | | 185,853 | | | |
Constellation Brands, Inc., Class A# | | | 2,100 | | | | 347,340 | | | |
PepsiCo, Inc.# | | | 1,700 | | | | 180,098 | | | |
| | | | | | | | | | |
| | | |
| | | | | | | 713,291 | | | |
| | | |
Biotechnology - 2.26% | | | | | | | | | | |
Alexion Pharmaceuticals, Inc,* | | | 500 | | | | 58,380 | | | |
Amgen, Inc.# | | | 1,600 | | | | 243,440 | | | |
Biogen, Inc.* | | | 900 | | | | 217,638 | | | |
Celgene Corp.* | | | 1,100 | | | | 108,493 | | | |
Gilead Sciences, Inc.# | | | 8,100 | | | | 675,702 | | | |
| | | | | | | | | | |
| | | |
| | | | | | | 1,303,653 | | | |
| | | |
Capital Markets - 1.15% | | | | | | | | | | |
Ameriprise Financial, Inc. | | | 680 | | | | 61,098 | | | |
BlackRock, Inc. | | | 300 | | | | 102,759 | | | |
Charles Schwab Corp. (The) | | | 7,100 | | | | 179,701 | | | |
Goldman Sachs Group, Inc. (The) | | | 700 | | | | 104,006 | | | |
| | | | | | | | | | |
| | | | | | | | | | |
| | | | | | | | |
| Industry Company | | Shares | | | Value | |
| | | | | | | | |
Capital Markets (continued) | | | | | | | | |
Morgan Stanley | | | 5,300 | | | | $ 137,694 | |
State Street Corp.# | | | 1,400 | | | | 75,488 | |
| | | | | | | | |
| | |
| | | | | | | 660,746 | |
| | |
Chemicals - 1.07% | | | | | | | | |
Dow Chemical Co. (The) | | | 1,800 | | | | 89,478 | |
LyondellBasell Industries NV, Class A | | | 800 | | | | 59,536 | |
Monsanto Co.# | | | 1,300 | | | | 134,433 | |
PPG Industries, Inc. | | | 800 | | | | 83,320 | |
Praxair, Inc.# | | | 1,200 | | | | 134,868 | |
Sherwin-Williams Co. (The) | | | 400 | | | | 117,468 | |
| | | | | | | | |
| | |
| | | | | | | 619,103 | |
|
Commercial Banks - 1.33% | |
BB&T Corp.# | | | 1,500 | | | | 53,415 | |
Comerica, Inc. | | | 1,100 | | | | 45,243 | |
Huntington Bancshares, Inc. | | | 7,700 | | | | 68,838 | |
KeyCorp | | | 4,800 | | | | 53,040 | |
PNC Financial Services Group, Inc. (The)# | | | 2,100 | | | | 170,919 | |
U.S. Bancorp | | | 2,800 | | | | 112,924 | |
Wells Fargo & Co. | | | 5,571 | | | | 263,675 | |
| | | | | | | | |
| | |
| | | | | | | 768,054 | |
|
Commercial Services & Supplies - 0.51% | |
Tyco International PLC# | | | 4,400 | | | | 187,440 | |
Waste Management, Inc. | | | 1,600 | | | | 106,032 | |
| | | | | | | | |
| | |
| | | | | | | 293,472 | |
|
Communications Equipment - 0.72% | |
Cisco Systems, Inc.# | | | 8,500 | | | | 243,865 | |
Juniper Networks, Inc.# | | | 7,500 | | | | 168,675 | |
| | | | | | | | |
| | |
| | | | | | | 412,540 | |
|
Computers & Peripherals - 2.79% | |
Apple, Inc.# | | | 14,700 | | | | 1,405,320 | |
EMC Corp.# | | | 2,000 | | | | 54,340 | |
HP, Inc.# | | | 5,900 | | | | 74,045 | |
Western Digital Corp.# | | | 1,510 | | | | 71,363 | |
| | | | | | | | |
| | |
| | | | | | | 1,605,068 | |
| | |
Consumer Finance - 0.69% | | | | | | | | |
American Express Co.# | | | 2,600 | | | | 157,976 | |
Capital One Financial Corp. | | | 1,400 | | | | 88,914 | |
Santander Consumer USA Holdings, Inc.*# | | | 14,500 | | | | 149,785 | |
| | | | | | | | |
| | |
| | | | | | | 396,675 | |
| | |
| 72 | | Annual Report | June 30, 2016 |
| | |
Managed Volatility Fund SCHEDULE OF INVESTMENTS (continued) | | |
Showing percentage of net assets as of June 30, 2016
| | | | | | | | | | |
| Industry Company | | Shares | | | Value | | | |
| |
Common Stocks (continued) | | | |
Containers & Packaging - 0.05% | | | |
Ball Corp.+ | | | 400 | | | | $ 28,916 | | | |
| |
Diversified Financial Services - 2.34% | | | |
AerCap Holdings NV*# | | | 1,100 | | | | 36,949 | | | |
Bank of America Corp.# | | | 7,800 | | | | 103,506 | | | |
Berkshire Hathaway, Inc., Class B* | | | 1,600 | | | | 231,664 | | | |
Citigroup, Inc.# | | | 5,110 | | | | 216,613 | | | |
CME Group, Inc.# | | | 5,000 | | | | 487,000 | | | |
JPMorgan Chase & Co.# | | | 4,400 | | | | 273,416 | | | |
| | | | | | | | | | |
| | | |
| | | | | | | 1,349,148 | | | |
| |
Diversified Telecommunication Services - 1.25% | | | |
AT&T, Inc.# | | | 7,900 | | | | 341,359 | | | |
CenturyLink, Inc.# | | | 4,300 | | | | 124,743 | | | |
Verizon Communications, Inc. | | | 4,500 | | | | 251,280 | | | |
| | | | | | | | | | |
| | | |
| | | | | | | 717,382 | | | |
| | | |
Electric Utilities - 0.80% | | | | | | | | | | |
American Electric Power Co., Inc.# | | | 2,300 | | | | 161,207 | | | |
Duke Energy Corp. | | | 1,683 | | | | 144,385 | | | |
Exelon Corp. | | | 4,300 | | | | 156,348 | | | |
| | | | | | | | | | |
| | | |
| | | | | | | 461,940 | | | |
| |
Electrical Equipment - 0.14% | | | |
Emerson Electric Co. | | | 1,500 | | | | 78,240 | | | |
| |
Energy Equipment & Services - 0.30% | | | |
Halliburton Co.# | | | 1,700 | | | | 76,993 | | | |
Helmerich & Payne, Inc.+ | | | 1,000 | | | | 67,130 | | | |
National Oilwell Varco, Inc. | | | 800 | | | | 26,920 | | | |
| | | | | | | | | | |
| | | |
| | | | | | | 171,043 | | | |
| | | |
Financials - 0.09% | | | | | | | | | | |
PayPal Holdings, Inc.*# | | | 1,500 | | | | 54,765 | | | |
| |
Food & Staples Retailing - 1.01% | | | |
Costco Wholesale Corp. | | | 700 | | | | 109,928 | | | |
CVS Health Corp.# | | | 1,200 | | | | 114,888 | | | |
Kroger Co. (The)# | | | 5,000 | | | | 183,950 | | | |
Wal-Mart Stores, Inc.# | | | 2,400 | | | | 175,248 | | | |
| | | | | | | | | | |
| | | |
| | | | | | | 584,014 | | | |
| | | |
Food Products - 2.57% | | | | | | | | | | |
Archer-Daniels-Midland Co.# | | | 2,000 | | | | 85,780 | | | |
Campbell Soup Co.# | | | 6,900 | | | | 459,057 | | | |
General Mills, Inc.# | | | 3,200 | | | | 228,224 | | | |
Hormel Foods Corp.# | | | 9,000 | | | | 329,400 | | | |
| | | | | | | | | | |
| | | | | | | | | | |
| | | | | | | | |
| Industry Company | | Shares | | | Value | |
| | | | | | | | |
Food Products (continued) | |
JM Smucker Co. (The)# | | | 1,400 | | | | $ 213,374 | |
Mondelez International, Inc. Class A# | | | 3,600 | | | | 163,836 | |
| | | | | | | | |
| | |
| | | | | | | 1,479,671 | |
|
Health Care Equipment & Supplies - 1.82% | |
Abbott Laboratories# | | | 1,800 | | | | 70,758 | |
Baxter International, Inc.# | | | 1,300 | | | | 58,786 | |
Becton Dickinson & Co. | | | 920 | | | | 156,023 | |
C.R. Bard, Inc. | | | 1,100 | | | | 258,676 | |
Edwards Lifesciences Corp.*# | | | 4,000 | | | | 398,920 | |
Stryker Corp. | | | 860 | | | | 103,054 | |
| | | | | | | | |
| | |
| | | | | | | 1,046,217 | |
|
Health Care Providers & Services - 1.40% | |
AmerisourceBergen Corp.# | | | 500 | | | | 39,660 | |
DaVita HealthCare Partners, Inc.*# | | | 1,600 | | | | 123,712 | |
Express Scripts Holding Co.*# | | | 1,734 | | | | 131,437 | |
Laboratory Corp. of America Holdings* | | | 900 | | | | 117,243 | |
UnitedHealth Group, Inc.# | | | 2,800 | | | | 395,360 | |
| | | | | | | | |
| | |
| | | | | | | 807,412 | |
|
Hotels, Restaurants & Leisure - 1.13% | |
Carnival Corp.# | | | 1,700 | | | | 75,140 | |
Domino’s Pizza, Inc.# | | | 1,000 | | | | 131,380 | |
McDonald’s Corp.# | | | 1,300 | | | | 156,442 | |
Starbucks Corp.# | | | 2,700 | | | | 154,224 | |
Wynn Resorts, Ltd.+ | | | 500 | | | | 45,320 | |
Yum! Brands, Inc.# | | | 1,100 | | | | 91,212 | |
| | | | | | | | |
| | |
| | | | | | | 653,718 | |
|
Household Products - 1.06% | |
Clorox Co. (The)# | | | 400 | | | | 55,356 | |
Colgate-Palmolive Co. | | | 2,500 | | | | 183,000 | |
Kimberly-Clark Corp.# | | | 1,400 | | | | 192,472 | |
Procter & Gamble Co. (The) | | | 2,100 | | | | 177,807 | |
| | | | | | | | |
| | |
| | | | | | | 608,635 | |
|
Independent Power Producers & Energy Traders - 0.15% | |
AES Corp. | | | 6,800 | | | | 84,864 | |
| |
Industrial Conglomerates - 0.97% | | | | | |
3M Co.# | | | 1,400 | | | | 245,168 | |
Danaher Corp.# | | | 1,700 | | | | 171,700 | |
| | |
Managed Volatility Fund SCHEDULE OF INVESTMENTS (continued) | | |
Showing percentage of net assets as of June 30, 2016
| | | | | | | | | | |
| Industry Company | | Shares | | | Value | | | |
| |
Common Stocks (continued) | | | |
Industrial Conglomerates (continued) | | | |
General Electric Co.# | | | 4,600 | | | | $ 144,808 | | | |
| | | | | | | | | | |
| | | |
| | | | | | | 561,676 | | | |
| | | |
Insurance - 1.56% | | | | | | | | | | |
Allstate Corp. (The)# | | | 1,300 | | | | 90,935 | | | |
Aon PLC# | | | 1,600 | | | | 174,768 | | | |
Chubb, Ltd. | | | 361 | | | | 47,186 | | | |
Marsh & McLennan Cos., Inc. | | | 1,500 | | | | 102,690 | | | |
Progressive Corp. (The)# | | | 3,720 | | | | 124,620 | | | |
Travelers Cos., Inc. (The)# | | | 3,000 | | | | 357,120 | | | |
| | | | | | | | | | |
| | | |
| | | | | | | 897,319 | | | |
| |
Internet & Catalog Retail - 0.84% | | | |
Amazon.com, Inc.* | | | 500 | | | | 357,810 | | | |
Priceline Group, Inc. (The)* | | | 100 | | | | 124,841 | | | |
| | | | | | | | | | |
| | | |
| | | | | | | 482,651 | | | |
| |
Internet Software & Services - 1.92% | | | |
Alphabet, Inc., Class A* | | | 260 | | | | 182,918 | | | |
Alphabet, Inc., Class C* | | | 260 | | | | 179,946 | | | |
eBay, Inc.* | | | 1,500 | | | | 35,115 | | | |
Facebook, Inc.,
Class A*# | | | 3,300 | | | | 377,124 | | | |
VeriSign, Inc.*# | | | 3,800 | | | | 328,548 | | | |
| | | | | | | | | | |
| | | |
| | | | | | | 1,103,651 | | | |
| | | |
IT Services - 2.06% | | | | | | | | | | |
Automatic Data Processing, Inc.# | | | 1,300 | | | | 119,431 | | | |
Cognizant Technology Solutions Corp.,
Class A*# | | | 4,100 | | | | 234,684 | | | |
International Business Machines Corp.# | | | 1,300 | | | | 197,314 | | | |
MasterCard, Inc.,
Class A# | | | 1,200 | | | | 105,672 | | | |
S&P Global, Inc. | | | 1,000 | | | | 107,260 | | | |
Teradata Corp.* | | | 400 | | | | 10,028 | | | |
Visa, Inc., Class A | | | 5,200 | | | | 385,684 | | | |
Western Union Co. (The) | | | 1,500 | | | | 28,770 | | | |
| | | | | | | | | | |
| | | |
| | | | | | | 1,188,843 | | | |
| |
Leisure Equipment & Products - 0.22% | | | |
Hasbro, Inc.# | | | 1,500 | | | | 125,985 | | | |
| |
Life Sciences Tools & Services - 0.36% | | | |
Thermo Fisher Scientific, Inc.# | | | 1,400 | | | | 206,864 | | | |
| | | |
Machinery - 0.27% | | | | | | | | | | |
Deere & Co.#+ | | | 1,900 | | | | 153,976 | | | |
| | | |
Media - 2.32% | | | | | | | | | | |
Comcast Corp., Class A | | | 2,750 | | | | 179,272 | | | |
| | | | | | | | |
| Industry Company | | Shares | | | Value | |
| | | | | | | | |
Media (continued) | | | | | | | | |
News Corp., Class A | | | 3,300 | | | | $ 37,455 | |
Omnicom Group, Inc.# | | | 1,200 | | | | 97,788 | |
Scripps Networks Interactive, Inc.,
Class A# | | | 10,400 | | | | 647,608 | |
Time Warner, Inc. | | | 933 | | | | 68,613 | |
Twenty-First Century Fox, Inc., Class A# | | | 3,300 | | | | 89,265 | |
Walt Disney Co. (The) | | | 2,200 | | | | 215,204 | |
| | | | | | | | |
| | |
| | | | | | | 1,335,205 | |
| | |
Multiline Retail - 0.70% | | | | | | | | |
Big Lots, Inc. | | | 500 | | | | 25,055 | |
Dollar General Corp.# | | | 2,300 | | | | 216,200 | |
Target Corp.# | | | 2,300 | | | | 160,586 | |
| | | | | | | | |
| | |
| | | | | | | 401,841 | |
| | |
Multi-Utilities - 0.68% | | | | | | | | |
Dominion Resources, Inc. | | | 1,920 | | | | 149,626 | |
Public Service Enterprise Group, Inc. | | | 2,800 | | | | 130,508 | |
Sempra Energy | | | 1,000 | | | | 114,020 | |
| | | | | | | | |
| | |
| | | | | | | 394,154 | |
|
Oil, Gas & Consumable Fuels - 3.55% | |
Anadarko Petroleum Corp. | | | 1,000 | | | | 53,250 | |
Apache Corp. | | | 500 | | | | 27,835 | |
California Resources Corp.+ | | | 59 | | | | 720 | |
Chesapeake Energy Corp.*+ | | | 2,100 | | | | 8,988 | |
Chevron Corp.# | | | 2,378 | | | | 249,286 | |
ConocoPhillips# | | | 1,287 | | | | 56,113 | |
EOG Resources, Inc.# | | | 1,000 | | | | 83,420 | |
Exxon Mobil Corp.# | | | 5,800 | | | | 543,692 | |
Kinder Morgan, Inc. | | | 3,300 | | | | 61,776 | |
Marathon Petroleum Corp.# | | | 2,400 | �� | | | 91,104 | |
Occidental Petroleum Corp.# | | | 1,200 | | | | 90,672 | |
Phillips 66# | | | 1,693 | | | | 134,323 | |
Valero Energy Corp.# | | | 12,600 | | | | 642,600 | |
| | | | | | | | |
| | |
| | | | | | | 2,043,779 | |
|
Paper & Forest Products - 0.15% | |
International Paper Co.# | | | 2,100 | | | | 88,998 | |
| | |
Pharmaceuticals - 3.80% | | | | | | | | |
AbbVie, Inc.# | | | 4,000 | | | | 247,640 | |
Allergan PLC* | | | 300 | | | | 69,327 | |
Bristol-Myers Squibb Co.# | | | 3,879 | | | | 285,300 | |
Johnson & Johnson# | | | 9,300 | | | | 1,128,090 | |
Merck & Co., Inc.# | | | 4,200 | | | | 241,962 | |
Pfizer, Inc.# | | | 5,100 | | | | 179,571 | |
| | |
| 74 | | Annual Report | June 30, 2016 |
| | |
Managed Volatility Fund SCHEDULE OF INVESTMENTS (continued) | | |
Showing percentage of net assets as of June 30, 2016
| | | | | | | | | | |
| Industry Company | | Shares | | | Value | | | |
| |
Common Stocks (continued) | | | |
Pharmaceuticals (continued) | | | |
Shire PLC, ADR | | | 192 | | | | $ 35,343 | | | |
| | | | | | | | | | |
| | | |
| | | | | | | 2,187,233 | | | |
| | | |
Professional Services - 0.20% | | | | | | | | | | |
Nielsen Holdings PLC# | | | 2,200 | | | | 114,334 | | | |
| |
Real Estate Investment Trusts (REITs) - 1.31% | | | |
American Tower Corp. | | | 800 | | | | 90,888 | | | |
Crown Castle International Corp.# | | | 1,200 | | | | 121,716 | | | |
Public Storage | | | 1,100 | | | | 281,149 | | | |
Simon Property Group, Inc.# | | | 1,200 | | | | 260,280 | | | |
| | | | | | | | | | |
| | | |
| | | | | | | 754,033 | | | |
| | | |
Road & Rail - 0.18% | | | | | | | | | | |
Union Pacific Corp.# | | | 1,200 | | | | 104,700 | | | |
| |
Semiconductors & Semiconductor Equipment - 1.75% | | | |
Applied Materials, Inc.# | | | 12,600 | | | | 302,022 | | | |
Intel Corp.# | | | 6,300 | | | | 206,640 | | | |
Micron Technology, Inc.*# | | | 8,000 | | | | 110,080 | | | |
QUALCOMM, Inc.# | | | 2,800 | | | | 149,996 | | | |
Skyworks Solutions, Inc. | | | 400 | | | | 25,312 | | | |
Texas Instruments, Inc.# | | | 3,370 | | | | 211,130 | | | |
| | | | | | | | | | |
| | | |
| | | | | | | 1,005,180 | | | |
| | | |
Software - 2.24% | | | | | | | | | | |
Adobe Systems, Inc.* | | | 800 | | | | 76,632 | | | |
Citrix Systems, Inc.*# | | | 1,100 | | | | 88,099 | | | |
Electronic Arts, Inc.*# | | | 2,000 | | | | 151,520 | | | |
Hewlett Packard Enterprise Co.# | | | 4,200 | | | | 76,734 | | | |
Intuit, Inc.# | | | 1,900 | | | | 212,059 | | | |
Microsoft Corp.# | | | 7,400 | | | | 378,658 | | | |
Oracle Corp.# | | | 3,860 | | | | 157,990 | | | |
salesforce.com, inc.*# | | | 1,900 | | | | 150,879 | | | |
| | | | | | | | | | |
| | | |
| | | | | | | 1,292,571 | | | |
| | | |
Specialty Retail - 1.08% | | | | | | | | | | |
AutoZone, Inc.* | | | 600 | | | | 476,304 | | | |
Gap, Inc. (The)+ | | | 600 | | | | 12,732 | | | |
Ross Stores, Inc.# | | | 2,300 | | | | 130,387 | | | |
| | | | | | | | | | |
| | | |
| | | | | | | 619,423 | | | |
| |
Textiles, Apparel & Luxury Goods - 1.47% | | | |
NIKE, Inc., Class B# | | | 9,200 | | | | 507,840 | | | |
Skechers U.S.A., Inc.,
Class A*# | | | 11,400 | | | | 338,808 | | | |
| | | | | | | | | | |
| | | |
| | | | | | | 846,648 | | | |
| |
Trading Companies & Distributors - 0.20% | | | |
NOW, Inc.*+ | | | 200 | | | | 3,628 | | | |
| | | | | | |
| Industry Company | | Shares | | | Value |
| | | | | | |
Trading Companies & Distributors (continued) |
W.W. Grainger, Inc. | | | 500 | | | $ 113,625 |
| | | | | | |
| | |
| | | | | | 117,253 |
| | | | | | |
| |
TOTAL COMMON STOCKS - 57.92% | | | 33,354,093 |
| | | | | | |
(Cost $26,486,322) | | | | | | |
| | | | | | |
| | | |
| Due Date | | Discount Rate or Coupon Rate | | Principal Amount | | Value |
|
U.S. GOVERNMENT OBLIGATIONS - 39.93% |
U.S. Treasury Bills - 39.93% | | |
07/14/2016 | | 0.000%(a) | | $4,000,000 | | 3,999,820 |
08/25/2016 | | 0.000%(a) | | 3,000,000 | | 2,998,977 |
09/01/2016 | | 0.000%(a) | | 5,000,000 | | 4,998,000 |
09/15/2016 | | 0.000%(a) | | 4,000,000 | | 3,998,280 |
09/22/2016 | | 0.000%(a) | | 4,000,000 | | 3,997,776 |
09/29/2016 | | 0.000%(a) | | 3,000,000 | | 2,998,044 |
| | | | | | |
| | | |
| | | | | | 22,990,897 |
| | | | | | |
TOTAL U.S. GOVERNMENT
OBLIGATIONS - 39.93% | | 22,990,897 |
| | | | | | |
(Cost $22,988,416) | | | | |
| | | |
| | | Rate^ | | Shares | | Value |
| |
MONEY MARKET FUND - 3.93% | | |
Dreyfus Cash Management Fund | | 0.30% | | 2,265,425 | | 2,265,425 |
| | | | | | |
| |
TOTAL MONEY MARKET FUND – 3.93% | | 2,265,425 |
| | | | | | |
(Cost $2,265,425) | | |
|
INVESTMENTS PURCHASED WITH CASH PROCEEDS FROM SECURITIES
LENDING - 0.33% |
Dreyfus Cash Management Fund** | | 0.30% | | 189,674 | | 189,674 |
| | | | | | |
TOTAL INVESTMENTS PURCHASED WITH CASH PROCEEDS FROM SECURITIES LENDING - 0.33% | | 189,674 |
| | | | | | |
(Cost $189,674) | | |
| | |
Managed Volatility Fund SCHEDULE OF INVESTMENTS (continued) | | |
Showing percentage of net assets as of June 30, 2016
| | | | | | | | |
| | | Value | | | | |
TOTAL INVESTMENTS - 102.11% | | $ | 58,800,089 | | | | | |
(Cost $51,929,837) | | | | | | | | |
Liabilities in Excess of Other
Assets - (2.11%) | | | (1,213,927 | ) | | | | |
| | | | | | | | |
| | |
NET ASSETS - 100.00% | | $ | 57,586,162 | | | | | |
| | | | | | | | |
* Non-income producing security. ** This security represents the investment of the collateral received in connection with securities out on loan as of June 30, 2016. # Security subject to call or put option written by the Fund. ^ Rate disclosed as of June 30, 2016. + This security or a portion of the security is out on loan as of June 30, 2016. Total loaned securities had a value of $185,838 as of June 30, 2016. (a) Rate represents the effective yield at purchase. PLC - Public Limited Company ADR - American Depositary Receipt See Notes to Financial Statements. | |
| | | | | | | | |
| | | | | | | | |
| | | | | | | | |
| | | | | | | | |
| | | | | | | | |
| | | | | | | | |
| | | | | | | | |
| | | | | | | | |
| | | | | | | | |
| | | | | | | | |
| | | | | | | | |
| | | | | | | | |
| | | | | | | | |
| | | | | | | | |
| | | | | | | | |
| | | | | | | | |
| | | | | | | | |
| | | | | | | | |
| | | | | | | | |
| | | | | | | | |
| | | | | | | | |
| | | | | | | | |
| | | | | | | | |
| | | | | | | | |
| | | | | | | | |
| | | | | | | | |
| | |
| 76 | | Annual Report | June 30, 2016 |
| | |
Managed Volatility Fund SCHEDULE OF OPTIONS WRITTEN | | |
Showing percentage of net assets as of June 30, 2016
| | | | | | | | | | |
| Company | | Number
of Contracts | | Value | | | | |
| |
CALL OPTIONS WRITTEN - (0.78%) | | | | | |
| | | |
3M Co. | | | | | | | | | | |
Expiring July, 2016 at $170.00 | | 4 | | | $ (2,208 | ) | | | | |
Abbott Laboratories | | | | | | | | | | |
Expiring August, 2016 at $38.00 | | 6 | | | (1,014 | ) | | | | |
AbbVie, Inc. | | | | | | | | | | |
Expiring August, 2016 at $65.00 | | 12 | | | (960 | ) | | | | |
AerCap Holdings NV | | | | | | | | | | |
Expiring July, 2016 at $40.00 | | 11 | | | (550 | ) | | | | |
Allstate Corp. (The) | | | | | | | | | | |
Expiring July, 2016 at $67.50 | | 4 | | | (996 | ) | | | | |
American Electric Power Co., Inc. | | | | | | | | | | |
Expiring August, 2016 at $67.50 | | 8 | | | (2,560 | ) | | | | |
American Express Co. | | | | | | | | | | |
Expiring July, 2016 at $62.50 | | 8 | | | (272 | ) | | | | |
Amgen, Inc. | | | | | | | | | | |
Expiring July, 2016 at $165.00 | | 5 | | | (15 | ) | | | | |
Aon PLC | | | | | | | | | | |
Expiring July, 2016 at $105.00 | | 5 | | | (1,975 | ) | | | | |
Apple, Inc. | | | | | | | | | | |
Expiring August, 2016 at $100.00 | | 115 | | | (13,915 | ) | | | | |
Applied Materials, Inc. | | | | | | | | | | |
Expiring July, 2016 at $21.00 | | 38 | | | (10,412 | ) | | | | |
Archer-Daniels-Midland Co. | | | | | | | | | | |
Expiring September, 2016 at $44.00 | | 6 | | | (768 | ) | | | | |
AT&T, Inc. | | | | | | | | | | |
Expiring September, 2016 at $41.00 | | 15 | | | (3,615 | ) | | | | |
Automatic Data Processing, Inc. | | | | | | | | | | |
Expiring August, 2016 at $87.50 | | 4 | | | (1,960 | ) | | | | |
Bank of America Corp. | | | | | | | | | | |
Expiring July, 2016 at $14.00 | | 24 | | | (192 | ) | | | | |
Baxter International, Inc. | | | | | | | | | | |
Expiring August, 2016 at $45.00 | | 4 | | | (540 | ) | | | | |
BB&T Corp. | | | | | | | | | | |
Expiring September, 2016 at $36.00 | | 5 | | | (460 | ) | | | | |
Bristol-Myers Squibb Co. | | | | | | | | | | |
Expiring September, 2016 at $75.00 | | 12 | | | (2,568 | ) | | | | |
Campbell Soup Co. | | | | | | | | | | |
Expiring August, 2016 at $62.50 | | 50 | | | (22,500 | ) | | | | |
Expiring August, 2016 at $67.50 | | 6 | | | (810 | ) | | | | |
| | | | | | | | | | |
| | | |
| | | | | (23,310 | ) | | | | |
Carnival Corp. | | | | | | | | | | |
Expiring July, 2016 at $52.50 | | 5 | | | (10 | ) | | | | |
CenturyLink, Inc. | | | | | | | | | | |
Expiring July, 2016 at $33.00 | | 13 | | | (26 | ) | | | | |
Chevron Corp. | | | | | | | | | | |
Expiring September, 2016 at $105.00 | | 7 | | | (2,170 | ) | | | | |
| | | | | | | | | | |
| Company | | Number
of Contracts | | Value | | | | |
| |
| | | | | |
Cisco Systems, Inc. | | | | | | | | | | |
Expiring September, 2016 at $29.00 | | 25 | | | $ (1,975 | ) | | | | |
Citrix Systems, Inc. | | | | | | | | | | |
Expiring September, 2016 at $90.00 | | 4 | | | (420 | ) | | | | |
CME Group, Inc. | | | | | | | | | | |
Expiring September, 2016 at $97.50 | | 50 | | | (16,000 | ) | | | | |
Cognizant Technology Solutions Corp., Class A | | | | | | | | | | |
Expiring July, 2016 at $62.50 | | 13 | | | (65 | ) | | | | |
ConocoPhillips | | | | | | | | | | |
Expiring August, 2016 at $47.50 | | 5 | | | (345 | ) | | | | |
Constellation Brands, Inc., Class A | | | | | | | | | | |
Expiring July, 2016 at $165.00 | | 9 | | | (2,250 | ) | | | | |
Crown Castle International Corp. | | | | | | | | | | |
Expiring October, 2016 at $95.00 | | 4 | | | (2,932 | ) | | | | |
CVS Health Corp. | | | | | | | | | | |
Expiring August, 2016 at $105.00 | | 4 | | | (40 | ) | | | | |
Danaher Corp. | | | | | | | | | | |
Expiring September, 2016 at $100.00 | | 5 | | | (1,850 | ) | | | | |
DaVita HealthCare Partners, Inc. | | | | | | | | | | |
Expiring July, 2016 at $75.00 | | 5 | | | (1,475 | ) | | | | |
Deere & Co. | | | | | | | | | | |
Expiring September, 2016 at $87.50 | | 6 | | | (666 | ) | | | | |
Dollar General Corp. | | | | | | | | | | |
Expiring August, 2016 at $85.00 | | 7 | | | (7,070 | ) | | | | |
Domino’s Pizza, Inc. | | | | | | | | | | |
Expiring September, 2016 at $130.00 | | 10 | | | (6,600 | ) | | | | |
Edwards Lifesciences Corp. | | | | | | | | | | |
Expiring August, 2016 at $105.00 | | 40 | | | (10,200 | ) | | | | |
Electronic Arts, Inc. | | | | | | | | | | |
Expiring September, 2016 at $77.50 | | 6 | | | (2,040 | ) | | | | |
EMC Corp. | | | | | | | | | | |
Expiring September, 2016 at $28.00 | | 6 | | | (270 | ) | | | | |
EOG Resources, Inc. | | | | | | | | | | |
Expiring July, 2016 at $77.50 | | 3 | | | (1,920 | ) | | | | |
Express Scripts Holding Co. | | | | | | | | | | |
Expiring August, 2016 at $77.50 | | 5 | | | (760 | ) | | | | |
Exxon Mobil Corp. | | | | | | | | | | |
Expiring July, 2016 at $85.00 | | 18 | | | (15,606 | ) | | | | |
Facebook, Inc., Class A | | | | | | | | | | |
Expiring September, 2016 at $125.00 | | 10 | | | (1,800 | ) | | | | |
| | |
Managed Volatility Fund SCHEDULE OF OPTIONS WRITTEN (continued) | | |
Showing percentage of net assets as of June 30, 2016
| | | | | | | | | | |
| Company | | Number
of Contracts | | Value | | | | |
| | |
Call Options Written (continued) | | | | | | | | |
FedEx Corp. | | | | | | | | | | |
Expiring July, 2016 at $170.00 | | 4 | | | $ (12 | ) | | | | |
Ford Motor Co. | | | | | | | | | | |
Expiring July, 2016 at $13.00 | | 22 | | | (176 | ) | | | | |
General Electric Co. | | | | | | | | | | |
Expiring September, 2016 at $31.00 | | 14 | | | (1,722 | ) | | | | |
General Mills, Inc. | | | | | | | | | | |
Expiring October, 2016 at $67.50 | | 10 | | | (4,750 | ) | | | | |
General Motors Co. | | | | | | | | | | |
Expiring August, 2016 at $30.00 | | 175 | | | (7,175 | ) | | | | |
Gilead Sciences, Inc. | | | | | | | | | | |
Expiring August, 2016 at $85.00 | | 50 | | | (12,350 | ) | | | | |
Goodyear Tire & Rubber Co. (The) | | | | | | | | | | |
Expiring July, 2016 at $32.00 | | 8 | | | (40 | ) | | | | |
Halliburton Co. | | | | | | | | | | |
Expiring July, 2016 at $39.00 | | 5 | | | (3,250 | ) | | | | |
Hasbro, Inc. | | | | | | | | | | |
Expiring July, 2016 at $90.00 | | 5 | | | (20 | ) | | | | |
Hewlett Packard Enterprise Co. | | | | | | | | | | |
Expiring August, 2016 at $17.00 | | 13 | | | (2,275 | ) | | | | |
Honeywell International, Inc. | | | | | | | | | | |
Expiring September, 2016 at $120.00 | | 4 | | | (720 | ) | | | | |
Hormel Foods Corp. | | | | | | | | | | |
Expiring September, 2016 at $35.00 | | 26 | | | (6,500 | ) | | | | |
Expiring September, 2016 at $37.50 | | 64 | | | (7,680 | ) | | | | |
| | | | | | | | | | |
| | | |
| | | | | (14,180 | ) | | | | |
HP, Inc. | | | | | | | | | | |
Expiring August, 2016 at $13.00 | | 18 | | | (558 | ) | | | | |
Intel Corp. | | | | | | | | | | |
Expiring August, 2016 at $31.00 | | 19 | | | (4,123 | ) | | | | |
International Business Machines Corp. | | | | | | | | | | |
Expiring October, 2016 at $155.00 | | 4 | | | (1,900 | ) | | | | |
International Paper Co. | | | | | | | | | | |
Expiring July, 2016 at $41.00 | | 6 | | | (858 | ) | | | | |
Intuit, Inc. | | | | | | | | | | |
Expiring July, 2016 at $110.00 | | 6 | | | (1,470 | ) | | | | |
JetBlue Airways Corp. | | | | | | | | | | |
Expiring September, 2016 at $17.00 | | 135 | | | (12,825 | ) | | | | |
Expiring September, 2016 at $19.00 | | 25 | | | (825 | ) | | | | |
| | | | | | | | | | |
| | | |
| | | | | (13,650 | ) | | | | |
JM Smucker Co. (The) | | | | | | | | | | |
Expiring July, 2016 at $130.00 | | 5 | | | (10,655 | ) | | | | |
| | | | | | | | | | |
| Company | | Number
of Contracts | | Value | | | | |
| | | | | | | | | | |
Johnson & Johnson | | | | | | | | | | |
Expiring July, 2016 at $110.00 | | 50 | | | $(55,850 | ) | | | | |
Expiring July, 2016 at $115.00 | | 20 | | | (12,500 | ) | | | | |
| | | | | | | | | | |
| | | |
| | | | | (68,350 | ) | | | | |
JPMorgan Chase & Co. | | | | | | | | | | |
Expiring July, 2016 at $62.50 | | 14 | | | (1,162 | ) | | | | |
Juniper Networks, Inc. | | | | | | | | | | |
Expiring July, 2016 at $25.00 | | 25 | | | (300 | ) | | | | |
Kimberly-Clark Corp. | | | | | | | | | | |
Expiring July, 2016 at $140.00 | | 4 | | | (160 | ) | | | | |
Kroger Co. (The) | | | | | | | | | | |
Expiring July, 2016 at $37.50 | | 15 | | | (450 | ) | | | | |
Marathon Petroleum Corp. | | | | | | | | | | |
Expiring July, 2016 at $42.50 | | 7 | | | (140 | ) | | | | |
MasterCard, Inc., Class A | | | | | | | | | | |
Expiring July, 2016 at $100.00 | | 4 | | | (8 | ) | | | | |
McDonald’s Corp. | | | | | | | | | | |
Expiring September, 2016 at $125.00 | | 4 | | | (524 | ) | | | | |
Merck & Co., Inc. | | | | | | | | | | |
Expiring July, 2016 at $57.50 | | 12 | | | (816 | ) | | | | |
Micron Technology, Inc. | | | | | | | | | | |
Expiring July, 2016 at $12.00 | | 24 | | | (4,512 | ) | | | | |
Microsoft Corp. | | | | | | | | | | |
Expiring August, 2016 at $52.50 | | 22 | | | (2,574 | ) | | | | |
Mondelez International, Inc. | | | | | | | | | | |
Expiring September, 2016 at $45.00 | | 11 | | | (2,574 | ) | | | | |
Monsanto Co. | | | | | | | | | | |
Expiring July, 2016 at $92.50 | | 5 | | | (5,775 | ) | | | | |
Nielsen Holdings PLC | | | | | | | | | | |
Expiring August, 2016 at $55.00 | | 7 | | | (525 | ) | | | | |
NIKE, Inc., Class B | | | | | | | | | | |
Expiring July, 2016 at $62.50 | | 14 | | | (28 | ) | | | | |
Expiring October, 2016 at $57.50 | | 50 | | | (8,950 | ) | | | | |
| | | | | | | | | | |
| | | |
| | | | | (8,978 | ) | | | | |
Northrop Grumman Corp. | | | | | | | | | | |
Expiring August, 2016 at $220.00 | | 4 | | | (2,888 | ) | | | | |
Occidental Petroleum Corp. | | | | | | | | | | |
Expiring August, 2016 at $77.50 | | 4 | | | (1,196 | ) | | | | |
Omnicom Group, Inc. | | | | | | | | | | |
Expiring October, 2016 at $85.00 | | 4 | | | (860 | ) | | | | |
Oracle Corp. | | | | | | | | | | |
Expiring July, 2016 at $43.00 | | 10 | | | (40 | ) | | | | |
PayPal Holdings, Inc. | | | | | | | | | | |
Expiring July, 2016 at $40.00 | | 5 | | | (55 | ) | | | | |
| | |
78 | | Annual Report | June 30, 2016 |
| | |
Managed Volatility Fund SCHEDULE OF OPTIONS WRITTEN (continued) | | |
Showing percentage of net assets as of June 30, 2016
| | | | | | | | | | |
| Company | | Number
of Contracts | | Value | | | | |
| |
Call Options Written (continued) | | | | | |
PepsiCo, Inc. | | | | | | | | | | |
Expiring July, 2016 at $105.00 | | 4 | | | $ (780 | ) | | | | |
Pfizer, Inc. | | | | | | | | | | |
Expiring September, 2016 at $36.00 | | 15 | | | (855 | ) | | | | |
Phillips 66 | | | | | | | | | | |
Expiring August, 2016 at $82.50 | | 5 | | | (670 | ) | | | | |
PNC Financial Services Group, Inc. (The) | | | | | | | | | | |
Expiring August, 2016 at $92.50 | | 6 | | | (60 | ) | | | | |
Praxair, Inc. | | | | | | | | | | |
Expiring October, 2016 at $115.00 | | 4 | | | (1,360 | ) | | | | |
Progressive Corp. (The) | | | | | | | | | | |
Expiring August, 2016 at $36.00 | | 10 | | | (200 | ) | | | | |
QUALCOMM, Inc. | | | | | | | | | | |
Expiring August, 2016 at $57.50 | | 9 | | | (450 | ) | | | | |
Raytheon Co. | | | | | | | | | | |
Expiring August, 2016 at $140.00 | | 6 | | | (852 | ) | | | | |
Ross Stores, Inc. | | | | | | | | | | |
Expiring August, 2016 at $57.50 | | 7 | | | (1,197 | ) | | | | |
salesforce.com, Inc. | | | | | | | | | | |
Expiring August, 2016 at $85.00 | | 6 | | | (792 | ) | | | | |
Santander Consumer USA Holdings, Inc. | | | | | | | | | | |
Expiring October, 2016 at $11.00 | | 145 | | | (16,675 | ) | | | | |
Scripps Networks Interactive, Inc., Class A | | | | | | | | | | |
Expiring September, 2016 at $65.00 | | 90 | | | (16,650 | ) | | | | |
Simon Property Group, Inc. | | | | | | | | | | |
Expiring October, 2016 at $210.00 | | 4 | | | (5,400 | ) | | | | |
Skechers U.S.A., Inc., Class A | | | | | | | | | | |
Expiring August, 2016 at $30.00 | | 114 | | | (23,370 | ) | | | | |
Southwest Airlines Co. | | | | | | | | | | |
Expiring September, 2016 at $44.00 | | 40 | | | (2,600 | ) | | | | |
Starbucks Corp. | | | | | | | | | | |
Expiring August, 2016 at $57.50 | | 8 | | | (1,224 | ) | | | | |
State Street Corp. | | | | | | | | | | |
Expiring August, 2016 at $65.00 | | 4 | | | (28 | ) | | | | |
Target Corp. | | | | | | | | | | |
Expiring July, 2016 at $82.50 | | 7 | | | (42 | ) | | | | |
Texas Instruments, Inc. | | | | | | | | | | |
Expiring July, 2016 at $60.00 | | 8 | | | (2,200 | ) | | | | |
Thermo Fisher Scientific, Inc. | | | | | | | | | | |
Expiring September, 2016 at $155.00 | | 4 | | | (800 | ) | | | | |
Travelers Cos., Inc. (The) | | | | | | | | | | |
Expiring July, 2016 at $115.00 | | 10 | | | (4,000 | ) | | | | |
| | | | | | | | | | |
| Company | | Number
of Contracts | | Value | | | | |
| | | |
| | | | | | | | | | |
Twenty-First Century Fox, Inc., Class A | | | | | | | | | | |
Expiring July, 2016 at $30.00 | | 11 | | | $ (55 | ) | | | | |
Tyco International PLC | | | | | | | | | | |
Expiring July, 2016 at $37.00 | | 13 | | | (7,995 | ) | | | | |
Union Pacific Corp. | | | | | | | | | | |
Expiring August, 2016 at $90.00 | | 4 | | | (740 | ) | | | | |
UnitedHealth Group, Inc. | | | | | | | | | | |
Expiring September, 2016 at $145.00 | | 10 | | | (2,950 | ) | | | | |
Valero Energy Corp. | | | | | | | | | | |
Expiring September, 2016 at $55.00 | | 85 | | | (9,350 | ) | | | | |
VeriSign, Inc. | | | | | | | | | | |
Expiring September, 2016 at $85.00 | | 38 | | | (18,810 | ) | | | | |
Wal-Mart Stores, Inc. | | | | | | | | | | |
Expiring September, 2016 at $72.50 | | 8 | | | (1,816 | ) | | | | |
Western Digital Corp. | | | | | | | | | | |
Expiring July, 2016 at $47.50 | | 5 | | | (735 | ) | | | | |
Yum! Brands, Inc. | | | | | | | | | | |
Expiring July, 2016 at $85.00 | | 3 | | | (315 | ) | | | | |
| | | | | | | | | | |
| | |
TOTAL CALL OPTIONS WRITTEN – (0.78%) | | | (449,522 | ) | | | | |
| | | | | | | | | | |
(Premiums received $(388,392)) | | | | | | | | | | |
| |
PUT OPTIONS WRITTEN - (0.81%) | | | | | |
| | | |
AerCap Holdings NV | | | | | | | | | | |
Expiring October, 2016 at $35.00 | | 90 | | | (35,100 | ) | | | | |
Aflac, Inc. | | | | | | | | | | |
Expiring August, 2016 at $65.00 | | 85 | | | (3,315 | ) | | | | |
American Financial Group, Inc. | | | | | | | | | | |
Expiring September, 2016 at $70.00 | | 20 | | | (3,100 | ) | | | | |
American International Group, Inc. | | | | | | | | | | |
Expiring August, 2016 at $52.50 | | 80 | | | (13,840 | ) | | | | |
AmerisourceBergen Corp. | | | | | | | | | | |
Expiring August, 2016 at $70.00 | | 30 | | �� | (1,410 | ) | | | | |
Expiring August, 2016 at $75.00 | | 20 | | | (2,900 | ) | | | | |
| | | | | | | | | | |
| | | |
| | | | | (4,310 | ) | | | | |
Antero Resources Corp. | | | | | | | | | | |
Expiring August, 2016 at $25.00 | | 80 | | | (10,000 | ) | | | | |
Bank of Nova Scotia (The) | | | | | | | | | | |
Expiring September, 2016 at $45.00 | | 125 | | | (12,500 | ) | | | | |
Barrick Gold Corp. | | | | | | | | | | |
Expiring August, 2016 at $20.00 | | 225 | | | (23,175 | ) | | | | |
CA, Inc. | | | | | | | | | | |
Expiring August, 2016 at $30.00 | | 20 | | | (720 | ) | | | | |
| | |
Managed Volatility Fund SCHEDULE OF OPTIONS WRITTEN (continued) | | |
Showing percentage of net assets as of June 30, 2016
| | | | | | | | | | |
| Company | | Number
of Contracts | | Value | | | | |
| |
Put Options Written (continued) | | | | | |
Campbell Soup Co. | | | | | | | | | | |
Expiring August, 2016 at $62.50 | | 20 | | | $ (1,700 | ) | | | | |
Canadian Imperial Bank of Commerce | | | | | | | | | | |
Expiring September, 2016 at $75.00 | | 30 | | | (9,600 | ) | | | | |
Citigroup, Inc. | | | | | | | | | | |
Expiring August, 2016 at $45.00 | | 105 | | | (38,010 | ) | | | | |
Clorox Co. (The) | | | | | | | | | | |
Expiring July, 2016 at $125.00 | | 9 | | | (108 | ) | | | | |
Delphi Automotive PLC | | | | | | | | | | |
Expiring August, 2016 at $65.00 | | 40 | | | (19,200 | ) | | | | |
Delta Air Lines, Inc. | | | | | | | | | | |
Expiring September, 2016 at $40.00 | | 130 | | | (62,400 | ) | | | | |
Digital Realty Trust, Inc. | | | | | | | | | | |
Expiring October, 2016 at $100.00 | | 30 | | | (6,600 | ) | | | | |
Edwards Lifesciences Corp. | | | | | | | | | | |
Expiring August, 2016 at $95.00 | | 50 | | | (14,500 | ) | | | | |
Everest Re Group, Ltd. | | | | | | | | | | |
Expiring October, 2016 at $170.00 | | 20 | | | (9,200 | ) | | | | |
Ford Motor Co. | | | | | | | | | | |
Expiring August, 2016 at $13.00 | | 355 | | | (30,175 | ) | | | | |
Expiring July, 2016 at $13.00 | | 45 | | | (2,520 | ) | | | | |
| | | | | | | | | | |
| | | |
| | | | | (32,695 | ) | | | | |
General Electric Co. | | | | | | | | | | |
Expiring September, 2016 at $30.00 | | 50 | | | (2,800 | ) | | | | |
Ingredion, Inc. | | | | | | | | | | |
Expiring July, 2016 at $105.00 | | 30 | | | (3,450 | ) | | | | |
Kellogg Co. | | | | | | | | | | |
Expiring September, 2016 at $72.50 | | 50 | | | (4,250 | ) | | | | |
Kroger Co. (The) | | | | | | | | | | |
Expiring July, 2016 at $37.50 | | 40 | | | (4,080 | ) | | | | |
Manulife Financial Corp. | | | | | | | | | | |
Expiring September, 2016 at $13.00 | | 170 | | | (10,200 | ) | | | | |
ONEOK, Inc. | | | | | | | | | | |
Expiring September, 2016 at $42.50 | | 10 | | | (1,750 | ) | | | | |
Reinsurance Group of America, Inc. | | | | | | | | | | |
Expiring July, 2016 at $95.00 | | 10 | | | (3,200 | ) | | | | |
Silver Wheaton Corp. | | | | | | | | | | |
Expiring September, 2016 at $20.00 | | 150 | | | (9,300 | ) | | | | |
Southwest Airlines Co. | | | | | | | | | | |
Expiring September, 2016 at $40.00 | | 120 | | | (33,240 | ) | | | | |
Spirit AeroSystems Holdings, Inc. | | | | | | | | | | |
Expiring July, 2016 at $45.00 | | 117 | | | (40,950 | ) | | | | |
| | | | | | | | | | |
| Company | | Number
of Contracts | | Value | | | | |
| | | | | | | | | | |
| | | |
Toronto-Dominion Bank (The) | | | | | | | | | | |
Expiring October, 2016 at $42.50 | | 56 | | | $ (11,480 | ) | | | | |
Tyson Foods, Inc. | | | | | | | | | | |
Expiring July, 2016 at $65.00 | | 20 | | | (1,500 | ) | | | | |
Ulta Salon Cosmetics & Fragrance, Inc. | | | | | | | | | | |
Expiring September, 2016 at $230.00 | | 30 | | | (27,270 | ) | | | | |
UnitedHealth Group, Inc. | | | | | | | | | | |
Expiring September, 2016 at $135.00 | | 40 | | | (12,400 | ) | | | | |
| | | | | | | | | | |
TOTAL PUT OPTIONS WRITTEN – (0.81%) | | | (465,943 | ) | | | | |
| | | | | | | | | | |
(Premiums received $(491,574)) | | | | | |
| | | |
TOTAL OPTIONS
WRITTEN – (1.59%) | | | | | $(915,465 | ) | | | | |
| | | | | | | | | | |
| | | | | | | | | | |
(Premiums received $(879,966)) | | | | | | | | | | |
| | |
80 | | Annual Report | June 30, 2016 |
| | |
Managed Volatility Fund SCHEDULE OF OPTIONS WRITTEN (continued) | | |
| | | | | | | | | | | | | | | | | | | | |
| Summary of inputs used to value the Fund’s investments as of 06/30/2016 (See Note 2 in Notes to Financial Statements): | | | | | |
| | |
| | | Assets Table | | | | |
| | | Valuation Inputs | | | | |
| | | Investment in Securities (Value) | | | | |
| | | Level 1 Quoted Prices | | | Level 2 Significant Observable Inputs | | | Level 3
Significant Unobservable
Inputs | | | Total | | | | |
| | | | | |
Common Stocks | | $ | 33,354,093 | | | $ | — | | | $ | — | | | $ | 33,354,093 | | | | | |
U.S. Government Obligations | | | — | | | | 22,990,897 | | | | — | | | | 22,990,897 | | | | | |
Money Market Fund | | | — | | | | 2,265,425 | | | | — | | | | 2,265,425 | | | | | |
Investments Purchased with Cash Proceeds from Securities Lending | | | — | | | | 189,674 | | | | — | | | | 189,674 | | | | | |
| | | | | | | | | | | | | | | | | | | | |
TOTAL | | $ | 33,354,093 | | | $ | 25,445,996 | | | $ | — | | | $ | 58,800,089 | | | | | |
| | | | | | | | | | | | | | | | | | | | |
| | | | | |
| | | | | | | | | | | | | | | | | | | | |
| | | Liabilities Table | | | | |
| | | Valuation Inputs | | | | |
| | | Investment in Securities (Value) | | | | |
| | | Level 1
Quoted
Prices | | | Level 2
Significant
Observable
Inputs | | | Level 3
Significant Unobservable
Inputs | | | Total | | | | |
| | | | | |
Options Written | | $ | (686,292 | ) | | $ | (229,173 | ) | | $ | — | | | $ | (915,465 | ) | | | | |
| | | | | | | | | | | | | | | | | | | | |
TOTAL | | $ | (686,292 | ) | | $ | (229,173 | ) | | $ | — | | | $ | (915,465 | ) | | | | |
| | | | | | | | | | | | | | | | | | | | |
See Notes to Financial Statements. | | | | | |
| | |
| STATEMENTS OF ASSETS AND LIABILITIES | | |
June 30, 2016
| | | | | | | | | | | | | | | | | | |
| ASSETS | | Aggressive Investors 1 | | | | | Ultra-Small Company | | | | | Ultra-Small Company Market | | | |
|
Investments at value | | $ | 234,894,990 | | | | | $ | 122,939,949 | | | | | $ | 386,713,261 | | | |
Receivables: | | | | | | | | | | | | | | | | | | |
Portfolio securities sold | | | 4,568,513 | | | | | | 399,429 | | | | | | 1,971,778 | | | |
Fund shares sold | | | 14,896 | | | | | | - | | | | | | 145,534 | | | |
Dividends and interest | | | 228,775 | | | | | | 156,790 | | | | | | 392,801 | | | |
Receivable from investment adviser | | | - | | | | | | - | | | | | | - | | | |
Deposits with brokers | | | - | | | | | | - | | | | | | - | | | |
Prepaid expenses | | | 35,281 | | | | | | 12,856 | | | | | | 41,433 | | | |
|
Total assets | | | 239,742,455 | | | | | | 123,509,024 | | | | | | 389,264,807 | | | |
|
LIABILITIES | | | | | | | | | | | | | | | | | | |
Payables: | | | | | | | | | | | | | | | | | | |
Portfolio securities purchased | | | 4,618,962 | | | | | | 52,841 | | | | | | 647,826 | | | |
Fund shares redeemed | | | 96,839 | | | | | | - | | | | | | 161,265 | | | |
Due to custodian | | | - | | | | | | - | | | | | | - | | | |
Loan payable | | | - | | | | | | 613,000 | | | | | | 1,326,000 | | | |
Payable upon return of securities loaned | | | 27,647,275 | | | | | | 21,256,738 | | | | | | 55,281,243 | | | |
Accrued Liabilities: | | | | | | | | | | | | | | | | | | |
Investment adviser fees | | | 37,138 | | | | | | 74,968 | | | | | | 137,092 | | | |
Administration fees | | | 4,098 | | | | | | 2,005 | | | | | | 6,621 | | | |
Directors’ fees | | | 129 | | | | | | 62 | | | | | | 210 | | | |
Other | | | 108,937 | | | | | | 58,697 | | | | | | 169,160 | | | |
Call options written at value | | | - | | | | | | - | | | | | | - | | | |
Put options written at value | | | - | | | | | | - | | | | | | - | | | |
|
Total liabilities | | | 32,513,378 | | | | | | 22,058,311 | | | | | | 57,729,417 | | | |
|
NET ASSETS | | $ | 207,229,077 | | | | | $ | 101,450,713 | | | | | $ | 331,535,390 | | | |
|
|
NET ASSETS REPRESENT | | | | | | | | | | | | | | | | | | |
Paid-in capital | | $ | 294,880,052 | | | | | $ | 105,716,288 | | | | | $ | 275,395,483 | | | |
Undistributed net investment income | | | 1,255,290 | | | | | | 1,155,911 | | | | | | 3 | | | |
Accumulated net realized gain (loss) on investments | | | (102,383,074 | ) | | | | | (9,065,474 | ) | | | | | 16,221,667 | | | |
Net unrealized appreciation on investments | | | 13,476,809 | | | | | | 3,643,988 | | | | | | 39,918,237 | | | |
|
NET ASSETS | | $ | 207,229,077 | | | | | $ | 101,450,713 | | | | | $ | 331,535,390 | | | |
|
|
Shares of common stock outstanding of $.001 par value* | | | 3,785,160 | | | | | | 3,903,469 | | | | | | 25,967,023 | | | |
|
Net asset value, offering price and redemption price per share | | $ | 54.75 | | | | | $ | 25.99 | | | | | $ | 12.77(a | ) | | |
|
|
Total investments at cost | | $ | 221,418,181 | | | | | $ | 119,295,961 | | | | | $ | 346,795,024 | | | |
Premiums received on call options written | | $ | - | | | | | $ | - | | | | | $ | - | | | |
Premiums received on put options written | | $ | - | | | | | $ | - | | | | | $ | - | | | |
| * | See Note 1 - Organization in the Notes to Financial Statements for shares authorized for each Fund. |
| (a) | Redemption of shares held less than six months may be charged a 2% redemption fee. See Note 8. |
| See | Notes to Financial Statements. |
| | |
| 82 | | Annual Report | June 30, 2016 |
| | |
| | | |
| | | | | | | | | | | | | | | | | | | | | | | | | | |
| | Small-Cap | | | | | | Small-Cap | | | | | | Small-Cap | | | | | | Blue Chip 35 | | | | | | Managed | |
| | Momentum | | | | | | Growth | | | | | | Value | | | | | | Index | | | | | | Volatility | |
| | |
| | $4,780,229 | | | | | | $ 43,617,838 | | | | | | $66,040,036 | | | | | | $570,888,405 | | | | | | $58,800,089 | |
| | | | | | | | | | | | | | | | | | | | | | | | | | |
| | - | | | | | | 3,973,718 | | | | | | - | | | | | | 41,356,998 | | | | | | - | |
| | - | | | | | | 33,818 | | | | | | 5,031 | | | | | | 1,642,952 | | | | | | 9,707 | |
| | 5,088 | | | | | | 39,015 | | | | | | 78,998 | | | | | | 489,281 | | | | | | 22,295 | |
| | 9,623 | | | | | | - | | | | | | - | | | | | | 20,717 | | | | | | - | |
| | - | | | | | | - | | | | | | - | | | | | | - | | | | | | 51 | |
| | 10,421 | | | | | | 7,761 | | | | | | 10,742 | | | | | | 60,698 | | | | | | 17,531 | |
| | |
| | 4,805,361 | | | | | | 47,672,150 | | | | | | 66,134,807 | | | | | | 614,459,051 | | | | | | 58,849,673 | |
| | |
| | | | | | | | |
| | | | | | | | | | | | | | | | | | | | | | | | | | |
| | 15,833 | | | | | | 3,357,615 | | | | | | - | | | | | | 733,340 | | | | | | 2,203 | |
| | - | | | | | | 30,323 | | | | | | 29,225 | | | | | | 1,192,861 | | | | | | 82,856 | |
| | - | | | | | | - | | | | | | - | | | | | | 28,126,677 | | | | | | - | |
| | - | | | | | | - | | | | | | - | | | | | | 12,561,000 | | | | | | - | |
| | 580,846 | | | | | | 7,838,131 | | | | | | 7,289,239 | | | | | | - | | | | | | 189,674 | |
| | | | | | | | | | | | | | | | | | | | | | | | | | |
| | - | | | | | | 9,834 | | | | | | 22,201 | | | | | | - | | | | | | 15,829 | |
| | 82 | | | | | | 724 | | | | | | 1,161 | | | | | | 12,132 | | | | | | 1,157 | |
| | 2 | | | | | | 28 | | | | | | 33 | | | | | | 441 | | | | | | 43 | |
| | 33,009 | | | | | | 41,852 | | | | | | 52,443 | | | | | | 189,011 | | | | | | 56,284 | |
| | - | | | | | | - | | | | | | - | | | | | | - | | | | | | 449,522 | |
| | - | | | | | | - | | | | | | - | | | | | | - | | | | | | 465,943 | |
| | |
| | 629,772 | | | | | | 11,278,507 | | | | | | 7,394,302 | | | | | | 42,815,462 | | | | | | 1,263,511 | |
| | |
| | $4,175,589 | | | | | | $ 36,393,643 | | | | | | $58,740,505 | | | | | | $571,643,589 | | | | | | $57,586,162 | |
| | |
| | |
| | | | | | | | | | | | | | | | | | | | | | | | | | |
| | $3,904,426 | | | | | | $ 45,254,166 | | | | | | $81,176,616 | | | | | | $371,960,600 | | | | | | $54,175,497 | |
| | 24,077 | | | | | | 128,428 | | | | | | 602,805 | | | | | | 6,660,578 | | | | | | 171,214 | |
| | (10,441 | ) | | | | | (12,694,984 | ) | | | | | (23,065,889 | ) | | | | | (8,791,292 | ) | | | | | (3,595,302) | |
| | 257,527 | | | | | | 3,706,033 | | | | | | 26,973 | | | | | | 201,813,703 | | | | | | 6,834,753 | |
| | |
| | $4,175,589 | | | | | | $ 36,393,643 | | | | | | $58,740,505 | | | | | | $571,643,589 | | | | | | $57,586,162 | |
| | |
| | |
| | 362,848 | | | | | | 1,790,353 | | | | | | 2,814,085 | | | | | | 46,542,827 | | | | | | 4,054,124 | |
| | |
| | | | | | | | |
| | $ 11.51(a | ) | | | | | $ 20.33 | | | | | | $ 20.87 | | | | | | $ 12.28 | | | | | | $ 14.20 | |
| | |
| | |
| | $4,522,702 | | | | | | $ 39,911,805 | | | | | | $66,013,063 | | | | | | $369,074,702 | | | | | | $51,929,837 | |
| | $ - | | | | | | $ - | | | | | | $ - | | | | | | $ - | | | | | | $ 388,392 | |
| | $ - | | | | | | $ - | | | | | | $ - | | | | | | $ - | | | | | | $ 491,574 | |
Year Ended June 30, 2016
| | | | | | | | | | | | | | | | |
| | |
| Aggressive
Investors 1 |
| |
| Ultra-Small
Company |
| |
| Ultra-Small
Company Market |
| | | | |
INVESTMENT INCOME | | | | | | | | | | | | | | | | |
Dividends | | $ | 2,275,518 | | | $ | 1,195,488 | | | | $ 3,862,772 | | | | | |
Less: foreign taxes withheld | | | (31,457 | ) | | | (2,783 | ) | | | - | | | | | |
Interest | | | - | | | | - | | | | - | | | | | |
Securities lending | | | 368,605 | | | | 1,210,786 | | | | 1,923,013 | | | | | |
Total Investment Income | | | 2,612,666 | | | | 2,403,491 | | | | 5,785,785 | | | | | |
| | | | |
EXPENSES | | | | | | | | | | | | | | | | |
Investment advisory fees - Base fees | | | 1,947,961 | | | | 974,580 | | | | 1,743,936 | | | | | |
Investment advisory fees - Performance adjustment | | | (1,168,525 | ) | | | - | | | | - | | | | | |
Administration fees | | | 52,483 | | | | 26,245 | | | | 84,553 | | | | | |
Accounting fees | | | 76,359 | | | | 65,755 | | | | 118,080 | | | | | |
Transfer agent fees | | | 139,219 | | | | 61,697 | | | | 107,850 | | | | | |
Audit fees | | | 22,212 | | | | 15,092 | | | | 31,471 | | | | | |
Legal fees | | | 28,954 | | | | 14,479 | | | | 46,551 | | | | | |
Custody fees | | | 5,801 | | | | 15,958 | | | | 22,393 | | | | | |
Blue sky fees | | | 24,615 | | | | 11,455 | | | | 26,292 | | | | | |
Directors’ and officers’ fees | | | 22,357 | | | | 11,125 | | | | 35,889 | | | | | |
Shareholder servicing fees | | | 130,747 | | | | 33,200 | | | | 296,354 | | | | | |
Reports to shareholders | | | 32,868 | | | | 13,656 | | | | 51,189 | | | | | |
Miscellaneous expenses | | | 42,303 | | | | 23,178 | | | | 63,901 | | | | | |
Total Expenses | | | 1,357,354 | | | | 1,266,420 | | | | 2,628,459 | | | | | |
Less investment advisory fees waived | | | - | | | | - | | | | (11,691 | ) | | | | |
Less expenses reimbursed by investment adviser | | | - | | | | - | | | | - | | | | | |
Net Expenses | | | 1,357,354 | | | | 1,266,420 | | | | 2,616,768 | | | | | |
NET INVESTMENT INCOME | | | 1,255,312 | | | | 1,137,071 | | | | 3,169,017 | | | | | |
| | | | |
NET REALIZED AND UNREALIZED GAIN (LOSS) ON INVESTMENTS | | | | | | | | | | | | | | | | |
Realized Gain (Loss) on: | | | | | | | | | | | | | | | | |
Investments | | | (2,615,832 | ) | | | (5,021,149 | ) | | | 28,557,753 | | | | | |
Written options | | | - | | | | - | | | | - | | | | | |
Futures contracts | | | - | | | | - | | | | - | | | | | |
Net Realized Gain (Loss) | | | (2,615,832 | ) | | | (5,021,149 | ) | | | 28,557,753 | | | | | |
Change in Unrealized Appreciation (Depreciation) on: | | | | | | | | | | | | | | | | |
Investments | | | (17,416,880 | ) | | | (13,372,489 | ) | | | (75,235,595 | ) | | | | |
Written options | | | - | | | | - | | | | - | | | | | |
Net Change in Unrealized Appreciation (Depreciation) | | | (17,416,880 | ) | | | (13,372,489 | ) | | | (75,235,595 | ) | | | | |
Net Realized and Unrealized Gain (Loss) on Investments | | | (20,032,712 | ) | | | (18,393,638 | ) | | | (46,677,842 | ) | | | | |
INCREASE (DECREASE) IN NET ASSETS RESULTING FROM OPERATIONS | | $ | (18,777,400 | ) | | $ | (17,256,567 | ) | | | $(43,508,825 | ) | | | | |
See Notes to Financial Statements.
| | |
| 84 | | Annual Report | June 30, 2016 |
| | |
| | | |
| | | | | | | | | | | | | | | | | | |
| | | | |
| Small-Cap
Momentum |
| |
| Small-Cap
Growth |
| |
| Small-Cap
Value |
| |
| Blue Chip 35
Index |
| |
| Managed
Volatility |
|
| | | | | | | | | | | | | | | | | | |
| | $ 57,603 | | | $ | 283,417 | | | $ | 1,281,750 | | | $ | 14,656,191 | | | $ | 677,392 | |
| | (386 | ) | | | - | | | | - | | | | - | | | | - | |
| | - | | | | - | | | | - | | | | - | | | | 32,890 | |
| | 8,035 | | | | 182,496 | | | | 181,790 | | | | - | | | | 1,638 | |
| | 65,252 | | | | 465,913 | | | | 1,463,540 | | | | 14,656,191 | | | | 711,920 | |
| | | | |
| | | | | | | | | | | | | | | | | | |
| | 23,614 | | | | 214,677 | | | | 374,165 | | | | 456,584 | | | | 342,685 | |
| | - | | | | 15,481 | | | | 16,421 | | | | - | | | | - | |
| | 1,039 | | | | 8,691 | | | | 15,113 | | | | 138,359 | | | | 13,892 | |
| | 61,821 | | | | 53,525 | | | | 56,757 | | | | 118,544 | | | | 66,987 | |
| | 34,679 | | | | 54,802 | | | | 66,236 | | | | 53,375 | | | | 48,442 | |
| | 9,286 | | | | 11,506 | | | | 12,678 | | | | 44,674 | | | | 18,296 | |
| | 580 | | | | 4,702 | | | | 8,391 | | | | 75,141 | | | | 9,996 | |
| | 11,367 | | | | 4,070 | | | | 3,089 | | | | 9,594 | | | | 7,738 | |
| | 19,491 | | | | 22,501 | | | | 23,966 | | | | 55,141 | | | | 24,414 | |
| | 442 | | | | 3,704 | | | | 6,407 | | | | 59,149 | | | | 5,920 | |
| | 3,267 | | | | 21,979 | | | | 39,889 | | | | 186,944 | | | | 44,531 | |
| | 557 | | | | 6,178 | | | | 9,721 | | | | 123,041 | | | | 9,397 | |
| | 3,496 | | | | 7,340 | | | | 12,803 | | | | 110,612 | | | | 10,568 | |
| | 169,639 | | | | 429,156 | | | | 645,636 | | | | 1,431,158 | | | | 602,866 | |
| | (23,614 | ) | | | (93,109 | ) | | | (59,286 | ) | | | (456,584 | ) | | | (65,740 | ) |
| | (107,392 | ) | | | - | | | | - | | | | (115,377 | ) | | | - | |
| | 38,633 | | | | 336,047 | | | | 586,350 | | | | 859,197 | | | | 537,126 | |
| | 26,619 | | | | 129,866 | | | | 877,190 | | | | 13,796,994 | | | | 174,794 | |
| | | | |
| | | | | | | | | | | | | | | | | | |
| | | | | | | | | | | | | | | | | | |
| | (11,415 | ) | | | 470,966 | | | | (2,163,966 | ) | | | 11,244,582 | | | | (2,022,424 | ) |
| | - | | | | - | | | | - | | | | - | | | | 2,277,709 | |
| | - | | | | - | | | | - | | | | - | | | | 315,961 | |
| | (11,415 | ) | | | 470,966 | | | | (2,163,966 | ) | | | 11,244,582 | | | | 571,246 | |
| | | | |
| | (179,316 | ) | | | (2,039,755 | ) | | | (2,863,660 | ) | | | 6,959,629 | | | | 68,174 | |
| | - | | | | - | | | | - | | | | - | | | | (186,294 | ) |
| | (179,316 | ) | | | (2,039,755 | ) | | | (2,863,660 | ) | | | 6,959,629 | | | | (118,120 | ) |
| | (190,731 | ) | | | (1,568,789 | ) | | | (5,027,626 | ) | | | 18,204,211 | | | | 453,126 | |
| | $(164,112 | ) | | $ | (1,438,923 | ) | | $ | (4,150,436 | ) | | $ | 32,001,205 | | | $ | 627,920 | |
| | |
STATEMENTS OF CHANGES IN NET ASSETS | | |
| | | | | | | | | | | | | | | | | | | | |
| | | |
| | | Aggressive Investors 1 | | | Ultra-Small Company | | | | |
| | | Year Ended
June 30, | | | Year Ended
June 30, | | | | |
| | | 2016 | | | 2015 | | | 2016 | | | 2015 | | | | |
| | | | | |
OPERATIONS | | | | | | | | | | | | | | | | | | | | |
Net investment income | | $ | 1,255,312 | | | $ | 99,006 | | | $ | 1,137,071 | | | $ | 945,005 | | | | | |
Net realized gain (loss) on investments | | | (2,615,832 | ) | | | 25,307,168 | | | | (5,021,149 | ) | | | (1,713,902 | ) | | | | |
Net change in unrealized appreciation (depreciation) on investments | | | (17,416,880 | ) | | | (13,663,556 | ) | | | (13,372,489 | ) | | | (10,407,890 | ) | | | | |
Net increase (decrease) in net assets resulting from operations | | | (18,777,400 | ) | | | 11,742,618 | | | | (17,256,567 | ) | | | (11,176,787 | ) | | | | |
| | | | | |
DISTRIBUTIONS: | | | | | | | | | | | | | | | | | | | | |
From net investment income | | | (99,024 | ) | | | (540,861 | ) | | | (1,116,218 | ) | | | (1,052,434 | ) | | | | |
From net realized gains | | | - | | | | - | | | | - | | | | (27,750,353 | ) | | | | |
Net decrease in net assets from distributions | | | (99,024 | ) | | | (540,861 | ) | | | (1,116,218 | ) | | | (28,802,787 | ) | | | | |
| | | | | |
SHARE TRANSACTIONS: | | | | | | | | | | | | | | | | | | | | |
Proceeds from sale of shares | | | 12,201,386 | | | | 9,973,079 | | | | 1,946,202 | | | | 1,395,869 | | | | | |
Reinvestment of distributions | | | 95,200 | | | | 511,322 | | | | 1,038,194 | | | | 27,164,352 | | | | | |
Cost of shares redeemed | | | (34,237,152 | ) | | | (33,042,204 | ) | | | (10,877,563 | ) | | | (13,194,608 | ) | | | | |
Redemption fees | | | - | | | | - | | | | - | | | | - | | | | | |
Net increase (decrease) in net assets resulting from share transactions | | | (21,940,566 | ) | | | (22,557,803 | ) | | | (7,893,167 | ) | | | 15,365,613 | | | | | |
Net decrease in net assets | | | (40,816,990 | ) | | | (11,356,046 | ) | | | (26,265,952 | ) | | | (24,613,961 | ) | | | | |
| | | | | |
NET ASSETS: | | | | | | | | | | | | | | | | | | | | |
Beginning of year | | | 248,046,067 | | | | 259,402,113 | | | | 127,716,665 | | | | 152,330,626 | | | | | |
End of year** | | $ | 207,229,077 | | | $ | 248,046,067 | | | $ | 101,450,713 | | | $ | 127,716,665 | | | | | |
| | | | | |
SHARES ISSUED & REDEEMED | | | | | | | | | | | | | | | | | | | | |
Issued | | | 226,120 | | | | 172,109 | | | | 71,929 | | | | 41,473 | | | | | |
Distributions reinvested | | | 1,751 | | | | 9,139 | | | | 39,808 | | | | 906,990 | | | | | |
Redeemed | | | (636,420 | ) | | | (563,075 | ) | | | (413,482 | ) | | | (384,777 | ) | | | | |
Net increase (decrease) | | | (408,549 | ) | | | (381,827 | ) | | | (301,745 | ) | | | 563,686 | | | | | |
Outstanding at beginning of year | | | 4,193,709 | | | | 4,575,536 | | | | 4,205,214 | | | | 3,641,528 | | | | | |
Outstanding at end of year | | | 3,785,160 | | | | 4,193,709 | | | | 3,903,469 | | | | 4,205,214 | | | | | |
| | | | | |
** Including undistributed net investment income of: | | $ | 1,255,290 | | | $ | 99,002 | | | $ | 1,155,911 | | | $ | 596,067 | | | | | |
See Notes to Financial Statements.
| | |
| 86 | | Annual Report | June 30, 2016 |
| | |
| | |
|
| | | | | | | | | | | | | | |
| |
Ultra-Small Company Market | | | Small-Cap Momentum | |
Year Ended
June 30, | | | Year Ended
June 30, | |
| 2016 | | | 2015 | | | 2016 | | | 2015 | |
| | | |
| | | | | | | | | | | | | | |
| $ | 3,169,017 | | | $ | 2,968,400 | | | $ | 26,619 | | | $ | 40,172 | |
| | 28,557,753 | | | | 33,400,024 | | | | (11,415 | ) | | | 142,632 | |
| | | |
| | (75,235,595 | ) | | | (23,058,470 | ) | | | (179,316 | ) | | | 11,922 | |
| | | |
| | (43,508,825 | ) | | | 13,309,954 | | | | (164,112 | ) | | | 194,726 | |
| | | |
| | | | | | | | | | | | | | |
| | (3,152,924 | ) | | | (3,294,374 | ) | | | (9,442 | ) | | | (27,463 | ) |
| | (37,504,226 | ) | | | (37,828,878 | ) | | | (115,288 | ) | | | (442,934 | ) |
| (40,657,150 | ) | | | (41,123,252 | ) | | | (124,730 | ) | | | (470,397 | ) |
| | | |
| | | | | | | | | | | | | | |
| | 52,017,890 | | | | 46,724,160 | | | | 261,156 | | | | 181,242 | |
| | 39,249,741 | | | | 39,489,770 | | | | 124,006 | | | | 467,987 | |
| | (78,477,718 | ) | | | (79,731,098 | ) | | | (1,043,587 | ) | | | (1,145,289 | ) |
| | 58,448 | | | | 87,151 | | | | 303 | | | | 28 | |
| | | |
| 12,848,361 | | | | 6,569,983 | | | | (658,122 | ) | | | (496,032 | ) |
| (71,317,614 | ) | | | (21,243,315 | ) | | | (946,964 | ) | | | (771,703 | ) |
| | | |
| | | | | | | | | | | | | | |
| | 402,853,004 | | | | 424,096,319 | | | | 5,122,553 | | | | 5,894,256 | |
$ | 331,535,390 | | | $ | 402,853,004 | | | $ | 4,175,589 | | | $ | 5,122,553 | |
| | | |
| | | | | | | | | | | | | | |
| | 3,904,938 | | | | 2,862,947 | | | | 22,889 | | | | 14,977 | |
| | 3,073,590 | | | | 2,643,224 | | | | 10,802 | | | | 42,390 | |
| | (5,905,983 | ) | | | (4,894,380 | ) | | | (87,732 | ) | | | (93,856 | ) |
| 1,072,545 | | | | 611,791 | | | | (54,041 | ) | | | (36,489 | ) |
| | 24,894,478 | | | | 24,282,687 | | | | 416,889 | | | | 453,378 | |
| 25,967,023 | | | | 24,894,478 | | | | 362,848 | | | | 416,889 | |
| | | |
| $ | 3 | | | $ | 3 | | | $ | 24,077 | | | $ | 9,442 | |
| | |
STATEMENTS OF CHANGES IN NET ASSETS (continued) | | |
| | | | | | | | | | | | | | | | | | | | |
| | | |
| | | Small-Cap Growth | | | Small-Cap Value | | | | |
| | | Year Ended
June 30, | | | Year Ended
June 30, | | | | |
| | | 2016 | | | 2015 | | | 2016 | | | 2015 | | | | |
| | | | | |
OPERATIONS | | | | | | | | | | | | | | | | | | | | |
Net investment income (loss) | | $ | 129,866 | | | $ | (23,592 | ) | | $ | 877,190 | | | $ | 1,006,371 | | | | | |
Net realized gain (loss) on investments | | | 470,966 | | | | 4,000,306 | | | | (2,163,966 | ) | | | 5,855,994 | | | | | |
Net change in unrealized appreciation (depreciation) on investments | | | (2,039,755 | ) | | | 481,668 | | | | (2,863,660 | ) | | | (8,924,705 | ) | | | | |
Net increase (decrease) in net assets resulting from operations | | | (1,438,923 | ) | | | 4,458,382 | | | | (4,150,436 | ) | | | (2,062,340 | ) | | | | |
| | | | | |
DISTRIBUTIONS: | | | | | | | | | | | | | | | | | | | | |
From net investment income | | | - | | | | (21,907 | ) | | | (1,200,493 | ) | | | (581,377 | ) | | | | |
Net decrease in net assets from distributions | | | - | | | | (21,907 | ) | | | (1,200,493 | ) | | | (581,377 | ) | | | | |
| | | | | |
SHARE TRANSACTIONS: | | | | | | | | | | | | | | | | | | | | |
Proceeds from sale of shares | | | 8,174,017 | | | | 4,488,921 | | | | 2,974,064 | | | | 5,477,606 | | | | | |
Reinvestment of distributions | | | - | | | | 20,925 | | | | 1,160,995 | | | | 548,083 | | | | | |
Cost of shares redeemed | | | (7,142,746 | ) | | | (5,563,663 | ) | | | (13,284,863 | ) | | | (15,922,282 | ) | | | | |
Net increase (decrease) in net assets resulting from share transactions | | | 1,031,271 | | | | (1,053,817 | ) | | | (9,149,804 | ) | | | (9,896,593 | ) | | | | |
| | | | | |
Net increase (decrease) in net assets | | | (407,652 | ) | | | 3,382,658 | | | | (14,500,733 | ) | | | (12,540,310 | ) | | | | |
| | | | | |
NET ASSETS: | | | | | | | | | | | | | | | | | | | | |
Beginning of year | | | 36,801,295 | | | | 33,418,637 | | | | 73,241,238 | | | | 85,781,548 | | | | | |
End of year* | | $ | 36,393,643 | | | $ | 36,801,295 | | | $ | 58,740,505 | | | $ | 73,241,238 | | | | | |
| | | | | |
SHARES ISSUED & REDEEMED | | | | | | | | | | | | | | | | | | | | |
Issued. | | | 417,698 | | | | 228,708 | | | | 146,711 | | | | 248,054 | | | | | |
Distributions reinvested | | | - | | | | 1,168 | | | | 57,532 | | | | 26,087 | | | | | |
Redeemed | | | (365,757 | ) | | | (280,771 | ) | | | (660,493 | ) | | | (723,093 | ) | | | | |
Net increase (decrease) | | | 51,941 | | | | (50,895 | ) | | | (456,250 | ) | | | (448,952 | ) | | | | |
Outstanding at beginning of year | | | 1,738,412 | | | | 1,789,307 | | | | 3,270,335 | | | | 3,719,287 | | | | | |
Outstanding at end of year | | | 1,790,353 | | | | 1,738,412 | | | | 2,814,085 | | | | 3,270,335 | | | | | |
| | | | | |
* Including undistributed net investment income of: | | $ | 128,428 | | | $ | - | | | $ | 602,805 | | | $ | 941,370 | | | | | |
See Notes to Financial Statements.
| | |
| 88 | | Annual Report | June 30, 2016 |
| | | | | | | | | | | | | | |
| |
Blue Chip 35 Index | | | Managed Volatility | |
Year Ended
June 30, | | | Year Ended
June 30, | |
| 2016 | | | 2015 | | | 2016 | | | 2015 | |
| | | |
| | | | | | | | | | | | | | | |
| $ | 13,796,994 | | | $ | 13,543,483 | | | $ | 174,794 | | | $ | 15,857 | |
| | 11,244,582 | | | | 4,936,744 | | | | 571,246 | | | | 950,869 | |
|
6,959,629 |
| | | 16,801,251 | | | | (118,120 | ) | | | (716,847 | ) |
| 32,001,205 | | | | 35,281,478 | | | | 627,920 | | | | 249,879 | |
| | | |
| | | | | | | | | | | | | | | |
| | (14,480,684 | ) | | | (11,713,217 | ) | | | (15,844 | ) | | | (59,691 | ) |
| (14,480,684 | ) | | | (11,713,217 | ) | | | (15,844 | ) | | | (59,691 | ) |
| | | |
| | 197,709,355 | | | | 187,796,541 | | | | 13,489,567 | | | | 24,595,261 | |
| | 13,464,160 | | | | 11,360,966 | | | | 15,001 | | | | 55,735 | |
| | (257,873,552 | ) | | | (178,887,373 | ) | | | (15,538,847 | ) | | | (12,740,758 | ) |
|
(46,700,037 |
) | | | 20,270,134 | | | | (2,034,279 | ) | | | 11,910,238 | |
| | | |
| | (29,179,516 | ) | | | 43,838,395 | | | | (1,422,203 | ) | | | 12,100,426 | |
| | | |
| | | | | | | | | | | | | | | |
| | 600,823,105 | | | | 556,984,710 | | | | 59,008,365 | | | | 46,907,939 | |
$ | 571,643,589 | | | $ | 600,823,105 | | | $ | 57,586,162 | | | $ | 59,008,365 | |
| | | |
| | 16,712,171 | | | | 16,033,306 | | | | 970,595 | | | | 1,745,954 | |
| | 1,130,492 | | | | 1,007,178 | | | | 1,078 | | | | 4,036 | |
| | (22,178,814 | ) | | | (15,052,751 | ) | | | (1,118,179 | ) | | | (913,317 | ) |
| (4,336,151 | ) | | | 1,987,733 | | | | (146,506 | ) | | | 836,673 | |
| | 50,878,978 | | | | 48,891,245 | | | | 4,200,630 | | | | 3,363,957 | |
| 46,542,827 | | | | 50,878,978 | | | | 4,054,124 | | | | 4,200,630 | |
| | | |
| $ | 6,660,578 | | | $ | 7,344,268 | | | $ | 171,214 | | | $ | 15,835 | |
(for a share outstanding throughout each year indicated)
AGGRESSIVE INVESTORS 1
| | | | | | | | | | |
| | | Year Ended June 30 |
| | | | | |
| | | 2016 | | 2015 | | 2014 | | 2013 | | 2012 |
| | | | | |
Net Asset Value, Beginning of Year | | $59.15 | | $56.69 | | $43.21 | | $33.13 | | $38.19 |
| | | | | | | | | | |
| | | | | |
Income from Investment Operations: | | | | | | | | | | |
Net Investment Income(a) | | 0.31 | | 0.02 | | 0.11 | | 0.65 | | 0.62 |
Net Realized and Unrealized Gain (Loss) | | (4.69) | | 2.56 | | 13.73 | | 9.84 | | (4.37) |
| | | | | | | | | | |
Total from Investment Operations | | (4.38) | | 2.58 | | 13.84 | | 10.49 | | (3.75) |
| | | | | | | | | | |
| | | | | |
Less Distributions to Shareholders from: | | | | | | | | | | |
Net Investment Income | | (0.02) | | (0.12) | | (0.36) | | (0.41) | | (1.31) |
| | | | | | | | | | |
Total Distributions | | (0.02) | | (0.12) | | (0.36) | | (0.41) | | (1.31) |
| | | | | | | | | | |
| | | | | |
Net Asset Value, End of Year | | $54.75 | | $59.15 | | $56.69 | | $43.21 | | $33.13 |
| | | | | | | | | | |
| | | | | |
Total Return | | (7.40%) | | 4.57% | | 32.14% | | 31.92% | | (9.57%) |
| | | | | |
Ratios and Supplemental Data: | | | | | | | | | | |
Net Assets, End of Year (in 000’s) | | $207,229 | | $248,046 | | $259,402 | | $221,337 | | $206,010 |
Expenses Before Waivers and Reimbursements | | 0.63%(b) | | 1.32% | | 1.01% | | 0.74%(b) | | (0.04%)(b) |
Expenses After Waivers and Reimbursements | | 0.63% | | 1.32% | | 1.01% | | 0.74% | | (0.04%) |
Net Investment Income After Waivers and Reimbursements | | 0.58% | | 0.04% | | 0.22% | | 1.69% | | 1.86% |
Portfolio Turnover Rate | | 124% | | 107% | | 125% | | 149% | | 125% |
| (a) | Per share amounts calculated based on the average daily shares outstanding during the period. |
| (b) | For the years ended June 30, 2012, June 30, 2013, and June 30, 2016 the expense ratio was significantly lower than in other years, due to a negative performance adjustment to the investment advisory fee. Please refer to Note 3 of the Notes to Financial Statements for further information. The rate shown may not be indicative of the rate going forward. |
See Notes to Financial Statements.
| | |
| 90 | | Annual Report | June 30, 2016 |
(for a share outstanding throughout each year indicated)
ULTRA-SMALL COMPANY
| | | | | | | | | | |
| | | Year Ended June 30 |
| | | 2016 | | 2015 | | 2014 | | 2013 | | 2012 |
| | | | | |
Net Asset Value, Beginning of Year | | $30.37 | | $41.83 | | $39.36 | | $27.57 | | $29.65 |
| | | | | | | | | | |
| | | | | |
Income from Investment Operations: | | | | | | | | | | |
Net Investment Income(a) | | 0.28 | | 0.24 | | 0.41 | | 0.43 | | 0.13 |
Net Realized and Unrealized Gain (Loss) | | (4.39) | | (3.53) | | 8.33 | | 11.38 | | (1.79) |
| | | | | | | | | | |
Total from Investment Operations | | (4.11) | | (3.29) | | 8.74 | | 11.81 | | (1.66) |
| | | | | | | | | | |
| | | | | |
Less Distributions to Shareholders from: | | | | | | | | | | |
Net Investment Income | | (0.27) | | (0.30) | | (0.76) | | (0.02) | | (0.42) |
Net Realized Gain | | - | | (7.87) | | (5.51) | | - | | - |
| | | | | | | | | | |
Total Distributions | | (0.27) | | (8.17) | | (6.27) | | (0.02) | | (0.42) |
| | | | | | | | | | |
| | | | | |
Net Asset Value, End of Year | | $25.99 | | $30.37 | | $41.83 | | $39.36 | | $27.57 |
| | | | | | | | | | |
| | | | | |
Total Return | | (13.53)% | | (7.60)% | | 23.72% | | 42.85% | | (5.41%) |
| | | | | |
Ratios and Supplemental Data: | | | | | | | | | | |
Net Assets, End of Year (in 000’s) | | $101,451 | | $127,717 | | $152,331 | | $132,064 | | $102,110 |
Expenses Before Waivers and Reimbursements | | 1.17% | | 1.11% | | 1.10% | | 1.17% | | 1.22% |
Expenses After Waivers and Reimbursements | | 1.17% | | 1.11% | | 1.10% | | 1.17% | | 1.22% |
Net Investment Income After Waivers and Reimbursements | | 1.05% | | 0.68% | | 0.98% | | 1.33% | | 0.49% |
Portfolio Turnover Rate | | 101% | | 90% | | 99% | | 89% | | 93% |
| (a) | Per share amounts calculated based on the average daily shares outstanding during the period. |
See Notes to Financial Statements.
(for a share outstanding throughout each year indicated)
ULTRA-SMALL COMPANY MARKET
| | | | | | | | | | |
| | | Year Ended June 30 |
| | | 2016 | | 2015 | | 2014 | | 2013 | | 2012 |
Net Asset Value, Beginning of Year | | $16.18 | | $17.46 | | $15.44 | | $14.67 | | $15.34 |
| | | | | | | | | | |
| | | | | |
Income from Investment Operations: | | | | | | | | | | |
Net Investment Income(a) | | 0.12 | | 0.12 | | 0.12 | | 0.22 | | 0.12 |
Net Realized and Unrealized Gain (Loss) | | (1.87) | | 0.38 | | 3.66 | | 3.49 | | (0.09) |
| | | | | | | | | | |
Total from Investment Operations | | (1.75) | | 0.50 | | 3.78 | | 3.71 | | 0.03 |
| | | | | | | | | | |
| | | | | |
Less Distributions to Shareholders from: | | | | | | | | | | |
Net Investment Income | | (0.13) | | (0.14) | | (0.18) | | (0.40) | | (0.14) |
Net Realized Gain | | (1.53) | | (1.64) | | (1.59) | | (2.54) | | (0.56) |
| | | | | | | | | | |
Total Distributions | | (1.66) | | (1.78) | | (1.77) | | (2.94) | | (0.70) |
| | | | | | | | | | |
| | | | | |
Paid in Capital from Redemption Fees(a) | | 0.00(b) | | 0.00(b) | | 0.01 | | 0.00(b) | | 0.00(b) |
| | | | | | | | | | |
| | | | | |
Net Asset Value, End of Year | | $12.77 | | $16.18 | | $17.46 | | $15.44 | | $14.67 |
| | | | | | | | | | |
| | | | | |
Total Return | | (10.83%)(c) | | 3.72% | | 25.48% | | 29.95%(c) | | 1.05%(c) |
| | | | | |
Ratios and Supplemental Data: | | | | | | | | | | |
Net Assets, End of Year (in 000’s) | | $331,535 | | $402,853 | | $424,096 | | $341,647 | | $302,432 |
Expenses Before Waivers and Reimbursements | | 0.75% | | 0.73% | | 0.72% | | 0.79% | | 0.83% |
Expenses After Waivers and Reimbursements | | 0.75% | | 0.73% | | 0.72% | | 0.75% | | 0.75% |
Net Investment Income After Waivers and Reimbursements | | 0.91% | | 0.74% | | 0.73% | | 1.52% | | 0.86% |
Portfolio Turnover Rate | | 41% | | 32% | | 29% | | 41% | | 31% |
| (a) | Per share amounts calculated based on the average daily shares outstanding during the period. |
| (b) | Amount represents less than $0.005. |
| (c) | Total return would have been lower had various fees not been waived during the period. |
See Notes to Financial Statements.
| | |
| 92 | | Annual Report | June 30, 2016 |
(for a share outstanding throughout each year indicated)
SMALL-CAP MOMENTUM
| | | | | | | | | | |
| | | Year Ended June 30 |
| | | 2016 | | 2015 | | 2014 | | 2013 | | 2012 |
Net Asset Value, Beginning of Year | | $12.29 | | $13.00 | | $12.19 | | $11.25 | | $12.74 |
| | | | | | | | | | |
| | | | | |
Income from Investment Operations: | | | | | | | | | | |
Net Investment Income(a) | | 0.07 | | 0.09 | | 0.01 | | 0.10 | | 0.04 |
Net Realized and Unrealized Gain (Loss) | | (0.50) | | 0.37 | | 2.29 | | 2.20 | | (0.35) |
| | | | | | | | | | |
Total from Investment Operations | | (0.43) | | 0.46 | | 2.30 | | 2.30 | | (0.31) |
| | | | | | | | | | |
| | | | | |
Less Distributions to Shareholders from: | | | | | | | | | | |
Net Investment Income | | (0.03) | | (0.07) | | (0.02) | | (0.19) | | (0.01) |
Net Realized Gain | | (0.32) | | (1.10) | | (1.47) | | (1.17) | | (1.18) |
| | | | | | | | | | |
Total Distributions | | (0.35) | | (1.17) | | (1.49) | | (1.36) | | (1.19) |
| | | | | | | | | | |
| | | | | |
Paid in Capital from Redemption Fees(a) | | 0.00(b) | | 0.00(b) | | 0.00(b) | | 0.00(b) | | 0.01 |
| | | | | | | | | | |
| | | | | |
Net Asset Value, End of Year | | $11.51 | | $12.29 | | $13.00 | | $12.19 | | $11.25 |
| | | | | | | | | | |
| | | | | |
Total Return(c) | | (3.48%) | | 4.54% | | 19.46% | | 22.31% | | (1.40%) |
| | | | | |
Ratios and Supplemental Data: | | | | | | | | | | |
Net Assets, End of Year (in 000’s) | | $4,176 | | $5,123 | | $5,894 | | $4,437 | | $2,070 |
Expenses Before Waivers and | | | | | | | | | | |
Reimbursements | | 3.95% | | 3.36% | | 3.08% | | 5.42% | | 5.73% |
Expenses After Waivers and Reimbursements | | 0.90% | | 0.90% | | 0.90% | | 0.90% | | 0.90% |
Net Investment Income After Waivers and Reimbursements | | 0.62% | | 0.77% | | 0.07% | | 0.89% | | 0.38% |
Portfolio Turnover Rate | | 184% | | 198% | | 242% | | 264% | | 230% |
| (a) | Per share amounts calculated based on the average daily shares outstanding during the period. |
| (b) | Amount represents less than $0.005. |
| (c) | Total return would have been lower had various fees not been waived during the period. |
See Notes to Financial Statements.
(for a share outstanding throughout each year indicated)
SMALL-CAP GROWTH
| | | | | | | | | | | | | | | | | | | | |
| | | Year Ended June 30 | |
| | | 2016 | | | 2015 | | | 2014 | | | 2013 | | | 2012 | |
Net Asset Value, Beginning of Year | | | $21.17 | | | | $18.68 | | | | $15.11 | | | | $11.63 | | | | $12.42 | |
| | | | | | | | | | | | | | | | | | | | |
| | | | | |
Income from Investment Operations: | | | | | | | | | | | | | | | | | | | | |
Net Investment Income (Loss)(a) | | | 0.07 | | | | (0.01) | | | | 0.01 | | | | 0.08 | | | | (0.02) | |
Net Realized and Unrealized Gain (Loss) | | | (0.91) | | | | 2.51 | | | | 3.63 | | | | 3.40 | | | | (0.77) | |
| | | | | | | | | | | | | | | | | | | | |
Total from Investment Operations | | | (0.84) | | | | 2.50 | | | | 3.64 | | | | 3.48 | | | | (0.79) | |
| | | | | | | | | | | | | | | | | | | | |
| | | | | |
Less Distributions to Shareholders from: | | | | | | | | | | | | | | | | | | | | |
Net Investment Income | | | - | | | | (0.01) | | | | (0.07) | | | | - | | | | 0.00(b) | |
| | | | | | | | | | | | | | | | | | | | |
Total Distributions | | | - | | | | (0.01) | | | | (0.07) | | | | - | | | | 0.00(b) | |
| | | | | | | | | | | | | | | | | | | | |
| | | | | |
Net Asset Value, End of Year | | | $20.33 | | | | $21.17 | | | | $18.68 | | | | $15.11 | | | | $11.63 | |
| | | | | | | | | | | | | | | | | | | | |
| | | | | |
Total Return(c) | | | (3.97%) | | | | 13.41% | | | | 24.11% | | | | 29.92% | | | | (6.35%) | |
| | | | | |
Ratios and Supplemental Data: | | | | | | | | | | | | | | | | | | | | |
Net Assets, End of Year (in 000’s) | | | $36,394 | | | | $36,801 | | | | $33,419 | | | | $30,605 | | | | $31,778 | |
Expenses Before Waivers and Reimbursements | | | 1.20% | | | | 1.08% | | | | 1.07% | | | | 1.13% | | | | 1.08% | |
Expenses After Waivers and Reimbursements | | | 0.94% | | | | 0.94% | | | | 0.94% | | | | 0.94% | | | | 0.94% | |
Net Investment Income (Loss) After Waivers and Reimbursements | | | 0.36% | | | | (0.07%) | | | | 0.06% | | | | 0.60% | | | | (0.14%) | |
Portfolio Turnover Rate | | | 137% | | | | 123% | | | | 121% | | | | 78% | | | | 63% | |
| (a) | Per share amounts calculated based on the average daily shares outstanding during the period. |
| (b) | Amount represents less than $0.005. |
| (c) | Total return would have been lower had various fees not been waived during the period. |
See Notes to Financial Statements.
| | |
| 94 | | Annual Report | June 30, 2016 |
(for a share outstanding throughout each year indicated)
SMALL-CAP VALUE
| | | | | | | | | | |
| | | Year Ended June 30 |
| | | | | |
| | | 2016 | | 2015 | | 2014 | | 2013 | | 2012 |
| | | | | |
| | | | | | | | | | |
Net Asset Value, Beginning of Year | | $22.40 | | $23.06 | | $19.21 | | $14.82 | | $15.12 |
| | | | | |
| | | | | | | | | | |
| | | | | |
Income from Investment Operations: | | | | | | | | | | |
Net Investment Income(a) | | 0.29 | | 0.29 | | 0.15 | | 0.29 | | 0.15 |
Net Realized and Unrealized Gain (Loss) | | (1.43) | | (0.78) | | 3.80 | | 4.46 | | (0.26) |
| | | | | |
| | | | | | | | | | |
Total from Investment Operations | | (1.14) | | (0.49) | | 3.95 | | 4.75 | | (0.11) |
| | | | | |
| | | | | | | | | | |
| | | | | |
Less Distributions to Shareholders from: | | | | | | | | | | |
Net Investment Income | | (0.39) | | (0.17) | | (0.10) | | (0.36) | | (0.19) |
| | | | | |
| | | | | | | | | | |
Total Distributions | | (0.39) | | (0.17) | | (0.10) | | (0.36) | | (0.19) |
| | | | | |
| | | | | | | | | | |
| | | | | |
Net Asset Value, End of Year | | $20.87 | | $22.40 | | $23.06 | | $19.21 | | $14.82 |
| | | | | |
| | | | | | | | | | |
| | | | | |
Total Return | | (5.02%)(b) | | (2.10%)(b) | | 20.63%(b) | | 32.49% | | (0.59%)(b) |
| | | | | |
Ratios and Supplemental Data: | | | | | | | | | | |
Net Assets, End of Year (in 000’s) | | $58,741 | | $73,241 | | $85,782 | | $79,248 | | $67,610 |
Expenses Before Waivers and Reimbursements | | 1.03% | | 0.98% | | 0.97% | | 0.91% | | 0.99% |
Expenses After Waivers and Reimbursements | | 0.94% | | 0.94% | | 0.94% | | 0.91% | | 0.94% |
Net Investment Income After Waivers and Reimbursements | | 1.41% | | 1.30% | | 0.71% | | 1.71% | | 1.10% |
Portfolio Turnover Rate | | 62% | | 74% | | 83% | | 64% | | 49% |
| (a) | Per share amounts calculated based on the average daily shares outstanding during the period. |
| (b) | Total return would have been lower had various fees not been waived during the period. |
See Notes to Financial Statements.
(for a share outstanding throughout each year indicated)
BLUE CHIP 35 INDEX
| | | | | | | | | | |
| | | Year Ended June 30 |
| | | | | |
| | | 2016 | | 2015 | | 2014 | | 2013 | | 2012 |
| | | | | |
Net Asset Value, Beginning of Year | | $11.81 | | $11.39 | | $9.59 | | $8.16 | | $7.60 |
| | | | | |
| | | | | | | | | | |
| | | | | |
Income from Investment Operations: | | | | | | | | | | |
Net Investment Income(a) | | 0.28 | | 0.26 | | 0.23 | | 0.21 | | 0.17 |
Net Realized and Unrealized Gain | | 0.49 | | 0.39 | | 1.77 | | 1.46 | | 0.55 |
| | | | | |
| | | | | | | | | | |
Total from Investment Operations | | 0.77 | | 0.65 | | 2.00 | | 1.67 | | 0.72 |
| | | | | |
| | | | | | | | | | |
| | | | | |
Less Distributions to Shareholders from: | | | | | | | | | | |
Net Investment Income | | (0.30) | | (0.23) | | (0.20) | | (0.24) | | (0.16) |
| | | | | |
| | | | | | | | | | |
Total Distributions | | (0.30) | | (0.23) | | (0.20) | | (0.24) | | (0.16) |
| | | | | |
| | | | | | | | | | |
| | | | | |
Net Asset Value, End of Year | | $12.28 | | $11.81 | | $11.39 | | $9.59 | | $8.16 |
| | | | | | | | | | |
| | | | | |
Total Return(b) | | 6.60% | | 5.77% | | 21.11% | | 20.89% | | 9.72% |
| | | | | |
Ratios and Supplemental Data: | | | | | | | | | | |
Net Assets, End of Year (in 000’s) | | $571,644 | | $600,823 | | $556,985 | | $463,146 | | $264,161 |
Expenses Before Waivers and Reimbursements | | 0.25% | | 0.23% | | 0.25% | | 0.27% | | 0.29% |
Expenses After Waivers and Reimbursements | | 0.15% | | 0.15% | | 0.15% | | 0.15% | | 0.15% |
Net Investment Income After Waivers and Reimbursements | | 2.42% | | 2.19% | | 2.20% | | 2.36% | | 2.28% |
Portfolio Turnover Rate | | 23% | | 19% | | 28% | | 28% | | 33% |
| (a) | Per share amounts calculated based on the average daily shares outstanding during the period. |
| (b) | Total return would have been lower had various fees not been waived during the period. |
See Notes to Financial Statements.
| | |
| 96 | | Annual Report | June 30, 2016 |
(for a share outstanding throughout each year indicated)
MANAGED VOLATILITY
| | | | | | | | | | |
| | | Year Ended June 30 |
| | | | | |
| | | 2016 | | 2015 | | 2014 | | 2013 | | 2012 |
| | | | | |
Net Asset Value, Beginning of Year | | $14.05 | | $13.94 | | $12.75 | | $11.94 | | $11.58 |
| | | | | |
| | | | | | | | | | |
| | | | | |
Income from Investment Operations: | | | | | | | | | | |
Net Investment Income(a) | | 0.04 | | 0.00(b) | | 0.02 | | 0.05 | | 0.04 |
Net Realized and Unrealized Gain | | 0.11 | | 0.13 | | 1.20 | | 0.81 | | 0.39 |
| | | | | |
| | | | | | | | | | |
Total from Investment Operations | | 0.15 | | 0.13 | | 1.22 | | 0.86 | | 0.43 |
| | | | | |
| | | | | | | | | | |
| | | | | |
Less Distributions to Shareholders from: | | | | | | | | | | |
Net Investment Income | | 0.00(b) | | (0.02) | | (0.03) | | (0.05) | | (0.07) |
| | | | | |
| | | | | | | | | | |
Total Distributions | | 0.00(b) | | (0.02) | | (0.03) | | (0.05) | | (0.07) |
| | | | | |
| | | | | | | | | | |
Net Asset Value, End of Year | | $14.20 | | $14.05 | | $13.94 | | $12.75 | | $11.94 |
| | | | | | | | | | |
| | | | | |
Total Return(c) | | 1.10% | | 0.92% | | 9.61% | | 7.23% | | 3.74% |
| | | | | |
Ratios and Supplemental Data: | | | | | | | | | | |
Net Assets, End of Year (in 000’s) | | $57,586 | | $59,008 | | $46,908 | | $26,703 | | $23,705 |
Expenses Before Waivers and Reimbursements | | 1.06% | | 1.04% | | 1.14% | | 1.35% | | 1.43% |
Expenses After Waivers and Reimbursements | | 0.94% | | 0.94% | | 0.94% | | 0.94% | | 0.94% |
Net Investment Income After Waivers and Reimbursements | | 0.31% | | 0.03% | | 0.17% | | 0.37% | | 0.39% |
Portfolio Turnover Rate | | 54% | | 38% | | 39% | | 45% | | 41% |
| (a) | Per share amounts calculated based on the average daily shares outstanding during the period. |
| (b) | Amount represents less than $0.005. |
| (c) | Total return would have been lower had various fees not been waived during the period. |
See Notes to Financial Statements.
| | |
| NOTES TO FINANCIAL STATEMENTS | | |
June 30, 2016
1. Organization:
Bridgeway Funds, Inc. (“Bridgeway” or the “Company”) was organized as a Maryland corporation on October 19, 1993, and is registered under the Investment Company Act of 1940, as amended (the “1940 Act”), as an open-end management investment company.
Bridgeway is organized as a series fund, with 10 investment funds as of June 30, 2016. The Aggressive Investors 1, Ultra-Small Company, Ultra-Small Company Market, Small-Cap Momentum, Small-Cap Growth, Small-Cap Value, Blue Chip 35 Index and Managed Volatility Funds are presented in this report (each is referred to as a “Fund” and collectively, the “Funds”). The Omni Small-Cap Value and Omni Tax-Managed Small-Cap Value Funds are included in a separate report.
Bridgeway is authorized to issue 1,915,000,000 shares of common stock at $0.001 per share. As of June 30, 2016, 100,000,000 shares have been classified into the Aggressive Investors 1 Fund. 130,000,000 shares have been classified into the Blue Chip 35 Index Fund. 15,000,000 shares have been classified into the Ultra-Small Company Fund. 100,000,000 shares each have been classified into the Ultra-Small Company Market, Omni Small-Cap Value, Omni Tax-Managed Small-Cap Value, Small-Cap Momentum, Small-Cap Growth, and Small-Cap Value Funds. 50,000,000 shares have been classified into the Managed Volatility Fund.
The Ultra-Small Company Fund is open to existing investors (direct only).
All of the Funds are no-load, diversified funds.
The Aggressive Investors 1 Fund seeks to exceed the stock market total return (primarily through capital appreciation) at a level of total risk roughly equal to that of the stock market over longer periods of time (three year intervals or more).
The Ultra-Small Company, Ultra-Small Company Market, Small-Cap Momentum, Small-Cap Growth, and Small-Cap Value Funds seek to provide a long-term total return on capital, primarily through capital appreciation.
The Blue Chip 35 Index Fund seeks to provide long-term total return on capital, primarily through capital appreciation, but also some income.
The Managed Volatility Fund seeks to provide a high current return with short-term risk less than or equal to 40% of the stock market.
Bridgeway Capital Management, Inc. (the “Adviser”) is the investment adviser for all of the Funds.
2. Significant Accounting Policies:
The following summary of significant accounting policies, followed in the preparation of the financial statements of the Funds, are in conformity with accounting principles generally accepted in the United States of America (“GAAP”). Each Fund is considered an investment company under GAAP and follows the accounting and reporting guidance applicable to investment companies.
Securities, Options, Futures and Other Investments Valuation Other than options, securities for which market quotations are readily available are valued at the last sale price on the national exchange on which such securities are primarily traded. In the case of securities reported on the National Association of Securities Dealers Automated Quotation (“NASDAQ”) system, the securities are valued based on the NASDAQ Official Closing Price (“NOCP”). In the absence of recorded sales on their primary exchange, or NOCP, in the case of NASDAQ traded securities, the security will be valued as follows: bid prices for long positions and ask prices for short positions.
Fixed income securities are valued on the basis of current market quotations provided by a pricing service. Options are valued at the close if there is trading volume and, if there is no trading volume, the options are valued at the bid on long positions and the ask on the short positions.
| | |
| 98 | | Annual Report | June 30, 2016 |
| | |
| NOTES TO FINANCIAL STATEMENTS (continued) | | |
June 30, 2016
Investments in open-end registered investment companies and closed-end registered investment companies that do not trade on an exchange are valued at the end of day net asset value (“NAV”) per share.
Investments in closed-end registered investment companies that trade on an exchange are valued at the last sales price as of the close of the customary trading session on the exchange where the security is principally traded.
When market quotations are not readily available or when events occur that make established valuation methods unreliable, securities of the Funds may be valued at fair value as determined in good faith by or under the direction of the Board of Directors. The valuation assigned to a fair valued security for purposes of calculating the Funds’ NAVs may differ from the security’s most recent closing market price and from the prices used by other mutual funds to calculate their NAVs.
The inputs and valuation techniques used to determine the value of a Fund’s investments are summarized into three levels as described in the hierarchy below:
| • | | Level 1 — quoted prices in active markets for identical assets |
Investments whose values are based on quoted market prices in active markets, and whose values are therefore classified as Level 1 prices, include active listed equity securities. The Funds do not adjust the quoted price for such investments, even in situations where the Funds hold a large position and a sale could reasonably impact the quoted price.
| • | | Level 2 — other significant observable inputs (including quoted prices for similar securities, interest rates, prepayment speeds, credit risk, etc.) |
Investments that trade in markets that are not considered to be active, but whose values are based on quoted market prices, dealer quotations or valuations provided by alternative pricing sources supported by observable inputs, are classified as Level 2 prices. These generally include certain U.S. Government and sovereign obligations, most government agency securities, investment-grade corporate bonds and less liquid listed equity securities. As investments whose values are classified as Level 2 prices include positions that are not traded in active markets and/or are subject to transfer restrictions, valuations may be adjusted to reflect illiquidity and/or non-transferability, which are generally based on available market information.
The Dreyfus Cash Management Fund, which is held by each Fund, invests primarily in securities that are valued at cost or amortized cost. Therefore, these investments are classified as Level 2 investments.
| • | | Level 3 — significant unobservable inputs (including the Fund’s own assumptions in determining the fair value of investments) |
Investments whose values are classified as Level 3 prices have significant unobservable inputs, as they may trade infrequently or not at all. When observable prices are not available for these securities, the Funds use one or more valuation techniques for which sufficient and reliable data is available. The inputs used by the Funds in estimating the value of Level 3 prices may include the original transaction price, quoted prices for similar securities or assets in active markets, completed or pending third-party transactions in the underlying investment or comparable issuers, and changes in financial ratios or cash flows. Level 3 prices may also be adjusted to reflect illiquidity and/or non-transferability, with the amount of such discount estimated by the Funds in the absence of market information. Assumptions used by the Funds due to the lack of observable inputs may significantly impact the resulting value and therefore the results of the Funds’ operations.
The inputs or methodology used for valuing investments are not necessarily an indication of the risk associated with investing in those investments. A summary of the inputs used to value the Funds’ investments as of June 30, 2016 is included with each Fund’s Schedule of Investments.
The Funds’ policy is to recognize transfers into, and transfers out of, each level of hierarchy as of the beginning of the reporting period. For the year ended June 30, 2016, the Ultra-Small Company Market Fund transferred a security with a value of $436,985 from Level 2 to Level 1, due to the market becoming active. There were no transfers between Level 1 and Level 2 in any of the other Funds. Details regarding transfers into, and transfers out of, Level 3 can be found at the end of each Schedule of Investments for Funds that held Level 3 securities.
| | |
| NOTES TO FINANCIAL STATEMENTS (continued) | | |
June 30, 2016
Securities Lending Upon lending its securities to third parties, each Fund receives compensation in the form of fees. The loans are secured by collateral at least equal to the fair value of the securities loaned plus accrued interest. Each Fund has the right under the lending agreement to recover the securities from the borrower on demand. Additionally, a Fund does not have the right to sell or re-pledge collateral received in the form of securities unless the borrower goes into default. The risks to a Fund of securities lending are that the borrower may not provide additional collateral when required or return the securities when due, resulting in a loss. Under the terms of the Securities Lending Agreement, the Funds are indemnified for such losses by the securities lending agent.
While securities are on loan, the Fund continues to receive dividends on the securities loaned and recognizes any gain or loss in the fair value of the securities loaned.
Securities lending transactions are entered into by a Fund under a Securities Lending Agreement which provides the right, in the event of default (including bankruptcy or insolvency) for the non-defaulting party to liquidate the collateral or to offset the market value of the collateral received against the market value of the securities loaned. The value of the collateral is typically greater than that of the market value of the securities loaned, leaving the lender with a net amount payable to the defaulting party. However, bankruptcy or insolvency laws of a particular jurisdiction may impose restrictions on or prohibitions against such a right of offset in the event of a counterparty’s bankruptcy or insolvency.
The market value of securities on loan, all of which are classified as common stocks in the Funds’ Schedules of Investments, and the value of the related collateral are shown in the Statements of Assets and Liabilities as a component of Investments at value.
The following table is a summary of the Funds’ securities loaned and related collateral, which are subject to a netting agreement as of June 30, 2016:
| | | | | | | | | | | | | | | | | | | | |
| | | | | | | | | | | Gross Amount Not
Offset in the Statement
of Assets and Liabilities | | | | |
| Fund | | Gross
Amounts of
Recognized
Assets1 | | | Gross Amounts
Offset in the
Statement of
Assets and
Liabilities | | Net Amounts of
Assets Presented
in the Statement
of Assets and
Liabilities | | | Financial
Instruments | | Cash
Collateral
Received2 | | | Net
Amount | |
| |
| | | | | | |
Aggressive Investors 1 | | | | | | | | | | | | | | | | | | | | |
Securities lending | | $ | 27,172,480 | | | - | | $ | 27,172,480 | | | - | | $ | 27,172,480 | | | | - | |
| | | | | | |
Ultra-Small Company | | | | | | | | | | | | | | | | | | | | |
Securities lending | | $ | 20,728,150 | | | - | | $ | 20,728,150 | | | - | | $ | 20,728,150 | | | | - | |
| | | | | | |
Ultra-Small Company Market | | | | | | | | | | | | | | | | | | | | |
Securities lending | | $ | 52,923,212 | | | - | | $ | 52,923,212 | | | - | | $ | 52,923,212 | | | | - | |
| | | | | | |
Small-Cap Momentum | | | | | | | | | | | | | | | | | | | | |
Securities lending | | $ | 573,566 | | | - | | $ | 573,566 | | | - | | $ | 573,566 | | | | - | |
| | | | | | |
Small-Cap Growth | | | | | | | | | | | | | | | | | | | | |
Securities lending | | $ | 7,707,161 | | | - | | $ | 7,707,161 | | | - | | $ | 7,707,161 | | | | - | |
| | | | | | |
Small-Cap Value | | | | | | | | | | | | | | | | | | | | |
Securities lending | | $ | 7,205,943 | | | - | | $ | 7,205,943 | | | - | | $ | 7,205,943 | | | | - | |
| | | | | | |
Managed Volatility | | | | | | | | | | | | | | | | | | | | |
Securities lending | | $ | 185,838 | | | - | | $ | 185,838 | | | - | | $ | 185,838 | | | | - | |
| 1 | Securities loaned with a value of $95,222 and $1,800,954 in Ultra-Small Company Market and Small-Cap Growth, respectively, have been sold and are pending settlement on July 1, 2016. |
| 2 | Collateral with a value of $27,647,275, $21,256,738, $55,281,243, $580,846, $7,838,131, $7,289,239, and $189,674 has been received in connection with securities lending of Aggressive Investors 1, Ultra-Small Company, Ultra-Small Company Market, Small-Cap Momentum, Small-Cap Growth, Small-Cap Value, and Managed Volatility Funds, respectively. Excess of collateral received from an individual counterparty is not shown here for financial reporting purposes. |
| | |
| 100 | | Annual Report | June 30, 2016 |
| | |
| NOTES TO FINANCIAL STATEMENTS (continued) | | |
June 30, 2016
It is each Fund’s policy to obtain additional collateral from, or return excess collateral to, the borrower by the end of the next business day following the valuation date of the securities loaned. Therefore, the value of the collateral held may be temporarily less than that required under the lending contract. As of June 30, 2016 the collateral consisted of an institutional money market fund.
Use of Estimates in Financial Statements In preparing financial statements in conformity with GAAP, management makes estimates and assumptions that affect the reported amounts of assets and liabilities on the date of the financial statements and the disclosure of contingent assets and liabilities on the date of the financial statements, as well as the reported amounts of revenue and expenses during the reporting period. Actual results could differ from those estimates.
Risks and Uncertainties The Funds provide for various investment options, including stocks, bonds and call and put options. Such investments are exposed to various risks, such as interest rate, market and credit risks. Due to the risks involved, it is at least reasonably possible that changes in risks in the near term would materially affect shareholders’ account values and the amounts reported in the financial statements.
Security Transactions, Investment Income and Expenses Security transactions are accounted for as of the trade date, the date the order to buy or sell is executed. Realized gains and losses are computed on the identified cost basis. Dividend income is recorded on the ex-dividend date, and interest income is recorded on the accrual basis from settlement date. Particularly related to the Managed Volatility Fund, discounts and premiums are accreted/amortized on the effective interest method.
Fund expenses that are not series-specific are allocated to each series based upon its relative proportion of net assets to the Funds’ total net assets or other appropriate basis.
Distributions to Shareholders The Funds pay dividends from net investment income and distribute realized capital gains annually, usually in December.
Derivatives
The Funds’ use of derivatives for the year ended June 30, 2016 was limited to futures contracts, purchased options, and written options. The following is a summary of how these derivatives are treated in the financial statements and their impact on the Funds, categorized by primary underlying risk.
| | | | | | | | | | | | |
Primary Underlying Risk/Fund | | Derivative
Assets | | | Derivative
Liabilities | | | Location on Statement of Assets and Liabilities | |
| |
| | | |
Equity Risk | | | | | | | | | | | | |
Managed Volatility: | | | | | | | | | | | | |
Written Call Options | | | - | | | | $449,522 | | | | Call options written at value | |
Written Put Options | | | - | | | | 465,943 | | | | Put options written at value | |
| | |
| NOTES TO FINANCIAL STATEMENTS (continued) | | |
June 30, 2016
| | | | | | | | | | |
Primary Underlying Risk/Fund | | Amount of Realized Gain (Loss) on Derivatives | | | Amount of Unrealized Gain (Loss) on Derivatives | | | Location of Gain (Loss) in the Statement of Operations |
|
Equity Risk | | | | | | | | | | |
Aggressive Investors 1: | | | | | | | | | | |
Call Options Purchased | | $ | (102,534) | | | $ | - | | | Realized Gain (Loss) on Investments |
| | | |
Managed Volatility: | | | | | | | | | | |
Written Options | | $ | 2,277,709 | | | | | | | Realized Gain (Loss) on Written Options and |
| | | | | | | | | | Change in Unrealized Appreciation |
| | | | | | $ | (186,294) | | | (Depreciation) on Written Options |
Futures Contracts | | $ | 315,961 | | | $ | - | | | Realized Gain (Loss) on Futures Contracts |
The derivative instruments outstanding as of June 30, 2016, as disclosed in the Notes to the Financial Statements, and the amounts of realized and changes in unrealized gains and losses on derivative instruments during the period, as disclosed in the Statements of Operations, serve as indicators of the volume of derivatives activity for the Funds.
Futures Contracts The Funds may purchase or sell financial futures contracts to hedge cash positions, manage market risk, and to dampen volatility in line with investment objectives. A futures contract is an agreement between two parties to buy or sell a financial instrument at a set price on a future date. Upon entering into such a contract, a Fund is required to pledge to the broker an amount of cash or U.S. Government securities equal to the minimum “initial margin” requirements of the exchange on which the futures contract is traded. The contract amount reflects the extent of a Fund’s exposure in these financial instruments. A Fund’s participation in the futures markets involves certain risks, including imperfect correlation between movements in the price of futures contracts and movements in the price of the securities hedged or used for cover. Pursuant to a contract, such Fund agrees to receive from, or pay to, the broker an amount of cash equal to the fluctuation in value of the contract. Such receipts or payments are known as “variation margin” and are recorded by a Fund as unrealized appreciation or depreciation. When a contract is closed, a Fund records a realized gain or loss equal to the difference between the value of the contract at the time it was opened and the value at the time it was closed. With futures, there is minimal counterparty risk to the Funds, since futures are exchange traded and the exchange’s clearinghouse, as counterparty to all exchange traded futures, guarantees the futures against default. As of June 30, 2016, the Funds had no open futures contracts.
Options The Aggressive Investors 1 Fund may buy and sell calls and puts to increase or decrease the Fund’s exposure to stock market risk or for purposes of diversification of risk. The Managed Volatility Fund may buy and sell calls and puts to reduce the Fund’s volatility and provide some cash flow. An option is a contract conveying a right to buy or sell a financial instrument at a specified price during a stipulated period. The premium paid by a Fund for the purchase of a call or a put option is included in such Fund’s Schedule of Investments as an investment and subsequently marked-to-market to reflect the current market value of the option. When a Fund writes a call or a put option, an amount equal to the premium received by such Fund is included in its Statement of Assets and Liabilities as a liability and is subsequently marked-to-market to reflect the current market value of the option written. If an option that a Fund has written either expires on its stipulated expiration date, or if such Fund enters into a closing purchase transaction, that Fund realizes a gain (or a loss if the cost of a closing purchase transaction exceeds the premium received when the option was written) without regard to any unrealized gain or loss on the underlying security, and the liability related to such options is extinguished. If a call option that a Fund has written is assigned, such Fund realizes a gain or loss from the sale of the underlying security, and the proceeds from such sale are increased by the premium originally received. If a put option that a Fund has written is assigned, the amount of the premium originally received reduces the cost of the security that such Fund purchased upon exercise of the option. Buying calls increases a Fund’s exposure to the underlying security to the extent of any premium paid. Buying puts on a stock market index tends to limit a Fund’s exposure to a stock market decline. All options purchased by the Funds were listed on exchanges and considered liquid positions with readily available market quotes.
Covered Call Options and Secured Puts The Aggressive Investors 1 and Managed Volatility Funds may write call options on a covered basis; that is, a Fund will own the underlying security, or a Fund may write secured puts. The principal reason for writing covered calls and secured puts on a security is to attempt to realize income through the receipt of premiums. The
| | |
| 102 | | Annual Report | June 30, 2016 |
| | |
| NOTES TO FINANCIAL STATEMENTS (continued) | | |
June 30, 2016
option writer has, in return for the premium, given up the opportunity for profit from a substantial price increase in the underlying security so long as the obligation as a writer continues, but has retained the risk of loss should the price of the security decline. All options were listed on exchanges and considered liquid positions with readily available market quotes. Transactions in options written during the year ended June 30, 2016 are as follows:
| | | | | | | | | | | | | | | | |
| | | Managed Volatility Fund
Written Call Options | | | Managed Volatility Fund
Written Put Options | |
| | | Contracts | | | Premiums | | | Contracts | | | Premiums | |
| |
| | | | | | | | | | | | | | | | |
Outstanding, June 30, 2015 | | | 2,062 | | | $ | 334,365 | | | | 2,016 | | | | $ 448,204 | |
Positions Opened | | | 14,441 | | | | 2,710,588 | | | | 7,936 | | | | 1,884,408 | |
Exercised | | | (3,224) | | | | (671,220) | | | | (3,610) | | | | (884,339) | |
Splits | | | 22 | | | | - | | | | 265 | | | | - | |
Expired | | | (9,721) | | | | (1,667,661) | | | | (4,105) | | | | (956,699) | |
Closed | | | (1,362) | | | | (317,680) | | | | - | | | | - | |
| |
| | | | |
Outstanding, June 30, 2016 | | | 2,218 | | | $ | 388,392 | | | | 2,502 | | | | $ 491,574 | |
| |
| | | | |
Market Value, June 30, 2016 | | | | | | $ | (449,522) | | | | | | | | $ (465,943) | |
| |
The Aggressive Investors 1 Fund had no transactions in written options during the year ended June 30, 2016.
Indemnification Under the Company’s organizational documents, the Funds’ officers, directors, employees and agents are indemnified against certain liabilities that may arise out of the performance of their duties to the Funds. Additionally, in the normal course of business, the Funds enter into contracts that contain a variety of indemnification clauses. The Funds’ maximum exposure under these arrangements is unknown, as this would involve future claims that may be made against the Funds that have not yet occurred. However, the Funds have not had prior claims or losses pursuant to these contracts.
3. Advisory Fees, Other Related Party Transactions and Contingencies:
The Funds have entered into management agreements with the Adviser. As compensation for the advisory services rendered, facilities furnished, and expenses borne by the Adviser, the Funds pay the Adviser a fee pursuant to each Fund’s management agreement, as described below.
Aggressive Investors 1: A total advisory fee is paid by the Fund to the Adviser that is comprised of a Base Fee and a Performance Adjustment. The Base Fee equals the Base Fee Rate times the average daily net assets of the Fund. The Base Fee Rate is based on the following annual rates: 0.90% of the first $250 million of the Fund’s average daily net assets, 0.875% of the next $250 million, 0.85% of the next $500 million and 0.80% of any excess over $1 billion.
The Performance Adjustment equals 4.67% times the difference in cumulative total return between the Fund and the Standard and Poor’s 500 Composite Stock Price Index with dividends reinvested (hereinafter “Index”) over a rolling five-year performance period. The Performance Adjustment Rate varies from a minimum of -0.70% to a maximum of +0.70%. However, the Performance Adjustment Rate is zero if the difference between the cumulative Fund performance and the Index performance is less than or equal to 2%.
Ultra-Small Company: The Fund pays advisory fees based on the following annual rates: 0.90% of the first $250 million of the Fund’s average daily net assets, 0.875% of the next $250 million and 0.85% of any excess over $500 million. The management fees are computed daily and are payable monthly. However, during any period when the Fund’s net assets range from $27,500,000 to $55,000,000, the advisory fee will be determined as if the Fund had $55,000,000 under management. This is limited to a maximum annualized expense ratio of 1.49% of average net assets.
Ultra-Small Company Market: The Fund’s advisory fee is a flat 0.50% of the value of the Fund’s average daily net assets, computed daily and payable monthly.
| | |
| NOTES TO FINANCIAL STATEMENTS (continued) | | |
June 30, 2016
Small-Cap Momentum: The Fund’s advisory fee is a flat 0.55% of the value of the Fund’s average daily net assets, computed daily and payable monthly.
Small-Cap Growth and Small-Cap Value: A total advisory fee is paid by each Fund to the Adviser that is comprised of a Base Fee and a Performance Adjustment. The Base Fee equals the Base Fee Rate times the average daily net assets of the Fund. The Base Fee Rate is based on the annual rate of 0.60% of the value of each Fund’s average daily net assets.
The Performance Adjustment equals 0.33% times the difference in cumulative total return between the Fund and the Russell 2000 Growth Index for Small-Cap Growth Fund and the Russell 2000 Value Index for Small-Cap Value Fund, with dividends reinvested (hereinafter “Index”) over a rolling five-year performance period. The Performance Adjustment Rate varies from a minimum of -0.05% to a maximum of +0.05%. However, the Performance Adjustment Rate is zero if the difference between the cumulative Fund’s performance and the Index performance is less than or equal to 2%.
Blue Chip 35 Index: The Fund’s advisory fee is a flat 0.08% of the value of the Fund’s average daily net assets, computed daily and payable monthly.
Managed Volatility: The Fund’s advisory fee is a flat 0.60% of the value of the Fund’s average daily net assets, computed daily and payable monthly.
Expense limitations: The Adviser has agreed to reimburse the Funds for operating expenses and management fees above the expense limitations shown in the table below, which are shown as a ratio of net expenses to average net assets, for each Fund, for the year ended June 30, 2016. Any material change to the expense limitation would require a vote by shareholders of the applicable Fund.
| | | | | | | | | | | | | | | |
| Bridgeway Fund | | Expense
Limitation | | Total Waivers and
Reimbursements
for Year Ending
06/30/16 | | |
| |
| | | | | | | | | | | | | | | |
Aggressive Investors 1 | | | | 1.75% | | | | | $ - | | | | | | |
Ultra-Small Company | | | | 1.85% | | | | | - | | | | | | |
Ultra-Small Company Market | | | | 0.75% | | | | | 11,691 | | | | | | |
Small-Cap Momentum* | | | | 0.90% | | | | | 131,006 | | | | | | |
Small-Cap Growth | | | | 0.94% | | | | | 93,109 | | | | | | |
Small-Cap Value | | | | 0.94% | | | | | 59,286 | | | | | | |
Blue Chip 35 Index | | | | 0.15% | | | | | 571,961 | | | | | | |
Managed Volatility | | | | 0.94% | | | | | 65,740 | | | | | | |
| | | | | | | | | | | | | | | |
*The Fund is authorized to reimburse the Adviser for management fees previously waived and/or for expenses previously paid by the Adviser, provided, however, that any reimbursements must be paid at a date not more than three years after the fiscal year in which the Adviser waived the fees or reimbursed the expenses and the reimbursements do not cause the Fund to exceed the expense limitation in the agreement. The Fund has recoupable expenses of $121,419, $128,110 and $131,006 which expire June 30, 2017, June 30, 2018, and June 30, 2019 respectively.
| | |
| 104 | | Annual Report | June 30, 2016 |
| | |
| NOTES TO FINANCIAL STATEMENTS (continued) | | |
June 30, 2016
Other Related Party Transactions: The Funds will engage in inter-portfolio trades when it is to the benefit of both parties. The Board of Directors reviews these trades quarterly. Inter-portfolio purchases and sales during the year ended June 30, 2016 were as follows:
| | | | | | | | |
| Bridgeway Fund | | Inter-Portfolio
Purchases | | | Inter-Portfolio
Sales | |
| |
| | | | | | | | |
Aggressive Investors 1 | | | $ - | | | | $ 4,124,559 | |
Ultra-Small Company | | | 995,577 | | | | 17,662,852 | |
Ultra-Small Company Market | | | 18,500,151 | | | | 10,187,658 | |
Small-Cap Momentum | | | 2,639 | | | | 104,718 | |
Small-Cap Growth | | | 4,873,176 | | | | 1,924,695 | |
Small-Cap Value | | | 722,541 | | | | 3,717,989 | |
The Adviser entered into an Administrative Services Agreement with Bridgeway, pursuant to which the Adviser provides various administrative services to the Funds including, but not limited to: (i) supervising and managing various aspects of the Funds’ business and affairs; (ii) selecting, overseeing and/or coordinating activities with other service providers to the Funds; (iii) providing reports to the Board of Directors as requested from time to time; (iv) assisting and/or reviewing amendments and updates to the Funds’ registration statement and other filings with the Securities and Exchange Commission (“SEC”); (v) providing certain shareholder services; (vi) providing administrative support in connection with meetings of the Board of Directors; and (vii) providing certain record-keeping services. Prior to July 1, 2016 for its services to all of the Bridgeway Funds, the Adviser was paid an aggregate annual fee of $590,000, payable in equal monthly installments. Effective July 1, 2016, the Adviser will be paid an aggregate annual fee of $665,000, payable in monthly installments.
Board of Directors Compensation Independent Directors are paid an annual retainer of $15,000, with an additional retainer of $5,000 paid to the Independent Chairman of the Board and an additional retainer of $1,000 paid to the Nominating and Corporate Governance Committee Chair. The retainer is paid in quarterly installments. Effective November 13, 2015, Independent Directors are paid $7,500 per meeting for meeting fees. Prior to November 13, 2015, Independent Directors were paid $6,250 per meeting. Such compensation is the total compensation from all Funds and is allocated among the Funds.
The Independent Directors each receive this compensation in the form of shares of the Bridgeway Funds, credited to his or her account. Such Directors are reimbursed for any expenses incurred in attending meetings and conferences, as well as expenses for subscriptions or printed materials. The amount of directors’ fees attributable to each Fund is disclosed in the Statements of Operations.
One director of Bridgeway, John Montgomery, is an owner and director of the Adviser. Under the 1940 Act definitions, he is considered to be an “affiliated person” of the Adviser and an “interested person” of the Adviser and of Bridgeway. Compensation for Mr. Montgomery is borne by the Adviser rather than the Funds.
4. Distribution and Shareholder Servicing Fees:
Foreside Fund Services, LLC acts as distributor of the Funds’ shares, pursuant to a Distribution Agreement dated November 12, 2010. The Adviser pays all costs and expenses associated with distribution of the Funds’ shares, pursuant to a protective plan adopted by shareholders pursuant to Rule 12b-1.
| | |
| NOTES TO FINANCIAL STATEMENTS (continued) | | |
June 30, 2016
5. Purchases and Sales of Investment Securities:
Purchases and sales of investments, other than short-term securities, for each Fund for the year ended June 30, 2016 were as follows:
| | | | | | | | | | | | | | | | |
| | | Purchases | | | Sales | |
| Bridgeway Fund | | U.S. Government | | | Other | | | U.S. Government | | | Other | |
| |
| | | | | | | | | | | | | | | | |
Aggressive Investors 1 | | $ | - | | | $ | 268,727,056 | | | $ | - | | | $ | 287,857,781 | |
Ultra-Small Company | | | - | | | | 109,371,419 | | | | - | | | | 115,699,337 | |
Ultra-Small Company Market | | | - | | | | 144,063,798 | | | | - | | | | 165,777,064 | |
Small-Cap Momentum | | | - | | | | 7,975,197 | | | | - | | | | 8,727,021 | |
Small-Cap Growth | | | - | | | | 50,277,433 | | | | - | | | | 49,072,894 | |
Small-Cap Value | | | - | | | | 38,533,110 | | | | - | | | | 49,104,279 | |
Blue Chip 35 Index | | | - | | | | 133,756,114 | | | | - | | | | 181,126,584 | |
Managed Volatility | | | - | | | | 24,354,568 | | | | - | | | | 18,648,367 | |
6. Federal Income Taxes
It is the Funds’ policy to continue to comply with the provisions of the Internal Revenue Code of 1986, as amended, applicable to regulated investment companies, and to distribute income to the extent necessary so that the Funds are not subject to federal income tax. Therefore, no federal income tax provision is required.
Unrealized Appreciation and Depreciation on Investments (Tax Basis) The amount of net unrealized appreciation/ depreciation and the cost of investment securities for tax purposes, including short-term securities as of June 30, 2016, were as follows:
| | | | | | | | | | | | |
| | | Aggressive Investors 1 | | | Ultra-Small Company | | | Ultra-Small
Company Market | |
Gross appreciation (excess of value over tax cost) | | | $ 25,127,853 | | | | $ 15,177,796 | | | | $ 83,689,525 | |
Gross depreciation (excess of tax cost over value) | | | (12,607,155) | | | | (11,591,997) | | | | (43,667,641) | |
| | | |
Net unrealized appreciation (depreciation) | | | $ 12,520,698 | | | | $ 3,585,799 | | | | $ 40,021,884 | |
| | | |
Cost of investments for income tax purposes | | | $222,374,292 | | | | $119,354,150 | | | | $346,691,377 | |
| | | |
| | | Small-Cap Momentum | | | Small-Cap
Growth | | | Small-Cap Value | |
Gross appreciation (excess of value over tax cost) | | | $ 365,445 | | | | $ 5,506,429 | | | | $ 6,713,321 | |
Gross depreciation (excess of tax cost over value) | | | (109,188) | | | | (1,920,525) | | | | (6,686,348) | |
| | | |
Net unrealized appreciation (depreciation) | | | $ 256,257 | | | | $ 3,585,904 | | | | $ 26,973 | |
| | | |
Cost of investments for income tax purposes | | | $4,523,972 | | | | $40,031,934 | | | | $66,013,063 | |
| | | | | | | | | | | | |
| | | |
| | | Blue Chip 35 Index | | | | | | Managed Volatility | |
Gross appreciation (excess of value over tax cost) | | | $205,117,068 | | | | | | | | $ 8,400,410 | |
Gross depreciation (excess of tax cost over value) | | | (7,449,307) | | | | | | | | (1,586,867) | |
| | | |
Net unrealized appreciation (depreciation) | | | $197,667,761 | | | | | | | | $ 6,813,543 | |
| | | |
Cost of investments for income tax purposes | | | $373,220,644 | | | | | | | | $51,071,081 | |
The differences between book and tax net unrealized appreciation (depreciation) are primarily due to wash sale and straddle loss deferrals and basis adjustments on investments in business development companies, partnerships and passive foreign investment companies (PFICs).
Classifications of Distributions Net investment income (loss) and net realized gain (loss) may differ for financial statement and tax purposes. The character of distributions made during the year from net investment income or net realized gains may differ from its ultimate characterization for federal income tax purposes.
| | |
| 106 | | Annual Report | June 30, 2016 |
| | |
| NOTES TO FINANCIAL STATEMENTS (continued) | | |
June 30, 2016
The tax character of the distributions paid by the Funds during the last two fiscal years ended June 30, 2016 and June 30, 2015 respectively, are as follows:
| | | | | | | | | | | | | | | | |
| | | Aggressive Investors 1 | | | Ultra-Small Company | |
| | | Year | | | Year | | | Year | | | Year | |
| | | Ended | | | Ended | | | Ended | | | Ended | |
| | | June 30, 2016 | | | June 30, 2015 | | | June 30, 2016 | | | June 30, 2015 | |
Distributions paid from: | | | | | | | | | | | | | | | | |
Ordinary Income | | | $99,024 | | | | $540,861 | | | | $1,116,218 | | | | $ 1,052,434 | |
Long-Term Capital Gain | | | - | | | | - | | | | - | | | | 27,750,353 | |
| | | | |
Total | | | $99,024 | | | | $540,861 | | | | $1,116,218 | | | | $28,802,787 | |
| | |
| | | Ultra-Small Company Market | | | Small-Cap Momentum | |
| | | Year | | | Year | | | Year | | | Year | |
| | | Ended | | | Ended | | | Ended | | | Ended | |
| | | June 30, 2016 | | | June 30, 2015 | | | June 30, 2016 | | | June 30, 2015 | |
Distributions paid from: | | | | | | | | | | | | | | | | |
Ordinary Income | | | $ 3,152,924 | | | | $ 2,780,087 | | | | $ 9,441 | | | | $282,147 | |
Long-Term Capital Gain | | | 37,504,226 | | | | 38,343,165 | | | | 115,289 | | | | 188,250 | |
| | | | |
Total | | | $40,657,150 | | | | $41,123,252 | | | | $ 124,730 | | | | $470,397 | |
| | |
| | | Small-Cap Growth | | | Small-Cap Value | |
| | | Year | | | Year | | | Year | | | Year | |
| | | Ended | | | Ended | | | Ended | | | Ended | |
| | | June 30, 2016 | | | June 30, 2015 | | | June 30, 2016 | | | June 30, 2015 | |
Distributions paid from: | | | | | | | | | | | | | | | | |
Ordinary Income | | | $ - | | | | $ 21,907 | | | | $1,200,493 | | | | $581,377 | |
| | | | |
Total | | | $ - | | | | $ 21,907 | | | | $1,200,493 | | | | $581,377 | |
| | |
| | | Blue Chip 35 Index | | | Managed Volatility | |
| | | Year | | | Year | | | Year | | | Year | |
| | | Ended | | | Ended | | | Ended | | | Ended | |
| | | June 30, 2016 | | | June 30, 2015 | | | June 30, 2016 | | | June 30, 2015 | |
Distributions paid from: | | | | | | | | | | | | | | | | |
Ordinary Income | | | $14,480,684 | | | | $11,713,217 | | | | $ 15,844 | | | | $ 59,691 | |
| | | | |
Total | | | $14,480,684 | | | | $11,713,217 | | | | $ 15,844 | | | | $ 59,691 | |
As of June 30, 2016, the Funds had available for tax purposes expiring capital loss carryovers as follows:
| | | | | | | | |
| | | Aggressive Investors 1 | | | Ultra-Small Company | |
Expiring 6/30/2017 | | | $80,187,088 | | | | $1,203,654 | |
6/30/2018 | | | 16,094,317 | | | | - | |
| | |
| | | Small-Cap Growth | | | Small-Cap Value | |
Expiring 6/30/2018 | | | $10,814,526 | | | | 20,917,186 | |
| | |
| NOTES TO FINANCIAL STATEMENTS (continued) | | |
June 30, 2016
| | | | | | | | |
| | | Blue Chip 35 Index | | | Managed Volatility | |
Expiring 6/30/2018 | | | $ - | | | | $2,770,129 | |
6/30/2019 | | | 2,100,878 | | | | - | |
For Aggressive Investors 1 and Ultra-Small Company Funds, capital losses related to prior year reorganizations are subject to limitations under Internal Revenue Code Section 381-384. For Aggressive Investors 1 and Ultra-Small Company Funds, capital losses of $16,094,317 and $1,203,654, respectively, are subject to limitation.
Under the Regulated Investment Company Modernization Act of 2010, capital losses incurred by these Funds after June 30, 2011 will not be subject to expiration and will retain their character as either short-term or long-term capital losses. In addition, such losses must be utilized prior to the losses incurred in the years preceding enactment.
As of June 30, 2016, the following Funds had capital loss carryovers available to offset future realized capital gains which are not subject to expiration:
| | | | | | | | | | | | |
| | | Short-term | | | Long-Term | | | Total | |
| |
Ultra-Small Company | | | 7,859,925 | | | | - | | | | 7,859,925 | |
Small-Cap Value | | | 1,209,727 | | | | 938,977 | | | | 2,148,704 | |
Small-Cap Momentum | | | 10,440 | | | | - | | | | 10,440 | |
There are no capital loss carryovers for Ultra-Small Company Market Fund as of June 30, 2016.
Capital loss carryovers utilized during the year ended June 30, 2016 were as follows:
| | |
| Bridgeway Fund | | Capital Loss
Carryover Utilized |
|
| | |
Aggressive Investors 1 | | $ 3,485,837 |
Small-Cap Growth | | 2,295,891 |
Blue Chip 35 Index | | 14,423,859 |
Managed Volatility | | 1,388,431 |
Components of Accumulated Earnings (Deficit) As of June 30, 2016, the components of accumulated earnings (deficit) on a tax basis were:
| | | | | | | | | | | | |
| | | Aggressive Investors 1 | | | Ultra-Small Company | | | Ultra-Small
Company Market | |
| |
Accumulated Net Investment Income | | | $ 1,255,289 | | | | $ 1,212,205 | | | | $ - | |
Accumulated Net Realized Gain (Loss) on Investments* | | | (101,426,962) | | | | (9,063,579) | | | | 16,118,023 | |
Net Unrealized Appreciation of Investments | | | 12,520,698 | | | | 3,585,799 | | | | 40,021,884 | |
| |
| | | |
Total | | | $ (87,650,975) | | | | $(4,265,575) | | | | $56,139,907 | |
| |
| | | |
| | | Small-Cap Momentum | | | Small-Cap Growth | | | Small-Cap Value | |
| |
Accumulated Net Investment Income | | | $ 25,346 | | | | $ 128,428 | | | | $ 602,805 | |
Accumulated Net Realized (Loss) on Investments* | | | (10,440) | | | | (12,574,855) | | | | (23,065,889) | |
Net Unrealized Appreciation of Investments | | | 256,257 | | | | 3,585,904 | | | | 26,973 | |
| |
| | | |
Total | | | $271,163 | | | | $ (8,860,523) | | | | $(22,436,111) | |
| |
| | |
| 108 | | Annual Report | June 30, 2016 |
| | |
| NOTES TO FINANCIAL STATEMENTS (continued) | | |
June 30, 2016
| | | | | | | | |
| | | Blue Chip 35 Index | | | Managed Volatility | |
| |
Accumulated Net Investment Income | | | $ 6,660,578 | | | | $ 171,214 | |
Accumulated Net Realized (Loss) on Investments* | | | (4,645,350) | | | | (3,574,092) | |
Net Unrealized Appreciation of Investments | | | 197,667,761 | | | | 6,813,543 | |
| |
| | |
Total | | | $199,682,989 | | | | $ 3,410,665 | |
| |
| * | Includes qualified late-year losses that the Funds have elected to defer to the beginning of their next fiscal year ending June 30, 2017. The Aggressive Investors I, Small-Cap Growth, and Blue Chip 35 Index Funds have elected to defer qualified short-term late-year losses of ($5,145,557), ($1,760,329), and ($2,544,472), respectively. Managed Volatility Fund has elected to defer qualified long-term late-year losses of ($803,963). The Ultra-Small Company, Ultra-Small Company Market, Small-Cap Momentum, and Small-Cap Value Funds have no deferred qualified late-year losses. |
For the fiscal year June 30, 2016, the Funds recorded the following reclassifications to the accounts listed below:
| | | | | | | | | | | | |
| | | Increase (Decrease) | |
| |
| | | Aggressive Investors 1 | | | Ultra-Small Company | | | Ultra-Small Company Market | |
| |
Paid-in-Capital | | | $ - | | | | $ 1 | | | | $ 1,348,569 | |
Undistributed Net Investment Income | | | - | | | | 538,991 | | | | (16,093) | |
Accumulated Net Realized Gain (Loss) on Investments | | | - | | | | (538,992) | | | | (1,332,476) | |
| |
| | | |
| | | Small-Cap Momentum | | | Small-Cap Growth | | | Small-Cap Value | |
| |
Paid-in-Capital | | | $ 1,568 | | | | $ - | | | | $ - | |
Undistributed Net Investment Income | | | (2,542) | | | | (1,438) | | | | (15,262) | |
Accumulated Net Realized Gain (Loss) on Investments | | | 974 | | | | 1,438 | | | | 15,262 | |
| |
| | | |
| | | Blue Chip 35 Index | | | Managed Volatility | | | | |
| | | | | |
Paid-in-Capital | | | $ - | | | | $ - | | | | | |
Undistributed Net Investment Income | | | - | | | | (3,571) | | | | | |
Accumulated Net Realized Gain (Loss) on Investments | | | - | | | | 3,571 | | | | | |
| | | | | |
The difference between book and tax components of net assets and the resulting reclassifications were primarily a result of the differing book/tax treatment of the deduction of equalization debits for tax purposes, redesignation of dividends paid and investments in real estate investment trusts, business development companies, partnerships and passive foreign investment companies (PFICs).
Accounting for Uncertainty in Income Taxes sets forth a minimum threshold for financial statement recognition of the benefit of a tax position taken or expected to be taken in a tax return. Management has analyzed each Fund’s tax positions and has concluded that no provision for income tax is required in each Fund’s financial statements. The Funds are not aware of any tax position for which it is reasonably possible that the total amounts of unrecognized tax benefits will significantly change in the next twelve months. Each Fund’s federal tax returns for the prior three fiscal years remain subject to examination by the Internal Revenue Service.
7. Line of Credit
Bridgeway established a line of credit agreement (“Facility”) with The Bank of New York Mellon, effective November 5, 2010. The Facility is for temporary or emergency purposes, such as to provide liquidity for shareholder redemptions, and is cancellable by either party. Unless cancelled earlier, the Facility shall be held available until September 15, 2016. Advances under the Facility are limited to $15,000,000 in total for all Funds, and advances to each Fund shall not exceed certain limits set forth in the credit agreement, including, but not limited to, the maximum amount a Fund is permitted to borrow under the 1940 Act.
The Funds incur a commitment fee of 0.07% per annum on the unused portion of the Facility and interest expense to the extent of amounts borrowed under the Facility. Interest is based on the “Overnight Rate” plus 1.25%. The Overnight Rate means the higher of (a) the Federal Funds rate, (b) the Overnight Eurodollar Rate, or (c) the One-Month Eurodollar Rate. The commitment fees are payable quarterly in arrears and are allocated to all participating Funds. Interest expense is charged directly to a Fund based upon actual amounts borrowed by such Fund.
| | |
| NOTES TO FINANCIAL STATEMENTS (continued) | | |
June 30, 2016
For the year ended June 30, 2016, borrowings by the Funds under this line of credit were as follows:
| | | | | | | | | | | | | | | | | | | | |
| Bridgeway Fund | | Weighted
Average
Interest Rate | | | Weighted
Average
Loan Balance | | | Number of
Days
Outstanding | | | Interest
Expense
Incurred1 | | | Maximum Amount
Borrowed During
the Period | |
| |
| | | | | | | | | | | | | | | | | | | | |
Aggressive Investors 1 | | | 1.59% | | | | $ 799,051 | | | | 99 | | | | $ 3,435 | | | | $ 2,328,000 | |
Ultra-Small Company | | | 1.51% | | | | 813,500 | | | | 70 | | | | 2,361 | | | | 3,070,000 | |
Ultra-Small Company Market | | | 1.64% | | | | 830,311 | | | | 74 | | | | 2,753 | | | | 2,606,000 | |
Small-Cap Growth | | | 1.61% | | | | 341,067 | | | | 30 | | | | 451 | | | | 790,000 | |
Small-Cap Value | | | 1.54% | | | | 564,472 | | | | 36 | | | | 859 | | | | 1,211,000 | |
Blue Chip 35 Index | | | 1.64% | | | | 2,682,315 | | | | 90 | | | | 10,824 | | | | 12,561,000 | |
Managed Volatility | | | 1.68% | | | | 1,047,000 | | | | 1 | | | | 48 | | | | 1,047,000 | |
Small Cap Momentum | | | 1.48% | | | | 210,000 | | | | 6 | | | | 51 | | | | 416,000 | |
| 1 Interest expense is included on the Statements of Operations in Miscellaneous expenses. | |
On June 30, 2016, Ultra-Small Company, Ultra-Small Company Market and Blue Chip 35 Index Value had loans outstanding in the amounts of $613,000, $1,326,000 and $12,561,000, respectively, exclusive of interest payable on the loans.
8. Redemption Fees
In Ultra-Small Company Market and Small-Cap Momentum Funds, a 2% redemption fee may be charged on shares held less than six months. The fee is charged for the benefit of the remaining shareholders and will be paid to the appropriate Fund to help offset transaction costs. The fee is accounted for as an addition to paid-in capital.
9. Subsequent Events
Management has evaluated the impact of all subsequent events on the Funds and has determined that there were no subsequent events requiring recognition or disclosure in the financial statements.
| | |
| 110 | | Annual Report | June 30, 2016 |
| | |
REPORT OF INDEPENDENT REGISTERED PUBLIC ACCOUNTING FIRM | | |
To the Shareholders and Board of Directors of Bridgeway Funds, Inc.
We have audited the accompanying statements of assets and liabilities of the Aggressive Investors 1 Fund, Ultra-Small Company Fund, Ultra-Small Company Market Fund, Small-Cap Momentum Fund, Small-Cap Growth Fund, Small-Cap Value Fund, Blue Chip 35 Index Fund, and Managed Volatility Fund (the “Funds”), each a series of Bridgeway Funds, Inc., including the schedules of investments, as of June 30, 2016, and the related statements of operations for the year then ended, the statements of changes in net assets for each of the years in the two-year period then ended and the financial highlights for each of the years in the five-year period then ended. These financial statements and financial highlights are the responsibility of the Funds’ management. Our responsibility is to express an opinion on these financial statements and financial highlights based on our audits.
We conducted our audits in accordance with the standards of the Public Company Accounting Oversight Board (United States). Those standards require that we plan and perform the audits to obtain reasonable assurance about whether the financial statements and financial highlights are free of material misstatement. An audit includes examining, on a test basis, evidence supporting the amounts and disclosures in the financial statements. Our procedures included confirmation of securities owned as of June 30, 2016 by correspondence with the custodian and brokers. An audit also includes assessing the accounting principles used and significant estimates made by management, as well as evaluating the overall financial statement presentation. We believe that our audits provide a reasonable basis for our opinion.
In our opinion, the financial statements and financial highlights referred to above present fairly, in all material respects, the financial position of the Aggressive Investors 1 Fund, Ultra-Small Company Fund, Ultra-Small Company Market Fund, Small-Cap Momentum Fund, Small-Cap Growth Fund, Small-Cap Value Fund, Blue Chip 35 Index Fund, and Managed Volatility Fund as of June 30, 2016 and the results of their operations for the year then ended, the changes in their net assets for each of the years in the two-year period then ended and their financial highlights for each of the years in the five-year period then ended, in conformity with accounting principles generally accepted in the United States of America.

BBD, LLP
Philadelphia, Pennsylvania
August 25, 2016
| | |
OTHER INFORMATION | | |
June 30, 2016 (Unaudited)
1. Shareholder Tax Information
Certain tax information regarding the Funds is required to be provided to shareholders based upon each Fund’s income and distributions for the taxable year ended June 30, 2016. The information and distributions reported herein may differ from information and distributions taxable to the shareholders for the calendar year ended December 31, 2015.
The Funds report the following items with regard to distributions paid during the fiscal year ended June 30, 2016. All reportings are based on financial information available as of the date of this annual report and, accordingly, are subject to change. For each item, it is the intention of each Fund to report the maximum amount permitted under the Internal Revenue Code of 1986, as amended, and the regulations there-under.
| | | | | | | | | | | | |
| | | Aggressive | | | Ultra-Small | | | Ultra-Small | |
| | | Investors 1 | | | Company | | | Company Market | |
Corporate Dividends Received Deduction | | | 100.00% | | �� | | 96.68% | | | | 100.00% | |
Qualified Dividend Income | | | 100.00% | | | | 97.69% | | | | 100.00% | |
Qualified Interest Related Dividends | | | 0.01% | | | | 0.01% | | | | 0.03% | |
Qualified Short Term Capital Gain Dividends | | | 0.00% | | | | 0.00% | | | | 0.00% | |
U.S. Government Income | | | 0.00% | | | | 0.00% | | | | 0.00% | |
| | | Small-Cap | | | | Small-Cap | | | | Small-Cap | |
| | | | Momentum | | | | Growth | | | | Value | |
Corporate Dividends Received Deduction | | | 97.32% | | | | 0.00% | | | | 88.78% | |
Qualified Dividend Income | | | 99.39% | | | | 0.00% | | | | 97.33% | |
Qualified Interest Related Dividends | | | 0.00% | | | | 0.00% | | | | 0.02% | |
Qualified Short Term Capital Gain Dividends | | | 0.00% | | | | 0.00% | | | | 0.00% | |
U.S. Government Income | | | 0.00% | | | | 0.00% | | | | 0.00% | |
| | | Blue Chip | | | | Managed | | | | | |
| | | | 35 Index | | | | Volatility | | | | | |
Corporate Dividends Received Deduction | | | 100.00% | | | | 100.00% | | | | | |
Qualified Dividend Income | | | 100.00% | | | | 100.00% | | | | | |
Qualified Interest Related Dividends | | | 0.01% | | | | 2.37% | | | | | |
Qualified Short Term Capital Gain Dividends | | | 0.00% | | | | 0.00% | | | | | |
U.S. Government Income | | | 0.00% | | | | 2.24% | | | | | |
U.S. Government Income represents the amount of interest that was derived from direct U.S. Government obligations. Generally, such interest is exempt from state income tax. However, for residents of California, New York and Connecticut, the statutory threshold requirements were not satisfied. Due to the diversity in state and local tax law, it is recommended you consult a tax adviser as to the applicability of the information provided for your specific situation.
During the fiscal year ended June 30, 2016, the Funds paid distributions from ordinary income and long-term capital gain which included equalization debits summarized below:
| | | | | | | | | | | | | | | | | | | | |
| | | Aggressive | | | Ultra-Small | | | Ultra-Small | | | Small-Cap | | | | |
| | | Investors 1 | | | Company | | | Company Market | | | Momentum | | | | |
Ordinary Income Distributions | | | $99,024 | | | | $1,116,218 | | | | $ 3,152,924 | | | | $ 9,441 | | | | | |
Equalization Debits Included in Ordinary Income Distributions | | | - | | | | - | | | | 18,659 | | | | 1,568 | | | | | |
Equalization Debits Included in Long-Term Capital Gain Distributions | | | - | | | | - | | | | 1,329,910 | | | | - | | | | | |
Long-Term Capital Gain Distributions | | | - | | | | - | | | | 37,504,226 | | | | 115,289 | | | | | |
| | | | | |
| | | Small-Cap | | | Small-Cap | | | Blue Chip | | | | | | | |
| | | Growth | | | Value | | | 35 Index | | | Managed Volatility | | | | |
Ordinary Income Distributions | | | $ - | | | | $1,200,493 | | | | $14,480,684 | | | | $ 15,844 | | | | | |
| | |
| 112 | | Annual Report | June 30, 2016 |
| | |
OTHER INFORMATION (continued) | | |
June 30, 2016 (Unaudited)
2. Proxy Voting
A description of the policies and procedures that the Funds use to determine how to vote proxies relating to the portfolio securities and a summary of proxies voted by the Funds for the period ended June 30, 2016 are available without a charge, upon request, by contacting Bridgeway Funds at 1-800-661-3550 and on the SEC’s website at http://www.sec.gov.
3. Fund Holdings
The complete schedules of the Funds’ holdings for the second and fourth quarters of each fiscal year are contained in the Funds’ Semi-Annual and Annual Shareholder Reports, respectively.
The Bridgeway Funds file complete schedules of the Funds’ holdings with the SEC for the first and third quarters of each fiscal year on Form N-Q within 60 days after the end of the period. Copies of the Funds’ Form N-Q are available without charge, upon request, by contacting Bridgeway Funds at 1-800-661-3550 and on the SEC’s website at http://www.sec.gov. You may also review and copy Form N-Q at the SEC’s Public Reference Room in Washington, D.C. For more information about the operation of the Public Reference Room, please call 1-800-SEC-0330.
4. Approval of Investment Management Agreement
The Bridgeway Funds, Inc.’s (the “Company”) management agreement (the “Management Agreement”) with its investment adviser, Bridgeway Capital Management, Inc. (the “Adviser”), on behalf of each of the Company’s funds must be approved for an initial term no greater than two years and renewed at least annually thereafter (i) by the vote of the Directors or by a vote of the shareholders of each fund and (ii) by the vote of a majority of the Directors who are not parties to the Management Agreement or “interested persons” of any party thereto (the “Independent Directors”), cast in person at a meeting called specifically for the purpose of voting on such approval.
The Board of Directors (the “Board”) has five regularly scheduled meetings each year and takes into account throughout the year matters bearing on the approval of the Management Agreement. For example, the Board and its standing committees also consider at each meeting factors that are relevant to the annual renewal of each fund’s Management Agreement, including the services and support provided to each fund by the Adviser, the Adviser’s compliance program, comparative performance information for each fund, the risk assessment of the funds and “deep dives” on the strategy and performance of certain funds on a periodic basis. In addition, the Board receives updated financial information on the Adviser and updates related to strategic direction and marketing efforts between meetings from the Adviser.
On May 13, 2016, the Board, including a majority of the Independent Directors, met in person (the “Meeting”) with the Adviser, Company counsel, independent legal counsel (“Independent Legal Counsel”) to the Independent Directors and others to give consideration to information bearing on the continuation of the Management Agreement with respect to the following funds: Aggressive Investors 1 Fund, Ultra-Small Company Fund, Ultra-Small Company Market Fund, Small-Cap Growth Fund, Small-Cap Value Fund, Blue Chip 35 Index Fund, Managed Volatility Fund and Small-Cap Momentum Fund (each a “Fund” and collectively, the “Funds”).
In reaching its decisions, the Board considered the information furnished and discussed throughout the year at regularly scheduled Board or committee meetings, as applicable and as described above, and reviewed and considered the information provided specifically in relation to the annual consideration of the approval of the Management Agreement.
In preparation for the Meeting, the Independent Directors requested that the Adviser provide specific information relevant to their consideration of the renewal of each Fund’s Management Agreement. In response to that request, the Board was furnished with a wide variety of information with respect to each Fund, including:
| | • | | investment performance over various time periods and the fees and expenses of each Fund as compared to a comparable group of funds (the “peer funds”) as determined and prepared by Broadridge Financial Solutions, Inc. (formerly, Lipper, Inc.) (hereinafter “Lipper”), an independent provider of investment company data; |
| | • | | the nature, extent and quality of services provided by the Adviser to each Fund, including investment advisory and administrative services; |
| | |
OTHER INFORMATION (continued) | | |
June 30, 2016 (Unaudited)
| | • | | actual management fees paid by each Fund to the Adviser and a comparison with the fees charged to other clients, if applicable; |
| | • | | the Adviser’s costs of providing services to each Fund and the profitability of the Adviser derived from its relationship with each Fund; |
| | • | | the extent to which economies of scale may be present and if so, the degree to which they would be shared with the Fund’s shareholders; and |
| | • | | any potential “fallout” or ancillary benefits accruing to the Adviser as a result of its relationship with each Fund. |
In addition to evaluating, among other things, the written information provided by the Adviser, the Board also considered the answers to questions posed by the Board to representatives of the Adviser at the Meeting.
In considering the information and materials described above, the Independent Directors received assistance from, and also met telephonically with, Independent Legal Counsel prior to the Meeting to review and discuss the information provided by the Adviser. Moreover, the Independent Directors also met in executive session with Independent Legal Counsel to consider the continuation of the Management Agreement outside the presence of management during the Meeting.
The Board also was provided with a written description of their statutory responsibilities and the legal standards that are applicable to approval of the Management Agreement.
Although the Management Agreement for all of the Funds were considered at the same Board meeting, the Directors considered each Fund separately.
In considering the aforementioned information, the Board took into account management style, investment strategies and prevailing market conditions. Furthermore, in evaluating the Management Agreement, the Directors also reviewed information provided by the Adviser concerning the following:
| | • | | the terms of the Management Agreement, including the services performed by the Adviser in managing each Fund in accordance with each Fund’s investment objectives, policies and restrictions and how those services and fees differ from the Adviser’s services to non-mutual fund accounts, to the extent applicable; |
| | • | | information regarding the structure of the advisory fees, the method of computing fees and the frequency of payment of fees and any expense limitation or fee waiver arrangements for each Fund; |
| | • | | the services provided by the Adviser under a separate Administrative Services Agreement and the fact that those services were provided at approximately cost to the Funds, although it was noted the annual fee under the Administrative Services Agreement was proposed to be increased at the Meeting; |
| | • | | the Adviser’s specialized skills and experience in statistical analysis and active and passive investment management and trading; |
| | • | | the Adviser’s personnel, staffing levels and the time and attention the Adviser’s personnel devote to the management of the Funds as compared to other Adviser clients; |
| | • | | the Adviser’s risk assessment and risk management capabilities; |
| | • | | the Adviser’s representation that it continues to use no soft dollars; and |
| | • | | the financial condition and stability of the Adviser, including supplemental financial information provided upon the request of the Board periodically during the year. |
| | |
| 114 | | Annual Report | June 30, 2016 |
| | |
OTHER INFORMATION (continued) | | |
June 30, 2016 (Unaudited)
In view of the broad scope and variety of factors and information, the Directors did not find it practicable to, and did not, assign relative weights to the specific factors considered in reaching their conclusions and determinations to approve the Management Agreement for an additional year. Rather, the approval determination was made on the basis of each Director’s business judgment after consideration of all of the factors taken in their entirety. Although not meant to be all-inclusive, the following describes some of the factors that were considered by the Board in deciding to approve the continuance of the Management Agreement for each Fund.
Nature, Extent and Quality of Services
In examining the nature, extent and quality of the services provided by the Adviser, the Directors considered the qualifications, experience and capability of the Adviser’s personnel and the extent of care and conscientiousness with which the Adviser performs its duties. In addition, the Directors considered information provided by the Adviser regarding its overall financial strength and considered the resources and staffing in place with respect to the services provided to the Funds, including (but not limited to) consideration of the Adviser’s skills and experience in statistical analysis and active and passive investment management and trading. The Board also considered that, in addition to providing investment management services to the Funds, the Adviser is also responsible for developing and maintaining policies and procedures to ensure that the Funds comply with applicable rules and regulations. Finally, the Board considered that the Adviser provides certain administrative services under the Administrative Services Agreement approximately at cost to the Funds, although it was noted the annual fees under the Administrative Services Agreement were proposed to be increased at this Meeting.
Based on the totality of the information considered, the Directors concluded that the Funds were likely to benefit from the nature, extent and quality of the Adviser’s services, and that the Adviser has the ability to continue to provide these services based on its experience, operations and current resources.
Investment Performance
Lipper provided a report (the “Lipper Report”) of comparative data regarding fees, expenses and performance for each Fund as compared to a peer group selected by Lipper (“Peer Group”). In particular, the Board reviewed the performance of each Fund, as applicable, over the most recent calendar year (“one-year period”) and the annualized performance over the most recent three calendar year period (“three-year period”), five calendar year period (five-year period”) and ten calendar year period (“ten-year period”). With regard to the performance information provided in the Lipper Report, the Board considered the performance of each Fund on a percentile and quintile basis as compared to its Peer Group. For purposes of the performance data provided, the first quintile is defined as 20% of the funds in the applicable Peer Group with the highest performance and the fifth quintile is defined as 20% of the funds in the applicable Peer Group with the lowest performance. The Board reviewed performance information in the Lipper Report as of December 31, 2015 for each Fund and considered the following:
| | • | | With regard to the Aggressive Investors 1 Fund, the Board noted that the Fund had below median performance compared to its Peer Group, ranking in the 5th quintile, 4th quintile and 5th quintile, respectively, and lagged the benchmark index for the one-year, five-year and ten-year periods. The Board considered that the Fund outperformed the median of the Peer Group for the three-year period, ranking in the 3rd quintile, but lagged its benchmark index for the same time period. The Board considered the Adviser’s explanation that the underperformance of this Fund can be partially explained by a spike in stock correlations in 2015, and that this Fund has outperformed its benchmark index since inception. |
| | • | | With regard to the Ultra-Small Company Fund, the Board considered that the Fund had below median performance compared to its Peer Group, ranking in the 5th quintile, 4th quintile, 4th quintile and 4th quintile, respectively, and lagged its benchmark index for the past one-year, three-year, five-year and ten-year periods. The Board also considered the Adviser’s explanation that the Ultra-Small Company Fund’s holdings in larger cap stocks accounts for much of the underperformance relative to the CRSP 10 benchmark index, and that this Fund has outperformed its benchmark index since inception. |
| | |
OTHER INFORMATION (continued) | | |
June 30, 2016 (Unaudited)
| | • | | With regard to the Ultra-Small Company Market Fund, the Board considered that the Fund has outperformed the median of its Peer Group, ranking in the 1st and 2nd quintiles, respectively, for the past three-year and five-year periods, and underperformed its Lipper peer funds, ranking in the 5th quintile for the one-year and ten-year periods. The Board considered that the Ultra-Small Company Market Fund has outperformed its benchmark index for the past one-year, three-year and five-year periods, lagged its benchmark index for the ten-year period and slightly lagged its benchmark index since inception (although by less than the Fund’s expense ratio). |
| | • | | With regard to the Small-Cap Growth Fund, the Board considered that the Fund has outperformed the median of its Peer Group, ranking in the 1st quintile for each of the one-year, three-year and five-year periods, and its benchmark index for the same time periods. The Board considered that the Small-Cap Growth Fund has underperformed its Peer Group, ranking in the 5th quintile, for the ten-year period and lagged its benchmark index for the ten-year and since inception periods. The Board also considered the Adviser’s explanation that it made some refinements to its investment process approximately four years ago and that the Adviser believes these refinements are having a positive impact on the Small-Cap Growth Fund. |
| | • | | With regard to the Small-Cap Value Fund, the Board considered that the Fund had below median performance compared to its Peer Group, ranking in the 4th quintile, 4th quintile and 5th quintile, respectively, and lagged its benchmark index for the one-year, three-year and ten-year periods. The Board considered that the Small-Cap Value Fund has outperformed the median of its Peer Group, ranking in the 2nd quintile, and its benchmark index for the five-year period. The Board also considered that the Small-Cap Value Fund has slightly lagged its benchmark index since inception (although by less than the Fund’s expense ratio as noted by the Adviser). |
| | • | | With regard to the Blue Chip 35 Index Fund, the Board considered that the Fund outperformed the median of its Peer Group, ranking in the 1st quintile for the one-year period and 2nd quintile for the three-year, five-year and ten-year periods. The Board considered that the Blue Chip 35 Index Fund outperformed its benchmark index for the one-year and ten-year periods but lagged its benchmark index for the three-year and five-year periods, and the Fund has outperformed its benchmark index since inception. The Board also considered the Adviser’s explanation that the primary reason for the difference in performance compared to its benchmark index is the larger market cap of the holdings in the Blue Chip 35 Index Fund as compared to the index. |
| | • | | With regard to the Managed Volatility Fund, the Board considered that the Fund outperformed the median of its Peer Group for the one-year, five-year and ten-year periods and had below median performance compared to its Peer Group for the three-year period, ranking in the 3rd quintile for the three-year, five-year and ten-year periods and in the 2nd quintile for the one-year period. The Board considered that the Managed Volatility Fund lagged its benchmark index for the one-year, three-year, five-year, ten-year and since inception periods. However, the Board also considered the Adviser’s explanation that in 10 out of 14 years since inception, the Managed Volatility Fund has captured at least 40% of the S&P 500 return in up years and 40% or less of the S&P 500 return in down years, which the Adviser believes is consistent with the design of the Fund. |
| | • | | With regard to the Small-Cap Momentum Fund, the Board considered that the Fund outperformed the median of its Peer Group for the one-year and five-year periods and had below median performance for the three-year period, ranking in the 1st quintile, 3rd quintile and 3rd quintile, respectively, for the one-year, three-year and five-year periods and outperformed its benchmark index for the one-year period. The Board considered that the Small-Cap Momentum Fund lagged its benchmark index for the three-year and five-year periods and has lagged its benchmark index since inception (although by less than the Fund’s expense ratio as noted by the Adviser). |
Fund Fees and Expenses
The Board reviewed the information compiled by Lipper comparing each Fund’s contractual management fee rate, actual management fee rate (which included the effect of any fee waivers) and total expense ratios as a percentage of average net assets to other funds in its expense Peer Group. In this regard, the Board considered the contractual and actual management fees and total expense ratios of each Fund on a quintile basis as compared to its Peer Group and noted the relative position of each Fund within the Peer Group. In particular, the Board considered the following:
| | |
| 116 | | Annual Report | June 30, 2016 |
| | |
OTHER INFORMATION (continued) | | |
June 30, 2016 (Unaudited)
| | • | | With respect to the Aggressive Investors 1 Fund, the management fee is performance-based and adjusts higher or lower in a range in response to investment results. The Aggressive Investors 1 Fund’s actual management fee and total expenses are higher than its Peer Group, partially due to the performance based portion. The Board also considered that the expense ratios in the Lipper Report are as of the most recent fiscal year end (June 30, 2015), a period in which the Adviser explained that the Aggressive Investors 1 Fund had a positive relative five-year return, which would have included a performance based component. The Board considered that the Fund’s contractual management fee, actual management fee and total expense ratio were in the 3rd quintile, 5th quintile and 3rd quintile, respectively, of its Peer Group. |
| | • | | With respect to the Ultra-Small Company Fund, the management fee and total expenses are significantly lower than its Peer Group. The Board considered that the Fund’s contractual management fee, actual management fee and total expense ratio were in the 1st quintile, 2nd quintile and 1st quintile, respectively, of its Peer Group. |
| | • | | With respect to the Ultra-Small Company Market Fund, the management fee and total expenses are significantly lower than its Peer Group. The Board considered that the Fund’s contractual management fee, actual management fee and total expense ratio were in the 1st quintile of its Peer Group. |
| | • | | With respect to each of the Small-Cap Growth Fund and Small-Cap Value Fund, the management fee is performance-based and adjusts higher or lower in a range in response to investment results. Each such Fund’s management fee and overall expenses were significantly lower than its respective Peer Group. The Board considered that each Fund’s contractual management fee, actual management fee and total expense ratio were in the 1st quintile of its respective Peer Group. |
| | • | | With respect to each of the Blue Chip 35 Index Fund, Managed Volatility Fund and Small-Cap Momentum Fund, the management fee and total expenses are significantly lower than its respective Peer Group. The Board considered that each Fund’s contractual management fee, actual management fee and total expense ratio were in the 1st quintile of its respective Peer Group. |
In addition, the Board considered that the Adviser agreed to contractual expense limitation agreements for each of the Funds to ensure that total expense levels do not increase above certain levels. The Board also reviewed the fees the Adviser charged to other funds (for which the Adviser serves as subadviser) and separately managed accounts, as applicable, and evaluated the differences in fees and services provided to the Funds and such other separately managed accounts, as applicable.
The foregoing comparisons assisted the Board by providing them with a basis for evaluating each Fund’s management fee and expense ratio on a relative basis. The Independent Directors concluded that the fees and expenses of each Fund were fair and reasonable in relation to the services and benefits provided to each Fund.
Profitability
The Board reviewed the materials they received from the Adviser regarding its revenues and costs in providing investment management and certain administrative services to the Funds and the Company as a whole. In particular, the Board considered the analysis of the Adviser’s profitability with respect to each Fund, calculated for the years ended December 31, 2012, December 31, 2013, December 31, 2014 and December 31, 2015. The Board also considered the Adviser’s representations that allocating expenses on a Fund-by-Fund basis to calculate Fund-by-Fund profitability is a subjective, and somewhat arbitrary, process since the Adviser does not track expenses or maintain staff on a Fund-by-Fund basis. The Board also considered the Adviser’s representations that profit margins for certain years can be affected by the seven to one total compensation cap for Adviser staff members (also referred to as “Partners”) (i.e., no Partner can make more than seven times the total compensation of the lowest paid Partner). The Board also considered that the Adviser was operating some Funds at a loss but that the Adviser’s overall business is profitable. Additionally, the Board considered the Adviser’s explanation that its financial strength has improved over the past year and that the Adviser has significant financial resources to support ongoing operations and future growth despite currently operating some of the Funds at a loss. In reviewing the profitability information, the Board also considered the potential “fall-out” or ancillary benefits that may accrue to the Adviser as a result of its relationship with the Funds, which are discussed below.
| | |
OTHER INFORMATION (continued) | | |
June 30, 2016 (Unaudited)
Economies of Scale
With respect to whether economies of scale are realized by the Adviser as a Fund’s assets increase and whether advisory fee levels reflect these economies of scale for the benefit of Fund investors, the Board considered, on a Fund-by-Fund basis, the current level of advisory fee charged and fee structure and concluded that the Adviser’s fee structure with respect to each Fund was appropriate at this time. The Board noted that the Aggressive Investors 1 Fund and Ultra-Small Company Fund each have fee breakpoints in their management fee schedules although the Board considered the Adviser’s explanation that neither Fund is at a size currently to benefit from such breakpoints. The Board considered the Adviser’s explanation that although the Aggressive Investors 1 Fund and Ultra-Small Company Fund are not currently at an asset level at which they can take advantage of the breakpoints contained in its fee schedules, the fee schedules are structured so that when the assets of each Fund increases, economies of scale may be shared for the benefit of shareholders. Although the Ultra-Small Company Market Fund does not have fee breakpoints in its management fee schedule, the Board considered the Adviser’s representation that it believes that the Fund does not exhibit significant economies of scale because it involves intensive and time-consuming portfolio and trading management because trades are small and oftentimes less liquid so they may take longer to execute. As a result, the Board considered the Adviser’s explanation that an increase in assets of the Ultra-Small Company Market Fund does not necessarily lead to economies of scale. Although the Small-Cap Growth Fund, Small-Cap Value Fund, Blue Chip 35 Index Fund, Managed Volatility Fund and Small-Cap Momentum Fund do not have fee breakpoints in their management fee schedules, the Board considered the Adviser’s explanation that these Funds were priced low relative to peers and ahead of the economies of scale curve at launch.
“Fallout” or Ancillary Benefits
The Board considered whether there were any “fallout” or ancillary benefits that may accrue to the Adviser as a result of its relationships with the Funds. In terms of potential “fallout” or ancillary benefits to the Adviser due to its position as manager of the Funds, the Board noted that the Adviser continues to use no soft dollars and its administrative services to the Funds are structured to approximate an at-cost relationship, including after the proposed increase in the administrative services fees. The Board also considered that the Adviser may experience certain reputational and marketing benefits due to its relationships with the Funds. The Board concluded that the benefits accruing to the Adviser by virtue of its relationship to the Funds appeared to be reasonable.
* * * * *
After evaluation of the performance, fee and expense information and the profitability, ancillary benefits and other considerations as described above, and in light of the nature, extent and quality of services provided by the Adviser, the Board, including a majority of the Independent Directors, concluded that the level of fees to be paid to the Adviser with respect to each Fund is reasonable.
In summary, based on all relevant information and factors discussed above, none of which was individually determinative of the outcome, the Board, including a majority of the Independent Directors, determined that the approval of the Management Agreement was in the best interests of each applicable Fund. As a result, the Board, including a majority of the Independent Directors, approved the renewal of the Management Agreement.
| | |
| 118 | | Annual Report | June 30, 2016 |
| | |
DISCLOSURE OF FUND EXPENSES | | |
June 30, 2016 (Unaudited)
As a shareholder of a Fund, you will incur no transaction costs from such Fund, including sales charges (loads) on purchases, on reinvested dividends or on other distributions. There are no exchange fees. Shareholders are subject to redemption fees on the Ultra-Small Company Market and Small-Cap Momentum Funds under certain circumstances. However, as a shareholder of a Fund, you will incur ongoing costs, including management fees and other Fund expenses. The following examples are intended to help you understand your ongoing costs (in dollars) of investing in a Fund and to compare these costs with ongoing costs of investing in other mutual funds. The examples are based on an investment of $1,000 invested on January 1, 2016 and held until June 30, 2016.
Actual Expenses. The first line of the table below provides information about actual account values and actual expenses. You may use the information in this line, together with the amount you invested, to estimate the expenses that you paid over the period. Simply divide your account value by $1,000 (for example, an $8,600 account value divided by $1,000 = 8.6), then multiply the result by the number in the first line under the heading “Expenses Paid During Period” to estimate the expenses you paid on your account during the period.
Hypothetical Example for Comparison Purposes. The second line of the table below provides information about hypothetical account values and hypothetical expenses based on the Fund’s actual expense ratio and an assumed rate of return of 5% per year before expenses, which is not the Fund’s actual return. The hypothetical account values and expenses may not be used to estimate the actual ending account balance or expenses you paid for the period. You may use this information to compare the ongoing costs of investing in a Fund and other mutual funds. To do so, compare this 5% hypothetical example with the 5% hypothetical examples that appear in the shareholder reports of other funds.
The expenses shown in the table are meant to highlight ongoing Fund costs only. Therefore, the second line of the table is useful in comparing ongoing costs only and will not help you determine the relative total costs of owning different funds, because other funds may also have transaction costs, such as sales charges, redemption fees or exchange fees.
| | | | | | | | | | | | | | | | |
| | | Beginning Account Value at 1/1/16 | | | Ending Account Value at 6/30/16 | | | Expense Ratio | | | Expenses Paid During Period* 1/1/16 - 6/30/16 | |
| | | | |
Bridgeway Aggressive Investors 1 Fund | | | | | | | | | | | | | | | | |
Actual Fund Return | | | $1,000.00 | | | | $1,022.80 | | | | 0.45% | | | | $2.26 | |
Hypothetical Fund Return | | | $1,000.00 | | | | $1,022.63 | | | | 0.45% | | | | $2.26 | |
| | | | |
Bridgeway Ultra-Small Company Fund | | | | | | | | | | | | | | | | |
Actual Fund Return | | | $1,000.00 | | | | $ 987.10 | | | | 1.18% | | | | $5.83 | |
Hypothetical Fund Return | | | $1,000.00 | | | | $1,019.00 | | | | 1.18% | | | | $5.92 | |
| | | |
Bridgeway Ultra-Small Company Market Fund | | | | | | | | | | | | | |
Actual Fund Return | | | $1,000.00 | | | | $ 989.90 | | | | 0.76% | | | | $3.76 | |
Hypothetical Fund Return | | | $1,000.00 | | | | $1,021.08 | | | | 0.76% | | | | $3.82 | |
| | | | |
Bridgeway Small-Cap Momentum Fund | | | | | | | | | | | | | | | | |
Actual Fund Return | | | $1,000.00 | | | | $1,019.50 | | | | 0.90% | | | | $4.52 | |
Hypothetical Fund Return | | | $1,000.00 | | | | $1,020.39 | | | | 0.90% | | | | $4.52 | |
| | | | |
Bridgeway Small-Cap Growth Fund | | | | | | | | | | | | | | | | |
Actual Fund Return | | | $1,000.00 | | | | $1,015.50 | | | | 0.94% | | | | $4.71 | |
Hypothetical Fund Return | | | $1,000.00 | | | | $1,020.19 | | | | 0.94% | | | | $4.72 | |
| | | | |
Bridgeway Small-Cap Value Fund | | | | | | | | | | | | | | | | |
Actual Fund Return | | | $1,000.00 | | | | $1,048.70 | | | | 0.94% | | | | $4.79 | |
Hypothetical Fund Return | | | $1,000.00 | | | | $1,020.19 | | | | 0.94% | | | | $4.72 | |
| | |
DISCLOSURE OF FUND EXPENSES (continued) | | |
June 30, 2016 (Unaudited)
| | | | | | | | |
| | | Beginning Account
Value at 1/1/16 | | Ending Account
Value at 6/30/16 | | Expense
Ratio | | Expenses Paid
During Period*
1/1/16 - 6/30/16 |
| | | | |
Bridgeway Blue Chip 35 Index Fund | | | | | | | | |
Actual Fund Return | | $1,000.00 | | $1,050.50 | | 0.15% | | $0.76 |
Hypothetical Fund Return | | $1,000.00 | | $1,024.12 | | 0.15% | | $0.75 |
| | | | |
Bridgeway Managed Volatility | | | | | | | | |
Actual Fund Return | | $1,000.00 | | $1,012.10 | | 0.94% | | $4.70 |
Hypothetical Fund Return | | $1,000.00 | | $1,020.19 | | 0.94% | | $4.72 |
| * | Expenses are equal to the average account value times the Fund’s annualized expense ratio multiplied by the number of days in the most recent six-month period (182) divided by the number of days in the fiscal year (366). |
| | |
| 120 | | Annual Report | June 30, 2016 |
| | |
DIRECTORS & OFFICERS | | |
June 30, 2016 (Unaudited)
| | | | | | | | | | | | | | | | |
Independent Directors | | | | | | | | | | | | | | | | |
| | | | | |
Name, Address and Age1 | | Position
Held with
Bridgeway
Funds | | | Term of
Office and
Length of
Time Served | | | Principal Occupation(s)
During Past Five Years | | No. of Bridgeway
Funds Overseen
by Director | | Other Directorships
Held by Director | |
| | | | | |
Kirbyjon Caldwell Age 62 | | | Director | | |
| Term: 1 Year
Length: 2001
to Present. |
| | Senior Pastor of Windsor Village United Methodist Church, since 1982. | | Ten | |
| American Church
Mortgage Company,
NRG Energy, Inc.,
Amegy Bancshares
Advisory Board |
|
| | | | | |
Karen S. Gerstner Age 61 | | | Director | | |
| Term: 1 Year
Length: 1994
to Present. |
| | Principal, Karen S. Gerstner & Associates, P.C., since 2004. | | Ten | | | None | |
| | | | | |
Miles Douglas Harper, III* Age 53 | | | Director | | |
| Term: 1 Year
Length: 1994
to Present. |
| | Partner, Carr, Riggs & Ingram, LLC, since 2013; Partner, Gainer Donnelly, LLP, 1998 to 2013 upon merger with Carr, Riggs & Ingram, LLC. | | Ten | |
| Calvert Social
Investment Fund (8
Portfolios), Calvert
Social Index Series,
Inc. (1 Portfolio),
Calvert Impact Fund
(4 Portfolios),
Calvert World
Values Fund (3
Portfolios) |
|
| | | | | |
Evan Harrel Age 55 | | | Director | | |
| Term: 1 Year
Length: 2006
to Present. |
| | Strategic Advisor, Small Steps Nurturing Center, since 2012; Executive Director, Small Steps Nurturing Center, 2004 to 2012. | | Ten | | | None | |
| | | | | |
| | | | | | | | | | | | | | | | | |
| | |
DIRECTORS & OFFICERS (continued) | | |
June 30, 2016 (Unaudited)
| | | | | | | | | | |
“Interested” or Affiliated Director and Officer | | | | |
| | | | | |
Name, Address and Age1 | | Position(s)
Held with
Bridgeway
Funds | | Term of
Office and
Length of
Time Served | | Principal Occupation(s) During Past Five Years | | No. of Bridgeway
Funds Overseen
by Director | | Other Directorships
Held by Director |
| | | | | |
| John N. R. Montgomery2 Age 60 | | Director | | Term: 1 Year
Length: 1993to Present. | | Chairman, Bridgeway Capital Management, Inc., since 2010; President, Bridgeway Capital Management, Inc., 1993 to 2010 and June 2015 to March 2016; President, Bridgeway Funds, June 2015 to June 2016; Vice President, Bridgeway Funds, 2005 to May 2015 and since June 2016. | | Ten | | None |
| | | | | |
| | | | | | | | | | | |
| | |
| 122 | | Annual Report | June 30, 2016 |
| | |
DIRECTORS & OFFICERS (continued) | | |
June 30, 2016 (Unaudited)
| | | | | | | | | | | | | | |
Other Officers | | | | | | | | | | | | | | |
| | | | | |
Name, Address and Age1 | | Position Held with
Bridgeway
Funds | | | Term of
Office and
Length of
Time Served | | | Principal Occupation(s) During Past Five Years | | No. of Bridgeway
Funds Overseen
by Officer | | Other Directorships
Held by Officer |
| | | | | |
| Richard P. Cancelmo, Jr. Age 58 | | | Vice President | | |
| Term: 1 Year
Length: 2004
to Present. |
| | Vice President, Bridgeway Funds, since 2004; Staff member, Bridgeway Capital Management, Inc., since 2000. | | N/A | | None |
| | | | | |
Linda G. Giuffré Age 54 | |
| Treasurer and
Chief
Compliance
Officer |
| |
| Term: 1 Year
Length: 2004
to Present. |
| | Chief Compliance Officer, Bridgeway Capital Management, Inc., since 2004; Staff member, Bridgeway Capital Management, Inc., since 2004. | | N/A | | None |
| | | | | |
Deborah L. Hanna Age 51 | | | Secretary | | |
| Term: 1 Year
Length: 2007
to Present. |
| | Self-employed, accounting and related projects for various organizations, since 2001. | | N/A | | None |
| | | | | |
Sharon Lester Age 61 | | | Vice President | | |
| Term: 1 Year
Length: 2011
to Present. |
| | Staff member, Bridgeway Capital Management, Inc., since 2010; Prior to 2010, Director of Portfolio Operations, Invesco. | | N/A | | None |
| | | | | |
Tammira Philippe Age 42 | | | President | | |
| Term: 1 Year
Length: May
2016 to
Present. |
| | Staff member, Bridgeway Capital Management, Inc., 2010 to March 2016; President, Bridgeway Capital Management, Inc., since March 2016. | | N/A | | None |
| 1 | The address of all of the Directors and Officers of Bridgeway Funds is 20 Greenway Plaza, Suite 450, Houston, Texas, 77046. |
| 2 | John Montgomery is chairman, director and majority shareholder of Bridgeway Capital Management, Inc., and therefore an interested person of Bridgeway Funds. |
The overall management of the business and affairs of Bridgeway Funds is vested with its Board of Directors (the “Board”). The Board approves all significant agreements between Bridgeway Funds and persons or companies furnishing services to it, including agreements with its Adviser and Custodian. The day-to-day operations of Bridgeway Funds are delegated to its officers, subject to its investment objectives and policies and general supervision by the Board.
The Funds’ Statement of Additional Information includes additional information about the Board and is available, without charge, upon request by calling 1-800-661-3550.
|
BRIDGEWAY FUNDS, INC. BNY Mellon Investment Servicing (US) Inc. P.O. Box 9860 Providence, RI 02940-8060 CUSTODIAN The Bank of New York Mellon One Wall Street New York, NY 10286 DISTRIBUTOR Foreside Fund Services, LLC Three Canal Plaza, Suite 100 Portland, ME 04101 |
| | | | |
| | |
| | You can review and copy information about our Funds (including the SAIs) at the SEC’s Public Reference Room in Washington, D.C. To find out more about this public service, call the SEC at 800-SEC-0330. Reports and other information about the Funds are also available on the SEC’s website at www.sec.gov. You can receive copies of this information, for a fee, by writing the Public Reference Section, Securities and Exchange Commission, Washington, D.C. 20549-1520 or by sending an electronic request to the following email address: publicinfo@sec.gov. | | |
| | |
| | | | |

A no-load mutual fund family of domestic funds
| | | | |
| | Annual Report | | |
| | June 30, 2016 | | |
| | OMNI SMALL-CAP VALUE | | BOSVX |
| | |
| | OMNI TAX-MANAGED SMALL-CAP VALUE | | BOTSX |
| | www.bridgeway.com | | |
| | |
| TABLE OF CONTENTS | |  |
|
Bridgeway Funds Standardized Returns as of June 30, 2016 (Unaudited)
| | | | | | | | | | | | | | | | |
| | | | | | | Annualized | | | | | | |
| Fund | | Quarter | | Six Months | | 1 Year | | 5 Years | | Inception
to Date | | Inception
Date | | Gross
Expense
Ratio2 | | Net
Expense
Ratio2 |
|
Omni Small-Cap Value | | 2.95% | | 3.97% | | -4.42% | | NA | | 12.03% | | 8/31/2011 | | 0.74%1 | | 0.63%1 |
Omni Tax-Managed Small-Cap Value | | 2.86% | | 4.23% | | -3.42% | | 7.90% | | 8.45% | | 12/31/2010 | | 0.72%1 | | 0.61%1 |
| | 1 | Some of the Fund’s fees were waived or expenses reimbursed; otherwise, returns would have been lower. The Adviser has contractually agreed to waive fees and/or reimburse expenses. Any material change to this Fund policy would require a vote by shareholders. |
| | 2 | Expense ratios are as stated in the current prospectus. Please see financial highlights for expense ratios as of June 30, 2016. |
Performance figures quoted represent past performance and are no guarantee of future results. Current performance may be lower or higher than the performance data quoted. Investment return and principal value will fluctuate, so that an investor’s shares, when redeemed, may be worth more or less than original cost. To obtain performance current to the most recent month-end, please visit our website at www.bridgeway.com or call 1-800-661-3550. Total return figures include the reinvestment of dividends and capital gains.
This report is submitted for the general information of the shareholders of each Fund. It is not authorized for distribution to prospective investors unless preceded or accompanied by an effective prospectus, which includes information regarding a Fund’s risks, objectives, fees and expenses, experience of its management, and other information. Investors should read the prospectus carefully before investing in a Fund. For questions or other Fund information, call 1-800-661-3550 or visit the Funds’ website at www.bridgeway.com. Funds are available for purchase by residents of the United States, Puerto Rico, U.S. Virgin Islands and Guam only. Foreside Fund Services, LLC, Distributor.
The views expressed here are exclusively those of Fund management. These views, including those relating to the market, sectors or individual stocks are not meant as investment advice and should not be considered predictive in nature.
| | |
| LETTER FROM THE INVESTMENT MANAGEMENT TEAM | |
|
|
June 30, 2016
Dear Fellow Shareholders,
At Bridgeway, we have a shared passion for applying logic, data and evidence to develop investment solutions. The construction of our Omni Small-Cap Value and Omni Tax-Managed Small-Cap Value Funds is based on fundamental academic research that relies on market efficiency to better capture risk premiums. We manage these Funds to provide broad diversification within the small-cap value universe and to keep transaction fees and expenses low. Bridgeway offers the Omni Small-Cap Value and Omni Tax-Managed Small-Cap Value Funds through a select group of advisers. We are committed to advisers and their clients who take a long-term perspective and whose investment goals fit our unique expertise: delivering investment solutions that are statistically driven and grounded in academic theory.
Thank you for your investment in Bridgeway’s Omni Small-Cap Value and Omni Tax-Managed Small-Cap Value Funds.
Sincerely,
Your Investment Management Team
| | | | |

| | 
| | 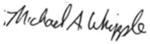 |
| John Montgomery | | Christine L. Wang | | Michael Whipple |
 | | | | |
| Elena Khoziaeva | | | | |
| | |
| LETTER FROM THE INVESTMENT MANAGEMENT TEAM (continued) | | |
|
Market Review
Performance across domestic equity markets was positive for the June 2016 quarter. Broad market returns for the quarter were up 2.63%, as represented by the Russell 3000 Index.
For the fiscal year ended June 30, 2016, stocks were up 2.14%. The performance difference between growth and value stocks was mixed across the market-cap spectrum. Small-cap stocks significantly lagged larger stocks during the year, with mid-cap value stocks delivering the best returns, up 3.25%, followed by large-cap growth stocks (3.02%) and large-cap value stocks (2.86%).
The following table presents returns for small-cap, mid-cap and large-cap stocks, as represented by various style-based Russell Indexes. Size (market capitalization) and style (value/growth) are among the key factors that drive differences in U.S. stock returns.
Russell Style-Based Indexes Ranked by Performance for the Quarter and Fiscal Year Ended June 30, 2016
| | | | |
| | | Quarter | | Fiscal Year |
Best Performing | | 4.77% Russell Midcap Value Index | | 3.25% Russell Midcap Value Index |
| | 4.58% Russell 1000 Value Index | | 3.02% Russell 1000 Growth Index |
| | 4.57% Russell 3000 Value Index | | 2.86% Russell 1000 Value Index |
| | 4.31% Russell 2000 Value Index | | 2.42% Russell 3000 Value Index |
| | 3.24% Russell 2000 Growth Index | | 1.88% Russell 3000 Growth Index |
| | 1.56% Russell Midcap Growth Index | | -2.14% Russell Midcap Growth Index |
| | 0.80% Russell 3000 Growth Index | | -2.58% Russell 2000 Value Index |
Worst Performing | | 0.61% Russell 1000 Growth Index | | -10.75% Russell 2000 Growth Index |
The Bridgeway Omni Funds in this annual report are asset class exposure strategies that seek broad diversification and risk premium exposure with low tracking error. These Funds were designed to capture the size and style benefits within the small-cap value asset class.
| | |
| 2 | | Annual Report | June 30, 2016 |
| | |
Omni Small-Cap Value Fund MANAGER’S COMMENTARY (Unaudited) | |
|
June 30, 2016
Dear Fellow Omni Small-Cap Value Fund Shareholder,
For the quarter ended June 30, 2016, our Fund returned 2.95%, underperforming our primary market benchmark, the Russell 2000 Value Index (4.31%).
For the fiscal year, our Fund returned -4.42%, underperforming the Russell 2000 Value Index (-2.58%).
The table below presents our June quarter, one-year and inception-to-date financial results. See the next page for a graph of performance since inception.
Standardized Returns as of June 30, 2016
| | | | | | | | | | | | | | | |
| | | | |
| | | | | | | Annualized |
| | | Quarter | | 1 Year | | Since Inception (8/31/11) |
| | | |
Omni Small-Cap Value Fund | | | | 2.95% | | | | | -4.42% | | | | | 12.03% | |
Russell 2000 Value Index | | | | 4.31% | | | | | -2.58% | | | | | 11.31% | |
Performance figures quoted in the table above and the graph on the next page represent past performance and are no guarantee of future results. Total return figures in the table above include the reinvestment of dividends and capital gains. The table above and the graph on the next page do not reflect the deduction of taxes that a shareholder would pay on Fund distributions or on the redemption of Fund shares.
The Russell 2000 Value Index is an unmanaged index that consists of stocks in the Russell 2000 Index with lower price-to-book ratios and lower forecasted growth values with dividends reinvested. It is not possible to invest directly in an index. Periods longer than one year are annualized.
According to data from Lipper as of June 30, 2016, Omni Small-Cap Value Fund ranked 162nd of 307 small-cap value funds for the 12 months ended June 30, 2016 and 72nd of 236 such funds since inception in August 2011. Lipper is an independent mutual fund rating service owned by Broadridge Financial Solutions, Inc. that ranks funds in various fund categories by making comparative calculations using total returns.
| | |
Omni Small-Cap Value Fund MANAGER’S COMMENTARY (Unaudited) (continued) | | |
Omni Small-Cap Value Fund vs. Russell 2000 Value Index
from Inception 8/31/11 to 6/30/16
Detailed Explanation of Quarterly Performance
The Omni Small-Cap Value Fund is designed to capture the returns of the small-cap value asset class through broad diversification of small company and value stocks. This approach is sometimes referred to as “passive, asset class investing.” As of June 30, 2016, we held 671 such stocks in a market-cap weighted style. We make no attempt to track any particular index in either performance or statistics.
The Fund’s bias toward deeper-value stocks, as measured by Bridgeway’s value metrics models, detracted from relative results as those deeper value stocks underperformed the Index during the quarter. By design, the Fund does not hold Utilities sector stocks and Real Estate Investment Trusts (REITs). Those assets performed very well during the quarter, which hurt the Fund’s relative returns. Our Fund’s higher weighting in Energy and Materials stocks contributed positively to relative returns, as did holdings in the Information Technology sector.
Detailed Explanation of Fiscal Year Performance
The Fund’s greater relative weighting in smaller stocks detracted from fiscal-year performance. A bias toward deeper-value stocks also hurt relative returns. However, increased exposure to higher momentum stocks boosted relative performance.
Lack of exposure to Utilities sector stocks and REITs, which performed well during the 12-month period, hurt relative performance. An overweighting of the Energy sector also detracted from results. By contrast, holdings in the Consumer Staples and Information Technology sectors helped relative results, as did holdings of Financials stocks other than REITs.
| | |
| 4 | | Annual Report | June 30, 2016 |
| | |
Omni Small-Cap Value Fund MANAGER’S COMMENTARY (Unaudited) (continued) | | |
Top Ten Holdings as of June 30, 2016
| | | | | | | | | |
| Rank | | Description | | Industry | | % of Net
Assets |
| 1 | | Central Garden & Pet Co. | | Household Products | | 1.0% |
| 2 | | Hawaiian Holdings, Inc. | | Airlines | | 0.9% |
| 3 | | Stepan Co. | | Chemicals | | 0.9% |
| 4 | | SpartanNash Co. | | Food & Staples Retailing | | 0.8% |
| 5 | | Ebix, Inc. | | Software | | 0.8% |
| 6 | | Air Transport Services Group, Inc. | | Air Freight & Logistics | | 0.7% |
| 7 | | ManTech International Corp. | | IT Services | | 0.7% |
| 8 | | Cooper-Standard Holding, Inc. | | Auto Components | | 0.7% |
| 9 | | Gibraltar Industries, Inc. | | Building Products | | 0.7% |
| 10 | | Kraton Performance Polymers, Inc. | | Chemicals | | 0.7% |
| | | |
| | Total | | | | 7.9% |
Industry Sector Representation as of June 30, 2016
| | | | | | | | | | | | | | | |
| | | % of Net Assets | | % of Russell 2000
Value Index | | Difference |
| Consumer Discretionary | | | | 12.9% | | | | | 10.5% | | | | | 2.4% | |
| Consumer Staples | | | | 3.9% | | | | | 3.0% | | | | | 0.9% | |
| Energy | | | | 8.8% | | | | | 5.1% | | | | | 3.7% | |
| Financials | | | | 33.8% | | | | | 41.3% | | | | | -7.5% | |
| Health Care | | | | 2.4% | | | | | 4.7% | | | | | -2.3% | |
| Industrials | | | | 18.1% | | | | | 12.1% | | | | | 6.0% | |
| Information Technology | | | | 11.6% | | | | | 10.1% | | | | | 1.5% | |
| Materials | | | | 6.4% | | | | | 4.6% | | | | | 1.8% | |
| Telecommunication Services | | | | 1.5% | | | | | 0.8% | | | | | 0.7% | |
| Utilities | | | | 0.0% | | | | | 7.8% | | | | | -7.8% | |
| Cash | | | | 0.6% | | | | | 0.0% | | | | | 0.6% | |
| | | |
Total | | | | 100.0% | | | | | 100.0% | | | | | | |
Disclaimer
The views expressed here are exclusively those of Fund management. These views, including those related to market sectors or individual stocks, are not meant as investment advice and should not be considered predictive in nature. Any favorable (or unfavorable) description of a holding applies only as of the quarter end, June 30, 2016, unless otherwise stated. Security positions can and do change thereafter. Discussions of historical performance do not guarantee and may not be indicative of future performance.
Market volatility can significantly impact short-term performance. The Fund is not an appropriate investment for short-term investors. Investments in small companies generally carry greater risk than is customarily associated with larger companies. This additional risk is attributable to a number of factors, including the relatively limited financial resources that are typically available to small companies and the fact that small companies often have comparatively limited product lines. In addition, the stock of small companies tends to be more volatile than the stock of large companies, particularly in the short term and particularly in the early stages of an economic or market downturn. Shareholders of the Fund, therefore, are taking on more risk than they would if they invested in the stock market as a whole.
Conclusion
Thank you for your continued investment in Omni Small-Cap Value Fund. We encourage your feedback; your reactions and concerns are important to us.
Sincerely,
The Investment Management Team
| | |
Omni Small-Cap Value Fund SCHEDULE OF INVESTMENTS | | |
Showing percentage of net assets as of June 30, 2016
| | | | | | | | | | |
| Industry | | Company | | Shares | | | Value | | |
| |
COMMON STOCKS - 99.35% | | |
Aerospace & Defense - 1.14% | | |
| | AAR Corp. | | | 92,600 | | | $ 2,161,284 | | |
| | Arotech Corp.* | | | 94,300 | | | 264,983 | | |
| | CPI Aerostructures, Inc.* | | | 4,700 | | | 28,905 | | |
| | Cubic Corp. | | | 44,500 | | | 1,787,120 | | |
| | DigitalGlobe, Inc.* | | | 29,800 | | | 637,422 | | |
| | Ducommun, Inc.* | | | 43,300 | | | 856,474 | | |
| | Erickson, Inc.* | | | 1,417 | | | 864 | | |
| | LMI Aerospace, Inc.*+ | | | 20,000 | | | 160,800 | | |
| | National Presto Industries, Inc.+ | | | 5,020 | | | 473,637 | | |
| | Sypris Solutions, Inc.* | | | 6,400 | | | 5,440 | | |
| | | | | | | | | | |
| | | | |
| | | | | | | | 6,376,929 | | |
| |
Air Freight & Logistics - 1.46% | | |
| | Air T, Inc.* | | | 2,800 | | | 60,200 | | |
| | Air Transport Services Group, Inc.* | | | 321,924 | | | 4,172,135 | | |
| | Atlas Air Worldwide Holdings, Inc.* | | | 57,700 | | | 2,389,934 | | |
| | Wesco Aircraft Holdings, Inc.* | | | 113,800 | | | 1,527,196 | | |
| | | | | | | | | | |
| | | | |
| | | | | | | | 8,149,465 | | |
| |
Airlines - 1.63% | | |
| | Hawaiian Holdings, Inc.* | | | 135,634 | | | 5,148,667 | | |
| | SkyWest, Inc. | | | 148,791 | | | 3,937,010 | | |
| | | | | | | | | | |
| | | | |
| | | | | | | | 9,085,677 | | |
| |
Auto Components - 1.81% | | |
| | China Automotive Systems, Inc.*+ | | | 28,200 | | | 91,086 | | |
| | China XD Plastics Co., Ltd.* | | | 163,000 | | | 524,860 | | |
| | Commercial Vehicle Group, Inc.* | | | 57,300 | | | 297,960 | | |
| | Cooper-Standard Holding, Inc.* | | | 51,000 | | | 4,028,490 | | |
| | Modine Manufacturing Co.* | | | 142,900 | | | 1,257,520 | | |
| | Shiloh Industries, Inc.* | | | 500 | | | 3,645 | | |
| | SORL Auto Parts, Inc.* | | | 129,900 | | | 231,222 | | |
| | Spartan Motors, Inc. | | | 22,000 | | | 137,720 | | |
| | Stoneridge, Inc.* | | | 900 | | | 13,446 | | |
| | Strattec Security Corp.+ | | | 10,600 | | | 432,162 | | |
| | Superior Industries International, Inc. | | | 115,400 | | | 3,090,412 | | |
| | Westport Fuel Systems, Inc.* | | | 302 | | | 504 | | |
| | | | | | | | | | |
| | | | |
| | | | | | | | 10,109,027 | | |
| |
Biotechnology - 0.09% | | |
| | AMAG Pharmaceuticals, Inc.*+ | | | 19,000 | | | 454,480 | | |
| | | | | | | | | | |
| | | | | | | | | | |
| | | | | | | | | | |
| Industry | | Company | | Shares | | | Value | | |
| | | | |
| | | | | | | | | | |
Biotechnology (continued) | | |
| | Enzon Pharmaceuticals, Inc. | | | 60,300 | | | $ 24,422 | | |
| | | | | | | | | | |
| | | | |
| | | | | | | | 478,902 | | |
| |
Building Products - 1.16% | | |
| | Alpha Pro Tech, Ltd.* | | | 743 | | | 1,687 | | |
| | Gibraltar Industries, Inc.* | | | 126,850 | | | 4,004,654 | | |
| | Griffon Corp. | | | 140,900 | | | 2,375,574 | | |
| | Universal Forest Products, Inc. | | | 1,000 | | | 92,690 | | |
| | | | | | | | | | |
| | | | |
| | | | | | | | 6,474,605 | | |
| |
Capital Markets - 1.26% | | |
| | American Capital Senior Floating Ltd. | | | 39,000 | | | 400,140 | | |
| | Arlington Asset Investment Corp., Class A+ | | | 10,000 | | | 130,100 | | |
| | Calamos Asset Management, Inc., Class A | | | 74,000 | | | 540,940 | | |
| | Cowen Group, Inc., Class A*+ | | | 329,800 | | | 976,208 | | |
| | FBR & Co. | | | 600 | | | 8,958 | | |
| | GAMCO Investors, Inc., Class A | | | 10,000 | | | 327,700 | | |
| | Great Elm Capital Group, Inc.* | | | 833 | | | 5,489 | | |
| | INTL FCStone, Inc.* | | | 15,100 | | | 412,079 | | |
| | Investment Technology Group, Inc. | | | 57,050 | | | 953,876 | | |
| | JMP Group LLC+ | | | 300 | | | 1,629 | | |
| | KCG Holdings, Inc., Class A* | | | 109,500 | | | 1,456,350 | | |
| | Oppenheimer Holdings, Inc., Class A+ | | | 31,093 | | | 480,698 | | |
| | Piper Jaffray Cos.* | | | 35,500 | | | 1,338,350 | | |
| | | | | | | | | | |
| | | | |
| | | | | | | | 7,032,517 | | |
| |
Chemicals - 3.21% | | |
| | American Vanguard Corp. | | | 20,000 | | | 302,200 | | |
| | China Green Agriculture, Inc.* | | | 133,000 | | | 176,890 | | |
| | Core Molding Technologies, Inc.* | | | 17,000 | | | 232,050 | | |
| | FutureFuel Corp. | | | 72,800 | | | 792,064 | | |
| | Gulf Resources, Inc.* | | | 178,200 | | | 274,428 | | |
| | Innophos Holdings, Inc. | | | 10,000 | | | 422,100 | | |
| | KMG Chemicals, Inc. | | | 58,200 | | | 1,512,618 | | |
| | Kraton Performance Polymers, Inc.* | | | 142,150 | | | 3,970,250 | | |
| | LSB Industries, Inc.*+ | | | 30,000 | | | 362,400 | | |
| | Minerals Technologies, Inc. | | | 15,000 | | | 852,000 | | |
| | |
6 | | Annual Report | June 30, 2016 |
| | |
Omni Small-Cap Value Fund SCHEDULE OF INVESTMENTS (continued) | | |
Showing percentage of net assets as of June 30, 2016
| | | | | | | | | | | | |
| Industry | | Company | | Shares | | | Value | | | |
| |
Common Stocks (continued) | | | | |
Chemicals (continued) | | | | |
| | Olin Corp.+ | | | 52,500 | | | $ 1,304,100 | | | | |
| | Schulman (A.), Inc. | | | 65,108 | | | 1,589,937 | | | | |
| | Stepan Co. | | | 82,000 | | | 4,881,460 | | | | |
| | Trecora Resources* | | | 1,100 | | | 11,473 | | | | |
| | Tredegar Corp. | | | 76,700 | | | 1,236,404 | | | | |
| | | | | | | | | | | | |
| | | | | | | | 17,920,374 | | | | |
| |
Commercial Banks - 16.29% | | | | |
| | 1st Constitution Bancorp* | | | 3,000 | | | 36,060 | | | | |
| | 1st Source Corp. | | | 86,847 | | | 2,812,974 | | | | |
| | Access National Corp. | | | 2,700 | | | 52,677 | | | | |
| | ACNB Corp.+ | | | 1,000 | | | 25,110 | | | | |
| | American National Bankshares, Inc. | | | 21,800 | | | 548,924 | | | | |
| | American River Bankshares* | | | 21,300 | | | 216,195 | | | | |
| | AmeriServ Financial, Inc. | | | 5,000 | | | 15,100 | | | | |
| | Banco Latinoamericano de Comercio Exterior SA | | | 15,000 | | | 397,500 | | | | |
| | Bank of Commerce Holdings | | | 56,750 | | | 374,550 | | | | |
| | Bankwell Financial Group, Inc.+ | | | 13,300 | | | 293,398 | | | | |
| | Banner Corp. | | | 11,450 | | | 487,083 | | | | |
| | Bar Harbor Bankshares+ | | | 11,250 | | | 394,875 | | | | |
| | BBCN Bancorp, Inc. | | | 15,000 | | | 223,800 | | | | |
| | BCB Bancorp, Inc. | | | 10,400 | | | 106,496 | | | | |
| | Blue Hills Bancorp, Inc. | | | 15,000 | | | 221,400 | | | | |
| | BNC Bancorp | | | 73,844 | | | 1,676,997 | | | | |
| | Boston Private Financial Holdings, Inc. | | | 10,000 | | | 117,800 | | | | |
| | BSB Bancorp, Inc.*+ | | | 31,633 | | | 716,487 | | | | |
| | C&F Financial Corp. | | | 1,200 | | | 53,712 | | | | |
| | Camden National Corp. | | | 9,500 | | | 399,000 | | | | |
| | Capital City Bank Group, Inc. | | | 83,150 | | | 1,157,448 | | | | |
| | Cardinal Financial Corp. | | | 25,000 | | | 548,500 | | | | |
| | Carolina Bank Holdings, Inc.* | | | 500 | | | 8,740 | | | | |
| | Cascade Bancorp* | | | 17,726 | | | 98,202 | | | | |
| | Central Pacific Financial Corp. | | | 25,000 | | | 590,000 | | | | |
| | Central Valley Community Bancorp | | | 50,000 | | | 700,000 | | | | |
| | Century Bancorp, Inc., Class A | | | 15,200 | | | 643,416 | | | | |
| | Chemical Financial Corp.+ | | | 61,500 | | | 2,293,335 | | | | |
| | Chemung Financial Corp. | | | 13,500 | | | 396,225 | | | | |
| | Citizens & Northern Corp. | | | 15,000 | | | 303,300 | | | | |
| | Civista Bancshares, Inc. | | | 2,000 | | | 26,200 | | | | |
| | CNB Financial Corp. | | | 83,800 | | | 1,491,640 | | | | |
| | Coastway Bancorp, Inc.* | | | 1,513 | | | 18,837 | | | | |
| | | | | | | | | | | | |
| | | | | | | | | | |
| Industry | | Company | | Shares | | | Value | | |
| | | | |
| | | | | | | | | | |
Commercial Banks (continued) | | |
| | Codorus Valley Bancorp, Inc.+ | | | 4,189 | | | $ 85,330 | | |
| | Community Bankers Trust Corp.* | | | 5,000 | | | 25,900 | | |
| | Community Trust Bancorp, Inc. | | | 17,500 | | | 606,550 | | |
| | ConnectOne Bancorp, Inc. | | | 15,000 | | | 235,350 | | |
| | Customers Bancorp, Inc.* | | | 20,000 | | | 502,600 | | |
| | DNB Financial Corp.+ | | | 465 | | | 10,974 | | |
| | Enterprise Bancorp, Inc. | | | 38,775 | | | 930,212 | | |
| | Enterprise Financial Services Corp. | | | 27,700 | | | 772,553 | | |
| | Farmers Capital Bank Corp. | | | 34,400 | | | 940,840 | | |
| | Farmers National Banc Corp.+ | | | 150 | | | 1,320 | | |
| | Fidelity Southern Corp. | | | 37,623 | | | 589,552 | | |
| | Financial Institutions, Inc. | | | 39,300 | | | 1,024,551 | | |
| | First Bancorp | | | 114,571 | | | 2,014,158 | | |
| | First Bancorp, Inc.+ | | | 9,045 | | | 194,829 | | |
| | First BanCorp. Puerto Rico* | | | 436,500 | | | 1,732,905 | | |
| | First Busey Corp. | | | 42,191 | | | 902,465 | | |
| | First Commonwealth Financial Corp. | | | 158,300 | | | 1,456,360 | | |
| | First Community Bancshares, Inc. | | | 44,000 | | | 987,360 | | |
| | First Community Corp. | | | 600 | | | 8,394 | | |
| | First Connecticut Bancorp, Inc. | | | 16,100 | | | 266,616 | | |
| | First Financial Corp. | | | 37,000 | | | 1,354,940 | | |
| | First Internet Bancorp | | | 1,500 | | | 35,730 | | |
| | First Interstate BancSystem, Inc., Class A | | | 95,200 | | | 2,675,120 | | |
| | First Merchants Corp. | | | 79,311 | | | 1,977,223 | | |
| | First Midwest Bancorp, Inc. | | | 129,000 | | | 2,265,240 | | |
| | First of Long Island Corp. (The) | | | 12,000 | | | 344,040 | | |
| | First United Corp.* | | | 5,000 | | | 49,200 | | |
| | Flushing Financial Corp. | | | 44,297 | | | 880,624 | | |
| | FNB Corp. | | | 64,782 | | | 812,366 | | |
| | German American Bancorp, Inc. | | | 13,000 | | | 415,610 | | |
| | Great Southern Bancorp, Inc. | | | 26,900 | | | 994,493 | | |
| | Great Western Bancorp, Inc. | | | 20,000 | | | 630,800 | | |
| | Green Bancorp, Inc.* | | | 52,000 | | | 453,440 | | |
| | Hampton Roads Bankshares, Inc.* | | | 411,754 | | | 737,040 | | |
| | Heartland Financial USA, Inc. | | | 41,600 | | | 1,468,064 | | |
| | Heritage Commerce Corp. | | | 28,100 | | | 295,893 | | |
| | |
Omni Small-Cap Value Fund SCHEDULE OF INVESTMENTS (continued) | | |
Showing percentage of net assets as of June 30, 2016
| | | | | | | | | | | | |
| Industry | | Company | | Shares | | | Value | | | |
| |
Common Stocks (continued) | | | | |
Commercial Banks (continued) | | | | |
| | Heritage Financial Corp. | | | 69,860 | | | $1,228,139 | | | | |
| | Heritage Oaks Bancorp | | | 139,800 | | | 1,110,012 | | | | |
| | HomeTrust Bancshares, Inc.* | | | 2,961 | | | 54,778 | | | | |
| | Horizon Bancorp | | | 3,150 | | | 79,191 | | | | |
| | Independent Bank Corp., MI | | | 63,125 | | | 915,944 | | | | |
| | Independent Bank Group, Inc. | | | 16,900 | | | 725,179 | | | | |
| | International Bancshares Corp. | | | 65,687 | | | 1,713,774 | | | | |
| | Lakeland Bancorp, Inc. | | | 102,050 | | | 1,161,329 | | | | |
| | Landmark Bancorp, Inc. | | | 1,050 | | | 26,596 | | | | |
| | LegacyTexas Financial Group, Inc. | | | 10,000 | | | 269,100 | | | | |
| | Macatawa Bank Corp. | | | 13,200 | | | 97,944 | | | | |
| | MainSource Financial Group, Inc. | | | 67,610 | | | 1,490,800 | | | | |
| | MBT Financial Corp.+ | | | 60,322 | | | 482,576 | | | | |
| | Mercantile Bank Corp. | | | 44,100 | | | 1,052,226 | | | | |
| | Merchants Bancshares, Inc. | | | 5,000 | | | 152,400 | | | | |
| | Middleburg Financial Corp. | | | 21,400 | | | 582,080 | | | | |
| | MidWestOne Financial Group, Inc. | | | 15,000 | | | 428,400 | | | | |
| | MutualFirst Financial, Inc. | | | 18,900 | | | 516,915 | | | | |
| | National Bankshares, Inc.+ | | | 2,500 | | | 87,300 | | | | |
| | National Commerce Corp.* | | | 400 | | | 9,328 | | | | |
| | NBT Bancorp, Inc. | | | 23,000 | | | 658,490 | | | | |
| | Nicolet Bankshares, Inc.* | | | 1,355 | | | 51,598 | | | | |
| | Northrim BanCorp, Inc. | | | 30,445 | | | 800,399 | | | | |
| | OFG Bancorp | | | 45,800 | | | 380,140 | | | | |
| | Old Line Bancshares, Inc. | | | 50 | | | 900 | | | | |
| | Old National Bancorp | | | 20,000 | | | 250,600 | | | | |
| | Old Second Bancorp, Inc. | | | 54,750 | | | 373,942 | | | | |
| | Opus Bank | | | 1,500 | | | 50,700 | | | | |
| | Orrstown Financial Services, Inc.+ | | | 35,500 | | | 640,775 | | | | |
| | Pacific Continental Corp. | | | 55,500 | | | 871,905 | | | | |
| | Pacific Mercantile Bancorp* | | | 20,000 | | | 142,000 | | | | |
| | Park Sterling Corp. | | | 248,817 | | | 1,764,113 | | | | |
| | Parke Bancorp, Inc. | | | 330 | | | 4,264 | | | | |
| | Peapack Gladstone Financial Corp. | | | 6,894 | | | 127,608 | | | | |
| | Peoples Bancorp, Inc. | | | 29,200 | | | 636,268 | | | | |
| | Preferred Bank | | | 35,700 | | | 1,030,838 | | | | |
| | Premier Financial Bancorp, Inc.+ | | | 25,200 | | | 424,620 | | | | |
| | QCR Holdings, Inc. | | | 2,000 | | | 54,380 | | | | |
| | Renasant Corp. | | | 97,046 | | | 3,137,497 | | | | |
| | Republic Bancorp, Inc., Class A | | | 21,550 | | | 595,426 | | | | |
| | Republic First Bancorp, Inc.*+ | | | 37,000 | | | 159,470 | | | | |
| | | | | | | | | | | | |
| | | | | | | | | | |
| Industry | | Company | | Shares | | | Value | | |
| | | | |
| | | | | | | | | | |
Commercial Banks (continued) | | |
| | S&T Bancorp, Inc. | | | 49,300 | | | $ 1,205,385 | | |
| | Salisbury Bancorp, Inc. | | | 1,183 | | | 35,230 | | |
| | Sandy Spring Bancorp, Inc. | | | 24,000 | | | 697,440 | | |
| | SB Financial Group, Inc. | | | 28,400 | | | 308,708 | | |
| | Shore Bancshares, Inc. | | | 67,012 | | | 787,391 | | |
| | Sierra Bancorp | | | 77,800 | | | 1,298,482 | | |
| | South State Corp. | | | 14,506 | | | 987,133 | | |
| | Southern National Bancorp of Virginia, Inc. | | | 30,000 | | | 364,500 | | |
| | Southside Bancshares, Inc. | | | 22,575 | | | 698,019 | | |
| | Southwest Bancorp, Inc. | | | 32,900 | | | 556,997 | | |
| | State Bank Financial Corp. | | | 97,384 | | | 1,981,764 | | |
| | Stonegate Bank | | | 44,100 | | | 1,423,107 | | |
| | Sussex Bancorp | | | 15,000 | | | 200,400 | | |
| | Tompkins Financial Corp. | | | 12,808 | | | 832,520 | | |
| | TowneBank | | | 1,642 | | | 35,549 | | |
| | TriCo Bancshares | | | 600 | | | 16,560 | | |
| | TriState Capital Holdings, Inc.* | | | 61,900 | | | 849,887 | | |
| | Triumph Bancorp, Inc.* | | | 20,000 | | | 320,000 | | |
| | Trustmark Corp. | | | 32,100 | | | 797,685 | | |
| | Union Bankshares Corp. | | | 60,966 | | | 1,506,470 | | |
| | United Community Banks, Inc. | | | 55,650 | | | 1,017,838 | | |
| | United Security Bancshares, Inc.+ | | | 4,000 | | | 35,600 | | |
| | Univest Corp. of Pennsylvania | | | 62,600 | | | 1,315,852 | | |
| | Veritex Holdings, Inc.* | | | 30,400 | | | 487,008 | | |
| | WesBanco, Inc. | | | 70,273 | | | 2,181,977 | | |
| | Westbury Bancorp, Inc.*+ | | | 1,000 | | | 19,500 | | |
| | Wilshire Bancorp, Inc. | | | 40,000 | | | 416,800 | | |
| | Yadkin Financial Corp. | | | 3,501 | | | 87,840 | | |
| | | | | | | | | | |
| | | | |
| | | | | | | | 90,930,209 | | |
| |
Commercial Services & Supplies - 2.99% | | |
| | ACCO Brands Corp.* | | | 364,300 | | | 3,763,219 | | |
| | Acme United Corp. | | | 735 | | | 13,450 | | |
| | Command Security Corp.* | | | 26,800 | | | 71,556 | | |
| | Ecology & Environment, Inc., Class A | | | 3,500 | | | 35,770 | | |
| | EnerNOC, Inc.*+ | | | 89,100 | | | 563,112 | | |
| | Ennis, Inc. | | | 136,892 | | | 2,625,589 | | |
| | Heritage-Crystal Clean, Inc.* | | | 39,854 | | | 486,617 | | |
| | Huron Consulting Group, Inc.* | | | 4,000 | | | 241,680 | | |
| | James River Group Holdings, Ltd. | | | 70,600 | | | 2,397,576 | | |
| | Kelly Services, Inc., Class A | | | 35,500 | | | 673,435 | | |
| | Kimball International, Inc., Class B | | | 31,800 | | | 361,884 | | |
| | |
|
| 8 | | Annual Report | June 30, 2016 |
| | |
Omni Small-Cap Value Fund SCHEDULE OF INVESTMENTS (continued) | | |
Showing percentage of net assets as of June 30, 2016
| | | | | | | | | | |
| Industry | | Company | | Shares | | | Value | | |
| |
Common Stocks (continued) | | |
Commercial Services & Supplies (continued) | | |
| | McGrath RentCorp | | | 83,300 | | | $ 2,548,147 | | |
| | PRGX Global, Inc.* | | | 115,739 | | | 604,158 | | |
| | Quad/Graphics, Inc. | | | 59,300 | | | 1,381,097 | | |
| | RCM Technologies, Inc. | | | 55,200 | | | 287,592 | | |
| | TRC Cos., Inc.* | | | 10,600 | | | 66,992 | | |
| | Versar, Inc.* | | | 8,600 | | | 9,288 | | |
| | Viad Corp. | | | 17,400 | | | 539,400 | | |
| | Willdan Group, Inc.* | | | 3,900 | | | 41,418 | | |
| | | | | | | | | | |
| | | | |
| | | | | | | | 16,711,980 | | |
| | |
Communications Equipment - 1.19% | | | | | |
| | ATN International, Inc.+ | | | 11,475 | | | 892,870 | | |
| | Bel Fuse, Inc., Class B | | | 18,500 | | | 328,930 | | |
| | Black Box Corp. | | | 35,900 | | | 469,572 | | |
| | Communications Systems, Inc. | | | 4,150 | | | 28,926 | | |
| | Comtech Telecommunications Corp. | | | 10,000 | | | 128,400 | | |
| | Digi International, Inc.* | | | 30,325 | | | 325,387 | | |
| | Finisar Corp.* | | | 80,700 | | | 1,413,057 | | |
| | Harmonic, Inc.* | | | 700 | | | 1,995 | | |
| | Infosonics Corp.* | | | 15,000 | | | 12,300 | | |
| | NETGEAR, Inc.* | | | 36,030 | | | 1,712,866 | | |
| | PC-Tel, Inc. | | | 56,700 | | | 267,057 | | |
| | Polycom, Inc.* | | | 92,300 | | | 1,038,375 | | |
| | Zhone Technologies, Inc.* | | | 38,100 | | | 45,339 | | |
| | | | | | | | | | |
| | | | |
| | | | | | | | 6,665,074 | | |
| |
Computers & Peripherals - 0.50% | | |
| | Concurrent Computer Corp. | | | 53,600 | | | 279,792 | | |
| | QLogic Corp.* | | | 162,150 | | | 2,390,091 | | |
| | USA Technologies, Inc.*+ | | | 25,000 | | | 106,750 | | |
| | | | | | | | | | |
| | | | |
| | | | | | | | 2,776,633 | | |
| |
Construction & Engineering - 1.81% | | |
| | Aegion Corp.* | | | 99,341 | | | 1,938,143 | | |
| | Goldfield Corp. (The)* | | | 121,000 | | | 396,880 | | |
| | Great Lakes Dredge & Dock Corp.* | | | 187,550 | | | 817,718 | | |
| | IES Holdings, Inc.* | | | 2,717 | | | 33,745 | | |
| | KB Home+ | | | 175,900 | | | 2,675,439 | | |
| | MasTec, Inc.* | | | 103,700 | | | 2,314,584 | | |
| | MYR Group, Inc.* | | | 12,100 | | | 291,368 | | |
| | Northwest Pipe Co.* | | | 1,000 | | | 10,780 | | |
| | Orion Marine Group, Inc.* | | | 27,592 | | | 146,514 | | |
| | Sterling Construction Co., Inc.* | | | 96,400 | | | 473,324 | | |
| | Tutor Perini Corp.* | | | 43,200 | | | 1,017,360 | | |
| | | | | | | | | | |
| | | | |
| | | | | | | | 10,115,855 | | |
| | | | | | | | | | |
| | | | | | | | | | |
| Industry | | Company | | Shares | | | Value | | |
| | | | | | | | | | |
Consumer Finance - 1.43% | | |
| | Cash America International, Inc. | | | 80,700 | | | $3,439,434 | | |
| | Consumer Portfolio Services, Inc.*+ | | | 97,000 | | | 365,690 | | |
| | Encore Capital Group, Inc.*+ | | | 19,600 | | | 461,188 | | |
| | EZCORP, Inc., Class A* | | | 33,900 | | | 256,284 | | |
| | Green Dot Corp., Class A* | | | 84,600 | | | 1,944,954 | | |
| | Nelnet, Inc., Class A | | | 7,800 | | | 271,050 | | |
| | Nicholas Financial, Inc.* | | | 25,000 | | | 257,000 | | |
| | Regional Management Corp.* | | | 43,100 | | | 631,846 | | |
| | World Acceptance Corp.* | | | 7,700 | | | 351,120 | | |
| | | | | | | | | | |
| | | | |
| | | | | | | | 7,978,566 | | |
| |
Distributors - 0.32% | | |
| | AMCON Distributing Co.+ | | | 1,350 | | | 117,450 | | |
| | Essendant, Inc. | | | 47,600 | | | 1,454,656 | | |
| | VOXX International Corp.* | | | 67,100 | | | 187,209 | | |
| | Weyco Group, Inc. | | | 200 | | | 5,556 | | |
| | | | | | | | | | |
| | | | |
| | | | | | | | 1,764,871 | | |
| |
Diversified Consumer Services - 0.65% | | |
| | American Public Education, Inc.* | | | 10,000 | | | 281,000 | | |
| | DeVry Education Group, Inc.+ | | | 22,900 | | | 408,536 | | |
| | K12, Inc.* | | | 55,600 | | | 694,444 | | |
| | Lincoln Educational Services Corp.* | | | 91,900 | | | 137,850 | | |
| | Regis Corp.* | | | 168,150 | | | 2,093,468 | | |
| | | | | | | | | | |
| | | | |
| | | | | | | | 3,615,298 | | |
| |
Diversified Financial Services - 0.81% | | |
| | Enova International, Inc.*+ | | | 9,333 | | | 68,691 | | |
| | GAIN Capital Holdings, Inc. | | | 139,805 | | | 883,568 | | |
| | Higher One Holdings, Inc.* | | | 157,700 | | | 805,847 | | |
| | Marlin Business Services Corp. | | | 10,580 | | | 172,454 | | |
| | PHH Corp.* | | | 45,050 | | | 600,066 | | |
| | Resource America, Inc., Class A | | | 65,291 | | | 634,629 | | |
| | Sterling Bancorp | | | 58,384 | | | 916,629 | | |
| | Summit Financial Group, Inc.+ | | | 22,015 | | | 385,262 | | |
| | Tiptree Financial, Inc., Class A+ | | | 10,000 | | | 54,800 | | |
| | | | | | | | | | |
| | | | |
| | | | | | | | 4,521,946 | | |
| | |
Omni Small-Cap Value Fund SCHEDULE OF INVESTMENTS (continued) | | |
Showing percentage of net assets as of June 30, 2016
| | | | | | | | | | |
| Industry | | Company | | Shares | | | Value | | |
| |
Common Stocks (continued) | | |
Diversified Telecommunication Services - 0.91% | | |
| | Alaska Communications Systems Group, Inc.* | | | 347,100 | | | $ 590,070 | | |
| | Hawaiian Telcom Holdco, Inc.* | | | 44,500 | | | 942,955 | | |
| | Iridium Communications, Inc.*+ | | | 391,325 | | | 3,474,966 | | |
| | Lumos Networks Corp.* | | | 5,000 | | | 60,500 | | |
| | | | | | | | | | |
| | | | |
| | | | | | | | 5,068,491 | | |
| |
Electrical Equipment - 0.78% | | |
| | Broadwind Energy, Inc.*+ | | | 5,000 | | | 21,100 | | |
| | Encore Wire Corp. | | | 16,500 | | | 615,120 | | |
| | General Cable Corp. | | | 65,000 | | | 826,150 | | |
| | Highpower International, Inc.* | | | 25,923 | | | 48,994 | | |
| | II-VI, Inc.* | | | 79,250 | | | 1,486,730 | | |
| | LSI Industries, Inc. | | | 15,000 | | | 166,050 | | |
| | Novanta, Inc.* | | | 9,600 | | | 145,440 | | |
| | Powell Industries, Inc. | | | 25,000 | | | 983,500 | | |
| | Preformed Line Products Co. | | | 1,000 | | | 40,390 | | |
| | Ultralife Corp.* | | | 7,350 | | | 36,824 | | |
| | | | | | | | | | |
| | | | |
| | | | | | | | 4,370,298 | | |
| |
Electronic Equipment, Instruments & Components - 3.27% | | |
| | Benchmark Electronics, Inc.* | | | 134,000 | | | 2,834,100 | | |
| | Electro Rent Corp. | | | 20,000 | | | 308,200 | | |
| | Fabrinet* | | | 30,050 | | | 1,115,456 | | |
| | Insight Enterprises, Inc.* | | | 64,800 | | | 1,684,800 | | |
| | Iteris, Inc.* | | | 87,000 | | | 248,820 | | |
| | Key Tronic Corp.* | | | 22,000 | | | 165,660 | | |
| | Kimball Electronics, Inc.* | | | 50,400 | | | 627,480 | | |
| | PAR Technology Corp.* | | | 101,800 | | | 487,622 | | |
| | PCM, Inc.* | | | 8,769 | | | 97,687 | | |
| | Rofin-Sinar Technologies, Inc.* | | | 20,000 | | | 638,800 | | |
| | Sanmina Corp.* | | | 142,700 | | | 3,825,787 | | |
| | ScanSource, Inc.* | | | 500 | | | 18,555 | | |
| | SigmaTron International, Inc.* | | | 2,500 | | | 15,200 | | |
| | SMTC Corp.* | | | 7,500 | | | 11,325 | | |
| | TTM Technologies, Inc.* | | | 520,153 | | | 3,916,752 | | |
| | Vishay Precision Group, Inc.* | | | 166,448 | | | 2,233,732 | | |
| | Wireless Telecom Group, Inc.* | | | 10,000 | | | 13,400 | | |
| | | | | | | | | | |
| | | | |
| | | | | | | | 18,243,376 | | |
| |
Energy Equipment & Services - 1.42% | | |
| | Basic Energy Services, Inc.*+ | | | 800 | | | 1,344 | | |
| | | | | | | | | | |
| | | | | | | | | | |
| Industry | | Company | | Shares | | | Value | | |
| | | | |
| | | | | | | | | | |
Energy Equipment & Services (continued) | | |
| | C&J Energy Services, Ltd.* | | | 1,200 | | | $ 723 | | |
| | ENGlobal Corp.* | | | 80,422 | | | 96,506 | | |
| | Era Group, Inc.* | | | 56,300 | | | 529,220 | | |
| | Gulf Island Fabrication, Inc. | | | 15,003 | | | 104,121 | | |
| | Natural Gas Services Group, Inc.* | | | 68,800 | | | 1,575,520 | | |
| | Newpark Resources, Inc.* | | | 50,000 | | | 289,500 | | |
| | Parker Drilling Co.* | | | 664,950 | | | 1,522,736 | | |
| | PHI, Inc.*+ | | | 12,300 | | | 219,924 | | |
| | Pioneer Energy Services Corp.* | | | 198,300 | | | 912,180 | | |
| | SEACOR Holdings, Inc.*+ | | | 45,900 | | | 2,659,905 | | |
| | | | | | | | | | |
| | | | |
| | | | | | | | 7,911,679 | | |
| |
Food & Staples Retailing - 1.86% | | |
| | Andersons, Inc. (The) | | | 88,100 | | | 3,131,074 | | |
| | Ingles Markets, Inc., Class A | | | 49,800 | | | 1,857,540 | | |
| | SpartanNash Co. | | | 145,946 | | | 4,463,029 | | |
| | Village Super Market, Inc., Class A | | | 1,709 | | | 49,373 | | |
| | Weis Markets, Inc. | | | 17,500 | | | 884,625 | | |
| | | | | | | | | | |
| | | | |
| | | | | | | | 10,385,641 | | |
| |
Food Products - 0.90% | | |
| | Alico, Inc. | | | 5,800 | | | 175,450 | | |
| | Fresh Del Monte Produce, Inc. | | | 6,650 | | | 361,960 | | |
| | Omega Protein Corp.* | | | 123,750 | | | 2,473,762 | | |
| | Post Holdings, Inc.*+ | | | 6,000 | | | 496,140 | | |
| | S&W Seed Co.*+ | | | 20,000 | | | 87,200 | | |
| | Seneca Foods Corp., Class A* | | | 40,100 | | | 1,452,021 | | |
| | | | | | | | | | |
| | | | |
| | | | | | | | 5,046,533 | | |
| |
Health Care Equipment & Supplies - 0.21% | | |
| | AngioDynamics, Inc.* | | | 14,400 | | | 206,928 | | |
| | Exactech, Inc.* | | | 17,500 | | | 467,950 | | |
| | Kewaunee Scientific Corp. | | | 3,000 | | | 56,640 | | |
| | Symmetry Surgical, Inc.*+ | | | 33,350 | | | 437,886 | | |
| | | | | | | | | | |
| | | | |
| | | | | | | | 1,169,404 | | |
| |
Health Care Providers & Services - 1.91% | | |
| | Almost Family, Inc.* | | | 600 | | | 25,566 | | |
| | Amedisys, Inc.* | | | 16,100 | | | 812,728 | | |
| | Everyday Health, Inc.* | | | 8,000 | | | 63,040 | | |
| | Five Star Quality Care, Inc.* | | | 214,650 | | | 502,281 | | |
| | Healthways, Inc.* | | | 10,000 | | | 115,500 | | |
| | InfuSystems Holdings, Inc.* | | | 36,100 | | | 93,860 | | |
| | Kindred Healthcare, Inc. | | | 81,350 | | | 918,442 | | |
| | LHC Group, Inc.* | | | 1,000 | | | 43,280 | | |
| | Magellan Health, Inc.* | | | 26,225 | | | 1,724,818 | | |
| | |
|
| 10 | | Annual Report | June 30, 2016 |
| | |
Omni Small-Cap Value Fund SCHEDULE OF INVESTMENTS (continued) | | |
Showing percentage of net assets as of June 30, 2016
| | | | | | | | | | |
| Industry | | Company | | Shares | | | Value | | |
| |
Common Stocks (continued) | | |
Health Care Providers & Services (continued) | | |
| | National Healthcare Corp. | | | 13,000 | | | $ 841,620 | | |
| | PharMerica Corp.* | | | 36,750 | | | 906,255 | | |
| | Select Medical Holdings Corp.* | | | 150,000 | | | 1,630,500 | | |
| | Triple-S Management Corp., Class B* | | | 122,300 | | | 2,987,789 | | |
| | | | | | | | | | |
| | | | |
| | | | | | | | 10,665,679 | | |
| |
Health Care Technology - 0.10% | | |
| | Halyard Health, Inc.* | | | 17,800 | | | 578,856 | | |
| |
Hotels, Restaurants & Leisure - 2.73% | | |
| | Caesars Entertainment Corp.*+ | | | 50,000 | | | 384,500 | | |
| | Century Casinos, Inc.* | | | 59,600 | | | 371,308 | | |
| | Flanigan’s Enterprises, Inc.+ | | | 2,500 | | | 51,700 | | |
| | International Speedway Corp., Class A | | | 76,456 | | | 2,557,453 | | |
| | Intrawest Resorts Holdings, Inc.*+ | | | 79,300 | | | 1,029,314 | | |
| | Isle of Capri Casinos, Inc.* | | | 46,200 | | | 846,384 | | |
| | Luby’s, Inc.*+ | | | 207,600 | | | 1,042,152 | | |
| | Marcus Corp. (The) | | | 130,150 | | | 2,746,165 | | |
| | Monarch Casino & Resort, Inc.* | | | 29,400 | | | 645,918 | | |
| | Nevada Gold & Casinos, Inc.*+ | | | 10,300 | | | 19,879 | | |
| | Peak Resorts, Inc. | | | 104,000 | | | 474,240 | | |
| | Penn National Gaming, Inc.* | | | 133,800 | | | 1,866,510 | | |
| | Red Lion Hotels Corp.* | | | 43,905 | | | 318,750 | | |
| | Ruby Tuesday, Inc.* | | | 200,300 | | | 723,083 | | |
| | Speedway Motorsports, Inc. | | | 120,800 | | | 2,144,200 | | |
| | | | | | | | | | |
| | | | |
| | | | | | | | 15,221,556 | | |
| |
Household Durables - 1.08% | | |
| | Bassett Furniture Industries, Inc. | | | 80,500 | | | 1,927,170 | | |
| | CSS Industries, Inc. | | | 53,100 | | | 1,423,611 | | |
| | Hooker Furniture Corp. | | | 15,000 | | | 322,350 | | |
| | Lifetime Brands, Inc. | | | 60,900 | | | 888,531 | | |
| | NACCO Industries, Inc., Class A | | | 9,250 | | | 518,000 | | |
| | P&F Industries, Inc., Class A | | | 696 | | | 6,508 | | |
| | William Lyon Homes, Class A*+ | | | 10,000 | | | 161,200 | | |
| | ZAGG, Inc.* | | | 145,700 | | | 764,925 | | |
| | | | | | | | | | |
| | | | |
| | | | | | | | 6,012,295 | | |
| |
Household Products - 0.97% | | |
| | Central Garden & Pet Co., Class A* | | | 245,003 | | | 5,319,015 | | |
| | | | | | | | | | |
| | | | | | | | | | |
| Industry | | Company | | Shares | | | Value | | |
| | | | |
| | | | | | | | | | |
Household Products (continued) | | |
| | Oil-Dri Corp. of America | | | 3,000 | | | $ 103,590 | | |
| | | | | | | | | | |
| | | | |
| | | | | | | | 5,422,605 | | |
| |
Insurance - 9.24% | | |
| | 1347 Property Insurance Holdings, Inc.* | | | 24,300 | | | 155,277 | �� | |
| | Ambac Financial Group, Inc.* | | | 66,000 | | | 1,086,360 | | |
| | American Equity Investment Life Holding Co. | | | 850 | | | 12,112 | | |
| | American Independence Corp.* | | | 1,800 | | | 44,154 | | |
| | AMERISAFE, Inc. | | | 26,800 | | | 1,640,696 | | |
| | Argo Group International Holdings Ltd. | | | 39,160 | | | 2,032,404 | | |
| | Baldwin & Lyons, Inc., Class B | | | 75,300 | | | 1,856,898 | | |
| | Citizens, Inc.*+ | | | 13,040 | | | 99,104 | | |
| | Crawford & Co., Class A | | | 11,600 | | | 88,508 | | |
| | Donegal Group, Inc., Class A | | | 26,900 | | | 443,581 | | |
| | EMC Insurance Group, Inc. | | | 30,550 | | | 846,846 | | |
| | Employers Holdings, Inc. | | | 91,300 | | | 2,649,526 | | |
| | FBL Financial Group, Inc., Class A | | | 50,806 | | | 3,082,400 | | |
| | Federated National Holding Co. | | | 37,288 | | | 709,964 | | |
| | Fidelity & Guaranty Life+ | | | 40,800 | | | 945,744 | | |
| | First Acceptance Corp.* | | | 140,000 | | | 196,000 | | |
| | Hallmark Financial Services, Inc.* | | | 57,800 | | | 669,902 | | |
| | HCI Group, Inc.+ | | | 40,400 | | | 1,102,112 | | |
| | Heritage Insurance Holdings, Inc.+ | | | 50,000 | | | 598,500 | | |
| | Horace Mann Educators Corp. | | | 93,600 | | | 3,162,744 | | |
| | Independence Holding Co. | | | 15,050 | | | 270,448 | | |
| | Infinity Property & Casualty Corp. | | | 20,900 | | | 1,685,794 | | |
| | Investors Title Co. | | | 1,000 | | | 95,250 | | |
| | Kansas City Life Insurance Co. | | | 7,000 | | | 276,640 | | |
| | Kingstone Cos., Inc. | | | 4,300 | | | 38,055 | | |
| | Maiden Holdings, Ltd. | | | 219,500 | | | 2,686,680 | | |
| | MBIA, Inc.* | | | 100,000 | | | 683,000 | | |
| | National Interstate Corp. | | | 23,000 | | | 695,750 | | |
| | National Western Life Group, Inc., Class A | | | 5,614 | | | 1,096,246 | | |
| | Navigators Group, Inc. (The) | | | 37,350 | | | 3,435,080 | | |
| | NMI Holdings, Inc., Class A* | | | 250,000 | | | 1,370,000 | | |
| | |
Omni Small-Cap Value Fund SCHEDULE OF INVESTMENTS (continued) | | |
Showing percentage of net assets as of June 30, 2016
| | | | | | | | | | | | |
| Industry | | Company | | Shares | | | Value | | | |
| |
Common Stocks (continued) | | | | |
Insurance (continued) | | | | |
| | OneBeacon Insurance Group Ltd., Class A | | | 87,800 | | | $ 1,211,640 | | | | |
| | Safety Insurance Group, Inc. | | | 24,000 | | | 1,477,920 | | | | |
| | Selective Insurance Group, Inc. | | | 90,950 | | | 3,475,200 | | | | |
| | State Auto Financial Corp. | | | 48,400 | | | 1,060,444 | | | | |
| | State National Cos, Inc. | | | 25,000 | | | 263,250 | | | | |
| | Stewart Information Services Corp. | | | 87,150 | | | 3,608,882 | | | | |
| | Third Point Reinsurance Ltd.*+ | | | 70,000 | | | 820,400 | | | | |
| | United Fire Group, Inc. | | | 78,800 | | | 3,343,484 | | | | |
| | United Insurance Holdings Corp.+ | | | 60,000 | | | 982,800 | | | | |
| | Universal Insurance Holdings, Inc.+ | | | 86,316 | | | 1,603,751 | | | | |
| | | | | | | | | | | | |
| | | | |
| | | | | | | | 51,603,546 | | | | |
| |
Internet & Catalog Retail - 0.15% | | | | |
| | CafePress, Inc.* | | | 11,000 | | | 34,100 | | | | |
| | FTD Cos., Inc.* | | | 25,380 | | | 633,485 | | | | |
| | Lands’ End, Inc.*+ | | | 10,000 | | | 164,200 | | | | |
| | | | | | | | | | | | |
| | | | |
| | | | | | | | 831,785 | | | | |
| |
Internet Software & Services - 0.43% | | | | |
| | Autobytel, Inc.*+ | | | 500 | | | 6,935 | | | | |
| | Blucora, Inc.* | | | 17,597 | | | 182,305 | | | | |
| | Liquidity Services, Inc.*+ | | | 41,200 | | | 323,008 | | | | |
| | Marchex, Inc., Class B* | | | 70,000 | | | 222,600 | | | | |
| | MeetMe, Inc.* | | | 35,100 | | | 187,083 | | | | |
| | Monster Worldwide, Inc.* | | | 114,100 | | | 272,699 | | | | |
| | RetailMeNot, Inc.* | | | 15,000 | | | 115,650 | | | | |
| | Synacor, Inc.* | | | 64,000 | | | 197,120 | | | | |
| | United Online, Inc.* | | | 69,729 | | | 767,019 | | | | |
| | YuMe, Inc.*+ | | | 35,700 | | | 131,376 | | | | |
| | | | | | | | | | | | |
| | | | |
| | | | | | | | 2,405,795 | | | | |
| |
IT Services - 1.88% | | | | |
| | CIBER, Inc.* | | | 350 | | | 525 | | | | |
| | Computer Task Group, Inc.+ | | | 4,400 | | | 21,868 | | | | |
| | Edgewater Technology, Inc.* | | | 51,100 | | | 441,504 | | | | |
| | Engility Holdings, Inc.* | | | 56,700 | | | 1,197,504 | | | | |
| | Everi Holdings, Inc.* | | | 60,000 | | | 69,000 | | | | |
| | ManTech International Corp., Class A | | | 108,800 | | | 4,114,816 | | | | |
| | ModusLink Global Solutions, Inc.* | | | 46,900 | | | 57,687 | | | | |
| | NCI, Inc., Class A+ | | | 62,804 | | | 882,396 | | | | |
| | NeuStar, Inc., Class A*+ | | | 64,881 | | | 1,525,352 | | | | |
| | Sykes Enterprises, Inc.* | | | 75,134 | | | 2,175,881 | | | | |
| | | | | | | | | | | | |
| | | | |
| | | | | | | | 10,486,533 | | | | |
| | | | | | | | | | | | |
| | | | | | | | | | |
| Industry | | Company | | Shares | | | Value | | |
| |
| | |
Leisure Equipment & Products - 0.22% | | |
| | Arctic Cat, Inc.+ | | | 8,000 | | | $ 136,000 | | |
| | JAKKS Pacific, Inc.*+ | | | 31,200 | | | 246,792 | | |
| | Johnson Outdoors, Inc., Class A | | | 32,779 | | | 842,420 | | |
| | | | | | | | | | |
| | | | |
| | | | | | | | 1,225,212 | | |
| |
Machinery - 1.66% | | |
| | American Railcar Industries, Inc.+ | | | 12,900 | | | 509,163 | | |
| | Ampco-Pittsburgh Corp. | | | 24,047 | | | 271,972 | | |
| | Briggs & Stratton Corp. | | | 114,300 | | | 2,420,874 | | |
| | Chart Industries, Inc.* | | | 10,800 | | | 260,604 | | |
| | Chicago Rivet & Machine Co. | | | 1,000 | | | 27,220 | | |
| | Cleantech Solutions International, Inc.*+ | | | 11,500 | | | 11,500 | | |
| | Columbus McKinnon Corp. | | | 5,400 | | | 76,410 | | |
| | Dynamic Materials Corp.+ | | | 20,100 | | | 216,075 | | |
| | Eastern Co. (The) | | | 18,401 | | | 305,089 | | |
| | FreightCar America, Inc. | | | 22,381 | | | 314,453 | | |
| | Hardinge, Inc. | | | 86,400 | | | 869,184 | | |
| | Hurco Companies, Inc. | | | 17,857 | | | 496,960 | | |
| | Kennametal, Inc. | | | 13,000 | | | 287,430 | | |
| | L.B. Foster Co., Class A | | | 100 | | | 1,089 | | |
| | L.S. Starrett Co. (The), Class A | | | 27,500 | | | 327,525 | | |
| | NN, Inc. | | | 45,500 | | | 636,545 | | |
| | Supreme Industries, Inc., Class A | | | 35,805 | | | 490,528 | | |
| | TriMas Corp.* | | | 20,000 | | | 360,000 | | |
| | Wabash National Corp.*+ | | | 110,100 | | | 1,398,270 | | |
| | WSI Industries, Inc.+ | | | 1,300 | | | 3,926 | | |
| | | | | | | | | | |
| | | | |
| | | | | | | | 9,284,817 | | |
| |
Marine - 1.57% | | |
| | Dorian LPG, Ltd.* | | | 163,000 | | | 1,149,150 | | |
| | Frontline, Ltd.+ | | | 35,300 | | | 277,811 | | |
| | Navios Maritime Acquisition Corp. | | | 368,800 | | | 579,016 | | |
| | Navios Maritime Holdings, Inc. | | | 500 | | | 405 | | |
| | Nordic American Tankers Ltd.+ | | | 131,300 | | | 1,823,757 | | |
| | Overseas Shipholding Group, Inc., Class A | | | 1,316 | | | 14,463 | | |
| | Rand Logistics, Inc.*+ | | | 9,000 | | | 9,270 | | |
| | Scorpio Tankers, Inc. | | | 230,000 | | | 966,000 | | |
| | Ship Finance International, Ltd.+ | | | 185,000 | | | 2,726,900 | | |
| | |
|
| 12 | | Annual Report | June 30, 2016 |
| | |
Omni Small-Cap Value Fund SCHEDULE OF INVESTMENTS (continued) | | |
Showing percentage of net assets as of June 30, 2016
| | | | | | | | | | | | |
| Industry | | Company | | Shares | | | Value | | | |
| |
Common Stocks (continued) | | | | |
Marine (continued) | | | | |
| | Teekay Tankers, Ltd., Class A+ | | | 404,800 | | | $ 1,206,304 | | | | |
| | | | | | | | | | | | |
| | | | |
| | | | | | | | 8,753,076 | | | | |
| |
Media - 1.90% | | | | |
| | Entercom Communications Corp., Class A | | | 220,225 | | | 2,988,453 | | | | |
| | Eros International PLC*+ | | | 24,700 | | | 401,869 | | | | |
| | Global Sources, Ltd.* | | | 4,200 | | | 38,514 | | | | |
| | Harte-Hanks, Inc. | | | 83,400 | | | 132,606 | | | | |
| | Insignia Systems, Inc.* | | | 4,900 | | | 10,682 | | | | |
| | McClatchy Co. (The), Class A*+ | | | 15,432 | | | 225,616 | | | | |
| | New Media Investment Group, Inc. | | | 63,300 | | | 1,143,831 | | | | |
| | Radio One, Inc., Class D* | | | 800 | | | 2,552 | | | | |
| | Reading International, Inc., Class A* | | | 31,209 | | | 389,800 | | | | |
| | Saga Communications, Inc., Class A | | | 6,765 | | | 267,488 | | | | |
| | Salem Media Group, Inc.+ | | | 83,452 | | | 602,523 | | | | |
| | Scholastic Corp.+ | | | 72,800 | | | 2,883,608 | | | | |
| | Sizmek, Inc.* | | | 4,700 | | | 10,763 | | | | |
| | Time, Inc. | | | 26,350 | | | 433,721 | | | | |
| | Townsquare Media, Inc., Class A* | | | 140,056 | | | 1,105,042 | | | | |
| | | | | | | | | | | | |
| | | | |
| | | | | | | | 10,637,068 | | | | |
| |
Metals & Mining - 2.19% | | | | |
| | Carpenter Technology Corp.+ | | | 36,600 | | | 1,205,238 | | | | |
| | Century Aluminum Co.* | | | 147,100 | | | 931,143 | | | | |
| | Coeur Mining, Inc.* | | | 91,800 | | | 978,588 | | | | |
| | Ferroglobe PLC+ | | | 20,000 | | | 172,200 | | | | |
| | Handy & Harman, Ltd.* | | | 8,150 | | | 213,448 | | | | |
| | Haynes International, Inc. | | | 25,200 | | | 808,416 | | | | |
| | Hecla Mining Co.+ | | | 557,000 | | | 2,840,700 | | | | |
| | Kaiser Aluminum Corp. | | | 21,980 | | | 1,987,212 | | | | |
| | Materion Corp. | | | 48,600 | | | 1,203,336 | | | | |
| | Olympic Steel, Inc. | | | 20,000 | | | 546,200 | | | | |
| | Schnitzer Steel Industries, Inc., Class A | | | 59,700 | | | 1,050,720 | | | | |
| | Stillwater Mining Co.* | | | 20,000 | | | 237,200 | | | | |
| | Synalloy Corp.+ | | | 7,000 | | | 53,620 | | | | |
| | | | | | | | | | | | |
| | | | |
| | | | | | | | 12,228,021 | | | | |
| |
Multiline Retail - 0.39% | | | | |
| | Fred’s, Inc., Class A | | | 133,600 | | | 2,152,296 | | | | |
| |
Oil, Gas & Consumable Fuels - 6.31% | | | | |
| | Adams Resources & Energy, Inc. | | | 23,100 | | | 889,350 | | | | |
| | | | | | | | | | | | |
| | | | | | | | |
| Industry | | Company | | Shares | | | Value |
| | | |
| | | | | | | | |
Oil, Gas & Consumable Fuels (continued) |
| | Alon USA Energy, Inc. | | | 232,850 | | | $ 1,508,868 |
| | Ardmore Shipping Corp. | | | 99,700 | | | 674,969 |
| | Bill Barrett Corp.*+ | | | 1,000 | | | 6,390 |
| | Bonanza Creek Energy, Inc.*+ | | | 16,000 | | | 32,160 |
| | California Resources Corp.+ | | | 40,000 | | | 488,000 |
| | Callon Petroleum Co.* | | | 336,300 | | | 3,776,649 |
| | Clayton Williams Energy, Inc.*+ | | | 54,500 | | | 1,496,570 |
| | Cloud Peak Energy, Inc.*+ | | | 800 | | | 1,648 |
| | Delek US Holdings, Inc. | | | 90,000 | | | 1,188,900 |
| | DHT Holdings, Inc. | | | 425,122 | | | 2,138,364 |
| | Earthstone Energy, Inc.*+ | | | 3,202 | | | 34,518 |
| | Forum Energy Technologies, Inc.* | | | 148,310 | | | 2,567,246 |
| | Gastar Exploration, Inc.* | | | 2,540 | | | 2,794 |
| | Gran Tierra Energy, Inc.*+ | | | 148,100 | | | 500,578 |
| | Green Plains, Inc. | | | 90,200 | | | 1,778,744 |
| | Hallador Energy Co.+ | | | 70,000 | | | 323,400 |
| | Independence Contract Drilling, Inc.*+ | | | 115,519 | | | 627,268 |
| | ION Geophysical Corp.*+ | | | 3,333 | | | 20,765 |
| | Matador Resources Co.*+ | | | 95,000 | | | 1,881,000 |
| | McDermott International, Inc.*+ | | | 538,400 | | | 2,659,696 |
| | Mexco Energy Corp.* | | | 6,000 | | | 14,820 |
| | Mitcham Industries, Inc.* | | | 15,100 | | | 56,625 |
| | MRC Global, Inc.* | | | 195,500 | | | 2,778,055 |
| | New Concept Energy, Inc.* | | | 4,800 | | | 8,688 |
| | Northern Oil and Gas, Inc.*+ | | | 1,000 | | | 4,620 |
| | Oasis Petroleum, Inc.* | | | 237,000 | | | 2,213,580 |
| | Oil States International, Inc.* | | | 18,000 | | | 591,840 |
| | Pacific Ethanol, Inc.*+ | | | 1,000 | | | 5,450 |
| | Renewable Energy Group, Inc.*+ | | | 163,885 | | | 1,447,105 |
| | REX American Resources Corp.* | | | 33,920 | | | 2,029,434 |
| | Ring Energy, Inc.*+ | | | 50,000 | | | 441,000 |
| | Sanchez Energy Corp.* | | | 500 | | | 3,530 |
| | SM Energy Co.+ | | | 12,000 | | | 324,000 |
| | Synergy Resources Corp.*+ | | | 110,000 | | | 732,600 |
| | TETRA Technologies, Inc.* | | | 303,600 | | | 1,933,932 |
| | TransAtlantic Petroleum, Ltd.* | | | 28,500 | | | 23,370 |
| | W&T Offshore, Inc.*+ | | | 800 | | | 1,856 |
| | | | | | | | |
| | | |
| | | | | | | | 35,208,382 |
|
Paper & Forest Products - 0.98% |
| | Clearwater Paper Corp.* | | | 30,500 | | | 1,993,785 |
| | Mercer International, Inc. | | | 276,250 | | | 2,204,475 |
| | |
Omni Small-Cap Value Fund SCHEDULE OF INVESTMENTS (continued) | | |
Showing percentage of net assets as of June 30, 2016
| | | | | | | | | | | | |
| Industry | | Company | | Shares | | | Value | | | |
| |
Common Stocks (continued) | | | | |
Paper & Forest Products (continued) | | | | |
| | PH Glatfelter Co. | | | 63,800 | | | $ 1,247,928 | | | | |
| | | | | | | | | | | | |
| | | | |
| | | | | | | | 5,446,188 | | | | |
| |
Personal Products - 0.16% | | | | |
| | Mannatech, Inc.*+ | | | 8,400 | | | 170,016 | | | | |
| | Natural Alternatives International, Inc.* | | | 6,400 | | | 70,656 | | | | |
| | Nutraceutical International Corp.* | | | 28,700 | | | 664,405 | | | | |
| | | | | | | | | | | | |
| | | | |
| | | | | | | | 905,077 | | | | |
| |
Pharmaceuticals - 0.10% | | | | |
| | Cumberland Pharmaceuticals, Inc.*+ | | | 23,000 | | | 103,500 | | | | |
| | Enanta Pharmaceuticals, Inc.*+ | | | 20,000 | | | 441,000 | | | | |
| | | | | | | | | | | | |
| | | | |
| | | | | | | | 544,500 | | | | |
| |
Professional Services - 2.75% | | | | |
| | CBIZ, Inc.* | | | 142,600 | | | 1,484,466 | | | | |
| | CDI Corp. | | | 51,689 | | | 315,303 | | | | |
| | CRA International, Inc.* | | | 53,500 | | | 1,349,270 | | | | |
| | FTI Consulting, Inc.* | | | 56,700 | | | 2,306,556 | | | | |
| | Heidrick & Struggles International, Inc. | | | 55,000 | | | 928,400 | | | | |
| | ICF International, Inc.* | | | 36,229 | | | 1,481,766 | | | | |
| | Mistras Group, Inc.* | | | 15,000 | | | 358,050 | | | | |
| | Navigant Consulting, Inc.* | | | 239,600 | | | 3,869,540 | | | | |
| | RPX Corp.* | | | 269,200 | | | 2,468,564 | | | | |
| | TrueBlue, Inc.* | | | 250 | | | 4,730 | | | | |
| | VSE Corp. | | | 11,800 | | | 788,240 | | | | |
| | | | | | | | | | | | |
| | | | |
| | | | | | | | 15,354,885 | | | | |
| |
Real Estate Management & Development - 0.26% | | | | |
| | Forestar Group, Inc.* | | | 80,000 | | | 951,200 | | | | |
| | RE/MAX Holdings, Inc., Class A | | | 6,168 | | | 248,324 | | | | |
| | St. Joe Co. (The)* | | | 15,000 | | | 265,800 | | | | |
| | | | | | | | | | | | |
| | | | |
| | | | | | | | 1,465,324 | | | | |
| |
Road & Rail - 1.54% | | | | |
| | ArcBest Corp. | | | 106,100 | | | 1,724,125 | | | | |
| | Celadon Group, Inc. | | | 46,900 | | | 383,173 | | | | |
| | Covenant Transportation Group, Inc., Class A* | | | 93,900 | | | 1,696,773 | | | | |
| | Greenbrier Companies., Inc. (The)+ | | | 18,000 | | | 524,340 | | | | |
| | Marten Transport, Ltd. | | | 152,982 | | | 3,029,044 | | | | |
| | PAM Transportation Services, Inc.* | | | 19,205 | | | 305,167 | | | | |
| | Providence & Worcester Railroad Co. | | | 2,000 | | | 32,600 | | | | |
| | | | | | | | | | | | |
| | | | | | | | | | |
| Industry | | Company | | Shares | | | Value | | |
| | | | |
| | | | | | | | | | |
Road & Rail (continued) | | |
| | USA Truck, Inc.* | | | 51,436 | | | $ 900,644 | | |
| | | | | | | | | | |
| | | | |
| | | | | | | | 8,595,866 | | |
| |
Semiconductors & Semiconductor Equipment - 2.60% | | |
| | Advanced Energy Industries, Inc.* | | | 44,400 | | | 1,685,424 | | |
| | Alpha & Omega Semiconductor, Ltd.* | | | 214,244 | | | 2,984,419 | | |
| | Amkor Technology, Inc.* | | | 202,291 | | | 1,163,173 | | |
| | AXT, Inc.* | | | 100,000 | | | 319,000 | | |
| | Brooks Automation, Inc. | | | 400 | | | 4,488 | | |
| | Cohu, Inc. | | | 5,000 | | | 54,250 | | |
| | Diodes, Inc.* | | | 105,399 | | | 1,980,447 | | |
| | FormFactor, Inc.* | | | 15,000 | | | 134,850 | | |
| | GigPeak, Inc.* | | | 60,000 | | | 117,600 | | |
| | inTEST Corp.*+ | | | 55,000 | | | 209,550 | | |
| | IXYS Corp. | | | 57,500 | | | 589,375 | | |
| | Kulicke & Soffa Industries, Inc.* | | | 123,632 | | | 1,504,601 | | |
| | NeoPhotonics Corp.* | | | 50,000 | | | 476,500 | | |
| | Photronics, Inc.* | | | 205,050 | | | 1,826,996 | | |
| | Rudolph Technologies, Inc.* | | | 39,600 | | | 614,988 | | |
| | SunEdison Semiconductor Ltd.* | | | 40,000 | | | 237,200 | | |
| | Ultra Clean Holdings, Inc.* | | | 85,700 | | | 487,633 | | |
| | Xcerra Corp.* | | | 25,000 | | | 143,750 | | |
| | | | | | | | | | |
| | | | |
| | | | | | | | 14,534,244 | | |
| |
Software - 1.40% | | |
| | Ebix, Inc.+ | | | 90,000 | | | 4,311,000 | | |
| | Epiq Systems, Inc. | | | 50,000 | | | 730,000 | | |
| | GSE Systems, Inc.*+ | | | 22,500 | | | 50,175 | | |
| | Mind CTI Ltd. | | | 200 | | | 428 | | |
| | Net 1 UEPS Technologies, Inc.* | | | 252,900 | | | 2,526,471 | | |
| | NetSol Technologies, Inc.*+ | | | 31,000 | | | 181,040 | | |
| | | | | | | | | | |
| | | | |
| | | | | | | | 7,799,114 | | |
| |
Specialty Retail - 2.67% | | |
| | Barnes & Noble Education, Inc.* | | | 51,824 | | | 526,014 | | |
| | Barnes & Noble, Inc. | | | 112,000 | | | 1,271,200 | | |
| | Big 5 Sporting Goods Corp. | | | 132,345 | | | 1,226,838 | | |
| | Children’s Place, Inc. (The) | | | 20,200 | | | 1,619,636 | | |
| | Citi Trends, Inc. | | | 53,900 | | | 837,067 | | |
| | Destination Maternity Corp. | | | 9,800 | | | 57,624 | | |
| | Finish Line, Inc. (The), Class A | | | 53,600 | | | 1,082,184 | | |
| | Genesco, Inc.* | | | 7,000 | | | 450,170 | | |
| | Group 1 Automotive, Inc. | | | 14,000 | | | 691,040 | | |
| | Guess?, Inc.+ | | | 35,000 | | | 526,750 | | |
| | |
|
| 14 | | Annual Report | June 30, 2016 |
| | |
Omni Small-Cap Value Fund SCHEDULE OF INVESTMENTS (continued) | | |
Showing percentage of net assets as of June 30, 2016
| | | | | | | | | | | | |
| Industry | | Company | | Shares | | | Value | | | |
| |
Common Stocks (continued) | | | | |
Specialty Retail (continued) | | | | |
| | Haverty Furniture Cos., Inc. | | | 12,700 | | | $ 228,981 | | | | |
| | hhgregg, Inc.*+ | | | 48,100 | | | 85,137 | | | | |
| | New York & Co., Inc.* | | | 48,100 | | | 71,669 | | | | |
| | Rent-A-Center, Inc. | | | 2,000 | | | 24,560 | | | | |
| | Sears Hometown & Outlet Stores, Inc.*+ | | | 10,000 | | | 67,400 | | | | |
| | Shoe Carnival, Inc. | | | 63,600 | | | 1,593,816 | | | | |
| | Sonic Automotive, Inc., Class A | | | 30,000 | | | 513,300 | | | | |
| | Stage Stores, Inc.+ | | | 54,255 | | | 264,764 | | | | |
| | Systemax, Inc.* | | | 500 | | | 4,265 | | | | |
| | Tandy Leather Factory, Inc.* | | | 3,000 | | | 21,330 | | | | |
| | Tilly’s, Inc., Class A*+ | | | 75,800 | | | 438,882 | | | | |
| | Trans World Entertainment Corp.*+ | | | 70,000 | | | 262,500 | | | | |
| | TravelCenters of America LLC* | | | 249,400 | | | 2,035,104 | | | | |
| | Vitamin Shoppe, Inc.*+ | | | 15,000 | | | 458,550 | | | | |
| | West Marine, Inc.* | | | 42,400 | | | 355,736 | | | | |
| | Zumiez, Inc.*+ | | | 15,500 | | | 221,805 | | | | |
| | | | | | | | | | | | |
| | | | |
| | | | | | | | 14,936,322 | | | | |
| |
Textiles, Apparel & Luxury Goods - 0.84% | | | | |
| | Abercrombie & Fitch Co., Class A | | | 70,000 | | | 1,246,700 | | | | |
| | Delta Apparel, Inc.*+ | | | 10,000 | | | 225,500 | | | | |
| | Movado Group, Inc. | | | 15,000 | | | 325,200 | | | | |
| | Perry Ellis International, Inc.* | | | 138,100 | | | 2,778,572 | | | | |
| | Rocky Brands, Inc. | | | 9,900 | | | 113,058 | | | | |
| | | | | | | | | | | | |
| | | | |
| | | | | | | | 4,689,030 | | | | |
| |
Thrifts & Mortgage Finance - 4.25% | | | | |
| | Astoria Financial Corp.+ | | | 112,100 | | | 1,718,493 | | | | |
| | Bank Mutual Corp. | | | 124,700 | | | 957,696 | | | | |
| | Berkshire Hills Bancorp, Inc. | | | 50,565 | | | 1,361,210 | | | | |
| | Brookline Bancorp, Inc. | | | 45,000 | | | 496,350 | | | | |
| | Charter Financial Corp. | | | 17,500 | | | 232,400 | | | | |
| | Chicopee Bancorp, Inc. | | | 12,500 | | | 228,250 | | | | |
| | Dime Community Bancshares, Inc. | | | 42,100 | | | 716,121 | | | | |
| | Entegra Financial Corp.* | | | 5,000 | | | 87,450 | | | | |
| | ESSA Bancorp, Inc. | | | 33,100 | | | 443,540 | | | | |
| | Federal Agricultural Mortgage Corp., Class C | | | 21,500 | | | 748,630 | | | | |
| | First Defiance Financial Corp. | | | 29,000 | | | 1,126,650 | | | | |
| | First Financial Northwest, Inc. | | | 35,182 | | | 467,217 | | | | |
| | Fox Chase Bancorp, Inc.+ | | | 31,000 | | | 630,540 | | | | |
| | Hingham Institution for Savings+ | | | 30 | | | 3,688 | | | | |
| | HMN Financial, Inc.* | | | 23,800 | | | 323,204 | | | | |
| | | | | | | | | | | | |
| | | | | | | | | | |
| Industry | | Company | | Shares | | | Value | | |
| | | | |
| | | | | | | | | | |
Thrifts & Mortgage Finance (continued) | | |
| | Home Bancorp, Inc. | | | 31,994 | | | $ 878,875 | | |
| | HomeStreet, Inc.* | | | 57,000 | | | 1,135,440 | | |
| | HopFed Bancorp, Inc.+ | | | 18,100 | | | 209,779 | | |
| | Lake Sunapee Bank Group | | | 2,000 | | | 34,220 | | |
| | Meta Financial Group, Inc. | | | 16,477 | | | 839,668 | | |
| | Northwest Bancshares, Inc. | | | 107,266 | | | 1,590,755 | | |
| | Ocean Shore Holding Co. | | | 39,200 | | | 664,832 | | |
| | OceanFirst Financial Corp. | | | 58,578 | | | 1,064,362 | | |
| | Ocwen Financial Corp.*+ | | | 131,000 | | | 224,010 | | |
| | Oritani Financial Corp. | | | 74,400 | | | 1,189,656 | | |
| | Pathfinder Bancorp, Inc. | | | 3,000 | | | 33,810 | | |
| | Provident Financial Holdings, Inc. | | | 51,000 | | | 933,300 | | |
| | Provident Financial Services, Inc. | | | 69,700 | | | 1,368,908 | | |
| | Riverview Bancorp, Inc.+ | | | 87,000 | | | 411,510 | | |
| | Security National Financial Corp., Class A* | | | 82,191 | | | 401,914 | | |
| | SI Financial Group, Inc. | | | 55,700 | | | 737,468 | | |
| | Territorial Bancorp, Inc. | | | 21,200 | | | 561,164 | | |
| | Timberland Bancorp, Inc. | | | 39,000 | | | 585,000 | | |
| | TrustCo Bank Corp. | | | 55,000 | | | 352,550 | | |
| | United Community Bancorp | | | 11,800 | | | 166,026 | | |
| | United Community Financial Corp. | | | 324 | | | 1,970 | | |
| | Walker & Dunlop, Inc.* | | | 175 | | | 3,986 | | |
| | Westfield Financial, Inc.+ | | | 53,081 | | | 408,724 | | |
| | WSFS Financial Corp. | | | 12,000 | | | 386,280 | | |
| | | | | | | | | | |
| | | | |
| | | | | | | | 23,725,646 | | |
| |
Trading Companies & Distributors - 1.56% | | |
| | AeroCentury Corp.* | | | 4,300 | | | 39,216 | | |
| | Aircastle, Ltd. | | | 24,600 | | | 481,176 | | |
| | CAI International, Inc.* | | | 90,600 | | | 679,500 | | |
| | General Finance Corp.*+ | | | 30,700 | | | 130,475 | | |
| | Houston Wire & Cable Co. | | | 46,100 | | | 242,025 | | |
| | Kaman Corp. | | | 6,600 | | | 280,632 | | |
| | Rush Enterprises, Inc., Class A* | | | 177,700 | | | 3,829,435 | | |
| | TAL International Group, Inc. | | | 17,250 | | | 231,322 | | |
| | Titan Machinery, Inc.*+ | | | 4,500 | | | 50,175 | | |
| | Veritiv Corp.* | | | 45,200 | | | 1,698,616 | | |
| | Willis Lease Finance Corp.*+ | | | 48,400 | | | 1,075,932 | | |
| | | | | | | | | | |
| | | | |
| | | | | | | | 8,738,504 | | |
| |
Wireless Telecommunication Services - 0.41% | | |
| | Spok Holdings, Inc.+ | | | 118,864 | | | 2,278,029 | | |
| | | | | | | | | | |
| | |
TOTAL COMMON STOCKS - 99.35% | | | 554,633,601 | | |
| | | | | | | | | | |
(Cost $474,730,790) | | | | | | | | |
| | |
Omni Small-Cap Value Fund SCHEDULE OF INVESTMENTS (continued) | | |
| | | | | | | | | | | | |
| Industry Company | | | | | Shares | | | Value | | |
| |
RIGHTS - 0.00% | | |
Leap Wireless CVR*D | | | | | | | 32,900 | | | $ — | | |
| | | | | | | | | | | | |
| | | |
TOTAL RIGHTS - 0.00% | | | | | | | — | | |
| | | | | | | | | | | | |
(Cost $80,276) | | | | | | | | | |
| |
WARRANTS - 0.00% | | |
Eagle Bulk Shipping, Inc.,
expiring 10/15/21* | | | | | | | 3,317 | | | 133 | | |
| | | | | | | | | | | | |
| | |
TOTAL WARRANTS - 0.00% | | | 133 | | |
| | | | | | | | | | | | |
(Cost $105,563) | | | | | | | | | |
| | | | | | | | | | | | |
| | | Rate^ | | | Shares | | | Value | | |
| | | | | |
| |
MONEY MARKET FUND - 0.83% | | |
Dreyfus Cash Management Fund | | | 0.30% | | | | 4,646,414 | | | 4,646,414 | | |
| | | | | | | | | | | | |
| | |
TOTAL MONEY MARKET FUND - 0.83% | | | 4,646,414 | | |
| | | | | | | | | | | | |
(Cost $4,646,414) | | | | | |
| |
| INVESTMENTS PURCHASED WITH CASH PROCEEDS FROM SECURITIES LENDING - 2.99% | | |
Dreyfus Cash Management Fund** | | | 0.30% | | | | 16,705,782 | | | 16,705,782 | | |
| | | | | | | | | | | | |
| | |
TOTAL INVESTMENTS PURCHASED WITH CASH PROCEEDS FROM SECURITIES LENDING - 2.99% | | | 16,705,782 | | |
| | | | | | | | | | | | |
(Cost $16,705,782) | | | | | |
| | |
TOTAL INVESTMENTS - 103.17% | | | $575,985,930 | | |
(Cost $496,268,825) | | | | | |
Liabilities in Excess of Other Assets - (3.17%) | | | (17,700,387) | | |
| | | | | | | | | | | | |
| | | |
NET ASSETS - 100.00% | | | | | | | $558,285,543 | | |
| | | | | | | | | | | | |
* Non-income producing security. ** This security represents the investment of the collateral received in connection with securities out on loan as of June 30, 2016. ^ Rate disclosed as of June 30, 2016. D Security was fair valued under procedures adopted by the Board of Directors (see Note 2). + This security or a portion of the security is out on loan as of June 30, 2016. Total loaned securities had a value of $16,483,194 as of June 30, 2016. CVR - Contingent Value Right LLC - Limited Liability Company PLC - Public Limited Company | | |
| |
| | |
Summary of inputs used to value the Fund’s investments as of 06/30/2016 (See Note 2 in Notes to Financial Statements):
| | | | | | | | | | | | | | | | |
| | | Valuation Inputs | |
| |
| | | Investment in Securities (Value) | |
| |
| | | Level 1
Quoted
Prices | | | Level 2
Significant
Observable
Inputs | | | Level 3
Significant
Unobservable
Inputs | | | Total | |
| |
| | | | |
Common Stocks | | $ | 554,633,601 | | | $ | — | | | $ | — | | | $ | 554,633,601 | |
Rights | | | — | | | | — | | | | — | | | | — | |
Warrants | | | 133 | | | | — | | | | — | | | | 133 | |
Money Market Fund | | | — | | | | 4,646,414 | | | | — | | | | 4,646,414 | |
Investments Purchased with Cash Proceeds from Securities Lending | | | — | | | | 16,705,782 | | | | — | | | | 16,705,782 | |
| | | | | | | | | | | | | | | | |
TOTAL | | $ | 554,633,734 | | | $ | 21,352,196 | | | $ | — | | | $ | 575,985,930 | |
| | | | | | | | | | | | | | | | |
Following is a reconciliation of Level 3 investments for which significant unobservable inputs were used to determine fair value:
| | | | | | | | | | |
| | | Investment in Securities (Value) | |
| |
| | | Rights | | | | | Total | |
| |
| | | |
Balance as of 06/30/2015 | | $ | 41,454 | | | | | $ | 41,454 | |
Purchases | | | — | | | | | | — | |
Sales | | | — | | | | | | — | |
Realized gain/(loss) | | | — | | | | | | — | |
Change in Unrealized Appreciation/(Depreciation) | | | (41,454) | | | | | | (41,454) | |
Transfers in | | | — | | | | | | — | |
Transfers out | | | — | | | | | | — | |
| | | | | | | | | | |
| | | |
Balance as of 06/30/2016 | | $ | — | | | | | $ | — | |
| | | | | | | | | | |
See Notes to Financial Statements.
| | |
| 16 | | Annual Report | June 30, 2016 |
| | |
| Omni Tax-Managed Small-Cap Value Fund | | |
MANAGER’S COMMENTARY (Unaudited) |
June 30, 2016
Dear Fellow Omni Tax-Managed Small-Cap Value Fund Shareholder,
For the quarter ended June 30, 2016, our Fund returned 2.86%, underperforming our primary market benchmark, the Russell 2000 Value Index (4.31%).
For the fiscal year, our Fund returned -3.42%, underperforming the Russell 2000 Value Index (-2.58%).
The table below presents our June quarter, one-year, five-year and inception-to-date financial results. See the next page for a graph of performance since inception.
Standardized Returns as of June 30, 2016
| | | | | | | | | | | | | | | | | | | | |
| | | | | | | | | Annualized |
| | | Quarter | | 1 Year | | 5 Years | | Since Inception
(12/31/10) |
| | | | |
Omni Tax-Managed Small-Cap Value Fund | | | | 2.86% | | | | | -3.42% | | | | | 7.90% | | | | | 8.45% | |
Russell 2000 Value Index | | | | 4.31% | | | | | -2.58% | | | | | 8.15% | | | | | 8.11% | |
Performance figures quoted in the table above and the graph on the next page represent past performance and are no guarantee of future results. Total return figures in the table above include the reinvestment of dividends and capital gains. The table above and the graph on the next page do not reflect the deduction of taxes that a shareholder would pay on Fund distributions or on the redemption of Fund shares.
The Russell 2000 Value Index is an unmanaged index that consists of stocks in the Russell 2000 Index with lower price-to-book ratios and lower forecasted growth values with dividends reinvested. It is not possible to invest directly in an index. Periods longer than one year are annualized.
According to data from Lipper as of June 30, 2016, Omni Tax-Managed Small-Cap Value Fund ranked 141st of 307 small-cap value funds for the 12 months ended June 30, 2016, 120th of 235 over the last five years, and 82nd of 220 such funds since inception in December 2010. Lipper is an independent mutual fund rating service owned by Broadridge Financial Solutions, Inc. that ranks funds in various fund categories by making comparative calculations using total returns.
| | |
Omni Tax-Managed Small-Cap Value Fund MANAGER’S COMMENTARY (Unaudited) (continued) | | |
Omni Tax-Managed Small-Cap Value Fund vs. Russell 2000 Value Index
from Inception 12/31/10 to 6/30/16
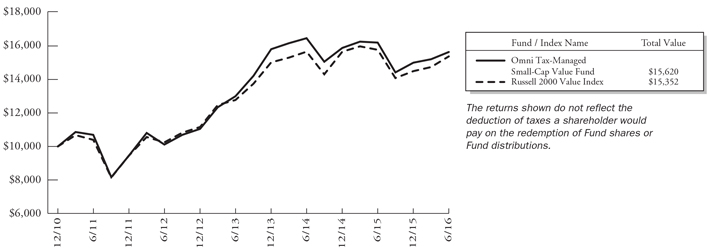
Detailed Explanation of Quarterly Performance
The Omni Tax-Managed Small-Cap Value Fund is designed to capture the returns of the small-cap value asset class through broad diversification of small company and value stocks. We also seek to minimize the distribution of capital gains within the constraints of the investment objective. This approach is sometimes referred to as “passive, asset class investing.” As of June 30, 2016, we held 650 such stocks in a market-cap weighted style. We make no attempt to track any particular index in either performance or statistics.
The Fund’s bias toward deeper-value stocks, as measured by Bridgeway’s value metrics models, detracted from relative results as those deeper value stocks underperformed the Index during the quarter. By design, the Fund does not hold Utilities stocks and Real Estate Investment Trusts (REITs). Those assets performed very well during the quarter, which hurt the Fund’s relative performance. However, our Fund’s higher weightings in the Energy and Materials sectors contributed positively to relative returns, as did holdings in the Information Technology sector.
Detailed Explanation of Fiscal Year Performance
Our Fund’s bias toward smaller stocks detracted from relative results as small-cap stocks generally underperformed large-cap stocks during the 12-month period. A bias toward deeper value stocks also hurt relative performance. However, the Fund benefited from its increased exposure to higher momentum stocks.
A lack of exposure to Utilities stocks and REITs negatively impacted relative performance, as did holdings in the Energy sector. By contrast, the Fund’s holdings in the Consumer Discretionary and Information Technology sectors boosted relative returns, as did holdings of Financials stocks other than REITs.
| | |
18 | | Annual Report | June 30, 2016 |
| | |
Omni Tax-Managed Small-Cap Value Fund MANAGER’S COMMENTARY (Unaudited) (continued) | |
|
Top Ten Holdings as of June 30, 2016
| | | | | | | | | | | | |
| Rank | | Description | | Industry | | % of Net Assets |
| | | 1 | | | Kraton Performance Polymers, Inc. | | Chemicals | | 1.0% |
| | | 2 | | | NETGEAR, Inc. | | Communications Equipment | | 1.0% |
| | | 3 | | | Central Garden & Pet Co. | | Household Products | | 1.0% |
| | | 4 | | | Hawaiian Holdings, Inc. | | Airlines | | 0.9% |
| | | 5 | | | Cooper-Standard Holding, Inc. | | Auto Components | | 0.9% |
| | | 6 | | | McDermott International, Inc. | | Oil, Gas & Consumable Fuels | | 0.8% |
| | | 7 | | | Sanmina Corp. | | Electronic Equipment, Instruments & Components | | 0.8% |
| | | 8 | | | Stepan Co. | | Chemicals | | 0.8% |
| | | 9 | | | SkyWest, Inc. | | Airlines | | 0.8% |
| | | 10 | | | Hecla Mining Co. | | Metals & Mining | | 0.8% |
| | | | | | Total | | | | 8.8% |
Industry Sector Representation as of June 30, 2016
| | | | | | | | | | | | | | | |
| | | % of Net Assets | | % of Russell 2000
Value Index | | Difference |
| Consumer Discretionary | | | | 13.7% | | | | | 10.5% | | | | | 3.2% | |
| Consumer Staples | | | | 3.9% | | | | | 3.0% | | | | | 0.9% | |
| Energy | | | | 9.5% | | | | | 5.1% | | | | | 4.4% | |
| Financials | | | | 32.9% | | | | | 41.3% | | | | | -8.4% | |
| Health Care | | | | 2.2% | | | | | 4.7% | | | | | -2.5% | |
| Industrials | | | | 18.2% | | | | | 12.1% | | | | | 6.1% | |
| Information Technology | | | | 11.3% | | | | | 10.1% | | | | | 1.2% | |
| Materials | | | | 7.1% | | | | | 4.6% | | | | | 2.5% | |
| Telecommunication Services | | | | 1.6% | | | | | 0.8% | | | | | 0.8% | |
| Utilities | | | | 0.0% | | | | | 7.8% | | | | | -7.8% | |
| Cash | | | | -0.4% | | | | | 0.0% | | | | | -0.4% | |
Total | | | | 100.0% | | | | | 100.0% | | | | | | |
Disclaimer
The views expressed here are exclusively those of Fund management. These views, including those related to market sectors or individual stocks, are not meant as investment advice and should not be considered predictive in nature. Any favorable (or unfavorable) description of a holding applies only as of the quarter end, June 30, 2016, unless otherwise stated. Security positions can and do change thereafter. Discussions of historical performance do not guarantee and may not be indicative of future performance.
Market volatility can significantly impact short-term performance. The Fund is not an appropriate investment for short-term investors. Investments in small companies generally carry greater risk than is customarily associated with larger companies. This additional risk is attributable to a number of factors, including the relatively limited financial resources that are typically available to small companies and the fact that small companies often have comparatively limited product lines. In addition, the stock of small companies tends to be more volatile than the stock of large companies, particularly in the short term and particularly in the early stages of an economic or market downturn. Shareholders of the Fund, therefore, are taking on more risk than they would if they invested in the stock market as a whole.
| | |
Omni Tax-Managed Small-Cap Value Fund MANAGER’S COMMENTARY (Unaudited) (continued) | | |
Conclusion
Thank you for your continued investment in Omni Tax-Managed Small-Cap Value Fund. We encourage your feedback; your reactions and concerns are important to us.
Sincerely,
The Investment Management Team
| | |
| 20 | | Annual Report | June 30, 2016 |
| | |
Omni Tax-Managed Small-Cap Value Fund SCHEDULE OF INVESTMENTS | | |
Showing percentage of net assets as of June 30, 2016
| | | | | | | | | | |
| Industry | | Company | | Shares | | | Value | | |
| |
COMMON STOCKS - 100.38% | | |
Aerospace & Defense - 1.18% | | |
| | AAR Corp. | | | 114,560 | | | $ 2,673,830 | | |
| | Arotech Corp.* | | | 52,800 | | | 148,368 | | |
| | Cubic Corp. | | | 10,000 | | | 401,600 | | |
| | DigitalGlobe, Inc.* | | | 29,800 | | | 637,422 | | |
| | Ducommun, Inc.* | | | 34,750 | | | 687,355 | | |
| | Erickson, Inc.* | | | 1,500 | | | 915 | | |
| | LMI Aerospace, Inc.* | | | 67,600 | | | 543,504 | | |
| | National Presto Industries, Inc.+ | | | 9,435 | | | 890,192 | | |
| | Sypris Solutions, Inc.* | | | 8,004 | | | 6,803 | | |
| | | | | | | | | | |
| | | | |
| | | | | | | | 5,989,989 | | |
| |
Air Freight & Logistics - 1.45% | | |
| | Air T, Inc.* | | | 6,700 | | | 144,050 | | |
| | Air Transport Services Group, Inc.* | | | 291,526 | | | 3,778,177 | | |
| | Atlas Air Worldwide Holdings, Inc.* | | | 41,900 | | | 1,735,498 | | |
| | Wesco Aircraft Holdings, Inc.* | | | 124,200 | | | 1,666,764 | | |
| | | | | | | | | | |
| | | | |
| | | | | | | | 7,324,489 | | |
| |
Airlines - 1.65% | | |
| | Hawaiian Holdings, Inc.* | | | 119,000 | | | 4,517,240 | | |
| | SkyWest, Inc. | | | 145,600 | | | 3,852,576 | | |
| | | | | | | | | | |
| | | | |
| | | | | | | | 8,369,816 | | |
| |
Auto Components - 2.03% | | |
| | China Automotive Systems, Inc.* | | | 28,500 | | | 92,055 | | |
| | China XD Plastics Co., Ltd.* | | | 17,400 | | | 56,028 | | |
| | Cooper-Standard Holding, Inc.* | | | 55,510 | | | 4,384,735 | | |
| | Metaldyne Performance Group, Inc.+ | | | 43,900 | | | 603,625 | | |
| | Modine Manufacturing Co.* | | | 28,900 | | | 254,320 | | |
| | Shiloh Industries, Inc.* | | | 500 | | | 3,645 | | |
| | SORL Auto Parts, Inc.* | | | 74,129 | | | 131,950 | | |
| | Spartan Motors, Inc. | | | 88,600 | | | 554,636 | | |
| | Strattec Security Corp. | | | 3,600 | | | 146,772 | | |
| | Superior Industries International, Inc. | | | 118,700 | | | 3,178,786 | | |
| | Titan International, Inc.+ | | | 136,000 | | | 843,200 | | |
| | Westport Fuel Systems, Inc.*+ | | | 995 | | | 1,662 | | |
| | | | | | | | | | |
| | | | |
| | | | | | | | 10,251,414 | | |
| |
Biotechnology - 0.09% | | |
| | AMAG Pharmaceuticals, Inc.*+ | | | 17,000 | | | 406,640 | | |
| | | | | | | | | | |
| | | | | | | | | | |
| | | | | | | | | | |
| Industry | | Company | | Shares | | | Value | | |
| |
| | |
Biotechnology (continued) | | |
| | Enzon Pharmaceuticals, Inc. | | | 93,500 | | | $ 37,868 | | |
| | | | |
| | | | | | | | 444,508 | | |
| |
Building Products - 1.00% | | |
| | Alpha Pro Tech, Ltd.* | | | 500 | | | 1,135 | | |
| | Gibraltar Industries, Inc.* | | | 84,706 | | | 2,674,168 | | |
| | Griffon Corp. | | | 140,250 | | | 2,364,615 | | |
| | | | |
| | | | | | | | 5,039,918 | | |
| |
Capital Markets - 1.06% | | |
| | American Capital Senior Floating Ltd. | | | 1,566 | | | 16,067 | | |
| | Arlington Asset Investment Corp., Class A+ | | | 17,400 | | | 226,374 | | |
| | Calamos Asset Management, Inc., Class A | | | 69,700 | | | 509,507 | | |
| | Cowen Group, Inc., Class A*+ | | | 301,400 | | | 892,144 | | |
| | FBR & Co. | | | 775 | | | 11,571 | | |
| | Great Elm Capital Group, Inc.*+ | | | 833 | | | 5,489 | | |
| | INTL FCStone, Inc.* | | | 26,900 | | | 734,101 | | |
| | Investment Technology Group, Inc. | | | 76,000 | | | 1,270,720 | | |
| | KCG Holdings, Inc., Class A* | | | 75,900 | | | 1,009,470 | | |
| | Oppenheimer Holdings, Inc., Class A | | | 4,419 | | | 68,318 | | |
| | Piper Jaffray Cos.* | | | 16,100 | | | 606,970 | | |
| | | | |
| | | | | | | | 5,350,731 | | |
| |
Chemicals - 2.95% | | |
| | American Vanguard Corp. | | | 34,200 | | | 516,762 | | |
| | China Green Agriculture, Inc.* | | | 80,300 | | | 106,799 | | |
| | Core Molding Technologies, Inc.* | | | 11,900 | | | 162,435 | | |
| | FutureFuel Corp. | | | 54,500 | | | 592,960 | | |
| | Gulf Resources, Inc.* | | | 85,750 | | | 132,055 | | |
| | Kraton Performance Polymers, Inc.* | | | 185,575 | | | 5,183,110 | | |
| | Olin Corp.+ | | | 20,900 | | | 519,156 | | |
| | OMNOVA Solutions, Inc.* | | | 62,300 | | | 451,675 | | |
| | Schulman (A.), Inc. | | | 116,100 | | | 2,835,162 | | |
| | Stepan Co. | | | 65,400 | | | 3,893,262 | | |
| | Trecora Resources* | | | 8,600 | | | 89,698 | | |
| | Tredegar Corp. | | | 28,900 | | | 465,868 | | |
| | | | |
| | | | | | | | 14,948,942 | | |
| | |
Omni Tax-Managed Small-Cap Value Fund SCHEDULE OF INVESTMENTS (continued) | | |
Showing percentage of net assets as of June 30, 2016
| | | | | | | | | | |
| Industry | | Company | | Shares | | | Value | | |
| |
Common Stocks (continued) | | |
Commercial Banks - 15.48% | | |
| | 1st Constitution Bancorp* | | | 5,250 | | | $ 63,105 | | |
| | 1st Source Corp. | | | 57,750 | | | 1,870,522 | | |
| | Access National Corp. | | | 600 | | | 11,706 | | |
| | ACNB Corp.+ | | | 600 | | | 15,066 | | |
| | American National Bankshares, Inc. | | | 13,060 | | | 328,851 | | |
| | American River Bankshares* | | | 20,744 | | | 210,552 | | |
| | AmeriServ Financial, Inc. | | | 5,000 | | | 15,100 | | |
| | Banco Latinoamericano de Comercio Exterior SA | | | 15,000 | | | 397,500 | | |
| | Bank of Commerce Holdings | | | 59,350 | | | 391,710 | | |
| | Bankwell Financial Group, Inc. | | | 1,000 | | | 22,060 | | |
| | Banner Corp. | | | 25,057 | | | 1,065,925 | | |
| | Bar Harbor Bankshares | | | 10,500 | | | 368,550 | | |
| | BBCN Bancorp, Inc. | | | 2,600 | | | 38,792 | | |
| | BCB Bancorp, Inc. | | | 11,300 | | | 115,712 | | |
| | Beneficial Bancorp, Inc.* | | | 20,000 | | | 254,400 | | |
| | BNC Bancorp | | | 74,956 | | | 1,702,251 | | |
| | Boston Private Financial Holdings, Inc. | | | 10,000 | | | 117,800 | | |
| | BSB Bancorp, Inc.*+ | | | 23,800 | | | 539,070 | | |
| | C&F Financial Corp. | | | 2,400 | | | 107,424 | | |
| | Camden National Corp. | | | 5,853 | | | 245,826 | | |
| | Capital City Bank Group, Inc. | | | 81,250 | | | 1,131,000 | | |
| | Cardinal Financial Corp. | | | 24,478 | | | 537,047 | | |
| | Central Pacific Financial Corp. | | | 47,100 | | | 1,111,560 | | |
| | Central Valley Community Bancorp+ | | | 51,000 | | | 714,000 | | |
| | Century Bancorp, Inc., Class A | | | 14,300 | | | 605,319 | | |
| | Chemical Financial Corp.+ | | | 60,300 | | | 2,248,587 | | |
| | Chemung Financial Corp.+ | | | 3,000 | | | 88,050 | | |
| | Citizens & Northern Corp. | | | 10,000 | | | 202,200 | | |
| | Civista Bancshares, Inc. | | | 2,000 | | | 26,200 | | |
| | CNB Financial Corp. | | | 70,800 | | | 1,260,240 | | |
| | Codorus Valley Bancorp, Inc. | | | 4,188 | | | 85,310 | | |
| | Community Bankers Trust Corp.* | | | 25,000 | | | 129,500 | | |
| | Community Trust Bancorp, Inc. | | | 32,500 | | | 1,126,450 | | |
| | ConnectOne Bancorp, Inc. | | | 15,000 | | | 235,350 | | |
| | Customers Bancorp, Inc.* | | | 20,000 | | | 502,600 | | |
| | Eastern Virginia Bankshares, Inc. | | | 7,051 | | | 53,235 | | |
| | Enterprise Bancorp, Inc. | | | 53,175 | | | 1,275,668 | | |
| | | | | | | | | | |
| | | | | | | | | | |
| | | | | | | | | | |
| Industry | | Company | | Shares | | | Value | | |
| | | | |
| | | | | | | | | | |
Commercial Banks (continued) | | |
| | Farmers Capital Bank Corp. | | | 30,400 | | | $ 831,440 | | |
| | Farmers National Banc Corp. | | | 150 | | | 1,320 | | |
| | Financial Institutions, Inc. | | | 40,300 | | | 1,050,621 | | |
| | First Bancorp | | | 102,856 | | | 1,808,208 | | |
| | First Bancorp, Inc. | | | 19,550 | | | 421,107 | | |
| | First BanCorp. Puerto Rico* | | | 146,000 | | | 579,620 | | |
| | First Busey Corp. | | | 37,798 | | | 808,499 | | |
| | First Business Financial Services, Inc. | | | 5,100 | | | 119,697 | | |
| | First Commonwealth Financial Corp. | | | 121,200 | | | 1,115,040 | | |
| | First Community Bancshares, Inc. | | | 61,300 | | | 1,375,572 | | |
| | First Connecticut Bancorp, Inc. | | | 4,800 | | | 79,488 | | |
| | First Financial Corp. | | | 38,830 | | | 1,421,955 | | |
| | First Internet Bancorp+ | | | 1,200 | | | 28,584 | | |
| | First Interstate BancSystem, Inc., Class A | | | 94,600 | | | 2,658,260 | | |
| | First Merchants Corp. | | | 71,000 | | | 1,770,030 | | |
| | First Midwest Bancorp, Inc. | | | 115,900 | | | 2,035,204 | | |
| | First of Long Island Corp. (The) | | | 18,000 | | | 516,060 | | |
| | First United Corp.* | | | 3,000 | | | 29,520 | | |
| | Flushing Financial Corp. | | | 43,300 | | | 860,804 | | |
| | FNB Corp. | | | 62,291 | | | 781,129 | | |
| | German American Bancorp, Inc. | | | 12,500 | | | 399,625 | | |
| | Great Southern Bancorp, Inc. | | | 39,850 | | | 1,473,254 | | |
| | Green Bancorp, Inc.* | | | 100,000 | | | 872,000 | | |
| | Hampton Roads Bankshares, Inc.*+ | | | 265,225 | | | 474,753 | | |
| | Heartland Financial USA, Inc. | | | 11,950 | | | 421,716 | | |
| | Heritage Commerce Corp. | | | 30,000 | | | 315,900 | | |
| | Heritage Financial Corp. | | | 40,502 | | | 712,025 | | |
| | Heritage Oaks Bancorp | | | 127,600 | | | 1,013,144 | | |
| | HomeTrust Bancshares, Inc.* | | | 50,000 | | | 925,000 | | |
| | Horizon Bancorp+ | | | 20,363 | | | 511,926 | | |
| | Independent Bank Corp., MI | | | 68,000 | | | 986,680 | | |
| | Independent Bank Group, Inc. | | | 17,787 | | | 763,240 | | |
| | International Bancshares Corp. | | | 64,600 | | | 1,685,414 | | |
| | Lakeland Bancorp, Inc.+ | | | 104,940 | | | 1,194,217 | | |
| | Landmark Bancorp, Inc. | | | 2,100 | | | 53,193 | | |
| | LCNB Corp.+ | | | 1,500 | | | 23,700 | | |
| | |
| 22 | | Annual Report | June 30, 2016 |
| | |
Omni Tax-Managed Small-Cap Value Fund SCHEDULE OF INVESTMENTS (continued) | | |
Showing percentage of net assets as of June 30, 2016
| | | | | | | | | | |
| Industry | | Company | | Shares | | | Value | | |
| |
Common Stocks (continued) | | |
Commercial Banks (continued) | | |
| | LegacyTexas Financial Group, Inc. | | | 20,000 | | | $ 538,200 | | |
| | Macatawa Bank Corp. | | | 12,550 | | | 93,121 | | |
| | MainSource Financial Group, Inc. | | | 41,765 | | | 920,918 | | |
| | MBT Financial Corp. | | | 62,011 | | | 496,088 | | |
| | Mercantile Bank Corp. | | | 2,000 | | | 47,720 | | |
| | Merchants Bancshares, Inc. | | | 5,000 | | | 152,400 | | |
| | Middleburg Financial Corp. | | | 22,463 | | | 610,994 | | |
| | MidWestOne Financial Group, Inc. | | | 13,800 | | | 394,128 | | |
| | MutualFirst Financial, Inc. | | | 700 | | | 19,145 | | |
| | National Bankshares, Inc.+ | | | 1,000 | | | 34,920 | | |
| | NBT Bancorp, Inc. | | | 20,932 | | | 599,283 | | |
| | Nicolet Bankshares, Inc.*+ | | | 2,529 | | | 96,304 | | |
| | Northrim BanCorp, Inc. | | | 24,073 | | | 632,879 | | |
| | Norwood Financial Corp.+ | | | 1,000 | | | 28,000 | | |
| | OFG Bancorp | | | 4,200 | | | 34,860 | | |
| | Old Line Bancshares, Inc. | | | 8,050 | | | 144,900 | | |
| | Old National Bancorp | | | 30,600 | | | 383,418 | | |
| | Old Second Bancorp, Inc. | | | 30,050 | | | 205,242 | | |
| | Opus Bank | | | 5,000 | | | 169,000 | | |
| | Orrstown Financial Services, Inc.+ | | | 28,000 | | | 505,400 | | |
| | Pacific Continental Corp. | | | 56,600 | | | 889,186 | | |
| | Pacific Mercantile Bancorp* | | | 20,000 | | | 142,000 | | |
| | Park Sterling Corp. | | | 50,298 | | | 356,613 | | |
| | Parke Bancorp, Inc. | | | 1,320 | | | 17,054 | | |
| | Peapack Gladstone Financial Corp. | | | 4,968 | | | 91,958 | | |
| | Peoples Bancorp, Inc. | | | 29,850 | | | 650,432 | | |
| | Peoples Financial Services Corp. | | | 2,600 | | | 101,764 | | |
| | Preferred Bank | | | 36,000 | | | 1,039,500 | | |
| | Premier Financial Bancorp, Inc. | | | 26,066 | | | 439,212 | | |
| | QCR Holdings, Inc. | | | 27,300 | | | 742,287 | | |
| | Renasant Corp. | | | 88,004 | | | 2,845,169 | | |
| | Republic Bancorp, Inc., Class A | | | 25,700 | | | 710,091 | | |
| | S&T Bancorp, Inc. | | | 30,700 | | | 750,615 | | |
| | Salisbury Bancorp, Inc.+ | | | 1,183 | | | 35,230 | | |
| | Sandy Spring Bancorp, Inc. | | | 14,300 | | | 415,558 | | |
| | SB Financial Group, Inc. | | | 28,952 | | | 314,708 | | |
| | Shore Bancshares, Inc. | | | 60,400 | | | 709,700 | | |
| | Sierra Bancorp | | | 59,400 | | | 991,386 | | |
| | South State Corp. | | | 16,911 | | | 1,150,794 | | |
| | Southern National Bancorp of Virginia, Inc. | | | 35,000 | | | 425,250 | | |
| | Southwest Bancorp, Inc. | | | 23,900 | | | 404,627 | | |
| | State Bank Financial Corp. | | | 39,300 | | | 799,755 | | |
| | Stonegate Bank | | | 29,000 | | | 935,830 | | |
| | | | | | | | | | |
| | | | | | | | | | |
| Industry | | Company | | Shares | | | Value | | |
| |
| | |
Commercial Banks (continued) | | |
| | Summit State Bank+ | | | 5,000 | | | $ 66,900 | | |
| | Sussex Bancorp | | | 15,000 | | | 200,400 | | |
| | Tompkins Financial Corp. | | | 8,400 | | | 546,000 | | |
| | TowneBank+ | | | 743 | | | 16,086 | | |
| | TriCo Bancshares | | | 200 | | | 5,520 | | |
| | TriState Capital Holdings, Inc.* | | | 51,760 | | | 710,665 | | |
| | Triumph Bancorp, Inc.* | | | 11,600 | | | 185,600 | | |
| | Trustmark Corp. | | | 20,800 | | | 516,880 | | |
| | Union Bankshares Corp. | | | 58,628 | | | 1,448,698 | | |
| | United Community Banks, Inc. | | | 57,770 | | | 1,056,613 | | |
| | United Security Bancshares, Inc.+ | | | 3,000 | | | 26,700 | | |
| | Univest Corp. of Pennsylvania+ | | | 39,200 | | | 823,984 | | |
| | WesBanco, Inc. | | | 66,385 | | | 2,061,254 | | |
| | Westbury Bancorp, Inc.* | | | 1,000 | | | 19,500 | | |
| | Wilshire Bancorp, Inc. | | | 25,000 | | | 260,500 | | |
| | | | | | | | | | |
| | | | |
| | | | | | | | 78,343,122 | | |
| |
Commercial Services & Supplies - 3.58% | | |
| | ACCO Brands Corp.* | | | 339,800 | | | 3,510,134 | | |
| | Acme United Corp. | | | 2,000 | | | 36,600 | | |
| | Command Security Corp.*+ | | | 17,800 | | | 47,526 | | |
| | Ecology & Environment, Inc., Class A | | | 2,811 | | | 28,728 | | |
| | EnerNOC, Inc.*+ | | | 90,000 | | | 568,800 | | |
| | Ennis, Inc. | | | 149,265 | | | 2,862,903 | | |
| | Heritage-Crystal Clean, Inc.* | | | 14,246 | | | 173,944 | | |
| | Huron Consulting Group, Inc.* | | | 9,100 | | | 549,822 | | |
| | James River Group Holdings, Ltd. | | | 65,600 | | | 2,227,776 | | |
| | Kelly Services, Inc., Class A | | | 68,400 | | | 1,297,548 | | |
| | Kimball International, Inc., Class B | | | 103,800 | | | 1,181,244 | | |
| | McGrath RentCorp | | | 93,000 | | | 2,844,870 | | |
| | Quad/Graphics, Inc. | | | 25,000 | | | 582,250 | | |
| | RCM Technologies, Inc. | | | 4,000 | | | 20,840 | | |
| | TRC Cos., Inc.* | | | 51,400 | | | 324,848 | | |
| | Versar, Inc.* | | | 35,000 | | | 37,800 | | |
| | Viad Corp. | | | 57,894 | | | 1,794,714 | | |
| | Willdan Group, Inc.* | | | 1,600 | | | 16,992 | | |
| | | | | | | | | | |
| | | | |
| | | | | | | | 18,107,339 | | |
| |
Communications Equipment - 2.38% | | |
| | ATN International, Inc. | | | 25,900 | | | 2,015,279 | | |
| | Bel Fuse, Inc., Class B | | | 63,600 | | | 1,130,808 | | |
| | Black Box Corp. | | | 42,275 | | | 552,957 | | |
| | Blonder Tongue Laboratories* | | | 17,859 | | | 8,572 | | |
| | |
Omni Tax-Managed Small-Cap Value Fund SCHEDULE OF INVESTMENTS (continued) | | |
Showing percentage of net assets as of June 30, 2016
| | | | | | | | | | |
| Industry | | Company | | Shares | | | Value | | |
| |
Common Stocks (continued) | | |
Communications Equipment (continued) | | |
| | Communications Systems, Inc. | | | 4,950 | | | $ 34,501 | | |
| | Comtech Telecommunications Corp. | | | 69,215 | | | 888,721 | | |
| | Digi International, Inc.* | | | 30,325 | | | 325,387 | | |
| | Finisar Corp.* | | | 68,000 | | | 1,190,680 | | |
| | Harmonic, Inc.* | | | 600 | | | 1,710 | | |
| | KVH Industries, Inc.* | | | 18,200 | | | 140,140 | | |
| | NETGEAR, Inc.* | | | 101,900 | | | 4,844,326 | | |
| | PC-Tel, Inc. | | | 56,000 | | | 263,760 | | |
| | Polycom, Inc.* | | | 54,100 | | | 608,625 | | |
| | Zhone Technologies, Inc.* | | | 34,000 | | | 40,460 | | |
| | | | | | | | | | |
| | | | |
| | | | | | | | 12,045,926 | | |
| |
Computers & Peripherals - 0.32% | | |
| | Concurrent Computer Corp. | | | 3,400 | | | 17,748 | | |
| | Datalink Corp.* | | | 500 | | | 3,750 | | |
| | QLogic Corp.* | | | 101,500 | | | 1,496,110 | | |
| | USA Technologies, Inc.*+ | | | 30,000 | | | 128,100 | | |
| | | | | | | | | | |
| | | | |
| | | | | | | | 1,645,708 | | |
| |
Construction & Engineering - 1.82% | | |
| | Aegion Corp.* | | | 120,300 | | | 2,347,053 | | |
| | Goldfield Corp. (The)* | | | 114,000 | | | 373,920 | | |
| | Great Lakes Dredge & Dock Corp.* | | | 167,000 | | | 728,120 | | |
| | IES Holdings, Inc.* | | | 3,600 | | | 44,712 | | |
| | KB Home+ | | | 134,700 | | | 2,048,787 | | |
| | MasTec, Inc.* | | | 63,500 | | | 1,417,320 | | |
| | MYR Group, Inc.* | | | 25,000 | | | 602,000 | | |
| | Northwest Pipe Co.* | | | 1,000 | | | 10,780 | | |
| | Orion Marine Group, Inc.* | | | 37,072 | | | 196,852 | | |
| | Tutor Perini Corp.* | | | 61,200 | | | 1,441,260 | | |
| | | | | | | | | | |
| | | | |
| | | | | | | | 9,210,804 | | |
| |
Consumer Finance - 1.51% | | |
| | Cash America International, Inc. | | | 85,100 | | | 3,626,962 | | |
| | Consumer Portfolio Services, Inc.* | | | 116,650 | | | 439,770 | | |
| | Encore Capital Group, Inc.*+ | | | 23,400 | | | 550,602 | | |
| | EZCORP, Inc., Class A* | | | 6,100 | | | 46,116 | | |
| | Green Dot Corp., Class A* | | | 56,900 | | | 1,308,131 | | |
| | Nelnet, Inc., Class A | | | 6,900 | | | 239,775 | | |
| | Nicholas Financial, Inc.* | | | 31,800 | | | 326,904 | | |
| | Regional Management Corp.* | | | 52,100 | | | 763,786 | | |
| | World Acceptance Corp.* | | | 7,000 | | | 319,200 | | |
| | | | | | | | | | |
| | | | |
| | | | | | | | 7,621,246 | | |
| | | | |
| | | | | | | | | | |
| | | | |
| | | | | | | | | | |
| | | | | | | | | | |
| Industry | | Company | | Shares | | | Value | | |
| |
| | |
Distributors - 0.28% | | |
| | AMCON Distributing Co. | | | 1,350 | | | $ 117,450 | | |
| | Essendant, Inc. | | | 35,600 | | | 1,087,936 | | |
| | VOXX International Corp.* | | | 83,064 | | | 231,749 | | |
| | | | | | | | | | |
| | | | |
| | | | | | | | 1,437,135 | | |
| |
Diversified Consumer Services - 0.43% | | |
| | American Public Education, Inc.* | | | 8,000 | | | 224,800 | | |
| | DeVry Education Group, Inc.+ | | | 24,000 | | | 428,160 | | |
| | K12, Inc.* | | | 23,500 | | | 293,515 | | |
| | Lincoln Educational Services Corp.* | | | 134,605 | | | 201,908 | | |
| | Regis Corp.* | | | 83,250 | | | 1,036,462 | | |
| | | | | | | | | | |
| | | | |
| | | | | | | | 2,184,845 | | |
| |
Diversified Financial Services - 0.85% | | |
| | Enova International, Inc.* | | | 22,783 | | | 167,683 | | |
| | GAIN Capital Holdings, Inc. | | | 146,000 | | | 922,720 | | |
| | Higher One Holdings, Inc.* | | | 80,400 | | | 410,844 | | |
| | Marlin Business Services Corp. | | | 15,775 | | | 257,132 | | |
| | PHH Corp.* | | | 8,300 | | | 110,556 | | |
| | Resource America, Inc., Class A | | | 71,900 | | | 698,868 | | |
| | Sterling Bancorp | | | 87,576 | | | 1,374,943 | | |
| | Summit Financial Group, Inc.+ | | | 1,500 | | | 26,250 | | |
| | Tiptree Financial, Inc., Class A+ | | | 56,200 | | | 307,976 | | |
| | | | | | | | | | |
| | | | |
| | | | | | | | 4,276,972 | | |
| |
Diversified Telecommunication Services - 0.81% | | |
| | Alaska Communications Systems Group, Inc.* | | | 344,187 | | | 585,118 | | |
| | Hawaiian Telcom Holdco, Inc.* | | | 2,600 | | | 55,094 | | |
| | Iridium Communications, Inc.*+ | | | 392,125 | | | 3,482,070 | | |
| | | | | | | | | | |
| | | | |
| | | | | | | | 4,122,282 | | |
| |
Electrical Equipment - 0.89% | | |
| | Broadwind Energy, Inc.* | | | 26,075 | | | 110,036 | | |
| | Encore Wire Corp. | | | 6,500 | | | 242,320 | | |
| | General Cable Corp. | | | 120,000 | | | 1,525,200 | | |
| | Highpower International, Inc.* | | | 25,922 | | | 48,993 | | |
| | II-VI, Inc.* | | | 63,404 | | | 1,189,459 | | |
| | LSI Industries, Inc. | | | 15,000 | | | 166,050 | | |
| | Novanta, Inc.* | | | 11,000 | | | 166,650 | | |
| | |
| 24 | | Annual Report | June 30, 2016 |
| | |
Omni Tax-Managed Small-Cap Value Fund SCHEDULE OF INVESTMENTS (continued) | | |
Showing percentage of net assets as of June 30, 2016
| | | | | | | | | | |
| Industry | | Company | | Shares | | | Value | | |
| |
Common Stocks (continued) | | |
Electrical Equipment (continued) | | |
| | Powell Industries, Inc. | | | 25,000 | | | $ 983,500 | | |
| | Preformed Line Products Co. | | | 1,200 | | | 48,468 | | |
| | Ultralife Corp.* | | | 8,350 | | | 41,834 | | |
| | | | | | | | | | |
| | | | |
| | | | | | | | 4,522,510 | | |
| |
Electronic Equipment, Instruments &
Components - 3.13% | | |
| | Benchmark Electronics, Inc.* | | | 121,800 | | | 2,576,070 | | |
| | Electro Rent Corp. | | | 31,503 | | | 485,461 | | |
| | Fabrinet* | | | 60,150 | | | 2,232,768 | | |
| | Insight Enterprises, Inc.* | | | 44,883 | | | 1,166,958 | | |
| | Iteris, Inc.* | | | 65,000 | | | 185,900 | | |
| | Key Tronic Corp.* | | | 11,900 | | | 89,607 | | |
| | Kimball Electronics, Inc.* | | | 59,100 | | | 735,795 | | |
| | PAR Technology Corp.* | | | 98,400 | | | 471,336 | | |
| | PCM, Inc.* | | | 82,175 | | | 915,430 | | |
| | Plexus Corp.* | | | 500 | | | 21,600 | | |
| | Rofin-Sinar Technologies, Inc.* | | | 26,200 | | | 836,828 | | |
| | Sanmina Corp.* | | | 149,100 | | | 3,997,371 | | |
| | SMTC Corp.* | | | 13,500 | | | 20,385 | | |
| | TTM Technologies, Inc.* | | | 219,402 | | | 1,652,097 | | |
| | Vishay Precision Group, Inc.* | | | 31,667 | | | 424,971 | | |
| | Wireless Telecom Group, Inc.* | | | 10,000 | | | 13,400 | | |
| | | | | | | | | | |
| | | | |
| | | | | | | | 15,825,977 | | |
| |
Energy Equipment & Services - 1.15% | | |
| | Basic Energy Services, Inc.* | | | 700 | | | 1,176 | | |
| | C&J Energy Services, Ltd.* | | | 30,000 | | | 18,069 | | |
| | CARBO Ceramics, Inc. | | | 500 | | | 6,550 | | |
| | ENGlobal Corp.* | | | 75,878 | | | 91,054 | | |
| | Era Group, Inc.* | | | 57,200 | | | 537,680 | | |
| | Gulf Island Fabrication, Inc. | | | 15,000 | | | 104,100 | | |
| | Natural Gas Services Group, Inc.* | | | 75,888 | | | 1,737,835 | | |
| | Newpark Resources, Inc.* | | | 12,500 | | | 72,375 | | |
| | Parker Drilling Co.* | | | 493,630 | | | 1,130,413 | | |
| | PHI, Inc.* | | | 3,750 | | | 67,050 | | |
| | Pioneer Energy Services Corp.* | | | 63,700 | | | 293,020 | | |
| | SEACOR Holdings, Inc.*+ | | | 30,200 | | | 1,750,090 | | |
| | | | | | | | | | |
| | | | |
| | | | | | | | 5,809,412 | | |
| |
Food & Staples Retailing - 2.04% | | |
| | Andersons, Inc. (The) | | | 94,700 | | | 3,365,638 | | |
| | Ingles Markets, Inc., Class A | | | 92,805 | | | 3,461,626 | | |
| | SpartanNash Co. | | | 78,682 | | | 2,406,096 | | |
| | Village Super Market, Inc., Class A | | | 1,100 | | | 31,779 | | |
| | | | | | | | | | |
| | | | | | | | | | |
| Industry | | Company | | Shares | | | Value | | |
| | | | |
| | | | | | | | | | |
Food & Staples Retailing (continued) | | |
| | Weis Markets, Inc. | | | 20,700 | | | $ 1,046,385 | | |
| | | | | | | | | | |
| | | | |
| | | | | | | | 10,311,524 | | |
| |
Food Products - 0.71% | | |
| | Alico, Inc.+ | | | 8,100 | | | 245,025 | | |
| | Fresh Del Monte Produce, Inc. | | | 3,200 | | | 174,176 | | |
| | Omega Protein Corp.* | | | 123,650 | | | 2,471,764 | | |
| | Post Holdings, Inc.*+ | | | 5,100 | | | 421,719 | | |
| | S&W Seed Co.*+ | | | 10,000 | | | 43,600 | | |
| | Seneca Foods Corp., Class A* | | | 6,650 | | | 240,796 | | |
| | | | | | | | | | |
| | | | |
| | | | | | | | 3,597,080 | | |
| |
Health Care Equipment & Supplies - 0.56% | | |
| | AngioDynamics, Inc.* | | | 52,000 | | | 747,240 | | |
| | Electromed, Inc.* | | | 10,000 | | | 38,600 | | |
| | Exactech, Inc.* | | | 17,500 | | | 467,950 | | |
| | FONAR Corp.* | | | 2,000 | | | 40,720 | | |
| | Halyard Health, Inc.* | | | 27,000 | | | 878,040 | | |
| | Kewaunee Scientific Corp. | | | 2,500 | | | 47,200 | | |
| | Merit Medical Systems, Inc.* | | | 18,100 | | | 358,923 | | |
| | Symmetry Surgical, Inc.* | | | 18,200 | | | 238,966 | | |
| | | | | | | | | | |
| | | | |
| | | | | | | | 2,817,639 | | |
| |
Health Care Providers & Services - 1.58% | | |
| | Amedisys, Inc.* | | | 14,210 | | | 717,321 | | |
| | Everyday Health, Inc.* | | | 37,000 | | | 291,560 | | |
| | Five Star Quality Care, Inc.* | | | 141,650 | | | 331,461 | | |
| | Healthways, Inc.* | | | 24,500 | | | 282,975 | | |
| | InfuSystems Holdings, Inc.* | | | 35,178 | | | 91,463 | | |
| | Kindred Healthcare, Inc. | | | 101,700 | | | 1,148,193 | | |
| | LHC Group, Inc.* | | | 500 | | | 21,640 | | |
| | Magellan Health, Inc.* | | | 27,125 | | | 1,784,011 | | |
| | National Healthcare Corp. | | | 8,920 | | | 577,481 | | |
| | PharMerica Corp.* | | | 5,300 | | | 130,698 | | |
| | Select Medical Holdings Corp.* | | | 140,000 | | | 1,521,800 | | |
| | Triple-S Management Corp., Class B* | | | 45,100 | | | 1,101,793 | | |
| | | | | | | | | | |
| | | | |
| | | | | | | | 8,000,396 | | |
| |
Hotels, Restaurants & Leisure - 2.68% | | |
| | Caesars Entertainment Corp.*+ | | | 30,000 | | | 230,700 | | |
| | Century Casinos, Inc.* | | | 79,200 | | | 493,416 | | |
| | Flanigan’s Enterprises, Inc.+ | | | 2,500 | | | 51,700 | | |
| | International Speedway Corp., Class A | | | 75,760 | | | 2,534,172 | | |
| | Intrawest Resorts Holdings, Inc.*+ | | | 25,000 | | | 324,500 | | |
| | |
Omni Tax-Managed Small-Cap Value Fund SCHEDULE OF INVESTMENTS (continued) | | |
Showing percentage of net assets as of June 30, 2016
| | | | | | | | | | |
| Industry | | Company | | Shares | | | Value | | |
| |
Common Stocks (continued) | | |
Hotels, Restaurants & Leisure (continued) | | |
| | Luby’s, Inc.* | | | 179,100 | | | $ 899,082 | | |
| | Marcus Corp. (The) | | | 136,454 | | | 2,879,179 | | |
| | Monarch Casino & Resort, Inc.* | | | 22,300 | | | 489,931 | | |
| | Nevada Gold & Casinos, Inc.* | | | 10,000 | | | 19,300 | | |
| | Peak Resorts, Inc. | | | 93,600 | | | 426,816 | | |
| | Penn National Gaming, Inc.* | | | 125,500 | | | 1,750,725 | | |
| | Red Lion Hotels Corp.*+ | | | 80,695 | | | 585,846 | | |
| | Ruby Tuesday, Inc.* | | | 333,800 | | | 1,205,018 | | |
| | Speedway Motorsports, Inc. | | | 93,963 | | | 1,667,843 | | |
| | | | | | | | | | |
| | | | |
| | | | | | | | 13,558,228 | | |
| |
Household Durables - 1.21% | | |
| | Bassett Furniture Industries, Inc. | | | 52,959 | | | 1,267,838 | | |
| | CSS Industries, Inc. | | | 68,558 | | | 1,838,040 | | |
| | Hooker Furniture Corp. | | | 15,000 | | | 322,350 | | |
| | Lifetime Brands, Inc. | | | 51,499 | | | 751,370 | | |
| | NACCO Industries, Inc., Class A | | | 16,450 | | | 921,200 | | |
| | P&F Industries, Inc., Class A | | | 492 | | | 4,600 | | |
| | William Lyon Homes, Class A*+ | | | 15,000 | | | 241,800 | | |
| | ZAGG, Inc.* | | | 144,000 | | | 756,000 | | |
| | | | | | | | | | |
| | | | |
| | | | | | | | 6,103,198 | | |
| |
Household Products - 0.95% | | |
| | Central Garden & Pet Co., Class A* | | | 221,400 | | | 4,806,594 | | |
| |
Insurance - 8.88% | | |
| | 1347 Property Insurance Holdings, Inc.* | | | 17,500 | | | 111,825 | | |
| | Ambac Financial Group, Inc.* | | | 18,000 | | | 296,280 | | |
| | American Equity Investment Life Holding Co. | | | 30,250 | | | 431,062 | | |
| | American Independence Corp.*+ | | | 15,264 | | | 374,426 | | |
| | AMERISAFE, Inc. | | | 56,500 | | | 3,458,930 | | |
| | Argo Group International Holdings Ltd. | | | 22,865 | | | 1,186,694 | | |
| | Baldwin & Lyons, Inc., Class B+ | | | 43,700 | | | 1,077,642 | | |
| | Citizens, Inc.*+ | | | 14,800 | | | 112,480 | | |
| | Donegal Group, Inc., Class A | | | 74,100 | | | 1,221,909 | | |
| | EMC Insurance Group, Inc. | | | 34,025 | | | 943,173 | | |
| | Employers Holdings, Inc. | | | 75,900 | | | 2,202,618 | | |
| | FBL Financial Group, Inc., Class A | | | 45,666 | | | 2,770,556 | | |
| | | | | | | | | | |
| | | | | | | | | | |
| Industry | | Company | | Shares | | | Value | | |
| | | | |
| | | | | | | | | | |
Insurance (continued) | | |
| | Federated National Holding Co. | | | 53,012 | | | $ 1,009,348 | | |
| | Fidelity & Guaranty Life+ | | | 45,000 | | | 1,043,100 | | |
| | First Acceptance Corp.* | | | 145,000 | | | 203,000 | | |
| | Hallmark Financial Services, Inc.* | | | 50,158 | | | 581,331 | | |
| | HCI Group, Inc. | | | 20,000 | | | 545,600 | | |
| | Heritage Insurance Holdings, Inc.+ | | | 20,000 | | | 239,400 | | |
| | Horace Mann Educators Corp. | | | 74,950 | | | 2,532,560 | | |
| | Independence Holding Co. | | | 14,950 | | | 268,652 | | |
| | Infinity Property & Casualty Corp. | | | 9,200 | | | 742,072 | | |
| | Investors Title Co.+ | | | 1,000 | | | 95,250 | | |
| | Kansas City Life Insurance Co.+ | | | 24,900 | | | 984,048 | | |
| | Kingstone Cos., Inc.+ | | | 4,000 | | | 35,400 | | |
| | Maiden Holdings, Ltd.+ | | | 167,450 | | | 2,049,588 | | |
| | MBIA, Inc.* | | | 102,800 | | | 702,124 | | |
| | National Interstate Corp. | | | 16,000 | | | 484,000 | | |
| | National Western Life Group, Inc., Class A | | | 5,350 | | | 1,044,694 | | |
| | Navigators Group, Inc. (The) | | | 37,650 | | | 3,462,670 | | |
| | NMI Holdings, Inc., Class A* | | | 185,000 | | | 1,013,800 | | |
| | OneBeacon Insurance Group Ltd., Class A | | | 107,500 | | | 1,483,500 | | |
| | Safety Insurance Group, Inc. | | | 31,800 | | | 1,958,244 | | |
| | Selective Insurance Group, Inc. | | | 50,100 | | | 1,914,321 | | |
| | State Auto Financial Corp. | | | 31,786 | | | 696,431 | | |
| | State National Cos, Inc. | | | 20,000 | | | 210,600 | | |
| | Stewart Information Services Corp. | | | 68,350 | | | 2,830,374 | | |
| | Third Point Reinsurance Ltd.*+ | | | 100,500 | | | 1,177,860 | | |
| | United Fire Group, Inc. | | | 60,900 | | | 2,583,987 | | |
| | United Insurance Holdings Corp. | | | 53,400 | | | 874,692 | | |
| | | | | | | | | | |
| | | | |
| | | | | | | | 44,954,241 | | |
| |
Internet & Catalog Retail - 0.19% | | |
| | CafePress, Inc.* | | | 11,000 | | | 34,100 | | |
| | FTD Cos., Inc.* | | | 27,160 | | | 677,914 | | |
| | Lands’ End, Inc.*+ | | | 16,000 | | | 262,720 | | |
| | | | | | | | | | |
| | | | |
| | | | | | | | 974,734 | | |
| |
Internet Software & Services - 0.79% | | |
| | Autobytel, Inc.* | | | 600 | | | 8,322 | | |
| | Blucora, Inc.* | | | 85,500 | | | 885,780 | | |
| | Liquidity Services, Inc.* | | | 35,000 | | | 274,400 | | |
| | |
|
| 26 | | Annual Report | June 30, 2016 |
| | |
Omni Tax-Managed Small-Cap Value Fund SCHEDULE OF INVESTMENTS (continued) | |
|
Showing percentage of net assets as of June 30, 2016
| | | | | | | | | | |
| Industry | | Company | | Shares | | | Value | | |
| | | |
Common Stocks (continued) | | | | | | | | |
Internet Software & Services (continued) | | |
| | Marchex, Inc., Class B* | | | 167,169 | | | $ 531,597 | | |
| | MeetMe, Inc.* | | | 41,731 | | | 222,426 | | |
| | Monster Worldwide, Inc.* | | | 532,600 | | | 1,272,914 | | |
| | RetailMeNot, Inc.* | | | 10,000 | | | 77,100 | | |
| | Synacor, Inc.* | | | 15,000 | | | 46,200 | | |
| | United Online, Inc.* | | | 59,999 | | | 659,989 | | |
| | | | | | | | | | |
| | | | |
| | | | | | | | 3,978,728 | | |
| |
IT Services - 1.72% | | |
| | CIBER, Inc.* | | | 501 | | | 751 | | |
| | Computer Task Group, Inc. | | | 72,400 | | | 359,828 | | |
| | Edgewater Technology, Inc.* | | | 11,710 | | | 101,174 | | |
| | Engility Holdings, Inc.* | | | 31,650 | | | 668,448 | | |
| | ManTech International Corp., Class A | | | 78,882 | | | 2,983,317 | | |
| | ModusLink Global Solutions, Inc.*+ | | | 105,300 | | | 129,519 | | |
| | NCI, Inc., Class A | | | 60,700 | | | 852,835 | | |
| | NeuStar, Inc., Class A*+ | | | 61,481 | | | 1,445,418 | | |
| | PRGX Global, Inc.* | | | 97,300 | | | 507,906 | | |
| | Sykes Enterprises, Inc.* | | | 56,750 | | | 1,643,480 | | |
| | | | | | | | | | |
| | | | |
| | | | | | | | 8,692,676 | | |
| |
Leisure Equipment & Products - 0.55% | | |
| | Arctic Cat, Inc. | | | 7,100 | | | 120,700 | | |
| | JAKKS Pacific, Inc.*+ | | | 129,100 | | | 1,021,181 | | |
| | Johnson Outdoors, Inc., Class A | | | 63,850 | | | 1,640,945 | | |
| | | | | | | | | | |
| | | | |
| | | | | | | | 2,782,826 | | |
| |
Machinery - 2.21% | | |
| | American Railcar Industries, Inc. | | | 18,000 | | | 710,460 | | |
| | Ampco-Pittsburgh Corp. | | | 64,005 | | | 723,897 | | |
| | Art’s-Way Manufacturing Co. Inc.* | | | 5,000 | | | 14,800 | | |
| | Briggs & Stratton Corp. | | | 169,450 | | | 3,588,951 | | |
| | Chart Industries, Inc.* | | | 10,000 | | | 241,300 | | |
| | Chicago Rivet & Machine Co. | | | 1,000 | | | 27,220 | | |
| | Cleantech Solutions International, Inc.*+ | | | 12,000 | | | 12,000 | | |
| | Columbus McKinnon Corp. | | | 33,800 | | | 478,270 | | |
| | Dynamic Materials Corp. | | | 100 | | | 1,075 | | |
| | Eastern Co. (The) | | | 20,104 | | | 333,324 | | |
| | FreightCar America, Inc. | | | 20,700 | | | 290,835 | | |
| | Hardinge, Inc. | | | 82,600 | | | 830,956 | | |
| | Hurco Companies, Inc. | | | 11,015 | | | 306,547 | | |
| | Hyster-Yale Materials Handling, Inc. | | | 2,700 | | | 160,623 | | |
| | Kennametal, Inc. | | | 24,000 | | | 530,640 | | |
| | | | | | | | | | |
| Industry | | Company | | Shares | | | Value | | |
| | | | |
| | | | | | | | | | |
Machinery (continued) | | |
| | L.B. Foster Co., Class A | | | 8,900 | | | $ 96,921 | | |
| | L.S. Starrett Co. (The), Class A | | | 23,900 | | | 284,649 | | |
| | NN, Inc. | | | 47,500 | | | 664,525 | | |
| | Supreme Industries, Inc., Class A | | | 30,450 | | | 417,165 | | |
| | TriMas Corp.* | | | 19,500 | | | 351,000 | | |
| | Wabash National Corp.* | | | 87,000 | | | 1,104,900 | | |
| | WSI Industries, Inc.+ | | | 1,000 | | | 3,020 | | |
| | | | | | | | | | |
| | | | |
| | | | | | | | 11,173,078 | | |
| |
Marine - 1.88% | | |
| | Dorian LPG, Ltd.*+ | | | 170,954 | | | 1,205,226 | | |
| | Frontline, Ltd.+ | | | 30,500 | | | 240,035 | | |
| | Navios Maritime Acquisition Corp. | | | 456,200 | | | 716,234 | | |
| | Nordic American Tankers Ltd.+ | | | 149,400 | | | 2,075,166 | | |
| | Overseas Shipholding Group, Inc., Class A | | | 1,200 | | | 13,188 | | |
| | Rand Logistics, Inc.* | | | 6,600 | | | 6,798 | | |
| | Scorpio Tankers, Inc. | | | 580,000 | | | 2,436,000 | | |
| | Ship Finance International, Ltd.+ | | | 95,500 | | | 1,407,670 | | |
| | Teekay Tankers, Ltd., Class A+ | | | 470,010 | | | 1,400,630 | | |
| | | | | | | | | | |
| | | | |
| | | | | | | | 9,500,947 | | |
| |
Media - 1.69% | | |
| | Entercom Communications Corp., Class A | | | 122,405 | | | 1,661,036 | | |
| | Eros International PLC*+ | | | 19,300 | | | 314,011 | | |
| | Global Sources, Ltd.* | | | 5,000 | | | 45,850 | | |
| | Harte-Hanks, Inc. | | | 500 | | | 795 | | |
| | McClatchy Co. (The), Class A*+ | | | 15,432 | | | 225,616 | | |
| | New Media Investment Group, Inc. | | | 29,800 | | | 538,486 | | |
| | Reading International, Inc., Class A*+ | | | 70,400 | | | 879,296 | | |
| | Saga Communications, Inc., Class A | | | 2,250 | | | 88,965 | | |
| | Salem Media Group, Inc. | | | 38,600 | | | 278,692 | | |
| | Scholastic Corp. | | | 75,950 | | | 3,008,380 | | |
| | Sizmek, Inc.* | | | 32,500 | | | 74,425 | | |
| | Time, Inc. | | | 26,350 | | | 433,721 | | |
| | Townsquare Media, Inc., Class A* | | | 130,044 | | | 1,026,047 | | |
| | | | | | | | | | |
| | | | |
| | | | | | | | 8,575,320 | | |
| | |
Omni Tax-Managed Small-Cap Value Fund SCHEDULE OF INVESTMENTS (continued) | |
|
Showing percentage of net assets as of June 30, 2016
| | | | | | | | | | |
| Industry | | Company | | Shares | | | Value | | |
| | | |
Common Stocks (continued) | | | | | | | | |
Metals & Mining - 3.08% | | | | | | | | |
| | Carpenter Technology Corp.+ | | | 25,400 | | | $ 836,422 | | |
| | Century Aluminum Co.*+ | | | 107,900 | | | 683,007 | | |
| | Coeur Mining, Inc.*+ | | | 179,700 | | | 1,915,602 | | |
| | Ferroglobe PLC+ | | | 50,000 | | | 430,500 | | |
| | Gold Resource Corp. | | | 20,000 | | | 71,800 | | |
| | Handy & Harman, Ltd.* | | | 30,300 | | | 793,557 | | |
| | Haynes International, Inc. | | | 22,200 | | | 712,176 | | |
| | Hecla Mining Co.+ | | | 749,000 | | | 3,819,900 | | |
| | Kaiser Aluminum Corp. | | | 26,700 | | | 2,413,947 | | |
| | Materion Corp. | | | 71,700 | | | 1,775,292 | | |
| | Olympic Steel, Inc. | | | 22,300 | | | 609,013 | | |
| | Schnitzer Steel Industries, Inc., Class A | | | 66,500 | | | 1,170,400 | | |
| | Stillwater Mining Co.* | | | 24,465 | | | 290,155 | | |
| | Synalloy Corp. | | | 7,000 | | | 53,620 | | |
| | | | | | | | | | |
| | | | |
| | | | | | | | 15,575,391 | | |
| | |
Multiline Retail - 0.35% | | | | | |
| | Fred’s, Inc., Class A | | | 108,450 | | | 1,747,130 | | |
| |
Oil, Gas & Consumable Fuels - 6.84% | | |
| | Adams Resources & Energy, Inc. | | | 11,600 | | | 446,600 | | |
| | Alon USA Energy, Inc.+ | | | 195,600 | | | 1,267,488 | | |
| | Ardmore Shipping Corp. | | | 223,988 | | | 1,516,399 | | |
| | Bill Barrett Corp.*+ | | | 500 | | | 3,195 | | |
| | Bonanza Creek Energy, Inc.*+ | | | 5,000 | | | 10,050 | | |
| | California Resources Corp.+ | | | 75,400 | | | 919,880 | | |
| | Callon Petroleum Co.* | | | 122,200 | | | 1,372,306 | | |
| | Clayton Williams Energy, Inc.*+ | | | 68,600 | | | 1,883,756 | | |
| | Cloud Peak Energy, Inc.* | | | 1,000 | | | 2,060 | | |
| | Delek US Holdings, Inc. | | | 60,000 | | | 792,600 | | |
| | DHT Holdings, Inc. | | | 261,800 | | | 1,316,854 | | |
| | Earthstone Energy, Inc.*+ | | | 4,000 | | | 43,120 | | |
| | Forum Energy Technologies, Inc.* | | | 75,000 | | | 1,298,250 | | |
| | GasLog Ltd.+ | | | 34,500 | | | 447,810 | | |
| | Gran Tierra Energy, Inc.*+ | | | 527,700 | | | 1,783,626 | | |
| | Green Plains, Inc. | | | 96,450 | | | 1,901,994 | | |
| | Hallador Energy Co.+ | | | 71,600 | | | 330,792 | | |
| | Independence Contract Drilling, Inc.* | | | 108,081 | | | 586,880 | | |
| | ION Geophysical Corp.* | | | 9,333 | | | 58,145 | | |
| | Matador Resources Co.*+ | | | 59,500 | | | 1,178,100 | | |
| | McDermott International, Inc.*+ | | | 857,000 | | | 4,233,580 | | |
| | Mexco Energy Corp.* | | | 6,000 | | | 14,820 | | |
| | Mitcham Industries, Inc.* | | | 5,000 | | | 18,750 | | |
| | | | | | | | | | | | |
| Industry | | Company | | Shares | | | Value | | | | |
| | | | | |
| | | | | | | | | | | | |
Oil, Gas & Consumable Fuels (continued) | | | | |
| | MRC Global, Inc.* | | | 138,020 | | | $ 1,961,264 | | | | |
| | New Concept Energy, Inc.* | | | 3,600 | | | 6,516 | | | | |
| | Northern Oil and Gas, Inc.* | | | 15,000 | | | 69,300 | | | | |
| | Oasis Petroleum, Inc.* | | | 213,000 | | | 1,989,420 | | | | |
| | Oil States International, Inc.* | | | 18,000 | | | 591,840 | | | | |
| | Pacific Ethanol, Inc.*+ | | | 800 | | | 4,360 | | | | |
| | PDC Energy, Inc.* | | | 13,100 | | | 754,691 | | | | |
| | Renewable Energy Group, Inc.*+ | | | 348,319 | | | 3,075,657 | | | | |
| | REX American Resources Corp.* | | | 25,250 | | | 1,510,708 | | | | |
| | Ring Energy, Inc.*+ | | | 28,300 | | | 249,606 | | | | |
| | Sanchez Energy Corp.*+ | | | 500 | | | 3,530 | | | | |
| | SM Energy Co.+ | | | 22,000 | | | 594,000 | | | | |
| | Synergy Resources Corp.* | | | 100,000 | | | 666,000 | | | | |
| | TETRA Technologies, Inc.* | | | 269,900 | | | 1,719,263 | | | | |
| | W&T Offshore, Inc.*+ | | | 600 | | | 1,392 | | | | |
| | | | | | | | | | | | |
| | | | | |
| | | | | | | | 34,624,602 | | | | |
| | |
Paper & Forest Products - 0.95% | | | | |
| | Clearwater Paper Corp.* | | | 16,182 | | | 1,057,817 | | | | |
| | Mercer International, Inc. | | | 89,950 | | | 717,801 | | | | |
| | PH Glatfelter Co. | | | 129,500 | | | 2,533,020 | | | | |
| | Resolute Forest Products, Inc.* | | | 94,700 | | | 500,963 | | | | |
| | | | | | | | | | | | |
| | | | | |
| | | | | | | | 4,809,601 | | | | |
| | |
Personal Products - 0.22% | | | | |
| | Mannatech, Inc.* | | | 25,700 | | | 520,168 | | | | |
| | Natural Alternatives International, Inc.* | | | 6,000 | | | 66,240 | | | | |
| | Nutraceutical International Corp.* | | | 23,250 | | | 538,238 | | | | |
| | | | | | | | | | | | |
| | | | | |
| | | | | | | | 1,124,646 | | | | |
| | |
Pharmaceuticals - 0.02% | | | | |
| | Cumberland Pharmaceuticals, Inc.* | | | 20,300 | | | 91,350 | | | | |
| | |
Professional Services - 2.57% | | | | |
| | CBIZ, Inc.* | | | 128,300 | | | 1,335,603 | | | | |
| | CDI Corp. | | | 35,700 | | | 217,770 | | | | |
| | CRA International, Inc.* | | | 51,000 | | | 1,286,220 | | | | |
| | FTI Consulting, Inc.* | | | 56,500 | | | 2,298,420 | | | | |
| | Heidrick & Struggles International, Inc. | | | 55,440 | | | 935,827 | | | | |
| | ICF International, Inc.* | | | 35,000 | | | 1,431,500 | | | | |
| | Navigant Consulting, Inc.* | | | 215,900 | | | 3,486,785 | | | | |
| | RPX Corp.* | | | 105,596 | | | 968,315 | | | | |
| | TrueBlue, Inc.* | | | 250 | | | 4,730 | | | | |
| | |
| 28 | | Annual Report | June 30, 2016 |
| | |
Omni Tax-Managed Small-Cap Value Fund SCHEDULE OF INVESTMENTS (continued) | |
|
Showing percentage of net assets as of June 30, 2016
| | | | | | | | | | |
| Industry | | Company | | Shares | | | Value | | |
| | | |
Common Stocks (continued) | | | | | | | | |
Professional Services (continued) | | | | | |
| | VSE Corp. | | | 15,830 | | | $ 1,057,444 | | |
| | | | | | | | | | |
| | | | |
| | | | | | | | 13,022,614 | | |
| |
Real Estate Management & Development - 0.54% | | |
| | Farmland Partners, Inc.+ | | | 3,800 | | | 43,016 | | |
| | Forestar Group, Inc.* | | | 100,500 | | | 1,194,945 | | |
| | Griffin Industrial Realty, Inc. | | | 4,000 | | | 122,600 | | |
| | RE/MAX Holdings, Inc., Class A | | | 26,900 | | | 1,082,994 | | |
| | St. Joe Co. (The)* | | | 15,000 | | | 265,800 | | |
| | | | | | | | | | |
| | | | |
| | | | | | | | 2,709,355 | | |
| | |
Road & Rail - 1.01% | | | | | |
| | ArcBest Corp. | | | 40,400 | | | 656,500 | | |
| | Celadon Group, Inc. | | | 42,000 | | | 343,140 | | |
| | Covenant Transportation Group, Inc., Class A* | | | 80,650 | | | 1,457,346 | | |
| | Greenbrier Companies., Inc. (The)+ | | | 22,100 | | | 643,773 | | |
| | Marten Transport, Ltd. | | | 60,466 | | | 1,197,227 | | |
| | PAM Transportation Services, Inc.* | | | 27,527 | | | 437,404 | | |
| | USA Truck, Inc.* | | | 21,435 | | | 375,327 | | |
| | | | | | | | | | |
| | | | |
| | | | | | | | 5,110,717 | | |
| |
Semiconductors & Semiconductor Equipment - 2.07% | | |
| | Advanced Energy Industries, Inc.* | | | 23,000 | | | 873,080 | | |
| | Alpha & Omega Semiconductor, Ltd.* | | | 161,905 | | | 2,255,337 | | |
| | Amkor Technology, Inc.* | | | 255,200 | | | 1,467,400 | | |
| | AXT, Inc.* | | | 25,000 | | | 79,750 | | |
| | Brooks Automation, Inc. | | | 500 | | | 5,610 | | |
| | Cohu, Inc. | | | 30,000 | | | 325,500 | | |
| | Diodes, Inc.* | | | 44,400 | | | 834,276 | | |
| | FormFactor, Inc.* | | | 15,000 | | | 134,850 | | |
| | GigPeak, Inc.* | | | 65,000 | | | 127,400 | | |
| | inTEST Corp.* | | | 54,500 | | | 207,645 | | |
| | IXYS Corp. | | | 39,000 | | | 399,750 | | |
| | Kulicke & Soffa Industries, Inc.* | | | 100,300 | | | 1,220,651 | | |
| | Photronics, Inc.* | | | 171,470 | | | 1,527,798 | | |
| | Rudolph Technologies, Inc.* | | | 31,100 | | | 482,983 | | |
| | Sigma Designs, Inc.* | | | 3,800 | | | 24,434 | | |
| | Ultra Clean Holdings, Inc.* | | | 57,000 | | | 324,330 | | |
| | Xcerra Corp.* | | | 30,000 | | | 172,500 | | |
| | | | | | | | | | |
| | | | |
| | | | | | | | 10,463,294 | | |
| | |
Software - 0.87% | | | | | |
| | Ebix, Inc.+ | | | 40,000 | | | 1,916,000 | | |
| | Epiq Systems, Inc. | | | 30,000 | | | 438,000 | | |
| | GSE Systems, Inc.* | | | 22,500 | | | 50,175 | | |
| | | | | | | | | | |
| Industry | | Company | | Shares | | | Value | | |
| | | | |
| | | | | | | | | | |
Software (continued) | | | | | | | | |
| | Mind CTI Ltd. | | | 500 | | | $ 1,070 | | |
| | Net 1 UEPS Technologies, Inc.* | | | 191,100 | | | 1,909,089 | | |
| | NetSol Technologies, Inc.*+ | | | 16,680 | | | 97,411 | | |
| | | | | | | | | | |
| | | | |
| | | | | | | | 4,411,745 | | |
| | | |
Specialty Retail - 3.21% | | | | | | | | |
| | Barnes & Noble Education, Inc.* | | | 50,560 | | | 513,184 | | |
| | Barnes & Noble, Inc. | | | 114,000 | | | 1,293,900 | | |
| | Big 5 Sporting Goods Corp. | | | 119,603 | | | 1,108,720 | | |
| | Children’s Place, Inc. (The) | | | 17,900 | | | 1,435,222 | | |
| | Christopher & Banks Corp.* | | | 200 | | | 438 | | |
| | Citi Trends, Inc. | | | 76,150 | | | 1,182,609 | | |
| | Destination Maternity Corp.+ | | | 2,200 | | | 12,936 | | |
| | Finish Line, Inc. (The), Class A | | | 103,000 | | | 2,079,570 | | |
| | Genesco, Inc.* | | | 5,000 | | | 321,550 | | |
| | Group 1 Automotive, Inc. | | | 13,000 | | | 641,680 | | |
| | Guess?, Inc. | | | 32,000 | | | 481,600 | | |
| | Haverty Furniture Cos., Inc. | | | 30,300 | | | 546,309 | | |
| | hhgregg, Inc.*+ | | | 38,500 | | | 68,145 | | |
| | New York & Co., Inc.* | | | 32,700 | | | 48,723 | | |
| | Rent-A-Center, Inc. | | | 800 | | | 9,824 | | |
| | Sears Hometown & Outlet Stores, Inc.* | | | 10,000 | | | 67,400 | | |
| | Shoe Carnival, Inc. | | | 57,500 | | | 1,440,950 | | |
| | Sonic Automotive, Inc., Class A | | | 73,500 | | | 1,257,585 | | |
| | Stage Stores, Inc. | | | 245 | | | 1,196 | | |
| | Systemax, Inc.* | | | 3,000 | | | 25,590 | | |
| | Tilly’s, Inc., Class A* | | | 67,400 | | | 390,246 | | |
| | Trans World Entertainment Corp.* | | | 30,000 | | | 112,500 | | |
| | TravelCenters of America LLC* | | | 219,850 | | | 1,793,976 | | |
| | West Marine, Inc.* | | | 86,000 | | | 721,540 | | |
| | Zumiez, Inc.*+ | | | 48,400 | | | 692,604 | | |
| | | | | | | | | | |
| | | | |
| | | | | | | | 16,247,997 | | |
| |
Textiles, Apparel & Luxury Goods - 1.00% | | |
| | Abercrombie & Fitch Co., Class A | | | 63,000 | | | 1,122,030 | | |
| | Delta Apparel, Inc.* | | | 13,200 | | | 297,660 | | |
| | Movado Group, Inc. | | | 25,600 | | | 555,008 | | |
| | Perry Ellis International, Inc.* | | | 135,184 | | | 2,719,902 | | |
| | Rocky Brands, Inc. | | | 30,450 | | | 347,739 | | |
| | | | | | | | | | |
| | | | |
| | | | | | | | 5,042,339 | | |
| | |
Thrifts & Mortgage Finance - 4.23% | | | | | |
| | Astoria Financial Corp. | | | 120,900 | | | 1,853,397 | | |
| | Bank Mutual Corp. | | | 121,800 | | | 935,424 | | |
| | |
Omni Tax-Managed Small-Cap Value Fund SCHEDULE OF INVESTMENTS (continued) | |
|
Showing percentage of net assets as of June 30, 2016
| | | | | | | | | | |
| Industry | | Company | | Shares | | | Value | | |
| | | |
Common Stocks (continued) | | | | | | | | |
Thrifts & Mortgage Finance (continued) | | |
| | Berkshire Hills Bancorp, Inc. | | | 40,970 | | | $ 1,102,912 | | |
| | Brookline Bancorp, Inc. | | | 30,000 | | | 330,900 | | |
| | Charter Financial Corp. | | | 12,500 | | | 166,000 | | |
| | Chicopee Bancorp, Inc. | | | 12,500 | | | 228,250 | | |
| | Citizens Community Bancorp, Inc. | | | 2,500 | | | 25,900 | | |
| | Dime Community Bancshares, Inc. | | | 15,000 | | | 255,150 | | |
| | ESSA Bancorp, Inc. | | | 35,000 | | | 469,000 | | |
| | Federal Agricultural Mortgage Corp., Class C | | | 9,700 | | | 337,754 | | |
| | First Defiance Financial Corp. | | | 29,150 | | | 1,132,478 | | |
| | First Financial Northwest, Inc. | | | 26,400 | | | 350,592 | | |
| | Fox Chase Bancorp, Inc.+ | | | 10,500 | | | 213,570 | | |
| | Hingham Institution for Savings | | | 1,143 | | | 140,498 | | |
| | Home Bancorp, Inc. | | | 15,597 | | | 428,450 | | |
| | HomeStreet, Inc.* | | | 54,000 | | | 1,075,680 | | |
| | HopFed Bancorp, Inc. | | | 23,500 | | | 272,365 | | |
| | Lake Sunapee Bank Group | | | 2,000 | | | 34,220 | | |
| | Laporte Bancorp, Inc. | | | 11,000 | | | 179,630 | | |
| | Meta Financial Group, Inc. | | | 20,078 | | | 1,023,175 | | |
| | Nationstar Mortgage Holdings, Inc.*+ | | | 35,000 | | | 394,100 | | |
| | Northwest Bancshares, Inc. | | | 44,837 | | | 664,933 | | |
| | Ocean Shore Holding Co. | | | 39,100 | | | 663,136 | | |
| | OceanFirst Financial Corp. | | | 67,126 | | | 1,219,679 | | |
| | Ocwen Financial Corp.*+ | | | 50,000 | | | 85,500 | | |
| | Oritani Financial Corp. | | | 50,000 | | | 799,500 | | |
| | Provident Financial Holdings, Inc. | | | 53,710 | | | 982,893 | | |
| | Provident Financial Services, Inc. | | | 67,400 | | | 1,323,736 | | |
| | Prudential Bancorp, Inc.+ | | | 957 | | | 13,494 | | |
| | Riverview Bancorp, Inc. | | | 72,478 | | | 342,821 | | |
| | Security National Financial Corp., Class A* | | | 13,671 | | | 66,851 | | |
| | SI Financial Group, Inc. | | | 30,000 | | | 397,200 | | |
| | Territorial Bancorp, Inc. | | | 21,900 | | | 579,693 | | |
| | Timberland Bancorp, Inc. | | | 32,000 | | | 480,000 | | |
| | TrustCo Bank Corp. | | | 20,000 | | | 128,200 | | |
| | United Community Bancorp | | | 10,000 | | | 140,700 | | |
| | United Community Financial Corp. | | | 163 | | | 991 | | |
| | United Financial Bancorp, Inc. | | | 10,000 | | | 129,800 | | |
| | Walker & Dunlop, Inc.* | | | 175 | | | 3,986 | | |
| | Westfield Financial, Inc. | | | 53,000 | | | 408,100 | | |
| | WSFS Financial Corp. | | | 63,000 | | | 2,027,970 | | |
| | | | | | | | | | |
| | | | |
| | | | | | | | 21,408,628 | | |
| | | | | | | | | | |
| Industry | | Company | | Shares | | | Value | | |
| | | | |
| | | | | | | | | | |
Trading Companies & Distributors - 1.32% | | |
| | AeroCentury Corp.* | | | 4,300 | | | $ 39,216 | | |
| | CAI International, Inc.* | | | 37,100 | | | 278,250 | | |
| | General Finance Corp.* | | | 135,064 | | | 574,022 | | |
| | Houston Wire & Cable Co. | | | 46,100 | | | 242,025 | | |
| | Kaman Corp. | | | 16,500 | | | 701,580 | | |
| | Rush Enterprises, Inc., Class A* | | | 48,600 | | | 1,047,330 | | |
| | TAL International Group, Inc. | | | 7,000 | | | 93,870 | | |
| | Titan Machinery, Inc.* | | | 75,500 | | | 841,825 | | |
| | Veritiv Corp.* | | | 46,133 | | | 1,733,678 | | |
| | Willis Lease Finance Corp.* | | | 50,950 | | | 1,132,618 | | |
| | | | | | | | | | |
| | | | |
| | | | | | | | 6,684,414 | | |
| |
Wireless Telecommunication Services - 0.42% | | |
| | Spok Holdings, Inc. | | | 111,100 | | | 2,129,232 | | |
| | | | | | | | | | |
| | |
TOTAL COMMON STOCKS - 100.38% | | | 507,903,349 | | |
| | | | | | | | | | |
(Cost $431,794,569) | | | | | |
| | |
WARRANTS - 0.00% | | | | | |
| | Eagle Bulk Shipping, Inc., expiring 10/15/21* | | | 8,501 | | | 340 | | |
| | | | | | | | | | |
| | |
TOTAL WARRANTS - 0.00% | | | 340 | | |
| | | | | | | | | | |
(Cost $70,770) | | | | | | | | |
| | | | | | | | | | | | | | |
| | | | | Rate^ | | | Shares | | | Value | | |
| | | | | | | |
| |
INVESTMENTS PURCHASED WITH CASH PROCEEDS FROM SECURITIES LENDING - 8.26% | | |
Dreyfus Cash Management Fund** | | | 0.30% | | | | 41,830,680 | | | 41,830,680 | | |
| | | | | | | | | | | | | | |
| | |
TOTAL INVESTMENTS PURCHASED WITH CASH PROCEEDS FROM SECURITIES LENDING - 8.26% | | | 41,830,680 | | |
| | | | | | | | | | | | | | |
(Cost $41,830,680) | | | | | |
| | |
TOTAL INVESTMENTS - 108.64% | | | $549,734,369 | | |
(Cost $473,696,019) | | | | | |
Liabilities in Excess of Other Assets - (8.64%) | | | (43,739,412) | | |
| | | | | | | | | | | | | | |
NET ASSETS - 100.00% | | | $505,994,957 | | |
| | | | | | | | | | | | | | |
| * | Non-income producing security. |
| ** | This security represents the investment of the collateral received in connection with securities out on loan as of June 30, 2016. |
| ^ | Rate disclosed as of June 30, 2016. |
| + | This security or a portion of the security is out on loan as of June 30, 2016. Total loaned securities had a value of $40,743,010 as of June 30, 2016. |
LLC - Limited Liability Company
PLC - Public Limited Company
| | |
| 30 | | Annual Report | June 30, 2016 |
| | |
Omni Tax-Managed Small-Cap Value Fund SCHEDULE OF INVESTMENTS (continued) | |
|
Showing percentage of net assets as of June 30, 2016
| | | | | | | | | | | | | | |
Summary of inputs used to value the Fund’s investments as of 06/30/2016 (See Note 2 in Notes to Financial Statements): | |
| | | Valuation Inputs | |
| |
| | | Investment in Securities (Value) | |
| |
| | | Level 1 Quoted Prices | | | Level 2
Significant Observable Inputs | | | Level 3 Significant Unobservable Inputs | | Total | |
| |
| | | | |
Common Stocks | | $ | 507,903,349 | | | $ | — | | | $ — | | $ | 507,903,349 | |
Warrants | | | 340 | | | | — | | | — | | | 340 | |
Investments Purchased with Cash Proceeds from Securities Lending | | | — | | | | 41,830,680 | | | — | | | 41,830,680 | |
| | | | | | | | | | | | | | |
TOTAL | | $ | 507,903,689 | | | $ | 41,830,680 | | | $ — | | $ | 549,734,369 | |
| | | | | | | | | | | | | | |
|
See Notes to Financial Statements. | |
| | |
| STATEMENTS OF ASSETS AND LIABILITIES | |
|
June 30, 2016
| | | | | | | | | | | | |
| ASSETS | | Omni Small-Cap Value | | | | | Omni Tax-Managed
Small-Cap Value | | | |
| | | | |
Investments at value | | $575,985,930 | | | | | | $549,734,369 | | | | |
| | | | |
Receivables: | | | | | | | | | | | | |
| | | | |
Portfolio securities sold | | 133,666 | | | | | | 181,886 | | | | |
| | | | |
Fund shares sold | | 3,013,534 | | | | | | 963,234 | | | | |
| | | | |
Dividends and interest | | 349,860 | | | | | | 347,834 | | | | |
| | | | |
Prepaid expenses | | 60,998 | | | | | | 66,758 | | | | |
| | | | |
Total assets | | 579,543,988 | | | | | | 551,294,081 | | | | |
| | | | |
LIABILITIES | | | | | | | | | | | | |
| | | | |
Payables: | | | | | | | | | | | | |
| | | | |
Portfolio securities purchased | | 1,362,104 | | | | | | 861,871 | | | | |
| | | | |
Fund shares redeemed | | 2,794,463 | | | | | | 866,174 | | | | |
| | | | |
Due to custodian | | - | | | | | | 889,225 | | | | |
| | | | |
Loan payable | | - | | | | | | 500,000 | | | | |
| | | | |
Payable upon return of securities loaned | | 16,705,782 | | | | | | 41,830,680 | | | | |
| | | | |
Accrued Liabilities: | | | | | | | | | | | | |
| | | | |
Investment advisory fees | | 184,769 | | | | | | 159,421 | | | | |
| | | | |
Administration fees | | 11,093 | | | | | | 10,027 | | | | |
| | | | |
Directors’ fees | | 449 | | | | | | 370 | | | | |
| | | | |
Other | | 199,785 | | | | | | 181,356 | | | | |
| | | | |
Total liabilities | | 21,258,445 | | | | | | 45,299,124 | | | | |
| | | | |
NET ASSETS | | $558,285,543 | | | | | | $505,994,957 | | | | |
| | | | |
NET ASSETS REPRESENT | | | | | | | | | | | | |
| | | | |
Paid-in capital | | $484,853,753 | | | | | | $433,555,644 | | | | |
| | | | |
Undistributed net investment income | | 2,918,574 | | | | | | 4,983,051 | | | | |
| | | | |
Accumulated net realized loss on investments | | (9,203,889) | | | | | | (8,582,088) | | | | |
| | | | |
Net unrealized appreciation on investments | | 79,717,105 | | | | | | 76,038,350 | | | | |
| | | | |
NET ASSETS | | $558,285,543 | | | | | | $505,994,957 | | | | |
| | | | |
Shares of common stock outstanding of $.001 par value* | | 38,088,167 | | | | | | 36,037,630 | | | | |
| | | | |
Net asset value, offering price and redemption price per share | | $ 14.66 | | | | | | $ 14.04 | | | | |
| | | | |
Total investments at cost | | $496,268,825 | | | | | | $473,696,019 | | | | |
* See Note 1 - Organization in the Notes to Financial Statements for shares authorized for each Fund.
See Notes to Financial Statements.
| | |
| 32 | | Annual Report | June 30, 2016 |
| | |
| STATEMENTS OF OPERATIONS | | |
Year Ended June 30, 2016
| | | | | | | | | | | | | | | | | | | | | | | | | |
| | | | | Omni Small-Cap Value | | | | Omni Tax-Managed Small-Cap Value | | |
| | | | | |
INVESTMENT INCOME | | | | | | | | | | | | | | | | | | | | | | | | | |
| | | | | |
Dividends | | | | | | | | | $ 8,292,901 | | | | | | | | | $ | 7,472,296 | | | | | | |
| | | | | |
Less: foreign taxes withheld | | | | | | | | | (3,247 | ) | | | | | | | | | (1,232 | ) | | | | | |
| | | | | |
Securities lending | | | | | | | | | 421,120 | | | | | | | | | | 456,542 | | | | | | |
| | | | | |
Total Investment Income | | | | | | | | | 8,710,774 | | | | | | | | | | 7,927,606 | | | | | | |
| | | | | |
EXPENSES | | | | | | | | | | | | | | | | | | | | | | | | | |
| | | | | |
Investment advisory fees | | | | | | | | | 2,457,732 | | | | | | | | | | 2,199,296 | | | | | | |
| | | | | |
Administration fees | | | | | | | | | 119,791 | | | | | | | | | | 106,901 | | | | | | |
| | | | | |
Accounting fees | | | | | | | | | 134,950 | | | | | | | | | | 127,709 | | | | | | |
| | | | | |
Transfer agent fees | | | | | | | | | 13,762 | | | | | | | | | | 13,799 | | | | | | |
| | | | | |
Professional fees | | | | | | | | | 104,642 | | | | | | | | | | 96,450 | | | | | | |
| | | | | |
Custody fees | | | | | | | | | 19,460 | | | | | | | | | | 18,821 | | | | | | |
| | | | | |
Blue sky fees | | | | | | | | | 54,908 | | | | | | | | | | 66,690 | | | | | | |
| | | | | |
Directors’ and officers’ fees | | | | | | | | | 50,201 | | | | | | | | | | 45,026 | | | | | | |
| | | | | |
Shareholder servicing fees | | | | | | | | | 440,951 | | | | | | | | | | 397,370 | | | | | | |
| | | | | |
Reports to shareholders | | | | | | | | | 34,450 | | | | | | | | | | 26,287 | | | | | | |
| | | | | |
Miscellaneous expenses | | | | | | | | | 80,467 | | | | | | | | | | 84,174 | | | | | | |
| | | | | |
Total Expenses | | | | | | | | | 3,511,314 | | | | | | | | | | 3,182,523 | | | | | | |
| | | | | |
Less investment advisory fees waived | | | | | | | | | (561,512 | ) | | | | | | | | | (547,245 | ) | | | | | |
| | | | | |
Net Expenses | | | | | | | | | 2,949,802 | | | | | | | | | | 2,635,278 | | | | | | |
| | | | | |
NET INVESTMENT INCOME | | | | | | | | | 5,760,972 | | | | | | | | | | 5,292,328 | | | | | | |
| | | | | |
NET REALIZED AND UNREALIZED LOSS ON INVESTMENTS | | | | | | | | | | | | | | | | | | | | | | | | | |
| | | | | |
Realized Loss on: | | | | | | | | | | | | | | | | | | | | | | | | | |
| | | | | |
Investments | | | | | | | | | (5,156,734 | ) | | | | | | | | | (5,787,803 | ) | | | | | |
| | | | | |
Change in Unrealized Appreciation (Depreciation) on: | | | | | | | | | | | | | | | | | | | | | | | | | |
| | | | | |
Investments | | | | | | | | | (11,917,008 | ) | | | | | | | | | (12,483,133 | ) | | | | | |
| | | | | |
Net Realized and Unrealized Loss on Investments | | | | | | | | | (17,073,742 | ) | | | | | | | | | (18,270,936 | ) | | | | | |
| | | | | |
NET DECREASE IN NET ASSETS RESULTING FROM OPERATIONS | | | | | | | | | $(11,312,770 | ) | | | | | | | | $ | (12,978,608 | ) | | | | | |
See Notes to Financial Statements.
| | |
| STATEMENTS OF CHANGES IN NET ASSETS | | |
| | | | | | | | | | | | | | | | | | |
| | | Omni Small-Cap Value | | | Omni Tax-Managed Small-Cap Value | | | |
| | | Year Ended June 30 | | | Year Ended June 30 | | | |
| | | 2016 | | | 2015 | | | 2016 | | | 2015 | | | |
| | | | | |
OPERATIONS | | | | | | | | | | | | | | | | | | |
| | | | | |
Net investment income | | $ | 5,760,972 | | | $ | 3,851,176 | | | $ | 5,292,328 | | | $ | 3,547,309 | | | |
| | | | | |
Net realized loss on investments | | | (5,156,734 | ) | | | (1,654,820 | ) | | | (5,787,803 | ) | | | (2,599,989 | ) | | |
| | | | | |
Net change in unrealized appreciation (depreciation) on investments | | | (11,917,008 | ) | | | (4,763,662 | ) | | | (12,483,133 | ) | | | (10,832,450 | ) | | |
| | | | | |
Net decrease in net assets resulting from operations | | | (11,312,770 | ) | | | (2,567,306 | ) | | | (12,978,608 | ) | | | (9,885,130 | ) | | |
| | | | | |
DISTRIBUTIONS: | | | | | | | | | | | | | | | | | | |
| | | | | |
From net investment income. | | | (4,704,613 | ) | | | (2,478,657 | ) | | | (3,274,284 | ) | | | (767,401 | ) | | |
| | | | | |
From net realized gains | | | - | | | | (20,389,241 | ) | | | - | | | | (14,502,076 | ) | | |
| | | | | |
Net decrease in net assets resulting from distributions | | | (4,704,613 | ) | | | (22,867,898 | ) | | | (3,274,284 | ) | | | (15,269,477 | ) | | |
| | | | | |
SHARE TRANSACTIONS: | | | | | | | | | | | | | | | | | | |
| | | | | |
Proceeds from sale of shares | | | 267,382,250 | | | | 150,345,339 | | | | 280,799,281 | | | | 153,736,050 | | | |
| | | | | |
Reinvestment of distributions | | | 4,704,241 | | | | 22,867,898 | | | | 3,264,234 | | | | 15,267,233 | | | |
| | | | | |
Cost of shares redeemed | | | (157,150,700 | ) | | | (95,602,458 | ) | | | (222,916,519 | ) | | | (108,078,029 | ) | | |
| | | | | |
Net increase in net assets resulting from share transactions | | | 114,935,791 | | | | 77,610,779 | | | | 61,146,996 | | | | 60,925,254 | | | |
| | | | | |
Net increase in net assets | | | 98,918,408 | | | | 52,175,575 | | | | 44,894,104 | | | | 35,770,647 | | | |
| | | | | |
NET ASSETS: | | | | | | | | | | | | | | | | | | |
| | | | | |
Beginning of year | | | 459,367,135 | | | | 407,191,560 | | | | 461,100,853 | | | | 425,330,206 | | | |
| | | | | |
End of year* | | $ | 558,285,543 | | | $ | 459,367,135 | | | $ | 505,994,957 | | | $ | 461,100,853 | | | |
| | | | | |
SHARES ISSUED & REDEEMED | | | | | | | | | | | | | | | | | | |
| | | | | |
Issued | | | 19,594,288 | | | | 9,811,973 | | | | 21,596,228 | | | | 10,661,864 | | | |
| | | | | |
Distributions reinvested | | | 330,354 | | | | 1,604,765 | | | | 240,017 | | | | 1,131,744 | | | |
| | | | | |
Redeemed | | | (11,488,298 | ) | | | (6,248,268 | ) | | | (17,275,572 | ) | | | (7,678,666 | ) | | |
| | | | | |
Net increase in shares | | | 8,436,344 | | | | 5,168,470 | | | | 4,560,673 | | | | 4,114,942 | | | |
| | | | | |
Outstanding at beginning of year | | | 29,651,823 | | | | 24,483,353 | | | | 31,476,957 | | | | 27,362,015 | | | |
| | | | | |
Outstanding at end of year | | | 38,088,167 | | | | 29,651,823 | | | | 36,037,630 | | | | 31,476,957 | | | |
| | | | | |
* Including undistributed net investment income of: | | $ | 2,918,574 | | | $ | 2,027,126 | | | $ | 4,983,051 | | | $ | 3,271,865 | | | |
See Notes to Financial Statements.
| | |
| 34 | | Annual Report | June 30, 2016 |
FINANCIAL HIGHLIGHTS
(for a share outstanding throughout each period indicated)
OMNI SMALL-CAP VALUE
| | | | | | | | | | | | | | | | | | |
| | | Year Ended June 30 | | | | |
| | | | | | |
| | | | | | | | | |
| | | 2016 | | | | 2015 | | | | 2014 | | | | 2013 | | | | For the
Period Ended
06/30/2012(a) |
| | | | | | | | | | | | | | | | | | |
| | | | | | | | | |
Net Asset Value, Beginning of Period | | $15.49 | | | | $16.63 | | | | $14.11 | | | | $11.11 | | | | $10.00 |
| | | | | | | | | | | | | | | | | | |
| | | | | | | | | |
Income from Investment Operations: | | | | | | | | | | | | | | | | | | |
Net Investment Income(b) | | 0.17 | | | | 0.14 | | | | 0.11 | | | | 0.17 | | | | 0.08 |
Net Realized and Unrealized Gain (Loss) | | (0.86) | | | | (0.46) | | | | 3.58 | | | | 3.12 | | | | 1.06 |
| | | | | | | | | | | | | | | | | | |
Total from Investment Operations | | (0.69) | | | | (0.32) | | | | 3.69 | | | | 3.29 | | | | 1.14 |
| | | | | | | | | | | | | | | | | | |
| | | | | | | | | |
Less Distributions to Shareholders from: | | | | | | | | | | | | | | | | | | |
Net Investment Income | | (0.14) | | | | (0.09) | | | | (0.08) | | | | (0.16) | | | | (0.03) |
Net Realized Gain | | - | | | | (0.73) | | | | (1.09) | | | | (0.13) | | | | - |
| | | | | | | | | | | | | | | | | | |
Total Distributions | | (0.14) | | | | (0.82) | | | | (1.17) | | | | (0.29) | | | | (0.03) |
| | | | | | | | | | | | | | | | | | |
| | | | | | | | | |
Net Asset Value, End of Period | | $14.66 | | | | $15.49 | | | | $16.63 | | | | $14.11 | | | | $11.11 |
| | | | | | | | | | | | | | | | | | |
| | | | | | | | | |
Total Return(c) | | (4.42%) | | | | (1.48%) | | | | 26.89% | | | | 30.08% | | | | 11.41%(d) |
| | | | | | | | | |
Ratios and Supplemental Data: | | | | | | | | | | | | | | | | | | |
Net Assets, End of Period (in 000’s) | | $558,286 | | | | $459,367 | | | | $407,192 | | | | $260,909 | | | | $179,553 |
Expenses Before Waivers and Reimbursements | | 0.71% | | | | 0.71% | | | | 0.71% | | | | 0.78% | | | | 0.84%(e) |
Expenses After Waivers and Reimbursements | | 0.60% | | | | 0.60% | | | | 0.60% | | | | 0.60% | | | | 0.60%(e) |
Net Investment Income After Waivers and Reimbursements | | 1.17% | | | | 0.88% | | | | 0.70% | | | | 1.36% | | | | 0.92%(e) |
Portfolio Turnover Rate | | 24% | | | | 25% | | | | 31% | | | | 34% | | | | 8%(d) |
| (a) | Commenced operations on August 31, 2011. |
| (b) | Per share amounts calculated based on the average daily shares outstanding during the period. |
| (c) | Total return would have been lower had various fees not been waived during the period. |
| (e) | Annualized for periods less than one year. |
See Notes to Financial Statements.
FINANCIAL HIGHLIGHTS
(for a share outstanding throughout each year indicated)
OMNI TAX-MANAGED SMALL-CAP VALUE
| | | | | | | | | | | | | | | | | | |
| | | Year Ended June 30 |
| | |
| | | 2016 | | | | 2015 | | | | 2014 | | | | 2013 | | | | 2012 |
| | | | | | | | | | | | | | | | | | |
Net Asset Value, Beginning of Year | | $14.65 | | | | $15.54 | | | | $12.75 | | | | $10.05 | | | | $10.68 |
| | | | | | | | | | | | | | | | | | |
| | | | | | | | | |
Income from Investment Operations: | | | | | | | | | | | | | | | | | | |
Net Investment Income(a) | | 0.16 | | | | 0.12 | | | | 0.09 | | | | 0.15 | | | | 0.09 |
Net Realized and Unrealized Gain (Loss) | | (0.66) | | | | (0.42) | | | | 3.26 | | | | 2.68 | | | | (0.67)(b) |
| | | | | | | | | | | | | | | | | | |
Total from Investment Operations | | (0.50) | | | | (0.30) | | | | 3.35 | | | | 2.83 | | | | (0.58) |
| | | | | | | | | | | | | | | | | | |
| | | | | | | | | |
Less Distributions to Shareholders from: | | | | | | | | | | | | | | | | | | |
Net Investment Income | | (0.11) | | | | (0.03) | | | | (0.08) | | | | (0.13) | | | | (0.05) |
Net Realized Gain | | - | | | | (0.56) | | | | (0.48) | | | | - | | | | - |
| | | | | | | | | | | | | | | | | | |
Total Distributions | | (0.11) | | | | (0.59) | | | | (0.56) | | | | (0.13) | | | | (0.05) |
| | | | | | | | | | | | | | | | | | |
| | | | | | | | | |
Net Asset Value, End of Year | | $14.04 | | | | $14.65 | | | | $15.54 | | | | $12.75 | | | | $10.05 |
| | | | | | | | | | | | | | | | | | |
| | | | | | | | | |
Total Return(c) | | (3.42%) | | | | (1.62%) | | | | 26.71% | | | | 28.43% | | | | (5.41%) |
| | | | | | | | | |
Ratios and Supplemental Data: | | | | | | | | | | | | | | | | | | |
Net Assets, End of Year (in 000’s) | | $505,995 | | | | $461,101 | | | | $425,330 | | | | $262,088 | | | | $127,216 |
Expenses Before Waivers and Reimbursements | | 0.72% | | | | 0.71% | | | | 0.71% | | | | 0.77% | | | | 0.90% |
Expenses After Waivers and Reimbursements | | 0.60% | | | | 0.60% | | | | 0.60% | | | | 0.60% | | | | 0.60% |
Net Investment Income After Waivers and Reimbursements | | 1.20% | | | | 0.84% | | | | 0.65% | | | | 1.34% | | | | 0.95% |
Portfolio Turnover Rate | | 29% | | | | 30% | | | | 25% | | | | 34% | | | | 26% |
| (a) | Per share amounts calculated based on the average daily shares outstanding during the period. |
| (b) | Realized and unrealized gain (loss) per share do not correlate to the aggregate of the net unrealized and realized gain in the Statements of Changes in Net Assets for the year ended June 30, 2012, primarily due to the timing of the sales and repurchases of the Fund’s shares in relation to fluctuating market values for the Fund’s portfolio. |
| (c) | Total return would have been lower had various fees not been waived during the period. |
See Notes to Financial Statements.
| | |
| 36 | | Annual Report | June 30, 2016 |
| | |
| NOTES TO FINANCIAL STATEMENTS | | |
June 30, 2016
1. Organization:
Bridgeway Funds, Inc. (“Bridgeway” or the “Company”) was organized as a Maryland corporation on October 19, 1993, and is registered under the Investment Company Act of 1940, as amended (the “1940 Act”), as an open-end management investment company.
Bridgeway is organized as a series fund, with 10 investment funds as of June 30, 2016 (each is referred to as a “Bridgeway Fund” and collectively, the “Bridgeway Funds”). The Aggressive Investors 1, Ultra-Small Company, Ultra-Small Company Market, Small-Cap Momentum, Small-Cap Growth, Small-Cap Value, Blue Chip 35 Index and Managed Volatility Funds are presented in a separate report. The Omni Small-Cap Value Fund and the Omni Tax-Managed Small-Cap Value Fund (each a “Fund” and together, the “Funds”) are presented in this report.
Bridgeway is authorized to issue 1,915,000,000 shares of common stock at $0.001 per share. As of June 30, 2016, 100,000,000 shares have been classified into the Aggressive Investors 1 Fund. 130,000,000 shares have been classified into the Blue Chip 35 Index Fund. 15,000,000 shares have been classified into the Ultra-Small Company Fund. 100,000,000 shares each have been classified into the Ultra-Small Company Market, Omni Small-Cap Value, Omni Tax-Managed Small-Cap Value, Small-Cap Momentum, Small-Cap Growth and Small-Cap Value Funds. 50,000,000 shares have been classified into the Managed Volatility Fund.
All of the Bridgeway Funds are no-load, diversified funds.
The Funds seek to provide long-term total return on capital, primarily through capital appreciation.
Bridgeway Capital Management, Inc. (the “Adviser”) is the investment adviser for all of the Bridgeway Funds.
2. Significant Accounting Policies:
The following summary of significant accounting policies, followed in the preparation of the financial statements of the Funds, are in conformity with accounting principles generally accepted in the United States of America (“GAAP”). Each Fund is considered an investment company under GAAP and follows the accounting and reporting guidance applicable to investment companies.
Securities and Other Investments Valuation Securities for which market quotations are readily available are valued at the last sale price on the national exchange on which such securities are primarily traded. In the case of securities reported on the National Association of Securities Dealers Automated Quotation (“NASDAQ”) system, the securities are valued based on the NASDAQ Official Closing Price (“NOCP”). In the absence of recorded sales on their home exchange, or NOCP, in the case of NASDAQ traded securities, the security will be valued as follows: bid prices for long positions and ask prices for short positions.
Investments in open-end registered investment companies and closed-end registered investment companies that do not trade on an exchange are valued at the end of day net asset value (“NAV”) per share.
Investments in closed-end registered investment companies that trade on an exchange are valued at the last sales price as of the close of the customary trading session on the exchange where the security is principally traded.
When market quotations are not readily available or when events occur that make established valuation methods unreliable, securities of the Funds may be valued at fair value as determined in good faith by or under the direction of the Board of Directors. The valuation assigned to a fair valued security for purposes of calculating the Funds’ NAV may differ from the security’s most recent closing market price and from the prices used by other mutual funds to calculate their NAVs.
| | |
| NOTES TO FINANCIAL STATEMENTS (continued) | | |
June 30, 2016
The inputs and valuation techniques used to determine the value of a fund’s investments are summarized into three levels as described in the hierarchy below:
| ● | | Level 1 — quoted prices in active markets for identical assets |
Investments whose values are based on quoted market prices in active markets, and whose values are therefore classified as Level 1 prices, include active listed equity securities. The Funds do not adjust the quoted price for such investments, even in situations where the Funds hold a large position and a sale could reasonably impact the quoted price.
| ● | | Level 2 — other significant observable inputs (including quoted prices for similar securities, interest rates, prepayment speeds, credit risk, etc.) |
Investments that trade in markets that are not considered to be active, but whose values are based on quoted market prices, dealer quotations or valuations provided by alternative pricing sources supported by observable inputs, are classified as Level 2 prices. These generally include certain U.S. Government and sovereign obligations, most government agency securities, investment-grade corporate bonds and less liquid listed equity securities. As investments whose values are classified as Level 2 prices include positions that are not traded in active markets and/or are subject to transfer restrictions, valuations may be adjusted to reflect illiquidity and/or non-transferability, which are generally based on available market information.
The Dreyfus Cash Management Fund, which is held by the Funds, invests primarily in securities that are valued at cost or amortized cost. Therefore, these investments are classified as Level 2 investments.
| ● | | Level 3 — significant unobservable inputs (including the Funds’ own assumptions in determining the fair value of investments) |
Investments whose values are classified as Level 3 prices have significant unobservable inputs, as they may trade infrequently or not at all. When observable prices are not available for these securities, the Funds use one or more valuation techniques for which sufficient and reliable data is available. The inputs used by the Funds in estimating the value of Level 3 prices may include the original transaction price, quoted prices for similar securities or assets in active markets, completed or pending third-party transactions in the underlying investment or comparable issuers, and changes in financial ratios or cash flows. Level 3 prices may also be adjusted to reflect illiquidity and/or non-transferability, with the amount of such discount estimated by the Funds in the absence of market information. Assumptions used by the Funds due to the lack of observable inputs may significantly impact the resulting value and therefore the results of the Funds’ operations.
The inputs or methodology used for valuing investments are not necessarily an indication of the risk associated with investing in those investments. A summary of the inputs used to value the Funds’ investments as of June 30, 2016 is included with each Fund’s Schedule of Investments.
The Funds’ policy is to recognize transfers into, and transfers out of, each level of hierarchy as of the beginning of the reporting period. For the year ended June 30, 2016, the Omni Small-Cap Value Fund and the Omni Tax-Managed Small-Cap Value Fund each transferred a security with a value of $206,125 from Level 2 to Level 1, due to the market becoming active. There were no transfers from Level 1 to Level 2 in any of the Funds.
Securities Lending Upon lending its securities to third parties, each Fund receives compensation in the form of fees. The loans are secured by collateral at least equal to the fair value of the securities loaned plus accrued interest. Each Fund has the right under the lending agreement to recover the securities from the borrower on demand. Additionally, a Fund does not have the right to sell or repledge collateral received in the form of securities unless the borrower goes into default. The risks to a Fund of securities lending are that the borrower may not provide additional collateral when required or return the securities when due, resulting in a loss. Under the terms of the Securities Lending Agreement, the Funds are indemnified for such losses by the securities lending agent.
While securities are on loan, the Fund continues to receive dividends on the securities loaned and recognizes any gain or loss in the fair value of the securities loaned.
| | |
| 38 | | Annual Report | June 30, 2016 |
| | |
| NOTES TO FINANCIAL STATEMENTS (continued) | | |
June 30, 2016
Securities lending transactions are entered into by a Fund under a Securities Lending Agreement which provides the right, in the event of default (including bankruptcy or insolvency) for the non-defaulting party to liquidate the collateral or to offset the market value of the collateral received against the market value of the securities loaned. The value of the collateral is typically greater than that of the market value of the securities loaned, leaving the lender with a net amount payable to the defaulting party. However, bankruptcy or insolvency laws of a particular jurisdiction may impose restrictions on or prohibitions against such a right of offset in the event of a counterparty’s bankruptcy or insolvency.
The market value of securities on loan, all of which are classified as common stocks in the Funds’ Schedules of Investments, and the value of the related collateral are shown in the Statements of Assets and Liabilities as a component of Investments at value.
The following table is a summary of the Funds’ securities loaned and related collateral, which are subject to a netting agreement as of June 30, 2016:
| | | | | | | | | | | | | | | | | | | | | | | | | | | |
| | | | | | | | | Gross Amount Not
Offset in the Statement
of Assets and Liabilities | | |
| Fund | | Gross
Amounts of
Recognized
Assets | | Gross Amounts
Offset in the
Statement of
Assets and
Liabilities | | Net Amounts of
Assets Presented
in the Statement
of Assets and
Liabilities | | Financial Instruments | | Cash Collateral Received1 | | Net
Amount |
| | | | | | |
Omni Small-Cap Value | | | | | | | | | | | | | | | | | | | | | | | | | | | |
Securities lending | | | $ | 16,483,194 | | | | | - | | | | $ | 16,483,194 | | | | | - | | | | $ | 16,483,194 | | | - |
| | | | | | |
Omni Tax-Managed Small-Cap Value | | | | | | | | | | | | | | | | | | | | | | | | | | | |
Securities lending | | | $ | 40,743,010 | | | | | - | | | | $ | 40,743,010 | | | | | - | | | | $ | 40,743,010 | | | - |
| 1 | Collateral with a value of $16,705,782 and $41,830,680 has been received in connection with securities lending of Omni Small-Cap Value Fund and Omni Tax-Managed Small-Cap Value Fund, respectively. Excess of collateral received from an individual counterparty is not shown here for financial reporting purposes. |
It is each Fund’s policy to obtain additional collateral from or return excess collateral to the borrower by the end of the next business day following the valuation date of the securities loaned. Therefore, the value of the collateral held may be temporarily less than that required under the lending contract. As of June 30, 2016, the collateral consisted of an institutional money market fund.
Use of Estimates in Financial Statements In preparing financial statements in conformity with GAAP, management makes estimates and assumptions that affect the reported amounts of assets and liabilities on the date of the financial statements and the disclosure of contingent assets and liabilities on the date of the financial statements, as well as the reported amounts of revenue and expenses during the reporting period. Actual results could differ from those estimates.
Risks and Uncertainties The Funds provide for various investment options, including stocks. Such investments are exposed to various risks, such as interest rate, market and credit risks. Due to the risks involved, it is at least reasonably possible that changes in risks in the near term would materially affect shareholders’ account values and the amounts reported in the financial statements.
Security Transactions, Investment Income and Expenses Security transactions are accounted for as of the trade date, the date the order to buy or sell is executed. Realized gains and losses are computed on the identified cost basis. Dividend income is recorded on the ex-dividend date, and interest income is recorded on the accrual basis from settlement date.
Bridgeway Funds’ expenses that are not series-specific are allocated to each series based upon its relative proportion of net assets to the Bridgeway Funds’ total net assets or other appropriate basis.
| | |
| NOTES TO FINANCIAL STATEMENTS (continued) | | |
June 30, 2016
Distributions to Shareholders The Funds pay dividends from net investment income and distribute realized capital gains annually, usually in December.
Indemnification Under the Company’s organizational documents, the Funds’ officers, directors, employees and agents are indemnified against certain liabilities that may arise out of the performance of their duties to the Funds. Additionally, in the normal course of business, the Funds enter into contracts that contain a variety of indemnification clauses. The Funds’ maximum exposure under these arrangements is unknown, as this would involve future claims that may be made against the Funds that have not yet occurred. However, the Funds have not had prior claims or losses pursuant to these contracts.
3. Advisory Fees, Other Related Party Transactions and Contingencies:
The Funds have entered into a management agreement with the Adviser. As compensation for the advisory services rendered, facilities furnished, and expenses borne by the Adviser, the Funds pay the Adviser a fee of 0.50% of the value of each Fund’s average daily net assets, computed daily and payable monthly.
Expense limitations: The Adviser has agreed to reimburse the Funds for operating expenses and advisory fees above the expense limitations shown in the table below, which are shown as a ratio of net expenses to average net assets, for each Fund, for the year ended June 30, 2016. Any material change to the expense limitation would require a vote by shareholders of the applicable Fund.
| | | | | | | | | | |
| Bridgeway Fund | | Expense
Limitation | | Total Waivers and Reimbursements for Year Ending 06/30/16 |
| | | | | | | | | | |
Omni Small-Cap Value* | | | | 0.60% | | | | | $561,512 | |
Omni Tax-Managed Small-Cap Value* | | | | 0.60% | | | | | 547,245 | |
| | | | | | | | | | |
*The Funds are authorized to reimburse the Adviser for management fees previously waived and/or for expenses previously paid by the Adviser, provided, however, that any reimbursements must be paid at a date not more than three years after the fiscal year in which the Adviser waived the fees or reimbursed the expenses and that the reimbursements do not cause the Funds to exceed the expense limitation in the agreement. The Omni Small-Cap Value Fund has recoupable expenses of $367,842, $480,284 and $561,512, which expire on June 30, 2017, June 30, 2018 and June 30, 2019 respectively. The Omni Tax-Managed Small-Cap Value Fund has recoupable expenses of $382,335, $479,218 and $547,245, which expire June 30, 2017, June 30, 2018 and June 30, 2019 respectively.
Other Related Party Transactions: The Bridgeway Funds will engage in inter-portfolio trades with other Bridgeway Funds when it is to the benefit of both parties. The Board of Directors reviews these trades quarterly. Inter-portfolio purchases and sales for the Funds during the year ended June 30, 2016 were as follows:
| | | | | | | | | | |
| Bridgeway Fund | | Inter-Portfolio Purchases | | Inter-Portfolio Sales |
| | | | | | | | | | |
Omni Small-Cap Value | | | | $27,556,098 | | | | | $15,451,273 | |
Omni Tax-Managed Small-Cap Value | | | | 21,889,654 | | | | | 23,323,996 | |
The Adviser entered into an Administrative Services Agreement with Bridgeway, pursuant to which the Adviser provides various administrative services to the Funds including, but not limited to: (i) supervising and managing various aspects of the Funds’ business and affairs; (ii) selecting, overseeing and/or coordinating activities with other service providers to the Funds; (iii) providing reports to the Board of Directors as requested from time to time; (iv) assisting and/or reviewing amendments and updates to the Funds’ registration statement and other filings with the Securities and Exchange Commission (“SEC”); (v) providing certain shareholder services; (vi) providing administrative support in connection with meetings of the Board of Directors; and (vii) providing certain record-keeping services. Prior to July 1, 2016 for its services to all of the Bridgeway Funds, the Adviser was paid an aggregate annual fee of $590,000, payable in equal monthly installments. Effective July 1, 2016, the
| | |
| 40 | | Annual Report | June 30, 2016 |
| | |
| NOTES TO FINANCIAL STATEMENTS (continued) | | |
June 30, 2016
Adviser will be paid an aggregate annual fee of $665,000, payable in monthly installments. During the year ended June 30, 2016, the allocation of this expense to the Omni Small-Cap Value and Omni Tax-Managed Small-Cap Value Funds was $119,791 and $106,901, respectively.
Board of Directors Compensation Independent Directors are paid an annual retainer of $15,000, with an additional retainer of $5,000 paid to the Independent Chairman of the Board and an additional retainer of $1,000 paid to the Nominating and Corporate Governance Committee Chair. The retainer is paid in quarterly installments. Effective November 13, 2015, Independent Directors are paid $7,500 per meeting for meeting fees. Prior to November 13, 2015, Independent Directors were paid $6,250 per meeting. Such compensation is the total compensation from all Bridgeway Funds and is allocated among the Bridgeway Funds.
The Independent Directors each receive this compensation in the form of shares of the Bridgeway Funds, credited to his or her account. Such Directors are reimbursed for any expenses incurred in attending meetings and conferences, as well as expenses for subscriptions or printed materials. The amount of Directors’ fees attributable to each Fund is disclosed in the Statement of Operations.
One director of Bridgeway, John Montgomery, is an owner and director of the Adviser. Under the 1940 Act definitions, he is considered to be an “affiliated person” of the Adviser and an “interested person” of the Adviser and of Bridgeway. Compensation for Mr. Montgomery is borne by the Adviser rather than the Bridgeway Funds.
4. Distribution and Shareholder Servicing Fees:
Foreside Fund Services, LLC acts as distributor of the Funds’ shares pursuant to a Distribution Agreement dated November 12, 2010. The Adviser pays all costs and expenses associated with distribution of the Funds’ shares, pursuant to a protective plan adopted by shareholders pursuant to Rule 12b-1.
5. Purchases and Sales of Investment Securities:
Purchases and sales of investments, other than short-term securities, for each Fund for the year ended June 30, 2016 were as follows:
| | | | | | | | | | | | | | | | | | | | |
| | | Purchases | | Sales |
| | | U.S. Government | | Other | | U.S. Government | | Other |
| | | | | | | | | | | | | | | | | | | | |
Omni Small-Cap Value | | | $ | - | | | | $ | 232,452,437 | | | | $ | - | | | | $ | 118,902,608 | |
Omni Tax-Managed Small-Cap Value | | | | - | | | | | 197,873,670 | | | | | - | | | | | 130,156,092 | |
6. Federal Income Taxes
It is the Funds’ policy to continue to comply with the provisions of the Internal Revenue Code of 1986, as amended (“Internal Revenue Code”), applicable to regulated investment companies, and to distribute income to the extent necessary so that such Fund is not subject to federal income tax. Therefore, no federal income tax provision is required.
Unrealized Appreciation and Depreciation on Investments (Tax Basis) The amount of net unrealized appreciation/ depreciation and the cost of investment securities for tax purposes, including short-term securities at June 30, 2016, were as follows:
| | | | | | | | | | |
| | | Omni Small-Cap Value | | Omni Tax-Managed Small-Cap Value |
Gross appreciation (excess of value over tax cost) | | | | $112,359,317 | | | | | $106,353,542 | |
Gross depreciation (excess of tax cost over value) | | | | (32,794,625 | ) | | | | (30,323,994 | ) |
Net unrealized appreciation | | | | $ 79,564,692 | | | | | $ 76,029,548 | |
Cost of investments for income tax purposes | | | | $496,421,238 | | | | | $473,704,821 | |
The differences between book and tax net unrealized appreciation (depreciation) are due to wash sale loss deferrals and basis adjustments on passive foreign investment companies (PFICs), and partnerships.
| | |
| NOTES TO FINANCIAL STATEMENTS (continued) | | |
June 30, 2016
Classifications of Distributions Net investment income (loss) and net realized gain (loss) may differ for financial statement and tax purposes. The character of distributions made during the year from net investment income or net realized gains may differ from its ultimate characterization for federal income tax purposes.
The tax character of the distributions paid by the Funds during the fiscal years ended June 30, 2016 and 2015, is as follows:
| | | | | | | | | | | | | | | | | | | | |
| | | Omni Small-Cap Value | | Omni Tax-Managed Small-Cap Value |
| | | Year Ended June 30, 2016 | | Year Ended June 30, 2015 | | Year Ended June 30, 2016 | | Year Ended June 30, 2015 |
Distributions paid from: | | | | | | | | | | | | | | | | | | | | |
Ordinary Income | | | $ | 4,704,613 | | | | $ | 2,478,657 | | | | $ | 3,274,284 | | | | $ | 767,401 | |
Long-Term Capital Gain | | | | - | | | | | 20,389,241 | | | | | - | | | | | 14,502,076 | |
Total | | | $ | 4,704,613 | | | | $ | 22,867,898 | | | | $ | 3,274,284 | | | | $ | 15,269,477 | |
At June 30, 2016, the Omni Small-Cap Value and Omni Tax-Managed Small-Cap Value Funds had net short-term capital loss carryforwards for federal income tax purposes of $9,051,476 and $8,573,286, respectively, which are available to reduce future required distributions of net capital gains to shareholders for an unlimited period. These capital losses will retain their character as short-term capital losses.
Components of Accumulated Earnings As of June 30, 2016, the components of accumulated earnings on a tax basis were:
| | | | | | | | | | | | | | | |
| | | Omni
Small-Cap Value | | | | Omni Tax-Managed Small-Cap Value |
Undistributed Net Investment Income | | | | $ 2,918,574 | | | | | | | | | | $ 4,983,051 | |
Accumulated Net Realized Loss on Investments | | | | (9,051,476 | ) | | | | | | | | | (8,573,286 | ) |
Net Unrealized Appreciation of Investments | | | | 79,564,692 | | | | | | | | | | 76,029,548 | |
Total | | | | $73,431,790 | | | | | | | | | | $72,439,313 | |
For the fiscal year June 30, 2016, the Funds recorded the following reclassifications to the accounts listed below:
| | | | | | | | | | | | |
| | | Increase (Decrease) |
| | | Omni
Small-Cap Value | | | | Omni Tax-Managed Small-Cap Value |
Paid-in-Capital | | | $ | 293,634 | | | | | | $ | 433,310 | |
Undistributed Net Investment Income | | | | (164,911 | ) | | | | | | (306,858 | ) |
Accumulated Net Realized Loss on Investments | | | | (128,723 | ) | | | | | | (126,452 | ) |
The difference between book and tax components of net assets and the resulting reclassifications were primarily a result of the differing book/tax treatment of the deduction of equalization debits for tax purposes and investments in passive foreign investment companies (PFICs), partnerships and business development companies.
Accounting for Uncertainty in Income Taxes sets forth a minimum threshold for financial statement recognition of the benefit of a tax position taken or expected to be taken in a tax return. Management has analyzed each Fund’s tax positions and has concluded that no provision for income tax is required in each Fund’s financial statements. The Funds are not aware of any tax position for which it is reasonably possible that the total amounts of unrecognized tax benefits will significantly change in the next twelve months. Each Fund’s federal tax returns for the prior three fiscal years remain subject to examination by the Internal Revenue Service.
| | |
| 42 | | Annual Report | June 30, 2016 |
| | |
| NOTES TO FINANCIAL STATEMENTS (continued) | | |
June 30, 2016
7. Line of Credit
Bridgeway established a line of credit agreement (“Facility”) with The Bank of New York Mellon, effective November 5, 2010. The Facility is for temporary or emergency purposes, such as to provide liquidity for shareholder redemptions, and is cancellable by either party. Unless cancelled earlier, the Facility shall be held available until September 15, 2016. Advances under the Facility are limited to $15,000,000 in total for all Bridgeway Funds, and advances to each Bridgeway Fund shall not exceed certain limits set forth in the credit agreement, including, but not limited to, the maximum amount a Bridgeway Fund is permitted to borrow under the 1940 Act.
The Bridgeway Funds incur a commitment fee of 0.07% per annum on the unused portion of the Facility and interest expense to the extent of amounts borrowed under the Facility. Interest is based on the “Overnight Rate” plus 1.25%. The Overnight Rate means the higher of (a) the Federal Funds rate, (b) the Overnight Eurodollar Rate, or (c) the One-month Eurodollar Rate. The commitment fees are payable quarterly in arrears and are allocated to all participating Bridgeway Funds. Interest expense is charged directly to each Bridgeway Fund, based upon actual amounts borrowed by such Bridgeway Fund.
For the year ended June 30, 2016, borrowings by the Funds under this line of credit were as follows:
| | | | | | | | | | | | | | | | | | | | | | | | | |
| Bridgeway Fund | | Weighted
Average
Interest Rate | | Weighted
Average
Loan Balance | | Number of
Days
Outstanding | | Interest
Expense
Incurred1 | | Maximum Amount Borrowed During the Period |
| | | | | | | | | | | | | | | | | | | | | | | | | |
Omni Small-Cap Value | | | | 1.50% | | | | $ | 1,875,800 | | | | | 35 | | | | $ | 2,698 | | | | | $ 5,932,000 | |
Omni Tax-Managed Small-Cap Value | | | | 1.49% | | | | | 4,030,507 | | | | | 67 | | | | | 11,034 | | | | | 14,200,000 | |
| | | | | | | | | | | | | | | | | | | | | | | | | |
1Interest expense is included on the Statements of Operations in Miscellaneous expenses. | | | | | | | | | | | | | | | | | | | | | | | | | |
On June 30, 2016, Omni Tax-Managed Small-Cap Value had a loan outstanding in the amount of $500,000, exclusive of interest payable on the loan.
8. Subsequent Events
Management has evaluated the impact of all subsequent events on the Funds and has determined that there were no subsequent events requiring recognition or disclosure in the financial statements.
| | |
| REPORT OF INDEPENDENT REGISTERED PUBLIC ACCOUNTING FIRM | | |
To the Shareholders and Board of Directors of Bridgeway Funds, Inc.
We have audited the accompanying statements of assets and liabilities of the Omni Small-Cap Value Fund and the Omni Tax Managed Small-Cap Value Fund (the “Funds”), each a series of Bridgeway Funds, Inc., including the schedules of investments, as of June 30, 2016, and the related statements of operations for the year then ended, the statements of changes in net assets for each of the years in the two-year period then ended and the financial highlights for each of the years or periods presented. These financial statements and financial highlights are the responsibility of the Funds’ management. Our responsibility is to express an opinion on these financial statements and financial highlights based on our audits.
We conducted our audits in accordance with the standards of the Public Company Accounting Oversight Board (United States). Those standards require that we plan and perform the audits to obtain reasonable assurance about whether the financial statements and financial highlights are free of material misstatement. An audit includes examining, on a test basis, evidence supporting the amounts and disclosures in the financial statements. Our procedures included confirmation of securities owned as of June 30, 2016 by correspondence with the custodian and brokers. An audit also includes assessing the accounting principles used and significant estimates made by management, as well as evaluating the overall financial statement presentation. We believe that our audits provide a reasonable basis for our opinion.
In our opinion, the financial statements and financial highlights referred to above present fairly, in all material respects, the financial position of the Omni Small-Cap Value Fund and the Omni Tax Managed Small-Cap Value Fund as of June 30, 2016 and the results of their operations for the year then ended, the changes in their net assets for each of the years in the two-year period then ended and their financial highlights for each of the years or periods presented, in conformity with accounting principles generally accepted in the United States of America.
|
 |
|
| BBD, LLP |
Philadelphia, Pennsylvania
August 25, 2016
| | |
| 44 | | Annual Report | June 30, 2016 |
| | |
| OTHER INFORMATION | | |
June 30, 2016 (unaudited)
1. Shareholder Tax Information
Certain tax information regarding the Funds is required to be provided to shareholders based upon each Fund’s income and distributions for the taxable year ended June 30, 2016. The information and distributions reported herein may differ from information and distributions taxable to the shareholders for the calendar year ended December 31, 2015.
The Funds report the following items with regard to distributions paid during the fiscal year ended June 30, 2016. All reportings are based on financial information available as of the date of this annual report and, accordingly, are subject to change. For each item, it is the intention of each Fund to report the maximum amount permitted under the Internal Revenue Code of 1986, as amended, and the regulations thereunder.
| | | | | | | | | | | | | | | | | | | |
| | | Omni Small-Cap
Value | | | | Omni Tax-Managed Small Cap Value | | | | |
Corporate Dividends Received Deduction | | | | 100.00% | | | | | | | | | | 100.00% | | | | | |
Qualified Dividend Income | | | | 100.00% | | | | | | | | | | 100.00% | | | | | |
Qualified Interest Related Dividends | | | | 0.03% | | | | | | | | | | 0.01% | | | | | |
Qualified Short Term Capital Gain Dividends | | | | 0.00% | | | | | | | | | | 0.00% | | | | | |
During the fiscal year ended June 30, 2016, the Funds paid distributions from ordinary income and long-term capital gain which included equalization debits summarized below:
| | | | | | | | | | | | | | | | | | | |
| | | Omni Small-Cap
Value | | | | Omni Tax-Managed Small-Cap Value | | | | |
Ordinary Income Distributions | | | $ | 4,704,613 | | | | | | | | | $ | 3,274,284 | | | | | |
Equalization Debits Included in Ordinary Income Distributions | | | | 293,634 | | | | | | | | | | 433,310 | | | | | |
Long-Term Capital Gain Distributions | | | | - | | | | | | | | | | - | | | | | |
Equalization Debits Included in Long-Term Capital Gain Distributions | | | | - | | | | | | | | | | - | | | | | |
2. Proxy Voting
A description of the policies and procedures that the Funds use to determine how to vote proxies relating to the portfolio securities and a summary of proxies voted by the Funds for the period ended June 30, 2016 are available without a charge, upon request, by contacting Bridgeway Funds at 1-800-661-3550 and on the SEC’s website at http://www.sec.gov.
3. Fund Holdings
The complete schedule of the Funds’ holdings for the second and fourth quarters of each fiscal year are contained in the Funds’ Semi-Annual and Annual Shareholder Reports, respectively.
The Bridgeway Funds file complete schedules of the Funds’ holdings with the SEC for the first and third quarters of each fiscal year on Form N-Q within 60 days after the end of the period. Copies of the Funds’ Form N-Q are available without charge, upon request, by contacting Bridgeway Funds at 1-800-661-3550 and on the SEC’s website at http://www.sec.gov. You may also review and copy Form N-Q at the SEC’s Public Reference Room in Washington, D.C. For more information about the operation of the Public Reference Room, please call 1-800-SEC-0330.
4. Approval of Investment Management Agreement
The Bridgeway Funds, Inc.’s (the “Company”) management agreement (the “Management Agreement”) with its investment adviser, Bridgeway Capital Management, Inc. (the “Adviser”), on behalf of each of the Company’s funds must be approved for an initial term no greater than two years and renewed at least annually thereafter (i) by the vote of the Directors or by a vote of
| | |
| OTHER INFORMATION (continued) | | |
June 30, 2016 (unaudited)
the shareholders of each fund and (ii) by the vote of a majority of the Directors who are not parties to the Management Agreement or “interested persons” of any party thereto (the “Independent Directors”), cast in person at a meeting called specifically for the purpose of voting on such approval.
The Board of Directors (the “Board”) has five regularly scheduled meetings each year and takes into account throughout the year matters bearing on the approval of the Management Agreement. For example, the Board and its standing committees also consider at each meeting factors that are relevant to the annual renewal of each fund’s Management Agreement, including the services and support provided to each fund by the Adviser, the Adviser’s compliance program, comparative performance information for each fund, the risk assessment of the funds and “deep dives” on the strategy and performance of certain funds on a periodic basis. In addition, the Board receives updated financial information on the Adviser and updates related to strategic direction and marketing efforts between meetings from the Adviser.
On May 13, 2016, the Board, including a majority of the Independent Directors, met in person (the “Meeting”) with the Adviser, Company counsel, independent legal counsel (“Independent Legal Counsel”) to the Independent Directors and others to give consideration to information bearing on the continuation of the Management Agreement with respect to the following funds: Omni Tax-Managed Small-Cap Value Fund and Omni Small-Cap Value Fund (each a “Fund” and collectively, the “Funds”).
In reaching its decisions, the Board considered the information furnished and discussed throughout the year at regularly scheduled Board or committee meetings, as applicable and as described above, and reviewed and considered the information provided specifically in relation to the annual consideration of the approval of the Management Agreement.
In preparation for the Meeting, the Independent Directors requested that the Adviser provide specific information relevant to their consideration of the renewal of each Fund’s Management Agreement. In response to that request, the Board was furnished with a wide variety of information with respect to each Fund, including:
| | | | |
| | ● | | investment performance over various time periods and the fees and expenses of each Fund as compared to a comparable group of funds (the “peer funds”) as determined and prepared by Broadridge Financial Solutions, Inc. (formerly, Lipper, Inc.) (hereinafter “Lipper”), an independent provider of investment company data; |
| | |
| | ● | | the nature, extent and quality of services provided by the Adviser to each Fund, including investment advisory and administrative services; |
| | |
| | ● | | actual management fees paid by each Fund to the Adviser; |
| | |
| | ● | | the Adviser’s costs of providing services to each Fund and the profitability of the Adviser derived from its relationship with each Fund; |
| | |
| | ● | | the extent to which economies of scale may be present and if so, the degree to which they would be shared with the Fund’s shareholders; and |
| | |
| | ● | | any potential “fall out” or ancillary benefits accruing to the Adviser as a result of its relationship with each Fund. |
In addition to evaluating, among other things, the written information provided by the Adviser, the Board also considered the answers to questions posed by the Board to representatives of the Adviser at the Meeting.
In considering the information and materials described above, the Independent Directors received assistance from, and also met telephonically with, Independent Legal Counsel prior to the Meeting to review and discuss the information provided by the Adviser. Moreover, the Independent Directors also met in executive session with Independent Legal Counsel to consider the continuation of the Management Agreement outside the presence of management during the Meeting.
The Board also was provided with a written description of their statutory responsibilities and the legal standards that are applicable to approval of the Management Agreement.
| | |
| 46 | | Annual Report | June 30, 2016 |
| | |
| OTHER INFORMATION (continued) | | |
June 30, 2016 (unaudited)
Although the Management Agreement for all of the Funds were considered at the same Board meeting, the Directors considered each Fund separately.
In considering the aforementioned information, the Board took into account management style, investment strategies and prevailing market conditions. Furthermore, in evaluating the Management Agreement, the Directors also reviewed information provided by the Adviser concerning the following:
| | ● | | the terms of the Management Agreement, including the services performed by the Adviser in managing each Fund in accordance with each Fund’s investment objectives, policies and restrictions and how those services and fees differ from the Adviser’s services to non-mutual fund accounts, to the extent applicable; |
| | ● | | information regarding the structure of the advisory fees, the method of computing fees and the frequency of payment of fees and any expense limitation or fee waiver arrangements for each Fund; |
| | ● | | the services provided by the Adviser under a separate Administrative Services Agreement and the fact that those services were provided at approximately cost to the Funds, although it was noted the annual fee under the Administrative Services Agreement was proposed to be increased at the Meeting; |
| | ● | | the Adviser’s specialized skills and experience in statistical analysis and active and passive investment management and trading; |
| | ● | | the Adviser’s personnel, staffing levels and the time and attention the Adviser’s personnel devote to the management of the Funds as compared to other Adviser clients; |
| | ● | | the Adviser’s risk assessment and risk management capabilities; |
| | ● | | the Adviser’s representation that it continues to use no soft dollars; and |
| | ● | | the financial condition and stability of the Adviser, including supplemental financial information provided upon the request of the Board periodically during the year. |
In view of the broad scope and variety of factors and information, the Directors did not find it practicable to, and did not, assign relative weights to the specific factors considered in reaching their conclusions and determinations to approve the Management Agreement for an additional year. Rather, the approval determination was made on the basis of each Director’s business judgment after consideration of all of the factors taken in their entirety. Although not meant to be all-inclusive, the following describes some of the factors that were considered by the Board in deciding to approve the continuance of the Management Agreement for each Fund.
Nature, Extent and Quality of Services
In examining the nature, extent and quality of the services provided by the Adviser, the Directors considered the qualifications, experience and capability of the Adviser’s personnel and the extent of care and conscientiousness with which the Adviser performs its duties. In addition, the Directors considered information provided by the Adviser regarding its overall financial strength and considered the resources and staffing in place with respect to the services provided to the Funds, including (but not limited to) consideration of the Adviser’s skills and experience in statistical analysis and investment management and trading. The Board also considered that, in addition to providing investment management services to the Funds, the Adviser is also responsible for developing and maintaining policies and procedures to ensure that the Funds comply with applicable rules and regulations. Finally, the Board considered that the Adviser provides certain administrative services under the Administrative Services Agreement approximately at cost to the Funds, although it was noted the annual fees under the Administrative Services Agreement were proposed to be increased at this Meeting.
| | |
| OTHER INFORMATION (continued) | | |
June 30, 2016 (unaudited)
Based on the totality of the information considered, the Directors concluded that the Funds were likely to benefit from the nature, extent and quality of the Adviser’s services, and that the Adviser has the ability to continue to provide these services based on its experience, operations and current resources.
Investment Performance
Lipper provided a report (the “Lipper Report”) of comparative data regarding fees, expenses and performance for each Fund as compared to a peer group selected by Lipper (“Peer Group”). In particular, the Board reviewed the performance of each Fund, as applicable, over the most recent calendar year (“one-year period”) and the annualized performance over the most recent three calendar year period (“three-year period”), five calendar year period (five-year period”) and ten calendar year period (“ten-year period”). With regard to the performance information provided in the Lipper Report, the Board considered the performance of each Fund on a percentile and quintile basis as compared to its Peer Group. For purposes of the performance data provided, the first quintile is defined as 20% of the funds in the applicable Peer Group with the highest performance and the fifth quintile is defined as 20% of the funds in the applicable Peer Group with the lowest performance. The Board reviewed performance information in the Lipper Report as of December 31, 2015 for each Fund and considered the following:
| | ● | | With regard to the Omni Tax-Managed Small-Cap Value Fund, the Board considered that the Fund has outperformed the median of its Peer Group, ranking in the 2nd quintile, 2nd quintile and 3rd quintile, respectively, for the one-year, three-year and five-year periods, and has outperformed its benchmark index for the same time periods as well as since inception. |
| | ● | | With regard to the Omni Small-Cap Value Fund, the Board considered that, during this Fund’s short operating history, the Omni Small-Cap Value Fund has outperformed the median of its Peer Group, ranking in the 3rd quintile and 2nd quintile, respectively, for the one-year and three-year periods. The Board also considered that the Omni Small-Cap Value Fund has outperformed its benchmark index for the same time periods and since inception. |
Fund Fees and Expenses
The Board reviewed the information compiled by Lipper comparing each Fund’s contractual management fee rate, actual management fee rate (which included the effect of any fee waivers) and total expense ratios as a percentage of average net assets to other funds in its expense Peer Group. In this regard, the Board considered the contractual and actual management fees and total expense ratios of each Fund on a quintile basis as compared to its Peer Group and noted the relative position of each Fund within the Peer Group. In particular, the Board considered that each Fund’s management fee and total expenses are significantly lower than its respective peer group and that each Fund’s contractual management fee, actual management fee and total expense ratio were in the 1st quintile of its respective peer group.
In addition, the Board considered that the Adviser agreed to contractual expense limitation agreements for each of the Funds to ensure that total expense levels do not increase above certain levels
The foregoing comparisons assisted the Board by providing them with a basis for evaluating each Fund’s management fee and expense ratio on a relative basis. The Independent Directors concluded that the fees and expenses of each Fund were fair and reasonable in relation to the services and benefits provided to each Fund.
| | |
| 48 | | Annual Report | June 30, 2016 |
| | |
| OTHER INFORMATION (continued) | | |
June 30, 2016 (unaudited)
Profitability
The Board reviewed the materials they received from the Adviser regarding its revenues and costs in providing investment management and certain administrative services to the Funds and the Company as a whole. In particular, the Board considered the analysis of the Adviser’s profitability with respect to each Fund, calculated for the years ended December 31, 2012, December 31, 2013, December 31, 2014 and December 31, 2015. The Board also considered the Adviser’s representations that allocating expenses on a Fund-by-Fund basis to calculate Fund-by-Fund profitability is a subjective, and somewhat arbitrary, process since the Adviser does not track expenses or maintain staff on a Fund-by-Fund basis. The Board also considered the Adviser’s representations that profit margins for certain years can be affected by the seven to one total compensation cap for Adviser staff members (also referred to as “Partners”) (i.e., no Partner can make more than seven times the total compensation of the lowest paid Partner). The Board also considered that the Adviser was operating the Funds at a relatively low profit margin. Additionally, the Board considered the Adviser’s explanation that its financial strength has improved over the past year and that the Adviser has significant financial resources to support ongoing operations and future growth. In reviewing the profitability information, the Board also considered the potential “fall-out” or ancillary benefits that may accrue to the Adviser as a result of its relationship with the Funds, which are discussed below.
Economies of Scale
With respect to whether economies of scale are realized by the Adviser as a Fund’s assets increase and whether advisory fee levels reflect these economies of scale for the benefit of Fund investors, the Board considered, on a Fund-by-Fund basis, the current level of advisory fee charged and fee structure and concluded that the Adviser’s fee structure with respect to each Fund was appropriate at this time. The Independent Directors considered the Adviser’s explanation that although the Omni Tax-Managed Small-Cap Value Fund and Omni Small-Cap Value Fund do not have fee breakpoints in their management fee schedules, these Funds were priced low relative to peers and ahead of the economies of scale curve at launch.
“Fallout” or Ancillary Benefits
The Board considered whether there were any potential “fallout” or ancillary benefits that may accrue to the Adviser as a result of its relationships with the Funds. In terms of potential “fallout” or ancillary benefits to the Adviser due to its position as manager of the Funds, the Board noted that the Adviser continues to use no soft dollars and its administrative services to the Funds are structured to approximate an at-cost relationship, including after the proposed increase in the administrative services fees. The Board also considered that the Adviser may experience certain reputational and marketing benefits due to its relationships with the Funds. The Board concluded that the benefits accruing to the Adviser by virtue of its relationship to the Funds appeared to be reasonable.
* * * * *
After evaluation of the performance, fee and expense information and the profitability, ancillary benefits and other considerations as described above, and in light of the nature, extent and quality of services provided by the Adviser, the Board, including a majority of the Independent Directors, concluded that the level of fees to be paid to the Adviser with respect to each Fund is reasonable.
In summary, based on all relevant information and factors discussed above, none of which was individually determinative of the outcome, the Board, including a majority of the Independent Directors, determined that the approval of the Management Agreement was in the best interests of each applicable Fund. As a result, the Board, including a majority of the Independent Directors, approved the renewal of the Management Agreement.
| | |
| DISCLOSURE OF FUND EXPENSES | | |
June 30, 2016 (unaudited)
As a shareholder of a Fund, you will incur no transaction costs from such Fund, including sales charges (loads) on purchases, on reinvested dividends, or on other distributions. There are no exchange fees. However, as a shareholder of a Fund, you will incur ongoing costs, including management fees and other Fund expenses. The following examples are intended to help you understand your ongoing costs (in dollars) of investing in a Fund and to compare these costs with ongoing costs of investing in other mutual funds. The examples are based on an investment of $1,000 invested on January 1, 2016 and held until June 30, 2016.
Actual Expenses. The first line of the table below provides information about actual account values and actual expenses. You may use the information in this line, together with the amount you invested, to estimate the expenses that you paid over the period. Simply divide your account value by $1,000 (for example, an $8,600 account value divided by $1,000 = 8.6), then multiply the result by the number in the first line under the heading “Expenses Paid During Period” to estimate the expenses you paid on your account during the period.
Hypothetical Example for Comparison Purposes. The second line of the table below provides information about hypothetical account values and hypothetical expenses based on the Fund’s actual expense ratio and an assumed rate of return of 5% per year before expenses, which is not the Fund’s actual return. The hypothetical account values and expenses may not be used to estimate the actual ending account balance or expenses you paid for the period. You may use this information to compare the ongoing costs of investing in a Fund and other mutual funds. To do so, compare this 5% hypothetical example with the 5% hypothetical examples that appear in the shareholder reports of other funds.
The expenses shown in the table are meant to highlight ongoing Fund costs only. Therefore, the second line of the table is useful in comparing ongoing costs only and will not help you determine the relative total costs of owning different funds, because other funds may also have transaction costs, such as sales charges, redemption fees or exchange fees.
| | | | | | | | | | | | | | | | | | | | |
| | | Beginning Account
Value at 1/1/16 | | Ending Account
Value at 6/30/16 | | Expense
Ratio | | Expenses Paid During Period* 1/1/16 - 6/30/16 |
| | | | |
Bridgeway Omni Small-Cap Value | | | | | | | | | | | | | | | | | | | | |
Actual Fund Return | | | | $1,000.00 | | | | | $1,039.70 | | | | | 0.60% | | | | | $3.04 | |
Hypothetical Fund Return | | | | $1,000.00 | | | | | $1,021.88 | | | | | 0.60% | | | | | $3.02 | |
| | | | |
Bridgeway Omni Tax-Managed Small-Cap Value | | | | | | | | | | | | | | | | | | | | |
Actual Fund Return | | | | $1,000.00 | | | | | $1,042.30 | | | | | 0.60% | | | | | $3.05 | |
Hypothetical Fund Return | | | | $1,000.00 | | | | | $1,021.88 | | | | | 0.60% | | | | | $3.02 | |
| * | Expenses are equal to the average account value times the Fund’s annualized expense ratio multiplied by the number of days in the most recent six-month period (182) divided by the number of days in the fiscal year (366). |
| | |
| 50 | | Annual Report | June 30, 2016 |
| | |
| DIRECTORS & OFFICERS | | |
June 30, 2016 (Unaudited)
Independent Directors
| | | | | | | | | | |
Name, Address and Age1 | | Position Held with Bridgeway Funds | | Term of
Office and
Length of
Time Served | | Principal Occupation(s)
During Past Five Years | | No. of Bridgeway
Funds Overseen by Director | | Other Directorships
Held by Director |
|
| | | | | |
Kirbyjon Caldwell Age 62 | | Director | | Term: 1 Year Length: 2001 to Present. | | Senior Pastor of Windsor Village United Methodist Church, since 1982. | | Ten | | American Church Mortgage Company, NRG Energy, Inc., Amegy Bancshares Advisory Board |
|
| | | | | |
Karen S. Gerstner Age 61 | | Director | | Term: 1 Year Length: 1994 to Present. | | Principal, Karen S. Gerstner & Associates, P.C., since 2004. | | Ten | | None |
|
| | | | | |
Miles Douglas Harper, III* Age 53 | | Director | | Term: 1 Year Length: 1994 to Present. | | Partner, Carr, Riggs & Ingram, LLC, since 2013; Partner, Gainer Donnelly, LLP, 1998 to 2013 upon merger with Carr, Riggs & Ingram, LLC. | | Ten | | Calvert Social Investment Fund (8 Portfolios), Calvert Social Index Series, Inc. (1 Portfolio), Calvert Impact Fund (4 Portfolios), Calvert World Values Fund (3 Portfolios) |
|
| | | | | |
Evan Harrel Age 55 | | Director | | Term: 1 Year Length: 2006 to Present. | | Strategic Advisor, Small Steps Nurturing Center, since 2012; Executive Director, Small Steps Nurturing Center, 2004 to 2012. | | Ten | | None |
|
| | | | | | | | | | |
| | | | | | | | | | |
|
| | |
| DIRECTORS & OFFICERS (continued) | | |
June 30, 2016 (Unaudited)
“Interested” or Affiliated Director and Officer
| | | | | | | | | | |
Name, Address and Age1 | | Position(s) Held with Bridgeway Funds | | Term of
Office and
Length of
Time Served | | Principal Occupation(s)
During Past Five Years | | No. of Bridgeway
Funds Overseen by Director | | Other Directorships
Held by Director |
|
| | | | | |
John N. R. Montgomery2 Age 60 | | Director | | Term: 1 Year Length: 1993 to Present. | | Chairman, Bridgeway Capital Management, Inc., since 2010; President, Bridgeway Capital Management, Inc., 1993 to 2010 and June 2015 to March 2016; President, Bridgeway Funds, June 2015 to June 2016; Vice President, Bridgeway Funds, 2005 to May 2015 and since June 2016. | | Ten | | None |
|
| | | | | | | | | | |
| | | | | | | | | | |
|
| | |
| 52 | | Annual Report | June 30, 2016 |
| | |
| DIRECTORS & OFFICERS (continued) | | |
June 30, 2016 (Unaudited)
Other Officers
| | | | | | | | | | |
Name, Address and Age1 | | Position Held with Bridgeway Funds | | Term of
Office and
Length of
Time Served | | Principal Occupation(s)
During Past Five Years | | No. of Bridgeway Funds Overseen by Officer | | Other Directorships
Held by Officer |
|
| | | | | |
Richard P. Cancelmo, Jr. Age 58 | | Vice President | | Term: 1 Year Length: 2004 to Present. | | Vice President, Bridgeway Funds, since 2004; Staff member, Bridgeway Capital Management, Inc., since 2000. | | N/A | | None |
|
| | | | | |
Linda G. Giuffré Age 54 | | Treasurer and Chief Compliance Officer | | Term: 1 Year Length: 2004 to Present. | | Chief Compliance Officer, Bridgeway Capital Management, Inc., since 2004; Staff member, Bridgeway Capital Management, Inc., since 2004. | | N/A | | None |
|
| | | | | |
Deborah L. Hanna Age 51 | | Secretary | | Term: 1 Year Length: 2007 to Present. | | Self-employed, accounting and related projects for various organizations, since 2001. | | N/A | | None |
|
| | | | | |
Sharon Lester Age 61 | | Vice President | | Term: 1 Year Length: 2011 to Present. | | Staff member, Bridgeway Capital Management, Inc., since 2010; Prior to 2010, Director of Portfolio Operations, Invesco. | | N/A | | None |
|
| | | | | |
Tammira Philippe Age 42 | | President | | Term: 1 Year Length: May 2016 to Present. | | Staff member, Bridgeway Capital Management, Inc., 2010 to March 2016; President, Bridgeway Capital Management, Inc., since March 2016. | | N/A | | None |
|
| 1 | The address of all of the Directors and Officers of Bridgeway Funds is 20 Greenway Plaza, Suite 450, Houston, Texas, 77046. |
| 2 | John Montgomery is chairman, director and majority shareholder of Bridgeway Capital Management, Inc., and therefore an interested person of Bridgeway Funds. |
The overall management of the business and affairs of Bridgeway Funds is vested with its Board of Directors (the “Board”). The Board approves all significant agreements between Bridgeway Funds and persons or companies furnishing services to it, including agreements with its Adviser and Custodian. The day-to-day operations of Bridgeway Funds are delegated to its officers, subject to its investment objectives and policies and general supervision by the Board.
The Funds’ Statement of Additional Information includes additional information about the Board and is available, without charge, upon request by calling 1-800-661-3550.
THIS PAGE INTENTIONALLY LEFT BLANK
| | | | |
| | | | | |
| | BRIDGEWAY FUNDS, INC. BNY Mellon Investment Servicing (US) Inc. P.O. Box 9860 Providence, RI 02940-8060 CUSTODIAN The Bank of New York Mellon One Wall Street New York, NY 10286 DISTRIBUTOR Foreside Fund Services, LLC Three Canal Plaza, Suite 100 Portland, ME 04101 | | |
| | You can review and copy information about our Funds (including the SAI) at the SEC’s Public Reference Room in Washington, D.C. To find out more about this public service, call the SEC at 800-SEC-0330. Reports and other information about the Funds are also available on the SEC’s website at www.sec.gov. You can receive copies of this information, for a fee, by writing the Public Reference Section, Securities and Exchange Commission, Washington, D.C. 20549-1520 or by sending an electronic request to the following email address: publicinfo@sec.gov. | | |
Item 2. Code of Ethics.
| | (a) | The registrant, as of the end of the period covered by this report, has adopted a code of ethics that applies to the registrant’s principal executive officer, principal financial officer, principal accounting officer or controller, or persons performing similar functions, regardless of whether these individuals are employed by the registrant or a third party. |
| | (c) | There have been no substantive amendments, during the period covered by this report, to a provision of the code of ethics that applies to the registrant’s principal executive officer, principal financial officer, principal accounting officer or controller, or persons performing similar functions, regardless of whether these individuals are employed by the registrant or a third party, and that relates to any element of the code of ethics description. |
| | (d) | The registrant has not granted any waivers, including an implicit waiver, from a provision of the code of ethics that applies to the registrant’s principal executive officer, principal financial officer, principal accounting officer or controller, or persons performing similar functions, regardless of whether these individuals are employed by the registrant or a third party, that relates to one or more of the items set forth in paragraph (b) of this item’s instructions. |
Item 3. Audit Committee Financial Expert.
3(a)(1) The Registrant’s board of directors has determined that the registrant has at least one audit committee financial expert serving on its audit committee.
3(a)(2) The audit committee financial expert is Miles Douglas Harper III, who is “independent” for purposes of this Item 3 of Form N-CSR.
Item 4. Principal Accountant Fees and Services.
Audit Fees
| | (a) | The aggregate fees billed for each of the last two fiscal years for professional services rendered by the principal accountant for the audit of the registrant’s annual financial statements or services that are normally provided by the accountant in connection with statutory and regulatory filings or engagements were $237,500 for the fiscal year ended June 30, 2016 and $232,000 for the fiscal year ended June 30, 2015. |
Audit-Related Fees
| | (b) | The aggregate fees billed in each of the last two fiscal years for assurance and related services by the principal accountant that are reasonably related to the performance of the audit of the registrant’s financial statements and are not reported under paragraph (a) of this Item were $0 for the fiscal year ended June 30, 2016 and $0 for the fiscal year ended June 30, 2015. |
Tax Fees
| | (c) | The aggregate fees billed in each of the last two fiscal years for professional services rendered by the principal accountant for tax compliance, tax advice, and tax planning were $22,000 for the fiscal year ended June 30, 2016 and $22,000 for the fiscal year ended June 30, 2015. Tax services include the review of the Funds’ federal income tax returns, the review of the Funds’ federal excise tax returns and the review of required distributions by the Funds. |
All Other Fees
| | (d) | The aggregate fees billed in each of the last two fiscal years for products and services provided by the principal accountant, other than the services reported in paragraphs (a) through (c) of this Item were $0 for the fiscal year ended June 30, 2016 and $0 for the fiscal year ended June 30, 2015. |
| | (e)(1) | Disclose the audit committee’s pre-approval policies and procedures described in paragraph (c)(7) of Rule 2-01 of Regulation S-X. |
The Registrant’s Audit Committee has adopted an Audit Committee Charter that provides that the Audit Committee shall approve, prior to appointment, the engagement of the auditor to provide audit services to the Registrant and non-audit services to the Registrant, its investment advisor or any entity controlling, controlled by or under common control with the investment adviser that provides on-going services to the Registrant if the engagement relates directly to the operations and financial reporting of the Registrant.
| | (e)(2) | No services described in paragraphs (b) through (d) above were approved pursuant to paragraph (c)(7)(i)(C) of Rule 2-01 of Regulation S-X |
| | (g) | The aggregate non-audit fees billed by the registrant’s accountant for services rendered to the registrant, and rendered to the registrant’s investment adviser (not including any sub-adviser whose role is primarily portfolio management and is subcontracted with or overseen by another investment adviser), and any entity controlling, controlled by, or under common control with the adviser that provides ongoing services to the registrant for each of the last two fiscal years of the registrant was $0 for the fiscal year ended June 30, 2016 and $0 for the fiscal year ended June 30, 2015. |
Item 5. Audit Committee of Listed Registrants.
Not applicable.
Item 6. Investments.
| | (a) | Schedule of Investments in securities of unaffiliated issuers as of the close of the reporting period is included as part of the report to shareholders filed under Item 1 of this form. |
| Item 7. | Disclosure of Proxy Voting Policies and Procedures for Closed-End Management Investment Companies. |
Not applicable.
Item 8. Portfolio Managers of Closed-End Management Investment Companies.
Not applicable.
| Item 9. | Purchases of Equity Securities by Closed-End Management Investment Company and Affiliated Purchasers. |
Not applicable.
Item 10. Submission of Matters to a Vote of Security Holders.
There have been no material changes to the procedures by which the shareholders may recommend nominees to the Registrant’s Board of Directors, where those changes were implemented after the registrant last provided disclosure in response to the requirements of Item 407(c)(2)(iv) of Regulation S-K (17 CFR 229.407) (as required by Item 22(b)(15) of Schedule 14A (17 CFR 240.14a-101)), or this Item.
Item 11. Controls and Procedures.
| | (a) | The registrant’s principal executive officer and principal financial officer, or persons performing similar functions, have concluded that the registrant’s disclosure controls and procedures (as defined in Rule 30a-3(c) under the Investment Company Act of 1940, as amended (the “1940 Act”) (17 CFR 270.30a-3(c))) are effectively designed, as of a date within 90 days of the filing date of the report that includes the disclosure required by this paragraph, based on their evaluation of these controls and procedures required by Rule 30a-3(b) under the 1940 Act (17 CFR 270.30a-3(b)) and Rules 13a-15(b) or 15d-15(b) under the Securities Exchange Act of 1934, as amended (17 CFR 240.13a-15(b) or 240.15d-15(b)). |
| | (b) | There were no changes in the registrant’s internal control over financial reporting (as defined in Rule 30a-3(d) under the Act (17 CFR 270.30a-3(d))) that occurred during the second fiscal quarter of the period covered by this report that have materially affected or are reasonably likely to materially affect, the registrant’s internal control over financial reporting. |
Item 12. Exhibits.
| | (a)(1) | Code of ethics, or any amendment thereto, that is the subject of disclosure required by Item 2 is attached hereto. |
| | (a)(2) | Certifications pursuant to Rule 30a-2(a) under the 1940 Act and Section 302 of the Sarbanes-Oxley Act of 2002 are attached hereto. |
| | (b) | Certifications pursuant to Rule 30a-2(b) under the 1940 Act and Section 906 of the Sarbanes-Oxley Act of 2002 are attached hereto. |
(12.other) Not applicable.
SIGNATURES
Pursuant to the requirements of the Securities Exchange Act of 1934 and the Investment Company Act of 1940, the registrant has duly caused this report to be signed on its behalf by the undersigned, thereunto duly authorized.
| | |
(Registrant) | | Bridgeway Funds, Inc. |
| | |
By (Signature and Title)* | | /s/ Tammira Philippe |
| | Tammira Philippe, President and Principal Executive Officer |
| | (principal executive officer) |
Pursuant to the requirements of the Securities Exchange Act of 1934 and the Investment Company Act of 1940, this report has been signed below by the following persons on behalf of the registrant and in the capacities and on the dates indicated.
| | |
By (Signature and Title)* | | /s/ Tammira Philippe |
| | Tammira Philippe, President and Principal Executive Officer |
| | (principal executive officer) |
| | |
By (Signature and Title)* | | /s/ Linda G. Giuffré |
| | Linda G. Giuffré, Treasurer and Principal Financial Officer |
| | (principal financial officer) |
* Print the name and title of each signing officer under his or her signature.