UNITED STATES
SECURITIES AND EXCHANGE COMMISSION
Washington, D.C. 20549
FORMN-CSR
CERTIFIED SHAREHOLDER REPORT OF
REGISTERED MANAGEMENT INVESTMENT COMPANIES
Investment Company Act file number811-08326
MFS VARIABLE INSURANCE TRUST
(Exact name of registrant as specified in charter)
111 Huntington Avenue, Boston, Massachusetts 02199
(Address of principal executive offices) (Zip code)
Christopher R. Bohane
Massachusetts Financial Services Company
111 Huntington Avenue
Boston, Massachusetts 02199
(Name and address of agents for service)
Registrant’s telephone number, including area code: (617)954-5000
Date of fiscal year end: December 31
Date of reporting period: December 31, 2019
| ITEM 1. | REPORTS TO STOCKHOLDERS. |
Annual Report
December 31, 2019

MFS® Global Equity Series

MFS® Variable Insurance Trust
Beginning on January 1, 2021, as permitted by regulations adopted by the U.S. Securities and Exchange Commission, the insurance company that offers your contract may determine that it will no longer send you paper copies of the fund’s annual and semiannual shareholder reports unless you specifically request paper copies from the insurance company or from your financial intermediary. Instead, the shareholder reports will be made available on a Web site (insurancefunds.mfs.com or other Web site of which you will be notified), and the insurance company will notify you by mail each time a report is posted and provide you with a Web site link to access the report. Instructions for requesting paper copies will be provided by your insurance company or financial intermediary.
If you already elected to receive shareholder reports by email, you will not be affected by this change and you need not take any action. If your insurance company or financial intermediary offers electronic delivery, you may elect to receive shareholder reports and other communications from the insurance company or financial intermediary by email by following the instructions provided by the insurance company or financial intermediary.
Beginning on January 1, 2019, you may elect to receive all future reports in paper free of charge from the insurance company or financial intermediary. You can inform the insurance company or financial intermediary that you wish to continue receiving paper copies of your shareholder reports by contacting your insurance company or financial intermediary. Your election to receive reports in paper will apply to all funds held in your account with your insurance company or financial intermediary.
VGE-ANN
MFS® Global Equity Series
CONTENTS
The report is prepared for the general information of contract owners. It is authorized for distribution to prospective investors only when preceded or accompanied by a current prospectus.
NOT FDIC INSURED• MAY LOSE VALUE• NO BANK OR CREDIT UNION GUARANTEE• NOT A DEPOSIT• NOT INSURED BY ANY FEDERAL GOVERNMENT AGENCY OR NCUA/NCUSIF
MFS Global Equity Series
LETTER FROM THE EXECUTIVE CHAIR

Dear Contract Owners:
Slowing global growth, low inflation, and trade friction between the United States and China have been hallmarks of the past 12 months. After experiencing an uptick in market volatility in late 2018, markets steadied for most of 2019, thanks in large measure to the adoption of a dovish policy stance on the part of global central banks, focused on supporting economic growth. Negotiations aimed at a “phase one” trade deal between the U.S. and China bore fruit at the end of the period, boosting investor sentiment, while signs of stability emerging from the global manufacturing sector also lifted spirits. Uncertainty over Brexit, along with the ripple effects from the trade conflict, hampered business confidence and investment in the United Kingdom and Europe for much of the period, though investors expect greater clarity regarding Brexit as a result of December’s general election. The pro-Brexit Conservative Party won the election by a comfortable margin and set the stage for the U.K.’s departure from the EU at the end of January.
Markets expect the longest economic expansion in U.S. history will continue, albeit at a slower pace, as trade tensions recede. In an effort to prolong the expansion, the U.S. Federal Reserve lowered interest rates three times between July and October and the European Central Bank loosened policy in September. While the global monetary policy backdrop remains quite accommodative, signs of easing trade tensions and fading global recession fears led to improved market sentiment in late 2019 as investors grew less risk averse. In early 2020, an outbreak of coronavirus emanating from China reintroduced global growth fears, causing an uptick in volatility.
Here at MFS®, we aim to help our clients navigate the growing complexity of the markets and world economies. Our long-term investment philosophy and commitment to the responsible allocation of capital allow us to tune out the noise and uncover what we believe are the best, most durable investment opportunities in the market. Through our powerful global investment platform, we combine collective expertise, thoughtful risk management and long-term discipline to create sustainable value for investors.
Respectfully,

Robert J. Manning
Executive Chair
MFS Investment Management
February 14, 2020
The opinions expressed in this letter are subject to change and may not be relied upon for investment advice. No forecasts can be guaranteed.
1
MFS Global Equity Series
PORTFOLIO COMPOSITION
Portfolio structure

| | | | |
| Top ten holdings | | | | |
| Thermo Fisher Scientific, Inc. | | | 3.2% | |
| Visa, Inc., “A” | | | 3.1% | |
| Medtronic PLC | | | 3.0% | |
| Comcast Corp., “A” | | | 2.9% | |
| Accenture PLC, “A” | | | 2.7% | |
| Nestle S.A. | | | 2.7% | |
| LVMH Moet Hennessy Louis Vuitton SE | | | 2.6% | |
| Schneider Electric SE | | | 2.4% | |
| Honeywell International, Inc. | | | 2.4% | |
| Diageo PLC | | | 2.2% | |
| |
| GICS equity sectors (g) | | | | |
| Health Care | | | 20.3% | |
| Industrials | | | 19.2% | |
| Consumer Staples | | | 15.6% | |
| Information Technology | | | 12.6% | |
| Financials | | | 9.6% | |
| Consumer Discretionary | | | 9.2% | |
| Communication Services | | | 6.5% | |
| Materials | | | 5.8% | |
| Energy | | | 0.5% | |
| Real Estate | | | 0.3% | |
| | | | |
| Issuer country weightings (x) | | | | |
| United States | | | 55.7% | |
| France | | | 10.9% | |
| Switzerland | | | 7.7% | |
| United Kingdom | | | 7.2% | |
| Germany | | | 4.8% | |
| Japan | | | 2.8% | |
| Netherlands | | | 2.2% | |
| Sweden | | | 2.1% | |
| Canada | | | 1.7% | |
| Other Countries | | | 4.9% | |
| |
| Currency exposure weightings (y) | | | | |
| United States Dollar | | | 56.9% | |
| Euro | | | 21.0% | |
| Swiss Franc | | | 7.7% | |
| British Pound Sterling | | | 7.2% | |
| Japanese Yen | | | 2.8% | |
| Swedish Krona | | | 2.1% | |
| South Korean Won | | | 0.8% | |
| Danish Krone | | | 0.6% | |
| Brazilian Real | | | 0.3% | |
| Other Currencies | | | 0.6% | |
| (g) | The Global Industry Classification Standard (GICS®) was developed by and/or is the exclusive property of MSCI, Inc. and S&P Global Market Intelligence Inc. (“S&P Global Market Intelligence”). GICS is a service mark of MSCI and S&P Global Market Intelligence and has been licensed for use by MFS. |
| (x) | Represents the portfolio’s exposure to issuer countries as a percentage of a portfolio’s net assets. For purposes of this presentation, United States includes Cash & Cash Equivalents. |
| (y) | Represents the portfolio’s exposure to a particular currency as a percentage of a portfolio’s net assets. For purposes of this presentation, United States Dollar includes Cash & Cash Equivalents. |
Cash & Cash Equivalents includes any cash, investments in money market funds, short-term securities, and other assets less liabilities. Please see the Statement of Assets and Liabilities for additional information related to the fund’s cash position and other assets and liabilities.
Percentages are based on net assets as of December 31, 2019.
The portfolio is actively managed and current holdings may be different.
2
MFS Global Equity Series
MANAGEMENT REVIEW
Summary of Results
For the twelve months ended December 31, 2019, Initial Class shares of the MFS Global Equity Series (fund) provided a total return of 30.57%, while Service Class shares of the fund provided a total return of 30.20%. These compare with a return of 27.67% over the same period for the fund’s benchmark, the MSCI World Index (net div).
Market Environment
Fading fears of a near-term global recession, the announcement of a partial trade deal between the United States and China and the decline in uncertainty over Brexit helped bolster market sentiment late in the period. Changes in market sentiment, largely driven by uncertainty over the outcome of trade negotiations between the US and China, had contributed to periodic bouts of volatility during the reporting period. The global economy decelerated, led by weakness in China and Europe, although the pace of the slowdown moderated late in the period amid nascent signs of stabilization in the manufacturing sector.
The deteriorating global growth backdrop, along with declining inflationary pressures, prompted the US Federal Reserve to adopt a more dovish posture beginning in early 2019, resulting in the first interest rate cut in over a decade at the end of July, followed by additional cuts in September and October. The Fed’s actions led to a sharp decline in long-term interest rates during the period’s second half, causing the inversion of portions of the US Treasury yield curve for a time. Amid an improvement in risk sentiment in Q4 2019 and indications of a bottoming in growth and a potential upturn in activity, the Fed indicated in October that further rate cuts were unlikely unless the outlook for the economy materially worsened.
Globally, central banks have tilted more dovish as well, with the European Central Bank unveiling a package of easing measures, which included putting overnight rates deeper into negative territory, restarting its bond-buying program and lengthening the term of cheap loans to banks to three years from two. The central banks of India and Australia are among those that have cut rates several times in recent months, although China has been more cautious in increasing liquidity as it keeps trying to deleverage its economy, cutting rates only marginally.
Emerging markets experienced considerable volatility through the end of 2018, as tighter global financial conditions exposed structural weakness in some countries. Those conditions improved in 2019 as the Fed became more dovish. Notwithstanding the periodic headwinds on market sentiment from significant trade friction between the US and China over much of the year, emerging market hard currency debt and local rates benefited from relatively cheap valuations at the beginning of the period and easier global monetary conditions. These factors, plus the fading of certain global risk factors mentioned above, hastened spread tightening in the latter part of the period. At the same time, idiosyncratic risks spiked in some countries (e.g., Argentina and Lebanon), contributing to increased dispersion in performance among sovereign assets.
Contributors to Performance
Security selection within thehealth care sector contributed to performance relative to the MSCI World Index. Within this sector, the fund’s overweight position in precision instruments and machines manufacturer Olympus (Japan), life sciences supply company Thermo Fisher Scientific and orthopedic products maker Zimmer Biomet Holdings aided relative performance. The stock price of Olympus rose after the company reported better-than-expected operating profits, driven by strong demand ahead of a scheduled consumption tax increase in Japan. The company also announced a new management strategy to improve operating margins to 20% by 2023, by reducing costs and reorganizing the business. Avoiding shares of pharmaceutical giant Pfizer bolstered relative performance. Shares of Pfizer fell as the company recorded sales that were shy of expectations, owing to weakness in its legacy product sales. Pfizer also cut its fiscal-year 2019 guidance to reflect the integration of a joint venture with GlaxoSmithKline and the acquisition of Array BioPharma.
Security selection within theindustrials sector also bolstered relative returns, led by the fund’s overweight positions in railroad company Kansas City Southern and electrical distribution equipment manufacturer Schneider Electric (France). The stock price of Kansas City Southern advanced on the back of strong earnings that surpassed market expectations due to both higher revenues and lower costs. Notably, volumes in chemical, petroleum, agriculture and mineral shipping were all up, outweighing the declines in energy and automobile volumes.
Stocks in other sectors that boosted relative results included overweight positions in luxury goods company LVMH Moet Hennessy Louis Vuitton (France), IT servicing firm Accenture, global payments technology company Visa and beauty products company Coty (h). The stock price of LVMH Moet Hennessy Louis Vuitton rose on the back of strong sales results, notably from its Fashion & Leather division.
Detractors from Performance
Stock selection within theinformation technology sector was a primary factor that detracted from relative performance. Within this sector, not owning shares of computer and personal electronics maker Apple and software giant Microsoft held back relative returns as both companies outperformed the benchmark during the year. The share price for Apple advanced as the company’s revenues came in higher than expected, driven by stronger-than-expected demand in its wearable technology and services segments.
3
MFS Global Equity Series
Management Review – continued
Elsewhere, the fund’s overweight positions in diversified technology company 3M, household products manufacturer Reckitt Benckiser Group (United Kingdom), custom IT consulting and technology services provider Cognizant Technology Solutions, wine and alcoholic beverage producer Pernod Ricard (France), global financial services provider Bank of New York Mellon, security software provider Check Point Software Technologies (Israel) and investment management and banking firm UBS Group hurt relative performance. Not owning strong-performing social networking service provider Facebook further weighed on relative returns.
During the reporting period, the fund’s relative currency exposure, resulting primarily from differences between the fund’s and the benchmark’s exposures to holdings of securities denominated in foreign currencies, was a detractor from relative performance. All of MFS’ investment decisions are driven by the fundamentals of each individual opportunity and as such, it is common for our funds to have different currency exposures than the benchmark.
Respectfully,
Portfolio Manager(s)
Ryan McAllister and Roger Morley
| (h) | Security was not held in the portfolio at period end. |
The views expressed in this report are those of the portfolio manager(s) only through the end of the period of the report as stated on the cover and do not necessarily reflect the views of MFS or any other person in the MFS organization. These views are subject to change at any time based on market or other conditions, and MFS disclaims any responsibility to update such views. These views may not be relied upon as investment advice or an indication of trading intent on behalf of any MFS portfolio. References to specific securities are not recommendations of such securities, and may not be representative of any MFS portfolio’s current or future investments.
4
MFS Global Equity Series
PERFORMANCE SUMMARY THROUGH 12/31/19
The following chart illustrates the historical performance of the fund in comparison to its benchmark(s). Benchmarks are unmanaged and may not be invested in directly. Benchmark returns do not reflect any fees or expenses. The performance of other share classes will be greater than or less than that of the class depicted below. (See Notes to Performance Summary.)
Performance data shown represents past performance and is no guarantee of future results. Investment return and principal value fluctuate so your units, when sold, may be worth more or less than the original cost; current performance may be lower or higher than quoted. The performance shown does not reflect the deduction of taxes, if any, that a contract holder would pay on fund distributions or the redemption of contract units. The returns for the fund shown also do not reflect the deduction of expenses associated with variable products, such as mortality and expense risk charges, separate account charges, and sales charges imposed by the insurance company separate accounts. Such expenses would reduce the overall returns shown.
Growth of a Hypothetical $10,000 Investment
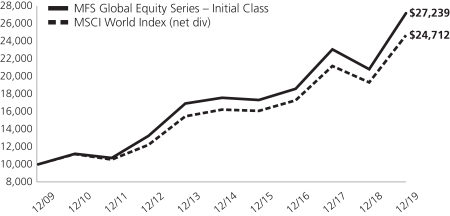
Total Returns through 12/31/19
Average annual total returns
| | | | | | | | | | | | |
| | | Share Class | | Class Inception Date | | 1-yr | | 5-yr | | 10-yr | | |
| | | Initial Class | | 5/03/99 | | 30.57% | | 9.12% | | 10.54% | | |
| | | Service Class | | 5/01/00 | | 30.20% | | 8.85% | | 10.26% | | |
| | | | |
| Comparative benchmark(s) | | | | | | | | |
| | | MSCI World Index (net div) (f) | | 27.67% | | 8.74% | | 9.47% | | |
| (f) | Source: FactSet Research Systems Inc. |
Benchmark Definition(s)
MSCI World Index (net div) – a market capitalization-weighted index that is designed to measure equity market performance in the global developed markets. Morgan Stanley Capital International (“MSCI”) makes no express or implied warranties or representations and shall have no liability whatsoever with respect to any MSCI data contained herein. The MSCI data may not be further redistributed or used as a basis for other indices or any securities or financial products. This report is not approved, reviewed, or produced by MSCI.
It is not possible to invest directly in an index.
Notes to Performance Summary
Average annual total return represents the average annual change in value for each share class for the periods presented.
Performance results reflect any applicable expense subsidies and waivers in effect during the periods shown. Without such subsidies and waivers the fund’s performance results would be less favorable. Please see the prospectus and financial statements for complete details. All results are historical and assume the reinvestment of any dividends and capital gains distributions.
Performance results do not include adjustments made for financial reporting purposes in accordance with U.S. generally accepted accounting principles and may differ from amounts reported in the financial highlights.
From time to time the fund may receive proceeds from litigation settlements, without which performance would be lower.
5
MFS Global Equity Series
EXPENSE TABLE
Fund Expenses Borne by the Contract Holders during the Period,
July 1, 2019 through December 31, 2019
As a contract holder of the fund, you incur ongoing costs, including management fees; distribution and/or service(12b-1) fees; and other fund expenses. This example is intended to help you understand your ongoing costs (in dollars) of investing in the fund and to compare these costs with the ongoing costs of investing in other mutual funds.
The example is based on an investment of $1,000 invested at the beginning of the period and held for the entire period July 1, 2019 through December 31, 2019.
Actual Expenses
The first line for each share class in the following table provides information about actual account values and actual expenses. You may use the information in this line, together with the amount you invested, to estimate the expenses that you paid over the period. Simply divide your account value by $1,000 (for example, an $8,600 account value divided by $1,000 = 8.6), then multiply the result by the number in the first line under the heading entitled “Expenses Paid During Period” to estimate the expenses you paid on your account during this period.
Hypothetical Example for Comparison Purposes
The second line for each share class in the following table provides information about hypothetical account values and hypothetical expenses based on the fund’s actual expense ratio and an assumed rate of return of 5% per year before expenses, which is not the fund’s actual return. The hypothetical account values and expenses may not be used to estimate the actual ending account balance or expenses you paid for the period. You may use this information to compare the ongoing costs of investing in the fund and other funds. To do so, compare this 5% hypothetical example with the 5% hypothetical examples that appear in the shareholder reports of the other funds.
Please note that the expenses shown in the table are meant to highlight the fund’s ongoing costs only and do not take into account the fees and expenses imposed under the variable contracts through which your investment in the fund is made. Therefore, the second line for each share class in the table is useful in comparing ongoing costs associated with an investment in vehicles (such as the fund) which fund benefits under variable annuity and variable life insurance contracts and to qualified pension and retirement plans only, and will not help you determine the relative total costs of investing in the fund through variable annuity and variable life insurance contracts. If the fees and expenses imposed under the variable contracts were included, your costs would have been higher.
| | | | | | | | | | | | | | | | | | |
| Share Class | | | | Annualized
Expense Ratio | | | Beginning
Account Value
7/01/19 | | | Ending
Account Value
12/31/19 | | | Expenses Paid
During Period (p)
7/01/19-12/31/19 | |
| Initial Class | | Actual | | | 0.93% | | | | $1,000.00 | | | | $1,078.24 | | | | $4.87 | |
| | Hypothetical (h) | | | 0.93% | | | | $1,000.00 | | | | $1,020.52 | | | | $4.74 | |
| Service Class | | Actual | | | 1.18% | | | | $1,000.00 | | | | $1,076.83 | | | | $6.18 | |
| | Hypothetical (h) | | | 1.18% | | | | $1,000.00 | | | | $1,019.26 | | | | $6.01 | |
| (h) | 5% class return per year before expenses. |
| (p) | “Expenses Paid During Period” are equal to each class’s annualized expense ratio, as shown above, multiplied by the average account value over the period, multiplied by 184/365 (to reflect theone-half year period). |
Notes to Expense Table
Changes to the fund’s fee arrangements occurred during the six month period. Had these fee changes been in effect throughout the entire six month period, the annualized expense ratios, the actual expenses paid during the period, and the hypothetical expenses paid during the period would have been approximately 0.92%, $4.82, and $4.69 for Initial Class and 1.17%, $6.12, and $5.96 for Service Class, respectively. For further information about the fund’s fee arrangements and changes to those fee arrangements, please see Note 3 in the Notes to Financial Statements.
6
MFS Global Equity Series
PORTFOLIO OF INVESTMENTS – 12/31/19
The Portfolio of Investments is a complete list of all securities owned by your fund. It is categorized by broad-based asset classes.
| | | | | | | | |
| | |
| Issuer | | Shares/Par | | | Value ($) | |
| COMMON STOCKS – 99.6% | | | | | | | | |
| Aerospace – 4.2% | | | | | | | | |
| Honeywell International, Inc. | | | 8,207 | | | $ | 1,452,639 | |
| MTU Aero Engines Holding AG | | | 1,683 | | | | 480,639 | |
| United Technologies Corp. | | | 4,341 | | | | 650,108 | |
| | | | | | | | |
| | | | | | $ | 2,583,386 | |
| | | | | | | | |
| Airlines – 1.1% | | | | | |
| Aena S.A. | | | 3,655 | | | $ | 699,018 | |
| | | | | | | | |
| Alcoholic Beverages – 5.5% | | | | | |
| Ambev S.A. | | | 39,968 | | | $ | 185,498 | |
| Carlsberg A.S., “B” | | | 2,417 | | | | 360,563 | |
| Diageo PLC | | | 31,585 | | | | 1,339,009 | |
| Heineken N.V. | | | 4,910 | | | | 522,776 | |
| Pernod Ricard S.A. | | | 5,369 | | | | 959,971 | |
| | | | | | | | |
| | | | | | $ | 3,367,817 | |
| | | | | | | | |
| Apparel Manufacturers – 4.2% | | | | | |
| Burberry Group PLC | | | 11,601 | | | $ | 338,835 | |
| Compagnie Financiere Richemont S.A. | | | 8,140 | | | | 639,728 | |
| LVMH Moet Hennessy Louis Vuitton SE | | | 3,477 | | | | 1,615,442 | |
| | | | | | | | |
| | | | | | $ | 2,594,005 | |
| | | | | | | | |
| Automotive – 0.5% | | | | | |
| Aptiv PLC | | | 3,328 | | | $ | 316,060 | |
| | | | | | | | |
| Broadcasting – 3.6% | | | | | |
| Omnicom Group, Inc. | | | 3,426 | | | $ | 277,575 | |
| Walt Disney Co. | | | 8,679 | | | | 1,255,244 | |
| WPP Group PLC | | | 47,238 | | | | 667,324 | |
| | | | | | | | |
| | | | | | $ | 2,200,143 | |
| | | | | | | | |
| Brokerage & Asset Managers – 1.5% | | | | | | | | |
| Charles Schwab Corp. | | | 2,353 | | | $ | 111,909 | |
| Deutsche Boerse AG | | | 1,670 | | | | 262,534 | |
| TD Ameritrade Holding Corp. | | | 10,934 | | | | 543,420 | |
| | | | | | | | |
| | | | | | $ | 917,863 | |
| | | | | | | | |
| Business Services – 7.0% | | | | | | | | |
| Accenture PLC, “A” | | | 7,822 | | | $ | 1,647,079 | |
| Adecco S.A. | | | 4,767 | | | | 301,546 | |
| Brenntag AG | | | 5,859 | | | | 318,612 | |
| Cognizant Technology Solutions Corp., “A” | | | 9,112 | | | | 565,126 | |
| Compass Group PLC | | | 20,328 | | | | 508,910 | |
| Equifax, Inc. | | | 3,891 | | | | 545,207 | |
| PayPal Holdings, Inc. (a) | | | 3,705 | | | | 400,770 | |
| | | | | | | | |
| | | | | | $ | 4,287,250 | |
| | | | | | | | |
| Cable TV – 2.9% | | | | | | | | |
| Comcast Corp., “A” | | | 39,535 | | | $ | 1,777,889 | |
| | | | | | | | |
| Chemicals – 2.7% | | | | | | | | |
| 3M Co. | | | 4,781 | | | $ | 843,464 | |
| PPG Industries, Inc. | | | 5,829 | | | | 778,113 | |
| | | | | | | | |
| �� | | | | | $ | 1,621,577 | |
| | | | | | | | |
| | | | | | | | |
| | |
| Issuer | | Shares/Par | | | Value ($) | |
| COMMON STOCKS – continued | | | | | |
| Computer Software – 2.5% | | | | | | | | |
| Check Point Software Technologies Ltd. (a) | | | 6,128 | | | $ | 679,963 | |
| Oracle Corp. | | | 15,472 | | | | 819,707 | |
| | | | | | | | |
| | | | | | $ | 1,499,670 | |
| | | | | | | | |
| Consumer Products – 5.0% | | | | | | | | |
| Colgate-Palmolive Co. | | | 8,914 | | | $ | 613,640 | |
| Essity AB | | | 40,366 | | | | 1,300,662 | |
| Reckitt Benckiser Group PLC | | | 14,250 | | | | 1,156,882 | |
| | | | | | | | |
| | | | | | $ | 3,071,184 | |
| | | | | | | | |
| Electrical Equipment – 4.1% | | | | | | | | |
| Amphenol Corp., “A” | | | 3,183 | | | $ | 344,496 | |
| Legrand S.A. | | | 7,942 | | | | 647,117 | |
| Resideo Technologies, Inc. (a) | | | 1,418 | | | | 16,917 | |
| Schneider Electric SE | | | 14,388 | | | | 1,476,720 | |
| | | | | | | | |
| | | | | | $ | 2,485,250 | |
| | | | | | | | |
| Electronics – 1.9% | | | | | | | | |
| Hoya Corp. | | | 4,200 | | | $ | 401,017 | |
| Microchip Technology, Inc. | | | 2,602 | | | | 272,481 | |
| Samsung Electronics Co. Ltd. | | | 10,690 | | | | 515,091 | |
| | | | | | | | |
| | | | | | $ | 1,188,589 | |
| | | | | | | | |
| Food & Beverages – 5.1% | | | | | | | | |
| Danone S.A. | | | 11,244 | | | $ | 932,056 | |
| Kellogg Co. | | | 7,484 | | | | 517,593 | |
| Nestle S.A. | | | 15,162 | | | | 1,641,532 | |
| | | | | | | | |
| | | | | | $ | 3,091,181 | |
| | | | | | | | |
| Gaming & Lodging – 1.2% | | | | | | | | |
| Marriott International, Inc., “A” | | | 3,319 | | | $ | 502,596 | |
| Sands China Ltd. | | | 20,000 | | | | 106,900 | |
| Wynn Resorts Ltd. | | | 832 | | | | 115,540 | |
| | | | | | | | |
| | | | | | $ | 725,036 | |
| | | | | | | | |
| Insurance – 1.2% | | | | | | | | |
| Aon PLC | | | 3,537 | | | $ | 736,722 | |
| | | | | | | | |
| Internet – 0.7% | | | | | | | | |
| eBay, Inc. | | | 12,536 | | | $ | 452,675 | |
| | | | | | | | |
| Leisure & Toys – 0.3% | | | | | | | | |
| Harley-Davidson, Inc. | | | 4,493 | | | $ | 167,095 | |
| | | | | | | | |
| Machinery & Tools – 1.3% | | | | | | | | |
| Kubota Corp. | | | 50,700 | | | $ | 794,258 | |
| | | | | | | | |
| Major Banks – 4.8% | | | | | | | | |
| Bank of New York Mellon Corp. | | | 16,379 | | | $ | 824,355 | |
| Erste Group Bank AG | | | 5,797 | | | | 218,224 | |
| Goldman Sachs Group, Inc. | | | 3,039 | | | | 698,757 | |
| State Street Corp. | | | 8,817 | | | | 697,425 | |
| UBS Group AG | | | 40,258 | | | | 508,528 | |
| | | | | | | | |
| | | | | | $ | 2,947,289 | |
| | | | | | | | |
7
MFS Global Equity Series
Portfolio of Investments – continued
| | | | | | | | |
| | |
| Issuer | | Shares/Par | | | Value ($) | |
| COMMON STOCKS – continued | | | | | |
| Medical Equipment – 15.0% | | | | | | | | |
| Abbott Laboratories | | | 10,279 | | | $ | 892,834 | |
| Cooper Cos., Inc. | | | 1,965 | | | | 631,335 | |
| EssilorLuxottica | | | 1,682 | | | | 256,214 | |
| Medtronic PLC | | | 16,099 | | | | 1,826,431 | |
| Olympus Corp. | | | 33,600 | | | | 517,412 | |
| Sonova Holding AG | | | 576 | | | | 131,829 | |
| Stryker Corp. | | | 5,033 | | | | 1,056,628 | |
| Thermo Fisher Scientific, Inc. | | | 6,090 | | | | 1,978,458 | |
| Waters Corp. (a) | | | 3,121 | | | | 729,222 | |
| Zimmer Biomet Holdings, Inc. | | | 7,463 | | | | 1,117,062 | |
| | | | | | | | |
| | | | | | $ | 9,137,425 | |
| | | | | | | | |
| Network & Telecom – 0.9% | | | | | | | | |
| Cisco Systems, Inc. | | | 11,094 | | | $ | 532,068 | |
| | | | | | | | |
| Oil Services – 0.6% | | | | | | | | |
| National Oilwell Varco, Inc. | | | 3,902 | | | $ | 97,745 | |
| NOW, Inc. (a) | | | 2,318 | | | | 26,054 | |
| Schlumberger Ltd. | | | 5,632 | | | | 226,407 | |
| | | | | | | | |
| | | | | | $ | 350,206 | |
| | | | | | | | |
| Other Banks & Diversified Financials – 5.2% | | | | | |
| American Express Co. | | | 6,111 | | | $ | 760,758 | |
| Grupo Financiero Banorte S.A. de C.V. | | | 26,815 | | | | 149,835 | |
| Julius Baer Group Ltd. | | | 5,169 | | | | 266,675 | |
| Kasikornbank Co. Ltd. | | | 18,200 | | | | 91,075 | |
| Visa, Inc., “A” | | | 10,090 | | | | 1,895,911 | |
| | | | | | | | |
| | | | | | $ | 3,164,254 | |
| | | | | | | | |
| Pharmaceuticals – 5.1% | | | | | | | | |
| Bayer AG | | | 13,888 | | | $ | 1,134,246 | |
| Johnson & Johnson | | | 1,555 | | | | 226,828 | |
| Merck KGaA | | | 4,360 | | | | 515,226 | |
| Roche Holding AG | | | 3,740 | | | | 1,213,433 | |
| | | | | | | | |
| | | | | | $ | 3,089,733 | |
| | | | | | | | |
| Railroad & Shipping – 4.5% | | | | | | | | |
| Canadian National Railway Co. | | | 11,564 | | | $ | 1,045,964 | |
| Kansas City Southern Co. | | | 7,916 | | | | 1,212,414 | |
| Union Pacific Corp. | | | 2,838 | | | | 513,082 | |
| | | | | | | | |
| | | | | | $ | 2,771,460 | |
| | | | | | | | |
| | | | | | | | |
| | |
| Issuer | | Shares/Par | | | Value ($) | |
| COMMON STOCKS – continued | | | | | |
| Real Estate – 0.3% | | | | | | | | |
| Deutsche Wohnen SE | | | 4,886 | | | $ | 199,604 | |
| | | | | | | | |
| Restaurants – 0.6% | | | | | | | | |
| Whitbread PLC | | | 5,523 | | | $ | 354,522 | |
| | | | | | | | |
| Specialty Chemicals – 4.5% | | | | | | | | |
| Akzo Nobel N.V. | | | 8,055 | | | $ | 818,959 | |
| L’Air Liquide S.A. | | | 4,565 | | | | 646,215 | |
| Linde PLC | | | 1,405 | | | | 299,124 | |
| Linde PLC | | | 4,745 | | | | 1,015,527 | |
| | | | | | | | |
| | | | | | $ | 2,779,825 | |
| | | | | | | | |
| Specialty Stores – 0.4% | | | | | | | | |
| Hermes International | | | 181 | | | $ | 135,257 | |
| Sally Beauty Holdings, Inc. (a) | | | 5,698 | | | | 103,989 | |
| | | | | | | | |
| | | | | | $ | 239,246 | |
| | | | | | | | |
| Trucking – 1.2% | | | | | | | | |
| United Parcel Service, Inc., “B” | | | 6,104 | | | $ | 714,534 | |
| | | | | | | | |
Total Common Stocks
(Identified Cost, $30,937,870) | | | | | | $ | 60,856,834 | |
| | | | | | | | |
| |
| INVESTMENT COMPANIES (h) – 0.3% | | | | | |
| Money Market Funds – 0.3% | | | | | | | | |
| MFS Institutional Money Market Portfolio, 1.7% (v) (Identified Cost, $198,259) | | | 198,259 | | | $ | 198,259 | |
| | | | | | | | |
OTHER ASSETS, LESS
LIABILITIES – 0.1% | | | | | | | 34,678 | |
| | | | | | | | |
| NET ASSETS – 100.0% | | | | | | $ | 61,089,771 | |
| | | | | | | | |
| (a) | | Non-income producing security. |
| (h) | | An affiliated issuer, which may be considered one in which the fund owns 5% or more of the outstanding voting securities, or a company which is under common control. At period end, the aggregate values of the fund’s investments in affiliated issuers and in unaffiliated issuers were $198,259 and $60,856,834, respectively. |
| (v) | | Affiliated issuer that is available only to investment companies managed by MFS. The rate quoted for the MFS Institutional Money Market Portfolio is the annualizedseven-day yield of the fund at period end. |
See Notes to Financial Statements
8
MFS Global Equity Series
FINANCIAL STATEMENTS | STATEMENT OF ASSETS AND LIABILITIES
This statement represents your fund’s balance sheet, which details the assets and liabilities comprising the total value of the fund.
| | | | |
At 12/31/19 | | | | |
| |
Assets | | | | |
Investments in unaffiliated issuers, at value (identified cost, $30,937,870) | | | $60,856,834 | |
Investments in affiliated issuers, at value (identified cost, $198,259) | | | 198,259 | |
Foreign currency, at value (identified cost, $4,119) | | | 4,143 | |
Receivables for | | | | |
Fund shares sold | | | 11,695 | |
Dividends | | | 141,248 | |
Receivable from investment adviser | | | 14,816 | |
Other assets | | | 528 | |
Total assets | | | $61,227,523 | |
| |
Liabilities | | | | |
Payables for | | | | |
Fund shares reacquired | | | $76,623 | |
Payable to affiliates | | | | |
Administrative services fee | | | 104 | |
Shareholder servicing costs | | | 150 | |
Distribution and/or service fees | | | 155 | |
Payable for independent Trustees’ compensation | | | 12 | |
Accrued expenses and other liabilities | | | 60,708 | |
Total liabilities | | | $137,752 | |
Net assets | | | $61,089,771 | |
| |
Net assets consist of | | | | |
Paid-in capital | | | $28,871,084 | |
Total distributable earnings (loss) | | | 32,218,687 | |
Net assets | | | $61,089,771 | |
Shares of beneficial interest outstanding | | | 2,684,441 | |
| | | | | | | | | | | | |
| | | |
| | | Net assets | | | Shares
outstanding | | | Net asset value
per share | |
Initial Class | | | $49,771,259 | | | | 2,184,019 | | | | $22.79 | |
Service Class | | | 11,318,512 | | | | 500,422 | | | | 22.62 | |
See Notes to Financial Statements
9
MFS Global Equity Series
FINANCIAL STATEMENTS | STATEMENT OF OPERATIONS
This statement describes how much your fund earned in investment income and accrued in expenses. It also describes any gains and/or losses generated by fund operations.
| | | | |
Year ended 12/31/19 | | | | |
| |
Net investment income (loss) | | | | |
Income | | | | |
Dividends | | | $1,256,948 | |
Dividends from affiliated issuers | | | 8,228 | |
Other | | | 20 | |
Foreign taxes withheld | | | (72,075 | ) |
Total investment income | | | $1,193,121 | |
Expenses | | | | |
Management fee | | | $512,213 | |
Distribution and/or service fees | | | 23,149 | |
Shareholder servicing costs | | | 5,246 | |
Administrative services fee | | | 18,407 | |
Independent Trustees’ compensation | | | 3,030 | |
Custodian fee | | | 24,800 | |
Shareholder communications | | | 8,049 | |
Audit and tax fees | | | 58,139 | |
Legal fees | | | 553 | |
Miscellaneous | | | 27,530 | |
Total expenses | | | $681,116 | |
Reduction of expenses by investment adviser | | | (117,168 | ) |
Net expenses | | | $563,948 | |
Net investment income (loss) | | | $629,173 | |
| |
Realized and unrealized gain (loss) | | | | |
Realized gain (loss) (identified cost basis) | | | | |
Unaffiliated issuers (net of $127 country tax) | | | $2,145,370 | |
Affiliated issuers | | | 82 | |
Foreign currency | | | (4,280 | ) |
Net realized gain (loss) | | | $2,141,172 | |
Change in unrealized appreciation or depreciation | | | | |
Unaffiliated issuers (net of $1,483 decrease in deferred country tax) | | | $12,138,582 | |
Translation of assets and liabilities in foreign currencies | | | 1,011 | |
Net unrealized gain (loss) | | | $12,139,593 | |
Net realized and unrealized gain (loss) | | | $14,280,765 | |
Change in net assets from operations | | | $14,909,938 | |
See Notes to Financial Statements
10
MFS Global Equity Series
FINANCIAL STATEMENTS | STATEMENTS OF CHANGES IN NET ASSETS
These statements describe the increases and/or decreases in net assets resulting from operations, any distributions, and any shareholder transactions.
| | | | | | | | |
| | | Year ended | |
| | | 12/31/19 | | | 12/31/18 | |
Change in net assets | | | | | | | | |
| | |
From operations | | | | | | | | |
Net investment income (loss) | | | $629,173 | | | | $613,901 | |
Net realized gain (loss) | | | 2,141,172 | | | | 3,443,173 | |
Net unrealized gain (loss) | | | 12,139,593 | | | | (9,540,418 | ) |
Change in net assets from operations | | | $14,909,938 | | | | $(5,483,344 | ) |
Total distributions to shareholders | | | $(4,146,029 | ) | | | $(3,119,040 | ) |
Change in net assets from fund share transactions | | | $(2,032,350 | ) | | | $(2,050,773 | ) |
Total change in net assets | | | $8,731,559 | | | | $(10,653,157 | ) |
| | |
Net assets | | | | | | | | |
At beginning of period | | | 52,358,212 | | | | 63,011,369 | |
At end of period | | | $61,089,771 | | | | $52,358,212 | |
See Notes to Financial Statements
11
MFS Global Equity Series
FINANCIAL STATEMENTS | FINANCIAL HIGHLIGHTS
The financial highlights table is intended to help you understand the fund’s financial performance for the past 5 years. Certain information reflects financial results for a single fund share. The total returns in the table represent the rate that an investor would have earned (or lost) on an investment in the fund share class (assuming reinvestment of all distributions) held for the entire period.
| | | | | | | | | | | | | | | | | | | | |
| Initial Class | | Year ended | |
| | | | | |
| | | 12/31/19 | | | 12/31/18 | | | 12/31/17 | | | 12/31/16 | | | 12/31/15 | |
| | | | | |
Net asset value, beginning of period | | | $18.82 | | | | $22.00 | | | | $18.59 | | | | $18.39 | | | | $19.59 | |
| | | | | |
| Income (loss) from investment operations | | | | | | | | | | | | | | | | | | | | |
Net investment income (loss) (d) | | | $0.25 | | | | $0.23 | | | | $0.20 | | | | $0.17 | | | | $0.18 | |
Net realized and unrealized gain (loss) | | | 5.35 | | | | (2.23 | ) | | | 4.20 | | | | 1.20 | | | | (0.49 | ) |
Total from investment operations | | | $5.60 | | | | $(2.00 | ) | | | $4.40 | | | | $1.37 | | | | $(0.31 | ) |
| | | | | |
| Less distributions declared to shareholders | | | | | | | | | | | | | | | | | | | | |
From net investment income | | | $(0.25 | ) | | | $(0.21 | ) | | | $(0.18 | ) | | | $(0.18 | ) | | | $(0.21 | ) |
From net realized gain | | | (1.38 | ) | | | (0.97 | ) | | | (0.81 | ) | | | (0.99 | ) | | | (0.68 | ) |
Total distributions declared to shareholders | | | $(1.63 | ) | | | $(1.18 | ) | | | $(0.99 | ) | | | $(1.17 | ) | | | $(0.89 | ) |
Net asset value, end of period (x) | | | $22.79 | | | | $18.82 | | | | $22.00 | | | | $18.59 | | | | $18.39 | |
Total return (%) (k)(r)(s)(x) | | | 30.57 | | | | (9.74 | ) | | | 24.07 | | | | 7.35 | | | | (1.41 | ) |
| | | | | |
Ratios (%) (to average net assets)
and Supplemental data: | | | | | | | | | | | | | | | | | | | | |
Expenses before expense reductions (f) | | | 1.16 | | | | 1.13 | | | | 1.16 | | | | 1.19 | | | | 1.26 | |
Expenses after expense reductions (f) | | | 0.95 | | | | 0.97 | | | | 0.97 | | | | 0.99 | | | | 1.00 | |
Net investment income (loss) | | | 1.16 | | | | 1.07 | | | | 0.95 | | | | 0.93 | | | | 0.91 | |
Portfolio turnover | | | 11 | | | | 15 | | | | 11 | | | | 13 | | | | 12 | |
Net assets at end of period (000 omitted) | | | $49,771 | | | | $45,219 | | | | $52,850 | | | | $44,756 | | | | $45,946 | |
| |
| Service Class | | Year ended | |
| | | | | |
| | | 12/31/19 | | | 12/31/18 | | | 12/31/17 | | | 12/31/16 | | | 12/31/15 | |
| | | | | |
Net asset value, beginning of period | | | $18.70 | | | | $21.86 | | | | $18.49 | | | | $18.30 | | | | $19.50 | |
| | | | | |
| Income (loss) from investment operations | | | | | | | | | | | | | | | | | | | | |
Net investment income (loss) (d) | | | $0.18 | | | | $0.18 | | | | $0.14 | | | | $0.13 | | | | $0.13 | |
Net realized and unrealized gain (loss) | | | 5.32 | | | | (2.21 | ) | | | 4.18 | | | | 1.18 | | | | (0.48 | ) |
Total from investment operations | | | $5.50 | | | | $(2.03 | ) | | | $4.32 | | | | $1.31 | | | | $(0.35 | ) |
| | | | | |
| Less distributions declared to shareholders | | | | | | | | | | | | | | | | | | | | |
From net investment income | | | $(0.20 | ) | | | $(0.16 | ) | | | $(0.14 | ) | | | $(0.13 | ) | | | $(0.17 | ) |
From net realized gain | | | (1.38 | ) | | | (0.97 | ) | | | (0.81 | ) | | | (0.99 | ) | | | (0.68 | ) |
Total distributions declared to shareholders | | | $(1.58 | ) | | | $(1.13 | ) | | | $(0.95 | ) | | | $(1.12 | ) | | | $(0.85 | ) |
Net asset value, end of period (x) | | | $22.62 | | | | $18.70 | | | | $21.86 | | | | $18.49 | | | | $18.30 | |
Total return (%) (k)(r)(s)(x) | | | 30.20 | | | | (9.92 | ) | | | 23.75 | | | | 7.06 | | | | (1.67 | ) |
| | | | | |
Ratios (%) (to average net assets)
and Supplemental data: | | | | | | | | | | | | | | | | | | | | |
Expenses before expense reductions (f) | | | 1.41 | | | | 1.38 | | | | 1.42 | | | | 1.44 | | | | 1.51 | |
Expenses after expense reductions (f) | | | 1.20 | | | | 1.22 | | | | 1.22 | | | | 1.24 | | | | 1.25 | |
Net investment income (loss) | | | 0.85 | | | | 0.86 | | | | 0.68 | | | | 0.70 | | | | 0.67 | |
Portfolio turnover | | | 11 | | | | 15 | | | | 11 | | | | 13 | | | | 12 | |
Net assets at end of period (000 omitted) | | | $11,319 | | | | $7,139 | | | | $10,162 | | | | $7,033 | | | | $6,893 | |
See Notes to Financial Statements
12
MFS Global Equity Series
Financial Highlights – continued
| (d) | Per share data is based on average shares outstanding. |
| (f) | Ratios do not reflect reductions from fees paid indirectly, if applicable. |
| (k) | The total return does not reflect expenses that apply to separate accounts. Inclusion of these charges would reduce the total return figures for all periods shown. |
| (r) | Certain expenses have been reduced without which performance would have been lower. |
| (s) | From time to time the fund may receive proceeds from litigation settlements, without which performance would be lower. |
| (x) | The net asset values and total returns have been calculated on net assets which include adjustments made in accordance with U.S. generally accepted accounting principles required at period end for financial reporting purposes. |
See Notes to Financial Statements
13
MFS Global Equity Series
NOTES TO FINANCIAL STATEMENTS
| (1) | | Business and Organization |
MFS Global Equity Series (the fund) is a diversified series of MFS Variable Insurance Trust (the trust). The trust is organized as a Massachusetts business trust and is registered under the Investment Company Act of 1940, as amended, as anopen-end management investment company. The shareholders of each series of the trust are separate accounts of insurance companies, which offer variable annuity and/or life insurance products, and qualified retirement and pension plans.
The fund is an investment company and accordingly follows the investment company accounting and reporting guidance of the Financial Accounting Standards Board (FASB) Accounting Standards Codification Topic 946 Financial Services – Investment Companies.
| (2) | | Significant Accounting Policies |
General– The preparation of financial statements in conformity with U.S. generally accepted accounting principles requires management to make estimates and assumptions that affect the reported amounts of assets and liabilities, and disclosure of contingent assets and liabilities at the date of the financial statements and the reported amounts of increases and decreases in net assets from operations during the reporting period. Actual results could differ from those estimates. In the preparation of these financial statements, management has evaluated subsequent events occurring after the date of the fund’s Statement of Assets and Liabilities through the date that the financial statements were issued. The fund invests in foreign securities. Investments in foreign securities are vulnerable to the effects of changes in the relative values of the local currency and the U.S. dollar and to the effects of changes in each country’s market, economic, industrial, political, regulatory, geopolitical, and other conditions.
Balance Sheet Offsetting– The fund’s accounting policy with respect to balance sheet offsetting is that, absent an event of default by the counterparty or a termination of the agreement, the International Swaps and Derivatives Association (ISDA) Master Agreement, or similar agreement, does not result in an offset of reported amounts of financial assets and financial liabilities in the Statement of Assets and Liabilities across transactions between the fund and the applicable counterparty. The fund’s right to setoff may be restricted or prohibited by the bankruptcy or insolvency laws of the particular jurisdiction to which a specific master netting agreement counterparty is subject. Balance sheet offsetting disclosures, to the extent applicable to the fund, have been included in the fund’s Significant Accounting Policies note under the captions for each of the fund’sin-scope financial instruments and transactions.
Investment Valuations– Equity securities, including restricted equity securities, are generally valued at the last sale or official closing price on their primary market or exchange as provided by a third-party pricing service. Equity securities, for which there were no sales reported that day, are generally valued at the last quoted daily bid quotation on their primary market or exchange as provided by a third-party pricing service. Short-term instruments with a maturity at issuance of 60 days or less may be valued at amortized cost, which approximates market value.Open-end investment companies are generally valued at net asset value per share. Securities and other assets generally valued on the basis of information from a third-party pricing service may also be valued at a broker/dealer bid quotation. In determining values, third-party pricing services can utilize both transaction data and market information such as yield, quality, coupon rate, maturity, type of issue, trading characteristics, and other market data. The values of foreign securities and other assets and liabilities expressed in foreign currencies are converted to U.S. dollars using the mean of bid and asked prices for rates provided by a third-party pricing service.
The Board of Trustees has delegated primary responsibility for determining or causing to be determined the value of the fund’s investments (including any fair valuation) to the adviser pursuant to valuation policies and procedures approved by the Board. If the adviser determines that reliable market quotations are not readily available, investments are valued at fair value as determined in good faith by the adviser in accordance with such procedures under the oversight of the Board of Trustees. Under the fund’s valuation policies and procedures, market quotations are not considered to be readily available for most types of debt instruments and floating rate loans and many types of derivatives. These investments are generally valued at fair value based on information from third-party pricing services. In addition, investments may be valued at fair value if the adviser determines that an investment’s value has been materially affected by events occurring after the close of the exchange or market on which the investment is principally traded (such as foreign exchange or market) and prior to the determination of the fund’s net asset value, or after the halt of trading of a specific security where trading does not resume prior to the close of the exchange or market on which the security is principally traded. Events that occur after foreign markets close (such as developments in foreign markets and significant movements in the U.S. markets) and prior to the determination of the fund’s net asset value may be deemed to have a material effect on the value of securities traded in foreign markets. Accordingly, the fund’s foreign equity securities may often be valued at fair value. The adviser generally relies on third-party pricing services or other information (such as the correlation with price movements of similar securities in the same or other markets; the type, cost and investment characteristics of the security; the business and financial condition of the issuer; and trading and other market data) to assist in determining whether to fair value and at what value to fair value an investment. The value of an investment for purposes of calculating the fund’s net asset value can differ depending on the source and method used to determine value. When fair valuation is used, the value of an investment used to determine the fund’s net asset
14
MFS Global Equity Series
Notes to Financial Statements – continued
value may differ from quoted or published prices for the same investment. There can be no assurance that the fund could obtain the fair value assigned to an investment if it were to sell the investment at the same time at which the fund determines its net asset value per share.
Various inputs are used in determining the value of the fund’s assets or liabilities. These inputs are categorized into three broad levels. In certain cases, the inputs used to measure fair value may fall into different levels of the fair value hierarchy. In such cases, an investment’s level within the fair value hierarchy is based on the lowest level of input that is significant to the fair value measurement. The fund’s assessment of the significance of a particular input to the fair value measurement in its entirety requires judgment, and considers factors specific to the investment. Level 1 includes unadjusted quoted prices in active markets for identical assets or liabilities. Level 2 includes other significant observable market-based inputs (including quoted prices for similar securities, interest rates, prepayment speed, and credit risk). Level 3 includes unobservable inputs, which may include the adviser’s own assumptions in determining the fair value of investments. The following is a summary of the levels used as of December 31, 2019 in valuing the fund’s assets or liabilities:
| | | | | | | | | | | | | | | | |
| Financial Instruments | | Level 1 | | | Level 2 | | | Level 3 | | | Total | |
| Equity Securities: | | | | | | | | | | | | | | | | |
United States | | | $33,801,013 | | | | $— | | | | $— | | | | $33,801,013 | |
France | | | 6,668,992 | | | | — | | | | — | | | | 6,668,992 | |
Switzerland | | | 4,703,271 | | | | — | | | | — | | | | 4,703,271 | |
United Kingdom | | | 4,365,482 | | | | — | | | | — | | | | 4,365,482 | |
Germany | | | 2,910,861 | | | | — | | | | — | | | | 2,910,861 | |
Japan | | | — | | | | 1,712,687 | | | | — | | | | 1,712,687 | |
Netherlands | | | 1,341,735 | | | | — | | | | — | | | | 1,341,735 | |
Sweden | | | 1,300,662 | | | | — | | | | — | | | | 1,300,662 | |
Canada | | | 1,045,964 | | | | — | | | | — | | | | 1,045,964 | |
Other Countries | | | 2,400,001 | | | | 606,166 | | | | — | | | | 3,006,167 | |
| Mutual Funds | | | 198,259 | | | | — | | | | — | | | | 198,259 | |
| Total | | | $58,736,240 | | | | $2,318,853 | | | | $— | | | | $61,055,093 | |
For further information regarding security characteristics, see the Portfolio of Investments.
Foreign Currency Translation– Purchases and sales of foreign investments, income, and expenses are converted into U.S. dollars based upon currency exchange rates prevailing on the respective dates of such transactions or on the reporting date for foreign denominated receivables and payables. Gains and losses attributable to foreign currency exchange rates on sales of securities are recorded for financial statement purposes as net realized gains and losses on investments. Gains and losses attributable to foreign exchange rate movements on receivables, payables, income and expenses are recorded for financial statement purposes as foreign currency transaction gains and losses. That portion of both realized and unrealized gains and losses on investments that results from fluctuations in foreign currency exchange rates is not separately disclosed.
Indemnifications– Under the fund’s organizational documents, its officers and Trustees may be indemnified against certain liabilities and expenses arising out of the performance of their duties to the fund. Additionally, in the normal course of business, the fund enters into agreements with service providers that may contain indemnification clauses. The fund’s maximum exposure under these agreements is unknown as this would involve future claims that may be made against the fund that have not yet occurred.
Investment Transactions and Income– Investment transactions are recorded on the trade date. Dividends received in cash are recorded on theex-dividend date. Certain dividends from foreign securities will be recorded when the fund is informed of the dividend if such information is obtained subsequent to theex-dividend date. Dividend payments received in additional securities are recorded on theex-dividend date in an amount equal to the value of the security on such date.
The fund may receive proceeds from litigation settlements. Any proceeds received from litigation involving portfolio holdings are reflected in the Statement of Operations in realized gain/loss if the security has been disposed of by the fund or in unrealized gain/loss if the security is still held by the fund. Any other proceeds from litigation not related to portfolio holdings are reflected as other income in the Statement of Operations.
Tax Matters and Distributions– The fund intends to qualify as a regulated investment company, as defined under Subchapter M of the Internal Revenue Code, and to distribute all of its taxable income, including realized capital gains. As a result, no provision for federal income tax is required. The fund’s federal tax returns, when filed, will remain subject to examination by the Internal Revenue Service for a three year period. Management has analyzed the fund’s tax positions taken on federal and state tax returns for all open tax years and does not believe that there are any uncertain tax positions that require recognition of a tax liability. Foreign taxes, if any, have been accrued by the fund in the accompanying financial statements in accordance with the applicable foreign tax law. Foreign income taxes may be withheld by certain countries in which the fund invests. Additionally, capital gains realized by the fund on securities issued in or by certain foreign countries may be subject to capital gains tax imposed by those countries.
15
MFS Global Equity Series
Notes to Financial Statements – continued
Distributions to shareholders are recorded on theex-dividend date. Income and capital gain distributions are determined in accordance with income tax regulations, which may differ from U.S. generally accepted accounting principles. Certain capital accounts in the financial statements are periodically adjusted for permanent differences in order to reflect their tax character. These adjustments have no impact on net assets or net asset value per share. Temporary differences which arise from recognizing certain items of income, expense, gain or loss in different periods for financial statement and tax purposes will reverse at some time in the future.
Book/tax differences primarily relate to wash sale loss deferrals.
The tax character of distributions declared to shareholders for the last two fiscal years is as follows:
| | | | | | | | |
| | | Year ended
12/31/19 | | | Year ended
12/31/18 | |
| Ordinary income (including any short-term capital gains) | | | $712,018 | | | | $692,013 | |
| Long-term capital gains | | | 3,434,011 | | | | 2,427,027 | |
| Total distributions | | | $4,146,029 | | | | $3,119,040 | |
The federal tax cost and the tax basis components of distributable earnings were as follows:
| | | | |
| As of 12/31/19 | | | | |
| |
| Cost of investments | | | $31,602,836 | |
| Gross appreciation | | | 29,854,877 | |
| Gross depreciation | | | (402,620 | ) |
| Net unrealized appreciation (depreciation) | | | $29,452,257 | |
| |
| Undistributed ordinary income | | | 698,843 | |
| Undistributed long-term capital gain | | | 2,067,497 | |
| Other temporary differences | | | 90 | |
Multiple Classes of Shares of Beneficial Interest– The fund offers multiple classes of shares, which differ in their respective distribution and/or service fees. The fund’s income, realized and unrealized gain (loss), and common expenses are allocated to shareholders based on the daily net assets of each class. Dividends are declared separately for each class. Differences in per share dividend rates are generally due to differences in separate class expenses. The fund’s distributions declared to shareholders as reported in the Statements of Changes in Net Assets are presented by class as follows:
| | | | | | | | |
| | |
| | | Year ended
12/31/19 | | | Year ended
12/31/18 | |
| Initial Class | | | $3,413,794 | | | | $2,649,222 | |
| Service Class | | | 732,235 | | | | 469,818 | |
| Total | | | $4,146,029 | | | | $3,119,040 | |
| (3) | | Transactions with Affiliates |
Investment Adviser– The fund has an investment advisory agreement with MFS to provide overall investment management and related administrative services and facilities to the fund. The management fee is computed daily and paid monthly at the following annual rates based on the fund’s average daily net assets:
| | | | |
| Up to $1 billion | | | 0.90% | |
| In excess of $1 billion and up to $2.5 billion | | | 0.75% | |
| In excess of $2.5 billion | | | 0.65% | |
MFS has agreed in writing to reduce its management fee by a specified amount if certain MFS mutual fund assets exceed thresholds agreed to by MFS and the fund’s Board of Trustees. For the year ended December 31, 2019, this management fee reduction amounted to $5,550, which is included in the reduction of total expenses in the Statement of Operations. The management fee incurred for the year ended December 31, 2019 was equivalent to an annual effective rate of 0.89% of the fund’s average daily net assets.
For the period from January 1, 2019 through July 31, 2019, the investment adviser had agreed in writing to pay a portion of the fund’s total annual operating expenses, excluding interest, taxes, extraordinary expenses, brokerage and transaction costs, and investment-related expenses, such that total annual operating expenses did not exceed 0.97% of average daily net assets for the Initial Class shares and 1.22% of average daily net assets for the Service Class shares. This written agreement terminated on July 31, 2019. For the period from January 1, 2019 through July 31, 2019, this reduction amounted to $58,024, which is included in the reduction of total expenses in the Statement of Operations. Effective August 1, 2019, the investment adviser has agreed in writing to pay a portion of the fund’s total annual operating expenses, excluding interest, taxes, extraordinary expenses, brokerage and transaction costs, and investment-related expenses, such that total annual operating expenses do not exceed 0.92% of average
16
MFS Global Equity Series
Notes to Financial Statements – continued
daily net assets for the Initial Class shares and 1.17% of average daily net assets for the Service Class shares. This written agreement will continue until modified by the fund’s Board of Trustees, but such agreement will continue at least until April 30, 2021. For the period from August 1, 2019 through December 31, 2019, this reduction amounted to $53,594, which is included in the reduction of total expenses in the Statement of Operations.
Distributor– MFS Fund Distributors, Inc. (MFD), a wholly-owned subsidiary of MFS, is the distributor of shares of the fund. The Trustees have adopted a distribution plan for the Service Class shares pursuant to Rule12b-1 under the Investment Company Act of 1940.
The fund’s distribution plan provides that the fund will pay MFD distribution and/or service fees equal to 0.25% per annum of its average daily net assets attributable to Service Class shares as partial consideration for services performed and expenses incurred by MFD and financial intermediaries (including participating insurance companies that invest in the fund to fund variable annuity and variable life insurance contracts, sponsors of qualified retirement and pension plans that invest in the fund, and affiliates of these participating insurance companies and plan sponsors) in connection with the sale and distribution of the Service Class shares. MFD may subsequently pay all, or a portion, of the distribution and/or service fees to financial intermediaries.
Shareholder Servicing Agent– MFS Service Center, Inc. (MFSC), a wholly-owned subsidiary of MFS, receives a fee from the fund for its services as shareholder servicing agent. For the year ended December 31, 2019, the fee was $4,916, which equated to 0.0086% annually of the fund’s average daily net assets. MFSC also receives payment from the fund forout-of-pocket expenses paid by MFSC on behalf of the fund. For the year ended December 31, 2019, these costs amounted to $330.
Administrator– MFS provides certain financial, legal, shareholder communications, compliance, and other administrative services to the fund. Under an administrative services agreement, the fund reimburses MFS the costs incurred to provide these services. The fund is charged an annual fixed amount of $17,500 plus a fee based on average daily net assets. The administrative services fee incurred for the year ended December 31, 2019 was equivalent to an annual effective rate of 0.0323% of the fund’s average daily net assets.
Trustees’ and Officers’ Compensation– The fund pays compensation to independent Trustees in the form of a retainer, attendance fees, and additional compensation to Board and Committee chairpersons. The fund does not pay compensation directly to Trustees or officers of the fund who are also officers of the investment adviser, all of whom receive remuneration from MFS for their services to the fund. Certain officers and Trustees of the fund are officers or directors of MFS, MFD, and MFSC.
Other– This fund and certain other funds managed by MFS (the funds) had entered into a service agreement (the ISO Agreement) which provided for payment of fees solely by the funds to Tarantino LLC in return for the provision of services of an Independent Senior Officer (ISO) for the funds. Frank L. Tarantino served as the ISO and was an officer of the funds and the sole member of Tarantino LLC. Effective June 30, 2019, Mr. Tarantino retired from his position as ISO for the funds, and the ISO Agreement was terminated. For the year ended December 31, 2019, the fee paid by the fund under this agreement was $65 and is included in “Miscellaneous” expense in the Statement of Operations. MFS had agreed to bear all expenses associated with office space, other administrative support, and supplies provided to the ISO.
The fund invests in the MFS Institutional Money Market Portfolio which is managed by MFS and seeks current income consistent with preservation of capital and liquidity. This money market fund does not pay a management fee to MFS.
The fund is permitted to engage in purchase and sale transactions with funds and accounts for which MFS serves as investment adviser orsub-adviser (“cross-trades”) pursuant to a policy adopted by the Board of Trustees. This policy has been designed to ensure that cross-trades conducted by the fund comply with Rule17a-7 under the Investment Company Act of 1940. During the year ended December 31, 2019, the fund engaged in purchase and sale transactions pursuant to this policy, which amounted to $1,342 and $9,657, respectively. The sales transactions resulted in net realized gains (losses) of $2,015.
For the year ended December 31, 2019, purchases and sales of investments, other than short-term obligations, aggregated $6,052,825 and $11,464,206, respectively.
17
MFS Global Equity Series
Notes to Financial Statements – continued
| (5) | | Shares of Beneficial Interest |
The fund’s Declaration of Trust permits the Trustees to issue an unlimited number of full and fractional shares of beneficial interest. Transactions in fund shares were as follows:
| | | | | | | | | | | | | | | | |
| | | Year ended 12/31/19 | | | Year ended 12/31/18 | |
| | | | |
| | | Shares | | | Amount | | | Shares | | | Amount | |
| Shares sold | | | | | | | | | | | | | | | | |
Initial Class | | | 243,665 | | | | $5,233,272 | | | | 317,099 | | | | $6,565,809 | |
Service Class | | | 181,904 | | | | 3,932,099 | | | | 91,085 | | | | 1,943,172 | |
| | | 425,569 | | | | $9,165,371 | | | | 408,184 | | | | $8,508,981 | |
| | | | |
| Shares issued to shareholders in reinvestment of distributions | | | | | | | | | | | | | | | | |
Initial Class | | | 164,362 | | | | $3,413,794 | | | | 123,334 | | | | $2,649,222 | |
Service Class | | | 35,494 | | | | 732,235 | | | | 22,006 | | | | 469,818 | |
| | | 199,856 | | | | $4,146,029 | | | | 145,340 | | | | $3,119,040 | |
| | | | |
| Shares reacquired | | | | | | | | | | | | | | | | |
Initial Class | | | (626,155 | ) | | | $(13,215,661 | ) | | | (440,375 | ) | | | $(9,499,130 | ) |
Service Class | | | (98,818 | ) | | | (2,128,089 | ) | | | (196,025 | ) | | | (4,179,664 | ) |
| | | (724,973 | ) | | | $(15,343,750 | ) | | | (636,400 | ) | | | $(13,678,794 | ) |
| | | | |
| Net change | | | | | | | | | | | | | | | | |
Initial Class | | | (218,128 | ) | | | $(4,568,595 | ) | | | 58 | | | | $(284,099 | ) |
Service Class | | | 118,580 | | | | 2,536,245 | | | | (82,934 | ) | | | (1,766,674 | ) |
| | | (99,548 | ) | | | $(2,032,350 | ) | | | (82,876 | ) | | | $(2,050,773 | ) |
The fund and certain other funds managed by MFS participate in a $1.25 billion unsecured committed line of credit, subject to a $1 billion sublimit, provided by a syndicate of banks under a credit agreement. Borrowings may be made for temporary financing needs. Interest is charged to each fund, based on its borrowings, generally at a rate equal to the highest of one month LIBOR, the Federal Funds Effective Rate and the Overnight Bank Funding Rate, plus an agreed upon spread. A commitment fee, based on the average daily, unused portion of the committed line of credit, is allocated among the participating funds. In addition, the fund and other funds managed by MFS have established unsecured uncommitted borrowing arrangements with certain banks for temporary financing needs. Interest is charged to each fund, based on its borrowings, at rates equal to customary reference rates plus an agreed upon spread. For the year ended December 31, 2019, the fund’s commitment fee and interest expense were $309 and $0, respectively, and are included in “Miscellaneous” expense in the Statement of Operations.
| (7) | | Investments in Affiliated Issuers |
An affiliated issuer may be considered one in which the fund owns 5% or more of the outstanding voting securities, or a company which is under common control. For the purposes of this report, the following were affiliated issuers:
| | | | | | | | | | | | | | | | | | | | | | | | |
| Affiliated Issuers | | Beginning
Value | | | Purchases | | | Sales
Proceeds | | | Realized
Gain
(Loss) | | | Change in
Unrealized
Appreciation or
Depreciation | | | Ending
Value | |
| MFS Institutional Money Market Portfolio | | | $373,176 | | | | $11,494,373 | | | | $11,669,372 | | | | $82 | | | | $— | | | | $198,259 | |
| | | | | | |
| Affiliated Issuers | | | | | | | | | | | | | | Dividend
Income | | | Capital Gain
Distributions | |
| MFS Institutional Money Market Portfolio | | | | | | | | | | | | | | | | | | | $8,228 | | | | $— | |
18
MFS Global Equity Series
REPORT OF INDEPENDENT REGISTERED PUBLIC ACCOUNTING FIRM
To the Board of Trustees of MFS Variable Insurance Trust and the Shareholders of MFS Global Equity Series:
Opinion on the Financial Statements and Financial Highlights
We have audited the accompanying statement of assets and liabilities of MFS Global Equity Series (the “Fund”), including the portfolio of investments, as of December 31, 2019, the related statement of operations for the year then ended, the statements of changes in net assets for each of the two years in the period then ended, the financial highlights for each of the five years in the period then ended, and the related notes. In our opinion, the financial statements and financial highlights present fairly, in all material respects, the financial position of the Fund as of December 31, 2019, and the results of its operations for the year then ended, the changes in its net assets for each of the two years in the period then ended, and the financial highlights for each of the five years in the period then ended, in conformity with accounting principles generally accepted in the United States of America.
Basis for Opinion
These financial statements and financial highlights are the responsibility of the Fund’s management. Our responsibility is to express an opinion on the Fund’s financial statements and financial highlights based on our audits. We are a public accounting firm registered with the Public Company Accounting Oversight Board (United States) (PCAOB) and are required to be independent with respect to the Fund in accordance with the U.S. federal securities laws and the applicable rules and regulations of the Securities and Exchange Commission and the PCAOB.
We conducted our audits in accordance with the standards of the PCAOB. Those standards require that we plan and perform the audit to obtain reasonable assurance about whether the financial statements and financial highlights are free of material misstatement, whether due to error or fraud. The Fund is not required to have, nor were we engaged to perform, an audit of its internal control over financial reporting. As part of our audits we are required to obtain an understanding of internal control over financial reporting but not for the purpose of expressing an opinion on the effectiveness of the Fund’s internal control over financial reporting. Accordingly, we express no such opinion.
Our audits included performing procedures to assess the risks of material misstatement of the financial statements and financial highlights, whether due to error or fraud, and performing procedures that respond to those risks. Such procedures included examining, on a test basis, evidence regarding the amounts and disclosures in the financial statements and financial highlights. Our audits also included evaluating the accounting principles used and significant estimates made by management, as well as evaluating the overall presentation of the financial statements and financial highlights. Our procedures included confirmation of securities owned as of December 31, 2019, by correspondence with the custodian. We believe that our audits provide a reasonable basis for our opinion.
DELOITTE & TOUCHE LLP
Boston, Massachusetts
February 14, 2020
We have served as the auditor of one or more of the MFS investment companies since 1924.
19
MFS Global Equity Series
TRUSTEES AND OFFICERS – IDENTIFICATION AND BACKGROUND
The Trustees and Officers of the Trust, as of February 1, 2020, are listed below, together with their principal occupations during the past five years. (Their titles may have varied during that period.) The address of each Trustee and Officer is 111 Huntington Avenue, Boston, Massachusetts 02199-7618.
| | | | | | | | | | |
Name, Age | | Position(s)
Held with Fund | | Trustee/Officer
Since (h) | | Number of MFS Funds
overseen by the
Trustee | | Principal Occupations
During the Past Five Years | | Other Directorships During the Past Five Years (j) |
| INTERESTED TRUSTEES |
Robert J. Manning (k)
(age 56) | | Trustee | | February 2004 | | 133 | | Massachusetts Financial Services Company, Executive Chairman (since January 2017); Director; Chairman of the Board; Chief Executive Officer (until 2015);Co-Chief Executive Officer(2015-2016) | | N/A |
| | | | | |
Robin A. Stelmach (k) (age 58) | | Trustee | | January 2014 | | 133 | | Massachusetts Financial Services Company, Vice Chair (since January 2017); Chief Operating Officer and Executive Vice President (until January 2017) | | N/A |
|
| INDEPENDENT TRUSTEES |
John P. Kavanaugh (age 65) | | Trustee and Chair of Trustees | | January 2009 | | 133 | | Private investor | | N/A |
| | | | | |
Steven E. Buller (age 68) | | Trustee | | February 2014 | | 133 | | Financial Accounting Standards Advisory Council, Chairman(2014-2015); Public Company Accounting Oversight Board, Standing Advisory Group, Member (until 2014); BlackRock, Inc. (investment management), Managing Director (until 2014), BlackRock Finco UK (investment management), Director (until 2014) | | N/A |
| | | | | |
John A. Caroselli (age 65) | | Trustee | | March 2017 | | 133 | | JC Global Advisors, LLC (management consulting), President (since 2015); First Capital Corporation (commercial finance), Executive Vice President (until 2015) | | N/A |
| | | | | |
Maureen R. Goldfarb (age 64) | | Trustee | | January 2009 | | 133 | | Private investor | | N/A |
| | | | | |
Peter D. Jones
(age 64) | | Trustee | | January 2019 | | 133 | | Franklin Templeton Distributors, Inc. (investment management), President (until 2015); Franklin Templeton Institutional, LLC (investment management), Chairman (until 2015) | | N/A |
| | | | | |
James W. Kilman, Jr.
(age 58) | | Trustee | | January 2019 | | 133 | | Burford Capital Limited (finance and investment management), Chief Financial Officer (since 2019); KielStrand Capital LLC (family office), Chief Executive Officer (since 2016); Morgan Stanley & Co. (financial services), Vice Chairman of Investment Banking,Co-Head of Diversified Financials Coverage – Financial Institutions Investment Banking Group (until 2016) | | Alpha-En Corporation, Director (2016-2019) |
20
MFS Global Equity Series
Trustees and Officers – continued
| | | | | | | | | | |
Name, Age | | Position(s)
Held with Fund | | Trustee/Officer
Since (h) | | Number of MFS Funds
overseen by the
Trustee | | Principal Occupations
During the Past Five Years | | Other Directorships During the Past Five Years (j) |
Clarence Otis, Jr. (age 63) | | Trustee | | March 2017 | | 133 | | Darden Restaurants, Inc., Chief Executive Officer (until 2014) | | VF Corporation, Director; Verizon Communications, Inc., Director; The Travelers Companies, Director; Federal Reserve Bank of Atlanta, Director (until 2015) |
| | | | | |
Maryanne L. Roepke (age 63) | | Trustee | | May 2014 | | 133 | | American Century Investments (investment management), Senior Vice President and Chief Compliance Officer (until 2014) | | N/A |
| | | | | |
Laurie J. Thomsen
(age 62) | | Trustee | | March 2005 | | 133 | | Private investor | | The Travelers Companies, Director; Dycom Industries, Inc., Director (since 2015) |
| | | | | | | | |
Name, Age | | Position(s)
Held with Fund | | Trustee/Officer
Since (h) | | Number of
MFS Funds
for which the
Person is an
Officer | | Principal Occupations During the Past Five Years |
| OFFICERS | | | | | | |
Christopher R. Bohane (k)
(age 46) | | Assistant Secretary and Assistant Clerk | | July 2005 | | 133 | | Massachusetts Financial Services Company, Vice President and Assistant General Counsel |
| | | | |
Kino Clark (k) (age 51) | | Assistant Treasurer | | January 2012 | | 133 | | Massachusetts Financial Services Company, Vice President |
| | | | |
John W. Clark, Jr. (k) (age 52) | | Assistant Treasurer | | April 2017 | | 133 | | Massachusetts Financial Services Company, Vice President (since March 2017); Deutsche Bank (financial services), Department Head –Treasurer’s Office (until February 2017) |
| | | | |
Thomas H. Connors (k) (age 60) | | Assistant Secretary and Assistant Clerk | | September 2012 | | 133 | | Massachusetts Financial Services Company, Vice President and Senior Counsel |
| | | | |
David L. DiLorenzo (k)
(age 51) | | President | | July 2005 | | 133 | | Massachusetts Financial Services Company, Senior Vice President |
| | | | |
Heidi W. Hardin (k) (age 52) | | Secretary and Clerk | | April 2017 | | 133 | | Massachusetts Financial Services Company, Executive Vice President and General Counsel (since March 2017); Harris Associates (investment management), General Counsel (from September 2015 to January 2017); Janus Capital Management LLC (investment management), Senior Vice President and General Counsel (until September 2015) |
| | | | |
Brian E. Langenfeld (k) (age 46) | | Assistant
Secretary and Assistant Clerk | | June 2006 | | 133 | | Massachusetts Financial Services Company, Vice President and Senior Counsel |
| | | | |
Amanda S. Mooradian (k) (age 40) | | Assistant
Secretary and Assistant Clerk | | September 2018 | | 133 | | Massachusetts Financial Services Company, Assistant Vice President and Counsel |
| | | | |
Susan A. Pereira (k)
(age 49) | | Assistant
Secretary and Assistant Clerk | | July 2005 | | 133 | | Massachusetts Financial Services Company, Vice President and Assistant General Counsel |
| | | | |
Kasey L. Phillips (k) (age 49) | | Assistant Treasurer | | September 2012 | | 133 | | Massachusetts Financial Services Company, Vice President |
| | | | |
Matthew A. Stowe (k) (age 45) | | Assistant Secretary and Assistant Clerk | | October 2014 | | 133 | | Massachusetts Financial Services Company, Vice President and Assistant General Counsel |
21
MFS Global Equity Series
Trustees and Officers – continued
| | | | | | | | |
Name, Age | | Position(s)
Held with Fund | | Trustee/Officer
Since (h) | | Number of
MFS Funds
for which the
Person is an
Officer | | Principal Occupations During the Past Five Years |
Martin J. Wolin (k) (age 52) | | Chief Compliance Officer | | July 2015 | | 133 | | Massachusetts Financial Services Company, Senior Vice President and Chief Compliance Officer (since July 2015); Mercer (financial service provider), Chief Risk and Compliance Officer, North America and Latin America (until June 2015) |
| | | | |
James O. Yost (k)
(age 59) | | Treasurer | | September 1990 | | 133 | | Massachusetts Financial Services Company, Senior Vice President |
| (h) | Date first appointed to serve as Trustee/officer of an MFS Fund. Each Trustee has served continuously since appointment unless indicated otherwise. For the period from December 15, 2004 until February 22, 2005, Mr. Manning served as Advisory Trustee. From January 2012 through December 2016, Messrs. DiLorenzo and Yost served as Treasurer and Deputy Treasurer of the Funds, respectively. |
| (j) | Directorships or trusteeships of companies required to report to the Securities and Exchange Commission (i.e., “public companies”). |
| (k) | “Interested person” of the Trust within the meaning of the Investment Company Act of 1940 (referred to as the 1940 Act), which is the principal federal law governing investment companies like the fund, as a result of a position with MFS. The address of MFS is 111 Huntington Avenue, Boston, Massachusetts 02199-7618. |
Each Trustee (other than Messrs. Jones and Kilman) has been elected by shareholders and each Trustee and Officer holds office until his or her successor is chosen and qualified or until his or her earlier death, resignation, retirement or removal. Messrs. Jones and Kilman became Trustees of the Funds on January 1, 2019. The Trust does not hold annual meetings for the purpose of electing Trustees, and Trustees are not elected for fixed terms. Under the terms of the Board’s retirement policy, an Independent Trustee shall retire at the end of the calendar year in which he or she reaches the earlier of 75 years of age or 15 years of service on the Board (or, in the case of any Independent Trustee who joined the Board prior to 2015, 20 years of service on the Board).
Messrs. Buller, Kilman and Otis and Ms. Roepke are members of the Trust’s Audit Committee.
Each of the Interested Trustees and certain Officers hold comparable officer positions with certain affiliates of MFS.
The Statement of Additional Information for a Fund includes further information about the Trustees and is available without charge upon request by calling1-800-225-2606.
| | |
Investment Adviser Massachusetts Financial Services Company 111 Huntington Avenue Boston, MA 02199-7618 | | Custodian State Street Bank and Trust Company 1 Lincoln Street Boston, MA 02111-2900 |
| |
Distributor MFS Fund Distributors, Inc. 111 Huntington Avenue Boston, MA 02199-7618 | | Independent Registered Public Accounting Firm Deloitte & Touche LLP 200 Berkeley Street Boston, MA 02116 |
| |
Portfolio Manager(s) Ryan McAllister Roger Morley | | |
22
MFS Global Equity Series
BOARD REVIEW OF INVESTMENT ADVISORY AGREEMENT
MFS Global Equity Series
The Investment Company Act of 1940 requires that both the full Board of Trustees and a majority of thenon-interested (“independent”) Trustees, voting separately, annually approve the continuation of the Fund’s investment advisory agreement with MFS. The Trustees consider matters bearing on the Fund and its advisory arrangements at their meetings throughout the year, including a review of performance data at each regular meeting. In addition, the independent Trustees met several times over the course of three months beginning in May and ending in July, 2019 (“contract review meetings”) for the specific purpose of considering whether to approve the continuation of the investment advisory agreement for the Fund and the other investment companies that the Board oversees (the “MFS Funds”). The independent Trustees were assisted in their evaluation of the Fund’s investment advisory agreement by independent legal counsel, from whom they received separate legal advice and with whom they met separately from MFS during various contract review meetings. The independent Trustees were also assisted in this process by the MFS Funds’ Independent Senior Officer, a senior officer appointed by and reporting to the independent Trustees.
In connection with their deliberations regarding the continuation of the investment advisory agreement, the Trustees, including the independent Trustees, considered such information and factors as they believed, in light of the legal advice furnished to them and their own business judgment, to be relevant. The investment advisory agreement for the Fund was considered separately, although the Trustees also took into account the common interests of all MFS Funds in their review. As described below, the Trustees considered the nature, quality, and extent of the various investment advisory, administrative, and shareholder services performed by MFS under the existing investment advisory agreement and other arrangements with the Fund.
In connection with their contract review meetings, the Trustees received and relied upon materials that included, among other items: (i) information provided by Broadridge Financial Solutions, Inc. (“Broadridge”), an independent third party, on the investment performance of the Fund for various time periods ended December 31, 2018 and the investment performance of a group of funds with substantially similar investment classifications/objectives (the “Broadridge performance universe”), (ii) information provided by Broadridge on the Fund’s advisory fees and other expenses and the advisory fees and other expenses of comparable funds identified by Broadridge as well as all other funds in the same investment classification/category (the “Broadridge expense group and universe”), (iii) information provided by MFS on the advisory fees of portfolios of other clients of MFS, including institutional separate accounts and other clients, (iv) information as to whether and to what extent applicable expense waivers, reimbursements or fee “breakpoints” are observed for the Fund, (v) information regarding MFS’ financial results and financial condition, including MFS’ and certain of its affiliates’ estimated profitability from services performed for the Fund and the MFS Funds as a whole, and compared to MFS’ institutional business, (vi) MFS’ views regarding the outlook for the mutual fund industry and the strategic business plans of MFS, (vii) descriptions of various functions performed by MFS for the Funds, such as compliance monitoring and portfolio trading practices, and (viii) information regarding the overall organization of MFS, including information about MFS’ senior management and other personnel providing investment advisory, administrative and other services to the Fund and the other MFS Funds. The comparative performance, fee and expense information prepared and provided by Broadridge was not independently verified and the independent Trustees did not independently verify any information provided to them by MFS.
The Trustees’ conclusion as to the continuation of the investment advisory agreement was based on a comprehensive consideration of all information provided to the Trustees and not the result of any single factor. Some of the factors that figured particularly in the Trustees’ deliberations are described below, although individual Trustees may have evaluated the information presented differently from one another, giving different weights to various factors. It is also important to recognize that the fee arrangements for the Fund and other MFS Funds are the result of years of review and discussion between the independent Trustees and MFS, that certain aspects of such arrangements may receive greater scrutiny in some years than in others, and that the Trustees’ conclusions may be based, in part, on their consideration of these same arrangements during the course of the year and in prior years.
Based on information provided by Broadridge and MFS, the Trustees reviewed the Fund’s total return investment performance as well as the Broadridge performance universe over various time periods. The Trustees placed particular emphasis on the total return performance of the Fund’s Initial Class shares in comparison to the performance of funds in its Broadridge performance universe over the five-year period ended December 31, 2018, which the Trustees believed was a long enough period to reflect differing market conditions. The total return performance of the Fund’s Initial Class shares was in the 4th quintile relative to the other funds in the universe for this five-year period (the 1st quintile being the best performers and the 5th quintile being the worst performers). The total return performance of the Fund’s Initial Class shares was in the 4th quintile for theone-year period and the 3rd quintile for the three-year period ended December 31, 2018 relative to the Broadridge performance universe. Because of the passage of time, these performance results may differ from the performance results for more recent periods, including those shown elsewhere in this report.
In the course of their deliberations, the Trustees took into account information provided by MFS in connection with the contract review meetings, as well as during investment review meetings conducted with portfolio management personnel during the course of the year regarding the Fund’s performance. The Trustees noted that the total return performance (Class A shares) of the Fund’s retail counterpart MFS Global Equity Fund, which has substantially similar investment strategies, was in the 2nd quintile relative to
23
MFS Global Equity Series
Board Review of Investment Advisory Agreement – continued
the other Funds in its Broadridge performance universe for the five-year period ended December 31, 2018. After reviewing these and related factors, the Trustees concluded, within the context of their overall conclusions regarding the investment advisory agreement, that they were satisfied with MFS’ responses and efforts relating to investment performance.
In assessing the reasonableness of the Fund’s advisory fee, the Trustees considered, among other information, the Fund’s advisory fee and the total expense ratio of the Fund’s Initial Class shares as a percentage of average daily net assets and the advisory fee and total expense ratios of the Broadridge expense group based on information provided by Broadridge. The Trustees considered that MFS currently observes an expense limitation for the Fund, which may not be changed without the Trustees’ approval. The Trustees also considered that, according to the data provided by Broadridge (which takes into account any fee reductions or expense limitations that were in effect during the Fund’s last fiscal year), the Fund’s effective advisory fee rate and total expense ratio were each higher than the Broadridge expense group median. The Trustees also noted that MFS has agreed to further reduce such expense limitation for the Fund effective August 1, 2019, which may not be changed without the Trustees’ approval.
The Trustees also considered the advisory fees charged by MFS to any institutional separate accounts advised by MFS (“separate accounts”) and unaffiliated investment companies for which MFS serves as subadviser (“subadvised funds”) that have comparable investment strategies to the Fund, if any. In comparing these fees, the Trustees considered information provided by MFS as to the generally broader scope of services provided by MFS to the Fund, as well as the more extensive regulatory burdens imposed on MFS in managing the Fund, in comparison to separate accounts and subadvised funds. The Trustees also considered the higher demands placed on MFS’ investment personnel and trading infrastructure as a result of the daily cashin-flows andout-flows of the Fund in comparison to separate accounts.
The Trustees also considered whether the Fund may benefit from any economies of scale in the management of the Fund in the event of growth in assets of the Fund and/or growth in assets of the MFS Funds as a whole. They noted that the Fund’s advisory fee rate schedule is subject to contractual breakpoints that reduce the Fund’s advisory fee rate on average daily net assets over $1 billion and $2.5 billion. The Trustees also noted that MFS has agreed in writing to waive a portion of the management fees of certain MFS Funds, including the Fund, if the total combined assets of certain funds within the MFS Funds’ complex increase above agreed upon thresholds (the “group fee waiver”), enabling the Fund’s shareholders to share in the benefits from any economies of scale at the complex level. The group fee waiver is reviewed and renewed annually between the Board and MFS. The Trustees concluded that the breakpoints and the group fee waiver were sufficient to allow the Fund to benefit from economies of scale as its assets and overall complex assets grow.
The Trustees also considered information prepared by MFS relating to MFS’ costs and profits with respect to the Fund, the MFS Funds considered as a group, and other investment companies and accounts advised by MFS, as well as MFS’ methodologies used to determine and allocate its costs to the MFS Funds, the Fund and other accounts and products for purposes of estimating profitability.
After reviewing these and other factors described herein, the Trustees concluded, within the context of their overall conclusions regarding the investment advisory agreement, that the advisory fees charged to the Fund represent reasonable compensation in light of the services being provided by MFS to the Fund.
In addition, the Trustees considered MFS’ resources and related efforts to continue to retain, attract and motivate capable personnel to serve the Fund. The Trustees also considered current and developing conditions in the financial services industry, including the presence of large and well-capitalized companies which are spending, and appear to be prepared to continue to spend, substantial sums to engage personnel and to provide services to competing investment companies. In this regard, the Trustees also considered the financial resources of MFS and its ultimate parent, Sun Life Financial Inc. The Trustees also considered the advantages and possible disadvantages to the Fund of having an adviser that also serves other investment companies as well as other accounts.
The Trustees also considered the nature, quality, cost, and extent of administrative, transfer agency, and distribution services provided to the Fund by MFS and its affiliates under agreements and plans other than the investment advisory agreement, including any12b-1 fees the Fund pays to MFS Fund Distributors, Inc., an affiliate of MFS. The Trustees also considered the nature, extent and quality of certain other services MFS performs or arranges for on the Fund’s behalf, which may include securities lending programs, directed expense payment programs, class action recovery programs, and MFS’ interaction with third-party service providers, principally custodians andsub-custodians. The Trustees concluded that the variousnon-advisory services provided by MFS and its affiliates on behalf of the Fund were satisfactory.
The Trustees consideredso-called“fall-out benefits” to MFS such as reputational value derived from serving as investment manager to the MFS Funds. The Trustees also considered that, effective January 3, 2018, MFS had discontinued its historic practice of obtaining investment research from portfolio brokerage commissions paid by certain MFS Funds and would thereafter directly pay for or voluntarily reimburse a Fund, if applicable, for the costs of external research acquired through the use of the Fund’s portfolio brokerage commissions.
Based on their evaluation of factors that they deemed to be material, including those factors described above, the Board of Trustees, including the independent Trustees, concluded that the Fund’s investment advisory agreement with MFS should be continued for an additionalone-year period, commencing August 1, 2019.
24
MFS Global Equity Series
PROXY VOTING POLICIES AND INFORMATION
MFS votes proxies on behalf of the fund pursuant to proxy voting policies and procedures that are available without charge, upon request, by calling 1-800-225-2606, by visitingmfs.com/proxyvoting, or by visiting the SEC’s Web site athttp://www.sec.gov.
Information regarding how the fund voted proxies relating to portfolio securities during the most recent twelve-month period ended June 30 is available by August 31 of each year without charge by visitingmfs.com/proxyvoting, or by visiting the SEC’s Web site athttp://www.sec.gov.
QUARTERLY PORTFOLIO DISCLOSURE
The fund files a complete schedule of portfolio holdings with the SEC for the first and third quarters of each fiscal year as an exhibit to its reports on Form N-PORT. The fund’s Form N-PORT reports are available on the SEC’s website athttp://www.sec.gov. A shareholder can obtain the portfolio holdings report for the first and third quarters of the fund’s fiscal year atmfs.com/vit1 by choosing the fund’s name and then selecting the “Resources” tab and clicking on “Prospectus and Reports”.
FURTHER INFORMATION
From time to time, MFS may post important information about the fund or the MFS funds on the MFS web site (mfs.com). This information is available at https://www.mfs.com/en-us/what-we-do/announcements.html or atmfs.com/vit1 by choosing the fund’s name.
INFORMATION ABOUT FUND CONTRACTS AND LEGAL CLAIMS
The fund has entered into contractual arrangements with an investment adviser, administrator, distributor, shareholder servicing agent, 529 program manager (if applicable), and custodian who each provide services to the fund. Unless expressly stated otherwise, shareholders are not parties to, or intended beneficiaries of these contractual arrangements, and these contractual arrangements are not intended to create any shareholder right to enforce them against the service providers or to seek any remedy under them against the service providers, either directly or on behalf of the fund.
Under the Trust’s By-Laws and Declaration of Trust, any claims asserted against or on behalf of the MFS Funds, including claims against Trustees and Officers, must be brought in state and federal courts located within the Commonwealth of Massachusetts.
FEDERAL TAX INFORMATION (unaudited)
The following information is provided pursuant to provisions of the Internal Revenue Code.
The fund designates $3,778,000 as capital gain dividends paid during the fiscal year.
For corporate shareholders, 66.96% of the ordinary income dividends paid during the fiscal year qualify for the corporate dividends received deduction.
Income derived from foreign sources was $849,578. The fund intends to pass through foreign tax credits of $71,323 for the fiscal year.
25
rev. 3/16
| | | | |
| | | |
| FACTS | | WHAT DOES MFS DO WITH YOUR
PERSONAL INFORMATION? | |  |
| | |
| Why? | | Financial companies choose how they share your personal information. Federal law gives consumers the right to limit some but not all sharing. Federal law also requires us to tell you how we collect, share, and protect your personal information. Please read this notice carefully to understand what we do. |
| | |
| What? | | The types of personal information we collect and share depend on the product or service you have with us. This information can include: • Social Security number and account balances • Account transactions and transaction history • Checking account information and wire transfer instructions When you areno longer our customer, we continue to share your information as described in this notice. |
| | |
| How? | | All financial companies need to share customers’ personal information to run their everyday business. In the section below, we list the reasons financial companies can share their customers’ personal information; the reasons MFS chooses to share; and whether you can limit this sharing. |
| | | | |
Reasons we can share your
personal information | | Does MFS share? | | Can you limit this
sharing? |
For our everyday business purposes – such as to process your transactions, maintain your account(s), respond to court orders and legal investigations, or report to credit bureaus | | Yes | | No |
For our marketing purposes – to offer our products and services to you | | No | | We don’t share |
| For joint marketing with other financial companies | | No | | We don’t share |
For our affiliates’ everyday business purposes – information about your transactions and experiences | | No | | We don’t share |
For our affiliates’ everyday business purposes – information about your creditworthiness | | No | | We don’t share |
| For nonaffiliates to market to you | | No | | We don’t share |
| | |
| | |
| Questions? | | Call800-225-2606 or go tomfs.com. |
26
| | |
| Who we are |
| Who is providing this notice? | | MFS Funds, MFS Investment Management, MFS Institutional Advisors, Inc., and MFS Heritage Trust Company. |
| | |
| What we do |
| How does MFS protect my personal information? | | To protect your personal information from unauthorized access and use, we use security measures that comply with federal law. These measures include procedural, electronic, and physical safeguards for the protection of the personal information we collect about you. |
How does MFS
collect my personal information? | | We collect your personal information, for example, when you • open an account or provide account information • direct us to buy securities or direct us to sell your securities • make a wire transfer We also collect your personal information from others, such as credit bureaus, affiliates, or other companies. |
| Why can’t I limit all sharing? | | Federal law gives you the right to limit only • sharing for affiliates’ everyday business purposes – information about your creditworthiness • affiliates from using your information to market to you • sharing for nonaffiliates to market to you State laws and individual companies may give you additional rights to limit sharing. |
| | |
| Definitions |
| Affiliates | | Companies related by common ownership or control. They can be financial and nonfinancial companies. • MFS does not share personal information with affiliates, except for everyday business purposes as described on page one of this notice. |
| Nonaffiliates | | Companies not related by common ownership or control. They can be financial and nonfinancial companies. • MFS does not share with nonaffiliates so they can market to you. |
| Joint marketing | | A formal agreement between nonaffiliated financial companies that together market financial products or services to you. • MFS doesn’t jointly market. |
| | |
| Other important information |
| If you own an MFS product or receive an MFS service in the name of a third party such as a bank or broker-dealer, their privacy policy may apply to you instead of ours. |
27
Annual Report
December 31, 2019

MFS® Growth Series

MFS® Variable Insurance Trust
Beginning on January 1, 2021, as permitted by regulations adopted by the U.S. Securities and Exchange Commission, the insurance company that offers your contract may determine that it will no longer send you paper copies of the fund’s annual and semiannual shareholder reports unless you specifically request paper copies from the insurance company or from your financial intermediary. Instead, the shareholder reports will be made available on a Web site (insurancefunds.mfs.com or other Web site of which you will be notified), and the insurance company will notify you by mail each time a report is posted and provide you with a Web site link to access the report. Instructions for requesting paper copies will be provided by your insurance company or financial intermediary.
If you already elected to receive shareholder reports by email, you will not be affected by this change and you need not take any action. If your insurance company or financial intermediary offers electronic delivery, you may elect to receive shareholder reports and other communications from the insurance company or financial intermediary by email by following the instructions provided by the insurance company or financial intermediary.
Beginning on January 1, 2019, you may elect to receive all future reports in paper free of charge from the insurance company or financial intermediary. You can inform the insurance company or financial intermediary that you wish to continue receiving paper copies of your shareholder reports by contacting your insurance company or financial intermediary. Your election to receive reports in paper will apply to all funds held in your account with your insurance company or financial intermediary.
VEG-ANN
MFS® Growth Series
CONTENTS
The report is prepared for the general information of contract owners. It is authorized for distribution to prospective investors only when preceded or accompanied by a current prospectus.
NOT FDIC INSURED• MAY LOSE VALUE• NO BANK OR CREDIT UNION GUARANTEE• NOT A DEPOSIT• NOT INSURED BY ANY FEDERAL GOVERNMENT AGENCY OR NCUA/NCUSIF
MFS Growth Series
LETTER FROM THE EXECUTIVE CHAIR

Dear Contract Owners:
Slowing global growth, low inflation, and trade friction between the United States and China have been hallmarks of the past 12 months. After experiencing an uptick in market volatility in late 2018, markets steadied for most of 2019, thanks in large measure to the adoption of a dovish policy stance on the part of global central banks, focused on supporting economic growth. Negotiations aimed at a “phase one” trade deal between the U.S. and China bore fruit at the end of the period, boosting investor sentiment, while signs of stability emerging from the global manufacturing sector also lifted spirits. Uncertainty over Brexit, along with the ripple effects from the trade conflict, hampered business confidence and investment in the United Kingdom and Europe for much of the period, though investors expect greater clarity regarding Brexit as a result of December’s general election. The pro-Brexit Conservative Party won the election by a comfortable margin and set the stage for the U.K.’s departure from the EU at the end of January.
Markets expect the longest economic expansion in U.S. history will continue, albeit at a slower pace, as trade tensions recede. In an effort to prolong the expansion, the U.S. Federal Reserve lowered interest rates three times between July and October and the European Central Bank loosened policy in September. While the global monetary policy backdrop remains quite accommodative, signs of easing trade tensions and fading global recession fears led to improved market sentiment in late 2019 as investors grew less risk averse. In early 2020, an outbreak of coronavirus emanating from China reintroduced global growth fears, causing an uptick in volatility.
Here at MFS®, we aim to help our clients navigate the growing complexity of the markets and world economies. Our long-term investment philosophy and commitment to the responsible allocation of capital allow us to tune out the noise and uncover what we believe are the best, most durable investment opportunities in the market. Through our powerful global investment platform, we combine collective expertise, thoughtful risk management and long-term discipline to create sustainable value for investors.
Respectfully,

Robert J. Manning
Executive Chair
MFS Investment Management
February 14, 2020
The opinions expressed in this letter are subject to change and may not be relied upon for investment advice. No forecasts can be guaranteed.
1
MFS Growth Series
PORTFOLIO COMPOSITION
Portfolio structure

| | | | |
| Top ten holdings | | | | |
| Microsoft Corp. | | | 8.1% | |
| Amazon.com, Inc. | | | 5.5% | |
| Visa, Inc., “A” | | | 4.9% | |
| Adobe Systems, Inc. | | | 4.5% | |
| Mastercard, Inc., “A” | | | 4.3% | |
| Alphabet, Inc., “A” | | | 4.1% | |
| Thermo Fisher Scientific, Inc. | | | 2.8% | |
| Facebook, Inc., “A” | | | 2.6% | |
| Fiserv, Inc. | | | 2.6% | |
| Global Payments, Inc. | | | 2.4% | |
| | | | |
| GICS equity sectors (g) | | | | |
| Information Technology | | | 39.0% | |
| Communication Services | | | 14.0% | |
| Health Care | | | 13.6% | |
| Consumer Discretionary | | | 12.3% | |
| Industrials | | | 7.5% | |
| Financials | | | 3.9% | |
| Consumer Staples | | | 3.4% | |
| Materials | | | 3.2% | |
| Real Estate | | | 1.6% | |
| Energy | | | 0.3% | |
| (g) | The Global Industry Classification Standard (GICS®) was developed by and/or is the exclusive property of MSCI, Inc. and S&P Global Market Intelligence Inc. (“S&P Global Market Intelligence”). GICS is a service mark of MSCI and S&P Global Market Intelligence and has been licensed for use by MFS. |
Cash & Cash Equivalents includes any cash, investments in money market funds, short-term securities, and other assets less liabilities. Please see the Statement of Assets and Liabilities for additional information related to the fund’s cash position and other assets and liabilities.
Percentages are based on net assets as of December 31, 2019.
The portfolio is actively managed and current holdings may be different.
2
MFS Growth Series
MANAGEMENT REVIEW
Summary of Results
For the twelve months ended December 31, 2019, Initial Class shares of the MFS Growth Series (fund) provided a total return of 38.15%, while Service Class shares of the fund provided a total return of 37.78%. These compare with a return of 36.39% over the same period for the fund’s benchmark, the Russell 1000® Growth Index.
Market Environment
Fading fears of a near-term global recession, the announcement of a partial trade deal between the United States and China and the decline in uncertainty over Brexit helped bolster market sentiment late in the period. Changes in market sentiment, largely driven by uncertainty over the outcome of trade negotiations between the US and China, had contributed to periodic bouts of volatility during the reporting period. The global economy decelerated, led by weakness in China and Europe, although the pace of the slowdown moderated late in the period amid nascent signs of stabilization in the manufacturing sector.
The deteriorating global growth backdrop, along with declining inflationary pressures, prompted the US Federal Reserve to adopt a more dovish posture beginning in early 2019, resulting in the first interest rate cut in over a decade at the end of July, followed by additional cuts in September and October. The Fed’s actions led to a sharp decline in long-term interest rates during the period’s second half, causing the inversion of portions of the US Treasury yield curve for a time. Amid an improvement in risk sentiment in Q4 2019 and indications of a bottoming in growth and a potential upturn in activity, the Fed indicated in October that further rate cuts were unlikely unless the outlook for the economy materially worsened.
Globally, central banks have tilted more dovish as well, with the European Central Bank unveiling a package of easing measures, which included putting overnight rates deeper into negative territory, restarting its bond-buying program and lengthening the term of cheap loans to banks to three years from two. The central banks of India and Australia are among those that have cut rates several times in recent months, although China has been more cautious in increasing liquidity as it keeps trying to deleverage its economy, cutting rates only marginally.
Emerging markets experienced considerable volatility through the end of 2018, as tighter global financial conditions exposed structural weakness in some countries. Those conditions improved in 2019 as the Fed became more dovish. Notwithstanding the periodic headwinds on market sentiment from significant trade friction between the US and China over much of the year, emerging market hard currency debt and local rates benefited from relatively cheap valuations at the beginning of the period and easier global monetary conditions. These factors, plus the fading of certain global risk factors mentioned above, hastened spread tightening in the latter part of the period. At the same time, idiosyncratic risks spiked in some countries (e.g., Argentina and Lebanon), contributing to increased dispersion in performance among sovereign assets.
Contributors to Performance
Stock selection in thehealth care sector contributed to performance relative to the Russell 1000® Growth Index. Within this sector, not holding shares of pharmaceutical company Abbvie and health insurance and Medicare/Medicaid provider UnitedHealth Group benefited relative returns as both stocks underperformed the benchmark during the reporting period. Abbvie’s stock price ended the period relatively unchanged, as sales of the company’s arthritis drug Humira were sluggish and investors appeared to have reacted unfavorably to themid-period announcement that the company would acquire Allergan for $63 billion.
Security selection and, to a lesser extent, underweight positions in both theindustrials andconsumer discretionary sectors further lifted relative results. Within theindustrials sector, not holding shares of aerospace company Boeing and diversified technology company 3M aided relative performance as both stocks underperformed the benchmark. The stock price of Boeing came under pressure as the company worked to respond to safety concerns that grounded its 737 Max airliner globally. Althoughconsumer discretionary was one of the highest-contributing sectors, there were no individual stocks within the sector that were among the fund’s strongest relative contributors during the reporting period.
Stocks in other sectors that also strengthened relative returns included not holding shares of poor-performing network equipment company Cisco Systems, and the fund’s overweight positions in debit and credit transaction processing company Mastercard, electronic payment services company Global Payments, financial technology services provider Fiserv, payments processing technology and solutions provider Worldpay (h) and software company Adobe Systems.
Detractors from Performance
Stock selection in both theinformation technology andcommunication services sectors weakened the fund’s relative performance. Within theinformation technology sector, an underweight position in computer and personal electronics maker Apple, and an overweight position in Salesforce.com, detracted from relative returns. The timing of the fund’s underweight position in shares of computer graphics processors maker NVIDIA (h), and not holding shares of global semiconductor company Advanced Micro Devices, also held back relative returns as both stocks outperformed the benchmark. The stock price of Apple advanced during the reporting
3
MFS Growth Series
Management Review – continued
period as the company’s revenues came in higher than anticipated, driven by stronger-than-expected demand in its wearable technology and services segments. Within thecommunication services sector, the timing of the fund’s overweight position in gaming company Activision Blizzard (h), and its overweight position in shares of technology company Alphabet, also hindered relative results.
Elsewhere, the fund’s overweight positions in global consumer products company Colgate-Palmolive, futures and OTC commodities online marketplace operator Intercontinental Exchange and discount variety store operator Dollar Tree detracted from relative returns as all three stocks lagged the benchmark.
The fund’s cash and/or cash equivalents position during the period was also a detractor from relative performance. Under normal market conditions, the fund strives to be fully invested and generally holds cash to buy new holdings and to provide liquidity. In a period when equity markets rose, as measured by the fund’s benchmark, holding cash hurt performance versus the benchmark, which has no cash position.
Respectfully,
Portfolio Manager(s)
Eric Fischman and Paul Gordon
| (h) | Security was not held in the portfolio at period end. |
The views expressed in this report are those of the portfolio manager(s) only through the end of the period of the report as stated on the cover and do not necessarily reflect the views of MFS or any other person in the MFS organization. These views are subject to change at any time based on market or other conditions, and MFS disclaims any responsibility to update such views. These views may not be relied upon as investment advice or an indication of trading intent on behalf of any MFS portfolio. References to specific securities are not recommendations of such securities, and may not be representative of any MFS portfolio’s current or future investments.
4
MFS Growth Series
PERFORMANCE SUMMARY THROUGH 12/31/19
The following chart illustrates the historical performance of the fund in comparison to its benchmark(s). Benchmarks are unmanaged and may not be invested in directly. Benchmark returns do not reflect any fees or expenses. The performance of other share classes will be greater than or less than that of the class depicted below. (See Notes to Performance Summary.)
Performance data shown represents past performance and is no guarantee of future results. Investment return and principal value fluctuate so your units, when sold, may be worth more or less than the original cost; current performance may be lower or higher than quoted. The performance shown does not reflect the deduction of taxes, if any, that a contract holder would pay on fund distributions or the redemption of contract units. The returns for the fund shown also do not reflect the deduction of expenses associated with variable products, such as mortality and expense risk charges, separate account charges, and sales charges imposed by the insurance company separate accounts. Such expenses would reduce the overall returns shown.
Growth of a Hypothetical $10,000 Investment

Total Returns through 12/31/19
Average annual total returns
| | | | | | | | | | | | |
| | | Share Class | | Class Inception Date | | 1-yr | | 5-yr | | 10-yr | | |
| | | Initial Class | | 7/24/95 | | 38.15% | | 15.48% | | 15.24% | | |
| | | Service Class | | 5/01/00 | | 37.78% | | 15.19% | | 14.95% | | |
| | | | |
| Comparative benchmark(s) | | | | | | | | |
| | | Russell 1000® Growth Index (f) | | 36.39% | | 14.63% | | 15.22% | | |
| (f) | Source: FactSet Research Systems Inc. |
Benchmark Definition(s)
Russell 1000® Growth Index – constructed to provide a comprehensive barometer for growth securities in the large-cap segment of the U.S. equity universe. Companies in this index generally have higher price-to-book ratios and higher forecasted growth values. Frank Russell Company (“Russell”) is the source and owner of the trademarks, service marks, and copyrights related to the Russell Indexes. Russell® is a trademark of Frank Russell Company. Neither Russell nor its licensors accept any liability for any errors or omissions in the Russell Indexes and/or Russell ratings or underlying data and no party may rely on any Russell Indexes and/or Russell ratings and/or underlying data contained in this document. No further distribution of Russell Data is permitted without Russell’s express written consent. Russell does not promote, sponsor, or endorse the content of this document.
It is not possible to invest directly in an index.
Notes to Performance Summary
Average annual total return represents the average annual change in value for each share class for the periods presented.
Performance results reflect any applicable expense subsidies and waivers in effect during the periods shown. Without such subsidies and waivers the fund’s performance results would be less favorable. Please see the prospectus and financial statements for complete details. All results are historical and assume the reinvestment of any dividends and capital gains distributions.
Performance results do not include adjustments made for financial reporting purposes in accordance with U.S. generally accepted accounting principles and may differ from amounts reported in the financial highlights.
From time to time the fund may receive proceeds from litigation settlements, without which performance would be lower.
5
MFS Growth Series
EXPENSE TABLE
Fund Expenses Borne by the Contract Holders during the Period,
July 1, 2019 through December 31, 2019
As a contract holder of the fund, you incur ongoing costs, including management fees; distribution and/or service(12b-1) fees; and other fund expenses. This example is intended to help you understand your ongoing costs (in dollars) of investing in the fund and to compare these costs with the ongoing costs of investing in other mutual funds.
The example is based on an investment of $1,000 invested at the beginning of the period and held for the entire period July 1, 2019 through December 31, 2019.
Actual Expenses
The first line for each share class in the following table provides information about actual account values and actual expenses. You may use the information in this line, together with the amount you invested, to estimate the expenses that you paid over the period. Simply divide your account value by $1,000 (for example, an $8,600 account value divided by $1,000 = 8.6), then multiply the result by the number in the first line under the heading entitled “Expenses Paid During Period” to estimate the expenses you paid on your account during this period.
Hypothetical Example for Comparison Purposes
The second line for each share class in the following table provides information about hypothetical account values and hypothetical expenses based on the fund’s actual expense ratio and an assumed rate of return of 5% per year before expenses, which is not the fund’s actual return. The hypothetical account values and expenses may not be used to estimate the actual ending account balance or expenses you paid for the period. You may use this information to compare the ongoing costs of investing in the fund and other funds. To do so, compare this 5% hypothetical example with the 5% hypothetical examples that appear in the shareholder reports of the other funds.
Please note that the expenses shown in the table are meant to highlight the fund’s ongoing costs only and do not take into account the fees and expenses imposed under the variable contracts through which your investment in the fund is made. Therefore, the second line for each share class in the table is useful in comparing ongoing costs associated with an investment in vehicles (such as the fund) which fund benefits under variable annuity and variable life insurance contracts and to qualified pension and retirement plans only, and will not help you determine the relative total costs of investing in the fund through variable annuity and variable life insurance contracts. If the fees and expenses imposed under the variable contracts were included, your costs would have been higher.
| | | | | | | | | | | | | | | | | | |
| Share Class | | | | Annualized
Expense Ratio | | | Beginning
Account Value
7/01/19 | | | Ending Account Value 12/31/19 | | | Expenses Paid During Period (p) 7/01/19-12/31/19 | |
| Initial Class | | Actual | | | 0.73% | | | | $1,000.00 | | | | $1,098.14 | | | | $3.86 | |
| | Hypothetical (h) | | | 0.73% | | | | $1,000.00 | | | | $1,021.53 | | | | $3.72 | |
| Service Class | | Actual | | | 0.98% | | | | $1,000.00 | | | | $1,096.51 | | | | $5.18 | |
| | Hypothetical (h) | | | 0.98% | | | | $1,000.00 | | | | $1,020.27 | | | | $4.99 | |
| (h) | 5% class return per year before expenses. |
| (p) | “Expenses Paid During Period” are equal to each class’s annualized expense ratio, as shown above, multiplied by the average account value over the period, multiplied by 184/365 (to reflect theone-half year period). |
6
MFS Growth Series
PORTFOLIO OF INVESTMENTS – 12/31/19
The Portfolio of Investments is a complete list of all securities owned by your fund. It is categorized by broad-based asset classes.
| | | | | | | | |
| | |
| Issuer | | Shares/Par | | | Value ($) | |
| COMMON STOCKS – 98.8% | | | | | | | | |
| Alcoholic Beverages – 0.7% | | | | | |
| Constellation Brands, Inc., “A” | | | 49,206 | | | $ | 9,336,839 | |
| Pernod Ricard S.A. | | | 22,751 | | | | 4,067,855 | |
| | | | | | | | |
| | | | | | $ | 13,404,694 | |
| | | | | | | | |
| Apparel Manufacturers – 1.2% | | | | | |
| NIKE, Inc., “B” | | | 214,757 | | | $ | 21,757,032 | |
| | | | | | | | |
| Biotechnology – 1.2% | | | | | |
| Illumina, Inc. (a) | | | 29,196 | | | $ | 9,685,481 | |
| Vertex Pharmaceuticals, Inc. (a) | | | 58,582 | | | | 12,826,529 | |
| | | | | | | | |
| | | | | | $ | 22,512,010 | |
| | | | | | | | |
| Broadcasting – 1.6% | | | | | |
| Netflix, Inc. (a) | | | 93,195 | | | $ | 30,155,106 | |
| | | | | | | | |
| Brokerage & Asset Managers – 1.0% | | | | | |
| Intercontinental Exchange, Inc. | | | 197,474 | | | $ | 18,276,219 | |
| | | | | | | | |
| Business Services – 13.0% | | | | | |
| Clarivate Analytics PLC (a) | | | 60,921 | | | $ | 1,023,473 | |
| CoStar Group, Inc. (a) | | | 9,414 | | | | 5,632,396 | |
| Equifax, Inc. | | | 19,843 | | | | 2,780,401 | |
| Fidelity National Information Services, Inc. | | | 268,799 | | | | 37,387,253 | |
| Fiserv, Inc. (a) | | | 415,768 | | | | 48,075,254 | |
| FleetCor Technologies, Inc. (a) | | | 67,527 | | | | 19,428,868 | |
| Global Payments, Inc. | | | 242,785 | | | | 44,322,830 | |
| MSCI, Inc. | | | 91,666 | | | | 23,666,328 | |
| PayPal Holdings, Inc. (a) | | | 175,271 | | | | 18,959,064 | |
| TransUnion | | | 134,443 | | | | 11,509,665 | |
| Verisk Analytics, Inc., “A” | | | 199,340 | | | | 29,769,436 | |
| | | | | | | | |
| | | | | | $ | 242,554,968 | |
| | | | | | | | |
| Cable TV – 1.9% | | | | | |
| Charter Communications, Inc., “A” (a) | | | 57,029 | | | $ | 27,663,627 | |
| Comcast Corp., “A” | | | 175,274 | | | | 7,882,072 | |
| | | | | | | | |
| | | | | | $ | 35,545,699 | |
| | | | | | | | |
| Computer Software – 16.8% | | | | | |
| Adobe Systems, Inc. (a) | | | 256,719 | | | $ | 84,668,493 | |
| Black Knight, Inc. (a) | | | 64,552 | | | | 4,162,313 | |
| Cadence Design Systems, Inc. (a) | | | 38,966 | | | | 2,702,682 | |
| Intuit, Inc. | | | 121,160 | | | | 31,735,439 | |
| Microsoft Corp. | | | 962,962 | | | | 151,859,107 | |
| Salesforce.com, Inc. (a) | | | 239,272 | | | | 38,915,198 | |
| | | | | | | | |
| | | | | | $ | 314,043,232 | |
| | | | | | | | |
| Computer Software – Systems – 2.4% | | | | | |
| Apple, Inc. | | | 122,782 | | | $ | 36,054,934 | |
| Shopify, Inc. (a) | | | 7,408 | | | | 2,945,273 | |
| Square, Inc., “A” (a) | | | 97,874 | | | | 6,122,997 | |
| | | | | | | | |
| | | | | | $ | 45,123,204 | |
| | | | | | | | |
| Construction – 3.2% | | | | | |
| Sherwin-Williams Co. | | | 55,885 | | | $ | 32,611,133 | |
| Vulcan Materials Co. | | | 182,800 | | | | 26,321,372 | |
| | | | | | | | |
| | | | | | $ | 58,932,505 | |
| | | | | | | | |
| | | | | | | | |
| | |
| Issuer | | Shares/Par | | | Value ($) | |
| COMMON STOCKS – continued | | | | | |
| Consumer Products – 1.9% | | | | | |
| Colgate-Palmolive Co. | | | 294,592 | | | $ | 20,279,713 | |
| Estee Lauder Cos., Inc., “A” | | | 74,139 | | | | 15,312,669 | |
| | | | | | | | |
| | | | | | $ | 35,592,382 | |
| | | | | | | | |
| Electrical Equipment – 2.4% | | | | | |
| AMETEK, Inc. | | | 167,764 | | | $ | 16,732,781 | |
| Amphenol Corp., “A” | | | 161,830 | | | | 17,514,861 | |
| Fortive Corp. | | | 133,167 | | | | 10,172,627 | |
| | | | | | | | |
| | | | | | $ | 44,420,269 | |
| | | | | | | | |
| Electronics – 0.6% | | | | | |
| Analog Devices, Inc. | | | 94,034 | | | $ | 11,175,001 | |
| | | | | | | | |
| Energy – Independent – 0.3% | | | | | |
| Pioneer Natural Resources Co. | | | 33,798 | | | $ | 5,116,003 | |
| | | | | | | | |
| Gaming & Lodging – 1.5% | | | | | |
| Hilton Worldwide Holdings, Inc. | | | 83,348 | | | $ | 9,244,127 | |
| Marriott International, Inc., “A” | | | 104,985 | | | | 15,897,878 | |
| Wynn Resorts Ltd. | | | 24,922 | | | | 3,460,918 | |
| | | | | | | | |
| | | | | | $ | 28,602,923 | |
| | | | | | | | |
| General Merchandise – 1.2% | | | | | |
| Dollar General Corp. | | | 78,528 | | | $ | 12,248,797 | |
| Dollar Tree, Inc. (a) | | | 110,459 | | | | 10,388,669 | |
| | | | | | | | |
| | | | | | $ | 22,637,466 | |
| | | | | | | | |
| Insurance – 1.6% | | | | | |
| Aon PLC | | | 144,704 | | | $ | 30,140,396 | |
| | | | | | | | |
| Internet – 9.0% | | | | | |
| Alibaba Group Holding Ltd., ADR (a) | | | 35,090 | | | $ | 7,442,589 | |
| Alphabet, Inc., “A” (a) | | | 57,528 | | | | 77,052,428 | |
| Alphabet, Inc., “C” (a) | | | 22,870 | | | | 30,577,647 | |
| Facebook, Inc., “A” (a) | | | 235,750 | | | | 48,387,688 | |
| Spotify Technology S.A. (a) | | | 30,017 | | | | 4,489,042 | |
| | | | | | | | |
| | | | | | $ | 167,949,394 | |
| | | | | | | | |
| Leisure & Toys – 1.9% | | | | | |
| Electronic Arts, Inc. (a) | | | 226,824 | | | $ | 24,385,848 | |
| Take-Two Interactive Software, Inc. (a) | | | 93,096 | | | | 11,397,744 | |
| | | | | | | | |
| | | | | | $ | 35,783,592 | |
| | | | | | | | |
| Machinery & Tools – 1.2% | | | | | |
| Roper Technologies, Inc. | | | 65,554 | | | $ | 23,221,193 | |
| | | | | | | | |
| Medical Equipment – 10.2% | | | | | |
| Abbott Laboratories | | | 257,568 | | | $ | 22,372,357 | |
| Becton, Dickinson and Co. | | | 30,634 | | | | 8,331,529 | |
| Boston Scientific Corp. (a) | | | 535,443 | | | | 24,212,732 | |
| Danaher Corp. | | | 238,855 | | | | 36,659,465 | |
| Edwards Lifesciences Corp. (a) | | | 63,241 | | | | 14,753,493 | |
| Medtronic PLC | | | 274,351 | | | | 31,125,121 | |
| Thermo Fisher Scientific, Inc. | | | 162,240 | | | | 52,706,909 | |
| | | | | | | | |
| | | | | | $ | 190,161,606 | |
| | | | | | | | |
7
MFS Growth Series
Portfolio of Investments – continued
| | | | | | | | |
| | |
| Issuer | | Shares/Par | | | Value ($) | |
| COMMON STOCKS – continued | | | | | |
| Other Banks & Diversified Financials – 9.2% | | | | | |
| Mastercard, Inc., “A” | | | 268,934 | | | $ | 80,301,003 | |
| Visa, Inc., “A” | | | 492,061 | | | | 92,458,262 | |
| | | | | | | | |
| | | | | | $ | 172,759,265 | |
| | | | | | | | |
| Pharmaceuticals – 2.3% | | | | | |
| Eli Lilly & Co. | | | 54,484 | | | $ | 7,160,832 | |
| Zoetis, Inc. | | | 264,637 | | | | 35,024,707 | |
| | | | | | | | |
| | | | | | $ | 42,185,539 | |
| | | | | | | | |
| Printing & Publishing – 0.5% | | | | | |
| IHS Markit Ltd. (a) | | | 131,545 | | | $ | 9,911,916 | |
| | | | | | | | |
| Railroad & Shipping – 1.6% | | | | | |
| Canadian Pacific Railway Ltd. | | | 62,472 | | | $ | 15,927,236 | |
| Union Pacific Corp. | | | 76,431 | | | | 13,817,961 | |
| | | | | | | | |
| | | | | | $ | 29,745,197 | |
| | | | | | | | |
| Restaurants – 0.8% | | | | | |
| Chipotle Mexican Grill, Inc., “A” (a) | | | 10,775 | | | $ | 9,019,860 | |
| Starbucks Corp. | | | 63,517 | | | | 5,584,415 | |
| | | | | | | | |
| | | | | | $ | 14,604,275 | |
| | | | | | | | |
| Specialty Stores – 8.0% | | | | | |
| Amazon.com, Inc. (a) | | | 55,836 | | | $ | 103,175,994 | |
| Costco Wholesale Corp. | | | 52,473 | | | | 15,422,864 | |
| Lululemon Athletica, Inc. (a) | | | 32,034 | | | | 7,421,317 | |
| O’Reilly Automotive, Inc. (a) | | | 5,967 | | | | 2,615,098 | |
| Ross Stores, Inc. | | | 180,788 | | | | 21,047,339 | |
| | | | | | | | |
| | | | | | $ | 149,682,612 | |
| | | | | | | | |
| | | | | | | | |
| | |
| Issuer | | Shares/Par | | | Value ($) | |
| COMMON STOCKS – continued | | | | | |
| Telecommunications – Wireless – 1.6% | | | | | |
| American Tower Corp., REIT | | | 129,263 | | | $ | 29,707,223 | |
| | | | | | | | |
Total Common Stocks
(Identified Cost, $717,347,071) | | | | | | $ | 1,845,700,921 | |
| | | | | | | | |
| |
| INVESTMENT COMPANIES (h) – 0.0% | | | | | |
| Money Market Funds – 0.0% | | | | | | | | |
| MFS Institutional Money Market Portfolio, 1.7% (v) (Identified Cost, $13,494) | | | 13,494 | | | $ | 13,494 | |
| | | | | | | | |
OTHER ASSETS, LESS
LIABILITIES – 1.2% | | | | | | | 22,573,083 | |
| | | | | | | | |
| NET ASSETS – 100.0% | | | | | | $ | 1,868,287,498 | |
| | | | | | | | |
| (a) | | Non-income producing security. |
| (h) | | An affiliated issuer, which may be considered one in which the fund owns 5% or more of the outstanding voting securities, or a company which is under common control. At period end, the aggregate values of the fund’s investments in affiliated issuers and in unaffiliated issuers were $13,494 and $1,845,700,921, respectively. |
| (v) | | Affiliated issuer that is available only to investment companies managed by MFS. The rate quoted for the MFS Institutional Money Market Portfolio is the annualizedseven-day yield of the fund at period end. |
The following abbreviations are used in this report and are defined:
| ADR | | American Depositary Receipt |
| REIT | | Real Estate Investment Trust |
See Notes to Financial Statements
8
MFS Growth Series
FINANCIAL STATEMENTS | STATEMENT OF ASSETS AND LIABILITIES
This statement represents your fund’s balance sheet, which details the assets and liabilities comprising the total value of the fund.
| | | | |
At 12/31/19 | | | | |
| |
Assets | | | | |
Investments in unaffiliated issuers, at value (identified cost, $717,347,071) | | | $1,845,700,921 | |
Investments in affiliated issuers, at value (identified cost, $13,494) | | | 13,494 | |
Receivables for | | | | |
Investments sold | | | 28,672,501 | |
Fund shares sold | | | 861,180 | |
Interest and dividends | | | 499,880 | |
Other assets | | | 6,825 | |
Total assets | | | $1,875,754,801 | |
| |
Liabilities | | | | |
Payable to custodian | | | $124,996 | |
Payables for | | | | |
Fund shares reacquired | | | 7,070,057 | |
Payable to affiliates | | | | |
Investment adviser | | | 71,263 | |
Administrative services fee | | | 1,335 | |
Shareholder servicing costs | | | 1,357 | |
Distribution and/or service fees | | | 5,498 | |
Payable for independent Trustees’ compensation | | | 14 | |
Accrued expenses and other liabilities | | | 192,783 | |
Total liabilities | | | $7,467,303 | |
Net assets | | | $1,868,287,498 | |
| |
Net assets consist of | | | | |
Paid-in capital | | | $613,566,523 | |
Total distributable earnings (loss) | | | 1,254,720,975 | |
Net assets | | | $1,868,287,498 | |
Shares of beneficial interest outstanding | | | 31,760,553 | |
| | | | | | | | | | | | |
| | | |
| | | Net assets | | | Shares
outstanding | | | Net asset value
per share | |
Initial Class | | | $1,467,279,835 | | | | 24,703,624 | | | | $59.40 | |
Service Class | | | 401,007,663 | | | | 7,056,929 | | | | 56.82 | |
See Notes to Financial Statements
9
MFS Growth Series
FINANCIAL STATEMENTS | STATEMENT OF OPERATIONS
This statement describes how much your fund earned in investment income and accrued in expenses. It also describes any gains and/or losses generated by fund operations.
| | | | |
Year ended 12/31/19 | | | | |
| |
Net investment income (loss) | | | | |
Income | | | | |
Dividends | | | $11,386,453 | |
Dividends from affiliated issuers | | | 341,847 | |
Other | | | 24,621 | |
Income on securities loaned | | | 9,966 | |
Foreign taxes withheld | | | (36,409 | ) |
Total investment income | | | $11,726,478 | |
Expenses | | | | |
Management fee | | | $12,375,999 | |
Distribution and/or service fees | | | 882,876 | |
Shareholder servicing costs | | | 30,855 | |
Administrative services fee | | | 245,146 | |
Independent Trustees’ compensation | | | 36,802 | |
Custodian fee | | | 84,806 | |
Shareholder communications | | | 99,232 | |
Audit and tax fees | | | 60,046 | |
Legal fees | | | 16,566 | |
Miscellaneous | | | 56,798 | |
Total expenses | | | $13,889,126 | |
Reduction of expenses by investment adviser | | | (170,598 | ) |
Net expenses | | | $13,718,528 | |
Net investment income (loss) | | | $(1,992,050 | ) |
| |
Realized and unrealized gain (loss) | | | | |
Realized gain (loss) (identified cost basis) | | | | |
Unaffiliated issuers | | | $128,299,641 | |
Affiliated issuers | | | 1,580 | |
Foreign currency | | | 1,418 | |
Net realized gain (loss) | | | $128,302,639 | |
Change in unrealized appreciation or depreciation | | | | |
Unaffiliated issuers | | | $424,577,754 | |
Translation of assets and liabilities in foreign currencies | | | 429 | |
Net unrealized gain (loss) | | | $424,578,183 | |
Net realized and unrealized gain (loss) | | | $552,880,822 | |
Change in net assets from operations | | | $550,888,772 | |
See Notes to Financial Statements
10
MFS Growth Series
FINANCIAL STATEMENTS | STATEMENTS OF CHANGES IN NET ASSETS
These statements describe the increases and/or decreases in net assets resulting from operations, any distributions, and any shareholder transactions.
| | | | | | | | |
| | | Year ended | |
| | | 12/31/19 | | | 12/31/18 | |
Change in net assets | | | | | | | | |
| | |
From operations | | | | | | | | |
Net investment income (loss) | | | $(1,992,050 | ) | | | $(740,252 | ) |
Net realized gain (loss) | | | 128,302,639 | | | | 152,572,534 | |
Net unrealized gain (loss) | | | 424,578,183 | | | | (96,117,913 | ) |
Change in net assets from operations | | | $550,888,772 | | | | $55,714,369 | |
Total distributions to shareholders | | | $(152,335,206 | ) | | | $(114,147,480 | ) |
Change in net assets from fund share transactions | | | $(43,895,060 | ) | | | $(49,798,519 | ) |
Total change in net assets | | | $354,658,506 | | | | $(108,231,630 | ) |
| | |
Net assets | | | | | | | | |
At beginning of period | | | 1,513,628,992 | | | | 1,621,860,622 | |
At end of period | | | $1,868,287,498 | | | | $1,513,628,992 | |
See Notes to Financial Statements
11
MFS Growth Series
FINANCIAL STATEMENTS | FINANCIAL HIGHLIGHTS
The financial highlights table is intended to help you understand the fund’s financial performance for the past 5 years. Certain information reflects financial results for a single fund share. The total returns in the table represent the rate that an investor would have earned (or lost) on an investment in the fund share class (assuming reinvestment of all distributions) held for the entire period.
| | | | | | | | | | | | | | | | | | | | |
| Initial Class | | Year ended | |
| | | | | |
| | | 12/31/19 | | | 12/31/18 | | | 12/31/17 | | | 12/31/16 | | | 12/31/15 | |
| | | | | |
Net asset value, beginning of period | | | $47.01 | | | | $48.90 | | | | $38.76 | | | | $40.17 | | | | $39.75 | |
| | | | | |
| Income (loss) from investment operations | | | | | | | | | | | | | | | | | | | | |
Net investment income (loss) (d) | | | $(0.04 | ) | | | $0.00 | (w) | | | $0.06 | | | | $0.05 | (c) | | | $0.03 | |
Net realized and unrealized gain (loss) | | | 17.53 | | | | 1.81 | | | | 11.95 | | | | 1.01 | | | | 2.73 | |
Total from investment operations | | | $17.49 | | | | $1.81 | | | | $12.01 | | | | $1.06 | | | | $2.76 | |
| | | | | |
| Less distributions declared to shareholders | | | | | | | | | | | | | | | | | | | | |
From net investment income | | | $— | | | | $(0.05 | ) | | | $(0.05 | ) | | | $(0.02 | ) | | | $(0.07 | ) |
From net realized gain | | | (5.10 | ) | | | (3.65 | ) | | | (1.82 | ) | | | (2.45 | ) | | | (2.27 | ) |
Total distributions declared to shareholders | | | $(5.10 | ) | | | $(3.70 | ) | | | $(1.87 | ) | | | $(2.47 | ) | | | $(2.34 | ) |
Net asset value, end of period (x) | | | $59.40 | | | | $47.01 | | | | $48.90 | | | | $38.76 | | | | $40.17 | |
Total return (%) (k)(r)(s)(x) | | | 38.15 | | | | 2.67 | | | | 31.40 | | | | 2.44 | (c) | | | 7.56 | |
| | | | | |
Ratios (%) (to average net assets)
and Supplemental data: | | | | | | | | | | | | | | | | | | | | |
Expenses before expense reductions (f) | | | 0.74 | | | | 0.75 | | | | 0.76 | | | | 0.75 | (c) | | | 0.76 | |
Expenses after expense reductions (f) | | | 0.73 | | | | 0.74 | | | | 0.75 | | | | 0.74 | (c) | | | 0.75 | |
Net investment income (loss) | | | (0.06 | ) | | | 0.00 | (w) | | | 0.13 | | | | 0.12 | (c) | | | 0.08 | |
Portfolio turnover | | | 11 | | | | 15 | | | | 14 | | | | 24 | | | | 31 | |
Net assets at end of period (000 omitted) | | | $1,467,280 | | | | $1,226,217 | | | | $1,332,128 | | | | $1,179,822 | | | | $1,273,204 | |
| |
| Service Class | | Year ended | |
| | | | | |
| | | 12/31/19 | | | 12/31/18 | | | 12/31/17 | | | 12/31/16 | | | 12/31/15 | |
| | | | | |
Net asset value, beginning of period | | | $45.26 | | | | $47.27 | | | | $37.57 | | | | $39.09 | | | | $38.77 | |
| | | | | |
| Income (loss) from investment operations | | | | | | | | | | | | | | | | | | | | |
Net investment income (loss) (d) | | | $(0.17 | ) | | | $(0.13 | ) | | | $(0.05 | ) | | | $(0.05 | )(c) | | | $(0.07 | ) |
Net realized and unrealized gain (loss) | | | 16.83 | | | | 1.77 | | | | 11.57 | | | | 0.98 | | | | 2.66 | |
Total from investment operations | | | $16.66 | | | | $1.64 | | | | $11.52 | | | | $0.93 | | | | $2.59 | |
| | | | | |
| Less distributions declared to shareholders | | | | | | | | | | | | | | | | | | | | |
From net investment income | | | $— | | | | $— | | | | $— | | | | $— | | | | $— | |
From net realized gain | | | (5.10 | ) | | | (3.65 | ) | | | (1.82 | ) | | | (2.45 | ) | | | (2.27 | ) |
Total distributions declared to shareholders | | | $(5.10 | ) | | | $(3.65 | ) | | | $(1.82 | ) | | | $(2.45 | ) | | | $(2.27 | ) |
Net asset value, end of period (x) | | | $56.82 | | | | $45.26 | | | | $47.27 | | | | $37.57 | | | | $39.09 | |
Total return (%) (k)(r)(s)(x) | | | 37.78 | | | | 2.41 | | | | 31.08 | | | | 2.18 | (c) | | | 7.30 | |
| | | | | |
Ratios (%) (to average net assets)
and Supplemental data: | | | | | | | | | | | | | | | | | | | | |
Expenses before expense reductions (f) | | | 0.99 | | | | 1.00 | | | | 1.01 | | | | 1.00 | (c) | | | 1.01 | |
Expenses after expense reductions (f) | | | 0.98 | | | | 0.99 | | | | 1.00 | | | | 0.99 | (c) | | | 1.00 | |
Net investment income (loss) | | | (0.31 | ) | | | (0.25 | ) | | | (0.12 | ) | | | (0.13 | )(c) | | | (0.16 | ) |
Portfolio turnover | | | 11 | | | | 15 | | | | 14 | | | | 24 | | | | 31 | |
Net assets at end of period (000 omitted) | | | $401,008 | | | | $287,412 | | | | $289,733 | | | | $235,869 | | | | $224,694 | |
See Notes to Financial Statements
12
MFS Growth Series
Financial Highlights – continued
| (c) | | Amount reflects aone-time reimbursement of expenses by the custodian (or former custodian) without which net investment income and performance would be lower and expenses would be higher. |
| (d) | | Per share data is based on average shares outstanding. |
| (f) | | Ratios do not reflect reductions from fees paid indirectly, if applicable. |
| (k) | | The total return does not reflect expenses that apply to separate accounts. Inclusion of these charges would reduce the total return figures for all periods shown. |
| (r) | | Certain expenses have been reduced without which performance would have been lower. |
| (s) | | From time to time the fund may receive proceeds from litigation settlements, without which performance would be lower. |
| (w) | | Per share amount was less than $0.01 and total return or ratio was less than 0.01%, as applicable. |
| (x) | | The net asset values and total returns have been calculated on net assets which include adjustments made in accordance with U.S. generally accepted accounting principles required at period end for financial reporting purposes. |
See Notes to Financial Statements
13
MFS Growth Series
NOTES TO FINANCIAL STATEMENTS
| (1) | | Business and Organization |
MFS Growth Series (the fund) is a diversified series of MFS Variable Insurance Trust (the trust). The trust is organized as a Massachusetts business trust and is registered under the Investment Company Act of 1940, as amended, as anopen-end management investment company. The shareholders of each series of the trust are separate accounts of insurance companies, which offer variable annuity and/or life insurance products, and qualified retirement and pension plans.
The fund is an investment company and accordingly follows the investment company accounting and reporting guidance of the Financial Accounting Standards Board (FASB) Accounting Standards Codification Topic 946 Financial Services – Investment Companies.
| (2) | | Significant Accounting Policies |
General– The preparation of financial statements in conformity with U.S. generally accepted accounting principles requires management to make estimates and assumptions that affect the reported amounts of assets and liabilities, and disclosure of contingent assets and liabilities at the date of the financial statements and the reported amounts of increases and decreases in net assets from operations during the reporting period. Actual results could differ from those estimates. In the preparation of these financial statements, management has evaluated subsequent events occurring after the date of the fund’s Statement of Assets and Liabilities through the date that the financial statements were issued.
Balance Sheet Offsetting– The fund’s accounting policy with respect to balance sheet offsetting is that, absent an event of default by the counterparty or a termination of the agreement, the International Swaps and Derivatives Association (ISDA) Master Agreement, or similar agreement, does not result in an offset of reported amounts of financial assets and financial liabilities in the Statement of Assets and Liabilities across transactions between the fund and the applicable counterparty. The fund’s right to setoff may be restricted or prohibited by the bankruptcy or insolvency laws of the particular jurisdiction to which a specific master netting agreement counterparty is subject. Balance sheet offsetting disclosures, to the extent applicable to the fund, have been included in the fund’s Significant Accounting Policies note under the captions for each of the fund’sin-scope financial instruments and transactions.
Investment Valuations– Equity securities, including restricted equity securities, are generally valued at the last sale or official closing price on their primary market or exchange as provided by a third-party pricing service. Equity securities, for which there were no sales reported that day, are generally valued at the last quoted daily bid quotation on their primary market or exchange as provided by a third-party pricing service. Short-term instruments with a maturity at issuance of 60 days or less may be valued at amortized cost, which approximates market value.Open-end investment companies are generally valued at net asset value per share. Securities and other assets generally valued on the basis of information from a third-party pricing service may also be valued at a broker/dealer bid quotation. In determining values, third-party pricing services can utilize both transaction data and market information such as yield, quality, coupon rate, maturity, type of issue, trading characteristics, and other market data. The values of foreign securities and other assets and liabilities expressed in foreign currencies are converted to U.S. dollars using the mean of bid and asked prices for rates provided by a third-party pricing service.
The Board of Trustees has delegated primary responsibility for determining or causing to be determined the value of the fund’s investments (including any fair valuation) to the adviser pursuant to valuation policies and procedures approved by the Board. If the adviser determines that reliable market quotations are not readily available, investments are valued at fair value as determined in good faith by the adviser in accordance with such procedures under the oversight of the Board of Trustees. Under the fund’s valuation policies and procedures, market quotations are not considered to be readily available for most types of debt instruments and floating rate loans and many types of derivatives. These investments are generally valued at fair value based on information from third-party pricing services. In addition, investments may be valued at fair value if the adviser determines that an investment’s value has been materially affected by events occurring after the close of the exchange or market on which the investment is principally traded (such as foreign exchange or market) and prior to the determination of the fund’s net asset value, or after the halt of trading of a specific security where trading does not resume prior to the close of the exchange or market on which the security is principally traded. Events that occur after foreign markets close (such as developments in foreign markets and significant movements in the U.S. markets) and prior to the determination of the fund’s net asset value may be deemed to have a material effect on the value of securities traded in foreign markets. Accordingly, the fund’s foreign equity securities may often be valued at fair value. The adviser generally relies on third-party pricing services or other information (such as the correlation with price movements of similar securities in the same or other markets; the type, cost and investment characteristics of the security; the business and financial condition of the issuer; and trading and other market data) to assist in determining whether to fair value and at what value to fair value an investment. The value of an investment for purposes of calculating the fund’s net asset value can differ depending on the source and method used to determine value. When fair valuation is used, the value of an investment used to determine the fund’s net asset value may differ from quoted or published prices for the same investment. There can be no assurance that the fund could obtain the fair value assigned to an investment if it were to sell the investment at the same time at which the fund determines its net asset value per share.
14
MFS Growth Series
Notes to Financial Statements – continued
Various inputs are used in determining the value of the fund’s assets or liabilities. These inputs are categorized into three broad levels. In certain cases, the inputs used to measure fair value may fall into different levels of the fair value hierarchy. In such cases, an investment’s level within the fair value hierarchy is based on the lowest level of input that is significant to the fair value measurement. The fund’s assessment of the significance of a particular input to the fair value measurement in its entirety requires judgment, and considers factors specific to the investment. Level 1 includes unadjusted quoted prices in active markets for identical assets or liabilities. Level 2 includes other significant observable market-based inputs (including quoted prices for similar securities, interest rates, prepayment speed, and credit risk). Level 3 includes unobservable inputs, which may include the adviser’s own assumptions in determining the fair value of investments. The following is a summary of the levels used as of December 31, 2019 in valuing the fund’s assets or liabilities:
| | | | | | | | | | | | | | | | |
| Financial Instruments | | Level 1 | | | Level 2 | | | Level 3 | | | Total | |
| Equity Securities | | | $1,845,700,921 | | | | $— | | | | $— | | | | $1,845,700,921 | |
| Mutual Funds | | | 13,494 | | | | — | | | | — | | | | 13,494 | |
| Total | | | $1,845,714,415 | | | | $— | | | | $— | | | | $1,845,714,415 | |
For further information regarding security characteristics, see the Portfolio of Investments.
Foreign Currency Translation– Purchases and sales of foreign investments, income, and expenses are converted into U.S. dollars based upon currency exchange rates prevailing on the respective dates of such transactions or on the reporting date for foreign denominated receivables and payables. Gains and losses attributable to foreign currency exchange rates on sales of securities are recorded for financial statement purposes as net realized gains and losses on investments. Gains and losses attributable to foreign exchange rate movements on receivables, payables, income and expenses are recorded for financial statement purposes as foreign currency transaction gains and losses. That portion of both realized and unrealized gains and losses on investments that results from fluctuations in foreign currency exchange rates is not separately disclosed.
Security Loans– Under its Securities Lending Agency Agreement with the fund, State Street Bank and Trust Company, as lending agent, loans the securities of the fund to certain qualified institutions (the “Borrowers”) approved by the fund. Security loans can be terminated at the discretion of either the lending agent or the fund and the related securities must be returned within the earlier of the standard trade settlement period for such securities or within three business days. The loans are collateralized by cash and/or U.S. Treasury and federal agency obligations in an amount typically at least equal to the market value of the securities loaned. On loans collateralized by cash, the cash collateral is invested in a money market fund. The market value of the loaned securities is determined at the close of business of the fund and any additional required collateral is delivered to the fund on the next business day. The lending agent provides the fund with indemnification against Borrower default. In the event of Borrower default, the lending agent will, for the benefit of the fund, either purchase securities identical to those loaned or, when such purchase is commercially impracticable, pay the fund the market value of the loaned securities. In return, the lending agent assumes the fund’s rights to the related collateral. If the collateral value is less than the cost to purchase identical securities, the lending agent is responsible for the shortfall, but only to the extent that such shortfall is not due to a decline in collateral value resulting from collateral reinvestment for which the fund bears the risk of loss. A portion of the income generated upon investment of the collateral is remitted to the Borrowers, and the remainder is allocated between the fund and the lending agent. On loans collateralized by U.S. Treasury and/or federal agency obligations, a fee is received from the Borrower, and is allocated between the fund and the lending agent. Income from securities lending is separately reported in the Statement of Operations. The dividend and interest income earned on the securities loaned is accounted for in the same manner as other dividend and interest income. At December 31, 2019, there were no securities on loan or collateral outstanding.
Indemnifications– Under the fund’s organizational documents, its officers and Trustees may be indemnified against certain liabilities and expenses arising out of the performance of their duties to the fund. Additionally, in the normal course of business, the fund enters into agreements with service providers that may contain indemnification clauses. The fund’s maximum exposure under these agreements is unknown as this would involve future claims that may be made against the fund that have not yet occurred.
Investment Transactions and Income– Investment transactions are recorded on the trade date. Interest income is recorded on the accrual basis. Dividends received in cash are recorded on theex-dividend date. Certain dividends from foreign securities will be recorded when the fund is informed of the dividend if such information is obtained subsequent to theex-dividend date. Dividend payments received in additional securities are recorded on theex-dividend date in an amount equal to the value of the security on such date.
The fund may receive proceeds from litigation settlements. Any proceeds received from litigation involving portfolio holdings are reflected in the Statement of Operations in realized gain/loss if the security has been disposed of by the fund or in unrealized gain/loss if the security is still held by the fund. Any other proceeds from litigation not related to portfolio holdings are reflected as other income in the Statement of Operations.
Tax Matters and Distributions– The fund intends to qualify as a regulated investment company, as defined under Subchapter M of the Internal Revenue Code, and to distribute all of its taxable income, including realized capital gains. As a result, no provision for
15
MFS Growth Series
Notes to Financial Statements – continued
federal income tax is required. The fund’s federal tax returns, when filed, will remain subject to examination by the Internal Revenue Service for a three year period. Management has analyzed the fund’s tax positions taken on federal and state tax returns for all open tax years and does not believe that there are any uncertain tax positions that require recognition of a tax liability. Foreign taxes, if any, have been accrued by the fund in the accompanying financial statements in accordance with the applicable foreign tax law. Foreign income taxes may be withheld by certain countries in which the fund invests. Additionally, capital gains realized by the fund on securities issued in or by certain foreign countries may be subject to capital gains tax imposed by those countries.
Distributions to shareholders are recorded on theex-dividend date. Income and capital gain distributions are determined in accordance with income tax regulations, which may differ from U.S. generally accepted accounting principles. Certain capital accounts in the financial statements are periodically adjusted for permanent differences in order to reflect their tax character. These adjustments have no impact on net assets or net asset value per share. Temporary differences which arise from recognizing certain items of income, expense, gain or loss in different periods for financial statement and tax purposes will reverse at some time in the future.
Book/tax differences primarily relate to net operating losses and wash sale loss deferrals.
The tax character of distributions declared to shareholders for the last two fiscal years is as follows:
| | | | | | | | |
| | | Year ended
12/31/19 | | | Year ended
12/31/18 | |
| Ordinary income (including any short-term capital gains) | | | $— | | | | $8,219,900 | |
| Long-term capital gains | | | 152,335,206 | | | | 105,927,580 | |
| Total distributions | | | $152,335,206 | | | | $114,147,480 | |
The federal tax cost and the tax basis components of distributable earnings were as follows:
| | | | |
| As of 12/31/19 | | | | |
| |
| Cost of investments | | | $718,584,549 | |
| Gross appreciation | | | 1,128,853,781 | |
| Gross depreciation | | | (1,723,915 | ) |
| Net unrealized appreciation (depreciation) | | | $1,127,129,866 | |
| |
| Undistributed long-term capital gain | | | 127,590,711 | |
| Other temporary differences | | | 398 | |
Multiple Classes of Shares of Beneficial Interest– The fund offers multiple classes of shares, which differ in their respective distribution and/or service fees. The fund’s income, realized and unrealized gain (loss), and common expenses are allocated to shareholders based on the daily net assets of each class. Dividends are declared separately for each class. Differences in per share dividend rates are generally due to differences in separate class expenses. The fund’s distributions declared to shareholders as reported in the Statements of Changes in Net Assets are presented by class as follows:
| | | | | | | | |
| | |
| | | Year ended
12/31/19 | | | Year ended
12/31/18 | |
| Initial Class | | | $120,147,549 | | | | $92,595,128 | |
| Service Class | | | 32,187,657 | | | | 21,552,352 | |
| Total | | | $152,335,206 | | | | $114,147,480 | |
| (3) | | Transactions with Affiliates |
Investment Adviser– The fund has an investment advisory agreement with MFS to provide overall investment management and related administrative services and facilities to the fund. The management fee is computed daily and paid monthly at the following annual rates based on the fund’s average daily net assets:
| | | | |
| Up to $1 billion | | | 0.75% | |
| In excess of $1 billion | | | 0.65% | |
MFS has agreed in writing to reduce its management fee by a specified amount if certain MFS mutual fund assets exceed thresholds agreed to by MFS and the fund’s Board of Trustees. For the year ended December 31, 2019, this management fee reduction amounted to $170,598, which is included in the reduction of total expenses in the Statement of Operations. The management fee incurred for the year ended December 31, 2019 was equivalent to an annual effective rate of 0.70% of the fund’s average daily net assets.
Distributor– MFS Fund Distributors, Inc. (MFD), a wholly-owned subsidiary of MFS, is the distributor of shares of the fund. The Trustees have adopted a distribution plan for the Service Class shares pursuant to Rule12b-1 under the Investment Company Act of 1940.
The fund’s distribution plan provides that the fund will pay MFD distribution and/or service fees equal to 0.25% per annum of its average daily net assets attributable to Service Class shares as partial consideration for services performed and expenses incurred by
16
MFS Growth Series
Notes to Financial Statements – continued
MFD and financial intermediaries (including participating insurance companies that invest in the fund to fund variable annuity and variable life insurance contracts, sponsors of qualified retirement and pension plans that invest in the fund, and affiliates of these participating insurance companies and plan sponsors) in connection with the sale and distribution of the Service Class shares. MFD may subsequently pay all, or a portion, of the distribution and/or service fees to financial intermediaries.
Shareholder Servicing Agent– MFS Service Center, Inc. (MFSC), a wholly-owned subsidiary of MFS, receives a fee from the fund for its services as shareholder servicing agent. For the year ended December 31, 2019, the fee was $27,855, which equated to 0.0016% annually of the fund’s average daily net assets. MFSC also receives payment from the fund forout-of-pocket expenses paid by MFSC on behalf of the fund. For the year ended December 31, 2019, these costs amounted to $3,000.
Administrator– MFS provides certain financial, legal, shareholder communications, compliance, and other administrative services to the fund. Under an administrative services agreement, the fund reimburses MFS the costs incurred to provide these services. The fund is charged an annual fixed amount of $17,500 plus a fee based on average daily net assets. The administrative services fee incurred for the year ended December 31, 2019 was equivalent to an annual effective rate of 0.0140% of the fund’s average daily net assets.
Trustees’ and Officers’ Compensation– The fund pays compensation to independent Trustees in the form of a retainer, attendance fees, and additional compensation to Board and Committee chairpersons. The fund does not pay compensation directly to Trustees or officers of the fund who are also officers of the investment adviser, all of whom receive remuneration from MFS for their services to the fund. Certain officers and Trustees of the fund are officers or directors of MFS, MFD, and MFSC.
Other– This fund and certain other funds managed by MFS (the funds) had entered into a service agreement (the ISO Agreement) which provided for payment of fees solely by the funds to Tarantino LLC in return for the provision of services of an Independent Senior Officer (ISO) for the funds. Frank L. Tarantino served as the ISO and was an officer of the funds and the sole member of Tarantino LLC. Effective June 30, 2019, Mr. Tarantino retired from his position as ISO for the funds, and the ISO Agreement was terminated. For the year ended December 31, 2019, the fee paid by the fund under this agreement was $2,037 and is included in “Miscellaneous” expense in the Statement of Operations. MFS had agreed to bear all expenses associated with office space, other administrative support, and supplies provided to the ISO.
The fund invests in the MFS Institutional Money Market Portfolio which is managed by MFS and seeks current income consistent with preservation of capital and liquidity. This money market fund does not pay a management fee to MFS.
The adviser has voluntarily undertaken to reimburse the fund from its own resources on a quarterly basis for the cost of investment research embedded in the cost of the fund’s securities trades. This agreement may be rescinded at any time. For the year ended December 31, 2019, this reimbursement amounted to $24,363, which is included in “Other” income in the Statement of Operations.
For the year ended December 31, 2019, purchases and sales of investments, other than short-term obligations, aggregated $185,241,655 and $377,855,953, respectively.
| (5) | | Shares of Beneficial Interest |
The fund’s Declaration of Trust permits the Trustees to issue an unlimited number of full and fractional shares of beneficial interest. Transactions in fund shares were as follows:
| | | | | | | | | | | | | | | | |
| | | Year ended 12/31/19 | | | Year ended 12/31/18 | |
| | | | |
| | | Shares | | | Amount | | | Shares | | | Amount | |
| Shares sold | | | | | | | | | | | | | | | | |
Initial Class | | | 1,217,214 | | | | $67,244,090 | | | | 1,885,287 | | | | $98,349,828 | |
Service Class | | | 1,261,274 | | | | 67,355,720 | | | | 1,291,280 | | | | 65,518,241 | |
| | | 2,478,488 | | | | $134,599,810 | | | | 3,176,567 | | | | $163,868,069 | |
| | | | |
| Shares issued to shareholders in reinvestment of distributions | | | | | | | | | | | | | | | | |
Initial Class | | | 2,176,755 | | | | $118,894,370 | | | | 1,680,711 | | | | $91,548,350 | |
Service Class | | | 615,443 | | | | 32,187,657 | | | | 410,599 | | | | 21,552,352 | |
| | | 2,792,198 | | | | $151,082,027 | | | | 2,091,310 | | | | $113,100,702 | |
| | | | |
| Shares reacquired | | | | | | | | | | | | | | | | |
Initial Class | | | (4,773,226 | ) | | | $(266,754,702 | ) | | | (4,724,710 | ) | | | $(251,082,206 | ) |
Service Class | | | (1,169,906 | ) | | | (62,822,195 | ) | | | (1,481,320 | ) | | | (75,685,084 | ) |
| | | (5,943,132 | ) | | | $(329,576,897 | ) | | | (6,206,030 | ) | | | $(326,767,290 | ) |
| | | | |
| Net change | | | | | | | | | | | | | | | | |
Initial Class | | | (1,379,257 | ) | | | $(80,616,242 | ) | | | (1,158,712 | ) | | | $(61,184,028 | ) |
Service Class | | | 706,811 | | | | 36,721,182 | | | | 220,559 | | | | 11,385,509 | |
| | | (672,446 | ) | | | $(43,895,060 | ) | | | (938,153 | ) | | | $(49,798,519 | ) |
17
MFS Growth Series
Notes to Financial Statements – continued
The fund is one of several mutual funds in which certain MFS funds may invest. The MFS funds do not invest in the underlying funds for the purpose of exercising management or control. At the end of the period, the MFS Moderate Allocation Portfolio, the MFS Growth Allocation Portfolio, and the MFS Conservative Allocation Portfolio were the owners of record of approximately 7%, 2%, and 1%, respectively, of the value of outstanding voting shares of the fund.
The fund and certain other funds managed by MFS participate in a $1.25 billion unsecured committed line of credit, subject to a $1 billion sublimit, provided by a syndicate of banks under a credit agreement. Borrowings may be made for temporary financing needs. Interest is charged to each fund, based on its borrowings, generally at a rate equal to the highest of one month LIBOR, the Federal Funds Effective Rate and the Overnight Bank Funding Rate, plus an agreed upon spread. A commitment fee, based on the average daily, unused portion of the committed line of credit, is allocated among the participating funds. In addition, the fund and other funds managed by MFS have established unsecured uncommitted borrowing arrangements with certain banks for temporary financing needs. Interest is charged to each fund, based on its borrowings, at rates equal to customary reference rates plus an agreed upon spread. For the year ended December 31, 2019, the fund’s commitment fee and interest expense were $9,712 and $0, respectively, and are included in “Miscellaneous” expense in the Statement of Operations.
| (7) | | Investments in Affiliated Issuers |
An affiliated issuer may be considered one in which the fund owns 5% or more of the outstanding voting securities, or a company which is under common control. For the purposes of this report, the following were affiliated issuers:
| | | | | | | | | | | | | | | | | | | | | | | | |
| Affiliated Issuers | | Beginning
Value | | | Purchases | | | Sales Proceeds | | | Realized
Gain
(Loss) | | | Change in
Unrealized
Appreciation or
Depreciation | | | Ending
Value | |
| MFS Institutional Money Market Portfolio | | | $30,545,398 | | | | $177,204,255 | | | | $207,737,739 | | | | $1,580 | | | | $— | | | | $13,494 | |
| | | | | | |
| Affiliated Issuers | | | | | | | | | | | | | | Dividend
Income | | | Capital Gain
Distributions | |
| MFS Institutional Money Market Portfolio | | | | | | | | | | | | $341,847 | | | | $— | |
18
MFS Growth Series
REPORT OF INDEPENDENT REGISTERED PUBLIC ACCOUNTING FIRM
To the Board of Trustees of MFS Variable Insurance Trust and the Shareholders of MFS Growth Series:
Opinion on the Financial Statements and Financial Highlights
We have audited the accompanying statement of assets and liabilities of MFS Growth Series (the “Fund”), including the portfolio of investments, as of December 31, 2019, the related statement of operations for the year then ended, the statements of changes in net assets for each of the two years in the period then ended, the financial highlights for each of the five years in the period then ended, and the related notes. In our opinion, the financial statements and financial highlights present fairly, in all material respects, the financial position of the Fund as of December 31, 2019, and the results of its operations for the year then ended, the changes in its net assets for each of the two years in the period then ended, and the financial highlights for each of the five years in the period then ended, in conformity with accounting principles generally accepted in the United States of America.
Basis for Opinion
These financial statements and financial highlights are the responsibility of the Fund’s management. Our responsibility is to express an opinion on the Fund’s financial statements and financial highlights based on our audits. We are a public accounting firm registered with the Public Company Accounting Oversight Board (United States) (PCAOB) and are required to be independent with respect to the Fund in accordance with the U.S. federal securities laws and the applicable rules and regulations of the Securities and Exchange Commission and the PCAOB.
We conducted our audits in accordance with the standards of the PCAOB. Those standards require that we plan and perform the audit to obtain reasonable assurance about whether the financial statements and financial highlights are free of material misstatement, whether due to error or fraud. The Fund is not required to have, nor were we engaged to perform, an audit of its internal control over financial reporting. As part of our audits we are required to obtain an understanding of internal control over financial reporting but not for the purpose of expressing an opinion on the effectiveness of the Fund’s internal control over financial reporting. Accordingly, we express no such opinion.
Our audits included performing procedures to assess the risks of material misstatement of the financial statements and financial highlights, whether due to error or fraud, and performing procedures that respond to those risks. Such procedures included examining, on a test basis, evidence regarding the amounts and disclosures in the financial statements and financial highlights. Our audits also included evaluating the accounting principles used and significant estimates made by management, as well as evaluating the overall presentation of the financial statements and financial highlights. Our procedures included confirmation of securities owned as of December 31, 2019, by correspondence with the custodian. We believe that our audits provide a reasonable basis for our opinion.
DELOITTE & TOUCHE LLP
Boston, Massachusetts
February 14, 2020
We have served as the auditor of one or more of the MFS investment companies since 1924.
19
MFS Growth Series
TRUSTEES AND OFFICERS – IDENTIFICATION AND BACKGROUND
The Trustees and Officers of the Trust, as of February 1, 2020, are listed below, together with their principal occupations during the past five years. (Their titles may have varied during that period.) The address of each Trustee and Officer is 111 Huntington Avenue, Boston, Massachusetts 02199-7618.
| | | | | | | | | | |
Name, Age | | Position(s)
Held with Fund | | Trustee/Officer
Since (h) | | Number of MFS Funds
overseen by the
Trustee | | Principal Occupations
During the Past Five Years | | Other Directorships During the Past Five Years (j) |
| INTERESTED TRUSTEES |
Robert J. Manning (k)
(age 56) | | Trustee | | February 2004 | | 133 | | Massachusetts Financial Services Company, Executive Chairman (since January 2017); Director; Chairman of the Board; Chief Executive Officer (until 2015);Co-Chief Executive Officer(2015-2016) | | N/A |
| | | | | |
Robin A. Stelmach (k) (age 58) | | Trustee | | January 2014 | | 133 | | Massachusetts Financial Services Company, Vice Chair (since January 2017); Chief Operating Officer and Executive Vice President (until January 2017) | | N/A |
|
| INDEPENDENT TRUSTEES |
John P. Kavanaugh (age 65) | | Trustee and Chair of Trustees | | January 2009 | | 133 | | Private investor | | N/A |
| | | | | |
Steven E. Buller (age 68) | | Trustee | | February 2014 | | 133 | | Financial Accounting Standards Advisory Council, Chairman(2014-2015); Public Company Accounting Oversight Board, Standing Advisory Group, Member (until 2014); BlackRock, Inc. (investment management), Managing Director (until 2014), BlackRock Finco UK (investment management), Director (until 2014) | | N/A |
| | | | | |
John A. Caroselli (age 65) | | Trustee | | March 2017 | | 133 | | JC Global Advisors, LLC (management consulting), President (since 2015); First Capital Corporation (commercial finance), Executive Vice President (until 2015) | | N/A |
| | | | | |
Maureen R. Goldfarb (age 64) | | Trustee | | January 2009 | | 133 | | Private investor | | N/A |
| | | | | |
Peter D. Jones
(age 64) | | Trustee | | January 2019 | | 133 | | Franklin Templeton Distributors, Inc. (investment management), President (until 2015); Franklin Templeton Institutional, LLC (investment management), Chairman (until 2015) | | N/A |
| | | | | |
James W. Kilman, Jr.
(age 58) | | Trustee | | January 2019 | | 133 | | Burford Capital Limited (finance and investment management), Chief Financial Officer (since 2019); KielStrand Capital LLC (family office), Chief Executive Officer (since 2016); Morgan Stanley & Co. (financial services), Vice Chairman of Investment Banking,Co-Head of Diversified Financials Coverage – Financial Institutions Investment Banking Group (until 2016) | | Alpha-En Corporation, Director (2016-2019) |
20
MFS Growth Series
Trustees and Officers – continued
| | | | | | | | | | |
Name, Age | | Position(s)
Held with Fund | | Trustee/Officer
Since (h) | | Number of MFS Funds
overseen by the
Trustee | | Principal Occupations
During the Past Five Years | | Other Directorships During the Past Five Years (j) |
Clarence Otis, Jr. (age 63) | | Trustee | | March 2017 | | 133 | | Darden Restaurants, Inc., Chief Executive Officer (until 2014) | | VF Corporation, Director; Verizon Communications, Inc., Director; The Travelers Companies, Director; Federal Reserve Bank of Atlanta, Director (until 2015) |
| | | | | |
Maryanne L. Roepke (age 63) | | Trustee | | May 2014 | | 133 | | American Century Investments (investment management), Senior Vice President and Chief Compliance Officer (until 2014) | | N/A |
| | | | | |
Laurie J. Thomsen
(age 62) | | Trustee | | March 2005 | | 133 | | Private investor | | The Travelers Companies, Director; Dycom Industries, Inc., Director (since 2015) |
| | | | | | | | |
Name, Age | | Position(s)
Held with Fund | | Trustee/Officer
Since (h) | | Number of
MFS Funds
for which the
Person is an
Officer | | Principal Occupations During the Past Five Years |
| OFFICERS | | | | | | |
Christopher R. Bohane (k)
(age 46) | | Assistant Secretary and Assistant Clerk | | July 2005 | | 133 | | Massachusetts Financial Services Company, Vice President and Assistant General Counsel |
| | | | |
Kino Clark (k) (age 51) | | Assistant Treasurer | | January 2012 | | 133 | | Massachusetts Financial Services Company, Vice President |
| | | | |
John W. Clark, Jr. (k) (age 52) | | Assistant Treasurer | | April 2017 | | 133 | | Massachusetts Financial Services Company, Vice President (since March 2017); Deutsche Bank (financial services), Department Head –Treasurer’s Office (until February 2017) |
| | | | |
Thomas H. Connors (k) (age 60) | | Assistant Secretary and Assistant Clerk | | September 2012 | | 133 | | Massachusetts Financial Services Company, Vice President and Senior Counsel |
| | | | |
David L. DiLorenzo (k)
(age 51) | | President | | July 2005 | | 133 | | Massachusetts Financial Services Company, Senior Vice President |
| | | | |
Heidi W. Hardin (k) (age 52) | | Secretary and Clerk | | April 2017 | | 133 | | Massachusetts Financial Services Company, Executive Vice President and General Counsel (since March 2017); Harris Associates (investment management), General Counsel (from September 2015 to January 2017); Janus Capital Management LLC (investment management), Senior Vice President and General Counsel (until September 2015) |
| | | | |
Brian E. Langenfeld (k) (age 46) | | Assistant
Secretary and Assistant Clerk | | June 2006 | | 133 | | Massachusetts Financial Services Company, Vice President and Senior Counsel |
| | | | |
Amanda S. Mooradian (k) (age 40) | | Assistant
Secretary and Assistant Clerk | | September 2018 | | 133 | | Massachusetts Financial Services Company, Assistant Vice President and Counsel |
| | | | |
Susan A. Pereira (k)
(age 49) | | Assistant
Secretary and Assistant Clerk | | July 2005 | | 133 | | Massachusetts Financial Services Company, Vice President and Assistant General Counsel |
| | | | |
Kasey L. Phillips (k) (age 49) | | Assistant Treasurer | | September 2012 | | 133 | | Massachusetts Financial Services Company, Vice President |
| | | | |
Matthew A. Stowe (k) (age 45) | | Assistant Secretary and Assistant Clerk | | October 2014 | | 133 | | Massachusetts Financial Services Company, Vice President and Assistant General Counsel |
21
MFS Growth Series
Trustees and Officers – continued
| | | | | | | | |
Name, Age | | Position(s)
Held with Fund | | Trustee/Officer
Since (h) | | Number of
MFS Funds
for which the
Person is an
Officer | | Principal Occupations During the Past Five Years |
Martin J. Wolin (k) (age 52) | | Chief Compliance Officer | | July 2015 | | 133 | | Massachusetts Financial Services Company, Senior Vice President and Chief Compliance Officer (since July 2015); Mercer (financial service provider), Chief Risk and Compliance Officer, North America and Latin America (until June 2015) |
| | | | |
James O. Yost (k)
(age 59) | | Treasurer | | September 1990 | | 133 | | Massachusetts Financial Services Company, Senior Vice President |
| (h) | Date first appointed to serve as Trustee/officer of an MFS Fund. Each Trustee has served continuously since appointment unless indicated otherwise. For the period from December 15, 2004 until February 22, 2005, Mr. Manning served as Advisory Trustee. From January 2012 through December 2016, Messrs. DiLorenzo and Yost served as Treasurer and Deputy Treasurer of the Funds, respectively. |
| (j) | Directorships or trusteeships of companies required to report to the Securities and Exchange Commission (i.e., “public companies”). |
| (k) | “Interested person” of the Trust within the meaning of the Investment Company Act of 1940 (referred to as the 1940 Act), which is the principal federal law governing investment companies like the fund, as a result of a position with MFS. The address of MFS is 111 Huntington Avenue, Boston, Massachusetts 02199-7618. |
Each Trustee (other than Messrs. Jones and Kilman) has been elected by shareholders and each Trustee and Officer holds office until his or her successor is chosen and qualified or until his or her earlier death, resignation, retirement or removal. Messrs. Jones and Kilman became Trustees of the Funds on January 1, 2019. The Trust does not hold annual meetings for the purpose of electing Trustees, and Trustees are not elected for fixed terms. Under the terms of the Board’s retirement policy, an Independent Trustee shall retire at the end of the calendar year in which he or she reaches the earlier of 75 years of age or 15 years of service on the Board (or, in the case of any Independent Trustee who joined the Board prior to 2015, 20 years of service on the Board).
Messrs. Buller, Kilman and Otis and Ms. Roepke are members of the Trust’s Audit Committee.
Each of the Interested Trustees and certain Officers hold comparable officer positions with certain affiliates of MFS.
The Statement of Additional Information for a Fund includes further information about the Trustees and is available without charge upon request by calling1-800-225-2606.
| | |
Investment Adviser Massachusetts Financial Services Company 111 Huntington Avenue Boston, MA 02199-7618 | | Custodian State Street Bank and Trust Company 1 Lincoln Street Boston, MA 02111-2900 |
| |
Distributor MFS Fund Distributors, Inc. 111 Huntington Avenue Boston, MA 02199-7618 | | Independent Registered Public Accounting Firm Deloitte & Touche LLP 200 Berkeley Street Boston, MA 02116 |
| |
Portfolio Manager(s) Eric Fischman Paul Gordon | | |
22
MFS Growth Series
BOARD REVIEW OF INVESTMENT ADVISORY AGREEMENT
MFS Growth Series
The Investment Company Act of 1940 requires that both the full Board of Trustees and a majority of thenon-interested (“independent”) Trustees, voting separately, annually approve the continuation of the Fund’s investment advisory agreement with MFS. The Trustees consider matters bearing on the Fund and its advisory arrangements at their meetings throughout the year, including a review of performance data at each regular meeting. In addition, the independent Trustees met several times over the course of three months beginning in May and ending in July, 2019 (“contract review meetings”) for the specific purpose of considering whether to approve the continuation of the investment advisory agreement for the Fund and the other investment companies that the Board oversees (the “MFS Funds”). The independent Trustees were assisted in their evaluation of the Fund’s investment advisory agreement by independent legal counsel, from whom they received separate legal advice and with whom they met separately from MFS during various contract review meetings. The independent Trustees were also assisted in this process by the MFS Funds’ Independent Senior Officer, a senior officer appointed by and reporting to the independent Trustees.
In connection with their deliberations regarding the continuation of the investment advisory agreement, the Trustees, including the independent Trustees, considered such information and factors as they believed, in light of the legal advice furnished to them and their own business judgment, to be relevant. The investment advisory agreement for the Fund was considered separately, although the Trustees also took into account the common interests of all MFS Funds in their review. As described below, the Trustees considered the nature, quality, and extent of the various investment advisory, administrative, and shareholder services performed by MFS under the existing investment advisory agreement and other arrangements with the Fund.
In connection with their contract review meetings, the Trustees received and relied upon materials that included, among other items: (i) information provided by Broadridge Financial Solutions, Inc. (“Broadridge”), an independent third party, on the investment performance of the Fund for various time periods ended December 31, 2018 and the investment performance of a group of funds with substantially similar investment classifications/objectives (the “Broadridge performance universe”), (ii) information provided by Broadridge on the Fund’s advisory fees and other expenses and the advisory fees and other expenses of comparable funds identified by Broadridge as well as all other funds in the same investment classification/category (the “Broadridge expense group and universe”), (iii) information provided by MFS on the advisory fees of portfolios of other clients of MFS, including institutional separate accounts and other clients, (iv) information as to whether and to what extent applicable expense waivers, reimbursements or fee “breakpoints” are observed for the Fund, (v) information regarding MFS’ financial results and financial condition, including MFS’ and certain of its affiliates’ estimated profitability from services performed for the Fund and the MFS Funds as a whole, and compared to MFS’ institutional business, (vi) MFS’ views regarding the outlook for the mutual fund industry and the strategic business plans of MFS, (vii) descriptions of various functions performed by MFS for the Funds, such as compliance monitoring and portfolio trading practices, and (viii) information regarding the overall organization of MFS, including information about MFS’ senior management and other personnel providing investment advisory, administrative and other services to the Fund and the other MFS Funds. The comparative performance, fee and expense information prepared and provided by Broadridge was not independently verified and the independent Trustees did not independently verify any information provided to them by MFS.
The Trustees’ conclusion as to the continuation of the investment advisory agreement was based on a comprehensive consideration of all information provided to the Trustees and not the result of any single factor. Some of the factors that figured particularly in the Trustees’ deliberations are described below, although individual Trustees may have evaluated the information presented differently from one another, giving different weights to various factors. It is also important to recognize that the fee arrangements for the Fund and other MFS Funds are the result of years of review and discussion between the independent Trustees and MFS, that certain aspects of such arrangements may receive greater scrutiny in some years than in others, and that the Trustees’ conclusions may be based, in part, on their consideration of these same arrangements during the course of the year and in prior years.
Based on information provided by Broadridge and MFS, the Trustees reviewed the Fund’s total return investment performance as well as the Broadridge performance universe over various time periods. The Trustees placed particular emphasis on the total return performance of the Fund’s Initial Class shares in comparison to the performance of funds in its Broadridge performance universe over the five-year period ended December 31, 2018, which the Trustees believed was a long enough period to reflect differing market conditions. The total return performance of the Fund’s Initial Class shares was in the 2nd quintile relative to the other funds in the universe for this five-year period (the 1st quintile being the best performers and the 5th quintile being the worst performers). The total return performance of the Fund’s Initial Class shares was in the 1st quintile for theone-year period and the 2nd quintile for the three-year period ended December 31, 2018 relative to the Broadridge performance universe. Because of the passage of time, these performance results may differ from the performance results for more recent periods, including those shown elsewhere in this report.
In the course of their deliberations, the Trustees took into account information provided by MFS in connection with the contract review meetings, as well as during investment review meetings conducted with portfolio management personnel during the course of the year regarding the Fund’s performance. After reviewing these and related factors, the Trustees concluded, within the context of their overall conclusions regarding the investment advisory agreement, that they were satisfied with MFS’ responses and efforts relating to investment performance.
23
MFS Growth Series
Board Review of Investment Advisory Agreement – continued
In assessing the reasonableness of the Fund’s advisory fee, the Trustees considered, among other information, the Fund’s advisory fee and the total expense ratio of the Fund’s Initial Class shares as a percentage of average daily net assets and the advisory fee and total expense ratios of the Broadridge expense group based on information provided by Broadridge. The Trustees considered that, according to the data provided by Broadridge (which takes into account any fee reductions or expense limitations that were in effect during the Fund’s last fiscal year), the Fund’s effective advisory fee rate and total expense ratio were each approximately at the Broadridge expense group median.
The Trustees also considered the advisory fees charged by MFS to any institutional separate accounts advised by MFS (“separate accounts”) and unaffiliated investment companies for which MFS serves as subadviser (“subadvised funds”) that have comparable investment strategies to the Fund, if any. In comparing these fees, the Trustees considered information provided by MFS as to the generally broader scope of services provided by MFS to the Fund, as well as the more extensive regulatory burdens imposed on MFS in managing the Fund, in comparison to separate accounts and subadvised funds. The Trustees also considered the higher demands placed on MFS’ investment personnel and trading infrastructure as a result of the daily cashin-flows andout-flows of the Fund in comparison to separate accounts.
The Trustees also considered whether the Fund may benefit from any economies of scale in the management of the Fund in the event of growth in assets of the Fund and/or growth in assets of the MFS Funds as a whole. They noted that the Fund’s advisory fee rate schedule is subject to a contractual breakpoint that reduces the Fund’s advisory fee rate on average daily net assets over $1 billion. The Trustees also noted that MFS has agreed in writing to waive a portion of the management fees of certain MFS Funds, including the Fund, if the total combined assets of certain funds within the MFS Funds’ complex increase above agreed upon thresholds (the “group fee waiver”), enabling the Fund’s shareholders to share in the benefits from any economies of scale at the complex level. The group fee waiver is reviewed and renewed annually between the Board and MFS. The Trustees concluded that the breakpoint and the group fee waiver were sufficient to allow the Fund to benefit from economies of scale as its assets and overall complex assets grow.
The Trustees also considered information prepared by MFS relating to MFS’ costs and profits with respect to the Fund, the MFS Funds considered as a group, and other investment companies and accounts advised by MFS, as well as MFS’ methodologies used to determine and allocate its costs to the MFS Funds, the Fund and other accounts and products for purposes of estimating profitability.
After reviewing these and other factors described herein, the Trustees concluded, within the context of their overall conclusions regarding the investment advisory agreement, that the advisory fees charged to the Fund represent reasonable compensation in light of the services being provided by MFS to the Fund.
In addition, the Trustees considered MFS’ resources and related efforts to continue to retain, attract and motivate capable personnel to serve the Fund. The Trustees also considered current and developing conditions in the financial services industry, including the presence of large and well-capitalized companies which are spending, and appear to be prepared to continue to spend, substantial sums to engage personnel and to provide services to competing investment companies. In this regard, the Trustees also considered the financial resources of MFS and its ultimate parent, Sun Life Financial Inc. The Trustees also considered the advantages and possible disadvantages to the Fund of having an adviser that also serves other investment companies as well as other accounts.
The Trustees also considered the nature, quality, cost, and extent of administrative, transfer agency, and distribution services provided to the Fund by MFS and its affiliates under agreements and plans other than the investment advisory agreement, including any12b-1 fees the Fund pays to MFS Fund Distributors, Inc., an affiliate of MFS. The Trustees also considered the nature, extent and quality of certain other services MFS performs or arranges for on the Fund’s behalf, which may include securities lending programs, directed expense payment programs, class action recovery programs, and MFS’ interaction with third-party service providers, principally custodians andsub-custodians. The Trustees concluded that the variousnon-advisory services provided by MFS and its affiliates on behalf of the Fund were satisfactory.
The Trustees consideredso-called“fall-out benefits” to MFS such as reputational value derived from serving as investment manager to the MFS Funds. The Trustees also considered that, effective January 3, 2018, MFS had discontinued its historic practice of obtaining investment research from portfolio brokerage commissions paid by certain MFS Funds and would thereafter directly pay for or voluntarily reimburse a Fund, if applicable, for the costs of external research acquired through the use of the Fund’s portfolio brokerage commissions.
Based on their evaluation of factors that they deemed to be material, including those factors described above, the Board of Trustees, including the independent Trustees, concluded that the Fund’s investment advisory agreement with MFS should be continued for an additionalone-year period, commencing August 1, 2019.
24
MFS Growth Series
PROXY VOTING POLICIES AND INFORMATION
MFS votes proxies on behalf of the fund pursuant to proxy voting policies and procedures that are available without charge, upon request, by calling 1-800-225-2606, by visitingmfs.com/proxyvoting, or by visiting the SEC’s Web site athttp://www.sec.gov.
Information regarding how the fund voted proxies relating to portfolio securities during the most recent twelve-month period ended June 30 is available by August 31 of each year without charge by visitingmfs.com/proxyvoting, or by visiting the SEC’s Web site athttp://www.sec.gov.
QUARTERLY PORTFOLIO DISCLOSURE
The fund files a complete schedule of portfolio holdings with the SEC for the first and third quarters of each fiscal year as an exhibit to its reports on Form N-PORT. The fund’s Form N-PORT reports are available on the SEC’s website athttp://www.sec.gov. A shareholder can obtain the portfolio holdings report for the first and third quarters of the fund’s fiscal year atmfs.com/vit1 by choosing the fund’s name and then selecting the “Resources” tab and clicking on “Prospectus and Reports”.
FURTHER INFORMATION
From time to time, MFS may post important information about the fund or the MFS funds on the MFS web site (mfs.com). This information is available at https://www.mfs.com/en-us/what-we-do/announcements.html or atmfs.com/vit1 by choosing the fund’s name.
INFORMATION ABOUT FUND CONTRACTS AND LEGAL CLAIMS
The fund has entered into contractual arrangements with an investment adviser, administrator, distributor, shareholder servicing agent, 529 program manager (if applicable), and custodian who each provide services to the fund. Unless expressly stated otherwise, shareholders are not parties to, or intended beneficiaries of these contractual arrangements, and these contractual arrangements are not intended to create any shareholder right to enforce them against the service providers or to seek any remedy under them against the service providers, either directly or on behalf of the fund.
Under the Trust’s By-Laws and Declaration of Trust, any claims asserted against or on behalf of the MFS Funds, including claims against Trustees and Officers, must be brought in state and federal courts located within the Commonwealth of Massachusetts.
FEDERAL TAX INFORMATION (unaudited)
The following information is provided pursuant to provisions of the Internal Revenue Code.
The fund designates $167,569,000 as capital gain dividends paid during the fiscal year.
25
rev. 3/16
| | | | |
| | | |
| FACTS | | WHAT DOES MFS DO WITH YOUR
PERSONAL INFORMATION? | |  |
| | |
| Why? | | Financial companies choose how they share your personal information. Federal law gives consumers the right to limit some but not all sharing. Federal law also requires us to tell you how we collect, share, and protect your personal information. Please read this notice carefully to understand what we do. |
| | |
| What? | | The types of personal information we collect and share depend on the product or service you have with us. This information can include: • Social Security number and account balances • Account transactions and transaction history • Checking account information and wire transfer instructions When you areno longer our customer, we continue to share your information as described in this notice. |
| | |
| How? | | All financial companies need to share customers’ personal information to run their everyday business. In the section below, we list the reasons financial companies can share their customers’ personal information; the reasons MFS chooses to share; and whether you can limit this sharing. |
| | | | |
Reasons we can share your
personal information | | Does MFS share? | | Can you limit this
sharing? |
For our everyday business purposes – such as to process your transactions, maintain your account(s), respond to court orders and legal investigations, or report to credit bureaus | | Yes | | No |
For our marketing purposes – to offer our products and services to you | | No | | We don’t share |
| For joint marketing with other financial companies | | No | | We don’t share |
For our affiliates’ everyday business purposes – information about your transactions and experiences | | No | | We don’t share |
For our affiliates’ everyday business purposes – information about your creditworthiness | | No | | We don’t share |
| For nonaffiliates to market to you | | No | | We don’t share |
| | |
| | |
| Questions? | | Call800-225-2606 or go tomfs.com. |
26
| | |
| Who we are |
| Who is providing this notice? | | MFS Funds, MFS Investment Management, MFS Institutional Advisors, Inc., and MFS Heritage Trust Company. |
| | |
| What we do |
| How does MFS protect my personal information? | | To protect your personal information from unauthorized access and use, we use security measures that comply with federal law. These measures include procedural, electronic, and physical safeguards for the protection of the personal information we collect about you. |
How does MFS
collect my personal information? | | We collect your personal information, for example, when you • open an account or provide account information • direct us to buy securities or direct us to sell your securities • make a wire transfer We also collect your personal information from others, such as credit bureaus, affiliates, or other companies. |
| Why can’t I limit all sharing? | | Federal law gives you the right to limit only • sharing for affiliates’ everyday business purposes – information about your creditworthiness • affiliates from using your information to market to you • sharing for nonaffiliates to market to you State laws and individual companies may give you additional rights to limit sharing. |
| | |
| Definitions |
| Affiliates | | Companies related by common ownership or control. They can be financial and nonfinancial companies. • MFS does not share personal information with affiliates, except for everyday business purposes as described on page one of this notice. |
| Nonaffiliates | | Companies not related by common ownership or control. They can be financial and nonfinancial companies. • MFS does not share with nonaffiliates so they can market to you. |
| Joint marketing | | A formal agreement between nonaffiliated financial companies that together market financial products or services to you. • MFS doesn’t jointly market. |
| | |
| Other important information |
| If you own an MFS product or receive an MFS service in the name of a third party such as a bank or broker-dealer, their privacy policy may apply to you instead of ours. |
27
Annual Report
December 31, 2019

MFS® Investors Trust Series

MFS® Variable Insurance Trust
Beginning on January 1, 2021, as permitted by regulations adopted by the U.S. Securities and Exchange Commission, the insurance company that offers your contract may determine that it will no longer send you paper copies of the fund’s annual and semiannual shareholder reports unless you specifically request paper copies from the insurance company or from your financial intermediary. Instead, the shareholder reports will be made available on a Web site (insurancefunds.mfs.com or other Web site of which you will be notified), and the insurance company will notify you by mail each time a report is posted and provide you with a Web site link to access the report. Instructions for requesting paper copies will be provided by your insurance company or financial intermediary.
If you already elected to receive shareholder reports by email, you will not be affected by this change and you need not take any action. If your insurance company or financial intermediary offers electronic delivery, you may elect to receive shareholder reports and other communications from the insurance company or financial intermediary by email by following the instructions provided by the insurance company or financial intermediary.
Beginning on January 1, 2019, you may elect to receive all future reports in paper free of charge from the insurance company or financial intermediary. You can inform the insurance company or financial intermediary that you wish to continue receiving paper copies of your shareholder reports by contacting your insurance company or financial intermediary. Your election to receive reports in paper will apply to all funds held in your account with your insurance company or financial intermediary.
VGI-ANN
MFS® Investors Trust Series
CONTENTS
The report is prepared for the general information of contract owners. It is authorized for distribution to prospective investors only when preceded or accompanied by a current prospectus.
NOT FDIC INSURED• MAY LOSE VALUE• NO BANK OR CREDIT UNION GUARANTEE• NOT A DEPOSIT• NOT INSURED BY ANY FEDERAL GOVERNMENT AGENCY OR NCUA/NCUSIF
MFS Investors Trust Series
LETTER FROM THE EXECUTIVE CHAIR

Dear Contract Owners:
Slowing global growth, low inflation, and trade friction between the United States and China have been hallmarks of the past 12 months. After experiencing an uptick in market volatility in late 2018, markets steadied for most of 2019, thanks in large measure to the adoption of a dovish policy stance on the part of global central banks, focused on supporting economic growth. Negotiations aimed at a “phase one” trade deal between the U.S. and China bore fruit at the end of the period, boosting investor sentiment, while signs of stability emerging from the global manufacturing sector also lifted spirits. Uncertainty over Brexit, along with the ripple effects from the trade conflict, hampered business confidence and investment in the United Kingdom and Europe for much of the period, though investors expect greater clarity regarding Brexit as a result of December’s general election. The pro-Brexit Conservative Party won the election by a comfortable margin and set the stage for the U.K.’s departure from the EU at the end of January.
Markets expect the longest economic expansion in U.S. history will continue, albeit at a slower pace, as trade tensions recede. In an effort to prolong the expansion, the U.S. Federal Reserve lowered interest rates three times between July and October and the European Central Bank loosened policy in September. While the global monetary policy backdrop remains quite accommodative, signs of easing trade tensions and fading global recession fears led to improved market sentiment in late 2019 as investors grew less risk averse. In early 2020, an outbreak of coronavirus emanating from China reintroduced global growth fears, causing an uptick in volatility.
Here at MFS®, we aim to help our clients navigate the growing complexity of the markets and world economies. Our long-term investment philosophy and commitment to the responsible allocation of capital allow us to tune out the noise and uncover what we believe are the best, most durable investment opportunities in the market. Through our powerful global investment platform, we combine collective expertise, thoughtful risk management and long-term discipline to create sustainable value for investors.
Respectfully,

Robert J. Manning
Executive Chair
MFS Investment Management
February 14, 2020
The opinions expressed in this letter are subject to change and may not be relied upon for investment advice. No forecasts can be guaranteed.
1
MFS Investors Trust Series
PORTFOLIO COMPOSITION
Portfolio structure
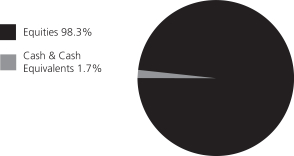
| | | | |
| Top ten holdings | | | | |
| Alphabet, Inc., “A” | | | 3.4% | |
| JPMorgan Chase & Co. | | | 3.1% | |
| Microsoft Corp. | | | 3.0% | |
| Medtronic PLC | | | 2.6% | |
| Mastercard, Inc., “A” | | | 2.5% | |
| Johnson & Johnson | | | 2.5% | |
| Bank of America Corp. | | | 2.4% | |
| Visa, Inc., “A” | | | 2.3% | |
| American Tower Corp., REIT | | | 2.3% | |
| Thermo Fisher Scientific, Inc. | | | 2.1% | |
| | | | |
| GICS equity sectors (g) | | | | |
| Information Technology | | | 23.0% | |
| Health Care | | | 16.2% | |
| Financials | | | 12.9% | |
| Communication Services | | | 10.2% | |
| Consumer Discretionary | | | 8.5% | |
| Industrials | | | 8.3% | |
| Consumer Staples | | | 7.7% | |
| Materials | | | 4.5% | |
| Energy | | | 4.1% | |
| Real Estate | | | 2.4% | |
| Utilities | | | 0.5% | |
| (g) | The Global Industry Classification Standard (GICS®) was developed by and/or is the exclusive property of MSCI, Inc. and S&P Global Market Intelligence Inc. (“S&P Global Market Intelligence”). GICS is a service mark of MSCI and S&P Global Market Intelligence and has been licensed for use by MFS. |
Cash & Cash Equivalents includes any cash, investments in money market funds, short-term securities, and other assets less liabilities. Please see the Statement of Assets and Liabilities for additional information related to the fund’s cash position and other assets and liabilities.
Percentages are based on net assets as of December 31, 2019.
The portfolio is actively managed and current holdings may be different.
2
MFS Investors Trust Series
MANAGEMENT REVIEW
Summary of Results
For the twelve months ended December 31, 2019, Initial Class shares of the MFS Investors Trust Series (fund) provided a total return of 31.58%, while Service Class shares of the fund provided a total return of 31.25%. These compare with a return of 31.49% over the same period for the fund’s benchmark, the Standard & Poor’s 500 Stock Index (S&P 500 Index).
Market Environment
Fading fears of a near-term global recession, the announcement of a partial trade deal between the United States and China and the decline in uncertainty over Brexit helped bolster market sentiment late in the period. Changes in market sentiment, largely driven by uncertainty over the outcome of trade negotiations between the US and China, had contributed to periodic bouts of volatility during the reporting period. The global economy decelerated, led by weakness in China and Europe, although the pace of the slowdown moderated late in the period amid nascent signs of stabilization in the manufacturing sector.
The deteriorating global growth backdrop, along with declining inflationary pressures, prompted the US Federal Reserve to adopt a more dovish posture beginning in early 2019, resulting in the first interest rate cut in over a decade at the end of July, followed by additional cuts in September and October. The Fed’s actions led to a sharp decline in long-term interest rates during the period’s second half, causing the inversion of portions of the US Treasury yield curve for a time. Amid an improvement in risk sentiment in Q4 2019 and indications of a bottoming in growth and a potential upturn in activity, the Fed indicated in October that further rate cuts were unlikely unless the outlook for the economy materially worsened.
Globally, central banks have tilted more dovish as well, with the European Central Bank unveiling a package of easing measures, which included putting overnight rates deeper into negative territory, restarting its bond-buying program and lengthening the term of cheap loans to banks to three years from two. The central banks of India and Australia are among those that have cut rates several times in recent months, although China has been more cautious in increasing liquidity as it keeps trying to deleverage its economy, cutting rates only marginally.
Emerging markets experienced considerable volatility through the end of 2018, as tighter global financial conditions exposed structural weakness in some countries. Those conditions improved in 2019 as the Fed became more dovish. Notwithstanding the periodic headwinds on market sentiment from significant trade friction between the US and China over much of the year, emerging market hard currency debt and local rates benefited from relatively cheap valuations at the beginning of the period and easier global monetary conditions. These factors, plus the fading of certain global risk factors mentioned above, hastened spread tightening in the latter part of the period. At the same time, idiosyncratic risks spiked in some countries (e.g., Argentina and Lebanon), contributing to increased dispersion in performance among sovereign assets.
Detractors from Performance
Security selection in theinformation technologysector detracted from performance relative to the S&P 500 Index. Within this sector, the fund’s underweight positions in computer and personal electronics maker Apple and software giant Microsoft weakened relative returns. The stock price of Apple advanced during the reporting period as the company’s revenues came in higher than consensus estimates, driven by stronger-than-expected demand in its wearable technology and services segments. Additionally, overweight positions in information technology company DXC Technology (h) and custom IT consulting and technology services provider Cognizant Technology Solutions held back relative returns.
Stock selection in theenergysector also weighed on relative performance. Within this sector, an overweight position in energy exploration and production company EOG Resources, and the fund’s holdings of core and fluid analysis provider in the petroleum industry Core Laboratories (b) (Netherlands), hampered relative results. The share price of EOG Resources came under pressure after management cut its 2019 oil and gas production guidance figures to below market estimates.
Elsewhere, the timing of the fund’s ownership in shares of biotechnology company Biogen (h) hurt relative returns. Despite Biogen’s stock price recovery towards the end of the reporting period, early weakness caused by an announcement that the company would discontinue the development of its Alzheimer’s treatment, after trial data indicated the drugs were unlikely to succeed, held back its overall stock price performance. The fund’s holdings of electronic brokerage firm TD Ameritrade Holding (b) and wine and alcoholic beverage producer Pernod Ricard (b) (France) also weighed on relative returns.
The fund’s cash and/or cash equivalents position during the period detracted from relative performance. Under normal market conditions, the fund strives to be fully invested and generally holds cash to buy new holdings and to provide liquidity. In a period when equity markets rose, as measured by the fund’s benchmark, holding cash hurt performance versus the benchmark, which has no cash position.
Contributors to Performance
Stock selection in thehealth care, financialsandconsumer discretionary sectors contributed to relative performance. Within thehealth caresector, not owning shares of pharmaceutical giant Pfizer, and an overweight position in health care tools company
3
MFS Investors Trust Series
Management Review – continued
Danaher, aided relative returns. The share price of Pfizer depreciated after the company recorded sales that were shy of market expectations, owing to weakness in its legacy product sales. Pfizer also cut its fiscal-year 2019 guidance to reflect the integration of a joint venture with GlaxoSmithKline and the acquisition of Array BioPharma, which further pressured the stock. Within thefinancialssector, the fund’s position in global alternative asset manager Blackstone Group (b), and not owning shares of insurance and investment firm Berkshire Hathaway, supported relative performance. Despite a challenging environment, the share price of Blackstone Group appreciated as the company delivered better-than-anticipated results, driven by strong growth infee-related earnings. The firm also benefited from growth in assets under management, with solid performance across most of its asset groups. Additionally, Blackstone Group’s decision to convert from a limited partnership structure to a C corporation broadened the firm’s potential ownership pool and further supported its share price performance. Within theconsumer discretionarysector, holdings of luxury goods company LVMH Moet Hennessy Louis Vuitton (b) (France), and not owning shares of internet retailer Amazon.com, also helped relative returns.
Security selection in thematerialssector further boosted relative results, led by the fund’s position in consumer goods packaging products manufacturer Crown Holdings (b). Shares of Crown Holdings advanced as the company reported strong cash flows and better-than-expected pricing impact from new contracts.
In other sectors, the fund’s overweight positions in broadcast and communication tower management firm American Tower and debit and credit transaction processing company Mastercard bolstered relative results. Not owning shares of integrated oil and gas company Exxon Mobil also helped relative performance.
Respectfully,
Portfolio Manager(s)
Kevin Beatty, Alison O’Neill Mackey, and Ted Maloney
| (b) | Security is not a benchmark constituent. |
| (h) | Security was not held in the portfolio at period end. |
The views expressed in this report are those of the portfolio manager(s) only through the end of the period of the report as stated on the cover and do not necessarily reflect the views of MFS or any other person in the MFS organization. These views are subject to change at any time based on market or other conditions, and MFS disclaims any responsibility to update such views. These views may not be relied upon as investment advice or an indication of trading intent on behalf of any MFS portfolio. References to specific securities are not recommendations of such securities, and may not be representative of any MFS portfolio’s current or future investments.
4
MFS Investors Trust Series
PERFORMANCE SUMMARY THROUGH 12/31/19
The following chart illustrates the historical performance of the fund in comparison to its benchmark(s). Benchmarks are unmanaged and may not be invested in directly. Benchmark returns do not reflect any fees or expenses. The performance of other share classes will be greater than or less than that of the class depicted below. (See Notes to Performance Summary.)
Performance data shown represents past performance and is no guarantee of future results. Investment return and principal value fluctuate so your units, when sold, may be worth more or less than the original cost; current performance may be lower or higher than quoted. The performance shown does not reflect the deduction of taxes, if any, that a contract holder would pay on fund distributions or the redemption of contract units. The returns for the fund shown also do not reflect the deduction of expenses associated with variable products, such as mortality and expense risk charges, separate account charges, and sales charges imposed by the insurance company separate accounts. Such expenses would reduce the overall returns shown.
Growth of a Hypothetical $10,000 Investment
Total Returns through 12/31/19
Average annual total returns
| | | | | | | | | | | | |
| | | Share Class | | Class Inception Date | | 1-yr | | 5-yr | | 10-yr | | |
| | | Initial Class | | 10/09/95 | | 31.58% | | 10.79% | | 12.23% | | |
| | | Service Class | | 5/01/00 | | 31.25% | | 10.51% | | 11.95% | | |
| | | | |
| Comparative benchmark(s) | | | | | | | | |
| | | Standard & Poor’s 500 Stock Index (f) | | 31.49% | | 11.70% | | 13.56% | | |
| (f) | Source: FactSet Research Systems Inc. |
Benchmark Definition(s)
Standard & Poor’s 500 Stock Index – a market capitalization-weighted index of 500 widely held equity securities, designed to measure broad U.S. equity performance. “Standard & Poor’s®” and “S&P®” are registered trademarks of Standard & Poor’s Financial Services LLC (“S&P”) and Dow Jones is a registered trademark of Dow Jones Trademark Holdings LLC (“Dow Jones”) and have been licensed for use by S&P Dow Jones Indices LLC and sublicensed for certain purposes by Massachusetts Financial Services Company. The S&P 500® is a product of S&P Dow Jones Indices LLC, and has been licensed for use by Massachusetts Financial Services Company. Massachusetts Financial Services Company’s product(s) is not sponsored, endorsed, sold, or promoted by S&P Dow Jones Indices LLC, Dow Jones, S&P, or their respective affiliates, and neither S&P Dow Jones Indices LLC, Dow Jones, S&P, nor their respective affiliates make any representation regarding the advisability of investing in such product(s).
It is not possible to invest directly in an index.
Notes to Performance Summary
Average annual total return represents the average annual change in value for each share class for the periods presented.
Performance results reflect any applicable expense subsidies and waivers in effect during the periods shown. Without such subsidies and waivers the fund’s performance results would be less favorable. Please see the prospectus and financial statements for complete details. All results are historical and assume the reinvestment of any dividends and capital gains distributions.
5
MFS Investors Trust Series
Performance Summary – continued
Performance results do not include adjustments made for financial reporting purposes in accordance with U.S. generally accepted accounting principles and may differ from amounts reported in the financial highlights.
From time to time the fund may receive proceeds from litigation settlements, without which performance would be lower.
6
MFS Investors Trust Series
EXPENSE TABLE
Fund Expenses Borne by the Contract Holders during the Period,
July 1, 2019 through December 31, 2019
As a contract holder of the fund, you incur ongoing costs, including management fees; distribution and/or service(12b-1) fees; and other fund expenses. This example is intended to help you understand your ongoing costs (in dollars) of investing in the fund and to compare these costs with the ongoing costs of investing in other mutual funds.
The example is based on an investment of $1,000 invested at the beginning of the period and held for the entire period July 1, 2019 through December 31, 2019.
Actual Expenses
The first line for each share class in the following table provides information about actual account values and actual expenses. You may use the information in this line, together with the amount you invested, to estimate the expenses that you paid over the period. Simply divide your account value by $1,000 (for example, an $8,600 account value divided by $1,000 = 8.6), then multiply the result by the number in the first line under the heading entitled “Expenses Paid During Period” to estimate the expenses you paid on your account during this period.
Hypothetical Example for Comparison Purposes
The second line for each share class in the following table provides information about hypothetical account values and hypothetical expenses based on the fund’s actual expense ratio and an assumed rate of return of 5% per year before expenses, which is not the fund’s actual return. The hypothetical account values and expenses may not be used to estimate the actual ending account balance or expenses you paid for the period. You may use this information to compare the ongoing costs of investing in the fund and other funds. To do so, compare this 5% hypothetical example with the 5% hypothetical examples that appear in the shareholder reports of the other funds.
Please note that the expenses shown in the table are meant to highlight the fund’s ongoing costs only and do not take into account the fees and expenses imposed under the variable contracts through which your investment in the fund is made. Therefore, the second line for each share class in the table is useful in comparing ongoing costs associated with an investment in vehicles (such as the fund) which fund benefits under variable annuity and variable life insurance contracts and to qualified pension and retirement plans only, and will not help you determine the relative total costs of investing in the fund through variable annuity and variable life insurance contracts. If the fees and expenses imposed under the variable contracts were included, your costs would have been higher.
| | | | | | | | | | | | | | | | | | |
| Share Class | | | | Annualized
Expense Ratio | | | Beginning
Account Value
7/01/19 | | | Ending Account Value
12/31/19 | | | Expenses Paid
During Period (p)
7/01/19-12/31/19 | |
| Initial Class | | Actual | | | 0.79% | | | | $1,000.00 | | | | $1,090.78 | | | | $4.16 | |
| | Hypothetical (h) | | | 0.79% | | | | $1,000.00 | | | | $1,021.22 | | | | $4.02 | |
| Service Class | | Actual | | | 1.04% | | | | $1,000.00 | | | | $1,089.16 | | | | $5.48 | |
| | Hypothetical (h) | | | 1.04% | | | | $1,000.00 | | | | $1,019.96 | | | | $5.30 | |
| (h) | 5% class return per year before expenses. |
| (p) | “Expenses Paid During Period” are equal to each class’s annualized expense ratio, as shown above, multiplied by the average account value over the period, multiplied by 184/365 (to reflect theone-half year period). |
7
MFS Investors Trust Series
PORTFOLIO OF INVESTMENTS – 12/31/19
The Portfolio of Investments is a complete list of all securities owned by your fund. It is categorized by broad-based asset classes.
| | | | | | | | |
| | |
| Issuer | | Shares/Par | | | Value ($) | |
| COMMON STOCKS – 98.3% | | | | | |
| Aerospace – 3.2% | | | | | | | | |
| Honeywell International, Inc. | | | 76,209 | | | $ | 13,488,993 | |
| United Technologies Corp. | | | 65,101 | | | | 9,749,526 | |
| | | | | | | | |
| | | | | | $ | 23,238,519 | |
| | | | | | | | |
| Alcoholic Beverages – 2.1% | | | | | |
| Diageo PLC | | | 168,454 | | | $ | 7,141,408 | |
| Pernod Ricard S.A. | | | 43,578 | | | | 7,791,702 | |
| | | | | | | | |
| | | | | | $ | 14,933,110 | |
| | | | | | | | |
| Apparel Manufacturers – 2.1% | | | | | |
| LVMH Moet Hennessy Louis Vuitton SE | | | 18,963 | | | $ | 8,810,364 | |
| NIKE, Inc., “B” | | | 62,562 | | | | 6,338,156 | |
| | | | | | | | |
| | | | | | $ | 15,148,520 | |
| | | | | | | | |
| Biotechnology – 0.4% | | | | | |
| Illumina, Inc. (a) | | | 8,924 | | | $ | 2,960,448 | |
| | | | | | | | |
| Broadcasting – 0.6% | | | | | |
| Walt Disney Co. | | | 31,855 | | | $ | 4,607,189 | |
| | | | | | | | |
| Brokerage & Asset Managers – 3.5% | | | | | |
| Blackstone Group, Inc. | | | 168,212 | | | $ | 9,409,779 | |
| NASDAQ, Inc. | | | 104,090 | | | | 11,148,039 | |
| TD Ameritrade Holding Corp. | | | 89,792 | | | | 4,462,663 | |
| | | | | | | | |
| | | | | | $ | 25,020,481 | |
| | | | | | | | |
| Business Services – 6.5% | | | | | |
| Accenture PLC, “A” | | | 69,494 | | | $ | 14,633,352 | |
| Amdocs Ltd. | | | 117,308 | | | | 8,468,464 | |
| Cognizant Technology Solutions Corp., “A” | | | 140,983 | | | | 8,743,766 | |
| Fidelity National Information Services, Inc. | | | 105,570 | | | | 14,683,731 | |
| | | | | | | | |
| | | | | | $ | 46,529,313 | |
| | | | | | | | |
| Cable TV – 2.0% | | | | | |
| Comcast Corp., “A” | | | 317,737 | | | $ | 14,288,633 | |
| | | | | | | | |
| Chemicals – 1.0% | | | | | |
| PPG Industries, Inc. | | | 55,741 | | | $ | 7,440,866 | |
| | | | | | | | |
| Computer Software – 5.4% | | | | | |
| Adobe Systems, Inc. (a) | | | 31,585 | | | $ | 10,417,049 | |
| Microsoft Corp. | | | 134,645 | | | | 21,233,516 | |
| Salesforce.com, Inc. (a) | | | 45,237 | | | | 7,357,346 | |
| | | | | | | | |
| | | | | | $ | 39,007,911 | |
| | | | | | | | |
| Computer Software – Systems – 1.5% | | | | | |
| Apple, Inc. | | | 37,585 | | | $ | 11,036,835 | |
| | | | | | | | |
| Construction – 1.4% | | | | | |
| Sherwin-Williams Co. | | | 17,559 | | | $ | 10,246,379 | |
| | | | | | | | |
| Consumer Products – 2.3% | | | | | |
| Colgate-Palmolive Co. | | | 107,822 | | | $ | 7,422,466 | |
| Estee Lauder Cos., Inc., “A” | | | 17,022 | | | | 3,515,724 | |
| Kimberly-Clark Corp. | | | 42,534 | | | | 5,850,552 | |
| | | | | | | | |
| | | | | | $ | 16,788,742 | |
| | | | | | | | |
| | | | | | | | |
| | |
Issuer | | Shares/Par | | | Value ($) | |
| COMMON STOCKS – continued | | | | | |
| Containers – 1.1% | | | | | |
| Crown Holdings, Inc. (a) | | | 110,025 | | | $ | 7,981,213 | |
| | | | | | | | |
| Electrical Equipment – 3.2% | | | | | |
| AMETEK, Inc. | | | 78,727 | | | $ | 7,852,231 | |
| Fortive Corp. | | | 118,259 | | | | 9,033,805 | |
| TE Connectivity Ltd. | | | 65,735 | | | | 6,300,042 | |
| | | | | | | | |
| | | | | | $ | 23,186,078 | |
| | | | | | | | |
| Electronics – 2.5% | | | | | | | | |
| Analog Devices, Inc. | | | 57,236 | | | $ | 6,801,926 | |
| Texas Instruments, Inc. | | | 84,671 | | | | 10,862,443 | |
| | | | | | | | |
| | | | | | $ | 17,664,369 | |
| | | | | | | | |
| Energy – Independent – 1.4% | | | | | | | | |
| EOG Resources, Inc. | | | 118,324 | | | $ | 9,910,818 | |
| | | | | | | | |
| Food & Beverages – 2.2% | | | | | | | | |
| Danone S.A. | | | 98,460 | | | $ | 8,161,707 | |
| Mondelez International, Inc. | | | 136,364 | | | | 7,510,929 | |
| | | | | | | | |
| | | | | | $ | 15,672,636 | |
| | | | | | | | |
| Gaming & Lodging – 0.7% | | | | | | | | |
| Marriott International, Inc., “A” | | | 33,043 | | | $ | 5,003,701 | |
| | | | | | | | |
| General Merchandise – 1.7% | | | | | | | | |
| Dollar General Corp. | | | 46,288 | | | $ | 7,220,002 | |
| Dollar Tree, Inc. (a) | | | 56,101 | | | | 5,276,299 | |
| | | | | | | | |
| | | | | | $ | 12,496,301 | |
| | | | | | | | |
| Insurance – 1.1% | | | | | | | | |
| Chubb Ltd. | | | 51,086 | | | $ | 7,952,047 | |
| | | | | | | | |
| Internet – 6.3% | | | | | | | | |
| Alphabet, Inc., “A” (a) | | | 18,100 | | | $ | 24,242,959 | |
| Alphabet, Inc., “C” (a) | | | 7,210 | | | | 9,639,914 | |
| Facebook, Inc., “A” (a) | | | 56,749 | | | | 11,647,732 | |
| | | | | | | | |
| | | | | | $ | 45,530,605 | |
| | | | | | | | |
| Leisure & Toys – 1.3% | | | | | | | | |
| Electronic Arts, Inc. (a) | | | 84,831 | | | $ | 9,120,181 | |
| | | | | | | | |
| Machinery & Tools – 0.8% | | | | | |
| Flowserve Corp. | | | 107,994 | | | $ | 5,374,861 | |
| | | | | | | | |
| Major Banks – 7.0% | | | | | |
| Bank of America Corp. | | | 489,398 | | | $ | 17,236,598 | |
| Goldman Sachs Group, Inc. | | | 47,250 | | | | 10,864,192 | |
| JPMorgan Chase & Co. | | | 158,246 | | | | 22,059,492 | |
| | | | | | | | |
| | | | | | $ | 50,160,282 | |
| | | | | | | | |
| Medical & Health Technology & Services – 0.8% | | | | | |
| PRA Health Sciences, Inc. | | | 53,687 | | | $ | 5,967,310 | |
| | | | | | | | |
| Medical Equipment – 9.3% | | | | | |
| Abbott Laboratories | | | 76,914 | | | $ | 6,680,750 | |
| Becton, Dickinson and Co. | | | 47,333 | | | | 12,873,156 | |
| Danaher Corp. | | | 83,377 | | | | 12,796,702 | |
| Medtronic PLC | | | 166,477 | | | | 18,886,816 | |
8
MFS Investors Trust Series
Portfolio of Investments – continued
| | | | | | | | |
| | |
| Issuer | | Shares/Par | | | Value ($) | |
| COMMON STOCKS – continued | | | | | |
| Medical Equipment – continued | | | | | |
| Thermo Fisher Scientific, Inc. | | | 46,884 | | | $ | 15,231,205 | |
| | | | | | | | |
| | | | | | $ | 66,468,629 | |
| | | | | | | | |
| Natural Gas – Pipeline – 1.5% | | | | | |
| Enterprise Products Partners LP | | | 369,861 | | | $ | 10,415,286 | |
| | | | | | | | |
| Network & Telecom – 1.4% | | | | | |
| Cisco Systems, Inc. | | | 208,930 | | | $ | 10,020,283 | |
| | | | | | | | |
| Oil Services – 1.3% | | | | | |
| Core Laboratories N.V. (l) | | | 56,740 | | | $ | 2,137,396 | |
| Schlumberger Ltd. | | | 170,676 | | | | 6,861,175 | |
| | | | | | | | |
| | | | | | $ | 8,998,571 | |
| | | | | | | | |
| Other Banks & Diversified Financials – 6.2% | | | | | |
| Mastercard, Inc., “A” | | | 60,611 | | | $ | 18,097,839 | |
| Truist Financial Corp. | | | 167,575 | | | | 9,437,824 | |
| Visa, Inc., “A” | | | 89,657 | | | | 16,846,550 | |
| | | | | | | | |
| | | | | | $ | 44,382,213 | |
| | | | | | | | |
| Pharmaceuticals – 5.7% | | | | | |
| Elanco Animal Health, Inc. (a) | | | 193,866 | | | $ | 5,709,354 | |
| Eli Lilly & Co. | | | 75,776 | | | | 9,959,240 | |
| Johnson & Johnson | | | 123,726 | | | | 18,047,911 | |
| Zoetis, Inc. | | | 55,180 | | | | 7,303,073 | |
| | | | | | | | |
| | | | | | $ | 41,019,578 | |
| | | | | | | | |
| Railroad & Shipping – 1.3% | | | | | |
| Canadian National Railway Co. | | | 103,363 | | | $ | 9,349,183 | |
| | | | | | | | |
| Restaurants – 1.0% | | | | | |
| Starbucks Corp. | | | 79,495 | | | $ | 6,989,200 | |
| | | | | | | | |
| Specialty Chemicals – 0.9% | | | | | |
| DuPont de Nemours, Inc. | | | 102,578 | | | $ | 6,585,508 | |
| | | | | | | | |
| Specialty Stores – 4.1% | | | | | |
| Costco Wholesale Corp. | | | 27,553 | | | $ | 8,098,378 | |
| Ross Stores, Inc. | | | 68,302 | | | | 7,951,719 | |
| Target Corp. | | | 40,334 | | | | 5,171,222 | |
| Tractor Supply Co. | | | 88,909 | | | | 8,307,657 | |
| | | | | | | | |
| | | | | | $ | 29,528,976 | |
| | | | | | | | |
| Telecommunications – Wireless – 2.3% | | | | | |
| American Tower Corp., REIT | | | 73,196 | | | $ | 16,821,905 | |
| | | | | | | | |
| | | | | | | | |
| | |
| Issuer | | Shares/Par | | | Value ($) | |
| COMMON STOCKS – continued | | | | | |
| Trucking – 0.7% | | | | | |
| Old Dominion Freight Line, Inc. | | | 26,022 | | | $ | 4,938,455 | |
| | | | | | | | |
| Utilities – Electric Power – 0.5% | | | | | |
| American Electric Power Co., Inc. | | | 39,821 | | | $ | 3,763,483 | |
| | | | | | | | |
Total Common Stocks
(Identified Cost, $381,954,142) | | | | | | $ | 706,548,618 | |
| | | | | | | | |
| |
| INVESTMENT COMPANIES (h) – 1.6% | | | | | |
| Money Market Funds – 1.6% | | | | | | | | |
| MFS Institutional Money Market Portfolio, 1.7% (v) (Identified Cost, $11,859,675) | | | 11,859,653 | | | $ | 11,859,653 | |
| | | | | | | | |
|
| COLLATERAL FOR SECURITIES LOANED – 0.1% | |
| State Street Navigator Securities Lending Government Money Market Portfolio, 1.58% (j) (Identified Cost, $492,566) | | | 492,566 | | | $ | 492,566 | |
| | | | | | | | |
OTHER ASSETS, LESS
LIABILITIES – (0.0)% | | | | | | | (269,000 | ) |
| | | | | | | | |
| NET ASSETS – 100.0% | | | | | | $ | 718,631,837 | |
| | | | | | | | |
| (a) | | Non-income producing security. |
| (h) | | An affiliated issuer, which may be considered one in which the fund owns 5% or more of the outstanding voting securities, or a company which is under common control. At period end, the aggregate values of the fund’s investments in affiliated issuers and in unaffiliated issuers were $11,859,653 and $707,041,184, respectively. |
| (j) | | The rate quoted is the annualizedseven-day yield of the fund at period end. |
| (l) | | A portion of this security is on loan. See Note 2 for additional information. |
| (v) | | Affiliated issuer that is available only to investment companies managed by MFS. The rate quoted for the MFS Institutional Money Market Portfolio is the annualizedseven-day yield of the fund at period end. |
The following abbreviations are used in this report and are defined:
| REIT | | Real Estate Investment Trust |
See Notes to Financial Statements
9
MFS Investors Trust Series
FINANCIAL STATEMENTS | STATEMENT OF ASSETS AND LIABILITIES
This statement represents your fund’s balance sheet, which details the assets and liabilities comprising the total value of the fund.
| | | | |
At 12/31/19 | | | | |
| |
Assets | | | | |
Investments in unaffiliated issuers, at value, including $382,577 of securities on loan (identified cost, $382,446,708) | | | $707,041,184 | |
Investments in affiliated issuers, at value (identified cost, $11,859,675) | | | 11,859,653 | |
Cash | | | 36,135 | |
Receivables for | | | | |
Fund shares sold | | | 399,118 | |
Interest and dividends | | | 490,698 | |
Other assets | | | 2,877 | |
Total assets | | | $719,829,665 | |
| |
Liabilities | | | | |
Payables for | | | | |
Fund shares reacquired | | | $552,983 | |
Collateral for securities loaned, at value | | | 492,566 | |
Payable to affiliates | | | | |
Investment adviser | | | 29,152 | |
Administrative services fee | | | 550 | |
Shareholder servicing costs | | | 722 | |
Distribution and/or service fees | | | 6,211 | |
Payable for independent Trustees’ compensation | | | 11 | |
Accrued expenses and other liabilities | | | 115,633 | |
Total liabilities | | | $1,197,828 | |
Net assets | | | $718,631,837 | |
| |
Net assets consist of | | | | |
Paid-in capital | | | $367,751,573 | |
Total distributable earnings (loss) | | | 350,880,264 | |
Net assets | | | $718,631,837 | |
Shares of beneficial interest outstanding | | | 21,808,150 | |
| | | | | | | | | | | | |
| | | |
| | | Net assets | | | Shares
outstanding | | | Net asset value
per share | |
Initial Class | | | $265,499,342 | | | | 7,980,822 | | | | $33.27 | |
Service Class | | | 453,132,495 | | | | 13,827,328 | | | | 32.77 | |
See Notes to Financial Statements
10
MFS Investors Trust Series
FINANCIAL STATEMENTS | STATEMENT OF OPERATIONS
This statement describes how much your fund earned in investment income and accrued in expenses. It also describes any gains and/or losses generated by fund operations.
| | | | |
Year ended 12/31/19 | | | | |
| |
Net investment income (loss) | | | | |
Income | | | | |
Dividends | | | $10,300,973 | |
Dividends from affiliated issuers | | | 164,937 | |
Income on securities loaned | | | 34,078 | |
Other | | | 14,797 | |
Foreign taxes withheld | | | (122,651 | ) |
Total investment income | | | $10,392,134 | |
Expenses | | | | |
Management fee | | | $4,899,254 | |
Distribution and/or service fees | | | 991,170 | |
Shareholder servicing costs | | | 20,764 | |
Administrative services fee | | | 98,263 | |
Independent Trustees’ compensation | | | 17,500 | |
Custodian fee | | | 35,160 | |
Shareholder communications | | | 51,517 | |
Audit and tax fees | | | 56,791 | |
Legal fees | | | 6,160 | |
Miscellaneous | | | 33,407 | |
Total expenses | | | $6,209,986 | |
Reduction of expenses by investment adviser | | | (63,727 | ) |
Net expenses | | | $6,146,259 | |
Net investment income (loss) | | | $4,245,875 | |
| |
Realized and unrealized gain (loss) | | | | |
Realized gain (loss) (identified cost basis) | | | | |
Unaffiliated issuers | | | $21,650,761 | |
Affiliated issuers | | | 380 | |
Foreign currency | | | (1,055 | ) |
Net realized gain (loss) | | | $21,650,086 | |
Change in unrealized appreciation or depreciation | | | | |
Unaffiliated issuers | | | $148,081,675 | |
Affiliated issuers | | | (200 | ) |
Net unrealized gain (loss) | | | $148,081,475 | |
Net realized and unrealized gain (loss) | | | $169,731,561 | |
Change in net assets from operations | | | $173,977,436 | |
See Notes to Financial Statements
11
MFS Investors Trust Series
FINANCIAL STATEMENTS | STATEMENTS OF CHANGES IN NET ASSETS
These statements describe the increases and/or decreases in net assets resulting from operations, any distributions, and any shareholder transactions.
| | | | | | | | |
| | | Year ended | |
| | | 12/31/19 | | | 12/31/18 | |
Change in net assets | | | | | | | | |
| | |
From operations | | | | | | | | |
Net investment income (loss) | | | $4,245,875 | | | | $4,410,167 | |
Net realized gain (loss) | | | 21,650,086 | | | | 38,546,790 | |
Net unrealized gain (loss) | | | 148,081,475 | | | | (75,138,678 | ) |
Change in net assets from operations | | | $173,977,436 | | | | $(32,181,721 | ) |
Total distributions to shareholders | | | $(42,277,259 | ) | | | $(30,377,311 | ) |
Change in net assets from fund share transactions | | | $29,872,889 | | | | $17,770,363 | |
Total change in net assets | | | $161,573,066 | | | | $(44,788,669 | ) |
| | |
Net assets | | | | | | | | |
At beginning of period | | | 557,058,771 | | | | 601,847,440 | |
At end of period | | | $718,631,837 | | | | $557,058,771 | |
See Notes to Financial Statements
12
MFS Investors Trust Series
FINANCIAL STATEMENTS | FINANCIAL HIGHLIGHTS
The financial highlights table is intended to help you understand the fund’s financial performance for the past 5 years. Certain information reflects financial results for a single fund share. The total returns in the table represent the rate that an investor would have earned (or lost) on an investment in the fund share class (assuming reinvestment of all distributions) held for the entire period.
| | | | | | | | | | | | | | | | | | | | |
| Initial Class | | Year ended | |
| | | | | |
| | | 12/31/19 | | | 12/31/18 | | | 12/31/17 | | | 12/31/16 | | | 12/31/15 | |
| | | | | |
Net asset value, beginning of period | | | $27.05 | | | | $30.07 | | | | $25.57 | | | | $26.58 | | | | $30.41 | |
| | | | | |
| Income (loss) from investment operations | | | | | | | | | | | | | | | | | | | | |
Net investment income (loss) (d) | | | $0.25 | | | | $0.26 | | | | $0.22 | | | | $0.23 | (c) | | | $0.21 | |
Net realized and unrealized gain (loss) | | | 8.08 | | | | (1.71 | ) | | | 5.62 | | | | 2.01 | | | | (0.42 | ) |
Total from investment operations | | | $8.33 | | | | $(1.45 | ) | | | $5.84 | | | | $2.24 | | | | $(0.21 | ) |
| | | | | |
| Less distributions declared to shareholders | | | | | | | | | | | | | | | | | | | | |
From net investment income | | | $(0.22 | ) | | | $(0.20 | ) | | | $(0.21 | ) | | | $(0.24 | ) | | | $(0.28 | ) |
From net realized gain | | | (1.89 | ) | | | (1.37 | ) | | | (1.13 | ) | | | (3.01 | ) | | | (3.34 | ) |
Total distributions declared to shareholders | | | $(2.11 | ) | | | $(1.57 | ) | | | $(1.34 | ) | | | $(3.25 | ) | | | $(3.62 | ) |
Net asset value, end of period (x) | | | $33.27 | | | | $27.05 | | | | $30.07 | | | | $25.57 | | | | $26.58 | |
Total return (%) (k)(r)(s)(x) | | | 31.58 | | | | (5.49 | ) | | | 23.35 | | | | 8.59 | (c) | | | 0.22 | |
| | | | | |
Ratios (%) (to average net assets)
and Supplemental data: | | | | | | | | | | | | | | | | | | | | |
Expenses before expense reductions (f) | | | 0.80 | | | | 0.80 | | | | 0.82 | | | | 0.80 | (c) | | | 0.82 | |
Expenses after expense reductions (f) | | | 0.79 | | | | 0.79 | | | | 0.79 | | | | 0.79 | (c) | | | 0.81 | |
Net investment income (loss) | | | 0.80 | | | | 0.86 | | | | 0.79 | | | | 0.89 | (c) | | | 0.73 | |
Portfolio turnover | | | 18 | | | | 16 | | | | 18 | | | | 20 | | | | 17 | |
Net assets at end of period (000 omitted) | | | $265,499 | | | | $231,900 | | | | $283,237 | | | | $270,796 | | | | $293,203 | |
| |
| Service Class | | Year ended | |
| | | | | |
| | | 12/31/19 | | | 12/31/18 | | | 12/31/17 | | | 12/31/16 | | | 12/31/15 | |
| | | | | |
Net asset value, beginning of period | | | $26.68 | | | | $29.69 | | | | $25.28 | | | | $26.30 | | | | $30.13 | |
| | | | | |
| Income (loss) from investment operations | | | | | | | | | | | | | | | | | | | | |
Net investment income (loss) (d) | | | $0.17 | | | | $0.18 | | | | $0.15 | | | | $0.16 | (c) | | | $0.14 | |
Net realized and unrealized gain (loss) | | | 7.97 | | | | (1.68 | ) | | | 5.55 | | | | 1.98 | | | | (0.42 | ) |
Total from investment operations | | | $8.14 | | | | $(1.50 | ) | | | $5.70 | | | | $2.14 | | | | $(0.28 | ) |
| | | | | |
| Less distributions declared to shareholders | | | | | | | | | | | | | | | | | | | | |
From net investment income | | | $(0.16 | ) | | | $(0.14 | ) | | | $(0.16 | ) | | | $(0.15 | ) | | | $(0.21 | ) |
From net realized gain | | | (1.89 | ) | | | (1.37 | ) | | | (1.13 | ) | | | (3.01 | ) | | | (3.34 | ) |
Total distributions declared to shareholders | | | $(2.05 | ) | | | $(1.51 | ) | | | $(1.29 | ) | | | $(3.16 | ) | | | $(3.55 | ) |
Net asset value, end of period (x) | | | $32.77 | | | | $26.68 | | | | $29.69 | | | | $25.28 | | | | $26.30 | |
Total return (%) (k)(r)(s)(x) | | | 31.25 | | | | (5.71 | ) | | | 23.03 | | | | 8.32 | (c) | | | (0.05 | ) |
| | | | | |
Ratios (%) (to average net assets)
and Supplemental data: | | | | | | | | | | | | | | | | | | | | |
Expenses before expense reductions (f) | | | 1.05 | | | | 1.05 | | | | 1.07 | | | | 1.04 | (c) | | | 1.07 | |
Expenses after expense reductions (f) | | | 1.04 | | | | 1.04 | | | | 1.04 | | | | 1.04 | (c) | | | 1.06 | |
Net investment income (loss) | | | 0.55 | | | | 0.62 | | | | 0.55 | | | | 0.64 | (c) | | | 0.47 | |
Portfolio turnover | | | 18 | | | | 16 | | | | 18 | | | | 20 | | | | 17 | |
Net assets at end of period (000 omitted) | | | $453,132 | | | | $325,159 | | | | $318,611 | | | | $228,741 | | | | $193,116 | |
See Notes to Financial Statements
13
MFS Investors Trust Series
Financial Highlights – continued
| (c) | Amount reflects aone-time reimbursement of expenses by the custodian (or former custodian) without which net investment income and performance would be lower and expenses would be higher. |
| (d) | Per share data is based on average shares outstanding. |
| (f) | Ratios do not reflect reductions from fees paid indirectly, if applicable. |
| (k) | The total return does not reflect expenses that apply to separate accounts. Inclusion of these charges would reduce the total return figures for all periods shown. |
| (r) | Certain expenses have been reduced without which performance would have been lower. |
| (s) | From time to time the fund may receive proceeds from litigation settlements, without which performance would be lower. |
| (x) | The net asset values and total returns have been calculated on net assets which include adjustments made in accordance with U.S. generally accepted accounting principles required at period end for financial reporting purposes. |
See Notes to Financial Statements
14
MFS Investors Trust Series
NOTES TO FINANCIAL STATEMENTS
| (1) | | Business and Organization |
MFS Investors Trust Series (the fund) is a diversified series of MFS Variable Insurance Trust (the trust). The trust is organized as a Massachusetts business trust and is registered under the Investment Company Act of 1940, as amended, as anopen-end management investment company. The shareholders of each series of the trust are separate accounts of insurance companies, which offer variable annuity and/or life insurance products, and qualified retirement and pension plans.
The fund is an investment company and accordingly follows the investment company accounting and reporting guidance of the Financial Accounting Standards Board (FASB) Accounting Standards Codification Topic 946 Financial Services – Investment Companies.
| (2) | | Significant Accounting Policies |
General– The preparation of financial statements in conformity with U.S. generally accepted accounting principles requires management to make estimates and assumptions that affect the reported amounts of assets and liabilities, and disclosure of contingent assets and liabilities at the date of the financial statements and the reported amounts of increases and decreases in net assets from operations during the reporting period. Actual results could differ from those estimates. In the preparation of these financial statements, management has evaluated subsequent events occurring after the date of the fund’s Statement of Assets and Liabilities through the date that the financial statements were issued.
Balance Sheet Offsetting– The fund’s accounting policy with respect to balance sheet offsetting is that, absent an event of default by the counterparty or a termination of the agreement, the International Swaps and Derivatives Association (ISDA) Master Agreement, or similar agreement, does not result in an offset of reported amounts of financial assets and financial liabilities in the Statement of Assets and Liabilities across transactions between the fund and the applicable counterparty. The fund’s right to setoff may be restricted or prohibited by the bankruptcy or insolvency laws of the particular jurisdiction to which a specific master netting agreement counterparty is subject. Balance sheet offsetting disclosures, to the extent applicable to the fund, have been included in the fund’s Significant Accounting Policies note under the captions for each of the fund’sin-scope financial instruments and transactions.
Investment Valuations– Equity securities, including restricted equity securities, are generally valued at the last sale or official closing price on their primary market or exchange as provided by a third-party pricing service. Equity securities, for which there were no sales reported that day, are generally valued at the last quoted daily bid quotation on their primary market or exchange as provided by a third-party pricing service. Short-term instruments with a maturity at issuance of 60 days or less may be valued at amortized cost, which approximates market value.Open-end investment companies are generally valued at net asset value per share. Securities and other assets generally valued on the basis of information from a third-party pricing service may also be valued at a broker/dealer bid quotation. In determining values, third-party pricing services can utilize both transaction data and market information such as yield, quality, coupon rate, maturity, type of issue, trading characteristics, and other market data. The values of foreign securities and other assets and liabilities expressed in foreign currencies are converted to U.S. dollars using the mean of bid and asked prices for rates provided by a third-party pricing service.
The Board of Trustees has delegated primary responsibility for determining or causing to be determined the value of the fund’s investments (including any fair valuation) to the adviser pursuant to valuation policies and procedures approved by the Board. If the adviser determines that reliable market quotations are not readily available, investments are valued at fair value as determined in good faith by the adviser in accordance with such procedures under the oversight of the Board of Trustees. Under the fund’s valuation policies and procedures, market quotations are not considered to be readily available for most types of debt instruments and floating rate loans and many types of derivatives. These investments are generally valued at fair value based on information from third-party pricing services. In addition, investments may be valued at fair value if the adviser determines that an investment’s value has been materially affected by events occurring after the close of the exchange or market on which the investment is principally traded (such as foreign exchange or market) and prior to the determination of the fund’s net asset value, or after the halt of trading of a specific security where trading does not resume prior to the close of the exchange or market on which the security is principally traded. Events that occur after foreign markets close (such as developments in foreign markets and significant movements in the U.S. markets) and prior to the determination of the fund’s net asset value may be deemed to have a material effect on the value of securities traded in foreign markets. Accordingly, the fund’s foreign equity securities may often be valued at fair value. The adviser generally relies on third-party pricing services or other information (such as the correlation with price movements of similar securities in the same or other markets; the type, cost and investment characteristics of the security; the business and financial condition of the issuer; and trading and other market data) to assist in determining whether to fair value and at what value to fair value an investment. The value of an investment for purposes of calculating the fund’s net asset value can differ depending on the source and method used to determine value. When fair valuation is used, the value of an investment used to determine the fund’s net asset value may differ from quoted or published prices for the same investment. There can be no assurance that the fund could obtain the fair value assigned to an investment if it were to sell the investment at the same time at which the fund determines its net asset value per share.
15
MFS Investors Trust Series
Notes to Financial Statements – continued
Various inputs are used in determining the value of the fund’s assets or liabilities. These inputs are categorized into three broad levels. In certain cases, the inputs used to measure fair value may fall into different levels of the fair value hierarchy. In such cases, an investment’s level within the fair value hierarchy is based on the lowest level of input that is significant to the fair value measurement. The fund’s assessment of the significance of a particular input to the fair value measurement in its entirety requires judgment, and considers factors specific to the investment. Level 1 includes unadjusted quoted prices in active markets for identical assets or liabilities. Level 2 includes other significant observable market-based inputs (including quoted prices for similar securities, interest rates, prepayment speed, and credit risk). Level 3 includes unobservable inputs, which may include the adviser’s own assumptions in determining the fair value of investments. The following is a summary of the levels used as of December 31, 2019 in valuing the fund’s assets or liabilities:
| | | | | | | | | | | | | | | | |
| Financial Instruments | | Level 1 | | | Level 2 | | | Level 3 | | | Total | |
| Equity Securities | | | $706,548,618 | | | | $— | | | | $— | | | | $706,548,618 | |
| Mutual Funds | | | 12,352,219 | | | | — | | | | — | | | | 12,352,219 | |
| Total | | | $718,900,837 | | | | $— | | | | $— | | | | $718,900,837 | |
For further information regarding security characteristics, see the Portfolio of Investments.
Foreign Currency Translation– Purchases and sales of foreign investments, income, and expenses are converted into U.S. dollars based upon currency exchange rates prevailing on the respective dates of such transactions or on the reporting date for foreign denominated receivables and payables. Gains and losses attributable to foreign currency exchange rates on sales of securities are recorded for financial statement purposes as net realized gains and losses on investments. Gains and losses attributable to foreign exchange rate movements on receivables, payables, income and expenses are recorded for financial statement purposes as foreign currency transaction gains and losses. That portion of both realized and unrealized gains and losses on investments that results from fluctuations in foreign currency exchange rates is not separately disclosed.
Security Loans– Under its Securities Lending Agency Agreement with the fund, State Street Bank and Trust Company, as lending agent, loans the securities of the fund to certain qualified institutions (the “Borrowers”) approved by the fund. Security loans can be terminated at the discretion of either the lending agent or the fund and the related securities must be returned within the earlier of the standard trade settlement period for such securities or within three business days. The loans are collateralized by cash and/or U.S. Treasury and federal agency obligations in an amount typically at least equal to the market value of the securities loaned. On loans collateralized by cash, the cash collateral is invested in a money market fund. The market value of the loaned securities is determined at the close of business of the fund and any additional required collateral is delivered to the fund on the next business day. The lending agent provides the fund with indemnification against Borrower default. In the event of Borrower default, the lending agent will, for the benefit of the fund, either purchase securities identical to those loaned or, when such purchase is commercially impracticable, pay the fund the market value of the loaned securities. In return, the lending agent assumes the fund’s rights to the related collateral. If the collateral value is less than the cost to purchase identical securities, the lending agent is responsible for the shortfall, but only to the extent that such shortfall is not due to a decline in collateral value resulting from collateral reinvestment for which the fund bears the risk of loss. At period end, the fund had investment securities on loan, all of which were classified as equity securities in the fund’s Portfolio of Investments, with a fair value of $382,577. The fair value of the fund’s investment securities on loan and a related liability of $492,566 for cash collateral received on securities loaned are both presented gross in the Statement of Assets and Liabilities. The collateral on securities loaned exceeded the value of securities on loan at period end. The liability for cash collateral for securities loaned is carried at fair value, which is categorized as level 2 within the fair value hierarchy. A portion of the income generated upon investment of the collateral is remitted to the Borrowers, and the remainder is allocated between the fund and the lending agent. On loans collateralized by U.S. Treasury and/or federal agency obligations, a fee is received from the Borrower, and is allocated between the fund and the lending agent. Income from securities lending is separately reported in the Statement of Operations. The dividend and interest income earned on the securities loaned is accounted for in the same manner as other dividend and interest income.
Indemnifications– Under the fund’s organizational documents, its officers and Trustees may be indemnified against certain liabilities and expenses arising out of the performance of their duties to the fund. Additionally, in the normal course of business, the fund enters into agreements with service providers that may contain indemnification clauses. The fund’s maximum exposure under these agreements is unknown as this would involve future claims that may be made against the fund that have not yet occurred.
Investment Transactions and Income– Investment transactions are recorded on the trade date. Interest income is recorded on the accrual basis. Dividends received in cash are recorded on theex-dividend date. Certain dividends from foreign securities will be recorded when the fund is informed of the dividend if such information is obtained subsequent to theex-dividend date. Dividend payments received in additional securities are recorded on theex-dividend date in an amount equal to the value of the security on such date.
16
MFS Investors Trust Series
Notes to Financial Statements – continued
The fund may receive proceeds from litigation settlements. Any proceeds received from litigation involving portfolio holdings are reflected in the Statement of Operations in realized gain/loss if the security has been disposed of by the fund or in unrealized gain/loss if the security is still held by the fund. Any other proceeds from litigation not related to portfolio holdings are reflected as other income in the Statement of Operations.
Tax Matters and Distributions– The fund intends to qualify as a regulated investment company, as defined under Subchapter M of the Internal Revenue Code, and to distribute all of its taxable income, including realized capital gains. As a result, no provision for federal income tax is required. The fund’s federal tax returns, when filed, will remain subject to examination by the Internal Revenue Service for a three year period. Management has analyzed the fund’s tax positions taken on federal and state tax returns for all open tax years and does not believe that there are any uncertain tax positions that require recognition of a tax liability. Foreign taxes, if any, have been accrued by the fund in the accompanying financial statements in accordance with the applicable foreign tax law. Foreign income taxes may be withheld by certain countries in which the fund invests. Additionally, capital gains realized by the fund on securities issued in or by certain foreign countries may be subject to capital gains tax imposed by those countries.
Distributions to shareholders are recorded on theex-dividend date. Income and capital gain distributions are determined in accordance with income tax regulations, which may differ from U.S. generally accepted accounting principles. Certain capital accounts in the financial statements are periodically adjusted for permanent differences in order to reflect their tax character. These adjustments have no impact on net assets or net asset value per share. Temporary differences which arise from recognizing certain items of income, expense, gain or loss in different periods for financial statement and tax purposes will reverse at some time in the future.
Book/tax differences primarily relate to wash sale loss deferrals and partnership adjustments.
The tax character of distributions declared to shareholders for the last two fiscal years is as follows:
| | | | | | | | |
| | | Year ended
12/31/19 | | | Year ended
12/31/18 | |
| Ordinary income (including any short-term capital gains) | | | $5,420,196 | | | | $5,939,205 | |
| Long-term capital gains | | | 36,857,063 | | | | 24,438,106 | |
| Total distributions | | | $42,277,259 | | | | $30,377,311 | |
The federal tax cost and the tax basis components of distributable earnings were as follows:
| | | | |
| As of 12/31/19 | | | | |
| |
| Cost of investments | | | $395,159,266 | |
| Gross appreciation | | | 332,129,321 | |
| Gross depreciation | | | (8,387,750 | ) |
| Net unrealized appreciation (depreciation) | | | $323,741,571 | |
| |
| Undistributed ordinary income | | | 4,647,476 | |
| Undistributed long-term capital gain | | | 21,127,709 | |
| Other temporary differences | | | 1,363,508 | |
Multiple Classes of Shares of Beneficial Interest– The fund offers multiple classes of shares, which differ in their respective distribution and/or service fees. The fund’s income, realized and unrealized gain (loss), and common expenses are allocated to shareholders based on the daily net assets of each class. Dividends are declared separately for each class. Differences in per share dividend rates are generally due to differences in separate class expenses. The fund’s distributions declared to shareholders as reported in the Statements of Changes in Net Assets are presented by class as follows:
| | | | | | | | |
| | |
| | | Year ended
12/31/19 | | | Year ended
12/31/18 | |
| Initial Class | | | $16,490,409 | | | | $13,459,865 | |
| Service Class | | | 25,786,850 | | | | 16,917,446 | |
| Total | | | $42,277,259 | | | | $30,377,311 | |
| (3) | | Transactions with Affiliates |
Investment Adviser– The fund has an investment advisory agreement with MFS to provide overall investment management and related administrative services and facilities to the fund. The management fee is computed daily and paid monthly at the following annual rates based on the fund’s average daily net assets:
| | | | |
| Up to $1 billion | | | 0.75% | |
| In excess of $1 billion and up to $2.5 billion | | | 0.65% | |
| In excess of $2.5 billion | | | 0.60% | |
17
MFS Investors Trust Series
Notes to Financial Statements – continued
MFS has agreed in writing to reduce its management fee by a specified amount if certain MFS mutual fund assets exceed thresholds agreed to by MFS and the fund’s Board of Trustees. For the year ended December 31, 2019, this management fee reduction amounted to $63,727, which is included in the reduction of total expenses in the Statement of Operations. The management fee incurred for the year ended December 31, 2019 was equivalent to an annual effective rate of 0.74% of the fund’s average daily net assets.
The investment adviser has agreed in writing to pay a portion of the fund’s total annual operating expenses, excluding interest, taxes, extraordinary expenses, brokerage and transaction costs, and investment-related expenses, such that total annual operating expenses do not exceed 0.79% of average daily net assets for the Initial Class shares and 1.04% of average daily net assets for the Service Class shares. This written agreement will continue until modified by the fund’s Board of Trustees, but such agreement will continue at least until April 30, 2021. For the year ended December 31, 2019, the fund’s actual operating expenses did not exceed the limit and therefore, the investment adviser did not pay any portion of the fund’s expenses related to this agreement.
Distributor– MFS Fund Distributors, Inc. (MFD), a wholly-owned subsidiary of MFS, is the distributor of shares of the fund. The Trustees have adopted a distribution plan for the Service Class shares pursuant to Rule12b-1 under the Investment Company Act of 1940.
The fund’s distribution plan provides that the fund will pay MFD distribution and/or service fees equal to 0.25% per annum of its average daily net assets attributable to Service Class shares as partial consideration for services performed and expenses incurred by MFD and financial intermediaries (including participating insurance companies that invest in the fund to fund variable annuity and variable life insurance contracts, sponsors of qualified retirement and pension plans that invest in the fund, and affiliates of these participating insurance companies and plan sponsors) in connection with the sale and distribution of the Service Class shares. MFD may subsequently pay all, or a portion, of the distribution and/or service fees to financial intermediaries.
Shareholder Servicing Agent– MFS Service Center, Inc. (MFSC), a wholly-owned subsidiary of MFS, receives a fee from the fund for its services as shareholder servicing agent. For the year ended December 31, 2019, the fee was $19,187, which equated to 0.0029% annually of the fund’s average daily net assets. MFSC also receives payment from the fund forout-of-pocket expenses paid by MFSC on behalf of the fund. For the year ended December 31, 2019, these costs amounted to $1,577.
Administrator– MFS provides certain financial, legal, shareholder communications, compliance, and other administrative services to the fund. Under an administrative services agreement, the fund reimburses MFS the costs incurred to provide these services. The fund is charged an annual fixed amount of $17,500 plus a fee based on average daily net assets. The administrative services fee incurred for the year ended December 31, 2019 was equivalent to an annual effective rate of 0.0150% of the fund’s average daily net assets.
Trustees’ and Officers’ Compensation– The fund pays compensation to independent Trustees in the form of a retainer, attendance fees, and additional compensation to Board and Committee chairpersons. The fund does not pay compensation directly to Trustees or officers of the fund who are also officers of the investment adviser, all of whom receive remuneration from MFS for their services to the fund. Certain officers and Trustees of the fund are officers or directors of MFS, MFD, and MFSC.
Other– This fund and certain other funds managed by MFS (the funds) had entered into a service agreement (the ISO Agreement) which provided for payment of fees solely by the funds to Tarantino LLC in return for the provision of services of an Independent Senior Officer (ISO) for the funds. Frank L. Tarantino served as the ISO and was an officer of the funds and the sole member of Tarantino LLC. Effective June 30, 2019, Mr. Tarantino retired from his position as ISO for the funds, and the ISO Agreement was terminated. For the year ended December 31, 2019, the fee paid by the fund under this agreement was $780 and is included in “Miscellaneous” expense in the Statement of Operations. MFS had agreed to bear all expenses associated with office space, other administrative support, and supplies provided to the ISO.
The fund invests in the MFS Institutional Money Market Portfolio which is managed by MFS and seeks current income consistent with preservation of capital and liquidity. This money market fund does not pay a management fee to MFS.
The fund is permitted to engage in purchase and sale transactions with funds and accounts for which MFS serves as investment adviser orsub-adviser (“cross-trades”) pursuant to a policy adopted by the Board of Trustees. This policy has been designed to ensure that cross-trades conducted by the fund comply with Rule17a-7 under the Investment Company Act of 1940. During the year ended December 31, 2019, the fund engaged in purchase and sale transactions pursuant to this policy, which amounted to $149,201 and $1,850,944, respectively. The sales transactions resulted in net realized gains (losses) of $(14,848).
The adviser has voluntarily undertaken to reimburse the fund from its own resources on a quarterly basis for the cost of investment research embedded in the cost of the fund’s securities trades. This agreement may be rescinded at any time. For the year ended December 31, 2019, this reimbursement amounted to $14,691, which is included in “Other” income in the Statement of Operations.
18
MFS Investors Trust Series
Notes to Financial Statements – continued
For the year ended December 31, 2019, purchases and sales of investments, other than short-term obligations, aggregated $115,895,305 and $126,534,947, respectively.
| (5) | | Shares of Beneficial Interest |
The fund’s Declaration of Trust permits the Trustees to issue an unlimited number of full and fractional shares of beneficial interest. Transactions in fund shares were as follows:
| | | | | | | | | | | | | | | | |
| | | Year ended 12/31/19 | | | Year ended 12/31/18 | |
| | | | |
| | | Shares | | | Amount | | | Shares | | | Amount | |
| Shares sold | | | | | | | | | | | | | | | | |
Initial Class | | | 273,184 | | | | $8,234,981 | | | | 460,046 | | | | $13,933,540 | |
Service Class | | | 2,049,570 | | | | 63,025,793 | | | | 2,206,956 | | | | 65,663,348 | |
| | | 2,322,754 | | | | $71,260,774 | | | | 2,667,002 | | | | $79,596,888 | |
| | | | |
| Shares issued to shareholders in reinvestment of distributions | | | | | | | | | | | | | | | | |
Initial Class | | | 543,879 | | | | $16,490,409 | | | | 435,876 | | | | $13,459,865 | |
Service Class | | | 862,725 | | | | 25,786,850 | | | | 555,034 | | | | 16,917,446 | |
| | | 1,406,604 | | | | $42,277,259 | | | | 990,910 | | | | $30,377,311 | |
| | | | |
| Shares reacquired | | | | | | | | | | | | | | | | |
Initial Class | | | (1,410,131 | ) | | | $(44,272,121 | ) | | | (1,742,162 | ) | | | $(53,053,828 | ) |
Service Class | | | (1,272,751 | ) | | | (39,393,023 | ) | | | (1,303,877 | ) | | | (39,150,008 | ) |
| | | (2,682,882 | ) | | | $(83,665,144 | ) | | | (3,046,039 | ) | | | $(92,203,836 | ) |
| | | | |
| Net change | | | | | | | | | | | | | | | | |
Initial Class | | | (593,068 | ) | | | $(19,546,731 | ) | | | (846,240 | ) | | | $(25,660,423 | ) |
Service Class | | | 1,639,544 | | | | 49,419,620 | | | | 1,458,113 | | | | 43,430,786 | |
| | | 1,046,476 | | | | $29,872,889 | | | | 611,873 | | | | $17,770,363 | |
The fund and certain other funds managed by MFS participate in a $1.25 billion unsecured committed line of credit, subject to a $1 billion sublimit, provided by a syndicate of banks under a credit agreement. Borrowings may be made for temporary financing needs. Interest is charged to each fund, based on its borrowings, generally at a rate equal to the highest of one month LIBOR, the Federal Funds Effective Rate and the Overnight Bank Funding Rate, plus an agreed upon spread. A commitment fee, based on the average daily, unused portion of the committed line of credit, is allocated among the participating funds. In addition, the fund and other funds managed by MFS have established unsecured uncommitted borrowing arrangements with certain banks for temporary financing needs. Interest is charged to each fund, based on its borrowings, at rates equal to customary reference rates plus an agreed upon spread. For the year ended December 31, 2019, the fund’s commitment fee and interest expense were $3,801 and $0, respectively, and are included in “Miscellaneous” expense in the Statement of Operations.
| (7) | | Investments in Affiliated Issuers |
An affiliated issuer may be considered one in which the fund owns 5% or more of the outstanding voting securities, or a company which is under common control. For the purposes of this report, the following were affiliated issuers:
| | | | | | | | | | | | | | | | | | | | | | | | |
| Affiliated Issuers | | Beginning
Value | | | Purchases | | | Sales
Proceeds | | | Realized
Gain (Loss) | | | Change in
Unrealized
Appreciation or
Depreciation | | | Ending
Value | |
| MFS Institutional Money Market Portfolio | | | $8,297,586 | | | | $57,827,989 | | | | $54,266,102 | | | | $380 | | | | $(200 | ) | | | $11,859,653 | |
| | | | | | |
| Affiliated Issuers | | | | | | | | | | | | | | Dividend
Income | | | Capital Gain
Distributions | |
| MFS Institutional Money Market Portfolio | | | | | | | | | | | | | | | | | | | $164,937 | | | | $— | |
19
MFS Investors Trust Series
REPORT OF INDEPENDENT REGISTERED PUBLIC ACCOUNTING FIRM
To the Board of Trustees of MFS Variable Insurance Trust and the Shareholders of
MFS Investors Trust Series:
Opinion on the Financial Statements and Financial Highlights
We have audited the accompanying statement of assets and liabilities of MFS Investors Trust Series (the “Fund”), including the portfolio of investments, as of December 31, 2019, the related statement of operations for the year then ended, the statements of changes in net assets for each of the two years in the period then ended, the financial highlights for each of the five years in the period then ended, and the related notes. In our opinion, the financial statements and financial highlights present fairly, in all material respects, the financial position of the Fund as of December 31, 2019, and the results of its operations for the year then ended, the changes in its net assets for each of the two years in the period then ended, and the financial highlights for each of the five years in the period then ended, in conformity with accounting principles generally accepted in the United States of America.
Basis for Opinion
These financial statements and financial highlights are the responsibility of the Fund’s management. Our responsibility is to express an opinion on the Fund’s financial statements and financial highlights based on our audits. We are a public accounting firm registered with the Public Company Accounting Oversight Board (United States) (PCAOB) and are required to be independent with respect to the Fund in accordance with the U.S. federal securities laws and the applicable rules and regulations of the Securities and Exchange Commission and the PCAOB.
We conducted our audits in accordance with the standards of the PCAOB. Those standards require that we plan and perform the audit to obtain reasonable assurance about whether the financial statements and financial highlights are free of material misstatement, whether due to error or fraud. The Fund is not required to have, nor were we engaged to perform, an audit of its internal control over financial reporting. As part of our audits we are required to obtain an understanding of internal control over financial reporting but not for the purpose of expressing an opinion on the effectiveness of the Fund’s internal control over financial reporting. Accordingly, we express no such opinion.
Our audits included performing procedures to assess the risks of material misstatement of the financial statements and financial highlights, whether due to error or fraud, and performing procedures that respond to those risks. Such procedures included examining, on a test basis, evidence regarding the amounts and disclosures in the financial statements and financial highlights. Our audits also included evaluating the accounting principles used and significant estimates made by management, as well as evaluating the overall presentation of the financial statements and financial highlights. Our procedures included confirmation of securities owned as of December 31, 2019, by correspondence with the custodian and brokers. We believe that our audits provide a reasonable basis for our opinion.
DELOITTE & TOUCHE LLP
Boston, Massachusetts
February 14, 2020
We have served as the auditor of one or more of the MFS investment companies since 1924.
20
MFS Investors Trust Series
TRUSTEES AND OFFICERS – IDENTIFICATION AND BACKGROUND
The Trustees and Officers of the Trust, as of February 1, 2020, are listed below, together with their principal occupations during the past five years. (Their titles may have varied during that period.) The address of each Trustee and Officer is 111 Huntington Avenue, Boston, Massachusetts 02199-7618.
| | | | | | | | | | |
Name, Age | | Position(s)
Held with Fund | | Trustee/Officer
Since (h) | | Number of MFS Funds
overseen by the
Trustee | | Principal Occupations
During the Past Five Years | | Other Directorships During the Past Five Years (j) |
| INTERESTED TRUSTEES |
Robert J. Manning (k)
(age 56) | | Trustee | | February 2004 | | 133 | | Massachusetts Financial Services Company, Executive Chairman (since January 2017); Director; Chairman of the Board; Chief Executive Officer (until 2015);Co-Chief Executive Officer(2015-2016) | | N/A |
| | | | | |
Robin A. Stelmach (k) (age 58) | | Trustee | | January 2014 | | 133 | | Massachusetts Financial Services Company, Vice Chair (since January 2017); Chief Operating Officer and Executive Vice President (until January 2017) | | N/A |
|
| INDEPENDENT TRUSTEES |
John P. Kavanaugh (age 65) | | Trustee and Chair of Trustees | | January 2009 | | 133 | | Private investor | | N/A |
| | | | | |
Steven E. Buller (age 68) | | Trustee | | February 2014 | | 133 | | Financial Accounting Standards Advisory Council, Chairman(2014-2015); Public Company Accounting Oversight Board, Standing Advisory Group, Member (until 2014); BlackRock, Inc. (investment management), Managing Director (until 2014), BlackRock Finco UK (investment management), Director (until 2014) | | N/A |
| | | | | |
John A. Caroselli (age 65) | | Trustee | | March 2017 | | 133 | | JC Global Advisors, LLC (management consulting), President (since 2015); First Capital Corporation (commercial finance), Executive Vice President (until 2015) | | N/A |
| | | | | |
Maureen R. Goldfarb (age 64) | | Trustee | | January 2009 | | 133 | | Private investor | | N/A |
| | | | | |
Peter D. Jones
(age 64) | | Trustee | | January 2019 | | 133 | | Franklin Templeton Distributors, Inc. (investment management), President (until 2015); Franklin Templeton Institutional, LLC (investment management), Chairman (until 2015) | | N/A |
| | | | | |
James W. Kilman, Jr.
(age 58) | | Trustee | | January 2019 | | 133 | | Burford Capital Limited (finance and investment management), Chief Financial Officer (since 2019); KielStrand Capital LLC (family office), Chief Executive Officer (since 2016); Morgan Stanley & Co. (financial services), Vice Chairman of Investment Banking,Co-Head of Diversified Financials Coverage – Financial Institutions Investment Banking Group (until 2016) | | Alpha-En Corporation, Director (2016-2019) |
21
MFS Investors Trust Series
Trustees and Officers – continued
| | | | | | | | | | |
Name, Age | | Position(s)
Held with Fund | | Trustee/Officer
Since (h) | | Number of MFS Funds
overseen by the
Trustee | | Principal Occupations
During the Past Five Years | | Other Directorships During the Past Five Years (j) |
Clarence Otis, Jr. (age 63) | | Trustee | | March 2017 | | 133 | | Darden Restaurants, Inc., Chief Executive Officer (until 2014) | | VF Corporation, Director; Verizon Communications, Inc., Director; The Travelers Companies, Director; Federal Reserve Bank of Atlanta, Director (until 2015) |
| | | | | |
Maryanne L. Roepke (age 63) | | Trustee | | May 2014 | | 133 | | American Century Investments (investment management), Senior Vice President and Chief Compliance Officer (until 2014) | | N/A |
| | | | | |
Laurie J. Thomsen
(age 62) | | Trustee | | March 2005 | | 133 | | Private investor | | The Travelers Companies, Director; Dycom Industries, Inc., Director (since 2015) |
| | | | | | | | |
Name, Age | | Position(s)
Held with Fund | | Trustee/Officer
Since (h) | | Number of
MFS Funds
for which the
Person is an
Officer | | Principal Occupations During the Past Five Years |
| OFFICERS | | | | | | |
Christopher R. Bohane (k)
(age 46) | | Assistant Secretary and Assistant Clerk | | July 2005 | | 133 | | Massachusetts Financial Services Company, Vice President and Assistant General Counsel |
| | | | |
Kino Clark (k) (age 51) | | Assistant Treasurer | | January 2012 | | 133 | | Massachusetts Financial Services Company, Vice President |
| | | | |
John W. Clark, Jr. (k) (age 52) | | Assistant Treasurer | | April 2017 | | 133 | | Massachusetts Financial Services Company, Vice President (since March 2017); Deutsche Bank (financial services), Department Head –Treasurer’s Office (until February 2017) |
| | | | |
Thomas H. Connors (k) (age 60) | | Assistant Secretary and Assistant Clerk | | September 2012 | | 133 | | Massachusetts Financial Services Company, Vice President and Senior Counsel |
| | | | |
David L. DiLorenzo (k)
(age 51) | | President | | July 2005 | | 133 | | Massachusetts Financial Services Company, Senior Vice President |
| | | | |
Heidi W. Hardin (k) (age 52) | | Secretary and Clerk | | April 2017 | | 133 | | Massachusetts Financial Services Company, Executive Vice President and General Counsel (since March 2017); Harris Associates (investment management), General Counsel (from September 2015 to January 2017); Janus Capital Management LLC (investment management), Senior Vice President and General Counsel (until September 2015) |
| | | | |
Brian E. Langenfeld (k) (age 46) | | Assistant
Secretary and Assistant Clerk | | June 2006 | | 133 | | Massachusetts Financial Services Company, Vice President and Senior Counsel |
| | | | |
Amanda S. Mooradian (k) (age 40) | | Assistant
Secretary and Assistant Clerk | | September 2018 | | 133 | | Massachusetts Financial Services Company, Assistant Vice President and Counsel |
| | | | |
Susan A. Pereira (k)
(age 49) | | Assistant
Secretary and Assistant Clerk | | July 2005 | | 133 | | Massachusetts Financial Services Company, Vice President and Assistant General Counsel |
| | | | |
Kasey L. Phillips (k) (age 49) | | Assistant Treasurer | | September 2012 | | 133 | | Massachusetts Financial Services Company, Vice President |
| | | | |
Matthew A. Stowe (k) (age 45) | | Assistant Secretary and Assistant Clerk | | October 2014 | | 133 | | Massachusetts Financial Services Company, Vice President and Assistant General Counsel |
22
MFS Investors Trust Series
Trustees and Officers – continued
| | | | | | | | |
Name, Age | | Position(s)
Held with Fund | | Trustee/Officer
Since (h) | | Number of
MFS Funds
for which the
Person is an
Officer | | Principal Occupations During the Past Five Years |
Martin J. Wolin (k) (age 52) | | Chief Compliance Officer | | July 2015 | | 133 | | Massachusetts Financial Services Company, Senior Vice President and Chief Compliance Officer (since July 2015); Mercer (financial service provider), Chief Risk and Compliance Officer, North America and Latin America (until June 2015) |
| | | | |
James O. Yost (k)
(age 59) | | Treasurer | | September 1990 | | 133 | | Massachusetts Financial Services Company, Senior Vice President |
| (h) | Date first appointed to serve as Trustee/officer of an MFS Fund. Each Trustee has served continuously since appointment unless indicated otherwise. For the period from December 15, 2004 until February 22, 2005, Mr. Manning served as Advisory Trustee. From January 2012 through December 2016, Messrs. DiLorenzo and Yost served as Treasurer and Deputy Treasurer of the Funds, respectively. |
| (j) | Directorships or trusteeships of companies required to report to the Securities and Exchange Commission (i.e., “public companies”). |
| (k) | “Interested person” of the Trust within the meaning of the Investment Company Act of 1940 (referred to as the 1940 Act), which is the principal federal law governing investment companies like the fund, as a result of a position with MFS. The address of MFS is 111 Huntington Avenue, Boston, Massachusetts 02199-7618. |
Each Trustee (other than Messrs. Jones and Kilman) has been elected by shareholders and each Trustee and Officer holds office until his or her successor is chosen and qualified or until his or her earlier death, resignation, retirement or removal. Messrs. Jones and Kilman became Trustees of the Funds on January 1, 2019. The Trust does not hold annual meetings for the purpose of electing Trustees, and Trustees are not elected for fixed terms. Under the terms of the Board’s retirement policy, an Independent Trustee shall retire at the end of the calendar year in which he or she reaches the earlier of 75 years of age or 15 years of service on the Board (or, in the case of any Independent Trustee who joined the Board prior to 2015, 20 years of service on the Board).
Messrs. Buller, Kilman and Otis and Ms. Roepke are members of the Trust’s Audit Committee.
Each of the Interested Trustees and certain Officers hold comparable officer positions with certain affiliates of MFS.
The Statement of Additional Information for a Fund includes further information about the Trustees and is available without charge upon request by calling1-800-225-2606.
| | |
Investment Adviser Massachusetts Financial Services Company 111 Huntington Avenue Boston, MA 02199-7618 | | Custodian State Street Bank and Trust Company 1 Lincoln Street Boston, MA 02111-2900 |
| |
Distributor MFS Fund Distributors, Inc. 111 Huntington Avenue Boston, MA 02199-7618 | | Independent Registered Public Accounting Firm Deloitte & Touche LLP 200 Berkeley Street Boston, MA 02116 |
| |
Portfolio Manager(s) Kevin Beatty Alison O’Neill Mackey Ted Maloney | | |
23
MFS Investors Trust Series
BOARD REVIEW OF INVESTMENT ADVISORY AGREEMENT
MFS Investors Trust Series
The Investment Company Act of 1940 requires that both the full Board of Trustees and a majority of thenon-interested (“independent”) Trustees, voting separately, annually approve the continuation of the Fund’s investment advisory agreement with MFS. The Trustees consider matters bearing on the Fund and its advisory arrangements at their meetings throughout the year, including a review of performance data at each regular meeting. In addition, the independent Trustees met several times over the course of three months beginning in May and ending in July, 2019 (“contract review meetings”) for the specific purpose of considering whether to approve the continuation of the investment advisory agreement for the Fund and the other investment companies that the Board oversees (the “MFS Funds”). The independent Trustees were assisted in their evaluation of the Fund’s investment advisory agreement by independent legal counsel, from whom they received separate legal advice and with whom they met separately from MFS during various contract review meetings. The independent Trustees were also assisted in this process by the MFS Funds’ Independent Senior Officer, a senior officer appointed by and reporting to the independent Trustees.
In connection with their deliberations regarding the continuation of the investment advisory agreement, the Trustees, including the independent Trustees, considered such information and factors as they believed, in light of the legal advice furnished to them and their own business judgment, to be relevant. The investment advisory agreement for the Fund was considered separately, although the Trustees also took into account the common interests of all MFS Funds in their review. As described below, the Trustees considered the nature, quality, and extent of the various investment advisory, administrative, and shareholder services performed by MFS under the existing investment advisory agreement and other arrangements with the Fund.
In connection with their contract review meetings, the Trustees received and relied upon materials that included, among other items: (i) information provided by Broadridge Financial Solutions, Inc. (“Broadridge”), an independent third party, on the investment performance of the Fund for various time periods ended December 31, 2018 and the investment performance of a group of funds with substantially similar investment classifications/objectives (the “Broadridge performance universe”), (ii) information provided by Broadridge on the Fund’s advisory fees and other expenses and the advisory fees and other expenses of comparable funds identified by Broadridge as well as all other funds in the same investment classification/category (the “Broadridge expense group and universe”), (iii) information provided by MFS on the advisory fees of portfolios of other clients of MFS, including institutional separate accounts and other clients, (iv) information as to whether and to what extent applicable expense waivers, reimbursements or fee “breakpoints” are observed for the Fund, (v) information regarding MFS’ financial results and financial condition, including MFS’ and certain of its affiliates’ estimated profitability from services performed for the Fund and the MFS Funds as a whole, and compared to MFS’ institutional business, (vi) MFS’ views regarding the outlook for the mutual fund industry and the strategic business plans of MFS, (vii) descriptions of various functions performed by MFS for the Funds, such as compliance monitoring and portfolio trading practices, and (viii) information regarding the overall organization of MFS, including information about MFS’ senior management and other personnel providing investment advisory, administrative and other services to the Fund and the other MFS Funds. The comparative performance, fee and expense information prepared and provided by Broadridge was not independently verified and the independent Trustees did not independently verify any information provided to them by MFS.
The Trustees’ conclusion as to the continuation of the investment advisory agreement was based on a comprehensive consideration of all information provided to the Trustees and not the result of any single factor. Some of the factors that figured particularly in the Trustees’ deliberations are described below, although individual Trustees may have evaluated the information presented differently from one another, giving different weights to various factors. It is also important to recognize that the fee arrangements for the Fund and other MFS Funds are the result of years of review and discussion between the independent Trustees and MFS, that certain aspects of such arrangements may receive greater scrutiny in some years than in others, and that the Trustees’ conclusions may be based, in part, on their consideration of these same arrangements during the course of the year and in prior years.
Based on information provided by Broadridge and MFS, the Trustees reviewed the Fund’s total return investment performance as well as the Broadridge performance universe over various time periods. The Trustees placed particular emphasis on the total return performance of the Fund’s Initial Class shares in comparison to the performance of funds in its Broadridge performance universe over the five-year period ended December 31, 2018, which the Trustees believed was a long enough period to reflect differing market conditions. The total return performance of the Fund’s Initial Class shares was in the 3rd quintile relative to the other funds in the universe for this five-year period (the 1st quintile being the best performers and the 5th quintile being the worst performers). The total return performance of the Fund’s Initial Class shares was in the 3rd quintile for the each of theone- and three-year periods ended December 31, 2018 relative to the Broadridge performance universe. Because of the passage of time, these performance results may differ from the performance results for more recent periods, including those shown elsewhere in this report.
In the course of their deliberations, the Trustees took into account information provided by MFS in connection with the contract review meetings, as well as during investment review meetings conducted with portfolio management personnel during the course of the year regarding the Fund’s performance. After reviewing these and related factors, the Trustees concluded, within the context of their overall conclusions regarding the investment advisory agreement, that they were satisfied with MFS’ responses and efforts relating to investment performance.
24
MFS Investors Trust Series
Board Review of Investment Advisory Agreement – continued
In assessing the reasonableness of the Fund’s advisory fee, the Trustees considered, among other information, the Fund’s advisory fee and the total expense ratio of the Fund’s Initial Class shares as a percentage of average daily net assets and the advisory fee and total expense ratios of the Broadridge expense group based on information provided by Broadridge. The Trustees considered that MFS currently observes an expense limitation for the Fund, which may not be changed without the Trustees’ approval. The Trustees also considered that, according to the data provided by Broadridge (which takes into account any fee reductions or expense limitations that were in effect during the Fund’s last fiscal year), the Fund’s effective advisory fee rate and total expense ratio were each higher than the Broadridge expense group median.
The Trustees also considered the advisory fees charged by MFS to any institutional separate accounts advised by MFS (“separate accounts”) and unaffiliated investment companies for which MFS serves as subadviser (“subadvised funds”) that have comparable investment strategies to the Fund, if any. In comparing these fees, the Trustees considered information provided by MFS as to the generally broader scope of services provided by MFS to the Fund, as well as the more extensive regulatory burdens imposed on MFS in managing the Fund, in comparison to separate accounts and subadvised funds. The Trustees also considered the higher demands placed on MFS’ investment personnel and trading infrastructure as a result of the daily cashin-flows andout-flows of the Fund in comparison to separate accounts.
The Trustees also considered whether the Fund may benefit from any economies of scale in the management of the Fund in the event of growth in assets of the Fund and/or growth in assets of the MFS Funds as a whole. They noted that the Fund’s advisory fee rate schedule is subject to contractual breakpoints that reduce the Fund’s advisory fee rate on average daily net assets over $1 billion and $2.5 billion. The Trustees also noted that MFS has agreed in writing to waive a portion of the management fees of certain MFS Funds, including the Fund, if the total combined assets of certain funds within the MFS Funds’ complex increase above agreed upon thresholds (the “group fee waiver”), enabling the Fund’s shareholders to share in the benefits from any economies of scale at the complex level. The group fee waiver is reviewed and renewed annually between the Board and MFS. The Trustees concluded that the breakpoints and the group fee waiver were sufficient to allow the Fund to benefit from economies of scale as its assets and overall complex assets grow.
The Trustees also considered information prepared by MFS relating to MFS’ costs and profits with respect to the Fund, the MFS Funds considered as a group, and other investment companies and accounts advised by MFS, as well as MFS’ methodologies used to determine and allocate its costs to the MFS Funds, the Fund and other accounts and products for purposes of estimating profitability.
After reviewing these and other factors described herein, the Trustees concluded, within the context of their overall conclusions regarding the investment advisory agreement, that the advisory fees charged to the Fund represent reasonable compensation in light of the services being provided by MFS to the Fund.
In addition, the Trustees considered MFS’ resources and related efforts to continue to retain, attract and motivate capable personnel to serve the Fund. The Trustees also considered current and developing conditions in the financial services industry, including the presence of large and well-capitalized companies which are spending, and appear to be prepared to continue to spend, substantial sums to engage personnel and to provide services to competing investment companies. In this regard, the Trustees also considered the financial resources of MFS and its ultimate parent, Sun Life Financial Inc. The Trustees also considered the advantages and possible disadvantages to the Fund of having an adviser that also serves other investment companies as well as other accounts.
The Trustees also considered the nature, quality, cost, and extent of administrative, transfer agency, and distribution services provided to the Fund by MFS and its affiliates under agreements and plans other than the investment advisory agreement, including any12b-1 fees the Fund pays to MFS Fund Distributors, Inc., an affiliate of MFS. The Trustees also considered the nature, extent and quality of certain other services MFS performs or arranges for on the Fund’s behalf, which may include securities lending programs, directed expense payment programs, class action recovery programs, and MFS’ interaction with third-party service providers, principally custodians andsub-custodians. The Trustees concluded that the variousnon-advisory services provided by MFS and its affiliates on behalf of the Fund were satisfactory.
The Trustees consideredso-called“fall-out benefits” to MFS such as reputational value derived from serving as investment manager to the MFS Funds. The Trustees also considered that, effective January 3, 2018, MFS had discontinued its historic practice of obtaining investment research from portfolio brokerage commissions paid by certain MFS Funds and would thereafter directly pay for or voluntarily reimburse a Fund, if applicable, for the costs of external research acquired through the use of the Fund’s portfolio brokerage commissions.
Based on their evaluation of factors that they deemed to be material, including those factors described above, the Board of Trustees, including the independent Trustees, concluded that the Fund’s investment advisory agreement with MFS should be continued for an additionalone-year period, commencing August 1, 2019.
25
MFS Investors Trust Series
PROXY VOTING POLICIES AND INFORMATION
MFS votes proxies on behalf of the fund pursuant to proxy voting policies and procedures that are available without charge, upon request, by calling 1-800-225-2606, by visitingmfs.com/proxyvoting, or by visiting the SEC’s Web site athttp://www.sec.gov.
Information regarding how the fund voted proxies relating to portfolio securities during the most recent twelve-month period ended June 30 is available by August 31 of each year without charge by visitingmfs.com/proxyvoting, or by visiting the SEC’s Web site athttp://www.sec.gov.
QUARTERLY PORTFOLIO DISCLOSURE
The fund files a complete schedule of portfolio holdings with the SEC for the first and third quarters of each fiscal year as an exhibit to its reports on Form N-PORT. The fund’s Form N-PORT reports are available on the SEC’s website athttp://www.sec.gov.A shareholder can obtain the portfolio holdings report for the first and third quarters of the fund’s fiscal year atmfs.com/vit1 by choosing the fund’s name and then selecting the “Resources” tab and clicking on “Prospectus and Reports”.
FURTHER INFORMATION
From time to time, MFS may post important information about the fund or the MFS funds on the MFS web site (mfs.com). This information is available at https://www.mfs.com/en-us/what-we-do/announcements.html or atmfs.com/vit1 by choosing the fund’s name.
INFORMATION ABOUT FUND CONTRACTS AND LEGAL CLAIMS
The fund has entered into contractual arrangements with an investment adviser, administrator, distributor, shareholder servicing agent, 529 program manager (if applicable), and custodian who each provide services to the fund. Unless expressly stated otherwise, shareholders are not parties to, or intended beneficiaries of these contractual arrangements, and these contractual arrangements are not intended to create any shareholder right to enforce them against the service providers or to seek any remedy under them against the service providers, either directly or on behalf of the fund.
Under the Trust’s By-Laws and Declaration of Trust, any claims asserted against or on behalf of the MFS Funds, including claims against Trustees and Officers, must be brought in state and federal courts located within the Commonwealth of Massachusetts.
FEDERAL TAX INFORMATION (unaudited)
The following information is provided pursuant to provisions of the Internal Revenue Code.
The fund designates $40,543,000 as capital gain dividends paid during the fiscal year.
For corporate shareholders, 100% of the ordinary income dividends paid during the fiscal year qualify for the corporate dividends received deduction.
26
rev. 3/16
| | | | |
| | | |
| FACTS | | WHAT DOES MFS DO WITH YOUR
PERSONAL INFORMATION? | |  |
| | |
| Why? | | Financial companies choose how they share your personal information. Federal law gives consumers the right to limit some but not all sharing. Federal law also requires us to tell you how we collect, share, and protect your personal information. Please read this notice carefully to understand what we do. |
| | |
| What? | | The types of personal information we collect and share depend on the product or service you have with us. This information can include: • Social Security number and account balances • Account transactions and transaction history • Checking account information and wire transfer instructions When you areno longer our customer, we continue to share your information as described in this notice. |
| | |
| How? | | All financial companies need to share customers’ personal information to run their everyday business. In the section below, we list the reasons financial companies can share their customers’ personal information; the reasons MFS chooses to share; and whether you can limit this sharing. |
| | | | |
Reasons we can share your
personal information | | Does MFS share? | | Can you limit this
sharing? |
For our everyday business purposes – such as to process your transactions, maintain your account(s), respond to court orders and legal investigations, or report to credit bureaus | | Yes | | No |
For our marketing purposes – to offer our products and services to you | | No | | We don’t share |
| For joint marketing with other financial companies | | No | | We don’t share |
For our affiliates’ everyday business purposes – information about your transactions and experiences | | No | | We don’t share |
For our affiliates’ everyday business purposes – information about your creditworthiness | | No | | We don’t share |
| For nonaffiliates to market to you | | No | | We don’t share |
| | |
| | |
| Questions? | | Call800-225-2606 or go tomfs.com. |
27
| | |
| Who we are |
| Who is providing this notice? | | MFS Funds, MFS Investment Management, MFS Institutional Advisors, Inc., and MFS Heritage Trust Company. |
| | |
| What we do |
| How does MFS protect my personal information? | | To protect your personal information from unauthorized access and use, we use security measures that comply with federal law. These measures include procedural, electronic, and physical safeguards for the protection of the personal information we collect about you. |
How does MFS
collect my personal information? | | We collect your personal information, for example, when you • open an account or provide account information • direct us to buy securities or direct us to sell your securities • make a wire transfer We also collect your personal information from others, such as credit bureaus, affiliates, or other companies. |
| Why can’t I limit all sharing? | | Federal law gives you the right to limit only • sharing for affiliates’ everyday business purposes – information about your creditworthiness • affiliates from using your information to market to you • sharing for nonaffiliates to market to you State laws and individual companies may give you additional rights to limit sharing. |
| | |
| Definitions |
| Affiliates | | Companies related by common ownership or control. They can be financial and nonfinancial companies. • MFS does not share personal information with affiliates, except for everyday business purposes as described on page one of this notice. |
| Nonaffiliates | | Companies not related by common ownership or control. They can be financial and nonfinancial companies. • MFS does not share with nonaffiliates so they can market to you. |
| Joint marketing | | A formal agreement between nonaffiliated financial companies that together market financial products or services to you. • MFS doesn’t jointly market. |
| | |
| Other important information |
| If you own an MFS product or receive an MFS service in the name of a third party such as a bank or broker-dealer, their privacy policy may apply to you instead of ours. |
28
Annual Report
December 31, 2019

MFS® Mid Cap Growth Series

MFS® Variable Insurance Trust
Beginning on January 1, 2021, as permitted by regulations adopted by the U.S. Securities and Exchange Commission, the insurance company that offers your contract may determine that it will no longer send you paper copies of the fund’s annual and semiannual shareholder reports unless you specifically request paper copies from the insurance company or from your financial intermediary. Instead, the shareholder reports will be made available on a Web site (insurancefunds.mfs.com or other Web site of which you will be notified), and the insurance company will notify you by mail each time a report is posted and provide you with a Web site link to access the report. Instructions for requesting paper copies will be provided by your insurance company or financial intermediary.
If you already elected to receive shareholder reports by email, you will not be affected by this change and you need not take any action. If your insurance company or financial intermediary offers electronic delivery, you may elect to receive shareholder reports and other communications from the insurance company or financial intermediary by email by following the instructions provided by the insurance company or financial intermediary.
Beginning on January 1, 2019, you may elect to receive all future reports in paper free of charge from the insurance company or financial intermediary. You can inform the insurance company or financial intermediary that you wish to continue receiving paper copies of your shareholder reports by contacting your insurance company or financial intermediary. Your election to receive reports in paper will apply to all funds held in your account with your insurance company or financial intermediary.
VMG-ANN
MFS® Mid Cap Growth Series
CONTENTS
The report is prepared for the general information of contract owners. It is authorized for distribution to prospective investors only when preceded or accompanied by a current prospectus.
NOT FDIC INSURED• MAY LOSE VALUE• NO BANK OR CREDIT UNION GUARANTEE• NOT A DEPOSIT• NOT INSURED BY ANY FEDERAL GOVERNMENT AGENCY OR NCUA/NCUSIF
MFS Mid Cap Growth Series
LETTER FROM THE EXECUTIVE CHAIR

Dear Contract Owners:
Slowing global growth, low inflation, and trade friction between the United States and China have been hallmarks of the past 12 months. After experiencing an uptick in market volatility in late 2018, markets steadied for most of 2019, thanks in large measure to the adoption of a dovish policy stance on the part of global central banks, focused on supporting economic growth. Negotiations aimed at a “phase one” trade deal between the U.S. and China bore fruit at the end of the period, boosting investor sentiment, while signs of stability emerging from the global manufacturing sector also lifted spirits. Uncertainty over Brexit, along with the ripple effects from the trade conflict, hampered business confidence and investment in the United Kingdom and Europe for much of the period, though investors expect greater clarity regarding Brexit as a result of December’s general election. The pro-Brexit Conservative Party won the election by a comfortable margin and set the stage for the U.K.’s departure from the EU at the end of January.
Markets expect the longest economic expansion in U.S. history will continue, albeit at a slower pace, as trade tensions recede. In an effort to prolong the expansion, the U.S. Federal Reserve lowered interest rates three times between July and October and the European Central Bank loosened policy in September. While the global monetary policy backdrop remains quite accommodative, signs of easing trade tensions and fading global recession fears led to improved market sentiment in late 2019 as investors grew less risk averse. In early 2020, an outbreak of coronavirus emanating from China reintroduced global growth fears, causing an uptick in volatility.
Here at MFS®, we aim to help our clients navigate the growing complexity of the markets and world economies. Our long-term investment philosophy and commitment to the responsible allocation of capital allow us to tune out the noise and uncover what we believe are the best, most durable investment opportunities in the market. Through our powerful global investment platform, we combine collective expertise, thoughtful risk management and long-term discipline to create sustainable value for investors.
Respectfully,

Robert J. Manning
Executive Chair
MFS Investment Management
February 14, 2020
The opinions expressed in this letter are subject to change and may not be relied upon for investment advice. No forecasts can be guaranteed.
1
MFS Mid Cap Growth Series
PORTFOLIO COMPOSITION
Portfolio structure

| | | | |
| Top ten holdings | | | | |
| Global Payments, Inc. | | | 4.0% | |
| Bright Horizons Family Solutions, Inc. | | | 3.6% | |
| Fidelity National Information Services, Inc. | | | 2.5% | |
| PerkinElmer, Inc. | | | 2.5% | |
| Copart, Inc. | | | 2.4% | |
| AMETEK, Inc. | | | 2.3% | |
| Fiserv, Inc. | | | 2.3% | |
| Verisk Analytics, Inc., “A” | | | 2.1% | |
| Cadence Design Systems, Inc. | | | 2.1% | |
| STERIS PLC | | | 2.1% | |
| | | | |
| GICS equity sectors (g) | | | | |
| Information Technology | | | 28.7% | |
| Industrials | | | 21.9% | |
| Consumer Discretionary | | | 15.1% | |
| Health Care | | | 15.0% | |
| Financials | | | 7.2% | |
| Communication Services | | | 4.7% | |
| Materials | | | 3.2% | |
| Real Estate | | | 3.0% | |
| Energy | | | 0.4% | |
| Consumer Staples | | | 0.2% | |
| (g) | The Global Industry Classification Standard (GICS®) was developed by and/or is the exclusive property of MSCI, Inc. and S&P Global Market Intelligence Inc. (“S&P Global Market Intelligence”). GICS is a service mark of MSCI and S&P Global Market Intelligence and has been licensed for use by MFS. |
Cash & Cash Equivalents includes any cash, investments in money market funds, short-term securities, and other assets less liabilities. Please see the Statement of Assets and Liabilities for additional information related to the fund’s cash position and other assets and liabilities.
Percentages are based on net assets as of December 31, 2019.
The portfolio is actively managed and current holdings may be different.
2
MFS Mid Cap Growth Series
MANAGEMENT REVIEW
Summary of Results
For the twelve months ended December 31, 2019, Initial Class shares of the MFS Mid Cap Growth Series (fund) provided a total return of 38.66%, while Service Class shares of the fund provided a total return of 38.28%. These compare with a return of 35.47% over the same period for the fund’s benchmark, the Russell Midcap® Growth Index.
Market Environment
Fading fears of a near-term global recession, the announcement of a partial trade deal between the United States and China and the decline in uncertainty over Brexit helped bolster market sentiment late in the period. Changes in market sentiment, largely driven by uncertainty over the outcome of trade negotiations between the US and China, had contributed to periodic bouts of volatility during the reporting period. The global economy decelerated, led by weakness in China and Europe, although the pace of the slowdown moderated late in the period amid nascent signs of stabilization in the manufacturing sector.
The deteriorating global growth backdrop, along with declining inflationary pressures, prompted the US Federal Reserve to adopt a more dovish posture beginning in early 2019, resulting in the first interest rate cut in over a decade at the end of July, followed by additional cuts in September and October. The Fed’s actions led to a sharp decline in long-term interest rates during the period’s second half, causing the inversion of portions of the US Treasury yield curve for a time. Amid an improvement in risk sentiment in Q4 2019 and indications of a bottoming in growth and a potential upturn in activity, the Fed indicated in October that further rate cuts were unlikely unless the outlook for the economy materially worsened.
Globally, central banks have tilted more dovish as well, with the European Central Bank unveiling a package of easing measures, which included putting overnight rates deeper into negative territory, restarting its bond-buying program and lengthening the term of cheap loans to banks to three years from two. The central banks of India and Australia are among those that have cut rates several times in recent months, although China has been more cautious in increasing liquidity as it keeps trying to deleverage its economy, cutting rates only marginally.
Emerging markets experienced considerable volatility through the end of 2018, as tighter global financial conditions exposed structural weakness in some countries. Those conditions improved in 2019 as the Fed became more dovish. Notwithstanding the periodic headwinds on market sentiment from significant trade friction between the US and China over much of the year, emerging market hard currency debt and local rates benefited from relatively cheap valuations at the beginning of the period and easier global monetary conditions. These factors, plus the fading of certain global risk factors mentioned above, hastened spread tightening in the latter part of the period. At the same time, idiosyncratic risks spiked in some countries (e.g., Argentina and Lebanon), contributing to increased dispersion in performance among sovereign assets.
Contributors to Performance
Stock selection in both theindustrialsandfinancialssectors contributed to performance relative to the Russell Midcap Growth® Index. Within theindustrials sector, an overweight position in online auction firm Copart, and holding shares of freight rail transportation company Kansas City Southern (b), benefited relative results. The stock price of Copart advanced during the period as the company reported strength in both revenue and operating margins, driven by an increase in demand from Germany and Brazil and a shift towards higher-priced vehicles in the US. Furthermore, the timing of the fund’s ownership in shares of analytics service provider IHS Markit also helped relative results. Within thefinancials sector, holding shares of alternative investment manager Apollo Global Management (b), and an overweight position in index data provider MSCI, supported relative returns. The stock price of Apollo Global Management rose as the company completed its conversion from a publicly traded partnership to a corporation, broadening its base of potential investors.
The combination of an underweight position and stock selection in theconsumer staples sector also strengthened relative results. Within this sector, there were no individual stocks that were among the fund’s largest relative contributors during the period.
Elsewhere, the fund’s overweight positions in payments processing technology and solutions provider Worldpay (h), electronic payment services provider Global Payments, payment processing services provider Total System Services (h) and integrated circuits and electronic devices developer Cadence Design Systems supported relative results. In addition, the timing of the fund’s ownership in shares of medical device maker ABIOMED (h) helped relative returns.
Detractors from Performance
Stock selection in thematerialssector detracted from relative performance, led by the fund’s holdings of global bioscience company Chr. Hansen Holding (b) (Denmark) and specialty chemicals and carbon materials manufacturer Ingevity (b).
An overweight position in thehealth care sector also held back relative results. Within this sector, the fund’s overweight position in animal health products manufacturer Elanco Animal Health and human and environmental health services provider PerkinElmer
3
MFS Mid Cap Growth Series
Management Review – continued
weakened relative returns. The stock price of Elanco Animal Health came under pressure as investors appeared to have responded negatively to the company’s announcement that it would acquire Bayer’s animal health business, which introduced uncertainty. Additionally, holding shares of molecular diagnostics provider QIAGEN (b) (Netherlands) further weighed on relative returns.
Stocks in other sectors that hindered relative performance included not holding shares of strong-performing global semiconductor company Advanced Micro Devices, semiconductor company Lam Research and nano-electronics industry services provider KLA. The stock price of Advanced Micro Devices rose, driven by strong performance in both its data center GPU (Graphics Processing Unit) and client CPU (Central Processing Unit) segments. Additionally, the fund’s overweight positions in software-based product management and development solutions provider PTC (h) and video game developerTake-Two Interactive Software weighed on relative results.
Respectfully,
Portfolio Manager(s)
Eric Fischman and Paul Gordon
| (b) | Security is not a benchmark constituent. |
| (h) | Security was not held in the portfolio at period end. |
The views expressed in this report are those of the portfolio manager(s) only through the end of the period of the report as stated on the cover and do not necessarily reflect the views of MFS or any other person in the MFS organization. These views are subject to change at any time based on market or other conditions, and MFS disclaims any responsibility to update such views. These views may not be relied upon as investment advice or an indication of trading intent on behalf of any MFS portfolio. References to specific securities are not recommendations of such securities, and may not be representative of any MFS portfolio’s current or future investments.
4
MFS Mid Cap Growth Series
PERFORMANCE SUMMARY THROUGH 12/31/19
The following chart illustrates the historical performance of the fund in comparison to its benchmark(s). Benchmarks are unmanaged and may not be invested in directly. Benchmark returns do not reflect any fees or expenses. The performance of other share classes will be greater than or less than that of the class depicted below. (See Notes to Performance Summary.)
Performance data shown represents past performance and is no guarantee of future results. Investment return and principal value fluctuate so your units, when sold, may be worth more or less than the original cost; current performance may be lower or higher than quoted. The performance shown does not reflect the deduction of taxes, if any, that a contract holder would pay on fund distributions or the redemption of contract units. The returns for the fund shown also do not reflect the deduction of expenses associated with variable products, such as mortality and expense risk charges, separate account charges, and sales charges imposed by the insurance company separate accounts. Such expenses would reduce the overall returns shown.
Growth of a Hypothetical $10,000 Investment
Total Returns through 12/31/19
Average annual total returns
| | | | | | | | | | | | |
| | | Share Class | | Class Inception Date | | 1-yr | | 5-yr | | 10-yr | | |
| | | Initial Class | | 4/28/00 | | 38.66% | | 14.37% | | 15.34% | | |
| | | Service Class | | 5/01/00 | | 38.28% | | 14.08% | | 15.05% | | |
| | | | |
| Comparative benchmark(s) | | | | | | | | |
| | | Russell Midcap® Growth Index (f) | | 35.47% | | 11.60% | | 14.24% | | |
| (f) | Source: FactSet Research Systems Inc. |
Benchmark Definition(s)
Russell Midcap® Growth Index – constructed to provide a comprehensive barometer for growth securities in the mid-cap segment of the U.S. equity universe. Companies in this index generally have higher price-to-book ratios and higher forecasted growth values. Frank Russell Company (“Russell”) is the source and owner of the trademarks, service marks, and copyrights related to the Russell Indexes. Russell® is a trademark of Frank Russell Company. Neither Russell nor its licensors accept any liability for any errors or omissions in the Russell Indexes and/or Russell ratings or underlying data and no party may rely on any Russell Indexes and/or Russell ratings and/or underlying data contained in this document. No further distribution of Russell Data is permitted without Russell’s express written consent. Russell does not promote, sponsor, or endorse the content of this document.
It is not possible to invest directly in an index.
Notes to Performance Summary
Average annual total return represents the average annual change in value for each share class for the periods presented.
Performance results reflect any applicable expense subsidies and waivers in effect during the periods shown. Without such subsidies and waivers the fund’s performance results would be less favorable. Please see the prospectus and financial statements for complete details. All results are historical and assume the reinvestment of any dividends and capital gains distributions.
Performance results do not include adjustments made for financial reporting purposes in accordance with U.S. generally accepted accounting principles and may differ from amounts reported in the financial highlights.
From time to time the fund may receive proceeds from litigation settlements, without which performance would be lower.
5
MFS Mid Cap Growth Series
EXPENSE TABLE
Fund Expenses Borne by the Contract Holders during the Period,
July 1, 2019 through December 31, 2019
As a contract holder of the fund, you incur ongoing costs, including management fees; distribution and/or service(12b-1) fees; and other fund expenses. This example is intended to help you understand your ongoing costs (in dollars) of investing in the fund and to compare these costs with the ongoing costs of investing in other mutual funds.
The example is based on an investment of $1,000 invested at the beginning of the period and held for the entire period July 1, 2019 through December 31, 2019.
Actual Expenses
The first line for each share class in the following table provides information about actual account values and actual expenses. You may use the information in this line, together with the amount you invested, to estimate the expenses that you paid over the period. Simply divide your account value by $1,000 (for example, an $8,600 account value divided by $1,000 = 8.6), then multiply the result by the number in the first line under the heading entitled “Expenses Paid During Period” to estimate the expenses you paid on your account during this period.
Hypothetical Example for Comparison Purposes
The second line for each share class in the following table provides information about hypothetical account values and hypothetical expenses based on the fund’s actual expense ratio and an assumed rate of return of 5% per year before expenses, which is not the fund’s actual return. The hypothetical account values and expenses may not be used to estimate the actual ending account balance or expenses you paid for the period. You may use this information to compare the ongoing costs of investing in the fund and other funds. To do so, compare this 5% hypothetical example with the 5% hypothetical examples that appear in the shareholder reports of the other funds.
Please note that the expenses shown in the table are meant to highlight the fund’s ongoing costs only and do not take into account the fees and expenses imposed under the variable contracts through which your investment in the fund is made. Therefore, the second line for each share class in the table is useful in comparing ongoing costs associated with an investment in vehicles (such as the fund) which fund benefits under variable annuity and variable life insurance contracts and to qualified pension and retirement plans only, and will not help you determine the relative total costs of investing in the fund through variable annuity and variable life insurance contracts. If the fees and expenses imposed under the variable contracts were included, your costs would have been higher.
| | | | | | | | | | | | | | | | | | |
| Share Class | | | | Annualized
Expense Ratio | | | Beginning
Account Value
7/01/19 | | | Ending
Account Value 12/31/19 | | | Expenses Paid
During Period (p)
7/01/19-12/31/19 | |
| Initial Class | | Actual | | | 0.79% | | | | $1,000.00 | | | | $1,064.54 | | | | $4.11 | |
| | Hypothetical (h) | | | 0.79% | | | | $1,000.00 | | | | $1,021.22 | | | | $4.02 | |
| Service Class | | Actual | | | 1.04% | | | | $1,000.00 | | | | $1,063.04 | | | | $5.41 | |
| | Hypothetical (h) | | | 1.04% | | | | $1,000.00 | | | | $1,019.96 | | | | $5.30 | |
| (h) | 5% class return per year before expenses. |
| (p) | “Expenses Paid During Period” are equal to each class’s annualized expense ratio, as shown above, multiplied by the average account value over the period, multiplied by 184/365 (to reflect theone-half year period). |
6
MFS Mid Cap Growth Series
PORTFOLIO OF INVESTMENTS – 12/31/19
The Portfolio of Investments is a complete list of all securities owned by your fund. It is categorized by broad-based asset classes.
| | | | | | | | |
| | |
| Issuer | | Shares/Par | | | Value ($) | |
| COMMON STOCKS – 99.4% | | | | | | | | |
| Aerospace – 3.3% | | | | | |
| FLIR Systems, Inc. | | | 52,346 | | | $ | 2,725,656 | |
| L3Harris Technologies, Inc. | | | 26,966 | | | | 5,335,763 | |
| TransDigm Group, Inc. | | | 9,054 | | | | 5,070,240 | |
| | | | | | | | |
| | | | | | $ | 13,131,659 | |
| | | | | | | | |
| Automotive – 2.9% | | | | | |
| Copart, Inc. (a) | | | 104,311 | | | $ | 9,486,043 | |
| IAA, Inc. (a) | | | 38,654 | | | | 1,819,057 | |
| | | | | | | | |
| | | | | | $ | 11,305,100 | |
| | | | | | | | |
| Biotechnology – 1.4% | | | | | |
| Adaptive Biotechnologies Corp. (a) | | | 22,248 | | | $ | 665,660 | |
| Bio-Techne Corp. | | | 22,063 | | | | 4,843,049 | |
| | | | | | | | |
| | | | | | $ | 5,508,709 | |
| | | | | | | | |
| Brokerage & Asset Managers – 3.0% | | | | | |
| Apollo Global Management, Inc. | | | 73,996 | | | $ | 3,530,349 | |
| NASDAQ, Inc. | | | 68,232 | | | | 7,307,647 | |
| Tradeweb Markets, Inc. | | | 23,304 | | | | 1,080,141 | |
| | | | | | | | |
| | | | | | $ | 11,918,137 | |
| | | | | | | | |
| Business Services – 19.4% | | | | | |
| Clarivate Analytics PLC (a) | | | 222,801 | | | $ | 3,743,057 | |
| CoStar Group, Inc. (a) | | | 8,616 | | | | 5,154,953 | |
| Equifax, Inc. | | | 7,998 | | | | 1,120,680 | |
| Fidelity National Information Services, Inc. | | | 71,494 | | | | 9,944,100 | |
| Fiserv, Inc. (a) | | | 78,280 | | | | 9,051,516 | |
| FleetCor Technologies, Inc. (a) | | | 18,986 | | | | 5,462,652 | |
| Global Payments, Inc. | | | 85,827 | | | | 15,668,577 | |
| MSCI, Inc. | | | 27,486 | | | | 7,096,336 | |
| TransUnion | | | 77,598 | | | | 6,643,165 | |
| Tyler Technologies, Inc. (a) | | | 14,390 | | | | 4,317,288 | |
| Verisk Analytics, Inc., “A” | | | 55,130 | | | | 8,233,114 | |
| | | | | | | | |
| | | | | | $ | 76,435,438 | |
| | | | | | | | |
| Cable TV – 1.0% | | | | | |
| Altice USA, Inc., “A” (a) | | | 139,859 | | | $ | 3,823,745 | |
| | | | | | | | |
| Chemicals – 0.6% | | | | | |
| Ingevity Corp. (a) | | | 27,909 | | | $ | 2,438,688 | |
| | | | | | | | |
| Computer Software – 5.3% | | | | | |
| Autodesk, Inc. (a) | | | 38,973 | | | $ | 7,149,987 | |
| Black Knight, Inc. (a) | | | 63,846 | | | | 4,116,790 | |
| Cadence Design Systems, Inc. (a) | | | 118,478 | | | | 8,217,634 | |
| DocuSign, Inc. (a) | | | 16,283 | | | | 1,206,733 | |
| | | | | | | | |
| | | | | | $ | 20,691,144 | |
| | | | | | | | |
| Computer Software – Systems – 6.4% | | | | | |
| Constellation Software, Inc. | | | 3,944 | | | $ | 3,830,438 | |
| Guidewire Software, Inc. (a) | | | 33,250 | | | | 3,649,853 | |
| NICE Systems Ltd., ADR (a) | | | 34,249 | | | | 5,313,732 | |
| Pluralsight, Inc., “A” (a) | | | 17,353 | | | | 298,645 | |
| ServiceNow, Inc. (a) | | | 23,281 | | | | 6,572,692 | |
| Square, Inc., “A” (a) | | | 31,675 | | | | 1,981,588 | |
| | | | | | | | |
| | |
| Issuer | | Shares/Par | | | Value ($) | |
| COMMON STOCKS – continued | | | | | |
| Computer Software – Systems – continued | | | | | |
| SS&C Technologies Holdings, Inc. | | | 55,817 | | | $ | 3,427,164 | |
| | | | | | | | |
| | | | | | $ | 25,074,112 | |
| | | | | | | | |
| Construction – 3.3% | | | | | |
| Lennox International, Inc. | | | 17,133 | | | $ | 4,179,938 | |
| Pool Corp. | | | 12,375 | | | | 2,628,203 | |
| Vulcan Materials Co. | | | 43,399 | | | | 6,249,022 | |
| | | | | | | | |
| | | | | | $ | 13,057,163 | |
| | | | | | | | |
| Consumer Products – 0.4% | | | | | |
| Scotts Miracle-Gro Co. | | | 14,656 | | | $ | 1,556,174 | |
| | | | | | | | |
| Consumer Services – 3.9% | | | | | |
| Bright Horizons Family Solutions, Inc. (a) | | | 94,333 | | | $ | 14,177,307 | |
| Peloton Interactive, Inc., “A” (a)(l) | | | 38,611 | | | | 1,096,552 | |
| | | | | | | | |
| | | | | | $ | 15,273,859 | |
| | | | | | | | |
| Electrical Equipment – 5.7% | | | | | |
| AMETEK, Inc. | | | 92,441 | | | $ | 9,220,065 | |
| Amphenol Corp., “A” | | | 53,269 | | | | 5,765,304 | |
| Littlefuse, Inc. | | | 14,469 | | | | 2,767,920 | |
| Mettler-Toledo International, Inc. (a) | | | 6,069 | | | | 4,814,416 | |
| | | | | | | | |
| | | | | | $ | 22,567,705 | |
| | | | | | | | |
| Electronics – 2.5% | | | | | |
| Monolithic Power Systems, Inc. | | | 38,131 | | | $ | 6,788,080 | |
| Silicon Laboratories, Inc. (a) | | | 26,858 | | | | 3,114,991 | |
| | | | | | | | |
| | | | | | $ | 9,903,071 | |
| | | | | | | | |
| Energy – Independent – 0.4% | | | | | |
| Diamondback Energy, Inc. | | | 16,919 | | | $ | 1,571,098 | |
| | | | | | | | |
| Entertainment – 0.2% | | | | | |
| World Wrestling Entertainment, Inc., “A” | | | 13,367 | | | $ | 867,117 | |
| | | | | | | | |
| Food & Beverages – 0.6% | | | | | |
| Chr. Hansen Holding A.S. | | | 27,474 | | | $ | 2,183,288 | |
| | | | | | | | |
| Gaming & Lodging – 1.0% | | | | | |
| Flutter Entertainment PLC | | | 11,801 | | | $ | 1,441,859 | |
| Vail Resorts, Inc. | | | 6,225 | | | | 1,492,942 | |
| Wynn Resorts Ltd. | | | 7,995 | | | | 1,110,265 | |
| | | | | | | | |
| | | | | | $ | 4,045,066 | |
| | | | | | | | |
| General Merchandise – 2.3% | | | | | |
| Dollar Tree, Inc. (a) | | | 41,048 | | | $ | 3,860,564 | |
| Five Below, Inc. (a) | | | 41,622 | | | | 5,321,789 | |
| | | | | | | | |
| | | | | | $ | 9,182,353 | |
| | | | | | | | |
| Insurance – 1.5% | | | | | |
| Arthur J. Gallagher & Co. | | | 63,289 | | | $ | 6,027,011 | |
| | | | | | | | |
| Internet – 2.0% | | | | | |
| IAC/InterActiveCorp (a) | | | 18,300 | | | $ | 4,558,713 | |
| Match Group, Inc. (a)(l) | | | 18,654 | | | | 1,531,680 | |
| Wix.com Ltd. (a) | | | 13,411 | | | | 1,641,238 | |
| | | | | | | | |
| | | | | | $ | 7,731,631 | |
| | | | | | | | |
7
MFS Mid Cap Growth Series
Portfolio of Investments – continued
| | | | | | | | |
| | |
| Issuer | | Shares/Par | | | Value ($) | |
| | | | | | | | |
| COMMON STOCKS – continued | |
| Leisure & Toys – 2.0% | | | | | | | | |
| Electronic Arts, Inc. (a) | | | 20,595 | | | $ | 2,214,169 | |
| Take-Two Interactive Software, Inc. (a) | | | 46,135 | | | | 5,648,308 | |
| | | | | | | | |
| | | | | | $ | 7,862,477 | |
| | | | | | | | |
| Machinery & Tools – 2.8% | | | | | | | | |
| IDEX Corp. | | | 16,129 | | | $ | 2,774,188 | |
| Roper Technologies, Inc. | | | 21,053 | | | | 7,457,604 | |
| Xylem, Inc. | | | 9,140 | | | | 720,141 | |
| | | | | | | | |
| | | | | | $ | 10,951,933 | |
| | | | | | | | |
| Medical & Health Technology & Services – 1.9% | | | | | |
| Guardant Health, Inc. (a) | | | 6,428 | | | $ | 502,284 | |
| ICON PLC (a) | | | 30,932 | | | | 5,327,419 | |
| IDEXX Laboratories, Inc. (a) | | | 6,795 | | | | 1,774,378 | |
| | | | | | | | |
| | | | | | $ | 7,604,081 | |
| | | | | | | | |
| Medical Equipment – 9.6% | | | | | | | | |
| Align Technology, Inc. (a) | | | 3,022 | | | $ | 843,259 | |
| Cooper Cos., Inc. | | | 10,163 | | | | 3,265,270 | |
| DexCom, Inc. (a) | | | 8,979 | | | | 1,964,066 | |
| Edwards Lifesciences Corp. (a) | | | 15,183 | | | | 3,542,042 | |
| Masimo Corp. (a) | | | 31,670 | | | | 5,005,760 | |
| PerkinElmer, Inc. | | | 101,006 | | | | 9,807,682 | |
| QIAGEN N.V. (a) | | | 76,152 | | | | 2,573,938 | |
| STERIS PLC | | | 53,380 | | | | 8,136,180 | |
| West Pharmaceutical Services, Inc. | | | 18,214 | | | | 2,738,111 | |
| | | | | | | | |
| | | | | | $ | 37,876,308 | |
| | | | | | | | |
| Other Banks & Diversified Financials – 0.8% | | | | | |
| First Republic Bank | | | 26,674 | | | $ | 3,132,861 | |
| | | | | | | | |
| Pharmaceuticals – 0.9% | | | | | | | | |
| Elanco Animal Health, Inc. (a) | | | 115,165 | | | $ | 3,391,609 | |
| | | | | | | | |
| Printing & Publishing – 2.3% | | | | | | | | |
| IHS Markit Ltd. (a) | | | 105,892 | | | $ | 7,978,962 | |
| Wolters Kluwer N.V. | | | 13,125 | | | | 957,245 | |
| | | | | | | | |
| | | | | | $ | 8,936,207 | |
| | | | | | | | |
| Railroad & Shipping – 1.6% | | | | | | | | |
| Kansas City Southern Co. | | | 41,789 | | | $ | 6,400,403 | |
| | | | | | | | |
| Real Estate – 1.2% | | | | | | | | |
| Extra Space Storage, Inc., REIT | | | 46,109 | | | $ | 4,870,033 | |
| | | | | | | | |
| Restaurants – 2.6% | | | | | | | | |
| Chipotle Mexican Grill, Inc., “A” (a) | | | 6,327 | | | $ | 5,296,395 | |
| Domino’s Pizza, Inc. | | | 5,648 | | | | 1,659,270 | |
| Dunkin Brands Group, Inc. | | | 42,615 | | | | 3,219,137 | |
| | | | | | | | |
| | | | | | $ | 10,174,802 | |
| | | | | | | | |
| | | | | | | | |
| | |
| Issuer | | Shares/Par | | | Value ($) | |
| COMMON STOCKS – continued | |
| Specialty Stores – 4.8% | | | | | | | | |
| BJ’s Wholesale Club Holdings, Inc. (a) | | | 33,273 | | | $ | 756,628 | |
| Burlington Stores, Inc. (a) | | | 8,371 | | | | 1,908,839 | |
| Chewy, Inc., “A” (a)(l) | | | 47,727 | | | | 1,384,083 | |
| Lululemon Athletica, Inc. (a) | | | 19,603 | | | | 4,541,427 | |
| O’Reilly Automotive, Inc. (a) | | | 9,948 | | | | 4,359,811 | |
| Ross Stores, Inc. | | | 22,245 | | | | 2,589,763 | |
| Tractor Supply Co. | | | 37,201 | | | | 3,476,061 | |
| | | | | | | | |
| | | | | | $ | 19,016,612 | |
| | | | | | | | |
| Telecommunications – Wireless – 1.8% | | | | | |
| SBA Communications Corp., REIT | | | 29,304 | | | $ | 7,061,971 | |
| | | | | | | | |
Total Common Stocks
(Identified Cost, $200,366,429) | | | | | | $ | 391,571,565 | |
| | | | | | | | |
| |
| INVESTMENT COMPANIES (h) – 0.5% | | | | | |
| Money Market Funds – 0.5% | | | | | | | | |
| MFS Institutional Money Market Portfolio, 1.7% (v) (Identified Cost, $2,090,605) | | | 2,090,550 | | | $ | 2,090,550 | |
| | | | | | | | |
|
| COLLATERAL FOR SECURITIES LOANED – 0.6% | |
| State Street Navigator Securities Lending Government Money Market Portfolio, 1.58% (j) (Identified Cost, $2,351,022) | | | 2,351,022 | | | $ | 2,351,022 | |
| | | | | | | | |
OTHER ASSETS, LESS
LIABILITIES – (0.5)% | | | | | | | (1,996,462 | ) |
| | | | | | | | |
| NET ASSETS – 100.0% | | | | | | $ | 394,016,675 | |
| | | | | | | | |
| (a) | | Non-income producing security. |
| (h) | | An affiliated issuer, which may be considered one in which the fund owns 5% or more of the outstanding voting securities, or a company which is under common control. At period end, the aggregate values of the fund’s investments in affiliated issuers and in unaffiliated issuers were $2,090,550 and $393,922,587, respectively. |
| (j) | | The rate quoted is the annualizedseven-day yield of the fund at period end. |
| (l) | | A portion of this security is on loan. See Note 2 for additional information. |
| (v) | | Affiliated issuer that is available only to investment companies managed by MFS. The rate quoted for the MFS Institutional Money Market Portfolio is the annualizedseven-day yield of the fund at period end. |
The following abbreviations are used in this report and are defined:
| ADR | | American Depositary Receipt |
| REIT | | Real Estate Investment Trust |
See Notes to Financial Statements
8
MFS Mid Cap Growth Series
FINANCIAL STATEMENTS | STATEMENT OF ASSETS AND LIABILITIES
This statement represents your fund’s balance sheet, which details the assets and liabilities comprising the total value of the fund.
| | | | |
At 12/31/19 | | | | |
| |
Assets | | | | |
Investments in unaffiliated issuers, at value, including $3,530,753 of securities on loan (identified cost, $202,717,451) | | | $393,922,587 | |
Investments in affiliated issuers, at value (identified cost, $2,090,605) | | | 2,090,550 | |
Cash | | | 113 | |
Receivables for | | | | |
Fund shares sold | | | 565,577 | |
Interest and dividends | | | 424,236 | |
Other assets | | | 1,809 | |
Total assets | | | $397,004,872 | |
| |
Liabilities | | | | |
Payables for | | | | |
Fund shares reacquired | | | $548,309 | |
Collateral for securities loaned, at value (c) | | | 2,351,022 | |
Payable to affiliates | | | | |
Investment adviser | | | 15,963 | |
Administrative services fee | | | 329 | |
Shareholder servicing costs | | | 367 | |
Distribution and/or service fees | | | 1,415 | |
Payable for independent Trustees’ compensation | | | 12 | |
Accrued expenses and other liabilities | | | 70,780 | |
Total liabilities | | | $2,988,197 | |
Net assets | | | $394,016,675 | |
| |
Net assets consist of | | | | |
Paid-in capital | | | $173,533,977 | |
Total distributable earnings (loss) | | | 220,482,698 | |
Net assets | | | $394,016,675 | |
Shares of beneficial interest outstanding | | | 40,469,029 | |
| | | | | | | | | | | | |
| | | |
| | | Net assets | | | Shares
outstanding | | | Net asset value
per share | |
Initial Class | | | $290,512,250 | | | | 29,181,644 | | | | $9.96 | |
Service Class | | | 103,504,425 | | | | 11,287,385 | | | | 9.17 | |
| (c) | Non-cash collateral is not included. |
See Notes to Financial Statements
9
MFS Mid Cap Growth Series
FINANCIAL STATEMENTS | STATEMENT OF OPERATIONS
This statement describes how much your fund earned in investment income and accrued in expenses. It also describes any gains and/or losses generated by fund operations.
| | | | |
Year ended 12/31/19 | | | | |
| |
Net investment income (loss) | | | | |
Income | | | | |
Dividends | | | $2,639,130 | |
Dividends from affiliated issuers | | | 79,788 | |
Income on securities loaned | | | 61,284 | |
Other | | | 12,555 | |
Foreign taxes withheld | | | (17,417 | ) |
Total investment income | | | $2,775,340 | |
Expenses | | | | |
Management fee | | | $2,846,286 | |
Distribution and/or service fees | | | 246,752 | |
Shareholder servicing costs | | | 9,741 | |
Administrative services fee | | | 61,642 | |
Independent Trustees’ compensation | | | 10,396 | |
Custodian fee | | | 22,296 | |
Shareholder communications | | | 18,692 | |
Audit and tax fees | | | 58,222 | |
Legal fees | | | 3,314 | |
Miscellaneous | | | 31,958 | |
Total expenses | | | $3,309,299 | |
Reduction of expenses by investment adviser | | | (36,981 | ) |
Net expenses | | | $3,272,318 | |
Net investment income (loss) | | | $(496,978 | ) |
| |
Realized and unrealized gain (loss) | | | | |
Realized gain (loss) (identified cost basis) | | | | |
Unaffiliated issuers | | | $30,021,574 | |
Affiliated issuers | | | (247 | ) |
Foreign currency | | | (21 | ) |
Net realized gain (loss) | | | $30,021,306 | |
Change in unrealized appreciation or depreciation | | | | |
Unaffiliated issuers | | | $91,392,464 | |
Affiliated issuers | | | (55 | ) |
Translation of assets and liabilities in foreign currencies | | | (935 | ) |
Net unrealized gain (loss) | | | $91,391,474 | |
Net realized and unrealized gain (loss) | | | $121,412,780 | |
Change in net assets from operations | | | $120,915,802 | |
See Notes to Financial Statements
10
MFS Mid Cap Growth Series
FINANCIAL STATEMENTS | STATEMENTS OF CHANGES IN NET ASSETS
These statements describe the increases and/or decreases in net assets resulting from operations, any distributions, and any shareholder transactions.
| | | | | | | | |
| | | Year ended | |
| | | 12/31/19 | | | 12/31/18 | |
Change in net assets | | | | | | | | |
| | |
From operations | | | | | | | | |
Net investment income (loss) | | | $(496,978 | ) | | | $(953,143 | ) |
Net realized gain (loss) | | | 30,021,306 | | | | 50,450,329 | |
Net unrealized gain (loss) | | | 91,391,474 | | | | (38,596,950 | ) |
Change in net assets from operations | | | $120,915,802 | | | | $10,900,236 | |
Total distributions to shareholders | | | $(49,459,422 | ) | | | $(60,563,444 | ) |
Change in net assets from fund share transactions | | | $(11,612,994 | ) | | | $(13,678,326 | ) |
Total change in net assets | | | $59,843,386 | | | | $(63,341,534 | ) |
| | |
Net assets | | | | | | | | |
At beginning of period | | | 334,173,289 | | | | 397,514,823 | |
At end of period | | | $394,016,675 | | | | $334,173,289 | |
See Notes to Financial Statements
11
MFS Mid Cap Growth Series
FINANCIAL STATEMENTS | FINANCIAL HIGHLIGHTS
The financial highlights table is intended to help you understand the fund’s financial performance for the past 5 years. Certain information reflects financial results for a single fund share. The total returns in the table represent the rate that an investor would have earned (or lost) on an investment in the fund share class (assuming reinvestment of all distributions) held for the entire period.
| | | | | | | | | | | | | | | | | | | | |
| Initial Class | | Year ended | |
| | | | | |
| | | 12/31/19 | | | 12/31/18 | | | 12/31/17 | | | 12/31/16 | | | 12/31/15 | |
| | | | | |
Net asset value, beginning of period | | | $8.23 | | | | $9.51 | | | | $7.96 | | | | $8.21 | | | | $8.76 | |
| | | | | |
| Income (loss) from investment operations | | | | | | | | | | | | | | | | | | | | |
Net investment income (loss) (d) | | | $(0.01 | ) | | | $(0.02 | ) | | | $(0.01 | ) | | | $0.01 | (c) | | | $(0.03 | ) |
Net realized and unrealized gain (loss) | | | 3.10 | | | | 0.39 | | | | 2.11 | | | | 0.41 | | | | 0.39 | |
Total from investment operations | | | $3.09 | | | | $0.37 | | | | $2.10 | | | | $0.42 | | | | $0.36 | |
| | | | | |
| Less distributions declared to shareholders | | | | | | | | | | | | | | | | | | | | |
From net investment income | | | $— | | | | $— | | | | $(0.01 | ) | | | $— | | | | $— | |
From net realized gain | | | (1.36 | ) | | | (1.65 | ) | | | (0.54 | ) | | | (0.67 | ) | | | (0.91 | ) |
Total distributions declared to shareholders | | | $(1.36 | ) | | | $(1.65 | ) | | | $(0.55 | ) | | | $(0.67 | ) | | | $(0.91 | ) |
Net asset value, end of period (x) | | | $9.96 | | | | $8.23 | | | | $9.51 | | | | $7.96 | | | | $8.21 | |
Total return (%) (k)(r)(s)(x) | | | 38.66 | | | | 1.24 | | | | 27.00 | | | | 4.91 | (c) | | | 4.61 | |
| | | | | |
Ratios (%) (to average net assets)
and Supplemental data: | | | | | | | | | | | | | | | | | | | | |
Expenses before expense reductions (f) | | | 0.81 | | | | 0.81 | | | | 0.81 | | | | 0.75 | (c) | | | 0.81 | |
Expenses after expense reductions (f) | | | 0.80 | | | | 0.80 | | | | 0.80 | | | | 0.74 | (c) | | | 0.80 | |
Net investment income (loss) | | | (0.07 | ) | | | (0.18 | ) | | | (0.15 | ) | | | 0.15 | (c) | | | (0.33 | ) |
Portfolio turnover | | | 17 | | | | 21 | | | | 32 | | | | 37 | | | | 37 | |
Net assets at end of period (000 omitted) | | | $290,512 | | | | $247,614 | | | | $297,463 | | | | $294,226 | | | | $324,754 | |
| |
| Service Class | | Year ended | |
| | | | | |
| | | 12/31/19 | | | 12/31/18 | | | 12/31/17 | | | 12/31/16 | | | 12/31/15 | |
| | | | | |
Net asset value, beginning of period | | | $7.68 | | | | $8.99 | | | | $7.56 | | | | $7.85 | | | | $8.43 | |
| | | | | |
| Income (loss) from investment operations | | | | | | | | | | | | | | | | | | | | |
Net investment income (loss) (d) | | | $(0.03 | ) | | | $(0.04 | ) | | | $(0.03 | ) | | | $(0.01 | )(c) | | | $(0.05 | ) |
Net realized and unrealized gain (loss) | | | 2.88 | | | | 0.38 | | | | 2.00 | | | | 0.39 | | | | 0.38 | |
Total from investment operations | | | $2.85 | | | | $0.34 | | | | $1.97 | | | | $0.38 | | | | $0.33 | |
| | | | | |
| Less distributions declared to shareholders | | | | | | | | | | | | | | | | | | | | |
From net investment income | | | $— | | | | $— | | | | $— | | | | $— | | | | $— | |
From net realized gain | | | (1.36 | ) | | | (1.65 | ) | | | (0.54 | ) | | | (0.67 | ) | | | (0.91 | ) |
Total distributions declared to shareholders | | | $(1.36 | ) | | | $(1.65 | ) | | | $(0.54 | ) | | | $(0.67 | ) | | | $(0.91 | ) |
Net asset value, end of period (x) | | | $9.17 | | | | $7.68 | | | | $8.99 | | | | $7.56 | | | | $7.85 | |
Total return (%) (k)(r)(s)(x) | | | 38.28 | | | | 0.95 | | | | 26.68 | | | | 4.62 | (c) | | | 4.43 | |
| | | | | |
Ratios (%) (to average net assets)
and Supplemental data: | | | | | | | | | | | | | | | | | | | | |
Expenses before expense reductions (f) | | | 1.06 | | | | 1.06 | | | | 1.06 | | | | 0.99 | (c) | | | 1.06 | |
Expenses after expense reductions (f) | | | 1.05 | | | | 1.05 | | | | 1.05 | | | | 0.99 | (c) | | | 1.05 | |
Net investment income (loss) | | | (0.32 | ) | | | (0.43 | ) | | | (0.40 | ) | | | (0.08 | )(c) | | | (0.57 | ) |
Portfolio turnover | | | 17 | | | | 21 | | | | 32 | | | | 37 | | | | 37 | |
Net assets at end of period (000 omitted) | | | $103,504 | | | | $86,560 | | | | $100,052 | | | | $87,529 | | | | $87,008 | |
See Notes to Financial Statements
12
MFS Mid Cap Growth Series
Financial Highlights – continued
| (c) | Amount reflects aone-time reimbursement of expenses by the custodian (or former custodian) without which net investment income and performance would be lower and expenses would be higher. |
| (d) | Per share data is based on average shares outstanding. |
| (f) | Ratios do not reflect reductions from fees paid indirectly, if applicable. |
| (k) | The total return does not reflect expenses that apply to separate accounts. Inclusion of these charges would reduce the total return figures for all periods shown. |
| (r) | Certain expenses have been reduced without which performance would have been lower. |
| (s) | From time to time the fund may receive proceeds from litigation settlements, without which performance would be lower. |
| (x) | The net asset values and total returns have been calculated on net assets which include adjustments made in accordance with U.S. generally accepted accounting principles required at period end for financial reporting purposes. |
See Notes to Financial Statements
13
MFS Mid Cap Growth Series
NOTES TO FINANCIAL STATEMENTS
| (1) | | Business and Organization |
MFS Mid Cap Growth Series (the fund) is a diversified series of MFS Variable Insurance Trust (the trust). The trust is organized as a Massachusetts business trust and is registered under the Investment Company Act of 1940, as amended, as anopen-end management investment company. The shareholders of each series of the trust are separate accounts of insurance companies, which offer variable annuity and/or life insurance products, and qualified retirement and pension plans.
The fund is an investment company and accordingly follows the investment company accounting and reporting guidance of the Financial Accounting Standards Board (FASB) Accounting Standards Codification Topic 946 Financial Services – Investment Companies.
| (2) | | Significant Accounting Policies |
General– The preparation of financial statements in conformity with U.S. generally accepted accounting principles requires management to make estimates and assumptions that affect the reported amounts of assets and liabilities, and disclosure of contingent assets and liabilities at the date of the financial statements and the reported amounts of increases and decreases in net assets from operations during the reporting period. Actual results could differ from those estimates. In the preparation of these financial statements, management has evaluated subsequent events occurring after the date of the fund’s Statement of Assets and Liabilities through the date that the financial statements were issued.
Balance Sheet Offsetting– The fund’s accounting policy with respect to balance sheet offsetting is that, absent an event of default by the counterparty or a termination of the agreement, the International Swaps and Derivatives Association (ISDA) Master Agreement, or similar agreement, does not result in an offset of reported amounts of financial assets and financial liabilities in the Statement of Assets and Liabilities across transactions between the fund and the applicable counterparty. The fund’s right to setoff may be restricted or prohibited by the bankruptcy or insolvency laws of the particular jurisdiction to which a specific master netting agreement counterparty is subject. Balance sheet offsetting disclosures, to the extent applicable to the fund, have been included in the fund’s Significant Accounting Policies note under the captions for each of the fund’sin-scope financial instruments and transactions.
Investment Valuations– Equity securities, including restricted equity securities, are generally valued at the last sale or official closing price on their primary market or exchange as provided by a third-party pricing service. Equity securities, for which there were no sales reported that day, are generally valued at the last quoted daily bid quotation on their primary market or exchange as provided by a third-party pricing service. Short-term instruments with a maturity at issuance of 60 days or less may be valued at amortized cost, which approximates market value.Open-end investment companies are generally valued at net asset value per share. Securities and other assets generally valued on the basis of information from a third-party pricing service may also be valued at a broker/dealer bid quotation. In determining values, third-party pricing services can utilize both transaction data and market information such as yield, quality, coupon rate, maturity, type of issue, trading characteristics, and other market data. The values of foreign securities and other assets and liabilities expressed in foreign currencies are converted to U.S. dollars using the mean of bid and asked prices for rates provided by a third-party pricing service.
The Board of Trustees has delegated primary responsibility for determining or causing to be determined the value of the fund’s investments (including any fair valuation) to the adviser pursuant to valuation policies and procedures approved by the Board. If the adviser determines that reliable market quotations are not readily available, investments are valued at fair value as determined in good faith by the adviser in accordance with such procedures under the oversight of the Board of Trustees. Under the fund’s valuation policies and procedures, market quotations are not considered to be readily available for most types of debt instruments and floating rate loans and many types of derivatives. These investments are generally valued at fair value based on information from third-party pricing services. In addition, investments may be valued at fair value if the adviser determines that an investment’s value has been materially affected by events occurring after the close of the exchange or market on which the investment is principally traded (such as foreign exchange or market) and prior to the determination of the fund’s net asset value, or after the halt of trading of a specific security where trading does not resume prior to the close of the exchange or market on which the security is principally traded. Events that occur after foreign markets close (such as developments in foreign markets and significant movements in the U.S. markets) and prior to the determination of the fund’s net asset value may be deemed to have a material effect on the value of securities traded in foreign markets. Accordingly, the fund’s foreign equity securities may often be valued at fair value. The adviser generally relies on third-party pricing services or other information (such as the correlation with price movements of similar securities in the same or other markets; the type, cost and investment characteristics of the security; the business and financial condition of the issuer; and trading and other market data) to assist in determining whether to fair value and at what value to fair value an investment. The value of an investment for purposes of calculating the fund’s net asset value can differ depending on the source and method used to determine value. When fair valuation is used, the value of an investment used to determine the fund’s net asset value may differ from quoted or published prices for the same investment. There can be no assurance that the fund could obtain the fair value assigned to an investment if it were to sell the investment at the same time at which the fund determines its net asset value per share.
14
MFS Mid Cap Growth Series
Notes to Financial Statements – continued
Various inputs are used in determining the value of the fund’s assets or liabilities. These inputs are categorized into three broad levels. In certain cases, the inputs used to measure fair value may fall into different levels of the fair value hierarchy. In such cases, an investment’s level within the fair value hierarchy is based on the lowest level of input that is significant to the fair value measurement. The fund’s assessment of the significance of a particular input to the fair value measurement in its entirety requires judgment, and considers factors specific to the investment. Level 1 includes unadjusted quoted prices in active markets for identical assets or liabilities. Level 2 includes other significant observable market-based inputs (including quoted prices for similar securities, interest rates, prepayment speed, and credit risk). Level 3 includes unobservable inputs, which may include the adviser’s own assumptions in determining the fair value of investments. The following is a summary of the levels used as of December 31, 2019 in valuing the fund’s assets or liabilities:
| | | | | | | | | | | | | | | | |
| Financial Instruments | | Level 1 | | | Level 2 | | | Level 3 | | | Total | |
| Equity Securities | | | $391,571,565 | | | | $— | | | | $— | | | | $391,571,565 | |
| Mutual Funds | | | 4,441,572 | | | | — | | | | — | | | | 4,441,572 | |
| Total | | | $396,013,137 | | | | $— | | | | $— | | | | $396,013,137 | |
For further information regarding security characteristics, see the Portfolio of Investments.
Foreign Currency Translation– Purchases and sales of foreign investments, income, and expenses are converted into U.S. dollars based upon currency exchange rates prevailing on the respective dates of such transactions or on the reporting date for foreign denominated receivables and payables. Gains and losses attributable to foreign currency exchange rates on sales of securities are recorded for financial statement purposes as net realized gains and losses on investments. Gains and losses attributable to foreign exchange rate movements on receivables, payables, income and expenses are recorded for financial statement purposes as foreign currency transaction gains and losses. That portion of both realized and unrealized gains and losses on investments that results from fluctuations in foreign currency exchange rates is not separately disclosed.
Security Loans– Under its Securities Lending Agency Agreement with the fund, State Street Bank and Trust Company, as lending agent, loans the securities of the fund to certain qualified institutions (the “Borrowers”) approved by the fund. Security loans can be terminated at the discretion of either the lending agent or the fund and the related securities must be returned within the earlier of the standard trade settlement period for such securities or within three business days. The loans are collateralized by cash and/or U.S. Treasury and federal agency obligations in an amount typically at least equal to the market value of the securities loaned. On loans collateralized by cash, the cash collateral is invested in a money market fund. The market value of the loaned securities is determined at the close of business of the fund and any additional required collateral is delivered to the fund on the next business day. The lending agent provides the fund with indemnification against Borrower default. In the event of Borrower default, the lending agent will, for the benefit of the fund, either purchase securities identical to those loaned or, when such purchase is commercially impracticable, pay the fund the market value of the loaned securities. In return, the lending agent assumes the fund’s rights to the related collateral. If the collateral value is less than the cost to purchase identical securities, the lending agent is responsible for the shortfall, but only to the extent that such shortfall is not due to a decline in collateral value resulting from collateral reinvestment for which the fund bears the risk of loss. At period end, the fund had investment securities on loan, all of which were classified as equity securities in the fund’s Portfolio of Investments, with a fair value of $3,530,753. The fair value of the fund’s investment securities on loan and a related liability of $2,351,022 for cash collateral received on securities loaned are both presented gross in the Statement of Assets and Liabilities. Additionally, these loans were collateralized by U.S. Treasury Obligations of $1,225,395 held by the lending agent. The collateral on securities loaned exceeded the value of securities on loan at period end. The liability for cash collateral for securities loaned is carried at fair value, which is categorized as level 2 within the fair value hierarchy. A portion of the income generated upon investment of the collateral is remitted to the Borrowers, and the remainder is allocated between the fund and the lending agent. On loans collateralized by U.S. Treasury and/or federal agency obligations, a fee is received from the Borrower, and is allocated between the fund and the lending agent. Income from securities lending is separately reported in the Statement of Operations. The dividend and interest income earned on the securities loaned is accounted for in the same manner as other dividend and interest income.
Indemnifications– Under the fund’s organizational documents, its officers and Trustees may be indemnified against certain liabilities and expenses arising out of the performance of their duties to the fund. Additionally, in the normal course of business, the fund enters into agreements with service providers that may contain indemnification clauses. The fund’s maximum exposure under these agreements is unknown as this would involve future claims that may be made against the fund that have not yet occurred.
Investment Transactions and Income– Investment transactions are recorded on the trade date. Interest income is recorded on the accrual basis. Dividends received in cash are recorded on theex-dividend date. Certain dividends from foreign securities will be recorded when the fund is informed of the dividend if such information is obtained subsequent to theex-dividend date. Dividend payments received in additional securities are recorded on theex-dividend date in an amount equal to the value of the security on such date.
15
MFS Mid Cap Growth Series
Notes to Financial Statements – continued
The fund may receive proceeds from litigation settlements. Any proceeds received from litigation involving portfolio holdings are reflected in the Statement of Operations in realized gain/loss if the security has been disposed of by the fund or in unrealized gain/loss if the security is still held by the fund. Any other proceeds from litigation not related to portfolio holdings are reflected as other income in the Statement of Operations.
Tax Matters and Distributions– The fund intends to qualify as a regulated investment company, as defined under Subchapter M of the Internal Revenue Code, and to distribute all of its taxable income, including realized capital gains. As a result, no provision for federal income tax is required. The fund’s federal tax returns, when filed, will remain subject to examination by the Internal Revenue Service for a three year period. Management has analyzed the fund’s tax positions taken on federal and state tax returns for all open tax years and does not believe that there are any uncertain tax positions that require recognition of a tax liability. Foreign taxes, if any, have been accrued by the fund in the accompanying financial statements in accordance with the applicable foreign tax law. Foreign income taxes may be withheld by certain countries in which the fund invests. Additionally, capital gains realized by the fund on securities issued in or by certain foreign countries may be subject to capital gains tax imposed by those countries.
Distributions to shareholders are recorded on theex-dividend date. Income and capital gain distributions are determined in accordance with income tax regulations, which may differ from U.S. generally accepted accounting principles. Certain capital accounts in the financial statements are periodically adjusted for permanent differences in order to reflect their tax character. These adjustments have no impact on net assets or net asset value per share. Temporary differences which arise from recognizing certain items of income, expense, gain or loss in different periods for financial statement and tax purposes will reverse at some time in the future.
Book/tax differences primarily relate to wash sale loss deferrals.
The tax character of distributions declared to shareholders for the last two fiscal years is as follows:
| | | | | | | | |
| | | Year ended
12/31/19 | | | Year ended
12/31/18 | |
| Ordinary income (including any short-term capital gains) | | | $3,440,170 | | | | $2,076,310 | |
| Long-term capital gains | | | 46,019,252 | | | | 58,487,134 | |
| Total distributions | | | $49,459,422 | | | | $60,563,444 | |
The federal tax cost and the tax basis components of distributable earnings were as follows:
| | | | |
| As of 12/31/19 | | | | |
| |
| Cost of investments | | | $205,001,927 | |
| Gross appreciation | | | 191,777,494 | |
| Gross depreciation | | | (766,284 | ) |
| Net unrealized appreciation (depreciation) | | | $191,011,210 | |
| |
| Undistributed ordinary income | | | 1,546,390 | |
| Undistributed long-term capital gain | | | 27,924,556 | |
| Other temporary differences | | | 542 | |
Multiple Classes of Shares of Beneficial Interest– The fund offers multiple classes of shares, which differ in their respective distribution and/or service fees. The fund’s income, realized and unrealized gain (loss), and common expenses are allocated to shareholders based on the daily net assets of each class. Dividends are declared separately for each class. Differences in per share dividend rates are generally due to differences in separate class expenses. The fund’s distributions declared to shareholders as reported in the Statements of Changes in Net Assets are presented by class as follows:
| | | | | | | | |
| | |
| | | Year ended
12/31/19 | | | Year ended
12/31/18 | |
| Initial Class | | | $35,977,779 | | | | $43,616,306 | |
| Service Class | | | 13,481,643 | | | | 16,947,138 | |
| Total | | | $49,459,422 | | | | $60,563,444 | |
| (3) | | Transactions with Affiliates |
Investment Adviser– The fund has an investment advisory agreement with MFS to provide overall investment management and related administrative services and facilities to the fund. The management fee is computed daily and paid monthly at the following annual rates based on the fund’s average daily net assets:
| | | | |
| Up to $1 billion | | | 0.75% | |
| In excess of $1 billion | | | 0.70% | |
16
MFS Mid Cap Growth Series
Notes to Financial Statements – continued
MFS has agreed in writing to reduce its management fee by a specified amount if certain MFS mutual fund assets exceed thresholds agreed to by MFS and the fund’s Board of Trustees. For the year ended December 31, 2019, this management fee reduction amounted to $36,981, which is included in the reduction of total expenses in the Statement of Operations. The management fee incurred for the year ended December 31, 2019 was equivalent to an annual effective rate of 0.74% of the fund’s average daily net assets.
Distributor– MFS Fund Distributors, Inc. (MFD), a wholly-owned subsidiary of MFS, is the distributor of shares of the fund. The Trustees have adopted a distribution plan for the Service Class shares pursuant to Rule12b-1 under the Investment Company Act of 1940.
The fund’s distribution plan provides that the fund will pay MFD distribution and/or service fees equal to 0.25% per annum of its average daily net assets attributable to Service Class shares as partial consideration for services performed and expenses incurred by MFD and financial intermediaries (including participating insurance companies that invest in the fund to fund variable annuity and variable life insurance contracts, sponsors of qualified retirement and pension plans that invest in the fund, and affiliates of these participating insurance companies and plan sponsors) in connection with the sale and distribution of the Service Class shares. MFD may subsequently pay all, or a portion, of the distribution and/or service fees to financial intermediaries.
Shareholder Servicing Agent– MFS Service Center, Inc. (MFSC), a wholly-owned subsidiary of MFS, receives a fee from the fund for its services as shareholder servicing agent. For the year ended December 31, 2019, the fee was $8,888, which equated to 0.0023% annually of the fund’s average daily net assets. MFSC also receives payment from the fund forout-of-pocket expenses paid by MFSC on behalf of the fund. For the year ended December 31, 2019, these costs amounted to $853.
Administrator– MFS provides certain financial, legal, shareholder communications, compliance, and other administrative services to the fund. Under an administrative services agreement, the fund reimburses MFS the costs incurred to provide these services. The fund is charged an annual fixed amount of $17,500 plus a fee based on average daily net assets. The administrative services fee incurred for the year ended December 31, 2019 was equivalent to an annual effective rate of 0.0162% of the fund’s average daily net assets.
Trustees’ and Officers’ Compensation– The fund pays compensation to independent Trustees in the form of a retainer, attendance fees, and additional compensation to Board and Committee chairpersons. The fund does not pay compensation directly to Trustees or officers of the fund who are also officers of the investment adviser, all of whom receive remuneration from MFS for their services to the fund. Certain officers and Trustees of the fund are officers or directors of MFS, MFD, and MFSC.
Other– This fund and certain other funds managed by MFS (the funds) had entered into a service agreement (the ISO Agreement) which provided for payment of fees solely by the funds to Tarantino LLC in return for the provision of services of an Independent Senior Officer (ISO) for the funds. Frank L. Tarantino served as the ISO and was an officer of the funds and the sole member of Tarantino LLC. Effective June 30, 2019, Mr. Tarantino retired from his position as ISO for the funds, and the ISO Agreement was terminated. For the year ended December 31, 2019, the fee paid by the fund under this agreement was $449 and is included in “Miscellaneous” expense in the Statement of Operations. MFS had agreed to bear all expenses associated with office space, other administrative support, and supplies provided to the ISO.
The fund invests in the MFS Institutional Money Market Portfolio which is managed by MFS and seeks current income consistent with preservation of capital and liquidity. This money market fund does not pay a management fee to MFS.
The fund is permitted to engage in purchase and sale transactions with funds and accounts for which MFS serves as investment adviser orsub-adviser (“cross-trades”) pursuant to a policy adopted by the Board of Trustees. This policy has been designed to ensure that cross-trades conducted by the fund comply with Rule17a-7 under the Investment Company Act of 1940. During the year ended December 31, 2019, the fund engaged in purchase and sale transactions pursuant to this policy, which amounted to $488,979 and $180,450, respectively. The sales transactions resulted in net realized gains (losses) of $77,475.
The adviser has voluntarily undertaken to reimburse the fund from its own resources on a quarterly basis for the cost of investment research embedded in the cost of the fund’s securities trades. This agreement may be rescinded at any time. For the year ended December 31, 2019, this reimbursement amounted to $12,484, which is included in “Other” income in the Statement of Operations.
For the year ended December 31, 2019, purchases and sales of investments, other than short-term obligations, aggregated $64,618,743 and $123,739,599, respectively.
17
MFS Mid Cap Growth Series
Notes to Financial Statements – continued
| (5) | | Shares of Beneficial Interest |
The fund’s Declaration of Trust permits the Trustees to issue an unlimited number of full and fractional shares of beneficial interest. Transactions in fund shares were as follows:
| | | | | | | | | | | | | | | | |
| | | Year ended 12/31/19 | | | Year ended 12/31/18 | |
| | | | |
| | | Shares | | | Amount | | | Shares | | | Amount | |
| Shares sold | | | | | | | | | | | | | | | | |
Initial Class | | | 2,461,006 | | | | $24,284,094 | | | | 1,454,735 | | | | $13,996,626 | |
Service Class | | | 2,054,824 | | | | 18,713,982 | | | | 2,340,234 | | | | 21,633,301 | |
| | | 4,515,830 | | | | $42,998,076 | | | | 3,794,969 | | | | $35,629,927 | |
| | | | |
| Shares issued to shareholders in reinvestment of distributions | | | | | | | | | | | | | | | | |
Initial Class | | | 3,800,896 | | | | $35,576,388 | | | | 4,425,624 | | | | $43,105,580 | |
Service Class | | | 1,562,183 | | | | 13,481,643 | | | | 1,862,323 | | | | 16,947,138 | |
| | | 5,363,079 | | | | $49,058,031 | | | | 6,287,947 | | | | $60,052,718 | |
| | | | |
| Shares reacquired | | | | | | | | | | | | | | | | |
Initial Class | | | (7,169,474 | ) | | | $(70,824,035 | ) | | | (7,082,285 | ) | | | $(72,234,596 | ) |
Service Class | | | (3,599,134 | ) | | | (32,845,066 | ) | | | (4,067,618 | ) | | | (37,126,375 | ) |
| | | (10,768,608 | ) | | | $(103,669,101 | ) | | | (11,149,903 | ) | | | $(109,360,971 | ) |
| | | | |
| Net change | | | | | | | | | | | | | | | | |
Initial Class | | | (907,572 | ) | | | $(10,963,553 | ) | | | (1,201,926 | ) | | | $(15,132,390 | ) |
Service Class | | | 17,873 | | | | (649,441 | ) | | | 134,939 | | | | 1,454,064 | |
| | | (889,699 | ) | | | $(11,612,994 | ) | | | (1,066,987 | ) | | | $(13,678,326 | ) |
The fund is one of several mutual funds in which certain MFS funds may invest. The MFS funds do not invest in the underlying funds for the purpose of exercising management or control. At the end of the period, the MFS Moderate Allocation Portfolio, the MFS Growth Allocation Portfolio, and the MFS Conservative Allocation Portfolio were the owners of record of approximately 25%, 8%, and 4%, respectively, of the value of outstanding voting shares of the fund.
The fund and certain other funds managed by MFS participate in a $1.25 billion unsecured committed line of credit, subject to a $1 billion sublimit, provided by a syndicate of banks under a credit agreement. Borrowings may be made for temporary financing needs. Interest is charged to each fund, based on its borrowings, generally at a rate equal to the highest of one month LIBOR, the Federal Funds Effective Rate and the Overnight Bank Funding Rate, plus an agreed upon spread. A commitment fee, based on the average daily, unused portion of the committed line of credit, is allocated among the participating funds. In addition, the fund and other funds managed by MFS have established unsecured uncommitted borrowing arrangements with certain banks for temporary financing needs. Interest is charged to each fund, based on its borrowings, at rates equal to customary reference rates plus an agreed upon spread. For the year ended December 31, 2019, the fund’s commitment fee and interest expense were $2,075 and $0, respectively, and are included in “Miscellaneous” expense in the Statement of Operations.
| (7) | | Investments in Affiliated Issuers |
An affiliated issuer may be considered one in which the fund owns 5% or more of the outstanding voting securities, or a company which is under common control. For the purposes of this report, the following were affiliated issuers:
| | | | | | | | | | | | | | | | | | | | | | | | |
| Affiliated Issuers | | Beginning
Value | | | Purchases | | | Sales
Proceeds | | | Realized
Gain
(Loss) | | | Change in
Unrealized
Appreciation or
Depreciation | | | Ending
Value | |
| MFS Institutional Money Market Portfolio | | | $4,413,261 | | | | $75,673,294 | | | | $77,995,703 | | | | $(247 | ) | | | $(55 | ) | | | $2,090,550 | |
| | | | | | |
| Affiliated Issuers | | | | | | | | | | | | | | Dividend
Income | | | Capital Gain
Distributions | |
| MFS Institutional Money Market Portfolio | | | | | | | | | | | | $79,788 | | | | $— | |
18
MFS Mid Cap Growth Series
REPORT OF INDEPENDENT REGISTERED PUBLIC ACCOUNTING FIRM
To the Board of Trustees of MFS Variable Insurance Trust and the Shareholders of
MFS Mid Cap Growth Series:
Opinion on the Financial Statements and Financial Highlights
We have audited the accompanying statement of assets and liabilities of MFS Mid Cap Growth Series (the “Fund”), including the portfolio of investments, as of December 31, 2019, the related statement of operations for the year then ended, the statements of changes in net assets for each of the two years in the period then ended, the financial highlights for each of the five years in the period then ended, and the related notes. In our opinion, the financial statements and financial highlights present fairly, in all material respects, the financial position of the Fund as of December 31, 2019, and the results of its operations for the year then ended, the changes in its net assets for each of the two years in the period then ended, and the financial highlights for each of the five years in the period then ended, in conformity with accounting principles generally accepted in the United States of America.
Basis for Opinion
These financial statements and financial highlights are the responsibility of the Fund’s management. Our responsibility is to express an opinion on the Fund’s financial statements and financial highlights based on our audits. We are a public accounting firm registered with the Public Company Accounting Oversight Board (United States) (PCAOB) and are required to be independent with respect to the Fund in accordance with the U.S. federal securities laws and the applicable rules and regulations of the Securities and Exchange Commission and the PCAOB.
We conducted our audits in accordance with the standards of the PCAOB. Those standards require that we plan and perform the audit to obtain reasonable assurance about whether the financial statements and financial highlights are free of material misstatement, whether due to error or fraud. The Fund is not required to have, nor were we engaged to perform, an audit of its internal control over financial reporting. As part of our audits we are required to obtain an understanding of internal control over financial reporting but not for the purpose of expressing an opinion on the effectiveness of the Fund’s internal control over financial reporting. Accordingly, we express no such opinion.
Our audits included performing procedures to assess the risks of material misstatement of the financial statements and financial highlights, whether due to error or fraud, and performing procedures that respond to those risks. Such procedures included examining, on a test basis, evidence regarding the amounts and disclosures in the financial statements and financial highlights. Our audits also included evaluating the accounting principles used and significant estimates made by management, as well as evaluating the overall presentation of the financial statements and financial highlights. Our procedures included confirmation of securities owned as of December 31, 2019, by correspondence with the custodian. We believe that our audits provide a reasonable basis for our opinion.
DELOITTE & TOUCHE LLP
Boston, Massachusetts
February 14, 2020
We have served as the auditor of one or more of the MFS investment companies since 1924.
19
MFS Mid Cap Growth Series
TRUSTEES AND OFFICERS – IDENTIFICATION AND BACKGROUND
The Trustees and Officers of the Trust, as of February 1, 2020, are listed below, together with their principal occupations during the past five years. (Their titles may have varied during that period.) The address of each Trustee and Officer is 111 Huntington Avenue, Boston, Massachusetts 02199-7618.
| | | | | | | | | | |
Name, Age | | Position(s)
Held with Fund | | Trustee/Officer
Since (h) | | Number of MFS Funds
overseen by the
Trustee | | Principal Occupations
During the Past Five Years | | Other Directorships During the Past Five Years (j) |
| INTERESTED TRUSTEES |
Robert J. Manning (k)
(age 56) | | Trustee | | February 2004 | | 133 | | Massachusetts Financial Services Company, Executive Chairman (since January 2017); Director; Chairman of the Board; Chief Executive Officer (until 2015);Co-Chief Executive Officer(2015-2016) | | N/A |
| | | | | |
Robin A. Stelmach (k) (age 58) | | Trustee | | January 2014 | | 133 | | Massachusetts Financial Services Company, Vice Chair (since January 2017); Chief Operating Officer and Executive Vice President (until January 2017) | | N/A |
|
| INDEPENDENT TRUSTEES |
John P. Kavanaugh (age 65) | | Trustee and Chair of Trustees | | January 2009 | | 133 | | Private investor | | N/A |
| | | | | |
Steven E. Buller (age 68) | | Trustee | | February 2014 | | 133 | | Financial Accounting Standards Advisory Council, Chairman(2014-2015); Public Company Accounting Oversight Board, Standing Advisory Group, Member (until 2014); BlackRock, Inc. (investment management), Managing Director (until 2014), BlackRock Finco UK (investment management), Director (until 2014) | | N/A |
| | | | | |
John A. Caroselli (age 65) | | Trustee | | March 2017 | | 133 | | JC Global Advisors, LLC (management consulting), President (since 2015); First Capital Corporation (commercial finance), Executive Vice President (until 2015) | | N/A |
| | | | | |
Maureen R. Goldfarb (age 64) | | Trustee | | January 2009 | | 133 | | Private investor | | N/A |
| | | | | |
Peter D. Jones
(age 64) | | Trustee | | January 2019 | | 133 | | Franklin Templeton Distributors, Inc. (investment management), President (until 2015); Franklin Templeton Institutional, LLC (investment management), Chairman (until 2015) | | N/A |
| | | | | |
James W. Kilman, Jr.
(age 58) | | Trustee | | January 2019 | | 133 | | Burford Capital Limited (finance and investment management), Chief Financial Officer (since 2019); KielStrand Capital LLC (family office), Chief Executive Officer (since 2016); Morgan Stanley & Co. (financial services), Vice Chairman of Investment Banking,Co-Head of Diversified Financials Coverage – Financial Institutions Investment Banking Group (until 2016) | | Alpha-En Corporation, Director (2016-2019) |
20
MFS Mid Cap Growth Series
Trustees and Officers – continued
| | | | | | | | | | |
Name, Age | | Position(s)
Held with Fund | | Trustee/Officer
Since (h) | | Number of MFS Funds
overseen by the
Trustee | | Principal Occupations
During the Past Five Years | | Other Directorships During the Past Five Years (j) |
Clarence Otis, Jr. (age 63) | | Trustee | | March 2017 | | 133 | | Darden Restaurants, Inc., Chief Executive Officer (until 2014) | | VF Corporation, Director; Verizon Communications, Inc., Director; The Travelers Companies, Director; Federal Reserve Bank of Atlanta, Director (until 2015) |
| | | | | |
Maryanne L. Roepke (age 63) | | Trustee | | May 2014 | | 133 | | American Century Investments (investment management), Senior Vice President and Chief Compliance Officer (until 2014) | | N/A |
| | | | | |
Laurie J. Thomsen
(age 62) | | Trustee | | March 2005 | | 133 | | Private investor | | The Travelers Companies, Director; Dycom Industries, Inc., Director (since 2015) |
| | | | | | | | |
Name, Age | | Position(s)
Held with Fund | | Trustee/Officer
Since (h) | | Number of
MFS Funds
for which the
Person is an
Officer | | Principal Occupations During the Past Five Years |
| OFFICERS | | | | | | |
Christopher R. Bohane (k)
(age 46) | | Assistant Secretary and Assistant Clerk | | July 2005 | | 133 | | Massachusetts Financial Services Company, Vice President and Assistant General Counsel |
| | | | |
Kino Clark (k) (age 51) | | Assistant Treasurer | | January 2012 | | 133 | | Massachusetts Financial Services Company, Vice President |
| | | | |
John W. Clark, Jr. (k) (age 52) | | Assistant Treasurer | | April 2017 | | 133 | | Massachusetts Financial Services Company, Vice President (since March 2017); Deutsche Bank (financial services), Department Head –Treasurer’s Office (until February 2017) |
| | | | |
Thomas H. Connors (k) (age 60) | | Assistant Secretary and Assistant Clerk | | September 2012 | | 133 | | Massachusetts Financial Services Company, Vice President and Senior Counsel |
| | | | |
David L. DiLorenzo (k)
(age 51) | | President | | July 2005 | | 133 | | Massachusetts Financial Services Company, Senior Vice President |
| | | | |
Heidi W. Hardin (k) (age 52) | | Secretary and Clerk | | April 2017 | | 133 | | Massachusetts Financial Services Company, Executive Vice President and General Counsel (since March 2017); Harris Associates (investment management), General Counsel (from September 2015 to January 2017); Janus Capital Management LLC (investment management), Senior Vice President and General Counsel (until September 2015) |
| | | | |
Brian E. Langenfeld (k) (age 46) | | Assistant
Secretary and Assistant Clerk | | June 2006 | | 133 | | Massachusetts Financial Services Company, Vice President and Senior Counsel |
| | | | |
Amanda S. Mooradian (k) (age 40) | | Assistant
Secretary and Assistant Clerk | | September 2018 | | 133 | | Massachusetts Financial Services Company, Assistant Vice President and Counsel |
| | | | |
Susan A. Pereira (k)
(age 49) | | Assistant
Secretary and Assistant Clerk | | July 2005 | | 133 | | Massachusetts Financial Services Company, Vice President and Assistant General Counsel |
| | | | |
Kasey L. Phillips (k) (age 49) | | Assistant Treasurer | | September 2012 | | 133 | | Massachusetts Financial Services Company, Vice President |
| | | | |
Matthew A. Stowe (k) (age 45) | | Assistant Secretary and Assistant Clerk | | October 2014 | | 133 | | Massachusetts Financial Services Company, Vice President and Assistant General Counsel |
21
MFS Mid Cap Growth Series
Trustees and Officers – continued
| | | | | | | | |
Name, Age | | Position(s)
Held with Fund | | Trustee/Officer
Since (h) | | Number of
MFS Funds
for which the
Person is an
Officer | | Principal Occupations During the Past Five Years |
Martin J. Wolin (k) (age 52) | | Chief Compliance Officer | | July 2015 | | 133 | | Massachusetts Financial Services Company, Senior Vice President and Chief Compliance Officer (since July 2015); Mercer (financial service provider), Chief Risk and Compliance Officer, North America and Latin America (until June 2015) |
| | | | |
James O. Yost (k)
(age 59) | | Treasurer | | September 1990 | | 133 | | Massachusetts Financial Services Company, Senior Vice President |
| (h) | Date first appointed to serve as Trustee/officer of an MFS Fund. Each Trustee has served continuously since appointment unless indicated otherwise. For the period from December 15, 2004 until February 22, 2005, Mr. Manning served as Advisory Trustee. From January 2012 through December 2016, Messrs. DiLorenzo and Yost served as Treasurer and Deputy Treasurer of the Funds, respectively. |
| (j) | Directorships or trusteeships of companies required to report to the Securities and Exchange Commission (i.e., “public companies”). |
| (k) | “Interested person” of the Trust within the meaning of the Investment Company Act of 1940 (referred to as the 1940 Act), which is the principal federal law governing investment companies like the fund, as a result of a position with MFS. The address of MFS is 111 Huntington Avenue, Boston, Massachusetts 02199-7618. |
Each Trustee (other than Messrs. Jones and Kilman) has been elected by shareholders and each Trustee and Officer holds office until his or her successor is chosen and qualified or until his or her earlier death, resignation, retirement or removal. Messrs. Jones and Kilman became Trustees of the Funds on January 1, 2019. The Trust does not hold annual meetings for the purpose of electing Trustees, and Trustees are not elected for fixed terms. Under the terms of the Board’s retirement policy, an Independent Trustee shall retire at the end of the calendar year in which he or she reaches the earlier of 75 years of age or 15 years of service on the Board (or, in the case of any Independent Trustee who joined the Board prior to 2015, 20 years of service on the Board).
Messrs. Buller, Kilman and Otis and Ms. Roepke are members of the Trust’s Audit Committee.
Each of the Interested Trustees and certain Officers hold comparable officer positions with certain affiliates of MFS.
The Statement of Additional Information for a Fund includes further information about the Trustees and is available without charge upon request by calling1-800-225-2606.
| | |
Investment Adviser Massachusetts Financial Services Company 111 Huntington Avenue Boston, MA 02199-7618 | | Custodian State Street Bank and Trust Company 1 Lincoln Street Boston, MA 02111-2900 |
| |
Distributor MFS Fund Distributors, Inc. 111 Huntington Avenue Boston, MA 02199-7618 | | Independent Registered Public Accounting Firm Deloitte & Touche LLP 200 Berkeley Street Boston, MA 02116 |
| |
Portfolio Manager(s) Eric Fischman Paul Gordon | | |
22
MFS Mid Cap Growth Series
BOARD REVIEW OF INVESTMENT ADVISORY AGREEMENT
MFS Mid Cap Growth Series
The Investment Company Act of 1940 requires that both the full Board of Trustees and a majority of thenon-interested (“independent”) Trustees, voting separately, annually approve the continuation of the Fund’s investment advisory agreement with MFS. The Trustees consider matters bearing on the Fund and its advisory arrangements at their meetings throughout the year, including a review of performance data at each regular meeting. In addition, the independent Trustees met several times over the course of three months beginning in May and ending in July, 2019 (“contract review meetings”) for the specific purpose of considering whether to approve the continuation of the investment advisory agreement for the Fund and the other investment companies that the Board oversees (the “MFS Funds”). The independent Trustees were assisted in their evaluation of the Fund’s investment advisory agreement by independent legal counsel, from whom they received separate legal advice and with whom they met separately from MFS during various contract review meetings. The independent Trustees were also assisted in this process by the MFS Funds’ Independent Senior Officer, a senior officer appointed by and reporting to the independent Trustees.
In connection with their deliberations regarding the continuation of the investment advisory agreement, the Trustees, including the independent Trustees, considered such information and factors as they believed, in light of the legal advice furnished to them and their own business judgment, to be relevant. The investment advisory agreement for the Fund was considered separately, although the Trustees also took into account the common interests of all MFS Funds in their review. As described below, the Trustees considered the nature, quality, and extent of the various investment advisory, administrative, and shareholder services performed by MFS under the existing investment advisory agreement and other arrangements with the Fund.
In connection with their contract review meetings, the Trustees received and relied upon materials that included, among other items: (i) information provided by Broadridge Financial Solutions, Inc. (“Broadridge”), an independent third party, on the investment performance of the Fund for various time periods ended December 31, 2018 and the investment performance of a group of funds with substantially similar investment classifications/objectives (the “Broadridge performance universe”), (ii) information provided by Broadridge on the Fund’s advisory fees and other expenses and the advisory fees and other expenses of comparable funds identified by Broadridge as well as all other funds in the same investment classification/category (the “Broadridge expense group and universe”), (iii) information provided by MFS on the advisory fees of portfolios of other clients of MFS, including institutional separate accounts and other clients, (iv) information as to whether and to what extent applicable expense waivers, reimbursements or fee “breakpoints” are observed for the Fund, (v) information regarding MFS’ financial results and financial condition, including MFS’ and certain of its affiliates’ estimated profitability from services performed for the Fund and the MFS Funds as a whole, and compared to MFS’ institutional business, (vi) MFS’ views regarding the outlook for the mutual fund industry and the strategic business plans of MFS, (vii) descriptions of various functions performed by MFS for the Funds, such as compliance monitoring and portfolio trading practices, and (viii) information regarding the overall organization of MFS, including information about MFS’ senior management and other personnel providing investment advisory, administrative and other services to the Fund and the other MFS Funds. The comparative performance, fee and expense information prepared and provided by Broadridge was not independently verified and the independent Trustees did not independently verify any information provided to them by MFS.
The Trustees’ conclusion as to the continuation of the investment advisory agreement was based on a comprehensive consideration of all information provided to the Trustees and not the result of any single factor. Some of the factors that figured particularly in the Trustees’ deliberations are described below, although individual Trustees may have evaluated the information presented differently from one another, giving different weights to various factors. It is also important to recognize that the fee arrangements for the Fund and other MFS Funds are the result of years of review and discussion between the independent Trustees and MFS, that certain aspects of such arrangements may receive greater scrutiny in some years than in others, and that the Trustees’ conclusions may be based, in part, on their consideration of these same arrangements during the course of the year and in prior years.
Based on information provided by Broadridge and MFS, the Trustees reviewed the Fund’s total return investment performance as well as the Broadridge performance universe over various time periods. The Trustees placed particular emphasis on the total return performance of the Fund’s Initial Class shares in comparison to the performance of funds in its Broadridge performance universe over the five-year period ended December 31, 2018, which the Trustees believed was a long enough period to reflect differing market conditions. The total return performance of the Fund’s Initial Class shares was in the 1st quintile relative to the other funds in the universe for this five-year period (the 1st quintile being the best performers and the 5th quintile being the worst performers). The total return performance of the Fund’s Initial Class shares was in the 1st quintile for each of theone- and three-year periods ended December 31, 2018 relative to the Broadridge performance universe. Because of the passage of time, these performance results may differ from the performance results for more recent periods, including those shown elsewhere in this report.
In the course of their deliberations, the Trustees took into account information provided by MFS in connection with the contract review meetings, as well as during investment review meetings conducted with portfolio management personnel during the course of the year regarding the Fund’s performance. After reviewing these and related factors, the Trustees concluded, within the context of their overall conclusions regarding the investment advisory agreement, that they were satisfied with MFS’ responses and efforts relating to investment performance.
23
MFS Mid Cap Growth Series
Board Review of Investment Advisory Agreement – continued
In assessing the reasonableness of the Fund’s advisory fee, the Trustees considered, among other information, the Fund’s advisory fee and the total expense ratio of the Fund’s Initial Class shares as a percentage of average daily net assets and the advisory fee and total expense ratios of the Broadridge expense group based on information provided by Broadridge. The Trustees considered that, according to the data provided by Broadridge (which takes into account any fee reductions or expense limitations that were in effect during the Fund’s last fiscal year), the Fund’s effective advisory fee rate and total expense ratio were each approximately at the Broadridge expense group median.
The Trustees also considered the advisory fees charged by MFS to any institutional separate accounts advised by MFS (“separate accounts”) and unaffiliated investment companies for which MFS serves as subadviser (“subadvised funds”) that have comparable investment strategies to the Fund, if any. In comparing these fees, the Trustees considered information provided by MFS as to the generally broader scope of services provided by MFS to the Fund, as well as the more extensive regulatory burdens imposed on MFS in managing the Fund, in comparison to separate accounts and subadvised funds. The Trustees also considered the higher demands placed on MFS’ investment personnel and trading infrastructure as a result of the daily cashin-flows andout-flows of the Fund in comparison to separate accounts.
The Trustees also considered whether the Fund may benefit from any economies of scale in the management of the Fund in the event of growth in assets of the Fund and/or growth in assets of the MFS Funds as a whole. They noted that the Fund’s advisory fee rate schedule is subject to a contractual breakpoint that reduces the Fund’s advisory fee rate on average daily net assets over $1 billion. The Trustees also noted that MFS has agreed in writing to waive a portion of the management fees of certain MFS Funds, including the Fund, if the total combined assets of certain funds within the MFS Funds’ complex increase above agreed upon thresholds (the “group fee waiver”), enabling the Fund’s shareholders to share in the benefits from any economies of scale at the complex level. The group fee waiver is reviewed and renewed annually between the Board and MFS. The Trustees concluded that the breakpoint and the group fee waiver were sufficient to allow the Fund to benefit from economies of scale as its assets and overall complex assets grow.
The Trustees also considered information prepared by MFS relating to MFS’ costs and profits with respect to the Fund, the MFS Funds considered as a group, and other investment companies and accounts advised by MFS, as well as MFS’ methodologies used to determine and allocate its costs to the MFS Funds, the Fund and other accounts and products for purposes of estimating profitability.
After reviewing these and other factors described herein, the Trustees concluded, within the context of their overall conclusions regarding the investment advisory agreement, that the advisory fees charged to the Fund represent reasonable compensation in light of the services being provided by MFS to the Fund.
In addition, the Trustees considered MFS’ resources and related efforts to continue to retain, attract and motivate capable personnel to serve the Fund. The Trustees also considered current and developing conditions in the financial services industry, including the presence of large and well-capitalized companies which are spending, and appear to be prepared to continue to spend, substantial sums to engage personnel and to provide services to competing investment companies. In this regard, the Trustees also considered the financial resources of MFS and its ultimate parent, Sun Life Financial Inc. The Trustees also considered the advantages and possible disadvantages to the Fund of having an adviser that also serves other investment companies as well as other accounts.
The Trustees also considered the nature, quality, cost, and extent of administrative, transfer agency, and distribution services provided to the Fund by MFS and its affiliates under agreements and plans other than the investment advisory agreement, including any12b-1 fees the Fund pays to MFS Fund Distributors, Inc., an affiliate of MFS. The Trustees also considered the nature, extent and quality of certain other services MFS performs or arranges for on the Fund’s behalf, which may include securities lending programs, directed expense payment programs, class action recovery programs, and MFS’ interaction with third-party service providers, principally custodians andsub-custodians. The Trustees concluded that the variousnon-advisory services provided by MFS and its affiliates on behalf of the Fund were satisfactory.
The Trustees consideredso-called“fall-out benefits” to MFS such as reputational value derived from serving as investment manager to the MFS Funds. The Trustees also considered that, effective January 3, 2018, MFS had discontinued its historic practice of obtaining investment research from portfolio brokerage commissions paid by certain MFS Funds and would thereafter directly pay for or voluntarily reimburse a Fund, if applicable, for the costs of external research acquired through the use of the Fund’s portfolio brokerage commissions.
Based on their evaluation of factors that they deemed to be material, including those factors described above, the Board of Trustees, including the independent Trustees, concluded that the Fund’s investment advisory agreement with MFS should be continued for an additionalone-year period, commencing August 1, 2019.
24
MFS Mid Cap Growth Series
PROXY VOTING POLICIES AND INFORMATION
MFS votes proxies on behalf of the fund pursuant to proxy voting policies and procedures that are available without charge, upon request, by calling 1-800-225-2606, by visitingmfs.com/proxyvoting, or by visiting the SEC’s Web site athttp://www.sec.gov.
Information regarding how the fund voted proxies relating to portfolio securities during the most recent twelve-month period ended June 30 is available by August 31 of each year without charge by visitingmfs.com/proxyvoting, or by visiting the SEC’s Web site athttp://www.sec.gov.
QUARTERLY PORTFOLIO DISCLOSURE
The fund files a complete schedule of portfolio holdings with the SEC for the first and third quarters of each fiscal year as an exhibit to its reports on Form N-PORT. The fund’s Form N-PORT reports are available on the SEC’s website athttp://www.sec.gov. A shareholder can obtain the portfolio holdings report for the first and third quarters of the fund’s fiscal year atmfs.com/vit1 by choosing the fund’s name and then selecting the “Resources” tab and clicking on “Prospectus and Reports”.
FURTHER INFORMATION
From time to time, MFS may post important information about the fund or the MFS funds on the MFS web site (mfs.com). This information is available at https://www.mfs.com/en-us/what-we-do/announcements.html or atmfs.com/vit1 by choosing the fund’s name.
INFORMATION ABOUT FUND CONTRACTS AND LEGAL CLAIMS
The fund has entered into contractual arrangements with an investment adviser, administrator, distributor, shareholder servicing agent, 529 program manager (if applicable), and custodian who each provide services to the fund. Unless expressly stated otherwise, shareholders are not parties to, or intended beneficiaries of these contractual arrangements, and these contractual arrangements are not intended to create any shareholder right to enforce them against the service providers or to seek any remedy under them against the service providers, either directly or on behalf of the fund.
Under the Trust’s By-Laws and Declaration of Trust, any claims asserted against or on behalf of the MFS Funds, including claims against Trustees and Officers, must be brought in state and federal courts located within the Commonwealth of Massachusetts.
FEDERAL TAX INFORMATION (unaudited)
The following information is provided pursuant to provisions of the Internal Revenue Code.
The fund designates $50,622,000 as capital gain dividends paid during the fiscal year.
For corporate shareholders, 52.04% of the ordinary income dividends paid during the fiscal year qualify for the corporate dividends received deduction.
25
rev. 3/16
| | | | |
| | | |
| FACTS | | WHAT DOES MFS DO WITH YOUR
PERSONAL INFORMATION? | |  |
| | |
| Why? | | Financial companies choose how they share your personal information. Federal law gives consumers the right to limit some but not all sharing. Federal law also requires us to tell you how we collect, share, and protect your personal information. Please read this notice carefully to understand what we do. |
| | |
| What? | | The types of personal information we collect and share depend on the product or service you have with us. This information can include: • Social Security number and account balances • Account transactions and transaction history • Checking account information and wire transfer instructions When you areno longer our customer, we continue to share your information as described in this notice. |
| | |
| How? | | All financial companies need to share customers’ personal information to run their everyday business. In the section below, we list the reasons financial companies can share their customers’ personal information; the reasons MFS chooses to share; and whether you can limit this sharing. |
| | | | |
Reasons we can share your
personal information | | Does MFS share? | | Can you limit this
sharing? |
For our everyday business purposes – such as to process your transactions, maintain your account(s), respond to court orders and legal investigations, or report to credit bureaus | | Yes | | No |
For our marketing purposes – to offer our products and services to you | | No | | We don’t share |
| For joint marketing with other financial companies | | No | | We don’t share |
For our affiliates’ everyday business purposes – information about your transactions and experiences | | No | | We don’t share |
For our affiliates’ everyday business purposes – information about your creditworthiness | | No | | We don’t share |
| For nonaffiliates to market to you | | No | | We don’t share |
| | |
| | |
| Questions? | | Call800-225-2606 or go tomfs.com. |
26
| | |
| Who we are |
| Who is providing this notice? | | MFS Funds, MFS Investment Management, MFS Institutional Advisors, Inc., and MFS Heritage Trust Company. |
| | |
| What we do |
| How does MFS protect my personal information? | | To protect your personal information from unauthorized access and use, we use security measures that comply with federal law. These measures include procedural, electronic, and physical safeguards for the protection of the personal information we collect about you. |
How does MFS
collect my personal information? | | We collect your personal information, for example, when you • open an account or provide account information • direct us to buy securities or direct us to sell your securities • make a wire transfer We also collect your personal information from others, such as credit bureaus, affiliates, or other companies. |
| Why can’t I limit all sharing? | | Federal law gives you the right to limit only • sharing for affiliates’ everyday business purposes – information about your creditworthiness • affiliates from using your information to market to you • sharing for nonaffiliates to market to you State laws and individual companies may give you additional rights to limit sharing. |
| | |
| Definitions |
| Affiliates | | Companies related by common ownership or control. They can be financial and nonfinancial companies. • MFS does not share personal information with affiliates, except for everyday business purposes as described on page one of this notice. |
| Nonaffiliates | | Companies not related by common ownership or control. They can be financial and nonfinancial companies. • MFS does not share with nonaffiliates so they can market to you. |
| Joint marketing | | A formal agreement between nonaffiliated financial companies that together market financial products or services to you. • MFS doesn’t jointly market. |
| | |
| Other important information |
| If you own an MFS product or receive an MFS service in the name of a third party such as a bank or broker-dealer, their privacy policy may apply to you instead of ours. |
27
Annual Report
December 31, 2019

MFS® New Discovery Series

MFS® Variable Insurance Trust
Beginning on January 1, 2021, as permitted by regulations adopted by the U.S. Securities and Exchange Commission, the insurance company that offers your contract may determine that it will no longer send you paper copies of the fund’s annual and semiannual shareholder reports unless you specifically request paper copies from the insurance company or from your financial intermediary. Instead, the shareholder reports will be made available on a Web site (insurancefunds.mfs.com or other Web site of which you will be notified), and the insurance company will notify you by mail each time a report is posted and provide you with a Web site link to access the report. Instructions for requesting paper copies will be provided by your insurance company or financial intermediary.
If you already elected to receive shareholder reports by email, you will not be affected by this change and you need not take any action. If your insurance company or financial intermediary offers electronic delivery, you may elect to receive shareholder reports and other communications from the insurance company or financial intermediary by email by following the instructions provided by the insurance company or financial intermediary.
Beginning on January 1, 2019, you may elect to receive all future reports in paper free of charge from the insurance company or financial intermediary. You can inform the insurance company or financial intermediary that you wish to continue receiving paper copies of your shareholder reports by contacting your insurance company or financial intermediary. Your election to receive reports in paper will apply to all funds held in your account with your insurance company or financial intermediary.
VND-ANN
MFS® New Discovery Series
CONTENTS
The report is prepared for the general information of contract owners. It is authorized for distribution to prospective investors only when preceded or accompanied by a current prospectus.
NOT FDIC INSURED• MAY LOSE VALUE• NO BANK OR CREDIT UNION GUARANTEE• NOT A DEPOSIT• NOT INSURED BY ANY FEDERAL GOVERNMENT AGENCY OR NCUA/NCUSIF
MFS New Discovery Series
LETTER FROM THE EXECUTIVE CHAIR

Dear Contract Owners:
Slowing global growth, low inflation, and trade friction between the United States and China have been hallmarks of the past 12 months. After experiencing an uptick in market volatility in late 2018, markets steadied for most of 2019, thanks in large measure to the adoption of a dovish policy stance on the part of global central banks, focused on supporting economic growth. Negotiations aimed at a “phase one” trade deal between the U.S. and China bore fruit at the end of the period, boosting investor sentiment, while signs of stability emerging from the global manufacturing sector also lifted spirits. Uncertainty over Brexit, along with the ripple effects from the trade conflict, hampered business confidence and investment in the United Kingdom and Europe for much of the period, though investors expect greater clarity regarding Brexit as a result of December’s general election. The pro-Brexit Conservative Party won the election by a comfortable margin and set the stage for the U.K.’s departure from the EU at the end of January.
Markets expect the longest economic expansion in U.S. history will continue, albeit at a slower pace, as trade tensions recede. In an effort to prolong the expansion, the U.S. Federal Reserve lowered interest rates three times between July and October and the European Central Bank loosened policy in September. While the global monetary policy backdrop remains quite accommodative, signs of easing trade tensions and fading global recession fears led to improved market sentiment in late 2019 as investors grew less risk averse. In early 2020, an outbreak of coronavirus emanating from China reintroduced global growth fears, causing an uptick in volatility.
Here at MFS®, we aim to help our clients navigate the growing complexity of the markets and world economies. Our long-term investment philosophy and commitment to the responsible allocation of capital allow us to tune out the noise and uncover what we believe are the best, most durable investment opportunities in the market. Through our powerful global investment platform, we combine collective expertise, thoughtful risk management and long-term discipline to create sustainable value for investors.
Respectfully,

Robert J. Manning
Executive Chair
MFS Investment Management
February 14, 2020
The opinions expressed in this letter are subject to change and may not be relied upon for investment advice. No forecasts can be guaranteed.
1
MFS New Discovery Series
PORTFOLIO COMPOSITION
Portfolio structure
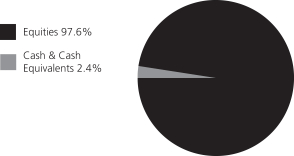
| | | | |
| Top ten holdings | | | | |
| Wyndham Hotels & Resorts, Inc. | | | 1.6% | |
| Rapid7, Inc. | | | 1.6% | |
| CACI International, Inc., “A” | | | 1.6% | |
| WNS (Holdings) Ltd., ADR | | | 1.5% | |
| Ollie’s Bargain Outlet Holdings, Inc. | | | 1.5% | |
| Charles River Laboratories International, Inc. | | | 1.4% | |
| Planet Fitness, Inc. | | | 1.4% | |
| Generac Holdings, Inc. | | | 1.4% | |
| ICON PLC | | | 1.4% | |
| Ferro Corp. | | | 1.4% | |
| | | | |
| GICS equity sectors (g) | | | | |
| Health Care | | | 26.9% | |
| Information Technology | | | 22.8% | |
| Consumer Discretionary | | | 14.3% | |
| Industrials | | | 10.2% | |
| Financials | | | 7.0% | |
| Materials | | | 5.5% | |
| Real Estate | | | 4.5% | |
| Communication Services | | | 2.6% | |
| Consumer Staples | | | 2.3% | |
| Energy | | | 1.5% | |
| (g) | The Global Industry Classification Standard (GICS®) was developed by and/or is the exclusive property of MSCI, Inc. and S&P Global Market Intelligence Inc. (“S&P Global Market Intelligence”). GICS is a service mark of MSCI and S&P Global Market Intelligence and has been licensed for use by MFS. |
Cash & Cash Equivalents includes any cash, investments in money market funds, short-term securities, and other assets less liabilities. Please see the Statement of Assets and Liabilities for additional information related to the fund’s cash position and other assets and liabilities.
Percentages are based on net assets as of December 31, 2019.
The portfolio is actively managed and current holdings may be different.
2
MFS New Discovery Series
MANAGEMENT REVIEW
Summary of Results
For the twelve months ended December 31, 2019, Initial Class shares of the MFS New Discovery Series (fund) provided a total return of 41.70%, while Service Class shares of the fund provided a total return of 41.27%. These compare with a return of 28.48% over the same period for the fund’s benchmark, the Russell 2000® Growth Index.
Market Environment
Fading fears of a near-term global recession, the announcement of a partial trade deal between the United States and China and the decline in uncertainty over Brexit helped bolster market sentiment late in the period. Changes in market sentiment, largely driven by uncertainty over the outcome of trade negotiations between the US and China, had contributed to periodic bouts of volatility during the reporting period. The global economy decelerated, led by weakness in China and Europe, although the pace of the slowdown moderated late in the period amid nascent signs of stabilization in the manufacturing sector.
The deteriorating global growth backdrop, along with declining inflationary pressures, prompted the US Federal Reserve to adopt a more dovish posture beginning in early 2019, resulting in the first interest rate cut in over a decade at the end of July, followed by additional cuts in September and October. The Fed’s actions led to a sharp decline in long-term interest rates during the period’s second half, causing the inversion of portions of the US Treasury yield curve for a time. Amid an improvement in risk sentiment in Q4 2019 and indications of a bottoming in growth and a potential upturn in activity, the Fed indicated in October that further rate cuts were unlikely unless the outlook for the economy materially worsened.
Globally, central banks have tilted more dovish as well, with the European Central Bank unveiling a package of easing measures, which included putting overnight rates deeper into negative territory, restarting its bond-buying program and lengthening the term of cheap loans to banks to three years from two. The central banks of India and Australia are among those that have cut rates several times in recent months, although China has been more cautious in increasing liquidity as it keeps trying to deleverage its economy, cutting rates only marginally.
Emerging markets experienced considerable volatility through the end of 2018, as tighter global financial conditions exposed structural weakness in some countries. Those conditions improved in 2019 as the Fed became more dovish. Notwithstanding the periodic headwinds on market sentiment from significant trade friction between the US and China over much of the year, emerging market hard currency debt and local rates benefited from relatively cheap valuations at the beginning of the period and easier global monetary conditions. These factors, plus the fading of certain global risk factors mentioned above, hastened spread tightening in the latter part of the period. At the same time, idiosyncratic risks spiked in some countries (e.g., Argentina and Lebanon), contributing to increased dispersion in performance among sovereign assets.
Contributors to Performance
Stock selection and an overweight position in theinformation technology sector contributed to performance relative to the Russell 2000® Growth Index. Notably, the fund’s holdings of technology services provider Endava (b) and government IT services provider CACI International (b), and its overweight positions in cloud-based software companies, Avalara and Paylocity Holding, lifted relative returns. Shares of Endava rose over the reporting period as the company reported faster-than-expected growth in sales and new customers.
Security selection in both thehealth care andindustrials sectors further benefited relative results over the reporting period. Within thehealth caresector, the timing of the fund’s position in gene therapy developer Spark Therapeutics (h) aided relative performance. Within theindustrials sector, holding shares of auto collision repair shop operator Boyd Group (b) (Canada), and the fund’s overweight position in Foundation Building Materials (h), positively impacted relative returns. The stock price of Boyd Group traded higher over the reporting period on the back of strong acquisition activity and repair services demand that drove earnings results.
Other top contributing stocks included the fund’s holdings of footwear retailer Skechers USA (b) and financial markets clearing and data services firm TMX Group (b) (Canada), and its overweight position in construction materials company Summit Materials.
Detractors from Performance
An overweight position and stock selection in theenergy sector held back relative performance over the reporting period. Notably, the fund’s holdings of oilfield and natural gas reservoir service firm Core Laboratories (b) (Netherlands) hurt relative returns as the company lowered its guidance for its reservoir description division, reported disappointing fourth-quarter earnings and cut its dividend.
An overweight allocation to thematerials sector also hindered relative results. Within this sector, an overweight position in industrial coatings and pigment producer Ferro negatively impacted relative performance. The stock price of Ferro declined, early in the reporting period, after the company reported lower-than-expected sales results arising from a challenging macro environment.
3
MFS New Discovery Series
Management Review – continued
Stocks in other sectors that further detracted from relative returns included not holding shares of biotech firms Array Biopharma and Arrowhead Pharmaceuticals, and overweight positions in disposable medical products maker Merit Medical Systems and travel retail store operator Hudson (United Kingdom). The timing of the fund’s ownership in shares of licensed pop culture products distributor Funko and discount retailer Ollie’s Bargain Outlet Holdings, and its holdings of digital operations management platform operator Pagerduty (b) and technology skills development firm Pluralsight (b), also dampened relative performance.
Respectfully,
Portfolio Manager(s)
Michael Grossman
| (b) | Security is not a benchmark constituent. |
| (h) | Security was not held in the portfolio at period end. |
The views expressed in this report are those of the portfolio manager(s) only through the end of the period of the report as stated on the cover and do not necessarily reflect the views of MFS or any other person in the MFS organization. These views are subject to change at any time based on market or other conditions, and MFS disclaims any responsibility to update such views. These views may not be relied upon as investment advice or an indication of trading intent on behalf of any MFS portfolio. References to specific securities are not recommendations of such securities, and may not be representative of any MFS portfolio’s current or future investments.
4
MFS New Discovery Series
PERFORMANCE SUMMARY THROUGH 12/31/19
The following chart illustrates the historical performance of the fund in comparison to its benchmark(s). Benchmarks are unmanaged and may not be invested in directly. Benchmark returns do not reflect any fees or expenses. The performance of other share classes will be greater than or less than that of the class depicted below. (See Notes to Performance Summary.)
Performance data shown represents past performance and is no guarantee of future results. Investment return and principal value fluctuate so your units, when sold, may be worth more or less than the original cost; current performance may be lower or higher than quoted. The performance shown does not reflect the deduction of taxes, if any, that a contract holder would pay on fund distributions or the redemption of contract units. The returns for the fund shown also do not reflect the deduction of expenses associated with variable products, such as mortality and expense risk charges, separate account charges, and sales charges imposed by the insurance company separate accounts. Such expenses would reduce the overall returns shown.
Growth of a Hypothetical $10,000 Investment
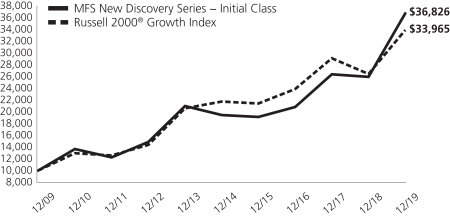
Total Returns through 12/31/19
Average annual total returns
| | | | | | | | | | | | |
| | | Share Class | | Class Inception Date | | 1-yr | | 5-yr | | 10-yr | | |
| | | Initial Class | | 5/01/98 | | 41.70% | | 13.60% | | 13.92% | | |
| | | Service Class | | 5/01/00 | | 41.27% | | 13.31% | | 13.63% | | |
| | | | |
| Comparative benchmark(s) | | | | | | | | |
| | | Russell 2000® Growth Index (f) | | 28.48% | | 9.34% | | 13.01% | | |
| (f) | Source: FactSet Research Systems Inc. |
Benchmark Definition(s)
Russell 2000® Growth Index – constructed to provide a comprehensive barometer for growth securities in the small-cap segment of the U.S. equity universe. Companies in this index generally have higher price-to-book ratios and higher forecasted growth values. Frank Russell Company (“Russell”) is the source and owner of the trademarks, service marks, and copyrights related to the Russell Indexes. Russell® is a trademark of Frank Russell Company. Neither Russell nor its licensors accept any liability for any errors or omissions in the Russell Indexes and/or Russell ratings or underlying data and no party may rely on any Russell Indexes and/or Russell ratings and/or underlying data contained in this document. No further distribution of Russell Data is permitted without Russell’s express written consent. Russell does not promote, sponsor, or endorse the content of this document.
It is not possible to invest directly in an index.
Notes to Performance Summary
Average annual total return represents the average annual change in value for each share class for the periods presented.
Performance results reflect any applicable expense subsidies and waivers in effect during the periods shown. Without such subsidies and waivers the fund’s performance results would be less favorable. Please see the prospectus and financial statements for complete details. All results are historical and assume the reinvestment of any dividends and capital gains distributions.
5
MFS New Discovery Series
Performance Summary – continued
Performance results do not include adjustments made for financial reporting purposes in accordance with U.S. generally accepted accounting principles and may differ from amounts reported in the financial highlights.
From time to time the fund may receive proceeds from litigation settlements, without which performance would be lower.
6
MFS New Discovery Series
EXPENSE TABLE
Fund Expenses Borne by the Contract Holders during the Period,
July 1, 2019 through December 31, 2019
As a contract holder of the fund, you incur ongoing costs, including management fees; distribution and/or service(12b-1) fees; and other fund expenses. This example is intended to help you understand your ongoing costs (in dollars) of investing in the fund and to compare these costs with the ongoing costs of investing in other mutual funds.
The example is based on an investment of $1,000 invested at the beginning of the period and held for the entire period July 1, 2019 through December 31, 2019.
Actual Expenses
The first line for each share class in the following table provides information about actual account values and actual expenses. You may use the information in this line, together with the amount you invested, to estimate the expenses that you paid over the period. Simply divide your account value by $1,000 (for example, an $8,600 account value divided by $1,000 = 8.6), then multiply the result by the number in the first line under the heading entitled “Expenses Paid During Period” to estimate the expenses you paid on your account during this period.
Hypothetical Example for Comparison Purposes
The second line for each share class in the following table provides information about hypothetical account values and hypothetical expenses based on the fund’s actual expense ratio and an assumed rate of return of 5% per year before expenses, which is not the fund’s actual return. The hypothetical account values and expenses may not be used to estimate the actual ending account balance or expenses you paid for the period. You may use this information to compare the ongoing costs of investing in the fund and other funds. To do so, compare this 5% hypothetical example with the 5% hypothetical examples that appear in the shareholder reports of the other funds.
Please note that the expenses shown in the table are meant to highlight the fund’s ongoing costs only and do not take into account the fees and expenses imposed under the variable contracts through which your investment in the fund is made. Therefore, the second line for each share class in the table is useful in comparing ongoing costs associated with an investment in vehicles (such as the fund) which fund benefits under variable annuity and variable life insurance contracts and to qualified pension and retirement plans only, and will not help you determine the relative total costs of investing in the fund through variable annuity and variable life insurance contracts. If the fees and expenses imposed under the variable contracts were included, your costs would have been higher.
| | | | | | | | | | | | | | | | | | |
| Share Class | | | | Annualized
Expense Ratio | | | Beginning
Account Value
7/01/19 | | | Ending Account Value
12/31/19 | | | Expenses Paid
During Period (p)
7/01/19-12/31/19 | |
| Initial Class | | Actual | | | 0.94% | | | | $1,000.00 | | | | $1,078.50 | | | | $4.92 | |
| | Hypothetical (h) | | | 0.94% | | | | $1,000.00 | | | | $1,020.47 | | | | $4.79 | |
| Service Class | | Actual | | | 1.19% | | | | $1,000.00 | | | | $1,076.99 | | | | $6.23 | |
| | Hypothetical (h) | | | 1.19% | | | | $1,000.00 | | | | $1,019.21 | | | | $6.06 | |
| (h) | 5% class return per year before expenses. |
| (p) | “Expenses Paid During Period” are equal to each class’s annualized expense ratio, as shown above, multiplied by the average account value over the period, multiplied by 184/365 (to reflect theone-half year period). |
7
MFS New Discovery Series
PORTFOLIO OF INVESTMENTS – 12/31/19
The Portfolio of Investments is a complete list of all securities owned by your fund. It is categorized by broad-based asset classes.
| | | | | | | | |
| | |
| Issuer | | Shares/Par | | | Value ($) | |
| COMMON STOCKS – 97.6% | | | | | | | | |
| Aerospace – 4.4% | | | | | | | | |
| CACI International, Inc., “A” (a) | | | 51,413 | | | $ | 12,852,736 | |
| Cubic Corp. | | | 110,605 | | | | 7,031,160 | |
| FLIR Systems, Inc. | | | 195,986 | | | | 10,204,991 | |
| Kratos Defense & Security Solutions, Inc. (a) | | | 315,540 | | | | 5,682,875 | |
| | | | | | | | |
| | | | | | $ | 35,771,762 | |
| | | | | | | | |
| Apparel Manufacturers – 2.2% | | | | | |
| Levi Strauss & Co., “A” | | | 589,013 | | | $ | 11,362,061 | |
| Skechers USA, Inc., “A” (a) | | | 149,924 | | | | 6,475,217 | |
| | | | | | | | |
| | | | | | $ | 17,837,278 | |
| | | | | | | | |
| Automotive – 3.1% | | | | | |
| Hella KGaA Hueck & Co. | | | 101,064 | | | $ | 5,593,354 | |
| IAA, Inc. (a) | | | 169,320 | | | | 7,968,199 | |
| Stoneridge, Inc. (a) | | | 265,143 | | | | 7,773,993 | |
| Visteon Corp. (a) | | | 43,798 | | | | 3,792,469 | |
| | | | | | | | |
| | | | | | $ | 25,128,015 | |
| | | | | | | | |
| Biotechnology – 6.0% | | | | | |
| 10x Genomics, Inc., “A” (a) | | | 49,478 | | | $ | 3,772,697 | |
| Adaptive Biotechnologies Corp. (a) | | | 133,169 | | | | 3,984,416 | |
| Aimmune Therapeutics, Inc. (a) | | | 102,295 | | | | 3,423,814 | |
| Amicus Therapeutics, Inc. (a) | | | 517,663 | | | | 5,042,037 | |
| Bio-Techne Corp. | | | 39,182 | | | | 8,600,841 | |
| Immunomedics, Inc. (a) | | | 165,986 | | | | 3,512,264 | |
| Morphosys AG, ADR (a)(l) | | | 162,709 | | | | 5,803,830 | |
| Neurocrine Biosciences, Inc. (a) | | | 45,618 | | | | 4,903,479 | |
| Sarepta Therapeutics, Inc. (a) | | | 21,143 | | | | 2,728,293 | |
| Tricida, Inc. (a) | | | 107,463 | | | | 4,055,654 | |
| Twist Bioscience Corp. (a) | | | 159,416 | | | | 3,347,736 | |
| | | | | | | | |
| | | | | | $ | 49,175,061 | |
| | | | | | | | |
| Brokerage & Asset Managers – 2.9% | |
| Hamilton Lane, Inc., “A” | | | 164,052 | | | $ | 9,777,499 | |
| TMX Group Ltd. | | | 116,641 | | | | 10,100,713 | |
| WisdomTree Investments, Inc. | | | 733,404 | | | | 3,549,675 | |
| | | | | | | | |
| | | | | | $ | 23,427,887 | |
| | | | | | | | |
| Business Services – 3.6% | | | | | |
| Endava PLC, ADR (a) | | | 115,319 | | | $ | 5,373,865 | |
| EVO Payments, Inc., “A” (a) | | | 166,070 | | | | 4,385,909 | |
| TriNet Group, Inc. (a) | | | 137,257 | | | | 7,770,119 | |
| WNS (Holdings) Ltd., ADR (a) | | | 184,302 | | | | 12,191,577 | |
| | | | | | | | |
| | | | | | $ | 29,721,470 | |
| | | | | | | | |
| Chemicals – 1.1% | | | | | |
| Ingevity Corp. (a) | | | 98,497 | | | $ | 8,606,668 | |
| | | | | | | | |
| Computer Software – 7.1% | | | | | |
| Altair Engineering, Inc., “A” (a) | | | 179,146 | | | $ | 6,433,133 | |
| Avalara, Inc. (a) | | | 85,604 | | | | 6,270,493 | |
| Bill.com Holdings, Inc. (a) | | | 48,406 | | | | 1,841,848 | |
| DocuSign, Inc. (a) | | | 85,814 | | | | 6,359,676 | |
| Everbridge, Inc. (a) | | | 145,606 | | | | 11,368,917 | |
| | | | | | | | |
| | |
Issuer | | Shares/Par | | | Value ($) | |
| COMMON STOCKS – continued | | | | | |
| Computer Software – continued | | | | | |
| Pagerduty, Inc. (a)(l) | | | 314,673 | | | $ | 7,360,201 | |
| Paylocity Holding Corp. (a) | | | 64,949 | | | | 7,847,138 | |
| Phreesia, Inc. (a) | | | 136,844 | | | | 3,645,524 | |
| Zendesk, Inc. | | | 91,751 | | | | 7,030,879 | |
| | | | | | | | |
| | | | | | $ | 58,157,809 | |
| | | | | | | | |
| Computer Software – Systems – 6.1% | |
| Box, Inc., “A” (a) | | | 193,219 | | | $ | 3,242,215 | |
| Five9, Inc. (a) | | | 49,151 | | | | 3,223,323 | |
| Pluralsight, Inc., “A” (a) | | | 349,509 | | | | 6,015,050 | |
| Proofpoint, Inc. (a) | | | 55,340 | | | | 6,351,925 | |
| Q2 Holdings, Inc. (a) | | | 140,977 | | | | 11,430,415 | |
| Rapid7, Inc. (a) | | | 229,767 | | | | 12,871,547 | |
| RealPage, Inc. (a) | | | 127,100 | | | | 6,831,625 | |
| | | | | | | | |
| | | | | | $ | 49,966,100 | |
| | | | | | | | |
| Construction – 2.2% | | | | | |
| Summit Materials, Inc., “A” (a) | | | 321,639 | | | $ | 7,687,172 | |
| Trex Co., Inc. (a) | | | 114,474 | | | | 10,288,923 | |
| | | | | | | | |
| | | | | | $ | 17,976,095 | |
| | | | | | | | |
| Consumer Services – 4.8% | | | | | |
| Bright Horizons Family Solutions, Inc. (a) | | | 62,492 | | | $ | 9,391,923 | |
| MakeMyTrip Ltd. (a) | | | 325,596 | | | | 7,456,148 | |
| OneSpaWorld Holdings Ltd. | | | 455,163 | | | | 7,664,945 | |
| Peloton Interactive, Inc., “A” (a)(l) | | | 89,000 | | | | 2,527,600 | |
| Planet Fitness, Inc. (a) | | | 157,378 | | | | 11,752,989 | |
| | | | | | | | |
| | | | | | $ | 38,793,605 | |
| | | | | | | | |
| Electrical Equipment – 2.7% | | | | | |
| CTS Corp. | | | 114,279 | | | $ | 3,429,513 | |
| Generac Holdings, Inc. (a) | | | 115,436 | | | | 11,611,707 | |
| Littlefuse, Inc. | | | 38,128 | | | | 7,293,887 | |
| | | | | | | | |
| | | | | | $ | 22,335,107 | |
| | | | | | | | |
| Electronics – 1.8% | | | | | |
| Monolithic Power Systems, Inc. | | | 34,197 | | | $ | 6,087,750 | |
| nLIGHT, Inc. (a) | | | 211,974 | | | | 4,298,833 | |
| Silicon Laboratories, Inc. (a) | | | 40,684 | | | | 4,718,530 | |
| | | | | | | | |
| | | | | | $ | 15,105,113 | |
| | | | | | | | |
| Entertainment – 2.2% | | | | | |
| CTS Eventim AG | | | 140,872 | | | $ | 8,856,803 | |
| Manchester United PLC, “A” | | | 452,487 | | | | 9,018,066 | |
| | | | | | | | |
| | | | | | $ | 17,874,869 | |
| | | | | | | | |
| Food & Drug Stores – 0.9% | | | | | |
| Grocery Outlet Holding Corp. (a) | | | 224,217 | | | $ | 7,275,842 | |
| | | | | | | | |
| Gaming & Lodging – 1.6% | | | | | |
| Wyndham Hotels & Resorts, Inc. | | | 206,792 | | | $ | 12,988,606 | |
| | | | | | | | |
| General Merchandise – 1.5% | | | | | |
| Ollie’s Bargain Outlet Holdings, Inc. (a) | | | 185,288 | | | $ | 12,101,159 | |
| | | | | | | | |
8
MFS New Discovery Series
Portfolio of Investments – continued
| | | | | | | | |
| | |
| Issuer | | Shares/Par | | | Value ($) | |
| COMMON STOCKS – continued | | | | | |
| Internet – 0.4% | | | | | |
| CarGurus, Inc. (a) | | | 90,080 | | | $ | 3,169,014 | |
| | | | | | | | |
| Leisure & Toys – 1.2% | | | | | |
| Funko, Inc., “A” (a)(l) | | | 567,294 | | | $ | 9,734,765 | |
| | | | | | | | |
| Machinery & Tools – 0.6% | | | | | | | | |
| Ritchie Bros. Auctioneers, Inc. | | | 123,879 | | | $ | 5,320,603 | |
| | | | | | | | |
| Medical & Health Technology & Services – 6.8% | |
| Charles River Laboratories International, Inc. (a) | | | 77,143 | | | $ | 11,784,365 | |
| Guardant Health, Inc. (a) | | | 65,307 | | | | 5,103,089 | |
| HealthEquity, Inc. (a) | | | 90,249 | | | | 6,684,743 | |
| ICON PLC (a) | | | 66,836 | | | | 11,511,164 | |
| PRA Health Sciences, Inc. | | | 95,164 | | | | 10,577,479 | |
| Teladoc Health, Inc. (a)(l) | | | 116,277 | | | | 9,734,711 | |
| | | | | | | | |
| | | | | | $ | 55,395,551 | |
| | | | | | | | |
| Medical Equipment – 10.0% | | | | | | | | |
| Inspire Medical Systems, Inc. (a) | | | 59,438 | | | $ | 4,410,894 | |
| iRhythm Technologies, Inc. (a) | | | 93,371 | | | | 6,357,631 | |
| Masimo Corp. (a) | | | 53,206 | | | | 8,409,740 | |
| Merit Medical Systems, Inc. (a) | | | 262,648 | | | | 8,199,871 | |
| Nevro Corp. (a) | | | 49,813 | | | | 5,855,020 | |
| OptiNose, Inc. (a)(l) | | | 354,152 | | | | 3,265,282 | |
| OrthoPediatrics Corp. (a) | | | 236,067 | | | | 11,092,788 | |
| PerkinElmer, Inc. | | | 66,022 | | | | 6,410,736 | |
| Quidel Corp. (a) | | | 111,748 | | | | 8,384,453 | |
| Silk Road Medical, Inc. (a) | | | 132,341 | | | | 5,343,930 | |
| STERIS PLC | | | 38,070 | | | | 5,802,629 | |
| TransMedics Group, Inc. (a)(l) | | | 126,590 | | | | 2,406,476 | |
| West Pharmaceutical Services, Inc. | | | 38,427 | | | | 5,776,731 | |
| | | | | | | | |
| | | | | | $ | 81,716,181 | |
| | | | | | | | |
| Network & Telecom – 2.5% | | | | | | | | |
| Interxion Holding N.V. (a) | | | 129,733 | | | $ | 10,872,923 | |
| QTS Realty Trust, Inc., REIT, “A” | | | 178,835 | | | | 9,705,375 | |
| | | | | | | | |
| | | | | | $ | 20,578,298 | |
| | | | | | | | |
| Oil Services – 1.3% | | | | | | | | |
| Core Laboratories N.V. | | | 164,542 | | | $ | 6,198,297 | |
| Patterson-UTI Energy, Inc. | | | 387,518 | | | | 4,068,939 | |
| | | | | | | | |
| | | | | | $ | 10,267,236 | |
| | | | | | | | |
| Other Banks & Diversified Financials – 4.1% | |
| Bank OZK | | | 128,474 | | | $ | 3,919,099 | |
| Prosperity Bancshares, Inc. | | | 93,410 | | | | 6,715,245 | |
| Signature Bank | | | 34,737 | | | | 4,745,422 | |
| Texas Capital Bancshares, Inc. (a) | | | 148,501 | | | | 8,430,402 | |
| Wintrust Financial Corp. | | | 133,685 | | | | 9,478,266 | |
| | | | | | | | |
| | | | | | $ | 33,288,434 | |
| | | | | | | | |
| Pharmaceuticals – 3.6% | | | | | |
| BridgeBio Pharma, Inc. (a)(l) | | | 106,917 | | | $ | 3,747,441 | |
| Collegium Pharmaceutical, Inc. (a) | | | 163,144 | | | | 3,357,504 | |
| Forty Seven, Inc. (a) | | | 114,805 | | | | 4,519,873 | |
| GW Pharmaceuticals PLC, ADR (a)(l) | | | 48,686 | | | | 5,090,608 | |
| Orchard RX Ltd., ADR (a) | | | 180,855 | | | | 2,486,756 | |
| | | | | | | | |
| | |
| Issuer | | Shares/Par | | | Value ($) | |
| COMMON STOCKS – continued | | | | | |
| Pharmaceuticals – continued | | | | | | | | |
| Principia Biopharma, Inc. (a) | | | 93,117 | | | $ | 5,100,949 | |
| SpringWorks Therapeutics, Inc. (a) | | | 137,296 | | | | 5,284,523 | |
| | | | | | | | |
| | | | | | $ | 29,587,654 | |
| | | | | | | | |
| Pollution Control – 0.5% | | | | | |
| Casella Waste Systems, Inc., “A” (a) | | | 91,442 | | | $ | 4,209,075 | |
| | | | | | | | |
| Railroad & Shipping – 0.3% | | | | | | | | |
| StealthGas, Inc. (a) | | | 617,281 | | | $ | 2,117,274 | |
| | | | | | | | |
| Real Estate – 3.3% | | | | | | | | |
| Big Yellow Group PLC, REIT | | | 362,529 | | | $ | 5,762,470 | |
| Industrial Logistics Properties Trust, REIT | | | 456,985 | | | | 10,245,604 | |
| STAG Industrial, Inc., REIT | | | 347,436 | | | | 10,968,554 | |
| | | | | | | | |
| | | | | | $ | 26,976,628 | |
| | | | | | | | |
| Restaurants – 1.4% | | | | | |
| Performance Food Group Co. (a) | | | 221,471 | | | $ | 11,401,327 | |
| | | | | | | | |
| Special Products & Services – 1.3% | | | | | |
| Boyd Group Income Fund, IEU (a) | | | 68,741 | | | $ | 10,693,221 | |
| | | | | | | | |
| Specialty Chemicals – 4.2% | | | | | | | | |
| Axalta Coating Systems Ltd. (a) | | | 366,395 | | | $ | 11,138,408 | |
| Ferro Corp. (a) | | | 771,267 | | | | 11,437,889 | |
| RPM International, Inc. | | | 73,776 | | | | 5,663,046 | |
| Univar Solutions, Inc. (a) | | | 238,336 | | | | 5,777,265 | |
| | | | | | | | |
| | | | | | $ | 34,016,608 | |
| | | | | | | | |
| Specialty Stores – 1.0% | | | | | | | | |
| Hudson Ltd., “A” (a) | | | 523,800 | | | $ | 8,035,092 | |
| | | | | | | | |
| Trucking – 0.9% | | | | | | | | |
| Schneider National, Inc. | | | 319,331 | | | $ | 6,967,803 | |
| | | | | | | | |
Total Common Stocks
(Identified Cost, $604,398,335) | | | | | | $ | 795,717,210 | |
| | | | | | | | |
|
| INVESTMENT COMPANIES (h) – 2.5% | |
| Money Market Funds – 2.5% | | | | | | | | |
| MFS Institutional Money Market Portfolio, 1.7% (v) (Identified Cost, $20,765,407) | | | 20,765,476 | | | $ | 20,765,476 | |
| | | | | | | | |
|
| COLLATERAL FOR SECURITIES LOANED – 1.2% | |
| State Street Navigator Securities Lending Government Money Market Portfolio, 1.58% (j) (Identified Cost, $9,826,556) | | | 9,826,556 | | | $ | 9,826,556 | |
| | | | | | | | |
OTHER ASSETS, LESS
LIABILITIES – (1.3)% | | | | | | | (10,783,896 | ) |
| | | | | | | | |
| NET ASSETS – 100.0% | | | | | | $ | 815,525,346 | |
| | | | | | | | |
9
MFS New Discovery Series
Portfolio of Investments – continued
| (a) | | Non-income producing security. |
| (h) | | An affiliated issuer, which may be considered one in which the fund owns 5% or more of the outstanding voting securities, or a company which is under common control. At period end, the aggregate values of the fund’s investments in affiliated issuers and in unaffiliated issuers were $20,765,476 and $805,543,766, respectively. |
| (j) | | The rate quoted is the annualizedseven-day yield of the fund at period end. |
| (l) | | A portion of this security is on loan. See Note 2 for additional information. |
| (v) | | Affiliated issuer that is available only to investment companies managed by MFS. The rate quoted for the MFS Institutional Money Market Portfolio is the annualizedseven-day yield of the fund at period end. |
The following abbreviations are used in this report and are defined:
| ADR | | American Depositary Receipt |
| IEU | | International Equity Unit |
| REIT | | Real Estate Investment Trust |
See Notes to Financial Statements
10
MFS New Discovery Series
FINANCIAL STATEMENTS | STATEMENT OF ASSETS AND LIABILITIES
This statement represents your fund’s balance sheet, which details the assets and liabilities comprising the total value of the fund.
| | | | |
At 12/31/19 | | | | |
| |
Assets | | | | |
Investments in unaffiliated issuers, at value, including $30,610,545 of securities on loan (identified cost, $614,224,891) | | | $805,543,766 | |
Investments in affiliated issuers, at value (identified cost, $20,765,407) | | | 20,765,476 | |
Cash | | | 626,996 | |
Receivables for | | | | |
Fund shares sold | | | 152,124 | |
Interest and dividends | | | 403,769 | |
Other assets | | | 3,017 | |
Total assets | | | $827,495,148 | |
| |
Liabilities | | | | |
Payables for | | | | |
Investments purchased | | | $1,217,733 | |
Fund shares reacquired | | | 707,967 | |
Collateral for securities loaned, at value (c) | | | 9,826,556 | |
Payable to affiliates | | | | |
Investment adviser | | | 53,239 | |
Administrative services fee | | | 617 | |
Shareholder servicing costs | | | 1,412 | |
Distribution and/or service fees | | | 6,487 | |
Payable for independent Trustees’ compensation | | | 12 | |
Accrued expenses and other liabilities | | | 155,779 | |
Total liabilities | | | $11,969,802 | |
Net assets | | | $815,525,346 | |
| |
Net assets consist of | | | | |
Paid-in capital | | | $546,930,467 | |
Total distributable earnings (loss) | | | 268,594,879 | |
Net assets | | | $815,525,346 | |
Shares of beneficial interest outstanding | | | 43,130,774 | |
| | | | | | | | | | | | |
| | | |
| | | Net assets | | | Shares
outstanding | | | Net asset value
per share | |
Initial Class | | | $343,132,560 | | | | 16,923,045 | | | | $20.28 | |
Service Class | | | 472,392,786 | | | | 26,207,729 | | | | 18.02 | |
| (c) | Non-cash collateral is not included. |
See Notes to Financial Statements
11
MFS New Discovery Series
FINANCIAL STATEMENTS | STATEMENT OF OPERATIONS
This statement describes how much your fund earned in investment income and accrued in expenses. It also describes any gains and/or losses generated by fund operations.
| | | | |
Year ended 12/31/19 | | | | |
| |
Net investment income (loss) | | | | |
Income | | | | |
Dividends | | | $4,100,783 | |
Income on securities loaned | | | 310,645 | |
Dividends from affiliated issuers | | | 273,941 | |
Other | | | 65,272 | |
Foreign taxes withheld | | | (183,985 | ) |
Total investment income | | | $4,566,656 | |
Expenses | | | | |
Management fee | | | $6,719,249 | |
Distribution and/or service fees | | | 1,062,614 | |
Shareholder servicing costs | | | 22,865 | |
Administrative services fee | | | 110,801 | |
Independent Trustees’ compensation | | | 17,698 | |
Custodian fee | | | 53,098 | |
Shareholder communications | | | 90,822 | |
Audit and tax fees | | | 58,946 | |
Legal fees | | | 7,079 | |
Miscellaneous | | | 37,672 | |
Total expenses | | | $8,180,844 | |
Reduction of expenses by investment adviser | | | (93,872 | ) |
Net expenses | | | $8,086,972 | |
Net investment income (loss) | | | $(3,520,316 | ) |
| |
Realized and unrealized gain (loss) | | | | |
Realized gain (loss) (identified cost basis) | | | | |
Unaffiliated issuers | | | $82,969,832 | |
Affiliated issuers | | | 560 | |
Foreign currency | | | 1,564 | |
Net realized gain (loss) | | | $82,971,956 | |
Change in unrealized appreciation or depreciation | | | | |
Unaffiliated issuers | | | $172,412,391 | |
Affiliated issuers | | | (111 | ) |
Translation of assets and liabilities in foreign currencies | | | 2,041 | |
Net unrealized gain (loss) | | | $172,414,321 | |
Net realized and unrealized gain (loss) | | | $255,386,277 | |
Change in net assets from operations | | | $251,865,961 | |
See Notes to Financial Statements
12
MFS New Discovery Series
FINANCIAL STATEMENTS | STATEMENTS OF CHANGES IN NET ASSETS
These statements describe the increases and/or decreases in net assets resulting from operations, any distributions, and any shareholder transactions.
| | | | | | | | |
| | | Year ended | |
| | | 12/31/19 | | | 12/31/18 | |
Change in net assets | | | | | | | | |
| | |
From operations | | | | | | | | |
Net investment income (loss) | | | $(3,520,316 | ) | | | $(4,370,199 | ) |
Net realized gain (loss) | | | 82,971,956 | | | | 145,027,607 | |
Net unrealized gain (loss) | | | 172,414,321 | | | | (144,035,189 | ) |
Change in net assets from operations | | | $251,865,961 | | | | $(3,377,781 | ) |
Total distributions to shareholders | | | $(140,125,461 | ) | | | $(102,401,393 | ) |
Change in net assets from fund share transactions | | | $72,834,089 | | | | $(13,116,105 | ) |
Total change in net assets | | | $184,574,589 | | | | $(118,895,279 | ) |
| | |
Net assets | | | | | | | | |
At beginning of period | | | 630,950,757 | | | | 749,846,036 | |
At end of period | | | $815,525,346 | | | | $630,950,757 | |
See Notes to Financial Statements
13
MFS New Discovery Series
FINANCIAL STATEMENTS | FINANCIAL HIGHLIGHTS
The financial highlights table is intended to help you understand the fund’s financial performance for the past 5 years. Certain information reflects financial results for a single fund share. The total returns in the table represent the rate that an investor would have earned (or lost) on an investment in the fund share class (assuming reinvestment of all distributions) held for the entire period.
| | | | | | | | | | | | | | | | | | | | |
| Initial Class | | Year ended | |
| | | | | |
| | | 12/31/19 | | | 12/31/18 | | | 12/31/17 | | | 12/31/16 | | | 12/31/15 | |
| | | | | |
Net asset value, beginning of period | | | $17.46 | | | | $20.10 | | | | $16.18 | | | | $15.49 | | | | $16.32 | |
| | | | | |
| Income (loss) from investment operations | | | | | | | | | | | | | | | | | | | | |
Net investment income (loss) (d) | | | $(0.07 | ) | | | $(0.09 | ) | | | $(0.07 | ) | | | $0.00 | (c)(w) | | | $(0.08 | ) |
Net realized and unrealized gain (loss) | | | 6.89 | | | | 0.35 | | | | 4.34 | | | | 1.40 | | | | (0.22 | ) |
Total from investment operations | | | $6.82 | | | | $0.26 | | | | $4.27 | | | | $1.40 | | | | $(0.30 | ) |
| | | | | |
| Less distributions declared to shareholders | | | | | | | | | | | | | | | | | | | | |
From net realized gain | | | $(4.00 | ) | | | $(2.90 | ) | | | $(0.35 | ) | | | $(0.71 | ) | | | $(0.53 | ) |
Net asset value, end of period (x) | | | $20.28 | | | | $17.46 | | | | $20.10 | | | | $16.18 | | | | $15.49 | |
Total return (%) (k)(r)(s)(x) | | | 41.70 | | | | (1.48 | ) | | | 26.65 | | | | 9.05 | (c) | | | (1.89 | ) |
| | | | | |
Ratios (%) (to average net assets)
and Supplemental data: | | | | | | | | | | | | | | | | | | | | |
Expenses before expense reductions (f) | | | 0.95 | | | | 0.96 | | | | 0.97 | | | | 0.94 | (c) | | | 0.96 | |
Expenses after expense reductions (f) | | | 0.94 | | | | 0.94 | | | | 0.94 | | | | 0.92 | (c) | | | 0.94 | |
Net investment income (loss) | | | (0.33 | ) | | | (0.43 | ) | | | (0.37 | ) | | | 0.02 | (c) | | | (0.48 | ) |
Portfolio turnover | | | 54 | | | | 71 | | | | 58 | | | | 63 | | | | 60 | |
Net assets at end of period (000 omitted) | | | $343,133 | | | | $272,039 | | | | $316,949 | | | | $292,368 | | | | $312,151 | |
| |
| Service Class | | Year ended | |
| | | | | |
| | | 12/31/19 | | | 12/31/18 | | | 12/31/17 | | | 12/31/16 | | | 12/31/15 | |
| | | | | |
Net asset value, beginning of period | | | $15.91 | | | | $18.57 | | | | $15.01 | | | | $14.45 | | | | $15.30 | |
| | | | | |
| Income (loss) from investment operations | | | | | | | | | | | | | | | | | | | | |
Net investment income (loss) (d) | | | $(0.11 | ) | | | $(0.13 | ) | | | $(0.10 | ) | | | $(0.03 | )(c) | | | $(0.11 | ) |
Net realized and unrealized gain (loss) | | | 6.22 | | | | 0.37 | | | | 4.01 | | | | 1.30 | | | | (0.21 | ) |
Total from investment operations | | | $6.11 | | | | $0.24 | | | | $3.91 | | | | $1.27 | | | | $(0.32 | ) |
| | | | | |
| Less distributions declared to shareholders | | | | | | | | | | | | | | | | | | | | |
From net realized gain | | | $(4.00 | ) | | | $(2.90 | ) | | | $(0.35 | ) | | | $(0.71 | ) | | | $(0.53 | ) |
Net asset value, end of period (x) | | | $18.02 | | | | $15.91 | | | | $18.57 | | | | $15.01 | | | | $14.45 | |
Total return (%) (k)(r)(s)(x) | | | 41.27 | | | | (1.72 | ) | | | 26.33 | | | | 8.80 | (c) | | | (2.15 | ) |
| | | | | |
Ratios (%) (to average net assets)
and Supplemental data: | | | | | | | | | | | | | | | | | | | | |
Expenses before expense reductions (f) | | | 1.20 | | | | 1.21 | | | | 1.22 | | | | 1.19 | (c) | | | 1.21 | |
Expenses after expense reductions (f) | | | 1.19 | | | | 1.19 | | | | 1.19 | | | | 1.17 | (c) | | | 1.19 | |
Net investment income (loss) | | | (0.58 | ) | | | (0.68 | ) | | | (0.62 | ) | | | (0.23 | )(c) | | | (0.73 | ) |
Portfolio turnover | | | 54 | | | | 71 | | | | 58 | | | | 63 | | | | 60 | |
Net assets at end of period (000 omitted) | | | $472,393 | | | | $358,912 | | | | $432,897 | | | | $380,884 | | | | $388,966 | |
See Notes to Financial Statements
14
MFS New Discovery Series
Financial Highlights – continued
| (c) | | Amount reflects aone-time reimbursement of expenses by the custodian (or former custodian) without which net investment income and performance would be lower and expenses would be higher. |
| (d) | | Per share data is based on average shares outstanding. |
| (f) | | Ratios do not reflect reductions from fees paid indirectly, if applicable. |
| (k) | | The total return does not reflect expenses that apply to separate accounts. Inclusion of these charges would reduce the total return figures for all periods shown. |
| (r) | | Certain expenses have been reduced without which performance would have been lower. |
| (s) | | From time to time the fund may receive proceeds from litigation settlements, without which performance would be lower. |
| (w) | | Per share amount was less than $0.01. |
| (x) | | The net asset values and total returns have been calculated on net assets which include adjustments made in accordance with U.S. generally accepted accounting principles required at period end for financial reporting purposes. |
See Notes to Financial Statements
15
MFS New Discovery Series
NOTES TO FINANCIAL STATEMENTS
| (1) | | Business and Organization |
MFS New Discovery Series (the fund) is a diversified series of MFS Variable Insurance Trust (the trust). The trust is organized as a Massachusetts business trust and is registered under the Investment Company Act of 1940, as amended, as anopen-end management investment company. The shareholders of each series of the trust are separate accounts of insurance companies, which offer variable annuity and/or life insurance products, and qualified retirement and pension plans.
The fund is an investment company and accordingly follows the investment company accounting and reporting guidance of the Financial Accounting Standards Board (FASB) Accounting Standards Codification Topic 946 Financial Services – Investment Companies.
| (2) | | Significant Accounting Policies |
General– The preparation of financial statements in conformity with U.S. generally accepted accounting principles requires management to make estimates and assumptions that affect the reported amounts of assets and liabilities, and disclosure of contingent assets and liabilities at the date of the financial statements and the reported amounts of increases and decreases in net assets from operations during the reporting period. Actual results could differ from those estimates. In the preparation of these financial statements, management has evaluated subsequent events occurring after the date of the fund’s Statement of Assets and Liabilities through the date that the financial statements were issued. The fund will generally focus on securities of small size companies which may be more volatile than those of larger companies. The fund invests in foreign securities. Investments in foreign securities are vulnerable to the effects of changes in the relative values of the local currency and the U.S. dollar and to the effects of changes in each country’s market, economic, industrial, political, regulatory, geopolitical, and other conditions.
Balance Sheet Offsetting– The fund’s accounting policy with respect to balance sheet offsetting is that, absent an event of default by the counterparty or a termination of the agreement, the International Swaps and Derivatives Association (ISDA) Master Agreement, or similar agreement, does not result in an offset of reported amounts of financial assets and financial liabilities in the Statement of Assets and Liabilities across transactions between the fund and the applicable counterparty. The fund’s right to setoff may be restricted or prohibited by the bankruptcy or insolvency laws of the particular jurisdiction to which a specific master netting agreement counterparty is subject. Balance sheet offsetting disclosures, to the extent applicable to the fund, have been included in the fund’s Significant Accounting Policies note under the captions for each of the fund’sin-scope financial instruments and transactions.
Investment Valuations– Equity securities, including restricted equity securities, are generally valued at the last sale or official closing price on their primary market or exchange as provided by a third-party pricing service. Equity securities, for which there were no sales reported that day, are generally valued at the last quoted daily bid quotation on their primary market or exchange as provided by a third-party pricing service. Short-term instruments with a maturity at issuance of 60 days or less may be valued at amortized cost, which approximates market value.Open-end investment companies are generally valued at net asset value per share. Securities and other assets generally valued on the basis of information from a third-party pricing service may also be valued at a broker/dealer bid quotation. In determining values, third-party pricing services can utilize both transaction data and market information such as yield, quality, coupon rate, maturity, type of issue, trading characteristics, and other market data. The values of foreign securities and other assets and liabilities expressed in foreign currencies are converted to U.S. dollars using the mean of bid and asked prices for rates provided by a third-party pricing service.
The Board of Trustees has delegated primary responsibility for determining or causing to be determined the value of the fund’s investments (including any fair valuation) to the adviser pursuant to valuation policies and procedures approved by the Board. If the adviser determines that reliable market quotations are not readily available, investments are valued at fair value as determined in good faith by the adviser in accordance with such procedures under the oversight of the Board of Trustees. Under the fund’s valuation policies and procedures, market quotations are not considered to be readily available for most types of debt instruments and floating rate loans and many types of derivatives. These investments are generally valued at fair value based on information from third-party pricing services. In addition, investments may be valued at fair value if the adviser determines that an investment’s value has been materially affected by events occurring after the close of the exchange or market on which the investment is principally traded (such as foreign exchange or market) and prior to the determination of the fund’s net asset value, or after the halt of trading of a specific security where trading does not resume prior to the close of the exchange or market on which the security is principally traded. Events that occur after foreign markets close (such as developments in foreign markets and significant movements in the U.S. markets) and prior to the determination of the fund’s net asset value may be deemed to have a material effect on the value of securities traded in foreign markets. Accordingly, the fund’s foreign equity securities may often be valued at fair value. The adviser generally relies on third-party pricing services or other information (such as the correlation with price movements of similar securities in the same or other markets; the type, cost and investment characteristics of the security; the business and financial condition of the issuer; and trading and other market data) to assist in determining whether to fair value and at what value to fair value an investment. The value of an investment for purposes of calculating the fund’s net asset value can differ depending on the source and method used to determine value. When fair valuation is used, the value of an investment used to determine the fund’s net asset
16
MFS New Discovery Series
Notes to Financial Statements – continued
value may differ from quoted or published prices for the same investment. There can be no assurance that the fund could obtain the fair value assigned to an investment if it were to sell the investment at the same time at which the fund determines its net asset value per share.
Various inputs are used in determining the value of the fund’s assets or liabilities. These inputs are categorized into three broad levels. In certain cases, the inputs used to measure fair value may fall into different levels of the fair value hierarchy. In such cases, an investment’s level within the fair value hierarchy is based on the lowest level of input that is significant to the fair value measurement. The fund’s assessment of the significance of a particular input to the fair value measurement in its entirety requires judgment, and considers factors specific to the investment. Level 1 includes unadjusted quoted prices in active markets for identical assets or liabilities. Level 2 includes other significant observable market-based inputs (including quoted prices for similar securities, interest rates, prepayment speed, and credit risk). Level 3 includes unobservable inputs, which may include the adviser’s own assumptions in determining the fair value of investments. The following is a summary of the levels used as of December 31, 2019 in valuing the fund’s assets or liabilities:
| | | | | | | | | | | | | | | | |
| Financial Instruments | | Level 1 | | | Level 2 | | | Level 3 | | | Total | |
| Equity Securities | | | $795,717,210 | | | | $— | | | | $— | | | | $795,717,210 | |
| Mutual Funds | | | 30,592,032 | | | | — | | | | — | | | | 30,592,032 | |
| Total | | | $826,309,242 | | | | $— | | | | $— | | | | $826,309,242 | |
For further information regarding security characteristics, see the Portfolio of Investments.
Foreign Currency Translation– Purchases and sales of foreign investments, income, and expenses are converted into U.S. dollars based upon currency exchange rates prevailing on the respective dates of such transactions or on the reporting date for foreign denominated receivables and payables. Gains and losses attributable to foreign currency exchange rates on sales of securities are recorded for financial statement purposes as net realized gains and losses on investments. Gains and losses attributable to foreign exchange rate movements on receivables, payables, income and expenses are recorded for financial statement purposes as foreign currency transaction gains and losses. That portion of both realized and unrealized gains and losses on investments that results from fluctuations in foreign currency exchange rates is not separately disclosed.
Security Loans– Under its Securities Lending Agency Agreement with the fund, State Street Bank and Trust Company, as lending agent, loans the securities of the fund to certain qualified institutions (the “Borrowers”) approved by the fund. Security loans can be terminated at the discretion of either the lending agent or the fund and the related securities must be returned within the earlier of the standard trade settlement period for such securities or within three business days. The loans are collateralized by cash and/or U.S. Treasury and federal agency obligations in an amount typically at least equal to the market value of the securities loaned. On loans collateralized by cash, the cash collateral is invested in a money market fund. The market value of the loaned securities is determined at the close of business of the fund and any additional required collateral is delivered to the fund on the next business day. The lending agent provides the fund with indemnification against Borrower default. In the event of Borrower default, the lending agent will, for the benefit of the fund, either purchase securities identical to those loaned or, when such purchase is commercially impracticable, pay the fund the market value of the loaned securities. In return, the lending agent assumes the fund’s rights to the related collateral. If the collateral value is less than the cost to purchase identical securities, the lending agent is responsible for the shortfall, but only to the extent that such shortfall is not due to a decline in collateral value resulting from collateral reinvestment for which the fund bears the risk of loss. At period end, the fund had investment securities on loan, all of which were classified as equity securities in the fund’s Portfolio of Investments, with a fair value of $30,610,545. The fair value of the fund’s investment securities on loan and a related liability of $9,826,556 for cash collateral received on securities loaned are both presented gross in the Statement of Assets and Liabilities. Additionally, these loans were collateralized by U.S. Treasury Obligations of $21,594,841 held by the lending agent. The collateral on securities loaned exceeded the value of securities on loan at period end. The liability for cash collateral for securities loaned is carried at fair value, which is categorized as level 2 within the fair value hierarchy. A portion of the income generated upon investment of the collateral is remitted to the Borrowers, and the remainder is allocated between the fund and the lending agent. On loans collateralized by U.S. Treasury and/or federal agency obligations, a fee is received from the Borrower, and is allocated between the fund and the lending agent. Income from securities lending is separately reported in the Statement of Operations. The dividend and interest income earned on the securities loaned is accounted for in the same manner as other dividend and interest income.
Indemnifications– Under the fund’s organizational documents, its officers and Trustees may be indemnified against certain liabilities and expenses arising out of the performance of their duties to the fund. Additionally, in the normal course of business, the fund enters into agreements with service providers that may contain indemnification clauses. The fund’s maximum exposure under these agreements is unknown as this would involve future claims that may be made against the fund that have not yet occurred.
Investment Transactions and Income– Investment transactions are recorded on the trade date. Interest income is recorded on the accrual basis. Dividends received in cash are recorded on theex-dividend date. Certain dividends from foreign securities will be
17
MFS New Discovery Series
Notes to Financial Statements – continued
recorded when the fund is informed of the dividend if such information is obtained subsequent to theex-dividend date. Dividend payments received in additional securities are recorded on theex-dividend date in an amount equal to the value of the security on such date.
The fund may receive proceeds from litigation settlements. Any proceeds received from litigation involving portfolio holdings are reflected in the Statement of Operations in realized gain/loss if the security has been disposed of by the fund or in unrealized gain/loss if the security is still held by the fund. Any other proceeds from litigation not related to portfolio holdings are reflected as other income in the Statement of Operations.
Tax Matters and Distributions– The fund intends to qualify as a regulated investment company, as defined under Subchapter M of the Internal Revenue Code, and to distribute all of its taxable income, including realized capital gains. As a result, no provision for federal income tax is required. The fund’s federal tax returns, when filed, will remain subject to examination by the Internal Revenue Service for a three year period. Management has analyzed the fund’s tax positions taken on federal and state tax returns for all open tax years and does not believe that there are any uncertain tax positions that require recognition of a tax liability. Foreign taxes, if any, have been accrued by the fund in the accompanying financial statements in accordance with the applicable foreign tax law. Foreign income taxes may be withheld by certain countries in which the fund invests. Additionally, capital gains realized by the fund on securities issued in or by certain foreign countries may be subject to capital gains tax imposed by those countries.
Distributions to shareholders are recorded on theex-dividend date. Income and capital gain distributions are determined in accordance with income tax regulations, which may differ from U.S. generally accepted accounting principles. Certain capital accounts in the financial statements are periodically adjusted for permanent differences in order to reflect their tax character. These adjustments have no impact on net assets or net asset value per share. Temporary differences which arise from recognizing certain items of income, expense, gain or loss in different periods for financial statement and tax purposes will reverse at some time in the future.
Book/tax differences primarily relate to wash sale loss deferrals.
The tax character of distributions declared to shareholders for the last two fiscal years is as follows:
| | | | | | | | |
| | | Year ended
12/31/19 | | | Year ended
12/31/18 | |
| Ordinary income (including any short-term capital gains) | | | $47,170,114 | | | | $25,836,100 | |
| Long-term capital gains | | | 92,955,347 | | | | 76,565,293 | |
| Total distributions | | | $140,125,461 | | | | $102,401,393 | |
The federal tax cost and the tax basis components of distributable earnings were as follows:
| | | | |
| As of 12/31/19 | | | | |
| |
| Cost of investments | | | $639,009,382 | |
| Gross appreciation | | | 218,134,900 | |
| Gross depreciation | | | (30,835,040 | ) |
| Net unrealized appreciation (depreciation) | | | $187,299,860 | |
| |
| Undistributed ordinary income | | | 24,422,627 | |
| Undistributed long-term capital gain | | | 56,870,869 | |
| Other temporary differences | | | 1,523 | |
Multiple Classes of Shares of Beneficial Interest– The fund offers multiple classes of shares, which differ in their respective distribution and/or service fees. The fund’s income, realized and unrealized gain (loss), and common expenses are allocated to shareholders based on the daily net assets of each class. Dividends are declared separately for each class. Differences in per share dividend rates are generally due to differences in separate class expenses. The fund’s distributions declared to shareholders as reported in the Statements of Changes in Net Assets are presented by class as follows:
| | | | | | | | |
| | |
| | | Year ended
12/31/19 | | | Year ended
12/31/18 | |
| Initial Class | | | $57,060,289 | | | | $41,425,844 | |
| Service Class | | | 83,065,172 | | | | 60,975,549 | |
| Total | | | $140,125,461 | | | | $102,401,393 | |
| (3) | | Transactions with Affiliates |
Investment Adviser– The fund has an investment advisory agreement with MFS to provide overall investment management and related administrative services and facilities to the fund. The management fee is computed daily and paid monthly at the following annual rates based on the fund’s average daily net assets:
| | | | |
| Up to $1 billion | | | 0.90% | |
| In excess of $1 billion | | | 0.80% | |
18
MFS New Discovery Series
Notes to Financial Statements – continued
MFS has agreed in writing to reduce its management fee by a specified amount if certain MFS mutual fund assets exceed thresholds agreed to by MFS and the fund’s Board of Trustees. For the year ended December 31, 2019, this management fee reduction amounted to $72,757, which is included in the reduction of total expenses in the Statement of Operations. The management fee incurred for the year ended December 31, 2019 was equivalent to an annual effective rate of 0.89% of the fund’s average daily net assets.
The investment adviser has agreed in writing to pay a portion of the fund’s total annual operating expenses, excluding interest, taxes, extraordinary expenses, brokerage and transaction costs, and investment-related expenses, such that total annual operating expenses do not exceed 0.94% of average daily net assets for the Initial Class shares and 1.19% of average daily net assets for the Service Class shares. This written agreement will continue until modified by the fund’s Board of Trustees, but such agreement will continue at least until April 30, 2021. For the year ended December 31, 2019, this reduction amounted to $21,115, which is included in the reduction of total expenses in the Statement of Operations.
Distributor– MFS Fund Distributors, Inc. (MFD), a wholly-owned subsidiary of MFS, is the distributor of shares of the fund. The Trustees have adopted a distribution plan for the Service Class shares pursuant to Rule12b-1 under the Investment Company Act of 1940.
The fund’s distribution plan provides that the fund will pay MFD distribution and/or service fees equal to 0.25% per annum of its average daily net assets attributable to Service Class shares as partial consideration for services performed and expenses incurred by MFD and financial intermediaries (including participating insurance companies that invest in the fund to fund variable annuity and variable life insurance contracts, sponsors of qualified retirement and pension plans that invest in the fund, and affiliates of these participating insurance companies and plan sponsors) in connection with the sale and distribution of the Service Class shares. MFD may subsequently pay all, or a portion, of the distribution and/or service fees to financial intermediaries.
Shareholder Servicing Agent– MFS Service Center, Inc. (MFSC), a wholly-owned subsidiary of MFS, receives a fee from the fund for its services as shareholder servicing agent. For the year ended December 31, 2019, the fee was $19,655, which equated to 0.0026% annually of the fund’s average daily net assets. MFSC also receives payment from the fund forout-of-pocket expenses paid by MFSC on behalf of the fund. For the year ended December 31, 2019, these costs amounted to $3,210.
Administrator– MFS provides certain financial, legal, shareholder communications, compliance, and other administrative services to the fund. Under an administrative services agreement, the fund reimburses MFS the costs incurred to provide these services. The fund is charged an annual fixed amount of $17,500 plus a fee based on average daily net assets. The administrative services fee incurred for the year ended December 31, 2019 was equivalent to an annual effective rate of 0.0148% of the fund’s average daily net assets.
Trustees’ and Officers’ Compensation– The fund pays compensation to independent Trustees in the form of a retainer, attendance fees, and additional compensation to Board and Committee chairpersons. The fund does not pay compensation directly to Trustees or officers of the fund who are also officers of the investment adviser, all of whom receive remuneration from MFS for their services to the fund. Certain officers and Trustees of the fund are officers or directors of MFS, MFD, and MFSC.
Other– This fund and certain other funds managed by MFS (the funds) had entered into a service agreement (the ISO Agreement) which provided for payment of fees solely by the funds to Tarantino LLC in return for the provision of services of an Independent Senior Officer (ISO) for the funds. Frank L. Tarantino served as the ISO and was an officer of the funds and the sole member of Tarantino LLC. Effective June 30, 2019, Mr. Tarantino retired from his position as ISO for the funds, and the ISO Agreement was terminated. For the year ended December 31, 2019, the fee paid by the fund under this agreement was $858 and is included in “Miscellaneous” expense in the Statement of Operations. MFS had agreed to bear all expenses associated with office space, other administrative support, and supplies provided to the ISO.
The fund invests in the MFS Institutional Money Market Portfolio which is managed by MFS and seeks current income consistent with preservation of capital and liquidity. This money market fund does not pay a management fee to MFS.
The fund is permitted to engage in purchase and sale transactions with funds and accounts for which MFS serves as investment adviser orsub-adviser (“cross-trades”) pursuant to a policy adopted by the Board of Trustees. This policy has been designed to ensure that cross-trades conducted by the fund comply with Rule17a-7 under the Investment Company Act of 1940. During the year ended December 31, 2019, the fund engaged in sale transactions pursuant to this policy, which amounted to $942,787. The sales transactions resulted in net realized gains (losses) of $(146,916).
The adviser has voluntarily undertaken to reimburse the fund from its own resources on a quarterly basis for the cost of investment research embedded in the cost of the fund’s securities trades. This agreement may be rescinded at any time. For the year ended December 31, 2019, this reimbursement amounted to $65,148, which is included in “Other” income in the Statement of Operations.
19
MFS New Discovery Series
Notes to Financial Statements – continued
For the year ended December 31, 2019, purchases and sales of investments, other than short-term obligations, aggregated $399,167,411 and $481,578,323, respectively.
| (5) | | Shares of Beneficial Interest |
The fund’s Declaration of Trust permits the Trustees to issue an unlimited number of full and fractional shares of beneficial interest. Transactions in fund shares were as follows:
| | | | | | | | | | | | | | | | |
| | | Year ended 12/31/19 | | | Year ended 12/31/18 | |
| | | | |
| | | Shares | | | Amount | | | Shares | | | Amount | |
| Shares sold | | | | | | | | | | | | | | | | |
Initial Class | | | 1,458,759 | | | | $29,581,160 | | | | 1,335,731 | | | | $28,577,256 | |
Service Class | | | 3,433,407 | | | | 62,530,706 | | | | 2,940,782 | | | | 57,380,560 | |
| | | 4,892,166 | | | | $92,111,866 | | | | 4,276,513 | | | | $85,957,816 | |
| | | | |
| Shares issued to shareholders in reinvestment of distributions | | | | | | | | | | | | | | | | |
Initial Class | | | 3,140,358 | | | | $57,060,289 | | | | 1,916,976 | | | | $41,425,844 | |
Service Class | | | 5,140,172 | | | | 83,065,172 | | | | 3,093,635 | | | | 60,975,549 | |
| | | 8,280,530 | | | | $140,125,461 | | | | 5,010,611 | | | | $102,401,393 | |
| | | | |
| Shares reacquired | | | | | | | | | | | | | | | | |
Initial Class | | | (3,255,470 | ) | | | $(67,473,742 | ) | | | (3,444,747 | ) | | | $(72,836,695 | ) |
Service Class | | | (4,923,843 | ) | | | (91,929,496 | ) | | | (6,791,905 | ) | | | (128,638,619 | ) |
| | | (8,179,313 | ) | | | $(159,403,238 | ) | | | (10,236,652 | ) | | | $(201,475,314 | ) |
| | | | |
| Net change | | | | | | | | | | | | | | | | |
Initial Class | | | 1,343,647 | | | | $19,167,707 | | | | (192,040 | ) | | | $(2,833,595 | ) |
Service Class | | | 3,649,736 | | | | 53,666,382 | | | | (757,488 | ) | | | (10,282,510 | ) |
| | | 4,993,383 | | | | $72,834,089 | | | | (949,528 | ) | | | $(13,116,105 | ) |
The fund is one of several mutual funds in which certain MFS funds may invest. The MFS funds do not invest in the underlying funds for the purpose of exercising management or control. At the end of the period, the MFS Moderate Allocation Portfolio was the owner of record of approximately 3% of the value of outstanding voting shares of the fund. In addition, the MFS Growth Allocation Portfolio and the MFS Conservative Allocation Portfolio were the owners of record of less than 1% of the value of outstanding voting shares of the fund.
The fund and certain other funds managed by MFS participate in a $1.25 billion unsecured committed line of credit, subject to a $1 billion sublimit, provided by a syndicate of banks under a credit agreement. Borrowings may be made for temporary financing needs. Interest is charged to each fund, based on its borrowings, generally at a rate equal to the highest of one month LIBOR, the Federal Funds Effective Rate and the Overnight Bank Funding Rate, plus an agreed upon spread. A commitment fee, based on the average daily, unused portion of the committed line of credit, is allocated among the participating funds. In addition, the fund and other funds managed by MFS have established unsecured uncommitted borrowing arrangements with certain banks for temporary financing needs. Interest is charged to each fund, based on its borrowings, at rates equal to customary reference rates plus an agreed upon spread. For the year ended December 31, 2019, the fund’s commitment fee and interest expense were $4,184 and $0, respectively, and are included in “Miscellaneous” expense in the Statement of Operations.
| (7) | | Investments in Affiliated Issuers |
An affiliated issuer may be considered one in which the fund owns 5% or more of the outstanding voting securities, or a company which is under common control. For the purposes of this report, the following were affiliated issuers:
| | | | | | | | | | | | | | | | | | | | | | | | |
| Affiliated Issuers | | Beginning
Value | | | Purchases | | | Sales
Proceeds | | | Realized
Gain
(Loss) | | | Change in
Unrealized
Appreciation or
Depreciation | | | Ending
Value | |
| MFS Institutional Money Market Portfolio | | | $7,829,160 | | | | $211,876,166 | | | | $198,940,299 | | | | $560 | | | | $(111 | ) | | | $20,765,476 | |
| | | | | | |
| Affiliated Issuers | | | | | | | | | | | | | | Dividend
Income | | | Capital Gain
Distributions | |
| MFS Institutional Money Market Portfolio | | | | | | | | | | | | | | | | | | | $273,941 | | | | $— | |
20
MFS New Discovery Series
REPORT OF INDEPENDENT REGISTERED PUBLIC ACCOUNTING FIRM
To the Board of Trustees of MFS Variable Insurance Trust and the Shareholders of MFS New Discovery Series:
Opinion on the Financial Statements and Financial Highlights
We have audited the accompanying statement of assets and liabilities of MFS New Discovery Series (the “Fund”), including the portfolio of investments, as of December 31, 2019, the related statement of operations for the year then ended, the statements of changes in net assets for each of the two years in the period then ended, the financial highlights for each of the five years in the period then ended, and the related notes. In our opinion, the financial statements and financial highlights present fairly, in all material respects, the financial position of the Fund as of December 31, 2019, and the results of its operations for the year then ended, the changes in its net assets for each of the two years in the period then ended, and the financial highlights for each of the five years in the period then ended, in conformity with accounting principles generally accepted in the United States of America.
Basis for Opinion
These financial statements and financial highlights are the responsibility of the Fund’s management. Our responsibility is to express an opinion on the Fund’s financial statements and financial highlights based on our audits. We are a public accounting firm registered with the Public Company Accounting Oversight Board (United States) (PCAOB) and are required to be independent with respect to the Fund in accordance with the U.S. federal securities laws and the applicable rules and regulations of the Securities and Exchange Commission and the PCAOB.
We conducted our audits in accordance with the standards of the PCAOB. Those standards require that we plan and perform the audit to obtain reasonable assurance about whether the financial statements and financial highlights are free of material misstatement, whether due to error or fraud. The Fund is not required to have, nor were we engaged to perform, an audit of its internal control over financial reporting. As part of our audits we are required to obtain an understanding of internal control over financial reporting but not for the purpose of expressing an opinion on the effectiveness of the Fund’s internal control over financial reporting. Accordingly, we express no such opinion.
Our audits included performing procedures to assess the risks of material misstatement of the financial statements and financial highlights, whether due to error or fraud, and performing procedures that respond to those risks. Such procedures included examining, on a test basis, evidence regarding the amounts and disclosures in the financial statements and financial highlights. Our audits also included evaluating the accounting principles used and significant estimates made by management, as well as evaluating the overall presentation of the financial statements and financial highlights. Our procedures included confirmation of securities owned as of December 31, 2019, by correspondence with the custodian and brokers; when replies were not received from brokers, we performed other auditing procedures. We believe that our audits provide a reasonable basis for our opinion.
DELOITTE & TOUCHE LLP
Boston, Massachusetts
February 14, 2020
We have served as the auditor of one or more of the MFS investment companies since 1924.
21
MFS New Discovery Series
TRUSTEES AND OFFICERS – IDENTIFICATION AND BACKGROUND
The Trustees and Officers of the Trust, as of February 1, 2020, are listed below, together with their principal occupations during the past five years. (Their titles may have varied during that period.) The address of each Trustee and Officer is 111 Huntington Avenue, Boston, Massachusetts 02199-7618.
| | | | | | | | | | |
Name, Age | | Position(s)
Held with Fund | | Trustee/Officer
Since (h) | | Number of MFS Funds
overseen by the
Trustee | | Principal Occupations
During the Past Five Years | | Other Directorships During the Past Five Years (j) |
| INTERESTED TRUSTEES |
Robert J. Manning (k)
(age 56) | | Trustee | | February 2004 | | 133 | | Massachusetts Financial Services Company, Executive Chairman (since January 2017); Director; Chairman of the Board; Chief Executive Officer (until 2015);Co-Chief Executive Officer(2015-2016) | | N/A |
| | | | | |
Robin A. Stelmach (k) (age 58) | | Trustee | | January 2014 | | 133 | | Massachusetts Financial Services Company, Vice Chair (since January 2017); Chief Operating Officer and Executive Vice President (until January 2017) | | N/A |
|
| INDEPENDENT TRUSTEES |
John P. Kavanaugh (age 65) | | Trustee and Chair of Trustees | | January 2009 | | 133 | | Private investor | | N/A |
| | | | | |
Steven E. Buller (age 68) | | Trustee | | February 2014 | | 133 | | Financial Accounting Standards Advisory Council, Chairman(2014-2015); Public Company Accounting Oversight Board, Standing Advisory Group, Member (until 2014); BlackRock, Inc. (investment management), Managing Director (until 2014), BlackRock Finco UK (investment management), Director (until 2014) | | N/A |
| | | | | |
John A. Caroselli (age 65) | | Trustee | | March 2017 | | 133 | | JC Global Advisors, LLC (management consulting), President (since 2015); First Capital Corporation (commercial finance), Executive Vice President (until 2015) | | N/A |
| | | | | |
Maureen R. Goldfarb (age 64) | | Trustee | | January 2009 | | 133 | | Private investor | | N/A |
| | | | | |
Peter D. Jones
(age 64) | | Trustee | | January 2019 | | 133 | | Franklin Templeton Distributors, Inc. (investment management), President (until 2015); Franklin Templeton Institutional, LLC (investment management), Chairman (until 2015) | | N/A |
| | | | | |
James W. Kilman, Jr.
(age 58) | | Trustee | | January 2019 | | 133 | | Burford Capital Limited (finance and investment management), Chief Financial Officer (since 2019); KielStrand Capital LLC (family office), Chief Executive Officer (since 2016); Morgan Stanley & Co. (financial services), Vice Chairman of Investment Banking,Co-Head of Diversified Financials Coverage – Financial Institutions Investment Banking Group (until 2016) | | Alpha-En Corporation, Director (2016-2019) |
22
MFS New Discovery Series
Trustees and Officers – continued
| | | | | | | | | | |
Name, Age | | Position(s)
Held with Fund | | Trustee/Officer
Since (h) | | Number of MFS Funds
overseen by the
Trustee | | Principal Occupations
During the Past Five Years | | Other Directorships During the Past Five Years (j) |
Clarence Otis, Jr. (age 63) | | Trustee | | March 2017 | | 133 | | Darden Restaurants, Inc., Chief Executive Officer (until 2014) | | VF Corporation, Director; Verizon Communications, Inc., Director; The Travelers Companies, Director; Federal Reserve Bank of Atlanta, Director (until 2015) |
| | | | | |
Maryanne L. Roepke (age 63) | | Trustee | | May 2014 | | 133 | | American Century Investments (investment management), Senior Vice President and Chief Compliance Officer (until 2014) | | N/A |
| | | | | |
Laurie J. Thomsen
(age 62) | | Trustee | | March 2005 | | 133 | | Private investor | | The Travelers Companies, Director; Dycom Industries, Inc., Director (since 2015) |
| | | | | | | | |
Name, Age | | Position(s)
Held with Fund | | Trustee/Officer
Since (h) | | Number of
MFS Funds
for which the
Person is an
Officer | | Principal Occupations During the Past Five Years |
| OFFICERS | | | | | | |
Christopher R. Bohane (k)
(age 46) | | Assistant Secretary and Assistant Clerk | | July 2005 | | 133 | | Massachusetts Financial Services Company, Vice President and Assistant General Counsel |
| | | | |
Kino Clark (k) (age 51) | | Assistant Treasurer | | January 2012 | | 133 | | Massachusetts Financial Services Company, Vice President |
| | | | |
John W. Clark, Jr. (k) (age 52) | | Assistant Treasurer | | April 2017 | | 133 | | Massachusetts Financial Services Company, Vice President (since March 2017); Deutsche Bank (financial services), Department Head –Treasurer’s Office (until February 2017) |
| | | | |
Thomas H. Connors (k) (age 60) | | Assistant Secretary and Assistant Clerk | | September 2012 | | 133 | | Massachusetts Financial Services Company, Vice President and Senior Counsel |
| | | | |
David L. DiLorenzo (k)
(age 51) | | President | | July 2005 | | 133 | | Massachusetts Financial Services Company, Senior Vice President |
| | | | |
Heidi W. Hardin (k) (age 52) | | Secretary and Clerk | | April 2017 | | 133 | | Massachusetts Financial Services Company, Executive Vice President and General Counsel (since March 2017); Harris Associates (investment management), General Counsel (from September 2015 to January 2017); Janus Capital Management LLC (investment management), Senior Vice President and General Counsel (until September 2015) |
| | | | |
Brian E. Langenfeld (k) (age 46) | | Assistant
Secretary and Assistant Clerk | | June 2006 | | 133 | | Massachusetts Financial Services Company, Vice President and Senior Counsel |
| | | | |
Amanda S. Mooradian (k) (age 40) | | Assistant
Secretary and Assistant Clerk | | September 2018 | | 133 | | Massachusetts Financial Services Company, Assistant Vice President and Counsel |
| | | | |
Susan A. Pereira (k)
(age 49) | | Assistant
Secretary and Assistant Clerk | | July 2005 | | 133 | | Massachusetts Financial Services Company, Vice President and Assistant General Counsel |
| | | | |
Kasey L. Phillips (k) (age 49) | | Assistant Treasurer | | September 2012 | | 133 | | Massachusetts Financial Services Company, Vice President |
| | | | |
Matthew A. Stowe (k) (age 45) | | Assistant Secretary and Assistant Clerk | | October 2014 | | 133 | | Massachusetts Financial Services Company, Vice President and Assistant General Counsel |
23
MFS New Discovery Series
Trustees and Officers – continued
| | | | | | | | |
Name, Age | | Position(s)
Held with Fund | | Trustee/Officer
Since (h) | | Number of
MFS Funds
for which the
Person is an
Officer | | Principal Occupations During the Past Five Years |
Martin J. Wolin (k) (age 52) | | Chief Compliance Officer | | July 2015 | | 133 | | Massachusetts Financial Services Company, Senior Vice President and Chief Compliance Officer (since July 2015); Mercer (financial service provider), Chief Risk and Compliance Officer, North America and Latin America (until June 2015) |
| | | | |
James O. Yost (k)
(age 59) | | Treasurer | | September 1990 | | 133 | | Massachusetts Financial Services Company, Senior Vice President |
| (h) | Date first appointed to serve as Trustee/officer of an MFS Fund. Each Trustee has served continuously since appointment unless indicated otherwise. For the period from December 15, 2004 until February 22, 2005, Mr. Manning served as Advisory Trustee. From January 2012 through December 2016, Messrs. DiLorenzo and Yost served as Treasurer and Deputy Treasurer of the Funds, respectively. |
| (j) | Directorships or trusteeships of companies required to report to the Securities and Exchange Commission (i.e., “public companies”). |
| (k) | “Interested person” of the Trust within the meaning of the Investment Company Act of 1940 (referred to as the 1940 Act), which is the principal federal law governing investment companies like the fund, as a result of a position with MFS. The address of MFS is 111 Huntington Avenue, Boston, Massachusetts 02199-7618. |
Each Trustee (other than Messrs. Jones and Kilman) has been elected by shareholders and each Trustee and Officer holds office until his or her successor is chosen and qualified or until his or her earlier death, resignation, retirement or removal. Messrs. Jones and Kilman became Trustees of the Funds on January 1, 2019. The Trust does not hold annual meetings for the purpose of electing Trustees, and Trustees are not elected for fixed terms. Under the terms of the Board’s retirement policy, an Independent Trustee shall retire at the end of the calendar year in which he or she reaches the earlier of 75 years of age or 15 years of service on the Board (or, in the case of any Independent Trustee who joined the Board prior to 2015, 20 years of service on the Board).
Messrs. Buller, Kilman and Otis and Ms. Roepke are members of the Trust’s Audit Committee.
Each of the Interested Trustees and certain Officers hold comparable officer positions with certain affiliates of MFS.
The Statement of Additional Information for a Fund includes further information about the Trustees and is available without charge upon request by calling1-800-225-2606.
| | |
Investment Adviser Massachusetts Financial Services Company 111 Huntington Avenue Boston, MA 02199-7618 | | Custodian State Street Bank and Trust Company 1 Lincoln Street Boston, MA 02111-2900 |
| |
Distributor MFS Fund Distributors, Inc. 111 Huntington Avenue Boston, MA 02199-7618 | | Independent Registered Public Accounting Firm Deloitte & Touche LLP 200 Berkeley Street Boston, MA 02116 |
| |
Portfolio Manager(s) Michael Grossman | | |
24
MFS New Discovery Series
BOARD REVIEW OF INVESTMENT ADVISORY AGREEMENT
MFS New Discovery Series
The Investment Company Act of 1940 requires that both the full Board of Trustees and a majority of the non-interested (“independent”) Trustees, voting separately, annually approve the continuation of the Fund’s investment advisory agreement with MFS. The Trustees consider matters bearing on the Fund and its advisory arrangements at their meetings throughout the year, including a review of performance data at each regular meeting. In addition, the independent Trustees met several times over the course of three months beginning in May and ending in July, 2019 (“contract review meetings”) for the specific purpose of considering whether to approve the continuation of the investment advisory agreement for the Fund and the other investment companies that the Board oversees (the “MFS Funds”). The independent Trustees were assisted in their evaluation of the Fund’s investment advisory agreement by independent legal counsel, from whom they received separate legal advice and with whom they met separately from MFS during various contract review meetings. The independent Trustees were also assisted in this process by the MFS Funds’ Independent Senior Officer, a senior officer appointed by and reporting to the independent Trustees.
In connection with their deliberations regarding the continuation of the investment advisory agreement, the Trustees, including the independent Trustees, considered such information and factors as they believed, in light of the legal advice furnished to them and their own business judgment, to be relevant. The investment advisory agreement for the Fund was considered separately, although the Trustees also took into account the common interests of all MFS Funds in their review. As described below, the Trustees considered the nature, quality, and extent of the various investment advisory, administrative, and shareholder services performed by MFS under the existing investment advisory agreement and other arrangements with the Fund.
In connection with their contract review meetings, the Trustees received and relied upon materials that included, among other items: (i) information provided by Broadridge Financial Solutions, Inc. (“Broadridge”), an independent third party, on the investment performance of the Fund for various time periods ended December 31, 2018 and the investment performance of a group of funds with substantially similar investment classifications/objectives (the “Broadridge performance universe”), (ii) information provided by Broadridge on the Fund’s advisory fees and other expenses and the advisory fees and other expenses of comparable funds identified by Broadridge as well as all other funds in the same investment classification/category (the “Broadridge expense group and universe”), (iii) information provided by MFS on the advisory fees of portfolios of other clients of MFS, including institutional separate accounts and other clients, (iv) information as to whether and to what extent applicable expense waivers, reimbursements or fee “breakpoints” are observed for the Fund, (v) information regarding MFS’ financial results and financial condition, including MFS’ and certain of its affiliates’ estimated profitability from services performed for the Fund and the MFS Funds as a whole, and compared to MFS’ institutional business, (vi) MFS’ views regarding the outlook for the mutual fund industry and the strategic business plans of MFS, (vii) descriptions of various functions performed by MFS for the Funds, such as compliance monitoring and portfolio trading practices, and (viii) information regarding the overall organization of MFS, including information about MFS’ senior management and other personnel providing investment advisory, administrative and other services to the Fund and the other MFS Funds. The comparative performance, fee and expense information prepared and provided by Broadridge was not independently verified and the independent Trustees did not independently verify any information provided to them by MFS.
The Trustees’ conclusion as to the continuation of the investment advisory agreement was based on a comprehensive consideration of all information provided to the Trustees and not the result of any single factor. Some of the factors that figured particularly in the Trustees’ deliberations are described below, although individual Trustees may have evaluated the information presented differently from one another, giving different weights to various factors. It is also important to recognize that the fee arrangements for the Fund and other MFS Funds are the result of years of review and discussion between the independent Trustees and MFS, that certain aspects of such arrangements may receive greater scrutiny in some years than in others, and that the Trustees’ conclusions may be based, in part, on their consideration of these same arrangements during the course of the year and in prior years.
Based on information provided by Broadridge and MFS, the Trustees reviewed the Fund’s total return investment performance as well as the Broadridge performance universe over various time periods. The Trustees placed particular emphasis on the total return performance of the Fund’s Initial Class shares in comparison to the performance of funds in its Broadridge performance universe over the five-year period ended December 31, 2018, which the Trustees believed was a long enough period to reflect differing market conditions. The total return performance of the Fund’s Initial Class shares was in the 4th quintile relative to the other funds in the universe for this five-year period (the 1st quintile being the best performers and the 5th quintile being the worst performers). The total return performance of the Fund’s Initial Class shares was in the 1st quintile for each of the one- and three-year periods ended December 31, 2018 relative to the Broadridge performance universe. Because of the passage of time, these performance results may differ from the performance results for more recent periods, including those shown elsewhere in this report.
In the course of their deliberations, the Trustees took into account information provided by MFS in connection with the contract review meetings, as well as during investment review meetings conducted with portfolio management personnel during the course of the year regarding the Fund’s performance. After reviewing these and related factors, the Trustees concluded, within the context of their overall conclusions regarding the investment advisory agreement, that they were satisfied with MFS’ responses and efforts relating to investment performance.
25
MFS New Discovery Series
Board Review of Investment Advisory Agreement – continued
In assessing the reasonableness of the Fund’s advisory fee, the Trustees considered, among other information, the Fund’s advisory fee and the total expense ratio of the Fund’s Initial Class shares as a percentage of average daily net assets and the advisory fee and total expense ratios of the Broadridge expense group based on information provided by Broadridge. The Trustees considered that MFS currently observes an expense limitation for the Fund, which may not be changed without the Trustees’ approval. The Trustees also considered that, according to the data provided by Broadridge (which takes into account any fee reductions or expense limitations that were in effect during the Fund’s last fiscal year), the Fund’s effective advisory fee rate and total expense ratio were each higher than the Broadridge expense group median.
The Trustees also considered the advisory fees charged by MFS to any institutional separate accounts advised by MFS (“separate accounts”) and unaffiliated investment companies for which MFS serves as subadviser (“subadvised funds”) that have comparable investment strategies to the Fund, if any. In comparing these fees, the Trustees considered information provided by MFS as to the generally broader scope of services provided by MFS to the Fund, as well as the more extensive regulatory burdens imposed on MFS in managing the Fund, in comparison to separate accounts and subadvised funds. The Trustees also considered the higher demands placed on MFS’ investment personnel and trading infrastructure as a result of the daily cash in-flows and out-flows of the Fund in comparison to separate accounts.
The Trustees also considered whether the Fund may benefit from any economies of scale in the management of the Fund in the event of growth in assets of the Fund and/or growth in assets of the MFS Funds as a whole. They noted that the Fund’s advisory fee rate schedule is subject to a contractual breakpoint that reduces the Fund’s advisory fee rate on average daily net assets over $1 billion. The Trustees also noted that MFS has agreed in writing to waive a portion of the management fees of certain MFS Funds, including the Fund, if the total combined assets of certain funds within the MFS Funds’ complex increase above agreed upon thresholds (the “group fee waiver”), enabling the Fund’s shareholders to share in the benefits from any economies of scale at the complex level. The group fee waiver is reviewed and renewed annually between the Board and MFS. The Trustees concluded that the breakpoint and the group fee waiver were sufficient to allow the Fund to benefit from economies of scale as its assets and overall complex assets grow.
The Trustees also considered information prepared by MFS relating to MFS’ costs and profits with respect to the Fund, the MFS Funds considered as a group, and other investment companies and accounts advised by MFS, as well as MFS’ methodologies used to determine and allocate its costs to the MFS Funds, the Fund and other accounts and products for purposes of estimating profitability.
After reviewing these and other factors described herein, the Trustees concluded, within the context of their overall conclusions regarding the investment advisory agreement, that the advisory fees charged to the Fund represent reasonable compensation in light of the services being provided by MFS to the Fund.
In addition, the Trustees considered MFS’ resources and related efforts to continue to retain, attract and motivate capable personnel to serve the Fund. The Trustees also considered current and developing conditions in the financial services industry, including the presence of large and well-capitalized companies which are spending, and appear to be prepared to continue to spend, substantial sums to engage personnel and to provide services to competing investment companies. In this regard, the Trustees also considered the financial resources of MFS and its ultimate parent, Sun Life Financial Inc. The Trustees also considered the advantages and possible disadvantages to the Fund of having an adviser that also serves other investment companies as well as other accounts.
The Trustees also considered the nature, quality, cost, and extent of administrative, transfer agency, and distribution services provided to the Fund by MFS and its affiliates under agreements and plans other than the investment advisory agreement, including any 12b-1 fees the Fund pays to MFS Fund Distributors, Inc., an affiliate of MFS. The Trustees also considered the nature, extent and quality of certain other services MFS performs or arranges for on the Fund’s behalf, which may include securities lending programs, directed expense payment programs, class action recovery programs, and MFS’ interaction with third-party service providers, principally custodians and sub-custodians. The Trustees concluded that the various non-advisory services provided by MFS and its affiliates on behalf of the Fund were satisfactory.
The Trustees considered so-called “fall-out benefits” to MFS such as reputational value derived from serving as investment manager to the MFS Funds. The Trustees also considered that, effective January 3, 2018, MFS had discontinued its historic practice of obtaining investment research from portfolio brokerage commissions paid by certain MFS Funds and would thereafter directly pay for or voluntarily reimburse a Fund, if applicable, for the costs of external research acquired through the use of the Fund’s portfolio brokerage commissions.
Based on their evaluation of factors that they deemed to be material, including those factors described above, the Board of Trustees, including the independent Trustees, concluded that the Fund’s investment advisory agreement with MFS should be continued for an additional one-year period, commencing August 1, 2019.
26
MFS New Discovery Series
PROXY VOTING POLICIES AND INFORMATION
MFS votes proxies on behalf of the fund pursuant to proxy voting policies and procedures that are available without charge, upon request, by calling 1-800-225-2606, by visitingmfs.com/proxyvoting, or by visiting the SEC’s Web site athttp://www.sec.gov.
Information regarding how the fund voted proxies relating to portfolio securities during the most recent twelve-month period ended June 30 is available by August 31 of each year without charge by visitingmfs.com/proxyvoting, or by visiting the SEC’s Web site athttp://www.sec.gov.
QUARTERLY PORTFOLIO DISCLOSURE
The fund files a complete schedule of portfolio holdings with the SEC for the first and third quarters of each fiscal year as an exhibit to its reports on Form N-PORT. The fund’s Form N-PORT reports are available on the SEC’s website athttp://www.sec.gov.A shareholder can obtain the portfolio holdings report for the first and third quarters of the fund’s fiscal year atmfs.com/vit1 by choosing the fund’s name and then selecting the “Resources” tab and clicking on “Prospectus and Reports”.
FURTHER INFORMATION
From time to time, MFS may post important information about the fund or the MFS funds on the MFS web site (mfs.com). This information is available at https://www.mfs.com/en-us/what-we-do/announcements.html or atmfs.com/vit1 by choosing the fund’s name.
INFORMATION ABOUT FUND CONTRACTS AND LEGAL CLAIMS
The fund has entered into contractual arrangements with an investment adviser, administrator, distributor, shareholder servicing agent, 529 program manager (if applicable), and custodian who each provide services to the fund. Unless expressly stated otherwise, shareholders are not parties to, or intended beneficiaries of these contractual arrangements, and these contractual arrangements are not intended to create any shareholder right to enforce them against the service providers or to seek any remedy under them against the service providers, either directly or on behalf of the fund.
Under the Trust’s By-Laws and Declaration of Trust, any claims asserted against or on behalf of the MFS Funds, including claims against Trustees and Officers, must be brought in state and federal courts located within the Commonwealth of Massachusetts.
FEDERAL TAX INFORMATION (unaudited)
The following information is provided pursuant to provisions of the Internal Revenue Code.
The fund designates $102,251,000 as capital gain dividends paid during the fiscal year.
For corporate shareholders, 4.08% of the ordinary income dividends paid during the fiscal year qualify for the corporate dividends received deduction.
27
rev. 3/16
| | | | |
| | | |
| FACTS | | WHAT DOES MFS DO WITH YOUR
PERSONAL INFORMATION? | |  |
| | |
| Why? | | Financial companies choose how they share your personal information. Federal law gives consumers the right to limit some but not all sharing. Federal law also requires us to tell you how we collect, share, and protect your personal information. Please read this notice carefully to understand what we do. |
| | |
| What? | | The types of personal information we collect and share depend on the product or service you have with us. This information can include: • Social Security number and account balances • Account transactions and transaction history • Checking account information and wire transfer instructions When you areno longer our customer, we continue to share your information as described in this notice. |
| | |
| How? | | All financial companies need to share customers’ personal information to run their everyday business. In the section below, we list the reasons financial companies can share their customers’ personal information; the reasons MFS chooses to share; and whether you can limit this sharing. |
| | | | |
Reasons we can share your
personal information | | Does MFS share? | | Can you limit this
sharing? |
For our everyday business purposes – such as to process your transactions, maintain your account(s), respond to court orders and legal investigations, or report to credit bureaus | | Yes | | No |
For our marketing purposes – to offer our products and services to you | | No | | We don’t share |
| For joint marketing with other financial companies | | No | | We don’t share |
For our affiliates’ everyday business purposes – information about your transactions and experiences | | No | | We don’t share |
For our affiliates’ everyday business purposes – information about your creditworthiness | | No | | We don’t share |
| For nonaffiliates to market to you | | No | | We don’t share |
| | |
| | |
| Questions? | | Call800-225-2606 or go tomfs.com. |
28
| | |
| Who we are |
| Who is providing this notice? | | MFS Funds, MFS Investment Management, MFS Institutional Advisors, Inc., and MFS Heritage Trust Company. |
| | |
| What we do |
| How does MFS protect my personal information? | | To protect your personal information from unauthorized access and use, we use security measures that comply with federal law. These measures include procedural, electronic, and physical safeguards for the protection of the personal information we collect about you. |
How does MFS
collect my personal information? | | We collect your personal information, for example, when you • open an account or provide account information • direct us to buy securities or direct us to sell your securities • make a wire transfer We also collect your personal information from others, such as credit bureaus, affiliates, or other companies. |
| Why can’t I limit all sharing? | | Federal law gives you the right to limit only • sharing for affiliates’ everyday business purposes – information about your creditworthiness • affiliates from using your information to market to you • sharing for nonaffiliates to market to you State laws and individual companies may give you additional rights to limit sharing. |
| | |
| Definitions |
| Affiliates | | Companies related by common ownership or control. They can be financial and nonfinancial companies. • MFS does not share personal information with affiliates, except for everyday business purposes as described on page one of this notice. |
| Nonaffiliates | | Companies not related by common ownership or control. They can be financial and nonfinancial companies. • MFS does not share with nonaffiliates so they can market to you. |
| Joint marketing | | A formal agreement between nonaffiliated financial companies that together market financial products or services to you. • MFS doesn’t jointly market. |
| | |
| Other important information |
| If you own an MFS product or receive an MFS service in the name of a third party such as a bank or broker-dealer, their privacy policy may apply to you instead of ours. |
29
Annual Report
December 31, 2019

MFS® Total Return Bond Series

MFS® Variable Insurance Trust
Beginning on January 1, 2021, as permitted by regulations adopted by the U.S. Securities and Exchange Commission, the insurance company that offers your contract may determine that it will no longer send you paper copies of the fund’s annual and semiannual shareholder reports unless you specifically request paper copies from the insurance company or from your financial intermediary. Instead, the shareholder reports will be made available on a Web site (insurancefunds.mfs.com or other Web site of which you will be notified), and the insurance company will notify you by mail each time a report is posted and provide you with a Web site link to access the report. Instructions for requesting paper copies will be provided by your insurance company or financial intermediary.
If you already elected to receive shareholder reports by email, you will not be affected by this change and you need not take any action. If your insurance company or financial intermediary offers electronic delivery, you may elect to receive shareholder reports and other communications from the insurance company or financial intermediary by email by following the instructions provided by the insurance company or financial intermediary.
Beginning on January 1, 2019, you may elect to receive all future reports in paper free of charge from the insurance company or financial intermediary. You can inform the insurance company or financial intermediary that you wish to continue receiving paper copies of your shareholder reports by contacting your insurance company or financial intermediary. Your election to receive reports in paper will apply to all funds held in your account with your insurance company or financial intermediary.
VFB-ANN
MFS® Total Return Bond Series
CONTENTS
The report is prepared for the general information of contract owners. It is authorized for distribution to prospective investors only when preceded or accompanied by a current prospectus.
NOT FDIC INSURED• MAY LOSE VALUE• NO BANK OR CREDIT UNION GUARANTEE• NOT A DEPOSIT• NOT INSURED BY ANY FEDERAL GOVERNMENT AGENCY OR NCUA/NCUSIF
MFS Total Return Bond Series
LETTER FROM THE EXECUTIVE CHAIR

Dear Contract Owners:
Slowing global growth, low inflation, and trade friction between the United States and China have been hallmarks of the past 12 months. After experiencing an uptick in market volatility in late 2018, markets steadied for most of 2019, thanks in large measure to the adoption of a dovish policy stance on the part of global central banks, focused on supporting economic growth. Negotiations aimed at a “phase one” trade deal between the U.S. and China bore fruit at the end of the period, boosting investor sentiment, while signs of stability emerging from the global manufacturing sector also lifted spirits. Uncertainty over Brexit, along with the ripple effects from the trade conflict, hampered business confidence and investment in the United Kingdom and Europe for much of the period, though investors expect greater clarity regarding Brexit as a result of December’s general election. The pro-Brexit Conservative Party won the election by a comfortable margin and set the stage for the U.K.’s departure from the EU at the end of January.
Markets expect the longest economic expansion in U.S. history will continue, albeit at a slower pace, as trade tensions recede. In an effort to prolong the expansion, the U.S. Federal Reserve lowered interest rates three times between July and October and the European Central Bank loosened policy in September. While the global monetary policy backdrop remains quite accommodative, signs of easing trade tensions and fading global recession fears led to improved market sentiment in late 2019 as investors grew less risk averse. In early 2020, an outbreak of coronavirus emanating from China reintroduced global growth fears, causing an uptick in volatility.
Here at MFS®, we aim to help our clients navigate the growing complexity of the markets and world economies. Our long-term investment philosophy and commitment to the responsible allocation of capital allow us to tune out the noise and uncover what we believe are the best, most durable investment opportunities in the market. Through our powerful global investment platform, we combine collective expertise, thoughtful risk management and long-term discipline to create sustainable value for investors.
Respectfully,

Robert J. Manning
Executive Chair
MFS Investment Management
February 14, 2020
The opinions expressed in this letter are subject to change and may not be relied upon for investment advice. No forecasts can be guaranteed.
1
MFS Total Return Bond Series
PORTFOLIO COMPOSITION
Portfolio structure at value (v)
| | | | |
| Fixed income sectors (i) | | | | |
| Investment Grade Corporates | | | 36.0% | |
| Mortgage-Backed Securities | | | 28.7% | |
| Commercial Mortgage-Backed Securities | | | 14.4% | |
| U.S. Treasury Securities | | | 12.9% | |
| High Yield Corporates | | | 5.9% | |
| Collateralized Debt Obligations | | | 5.7% | |
| Asset-Backed Securities | | | 2.9% | |
| Municipal Bonds | | | 2.8% | |
| Emerging Markets Bonds | | | 1.8% | |
| U.S. Government Agencies | | | 1.7% | |
| Residential Mortgage-Backed Securities | | | 0.5% | |
| Non-U.S. Government Bonds | | | 0.2% | |
|
| Composition including fixed income credit quality (a)(i) | |
| AAA | | | 14.9% | |
| AA | | | 4.9% | |
| A | | | 12.8% | |
| BBB | | | 26.5% | |
| BB | | | 5.4% | |
| B | | | 1.1% | |
| D (o) | | | 0.0% | |
| U.S. Government | | | 1.9% | |
| Federal Agencies | | | 30.4% | |
| Not Rated | | | 15.6% | |
| Cash & Cash Equivalents | | | (2.0)% | |
| Other | | | (11.5)% | |
Portfolio structure reflecting equivalent exposure of derivative positions (i)
| | | | |
| Portfolio facts (i) | | | | |
| Average Duration (d) | | | 5.8 | |
| Average Effective Maturity (m) | | | 6.9 yrs. | |
2
MFS Total Return Bond Series
Portfolio Composition – continued
| (a) | | For all securities other than those specifically described below, ratings are assigned to underlying securities utilizing ratings from Moody’s, Fitch, and Standard & Poor’s rating agencies and applying the following hierarchy: If all three agencies provide a rating, the middle rating (after dropping the highest and lowest ratings) is assigned; if two of the three agencies rate a security, the lower of the two is assigned. Ratings are shown in the S&P and Fitch scale (e.g., AAA). Securities rated BBB or higher are considered investment grade. All ratings are subject to change. U.S. Government includes securities issued by the U.S. Department of the Treasury. Federal Agencies includes rated and unrated U.S. Agency fixed-income securities, U.S. Agency mortgage-backed securities, and collateralized mortgage obligations of U.S. Agency mortgage-backed securities. Not Rated includes fixed income securities and fixed income derivatives, which have not been rated by any rating agency. The fund may or may not have held all of these instruments on this date. The fund is not rated by these agencies. |
| (d) | | Duration is a measure of how much a bond’s price is likely to fluctuate with general changes in interest rates, e.g., if rates rise 1.00%, a bond with a5-year duration is likely to lose about 5.00% of its value due to the interest rate move. |
| (i) | | For purposes of this presentation, the components include the value of securities, and reflect the impact of the equivalent exposure of derivative positions, if any. These amounts may be negative from time to time. Equivalent exposure is a calculated amount that translates the derivative position into a reasonable approximation of the amount of the underlying asset that the portfolio would have to hold at a given point in time to have the same price sensitivity that results from the portfolio’s ownership of the derivative contract. When dealing with derivatives, equivalent exposure is a more representative measure of the potential impact of a position on portfolio performance than value. The bond component will include any accrued interest amounts. |
| (m) | | In determining each instrument’s effective maturity for purposes of calculating the fund’s dollar-weighted average effective maturity, MFS uses the instrument’s stated maturity or, if applicable, an earlier date on which MFS believes it is probable that a maturity-shortening device (such as a put,pre-refunding or prepayment) will cause the instrument to be repaid. Such an earlier date can be substantially shorter than the instrument’s stated maturity. |
| (v) | | For purposes of this presentation, market value of fixed income and/or equity derivatives, if any, is included in Cash & Cash Equivalents. |
Where the fund holds convertible bonds, they are treated as part of the equity portion of the portfolio.
Cash & Cash Equivalents includes any cash, investments in money market funds, short-term securities, and other assets less liabilities. Please see the Statement of Assets and Liabilities for additional information related to the fund’s cash position and other assets and liabilities.
Other includes equivalent exposure from currency derivatives and/or any offsets to derivative positions and may be negative.
Percentages are based on net assets as of December 31, 2019.
The portfolio is actively managed and current holdings may be different.
3
MFS Total Return Bond Series
MANAGEMENT REVIEW
Summary of Results
For the twelve months ended December 31, 2019, Initial Class shares of the MFS Total Return Bond Series (fund) provided a total return of 10.21%, while Service Class shares of the fund provided a total return of 9.92%. These compare with a return of 8.72% over the same period for the fund’s benchmark, the Bloomberg Barclays U.S. Aggregate Bond Index.
Market Environment
Fading fears of a near-term global recession, the announcement of a partial trade deal between the United States and China and the decline in uncertainty over Brexit helped bolster market sentiment late in the period. Changes in market sentiment, largely driven by uncertainty over the outcome of trade negotiations between the US and China, had contributed to periodic bouts of volatility during the reporting period. The global economy decelerated, led by weakness in China and Europe, although the pace of the slowdown moderated late in the period amid nascent signs of stabilization in the manufacturing sector.
The deteriorating global growth backdrop, along with declining inflationary pressures, prompted the US Federal Reserve to adopt a more dovish posture beginning in early 2019, resulting in the first interest rate cut in over a decade at the end of July, followed by additional cuts in September and October. The Fed’s actions led to a sharp decline in long-term interest rates during the period’s second half, causing the inversion of portions of the US Treasury yield curve for a time. Amid an improvement in risk sentiment in Q4 2019 and indications of a bottoming in growth and a potential upturn in activity, the Fed indicated in October that further rate cuts were unlikely unless the outlook for the economy materially worsened.
Globally, central banks have tilted more dovish as well, with the European Central Bank unveiling a package of easing measures, which included putting overnight rates deeper into negative territory, restarting its bond-buying program and lengthening the term of cheap loans to banks to three years from two. The central banks of India and Australia are among those that have cut rates several times in recent months, although China has been more cautious in increasing liquidity as it keeps trying to deleverage its economy, cutting rates only marginally.
Emerging markets experienced considerable volatility through the end of 2018, as tighter global financial conditions exposed structural weakness in some countries. Those conditions improved in 2019 as the Fed became more dovish. Notwithstanding the periodic headwinds on market sentiment from significant trade friction between the US and China over much of the year, emerging market hard currency debt and local rates benefited from relatively cheap valuations at the beginning of the period and easier global monetary conditions. These factors, plus the fading of certain global risk factors mentioned above, hastened spread tightening in the latter part of the period. At the same time, idiosyncratic risks spiked in some countries (e.g., Argentina and Lebanon), contributing to increased dispersion in performance among sovereign assets.
Factors Affecting Performance
Relative to the Bloomberg Barclays U.S. Aggregate Bond Index, the fund’s underweight allocation to thetreasury sector, and its overweight exposure to both theindustrials andfinancial institutions sectors, contributed to performance. The fund’sout-of-benchmark allocation to “BB” rated (r) securities further bolstered relative results as this credit quality segment turned in strong performance during the reporting period. Favorable bond selection within “BBB” rated securities was another area of relative strength.
Conversely, the fund’sout-of-benchmark exposure toderivatives, particularly its position in10-Year US Treasury Note Futures, and an overweight allocation to theasset-backed securitiessector, held back relative performance.
Respectfully,
Portfolio Manager(s)
Alexander Mackey, Joshua Marston, and Robert Persons
Note to Shareholders: Effective December 31, 2019, Alexander Mackey was added as a Portfolio Manager of the Fund.
| (r) | Bonds rated “BBB”, “Baa”, or higher are considered investment grade; bonds rated “BB”, “Ba”, or below are considerednon-investment grade. The source for bond quality ratings is Moody’s Investors Service, Standard & Poor’s and Fitch, Inc. and are applied using the following hierarchy: If all three agencies provide a rating, the middle rating (after dropping the highest and lowest ratings) is assigned; if two of the three agencies rate a security, the lower of the two is assigned. Ratings are shown in the S&P and Fitch scale (e.g., AAA). For securities which are not rated by any of the three agencies, the security is considered Not Rated. |
The views expressed in this report are those of the portfolio manager(s) only through the end of the period of the report as stated on the cover and do not necessarily reflect the views of MFS or any other person in the MFS organization. These views are subject to change at any time based on market or other conditions, and MFS disclaims any responsibility to update such views. These views may not be relied upon as investment advice or an indication of trading intent on behalf of any MFS portfolio. References to specific securities are not recommendations of such securities, and may not be representative of any MFS portfolio’s current or future investments.
4
MFS Total Return Bond Series
PERFORMANCE SUMMARY THROUGH 12/31/19
The following chart illustrates the historical performance of the fund in comparison to its benchmark(s). Benchmarks are unmanaged and may not be invested in directly. Benchmark returns do not reflect any fees or expenses. The performance of other share classes will be greater than or less than that of the class depicted below. (See Notes to Performance Summary.)
Performance data shown represents past performance and is no guarantee of future results. Investment return and principal value fluctuate so your units, when sold, may be worth more or less than the original cost; current performance may be lower or higher than quoted. The performance shown does not reflect the deduction of taxes, if any, that a contract holder would pay on fund distributions or the redemption of contract units. The returns for the fund shown also do not reflect the deduction of expenses associated with variable products, such as mortality and expense risk charges, separate account charges, and sales charges imposed by the insurance company separate accounts. Such expenses would reduce the overall returns shown.
Growth of a Hypothetical $10,000 Investment
Total Returns through 12/31/19
Average annual total returns
| | | | | | | | | | | | |
| | | Share Class | | Class Inception Date | | 1-yr | | 5-yr | | 10-yr | | |
| | | Initial Class | | 10/24/95 | | 10.21% | | 3.42% | | 4.32% | | |
| | | Service Class | | 5/01/00 | | 9.92% | | 3.16% | | 4.06% | | |
| | | | |
| Comparative benchmark(s) | | | | | | | | |
| | | Bloomberg Barclays U.S. Aggregate Bond Index (f) | | 8.72% | | 3.05% | | 3.75% | | |
| (f) | Source: FactSet Research Systems Inc. |
Benchmark Definition(s)
Bloomberg Barclays U.S. Aggregate Bond Index – a market capitalization-weighted index that measures the performance of the U.S. investment-grade, fixed rate bond market, with index components for government and corporate securities, mortgage pass-through securities, and asset-backed securities with at least one year to final maturity. BLOOMBERG® is a trademark and service mark of Bloomberg Finance L.P. and its affiliates (collectively “Bloomberg”). BARCLAYS® is a trademark and service mark of Barclays Bank Plc (collectively with its affiliates, “Barclays”), used under license. Bloomberg or Bloomberg’s licensors, including Barclays, own all proprietary rights in the Bloomberg Barclays Indices. Neither Bloomberg nor Barclays approves or endorses this material, or guarantees the accuracy or completeness of any information herein, or makes any warranty, express or implied, as to the results to be obtained therefrom, and, to the maximum extent allowed by law, neither shall have any liability or responsibility for injury or damages arising in connection therewith.
It is not possible to invest directly in an index.
Notes to Performance Summary
Average annual total return represents the average annual change in value for each share class for the periods presented.
Performance results reflect any applicable expense subsidies and waivers in effect during the periods shown. Without such subsidies and waivers the fund’s performance results would be less favorable. Please see the prospectus and financial statements for complete details. All results are historical and assume the reinvestment of any dividends and capital gains distributions.
5
MFS Total Return Bond Series
Performance Summary – continued
Performance results do not include adjustments made for financial reporting purposes in accordance with U.S. generally accepted accounting principles and may differ from amounts reported in the financial highlights.
From time to time the fund may receive proceeds from litigation settlements, without which performance would be lower.
6
MFS Total Return Bond Series
EXPENSE TABLE
Fund Expenses Borne by the Contract Holders during the Period,
July 1, 2019 through December 31, 2019
As a contract holder of the fund, you incur ongoing costs, including management fees; distribution and/or service(12b-1) fees; and other fund expenses. This example is intended to help you understand your ongoing costs (in dollars) of investing in the fund and to compare these costs with the ongoing costs of investing in other mutual funds.
The example is based on an investment of $1,000 invested at the beginning of the period and held for the entire period July 1, 2019 through December 31, 2019.
Actual Expenses
The first line for each share class in the following table provides information about actual account values and actual expenses. You may use the information in this line, together with the amount you invested, to estimate the expenses that you paid over the period. Simply divide your account value by $1,000 (for example, an $8,600 account value divided by $1,000 = 8.6), then multiply the result by the number in the first line under the heading entitled “Expenses Paid During Period” to estimate the expenses you paid on your account during this period.
Hypothetical Example for Comparison Purposes
The second line for each share class in the following table provides information about hypothetical account values and hypothetical expenses based on the fund’s actual expense ratio and an assumed rate of return of 5% per year before expenses, which is not the fund’s actual return. The hypothetical account values and expenses may not be used to estimate the actual ending account balance or expenses you paid for the period. You may use this information to compare the ongoing costs of investing in the fund and other funds. To do so, compare this 5% hypothetical example with the 5% hypothetical examples that appear in the shareholder reports of the other funds.
Please note that the expenses shown in the table are meant to highlight the fund’s ongoing costs only and do not take into account the fees and expenses imposed under the variable contracts through which your investment in the fund is made. Therefore, the second line for each share class in the table is useful in comparing ongoing costs associated with an investment in vehicles (such as the fund) which fund benefits under variable annuity and variable life insurance contracts and to qualified pension and retirement plans only, and will not help you determine the relative total costs of investing in the fund through variable annuity and variable life insurance contracts. If the fees and expenses imposed under the variable contracts were included, your costs would have been higher.
| | | | | | | | | | | | | | | | | | |
| Share Class | | | | Annualized
Expense Ratio | | | Beginning
Account Value
7/01/19 | | | Ending Account Value
12/31/19 | | | Expenses Paid
During Period (p)
7/01/19-12/31/19 | |
| Initial Class | | Actual | | | 0.52% | | | | $1,000.00 | | | | $1,027.35 | | | | $2.66 | |
| | Hypothetical (h) | | | 0.52% | | | | $1,000.00 | | | | $1,022.58 | | | | $2.65 | |
| Service Class | | Actual | | | 0.77% | | | | $1,000.00 | | | | $1,026.52 | | | | $3.93 | |
| | Hypothetical (h) | | | 0.77% | | | | $1,000.00 | | | | $1,021.32 | | | | $3.92 | |
| (h) | 5% class return per year before expenses. |
| (p) | “Expenses Paid During Period” are equal to each class’s annualized expense ratio, as shown above, multiplied by the average account value over the period, multiplied by 184/365 (to reflect theone-half year period). |
7
MFS Total Return Bond Series
PORTFOLIO OF INVESTMENTS – 12/31/19
The Portfolio of Investments is a complete list of all securities owned by your fund. It is categorized by broad-based asset classes.
| | | | | | | | |
| | |
| Issuer | | Shares/Par | | | Value ($) | |
| BONDS – 101.3% | | | | | | | | |
| Aerospace – 0.3% | | | | | | | | |
| TransDigm, Inc., 6.5%, 7/15/2024 | | $ | 5,985,000 | | | $ | 6,172,630 | |
| | | | | | | | |
| Asset-Backed & Securitized – 23.5% | | | | | |
| Allegro CLO Ltd.,2014-1RA, “A2”, FLR, 3.566% (LIBOR - 3mo. + 1.6%), 10/21/2028 (n) | | $ | 5,554,267 | | | $ | 5,524,124 | |
| ALM Loan Funding, CLO,2015-12A, “A1R2”, FLR, 2.89% (LIBOR - 3mo. + 0.89%), 4/16/2027 (n) | | | 5,620,304 | | | | 5,618,191 | |
| ALM Loan Funding, CLO,2015-16A, “AAR2”, FLR, 2.901% (LIBOR - 3mo. + 0.90%), 7/15/2027 (n) | | | 2,000,000 | | | | 1,995,946 | |
| ALM V Ltd.,2012-5A, “A2R3”, FLR, 3.253% (LIBOR - 3mo. + 1.25%), 10/18/2027 (n) | | | 4,010,000 | | | | 3,990,748 | |
| ALM V Ltd.,2012-5A, “BR3”, FLR, 3.653% (LIBOR - 3mo. + 1.7%), 10/18/2027 (n) | | | 1,750,000 | | | | 1,728,125 | |
| Arbor Realty CLO Ltd.,2017-FL2, “C”, FLR, 4.089% (LIBOR - 1mo. + 2.35%), 8/15/2027 (n) | | | 1,494,500 | | | | 1,495,876 | |
| Arbor Realty Trust, Inc., CLO,2018-FL1, “A”, FLR, 2.889% (LIBOR - 1mo. + 1.15%), 6/15/2028 (n) | | | 7,720,000 | | | | 7,724,823 | |
| Arbor Realty Trust, Inc., CLO,2019-FL1, “D”, FLR, 4.24% (LIBOR - 1mo. + 2.5%), 5/15/2037 (n) | | | 6,995,000 | | | | 6,999,372 | |
| AREIT CRE Trust, 2019-CRE3, “A”, FLR, 2.76% (LIBOR - 1mo. + 1.02%), 9/14/2036 (n) | | | 1,230,000 | | | | 1,229,106 | |
| AREIT CRE Trust, 2019-CRE3, “B”, FLR, 3.29% (LIBOR - 1mo. + 1.55%), 9/14/2036 (n) | | | 2,569,500 | | | | 2,569,474 | |
| AREIT CRE Trust, 2019-CRE3, “C”, FLR, 3.639% (LIBOR - 1mo. + 1.9%), 9/14/2036 (n) | | | 2,242,500 | | | | 2,242,475 | |
| AREIT CRE Trust, 2019-CRE3, “D”, FLR, 4.39% (LIBOR - 1mo. + 2.65%), 9/14/2036 (n) | | | 1,849,000 | | | | 1,848,541 | |
| Atrium XII Corp.,2012-A, “B1R”, FLR, 3.303% (LIBOR - 3mo. + 1.35%), 4/22/2027 (n) | | | 7,430,000 | | | | 7,392,657 | |
| Bancorp Commercial Mortgage Trust, 2017-CRE2, “B”, FLR, 3.339% (LIBOR - 1mo. + 1.6%), 8/15/2032 (n) | | | 2,312,000 | | | | 2,323,068 | |
| Bancorp Commercial Mortgage Trust, 2018-CRE3, “A”, FLR, 2.59% (LIBOR -1mo. + 0.85%), 1/15/2033 (n) | | | 3,759,175 | | | | 3,755,757 | |
| Bancorp Commercial Mortgage Trust, 2018-CRE3, “AS”, FLR, 2.989% (LIBOR - 1mo. + 1.25%), 1/15/2033 (n) | | | 3,929,321 | | | | 3,933,910 | |
| Bancorp Commercial Mortgage Trust, 2018-CRE3, “D”, FLR, 4.44% (LIBOR - 1mo. + 2.7%), 1/15/2033 (n) | | | 1,668,091 | | | | 1,682,662 | |
| | | | | | | | |
| | |
Issuer | | Shares/Par | | | Value ($) | |
| BONDS – continued | | | | | |
| Asset-Backed & Securitized – continued | | | | | |
| Bancorp Commercial Mortgage Trust, 2018-CRE4, “AS”, FLR, 2.839% (LIBOR - 1mo. + 1.1%), 9/15/2035 (n) | | $ | 2,255,000 | | | $ | 2,257,366 | |
| Bancorp Commercial Mortgage Trust, 2018-CRE4, “B”, FLR, 2.99% (LIBOR - 1mo. + 1.25%), 9/15/2035 (n) | | | 2,030,000 | | | | 2,032,123 | |
| Bancorp Commercial Mortgage Trust, 2018-CRE4, “D”, FLR, 3.839% (LIBOR - 1mo. + 2.1%), 9/15/2035 (n) | | | 1,465,000 | | | | 1,466,680 | |
| Bancorp Commercial Mortgage Trust, 2019-CRE5, “A”, FLR, 2.74% (LIBOR -1mo. + 1%), 3/15/2036 (n) | | | 4,444,860 | | | | 4,439,273 | |
| Bancorp Commercial Mortgage Trust, 2019-CRE5, “AS”, FLR, 3.09% (LIBOR - 1mo. + 1.35%), 3/15/2036 (n) | | | 1,394,437 | | | | 1,394,434 | |
| Bancorp Commercial Mortgage Trust, 2019-CRE6, “B”, FLR, 3.315% (LIBOR - 1mo. + 1.55%), 9/15/2036 (n) | | | 8,289,572 | | | | 8,289,555 | |
| Barclays Commercial Mortgage Securities LLC,2019-C5, “A4”, 3.063%, 11/15/2052 | | | 2,755,000 | | | | 2,841,718 | |
| Bayview Commercial Asset Trust, 0%, 12/25/2036 (i)(n) | | | 111,313 | | | | 11 | |
| Bayview Financial Revolving Mortgage Loan Trust, FLR, 3.404% (LIBOR - 1mo. + 1.6%), 12/28/2040 (n) | | | 61,463 | | | | 61,696 | |
| BDS Ltd.,2018-FL2, “A”, FLR, 2.687% (LIBOR - 1mo. + 0.95%), 8/15/2035 (n) | | | 3,421,384 | | | | 3,419,263 | |
| BDS Ltd.,2019-FL4, “A”, FLR, 2.839% (LIBOR - 1mo. + 1.10%), 8/15/2036 (n) | | | 5,165,000 | | | | 5,155,254 | |
| Bear Stearns Cos., Inc., “A2”, FLR, 2.242% (LIBOR - 1mo. + 0.45%), 12/25/2042 | | | 379,983 | | | | 378,128 | |
| Benchmark Mortgage Trust,2019-B10, “A4”, 3.717%, 3/15/2062 | | | 9,521,000 | | | | 10,344,987 | |
| BSPRT Ltd.,2019-FL5, “C”, FLR, 3.765% (LIBOR - 1mo. + 2%), 5/15/2029 (n) | | | 3,295,000 | | | | 3,282,785 | |
| Business Jet Securities LLC,2018-1, “A”, 4.335%, 2/15/2033 (n) | | | 6,544,123 | | | | 6,614,221 | |
| Cantor Commercial Real Estate,2019-CF2, “A5”, 2.874%, 11/15/2052 | | | 6,645,635 | | | | 6,728,254 | |
| Chesapeake Funding II LLC,2017-4A, “A1”, 2.12%, 11/15/2029 (n) | | | 3,205,177 | | | | 3,205,888 | |
| Chesapeake Funding II LLC,2018-1A, “A1”, 3.04%, 4/15/2030 (n) | | | 3,723,986 | | | | 3,765,671 | |
| Citigroup Commercial Mortgage Trust, 2014-GC25, “A4”, 3.635%, 10/10/2047 | | | 3,128,793 | | | | 3,295,496 | |
| Citigroup Commercial Mortgage Trust,2016-P6, “A5”, 3.72%, 12/10/2049 | | | 1,754,000 | | | | 1,886,066 | |
| Citigroup Commercial Mortgage Trust,2019-C7, “A4”, 3.102%, 12/15/2072 | | | 790,000 | | | | 816,180 | |
| Commercial Mortgage Pass-Through Certificates, 2014-LC19 “A4”, 3.183%, 2/10/2048 | | | 7,671,000 | | | | 7,949,994 | |
8
MFS Total Return Bond Series
Portfolio of Investments – continued
| | | | | | | | |
| | |
| Issuer | | Shares/Par | | | Value ($) | |
| BONDS – continued | | | | | |
| Asset-Backed & Securitized – continued | | | | | |
| Commercial Mortgage Pass-Through Certificates, 2019-BN17, “A4”, 3.714%, 4/15/2052 | | $ | 5,904,000 | | | $ | 6,409,489 | |
| Commercial Mortgage Pass-Through Certificates, 2019-BN24, “A3”, 2.96%, 11/15/2062 | | | 864,286 | | | | 885,324 | |
| Commercial Mortgage Trust,2012-CR2, “A4”, 3.147%, 8/15/2045 | | | 3,950,000 | | | | 4,033,245 | |
| Commercial Mortgage Trust, 2015-LC21, “A4”, 3.708%, 7/10/2048 | | | 10,000,000 | | | | 10,621,564 | |
| Commercial Mortgage Trust,2015-PC1, “A5”, 3.902%, 7/10/2050 | | | 2,888,848 | | | | 3,074,173 | |
| Commercial Mortgage Trust, 2017-COR2, “A3”, 3.51%, 9/10/2050 | | | 12,940,000 | | | | 13,700,066 | |
CPS Auto Trust,2019-B, “B”, 3.09%, 4/17/2023 (n) | | | 2,302,000 | | | | 2,325,547 | |
| CSAIL Commercial Mortgage Trust,2015-C2, “A4”, 3.504%, 6/15/2057 | | | 2,695,346 | | | | 2,816,687 | |
| Cutwater Ltd.,2014-1A, “BR”, FLR, 4.401% (LIBOR - 3mo. + 2.4%), 7/15/2026 (n) | | | 3,135,000 | | | | 3,124,118 | |
| Cutwater Ltd.,2015-IA, “BR”, FLR, 3.8% (LIBOR - 3mo. + 1.8%), 1/15/2029 (n) | | | 10,770,000 | | | | 10,715,041 | |
| Drive Auto Receivables Trust,2017-1, “C”, 2.84%, 4/15/2022 | | | 140,011 | | | | 140,045 | |
| DT Auto Owner Trust,2019-2A, “C”, 3.18%, 2/18/2025 (n) | | | 3,392,000 | | | | 3,432,908 | |
| Exantas Capital Corp. CLO Ltd.,2018-RS06, “B”, FLR, 2.887% (LIBOR - 1mo. + 1.15%), 6/15/2035 (n) | | | 2,090,000 | | | | 2,083,469 | |
| Exantas Capital Corp. CLO Ltd.,2019-RS07, “B”, FLR, 3.437% (LIBOR - 1mo. + 1.7%), 4/15/2036 (n) | | | 2,753,500 | | | | 2,759,633 | |
| Figueroa CLO Ltd.,2013-2A, “BRR”, FLR, 3.758% (LIBOR - 3mo. + 1.85%), 6/20/2027 (n) | | | 1,145,000 | | | | 1,140,509 | |
| Flatiron CLO Ltd.,2015-1A, “BR”, FLR, 3.4% (LIBOR - 3mo. + 1.4%), 4/15/2027 (n) | | | 10,675,817 | | | | 10,675,927 | |
| Flatiron CLO Ltd.,2015-1A, “CR”, FLR, 3.901% (LIBOR - 3mo. + 1.9%), 4/15/2027 (n) | | | 1,970,000 | | | | 1,962,400 | |
| Fort CRE LLC,2018-1A, “A1”, FLR, 3.135% (LIBOR - 1mo. + 1.35%), 11/16/2035 (n) | | | 6,199,500 | | | | 6,199,488 | |
| Galaxy CLO Ltd.,2018-29A, “A”, FLR, 2.7% (LIBOR - 3mo. + 0.79%), 11/15/2026 (n) | | | 6,090,295 | | | | 6,087,171 | |
| Galaxy CLO Ltd.,2018-29A, “B”, FLR, 3.309% (LIBOR - 3mo. + 1.4%), 11/15/2026 (n) | | | 2,878,803 | | | | 2,876,054 | |
| GMF Floorplan Owner Revolving Trust,2017-1, “A2”, FLR, 2.309% (LIBOR - 1mo. + 0.57%), 1/18/2022 (n) | | | 14,876,000 | | | | 14,877,935 | |
| GMF Floorplan Owner Revolving Trust,2017-2, “C”, 2.63%, 7/15/2022 (n) | | | 3,932,000 | | | | 3,936,599 | |
| | | | | | | | |
| | |
| Issuer | | Shares/Par | | | Value ($) | |
| BONDS – continued | | | | | |
| Asset-Backed & Securitized – continued | | | | | |
| Grand Avenue CRE Ltd.,2019-FL1, “A”, FLR, 2.86% (LIBOR - 1mo. + 1.12%), 6/15/2037 (n) | | $ | 5,172,500 | | | $ | 5,172,500 | |
| Granite Point Mortgage Trust, Inc., FLR, 2.664% (LIBOR - 1mo. + 0.9%), 11/21/2035 (n) | | | 1,866,982 | | | | 1,862,471 | |
| GS Mortgage Securities Trust,2015 - GC30, “A4”, 3.382%, 5/10/2050 | | | 7,904,407 | | | | 8,267,696 | |
| GS Mortgage Securities Trust,2019 - GSA1, “A4”, 3.047%, 11/10/2052 | | | 10,169,944 | | | | 10,437,536 | |
| HarbourView CLO VII Ltd., 7RA, “B”, FLR, 3.703% (LIBOR - 3mo. + 1.7%), 7/18/2031 (n) | | | 6,545,000 | | | | 6,398,693 | |
| Hunt CRE Ltd.,2018-FL2, “AS”, FLR, 3.189% (LIBOR - 1mo. + 1.45%), 8/15/2028 (n) | | | 875,000 | | | | 873,361 | |
| Hunt CRE Ltd.,2018-FL2, “B”, FLR, 3.39% (LIBOR - 1mo. + 1.65%), 8/15/2028 (n) | | | 1,800,000 | | | | 1,799,443 | |
| Hunt CRE Ltd.,2018-FL2, “C”, FLR, 4.089% (LIBOR - 1mo. + 2.35%), 8/15/2028 (n) | | | 595,000 | | | | 595,000 | |
| Invitation Homes Trust, 2018-SFR1, “B”, FLR, 2.437% (LIBOR- 1mo. + 0.7%), 3/17/2037 (n) | | | 9,420,780 | | | | 9,341,462 | |
| Invitation Homes Trust, 2018-SFR2, “A”, FLR, 2.587% (LIBOR - 1mo. + 0.85%), 12/17/2036 (n) | | | 1,282,399 | | | | 1,277,523 | |
| JPMBB Commercial Mortgage Securities Trust,2015-C28, “A4”, 3.227%, 10/15/2048 | | | 12,188,428 | | | | 12,645,434 | |
| JPMorgan Chase Commercial Mortgage Securities Corp., 5.784%, 7/15/2042 (n)(q) | | | 34,046 | | | | 23,137 | |
| JPMorgan Chase Commercial Mortgage Securities Corp., 3.454%, 9/15/2050 | | | 7,520,623 | | | | 7,952,168 | |
| JPMorgan Chase Commercial Mortgage Securities Corp., “A3”, 4.171%, 8/15/2046 | | | 124,286 | | | | 126,898 | |
| JPMorgan Mortgage Trust, “A1”, 3.758%, 10/25/2033 | | | 108,641 | | | | 111,514 | |
| KKR Real Estate Financial Trust, Inc.,2018-FL1, “C”, FLR, 3.737% (LIBOR -1mo. + 2%), 6/15/2036 (n) | | | 5,197,500 | | | | 5,200,748 | |
| Lehman Brothers Commercial Conduit Mortgage Trust, 0.947%, 2/18/2030 (i) | | | 2,931 | | | | 0 | |
| LoanCore Ltd., 2018-CRE1, “AS”, FLR, 3.239% (LIBOR - 1mo. + 1.5%), 5/15/2028 (n) | | | 8,900,000 | | | | 8,911,761 | |
| LoanCore Ltd., 2018-CRE1, “C”, FLR, 4.29% (LIBOR - 1mo. + 2.55%), 5/15/2028 (n) | | | 2,340,000 | | | | 2,347,065 | |
| LoanCore Ltd., 2018-CRE1, “C”, FLR, 3.689% (LIBOR - 1mo. + 1.95%), 4/15/2034 (n) | | | 2,041,000 | | | | 2,041,003 | |
9
MFS Total Return Bond Series
Portfolio of Investments – continued
| | | | | | | | |
| | |
| Issuer | | Shares/Par | | | Value ($) | |
| BONDS – continued | | | | | |
| Asset-Backed & Securitized – continued | | | | | |
| LoanCore Ltd., 2018-CRE1/CRE3, “B”, FLR, 3.34% (LIBOR - 1mo. + 1.6%), 4/15/2034 (n) | | $ | 2,082,000 | | | $ | 2,082,004 | |
| LoanCore Ltd., 2019-CRE2, “D”, FLR, 4.19% (LIBOR - 1mo. + 2.45%), 5/15/2036 (n) | | | 1,121,500 | | | | 1,120,817 | |
| LoanCore Ltd., 2019-CRE3, “AS”, FLR, 3.109% (LIBOR - 1mo. + 1.37%), 4/15/2034 (n) | | | 1,618,000 | | | | 1,617,997 | |
| Loomis, Sayles & Co., CLO,2015-2A, “A1R”, FLR, 2.9% (LIBOR - 3mo. + 0.9%), 4/15/2028 (n) | | | 3,000,000 | | | | 2,989,815 | |
| Merrill Lynch Mortgage Investors, Inc., “A”, 3.924%, 5/25/2036 | | | 196,670 | | | | 200,695 | |
| Merrill Lynch Mortgage Investors, Inc., “A5”, 4.004%, 4/25/2035 | | | 159,096 | | | | 157,442 | |
| MF1 CLO Ltd.,2019-FL2, “AS”, FLR, 3.222% (LIBOR - 1mo. + 1.43%), 12/25/2034 (n) | | | 11,245,000 | | | | 11,248,468 | |
| Morgan Stanley Bank of America/Merrill Lynch Trust, “A4”, 3.176%, 8/15/2045 | | | 5,000,000 | | | | 5,104,560 | |
| Navistar Financial Dealer Note Master Owner (NAVMT),2019-1, “A”, FLR, 2.432% (LIBOR -1mo. + 0.64%), 5/25/2024 (n) | | | 6,175,000 | | | | 6,191,419 | |
| Neuberger Berman CLO Ltd., 2017-16SA, “B”, FLR, 3.25% (LIBOR - 3mo. + 1.25%), 1/15/2028 (n) | | | 4,360,000 | | | | 4,308,918 | |
| NextGear Floorplan Master Owner Trust,2018-1A, “A2”, 3.22%, 2/15/2023 (n) | | | 3,250,000 | | | | 3,287,865 | |
| NextGear Floorplan Master Owner Trust,2019-2A, “A2”, 2.07%, 10/15/2024 (n) | | | 2,465,000 | | | | 2,447,628 | |
| OCP CLO Ltd.,2015-9A, “A2R”, FLR, 3.351% (LIBOR - 3mo. + 1.35%), 7/15/2027 (n) | | | 6,280,000 | | | | 6,237,164 | |
| Parallel Ltd.,2015-1A, “C1R”, FLR, 3.715% (LIBOR - 3mo. + 1.75%), 7/20/2027 (n) | | | 1,680,000 | | | | 1,640,488 | |
| Parallel Ltd.,2015-1A, “C2R”, FLR, 3.715% (LIBOR - 3mo. + 1.75%), 7/20/2027 (n) | | | 1,810,000 | | | | 1,767,431 | |
| Preferred Term Securities XIX Ltd., CDO, FLR, 2.243% (LIBOR - 3mo. + 0.35%), 12/22/2035 (n) | | | 249,891 | | | | 218,030 | |
| Race Point CLO Ltd.,2013-8A, “AR”, FLR, 3.238% (LIBOR - 3mo. + 1.34%), 2/20/2030 (n) | | | 5,825,355 | | | | 5,820,790 | |
| Residential Funding Mortgage Securities, Inc., 5.32%, 12/25/2035 | | | 23,709 | | | | 23,832 | |
| Santander Retail Auto Lease Trust,2019-A, “B”, 3.01%, 5/22/2023 (n) | | | 3,222,000 | | | | 3,255,897 | |
| Securitized Term Auto Receivable Trust 2019-CRTA, “B”, 2.453%, 3/25/2026 (n) | | | 2,211,628 | | | | 2,207,706 | |
| Securitized Term Auto Receivable Trust 2019-CRTA, “C”, 2.849%, 3/25/2026 (n) | | | 2,637,440 | | | | 2,632,776 | |
| | | | | | | | |
| | |
| Issuer | | Shares/Par | | | Value ($) | |
| BONDS – continued | | | | | |
| Asset-Backed & Securitized – continued | | | | | |
| Shelter Growth CRE,2018-FL1, “B”, FLR, 3.239% (LIBOR - 1mo. + 1.5%), 1/15/2035 (n) | | $ | 3,381,750 | | | $ | 3,381,748 | |
| TICP CLO Ltd.,2018-IA, “A2”, FLR, 3.436% (LIBOR - 3mo. + 1.5%), 4/26/2028 (n) | | | 6,750,828 | | | | 6,651,895 | |
| UBS Commercial Mortgage Trust,2017-C8, “A4”, 3.983%, 2/15/2051 | | | 5,865,766 | | | | 6,425,086 | |
| UBS Commercial Mortgage Trust,2019-C17, “A4”, 2.921%, 9/15/2052 | | | 7,729,133 | | | | 7,846,543 | |
| Voya CLO Ltd.,2012-4A, “A2AR”, FLR, 3.79% (LIBOR - 3mo. + 1.90%), 10/15/2030 (n) | | | 1,940,000 | | | | 1,938,840 | |
| Wells Fargo Commercial Mortgage Trust,2016-C34, “A4”, 3.096%, 6/15/2049 | | | 2,280,000 | | | | 2,345,039 | |
| Wells Fargo Commercial Mortgage Trust, 2016-LC25, “A4”, 3.64%, 12/15/2059 | | | 13,071,416 | | | | 13,972,642 | |
| Wells Fargo Commercial Mortgage Trust,2017-C42, “A5”, 3.589%, 12/15/2050 | | | 3,970,000 | | | | 4,246,436 | |
| Wells Fargo Commercial Mortgage Trust,2018-C46, “A4”, 4.152%, 8/15/2051 | | | 1,430,000 | | | | 1,588,896 | |
| Wells Fargo Commercial Mortgage Trust,2019-C53, “A4”, 3.04%, 10/15/2052 | | | 10,239,837 | | | | 10,540,212 | |
| West CLO Ltd.,2014-1A, “A2R”, FLR, 3.353% (LIBOR - 3mo. + 1.35%), 7/18/2026 (n) | | | 8,174,074 | | | | 8,149,838 | |
| West CLO Ltd.,2014-1A, “CR”, FLR, 5.003% (LIBOR - 3mo. + 3%), 7/18/2026 (n) | | | 1,680,000 | | | | 1,680,013 | |
| Wind River CLO Ltd.,2012-1A, “CR2”, FLR, 4.05% (LIBOR - 3mo. + 2.05%), 1/15/2026 (n) | | | 5,112,331 | | | | 5,112,316 | |
| Wind River CLO Ltd.,2015-2A, “CR”, FLR, 3.686% (LIBOR - 1mo. + 1.7%), 10/15/2027 (n) | | | 975,000 | | | | 961,936 | |
| | | | | | | | |
| | | | | | $ | 480,345,885 | |
| | | | | | | | |
| Automotive – 0.9% | | | | | |
| Allison Transmission, Inc., 4.75%, 10/01/2027 (n) | | $ | 6,375,000 | | | $ | 6,614,062 | |
| General Motors Co., 4.875%, 10/02/2023 | | | 4,291,000 | | | | 4,603,232 | |
| KAR Auction Services, Inc., 5.125%, 6/01/2025 (n) | | | 3,035,000 | | | | 3,156,400 | |
| Volkswagen Group of America, Inc., 3.2%, 9/26/2026 (n) | | | 3,881,000 | | | | 3,975,950 | |
| | | | | | | | |
| | | | | | $ | 18,349,644 | |
| | | | | | | | |
| Broadcasting – 0.5% | | | | | |
| Fox Corp., 4.709%, 1/25/2029 (n) | | $ | 8,554,000 | | | $ | 9,742,120 | |
| | | | | | | | |
| Brokerage & Asset Managers – 1.2% | | | | | |
| Charles Schwab Corp., 3.2%, 1/25/2028 | | $ | 2,607,000 | | | $ | 2,735,939 | |
| E*TRADE Financial Corp., 3.8%, 8/24/2027 | | | 5,435,000 | | | | 5,645,603 | |
| E*TRADE Financial Corp., 4.5%, 6/20/2028 | | | 3,485,000 | | | | 3,787,300 | |
10
MFS Total Return Bond Series
Portfolio of Investments – continued
| | | | | | | | |
| | |
| Issuer | | Shares/Par | | | Value ($) | |
| BONDS – continued | | | | | |
| Brokerage & Asset Managers – continued | | | | | |
| Intercontinental Exchange, Inc., 3.75%, 9/21/2028 | | $ | 3,417,000 | | | $ | 3,728,336 | |
| Raymond James Financial, Inc., 4.95%, 7/15/2046 | | | 4,683,000 | | | | 5,459,481 | |
| TD Ameritrade Holding Corp., 2.95%, 4/01/2022 | | | 1,773,000 | | | | 1,811,803 | |
TD Ameritrade Holding Corp., 3.3%, 4/01/2027 | | | 1,271,000 | | | | 1,329,937 | |
| | | | | | | | |
| | | | | | $ | 24,498,399 | |
| | | | | | | | |
| Building – 1.3% | | | | | |
| Martin Marietta Materials, Inc., 4.25%, 7/02/2024 | | $ | 8,330,000 | | | $ | 8,911,485 | |
| Martin Marietta Materials, Inc., 3.45%, 6/01/2027 | | | 1,407,000 | | | | 1,438,656 | |
| Martin Marietta Materials, Inc., 4.25%, 12/15/2047 | | | 3,819,000 | | | | 3,958,839 | |
| Masco Corp., 4.375%, 4/01/2026 | | | 6,170,000 | | | | 6,661,664 | |
| Standard Industries, Inc., 5.375%, 11/15/2024 (n) | | | 2,645,000 | | | | 2,717,738 | |
| Standard Industries, Inc., 6%, 10/15/2025 (n) | | | 2,645,000 | | | | 2,780,556 | |
| | | | | | | | |
| | | | | | $ | 26,468,938 | |
| | | | | | | | |
| Business Services – 0.9% | | | | | |
| Equinix, Inc., 5.375%, 5/15/2027 | | $ | 6,006,000 | | | $ | 6,522,696 | |
| Fidelity National Information Services, Inc., 3%, 8/15/2026 | | | 7,885,000 | | | | 8,150,991 | |
| Fiserv, Inc., 3.5%, 7/01/2029 | | | 3,911,000 | | | | 4,104,984 | |
| | | | | | | | |
| | | | | | $ | 18,778,671 | |
| | | | | | | | |
| Cable TV – 1.9% | | | | | |
| CCO Holdings LLC/CCO Holdings Capital Corp., 5.75%, 1/15/2024 | | $ | 580,000 | | | $ | 590,150 | |
| CCO Holdings LLC/CCO Holdings Capital Corp., 5%, 2/01/2028 (n) | | | 5,680,000 | | | | 5,960,138 | |
| Charter Communications Operating LLC/Charter Communications Operating Capital Corp., 4.908%, 7/23/2025 | | | 7,676,000 | | | | 8,449,411 | |
| CSC Holdings LLC, 5.5%, 5/15/2026 (n) | �� | | 6,560,000 | | | | 6,945,334 | |
| Sirius XM Radio, Inc., 5.375%, 7/15/2026 (n) | | | 7,020,000 | | | | 7,456,556 | |
| Time Warner Cable, Inc., 4.5%, 9/15/2042 | | | 3,721,000 | | | | 3,794,229 | |
| Time Warner Entertainment Co. LP, 8.375%, 7/15/2033 | | | 290,000 | | | | 406,102 | |
| Videotron Ltd., 5%, 7/15/2022 | | | 4,605,000 | | | | 4,858,275 | |
| | | | | | | | |
| | | | | | $ | 38,460,195 | |
| | | | | | | | |
| Computer Software – 0.9% | | | | | |
| Dell Investments LLC/EMC Corp., 5.3%, 10/01/2029 (n) | | $ | 10,112,000 | | | $ | 11,386,802 | |
| Microsoft Corp., 4.1%, 2/06/2037 | | | 5,836,000 | | | | 6,884,585 | |
| | | | | | | | |
| | | | | | $ | 18,271,387 | |
| | | | | | | | |
| Computer Software – Systems – 0.3% | | | | | |
| Apple, Inc., 4.375%, 5/13/2045 | | $ | 4,792,000 | | | $ | 5,790,176 | |
| | | | | | | | |
| | | | | | | | |
| | |
| Issuer | | Shares/Par | | | Value ($) | |
| BONDS – continued | | | | | |
| Conglomerates – 0.7% | | | | | |
| United Technologies Corp., 4.125%, 11/16/2028 | | $ | 2,100,000 | | | $ | 2,363,679 | |
| United Technologies Corp., 4.05%, 5/04/2047 | | | 3,608,000 | | | | 4,124,452 | |
| Wabtec Corp., 4.95%, 9/15/2028 | | | 7,993,000 | | | | 8,787,865 | |
| | | | | | | | |
| | | | | | $ | 15,275,996 | |
| | | | | | | | |
| Consumer Products – 1.0% | | | | | |
| Reckitt Benckiser Treasury Services PLC, 3.625%, 9/21/2023 (n) | | $ | 6,765,000 | | | $ | 7,043,696 | |
| Reckitt Benckiser Treasury Services PLC, 2.75%, 6/26/2024 (n) | | | 13,673,000 | | | | 13,934,322 | |
| | | | | | | | |
| | | | | | $ | 20,978,018 | |
| | | | | | | | |
| Consumer Services – 0.7% | | | | | |
| Booking Holdings, Inc., 3.65%, 3/15/2025 | | $ | 3,610,000 | | | $ | 3,856,188 | |
| Priceline Group, Inc., 2.75%, 3/15/2023 | | | 1,728,000 | | | | 1,764,591 | |
| Toll Road Investors Partnership II LP, Capital Appreciation, 0%, 2/15/2026 (n) | | | 2,145,000 | | | | 1,594,555 | |
| Toll Road Investors Partnership II LP, Capital Appreciation, 0%, 2/15/2029 (z) | | | 6,221,000 | | | | 3,958,641 | |
| Toll Road Investors Partnership II LP, Capital Appreciation, 0%, 2/15/2031 (n) | | | 2,145,000 | | | | 1,229,199 | |
| Toll Road Investors Partnership II LP, Capital Appreciation, 0%, 2/15/2043 (n) | | | 5,600,000 | | | | 1,636,111 | |
| | | | | | | | |
| | | | | | $ | 14,039,285 | |
| | | | | | | | |
| Containers – 0.4% | | | | | |
| Crown Americas LLC/Crown Americas Capital Corp. VI, 4.75%, 2/01/2026 | | $ | 7,030,000 | | | $ | 7,425,437 | |
| | | | | | | | |
| Electronics – 1.1% | | | | | |
| Broadcom Corp./Broadcom Cayman Finance Ltd., 3.875%, 1/15/2027 | | $ | 8,969,000 | | | $ | 9,306,746 | |
| Broadcom, Inc., 3.625%, 10/15/2024 (n) | | | 8,720,000 | | | | 9,062,821 | |
| Broadcom, Inc., 4.75%, 4/15/2029 (n) | | | 3,794,000 | | | | 4,148,432 | |
| | | | | | | | |
| | | | | | $ | 22,517,999 | |
| | | | | | | | |
| Emerging Market Quasi-Sovereign – 1.4% | | | | | |
| Petrobras Global Finance B.V. (Federative Republic of Brazil), 5.75%, 2/01/2029 | | $ | 5,930,000 | | | $ | 6,689,040 | |
| Saudi Arabian Oil Co., 3.5%, 4/16/2029 (n) | | | 5,389,000 | | | | 5,579,338 | |
| State Grid Overseas Investment (2016) Ltd. (People’s Republic of China), 2.75%, 5/04/2022 (n) | | | 15,191,000 | | | | 15,347,844 | |
| | | | | | | | |
| | | | | | $ | 27,616,222 | |
| | | | | | | | |
| Energy – Integrated – 0.3% | | | | | |
| Eni S.p.A., 4%, 9/12/2023 (n) | | $ | 5,485,000 | | | $ | 5,782,250 | |
| | | | | | | | |
| Entertainment – 0.4% | | | | | |
| Six Flags Entertainment Corp., 4.875%, 7/31/2024 (n) | | $ | 7,151,000 | | | $ | 7,410,224 | |
| | | | | | | | |
| Financial Institutions – 0.7% | | | | | |
| Avolon Holdings Funding Ltd., 5.25%, 5/15/2024 (n) | | $ | 5,845,000 | | | $ | 6,380,285 | |
11
MFS Total Return Bond Series
Portfolio of Investments – continued
| | | | | | | | |
| | |
| Issuer | | Shares/Par | | | Value ($) | |
| BONDS – continued | | | | | |
| Financial Institutions – continued | | | | | |
| Avolon Holdings Funding Ltd., 3.95%, 7/01/2024 (n) | | $ | 4,754,000 | | | $ | 4,954,143 | |
| GE Capital International Funding Co., 4.418%, 11/15/2035 | | | 3,160,000 | | | | 3,364,692 | |
| | | | | | | | |
| | | | | | $ | 14,699,120 | |
| | | | | | | | |
| Food & Beverages – 0.7% | | | | | |
| Anheuser-Busch Cos. LLC/Anheuser-Busch InBev Worldwide, Inc., 4.9%, 2/01/2046 | | $ | 3,064,000 | | | $ | 3,623,604 | |
| Anheuser-Busch InBev Worldwide, Inc., 3.7%, 2/01/2024 | | | 2,400,000 | | | | 2,544,754 | |
| Anheuser-Busch InBev Worldwide, Inc., 5.45%, 1/23/2039 | | | 2,702,000 | | | | 3,392,321 | |
| Conagra Brands, Inc., 4.6%, 11/01/2025 | | | 4,150,000 | | | | 4,580,230 | |
| | | | | | | | |
| | | | | | $ | 14,140,909 | |
| | | | | | | | |
| Gaming & Lodging – 0.5% | | | | | |
| GLP Capital LP/GLP Financing II, Inc., 5.375%, 11/01/2023 | | $ | 4,350,000 | | | $ | 4,733,148 | |
| GLP Capital LP/GLP Financing II, Inc., 5.25%, 6/01/2025 | | | 2,257,000 | | | | 2,477,283 | |
| Las Vegas Sands Corp., 3.5%, 8/18/2026 | | | 3,415,000 | | | | 3,509,564 | |
| | | | | | | | |
| | | | | | $ | 10,719,995 | |
| | | | | | | | |
| Insurance – 1.0% | | | | | |
| American International Group, Inc., 3.75%, 7/10/2025 | | $ | 4,804,000 | | | $ | 5,136,825 | |
| American International Group, Inc., 3.9%, 4/01/2026 | | | 5,113,000 | | | | 5,475,249 | |
| American International Group, Inc., 4.7%, 7/10/2035 | | | 2,777,000 | | | | 3,212,377 | |
| Lincoln National Corp., 3.8%, 3/01/2028 | | | 1,785,000 | | | | 1,900,541 | |
| Principal Financial Group, Inc., 3.4%, 5/15/2025 | | | 4,724,000 | | | | 4,945,985 | |
| | | | | | | | |
| | | | | | $ | 20,670,977 | |
| | | | | | | | |
| Insurance – Health – 0.5% | | | | | |
| Centene Corp., 4.625%, 12/15/2029 (n) | | $ | 1,877,000 | | | $ | 1,978,077 | |
| UnitedHealth Group, Inc., 2.375%, 10/15/2022 | | | 8,997,000 | | | | 9,104,548 | |
| | | | | | | | |
| | | | | | $ | 11,082,625 | |
| | | | | | | | |
| Insurance – Property & Casualty – 2.1% | | | | | |
| Allied World Assurance Co. Holdings Ltd., 4.35%, 10/29/2025 | | $ | 6,835,000 | | | $ | 7,209,634 | |
| Aon Corp., 3.75%, 5/02/2029 | | | 7,982,000 | | | | 8,543,444 | |
| Fairfax Financial Holdings Ltd., 4.85%, 4/17/2028 | | | 5,854,000 | | | | 6,371,161 | |
| Hartford Financial Services Group, Inc., 2.8%, 8/19/2029 | | | 6,063,000 | | | | 6,124,930 | |
| Liberty Mutual Group, Inc., 3.951%, 10/15/2050 (n) | | | 2,900,000 | | | | 3,006,353 | |
| Marsh & McLennan Cos., Inc., 4.375%, 3/15/2029 | | | 1,962,000 | | | | 2,233,963 | |
| Marsh & McLennan Cos., Inc., 4.2%, 3/01/2048 | | | 6,949,000 | | | | 7,884,456 | |
| Swiss Re Ltd., 4.25%, 12/06/2042 (n) | | | 926,000 | | | | 1,067,006 | |
| | | | | | | | |
| | | | | | $ | 42,440,947 | |
| | | | | | | | |
| | | | | | | | |
| | |
| Issuer | | Shares/Par | | | Value ($) | |
| BONDS – continued | | | | | |
| International Market Quasi-Sovereign – 0.2% | | | | | |
| Electricite de France S.A., 4.875%, 9/21/2038 (n) | | $ | 2,687,000 | | | $ | 3,151,355 | |
| | | | | | | | |
| Machinery & Tools – 0.2% | | | | | |
| CNH Industrial Capital LLC, 4.2%, 1/15/2024 | | $ | 1,209,000 | | | $ | 1,279,822 | |
| CNH Industrial Capital LLC, 3.85%, 11/15/2027 | | | 3,385,000 | | | | 3,530,083 | |
| | | | | | | | |
| | | | | | $ | 4,809,905 | |
| | | | | | | | |
| Major Banks – 5.8% | | | | | |
| ABN AMRO Bank N.V., 4.8%, 4/18/2026 (n) | | $ | 5,000,000 | | | $ | 5,453,467 | |
| Bank of America Corp., 3.419% to 12/20/2027, FLR (LIBOR - 3mo. + 1.04%) to 12/20/2028 | | | 8,376,000 | | | | 8,783,844 | |
| Bank of America Corp., 4.443%, 1/20/2048 | | | 6,670,000 | | | | 8,094,375 | |
| Bank of America Corp., 6.1%, 12/29/2049 | | | 8,260,000 | | | | 9,199,988 | |
| Bank of America Corp., 5.875%, 12/31/2059 | | | 6,088,000 | | | | 6,750,374 | |
| Bank of America Corp., FLR, 6.5% (LIBOR - 3mo. + 4.174%), 10/23/2049 | | | 4,004,000 | | | | 4,544,540 | |
| Barclays PLC, 4.972% to 5/16/2028, FLR (LIBOR - 3mo. + 1.902%) to 5/16/2029 | | | 3,499,000 | | | | 3,940,636 | |
| Credit Suisse Group AG, 6.5%, 8/08/2023 (n) | | | 1,899,000 | | | | 2,115,011 | |
| Credit Suisse Group Fund (Guernsey) Ltd., 3.75%, 3/26/2025 | | | 3,355,000 | | | | 3,547,950 | |
| Goldman Sachs Group, Inc., 3.625%, 1/22/2023 | | | 6,374,000 | | | | 6,635,477 | |
| JPMorgan Chase & Co., 4.25%, 10/15/2020 | | | 1,385,000 | | | | 1,409,548 | |
| JPMorgan Chase & Co., 4.5%, 1/24/2022 | | | 947,000 | | | | 994,045 | |
| JPMorgan Chase & Co., 3.125%, 1/23/2025 | | | 374,000 | | | | 390,186 | |
| JPMorgan Chase & Co., 3.509%, 1/23/2029 | | | 2,455,000 | | | | 2,606,125 | |
| JPMorgan Chase & Co., 4.005%, 4/23/2029 | | | 11,547,000 | | | | 12,667,171 | |
| JPMorgan Chase & Co., 4.203% to 7/23/2028, FLR (LIBOR - 3mo. + 1.26%) to 7/23/2029 | | | 4,743,000 | | | | 5,287,543 | |
| Lloyds Bank PLC, 3.75%, 1/11/2027 | | | 5,639,000 | | | | 5,922,078 | |
| Morgan Stanley, 3.75%, 2/25/2023 | | | 8,585,000 | | | | 8,988,129 | |
| PNC Bank N.A., 3.1%, 10/25/2027 | | | 8,157,000 | | | | 8,503,758 | |
| UBS Group Funding (Jersey) Ltd., 4.125%, 9/24/2025 (n) | | | 4,836,000 | | | | 5,256,195 | |
| Wachovia Corp., 6.605%, 10/01/2025 | | | 1,764,000 | | | | 2,114,452 | |
| Wells Fargo & Co., 3.069%, 1/24/2023 | | | 4,635,000 | | | | 4,730,183 | |
| | | | | | | | |
| | | | | | $ | 117,935,075 | |
| | | | | | | | |
| Medical & Health Technology & Services – 3.0% | | | | | |
| Alcon Finance Corp., 2.75%, 9/23/2026 (n) | | $ | 901,000 | | | $ | 916,678 | |
| Catholic Health Initiatives, 2.95%, 11/01/2022 | | | 6,666,000 | | | | 6,788,504 | |
12
MFS Total Return Bond Series
Portfolio of Investments – continued
| | | | | | | | |
| | |
| Issuer | | Shares/Par | | | Value ($) | |
| BONDS – continued | | | | | |
| Medical & Health Technology & Services – continued | |
| Cigna Corp., 3.75%, 7/15/2023 | | $ | 9,040,000 | | | $ | 9,474,606 | |
| Hackensack Meridian Health, Inc., 4.211%, 7/01/2048 | | | 3,555,000 | | | | 3,986,663 | |
| Hackensack Meridian Health, Inc., 4.5%, 7/01/2057 | | | 5,360,000 | | | | 6,293,312 | |
| HCA, Inc., 5.25%, 6/15/2026 | | | 3,026,000 | | | | 3,387,009 | |
| HCA, Inc., 5.625%, 9/01/2028 | | | 7,640,000 | | | | 8,706,544 | |
| HCA, Inc., 4.125%, 6/15/2029 | | | 4,743,000 | | | | 5,025,824 | |
| Laboratory Corp. of America Holdings, 4.7%, 2/01/2045 | | | 2,518,000 | | | | 2,827,196 | |
| Northwell Healthcare, Inc., 3.979%, 11/01/2046 | | | 1,503,000 | | | | 1,535,192 | |
| Northwell Healthcare, Inc., 4.26%, 11/01/2047 | | | 4,465,000 | | | | 4,788,574 | |
| Toledo Hospital, 5.325%, 11/15/2028 | | | 7,120,000 | | | | 7,743,358 | |
| | | | | | | | |
| | | | | | $ | 61,473,460 | |
| | | | | | | | |
| Medical Equipment – 0.6% | | | | | |
| Abbott Laboratories, 3.4%, 11/30/2023 | | $ | 2,684,000 | | | $ | 2,821,147 | |
| Abbott Laboratories, 4.9%, 11/30/2046 | | | 5,863,000 | | | | 7,692,502 | |
| Boston Scientific Corp., 4%, 3/01/2029 | | | 2,000,000 | | | | 2,210,489 | |
| | | | | | | | |
| | | | | | $ | 12,724,138 | |
| | | | | | | | |
| Metals & Mining – 1.0% | | | | | |
| Freeport-McMoRan Copper & Gold, Inc., 5.4%, 11/14/2034 | | $ | 5,570,000 | | | $ | 5,834,575 | |
| Glencore Funding LLC, 4.125%, 5/30/2023 (n) | | | 2,796,000 | | | | 2,913,723 | |
| Novelis Corp., 5.875%, 9/30/2026 (n) | | | 5,245,000 | | | | 5,581,231 | |
| Vale Overseas Ltd., 6.25%, 8/10/2026 | | | 4,758,000 | | | | 5,584,940 | |
| | | | | | | | |
| | | | | | $ | 19,914,469 | |
| | | | | | | | |
| Midstream – 2.4% | | | | | |
| Enbridge, Inc., 4.25%, 12/01/2026 | | $ | 7,802,000 | | | $ | 8,583,384 | |
| Kinder Morgan (Delaware), Inc., 7.75%, 1/15/2032 | | | 6,550,000 | | | | 9,001,124 | |
| Kinder Morgan Energy Partners LP, 6.375%, 3/01/2041 | | | 2,240,000 | | | | 2,819,271 | |
| Kinder Morgan Energy Partners LP, 5.4%, 9/01/2044 | | | 2,778,000 | | | | 3,208,831 | |
| ONEOK, Inc., 5.2%, 7/15/2048 | | | 5,276,000 | | | | 5,970,311 | |
| Plains All American Pipeline, 3.55%, 12/15/2029 | | | 3,000,000 | | | | 2,952,768 | |
| Sabine Pass Liquefaction LLC, 5.75%, 5/15/2024 | | | 5,449,000 | | | | 6,074,767 | |
| Sabine Pass Liquefaction LLC, 4.2%, 3/15/2028 | | | 2,847,000 | | | | 3,014,417 | |
| Targa Resources Partners LP/Targa Resources Finance Corp., 5.875%, 4/15/2026 | | | 6,555,000 | | | | 6,964,687 | |
| | | | | | | | |
| | | | | | $ | 48,589,560 | |
| | | | | | | | |
| Mortgage-Backed – 28.6% | | | | | |
| Fannie Mae, 5.5%, 3/01/2020 - 4/01/2040 | | $ | 7,956,069 | | | $ | 8,894,888 | |
| Fannie Mae, 5%, 6/01/2020 - 3/01/2042 | | | 5,909,159 | | | | 6,505,603 | |
| Fannie Mae, 5.19%, 9/01/2020 | | | 131,988 | | | | 132,668 | |
| | | | | | | | |
| | |
| Issuer | | Shares/Par | | | Value ($) | |
| BONDS – continued | | | | | |
| Mortgage-Backed – continued | | | | | |
| Fannie Mae, 3.416%, 10/01/2020 | | $ | 436,979 | | | $ | 441,372 | |
| Fannie Mae, 2.14%, 5/01/2021 | | | 872,760 | | | | 873,231 | |
| Fannie Mae, 3.89%, 7/01/2021 | | | 1,079,955 | | | | 1,102,116 | |
| Fannie Mae, 2.56%, 10/01/2021 | | | 771,272 | | | | 776,652 | |
| Fannie Mae, 2.64%, 11/01/2021 | | | 1,134,307 | | | | 1,145,443 | |
| Fannie Mae, 2.75%, 3/01/2022 | | | 1,077,380 | | | | 1,095,825 | |
| Fannie Mae, 6%, 8/01/2022 - 3/01/2039 | | | 2,039,609 | | | | 2,321,172 | |
| Fannie Mae, 2.525%, 10/01/2022 | | | 1,723,940 | | | | 1,749,072 | |
| Fannie Mae, 2.68%, 3/01/2023 | | | 1,658,425 | | | | 1,686,407 | |
| Fannie Mae, 2.41%, 5/01/2023 | | | 1,932,962 | | | | 1,950,937 | |
| Fannie Mae, 2.55%, 5/01/2023 | | | 990,247 | | | | 1,003,758 | |
| Fannie Mae, 4.5%, 5/01/2024 - 6/01/2044 | | | 22,088,308 | | | | 23,974,480 | |
| Fannie Mae, 3.5%, 5/25/2025 - 1/01/2050 | | | 39,833,248 | | | | 41,498,128 | |
| Fannie Mae, 2.672%, 12/25/2026 | | | 6,265,000 | | | | 6,373,309 | |
| Fannie Mae, 3.95%, 1/01/2027 | | | 343,620 | | | | 376,718 | |
| Fannie Mae, 3%, 11/01/2028 - 8/01/2047 | | | 25,404,054 | | | | 26,089,957 | |
| Fannie Mae, 6.5%, 7/01/2032 - 1/01/2033 | | | 4,212 | | | | 4,708 | |
| Fannie Mae, 3%, 2/25/2033 (i) | | | 720,181 | | | | 82,328 | |
| Fannie Mae,4%, 12/01/2039 - 11/01/2049 | | | 42,294,089 | | | | 45,260,437 | |
| Fannie Mae, 3.25%, 5/25/2040 | | | 353,017 | | | | 365,176 | |
| Fannie Mae, 2%, 10/25/2040 - 4/25/2046 | | | 916,176 | | | | 906,159 | |
| Fannie Mae, 4%, 7/25/2046 (i) | | | 634,308 | | | | 123,119 | |
| Fannie Mae, TBA,2.5%, 1/16/2035 - 2/18/2035 | | | 19,875,000 | | | | 20,041,058 | |
| Fannie Mae, TBA,3%, 1/16/2035 - 1/25/2050 | | | 50,275,000 | | | | 51,064,821 | |
| Fannie Mae, TBA,3.5%, 1/16/2035 - 1/14/2050 | | | 20,467,715 | | | | 21,090,552 | |
| Fannie Mae, TBA, 5%, 1/25/2050 | | | 1,225,000 | | | | 1,309,735 | |
| Federal Home Loan Bank, 5%, 7/01/2035 | | | 1,663,205 | | | | 1,835,015 | |
| Federal Home Loan Bank, 3.5%, 5/01/2049 | | | 877,327 | | | | 911,078 | |
| Federal Home Loan Bank, 4%, 1/01/2050 | | | 3,775,000 | | | | 3,933,722 | |
| Freddie Mac, 4.251%, 1/25/2020 | | | 50,769 | | | | 50,682 | |
| Freddie Mac, 5%, 4/01/2020 - 7/01/2041 | | | 2,294,417 | | | | 2,531,506 | |
| Freddie Mac, 3.034%, 10/25/2020 | | | 2,531,942 | | | | 2,542,648 | |
| Freddie Mac,5.5%, 11/01/2020 - 1/01/2038 | | | 359,001 | | | | 403,048 | |
| Freddie Mac, 2.791%, 1/25/2022 | | | 4,439,000 | | | | 4,494,635 | |
| Freddie Mac, 3.32%, 2/25/2023 | | | 3,956,000 | | | | 4,101,523 | |
| Freddie Mac,3.3%, 4/25/2023 - 10/25/2026 | | | 9,057,972 | | | | 9,476,943 | |
| Freddie Mac, 3.06%, 7/25/2023 | | | 4,230,000 | | | | 4,367,475 | |
| Freddie Mac, 3.531%, 7/25/2023 | | | 2,401,000 | | | | 2,517,048 | |
| Freddie Mac, 3.458%, 8/25/2023 | | | 7,000,000 | | | | 7,324,392 | |
| Freddie Mac, 2.67%, 12/25/2024 | | | 2,784,000 | | | | 2,851,090 | |
| Freddie Mac, 2.811%, 1/25/2025 | | | 4,169,000 | | | | 4,293,074 | |
| Freddie Mac, 3.329%, 5/25/2025 | | | 6,457,000 | | | | 6,819,730 | |
| Freddie Mac, 4%, 7/01/2025 - 4/01/2044 | | | 4,257,786 | | | | 4,526,070 | |
| Freddie Mac,4.5%, 7/01/2025 - 5/01/2042 | | | 5,586,343 | | | | 6,063,878 | |
| Freddie Mac, 2.673%, 3/25/2026 | | | 4,000,000 | | | | 4,102,092 | |
| Freddie Mac, 3%, 6/15/2028 - 2/25/2059 | | | 36,884,872 | | | | 37,861,532 | |
| Freddie Mac, 3.926%, 7/25/2028 | | | 4,066,000 | | | | 4,502,253 | |
13
MFS Total Return Bond Series
Portfolio of Investments – continued
| | | | | | | | |
| | |
| Issuer | | Shares/Par | | | Value ($) | |
| BONDS – continued | | | | | |
| Mortgage-Backed – continued | | | | | |
| Freddie Mac, 4.06%, 10/25/2028 | | $ | 2,437,000 | | | $ | 2,723,268 | |
| Freddie Mac, 1.089%, 7/25/2029 (i) | | | 4,056,498 | | | | 361,176 | |
| Freddie Mac, 1.27%, 8/25/2029 (i) | | | 7,037,200 | | | | 652,220 | |
| Freddie Mac, 0.756%, 11/25/2029 (i) | | | 15,615,000 | | | | 849,707 | |
| Freddie Mac, 2.5%, 11/01/2031 | | | 195,951 | | | | 198,450 | |
| Freddie Mac, 6%, 8/01/2034 - 7/01/2038 | | | 104,455 | | | | 117,988 | |
| Freddie Mac, 5.5%, 2/15/2036 (i) | | | 151,008 | | | | 29,591 | |
| Freddie Mac,3.5%, 11/01/2037 - 10/25/2058 | | | 43,236,063 | | | | 45,183,542 | |
| Freddie Mac, 4.5%, 12/15/2040 (i) | | | 192,647 | | | | 18,144 | |
| Freddie Mac, 4%, 8/15/2044 (i) | | | 184,835 | | | | 25,562 | |
| Ginnie Mae, 2.5%, 7/20/2032 | | | 500,000 | | | | 493,584 | |
| Ginnie Mae, 5.5%, 5/15/2033 - 1/20/2042 | | | 1,904,577 | | | | 2,124,614 | |
| Ginnie Mae, 6%, 1/20/2036 - 1/15/2039 | | | 234,160 | | | | 265,505 | |
| Ginnie Mae, 4.5%, 4/15/2039 - 7/20/2049 | | | 13,557,225 | | | | 14,526,149 | |
| Ginnie Mae,4%, 10/20/2040 - 10/20/2049 | | | 22,763,799 | | | | 23,684,690 | |
| Ginnie Mae,3.5%, 11/15/2040 - 12/20/2049 | | | 47,287,063 | | | | 49,015,086 | |
| Ginnie Mae, 3%, 11/20/2044 - 1/20/2048 | | | 29,706,927 | | | | 30,568,290 | |
| Ginnie Mae, TBA, 4%, 1/15/2050 | | | 11,325,000 | | | | 11,721,118 | |
| Ginnie Mae, TBA,3%, 1/21/2050 - 3/23/2050 | | | 13,375,000 | | | | 13,722,517 | |
| Ginnie Mae, TBA, 3.5%, 1/21/2050 | | | 4,825,000 | | | | 4,971,856 | |
| | | | | | | | |
| | | | | | $ | 585,002,320 | |
| | | | | | | | |
| Municipals – 2.7% | | | | | |
| Bridgeview, IL, Stadium and Redevelopment Projects, 5.06%, 12/01/2025 | | $ | 910,000 | | | $ | 938,583 | |
| Bridgeview, IL, Stadium and Redevelopment Projects, 5.14%, 12/01/2036 | | | 8,850,000 | | | | 8,952,395 | |
| Chicago, IL, “B”, 7.375%, 1/01/2033 | | | 490,000 | | | | 586,961 | |
| New Jersey Economic Development Authority State Pension Funding Rev., “A”, 7.425%, 2/15/2029 | | | 8,019,000 | | | | 10,053,661 | |
| New Jersey Economic Development Authority State Pension Funding Rev., Capital Appreciation, “B”, 0%, 2/15/2023 | | | 13,215,000 | | | | 12,250,173 | |
| Oklahoma Development Finance Authority, Health System Rev. (OU Medicine Project), “C”, 5.45%, 8/15/2028 | | | 3,770,000 | | | | 4,244,266 | |
| Philadelphia, PA, School District, “B”, 6.615%, 6/01/2030 | | | 3,250,000 | | | | 4,021,160 | |
| Philadelphia, PA, School District, “B”, 6.765%, 6/01/2040 | | | 2,195,000 | | | | 2,957,345 | |
| State of California (Build America Bonds), 7.625%, 3/01/2040 | | | 860,000 | | | | 1,377,058 | |
| State of California (Build America Bonds), 7.6%, 11/01/2040 | | | 5,010,000 | | | | 8,270,057 | |
| University of California Limited Project Rev., “J”, 4.131%, 5/15/2045 | | | 2,260,000 | | | | 2,485,073 | |
| | | | | | | | |
| | | | | | $ | 56,136,732 | |
| | | | | | | | |
| | | | | | | | |
| | |
| Issuer | | Shares/Par | | | Value ($) | |
| BONDS – continued | | | | | |
| Natural Gas – Distribution – 0.9% | | | | | |
| Boston Gas Co., 3.15%, 8/01/2027 (n) | | $ | 9,294,000 | | | $ | 9,618,453 | |
| KeySpan Gas East Corp., 2.742%, 8/15/2026 (n) | | | 8,200,000 | | | | 8,211,755 | |
| | | | | | | | |
| | | | | | $ | 17,830,208 | |
| | | | | | | | |
| Network & Telecom – 0.2% | | | | | |
| AT&T, Inc., 5.25%, 3/01/2037 | | $ | 3,281,000 | | | $ | 3,911,542 | |
| | | | | | | | |
| Oils – 0.4% | | | | | |
| Marathon Petroleum Corp., 4.75%, 9/15/2044 | | $ | 4,350,000 | | | $ | 4,768,990 | |
| Marathon Petroleum Corp., 5.85%, 12/15/2045 | | | 2,683,000 | | | | 3,072,838 | |
| | | | | | | | |
| | | | | | $ | 7,841,828 | |
| | | | | | | | |
| Other Banks & Diversified Financials – 1.5% | | | | | |
| BBVA Bancomer S.A. de C.V., 6.75%, 9/30/2022 (n) | | $ | 2,570,000 | | | $ | 2,798,113 | |
| BBVA USA, 2.875%, 6/29/2022 | | | 10,895,000 | | | | 11,045,396 | |
| Capital One Financial Corp., 3.75%, 3/09/2027 | | | 3,516,000 | | | | 3,746,375 | |
| Capital One Financial Corp., 3.8%, 1/31/2028 | | | 2,363,000 | | | | 2,537,683 | |
| Groupe BPCE S.A., 4.5%, 3/15/2025 (n) | | | 5,771,000 | | | | 6,214,738 | |
| Macquarie Bank Ltd. of London, 6.125% to 9/12/2025, FLR (Swap Rate - 5yr. + 4.332%) to 12/31/2165 (n) | | | 5,003,000 | | | | 5,178,105 | |
| | | | | | | | |
| | | | | | $ | 31,520,410 | |
| | | | | | | | |
| Pharmaceuticals – 0.8% | | | | | |
| Allergan Funding SCS, 3.8%, 3/15/2025 | | $ | 9,371,000 | | | $ | 9,838,826 | |
| Elanco Animal Health, Inc., 4.272%, 8/28/2023 | | | 3,654,000 | | | | 3,857,404 | |
| Elanco Animal Health, Inc., 4.9%, 8/28/2028 | | | 2,914,000 | | | | 3,167,167 | |
| | | | | | | | |
| | | | | | $ | 16,863,397 | |
| | | | | | | | |
| Pollution Control – 0.2% | | | | | |
| Republic Services, Inc., 3.95%, 5/15/2028 | | $ | 2,924,000 | | | $ | 3,218,237 | |
| | | | | | | | |
| Real Estate – Apartment – 0.1% | | | | | |
| Mid-America Apartment Communities, Inc., REIT, 4.3%, 10/15/2023 | | $ | 2,417,000 | | | $ | 2,584,926 | |
| | | | | | | | |
| Real Estate – Healthcare – 0.2% | | | | | |
| MPT Operating Partnership LP/MPT Financial Co., REIT, 5%, 10/15/2027 | | $ | 3,890,000 | | | $ | 4,123,400 | |
| | | | | | | | |
| Real Estate – Retail – 0.6% | | | | | |
| Brixmor Operating Partnership LP, REIT, 3.875%, 8/15/2022 | | $ | 4,811,000 | | | $ | 5,010,233 | |
| VEREIT Operating Partnership LP, REIT, 3.1%, 12/15/2029 | | | 7,508,000 | | | | 7,372,139 | |
| | | | | | | | |
| | | | | | $ | 12,382,372 | |
| | | | | | | | |
| Retailers – 0.6% | | | | | |
| Best Buy Co., Inc., 5.5%, 3/15/2021 | | $ | 7,906,000 | | | $ | 8,159,000 | |
| Dollar Tree, Inc., 4.2%, 5/15/2028 | | | 4,440,000 | | | | 4,757,130 | |
| | | | | | | | |
| | | | | | $ | 12,916,130 | |
| | | | | | | | |
14
MFS Total Return Bond Series
Portfolio of Investments – continued
| | | | | | | | |
| | |
| Issuer | | Shares/Par | | | Value ($) | |
| BONDS – continued | | | | | |
| Telecommunications – Wireless – 1.3% | | | | | |
| American Tower Corp., REIT, 3.55%, 7/15/2027 | | $ | 12,018,000 | | | $ | 12,588,826 | |
| American Tower Corp., REIT, 3.8%, 8/15/2029 | | | 1,564,000 | | | | 1,669,764 | |
| Crown Castle International Corp., 2.25%, 9/01/2021 | | | 2,264,000 | | | | 2,269,978 | |
| Crown Castle International Corp., 3.2%, 9/01/2024 | | | 2,497,000 | | | | 2,581,192 | |
| Crown Castle International Corp., 3.7%, 6/15/2026 | | | 2,419,000 | | | | 2,554,713 | |
| Crown Castle International Corp., 4%, 3/01/2027 | | | 984,000 | | | | 1,061,387 | |
| Crown Castle International Corp., 3.8%, 2/15/2028 | | | 4,000,000 | | | | 4,258,786 | |
| | | | | | | | |
| | | | | | $ | 26,984,646 | |
| | | | | | | | |
| Tobacco – 0.8% | | | | | |
| Altria Group, Inc., 4.8%, 2/14/2029 | | $ | 1,814,000 | | | $ | 2,019,374 | |
| B.A.T Capital Corp., 3.222%, 8/15/2024 | | | 6,134,000 | | | | 6,268,949 | |
| Imperial Tobacco Finance PLC, 3.75%, 7/21/2022 (n) | | | 7,775,000 | | | | 8,001,804 | |
| | | | | | | | |
| | | | | | $ | 16,290,127 | |
| | | | | | | | |
| Transportation – Services – 0.3% | | | | | |
| ERAC USA Finance LLC, 3.85%, 11/15/2024 (n) | | $ | 1,612,000 | | | $ | 1,705,307 | |
| ERAC USA Finance LLC, 7%, 10/15/2037 (n) | | | 3,603,000 | | | | 5,086,792 | |
| | | | | | | | |
| | | | | | $ | 6,792,099 | |
| | | | | | | | |
| U.S. Government Agencies and Equivalents – 1.7% | |
| Small Business Administration, 4.93%, 1/01/2024 | | $ | 5,009 | | | $ | 5,185 | |
| Small Business Administration, 4.34%, 3/01/2024 | | | 11,828 | | | | 12,151 | |
| Small Business Administration, 4.99%, 9/01/2024 | | | 8,357 | | | | 8,676 | |
| Small Business Administration, 4.86%, 1/01/2025 | | | 20,099 | | | | 20,889 | |
| Small Business Administration, 4.625%, 2/01/2025 | | | 21,682 | | | | 22,571 | |
| Small Business Administration, 5.11%, 4/01/2025 | | | 11,222 | | | | 11,713 | |
| Small Business Administration, 4.43%, 5/01/2029 | | | 240,734 | | | | 252,446 | |
| Small Business Administration, 3.21%, 9/01/2030 | | | 3,353,195 | | | | 3,431,553 | |
| Small Business Administration, 3.25%, 11/01/2030 | | | 307,742 | | | | 317,769 | |
| Small Business Administration, 2.85%, 9/01/2031 | | | 701,277 | | | | 706,844 | |
| Small Business Administration, 2.37%, 8/01/2032 | | | 536,648 | | | | 535,396 | |
| Small Business Administration, 2.13%, 1/01/2033 | | | 2,181,417 | | | | 2,156,632 | |
| | | | | | | | |
| | |
| Issuer | | Shares/Par | | | Value ($) | |
| BONDS – continued | | | | | |
| U.S. Government Agencies and Equivalents – continued | |
| Small Business Administration, 2.21%, 2/01/2033 | | $ | 623,784 | | | $ | 617,330 | |
| Small Business Administration, 2.22%, 3/01/2033 | | | 2,124,852 | | | | 2,104,947 | |
| Small Business Administration, 2.08%, 4/01/2033 | | | 3,352,147 | | | | 3,299,785 | |
| Small Business Administration, 2.45%, 6/01/2033 | | | 3,511,491 | | | | 3,501,183 | |
| Small Business Administration, 3.15%, 7/01/2033 | | | 5,686,018 | | | | 5,835,150 | |
| Small Business Administration, 3.16%, 8/01/2033 | | | 5,416,098 | | | | 5,561,159 | |
| Small Business Administration, 3.62%, 9/01/2033 | | | 5,185,862 | | | | 5,431,501 | |
| | | | | | | | |
| | | | | | $ | 33,832,880 | |
| | | | | | | | |
| U.S. Treasury Obligations – 1.9% | |
| U.S. Treasury Bonds, 4.75%, 2/15/2037 | | $ | 1,576,000 | | | $ | 2,166,259 | |
| U.S. Treasury Bonds, 4.375%, 2/15/2038 | | | 7,523,000 | | | | 9,995,598 | |
| U.S. Treasury Bonds, 4.5%, 8/15/2039 | | | 228,600 | | | | 309,890 | |
| U.S. Treasury Bonds, 3.125%, 11/15/2041 | | | 500,000 | | | | 566,455 | |
| U.S. Treasury Bonds, 3%, 11/15/2045 | | | 7,735,000 | | | | 8,642,761 | |
| U.S. Treasury Bonds, 3%, 2/15/2048 (f) | | | 5,323,000 | | | | 5,976,993 | |
| U.S. Treasury Bonds, 2.875%, 5/15/2049 | | | 10,610,000 | | | | 11,681,458 | |
| | | | | | | | |
| | | | | | $ | 39,339,414 | |
| | | | | | | | |
| Utilities – Electric Power – 2.1% | |
| AEP Transmission Co. LLC, 3.1%, 12/01/2026 | | $ | 2,539,000 | | | $ | 2,628,460 | |
| Dominion Resources, Inc., 3.9%, 10/01/2025 | | | 2,048,000 | | | | 2,198,206 | |
| Enel Finance International N.V., 3.625%, 5/25/2027 (n) | | | 14,433,000 | | | | 14,937,526 | |
| Enel Finance International N.V., 3.5%, 4/06/2028 (n) | | | 6,000,000 | | | | 6,134,553 | |
| Exelon Corp., 3.497%, 6/01/2022 | | | 1,184,000 | | | | 1,215,461 | |
| FirstEnergy Corp., 4.85%, 7/15/2047 | | | 5,403,000 | | | | 6,408,223 | |
| PPL WEM Holdings PLC, 5.375%, 5/01/2021 (n) | | | 8,842,000 | | | | 9,101,097 | |
| | | | | | | | |
| | | | | | $ | 42,623,526 | |
| | | | | | | | |
Total Bonds
(Identified Cost, $1,989,824,816) | | | | | | $ | 2,070,470,205 | |
| | | | | | | | |
|
| INVESTMENT COMPANIES (h) – 1.1% | |
| Money Market Funds – 1.1% | | | | | | | | |
MFS Institutional Money Market Portfolio, 1.7% (v)
(Identified Cost, $23,060,708) | | | 23,060,848 | | | $ | 23,060,848 | |
| | | | | | | | |
15
MFS Total Return Bond Series
Portfolio of Investments – continued
| | | | | | | | | | | | | | | | |
| | | | | |
Underlying/
Expiration Date/ Exercise
Price | | Put/ Call | | Counter-
party | | Notional
Amount | | | Par
Amount/
Number of
Contracts | | | Value ($) | |
| PURCHASED OPTIONS – 0.0% | | | | | |
| Market Index Securities – 0.0% | | | | | |
| Markit CDX North America Investment Grade Index – March 2020 @ $72.5 (Premiums Paid, $420,660) | | Put | | Goldman
Sachs
International | | $ | 105,294,860 | | | $ | 102,600,000 | | | $ | 32,382 | |
| | | | | | | | | | | | | | | | |
OTHER ASSETS, LESS
LIABILITIES – (2.4)% | | | | | | | | (49,379,022 | ) |
| | | | | | | | | | | | | | | | |
| NET ASSETS – 100.0% | | | | | | | $ | 2,044,184,413 | |
| | | | | | | | | | | | | | | | |
| (f) | | All or a portion of the security has been segregated as collateral for open futures contracts. |
| (h) | | An affiliated issuer, which may be considered one in which the fund owns 5% or more of the outstanding voting securities, or a company which is under common control. At period end, the aggregate values of the fund’s investments in affiliated issuers and in unaffiliated issuers were $23,060,848 and $2,070,502,587, respectively. |
| (i) | | Interest only security for which the fund receives interest on notional principal (Par amount). Par amount shown is the notional principal and does not reflect the cost of the security. |
| (n) | | Securities exempt from registration under Rule 144A of the Securities Act of 1933. These securities may be sold in the ordinary course of business in transactions exempt from registration, normally to qualified institutional buyers. At period end, the aggregate value of these securities was $565,698,055, representing 27.7% of net assets. |
| (q) | | Interest received was less than stated coupon rate. |
| (v) | | Affiliated issuer that is available only to investment companies managed by MFS. The rate quoted for the MFS Institutional Money Market Portfolio is the annualizedseven-day yield of the fund at period end. |
| (z) | | Restricted securities are not registered under the Securities Act of 1933 and are subject to legal restrictions on resale. These securities generally may be resold in transactions exempt from registration or to the public if the securities are subsequently registered. Disposal of these securities may involve time-consuming negotiations and prompt sale at an acceptable price may be difficult. The fund holds the following restricted securities: |
| | | | | | | | | | |
| Restricted Securities | | Acquisition
Date | | Cost | | | Value | |
| | | |
| Toll Road Investors Partnership II LP, Capital Appreciation, 0%, 2/15/2029 | | 5/23/18 | | | $3,684,235 | | | | $3,958,641 | |
| | | |
| % of Net assets | | | | | | | | | 0.2% | |
The following abbreviations are used in this report and are defined:
| CDO | | Collateralized Debt Obligation |
| CLO | | Collateralized Loan Obligation |
| FLR | | Floating Rate. Interest rate resets periodically based on the parenthetically disclosed reference rate plus a spread (if any). Theperiod-end rate reported may not be the current rate. All reference rates are USD unless otherwise noted. |
| LIBOR | | London Interbank Offered Rate |
| REIT | | Real Estate Investment Trust |
Abbreviations indicate amounts shown in currencies other than the U.S. dollar. All amounts are stated in U.S. dollars unless otherwise indicated. A list of abbreviations is shown below:
16
MFS Total Return Bond Series
Portfolio of Investments – continued
Derivative Contracts at 12/31/19
Forward Foreign Currency Exchange Contracts
| | | | | | | | | | | | | | | | | | | | |
| Currency Purchased | | | | | Currency Sold | | Counterparty | | Settlement Date | | | Unrealized
Appreciation
(Depreciation) | |
| Asset Derivatives | | | | | | | | | | | | |
| USD | | | 60,625,523 | | | | | JPY | | 6,570,000,000 | | State Street Bank Corp. | | | 1/06/2020 | | | | $158,908 | |
| | | | | | | | | | | | | | | | | | | | |
Futures Contracts
| | | | | | | | | | | | | | | | | | | | | | |
| Description | | Long/
Short | | | Currency | | | Contracts | | | Notional
Amount | | | Expiration
Date | | Value/Unrealized
Appreciation
(Depreciation) | |
| Asset Derivatives | | | | | | | | | | | | | | | | | | | |
| Interest Rate Futures | | | | | | | | | | | | | | | | | | | |
| U.S. Treasury Ultra Note 10 yr | | | Short | | | | USD | | | | 893 | | | | $125,647,891 | | | March - 2020 | | | $1,826,224 | |
| | | | | | | | | | | | | | | | | | | | | | |
| Liability Derivatives | | | | | | | | | | | | | | | | | | | |
| Interest Rate Futures | | | | | | | | | | | | | | | | | | | |
| U.S. Treasury Note 2 yr | | | Long | | | | USD | | | | 1,011 | | | | $217,870,500 | | | March - 2020 | | | $(178,436 | ) |
| U.S. Treasury Ultra Bond | | | Long | | | | USD | | | | 728 | | | | 132,245,750 | | | March - 2020 | | | (2,958,071 | ) |
| | | | | | | | | | | | | | | | | | | | | | |
| | | | | | | | | | | | | | | | | | | | | $(3,136,507 | ) |
| | | | | | | | | | | | | | | | | | | | | | |
At December 31, 2019, the fund had liquid securities with an aggregate value of $2,919,436 to cover any collateral or margin obligations for certain derivative contracts.
See Notes to Financial Statements
17
MFS Total Return Bond Series
FINANCIAL STATEMENTS | STATEMENT OF ASSETS AND LIABILITIES
This statement represents your fund’s balance sheet, which details the assets and liabilities comprising the total value of the fund.
| | | | |
At 12/31/19 | | | | |
| |
Assets | | | | |
Investments in unaffiliated issuers, at value (identified cost, $1,990,245,476) | | | $2,070,502,587 | |
Investments in affiliated issuers, at value (identified cost, $23,060,708) | | | 23,060,848 | |
Cash | | | 1,196 | |
Foreign currency, at value (identified cost, $60,483,314) | | | 60,466,615 | |
Receivables for | | | | |
Forward foreign currency exchange contracts | | | 158,908 | |
Investments sold on an extended settlement basis | | | 22,777,384 | |
Fund shares sold | | | 1,977,996 | |
Interest | | | 13,838,732 | |
Other assets | | | 7,647 | |
Total assets | | | $2,192,791,913 | |
| |
Liabilities | | | | |
Payables for | | | | |
Net daily variation margin on open futures contracts | | | $640,874 | |
Investments purchased on an extended settlement basis | | | 146,871,377 | |
Fund shares reacquired | | | 790,775 | |
Payable to affiliates | | | | |
Investment adviser | | | 54,946 | |
Administrative services fee | | | 1,451 | |
Shareholder servicing costs | | | 565 | |
Distribution and/or service fees | | | 15,167 | |
Payable for independent Trustees’ compensation | | | 13 | |
Accrued expenses and other liabilities | | | 232,332 | |
Total liabilities | | | $148,607,500 | |
Net assets | | | $2,044,184,413 | |
| |
Net assets consist of | | | | |
Paid-in capital | | | $1,947,858,533 | |
Total distributable earnings (loss) | | | 96,325,880 | |
Net assets | | | $2,044,184,413 | |
Shares of beneficial interest outstanding | | | 153,157,137 | |
| | | | | | | | | | | | |
| | | |
| | | Net assets | | | Shares
outstanding | | | Net asset value
per share | |
Initial Class | | | $939,179,196 | | | | 69,679,485 | | | | $13.48 | |
Service Class | | | 1,105,005,217 | | | | 83,477,652 | | | | 13.24 | |
See Notes to Financial Statements
18
MFS Total Return Bond Series
FINANCIAL STATEMENTS | STATEMENT OF OPERATIONS
This statement describes how much your fund earned in investment income and accrued in expenses. It also describes any gains and/or losses generated by fund operations.
| | | | |
Year ended 12/31/19 | | | | |
| |
Net investment income (loss) | | | | |
Income | | | | |
Interest | | | $73,761,933 | |
Dividends from affiliated issuers | | | 960,468 | |
Other | | | 2,983 | |
Total investment income | | | $74,725,384 | |
Expenses | | | | |
Management fee | | | $10,184,835 | |
Distribution and/or service fees | | | 2,821,983 | |
Shareholder servicing costs | | | 25,093 | |
Administrative services fee | | | 284,369 | |
Independent Trustees’ compensation | | | 45,621 | |
Custodian fee | | | 99,921 | |
Shareholder communications | | | 77,002 | |
Audit and tax fees | | | 77,090 | |
Legal fees | | | 19,509 | |
Miscellaneous | | | 90,823 | |
Total expenses | | | $13,726,246 | |
Reduction of expenses by investment adviser | | | (198,744 | ) |
Net expenses | | | $13,527,502 | |
Net investment income (loss) | | | $61,197,882 | |
| |
Realized and unrealized gain (loss) | | | | |
Realized gain (loss) (identified cost basis) | | | | |
Unaffiliated issuers | | | $22,578,516 | |
Affiliated issuers | | | 4,517 | |
Futures contracts | | | (7,704,963 | ) |
Swap agreements | | | (1,069,252 | ) |
Forward foreign currency exchange contracts | | | 81,924 | |
Foreign currency | | | (16 | ) |
Net realized gain (loss) | | | $13,890,726 | |
Change in unrealized appreciation or depreciation | | | | |
Unaffiliated issuers | | | $119,314,045 | |
Affiliated issuers | | | 140 | |
Futures contracts | | | 108,055 | |
Swap agreements | | | 113,044 | |
Forward foreign currency exchange contracts | | | 158,908 | |
Translation of assets and liabilities in foreign currencies | | | (16,699 | ) |
Net unrealized gain (loss) | | | $119,677,493 | |
Net realized and unrealized gain (loss) | | | $133,568,219 | |
Change in net assets from operations | | | $194,766,101 | |
See Notes to Financial Statements
19
MFS Total Return Bond Series
FINANCIAL STATEMENTS | STATEMENTS OF CHANGES IN NET ASSETS
These statements describe the increases and/or decreases in net assets resulting from operations, any distributions, and any shareholder transactions.
| | | | | | | | |
| | | Year ended | |
| | | 12/31/19 | | | 12/31/18 | |
Change in net assets | | | | | | | | |
| | |
From operations | | | | | | | | |
Net investment income (loss) | | | $61,197,882 | | | | $63,995,629 | |
Net realized gain (loss) | | | 13,890,726 | | | | (13,616,978 | ) |
Net unrealized gain (loss) | | | 119,677,493 | | | | (82,182,005 | ) |
Change in net assets from operations | | | $194,766,101 | | | | $(31,803,354 | ) |
Total distributions to shareholders | | | $(66,623,045 | ) | | | $(67,069,142 | ) |
Change in net assets from fund share transactions | | | $(83,743,514 | ) | | | $(348,017,054 | ) |
Total change in net assets | | | $44,399,542 | | | | $(446,889,550 | ) |
| | |
Net assets | | | | | | | | |
At beginning of period | | | 1,999,784,871 | | | | 2,446,674,421 | |
At end of period | | | $2,044,184,413 | | | | $1,999,784,871 | |
See Notes to Financial Statements
20
MFS Total Return Bond Series
FINANCIAL STATEMENTS | FINANCIAL HIGHLIGHTS
The financial highlights table is intended to help you understand the fund’s financial performance for the past 5 years. Certain information reflects financial results for a single fund share. The total returns in the table represent the rate that an investor would have earned (or lost) on an investment in the fund share class (assuming reinvestment of all distributions) held for the entire period.
| | | | | | | | | | | | | | | | | | | | |
| Initial Class | | Year ended | |
| | | | | |
| | | 12/31/19 | | | 12/31/18 | | | 12/31/17 | | | 12/31/16 | | | 12/31/15 | |
| | | | | |
Net asset value, beginning of period | | | $12.65 | | | | $13.22 | | | | $13.09 | | | | $13.00 | | | | $13.50 | |
| | | | | |
| Income (loss) from investment operations | | | | | | | | | | | | | | | | | | | | |
Net investment income (loss) (d) | | | $0.42 | | | | $0.39 | | | | $0.36 | | | | $0.40 | (c) | | | $0.38 | |
Net realized and unrealized gain (loss) | | | 0.87 | | | | (0.53 | ) | | | 0.22 | | | | 0.16 | | | | (0.42 | ) |
Total from investment operations | | | $1.29 | | | | $(0.14 | ) | | | $0.58 | | | | $0.56 | | | | $(0.04 | ) |
| | | | | |
| Less distributions declared to shareholders | | | | | | | | | | | | | | | | | | | | |
From net investment income | | | $(0.46 | ) | | | $(0.43 | ) | | | $(0.45 | ) | | | $(0.47 | ) | | | $(0.46 | ) |
Net asset value, end of period (x) | | | $13.48 | | | | $12.65 | | | | $13.22 | | | | $13.09 | | | | $13.00 | |
Total return (%) (k)(r)(s)(x) | | | 10.21 | | | | (1.09 | ) | | | 4.46 | | | | 4.23 | (c) | | | (0.30 | ) |
| | | | | |
Ratios (%) (to average net assets)
and Supplemental data: | | | | | | | | | | | | | | | | | | | | |
Expenses before expense reductions (f) | | | 0.54 | | | | 0.54 | | | | 0.54 | | | | 0.53 | (c) | | | 0.54 | |
Expenses after expense reductions (f) | | | 0.53 | | | | 0.53 | | | | 0.53 | | | | 0.52 | (c) | | | 0.53 | |
Net investment income (loss) | | | 3.14 | | | | 3.04 | | | | 2.70 | | | | 2.98 | (c) | | | 2.83 | |
Portfolio turnover | | | 79 | | | | 48 | | | | 47 | | | | 37 | | | | 62 | |
Net assets at end of period (000 omitted) | | | $939,179 | | | | $862,752 | | | | $997,415 | | | | $986,877 | | | | $1,030,563 | |
| |
| Service Class | | Year ended | |
| | | | | |
| | | 12/31/19 | | | 12/31/18 | | | 12/31/17 | | | 12/31/16 | | | 12/31/15 | |
| | | | | |
Net asset value, beginning of period | | | $12.43 | | | | $12.99 | | | | $12.87 | | | | $12.78 | | | | $13.28 | |
| | | | | |
| Income (loss) from investment operations | | | | | | | | | | | | | | | | | | | | |
Net investment income (loss) (d) | | | $0.38 | | | | $0.35 | | | | $0.32 | | | | $0.36 | (c) | | | $0.34 | |
Net realized and unrealized gain (loss) | | | 0.85 | | | | (0.52 | ) | | | 0.22 | | | | 0.16 | | | | (0.41 | ) |
Total from investment operations | | | $1.23 | | | | $(0.17 | ) | | | $0.54 | | | | $0.52 | | | | $(0.07 | ) |
| | | | | |
| Less distributions declared to shareholders | | | | | | | | | | | | | | | | | | | | |
From net investment income | | | $(0.42 | ) | | | $(0.39 | ) | | | $(0.42 | ) | | | $(0.43 | ) | | | $(0.43 | ) |
Net asset value, end of period (x) | | | $13.24 | | | | $12.43 | | | | $12.99 | | | | $12.87 | | | | $12.78 | |
Total return (%) (k)(r)(s)(x) | | | 9.92 | | | | (1.33 | ) | | | 4.18 | | | | 4.01 | (c) | | | (0.58 | ) |
| | | | | |
Ratios (%) (to average net assets)
and Supplemental data: | | | | | | | | | | | | | | | | | | | | |
Expenses before expense reductions (f) | | | 0.79 | | | | 0.79 | | | | 0.79 | | | | 0.78 | (c) | | | 0.79 | |
Expenses after expense reductions (f) | | | 0.78 | | | | 0.78 | | | | 0.78 | | | | 0.77 | (c) | | | 0.78 | |
Net investment income (loss) | | | 2.89 | | | | 2.79 | | | | 2.45 | | | | 2.73 | (c) | | | 2.58 | |
Portfolio turnover | | | 79 | | | | 48 | | | | 47 | | | | 37 | | | | 62 | |
Net assets at end of period (000 omitted) | | | $1,105,005 | | | | $1,137,033 | | | | $1,449,260 | | | | $1,457,118 | | | | $1,539,194 | |
See Notes to Financial Statements
21
MFS Total Return Bond Series
Financial Highlights – continued
| (c) | Amount reflects aone-time reimbursement of expenses by the custodian (or former custodian) without which net investment income and performance would be lower and expenses would be higher. |
| (d) | Per share data is based on average shares outstanding. |
| (f) | Ratios do not reflect reductions from fees paid indirectly, if applicable. |
| (k) | The total return does not reflect expenses that apply to separate accounts. Inclusion of these charges would reduce the total return figures for all periods shown. |
| (r) | Certain expenses have been reduced without which performance would have been lower. |
| (s) | From time to time the fund may receive proceeds from litigation settlements, without which performance would be lower. |
| (x) | The net asset values and total returns have been calculated on net assets which include adjustments made in accordance with U.S. generally accepted accounting principles required at period end for financial reporting purposes. |
See Notes to Financial Statements
22
MFS Total Return Bond Series
NOTES TO FINANCIAL STATEMENTS
| (1) | | Business and Organization |
MFS Total Return Bond Series (the fund) is a diversified series of MFS Variable Insurance Trust (the trust). The trust is organized as a Massachusetts business trust and is registered under the Investment Company Act of 1940, as amended, as anopen-end management investment company. The shareholders of each series of the trust are separate accounts of insurance companies, which offer variable annuity and/or life insurance products, and qualified retirement and pension plans.
The fund is an investment company and accordingly follows the investment company accounting and reporting guidance of the Financial Accounting Standards Board (FASB) Accounting Standards Codification Topic 946 Financial Services – Investment Companies.
| (2) | | Significant Accounting Policies |
General– The preparation of financial statements in conformity with U.S. generally accepted accounting principles requires management to make estimates and assumptions that affect the reported amounts of assets and liabilities, and disclosure of contingent assets and liabilities at the date of the financial statements and the reported amounts of increases and decreases in net assets from operations during the reporting period. Actual results could differ from those estimates. In the preparation of these financial statements, management has evaluated subsequent events occurring after the date of the fund’s Statement of Assets and Liabilities through the date that the financial statements were issued. The fund invests in foreign securities. Investments in foreign securities are vulnerable to the effects of changes in the relative values of the local currency and the U.S. dollar and to the effects of changes in each country’s market, economic, industrial, political, regulatory, geopolitical, and other conditions.
In March 2017, the FASB issued Accounting Standards Update2017-08, Receivables – Nonrefundable Fees and Other Costs (Subtopic310-20) – Premium Amortization on Purchased Callable Debt Securities (“ASU2017-08”). For callable debt securities purchased at a premium that have explicit,non-contingent call features and that are callable at fixed prices on preset dates,ASU 2017-08 requires the premium to be amortized to the earliest call date. The fund adopted ASU2017-08 as of the beginning of the reporting period on a modified retrospective basis. The adoption resulted in a change in accounting principle, since the fund had historically amortized such premiums to maturity for U.S. GAAP. As a result of the adoption, the fund recognized a cumulative effect adjustment that decreased the beginning of period cost of investments and increased the unrealized appreciation on investments by $1,664,926. Adoption had no impact on the fund’s net assets or any prior period information presented in the financial statements. With respect to the fund’s results of operations, amortization of premium to first call date under ASU2017-08 accelerates amortization with the intent of more closely aligning the recognition of income on such bonds with the economics of the instrument.
Balance Sheet Offsetting– The fund’s accounting policy with respect to balance sheet offsetting is that, absent an event of default by the counterparty or a termination of the agreement, the International Swaps and Derivatives Association (ISDA) Master Agreement, or similar agreement, does not result in an offset of reported amounts of financial assets and financial liabilities in the Statement of Assets and Liabilities across transactions between the fund and the applicable counterparty. The fund’s right to setoff may be restricted or prohibited by the bankruptcy or insolvency laws of the particular jurisdiction to which a specific master netting agreement counterparty is subject. Balance sheet offsetting disclosures, to the extent applicable to the fund, have been included in the fund’s Significant Accounting Policies note under the captions for each of the fund’sin-scope financial instruments and transactions.
Investment Valuations– Debt instruments and floating rate loans, including restricted debt instruments, are generally valued at an evaluated or composite bid as provided by a third-party pricing service. Short-term instruments with a maturity at issuance of 60 days or less may be valued at amortized cost, which approximates market value. Exchange-traded options are generally valued at the last sale or official closing price on their primary exchange as provided by a third-party pricing service. Exchange-traded options for which there were no sales reported that day are generally valued at the last daily bid quotation on their primary exchange as provided by a third-party pricing service. For put options, the position may be valued at the last daily ask quotation if there are no trades reported during the day. Options not traded on an exchange are generally valued at a broker/dealer bid quotation. Foreign currency options are generally valued at valuations provided by a third-party pricing service. Futures contracts are generally valued at last posted settlement price on their primary exchange as provided by a third-party pricing service. Futures contracts for which there were no trades that day for a particular position are generally valued at the closing bid quotation on their primary exchange as provided by a third-party pricing service. Forward foreign currency exchange contracts are generally valued at the mean of bid and asked prices for the time period interpolated from rates provided by a third-party pricing service for proximate time periods. Swap agreements are generally valued using valuations provided by a third-party pricing service, which for cleared swaps includes an evaluation of any trading activity at the clearinghouses.Open-end investment companies are generally valued at net asset value per share. Securities and other assets generally valued on the basis of information from a third-party pricing service may also be valued at a broker/dealer bid quotation. In determining values, third-party pricing services can utilize both transaction data and market information such as yield, quality, coupon rate, maturity, type of issue, trading characteristics, and other market data. The values of foreign securities and other assets and liabilities expressed in foreign currencies are converted to U.S. dollars using the mean of bid and asked prices for rates provided by a third-party pricing service.
23
MFS Total Return Bond Series
Notes to Financial Statements – continued
The Board of Trustees has delegated primary responsibility for determining or causing to be determined the value of the fund’s investments (including any fair valuation) to the adviser pursuant to valuation policies and procedures approved by the Board. If the adviser determines that reliable market quotations are not readily available, investments are valued at fair value as determined in good faith by the adviser in accordance with such procedures under the oversight of the Board of Trustees. Under the fund’s valuation policies and procedures, market quotations are not considered to be readily available for most types of debt instruments and floating rate loans and many types of derivatives. These investments are generally valued at fair value based on information from third-party pricing services. In addition, investments may be valued at fair value if the adviser determines that an investment’s value has been materially affected by events occurring after the close of the exchange or market on which the investment is principally traded (such as foreign exchange or market) and prior to the determination of the fund’s net asset value, or after the halt of trading of a specific security where trading does not resume prior to the close of the exchange or market on which the security is principally traded. The adviser generally relies on third-party pricing services or other information (such as the correlation with price movements of similar securities in the same or other markets; the type, cost and investment characteristics of the security; the business and financial condition of the issuer; and trading and other market data) to assist in determining whether to fair value and at what value to fair value an investment. The value of an investment for purposes of calculating the fund’s net asset value can differ depending on the source and method used to determine value. When fair valuation is used, the value of an investment used to determine the fund’s net asset value may differ from quoted or published prices for the same investment. There can be no assurance that the fund could obtain the fair value assigned to an investment if it were to sell the investment at the same time at which the fund determines its net asset value per share.
Various inputs are used in determining the value of the fund’s assets or liabilities. These inputs are categorized into three broad levels. In certain cases, the inputs used to measure fair value may fall into different levels of the fair value hierarchy. In such cases, an investment’s level within the fair value hierarchy is based on the lowest level of input that is significant to the fair value measurement. The fund’s assessment of the significance of a particular input to the fair value measurement in its entirety requires judgment, and considers factors specific to the investment. Level 1 includes unadjusted quoted prices in active markets for identical assets or liabilities. Level 2 includes other significant observable market-based inputs (including quoted prices for similar securities, interest rates, prepayment speed, and credit risk). Level 3 includes unobservable inputs, which may include the adviser’s own assumptions in determining the fair value of investments. Other financial instruments are derivative instruments, such as futures contracts and forward foreign currency exchange contracts. The following is a summary of the levels used as of December 31, 2019 in valuing the fund’s assets or liabilities:
| | | | | | | | | | | | | | | | |
| Financial Instruments | | Level 1 | | | Level 2 | | | Level 3 | | | Total | |
| U.S. Treasury Bonds & U.S. Government Agencies & Equivalents | | | $— | | | | $73,172,294 | | | | $— | | | | $73,172,294 | |
| Non-U.S. Sovereign Debt | | | — | | | | 30,767,577 | | | | — | | | | 30,767,577 | |
| Municipal Bonds | | | — | | | | 56,136,732 | | | | — | | | | 56,136,732 | |
| U.S. Corporate Bonds | | | — | | | | 675,667,660 | | | | — | | | | 675,667,660 | |
| Residential Mortgage-Backed Securities | | | — | | | | 596,492,916 | | | | — | | | | 596,492,916 | |
| Commercial Mortgage-Backed Securities | | | — | | | | 293,764,310 | | | | — | | | | 293,764,310 | |
| Asset-Backed Securities (including CDOs) | | | — | | | | 175,090,979 | | | | — | | | | 175,090,979 | |
| Foreign Bonds | | | — | | | | 169,410,119 | | | | — | | | | 169,410,119 | |
| Mutual Funds | | | 23,060,848 | | | | — | | | | — | | | | 23,060,848 | |
| Total | | | $23,060,848 | | | | $2,070,502,587 | | | | $— | | | | $2,093,563,435 | |
| | | | |
| Other Financial Instruments | | | | | | | | | | | | |
| Futures Contracts – Assets | | | $1,826,224 | | | | $— | | | | $— | | | | $1,826,224 | |
| Futures Contracts – Liabilities | | | (3,136,507 | ) | | | — | | | | — | | | | (3,136,507 | ) |
| Forward Foreign Currency Exchange Contracts – Assets | | | — | | | | 158,908 | | | | — | | | | 158,908 | |
For further information regarding security characteristics, see the Portfolio of Investments.
Foreign Currency Translation– Purchases and sales of foreign investments, income, and expenses are converted into U.S. dollars based upon currency exchange rates prevailing on the respective dates of such transactions or on the reporting date for foreign denominated receivables and payables. Gains and losses attributable to foreign currency exchange rates on sales of securities are recorded for financial statement purposes as net realized gains and losses on investments. Gains and losses attributable to foreign exchange rate movements on receivables, payables, income and expenses are recorded for financial statement purposes as foreign currency transaction gains and losses. That portion of both realized and unrealized gains and losses on investments that results from fluctuations in foreign currency exchange rates is not separately disclosed.
Derivatives– The fund uses derivatives primarily to increase or decrease exposure to a particular market or segment of the market, or security, to increase or decrease interest rate or currency exposure, or as alternatives to direct investments. Derivatives are used for
24
MFS Total Return Bond Series
Notes to Financial Statements – continued
hedging ornon-hedging purposes. While hedging can reduce or eliminate losses, it can also reduce or eliminate gains. When the fund uses derivatives as an investment to increase market exposure, or for hedging purposes, gains and losses from derivative instruments may be substantially greater than the derivative’s original cost.
The derivative instruments used by the fund during the period were purchased options, futures contracts, forward foreign currency exchange contracts, and swap agreements. Depending on the type of derivative, the fund may exit a derivative position by entering into an offsetting transaction with a counterparty or exchange, negotiating an agreement with the derivative counterparty, or novating the position to a third party. The fund may be unable to promptly close out a futures position in instances where the daily fluctuation in the price for that type of future exceeds the daily limit set by the exchange. The fund’s period end derivatives, as presented in the Portfolio of Investments and the associated Derivative Contract tables, generally are indicative of the volume of its derivative activity during the period.
The following table presents, by major type of derivative contract, the fair value, on a gross basis, of the asset and liability components of derivatives held by the fund at December 31, 2019 as reported in the Statement of Assets and Liabilities:
| | | | | | | | | | |
| | | | | Fair Value (a) | |
| Risk | | Derivative Contracts | | Asset Derivatives | | | Liability Derivatives | |
| Interest Rate | | Interest Rate Futures | | | $1,826,224 | | | | $(3,136,507 | ) |
| Foreign Exchange | | Forward Foreign Currency Exchange Contracts | | | 158,908 | | | | — | |
| Credit | | Purchased Credit Options | | | 32,382 | | | | — | |
| Total | | | | | $2,017,514 | | | | $(3,136,507 | ) |
| (a) | The value of purchased options outstanding is included in investments in unaffiliated issuers, at value, within the fund’s Statement of Assets and Liabilities. Values presented in this table for futures contracts correspond to the values reported in the fund’s Portfolio of Investments. Only the current day net variation margin for futures contracts is separately reported within the fund’s Statement of Assets and Liabilities. |
The following table presents, by major type of derivative contract, the realized gain (loss) on derivatives held by the fund for the year ended December 31, 2019 as reported in the Statement of Operations:
| | | | | | | | | | | | | | | | |
Risk | | Futures Contracts | | | Swap Agreements | | | Forward Foreign
Currency
Exchange
Contracts | | | Unaffiliated Issuers
(Purchased
Options) | |
| Interest Rate | | | $(7,704,963 | ) | | | $— | | | | $— | | | | $(347,400 | ) |
| Foreign Exchange | | | — | | | | — | | | | 81,924 | | | | — | |
| Credit | | | — | | | | (1,069,252 | ) | | | — | | | | (356,490 | ) |
| Total | | | $(7,704,963 | ) | | | $(1,069,252 | ) | | | $81,924 | | | | $(703,890 | ) |
The following table presents, by major type of derivative contract, the change in unrealized appreciation or depreciation on derivatives held by the fund for the year ended December 31, 2019 as reported in the Statement of Operations:
| | | | | | | | | | | | | | | | |
| Risk | | Futures
Contracts | | | Swap
Agreements | | | Forward Foreign
Currency
Exchange
Contracts | | | Unaffiliated Issuers
(Purchased
Options) | |
| Interest Rate | | | $108,055 | | | | $— | | | | $— | | | | $— | |
| Foreign Exchange | | | — | | | | — | | | | 158,908 | | | | — | |
| Credit | | | — | | | | 113,044 | | | | — | | | | (388,278 | ) |
| Total | | | $108,055 | | | | $113,044 | | | | $158,908 | | | | $(388,278 | ) |
Derivative counterparty credit risk is managed through formal evaluation of the creditworthiness of all potential counterparties. On certain, but not all, uncleared derivatives, the fund attempts to reduce its exposure to counterparty credit risk whenever possible by entering into an ISDA Master Agreement on a bilateral basis. The ISDA Master Agreement gives each party to the agreement the right to terminate all transactions traded under such agreement if there is a specified deterioration in the credit quality of the other party. Upon an event of default or a termination of the ISDA Master Agreement, thenon-defaulting party has the right to close out all transactions traded under such agreement and to net amounts owed under each agreement to one net amount payable by one party to the other. This right to close out and net payments across all transactions traded under the ISDA Master Agreement could result in a reduction of the fund’s credit risk to such counterparty equal to any amounts payable by the fund under the applicable transactions, if any.
Collateral and margin requirements differ by type of derivative. For cleared derivatives (e.g., futures contracts, cleared swaps, and exchange-traded options), margin requirements are set by the clearing broker and the clearing house and collateral, in the form of
25
MFS Total Return Bond Series
Notes to Financial Statements – continued
cash or securities, is posted by the fund directly with the clearing broker. Collateral terms are counterparty agreement specific for uncleared derivatives (e.g., forward foreign currency exchange contracts, uncleared swap agreements, and uncleared options) and collateral, in the form of cash and securities, is held in segregated accounts with the fund’s custodian in connection with these agreements. For derivatives traded under an ISDA Master Agreement, which contains a collateral support annex, the collateral requirements are netted across all transactions traded under such counterparty-specific agreement and an amount is posted from one party to the other to collateralize such obligations. Cash that has been segregated or delivered to cover the fund’s collateral or margin obligations under derivative contracts, if any, will be reported separately in the Statement of Assets and Liabilities as restricted cash for uncleared derivatives and/or deposits with brokers for cleared derivatives. Securities pledged as collateral or margin for the same purpose, if any, are noted in the Portfolio of Investments. The fund may be required to make payments of interest on uncovered collateral or margin obligations with the broker. Any such payments are included in “Miscellaneous” expense in the Statement of Operations.
Purchased Options– The fund purchased put options for a premium. Purchased put options entitle the holder to sell a specified number of shares or units of a particular security, currency or index at a specified price at a specified date or within a specified period of time. Purchasing put options may hedge against an anticipated decline in the value of portfolio securities or currency or decrease the fund’s exposure to an underlying instrument.
The premium paid is initially recorded as an investment in the Statement of Assets and Liabilities. That investment is subsequentlymarked-to-market daily with the difference between the premium paid and the market value of the purchased option being recorded as unrealized appreciation or depreciation. Premiums paid for purchased put options which have expired are treated as realized losses on investments in the Statement of Operations. Upon the exercise or closing of a purchased put option, the premium paid is offset against the proceeds on the sale of the underlying security or financial instrument in order to determine the realized gain or loss on investments.
Whether or not the option is exercised, the fund’s maximum risk of loss from purchasing an option is the amount of premium paid. All option contracts involve credit risk if the counterparty to the option contract fails to perform. For uncleared options, this risk is mitigated in cases where there is an ISDA Master Agreement between the fund and the counterparty providing for netting as described above and, where applicable, by the posting of collateral by the counterparty to the fund to cover the fund’s exposure to the counterparty under such ISDA Master Agreement.
Futures Contracts– The fund entered into futures contracts which may be used to hedge against or obtain broad market exposure, interest rate exposure, currency exposure, or to manage duration. A futures contract represents a commitment for the future purchase or sale of an asset at a specified price on a specified date.
Upon entering into a futures contract, the fund is required to deposit with the broker, either in cash or securities, an initial margin in an amount equal to a specified percentage of the notional amount of the contract. Subsequent payments (variation margin) are made or received by the fund each day, depending on the daily fluctuations in the value of the contract, and are recorded for financial statement purposes as unrealized gain or loss by the fund until the contract is closed or expires at which point the gain or loss on futures contracts is realized.
The fund bears the risk of interest rates, exchange rates or securities prices moving unexpectedly, in which case, the fund may not achieve the anticipated benefits of the futures contracts and may realize a loss. While futures contracts may present less counterparty risk to the fund since the contracts are exchange traded and the exchange’s clearinghouse guarantees payments to the broker, there is still counterparty credit risk due to the insolvency of the broker. The fund’s maximum risk of loss due to counterparty credit risk is equal to the margin posted by the fund to the broker plus any gains or minus any losses on the outstanding futures contracts.
Forward Foreign Currency Exchange Contracts– The fund entered into forward foreign currency exchange contracts for the purchase or sale of a specific foreign currency at a fixed price on a future date. These contracts may be used to hedge the fund’s currency risk or for non-hedging purposes. For hedging purposes, the fund may enter into contracts to deliver or receive foreign currency that the fund will receive from or use in its normal investment activities. The fund may also use contracts to hedge against declines in the value of foreign currency denominated securities due to unfavorable exchange rate movements. For non-hedging purposes, the fund may enter into contracts with the intent of changing the relative exposure of the fund’s portfolio of securities to different currencies to take advantage of anticipated exchange rate changes.
Forward foreign currency exchange contracts are adjusted by the daily exchange rate of the underlying currency and any unrealized gains or losses are recorded as a receivable or payable for forward foreign currency exchange contracts until the contract settlement date. On contract settlement date, any gain or loss on the contract is recorded as realized gains or losses on forward foreign currency exchange contracts.
Risks may arise upon entering into these contracts from unanticipated movements in the value of the contract and from the potential inability of counterparties to meet the terms of their contracts. Generally, the fund’s maximum risk due to counterparty credit risk is the unrealized gain on the contract due to the use of Continuous Linked Settlement, a multicurrency cash settlement system for the
26
MFS Total Return Bond Series
Notes to Financial Statements – continued
centralized settlement of foreign transactions. This risk is mitigated in cases where there is an ISDA Master Agreement between the fund and the counterparty providing for netting as described above and, where applicable, by the posting of collateral by the counterparty to the fund to cover the fund’s exposure to the counterparty under such ISDA Master Agreement.
Swap Agreements– During the period the fund entered into swap agreements. Swap agreements generally involve a periodic exchange of cash payments on a net basis, at specified intervals or upon the occurrence of specified events, between the fund and a counterparty. Certain swap agreements may be entered into as a bilateral contract (“uncleared swaps”) while others are required to be centrally cleared (“cleared swaps”). In a cleared swap transaction, the ultimate counterparty to the transaction is a clearinghouse (the “clearinghouse”). The contract is transferred and accepted by the clearinghouse immediately following execution of the swap contract with an executing broker. Thereafter, throughout the term of the cleared swap, the fund interfaces indirectly with the clearinghouse through a clearing broker and has counterparty risk to the clearing broker as well.
Both cleared and uncleared swap agreements are marked to market daily. The value of uncleared swap agreements is reported in the Statement of Assets and Liabilities as “Uncleared swaps, at value” which includes any related interest accruals to be paid or received by the fund. For cleared swaps, payments (variation margin) are made or received by the fund each day, depending on the daily fluctuations in the value of the cleared swap, such that only the current day net receivable or payable for variation margin is reported in the Statement of Assets and Liabilities.
For both cleared and uncleared swaps, the periodic exchange of net cash payments, at specified intervals or upon the occurrence of specified events as stipulated by the agreement, is recorded as realized gain or loss on swap agreements in the Statement of Operations. Premiums paid or received at the inception of the agreements are amortized using the effective interest method over the term of the agreement as realized gain or loss on swap agreements in the Statement of Operations. A liquidation payment received or made upon early termination is recorded as a realized gain or loss on swap agreements in the Statement of Operations. The change in unrealized appreciation or depreciation on swap agreements in the Statement of Operations reflects the aggregate change over the reporting period in the value of swaps net of any unamortized premiums paid or received.
Risks related to swap agreements include the possible lack of a liquid market, unfavorable market and interest rate movements of the underlying instrument and the failure of the counterparty to perform under the terms of the agreements. The fund’s maximum risk of loss from counterparty credit risk is the discounted net value of the cash flows to be received from/paid to the counterparty over the contract’s remaining life, to the extent that the amount is positive. To address counterparty risk, uncleared swap agreements are limited to only highly-rated counterparties. Risk is further reduced by having an ISDA Master Agreement between the fund and the counterparty providing for netting as described above and, where applicable, by the posting of collateral by the counterparty to the fund to cover the fund’s exposure to the counterparty under such ISDA Master Agreement. The fund’s counterparty risk due to cleared swaps is mitigated by the fact that the clearinghouse is the true counterparty to the transaction and the regulatory requirement safeguards in the event of a clearing broker bankruptcy.
The fund entered into credit default swap agreements in order to manage its exposure to the market or certain sectors of the market, to reduce its credit risk exposure to defaults of corporate and sovereign issuers or to create exposure to corporate or sovereign issuers to which it is not otherwise exposed. In a credit default swap agreement, the protection buyer can make an upfront payment and will make a stream of payments to the protection seller based on a fixed percentage applied to the agreement notional amount in exchange for the right to receive a specified return upon the occurrence of a defined credit event on the reference obligation (which may be either a single security or a basket of securities issued by corporate or sovereign issuers) and, with respect to the cases where physical settlement applies, the delivery by the buyer to the seller of a defined deliverable obligation. Although agreement-specific, credit events generally consist of a combination of the following: bankruptcy, failure to pay, restructuring, obligation acceleration, obligation default, or repudiation/moratorium, each as defined in the 2003 ISDA Credit Derivatives Definitions as amended by the relevant agreement. Restructuring is generally not applicable when the reference obligation is issued by a North American corporation and obligation acceleration, obligation default, or repudiation/moratorium are generally only applicable when the reference obligation is issued by a sovereign entity or an entity in an emerging country. Upon determination of the final price for the deliverable obligation (or upon delivery of the deliverable obligation in the case of physical settlement), the difference between the value of the deliverable obligation and the swap agreement’s notional amount is recorded as realized gain or loss on swap agreements in the Statement of Operations.
TBA Dollar Roll Transactions– The fund enters into TBA dollar roll transactions in which the fund sells TBA mortgage-backed securities to financial institutions and simultaneously agrees to repurchase similar (same issuer, type and coupon) securities at a later date at an agreed-upon price. During the period between the sale and repurchase, the fund will not be entitled to receive interest and principal payments on the securities sold. The fund accounts for dollar roll transactions as purchases and sales and realizes gains and losses on these transactions. TBA dollar roll transactions involve the risk that the market value of the securities that the fund is required to purchase may decline below the agreed upon repurchase price of those securities.
Indemnifications– Under the fund’s organizational documents, its officers and Trustees may be indemnified against certain liabilities and expenses arising out of the performance of their duties to the fund. Additionally, in the normal course of business, the
27
MFS Total Return Bond Series
Notes to Financial Statements – continued
fund enters into agreements with service providers that may contain indemnification clauses. The fund’s maximum exposure under these agreements is unknown as this would involve future claims that may be made against the fund that have not yet occurred.
Investment Transactions and Income– Investment transactions are recorded on the trade date. Interest income is recorded on the accrual basis. All premium and discount is amortized or accreted for financial statement purposes in accordance with U.S. generally accepted accounting principles. Some securities may be purchased on a “when-issued” or “forward delivery” basis, which means that the securities will be delivered to the fund at a future date, usually beyond customary settlement time. Interest payments received in additional securities are recorded on theex-interest date in an amount equal to the value of the security on such date.
The fund may receive proceeds from litigation settlements. Any proceeds received from litigation involving portfolio holdings are reflected in the Statement of Operations in realized gain/loss if the security has been disposed of by the fund or in unrealized gain/loss if the security is still held by the fund. Any other proceeds from litigation not related to portfolio holdings are reflected as other income in the Statement of Operations.
The fund invests a significant portion of its assets in asset-backed and/or mortgage-backed securities. For these securities, the value of the debt instrument also depends on the credit quality and adequacy of the underlying assets or collateral as well as whether there is a security interest in the underlying assets or collateral. Enforcing rights, if any, against the underlying assets or collateral may be difficult. U.S. Government securities not supported as to the payment of principal or interest by the U.S. Treasury, such as those issued by Fannie Mae, Freddie Mac, and the Federal Home Loan Banks, are subject to greater credit risk than are U.S. Government securities supported by the U.S. Treasury, such as those issued by Ginnie Mae.
The fund purchased or sold debt securities on a when-issued or delayed delivery basis, or in a “To Be Announced” (TBA) or “forward commitment” transaction with delivery or payment to occur at a later date beyond the normal settlement period. When the fund sells securities on a when-issued, delayed delivery, or forward commitment basis, the fund typically owns or has the right to acquire securities equivalent in kind and amount to the delivered securities. At the time a fund enters into a commitment to purchase or sell a security, the transaction is recorded and the value of the security acquired or sold is reflected in the fund’s net asset value. The price of such security and the date that the security will be delivered and paid for are fixed at the time the transaction is negotiated. The value of the security may vary with market fluctuations. TBA securities resulting from these transactions are included in the Portfolio of Investments. TBA purchase and sale commitments are held at carrying amount, which approximates fair value and are categorized as level 2 within the fair value hierarchy and included in Investments purchased or sold on an extended settlement basis in the Statement of Assets and Liabilities. No interest accrues to the fund until payment takes place. At the time that a fund enters into this type of transaction, the fund is required to have sufficient cash and/or liquid securities to cover its commitments. Losses may arise due to changes in the value of the underlying securities prior to settlement date or if the counterparty does not perform under the contract’s terms, or if the issuer does not issue the securities due to political, economic or other factors.
To mitigate the counterparty credit risk on TBA securities and other types of forward settling mortgage-backed securities, the fund whenever possible enters into a Master Securities Forward Transaction Agreement (“MSFTA”) on a bilateral basis with each of the counterparties with whom it undertakes a significant volume of transactions. The MSFTA gives each party to the agreement the right to terminate all transactions traded under such agreement if there is a specified deterioration in the credit quality of the other party. Upon an event of default or a termination of the MSFTA, thenon-defaulting party has the right to close out all transactions traded under such agreement and to net amounts owed under each transaction to one net amount payable by one party to the other. This right to close out and net payments across all transactions traded under the MSFTA could result in a reduction of the fund’s credit risk to such counterparty equal to any amounts payable by the fund under the applicable transactions, if any.
For mortgage-backed securities traded under a MSFTA, the collateral and margining requirements are contract specific. Collateral amounts across all transactions traded under such agreement are netted and an amount is posted from one party to the other to collateralize such obligations. Cash that has been pledged to cover the fund’s collateral or margin obligations under a MSFTA, if any, will be reported separately on the Statement of Assets and Liabilities as restricted cash. Securities pledged as collateral or margin for the same purpose, if any, are noted in the Portfolio of Investments.
Tax Matters and Distributions– The fund intends to qualify as a regulated investment company, as defined under Subchapter M of the Internal Revenue Code, and to distribute all of its taxable income, including realized capital gains. As a result, no provision for federal income tax is required. The fund’s federal tax returns, when filed, will remain subject to examination by the Internal Revenue Service for a three year period. Management has analyzed the fund’s tax positions taken on federal and state tax returns for all open tax years and does not believe that there are any uncertain tax positions that require recognition of a tax liability. Foreign taxes, if any, have been accrued by the fund in the accompanying financial statements in accordance with the applicable foreign tax law. Foreign income taxes may be withheld by certain countries in which the fund invests. Additionally, capital gains realized by the fund on securities issued in or by certain foreign countries may be subject to capital gains tax imposed by those countries.
Distributions to shareholders are recorded on theex-dividend date. Income and capital gain distributions are determined in accordance with income tax regulations, which may differ from U.S. generally accepted accounting principles. Certain capital
28
MFS Total Return Bond Series
Notes to Financial Statements – continued
accounts in the financial statements are periodically adjusted for permanent differences in order to reflect their tax character. These adjustments have no impact on net assets or net asset value per share. Temporary differences which arise from recognizing certain items of income, expense, gain or loss in different periods for financial statement and tax purposes will reverse at some time in the future.
Book/tax differences primarily relate to amortization and accretion of debt securities and derivative transactions.
The tax character of distributions declared to shareholders for the last two fiscal years is as follows:
| | | | | | | | |
| | | Year ended
12/31/19 | | | Year ended
12/31/18 | |
| Ordinary income (including any short-term capital gains) | | | $66,623,045 | | | | $67,069,142 | |
The federal tax cost and the tax basis components of distributable earnings were as follows:
| | | | |
| As of 12/31/19 | | | | |
| |
| Cost of investments | | | $2,017,194,428 | |
| Gross appreciation | | | 78,988,155 | |
| Gross depreciation | | | (3,770,523 | ) |
| Net unrealized appreciation (depreciation) | | | $75,217,632 | |
| |
| Undistributed ordinary income | | | 63,393,954 | |
| Capital loss carryforwards | | | (42,269,007 | ) |
| Other temporary differences | | | (16,699 | ) |
As of December 31, 2019, the fund had capital loss carryforwards available to offset future realized gains. These net capital losses may be carried forward indefinitely and their character is retained as short-term and/or long-term losses. Such losses are characterized as follows:
| | | | |
| Short-Term | | | $(13,097,459 | ) |
| Long-Term | | | (29,171,548 | ) |
| Total | | | $(42,269,007 | ) |
Multiple Classes of Shares of Beneficial Interest– The fund offers multiple classes of shares, which differ in their respective distribution and/or service fees. The fund’s income, realized and unrealized gain (loss), and common expenses are allocated to shareholders based on the daily net assets of each class. Dividends are declared separately for each class. Differences in per share dividend rates are generally due to differences in separate class expenses. The fund’s distributions declared to shareholders as reported in the Statements of Changes in Net Assets are presented by class as follows:
| | | | | | | | |
| | |
| | | Year ended
12/31/19 | | | Year ended
12/31/18 | |
| Initial Class | | | $31,038,442 | | | | $30,420,323 | |
| Service Class | | | 35,584,603 | | | | 36,648,819 | |
| Total | | | $66,623,045 | | | | $67,069,142 | |
| (3) | | Transactions with Affiliates |
Investment Adviser– The fund has an investment advisory agreement with MFS to provide overall investment management and related administrative services and facilities to the fund. The management fee is computed daily and paid monthly at the following annual rates based on the fund’s average daily net assets:
| | | | |
| Up to $2.5 billion | | | 0.50% | |
| In excess of $2.5 billion and up to $5 billion | | | 0.45% | |
| In excess of $5 billion | | | 0.40% | |
MFS has agreed in writing to reduce its management fee by a specified amount if certain MFS mutual fund assets exceed thresholds agreed to by MFS and the fund’s Board of Trustees. For the year ended December 31, 2019, this management fee reduction amounted to $198,744, which is included in the reduction of total expenses in the Statement of Operations. The management fee incurred for the year ended December 31, 2019 was equivalent to an annual effective rate of 0.49% of the fund’s average daily net assets.
Distributor– MFS Fund Distributors, Inc. (MFD), a wholly-owned subsidiary of MFS, is the distributor of shares of the fund. The Trustees have adopted a distribution plan for the Service Class shares pursuant to Rule12b-1 under the Investment Company Act of 1940.
The fund’s distribution plan provides that the fund will pay MFD distribution and/or service fees equal to 0.25% per annum of its average daily net assets attributable to Service Class shares as partial consideration for services performed and expenses incurred by MFD and financial intermediaries (including participating insurance companies that invest in the fund to fund variable annuity and
29
MFS Total Return Bond Series
Notes to Financial Statements – continued
variable life insurance contracts, sponsors of qualified retirement and pension plans that invest in the fund, and affiliates of these participating insurance companies and plan sponsors) in connection with the sale and distribution of the Service Class shares. MFD may subsequently pay all, or a portion, of the distribution and/or service fees to financial intermediaries.
Shareholder Servicing Agent– MFS Service Center, Inc. (MFSC), a wholly-owned subsidiary of MFS, receives a fee from the fund for its services as shareholder servicing agent. For the year ended December 31, 2019, the fee was $23,966, which equated to 0.0012% annually of the fund’s average daily net assets. MFSC also receives payment from the fund forout-of-pocket expenses paid by MFSC on behalf of the fund. For the year ended December 31, 2019, these costs amounted to $1,127.
Administrator– MFS provides certain financial, legal, shareholder communications, compliance, and other administrative services to the fund. Under an administrative services agreement, the fund reimburses MFS the costs incurred to provide these services. The fund is charged an annual fixed amount of $17,500 plus a fee based on average daily net assets. The administrative services fee incurred for the year ended December 31, 2019 was equivalent to an annual effective rate of 0.0140% of the fund’s average daily net assets.
Trustees’ and Officers’ Compensation– The fund pays compensation to independent Trustees in the form of a retainer, attendance fees, and additional compensation to Board and Committee chairpersons. The fund does not pay compensation directly to Trustees or officers of the fund who are also officers of the investment adviser, all of whom receive remuneration from MFS for their services to the fund. Certain officers and Trustees of the fund are officers or directors of MFS, MFD, and MFSC.
Other– This fund and certain other funds managed by MFS (the funds) had entered into a service agreement (the ISO Agreement) which provided for payment of fees solely by the funds to Tarantino LLC in return for the provision of services of an Independent Senior Officer (ISO) for the funds. Frank L. Tarantino served as the ISO and was an officer of the funds and the sole member of Tarantino LLC. Effective June 30, 2019, Mr. Tarantino retired from his position as ISO for the funds, and the ISO Agreement was terminated. For the year ended December 31, 2019, the fee paid by the fund under this agreement was $2,394 and is included in “Miscellaneous” expense in the Statement of Operations. MFS had agreed to bear all expenses associated with office space, other administrative support, and supplies provided to the ISO.
The fund invests in the MFS Institutional Money Market Portfolio which is managed by MFS and seeks current income consistent with preservation of capital and liquidity. This money market fund does not pay a management fee to MFS.
The fund is permitted to engage in purchase and sale transactions with funds and accounts for which MFS serves as investment adviser orsub-adviser (“cross-trades”) pursuant to a policy adopted by the Board of Trustees. This policy has been designed to ensure that cross-trades conducted by the fund comply with Rule17a-7 under the Investment Company Act of 1940. During the year ended December 31, 2019, the fund engaged sale transactions pursuant to this policy, which amounted to $4,202,200. The sales transactions resulted in net realized gains (losses) of $151,343.
For the year ended December 31, 2019, purchases and sales of investments, other than purchased option transactions andshort-term obligations, were as follows:
| | | | | | | | |
| | | Purchases | | | Sales | |
| U.S. Government securities | | | $1,143,651,318 | | | | $1,196,396,628 | |
| Non-U.S. Government securities | | | $481,173,816 | | | | $458,051,342 | |
30
MFS Total Return Bond Series
Notes to Financial Statements – continued
| (5) | | Shares of Beneficial Interest |
The fund’s Declaration of Trust permits the Trustees to issue an unlimited number of full and fractional shares of beneficial interest. Transactions in fund shares were as follows:
| | | | | | | | | | | | | | | | |
| | | Year ended 12/31/19 | | | Year ended 12/31/18 | |
| | | | |
| | | Shares | | | Amount | | | Shares | | | Amount | |
| Shares sold | | | | | | | | | | | | | | | | |
Initial Class | | | 8,456,171 | | | | $112,135,400 | | | | 5,734,240 | | | | $73,767,560 | |
Service Class | | | 5,257,057 | | | | 68,444,844 | | | | 7,241,190 | | | | 90,993,877 | |
| | | 13,713,228 | | | | $180,580,244 | | | | 12,975,430 | | | | $164,761,437 | |
| | | | |
| Shares issued to shareholders in reinvestment of distributions | | | | | | | | | | | | | | | | |
Initial Class | | | 2,247,912 | | | | $30,369,288 | | | | 2,357,326 | | | | $29,749,458 | |
Service Class | | | 2,679,563 | | | | 35,584,603 | | | | 2,953,168 | | | | 36,648,819 | |
| | | 4,927,475 | | | | $65,953,891 | | | | 5,310,494 | | | | $66,398,277 | |
| | | | |
| Shares reacquired | | | | | | | | | | | | | | | | |
Initial Class | | | (9,216,617 | ) | | | $(122,502,428 | ) | | | (15,362,499 | ) | | | $(196,308,933 | ) |
Service Class | | | (15,939,795 | ) | | | (207,775,221 | ) | | | (30,317,090 | ) | | | (382,867,835 | ) |
| | | (25,156,412 | ) | | | $(330,277,649 | ) | | | (45,679,589 | ) | | | $(579,176,768 | ) |
| | | | |
| Net change | | | | | | | | | | | | | | | | |
Initial Class | | | 1,487,466 | | | | $20,002,260 | | | | (7,270,933 | ) | | | $(92,791,915 | ) |
Service Class | | | (8,003,175 | ) | | | (103,745,774 | ) | | | (20,122,732 | ) | | | (255,225,139 | ) |
| | | (6,515,709 | ) | | | $(83,743,514 | ) | | | (27,393,665 | ) | | | $(348,017,054 | ) |
The fund is one of several mutual funds in which certain MFS funds may invest. The MFS funds do not invest in the underlying funds for the purpose of exercising management or control. At the end of the period, the MFS Moderate Allocation Portfolio and the MFS Conservative Allocation Portfolio were the owners of record of approximately 8% and 4%, respectively, of the value of outstanding voting shares of the fund. In addition, the MFS Growth Allocation Portfolio was the owner of record of less than 1% of the value of the outstanding voting shares of the fund.
The fund and certain other funds managed by MFS participate in a $1.25 billion unsecured committed line of credit, subject to a $1 billion sublimit, provided by a syndicate of banks under a credit agreement. Borrowings may be made for temporary financing needs. Interest is charged to each fund, based on its borrowings, generally at a rate equal to the highest of one month LIBOR, the Federal Funds Effective Rate and the Overnight Bank Funding Rate, plus an agreed upon spread. A commitment fee, based on the average daily, unused portion of the committed line of credit, is allocated among the participating funds. In addition, the fund and other funds managed by MFS have established unsecured uncommitted borrowing arrangements with certain banks for temporary financing needs. Interest is charged to each fund, based on its borrowings, at rates equal to customary reference rates plus an agreed upon spread. For the year ended December 31, 2019, the fund’s commitment fee and interest expense were $11,677 and $0, respectively, and are included in “Miscellaneous” expense in the Statement of Operations.
| (7) | | Investments in Affiliated Issuers |
An affiliated issuer may be considered one in which the fund owns 5% or more of the outstanding voting securities, or a company which is under common control. For the purposes of this report, the following were affiliated issuers:
| | | | | | | | | | | | | | | | | | | | | | | | |
| Affiliated Issuers | | Beginning
Value | | | Purchases | | | Sales
Proceeds | | | Realized
Gain
(Loss) | | | Change in
Unrealized
Appreciation or
Depreciation | | | Ending
Value | |
| MFS Institutional Money Market Portfolio | | | $3,161,922 | | | | $611,937,414 | | | | $592,043,145 | | | | $4,517 | | | | $140 | | | | $23,060,848 | |
| | | | | | |
| Affiliated Issuers | | | | | | | | | | | | | | Dividend
Income | | | Capital Gain
Distributions | |
| MFS Institutional Money Market Portfolio | | | | | | | | | | | | $960,468 | | | | $— | |
31
MFS Total Return Bond Series
REPORT OF INDEPENDENT REGISTERED PUBLIC ACCOUNTING FIRM
To the Board of Trustees of MFS Variable Insurance Trust and the Shareholders of
MFS Total Return Bond Series:
Opinion on the Financial Statements and Financial Highlights
We have audited the accompanying statement of assets and liabilities of MFS Total Return Bond Series (the “Fund”), including the portfolio of investments, as of December 31, 2019, the related statement of operations for the year then ended, the statements of changes in net assets for each of the two years in the period then ended, the financial highlights for each of the five years in the period then ended, and the related notes. In our opinion, the financial statements and financial highlights present fairly, in all material respects, the financial position of the Fund as of December 31, 2019, and the results of its operations for the year then ended, the changes in its net assets for each of the two years in the period then ended, and the financial highlights for each of the five years in the period then ended, in conformity with accounting principles generally accepted in the United States of America.
Basis for Opinion
These financial statements and financial highlights are the responsibility of the Fund’s management. Our responsibility is to express an opinion on the Fund’s financial statements and financial highlights based on our audits. We are a public accounting firm registered with the Public Company Accounting Oversight Board (United States) (PCAOB) and are required to be independent with respect to the Fund in accordance with the U.S. federal securities laws and the applicable rules and regulations of the Securities and Exchange Commission and the PCAOB.
We conducted our audits in accordance with the standards of the PCAOB. Those standards require that we plan and perform the audit to obtain reasonable assurance about whether the financial statements and financial highlights are free of material misstatement, whether due to error or fraud. The Fund is not required to have, nor were we engaged to perform, an audit of its internal control over financial reporting. As part of our audits we are required to obtain an understanding of internal control over financial reporting but not for the purpose of expressing an opinion on the effectiveness of the Fund’s internal control over financial reporting. Accordingly, we express no such opinion.
Our audits included performing procedures to assess the risks of material misstatement of the financial statements and financial highlights, whether due to error or fraud, and performing procedures that respond to those risks. Such procedures included examining, on a test basis, evidence regarding the amounts and disclosures in the financial statements and financial highlights. Our audits also included evaluating the accounting principles used and significant estimates made by management, as well as evaluating the overall presentation of the financial statements and financial highlights. Our procedures included confirmation of securities owned as of December 31, 2019, by correspondence with the custodian and brokers; when replies were not received from brokers, we performed other auditing procedures. We believe that our audits provide a reasonable basis for our opinion.
DELOITTE & TOUCHE LLP
Boston, Massachusetts
February 14, 2020
We have served as the auditor of one or more of the MFS investment companies since 1924.
32
MFS Total Return Bond Series
TRUSTEES AND OFFICERS – IDENTIFICATION AND BACKGROUND
The Trustees and Officers of the Trust, as of February 1, 2020, are listed below, together with their principal occupations during the past five years. (Their titles may have varied during that period.) The address of each Trustee and Officer is 111 Huntington Avenue, Boston, Massachusetts 02199-7618.
| | | | | | | | | | |
Name, Age | | Position(s)
Held with Fund | | Trustee/Officer
Since (h) | | Number of MFS Funds
overseen by the
Trustee | | Principal Occupations
During the Past Five Years | | Other Directorships During the Past Five Years (j) |
| INTERESTED TRUSTEES |
Robert J. Manning (k)
(age 56) | | Trustee | | February 2004 | | 133 | | Massachusetts Financial Services Company, Executive Chairman (since January 2017); Director; Chairman of the Board; Chief Executive Officer (until 2015);Co-Chief Executive Officer(2015-2016) | | N/A |
| | | | | |
Robin A. Stelmach (k) (age 58) | | Trustee | | January 2014 | | 133 | | Massachusetts Financial Services Company, Vice Chair (since January 2017); Chief Operating Officer and Executive Vice President (until January 2017) | | N/A |
|
| INDEPENDENT TRUSTEES |
John P. Kavanaugh (age 65) | | Trustee and Chair of Trustees | | January 2009 | | 133 | | Private investor | | N/A |
| | | | | |
Steven E. Buller (age 68) | | Trustee | | February 2014 | | 133 | | Financial Accounting Standards Advisory Council, Chairman(2014-2015); Public Company Accounting Oversight Board, Standing Advisory Group, Member (until 2014); BlackRock, Inc. (investment management), Managing Director (until 2014), BlackRock Finco UK (investment management), Director (until 2014) | | N/A |
| | | | | |
John A. Caroselli (age 65) | | Trustee | | March 2017 | | 133 | | JC Global Advisors, LLC (management consulting), President (since 2015); First Capital Corporation (commercial finance), Executive Vice President (until 2015) | | N/A |
| | | | | |
Maureen R. Goldfarb (age 64) | | Trustee | | January 2009 | | 133 | | Private investor | | N/A |
| | | | | |
Peter D. Jones
(age 64) | | Trustee | | January 2019 | | 133 | | Franklin Templeton Distributors, Inc. (investment management), President (until 2015); Franklin Templeton Institutional, LLC (investment management), Chairman (until 2015) | | N/A |
| | | | | |
James W. Kilman, Jr.
(age 58) | | Trustee | | January 2019 | | 133 | | Burford Capital Limited (finance and investment management), Chief Financial Officer (since 2019); KielStrand Capital LLC (family office), Chief Executive Officer (since 2016); Morgan Stanley & Co. (financial services), Vice Chairman of Investment Banking,Co-Head of Diversified Financials Coverage – Financial Institutions Investment Banking Group (until 2016) | | Alpha-En Corporation, Director (2016-2019) |
33
MFS Total Return Bond Series
Trustees and Officers – continued
| | | | | | | | | | |
Name, Age | | Position(s)
Held with Fund | | Trustee/Officer
Since (h) | | Number of MFS Funds
overseen by the
Trustee | | Principal Occupations
During the Past Five Years | | Other Directorships During the Past Five Years (j) |
Clarence Otis, Jr. (age 63) | | Trustee | | March 2017 | | 133 | | Darden Restaurants, Inc., Chief Executive Officer (until 2014) | | VF Corporation, Director; Verizon Communications, Inc., Director; The Travelers Companies, Director; Federal Reserve Bank of Atlanta, Director (until 2015) |
| | | | | |
Maryanne L. Roepke (age 63) | | Trustee | | May 2014 | | 133 | | American Century Investments (investment management), Senior Vice President and Chief Compliance Officer (until 2014) | | N/A |
| | | | | |
Laurie J. Thomsen
(age 62) | | Trustee | | March 2005 | | 133 | | Private investor | | The Travelers Companies, Director; Dycom Industries, Inc., Director (since 2015) |
| | | | | | | | |
Name, Age | | Position(s)
Held with Fund | | Trustee/Officer
Since (h) | | Number of
MFS Funds
for which the
Person is an
Officer | | Principal Occupations During the Past Five Years |
| OFFICERS | | | | | | |
Christopher R. Bohane (k)
(age 46) | | Assistant Secretary and Assistant Clerk | | July 2005 | | 133 | | Massachusetts Financial Services Company, Vice President and Assistant General Counsel |
| | | | |
Kino Clark (k) (age 51) | | Assistant Treasurer | | January 2012 | | 133 | | Massachusetts Financial Services Company, Vice President |
| | | | |
John W. Clark, Jr. (k) (age 52) | | Assistant Treasurer | | April 2017 | | 133 | | Massachusetts Financial Services Company, Vice President (since March 2017); Deutsche Bank (financial services), Department Head –Treasurer’s Office (until February 2017) |
| | | | |
Thomas H. Connors (k) (age 60) | | Assistant Secretary and Assistant Clerk | | September 2012 | | 133 | | Massachusetts Financial Services Company, Vice President and Senior Counsel |
| | | | |
David L. DiLorenzo (k)
(age 51) | | President | | July 2005 | | 133 | | Massachusetts Financial Services Company, Senior Vice President |
| | | | |
Heidi W. Hardin (k) (age 52) | | Secretary and Clerk | | April 2017 | | 133 | | Massachusetts Financial Services Company, Executive Vice President and General Counsel (since March 2017); Harris Associates (investment management), General Counsel (from September 2015 to January 2017); Janus Capital Management LLC (investment management), Senior Vice President and General Counsel (until September 2015) |
| | | | |
Brian E. Langenfeld (k) (age 46) | | Assistant
Secretary and Assistant Clerk | | June 2006 | | 133 | | Massachusetts Financial Services Company, Vice President and Senior Counsel |
| | | | |
Amanda S. Mooradian (k) (age 40) | | Assistant
Secretary and Assistant Clerk | | September 2018 | | 133 | | Massachusetts Financial Services Company, Assistant Vice President and Counsel |
| | | | |
Susan A. Pereira (k)
(age 49) | | Assistant
Secretary and Assistant Clerk | | July 2005 | | 133 | | Massachusetts Financial Services Company, Vice President and Assistant General Counsel |
| | | | |
Kasey L. Phillips (k) (age 49) | | Assistant Treasurer | | September 2012 | | 133 | | Massachusetts Financial Services Company, Vice President |
| | | | |
Matthew A. Stowe (k) (age 45) | | Assistant Secretary and Assistant Clerk | | October 2014 | | 133 | | Massachusetts Financial Services Company, Vice President and Assistant General Counsel |
34
MFS Total Return Bond Series
Trustees and Officers – continued
| | | | | | | | |
Name, Age | | Position(s)
Held with Fund | | Trustee/Officer
Since (h) | | Number of
MFS Funds
for which the
Person is an
Officer | | Principal Occupations During the Past Five Years |
Martin J. Wolin (k) (age 52) | | Chief Compliance Officer | | July 2015 | | 133 | | Massachusetts Financial Services Company, Senior Vice President and Chief Compliance Officer (since July 2015); Mercer (financial service provider), Chief Risk and Compliance Officer, North America and Latin America (until June 2015) |
| | | | |
James O. Yost (k)
(age 59) | | Treasurer | | September 1990 | | 133 | | Massachusetts Financial Services Company, Senior Vice President |
| (h) | Date first appointed to serve as Trustee/officer of an MFS Fund. Each Trustee has served continuously since appointment unless indicated otherwise. For the period from December 15, 2004 until February 22, 2005, Mr. Manning served as Advisory Trustee. From January 2012 through December 2016, Messrs. DiLorenzo and Yost served as Treasurer and Deputy Treasurer of the Funds, respectively. |
| (j) | Directorships or trusteeships of companies required to report to the Securities and Exchange Commission (i.e., “public companies”). |
| (k) | “Interested person” of the Trust within the meaning of the Investment Company Act of 1940 (referred to as the 1940 Act), which is the principal federal law governing investment companies like the fund, as a result of a position with MFS. The address of MFS is 111 Huntington Avenue, Boston, Massachusetts 02199-7618. |
Each Trustee (other than Messrs. Jones and Kilman) has been elected by shareholders and each Trustee and Officer holds office until his or her successor is chosen and qualified or until his or her earlier death, resignation, retirement or removal. Messrs. Jones and Kilman became Trustees of the Funds on January 1, 2019. The Trust does not hold annual meetings for the purpose of electing Trustees, and Trustees are not elected for fixed terms. Under the terms of the Board’s retirement policy, an Independent Trustee shall retire at the end of the calendar year in which he or she reaches the earlier of 75 years of age or 15 years of service on the Board (or, in the case of any Independent Trustee who joined the Board prior to 2015, 20 years of service on the Board).
Messrs. Buller, Kilman and Otis and Ms. Roepke are members of the Trust’s Audit Committee.
Each of the Interested Trustees and certain Officers hold comparable officer positions with certain affiliates of MFS.
The Statement of Additional Information for a Fund includes further information about the Trustees and is available without charge upon request by calling1-800-225-2606.
| | |
Investment Adviser Massachusetts Financial Services Company 111 Huntington Avenue Boston, MA 02199-7618 | | Custodian State Street Bank and Trust Company 1 Lincoln Street Boston, MA 02111-2900 |
| |
Distributor MFS Fund Distributors, Inc. 111 Huntington Avenue Boston, MA 02199-7618 | | Independent Registered Public Accounting Firm Deloitte & Touche LLP 200 Berkeley Street Boston, MA 02116 |
| |
Portfolio Manager(s) Alexander Mackey Joshua Marston Robert Persons | | |
35
MFS Total Return Bond Series
BOARD REVIEW OF INVESTMENT ADVISORY AGREEMENT
MFS Total Return Bond Series
The Investment Company Act of 1940 requires that both the full Board of Trustees and a majority of thenon-interested (“independent”) Trustees, voting separately, annually approve the continuation of the Fund’s investment advisory agreement with MFS. The Trustees consider matters bearing on the Fund and its advisory arrangements at their meetings throughout the year, including a review of performance data at each regular meeting. In addition, the independent Trustees met several times over the course of three months beginning in May and ending in July, 2019 (“contract review meetings”) for the specific purpose of considering whether to approve the continuation of the investment advisory agreement for the Fund and the other investment companies that the Board oversees (the “MFS Funds”). The independent Trustees were assisted in their evaluation of the Fund’s investment advisory agreement by independent legal counsel, from whom they received separate legal advice and with whom they met separately from MFS during various contract review meetings. The independent Trustees were also assisted in this process by the MFS Funds’ Independent Senior Officer, a senior officer appointed by and reporting to the independent Trustees.
In connection with their deliberations regarding the continuation of the investment advisory agreement, the Trustees, including the independent Trustees, considered such information and factors as they believed, in light of the legal advice furnished to them and their own business judgment, to be relevant. The investment advisory agreement for the Fund was considered separately, although the Trustees also took into account the common interests of all MFS Funds in their review. As described below, the Trustees considered the nature, quality, and extent of the various investment advisory, administrative, and shareholder services performed by MFS under the existing investment advisory agreement and other arrangements with the Fund.
In connection with their contract review meetings, the Trustees received and relied upon materials that included, among other items: (i) information provided by Broadridge Financial Solutions, Inc. (“Broadridge”), an independent third party, on the investment performance of the Fund for various time periods ended December 31, 2018 and the investment performance of a group of funds with substantially similar investment classifications/objectives (the “Broadridge performance universe”), (ii) information provided by Broadridge on the Fund’s advisory fees and other expenses and the advisory fees and other expenses of comparable funds identified by Broadridge as well as all other funds in the same investment classification/category (the “Broadridge expense group and universe”), (iii) information provided by MFS on the advisory fees of portfolios of other clients of MFS, including institutional separate accounts and other clients, (iv) information as to whether and to what extent applicable expense waivers, reimbursements or fee “breakpoints” are observed for the Fund, (v) information regarding MFS’ financial results and financial condition, including MFS’ and certain of its affiliates’ estimated profitability from services performed for the Fund and the MFS Funds as a whole, and compared to MFS’ institutional business, (vi) MFS’ views regarding the outlook for the mutual fund industry and the strategic business plans of MFS, (vii) descriptions of various functions performed by MFS for the Funds, such as compliance monitoring and portfolio trading practices, and (viii) information regarding the overall organization of MFS, including information about MFS’ senior management and other personnel providing investment advisory, administrative and other services to the Fund and the other MFS Funds. The comparative performance, fee and expense information prepared and provided by Broadridge was not independently verified and the independent Trustees did not independently verify any information provided to them by MFS.
The Trustees’ conclusion as to the continuation of the investment advisory agreement was based on a comprehensive consideration of all information provided to the Trustees and not the result of any single factor. Some of the factors that figured particularly in the Trustees’ deliberations are described below, although individual Trustees may have evaluated the information presented differently from one another, giving different weights to various factors. It is also important to recognize that the fee arrangements for the Fund and other MFS Funds are the result of years of review and discussion between the independent Trustees and MFS, that certain aspects of such arrangements may receive greater scrutiny in some years than in others, and that the Trustees’ conclusions may be based, in part, on their consideration of these same arrangements during the course of the year and in prior years.
Based on information provided by Broadridge and MFS, the Trustees reviewed the Fund’s total return investment performance as well as the Broadridge performance universe over various time periods. The Trustees placed particular emphasis on the total return performance of the Fund’s Initial Class shares in comparison to the performance of funds in its Broadridge performance universe over the five-year period ended December 31, 2018, which the Trustees believed was a long enough period to reflect differing market conditions. The total return performance of the Fund’s Initial Class shares was in the 2nd quintile relative to the other funds in the universe for this five-year period (the 1st quintile being the best performers and the 5th quintile being the worst performers). The total return performance of the Fund’s Initial Class shares was in the 5th quintile for theone-year period and the 2nd quintile for thethree-year period ended December 31, 2018 relative to the Broadridge performance universe. Because of the passage of time, these performance results may differ from the performance results for more recent periods, including those shown elsewhere in this report.
In the course of their deliberations, the Trustees took into account information provided by MFS in connection with the contract review meetings, as well as during investment review meetings conducted with portfolio management personnel during the course of the year regarding the Fund’s performance. After reviewing these and related factors, the Trustees concluded, within the context of their overall conclusions regarding the investment advisory agreement, that they were satisfied with MFS’ responses and efforts relating to investment performance.
36
MFS Total Return Bond Series
Board Review of Investment Advisory Agreement – continued
In assessing the reasonableness of the Fund’s advisory fee, the Trustees considered, among other information, the Fund’s advisory fee and the total expense ratio of the Fund’s Initial Class shares as a percentage of average daily net assets and the advisory fee and total expense ratios of the Broadridge expense group based on information provided by Broadridge. The Trustees considered that, according to the data provided by Broadridge (which takes into account any fee reductions or expense limitations that were in effect during the Fund’s last fiscal year), the Fund’s effective advisory fee rate and total expense ratio were each approximately at the Broadridge expense group median.
The Trustees also considered the advisory fees charged by MFS to any institutional separate accounts advised by MFS (“separate accounts”) and unaffiliated investment companies for which MFS serves as subadviser (“subadvised funds”) that have comparable investment strategies to the Fund, if any. In comparing these fees, the Trustees considered information provided by MFS as to the generally broader scope of services provided by MFS to the Fund, as well as the more extensive regulatory burdens imposed on MFS in managing the Fund, in comparison to separate accounts and subadvised funds. The Trustees also considered the higher demands placed on MFS’ investment personnel and trading infrastructure as a result of the daily cashin-flows andout-flows of the Fund in comparison to separate accounts.
The Trustees also considered whether the Fund may benefit from any economies of scale in the management of the Fund in the event of growth in assets of the Fund and/or growth in assets of the MFS Funds as a whole. They noted that the Fund’s advisory fee rate schedule is subject to contractual breakpoints that reduce the Fund’s advisory fee rate on average daily net assets over $2.5 billion and $5 billion. The Trustees also noted that MFS has agreed in writing to waive a portion of the management fees of certain MFS Funds, including the Fund, if the total combined assets of certain funds within the MFS Funds’ complex increase above agreed upon thresholds (the “group fee waiver”), enabling the Fund’s shareholders to share in the benefits from any economies of scale at the complex level. The group fee waiver is reviewed and renewed annually between the Board and MFS. The Trustees concluded that the breakpoints and the group fee waiver were sufficient to allow the Fund to benefit from economies of scale as its assets and overall complex assets grow.
The Trustees also considered information prepared by MFS relating to MFS’ costs and profits with respect to the Fund, the MFS Funds considered as a group, and other investment companies and accounts advised by MFS, as well as MFS’ methodologies used to determine and allocate its costs to the MFS Funds, the Fund and other accounts and products for purposes of estimating profitability.
After reviewing these and other factors described herein, the Trustees concluded, within the context of their overall conclusions regarding the investment advisory agreement, that the advisory fees charged to the Fund represent reasonable compensation in light of the services being provided by MFS to the Fund.
In addition, the Trustees considered MFS’ resources and related efforts to continue to retain, attract and motivate capable personnel to serve the Fund. The Trustees also considered current and developing conditions in the financial services industry, including the presence of large and well-capitalized companies which are spending, and appear to be prepared to continue to spend, substantial sums to engage personnel and to provide services to competing investment companies. In this regard, the Trustees also considered the financial resources of MFS and its ultimate parent, Sun Life Financial Inc. The Trustees also considered the advantages and possible disadvantages to the Fund of having an adviser that also serves other investment companies as well as other accounts.
The Trustees also considered the nature, quality, cost, and extent of administrative, transfer agency, and distribution services provided to the Fund by MFS and its affiliates under agreements and plans other than the investment advisory agreement, including any12b-1 fees the Fund pays to MFS Fund Distributors, Inc., an affiliate of MFS. The Trustees also considered the nature, extent and quality of certain other services MFS performs or arranges for on the Fund’s behalf, which may include securities lending programs, directed expense payment programs, class action recovery programs, and MFS’ interaction with third-party service providers, principally custodians andsub-custodians. The Trustees concluded that the variousnon-advisory services provided by MFS and its affiliates on behalf of the Fund were satisfactory.
The Trustees consideredso-called“fall-out benefits” to MFS such as reputational value derived from serving as investment manager to the MFS Funds. The Trustees also considered that, effective January 3, 2018, MFS had discontinued its historic practice of obtaining investment research from portfolio brokerage commissions paid by certain MFS Funds and would thereafter directly pay for or voluntarily reimburse a Fund, if applicable, for the costs of external research acquired through the use of the Fund’s portfolio brokerage commissions.
Based on their evaluation of factors that they deemed to be material, including those factors described above, the Board of Trustees, including the independent Trustees, concluded that the Fund’s investment advisory agreement with MFS should be continued for an additionalone-year period, commencing August 1, 2019.
37
MFS Total Return Bond Series
PROXY VOTING POLICIES AND INFORMATION
MFS votes proxies on behalf of the fund pursuant to proxy voting policies and procedures that are available without charge, upon request, by calling 1-800-225-2606, by visitingmfs.com/proxyvoting, or by visiting the SEC’s Web site athttp://www.sec.gov.
Information regarding how the fund voted proxies relating to portfolio securities during the most recent twelve-month period ended June 30 is available by August 31 of each year without charge by visitingmfs.com/proxyvoting, or by visiting the SEC’s Web site athttp://www.sec.gov.
QUARTERLY PORTFOLIO DISCLOSURE
The fund files a complete schedule of portfolio holdings with the SEC for the first and third quarters of each fiscal year as an exhibit to its reports on Form N-PORT. The fund’s Form N-PORT reports are available on the SEC’s website athttp://www.sec.gov. A shareholder can obtain the portfolio holdings report for the first and third quarters of the fund’s fiscal year atmfs.com/vit1 by choosing the fund’s name and then selecting the “Resources” tab and clicking on “Prospectus and Reports”.
FURTHER INFORMATION
From time to time, MFS may post important information about the fund or the MFS funds on the MFS web site (mfs.com). This information is available at https://www.mfs.com/en-us/what-we-do/announcements.html or atmfs.com/vit1 by choosing the fund’s name.
INFORMATION ABOUT FUND CONTRACTS AND LEGAL CLAIMS
The fund has entered into contractual arrangements with an investment adviser, administrator, distributor, shareholder servicing agent, 529 program manager (if applicable), and custodian who each provide services to the fund. Unless expressly stated otherwise, shareholders are not parties to, or intended beneficiaries of these contractual arrangements, and these contractual arrangements are not intended to create any shareholder right to enforce them against the service providers or to seek any remedy under them against the service providers, either directly or on behalf of the fund.
Under the Trust’s By-Laws and Declaration of Trust, any claims asserted against or on behalf of the MFS Funds, including claims against Trustees and Officers, must be brought in state and federal courts located within the Commonwealth of Massachusetts.
38
rev. 3/16
| | | | |
| | | |
| FACTS | | WHAT DOES MFS DO WITH YOUR
PERSONAL INFORMATION? | |  |
| | |
| Why? | | Financial companies choose how they share your personal information. Federal law gives consumers the right to limit some but not all sharing. Federal law also requires us to tell you how we collect, share, and protect your personal information. Please read this notice carefully to understand what we do. |
| | |
| What? | | The types of personal information we collect and share depend on the product or service you have with us. This information can include: • Social Security number and account balances • Account transactions and transaction history • Checking account information and wire transfer instructions When you areno longer our customer, we continue to share your information as described in this notice. |
| | |
| How? | | All financial companies need to share customers’ personal information to run their everyday business. In the section below, we list the reasons financial companies can share their customers’ personal information; the reasons MFS chooses to share; and whether you can limit this sharing. |
| | | | |
Reasons we can share your
personal information | | Does MFS share? | | Can you limit this
sharing? |
For our everyday business purposes – such as to process your transactions, maintain your account(s), respond to court orders and legal investigations, or report to credit bureaus | | Yes | | No |
For our marketing purposes – to offer our products and services to you | | No | | We don’t share |
| For joint marketing with other financial companies | | No | | We don’t share |
For our affiliates’ everyday business purposes – information about your transactions and experiences | | No | | We don’t share |
For our affiliates’ everyday business purposes – information about your creditworthiness | | No | | We don’t share |
| For nonaffiliates to market to you | | No | | We don’t share |
| | |
| | |
| Questions? | | Call800-225-2606 or go tomfs.com. |
39
| | |
| Who we are |
| Who is providing this notice? | | MFS Funds, MFS Investment Management, MFS Institutional Advisors, Inc., and MFS Heritage Trust Company. |
| | |
| What we do |
| How does MFS protect my personal information? | | To protect your personal information from unauthorized access and use, we use security measures that comply with federal law. These measures include procedural, electronic, and physical safeguards for the protection of the personal information we collect about you. |
How does MFS
collect my personal information? | | We collect your personal information, for example, when you • open an account or provide account information • direct us to buy securities or direct us to sell your securities • make a wire transfer We also collect your personal information from others, such as credit bureaus, affiliates, or other companies. |
| Why can’t I limit all sharing? | | Federal law gives you the right to limit only • sharing for affiliates’ everyday business purposes – information about your creditworthiness • affiliates from using your information to market to you • sharing for nonaffiliates to market to you State laws and individual companies may give you additional rights to limit sharing. |
| | |
| Definitions |
| Affiliates | | Companies related by common ownership or control. They can be financial and nonfinancial companies. • MFS does not share personal information with affiliates, except for everyday business purposes as described on page one of this notice. |
| Nonaffiliates | | Companies not related by common ownership or control. They can be financial and nonfinancial companies. • MFS does not share with nonaffiliates so they can market to you. |
| Joint marketing | | A formal agreement between nonaffiliated financial companies that together market financial products or services to you. • MFS doesn’t jointly market. |
| | |
| Other important information |
| If you own an MFS product or receive an MFS service in the name of a third party such as a bank or broker-dealer, their privacy policy may apply to you instead of ours. |
40
Annual Report
December 31, 2019

MFS® Research Series

MFS® Variable Insurance Trust
Beginning on January 1, 2021, as permitted by regulations adopted by the U.S. Securities and Exchange Commission, the insurance company that offers your contract may determine that it will no longer send you paper copies of the fund’s annual and semiannual shareholder reports unless you specifically request paper copies from the insurance company or from your financial intermediary. Instead, the shareholder reports will be made available on a Web site (insurancefunds.mfs.com or other Web site of which you will be notified), and the insurance company will notify you by mail each time a report is posted and provide you with a Web site link to access the report. Instructions for requesting paper copies will be provided by your insurance company or financial intermediary.
If you already elected to receive shareholder reports by email, you will not be affected by this change and you need not take any action. If your insurance company or financial intermediary offers electronic delivery, you may elect to receive shareholder reports and other communications from the insurance company or financial intermediary by email by following the instructions provided by the insurance company or financial intermediary.
Beginning on January 1, 2019, you may elect to receive all future reports in paper free of charge from the insurance company or financial intermediary. You can inform the insurance company or financial intermediary that you wish to continue receiving paper copies of your shareholder reports by contacting your insurance company or financial intermediary. Your election to receive reports in paper will apply to all funds held in your account with your insurance company or financial intermediary.
VFR-ANN
MFS® Research Series
CONTENTS
The report is prepared for the general information of contract owners. It is authorized for distribution to prospective investors only when preceded or accompanied by a current prospectus.
NOT FDIC INSURED• MAY LOSE VALUE• NO BANK OR CREDIT UNION GUARANTEE• NOT A DEPOSIT• NOT INSURED BY ANY FEDERAL GOVERNMENT AGENCY OR NCUA/NCUSIF
MFS Research Series
LETTER FROM THE EXECUTIVE CHAIR

Dear Contract Owners:
Slowing global growth, low inflation, and trade friction between the United States and China have been hallmarks of the past 12 months. After experiencing an uptick in market volatility in late 2018, markets steadied for most of 2019, thanks in large measure to the adoption of a dovish policy stance on the part of global central banks, focused on supporting economic growth. Negotiations aimed at a “phase one” trade deal between the U.S. and China bore fruit at the end of the period, boosting investor sentiment, while signs of stability emerging from the global manufacturing sector also lifted spirits. Uncertainty over Brexit, along with the ripple effects from the trade conflict, hampered business confidence and investment in the United Kingdom and Europe for much of the period, though investors expect greater clarity regarding Brexit as a result of December’s general election. The pro-Brexit Conservative Party won the election by a comfortable margin and set the stage for the U.K.’s departure from the EU at the end of January.
Markets expect the longest economic expansion in U.S. history will continue, albeit at a slower pace, as trade tensions recede. In an effort to prolong the expansion, the U.S. Federal Reserve lowered interest rates three times between July and October and the European Central Bank loosened policy in September. While the global monetary policy backdrop remains quite accommodative, signs of easing trade tensions and fading global recession fears led to improved market sentiment in late 2019 as investors grew less risk averse. In early 2020, an outbreak of coronavirus emanating from China reintroduced global growth fears, causing an uptick in volatility.
Here at MFS®, we aim to help our clients navigate the growing complexity of the markets and world economies. Our long-term investment philosophy and commitment to the responsible allocation of capital allow us to tune out the noise and uncover what we believe are the best, most durable investment opportunities in the market. Through our powerful global investment platform, we combine collective expertise, thoughtful risk management and long-term discipline to create sustainable value for investors.
Respectfully,

Robert J. Manning
Executive Chair
MFS Investment Management
February 14, 2020
The opinions expressed in this letter are subject to change and may not be relied upon for investment advice. No forecasts can be guaranteed.
1
MFS Research Series
PORTFOLIO COMPOSITION
Portfolio structure
| | | | |
| Top ten holdings | | | | |
| Microsoft Corp. | | | 5.2% | |
| Alphabet, Inc., “A” | | | 3.7% | |
| Amazon.com, Inc. | | | 3.6% | |
| Mastercard, Inc., “A” | | | 2.7% | |
| Facebook, Inc., “A” | | | 2.4% | |
| Johnson & Johnson | | | 1.8% | |
| Citigroup, Inc. | | | 1.8% | |
| Salesforce.com, Inc. | | | 1.7% | |
| Adobe Systems, Inc. | | | 1.6% | |
| Apple, Inc. | | | 1.6% | |
| | | | |
| Global equity sectors (k) | | | | |
| Technology | | | 25.3% | |
| Financial Services | | | 16.3% | |
| Health Care (s) | | | 14.4% | |
| Consumer Cyclicals | | | 13.8% | |
| Capital Goods | | | 12.2% | |
| Energy | | | 7.5% | |
| Consumer Staples | | | 5.5% | |
| Telecommunications/Cable Television (s) | | | 3.9% | |
| (k) | The sectors set forth above and the associated portfolio composition are based on MFS’ own custom sector classification methodology. |
| (s) | Includes securities sold short. |
Cash & Cash Equivalents includes any cash, investments in money market funds, short-term securities, and other assets less liabilities. Please see the Statement of Assets and Liabilities for additional information related to the fund’s cash position and other assets and liabilities.
Percentages are based on net assets as of December 31, 2019.
The portfolio is actively managed and current holdings may be different.
2
MFS Research Series
MANAGEMENT REVIEW
Summary of Results
For the twelve months ended December 31, 2019, Initial Class shares of the MFS Research Series (fund) provided a total return of 32.95%, while Service Class shares of the fund provided a total return of 32.60%. These compare with a return of 31.49% over the same period for the fund’s benchmark, the Standard & Poor’s 500 Stock Index (S&P 500 Index).
Market Environment
Fading fears of a near-term global recession, the announcement of a partial trade deal between the United States and China and the decline in uncertainty over Brexit helped bolster market sentiment late in the period. Changes in market sentiment, largely driven by uncertainty over the outcome of trade negotiations between the US and China, had contributed to periodic bouts of volatility during the reporting period. The global economy decelerated, led by weakness in China and Europe, although the pace of the slowdown moderated late in the period amid nascent signs of stabilization in the manufacturing sector.
The deteriorating global growth backdrop, along with declining inflationary pressures, prompted the US Federal Reserve to adopt a more dovish posture beginning in early 2019, resulting in the first interest rate cut in over a decade at the end of July, followed by additional cuts in September and October. The Fed’s actions led to a sharp decline in long-term interest rates during the period’s second half, causing the inversion of portions of the US Treasury yield curve for a time. Amid an improvement in risk sentiment in Q4 2019 and indications of a bottoming in growth and a potential upturn in activity, the Fed indicated in October that further rate cuts were unlikely unless the outlook for the economy materially worsened.
Globally, central banks have tilted more dovish as well, with the European Central Bank unveiling a package of easing measures, which included putting overnight rates deeper into negative territory, restarting its bond-buying program and lengthening the term of cheap loans to banks to three years from two. The central banks of India and Australia are among those that have cut rates several times in recent months, although China has been more cautious in increasing liquidity as it keeps trying to deleverage its economy, cutting rates only marginally.
Emerging markets experienced considerable volatility through the end of 2018, as tighter global financial conditions exposed structural weakness in some countries. Those conditions improved in 2019 as the Fed became more dovish. Notwithstanding the periodic headwinds on market sentiment from significant trade friction between the US and China over much of the year, emerging market hard currency debt and local rates benefited from relatively cheap valuations at the beginning of the period and easier global monetary conditions. These factors, plus the fading of certain global risk factors mentioned above, hastened spread tightening in the latter part of the period. At the same time, idiosyncratic risks spiked in some countries (e.g., Argentina and Lebanon), contributing to increased dispersion in performance among sovereign assets.
Contributors to Performance
Security selection in both thefinancial servicesand consumer cyclicals sectors contributed to performance relative to the S&P 500 Index. Within thefinancial servicessector, the fund’s position in global alternative asset manager Blackstone Group (b), overweight positions in debit and credit transaction processing company Mastercard and financial services firm Citigroup and not owning shares of insurance and investment firm Berkshire Hathaway supported relative performance. Despite a challenging environment, the share price of Blackstone appreciated as the company delivered better-than-anticipated results, driven by strong growth infee-related earnings andfee-paying assets under management. The firm also showed growth in assets under management, with solid performance across most of its asset groups. Additionally, Blackstone Group’s decision to convert from a limited partnership structure to a C corporation broadened the firm’s potential ownership pool and further supported its share price performance. Within theconsumer cyclicalssector, an overweight position in retail giant Target aided relative results. The share price of Target advanced during the period on the back of solidtop-line performance and margin growth that expanded due to merchandising incentives and changes in product mix. Management also upgraded its full-year 2019 guidance following stronger-than-expected same-store sales.
Elsewhere, the fund’s overweight positions in electronic payment services company Global Payments and financial technology services provider Fiserv bolstered relative performance. The share price of Global Payments rose after the company reported solid growth across all regions, particularly within the firm’s Merchant Solutions and Issuer Solutions divisions. Management also increased its revenue guidance, which further supported the stock price. Additionally, not owning shares of integrated oil and gas company Exxon Mobil, holdings of cable and telecommunications company Altice (b)(h) and an underweight position in diversified medical products maker Johnson & Johnson supported relative returns.
Detractors from Performance
Stock selection in thetechnologysector detracted from relative performance. Within this sector, the fund’s underweight position in computer and personal electronics maker Apple and an overweight position in information technology company DXC Technology (h) held back relative returns. The stock price of Apple advanced during the reporting period as the company’s revenues came in higher than consensus estimates, driven by stronger-than-expected demand in its wearable technology and services segments.
3
MFS Research Series
Management Review – continued
In other sectors, the fund’s holdings of oil and gas company BP (b) (United Kingdom), electronic brokerage firm TD Ameritrade (b)(h) and animal food producer Elanco Animal Health (b) weighed on relative results. The share price of BP was negatively affected by weaker-than-expected upstream production, driven by lower pricing, higher maintenance costs and the impact of Hurricane Barry in the Gulf of Mexico. Furthermore, the company’s efforts to reduce debt by its divestment program were slower-than-expected, which negatively affected BP’s balance sheet. The fund’s overweight positions in pharmaceutical giant Pfizer (h) and specialty materials and chemicals producer DuPont de Nemours also hindered relative returns. The share price of Pfizer depreciated after the company recorded sales that were shy of market expectations, owing to weakness in its legacy product sales. Pfizer also cut its fiscal-year 2019 guidance to reflect the integration of a joint venture with GlaxoSmithKline and the acquisition of Array BioPharma, which further pressured the stock. The timing of the fund’s ownership in shares of biotechnology company Biogen (h) and discount variety store operator Dollar Tree, and not owning shares of global financial services firm JPMorgan Chase, also held back relative results.
Respectfully,
Portfolio Manager(s)
Joseph MacDougall
| (b) | Security is not a benchmark constituent. |
| (h) | Security was not held in the portfolio at period end. |
The views expressed in this report are those of the portfolio manager(s) only through the end of the period of the report as stated on the cover and do not necessarily reflect the views of MFS or any other person in the MFS organization. These views are subject to change at any time based on market or other conditions, and MFS disclaims any responsibility to update such views. These views may not be relied upon as investment advice or an indication of trading intent on behalf of any MFS portfolio. References to specific securities are not recommendations of such securities, and may not be representative of any MFS portfolio’s current or future investments.
4
MFS Research Series
PERFORMANCE SUMMARY THROUGH 12/31/19
The following chart illustrates the historical performance of the fund in comparison to its benchmark(s). Benchmarks are unmanaged and may not be invested in directly. Benchmark returns do not reflect any fees or expenses. The performance of other share classes will be greater than or less than that of the class depicted below. (See Notes to Performance Summary.)
Performance data shown represents past performance and is no guarantee of future results. Investment return and principal value fluctuate so your units, when sold, may be worth more or less than the original cost; current performance may be lower or higher than quoted. The performance shown does not reflect the deduction of taxes, if any, that a contract holder would pay on fund distributions or the redemption of contract units. The returns for the fund shown also do not reflect the deduction of expenses associated with variable products, such as mortality and expense risk charges, separate account charges, and sales charges imposed by the insurance company separate accounts. Such expenses would reduce the overall returns shown.
Growth of a Hypothetical $10,000 Investment
Total Returns through 12/31/19
Average annual total returns
| | | | | | | | | | | | |
| | | Share Class | | Class Inception Date | | 1-yr | | 5-yr | | 10-yr | | |
| | | Initial Class | | 7/26/95 | | 32.95% | | 11.45% | | 12.99% | | |
| | | Service Class | | 5/01/00 | | 32.60% | | 11.16% | | 12.71% | | |
| | | | |
| Comparative benchmark(s) | | | | | | | | |
| | | Standard & Poor’s 500 Stock Index (f) | | 31.49% | | 11.70% | | 13.56% | | |
| (f) | Source: FactSet Research Systems Inc. |
Benchmark Definition(s)
Standard & Poor’s 500 Stock Index – a market capitalization-weighted index of 500 widely held equity securities, designed to measure broad U.S. equity performance. “Standard & Poor’s®” and “S&P®” are registered trademarks of Standard & Poor’s Financial Services LLC (“S&P”) and Dow Jones is a registered trademark of Dow Jones Trademark Holdings LLC (“Dow Jones”) and have been licensed for use by S&P Dow Jones Indices LLC and sublicensed for certain purposes by Massachusetts Financial Services Company. The S&P 500® is a product of S&P Dow Jones Indices LLC, and has been licensed for use by Massachusetts Financial Services Company. Massachusetts Financial Services Company’s product(s) is not sponsored, endorsed, sold, or promoted by S&P Dow Jones Indices LLC, Dow Jones, S&P, or their respective affiliates, and neither S&P Dow Jones Indices LLC, Dow Jones, S&P, nor their respective affiliates make any representation regarding the advisability of investing in such product(s).
It is not possible to invest directly in an index.
Notes to Performance Summary
Average annual total return represents the average annual change in value for each share class for the periods presented.
Performance results reflect any applicable expense subsidies and waivers in effect during the periods shown. Without such subsidies and waivers the fund’s performance results would be less favorable. Please see the prospectus and financial statements for complete details. All results are historical and assume the reinvestment of any dividends and capital gains distributions.
5
MFS Research Series
Performance Summary – continued
Performance results do not include adjustments made for financial reporting purposes in accordance with U.S. generally accepted accounting principles and may differ from amounts reported in the financial highlights.
From time to time the fund may receive proceeds from litigation settlements, without which performance would be lower.
6
MFS Research Series
EXPENSE TABLE
Fund Expenses Borne by the Contract Holders during the Period,
July 1, 2019 through December 31, 2019
As a contract holder of the fund, you incur ongoing costs, including management fees; distribution and/or service(12b-1) fees; and other fund expenses. This example is intended to help you understand your ongoing costs (in dollars) of investing in the fund and to compare these costs with the ongoing costs of investing in other mutual funds.
The example is based on an investment of $1,000 invested at the beginning of the period and held for the entire period July 1, 2019 through December 31, 2019.
Actual Expenses
The first line for each share class in the following table provides information about actual account values and actual expenses. You may use the information in this line, together with the amount you invested, to estimate the expenses that you paid over the period. Simply divide your account value by $1,000 (for example, an $8,600 account value divided by $1,000 = 8.6), then multiply the result by the number in the first line under the heading entitled “Expenses Paid During Period” to estimate the expenses you paid on your account during this period.
Hypothetical Example for Comparison Purposes
The second line for each share class in the following table provides information about hypothetical account values and hypothetical expenses based on the fund’s actual expense ratio and an assumed rate of return of 5% per year before expenses, which is not the fund’s actual return. The hypothetical account values and expenses may not be used to estimate the actual ending account balance or expenses you paid for the period. You may use this information to compare the ongoing costs of investing in the fund and other funds. To do so, compare this 5% hypothetical example with the 5% hypothetical examples that appear in the shareholder reports of the other funds.
Please note that the expenses shown in the table are meant to highlight the fund’s ongoing costs only and do not take into account the fees and expenses imposed under the variable contracts through which your investment in the fund is made. Therefore, the second line for each share class in the table is useful in comparing ongoing costs associated with an investment in vehicles (such as the fund) which fund benefits under variable annuity and variable life insurance contracts and to qualified pension and retirement plans only, and will not help you determine the relative total costs of investing in the fund through variable annuity and variable life insurance contracts. If the fees and expenses imposed under the variable contracts were included, your costs would have been higher.
| | | | | | | | | | | | | | | | | | |
| Share Class | | | | Annualized
Expense Ratio | | | Beginning
Account Value
7/01/19 | | | Ending Account Value
12/31/19 | | | Expenses Paid During Period (p)
7/01/19-12/31/19 | |
| Initial Class | | Actual | | | 0.80% | | | | $1,000.00 | | | | $1,095.66 | | | | $4.23 | |
| | Hypothetical (h) | | | 0.80% | | | | $1,000.00 | | | | $1,021.17 | | | | $4.08 | |
| Service Class | | Actual | | | 1.05% | | | | $1,000.00 | | | | $1,093.98 | | | | $5.54 | |
| | Hypothetical (h) | | | 1.05% | | | | $1,000.00 | | | | $1,019.91 | | | | $5.35 | |
| (h) | 5% class return per year before expenses. |
| (p) | “Expenses Paid During Period” are equal to each class’s annualized expense ratio, as shown above, multiplied by the average account value over the period, multiplied by 184/365 (to reflect theone-half year period). |
Notes to Expense Table
Expense ratios include 0.03% of investment related expenses from short sales (See Note 2 of the Notes to Financial Statements) that are outside of the expense limitation arrangement (See Note 3 of the Notes to Financial Statements).
7
MFS Research Series
PORTFOLIO OF INVESTMENTS – 12/31/19
The Portfolio of Investments is a complete list of all securities owned by your fund. It is categorized by broad-based asset classes.
| | | | | | | | |
| | |
| Issuer | | Shares/Par | | | Value ($) | |
| COMMON STOCKS – 99.4% | | | | | | | | |
| Aerospace – 4.0% | | | | | | | | |
| Honeywell International, Inc. | | | 48,560 | | | $ | 8,595,120 | |
| Huntington Ingalls Industries, Inc. | | | 13,369 | | | | 3,354,015 | |
| L3Harris Technologies, Inc. | | | 20,311 | | | | 4,018,938 | |
| Northrop Grumman Corp. | | | 12,169 | | | | 4,185,771 | |
| United Technologies Corp. | | | 49,540 | | | | 7,419,110 | |
| | | | | | | | |
| | | | | | $ | 27,572,954 | |
| | | | | | | | |
| Alcoholic Beverages – 0.6% | | | | | |
| Constellation Brands, Inc., “A” | | | 19,795 | | | $ | 3,756,101 | |
| | | | | | | | |
| Apparel Manufacturers – 1.3% | | | | | |
| NIKE, Inc., “B” | | | 89,162 | | | $ | 9,033,002 | |
| | | | | | | | |
| Automotive – 0.4% | | | | | |
| IAA, Inc. (a) | | | 58,410 | | | $ | 2,748,775 | |
| | | | | | | | |
| Brokerage & Asset Managers – 2.5% | | | | | |
| Blackstone Group, Inc. | | | 67,570 | | | $ | 3,779,866 | |
| Charles Schwab Corp. | | | 195,570 | | | | 9,301,309 | |
| CME Group, Inc. | | | 21,319 | | | | 4,279,150 | |
| | | | | | | | |
| | | | | | $ | 17,360,325 | |
| | | | | | | | |
| Business Services – 5.4% | | | | | |
| Accenture PLC, “A” | | | 30,384 | | | $ | 6,397,959 | |
| Cognizant Technology Solutions Corp., “A” | | | 21,509 | | | | 1,333,988 | |
| Fidelity National Information Services, Inc. | | | 62,977 | | | | 8,759,471 | |
| Fiserv, Inc. (a) | | | 84,678 | | | | 9,791,317 | |
| Global Payments, Inc. | | | 39,067 | | | | 7,132,072 | |
| Verisk Analytics, Inc., “A” | | | 23,547 | | | | 3,516,509 | |
| | | | | | | | |
| | | | | | $ | 36,931,316 | |
| | | | | | | | |
| Cable TV – 2.3% | | | | | |
| Charter Communications, Inc., “A” (a) | | | 10,881 | | | $ | 5,278,156 | |
| Comcast Corp., “A” | | | 223,951 | | | | 10,071,076 | |
| | | | | | | | |
| | | | | | $ | 15,349,232 | |
| | | | | | | | |
| Chemicals – 0.5% | | | | | |
| FMC Corp. | | | 36,979 | | | $ | 3,691,244 | |
| | | | | | | | |
| Computer Software – 9.0% | | | | | |
| Adobe Systems, Inc. (a) | | | 32,775 | | | $ | 10,809,523 | |
| Cadence Design Systems, Inc. (a) | | | 59,917 | | | | 4,155,843 | |
| Microsoft Corp. (s) | | | 222,967 | | | | 35,161,896 | |
| Salesforce.com, Inc. (a) | | | 69,208 | | | | 11,255,989 | |
| | | | | | | | |
| | | | | | $ | 61,383,251 | |
| | | | | | | | |
| Computer Software – Systems – 2.8% | |
| Apple, Inc. | | | 36,581 | | | $ | 10,742,011 | |
| Constellation Software, Inc. | | | 4,167 | | | | 4,047,017 | |
| Square, Inc., “A” (a) | | | 30,957 | | | | 1,936,670 | |
| Zebra Technologies Corp., “A” (a) | | | 9,435 | | | | 2,410,076 | |
| | | | | | | | |
| | | | | | $ | 19,135,774 | |
| | | | | | | | |
| Construction – 2.5% | | | | | |
| Masco Corp. | | | 115,503 | | | $ | 5,542,989 | |
| Sherwin-Williams Co. | | | 7,866 | | | | 4,590,126 | |
| | | | | | | | |
| | |
Issuer | | Shares/Par | | | Value ($) | |
| COMMON STOCKS – continued | | | | | |
| Construction – continued | | | | | |
| Toll Brothers, Inc. | | | 82,558 | | | $ | 3,261,866 | |
| Vulcan Materials Co. | | | 24,607 | | | | 3,543,162 | |
| | | | | | | | |
| | | | | | $ | 16,938,143 | |
| | | | | | | | |
| Consumer Products – 1.6% | | | | | |
| Colgate-Palmolive Co. | | | 64,218 | | | $ | 4,420,767 | |
| Energizer Holdings, Inc. | | | 32,311 | | | | 1,622,658 | |
| Kimberly-Clark Corp. | | | 34,469 | | | | 4,741,211 | |
| | | | | | | | |
| | | | | | $ | 10,784,636 | |
| | | | | | | | |
| Consumer Services – 0.7% | | | | | |
| Booking Holdings, Inc. (a) | | | 2,387 | | | $ | 4,902,253 | |
| | | | | | �� | | |
| Electrical Equipment – 1.3% | | | | | | | | |
| HD Supply Holdings, Inc. (a) | | | 68,056 | | | $ | 2,737,212 | |
| Sensata Technologies Holding PLC (a) | | | 61,945 | | | | 3,336,977 | |
| TE Connectivity Ltd. | | | 31,827 | | | | 3,050,300 | |
| | | | | | | | |
| | | | | | $ | 9,124,489 | |
| | | | | | | | |
| Electronics – 2.0% | | | | | | | | |
| Analog Devices, Inc. | | | 56,073 | | | $ | 6,663,715 | |
| NXP Semiconductors N.V. | | | 52,892 | | | | 6,731,036 | |
| | | | | | | | |
| | | | | | $ | 13,394,751 | |
| | | | | | | | |
| Energy – Independent – 2.2% | | | | | | | | |
| ConocoPhillips | | | 79,398 | | | $ | 5,163,252 | |
| Diamondback Energy, Inc. | | | 25,797 | | | | 2,395,510 | |
| Pioneer Natural Resources Co. | | | 24,517 | | | | 3,711,138 | |
| Valero Energy Corp. | | | 38,182 | | | | 3,575,744 | |
| | | | | | | | |
| | | | | | $ | 14,845,644 | |
| | | | | | | | |
| Energy – Integrated – 1.2% | | | | | | | | |
| BP PLC, ADR | | | 210,270 | | | $ | 7,935,590 | |
| | | | | | | | |
| Food & Beverages – 2.6% | | | | | | | | |
| J.M. Smucker Co. | | | 20,016 | | | $ | 2,084,266 | |
| Mondelez International, Inc. | | | 119,364 | | | | 6,574,569 | |
| PepsiCo, Inc. | | | 65,141 | | | | 8,902,821 | |
| | | | | | | | |
| | | | | | $ | 17,561,656 | |
| | | | | | | | |
| Gaming & Lodging – 1.0% | | | | | |
| Marriott International, Inc., “A” | | | 32,826 | | | $ | 4,970,841 | |
| Wyndham Hotels & Resorts, Inc. | | | 33,458 | | | | 2,101,497 | |
| | | | | | | | |
| | | | | | $ | 7,072,338 | |
| | | | | | | | |
| General Merchandise – 1.6% | | | | | |
| Dollar General Corp. | | | 40,410 | | | $ | 6,303,152 | |
| Dollar Tree, Inc. (a) | | | 48,319 | | | | 4,544,402 | |
| | | | | | | | |
| | | | | | $ | 10,847,554 | |
| | | | | | | | |
| Health Maintenance Organizations – 1.8% | |
| Cigna Corp. | | | 33,224 | | | $ | 6,793,976 | |
| Humana, Inc. | | | 14,320 | | | | 5,248,566 | |
| | | | | | | | |
| | | | | | $ | 12,042,542 | |
| | | | | | | | |
8
MFS Research Series
Portfolio of Investments – continued
| | | | | | | | |
| | |
| Issuer | | Shares/Par | | | Value ($) | |
| COMMON STOCKS – continued | | | | | |
| Insurance – 2.6% | | | | | | | | |
| Aon PLC | | | 49,233 | | | $ | 10,254,741 | |
| Chubb Ltd. | | | 47,121 | | | | 7,334,855 | |
| | | | | | | | |
| | | | | | $ | 17,589,596 | |
| | | | | | | | |
| Internet – 6.1% | | | | | | | | |
| Alphabet, Inc., “A” (a)(s) | | | 18,742 | | | $ | 25,102,847 | |
| Facebook, Inc., “A” (a) | | | 80,150 | | | | 16,450,788 | |
| | | | | | | | |
| | | | | | $ | 41,553,635 | |
| | | | | | | | |
| Leisure & Toys – 1.0% | | | | | | | | |
| Electronic Arts, Inc. (a) | | | 64,742 | | | $ | 6,960,412 | |
| | | | | | | | |
| Machinery & Tools – 1.2% | | | | | | | | |
| Flowserve Corp. | | | 51,246 | | | $ | 2,550,513 | |
| Roper Technologies, Inc. | | | 15,874 | | | | 5,623,047 | |
| | | | | | | | |
| | | | | | $ | 8,173,560 | |
| | | | | | | | |
| Major Banks – 2.8% | | | | | | | | |
| Goldman Sachs Group, Inc. | | | 43,223 | | | $ | 9,938,264 | |
| PNC Financial Services Group, Inc. | | | 27,870 | | | | 4,448,888 | |
| State Street Corp. | | | 56,987 | | | | 4,507,672 | |
| | | | | | | | |
| | | | | | $ | 18,894,824 | |
| | | | | | | | |
| Medical & Health Technology & Services – 1.3% | |
| ICON PLC (a) | | | 33,957 | | | $ | 5,848,414 | |
| McKesson Corp. | | | 22,439 | | | | 3,103,763 | |
| | | | | | | | |
| | | | | | $ | 8,952,177 | |
| | | | | | | | |
| Medical Equipment – 7.2% | | | | | | | | |
| Becton, Dickinson and Co. | | | 29,869 | | | $ | 8,123,472 | |
| Boston Scientific Corp. (a) | | | 131,609 | | | | 5,951,359 | |
| Danaher Corp. | | | 46,312 | | | | 7,107,966 | |
| Masimo Corp. (a) | | | 21,845 | | | | 3,452,821 | |
| Medtronic PLC | | | 86,761 | | | | 9,843,035 | |
| PerkinElmer, Inc. | | | 71,134 | | | | 6,907,111 | |
| STERIS PLC | | | 22,473 | | | | 3,425,335 | |
| West Pharmaceutical Services, Inc. | | | 26,347 | | | | 3,960,744 | |
| | | | | | | | |
| | | | | | $ | 48,771,843 | |
| | | | | | | | |
| Natural Gas – Distribution – 0.5% | | | | | | | | |
| Sempra Energy | | | 21,386 | | | $ | 3,239,551 | |
| | | | | | | | |
| Natural Gas – Pipeline – 0.6% | | | | | | | | |
| Enterprise Products Partners LP | | | 139,704 | | | $ | 3,934,065 | |
| | | | | | | | |
| Oil Services – 0.1% | | | | | | | | |
| Core Laboratories N.V. (l) | | | 23,376 | | | $ | 880,574 | |
| | | | | | | | |
| Other Banks & Diversified Financials – 6.9% | |
| Citigroup, Inc. | | | 154,213 | | | $ | 12,320,077 | |
| Mastercard, Inc., “A” | | | 61,323 | | | | 18,310,435 | |
| Truist Financial Corp. | | | 158,960 | | | | 8,952,627 | |
| U.S. Bancorp | | | 126,163 | | | | 7,480,204 | |
| | | | | | | | |
| | | | | | $ | 47,063,343 | |
| | | | | | | | |
| Pharmaceuticals – 4.3% | | | | | | | | |
| Elanco Animal Health, Inc. (a) | | | 109,432 | | | $ | 3,222,772 | |
| Eli Lilly & Co. | | | 44,853 | | | | 5,895,030 | |
| Johnson & Johnson | | | 86,347 | | | | 12,595,437 | |
| | | | | | | | |
| | |
| Issuer | | Shares/Par | | | Value ($) | |
| COMMON STOCKS – continued | | | | | |
| Pharmaceuticals – continued | | | | | | | | |
| Zoetis, Inc. | | | 59,750 | | | $ | 7,907,913 | |
| | | | | | | | |
| | | | | | $ | 29,621,152 | |
| | | | | | | | |
| Railroad & Shipping – 1.5% | | | | | | | | |
| Canadian Pacific Railway Ltd. | | | 21,233 | | | $ | 5,413,353 | |
| Kansas City Southern Co. | | | 30,649 | | | | 4,694,201 | |
| | | | | | | | |
| | | | | | $ | 10,107,554 | |
| | | | | | | | |
| Real Estate – 1.5% | | | | | | | | |
| Public Storage, Inc., REIT | | | 31,019 | | | $ | 6,605,806 | |
| STORE Capital Corp., REIT | | | 97,447 | | | | 3,628,927 | |
| | | | | | | | |
| | | | | | $ | 10,234,733 | |
| | | | | | | | |
| Restaurants – 1.6% | | | | | | | | |
| Chipotle Mexican Grill, Inc., “A” (a) | | | 2,950 | | | $ | 2,469,475 | |
| Starbucks Corp. | | | 96,036 | | | | 8,443,485 | |
| | | | | | | | |
| | | | | | $ | 10,912,960 | |
| | | | | | | | |
| Specialty Chemicals – 0.7% | | | | | | | | |
| DuPont de Nemours, Inc. | | | 74,906 | | | $ | 4,808,965 | |
| | | | | | | | |
| Specialty Stores – 6.5% | | | | | | | | |
| Amazon.com, Inc. (a)(s) | | | 13,202 | | | $ | 24,395,184 | |
| Burlington Stores, Inc. (a) | | | 18,812 | | | | 4,289,700 | |
| Chewy, Inc., “A” (a)(l) | | | 42,208 | | | | 1,224,032 | |
| Ross Stores, Inc. | | | 54,583 | | | | 6,354,553 | |
| Target Corp. | | | 64,386 | | | | 8,254,929 | |
| | | | | | | | |
| | | | | | $ | 44,518,398 | |
| | | | | | | | |
| Telecommunications – Wireless – 1.4% | |
| American Tower Corp., REIT | | | 41,016 | | | $ | 9,426,297 | |
| | | | | | | | |
| Telephone Services – 0.6% | | | | | | | | |
| Verizon Communications, Inc. | | | 66,662 | | | $ | 4,093,047 | |
| | | | | | | | |
| Tobacco – 0.8% | | | | | | | | |
| Philip Morris International, Inc. | | | 66,250 | | | $ | 5,637,212 | |
| | | | | | | | |
| Utilities – Electric Power – 2.9% | | | | | | | | |
| American Electric Power Co., Inc. | | | 40,374 | | | $ | 3,815,747 | |
| CMS Energy Corp. | | | 51,001 | | | | 3,204,903 | |
| Duke Energy Corp. | | | 44,473 | | | | 4,056,382 | |
| FirstEnergy Corp. | | | 91,661 | | | | 4,454,724 | |
| NextEra Energy, Inc. | | | 18,223 | | | | 4,412,882 | |
| | | | | | | | |
| | | | | | $ | 19,944,638 | |
| | | | | | | | |
Total Common Stocks
(Identified Cost, $438,069,886) | | | | | | $ | 677,730,106 | |
| | | | | | | | |
|
| INVESTMENT COMPANIES (h) – 0.2% | |
| Money Market Funds – 0.2% | | | | | | | | |
| MFS Institutional Money Market Portfolio, 1.7% (v) (Identified Cost, $1,194,823) | | | 1,194,880 | | | $ | 1,194,880 | |
| | | | | | | | |
|
| COLLATERAL FOR SECURITIES LOANED – 0.0% | |
| State Street Navigator Securities Lending Government Money Market Portfolio, 1.58% (j) (Identified Cost, $204,670) | | | 204,670 | | | $ | 204,670 | |
| | | | | | | | |
9
MFS Research Series
Portfolio of Investments – continued
| | | | | | | | |
| | |
| Issuer | | Shares/Par | | | Value ($) | |
| SECURITIES SOLD SHORT – (0.5)% | | | | | |
| Medical & Health Technology & Services – (0.2)% | |
| Healthcare Services Group, Inc. | | | (44,372 | ) | | $ | (1,079,127 | ) |
| | | | | | | | |
| Telecommunications – Wireless – (0.3)% | | | | | |
| Crown Castle International Corp., REIT | | | (16,616 | ) | | $ | (2,361,964 | ) |
| | | | | | | | |
| Total Securities Sold Short (Proceeds Received, $2,805,414) | | | | | | $ | (3,441,091 | ) |
| | | | | | | | |
OTHER ASSETS, LESS
LIABILITIES – 0.9% | | | | | | | 5,995,912 | |
| | | | | | | | |
| NET ASSETS – 100.0% | | | | | | $ | 681,684,477 | |
| | | | | | | | |
| (a) | | Non-income producing security. |
| (h) | | An affiliated issuer, which may be considered one in which the fund owns 5% or more of the outstanding voting securities, or a company which is under common control. At period end, the aggregate values of the fund’s investments in affiliated issuers and in unaffiliated issuers were $1,194,880 and $677,934,776, respectively. |
| (j) | | The rate quoted is the annualizedseven-day yield of the fund at period end. |
| (l) | | A portion of this security is on loan. See Note 2 for additional information. |
| (s) | | Security or a portion of the security was pledged to cover collateral requirements for securities sold short. |
| (v) | | Affiliated issuer that is available only to investment companies managed by MFS. The rate quoted for the MFS Institutional Money Market Portfolio is the annualizedseven-day yield of the fund at period end. |
The following abbreviations are used in this report and are defined:
| ADR | | American Depositary Receipt |
| REIT | | Real Estate Investment Trust |
At December 31, 2019, the fund had cash collateral of $16,071 and other liquid securities with an aggregate value of $7,821,150 to cover any collateral or margin obligations for securities sold short. Restricted cash and/or deposits with brokers in the Statement of Assets and Liabilities are comprised of cash collateral.
See Notes to Financial Statements
10
MFS Research Series
FINANCIAL STATEMENTS | STATEMENT OF ASSETS AND LIABILITIES
This statement represents your fund’s balance sheet, which details the assets and liabilities comprising the total value of the fund.
| | | | |
At 12/31/19 | | | | |
| |
Assets | | | | |
Investments in unaffiliated issuers, at value, including $1,236,114 of securities on loan (identified cost, $438,274,556) | | | $677,934,776 | |
Investments in affiliated issuers, at value (identified cost, $1,194,823) | | | 1,194,880 | |
Deposits with brokers for | | | | |
Securities sold short | | | 16,071 | |
Receivables for | | | | |
Investments sold | | | 5,859,227 | |
Fund shares sold | | | 567,036 | |
Interest and dividends | | | 657,013 | |
Other assets | | | 2,800 | |
Total assets | | | $686,231,803 | |
| |
Liabilities | | | | |
Payables for | | | | |
Securities sold short, at value (proceeds received, $2,805,414) | | | $3,441,091 | |
Fund shares reacquired | | | 767,221 | |
Collateral for securities loaned, at value (c) | | | 204,670 | |
Payable to affiliates | | | | |
Investment adviser | | | 21,938 | |
Administrative services fee | | | 525 | |
Shareholder servicing costs | | | 797 | |
Distribution and/or service fees | | | 4,383 | |
Payable for independent Trustees’ compensation | | | 12 | |
Accrued expenses and other liabilities | | | 106,689 | |
Total liabilities | | | $4,547,326 | |
Net assets | | | $681,684,477 | |
| |
Net assets consist of | | | | |
Paid-in capital | | | $411,115,493 | |
Total distributable earnings (loss) | | | 270,568,984 | |
Net assets | | | $681,684,477 | |
Shares of beneficial interest outstanding | | | 23,279,469 | |
| | | | | | | | | | | | |
| | | |
| | | Net assets | | | Shares
outstanding | | | Net asset value
per share | |
Initial Class | | | $361,842,455 | | | | 12,270,466 | | | | $29.49 | |
Service Class | | | 319,842,022 | | | | 11,009,003 | | | | 29.05 | |
| (c) | Non-cash collateral is not included. |
See Notes to Financial Statements
11
MFS Research Series
FINANCIAL STATEMENTS | STATEMENT OF OPERATIONS
This statement describes how much your fund earned in investment income and accrued in expenses. It also describes any gains and/or losses generated by fund operations.
| | | | |
Year ended 12/31/19 | | | | |
| |
Net investment income (loss) | | | | |
Income | | | | |
Dividends | | | $9,977,961 | |
Dividends from affiliated issuers | | | 120,360 | |
Other | | | 88,993 | |
Income on securities loaned | | | 53,796 | |
Foreign taxes withheld | | | (39,019 | ) |
Total investment income | | | $10,202,091 | |
Expenses | | | | |
Management fee | | | $4,699,526 | |
Distribution and/or service fees | | | 683,655 | |
Shareholder servicing costs | | | 17,757 | |
Administrative services fee | | | 94,656 | |
Independent Trustees’ compensation | | | 17,447 | |
Custodian fee | | | 31,512 | |
Shareholder communications | | | 49,078 | |
Audit and tax fees | | | 59,234 | |
Legal fees | | | 5,888 | |
Dividend and interest expense on securities sold short | | | 190,574 | |
Interest expense and fees | | | 3,677 | |
Miscellaneous | | | 36,796 | |
Total expenses | | | $5,889,800 | |
Reduction of expenses by investment adviser | | | (115,573 | ) |
Net expenses | | | $5,774,227 | |
Net investment income (loss) | | | $4,427,864 | |
| |
Realized and unrealized gain (loss) | | | | |
Realized gain (loss) (identified cost basis) | | | | |
Unaffiliated issuers | | | $27,940,502 | |
Affiliated issuers | | | 338 | |
Foreign currency | | | 46 | |
Net realized gain (loss) | | | $27,940,886 | |
Change in unrealized appreciation or depreciation | | | | |
Unaffiliated issuers | | | $141,599,686 | |
Affiliated issuers | | | 78 | |
Securities sold short | | | (206,238 | ) |
Translation of assets and liabilities in foreign currencies | | | 141 | |
Net unrealized gain (loss) | | | $141,393,667 | |
Net realized and unrealized gain (loss) | | | $169,334,553 | |
Change in net assets from operations | | | $173,762,417 | |
See Notes to Financial Statements
12
MFS Research Series
FINANCIAL STATEMENTS | STATEMENTS OF CHANGES IN NET ASSETS
These statements describe the increases and/or decreases in net assets resulting from operations, any distributions, and any shareholder transactions.
| | | | | | | | |
| | | Year ended | |
| | | 12/31/19 | | | 12/31/18 | |
Change in net assets | | | | | | | | |
| | |
From operations | | | | | | | | |
Net investment income (loss) | | | $4,427,864 | | | | $4,710,335 | |
Net realized gain (loss) | | | 27,940,886 | | | | 64,792,203 | |
Net unrealized gain (loss) | | | 141,393,667 | | | | (91,045,222 | ) |
Change in net assets from operations | | | $173,762,417 | | | | $(21,542,684 | ) |
Total distributions to shareholders | | | $(69,043,322 | ) | | | $(71,592,214 | ) |
Change in net assets from fund share transactions | | | $41,645,153 | | | | $5,486,232 | |
Total change in net assets | | | $146,364,248 | | | | $(87,648,666 | ) |
| | |
Net assets | | | | | | | | |
At beginning of period | | | 535,320,229 | | | | 622,968,895 | |
At end of period | | | $681,684,477 | | | | $535,320,229 | |
See Notes to Financial Statements
13
MFS Research Series
FINANCIAL STATEMENTS | FINANCIAL HIGHLIGHTS
The financial highlights table is intended to help you understand the fund’s financial performance for the past 5 years. Certain information reflects financial results for a single fund share. The total returns in the table represent the rate that an investor would have earned (or lost) on an investment in the fund share class (assuming reinvestment of all distributions) held for the entire period.
| | | | | | | | | | | | | | | | | | | | |
| Initial Class | | Year ended | |
| | | | | |
| | | 12/31/19 | | | 12/31/18 | | | 12/31/17 | | | 12/31/16 | | | 12/31/15 | |
| | | | | |
Net asset value, beginning of period | | | $24.93 | | | | $29.50 | | | | $26.00 | | | | $26.68 | | | | $29.11 | |
| | | | | |
| Income (loss) from investment operations | | | | | | | | | | | | | | | | | | | | |
Net investment income (loss) (d) | | | $0.23 | | | | $0.26 | | | | $0.20 | | | | $0.36 | (c) | | | $0.21 | |
Net realized and unrealized gain (loss) | | | 7.66 | | | | (1.04 | ) | | | 5.67 | | | | 1.98 | | | | (0.17 | )(g) |
Total from investment operations | | | $7.89 | | | | $(0.78 | ) | | | $5.87 | | | | $2.34 | | | | $0.04 | |
| | | | | |
| Less distributions declared to shareholders | | | | | | | | | | | | | | | | | | | | |
From net investment income | | | $(0.24 | ) | | | $(0.22 | ) | | | $(0.40 | ) | | | $(0.22 | ) | | | $(0.22 | ) |
From net realized gain | | | (3.09 | ) | | | (3.57 | ) | | | (1.97 | ) | | | (2.80 | ) | | | (2.25 | ) |
Total distributions declared to shareholders | | | $(3.33 | ) | | | $(3.79 | ) | | | $(2.37 | ) | | | $(3.02 | ) | | | $(2.47 | ) |
Net asset value, end of period (x) | | | $29.49 | | | | $24.93 | | | | $29.50 | | | | $26.00 | | | | $26.68 | |
Total return (%) (k)(r)(s)(x) | | | 32.95 | | | | (4.37 | ) | | | 23.37 | | | | 8.74 | (c) | | | 0.80 | |
| | | | | |
Ratios (%) (to average net assets)
and Supplemental data: | | | | | | | | | | | | | | | | | | | | |
Expenses before expense reductions (f) | | | 0.83 | | | | 0.82 | | | | 0.83 | | | | 0.80 | (c) | | | 0.82 | |
Expenses after expense reductions (f) | | | 0.81 | | | | 0.81 | | | | 0.81 | | | | 0.79 | (c) | | | 0.81 | |
Net investment income (loss) | | | 0.82 | | | | 0.88 | | | | 0.70 | | | | 1.36 | (c) | | | 0.72 | |
Portfolio turnover | | | 35 | | | | 31 | | | | 37 | | | | 45 | | | | 43 | |
Net assets at end of period (000 omitted) | | | $361,842 | | | | $319,422 | | | | $394,867 | | | | $386,256 | | | | $410,178 | |
| | | | | |
| Supplemental Ratios (%): | | | | | | | | | | | | | | | | | | | | |
Ratios of expenses to average net assets after expense reductions excluding short sale expenses and interest expense and fees (f) | | | 0.78 | | | | 0.79 | | | | 0.79 | | | | 0.78 | (c) | | | 0.80 | |
See Notes to Financial Statements
14
MFS Research Series
Financial Highlights – continued
| | | | | | | | | | | | | | | | | | | | |
| Service Class | | Year ended | |
| | | | | |
| | | 12/31/19 | | | 12/31/18 | | | 12/31/17 | | | 12/31/16 | | | 12/31/15 | |
| | | | | |
Net asset value, beginning of period | | | $24.61 | | | | $29.17 | | | | $25.73 | | | | $26.42 | | | | $28.84 | |
| | | | | |
| Income (loss) from investment operations | | | | | | | | | | | | | | | | | | | | |
Net investment income (loss) (d) | | | $0.16 | | | | $0.18 | | | | $0.13 | | | | $0.29 | (c) | | | $0.13 | |
Net realized and unrealized gain (loss) | | | 7.55 | | | | (1.03 | ) | | | 5.61 | | | | 1.96 | | | | (0.16 | )(g) |
Total from investment operations | | | $7.71 | | | | $(0.85 | ) | | | $5.74 | | | | $2.25 | | | | $(0.03 | ) |
| | | | | |
| Less distributions declared to shareholders | | | | | | | | | | | | | | | | | | | | |
From net investment income | | | $(0.18 | ) | | | $(0.14 | ) | | | $(0.33 | ) | | | $(0.14 | ) | | | $(0.14 | ) |
From net realized gain | | | (3.09 | ) | | | (3.57 | ) | | | (1.97 | ) | | | (2.80 | ) | | | (2.25 | ) |
Total distributions declared to shareholders | | | $(3.27 | ) | | | $(3.71 | ) | | | $(2.30 | ) | | | $(2.94 | ) | | | $(2.39 | ) |
Net asset value, end of period (x) | | | $29.05 | | | | $24.61 | | | | $29.17 | | | | $25.73 | | | | $26.42 | |
Total return (%) (k)(r)(s)(x) | | | 32.60 | | | | (4.62 | ) | | | 23.07 | | | | 8.49 | (c) | | | 0.53 | |
| | | | | |
Ratios (%) (to average net assets)
and Supplemental data: | | | | | | | | | | | | | | | | | | | | |
Expenses before expense reductions (f) | | | 1.08 | | | | 1.07 | | | | 1.08 | | | | 1.05 | (c) | | | 1.07 | |
Expenses after expense reductions (f) | | | 1.06 | | | | 1.06 | | | | 1.06 | | | | 1.04 | (c) | | | 1.06 | |
Net investment income (loss) | | | 0.57 | | | | 0.63 | | | | 0.47 | | | | 1.11 | (c) | | | 0.47 | |
Portfolio turnover | | | 35 | | | | 31 | | | | 37 | | | | 45 | | | | 43 | |
Net assets at end of period (000 omitted) | | | $319,842 | | | | $215,898 | | | | $228,102 | | | | $220,341 | | | | $226,704 | |
| | | | | |
| Supplemental Ratios (%): | | | | | | | | | | | | | | | | | | | | |
Ratios of expenses to average net assets after expense reductions excluding short sale expenses and interest expense and fees (f) | | | 1.03 | | | | 1.04 | | | | 1.04 | | | | 1.03 | (c) | | | 1.05 | |
| (c) | Amount reflects aone-time reimbursement of expenses by the custodian (or former custodian) without which net investment income and performance would be lower and expenses would be higher. |
| (d) | Per share data is based on average shares outstanding. |
| (f) | Ratios do not reflect reductions from fees paid indirectly, if applicable. |
| (g) | The per share amount varies from the net realized and unrealized gain/loss for the period because of the timing of sales of fund shares and the per share amount of realized and unrealized gains and losses at such time. |
| (k) | The total return does not reflect expenses that apply to separate accounts. Inclusion of these charges would reduce the total return figures for all periods shown. |
| (r) | Certain expenses have been reduced without which performance would have been lower. |
| (s) | From time to time the fund may receive proceeds from litigation settlements, without which performance would be lower. |
| (x) | The net asset values and total returns have been calculated on net assets which include adjustments made in accordance with U.S. generally accepted accounting principles required at period end for financial reporting purposes. |
See Notes to Financial Statements
15
MFS Research Series
NOTES TO FINANCIAL STATEMENTS
| (1) | | Business and Organization |
MFS Research Series (the fund) is a diversified series of MFS Variable Insurance Trust (the trust). The trust is organized as a Massachusetts business trust and is registered under the Investment Company Act of 1940, as amended, as anopen-end management investment company. The shareholders of each series of the trust are separate accounts of insurance companies, which offer variable annuity and/or life insurance products, and qualified retirement and pension plans.
The fund is an investment company and accordingly follows the investment company accounting and reporting guidance of the Financial Accounting Standards Board (FASB) Accounting Standards Codification Topic 946 Financial Services – Investment Companies.
| (2) | | Significant Accounting Policies |
General– The preparation of financial statements in conformity with U.S. generally accepted accounting principles requires management to make estimates and assumptions that affect the reported amounts of assets and liabilities, and disclosure of contingent assets and liabilities at the date of the financial statements and the reported amounts of increases and decreases in net assets from operations during the reporting period. Actual results could differ from those estimates. In the preparation of these financial statements, management has evaluated subsequent events occurring after the date of the fund’s Statement of Assets and Liabilities through the date that the financial statements were issued.
Balance Sheet Offsetting– The fund’s accounting policy with respect to balance sheet offsetting is that, absent an event of default by the counterparty or a termination of the agreement, the International Swaps and Derivatives Association (ISDA) Master Agreement, or similar agreement, does not result in an offset of reported amounts of financial assets and financial liabilities in the Statement of Assets and Liabilities across transactions between the fund and the applicable counterparty. The fund’s right to setoff may be restricted or prohibited by the bankruptcy or insolvency laws of the particular jurisdiction to which a specific master netting agreement counterparty is subject. Balance sheet offsetting disclosures, to the extent applicable to the fund, have been included in the fund’s Significant Accounting Policies note under the captions for each of the fund’sin-scope financial instruments and transactions.
Investment Valuations– Equity securities, including restricted equity securities and equity securities sold short, are generally valued at the last sale or official closing price on their primary market or exchange as provided by a third-party pricing service. Equity securities, for which there were no sales reported that day, are generally valued at the last quoted daily bid quotation on their primary market or exchange as provided by a third-party pricing service. Equity securities sold short, for which there were no sales reported for that day, are generally valued at the last quoted daily ask quotation on their primary market or exchange as provided by a third-party pricing service. Short-term instruments with a maturity at issuance of 60 days or less may be valued at amortized cost, which approximates market value.Open-end investment companies are generally valued at net asset value per share. Securities and other assets generally valued on the basis of information from a third-party pricing service may also be valued at a broker/dealer bid quotation. In determining values, third-party pricing services can utilize both transaction data and market information such as yield, quality, coupon rate, maturity, type of issue, trading characteristics, and other market data. The values of foreign securities and other assets and liabilities expressed in foreign currencies are converted to U.S. dollars using the mean of bid and asked prices for rates provided by a third-party pricing service.
The Board of Trustees has delegated primary responsibility for determining or causing to be determined the value of the fund’s investments (including any fair valuation) to the adviser pursuant to valuation policies and procedures approved by the Board. If the adviser determines that reliable market quotations are not readily available, investments are valued at fair value as determined in good faith by the adviser in accordance with such procedures under the oversight of the Board of Trustees. Under the fund’s valuation policies and procedures, market quotations are not considered to be readily available for most types of debt instruments and floating rate loans and many types of derivatives. These investments are generally valued at fair value based on information from third-party pricing services. In addition, investments may be valued at fair value if the adviser determines that an investment’s value has been materially affected by events occurring after the close of the exchange or market on which the investment is principally traded (such as foreign exchange or market) and prior to the determination of the fund’s net asset value, or after the halt of trading of a specific security where trading does not resume prior to the close of the exchange or market on which the security is principally traded. Events that occur after foreign markets close (such as developments in foreign markets and significant movements in the U.S. markets) and prior to the determination of the fund’s net asset value may be deemed to have a material effect on the value of securities traded in foreign markets. Accordingly, the fund’s foreign equity securities may often be valued at fair value. The adviser generally relies on third-party pricing services or other information (such as the correlation with price movements of similar securities in the same or other markets; the type, cost and investment characteristics of the security; the business and financial condition of the issuer; and trading and other market data) to assist in determining whether to fair value and at what value to fair value an investment. The value of an investment for purposes of calculating the fund’s net asset value can differ depending on the source and method used to determine value. When fair valuation is used, the value of an investment used to determine the fund’s net asset
16
MFS Research Series
Notes to Financial Statements – continued
value may differ from quoted or published prices for the same investment. There can be no assurance that the fund could obtain the fair value assigned to an investment if it were to sell the investment at the same time at which the fund determines its net asset value per share.
Various inputs are used in determining the value of the fund’s assets or liabilities. These inputs are categorized into three broad levels. In certain cases, the inputs used to measure fair value may fall into different levels of the fair value hierarchy. In such cases, an investment’s level within the fair value hierarchy is based on the lowest level of input that is significant to the fair value measurement. The fund’s assessment of the significance of a particular input to the fair value measurement in its entirety requires judgment, and considers factors specific to the investment. Level 1 includes unadjusted quoted prices in active markets for identical assets or liabilities. Level 2 includes other significant observable market-based inputs (including quoted prices for similar securities, interest rates, prepayment speed, and credit risk). Level 3 includes unobservable inputs, which may include the adviser’s own assumptions in determining the fair value of investments. The following is a summary of the levels used as of December 31, 2019 in valuing the fund’s assets or liabilities:
| | | | | | | | | | | | | | | | |
| Financial Instruments | | Level 1 | | | Level 2 | | | Level 3 | | | Total | |
| Equity Securities | | | $677,730,106 | | | | $— | | | | $— | | | | $677,730,106 | |
| Mutual Funds | | | 1,399,550 | | | | — | | | | — | | | | 1,399,550 | |
| Total | | | $679,129,656 | | | | $— | | | | $— | | | | $679,129,656 | |
| | | | |
| Securities Sold Short | | | $(3,441,091 | ) | | | $— | | | | $— | | | | $(3,441,091 | ) |
For further information regarding security characteristics, see the Portfolio of Investments.
Foreign Currency Translation– Purchases and sales of foreign investments, income, and expenses are converted into U.S. dollars based upon currency exchange rates prevailing on the respective dates of such transactions or on the reporting date for foreign denominated receivables and payables. Gains and losses attributable to foreign currency exchange rates on sales of securities are recorded for financial statement purposes as net realized gains and losses on investments. Gains and losses attributable to foreign exchange rate movements on receivables, payables, income and expenses are recorded for financial statement purposes as foreign currency transaction gains and losses. That portion of both realized and unrealized gains and losses on investments that results from fluctuations in foreign currency exchange rates is not separately disclosed.
Short Sales– The fund entered into short sales whereby it sells a security it does not own in anticipation of a decline in the value of that security. The fund will realize a gain if the security price decreases and a loss if the security price increases between the date of the short sale and the date on which the fund replaces the borrowed security. Losses from short sales can exceed the proceeds of the security sold; and they can also exceed the potential loss from an ordinary buy and sell transaction. The amount of any premium, dividends, or interest the fund may be required to pay in connection with a short sale will be recognized as a fund expense. During the year ended December 31, 2019, this expense amounted to $190,574. The fund segregates cash or marketable securities in an amount that, when combined with the amount of proceeds from the short sale deposited with the broker, at least equals the current market value of the security sold short.
Security Loans– Under its Securities Lending Agency Agreement with the fund, State Street Bank and Trust Company, as lending agent, loans the securities of the fund to certain qualified institutions (the “Borrowers”) approved by the fund. Security loans can be terminated at the discretion of either the lending agent or the fund and the related securities must be returned within the earlier of the standard trade settlement period for such securities or within three business days. The loans are collateralized by cash and/or U.S. Treasury and federal agency obligations in an amount typically at least equal to the market value of the securities loaned. On loans collateralized by cash, the cash collateral is invested in a money market fund. The market value of the loaned securities is determined at the close of business of the fund and any additional required collateral is delivered to the fund on the next business day. The lending agent provides the fund with indemnification against Borrower default. In the event of Borrower default, the lending agent will, for the benefit of the fund, either purchase securities identical to those loaned or, when such purchase is commercially impracticable, pay the fund the market value of the loaned securities. In return, the lending agent assumes the fund’s rights to the related collateral. If the collateral value is less than the cost to purchase identical securities, the lending agent is responsible for the shortfall, but only to the extent that such shortfall is not due to a decline in collateral value resulting from collateral reinvestment for which the fund bears the risk of loss. At period end, the fund had investment securities on loan, all of which were classified as equity securities in the fund’s Portfolio of Investments, with a fair value of $1,236,114. The fair value of the fund’s investment securities on loan and a related liability of $204,670 for cash collateral received on securities loaned are both presented gross in the Statement of Assets and Liabilities. Additionally, these loans were collateralized by U.S. Treasury Obligations of $1,083,713 held by the lending agent. The collateral on securities loaned exceeded the value of securities on loan at period end. The liability for cash collateral for securities loaned is carried at fair value, which is categorized as level 2 within the fair value hierarchy. A portion of the income generated upon investment of the collateral is remitted to the Borrowers, and the remainder is allocated between the fund and the lending agent. On loans collateralized by U.S. Treasury and/or federal agency obligations, a fee is received from the Borrower, and is
17
MFS Research Series
Notes to Financial Statements – continued
allocated between the fund and the lending agent. Income from securities lending is separately reported in the Statement of Operations. The dividend and interest income earned on the securities loaned is accounted for in the same manner as other dividend and interest income.
Indemnifications– Under the fund’s organizational documents, its officers and Trustees may be indemnified against certain liabilities and expenses arising out of the performance of their duties to the fund. Additionally, in the normal course of business, the fund enters into agreements with service providers that may contain indemnification clauses. The fund’s maximum exposure under these agreements is unknown as this would involve future claims that may be made against the fund that have not yet occurred.
Investment Transactions and Income– Investment transactions are recorded on the trade date. Interest income is recorded on the accrual basis. Dividends received in cash are recorded on theex-dividend date. Certain dividends from foreign securities will be recorded when the fund is informed of the dividend if such information is obtained subsequent to theex-dividend date. Dividend payments received in additional securities are recorded on theex-dividend date in an amount equal to the value of the security on such date.
The fund may receive proceeds from litigation settlements. Any proceeds received from litigation involving portfolio holdings are reflected in the Statement of Operations in realized gain/loss if the security has been disposed of by the fund or in unrealized gain/loss if the security is still held by the fund. Any other proceeds from litigation not related to portfolio holdings are reflected as other income in the Statement of Operations.
Tax Matters and Distributions– The fund intends to qualify as a regulated investment company, as defined under Subchapter M of the Internal Revenue Code, and to distribute all of its taxable income, including realized capital gains. As a result, no provision for federal income tax is required. The fund’s federal tax returns, when filed, will remain subject to examination by the Internal Revenue Service for a three year period. Management has analyzed the fund’s tax positions taken on federal and state tax returns for all open tax years and does not believe that there are any uncertain tax positions that require recognition of a tax liability. Foreign taxes, if any, have been accrued by the fund in the accompanying financial statements in accordance with the applicable foreign tax law. Foreign income taxes may be withheld by certain countries in which the fund invests. Additionally, capital gains realized by the fund on securities issued in or by certain foreign countries may be subject to capital gains tax imposed by those countries.
Distributions to shareholders are recorded on theex-dividend date. Income and capital gain distributions are determined in accordance with income tax regulations, which may differ from U.S. generally accepted accounting principles. Certain capital accounts in the financial statements are periodically adjusted for permanent differences in order to reflect their tax character. These adjustments have no impact on net assets or net asset value per share. Temporary differences which arise from recognizing certain items of income, expense, gain or loss in different periods for financial statement and tax purposes will reverse at some time in the future.
Book/tax differences primarily relate to wash sale loss deferrals and partnership adjustments.
The tax character of distributions declared to shareholders for the last two fiscal years is as follows:
| | | | | | | | |
| | | Year ended
12/31/19 | | | Year ended
12/31/18 | |
| Ordinary income (including any short-term capital gains) | | | $8,055,147 | | | | $15,192,066 | |
| Long-term capital gains | | | 60,988,175 | | | | 56,400,148 | |
| Total distributions | | | $69,043,322 | | | | $71,592,214 | |
The federal tax cost and the tax basis components of distributable earnings were as follows:
| | | | |
| As of 12/31/19 | | | | |
| |
| Cost of investments | | | $438,092,584 | |
| Gross appreciation | | | 243,206,803 | |
| Gross depreciation | | | (5,610,822 | ) |
| Net unrealized appreciation (depreciation) | | | $237,595,981 | |
| |
| Undistributed ordinary income | | | 6,993,168 | |
| Undistributed long-term capital gain | | | 24,897,394 | |
| Other temporary differences | | | 1,082,441 | |
Multiple Classes of Shares of Beneficial Interest– The fund offers multiple classes of shares, which differ in their respective distribution and/or service fees. The fund’s income, realized and unrealized gain (loss), and common expenses are allocated to shareholders based on the daily net assets of each class. Dividends are declared separately for each class. Differences in per share
18
MFS Research Series
Notes to Financial Statements – continued
dividend rates are generally due to differences in separate class expenses. The fund’s distributions declared to shareholders as reported in the Statements of Changes in Net Assets are presented by class as follows:
| | | | | | | | |
| | |
| | | Year ended
12/31/19 | | | Year ended
12/31/18 | |
| Initial Class | | | $38,326,191 | | | | $44,328,950 | |
| Service Class | | | 30,717,131 | | | | 27,263,264 | |
| Total | | | $69,043,322 | | | | $71,592,214 | |
| (3) | | Transactions with Affiliates |
Investment Adviser– The fund has an investment advisory agreement with MFS to provide overall investment management and related administrative services and facilities to the fund. The management fee is computed daily and paid monthly at the following annual rates based on the fund’s average daily net assets:
| | | | |
| Up to $1 billion | | | 0.75% | |
| In excess of $1 billion | | | 0.65% | |
MFS has agreed in writing to reduce its management fee by a specified amount if certain MFS mutual fund assets exceed thresholds agreed to by MFS and the fund’s Board of Trustees. For the year ended December 31, 2019, this management fee reduction amounted to $61,095, which is included in the reduction of total expenses in the Statement of Operations. The management fee incurred for the year ended December 31, 2019 was equivalent to an annual effective rate of 0.74% of the fund’s average daily net assets.
For the period from January 1, 2019 through July 31, 2019, the investment adviser had agreed in writing to pay a portion of the fund’s total annual operating expenses, excluding interest, taxes, extraordinary expenses, brokerage and transaction costs, and investment-related expenses (such as short sale dividend and interest expenses incurred in connection with the fund’s investment activity), such that total annual operating expenses did not exceed 0.79% of average daily net assets for the Initial Class shares and 1.04% of average daily net assets for the Service Class shares. This written agreement terminated on July 31, 2019. For the period from January 1, 2019 through July 31, 2019, this reduction amounted to $9,933, which is included in the reduction of total expenses in the Statement of Operations. Effective August 1, 2019, the investment adviser has agreed in writing to pay a portion of the fund’s total annual operating expenses, excluding interest, taxes, extraordinary expenses, brokerage and transaction costs, and investment-related expenses (such as short sale dividend and interest expenses incurred in connection with the fund’s investment activity), such that total annual operating expenses do not exceed 0.77% of average daily net assets for the Initial Class shares and 1.02% of average daily net assets for the Service Class shares. This written agreement will continue until modified by the fund’s Board of Trustees, but such agreement will continue at least until April 30, 2021. For the period from August 1, 2019 through December 31, 2019, this reduction amounted to $44,545, which is included in the reduction of total expenses in the Statement of Operations.
Distributor– MFS Fund Distributors, Inc. (MFD), a wholly-owned subsidiary of MFS, is the distributor of shares of the fund. The Trustees have adopted a distribution plan for the Service Class shares pursuant to Rule12b-1 under the Investment Company Act of 1940.
The fund’s distribution plan provides that the fund will pay MFD distribution and/or service fees equal to 0.25% per annum of its average daily net assets attributable to Service Class shares as partial consideration for services performed and expenses incurred by MFD and financial intermediaries (including participating insurance companies that invest in the fund to fund variable annuity and variable life insurance contracts, sponsors of qualified retirement and pension plans that invest in the fund, and affiliates of these participating insurance companies and plan sponsors) in connection with the sale and distribution of the Service Class shares. MFD may subsequently pay all, or a portion, of the distribution and/or service fees to financial intermediaries.
Shareholder Servicing Agent– MFS Service Center, Inc. (MFSC), a wholly-owned subsidiary of MFS, receives a fee from the fund for its services as shareholder servicing agent. For the year ended December 31, 2019, the fee was $15,987, which equated to 0.0026% annually of the fund’s average daily net assets. MFSC also receives payment from the fund forout-of-pocket expenses paid by MFSC on behalf of the fund. For the year ended December 31, 2019, these costs amounted to $1,770.
Administrator– MFS provides certain financial, legal, shareholder communications, compliance, and other administrative services to the fund. Under an administrative services agreement, the fund reimburses MFS the costs incurred to provide these services. The fund is charged an annual fixed amount of $17,500 plus a fee based on average daily net assets. The administrative services fee incurred for the year ended December 31, 2019 was equivalent to an annual effective rate of 0.0151% of the fund’s average daily net assets.
Trustees’ and Officers’ Compensation– The fund pays compensation to independent Trustees in the form of a retainer, attendance fees, and additional compensation to Board and Committee chairpersons. The fund does not pay compensation directly to Trustees or officers of the fund who are also officers of the investment adviser, all of whom receive remuneration from MFS for their services to the fund. Certain officers and Trustees of the fund are officers or directors of MFS, MFD, and MFSC.
19
MFS Research Series
Notes to Financial Statements – continued
Other– This fund and certain other funds managed by MFS (the funds) had entered into a service agreement (the ISO Agreement) which provided for payment of fees solely by the funds to Tarantino LLC in return for the provision of services of an Independent Senior Officer (ISO) for the funds. Frank L. Tarantino served as the ISO and was an officer of the funds and the sole member of Tarantino LLC. Effective June 30, 2019, Mr. Tarantino retired from his position as ISO for the funds, and the ISO Agreement was terminated. For the year ended December 31, 2019, the fee paid by the fund under this agreement was $699 and is included in “Miscellaneous” expense in the Statement of Operations. MFS had agreed to bear all expenses associated with office space, other administrative support, and supplies provided to the ISO.
The fund invests in the MFS Institutional Money Market Portfolio which is managed by MFS and seeks current income consistent with preservation of capital and liquidity. This money market fund does not pay a management fee to MFS.
The fund is permitted to engage in purchase and sale transactions with funds and accounts for which MFS serves as investment adviser orsub-adviser (“cross-trades”) pursuant to a policy adopted by the Board of Trustees. This policy has been designed to ensure that cross-trades conducted by the fund comply with Rule17a-7 under the Investment Company Act of 1940. During the year ended December 31, 2019, the fund engaged in purchase and sale transactions pursuant to this policy, which amounted to $85,219 and $313,467, respectively. The sales transactions resulted in net realized gains (losses) of $44,936.
The adviser has voluntarily undertaken to reimburse the fund from its own resources on a quarterly basis for the cost of investment research embedded in the cost of the fund’s securities trades. This agreement may be rescinded at any time. For the year ended December 31, 2019, this reimbursement amounted to $29,674, which is included in “Other” income in the Statement of Operations.
For the year ended December 31, 2019, purchases and sales of investments, other than short sales and short-term obligations, aggregated $214,550,172 and $233,991,707, respectively.
| (5) | | Shares of Beneficial Interest |
The fund’s Declaration of Trust permits the Trustees to issue an unlimited number of full and fractional shares of beneficial interest. Transactions in fund shares were as follows:
| | | | | | | | | | | | | | | | |
| | | Year ended 12/31/19 | | | Year ended 12/31/18 | |
| | | | |
| | | Shares | | | Amount | | | Shares | | | Amount | |
| Shares sold | | | | | | | | | | | | | | | | |
Initial Class | | | 633,043 | | | | $17,785,306 | | | | 329,221 | | | | $9,452,088 | |
Service Class | | | 2,518,541 | | | | 70,524,436 | | | | 1,628,313 | | | | 45,814,010 | |
| | | 3,151,584 | | | | $88,309,742 | | | | 1,957,534 | | | | $55,266,098 | |
| | | | |
| Shares issued to shareholders in reinvestment of distributions | | | | | | | | | | | | | | | | |
Initial Class | | | 1,429,548 | | | | $38,326,191 | | | | 1,541,340 | | | | $44,328,950 | |
Service Class | | | 1,161,767 | | | | 30,717,131 | | | | 959,299 | | | | 27,263,264 | |
| | | 2,591,315 | | | | $69,043,322 | | | | 2,500,639 | | | | $71,592,214 | |
| | | | |
| Shares reacquired | | | | | | | | | | | | | | | | |
Initial Class | | | (2,606,676 | ) | | | $(74,894,897 | ) | | | (2,439,153 | ) | | | $(73,589,103 | ) |
Service Class | | | (1,444,916 | ) | | | (40,813,014 | ) | | | (1,633,597 | ) | | | (47,782,977 | ) |
| | | (4,051,592 | ) | | | $(115,707,911 | ) | | | (4,072,750 | ) | | | $(121,372,080 | ) |
| | | | |
| Net change | | | | | | | | | | | | | | | | |
Initial Class | | | (544,085 | ) | | | $(18,783,400 | ) | | | (568,592 | ) | | | $(19,808,065 | ) |
Service Class | | | 2,235,392 | | | | 60,428,553 | | | | 954,015 | | | | 25,294,297 | |
| | | 1,691,307 | | | | $41,645,153 | | | | 385,423 | | | | $5,486,232 | |
The fund is one of several mutual funds in which certain MFS funds may invest. The MFS funds do not invest in the underlying funds for the purpose of exercising management or control. At the end of the period, the MFS Moderate Allocation Portfolio, the MFS Growth Allocation Portfolio, and the MFS Conservative Allocation Portfolio were the owners of record of approximately 17%, 5%, and 4%, respectively, of the value of outstanding voting shares of the fund.
The fund and certain other funds managed by MFS participate in a $1.25 billion unsecured committed line of credit, subject to a $1 billion sublimit, provided by a syndicate of banks under a credit agreement. Borrowings may be made for temporary financing needs. Interest is charged to each fund, based on its borrowings, generally at a rate equal to the highest of one month LIBOR, the Federal Funds Effective Rate and the Overnight Bank Funding Rate, plus an agreed upon spread. A commitment fee, based on the average daily, unused portion of the committed line of credit, is allocated among the participating funds. In addition, the fund and
20
MFS Research Series
Notes to Financial Statements – continued
other funds managed by MFS have established unsecured uncommitted borrowing arrangements with certain banks for temporary financing needs. Interest is charged to each fund, based on its borrowings, at rates equal to customary reference rates plus an agreed upon spread. For the year ended December 31, 2019, the fund’s commitment fee and interest expense were $3,410 and $0, respectively, and are included in “Interest expense and fees” in the Statement of Operations.
| (7) | | Investments in Affiliated Issuers |
An affiliated issuer may be considered one in which the fund owns 5% or more of the outstanding voting securities, or a company which is under common control. For the purposes of this report, the following were affiliated issuers:
| | | | | | | | | | | | | | | | | | | | | | | | |
| Affiliated Issuers | | Beginning
Value | | | Purchases | | | Sales
Proceeds | | | Realized
Gain
(Loss) | | | Change in
Unrealized
Appreciation or
Depreciation | | | Ending
Value | |
| MFS Institutional Money Market Portfolio | | | $8,681,716 | | | | $73,637,101 | | | | $81,124,353 | | | | $338 | | | | $78 | | | | $1,194,880 | |
| | | | | | |
| Affiliated Issuers | | | | | | | | | | | | | | Dividend
Income | | | Capital Gain
Distributions | |
| MFS Institutional Money Market Portfolio | | | | | | | | | | | | | | | | | | | $120,360 | | | | $— | |
21
MFS Research Series
REPORT OF INDEPENDENT REGISTERED PUBLIC ACCOUNTING FIRM
To the Board of Trustees of MFS Variable Insurance Trust and the Shareholders of MFS Research Series:
Opinion on the Financial Statements and Financial Highlights
We have audited the accompanying statement of assets and liabilities of MFS Research Series (the “Fund”), including the portfolio of investments, as of December 31, 2019, the related statement of operations for the year then ended, the statements of changes in net assets for each of the two years in the period then ended, the financial highlights for each of the five years in the period then ended, and the related notes. In our opinion, the financial statements and financial highlights present fairly, in all material respects, the financial position of the Fund as of December 31, 2019, and the results of its operations for the year then ended, the changes in its net assets for each of the two years in the period then ended, and the financial highlights for each of the five years in the period then ended, in conformity with accounting principles generally accepted in the United States of America.
Basis for Opinion
These financial statements and financial highlights are the responsibility of the Fund’s management. Our responsibility is to express an opinion on the Fund’s financial statements and financial highlights based on our audits. We are a public accounting firm registered with the Public Company Accounting Oversight Board (United States) (PCAOB) and are required to be independent with respect to the Fund in accordance with the U.S. federal securities laws and the applicable rules and regulations of the Securities and Exchange Commission and the PCAOB.
We conducted our audits in accordance with the standards of the PCAOB. Those standards require that we plan and perform the audit to obtain reasonable assurance about whether the financial statements and financial highlights are free of material misstatement, whether due to error or fraud. The Fund is not required to have, nor were we engaged to perform, an audit of its internal control over financial reporting. As part of our audits we are required to obtain an understanding of internal control over financial reporting but not for the purpose of expressing an opinion on the effectiveness of the Fund’s internal control over financial reporting. Accordingly, we express no such opinion.
Our audits included performing procedures to assess the risks of material misstatement of the financial statements and financial highlights, whether due to error or fraud, and performing procedures that respond to those risks. Such procedures included examining, on a test basis, evidence regarding the amounts and disclosures in the financial statements and financial highlights. Our audits also included evaluating the accounting principles used and significant estimates made by management, as well as evaluating the overall presentation of the financial statements and financial highlights. Our procedures included confirmation of securities owned as of December 31, 2019, by correspondence with the custodian and brokers; when replies were not received from brokers, we performed other auditing procedures. We believe that our audits provide a reasonable basis for our opinion.
DELOITTE & TOUCHE LLP
Boston, Massachusetts
February 14, 2020
We have served as the auditor of one or more of the MFS investment companies since 1924.
22
MFS Research Series
TRUSTEES AND OFFICERS – IDENTIFICATION AND BACKGROUND
The Trustees and Officers of the Trust, as of February 1, 2020, are listed below, together with their principal occupations during the past five years. (Their titles may have varied during that period.) The address of each Trustee and Officer is 111 Huntington Avenue, Boston, Massachusetts 02199-7618.
| | | | | | | | | | |
Name, Age | | Position(s)
Held with Fund | | Trustee/Officer
Since (h) | | Number of MFS Funds
overseen by the
Trustee | | Principal Occupations
During the Past Five Years | | Other Directorships During the Past Five Years (j) |
| INTERESTED TRUSTEES |
Robert J. Manning (k)
(age 56) | | Trustee | | February 2004 | | 133 | | Massachusetts Financial Services Company, Executive Chairman (since January 2017); Director; Chairman of the Board; Chief Executive Officer (until 2015);Co-Chief Executive Officer(2015-2016) | | N/A |
| | | | | |
Robin A. Stelmach (k) (age 58) | | Trustee | | January 2014 | | 133 | | Massachusetts Financial Services Company, Vice Chair (since January 2017); Chief Operating Officer and Executive Vice President (until January 2017) | | N/A |
|
| INDEPENDENT TRUSTEES |
John P. Kavanaugh (age 65) | | Trustee and Chair of Trustees | | January 2009 | | 133 | | Private investor | | N/A |
| | | | | |
Steven E. Buller (age 68) | | Trustee | | February 2014 | | 133 | | Financial Accounting Standards Advisory Council, Chairman(2014-2015); Public Company Accounting Oversight Board, Standing Advisory Group, Member (until 2014); BlackRock, Inc. (investment management), Managing Director (until 2014), BlackRock Finco UK (investment management), Director (until 2014) | | N/A |
| | | | | |
John A. Caroselli (age 65) | | Trustee | | March 2017 | | 133 | | JC Global Advisors, LLC (management consulting), President (since 2015); First Capital Corporation (commercial finance), Executive Vice President (until 2015) | | N/A |
| | | | | |
Maureen R. Goldfarb (age 64) | | Trustee | | January 2009 | | 133 | | Private investor | | N/A |
| | | | | |
Peter D. Jones
(age 64) | | Trustee | | January 2019 | | 133 | | Franklin Templeton Distributors, Inc. (investment management), President (until 2015); Franklin Templeton Institutional, LLC (investment management), Chairman (until 2015) | | N/A |
| | | | | |
James W. Kilman, Jr.
(age 58) | | Trustee | | January 2019 | | 133 | | Burford Capital Limited (finance and investment management), Chief Financial Officer (since 2019); KielStrand Capital LLC (family office), Chief Executive Officer (since 2016); Morgan Stanley & Co. (financial services), Vice Chairman of Investment Banking,Co-Head of Diversified Financials Coverage – Financial Institutions Investment Banking Group (until 2016) | | Alpha-En Corporation, Director (2016-2019) |
23
MFS Research Series
Trustees and Officers – continued
| | | | | | | | | | |
Name, Age | | Position(s)
Held with Fund | | Trustee/Officer
Since (h) | | Number of MFS Funds
overseen by the
Trustee | | Principal Occupations
During the Past Five Years | | Other Directorships During the Past Five Years (j) |
Clarence Otis, Jr. (age 63) | | Trustee | | March 2017 | | 133 | | Darden Restaurants, Inc., Chief Executive Officer (until 2014) | | VF Corporation, Director; Verizon Communications, Inc., Director; The Travelers Companies, Director; Federal Reserve Bank of Atlanta, Director (until 2015) |
| | | | | |
Maryanne L. Roepke (age 63) | | Trustee | | May 2014 | | 133 | | American Century Investments (investment management), Senior Vice President and Chief Compliance Officer (until 2014) | | N/A |
| | | | | |
Laurie J. Thomsen
(age 62) | | Trustee | | March 2005 | | 133 | | Private investor | | The Travelers Companies, Director; Dycom Industries, Inc., Director (since 2015) |
| | | | | | | | |
Name, Age | | Position(s)
Held with Fund | | Trustee/Officer
Since (h) | | Number of
MFS Funds
for which the
Person is an
Officer | | Principal Occupations During the Past Five Years |
| OFFICERS | | | | | | |
Christopher R. Bohane (k)
(age 46) | | Assistant Secretary and Assistant Clerk | | July 2005 | | 133 | | Massachusetts Financial Services Company, Vice President and Assistant General Counsel |
| | | | |
Kino Clark (k) (age 51) | | Assistant Treasurer | | January 2012 | | 133 | | Massachusetts Financial Services Company, Vice President |
| | | | |
John W. Clark, Jr. (k) (age 52) | | Assistant Treasurer | | April 2017 | | 133 | | Massachusetts Financial Services Company, Vice President (since March 2017); Deutsche Bank (financial services), Department Head –Treasurer’s Office (until February 2017) |
| | | | |
Thomas H. Connors (k) (age 60) | | Assistant Secretary and Assistant Clerk | | September 2012 | | 133 | | Massachusetts Financial Services Company, Vice President and Senior Counsel |
| | | | |
David L. DiLorenzo (k)
(age 51) | | President | | July 2005 | | 133 | | Massachusetts Financial Services Company, Senior Vice President |
| | | | |
Heidi W. Hardin (k) (age 52) | | Secretary and Clerk | | April 2017 | | 133 | | Massachusetts Financial Services Company, Executive Vice President and General Counsel (since March 2017); Harris Associates (investment management), General Counsel (from September 2015 to January 2017); Janus Capital Management LLC (investment management), Senior Vice President and General Counsel (until September 2015) |
| | | | |
Brian E. Langenfeld (k) (age 46) | | Assistant
Secretary and Assistant Clerk | | June 2006 | | 133 | | Massachusetts Financial Services Company, Vice President and Senior Counsel |
| | | | |
Amanda S. Mooradian (k) (age 40) | | Assistant
Secretary and Assistant Clerk | | September 2018 | | 133 | | Massachusetts Financial Services Company, Assistant Vice President and Counsel |
| | | | |
Susan A. Pereira (k)
(age 49) | | Assistant
Secretary and Assistant Clerk | | July 2005 | | 133 | | Massachusetts Financial Services Company, Vice President and Assistant General Counsel |
| | | | |
Kasey L. Phillips (k) (age 49) | | Assistant Treasurer | | September 2012 | | 133 | | Massachusetts Financial Services Company, Vice President |
| | | | |
Matthew A. Stowe (k) (age 45) | | Assistant Secretary and Assistant Clerk | | October 2014 | | 133 | | Massachusetts Financial Services Company, Vice President and Assistant General Counsel |
24
MFS Research Series
Trustees and Officers – continued
| | | | | | | | |
Name, Age | | Position(s)
Held with Fund | | Trustee/Officer
Since (h) | | Number of
MFS Funds
for which the
Person is an
Officer | | Principal Occupations During the Past Five Years |
Martin J. Wolin (k) (age 52) | | Chief Compliance Officer | | July 2015 | | 133 | | Massachusetts Financial Services Company, Senior Vice President and Chief Compliance Officer (since July 2015); Mercer (financial service provider), Chief Risk and Compliance Officer, North America and Latin America (until June 2015) |
| | | | |
James O. Yost (k)
(age 59) | | Treasurer | | September 1990 | | 133 | | Massachusetts Financial Services Company, Senior Vice President |
| (h) | Date first appointed to serve as Trustee/officer of an MFS Fund. Each Trustee has served continuously since appointment unless indicated otherwise. For the period from December 15, 2004 until February 22, 2005, Mr. Manning served as Advisory Trustee. From January 2012 through December 2016, Messrs. DiLorenzo and Yost served as Treasurer and Deputy Treasurer of the Funds, respectively. |
| (j) | Directorships or trusteeships of companies required to report to the Securities and Exchange Commission (i.e., “public companies”). |
| (k) | “Interested person” of the Trust within the meaning of the Investment Company Act of 1940 (referred to as the 1940 Act), which is the principal federal law governing investment companies like the fund, as a result of a position with MFS. The address of MFS is 111 Huntington Avenue, Boston, Massachusetts 02199-7618. |
Each Trustee (other than Messrs. Jones and Kilman) has been elected by shareholders and each Trustee and Officer holds office until his or her successor is chosen and qualified or until his or her earlier death, resignation, retirement or removal. Messrs. Jones and Kilman became Trustees of the Funds on January 1, 2019. The Trust does not hold annual meetings for the purpose of electing Trustees, and Trustees are not elected for fixed terms. Under the terms of the Board’s retirement policy, an Independent Trustee shall retire at the end of the calendar year in which he or she reaches the earlier of 75 years of age or 15 years of service on the Board (or, in the case of any Independent Trustee who joined the Board prior to 2015, 20 years of service on the Board).
Messrs. Buller, Kilman and Otis and Ms. Roepke are members of the Trust’s Audit Committee.
Each of the Interested Trustees and certain Officers hold comparable officer positions with certain affiliates of MFS.
The Statement of Additional Information for a Fund includes further information about the Trustees and is available without charge upon request by calling1-800-225-2606.
| | |
Investment Adviser Massachusetts Financial Services Company 111 Huntington Avenue Boston, MA 02199-7618 | | Custodian State Street Bank and Trust Company 1 Lincoln Street Boston, MA 02111-2900 |
| |
Distributor MFS Fund Distributors, Inc. 111 Huntington Avenue Boston, MA 02199-7618 | | Independent Registered Public Accounting Firm Deloitte & Touche LLP 200 Berkeley Street Boston, MA 02116 |
| |
Portfolio Manager(s) Joseph MacDougall | | |
25
MFS Research Series
BOARD REVIEW OF INVESTMENT ADVISORY AGREEMENT
MFS Research Series
The Investment Company Act of 1940 requires that both the full Board of Trustees and a majority of thenon-interested (“independent”) Trustees, voting separately, annually approve the continuation of the Fund’s investment advisory agreement with MFS. The Trustees consider matters bearing on the Fund and its advisory arrangements at their meetings throughout the year, including a review of performance data at each regular meeting. In addition, the independent Trustees met several times over the course of three months beginning in May and ending in July, 2019 (“contract review meetings”) for the specific purpose of considering whether to approve the continuation of the investment advisory agreement for the Fund and the other investment companies that the Board oversees (the “MFS Funds”). The independent Trustees were assisted in their evaluation of the Fund’s investment advisory agreement by independent legal counsel, from whom they received separate legal advice and with whom they met separately from MFS during various contract review meetings. The independent Trustees were also assisted in this process by the MFS Funds’ Independent Senior Officer, a senior officer appointed by and reporting to the independent Trustees.
In connection with their deliberations regarding the continuation of the investment advisory agreement, the Trustees, including the independent Trustees, considered such information and factors as they believed, in light of the legal advice furnished to them and their own business judgment, to be relevant. The investment advisory agreement for the Fund was considered separately, although the Trustees also took into account the common interests of all MFS Funds in their review. As described below, the Trustees considered the nature, quality, and extent of the various investment advisory, administrative, and shareholder services performed by MFS under the existing investment advisory agreement and other arrangements with the Fund.
In connection with their contract review meetings, the Trustees received and relied upon materials that included, among other items: (i) information provided by Broadridge Financial Solutions, Inc. (“Broadridge”), an independent third party, on the investment performance of the Fund for various time periods ended December 31, 2018 and the investment performance of a group of funds with substantially similar investment classifications/objectives (the “Broadridge performance universe”), (ii) information provided by Broadridge on the Fund’s advisory fees and other expenses and the advisory fees and other expenses of comparable funds identified by Broadridge as well as all other funds in the same investment classification/category (the “Broadridge expense group and universe”), (iii) information provided by MFS on the advisory fees of portfolios of other clients of MFS, including institutional separate accounts and other clients, (iv) information as to whether and to what extent applicable expense waivers, reimbursements or fee “breakpoints” are observed for the Fund, (v) information regarding MFS’ financial results and financial condition, including MFS’ and certain of its affiliates’ estimated profitability from services performed for the Fund and the MFS Funds as a whole, and compared to MFS’ institutional business, (vi) MFS’ views regarding the outlook for the mutual fund industry and the strategic business plans of MFS, (vii) descriptions of various functions performed by MFS for the Funds, such as compliance monitoring and portfolio trading practices, and (viii) information regarding the overall organization of MFS, including information about MFS’ senior management and other personnel providing investment advisory, administrative and other services to the Fund and the other MFS Funds. The comparative performance, fee and expense information prepared and provided by Broadridge was not independently verified and the independent Trustees did not independently verify any information provided to them by MFS.
The Trustees’ conclusion as to the continuation of the investment advisory agreement was based on a comprehensive consideration of all information provided to the Trustees and not the result of any single factor. Some of the factors that figured particularly in the Trustees’ deliberations are described below, although individual Trustees may have evaluated the information presented differently from one another, giving different weights to various factors. It is also important to recognize that the fee arrangements for the Fund and other MFS Funds are the result of years of review and discussion between the independent Trustees and MFS, that certain aspects of such arrangements may receive greater scrutiny in some years than in others, and that the Trustees’ conclusions may be based, in part, on their consideration of these same arrangements during the course of the year and in prior years.
Based on information provided by Broadridge and MFS, the Trustees reviewed the Fund’s total return investment performance as well as the Broadridge performance universe over various time periods. The Trustees placed particular emphasis on the total return performance of the Fund’s Initial Class shares in comparison to the performance of funds in its Broadridge performance universe over the five-year period ended December 31, 2018, which the Trustees believed was a long enough period to reflect differing market conditions. The total return performance of the Fund’s Initial Class shares was in the 3rd quintile relative to the other funds in the universe for this five-year period (the 1st quintile being the best performers and the 5th quintile being the worst performers). The total return performance of the Fund’s Initial Class shares was in the 2nd quintile for each of theone- and three-year periods ended December 31, 2018 relative to the Broadridge performance universe. Because of the passage of time, these performance results may differ from the performance results for more recent periods, including those shown elsewhere in this report.
In the course of their deliberations, the Trustees took into account information provided by MFS in connection with the contract review meetings, as well as during investment review meetings conducted with portfolio management personnel during the course of the year regarding the Fund’s performance. After reviewing these and related factors, the Trustees concluded, within the context of their overall conclusions regarding the investment advisory agreement, that they were satisfied with MFS’ responses and efforts relating to investment performance.
26
MFS Research Series
Board Review of Investment Advisory Agreement – continued
In assessing the reasonableness of the Fund’s advisory fee, the Trustees considered, among other information, the Fund’s advisory fee and the total expense ratio of the Fund’s Initial Class shares as a percentage of average daily net assets and the advisory fee and total expense ratios of the Broadridge expense group based on information provided by Broadridge. The Trustees considered that MFS currently observes an expense limitation for the Fund, which may not be changed without the Trustees’ approval. The Trustees also considered that, according to the data provided by Broadridge (which takes into account any fee reductions or expense limitations that were in effect during the Fund’s last fiscal year), the Fund’s effective advisory fee rate and total expense ratio were each higher than the Broadridge expense group median. The Trustees also noted that MFS has agreed to further reduce such expense limitation for the Fund effective August 1, 2019, which may not be changed without the Trustees’ approval.
The Trustees also considered the advisory fees charged by MFS to any institutional separate accounts advised by MFS (“separate accounts”) and unaffiliated investment companies for which MFS serves as subadviser (“subadvised funds”) that have comparable investment strategies to the Fund, if any. In comparing these fees, the Trustees considered information provided by MFS as to the generally broader scope of services provided by MFS to the Fund, as well as the more extensive regulatory burdens imposed on MFS in managing the Fund, in comparison to separate accounts and subadvised funds. The Trustees also considered the higher demands placed on MFS’ investment personnel and trading infrastructure as a result of the daily cashin-flows andout-flows of the Fund in comparison to separate accounts.
The Trustees also considered whether the Fund may benefit from any economies of scale in the management of the Fund in the event of growth in assets of the Fund and/or growth in assets of the MFS Funds as a whole. They noted that the Fund’s advisory fee rate schedule is subject to a contractual breakpoint that reduces the Fund’s advisory fee rate on average daily net assets over $1 billion. The Trustees also noted that MFS has agreed in writing to waive a portion of the management fees of certain MFS Funds, including the Fund, if the total combined assets of certain funds within the MFS Funds’ complex increase above agreed upon thresholds (the “group fee waiver”), enabling the Fund’s shareholders to share in the benefits from any economies of scale at the complex level. The group fee waiver is reviewed and renewed annually between the Board and MFS. The Trustees concluded that the breakpoint and the group fee waiver were sufficient to allow the Fund to benefit from economies of scale as its assets and overall complex assets grow.
The Trustees also considered information prepared by MFS relating to MFS’ costs and profits with respect to the Fund, the MFS Funds considered as a group, and other investment companies and accounts advised by MFS, as well as MFS’ methodologies used to determine and allocate its costs to the MFS Funds, the Fund and other accounts and products for purposes of estimating profitability.
After reviewing these and other factors described herein, the Trustees concluded, within the context of their overall conclusions regarding the investment advisory agreement, that the advisory fees charged to the Fund represent reasonable compensation in light of the services being provided by MFS to the Fund.
In addition, the Trustees considered MFS’ resources and related efforts to continue to retain, attract and motivate capable personnel to serve the Fund. The Trustees also considered current and developing conditions in the financial services industry, including the presence of large and well-capitalized companies which are spending, and appear to be prepared to continue to spend, substantial sums to engage personnel and to provide services to competing investment companies. In this regard, the Trustees also considered the financial resources of MFS and its ultimate parent, Sun Life Financial Inc. The Trustees also considered the advantages and possible disadvantages to the Fund of having an adviser that also serves other investment companies as well as other accounts.
The Trustees also considered the nature, quality, cost, and extent of administrative, transfer agency, and distribution services provided to the Fund by MFS and its affiliates under agreements and plans other than the investment advisory agreement, including any12b-1 fees the Fund pays to MFS Fund Distributors, Inc., an affiliate of MFS. The Trustees also considered the nature, extent and quality of certain other services MFS performs or arranges for on the Fund’s behalf, which may include securities lending programs, directed expense payment programs, class action recovery programs, and MFS’ interaction with third-party service providers, principally custodians andsub-custodians. The Trustees concluded that the variousnon-advisory services provided by MFS and its affiliates on behalf of the Fund were satisfactory.
The Trustees consideredso-called“fall-out benefits” to MFS such as reputational value derived from serving as investment manager to the MFS Funds. The Trustees also considered that, effective January 3, 2018, MFS had discontinued its historic practice of obtaining investment research from portfolio brokerage commissions paid by certain MFS Funds and would thereafter directly pay for or voluntarily reimburse a Fund, if applicable, for the costs of external research acquired through the use of the Fund’s portfolio brokerage commissions.
Based on their evaluation of factors that they deemed to be material, including those factors described above, the Board of Trustees, including the independent Trustees, concluded that the Fund’s investment advisory agreement with MFS should be continued for an additionalone-year period, commencing August 1, 2019.
27
MFS Research Series
PROXY VOTING POLICIES AND INFORMATION
MFS votes proxies on behalf of the fund pursuant to proxy voting policies and procedures that are available without charge, upon request, by calling 1-800-225-2606, by visitingmfs.com/proxyvoting, or by visiting the SEC’s Web site athttp://www.sec.gov.
Information regarding how the fund voted proxies relating to portfolio securities during the most recent twelve-month period ended June 30 is available by August 31 of each year without charge by visitingmfs.com/proxyvoting, or by visiting the SEC’s Web site athttp://www.sec.gov.
QUARTERLY PORTFOLIO DISCLOSURE
The fund files a complete schedule of portfolio holdings with the SEC for the first and third quarters of each fiscal year as an exhibit to its reports on Form N-PORT. The fund’s Form N-PORT reports are available on the SEC’s website athttp://www.sec.gov.A shareholder can obtain the portfolio holdings report for the first and third quarters of the fund’s fiscal year atmfs.com/vit1 by choosing the fund’s name and then selecting the “Resources” tab and clicking on “Prospectus and Reports”.
FURTHER INFORMATION
From time to time, MFS may post important information about the fund or the MFS funds on the MFS web site (mfs.com). This information is available at https://www.mfs.com/en-us/what-we-do/announcements.html or atmfs.com/vit1 by choosing the fund’s name.
INFORMATION ABOUT FUND CONTRACTS AND LEGAL CLAIMS
The fund has entered into contractual arrangements with an investment adviser, administrator, distributor, shareholder servicing agent, 529 program manager (if applicable), and custodian who each provide services to the fund. Unless expressly stated otherwise, shareholders are not parties to, or intended beneficiaries of these contractual arrangements, and these contractual arrangements are not intended to create any shareholder right to enforce them against the service providers or to seek any remedy under them against the service providers, either directly or on behalf of the fund.
Under the Trust’s By-Laws and Declaration of Trust, any claims asserted against or on behalf of the MFS Funds, including claims against Trustees and Officers, must be brought in state and federal courts located within the Commonwealth of Massachusetts.
FEDERAL TAX INFORMATION (unaudited)
The following information is provided pursuant to provisions of the Internal Revenue Code.
The fund designates $67,087,000 as capital gain dividends paid during the fiscal year.
For corporate shareholders, 92.28% of the ordinary income dividends paid during the fiscal year qualify for the corporate dividends received deduction.
28
rev. 3/16
| | | | |
| | | |
| FACTS | | WHAT DOES MFS DO WITH YOUR
PERSONAL INFORMATION? | |  |
| | |
| Why? | | Financial companies choose how they share your personal information. Federal law gives consumers the right to limit some but not all sharing. Federal law also requires us to tell you how we collect, share, and protect your personal information. Please read this notice carefully to understand what we do. |
| | |
| What? | | The types of personal information we collect and share depend on the product or service you have with us. This information can include: • Social Security number and account balances • Account transactions and transaction history • Checking account information and wire transfer instructions When you areno longer our customer, we continue to share your information as described in this notice. |
| | |
| How? | | All financial companies need to share customers’ personal information to run their everyday business. In the section below, we list the reasons financial companies can share their customers’ personal information; the reasons MFS chooses to share; and whether you can limit this sharing. |
| | | | |
Reasons we can share your
personal information | | Does MFS share? | | Can you limit this
sharing? |
For our everyday business purposes – such as to process your transactions, maintain your account(s), respond to court orders and legal investigations, or report to credit bureaus | | Yes | | No |
For our marketing purposes – to offer our products and services to you | | No | | We don’t share |
| For joint marketing with other financial companies | | No | | We don’t share |
For our affiliates’ everyday business purposes – information about your transactions and experiences | | No | | We don’t share |
For our affiliates’ everyday business purposes – information about your creditworthiness | | No | | We don’t share |
| For nonaffiliates to market to you | | No | | We don’t share |
| | |
| | |
| Questions? | | Call800-225-2606 or go tomfs.com. |
29
| | |
| Who we are |
| Who is providing this notice? | | MFS Funds, MFS Investment Management, MFS Institutional Advisors, Inc., and MFS Heritage Trust Company. |
| | |
| What we do |
| How does MFS protect my personal information? | | To protect your personal information from unauthorized access and use, we use security measures that comply with federal law. These measures include procedural, electronic, and physical safeguards for the protection of the personal information we collect about you. |
How does MFS
collect my personal information? | | We collect your personal information, for example, when you • open an account or provide account information • direct us to buy securities or direct us to sell your securities • make a wire transfer We also collect your personal information from others, such as credit bureaus, affiliates, or other companies. |
| Why can’t I limit all sharing? | | Federal law gives you the right to limit only • sharing for affiliates’ everyday business purposes – information about your creditworthiness • affiliates from using your information to market to you • sharing for nonaffiliates to market to you State laws and individual companies may give you additional rights to limit sharing. |
| | |
| Definitions |
| Affiliates | | Companies related by common ownership or control. They can be financial and nonfinancial companies. • MFS does not share personal information with affiliates, except for everyday business purposes as described on page one of this notice. |
| Nonaffiliates | | Companies not related by common ownership or control. They can be financial and nonfinancial companies. • MFS does not share with nonaffiliates so they can market to you. |
| Joint marketing | | A formal agreement between nonaffiliated financial companies that together market financial products or services to you. • MFS doesn’t jointly market. |
| | |
| Other important information |
| If you own an MFS product or receive an MFS service in the name of a third party such as a bank or broker-dealer, their privacy policy may apply to you instead of ours. |
30
Annual Report
December 31, 2019

MFS® Total Return Series

MFS® Variable Insurance Trust
Beginning on January 1, 2021, as permitted by regulations adopted by the U.S. Securities and Exchange Commission, the insurance company that offers your contract may determine that it will no longer send you paper copies of the fund’s annual and semiannual shareholder reports unless you specifically request paper copies from the insurance company or from your financial intermediary. Instead, the shareholder reports will be made available on a Web site (insurancefunds.mfs.com or other Web site of which you will be notified), and the insurance company will notify you by mail each time a report is posted and provide you with a Web site link to access the report. Instructions for requesting paper copies will be provided by your insurance company or financial intermediary.
If you already elected to receive shareholder reports by email, you will not be affected by this change and you need not take any action. If your insurance company or financial intermediary offers electronic delivery, you may elect to receive shareholder reports and other communications from the insurance company or financial intermediary by email by following the instructions provided by the insurance company or financial intermediary.
Beginning on January 1, 2019, you may elect to receive all future reports in paper free of charge from the insurance company or financial intermediary. You can inform the insurance company or financial intermediary that you wish to continue receiving paper copies of your shareholder reports by contacting your insurance company or financial intermediary. Your election to receive reports in paper will apply to all funds held in your account with your insurance company or financial intermediary.
VTR-ANN
MFS® Total Return Series
CONTENTS
The report is prepared for the general information of contract owners. It is authorized for distribution to prospective investors only when preceded or accompanied by a current prospectus.
NOT FDIC INSURED• MAY LOSE VALUE• NO BANK OR CREDIT UNION GUARANTEE• NOT A DEPOSIT• NOT INSURED BY ANY FEDERAL GOVERNMENT AGENCY OR NCUA/NCUSIF
MFS Total Return Series
LETTER FROM THE EXECUTIVE CHAIR

Dear Contract Owners:
Slowing global growth, low inflation, and trade friction between the United States and China have been hallmarks of the past 12 months. After experiencing an uptick in market volatility in late 2018, markets steadied for most of 2019, thanks in large measure to the adoption of a dovish policy stance on the part of global central banks, focused on supporting economic growth. Negotiations aimed at a “phase one” trade deal between the U.S. and China bore fruit at the end of the period, boosting investor sentiment, while signs of stability emerging from the global manufacturing sector also lifted spirits. Uncertainty over Brexit, along with the ripple effects from the trade conflict, hampered business confidence and investment in the United Kingdom and Europe for much of the period, though investors expect greater clarity regarding Brexit as a result of December’s general election. The pro-Brexit Conservative Party won the election by a comfortable margin and set the stage for the U.K.’s departure from the EU at the end of January.
Markets expect the longest economic expansion in U.S. history will continue, albeit at a slower pace, as trade tensions recede. In an effort to prolong the expansion, the U.S. Federal Reserve lowered interest rates three times between July and October and the European Central Bank loosened policy in September. While the global monetary policy backdrop remains quite accommodative, signs of easing trade tensions and fading global recession fears led to improved market sentiment in late 2019 as investors grew less risk averse. In early 2020, an outbreak of coronavirus emanating from China reintroduced global growth fears, causing an uptick in volatility.
Here at MFS®, we aim to help our clients navigate the growing complexity of the markets and world economies. Our long-term investment philosophy and commitment to the responsible allocation of capital allow us to tune out the noise and uncover what we believe are the best, most durable investment opportunities in the market. Through our powerful global investment platform, we combine collective expertise, thoughtful risk management and long-term discipline to create sustainable value for investors.
Respectfully,

Robert J. Manning
Executive Chair
MFS Investment Management
February 14, 2020
The opinions expressed in this letter are subject to change and may not be relied upon for investment advice. No forecasts can be guaranteed.
1
MFS Total Return Series
PORTFOLIO COMPOSITION
Portfolio structure (i)

| | | | |
| Top ten holdings (i) | | | | |
| U.S. Treasury Notes, 1.75%, 11/30/2021 | | | 2.6% | |
| JPMorgan Chase & Co. | | | 1.8% | |
| U.S. Treasury Bonds, 2.875%, 5/15/2043 | | | 1.7% | |
| Comcast Corp., “A” | | | 1.6% | |
| Microsoft Corp. | | | 1.5% | |
| Citigroup, Inc. | | | 1.3% | |
| Johnson & Johnson | | | 1.2% | |
| Pfizer, Inc. | | | 1.2% | |
| Fannie Mae, 3.5%, 30 Years | | | 1.2% | |
| Ginnie Mae, 3%, 30 Years | | | 1.1% | |
|
| Composition including fixed income credit quality (a)(i) | |
| AAA | | | 4.2% | |
| AA | | | 0.6% | |
| A | | | 3.2% | |
| BBB | | | 7.6% | |
| BB | | | 0.1% | |
| B | | | 0.1% | |
| CCC (o) | | | 0.0% | |
| U.S. Government | | | 10.3% | |
| Federal Agencies | | | 14.7% | |
| Not Rated | | | 0.5% | |
| Non-Fixed Income | | | 60.5% | |
| Cash & Cash Equivalents | | | (1.8)% | |
| | | | |
| GICS equity sectors (g) | | | | |
| Financials | | | 14.8% | |
| Health Care | | | 9.9% | |
| Industrials | | | 8.5% | |
| Information Technology | | | 7.7% | |
| Consumer Staples | | | 4.6% | |
| Consumer Discretionary | | | 3.3% | |
| Energy | | | 3.2% | |
| Utilities | | | 2.9% | |
| Communication Services | | | 2.7% | |
| Materials | | | 1.8% | |
| Real Estate | | | 1.1% | |
| |
| Fixed income sectors (i) | | | | |
| Mortgage-Backed Securities | | | 14.7% | |
| Investment Grade Corporates | | | 11.0% | |
| U.S. Treasury Securities | | | 10.3% | |
| Commercial Mortgage-Backed Securities | | | 2.9% | |
| Collateralized Debt Obligations | | | 1.1% | |
| Asset-Backed Securities | | | 0.4% | |
| Municipal Bonds | | | 0.4% | |
| Non-U.S. Government Bonds | | | 0.3% | |
| Emerging Markets Bonds | | | 0.2% | |
| U.S. Government Agencies (o) | | | 0.0% | |
| (a) | For all securities other than those specifically described below, ratings are assigned to underlying securities utilizing ratings from Moody’s, Fitch, and Standard & Poor’s rating agencies and applying the following hierarchy: If all three agencies provide a rating, the middle rating (after dropping the highest and lowest ratings) is assigned; if two of the three agencies rate a security, the lower of the two is assigned. Ratings are shown in the S&P and Fitch scale (e.g., AAA). Securities rated BBB or higher are considered investment grade. All ratings are subject to change. U.S. Government includes securities issued by the U.S. Department of the Treasury. Federal Agencies includes rated and unrated U.S. Agency fixed-income securities, U.S. Agency mortgage-backed securities, and collateralized mortgage obligations of U.S. Agency mortgage-backed securities. Not Rated includes fixed income securities and fixed income derivatives, which have not been rated by any rating agency.Non-Fixed Income includes any equity securities (including convertible bonds and equity derivatives) and/or commodity-linked derivatives. The fund may or may not have held all of these instruments on this date. The fund is not rated by these agencies. |
2
MFS Total Return Series
Portfolio Composition – continued
| (g) | The Global Industry Classification Standard (GICS®) was developed by and/or is the exclusive property of MSCI, Inc. and S&P Global Market Intelligence Inc. (“S&P Global Market Intelligence”). GICS is a service mark of MSCI and S&P Global Market Intelligence and has been licensed for use by MFS. |
| (i) | For purposes of this presentation, the components include the value of securities, and reflect the impact of the equivalent exposure of derivative positions, if any. These amounts may be negative from time to time. Equivalent exposure is a calculated amount that translates the derivative position into a reasonable approximation of the amount of the underlying asset that the portfolio would have to hold at a given point in time to have the same price sensitivity that results from the portfolio’s ownership of the derivative contract. When dealing with derivatives, equivalent exposure is a more representative measure of the potential impact of a position on portfolio performance than value. The bond component will include any accrued interest amounts. |
Where the fund holds convertible bonds, they are treated as part of the equity portion of the portfolio.
Cash & Cash Equivalents includes any cash, investments in money market funds, short-term securities, and other assets less liabilities. Please see the Statement of Assets and Liabilities for additional information related to the fund’s cash position and other assets and liabilities.
From time to time Cash & Cash Equivalents may be negative due to timing of cash receipts and disbursements.
Percentages are based on net assets as of December 31, 2019.
The portfolio is actively managed and current holdings may be different.
3
MFS Total Return Series
MANAGEMENT REVIEW
Summary of Results
For the twelve months ended December 31, 2019, Initial Class shares of the MFS Total Return Series (fund) provided a total return of 20.38%, while Service Class shares of the fund provided a total return of 20.12%. These compare with returns of 31.49% and 8.72% over the same period for the fund’s benchmarks, the Standard & Poor’s 500 Stock Index (S&P 500 Index) and the Bloomberg Barclays U.S. Aggregate Bond Index, respectively. The fund’s other benchmark, the MFS Total Return Blended Index (Blended Index), generated a return of 22.18%. The Blended Index reflects the blended returns of the equity and fixed income market indices, with percentage allocations to each index designed to resemble the equity and fixed income allocations of the fund. The market indices and related percentage allocations used to compile the Blended Index are set forth in the Performance Summary.
Market Environment
Fading fears of a near-term global recession, the announcement of a partial trade deal between the United States and China and the decline in uncertainty over Brexit helped bolster market sentiment late in the period. Changes in market sentiment, largely driven by uncertainty over the outcome of trade negotiations between the US and China, had contributed to periodic bouts of volatility during the reporting period. The global economy decelerated, led by weakness in China and Europe, although the pace of the slowdown moderated late in the period amid nascent signs of stabilization in the manufacturing sector.
The deteriorating global growth backdrop, along with declining inflationary pressures, prompted the US Federal Reserve to adopt a more dovish posture beginning in early 2019, resulting in the first interest rate cut in over a decade at the end of July, followed by additional cuts in September and October. The Fed’s actions led to a sharp decline in long-term interest rates during the period’s second half, causing the inversion of portions of the US Treasury yield curve for a time. Amid an improvement in risk sentiment in Q4 2019 and indications of a bottoming in growth and a potential upturn in activity, the Fed indicated in October that further rate cuts were unlikely unless the outlook for the economy materially worsened.
Globally, central banks have tilted more dovish as well, with the European Central Bank unveiling a package of easing measures, which included putting overnight rates deeper into negative territory, restarting its bond-buying program and lengthening the term of cheap loans to banks to three years from two. The central banks of India and Australia are among those that have cut rates several times in recent months, although China has been more cautious in increasing liquidity as it keeps trying to deleverage its economy, cutting rates only marginally.
Emerging markets experienced considerable volatility through the end of 2018, as tighter global financial conditions exposed structural weakness in some countries. Those conditions improved in 2019 as the Fed became more dovish. Notwithstanding the periodic headwinds on market sentiment from significant trade friction between the US and China over much of the year, emerging market hard currency debt and local rates benefited from relatively cheap valuations at the beginning of the period and easier global monetary conditions. These factors, plus the fading of certain global risk factors mentioned above, hastened spread tightening in the latter part of the period. At the same time, idiosyncratic risks spiked in some countries (e.g., Argentina and Lebanon), contributing to increased dispersion in performance among sovereign assets.
Detractors from Performance
Within the equity portion of the fund, the combination of an underweight position and stock selection in theinformation technologysector detracted from performance relative to the S&P 500 Index. Here, the fund’s underweight positions in computer and personal electronics maker Apple and software giant Microsoft weakened relative returns. The stock price of Apple advanced during the reporting period as the company’s revenues came in higher than consensus estimates, driven by stronger-than-expected demand in its wearable technology and services segments. Additionally, an overweight position in information technology company DXC Technology (h), and not owning shares of debit and credit transaction processing company Mastercard, held back relative returns.
Stock selection and an overweight position in thehealth caresector dampened relative results. Within this sector, an overweight position in pharmaceutical giant Pfizer, and the timing of the fund’s ownership in shares of health care services provider Humana (h), hindered relative performance. The share price of Pfizer depreciated after the company recorded sales that were shy of market expectations, owing to weakness in its legacy product sales. Pfizer also cut its fiscal-year 2019 guidance to reflect the integration of a joint venture with GlaxoSmithKline and the acquisition of Array BioPharma.
Stock selection in theutilitiessector also weakened relative returns, led by the fund’s overweight position in utility services provider Exelon. The share price of Exelon fell on the back of weaker-than-expected natural gas prices, mild weather, especially in Texas, and the risk of import tariffs on uranium. Additionally, two of Exelon’s senior executives resigned amid an ongoing federal investigation into potential corruption involving Illinois lobbying activities, which further pressured its stock price.
Elsewhere, the fund’s underweight position in social networking service provider Facebook, holdings of natural gas producer Equitrans Midstream (b), and an overweight position in drug store operator Walgreens Boots Alliance (h), detracted from relative performance. The share price of Facebook traded higher as the company posted better-than-expected revenue figures, driven by
4
MFS Total Return Series
Management Review – continued
strong advertising revenues from Instagram and Facebook mobile, as well as robust growth in its active user base. Additionally, Facebook unveiled the new blockchain-based Libra cryptocurrency that is expected to launch in the first half of 2020. What differentiates Libra from other digital currencies is that Libra is backed by a reserve of real assets that provides value preservation.
Within the fixed income portion of the fund, a lack of exposure to thegovernment-related sovereignsector detracted from the fund’s performance relative to the Bloomberg Barclays U.S. Aggregate Bond Index. The fund’s positioning along the yield curve (y) also held back relative results.
Contributors to Performance
Within the equity portion of the fund, stock selection in both thefinancialsandindustrialssectors aided performance relative to the S&P 500 Index. Within thefinancialssector, not owning shares of insurance and investment firm Berkshire Hathaway boosted relative returns. Despite positive absolute performance, the share price of Berkshire Hathaway lagged the benchmark during the period. Although the company’s results were broadly in line with market expectations, investors appeared to have responded negatively to Warren Buffet’s comment that Berkshire Hathaway was unlikely to make a significant acquisition during 2019, given current valuations for good businesses. Additionally, the fund’s overweight positions in global financial services firms, Citigroup and JPMorgan Chase & Co., and its holdings of electronic brokerage firm TD Ameritrade Holding (b), also aided relative results. Within theindustrialssector, an underweight position in aerospace company Boeing (h) supported relative returns. The share price of Boeing fell on uncertainties stemming from its 737 MAX groundings, subsequent to two plane crashes within five months. Additionally, Boeing’s earnings missed consensus estimates, driven by increased costs related to slower production and charges associated with its safety software update and related training.
Elsewhere, the fund’s overweight positions in IT servicing firm Accenture and healthcare equipment manufacturer Danaher benefited relative performance. The share price of Accenture advanced during the period, driven by strong organic revenue growth, an improvement in operating margins and a more favorable tax rate. Accenture also benefited from strong outsourcing bookings and management’s positive tone on its pipeline and future outlook. Additionally, not owning shares of pharmaceutical company Abbvie, the fund’s holdings of semiconductor manufacturer Taiwan Semiconductor Manufacturing (b) (Taiwan), and its underweight position in internet retailer Amazon.com bolstered relative results.
Within the fixed income portion of the fund, an underweight exposure to thetreasury sector contributed to the fund’s performance relative to the Bloomberg Barclays U.S. Aggregate Bond Index. Favorable security selection within theindustrialssector also helped relative returns.
Respectfully,
Portfolio Manager(s)
Steven Gorham, Alexander Mackey, Joshua Marston, Jonathan Munko, Henry Peabody, Robert Persons, Jonathan Sage, and Brooks Taylor
Note to Shareholders: Effective December 31, 2019, Alexander Mackey, Johnathan Munko, and Henry Peabody were added as Portfolio Managers of the Fund and Nevin Chitkara was removed as a Portfolio Manager of the Fund. Effective December 31, 2020, Jonathan Sage and Brooks Taylor will be removed as Portfolio Managers of the Fund.
| (b) | Security is not a benchmark constituent. |
| (h) | Security was not held in the portfolio at period end. |
| (y) | A yield curve graphically depicts the yields of different maturity bonds of the same credit quality and type; a normal yield curve is upward sloping, with short-term rates lower than long-term rates. |
The views expressed in this report are those of the portfolio manager(s) only through the end of the period of the report as stated on the cover and do not necessarily reflect the views of MFS or any other person in the MFS organization. These views are subject to change at any time based on market or other conditions, and MFS disclaims any responsibility to update such views. These views may not be relied upon as investment advice or an indication of trading intent on behalf of any MFS portfolio. References to specific securities are not recommendations of such securities, and may not be representative of any MFS portfolio’s current or future investments.
5
MFS Total Return Series
PERFORMANCE SUMMARY THROUGH 12/31/19
The following chart illustrates the historical performance of the fund in comparison to its benchmark(s). Benchmarks are unmanaged and may not be invested in directly. Benchmark returns do not reflect any fees or expenses. The performance of other share classes will be greater than or less than that of the class depicted below. (See Notes to Performance Summary.)
Performance data shown represents past performance and is no guarantee of future results. Investment return and principal value fluctuate so your units, when sold, may be worth more or less than the original cost; current performance may be lower or higher than quoted. The performance shown does not reflect the deduction of taxes, if any, that a contract holder would pay on fund distributions or the redemption of contract units. The returns for the fund shown also do not reflect the deduction of expenses associated with variable products, such as mortality and expense risk charges, separate account charges, and sales charges imposed by the insurance company separate accounts. Such expenses would reduce the overall returns shown.
Growth of a Hypothetical $10,000 Investment
Total Returns through 12/31/19
Average annual total returns
| | | | | | | | | | | | |
| | | Share Class | | Class Inception Date | | 1-yr | | 5-yr | | 10-yr | | |
| | | Initial Class | | 1/03/95 | | 20.38% | | 6.76% | | 8.35% | | |
| | | Service Class | | 5/01/00 | | 20.12% | | 6.50% | | 8.08% | | |
| | | | |
| Comparative benchmark(s) | | | | | | | | |
| | | Standard & Poor’s 500 Stock Index (f) | | 31.49% | | 11.70% | | 13.56% | | |
| | | Bloomberg Barclays U.S. Aggregate Bond Index (f) | | 8.72% | | 3.05% | | 3.75% | | |
| | | MFS Total Return Blended Index (f)(w) | | 22.18% | | 8.37% | | 9.77% | | |
| (f) | | Source: FactSet Research Systems Inc. |
| (w) | | As of December 31, 2019, the MFS Total Return Blended Index (a custom index) was comprised of 60% Standard & Poor’s 500 Stock Index and 40% Bloomberg Barclays U.S. Aggregate Bond Index. |
Benchmark Definition(s)
Bloomberg Barclays U.S. Aggregate Bond Index – a market capitalization-weighted index that measures the performance of the U.S. investment-grade, fixed rate bond market, with index components for government and corporate securities, mortgage pass-through securities, and asset-backed securities with at least one year to final maturity. BLOOMBERG® is a trademark and service mark of Bloomberg Finance L.P. and its affiliates (collectively “Bloomberg”). BARCLAYS® is a trademark and service mark of Barclays Bank Plc (collectively with its affiliates, “Barclays”), used under license. Bloomberg or Bloomberg’s licensors, including Barclays, own all proprietary rights in the Bloomberg Barclays Indices. Neither Bloomberg nor Barclays approves or endorses this material, or guarantees the accuracy or completeness of any information herein, or makes any warranty, express or implied, as to the results to be obtained therefrom, and, to the maximum extent allowed by law, neither shall have any liability or responsibility for injury or damages arising in connection therewith.
Standard & Poor’s 500 Stock Index – a market capitalization-weighted index of 500 widely held equity securities, designed to measure broad U.S. equity performance. “Standard & Poor’s®” and “S&P®” are registered trademarks of Standard & Poor’s
6
MFS Total Return Series
Performance Summary – continued
Financial Services LLC (“S&P”) and Dow Jones is a registered trademark of Dow Jones Trademark Holdings LLC (“Dow Jones”) and have been licensed for use by S&P Dow Jones Indices LLC and sublicensed for certain purposed by Massachusetts Financial Services Company. The S&P 500® is a product of S&P Dow Jones Indices LLC, and has been licensed for use by Massachusetts Financial Services Company. Massachusetts Financial Services Company’s product(s) is not sponsored, endorsed, sold, or promoted by S&P Dow Jones Indices LLC, Dow Jones, S&P, or their respective affiliates, and neither S&P Dow Jones Indices LLC, Dow Jones, S&P, nor their respective affiliates make any representation regarding the advisability of investing in such product(s).
It is not possible to invest directly in an index.
Notes to Performance Summary
Average annual total return represents the average annual change in value for each share class for the periods presented.
Performance results reflect any applicable expense subsidies and waivers in effect during the periods shown. Without such subsidies and waivers the fund’s performance results would be less favorable. Please see the prospectus and financial statements for complete details. All results are historical and assume the reinvestment of any dividends and capital gains distributions.
Performance results do not include adjustments made for financial reporting purposes in accordance with U.S. generally accepted accounting principles and may differ from amounts reported in the financial highlights.
From time to time the fund may receive proceeds from litigation settlements, without which performance would be lower.
7
MFS Total Return Series
EXPENSE TABLE
Fund Expenses Borne by the Contract Holders during the Period,
July 1, 2019 through December 31, 2019
As a contract holder of the fund, you incur ongoing costs, including management fees; distribution and/or service(12b-1) fees; and other fund expenses. This example is intended to help you understand your ongoing costs (in dollars) of investing in the fund and to compare these costs with the ongoing costs of investing in other mutual funds.
The example is based on an investment of $1,000 invested at the beginning of the period and held for the entire period July 1, 2019 through December 31, 2019.
Actual Expenses
The first line for each share class in the following table provides information about actual account values and actual expenses. You may use the information in this line, together with the amount you invested, to estimate the expenses that you paid over the period. Simply divide your account value by $1,000 (for example, an $8,600 account value divided by $1,000 = 8.6), then multiply the result by the number in the first line under the heading entitled “Expenses Paid During Period” to estimate the expenses you paid on your account during this period.
Hypothetical Example for Comparison Purposes
The second line for each share class in the following table provides information about hypothetical account values and hypothetical expenses based on the fund’s actual expense ratio and an assumed rate of return of 5% per year before expenses, which is not the fund’s actual return. The hypothetical account values and expenses may not be used to estimate the actual ending account balance or expenses you paid for the period. You may use this information to compare the ongoing costs of investing in the fund and other funds. To do so, compare this 5% hypothetical example with the 5% hypothetical examples that appear in the shareholder reports of the other funds.
Please note that the expenses shown in the table are meant to highlight the fund’s ongoing costs only and do not take into account the fees and expenses imposed under the variable contracts through which your investment in the fund is made. Therefore, the second line for each share class in the table is useful in comparing ongoing costs associated with an investment in vehicles (such as the fund) which fund benefits under variable annuity and variable life insurance contracts and to qualified pension and retirement plans only, and will not help you determine the relative total costs of investing in the fund through variable annuity and variable life insurance contracts. If the fees and expenses imposed under the variable contracts were included, your costs would have been higher.
| | | | | | | | | | | | | | | | | | |
| Share Class | | | | Annualized
Expense Ratio | | | Beginning
Account Value
7/01/19 | | | Ending Account Value
12/31/19 | | | Expenses Paid
During Period (p)
7/01/19-12/31/19 | |
| Initial Class | | Actual | | | 0.61% | | | | $1,000.00 | | | | $1,066.71 | | | | $3.18 | |
| | Hypothetical (h) | | | 0.61% | | | | $1,000.00 | | | | $1,022.13 | | | | $3.11 | |
| Service Class | | Actual | | | 0.86% | | | | $1,000.00 | | | | $1,065.60 | | | | $4.48 | |
| | Hypothetical (h) | | | 0.86% | | | | $1,000.00 | | | | $1,020.87 | | | | $4.38 | |
| (h) | 5% class return per year before expenses. |
| (p) | “Expenses Paid During Period” are equal to each class’s annualized expense ratio, as shown above, multiplied by the average account value over the period, multiplied by 184/365 (to reflect theone-half year period). |
8
MFS Total Return Series
PORTFOLIO OF INVESTMENTS – 12/31/19
The Portfolio of Investments is a complete list of all securities owned by your fund. It is categorized by broad-based asset classes.
| | | | | | | | |
| | |
| Issuer | | Shares/Par | | | Value ($) | |
| COMMON STOCKS – 60.0% | | | | | | | | |
| Aerospace – 2.5% | | | | | |
| Honeywell International, Inc. | | | 128,214 | | | $ | 22,693,878 | |
| L3Harris Technologies, Inc. | | | 18,446 | | | | 3,649,910 | |
| Lockheed Martin Corp. | | | 25,796 | | | | 10,044,447 | |
| Northrop Grumman Corp. | | | 29,489 | | | | 10,143,331 | |
| United Technologies Corp. | | | 117,238 | | | | 17,557,563 | |
| | | | | | | | |
| | | | | | $ | 64,089,129 | |
| | | | | | | | |
| Airlines – 0.1% | | | | | |
| Delta Air Lines, Inc. | | | 62,308 | | | $ | 3,643,772 | |
| | | | | | | | |
| Alcoholic Beverages – 0.4% | | | | | |
| Diageo PLC | | | 268,696 | | | $ | 11,391,049 | |
| | | | | | | | |
| Apparel Manufacturers – 0.4% | | | | | |
| Hanesbrands, Inc. | | | 25,619 | | | $ | 380,442 | |
| LVMH Moet Hennessy Louis Vuitton SE | | | 9,878 | | | | 4,589,399 | |
| NIKE, Inc., “B” | | | 50,029 | | | | 5,068,438 | |
| | | | | | | | |
| | | | | | $ | 10,038,279 | |
| | | | | | | | |
| Automotive – 0.9% | | | | | |
| Aptiv PLC | | | 48,634 | | | $ | 4,618,771 | |
| Lear Corp. | | | 115,295 | | | | 15,818,474 | |
| Magna International, Inc. | | | 41,056 | | | | 2,251,116 | |
| | | | | | | | |
| | | | | | $ | 22,688,361 | |
| | | | | | | | |
| Broadcasting – 0.1% | | | | | |
| Omnicom Group, Inc. | | | 39,010 | | | $ | 3,160,590 | |
| | | | | | | | |
| Brokerage & Asset Managers – 2.1% | | | | | |
| BlackRock, Inc. | | | 18,477 | | | $ | 9,288,388 | |
| Blackstone Group, Inc. | | | 168,184 | | | | 9,408,213 | |
| Charles Schwab Corp. | | | 135,236 | | | | 6,431,824 | |
| Invesco Ltd. | | | 356,591 | | | | 6,411,506 | |
| NASDAQ, Inc. | | | 56,893 | | | | 6,093,240 | |
| T. Rowe Price Group, Inc. | | | 51,667 | | | | 6,295,107 | |
| TD Ameritrade Holding Corp. | | | 205,422 | | | | 10,209,474 | |
| | | | | | | | |
| | | | | | $ | 54,137,752 | |
| | | | | | | | |
| Business Services – 2.5% | | | | | |
| Accenture PLC, “A” | | | 109,553 | | | $ | 23,068,575 | |
| Amdocs Ltd. | | | 71,688 | | | | 5,175,157 | |
| Cognizant Technology Solutions Corp., “A” | | | 32,105 | | | | 1,991,152 | |
| Equifax, Inc. | | | 49,495 | | | | 6,935,239 | |
| Fidelity National Information Services, Inc. | | | 80,652 | | | | 11,217,887 | |
| Fiserv, Inc. (a) | | | 124,012 | | | | 14,339,508 | |
| | | | | | | | |
| | | | | | $ | 62,727,518 | |
| | | | | | | | |
| Cable TV – 1.6% | | | | | |
| Comcast Corp., “A” | | | 886,066 | | | $ | 39,846,388 | |
| | | | | | | | |
| Chemicals – 1.2% | | | | | |
| 3M Co. | | | 62,083 | | | $ | 10,952,683 | |
| PPG Industries, Inc. | | | 151,153 | | | | 20,177,414 | |
| | | | | | | | |
| | | | | | $ | 31,130,097 | |
| | | | | | | | |
| | | | | | | | |
| | |
Issuer | | Shares/Par | | | Value ($) | |
| COMMON STOCKS – continued | | | | | |
| Computer Software – 2.1% | | | | | |
| Adobe Systems, Inc. (a) | | | 28,748 | | | $ | 9,481,378 | |
| Microsoft Corp. | | | 243,415 | | | | 38,386,545 | |
| Oracle Corp. | | | 84,263 | | | | 4,464,254 | |
| | | | | | | | |
| | | | | | $ | 52,332,177 | |
| | | | | | | | |
| Computer Software – Systems – 0.9% | | | | | |
| Apple, Inc. | | | 54,707 | | | $ | 16,064,711 | |
| Hitachi Ltd. | | | 178,100 | | | | 7,501,935 | |
| | | | | | | | |
| | | | | | $ | 23,566,646 | |
| | | | | | | | |
| Construction – 1.1% | | | | | |
| Masco Corp. | | | 120,874 | | | $ | 5,800,743 | |
| Sherwin-Williams Co. | | | 9,826 | | | | 5,733,864 | |
| Stanley Black & Decker, Inc. | | | 66,795 | | | | 11,070,603 | |
| Whirlpool Corp. | | | 40,547 | | | | 5,981,899 | |
| | | | | | | | |
| | | | | | $ | 28,587,109 | |
| | | | | | | | |
| Consumer Products – 0.9% | | | | | |
| Colgate-Palmolive Co. | | | 85,037 | | | $ | 5,853,947 | |
| Kimberly-Clark Corp. | | | 76,481 | | | | 10,519,961 | |
| Procter & Gamble Co. | | | 9,103 | | | | 1,136,965 | |
| Reckitt Benckiser Group PLC | | | 51,927 | | | | 4,215,679 | |
| | | | | | | | |
| | | | | | $ | 21,726,552 | |
| | | | | | | | |
| Electrical Equipment – 0.7% | | | | | |
| Johnson Controls International PLC | | | 425,738 | | | $ | 17,331,794 | |
| Schneider Electric SE | | | 15,599 | | | | 1,601,012 | |
| | | | | | | | |
| | | | | | $ | 18,932,806 | |
| | | | | | | | |
| Electronics – 2.1% | | | | | |
| Analog Devices, Inc. | | | 27,885 | | | $ | 3,313,853 | |
| Applied Materials, Inc. | | | 91,044 | | | | 5,557,326 | |
| Intel Corp. | | | 89,889 | | | | 5,379,856 | |
| Marvell Technology Group Ltd. | | | 127,146 | | | | 3,376,998 | |
| Maxim Integrated Products, Inc. | | | 63,759 | | | | 3,921,816 | |
| NXP Semiconductors N.V. | | | 18,691 | | | | 2,378,617 | |
| Taiwan Semiconductor Manufacturing Co. Ltd., ADR | | | 211,771 | | | | 12,303,895 | |
| Texas Instruments, Inc. | | | 133,768 | | | | 17,161,097 | |
| | | | | | | | |
| | | | | | $ | 53,393,458 | |
| | | | | | | | |
| Energy – Independent – 0.9% | | | | | |
| EOG Resources, Inc. | | | 81,528 | | | $ | 6,828,785 | |
| Noble Energy, Inc. | | | 105,819 | | | | 2,628,544 | |
| Phillips 66 | | | 16,460 | | | | 1,833,809 | |
| Pioneer Natural Resources Co. | | | 29,956 | | | | 4,534,440 | |
| Valero Energy Corp. | | | 70,914 | | | | 6,641,096 | |
| | | | | | | | |
| | | | | | $ | 22,466,674 | |
| | | | | | | | |
| Energy – Integrated – 1.4% | | | | | |
| BP PLC | | | 1,014,821 | | | $ | 6,339,397 | |
| Chevron Corp. | | | 73,081 | | | | 8,806,991 | |
| Eni S.p.A. | | | 369,315 | | | | 5,735,852 | |
| Exxon Mobil Corp. | | | 116,189 | | | | 8,107,668 | |
9
MFS Total Return Series
Portfolio of Investments – continued
| | | | | | | | |
| | |
| Issuer | | Shares/Par | | | Value ($) | |
| COMMON STOCKS – continued | | | | | |
| Energy – Integrated – continued | | | | | |
| Hess Corp. | | | 53,116 | | | $ | 3,548,680 | |
| Suncor Energy, Inc. | | | 129,808 | | | | 4,254,460 | |
| | | | | | | | |
| | | | | | $ | 36,793,048 | |
| | | | | | | | |
| Food & Beverages – 2.0% | | | | | | | | |
| Archer Daniels Midland Co. | | | 135,817 | | | $ | 6,295,118 | |
| Coca-Cola European Partners PLC | | | 54,520 | | | | 2,773,978 | |
| Danone S.A. | | | 59,447 | | | | 4,927,777 | |
| General Mills, Inc. | | | 96,436 | | | | 5,165,112 | |
| Ingredion, Inc. | | | 44,031 | | | | 4,092,682 | |
| J.M. Smucker Co. | | | 53,487 | | | | 5,569,601 | |
| Mondelez International, Inc. | | | 59,588 | | | | 3,282,107 | |
| Nestle S.A. | | | 123,214 | | | | 13,339,908 | |
| PepsiCo, Inc. | | | 47,749 | | | | 6,525,856 | |
| | | | | | | | |
| | | | | | $ | 51,972,139 | |
| | | | | | | | |
| Gaming & Lodging – 0.1% | | | | | | | | |
| Marriott International, Inc., “A” | | | 23,468 | | | $ | 3,553,759 | |
| | | | | | | | |
| General Merchandise – 0.1% | | | | | | | | |
| Dollar Tree, Inc. (a) | | | 38,470 | | | $ | 3,618,103 | |
| | | | | | | | |
| Health Maintenance Organizations – 0.8% | | | | | |
| Cigna Corp. | | | 93,369 | | | $ | 19,093,027 | |
| | | | | | | | |
| Insurance – 3.4% | | | | | | | | |
| Aon PLC | | | 100,838 | | | $ | 21,003,547 | |
| Chubb Ltd. | | | 130,933 | | | | 20,381,031 | |
| Marsh & McLennan Cos., Inc. | | | 69,141 | | | | 7,702,999 | |
| MetLife, Inc. | | | 205,213 | | | | 10,459,706 | |
| Prudential Financial, Inc. | | | 56,874 | | | | 5,331,369 | |
| Travelers Cos., Inc. | | | 108,926 | | | | 14,917,416 | |
| Zurich Insurance Group AG | | | 18,821 | | | | 7,722,483 | |
| | | | | | | | |
| | | | | | $ | 87,518,551 | |
| | | | | | | | |
| Internet – 0.4% | | | | | | | | |
| Alphabet, Inc., “A” (a) | | | 5,882 | | | $ | 7,878,292 | |
| Facebook, Inc., “A” (a) | | | 7,590 | | | | 1,557,847 | |
| | | | | | | | |
| | | | | | $ | 9,436,139 | |
| | | | | | | | |
| Leisure & Toys – 0.2% | | | | | | | | |
| Electronic Arts, Inc. (a) | | | 36,404 | | | $ | 3,913,794 | |
| Harley-Davidson, Inc. | | | 14,425 | | | | 536,466 | |
| | | | | | | | |
| | | | | | $ | 4,450,260 | |
| | | | | | | | |
| Machinery & Tools – 2.5% | | | | | | | | |
| AGCO Corp. | | | 115,659 | | | $ | 8,934,658 | |
| Cummins, Inc. | | | 17,496 | | | | 3,131,084 | |
| Deere & Co. | | | 20,272 | | | | 3,512,327 | |
| Eaton Corp. PLC | | | 256,680 | | | | 24,312,730 | |
| Illinois Tool Works, Inc. | | | 89,800 | | | | 16,130,774 | |
| Ingersoll-Rand Co. PLC, “A” | | | 40,620 | | | | 5,399,210 | |
| Regal Beloit Corp. | | | 15,345 | | | | 1,313,685 | |
| | | | | | | | |
| | | | | | $ | 62,734,468 | |
| | | | | | | | |
| Major Banks – 5.9% | | | | | | | | |
| Bank of America Corp. | | | 724,104 | | | $ | 25,502,943 | |
| Bank of New York Mellon Corp. | | | 88,802 | | | | 4,469,405 | |
| BNP Paribas | | | 25,767 | | | | 1,526,937 | |
| | | | | | | | |
| | |
| Issuer | | Shares/Par | | | Value ($) | |
| COMMON STOCKS – continued | | | | | |
| Major Banks – continued | | | | | | | | |
| Goldman Sachs Group, Inc. | | | 113,386 | | | $ | 26,070,843 | |
| JPMorgan Chase & Co. | | | 332,463 | | | | 46,345,342 | |
| Morgan Stanley | | | 88,476 | | | | 4,522,893 | |
| PNC Financial Services Group, Inc. | | | 90,585 | | | | 14,460,083 | |
| State Street Corp. | | | 113,922 | | | | 9,011,230 | |
| Sumitomo Mitsui Financial Group, Inc. | | | 32,200 | | | | 1,185,353 | |
| Wells Fargo & Co. | | | 315,740 | | | | 16,986,812 | |
| | | | | | | | |
| | | | | | $ | 150,081,841 | |
| | | | | | | | |
| Medical & Health Technology & Services – 1.1% | |
| HCA Healthcare, Inc. | | | 102,113 | | | $ | 15,093,322 | |
| McKesson Corp. | | | 89,674 | | | | 12,403,708 | |
| | | | | | | | |
| | | | | | $ | 27,497,030 | |
| | | | | | | | |
| Medical Equipment – 3.5% | | | | | | | | |
| Abbott Laboratories | | | 185,084 | | | $ | 16,076,396 | |
| Danaher Corp. | | | 162,592 | | | | 24,954,620 | |
| Medtronic PLC | | | 209,424 | | | | 23,759,153 | |
| Thermo Fisher Scientific, Inc. | | | 58,050 | | | | 18,858,704 | |
| Zimmer Biomet Holdings, Inc. | | | 32,293 | | | | 4,833,616 | |
| | | | | | | | |
| | | | | | $ | 88,482,489 | |
| | | | | | | | |
| Metals & Mining – 0.2% | | | | | | | | |
| Rio Tinto PLC | | | 103,668 | | | $ | 6,183,457 | |
| | | | | | | | |
| Natural Gas – Distribution – 0.2% | | | | | | | | |
| Sempra Energy | | | 27,772 | | | $ | 4,206,903 | |
| | | | | | | | |
| Natural Gas – Pipeline – 0.8% | | | | | | | | |
| Enbridge, Inc. | | | 59,199 | | | $ | 2,354,344 | |
| Enterprise Products Partners LP | | | 314,363 | | | | 8,852,462 | |
| EQM Midstream Partners LP | | | 75,855 | | | | 2,268,823 | |
| Equitrans Midstream Corp. | | | 202,616 | | | | 2,706,950 | |
| MPLX LP | | | 64,874 | | | | 1,651,692 | |
| Plains GP Holdings LP | | | 139,592 | | | | 2,645,269 | |
| | | | | | | | |
| | | | | | $ | 20,479,540 | |
| | | | | | | | |
| Network & Telecom – 0.1% | | | | | | | | |
| Cisco Systems, Inc. | | | 55,070 | | | $ | 2,641,157 | |
| | | | | | | | |
| Oil Services – 0.1% | | | | | | | | |
| Schlumberger Ltd. | | | 38,314 | | | $ | 1,540,223 | |
| | | | | | | | |
| Other Banks & Diversified Financials – 3.3% | | | | | |
| American Express Co. | | | 31,102 | | | $ | 3,871,888 | |
| Citigroup, Inc. | | | 422,445 | | | | 33,749,131 | |
| Intesa Sanpaolo S.p.A. | | | 874,803 | | | | 2,304,504 | |
| Synchrony Financial | | | 61,434 | | | | 2,212,238 | |
| Truist Financial Corp. | | | 356,589 | | | | 20,083,093 | |
| U.S. Bancorp | | | 302,691 | | | | 17,946,550 | |
| Visa, Inc., “A” | | | 27,118 | | | | 5,095,472 | |
| | | | | | | | |
| | | | | | $ | 85,262,876 | |
| | | | | | | | |
| Pharmaceuticals – 4.5% | | | | | | | | |
| Bayer AG | | | 79,572 | | | $ | 6,498,723 | |
| Bristol-Myers Squibb Co. | | | 131,812 | | | | 8,461,012 | |
| Elanco Animal Health, Inc. (a) | | | 150,148 | | | | 4,421,859 | |
| Eli Lilly & Co. | | | 108,544 | | | | 14,265,938 | |
| Johnson & Johnson | | | 213,752 | | | | 31,180,004 | |
10
MFS Total Return Series
Portfolio of Investments – continued
| | | | | | | | |
| | |
| Issuer | | Shares/Par | | | Value ($) | |
| COMMON STOCKS – continued | | | | | |
| Pharmaceuticals – continued | | | | | | | | |
| Merck & Co., Inc. | | | 63,976 | | | $ | 5,818,617 | |
| Novartis AG | | | 12,261 | | | | 1,164,275 | |
| Pfizer, Inc. | | | 772,449 | | | | 30,264,552 | |
| Roche Holding AG | | | 39,306 | | | | 12,752,722 | |
| | | | | | | | |
| | | | | | $ | 114,827,702 | |
| | | | | | | | |
| Printing & Publishing – 0.2% | | | | | |
| Moody’s Corp. | | | 17,340 | | | $ | 4,116,689 | |
| Transcontinental, Inc., “A” | | | 115,535 | | | | 1,411,991 | |
| | | | | | | | |
| | | | | | $ | 5,528,680 | |
| | | | | | | | |
| Railroad & Shipping – 1.2% | | | | | |
| Canadian National Railway Co. | | | 31,597 | | | $ | 2,857,948 | |
| Union Pacific Corp. | | | 154,020 | | | | 27,845,276 | |
| | | | | | | | |
| | | | | | $ | 30,703,224 | |
| | | | | | | | |
| Real Estate – 1.2% | | | | | |
| Brixmor Property Group, Inc., REIT | | | 99,535 | | | $ | 2,150,951 | |
| EPR Properties, REIT | | | 75,583 | | | | 5,339,183 | |
| Medical Properties Trust, Inc., REIT | | | 249,793 | | | | 5,273,130 | |
| Public Storage, Inc., REIT | | | 18,123 | | | | 3,859,474 | |
| Simon Property Group, Inc., REIT | | | 20,549 | | | | 3,060,979 | |
| STORE Capital Corp., REIT | | | 257,727 | | | | 9,597,754 | |
| | | | | | | | |
| | | | | | $ | 29,281,471 | |
| | | | | | | | |
| Restaurants – 0.6% | | | | | |
| Chipotle Mexican Grill, Inc., “A” (a) | | | 4,117 | | | $ | 3,446,382 | |
| Starbucks Corp. | | | 122,291 | | | | 10,751,825 | |
| U.S. Foods Holding Corp. (a) | | | 38,008 | | | | 1,592,155 | |
| | | | | | | | |
| | | | | | $ | 15,790,362 | |
| | | | | | | | |
| Specialty Chemicals – 0.6% | | | | | |
| Axalta Coating Systems Ltd. (a) | | | 130,337 | | | $ | 3,962,245 | |
| Corteva, Inc. | | | 67,467 | | | | 1,994,324 | |
| DuPont de Nemours, Inc. | | | 135,673 | | | | 8,710,207 | |
| | | | | | | | |
| | | | | | $ | 14,666,776 | |
| | | | | | | | |
| Specialty Stores – 1.0% | | | | | |
| Amazon.com, Inc. (a) | | | 1,806 | | | $ | 3,337,199 | |
| Best Buy Co., Inc. | | | 23,955 | | | | 2,103,249 | |
| Target Corp. | | | 129,346 | | | | 16,583,451 | |
| Tractor Supply Co. | | | 24,786 | | | | 2,316,004 | |
| | | | | | | | |
| | | | | | $ | 24,339,903 | |
| | | | | | | | |
| Telephone Services – 0.5% | | | | | |
| Verizon Communications, Inc. | | | 194,799 | | | $ | 11,960,659 | |
| | | | | | | | |
| Tobacco – 1.2% | | | | | |
| Altria Group, Inc. | | | 47,812 | | | $ | 2,386,297 | |
| British American Tobacco PLC | | | 97,950 | | | | 4,192,695 | |
| Japan Tobacco, Inc. | | | 181,900 | | | | 4,055,115 | |
| Philip Morris International, Inc. | | | 228,713 | | | | 19,461,189 | |
| | | | | | | | |
| | | | | | $ | 30,095,296 | |
| | | | | | | | |
| Utilities – Electric Power – 2.4% | | | | | |
| Duke Energy Corp. | | | 188,067 | | | $ | 17,153,591 | |
| Exelon Corp. | | | 266,241 | | | | 12,137,927 | |
| FirstEnergy Corp. | | | 146,434 | | | | 7,116,693 | |
| | | | | | | | |
| | |
| Issuer | | Shares/Par | | | Value ($) | |
| COMMON STOCKS – continued | | | | | |
| Utilities – Electric Power – continued | | | | | |
| NextEra Energy, Inc. | | | 6,774 | | | $ | 1,640,392 | |
| Public Service Enterprise Group, Inc. | | | 68,488 | | | | 4,044,216 | |
| Southern Co. | | | 215,786 | | | | 13,745,568 | |
| WEC Energy Group, Inc. | | | 36,517 | | | | 3,367,963 | |
| Xcel Energy, Inc. | | | 39,058 | | | | 2,479,793 | |
| | | | | | | | |
| | | | | | $ | 61,686,143 | |
| | | | | | | | |
Total Common Stocks
(Identified Cost, $929,372,499) | | | | | | $ | 1,528,283,583 | |
| | | | | | | | |
| | |
| BONDS – 41.0% | | | | | | | | |
| Aerospace – 0.1% | | | | | |
| L3Harris Technologies, Inc., 3.85%, 6/15/2023 (n) | | $ | 2,728,000 | | | $ | 2,871,690 | |
| | | | | | | | |
| Apparel Manufacturers – 0.0% | | | | | |
| Tapestry, Inc., 4.125%, 7/15/2027 | | $ | 857,000 | | | $ | 875,037 | |
| | | | | | | | |
| Asset-Backed & Securitized – 4.4% | | | | | |
| ALM Loan Funding, CLO, 2013-7R2A, “A1B2”, FLR, 3.386% (LIBOR - 3mo. + 1.4%), 10/15/2027 (n) | | $ | 4,410,000 | | | $ | 4,381,132 | |
| ALM V Ltd.,2012-5A, “A2R3”, FLR, 3.253% (LIBOR - 3mo. + 1.25%), 10/18/2027 (n) | | | 2,667,000 | | | | 2,654,196 | |
| AREIT CRE Trust, 2018-CRE2, “A”, FLR, 2.719% (LIBOR - 1mo. + 0.98%), 11/14/2035 (n) | | | 3,166,419 | | | | 3,165,038 | |
| AREIT CRE Trust, 2019-CRE3, “AS” FLR, 3.04% (LIBOR - 1mo. + 1.3%), 9/14/2036 (n) | | | 3,366,000 | | | | 3,366,650 | |
| Avis Budget Rental Car Funding LLC,2019-1A, “A”, 3.45%, 3/20/2023 (n) | | | 3,880,000 | | | | 3,968,457 | |
| Bancorp Commercial Mortgage Trust, 2018-CRE4, “A”, FLR, 2.639% (LIBOR - 1mo. + 0.9%), 9/15/2035 (n) | | | 2,813,292 | | | | 2,808,304 | |
| Bancorp Commercial Mortgage Trust, 2019-CRE6, “AS”, FLR, 3.065% (LIBOR - 1mo. + 1.3%), 9/15/2036 (n) | | | 3,469,924 | | | | 3,469,841 | |
| Barclays Commercial Mortgage Securities LLC,2019-C5, “A4”, 3.063%, 11/15/2052 | | | 3,520,000 | | | | 3,630,798 | |
| Bayview Financial Revolving Mortgage Loan Trust, FLR, 3.404% (LIBOR - 1mo. + 1.6%), 12/28/2040 (n) | | | 1,256,057 | | | | 1,260,819 | |
| BDS Ltd.,2019-FL4, “A”, FLR, 3.137% (LIBOR - 1mo. + 1.4%), 8/15/2035 (n) | | | 4,179,000 | | | | 4,177,710 | |
| BDS Ltd.,2019-FL4, “A”, FLR, 2.839% (LIBOR - 1mo. + 1.10%), 8/15/2036 (n) | | | 2,416,000 | | | | 2,411,441 | |
| Chesapeake Funding II LLC,2018-1A, “A1”, 3.04%, 4/15/2030 (n) | | | 1,045,751 | | | | 1,057,457 | |
| Commercial Mortgage Pass-Through Certificates, 2019-BN17, “A4”, 3.714%, 4/15/2052 | | | 2,789,000 | | | | 3,027,788 | |
| Commercial Mortgage Trust, 2015-LC21, “A4”, 3.708%, 7/10/2048 | | | 3,980,975 | | | | 4,228,418 | |
| CSAIL Commercial Mortgage Trust,2015-C2, “A4”, 3.504%, 6/15/2057 | | | 2,316,427 | | | | 2,420,709 | |
11
MFS Total Return Series
Portfolio of Investments – continued
| | | | | | | | |
| | |
| Issuer | | Shares/Par | | | Value ($) | |
| BONDS – continued | | | | | | | | |
| Asset-Backed & Securitized – continued | | | | | |
| Cutwater CLO Ltd.,2015-1A, “AR”, FLR, 3.221% (LIBOR - 3mo. + 1.22%), 1/15/2029 (n) | | $ | 4,410,000 | | | $ | 4,409,762 | |
| Dryden Senior Loan Fund,2013-26A, “AR”, CLO, FLR, 2.9% (LIBOR - 3mo. + 0.9%), 4/15/2029 (n) | | | 2,088,000 | | | | 2,085,141 | |
| Dryden Senior Loan Fund,2018-55A, “A1”, CLO, FLR, 3.02% (LIBOR - 3mo. + 1.02%), 4/15/2031 (n) | | | 4,414,000 | | | | 4,383,155 | |
Exantas Capital Corp. CLO Ltd.,
2019-RS07, “A”, FLR, 2.737% (LIBOR - 1mo. + 1%), 4/15/2036 (n) | | | 506,829 | | | | 506,671 | |
| Figueroa CLO Ltd.,2014-1A, “BR”, FLR, 3.5% (LIBOR - 3mo. + 1.5%), 1/15/2027 (n) | | | 1,330,000 | | | | 1,326,922 | |
| Fort CRE LLC,2018-1A, “A1”, FLR, 3.135% (LIBOR - 1mo. + 1.35%), 11/16/2035 (n) | | | 1,638,500 | | | | 1,638,497 | |
| GMAC Mortgage Corp. Loan Trust, 5.805%, 10/25/2036 | | | 326,448 | | | | 329,591 | |
| GS Mortgage Securities Trust, 2015-GC30, “A4”, 3.382%, 5/10/2050 | | | 4,243,101 | | | | 4,438,115 | |
| GS Mortgage Securities Trust, 2019-GSA1, “A4”, 3.047%, 11/10/2052 | | | 2,182,474 | | | | 2,239,899 | |
| JPMBB Commercial Mortgage Securities Trust,2014-C26, 3.494%, 1/15/2048 | | | 4,880,000 | | | | 5,122,145 | |
| JPMBB Commercial Mortgage Securities Trust,2015-C28, “A4”, 3.227%, 10/15/2048 | | | 3,256,792 | | | | 3,378,906 | |
| KKR Real Estate Financial Trust, Inc.,2018-FL1, “A”, FLR, 2.837% (LIBOR -1mo. + 1.1%), 6/15/2036 (n) | | | 2,180,000 | | | | 2,183,405 | |
| MF1 CLO Ltd.,2019-FL2, “A”, FLR, 2.922% (LIBOR - 1mo. + 1.13%), 12/25/2034 (n) | | | 4,395,000 | | | | 4,396,332 | |
| Morgan Stanley Bank of America Merrill Lynch Trust,2017-C34, “A4”, 3.536%, 11/15/2052 | | | 1,600,004 | | | | 1,703,527 | |
| Morgan Stanley Capital I Trust,2017-H1, “A5”, 3.53%, 6/15/2050 | | | 1,456,742 | | | | 1,547,493 | |
| Mountain Hawk CLO Ltd.,2014-3A, “BR”, FLR, 3.803% (LIBOR - 3mo. + 1.8%), 4/18/2025 (n) | | | 4,534,203 | | | | 4,530,285 | |
| Navistar Financial Dealer Note Master Owner Trust II,2018-1, “A”, FLR, 2.422% (LIBOR - 1mo. + 0.63%), 9/25/2023 (n) | | | 2,554,000 | | | | 2,558,218 | |
| Neuberger Berman CLO Ltd., FLR, 2.8% (LIBOR - 3mo. + 0.8%), 1/15/2028 (n) | | | 1,900,000 | | | | 1,898,698 | |
| Oaktree CLO Ltd.,2015-1A, “A2AR”, FLR, 3.316% (LIBOR - 3mo. + 1.35%), 10/20/2027 (n) | | | 809,537 | | | | 802,530 | |
| Residential Funding Mortgage Securities, Inc., 5.32%, 12/25/2035 | | | 503,882 | | | | 506,503 | |
| | | | | | | | |
| | |
| Issuer | | Shares/Par | | | Value ($) | |
| BONDS – continued | | | | | | | | |
| Asset-Backed & Securitized – continued | | | | | |
| Sound Point CLO Ltd.,2015-3A, “AR”, FLR, 2.856% (LIBOR - 3mo. + 0.89%), 1/20/2028 (n) | | $ | 910,000 | | | $ | 906,870 | |
| UBS Commercial Mortgage Trust,2017-C8, “A4”, 3.983%, 2/15/2051 | | | 2,950,000 | | | | 3,231,292 | |
| UBS Commercial Mortgage Trust,2019-C17, “A4”, 2.921%, 9/15/2052 | | | 2,461,404 | | | | 2,498,794 | |
| Wells Fargo Commercial Mortgage Trust,2015-C28, “A4”, 3.54%, 5/15/2048 | | | 4,315,766 | | | | 4,554,208 | |
| Wells Fargo Commercial Mortgage Trust,2019-C54, “A4”, 3.146%, 12/15/2052 | | | 3,579,870 | | | | 3,704,997 | |
| | | | | | | | |
| | | | | | $ | 110,910,714 | |
| | | | | | | | |
| Automotive – 0.2% | | | | | |
| General Motors Co., 6.75%, 4/01/2046 | | $ | 1,124,000 | | | $ | 1,319,335 | |
| General Motors Financial Co., Inc., 4.35%, 4/09/2025 | | | 1,137,000 | | | | 1,217,606 | |
| Lear Corp., 3.8%, 9/15/2027 | | | 2,474,000 | | | | 2,496,123 | |
| Lear Corp., 4.25%, 5/15/2029 | | | 1,085,000 | | | | 1,120,061 | |
| | | | | | | | |
| | | | | | $ | 6,153,125 | |
| | | | | | | | |
| Broadcasting – 0.1% | | | | | |
| Fox Corp., 4.03%, 1/25/2024 (n) | | $ | 2,654,000 | | | $ | 2,827,721 | |
| | | | | | | | |
| Brokerage & Asset Managers – 0.4% | | | | | |
| E*TRADE Financial Corp., 2.95%, 8/24/2022 | | $ | 750,000 | | | $ | 763,696 | |
| E*TRADE Financial Corp., 3.8%, 8/24/2027 | | | 1,078,000 | | | | 1,119,772 | |
| E*TRADE Financial Corp., 4.5%, 6/20/2028 | | | 1,107,000 | | | | 1,203,025 | |
| Intercontinental Exchange, Inc., 2.35%, 9/15/2022 | | | 1,484,000 | | | | 1,499,198 | |
| Intercontinental Exchange, Inc., 4%, 10/15/2023 | | | 2,519,000 | | | | 2,686,486 | |
| Raymond James Financial, Inc., 4.95%, 7/15/2046 | | | 2,325,000 | | | | 2,710,504 | |
| | | | | | | | |
| | | | | | $ | 9,982,681 | |
| | | | | | | | |
| Building – 0.2% | | | | | |
| CRH America Finance, Inc., 4.5%, 4/04/2048 (n) | | $ | 1,146,000 | | | $ | 1,247,479 | |
| Martin Marietta Materials, Inc., 3.5%, 12/15/2027 | | | 927,000 | | | | 961,425 | |
| Masco Corp., 4.375%, 4/01/2026 | | | 1,938,000 | | | | 2,092,432 | |
| | | | | | | | |
| | | | | | $ | 4,301,336 | |
| | | | | | | | |
| Business Services – 0.3% | | | | | |
| Equinix, Inc., 2.625%, 11/18/2024 | | $ | 3,239,000 | | | $ | 3,245,024 | |
| Fiserv, Inc., 4.4%, 7/01/2049 | | | 1,654,000 | | | | 1,871,721 | |
| Verisk Analytics, Inc., 4.125%, 3/15/2029 | | | 2,462,000 | | | | 2,700,213 | |
| | | | | | | | |
| | | | | | $ | 7,816,958 | |
| | | | | | | | |
| Cable TV – 0.2% | | | | | |
| Comcast Corp., 3.45%, 2/01/2050 | | $ | 2,183,000 | | | $ | 2,230,173 | |
| Time Warner Entertainment Co. LP, 8.375%, 7/15/2033 | | | 2,855,000 | | | | 3,998,001 | |
| | | | | | | | |
| | | | | | $ | 6,228,174 | |
| | | | | | | | |
12
MFS Total Return Series
Portfolio of Investments – continued
| | | | | | | | |
| | |
| Issuer | | Shares/Par | | | Value ($) | |
| BONDS – continued | | | | | | | | |
| Chemicals – 0.0% | | | | | |
| Sherwin-Williams Co., 4.5%, 6/01/2047 | | $ | 1,201,000 | | | $ | 1,360,447 | |
| | | | | | | | |
| Computer Software – 0.2% | | | | | |
| Dell International LLC/EMC Corp., 4.9%, 10/01/2026 (n) | | $ | 1,857,000 | | | $ | 2,042,775 | |
| Microsoft Corp., 4.25%, 2/06/2047 | | | 2,278,000 | | | | 2,786,318 | |
| | | | | | | | |
| | | | | | $ | 4,829,093 | |
| | | | | | | | |
| Computer Software – Systems – 0.2% | | | | | |
| Apple, Inc., 2.85%, 2/23/2023 | | $ | 3,502,000 | | | $ | 3,600,018 | |
| Apple, Inc., 3.35%, 2/09/2027 | | | 1,145,000 | | | | 1,218,306 | |
| Apple, Inc., 3.85%, 5/04/2043 | | | 1,303,000 | | | | 1,458,537 | |
| | | | | | | | |
| | | | | | $ | 6,276,861 | |
| | | | | | | | |
| Conglomerates – 0.2% | | | | | |
| Roper Technologies, Inc., 4.2%, 9/15/2028 | | $ | 900,000 | | | $ | 985,142 | |
| Roper Technologies, Inc. , 2.95%, 9/15/2029 | | | 551,000 | | | | 555,798 | |
| United Technologies Corp., 4.125%, 11/16/2028 | | | 1,778,000 | | | | 2,001,248 | |
| Wabtec Corp., 4.95%, 9/15/2028 | | | 2,041,000 | | | | 2,243,967 | |
| | | | | | | | |
| | | | | | $ | 5,786,155 | |
| | | | | | | | |
| Consumer Products – 0.2% | | | | | |
| Reckitt Benckiser Treasury Services | | | | | | | | |
| PLC, 3.625%, 9/21/2023 (n) | | $ | 3,463,000 | | | $ | 3,605,664 | |
| Reckitt Benckiser Treasury Services PLC, 2.75%, 6/26/2024 (n) | | | 1,097,000 | | | | 1,117,966 | |
| | | | | | | | |
| | | | | | $ | 4,723,630 | |
| | | | | | | | |
| Consumer Services – 0.6% | | | | | |
| Expedia Group, Inc., 3.25%, 2/15/2030 (n) | | $ | 2,188,000 | | | $ | 2,102,674 | |
| Experian Finance PLC, 4.25%, 2/01/2029 (n) | | | 1,699,000 | | | | 1,867,167 | |
| IHS Markit Ltd., 3.625%, 5/01/2024 | | | 385,000 | | | | 400,034 | |
| IHS Markit Ltd., 4%, 3/01/2026 (n) | | | 2,212,000 | | | | 2,332,466 | |
| IHS Markit Ltd., 4.25%, 5/01/2029 | | | 578,000 | | | | 622,865 | |
| Priceline Group, Inc., 2.75%, 3/15/2023 | | | 4,026,000 | | | | 4,111,252 | |
| Visa, Inc., 3.15%, 12/14/2025 | | | 2,934,000 | | | | 3,098,650 | |
| Western Union Co., 2.85%, 1/10/2025 | | | 660,000 | | | | 661,599 | |
| | | | | | | | |
| | | | | | $ | 15,196,707 | |
| | | | | | | | |
| Electronics – 0.2% | | | | | |
| Broadcom Corp./Broadcom Cayman | | | | | | | | |
| Finance Ltd., 3.875%, 1/15/2027 | | $ | 1,105,000 | | | $ | 1,146,611 | |
| Broadcom Corp./Broadcom Cayman Finance Ltd., 3.5%, 1/15/2028 | | | 3,096,000 | | | | 3,114,534 | |
| Broadcom, Inc., 4.25%, 4/15/2026 (n) | | | 1,580,000 | | | | 1,678,723 | |
| | | | | | | | |
| | | | | | $ | 5,939,868 | |
| | | | | | | | |
| Energy – Integrated – 0.1% | | | | | |
| Eni S.p.A., 4.75%, 9/12/2028 (n) | | $ | 1,944,000 | | | $ | 2,198,160 | |
| | | | | | | | |
| Financial Institutions – 0.2% | | | | | |
| AerCap Ireland Capital DAC, 3.65%, 7/21/2027 | | $ | 3,053,000 | | | $ | 3,142,383 | |
| | | | | | | | |
| | |
| Issuer | | Shares/Par | | | Value ($) | |
| BONDS – continued | | | | | | | | |
| Financial Institutions – continued | | | | | |
| AerCap Ireland Capital Ltd., 4.875%, 1/16/2024 | | $ | 362,000 | | | $ | 392,144 | |
| Avolon Holdings Funding Ltd., 4.375%, 5/01/2026 (n) | | | 776,000 | | | | 819,689 | |
| | | | | | | | |
| | | | | | $ | 4,354,216 | |
| | | | | | | | |
| Food & Beverages – 0.4% | | | | | |
| Anheuser-Busch InBev S.A., 8%, 11/15/2039 | | $ | 2,610,000 | | | $ | 4,143,925 | |
| Constellation Brands, Inc., 3.5%, 5/09/2027 | | | 3,365,000 | | | | 3,511,464 | |
| Diageo Capital PLC, 2.375%, 10/24/2029 | | | 3,467,000 | | | | 3,415,503 | |
| | | | | | | | |
| | | | | | $ | 11,070,892 | |
| | | | | | | | |
| Gaming & Lodging – 0.2% | | | | | |
| GLP Capital LP/GLP Financing II, Inc., 5.3%, 1/15/2029 | | $ | 1,804,000 | | | $ | 2,003,703 | |
| Las Vegas Sands Corp., 3.9%, 8/08/2029 | | | 1,044,000 | | | | 1,088,862 | |
| Marriott International, Inc., 4%, 4/15/2028 | | | 2,208,000 | | | | 2,383,589 | |
| | | | | | | | |
| | | | | | $ | 5,476,154 | |
| | | | | | | | |
| Insurance – 0.3% | | | | | |
| American International Group, Inc., 4.875%, 6/01/2022 | | $ | 3,566,000 | | | $ | 3,805,388 | |
| American International Group, Inc., 4.125%, 2/15/2024 | | | 2,620,000 | | | | 2,811,555 | |
| | | | | | | | |
| | | | | | $ | 6,616,943 | |
| | | | | | | | |
| Insurance – Health – 0.0% | | | | | |
| UnitedHealth Group, Inc., 3.5%, 8/15/2039 | | $ | 833,000 | | | $ | 872,505 | |
| | | | | | | | |
| Insurance – Property & Casualty – 0.3% | | | | | |
| Aon Corp., 3.75%, 5/02/2029 | | $ | 2,810,000 | | | $ | 3,007,652 | |
| Berkshire Hathaway, Inc., 3.125%, 3/15/2026 | | | 1,162,000 | | | | 1,223,574 | |
| Hartford Financial Services Group, Inc., 3.6%, 8/19/2049 | | | 1,068,000 | | | | 1,095,822 | |
| Liberty Mutual Group, Inc., 3.951%, 10/15/2050 (n) | | | 1,469,000 | | | | 1,522,873 | |
| Marsh & McLennan Cos., Inc., 4.75%, 3/15/2039 | | | 944,000 | | | | 1,138,599 | |
| | | | | | | | |
| | | | | | $ | 7,988,520 | |
| | | | | | | | |
| International Market Quasi-Sovereign – 0.3% | | | | | |
| Temasek Financial I Ltd. (Republic of | | | | | | | | |
| Singapore), 2.375%, 1/23/2023 (n) | | $ | 6,400,000 | | | $ | 6,479,793 | |
| | | | | | | | |
| Machinery & Tools – 0.1% | | | | | |
| CNH Industrial Capital LLC, 4.2%, 1/15/2024 | | $ | 2,120,000 | | | $ | 2,244,187 | |
| | | | | | | | |
| Major Banks – 1.5% | | | | | |
| Bank of America Corp., 4.1%, 7/24/2023 | | $ | 3,870,000 | | | $ | 4,127,643 | |
| Bank of America Corp., 4.125%, 1/22/2024 | | | 5,102,000 | | | | 5,487,488 | |
13
MFS Total Return Series
Portfolio of Investments – continued
| | | | | | | | |
| | |
| Issuer | | Shares/Par | | | Value ($) | |
| BONDS – continued | | | | | | | | |
| Major Banks – continued | | | | | |
| Bank of America Corp., 3.366% to 1/23/2025, FLR (LIBOR - 3mo. + 0.81%) to 1/23/2026 | | $ | 1,842,000 | | | $ | 1,925,773 | |
| Bank of America Corp., 3.5%, 4/19/2026 | | | 1,814,000 | | | | 1,927,337 | |
| Goldman Sachs Group, Inc., 3.85%, 1/26/2027 | | | 2,206,000 | | | | 2,346,127 | |
| JPMorgan Chase & Co., 3.2%, 1/25/2023 | | | 5,489,000 | | | | 5,662,099 | |
JPMorgan Chase & Co., 3.782% to 2/01/2027, FLR (LIBOR - 3mo. +
1.337%) to 2/01/2028 | | | 4,188,000 | | | | 4,511,231 | |
| JPMorgan Chase & Co., 3.897%, 1/23/2049 | | | 1,248,000 | | | | 1,399,958 | |
| Morgan Stanley, 3.125%, 1/23/2023 | | | 424,000 | | | | 435,809 | |
| Morgan Stanley, 3.875%, 4/29/2024 | | | 1,539,000 | | | | 1,636,145 | |
| Morgan Stanley, 4%, 7/23/2025 | | | 1,206,000 | | | | 1,304,013 | |
| PNC Bank N.A., 2.7%, 10/22/2029 | | | 835,000 | | | | 833,293 | |
| Wells Fargo & Co., 3.75%, 1/24/2024 | | | 1,723,000 | | | | 1,819,852 | |
Wells Fargo & Co., 3.196% to 6/17/2026, FLR (LIBOR - 3mo. +
1.17%) to 6/17/2027 | | | 5,235,000 | | | | 5,426,314 | |
| | | | | | | | |
| | | | | | $ | 38,843,082 | |
| | | | | | | | |
| Medical & Health Technology & Services – 0.8% | | | | | |
| Alcon, Inc., 3.8%, 9/23/2049 (n) | | $ | 1,844,000 | | | $ | 1,928,319 | |
| Becton, Dickinson and Co., 3.125%, 11/08/2021 | | | 1,075,000 | | | | 1,095,019 | |
| Becton, Dickinson and Co., 4.669%, 6/06/2047 | | | 2,270,000 | | | | 2,698,006 | |
| HCA, Inc., 5.125%, 6/15/2039 | | | 2,562,000 | | | | 2,827,472 | |
| Laboratory Corp. of America Holdings, 3.2%, 2/01/2022 | | | 660,000 | | | | 674,798 | |
| Laboratory Corp. of America Holdings, 3.25%, 9/01/2024 | | | 1,672,000 | | | | 1,737,965 | |
| Laboratory Corp. of America Holdings, 4.7%, 2/01/2045 | | | 1,802,000 | | | | 2,023,275 | |
| Northwell Healthcare, Inc., 3.979%, 11/01/2046 | | | 171,000 | | | | 174,662 | |
| Northwell Healthcare, Inc., 4.26%, 11/01/2047 | | | 1,367,000 | | | | 1,466,065 | |
| Thermo Fisher Scientific, Inc., 2.95%, 9/19/2026 | | | 2,583,000 | | | | 2,653,573 | |
| Thermo Fisher Scientific, Inc., 3.2%, 8/15/2027 | | | 2,566,000 | | | | 2,682,024 | |
| | | | | | | | |
| | | | | | $ | 19,961,178 | |
| | | | | | | | |
| Medical Equipment – 0.4% | | | | | |
| Abbott Laboratories, 4.9%, 11/30/2046 | | $ | 2,249,000 | | | $ | 2,950,782 | |
| Boston Scientific Corp., 3.75%, 3/01/2026 | | | 2,900,000 | | | | 3,105,494 | |
| Zimmer Biomet Holdings, Inc., 3.55%, 4/01/2025 | | | 2,940,000 | | | | 3,097,601 | |
| Zimmer Biomet Holdings, Inc., FLR, 2.652% (LIBOR - 3mo. + 0.75%), 3/19/2021 | | | 992,000 | | | | 992,097 | |
| | | | | | | | |
| | | | | | $ | 10,145,974 | |
| | | | | | | | |
| | | | | | | | |
| | |
| Issuer | | Shares/Par | | | Value ($) | |
| BONDS – continued | | | | | | | | |
| Metals & Mining – 0.1% | | | | | |
| Glencore Funding LLC, 4.125%, 5/30/2023 (n) | | $ | 1,412,000 | | | $ | 1,471,451 | |
| | | | | | | | |
| Midstream – 0.7% | | | | | |
| APT Pipelines Ltd., 4.2%, 3/23/2025 (n) | | $ | 3,780,000 | | | $ | 4,016,739 | |
| APT Pipelines Ltd., 4.25%, 7/15/2027 (n) | | | 280,000 | | | | 300,698 | |
| Cheniere Energy, Inc., 3.7%, 11/15/2029 (n) | | | 1,929,000 | | | | 1,967,160 | |
| Enbridge, Inc., 2.5%, 1/15/2025 | | | 1,100,000 | | | | 1,106,476 | |
| Enterprise Products Operating LLC, 4.2%, 1/31/2050 | | | 882,000 | | | | 943,446 | |
| Kinder Morgan Energy Partners LP, 4.15%, 2/01/2024 | | | 1,369,000 | | | | 1,452,198 | |
| MPLX LP, 4.5%, 4/15/2038 | | | 938,000 | | | | 952,294 | |
| ONEOK, Inc., 4.95%, 7/13/2047 | | | 2,637,000 | | | | 2,899,448 | |
| Plains All American Pipeline, 3.55%, 12/15/2029 | | | 882,000 | | | | 868,114 | |
| Sabine Pass Liquefaction LLC, 5%, 3/15/2027 | | | 2,319,000 | | | | 2,550,123 | |
| | | | | | | | |
| | | | | | $ | 17,056,696 | |
| | | | | | | | |
| Mortgage-Backed – 14.7% | | | | | |
| Fannie Mae, 5%, 3/01/2020 - 3/01/2041 | | $ | 3,713,642 | | | $ | 4,087,459 | |
Fannie Mae,
4.5%, 4/01/2020 - 6/01/2044 | | | 9,629,371 | | | | 10,439,733 | |
Fannie Mae,
5.5%, 1/01/2021 - 4/01/2040 | | | 8,611,308 | | | | 9,550,499 | |
| Fannie Mae, 6%, 1/01/2021 - 7/01/2037 | | | 4,748,798 | | | | 5,356,776 | |
| Fannie Mae, 2.59%, 5/01/2023 | | | 442,525 | | | | 449,125 | |
Fannie Mae,
3.5%, 5/25/2025 - 11/01/2048 | | | 30,678,700 | | | | 32,212,626 | |
| Fannie Mae, 2.7%, 7/01/2025 | | | 367,000 | | | | 375,365 | |
| Fannie Mae, 3.43%, 6/01/2026 | | | 567,512 | | | | 603,408 | |
| Fannie Mae, 2.28%, 11/01/2026 | | | 474,186 | | | | 472,647 | |
| Fannie Mae, 2.672%, 12/25/2026 | | | 1,585,000 | | | | 1,612,401 | |
| Fannie Mae,3%, 11/01/2028 - 11/01/2046 | | | 13,710,393 | | | | 14,103,342 | |
Fannie Mae,
6.5%, 6/01/2031 - 7/01/2037 | | | 1,516,759 | | | | 1,703,229 | |
| Fannie Mae, 3%, 2/25/2033 (i) | | | 560,282 | | | | 64,097 | |
| Fannie Mae, 3.25%, 5/25/2040 | | | 249,003 | | | | 257,579 | |
| Fannie Mae, 4%, 9/01/2040 - 11/01/2049 | | | 22,224,265 | | | | 23,740,161 | |
| Fannie Mae, 2%, 10/25/2040 - 4/25/2046 | | | 1,607,488 | | | | 1,591,976 | |
| Fannie Mae, 4%, 7/25/2046 (i) | | | 481,204 | | | | 93,402 | |
| Fannie Mae, TBA,2.5%, 1/16/2035 - 2/18/2035 | | | 11,450,000 | | | | 11,545,673 | |
Fannie Mae, TBA,
3%, 1/16/2035 - 1/25/2050 | | | 30,350,000 | | | | 30,826,825 | |
Fannie Mae, TBA,
3.5%, 1/16/2035 - 1/14/2050 | | | 19,881,080 | | | | 20,449,581 | |
| Fannie Mae, TBA, 4%, 1/14/2050 | | | 3,925,000 | | | | 4,081,415 | |
| Fannie Mae, TBA, 4.5%, 1/25/2050 | | | 1,950,000 | | | | 2,052,728 | |
| Fannie Mae, TBA, 5%, 1/25/2050 | | | 850,000 | | | | 908,796 | |
Freddie Mac,
4.5%, 2/01/2020 - 5/01/2042 | | | 1,940,891 | | | | 2,092,968 | |
Freddie Mac,
5.5%, 2/01/2020 - 2/01/2037 | | | 1,320,435 | | | | 1,463,700 | |
| Freddie Mac, 5%, 4/01/2020 - 1/15/2040 | | | 2,345,691 | | | | 2,588,664 | |
14
MFS Total Return Series
Portfolio of Investments – continued
| | | | | | | | |
| | |
| Issuer | | Shares/Par | | | Value ($) | |
| BONDS – continued | | | | | | | | |
| Mortgage-Backed – continued | | | | | |
| Freddie Mac, 6%, 5/01/2021 - 6/01/2037 | | $ | 1,866,032 | | | $ | 2,107,015 | |
| Freddie Mac, 2.791%, 1/25/2022 | | | 1,485,000 | | | | 1,503,612 | |
| Freddie Mac, 2.51%, 11/25/2022 | | | 1,503,000 | | | | 1,523,120 | |
| Freddie Mac, 3.111%, 2/25/2023 | | | 2,136,000 | | | | 2,200,262 | |
| Freddie Mac, 3.32%, 2/25/2023 | | | 745,000 | | | | 772,405 | |
| Freddie Mac, 3.25%, 4/25/2023 | | | 2,474,000 | | | | 2,560,949 | |
| Freddie Mac, 3.06%, 7/25/2023 | | | 685,000 | | | | 707,262 | |
| Freddie Mac, 3.458%, 8/25/2023 | | | 2,553,000 | | | | 2,671,310 | |
| Freddie Mac, 0.879%, 4/25/2024 (i) | | | 6,076,371 | | | | 182,974 | |
| Freddie Mac, 0.502%, 7/25/2024 (i) | | | 14,179,000 | | | | 326,912 | |
| Freddie Mac, 0.606%, 7/25/2024 (i) | | | 5,124,500 | | | | 122,447 | |
| Freddie Mac, 0.314%, 8/25/2024 (i) | | | 15,246,000 | | | | 244,232 | |
| Freddie Mac, 0.413%, 8/25/2024 (i) | | | 28,133,803 | | | | 464,939 | |
| Freddie Mac, 3.064%, 8/25/2024 | | | 794,000 | | | | 823,479 | |
| Freddie Mac,0.365%, 10/25/2024 - 9/25/2027 (i) | | | 29,083,530 | | | | 526,205 | |
| Freddie Mac, 3.171%, 10/25/2024 | | | 1,304,000 | | | | 1,364,471 | |
| Freddie Mac, 0.274%, 11/25/2024 (i) | | | 15,385,000 | | | | 214,124 | |
| Freddie Mac, 2.67%, 12/25/2024 | | | 1,561,000 | | | | 1,598,618 | |
| Freddie Mac, 3.329%, 5/25/2025 | | | 2,660,000 | | | | 2,809,429 | |
| Freddie Mac, 3.01%, 7/25/2025 | | | 423,000 | | | | 440,307 | |
| Freddie Mac, 3.151%, 11/25/2025 | | | 1,001,000 | | | | 1,050,416 | |
| Freddie Mac, 2.673%, 3/25/2026 | | | 2,597,000 | | | | 2,663,283 | |
| Freddie Mac, 3.413%, 12/25/2026 | | | 780,000 | | | | 833,659 | |
| Freddie Mac, 3.43%, 1/25/2027 | | | 764,912 | | | | 818,263 | |
| Freddie Mac, 0.636%, 6/25/2027 (i) | | | 13,682,000 | | | | 625,330 | |
| Freddie Mac, 0.751%, 6/25/2027 (i) | | | 4,701,953 | | | | 227,483 | |
| Freddie Mac, 3.117%, 6/25/2027 | | | 1,114,000 | | | | 1,170,984 | |
| Freddie Mac, 0.577%, 7/25/2027 (i) | | | 12,088,369 | | | | 470,785 | |
| Freddie Mac, 0.329%, 8/25/2027 (i) | | | 9,650,000 | | | | 247,047 | |
| Freddie Mac, 0.434%, 8/25/2027 (i) | | | 6,742,316 | | | | 198,635 | |
| Freddie Mac, 3.244%, 8/25/2027 | | | 786,000 | | | | 833,291 | |
| Freddie Mac, 0.279%, 9/25/2027 (i) | | | 10,419,000 | | | | 232,460 | |
| Freddie Mac, 3.187%, 9/25/2027 | | | 754,000 | | | | 796,283 | |
| Freddie Mac, 0.196%, 11/25/2027 (i) | | | 16,290,000 | | | | 270,543 | |
| Freddie Mac, 0.291%, 11/25/2027 (i) | | | 11,677,579 | | | | 243,981 | |
| Freddie Mac, 0.326%, 11/25/2027 (i) | | | 10,474,491 | | | | 249,837 | |
| Freddie Mac, 0.24%, 12/25/2027 (i) | | | 10,109,000 | | | | 205,347 | |
| Freddie Mac, 0.288%, 12/25/2027 (i) | | | 11,210,000 | | | | 262,707 | |
| Freddie Mac, 0.369%, 12/25/2027 (i) | | | 17,908,304 | | | | 475,892 | |
| Freddie Mac, 3.65%, 2/25/2028 | | | 904,000 | | | | 982,045 | |
| Freddie Mac, 3.9%, 4/25/2028 | | | 1,667,000 | | | | 1,840,315 | |
| Freddie Mac, 3.926%, 7/25/2028 | | | 817,000 | | | | 904,658 | |
| Freddie Mac, 1.089%, 7/25/2029 (i) | | | 830,335 | | | | 73,930 | |
| Freddie Mac, 1.27%, 8/25/2029 (i) | | | 5,237,916 | | | | 485,459 | |
| Freddie Mac, 0.756%, 11/25/2029 (i) | | | 12,167,000 | | | | 662,081 | |
| Freddie Mac, 2.5%, 11/01/2031 | | | 143,697 | | | | 145,530 | |
| Freddie Mac, 0.308%, 11/25/2032 (i) | | | 8,880,781 | | | | 270,070 | |
| Freddie Mac, 3%,10/01/2034 - 2/25/2059 | | | 24,447,126 | | | | 25,124,519 | |
| Freddie Mac,6.5%, 5/01/2034 - 7/01/2037 | | | 857,210 | | | | 962,252 | |
| Freddie Mac, 5.5%, 2/15/2036 (i) | | | 114,683 | | | | 22,473 | |
| Freddie Mac, 4%, 8/01/2037 - 8/01/2047 | | | 10,928,407 | | | | 11,619,463 | |
| Freddie Mac,3.5%, 11/01/2037 - 10/25/2058 | | | 23,287,880 | | | | 24,407,104 | |
| Freddie Mac, 4.5%, 12/15/2040 (i) | | | 146,269 | | | | 13,776 | |
| Freddie Mac, 4%, 8/15/2044 (i) | | | 140,374 | | | | 19,413 | |
| | | | | | | | |
| | |
| Issuer | | Shares/Par | | | Value ($) | |
| BONDS – continued | | | | | | | | |
| Mortgage-Backed – continued | | | | | |
| Ginnie Mae, 2.5%, 7/20/2032 | | $ | 350,000 | | | $ | 345,509 | |
| Ginnie Mae, 6%, 9/15/2032 - 1/15/2038 | | | 2,041,635 | | | | 2,313,134 | |
Ginnie Mae,
5.5%, 5/15/2033 - 10/15/2035 | | | 1,231,244 | | | | 1,379,036 | |
Ginnie Mae,
4.5%, 7/20/2033 - 7/20/2049 | | | 7,643,951 | | | | 8,115,011 | |
| Ginnie Mae, 5%, 7/20/2033 - 12/15/2034 | | | 404,713 | | | | 448,596 | |
| Ginnie Mae, 4%, 1/20/2041 - 10/20/2049 | | | 15,882,828 | | | | 16,559,724 | |
Ginnie Mae,
3.5%, 12/15/2041 - 12/20/2049 | | | 19,895,675 | | | | 20,715,597 | |
| Ginnie Mae, 3%, 4/20/2045 - 3/20/2048 | | | 20,535,897 | | | | 21,129,129 | |
| Ginnie Mae, 0.66%, 2/16/2059 (i) | | | 7,235,446 | | | | 409,690 | |
| Ginnie Mae, TBA, 4%, 1/15/2050 | | | 5,150,000 | | | | 5,330,133 | |
| Ginnie Mae, TBA,3%, 1/21/2050 - 3/23/2050 | | | 7,700,000 | | | | 7,900,043 | |
| Ginnie Mae, TBA, 3.5%, 1/21/2050 | | | 3,300,000 | | | | 3,400,440 | |
| | | | | | | | |
| | | | | | $ | 373,343,603 | |
| | | | | | | | |
| Municipals – 0.4% | | | | | |
| New Jersey Economic Development | | | | | | | | |
| Authority State Pension Funding Rev., | | | | | | | | |
| “A”, 7.425%, 2/15/2029 | | $ | 2,750,000 | | | $ | 3,447,758 | |
| New Jersey Turnpike Authority Rev. | | | | | | | | |
| (Build America Bonds), “F”, 7.414%, 1/01/2040 | | | 3,685,000 | | | | 5,780,512 | |
| | | | | | | | |
| | | | | | $ | 9,228,270 | |
| | | | | | | | |
| Natural Gas – Distribution – 0.0% | | | | | |
| NiSource, Inc., 5.65%, 2/01/2045 | | $ | 554,000 | | | $ | 705,941 | |
| | | | | | | | |
| Network & Telecom – 0.2% | | | | | |
| AT&T, Inc., 5.45%, 3/01/2047 | | $ | 1,601,000 | | | $ | 1,983,154 | |
| Verizon Communications, Inc., 4.812%, 3/15/2039 | | | 2,183,000 | | | | 2,628,724 | |
| | | | | | | | |
| | | | | | $ | 4,611,878 | |
| | | | | | | | |
| Oils – 0.3% | | | | | |
| Marathon Petroleum Corp., 3.625%, 9/15/2024 | | $ | 2,653,000 | | | $ | 2,784,450 | |
| Marathon Petroleum Corp., 4.75%, 9/15/2044 | | | 1,814,000 | | | | 1,988,723 | |
| Valero Energy Corp., 4.9%, 3/15/2045 | | | 2,669,000 | | | | 3,073,328 | |
| | | | | | | | |
| | | | | | $ | 7,846,501 | |
| | | | | | | | |
| Other Banks & Diversified Financials – 0.3% | | | | | |
| Banco de Credito del Peru, 5.375%, 9/16/2020 | | $ | 2,967,000 | | | $ | 3,030,227 | |
| BBVA Bancomer S.A. de C.V., 6.75%, 9/30/2022 (n) | | | 2,890,000 | | | | 3,146,516 | |
| Capital One Financial Corp., 3.75%, 3/09/2027 | | | 2,581,000 | | | | 2,750,112 | |
| | | | | | | | |
| | | | | | $ | 8,926,855 | |
| | | | | | | | |
| Pollution Control – 0.1% | | | | | |
| Republic Services, Inc., 3.95%, 5/15/2028 | | $ | 1,412,000 | | | $ | 1,554,087 | |
| | | | | | | | |
| Real Estate – Retail – 0.1% | | | | | |
| VEREIT Operating Partnership LP, | | | | | | | | |
| REIT, 3.1%, 12/15/2029 | | $ | 1,759,000 | | | $ | 1,727,170 | |
| | | | | | | | |
15
MFS Total Return Series
Portfolio of Investments – continued
| | | | | | | | |
| | |
| Issuer | | Shares/Par | | | Value ($) | |
| BONDS – continued | | | | | | | | |
| Retailers – 0.3% | | | | | |
| Best Buy Co., Inc., 4.45%, 10/01/2028 | | $ | 2,523,000 | | | $ | 2,765,541 | |
| Dollar Tree, Inc., 4%, 5/15/2025 | | | 2,203,000 | | | | 2,354,654 | |
| Dollar Tree, Inc., 4.2%, 5/15/2028 | | | 515,000 | | | | 551,784 | |
| Home Depot, Inc., 3.9%, 6/15/2047 | | | 1,482,000 | | | | 1,671,776 | |
| | | | | | | | |
| | | | | | $ | 7,343,755 | |
| | | | | | | | |
| Telecommunications – Wireless – 0.4% | | | | | |
| American Tower Corp., REIT, 3%, 6/15/2023 | | $ | 1,291,000 | | | $ | 1,321,330 | |
| American Tower Corp., REIT, 3.6%, 1/15/2028 | | | 1,291,000 | | | | 1,355,001 | |
| American Tower Trust I, REIT, 3.07%, 3/15/2023 (n) | | | 3,560,000 | | | | 3,604,793 | |
| Crown Castle International Corp., 3.65%, 9/01/2027 | | | 3,122,000 | | | | 3,300,147 | |
| | | | | | | | |
| | | | | | $ | 9,581,271 | |
| | | | | | | | |
| Transportation – Services – 0.1% | | | | | |
| ERAC USA Finance LLC, 7%, 10/15/2037 (n) | | $ | 2,296,000 | | | $ | 3,241,542 | |
| | | | | | | | |
| U.S. Government Agencies and Equivalents – 0.0% | |
| Small Business Administration, 4.35%, 7/01/2023 | | $ | 1,597 | | | $ | 1,642 | |
| Small Business Administration, 4.77%, 4/01/2024 | | | 105,055 | | | | 108,785 | |
| Small Business Administration, 5.18%, 5/01/2024 | | | 156,137 | | | | 163,571 | |
| Small Business Administration, 5.52%, 6/01/2024 | | | 7,641 | | | | 8,035 | |
| Small Business Administration, 4.99%, 9/01/2024 | | | 177,216 | | | | 183,992 | |
| Small Business Administration, 4.95%, 3/01/2025 | | | 5,985 | | | | 6,215 | |
| Small Business Administration, 5.11%, 8/01/2025 | | | 568,164 | | | | 595,526 | |
| | | | | | | | |
| | | | | | $ | 1,067,766 | |
| | | | | | | | |
| U.S. Treasury Obligations – 10.3% | | | | | |
| U.S. Treasury Bonds, 8%, 11/15/2021 | | $ | 723,000 | | | $ | 807,290 | |
| U.S. Treasury Bonds, 6%, 2/15/2026 | | | 777,000 | | | | 966,574 | |
| U.S. Treasury Bonds, 6.75%, 8/15/2026 | | | 2,569,000 | | | | 3,361,645 | |
| U.S. Treasury Bonds, 3.5%, 2/15/2039 | | | 7,097,000 | | | | 8,495,375 | |
| U.S. Treasury Bonds, 2.875%, 5/15/2043 | | | 39,156,500 | | | | 42,606,220 | |
| U.S. Treasury Bonds, 2.5%, 2/15/2045 | | | 9,797,000 | | | | 9,983,621 | |
| U.S. Treasury Bonds, 3%, 11/15/2045 | | | 3,638,000 | | | | 4,064,947 | |
| U.S. Treasury Bonds, 2.875%, 11/15/2046 | | | 7,268,000 | | | | 7,962,821 | |
| U.S. Treasury Bonds, 3%, 2/15/2048 | | | 15,510,000 | | | | 17,415,584 | |
| U.S. Treasury Bonds, 2.875%, 5/15/2049 | | | 900,000 | | | | 990,887 | |
| U.S. Treasury Notes, 1.375%, 2/29/2020 | | | 2,412,000 | | | | 2,410,878 | |
| U.S. Treasury Notes, 3.5%, 5/15/2020 | | | 25,260,000 | | | | 25,428,729 | |
| U.S. Treasury Notes, 3.125%, 5/15/2021 | | | 17,180,000 | | | | 17,528,227 | |
| U.S. Treasury Notes, 1.75%, 11/30/2021 | | | 67,105,000 | | | | 67,292,498 | |
| U.S. Treasury Notes, 1.75%, 9/30/2022 | | | 23,068,000 | | | | 23,148,917 | |
| U.S. Treasury Notes, 2.5%, 8/15/2023 | | | 21,333,000 | | | | 21,956,481 | |
| U.S. Treasury Notes, 2%, 11/15/2026 | | | 5,700,000 | | | | 5,759,261 | |
| | | | | | | | |
| | |
| Issuer | | Shares/Par | | | Value ($) | |
| BONDS – continued | | | | | | | | |
| U.S. Treasury Obligations – continued | | | | | |
| U.S. Treasury Notes, 2.375%, 5/15/2029 | | $ | 1,680,000 | | | $ | 1,744,807 | |
| | | | | | | | |
| | | | | | $ | 261,924,762 | |
| | | | | | | | |
| Utilities – Electric Power – 0.9% | | | | | |
| Berkshire Hathaway Energy Co., 3.75%, 11/15/2023 | | $ | 1,930,000 | | | $ | 2,043,690 | |
| Duke Energy Corp., 2.65%, 9/01/2026 | | | 397,000 | | | | 398,516 | |
| Enel Finance International N.V., 2.65%, 9/10/2024 | | | 2,139,000 | | | | 2,144,261 | |
| Enel Finance International N.V., 4.875%, 6/14/2029 (n) | | | 2,190,000 | | | | 2,469,465 | |
| Enel Finance International N.V., 4.75%, 5/25/2047 (n) | | | 392,000 | | | | 440,178 | |
| Evergy, Inc., 2.9%, 9/15/2029 | | | 1,863,000 | | | | 1,851,475 | |
| Exelon Corp., 3.4%, 4/15/2026 | | | 3,438,000 | | | | 3,588,704 | |
| Jersey Central Power & Light Co., 4.3%, 1/15/2026 (n) | | | 1,511,000 | | | | 1,643,775 | |
| Oncor Electric Delivery Co. LLC, 5.75%, 3/15/2029 | | | 2,810,000 | | | | 3,465,310 | |
| PPL Capital Funding, Inc., 5%, 3/15/2044 | | | 870,000 | | | | 999,126 | |
| PPL Corp., 3.4%, 6/01/2023 | | | 2,940,000 | | | | 3,033,647 | |
| Xcel Energy, Inc., 3.5%, 12/01/2049 | | | 1,310,000 | | | | 1,327,289 | |
| | | | | | | | |
| | | | | | $ | 23,405,436 | |
| | | | | | | | |
Total Bonds
(Identified Cost, $1,002,460,110) | | | | | | $ | 1,045,368,785 | |
| | | | | | | | |
|
| CONVERTIBLE PREFERRED STOCKS – 0.4% | |
| Medical Equipment – 0.1% | | | | | |
| Danaher Corp., 4.75% | | | 1,324 | | | $ | 1,561,049 | |
| | | | | | | | |
| Utilities – Electric Power – 0.3% | | | | | | | | |
| CenterPoint Energy, Inc., 7% | | | 162,120 | | | $ | 7,901,729 | |
| | | | | | | | |
Total Convertible Preferred Stocks
(Identified Cost, $9,623,042) | | | $ | 9,462,778 | |
| | | | | | | | |
| |
| PREFERRED STOCKS – 0.1% | | | | | |
| Electronics – 0.1% | | | | | |
Samsung Electronics Co. Ltd.
(Identified Cost, $2,090,086) | | | 62,580 | | | $ | 2,441,516 | |
| | | | | | | | |
|
| INVESTMENT COMPANIES (h) – 1.6% | |
| Money Market Funds – 1.6% | | | | | |
MFS Institutional Money Market Portfolio, 1.7% (v)
(Identified Cost, $40,929,175) | | | 40,930,012 | | | $ | 40,930,012 | |
| | | | | | | | |
OTHER ASSETS, LESS
LIABILITIES – (3.1)% | | | | | | | (79,507,128 | ) |
| | | | | | | | |
| NET ASSETS – 100.0% | | | | | | $ | 2,546,979,546 | |
| | | | | | | | |
| (a) | | Non-income producing security. |
| (h) | | An affiliated issuer, which may be considered one in which the fund owns 5% or more of the outstanding voting securities, or a company which is under common control. At period end, the aggregate values of the fund’s investments in affiliated issuers and in unaffiliated issuers were $40,930,012 and $2,585,556,662, respectively. |
16
MFS Total Return Series
Portfolio of Investments – continued
| (i) | | Interest only security for which the fund receives interest on notional principal (Par amount). Par amount shown is the notional principal and does not reflect the cost of the security. |
| (n) | | Securities exempt from registration under Rule 144A of the Securities Act of 1933. These securities may be sold in the ordinary course of business in transactions exempt from registration, normally to qualified institutional buyers. At period end, the aggregate value of these securities was $121,293,007, representing 4.8% of net assets. |
| (v) | | Affiliated issuer that is available only to investment companies managed by MFS. The rate quoted for the MFS Institutional Money Market Portfolio is the annualizedseven-day yield of the fund at period end. |
The following abbreviations are used in this report and are defined:
| ADR | | American Depositary Receipt |
| CLO | | Collateralized Loan Obligation |
| FLR | | Floating Rate. Interest rate resets periodically based on the parenthetically disclosed reference rate plus a spread (if any). Theperiod-end rate reported may not be the current rate. All reference rates are USD unless otherwise noted. |
| LIBOR | | London Interbank Offered Rate |
| REIT | | Real Estate Investment Trust |
See Notes to Financial Statements
17
MFS Total Return Series
FINANCIAL STATEMENTS | STATEMENT OF ASSETS AND LIABILITIES
This statement represents your fund’s balance sheet, which details the assets and liabilities comprising the total value of the fund.
| | | | |
At 12/31/19 | | | | |
| |
Assets | | | | |
Investments in unaffiliated issuers, at value (identified cost, $1,943,545,737) | | | $2,585,556,662 | |
Investments in affiliated issuers, at value (identified cost, $40,929,175) | | | 40,930,012 | |
Cash | | | 45,967 | |
Receivables for | | | | |
Investments sold on an extended settlement basis | | | 7,713,621 | |
Fund shares sold | | | 870,829 | |
Interest and dividends | | | 8,318,022 | |
Receivable from investment adviser | | | 87,869 | |
Other assets | | | 9,250 | |
Total assets | | | $2,643,532,232 | |
| |
Liabilities | | | | |
Payables for | | | | |
Investments purchased on an extended settlement basis | | | $94,296,410 | |
Fund shares reacquired | | | 1,966,099 | |
Payable to affiliates | | | | |
Administrative services fee | | | 1,792 | |
Shareholder servicing costs | | | 1,245 | |
Distribution and/or service fees | | | 18,154 | |
Payable for independent Trustees’ compensation | | | 10 | |
Accrued expenses and other liabilities | | | 268,976 | |
Total liabilities | | | $96,552,686 | |
Net assets | | | $2,546,979,546 | |
| |
Net assets consist of | | | | |
Paid-in capital | | | $1,801,984,093 | |
Total distributable earnings (loss) | | | 744,995,453 | |
Net assets | | | $2,546,979,546 | |
Shares of beneficial interest outstanding | | | 103,309,617 | |
| | | | | | | | | | | | |
| | | |
| | | Net assets | | | Shares
outstanding | | | Net asset value
per share | |
Initial Class | | | $1,223,166,224 | | | | 49,115,383 | | | | $24.90 | |
Service Class | | | 1,323,813,322 | | | | 54,194,234 | | | | 24.43 | |
See Notes to Financial Statements
18
MFS Total Return Series
FINANCIAL STATEMENTS | STATEMENT OF OPERATIONS
This statement describes how much your fund earned in investment income and accrued in expenses. It also describes any gains and/or losses generated by fund operations.
| | | | |
Year ended 12/31/19 | | | | |
| |
Net investment income (loss) | | | | |
Income | | | | |
Dividends | | | $37,854,929 | |
Interest | | | 30,891,200 | |
Dividends from affiliated issuers | | | 851,622 | |
Income on securities loaned | | | 74,562 | |
Other | | | 43,091 | |
Foreign taxes withheld | | | (574,116 | ) |
Total investment income | | | $69,141,288 | |
Expenses | | | | |
Management fee | | | $16,562,696 | |
Distribution and/or service fees | | | 3,192,636 | |
Shareholder servicing costs | | | 35,328 | |
Administrative services fee | | | 342,626 | |
Independent Trustees’ compensation | | | 46,485 | |
Custodian fee | | | 133,389 | |
Shareholder communications | | | 99,060 | |
Audit and tax fees | | | 76,581 | |
Legal fees | | | 23,832 | |
Miscellaneous | | | 80,420 | |
Total expenses | | | $20,593,053 | |
Reduction of expenses by investment adviser | | | (2,150,333 | ) |
Net expenses | | | $18,442,720 | |
Net investment income (loss) | | | $50,698,568 | |
| |
Realized and unrealized gain (loss) | | | | |
Realized gain (loss) (identified cost basis) | | | | |
Unaffiliated issuers | | | $66,314,285 | |
Affiliated issuers | | | (5,672 | ) |
Foreign currency | | | 19,124 | |
Net realized gain (loss) | | | $66,327,737 | |
Change in unrealized appreciation or depreciation | | | | |
Unaffiliated issuers | | | $335,250,391 | |
Affiliated issuers | | | 676 | |
Translation of assets and liabilities in foreign currencies | | | 13,380 | |
Net unrealized gain (loss) | | | $335,264,447 | |
Net realized and unrealized gain (loss) | | | $401,592,184 | |
Change in net assets from operations | | | $452,290,752 | |
See Notes to Financial Statements
19
MFS Total Return Series
FINANCIAL STATEMENTS | STATEMENTS OF CHANGES IN NET ASSETS
These statements describe the increases and/or decreases in net assets resulting from operations, any distributions, and any shareholder transactions.
| | | | | | | | |
| | | Year ended | |
| | | 12/31/19 | | | 12/31/18 | |
Change in net assets | | | | | | | | |
| | |
From operations | | | | | | | | |
Net investment income (loss) | | | $50,698,568 | | | | $53,999,146 | |
Net realized gain (loss) | | | 66,327,737 | | | | 71,944,285 | |
Net unrealized gain (loss) | | | 335,264,447 | | | | (270,626,935 | ) |
Change in net assets from operations | | | $452,290,752 | | | | $(144,683,504 | ) |
Total distributions to shareholders | | | $(121,022,024 | ) | | | $(170,382,669 | ) |
Change in net assets from fund share transactions | | | $(109,812,128 | ) | | | $(137,972,142 | ) |
Total change in net assets | | | $221,456,600 | | | | $(453,038,315 | ) |
| | |
Net assets | | | | | | | | |
At beginning of period | | | 2,325,522,946 | | | | 2,778,561,261 | |
At end of period | | | $2,546,979,546 | | | | $2,325,522,946 | |
See Notes to Financial Statements
20
MFS Total Return Series
FINANCIAL STATEMENTS | FINANCIAL HIGHLIGHTS
The financial highlights table is intended to help you understand the fund’s financial performance for the past 5 years. Certain information reflects financial results for a single fund share. The total returns in the table represent the rate that an investor would have earned (or lost) on an investment in the fund share class (assuming reinvestment of all distributions) held for the entire period.
| | | | | | | | | | | | | | | | | | | | |
| Initial Class | | Year ended | |
| | | | | |
| | | 12/31/19 | | | 12/31/18 | | | 12/31/17 | | | 12/31/16 | | | 12/31/15 | |
| | | | | |
Net asset value, beginning of period | | | $21.78 | | | | $24.70 | | | | $23.18 | | | | $22.60 | | | | $24.31 | |
| | | | | |
| Income (loss) from investment operations | | | | | | | | | | | | | | | | | | | | |
Net investment income (loss) (d) | | | $0.52 | | | | $0.53 | | | | $0.49 | | | | $0.54 | (c) | | | $0.62 | |
Net realized and unrealized gain (loss) | | | 3.83 | | | | (1.80 | ) | | | 2.29 | | | | 1.51 | | | | (0.77 | ) |
Total from investment operations | | | $4.35 | | | | $(1.27 | ) | | | $2.78 | | | | $2.05 | | | | $(0.15 | ) |
| | | | | |
| Less distributions declared to shareholders | | | | | | | | | | | | | | | | | | | | |
From net investment income | | | $(0.58 | ) | | | $(0.54 | ) | | | $(0.58 | ) | | | $(0.69 | ) | | | $(0.64 | ) |
From net realized gain | | | (0.65 | ) | | | (1.11 | ) | | | (0.68 | ) | | | (0.78 | ) | | | (0.92 | ) |
Total distributions declared to shareholders | | | $(1.23 | ) | | | $(1.65 | ) | | | $(1.26 | ) | | | $(1.47 | ) | | | $(1.56 | ) |
Net asset value, end of period (x) | | | $24.90 | | | | $21.78 | | | | $24.70 | | | | $23.18 | | | | $22.60 | |
Total return (%) (k)(r)(s)(x) | | | 20.38 | | | | (5.61 | ) | | | 12.30 | | | | 9.09 | (c) | | | (0.37 | ) |
| | | | | |
Ratios (%) (to average net assets)
and Supplemental data: | | | | | | | | | | | | | | | | | | | | |
Expenses before expense reductions (f) | | | 0.70 | | | | 0.70 | | | | 0.71 | | | | 0.71 | (c) | | | 0.79 | |
Expenses after expense reductions (f) | | | 0.62 | | | | 0.62 | | | | 0.63 | | | | 0.62 | (c) | | | 0.65 | |
Net investment income (loss) | | | 2.18 | | | | 2.20 | | | | 2.04 | | | | 2.33 | (c) | | | 2.57 | |
Portfolio turnover | | | 42 | | | | 26 | | | | 34 | | | | 35 | | | | 41 | |
Net assets at end of period (000 omitted) | | | $1,223,166 | | | | $1,134,301 | | | | $1,350,737 | | | | $1,359,943 | | | | $1,423,284 | |
| |
| Service Class | | Year ended | |
| | | | | |
| | | 12/31/19 | | | 12/31/18 | | | 12/31/17 | | | 12/31/16 | | | 12/31/15 | |
| | | | | |
Net asset value, beginning of period | | | $21.38 | | | | $24.28 | | | | $22.81 | | | | $22.26 | | | | $23.95 | |
| | | | | |
| Income (loss) from investment operations | | | | | | | | | | | | | | | | | | | | |
Net investment income (loss) (d) | | | $0.45 | | | | $0.46 | | | | $0.43 | | | | $0.47 | (c) | | | $0.55 | |
Net realized and unrealized gain (loss) | | | 3.76 | | | | (1.77 | ) | | | 2.25 | | | | 1.49 | | | | (0.74 | ) |
Total from investment operations | | | $4.21 | | | | $(1.31 | ) | | | $2.68 | | | | $1.96 | | | | $(0.19 | ) |
| | | | | |
| Less distributions declared to shareholders | | | | | | | | | | | | | | | | | | | | |
From net investment income | | | $(0.51 | ) | | | $(0.48 | ) | | | $(0.53 | ) | | | $(0.63 | ) | | | $(0.58 | ) |
From net realized gain | | | (0.65 | ) | | | (1.11 | ) | | | (0.68 | ) | | | (0.78 | ) | | | (0.92 | ) |
Total distributions declared to shareholders | | | $(1.16 | ) | | | $(1.59 | ) | | | $(1.21 | ) | | | $(1.41 | ) | | | $(1.50 | ) |
Net asset value, end of period (x) | | | $24.43 | | | | $21.38 | | | | $24.28 | | | | $22.81 | | | | $22.26 | |
Total return (%) (k)(r)(s)(x) | | | 20.12 | | | | (5.87 | ) | | | 12.02 | | | | 8.81 | (c) | | | (0.58 | ) |
| | | | | |
Ratios (%) (to average net assets)
and Supplemental data: | | | | | | | | | | | | | | | | | | | | |
Expenses before expense reductions (f) | | | 0.95 | | | | 0.95 | | | | 0.96 | | | | 0.96 | (c) | | | 1.04 | |
Expenses after expense reductions (f) | | | 0.87 | | | | 0.87 | | | | 0.88 | | | | 0.87 | (c) | | | 0.90 | |
Net investment income (loss) | | | 1.93 | | | | 1.95 | | | | 1.79 | | | | 2.08 | (c) | | | 2.32 | |
Portfolio turnover | | | 42 | | | | 26 | | | | 34 | | | | 35 | | | | 41 | |
Net assets at end of period (000 omitted) | | | $1,323,813 | | | | $1,191,222 | | | | $1,427,824 | | | | $1,276,603 | | | | $1,191,583 | |
See Notes to Financial Statements
21
MFS Total Return Series
Financial Highlights – continued
| (c) | Amount reflects aone-time reimbursement of expenses by the custodian (or former custodian) without which net investment income and performance would be lower and expenses would be higher. |
| (d) | Per share data is based on average shares outstanding. |
| (f) | Ratios do not reflect reductions from fees paid indirectly, if applicable. |
| (k) | The total return does not reflect expenses that apply to separate accounts. Inclusion of these charges would reduce the total return figures for all periods shown. |
| (r) | Certain expenses have been reduced without which performance would have been lower. |
| (s) | From time to time the fund may receive proceeds from litigation settlements, without which performance would be lower. |
| (x) | The net asset values and total returns have been calculated on net assets which include adjustments made in accordance with U.S. generally accepted accounting principles required at period end for financial reporting purposes. |
See Notes to Financial Statements
22
MFS Total Return Series
NOTES TO FINANCIAL STATEMENTS
| (1) | | Business and Organization |
MFS Total Return Series (the fund) is a diversified series of MFS Variable Insurance Trust (the trust). The trust is organized as a Massachusetts business trust and is registered under the Investment Company Act of 1940, as amended, as anopen-end management investment company. The shareholders of each series of the trust are separate accounts of insurance companies, which offer variable annuity and/or life insurance products, and qualified retirement and pension plans.
The fund is an investment company and accordingly follows the investment company accounting and reporting guidance of the Financial Accounting Standards Board (FASB) Accounting Standards Codification Topic 946 Financial Services – Investment Companies.
| (2) | | Significant Accounting Policies |
General – The preparation of financial statements in conformity with U.S. generally accepted accounting principles requires management to make estimates and assumptions that affect the reported amounts of assets and liabilities, and disclosure of contingent assets and liabilities at the date of the financial statements and the reported amounts of increases and decreases in net assets from operations during the reporting period. Actual results could differ from those estimates. In the preparation of these financial statements, management has evaluated subsequent events occurring after the date of the fund’s Statement of Assets and Liabilities through the date that the financial statements were issued.
In March 2017, the FASB issued Accounting Standards Update2017-08, Receivables – Nonrefundable Fees and Other Costs (Subtopic310-20) – Premium Amortization on Purchased Callable Debt Securities (“ASU2017-08”). For callable debt securities purchased at a premium that have explicit,non-contingent call features and that are callable at fixed prices on preset dates, ASU2017-08 requires the premium to be amortized to the earliest call date. The fund adopted ASU2017-08 as of the beginning of the reporting period on a modified retrospective basis. The adoption resulted in a change in accounting principle, since the fund had historically amortized such premiums to maturity for U.S. GAAP. As a result of the adoption, the fund recognized a cumulative effect adjustment that decreased the beginning of period cost of investments and increased the unrealized appreciation on investments by offsetting amounts. Adoption had no impact on the fund’s net assets or any prior period information presented in the financial statements. With respect to the fund’s results of operations, amortization of premium to first call date under ASU2017-08 accelerates amortization with the intent of more closely aligning the recognition of income on such bonds with the economics of the instrument.
Balance Sheet Offsetting – The fund’s accounting policy with respect to balance sheet offsetting is that, absent an event of default by the counterparty or a termination of the agreement, the International Swaps and Derivatives Association (ISDA) Master Agreement, or similar agreement, does not result in an offset of reported amounts of financial assets and financial liabilities in the Statement of Assets and Liabilities across transactions between the fund and the applicable counterparty. The fund’s right to setoff may be restricted or prohibited by the bankruptcy or insolvency laws of the particular jurisdiction to which a specific master netting agreement counterparty is subject. Balance sheet offsetting disclosures, to the extent applicable to the fund, have been included in the fund’s Significant Accounting Policies note under the captions for each of the fund’sin-scope financial instruments and transactions.
Investment Valuations – Equity securities, including restricted equity securities, are generally valued at the last sale or official closing price on their primary market or exchange as provided by a third-party pricing service. Equity securities, for which there were no sales reported that day, are generally valued at the last quoted daily bid quotation on their primary market or exchange as provided by a third-party pricing service. Debt instruments and floating rate loans, including restricted debt instruments, are generally valued at an evaluated or composite bid as provided by a third-party pricing service. Debt instruments sold short are generally valued at an evaluated or composite mean as provided by a third-party pricing service. Short-term instruments with a maturity at issuance of 60 days or less may be valued at amortized cost, which approximates market value.Open-end investment companies are generally valued at net asset value per share. Securities and other assets generally valued on the basis of information from a third-party pricing service may also be valued at a broker/dealer bid quotation. In determining values, third-party pricing services can utilize both transaction data and market information such as yield, quality, coupon rate, maturity, type of issue, trading characteristics, and other market data. The values of foreign securities and other assets and liabilities expressed in foreign currencies are converted to U.S. dollars using the mean of bid and asked prices for rates provided by a third-party pricing service.
The Board of Trustees has delegated primary responsibility for determining or causing to be determined the value of the fund’s investments (including any fair valuation) to the adviser pursuant to valuation policies and procedures approved by the Board. If the adviser determines that reliable market quotations are not readily available, investments are valued at fair value as determined in good faith by the adviser in accordance with such procedures under the oversight of the Board of Trustees. Under the fund’s valuation policies and procedures, market quotations are not considered to be readily available for most types of debt instruments and floating rate loans and many types of derivatives. These investments are generally valued at fair value based on information from third-party pricing services. In addition, investments may be valued at fair value if the adviser determines that an investment’s value has been materially affected by events occurring after the close of the exchange or market on which the investment is principally
23
MFS Total Return Series
Notes to Financial Statements – continued
traded (such as foreign exchange or market) and prior to the determination of the fund’s net asset value, or after the halt of trading of a specific security where trading does not resume prior to the close of the exchange or market on which the security is principally traded. Events that occur after foreign markets close (such as developments in foreign markets and significant movements in the U.S. markets) and prior to the determination of the fund’s net asset value may be deemed to have a material effect on the value of securities traded in foreign markets. Accordingly, the fund’s foreign equity securities may often be valued at fair value. The adviser generally relies on third-party pricing services or other information (such as the correlation with price movements of similar securities in the same or other markets; the type, cost and investment characteristics of the security; the business and financial condition of the issuer; and trading and other market data) to assist in determining whether to fair value and at what value to fair value an investment. The value of an investment for purposes of calculating the fund’s net asset value can differ depending on the source and method used to determine value. When fair valuation is used, the value of an investment used to determine the fund’s net asset value may differ from quoted or published prices for the same investment. There can be no assurance that the fund could obtain the fair value assigned to an investment if it were to sell the investment at the same time at which the fund determines its net asset value per share.
Various inputs are used in determining the value of the fund’s assets or liabilities. These inputs are categorized into three broad levels. In certain cases, the inputs used to measure fair value may fall into different levels of the fair value hierarchy. In such cases, an investment’s level within the fair value hierarchy is based on the lowest level of input that is significant to the fair value measurement. The fund’s assessment of the significance of a particular input to the fair value measurement in its entirety requires judgment, and considers factors specific to the investment. Level 1 includes unadjusted quoted prices in active markets for identical assets or liabilities. Level 2 includes other significant observable market-based inputs (including quoted prices for similar securities, interest rates, prepayment speed, and credit risk). Level 3 includes unobservable inputs, which may include the adviser’s own assumptions in determining the fair value of investments. The following is a summary of the levels used as of December 31, 2019 in valuing the fund’s assets or liabilities:
| | | | | | | | | | | | | | | | |
| Financial Instruments | | Level 1 | | | Level 2 | | | Level 3 | | | Total | |
| Equity Securities: | | | | | | | | | | | | | | | | |
United States | | | $1,399,931,740 | | | | $— | | | | $— | | | | $1,399,931,740 | |
United Kingdom | | | 35,096,255 | | | | — | | | | — | | | | 35,096,255 | |
Switzerland | | | 34,979,388 | | | | — | | | | — | | | | 34,979,388 | |
Canada | | | 13,129,859 | | | | — | | | | — | | | | 13,129,859 | |
Japan | | | — | | | | 12,742,403 | | | | — | | | | 12,742,403 | |
France | | | 12,645,125 | | | | — | | | | — | | | | 12,645,125 | |
Taiwan | | | 12,303,895 | | | | — | | | | — | | | | 12,303,895 | |
Italy | | | 8,040,356 | | | | — | | | | — | | | | 8,040,356 | |
Germany | | | 6,498,723 | | | | — | | | | — | | | | 6,498,723 | |
Other Countries | | | 2,378,617 | | | | 2,441,516 | | | | — | | | | 4,820,133 | |
| U.S. Treasury Bonds & U.S. Government Agencies & Equivalents | | | — | | | | 262,992,528 | | | | — | | | | 262,992,528 | |
| Non-U.S. Sovereign Debt | | | — | | | | 6,479,793 | | | | — | | | | 6,479,793 | |
| Municipal Bonds | | | — | | | | 9,228,270 | | | | — | | | | 9,228,270 | |
| U.S. Corporate Bonds | | | — | | | | 242,337,786 | | | | — | | | | 242,337,786 | |
| Residential Mortgage-Backed Securities | | | — | | | | 374,179,697 | | | | — | | | | 374,179,697 | |
| Commercial Mortgage-Backed Securities | | | — | | | | 73,850,978 | | | | — | | | | 73,850,978 | |
| Asset-Backed Securities (including CDOs) | | | — | | | | 36,223,642 | | | | — | | | | 36,223,642 | |
| Foreign Bonds | | | — | | | | 40,076,091 | | | | — | | | | 40,076,091 | |
| Mutual Funds | | | 40,930,012 | | | | — | | | | — | | | | 40,930,012 | |
| Total | | | $1,565,933,970 | | | | $1,060,552,704 | | | | $— | | | | $2,626,486,674 | |
For further information regarding security characteristics, see the Portfolio of Investments.
Foreign Currency Translation – Purchases and sales of foreign investments, income, and expenses are converted into U.S. dollars based upon currency exchange rates prevailing on the respective dates of such transactions or on the reporting date for foreign denominated receivables and payables. Gains and losses attributable to foreign currency exchange rates on sales of securities are recorded for financial statement purposes as net realized gains and losses on investments. Gains and losses attributable to foreign exchange rate movements on receivables, payables, income and expenses are recorded for financial statement purposes as foreign currency transaction gains and losses. That portion of both realized and unrealized gains and losses on investments that results from fluctuations in foreign currency exchange rates is not separately disclosed.
Security Loans – Under its Securities Lending Agency Agreement with the fund, State Street Bank and Trust Company, as lending agent, loans the securities of the fund to certain qualified institutions (the “Borrowers”) approved by the fund. Security loans can be
24
MFS Total Return Series
Notes to Financial Statements – continued
terminated at the discretion of either the lending agent or the fund and the related securities must be returned within the earlier of the standard trade settlement period for such securities or within three business days. The loans are collateralized by cash and/or U.S. Treasury and federal agency obligations in an amount typically at least equal to the market value of the securities loaned. On loans collateralized by cash, the cash collateral is invested in a money market fund. The market value of the loaned securities is determined at the close of business of the fund and any additional required collateral is delivered to the fund on the next business day. The lending agent provides the fund with indemnification against Borrower default. In the event of Borrower default, the lending agent will, for the benefit of the fund, either purchase securities identical to those loaned or, when such purchase is commercially impracticable, pay the fund the market value of the loaned securities. In return, the lending agent assumes the fund’s rights to the related collateral. If the collateral value is less than the cost to purchase identical securities, the lending agent is responsible for the shortfall, but only to the extent that such shortfall is not due to a decline in collateral value resulting from collateral reinvestment for which the fund bears the risk of loss. A portion of the income generated upon investment of the collateral is remitted to the Borrowers, and the remainder is allocated between the fund and the lending agent. On loans collateralized by U.S. Treasury and/or federal agency obligations, a fee is received from the Borrower, and is allocated between the fund and the lending agent. Income from securities lending is separately reported in the Statement of Operations. The dividend and interest income earned on the securities loaned is accounted for in the same manner as other dividend and interest income. At December 31, 2019, there were no securities on loan or collateral outstanding.
TBA Dollar Roll Transactions– The fund enters into TBA dollar roll transactions in which the fund sells TBA mortgage-backed securities to financial institutions and simultaneously agrees to repurchase similar (same issuer, type and coupon) securities at a later date at an agreed-upon price. During the period between the sale and repurchase, the fund will not be entitled to receive interest and principal payments on the securities sold. The fund accounts for dollar roll transactions as purchases and sales and realizes gains and losses on these transactions. TBA dollar roll transactions involve the risk that the market value of the securities that the fund is required to purchase may decline below the agreed upon repurchase price of those securities.
Indemnifications– Under the fund’s organizational documents, its officers and Trustees may be indemnified against certain liabilities and expenses arising out of the performance of their duties to the fund. Additionally, in the normal course of business, the fund enters into agreements with service providers that may contain indemnification clauses. The fund’s maximum exposure under these agreements is unknown as this would involve future claims that may be made against the fund that have not yet occurred.
Investment Transactions and Income– Investment transactions are recorded on the trade date. Interest income is recorded on the accrual basis. All premium and discount is amortized or accreted for financial statement purposes in accordance with U.S. generally accepted accounting principles. Some securities may be purchased on a “when-issued” or “forward delivery” basis, which means that the securities will be delivered to the fund at a future date, usually beyond customary settlement time. Dividends received in cash are recorded on theex-dividend date. Certain dividends from foreign securities will be recorded when the fund is informed of the dividend if such information is obtained subsequent to theex-dividend date. Dividend and interest payments received in additional securities are recorded on theex-dividend orex-interest date in an amount equal to the value of the security on such date.
The fund may receive proceeds from litigation settlements. Any proceeds received from litigation involving portfolio holdings are reflected in the Statement of Operations in realized gain/loss if the security has been disposed of by the fund or in unrealized gain/loss if the security is still held by the fund. Any other proceeds from litigation not related to portfolio holdings are reflected as other income in the Statement of Operations.
The fund invests a significant portion of its assets in asset-backed and/or mortgage-backed securities. For these securities, the value of the debt instrument also depends on the credit quality and adequacy of the underlying assets or collateral as well as whether there is a security interest in the underlying assets or collateral. Enforcing rights, if any, against the underlying assets or collateral may be difficult. U.S. Government securities not supported as to the payment of principal or interest by the U.S. Treasury, such as those issued by Fannie Mae, Freddie Mac, and the Federal Home Loan Banks, are subject to greater credit risk than are U.S. Government securities supported by the U.S. Treasury, such as those issued by Ginnie Mae.
The fund purchased or sold debt securities on a when-issued or delayed delivery basis, or in a “To Be Announced” (TBA) or “forward commitment” transaction with delivery or payment to occur at a later date beyond the normal settlement period. When the fund sells securities on a when-issued, delayed delivery, or forward commitment basis, the fund typically owns or has the right to acquire securities equivalent in kind and amount to the delivered securities. At the time a fund enters into a commitment to purchase or sell a security, the transaction is recorded and the value of the security acquired or sold is reflected in the fund’s net asset value. The price of such security and the date that the security will be delivered and paid for are fixed at the time the transaction is negotiated. The value of the security may vary with market fluctuations. TBA securities resulting from these transactions are included in the Portfolio of Investments. TBA purchase (sale) commitments are held at carrying amount, which approximates fair value and are categorized as level 2 within the fair value hierarchy and included in investments purchased or sold on an extended settlement basis in the Statement of Assets and Liabilities. No interest accrues to the fund until payment takes place. At the time that a fund enters into this type of transaction, the fund is required to have sufficient cash and/or liquid securities to cover its commitments. Losses may
25
MFS Total Return Series
Notes to Financial Statements – continued
arise due to changes in the value of the underlying securities prior to settlement date or if the counterparty does not perform under the contract’s terms, or if the issuer does not issue the securities due to political, economic or other factors.
To mitigate the counterparty credit risk on TBA securities and other types of forward settling mortgage-backed securities, the fund whenever possible enters into a Master Securities Forward Transaction Agreement (“MSFTA”) on a bilateral basis with each of the counterparties with whom it undertakes a significant volume of transactions. The MSFTA gives each party to the agreement the right to terminate all transactions traded under such agreement if there is a specified deterioration in the credit quality of the other party. Upon an event of default or a termination of the MSFTA, thenon-defaulting party has the right to close out all transactions traded under such agreement and to net amounts owed under each transaction to one net amount payable by one party to the other. This right to close out and net payments across all transactions traded under the MSFTA could result in a reduction of the fund’s credit risk to such counterparty equal to any amounts payable by the fund under the applicable transactions, if any.
For mortgage-backed securities traded under a MSFTA, the collateral and margining requirements are contract specific. Collateral amounts across all transactions traded under such agreement are netted and an amount is posted from one party to the other to collateralize such obligations. Cash that has been pledged to cover the fund’s collateral or margin obligations under a MSFTA, if any, will be reported separately on the Statement of Assets and Liabilities as restricted cash. Securities pledged as collateral or margin for the same purpose, if any, are noted in the Portfolio of Investments.
Tax Matters and Distributions– The fund intends to qualify as a regulated investment company, as defined under Subchapter M of the Internal Revenue Code, and to distribute all of its taxable income, including realized capital gains. As a result, no provision for federal income tax is required. The fund’s federal tax returns, when filed, will remain subject to examination by the Internal Revenue Service for a three year period. Management has analyzed the fund’s tax positions taken on federal and state tax returns for all open tax years and does not believe that there are any uncertain tax positions that require recognition of a tax liability. Foreign taxes, if any, have been accrued by the fund in the accompanying financial statements in accordance with the applicable foreign tax law. Foreign income taxes may be withheld by certain countries in which the fund invests. Additionally, capital gains realized by the fund on securities issued in or by certain foreign countries may be subject to capital gains tax imposed by those countries.
Distributions to shareholders are recorded on theex-dividend date. Income and capital gain distributions are determined in accordance with income tax regulations, which may differ from U.S. generally accepted accounting principles. Certain capital accounts in the financial statements are periodically adjusted for permanent differences in order to reflect their tax character. These adjustments have no impact on net assets or net asset value per share. Temporary differences which arise from recognizing certain items of income, expense, gain or loss in different periods for financial statement and tax purposes will reverse at some time in the future.
Book/tax differences primarily relate to amortization and accretion of debt securities, wash sale loss deferrals, and partnership adjustments.
The tax character of distributions declared to shareholders for the last two fiscal years is as follows:
| | | | | | | | |
| | | Year ended
12/31/19 | | | Year ended
12/31/18 | |
| Ordinary income (including any short-term capital gains) | | | $54,824,164 | | | | $64,650,616 | |
| Long-term capital gains | | | 66,197,860 | | | | 105,732,053 | |
| Total distributions | | | $121,022,024 | | | | $170,382,669 | |
The federal tax cost and the tax basis components of distributable earnings were as follows:
| | | | |
| As of 12/31/19 | | | | |
| |
| Cost of investments | | | $2,001,001,821 | |
| Gross appreciation | | | 642,631,768 | |
| Gross depreciation | | | (17,146,915 | ) |
| Net unrealized appreciation (depreciation) | | | $625,484,853 | |
| |
| Undistributed ordinary income | | | 52,951,957 | |
| Undistributed long-term capital gain | | | 63,475,232 | |
| Other temporary differences | | | 3,083,411 | |
26
MFS Total Return Series
Notes to Financial Statements – continued
Multiple Classes of Shares of Beneficial Interest– The fund offers multiple classes of shares, which differ in their respective distribution and/or service fees. The fund’s income, realized and unrealized gain (loss), and common expenses are allocated to shareholders based on the daily net assets of each class. Dividends are declared separately for each class. Differences in per share dividend rates are generally due to differences in separate class expenses. The fund’s distributions declared to shareholders as reported in the Statements of Changes in Net Assets are presented by class as follows:
| | | | | | | | |
| | |
| | | Year ended
12/31/19 | | | Year ended
12/31/18 | |
| Initial Class | | | $59,383,887 | | | | $83,981,606 | |
| Service Class | | | 61,638,137 | | | | 86,401,063 | |
| Total | | | $121,022,024 | | | | $170,382,669 | |
| (3) | | Transactions with Affiliates |
Investment Adviser– The fund has an investment advisory agreement with MFS to provide overall investment management and related administrative services and facilities to the fund. The management fee is computed daily and paid monthly at the following annual rates based on the fund’s average daily net assets:
| | | | |
| Up to $1 billion | | | 0.70% | |
| In excess of $1 billion and up to $2.5 billion | | | 0.65% | |
| In excess of $2.5 billion and up to $5 billion | | | 0.55% | |
| In excess of $5 billion | | | 0.50% | |
MFS has agreed in writing to reduce its management fee by a specified amount if certain MFS mutual fund assets exceed thresholds agreed to by MFS and the fund’s Board of Trustees. For the year ended December 31, 2019, this management fee reduction amounted to $241,221, which is included in the reduction of total expenses in the Statement of Operations. The management fee incurred for the year ended December 31, 2019 was equivalent to an annual effective rate of 0.66% of the fund’s average daily net assets.
For the period from January 1, 2019 through July 31, 2019, the investment adviser had agreed in writing to pay a portion of the fund’s total annual operating expenses, excluding interest, taxes, extraordinary expenses, brokerage and transaction costs, andinvestment-related expenses, such that total annual operating expenses did not exceed 0.62% of average daily net assets for the Initial Class shares and 0.87% of average daily net assets for the Service Class shares. This written agreement terminated on July 31, 2019. For the period from January 1, 2019 through July 31, 2019, this reduction amounted to $1,087,624, which is included in the reduction of total expenses in the Statement of Operations. Effective August 1, 2019, the investment adviser has agreed in writing to pay a portion of the fund’s total annual operating expenses, excluding interest, taxes, extraordinary expenses, brokerage and transaction costs, and investment-related expenses, such that total annual operating expenses do not exceed 0.61% of average daily net assets for the Initial Class shares and 0.86% of average daily net assets for the Service Class shares. This written agreement will continue until modified by the fund’s Board of Trustees, but such agreement will continue at least until April 30, 2021. For the period from August 1, 2019 through December 31, 2019, this reduction amounted to $821,488, which is included in the reduction of total expenses in the Statement of Operations.
Distributor– MFS Fund Distributors, Inc. (MFD), a wholly-owned subsidiary of MFS, is the distributor of shares of the fund. The Trustees have adopted a distribution plan for the Service Class shares pursuant to Rule12b-1 under the Investment Company Act of 1940.
The fund’s distribution plan provides that the fund will pay MFD distribution and/or service fees equal to 0.25% per annum of its average daily net assets attributable to Service Class shares as partial consideration for services performed and expenses incurred by MFD and financial intermediaries (including participating insurance companies that invest in the fund to fund variable annuity and variable life insurance contracts, sponsors of qualified retirement and pension plans that invest in the fund, and affiliates of these participating insurance companies and plan sponsors) in connection with the sale and distribution of the Service Class shares. MFD may subsequently pay all, or a portion, of the distribution and/or service fees to financial intermediaries.
Shareholder Servicing Agent– MFS Service Center, Inc. (MFSC), a wholly-owned subsidiary of MFS, receives a fee from the fund for its services as shareholder servicing agent. For the year ended December 31, 2019, the fee was $32,675, which equated to 0.0013% annually of the fund’s average daily net assets. MFSC also receives payment from the fund forout-of-pocket expenses paid by MFSC on behalf of the fund. For the year ended December 31, 2019, these costs amounted to $2,653.
Administrator– MFS provides certain financial, legal, shareholder communications, compliance, and other administrative services to the fund. Under an administrative services agreement, the fund reimburses MFS the costs incurred to provide these services. The fund is charged an annual fixed amount of $17,500 plus a fee based on average daily net assets. The administrative services fee incurred for the year ended December 31, 2019 was equivalent to an annual effective rate of 0.0139% of the fund’s average daily net assets.
27
MFS Total Return Series
Notes to Financial Statements – continued
Trustees’ and Officers’ Compensation– The fund pays compensation to independent Trustees in the form of a retainer, attendance fees, and additional compensation to Board and Committee chairpersons. The fund does not pay compensation directly to Trustees or officers of the fund who are also officers of the investment adviser, all of whom receive remuneration from MFS for their services to the fund. Certain officers and Trustees of the fund are officers or directors of MFS, MFD, and MFSC.
Other– This fund and certain other funds managed by MFS (the funds) had entered into a service agreement (the ISO Agreement) which provided for payment of fees solely by the funds to Tarantino LLC in return for the provision of services of an Independent Senior Officer (ISO) for the funds. Frank L. Tarantino served as the ISO and was an officer of the funds and the sole member of Tarantino LLC. Effective June 30, 2019, Mr. Tarantino retired from his position as ISO for the funds, and the ISO Agreement was terminated. For the year ended December 31, 2019, the fee paid by the fund under this agreement was $2,749 and is included in “Miscellaneous” expense in the Statement of Operations. MFS had agreed to bear all expenses associated with office space, other administrative support, and supplies provided to the ISO.
The fund invests in the MFS Institutional Money Market Portfolio which is managed by MFS and seeks current income consistent with preservation of capital and liquidity. This money market fund does not pay a management fee to MFS.
The fund is permitted to engage in purchase and sale transactions with funds and accounts for which MFS serves as investment adviser orsub-adviser (“cross-trades”) pursuant to a policy adopted by the Board of Trustees. This policy has been designed to ensure that cross-trades conducted by the fund comply with Rule17a-7 under the Investment Company Act of 1940. During the year ended December 31, 2019, the fund engaged in purchase and sale transactions pursuant to this policy, which amounted to $1,964,040 and $796,228, respectively. The sales transactions resulted in net realized gains (losses) of $(150,489).
The adviser has voluntarily undertaken to reimburse the fund from its own resources on a quarterly basis for the cost of investment research embedded in the cost of the fund’s securities trades. This agreement may be rescinded at any time. For the year ended December 31, 2019, this reimbursement amounted to $42,493, which is included in “Other” income in the Statement of Operations.
For the year ended December 31, 2019, purchases and sales of investments, other than TBA sale commitments and short-term obligations, were as follows:
| | | | | | | | |
| | | Purchases | | | Sales | |
| U.S. Government securities | | | $537,596,373 | | | | $562,688,686 | |
| Non-U.S. Government securities | | | $486,817,488 | | | | $599,304,678 | |
| (5) | | Shares of Beneficial Interest |
The fund’s Declaration of Trust permits the Trustees to issue an unlimited number of full and fractional shares of beneficial interest. Transactions in fund shares were as follows:
| | | | | | | | | | | | | | | | |
| | | Year ended 12/31/19 | | | Year ended 12/31/18 | |
| | | | |
| | | Shares | | | Amount | | | Shares | | | Amount | |
| Shares sold | | | | | | | | | | | | | | | | |
Initial Class | | | 1,735,912 | | | | $41,322,525 | | | | 1,682,755 | | | | $40,546,554 | |
Service Class | | | 3,594,794 | | | | 83,324,924 | | | | 3,647,300 | | | | 86,160,110 | |
| | | 5,330,706 | | | | $124,647,449 | | | | 5,330,055 | | | | $126,706,664 | |
| | | | |
| Shares issued to shareholders in reinvestment of distributions | | | | | | | | | | | | | | | | |
Initial Class | | | 2,558,547 | | | | $59,383,887 | | | | 3,585,893 | | | | $83,981,606 | |
Service Class | | | 2,704,613 | | | | 61,638,137 | | | | 3,754,935 | | | | 86,401,063 | |
| | | 5,263,160 | | | | $121,022,024 | | | | 7,340,828 | | | | $170,382,669 | |
| | | | |
| Shares reacquired | | | | | | | | | | | | | | | | |
Initial Class | | | (7,253,162 | ) | | | $(172,852,561 | ) | | | (7,875,486 | ) | | | $(187,920,375 | ) |
Service Class | | | (7,815,403 | ) | | | (182,629,040 | ) | | | (10,508,339 | ) | | | (247,141,100 | ) |
| | | (15,068,565 | ) | | | $(355,481,601 | ) | | | (18,383,825 | ) | | | $(435,061,475 | ) |
| | | | |
| Net change | | | | | | | | | | | | | | | | |
Initial Class | | | (2,958,703 | ) | | | $(72,146,149 | ) | | | (2,606,838 | ) | | | $(63,392,215 | ) |
Service Class | | | (1,515,996 | ) | | | (37,665,979 | ) | | | (3,106,104 | ) | | | (74,579,927 | ) |
| | | (4,474,699 | ) | | | $(109,812,128 | ) | | | (5,712,942 | ) | | | $(137,972,142 | ) |
The fund and certain other funds managed by MFS participate in a $1.25 billion unsecured committed line of credit, subject to a $1 billion sublimit, provided by a syndicate of banks under a credit agreement. Borrowings may be made for temporary financing needs. Interest is charged to each fund, based on its borrowings, generally at a rate equal to the highest of one month LIBOR, the
28
MFS Total Return Series
Notes to Financial Statements – continued
Federal Funds Effective Rate and the Overnight Bank Funding Rate, plus an agreed upon spread. A commitment fee, based on the average daily, unused portion of the committed line of credit, is allocated among the participating funds. In addition, the fund and other funds managed by MFS have established unsecured uncommitted borrowing arrangements with certain banks for temporary financing needs. Interest is charged to each fund, based on its borrowings, at rates equal to customary reference rates plus an agreed upon spread. For the year ended December 31, 2019, the fund’s commitment fee and interest expense were $13,906 and $0, respectively, and are included in “Miscellaneous” expense in the Statement of Operations.
| (7) | | Investments in Affiliated Issuers |
An affiliated issuer may be considered one in which the fund owns 5% or more of the outstanding voting securities, or a company which is under common control. For the purposes of this report, the following were affiliated issuers:
| | | | | | | | | | | | | | | | | | | | | | | | |
| Affiliated Issuers | | Beginning
Value | | | Purchases | | | Sales
Proceeds | | | Realized
Gain
(Loss) | | | Change in
Unrealized
Appreciation or
Depreciation | | | Ending
Value | |
| MFS Institutional Money Market Portfolio | | | $6,322,055 | | | | $367,033,273 | | | | $332,420,320 | | | | $(5,672 | ) | | | $676 | | | | $40,930,012 | |
| | | | | | |
| Affiliated Issuers | | | | | | | | | | | | | | Dividend
Income | | | Capital Gain
Distributions | |
| MFS Institutional Money Market Portfolio | | | | | | | | | | | | | | | | | | | $851,622 | | | | $— | |
29
MFS Total Return Series
REPORT OF INDEPENDENT REGISTERED PUBLIC ACCOUNTING FIRM
To the Board of Trustees of MFS Variable Insurance Trust and the Shareholders of MFS Total Return Series:
Opinion on the Financial Statements and Financial Highlights
We have audited the accompanying statement of assets and liabilities of MFS Total Return Series (the “Fund”), including the portfolio of investments, as of December 31, 2019, the related statement of operations for the year then ended, the statements of changes in net assets for each of the two years in the period then ended, the financial highlights for each of the five years in the period then ended, and the related notes. In our opinion, the financial statements and financial highlights present fairly, in all material respects, the financial position of the Fund as of December 31, 2019, and the results of its operations for the year then ended, the changes in its net assets for each of the two years in the period then ended, and the financial highlights for each of the five years in the period then ended, in conformity with accounting principles generally accepted in the United States of America.
Basis for Opinion
These financial statements and financial highlights are the responsibility of the Fund’s management. Our responsibility is to express an opinion on the Fund’s financial statements and financial highlights based on our audits. We are a public accounting firm registered with the Public Company Accounting Oversight Board (United States) (PCAOB) and are required to be independent with respect to the Fund in accordance with the U.S. federal securities laws and the applicable rules and regulations of the Securities and Exchange Commission and the PCAOB.
We conducted our audits in accordance with the standards of the PCAOB. Those standards require that we plan and perform the audit to obtain reasonable assurance about whether the financial statements and financial highlights are free of material misstatement, whether due to error or fraud. The Fund is not required to have, nor were we engaged to perform, an audit of its internal control over financial reporting. As part of our audits we are required to obtain an understanding of internal control over financial reporting but not for the purpose of expressing an opinion on the effectiveness of the Fund’s internal control over financial reporting. Accordingly, we express no such opinion.
Our audits included performing procedures to assess the risks of material misstatement of the financial statements and financial highlights, whether due to error or fraud, and performing procedures that respond to those risks. Such procedures included examining, on a test basis, evidence regarding the amounts and disclosures in the financial statements and financial highlights. Our audits also included evaluating the accounting principles used and significant estimates made by management, as well as evaluating the overall presentation of the financial statements and financial highlights. Our procedures included confirmation of securities owned as of December 31, 2019, by correspondence with the custodian and brokers; when replies were not received from brokers, we performed other auditing procedures. We believe that our audits provide a reasonable basis for our opinion.
DELOITTE & TOUCHE LLP
Boston, Massachusetts
February 14, 2020
We have served as the auditor of one or more of the MFS investment companies since 1924.
30
MFS Total Return Series
TRUSTEES AND OFFICERS – IDENTIFICATION AND BACKGROUND
The Trustees and Officers of the Trust, as of February 1, 2020, are listed below, together with their principal occupations during the past five years. (Their titles may have varied during that period.) The address of each Trustee and Officer is 111 Huntington Avenue, Boston, Massachusetts 02199-7618.
| | | | | | | | | | |
Name, Age | | Position(s)
Held with Fund | | Trustee/Officer
Since (h) | | Number of MFS Funds
overseen by the
Trustee | | Principal Occupations
During the Past Five Years | | Other Directorships During the Past Five Years (j) |
| INTERESTED TRUSTEES |
Robert J. Manning (k)
(age 56) | | Trustee | | February 2004 | | 133 | | Massachusetts Financial Services Company, Executive Chairman (since January 2017); Director; Chairman of the Board; Chief Executive Officer (until 2015);Co-Chief Executive Officer(2015-2016) | | N/A |
| | | | | |
Robin A. Stelmach (k) (age 58) | | Trustee | | January 2014 | | 133 | | Massachusetts Financial Services Company, Vice Chair (since January 2017); Chief Operating Officer and Executive Vice President (until January 2017) | | N/A |
|
| INDEPENDENT TRUSTEES |
John P. Kavanaugh (age 65) | | Trustee and Chair of Trustees | | January 2009 | | 133 | | Private investor | | N/A |
| | | | | |
Steven E. Buller (age 68) | | Trustee | | February 2014 | | 133 | | Financial Accounting Standards Advisory Council, Chairman(2014-2015); Public Company Accounting Oversight Board, Standing Advisory Group, Member (until 2014); BlackRock, Inc. (investment management), Managing Director (until 2014), BlackRock Finco UK (investment management), Director (until 2014) | | N/A |
| | | | | |
John A. Caroselli (age 65) | | Trustee | | March 2017 | | 133 | | JC Global Advisors, LLC (management consulting), President (since 2015); First Capital Corporation (commercial finance), Executive Vice President (until 2015) | | N/A |
| | | | | |
Maureen R. Goldfarb (age 64) | | Trustee | | January 2009 | | 133 | | Private investor | | N/A |
| | | | | |
Peter D. Jones
(age 64) | | Trustee | | January 2019 | | 133 | | Franklin Templeton Distributors, Inc. (investment management), President (until 2015); Franklin Templeton Institutional, LLC (investment management), Chairman (until 2015) | | N/A |
| | | | | |
James W. Kilman, Jr.
(age 58) | | Trustee | | January 2019 | | 133 | | Burford Capital Limited (finance and investment management), Chief Financial Officer (since 2019); KielStrand Capital LLC (family office), Chief Executive Officer (since 2016); Morgan Stanley & Co. (financial services), Vice Chairman of Investment Banking,Co-Head of Diversified Financials Coverage – Financial Institutions Investment Banking Group (until 2016) | | Alpha-En Corporation, Director (2016-2019) |
31
MFS Total Return Series
Trustees and Officers – continued
| | | | | | | | | | |
Name, Age | | Position(s)
Held with Fund | | Trustee/Officer
Since (h) | | Number of MFS Funds
overseen by the
Trustee | | Principal Occupations
During the Past Five Years | | Other Directorships During the Past Five Years (j) |
Clarence Otis, Jr. (age 63) | | Trustee | | March 2017 | | 133 | | Darden Restaurants, Inc., Chief Executive Officer (until 2014) | | VF Corporation, Director; Verizon Communications, Inc., Director; The Travelers Companies, Director; Federal Reserve Bank of Atlanta, Director (until 2015) |
| | | | | |
Maryanne L. Roepke (age 63) | | Trustee | | May 2014 | | 133 | | American Century Investments (investment management), Senior Vice President and Chief Compliance Officer (until 2014) | | N/A |
| | | | | |
Laurie J. Thomsen
(age 62) | | Trustee | | March 2005 | | 133 | | Private investor | | The Travelers Companies, Director; Dycom Industries, Inc., Director (since 2015) |
| | | | | | | | |
Name, Age | | Position(s)
Held with Fund | | Trustee/Officer
Since (h) | | Number of
MFS Funds
for which the
Person is an
Officer | | Principal Occupations During the Past Five Years |
| OFFICERS | | | | | | |
Christopher R. Bohane (k)
(age 46) | | Assistant Secretary and Assistant Clerk | | July 2005 | | 133 | | Massachusetts Financial Services Company, Vice President and Assistant General Counsel |
| | | | |
Kino Clark (k) (age 51) | | Assistant Treasurer | | January 2012 | | 133 | | Massachusetts Financial Services Company, Vice President |
| | | | |
John W. Clark, Jr. (k) (age 52) | | Assistant Treasurer | | April 2017 | | 133 | | Massachusetts Financial Services Company, Vice President (since March 2017); Deutsche Bank (financial services), Department Head –Treasurer’s Office (until February 2017) |
| | | | |
Thomas H. Connors (k) (age 60) | | Assistant Secretary and Assistant Clerk | | September 2012 | | 133 | | Massachusetts Financial Services Company, Vice President and Senior Counsel |
| | | | |
David L. DiLorenzo (k)
(age 51) | | President | | July 2005 | | 133 | | Massachusetts Financial Services Company, Senior Vice President |
| | | | |
Heidi W. Hardin (k) (age 52) | | Secretary and Clerk | | April 2017 | | 133 | | Massachusetts Financial Services Company, Executive Vice President and General Counsel (since March 2017); Harris Associates (investment management), General Counsel (from September 2015 to January 2017); Janus Capital Management LLC (investment management), Senior Vice President and General Counsel (until September 2015) |
| | | | |
Brian E. Langenfeld (k) (age 46) | | Assistant
Secretary and Assistant Clerk | | June 2006 | | 133 | | Massachusetts Financial Services Company, Vice President and Senior Counsel |
| | | | |
Amanda S. Mooradian (k) (age 40) | | Assistant
Secretary and Assistant Clerk | | September 2018 | | 133 | | Massachusetts Financial Services Company, Assistant Vice President and Counsel |
| | | | |
Susan A. Pereira (k)
(age 49) | | Assistant
Secretary and Assistant Clerk | | July 2005 | | 133 | | Massachusetts Financial Services Company, Vice President and Assistant General Counsel |
| | | | |
Kasey L. Phillips (k) (age 49) | | Assistant Treasurer | | September 2012 | | 133 | | Massachusetts Financial Services Company, Vice President |
| | | | |
Matthew A. Stowe (k) (age 45) | | Assistant Secretary and Assistant Clerk | | October 2014 | | 133 | | Massachusetts Financial Services Company, Vice President and Assistant General Counsel |
32
MFS Total Return Series
Trustees and Officers – continued
| | | | | | | | |
Name, Age | | Position(s)
Held with Fund | | Trustee/Officer
Since (h) | | Number of
MFS Funds
for which the
Person is an
Officer | | Principal Occupations During the Past Five Years |
Martin J. Wolin (k) (age 52) | | Chief Compliance Officer | | July 2015 | | 133 | | Massachusetts Financial Services Company, Senior Vice President and Chief Compliance Officer (since July 2015); Mercer (financial service provider), Chief Risk and Compliance Officer, North America and Latin America (until June 2015) |
| | | | |
James O. Yost (k)
(age 59) | | Treasurer | | September 1990 | | 133 | | Massachusetts Financial Services Company, Senior Vice President |
| (h) | Date first appointed to serve as Trustee/officer of an MFS Fund. Each Trustee has served continuously since appointment unless indicated otherwise. For the period from December 15, 2004 until February 22, 2005, Mr. Manning served as Advisory Trustee. From January 2012 through December 2016, Messrs. DiLorenzo and Yost served as Treasurer and Deputy Treasurer of the Funds, respectively. |
| (j) | Directorships or trusteeships of companies required to report to the Securities and Exchange Commission (i.e., “public companies”). |
| (k) | “Interested person” of the Trust within the meaning of the Investment Company Act of 1940 (referred to as the 1940 Act), which is the principal federal law governing investment companies like the fund, as a result of a position with MFS. The address of MFS is 111 Huntington Avenue, Boston, Massachusetts 02199-7618. |
Each Trustee (other than Messrs. Jones and Kilman) has been elected by shareholders and each Trustee and Officer holds office until his or her successor is chosen and qualified or until his or her earlier death, resignation, retirement or removal. Messrs. Jones and Kilman became Trustees of the Funds on January 1, 2019. The Trust does not hold annual meetings for the purpose of electing Trustees, and Trustees are not elected for fixed terms. Under the terms of the Board’s retirement policy, an Independent Trustee shall retire at the end of the calendar year in which he or she reaches the earlier of 75 years of age or 15 years of service on the Board (or, in the case of any Independent Trustee who joined the Board prior to 2015, 20 years of service on the Board).
Messrs. Buller, Kilman and Otis and Ms. Roepke are members of the Trust’s Audit Committee.
Each of the Interested Trustees and certain Officers hold comparable officer positions with certain affiliates of MFS.
The Statement of Additional Information for a Fund includes further information about the Trustees and is available without charge upon request by calling1-800-225-2606.
| | |
Investment Adviser Massachusetts Financial Services Company 111 Huntington Avenue Boston, MA 02199-7618 | | Custodian State Street Bank and Trust Company 1 Lincoln Street Boston, MA 02111-2900 |
| |
Distributor MFS Fund Distributors, Inc. 111 Huntington Avenue Boston, MA 02199-7618 | | Independent Registered Public Accounting Firm Deloitte & Touche LLP 200 Berkeley Street Boston, MA 02116 |
| |
Portfolio Manager(s) Steven Gorham Alexander Mackey Joshua Marston Johnathan Munko Henry Peabody Robert Persons Jonathan Sage Brooks Taylor | | |
33
MFS Total Return Series
BOARD REVIEW OF INVESTMENT ADVISORY AGREEMENT
MFS Total Return Series
The Investment Company Act of 1940 requires that both the full Board of Trustees and a majority of thenon-interested (“independent”) Trustees, voting separately, annually approve the continuation of the Fund’s investment advisory agreement with MFS. The Trustees consider matters bearing on the Fund and its advisory arrangements at their meetings throughout the year, including a review of performance data at each regular meeting. In addition, the independent Trustees met several times over the course of three months beginning in May and ending in July, 2019 (“contract review meetings”) for the specific purpose of considering whether to approve the continuation of the investment advisory agreement for the Fund and the other investment companies that the Board oversees (the “MFS Funds”). The independent Trustees were assisted in their evaluation of the Fund’s investment advisory agreement by independent legal counsel, from whom they received separate legal advice and with whom they met separately from MFS during various contract review meetings. The independent Trustees were also assisted in this process by the MFS Funds’ Independent Senior Officer, a senior officer appointed by and reporting to the independent Trustees.
In connection with their deliberations regarding the continuation of the investment advisory agreement, the Trustees, including the independent Trustees, considered such information and factors as they believed, in light of the legal advice furnished to them and their own business judgment, to be relevant. The investment advisory agreement for the Fund was considered separately, although the Trustees also took into account the common interests of all MFS Funds in their review. As described below, the Trustees considered the nature, quality, and extent of the various investment advisory, administrative, and shareholder services performed by MFS under the existing investment advisory agreement and other arrangements with the Fund.
In connection with their contract review meetings, the Trustees received and relied upon materials that included, among other items: (i) information provided by Broadridge Financial Solutions, Inc. (“Broadridge”), an independent third party, on the investment performance of the Fund for various time periods ended December 31, 2018 and the investment performance of a group of funds with substantially similar investment classifications/objectives (the “Broadridge performance universe”), (ii) information provided by Broadridge on the Fund’s advisory fees and other expenses and the advisory fees and other expenses of comparable funds identified by Broadridge as well as all other funds in the same investment classification/category (the “Broadridge expense group and universe”), (iii) information provided by MFS on the advisory fees of portfolios of other clients of MFS, including institutional separate accounts and other clients, (iv) information as to whether and to what extent applicable expense waivers, reimbursements or fee “breakpoints” are observed for the Fund, (v) information regarding MFS’ financial results and financial condition, including MFS’ and certain of its affiliates’ estimated profitability from services performed for the Fund and the MFS Funds as a whole, and compared to MFS’ institutional business, (vi) MFS’ views regarding the outlook for the mutual fund industry and the strategic business plans of MFS, (vii) descriptions of various functions performed by MFS for the Funds, such as compliance monitoring and portfolio trading practices, and (viii) information regarding the overall organization of MFS, including information about MFS’ senior management and other personnel providing investment advisory, administrative and other services to the Fund and the other MFS Funds. The comparative performance, fee and expense information prepared and provided by Broadridge was not independently verified and the independent Trustees did not independently verify any information provided to them by MFS.
The Trustees’ conclusion as to the continuation of the investment advisory agreement was based on a comprehensive consideration of all information provided to the Trustees and not the result of any single factor. Some of the factors that figured particularly in the Trustees’ deliberations are described below, although individual Trustees may have evaluated the information presented differently from one another, giving different weights to various factors. It is also important to recognize that the fee arrangements for the Fund and other MFS Funds are the result of years of review and discussion between the independent Trustees and MFS, that certain aspects of such arrangements may receive greater scrutiny in some years than in others, and that the Trustees’ conclusions may be based, in part, on their consideration of these same arrangements during the course of the year and in prior years.
Based on information provided by Broadridge and MFS, the Trustees reviewed the Fund’s total return investment performance as well as the Broadridge performance universe over various time periods. The Trustees placed particular emphasis on the total return performance of the Fund’s Initial Class shares in comparison to the performance of funds in its Broadridge performance universe over the five-year period ended December 31, 2018, which the Trustees believed was a long enough period to reflect differing market conditions. The total return performance of the Fund’s Initial Class shares was in the 1st quintile relative to the other funds in the universe for this five-year period (the 1st quintile being the best performers and the 5th quintile being the worst performers). The total return performance of the Fund’s Initial Class shares was in the 4th quintile for theone-year period and the 2nd quintile for thethree-year period ended December 31, 2018 relative to the Broadridge performance universe. Because of the passage of time, these performance results may differ from the performance results for more recent periods, including those shown elsewhere in this report.
In the course of their deliberations, the Trustees took into account information provided by MFS in connection with the contract review meetings, as well as during investment review meetings conducted with portfolio management personnel during the course of the year regarding the Fund’s performance. After reviewing these and related factors, the Trustees concluded, within the context of their overall conclusions regarding the investment advisory agreement, that they were satisfied with MFS’ responses and efforts relating to investment performance.
34
MFS Total Return Series
Board Review of Investment Advisory Agreement – continued
In assessing the reasonableness of the Fund’s advisory fee, the Trustees considered, among other information, the Fund’s advisory fee and the total expense ratio of the Fund’s Initial Class shares as a percentage of average daily net assets and the advisory fee and total expense ratios of the Broadridge expense group based on information provided by Broadridge. The Trustees considered that MFS currently observes an expense limitation for the Fund, which may not be changed without the Trustees’ approval. The Trustees also considered that, according to the data provided by Broadridge (which takes into account any fee reductions or expense limitations that were in effect during the Fund’s last fiscal year), the Fund’s effective advisory fee rate and total expense ratio were each higher than the Broadridge expense group median. The Trustees also noted that MFS has agreed to further reduce such expense limitation for the Fund effective August 1, 2019, which may not be changed without the Trustees’ approval.
The Trustees also considered the advisory fees charged by MFS to any institutional separate accounts advised by MFS (“separate accounts”) and unaffiliated investment companies for which MFS serves as subadviser (“subadvised funds”) that have comparable investment strategies to the Fund, if any. In comparing these fees, the Trustees considered information provided by MFS as to the generally broader scope of services provided by MFS to the Fund, as well as the more extensive regulatory burdens imposed on MFS in managing the Fund, in comparison to separate accounts and subadvised funds. The Trustees also considered the higher demands placed on MFS’ investment personnel and trading infrastructure as a result of the daily cashin-flows andout-flows of the Fund in comparison to separate accounts.
The Trustees also considered whether the Fund may benefit from any economies of scale in the management of the Fund in the event of growth in assets of the Fund and/or growth in assets of the MFS Funds as a whole. They noted that the Fund’s advisory fee rate schedule is subject to contractual breakpoints that reduce the Fund’s advisory fee rate on average daily net assets over $1 billion, $2.5 billion, and $5 billion. The Trustees also noted that MFS has agreed in writing to waive a portion of the management fees of certain MFS Funds, including the Fund, if the total combined assets of certain funds within the MFS Funds’ complex increase above agreed upon thresholds (the “group fee waiver”), enabling the Fund’s shareholders to share in the benefits from any economies of scale at the complex level. The group fee waiver is reviewed and renewed annually between the Board and MFS. The Trustees concluded that the breakpoints and the group fee waiver were sufficient to allow the Fund to benefit from economies of scale as its assets and overall complex assets grow.
The Trustees also considered information prepared by MFS relating to MFS’ costs and profits with respect to the Fund, the MFS Funds considered as a group, and other investment companies and accounts advised by MFS, as well as MFS’ methodologies used to determine and allocate its costs to the MFS Funds, the Fund and other accounts and products for purposes of estimating profitability.
After reviewing these and other factors described herein, the Trustees concluded, within the context of their overall conclusions regarding the investment advisory agreement, that the advisory fees charged to the Fund represent reasonable compensation in light of the services being provided by MFS to the Fund.
In addition, the Trustees considered MFS’ resources and related efforts to continue to retain, attract and motivate capable personnel to serve the Fund. The Trustees also considered current and developing conditions in the financial services industry, including the presence of large and well-capitalized companies which are spending, and appear to be prepared to continue to spend, substantial sums to engage personnel and to provide services to competing investment companies. In this regard, the Trustees also considered the financial resources of MFS and its ultimate parent, Sun Life Financial Inc. The Trustees also considered the advantages and possible disadvantages to the Fund of having an adviser that also serves other investment companies as well as other accounts.
The Trustees also considered the nature, quality, cost, and extent of administrative, transfer agency, and distribution services provided to the Fund by MFS and its affiliates under agreements and plans other than the investment advisory agreement, including any12b-1 fees the Fund pays to MFS Fund Distributors, Inc., an affiliate of MFS. The Trustees also considered the nature, extent and quality of certain other services MFS performs or arranges for on the Fund’s behalf, which may include securities lending programs, directed expense payment programs, class action recovery programs, and MFS’ interaction with third-party service providers, principally custodians andsub-custodians. The Trustees concluded that the variousnon-advisory services provided by MFS and its affiliates on behalf of the Fund were satisfactory.
The Trustees consideredso-called“fall-out benefits” to MFS such as reputational value derived from serving as investment manager to the MFS Funds. The Trustees also considered that, effective January 3, 2018, MFS had discontinued its historic practice of obtaining investment research from portfolio brokerage commissions paid by certain MFS Funds and would thereafter directly pay for or voluntarily reimburse a Fund, if applicable, for the costs of external research acquired through the use of the Fund’s portfolio brokerage commissions.
Based on their evaluation of factors that they deemed to be material, including those factors described above, the Board of Trustees, including the independent Trustees, concluded that the Fund’s investment advisory agreement with MFS should be continued for an additionalone-year period, commencing August 1, 2019.
35
MFS Total Return Series
PROXY VOTING POLICIES AND INFORMATION
MFS votes proxies on behalf of the fund pursuant to proxy voting policies and procedures that are available without charge, upon request, by calling 1-800-225-2606, by visitingmfs.com/proxyvoting, or by visiting the SEC’s Web site athttp://www.sec.gov.
Information regarding how the fund voted proxies relating to portfolio securities during the most recent twelve-month period ended June 30 is available by August 31 of each year without charge by visitingmfs.com/proxyvoting, or by visiting the SEC’s Web site athttp://www.sec.gov.
QUARTERLY PORTFOLIO DISCLOSURE
The fund files a complete schedule of portfolio holdings with the SEC for the first and third quarters of each fiscal year as an exhibit to its reports on Form N-PORT. The fund’s Form N-PORT reports are available on the SEC’s website athttp://www.sec.gov. A shareholder can obtain the portfolio holdings report for the first and third quarters of the fund’s fiscal year atmfs.com/vit1 by choosing the fund’s name and then selecting the “Resources” tab and clicking on “Prospectus and Reports”.
FURTHER INFORMATION
From time to time, MFS may post important information about the fund or the MFS funds on the MFS web site (mfs.com). This information is available at https://www.mfs.com/en-us/what-we-do/announcements.html or atmfs.com/vit1 by choosing the fund’s name.
INFORMATION ABOUT FUND CONTRACTS AND LEGAL CLAIMS
The fund has entered into contractual arrangements with an investment adviser, administrator, distributor, shareholder servicing agent, 529 program manager (if applicable), and custodian who each provide services to the fund. Unless expressly stated otherwise, shareholders are not parties to, or intended beneficiaries of these contractual arrangements, and these contractual arrangements are not intended to create any shareholder right to enforce them against the service providers or to seek any remedy under them against the service providers, either directly or on behalf of the fund.
Under the Trust’s By-Laws and Declaration of Trust, any claims asserted against or on behalf of the MFS Funds, including claims against Trustees and Officers, must be brought in state and federal courts located within the Commonwealth of Massachusetts.
FEDERAL TAX INFORMATION (unaudited)
The following information is provided pursuant to provisions of the Internal Revenue Code.
The fund designates $72,818,000 as capital gain dividends paid during the fiscal year.
For corporate shareholders, 53.55% of the ordinary income dividends paid during the fiscal year qualify for the corporate dividends received deduction.
36
rev. 3/16
| | | | |
| | | |
| FACTS | | WHAT DOES MFS DO WITH YOUR
PERSONAL INFORMATION? | |  |
| | |
| Why? | | Financial companies choose how they share your personal information. Federal law gives consumers the right to limit some but not all sharing. Federal law also requires us to tell you how we collect, share, and protect your personal information. Please read this notice carefully to understand what we do. |
| | |
| What? | | The types of personal information we collect and share depend on the product or service you have with us. This information can include: • Social Security number and account balances • Account transactions and transaction history • Checking account information and wire transfer instructions When you areno longer our customer, we continue to share your information as described in this notice. |
| | |
| How? | | All financial companies need to share customers’ personal information to run their everyday business. In the section below, we list the reasons financial companies can share their customers’ personal information; the reasons MFS chooses to share; and whether you can limit this sharing. |
| | | | |
Reasons we can share your
personal information | | Does MFS share? | | Can you limit this
sharing? |
For our everyday business purposes – such as to process your transactions, maintain your account(s), respond to court orders and legal investigations, or report to credit bureaus | | Yes | | No |
For our marketing purposes – to offer our products and services to you | | No | | We don’t share |
| For joint marketing with other financial companies | | No | | We don’t share |
For our affiliates’ everyday business purposes – information about your transactions and experiences | | No | | We don’t share |
For our affiliates’ everyday business purposes – information about your creditworthiness | | No | | We don’t share |
| For nonaffiliates to market to you | | No | | We don’t share |
| | |
| | |
| Questions? | | Call800-225-2606 or go tomfs.com. |
37
| | |
| Who we are |
| Who is providing this notice? | | MFS Funds, MFS Investment Management, MFS Institutional Advisors, Inc., and MFS Heritage Trust Company. |
| | |
| What we do |
| How does MFS protect my personal information? | | To protect your personal information from unauthorized access and use, we use security measures that comply with federal law. These measures include procedural, electronic, and physical safeguards for the protection of the personal information we collect about you. |
How does MFS
collect my personal information? | | We collect your personal information, for example, when you • open an account or provide account information • direct us to buy securities or direct us to sell your securities • make a wire transfer We also collect your personal information from others, such as credit bureaus, affiliates, or other companies. |
| Why can’t I limit all sharing? | | Federal law gives you the right to limit only • sharing for affiliates’ everyday business purposes – information about your creditworthiness • affiliates from using your information to market to you • sharing for nonaffiliates to market to you State laws and individual companies may give you additional rights to limit sharing. |
| | |
| Definitions |
| Affiliates | | Companies related by common ownership or control. They can be financial and nonfinancial companies. • MFS does not share personal information with affiliates, except for everyday business purposes as described on page one of this notice. |
| Nonaffiliates | | Companies not related by common ownership or control. They can be financial and nonfinancial companies. • MFS does not share with nonaffiliates so they can market to you. |
| Joint marketing | | A formal agreement between nonaffiliated financial companies that together market financial products or services to you. • MFS doesn’t jointly market. |
| | |
| Other important information |
| If you own an MFS product or receive an MFS service in the name of a third party such as a bank or broker-dealer, their privacy policy may apply to you instead of ours. |
38
Annual Report
December 31, 2019

MFS® Utilities Series

MFS® Variable Insurance Trust
Beginning on January 1, 2021, as permitted by regulations adopted by the U.S. Securities and Exchange Commission, the insurance company that offers your contract may determine that it will no longer send you paper copies of the fund’s annual and semiannual shareholder reports unless you specifically request paper copies from the insurance company or from your financial intermediary. Instead, the shareholder reports will be made available on a Web site (insurancefunds.mfs.com or other Web site of which you will be notified), and the insurance company will notify you by mail each time a report is posted and provide you with a Web site link to access the report. Instructions for requesting paper copies will be provided by your insurance company or financial intermediary.
If you already elected to receive shareholder reports by email, you will not be affected by this change and you need not take any action. If your insurance company or financial intermediary offers electronic delivery, you may elect to receive shareholder reports and other communications from the insurance company or financial intermediary by email by following the instructions provided by the insurance company or financial intermediary.
Beginning on January 1, 2019, you may elect to receive all future reports in paper free of charge from the insurance company or financial intermediary. You can inform the insurance company or financial intermediary that you wish to continue receiving paper copies of your shareholder reports by contacting your insurance company or financial intermediary. Your election to receive reports in paper will apply to all funds held in your account with your insurance company or financial intermediary.
VUF-ANN
MFS® Utilities Series
CONTENTS
The report is prepared for the general information of contract owners. It is authorized for distribution to prospective investors only when preceded or accompanied by a current prospectus.
NOT FDIC INSURED• MAY LOSE VALUE• NO BANK OR CREDIT UNION GUARANTEE• NOT A DEPOSIT• NOT INSURED BY ANY FEDERAL GOVERNMENT AGENCY OR NCUA/NCUSIF
MFS Utilities Series
LETTER FROM THE EXECUTIVE CHAIR

Dear Contract Owners:
Slowing global growth, low inflation, and trade friction between the United States and China have been hallmarks of the past 12 months. After experiencing an uptick in market volatility in late 2018, markets steadied for most of 2019, thanks in large measure to the adoption of a dovish policy stance on the part of global central banks, focused on supporting economic growth. Negotiations aimed at a “phase one” trade deal between the U.S. and China bore fruit at the end of the period, boosting investor sentiment, while signs of stability emerging from the global manufacturing sector also lifted spirits. Uncertainty over Brexit, along with the ripple effects from the trade conflict, hampered business confidence and investment in the United Kingdom and Europe for much of the period, though investors expect greater clarity regarding Brexit as a result of December’s general election. The pro-Brexit Conservative Party won the election by a comfortable margin and set the stage for the U.K.’s departure from the EU at the end of January.
Markets expect the longest economic expansion in U.S. history will continue, albeit at a slower pace, as trade tensions recede. In an effort to prolong the expansion, the U.S. Federal Reserve lowered interest rates three times between July and October and the European Central Bank loosened policy in September. While the global monetary policy backdrop remains quite accommodative, signs of easing trade tensions and fading global recession fears led to improved market sentiment in late 2019 as investors grew less risk averse. In early 2020, an outbreak of coronavirus emanating from China reintroduced global growth fears, causing an uptick in volatility.
Here at MFS®, we aim to help our clients navigate the growing complexity of the markets and world economies. Our long-term investment philosophy and commitment to the responsible allocation of capital allow us to tune out the noise and uncover what we believe are the best, most durable investment opportunities in the market. Through our powerful global investment platform, we combine collective expertise, thoughtful risk management and long-term discipline to create sustainable value for investors.
Respectfully,

Robert J. Manning
Executive Chair
MFS Investment Management
February 14, 2020
The opinions expressed in this letter are subject to change and may not be relied upon for investment advice. No forecasts can be guaranteed.
1
MFS Utilities Series
PORTFOLIO COMPOSITION
Portfolio structure (i)
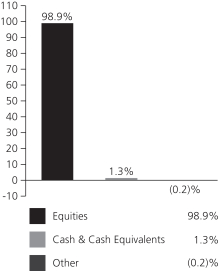
| | | | |
| Top ten holdings (i) | | | | |
| NextEra Energy, Inc. | | | 6.4% | |
| EDP Renovaveis S.A. | | | 5.6% | |
| Exelon Corp. | | | 4.8% | |
| FirstEnergy Corp. | | | 4.5% | |
| Dominion Energy, Inc. | | | 4.2% | |
| Entergy Corp. | | | 3.3% | |
| Public Service Enterprise Group, Inc. | | | 2.7% | |
| American Electric Power Co., Inc. | | | 2.7% | |
| Enel S.p.A. | | | 2.7% | |
| Enterprise Products Partners LP | | | 2.6% | |
| | | | |
| Top five industries (i) | | | | |
| Utilities-Electric Power | | | 66.9% | |
| NaturalGas-Pipeline | | | 10.8% | |
| Telecommunications – Wireless | | | 7.4% | |
| Natural Gas – Distribution | | | 6.2% | |
| Cable TV | | | 4.8% | |
| |
| Issuer country weightings (i)(x) | | | | |
| United States | | | 65.7% | |
| Canada | | | 8.0% | |
| Portugal | | | 7.5% | |
| United Kingdom | | | 3.8% | |
| Spain | | | 3.2% | |
| Italy | | | 2.7% | |
| Germany | | | 1.4% | |
| Sweden | | | 1.4% | |
| Japan | | | 1.0% | |
| Other Countries | | | 5.3% | |
| (i) | For purposes of this presentation, the components include the value of securities, and reflect the impact of the equivalent exposure of derivative positions, if any. These amounts may be negative from time to time. Equivalent exposure is a calculated amount that translates the derivative position into a reasonable approximation of the amount of the underlying asset that the portfolio would have to hold at a given point in time to have the same price sensitivity that results from the portfolio’s ownership of the derivative contract. When dealing with derivatives, equivalent exposure is a more representative measure of the potential impact of a position on portfolio performance than value. The bond component will include any accrued interest amounts. |
| (x) | Represents the portfolio’s exposure to issuer countries as a percentage of a portfolio’s net assets. For purposes of this presentation, United States includes Cash & Cash Equivalents and Other. |
Where the fund holds convertible bonds, they are treated as part of the equity portion of the portfolio.
Cash & Cash Equivalents includes any cash, investments in money market funds, short-term securities, and other assets less liabilities. Please see the Statement of Assets and Liabilities for additional information related to the fund’s cash position and other assets and liabilities.
Other includes equivalent exposure from currency derivatives and/or any offsets to derivative positions and may be negative.
Percentages are based on net assets as of December 31, 2019.
The portfolio is actively managed and current holdings may be different.
2
MFS Utilities Series
MANAGEMENT REVIEW
Summary of Results
For the twelve months ended December 31, 2019, Initial Class shares of the MFS Utilities Series (fund) provided a total return of 25.07%, while Service Class shares of the fund provided a total return of 24.80%. These compare with a return of 31.49% over the same period for the fund’s benchmark, the Standard & Poor’s 500 Stock Index, and a return of 26.35% for the fund’s other benchmark, the Standard & Poor’s 500 Utilities Index (S&P Utilities Index).
Market Environment
Fading fears of a near-term global recession, the announcement of a partial trade deal between the United States and China and the decline in uncertainty over Brexit helped bolster market sentiment late in the period. Changes in market sentiment, largely driven by uncertainty over the outcome of trade negotiations between the US and China, had contributed to periodic bouts of volatility during the reporting period. The global economy decelerated, led by weakness in China and Europe, although the pace of the slowdown moderated late in the period amid nascent signs of stabilization in the manufacturing sector.
The deteriorating global growth backdrop, along with declining inflationary pressures, prompted the US Federal Reserve to adopt a more dovish posture beginning in early 2019, resulting in the first interest rate cut in over a decade at the end of July, followed by additional cuts in September and October. The Fed’s actions led to a sharp decline in long-term interest rates during the period’s second half, causing the inversion of portions of the US Treasury yield curve for a time. Amid an improvement in risk sentiment in Q4 2019 and indications of a bottoming in growth and a potential upturn in activity, the Fed indicated in October that further rate cuts were unlikely unless the outlook for the economy materially worsened.
Globally, central banks have tilted more dovish as well, with the European Central Bank unveiling a package of easing measures, which included putting overnight rates deeper into negative territory, restarting its bond-buying program and lengthening the term of cheap loans to banks to three years from two. The central banks of India and Australia are among those that have cut rates several times in recent months, although China has been more cautious in increasing liquidity as it keeps trying to deleverage its economy, cutting rates only marginally.
Emerging markets experienced considerable volatility through the end of 2018, as tighter global financial conditions exposed structural weakness in some countries. Those conditions improved in 2019 as the Fed became more dovish. Notwithstanding the periodic headwinds on market sentiment from significant trade friction between the US and China over much of the year, emerging market hard currency debt and local rates benefited from relatively cheap valuations at the beginning of the period and easier global monetary conditions. These factors, plus the fading of certain global risk factors mentioned above, hastened spread tightening in the latter part of the period. At the same time, idiosyncratic risks spiked in some countries (e.g., Argentina and Lebanon), contributing to increased dispersion in performance among sovereign assets.
Detractors from Performance
The fund’sout-of-benchmark exposure to thenatural gas pipelineindustry weakened performance relative to the S&P Utilities Index. Here, notable relative detractors included the fund’s holdings of oil & gas pipeline operator EQM Midstream Partners (b), natural gas services provider Cheniere Energy (b) and natural gas gatherer Equitrans Midstream (b). The share price of EQM Midstream Partners declined amidst a deteriorating commodity outlook for EQM’s primary customer.
Elsewhere, not owning shares of retail electric services provider Southern Company and electricity and natural gas distributor WEC Energy held back relative returns as both companies outperformed the benchmark over the reporting period. The share price of Southern Company rose after the company reported strong earnings results, which benefited from above-normal weather conditions across its service territories. An underweight position in electricity provider NextEra Energy also detracted from relative performance as the company reported higher-than-expected earnings growth, driven by strong performance across the board, includingbetter-than-expected earnings at Gulf Power and higher wind generation. NextEra was one of the fund’s top holdings during the reporting period and performed strongly throughout the year but, due to our limitations on position size, we were unable to hold as much weight as the benchmark and, therefore, this stock was among the fund’s largest detractors. The fund’s holdings of electricity provider Vistra Energy (b), cable and mobile services provider Millicom International Cellular (b) (Sweden) and television, internet, and telephone services NOS, SGPS (b) (Portugal) further weighed on relative results.
The fund’s cash and/or cash equivalents position during the period was another detractor from relative performance. The fund strives to be fully invested and generally holds cash to buy new holdings and to provide liquidity. In a period when equity markets appreciated, as measured by the fund’s benchmark, holding cash hurt performance versus the benchmark, which has no cash position.
3
MFS Utilities Series
Management Review – continued
Contributors to Performance
The fund’sout-of-benchmark exposure to both thecable TVandwireless communicationsindustries contributed to relative performance. Within thecable TVindustry,the fund’s position in cable and telecommunications company Altice USA (b) supported relative returns. Within thewireless communicationsindustry, holdings of telecommunications services provider Cellnex Telecom (b) (Spain) and broadcast and communication tower management firm American Tower (b) benefited relative performance.
Elsewhere, the fund’s underweight holdings of power & natural gas distributor Duke Energy, utility company PG&E (h) and energy products and services supplier Dominion Energy positively affected relative returns. The stock price of Duke Energy declined after the firm announced that it would issue equity in 2020 in order to maintain and protect credit metrics during its Atlantic Coast Pipeline construction. The fund’s holdings of energy infrastructure services provider TC Energy (b) (Canada), electricity and gas distributor Enel (b) (Italy), electric services provider SSE (b) (United Kingdom) and renewable energy company EDP Renovaveis (b) (Portugal) further supported relative performance.
Respectfully,
Portfolio Manager(s)
Claud Davis and J. Scott Walker
Note to Shareholders: Effective August 1, 2019, Maura Shaughnessy was removed as a Portfolio Manager of the Fund.
| (b) | Security is not a benchmark constituent. |
| (h) | Security was not held in the portfolio at period end. |
The views expressed in this report are those of the portfolio manager(s) only through the end of the period of the report as stated on the cover and do not necessarily reflect the views of MFS or any other person in the MFS organization. These views are subject to change at any time based on market or other conditions, and MFS disclaims any responsibility to update such views. These views may not be relied upon as investment advice or an indication of trading intent on behalf of any MFS portfolio. References to specific securities are not recommendations of such securities, and may not be representative of any MFS portfolio’s current or future investments.
4
MFS Utilities Series
PERFORMANCE SUMMARY THROUGH 12/31/19
The following chart illustrates the historical performance of the fund in comparison to its benchmark(s). Benchmarks are unmanaged and may not be invested in directly. Benchmark returns do not reflect any fees or expenses. The performance of other share classes will be greater than or less than that of the class depicted below. (See Notes to Performance Summary.)
Performance data shown represents past performance and is no guarantee of future results. Investment return and principal value fluctuate so your units, when sold, may be worth more or less than the original cost; current performance may be lower or higher than quoted. The performance shown does not reflect the deduction of taxes, if any, that a contract holder would pay on fund distributions or the redemption of contract units. The returns for the fund shown also do not reflect the deduction of expenses associated with variable products, such as mortality and expense risk charges, separate account charges, and sales charges imposed by the insurance company separate accounts. Such expenses would reduce the overall returns shown.
Growth of a Hypothetical $10,000 Investment
Total Returns through 12/31/19
Average annual total returns
| | | | | | | | | | | | |
| | | Share Class | | Class Inception Date | | 1-yr | | 5-yr | | 10-yr | | |
| | | Initial Class | | 1/03/95 | | 25.07% | | 6.70% | | 9.99% | | |
| | | Service Class | | 5/01/00 | | 24.80% | | 6.43% | | 9.72% | | |
| | | | |
| Comparative benchmark(s) | | | | | | | | |
| | | Standard & Poor’s 500 Stock Index (f) | | 31.49% | | 11.70% | | 13.56% | | |
| | | Standard & Poor’s 500 Utilities Index (f) | | 26.35% | | 10.29% | | 11.80% | | |
| (f) | Source: FactSet Research Systems Inc. |
Benchmark Definition(s)
Standard & Poor’s 500 Stock Index – a market capitalization-weighted index of 500 widely held equity securities, designed to measure broad U.S. equity performance. (b)
Standard & Poor’s 500 Utilities Index – a market capitalization-weighted index designed to measure the utilities sector, including those companies considered electric, gas or water utilities, or companies that operate as independent producers and/or distributors of power. (b)
It is not possible to invest directly in an index.
| (b) | “Standard & Poor’s®” and “S&P®” are registered trademarks of Standard & Poor’s Financial Services LLC (“S&P”) and Dow Jones is a registered trademark of Dow Jones Trademark Holdings LLC (“Dow Jones”) and have been licensed for use by S&P Dow Jones Indices LLC and sublicensed for certain purposes by Massachusetts Financial Services Company. The S&P 500® is a product of S&P Dow Jones Indices LLC, and has been licensed for use by Massachusetts Financial Services Company. Massachusetts Financial Services Company’s product(s) is not sponsored, endorsed, sold, or promoted by S&P Dow Jones Indices LLC, Dow Jones, S&P, or their respective affiliates, and neither S&P Dow Jones Indices LLC, Dow Jones, S&P, nor their respective affiliates make any representation regarding the advisability of investing in such product(s). |
Notes to Performance Summary
Average annual total return represents the average annual change in value for each share class for the periods presented.
5
MFS Utilities Series
Performance Summary – continued
Performance results reflect any applicable expense subsidies and waivers in effect during the periods shown. Without such subsidies and waivers the fund’s performance results would be less favorable. Please see the prospectus and financial statements for complete details. All results are historical and assume the reinvestment of any dividends and capital gains distributions.
Performance results do not include adjustments made for financial reporting purposes in accordance with U.S. generally accepted accounting principles and may differ from amounts reported in the financial highlights.
From time to time the fund may receive proceeds from litigation settlements, without which performance would be lower.
6
MFS Utilities Series
EXPENSE TABLE
Fund Expenses Borne by the Contract Holders during the Period,
July 1, 2019 through December 31, 2019
As a contract holder of the fund, you incur ongoing costs, including management fees; distribution and/or service(12b-1) fees; and other fund expenses. This example is intended to help you understand your ongoing costs (in dollars) of investing in the fund and to compare these costs with the ongoing costs of investing in other mutual funds.
The example is based on an investment of $1,000 invested at the beginning of the period and held for the entire period July 1, 2019 through December 31, 2019.
Actual Expenses
The first line for each share class in the following table provides information about actual account values and actual expenses. You may use the information in this line, together with the amount you invested, to estimate the expenses that you paid over the period. Simply divide your account value by $1,000 (for example, an $8,600 account value divided by $1,000 = 8.6), then multiply the result by the number in the first line under the heading entitled “Expenses Paid During Period” to estimate the expenses you paid on your account during this period.
Hypothetical Example for Comparison Purposes
The second line for each share class in the following table provides information about hypothetical account values and hypothetical expenses based on the fund’s actual expense ratio and an assumed rate of return of 5% per year before expenses, which is not the fund’s actual return. The hypothetical account values and expenses may not be used to estimate the actual ending account balance or expenses you paid for the period. You may use this information to compare the ongoing costs of investing in the fund and other funds. To do so, compare this 5% hypothetical example with the 5% hypothetical examples that appear in the shareholder reports of the other funds.
Please note that the expenses shown in the table are meant to highlight the fund’s ongoing costs only and do not take into account the fees and expenses imposed under the variable contracts through which your investment in the fund is made. Therefore, the second line for each share class in the table is useful in comparing ongoing costs associated with an investment in vehicles (such as the fund) which fund benefits under variable annuity and variable life insurance contracts and to qualified pension and retirement plans only, and will not help you determine the relative total costs of investing in the fund through variable annuity and variable life insurance contracts. If the fees and expenses imposed under the variable contracts were included, your costs would have been higher.
| | | | | | | | | | | | | | | | | | |
| Share Class | | | | Annualized
Expense Ratio | | | Beginning
Account Value
7/01/19 | | | Ending Account Value 12/31/19 | | | Expenses Paid
During Period (p)
7/01/19-12/31/19 | |
| Initial Class | | Actual | | | 0.78% | | | | $1,000.00 | | | | $1,078.52 | | | | $4.09 | |
| | Hypothetical (h) | | | 0.78% | | | | $1,000.00 | | | | $1,021.27 | | | | $3.97 | |
| Service Class | | Actual | | | 1.03% | | | | $1,000.00 | | | | $1,077.40 | | | | $5.39 | |
| | Hypothetical (h) | | | 1.03% | | | | $1,000.00 | | | | $1,020.01 | | | | $5.24 | |
| (h) | 5% class return per year before expenses. |
| (p) | “Expenses Paid During Period” are equal to each class’s annualized expense ratio, as shown above, multiplied by the average account value over the period, multiplied by 184/365 (to reflect theone-half year period). |
7
MFS Utilities Series
PORTFOLIO OF INVESTMENTS – 12/31/19
The Portfolio of Investments is a complete list of all securities owned by your fund. It is categorized by broad-based asset classes.
| | | | | | | | |
| | |
| Issuer | | Shares/Par | | | Value ($) | |
| COMMON STOCKS – 95.7% | | | | | | | | |
| Cable TV – 4.9% | | | | | |
| Altice USA, Inc., “A” (a) | | | 467,425 | | | $ | 12,779,400 | |
| Charter Communications, Inc., “A” (a) | | | 33,227 | | | | 16,117,753 | |
| Comcast Corp., “A” | | | 521,994 | | | | 23,474,070 | |
| NOS, SGPS S.A. | | | 1,881,810 | | | | 10,131,966 | |
| | | | | | | | |
| | | | | | $ | 62,503,189 | |
| | | | | | | | |
| Natural Gas – Distribution – 4.5% | | | | | |
| China Resources Gas Group Ltd. | | | 2,210,000 | | | $ | 12,138,650 | |
| NiSource, Inc. | | | 602,721 | | | | 16,779,752 | |
| Sempra Energy | | | 195,783 | | | | 29,657,209 | |
| | | | | | | | |
| | | | | | $ | 58,575,611 | |
| | | | | | | | |
| Natural Gas – Pipeline – 10.8% | | | | | |
| Cheniere Energy, Inc. (a) | | | 520,985 | | | $ | 31,816,554 | |
| Enbridge, Inc. | | | 223,436 | | | | 8,883,756 | |
| Enterprise Products Partners LP | | | 1,198,663 | | | | 33,754,350 | |
| EQM Midstream Partners LP | | | 379,460 | | | | 11,349,649 | |
| Equitrans Midstream Corp. | | | 389,762 | | | | 5,207,220 | |
| Plains All American Pipeline LP | | | 1,072,288 | | | | 19,719,376 | |
| TC Energy Corp. | | | 531,044 | | | | 28,283,087 | |
| | | | | | | | |
| | | | | | $ | 139,013,992 | |
| | | | | | | | |
| Telecommunications – Wireless – 7.4% | | | | | |
| Advanced Info Service Public Co. Ltd. | | | 1,534,500 | | | $ | 10,911,772 | |
| American Tower Corp., REIT | | | 61,476 | | | | 14,128,415 | |
| Cellnex Telecom S.A. | | | 313,260 | | | | 13,482,594 | |
| KDDI Corp. | | | 410,000 | | | | 12,197,415 | |
| Millicom International Cellular S.A., SDR | | | 119,085 | | | | 5,703,559 | |
| Mobile TeleSystems PJSC, ADR | | | 589,505 | | | | 5,983,476 | |
| Rogers Communications, Inc., “B” | | | 267,264 | | | | 13,271,097 | |
| Tele2 AB, “B” | | | 846,392 | | | | 12,276,111 | |
| Vodafone Group PLC | | | 3,958,719 | | | | 7,695,681 | |
| | | | | | | | |
| | | | | | $ | 95,650,120 | |
| | | | | | | | |
| Telephone Services – 2.7% | | | | | |
| Hellenic Telecommunications Organization S.A. | | | 539,978 | | | $ | 8,637,186 | |
| Koninklijke KPN N.V. | | | 1,625,582 | | | | 4,797,406 | |
| Telesites S.A.B. de C.V. (a) | | | 5,534,000 | | | | 4,097,633 | |
| TELUS Corp. | | | 460,442 | | | | 17,828,365 | |
| | | | | | | | |
| | | | | | $ | 35,360,590 | |
| | | | | | | | |
| Utilities – Electric Power – 65.4% | | | | | |
| AES Corp. | | | 1,034,568 | | | $ | 20,587,903 | |
| AltaGas Ltd. | | | 1,407,450 | | | | 21,438,806 | |
| American Electric Power Co., Inc. | | | 370,717 | | | | 35,036,464 | |
| CenterPoint Energy, Inc. | | | 1,100,711 | | | | 30,016,389 | |
| Clearway Energy, Inc., “A” | | | 296,134 | | | | 5,662,082 | |
| CLP Holdings Ltd. | | | 552,000 | | | | 5,801,727 | |
| Dominion Energy, Inc. | | | 659,206 | | | | 54,595,441 | |
| Duke Energy Corp. | | | 366,236 | | | | 33,404,386 | |
| Edison International | | | 379,465 | | | | 28,615,456 | |
| | | | | | | | |
| | |
Issuer | | Shares/Par | | | Value ($) | |
| COMMON STOCKS – continued | | | | | |
| Utilities – Electric Power – continued | | | | | |
| EDP Renovaveis S.A. | | | 6,170,424 | | | $ | 72,674,326 | |
| Emera, Inc. | | | 310,221 | | | | 13,328,119 | |
| Enel S.p.A. | | | 4,415,164 | | | | 35,024,004 | |
| Energias de Portugal S.A. | | | 3,289,103 | | | | 14,255,790 | |
| Entergy Corp. | | | 353,116 | | | | 42,303,297 | |
| Equatorial Energia S.A. | | | 1,065,500 | | | | 6,036,429 | |
| Evergy, Inc. | | | 400,760 | | | | 26,085,468 | |
| Exelon Corp. | | | 1,349,424 | | | | 61,520,242 | |
| FirstEnergy Corp. | | | 1,200,366 | | | | 58,337,788 | |
| Iberdrola S.A. | | | 2,663,707 | | | | 27,428,739 | |
| National Grid PLC | | | 1,653,297 | | | | 20,679,763 | |
| Neoenergia S.A. | | | 844,400 | | | | 5,222,530 | |
| NextEra Energy Partners LP | | | 292,441 | | | | 15,397,019 | |
| NextEra Energy, Inc. | | | 339,771 | | | | 82,278,948 | |
| NRG Energy, Inc. | | | 393,429 | | | | 15,638,803 | |
| NTPC Ltd. | | | 3,166,407 | | | | 5,281,179 | |
| Public Service Enterprise Group, Inc. | | | 599,200 | | | | 35,382,760 | |
| RWE AG | | | 604,545 | | | | 18,546,530 | |
| SSE PLC | | | 1,112,637 | | | | 21,200,595 | |
| Vistra Energy Corp. | | | 1,408,788 | | | | 32,388,036 | |
| | | | | | | | |
| | | | | | $ | 844,169,019 | |
| | | | | | | | |
Total Common Stocks
(Identified Cost, $929,385,720) | | | | | | $ | 1,235,272,521 | |
| | | | | | | | |
|
| CONVERTIBLE PREFERRED STOCKS – 3.2% | |
| Natural Gas – Distribution – 1.7% | | | | | | | | |
| Sempra Energy, 6% | | | 64,703 | | | $ | 7,765,654 | |
| Sempra Energy, 6.75% | | | 64,868 | | | | 7,723,833 | |
| South Jersey Industries, Inc., 7.25% | | | 114,261 | | | | 5,931,289 | |
| | | | | | | | |
| | | | | | $ | 21,420,776 | |
| | | | | | | | |
| Utilities – Electric Power – 1.5% | | | | | | | | |
| American Electric Power Co., Inc., 6.125% | | | 21,150 | | | $ | 1,144,849 | |
| CenterPoint Energy, Inc., 7% | | | 183,736 | | | | 8,955,293 | |
| Dominion Energy, Inc., 7.25% | | | 88,614 | | | | 9,480,812 | |
| | | | | | | | |
| | | | | | $ | 19,580,954 | |
| | | | | | | | |
Total Convertible Preferred Stocks
(Identified Cost, $37,935,333) | | | $ | 41,001,730 | |
| | | | | | | | |
| |
| INVESTMENT COMPANIES (h) – 1.0% | | | | | |
| Money Market Funds – 1.0% | | | | | | | | |
| MFS Institutional Money Market Portfolio, 1.7% (v) (Identified Cost, $13,336,599) | | | 13,336,599 | | | $ | 13,336,599 | |
| | | | | | | | |
OTHER ASSETS, LESS
LIABILITIES – 0.1% | | | | | | | 682,542 | |
| | | | | | | | |
| NET ASSETS – 100.0% | | | | | | $ | 1,290,293,392 | |
| | | | | | | | |
8
MFS Utilities Series
Portfolio of Investments – continued
| (a) | | Non-income producing security. |
| (h) | | An affiliated issuer, which may be considered one in which the fund owns 5% or more of the outstanding voting securities, or a company which is under common control. At period end, the aggregate values of the fund’s investments in affiliated issuers and in unaffiliated issuers were $13,336,599 and $1,276,274,251, respectively. |
| (v) | | Affiliated issuer that is available only to investment companies managed by MFS. The rate quoted for the MFS Institutional Money Market Portfolio is the annualizedseven-day yield of the fund at period end. |
The following abbreviations are used in this report and are defined:
| ADR | | American Depositary Receipt |
| REIT | | Real Estate Investment Trust |
| SDR | | Swedish Depository Receipt |
Abbreviations indicate amounts shown in currencies other than the U.S. dollar. All amounts are stated in U.S. dollars unless otherwise indicated. A list of abbreviations is shown below:
Derivative Contracts at 12/31/19
Forward Foreign Currency Exchange Contracts
| | | | | | | | | | | | | | | | | | | | | | | | |
| Currency Purchased | | | Currency Sold | | Counterparty | | Settlement Date
| | | Unrealized
Appreciation (Depreciation) | |
| Asset Derivatives | | | | | | | | | | | | | | | | | | | | | |
| CAD | | | 1,059,619 | | | | | | | | USD | | | 801,364 | | Merrill Lynch International | | | 2/28/2020 | | | | $14,815 | |
| CAD | | | 2,175,739 | | | | | | | | USD | | | 1,641,546 | | State Street Bank Corp. | | | 2/28/2020 | | | | 34,331 | |
| EUR | | | 188,660 | | | | | | | | USD | | | 211,804 | | Morgan Stanley Capital Services, Inc. | | | 2/28/2020 | | | | 555 | |
| GBP | | | 309,782 | | | | | | | | USD | | | 409,396 | | HSBC Bank | | | 2/28/2020 | | | | 1,580 | |
| GBP | | | 595,756 | | | | | | | | USD | | | 781,157 | | State Street Bank Corp. | | | 2/28/2020 | | | | 9,208 | |
| SEK | | | 11,851,687 | | | | | | | | USD | | | 1,261,250 | | Brown Brothers Harriman | | | 2/28/2020 | | | | 7,509 | |
| SEK | | | 12,589,878 | | | | | | | | USD | | | 1,341,732 | | Morgan Stanley Capital Services, Inc. | | | 2/28/2020 | | | | 6,053 | |
| SEK | | | 8,371,603 | | | | | | | | USD | | | 890,183 | | State Street Bank Corp. | | | 2/28/2020 | | | | 6,023 | |
| USD | | | 2,527,593 | | | | | | | | GBP | | | 1,890,000 | | UBS AG | | | 2/28/2020 | | | | 20,208 | |
| | | | | | | | | | | | | | | | | | | | | | | | |
| | | | | | | | | | | | | | | | | | | | | | | $100,282 | |
| | | | | | | | | | | | | | | | | | | | | | | | |
| Liability Derivatives | | | | | | | | | | | | | |
| GBP | | | 1,234,281 | | | | | | | | USD | | | 1,649,841 | | Morgan Stanley Capital Services, Inc. | | | 2/28/2020 | | | | $(12,370 | ) |
| SEK | | | 11,188,193 | | | | | | | | USD | | | 1,202,631 | | Morgan Stanley Capital Services, Inc. | | | 2/28/2020 | | | | (4,901 | ) |
| USD | | | 1,332,455 | | | | | | | | CAD | | | 1,754,392 | | Morgan Stanley Capital Services, Inc. | | | 2/28/2020 | | | | (18,877 | ) |
| USD | | | 65,850,201 | | | | | | | | CAD | | | 87,107,106 | | State Street Bank Corp. | | | 2/28/2020 | | | | (1,244,627 | ) |
| USD | | | 5,332,902 | | | | | | | | EUR | | | 4,795,150 | | BNP Paribas S.A. | | | 2/28/2020 | | | | (64,606 | ) |
| USD | | | 607,764 | | | | | | | | EUR | | | 544,781 | | Brown Brothers Harriman | | | 2/28/2020 | | | | (5,452 | ) |
| USD | | | 64,968,836 | | | | | | | | EUR | | | 58,647,884 | | Deutsche Bank AG | | | 2/18/2020 | | | | (1,005,002 | ) |
| USD | | | 52,456,691 | | | | | | | | EUR | | | 47,170,526 | | Deutsche Bank AG | | | 2/28/2020 | | | | (639,309 | ) |
| USD | | | 540,238 | | | | | | | | EUR | | | 483,535 | | Morgan Stanley Capital Services, Inc. | | | 2/28/2020 | | | | (4,037 | ) |
| USD | | | 31,335,293 | | | | | | | | GBP | | | 23,694,611 | | Merrill Lynch International | | | 2/28/2020 | | | | (99,376 | ) |
| USD | | | 16,297,993 | | | | | | | | SEK | | | 154,116,269 | | Deutsche Bank AG | | | 2/28/2020 | | | | (200,630 | ) |
| | | | | | | | | | | | | | | | | | | | | | | | |
| | | | | | | | | | | | | | | | | | | | | | | $(3,299,187 | ) |
| | | | | | | | | | | | | | | | | | | | | | | | |
At December 31, 2019, the fund had cash collateral of $1,550,000 to cover any collateral or margin obligations for certain derivative contracts. Restricted cash and/or deposits with brokers in the Statement of Assets and Liabilities are comprised of cash collateral.
See Notes to Financial Statements
9
MFS Utilities Series
FINANCIAL STATEMENTS | STATEMENT OF ASSETS AND LIABILITIES
This statement represents your fund’s balance sheet, which details the assets and liabilities comprising the total value of the fund.
| | | | |
At 12/31/19 | | | | |
| |
Assets | | | | |
Investments in unaffiliated issuers, at value (identified cost, $967,321,053) | | | $1,276,274,251 | |
Investments in affiliated issuers, at value (identified cost, $13,336,599) | | | 13,336,599 | |
Restricted cash for | | | | |
Forward foreign currency exchange contracts | | | 1,550,000 | |
Receivables for | | | | |
Forward foreign currency exchange contracts | | | 100,282 | |
Investments sold | | | 1,877,345 | |
Fund shares sold | | | 259,553 | |
Interest and dividends | | | 2,575,681 | |
Other assets | | | 4,973 | |
Total assets | | | $1,295,978,684 | |
| |
Liabilities | | | | |
Payables for | | | | |
Forward foreign currency exchange contracts | | | $3,299,187 | |
Fund shares reacquired | | | 1,734,420 | |
Payable to affiliates | | | | |
Investment adviser | | | 51,423 | |
Administrative services fee | | | 936 | |
Shareholder servicing costs | | | 1,418 | |
Distribution and/or service fees | | | 10,031 | |
Payable for independent Trustees’ compensation | | | 14 | |
Deferred country tax expense payable | | | 316,126 | |
Accrued expenses and other liabilities | | | 271,737 | |
Total liabilities | | | $5,685,292 | |
Net assets | | | $1,290,293,392 | |
| |
Net assets consist of | | | | |
Paid-in capital | | | $917,003,096 | |
Total distributable earnings (loss) | | | 373,290,296 | |
Net assets | | | $1,290,293,392 | |
Shares of beneficial interest outstanding | | | 37,050,374 | |
| | | | | | | | | | | | |
| | | |
| | | Net assets | | | Shares
outstanding | | | Net asset value
per share | |
Initial Class | | | $556,301,408 | | | | 15,810,906 | | | | $35.18 | |
Service Class | | | 733,991,984 | | | | 21,239,468 | | | | 34.56 | |
See Notes to Financial Statements
10
MFS Utilities Series
FINANCIAL STATEMENTS | STATEMENT OF OPERATIONS
This statement describes how much your fund earned in investment income and accrued in expenses. It also describes any gains and/or losses generated by fund operations.
| | | | |
Year ended 12/31/19 | | | | |
| |
Net investment income (loss) | | | | |
Income | | | | |
Dividends | | | $46,929,242 | |
Dividends from affiliated issuers | | | 636,517 | |
Other | | | 90,413 | |
Income on securities loaned | | | 3,698 | |
Foreign taxes withheld | | | (2,113,617 | ) |
Total investment income | | | $45,546,253 | |
Expenses | | | | |
Management fee | | | $9,684,438 | |
Distribution and/or service fees | | | 1,936,550 | |
Shareholder servicing costs | | | 29,480 | |
Administrative services fee | | | 186,989 | |
Independent Trustees’ compensation | | | 27,389 | |
Custodian fee | | | 173,554 | |
Shareholder communications | | | 124,594 | |
Audit and tax fees | | | 63,672 | |
Legal fees | | | 13,675 | |
Miscellaneous | | | 47,925 | |
Total expenses | | | $12,288,266 | |
Reduction of expenses by investment adviser | | | (127,946 | ) |
Net expenses | | | $12,160,320 | |
Net investment income (loss) | | | $33,385,933 | |
| |
Realized and unrealized gain (loss) | | | | |
Realized gain (loss) (identified cost basis) | | | | |
Unaffiliated issuers (net of $121,570 country tax) | | | $40,971,116 | |
Affiliated issuers | | | 4,610 | |
Forward foreign currency exchange contracts | | | 10,851,781 | |
Foreign currency | | | (36,592 | ) |
Net realized gain (loss) | | | $51,790,915 | |
Change in unrealized appreciation or depreciation | | | | |
Unaffiliated issuers (net of $244,009 increase in deferred country tax) | | | $211,754,878 | |
Affiliated issuers | | | (38 | ) |
Forward foreign currency exchange contracts | | | (7,277,804 | ) |
Translation of assets and liabilities in foreign currencies | | | 8,122 | |
Net unrealized gain (loss) | | | $204,485,158 | |
Net realized and unrealized gain (loss) | | | $256,276,073 | |
Change in net assets from operations | | | $289,662,006 | |
See Notes to Financial Statements
11
MFS Utilities Series
FINANCIAL STATEMENTS | STATEMENTS OF CHANGES IN NET ASSETS
These statements describe the increases and/or decreases in net assets resulting from operations, any distributions, and any shareholder transactions.
| | | | | | | | |
| | | Year ended | |
| | | 12/31/19 | | | 12/31/18 | |
Change in net assets | | | | | | | | |
| | |
From operations | | | | | | | | |
Net investment income (loss) | | | $33,385,933 | | | | $41,660,202 | |
Net realized gain (loss) | | | 51,790,915 | | | | 61,480,364 | |
Net unrealized gain (loss) | | | 204,485,158 | | | | (82,273,229 | ) |
Change in net assets from operations | | | $289,662,006 | | | | $20,867,337 | |
Total distributions to shareholders | | | $(55,125,457 | ) | | | $(19,792,653 | ) |
Change in net assets from fund share transactions | | | $(164,373,912 | ) | | | $(363,898,666 | ) |
Total change in net assets | | | $70,162,637 | | | | $(362,823,982 | ) |
| | |
Net assets | | | | | | | | |
At beginning of period | | | 1,220,130,755 | | | | 1,582,954,737 | |
At end of period | | | $1,290,293,392 | | | | $1,220,130,755 | |
See Notes to Financial Statements
12
MFS Utilities Series
FINANCIAL STATEMENTS | FINANCIAL HIGHLIGHTS
The financial highlights table is intended to help you understand the fund’s financial performance for the past 5 years. Certain information reflects financial results for a single fund share. The total returns in the table represent the rate that an investor would have earned (or lost) on an investment in the fund share class (assuming reinvestment of all distributions) held for the entire period.
| | | | | | | | | | | | | | | | | | | | |
| Initial Class | | Year ended | |
| | | | | |
| | | 12/31/19 | | | 12/31/18 | | | 12/31/17 | | | 12/31/16 | | | 12/31/15 | |
| | | | | |
Net asset value, beginning of period | | | $29.38 | | | | $29.50 | | | | $26.81 | | | | $25.56 | | | | $33.97 | |
| | | | | |
| Income (loss) from investment operations | | | | | | | | | | | | | | | | | | | | |
Net investment income (loss) (d) | | | $0.90 | | | | $0.89 | | | | $0.81 | | | | $1.06 | (c) | | | $0.81 | |
Net realized and unrealized gain (loss) | | | 6.37 | | | | (0.56 | ) | | | 3.17 | | | | 1.91 | | | | (5.56 | ) |
Total from investment operations | | | $7.27 | | | | $0.33 | | | | $3.98 | | | | $2.97 | | | | $(4.75 | ) |
| | | | | |
| Less distributions declared to shareholders | | | | | | | | | | | | | | | | | | | | |
From net investment income | | | $(1.37 | ) | | | $(0.33 | ) | | | $(1.29 | ) | | | $(1.08 | ) | | | $(1.38 | ) |
From net realized gain | | | (0.10 | ) | | | (0.12 | ) | | | — | | | | (0.64 | ) | | | (2.28 | ) |
Total distributions declared to shareholders | | | $(1.47 | ) | | | $(0.45 | ) | | | $(1.29 | ) | | | $(1.72 | ) | | | $(3.66 | ) |
Net asset value, end of period (x) | | | $35.18 | | | | $29.38 | | | | $29.50 | | | | $26.81 | | | | $25.56 | |
Total return (%) (k)(r)(s)(x) | | | 25.07 | | | | 1.06 | | | | 14.83 | | | | 11.47 | (c) | | | (14.54 | ) |
| | | | | |
Ratios (%) (to average net assets)
and Supplemental data: | | | | | | | | | | | | | | | | | | | | |
Expenses before expense reductions (f) | | | 0.79 | | | | 0.78 | | | | 0.80 | | | | 0.77 | (c) | | | 0.79 | |
Expenses after expense reductions (f) | | | 0.78 | | | | 0.78 | | | | 0.79 | | | | 0.77 | (c) | | | 0.78 | |
Net investment income (loss) | | | 2.69 | | | | 2.98 | | | | 2.78 | | | | 3.89 | (c) | | | 2.59 | |
Portfolio turnover | | | 28 | | | | 27 | | | | 27 | | | | 33 | | | | 42 | |
Net assets at end of period (000 omitted) | | | $556,301 | | | | $492,930 | | | | $561,744 | | | | $556,607 | | | | $561,517 | |
| |
| Service Class | | Year ended | |
| | | | | |
| | | 12/31/19 | | | 12/31/18 | | | 12/31/17 | | | 12/31/16 | | | 12/31/15 | |
| | | | | |
Net asset value, beginning of period | | | $28.86 | | | | $28.98 | | | | $26.37 | | | | $25.15 | | | | $33.48 | |
| | | | | |
| Income (loss) from investment operations | | | | | | | | | | | | | | | | | | | | |
Net investment income (loss) (d) | | | $0.80 | | | | $0.81 | | | | $0.73 | | | | $0.97 | (c) | | | $0.72 | |
Net realized and unrealized gain (loss) | | | 6.27 | | | | (0.56 | ) | | | 3.09 | | | | 1.90 | | | | (5.47 | ) |
Total from investment operations | | | $7.07 | | | | $0.25 | | | | $3.82 | | | | $2.87 | | | | $(4.75 | ) |
| | | | | |
| Less distributions declared to shareholders | | | | | | | | | | | | | | | | | | | | |
From net investment income | | | $(1.27 | ) | | | $(0.25 | ) | | | $(1.21 | ) | | | $(1.01 | ) | | | $(1.30 | ) |
From net realized gain | | | (0.10 | ) | | | (0.12 | ) | | | — | | | | (0.64 | ) | | | (2.28 | ) |
Total distributions declared to shareholders | | | $(1.37 | ) | | | $(0.37 | ) | | | $(1.21 | ) | | | $(1.65 | ) | | | $(3.58 | ) |
Net asset value, end of period (x) | | | $34.56 | | | | $28.86 | | | | $28.98 | | | | $26.37 | | | | $25.15 | |
Total return (%) (k)(r)(s)(x) | | | 24.80 | | | | 0.81 | | | | 14.49 | | | | 11.24 | (c) | | | (14.76 | ) |
| | | | | |
Ratios (%) (to average net assets)
and Supplemental data: | | | | | | | | | | | | | | | | | | | | |
Expenses before expense reductions (f) | | | 1.04 | | | | 1.04 | | | | 1.05 | | | | 1.02 | (c) | | | 1.04 | |
Expenses after expense reductions (f) | | | 1.03 | | | | 1.03 | | | | 1.04 | | | | 1.02 | (c) | | | 1.03 | |
Net investment income (loss) | | | 2.44 | | | | 2.76 | | | | 2.53 | | | | 3.64 | (c) | | | 2.34 | |
Portfolio turnover | | | 28 | | | | 27 | | | | 27 | | | | 33 | | | | 42 | |
Net assets at end of period (000 omitted) | | | $733,992 | | | | $727,201 | | | | $1,021,211 | | | | $998,836 | | | | $967,824 | |
See Notes to Financial Statements
13
MFS Utilities Series
Financial Highlights – continued
| (c) | Amount reflects aone-time reimbursement of expenses by the custodian (or former custodian) without which net investment income and performance would be lower and expenses would be higher. |
| (d) | Per share data is based on average shares outstanding. |
| (f) | Ratios do not reflect reductions from fees paid indirectly, if applicable. |
| (k) | The total return does not reflect expenses that apply to separate accounts. Inclusion of these charges would reduce the total return figures for all periods shown. |
| (r) | Certain expenses have been reduced without which performance would have been lower. |
| (s) | From time to time the fund may receive proceeds from litigation settlements, without which performance would be lower. |
| (x) | The net asset values and total returns have been calculated on net assets which include adjustments made in accordance with U.S. generally accepted accounting principles required at period end for financial reporting purposes. |
See Notes to Financial Statements
14
MFS Utilities Series
NOTES TO FINANCIAL STATEMENTS
| (1) | | Business and Organization |
MFS Utilities Series (the fund) is a diversified series of MFS Variable Insurance Trust (the trust). The trust is organized as a Massachusetts business trust and is registered under the Investment Company Act of 1940, as amended, as anopen-end management investment company. The shareholders of each series of the trust are separate accounts of insurance companies, which offer variable annuity and/or life insurance products, and qualified retirement and pension plans.
The fund is an investment company and accordingly follows the investment company accounting and reporting guidance of the Financial Accounting Standards Board (FASB) Accounting Standards Codification Topic 946 Financial Services – Investment Companies.
| (2) | | Significant Accounting Policies |
General– The preparation of financial statements in conformity with U.S. generally accepted accounting principles requires management to make estimates and assumptions that affect the reported amounts of assets and liabilities, and disclosure of contingent assets and liabilities at the date of the financial statements and the reported amounts of increases and decreases in net assets from operations during the reporting period. Actual results could differ from those estimates. In the preparation of these financial statements, management has evaluated subsequent events occurring after the date of the fund’s Statement of Assets and Liabilities through the date that the financial statements were issued. The fund invests primarily in securities of issuers in the utility industry. Issuers in a single industry can react similarly to market, currency, political, economic, regulatory, geopolitical, and other conditions. The value of stocks in the utilities sector can be very volatile due to supply and/or demand for services or fuel, financing costs, conservation efforts, the negative impact of regulation, and other factors. The fund invests in foreign securities. Investments in foreign securities are vulnerable to the effects of changes in the relative values of the local currency and the U.S. dollar and to the effects of changes in each country’s market, economic, industrial, political, regulatory, geopolitical, and other conditions.
Balance Sheet Offsetting– The fund’s accounting policy with respect to balance sheet offsetting is that, absent an event of default by the counterparty or a termination of the agreement, the International Swaps and Derivatives Association (ISDA) Master Agreement, or similar agreement, does not result in an offset of reported amounts of financial assets and financial liabilities in the Statement of Assets and Liabilities across transactions between the fund and the applicable counterparty. The fund’s right to setoff may be restricted or prohibited by the bankruptcy or insolvency laws of the particular jurisdiction to which a specific master netting agreement counterparty is subject. Balance sheet offsetting disclosures, to the extent applicable to the fund, have been included in the fund’s Significant Accounting Policies note under the captions for each of the fund’sin-scope financial instruments and transactions.
Investment Valuations– Equity securities, including restricted equity securities, are generally valued at the last sale or official closing price on their primary market or exchange as provided by a third-party pricing service. Equity securities, for which there were no sales reported that day, are generally valued at the last quoted daily bid quotation on their primary market or exchange as provided by a third-party pricing service. Short-term instruments with a maturity at issuance of 60 days or less may be valued at amortized cost, which approximates market value. Forward foreign currency exchange contracts are generally valued at the mean of bid and asked prices for the time period interpolated from rates provided by a third-party pricing service for proximate time periods.Open-end investment companies are generally valued at net asset value per share. Securities and other assets generally valued on the basis of information from a third-party pricing service may also be valued at a broker/dealer bid quotation. In determining values, third-party pricing services can utilize both transaction data and market information such as yield, quality, coupon rate, maturity, type of issue, trading characteristics, and other market data. The values of foreign securities and other assets and liabilities expressed in foreign currencies are converted to U.S. dollars using the mean of bid and asked prices for rates provided by a third-party pricing service.
The Board of Trustees has delegated primary responsibility for determining or causing to be determined the value of the fund’s investments (including any fair valuation) to the adviser pursuant to valuation policies and procedures approved by the Board. If the adviser determines that reliable market quotations are not readily available, investments are valued at fair value as determined in good faith by the adviser in accordance with such procedures under the oversight of the Board of Trustees. Under the fund’s valuation policies and procedures, market quotations are not considered to be readily available for most types of debt instruments and floating rate loans and many types of derivatives. These investments are generally valued at fair value based on information from third-party pricing services. In addition, investments may be valued at fair value if the adviser determines that an investment’s value has been materially affected by events occurring after the close of the exchange or market on which the investment is principally traded (such as foreign exchange or market) and prior to the determination of the fund’s net asset value, or after the halt of trading of a specific security where trading does not resume prior to the close of the exchange or market on which the security is principally traded. Events that occur after foreign markets close (such as developments in foreign markets and significant movements in the U.S. markets) and prior to the determination of the fund’s net asset value may be deemed to have a material effect on the value of securities traded in foreign markets. Accordingly, the fund’s foreign equity securities may often be valued at fair value. The adviser generally relies on third-party pricing services or other information (such as the correlation with price movements of similar securities
15
MFS Utilities Series
Notes to Financial Statements – continued
in the same or other markets; the type, cost and investment characteristics of the security; the business and financial condition of the issuer; and trading and other market data) to assist in determining whether to fair value and at what value to fair value an investment. The value of an investment for purposes of calculating the fund’s net asset value can differ depending on the source and method used to determine value. When fair valuation is used, the value of an investment used to determine the fund’s net asset value may differ from quoted or published prices for the same investment. There can be no assurance that the fund could obtain the fair value assigned to an investment if it were to sell the investment at the same time at which the fund determines its net asset value per share.
Various inputs are used in determining the value of the fund’s assets or liabilities. These inputs are categorized into three broad levels. In certain cases, the inputs used to measure fair value may fall into different levels of the fair value hierarchy. In such cases, an investment’s level within the fair value hierarchy is based on the lowest level of input that is significant to the fair value measurement. The fund’s assessment of the significance of a particular input to the fair value measurement in its entirety requires judgment, and considers factors specific to the investment. Level 1 includes unadjusted quoted prices in active markets for identical assets or liabilities. Level 2 includes other significant observable market-based inputs (including quoted prices for similar securities, interest rates, prepayment speed, and credit risk). Level 3 includes unobservable inputs, which may include the adviser’s own assumptions in determining the fair value of investments. Other financial instruments are derivative instruments, such as forward foreign currency exchange contracts. The following is a summary of the levels used as of December 31, 2019 in valuing the fund’s assets or liabilities:
| | | | | | | | | | | | | | | | |
| Financial Instruments | | Level 1 | | | Level 2 | | | Level 3 | | | Total | |
| Equity Securities: | | | | | | | | | | | | | | | | |
United States | | | $833,035,960 | | | | $— | | | | $— | | | | $833,035,960 | |
Canada | | | 103,033,230 | | | | — | | | | — | | | | 103,033,230 | |
Portugal | | | 97,062,082 | | | | — | | | | — | | | | 97,062,082 | |
United Kingdom | | | 49,576,039 | | | | — | | | | — | | | | 49,576,039 | |
Spain | | | 40,911,333 | | | | — | | | | — | | | | 40,911,333 | |
Italy | | | 35,024,004 | | | | — | | | | — | | | | 35,024,004 | |
Germany | | | 18,546,530 | | | | — | | | | — | | | | 18,546,530 | |
Sweden | | | 17,979,670 | | | | — | | | | — | | | | 17,979,670 | |
Japan | | | — | | | | 12,197,415 | | | | — | | | | 12,197,415 | |
Other Countries | | | 57,996,216 | | | | 10,911,772 | | | | — | | | | 68,907,988 | |
| Mutual Funds | | | 13,336,599 | | | | — | | | | — | | | | 13,336,599 | |
| Total | | | $1,266,501,663 | | | | $23,109,187 | | | | $— | | | | $1,289,610,850 | |
| | | | |
| Other Financial Instruments | | | | | | | | | | | | |
| Forward Foreign Currency Exchange Contracts – Assets | | | $— | | | | $100,282 | | | | $— | | | | $100,282 | |
| Forward Foreign Currency Exchange Contracts – Liabilities | | | — | | | | (3,299,187 | ) | | | — | | | | (3,299,187 | ) |
For further information regarding security characteristics, see the Portfolio of Investments.
Foreign Currency Translation– Purchases and sales of foreign investments, income, and expenses are converted into U.S. dollars based upon currency exchange rates prevailing on the respective dates of such transactions or on the reporting date for foreign denominated receivables and payables. Gains and losses attributable to foreign currency exchange rates on sales of securities are recorded for financial statement purposes as net realized gains and losses on investments. Gains and losses attributable to foreign exchange rate movements on receivables, payables, income and expenses are recorded for financial statement purposes as foreign currency transaction gains and losses. That portion of both realized and unrealized gains and losses on investments that results from fluctuations in foreign currency exchange rates is not separately disclosed.
Derivatives– The fund uses derivatives primarily to increase or decrease exposure to a particular market or segment of the market, or security, to increase or decrease interest rate or currency exposure, or as alternatives to direct investments. Derivatives are used for hedging ornon-hedging purposes. While hedging can reduce or eliminate losses, it can also reduce or eliminate gains. When the fund uses derivatives as an investment to increase market exposure, or for hedging purposes, gains and losses from derivative instruments may be substantially greater than the derivative’s original cost.
The derivative instruments used by the fund during the period were forward foreign currency exchange contracts. Depending on the type of derivative, the fund may exit a derivative position by entering into an offsetting transaction with a counterparty or exchange, negotiating an agreement with the derivative counterparty, or novating the position to a third party. The fund’s period end derivatives, as presented in the Portfolio of Investments and the associated Derivative Contract tables, generally are indicative of the volume of its derivative activity during the period.
16
MFS Utilities Series
Notes to Financial Statements – continued
The following table presents, by major type of derivative contract, the fair value, on a gross basis, of the asset and liability components of derivatives held by the fund at December 31, 2019 as reported in the Statement of Assets and Liabilities:
| | | | | | | | | | |
| | | | | Fair Value | |
| Risk | | Derivative Contracts | | Asset Derivatives | | | Liability Derivatives | |
| Foreign Exchange | | Forward Foreign Currency Exchange Contracts | | | $100,282 | | | | $(3,299,187 | ) |
The following table presents, by major type of derivative contract, the realized gain (loss) on derivatives held by the fund for the year ended December 31, 2019 as reported in the Statement of Operations:
| | | | |
| Risk | | Forward Foreign
Currency Exchange
Contracts | |
| Foreign Exchange | | | $10,851,781 | |
The following table presents, by major type of derivative contract, the change in unrealized appreciation or depreciation on derivatives held by the fund for the year ended December 31, 2019 as reported in the Statement of Operations:
| | | | |
| Risk | | Forward Foreign
Currency Exchange
Contracts | |
| Foreign Exchange | | | $(7,277,804 | ) |
Derivative counterparty credit risk is managed through formal evaluation of the creditworthiness of all potential counterparties. On certain, but not all, uncleared derivatives, the fund attempts to reduce its exposure to counterparty credit risk whenever possible by entering into an ISDA Master Agreement on a bilateral basis. The ISDA Master Agreement gives each party to the agreement the right to terminate all transactions traded under such agreement if there is a specified deterioration in the credit quality of the other party. Upon an event of default or a termination of the ISDA Master Agreement, thenon-defaulting party has the right to close out all transactions traded under such agreement and to net amounts owed under each agreement to one net amount payable by one party to the other. This right to close out and net payments across all transactions traded under the ISDA Master Agreement could result in a reduction of the fund’s credit risk to such counterparty equal to any amounts payable by the fund under the applicable transactions, if any.
Collateral and margin requirements differ by type of derivative. For cleared derivatives (e.g., futures contracts, cleared swaps, and exchange-traded options), margin requirements are set by the clearing broker and the clearing house and collateral, in the form of cash or securities, is posted by the fund directly with the clearing broker. Collateral terms are counterparty agreement specific for uncleared derivatives (e.g., forward foreign currency exchange contracts, uncleared swap agreements, and uncleared options) and collateral, in the form of cash and securities, is held in segregated accounts with the fund’s custodian in connection with these agreements. For derivatives traded under an ISDA Master Agreement, which contains a collateral support annex, the collateral requirements are netted across all transactions traded under such counterparty-specific agreement and an amount is posted from one party to the other to collateralize such obligations. Cash that has been segregated or delivered to cover the fund’s collateral or margin obligations under derivative contracts, if any, will be reported separately in the Statement of Assets and Liabilities as restricted cash for uncleared derivatives and/or deposits with brokers for cleared derivatives. Securities pledged as collateral or margin for the same purpose, if any, are noted in the Portfolio of Investments. The fund may be required to make payments of interest on uncovered collateral or margin obligations with the broker. Any such payments are included in “Miscellaneous” expense in the Statement of Operations.
Forward Foreign Currency Exchange Contracts– The fund entered into forward foreign currency exchange contracts for the purchase or sale of a specific foreign currency at a fixed price on a future date. These contracts may be used to hedge the fund’s currency risk or fornon-hedging purposes. For hedging purposes, the fund may enter into contracts to deliver or receive foreign currency that the fund will receive from or use in its normal investment activities. The fund may also use contracts to hedge against declines in the value of foreign currency denominated securities due to unfavorable exchange rate movements. Fornon-hedging purposes, the fund may enter into contracts with the intent of changing the relative exposure of the fund’s portfolio of securities to different currencies to take advantage of anticipated exchange rate changes.
Forward foreign currency exchange contracts are adjusted by the daily exchange rate of the underlying currency and any unrealized gains or losses are recorded as a receivable or payable for forward foreign currency exchange contracts until the contract settlement date. On contract settlement date, any gain or loss on the contract is recorded as realized gains or losses on forward foreign currency exchange contracts.
Risks may arise upon entering into these contracts from unanticipated movements in the value of the contract and from the potential inability of counterparties to meet the terms of their contracts. Generally, the fund’s maximum risk due to counterparty credit risk is the unrealized gain on the contract due to the use of Continuous Linked Settlement, a multicurrency cash settlement system for the
17
MFS Utilities Series
Notes to Financial Statements – continued
centralized settlement of foreign transactions. This risk is mitigated in cases where there is an ISDA Master Agreement between the fund and the counterparty providing for netting as described above and, where applicable, by the posting of collateral by the counterparty to the fund to cover the fund’s exposure to the counterparty under such ISDA Master Agreement.
Security Loans– Under its Securities Lending Agency Agreement with the fund, State Street Bank and Trust Company, as lending agent, loans the securities of the fund to certain qualified institutions (the “Borrowers”) approved by the fund. Security loans can be terminated at the discretion of either the lending agent or the fund and the related securities must be returned within the earlier of the standard trade settlement period for such securities or within three business days. The loans are collateralized by cash and/or U.S. Treasury and federal agency obligations in an amount typically at least equal to the market value of the securities loaned. On loans collateralized by cash, the cash collateral is invested in a money market fund. The market value of the loaned securities is determined at the close of business of the fund and any additional required collateral is delivered to the fund on the next business day. The lending agent provides the fund with indemnification against Borrower default. In the event of Borrower default, the lending agent will, for the benefit of the fund, either purchase securities identical to those loaned or, when such purchase is commercially impracticable, pay the fund the market value of the loaned securities. In return, the lending agent assumes the fund’s rights to the related collateral. If the collateral value is less than the cost to purchase identical securities, the lending agent is responsible for the shortfall, but only to the extent that such shortfall is not due to a decline in collateral value resulting from collateral reinvestment for which the fund bears the risk of loss. A portion of the income generated upon investment of the collateral is remitted to the Borrowers, and the remainder is allocated between the fund and the lending agent. On loans collateralized by U.S. Treasury and/or federal agency obligations, a fee is received from the Borrower, and is allocated between the fund and the lending agent. Income from securities lending is separately reported in the Statement of Operations. The dividend and interest income earned on the securities loaned is accounted for in the same manner as other dividend and interest income. At December 31, 2019, there were no securities on loan or collateral outstanding.
Indemnifications– Under the fund’s organizational documents, its officers and Trustees may be indemnified against certain liabilities and expenses arising out of the performance of their duties to the fund. Additionally, in the normal course of business, the fund enters into agreements with service providers that may contain indemnification clauses. The fund’s maximum exposure under these agreements is unknown as this would involve future claims that may be made against the fund that have not yet occurred.
Investment Transactions and Income– Investment transactions are recorded on the trade date. Interest income is recorded on the accrual basis. All premium and discount is amortized or accreted for financial statement purposes in accordance with U.S. generally accepted accounting principles. Dividends received in cash are recorded on theex-dividend date. Certain dividends from foreign securities will be recorded when the fund is informed of the dividend if such information is obtained subsequent to theex-dividend date. Dividend payments received in additional securities are recorded on theex-dividend date in an amount equal to the value of the security on such date.
The fund may receive proceeds from litigation settlements. Any proceeds received from litigation involving portfolio holdings are reflected in the Statement of Operations in realized gain/loss if the security has been disposed of by the fund or in unrealized gain/loss if the security is still held by the fund. Any other proceeds from litigation not related to portfolio holdings are reflected as other income in the Statement of Operations.
Tax Matters and Distributions– The fund intends to qualify as a regulated investment company, as defined under Subchapter M of the Internal Revenue Code, and to distribute all of its taxable income, including realized capital gains. As a result, no provision for federal income tax is required. The fund’s federal tax returns, when filed, will remain subject to examination by the Internal Revenue Service for a three year period. Management has analyzed the fund’s tax positions taken on federal and state tax returns for all open tax years and does not believe that there are any uncertain tax positions that require recognition of a tax liability. Foreign taxes, if any, have been accrued by the fund in the accompanying financial statements in accordance with the applicable foreign tax law. Foreign income taxes may be withheld by certain countries in which the fund invests. Additionally, capital gains realized by the fund on securities issued in or by certain foreign countries may be subject to capital gains tax imposed by those countries.
Distributions to shareholders are recorded on theex-dividend date. Income and capital gain distributions are determined in accordance with income tax regulations, which may differ from U.S. generally accepted accounting principles. Certain capital accounts in the financial statements are periodically adjusted for permanent differences in order to reflect their tax character. These adjustments have no impact on net assets or net asset value per share. Temporary differences which arise from recognizing certain items of income, expense, gain or loss in different periods for financial statement and tax purposes will reverse at some time in the future.
Book/tax differences primarily relate to wash sale loss deferrals, derivative transactions, redemptions in-kind, partnership adjustments and certain preferred stock treated as debt for tax purposes.
18
MFS Utilities Series
Notes to Financial Statements – continued
The tax character of distributions declared to shareholders for the last two fiscal years is as follows:
| | | | | | | | |
| | | Year ended
12/31/19 | | | Year ended
12/31/18 | |
| Ordinary income (including any short-term capital gains) | | | $51,291,242 | | | | $19,792,653 | |
| Long-term capital gains | | | 3,834,215 | | | | — | |
| Total distributions | | | $55,125,457 | | | | $19,792,653 | |
The federal tax cost and the tax basis components of distributable earnings were as follows:
| | | | |
| As of 12/31/19 | | | | |
| |
| Cost of investments | | | $933,454,636 | |
| Gross appreciation | | | 388,211,272 | |
| Gross depreciation | | | (35,253,963 | ) |
| Net unrealized appreciation (depreciation) | | | $352,957,309 | |
| |
| Undistributed ordinary income | | | 51,545,614 | |
| Undistributed long-term capital gain | | | 4,351,856 | |
| Other temporary differences | | | (35,564,483 | ) |
Multiple Classes of Shares of Beneficial Interest– The fund offers multiple classes of shares, which differ in their respective distribution and/or service fees. The fund’s income, realized and unrealized gain (loss), and common expenses are allocated to shareholders based on the daily net assets of each class. Dividends are declared separately for each class. Differences in per share dividend rates are generally due to differences in separate class expenses. The fund’s distributions declared to shareholders as reported in the Statements of Changes in Net Assets are presented by class as follows:
| | | | | | | | |
| | |
| | | Year ended
12/31/19 | | | Year ended
12/31/18 | |
| Initial Class | | | $22,976,155 | | | | $7,824,431 | |
| Service Class | | | 32,149,302 | | | | 11,968,222 | |
| Total | | | $55,125,457 | | | | $19,792,653 | |
| (3) | | Transactions with Affiliates |
Investment Adviser– The fund has an investment advisory agreement with MFS to provide overall investment management and related administrative services and facilities to the fund. The management fee is computed daily and paid monthly at the following annual rates based on the fund’s average daily net assets:
| | | | |
| Up to $1 billion | | | 0.75% | |
| In excess of $1 billion and up to $3 billion | | | 0.70% | |
| In excess of $3 billion | | | 0.65% | |
MFS has agreed in writing to reduce its management fee by a specified amount if certain MFS mutual fund assets exceed thresholds agreed to by MFS and the fund’s Board of Trustees. For the year ended December 31, 2019, this management fee reduction amounted to $127,946, which is included in the reduction of total expenses in the Statement of Operations. The management fee incurred for the year ended December 31, 2019 was equivalent to an annual effective rate of 0.73% of the fund’s average daily net assets.
Distributor– MFS Fund Distributors, Inc. (MFD), a wholly-owned subsidiary of MFS, is the distributor of shares of the fund. The Trustees have adopted a distribution plan for the Service Class shares pursuant to Rule12b-1 under the Investment Company Act of 1940.
The fund’s distribution plan provides that the fund will pay MFD distribution and/or service fees equal to 0.25% per annum of its average daily net assets attributable to Service Class shares as partial consideration for services performed and expenses incurred by MFD and financial intermediaries (including participating insurance companies that invest in the fund to fund variable annuity and variable life insurance contracts, sponsors of qualified retirement and pension plans that invest in the fund, and affiliates of these participating insurance companies and plan sponsors) in connection with the sale and distribution of the Service Class shares. MFD may subsequently pay all, or a portion, of the distribution and/or service fees to financial intermediaries.
Shareholder Servicing Agent– MFS Service Center, Inc. (MFSC), a wholly-owned subsidiary of MFS, receives a fee from the fund for its services as shareholder servicing agent. For the year ended December 31, 2019, the fee was $26,360, which equated to 0.0020% annually of the fund’s average daily net assets. MFSC also receives payment from the fund forout-of-pocket expenses paid by MFSC on behalf of the fund. For the year ended December 31, 2019, these costs amounted to $3,120.
Administrator– MFS provides certain financial, legal, shareholder communications, compliance, and other administrative services to the fund. Under an administrative services agreement, the fund reimburses MFS the costs incurred to provide these services. The
19
MFS Utilities Series
Notes to Financial Statements – continued
fund is charged an annual fixed amount of $17,500 plus a fee based on average daily net assets. The administrative services fee incurred for the year ended December 31, 2019 was equivalent to an annual effective rate of 0.0142% of the fund’s average daily net assets.
Trustees’ and Officers’ Compensation– The fund pays compensation to independent Trustees in the form of a retainer, attendance fees, and additional compensation to Board and Committee chairpersons. The fund does not pay compensation directly to Trustees or officers of the fund who are also officers of the investment adviser, all of whom receive remuneration from MFS for their services to the fund. Certain officers and Trustees of the fund are officers or directors of MFS, MFD, and MFSC.
Other– This fund and certain other funds managed by MFS (the funds) had entered into a service agreement (the ISO Agreement) which provided for payment of fees solely by the funds to Tarantino LLC in return for the provision of services of an Independent Senior Officer (ISO) for the funds. Frank L. Tarantino served as the ISO and was an officer of the funds and the sole member of Tarantino LLC. Effective June 30, 2019, Mr. Tarantino retired from his position as ISO for the funds, and the ISO Agreement was terminated. For the year ended December 31, 2019, the fee paid by the fund under this agreement was $1,585 and is included in “Miscellaneous” expense in the Statement of Operations. MFS had agreed to bear all expenses associated with office space, other administrative support, and supplies provided to the ISO.
The fund invests in the MFS Institutional Money Market Portfolio which is managed by MFS and seeks current income consistent with preservation of capital and liquidity. This money market fund does not pay a management fee to MFS.
The fund is permitted to engage in purchase and sale transactions with funds and accounts for which MFS serves as investment adviser orsub-adviser (“cross-trades”) pursuant to a policy adopted by the Board of Trustees. This policy has been designed to ensure that cross-trades conducted by the fund comply with Rule17a-7 under the Investment Company Act of 1940. During the year ended December 31, 2019, the fund engaged in purchase and sale transactions pursuant to this policy, which amounted to $1,677,563 and $4,818,692, respectively. The sales transactions resulted in net realized gains (losses) of $1,054,407.
The adviser has voluntarily undertaken to reimburse the fund from its own resources on a quarterly basis for the cost of investment research embedded in the cost of the fund’s securities trades. This agreement may be rescinded at any time. For the year ended December 31, 2019, this reimbursement amounted to $72,882, which is included in “Other” income in the Statement of Operations.
For the year ended December 31, 2019, purchases and sales of investments, other than in-kind transactions and short-term obligations, aggregated $360,751,501 and $463,226,308, respectively.
| (5) | | Shares of Beneficial Interest |
The fund’s Declaration of Trust permits the Trustees to issue an unlimited number of full and fractional shares of beneficial interest. Transactions in fund shares were as follows:
| | | | | | | | | | | | | | | | |
| | | Year ended 12/31/19 | | | Year ended 12/31/18 | |
| | | | |
| | | Shares | | | Amount | | | Shares | | | Amount | |
| Shares sold | | | | | | | | | | | | | | | | |
Initial Class | | | 575,639 | | | | $19,334,145 | | | | 429,050 | | | | $12,756,598 | |
Service Class | | | 1,744,019 | | | | 57,235,971 | | | | 1,975,414 | | | | 57,690,212 | |
| | | 2,319,658 | | | | $76,570,116 | | | | 2,404,464 | | | | $70,446,810 | |
| | | | |
| Shares issued to shareholders in reinvestment of distributions | | | | | | | | | | | | | | | | |
Initial Class | | | 693,515 | | | | $22,976,155 | | | | 256,371 | | | | $7,824,431 | |
Service Class | | | 987,083 | | | | 32,149,302 | | | | 398,808 | | | | 11,968,222 | |
| | | 1,680,598 | | | | $55,125,457 | | | | 655,179 | | | | $19,792,653 | |
| | | | |
| Shares reacquired | | | | | | | | | | | | | | | | |
Initial Class | | | (2,237,515 | ) | | | $(74,404,174 | ) | | | (2,951,323 | ) | | | $(87,750,125 | ) |
Service Class | | | (6,687,020 | ) | | | (221,665,311 | ) | | | (12,415,527 | ) | | | (366,388,004 | ) |
| | | (8,924,535 | ) | | | $(296,069,485 | ) | | | (15,366,850 | ) | | | $(454,138,129 | ) |
| | | | |
| Net change | | | | | | | | | | | | | | | | |
Initial Class | | | (968,361 | ) | | | $(32,093,874 | ) | | | (2,265,902 | ) | | | $(67,169,096 | ) |
Service Class | | | (3,955,918 | ) | | | (132,280,038 | ) | | | (10,041,305 | ) | | | (296,729,570 | ) |
| | | (4,924,279 | ) | | | $(164,373,912 | ) | | | (12,307,207 | ) | | | $(363,898,666 | ) |
The fund and certain other funds managed by MFS participate in a $1.25 billion unsecured committed line of credit, subject to a $1 billion sublimit, provided by a syndicate of banks under a credit agreement. Borrowings may be made for temporary financing
20
MFS Utilities Series
Notes to Financial Statements – continued
needs. Interest is charged to each fund, based on its borrowings, generally at a rate equal to the highest of one month LIBOR, the Federal Funds Effective Rate and the Overnight Bank Funding Rate, plus an agreed upon spread. A commitment fee, based on the average daily, unused portion of the committed line of credit, is allocated among the participating funds. In addition, the fund and other funds managed by MFS have established unsecured uncommitted borrowing arrangements with certain banks for temporary financing needs. Interest is charged to each fund, based on its borrowings, at rates equal to customary reference rates plus an agreed upon spread. For the year ended December 31, 2019, the fund’s commitment fee and interest expense were $7,411 and $0, respectively, and are included in “Miscellaneous” expense in the Statement of Operations.
| (7) | | Investments in Affiliated Issuers |
An affiliated issuer may be considered one in which the fund owns 5% or more of the outstanding voting securities, or a company which is under common control. For the purposes of this report, the following were affiliated issuers:
| | | | | | | | | | | | | | | | | | | | | | | | |
| Affiliated Issuers | | Beginning
Value | | | Purchases | | | Sales
Proceeds | | | Realized
Gain
(Loss) | | | Change in
Unrealized
Appreciation or
Depreciation | | | Ending
Value | |
| MFS Institutional Money Market Portfolio | | | $36,148,022 | | | | $229,718,808 | | | | $252,534,803 | | | | $4,610 | | | | $(38 | ) | | | $13,336,599 | |
| | | | | | |
| Affiliated Issuers | | | | | | | | | | | | | | Dividend
Income | | | Capital Gain
Distributions | |
| MFS Institutional Money Market Portfolio | | | | | | | | | | | | | | | | | | | $636,517 | | | | $— | |
On October 18, 2019, the fund recorded a redemptionin-kind of portfolio securities and cash that were valued at $87,561,735. The redeeming shareholder generally receives a pro rata share of the securities held by the fund. The distribution of such securities generated a realized gain of $20,621,464 for the fund, which is included in Net realized gain (loss) in the Statement of Operations. For tax purposes, no gains or losses were recognized with respect to the portfolio securities redeemed in-kind.
21
MFS Utilities Series
REPORT OF INDEPENDENT REGISTERED PUBLIC ACCOUNTING FIRM
To the Board of Trustees of MFS Variable Insurance Trust and the Shareholders of MFS Utilities Series:
Opinion on the Financial Statements and Financial Highlights
We have audited the accompanying statement of assets and liabilities of MFS Utilities Series (the “Fund”), including the portfolio of investments, as of December 31, 2019, the related statement of operations for the year then ended, the statements of changes in net assets for each of the two years in the period then ended, the financial highlights for each of the five years in the period then ended, and the related notes. In our opinion, the financial statements and financial highlights present fairly, in all material respects, the financial position of the Fund as of December 31, 2019, and the results of its operations for the year then ended, the changes in its net assets for each of the two years in the period then ended, and the financial highlights for each of the five years in the period then ended, in conformity with accounting principles generally accepted in the United States of America.
Basis for Opinion
These financial statements and financial highlights are the responsibility of the Fund’s management. Our responsibility is to express an opinion on the Fund’s financial statements and financial highlights based on our audits. We are a public accounting firm registered with the Public Company Accounting Oversight Board (United States) (PCAOB) and are required to be independent with respect to the Fund in accordance with the U.S. federal securities laws and the applicable rules and regulations of the Securities and Exchange Commission and the PCAOB.
We conducted our audits in accordance with the standards of the PCAOB. Those standards require that we plan and perform the audit to obtain reasonable assurance about whether the financial statements and financial highlights are free of material misstatement, whether due to error or fraud. The Fund is not required to have, nor were we engaged to perform, an audit of its internal control over financial reporting. As part of our audits we are required to obtain an understanding of internal control over financial reporting but not for the purpose of expressing an opinion on the effectiveness of the Fund’s internal control over financial reporting. Accordingly, we express no such opinion.
Our audits included performing procedures to assess the risks of material misstatement of the financial statements and financial highlights, whether due to error or fraud, and performing procedures that respond to those risks. Such procedures included examining, on a test basis, evidence regarding the amounts and disclosures in the financial statements and financial highlights. Our audits also included evaluating the accounting principles used and significant estimates made by management, as well as evaluating the overall presentation of the financial statements and financial highlights. Our procedures included confirmation of securities owned as of December 31, 2019, by correspondence with the custodian and brokers; when replies were not received from brokers, we performed other auditing procedures. We believe that our audits provide a reasonable basis for our opinion.
DELOITTE & TOUCHE LLP
Boston, Massachusetts
February 14, 2020
We have served as the auditor of one or more of the MFS investment companies since 1924.
22
MFS Utilities Series
TRUSTEES AND OFFICERS – IDENTIFICATION AND BACKGROUND
The Trustees and Officers of the Trust, as of February 1, 2020, are listed below, together with their principal occupations during the past five years. (Their titles may have varied during that period.) The address of each Trustee and Officer is 111 Huntington Avenue, Boston, Massachusetts 02199-7618.
| | | | | | | | | | |
Name, Age | | Position(s)
Held with Fund | | Trustee/Officer
Since (h) | | Number of MFS Funds
overseen by the
Trustee | | Principal Occupations
During the Past Five Years | | Other Directorships During the Past Five Years (j) |
| INTERESTED TRUSTEES |
Robert J. Manning (k)
(age 56) | | Trustee | | February 2004 | | 133 | | Massachusetts Financial Services Company, Executive Chairman (since January 2017); Director; Chairman of the Board; Chief Executive Officer (until 2015);Co-Chief Executive Officer(2015-2016) | | N/A |
| | | | | |
Robin A. Stelmach (k) (age 58) | | Trustee | | January 2014 | | 133 | | Massachusetts Financial Services Company, Vice Chair (since January 2017); Chief Operating Officer and Executive Vice President (until January 2017) | | N/A |
|
| INDEPENDENT TRUSTEES |
John P. Kavanaugh (age 65) | | Trustee and Chair of Trustees | | January 2009 | | 133 | | Private investor | | N/A |
| | | | | |
Steven E. Buller (age 68) | | Trustee | | February 2014 | | 133 | | Financial Accounting Standards Advisory Council, Chairman(2014-2015); Public Company Accounting Oversight Board, Standing Advisory Group, Member (until 2014); BlackRock, Inc. (investment management), Managing Director (until 2014), BlackRock Finco UK (investment management), Director (until 2014) | | N/A |
| | | | | |
John A. Caroselli (age 65) | | Trustee | | March 2017 | | 133 | | JC Global Advisors, LLC (management consulting), President (since 2015); First Capital Corporation (commercial finance), Executive Vice President (until 2015) | | N/A |
| | | | | |
Maureen R. Goldfarb (age 64) | | Trustee | | January 2009 | | 133 | | Private investor | | N/A |
| | | | | |
Peter D. Jones
(age 64) | | Trustee | | January 2019 | | 133 | | Franklin Templeton Distributors, Inc. (investment management), President (until 2015); Franklin Templeton Institutional, LLC (investment management), Chairman (until 2015) | | N/A |
| | | | | |
James W. Kilman, Jr.
(age 58) | | Trustee | | January 2019 | | 133 | | Burford Capital Limited (finance and investment management), Chief Financial Officer (since 2019); KielStrand Capital LLC (family office), Chief Executive Officer (since 2016); Morgan Stanley & Co. (financial services), Vice Chairman of Investment Banking,Co-Head of Diversified Financials Coverage – Financial Institutions Investment Banking Group (until 2016) | | Alpha-En Corporation, Director (2016-2019) |
23
MFS Utilities Series
Trustees and Officers – continued
| | | | | | | | | | |
Name, Age | | Position(s)
Held with Fund | | Trustee/Officer
Since (h) | | Number of MFS Funds
overseen by the
Trustee | | Principal Occupations
During the Past Five Years | | Other Directorships During the Past Five Years (j) |
Clarence Otis, Jr. (age 63) | | Trustee | | March 2017 | | 133 | | Darden Restaurants, Inc., Chief Executive Officer (until 2014) | | VF Corporation, Director; Verizon Communications, Inc., Director; The Travelers Companies, Director; Federal Reserve Bank of Atlanta, Director (until 2015) |
| | | | | |
Maryanne L. Roepke (age 63) | | Trustee | | May 2014 | | 133 | | American Century Investments (investment management), Senior Vice President and Chief Compliance Officer (until 2014) | | N/A |
| | | | | |
Laurie J. Thomsen
(age 62) | | Trustee | | March 2005 | | 133 | | Private investor | | The Travelers Companies, Director; Dycom Industries, Inc., Director (since 2015) |
| | | | | | | | |
Name, Age | | Position(s)
Held with Fund | | Trustee/Officer
Since (h) | | Number of
MFS Funds
for which the
Person is an
Officer | | Principal Occupations During the Past Five Years |
| OFFICERS | | | | | | |
Christopher R. Bohane (k)
(age 46) | | Assistant Secretary and Assistant Clerk | | July 2005 | | 133 | | Massachusetts Financial Services Company, Vice President and Assistant General Counsel |
| | | | |
Kino Clark (k) (age 51) | | Assistant Treasurer | | January 2012 | | 133 | | Massachusetts Financial Services Company, Vice President |
| | | | |
John W. Clark, Jr. (k) (age 52) | | Assistant Treasurer | | April 2017 | | 133 | | Massachusetts Financial Services Company, Vice President (since March 2017); Deutsche Bank (financial services), Department Head – Treasurer’s Office (until February 2017) |
| | | | |
Thomas H. Connors (k) (age 60) | | Assistant Secretary and Assistant Clerk | | September 2012 | | 133 | | Massachusetts Financial Services Company, Vice President and Senior Counsel |
| | | | |
David L. DiLorenzo (k)
(age 51) | | President | | July 2005 | | 133 | | Massachusetts Financial Services Company, Senior Vice President |
| | | | |
Heidi W. Hardin (k) (age 52) | | Secretary and Clerk | | April 2017 | | 133 | | Massachusetts Financial Services Company, Executive Vice President and General Counsel (since March 2017); Harris Associates (investment management), General Counsel (from September 2015 to January 2017); Janus Capital Management LLC (investment management), Senior Vice President and General Counsel (until September 2015) |
| | | | |
Brian E. Langenfeld (k) (age 46) | | Assistant
Secretary and Assistant Clerk | | June 2006 | | 133 | | Massachusetts Financial Services Company, Vice President and Senior Counsel |
| | | | |
Amanda S. Mooradian (k) (age 40) | | Assistant
Secretary and Assistant Clerk | | September 2018 | | 133 | | Massachusetts Financial Services Company, Assistant Vice President and Counsel |
| | | | |
Susan A. Pereira (k)
(age 49) | | Assistant
Secretary and Assistant Clerk | | July 2005 | | 133 | | Massachusetts Financial Services Company, Vice President and Assistant General Counsel |
| | | | |
Kasey L. Phillips (k) (age 49) | | Assistant Treasurer | | September 2012 | | 133 | | Massachusetts Financial Services Company, Vice President |
| | | | |
Matthew A. Stowe (k) (age 45) | | Assistant Secretary and Assistant Clerk | | October 2014 | | 133 | | Massachusetts Financial Services Company, Vice President and Assistant General Counsel |
24
MFS Utilities Series
Trustees and Officers – continued
| | | | | | | | |
Name, Age | | Position(s)
Held with Fund | | Trustee/Officer
Since (h) | | Number of
MFS Funds
for which the
Person is an
Officer | | Principal Occupations During the Past Five Years |
Martin J. Wolin (k) (age 52) | | Chief Compliance Officer | | July 2015 | | 133 | | Massachusetts Financial Services Company, Senior Vice President and Chief Compliance Officer (since July 2015); Mercer (financial service provider), Chief Risk and Compliance Officer, North America and Latin America (until June 2015) |
| | | | |
James O. Yost (k)
(age 59) | | Treasurer | | September 1990 | | 133 | | Massachusetts Financial Services Company, Senior Vice President |
| (h) | Date first appointed to serve as Trustee/officer of an MFS Fund. Each Trustee has served continuously since appointment unless indicated otherwise. For the period from December 15, 2004 until February 22, 2005, Mr. Manning served as Advisory Trustee. From January 2012 through December 2016, Messrs. DiLorenzo and Yost served as Treasurer and Deputy Treasurer of the Funds, respectively. |
| (j) | Directorships or trusteeships of companies required to report to the Securities and Exchange Commission (i.e., “public companies”). |
| (k) | “Interested person” of the Trust within the meaning of the Investment Company Act of 1940 (referred to as the 1940 Act), which is the principal federal law governing investment companies like the fund, as a result of a position with MFS. The address of MFS is 111 Huntington Avenue, Boston, Massachusetts 02199-7618. |
Each Trustee (other than Messrs. Jones and Kilman) has been elected by shareholders and each Trustee and Officer holds office until his or her successor is chosen and qualified or until his or her earlier death, resignation, retirement or removal. Messrs. Jones and Kilman became Trustees of the Funds on January 1, 2019. The Trust does not hold annual meetings for the purpose of electing Trustees, and Trustees are not elected for fixed terms. Under the terms of the Board’s retirement policy, an Independent Trustee shall retire at the end of the calendar year in which he or she reaches the earlier of 75 years of age or 15 years of service on the Board (or, in the case of any Independent Trustee who joined the Board prior to 2015, 20 years of service on the Board).
Messrs. Buller, Kilman and Otis and Ms. Roepke are members of the Trust’s Audit Committee.
Each of the Interested Trustees and certain Officers hold comparable officer positions with certain affiliates of MFS.
The Statement of Additional Information for a Fund includes further information about the Trustees and is available without charge upon request by calling1-800-225-2606.
| | |
Investment Adviser Massachusetts Financial Services Company 111 Huntington Avenue Boston, MA 02199-7618 | | Custodian State Street Bank and Trust Company 1 Lincoln Street Boston, MA 02111-2900 |
| |
Distributor MFS Fund Distributors, Inc. 111 Huntington Avenue Boston, MA 02199-7618 | | Independent Registered Public Accounting Firm Deloitte & Touche LLP 200 Berkeley Street Boston, MA 02116 |
| |
Portfolio Manager(s) Claud Davis J. Scott Walker | | |
25
MFS Utilities Series
BOARD REVIEW OF INVESTMENT ADVISORY AGREEMENT
MFS Utilities Series
The Investment Company Act of 1940 requires that both the full Board of Trustees and a majority of thenon-interested (“independent”) Trustees, voting separately, annually approve the continuation of the Fund’s investment advisory agreement with MFS. The Trustees consider matters bearing on the Fund and its advisory arrangements at their meetings throughout the year, including a review of performance data at each regular meeting. In addition, the independent Trustees met several times over the course of three months beginning in May and ending in July, 2019 (“contract review meetings”) for the specific purpose of considering whether to approve the continuation of the investment advisory agreement for the Fund and the other investment companies that the Board oversees (the “MFS Funds”). The independent Trustees were assisted in their evaluation of the Fund’s investment advisory agreement by independent legal counsel, from whom they received separate legal advice and with whom they met separately from MFS during various contract review meetings. The independent Trustees were also assisted in this process by the MFS Funds’ Independent Senior Officer, a senior officer appointed by and reporting to the independent Trustees.
In connection with their deliberations regarding the continuation of the investment advisory agreement, the Trustees, including the independent Trustees, considered such information and factors as they believed, in light of the legal advice furnished to them and their own business judgment, to be relevant. The investment advisory agreement for the Fund was considered separately, although the Trustees also took into account the common interests of all MFS Funds in their review. As described below, the Trustees considered the nature, quality, and extent of the various investment advisory, administrative, and shareholder services performed by MFS under the existing investment advisory agreement and other arrangements with the Fund.
In connection with their contract review meetings, the Trustees received and relied upon materials that included, among other items: (i) information provided by Broadridge Financial Solutions, Inc. (“Broadridge”), an independent third party, on the investment performance of the Fund for various time periods ended December 31, 2018 and the investment performance of a group of funds with substantially similar investment classifications/objectives (the “Broadridge performance universe”), (ii) information provided by Broadridge on the Fund’s advisory fees and other expenses and the advisory fees and other expenses of comparable funds identified by Broadridge as well as all other funds in the same investment classification/category (the “Broadridge expense group and universe”), (iii) information provided by MFS on the advisory fees of portfolios of other clients of MFS, including institutional separate accounts and other clients, (iv) information as to whether and to what extent applicable expense waivers, reimbursements or fee “breakpoints” are observed for the Fund, (v) information regarding MFS’ financial results and financial condition, including MFS’ and certain of its affiliates’ estimated profitability from services performed for the Fund and the MFS Funds as a whole, and compared to MFS’ institutional business, (vi) MFS’ views regarding the outlook for the mutual fund industry and the strategic business plans of MFS, (vii) descriptions of various functions performed by MFS for the Funds, such as compliance monitoring and portfolio trading practices, and (viii) information regarding the overall organization of MFS, including information about MFS’ senior management and other personnel providing investment advisory, administrative and other services to the Fund and the other MFS Funds. The comparative performance, fee and expense information prepared and provided by Broadridge was not independently verified and the independent Trustees did not independently verify any information provided to them by MFS.
The Trustees’ conclusion as to the continuation of the investment advisory agreement was based on a comprehensive consideration of all information provided to the Trustees and not the result of any single factor. Some of the factors that figured particularly in the Trustees’ deliberations are described below, although individual Trustees may have evaluated the information presented differently from one another, giving different weights to various factors. It is also important to recognize that the fee arrangements for the Fund and other MFS Funds are the result of years of review and discussion between the independent Trustees and MFS, that certain aspects of such arrangements may receive greater scrutiny in some years than in others, and that the Trustees’ conclusions may be based, in part, on their consideration of these same arrangements during the course of the year and in prior years.
Based on information provided by Broadridge and MFS, the Trustees reviewed the Fund’s total return investment performance as well as the Broadridge performance universe over various time periods. The Trustees placed particular emphasis on the total return performance of the Fund’s Initial Class shares in comparison to the performance of funds in its Broadridge performance universe over the five-year period ended December 31, 2018, which the Trustees believed was a long enough period to reflect differing market conditions. The total return performance of the Fund’s Initial Class shares was in the 3rd quintile relative to the other funds in the universe for this five-year period (the 1st quintile being the best performers and the 5th quintile being the worst performers). The total return performance of the Fund’s Initial Class shares was in the 3rd quintile for theone-year period and the 2nd quintile for thethree-year period ended December 31, 2018 relative to the Broadridge performance universe. Because of the passage of time, these performance results may differ from the performance results for more recent periods, including those shown elsewhere in this report.
In the course of their deliberations, the Trustees took into account information provided by MFS in connection with the contract review meetings, as well as during investment review meetings conducted with portfolio management personnel during the course of the year regarding the Fund’s performance. After reviewing these and related factors, the Trustees concluded, within the context of their overall conclusions regarding the investment advisory agreement, that they were satisfied with MFS’ responses and efforts relating to investment performance.
26
MFS Utilities Series
Board Review of Investment Advisory Agreement – continued
In assessing the reasonableness of the Fund’s advisory fee, the Trustees considered, among other information, the Fund’s advisory fee and the total expense ratio of the Fund’s Initial Class shares as a percentage of average daily net assets and the advisory fee and total expense ratios of the Broadridge expense group based on information provided by Broadridge. The Trustees considered that, according to the data provided by Broadridge (which takes into account any fee reductions or expense limitations that were in effect during the Fund’s last fiscal year), the Fund’s effective advisory fee rate and total expense ratio were each approximately at the Broadridge expense group median.
The Trustees also considered the advisory fees charged by MFS to any institutional separate accounts advised by MFS (“separate accounts”) and unaffiliated investment companies for which MFS serves as subadviser (“subadvised funds”) that have comparable investment strategies to the Fund, if any. In comparing these fees, the Trustees considered information provided by MFS as to the generally broader scope of services provided by MFS to the Fund, as well as the more extensive regulatory burdens imposed on MFS in managing the Fund, in comparison to separate accounts and subadvised funds. The Trustees also considered the higher demands placed on MFS’ investment personnel and trading infrastructure as a result of the daily cashin-flows andout-flows of the Fund in comparison to separate accounts.
The Trustees also considered whether the Fund may benefit from any economies of scale in the management of the Fund in the event of growth in assets of the Fund and/or growth in assets of the MFS Funds as a whole. They noted that the Fund’s advisory fee rate schedule is subject to contractual breakpoints that reduce the Fund’s advisory fee rate on average daily net assets over $1 billion and $3 billion. The Trustees also noted that MFS has agreed in writing to waive a portion of the management fees of certain MFS Funds, including the Fund, if the total combined assets of certain funds within the MFS Funds’ complex increase above agreed upon thresholds (the “group fee waiver”), enabling the Fund’s shareholders to share in the benefits from any economies of scale at the complex level. The group fee waiver is reviewed and renewed annually between the Board and MFS. The Trustees concluded that the breakpoints and the group fee waiver were sufficient to allow the Fund to benefit from economies of scale as its assets and overall complex assets grow.
The Trustees also considered information prepared by MFS relating to MFS’ costs and profits with respect to the Fund, the MFS Funds considered as a group, and other investment companies and accounts advised by MFS, as well as MFS’ methodologies used to determine and allocate its costs to the MFS Funds, the Fund and other accounts and products for purposes of estimating profitability.
After reviewing these and other factors described herein, the Trustees concluded, within the context of their overall conclusions regarding the investment advisory agreement, that the advisory fees charged to the Fund represent reasonable compensation in light of the services being provided by MFS to the Fund.
In addition, the Trustees considered MFS’ resources and related efforts to continue to retain, attract and motivate capable personnel to serve the Fund. The Trustees also considered current and developing conditions in the financial services industry, including the presence of large and well-capitalized companies which are spending, and appear to be prepared to continue to spend, substantial sums to engage personnel and to provide services to competing investment companies. In this regard, the Trustees also considered the financial resources of MFS and its ultimate parent, Sun Life Financial Inc. The Trustees also considered the advantages and possible disadvantages to the Fund of having an adviser that also serves other investment companies as well as other accounts.
The Trustees also considered the nature, quality, cost, and extent of administrative, transfer agency, and distribution services provided to the Fund by MFS and its affiliates under agreements and plans other than the investment advisory agreement, including any12b-1 fees the Fund pays to MFS Fund Distributors, Inc., an affiliate of MFS. The Trustees also considered the nature, extent and quality of certain other services MFS performs or arranges for on the Fund’s behalf, which may include securities lending programs, directed expense payment programs, class action recovery programs, and MFS’ interaction with third-party service providers, principally custodians andsub-custodians. The Trustees concluded that the variousnon-advisory services provided by MFS and its affiliates on behalf of the Fund were satisfactory.
The Trustees consideredso-called“fall-out benefits” to MFS such as reputational value derived from serving as investment manager to the MFS Funds. The Trustees also considered that, effective January 3, 2018, MFS had discontinued its historic practice of obtaining investment research from portfolio brokerage commissions paid by certain MFS Funds and would thereafter directly pay for or voluntarily reimburse a Fund, if applicable, for the costs of external research acquired through the use of the Fund’s portfolio brokerage commissions.
Based on their evaluation of factors that they deemed to be material, including those factors described above, the Board of Trustees, including the independent Trustees, concluded that the Fund’s investment advisory agreement with MFS should be continued for an additionalone-year period, commencing August 1, 2019.
27
MFS Utilities Series
PROXY VOTING POLICIES AND INFORMATION
MFS votes proxies on behalf of the fund pursuant to proxy voting policies and procedures that are available without charge, upon request, by calling 1-800-225-2606, by visitingmfs.com/proxyvoting, or by visiting the SEC’s Web site athttp://www.sec.gov.
Information regarding how the fund voted proxies relating to portfolio securities during the most recent twelve-month period ended June 30 is available by August 31 of each year without charge by visitingmfs.com/proxyvoting, or by visiting the SEC’s Web site athttp://www.sec.gov.
QUARTERLY PORTFOLIO DISCLOSURE
The fund files a complete schedule of portfolio holdings with the SEC for the first and third quarters of each fiscal year as an exhibit to its reports on Form N-PORT. The fund’s Form N-PORT reports are available on the SEC’s website athttp://www.sec.gov. A shareholder can obtain the portfolio holdings report for the first and third quarters of the fund’s fiscal year atmfs.com/vit1 by choosing the fund’s name and then selecting the “Resources” tab and clicking on “Prospectus and Reports”.
FURTHER INFORMATION
From time to time, MFS may post important information about the fund or the MFS funds on the MFS web site (mfs.com). This information is available at https://www.mfs.com/en-us/what-we-do/announcements.html or atmfs.com/vit1 by choosing the fund’s name.
INFORMATION ABOUT FUND CONTRACTS AND LEGAL CLAIMS
The fund has entered into contractual arrangements with an investment adviser, administrator, distributor, shareholder servicing agent, 529 program manager (if applicable), and custodian who each provide services to the fund. Unless expressly stated otherwise, shareholders are not parties to, or intended beneficiaries of these contractual arrangements, and these contractual arrangements are not intended to create any shareholder right to enforce them against the service providers or to seek any remedy under them against the service providers, either directly or on behalf of the fund.
Under the Trust’s By-Laws and Declaration of Trust, any claims asserted against or on behalf of the MFS Funds, including claims against Trustees and Officers, must be brought in state and federal courts located within the Commonwealth of Massachusetts.
FEDERAL TAX INFORMATION (unaudited)
The following information is provided pursuant to provisions of the Internal Revenue Code.
The fund designates $4,218,000 as capital gain dividends paid during the fiscal year.
For corporate shareholders, 54.29% of the ordinary income dividends paid during the fiscal year qualify for the corporate dividends received deduction.
28
rev. 3/16
| | | | |
| | | |
| FACTS | | WHAT DOES MFS DO WITH YOUR
PERSONAL INFORMATION? | |  |
| | |
| Why? | | Financial companies choose how they share your personal information. Federal law gives consumers the right to limit some but not all sharing. Federal law also requires us to tell you how we collect, share, and protect your personal information. Please read this notice carefully to understand what we do. |
| | |
| What? | | The types of personal information we collect and share depend on the product or service you have with us. This information can include: • Social Security number and account balances • Account transactions and transaction history • Checking account information and wire transfer instructions When you areno longer our customer, we continue to share your information as described in this notice. |
| | |
| How? | | All financial companies need to share customers’ personal information to run their everyday business. In the section below, we list the reasons financial companies can share their customers’ personal information; the reasons MFS chooses to share; and whether you can limit this sharing. |
| | | | |
Reasons we can share your
personal information | | Does MFS share? | | Can you limit this
sharing? |
For our everyday business purposes – such as to process your transactions, maintain your account(s), respond to court orders and legal investigations, or report to credit bureaus | | Yes | | No |
For our marketing purposes – to offer our products and services to you | | No | | We don’t share |
| For joint marketing with other financial companies | | No | | We don’t share |
For our affiliates’ everyday business purposes – information about your transactions and experiences | | No | | We don’t share |
For our affiliates’ everyday business purposes – information about your creditworthiness | | No | | We don’t share |
| For nonaffiliates to market to you | | No | | We don’t share |
| | |
| | |
| Questions? | | Call800-225-2606 or go tomfs.com. |
29
| | |
| Who we are |
| Who is providing this notice? | | MFS Funds, MFS Investment Management, MFS Institutional Advisors, Inc., and MFS Heritage Trust Company. |
| | |
| What we do |
| How does MFS protect my personal information? | | To protect your personal information from unauthorized access and use, we use security measures that comply with federal law. These measures include procedural, electronic, and physical safeguards for the protection of the personal information we collect about you. |
How does MFS
collect my personal information? | | We collect your personal information, for example, when you • open an account or provide account information • direct us to buy securities or direct us to sell your securities • make a wire transfer We also collect your personal information from others, such as credit bureaus, affiliates, or other companies. |
| Why can’t I limit all sharing? | | Federal law gives you the right to limit only • sharing for affiliates’ everyday business purposes – information about your creditworthiness • affiliates from using your information to market to you • sharing for nonaffiliates to market to you State laws and individual companies may give you additional rights to limit sharing. |
| | |
| Definitions |
| Affiliates | | Companies related by common ownership or control. They can be financial and nonfinancial companies. • MFS does not share personal information with affiliates, except for everyday business purposes as described on page one of this notice. |
| Nonaffiliates | | Companies not related by common ownership or control. They can be financial and nonfinancial companies. • MFS does not share with nonaffiliates so they can market to you. |
| Joint marketing | | A formal agreement between nonaffiliated financial companies that together market financial products or services to you. • MFS doesn’t jointly market. |
| | |
| Other important information |
| If you own an MFS product or receive an MFS service in the name of a third party such as a bank or broker-dealer, their privacy policy may apply to you instead of ours. |
30
Annual Report
December 31, 2019

MFS® Value Series

MFS® Variable Insurance Trust
Beginning on January 1, 2021, as permitted by regulations adopted by the U.S. Securities and Exchange Commission, the insurance company that offers your contract may determine that it will no longer send you paper copies of the fund’s annual and semiannual shareholder reports unless you specifically request paper copies from the insurance company or from your financial intermediary. Instead, the shareholder reports will be made available on a Web site (insurancefunds.mfs.com or other Web site of which you will be notified), and the insurance company will notify you by mail each time a report is posted and provide you with a Web site link to access the report. Instructions for requesting paper copies will be provided by your insurance company or financial intermediary.
If you already elected to receive shareholder reports by email, you will not be affected by this change and you need not take any action. If your insurance company or financial intermediary offers electronic delivery, you may elect to receive shareholder reports and other communications from the insurance company or financial intermediary by email by following the instructions provided by the insurance company or financial intermediary.
Beginning on January 1, 2019, you may elect to receive all future reports in paper free of charge from the insurance company or financial intermediary. You can inform the insurance company or financial intermediary that you wish to continue receiving paper copies of your shareholder reports by contacting your insurance company or financial intermediary. Your election to receive reports in paper will apply to all funds held in your account with your insurance company or financial intermediary.
VLU-ANN
MFS® Value Series
CONTENTS
The report is prepared for the general information of contract owners. It is authorized for distribution to prospective investors only when preceded or accompanied by a current prospectus.
NOT FDIC INSURED• MAY LOSE VALUE• NO BANK OR CREDIT UNION GUARANTEE• NOT A DEPOSIT• NOT INSURED BY ANY FEDERAL GOVERNMENT AGENCY OR NCUA/NCUSIF
MFS Value Series
LETTER FROM THE EXECUTIVE CHAIR

Dear Contract Owners:
Slowing global growth, low inflation, and trade friction between the United States and China have been hallmarks of the past 12 months. After experiencing an uptick in market volatility in late 2018, markets steadied for most of 2019, thanks in large measure to the adoption of a dovish policy stance on the part of global central banks, focused on supporting economic growth. Negotiations aimed at a “phase one” trade deal between the U.S. and China bore fruit at the end of the period, boosting investor sentiment, while signs of stability emerging from the global manufacturing sector also lifted spirits. Uncertainty over Brexit, along with the ripple effects from the trade conflict, hampered business confidence and investment in the United Kingdom and Europe for much of the period, though investors expect greater clarity regarding Brexit as a result of December’s general election. The pro-Brexit Conservative Party won the election by a comfortable margin and set the stage for the U.K.’s departure from the EU at the end of January.
Markets expect the longest economic expansion in U.S. history will continue, albeit at a slower pace, as trade tensions recede. In an effort to prolong the expansion, the U.S. Federal Reserve lowered interest rates three times between July and October and the European Central Bank loosened policy in September. While the global monetary policy backdrop remains quite accommodative, signs of easing trade tensions and fading global recession fears led to improved market sentiment in late 2019 as investors grew less risk averse. In early 2020, an outbreak of coronavirus emanating from China reintroduced global growth fears, causing an uptick in volatility.
Here at MFS®, we aim to help our clients navigate the growing complexity of the markets and world economies. Our long-term investment philosophy and commitment to the responsible allocation of capital allow us to tune out the noise and uncover what we believe are the best, most durable investment opportunities in the market. Through our powerful global investment platform, we combine collective expertise, thoughtful risk management and long-term discipline to create sustainable value for investors.
Respectfully,

Robert J. Manning
Executive Chair
MFS Investment Management
February 14, 2020
The opinions expressed in this letter are subject to change and may not be relied upon for investment advice. No forecasts can be guaranteed.
1
MFS Value Series
PORTFOLIO COMPOSITION
Portfolio structure

| | | | |
| Top ten holdings | | | | |
| JPMorgan Chase & Co. | | | 5.0% | |
| Johnson & Johnson | | | 3.3% | |
| Medtronic PLC | | | 2.9% | |
| Comcast Corp., “A” | | | 2.8% | |
| Accenture PLC, “A” | | | 2.7% | |
| Citigroup, Inc. | | | 2.6% | |
| Aon PLC | | | 2.3% | |
| Duke Energy Corp. | | | 2.3% | |
| Wells Fargo & Co. | | | 2.2% | |
| U.S. Bancorp | | | 2.2% | |
| | | | |
| GICS equity sectors (g) | | | | |
| Financials | | | 30.0% | |
| Health Care | | | 17.2% | |
| Industrials | | | 16.2% | |
| Information Technology | | | 9.2% | |
| Consumer Staples | | | 7.9% | |
| Utilities | | | 6.0% | |
| Materials | | | 4.0% | |
| Communication Services | | | 3.4% | |
| Energy | | | 3.3% | |
| Consumer Discretionary | | | 1.2% | |
| Real Estate | | | 0.3% | |
| (g) | The Global Industry Classification Standard (GICS®) was developed by and/or is the exclusive property of MSCI, Inc. and S&P Global Market Intelligence Inc. (“S&P Global Market Intelligence”). GICS is a service mark of MSCI and S&P Global Market Intelligence and has been licensed for use by MFS. |
Cash & Cash Equivalents includes any cash, investments in money market funds, short-term securities, and other assets less liabilities. Please see the Statement of Assets and Liabilities for additional information related to the fund’s cash position and other assets and liabilities.
Percentages are based on net assets as of December 31, 2019.
The portfolio is actively managed and current holdings may be different.
2
MFS Value Series
MANAGEMENT REVIEW
Summary of Results
For the twelve months ended December 31, 2019, Initial Class shares of the MFS Value Series (fund) provided a total return of 29.80%, while Service Class shares of the fund provided a total return of 29.51%. These compare with a return of 26.54% for the fund’s benchmark, the Russell 1000® Value Index.
Market Environment
Fading fears of a near-term global recession, the announcement of a partial trade deal between the United States and China and the decline in uncertainty over Brexit helped bolster market sentiment late in the period. Changes in market sentiment, largely driven by uncertainty over the outcome of trade negotiations between the US and China, had contributed to periodic bouts of volatility during the reporting period. The global economy decelerated, led by weakness in China and Europe, although the pace of the slowdown moderated late in the period amid nascent signs of stabilization in the manufacturing sector.
The deteriorating global growth backdrop, along with declining inflationary pressures, prompted the US Federal Reserve to adopt a more dovish posture beginning in early 2019, resulting in the first interest rate cut in over a decade at the end of July, followed by additional cuts in September and October. The Fed’s actions led to a sharp decline in long-term interest rates during the period’s second half, causing the inversion of portions of the US Treasury yield curve for a time. Amid an improvement in risk sentiment in Q4 2019 and indications of a bottoming in growth and a potential upturn in activity, the Fed indicated in October that further rate cuts were unlikely unless the outlook for the economy materially worsened.
Globally, central banks have tilted more dovish as well, with the European Central Bank unveiling a package of easing measures, which included putting overnight rates deeper into negative territory, restarting its bond-buying program and lengthening the term of cheap loans to banks to three years from two. The central banks of India and Australia are among those that have cut rates several times in recent months, although China has been more cautious in increasing liquidity as it keeps trying to deleverage its economy, cutting rates only marginally.
Emerging markets experienced considerable volatility through the end of 2018, as tighter global financial conditions exposed structural weakness in some countries. Those conditions improved in 2019 as the Fed became more dovish. Notwithstanding the periodic headwinds on market sentiment from significant trade friction between the US and China over much of the year, emerging market hard currency debt and local rates benefited from relatively cheap valuations at the beginning of the period and easier global monetary conditions. These factors, plus the fading of certain global risk factors mentioned above, hastened spread tightening in the latter part of the period. At the same time, idiosyncratic risks spiked in some countries (e.g., Argentina and Lebanon), contributing to increased dispersion in performance among sovereign assets.
Contributors to Performance
The combination of stock selection and, to a lesser extent, an overweight position in thefinancials sector contributed to performance relative to the Russell 1000® Value Index. Within this sector, not owning shares of insurance and investment firm Berkshire Hathaway aided relative performance. The fund’s overweight holdings of global financial services firms JPMorgan Chase & Co. and Citigroup also lifted relative results. Financials, and the banks in particular, were one of the better-performing segments of the market in 2019, and shares of JPMorgan Chase & Co. were no exception. In addition, despite interest rates declining during the year, the company had a strong second half, reporting third-quarter earnings above consensus estimates, led by better-than-expected revenue in Fixed Income, Currencies and Commodities (FICC), Investment Banking and Mortgage Banking. The fund’s holdings of risk management and human capital consulting services provider Aon (b) and credit rating agency Moody’s (b) further boosted relative returns. The share price of Aon climbed after the firm reported better-than-expected earnings per share and operating margins.
An overweight position and, to a lesser extent, security selection in theindustrialssector helped relative performance. Here, the fund’s holdings of industrial products and equipment manufacturer Illinois Tool Works (b) and global security company Northrop Grumman (b) bolstered relative returns. The stock price for Illinois Tool Works advanced as the company reported quarterly earnings that were above consensus estimates.
Elsewhere, the fund’s holdings of IT servicing firm Accenture (b) and financial technology services provider Fiserv (b), and an underweight position in integrated oil and gas company Exxon Mobil, supported relative performance. Investors in Accenture appeared to have responded positively to the company’s announcement of a new CEO and earnings that were in line with analyst expectations, as many competitors went through turnarounds and leadership changes. Strong outsourcing bookings and management’s positive tone on its pipeline and outlook also drove the stock price higher.
Detractors from Performance
Individual stocks that were among the fund’s top relative detractors included not owning shares of financial services firm Bank of America, telecommunication services provider AT&T, network equipment company Cisco Systems and retail giant Target, as all four
3
MFS Value Series
Management Review – continued
stocks outperformed the benchmark during the reporting period. The share price for Bank of America appreciated after the company reported earnings per share results that were ahead of expectations, primarily driven by stronger-than-expected consumer and global banking revenues. The fund’s overweight positions in diversified technology company 3M, power & natural gas distributor Duke Energy, pharmaceutical giant Pfizer and oil field services company Schlumberger (h) held back relative results. An underweight position in household products maker Procter & Gamble also weighed on relative performance.
The fund’s cash and/or cash equivalents position during the period detracted from relative performance. The fund strives to be fully invested and generally holds cash to buy new holdings and to provide liquidity. In a period when equity markets appreciated, as measured by the fund’s benchmark, holding cash hurt performance versus the benchmark, which has no cash position.
Respectfully,
Portfolio Manager(s)
Katherine Cannan, Nevin Chitkara, and Steven Gorham
Note to Shareholders: Effective December 31, 2019, Katherine Cannan was added as a Portfolio Manager of the Fund. Effective December 31, 2020, Steven Gorham will be removed as a Portfolio Manager of the Fund.
| (b) | Security is not a benchmark constituent. |
| (h) | Security was not held in the portfolio at period end. |
The views expressed in this report are those of the portfolio manager(s) only through the end of the period of the report as stated on the cover and do not necessarily reflect the views of MFS or any other person in the MFS organization. These views are subject to change at any time based on market or other conditions, and MFS disclaims any responsibility to update such views. These views may not be relied upon as investment advice or an indication of trading intent on behalf of any MFS portfolio. References to specific securities are not recommendations of such securities, and may not be representative of any MFS portfolio’s current or future investments.
4
MFS Value Series
PERFORMANCE SUMMARY THROUGH 12/31/19
The following chart illustrates the historical performance of the fund in comparison to its benchmark(s). Benchmarks are unmanaged and may not be invested in directly. Benchmark returns do not reflect any fees or expenses. The performance of other share classes will be greater than or less than that of the class depicted below. (See Notes to Performance Summary.)
Performance data shown represents past performance and is no guarantee of future results. Investment return and principal value fluctuate so your units, when sold, may be worth more or less than the original cost; current performance may be lower or higher than quoted. The performance shown does not reflect the deduction of taxes, if any, that a contract holder would pay on fund distributions or the redemption of contract units. The returns for the fund shown also do not reflect the deduction of expenses associated with variable products, such as mortality and expense risk charges, separate account charges, and sales charges imposed by the insurance company separate accounts. Such expenses would reduce the overall returns shown.
Growth of a Hypothetical $10,000 Investment
Total Returns through 12/31/19
Average annual total returns
| | | | | | | | | | | | |
| | | Share Class | | Class Inception Date | | 1-yr | | 5-yr | | 10-yr | | |
| | | Initial Class | | 1/02/02 | | 29.80% | | 9.23% | | 11.68% | | |
| | | Service Class | | 1/02/02 | | 29.51% | | 8.96% | | 11.40% | | |
| | | | |
| Comparative benchmark(s) | | | | | | | | |
| | | Russell 1000® Value Index (f) | | 26.54% | | 8.29% | | 11.80% | | |
| (f) | Source: FactSet Research Systems Inc. |
Benchmark Definition(s)
Russell 1000® Value Index – constructed to provide a comprehensive barometer for the value securities in the large-cap segment of the U.S. equity universe. Companies in this index generally have lower price-to-book ratios and lower forecasted growth values. Frank Russell Company (“Russell”) is the source and owner of the trademarks, service marks, and copyrights related to the Russell Indexes. Russell® is a trademark of Frank Russell Company. Neither Russell nor its licensors accept any liability for any errors or omissions in the Russell Indexes and/or Russell ratings or underlying data and no party may rely on any Russell Indexes and/or Russell ratings and/or underlying data contained in this document. No further distribution of Russell Data is permitted without Russell’s express written consent. Russell does not promote, sponsor, or endorse the content of this document.
It is not possible to invest directly in an index.
Notes to Performance Summary
Average annual total return represents the average annual change in value for each share class for the periods presented.
Performance results reflect any applicable expense subsidies and waivers in effect during the periods shown. Without such subsidies and waivers the fund’s performance results would be less favorable. Please see the prospectus and financial statements for complete details. All results are historical and assume the reinvestment of any dividends and capital gains distributions.
Performance results do not include adjustments made for financial reporting purposes in accordance with U.S. generally accepted accounting principles and may differ from amounts reported in the financial highlights.
From time to time the fund may receive proceeds from litigation settlements, without which performance would be lower.
5
MFS Value Series
EXPENSE TABLE
Fund Expenses Borne by the Contract Holders during the Period, July 1, 2019 through December 31, 2019
As a contract holder of the fund, you incur ongoing costs, including management fees; distribution and/or service(12b-1) fees; and other fund expenses. This example is intended to help you understand your ongoing costs (in dollars) of investing in the fund and to compare these costs with the ongoing costs of investing in other mutual funds.
The example is based on an investment of $1,000 invested at the beginning of the period and held for the entire period July 1, 2019 through December 31, 2019.
Actual Expenses
The first line for each share class in the following table provides information about actual account values and actual expenses. You may use the information in this line, together with the amount you invested, to estimate the expenses that you paid over the period. Simply divide your account value by $1,000 (for example, an $8,600 account value divided by $1,000 = 8.6), then multiply the result by the number in the first line under the heading entitled “Expenses Paid During Period” to estimate the expenses you paid on your account during this period.
Hypothetical Example for Comparison Purposes
The second line for each share class in the following table provides information about hypothetical account values and hypothetical expenses based on the fund’s actual expense ratio and an assumed rate of return of 5% per year before expenses, which is not the fund’s actual return. The hypothetical account values and expenses may not be used to estimate the actual ending account balance or expenses you paid for the period. You may use this information to compare the ongoing costs of investing in the fund and other funds. To do so, compare this 5% hypothetical example with the 5% hypothetical examples that appear in the shareholder reports of the other funds.
Please note that the expenses shown in the table are meant to highlight the fund’s ongoing costs only and do not take into account the fees and expenses imposed under the variable contracts through which your investment in the fund is made. Therefore, the second line for each share class in the table is useful in comparing ongoing costs associated with an investment in vehicles (such as the fund) which fund benefits under variable annuity and variable life insurance contracts and to qualified pension and retirement plans only, and will not help you determine the relative total costs of investing in the fund through variable annuity and variable life insurance contracts. If the fees and expenses imposed under the variable contracts were included, your costs would have been higher.
| | | | | | | | | | | | | | | | | | |
| Share Class | | | | Annualized
Expense Ratio | | | Beginning
Account Value
7/01/19 | | | Ending Account Value 12/31/19 | | | Expenses Paid
During Period (p)
7/01/19-12/31/19 | |
| Initial Class | | Actual | | | 0.71% | | | | $1,000.00 | | | | $1,097.00 | | | | $3.75 | |
| | Hypothetical (h) | | | 0.71% | | | | $1,000.00 | | | | $1,021.63 | | | | $3.62 | |
| Service Class | | Actual | | | 0.96% | | | | $1,000.00 | | | | $1,095.47 | | | | $5.07 | |
| | Hypothetical (h) | | | 0.96% | | | | $1,000.00 | | | | $1,020.37 | | | | $4.89 | |
| (h) | 5% class return per year before expenses. |
| (p) | “Expenses Paid During Period” are equal to each class’s annualized expense ratio, as shown above, multiplied by the average account value over the period, multiplied by 184/365 (to reflect theone-half year period). |
6
MFS Value Series
PORTFOLIO OF INVESTMENTS – 12/31/19
The Portfolio of Investments is a complete list of all securities owned by your fund. It is categorized by broad-based asset classes.
| | | | | | | | |
| | |
| Issuer | | Shares/Par | | | Value ($) | |
| COMMON STOCKS – 98.7% | | | | | | | | |
| Aerospace – 6.5% | | | | | |
| Honeywell International, Inc. | | | 248,016 | | | $ | 43,898,832 | |
| Lockheed Martin Corp. | | | 62,168 | | | | 24,206,976 | |
| Northrop Grumman Corp. | | | 126,810 | | | | 43,618,835 | |
| United Technologies Corp. | | | 213,113 | | | | 31,915,803 | |
| | | | | | | | |
| | | | | | $ | 143,640,446 | |
| | | | | | | | |
| Alcoholic Beverages – 1.4% | | | | | |
| Diageo PLC | | | 749,795 | | | $ | 31,786,672 | |
| | | | | | | | |
| Apparel Manufacturers – 0.1% | | | | | |
| Hanesbrands, Inc. | | | 109,510 | | | $ | 1,626,224 | |
| | | | | | | | |
| Automotive – 1.1% | | | | | |
| Aptiv PLC | | | 206,897 | | | $ | 19,649,008 | |
| Lear Corp. | | | 28,565 | | | | 3,919,118 | |
| | | | | | | | |
| | | | | | $ | 23,568,126 | |
| | | | | | | | |
| Broadcasting – 0.1% | | | | | |
| Omnicom Group, Inc. | | | 40,579 | | | $ | 3,287,711 | |
| | | | | | | | |
| Brokerage & Asset Managers – 2.6% | | | | | |
| BlackRock, Inc. | | | 42,411 | | | $ | 21,320,010 | |
| NASDAQ, Inc. | | | 241,053 | | | | 25,816,776 | |
| T. Rowe Price Group, Inc. | | | 89,937 | | | | 10,957,924 | |
| | | | | | | | |
| | | | | | $ | 58,094,710 | |
| | | | | | | | |
| Business Services – 6.8% | | | | | |
| Accenture PLC, “A” | | | 287,677 | | | $ | 60,576,146 | |
| Cognizant Technology Solutions Corp., “A” | | | 136,815 | | | | 8,485,266 | |
| Equifax, Inc. | | | 132,499 | | | | 18,565,760 | |
| Fidelity National Information Services, Inc. | | | 210,173 | | | | 29,232,963 | |
| Fiserv, Inc. (a) | | | 288,922 | | | | 33,408,051 | |
| | | | | | | | |
| | | | | | $ | 150,268,186 | |
| | | | | | | | |
| Cable TV – 2.8% | | | | | |
| Comcast Corp., “A” | | | 1,394,608 | | | $ | 62,715,522 | |
| | | | | | | | |
| Chemicals – 2.9% | | | | | |
| 3M Co. | | | 110,979 | | | $ | 19,578,915 | |
| PPG Industries, Inc. | | | 332,637 | | | | 44,403,713 | |
| | | | | | | | |
| | | | | | $ | 63,982,628 | |
| | | | | | | | |
| Construction – 2.2% | | | | | |
| Sherwin-Williams Co. | | | 42,644 | | | $ | 24,884,480 | |
| Stanley Black & Decker, Inc. | | | 152,302 | | | | 25,242,533 | |
| | | | | | | | |
| | | | | | $ | 50,127,013 | |
| | | | | | | | |
| Consumer Products – 1.2% | | | | | |
| Colgate-Palmolive Co. | | | 59,582 | | | $ | 4,101,625 | |
| Kimberly-Clark Corp. | | | 53,952 | | | | 7,421,098 | |
| Procter & Gamble Co. | | | 38,729 | | | | 4,837,252 | |
| Reckitt Benckiser Group PLC | | | 114,667 | | | | 9,309,208 | |
| | | | | | | | |
| | | | | | $ | 25,669,183 | |
| | | | | | | | |
| Electrical Equipment – 1.2% | | | | | |
| Johnson Controls International PLC | | | 632,150 | | | $ | 25,734,827 | |
| | | | | | | | |
| | | | | | | | |
| | |
| Issuer | | Shares/Par | | | Value ($) | |
| COMMON STOCKS – continued | | | | | |
| Electronics – 3.2% | | | | | |
| Analog Devices, Inc. | | | 119,033 | | | $ | 14,145,882 | |
| NXP Semiconductors N.V. | | | 80,346 | | | | 10,224,832 | |
| Texas Instruments, Inc. | | | 370,921 | | | | 47,585,455 | |
| | | | | | | | |
| | | | | | $ | 71,956,169 | |
| | | | | | | | |
| Energy – Independent – 1.1% | | | | | |
| EOG Resources, Inc. | | | 189,916 | | | $ | 15,907,364 | |
| Pioneer Natural Resources Co. | | | 57,282 | | | | 8,670,777 | |
| | | | | | | | |
| | | | | | $ | 24,578,141 | |
| | | | | | | | |
| Energy – Integrated – 2.2% | | | | | |
| Chevron Corp. | | | 142,051 | | | $ | 17,118,566 | |
| Exxon Mobil Corp. | | | 205,427 | | | | 14,334,696 | |
| Suncor Energy, Inc. | | | 555,186 | | | | 18,196,231 | |
| | | | | | | | |
| | | | | | $ | 49,649,493 | |
| | | | | | | | |
| Food & Beverages – 3.5% | | | | | |
| Archer Daniels Midland Co. | | | 269,211 | | | $ | 12,477,930 | |
| Danone S.A. | | | 116,594 | | | | 9,664,899 | |
| J.M. Smucker Co. | | | 70,616 | | | | 7,353,244 | |
| Nestle S.A. | | | 339,868 | | | | 36,796,207 | |
| PepsiCo, Inc. | | | 85,618 | | | | 11,701,412 | |
| | | | | | | | |
| | | | | | $ | 77,993,692 | |
| | | | | | | | |
| Health Maintenance Organizations – 2.1% | | | | | |
| Cigna Corp. | | | 223,479 | | | $ | 45,699,221 | |
| | | | | | | | |
| Insurance – 7.6% | | | | | |
| Aon PLC | | | 248,276 | | | $ | 51,713,408 | |
| Chubb Ltd. | | | 295,364 | | | | 45,976,360 | |
| Marsh & McLennan Cos., Inc. | | | 295,143 | | | | 32,881,882 | |
| Travelers Cos., Inc. | | | 283,153 | | | | 38,777,803 | |
| | | | | | | | |
| | | | | | $ | 169,349,453 | |
| | | | | | | | |
| Leisure & Toys – 0.1% | | | | | |
| Harley-Davidson, Inc. | | | 61,935 | | | $ | 2,303,363 | |
| | | | | | | | |
| Machinery & Tools – 3.9% | | | | | |
| Eaton Corp. PLC | | | 282,580 | | | $ | 26,765,978 | |
| Illinois Tool Works, Inc. | | | 209,263 | | | | 37,589,913 | |
| Ingersoll-Rand Co. PLC, “A” | | | 171,406 | | | | 22,783,285 | |
| | | | | | | | |
| | | | | | $ | 87,139,176 | |
| | | | | | | | |
| Major Banks – 12.0% | | | | | |
| Bank of New York Mellon Corp. | | | 376,635 | | | $ | 18,956,039 | |
| Goldman Sachs Group, Inc. | | | 159,953 | | | | 36,777,993 | |
| JPMorgan Chase & Co. | | | 791,217 | | | | 110,295,650 | |
| PNC Financial Services Group, Inc. | | | 204,942 | | | | 32,714,891 | |
| State Street Corp. | | | 232,736 | | | | 18,409,418 | |
| Wells Fargo & Co. | | | 916,837 | | | | 49,325,831 | |
| | | | | | | | |
| | | | | | $ | 266,479,822 | |
| | | | | | | | |
| Medical & Health Technology & Services – 0.7% | |
| McKesson Corp. | | | 105,870 | | | $ | 14,643,938 | |
| | | | | | | | |
7
MFS Value Series
Portfolio of Investments – continued
| | | | | | | | |
| | |
| Issuer | | Shares/Par | | | Value ($) | |
| COMMON STOCKS – continued | | | | | |
| Medical Equipment – 7.4% | | | | | |
| Abbott Laboratories | | | 327,104 | | | $ | 28,412,253 | |
| Danaher Corp. | | | 260,528 | | | | 39,985,838 | |
| Medtronic PLC | | | 574,102 | | | | 65,131,872 | |
| Thermo Fisher Scientific, Inc. | | | 96,933 | | | | 31,490,624 | |
| | | | | | | | |
| | | | | | $ | 165,020,587 | |
| | | | | | | | |
| Other Banks & Diversified Financials – 6.9% | | | | | |
| American Express Co. | | | 133,274 | | | $ | 16,591,280 | |
| Citigroup, Inc. | | | 710,044 | | | | 56,725,415 | |
| Truist Financial Corp. | | | 587,693 | | | | 33,098,870 | |
| U.S. Bancorp | | | 813,838 | | | | 48,252,455 | |
| | | | | | | | |
| | | | | | $ | 154,668,020 | |
| | | | | | | | |
| Pharmaceuticals – 7.1% | | | | | |
| Johnson & Johnson | | | 510,251 | | | $ | 74,430,313 | |
| Merck & Co., Inc. | | | 272,518 | | | | 24,785,512 | |
| Novartis AG | | | 55,496 | | | | 5,269,769 | |
| Pfizer, Inc. | | | 1,101,710 | | | | 43,164,998 | |
| Roche Holding AG | | | 31,328 | | | | 10,164,282 | |
| | | | | | | | |
| | | | | | $ | 157,814,874 | |
| | | | | | | | |
| Printing & Publishing – 0.8% | | | | | |
| Moody’s Corp. | | | 74,018 | | | $ | 17,572,613 | |
| | | | | | | | |
| Railroad & Shipping – 1.8% | | | | | |
| Canadian National Railway Co. | | | 134,460 | | | $ | 12,161,907 | |
| Union Pacific Corp. | | | 157,987 | | | | 28,562,470 | |
| | | | | | | | |
| | | | | | $ | 40,724,377 | |
| | | | | | | | |
| Real Estate – 0.3% | | | | | |
| Public Storage, Inc., REIT | | | 34,672 | | | $ | 7,383,749 | |
| | | | | | | | |
| Specialty Chemicals – 0.9% | | | | | |
| Corteva, Inc. | | | 86,801 | | | $ | 2,565,838 | |
| DuPont de Nemours, Inc. | | | 272,442 | | | | 17,490,776 | |
| | | | | | | | |
| | | | | | $ | 20,056,614 | |
| | | | | | | | |
| Telephone Services – 0.5% | | | | | |
| Verizon Communications, Inc. | | | 169,711 | | | $ | 10,420,255 | |
| | | | | | | | |
| | | | | | | | |
| | |
| Issuer | | Shares/Par | | | Value ($) | |
| COMMON STOCKS – continued | | | | | |
| Tobacco – 1.8% | | | | | |
| Altria Group, Inc. | | | 203,276 | | | $ | 10,145,505 | |
| Philip Morris International, Inc. | | | 349,187 | | | | 29,712,322 | |
| | | | | | | | |
| | | | | | $ | 39,857,827 | |
| | | | | | | | |
| Utilities – Electric Power – 5.9% | | | | | |
| Duke Energy Corp. | | | 549,603 | | | $ | 50,129,289 | |
| FirstEnergy Corp. | | | 625,532 | | | | 30,400,855 | |
| Southern Co. | | | 644,340 | | | | 41,044,458 | |
| Xcel Energy, Inc. | | | 167,188 | | | | 10,614,766 | |
| | | | | | | | |
| | | | | | $ | 132,189,368 | |
| | | | | | | | |
Total Common Stocks
(Identified Cost, $1,100,185,905) | | | | | | $ | 2,196,002,000 | |
| | | | | | | | |
| |
| INVESTMENT COMPANIES (h) – 1.2% | | | | | |
| Money Market Funds – 1.2% | | | | | | | | |
| MFS Institutional Money Market Portfolio, 1.7% (v) (Identified Cost, $25,583,427) | | | 25,583,427 | | | $ | 25,583,427 | |
| | | | | | | | |
OTHER ASSETS, LESS
LIABILITIES – 0.1% | | | | | | | 2,720,653 | |
| | | | | | | | |
| NET ASSETS – 100.0% | | | | | | $ | 2,224,306,080 | |
| | | | | | | | |
| (a) | | Non-income producing security. |
| (h) | | An affiliated issuer, which may be considered one in which the fund owns 5% or more of the outstanding voting securities, or a company which is under common control. At period end, the aggregate values of the fund’s investments in affiliated issuers and in unaffiliated issuers were $25,583,427 and $2,196,002,000, respectively. |
| (v) | | Affiliated issuer that is available only to investment companies managed by MFS. The rate quoted for the MFS Institutional Money Market Portfolio is the annualizedseven-day yield of the fund at period end. |
The following abbreviations are used in this report and are defined:
| REIT | | Real Estate Investment Trust |
See Notes to Financial Statements
8
MFS Value Series
FINANCIAL STATEMENTS | STATEMENT OF ASSETS AND LIABILITIES
This statement represents your fund’s balance sheet, which details the assets and liabilities comprising the total value of the fund.
| | | | |
At 12/31/19 | | | | |
| |
Assets | | | | |
Investments in unaffiliated issuers, at value (identified cost, $1,100,185,905) | | | $2,196,002,000 | |
Investments in affiliated issuers, at value (identified cost, $25,583,427) | | | 25,583,427 | |
Cash | | | 91,821 | |
Receivables for | | | | |
Investments sold | | | 104,695 | |
Fund shares sold | | | 1,256,735 | |
Interest and dividends | | | 3,449,063 | |
Other assets | | | 7,980 | |
Total assets | | | $2,226,495,721 | |
| |
Liabilities | | | | |
Payable to custodian | | | $104,695 | |
Payables for | | | | |
Fund shares reacquired | | | 1,775,335 | |
Payable to affiliates | | | | |
Investment adviser | | | 86,150 | |
Administrative services fee | | | 1,571 | |
Shareholder servicing costs | | | 905 | |
Distribution and/or service fees | | | 17,521 | |
Payable for independent Trustees’ compensation | | | 15 | |
Accrued expenses and other liabilities | | | 203,449 | |
Total liabilities | | | $2,189,641 | |
Net assets | | | $2,224,306,080 | |
| |
Net assets consist of | | | | |
Paid-in capital | | | $1,002,746,842 | |
Total distributable earnings (loss) | | | 1,221,559,238 | |
Net assets | | | $2,224,306,080 | |
Shares of beneficial interest outstanding | | | 107,458,783 | |
| | | | | | | | | | | | |
| | | |
| | | Net assets | | | Shares
outstanding | | | Net asset value
per share | |
Initial Class | | | $945,182,924 | | | | 45,124,475 | | | | $20.95 | |
Service Class | | | 1,279,123,156 | | | | 62,334,308 | | | | 20.52 | |
See Notes to Financial Statements
9
MFS Value Series
FINANCIAL STATEMENTS | STATEMENT OF OPERATIONS
This statement describes how much your fund earned in investment income and accrued in expenses. It also describes any gains and/or losses generated by fund operations.
| | | | |
Year ended 12/31/19 | | | | |
| |
Net investment income (loss) | | | | |
Income | | | | |
Dividends | | | $50,837,276 | |
Dividends from affiliated issuers | | | 441,982 | |
Other | | | 43,083 | |
Income on securities loaned | | | 336 | |
Foreign taxes withheld | | | (317,868 | ) |
Total investment income | | | $51,004,809 | |
Expenses | | | | |
Management fee | | | $14,896,006 | |
Distribution and/or service fees | | | 3,079,668 | |
Shareholder servicing costs | | | 29,544 | |
Administrative services fee | | | 297,613 | |
Independent Trustees’ compensation | | | 37,579 | |
Custodian fee | | | 112,570 | |
Shareholder communications | | | 87,256 | |
Audit and tax fees | | | 58,023 | |
Legal fees | | | 20,636 | |
Miscellaneous | | | 57,835 | |
Total expenses | | | $18,676,730 | |
Reduction of expenses by investment adviser | | | (246,128 | ) |
Net expenses | | | $18,430,602 | |
Net investment income (loss) | | | $32,574,207 | |
| |
Realized and unrealized gain (loss) | | | | |
Realized gain (loss) (identified cost basis) | | | | |
Unaffiliated issuers | | | $103,175,683 | |
Affiliated issuers | | | 2,204 | |
Foreign currency | | | (4,208 | ) |
Net realized gain (loss) | | | $103,173,679 | |
Change in unrealized appreciation or depreciation | | | | |
Unaffiliated issuers | | | $413,690,283 | |
Translation of assets and liabilities in foreign currencies | | | 19,410 | |
Net unrealized gain (loss) | | | $413,709,693 | |
Net realized and unrealized gain (loss) | | | $516,883,372 | |
Change in net assets from operations | | | $549,457,579 | |
See Notes to Financial Statements
10
MFS Value Series
FINANCIAL STATEMENTS | STATEMENTS OF CHANGES IN NET ASSETS
These statements describe the increases and/or decreases in net assets resulting from operations, any distributions, and any shareholder transactions.
| | | | | | | | |
| | | Year ended | |
| | | 12/31/19 | | | 12/31/18 | |
Change in net assets | | | | | | | | |
| | |
From operations | | | | | | | | |
Net investment income (loss) | | | $32,574,207 | | | | $42,329,620 | |
Net realized gain (loss) | | | 103,173,679 | | | | 96,194,739 | |
Net unrealized gain (loss) | | | 413,709,693 | | | | (358,627,489 | ) |
Change in net assets from operations | | | $549,457,579 | | | | $(220,103,130 | ) |
Total distributions to shareholders | | | $(138,541,235 | ) | | | $(183,683,470 | ) |
Change in net assets from fund share transactions | | | $(138,202,942 | ) | | | $(39,789,597 | ) |
Total change in net assets | | | $272,713,402 | | | | $(443,576,197 | ) |
| | |
Net assets | | | | | | | | |
At beginning of period | | | 1,951,592,678 | | | | 2,395,168,875 | |
At end of period | | | $2,224,306,080 | | | | $1,951,592,678 | |
See Notes to Financial Statements
11
MFS Value Series
FINANCIAL STATEMENTS | FINANCIAL HIGHLIGHTS
The financial highlights table is intended to help you understand the fund’s financial performance for the past 5 years. Certain information reflects financial results for a single fund share. The total returns in the table represent the rate that an investor would have earned (or lost) on an investment in the fund share class (assuming reinvestment of all distributions) held for the entire period.
| | | | | | | | | | | | | | | | | | | | |
| Initial Class | | Year ended | |
| | | | | |
| | | 12/31/19 | | | 12/31/18 | | | 12/31/17 | | | 12/31/16 | | | 12/31/15 | |
| | | | | |
Net asset value, beginning of period | | | $17.30 | | | | $20.92 | | | | $18.90 | | | | $18.39 | | | | $20.34 | |
| | | | | |
| Income (loss) from investment operations | | | | | | | | | | | | | | | | | | | | |
Net investment income (loss) (d) | | | $0.33 | | | | $0.41 | | | | $0.30 | | | | $0.38 | (c) | | | $0.40 | |
Net realized and unrealized gain (loss) | | | 4.68 | | | | (2.32 | ) | | | 2.93 | | | | 2.16 | | | | (0.67 | ) |
Total from investment operations | | | $5.01 | | | | $(1.91 | ) | | | $3.23 | | | | $2.54 | | | | $(0.27 | ) |
| | | | | |
| Less distributions declared to shareholders | | | | | | | | | | | | | | | | | | | | |
From net investment income | | | $(0.44 | ) | | | $(0.32 | ) | | | $(0.40 | ) | | | $(0.42 | ) | | | $(0.48 | ) |
From net realized gain | | | (0.92 | ) | | | (1.39 | ) | | | (0.81 | ) | | | (1.61 | ) | | | (1.20 | ) |
Total distributions declared to shareholders | | | $(1.36 | ) | | | $(1.71 | ) | | | $(1.21 | ) | | | $(2.03 | ) | | | $(1.68 | ) |
Net asset value, end of period (x) | | | $20.95 | | | | $17.30 | | | | $20.92 | | | | $18.90 | | | | $18.39 | |
Total return (%) (k)(r)(s)(x) | | | 29.80 | | | | (10.09 | ) | | | 17.65 | | | | 14.09 | (c) | | | (0.74 | ) |
| | | | | |
Ratios (%) (to average net assets)
and Supplemental data: | | | | | | | | | | | | | | | | | | | | |
Expenses before expense reductions (f) | | | 0.73 | | | | 0.73 | | | | 0.74 | | | | 0.73 | (c) | | | 0.73 | |
Expenses after expense reductions (f) | | | 0.72 | | | | 0.72 | | | | 0.73 | | | | 0.72 | (c) | | | 0.73 | |
Net investment income (loss) | | | 1.67 | | | | 2.02 | | | | 1.51 | | | | 2.02 | (c) | | | 2.00 | |
Portfolio turnover | | | 13 | | | | 8 | | | | 10 | | | | 15 | | | | 13 | |
Net assets at end of period (000 omitted) | | | $945,183 | | | | $823,744 | | | | $996,794 | | | | $968,078 | | | | $964,811 | |
| |
| Service Class | | Year ended | |
| | | | | |
| | | 12/31/19 | | | 12/31/18 | | | 12/31/17 | | | 12/31/16 | | | 12/31/15 | |
| | | | | |
Net asset value, beginning of period | | | $16.96 | | | | $20.55 | | | | $18.59 | | | | $18.12 | | | | $20.05 | |
| | | | | |
| Income (loss) from investment operations | | | | | | | | | | | | | | | | | | | | |
Net investment income (loss) (d) | | | $0.27 | | | | $0.35 | | | | $0.25 | | | | $0.33 | (c) | | | $0.34 | |
Net realized and unrealized gain (loss) | | | 4.59 | | | | (2.28 | ) | | | 2.87 | | | | 2.11 | | | | (0.65 | ) |
Total from investment operations | | | $4.86 | | | | $(1.93 | ) | | | $3.12 | | | | $2.44 | | | | $(0.31 | ) |
| | | | | |
| Less distributions declared to shareholders | | | | | | | | | | | | | | | | | | | | |
From net investment income | | | $(0.38 | ) | | | $(0.27 | ) | | | $(0.35 | ) | | | $(0.36 | ) | | | $(0.42 | ) |
From net realized gain | | | (0.92 | ) | | | (1.39 | ) | | | (0.81 | ) | | | (1.61 | ) | | | (1.20 | ) |
Total distributions declared to shareholders | | | $(1.30 | ) | | | $(1.66 | ) | | | $(1.16 | ) | | | $(1.97 | ) | | | $(1.62 | ) |
Net asset value, end of period (x) | | | $20.52 | | | | $16.96 | | | | $20.55 | | | | $18.59 | | | | $18.12 | |
Total return (%) (k)(r)(s)(x) | | | 29.51 | | | | (10.36 | ) | | | 17.35 | | | | 13.78 | (c) | | | (0.93 | ) |
| | | | | |
Ratios (%) (to average net assets)
and Supplemental data: | | | | | | | | | | | | | | | | | | | | |
Expenses before expense reductions (f) | | | 0.98 | | | | 0.98 | | | | 0.99 | | | | 0.98 | (c) | | | 0.98 | |
Expenses after expense reductions (f) | | | 0.97 | | | | 0.97 | | | | 0.98 | | | | 0.97 | (c) | | | 0.98 | |
Net investment income (loss) | | | 1.42 | | | | 1.77 | | | | 1.26 | | | | 1.78 | (c) | | | 1.76 | |
Portfolio turnover | | | 13 | | | | 8 | | | | 10 | | | | 15 | | | | 13 | |
Net assets at end of period (000 omitted) | | | $1,279,123 | | | | $1,127,848 | | | | $1,398,374 | | | | $1,302,307 | | | | $1,167,754 | |
See Notes to Financial Statements
12
MFS Value Series
Financial Highlights – continued
| (c) | Amount reflects aone-time reimbursement of expenses by the custodian (or former custodian) without which net investment income and performance would be lower and expenses would be higher. |
| (d) | Per share data is based on average shares outstanding. |
| (f) | Ratios do not reflect reductions from fees paid indirectly, if applicable. |
| (k) | The total return does not reflect expenses that apply to separate accounts. Inclusion of these charges would reduce the total return figures for all periods shown. |
| (r) | Certain expenses have been reduced without which performance would have been lower. |
| (s) | From time to time the fund may receive proceeds from litigation settlements, without which performance would be lower. |
| (x) | The net asset values and total returns have been calculated on net assets which include adjustments made in accordance with U.S. generally accepted accounting principles required at period end for financial reporting purposes. |
See Notes to Financial Statements
13
MFS Value Series
NOTES TO FINANCIAL STATEMENTS
| (1) | | Business and Organization |
MFS Value Series (the fund) is a diversified series of MFS Variable Insurance Trust (the trust). The trust is organized as a Massachusetts business trust and is registered under the Investment Company Act of 1940, as amended, as anopen-end management investment company. The shareholders of each series of the trust are separate accounts of insurance companies, which offer variable annuity and/or life insurance products, and qualified retirement and pension plans.
The fund is an investment company and accordingly follows the investment company accounting and reporting guidance of the Financial Accounting Standards Board (FASB) Accounting Standards Codification Topic 946 Financial Services – Investment Companies.
| (2) | | Significant Accounting Policies |
General– The preparation of financial statements in conformity with U.S. generally accepted accounting principles requires management to make estimates and assumptions that affect the reported amounts of assets and liabilities, and disclosure of contingent assets and liabilities at the date of the financial statements and the reported amounts of increases and decreases in net assets from operations during the reporting period. Actual results could differ from those estimates. In the preparation of these financial statements, management has evaluated subsequent events occurring after the date of the fund’s Statement of Assets and Liabilities through the date that the financial statements were issued.
Balance Sheet Offsetting– The fund’s accounting policy with respect to balance sheet offsetting is that, absent an event of default by the counterparty or a termination of the agreement, the International Swaps and Derivatives Association (ISDA) Master Agreement, or similar agreement, does not result in an offset of reported amounts of financial assets and financial liabilities in the Statement of Assets and Liabilities across transactions between the fund and the applicable counterparty. The fund’s right to setoff may be restricted or prohibited by the bankruptcy or insolvency laws of the particular jurisdiction to which a specific master netting agreement counterparty is subject. Balance sheet offsetting disclosures, to the extent applicable to the fund, have been included in the fund’s Significant Accounting Policies note under the captions for each of the fund’sin-scope financial instruments and transactions.
Investment Valuations– Equity securities, including restricted equity securities, are generally valued at the last sale or official closing price on their primary market or exchange as provided by a third-party pricing service. Equity securities, for which there were no sales reported that day, are generally valued at the last quoted daily bid quotation on their primary market or exchange as provided by a third-party pricing service. Short-term instruments with a maturity at issuance of 60 days or less may be valued at amortized cost, which approximates market value.Open-end investment companies are generally valued at net asset value per share. Securities and other assets generally valued on the basis of information from a third-party pricing service may also be valued at a broker/dealer bid quotation. In determining values, third-party pricing services can utilize both transaction data and market information such as yield, quality, coupon rate, maturity, type of issue, trading characteristics, and other market data. The values of foreign securities and other assets and liabilities expressed in foreign currencies are converted to U.S. dollars using the mean of bid and asked prices for rates provided by a third-party pricing service.
The Board of Trustees has delegated primary responsibility for determining or causing to be determined the value of the fund’s investments (including any fair valuation) to the adviser pursuant to valuation policies and procedures approved by the Board. If the adviser determines that reliable market quotations are not readily available, investments are valued at fair value as determined in good faith by the adviser in accordance with such procedures under the oversight of the Board of Trustees. Under the fund’s valuation policies and procedures, market quotations are not considered to be readily available for most types of debt instruments and floating rate loans and many types of derivatives. These investments are generally valued at fair value based on information from third-party pricing services. In addition, investments may be valued at fair value if the adviser determines that an investment’s value has been materially affected by events occurring after the close of the exchange or market on which the investment is principally traded (such as foreign exchange or market) and prior to the determination of the fund’s net asset value, or after the halt of trading of a specific security where trading does not resume prior to the close of the exchange or market on which the security is principally traded. Events that occur after foreign markets close (such as developments in foreign markets and significant movements in the U.S. markets) and prior to the determination of the fund’s net asset value may be deemed to have a material effect on the value of securities traded in foreign markets. Accordingly, the fund’s foreign equity securities may often be valued at fair value. The adviser generally relies on third-party pricing services or other information (such as the correlation with price movements of similar securities in the same or other markets; the type, cost and investment characteristics of the security; the business and financial condition of the issuer; and trading and other market data) to assist in determining whether to fair value and at what value to fair value an investment. The value of an investment for purposes of calculating the fund’s net asset value can differ depending on the source and method used to determine value. When fair valuation is used, the value of an investment used to determine the fund’s net asset value may differ from quoted or published prices for the same investment. There can be no assurance that the fund could obtain the fair value assigned to an investment if it were to sell the investment at the same time at which the fund determines its net asset value per share.
14
MFS Value Series
Notes to Financial Statements – continued
Various inputs are used in determining the value of the fund’s assets or liabilities. These inputs are categorized into three broad levels. In certain cases, the inputs used to measure fair value may fall into different levels of the fair value hierarchy. In such cases, an investment’s level within the fair value hierarchy is based on the lowest level of input that is significant to the fair value measurement. The fund’s assessment of the significance of a particular input to the fair value measurement in its entirety requires judgment, and considers factors specific to the investment. Level 1 includes unadjusted quoted prices in active markets for identical assets or liabilities. Level 2 includes other significant observable market-based inputs (including quoted prices for similar securities, interest rates, prepayment speed, and credit risk). Level 3 includes unobservable inputs, which may include the adviser’s own assumptions in determining the fair value of investments. The following is a summary of the levels used as of December 31, 2019 in valuing the fund’s assets or liabilities:
| | | | | | | | | | | | | | | | |
| Financial Instruments | | Level 1 | | | Level 2 | | | Level 3 | | | Total | |
| Equity Securities | | | $2,196,002,000 | | | | $— | | | | $— | | | | $2,196,002,000 | |
| Mutual Funds | | | 25,583,427 | | | | — | | | | — | | | | 25,583,427 | |
| Total | | | $2,221,585,427 | | | | $— | | | | $— | | | | $2,221,585,427 | |
For further information regarding security characteristics, see the Portfolio of Investments.
Foreign Currency Translation– Purchases and sales of foreign investments, income, and expenses are converted into U.S. dollars based upon currency exchange rates prevailing on the respective dates of such transactions or on the reporting date for foreign denominated receivables and payables. Gains and losses attributable to foreign currency exchange rates on sales of securities are recorded for financial statement purposes as net realized gains and losses on investments. Gains and losses attributable to foreign exchange rate movements on receivables, payables, income and expenses are recorded for financial statement purposes as foreign currency transaction gains and losses. That portion of both realized and unrealized gains and losses on investments that results from fluctuations in foreign currency exchange rates is not separately disclosed.
Security Loans– Under its Securities Lending Agency Agreement with the fund, State Street Bank and Trust Company, as lending agent, loans the securities of the fund to certain qualified institutions (the “Borrowers”) approved by the fund. Security loans can be terminated at the discretion of either the lending agent or the fund and the related securities must be returned within the earlier of the standard trade settlement period for such securities or within three business days. The loans are collateralized by cash and/or U.S. Treasury and federal agency obligations in an amount typically at least equal to the market value of the securities loaned. On loans collateralized by cash, the cash collateral is invested in a money market fund. The market value of the loaned securities is determined at the close of business of the fund and any additional required collateral is delivered to the fund on the next business day. The lending agent provides the fund with indemnification against Borrower default. In the event of Borrower default, the lending agent will, for the benefit of the fund, either purchase securities identical to those loaned or, when such purchase is commercially impracticable, pay the fund the market value of the loaned securities. In return, the lending agent assumes the fund’s rights to the related collateral. If the collateral value is less than the cost to purchase identical securities, the lending agent is responsible for the shortfall, but only to the extent that such shortfall is not due to a decline in collateral value resulting from collateral reinvestment for which the fund bears the risk of loss. A portion of the income generated upon investment of the collateral is remitted to the Borrowers, and the remainder is allocated between the fund and the lending agent. On loans collateralized by U.S. Treasury and/or federal agency obligations, a fee is received from the Borrower, and is allocated between the fund and the lending agent. Income from securities lending is separately reported in the Statement of Operations. The dividend and interest income earned on the securities loaned is accounted for in the same manner as other dividend and interest income. At December 31, 2019, there were no securities on loan or collateral outstanding.
Indemnifications– Under the fund’s organizational documents, its officers and Trustees may be indemnified against certain liabilities and expenses arising out of the performance of their duties to the fund. Additionally, in the normal course of business, the fund enters into agreements with service providers that may contain indemnification clauses. The fund’s maximum exposure under these agreements is unknown as this would involve future claims that may be made against the fund that have not yet occurred.
Investment Transactions and Income– Investment transactions are recorded on the trade date. Interest income is recorded on the accrual basis. Dividends received in cash are recorded on theex-dividend date. Certain dividends from foreign securities will be recorded when the fund is informed of the dividend if such information is obtained subsequent to theex-dividend date. Dividend payments received in additional securities are recorded on theex-dividend date in an amount equal to the value of the security on such date.
The fund may receive proceeds from litigation settlements. Any proceeds received from litigation involving portfolio holdings are reflected in the Statement of Operations in realized gain/loss if the security has been disposed of by the fund or in unrealized gain/loss if the security is still held by the fund. Any other proceeds from litigation not related to portfolio holdings are reflected as other income in the Statement of Operations.
15
MFS Value Series
Notes to Financial Statements – continued
Tax Matters and Distributions– The fund intends to qualify as a regulated investment company, as defined under Subchapter M of the Internal Revenue Code, and to distribute all of its taxable income, including realized capital gains. As a result, no provision for federal income tax is required. The fund’s federal tax returns, when filed, will remain subject to examination by the Internal Revenue Service for a three year period. Management has analyzed the fund’s tax positions taken on federal and state tax returns for all open tax years and does not believe that there are any uncertain tax positions that require recognition of a tax liability. Foreign taxes, if any, have been accrued by the fund in the accompanying financial statements in accordance with the applicable foreign tax law. Foreign income taxes may be withheld by certain countries in which the fund invests. Additionally, capital gains realized by the fund on securities issued in or by certain foreign countries may be subject to capital gains tax imposed by those countries.
Distributions to shareholders are recorded on theex-dividend date. Income and capital gain distributions are determined in accordance with income tax regulations, which may differ from U.S. generally accepted accounting principles. Certain capital accounts in the financial statements are periodically adjusted for permanent differences in order to reflect their tax character. These adjustments have no impact on net assets or net asset value per share. Temporary differences which arise from recognizing certain items of income, expense, gain or loss in different periods for financial statement and tax purposes will reverse at some time in the future.
Book/tax differences primarily relate to wash sale loss deferrals.
The tax character of distributions declared to shareholders for the last two fiscal years is as follows:
| | | | | | | | |
| | | Year ended
12/31/19 | | | Year ended
12/31/18 | |
| Ordinary income (including any short-term capital gains) | | | $42,575,241 | | | | $38,931,264 | |
| Long-term capital gains | | | 95,965,994 | | | | 144,752,206 | |
| Total distributions | | | $138,541,235 | | | | $183,683,470 | |
The federal tax cost and the tax basis components of distributable earnings were as follows:
| | | | |
| As of 12/31/19 | | | | |
| |
| Cost of investments | | | $1,132,096,994 | |
| Gross appreciation | | | 1,095,977,793 | |
| Gross depreciation | | | (6,489,360 | ) |
| Net unrealized appreciation (depreciation) | | | $1,089,488,433 | |
| |
| Undistributed ordinary income | | | 34,919,798 | |
| Undistributed long-term capital gain | | | 97,132,418 | |
| Other temporary differences | | | 18,589 | |
Multiple Classes of Shares of Beneficial Interest– The fund offers multiple classes of shares, which differ in their respective distribution and/or service fees. The fund’s income, realized and unrealized gain (loss), and common expenses are allocated to shareholders based on the daily net assets of each class. Dividends are declared separately for each class. Differences in per share dividend rates are generally due to differences in separate class expenses. The fund’s distributions declared to shareholders as reported in the Statements of Changes in Net Assets are presented by class as follows:
| | | | | | | | |
| | |
| | | Year ended
12/31/19 | | | Year ended
12/31/18 | |
| Initial Class | | | $59,678,116 | | | | $77,417,528 | |
| Service Class | | | 78,863,119 | | | | 106,265,942 | |
| Total | | | $138,541,235 | | | | $183,683,470 | |
| (3) | | Transactions with Affiliates |
Investment Adviser– The fund has an investment advisory agreement with MFS to provide overall investment management and related administrative services and facilities to the fund. The management fee is computed daily and paid monthly at the following annual rates based on the fund’s average daily net assets:
| | | | |
| Up to $1 billion | | | 0.75% | |
| In excess of $1 billion and up to $2.5 billion | | | 0.65% | |
| In excess of $2.5 billion | | | 0.60% | |
MFS has agreed in writing to reduce its management fee by a specified amount if certain MFS mutual fund assets exceed thresholds agreed to by MFS and the fund’s Board of Trustees. For the year ended December 31, 2019, this management fee reduction amounted to $208,490, which is included in the reduction of total expenses in the Statement of Operations. The management fee incurred for the year ended December 31, 2019 was equivalent to an annual effective rate of 0.69% of the fund’s average daily net assets.
16
MFS Value Series
Notes to Financial Statements – continued
For the period from January 1, 2019 through July 31, 2019, the investment adviser had agreed in writing to pay a portion of the fund’s total annual operating expenses, excluding interest, taxes, extraordinary expenses, brokerage and transaction costs, and investment-related expenses, such that total annual operating expenses did not exceed 0.90% of average daily net assets for the Initial Class shares and 1.15% of average daily net assets for the Service Class shares. This written agreement was terminated on July 31, 2019. For the period from January 1, 2019 through July 31, 2019, the fund’s actual operating expenses did not exceed the limit and therefore, the investment adviser did not pay any portion of the fund’s expenses related to this agreement. Effective August 1, 2019, the investment adviser has agreed in writing to pay a portion of the fund’s total annual operating expenses, excluding interest, taxes, extraordinary expenses, brokerage and transaction costs, and investment-related expenses, such that total annual operating expenses do not exceed 0.71% of average daily net assets for the Initial Class shares and 0.96% of average daily net assets for the Service Class shares. This written agreement will continue until modified by the fund’s Board of Trustees, but such agreement will continue at least until April 30, 2021. For the period from August 1, 2019 through December 31, 2019, this reduction amounted to $37,638, which is included in the reduction of total expenses in the Statement of Operations.
Distributor– MFS Fund Distributors, Inc. (MFD), a wholly-owned subsidiary of MFS, is the distributor of shares of the fund. The Trustees have adopted a distribution plan for the Service Class shares pursuant to Rule12b-1 under the Investment Company Act of 1940.
The fund’s distribution plan provides that the fund will pay MFD distribution and/or service fees equal to 0.25% per annum of its average daily net assets attributable to Service Class shares as partial consideration for services performed and expenses incurred by MFD and financial intermediaries (including participating insurance companies that invest in the fund to fund variable annuity and variable life insurance contracts, sponsors of qualified retirement and pension plans that invest in the fund, and affiliates of these participating insurance companies and plan sponsors) in connection with the sale and distribution of the Service Class shares. MFD may subsequently pay all, or a portion, of the distribution and/or service fees to financial intermediaries.
Shareholder Servicing Agent– MFS Service Center, Inc. (MFSC), a wholly-owned subsidiary of MFS, receives a fee from the fund for its services as shareholder servicing agent. For the year ended December 31, 2019, the fee was $27,599, which equated to 0.0013% annually of the fund’s average daily net assets. MFSC also receives payment from the fund forout-of-pocket expenses paid by MFSC on behalf of the fund. For the year ended December 31, 2019, these costs amounted to $1,945.
Administrator– MFS provides certain financial, legal, shareholder communications, compliance, and other administrative services to the fund. Under an administrative services agreement, the fund reimburses MFS the costs incurred to provide these services. The fund is charged an annual fixed amount of $17,500 plus a fee based on average daily net assets. The administrative services fee incurred for the year ended December 31, 2019 was equivalent to an annual effective rate of 0.0139% of the fund’s average daily net assets.
Trustees’ and Officers’ Compensation– The fund pays compensation to independent Trustees in the form of a retainer, attendance fees, and additional compensation to Board and Committee chairpersons. The fund does not pay compensation directly to Trustees or officers of the fund who are also officers of the investment adviser, all of whom receive remuneration from MFS for their services to the fund. Certain officers and Trustees of the fund are officers or directors of MFS, MFD, and MFSC.
Other– This fund and certain other funds managed by MFS (the funds) had entered into a service agreement (the ISO Agreement) which provided for payment of fees solely by the funds to Tarantino LLC in return for the provision of services of an Independent Senior Officer (ISO) for the funds. Frank L. Tarantino served as the ISO and was an officer of the funds and the sole member of Tarantino LLC. Effective June 30, 2019, Mr. Tarantino retired from his position as ISO for the funds, and the ISO Agreement was terminated. For the year ended December 31, 2019, the fee paid by the fund under this agreement was $2,412 and is included in “Miscellaneous” expense in the Statement of Operations. MFS had agreed to bear all expenses associated with office space, other administrative support, and supplies provided to the ISO.
The fund invests in the MFS Institutional Money Market Portfolio which is managed by MFS and seeks current income consistent with preservation of capital and liquidity. This money market fund does not pay a management fee to MFS.
The fund is permitted to engage in purchase and sale transactions with funds and accounts for which MFS serves as investment adviser orsub-adviser (“cross-trades”) pursuant to a policy adopted by the Board of Trustees. This policy has been designed to ensure that cross-trades conducted by the fund comply with Rule17a-7 under the Investment Company Act of 1940. During the year ended December 31, 2019, the fund engaged in purchase and sale transactions pursuant to this policy, which amounted to $110,068 and $3,712,072, respectively. The sales transactions resulted in net realized gains (losses) of $1,686,827.
The adviser has voluntarily undertaken to reimburse the fund from its own resources on a quarterly basis for the cost of investment research embedded in the cost of the fund’s securities trades. This agreement may be rescinded at any time. For the year ended December 31, 2019, this reimbursement amounted to $42,754 which is included in “Other” income in the Statement of Operations.
17
MFS Value Series
Notes to Financial Statements – continued
For the year ended December 31, 2019, purchases and sales of investments, other than short-term obligations, aggregated $270,370,702 and $496,321,859, respectively.
| (5) | | Shares of Beneficial Interest |
The fund’s Declaration of Trust permits the Trustees to issue an unlimited number of full and fractional shares of beneficial interest. Transactions in fund shares were as follows:
| | | | | | | | | | | | | | | | |
| | | Year ended 12/31/19 | | | Year ended 12/31/18 | |
| | | | |
| | | Shares | | | Amount | | | Shares | | | Amount | |
| Shares sold | | | | | | | | | | | | | | | | |
Initial Class | | | 3,030,553 | | | | $59,564,452 | | | | 4,661,112 | | | | $90,066,477 | |
Service Class | | | 4,216,291 | | | | 80,005,530 | | | | 4,717,524 | | | | 92,678,949 | |
| | | 7,246,844 | | | | $139,569,982 | | | | 9,378,636 | | | | $182,745,426 | |
| | | | |
| Shares issued to shareholders in reinvestment of distributions | | | | | | | | | | | | | | | | |
Initial Class | | | 3,169,311 | | | | $59,678,116 | | | | 3,951,890 | | | | $77,417,528 | |
Service Class | | | 4,272,108 | | | | 78,863,119 | | | | 5,526,050 | | | | 106,265,942 | |
| | | 7,441,419 | | | | $138,541,235 | | | | 9,477,940 | | | | $183,683,470 | |
| | | | |
| Shares reacquired | | | | | | | | | | | | | | | | |
Initial Class | | | (8,697,665 | ) | | | $(171,759,644 | ) | | | (8,629,565 | ) | | | $(173,072,220 | ) |
Service Class | | | (12,637,014 | ) | | | (244,554,515 | ) | | | (11,801,477 | ) | | | (233,146,273 | ) |
| | | (21,334,679 | ) | | | $(416,314,159 | ) | | | (20,431,042 | ) | | | $(406,218,493 | ) |
| | | | |
| Net change | | | | | | | | | | | | | | | | |
Initial Class | | | (2,497,801 | ) | | | $(52,517,076 | ) | | | (16,563 | ) | | | $(5,588,215 | ) |
Service Class | | | (4,148,615 | ) | | | (85,685,866 | ) | | | (1,557,903 | ) | | | (34,201,382 | ) |
| | | (6,646,416 | ) | | | $(138,202,942 | ) | | | (1,574,466 | ) | | | $(39,789,597 | ) |
The fund is one of several mutual funds in which certain MFS funds may invest. The MFS funds do not invest in the underlying funds for the purpose of exercising management or control. At the end of the period, the MFS Moderate Allocation Portfolio, the MFS Growth Allocation Portfolio, and the MFS Conservative Allocation Portfolio were the owners of record of approximately 6%, 2%, and 1%, respectively, of the value of outstanding voting shares of the fund.
The fund and certain other funds managed by MFS participate in a $1.25 billion unsecured committed line of credit, subject to a $1 billion sublimit, provided by a syndicate of banks under a credit agreement. Borrowings may be made for temporary financing needs. Interest is charged to each fund, based on its borrowings, generally at a rate equal to the highest of one month LIBOR, the Federal Funds Effective Rate and the Overnight Bank Funding Rate, plus an agreed upon spread. A commitment fee, based on the average daily, unused portion of the committed line of credit, is allocated among the participating funds. In addition, the fund and other funds managed by MFS have established unsecured uncommitted borrowing arrangements with certain banks for temporary financing needs. Interest is charged to each fund, based on its borrowings, at rates equal to customary reference rates plus an agreed upon spread. For the year ended December 31, 2019, the fund’s commitment fee and interest expense were $11,990 and $0, respectively, and are included in “Miscellaneous” expense in the Statement of Operations.
| (7) | | Investments in Affiliated Issuers |
An affiliated issuer may be considered one in which the fund owns 5% or more of the outstanding voting securities, or a company which is under common control. For the purposes of this report, the following were affiliated issuers:
| | | | | | | | | | | | | | | | | | | | | | | | |
| Affiliated Issuers | | Beginning
Value | | | Purchases | | | Sales
Proceeds | | | Realized
Gain
(Loss) | | | Change in
Unrealized
Appreciation or
Depreciation | | | Ending
Value | |
| MFS Institutional Money Market Portfolio | | | $36,749,270 | | | | $313,709,385 | | | | $324,877,432 | | | | $2,204 | | | | $— | | | | $25,583,427 | |
| | | | | | |
| Affiliated Issuers | | | | | | | | | | | | | | Dividend
Income | | | Capital Gain
Distributions | |
| MFS Institutional Money Market Portfolio | | | | | | | | | | | | | | | | | | | $441,982 | | | | $— | |
18
MFS Value Series
REPORT OF INDEPENDENT REGISTERED PUBLIC ACCOUNTING FIRM
To the Board of Trustees of MFS Variable Insurance Trust and the Shareholders of MFS Value Series:
Opinion on the Financial Statements and Financial Highlights
We have audited the accompanying statement of assets and liabilities of MFS Value Series (the “Fund”), including the portfolio of investments, as of December 31, 2019, the related statement of operations for the year then ended, the statements of changes in net assets for each of the two years in the period then ended, the financial highlights for each of the five years in the period then ended, and the related notes. In our opinion, the financial statements and financial highlights present fairly, in all material respects, the financial position of the Fund as of December 31, 2019, and the results of its operations for the year then ended, the changes in its net assets for each of the two years in the period then ended, and the financial highlights for each of the five years in the period then ended, in conformity with accounting principles generally accepted in the United States of America.
Basis for Opinion
These financial statements and financial highlights are the responsibility of the Fund’s management. Our responsibility is to express an opinion on the Fund’s financial statements and financial highlights based on our audits. We are a public accounting firm registered with the Public Company Accounting Oversight Board (United States) (PCAOB) and are required to be independent with respect to the Fund in accordance with the U.S. federal securities laws and the applicable rules and regulations of the Securities and Exchange Commission and the PCAOB.
We conducted our audits in accordance with the standards of the PCAOB. Those standards require that we plan and perform the audit to obtain reasonable assurance about whether the financial statements and financial highlights are free of material misstatement, whether due to error or fraud. The Fund is not required to have, nor were we engaged to perform, an audit of its internal control over financial reporting. As part of our audits we are required to obtain an understanding of internal control over financial reporting but not for the purpose of expressing an opinion on the effectiveness of the Fund’s internal control over financial reporting. Accordingly, we express no such opinion.
Our audits included performing procedures to assess the risks of material misstatement of the financial statements and financial highlights, whether due to error or fraud, and performing procedures that respond to those risks. Such procedures included examining, on a test basis, evidence regarding the amounts and disclosures in the financial statements and financial highlights. Our audits also included evaluating the accounting principles used and significant estimates made by management, as well as evaluating the overall presentation of the financial statements and financial highlights. Our procedures included confirmation of securities owned as of December 31, 2019, by correspondence with the custodian. We believe that our audits provide a reasonable basis for our opinion.
DELOITTE & TOUCHE LLP
Boston, Massachusetts
February 14, 2020
We have served as the auditor of one or more of the MFS investment companies since 1924.
19
MFS Value Series
TRUSTEES AND OFFICERS – IDENTIFICATION AND BACKGROUND
The Trustees and Officers of the Trust, as of February 1, 2020, are listed below, together with their principal occupations during the past five years. (Their titles may have varied during that period.) The address of each Trustee and Officer is 111 Huntington Avenue, Boston, Massachusetts 02199-7618.
| | | | | | | | | | |
Name, Age | | Position(s)
Held with Fund | | Trustee/Officer
Since (h) | | Number of MFS Funds
overseen by the
Trustee | | Principal Occupations
During the Past Five Years | | Other Directorships During the Past Five Years (j) |
| INTERESTED TRUSTEES |
Robert J. Manning (k)
(age 56) | | Trustee | | February 2004 | | 133 | | Massachusetts Financial Services Company, Executive Chairman (since January 2017); Director; Chairman of the Board; Chief Executive Officer (until 2015);Co-Chief Executive Officer(2015-2016) | | N/A |
| | | | | |
Robin A. Stelmach (k) (age 58) | | Trustee | | January 2014 | | 133 | | Massachusetts Financial Services Company, Vice Chair (since January 2017); Chief Operating Officer and Executive Vice President (until January 2017) | | N/A |
|
| INDEPENDENT TRUSTEES |
John P. Kavanaugh (age 65) | | Trustee and Chair of Trustees | | January 2009 | | 133 | | Private investor | | N/A |
| | | | | |
Steven E. Buller (age 68) | | Trustee | | February 2014 | | 133 | | Financial Accounting Standards Advisory Council, Chairman(2014-2015); Public Company Accounting Oversight Board, Standing Advisory Group, Member (until 2014); BlackRock, Inc. (investment management), Managing Director (until 2014), BlackRock Finco UK (investment management), Director (until 2014) | | N/A |
| | | | | |
John A. Caroselli (age 65) | | Trustee | | March 2017 | | 133 | | JC Global Advisors, LLC (management consulting), President (since 2015); First Capital Corporation (commercial finance), Executive Vice President (until 2015) | | N/A |
| | | | | |
Maureen R. Goldfarb (age 64) | | Trustee | | January 2009 | | 133 | | Private investor | | N/A |
| | | | | |
Peter D. Jones
(age 64) | | Trustee | | January 2019 | | 133 | | Franklin Templeton Distributors, Inc. (investment management), President (until 2015); Franklin Templeton Institutional, LLC (investment management), Chairman (until 2015) | | N/A |
| | | | | |
James W. Kilman, Jr.
(age 58) | | Trustee | | January 2019 | | 133 | | Burford Capital Limited (finance and investment management), Chief Financial Officer (since 2019); KielStrand Capital LLC (family office), Chief Executive Officer (since 2016); Morgan Stanley & Co. (financial services), Vice Chairman of Investment Banking,Co-Head of Diversified Financials Coverage – Financial Institutions Investment Banking Group (until 2016) | | Alpha-En Corporation, Director (2016-2019) |
20
MFS Value Series
Trustees and Officers – continued
| | | | | | | | | | |
Name, Age | | Position(s)
Held with Fund | | Trustee/Officer
Since (h) | | Number of MFS Funds
overseen by the
Trustee | | Principal Occupations
During the Past Five Years | | Other Directorships During the Past Five Years (j) |
Clarence Otis, Jr. (age 63) | | Trustee | | March 2017 | | 133 | | Darden Restaurants, Inc., Chief Executive Officer (until 2014) | | VF Corporation, Director; Verizon Communications, Inc., Director; The Travelers Companies, Director; Federal Reserve Bank of Atlanta, Director (until 2015) |
| | | | | |
Maryanne L. Roepke (age 63) | | Trustee | | May 2014 | | 133 | | American Century Investments (investment management), Senior Vice President and Chief Compliance Officer (until 2014) | | N/A |
| | | | | |
Laurie J. Thomsen
(age 62) | | Trustee | | March 2005 | | 133 | | Private investor | | The Travelers Companies, Director; Dycom Industries, Inc., Director (since 2015) |
| | | | | | | | |
Name, Age | | Position(s)
Held with Fund | | Trustee/Officer
Since (h) | | Number of
MFS Funds
for which the
Person is an
Officer | | Principal Occupations During the Past Five Years |
| OFFICERS | | | | | | |
Christopher R. Bohane (k)
(age 46) | | Assistant Secretary and Assistant Clerk | | July 2005 | | 133 | | Massachusetts Financial Services Company, Vice President and Assistant General Counsel |
| | | | |
Kino Clark (k) (age 51) | | Assistant Treasurer | | January 2012 | | 133 | | Massachusetts Financial Services Company, Vice President |
| | | | |
John W. Clark, Jr. (k) (age 52) | | Assistant Treasurer | | April 2017 | | 133 | | Massachusetts Financial Services Company, Vice President (since March 2017); Deutsche Bank (financial services), Department Head –Treasurer’s Office (until February 2017) |
| | | | |
Thomas H. Connors (k) (age 60) | | Assistant Secretary and Assistant Clerk | | September 2012 | | 133 | | Massachusetts Financial Services Company, Vice President and Senior Counsel |
| | | | |
David L. DiLorenzo (k)
(age 51) | | President | | July 2005 | | 133 | | Massachusetts Financial Services Company, Senior Vice President |
| | | | |
Heidi W. Hardin (k) (age 52) | | Secretary and Clerk | | April 2017 | | 133 | | Massachusetts Financial Services Company, Executive Vice President and General Counsel (since March 2017); Harris Associates (investment management), General Counsel (from September 2015 to January 2017); Janus Capital Management LLC (investment management), Senior Vice President and General Counsel (until September 2015) |
| | | | |
Brian E. Langenfeld (k) (age 46) | | Assistant
Secretary and Assistant Clerk | | June 2006 | | 133 | | Massachusetts Financial Services Company, Vice President and Senior Counsel |
| | | | |
Amanda S. Mooradian (k) (age 40) | | Assistant
Secretary and Assistant Clerk | | September 2018 | | 133 | | Massachusetts Financial Services Company, Assistant Vice President and Counsel |
| | | | |
Susan A. Pereira (k)
(age 49) | | Assistant
Secretary and Assistant Clerk | | July 2005 | | 133 | | Massachusetts Financial Services Company, Vice President and Assistant General Counsel |
| | | | |
Kasey L. Phillips (k) (age 49) | | Assistant Treasurer | | September 2012 | | 133 | | Massachusetts Financial Services Company, Vice President |
| | | | |
Matthew A. Stowe (k) (age 45) | | Assistant Secretary and Assistant Clerk | | October 2014 | | 133 | | Massachusetts Financial Services Company, Vice President and Assistant General Counsel |
21
MFS Value Series
Trustees and Officers – continued
| | | | | | | | |
Name, Age | | Position(s)
Held with Fund | | Trustee/Officer
Since (h) | | Number of
MFS Funds
for which the
Person is an
Officer | | Principal Occupations During the Past Five Years |
Martin J. Wolin (k) (age 52) | | Chief Compliance Officer | | July 2015 | | 133 | | Massachusetts Financial Services Company, Senior Vice President and Chief Compliance Officer (since July 2015); Mercer (financial service provider), Chief Risk and Compliance Officer, North America and Latin America (until June 2015) |
| | | | |
James O. Yost (k)
(age 59) | | Treasurer | | September 1990 | | 133 | | Massachusetts Financial Services Company, Senior Vice President |
| (h) | Date first appointed to serve as Trustee/officer of an MFS Fund. Each Trustee has served continuously since appointment unless indicated otherwise. For the period from December 15, 2004 until February 22, 2005, Mr. Manning served as Advisory Trustee. From January 2012 through December 2016, Messrs. DiLorenzo and Yost served as Treasurer and Deputy Treasurer of the Funds, respectively. |
| (j) | Directorships or trusteeships of companies required to report to the Securities and Exchange Commission (i.e., “public companies”). |
| (k) | “Interested person” of the Trust within the meaning of the Investment Company Act of 1940 (referred to as the 1940 Act), which is the principal federal law governing investment companies like the fund, as a result of a position with MFS. The address of MFS is 111 Huntington Avenue, Boston, Massachusetts 02199-7618. |
Each Trustee (other than Messrs. Jones and Kilman) has been elected by shareholders and each Trustee and Officer holds office until his or her successor is chosen and qualified or until his or her earlier death, resignation, retirement or removal. Messrs. Jones and Kilman became Trustees of the Funds on January 1, 2019. The Trust does not hold annual meetings for the purpose of electing Trustees, and Trustees are not elected for fixed terms. Under the terms of the Board’s retirement policy, an Independent Trustee shall retire at the end of the calendar year in which he or she reaches the earlier of 75 years of age or 15 years of service on the Board (or, in the case of any Independent Trustee who joined the Board prior to 2015, 20 years of service on the Board).
Messrs. Buller, Kilman and Otis and Ms. Roepke are members of the Trust’s Audit Committee.
Each of the Interested Trustees and certain Officers hold comparable officer positions with certain affiliates of MFS.
The Statement of Additional Information for a Fund includes further information about the Trustees and is available without charge upon request by calling1-800-225-2606.
| | |
Investment Adviser Massachusetts Financial Services Company 111 Huntington Avenue Boston, MA 02199-7618 | | Custodian State Street Bank and Trust Company 1 Lincoln Street Boston, MA 02111-2900 |
| |
Distributor MFS Fund Distributors, Inc. 111 Huntington Avenue Boston, MA 02199-7618 | | Independent Registered Public Accounting Firm Deloitte & Touche LLP 200 Berkeley Street Boston, MA 02116 |
| |
Portfolio Manager(s) Katherine Cannan Nevin Chitkara Steven Gorham | | |
22
MFS Value Series
BOARD REVIEW OF INVESTMENT ADVISORY AGREEMENT
MFS Value Series
The Investment Company Act of 1940 requires that both the full Board of Trustees and a majority of thenon-interested (“independent”) Trustees, voting separately, annually approve the continuation of the Fund’s investment advisory agreement with MFS. The Trustees consider matters bearing on the Fund and its advisory arrangements at their meetings throughout the year, including a review of performance data at each regular meeting. In addition, the independent Trustees met several times over the course of three months beginning in May and ending in July, 2019 (“contract review meetings”) for the specific purpose of considering whether to approve the continuation of the investment advisory agreement for the Fund and the other investment companies that the Board oversees (the “MFS Funds”). The independent Trustees were assisted in their evaluation of the Fund’s investment advisory agreement by independent legal counsel, from whom they received separate legal advice and with whom they met separately from MFS during various contract review meetings. The independent Trustees were also assisted in this process by the MFS Funds’ Independent Senior Officer, a senior officer appointed by and reporting to the independent Trustees.
In connection with their deliberations regarding the continuation of the investment advisory agreement, the Trustees, including the independent Trustees, considered such information and factors as they believed, in light of the legal advice furnished to them and their own business judgment, to be relevant. The investment advisory agreement for the Fund was considered separately, although the Trustees also took into account the common interests of all MFS Funds in their review. As described below, the Trustees considered the nature, quality, and extent of the various investment advisory, administrative, and shareholder services performed by MFS under the existing investment advisory agreement and other arrangements with the Fund.
In connection with their contract review meetings, the Trustees received and relied upon materials that included, among other items: (i) information provided by Broadridge Financial Solutions, Inc. (“Broadridge”), an independent third party, on the investment performance of the Fund for various time periods ended December 31, 2018 and the investment performance of a group of funds with substantially similar investment classifications/objectives (the “Broadridge performance universe”), (ii) information provided by Broadridge on the Fund’s advisory fees and other expenses and the advisory fees and other expenses of comparable funds identified by Broadridge as well as all other funds in the same investment classification/category (the “Broadridge expense group and universe”), (iii) information provided by MFS on the advisory fees of portfolios of other clients of MFS, including institutional separate accounts and other clients, (iv) information as to whether and to what extent applicable expense waivers, reimbursements or fee “breakpoints” are observed for the Fund, (v) information regarding MFS’ financial results and financial condition, including MFS’ and certain of its affiliates’ estimated profitability from services performed for the Fund and the MFS Funds as a whole, and compared to MFS’ institutional business, (vi) MFS’ views regarding the outlook for the mutual fund industry and the strategic business plans of MFS, (vii) descriptions of various functions performed by MFS for the Funds, such as compliance monitoring and portfolio trading practices, and (viii) information regarding the overall organization of MFS, including information about MFS’ senior management and other personnel providing investment advisory, administrative and other services to the Fund and the other MFS Funds. The comparative performance, fee and expense information prepared and provided by Broadridge was not independently verified and the independent Trustees did not independently verify any information provided to them by MFS.
The Trustees’ conclusion as to the continuation of the investment advisory agreement was based on a comprehensive consideration of all information provided to the Trustees and not the result of any single factor. Some of the factors that figured particularly in the Trustees’ deliberations are described below, although individual Trustees may have evaluated the information presented differently from one another, giving different weights to various factors. It is also important to recognize that the fee arrangements for the Fund and other MFS Funds are the result of years of review and discussion between the independent Trustees and MFS, that certain aspects of such arrangements may receive greater scrutiny in some years than in others, and that the Trustees’ conclusions may be based, in part, on their consideration of these same arrangements during the course of the year and in prior years.
Based on information provided by Broadridge and MFS, the Trustees reviewed the Fund’s total return investment performance as well as the Broadridge performance universe over various time periods. The Trustees placed particular emphasis on the total return performance of the Fund’s Initial Class shares in comparison to the performance of funds in its Broadridge performance universe over the five-year period ended December 31, 2018, which the Trustees believed was a long enough period to reflect differing market conditions. The total return performance of the Fund’s Initial Class shares was in the 2nd quintile relative to the other funds in the universe for this five-year period (the 1st quintile being the best performers and the 5th quintile being the worst performers). The total return performance of the Fund’s Initial Class shares was in the 3rd quintile for theone-year period and the 2nd quintile for the three-year period ended December 31, 2018 relative to the Broadridge performance universe. Because of the passage of time, these performance results may differ from the performance results for more recent periods, including those shown elsewhere in this report.
In the course of their deliberations, the Trustees took into account information provided by MFS in connection with the contract review meetings, as well as during investment review meetings conducted with portfolio management personnel during the course of the year regarding the Fund’s performance. After reviewing these and related factors, the Trustees concluded, within the context of their overall conclusions regarding the investment advisory agreement, that they were satisfied with MFS’ responses and efforts relating to investment performance.
23
MFS Value Series
Board Review of Investment Advisory Agreement – continued
In assessing the reasonableness of the Fund’s advisory fee, the Trustees considered, among other information, the Fund’s advisory fee and the total expense ratio of the Fund’s Initial Class shares as a percentage of average daily net assets and the advisory fee and total expense ratios of the Broadridge expense group based on information provided by Broadridge. The Trustees considered that MFS currently observes an expense limitation for the Fund, which may not be changed without the Trustees’ approval. The Trustees also considered that, according to the data provided by Broadridge (which takes into account any fee reductions or expense limitations that were in effect during the Fund’s last fiscal year), the Fund’s effective advisory fee rate was approximately at the Broadridge expense group median and the Fund’s total expense ratio was higher than the Broadridge expense group median. The Trustees also noted that MFS has agreed to further reduce such expense limitation for the Fund effective August 1, 2019, which may not be changed without the Trustees’ approval.
The Trustees also considered the advisory fees charged by MFS to any institutional separate accounts advised by MFS (“separate accounts”) and unaffiliated investment companies for which MFS serves as subadviser (“subadvised funds”) that have comparable investment strategies to the Fund, if any. In comparing these fees, the Trustees considered information provided by MFS as to the generally broader scope of services provided by MFS to the Fund, as well as the more extensive regulatory burdens imposed on MFS in managing the Fund, in comparison to separate accounts and subadvised funds. The Trustees also considered the higher demands placed on MFS’ investment personnel and trading infrastructure as a result of the daily cashin-flows andout-flows of the Fund in comparison to separate accounts.
The Trustees also considered whether the Fund may benefit from any economies of scale in the management of the Fund in the event of growth in assets of the Fund and/or growth in assets of the MFS Funds as a whole. They noted that the Fund’s advisory fee rate schedule is subject to contractual breakpoints that reduce the Fund’s advisory fee rate on average daily net assets over $1 billion and $2.5 billion. The Trustees also noted that MFS has agreed in writing to waive a portion of the management fees of certain MFS Funds, including the Fund, if the total combined assets of certain funds within the MFS Funds’ complex increase above agreed upon thresholds (the “group fee waiver”), enabling the Fund’s shareholders to share in the benefits from any economies of scale at the complex level. The group fee waiver is reviewed and renewed annually between the Board and MFS. The Trustees concluded that the breakpoints and the group fee waiver were sufficient to allow the Fund to benefit from economies of scale as its assets and overall complex assets grow.
The Trustees also considered information prepared by MFS relating to MFS’ costs and profits with respect to the Fund, the MFS Funds considered as a group, and other investment companies and accounts advised by MFS, as well as MFS’ methodologies used to determine and allocate its costs to the MFS Funds, the Fund and other accounts and products for purposes of estimating profitability.
After reviewing these and other factors described herein, the Trustees concluded, within the context of their overall conclusions regarding the investment advisory agreement, that the advisory fees charged to the Fund represent reasonable compensation in light of the services being provided by MFS to the Fund.
In addition, the Trustees considered MFS’ resources and related efforts to continue to retain, attract and motivate capable personnel to serve the Fund. The Trustees also considered current and developing conditions in the financial services industry, including the presence of large and well-capitalized companies which are spending, and appear to be prepared to continue to spend, substantial sums to engage personnel and to provide services to competing investment companies. In this regard, the Trustees also considered the financial resources of MFS and its ultimate parent, Sun Life Financial Inc. The Trustees also considered the advantages and possible disadvantages to the Fund of having an adviser that also serves other investment companies as well as other accounts.
The Trustees also considered the nature, quality, cost, and extent of administrative, transfer agency, and distribution services provided to the Fund by MFS and its affiliates under agreements and plans other than the investment advisory agreement, including any12b-1 fees the Fund pays to MFS Fund Distributors, Inc., an affiliate of MFS. The Trustees also considered the nature, extent and quality of certain other services MFS performs or arranges for on the Fund’s behalf, which may include securities lending programs, directed expense payment programs, class action recovery programs, and MFS’ interaction with third-party service providers, principally custodians andsub-custodians. The Trustees concluded that the variousnon-advisory services provided by MFS and its affiliates on behalf of the Fund were satisfactory.
The Trustees consideredso-called“fall-out benefits” to MFS such as reputational value derived from serving as investment manager to the MFS Funds. The Trustees also considered that, effective January 3, 2018, MFS had discontinued its historic practice of obtaining investment research from portfolio brokerage commissions paid by certain MFS Funds and would thereafter directly pay for or voluntarily reimburse a Fund, if applicable, for the costs of external research acquired through the use of the Fund’s portfolio brokerage commissions.
Based on their evaluation of factors that they deemed to be material, including those factors described above, the Board of Trustees, including the independent Trustees, concluded that the Fund’s investment advisory agreement with MFS should be continued for an additionalone-year period, commencing August 1, 2019.
24
MFS Value Series
PROXY VOTING POLICIES AND INFORMATION
MFS votes proxies on behalf of the fund pursuant to proxy voting policies and procedures that are available without charge, upon request, by calling 1-800-225-2606, by visitingmfs.com/proxyvoting, or by visiting the SEC’s Web site athttp://www.sec.gov.
Information regarding how the fund voted proxies relating to portfolio securities during the most recent twelve-month period ended June 30 is available by August 31 of each year without charge by visitingmfs.com/proxyvoting, or by visiting the SEC’s Web site athttp://www.sec.gov.
QUARTERLY PORTFOLIO DISCLOSURE
The fund files a complete schedule of portfolio holdings with the SEC for the first and third quarters of each fiscal year as an exhibit to its reports on Form N-PORT. The fund’s Form N-PORT reports are available on the SEC’s website athttp://www.sec.gov. A shareholder can obtain the portfolio holdings report for the first and third quarters of the fund’s fiscal year atmfs.com/vit1 by choosing the fund’s name and then selecting the “Resources” tab and clicking on “Prospectus and Reports”.
FURTHER INFORMATION
From time to time, MFS may post important information about the fund or the MFS funds on the MFS web site (mfs.com). This information is available at https://www.mfs.com/en-us/what-we-do/announcements.html or atmfs.com/vit1 by choosing the fund’s name.
INFORMATION ABOUT FUND CONTRACTS AND LEGAL CLAIMS
The fund has entered into contractual arrangements with an investment adviser, administrator, distributor, shareholder servicing agent, 529 program manager (if applicable), and custodian who each provide services to the fund. Unless expressly stated otherwise, shareholders are not parties to, or intended beneficiaries of these contractual arrangements, and these contractual arrangements are not intended to create any shareholder right to enforce them against the service providers or to seek any remedy under them against the service providers, either directly or on behalf of the fund.
Under the Trust’s By-Laws and Declaration of Trust, any claims asserted against or on behalf of the MFS Funds, including claims against Trustees and Officers, must be brought in state and federal courts located within the Commonwealth of Massachusetts.
FEDERAL TAX INFORMATION (unaudited)
The following information is provided pursuant to provisions of the Internal Revenue Code.
The fund designates $105,563,000 as capital gain dividends paid during the fiscal year.
For corporate shareholders, 100% of the ordinary income dividends paid during the fiscal year qualify for the corporate dividends received deduction.
25
rev. 3/16
| | | | |
| | | |
| FACTS | | WHAT DOES MFS DO WITH YOUR
PERSONAL INFORMATION? | |  |
| | |
| Why? | | Financial companies choose how they share your personal information. Federal law gives consumers the right to limit some but not all sharing. Federal law also requires us to tell you how we collect, share, and protect your personal information. Please read this notice carefully to understand what we do. |
| | |
| What? | | The types of personal information we collect and share depend on the product or service you have with us. This information can include: • Social Security number and account balances • Account transactions and transaction history • Checking account information and wire transfer instructions When you areno longer our customer, we continue to share your information as described in this notice. |
| | |
| How? | | All financial companies need to share customers’ personal information to run their everyday business. In the section below, we list the reasons financial companies can share their customers’ personal information; the reasons MFS chooses to share; and whether you can limit this sharing. |
| | | | |
Reasons we can share your
personal information | | Does MFS share? | | Can you limit this
sharing? |
For our everyday business purposes – such as to process your transactions, maintain your account(s), respond to court orders and legal investigations, or report to credit bureaus | | Yes | | No |
For our marketing purposes – to offer our products and services to you | | No | | We don’t share |
| For joint marketing with other financial companies | | No | | We don’t share |
For our affiliates’ everyday business purposes – information about your transactions and experiences | | No | | We don’t share |
For our affiliates’ everyday business purposes – information about your creditworthiness | | No | | We don’t share |
| For nonaffiliates to market to you | | No | | We don’t share |
| | |
| | |
| Questions? | | Call800-225-2606 or go tomfs.com. |
26
| | |
| Who we are |
| Who is providing this notice? | | MFS Funds, MFS Investment Management, MFS Institutional Advisors, Inc., and MFS Heritage Trust Company. |
| | |
| What we do |
| How does MFS protect my personal information? | | To protect your personal information from unauthorized access and use, we use security measures that comply with federal law. These measures include procedural, electronic, and physical safeguards for the protection of the personal information we collect about you. |
How does MFS
collect my personal information? | | We collect your personal information, for example, when you • open an account or provide account information • direct us to buy securities or direct us to sell your securities • make a wire transfer We also collect your personal information from others, such as credit bureaus, affiliates, or other companies. |
| Why can’t I limit all sharing? | | Federal law gives you the right to limit only • sharing for affiliates’ everyday business purposes – information about your creditworthiness • affiliates from using your information to market to you • sharing for nonaffiliates to market to you State laws and individual companies may give you additional rights to limit sharing. |
| | |
| Definitions |
| Affiliates | | Companies related by common ownership or control. They can be financial and nonfinancial companies. • MFS does not share personal information with affiliates, except for everyday business purposes as described on page one of this notice. |
| Nonaffiliates | | Companies not related by common ownership or control. They can be financial and nonfinancial companies. • MFS does not share with nonaffiliates so they can market to you. |
| Joint marketing | | A formal agreement between nonaffiliated financial companies that together market financial products or services to you. • MFS doesn’t jointly market. |
| | |
| Other important information |
| If you own an MFS product or receive an MFS service in the name of a third party such as a bank or broker-dealer, their privacy policy may apply to you instead of ours. |
27
The Registrant has adopted a Code of Ethics (the “Code”) pursuant to Section 406 of the Sarbanes-Oxley Act and as defined in FormN-CSR that applies to the Registrant’s principal executive officer and principal financial and accounting officer. During the period covered by this report, the Registrant has not amended any provision in the Code that relates to an element of the Code’s definition enumerated in paragraph (b) of Item 2 of this FormN-CSR. During the period covered by this report, the Registrant did not grant a waiver, including an implicit waiver, from any provision of the Code.
A copy of the Code is filed as an exhibit to this FormN-CSR.
| ITEM 3. | AUDIT COMMITTEE FINANCIAL EXPERT. |
Messrs. Steven E. Buller, James Kilman, and Clarence Otis, Jr. and Ms. Maryanne L. Roepke, members of the Audit Committee, have been determined by the Board of Trustees in their reasonable business judgment to meet the definition of “audit committee financial expert” as such term is defined in FormN-CSR. In addition, Messrs. Buller, Kilman, and Otis and Ms. Roepke are “independent” members of the Audit Committee (as such term has been defined by the Securities and Exchange Commission in regulations implementing Section 407 of the Sarbanes-Oxley Act of 2002). The Securities and Exchange Commission has stated that the designation of a person as an audit committee financial expert pursuant to this Item 3 on the FormN-CSR does not impose on such a person any duties, obligations or liability that are greater than the duties, obligations or liability imposed on such person as a member of the Audit Committee and the Board of Trustees in the absence of such designation or identification.
| ITEM 4. | PRINCIPAL ACCOUNTANT FEES AND SERVICES. |
Items 4(a) through 4(d) and 4(g):
The Board of Trustees has appointed Deloitte & Touche LLP (“Deloitte”) to serve as independent accountants to the Registrant (hereinafter the “Registrant” or the “Fund”). The tables below set forth the audit fees billed to the Fund as well as fees fornon-audit services provided to the Fund and/or to the Fund’s investment adviser, Massachusetts Financial Services Company (“MFS”), and to various entities either controlling, controlled by, or under common control with MFS that provide ongoing services to the Fund (“MFS Related Entities”).
For the fiscal years ended December 31, 2019 and 2018, audit fees billed to the Fund by Deloitte were as follows:
| | | | | | | | |
| | | Audit Fees | |
| | 2019 | | | 2018 | |
Fees billed by Deloitte: | | | | | | | | |
MFS Global Equity Series | | | 47,102 | | | | 46,007 | |
MFS Growth Series | | | 47,946 | | | | 46,832 | |
MFS Investors Trust Series | | | 47,102 | | | | 46,007 | |
MFS Mid Cap Growth Series | | | 47,102 | | | | 46,007 | |
MFS New Discovery Series | | | 47,102 | | | | 46,007 | |
MFS Research Series | | | 48,052 | | | | 46,936 | |
MFS Total Return Bond Series | | | 67,425 | | | | 65,873 | |
MFS Total Return Series | | | 66,415 | | | | 64,886 | |
MFS Utilities Series | | | 47,209 | | | | 46,112 | |
MFS Value Series | | | 47,946 | | | | 46,832 | |
| | | | | | | | |
Total | | | 513,401 | | | | 501,499 | |
For the fiscal years ended December 31, 2019 and 2018, fees billed by Deloitte for audit-related, tax and other services provided to each Fund and for audit-related, tax and other services provided to MFS and MFS Related Entities were as follows:
| | | | | | | | | | | | | | | | | | | | | | | | |
| | | Audit-Related Fees1 | | | Tax Fees2 | | | All Other Fees3 | |
| | 2019 | | | 2018 | | | 2019 | | | 2018 | | | 2019 | | | 2018 | |
Fees billed by Deloitte: | | | | | | | | | | | | | | | | | | | | | | | | |
To MFS Global Equity Series | | | 2,400 | | | | 2,400 | | | | 5,458 | | | | 5,335 | | | | 0 | | | | 0 | |
To MFS Growth Series | | | 2,400 | | | | 2,400 | | | | 5,458 | | | | 5,335 | | | | 0 | | | | 0 | |
To MFS Investors Trust Series | | | 2,400 | | | | 2,400 | | | | 5,458 | | | | 5,335 | | | | 0 | | | | 0 | |
To MFS Mid Cap Growth Series | | | 2,400 | | | | 2,400 | | | | 5,458 | | | | 5,335 | | | | 0 | | | | 0 | |
To MFS New Discovery Series | | | 2,400 | | | | 2,400 | | | | 5,458 | | | | 5,335 | | | | 0 | | | | 0 | |
To MFS Research Series | | | 2,400 | | | | 2,400 | | | | 5,458 | | | | 5,335 | | | | 0 | | | | 0 | |
To MFS Total Return Bond Series | | | 2,400 | | | | 2,400 | | | | 5,458 | | | | 5,335 | | | | 0 | | | | 0 | |
To MFS Total Return Series | | | 2,400 | | | | 2,400 | | | | 5,458 | | | | 5,335 | | | | 0 | | | | 0 | |
To MFS Utilities Series | | | 2,400 | | | | 2,400 | | | | 5,458 | | | | 5,335 | | | | 0 | | | | 0 | |
To MFS Value Series | | | 2,400 | | | | 2,400 | | | | 5,458 | | | | 5,335 | | | | 0 | | | | 0 | |
Total fees billed by Deloitte to above Funds: | | | 24,000 | | | | 24,000 | | | | 54,580 | | | | 53,350 | | | | 0 | | | | 0 | |
| | | | | | | | | | | | | | | | | | | | | | | | |
| | | Audit-Related Fees1 | | | Tax Fees2 | | | All Other Fees3 | |
| | 2019 | | | 2018 | | | 2019 | | | 2018 | | | 2019 | | | 2018 | |
Fees billed by Deloitte: | | | | | | | | | | | | | | | | | | | | | | | | |
To MFS and MFS Related Entities of MFS Global Equity Series* | | | 0 | | | | 0 | | | | 0 | | | | 0 | | | | 3,790 | | | | 5,390 | |
To MFS and MFS Related Entities of MFS Growth Series* | | | 0 | | | | 0 | | | | 0 | | | | 0 | | | | 3,790 | | | | 5,390 | |
To MFS and MFS Related Entities of MFS Investors Trust Series* | | | 0 | | | | 0 | | | | 0 | | | | 0 | | | | 3,790 | | | | 5,390 | |
To MFS and MFS Related Entities of MFS Mid Cap Growth Series* | | | 0 | | | | 0 | | | | 0 | | | | 0 | | | | 3,790 | | | | 5,390 | |
To MFS and MFS Related Entities of MFS New Discovery Series* | | | 0 | | | | 0 | | | | 0 | | | | 0 | | | | 3,790 | | | | 5,390 | |
To MFS and MFS Related Entities of MFS Research Series* | | | 0 | | | | 0 | | | | 0 | | | | 0 | | | | 3,790 | | | | 5,390 | |
To MFS and MFS Related Entities of MFS Total Return Bond Series* | | | 0 | | | | 0 | | | | 0 | | | | 0 | | | | 3,790 | | | | 5,390 | |
To MFS and MFS Related Entities of MFS Total Return Series* | | | 0 | | | | 0 | | | | 0 | | | | 0 | | | | 3,790 | | | | 5,390 | |
To MFS and MFS Related Entities of MFS Utilities Series* | | | 0 | | | | 0 | | | | 0 | | | | 0 | | | | 3,790 | | | | 5,390 | |
To MFS and MFS Related Entities of MFS Value Series* | | | 0 | | | | 0 | | | | 0 | | | | 0 | | | | 3,790 | | | | 5,390 | |
| | | | | | | | |
| | | Aggregate fees for non-audit
services: | |
| | 2019 | | | 2018 | |
Fees billed by Deloitte: | | | | | | | | |
To MFS Global Equity Series, MFS and MFS Related Entities# | | | 361,648 | | | | 13,125 | |
To MFS Growth Series, MFS and MFS Related Entities# | | | 361,648 | | | | 13,125 | |
To MFS Investors Trust Series, MFS and MFS Related Entities# | | | 361,648 | | | | 13,125 | |
To MFS Mid Cap Growth Series, MFS and MFS Related Entities# | | | 361,648 | | | | 13,125 | |
To MFS New Discovery Series, MFS and MFS Related Entities# | | | 361,648 | | | | 13,125 | |
To MFS Research Series, MFS and MFS Related Entities# | | | 361,648 | | | | 13,125 | |
To MFS Total Return Bond Series, MFS and MFS Related Entities# | | | 361,648 | | | | 13,125 | |
To MFS Total Return Series, MFS and MFS Related Entities# | | | 361,648 | | | | 13,125 | |
To MFS Utilities Series, MFS and MFS Related Entities# | | | 361,648 | | | | 13,125 | |
To MFS Value Series, MFS and MFS Related Entities# | | | 361,648 | | | | 13,125 | |
| * | This amount reflects the fees billed to MFS and MFS Related Entities fornon-audit services relating directly to the operations and financial reporting of the Fund (portions of which services also related to the operations and financial reporting of other funds within the MFS Funds complex). |
| # | This amount reflects the aggregate fees billed by Deloitte fornon-audit services rendered to the Fund and fornon-audit services rendered to MFS and the MFS Related Entities. |
| 1 | The fees included under “Audit-Related Fees” are fees related to assurance and related services that are reasonably related to the performance of the audit or review of financial statements, but not reported under ‘‘Audit Fees,’’ including accounting consultations, agreed-upon procedure reports, attestation reports, comfort letters and internal control reviews. |
| 2 | The fees included under “Tax Fees” are fees associated with tax compliance, tax advice and tax planning, including services relating to the filing or amendment of federal, state or local income tax returns, regulated investment company qualification reviews and tax distribution and analysis. |
| 3 | The fees included under “All Other Fees” are fees for products and services provided by Deloitte other than those reported under “Audit Fees,” “Audit-Related Fees” and “Tax Fees”. |
Item 4(e)(1):
Set forth below are the policies and procedures established by the Audit Committee of the Board of Trustees relating to thepre-approval of audit andnon-audit related services:
To the extent required by applicable law,pre-approval by the Audit Committee of the Board is needed for all audit and permissiblenon-audit services rendered to the Fund and all permissiblenon-audit services rendered to MFS or MFS Related Entities if the services relate directly to the operations and financial reporting of the Registrant.Pre-approval is currently on anengagement-by-engagement basis. In the eventpre-approval of such services is necessary between regular meetings of the Audit Committee and it is not practical to wait to seekpre-approval at the next regular meeting of the Audit Committee,pre-approval of such services may be referred to the Chair of the Audit Committee for approval; provided that the Chair may notpre-approve any individual engagement for such services exceeding $50,000 or multiple engagements for such services in the aggregate exceeding $100,000 between such regular meetings of the Audit Committee. Any engagementpre-approved by the Chair between regular meetings of the Audit Committee shall be presented for ratification by the entire Audit Committee at its next regularly scheduled meeting.
Item 4(e)(2):
None, or 0%, of the services relating to the Audit-Related Fees, Tax Fees and All Other Fees paid by the Fund and MFS and MFS Related Entities relating directly to the operations and financial reporting of the Registrant disclosed above were approved by the audit committee pursuant to paragraphs (c)(7)(i)(C) of Rule2-01 of RegulationS-X (which permits audit committee approval after the start of the engagement with respect to services other than audit, review or attest services, if certain conditions are satisfied).
Item 4(f):
Not applicable.
Item 4(h):
The Registrant’s Audit Committee has considered whether the provision by a Registrant’s independent registered public accounting firm ofnon-audit services to MFS and MFS Related Entities that were notpre-approved by the Committee (because such services were provided prior to the effectiveness of SEC rules requiringpre-approval or because such services did not relate directly to the operations and financial reporting of the Registrant) was compatible with maintaining the independence of the independent registered public accounting firm as the Registrant’s principal auditors.
| ITEM 5. | AUDIT COMMITTEE OF LISTED REGISTRANTS. |
Not applicable to the Registrant.
A schedule of investments of each series of the Registrant is included as part of the report to shareholders of such series under Item 1 of this FormN-CSR.
| ITEM 7. | DISCLOSURE OF PROXY VOTING POLICIES AND PROCEDURES FORCLOSED-END MANAGEMENT INVESTMENT COMPANIES. |
Not applicable to the Registrant.
| ITEM 8. | PORTFOLIO MANAGERS OFCLOSED-END MANAGEMENT INVESTMENT COMPANIES. |
Not applicable to the Registrant.
| ITEM 9. | PURCHASES OF EQUITY SECURITIES BYCLOSED-END MANAGEMENT INVESTMENT COMPANY AND AFFILIATED PURCHASERS. |
Not applicable to the Registrant.
| ITEM 10. | SUBMISSION OF MATTERS TO A VOTE OF SECURITY HOLDERS. |
There were no material changes to the procedures by which shareholders may send recommendations to the Board for nominees to the Registrant’s Board since the Registrant last provided disclosure as to such procedures in response to the requirements of Item 407 (c)(2)(iv) of RegulationS-K or this Item.
| ITEM 11. | CONTROLS AND PROCEDURES. |
| (a) | Based upon their evaluation of the effectiveness of the registrant’s disclosure controls and procedures (as defined in Rule30a-3(c) under the Investment Company Act of 1940 (the “Act”)) as conducted within 90 days of the filing date of this report on FormN-CSR, the registrant’s principal financial officer and principal executive officer have concluded that those disclosure controls and procedures provide reasonable assurance that the material information required to be disclosed by the registrant on this report is recorded, processed, summarized and reported within the time periods specified in the Securities and Exchange Commission’s rules and forms. |
| (b) | There were no changes in the registrant’s internal controls over financial reporting (as defined in Rule30a-3(d) under the Act) that occurred during the period covered by the report that have materially affected, or are reasonably likely to materially affect, the registrant’s internal control over financial reporting. |
| ITEM 12. | DISCLOSURE OF SECURITIES LENDING ACTIVITIES FORCLOSED-END MANAGEMENT INVESTMENT COMPANIES. |
Not applicable to the Registrant.
| (a) (1) | Any code of ethics, or amendment thereto, that is the subject of the disclosure required by Item 2, to the extent that the registrant intends to satisfy the Item 2 requirements through filing of an exhibit: Attached hereto asEX-99.COE. |
| | (2) | A separate certification for each principal executive officer and principal financial officer of the registrant as required by Rule30a-2(a) under the Act (17 CFR270.30a-2): Attached hereto asEX-99.302CERT. |
| | (3) | Any written solicitation to purchase securities under Rule23c-1 under the Act (17 CFR270.23c-1) sent or given during the period covered by the report by or on behalf of the registrant to 10 or more persons. Not applicable. |
| | (4) | Change in the registrant’s independent public accountant. Not applicable. |
| (b) | If the report is filed under Section 13(a) or 15(d) of the Exchange Act, provide the certifications required by Rule30a-2(b) under the Act (17 CFR270.30a-2(b)), Rule13a-14(b) or Rule15d-14(b) under the Exchange Act (17 CFR240.13a-14(b) or240.15d-14(b)) and Section 1350 of Chapter 63 of Title 18 of the United States Code (18 U.S.C. 1350) as an exhibit. A certification furnished pursuant to this paragraph will not be deemed “filed” for the purposes of Section 18 of the Exchange Act (15 U.S.C. 78r), or otherwise subject to the liability of that section. Such certification will not be deemed to be incorporated by reference into any filing under the Securities Act of 1933 or the Exchange Act, except to the extent that the registrant specifically incorporates it by reference. Attached hereto asEX-99.906CERT. |
Notice
A copy of the Amended and Restated Declaration of Trust, as amended, of the Registrant is on file with the Secretary of State of The Commonwealth of Massachusetts and notice is hereby given that this instrument is executed on behalf of the Registrant by an officer of the Registrant as an officer and not individually and the obligations of or arising out of this instrument are not binding upon any of the Trustees or shareholders individually, but are binding only upon the assets and property of the respective constituent series of the Registrant.
SIGNATURES
Pursuant to the requirements of the Securities Exchange Act of 1934 and the Investment Company Act of 1940, the registrant has duly caused this report to be signed on its behalf by the undersigned, thereunto duly authorized.
(Registrant) MFS VARIABLE INSURANCE TRUST
| | |
| By (Signature and Title)* | | DAVID L. DILORENZO |
| | David L. DiLorenzo, President |
Date: February 14, 2020
Pursuant to the requirements of the Securities Exchange Act of 1934 and the Investment Company Act of 1940, this report has been signed below by the following persons on behalf of the registrant and in the capacities and on the dates indicated.
| | |
| By (Signature and Title)* | | DAVID L. DILORENZO |
| | David L. DiLorenzo, President (Principal Executive Officer) |
Date: February 14, 2020
| | |
| By (Signature and Title)* | | JAMES O. YOST |
| | James O. Yost, Treasurer (Principal Financial Officer and Accounting Officer) |
Date: February 14, 2020
| * | Print name and title of each signing officer under his or her signature. |