UNITED STATES
SECURITIES AND EXCHANGE COMMISSION
Washington, D.C. 20549
FORM N-CSR
CERTIFIED SHAREHOLDER REPORT OF
REGISTERED MANAGEMENT INVESTMENT COMPANIES
Investment Company Act file number 811-08326
MFS VARIABLE INSURANCE TRUST
(Exact name of registrant as specified in charter)
111 Huntington Avenue, Boston, Massachusetts 02199
(Address of principal executive offices) (Zip code)
Christopher R. Bohane
Massachusetts Financial Services Company
111 Huntington Avenue
Boston, Massachusetts 02199
(Name and address of agents for service)
Registrant’s telephone number, including area code: (617) 954-5000
Date of fiscal year end: December 31
Date of reporting period: December 31, 2020
| ITEM 1. | REPORTS TO STOCKHOLDERS. |
Item (1)(a):
Annual Report
December 31, 2020

MFS® Global Equity Series

MFS® Variable Insurance Trust
VGE-ANN
MFS® Global Equity Series
CONTENTS
The report is prepared for the general information of contract owners. It is authorized for distribution to prospective investors only when preceded or accompanied by a current prospectus.
NOT FDIC INSURED • MAY LOSE VALUE • NO BANK OR CREDIT UNION GUARANTEE • NOT A DEPOSIT • NOT INSURED BY ANY FEDERAL GOVERNMENT AGENCY OR NCUA/NCUSIF
MFS Global Equity Series
LETTER FROM THE CEO

Dear Contract Owners:
Markets experienced dramatic swings this year as the coronavirus pandemic brought the global economy to a standstill for several months early in the year. The speedy development of vaccines and therapeutics later brightened the economic and market outlook, but a great deal of uncertainty remains as case counts remain high, new variants of the virus are appearing and questions persist over how fast the vaccine can be made widely available. In the United States, political uncertainty eased after former Vice President Joe Biden won the presidential election and the Democrats gained control of a closely divided Senate.
Global central banks have taken aggressive steps to cushion the economic and market fallout related to the virus, and governments are deploying unprecedented levels of fiscal support. Additional U.S. stimulus is anticipated with the Democrats in the White House and in control of both houses of Congress. The measures already put in place have helped build a supportive environment and are encouraging economic recovery; however, if markets disconnect from fundamentals, they can sow the seeds of instability. As such, dramatic increases in speculative retail trading bear watching.
In the aftermath of the crisis, we could see societal changes as households, businesses, and governments adjust to a new reality, and any such alterations could affect the investment landscape. For investors, events such as the COVID-19 outbreak demonstrate the importance of having a deep understanding of company fundamentals, and we have built our global research platform to do just that.
At MFS®, we put our clients’ assets to work responsibly by carefully navigating the increasing complexity of our global markets and economies. Guided by our long-term philosophy and adhering to our commitment to sustainable investing, we tune out the noise and aim to uncover what we believe are the best, most durable investment opportunities in the market. Our unique global investment platform combines collective expertise, long-term discipline and thoughtful risk management to create sustainable value for investors.
Respectfully,

Michael W. Roberge
Chief Executive Officer
MFS Investment Management
February 16, 2021
The opinions expressed in this letter are subject to change and may not be relied upon for investment advice. No forecasts can be guaranteed.
1
MFS Global Equity Series
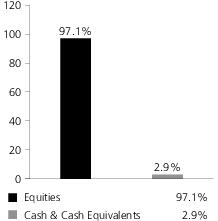
PORTFOLIO COMPOSITION
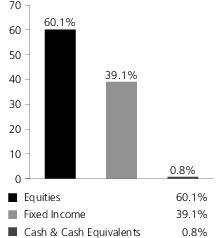
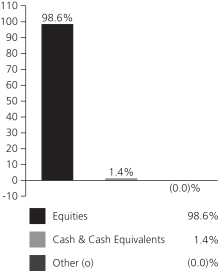
Portfolio structure
| | | | |
| Top ten holdings | | | | |
| Comcast Corp., “A” | | | 3.4% | |
| Thermo Fisher Scientific, Inc. | | | 3.2% | |
| Visa, Inc., “A” | | | 3.1% | |
| Medtronic PLC | | | 3.0% | |
| Schneider Electric SE | | | 2.9% | |
| LVMH Moet Hennessy Louis Vuitton SE | | | 2.6% | |
| Accenture PLC, “A” | | | 2.6% | |
| Nestle S.A. | | | 2.5% | |
| Honeywell International, Inc. | | | 2.4% | |
| Walt Disney Co. | | | 2.2% | |
| | | | |
| GICS equity sectors (g) | | | | |
| Industrials | | | 19.9% | |
| Health Care | | | 19.2% | |
| Consumer Staples | | | 14.7% | |
| Information Technology | | | 14.3% | |
| Financials | | | 9.2% | |
| Consumer Discretionary | | | 8.1% | |
| Communication Services | | | 7.2% | |
| Materials | | | 5.6% | |
| Real Estate | | | 0.4% | |
| |
| Issuer country weightings (x) | | | | |
| United States | | | 55.8% | |
| France | | | 11.5% | |
| Switzerland | | | 7.7% | |
| United Kingdom | | | 6.7% | |
| Germany | | | 4.4% | |
| Netherlands | | | 3.0% | |
| Japan | | | 2.7% | |
| Canada | | | 1.9% | |
| Sweden | | | 1.8% | |
| Other Countries | | | 4.5% | |
| |
| Currency exposure weightings (y) | | | | |
| United States Dollar | | | 57.2% | |
| Euro | | | 21.9% | |
| Swiss Franc | | | 7.7% | |
| British Pound Sterling | | | 6.7% | |
| Japanese Yen | | | 2.7% | |
| Swedish Krona | | | 1.8% | |
| South Korean Won | | | 1.1% | |
| Danish Krone | | | 0.6% | |
| Mexican Peso | | | 0.2% | |
| Other Currencies | | | 0.1% | |
| (g) | The Global Industry Classification Standard (GICS®) was developed by and/or is the exclusive property of MSCI, Inc. and S&P Global Market Intelligence Inc. (“S&P Global Market Intelligence”). GICS is a service mark of MSCI and S&P Global Market Intelligence and has been licensed for use by MFS. MFS has applied its own internal sector/industry classification methodology for equity securities and non-equity securities that are unclassified by GICS. |
| (x) | Represents the portfolio’s exposure to issuer countries as a percentage of a portfolio’s net assets. For purposes of this presentation, United States includes Cash & Cash Equivalents and Other. |
| (y) | Represents the portfolio’s exposure to a particular currency as a percentage of a portfolio’s net assets. For purposes of this presentation, United States Dollar includes Cash & Cash Equivalents. |
Cash & Cash Equivalents includes any cash, investments in money market funds, short-term securities, and other assets less liabilities. Please see the Statement of Assets and Liabilities for additional information related to the fund’s cash position and other assets and liabilities.
Other includes equivalent exposure from currency derivatives and/or any offsets to derivative positions and may be negative.
Percentages are based on net assets as of December 31, 2020.
The portfolio is actively managed and current holdings may be different.
2
MFS Global Equity Series
MANAGEMENT REVIEW
Summary of Results
For the twelve months ended December 31, 2020, Initial Class shares of the MFS Global Equity Series (fund) provided a total return of 13.29%, while Service Class shares of the fund provided a total return of 13.04%. These compare with a return of 15.90% over the same period for the fund’s benchmark, the MSCI World Index (net div).
Market Environment
Markets experienced an extraordinarily sharp selloff early in the period and, in many cases, an unusually rapid recovery later. Central banks and fiscal authorities undertook astonishing levels of stimulus to offset the economic effects of government-imposed social-distancing measures implemented to slow the spread of the COVID-19 virus. At this point, the global economy looks to have experienced the shortest – albeit the deepest and steepest – recession in the postwar period. However, the recovery remains subject to more than the usual number of uncertainties due to questions about the evolution of the virus, what its continued impact will be and how quickly vaccines to guard against it can be manufactured and distributed at scale. There are also worries over the public’s willingness to be inoculated.
Around the world, central banks responded quickly and massively to the crisis with programs to improve liquidity and support markets. These programs proved largely successful in helping to restore market function, ease volatility and stimulate a continued market rebound. Late in the period, the US Federal Reserve adopted a new, flexible, average-inflation-targeting framework, which is expected to result in the federal funds rate remaining at low levels longer than under its previous model. In developed countries, monetary easing measures were complemented by unusually large fiscal stimulus initiatives. Due to relatively manageable external liabilities and balances of payments in many countries and persistently low inflation, even emerging market countries were able to implement countercyclical policies – a departure from the usual market-dictated response to risk-off crises.
Compounding market uncertainty earlier in the pandemic was a crash in the price of crude oil due to a sharp drop in global demand and a disagreement between Saudi Arabia and Russia over production cuts, which resulted in an oil price war. The subsequent decline in prices undercut oil exporters, many of which are in emerging markets, as well as a large segment of the high-yield credit market. The OPEC+ group later agreed on output cuts, with shale oil producers in the US also decreasing production, which, along with the gradual reopening of some major economies and the resultant boost in demand, helped stabilize the price of crude oil.
In the immediate aftermath of the market disruption that accompanied the initial phases of the pandemic, many companies that had added significant leverage to their balance sheets in recent years by borrowing to fund dividend payments and stock buybacks halted those activities, and some companies were forced to recapitalize. As markets and the economy stabilized later in the period, in many cases dividend payments and buybacks resumed. Conversely, some companies found themselves flush with liquidity, having borrowed preemptively during the worst of the crisis only to end up with excess cash on their balance sheets.
Detractors from Performance
A combination of security selection and an underweight allocation to the information technology sector detracted from the fund’s performance relative to the MSCI World Index. Here, not owning shares of computer and personal electronics maker Apple and software giant Microsoft hurt relative results. Despite headwinds related to COVID-19, the share price of Apple appreciated as product demand recovered more rapidly than expected. The shift toward work-from-home and remote learning helped to support strong iPhone and iPad sales. Additionally, shares of Apple reacted positively to the announcement of a new line of its flagship iPhone product with 5G compatibility.
Stock selection within the consumer discretionary sector further weakened relative performance. Not owning shares of internet retailer Amazon.com and electric vehicle manufacturer Tesla weakened relative performance. The share price of Tesla appreciated throughout the period after the company disclosed record deliveries amid the launch of its Model Y and China factory. Additionally, Tesla was added as a constituent to the S&P 500 Index, which further boosted its stock performance.
Stocks in other sectors that held back relative results included the fund’s overweight positions in food processing company Danone (France), life sciences company Bayer (Germany), diversified industrial manufacturer Rolls-Royce Holdings (United Kingdom), premium drinks distributer Diageo (United Kingdom), advertising and marketing firm WPP Group (United Kingdom) and global financial services provider Bank of New York Mellon.
Contributors to Performance
An underweight allocation to the energy sector contributed to the fund’s relative performance. Here, not owning shares of integrated oil and gas company Exxon Mobil and global energy and petrochemicals company Royal Dutch Shell (United Kingdom) contributed to relative returns. The share price of Exxon suffered as oil and gas prices came under significant pressure during the period due to lower volumes and production caused by the COVID-19 virus and the price war between Saudi Arabia and Russia.
Elsewhere, the fund’s overweight positions in life sciences supply company Thermo Fisher Scientific, electrical distribution equipment manufacturer Schneider Electric (France), luxury goods company LVMH Moet Hennessy Louis Vuitton (France), digital payment
3
MFS Global Equity Series
Management Review – continued
technology developer PayPal Holdings, railroad company Kansas City Southern, machinery and industrial products manufacturer Kubota (Japan) and ground delivery service company United Parcel Service further benefited relative returns. The fund’s holdings of microchip and electronics manufacturer Samsung Electronics (b) (South Korea) also contributed to relative performance. The share price of Samsung Electronics appreciated as the company announced operating profit that easily beat market expectations, driven by its strong consumer electronics (TV & Home Appliances) and smartphone businesses.
Respectfully,
Portfolio Manager(s)
Ryan McAllister and Roger Morley
| (b) | Security is not a benchmark constituent. |
The views expressed in this report are those of the portfolio manager(s) only through the end of the period of the report as stated on the cover and do not necessarily reflect the views of MFS or any other person in the MFS organization. These views are subject to change at any time based on market or other conditions, and MFS disclaims any responsibility to update such views. These views may not be relied upon as investment advice or an indication of trading intent on behalf of any MFS portfolio. References to specific securities are not recommendations of such securities, and may not be representative of any MFS portfolio’s current or future investments.
4
MFS Global Equity Series
PERFORMANCE SUMMARY THROUGH 12/31/20
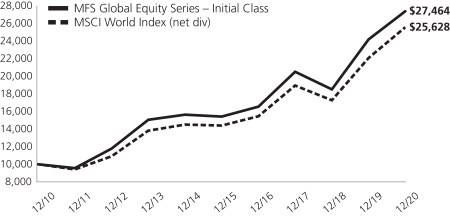
The following chart illustrates the historical performance of the fund in comparison to its benchmark(s). Benchmarks are unmanaged and may not be invested in directly. Benchmark returns do not reflect any fees or expenses. The performance of other share classes will be greater than or less than that of the class depicted below. (See Notes to Performance Summary.)
Performance data shown represents past performance and is no guarantee of future results. Investment return and principal value fluctuate so your units, when sold, may be worth more or less than the original cost; current performance may be lower or higher than quoted. The performance shown does not reflect the deduction of taxes, if any, that a contract holder would pay on fund distributions or the redemption of contract units. The returns for the fund shown also do not reflect the deduction of expenses associated with variable products, such as mortality and expense risk charges, separate account charges, and sales charges imposed by the insurance company separate accounts. Such expenses would reduce the overall returns shown.
Growth of a Hypothetical $10,000 Investment
Total Returns through 12/31/20
Average annual total returns
| | | | | | | | | | | | |
| | | Share Class | | Class Inception Date | | 1-yr | | 5-yr | | 10-yr | | |
| | | Initial Class | | 5/03/99 | | 13.29% | | 12.20% | | 10.63% | | |
| | | Service Class | | 5/01/00 | | 13.04% | | 11.92% | | 10.36% | | |
| | | | |
| Comparative benchmark(s) | | | | | | | | |
| | | MSCI World Index (net div) (f) | | 15.90% | | 12.19% | | 9.87% | | |
| (f) | Source: FactSet Research Systems Inc. |
Benchmark Definition(s)
MSCI World Index (e) (net div) – a market capitalization-weighted index that is designed to measure equity market performance in the global developed markets.
It is not possible to invest directly in an index.
| (e) | Morgan Stanley Capital International (“MSCI”) makes no express or implied warranties or representations and shall have no liability whatsoever with respect to any MSCI data contained herein. The MSCI data may not be further redistributed or used as a basis for other indices or any securities or financial products. This report is not approved, reviewed, or produced by MSCI. |
Notes to Performance Summary
Average annual total return represents the average annual change in value for each share class for the periods presented.
Performance results reflect any applicable expense subsidies and waivers in effect during the periods shown. Without such subsidies and waivers the fund’s performance results would be less favorable. Please see the prospectus and financial statements for complete details. All results are historical and assume the reinvestment of any dividends and capital gains distributions.
Performance results do not include adjustments made for financial reporting purposes in accordance with U.S. generally accepted accounting principles and may differ from amounts reported in the financial highlights.
From time to time the fund may receive proceeds from litigation settlements, without which performance would be lower.
5
MFS Global Equity Series
EXPENSE TABLE
Fund Expenses Borne by the Contract Holders during the Period,
July 1, 2020 through December 31, 2020
As a contract holder of the fund, you incur ongoing costs, including management fees; distribution and/or service (12b-1) fees; and other fund expenses. This example is intended to help you understand your ongoing costs (in dollars) of investing in the fund and to compare these costs with the ongoing costs of investing in other mutual funds.
The example is based on an investment of $1,000 invested at the beginning of the period and held for the entire period
July 1, 2020 through December 31, 2020.
Actual Expenses
The first line for each share class in the following table provides information about actual account values and actual expenses. You may use the information in this line, together with the amount you invested, to estimate the expenses that you paid over the period.
Simply divide your account value by $1,000 (for example, an $8,600 account value divided by $1,000 = 8.6), then multiply the result by the number in the first line under the heading entitled “Expenses Paid During Period” to estimate the expenses you paid on your account during this period.
Hypothetical Example for Comparison Purposes
The second line for each share class in the following table provides information about hypothetical account values and hypothetical expenses based on the fund’s actual expense ratio and an assumed rate of return of 5% per year before expenses, which is not the fund’s actual return. The hypothetical account values and expenses may not be used to estimate the actual ending account balance or expenses you paid for the period. You may use this information to compare the ongoing costs of investing in the fund and other funds. To do so, compare this 5% hypothetical example with the 5% hypothetical examples that appear in the shareholder reports of the other funds.
Please note that the expenses shown in the table are meant to highlight the fund’s ongoing costs only and do not take into account the fees and expenses imposed under the variable contracts through which your investment in the fund is made. Therefore, the second line for each share class in the table is useful in comparing ongoing costs associated with an investment in vehicles (such as the fund) which fund benefits under variable annuity and variable life insurance contracts and to qualified pension and retirement plans only, and will not help you determine the relative total costs of investing in the fund through variable annuity and variable life insurance contracts. If the fees and expenses imposed under the variable contracts were included, your costs would have been higher.
| | | | | | | | | | | | | | | | | | |
| Share Class | | | | Annualized
Expense Ratio | | | Beginning
Account Value
7/01/20 | | | Ending
Account Value
12/31/20 | | | Expenses Paid
During Period (p)
7/01/20-12/31/20 | |
| Initial Class | | Actual | | | 0.92% | | | | $1,000.00 | | | | $1,243.06 | | | | $5.19 | |
| | Hypothetical (h) | | | 0.92% | | | | $1,000.00 | | | | $1,020.51 | | | | $4.67 | |
| Service Class | | Actual | | | 1.17% | | | | $1,000.00 | | | | $1,242.41 | | | | $6.59 | |
| | Hypothetical (h) | | | 1.17% | | | | $1,000.00 | | | | $1,019.25 | | | | $5.94 | |
| (h) | 5% class return per year before expenses. |
| (p) | “Expenses Paid During Period” are equal to each class’s annualized expense ratio, as shown above, multiplied by the average account value over the period, multiplied by 184/366 (to reflect the one-half year period). |
6
MFS Global Equity Series
PORTFOLIO OF INVESTMENTS – 12/31/20
The Portfolio of Investments is a complete list of all securities owned by your fund. It is categorized by broad-based asset classes.
| | | | | | | | |
| Issuer | | Shares/Par | | | Value ($) | |
| COMMON STOCKS – 98.6% | | | | | | | | |
| Aerospace – 3.6% | | | | | |
| Honeywell International, Inc. | | | 6,727 | | | $ | 1,430,833 | |
| MTU Aero Engines Holding AG | | | 1,300 | | | | 338,910 | |
| Rolls-Royce Holdings PLC (a) | | | 246,111 | | | | 374,420 | |
| | | | | | | | |
| | | | | | $ | 2,144,163 | |
| | | | | | | | |
| Airlines – 1.0% | | | | | |
| Aena S.A. (a) | | | 3,476 | | | $ | 606,969 | |
| | | | | | | | |
| Alcoholic Beverages – 5.9% | | | | | |
| Carlsberg A.S., “B” | | | 2,074 | | | $ | 331,981 | |
| Diageo PLC | | | 32,891 | | | | 1,299,889 | |
| Heineken N.V. | | | 9,245 | | | | 1,030,253 | |
| Pernod Ricard S.A. | | | 4,610 | | | | 883,067 | |
| | | | | | | | |
| | | | | | $ | 3,545,190 | |
| | | | | | | | |
| Apparel Manufacturers – 4.3% | | | | | |
| Burberry Group PLC (a) | | | 14,100 | | | $ | 345,047 | |
| Compagnie Financiere Richemont S.A. | | | 7,375 | | | | 667,107 | |
| LVMH Moet Hennessy Louis Vuitton SE | | | 2,502 | | | | 1,561,601 | |
| | | | | | | | |
| | | | | | $ | 2,573,755 | |
| | | | | | | | |
| Automotive – 0.5% | | | | | |
| Aptiv PLC | | | 2,541 | | | $ | 331,067 | |
| | | | | | | | |
| Broadcasting – 3.2% | | | | | |
| Omnicom Group, Inc. | | | 2,942 | | | $ | 183,493 | |
| Walt Disney Co. (a) | | | 7,260 | | | | 1,315,367 | |
| WPP Group PLC | | | 37,400 | | | | 406,352 | |
| | | | | | | | |
| | | | | | $ | 1,905,212 | |
| | | | | | | | |
| Brokerage & Asset Managers – 1.7% | | | | | |
| Charles Schwab Corp. | | | 13,350 | | | $ | 708,084 | |
| Deutsche Boerse AG | | | 1,830 | | | | 311,310 | |
| | | | | | | | |
| | | | | | $ | 1,019,394 | |
| | | | | | | | |
| Business Services – 8.6% | | | | | |
| Accenture PLC, “A” | | | 5,952 | | | $ | 1,554,722 | |
| Adecco S.A. | | | 4,093 | | | | 274,446 | |
| Brenntag AG | | | 3,814 | | | | 295,125 | |
| Cognizant Technology Solutions Corp., “A” | | | 7,825 | | | | 641,259 | |
| Compass Group PLC | | | 21,112 | | | | 393,507 | |
| Equifax, Inc. | | | 3,341 | | | | 644,278 | |
| Fidelity National Information Services, Inc. | | | 4,485 | | | | 634,448 | |
| PayPal Holdings, Inc. (a) | | | 3,182 | | | | 745,224 | |
| | | | | | | | |
| | | | | | $ | 5,183,009 | |
| | | | | | | | |
| Cable TV – 4.0% | | | | | |
| Comcast Corp., “A” | | | 39,573 | | | $ | 2,073,625 | |
| Liberty Broadband Corp. (a) | | | 2,213 | | | | 350,473 | |
| | | | | | | | |
| | | | | | $ | 2,424,098 | |
| | | | | | | | |
| Chemicals – 2.5% | | | | | |
| 3M Co. | | | 4,816 | | | $ | 841,789 | |
| PPG Industries, Inc. | | | 4,807 | | | | 693,265 | |
| | | | | | | | |
| | | | | | $ | 1,535,054 | |
| | | | | | | | |
| | | | | | | | |
| Issuer | | Shares/Par | | | Value ($) | |
| COMMON STOCKS – continued | | | | | | | | |
| Computer Software – 2.6% | | | | | |
| Check Point Software Technologies Ltd. (a) | | | 5,487 | | | $ | 729,277 | |
| Oracle Corp. | | | 13,284 | | | | 859,342 | |
| | | | | | | | |
| | | | | | $ | 1,588,619 | |
| | | | | | | | |
| Computer Software – Systems – 1.6% | | | | | |
| Cisco Systems, Inc. | | | 6,407 | | | $ | 286,713 | |
| Samsung Electronics Co. Ltd. | | | 9,181 | | | | 684,582 | |
| | | | | | | | |
| | | | | | $ | 971,295 | |
| | | | | | | | |
| Construction – 0.5% | | | | | |
| Otis Worldwide Corp. | | | 4,349 | | | $ | 293,775 | |
| | | | | | | | |
| Consumer Products – 4.4% | | | | | |
| Colgate-Palmolive Co. | | | 7,269 | | | $ | 621,572 | |
| Essity AB | | | 34,157 | | | | 1,098,075 | |
| Reckitt Benckiser Group PLC | | | 10,627 | | | | 950,712 | |
| | | | | | | | |
| | | | | | $ | 2,670,359 | |
| | | | | | | | |
| Electrical Equipment – 4.6% | | | | | |
| Amphenol Corp., “A” | | | 2,732 | | | $ | 357,264 | |
| Legrand S.A. | | | 7,337 | | | | 654,317 | |
| Schneider Electric SE | | | 12,276 | | | | 1,774,142 | |
| | | | | | | | |
| | | | | | $ | 2,785,723 | |
| | | | | | | | |
| Electronics – 1.1% | | | | | |
| Hoya Corp. | | | 2,800 | | | $ | 386,964 | |
| Microchip Technology, Inc. | | | 2,235 | | | | 308,676 | |
| | | | | | | | |
| | | | | | $ | 695,640 | |
| | | | | | | | |
| Food & Beverages – 4.4% | | | | | |
| Danone S.A. | | | 16,775 | | | $ | 1,101,714 | |
| Nestle S.A. | | | 12,990 | | | | 1,529,806 | |
| | | | | | | | |
| | | | | | $ | 2,631,520 | |
| | | | | | | | |
| Gaming & Lodging – 1.1% | | | | | |
| Marriott International, Inc., “A” | | | 2,830 | | | $ | 373,334 | |
| Whitbread PLC (a) | | | 7,113 | | | | 301,538 | |
| | | | | | | | |
| | | | | | $ | 674,872 | |
| | | | | | | | |
| Insurance – 1.5% | | | | | |
| AON PLC | | | 3,039 | | | $ | 642,049 | |
| Willis Towers Watson PLC | | | 1,238 | | | | 260,822 | |
| | | | | | | | |
| | | | | | $ | 902,871 | |
| | | | | | | | |
| Internet – 0.9% | | | | | |
| eBay, Inc. | | | 10,763 | | | $ | 540,841 | |
| | | | | | | | |
| Machinery & Tools – 1.7% | | | | | |
| Carrier Global Corp. | | | 3,593 | | | $ | 135,528 | |
| Kubota Corp. | | | 40,300 | | | | 878,556 | |
| | | | | | | | |
| | | | | | $ | 1,014,084 | |
| | | | | | | | |
| Major Banks – 4.3% | | | | | |
| Bank of New York Mellon Corp. | | | 14,063 | | | $ | 596,834 | |
| Erste Group Bank AG | | | 5,154 | | | | 157,032 | |
| Goldman Sachs Group, Inc. | | | 3,447 | | | | 909,008 | |
| State Street Corp. | | | 5,990 | | | | 435,952 | |
7
MFS Global Equity Series
Portfolio of Investments – continued
| | | | | | | | |
| Issuer | | Shares/Par | | | Value ($) | |
| COMMON STOCKS – continued | | | | | | | | |
| Major Banks – continued | | | | | | | | |
| UBS Group AG | | | 34,568 | | | $ | 483,483 | |
| | | | | | | | |
| | | | | | $ | 2,582,309 | |
| | | | | | | | |
| Medical Equipment – 14.5% | | | | | | | | |
| Abbott Laboratories | | | 7,889 | | | $ | 863,767 | |
| Cooper Cos., Inc. | | | 1,630 | | | | 592,212 | |
| EssilorLuxottica | | | 1,445 | | | | 225,162 | |
| Medtronic PLC | | | 15,466 | | | | 1,811,687 | |
| Olympus Corp. | | | 18,000 | | | | 393,366 | |
| Sonova Holding AG (a) | | | 603 | | | | 155,238 | |
| Stryker Corp. | | | 4,651 | | | | 1,139,681 | |
| Thermo Fisher Scientific, Inc. | | | 4,185 | | | | 1,949,289 | |
| Waters Corp. (a) | | | 2,463 | | | | 609,395 | |
| Zimmer Biomet Holdings, Inc. | | | 6,410 | | | | 987,717 | |
| | | | | | | | |
| | | | | | $ | 8,727,514 | |
| | | | | | | | |
| Other Banks & Diversified Financials – 4.8% | |
| American Express Co. | | | 5,247 | | | $ | 634,415 | |
| Grupo Financiero Banorte S.A. de C.V. (a) | | | 22,198 | | | | 122,627 | |
| Julius Baer Group Ltd. | | | 4,437 | | | | 257,011 | |
| Kasikornbank Co. Ltd. | | | 15,000 | | | | 57,076 | |
| Visa, Inc., “A” | | | 8,481 | | | | 1,855,049 | |
| | | | | | | | |
| | | | | | $ | 2,926,178 | |
| | | | | | | | |
| Pharmaceuticals – 4.5% | | | | | | | | |
| Bayer AG | | | 11,926 | | | $ | 701,589 | |
| Merck KGaA | | | 4,406 | | | | 755,447 | |
| Roche Holding AG | | | 3,620 | | | | 1,263,504 | |
| | | | | | | | |
| | | | | | $ | 2,720,540 | |
| | | | | | | | |
| Railroad & Shipping – 4.7% | | | | | | | | |
| Canadian National Railway Co. | | | 10,550 | | | $ | 1,158,918 | |
| Kansas City Southern Co. | | | 5,674 | | | | 1,158,234 | |
| Union Pacific Corp. | | | 2,561 | | | | 533,251 | |
| | | | | | | | |
| | | | | | $ | 2,850,403 | |
| | | | | | | | |
| Real Estate – 0.4% | | | | | | | | |
| Deutsche Wohnen SE | | | 4,254 | | | $ | 227,053 | |
| | | | | | | | |
| Specialty Chemicals – 4.4% | | | | | | | | |
| Akzo Nobel N.V. | | | 7,019 | | | $ | 753,379 | |
| L’Air Liquide S.A. | | | 3,544 | | | | 581,239 | |
| Linde PLC | | | 1,080 | | | | 284,591 | |
| Linde PLC (a) | | | 4,074 | | | | 1,060,101 | |
| | | | | | | | |
| | | | | | $ | 2,679,310 | |
| | | | | | | | |
| Specialty Stores – 0.3% | | | | | | | | |
| Hermes International | | | 153 | | | $ | 164,408 | |
| | | | | | | | |
| Trucking – 1.0% | | | | | | | | |
| United Parcel Service, Inc., “B” | | | 3,696 | | | $ | 622,406 | |
| | | | | | | | |
Total Common Stocks
(Identified Cost, $26,878,613) | | | | | | $ | 59,537,631 | |
| | | | | | | | |
| | | | | | | | | | | | | | | | |
| | | Strike
Price | | | First
Exercise | | | Shares/Par | | | Value ($) | |
| WARRANTS – 0.0% | | | | | | | | | | | | | |
| Apparel Manufacturers – 0.0% | | | | | | | | | |
Compagnie Financiere Richemont S.A. (1 share for 2 warrants, Expiration 12/04/23) (a)(n)
(Identified Cost, $0) | | | CHF 67.00 | | | | 11/20/23 | | | | 14,904 | | | $ | 3,872 | |
| | | | | | | | | | | | | | | | |
| | |
| INVESTMENT COMPANIES (h) – 1.1% | | | | | | | | | |
| Money Market Funds – 1.1% | | | | | | | | | |
| MFS Institutional Money Market Portfolio, 0.1% (v) (Identified Cost, $651,977) | | | | 651,977 | | | $ | 651,977 | |
| | | | | | | | | | | | | | | | |
OTHER ASSETS, LESS
LIABILITIES – 0.3% | | | | | | | | | | | | 154,390 | |
| | | | | | | | | | | | | | | | |
| NET ASSETS – 100.0% | | | | | | | | | | | $ | 60,347,870 | |
| | | | | | | | | | | | | | | | |
| (a) | | Non-income producing security. |
| (h) | | An affiliated issuer, which may be considered one in which the fund owns 5% or more of the outstanding voting securities, or a company which is under common control. At period end, the aggregate values of the fund’s investments in affiliated issuers and in unaffiliated issuers were $651,977 and $59,541,503, respectively. |
| (n) | | Securities exempt from registration under Rule 144A of the Securities Act of 1933. These securities may be sold in the ordinary course of business in transactions exempt from registration, normally to qualified institutional buyers. At period end, the aggregate value of these securities was $3,872, representing 0.0% of net assets. |
| (v) | | Affiliated issuer that is available only to investment companies managed by MFS. The rate quoted for the MFS Institutional Money Market Portfolio is the annualized seven-day yield of the fund at period end. |
Abbreviations indicate amounts shown in currencies other than the U.S. dollar. All amounts are stated in U.S. dollars unless otherwise indicated. A list of abbreviations is shown below:
See Notes to Financial Statements
8
MFS Global Equity Series
FINANCIAL STATEMENTS | STATEMENT OF ASSETS AND LIABILITIES
This statement represents your fund’s balance sheet, which details the assets and liabilities comprising the total value of the fund.
| | | | |
At 12/31/20 | | | | |
| |
Assets | | | | |
Investments in unaffiliated issuers, at value (identified cost, $26,878,613) | | | $59,541,503 | |
Investments in affiliated issuers, at value (identified cost, $651,977) | | | 651,977 | |
Receivables for | | | | |
Fund shares sold | | | 121,064 | |
Dividends | | | 119,792 | |
Receivable from investment adviser | | | 6,514 | |
Other assets | | | 501 | |
Total assets | | | $60,441,351 | |
| |
Liabilities | | | | |
Payables for | | | | |
Fund shares reacquired | | | $44,609 | |
Payable to affiliates | | | | |
Administrative services fee | | | 102 | |
Shareholder servicing costs | | | 102 | |
Distribution and/or service fees | | | 184 | |
Accrued expenses and other liabilities | | | 48,484 | |
Total liabilities | | | $93,481 | |
Net assets | | | $60,347,870 | |
| |
Net assets consist of | | | | |
Paid-in capital | | | $23,795,532 | |
Total distributable earnings (loss) | | | 36,552,338 | |
Net assets | | | $60,347,870 | |
Shares of beneficial interest outstanding | | | 2,460,409 | |
| | | | | | | | | | | | |
| | | |
| | | Net assets | | | Shares
outstanding | | | Net asset value
per share | |
Initial Class | | | $46,879,316 | | | | 1,907,649 | | | | $24.57 | |
Service Class | | | 13,468,554 | | | | 552,760 | | | | 24.37 | |
See Notes to Financial Statements
9
MFS Global Equity Series
FINANCIAL STATEMENTS | STATEMENT OF OPERATIONS
This statement describes how much your fund earned in investment income and accrued in expenses. It also describes any gains and/or losses generated by fund operations.
| | | | |
Year ended 12/31/20 | | | | |
| |
Net investment income (loss) | | | | |
Income | | | | |
Dividends | | | $986,337 | |
Dividends from affiliated issuers | | | 2,585 | |
Other | | | 685 | |
Income on securities loaned | | | 286 | |
Foreign taxes withheld | | | (62,488 | ) |
Total investment income | | | $927,405 | |
Expenses | | | | |
Management fee | | | $500,247 | |
Distribution and/or service fees | | | 28,568 | |
Shareholder servicing costs | | | 7,966 | |
Administrative services fee | | | 18,276 | |
Independent Trustees’ compensation | | | 2,448 | |
Custodian fee | | | 20,802 | |
Shareholder communications | | | 10,538 | |
Audit and tax fees | | | 59,462 | |
Legal fees | | | 557 | |
Miscellaneous | | | 23,237 | |
Total expenses | | | $672,101 | |
Reduction of expenses by investment adviser | | | (131,363 | ) |
Net expenses | | | $540,738 | |
Net investment income (loss) | | | $386,667 | |
| |
Realized and unrealized gain (loss) | | | | |
Realized gain (loss) (identified cost basis) | | | | |
Unaffiliated issuers | | | $3,964,367 | |
Affiliated issuers | | | (54 | ) |
Foreign currency | | | (1,269 | ) |
Net realized gain (loss) | | | $3,963,044 | |
Change in unrealized appreciation or depreciation | | | | |
Unaffiliated issuers | | | $2,743,926 | |
Translation of assets and liabilities in foreign currencies | | | 7,035 | |
Net unrealized gain (loss) | | | $2,750,961 | |
Net realized and unrealized gain (loss) | | | $6,714,005 | |
Change in net assets from operations | | | $7,100,672 | |
See Notes to Financial Statements
10
MFS Global Equity Series
FINANCIAL STATEMENTS | STATEMENTS OF CHANGES IN NET ASSETS
These statements describe the increases and/or decreases in net assets resulting from operations, any distributions, and any shareholder transactions.
| | | | | | | | |
| | | Year ended | |
| | | 12/31/20 | | | 12/31/19 | |
Change in net assets | | | | | | | | |
| | |
From operations | | | | | | | | |
Net investment income (loss) | | | $386,667 | | | | $629,173 | |
Net realized gain (loss) | | | 3,963,044 | | | | 2,141,172 | |
Net unrealized gain (loss) | | | 2,750,961 | | | | 12,139,593 | |
Change in net assets from operations | | | $7,100,672 | | | | $14,909,938 | |
Total distributions to shareholders | | | $(2,767,021 | ) | | | $(4,146,029 | ) |
Change in net assets from fund share transactions | | | $(5,075,552 | ) | | | $(2,032,350 | ) |
Total change in net assets | | | $(741,901 | ) | | | $8,731,559 | |
| | |
Net assets | | | | | | | | |
At beginning of period | | | 61,089,771 | | | | 52,358,212 | |
At end of period | | | $60,347,870 | | | | $61,089,771 | |
See Notes to Financial Statements
11
MFS Global Equity Series
FINANCIAL STATEMENTS | FINANCIAL HIGHLIGHTS
The financial highlights table is intended to help you understand the fund’s financial performance for the past 5 years. Certain information reflects financial results for a single fund share. The total returns in the table represent the rate that an investor would have earned (or lost) on an investment in the fund share class (assuming reinvestment of all distributions) held for the entire period.
| | | | | | | | | | | | | | | | | | | | |
| Initial Class | | Year ended | |
| | | | | |
| | | 12/31/20 | | | 12/31/19 | | | 12/31/18 | | | 12/31/17 | | | 12/31/16 | |
| | | | | |
Net asset value, beginning of period | | | $22.79 | | | | $18.82 | | | | $22.00 | | | | $18.59 | | | | $18.39 | |
| | | | | |
| Income (loss) from investment operations | | | | | | | | | | | | | | | | | | | | |
Net investment income (loss) (d) | | | $0.16 | | | | $0.25 | | | | $0.23 | | | | $0.20 | | | | $0.17 | |
Net realized and unrealized gain (loss) | | | 2.73 | | | | 5.35 | | | | (2.23 | ) | | | 4.20 | | | | 1.20 | |
Total from investment operations | | | $2.89 | | | | $5.60 | | | | $(2.00 | ) | | | $4.40 | | | | $1.37 | |
| | | | | |
| Less distributions declared to shareholders | | | | | | | | | | | | | | | | | | | | |
From net investment income | | | $(0.26 | ) | | | $(0.25 | ) | | | $(0.21 | ) | | | $(0.18 | ) | | | $(0.18 | ) |
From net realized gain | | | (0.85 | ) | | | (1.38 | ) | | | (0.97 | ) | | | (0.81 | ) | | | (0.99 | ) |
Total distributions declared to shareholders | | | $(1.11 | ) | | | $(1.63 | ) | | | $(1.18 | ) | | | $(0.99 | ) | | | $(1.17 | ) |
Net asset value, end of period (x) | | | $24.57 | | | | $22.79 | | | | $18.82 | | | | $22.00 | | | | $18.59 | |
Total return (%) (k)(r)(s)(x) | | | 13.29 | | | | 30.57 | | | | (9.74 | ) | | | 24.07 | | | | 7.35 | |
| | | | | |
Ratios (%) (to average net assets)
and Supplemental data: | | | | | | | | | | | | | | | | | | | | |
Expenses before expense reductions (f) | | | 1.16 | | | | 1.16 | | | | 1.13 | | | | 1.16 | | | | 1.19 | |
Expenses after expense reductions (f) | | | 0.92 | | | | 0.95 | | | | 0.97 | | | | 0.97 | | | | 0.99 | |
Net investment income (loss) | | | 0.75 | | | | 1.16 | | | | 1.07 | | | | 0.95 | | | | 0.93 | |
Portfolio turnover | | | 12 | | | | 11 | | | | 15 | | | | 11 | | | | 13 | |
Net assets at end of period (000 omitted) | | | $46,879 | | | | $49,771 | | | | $45,219 | | | | $52,850 | | | | $44,756 | |
| |
| Service Class | | Year ended | |
| | | | | |
| | | 12/31/20 | | | 12/31/19 | | | 12/31/18 | | | 12/31/17 | | | 12/31/16 | |
| | | | | |
Net asset value, beginning of period | | | $22.62 | | | | $18.70 | | | | $21.86 | | | | $18.49 | | | | $18.30 | |
| | | | | |
| Income (loss) from investment operations | | | | | | | | | | | | | | | | | | | | |
Net investment income (loss) (d) | | | $0.10 | | | | $0.18 | | | | $0.18 | | | | $0.14 | | | | $0.13 | |
Net realized and unrealized gain (loss) | | | 2.71 | | | | 5.32 | | | | (2.21 | ) | | | 4.18 | | | | 1.18 | |
Total from investment operations | | | $2.81 | | | | $5.50 | | | | $(2.03 | ) | | | $4.32 | | | | $1.31 | |
| | | | | |
| Less distributions declared to shareholders | | | | | | | | | | | | | | | | | | | | |
From net investment income | | | $(0.21 | ) | | | $(0.20 | ) | | | $(0.16 | ) | | | $(0.14 | ) | | | $(0.13 | ) |
From net realized gain | | | (0.85 | ) | | | (1.38 | ) | | | (0.97 | ) | | | (0.81 | ) | | | (0.99 | ) |
Total distributions declared to shareholders | | | $(1.06 | ) | | | $(1.58 | ) | | | $(1.13 | ) | | | $(0.95 | ) | | | $(1.12 | ) |
Net asset value, end of period (x) | | | $24.37 | | | | $22.62 | | | | $18.70 | | | | $21.86 | | | | $18.49 | |
Total return (%) (k)(r)(s)(x) | | | 13.04 | | | | 30.20 | | | | (9.92 | ) | | | 23.75 | | | | 7.06 | |
| | | | | |
Ratios (%) (to average net assets)
and Supplemental data: | | | | | | | | | | | | | | | | | | | | |
Expenses before expense reductions (f) | | | 1.41 | | | | 1.41 | | | | 1.38 | | | | 1.42 | | | | 1.44 | |
Expenses after expense reductions (f) | | | 1.17 | | | | 1.20 | | | | 1.22 | | | | 1.22 | | | | 1.24 | |
Net investment income (loss) | | | 0.48 | | | | 0.85 | | | | 0.86 | | | | 0.68 | | | | 0.70 | |
Portfolio turnover | | | 12 | | | | 11 | | | | 15 | | | | 11 | | | | 13 | |
Net assets at end of period (000 omitted) | | | $13,469 | | | | $11,319 | | | | $7,139 | | | | $10,162 | | | | $7,033 | |
See Notes to Financial Statements
12
MFS Global Equity Series
Financial Highlights – continued
| (d) | Per share data is based on average shares outstanding. |
| (f) | Ratios do not reflect reductions from fees paid indirectly, if applicable. |
| (k) | The total return does not reflect expenses that apply to separate accounts. Inclusion of these charges would reduce the total return figures for all periods shown. |
| (r) | Certain expenses have been reduced without which performance would have been lower. |
| (s) | From time to time the fund may receive proceeds from litigation settlements, without which performance would be lower. |
| (x) | The net asset values and total returns have been calculated on net assets which include adjustments made in accordance with U.S. generally accepted accounting principles required at period end for financial reporting purposes. |
See Notes to Financial Statements
13
MFS Global Equity Series
NOTES TO FINANCIAL STATEMENTS
| (1) | | Business and Organization |
MFS Global Equity Series (the fund) is a diversified series of MFS Variable Insurance Trust (the trust). The trust is organized as a Massachusetts business trust and is registered under the Investment Company Act of 1940, as amended, as an open-end management investment company. The shareholders of each series of the trust are separate accounts of insurance companies, which offer variable annuity and/or life insurance products, and qualified retirement and pension plans.
The fund is an investment company and accordingly follows the investment company accounting and reporting guidance of the Financial Accounting Standards Board (FASB) Accounting Standards Codification Topic 946 Financial Services – Investment Companies.
| (2) | | Significant Accounting Policies |
General – The preparation of financial statements in conformity with U.S. generally accepted accounting principles requires management to make estimates and assumptions that affect the reported amounts of assets and liabilities, and disclosure of contingent assets and liabilities at the date of the financial statements and the reported amounts of increases and decreases in net assets from operations during the reporting period. Actual results could differ from those estimates. In the preparation of these financial statements, management has evaluated subsequent events occurring after the date of the fund’s Statement of Assets and Liabilities through the date that the financial statements were issued. The fund invests in foreign securities. Investments in foreign securities are vulnerable to the effects of changes in the relative values of the local currency and the U.S. dollar and to the effects of changes in each country’s market, economic, industrial, political, regulatory, geopolitical, environmental, public health, and other conditions.
In March 2020, the FASB issued Accounting Standards Update 2020-04, Reference Rate Reform (Topic 848) – Facilitation of the Effects of Reference Rate Reform on Financial Reporting (“ASU 2020-04”), which provides optional, temporary relief with respect to the financial reporting of contracts subject to certain types of modifications due to the planned discontinuation of the London Interbank Offered Rate (LIBOR) and other IBOR-based reference rates as of the end of 2021. The temporary relief provided by ASU 2020-04 is effective for certain reference rate-related contract modifications that occur during the period from March 12, 2020 through December 31, 2022. Management is evaluating the impact of ASU 2020-04 on the fund’s investments, derivatives, debt and other contracts that will undergo reference rate-related modifications as a result of the reference rate reform.
Balance Sheet Offsetting – The fund’s accounting policy with respect to balance sheet offsetting is that, absent an event of default by the counterparty or a termination of the agreement, the International Swaps and Derivatives Association (ISDA) Master Agreement, or similar agreement, does not result in an offset of reported amounts of financial assets and financial liabilities in the Statement of Assets and Liabilities across transactions between the fund and the applicable counterparty. The fund’s right to setoff may be restricted or prohibited by the bankruptcy or insolvency laws of the particular jurisdiction to which a specific master netting agreement counterparty is subject. Balance sheet offsetting disclosures, to the extent applicable to the fund, have been included in the fund’s Significant Accounting Policies note under the captions for each of the fund’s in-scope financial instruments and transactions.
Investment Valuations – Equity securities, including restricted equity securities, are generally valued at the last sale or official closing price on their primary market or exchange as provided by a third-party pricing service. Equity securities, for which there were no sales reported that day, are generally valued at the last quoted daily bid quotation on their primary market or exchange as provided by a third-party pricing service. Short-term instruments with a maturity at issuance of 60 days or less may be valued at amortized cost, which approximates market value. Open-end investment companies are generally valued at net asset value per share. Securities and other assets generally valued on the basis of information from a third-party pricing service may also be valued at a broker/dealer bid quotation. In determining values, third-party pricing services can utilize both transaction data and market information such as yield, quality, coupon rate, maturity, type of issue, trading characteristics, and other market data. The values of foreign securities and other assets and liabilities expressed in foreign currencies are converted to U.S. dollars using the mean of bid and asked prices for rates provided by a third-party pricing service.
The Board of Trustees has delegated primary responsibility for determining or causing to be determined the value of the fund’s investments (including any fair valuation) to the adviser pursuant to valuation policies and procedures approved by the Board. If the adviser determines that reliable market quotations are not readily available, investments are valued at fair value as determined in good faith by the adviser in accordance with such procedures under the oversight of the Board of Trustees. Under the fund’s valuation policies and procedures, market quotations are not considered to be readily available for most types of debt instruments and floating rate loans and many types of derivatives. These investments are generally valued at fair value based on information from third-party pricing services. In addition, investments may be valued at fair value if the adviser determines that an investment’s value has been materially affected by events occurring after the close of the exchange or market on which the investment is principally traded (such as foreign exchange or market) and prior to the determination of the fund’s net asset value, or after the halt of trading of a specific security where trading does not resume prior to the close of the exchange or market on which the security is principally
14
MFS Global Equity Series
Notes to Financial Statements – continued
traded. Events that occur after foreign markets close (such as developments in foreign markets and significant movements in the U.S. markets) and prior to the determination of the fund’s net asset value may be deemed to have a material effect on the value of securities traded in foreign markets. Accordingly, the fund’s foreign equity securities may often be valued at fair value. The adviser generally relies on third-party pricing services or other information (such as the correlation with price movements of similar securities in the same or other markets; the type, cost and investment characteristics of the security; the business and financial condition of the issuer; and trading and other market data) to assist in determining whether to fair value and at what value to fair value an investment. The value of an investment for purposes of calculating the fund’s net asset value can differ depending on the source and method used to determine value. When fair valuation is used, the value of an investment used to determine the fund’s net asset value may differ from quoted or published prices for the same investment. There can be no assurance that the fund could obtain the fair value assigned to an investment if it were to sell the investment at the same time at which the fund determines its net asset value per share.
Various inputs are used in determining the value of the fund’s assets or liabilities. These inputs are categorized into three broad levels. In certain cases, the inputs used to measure fair value may fall into different levels of the fair value hierarchy. In such cases, an investment’s level within the fair value hierarchy is based on the lowest level of input that is significant to the fair value measurement. The fund’s assessment of the significance of a particular input to the fair value measurement in its entirety requires judgment, and considers factors specific to the investment. Level 1 includes unadjusted quoted prices in active markets for identical assets or liabilities. Level 2 includes other significant observable market-based inputs (including quoted prices for similar securities, interest rates, prepayment speed, and credit risk). Level 3 includes unobservable inputs, which may include the adviser’s own assumptions in determining the fair value of investments. The following is a summary of the levels used as of December 31, 2020 in valuing the fund’s assets or liabilities:
| | | | | | | | | | | | | | | | |
| Financial Instruments | | Level 1 | | | Level 2 | | | Level 3 | | | Total | |
| Equity Securities: | | | | | | | | | | | | | | | | |
United States | | | $32,871,432 | | | | $— | | | | $— | | | | $32,871,432 | |
France | | | 6,945,650 | | | | — | | | | — | | | | 6,945,650 | |
Switzerland | | | 3,464,289 | | | | 1,170,178 | | | | — | | | | 4,634,467 | |
United Kingdom | | | 2,365,224 | | | | 1,706,241 | | | | — | | | | 4,071,465 | |
Germany | | | 2,629,434 | | | | — | | | | — | | | | 2,629,434 | |
Netherlands | | | 1,783,632 | | | | — | | | | — | | | | 1,783,632 | |
Japan | | | 1,658,886 | | | | — | | | | — | | | | 1,658,886 | |
Canada | | | 1,158,918 | | | | — | | | | — | | | | 1,158,918 | |
Sweden | | | 1,098,075 | | | | — | | | | — | | | | 1,098,075 | |
Other Countries | | | 2,082,575 | | | | 606,969 | | | | — | | | | 2,689,544 | |
| Mutual Funds | | | 651,977 | | | | — | | | | — | | | | 651,977 | |
| Total | | | $56,710,092 | | | | $3,483,388 | | | | $— | | | | $60,193,480 | |
For further information regarding security characteristics, see the Portfolio of Investments.
Foreign Currency Translation – Purchases and sales of foreign investments, income, and expenses are converted into U.S. dollars based upon currency exchange rates prevailing on the respective dates of such transactions or on the reporting date for foreign denominated receivables and payables. Gains and losses attributable to foreign currency exchange rates on sales of securities are recorded for financial statement purposes as net realized gains and losses on investments. Gains and losses attributable to foreign exchange rate movements on receivables, payables, income and expenses are recorded for financial statement purposes as foreign currency transaction gains and losses. That portion of both realized and unrealized gains and losses on investments that results from fluctuations in foreign currency exchange rates is not separately disclosed.
Security Loans – Under its Securities Lending Agency Agreement with the fund, State Street Bank and Trust Company, as lending agent, loans the securities of the fund to certain qualified institutions (the “Borrowers”) approved by the fund. Security loans can be terminated at the discretion of either the lending agent or the fund and the related securities must be returned within the earlier of the standard trade settlement period for such securities or within three business days. The loans are collateralized by cash and/or U.S. Treasury and federal agency obligations in an amount typically at least equal to the market value of the securities loaned. On loans collateralized by cash, the cash collateral is invested in a money market fund. The market value of the loaned securities is determined at the close of business of the fund and any additional required collateral is delivered to the fund on the next business day. The lending agent provides the fund with indemnification against Borrower default. In the event of Borrower default, the lending agent will, for the benefit of the fund, either purchase securities identical to those loaned or, when such purchase is commercially impracticable, pay the fund the market value of the loaned securities. In return, the lending agent assumes the fund’s rights to the related collateral. If the collateral value is less than the cost to purchase identical securities, the lending agent is responsible for the shortfall, but only to the extent that such shortfall is not due to a decline in collateral value resulting from collateral reinvestment for which the fund bears the risk of loss. A portion of the income generated upon investment of the collateral is remitted to the
15
MFS Global Equity Series
Notes to Financial Statements – continued
Borrowers, and the remainder is allocated between the fund and the lending agent. On loans collateralized by U.S. Treasury and/or federal agency obligations, a fee is received from the Borrower, and is allocated between the fund and the lending agent. Income from securities lending is separately reported in the Statement of Operations. The dividend and interest income earned on the securities loaned is accounted for in the same manner as other dividend and interest income. At December 31, 2020, there were no securities on loan or collateral outstanding.
Indemnifications – Under the fund’s organizational documents, its officers and Trustees may be indemnified against certain liabilities and expenses arising out of the performance of their duties to the fund. Additionally, in the normal course of business, the fund enters into agreements with service providers that may contain indemnification clauses. The fund’s maximum exposure under these agreements is unknown as this would involve future claims that may be made against the fund that have not yet occurred.
Investment Transactions and Income – Investment transactions are recorded on the trade date. Dividends received in cash are recorded on the ex-dividend date. Certain dividends from foreign securities will be recorded when the fund is informed of the dividend if such information is obtained subsequent to the ex-dividend date. Dividend payments received in additional securities are recorded on the ex-dividend date in an amount equal to the value of the security on such date.
The fund may receive proceeds from litigation settlements. Any proceeds received from litigation involving portfolio holdings are reflected in the Statement of Operations in realized gain/loss if the security has been disposed of by the fund or in unrealized gain/loss if the security is still held by the fund. Any other proceeds from litigation not related to portfolio holdings are reflected as other income in the Statement of Operations.
Tax Matters and Distributions – The fund intends to qualify as a regulated investment company, as defined under Subchapter M of the Internal Revenue Code, and to distribute all of its taxable income, including realized capital gains. As a result, no provision for federal income tax is required. The fund’s federal tax returns, when filed, will remain subject to examination by the Internal Revenue Service for a three year period. Management has analyzed the fund’s tax positions taken on federal and state tax returns for all open tax years and does not believe that there are any uncertain tax positions that require recognition of a tax liability. Foreign taxes, if any, have been accrued by the fund in the accompanying financial statements in accordance with the applicable foreign tax law. Foreign income taxes may be withheld by certain countries in which the fund invests. Additionally, capital gains realized by the fund on securities issued in or by certain foreign countries may be subject to capital gains tax imposed by those countries.
Distributions to shareholders are recorded on the ex-dividend date. Income and capital gain distributions are determined in accordance with income tax regulations, which may differ from U.S. generally accepted accounting principles. Certain capital accounts in the financial statements are periodically adjusted for permanent differences in order to reflect their tax character. These adjustments have no impact on net assets or net asset value per share. Temporary differences which arise from recognizing certain items of income, expense, gain or loss in different periods for financial statement and tax purposes will reverse at some time in the future.
Book/tax differences primarily relate to wash sale loss deferrals.
The tax character of distributions declared to shareholders for the last two fiscal years is as follows:
| | | | | | | | |
| | | Year ended
12/31/20 | | | Year ended
12/31/19 | |
| Ordinary income (including any short-term capital gains) | | | $699,005 | | | | $712,018 | |
| Long-term capital gains | | | 2,068,016 | | | | 3,434,011 | |
| Total distributions | | | $2,767,021 | | | | $4,146,029 | |
The federal tax cost and the tax basis components of distributable earnings were as follows:
| | | | |
| As of 12/31/20 | | | | |
| |
| Cost of investments | | | $28,052,924 | |
| Gross appreciation | | | 32,398,911 | |
| Gross depreciation | | | (258,355 | ) |
| Net unrealized appreciation (depreciation) | | | $32,140,556 | |
| |
| Undistributed ordinary income | | | 463,083 | |
| Undistributed long-term capital gain | | | 3,941,434 | |
| Other temporary differences | | | 7,265 | |
Multiple Classes of Shares of Beneficial Interest – The fund offers multiple classes of shares, which differ in their respective distribution and/or service fees. The fund’s income, realized and unrealized gain (loss), and common expenses are allocated to shareholders based on the daily net assets of each class. Dividends are declared separately for each class. Differences in per share
16
MFS Global Equity Series
Notes to Financial Statements – continued
dividend rates are generally due to differences in separate class expenses. The fund’s distributions declared to shareholders as reported in the Statements of Changes in Net Assets are presented by class as follows:
| | | | | | | | |
| | |
| | | Year ended
12/31/20 | | | Year ended
12/31/19 | |
| Initial Class | | | $2,194,634 | | | | $3,413,794 | |
| Service Class | | | 572,387 | | | | 732,235 | |
| Total | | | $2,767,021 | | | | $4,146,029 | |
| (3) | | Transactions with Affiliates |
Investment Adviser – The fund has an investment advisory agreement with MFS to provide overall investment management and related administrative services and facilities to the fund. The management fee is computed daily and paid monthly at the following annual rates based on the fund’s average daily net assets:
| | | | |
| Up to $1 billion | | | 0.90% | |
| In excess of $1 billion and up to $2.5 billion | | | 0.75% | |
| In excess of $2.5 billion | | | 0.65% | |
MFS has agreed in writing to reduce its management fee by a specified amount if certain MFS mutual fund assets exceed thresholds agreed to by MFS and the fund’s Board of Trustees. For the year ended December 31, 2020, this management fee reduction amounted to $6,106, which is included in the reduction of total expenses in the Statement of Operations. The management fee incurred for the year ended December 31, 2020 was equivalent to an annual effective rate of 0.89% of the fund’s average daily net assets.
The investment adviser has agreed in writing to pay a portion of the fund’s total annual operating expenses, excluding interest, taxes, extraordinary expenses, brokerage and transaction costs, and investment-related expenses, such that total annual operating expenses do not exceed 0.92% of average daily net assets for the Initial Class shares and 1.17% of average daily net assets for the Service Class shares. This written agreement will continue until modified by the fund’s Board of Trustees, but such agreement will continue at least until April 30, 2022. For the year ended December 31, 2020, this reduction amounted to $125,257, which is included in the reduction of total expenses in the Statement of Operations.
Distributor – MFS Fund Distributors, Inc. (MFD), a wholly-owned subsidiary of MFS, is the distributor of shares of the fund. The Trustees have adopted a distribution plan for the Service Class shares pursuant to Rule 12b-1 under the Investment Company Act of 1940.
The fund’s distribution plan provides that the fund will pay MFD distribution and/or service fees equal to 0.25% per annum of its average daily net assets attributable to Service Class shares as partial consideration for services performed and expenses incurred by MFD and financial intermediaries (including participating insurance companies that invest in the fund to fund variable annuity and variable life insurance contracts, sponsors of qualified retirement and pension plans that invest in the fund, and affiliates of these participating insurance companies and plan sponsors) in connection with the sale and distribution of the Service Class shares. MFD may subsequently pay all, or a portion, of the distribution and/or service fees to financial intermediaries.
Shareholder Servicing Agent – MFS Service Center, Inc. (MFSC), a wholly-owned subsidiary of MFS, receives a fee from the fund for its services as shareholder servicing agent. For the year ended December 31, 2020, the fee was $7,691, which equated to 0.0138% annually of the fund’s average daily net assets. MFSC also receives reimbursement from the fund for out-of-pocket expenses paid by MFSC on behalf of the fund. For the year ended December 31, 2020, these costs amounted to $275.
Administrator – MFS provides certain financial, legal, shareholder communications, compliance, and other administrative services to the fund. Under an administrative services agreement, the fund reimburses MFS the costs incurred to provide these services. The fund is charged an annual fixed amount of $17,500 plus a fee based on average daily net assets. The administrative services fee incurred for the year ended December 31, 2020 was equivalent to an annual effective rate of 0.0329% of the fund’s average daily net assets.
Trustees’ and Officers’ Compensation – The fund pays compensation to independent Trustees in the form of a retainer, attendance fees, and additional compensation to Board and Committee chairpersons. The fund does not pay compensation directly to Trustees or officers of the fund who are also officers of the investment adviser, all of whom receive remuneration from MFS for their services to the fund. Certain officers and Trustees of the fund are officers or directors of MFS, MFD, and MFSC.
Other – The fund invests in the MFS Institutional Money Market Portfolio which is managed by MFS and seeks current income consistent with preservation of capital and liquidity. This money market fund does not pay a management fee to MFS but does incur investment and operating costs.
17
MFS Global Equity Series
Notes to Financial Statements – continued
The fund is permitted to engage in purchase and sale transactions with funds and accounts for which MFS serves as investment adviser or sub-adviser (“cross-trades”) pursuant to a policy adopted by the Board of Trustees. This policy has been designed to ensure that cross-trades conducted by the fund comply with Rule 17a-7 under the Investment Company Act of 1940. During the year ended December 31, 2020, the fund engaged in purchase and sale transactions pursuant to this policy, which amounted to $32,976 and $44,793, respectively. The sales transactions resulted in net realized gains (losses) of $15,931.
For the year ended December 31, 2020, purchases and sales of investments, other than short-term obligations, aggregated $6,837,832 and $14,669,101, respectively.
| (5) | | Shares of Beneficial Interest |
The fund’s Declaration of Trust permits the Trustees to issue an unlimited number of full and fractional shares of beneficial interest. Transactions in fund shares were as follows:
| | | | | | | | | | | | | | | | |
| | | Year ended 12/31/20 | | | Year ended 12/31/19 | |
| | | | |
| | | Shares | | | Amount | | | Shares | | | Amount | |
| Shares sold | | | | | | | | | | | | | | | | |
Initial Class | | | 374,120 | | | | $7,560,367 | | | | 243,665 | | | | $5,233,272 | |
Service Class | | | 195,660 | | | | 4,034,412 | | | | 181,904 | | | | 3,932,099 | |
| | | 569,780 | | | | $11,594,779 | | | | 425,569 | | | | $9,165,371 | |
| | | | |
| Shares issued to shareholders in reinvestment of distributions | | | | | | | | | | | | | | | | |
Initial Class | | | 100,487 | | | | $2,194,634 | | | | 164,362 | | | | $3,413,794 | |
Service Class | | | 26,402 | | | | 572,387 | | | | 35,494 | | | | 732,235 | |
| | | 126,889 | | | | $2,767,021 | | | | 199,856 | | | | $4,146,029 | |
| | | | |
| Shares reacquired | | | | | | | | | | | | | | | | |
Initial Class | | | (750,977 | ) | | | $(15,997,296 | ) | | | (626,155 | ) | | | $(13,215,661 | ) |
Service Class | | | (169,724 | ) | | | (3,440,056 | ) | | | (98,818 | ) | | | (2,128,089 | ) |
| | | (920,701 | ) | | | $(19,437,352 | ) | | | (724,973 | ) | | | $(15,343,750 | ) |
| | | | |
| Net change | | | | | | | | | | | | | | | | |
Initial Class | | | (276,370 | ) | | | $(6,242,295 | ) | | | (218,128 | ) | | | $(4,568,595 | ) |
Service Class | | | 52,338 | | | | 1,166,743 | | | | 118,580 | | | | 2,536,245 | |
| | | (224,032 | ) | | | $(5,075,552 | ) | | | (99,548 | ) | | | $(2,032,350 | ) |
The fund and certain other funds managed by MFS participate in a $1.25 billion unsecured committed line of credit of which $1 billion is reserved for use by the fund and certain other U.S. funds. The line of credit is provided by a syndicate of banks under a credit agreement. Borrowings may be made for temporary financing needs. Interest is charged to each fund, based on its borrowings, generally at a rate equal to the highest of one month LIBOR, the Federal Funds Effective Rate and the Overnight Bank Funding Rate, plus an agreed upon spread. A commitment fee, based on the average daily, unused portion of the committed line of credit, is allocated among the participating funds. In addition, the fund and other funds managed by MFS have established unsecured uncommitted borrowing arrangements with certain banks for temporary financing needs. Interest is charged to each fund, based on its borrowings, at rates equal to customary reference rates plus an agreed upon spread. For the year ended December 31, 2020, the fund’s commitment fee and interest expense were $276 and $0, respectively, and are included in “Miscellaneous” expense in the Statement of Operations.
| (7) | | Investments in Affiliated Issuers |
An affiliated issuer may be considered one in which the fund owns 5% or more of the outstanding voting securities, or a company which is under common control. For the purposes of this report, the following were affiliated issuers:
| | | | | | | | | | | | | | | | | | | | | | | | |
| Affiliated Issuers | | Beginning
Value | | | Purchases | | | Sales
Proceeds | | | Realized
Gain
(Loss) | | | Change in
Unrealized
Appreciation or
Depreciation | | | Ending
Value | |
| MFS Institutional Money Market Portfolio | | | $198,259 | | | | $12,087,670 | | | | $11,633,898 | | | | $(54 | ) | | | $— | | | | $651,977 | |
| | | | | | |
| Affiliated Issuers | | | | | | | | | | | | | | Dividend
Income | | | Capital Gain
Distributions | |
| MFS Institutional Money Market Portfolio | | | | | | | | | | | | $2,585 | | | | $— | |
18
MFS Global Equity Series
Notes to Financial Statements – continued
The pandemic related to the global spread of novel coronavirus disease (COVID-19), which was first detected in December 2019, has resulted in significant disruptions to global business activity and the global economy, as well as the economies of individual countries, the financial performance of individual companies and sectors, and the securities and commodities markets in general. This pandemic, the full effects of which are still unknown, has resulted in substantial market volatility and may have adversely impacted the prices and liquidity of the fund’s investments and the fund’s performance.
19
MFS Global Equity Series
REPORT OF INDEPENDENT REGISTERED PUBLIC ACCOUNTING FIRM
To the Board of Trustees of MFS Variable Insurance Trust and the Shareholders of
MFS Global Equity Series:
Opinion on the Financial Statements and Financial Highlights
We have audited the accompanying statement of assets and liabilities of MFS Global Equity Series (the “Fund”), including the portfolio of investments, as of December 31, 2020, the related statement of operations for the year then ended, the statements of changes in net assets for each of the two years in the period then ended, the financial highlights for each of the five years in the period then ended, and the related notes. In our opinion, the financial statements and financial highlights present fairly, in all material respects, the financial position of the Fund as of December 31, 2020, and the results of its operations for the year then ended, the changes in its net assets for each of the two years in the period then ended, and the financial highlights for each of the five years in the period then ended, in conformity with accounting principles generally accepted in the United States of America.
Basis for Opinion
These financial statements and financial highlights are the responsibility of the Fund’s management. Our responsibility is to express an opinion on the Fund’s financial statements and financial highlights based on our audits. We are a public accounting firm registered with the Public Company Accounting Oversight Board (United States) (PCAOB) and are required to be independent with respect to the Fund in accordance with the U.S. federal securities laws and the applicable rules and regulations of the Securities and Exchange Commission and the PCAOB.
We conducted our audits in accordance with the standards of the PCAOB. Those standards require that we plan and perform the audit to obtain reasonable assurance about whether the financial statements and financial highlights are free of material misstatement, whether due to error or fraud. The Fund is not required to have, nor were we engaged to perform, an audit of its internal control over financial reporting. As part of our audits, we are required to obtain an understanding of internal control over financial reporting but not for the purpose of expressing an opinion on the effectiveness of the Fund’s internal control over financial reporting. Accordingly, we express no such opinion.
Our audits included performing procedures to assess the risks of material misstatement of the financial statements and financial highlights, whether due to error or fraud, and performing procedures that respond to those risks. Such procedures included examining, on a test basis, evidence regarding the amounts and disclosures in the financial statements and financial highlights. Our audits also included evaluating the accounting principles used and significant estimates made by management, as well as evaluating the overall presentation of the financial statements and financial highlights. Our procedures included confirmation of securities owned as of December 31, 2020, by correspondence with the custodian. We believe that our audits provide a reasonable basis for our opinion.
DELOITTE & TOUCHE LLP
Boston, Massachusetts
February 16, 2021
We have served as the auditor of one or more of the MFS investment companies since 1924.
20
MFS Global Equity Series
TRUSTEES AND OFFICERS – IDENTIFICATION AND BACKGROUND
The Trustees and Officers of the Trust, as of February 1, 2021, are listed below, together with their principal occupations during the past five years. (Their titles may have varied during that period.) The address of each Trustee and Officer is 111 Huntington Avenue, Boston, Massachusetts 02199-7618.
| | | | | | | | | | |
Name, Age | | Position(s)
Held with Fund | | Trustee/Officer
Since (h) | | Number of MFS Funds
overseen by the
Trustee | | Principal Occupations
During the Past Five Years | | Other Directorships
During the Past Five Years (j) |
| INTERESTED TRUSTEES |
Robert J. Manning (k)
(age 57) | | Trustee | | February 2004 | | 134 | | Massachusetts Financial Services Company, Non-Executive Chairman (since January 2021); Director; Chairman of the Board; Executive Chairman (January 2017-2020); Co-Chief Executive Officer (2015-2016) | | N/A |
| | | | | |
Michael W. Roberge (k) (age 54) | | Trustee | | January 2021 | | 134 | | Massachusetts Financial Services Company, Chairman (since January 2021); Chief Executive Officer (since January 2017); Director; President (until December 2018); Chief Investment Officer (until December 2018); Co-Chief Executive Officer (until December 2016) | | N/A |
|
| INDEPENDENT TRUSTEES |
John P. Kavanaugh
(age 66) | | Trustee and Chair of Trustees | | January 2009 | | 134 | | Private investor | | N/A |
| | | | | |
Steven E. Buller
(age 69) | | Trustee | | February 2014 | | 134 | | Private investor | | N/A |
| | | | | |
John A. Caroselli
(age 66) | | Trustee | | March 2017 | | 134 | | Private investor; JC Global Advisors, LLC (management consulting), President (since 2015) | | N/A |
| | | | | |
Maureen R. Goldfarb
(age 65) | | Trustee | | January 2009 | | 134 | | Private investor | | N/A |
| | | | | |
Peter D. Jones
(age 65) | | Trustee | | January 2019 | | 134 | | Private investor | | N/A |
| | | | | |
James W. Kilman, Jr.
(age 59) | | Trustee | | January 2019 | | 134 | | Burford Capital Limited (finance and investment management), Chief Financial Officer (since 2019); KielStrand Capital LLC (family office), Chief Executive Officer (since 2016); Morgan Stanley & Co. (financial services), Vice Chairman of Investment Banking, Co-Head of Diversified Financials Coverage – Financial Institutions Investment Banking Group (until 2016) | | Alpha-En Corporation, Director (2016-2019) |
| | | | | |
Clarence Otis, Jr.
(age 64) | | Trustee | | March 2017 | | 134 | | Private investor | | VF Corporation, Director; Verizon Communications, Inc., Director; The Travelers Companies, Director |
| | | | | |
Maryanne L. Roepke
(age 64) | | Trustee | | May 2014 | | 134 | | Private investor | | N/A |
| | | | | |
Laurie J. Thomsen
(age 63) | | Trustee | | March 2005 | | 134 | | Private investor | | The Travelers Companies, Director; Dycom Industries, Inc., Director |
21
MFS Global Equity Series
Trustees and Officers – continued
| | | | | | | | |
Name, Age | | Position(s)
Held with Fund | | Trustee/Officer
Since (h) | | Number of
MFS Funds
for which the
Person is an
Officer | | Principal Occupations During the Past Five Years |
| OFFICERS | | | | | | |
Christopher R. Bohane (k)
(age 47) | | Assistant Secretary and Assistant Clerk | | July 2005 | | 134 | | Massachusetts Financial Services Company, Senior Vice President and Associate General Counsel |
| | | | |
Kino Clark (k) (age 52) | | Assistant Treasurer | | January 2012 | | 134 | | Massachusetts Financial Services Company, Vice President |
| | | | |
John W. Clark, Jr. (k) (age 53) | | Assistant Treasurer | | April 2017 | | 134 | | Massachusetts Financial Services Company, Vice President (since March 2017); Deutsche Bank (financial services), Department Head – Treasurer’s Office (until February 2017) |
| | | | |
Thomas H. Connors (k) (age 61) | | Assistant Secretary and Assistant Clerk | | September 2012 | | 134 | | Massachusetts Financial Services Company, Vice President and Senior Counsel |
| | | | |
David L. DiLorenzo (k)
(age 52) | | President | | July 2005 | | 134 | | Massachusetts Financial Services Company, Senior Vice President |
| | | | |
Heidi W. Hardin (k) (age 53) | | Secretary and Clerk | | April 2017 | | 134 | | Massachusetts Financial Services Company, Executive Vice President and General Counsel (since March 2017); Harris Associates (investment management), General Counsel (until January 2017) |
| | | | |
Brian E. Langenfeld (k) (age 47) | | Assistant
Secretary and Assistant Clerk | | June 2006 | | 134 | | Massachusetts Financial Services Company, Vice President and Senior Counsel |
| | | | |
Amanda S. Mooradian (k) (age 41) | | Assistant
Secretary and Assistant Clerk | | September 2018 | | 134 | | Massachusetts Financial Services Company, Assistant Vice President and Senior Counsel |
| | | | |
Susan A. Pereira (k)
(age 50) | | Assistant
Secretary and Assistant Clerk | | July 2005 | | 134 | | Massachusetts Financial Services Company, Vice President and Assistant General Counsel |
| | | | |
Kasey L. Phillips (k) (age 50) | | Assistant Treasurer | | September 2012 | | 134 | | Massachusetts Financial Services Company, Vice President |
| | | | |
Matthew A. Stowe (k) (age 46) | | Assistant Secretary and Assistant Clerk | | October 2014 | | 134 | | Massachusetts Financial Services Company, Vice President and Assistant General Counsel |
| | | | |
Martin J. Wolin (k) (age 53) | | Chief Compliance Officer | | July 2015 | | 134 | | Massachusetts Financial Services Company, Senior Vice President and Chief Compliance Officer |
| | | | |
James O. Yost (k)
(age 60) | | Treasurer | | September 1990 | | 134 | | Massachusetts Financial Services Company, Senior Vice President |
| (h) | Date first appointed to serve as Trustee/officer of an MFS Fund. Each Trustee has served continuously since appointment unless indicated otherwise. For the period from December 15, 2004 until February 22, 2005, Mr. Manning served as Advisory Trustee. From January 2012 through December 2016, Messrs. DiLorenzo and Yost served as Treasurer and Deputy Treasurer of the Funds, respectively. |
| (j) | Directorships or trusteeships of companies required to report to the Securities and Exchange Commission (i.e., “public companies”). |
| (k) | “Interested person” of the Trust within the meaning of the Investment Company Act of 1940 (referred to as the 1940 Act), which is the principal federal law governing investment companies like the fund, as a result of a position with MFS. The address of MFS is 111 Huntington Avenue, Boston, Massachusetts 02199-7618. |
Each Trustee (other than Messrs. Jones, Kilman and Roberge) has been elected by shareholders and each Trustee and Officer holds office until his or her successor is chosen and qualified or until his or her earlier death, resignation, retirement or removal. Mr. Roberge became a Trustee of the Funds on January 1, 2021 and Messrs. Jones and Kilman became Trustees of the Funds on January 1, 2019. The Trust does not hold annual meetings for the purpose of electing Trustees, and Trustees are not elected for fixed terms. Under the terms of the Board’s retirement policy, an Independent Trustee shall retire at the end of the calendar year in which he or she reaches the earlier of 75 years of age or 15 years of service on the Board (or, in the case of any Independent Trustee who joined the Board prior to 2015, 20 years of service on the Board).
Messrs. Buller, Kilman and Otis and Ms. Roepke are members of the Trust’s Audit Committee.
22
MFS Global Equity Series
Trustees and Officers – continued
Each of the Interested Trustees and certain Officers hold comparable officer positions with certain affiliates of MFS.
The Statement of Additional Information for a Fund includes further information about the Trustees and is available without charge upon request by calling 1-800-225-2606.
| | |
Investment Adviser Massachusetts Financial Services Company 111 Huntington Avenue Boston, MA 02199-7618 | | Custodian State Street Bank and Trust Company 1 Lincoln Street Boston, MA 02111-2900 |
| |
Distributor MFS Fund Distributors, Inc. 111 Huntington Avenue Boston, MA 02199-7618 | | Independent Registered Public Accounting Firm Deloitte & Touche LLP 200 Berkeley Street Boston, MA 02116 |
| |
Portfolio Manager(s) Ryan McAllister Roger Morley | | |
23
MFS Global Equity Series
BOARD REVIEW OF INVESTMENT ADVISORY AGREEMENT
MFS Global Equity Series
The Investment Company Act of 1940 requires that both the full Board of Trustees and a majority of the non-interested (“independent”) Trustees, voting separately, annually approve the continuation of the Fund’s investment advisory agreement with MFS. The Trustees consider matters bearing on the Fund and its advisory arrangements at their meetings throughout the year, including a review of performance data at each regular meeting. In addition, the independent Trustees met several times by videoconference (in accordance with Securities and Exchange Commission relief) over the course of three months beginning in May and ending in July, 2020 (“contract review meetings”) for the specific purpose of considering whether to approve the continuation of the investment advisory agreement for the Fund and the other investment companies that the Board oversees (the “MFS Funds”). The independent Trustees were assisted in their evaluation of the Fund’s investment advisory agreement by independent legal counsel, from whom they received separate legal advice and with whom they met separately from MFS during various contract review meetings. The independent Trustees were also assisted in this process by an independent consultant who was retained by and reported to the independent Trustees.
In connection with their deliberations regarding the continuation of the investment advisory agreement, the Trustees, including the independent Trustees, considered such information and factors as they believed, in light of the legal advice furnished to them and their own business judgment, to be relevant. The investment advisory agreement for the Fund was considered separately, although the Trustees also took into account the common interests of all MFS Funds in their review. As described below, the Trustees considered the nature, quality, and extent of the various investment advisory, administrative, and shareholder services performed by MFS under the existing investment advisory agreement and other arrangements with the Fund.
In connection with their contract review meetings, the Trustees received and relied upon materials that included, among other items: (i) information provided by Broadridge Financial Solutions, Inc. (“Broadridge”), an independent third party, on the investment performance of the Fund for various time periods ended December 31, 2019 and the investment performance of a group of funds with substantially similar investment classifications/objectives (the “Broadridge performance universe”), (ii) information provided by Broadridge on the Fund’s advisory fees and other expenses and the advisory fees and other expenses of comparable funds identified by Broadridge as well as all other funds in the same investment classification/category (the “Broadridge expense group and universe”), (iii) information provided by MFS on the advisory fees of portfolios of other clients of MFS, including institutional separate accounts and other clients, (iv) information as to whether and to what extent applicable expense waivers, reimbursements or fee “breakpoints” are observed for the Fund, (v) information regarding MFS’ financial results and financial condition, including MFS’ and certain of its affiliates’ estimated profitability from services performed for the Fund and the MFS Funds as a whole, and compared to MFS’ institutional business, (vi) MFS’ views regarding the outlook for the mutual fund industry and the strategic business plans of MFS, (vii) descriptions of various functions performed by MFS for the Funds, such as compliance monitoring and portfolio trading practices, and (viii) information regarding the overall organization of MFS, including information about MFS’ senior management and other personnel providing investment advisory, administrative and other services to the Fund and the other MFS Funds. The comparative performance, fee and expense information prepared and provided by Broadridge was not independently verified and the independent Trustees did not independently verify any information provided to them by MFS.
The Trustees’ conclusion as to the continuation of the investment advisory agreement was based on a comprehensive consideration of all information provided to the Trustees and not the result of any single factor. Some of the factors that figured particularly in the Trustees’ deliberations are described below, although individual Trustees may have evaluated the information presented differently from one another, giving different weights to various factors. It is also important to recognize that the fee arrangements for the Fund and other MFS Funds are the result of years of review and discussion between the independent Trustees and MFS, that certain aspects of such arrangements may receive greater scrutiny in some years than in others, and that the Trustees’ conclusions may be based, in part, on their consideration of these same arrangements during the course of the year and in prior years.
Based on information provided by Broadridge and MFS, the Trustees reviewed the Fund’s total return investment performance as well as the Broadridge performance universe over various time periods. The Trustees placed particular emphasis on the total return performance of the Fund’s Initial Class shares in comparison to the performance of funds in its Broadridge performance universe over the five-year period ended December 31, 2019, which the Trustees believed was a long enough period to reflect differing market conditions. The total return performance of the Fund’s Initial Class shares was in the 3rd quintile relative to the other funds in the universe for this five-year period (the 1st quintile being the best performers and the 5th quintile being the worst performers). The total return performance of the Fund’s Initial Class shares was in the 2nd quintile for each of the one- and three-year periods ended December 31, 2019 relative to the Broadridge performance universe. Because of the passage of time, these performance results may differ from the performance results for more recent periods, including those shown elsewhere in this report.
In the course of their deliberations, the Trustees took into account information provided by MFS in connection with the contract review meetings, as well as during investment review meetings conducted with portfolio management personnel during the course of the year regarding the Fund’s performance. After reviewing these and related factors, the Trustees concluded, within the context of their overall conclusions regarding the investment advisory agreement, that they were satisfied with MFS’ responses and efforts relating to investment performance.
24
MFS Global Equity Series
Board Review of Investment Advisory Agreement – continued
In assessing the reasonableness of the Fund’s advisory fee, the Trustees considered, among other information, the Fund’s advisory fee and the total expense ratio of the Fund’s Initial Class shares as a percentage of average daily net assets and the advisory fee and total expense ratios of the Broadridge expense group based on information provided by Broadridge. The Trustees considered that MFS currently observes an expense limitation for the Fund, which may not be changed without the Trustees’ approval. The Trustees also considered that, according to the data provided by Broadridge (which takes into account any fee reductions or expense limitations that were in effect during the Fund’s last fiscal year), the Fund’s effective advisory fee rate was approximately at the Broadridge expense group median and the Fund’s total expense ratio was higher than the Broadridge expense group median.
The Trustees also considered the advisory fees charged by MFS to any institutional separate accounts advised by MFS (“separate accounts”) and unaffiliated investment companies for which MFS serves as subadviser (“subadvised funds”) that have comparable investment strategies to the Fund, if any. In comparing these fees, the Trustees considered information provided by MFS as to the generally broader scope of services provided by MFS to the Fund, as well as the more extensive regulatory burdens imposed on MFS in managing the Fund, in comparison to separate accounts and subadvised funds. The Trustees also considered the higher demands placed on MFS’ investment personnel and trading infrastructure as a result of the daily cash in-flows and out-flows of the Fund in comparison to separate accounts.
The Trustees also considered whether the Fund may benefit from any economies of scale in the management of the Fund in the event of growth in assets of the Fund and/or growth in assets of the MFS Funds as a whole. They noted that the Fund’s advisory fee rate schedule is subject to contractual breakpoints that reduce the Fund’s advisory fee rate on average daily net assets over $1 billion and $2.5 billion. The Trustees also noted that MFS has agreed in writing to waive a portion of the management fees of certain MFS Funds, including the Fund, if the total combined assets of certain funds within the MFS Funds’ complex increase above agreed upon thresholds (the “group fee waiver”), enabling the Fund’s shareholders to share in the benefits from any economies of scale at the complex level. The group fee waiver is reviewed and renewed annually between the Board and MFS. The Trustees concluded that the breakpoints and the group fee waiver were sufficient to allow the Fund to benefit from economies of scale as its assets and overall complex assets grow.
The Trustees also considered information prepared by MFS relating to MFS’ costs and profits with respect to the Fund, the MFS Funds considered as a group, and other investment companies and accounts advised by MFS, as well as MFS’ methodologies used to determine and allocate its costs to the MFS Funds, the Fund and other accounts and products for purposes of estimating profitability.
After reviewing these and other factors described herein, the Trustees concluded, within the context of their overall conclusions regarding the investment advisory agreement, that the advisory fees charged to the Fund represent reasonable compensation in light of the services being provided by MFS to the Fund.
In addition, the Trustees considered MFS’ resources and related efforts to continue to retain, attract and motivate capable personnel to serve the Fund. The Trustees also considered current and developing conditions in the financial services industry, including the presence of large and well-capitalized companies which are spending, and appear to be prepared to continue to spend, substantial sums to engage personnel and to provide services to competing investment companies. In this regard, the Trustees also considered the financial resources of MFS and its ultimate parent, Sun Life Financial Inc. The Trustees also considered the advantages and possible disadvantages to the Fund of having an adviser that also serves other investment companies as well as other accounts.
The Trustees also considered the nature, quality, cost, and extent of administrative, transfer agency, and distribution services provided to the Fund by MFS and its affiliates under agreements and plans other than the investment advisory agreement, including any 12b-1 fees the Fund pays to MFS Fund Distributors, Inc., an affiliate of MFS. The Trustees also considered the nature, extent and quality of certain other services MFS performs or arranges for on the Fund’s behalf, which may include securities lending programs, directed expense payment programs, class action recovery programs, and MFS’ interaction with third-party service providers, principally custodians and sub-custodians. The Trustees concluded that the various non-advisory services provided by MFS and its affiliates on behalf of the Fund were satisfactory.
The Trustees considered so-called “fall-out benefits” to MFS such as reputational value derived from serving as investment manager to the MFS Funds. The Trustees also considered that MFS discontinued its historic practice of obtaining investment research from portfolio brokerage commissions paid by certain MFS Funds effective January 2018, and directly pays or voluntarily reimburses a Fund, if applicable, for the costs of external research acquired through the use of the Fund’s portfolio brokerage commissions.
Based on their evaluation of factors that they deemed to be material, including those factors described above, the Board of Trustees, including the independent Trustees, concluded that the Fund’s investment advisory agreement with MFS should be continued for an additional one-year period, commencing August 1, 2020.
25
MFS Global Equity Series
PROXY VOTING POLICIES AND INFORMATION
MFS votes proxies on behalf of the fund pursuant to proxy voting policies and procedures that are available without charge, upon request, by calling 1-800-225-2606, by visiting mfs.com/proxyvoting, or by visiting the SEC Web site at http://www.sec.gov.
Information regarding how the fund voted proxies relating to portfolio securities during the most recent twelve-month period ended June 30 is available by August 31 of each year without charge by visiting mfs.com/proxyvoting, or by visiting the SEC’s Web site at http://www.sec.gov.
QUARTERLY PORTFOLIO DISCLOSURE
The fund files a complete schedule of portfolio holdings with the SEC for the first and third quarters of each fiscal year as an exhibit to its reports on Form N-PORT. The fund’s Form N-PORT reports are available on the SEC’s Web site at http://www.sec.gov. A shareholder can obtain the portfolio holdings report for the first and third quarters of the fund’s fiscal year at mfs.com/vit1 by choosing the fund’s name and then scrolling to the “Resources” section and clicking on the “Prospectus and Reports” tab.
FURTHER INFORMATION
From time to time, MFS may post important information about the fund or the MFS funds on the MFS Web site (mfs.com). This information is available at https://www.mfs.com/announcements or at mfs.com/vit1 by choosing the fund’s name and then scrolling to the “Resources” section and clicking on the “Announcements” tab, if any.
INFORMATION ABOUT FUND CONTRACTS AND LEGAL CLAIMS
The fund has entered into contractual arrangements with an investment adviser, administrator, distributor, shareholder servicing agent, 529 program manager (if applicable), and custodian who each provide services to the fund. Unless expressly stated otherwise, shareholders are not parties to, or intended beneficiaries of these contractual arrangements, and these contractual arrangements are not intended to create any shareholder right to enforce them against the service providers or to seek any remedy under them against the service providers, either directly or on behalf of the fund.
Under the Trust’s By-Laws and Declaration of Trust, any claims asserted against or on behalf of the MFS Funds, including claims against Trustees and Officers, must be brought in state and federal courts located within the Commonwealth of Massachusetts.
FEDERAL TAX INFORMATION (unaudited)
The following information is provided pursuant to provisions of the Internal Revenue Code.
The fund designates $2,275,000 as capital gain dividends paid during the fiscal year.
For corporate shareholders, 52.77% of the ordinary income dividends paid during the fiscal year qualify for the corporate dividends received deduction.
Income derived from foreign sources was $612,471. The fund intends to pass through foreign tax credits of $61,853 for the fiscal year.
26
rev. 3/16
| | | | |
| | | |
| FACTS | | WHAT DOES MFS DO WITH YOUR
PERSONAL INFORMATION? | |  |
| | |
| Why? | | Financial companies choose how they share your personal information. Federal law gives consumers the right to limit some but not all sharing. Federal law also requires us to tell you how we collect, share, and protect your personal information. Please read this notice carefully to understand what we do. |
| | |
| What? | | The types of personal information we collect and share depend on the product or service you have with us. This information can include: • Social Security number and account balances • Account transactions and transaction history • Checking account information and wire transfer instructions When you are no longer our customer, we continue to share your information as described in this notice. |
| | |
| How? | | All financial companies need to share customers’ personal information to run their everyday business. In the section below, we list the reasons financial companies can share their customers’ personal information; the reasons MFS chooses to share; and whether you can limit this sharing. |
| | | | |
Reasons we can share your
personal information | | Does MFS share? | | Can you limit this
sharing? |
For our everyday business purposes – such as to process your transactions, maintain your account(s), respond to court orders and legal investigations, or report to credit bureaus | | Yes | | No |
For our marketing purposes – to offer our products and services to you | | No | | We don’t share |
| For joint marketing with other financial companies | | No | | We don’t share |
For our affiliates’ everyday business purposes – information about your transactions and experiences | | No | | We don’t share |
For our affiliates’ everyday business purposes – information about your creditworthiness | | No | | We don’t share |
| For nonaffiliates to market to you | | No | | We don’t share |
| | |
| | |
| Questions? | | Call 800-225-2606 or go to mfs.com. |
27
| | |
| Who we are |
| Who is providing this notice? | | MFS Funds, MFS Investment Management, MFS Institutional Advisors, Inc., and MFS Heritage Trust Company. |
| | |
| What we do |
| How does MFS protect my personal information? | | To protect your personal information from unauthorized access and use, we use security measures that comply with federal law. These measures include procedural, electronic, and physical safeguards for the protection of the personal information we collect about you. |
How does MFS
collect my personal information? | | We collect your personal information, for example, when you • open an account or provide account information • direct us to buy securities or direct us to sell your securities • make a wire transfer We also collect your personal information from others, such as credit bureaus, affiliates, or other companies. |
| Why can’t I limit all sharing? | | Federal law gives you the right to limit only • sharing for affiliates’ everyday business purposes – information about your creditworthiness • affiliates from using your information to market to you • sharing for nonaffiliates to market to you State laws and individual companies may give you additional rights to limit sharing. |
| | |
| Definitions |
| Affiliates | | Companies related by common ownership or control. They can be financial and nonfinancial companies. • MFS does not share personal information with affiliates, except for everyday business purposes as described on page one of this notice. |
| Nonaffiliates | | Companies not related by common ownership or control. They can be financial and nonfinancial companies. • MFS does not share with nonaffiliates so they can market to you. |
| Joint marketing | | A formal agreement between nonaffiliated financial companies that together market financial products or services to you. • MFS doesn’t jointly market. |
| | |
| Other important information |
| If you own an MFS product or receive an MFS service in the name of a third party such as a bank or broker-dealer, their privacy policy may apply to you instead of ours. |
28
Annual Report
December 31, 2020

MFS® Growth Series

MFS® Variable Insurance Trust
VEG-ANN
MFS® Growth Series
CONTENTS
The report is prepared for the general information of contract owners. It is authorized for distribution to prospective investors only when preceded or accompanied by a current prospectus.
NOT FDIC INSURED • MAY LOSE VALUE • NO BANK OR CREDIT UNION GUARANTEE • NOT A DEPOSIT • NOT INSURED BY ANY FEDERAL GOVERNMENT AGENCY OR NCUA/NCUSIF
MFS Growth Series
LETTER FROM THE CEO

Dear Contract Owners:
Markets experienced dramatic swings this year as the coronavirus pandemic brought the global economy to a standstill for several months early in the year. The speedy development of vaccines and therapeutics later brightened the economic and market outlook, but a great deal of uncertainty remains as case counts remain high, new variants of the virus are appearing and questions persist over how fast the vaccine can be made widely available. In the United States, political uncertainty eased after former Vice President Joe Biden won the presidential election and the Democrats gained control of a closely divided Senate.
Global central banks have taken aggressive steps to cushion the economic and market fallout related to the virus, and governments are deploying unprecedented levels of fiscal support. Additional U.S. stimulus is anticipated with the Democrats in the White House and in control of both houses of Congress. The measures already put in place have helped build a supportive environment and are encouraging economic recovery; however, if markets disconnect from fundamentals, they can sow the seeds of instability. As such, dramatic increases in speculative retail trading bear watching.
In the aftermath of the crisis, we could see societal changes as households, businesses, and governments adjust to a new reality, and any such alterations could affect the investment landscape. For investors, events such as the COVID-19 outbreak demonstrate the importance of having a deep understanding of company fundamentals, and we have built our global research platform to do just that.
At MFS®, we put our clients’ assets to work responsibly by carefully navigating the increasing complexity of our global markets and economies. Guided by our long-term philosophy and adhering to our commitment to sustainable investing, we tune out the noise and aim to uncover what we believe are the best, most durable investment opportunities in the market. Our unique global investment platform combines collective expertise, long-term discipline and thoughtful risk management to create sustainable value for investors.
Respectfully,

Michael W. Roberge
Chief Executive Officer
MFS Investment Management
February 16, 2021
The opinions expressed in this letter are subject to change and may not be relied upon for investment advice. No forecasts can be guaranteed.
1
MFS Growth Series
PORTFOLIO COMPOSITION
Portfolio structure
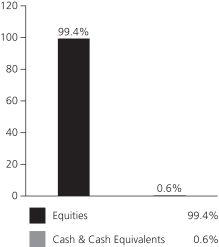
| | | | |
| Top ten holdings | | | | |
| Microsoft Corp. | | | 9.6% | |
| Amazon.com, Inc. | | | 8.8% | |
| Alphabet, Inc., “A” | | | 4.5% | |
| Adobe Systems, Inc. | | | 3.9% | |
| Facebook, Inc., “A” | | | 3.5% | |
| MasterCard, Inc., “A” | | | 3.3% | |
| Visa, Inc., “A” | | | 2.8% | |
| Apple, Inc. | | | 2.6% | |
| PayPal Holdings, Inc. | | | 2.6% | |
| Thermo Fisher Scientific, Inc. | | | 2.1% | |
| | | | |
| GICS equity sectors (g) | | | | |
| Information Technology | | | 41.4% | |
| Communication Services | | | 18.0% | |
| Consumer Discretionary | | | 12.3% | |
| Health Care | | | 11.3% | |
| Industrials | | | 7.5% | |
| Consumer Staples | | | 2.6% | |
| Financials | | | 2.4% | |
| Materials | | | 2.4% | |
| Real Estate | | | 1.5% | |
| (g) | The Global Industry Classification Standard (GICS®) was developed by and/or is the exclusive property of MSCI, Inc. and S&P Global Market Intelligence Inc. (“S&P Global Market Intelligence”). GICS is a service mark of MSCI and S&P Global Market Intelligence and has been licensed for use by MFS. MFS has applied its own internal sector/industry classification methodology for equity securities and non-equity securities that are unclassified by GICS. |
Cash & Cash Equivalents includes any cash, investments in money market funds, short-term securities, and other assets less liabilities. Please see the Statement of Assets and Liabilities for additional information related to the fund’s cash position and other assets and liabilities.
Percentages are based on net assets as of December 31, 2020.
The portfolio is actively managed and current holdings may be different.
2
MFS Growth Series
MANAGEMENT REVIEW
Summary of Results
For the twelve months ended December 31, 2020 Initial Class shares of the MFS Growth Series (fund) provided a total return of 31.86%, while Service Class shares of the fund provided a total return of 31.54%. These compare with a return of 38.49% over the same period for the fund’s benchmark, the Russell 1000® Growth Index.
Market Environment
Markets experienced an extraordinarily sharp selloff early in the period and, in many cases, an unusually rapid recovery later. Central banks and fiscal authorities undertook astonishing levels of stimulus to offset the economic effects of government-imposed social-distancing measures implemented to slow the spread of the COVID-19 virus. At this point, the global economy looks to have experienced the shortest – albeit the deepest and steepest – recession in the postwar period. However, the recovery remains subject to more than the usual number of uncertainties due to questions about the evolution of the virus, what its continued impact will be and how quickly vaccines to guard against it can be manufactured and distributed at scale. There are also worries over the public’s willingness to be inoculated.
Around the world, central banks responded quickly and massively to the crisis with programs to improve liquidity and support markets. These programs proved largely successful in helping to restore market function, ease volatility and stimulate a continued market rebound. Late in the period, the US Federal Reserve adopted a new, flexible, average-inflation-targeting framework, which is expected to result in the federal funds rate remaining at low levels longer than under its previous model. In developed countries, monetary easing measures were complemented by unusually large fiscal stimulus initiatives. Due to relatively manageable external liabilities and balances of payments in many countries and persistently low inflation, even emerging market countries were able to implement countercyclical policies – a departure from the usual market-dictated response to risk-off crises.
Compounding market uncertainty earlier in the pandemic was a crash in the price of crude oil due to a sharp drop in global demand and a disagreement between Saudi Arabia and Russia over production cuts, which resulted in an oil price war. The subsequent decline in prices undercut oil exporters, many of which are in emerging markets, as well as a large segment of the high-yield credit market. The OPEC+ group later agreed on output cuts, with shale oil producers in the US also decreasing production, which, along with the gradual reopening of some major economies and the resultant boost in demand, helped stabilize the price of crude oil.
In the immediate aftermath of the market disruption that accompanied the initial phases of the pandemic, many companies that had added significant leverage to their balance sheets in recent years by borrowing to fund dividend payments and stock buybacks halted those activities, and some companies were forced to recapitalize. As markets and the economy stabilized later in the period, in many cases dividend payments and buybacks resumed. Conversely, some companies found themselves flush with liquidity, having borrowed preemptively during the worst of the crisis only to end up with excess cash on their balance sheets.
Detractors from Performance
Stock selection in both the information technology and consumer discretionary sectors weakened performance relative to the Russell 1000® Growth Index. Within the information technology sector, an underweight position in computer and personal electronics maker Apple, and the timing of the fund’s overweight positions in financial technology services provider Fiserv (h), electronic payment services company Global Payments and global banking and payment technologies provider Fidelity National Information Services, held back relative returns. Despite headwinds related to COVID-19, the share price of Apple appreciated as product demand recovered more rapidly than expected. The shift toward work-from-home and remote learning helped to support strong iPhone and iPad sales. Additionally, shares of Apple reacted positively to the announcement of a new line of its flagship iPhone product with 5G compatibility. Within the consumer discretionary sector, not owning shares of electric vehicle manufacturer Tesla detracted from relative results. The share price of Tesla appreciated throughout the period after the company disclosed record deliveries amid the launch of its Model Y and China factory. Additionally, Tesla was added as a constituent to the S&P 500 Index, which further boosted the stock’s performance.
Elsewhere, the fund’s overweight positions in medical devices maker Boston Scientific, construction materials company Vulcan Materials and risk management and human capital consulting services provider AON, and the fund’s position in medical device maker Medtronic (b)(h), detracted from relative returns. The share price of Boston Scientific came under pressure amid the ongoing market turbulence, and after its management reported lower-than-expected revenue growth, driven by price declines in Japan and China due to the COVID-19 outbreak.
The fund’s cash and/or cash equivalents position during the period was also a detractor from relative performance. Under normal market conditions, the fund strives to be fully invested and generally holds cash to buy new holdings and to provide liquidity. In a period when equity markets rose, as measured by the fund’s benchmark, holding cash hurt performance versus the benchmark, which has no cash position.
3
MFS Growth Series
Management Review – continued
Contributors to Performance
Stock selection in the industrials sector contributed to relative performance. Within this sector, not holding shares of aerospace company Boeing and defense contractor Lockheed Martin benefited relative returns. The share price of Boeing declined as the travel and airline industries came under intense pressure amid the outbreak of the COVID-19 virus, which resulted in widespread travel restrictions across the globe and ultimately led the company to suspend production.
An underweight allocation and stock selection within the consumer staples sector bolstered relative results. Within this sector, not holding shares of beverage maker Coca-Cola aided relative performance. Shares of Coca-Cola declined as restrictions on travel, sporting events, restaurants and other away-from-home consumption venues had an adverse impact on volume and revenues. The company also withdrew guidance due to uncertainty and disruptions caused by COVID-19 and the policies put in place to reduce the spread of the virus.
Stock selection in both the financials and communication services sectors further supported relative returns. Within the financials sector, an overweight position in index data provider MSCI helped in relative terms. The share price of MSCI benefited from better-than-expected revenue growth, driven by strength in non-recurring subscription index revenues, lower expenses and a much lower-than-expected tax rate. Within the communication services sector, there were no individual stocks, either in the fund or in the benchmark, that were among the fund’s largest relative contributors during the period.
Stocks in other sectors that strengthened relative returns included the fund’s overweight positions in credit card payment processing solutions services provider Square, software company Adobe Systems and digital payment technology developer PayPal Holdings. Additionally, not owning shares of biotechnology firm Amgen, holdings of cloud-based e-commerce platform operator Shopify (b) and the timing of the fund’s underweight position in pharmaceutical company Merck & Co. further aided relative performance.
Respectfully,
Portfolio Manager(s)
Eric Fischman and Paul Gordon
| (b) | Security is not a benchmark constituent. |
| (h) | Security was not held in the fund at period end. |
The views expressed in this report are those of the portfolio manager(s) only through the end of the period of the report as stated on the cover and do not necessarily reflect the views of MFS or any other person in the MFS organization. These views are subject to change at any time based on market or other conditions, and MFS disclaims any responsibility to update such views. These views may not be relied upon as investment advice or an indication of trading intent on behalf of any MFS portfolio. References to specific securities are not recommendations of such securities, and may not be representative of any MFS portfolio’s current or future investments.
4
MFS Growth Series
PERFORMANCE SUMMARY THROUGH 12/31/20
The following chart illustrates the historical performance of the fund in comparison to its benchmark(s). Benchmarks are unmanaged and may not be invested in directly. Benchmark returns do not reflect any fees or expenses. The performance of other share classes will be greater than or less than that of the class depicted below. (See Notes to Performance Summary.)
Performance data shown represents past performance and is no guarantee of future results. Investment return and principal value fluctuate so your units, when sold, may be worth more or less than the original cost; current performance may be lower or higher than quoted. The performance shown does not reflect the deduction of taxes, if any, that a contract holder would pay on fund distributions or the redemption of contract units. The returns for the fund shown also do not reflect the deduction of expenses associated with variable products, such as mortality and expense risk charges, separate account charges, and sales charges imposed by the insurance company separate accounts. Such expenses would reduce the overall returns shown.
Growth of a Hypothetical $10,000 Investment
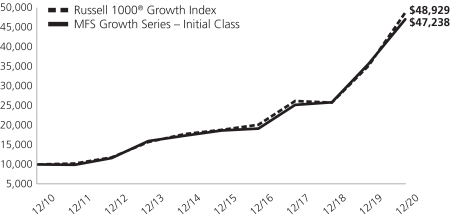
Total Returns through 12/31/20
Average annual total returns
| | | | | | | | | | | | |
| | | Share Class | | Class Inception Date | | 1-yr | | 5-yr | | 10-yr | | |
| | | Initial Class | | 7/24/95 | | 31.86% | | 20.28% | | 16.80% | | |
| | | Service Class | | 5/01/00 | | 31.54% | | 19.98% | | 16.50% | | |
| | | | |
| Comparative benchmark(s) | | | | | | | | |
| | | Russell 1000® Growth Index (f) | | 38.49% | | 21.00% | | 17.21% | | |
| (f) | Source: FactSet Research Systems Inc. |
Benchmark Definition(s)
Russell 1000® Growth Index (h) – constructed to provide a comprehensive barometer for growth securities in the large-cap segment of the U.S. equity universe. Companies in this index generally have higher price-to-book ratios and higher forecasted growth values.
It is not possible to invest directly in an index.
| (h) | Frank Russell Company (“Russell”) is the source and owner of the trademarks, service marks, and copyrights related to the Russell Indexes. Russell® is a trademark of Frank Russell Company. Neither Russell nor its licensors accept any liability for any errors or omissions in the Russell Indexes and/or Russell ratings or underlying data and no party may rely on any Russell Indexes and/or Russell ratings and/or underlying data contained in this document. No further distribution of Russell Data is permitted without Russell’s express written consent. Russell does not promote, sponsor, or endorse the content of this document. |
Notes to Performance Summary
Average annual total return represents the average annual change in value for each share class for the periods presented.
Performance results reflect any applicable expense subsidies and waivers in effect during the periods shown. Without such subsidies and waivers the fund’s performance results would be less favorable. Please see the prospectus and financial statements for complete details. All results are historical and assume the reinvestment of any dividends and capital gains distributions.
Performance results do not include adjustments made for financial reporting purposes in accordance with U.S. generally accepted accounting principles and may differ from amounts reported in the financial highlights.
From time to time the fund may receive proceeds from litigation settlements, without which performance would be lower.
5
MFS Growth Series
EXPENSE TABLE
Fund Expenses Borne by the Contract Holders during the Period,
July 1, 2020 through December 31, 2020
As a contract holder of the fund, you incur ongoing costs, including management fees; distribution and/or service (12b-1) fees; and other fund expenses. This example is intended to help you understand your ongoing costs (in dollars) of investing in the fund and to compare these costs with the ongoing costs of investing in other mutual funds.
The example is based on an investment of $1,000 invested at the beginning of the period and held for the entire period July 1, 2020 through December 31, 2020.
Actual Expenses
The first line for each share class in the following table provides information about actual account values and actual expenses. You may use the information in this line, together with the amount you invested, to estimate the expenses that you paid over the period. Simply divide your account value by $1,000 (for example, an $8,600 account value divided by $1,000 = 8.6), then multiply the result by the number in the first line under the heading entitled “Expenses Paid During Period” to estimate the expenses you paid on your account during this period.
Hypothetical Example for Comparison Purposes
The second line for each share class in the following table provides information about hypothetical account values and hypothetical expenses based on the fund’s actual expense ratio and an assumed rate of return of 5% per year before expenses, which is not the fund’s actual return. The hypothetical account values and expenses may not be used to estimate the actual ending account balance or expenses you paid for the period. You may use this information to compare the ongoing costs of investing in the fund and other funds. To do so, compare this 5% hypothetical example with the 5% hypothetical examples that appear in the shareholder reports of the other funds.
Please note that the expenses shown in the table are meant to highlight the fund’s ongoing costs only and do not take into account the fees and expenses imposed under the variable contracts through which your investment in the fund is made. Therefore, the second line for each share class in the table is useful in comparing ongoing costs associated with an investment in vehicles (such as the fund) which fund benefits under variable annuity and variable life insurance contracts and to qualified pension and retirement plans only, and will not help you determine the relative total costs of investing in the fund through variable annuity and variable life insurance contracts. If the fees and expenses imposed under the variable contracts were included, your costs would have been higher.
| | | | | | | | | | | | | | | | | | |
| Share Class | | | | Annualized
Expense Ratio | | | Beginning
Account Value
7/01/20 | | | Ending
Account Value
12/31/20 | | | Expenses Paid
During Period (p)
7/01/20-12/31/20 | |
| Initial Class | | Actual | | | 0.72% | | | | $1,000.00 | | | | $1,198.51 | | | | $3.98 | |
| | Hypothetical (h) | | | 0.72% | | | | $1,000.00 | | | | $1,021.52 | | | | $3.66 | |
| Service Class | | Actual | | | 0.97% | | | | $1,000.00 | | | | $1,196.77 | | | | $5.36 | |
| | Hypothetical (h) | | | 0.97% | | | | $1,000.00 | | | | $1,020.26 | | | | $4.93 | |
| (h) | 5% class return per year before expenses. |
| (p) | “Expenses Paid During Period” are equal to each class’s annualized expense ratio, as shown above, multiplied by the average account value over the period, multiplied by 184/366 (to reflect the one-half year period). |
6
MFS Growth Series
PORTFOLIO OF INVESTMENTS – 12/31/20
The Portfolio of Investments is a complete list of all securities owned by your fund. It is categorized by broad-based asset classes.
| | | | | | | | |
| Issuer | | Shares/Par | | | Value ($) | |
| COMMON STOCKS – 99.4% | | | | | | | | |
| Apparel Manufacturers – 0.8% | | | | | |
| NIKE, Inc., “B” | | | 131,205 | | | $ | 18,561,571 | |
| | | | | | | | |
| Biotechnology – 1.5% | | | | | |
| Alnylam Pharmaceuticals, Inc. (a) | | | 36,361 | | | $ | 4,725,839 | |
| Seagen, Inc. (a) | | | 56,147 | | | | 9,833,586 | |
| Vertex Pharmaceuticals, Inc. (a) | | | 77,048 | | | | 18,209,524 | |
| | | | | | | | |
| | | | | | $ | 32,768,949 | |
| | | | | | | | |
| Broadcasting – 1.6% | | | | | |
| Netflix, Inc. (a) | | | 63,814 | | | $ | 34,506,144 | |
| | | | | | | | |
| Business Services – 9.4% | | | | | |
| Clarivate PLC (a) | | | 592,320 | | | $ | 17,597,827 | |
| CoStar Group, Inc. (a) | | | 22,931 | | | | 21,194,665 | |
| Equifax, Inc. | | | 43,147 | | | | 8,320,467 | |
| Fidelity National Information Services, Inc. | | | 43,469 | | | | 6,149,125 | |
| Global Payments, Inc. | | | 71,589 | | | | 15,421,702 | |
| IHS Markit Ltd. | | | 84,785 | | | | 7,616,237 | |
| MSCI, Inc. | | | 81,327 | | | | 36,314,945 | |
| PayPal Holdings, Inc. (a) | | | 241,393 | | | | 56,534,241 | |
| Verisk Analytics, Inc., “A” | | | 176,858 | | | | 36,713,952 | |
| | | | | | | | |
| | | | | | $ | 205,863,161 | |
| | | | | | | | |
| Cable TV – 1.6% | | | | | |
| Charter Communications, Inc., “A” (a) | | | 54,075 | | | $ | 35,773,316 | |
| | | | | | | | |
| Computer Software – 21.0% | | | | | |
| Adobe Systems, Inc. (a) | | | 172,694 | | | $ | 86,367,723 | |
| Atlassian Corp. PLC, “A” (a) | | | 62,058 | | | | 14,513,505 | |
| Autodesk, Inc. (a) | | | 85,868 | | | | 26,218,935 | |
| Black Knight, Inc. (a) | | | 78,540 | | | | 6,939,009 | |
| Cadence Design Systems, Inc. (a) | | | 150,947 | | | | 20,593,699 | |
| Intuit, Inc. | | | 110,598 | | | | 42,010,650 | |
| Microsoft Corp. | | | 948,722 | | | | 211,014,747 | |
| salesforce.com, inc. (a) | | | 160,792 | | | | 35,781,044 | |
| Snowflake, Inc., “A” (a) | | | 8,917 | | | | 2,509,244 | |
| Synopsys, Inc. (a) | | | 55,183 | | | | 14,305,641 | |
| | | | | | | | |
| | | | | | $ | 460,254,197 | |
| | | | | | | | |
| Computer Software – Systems – 6.5% | | | | | |
| Apple, Inc. | | | 435,737 | | | $ | 57,817,943 | |
| ServiceNow, Inc. (a) | | | 59,445 | | | | 32,720,311 | |
| Square, Inc., “A” (a) | | | 149,152 | | | | 32,461,441 | |
| TransUnion | | | 195,721 | | | | 19,419,438 | |
| | | | | | | | |
| | | | | | $ | 142,419,133 | |
| | | | | | | | |
| Construction – 2.3% | | | | | |
| Sherwin-Williams Co. | | | 41,662 | | | $ | 30,617,821 | |
| Vulcan Materials Co. | | | 141,869 | | | | 21,040,591 | |
| | | | | | | | |
| | | | | | $ | 51,658,412 | |
| | | | | | | | |
| Consumer Products – 2.5% | | | | | |
| Colgate-Palmolive Co. | | | 329,620 | | | $ | 28,185,806 | |
| Estee Lauder Cos., Inc., “A” | | | 99,032 | | | | 26,361,328 | |
| | | | | | | | |
| | | | | | $ | 54,547,134 | |
| | | | | | | | |
| | | | | | | | |
| Issuer | | Shares/Par | | | Value ($) | |
| COMMON STOCKS – continued | | | | | |
| Electrical Equipment – 0.9% | | | | | |
| AMETEK, Inc. | | | 157,217 | | | $ | 19,013,824 | |
| | | | | | | | |
| Electronics – 4.7% | | | | | |
| Applied Materials, Inc. | | | 192,078 | | | $ | 16,576,331 | |
| ASML Holding N.V. | | | 31,744 | | | | 15,482,184 | |
| Lam Research Corp. | | | 63,812 | | | | 30,136,493 | |
| NVIDIA Corp. | | | 79,657 | | | | 41,596,886 | |
| | | | | | | | |
| | | | | | $ | 103,791,894 | |
| | | | | | | | |
| General Merchandise – 0.7% | | | | | |
| Dollar General Corp. | | | 69,201 | | | $ | 14,552,970 | |
| | | | | | | | |
| Health Maintenance Organizations – 0.4% | | | | | |
| UnitedHealth Group, Inc. | | | 24,195 | | | $ | 8,484,703 | |
| | | | | | | | |
| Insurance – 0.7% | | | | | |
| Aon PLC | | | 74,021 | | | $ | 15,638,417 | |
| | | | | | | | |
| Internet – 12.5% | | | | | |
| Airbnb, Inc., “A” (a) | | | 3,631 | | | $ | 533,031 | |
| Alibaba Group Holding Ltd., ADR (a) | | | 64,027 | | | | 14,901,004 | |
| Alphabet, Inc., “A” (a) | | | 56,068 | | | | 98,267,019 | |
| Alphabet, Inc., “C” (a) | | | 16,892 | | | | 29,592,757 | |
| Facebook, Inc., “A” (a) | | | 280,491 | | | | 76,618,922 | |
| Match Group, Inc. (a) | | | 172,427 | | | | 26,069,238 | |
| Pinterest, Inc. (a) | | | 149,168 | | | | 9,830,171 | |
| Sea Ltd., ADR (a) | | | 55,851 | | | | 11,117,142 | |
| Spotify Technology S.A. (a) | | | 26,632 | | | | 8,380,025 | |
| | | | | | | | |
| | | | | | $ | 275,309,309 | |
| | | | | | | | |
| Leisure & Toys – 3.0% | | | | | |
| Activision Blizzard, Inc. | | | 229,602 | | | $ | 21,318,546 | |
| Electronic Arts, Inc. | | | 201,241 | | | | 28,898,208 | |
| Take-Two Interactive Software, Inc. (a) | | | 72,322 | | | | 15,027,788 | |
| | | | | | | | |
| | | | | | $ | 65,244,542 | |
| | | | | | | | |
| Machinery & Tools – 0.8% | | | | | |
| Roper Technologies, Inc. | | | 42,156 | | | $ | 18,173,030 | |
| | | | | | | | |
| Medical & Health Technology & Services – 0.4% | |
| Teladoc Health, Inc. (a) | | | 45,689 | | | $ | 9,135,972 | |
| | | | | | | | |
| Medical Equipment – 7.5% | | | | | |
| Abbott Laboratories | | | 284,007 | | | $ | 31,095,927 | |
| Becton, Dickinson and Co. | | | 44,605 | | | | 11,161,063 | |
| Boston Scientific Corp. (a) | | | 361,306 | | | | 12,988,951 | |
| Danaher Corp. | | | 195,714 | | | | 43,475,908 | |
| Edwards Lifesciences Corp. (a) | | | 141,271 | | | | 12,888,153 | |
| STERIS PLC | | | 33,063 | | | | 6,266,761 | |
| Thermo Fisher Scientific, Inc. | | | 99,041 | | | | 46,131,317 | |
| | | | | | | | |
| | | | | | $ | 164,008,080 | |
| | | | | | | | |
| Network & Telecom – 0.7% | | | | | |
| Equinix, Inc., REIT | | | 22,035 | | | $ | 15,736,956 | |
| | | | | | | | |
| | | | | | | | |
7
MFS Growth Series
Portfolio of Investments – continued
| | | | | | | | |
| Issuer | | Shares/Par | | | Value ($) | |
| COMMON STOCKS – continued | |
| Other Banks & Diversified Financials – 6.1% | |
| Mastercard, Inc., “A” | | | 203,943 | | | $ | 72,795,415 | |
| Visa, Inc., “A” | | | 277,347 | | | | 60,664,109 | |
| | | | | | | | |
| | | | | | $ | 133,459,524 | |
| | | | | | | | |
| Pharmaceuticals – 1.6% | |
| Merck & Co., Inc. | | | 37,842 | | | $ | 3,095,476 | |
| Zoetis, Inc. | | | 188,547 | | | | 31,204,528 | |
| | | | | | | | |
| | | | | | $ | 34,300,004 | |
| | | | | | | | |
| Railroad & Shipping – 0.7% | |
| Canadian Pacific Railway Ltd. | | | 43,418 | | | $ | 15,052,586 | |
| | | | | | | | |
| Restaurants – 0.7% | |
| Chipotle Mexican Grill, Inc., “A” (a) | | | 9,588 | | | $ | 13,295,776 | |
| Starbucks Corp. | | | 26,582 | | | | 2,843,742 | |
| | | | | | | | |
| | | | | | $ | 16,139,518 | |
| | | | | | | | |
| Specialty Stores – 10.0% | |
| Amazon.com, Inc. (a) | | | 59,563 | | | $ | 193,992,521 | |
| Costco Wholesale Corp. | | | 7,270 | | | | 2,739,191 | |
| Lululemon Athletica, Inc. (a) | | | 34,281 | | | | 11,930,816 | |
| Shopify, Inc. (a) | | | 9,384 | | | | 10,622,219 | |
| | | | | | | | |
| | | | | | $ | 219,284,747 | |
| | | | | | | | |
| Telecommunications – Wireless – 0.8% | | | | | |
| American Tower Corp., REIT | | | 78,393 | | | $ | 17,596,093 | |
| | | | | | | | |
| Total Common Stocks (Identified Cost, $818,569,021) | | | | | | $ | 2,181,274,186 | |
| | | | | | | | |
| | | | | | | | |
| Issuer | | Shares/Par | | | Value ($) | |
| INVESTMENT COMPANIES (h) – 0.8% | | | | | |
| Money Market Funds – 0.8% | | | | | | | | |
| MFS Institutional Money Market Portfolio, 0.1% (v) (Identified Cost, $18,169,621) | | | 18,169,621 | | | $ | 18,169,621 | |
| | | | | | | | |
OTHER ASSETS, LESS
LIABILITIES – (0.2)% | | | | | | | (4,014,236 | ) |
| | | | | | | | |
| NET ASSETS – 100.0% | | | | | | $ | 2,195,429,571 | |
| | | | | | | | |
| (a) | | Non-income producing security. |
| (h) | | An affiliated issuer, which may be considered one in which the fund owns 5% or more of the outstanding voting securities, or a company which is under common control. At period end, the aggregate values of the fund’s investments in affiliated issuers and in unaffiliated issuers were $18,169,621 and $2,181,274,186, respectively. |
| (v) | | Affiliated issuer that is available only to investment companies managed by MFS. The rate quoted for the MFS Institutional Money Market Portfolio is the annualized seven-day yield of the fund at period end. |
The following abbreviations are used in this report and are defined:
| ADR | | American Depositary Receipt |
| REIT | | Real Estate Investment Trust |
See Notes to Financial Statements
8
MFS Growth Series
FINANCIAL STATEMENTS | STATEMENT OF ASSETS AND LIABILITIES
This statement represents your fund’s balance sheet, which details the assets and liabilities comprising the total value of the fund.
| | | | |
At 12/31/20 | | | | |
| |
Assets | | | | |
Investments in unaffiliated issuers, at value (identified cost, $818,569,021) | | | $2,181,274,186 | |
Investments in affiliated issuers, at value (identified cost, $18,169,621) | | | 18,169,621 | |
Receivables for | | | | |
Fund shares sold | | | 2,040,223 | |
Interest and dividends | | | 283,847 | |
Other assets | | | 7,899 | |
Total assets | | | $2,201,775,776 | |
| |
Liabilities | | | | |
Payables for | | | | |
Fund shares reacquired | | | $6,083,370 | |
Payable to affiliates | | | | |
Investment adviser | | | 82,019 | |
Administrative services fee | | | 1,445 | |
Shareholder servicing costs | | | 789 | |
Distribution and/or service fees | | | 7,016 | |
Payable for independent Trustees’ compensation | | | 15 | |
Accrued expenses and other liabilities | | | 171,551 | |
Total liabilities | | | $6,346,205 | |
Net assets | | | $2,195,429,571 | |
| |
Net assets consist of | | | | |
Paid-in capital | | | $517,849,970 | |
Total distributable earnings (loss) | | | 1,677,579,601 | |
Net assets | | | $2,195,429,571 | |
Shares of beneficial interest outstanding | | | 30,100,314 | |
| | | | | | | | | | | | |
| | | |
| | | Net assets | | | Shares
outstanding | | | Net asset value
per share | |
Initial Class | | | $1,681,327,086 | | | | 22,780,389 | | | | $73.81 | |
Service Class | | | 514,102,485 | | | | 7,319,925 | | | | 70.23 | |
See Notes to Financial Statements
9
MFS Growth Series
FINANCIAL STATEMENTS | STATEMENT OF OPERATIONS
This statement describes how much your fund earned in investment income and accrued in expenses. It also describes any gains and/or losses generated by fund operations.
| | | | |
Year ended 12/31/20 | | | | |
| |
Net investment income (loss) | | | | |
Income | | | | |
Dividends | | | $9,826,385 | |
Dividends from affiliated issuers | | | 99,303 | |
Income on securities loaned | | | 61,629 | |
Other | | | 46,745 | |
Foreign taxes withheld | | | (23,957 | ) |
Total investment income | | | $10,010,105 | |
Expenses | | | | |
Management fee | | | $13,709,727 | |
Distribution and/or service fees | | | 1,097,256 | |
Shareholder servicing costs | | | 52,043 | |
Administrative services fee | | | 268,135 | |
Independent Trustees’ compensation | | | 29,867 | |
Custodian fee | | | 95,152 | |
Shareholder communications | | | 104,946 | |
Audit and tax fees | | | 61,736 | |
Legal fees | | | 15,577 | |
Miscellaneous | | | 49,660 | |
Total expenses | | | $15,484,099 | |
Reduction of expenses by investment adviser | | | (215,147 | ) |
Net expenses | | | $15,268,952 | |
Net investment income (loss) | | | $(5,258,847 | ) |
| |
Realized and unrealized gain (loss) | | | | |
Realized gain (loss) (identified cost basis) | | | | |
Unaffiliated issuers | | | $321,365,015 | |
Affiliated issuers | | | (2,225 | ) |
Foreign currency | | | (914 | ) |
Net realized gain (loss) | | | $321,361,876 | |
Change in unrealized appreciation or depreciation | | | | |
Unaffiliated issuers | | | $234,351,315 | |
Translation of assets and liabilities in foreign currencies | | | (335 | ) |
Net unrealized gain (loss) | | | $234,350,980 | |
Net realized and unrealized gain (loss) | | | $555,712,856 | |
Change in net assets from operations | | | $550,454,009 | |
See Notes to Financial Statements
10
MFS Growth Series
FINANCIAL STATEMENTS | STATEMENTS OF CHANGES IN NET ASSETS
These statements describe the increases and/or decreases in net assets resulting from operations, any distributions, and any shareholder transactions.
| | | | | | | | |
| | | Year ended | |
| | | 12/31/20 | | | 12/31/19 | |
Change in net assets | | | | | | | | |
| | |
From operations | | | | | | | | |
Net investment income (loss) | | | $(5,258,847 | ) | | | $(1,992,050 | ) |
Net realized gain (loss) | | | 321,361,876 | | | | 128,302,639 | |
Net unrealized gain (loss) | | | 234,350,980 | | | | 424,578,183 | |
Change in net assets from operations | | | $550,454,009 | | | | $550,888,772 | |
Total distributions to shareholders | | | $(127,591,165 | ) | | | $(152,335,206 | ) |
Change in net assets from fund share transactions | | | $(95,720,771 | ) | | | $(43,895,060 | ) |
Total change in net assets | | | $327,142,073 | | | | $354,658,506 | |
| | |
Net assets | | | | | | | | |
At beginning of period | | | 1,868,287,498 | | | | 1,513,628,992 | |
At end of period | | | $2,195,429,571 | | | | $1,868,287,498 | |
See Notes to Financial Statements
11
MFS Growth Series
FINANCIAL STATEMENTS | FINANCIAL HIGHLIGHTS
The financial highlights table is intended to help you understand the fund’s financial performance for the past 5 years. Certain information reflects financial results for a single fund share. The total returns in the table represent the rate that an investor would have earned (or lost) on an investment in the fund share class (assuming reinvestment of all distributions) held for the entire period.
| | | | | | | | | | | | | | | | | | | | |
| Initial Class | | Year ended | |
| | | | | |
| | | 12/31/20 | | | 12/31/19 | | | 12/31/18 | | | 12/31/17 | | | 12/31/16 | |
| | | | | |
Net asset value, beginning of period | | | $59.40 | | | | $47.01 | | | | $48.90 | | | | $38.76 | | | | $40.17 | |
| | | | | |
| Income (loss) from investment operations | | | | | | | | | | | | | | | | | | | | |
Net investment income (loss) (d) | | | $(0.14 | ) | | | $(0.04 | ) | | | $0.00 | (w) | | | $0.06 | | | | $0.05 | (c) |
Net realized and unrealized gain (loss) | | | 18.88 | | | | 17.53 | | | | 1.81 | | | | 11.95 | | | | 1.01 | |
Total from investment operations | | | $18.74 | | | | $17.49 | | | | $1.81 | | | | $12.01 | | | | $1.06 | |
| | | | | |
| Less distributions declared to shareholders | | | | | | | | | | | | | | | | | | | | |
From net investment income | | | $— | | | | $— | | | | $(0.05 | ) | | | $(0.05 | ) | | | $(0.02 | ) |
From net realized gain | | | (4.33 | ) | | | (5.10 | ) | | | (3.65 | ) | | | (1.82 | ) | | | (2.45 | ) |
Total distributions declared to shareholders | | | $(4.33 | ) | | | $(5.10 | ) | | | $(3.70 | ) | | | $(1.87 | ) | | | $(2.47 | ) |
Net asset value, end of period (x) | | | $73.81 | | | | $59.40 | | | | $47.01 | | | | $48.90 | | | | $38.76 | |
Total return (%) (k)(r)(s)(x) | | | 31.86 | | | | 38.15 | | | | 2.67 | | | | 31.40 | | | | 2.44 | (c) |
| | | | | |
Ratios (%) (to average net assets)
and Supplemental data: | | | | | | | | | | | | | | | | | | | | |
Expenses before expense reductions (f) | | | 0.74 | | | | 0.74 | | | | 0.75 | | | | 0.76 | | | | 0.75 | (c) |
Expenses after expense reductions (f) | | | 0.72 | | | | 0.73 | | | | 0.74 | | | | 0.75 | | | | 0.74 | (c) |
Net investment income (loss) | | | (0.21 | ) | | | (0.06 | ) | | | 0.00 | (w) | | | 0.13 | | | | 0.12 | (c) |
Portfolio turnover | | | 29 | | | | 11 | | | | 15 | | | | 14 | | | | 24 | |
Net assets at end of period (000 omitted) | | | $1,681,327 | | | | $1,467,280 | | | | $1,226,217 | | | | $1,332,128 | | | | $1,179,822 | |
| |
| Service Class | | Year ended | |
| | | | | |
| | | 12/31/20 | | | 12/31/19 | | | 12/31/18 | | | 12/31/17 | | | 12/31/16 | |
| | | | | |
Net asset value, beginning of period | | | $56.82 | | | | $45.26 | | | | $47.27 | | | | $37.57 | | | | $39.09 | |
| | | | | |
| Income (loss) from investment operations | | | | | | | | | | | | | | | | | | | | |
Net investment income (loss) (d) | | | $(0.29 | ) | | | $(0.17 | ) | | | $(0.13 | ) | | | $(0.05 | ) | | | $(0.05 | )(c) |
Net realized and unrealized gain (loss) | | | 18.03 | | | | 16.83 | | | | 1.77 | | | | 11.57 | | | | 0.98 | |
Total from investment operations | | | $17.74 | | | | $16.66 | | | | $1.64 | | | | $11.52 | | | | $0.93 | |
| | | | | |
| Less distributions declared to shareholders | | | | | | | | | | | | | | | | | | | | |
From net investment income | | | $— | | | | $— | | | | $— | | | | $— | | | | $— | |
From net realized gain | | | (4.33 | ) | | | (5.10 | ) | | | (3.65 | ) | | | (1.82 | ) | | | (2.45 | ) |
Total distributions declared to shareholders | | | $(4.33 | ) | | | $(5.10 | ) | | | $(3.65 | ) | | | $(1.82 | ) | | | $(2.45 | ) |
Net asset value, end of period (x) | | | $70.23 | | | | $56.82 | | | | $45.26 | | | | $47.27 | | | | $37.57 | |
Total return (%) (k)(r)(s)(x) | | | 31.54 | | | | 37.78 | | | | 2.41 | | | | 31.08 | | | | 2.18 | (c) |
| | | | | |
Ratios (%) (to average net assets)
and Supplemental data: | | | | | | | | | | | | | | | | | | | | |
Expenses before expense reductions (f) | | | 0.99 | | | | 0.99 | | | | 1.00 | | | | 1.01 | | | | 1.00 | (c) |
Expenses after expense reductions (f) | | | 0.97 | | | | 0.98 | | | | 0.99 | | | | 1.00 | | | | 0.99 | (c) |
Net investment income (loss) | | | (0.46 | ) | | | (0.31 | ) | | | (0.25 | ) | | | (0.12 | ) | | | (0.13 | )(c) |
Portfolio turnover | | | 29 | | | | 11 | | | | 15 | | | | 14 | | | | 24 | |
Net assets at end of period (000 omitted) | | | $514,102 | | | | $401,008 | | | | $287,412 | | | | $289,733 | | | | $235,869 | |
See Notes to Financial Statements
12
MFS Growth Series
Financial Highlights – continued
| (c) | | Amount reflects a one-time reimbursement of expenses by the custodian (or former custodian) without which net investment income and performance would be lower and expenses would be higher. |
| (d) | | Per share data is based on average shares outstanding. |
| (f) | | Ratios do not reflect reductions from fees paid indirectly, if applicable. |
| (k) | | The total return does not reflect expenses that apply to separate accounts. Inclusion of these charges would reduce the total return figures for all periods shown. |
| (r) | | Certain expenses have been reduced without which performance would have been lower. |
| (s) | | From time to time the fund may receive proceeds from litigation settlements, without which performance would be lower. |
| (w) | | Per share amount was less than $0.01 and total return or ratio was less than 0.01%, as applicable. |
| (x) | | The net asset values and total returns have been calculated on net assets which include adjustments made in accordance with U.S. generally accepted accounting principles required at period end for financial reporting purposes. |
See Notes to Financial Statements
13
MFS Growth Series
NOTES TO FINANCIAL STATEMENTS
| (1) | | Business and Organization |
MFS Growth Series (the fund) is a diversified series of MFS Variable Insurance Trust (the trust). The trust is organized as a Massachusetts business trust and is registered under the Investment Company Act of 1940, as amended, as an open-end management investment company. The shareholders of each series of the trust are separate accounts of insurance companies, which offer variable annuity and/or life insurance products, and qualified retirement and pension plans.
The fund is an investment company and accordingly follows the investment company accounting and reporting guidance of the Financial Accounting Standards Board (FASB) Accounting Standards Codification Topic 946 Financial Services – Investment Companies.
| (2) | | Significant Accounting Policies |
General – The preparation of financial statements in conformity with U.S. generally accepted accounting principles requires management to make estimates and assumptions that affect the reported amounts of assets and liabilities, and disclosure of contingent assets and liabilities at the date of the financial statements and the reported amounts of increases and decreases in net assets from operations during the reporting period. Actual results could differ from those estimates. In the preparation of these financial statements, management has evaluated subsequent events occurring after the date of the fund’s Statement of Assets and Liabilities through the date that the financial statements were issued.
In March 2020, the FASB issued Accounting Standards Update 2020-04, Reference Rate Reform (Topic 848) – Facilitation of the Effects of Reference Rate Reform on Financial Reporting (“ASU 2020-04”), which provides optional, temporary relief with respect to the financial reporting of contracts subject to certain types of modifications due to the planned discontinuation of the London Interbank Offered Rate (LIBOR) and other IBOR-based reference rates as of the end of 2021. The temporary relief provided by ASU 2020-04 is effective for certain reference rate-related contract modifications that occur during the period from March 12, 2020 through December 31, 2022. Management is evaluating the impact of ASU 2020-04 on the fund’s investments, derivatives, debt and other contracts that will undergo reference rate-related modifications as a result of the reference rate reform.
Balance Sheet Offsetting – The fund’s accounting policy with respect to balance sheet offsetting is that, absent an event of default by the counterparty or a termination of the agreement, the International Swaps and Derivatives Association (ISDA) Master Agreement, or similar agreement, does not result in an offset of reported amounts of financial assets and financial liabilities in the Statement of Assets and Liabilities across transactions between the fund and the applicable counterparty. The fund’s right to setoff may be restricted or prohibited by the bankruptcy or insolvency laws of the particular jurisdiction to which a specific master netting agreement counterparty is subject. Balance sheet offsetting disclosures, to the extent applicable to the fund, have been included in the fund’s Significant Accounting Policies note under the captions for each of the fund’s in-scope financial instruments and transactions.
Investment Valuations – Equity securities, including restricted equity securities, are generally valued at the last sale or official closing price on their primary market or exchange as provided by a third-party pricing service. Equity securities, for which there were no sales reported that day, are generally valued at the last quoted daily bid quotation on their primary market or exchange as provided by a third-party pricing service. Short-term instruments with a maturity at issuance of 60 days or less may be valued at amortized cost, which approximates market value. Open-end investment companies are generally valued at net asset value per share. Securities and other assets generally valued on the basis of information from a third-party pricing service may also be valued at a broker/dealer bid quotation. In determining values, third-party pricing services can utilize both transaction data and market information such as yield, quality, coupon rate, maturity, type of issue, trading characteristics, and other market data. The values of foreign securities and other assets and liabilities expressed in foreign currencies are converted to U.S. dollars using the mean of bid and asked prices for rates provided by a third-party pricing service.
The Board of Trustees has delegated primary responsibility for determining or causing to be determined the value of the fund’s investments (including any fair valuation) to the adviser pursuant to valuation policies and procedures approved by the Board. If the adviser determines that reliable market quotations are not readily available, investments are valued at fair value as determined in good faith by the adviser in accordance with such procedures under the oversight of the Board of Trustees. Under the fund’s valuation policies and procedures, market quotations are not considered to be readily available for most types of debt instruments and floating rate loans and many types of derivatives. These investments are generally valued at fair value based on information from third-party pricing services. In addition, investments may be valued at fair value if the adviser determines that an investment’s value has been materially affected by events occurring after the close of the exchange or market on which the investment is principally traded (such as foreign exchange or market) and prior to the determination of the fund’s net asset value, or after the halt of trading of a specific security where trading does not resume prior to the close of the exchange or market on which the security is principally traded. Events that occur after foreign markets close (such as developments in foreign markets and significant movements in the U.S. markets) and prior to the determination of the fund’s net asset value may be deemed to have a material effect on the value of securities traded in foreign markets. Accordingly, the fund’s foreign equity securities may often be valued at fair value. The adviser
14
MFS Growth Series
Notes to Financial Statements – continued
generally relies on third-party pricing services or other information (such as the correlation with price movements of similar securities in the same or other markets; the type, cost and investment characteristics of the security; the business and financial condition of the issuer; and trading and other market data) to assist in determining whether to fair value and at what value to fair value an investment. The value of an investment for purposes of calculating the fund’s net asset value can differ depending on the source and method used to determine value. When fair valuation is used, the value of an investment used to determine the fund’s net asset value may differ from quoted or published prices for the same investment. There can be no assurance that the fund could obtain the fair value assigned to an investment if it were to sell the investment at the same time at which the fund determines its net asset value per share.
Various inputs are used in determining the value of the fund’s assets or liabilities. These inputs are categorized into three broad levels. In certain cases, the inputs used to measure fair value may fall into different levels of the fair value hierarchy. In such cases, an investment’s level within the fair value hierarchy is based on the lowest level of input that is significant to the fair value measurement. The fund’s assessment of the significance of a particular input to the fair value measurement in its entirety requires judgment, and considers factors specific to the investment. Level 1 includes unadjusted quoted prices in active markets for identical assets or liabilities. Level 2 includes other significant observable market-based inputs (including quoted prices for similar securities, interest rates, prepayment speed, and credit risk). Level 3 includes unobservable inputs, which may include the adviser’s own assumptions in determining the fair value of investments. The following is a summary of the levels used as of December 31, 2020 in valuing the fund’s assets or liabilities:
| | | | | | | | | | | | | | | | |
| Financial Instruments | | Level 1 | | | Level 2 | | | Level 3 | | | Total | |
| Equity Securities | | | $2,181,274,186 | | | | $— | | | | $— | | | | $2,181,274,186 | |
| Mutual Funds | | | 18,169,621 | | | | — | | | | — | | | | 18,169,621 | |
| Total | | | $2,199,443,807 | | | | $— | | | | $— | | | | $2,199,443,807 | |
For further information regarding security characteristics, see the Portfolio of Investments.
Foreign Currency Translation – Purchases and sales of foreign investments, income, and expenses are converted into U.S. dollars based upon currency exchange rates prevailing on the respective dates of such transactions or on the reporting date for foreign denominated receivables and payables. Gains and losses attributable to foreign currency exchange rates on sales of securities are recorded for financial statement purposes as net realized gains and losses on investments. Gains and losses attributable to foreign exchange rate movements on receivables, payables, income and expenses are recorded for financial statement purposes as foreign currency transaction gains and losses. That portion of both realized and unrealized gains and losses on investments that results from fluctuations in foreign currency exchange rates is not separately disclosed.
Security Loans – Under its Securities Lending Agency Agreement with the fund, State Street Bank and Trust Company, as lending agent, loans the securities of the fund to certain qualified institutions (the “Borrowers”) approved by the fund. Security loans can be terminated at the discretion of either the lending agent or the fund and the related securities must be returned within the earlier of the standard trade settlement period for such securities or within three business days. The loans are collateralized by cash and/or U.S. Treasury and federal agency obligations in an amount typically at least equal to the market value of the securities loaned. On loans collateralized by cash, the cash collateral is invested in a money market fund. The market value of the loaned securities is determined at the close of business of the fund and any additional required collateral is delivered to the fund on the next business day. The lending agent provides the fund with indemnification against Borrower default. In the event of Borrower default, the lending agent will, for the benefit of the fund, either purchase securities identical to those loaned or, when such purchase is commercially impracticable, pay the fund the market value of the loaned securities. In return, the lending agent assumes the fund’s rights to the related collateral. If the collateral value is less than the cost to purchase identical securities, the lending agent is responsible for the shortfall, but only to the extent that such shortfall is not due to a decline in collateral value resulting from collateral reinvestment for which the fund bears the risk of loss. A portion of the income generated upon investment of the collateral is remitted to the Borrowers, and the remainder is allocated between the fund and the lending agent. On loans collateralized by U.S. Treasury and/or federal agency obligations, a fee is received from the Borrower, and is allocated between the fund and the lending agent. Income from securities lending is separately reported in the Statement of Operations. The dividend and interest income earned on the securities loaned is accounted for in the same manner as other dividend and interest income. At December 31, 2020, there were no securities on loan or collateral outstanding.
Indemnifications – Under the fund’s organizational documents, its officers and Trustees may be indemnified against certain liabilities and expenses arising out of the performance of their duties to the fund. Additionally, in the normal course of business, the fund enters into agreements with service providers that may contain indemnification clauses. The fund’s maximum exposure under these agreements is unknown as this would involve future claims that may be made against the fund that have not yet occurred.
Investment Transactions and Income – Investment transactions are recorded on the trade date. Interest income is recorded on the accrual basis. Dividends received in cash are recorded on the ex-dividend date. Certain dividends from foreign securities will be
15
MFS Growth Series
Notes to Financial Statements – continued
recorded when the fund is informed of the dividend if such information is obtained subsequent to the ex-dividend date. Dividend payments received in additional securities are recorded on the ex-dividend date in an amount equal to the value of the security on such date.
The fund may receive proceeds from litigation settlements. Any proceeds received from litigation involving portfolio holdings are reflected in the Statement of Operations in realized gain/loss if the security has been disposed of by the fund or in unrealized gain/loss if the security is still held by the fund. Any other proceeds from litigation not related to portfolio holdings are reflected as other income in the Statement of Operations.
Tax Matters and Distributions – The fund intends to qualify as a regulated investment company, as defined under Subchapter M of the Internal Revenue Code, and to distribute all of its taxable income, including realized capital gains. As a result, no provision for federal income tax is required. The fund’s federal tax returns, when filed, will remain subject to examination by the Internal Revenue Service for a three year period. Management has analyzed the fund’s tax positions taken on federal and state tax returns for all open tax years and does not believe that there are any uncertain tax positions that require recognition of a tax liability. Foreign taxes, if any, have been accrued by the fund in the accompanying financial statements in accordance with the applicable foreign tax law. Foreign income taxes may be withheld by certain countries in which the fund invests. Additionally, capital gains realized by the fund on securities issued in or by certain foreign countries may be subject to capital gains tax imposed by those countries.
Distributions to shareholders are recorded on the ex-dividend date. Income and capital gain distributions are determined in accordance with income tax regulations, which may differ from U.S. generally accepted accounting principles. Certain capital accounts in the financial statements are periodically adjusted for permanent differences in order to reflect their tax character. These adjustments have no impact on net assets or net asset value per share. Temporary differences which arise from recognizing certain items of income, expense, gain or loss in different periods for financial statement and tax purposes will reverse at some time in the future.
Book/tax differences primarily relate to wash sale loss deferrals.
The tax character of distributions declared to shareholders for the last two fiscal years is as follows:
| | | | | | | | |
| | | Year ended
12/31/20 | | | Year ended
12/31/19 | |
| Long-term capital gains | | | $127,591,165 | | | | $152,335,206 | |
The federal tax cost and the tax basis components of distributable earnings were as follows:
| | | | |
| As of 12/31/20 | | | | |
| |
| Cost of investments | | | $839,003,900 | |
| Gross appreciation | | | 1,361,814,542 | |
| Gross depreciation | | | (1,374,635 | ) |
| Net unrealized appreciation (depreciation) | | | $1,360,439,907 | |
| |
| Undistributed ordinary income | | | 1,658,165 | |
| Undistributed long-term capital gain | | | 315,481,466 | |
| Other temporary differences | | | 63 | |
Multiple Classes of Shares of Beneficial Interest – The fund offers multiple classes of shares, which differ in their respective distribution and/or service fees. The fund’s income, realized and unrealized gain (loss), and common expenses are allocated to shareholders based on the daily net assets of each class. Dividends are declared separately for each class. Differences in per share dividend rates are generally due to differences in separate class expenses. The fund’s distributions declared to shareholders as reported in the Statements of Changes in Net Assets are presented by class as follows:
| | | | | | | | |
| | |
| | | Year ended
12/31/20 | | | Year ended
12/31/19 | |
| Initial Class | | | $97,613,169 | | | | $120,147,549 | |
| Service Class | | | 29,977,996 | | | | 32,187,657 | |
| Total | | | $127,591,165 | | | | $152,335,206 | |
16
MFS Growth Series
Notes to Financial Statements – continued
| (3) | | Transactions with Affiliates |
Investment Adviser – The fund has an investment advisory agreement with MFS to provide overall investment management and related administrative services and facilities to the fund. The management fee is computed daily and paid monthly at the following annual rates based on the fund’s average daily net assets:
| | | | |
| Up to $1 billion | | | 0.75% | |
| In excess of $1 billion | | | 0.65% | |
MFS has agreed in writing to reduce its management fee by a specified amount if certain MFS mutual fund assets exceed thresholds agreed to by MFS and the fund’s Board of Trustees. For the year ended December 31, 2020, this management fee reduction amounted to $215,147, which is included in the reduction of total expenses in the Statement of Operations. The management fee incurred for the year ended December 31, 2020 was equivalent to an annual effective rate of 0.69% of the fund’s average daily net assets.
Distributor – MFS Fund Distributors, Inc. (MFD), a wholly-owned subsidiary of MFS, is the distributor of shares of the fund. The Trustees have adopted a distribution plan for the Service Class shares pursuant to Rule 12b-1 under the Investment Company Act of 1940.
The fund’s distribution plan provides that the fund will pay MFD distribution and/or service fees equal to 0.25% per annum of its average daily net assets attributable to Service Class shares as partial consideration for services performed and expenses incurred by MFD and financial intermediaries (including participating insurance companies that invest in the fund to fund variable annuity and variable life insurance contracts, sponsors of qualified retirement and pension plans that invest in the fund, and affiliates of these participating insurance companies and plan sponsors) in connection with the sale and distribution of the Service Class shares. MFD may subsequently pay all, or a portion, of the distribution and/or service fees to financial intermediaries.
Shareholder Servicing Agent – MFS Service Center, Inc. (MFSC), a wholly-owned subsidiary of MFS, receives a fee from the fund for its services as shareholder servicing agent. For the year ended December 31, 2020, the fee was $49,237, which equated to 0.0025% annually of the fund’s average daily net assets. MFSC also receives reimbursement from the fund for out-of-pocket expenses paid by MFSC on behalf of the fund. For the year ended December 31, 2020, these costs amounted to $2,806.
Administrator – MFS provides certain financial, legal, shareholder communications, compliance, and other administrative services to the fund. Under an administrative services agreement, the fund reimburses MFS the costs incurred to provide these services. The fund is charged an annual fixed amount of $17,500 plus a fee based on average daily net assets. The administrative services fee incurred for the year ended December 31, 2020 was equivalent to an annual effective rate of 0.0137% of the fund’s average daily net assets.
Trustees’ and Officers’ Compensation – The fund pays compensation to independent Trustees in the form of a retainer, attendance fees, and additional compensation to Board and Committee chairpersons. The fund does not pay compensation directly to Trustees or officers of the fund who are also officers of the investment adviser, all of whom receive remuneration from MFS for their services to the fund. Certain officers and Trustees of the fund are officers or directors of MFS, MFD, and MFSC.
Other – The fund invests in the MFS Institutional Money Market Portfolio which is managed by MFS and seeks current income consistent with preservation of capital and liquidity. This money market fund does not pay a management fee to MFS but does incur investment and operating costs.
The fund is permitted to engage in purchase and sale transactions with funds and accounts for which MFS serves as investment adviser or sub-adviser (“cross-trades”) pursuant to a policy adopted by the Board of Trustees. This policy has been designed to ensure that cross-trades conducted by the fund comply with Rule 17a-7 under the Investment Company Act of 1940. During the year ended December 31, 2020, the fund engaged in purchase and sale transactions pursuant to this policy, which amounted to $2,174,020 and $3,288,451, respectively. The sales transactions resulted in net realized gains (losses) of $1,846,523.
The adviser has voluntarily undertaken to reimburse the fund from its own resources on a quarterly basis for the cost of investment research embedded in the cost of the fund’s securities trades. This agreement may be rescinded at any time. For the year ended December 31, 2020, this reimbursement amounted to $46,500, which is included in “Other” income in the Statement of Operations.
For the year ended December 31, 2020, purchases and sales of investments, other than short-term obligations, aggregated $557,795,860 and $777,307,835, respectively.
17
MFS Growth Series
Notes to Financial Statements – continued
| (5) | | Shares of Beneficial Interest |
The fund’s Declaration of Trust permits the Trustees to issue an unlimited number of full and fractional shares of beneficial interest. Transactions in fund shares were as follows:
| | | | | | | | | | | | | | | | |
| | | Year ended 12/31/20 | | | Year ended 12/31/19 | |
| | | | |
| | | Shares | | | Amount | | | Shares | | | Amount | |
| Shares sold | | | | | | | | | | | | | | | | |
Initial Class | | | 1,476,731 | | | | $92,793,470 | | | | 1,217,214 | | | | $67,244,090 | |
Service Class | | | 1,452,278 | | | | 89,443,781 | | | | 1,261,274 | | | | 67,355,720 | |
| | | 2,929,009 | | | | $182,237,251 | | | | 2,478,488 | | | | $134,599,810 | |
| | | | |
| Shares issued to shareholders in reinvestment of distributions | | | | | | | | | | | | | | | | |
Initial Class | | | 1,364,516 | | | | $96,648,663 | | | | 2,176,755 | | | | $118,894,370 | |
Service Class | | | 444,382 | | | | 29,977,996 | | | | 615,443 | | | | 32,187,657 | |
| | | 1,808,898 | | | | $126,626,659 | | | | 2,792,198 | | | | $151,082,027 | |
| | | | |
| Shares reacquired | | | | | | | | | | | | | | | | |
Initial Class | | | (4,764,482 | ) | | | $(305,550,308 | ) | | | (4,773,226 | ) | | | $(266,754,702 | ) |
Service Class | | | (1,633,664 | ) | | | (99,034,373 | ) | | | (1,169,906 | ) | | | (62,822,195 | ) |
| | | (6,398,146 | ) | | | $(404,584,681 | ) | | | (5,943,132 | ) | | | $(329,576,897 | ) |
| | | | |
| Net change | | | | | | | | | | | | | | | | |
Initial Class | | | (1,923,235 | ) | | | $(116,108,175 | ) | | | (1,379,257 | ) | | | $(80,616,242 | ) |
Service Class | | | 262,996 | | | | 20,387,404 | | | | 706,811 | | | | 36,721,182 | |
| | | (1,660,239 | ) | | | $(95,720,771 | ) | | | (672,446 | ) | | | $(43,895,060 | ) |
The fund is one of several mutual funds in which certain MFS funds may invest. The MFS funds do not invest in the underlying funds for the purpose of exercising management or control. At the end of the period, the MFS Moderate Allocation Portfolio, the MFS Growth Allocation Portfolio, and the MFS Conservative Allocation Portfolio were the owners of record of approximately 6%, 2%, and 1%, respectively, of the value of outstanding voting shares of the fund.
The fund and certain other funds managed by MFS participate in a $1.25 billion unsecured committed line of credit of which $1 billion is reserved for use by the fund and certain other U.S. funds. The line of credit is provided by a syndicate of banks under a credit agreement. Borrowings may be made for temporary financing needs. Interest is charged to each fund, based on its borrowings, generally at a rate equal to the highest of one month LIBOR, the Federal Funds Effective Rate and the Overnight Bank Funding Rate, plus an agreed upon spread. A commitment fee, based on the average daily, unused portion of the committed line of credit, is allocated among the participating funds. In addition, the fund and other funds managed by MFS have established unsecured uncommitted borrowing arrangements with certain banks for temporary financing needs. Interest is charged to each fund, based on its borrowings, at rates equal to customary reference rates plus an agreed upon spread. For the year ended December 31, 2020, the fund’s commitment fee and interest expense were $9,093 and $0, respectively, and are included in “Miscellaneous” expense in the Statement of Operations.
| (7) | | Investments in Affiliated Issuers |
An affiliated issuer may be considered one in which the fund owns 5% or more of the outstanding voting securities, or a company which is under common control. For the purposes of this report, the following were affiliated issuers:
| | | | | | | | | | | | | | | | | | | | | | | | |
| Affiliated Issuers | | Beginning
Value | | | Purchases | | | Sales
Proceeds | | | Realized
Gain
(Loss) | | | Change in
Unrealized
Appreciation or
Depreciation | | | Ending
Value | |
| MFS Institutional Money Market Portfolio | | | $13,494 | | | | $335,131,661 | | | | $316,973,309 | | | | $(2,225 | ) | | | $— | | | | $18,169,621 | |
| | | | | | |
| Affiliated Issuers | | | | | | | | | | | | | | Dividend
Income | | | Capital Gain
Distributions | |
| MFS Institutional Money Market Portfolio | | | | | | | | | | | | | | | | | | | $99,303 | | | | $— | |
The pandemic related to the global spread of novel coronavirus disease (COVID-19), which was first detected in December 2019, has resulted in significant disruptions to global business activity and the global economy, as well as the economies of individual countries, the financial performance of individual companies and sectors, and the securities and commodities markets in general. This pandemic, the full effects of which are still unknown, has resulted in substantial market volatility and may have adversely impacted the prices and liquidity of the fund’s investments and the fund’s performance.
18
MFS Growth Series
REPORT OF INDEPENDENT REGISTERED PUBLIC ACCOUNTING FIRM
To the Board of Trustees of MFS Variable Insurance Trust and the Shareholders of
MFS Growth Series:
Opinion on the Financial Statements and Financial Highlights
We have audited the accompanying statement of assets and liabilities of MFS Growth Series (the “Fund”), including the portfolio of investments, as of December 31, 2020, the related statement of operations for the year then ended, the statements of changes in net assets for each of the two years in the period then ended, the financial highlights for each of the five years in the period then ended, and the related notes. In our opinion, the financial statements and financial highlights present fairly, in all material respects, the financial position of the Fund as of December 31, 2020, and the results of its operations for the year then ended, the changes in its net assets for each of the two years in the period then ended, and the financial highlights for each of the five years in the period then ended, in conformity with accounting principles generally accepted in the United States of America.
Basis for Opinion
These financial statements and financial highlights are the responsibility of the Fund’s management. Our responsibility is to express an opinion on the Fund’s financial statements and financial highlights based on our audits. We are a public accounting firm registered with the Public Company Accounting Oversight Board (United States) (PCAOB) and are required to be independent with respect to the Fund in accordance with the U.S. federal securities laws and the applicable rules and regulations of the Securities and Exchange Commission and the PCAOB.
We conducted our audits in accordance with the standards of the PCAOB. Those standards require that we plan and perform the audit to obtain reasonable assurance about whether the financial statements and financial highlights are free of material misstatement, whether due to error or fraud. The Fund is not required to have, nor were we engaged to perform, an audit of its internal control over financial reporting. As part of our audits, we are required to obtain an understanding of internal control over financial reporting but not for the purpose of expressing an opinion on the effectiveness of the Fund’s internal control over financial reporting. Accordingly, we express no such opinion.
Our audits included performing procedures to assess the risks of material misstatement of the financial statements and financial highlights, whether due to error or fraud, and performing procedures that respond to those risks. Such procedures included examining, on a test basis, evidence regarding the amounts and disclosures in the financial statements and financial highlights. Our audits also included evaluating the accounting principles used and significant estimates made by management, as well as evaluating the overall presentation of the financial statements and financial highlights. Our procedures included confirmation of securities owned as of December 31, 2020, by correspondence with the custodian. We believe that our audits provide a reasonable basis for our opinion.
DELOITTE & TOUCHE LLP
Boston, Massachusetts
February 16, 2021
We have served as the auditor of one or more of the MFS investment companies since 1924.
19
MFS Growth Series
TRUSTEES AND OFFICERS – IDENTIFICATION AND BACKGROUND
The Trustees and Officers of the Trust, as of February 1, 2021, are listed below, together with their principal occupations during the past five years. (Their titles may have varied during that period.) The address of each Trustee and Officer is 111 Huntington Avenue, Boston, Massachusetts 02199-7618.
| | | | | | | | | | |
Name, Age | | Position(s)
Held with Fund | | Trustee/Officer
Since (h) | | Number of
MFS Funds
overseen by the
Trustee | | Principal Occupations
During the Past Five Years | | Other Directorships
During the Past Five Years (j) |
| INTERESTED TRUSTEES |
Robert J. Manning (k) (age 57) | | Trustee | | February 2004 | | 134 | | Massachusetts Financial Services Company, Non-Executive Chairman (since January 2021); Director; Chairman of the Board; Executive Chairman (January 2017-2020); Co-Chief Executive Officer (2015-2016) | | N/A |
| | | | | |
Michael W. Roberge (k) (age 54) | | Trustee | | January 2021 | | 134 | | Massachusetts Financial Services Company, Chairman (since January 2021); Chief Executive Officer (since January 2017); Director; President (until December 2018); Chief Investment Officer (until December 2018); Co-Chief Executive Officer (until December 2016) | | N/A |
|
| INDEPENDENT TRUSTEES |
John P. Kavanaugh (age 66) | | Trustee and Chair of Trustees | | January 2009 | | 134 | | Private investor | | N/A |
| | | | | |
Steven E. Buller (age 69) | | Trustee | | February 2014 | | 134 | | Private investor | | N/A |
| | | | | |
John A. Caroselli (age 66) | | Trustee | | March 2017 | | 134 | | Private investor; JC Global Advisors, LLC (management consulting), President (since 2015) | | N/A |
| | | | | |
Maureen R. Goldfarb (age 65) | | Trustee | | January 2009 | | 134 | | Private investor | | N/A |
| | | | | |
Peter D. Jones (age 65) | | Trustee | | January 2019 | | 134 | | Private investor | | N/A |
| | | | | |
James W. Kilman, Jr. (age 59) | | Trustee | | January 2019 | | 134 | | Burford Capital Limited (finance and investment management), Chief Financial Officer (since 2019); KielStrand Capital LLC (family office), Chief Executive Officer (since 2016); Morgan Stanley & Co. (financial services), Vice Chairman of Investment Banking, Co-Head of Diversified Financials Coverage – Financial Institutions Investment Banking Group (until 2016) | | Alpha-En Corporation, Director (2016-2019) |
| | | | | |
Clarence Otis, Jr. (age 64) | | Trustee | | March 2017 | | 134 | | Private investor | | VF Corporation, Director; Verizon Communications, Inc., Director; The Travelers Companies, Director |
| | | | | |
Maryanne L. Roepke (age 64) | | Trustee | | May 2014 | | 134 | | Private investor | | N/A |
| | | | | |
Laurie J. Thomsen (age 63) | | Trustee | | March 2005 | | 134 | | Private investor | | The Travelers Companies, Director; Dycom Industries, Inc., Director |
20
MFS Growth Series
Trustees and Officers – continued
| | | | | | | | |
Name, Age | | Position(s)
Held with Fund | | Trustee/Officer
Since (h) | | Number of
MFS Funds
for which the
Person is an
Officer | | Principal Occupations
During the Past Five Years |
| OFFICERS | | | | | | |
Christopher R. Bohane (k) (age 47) | | Assistant Secretary and Assistant Clerk | | July 2005 | | 134 | | Massachusetts Financial Services Company, Senior Vice President and Associate General Counsel |
| | | | |
Kino Clark (k) (age 52) | | Assistant Treasurer | | January 2012 | | 134 | | Massachusetts Financial Services Company, Vice President |
| | | | |
John W. Clark, Jr. (k) (age 53) | | Assistant Treasurer | | April 2017 | | 134 | | Massachusetts Financial Services Company, Vice President (since March 2017); Deutsche Bank (financial services), Department Head – Treasurer’s Office (until February 2017) |
| | | | |
Thomas H. Connors (k) (age 61) | | Assistant Secretary and Assistant Clerk | | September 2012 | | 134 | | Massachusetts Financial Services Company, Vice President and Senior Counsel |
| | | | |
David L. DiLorenzo (k) (age 52) | | President | | July 2005 | | 134 | | Massachusetts Financial Services Company, Senior Vice President |
| | | | |
Heidi W. Hardin (k) (age 53) | | Secretary and Clerk | | April 2017 | | 134 | | Massachusetts Financial Services Company, Executive Vice President and General Counsel (since March 2017); Harris Associates (investment management), General Counsel (until January 2017) |
| | | | |
Brian E. Langenfeld (k) (age 47) | | Assistant
Secretary and Assistant Clerk | | June 2006 | | 134 | | Massachusetts Financial Services Company, Vice President and Senior Counsel |
| | | | |
Amanda S. Mooradian (k) (age 41) | | Assistant
Secretary and Assistant Clerk | | September 2018 | | 134 | | Massachusetts Financial Services Company, Assistant Vice President and Senior Counsel |
| | | | |
Susan A. Pereira (k) (age 50) | | Assistant
Secretary and Assistant Clerk | | July 2005 | | 134 | | Massachusetts Financial Services Company, Vice President and Assistant General Counsel |
| | | | |
Kasey L. Phillips (k) (age 50) | | Assistant Treasurer | | September 2012 | | 134 | | Massachusetts Financial Services Company, Vice President |
| | | | |
Matthew A. Stowe (k) (age 46) | | Assistant Secretary and Assistant Clerk | | October 2014 | | 134 | | Massachusetts Financial Services Company, Vice President and Assistant General Counsel |
| | | | |
Martin J. Wolin (k) (age 53) | | Chief Compliance Officer | | July 2015 | | 134 | | Massachusetts Financial Services Company, Senior Vice President and Chief Compliance Officer |
| | | | |
James O. Yost (k) (age 60) | | Treasurer | | September 1990 | | 134 | | Massachusetts Financial Services Company, Senior Vice President |
| (h) | Date first appointed to serve as Trustee/officer of an MFS Fund. Each Trustee has served continuously since appointment unless indicated otherwise. For the period from December 15, 2004 until February 22, 2005, Mr. Manning served as Advisory Trustee. From January 2012 through December 2016, Messrs. DiLorenzo and Yost served as Treasurer and Deputy Treasurer of the Funds, respectively. |
| (j) | Directorships or trusteeships of companies required to report to the Securities and Exchange Commission (i.e., “public companies”). |
| (k) | “Interested person” of the Trust within the meaning of the Investment Company Act of 1940 (referred to as the 1940 Act), which is the principal federal law governing investment companies like the fund, as a result of a position with MFS. The address of MFS is 111 Huntington Avenue, Boston, Massachusetts 02199-7618. |
Each Trustee (other than Messrs. Jones, Kilman and Roberge) has been elected by shareholders and each Trustee and Officer holds office until his or her successor is chosen and qualified or until his or her earlier death, resignation, retirement or removal. Mr. Roberge became a Trustee of the Funds on January 1, 2021 and Messrs. Jones and Kilman became Trustees of the Funds on January 1, 2019. The Trust does not hold annual meetings for the purpose of electing Trustees, and Trustees are not elected for fixed terms. Under the terms of the Board’s retirement policy, an Independent Trustee shall retire at the end of the calendar year in which he or she reaches the earlier of 75 years of age or 15 years of service on the Board (or, in the case of any Independent Trustee who joined the Board prior to 2015, 20 years of service on the Board).
Messrs. Buller, Kilman and Otis and Ms. Roepke are members of the Trust’s Audit Committee.
21
MFS Growth Series
Trustees and Officers – continued
Each of the Interested Trustees and certain Officers hold comparable officer positions with certain affiliates of MFS.
The Statement of Additional Information for a Fund includes further information about the Trustees and is available without charge upon request by calling 1-800-225-2606.
| | |
Investment Adviser Massachusetts Financial Services Company 111 Huntington Avenue Boston, MA 02199-7618 | | Custodian State Street Bank and Trust Company 1 Lincoln Street Boston, MA 02111-2900 |
| |
Distributor MFS Fund Distributors, Inc. 111 Huntington Avenue Boston, MA 02199-7618 | | Independent Registered Public Accounting Firm Deloitte & Touche LLP 200 Berkeley Street Boston, MA 02116 |
| |
Portfolio Manager(s) Eric Fischman Paul Gordon | | |
22
MFS Growth Series
BOARD REVIEW OF INVESTMENT ADVISORY AGREEMENT
MFS Growth Series
The Investment Company Act of 1940 requires that both the full Board of Trustees and a majority of the non-interested (“independent”) Trustees, voting separately, annually approve the continuation of the Fund’s investment advisory agreement with MFS. The Trustees consider matters bearing on the Fund and its advisory arrangements at their meetings throughout the year, including a review of performance data at each regular meeting. In addition, the independent Trustees met several times by videoconference (in accordance with Securities and Exchange Commission relief) over the course of three months beginning in May and ending in July, 2020 (“contract review meetings”) for the specific purpose of considering whether to approve the continuation of the investment advisory agreement for the Fund and the other investment companies that the Board oversees (the “MFS Funds”). The independent Trustees were assisted in their evaluation of the Fund’s investment advisory agreement by independent legal counsel, from whom they received separate legal advice and with whom they met separately from MFS during various contract review meetings. The independent Trustees were also assisted in this process by an independent consultant who was retained by and reported to the independent Trustees.
In connection with their deliberations regarding the continuation of the investment advisory agreement, the Trustees, including the independent Trustees, considered such information and factors as they believed, in light of the legal advice furnished to them and their own business judgment, to be relevant. The investment advisory agreement for the Fund was considered separately, although the Trustees also took into account the common interests of all MFS Funds in their review. As described below, the Trustees considered the nature, quality, and extent of the various investment advisory, administrative, and shareholder services performed by MFS under the existing investment advisory agreement and other arrangements with the Fund.
In connection with their contract review meetings, the Trustees received and relied upon materials that included, among other items: (i) information provided by Broadridge Financial Solutions, Inc. (“Broadridge”), an independent third party, on the investment performance of the Fund for various time periods ended December 31, 2019 and the investment performance of a group of funds with substantially similar investment classifications/objectives (the “Broadridge performance universe”), (ii) information provided by Broadridge on the Fund’s advisory fees and other expenses and the advisory fees and other expenses of comparable funds identified by Broadridge as well as all other funds in the same investment classification/category (the “Broadridge expense group and universe”), (iii) information provided by MFS on the advisory fees of portfolios of other clients of MFS, including institutional separate accounts and other clients, (iv) information as to whether and to what extent applicable expense waivers, reimbursements or fee “breakpoints” are observed for the Fund, (v) information regarding MFS’ financial results and financial condition, including MFS’ and certain of its affiliates’ estimated profitability from services performed for the Fund and the MFS Funds as a whole, and compared to MFS’ institutional business, (vi) MFS’ views regarding the outlook for the mutual fund industry and the strategic business plans of MFS, (vii) descriptions of various functions performed by MFS for the Funds, such as compliance monitoring and portfolio trading practices, and (viii) information regarding the overall organization of MFS, including information about MFS’ senior management and other personnel providing investment advisory, administrative and other services to the Fund and the other MFS Funds. The comparative performance, fee and expense information prepared and provided by Broadridge was not independently verified and the independent Trustees did not independently verify any information provided to them by MFS.
The Trustees’ conclusion as to the continuation of the investment advisory agreement was based on a comprehensive consideration of all information provided to the Trustees and not the result of any single factor. Some of the factors that figured particularly in the Trustees’ deliberations are described below, although individual Trustees may have evaluated the information presented differently from one another, giving different weights to various factors. It is also important to recognize that the fee arrangements for the Fund and other MFS Funds are the result of years of review and discussion between the independent Trustees and MFS, that certain aspects of such arrangements may receive greater scrutiny in some years than in others, and that the Trustees’ conclusions may be based, in part, on their consideration of these same arrangements during the course of the year and in prior years.
Based on information provided by Broadridge and MFS, the Trustees reviewed the Fund’s total return investment performance as well as the Broadridge performance universe over various time periods. The Trustees placed particular emphasis on the total return performance of the Fund’s Initial Class shares in comparison to the performance of funds in its Broadridge performance universe over the five-year period ended December 31, 2019, which the Trustees believed was a long enough period to reflect differing market conditions. The total return performance of the Fund’s Initial Class shares was in the 1st quintile relative to the other funds in the universe for this five-year period (the 1st quintile being the best performers and the 5th quintile being the worst performers). The total return performance of the Fund’s Initial Class shares was in the 1st quintile for each of the one- and three-year periods ended December 31, 2019 relative to the Broadridge performance universe. Because of the passage of time, these performance results may differ from the performance results for more recent periods, including those shown elsewhere in this report.
In the course of their deliberations, the Trustees took into account information provided by MFS in connection with the contract review meetings, as well as during investment review meetings conducted with portfolio management personnel during the course
23
MFS Growth Series
Board Review of Investment Advisory Agreement – continued
of the year regarding the Fund’s performance. After reviewing these and related factors, the Trustees concluded, within the context of their overall conclusions regarding the investment advisory agreement, that they were satisfied with MFS’ responses and efforts relating to investment performance.
In assessing the reasonableness of the Fund’s advisory fee, the Trustees considered, among other information, the Fund’s advisory fee and the total expense ratio of the Fund’s Initial Class shares as a percentage of average daily net assets and the advisory fee and total expense ratios of the Broadridge expense group based on information provided by Broadridge. The Trustees considered that, according to the data provided by Broadridge (which takes into account any fee reductions or expense limitations that were in effect during the Fund’s last fiscal year), the Fund’s effective advisory fee rate was higher than the Broadridge expense group median and the Fund’s total expense ratio was approximately at the Broadridge expense group median.
The Trustees also considered the advisory fees charged by MFS to any institutional separate accounts advised by MFS (“separate accounts”) and unaffiliated investment companies for which MFS serves as subadviser (“subadvised funds”) that have comparable investment strategies to the Fund, if any. In comparing these fees, the Trustees considered information provided by MFS as to the generally broader scope of services provided by MFS to the Fund, as well as the more extensive regulatory burdens imposed on MFS in managing the Fund, in comparison to separate accounts and subadvised funds. The Trustees also considered the higher demands placed on MFS’ investment personnel and trading infrastructure as a result of the daily cash in-flows and out-flows of the Fund in comparison to separate accounts.
The Trustees also considered whether the Fund may benefit from any economies of scale in the management of the Fund in the event of growth in assets of the Fund and/or growth in assets of the MFS Funds as a whole. They noted that the Fund’s advisory fee rate schedule is subject to a contractual breakpoint that reduces the Fund’s advisory fee rate on average daily net assets over $1 billion. The Trustees also noted that MFS has agreed in writing to waive a portion of the management fees of certain MFS Funds, including the Fund, if the total combined assets of certain funds within the MFS Funds’ complex increase above agreed upon thresholds (the “group fee waiver”), enabling the Fund’s shareholders to share in the benefits from any economies of scale at the complex level. The group fee waiver is reviewed and renewed annually between the Board and MFS. The Trustees concluded that the breakpoint and the group fee waiver were sufficient to allow the Fund to benefit from economies of scale as its assets and overall complex assets grow.
The Trustees also considered information prepared by MFS relating to MFS’ costs and profits with respect to the Fund, the MFS Funds considered as a group, and other investment companies and accounts advised by MFS, as well as MFS’ methodologies used to determine and allocate its costs to the MFS Funds, the Fund and other accounts and products for purposes of estimating profitability.
After reviewing these and other factors described herein, the Trustees concluded, within the context of their overall conclusions regarding the investment advisory agreement, that the advisory fees charged to the Fund represent reasonable compensation in light of the services being provided by MFS to the Fund.
In addition, the Trustees considered MFS’ resources and related efforts to continue to retain, attract and motivate capable personnel to serve the Fund. The Trustees also considered current and developing conditions in the financial services industry, including the presence of large and well-capitalized companies which are spending, and appear to be prepared to continue to spend, substantial sums to engage personnel and to provide services to competing investment companies. In this regard, the Trustees also considered the financial resources of MFS and its ultimate parent, Sun Life Financial Inc. The Trustees also considered the advantages and possible disadvantages to the Fund of having an adviser that also serves other investment companies as well as other accounts.
The Trustees also considered the nature, quality, cost, and extent of administrative, transfer agency, and distribution services provided to the Fund by MFS and its affiliates under agreements and plans other than the investment advisory agreement, including any 12b-1 fees the Fund pays to MFS Fund Distributors, Inc., an affiliate of MFS. The Trustees also considered the nature, extent and quality of certain other services MFS performs or arranges for on the Fund’s behalf, which may include securities lending programs, directed expense payment programs, class action recovery programs, and MFS’ interaction with third-party service providers, principally custodians and sub-custodians. The Trustees concluded that the various non-advisory services provided by MFS and its affiliates on behalf of the Fund were satisfactory.
The Trustees considered so-called “fall-out benefits” to MFS such as reputational value derived from serving as investment manager to the MFS Funds. The Trustees also considered that MFS discontinued its historic practice of obtaining investment research from portfolio brokerage commissions paid by certain MFS Funds effective January 2018, and directly pays or voluntarily reimburses a Fund, if applicable, for the costs of external research acquired through the use of the Fund’s portfolio brokerage commissions.
Based on their evaluation of factors that they deemed to be material, including those factors described above, the Board of Trustees, including the independent Trustees, concluded that the Fund’s investment advisory agreement with MFS should be continued for an additional one-year period, commencing August 1, 2020.
24
MFS Growth Series
PROXY VOTING POLICIES AND INFORMATION
MFS votes proxies on behalf of the fund pursuant to proxy voting policies and procedures that are available without charge, upon request, by calling 1-800-225-2606, by visiting mfs.com/proxyvoting, or by visiting the SEC Web site at http://www.sec.gov.
Information regarding how the fund voted proxies relating to portfolio securities during the most recent twelve-month period ended June 30 is available by August 31 of each year without charge by visiting mfs.com/proxyvoting, or by visiting the SEC’s Web site at http://www.sec.gov.
QUARTERLY PORTFOLIO DISCLOSURE
The fund files a complete schedule of portfolio holdings with the SEC for the first and third quarters of each fiscal year as an exhibit to its reports on Form N-PORT. The fund’s Form N-PORT reports are available on the SEC’s Web site at http://www.sec.gov. A shareholder can obtain the portfolio holdings report for the first and third quarters of the fund’s fiscal year at mfs.com/vit1 by choosing the fund’s name and then scrolling to the “Resources” section and clicking on the “Prospectus and Reports” tab.
FURTHER INFORMATION
From time to time, MFS may post important information about the fund or the MFS funds on the MFS Web site (mfs.com). This information is available at https://www.mfs.com/announcements or at mfs.com/vit1 by choosing the fund’s name and then scrolling to the “Resources” section and clicking on the “Announcements” tab, if any.
INFORMATION ABOUT FUND CONTRACTS AND LEGAL CLAIMS
The fund has entered into contractual arrangements with an investment adviser, administrator, distributor, shareholder servicing agent, 529 program manager (if applicable), and custodian who each provide services to the fund. Unless expressly stated otherwise, shareholders are not parties to, or intended beneficiaries of these contractual arrangements, and these contractual arrangements are not intended to create any shareholder right to enforce them against the service providers or to seek any remedy under them against the service providers, either directly or on behalf of the fund.
Under the Trust’s By-Laws and Declaration of Trust, any claims asserted against or on behalf of the MFS Funds, including claims against Trustees and Officers, must be brought in state and federal courts located within the Commonwealth of Massachusetts.
FEDERAL TAX INFORMATION (unaudited)
The following information is provided pursuant to provisions of the Internal Revenue Code.
The fund designates $140,351,000 as capital gain dividends paid during the fiscal year.
25
rev. 3/16
| | | | |
| | | |
| FACTS | | WHAT DOES MFS DO WITH YOUR
PERSONAL INFORMATION? | |  |
| | |
| Why? | | Financial companies choose how they share your personal information. Federal law gives consumers the right to limit some but not all sharing. Federal law also requires us to tell you how we collect, share, and protect your personal information. Please read this notice carefully to understand what we do. |
| | |
| What? | | The types of personal information we collect and share depend on the product or service you have with us. This information can include: • Social Security number and account balances • Account transactions and transaction history • Checking account information and wire transfer instructions When you are no longer our customer, we continue to share your information as described in this notice. |
| | |
| How? | | All financial companies need to share customers’ personal information to run their everyday business. In the section below, we list the reasons financial companies can share their customers’ personal information; the reasons MFS chooses to share; and whether you can limit this sharing. |
| | | | |
Reasons we can share your
personal information | | Does MFS share? | | Can you limit this
sharing? |
For our everyday business purposes – such as to process your transactions, maintain your account(s), respond to court orders and legal investigations, or report to credit bureaus | | Yes | | No |
For our marketing purposes – to offer our products and services to you | | No | | We don’t share |
| For joint marketing with other financial companies | | No | | We don’t share |
For our affiliates’ everyday business purposes – information about your transactions and experiences | | No | | We don’t share |
For our affiliates’ everyday business purposes – information about your creditworthiness | | No | | We don’t share |
| For nonaffiliates to market to you | | No | | We don’t share |
| | |
| | |
| Questions? | | Call 800-225-2606 or go to mfs.com. |
26
| | |
| Who we are |
| Who is providing this notice? | | MFS Funds, MFS Investment Management, MFS Institutional Advisors, Inc., and MFS Heritage Trust Company. |
| | |
| What we do |
| How does MFS protect my personal information? | | To protect your personal information from unauthorized access and use, we use security measures that comply with federal law. These measures include procedural, electronic, and physical safeguards for the protection of the personal information we collect about you. |
How does MFS
collect my personal information? | | We collect your personal information, for example, when you • open an account or provide account information • direct us to buy securities or direct us to sell your securities • make a wire transfer We also collect your personal information from others, such as credit bureaus, affiliates, or other companies. |
| Why can’t I limit all sharing? | | Federal law gives you the right to limit only • sharing for affiliates’ everyday business purposes – information about your creditworthiness • affiliates from using your information to market to you • sharing for nonaffiliates to market to you State laws and individual companies may give you additional rights to limit sharing. |
| | |
| Definitions |
| Affiliates | | Companies related by common ownership or control. They can be financial and nonfinancial companies. • MFS does not share personal information with affiliates, except for everyday business purposes as described on page one of this notice. |
| Nonaffiliates | | Companies not related by common ownership or control. They can be financial and nonfinancial companies. • MFS does not share with nonaffiliates so they can market to you. |
| Joint marketing | | A formal agreement between nonaffiliated financial companies that together market financial products or services to you. • MFS doesn’t jointly market. |
| | |
| Other important information |
| If you own an MFS product or receive an MFS service in the name of a third party such as a bank or broker-dealer, their privacy policy may apply to you instead of ours. |
27
Annual Report
December 31, 2020

MFS® Investors Trust Series

MFS® Variable Insurance Trust
VGI-ANN
MFS® Investors Trust Series
CONTENTS
The report is prepared for the general information of contract owners. It is authorized for distribution to prospective investors only when preceded or accompanied by a current prospectus.
NOT FDIC INSURED • MAY LOSE VALUE • NO BANK OR CREDIT UNION GUARANTEE • NOT A DEPOSIT • NOT INSURED BY ANY FEDERAL GOVERNMENT AGENCY OR NCUA/NCUSIF
MFS Investors Trust Series
LETTER FROM THE CEO

Dear Contract Owners:
Markets experienced dramatic swings this year as the coronavirus pandemic brought the global economy to a standstill for several months early in the year. The speedy development of vaccines and therapeutics later brightened the economic and market outlook, but a great deal of uncertainty remains as case counts remain high, new variants of the virus are appearing and questions persist over how fast the vaccine can be made widely available. In the United States, political uncertainty eased after former Vice President Joe Biden won the presidential election and the Democrats gained control of a closely divided Senate.
Global central banks have taken aggressive steps to cushion the economic and market fallout related to the virus, and governments are deploying unprecedented levels of fiscal support. Additional U.S. stimulus is anticipated with the Democrats in the White House and in control of both houses of Congress. The measures already put in place have helped build a supportive environment and are encouraging economic recovery; however, if markets disconnect from fundamentals, they can sow the seeds of instability. As such, dramatic increases in speculative retail trading bear watching.
In the aftermath of the crisis, we could see societal changes as households, businesses, and governments adjust to a new reality, and any such alterations could affect the investment landscape. For investors, events such as the COVID-19 outbreak demonstrate the importance of having a deep understanding of company fundamentals, and we have built our global research platform to do just that.
At MFS®, we put our clients’ assets to work responsibly by carefully navigating the increasing complexity of our global markets and economies. Guided by our long-term philosophy and adhering to our commitment to sustainable investing, we tune out the noise and aim to uncover what we believe are the best, most durable investment opportunities in the market. Our unique global investment platform combines collective expertise, long-term discipline and thoughtful risk management to create sustainable value for investors.
Respectfully,

Michael W. Roberge
Chief Executive Officer
MFS Investment Management
February 16, 2021
The opinions expressed in this letter are subject to change and may not be relied upon for investment advice. No forecasts can be guaranteed.
1
MFS Investors Trust Series
PORTFOLIO COMPOSITION
Portfolio structure
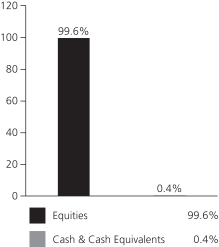
| | | | |
| Top ten holdings | | | | |
| Microsoft Corp. | | | 5.0% | |
| Alphabet, Inc., “A” | | | 4.1% | |
| Apple, Inc. | | | 2.6% | |
| JPMorgan Chase & Co. | | | 2.5% | |
| Johnson & Johnson | | | 2.4% | |
| Visa, Inc., “A” | | | 2.4% | |
| Medtronic PLC | | | 2.3% | |
| Mastercard, Inc., “A” | | | 2.2% | |
| Honeywell International, Inc. | | | 2.2% | |
| Comcast Corp., “A” | | | 2.1% | |
| | | | |
| GICS equity sectors (g) | | | | |
| Information Technology | | | 24.5% | |
| Health Care | | | 18.1% | |
| Communication Services | | | 11.7% | |
| Financials | | | 11.2% | |
| Consumer Discretionary | | | 9.2% | |
| Consumer Staples | | | 8.3% | |
| Industrials | | | 6.8% | |
| Materials | | | 4.5% | |
| Real Estate | | | 3.1% | |
| Energy | | | 1.6% | |
| Utilities | | | 0.6% | |
| (g) | The Global Industry Classification Standard (GICS®) was developed by and/or is the exclusive property of MSCI, Inc. and S&P Global Market Intelligence Inc. (“S&P Global Market Intelligence”). GICS is a service mark of MSCI and S&P Global Market Intelligence and has been licensed for use by MFS. MFS has applied its own internal sector/industry classification methodology for equity securities and non-equity securities that are unclassified by GICS. |
Cash & Cash Equivalents includes any cash, investments in money market funds, short-term securities, and other assets less liabilities. Please see the Statement of Assets and Liabilities for additional information related to the fund’s cash position and other assets and liabilities.
Percentages are based on net assets as of December 31, 2020.
The portfolio is actively managed and current holdings may be different.
2
MFS Investors Trust Series
MANAGEMENT REVIEW
Summary of Results
For the twelve months ended December 31, 2020, Initial Class shares of the MFS Investors Trust Series (fund) provided a total return of 13.87%, while Service Class shares of the fund provided a total return of 13.60%. These compare with a return of 18.40% over the same period for the fund’s benchmark, the Standard & Poor’s 500 Stock Index (S&P 500 Index).
Market Environment
Markets experienced an extraordinarily sharp selloff early in the period and, in many cases, an unusually rapid recovery later. Central banks and fiscal authorities undertook astonishing levels of stimulus to offset the economic effects of government-imposed social-distancing measures implemented to slow the spread of the COVID-19 virus. At this point, the global economy looks to have experienced the shortest – albeit the deepest and steepest – recession in the postwar period. However, the recovery remains subject to more than the usual number of uncertainties due to questions about the evolution of the virus, what its continued impact will be and how quickly vaccines to guard against it can be manufactured and distributed at scale. There are also worries over the public’s willingness to be inoculated.
Around the world, central banks responded quickly and massively to the crisis with programs to improve liquidity and support markets. These programs proved largely successful in helping to restore market function, ease volatility and stimulate a continued market rebound. Late in the period, the US Federal Reserve adopted a new, flexible, average-inflation-targeting framework, which is expected to result in the federal funds rate remaining at low levels longer than under its previous model. In developed countries, monetary easing measures were complemented by unusually large fiscal stimulus initiatives. Due to relatively manageable external liabilities and balances of payments in many countries and persistently low inflation, even emerging market countries were able to implement countercyclical policies – a departure from the usual market-dictated response to risk-off crises.
Compounding market uncertainty earlier in the pandemic was a crash in the price of crude oil due to a sharp drop in global demand and a disagreement between Saudi Arabia and Russia over production cuts, which resulted in an oil price war. The subsequent decline in prices undercut oil exporters, many of which are in emerging markets, as well as a large segment of the high-yield credit market. The OPEC+ group later agreed on output cuts, with shale oil producers in the US also decreasing production, which, along with the gradual reopening of some major economies and the resultant boost in demand, helped stabilize the price of crude oil.
In the immediate aftermath of the market disruption that accompanied the initial phases of the pandemic, many companies that had added significant leverage to their balance sheets in recent years by borrowing to fund dividend payments and stock buybacks halted those activities, and some companies were forced to recapitalize. As markets and the economy stabilized later in the period, in many cases dividend payments and buybacks resumed. Conversely, some companies found themselves flush with liquidity, having borrowed preemptively during the worst of the crisis only to end up with excess cash on their balance sheets.
Detractors from Performance
Security selection in the information technology sector detracted from performance relative to the S&P 500 Index. Within this sector, the fund’s underweight position in computer and personal electronics maker Apple, and not holding shares of strong-performing computer graphics processor maker NVIDIA and digital payment technology developer PayPal, hurt relative returns. Despite headwinds related to COVID-19, the share price of Apple appreciated as product demand recovered more rapidly than expected and the shift toward work-from-home and remote learning supported strong iPhone and iPad sales. Additionally, shares of Apple reacted positively to the announcement of a new line of its flagship iPhone product with 5G compatibility.
Stock selection and, to a lesser extent, an underweight position in the consumer discretionary sector also weakened relative returns over the reporting period. Here, not holding shares of strong-performing internet retailer Amazon.com hindered the fund’s relative results as Amazon’s share price rose over the reporting period, driven by increased demand for cloud-computing services and at-home retail demand.
Stocks in other sectors that were among the fund’s top relative detractors included holding shares of natural gas and petrochemical products manufacturer Enterprise Products Partners (b) and food processing company Danone (b) (France), as well as the timing of the fund’s overweight positions in oil field services company Schlumberger (h) and energy exploration and production company EOG Resources (h). Lastly, the fund’s overweight position in shares of medical technology company Becton, Dickinson & Co. also held back relative returns.
The fund’s cash and/or cash equivalents position during the period detracted from relative performance. Under normal market conditions, the fund strives to be fully invested and generally holds cash to buy new holdings and to provide liquidity. In a period when equity markets rose, as measured by the fund’s benchmark, holding cash hurt performance versus the benchmark, which has no cash position.
3
MFS Investors Trust Series
Management Review – continued
Contributors to Performance
Stock selection in both the financials and communication services sectors benefited performance relative to the benchmark over the reporting period. Within the financials sector, not holding shares of diversified financial services firm Wells Fargo supported relative results. The stock price of Wells Fargo declined early in the reporting period, along with many other financial services stocks, as bond yields collapsed, notably on US 10-year Treasury bonds, and concerns about increased potential loan losses arose as global economic activity ground to a halt in efforts to stem the spread of the COVID-19 virus. Within the communication services sector, not holding shares of telecommunication services provider AT&T contributed to relative returns as the company’s stock price declined along with broader equity markets in the spring, but never recovered, as lower advertising revenue and foreign exchange headwinds weighed on the company’s earnings results.
An underweight position in the weak-performing utilities sector also lifted relative performance. However, there were no individual stocks within this sector, either in the fund or in the benchmark, that were among the fund’s top relative contributors over the reporting period.
Elsewhere, not holding shares of poor-performing integrated oil and gas company Exxon Mobil, energy company Chevron and aerospace company Boeing added to relative results. Overweight positions in specialty rural lifestyle retailer Tractor Supply Company, life sciences supply company Thermo Fisher Scientific, healthcare equipment manufacturer Danaher, retail giant Target and software company Adobe Systems further contributed to relative performance.
During the reporting period, the fund’s relative currency exposure, resulting primarily from differences between the fund’s and the benchmark’s exposures to holdings of securities denominated in foreign currencies, was a contributor to relative performance. All of MFS’ investment decisions are driven by the fundamentals of each individual opportunity and as such, it is common for our portfolios to have different currency exposure than the benchmark.
Respectfully,
Portfolio Manager(s)
Kevin Beatty, Alison O’Neill Mackey, and Ted Maloney
Note to Contract Owners: Effective September 30, 2021, Kevin Beatty will no longer be a Portfolio Manager of the fund.
| (b) | Security is not a benchmark constituent. |
| (h) | Security was not held in the portfolio at period end. |
The views expressed in this report are those of the portfolio manager(s) only through the end of the period of the report as stated on the cover and do not necessarily reflect the views of MFS or any other person in the MFS organization. These views are subject to change at any time based on market or other conditions, and MFS disclaims any responsibility to update such views. These views may not be relied upon as investment advice or an indication of trading intent on behalf of any MFS portfolio. References to specific securities are not recommendations of such securities, and may not be representative of any MFS portfolio’s current or future investments.
4
MFS Investors Trust Series
PERFORMANCE SUMMARY THROUGH 12/31/20
The following chart illustrates the historical performance of the fund in comparison to its benchmark(s). Benchmarks are unmanaged and may not be invested in directly. Benchmark returns do not reflect any fees or expenses. The performance of other share classes will be greater than or less than that of the class depicted below. (See Notes to Performance Summary.)
Performance data shown represents past performance and is no guarantee of future results. Investment return and principal value fluctuate so your units, when sold, may be worth more or less than the original cost; current performance may be lower or higher than quoted. The performance shown does not reflect the deduction of taxes, if any, that a contract holder would pay on fund distributions or the redemption of contract units. The returns for the fund shown also do not reflect the deduction of expenses associated with variable products, such as mortality and expense risk charges, separate account charges, and sales charges imposed by the insurance company separate accounts. Such expenses would reduce the overall returns shown.
Growth of a Hypothetical $10,000 Investment
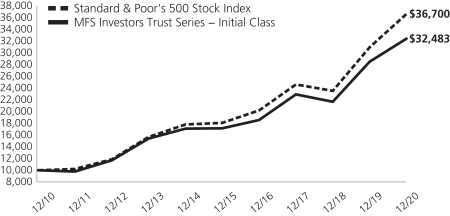
Total Returns through 12/31/20
Average annual total returns
| | | | | | | | | | | | |
| | | Share Class | | Class Inception Date | | 1-yr | | 5-yr | | 10-yr | | |
| | | Initial Class | | 10/09/95 | | 13.87% | | 13.66% | | 12.50% | | |
| | | Service Class | | 5/01/00 | | 13.60% | | 13.38% | | 12.22% | | |
| | | | |
| Comparative benchmark(s) | | | | | | | | |
| | | Standard & Poor’s 500 Stock Index (f) | | 18.40% | | 15.22% | | 13.88% | | |
| (f) | Source: FactSet Research Systems Inc. |
Benchmark Definition(s)
Standard & Poor’s 500 Stock Index (g) – a market capitalization-weighted index of 500 widely held equity securities, designed to measure broad U.S. equity performance.
It is not possible to invest directly in an index.
| (g) | “Standard & Poor’s®” and “S&P®” are registered trademarks of Standard & Poor’s Financial Services LLC (“S&P”) and Dow Jones is a registered trademark of Dow Jones Trademark Holdings LLC (“Dow Jones”) and have been licensed for use by S&P Dow Jones Indices LLC and sublicensed for certain purposes by MFS. The S&P 500® is a product of S&P Dow Jones Indices LLC, and has been licensed for use by MFS. MFS’s product(s) is not sponsored, endorsed, sold, or promoted by S&P Dow Jones Indices LLC, Dow Jones, S&P, or their respective affiliates, and neither S&P Dow Jones Indices LLC, Dow Jones, S&P, nor their respective affiliates make any representation regarding the advisability of investing in such product(s). |
Notes to Performance Summary
Average annual total return represents the average annual change in value for each share class for the periods presented.
Performance results reflect any applicable expense subsidies and waivers in effect during the periods shown. Without such subsidies and waivers the fund’s performance results would be less favorable. Please see the prospectus and financial statements for complete details. All results are historical and assume the reinvestment of any dividends and capital gains distributions.
Performance results do not include adjustments made for financial reporting purposes in accordance with U.S. generally accepted accounting principles and may differ from amounts reported in the financial highlights.
From time to time the fund may receive proceeds from litigation settlements, without which performance would be lower.
5
MFS Investors Trust Series
EXPENSE TABLE
Fund Expenses Borne by the Contract Holders during the Period,
July 1, 2020 through December 31, 2020
As a contract holder of the fund, you incur ongoing costs, including management fees; distribution and/or service (12b-1) fees; and other fund expenses. This example is intended to help you understand your ongoing costs (in dollars) of investing in the fund and to compare these costs with the ongoing costs of investing in other mutual funds.
The example is based on an investment of $1,000 invested at the beginning of the period and held for the entire period July 1, 2020 through December 31, 2020.
Actual Expenses
The first line for each share class in the following table provides information about actual account values and actual expenses. You may use the information in this line, together with the amount you invested, to estimate the expenses that you paid over the period. Simply divide your account value by $1,000 (for example, an $8,600 account value divided by $1,000 = 8.6), then multiply the result by the number in the first line under the heading entitled “Expenses Paid During Period” to estimate the expenses you paid on your account during this period.
Hypothetical Example for Comparison Purposes
The second line for each share class in the following table provides information about hypothetical account values and hypothetical expenses based on the fund’s actual expense ratio and an assumed rate of return of 5% per year before expenses, which is not the fund’s actual return. The hypothetical account values and expenses may not be used to estimate the actual ending account balance or expenses you paid for the period. You may use this information to compare the ongoing costs of investing in the fund and other funds. To do so, compare this 5% hypothetical example with the 5% hypothetical examples that appear in the shareholder reports of the other funds.
Please note that the expenses shown in the table are meant to highlight the fund’s ongoing costs only and do not take into account the fees and expenses imposed under the variable contracts through which your investment in the fund is made. Therefore, the second line for each share class in the table is useful in comparing ongoing costs associated with an investment in vehicles (such as the fund) which fund benefits under variable annuity and variable life insurance contracts and to qualified pension and retirement plans only, and will not help you determine the relative total costs of investing in the fund through variable annuity and variable life insurance contracts. If the fees and expenses imposed under the variable contracts were included, your costs would have been higher.
| | | | | | | | | | | | | | | | | | |
| Share Class | | | | Annualized
Expense Ratio | | | Beginning
Account Value
7/01/20 | | | Ending Account Value
12/31/20 | | | Expenses Paid
During Period (p)
7/01/20-12/31/20 | |
| Initial Class | | Actual | | | 0.79% | | | | $1,000.00 | | | | $1,200.00 | | | | $4.37 | |
| | Hypothetical (h) | | | 0.79% | | | | $1,000.00 | | | | $1,021.17 | | | | $4.01 | |
| Service Class | | Actual | | | 1.04% | | | | $1,000.00 | | | | $1,198.54 | | | | $5.75 | |
| | Hypothetical (h) | | | 1.04% | | | | $1,000.00 | | | | $1,019.91 | | | | $5.28 | |
| (h) | 5% class return per year before expenses. |
| (p) | “Expenses Paid During Period” are equal to each class’s annualized expense ratio, as shown above, multiplied by the average account value over the period, multiplied by 184/366 (to reflect the one-half year period). |
6
MFS Investors Trust Series
PORTFOLIO OF INVESTMENTS – 12/31/20
The Portfolio of Investments is a complete list of all securities owned by your fund. It is categorized by broad-based asset classes.
| | | | | | | | |
| Issuer | | Shares/Par | | | Value ($) | |
| COMMON STOCKS – 99.6% | | | | | | | | |
| Aerospace – 2.8% | | | | | |
| Honeywell International, Inc. | | | 78,314 | | | $ | 16,657,388 | |
| Raytheon Technologies Corp. | | | 70,609 | | | | 5,049,249 | |
| | | | | | | | |
| | | | | | $ | 21,706,637 | |
| | | | | | | | |
| Alcoholic Beverages – 2.4% | | | | | |
| Diageo PLC | | | 248,815 | | | $ | 9,833,444 | |
| Pernod Ricard S.A. | | | 46,406 | | | | 8,889,289 | |
| | | | | | | | |
| | | | | | $ | 18,722,733 | |
| | | | | | | | |
| Apparel Manufacturers – 2.5% | | | | | |
| LVMH Moet Hennessy Louis Vuitton SE | | | 18,493 | | | $ | 11,542,240 | |
| NIKE, Inc., “B” | | | 55,180 | | | | 7,806,315 | |
| | | | | | | | |
| | | | | | $ | 19,348,555 | |
| | | | | | | | |
| Biotechnology – 1.3% | | | | | |
| Illumina, Inc. (a) | | | 17,251 | | | $ | 6,382,870 | |
| Vertex Pharmaceuticals, Inc. (a) | | | 16,525 | | | | 3,905,518 | |
| | | | | | | | |
| | | | | | $ | 10,288,388 | |
| | | | | | | | |
| Brokerage & Asset Managers – 2.9% | | | | | |
| Blackstone Group, Inc. | | | 87,876 | | | $ | 5,695,244 | |
| Charles Schwab Corp. | | | 94,594 | | | | 5,017,266 | |
| NASDAQ, Inc. | | | 88,153 | | | | 11,701,429 | |
| | | | | | | | |
| | | | | | $ | 22,413,939 | |
| | | | | | | | |
| Business Services – 4.5% | | | | | |
| Accenture PLC, “A” | | | 40,953 | | | $ | 10,697,333 | |
| Amdocs Ltd. | | | 126,590 | | | | 8,979,029 | |
| Fidelity National Information Services, Inc. | | | 105,690 | | | | 14,950,907 | |
| | | | | | | | |
| | | | | | $ | 34,627,269 | |
| | | | | | | | |
| Cable TV – 2.5% | | | | | |
| Cable One, Inc. | | | 1,122 | | | $ | 2,499,502 | |
| Comcast Corp., “A” | | | 311,516 | | | | 16,323,438 | |
| | | | | | | | |
| | | | | | $ | 18,822,940 | |
| | | | | | | | |
| Chemicals – 0.9% | | | | | | | | |
| PPG Industries, Inc. | | | 45,080 | | | $ | 6,501,438 | |
| | | | | | | | |
| Computer Software – 8.1% | | | | | |
| Adobe Systems, Inc. (a) | | | 27,685 | | | $ | 13,845,822 | |
| Microsoft Corp. | | | 173,815 | | | | 38,659,932 | |
| salesforce.com, inc. (a) | | | 44,114 | | | | 9,816,689 | |
| | | | | | | | |
| | | | | | $ | 62,322,443 | |
| | | | | | | | |
| Computer Software – Systems – 2.6% | | | | | |
| Apple, Inc. | | | 147,395 | | | $ | 19,557,843 | |
| | | | | | | | |
| Construction – 1.3% | | | | | |
| Sherwin-Williams Co. | | | 13,761 | | | $ | 10,113,096 | |
| | | | | | | | |
| Consumer Products – 2.6% | | | | | |
| Colgate-Palmolive Co. | | | 105,705 | | | $ | 9,038,835 | |
| Estee Lauder Cos., Inc., “A” | | | 16,674 | | | | 4,438,452 | |
| Kimberly-Clark Corp. | | | 48,968 | | | | 6,602,355 | |
| | | | | | | | |
| | | | | | $ | 20,079,642 | |
| | | | | | | | |
| | | | | | | | |
| Issuer | | Shares/Par | | | Value ($) | |
| COMMON STOCKS – continued | | | | | | | | |
| Containers – 1.4% | | | | | |
| Crown Holdings, Inc. (a) | | | 103,518 | | | $ | 10,372,504 | |
| | | | | | | | |
| Electrical Equipment – 3.4% | | | | | |
| AMETEK, Inc. | | | 79,679 | | | $ | 9,636,378 | |
| Fortive Corp. | | | 115,911 | | | | 8,208,817 | |
| TE Connectivity Ltd. | | | 64,447 | | | | 7,802,599 | |
| | | | | | | | |
| | | | | | $ | 25,647,794 | |
| | | | | | | | |
| Electronics – 3.6% | | | | | |
| Analog Devices, Inc. | | | 56,115 | | | $ | 8,289,869 | |
| Applied Materials, Inc. | | | 66,280 | | | | 5,719,964 | |
| Texas Instruments, Inc. | | | 82,979 | | | | 13,619,343 | |
| | | | | | | | |
| | | | | | $ | 27,629,176 | |
| | | | | | | | |
| Energy – Independent – 0.6% | | | | | |
| ConocoPhillips | | | 104,773 | | | $ | 4,189,872 | |
| | | | | | | | |
| Food & Beverages – 2.1% | | | | | |
| Danone S.A. | | | 135,950 | | | $ | 8,928,640 | |
| Mondelez International, Inc. | | | 115,675 | | | | 6,763,517 | |
| | | | | | | | |
| | | | | | $ | 15,692,157 | |
| | | | | | | | |
| General Merchandise – 1.2% | | | | | |
| Dollar General Corp. | | | 45,414 | | | $ | 9,550,564 | |
| | | | | | | | |
| Health Maintenance Organizations – 1.0% | | | | | |
| Cigna Corp. | | | 36,714 | | | $ | 7,643,121 | |
| | | | | | | | |
| Insurance – 1.0% | | | | | |
| Chubb Ltd. | | | 50,086 | | | $ | 7,709,237 | |
| | | | | | | | |
| Internet – 7.6% | | | | | |
| Alphabet, Inc., “A” (a) | | | 17,744 | | | $ | 31,098,844 | |
| Alphabet, Inc., “C” (a) | | | 6,593 | | | | 11,550,145 | |
| Facebook, Inc., “A” (a) | | | 55,638 | | | | 15,198,076 | |
| | | | | | | | |
| | | | | | $ | 57,847,065 | |
| | | | | | | | |
| Leisure & Toys – 1.7% | | | | | |
| Electronic Arts, Inc. | | | 92,036 | | | $ | 13,216,370 | |
| | | | | | | | |
| Major Banks – 6.2% | | | | | |
| Bank of America Corp. | | | 518,456 | | | $ | 15,714,401 | |
| Goldman Sachs Group, Inc. | | | 48,042 | | | | 12,669,156 | |
| JPMorgan Chase & Co. | | | 149,888 | | | | 19,046,268 | |
| | | | | | | | |
| | | | | | $ | 47,429,825 | |
| | | | | | | | |
| Medical & Health Technology & Services – 1.8% | | | | | |
| ICON PLC (a) | | | 23,409 | | | $ | 4,564,287 | |
| PRA Health Sciences, Inc. (a) | | | 76,200 | | | | 9,558,528 | |
| | | | | | | | |
| | | | | | $ | 14,122,815 | |
| | | | | | | | |
| Medical Equipment – 7.5% | | | | | |
| Becton, Dickinson and Co. | | | 58,028 | | | $ | 14,519,766 | |
| Danaher Corp. | | | 49,627 | | | | 11,024,142 | |
| Medtronic PLC | | | 150,743 | | | | 17,658,035 | |
| Thermo Fisher Scientific, Inc. | | | 30,822 | | | | 14,356,271 | |
| | | | | | | | |
| | | | | | $ | 57,558,214 | |
| | | | | | | | |
7
MFS Investors Trust Series
Portfolio of Investments – continued
| | | | | | | | |
| Issuer | | Shares/Par | | | Value ($) | |
| COMMON STOCKS – continued | | | | | |
| Natural Gas – Pipeline – 1.1% | | | | | |
| Enterprise Products Partners LP | | | 425,243 | | | $ | 8,330,510 | |
| | | | | | | | |
| Network & Telecom – 1.2% | | | | | |
| Equinix, Inc., REIT | | | 13,291 | | | $ | 9,492,166 | |
| | | | | | | | |
| Other Banks & Diversified Financials – 5.7% | | | | | |
| Mastercard, Inc., “A” | | | 47,749 | | | $ | 17,043,528 | |
| Truist Financial Corp. | | | 176,679 | | | | 8,468,225 | |
| Visa, Inc., “A” | | | 83,803 | | | | 18,330,230 | |
| | | | | | | | |
| | | | | | $ | 43,841,983 | |
| | | | | | | | |
| Pharmaceuticals – 6.4% | | | | | |
| Eli Lilly & Co. | | | 70,369 | | | $ | 11,881,102 | |
| Johnson & Johnson | | | 118,657 | | | | 18,674,238 | |
| Merck & Co., Inc. | | | 138,076 | | | | 11,294,617 | |
| Zoetis, Inc. | | | 45,226 | | | | 7,484,903 | |
| | | | | | | | |
| | | | | | $ | 49,334,860 | |
| | | | | | | | |
| Railroad & Shipping – 1.5% | | | | | |
| Canadian National Railway Co. | | | 104,659 | | | $ | 11,496,791 | |
| | | | | | | | |
| Restaurants – 0.9% | | | | | |
| Starbucks Corp. | | | 61,836 | | | $ | 6,615,215 | |
| | | | | | | | |
| Specialty Chemicals – 0.9% | | | | | |
| DuPont de Nemours, Inc. | | | 100,541 | | | $ | 7,149,471 | |
| | | | | | | | |
| Specialty Stores – 5.7% | | | | | |
| Costco Wholesale Corp. | | | 23,787 | | | $ | 8,962,466 | |
| Home Depot, Inc. | | | 44,996 | | | | 11,951,837 | |
| Target Corp. | | | 68,300 | | | | 12,056,999 | |
| Tractor Supply Co. | | | 75,622 | | | | 10,630,941 | |
| | | | | | | | |
| | | | | | $ | 43,602,243 | |
| | | | | | | | |
| Telecommunications – Wireless – 1.9% | | | | | |
| American Tower Corp., REIT | | | 63,137 | | | $ | 14,171,731 | |
| | | | | | | | |
| | | | | | | | |
| Issuer | | Shares/Par | | | Value ($) | |
| COMMON STOCKS – continued | | | | | | | | |
| Trucking – 0.2% | | | | | |
| Old Dominion Freight Line, Inc. | | | 6,654 | | | $ | 1,298,728 | |
| | | | | | | | |
| Utilities – Electric Power – 0.6% | | | | | |
| American Electric Power Co., Inc. | | | 57,292 | | | $ | 4,770,705 | |
| | | | | | | | |
Total Common Stocks
(Identified Cost, $371,954,112) | | | | | | $ | 763,218,040 | |
| | | | | | | | |
| |
| INVESTMENT COMPANIES (h) – 0.4% | | | | | |
| Money Market Funds – 0.4% | | | | | | | | |
| MFS Institutional Money Market Portfolio, 0.1% (v) (Identified Cost, $2,722,233) | | | 2,722,233 | | | $ | 2,722,233 | |
| | | | | | | | |
OTHER ASSETS, LESS
LIABILITIES – 0.0% | | | | | | | 5,221 | |
| | | | | | | | |
| NET ASSETS – 100.0% | | | | | | $ | 765,945,494 | |
| | | | | | | | |
| (a) | | Non-income producing security. |
| (h) | | An affiliated issuer, which may be considered one in which the fund owns 5% or more of the outstanding voting securities, or a company which is under common control. At period end, the aggregate values of the fund’s investments in affiliated issuers and in unaffiliated issuers were $2,722,233 and $763,218,040, respectively. |
| (v) | | Affiliated issuer that is available only to investment companies managed by MFS. The rate quoted for the MFS Institutional Money Market Portfolio is the annualized seven-day yield of the fund at period end. |
The following abbreviations are used in this report and are defined:
| REIT | | Real Estate Investment Trust |
See Notes to Financial Statements
8
MFS Investors Trust Series
FINANCIAL STATEMENTS | STATEMENT OF ASSETS AND LIABILITIES
This statement represents your fund’s balance sheet, which details the assets and liabilities comprising the total value of the fund.
| | | | |
At 12/31/20 | | | | |
| |
Assets | | | | |
Investments in unaffiliated issuers, at value (identified cost, $371,954,112) | | | $763,218,040 | |
Investments in affiliated issuers, at value (identified cost, $2,722,233) | | | 2,722,233 | |
Receivables for | | | | |
Fund shares sold | | | 104,889 | |
Dividends | | | 439,058 | |
Other assets | | | 2,922 | |
Total assets | | | $766,487,142 | |
| |
Liabilities | | | | |
Payables for | | | | |
Fund shares reacquired | | | $390,099 | |
Payable to affiliates | | | | |
Investment adviser | | | 30,712 | |
Administrative services fee | | | 543 | |
Shareholder servicing costs | | | 428 | |
Distribution and/or service fees | | | 6,730 | |
Payable for independent Trustees’ compensation | | | 11 | |
Accrued expenses and other liabilities | | | 113,125 | |
Total liabilities | | | $541,648 | |
Net assets | | | $765,945,494 | |
| |
Net assets consist of | | | | |
Paid-in capital | | | $343,946,647 | |
Total distributable earnings (loss) | | | 421,998,847 | |
Net assets | | | $765,945,494 | |
Shares of beneficial interest outstanding | | | 21,161,530 | |
| | | | | | | | | | | | |
| | | |
| | | Net assets | | | Shares
outstanding | | | Net asset value
per share | |
Initial Class | | | $269,852,116 | | | | 7,378,320 | | | | $36.57 | |
Service Class | | | 496,093,378 | | | | 13,783,210 | | | | 35.99 | |
See Notes to Financial Statements
9
MFS Investors Trust Series
FINANCIAL STATEMENTS | STATEMENT OF OPERATIONS
This statement describes how much your fund earned in investment income and accrued in expenses. It also describes any gains and/or losses generated by fund operations.
| | | | |
Year ended 12/31/20 | | | | |
| |
Net investment income (loss) | | | | |
Income | | | | |
Dividends | | | $10,927,808 | |
Dividends from affiliated issuers | | | 58,140 | |
Other | | | 21,903 | |
Income on securities loaned | | | 18,440 | |
Foreign taxes withheld | | | (107,081 | ) |
Total investment income | | | $10,919,210 | |
Expenses | | | | |
Management fee | | | $5,204,882 | |
Distribution and/or service fees | | | 1,118,247 | |
Shareholder servicing costs | | | 32,080 | |
Administrative services fee | | | 102,252 | |
Independent Trustees’ compensation | | | 14,203 | |
Custodian fee | | | 39,433 | |
Shareholder communications | | | 66,463 | |
Audit and tax fees | | | 58,368 | |
Legal fees | | | 5,867 | |
Miscellaneous | | | 30,878 | |
Total expenses | | | $6,672,673 | |
Reduction of expenses by investment adviser | | | (76,296 | ) |
Net expenses | | | $6,596,377 | |
Net investment income (loss) | | | $4,322,833 | |
| |
Realized and unrealized gain (loss) | | | | |
Realized gain (loss) (identified cost basis) | | | | |
Unaffiliated issuers | | | $25,241,190 | |
Affiliated issuers | | | (2,280 | ) |
Foreign currency | | | (8,993 | ) |
Net realized gain (loss) | | | $25,229,917 | |
Change in unrealized appreciation or depreciation | | | | |
Unaffiliated issuers | | | $66,669,452 | |
Affiliated issuers | | | 22 | |
Net unrealized gain (loss) | | | $66,669,474 | |
Net realized and unrealized gain (loss) | | | $91,899,391 | |
Change in net assets from operations | | | $96,222,224 | |
See Notes to Financial Statements
10
MFS Investors Trust Series
FINANCIAL STATEMENTS | STATEMENTS OF CHANGES IN NET ASSETS
These statements describe the increases and/or decreases in net assets resulting from operations, any distributions, and any shareholder transactions.
| | | | | | | | |
| | | Year ended | |
| | | 12/31/20 | | | 12/31/19 | |
Change in net assets | | | | | | | | |
| | |
From operations | | | | | | | | |
Net investment income (loss) | | | $4,322,833 | | | | $4,245,875 | |
Net realized gain (loss) | | | 25,229,917 | | | | 21,650,086 | |
Net unrealized gain (loss) | | | 66,669,474 | | | | 148,081,475 | |
Change in net assets from operations | | | $96,222,224 | | | | $173,977,436 | |
Total distributions to shareholders | | | $(25,105,390 | ) | | | $(42,277,259 | ) |
Change in net assets from fund share transactions | | | $(23,803,177 | ) | | | $29,872,889 | |
Total change in net assets | | | $47,313,657 | | | | $161,573,066 | |
| | |
Net assets | | | | | | | | |
At beginning of period | | | 718,631,837 | | | | 557,058,771 | |
At end of period | | | $765,945,494 | | | | $718,631,837 | |
See Notes to Financial Statements
11
MFS Investors Trust Series
FINANCIAL STATEMENTS | FINANCIAL HIGHLIGHTS
The financial highlights table is intended to help you understand the fund’s financial performance for the past 5 years. Certain information reflects financial results for a single fund share. The total returns in the table represent the rate that an investor would have earned (or lost) on an investment in the fund share class (assuming reinvestment of all distributions) held for the entire period.
| | | | | | | | | | | | | | | | | | | | |
| Initial Class | | Year ended | |
| | | | | |
| | | 12/31/20 | | | 12/31/19 | | | 12/31/18 | | | 12/31/17 | | | 12/31/16 | |
| | | | | |
Net asset value, beginning of period | | | $33.27 | | | | $27.05 | | | | $30.07 | | | | $25.57 | | | | $26.58 | |
| | | | | |
| Income (loss) from investment operations | | | | | | | | | | | | | | | | | | | | |
Net investment income (loss) (d) | | | $0.25 | | | | $0.25 | | | | $0.26 | | | | $0.22 | | | | $0.23 | (c) |
Net realized and unrealized gain (loss) | | | 4.26 | | | | 8.08 | | | | (1.71 | ) | | | 5.62 | | | | 2.01 | |
Total from investment operations | | | $4.51 | | | | $8.33 | | | | $(1.45 | ) | | | $5.84 | | | | $2.24 | |
| | | | | |
| Less distributions declared to shareholders | | | | | | | | | | | | | | | | | | | | |
From net investment income | | | $(0.21 | ) | | | $(0.22 | ) | | | $(0.20 | ) | | | $(0.21 | ) | | | $(0.24 | ) |
From net realized gain | | | (1.00 | ) | | | (1.89 | ) | | | (1.37 | ) | | | (1.13 | ) | | | (3.01 | ) |
Total distributions declared to shareholders | | | $(1.21 | ) | | | $(2.11 | ) | | | $(1.57 | ) | | | $(1.34 | ) | | | $(3.25 | ) |
Net asset value, end of period (x) | | | $36.57 | | | | $33.27 | | | | $27.05 | | | | $30.07 | | | | $25.57 | |
Total return (%) (k)(r)(s)(x) | | | 13.87 | | | | 31.58 | | | | (5.49 | ) | | | 23.35 | | | | 8.59 | (c) |
| | | | | |
Ratios (%) (to average net assets)
and Supplemental data: | | | | | | | | | | | | | | | | | | | | |
Expenses before expense reductions (f) | | | 0.80 | | | | 0.80 | | | | 0.80 | | | | 0.82 | | | | 0.80 | (c) |
Expenses after expense reductions (f) | | | 0.79 | | | | 0.79 | | | | 0.79 | | | | 0.79 | | | | 0.79 | (c) |
Net investment income (loss) | | | 0.78 | | | | 0.80 | | | | 0.86 | | | | 0.79 | | | | 0.89 | (c) |
Portfolio turnover | | | 19 | | | | 18 | | | | 16 | | | | 18 | | | | 20 | |
Net assets at end of period (000 omitted) | | | $269,852 | | | | $265,499 | | | | $231,900 | | | | $283,237 | | | | $270,796 | |
| | | | | | | | | | | | | | | | | | | | |
| Service Class | | Year ended | |
| | | | | |
| | | 12/31/20 | | | 12/31/19 | | | 12/31/18 | | | 12/31/17 | | | 12/31/16 | |
| | | | | |
Net asset value, beginning of period | | | $32.77 | | | | $26.68 | | | | $29.69 | | | | $25.28 | | | | $26.30 | |
| | | | | |
| Income (loss) from investment operations | | | | | | | | | | | | | | | | | | | | |
Net investment income (loss) (d) | | | $0.17 | | | | $0.17 | | | | $0.18 | | | | $0.15 | | | | $0.16 | (c) |
Net realized and unrealized gain (loss) | | | 4.19 | | | | 7.97 | | | | (1.68 | ) | | | 5.55 | | | | 1.98 | |
Total from investment operations | | | $4.36 | | | | $8.14 | | | | $(1.50 | ) | | | $5.70 | | | | $2.14 | |
| | | | | |
| Less distributions declared to shareholders | | | | | | | | | | | | | | | | | | | | |
From net investment income | | | $(0.14 | ) | | | $(0.16 | ) | | | $(0.14 | ) | | | $(0.16 | ) | | | $(0.15 | ) |
From net realized gain | | | (1.00 | ) | | | (1.89 | ) | | | (1.37 | ) | | | (1.13 | ) | | | (3.01 | ) |
Total distributions declared to shareholders | | | $(1.14 | ) | | | $(2.05 | ) | | | $(1.51 | ) | | | $(1.29 | ) | | | $(3.16 | ) |
Net asset value, end of period (x) | | | $35.99 | | | | $32.77 | | | | $26.68 | | | | $29.69 | | | | $25.28 | |
Total return (%) (k)(r)(s)(x) | | | 13.60 | | | | 31.25 | | | | (5.71 | ) | | | 23.03 | | | | 8.32 | (c) |
| | | | | |
Ratios (%) (to average net assets)
and Supplemental data: | | | | | | | | | | | | | | | | | | | | |
Expenses before expense reductions (f) | | | 1.05 | | | | 1.05 | | | | 1.05 | | | | 1.07 | | | | 1.04 | (c) |
Expenses after expense reductions (f) | | | 1.04 | | | | 1.04 | | | | 1.04 | | | | 1.04 | | | | 1.04 | (c) |
Net investment income (loss) | | | 0.53 | | | | 0.55 | | | | 0.62 | | | | 0.55 | | | | 0.64 | (c) |
Portfolio turnover | | | 19 | | | | 18 | | | | 16 | | | | 18 | | | | 20 | |
Net assets at end of period (000 omitted) | | | $496,093 | | | | $453,132 | | | | $325,159 | | | | $318,611 | | | | $228,741 | |
See Notes to Financial Statements
12
MFS Investors Trust Series
Financial Highlights – continued
| (c) | Amount reflects a one-time reimbursement of expenses by the custodian (or former custodian) without which net investment income and performance would be lower and expenses would be higher. |
| (d) | Per share data is based on average shares outstanding. |
| (f) | Ratios do not reflect reductions from fees paid indirectly, if applicable. |
| (k) | The total return does not reflect expenses that apply to separate accounts. Inclusion of these charges would reduce the total return figures for all periods shown. |
| (r) | Certain expenses have been reduced without which performance would have been lower. |
| (s) | From time to time the fund may receive proceeds from litigation settlements, without which performance would be lower. |
| (x) | The net asset values and total returns have been calculated on net assets which include adjustments made in accordance with U.S. generally accepted accounting principles required at period end for financial reporting purposes. |
See Notes to Financial Statements
13
MFS Investors Trust Series
NOTES TO FINANCIAL STATEMENTS
| (1) | | Business and Organization |
MFS Investors Trust Series (the fund) is a diversified series of MFS Variable Insurance Trust (the trust). The trust is organized as a Massachusetts business trust and is registered under the Investment Company Act of 1940, as amended, as an open-end management investment company. The shareholders of each series of the trust are separate accounts of insurance companies, which offer variable annuity and/or life insurance products, and qualified retirement and pension plans.
The fund is an investment company and accordingly follows the investment company accounting and reporting guidance of the Financial Accounting Standards Board (FASB) Accounting Standards Codification Topic 946 Financial Services – Investment Companies.
| (2) | | Significant Accounting Policies |
General – The preparation of financial statements in conformity with U.S. generally accepted accounting principles requires management to make estimates and assumptions that affect the reported amounts of assets and liabilities, and disclosure of contingent assets and liabilities at the date of the financial statements and the reported amounts of increases and decreases in net assets from operations during the reporting period. Actual results could differ from those estimates. In the preparation of these financial statements, management has evaluated subsequent events occurring after the date of the fund’s Statement of Assets and Liabilities through the date that the financial statements were issued.
In March 2020, the FASB issued Accounting Standards Update 2020-04, Reference Rate Reform (Topic 848) – Facilitation of the Effects of Reference Rate Reform on Financial Reporting (“ASU 2020-04”), which provides optional, temporary relief with respect to the financial reporting of contracts subject to certain types of modifications due to the planned discontinuation of the London Interbank Offered Rate (LIBOR) and other IBOR-based reference rates as of the end of 2021. The temporary relief provided by ASU 2020-04 is effective for certain reference rate-related contract modifications that occur during the period from March 12, 2020 through December 31, 2022. Management is evaluating the impact of ASU 2020-04 on the fund’s investments, derivatives, debt and other contracts that will undergo reference rate-related modifications as a result of the reference rate reform.
Balance Sheet Offsetting – The fund’s accounting policy with respect to balance sheet offsetting is that, absent an event of default by the counterparty or a termination of the agreement, the International Swaps and Derivatives Association (ISDA) Master Agreement, or similar agreement, does not result in an offset of reported amounts of financial assets and financial liabilities in the Statement of Assets and Liabilities across transactions between the fund and the applicable counterparty. The fund’s right to setoff may be restricted or prohibited by the bankruptcy or insolvency laws of the particular jurisdiction to which a specific master netting agreement counterparty is subject. Balance sheet offsetting disclosures, to the extent applicable to the fund, have been included in the fund’s Significant Accounting Policies note under the captions for each of the fund’s in-scope financial instruments and transactions.
Investment Valuations – Equity securities, including restricted equity securities, are generally valued at the last sale or official closing price on their primary market or exchange as provided by a third-party pricing service. Equity securities, for which there were no sales reported that day, are generally valued at the last quoted daily bid quotation on their primary market or exchange as provided by a third-party pricing service. Short-term instruments with a maturity at issuance of 60 days or less may be valued at amortized cost, which approximates market value. Open-end investment companies are generally valued at net asset value per share. Securities and other assets generally valued on the basis of information from a third-party pricing service may also be valued at a broker/dealer bid quotation. In determining values, third-party pricing services can utilize both transaction data and market information such as yield, quality, coupon rate, maturity, type of issue, trading characteristics, and other market data. The values of foreign securities and other assets and liabilities expressed in foreign currencies are converted to U.S. dollars using the mean of bid and asked prices for rates provided by a third-party pricing service.
The Board of Trustees has delegated primary responsibility for determining or causing to be determined the value of the fund’s investments (including any fair valuation) to the adviser pursuant to valuation policies and procedures approved by the Board. If the adviser determines that reliable market quotations are not readily available, investments are valued at fair value as determined in good faith by the adviser in accordance with such procedures under the oversight of the Board of Trustees. Under the fund’s valuation policies and procedures, market quotations are not considered to be readily available for most types of debt instruments and floating rate loans and many types of derivatives. These investments are generally valued at fair value based on information from third-party pricing services. In addition, investments may be valued at fair value if the adviser determines that an investment’s value has been materially affected by events occurring after the close of the exchange or market on which the investment is principally traded (such as foreign exchange or market) and prior to the determination of the fund’s net asset value, or after the halt of trading of a specific security where trading does not resume prior to the close of the exchange or market on which the security is principally traded. Events that occur after foreign markets close (such as developments in foreign markets and significant movements in the U.S. markets) and prior to the determination of the fund’s net asset value may be deemed to have a material effect on the value of securities traded in foreign markets. Accordingly, the fund’s foreign equity securities may often be valued at fair value. The adviser
14
MFS Investors Trust Series
Notes to Financial Statements – continued
generally relies on third-party pricing services or other information (such as the correlation with price movements of similar securities in the same or other markets; the type, cost and investment characteristics of the security; the business and financial condition of the issuer; and trading and other market data) to assist in determining whether to fair value and at what value to fair value an investment. The value of an investment for purposes of calculating the fund’s net asset value can differ depending on the source and method used to determine value. When fair valuation is used, the value of an investment used to determine the fund’s net asset value may differ from quoted or published prices for the same investment. There can be no assurance that the fund could obtain the fair value assigned to an investment if it were to sell the investment at the same time at which the fund determines its net asset value per share.
Various inputs are used in determining the value of the fund’s assets or liabilities. These inputs are categorized into three broad levels. In certain cases, the inputs used to measure fair value may fall into different levels of the fair value hierarchy. In such cases, an investment’s level within the fair value hierarchy is based on the lowest level of input that is significant to the fair value measurement. The fund’s assessment of the significance of a particular input to the fair value measurement in its entirety requires judgment, and considers factors specific to the investment. Level 1 includes unadjusted quoted prices in active markets for identical assets or liabilities. Level 2 includes other significant observable market-based inputs (including quoted prices for similar securities, interest rates, prepayment speed, and credit risk). Level 3 includes unobservable inputs, which may include the adviser’s own assumptions in determining the fair value of investments. The following is a summary of the levels used as of December 31, 2020 in valuing the fund’s assets or liabilities:
| | | | | | | | | | | | | | | | |
| Financial Instruments | | Level 1 | | | Level 2 | | | Level 3 | | | Total | |
| Equity Securities: | | | | | | | | | | | | | | | | |
United States | | | $707,963,349 | | | | $— | | | | $— | | | | $707,963,349 | |
France | | | 29,360,169 | | | | — | | | | — | | | | 29,360,169 | |
Canada | | | 11,496,791 | | | | — | | | | — | | | | 11,496,791 | |
United Kingdom | | | — | | | | 9,833,444 | | | | — | | | | 9,833,444 | |
Ireland | | | 4,564,287 | | | | — | | | | — | | | | 4,564,287 | |
| Mutual Funds | | | 2,722,233 | | | | — | | | | — | | | | 2,722,233 | |
| Total | | | $756,106,829 | | | | $9,833,444 | | | | $— | | | | $765,940,273 | |
For further information regarding security characteristics, see the Portfolio of Investments.
Foreign Currency Translation – Purchases and sales of foreign investments, income, and expenses are converted into U.S. dollars based upon currency exchange rates prevailing on the respective dates of such transactions or on the reporting date for foreign denominated receivables and payables. Gains and losses attributable to foreign currency exchange rates on sales of securities are recorded for financial statement purposes as net realized gains and losses on investments. Gains and losses attributable to foreign exchange rate movements on receivables, payables, income and expenses are recorded for financial statement purposes as foreign currency transaction gains and losses. That portion of both realized and unrealized gains and losses on investments that results from fluctuations in foreign currency exchange rates is not separately disclosed.
Security Loans – Under its Securities Lending Agency Agreement with the fund, State Street Bank and Trust Company, as lending agent, loans the securities of the fund to certain qualified institutions (the “Borrowers”) approved by the fund. Security loans can be terminated at the discretion of either the lending agent or the fund and the related securities must be returned within the earlier of the standard trade settlement period for such securities or within three business days. The loans are collateralized by cash and/or U.S. Treasury and federal agency obligations in an amount typically at least equal to the market value of the securities loaned. On loans collateralized by cash, the cash collateral is invested in a money market fund. The market value of the loaned securities is determined at the close of business of the fund and any additional required collateral is delivered to the fund on the next business day. The lending agent provides the fund with indemnification against Borrower default. In the event of Borrower default, the lending agent will, for the benefit of the fund, either purchase securities identical to those loaned or, when such purchase is commercially impracticable, pay the fund the market value of the loaned securities. In return, the lending agent assumes the fund’s rights to the related collateral. If the collateral value is less than the cost to purchase identical securities, the lending agent is responsible for the shortfall, but only to the extent that such shortfall is not due to a decline in collateral value resulting from collateral reinvestment for which the fund bears the risk of loss. A portion of the income generated upon investment of the collateral is remitted to the Borrowers, and the remainder is allocated between the fund and the lending agent. On loans collateralized by U.S. Treasury and/or federal agency obligations, a fee is received from the Borrower, and is allocated between the fund and the lending agent. Income from securities lending is separately reported in the Statement of Operations. The dividend and interest income earned on the securities loaned is accounted for in the same manner as other dividend and interest income. At December 31, 2020, there were no securities on loan or collateral outstanding.
Indemnifications – Under the fund’s organizational documents, its officers and Trustees may be indemnified against certain liabilities and expenses arising out of the performance of their duties to the fund. Additionally, in the normal course of business, the
15
MFS Investors Trust Series
Notes to Financial Statements – continued
fund enters into agreements with service providers that may contain indemnification clauses. The fund’s maximum exposure under these agreements is unknown as this would involve future claims that may be made against the fund that have not yet occurred.
Investment Transactions and Income – Investment transactions are recorded on the trade date. Dividends received in cash are recorded on the ex-dividend date. Certain dividends from foreign securities will be recorded when the fund is informed of the dividend if such information is obtained subsequent to the ex-dividend date. Dividend payments received in additional securities are recorded on the ex-dividend date in an amount equal to the value of the security on such date.
The fund may receive proceeds from litigation settlements. Any proceeds received from litigation involving portfolio holdings are reflected in the Statement of Operations in realized gain/loss if the security has been disposed of by the fund or in unrealized gain/loss if the security is still held by the fund. Any other proceeds from litigation not related to portfolio holdings are reflected as other income in the Statement of Operations.
Tax Matters and Distributions – The fund intends to qualify as a regulated investment company, as defined under Subchapter M of the Internal Revenue Code, and to distribute all of its taxable income, including realized capital gains. As a result, no provision for federal income tax is required. The fund’s federal tax returns, when filed, will remain subject to examination by the Internal Revenue Service for a three year period. Management has analyzed the fund’s tax positions taken on federal and state tax returns for all open tax years and does not believe that there are any uncertain tax positions that require recognition of a tax liability. Foreign taxes, if any, have been accrued by the fund in the accompanying financial statements in accordance with the applicable foreign tax law. Foreign income taxes may be withheld by certain countries in which the fund invests. Additionally, capital gains realized by the fund on securities issued in or by certain foreign countries may be subject to capital gains tax imposed by those countries.
Distributions to shareholders are recorded on the ex-dividend date. Income and capital gain distributions are determined in accordance with income tax regulations, which may differ from U.S. generally accepted accounting principles. Certain capital accounts in the financial statements are periodically adjusted for permanent differences in order to reflect their tax character. These adjustments have no impact on net assets or net asset value per share. Temporary differences which arise from recognizing certain items of income, expense, gain or loss in different periods for financial statement and tax purposes will reverse at some time in the future.
Book/tax differences primarily relate to wash sale loss deferrals and partnership adjustments.
The tax character of distributions declared to shareholders for the last two fiscal years is as follows:
| | | | | | | | |
| | | Year ended
12/31/20 | | | Year ended
12/31/19 | |
| Ordinary income (including any short-term capital gains) | | | $3,919,176 | | | | $5,420,196 | |
| Long-term capital gains | | | 21,186,214 | | | | 36,857,063 | |
| Total distributions | | | $25,105,390 | | | | $42,277,259 | |
The federal tax cost and the tax basis components of distributable earnings were as follows:
| | | | |
| As of 12/31/20 | | | | |
| |
| Cost of investments | | | $375,982,282 | |
| Gross appreciation | | | 393,194,681 | |
| Gross depreciation | | | (3,236,690 | ) |
| Net unrealized appreciation (depreciation) | | | $389,957,991 | |
| |
| Undistributed ordinary income | | | 4,410,501 | |
| Undistributed long-term capital gain | | | 25,400,697 | |
| Other temporary differences | | | 2,229,658 | |
Multiple Classes of Shares of Beneficial Interest – The fund offers multiple classes of shares, which differ in their respective distribution and/or service fees. The fund’s income, realized and unrealized gain (loss), and common expenses are allocated to shareholders based on the daily net assets of each class. Dividends are declared separately for each class. Differences in per share dividend rates are generally due to differences in separate class expenses. The fund’s distributions declared to shareholders as reported in the Statements of Changes in Net Assets are presented by class as follows:
| | | | | | | | |
| | |
| | | Year ended
12/31/20 | | | Year ended
12/31/19 | |
| Initial Class | | | $9,047,272 | | | | $16,490,409 | |
| Service Class | | | 16,058,118 | | | | 25,786,850 | |
| Total | | | $25,105,390 | | | | $42,277,259 | |
16
MFS Investors Trust Series
Notes to Financial Statements – continued
| (3) | | Transactions with Affiliates |
Investment Adviser – The fund has an investment advisory agreement with MFS to provide overall investment management and related administrative services and facilities to the fund. The management fee is computed daily and paid monthly at the following annual rates based on the fund’s average daily net assets:
| | | | |
| Up to $1 billion | | | 0.75% | |
| In excess of $1 billion and up to $2.5 billion | | | 0.65% | |
| In excess of $2.5 billion | | | 0.60% | |
MFS has agreed in writing to reduce its management fee by a specified amount if certain MFS mutual fund assets exceed thresholds agreed to by MFS and the fund’s Board of Trustees. For the year ended December 31, 2020, this management fee reduction amounted to $76,296, which is included in the reduction of total expenses in the Statement of Operations. The management fee incurred for the year ended December 31, 2020 was equivalent to an annual effective rate of 0.74% of the fund’s average daily net assets.
The investment adviser has agreed in writing to pay a portion of the fund’s total annual operating expenses, excluding interest, taxes, extraordinary expenses, brokerage and transaction costs, and investment-related expenses, such that total annual operating expenses do not exceed 0.79% of average daily net assets for the Initial Class shares and 1.04% of average daily net assets for the Service Class shares. This written agreement will continue until modified by the fund’s Board of Trustees, but such agreement will continue at least until April 30, 2022. For the year ended December 31, 2020, the fund’s actual operating expenses did not exceed the limit and therefore, the investment adviser did not pay any portion of the fund’s expenses related to this agreement.
Distributor – MFS Fund Distributors, Inc. (MFD), a wholly-owned subsidiary of MFS, is the distributor of shares of the fund. The Trustees have adopted a distribution plan for the Service Class shares pursuant to Rule 12b-1 under the Investment Company Act of 1940.
The fund’s distribution plan provides that the fund will pay MFD distribution and/or service fees equal to 0.25% per annum of its average daily net assets attributable to Service Class shares as partial consideration for services performed and expenses incurred by MFD and financial intermediaries (including participating insurance companies that invest in the fund to fund variable annuity and variable life insurance contracts, sponsors of qualified retirement and pension plans that invest in the fund, and affiliates of these participating insurance companies and plan sponsors) in connection with the sale and distribution of the Service Class shares. MFD may subsequently pay all, or a portion, of the distribution and/or service fees to financial intermediaries.
Shareholder Servicing Agent – MFS Service Center, Inc. (MFSC), a wholly-owned subsidiary of MFS, receives a fee from the fund for its services as shareholder servicing agent. For the year ended December 31, 2020, the fee was $30,550, which equated to 0.0044% annually of the fund’s average daily net assets. MFSC also receives reimbursement from the fund for out-of-pocket expenses paid by MFSC on behalf of the fund. For the year ended December 31, 2020, these costs amounted to $1,530.
Administrator – MFS provides certain financial, legal, shareholder communications, compliance, and other administrative services to the fund. Under an administrative services agreement, the fund reimburses MFS the costs incurred to provide these services. The fund is charged an annual fixed amount of $17,500 plus a fee based on average daily net assets. The administrative services fee incurred for the year ended December 31, 2020 was equivalent to an annual effective rate of 0.0147% of the fund’s average daily net assets.
Trustees’ and Officers’ Compensation – The fund pays compensation to independent Trustees in the form of a retainer, attendance fees, and additional compensation to Board and Committee chairpersons. The fund does not pay compensation directly to Trustees or officers of the fund who are also officers of the investment adviser, all of whom receive remuneration from MFS for their services to the fund. Certain officers and Trustees of the fund are officers or directors of MFS, MFD, and MFSC.
Other – The fund invests in the MFS Institutional Money Market Portfolio which is managed by MFS and seeks current income consistent with preservation of capital and liquidity. This money market fund does not pay a management fee to MFS but does incur investment and operating costs.
The fund is permitted to engage in purchase and sale transactions with funds and accounts for which MFS serves as investment adviser or sub-adviser (“cross-trades”) pursuant to a policy adopted by the Board of Trustees. This policy has been designed to ensure that cross-trades conducted by the fund comply with Rule 17a-7 under the Investment Company Act of 1940. During the year ended December 31, 2020, the fund engaged in purchase transactions pursuant to this policy, which amounted to $169,780.
The adviser has voluntarily undertaken to reimburse the fund from its own resources on a quarterly basis for the cost of investment research embedded in the cost of the fund’s securities trades. This agreement may be rescinded at any time. For the year ended December 31, 2020, this reimbursement amounted to $21,800, which is included in “Other” income in the Statement of Operations.
17
MFS Investors Trust Series
Notes to Financial Statements – continued
For the year ended December 31, 2020, purchases and sales of investments, other than short-term obligations, aggregated $128,195,186 and $163,206,330, respectively.
| (5) | | Shares of Beneficial Interest |
The fund’s Declaration of Trust permits the Trustees to issue an unlimited number of full and fractional shares of beneficial interest. Transactions in fund shares were as follows:
| | | | | | | | | | | | | | | | |
| | | Year ended 12/31/20 | | | Year ended 12/31/19 | |
| | | | |
| | | Shares | | | Amount | | | Shares | | | Amount | |
| Shares sold | | | | | | | | | | | | | | | | |
Initial Class | | | 284,529 | | | | $8,347,359 | | | | 273,184 | | | | $8,234,981 | |
Service Class | | | 1,666,170 | | | | 49,859,186 | | | | 2,049,570 | | | | 63,025,793 | |
| | | 1,950,699 | | | | $58,206,545 | | | | 2,322,754 | | | | $71,260,774 | |
| | | | |
| Shares issued to shareholders in reinvestment of distributions | | | | | | | | | | | | | | | | |
Initial Class | | | 267,829 | | | | $9,047,272 | | | | 543,879 | | | | $16,490,409 | |
Service Class | | | 482,660 | | | | 16,058,118 | | | | 862,725 | | | | 25,786,850 | |
| | | 750,489 | | | | $25,105,390 | | | | 1,406,604 | | | | $42,277,259 | |
| | | | |
| Shares reacquired | | | | | | | | | | | | | | | | |
Initial Class | | | (1,154,860 | ) | | | $(37,139,929 | ) | | | (1,410,131 | ) | | | $(44,272,121 | ) |
Service Class | | | (2,192,948 | ) | | | (69,975,183 | ) | | | (1,272,751 | ) | | | (39,393,023 | ) |
| | | (3,347,808 | ) | | | $(107,115,112 | ) | | | (2,682,882 | ) | | | $(83,665,144 | ) |
| | | | |
| Net change | | | | | | | | | | | | | | | | |
Initial Class | | | (602,502 | ) | | | $(19,745,298 | ) | | | (593,068 | ) | | | $(19,546,731 | ) |
Service Class | | | (44,118 | ) | | | (4,057,879 | ) | | | 1,639,544 | | | | 49,419,620 | |
| | | (646,620 | ) | | | $(23,803,177 | ) | | | 1,046,476 | | | | $29,872,889 | |
The fund and certain other funds managed by MFS participate in a $1.25 billion unsecured committed line of credit of which $1 billion is reserved for use by the fund and certain other U.S. funds. The line of credit is provided by a syndicate of banks under a credit agreement. Borrowings may be made for temporary financing needs. Interest is charged to each fund, based on its borrowings, generally at a rate equal to the highest of one month LIBOR, the Federal Funds Effective Rate and the Overnight Bank Funding Rate, plus an agreed upon spread. A commitment fee, based on the average daily, unused portion of the committed line of credit, is allocated among the participating funds. In addition, the fund and other funds managed by MFS have established unsecured uncommitted borrowing arrangements with certain banks for temporary financing needs. Interest is charged to each fund, based on its borrowings, at rates equal to customary reference rates plus an agreed upon spread. For the year ended December 31, 2020, the fund’s commitment fee and interest expense were $3,353 and $0, respectively, and are included in “Miscellaneous” expense in the Statement of Operations.
| (7) | | Investments in Affiliated Issuers |
An affiliated issuer may be considered one in which the fund owns 5% or more of the outstanding voting securities, or a company which is under common control. For the purposes of this report, the following were affiliated issuers:
| | | | | | | | | | | | | | | | | | | | | | | | |
| Affiliated Issuers | | Beginning
Value | | | Purchases | | | Sales
Proceeds | | | Realized
Gain
(Loss) | | | Change in
Unrealized
Appreciation or
Depreciation | | | Ending
Value | |
| MFS Institutional Money Market Portfolio | | | $11,859,653 | | | | $74,743,209 | | | | $83,878,371 | | | | $(2,280 | ) | | | $22 | | | | $2,722,233 | |
| | | | | | |
| Affiliated Issuers | | | | | | | | | | | | | | Dividend
Income | | | Capital Gain
Distributions | |
| MFS Institutional Money Market Portfolio | | | | | | | | | | | | $58,140 | | | | $— | |
The pandemic related to the global spread of novel coronavirus disease (COVID-19), which was first detected in December 2019, has resulted in significant disruptions to global business activity and the global economy, as well as the economies of individual countries, the financial performance of individual companies and sectors, and the securities and commodities markets in general. This pandemic, the full effects of which are still unknown, has resulted in substantial market volatility and may have adversely impacted the prices and liquidity of the fund’s investments and the fund’s performance.
18
MFS Investors Trust Series
REPORT OF INDEPENDENT REGISTERED PUBLIC ACCOUNTING FIRM
To the Board of Trustees of MFS Variable Insurance Trust and the Shareholders of
MFS Investors Trust Series:
Opinion on the Financial Statements and Financial Highlights
We have audited the accompanying statement of assets and liabilities of MFS Investors Trust Series (the “Fund”), including the portfolio of investments, as of December 31, 2020, the related statement of operations for the year then ended, the statements of changes in net assets for each of the two years in the period then ended, the financial highlights for each of the five years in the period then ended, and the related notes. In our opinion, the financial statements and financial highlights present fairly, in all material respects, the financial position of the Fund as of December 31, 2020, and the results of its operations for the year then ended, the changes in its net assets for each of the two years in the period then ended, and the financial highlights for each of the five years in the period then ended, in conformity with accounting principles generally accepted in the United States of America.
Basis for Opinion
These financial statements and financial highlights are the responsibility of the Fund’s management. Our responsibility is to express an opinion on the Fund’s financial statements and financial highlights based on our audits. We are a public accounting firm registered with the Public Company Accounting Oversight Board (United States) (PCAOB) and are required to be independent with respect to the Fund in accordance with the U.S. federal securities laws and the applicable rules and regulations of the Securities and Exchange Commission and the PCAOB.
We conducted our audits in accordance with the standards of the PCAOB. Those standards require that we plan and perform the audit to obtain reasonable assurance about whether the financial statements and financial highlights are free of material misstatement, whether due to error or fraud. The Fund is not required to have, nor were we engaged to perform, an audit of its internal control over financial reporting. As part of our audits, we are required to obtain an understanding of internal control over financial reporting but not for the purpose of expressing an opinion on the effectiveness of the Fund’s internal control over financial reporting. Accordingly, we express no such opinion.
Our audits included performing procedures to assess the risks of material misstatement of the financial statements and financial highlights, whether due to error or fraud, and performing procedures that respond to those risks. Such procedures included examining, on a test basis, evidence regarding the amounts and disclosures in the financial statements and financial highlights. Our audits also included evaluating the accounting principles used and significant estimates made by management, as well as evaluating the overall presentation of the financial statements and financial highlights. Our procedures included confirmation of securities owned as of December 31, 2020, by correspondence with the custodian and brokers; when replies were not received from brokers, we performed other auditing procedures. We believe that our audits provide a reasonable basis for our opinion.
DELOITTE & TOUCHE LLP
Boston, Massachusetts
February 16, 2021
We have served as the auditor of one or more of the MFS investment companies since 1924.
19
MFS Investors Trust Series
TRUSTEES AND OFFICERS – IDENTIFICATION AND BACKGROUND
The Trustees and Officers of the Trust, as of February 1, 2021, are listed below, together with their principal occupations during the past five years. (Their titles may have varied during that period.) The address of each Trustee and Officer is 111 Huntington Avenue, Boston, Massachusetts 02199-7618.
| | | | | | | | | | |
Name, Age | | Position(s)
Held with Fund | | Trustee/Officer
Since (h) | | Number of MFS Funds
overseen by the
Trustee | | Principal Occupations
During the Past Five Years | | Other Directorships During the Past Five Years (j) |
| INTERESTED TRUSTEES |
Robert J. Manning (k)
(age 57) | | Trustee | | February 2004 | | 134 | | Massachusetts Financial Services Company, Non-Executive Chairman (since January 2021); Director; Chairman of the Board; Executive Chairman (January 2017-2020); Co-Chief Executive Officer (2015-2016) | | N/A |
| | | | | |
Michael W. Roberge (k) (age 54) | | Trustee | | January 2021 | | 134 | | Massachusetts Financial Services Company, Chairman (since January 2021); Chief Executive Officer (since January 2017); Director; President (until December 2018); Chief Investment Officer (until December 2018); Co-Chief Executive Officer (until December 2016) | | N/A |
|
| INDEPENDENT TRUSTEES |
John P. Kavanaugh (age 66) | | Trustee and Chair of Trustees | | January 2009 | | 134 | | Private investor | | N/A |
| | | | | |
Steven E. Buller (age 69) | | Trustee | | February 2014 | | 134 | | Private investor | | N/A |
| | | | | |
John A. Caroselli (age 66) | | Trustee | | March 2017 | | 134 | | Private investor; JC Global Advisors, LLC (management consulting), President (since 2015) | | N/A |
| | | | | |
Maureen R. Goldfarb (age 65) | | Trustee | | January 2009 | | 134 | | Private investor | | N/A |
| | | | | |
Peter D. Jones
(age 65) | | Trustee | | January 2019 | | 134 | | Private investor | | N/A |
| | | | | |
James W. Kilman, Jr.
(age 59) | | Trustee | | January 2019 | | 134 | | Burford Capital Limited (finance and investment management), Chief Financial Officer (since 2019); KielStrand Capital LLC (family office), Chief Executive Officer (since 2016); Morgan Stanley & Co. (financial services), Vice Chairman of Investment Banking, Co-Head of Diversified Financials Coverage – Financial Institutions Investment Banking Group (until 2016) | | Alpha-En Corporation, Director (2016-2019) |
| | | | | |
Clarence Otis, Jr. (age 64) | | Trustee | | March 2017 | | 134 | | Private investor | | VF Corporation, Director; Verizon Communications, Inc., Director; The Travelers Companies, Director |
| | | | | |
Maryanne L. Roepke (age 64) | | Trustee | | May 2014 | | 134 | | Private investor | | N/A |
| | | | | |
Laurie J. Thomsen
(age 63) | | Trustee | | March 2005 | | 134 | | Private investor | | The Travelers Companies, Director; Dycom Industries, Inc., Director |
20
MFS Investors Trust Series
Trustees and Officers – continued
| | | | | | | | |
Name, Age | | Position(s)
Held with Fund | | Trustee/Officer
Since (h) | | Number of
MFS Funds
for which the
Person is an
Officer | | Principal Occupations
During the Past Five Years |
| OFFICERS | | | | | | |
Christopher R. Bohane (k)
(age 47) | | Assistant Secretary and Assistant Clerk | | July 2005 | | 134 | | Massachusetts Financial Services Company, Senior Vice President and Associate General Counsel |
| | | | |
Kino Clark (k) (age 52) | | Assistant Treasurer | | January 2012 | | 134 | | Massachusetts Financial Services Company, Vice President |
| | | | |
John W. Clark, Jr. (k) (age 53) | | Assistant Treasurer | | April 2017 | | 134 | | Massachusetts Financial Services Company, Vice President (since March 2017); Deutsche Bank (financial services), Department Head – Treasurer’s Office (until February 2017) |
| | | | |
Thomas H. Connors (k) (age 61) | | Assistant Secretary and Assistant Clerk | | September 2012 | | 134 | | Massachusetts Financial Services Company, Vice President and Senior Counsel |
| | | | |
David L. DiLorenzo (k)
(age 52) | | President | | July 2005 | | 134 | | Massachusetts Financial Services Company, Senior Vice President |
| | | | |
Heidi W. Hardin (k) (age 53) | | Secretary and Clerk | | April 2017 | | 134 | | Massachusetts Financial Services Company, Executive Vice President and General Counsel (since March 2017); Harris Associates (investment management), General Counsel (until January 2017) |
| | | | |
Brian E. Langenfeld (k) (age 47) | | Assistant
Secretary and Assistant Clerk | | June 2006 | | 134 | | Massachusetts Financial Services Company, Vice President and Senior Counsel |
| | | | |
Amanda S. Mooradian (k) (age 41) | | Assistant
Secretary and Assistant Clerk | | September 2018 | | 134 | | Massachusetts Financial Services Company, Assistant Vice President and Senior Counsel |
| | | | |
Susan A. Pereira (k)
(age 50) | | Assistant
Secretary and Assistant Clerk | | July 2005 | | 134 | | Massachusetts Financial Services Company, Vice President and Assistant General Counsel |
| | | | |
Kasey L. Phillips (k) (age 50) | | Assistant Treasurer | | September 2012 | | 134 | | Massachusetts Financial Services Company, Vice President |
| | | | |
Matthew A. Stowe (k) (age 46) | | Assistant Secretary and Assistant Clerk | | October 2014 | | 134 | | Massachusetts Financial Services Company, Vice President and Assistant General Counsel |
| | | | |
Martin J. Wolin (k) (age 53) | | Chief Compliance Officer | | July 2015 | | 134 | | Massachusetts Financial Services Company, Senior Vice President and Chief Compliance Officer |
| | | | |
James O. Yost (k)
(age 60) | | Treasurer | | September 1990 | | 134 | | Massachusetts Financial Services Company, Senior Vice President |
| (h) | Date first appointed to serve as Trustee/officer of an MFS Fund. Each Trustee has served continuously since appointment unless indicated otherwise. For the period from December 15, 2004 until February 22, 2005, Mr. Manning served as Advisory Trustee. From January 2012 through December 2016, Messrs. DiLorenzo and Yost served as Treasurer and Deputy Treasurer of the Funds, respectively. |
| (j) | Directorships or trusteeships of companies required to report to the Securities and Exchange Commission (i.e., “public companies”). |
| (k) | “Interested person” of the Trust within the meaning of the Investment Company Act of 1940 (referred to as the 1940 Act), which is the principal federal law governing investment companies like the fund, as a result of a position with MFS. The address of MFS is 111 Huntington Avenue, Boston, Massachusetts 02199-7618. |
Each Trustee (other than Messrs. Jones, Kilman and Roberge) has been elected by shareholders and each Trustee and Officer holds office until his or her successor is chosen and qualified or until his or her earlier death, resignation, retirement or removal. Mr. Roberge became a Trustee of the Funds on January 1, 2021 and Messrs. Jones and Kilman became Trustees of the Funds on January 1, 2019. The Trust does not hold annual meetings for the purpose of electing Trustees, and Trustees are not elected for fixed terms. Under the terms of the Board’s retirement policy, an Independent Trustee shall retire at the end of the calendar year in which he or she reaches the earlier of 75 years of age or 15 years of service on the Board (or, in the case of any Independent Trustee who joined the Board prior to 2015, 20 years of service on the Board).
Messrs. Buller, Kilman and Otis and Ms. Roepke are members of the Trust’s Audit Committee.
21
MFS Investors Trust Series
Trustees and Officers – continued
Each of the Interested Trustees and certain Officers hold comparable officer positions with certain affiliates of MFS.
The Statement of Additional Information for a Fund includes further information about the Trustees and is available without charge upon request by calling 1-800-225-2606.
| | |
Investment Adviser Massachusetts Financial Services Company 111 Huntington Avenue Boston, MA 02199-7618 | | Custodian State Street Bank and Trust Company 1 Lincoln Street Boston, MA 02111-2900 |
| |
Distributor MFS Fund Distributors, Inc. 111 Huntington Avenue Boston, MA 02199-7618 | | Independent Registered Public Accounting Firm Deloitte & Touche LLP 200 Berkeley Street Boston, MA 02116 |
| |
Portfolio Manager(s) Kevin Beatty Alison O’Neill Mackey Ted Maloney | | |
22
MFS Investors Trust Series
BOARD REVIEW OF INVESTMENT ADVISORY AGREEMENT
MFS Investors Trust Series
The Investment Company Act of 1940 requires that both the full Board of Trustees and a majority of the non-interested (“independent”) Trustees, voting separately, annually approve the continuation of the Fund’s investment advisory agreement with MFS. The Trustees consider matters bearing on the Fund and its advisory arrangements at their meetings throughout the year, including a review of performance data at each regular meeting. In addition, the independent Trustees met several times by videoconference (in accordance with Securities and Exchange Commission relief) over the course of three months beginning in May and ending in July, 2020 (“contract review meetings”) for the specific purpose of considering whether to approve the continuation of the investment advisory agreement for the Fund and the other investment companies that the Board oversees (the “MFS Funds”). The independent Trustees were assisted in their evaluation of the Fund’s investment advisory agreement by independent legal counsel, from whom they received separate legal advice and with whom they met separately from MFS during various contract review meetings. The independent Trustees were also assisted in this process by an independent consultant who was retained by and reported to the independent Trustees.
In connection with their deliberations regarding the continuation of the investment advisory agreement, the Trustees, including the independent Trustees, considered such information and factors as they believed, in light of the legal advice furnished to them and their own business judgment, to be relevant. The investment advisory agreement for the Fund was considered separately, although the Trustees also took into account the common interests of all MFS Funds in their review. As described below, the Trustees considered the nature, quality, and extent of the various investment advisory, administrative, and shareholder services performed by MFS under the existing investment advisory agreement and other arrangements with the Fund.
In connection with their contract review meetings, the Trustees received and relied upon materials that included, among other items: (i) information provided by Broadridge Financial Solutions, Inc. (“Broadridge”), an independent third party, on the investment performance of the Fund for various time periods ended December 31, 2019 and the investment performance of a group of funds with substantially similar investment classifications/objectives (the “Broadridge performance universe”), (ii) information provided by Broadridge on the Fund’s advisory fees and other expenses and the advisory fees and other expenses of comparable funds identified by Broadridge as well as all other funds in the same investment classification/category (the “Broadridge expense group and universe”), (iii) information provided by MFS on the advisory fees of portfolios of other clients of MFS, including institutional separate accounts and other clients, (iv) information as to whether and to what extent applicable expense waivers, reimbursements or fee “breakpoints” are observed for the Fund, (v) information regarding MFS’ financial results and financial condition, including MFS’ and certain of its affiliates’ estimated profitability from services performed for the Fund and the MFS Funds as a whole, and compared to MFS’ institutional business, (vi) MFS’ views regarding the outlook for the mutual fund industry and the strategic business plans of MFS, (vii) descriptions of various functions performed by MFS for the Funds, such as compliance monitoring and portfolio trading practices, and (viii) information regarding the overall organization of MFS, including information about MFS’ senior management and other personnel providing investment advisory, administrative and other services to the Fund and the other MFS Funds. The comparative performance, fee and expense information prepared and provided by Broadridge was not independently verified and the independent Trustees did not independently verify any information provided to them by MFS.
The Trustees’ conclusion as to the continuation of the investment advisory agreement was based on a comprehensive consideration of all information provided to the Trustees and not the result of any single factor. Some of the factors that figured particularly in the Trustees’ deliberations are described below, although individual Trustees may have evaluated the information presented differently from one another, giving different weights to various factors. It is also important to recognize that the fee arrangements for the Fund and other MFS Funds are the result of years of review and discussion between the independent Trustees and MFS, that certain aspects of such arrangements may receive greater scrutiny in some years than in others, and that the Trustees’ conclusions may be based, in part, on their consideration of these same arrangements during the course of the year and in prior years.
Based on information provided by Broadridge and MFS, the Trustees reviewed the Fund’s total return investment performance as well as the Broadridge performance universe over various time periods. The Trustees placed particular emphasis on the total return performance of the Fund’s Initial Class shares in comparison to the performance of funds in its Broadridge performance universe over the five-year period ended December 31, 2019, which the Trustees believed was a long enough period to reflect differing market conditions. The total return performance of the Fund’s Initial Class shares was in the 3rd quintile relative to the other funds in the universe for this five-year period (the 1st quintile being the best performers and the 5th quintile being the worst performers). The total return performance of the Fund’s Initial Class shares was in the 2nd quintile for each of the one- and three-year periods ended December 31, 2019 relative to the Broadridge performance universe. Because of the passage of time, these performance results may differ from the performance results for more recent periods, including those shown elsewhere in this report.
In the course of their deliberations, the Trustees took into account information provided by MFS in connection with the contract review meetings, as well as during investment review meetings conducted with portfolio management personnel during the course
23
MFS Investors Trust Series
Board Review of Investment Advisory Agreement – continued
of the year regarding the Fund’s performance. After reviewing these and related factors, the Trustees concluded, within the context of their overall conclusions regarding the investment advisory agreement, that they were satisfied with MFS’ responses and efforts relating to investment performance.
In assessing the reasonableness of the Fund’s advisory fee, the Trustees considered, among other information, the Fund’s advisory fee and the total expense ratio of the Fund’s Initial Class shares as a percentage of average daily net assets and the advisory fee and total expense ratios of the Broadridge expense group based on information provided by Broadridge. The Trustees considered that MFS currently observes an expense limitation for the Fund, which may not be changed without the Trustees’ approval. The Trustees also considered that, according to the data provided by Broadridge (which takes into account any fee reductions or expense limitations that were in effect during the Fund’s last fiscal year), the Fund’s effective advisory fee rate and total expense ratio were each higher than the Broadridge expense group median.
The Trustees also considered the advisory fees charged by MFS to any institutional separate accounts advised by MFS (“separate accounts”) and unaffiliated investment companies for which MFS serves as subadviser (“subadvised funds”) that have comparable investment strategies to the Fund, if any. In comparing these fees, the Trustees considered information provided by MFS as to the generally broader scope of services provided by MFS to the Fund, as well as the more extensive regulatory burdens imposed on MFS in managing the Fund, in comparison to separate accounts and subadvised funds. The Trustees also considered the higher demands placed on MFS’ investment personnel and trading infrastructure as a result of the daily cash in-flows and out-flows of the Fund in comparison to separate accounts.
The Trustees also considered whether the Fund may benefit from any economies of scale in the management of the Fund in the event of growth in assets of the Fund and/or growth in assets of the MFS Funds as a whole. They noted that the Fund’s advisory fee rate schedule is subject to contractual breakpoints that reduce the Fund’s advisory fee rate on average daily net assets over $1 billion and $2.5 billion. The Trustees also noted that MFS has agreed in writing to waive a portion of the management fees of certain MFS Funds, including the Fund, if the total combined assets of certain funds within the MFS Funds’ complex increase above agreed upon thresholds (the “group fee waiver”), enabling the Fund’s shareholders to share in the benefits from any economies of scale at the complex level. The group fee waiver is reviewed and renewed annually between the Board and MFS. The Trustees concluded that the breakpoints and the group fee waiver were sufficient to allow the Fund to benefit from economies of scale as its assets and overall complex assets grow.
The Trustees also considered information prepared by MFS relating to MFS’ costs and profits with respect to the Fund, the MFS Funds considered as a group, and other investment companies and accounts advised by MFS, as well as MFS’ methodologies used to determine and allocate its costs to the MFS Funds, the Fund and other accounts and products for purposes of estimating profitability.
After reviewing these and other factors described herein, the Trustees concluded, within the context of their overall conclusions regarding the investment advisory agreement, that the advisory fees charged to the Fund represent reasonable compensation in light of the services being provided by MFS to the Fund.
In addition, the Trustees considered MFS’ resources and related efforts to continue to retain, attract and motivate capable personnel to serve the Fund. The Trustees also considered current and developing conditions in the financial services industry, including the presence of large and well-capitalized companies which are spending, and appear to be prepared to continue to spend, substantial sums to engage personnel and to provide services to competing investment companies. In this regard, the Trustees also considered the financial resources of MFS and its ultimate parent, Sun Life Financial Inc. The Trustees also considered the advantages and possible disadvantages to the Fund of having an adviser that also serves other investment companies as well as other accounts.
The Trustees also considered the nature, quality, cost, and extent of administrative, transfer agency, and distribution services provided to the Fund by MFS and its affiliates under agreements and plans other than the investment advisory agreement, including any 12b-1 fees the Fund pays to MFS Fund Distributors, Inc., an affiliate of MFS. The Trustees also considered the nature, extent and quality of certain other services MFS performs or arranges for on the Fund’s behalf, which may include securities lending programs, directed expense payment programs, class action recovery programs, and MFS’ interaction with third-party service providers, principally custodians and sub-custodians. The Trustees concluded that the various non-advisory services provided by MFS and its affiliates on behalf of the Fund were satisfactory.
The Trustees considered so-called “fall-out benefits” to MFS such as reputational value derived from serving as investment manager to the MFS Funds. The Trustees also considered that MFS discontinued its historic practice of obtaining investment research from portfolio brokerage commissions paid by certain MFS Funds effective January 2018, and directly pays or voluntarily reimburses a Fund, if applicable, for the costs of external research acquired through the use of the Fund’s portfolio brokerage commissions.
Based on their evaluation of factors that they deemed to be material, including those factors described above, the Board of Trustees, including the independent Trustees, concluded that the Fund’s investment advisory agreement with MFS should be continued for an additional one-year period, commencing August 1, 2020.
24
MFS Investors Trust Series
PROXY VOTING POLICIES AND INFORMATION
MFS votes proxies on behalf of the fund pursuant to proxy voting policies and procedures that are available without charge, upon request, by calling 1-800-225-2606, by visiting mfs.com/proxyvoting, or by visiting the SEC Web site at http://www.sec.gov.
Information regarding how the fund voted proxies relating to portfolio securities during the most recent twelve-month period ended June 30 is available by August 31 of each year without charge by visiting mfs.com/proxyvoting, or by visiting the SEC’s Web site at http://www.sec.gov.
QUARTERLY PORTFOLIO DISCLOSURE
The fund files a complete schedule of portfolio holdings with the SEC for the first and third quarters of each fiscal year as an exhibit to its reports on Form N-PORT. The fund’s Form N-PORT reports are available on the SEC’s Web site at http://www.sec.gov. A shareholder can obtain the portfolio holdings report for the first and third quarters of the fund’s fiscal year at mfs.com/vit1 by choosing the fund’s name and then scrolling to the “Resources” section and clicking on the “Prospectus and Reports” tab.
FURTHER INFORMATION
From time to time, MFS may post important information about the fund or the MFS funds on the MFS Web site (mfs.com). This information is available at https://www.mfs.com/announcements or at mfs.com/vit1 by choosing the fund’s name and then scrolling to the “Resources” section and clicking on the “Announcements” tab, if any.
INFORMATION ABOUT FUND CONTRACTS AND LEGAL CLAIMS
The fund has entered into contractual arrangements with an investment adviser, administrator, distributor, shareholder servicing agent, 529 program manager (if applicable), and custodian who each provide services to the fund. Unless expressly stated otherwise, shareholders are not parties to, or intended beneficiaries of these contractual arrangements, and these contractual arrangements are not intended to create any shareholder right to enforce them against the service providers or to seek any remedy under them against the service providers, either directly or on behalf of the fund.
Under the Trust’s By-Laws and Declaration of Trust, any claims asserted against or on behalf of the MFS Funds, including claims against Trustees and Officers, must be brought in state and federal courts located within the Commonwealth of Massachusetts.
FEDERAL TAX INFORMATION (unaudited)
The following information is provided pursuant to provisions of the Internal Revenue Code.
The fund designates $23,305,000 as capital gain dividends paid during the fiscal year.
For corporate shareholders, 100% of the ordinary income dividends paid during the fiscal year qualify for the corporate dividends received deduction.
25
rev. 3/16
| | | | |
| | | |
| FACTS | | WHAT DOES MFS DO WITH YOUR
PERSONAL INFORMATION? | |  |
| | |
| Why? | | Financial companies choose how they share your personal information. Federal law gives consumers the right to limit some but not all sharing. Federal law also requires us to tell you how we collect, share, and protect your personal information. Please read this notice carefully to understand what we do. |
| | |
| What? | | The types of personal information we collect and share depend on the product or service you have with us. This information can include: • Social Security number and account balances • Account transactions and transaction history • Checking account information and wire transfer instructions When you are no longer our customer, we continue to share your information as described in this notice. |
| | |
| How? | | All financial companies need to share customers’ personal information to run their everyday business. In the section below, we list the reasons financial companies can share their customers’ personal information; the reasons MFS chooses to share; and whether you can limit this sharing. |
| | | | |
Reasons we can share your
personal information | | Does MFS share? | | Can you limit this
sharing? |
For our everyday business purposes – such as to process your transactions, maintain your account(s), respond to court orders and legal investigations, or report to credit bureaus | | Yes | | No |
For our marketing purposes – to offer our products and services to you | | No | | We don’t share |
| For joint marketing with other financial companies | | No | | We don’t share |
For our affiliates’ everyday business purposes – information about your transactions and experiences | | No | | We don’t share |
For our affiliates’ everyday business purposes – information about your creditworthiness | | No | | We don’t share |
| For nonaffiliates to market to you | | No | | We don’t share |
| | |
| | |
| Questions? | | Call 800-225-2606 or go to mfs.com. |
26
| | |
| Who we are |
| Who is providing this notice? | | MFS Funds, MFS Investment Management, MFS Institutional Advisors, Inc., and MFS Heritage Trust Company. |
| | |
| What we do |
| How does MFS protect my personal information? | | To protect your personal information from unauthorized access and use, we use security measures that comply with federal law. These measures include procedural, electronic, and physical safeguards for the protection of the personal information we collect about you. |
How does MFS
collect my personal information? | | We collect your personal information, for example, when you • open an account or provide account information • direct us to buy securities or direct us to sell your securities • make a wire transfer We also collect your personal information from others, such as credit bureaus, affiliates, or other companies. |
| Why can’t I limit all sharing? | | Federal law gives you the right to limit only • sharing for affiliates’ everyday business purposes – information about your creditworthiness • affiliates from using your information to market to you • sharing for nonaffiliates to market to you State laws and individual companies may give you additional rights to limit sharing. |
| | |
| Definitions |
| Affiliates | | Companies related by common ownership or control. They can be financial and nonfinancial companies. • MFS does not share personal information with affiliates, except for everyday business purposes as described on page one of this notice. |
| Nonaffiliates | | Companies not related by common ownership or control. They can be financial and nonfinancial companies. • MFS does not share with nonaffiliates so they can market to you. |
| Joint marketing | | A formal agreement between nonaffiliated financial companies that together market financial products or services to you. • MFS doesn’t jointly market. |
| | |
| Other important information |
| If you own an MFS product or receive an MFS service in the name of a third party such as a bank or broker-dealer, their privacy policy may apply to you instead of ours. |
27
Annual Report
December 31, 2020

MFS® Mid Cap Growth Series

MFS® Variable Insurance Trust
VMG-ANN
MFS® Mid Cap Growth Series
CONTENTS
The report is prepared for the general information of contract owners. It is authorized for distribution to prospective investors only when preceded or accompanied by a current prospectus.
NOT FDIC INSURED • MAY LOSE VALUE • NO BANK OR CREDIT UNION GUARANTEE • NOT A DEPOSIT • NOT INSURED BY ANY FEDERAL GOVERNMENT AGENCY OR NCUA/NCUSIF
MFS Mid Cap Growth Series
LETTER FROM THE CEO

Dear Contract Owners:
Markets experienced dramatic swings this year as the coronavirus pandemic brought the global economy to a standstill for several months early in the year. The speedy development of vaccines and therapeutics later brightened the economic and market outlook, but a great deal of uncertainty remains as case counts remain high, new variants of the virus are appearing and questions persist over how fast the vaccine can be made widely available. In the United States, political uncertainty eased after former Vice President Joe Biden won the presidential election and the Democrats gained control of a closely divided Senate.
Global central banks have taken aggressive steps to cushion the economic and market fallout related to the virus, and governments are deploying unprecedented levels of fiscal support. Additional U.S. stimulus is anticipated with the Democrats in the White House and in control of both houses of Congress. The measures already put in place have helped build a supportive environment and are encouraging economic recovery; however, if markets disconnect from fundamentals, they can sow the seeds of instability. As such, dramatic increases in speculative retail trading bear watching.
In the aftermath of the crisis, we could see societal changes as households, businesses, and governments adjust to a new reality, and any such alterations could affect the investment landscape. For investors, events such as the COVID-19 outbreak demonstrate the importance of having a deep understanding of company fundamentals, and we have built our global research platform to do just that.
At MFS®, we put our clients’ assets to work responsibly by carefully navigating the increasing complexity of our global markets and economies. Guided by our long-term philosophy and adhering to our commitment to sustainable investing, we tune out the noise and aim to uncover what we believe are the best, most durable investment opportunities in the market. Our unique global investment platform combines collective expertise, long-term discipline and thoughtful risk management to create sustainable value for investors.
Respectfully,

Michael W. Roberge
Chief Executive Officer
MFS Investment Management
February 16, 2021
The opinions expressed in this letter are subject to change and may not be relied upon for investment advice. No forecasts can be guaranteed.
1
MFS Mid Cap Growth Series
PORTFOLIO COMPOSITION
Portfolio structure

| | | | |
| Top ten holdings | | | | |
| Cadence Design Systems, Inc. | | | 2.9% | |
| Bright Horizons Family Solutions, Inc. | | | 2.6% | |
| PerkinElmer, Inc. | | | 2.5% | |
| Monolithic Power Systems, Inc. | | | 2.5% | |
| Take-Two Interactive Software, Inc. | | | 2.4% | |
| MSCI, Inc. | | | 2.2% | |
| Match Group, Inc. | | | 2.1% | |
| Verisk Analytics, Inc., “A” | | | 2.1% | |
| Copart, Inc. | | | 2.0% | |
| AMETEK, Inc. | | | 1.9% | |
| | | | |
| GICS equity sectors (g) | | | | |
| Information Technology | | | 28.9% | |
| Health Care | | | 19.5% | |
| Industrials | | | 18.2% | |
| Consumer Discretionary | | | 13.6% | |
| Communication Services | | | 7.1% | |
| Financials | | | 6.4% | |
| Materials | | | 3.7% | |
| Real Estate | | | 2.1% | |
| (g) | The Global Industry Classification Standard (GICS®) was developed by and/or is the exclusive property of MSCI, Inc. and S&P Global Market Intelligence Inc. (“S&P Global Market Intelligence”). GICS is a service mark of MSCI and S&P Global Market Intelligence and has been licensed for use by MFS. MFS has applied its own internal sector/industry classification methodology for equity securities and non-equity securities that are unclassified by GICS. |
Cash & Cash Equivalents includes any cash, investments in money market funds, short-term securities, and other assets less liabilities. Please see the Statement of Assets and Liabilities for additional information related to the fund’s cash position and other assets and liabilities.
Percentages are based on net assets as of December 31, 2020.
The portfolio is actively managed and current holdings may be different.
2
MFS Mid Cap Growth Series
MANAGEMENT REVIEW
Summary of Results
For the twelve months ended December 31, 2020, Initial Class shares of the MFS Mid Cap Growth Series (fund) provided a total return of 36.48%, while Service Class shares of the fund provided a total return of 36.12%. These compare with a return of 35.59% over the same period for the fund’s benchmark, the Russell Midcap® Growth Index.
Market Environment
Markets experienced an extraordinarily sharp selloff early in the period and, in many cases, an unusually rapid recovery later. Central banks and fiscal authorities undertook astonishing levels of stimulus to offset the economic effects of government-imposed social-distancing measures implemented to slow the spread of the COVID-19 virus. At this point, the global economy looks to have experienced the shortest – albeit the deepest and steepest – recession in the postwar period. However, the recovery remains subject to more than the usual number of uncertainties due to questions about the evolution of the virus, what its continued impact will be and how quickly vaccines to guard against it can be manufactured and distributed at scale. There are also worries over the public’s willingness to be inoculated.
Around the world, central banks responded quickly and massively to the crisis with programs to improve liquidity and support markets. These programs proved largely successful in helping to restore market function, ease volatility and stimulate a continued market rebound. Late in the period, the US Federal Reserve adopted a new, flexible, average-inflation-targeting framework, which is expected to result in the federal funds rate remaining at low levels longer than under its previous model. In developed countries, monetary easing measures were complemented by unusually large fiscal stimulus initiatives. Due to relatively manageable external liabilities and balances of payments in many countries and persistently low inflation, even emerging market countries were able to implement countercyclical policies – a departure from the usual market-dictated response to risk-off crises.
Compounding market uncertainty earlier in the pandemic was a crash in the price of crude oil due to a sharp drop in global demand and a disagreement between Saudi Arabia and Russia over production cuts, which resulted in an oil price war. The subsequent decline in prices undercut oil exporters, many of which are in emerging markets, as well as a large segment of the high-yield credit market. The OPEC+ group later agreed on output cuts, with shale oil producers in the US also decreasing production, which, along with the gradual reopening of some major economies and the resultant boost in demand, helped stabilize the price of crude oil.
In the immediate aftermath of the market disruption that accompanied the initial phases of the pandemic, many companies that had added significant leverage to their balance sheets in recent years by borrowing to fund dividend payments and stock buybacks halted those activities, and some companies were forced to recapitalize. As markets and the economy stabilized later in the period, in many cases dividend payments and buybacks resumed. Conversely, some companies found themselves flush with liquidity, having borrowed preemptively during the worst of the crisis only to end up with excess cash on their balance sheets.
Contributors to Performance
Stock selection in both the consumer discretionary and financials sectors contributed to the fund’s performance relative to the Russell Midcap Growth® Index. Within the consumer discretionary sector, the timing of the fund’s overweight position in exercise and media company Peloton Interactive, holding shares of online pet food and pet supplies retailer Chewy (b) and not holding shares of poor-performing hotel and timeshare operator Hilton Worldwide benefited relative returns. Shares of Peloton climbed, benefiting from COVID-19 related demand for at-home exercise solutions. Although security selection in the financials sector was a positive driver of relative performance, there were no individual stocks within this sector, either in the fund or in the benchmark, that were among the fund’s top relative contributors over the reporting period.
The fund’s underweight position in the weak-performing consumer staples sector also aided relative results. There were no individual stocks within this sector, either in the fund or in the benchmark, that were among the fund’s top relative contributors.
In other sectors, top relative contributors included overweighting shares of cloud-computing power circuits manufacturer Monolithic Power Systems, integrated circuits and electronic devices developer Cadence Design Systems and game software developer Take-Two Interactive. The stock price of Monolithic Power Systems climbed, benefiting from strong circuit demand as the world turned to working and schooling virtually, in light of the pandemic. Holding shares of enterprise cloud computing solutions provider ServiceNow (b), data recording products provider NICE (b) (Israel) and software services provider AutoDesk (b), as well as the timing of the fund’s position in credit card payment processing solutions services provider Square, also supported relative results.
Detractors from Performance
Stock selection in the health care sector was a primary factor that detracted from relative performance over the reporting period. Here, not holding shares of strong-performing biotechnology firm Moderna held back relative returns. The stock price of Moderna climbed as the company successfully developed a COVID-19 vaccine to be used in combating the virus.
3
MFS Mid Cap Growth Series
Management Review – continued
Security selection and, to a lesser extent, an overweight position in the real estate sector also weakened relative performance. Within this sector, the timing of the fund’s overweight position in shares of SBA Communications weighed on relative returns. The stock was held in the fund the entire period, but exited the benchmark as a constituent at the end of June. Over the entire reporting period, the stock price of SBA Communications rose, but lagged the overall performance of the benchmark, as weaker-than-expected international leasing activity, stemming from changes in customer spending patterns amid the pandemic, appeared to have dampened investor sentiment.
Stocks in other sectors that further weighed on relative results included not holding shares of strong-performing communication software services provider Twilio, advertising technology platform operator The Trade Desk, streaming platform services provider Roku, pinboard-style e-commerce website Pinterest and micro-inverter systems manufacturer Enphase Energy. Overweighting shares of education services provider Bright Horizons Family Solutions, and the timing of the fund’s position in specialty value retailer Five Below, also hindered relative returns.
The fund’s cash and/or cash equivalents position during the period was another detractor from relative performance. Under normal market conditions, the fund strives to be fully invested and generally holds cash to buy new holdings and to provide liquidity. In a period when equity markets rose, as measured by the fund’s benchmark, holding cash hurt performance versus the benchmark, which has no cash position.
Respectfully,
Portfolio Manager(s)
Eric Fischman and Paul Gordon
| (b) | Security is not a benchmark constituent. |
The views expressed in this report are those of the portfolio manager(s) only through the end of the period of the report as stated on the cover and do not necessarily reflect the views of MFS or any other person in the MFS organization. These views are subject to change at any time based on market or other conditions, and MFS disclaims any responsibility to update such views. These views may not be relied upon as investment advice or an indication of trading intent on behalf of any MFS portfolio. References to specific securities are not recommendations of such securities, and may not be representative of any MFS portfolio’s current or future investments.
4
MFS Mid Cap Growth Series
PERFORMANCE SUMMARY THROUGH 12/31/20
The following chart illustrates the historical performance of the fund in comparison to its benchmark(s). Benchmarks are unmanaged and may not be invested in directly. Benchmark returns do not reflect any fees or expenses. The performance of other share classes will be greater than or less than that of the class depicted below. (See Notes to Performance Summary.)
Performance data shown represents past performance and is no guarantee of future results. Investment return and principal value fluctuate so your units, when sold, may be worth more or less than the original cost; current performance may be lower or higher than quoted. The performance shown does not reflect the deduction of taxes, if any, that a contract holder would pay on fund distributions or the redemption of contract units. The returns for the fund shown also do not reflect the deduction of expenses associated with variable products, such as mortality and expense risk charges, separate account charges, and sales charges imposed by the insurance company separate accounts. Such expenses would reduce the overall returns shown.
Growth of a Hypothetical $10,000 Investment
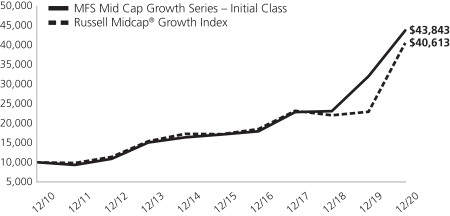
Total Returns through 12/31/20
Average annual total returns
| | | | | | | | | | | | |
| | | Share Class | | Class Inception Date | | 1-yr | | 5-yr | | 10-yr | | |
| | | Initial Class | | 4/28/00 | | 36.48% | | 20.61% | | 15.93% | | |
| | | Service Class | | 5/01/00 | | 36.12% | | 20.29% | | 15.65% | | |
| | | | |
| Comparative benchmark(s) | | | | | | | | |
| | | Russell Midcap® Growth Index (f) | | 35.59% | | 18.66% | | 15.04% | | |
| (f) | Source: FactSet Research Systems Inc. |
Benchmark Definition(s)
Russell Midcap® Growth Index (h) – constructed to provide a comprehensive barometer for growth securities in the mid-cap segment of the U.S. equity universe. Companies in this index generally have higher price-to-book ratios and higher forecasted growth values.
It is not possible to invest directly in an index.
| (h) | Frank Russell Company (“Russell”) is the source and owner of the trademarks, service marks, and copyrights related to the Russell Indexes. Russell® is a trademark of Frank Russell Company. Neither Russell nor its licensors accept any liability for any errors or omissions in the Russell Indexes and/or Russell ratings or underlying data and no party may rely on any Russell Indexes and/or Russell ratings and/or underlying data contained in this document. No further distribution of Russell Data is permitted without Russell’s express written consent. Russell does not promote, sponsor, or endorse the content of this document. |
Notes to Performance Summary
Average annual total return represents the average annual change in value for each share class for the periods presented.
Performance results reflect any applicable expense subsidies and waivers in effect during the periods shown. Without such subsidies and waivers the fund’s performance results would be less favorable. Please see the prospectus and financial statements for complete details. All results are historical and assume the reinvestment of any dividends and capital gains distributions.
Performance results do not include adjustments made for financial reporting purposes in accordance with U.S. generally accepted accounting principles and may differ from amounts reported in the financial highlights.
From time to time the fund may receive proceeds from litigation settlements, without which performance would be lower.
5
MFS Mid Cap Growth Series
EXPENSE TABLE
Fund Expenses Borne by the Contract Holders during the Period,
July 1, 2020 through December 31, 2020
As a contract holder of the fund, you incur ongoing costs, including management fees; distribution and/or service (12b-1) fees; and other fund expenses. This example is intended to help you understand your ongoing costs (in dollars) of investing in the fund and to compare these costs with the ongoing costs of investing in other mutual funds.
The example is based on an investment of $1,000 invested at the beginning of the period and held for the entire period July 1, 2020 through December 31, 2020.
Actual Expenses
The first line for each share class in the following table provides information about actual account values and actual expenses. You may use the information in this line, together with the amount you invested, to estimate the expenses that you paid over the period. Simply divide your account value by $1,000 (for example, an $8,600 account value divided by $1,000 = 8.6), then multiply the result by the number in the first line under the heading entitled “Expenses Paid During Period” to estimate the expenses you paid on your account during this period.
Hypothetical Example for Comparison Purposes
The second line for each share class in the following table provides information about hypothetical account values and hypothetical expenses based on the fund’s actual expense ratio and an assumed rate of return of 5% per year before expenses, which is not the fund’s actual return. The hypothetical account values and expenses may not be used to estimate the actual ending account balance or expenses you paid for the period. You may use this information to compare the ongoing costs of investing in the fund and other funds. To do so, compare this 5% hypothetical example with the 5% hypothetical examples that appear in the shareholder reports of the other funds.
Please note that the expenses shown in the table are meant to highlight the fund’s ongoing costs only and do not take into account the fees and expenses imposed under the variable contracts through which your investment in the fund is made. Therefore, the second line for each share class in the table is useful in comparing ongoing costs associated with an investment in vehicles (such as the fund) which fund benefits under variable annuity and variable life insurance contracts and to qualified pension and retirement plans only, and will not help you determine the relative total costs of investing in the fund through variable annuity and variable life insurance contracts. If the fees and expenses imposed under the variable contracts were included, your costs would have been higher.
| | | | | | | | | | | | | | | | | | |
| Share Class | | | | Annualized
Expense Ratio | | | Beginning
Account Value
7/01/20 | | | Ending
Account Value
12/31/20 | | | Expenses Paid
During Period (p)
7/01/20-12/31/20 | |
| Initial Class | | Actual | | | 0.79% | | | | $1,000.00 | | | | $1,286.03 | | | | $4.54 | |
| | Hypothetical (h) | | | 0.79% | | | | $1,000.00 | | | | $1,021.17 | | | | $4.01 | |
| Service Class | | Actual | | | 1.04% | | | | $1,000.00 | | | | $1,284.17 | | | | $5.97 | |
| | Hypothetical (h) | | | 1.04% | | | | $1,000.00 | | | | $1,019.91 | | | | $5.28 | |
| (h) | 5% class return per year before expenses. |
| (p) | “Expenses Paid During Period” are equal to each class’s annualized expense ratio, as shown above, multiplied by the average account value over the period, multiplied by 184/366 (to reflect the one-half year period). |
6
MFS Mid Cap Growth Series
PORTFOLIO OF INVESTMENTS – 12/31/20
The Portfolio of Investments is a complete list of all securities owned by your fund. It is categorized by broad-based asset classes.
| | | | | | | | |
| Issuer | | Shares/Par | | | Value ($) | |
| COMMON STOCKS – 99.5% | | | | | | | | |
| Automotive – 2.0% | | | | | |
| Copart, Inc. (a) | | | 70,341 | | | $ | 8,950,892 | |
| | | | | | | | |
| Biotechnology – 2.4% | | | | | |
| Adaptive Biotechnologies Corp. (a) | | | 45,525 | | | $ | 2,691,893 | |
| Alnylam Pharmaceuticals, Inc. (a) | | | 21,587 | | | | 2,805,662 | |
| Exelixis, Inc. (a) | | | 89,437 | | | | 1,795,001 | |
| Seagen, Inc. (a) | | | 20,328 | | | | 3,560,246 | |
| | | | | | | | |
| | | | | | $ | 10,852,802 | |
| | | | | | | | |
| Brokerage & Asset Managers – 1.6% | | | | | |
| NASDAQ, Inc. | | | 37,384 | | | $ | 4,962,352 | |
| Tradeweb Markets, Inc. | | | 33,040 | | | | 2,063,348 | |
| | | | | | | | |
| | | | | | $ | 7,025,700 | |
| | | | | | | | |
| Business Services – 11.8% | | | | | | | | |
| Clarivate PLC (a) | | | 266,261 | | | $ | 7,910,614 | |
| CoStar Group, Inc. (a) | | | 6,957 | | | | 6,430,216 | |
| Equifax, Inc. | | | 22,706 | | | | 4,378,625 | |
| Fidelity National Information Services, Inc. | | | 9,055 | | | | 1,280,920 | |
| Global Payments, Inc. | | | 16,969 | | | | 3,655,462 | |
| IHS Markit Ltd. | | | 37,541 | | | | 3,372,308 | |
| MSCI, Inc. | | | 22,197 | | | | 9,911,626 | |
| Tyler Technologies, Inc. (a) | | | 13,651 | | | | 5,958,935 | |
| Verisk Analytics, Inc., “A” | | | 44,523 | | | | 9,242,530 | |
| | | | | | | | |
| | | | | | $ | 52,141,236 | |
| | | | | | | | |
| Cable TV – 0.4% | | | | | | | | |
| Cable One, Inc. | | | 761 | | | $ | 1,695,295 | |
| | | | | | | | |
| Computer Software – 14.5% | | | | | | | | |
| Autodesk, Inc. (a) | | | 22,503 | | | $ | 6,871,066 | |
| Black Knight, Inc. (a) | | | 65,668 | | | | 5,801,768 | |
| Cadence Design Systems, Inc. (a) | | | 94,507 | | | | 12,893,590 | |
| Coupa Software, Inc. (a) | | | 16,872 | | | | 5,718,089 | |
| DocuSign, Inc. (a) | | | 13,169 | | | | 2,927,469 | |
| Dun & Bradstreet Holdings, Inc. (a) | | | 92,418 | | | | 2,301,208 | |
| Eventbrite, Inc. (a) | | | 50,681 | | | | 917,326 | |
| Everbridge, Inc. (a) | | | 24,218 | | | | 3,610,177 | |
| Okta, Inc. (a) | | | 20,777 | | | | 5,282,760 | |
| Paylocity Holding Corp. (a) | | | 22,776 | | | | 4,689,806 | |
| RingCentral, Inc. (a) | | | 15,015 | | | | 5,690,235 | |
| Snowflake, Inc., “A” (a) | | | 1,912 | | | | 538,037 | |
| Synopsys, Inc. (a) | | | 19,941 | | | | 5,169,505 | |
| Topicus.com, Inc. (a) | | | 6,243 | | | | 23,602 | |
| Unity Software, Inc. (a)(l) | | | 11,395 | | | | 1,748,791 | |
| | | | | | | | |
| | | | | | $ | 64,183,429 | |
| | | | | | | | |
| Computer Software – Systems – 8.2% | | | | | |
| Constellation Software, Inc. | | | 3,357 | | | $ | 4,359,221 | |
| Guidewire Software, Inc. (a) | | | 5,898 | | | | 759,250 | |
| NICE Systems Ltd., ADR (a) | | | 25,944 | | | | 7,356,162 | |
| ServiceNow, Inc. (a) | | | 11,900 | | | | 6,550,117 | |
| Square, Inc., “A” (a) | | | 24,092 | | | | 5,243,383 | |
| SS&C Technologies Holdings, Inc. | | | 39,035 | | | | 2,839,796 | |
| TransUnion | | | 64,848 | | | | 6,434,219 | |
| | | | | | | | |
| Issuer | | Shares/Par | | | Value ($) | |
| COMMON STOCKS – continued | | | | | |
| Computer Software – Systems – continued | | | | | |
| Wix.com Ltd. (a) | | | 11,437 | | | $ | 2,858,792 | |
| | | | | | | | |
| | | | | | $ | 36,400,940 | |
| | | | | | | | |
| Construction – 3.5% | | | | | | | | |
| AZEK Co. LLC (a) | | | 23,281 | | | $ | 895,154 | |
| Lennox International, Inc. | | | 12,465 | | | | 3,415,036 | |
| Pool Corp. | | | 15,171 | | | | 5,651,198 | |
| Vulcan Materials Co. | | | 36,525 | | | | 5,417,023 | |
| | | | | | | | |
| | | | | | $ | 15,378,411 | |
| | | | | | | | |
| Consumer Products – 1.4% | | | | | | | | |
| Scotts Miracle-Gro Co. | | | 30,631 | | | $ | 6,099,857 | |
| | | | | | | | |
| Consumer Services – 3.7% | | | | | | | | |
| Bright Horizons Family Solutions, Inc. (a) | | | 66,758 | | | $ | 11,548,466 | |
| Peloton Interactive, Inc., “A” (a) | | | 31,183 | | | | 4,731,085 | |
| | | | | | | | |
| | | | | | $ | 16,279,551 | |
| | | | | | | | |
| Containers – 0.6% | | | | | | | | |
| Ball Corp. | | | 28,480 | | | $ | 2,653,767 | |
| | | | | | | | |
| Electrical Equipment – 2.6% | | | | | | | | |
| AMETEK, Inc. | | | 70,404 | | | $ | 8,514,660 | |
| Littlefuse, Inc. | | | 11,391 | | | | 2,900,832 | |
| | | | | | | | |
| | | | | | $ | 11,415,492 | |
| | | | | | | | |
| Electronics – 5.2% | | | | | | | | |
| ASM International N.V. | | | 7,520 | | | $ | 1,644,041 | |
| Entegris, Inc. | | | 58,007 | | | | 5,574,473 | |
| MKS Instruments, Inc. | | | 22,803 | | | | 3,430,711 | |
| Monolithic Power Systems, Inc. | | | 30,480 | | | | 11,162,690 | |
| Silicon Laboratories, Inc. (a) | | | 11,577 | | | | 1,474,215 | |
| | | | | | | | |
| | | | | | $ | 23,286,130 | |
| | | | | | | | |
| Food & Beverages – 0.5% | | | | | | | | |
| Chr. Hansen Holding A.S. (a) | | | 22,185 | | | $ | 2,280,987 | |
| | | | | | | | |
| Gaming & Lodging – 1.3% | | | | | | | | |
| Caesars Entertainment, Inc. (a) | | | 25,814 | | | $ | 1,917,206 | |
| Penn National Gaming, Inc. (a) | | | 30,645 | | | | 2,646,808 | |
| Vail Resorts, Inc. | | | 5,028 | | | | 1,402,611 | |
| | | | | | | | |
| | | | | | $ | 5,966,625 | |
| | | | | | | | |
| General Merchandise – 0.3% | | | | | | | | |
| Five Below, Inc. (a) | | | 8,248 | | | $ | 1,443,235 | |
| | | | | | | | |
| Insurance – 1.6% | | | | | | | | |
| Arthur J. Gallagher & Co. | | | 58,959 | | | $ | 7,293,818 | |
| | | | | | | | |
| Internet – 3.5% | | | | | | | | |
| DraftKings, Inc. (a) | | | 16,118 | | | $ | 750,454 | |
| IAC/InterActiveCorp (a) | | | 26,786 | | | | 5,071,929 | |
| Match Group, Inc. (a) | | | 62,772 | | | | 9,490,499 | |
| | | | | | | | |
| | | | | | $ | 15,312,882 | |
| | | | | | | | |
7
MFS Mid Cap Growth Series
Portfolio of Investments – continued
| | | | | | | | |
| Issuer | | Shares/Par | | | Value ($) | |
| COMMON STOCKS – continued | | | | | |
| Leisure & Toys – 2.9% | | | | | | | | |
| Electronic Arts, Inc. | | | 16,634 | | | $ | 2,388,643 | |
| Take-Two Interactive Software, Inc. (a) | | | 50,442 | | | | 10,481,343 | |
| | | | | | | | |
| | | | | | $ | 12,869,986 | |
| | | | | | | | |
| Machinery & Tools – 1.7% | | | | | | | | |
| IDEX Corp. | | | 27,588 | | | $ | 5,495,530 | |
| Roper Technologies, Inc. | | | 4,987 | | | | 2,149,846 | |
| | | | | | | | |
| | | | | | $ | 7,645,376 | |
| | | | | | | | |
| Medical & Health Technology & Services – 5.4% | | | | | |
| Charles River Laboratories International, Inc. (a) | | | 29,506 | | | $ | 7,372,369 | |
| Guardant Health, Inc. (a) | | | 20,222 | | | | 2,606,211 | |
| ICON PLC (a) | | | 27,837 | | | | 5,427,658 | |
| IDEXX Laboratories, Inc. (a) | | | 6,539 | | | | 3,268,650 | |
| PRA Health Sciences, Inc. (a) | | | 6,798 | | | | 852,741 | |
| Quest Diagnostics, Inc. | | | 12,939 | | | | 1,541,941 | |
| Teladoc Health, Inc. (a) | | | 14,703 | | | | 2,940,012 | |
| | | | | | | | |
| | | | | | $ | 24,009,582 | |
| | | | | | | | |
| Medical Equipment – 11.0% | | | | | | | | |
| Agilent Technologies, Inc. | | | 35,975 | | | $ | 4,262,678 | |
| Align Technology, Inc. (a) | | | 7,011 | | | | 3,746,538 | |
| Bio-Techne Corp. | | | 18,730 | | | | 5,947,712 | |
| Maravai Lifesciences Holdings, Inc., “A” (a) | | | 46,737 | | | | 1,310,973 | |
| Masimo Corp. (a) | | | 24,232 | | | | 6,503,384 | |
| Mettler-Toledo International, Inc. (a) | | | 1,922 | | | | 2,190,465 | |
| PerkinElmer, Inc. | | | 77,954 | | | | 11,186,399 | |
| Quidel Corp. (a) | | | 3,235 | | | | 581,168 | |
| STERIS PLC | | | 43,108 | | | | 8,170,690 | |
| West Pharmaceutical Services, Inc. | | | 17,342 | | | | 4,913,162 | |
| | | | | | | | |
| | | | | | $ | 48,813,169 | |
| | | | | | | | |
| Metals & Mining – 0.7% | | | | | | | | |
| Howmet Aerospace, Inc. | | | 102,980 | | | $ | 2,939,049 | |
| | | | | | | | |
| Network & Telecom – 1.0% | | | | | | | | |
| CoreSite Realty Corp., REIT | | | 36,140 | | | $ | 4,527,619 | |
| | | | | | | | |
| Other Banks & Diversified Financials – 0.9% | | | | | |
| Altimeter Growth Corp. (a) | | | 69,894 | | | $ | 908,622 | |
| Cohn Robbins Holdings Corp. (a) | | | 55,022 | | | | 591,487 | |
| Dragoneer Growth Opportunities Corp. (a) | | | 56,969 | | | | 796,996 | |
| Foley Trasimene Acquisition Corp. (a) | | | 56,798 | | | | 965,566 | |
| Reinvent Technology Partners (a) | | | 74,778 | | | | 916,030 | |
| | | | | | | | |
| | | | | | $ | 4,178,701 | |
| | | | | | | | |
| Pharmaceuticals – 0.7% | | | | | | | | |
| Ascendis Pharma (a) | | | 18,143 | | | $ | 3,025,890 | |
| | | | | | | | |
| Printing & Publishing – 1.5% | | | | | | | | |
| Warner Music Group Corp. | | | 33,893 | | | $ | 1,287,595 | |
| Wolters Kluwer N.V. | | | 63,282 | | | | 5,338,922 | |
| | | | | | | | |
| | | | | | $ | 6,626,517 | |
| | | | | | | | |
| Railroad & Shipping – 0.7% | | | | | | | | |
| Kansas City Southern Co. | | | 15,039 | | | $ | 3,069,911 | |
| | | | | | | | |
| | | | | | | | |
| Issuer | | Shares/Par | | | Value ($) | |
| COMMON STOCKS – continued | | | | | |
| Restaurants – 2.0% | | | | | | | | |
| Chipotle Mexican Grill, Inc., “A” (a) | | | 3,995 | | | $ | 5,539,906 | |
| Domino’s Pizza, Inc. | | | 9,010 | | | | 3,454,975 | |
| | | | | | | | |
| | | | | | $ | 8,994,881 | |
| | | | | | | | |
| Specialty Stores – 4.8% | | | | | | | | |
| Burlington Stores, Inc. (a) | | | 20,587 | | | $ | 5,384,530 | |
| Chewy, Inc., “A” (a) | | | 39,732 | | | | 3,571,509 | |
| Lululemon Athletica, Inc. (a) | | | 15,831 | | | | 5,509,663 | |
| O’Reilly Automotive, Inc. (a) | | | 5,996 | | | | 2,713,610 | |
| Tractor Supply Co. | | | 12,228 | | | | 1,719,012 | |
| Ulta Beauty, Inc. (a) | | | 8,537 | | | | 2,451,485 | |
| | | | | | | | |
| | | | | | $ | 21,349,809 | |
| | | | | | | | |
| Telecommunications – Wireless – 1.1% | | | | | |
| SBA Communications Corp., REIT | | | 17,417 | | | $ | 4,913,858 | |
| | | | | | | | |
Total Common Stocks
(Identified Cost, $210,506,972) | | | | | | $ | 441,625,397 | |
| | | | | | | | |
| |
| INVESTMENT COMPANIES (h) – 0.6% | | | | | |
| Money Market Funds – 0.6% | | | | | | | | |
| MFS Institutional Money Market Portfolio, 0.1% (v) (Identified Cost, $2,635,619) | | | 2,635,619 | | | $ | 2,635,619 | |
| | | | | | | | |
|
| COLLATERAL FOR SECURITIES LOANED – 0.2% | |
| State Street Navigator Securities Lending Government Money Market Portfolio, 0.1% (j) (Identified Cost, $900,126) | | | 900,126 | | | $ | 900,126 | |
| | | | | | | | |
OTHER ASSETS, LESS
LIABILITIES – (0.3)% | | | | | | | (1,328,204 | ) |
| | | | | | | | |
| NET ASSETS – 100.0% | | | | | | $ | 443,832,938 | |
| | | | | | | | |
| (a) | | Non-income producing security. |
| (h) | | An affiliated issuer, which may be considered one in which the fund owns 5% or more of the outstanding voting securities, or a company which is under common control. At period end, the aggregate values of the fund’s investments in affiliated issuers and in unaffiliated issuers were $2,635,619 and $442,525,523, respectively. |
| (j) | | The rate quoted is the annualized seven-day yield of the fund at period end. |
| (l) | | A portion of this security is on loan. See Note 2 for additional information. |
| (v) | | Affiliated issuer that is available only to investment companies managed by MFS. The rate quoted for the MFS Institutional Money Market Portfolio is the annualized seven-day yield of the fund at period end. |
The following abbreviations are used in this report and are defined:
| ADR | | American Depositary Receipt |
| REIT | | Real Estate Investment Trust |
See Notes to Financial Statements
8
MFS Mid Cap Growth Series
FINANCIAL STATEMENTS | STATEMENT OF ASSETS AND LIABILITIES
This statement represents your fund’s balance sheet, which details the assets and liabilities comprising the total value of the fund.
| | | | |
At 12/31/20 | | | | |
| |
Assets | | | | |
Investments in unaffiliated issuers, at value, including $874,319 of securities on loan (identified cost, $211,407,098) | | | $442,525,523 | |
Investments in affiliated issuers, at value (identified cost, $2,635,619) | | | 2,635,619 | |
Receivables for | | | | |
Fund shares sold | | | 251,061 | |
Interest and dividends | | | 157,741 | |
Other assets | | | 1,871 | |
Total assets | | | $445,571,815 | |
| |
Liabilities | | | | |
Payables for | | | | |
Investments purchased | | | $23,347 | |
Fund shares reacquired | | | 735,601 | |
Collateral for securities loaned, at value | | | 900,126 | |
Payable to affiliates | | | | |
Investment adviser | | | 17,802 | |
Administrative services fee | | | 342 | |
Shareholder servicing costs | | | 262 | |
Distribution and/or service fees | | | 1,790 | |
Payable for independent Trustees’ compensation | | | 13 | |
Accrued expenses and other liabilities | | | 59,594 | |
Total liabilities | | | $1,738,877 | |
Net assets | | | $443,832,938 | |
| |
Net assets consist of | | | | |
Paid-in capital | | | $125,301,900 | |
Total distributable earnings (loss) | | | 318,531,038 | |
Net assets | | | $443,832,938 | |
Shares of beneficial interest outstanding | | | 36,120,612 | |
| | | | | | | | | | | | |
| | | |
| | | Net assets | | | Shares
outstanding | | | Net asset value
per share | |
Initial Class | | | $311,987,852 | | | | 24,689,690 | | | | $12.64 | |
Service Class | | | 131,845,086 | | | | 11,430,922 | | | | 11.53 | |
See Notes to Financial Statements
9
MFS Mid Cap Growth Series
FINANCIAL STATEMENTS | STATEMENT OF OPERATIONS
This statement describes how much your fund earned in investment income and accrued in expenses. It also describes any gains and/or losses generated by fund operations.
| | | | |
Year ended 12/31/20 | | | | |
| |
Net investment income (loss) | | | | |
Income | | | | |
Dividends | | | $2,007,498 | |
Income on securities loaned | | | 72,792 | |
Other | | | 17,043 | |
Dividends from affiliated issuers | | | 25,896 | |
Foreign taxes withheld | | | (16,984 | ) |
Total investment income | | | $2,106,245 | |
Expenses | | | | |
Management fee | | | $2,927,462 | |
Distribution and/or service fees | | | 270,799 | |
Shareholder servicing costs | | | 17,675 | |
Administrative services fee | | | 62,243 | |
Independent Trustees’ compensation | | | 8,412 | |
Custodian fee | | | 24,453 | |
Shareholder communications | | | 20,132 | |
Audit and tax fees | | | 59,543 | |
Legal fees | | | 2,997 | |
Miscellaneous | | | 26,927 | |
Total expenses | | | $3,420,643 | |
Reduction of expenses by investment adviser | | | (42,904 | ) |
Net expenses | | | $3,377,739 | |
Net investment income (loss) | | | $(1,271,494 | ) |
| |
Realized and unrealized gain (loss) | | | | |
Realized gain (loss) (identified cost basis) | | | | |
Unaffiliated issuers | | | $88,857,102 | |
Affiliated issuers | | | (1,593 | ) |
Foreign currency | | | 6,527 | |
Net realized gain (loss) | | | $88,862,036 | |
Change in unrealized appreciation or depreciation | | | | |
Unaffiliated issuers | | | $39,913,289 | |
Affiliated issuers | | | 55 | |
Translation of assets and liabilities in foreign currencies | | | 4,734 | |
Net unrealized gain (loss) | | | $39,918,078 | |
Net realized and unrealized gain (loss) | | | $128,780,114 | |
Change in net assets from operations | | | $127,508,620 | |
See Notes to Financial Statements
10
MFS Mid Cap Growth Series
FINANCIAL STATEMENTS | STATEMENTS OF CHANGES IN NET ASSETS
These statements describe the increases and/or decreases in net assets resulting from operations, any distributions, and any shareholder transactions.
| | | | | | | | |
| | | Year ended | |
| | | 12/31/20 | | | 12/31/19 | |
Change in net assets | | | | | | | | |
| | |
From operations | | | | | | | | |
Net investment income (loss) | | | $(1,271,494 | ) | | | $(496,978 | ) |
Net realized gain (loss) | | | 88,862,036 | | | | 30,021,306 | |
Net unrealized gain (loss) | | | 39,918,078 | | | | 91,391,474 | |
Change in net assets from operations | | | $127,508,620 | | | | $120,915,802 | |
Total distributions to shareholders | | | $(29,460,280 | ) | | | $(49,459,422 | ) |
Change in net assets from fund share transactions | | | $(48,232,077 | ) | | | $(11,612,994 | ) |
Total change in net assets | | | $49,816,263 | | | | $59,843,386 | |
| | |
Net assets | | | | | | | | |
At beginning of period | | | 394,016,675 | | | | 334,173,289 | |
At end of period | | | $443,832,938 | | | | $394,016,675 | |
See Notes to Financial Statements
11
MFS Mid Cap Growth Series
FINANCIAL STATEMENTS | FINANCIAL HIGHLIGHTS
The financial highlights table is intended to help you understand the fund’s financial performance for the past 5 years. Certain information reflects financial results for a single fund share. The total returns in the table represent the rate that an investor would have earned (or lost) on an investment in the fund share class (assuming reinvestment of all distributions) held for the entire period.
| | | | | | | | | | | | | | | | | | | | |
| Initial Class | | Year ended | |
| | | | | |
| | | 12/31/20 | | | 12/31/19 | | | 12/31/18 | | | 12/31/17 | | | 12/31/16 | |
| | | | | |
Net asset value, beginning of period | | | $9.96 | | | | $8.23 | | | | $9.51 | | | | $7.96 | | | | $8.21 | |
| | | | | |
| Income (loss) from investment operations | | | | | | | | | | | | | | | | | | | | |
Net investment income (loss) (d) | | | $(0.03 | ) | | | $(0.01 | ) | | | $(0.02 | ) | | | $(0.01 | ) | | | $0.01 | (c) |
Net realized and unrealized gain (loss) | | | 3.53 | | | | 3.10 | | | | 0.39 | | | | 2.11 | | | | 0.41 | |
Total from investment operations | | | $3.50 | | | | $3.09 | | | | $0.37 | | | | $2.10 | | | | $0.42 | |
| | | | | |
| Less distributions declared to shareholders | | | | | | | | | | | | | | | | | | | | |
From net investment income | | | $— | | | | $— | | | | $— | | | | $(0.01 | ) | | | $— | |
From net realized gain | | | (0.82 | ) | | | (1.36 | ) | | | (1.65 | ) | | | (0.54 | ) | | | (0.67 | ) |
Total distributions declared to shareholders | | | $(0.82 | ) | | | $(1.36 | ) | | | $(1.65 | ) | | | $(0.55 | ) | | | $(0.67 | ) |
Net asset value, end of period (x) | | | $12.64 | | | | $9.96 | | | | $8.23 | | | | $9.51 | | | | $7.96 | |
Total return (%) (k)(r)(s)(x) | | | 36.48 | | | | 38.66 | | | | 1.24 | | | | 27.00 | | | | 4.91 | (c) |
| | | | | |
Ratios (%) (to average net assets)
and Supplemental data: | | | | | | | | | | | | | | | | | | | | |
Expenses before expense reductions (f) | | | 0.81 | | | | 0.81 | | | | 0.81 | | | | 0.81 | | | | 0.75 | (c) |
Expenses after expense reductions (f) | | | 0.80 | | | | 0.80 | | | | 0.80 | | | | 0.80 | | | | 0.74 | (c) |
Net investment income (loss) | | | (0.26 | ) | | | (0.07 | ) | | | (0.18 | ) | | | (0.15 | ) | | | 0.15 | (c) |
Portfolio turnover | | | 40 | | | | 17 | | | | 21 | | | | 32 | | | | 37 | |
Net assets at end of period (000 omitted) | | | $311,988 | | | | $290,512 | | | | $247,614 | | | | $297,463 | | | | $294,226 | |
| |
| Service Class | | Year ended | |
| | | | | |
| | | 12/31/20 | | | 12/31/19 | | | 12/31/18 | | | 12/31/17 | | | 12/31/16 | |
| | | | | |
Net asset value, beginning of period | | | $9.17 | | | | $7.68 | | | | $8.99 | | | | $7.56 | | | | $7.85 | |
| | | | | |
| Income (loss) from investment operations | | | | | | | | | | | | | | | | | | | | |
Net investment income (loss) (d) | | | $(0.05 | ) | | | $(0.03 | ) | | | $(0.04 | ) | | | $(0.03 | ) | | | $(0.01 | )(c) |
Net realized and unrealized gain (loss) | | | 3.23 | | | | 2.88 | | | | 0.38 | | | | 2.00 | | | | 0.39 | |
Total from investment operations | | | $3.18 | | | | $2.85 | | | | $0.34 | | | | $1.97 | | | | $0.38 | |
| | | | | |
| Less distributions declared to shareholders | | | | | | | | | | | | | | | | | | | | |
From net investment income | | | $— | | | | $— | | | | $— | | | | $— | | | | $— | |
From net realized gain | | | (0.82 | ) | | | (1.36 | ) | | | (1.65 | ) | | | (0.54 | ) | | | (0.67 | ) |
Total distributions declared to shareholders | | | $(0.82 | ) | | | $(1.36 | ) | | | $(1.65 | ) | | | $(0.54 | ) | | | $(0.67 | ) |
Net asset value, end of period (x) | | | $11.53 | | | | $9.17 | | | | $7.68 | | | | $8.99 | | | | $7.56 | |
Total return (%) (k)(r)(s)(x) | | | 36.12 | | | | 38.28 | | | | 0.95 | | | | 26.68 | | | | 4.62 | (c) |
| | | | | |
Ratios (%) (to average net assets)
and Supplemental data: | | | | | | | | | | | | | | | | | | | | |
Expenses before expense reductions (f) | | | 1.06 | | | | 1.06 | | | | 1.06 | | | | 1.06 | | | | 0.99 | (c) |
Expenses after expense reductions (f) | | | 1.05 | | | | 1.05 | | | | 1.05 | | | | 1.05 | | | | 0.99 | (c) |
Net investment income (loss) | | | (0.51 | ) | | | (0.32 | ) | | | (0.43 | ) | | | (0.40 | ) | | | (0.08 | )(c) |
Portfolio turnover | | | 40 | | | | 17 | | | | 21 | | | | 32 | | | | 37 | |
Net assets at end of period (000 omitted) | | | $131,845 | | | | $103,504 | | | | $86,560 | | | | $100,052 | | | | $87,529 | |
See Notes to Financial Statements
12
MFS Mid Cap Growth Series
Financial Highlights – continued
| (c) | Amount reflects a one-time reimbursement of expenses by the custodian (or former custodian) without which net investment income and performance would be lower and expenses would be higher. |
| (d) | Per share data is based on average shares outstanding. |
| (f) | Ratios do not reflect reductions from fees paid indirectly, if applicable. |
| (k) | The total return does not reflect expenses that apply to separate accounts. Inclusion of these charges would reduce the total return figures for all periods shown. |
| (r) | Certain expenses have been reduced without which performance would have been lower. |
| (s) | From time to time the fund may receive proceeds from litigation settlements, without which performance would be lower. |
| (x) | The net asset values and total returns have been calculated on net assets which include adjustments made in accordance with U.S. generally accepted accounting principles required at period end for financial reporting purposes. |
See Notes to Financial Statements
13
MFS Mid Cap Growth Series
NOTES TO FINANCIAL STATEMENTS
| (1) | | Business and Organization |
MFS Mid Cap Growth Series (the fund) is a diversified series of MFS Variable Insurance Trust (the trust). The trust is organized as a Massachusetts business trust and is registered under the Investment Company Act of 1940, as amended, as an open-end management investment company. The shareholders of each series of the trust are separate accounts of insurance companies, which offer variable annuity and/or life insurance products, and qualified retirement and pension plans.
The fund is an investment company and accordingly follows the investment company accounting and reporting guidance of the Financial Accounting Standards Board (FASB) Accounting Standards Codification Topic 946 Financial Services – Investment Companies.
| (2) | | Significant Accounting Policies |
General – The preparation of financial statements in conformity with U.S. generally accepted accounting principles requires management to make estimates and assumptions that affect the reported amounts of assets and liabilities, and disclosure of contingent assets and liabilities at the date of the financial statements and the reported amounts of increases and decreases in net assets from operations during the reporting period. Actual results could differ from those estimates. In the preparation of these financial statements, management has evaluated subsequent events occurring after the date of the fund’s Statement of Assets and Liabilities through the date that the financial statements were issued.
In March 2020, the FASB issued Accounting Standards Update 2020-04, Reference Rate Reform (Topic 848) – Facilitation of the Effects of Reference Rate Reform on Financial Reporting (“ASU 2020-04”), which provides optional, temporary relief with respect to the financial reporting of contracts subject to certain types of modifications due to the planned discontinuation of the London Interbank Offered Rate (LIBOR) and other IBOR-based reference rates as of the end of 2021. The temporary relief provided by ASU 2020-04 is effective for certain reference rate-related contract modifications that occur during the period from March 12, 2020 through December 31, 2022. Management is evaluating the impact of ASU 2020-04 on the fund’s investments, derivatives, debt and other contracts that will undergo reference rate-related modifications as a result of the reference rate reform.
Balance Sheet Offsetting – The fund’s accounting policy with respect to balance sheet offsetting is that, absent an event of default by the counterparty or a termination of the agreement, the International Swaps and Derivatives Association (ISDA) Master Agreement, or similar agreement, does not result in an offset of reported amounts of financial assets and financial liabilities in the Statement of Assets and Liabilities across transactions between the fund and the applicable counterparty. The fund’s right to setoff may be restricted or prohibited by the bankruptcy or insolvency laws of the particular jurisdiction to which a specific master netting agreement counterparty is subject. Balance sheet offsetting disclosures, to the extent applicable to the fund, have been included in the fund’s Significant Accounting Policies note under the captions for each of the fund’s in-scope financial instruments and transactions.
Investment Valuations – Equity securities, including restricted equity securities, are generally valued at the last sale or official closing price on their primary market or exchange as provided by a third-party pricing service. Equity securities, for which there were no sales reported that day, are generally valued at the last quoted daily bid quotation on their primary market or exchange as provided by a third-party pricing service. Short-term instruments with a maturity at issuance of 60 days or less may be valued at amortized cost, which approximates market value. Open-end investment companies are generally valued at net asset value per share. Securities and other assets generally valued on the basis of information from a third-party pricing service may also be valued at a broker/dealer bid quotation. In determining values, third-party pricing services can utilize both transaction data and market information such as yield, quality, coupon rate, maturity, type of issue, trading characteristics, and other market data. The values of foreign securities and other assets and liabilities expressed in foreign currencies are converted to U.S. dollars using the mean of bid and asked prices for rates provided by a third-party pricing service.
The Board of Trustees has delegated primary responsibility for determining or causing to be determined the value of the fund’s investments (including any fair valuation) to the adviser pursuant to valuation policies and procedures approved by the Board. If the adviser determines that reliable market quotations are not readily available, investments are valued at fair value as determined in good faith by the adviser in accordance with such procedures under the oversight of the Board of Trustees. Under the fund’s valuation policies and procedures, market quotations are not considered to be readily available for most types of debt instruments and floating rate loans and many types of derivatives. These investments are generally valued at fair value based on information from third-party pricing services. In addition, investments may be valued at fair value if the adviser determines that an investment’s value has been materially affected by events occurring after the close of the exchange or market on which the investment is principally traded (such as foreign exchange or market) and prior to the determination of the fund’s net asset value, or after the halt of trading of a specific security where trading does not resume prior to the close of the exchange or market on which the security is principally traded. Events that occur after foreign markets close (such as developments in foreign markets and significant movements in the U.S. markets) and prior to the determination of the fund’s net asset value may be deemed to have a material effect on the value of securities traded in foreign markets. Accordingly, the fund’s foreign equity securities may often be valued at fair value. The adviser
14
MFS Mid Cap Growth Series
Notes to Financial Statements – continued
generally relies on third-party pricing services or other information (such as the correlation with price movements of similar securities in the same or other markets; the type, cost and investment characteristics of the security; the business and financial condition of the issuer; and trading and other market data) to assist in determining whether to fair value and at what value to fair value an investment. The value of an investment for purposes of calculating the fund’s net asset value can differ depending on the source and method used to determine value. When fair valuation is used, the value of an investment used to determine the fund’s net asset value may differ from quoted or published prices for the same investment. There can be no assurance that the fund could obtain the fair value assigned to an investment if it were to sell the investment at the same time at which the fund determines its net asset value per share.
Various inputs are used in determining the value of the fund’s assets or liabilities. These inputs are categorized into three broad levels. In certain cases, the inputs used to measure fair value may fall into different levels of the fair value hierarchy. In such cases, an investment’s level within the fair value hierarchy is based on the lowest level of input that is significant to the fair value measurement. The fund’s assessment of the significance of a particular input to the fair value measurement in its entirety requires judgment, and considers factors specific to the investment. Level 1 includes unadjusted quoted prices in active markets for identical assets or liabilities. Level 2 includes other significant observable market-based inputs (including quoted prices for similar securities, interest rates, prepayment speed, and credit risk). Level 3 includes unobservable inputs, which may include the adviser’s own assumptions in determining the fair value of investments. The following is a summary of the levels used as of December 31, 2020 in valuing the fund’s assets or liabilities:
| | | | | | | | | | | | | | | | |
| Financial Instruments | | Level 1 | | | Level 2 | | | Level 3 | | | Total | |
| Equity Securities: | | | | | | | | | | | | | | | | |
United States | | | $401,399,508 | | | | $— | | | | $— | | | | $401,399,508 | |
Israel | | | 10,214,954 | | | | — | | | | — | | | | 10,214,954 | |
United Kingdom | | | 7,910,614 | | | | — | | | | — | | | | 7,910,614 | |
Netherlands | | | 5,338,922 | | | | 1,644,041 | | | | — | | | | 6,982,963 | |
Ireland | | | 5,427,658 | | | | — | | | | — | | | | 5,427,658 | |
Denmark | | | 5,306,877 | | | | — | | | | — | | | | 5,306,877 | |
Canada | | | 4,359,221 | | | | 23,602 | | | | — | | | | 4,382,823 | |
| Mutual Funds | | | 3,535,745 | | | | — | | | | — | | | | 3,535,745 | |
| Total | | | $443,493,499 | | | | $1,667,643 | | | | $— | | | | $445,161,142 | |
For further information regarding security characteristics, see the Portfolio of Investments.
Foreign Currency Translation – Purchases and sales of foreign investments, income, and expenses are converted into U.S. dollars based upon currency exchange rates prevailing on the respective dates of such transactions or on the reporting date for foreign denominated receivables and payables. Gains and losses attributable to foreign currency exchange rates on sales of securities are recorded for financial statement purposes as net realized gains and losses on investments. Gains and losses attributable to foreign exchange rate movements on receivables, payables, income and expenses are recorded for financial statement purposes as foreign currency transaction gains and losses. That portion of both realized and unrealized gains and losses on investments that results from fluctuations in foreign currency exchange rates is not separately disclosed.
Security Loans – Under its Securities Lending Agency Agreement with the fund, State Street Bank and Trust Company, as lending agent, loans the securities of the fund to certain qualified institutions (the “Borrowers”) approved by the fund. Security loans can be terminated at the discretion of either the lending agent or the fund and the related securities must be returned within the earlier of the standard trade settlement period for such securities or within three business days. The loans are collateralized by cash and/or U.S. Treasury and federal agency obligations in an amount typically at least equal to the market value of the securities loaned. On loans collateralized by cash, the cash collateral is invested in a money market fund. The market value of the loaned securities is determined at the close of business of the fund and any additional required collateral is delivered to the fund on the next business day. The lending agent provides the fund with indemnification against Borrower default. In the event of Borrower default, the lending agent will, for the benefit of the fund, either purchase securities identical to those loaned or, when such purchase is commercially impracticable, pay the fund the market value of the loaned securities. In return, the lending agent assumes the fund’s rights to the related collateral. If the collateral value is less than the cost to purchase identical securities, the lending agent is responsible for the shortfall, but only to the extent that such shortfall is not due to a decline in collateral value resulting from collateral reinvestment for which the fund bears the risk of loss. At period end, the fund had investment securities on loan, all of which were classified as equity securities in the fund’s Portfolio of Investments, with a fair value of $874,319. The fair value of the fund’s investment securities on loan and a related liability of $900,126 for cash collateral received on securities loaned are both presented gross in the Statement of Assets and Liabilities. The collateral on securities loaned exceeded the value of securities on loan at period end. The liability for cash collateral for securities loaned is carried at fair value, which is categorized as level 2 within the fair value hierarchy. A portion of the income generated upon investment of the collateral is remitted to the Borrowers, and the remainder is allocated between the fund
15
MFS Mid Cap Growth Series
Notes to Financial Statements – continued
and the lending agent. On loans collateralized by U.S. Treasury and/or federal agency obligations, a fee is received from the Borrower, and is allocated between the fund and the lending agent. Income from securities lending is separately reported in the Statement of Operations. The dividend and interest income earned on the securities loaned is accounted for in the same manner as other dividend and interest income.
Indemnifications – Under the fund’s organizational documents, its officers and Trustees may be indemnified against certain liabilities and expenses arising out of the performance of their duties to the fund. Additionally, in the normal course of business, the fund enters into agreements with service providers that may contain indemnification clauses. The fund’s maximum exposure under these agreements is unknown as this would involve future claims that may be made against the fund that have not yet occurred.
Investment Transactions and Income – Investment transactions are recorded on the trade date. Interest income is recorded on the accrual basis. Dividends received in cash are recorded on the ex-dividend date. Certain dividends from foreign securities will be recorded when the fund is informed of the dividend if such information is obtained subsequent to the ex-dividend date. Dividend payments received in additional securities are recorded on the ex-dividend date in an amount equal to the value of the security on such date.
The fund may receive proceeds from litigation settlements. Any proceeds received from litigation involving portfolio holdings are reflected in the Statement of Operations in realized gain/loss if the security has been disposed of by the fund or in unrealized gain/loss if the security is still held by the fund. Any other proceeds from litigation not related to portfolio holdings are reflected as other income in the Statement of Operations.
Tax Matters and Distributions – The fund intends to qualify as a regulated investment company, as defined under Subchapter M of the Internal Revenue Code, and to distribute all of its taxable income, including realized capital gains. As a result, no provision for federal income tax is required. The fund’s federal tax returns, when filed, will remain subject to examination by the Internal Revenue Service for a three year period. Management has analyzed the fund’s tax positions taken on federal and state tax returns for all open tax years and does not believe that there are any uncertain tax positions that require recognition of a tax liability. Foreign taxes, if any, have been accrued by the fund in the accompanying financial statements in accordance with the applicable foreign tax law. Foreign income taxes may be withheld by certain countries in which the fund invests. Additionally, capital gains realized by the fund on securities issued in or by certain foreign countries may be subject to capital gains tax imposed by those countries.
Distributions to shareholders are recorded on the ex-dividend date. Income and capital gain distributions are determined in accordance with income tax regulations, which may differ from U.S. generally accepted accounting principles. Certain capital accounts in the financial statements are periodically adjusted for permanent differences in order to reflect their tax character. These adjustments have no impact on net assets or net asset value per share. Temporary differences which arise from recognizing certain items of income, expense, gain or loss in different periods for financial statement and tax purposes will reverse at some time in the future.
Book/tax differences primarily relate to wash sale loss deferrals.
The tax character of distributions declared to shareholders for the last two fiscal years is as follows:
| | | | | | | | |
| | | Year ended
12/31/20 | | | Year ended
12/31/19 | |
| Ordinary income (including any short-term capital gains) | | | $1,520,227 | | | | $3,440,170 | |
| Long-term capital gains | | | 27,940,053 | | | | 46,019,252 | |
| Total distributions | | | $29,460,280 | | | | $49,459,422 | |
The federal tax cost and the tax basis components of distributable earnings were as follows:
| | | | |
| As of 12/31/20 | | | | |
| |
| Cost of investments | | | $214,697,721 | |
| Gross appreciation | | | 231,527,357 | |
| Gross depreciation | | | (1,063,936 | ) |
| Net unrealized appreciation (depreciation) | | | $230,463,421 | |
| |
| Undistributed ordinary income | | | 1,059,807 | |
| Undistributed long-term capital gain | | | 87,002,534 | |
| Other temporary differences | | | 5,276 | |
Multiple Classes of Shares of Beneficial Interest – The fund offers multiple classes of shares, which differ in their respective distribution and/or service fees. The fund’s income, realized and unrealized gain (loss), and common expenses are allocated to shareholders based on the daily net assets of each class. Dividends are declared separately for each class. Differences in per share
16
MFS Mid Cap Growth Series
Notes to Financial Statements – continued
dividend rates are generally due to differences in separate class expenses. The fund’s distributions declared to shareholders as reported in the Statements of Changes in Net Assets are presented by class as follows:
| | | | | | | | |
| | |
| | | Year ended
12/31/20 | | | Year ended
12/31/19 | |
| Initial Class | | | $20,588,572 | | | | $35,977,779 | |
| Service Class | | | 8,871,708 | | | | 13,481,643 | |
| Total | | | $29,460,280 | | | | $49,459,422 | |
| (3) | | Transactions with Affiliates |
Investment Adviser – The fund has an investment advisory agreement with MFS to provide overall investment management and related administrative services and facilities to the fund. The management fee is computed daily and paid monthly at the following annual rates based on the fund’s average daily net assets:
| | | | |
| Up to $1 billion | | | 0.75% | |
| In excess of $1 billion | | | 0.70% | |
MFS has agreed in writing to reduce its management fee by a specified amount if certain MFS mutual fund assets exceed thresholds agreed to by MFS and the fund’s Board of Trustees. For the year ended December 31, 2020, this management fee reduction amounted to $42,904, which is included in the reduction of total expenses in the Statement of Operations. The management fee incurred for the year ended December 31, 2020 was equivalent to an annual effective rate of 0.74% of the fund’s average daily net assets.
Distributor – MFS Fund Distributors, Inc. (MFD), a wholly-owned subsidiary of MFS, is the distributor of shares of the fund. The Trustees have adopted a distribution plan for the Service Class shares pursuant to Rule 12b-1 under the Investment Company Act of 1940.
The fund’s distribution plan provides that the fund will pay MFD distribution and/or service fees equal to 0.25% per annum of its average daily net assets attributable to Service Class shares as partial consideration for services performed and expenses incurred by MFD and financial intermediaries (including participating insurance companies that invest in the fund to fund variable annuity and variable life insurance contracts, sponsors of qualified retirement and pension plans that invest in the fund, and affiliates of these participating insurance companies and plan sponsors) in connection with the sale and distribution of the Service Class shares. MFD may subsequently pay all, or a portion, of the distribution and/or service fees to financial intermediaries.
Shareholder Servicing Agent – MFS Service Center, Inc. (MFSC), a wholly-owned subsidiary of MFS, receives a fee from the fund for its services as shareholder servicing agent. For the year ended December 31, 2020, the fee was $16,653, which equated to 0.0043% annually of the fund’s average daily net assets. MFSC also receives reimbursement from the fund for out-of-pocket expenses paid by MFSC on behalf of the fund. For the year ended December 31, 2020, these costs amounted to $1,022.
Administrator – MFS provides certain financial, legal, shareholder communications, compliance, and other administrative services to the fund. Under an administrative services agreement, the fund reimburses MFS the costs incurred to provide these services. The fund is charged an annual fixed amount of $17,500 plus a fee based on average daily net assets. The administrative services fee incurred for the year ended December 31, 2020 was equivalent to an annual effective rate of 0.0159% of the fund’s average daily net assets.
Trustees’ and Officers’ Compensation – The fund pays compensation to independent Trustees in the form of a retainer, attendance fees, and additional compensation to Board and Committee chairpersons. The fund does not pay compensation directly to Trustees or officers of the fund who are also officers of the investment adviser, all of whom receive remuneration from MFS for their services to the fund. Certain officers and Trustees of the fund are officers or directors of MFS, MFD, and MFSC.
Other – The fund invests in the MFS Institutional Money Market Portfolio which is managed by MFS and seeks current income consistent with preservation of capital and liquidity. This money market fund does not pay a management fee to MFS but does incur investment and operating costs.
The fund is permitted to engage in purchase and sale transactions with funds and accounts for which MFS serves as investment adviser or sub-adviser (“cross-trades”) pursuant to a policy adopted by the Board of Trustees. This policy has been designed to ensure that cross-trades conducted by the fund comply with Rule 17a-7 under the Investment Company Act of 1940. During the year ended December 31, 2020, the fund engaged in purchase and sale transactions pursuant to this policy, which amounted to $330,315 and $826,078, respectively. The sales transactions resulted in net realized gains (losses) of $650,754.
The adviser has voluntarily undertaken to reimburse the fund from its own resources on a quarterly basis for the cost of investment research embedded in the cost of the fund’s securities trades. This agreement may be rescinded at any time. For the year ended December 31, 2020, this reimbursement amounted to $16,978, which is included in “Other” income in the Statement of Operations.
17
MFS Mid Cap Growth Series
Notes to Financial Statements – continued
For the year ended December 31, 2020, purchases and sales of investments, other than short-term obligations, aggregated $154,084,994 and $232,599,493, respectively.
| (5) | | Shares of Beneficial Interest |
The fund’s Declaration of Trust permits the Trustees to issue an unlimited number of full and fractional shares of beneficial interest. Transactions in fund shares were as follows:
| | | | | | | | | | | | | | | | |
| | | Year ended 12/31/20 | | | Year ended 12/31/19 | |
| | | | |
| | | Shares | | | Amount | | | Shares | | | Amount | |
| Shares sold | | | | | | | | | | | | | | | | |
Initial Class | | | 2,228,807 | | | | $21,405,127 | | | | 2,461,006 | | | | $24,284,094 | |
Service Class | | | 3,158,059 | | | | 30,335,847 | | | | 2,054,824 | | | | 18,713,982 | |
| | | 5,386,866 | | | | $51,740,974 | | | | 4,515,830 | | | | $42,998,076 | |
| | | | |
| Shares issued to shareholders in reinvestment of distributions | | | | | | | | | | | | | | | | |
Initial Class | | | 1,877,652 | | | | $20,372,526 | | | | 3,800,896 | | | | $35,576,388 | |
Service Class | | | 895,228 | | | | 8,871,708 | | | | 1,562,183 | | | | 13,481,643 | |
| | | 2,772,880 | | | | $29,244,234 | | | | 5,363,079 | | | | $49,058,031 | |
| | | | |
| Shares reacquired | | | | | | | | | | | | | | | | |
Initial Class | | | (8,598,413 | ) | | | $(91,175,151 | ) | | | (7,169,474 | ) | | | $(70,824,035 | ) |
Service Class | | | (3,909,750 | ) | | | (38,042,134 | ) | | | (3,599,134 | ) | | | (32,845,066 | ) |
| | | (12,508,163 | ) | | | $(129,217,285 | ) | | | (10,768,608 | ) | | | $(103,669,101 | ) |
| | | | |
| Net change | | | | | | | | | | | | | | | | |
Initial Class | | | (4,491,954 | ) | | | $(49,397,498 | ) | | | (907,572 | ) | | | $(10,963,553 | ) |
Service Class | | | 143,537 | | | | 1,165,421 | | | | 17,873 | | | | (649,441 | ) |
| | | (4,348,417 | ) | | | $(48,232,077 | ) | | | (889,699 | ) | | | $(11,612,994 | ) |
The fund is one of several mutual funds in which certain MFS funds may invest. The MFS funds do not invest in the underlying funds for the purpose of exercising management or control. At the end of the period, the MFS Moderate Allocation Portfolio, the MFS Growth Allocation Portfolio, and the MFS Conservative Allocation Portfolio were the owners of record of approximately 24%, 7%, and 4%, respectively, of the value of outstanding voting shares of the fund.
The fund and certain other funds managed by MFS participate in a $1.25 billion unsecured committed line of credit of which $1 billion is reserved for use by the fund and certain other U.S. funds. The line of credit is provided by a syndicate of banks under a credit agreement. Borrowings may be made for temporary financing needs. Interest is charged to each fund, based on its borrowings, generally at a rate equal to the highest of one month LIBOR, the Federal Funds Effective Rate and the Overnight Bank Funding Rate, plus an agreed upon spread. A commitment fee, based on the average daily, unused portion of the committed line of credit, is allocated among the participating funds. In addition, the fund and other funds managed by MFS have established unsecured uncommitted borrowing arrangements with certain banks for temporary financing needs. Interest is charged to each fund, based on its borrowings, at rates equal to customary reference rates plus an agreed upon spread. For the year ended December 31, 2020, the fund’s commitment fee and interest expense were $1,872 and $0, respectively, and are included in “Miscellaneous” expense in the Statement of Operations.
| (7) | | Investments in Affiliated Issuers |
An affiliated issuer may be considered one in which the fund owns 5% or more of the outstanding voting securities, or a company which is under common control. For the purposes of this report, the following were affiliated issuers:
| | | | | | | | | | | | | | | | | | | | | | | | |
| Affiliated Issuers | | Beginning
Value | | | Purchases | | | Sales
Proceeds | | | Realized
Gain
(Loss) | | | Change in
Unrealized
Appreciation or
Depreciation | | | Ending
Value | |
| MFS Institutional Money Market Portfolio | | | $2,090,550 | | | | $105,418,100 | | | | $104,871,493 | | | | $(1,593 | ) | | | $55 | | | | $2,635,619 | |
| | | | | | |
| Affiliated Issuers | | | | | | | | | | | | | | Dividend
Income | | | Capital Gain
Distributions | |
| MFS Institutional Money Market Portfolio | | | | | | | | | | | | $25,896 | | | | $— | |
18
MFS Mid Cap Growth Series
Notes to Financial Statements – continued
The pandemic related to the global spread of novel coronavirus disease (COVID-19), which was first detected in December 2019, has resulted in significant disruptions to global business activity and the global economy, as well as the economies of individual countries, the financial performance of individual companies and sectors, and the securities and commodities markets in general. This pandemic, the full effects of which are still unknown, has resulted in substantial market volatility and may have adversely impacted the prices and liquidity of the fund’s investments and the fund’s performance.
19
MFS Mid Cap Growth Series
REPORT OF INDEPENDENT REGISTERED PUBLIC ACCOUNTING FIRM
To the Board of Trustees of MFS Variable Insurance Trust and the Shareholders of
MFS Mid Cap Growth Series:
Opinion on the Financial Statements and Financial Highlights
We have audited the accompanying statement of assets and liabilities of MFS Mid Cap Growth Series (the “Fund”), including the portfolio of investments, as of December 31, 2020, the related statement of operations for the year then ended, the statements of changes in net assets for each of the two years in the period then ended, the financial highlights for each of the five years in the period then ended, and the related notes. In our opinion, the financial statements and financial highlights present fairly, in all material respects, the financial position of the Fund as of December 31, 2020, and the results of its operations for the year then ended, the changes in its net assets for each of the two years in the period then ended, and the financial highlights for each of the five years in the period then ended, in conformity with accounting principles generally accepted in the United States of America.
Basis for Opinion
These financial statements and financial highlights are the responsibility of the Fund’s management. Our responsibility is to express an opinion on the Funds’s financial statements and financial highlights based on our audits. We are a public accounting firm registered with the Public Company Accounting Oversight Board (United States) (PCAOB) and are required to be independent with respect to the Fund in accordance with the U.S. federal securities laws and the applicable rules and regulations of the Securities and Exchange Commission and the PCAOB.
We conducted our audits in accordance with the standards of the PCAOB. Those standards require that we plan and perform the audit to obtain reasonable assurance about whether the financial statements and financial highlights are free of material misstatement, whether due to error or fraud. The Fund is not required to have, nor were we engaged to perform, an audit of its internal control over financial reporting. As part of our audits, we are required to obtain an understanding of internal control over financial reporting but not for the purpose of expressing an opinion on the effectiveness of the Fund’s internal control over financial reporting. Accordingly, we express no such opinion.
Our audits included performing procedures to assess the risks of material misstatement of the financial statements and financial highlights, whether due to error or fraud, and performing procedures that respond to those risks. Such procedures included examining, on a test basis, evidence regarding the amounts and disclosures in the financial statements and financial highlights. Our audits also included evaluating the accounting principles used and significant estimates made by management, as well as evaluating the overall presentation of the financial statements and financial highlights. Our procedures included confirmation of securities owned as of December 31, 2020, by correspondence with the custodian and brokers; when replies were not received from brokers, we performed other auditing procedures. We believe that our audits provide a reasonable basis for our opinion.
DELOITTE & TOUCHE LLP
Boston, Massachusetts
February 16, 2021
We have served as the auditor of one or more of the MFS investment companies since 1924.
20
MFS Mid Cap Growth Series
TRUSTEES AND OFFICERS – IDENTIFICATION AND BACKGROUND
The Trustees and Officers of the Trust, as of February 1, 2021, are listed below, together with their principal occupations during the past five years. (Their titles may have varied during that period.) The address of each Trustee and Officer is 111 Huntington Avenue, Boston, Massachusetts 02199-7618.
| | | | | | | | | | |
Name, Age | | Position(s)
Held with Fund | | Trustee/Officer
Since (h) | | Number of
MFS Funds
overseen by the
Trustee | | Principal Occupations
During the Past Five Years | | Other Directorships During the Past Five Years (j) |
| INTERESTED TRUSTEES |
Robert J. Manning (k)
(age 57) | | Trustee | | February 2004 | | 134 | | Massachusetts Financial Services Company, Non-Executive Chairman (since January 2021); Director; Chairman of the Board; Executive Chairman (January 2017-2020); Co-Chief Executive Officer (2015-2016) | | N/A |
| | | | | |
Michael W. Roberge (k) (age 54) | | Trustee | | January 2021 | | 134 | | Massachusetts Financial Services Company, Chairman (since January 2021); Chief Executive Officer (since January 2017); Director; President (until December 2018); Chief Investment Officer (until December 2018); Co-Chief Executive Officer (until December 2016) | | N/A |
|
| INDEPENDENT TRUSTEES |
John P. Kavanaugh (age 66) | | Trustee and Chair of Trustees | | January 2009 | | 134 | | Private investor | | N/A |
| | | | | |
Steven E. Buller (age 69) | | Trustee | | February 2014 | | 134 | | Private investor | | N/A |
| | | | | |
John A. Caroselli (age 66) | | Trustee | | March 2017 | | 134 | | Private investor; JC Global Advisors, LLC (management consulting), President (since 2015) | | N/A |
| | | | | |
Maureen R. Goldfarb (age 65) | | Trustee | | January 2009 | | 134 | | Private investor | | N/A |
| | | | | |
Peter D. Jones
(age 65) | | Trustee | | January 2019 | | 134 | | Private investor | | N/A |
| | | | | |
James W. Kilman, Jr.
(age 59) | | Trustee | | January 2019 | | 134 | | Burford Capital Limited (finance and investment management), Chief Financial Officer (since 2019); KielStrand Capital LLC (family office), Chief Executive Officer (since 2016); Morgan Stanley & Co. (financial services), Vice Chairman of Investment Banking, Co-Head of Diversified Financials Coverage – Financial Institutions Investment Banking Group (until 2016) | | Alpha-En Corporation, Director (2016-2019) |
| | | | | |
Clarence Otis, Jr. (age 64) | | Trustee | | March 2017 | | 134 | | Private investor | | VF Corporation, Director; Verizon Communications, Inc., Director; The Travelers Companies, Director |
| | | | | |
Maryanne L. Roepke (age 64) | | Trustee | | May 2014 | | 134 | | Private investor | | N/A |
| | | | | |
Laurie J. Thomsen
(age 63) | | Trustee | | March 2005 | | 134 | | Private investor | | The Travelers Companies, Director; Dycom Industries, Inc., Director |
21
MFS Mid Cap Growth Series
Trustees and Officers – continued
| | | | | | | | |
Name, Age | | Position(s)
Held with Fund | | Trustee/Officer
Since (h) | | Number of
MFS Funds
for which the
Person is an
Officer | | Principal Occupations During the Past Five Years |
| OFFICERS | | | | | | |
Christopher R. Bohane (k)
(age 47) | | Assistant Secretary and Assistant Clerk | | July 2005 | | 134 | | Massachusetts Financial Services Company, Senior Vice President and Associate General Counsel |
| | | | |
Kino Clark (k) (age 52) | | Assistant Treasurer | | January 2012 | | 134 | | Massachusetts Financial Services Company, Vice President |
| | | | |
John W. Clark, Jr. (k) (age 53) | | Assistant Treasurer | | April 2017 | | 134 | | Massachusetts Financial Services Company, Vice President (since March 2017); Deutsche Bank (financial services), Department Head – Treasurer’s Office (until February 2017) |
| | | | |
Thomas H. Connors (k) (age 61) | | Assistant Secretary and Assistant Clerk | | September 2012 | | 134 | | Massachusetts Financial Services Company, Vice President and Senior Counsel |
| | | | |
David L. DiLorenzo (k)
(age 52) | | President | | July 2005 | | 134 | | Massachusetts Financial Services Company, Senior Vice President |
| | | | |
Heidi W. Hardin (k) (age 53) | | Secretary and Clerk | | April 2017 | | 134 | | Massachusetts Financial Services Company, Executive Vice President and General Counsel (since March 2017); Harris Associates (investment management), General Counsel (until January 2017) |
| | | | |
Brian E. Langenfeld (k) (age 47) | | Assistant
Secretary and Assistant Clerk | | June 2006 | | 134 | | Massachusetts Financial Services Company, Vice President and Senior Counsel |
| | | | |
Amanda S. Mooradian (k) (age 41) | | Assistant
Secretary and Assistant Clerk | | September 2018 | | 134 | | Massachusetts Financial Services Company, Assistant Vice President and Senior Counsel |
| | | | |
Susan A. Pereira (k)
(age 50) | | Assistant
Secretary and Assistant Clerk | | July 2005 | | 134 | | Massachusetts Financial Services Company, Vice President and Assistant General Counsel |
| | | | |
Kasey L. Phillips (k) (age 50) | | Assistant Treasurer | | September 2012 | | 134 | | Massachusetts Financial Services Company, Vice President |
| | | | |
Matthew A. Stowe (k) (age 46) | | Assistant Secretary and Assistant Clerk | | October 2014 | | 134 | | Massachusetts Financial Services Company, Vice President and Assistant General Counsel |
| | | | |
Martin J. Wolin (k) (age 53) | | Chief Compliance Officer | | July 2015 | | 134 | | Massachusetts Financial Services Company, Senior Vice President and Chief Compliance Officer |
| | | | |
James O. Yost (k)
(age 60) | | Treasurer | | September 1990 | | 134 | | Massachusetts Financial Services Company, Senior Vice President |
| (h) | Date first appointed to serve as Trustee/officer of an MFS Fund. Each Trustee has served continuously since appointment unless indicated otherwise. For the period from December 15, 2004 until February 22, 2005, Mr. Manning served as Advisory Trustee. From January 2012 through December 2016, Messrs. DiLorenzo and Yost served as Treasurer and Deputy Treasurer of the Funds, respectively. |
| (j) | Directorships or trusteeships of companies required to report to the Securities and Exchange Commission (i.e., “public companies”). |
| (k) | “Interested person” of the Trust within the meaning of the Investment Company Act of 1940 (referred to as the 1940 Act), which is the principal federal law governing investment companies like the fund, as a result of a position with MFS. The address of MFS is 111 Huntington Avenue, Boston, Massachusetts 02199-7618. |
Each Trustee (other than Messrs. Jones, Kilman and Roberge) has been elected by shareholders and each Trustee and Officer holds office until his or her successor is chosen and qualified or until his or her earlier death, resignation, retirement or removal. Mr. Roberge became a Trustee of the Funds on January 1, 2021 and Messrs. Jones and Kilman became Trustees of the Funds on January 1, 2019. The Trust does not hold annual meetings for the purpose of electing Trustees, and Trustees are not elected for fixed terms. Under the terms of the Board’s retirement policy, an Independent Trustee shall retire at the end of the calendar year in which he or she reaches the earlier of 75 years of age or 15 years of service on the Board (or, in the case of any Independent Trustee who joined the Board prior to 2015, 20 years of service on the Board).
Messrs. Buller, Kilman and Otis and Ms. Roepke are members of the Trust’s Audit Committee.
22
MFS Mid Cap Growth Series
Trustees and Officers – continued
Each of the Interested Trustees and certain Officers hold comparable officer positions with certain affiliates of MFS.
The Statement of Additional Information for a Fund includes further information about the Trustees and is available without charge upon request by calling 1-800-225-2606.
| | |
Investment Adviser Massachusetts Financial Services Company 111 Huntington Avenue Boston, MA 02199-7618 | | Custodian State Street Bank and Trust Company 1 Lincoln Street Boston, MA 02111-2900 |
| |
Distributor MFS Fund Distributors, Inc. 111 Huntington Avenue Boston, MA 02199-7618 | | Independent Registered Public Accounting Firm Deloitte & Touche LLP 200 Berkeley Street Boston, MA 02116 |
| |
Portfolio Manager(s) Eric Fischman Paul Gordon | | |
23
MFS Mid Cap Growth Series
BOARD REVIEW OF INVESTMENT ADVISORY AGREEMENT
MFS Mid Cap Growth Series
The Investment Company Act of 1940 requires that both the full Board of Trustees and a majority of the non-interested (“independent”) Trustees, voting separately, annually approve the continuation of the Fund’s investment advisory agreement with MFS. The Trustees consider matters bearing on the Fund and its advisory arrangements at their meetings throughout the year, including a review of performance data at each regular meeting. In addition, the independent Trustees met several times by videoconference (in accordance with Securities and Exchange Commission relief) over the course of three months beginning in May and ending in July, 2020 (“contract review meetings”) for the specific purpose of considering whether to approve the continuation of the investment advisory agreement for the Fund and the other investment companies that the Board oversees (the “MFS Funds”). The independent Trustees were assisted in their evaluation of the Fund’s investment advisory agreement by independent legal counsel, from whom they received separate legal advice and with whom they met separately from MFS during various contract review meetings. The independent Trustees were also assisted in this process by an independent consultant who was retained by and reported to the independent Trustees.
In connection with their deliberations regarding the continuation of the investment advisory agreement, the Trustees, including the independent Trustees, considered such information and factors as they believed, in light of the legal advice furnished to them and their own business judgment, to be relevant. The investment advisory agreement for the Fund was considered separately, although the Trustees also took into account the common interests of all MFS Funds in their review. As described below, the Trustees considered the nature, quality, and extent of the various investment advisory, administrative, and shareholder services performed by MFS under the existing investment advisory agreement and other arrangements with the Fund.
In connection with their contract review meetings, the Trustees received and relied upon materials that included, among other items: (i) information provided by Broadridge Financial Solutions, Inc. (“Broadridge”), an independent third party, on the investment performance of the Fund for various time periods ended December 31, 2019 and the investment performance of a group of funds with substantially similar investment classifications/objectives (the “Broadridge performance universe”), (ii) information provided by Broadridge on the Fund’s advisory fees and other expenses and the advisory fees and other expenses of comparable funds identified by Broadridge as well as all other funds in the same investment classification/category (the “Broadridge expense group and universe”), (iii) information provided by MFS on the advisory fees of portfolios of other clients of MFS, including institutional separate accounts and other clients, (iv) information as to whether and to what extent applicable expense waivers, reimbursements or fee “breakpoints” are observed for the Fund, (v) information regarding MFS’ financial results and financial condition, including MFS’ and certain of its affiliates’ estimated profitability from services performed for the Fund and the MFS Funds as a whole, and compared to MFS’ institutional business, (vi) MFS’ views regarding the outlook for the mutual fund industry and the strategic business plans of MFS, (vii) descriptions of various functions performed by MFS for the Funds, such as compliance monitoring and portfolio trading practices, and (viii) information regarding the overall organization of MFS, including information about MFS’ senior management and other personnel providing investment advisory, administrative and other services to the Fund and the other MFS Funds. The comparative performance, fee and expense information prepared and provided by Broadridge was not independently verified and the independent Trustees did not independently verify any information provided to them by MFS.
The Trustees’ conclusion as to the continuation of the investment advisory agreement was based on a comprehensive consideration of all information provided to the Trustees and not the result of any single factor. Some of the factors that figured particularly in the Trustees’ deliberations are described below, although individual Trustees may have evaluated the information presented differently from one another, giving different weights to various factors. It is also important to recognize that the fee arrangements for the Fund and other MFS Funds are the result of years of review and discussion between the independent Trustees and MFS, that certain aspects of such arrangements may receive greater scrutiny in some years than in others, and that the Trustees’ conclusions may be based, in part, on their consideration of these same arrangements during the course of the year and in prior years.
Based on information provided by Broadridge and MFS, the Trustees reviewed the Fund’s total return investment performance as well as the Broadridge performance universe over various time periods. The Trustees placed particular emphasis on the total return performance of the Fund’s Initial Class shares in comparison to the performance of funds in its Broadridge performance universe over the five-year period ended December 31, 2019, which the Trustees believed was a long enough period to reflect differing market conditions. The total return performance of the Fund’s Initial Class shares was in the 1st quintile relative to the other funds in the universe for this five-year period (the 1st quintile being the best performers and the 5th quintile being the worst performers). The total return performance of the Fund’s Initial Class shares was in the 1st quintile for each of the one- and three-year periods ended December 31, 2019 relative to the Broadridge performance universe. Because of the passage of time, these performance results may differ from the performance results for more recent periods, including those shown elsewhere in this report.
In the course of their deliberations, the Trustees took into account information provided by MFS in connection with the contract review meetings, as well as during investment review meetings conducted with portfolio management personnel during the course
24
MFS Mid Cap Growth Series
Board Review of Investment Advisory Agreement – continued
of the year regarding the Fund’s performance. After reviewing these and related factors, the Trustees concluded, within the context of their overall conclusions regarding the investment advisory agreement, that they were satisfied with MFS’ responses and efforts relating to investment performance.
In assessing the reasonableness of the Fund’s advisory fee, the Trustees considered, among other information, the Fund’s advisory fee and the total expense ratio of the Fund’s Initial Class shares as a percentage of average daily net assets and the advisory fee and total expense ratios of the Broadridge expense group based on information provided by Broadridge. The Trustees considered that, according to the data provided by Broadridge (which takes into account any fee reductions or expense limitations that were in effect during the Fund’s last fiscal year), the Fund’s effective advisory fee rate and total expense ratio were each approximately at the Broadridge expense group median.
The Trustees also considered the advisory fees charged by MFS to any institutional separate accounts advised by MFS (“separate accounts”) and unaffiliated investment companies for which MFS serves as subadviser (“subadvised funds”) that have comparable investment strategies to the Fund, if any. In comparing these fees, the Trustees considered information provided by MFS as to the generally broader scope of services provided by MFS to the Fund, as well as the more extensive regulatory burdens imposed on MFS in managing the Fund, in comparison to separate accounts and subadvised funds. The Trustees also considered the higher demands placed on MFS’ investment personnel and trading infrastructure as a result of the daily cash in-flows and out-flows of the Fund in comparison to separate accounts.
The Trustees also considered whether the Fund may benefit from any economies of scale in the management of the Fund in the event of growth in assets of the Fund and/or growth in assets of the MFS Funds as a whole. They noted that the Fund’s advisory fee rate schedule is subject to a contractual breakpoint that reduces the Fund’s advisory fee rate on average daily net assets over $1 billion. The Trustees also noted that MFS has agreed in writing to waive a portion of the management fees of certain MFS Funds, including the Fund, if the total combined assets of certain funds within the MFS Funds’ complex increase above agreed upon thresholds (the “group fee waiver”), enabling the Fund’s shareholders to share in the benefits from any economies of scale at the complex level. The group fee waiver is reviewed and renewed annually between the Board and MFS. The Trustees concluded that the breakpoint and the group fee waiver were sufficient to allow the Fund to benefit from economies of scale as its assets and overall complex assets grow.
The Trustees also considered information prepared by MFS relating to MFS’ costs and profits with respect to the Fund, the MFS Funds considered as a group, and other investment companies and accounts advised by MFS, as well as MFS’ methodologies used to determine and allocate its costs to the MFS Funds, the Fund and other accounts and products for purposes of estimating profitability.
After reviewing these and other factors described herein, the Trustees concluded, within the context of their overall conclusions regarding the investment advisory agreement, that the advisory fees charged to the Fund represent reasonable compensation in light of the services being provided by MFS to the Fund.
In addition, the Trustees considered MFS’ resources and related efforts to continue to retain, attract and motivate capable personnel to serve the Fund. The Trustees also considered current and developing conditions in the financial services industry, including the presence of large and well-capitalized companies which are spending, and appear to be prepared to continue to spend, substantial sums to engage personnel and to provide services to competing investment companies. In this regard, the Trustees also considered the financial resources of MFS and its ultimate parent, Sun Life Financial Inc. The Trustees also considered the advantages and possible disadvantages to the Fund of having an adviser that also serves other investment companies as well as other accounts.
The Trustees also considered the nature, quality, cost, and extent of administrative, transfer agency, and distribution services provided to the Fund by MFS and its affiliates under agreements and plans other than the investment advisory agreement, including any 12b-1 fees the Fund pays to MFS Fund Distributors, Inc., an affiliate of MFS. The Trustees also considered the nature, extent and quality of certain other services MFS performs or arranges for on the Fund’s behalf, which may include securities lending programs, directed expense payment programs, class action recovery programs, and MFS’ interaction with third-party service providers, principally custodians and sub-custodians. The Trustees concluded that the various non-advisory services provided by MFS and its affiliates on behalf of the Fund were satisfactory.
The Trustees considered so-called “fall-out benefits” to MFS such as reputational value derived from serving as investment manager to the MFS Funds. The Trustees also considered that MFS discontinued its historic practice of obtaining investment research from portfolio brokerage commissions paid by certain MFS Funds effective January 2018, and directly pays or voluntarily reimburses a Fund, if applicable, for the costs of external research acquired through the use of the Fund’s portfolio brokerage commissions.
Based on their evaluation of factors that they deemed to be material, including those factors described above, the Board of Trustees, including the independent Trustees, concluded that the Fund’s investment advisory agreement with MFS should be continued for an additional one-year period, commencing August 1, 2020.
25
MFS Mid Cap Growth Series
PROXY VOTING POLICIES AND INFORMATION
MFS votes proxies on behalf of the fund pursuant to proxy voting policies and procedures that are available without charge, upon request, by calling 1-800-225-2606, by visiting mfs.com/proxyvoting, or by visiting the SEC Web site at http://www.sec.gov.
Information regarding how the fund voted proxies relating to portfolio securities during the most recent twelve-month period ended June 30 is available by August 31 of each year without charge by visiting mfs.com/proxyvoting, or by visiting the SEC’s Web site at http://www.sec.gov.
QUARTERLY PORTFOLIO DISCLOSURE
The fund files a complete schedule of portfolio holdings with the SEC for the first and third quarters of each fiscal year as an exhibit to its reports on Form N-PORT. The fund’s Form N-PORT reports are available on the SEC’s Web site at http://www.sec.gov. A shareholder can obtain the portfolio holdings report for the first and third quarters of the fund’s fiscal year at mfs.com/vit1 by choosing the fund’s name and then scrolling to the “Resources” section and clicking on the “Prospectus and Reports” tab.
FURTHER INFORMATION
From time to time, MFS may post important information about the fund or the MFS funds on the MFS Web site (mfs.com). This information is available at https://www.mfs.com/announcements or at mfs.com/vit1 by choosing the fund’s name and then scrolling to the “Resources” section and clicking on the “Announcements” tab, if any.
INFORMATION ABOUT FUND CONTRACTS AND LEGAL CLAIMS
The fund has entered into contractual arrangements with an investment adviser, administrator, distributor, shareholder servicing agent, 529 program manager (if applicable), and custodian who each provide services to the fund. Unless expressly stated otherwise, shareholders are not parties to, or intended beneficiaries of these contractual arrangements, and these contractual arrangements are not intended to create any shareholder right to enforce them against the service providers or to seek any remedy under them against the service providers, either directly or on behalf of the fund.
Under the Trust’s By-Laws and Declaration of Trust, any claims asserted against or on behalf of the MFS Funds, including claims against Trustees and Officers, must be brought in state and federal courts located within the Commonwealth of Massachusetts.
FEDERAL TAX INFORMATION (unaudited)
The following information is provided pursuant to provisions of the Internal Revenue Code.
The fund designates $30,735,000 as capital gain dividends paid during the fiscal year.
For corporate shareholders, 100% of the ordinary income dividends paid during the fiscal year qualify for the corporate dividends received deduction.
26
rev. 3/16
| | | | |
| | | |
| FACTS | | WHAT DOES MFS DO WITH YOUR
PERSONAL INFORMATION? | |  |
| | |
| Why? | | Financial companies choose how they share your personal information. Federal law gives consumers the right to limit some but not all sharing. Federal law also requires us to tell you how we collect, share, and protect your personal information. Please read this notice carefully to understand what we do. |
| | |
| What? | | The types of personal information we collect and share depend on the product or service you have with us. This information can include: • Social Security number and account balances • Account transactions and transaction history • Checking account information and wire transfer instructions When you are no longer our customer, we continue to share your information as described in this notice. |
| | |
| How? | | All financial companies need to share customers’ personal information to run their everyday business. In the section below, we list the reasons financial companies can share their customers’ personal information; the reasons MFS chooses to share; and whether you can limit this sharing. |
| | | | |
Reasons we can share your
personal information | | Does MFS share? | | Can you limit this
sharing? |
For our everyday business purposes – such as to process your transactions, maintain your account(s), respond to court orders and legal investigations, or report to credit bureaus | | Yes | | No |
For our marketing purposes – to offer our products and services to you | | No | | We don’t share |
| For joint marketing with other financial companies | | No | | We don’t share |
For our affiliates’ everyday business purposes – information about your transactions and experiences | | No | | We don’t share |
For our affiliates’ everyday business purposes – information about your creditworthiness | | No | | We don’t share |
| For nonaffiliates to market to you | | No | | We don’t share |
| | |
| | |
| Questions? | | Call 800-225-2606 or go to mfs.com. |
27
| | |
| Who we are |
| Who is providing this notice? | | MFS Funds, MFS Investment Management, MFS Institutional Advisors, Inc., and MFS Heritage Trust Company. |
| | |
| What we do |
| How does MFS protect my personal information? | | To protect your personal information from unauthorized access and use, we use security measures that comply with federal law. These measures include procedural, electronic, and physical safeguards for the protection of the personal information we collect about you. |
How does MFS
collect my personal information? | | We collect your personal information, for example, when you • open an account or provide account information • direct us to buy securities or direct us to sell your securities • make a wire transfer We also collect your personal information from others, such as credit bureaus, affiliates, or other companies. |
| Why can’t I limit all sharing? | | Federal law gives you the right to limit only • sharing for affiliates’ everyday business purposes – information about your creditworthiness • affiliates from using your information to market to you • sharing for nonaffiliates to market to you State laws and individual companies may give you additional rights to limit sharing. |
| | |
| Definitions |
| Affiliates | | Companies related by common ownership or control. They can be financial and nonfinancial companies. • MFS does not share personal information with affiliates, except for everyday business purposes as described on page one of this notice. |
| Nonaffiliates | | Companies not related by common ownership or control. They can be financial and nonfinancial companies. • MFS does not share with nonaffiliates so they can market to you. |
| Joint marketing | | A formal agreement between nonaffiliated financial companies that together market financial products or services to you. • MFS doesn’t jointly market. |
| | |
| Other important information |
| If you own an MFS product or receive an MFS service in the name of a third party such as a bank or broker-dealer, their privacy policy may apply to you instead of ours. |
28
Annual Report
December 31, 2020
MFS® New Discovery Series
MFS® Variable Insurance Trust
MFS® New Discovery Series
| 1 |
| 2 |
| 3 |
| 5 |
| 7 |
| 8 |
| 11 |
| 12 |
| 13 |
| 14 |
| 16 |
| 22 |
| 23 |
| 26 |
| 29 |
| 29 |
| 29 |
| 29 |
| 29 |
| 30 |
The report is prepared for the general information of contract owners. It is authorized for distribution to prospective investors only when preceded or accompanied by a current prospectus.
NOT FDIC INSURED • MAY LOSE VALUE • NO BANK OR CREDIT UNION GUARANTEE •
NOT A DEPOSIT • NOT INSURED BY ANY FEDERAL GOVERNMENT AGENCY OR NCUA/NCUSIF
Dear Contract Owners:
Markets experienced dramatic swings this year as the coronavirus pandemic brought the global economy to a standstill for several months early in the year. The speedy development of vaccines and therapeutics later brightened the economic and market outlook, but a great deal of uncertainty remains as case counts remain high, new variants of the virus are appearing and questions persist over how fast the vaccine can be made widely available. In the United States, political uncertainty eased after former Vice President Joe Biden won the presidential election and the Democrats gained control of a closely divided Senate.
Global central banks have taken aggressive steps to cushion the economic and market fallout related to the virus, and governments are deploying unprecedented levels of fiscal support. Additional U.S. stimulus is anticipated with the Democrats in the White House and in control of both houses of Congress. The measures already put in place have helped build a supportive environment and are encouraging economic recovery; however, if markets disconnect from fundamentals, they can sow the seeds of instability. As such, dramatic increases in speculative retail trading bear watching.
In the aftermath of the crisis, we could see societal changes as households, businesses, and governments adjust to a new reality, and any such alterations could affect the investment landscape. For investors, events such as the COVID-19 outbreak demonstrate the importance of having a deep understanding of company fundamentals, and we have built our global research platform to do just that.
At MFS®, we put our clients’ assets to work responsibly by carefully navigating the increasing complexity of our global markets and economies. Guided by our long-term philosophy and adhering to our commitment to sustainable investing, we tune out the noise and aim to uncover what we believe are the best, most durable investment opportunities in the market. Our unique global investment platform combines collective expertise, long-term discipline and thoughtful risk management to create sustainable value for investors.
Respectfully,
Michael W. Roberge
Chief Executive Officer
MFS Investment Management
February 16, 2021
The opinions expressed in this letter are subject to change and may not be relied upon for investment advice. No forecasts can be guaranteed.
Top ten holdings
| PRA Health Sciences, Inc. | 2.3% |
| Rapid7, Inc. | 2.2% |
| CACI International, Inc., “A” | 2.0% |
| QTS Realty Trust, Inc., REIT, “A” | 1.8% |
| Nuvei Corp. | 1.7% |
| Q2 Holdings, Inc. | 1.7% |
| Advanced Energy Industries, Inc. | 1.6% |
| Leslie’s, Inc. | 1.6% |
| Ping Identity Holding Corp. | 1.6% |
| 8x8, Inc. | 1.5% |
GICS equity sectors (g)
| Information Technology | 30.7% |
| Health Care | 24.3% |
| Industrials | 12.2% |
| Consumer Discretionary | 8.8% |
| Financials | 8.7% |
| Real Estate | 6.2% |
| Materials | 4.0% |
| Consumer Staples | 1.1% |
| Communication Services | 1.0% |
| Energy | 0.1% |
| (g) | The Global Industry Classification Standard (GICS®) was developed by and/or is the exclusive property of MSCI, Inc. and S&P Global Market Intelligence Inc. (“S&P Global Market Intelligence”). GICS is a service mark of MSCI and S&P Global Market Intelligence and has been licensed for use by MFS. MFS has applied its own internal sector/industry classification methodology for equity securities and non-equity securities that are unclassified by GICS. |
Cash & Cash Equivalents includes any cash, investments in money market funds, short-term securities, and other assets less liabilities. Please see the Statement of Assets and Liabilities for additional information related to the fund’s cash position and other assets and liabilities.
Percentages are based on net assets as of December 31, 2020.
The portfolio is actively managed and current holdings may be different.
Management Review
Summary of Results
For the twelve months ended December 31, 2020, Initial Class shares of the MFS New Discovery Series (fund) provided a total return of 45.89%, while Service Class shares of the fund provided a total return of 45.58%. These compare with a return of 34.63% over the same period for the fund’s benchmark, the Russell 2000® Growth Index.
Market Environment
Markets experienced an extraordinarily sharp selloff early in the period and, in many cases, an unusually rapid recovery later. Central banks and fiscal authorities undertook astonishing levels of stimulus to offset the economic effects of government-imposed social-distancing measures implemented to slow the spread of the COVID-19 virus. At this point, the global economy looks to have experienced the shortest — albeit the deepest and steepest — recession in the postwar period. However, the recovery remains subject to more than the usual number of uncertainties due to questions about the evolution of the virus, what its continued impact will be and how quickly vaccines to guard against it can be manufactured and distributed at scale. There are also worries over the public's willingness to be inoculated.
Around the world, central banks responded quickly and massively to the crisis with programs to improve liquidity and support markets. These programs proved largely successful in helping to restore market function, ease volatility and stimulate a continued market rebound. Late in the period, the US Federal Reserve adopted a new, flexible, average-inflation-targeting framework, which is expected to result in the federal funds rate remaining at low levels longer than under its previous model. In developed countries, monetary easing measures were complemented by unusually large fiscal stimulus initiatives. Due to relatively manageable external liabilities and balances of payments in many countries and persistently low inflation, even emerging market countries were able to implement countercyclical policies — a departure from the usual market-dictated response to risk-off crises.
Compounding market uncertainty earlier in the pandemic was a crash in the price of crude oil due to a sharp drop in global demand and a disagreement between Saudi Arabia and Russia over production cuts, which resulted in an oil price war. The subsequent decline in prices undercut oil exporters, many of which are in emerging markets, as well as a large segment of the high-yield credit market. The OPEC+ group later agreed on output cuts, with shale oil producers in the US also decreasing production, which, along with the gradual reopening of some major economies and the resultant boost in demand, helped stabilize the price of crude oil.
In the immediate aftermath of the market disruption that accompanied the initial phases of the pandemic, many companies that had added significant leverage to their balance sheets in recent years by borrowing to fund dividend payments and stock buybacks halted those activities, and some companies were forced to recapitalize. As markets and the economy stabilized later in the period, in many cases dividend payments and buybacks resumed. Conversely, some companies found themselves flush with liquidity, having borrowed preemptively during the worst of the crisis only to end up with excess cash on their balance sheets.
Contributors to Performance
Stock selection in the health care sector contributed to the fund's performance relative to the Russell 2000® Growth Index. Within this sector, the portfolio's overweight positions in consumer digital health company Livongo Health(h), synthetic DNA manufacturer Twist Bioscience, diagnostic healthcare products manufacturer Quidel(h), biopharmaceutical company Immunomedics(h) and clinical-stage immuno-oncology company Forty Seven(h) boosted relative performance. The share price of Livongo Health appreciated after the company announced better-than-expected sales results, a record number of client acquisitions and a strong new-business pipeline. Additionally, telehealthcare services provider Teladoc announced an agreement to merge with Livongo, which appeared to have been well received by the markets.
Security selection and, to a lesser extent, the fund's overweight position in the information technology sector also aided relative returns. Within this sector, the timing of the fund's ownership in shares of video gaming peripherals equipment supplier Corsair Gaming, its overweight position in event management and enterprise safety software developer Everbridge, and its holdings of cloud-based software provider Avalara(b) helped relative results. The share price of Corsair Gaming advanced on the back of stronger-than-expected earnings results. Strong sales of gaming peripherals and solid growth in its Computer & Systems division led management to raise its full-year 2020 outlook.
The combination of an underweight position and stock selection in the industrials sector further bolstered relative performance, led by the timing of the fund's ownership in shares of power generation equipment manufacturer Generac Holdings. The share price of Generac Holdings advanced on the back of record revenue in its core residential segment as demand for backup power from customers working from home increased. Additionally, the firm increased its fiscal-year 2020 guidance due to forced grid-outages in California and a higher-than-forecasted Atlantic hurricane season.
Elsewhere, the fund's holdings of strong-performing digital sports entertainment and gaming company DraftKings(b)(h) further supported relative results.
Management Review - continued
Detractors from Performance
Stock selection and, to a lesser extent, an underweight position in the consumer discretionary sector held back relative performance, led by the fund's holdings of licensed pop culture products distributor Funko(h). The share price of Funko fell, early in the reporting period, amid the ongoing market turbulence caused by the COVID-19 virus. The company reported a decline in adjusted earnings and lower-than-expected revenue due to weak sales and underperformance of its properties tied to Frozen 2 and Star Wars: The Rise of Skywalker.
Security selection in the financials sector also weakened relative performance. Within this sector, the fund's holdings of banking services providers, Texas Capital Bancshares(b)(h) and Wintrust Financial(b)(h), and insurance services provider GoHealth(b) weakened relative returns. The share price of Texas Capital Bancshares declined at the beginning of the calendar year, along with many other financial services stocks, as bond yields collapsed, notably on US 10-year Treasury bonds, and concerns about increased potential loan losses arose as global economic activity ground to a halt in efforts to stem the spread of the COVID-19 virus.
An overweight position and stock selection in the real estate sector dampened relative results, led by the fund's holdings of real estate investment trust CoreSite Realty(b). Although the company delivered solid funds from operations (FFO) and earnings, CoreSite Realty's share price lagged the broader market and subsequently weighed on the fund's relative performance.
Elsewhere, not owning shares of strong-performing alternative energy technology company Plug Power and clinical-stage biopharmaceutical company MyoKardia, and the fund's holdings of weak-performing oilfield and natural gas reservoir service firm Core Laboratories(b)(h) (The Netherlands), government intelligence and security information services provider CACI International(b) and professional football club Manchester United(b) (United Kingdom), dampened relative returns.
Respectfully,
Portfolio Manager(s)
Michael Grossman
| (b) | Security is not a benchmark constituent. |
| (h) | Security was not held in the portfolio at period end. |
The views expressed in this report are those of the portfolio manager(s) only through the end of the period of the report as stated on the cover and do not necessarily reflect the views of MFS or any other person in the MFS organization. These views are subject to change at any time based on market or other conditions, and MFS disclaims any responsibility to update such views. These views may not be relied upon as investment advice or an indication of trading intent on behalf of any MFS portfolio. References to specific securities are not recommendations of such securities, and may not be representative of any MFS portfolio’s current or future investments.
Performance Summary Through 12/31/20
The following chart illustrates the historical performance of the fund in comparison to its benchmark(s). Benchmarks are unmanaged and may not be invested in directly. Benchmark returns do not reflect any fees or expenses. The performance of other share classes will be greater than or less than that of the class depicted below. (See Notes to Performance Summary.)
Performance data shown represents past performance and is no guarantee of future results. Investment return and principal value fluctuate so your units, when sold, may be worth more or less than the original cost; current performance may be lower or higher than quoted. The performance shown does not reflect the deduction of taxes, if any, that a contract holder would pay on fund distributions or the redemption of contract units. The returns for the fund shown also do not reflect the deduction of expenses associated with variable products, such as mortality and expense risk charges, separate account charges, and sales charges imposed by the insurance company separate accounts. Such expenses would reduce the overall returns shown.
Growth of a Hypothetical $10,000 Investment
Total Returns through 12/31/20
Average annual total returns
| Share Class | Class Inception Date | 1-yr | 5-yr | 10-yr |
| Initial Class | 5/01/98 | 45.89% | 22.98% | 14.70% |
| Service Class | 5/01/00 | 45.58% | 22.68% | 14.41% |
Comparative benchmark(s)
| Russell 2000® Growth Index (f) | 34.63% | 16.36% | 13.48% |
| (f) | Source: FactSet Research Systems Inc. |
Benchmark Definition(s)
Russell 2000® Growth Index(h) - constructed to provide a comprehensive barometer for growth securities in the small-cap segment of the U.S. equity universe. Companies in this index generally have higher price-to-book ratios and higher forecasted growth values.
It is not possible to invest directly in an index.
| (h) | Frank Russell Company (“Russell”) is the source and owner of the trademarks, service marks, and copyrights related to the Russell Indexes. Russell® is a trademark of Frank Russell Company. Neither Russell nor its licensors accept any liability for any errors or omissions in the Russell Indexes and/or Russell ratings or underlying data and no party may rely on any Russell Indexes and/or Russell ratings and/or underlying data contained in this document. No further distribution of Russell Data is permitted without Russell's express written consent. Russell does not promote, sponsor, or endorse the content of this document. |
Notes to Performance Summary
Average annual total return represents the average annual change in value for each share class for the periods presented.
Performance results reflect any applicable expense subsidies and waivers in effect during the periods shown. Without such subsidies and waivers the fund's performance results would be less favorable. Please see the prospectus and financial statements for complete details. All results are historical and assume the reinvestment of any dividends and capital gains distributions.
Performance Summary – continued
Performance results do not include adjustments made for financial reporting purposes in accordance with U.S. generally accepted accounting principles and may differ from amounts reported in the financial highlights.
From time to time the fund may receive proceeds from litigation settlements, without which performance would be lower.
Expense Table
Fund Expenses Borne by the Contract Holders during the Period,
July 1, 2020 through December 31, 2020
As a contract holder of the fund, you incur ongoing costs, including management fees; distribution and/or service (12b-1) fees; and other fund expenses. This example is intended to help you understand your ongoing costs (in dollars) of investing in the fund and to compare these costs with the ongoing costs of investing in other mutual funds.
The example is based on an investment of $1,000 invested at the beginning of the period and held for the entire period July 1, 2020 through December 31, 2020.
Actual Expenses
The first line for each share class in the following table provides information about actual account values and actual expenses. You may use the information in this line, together with the amount you invested, to estimate the expenses that you paid over the period. Simply divide your account value by $1,000 (for example, an $8,600 account value divided by $1,000 = 8.6), then multiply the result by the number in the first line under the heading entitled “Expenses Paid During Period” to estimate the expenses you paid on your account during this period.
Hypothetical Example for Comparison Purposes
The second line for each share class in the following table provides information about hypothetical account values and hypothetical expenses based on the fund’s actual expense ratio and an assumed rate of return of 5% per year before expenses, which is not the fund’s actual return. The hypothetical account values and expenses may not be used to estimate the actual ending account balance or expenses you paid for the period. You may use this information to compare the ongoing costs of investing in the fund and other funds. To do so, compare this 5% hypothetical example with the 5% hypothetical examples that appear in the shareholder reports of the other funds.
Please note that the expenses shown in the table are meant to highlight the fund's ongoing costs only and do not take into account the fees and expenses imposed under the variable contracts through which your investment in the fund is made. Therefore, the second line for each share class in the table is useful in comparing ongoing costs associated with an investment in vehicles (such as the fund) which fund benefits under variable annuity and variable life insurance contracts and to qualified pension and retirement plans only, and will not help you determine the relative total costs of investing in the fund through variable annuity and variable life insurance contracts. If the fees and expenses imposed under the variable contracts were included, your costs would have been higher.
Share
Class | | Annualized
Expense
Ratio | Beginning
Account Value
7/01/20 | Ending
Account Value
12/31/20 | Expenses
Paid During
Period (p)
7/01/20-12/31/20 |
| Initial Class | Actual | 0.88% | $1,000.00 | $1,387.06 | $5.28 |
| Hypothetical (h) | 0.88% | $1,000.00 | $1,020.71 | $4.47 |
| Service Class | Actual | 1.13% | $1,000.00 | $1,385.12 | $6.77 |
| Hypothetical (h) | 1.13% | $1,000.00 | $1,019.46 | $5.74 |
| (h) | 5% class return per year before expenses. |
| (p) | “Expenses Paid During Period” are equal to each class's annualized expense ratio, as shown above, multiplied by the average account value over the period, multiplied by 184/366 (to reflect the one-half year period). |
Notes to Expense Table
Changes to the fund’s fee arrangements occurred during the six month period. Had these fee changes been in effect throughout the entire six month period, the annualized expense ratios, the actual expenses paid during the period, and the hypothetical expenses paid during the period would have been approximately 0.87%, $5.22, and $4.42 for Initial Class and 1.12%, $6.71, and $5.69 for Service Class, respectively. For further information about the fund’s fee arrangements and changes to those fee arrangements, please see Note 3 in the Notes to Financial Statements.
Portfolio of Investments − 12/31/20
The Portfolio of Investments is a complete list of all securities owned by your fund. It is categorized by broad-based asset classes.
| Issuer | | | Shares/Par | Value ($) |
| Common Stocks – 97.1% |
| Aerospace – 3.3% | |
| CACI International, Inc., “A” (a) | | 86,054 | $ 21,455,844 |
| Kratos Defense & Security Solutions, Inc. (a) | | 459,079 | 12,592,537 |
| | | | | $34,048,381 |
| Apparel Manufacturers – 1.4% | |
| Skechers USA, Inc., “A” (a) | | 398,100 | $ 14,307,714 |
| Automotive – 0.6% | |
| Visteon Corp. (a) | | 53,532 | $ 6,719,337 |
| Biotechnology – 7.0% | |
| Abcam PLC | | 275,375 | $ 5,836,921 |
| Abcam PLC (a) | | 100,801 | 2,172,261 |
| Adaptive Biotechnologies Corp. (a) | | 126,710 | 7,492,362 |
| AlloVir, Inc. (a) | | 162,878 | 6,261,030 |
| Amicus Therapeutics, Inc. (a) | | 299,080 | 6,905,757 |
| Berkeley Lights, Inc. (a) | | 38,709 | 3,460,972 |
| BioAtla, Inc. (a) | | 127,359 | 4,331,480 |
| BioXcel Therapeutics, Inc. (a) | | 77,245 | 3,568,719 |
| bluebird bio, Inc. (a) | | 114,469 | 4,953,074 |
| BridgeBio Pharma, Inc. (a) | | 110,530 | 7,859,788 |
| Morphosys AG, ADR (a) | | 175,726 | 4,980,075 |
| Neurocrine Biosciences, Inc. (a) | | 37,675 | 3,611,149 |
| Prelude Therapeutics, Inc. (a) | | 72,719 | 5,203,044 |
| Seer, Inc. (a) | | 55,615 | 3,122,226 |
| Twist Bioscience Corp. (a) | | 29,044 | 4,103,627 |
| | | | | $73,862,485 |
| Brokerage & Asset Managers – 4.4% | |
| Focus Financial Partners, “A” (a) | | 304,823 | $ 13,259,801 |
| GCM Grosvenor, Inc. | | 171,251 | 2,281,063 |
| Grosvenor Capital Management LLC (a) | | 533,386 | 7,104,702 |
| Hamilton Lane, Inc., “A” | | 114,221 | 8,914,949 |
| TMX Group Ltd. | | 66,799 | 6,672,028 |
| WisdomTree Investments, Inc. | | 1,533,554 | 8,204,514 |
| | | | | $46,437,057 |
| Business Services – 9.9% | |
| Endava PLC, ADR (a) | | 40,778 | $ 3,129,711 |
| EVO Payments, Inc., “A” (a) | | 297,309 | 8,030,316 |
| ExlService Holdings, Inc. (a) | | 156,599 | 13,331,273 |
| Keywords Studios PLC (a) | | 312,690 | 12,270,218 |
| Nuvei Corp. (a) | | 304,322 | 18,329,314 |
| Proofpoint, Inc. (a) | | 91,629 | 12,499,112 |
| Stamps.com, Inc. (a) | | 58,927 | 11,560,888 |
| TriNet Group, Inc. (a) | | 127,666 | 10,289,880 |
| WNS (Holdings) Ltd., ADR (a) | | 205,605 | 14,813,840 |
| | | | | $104,254,552 |
| Chemicals – 1.2% | |
| Ingevity Corp. (a) | | 163,217 | $ 12,360,423 |
| Computer Software – 12.0% | |
| 8x8, Inc. (a) | | 471,197 | $ 16,242,161 |
| Asana, Inc. (a) | | 256,305 | 7,573,813 |
| Avalara, Inc. (a) | | 44,871 | 7,398,779 |
| Issuer | | | Shares/Par | Value ($) |
| Common Stocks – continued |
| Computer Software – continued | |
| Certara, Inc. (a) | | 223,866 | $ 7,548,761 |
| Everbridge, Inc. (a) | | 104,980 | 15,649,369 |
| Open Lending Corp., “A” (a) | | 344,831 | 12,055,292 |
| Pagerduty, Inc. (a) | | 278,211 | 11,601,399 |
| Paylocity Holding Corp. (a) | | 36,660 | 7,548,661 |
| Ping Identity Holding Corp. (a) | | 579,963 | 16,610,140 |
| VERTEX, Inc. (a) | | 465,200 | 16,212,220 |
| Zendesk, Inc. (a) | | 54,821 | 7,845,981 |
| | | | | $126,286,576 |
| Computer Software - Systems – 6.7% | |
| Box, Inc., “A” (a) | | 573,953 | $ 10,359,852 |
| Five9, Inc. (a) | | 39,982 | 6,972,861 |
| Q2 Holdings, Inc. (a) | | 143,018 | 18,096,067 |
| Rapid7, Inc. (a) | | 261,513 | 23,578,012 |
| RealPage, Inc. (a) | | 124,995 | 10,904,564 |
| | | | | $69,911,356 |
| Construction – 2.7% | |
| AZEK Co. LLC (a) | | 283,069 | $ 10,884,003 |
| Summit Materials, Inc., “A” (a) | | 458,527 | 9,207,222 |
| Trex Co., Inc. (a) | | 98,818 | 8,273,043 |
| | | | | $28,364,268 |
| Consumer Services – 1.4% | |
| Boyd Group Services, Inc. | | 41,375 | $ 7,136,692 |
| Bright Horizons Family Solutions, Inc. (a) | | 21,954 | 3,797,822 |
| MakeMyTrip Ltd. (a) | | 132,281 | 3,906,258 |
| | | | | $14,840,772 |
| Containers – 1.3% | |
| Gerresheimer AG | | 125,229 | $ 13,424,523 |
| Electrical Equipment – 3.1% | |
| Advanced Drainage Systems, Inc. | | 31,650 | $ 2,645,307 |
| Generac Holdings, Inc. (a) | | 54,777 | 12,456,837 |
| Littlefuse, Inc. | | 25,683 | 6,540,433 |
| Sensata Technologies Holding PLC (a) | | 209,509 | 11,049,505 |
| | | | | $32,692,082 |
| Electronics – 3.7% | |
| Advanced Energy Industries, Inc. (a) | | 178,476 | $ 17,306,818 |
| Array Technologies, Inc. (a) | | 316,505 | 13,654,025 |
| Silicon Laboratories, Inc. (a) | | 61,497 | 7,831,028 |
| | | | | $38,791,871 |
| Entertainment – 1.0% | |
| Manchester United PLC, “A” | | 640,277 | $ 10,718,237 |
| Food & Beverages – 0.2% | |
| Laird Superfood, Inc. (a) | | 51,050 | $ 2,415,686 |
| Food & Drug Stores – 0.9% | |
| Grocery Outlet Holding Corp. (a) | | 233,922 | $ 9,181,439 |
| Gaming & Lodging – 0.5% | |
| Penn National Gaming, Inc. (a) | | 57,151 | $ 4,936,132 |
Portfolio of Investments – continued
| Issuer | | | Shares/Par | Value ($) |
| Common Stocks – continued |
| General Merchandise – 0.8% | |
| Ollie's Bargain Outlet Holdings, Inc. (a) | | 104,234 | $ 8,523,214 |
| Insurance – 1.0% | |
| GoHealth, Inc. (a) | | 448,102 | $ 6,121,073 |
| SelectQuote, Inc. (a) | | 216,392 | 4,490,134 |
| | | | | $10,611,207 |
| Leisure & Toys – 1.7% | |
| Corsair Gaming, Inc. (a)(l) | | 60,701 | $ 2,198,590 |
| Malibu Boats, Inc., “A” (a) | | 160,884 | 10,045,597 |
| Thule Group AB (a) | | 147,498 | 5,514,413 |
| | | | | $17,758,600 |
| Machinery & Tools – 0.9% | |
| Hydrofarm Holdings Group, Inc. (a) | | 51,173 | $ 2,690,676 |
| Ritchie Bros. Auctioneers, Inc. | | 103,092 | 7,170,049 |
| | | | | $9,860,725 |
| Medical & Health Technology & Services – 5.4% | |
| Charles River Laboratories International, Inc. (a) | | 41,707 | $ 10,420,911 |
| Guardant Health, Inc. (a) | | 33,825 | 4,359,366 |
| Health Catalyst, Inc. (a) | | 129,850 | 5,652,371 |
| ICON PLC (a) | | 38,542 | 7,514,919 |
| PRA Health Sciences, Inc. (a) | | 188,667 | 23,666,389 |
| Schrodinger, Inc. (a) | | 69,719 | 5,520,350 |
| | | | | $57,134,306 |
| Medical Equipment – 6.1% | |
| Acutus Medical, Inc. (a) | | 152,434 | $ 4,391,624 |
| Bio-Techne Corp. | | 20,188 | 6,410,699 |
| Maravai Lifesciences Holdings, Inc., “A” (a) | | 348,717 | 9,781,512 |
| Merit Medical Systems, Inc. (a) | | 156,801 | 8,704,024 |
| Nevro Corp. (a) | | 36,429 | 6,305,860 |
| OptiNose, Inc. (a)(l) | | 475,828 | 1,969,928 |
| OrthoPediatrics Corp. (a) | | 168,331 | 6,943,654 |
| Outset Medical, Inc. (a) | | 78,348 | 4,453,300 |
| PerkinElmer, Inc. | | 36,293 | 5,208,045 |
| Silk Road Medical, Inc. (a) | | 84,525 | 5,323,384 |
| STERIS PLC | | 24,491 | 4,642,024 |
| | | | | $64,134,054 |
| Network & Telecom – 3.3% | |
| CoreSite Realty Corp., REIT | | 120,669 | $ 15,117,412 |
| QTS Realty Trust, Inc., REIT, “A” | | 314,066 | 19,434,404 |
| | | | | $34,551,816 |
| Other Banks & Diversified Financials – 2.1% | |
| Bank OZK | | 130,980 | $ 4,095,745 |
| dMY Technology Group, Inc. II (a) | | 269,780 | 4,745,430 |
| Insu Acquisition Corp. II (a) | | 283,941 | 4,415,282 |
| Prosperity Bancshares, Inc. | | 124,141 | 8,610,420 |
| | | | | $21,866,877 |
| Pharmaceuticals – 3.3% | |
| Annexon, Inc. (a) | | 228,725 | $ 5,724,987 |
| Collegium Pharmaceutical, Inc. (a) | | 151,853 | 3,041,616 |
| GW Pharmaceuticals PLC, ADR (a)(l) | | 58,565 | 6,758,987 |
| Issuer | | | Shares/Par | Value ($) |
| Common Stocks – continued |
| Pharmaceuticals – continued | |
| Harmony Biosciences Holdings (a) | | 130,357 | $ 4,712,405 |
| Orchard RX Ltd., ADR (a) | | 134,310 | 580,219 |
| SpringWorks Therapeutics, Inc. (a) | | 101,579 | 7,366,509 |
| Turning Point Therapeutics, Inc. (a) | | 48,429 | 5,901,074 |
| | | | | $34,085,797 |
| Pollution Control – 1.1% | |
| GFL Environmental, Inc. | | 405,377 | $ 11,828,901 |
| Railroad & Shipping – 0.1% | |
| StealthGas, Inc. (a) | | 479,763 | $ 1,127,443 |
| Real Estate – 2.9% | |
| Big Yellow Group PLC, REIT | | 523,533 | $ 7,853,772 |
| Industrial Logistics Properties Trust, REIT | | 378,777 | 8,821,716 |
| STAG Industrial, Inc., REIT | | 440,789 | 13,805,512 |
| | | | | $30,481,000 |
| Specialty Chemicals – 2.0% | |
| Axalta Coating Systems Ltd. (a) | | 421,233 | $ 12,026,202 |
| Ferro Corp. (a) | | 600,948 | 8,791,869 |
| | | | | $20,818,071 |
| Specialty Stores – 2.2% | |
| Leslie's, Inc. (a) | | 617,559 | $ 17,137,262 |
| Vroom, Inc. (a) | | 144,386 | 5,915,495 |
| | | | | $23,052,757 |
| Trucking – 2.9% | |
| CryoPort, Inc. (a) | | 283,193 | $ 12,426,509 |
| Knight-Swift Transportation Holdings, Inc. | | 216,670 | 9,061,139 |
| Schneider National, Inc. | | 421,867 | 8,732,647 |
| | | | | $30,220,295 |
| Total Common Stocks (Identified Cost, $664,492,055) | | $1,019,607,954 |
| Investment Companies (h) – 3.0% |
| Money Market Funds – 3.0% | |
| MFS Institutional Money Market Portfolio, 0.1% (v) (Identified Cost, $31,899,275) | | | 31,899,306 | $ 31,899,306 |
| Collateral for Securities Loaned – 0.1% |
| State Street Navigator Securities Lending Government Money Market Portfolio, 0.1% (j) (Identified Cost, $906,482) | | | 906,482 | $ 906,482 |
| Other Assets, Less Liabilities – (0.2)% | | (1,822,950) |
| Net Assets – 100.0% | $1,050,590,792 |
Portfolio of Investments – continued
| (a) | Non-income producing security. | | | |
| (h) | An affiliated issuer, which may be considered one in which the fund owns 5% or more of the outstanding voting securities, or a company which is under common control. At period end, the aggregate values of the fund's investments in affiliated issuers and in unaffiliated issuers were $31,899,306 and $1,020,514,436, respectively. | | | |
| (j) | The rate quoted is the annualized seven-day yield of the fund at period end. | | | |
| (l) | A portion of this security is on loan. See Note 2 for additional information. | | | |
| (v) | Affiliated issuer that is available only to investment companies managed by MFS. The rate quoted for the MFS Institutional Money Market Portfolio is the annualized seven-day yield of the fund at period end. | | | |
| The following abbreviations are used in this report and are defined: |
| ADR | American Depositary Receipt |
| REIT | Real Estate Investment Trust |
See Notes to Financial Statements
| Financial Statements | Statement of Assets and Liabilities |
This statement represents your fund’s balance sheet, which details the assets and liabilities comprising the total value of the fund.
| At 12/31/20Assets | |
| Investments in unaffiliated issuers, at value, including $1,576,806 of securities on loan (identified cost, $665,398,537) | $1,020,514,436 |
| Investments in affiliated issuers, at value (identified cost, $31,899,275) | 31,899,306 |
| Receivables for | |
| Fund shares sold | 712,928 |
| Interest and dividends | 758,475 |
| Other assets | 3,681 |
| Total assets | $1,053,888,826 |
| Liabilities | |
| Payables for | |
| Investments purchased | $1,536,695 |
| Fund shares reacquired | 699,314 |
| Collateral for securities loaned, at value (c) | 906,482 |
| Payable to affiliates | |
| Investment adviser | 1,958 |
| Administrative services fee | 724 |
| Shareholder servicing costs | 774 |
| Distribution and/or service fees | 7,973 |
| Payable for independent Trustees' compensation | 12 |
| Accrued expenses and other liabilities | 144,102 |
| Total liabilities | $3,298,034 |
| Net assets | $1,050,590,792 |
| Net assets consist of | |
| Paid-in capital | $526,748,362 |
| Total distributable earnings (loss) | 523,842,430 |
| Net assets | $1,050,590,792 |
| Shares of beneficial interest outstanding | 42,047,644 |
| | Net assets | Shares
outstanding | Net asset value
per share |
| Initial Class | $465,662,741 | 17,273,408 | $26.96 |
| Service Class | 584,928,051 | 24,774,236 | 23.61 |
| (c) | Non-cash collateral is not included. |
See Notes to Financial Statements
| Financial Statements | Statement of Operations |
This statement describes how much your fund earned in investment income and accrued in expenses. It also describes any gains and/or losses generated by fund operations.
| Year ended 12/31/20 | |
| Net investment income (loss) | |
| Income | |
| Dividends | $4,671,348 |
| Income on securities loaned | 153,852 |
| Dividends from affiliated issuers | 80,837 |
| Other | 80,543 |
| Foreign taxes withheld | (107,471) |
| Total investment income | $4,879,109 |
| Expenses | |
| Management fee | $7,318,319 |
| Distribution and/or service fees | 1,158,172 |
| Shareholder servicing costs | 38,015 |
| Administrative services fee | 117,474 |
| Independent Trustees' compensation | 14,337 |
| Custodian fee | 54,990 |
| Shareholder communications | 100,425 |
| Audit and tax fees | 60,353 |
| Legal fees | 5,892 |
| Miscellaneous | 31,495 |
| Total expenses | $8,899,472 |
| Reduction of expenses by investment adviser | (357,304) |
| Net expenses | $8,542,168 |
| Net investment income (loss) | $(3,663,059) |
| Realized and unrealized gain (loss) | |
| Realized gain (loss) (identified cost basis) | |
| Unaffiliated issuers | $176,395,184 |
| Affiliated issuers | (3,037) |
| Foreign currency | 7,519 |
| Net realized gain (loss) | $176,399,666 |
| Change in unrealized appreciation or depreciation | |
| Unaffiliated issuers | $163,797,024 |
| Affiliated issuers | (38) |
| Translation of assets and liabilities in foreign currencies | 9,126 |
| Net unrealized gain (loss) | $163,806,112 |
| Net realized and unrealized gain (loss) | $340,205,778 |
| Change in net assets from operations | $336,542,719 |
See Notes to Financial Statements
| Financial Statements | Statements of Changes in Net Assets |
These statements describe the increases and/or decreases in net assets resulting from operations, any distributions, and any shareholder transactions.
| | Year ended |
| | 12/31/20 | 12/31/19 |
| Change in net assets | | |
| From operations | | |
| Net investment income (loss) | $(3,663,059) | $(3,520,316) |
| Net realized gain (loss) | 176,399,666 | 82,971,956 |
| Net unrealized gain (loss) | 163,806,112 | 172,414,321 |
| Change in net assets from operations | $336,542,719 | $251,865,961 |
| Total distributions to shareholders | $(81,295,168) | $(140,125,461) |
| Change in net assets from fund share transactions | $(20,182,105) | $72,834,089 |
| Total change in net assets | $235,065,446 | $184,574,589 |
| Net assets | | |
| At beginning of period | 815,525,346 | 630,950,757 |
| At end of period | $1,050,590,792 | $815,525,346 |
See Notes to Financial Statements
| Financial Statements | Financial Highlights |
The financial highlights table is intended to help you understand the fund's financial performance for the past 5 years. Certain information reflects financial results for a single fund share. The total returns in the table represent the rate that an investor would have earned (or lost) on an investment in the fund share class (assuming reinvestment of all distributions) held for the entire period.
| Initial Class | Year ended |
| | 12/31/20 | 12/31/19 | 12/31/18 | 12/31/17 | 12/31/16 |
| Net asset value, beginning of period | $20.28 | $17.46 | $20.10 | $16.18 | $15.49 |
| Income (loss) from investment operations | | | | | |
| Net investment income (loss) (d) | $(0.06) | $(0.07) | $(0.09) | $(0.07) | $0.00(c)(w) |
| Net realized and unrealized gain (loss) | 8.84 | 6.89 | 0.35 | 4.34 | 1.40 |
| Total from investment operations | $8.78 | $6.82 | $0.26 | $4.27 | $1.40 |
| Less distributions declared to shareholders | | | | | |
| From net realized gain | $(2.10) | $(4.00) | $(2.90) | $(0.35) | $(0.71) |
| Net asset value, end of period (x) | $26.96 | $20.28 | $17.46 | $20.10 | $16.18 |
| Total return (%) (k)(r)(s)(x) | 45.89 | 41.70 | (1.48) | 26.65 | 9.05(c) |
Ratios (%) (to average net assets)
and Supplemental data: | | | | | |
| Expenses before expense reductions (f) | 0.95 | 0.95 | 0.96 | 0.97 | 0.94(c) |
| Expenses after expense reductions (f) | 0.91 | 0.94 | 0.94 | 0.94 | 0.92(c) |
| Net investment income (loss) | (0.30) | (0.33) | (0.43) | (0.37) | 0.02(c) |
| Portfolio turnover | 80 | 54 | 71 | 58 | 63 |
| Net assets at end of period (000 omitted) | $465,663 | $343,133 | $272,039 | $316,949 | $292,368 |
| Service Class | Year ended |
| | 12/31/20 | 12/31/19 | 12/31/18 | 12/31/17 | 12/31/16 |
| Net asset value, beginning of period | $18.02 | $15.91 | $18.57 | $15.01 | $14.45 |
| Income (loss) from investment operations | | | | | |
| Net investment income (loss) (d) | $(0.10) | $(0.11) | $(0.13) | $(0.10) | $(0.03)(c) |
| Net realized and unrealized gain (loss) | 7.79 | 6.22 | 0.37 | 4.01 | 1.30 |
| Total from investment operations | $7.69 | $6.11 | $0.24 | $3.91 | $1.27 |
| Less distributions declared to shareholders | | | | | |
| From net realized gain | $(2.10) | $(4.00) | $(2.90) | $(0.35) | $(0.71) |
| Net asset value, end of period (x) | $23.61 | $18.02 | $15.91 | $18.57 | $15.01 |
| Total return (%) (k)(r)(s)(x) | 45.58 | 41.27 | (1.72) | 26.33 | 8.80(c) |
Ratios (%) (to average net assets)
and Supplemental data: | | | | | |
| Expenses before expense reductions (f) | 1.20 | 1.20 | 1.21 | 1.22 | 1.19(c) |
| Expenses after expense reductions (f) | 1.16 | 1.19 | 1.19 | 1.19 | 1.17(c) |
| Net investment income (loss) | (0.56) | (0.58) | (0.68) | (0.62) | (0.23)(c) |
| Portfolio turnover | 80 | 54 | 71 | 58 | 63 |
| Net assets at end of period (000 omitted) | $584,928 | $472,393 | $358,912 | $432,897 | $380,884 |
See Notes to Financial Statements
Financial Highlights - continued
| (c) | Amount reflects a one-time reimbursement of expenses by the custodian (or former custodian) without which net investment income and performance would be lower and expenses would be higher. |
| (d) | Per share data is based on average shares outstanding. |
| (f) | Ratios do not reflect reductions from fees paid indirectly, if applicable. |
| (k) | The total return does not reflect expenses that apply to separate accounts. Inclusion of these charges would reduce the total return figures for all periods shown. |
| (r) | Certain expenses have been reduced without which performance would have been lower. |
| (s) | From time to time the fund may receive proceeds from litigation settlements, without which performance would be lower. |
| (w) | Per share amount was less than $0.01. |
| (x) | The net asset values and total returns have been calculated on net assets which include adjustments made in accordance with U.S. generally accepted accounting principles required at period end for financial reporting purposes. |
See Notes to Financial Statements
Notes to Financial Statements
(1) Business and Organization
MFS New Discovery Series (the fund) is a diversified series of MFS Variable Insurance Trust (the trust). The trust is organized as a Massachusetts business trust and is registered under the Investment Company Act of 1940, as amended, as an open-end management investment company. The shareholders of each series of the trust are separate accounts of insurance companies, which offer variable annuity and/or life insurance products, and qualified retirement and pension plans.
The fund is an investment company and accordingly follows the investment company accounting and reporting guidance of the Financial Accounting Standards Board (FASB) Accounting Standards Codification Topic 946 Financial Services - Investment Companies.
(2) Significant Accounting Policies
General — The preparation of financial statements in conformity with U.S. generally accepted accounting principles requires management to make estimates and assumptions that affect the reported amounts of assets and liabilities, and disclosure of contingent assets and liabilities at the date of the financial statements and the reported amounts of increases and decreases in net assets from operations during the reporting period. Actual results could differ from those estimates. In the preparation of these financial statements, management has evaluated subsequent events occurring after the date of the fund’s Statement of Assets and Liabilities through the date that the financial statements were issued. The fund will generally focus on securities of small size companies which may be more volatile than those of larger companies. The fund invests in foreign securities. Investments in foreign securities are vulnerable to the effects of changes in the relative values of the local currency and the U.S. dollar and to the effects of changes in each country’s market, economic, industrial, political, regulatory, geopolitical, and other conditions.
In March 2020, the FASB issued Accounting Standards Update 2020-04, Reference Rate Reform (Topic 848) – Facilitation of the Effects of Reference Rate Reform on Financial Reporting (“ASU 2020-04”), which provides optional, temporary relief with respect to the financial reporting of contracts subject to certain types of modifications due to the planned discontinuation of the London Interbank Offered Rate (LIBOR) and other IBOR-based reference rates as of the end of 2021. The temporary relief provided by ASU 2020-04 is effective for certain reference rate-related contract modifications that occur during the period from March 12, 2020 through December 31, 2022. Management is evaluating the impact of ASU 2020-04 on the fund's investments, derivatives, debt and other contracts that will undergo reference rate-related modifications as a result of the reference rate reform.
Balance Sheet Offsetting — The fund's accounting policy with respect to balance sheet offsetting is that, absent an event of default by the counterparty or a termination of the agreement, the International Swaps and Derivatives Association (ISDA) Master Agreement, or similar agreement, does not result in an offset of reported amounts of financial assets and financial liabilities in the Statement of Assets and Liabilities across transactions between the fund and the applicable counterparty. The fund's right to setoff may be restricted or prohibited by the bankruptcy or insolvency laws of the particular jurisdiction to which a specific master netting agreement counterparty is subject. Balance sheet offsetting disclosures, to the extent applicable to the fund, have been included in the fund’s Significant Accounting Policies note under the captions for each of the fund’s in-scope financial instruments and transactions.
Investment Valuations — Equity securities, including restricted equity securities, are generally valued at the last sale or official closing price on their primary market or exchange as provided by a third-party pricing service. Equity securities, for which there were no sales reported that day, are generally valued at the last quoted daily bid quotation on their primary market or exchange as provided by a third-party pricing service. Short-term instruments with a maturity at issuance of 60 days or less may be valued at amortized cost, which approximates market value. Open-end investment companies are generally valued at net asset value per share. Securities and other assets generally valued on the basis of information from a third-party pricing service may also be valued at a broker/dealer bid quotation. In determining values, third-party pricing services can utilize both transaction data and market information such as yield, quality, coupon rate, maturity, type of issue, trading characteristics, and other market data. The values of foreign securities and other assets and liabilities expressed in foreign currencies are converted to U.S. dollars using the mean of bid and asked prices for rates provided by a third-party pricing service.
The Board of Trustees has delegated primary responsibility for determining or causing to be determined the value of the fund’s investments (including any fair valuation) to the adviser pursuant to valuation policies and procedures approved by the Board. If the adviser determines that reliable market quotations are not readily available, investments are valued at fair value as determined in good faith by the adviser in accordance with such procedures under the oversight of the Board of Trustees. Under the fund’s valuation policies and procedures, market quotations are not considered to be readily available for most types of debt instruments and floating rate loans and many types of derivatives. These investments are generally valued at fair value based on information from third-party pricing services. In addition, investments may be valued at fair value if the adviser determines that an investment’s value has been materially affected by events occurring after the close of the exchange or market on which the investment is principally traded (such as foreign exchange or market) and prior to the determination of the fund’s net asset value, or after the halt of trading
Notes to Financial Statements - continued
of a specific security where trading does not resume prior to the close of the exchange or market on which the security is principally traded. Events that occur after foreign markets close (such as developments in foreign markets and significant movements in the U.S. markets) and prior to the determination of the fund’s net asset value may be deemed to have a material effect on the value of securities traded in foreign markets. Accordingly, the fund’s foreign equity securities may often be valued at fair value. The adviser generally relies on third-party pricing services or other information (such as the correlation with price movements of similar securities in the same or other markets; the type, cost and investment characteristics of the security; the business and financial condition of the issuer; and trading and other market data) to assist in determining whether to fair value and at what value to fair value an investment. The value of an investment for purposes of calculating the fund’s net asset value can differ depending on the source and method used to determine value. When fair valuation is used, the value of an investment used to determine the fund’s net asset value may differ from quoted or published prices for the same investment. There can be no assurance that the fund could obtain the fair value assigned to an investment if it were to sell the investment at the same time at which the fund determines its net asset value per share.
Various inputs are used in determining the value of the fund's assets or liabilities. These inputs are categorized into three broad levels. In certain cases, the inputs used to measure fair value may fall into different levels of the fair value hierarchy. In such cases, an investment's level within the fair value hierarchy is based on the lowest level of input that is significant to the fair value measurement. The fund's assessment of the significance of a particular input to the fair value measurement in its entirety requires judgment, and considers factors specific to the investment. Level 1 includes unadjusted quoted prices in active markets for identical assets or liabilities. Level 2 includes other significant observable market-based inputs (including quoted prices for similar securities, interest rates, prepayment speed, and credit risk). Level 3 includes unobservable inputs, which may include the adviser's own assumptions in determining the fair value of investments. The following is a summary of the levels used as of December 31, 2020 in valuing the fund's assets or liabilities:
| Financial Instruments | Level 1 | Level 2 | Level 3 | Total |
| Equity Securities: | | | | |
| United States | $860,764,471 | $7,104,702 | $— | $867,869,173 |
| Canada | 51,136,984 | — | — | 51,136,984 |
| United Kingdom | 37,050,108 | 12,270,218 | — | 49,320,326 |
| India | 18,720,098 | — | — | 18,720,098 |
| Germany | 18,404,598 | — | — | 18,404,598 |
| Ireland | 7,514,919 | — | — | 7,514,919 |
| Sweden | 5,514,413 | — | — | 5,514,413 |
| Greece | 1,127,443 | — | — | 1,127,443 |
| Mutual Funds | 32,805,788 | — | — | 32,805,788 |
| Total | $1,033,038,822 | $19,374,920 | $— | $1,052,413,742 |
For further information regarding security characteristics, see the Portfolio of Investments.
Foreign Currency Translation — Purchases and sales of foreign investments, income, and expenses are converted into U.S. dollars based upon currency exchange rates prevailing on the respective dates of such transactions or on the reporting date for foreign denominated receivables and payables. Gains and losses attributable to foreign currency exchange rates on sales of securities are recorded for financial statement purposes as net realized gains and losses on investments. Gains and losses attributable to foreign exchange rate movements on receivables, payables, income and expenses are recorded for financial statement purposes as foreign currency transaction gains and losses. That portion of both realized and unrealized gains and losses on investments that results from fluctuations in foreign currency exchange rates is not separately disclosed.
Security Loans — Under its Securities Lending Agency Agreement with the fund, State Street Bank and Trust Company, as lending agent, loans the securities of the fund to certain qualified institutions (the “Borrowers”) approved by the fund. Security loans can be terminated at the discretion of either the lending agent or the fund and the related securities must be returned within the earlier of the standard trade settlement period for such securities or within three business days. The loans are collateralized by cash and/or U.S. Treasury and federal agency obligations in an amount typically at least equal to the market value of the securities loaned. On loans collateralized by cash, the cash collateral is invested in a money market fund. The market value of the loaned securities is determined at the close of business of the fund and any additional required collateral is delivered to the fund on the next business day. The lending agent provides the fund with indemnification against Borrower default. In the event of Borrower default, the lending agent will, for the benefit of the fund, either purchase securities identical to those loaned or, when such purchase is commercially impracticable, pay the fund the market value of the loaned securities. In return, the lending agent assumes the fund's rights to the related collateral. If the collateral value is less than the cost to purchase identical securities, the lending agent is responsible for the shortfall, but only to the extent that such shortfall is not due to a decline in collateral value resulting from collateral reinvestment for which the fund bears the risk of loss. At period end, the fund had investment securities on loan, all of which were classified as equity securities in the fund's Portfolio of Investments, with a fair value of $1,576,806. The fair value of the
Notes to Financial Statements - continued
fund's investment securities on loan and a related liability of $906,482 for cash collateral received on securities loaned are both presented gross in the Statement of Assets and Liabilities. Additionally, these loans were collateralized by U.S. Treasury Obligations of $728,277 held by the lending agent. The collateral on securities loaned exceeded the value of securities on loan at period end. The liability for cash collateral for securities loaned is carried at fair value, which is categorized as level 2 within the fair value hierarchy. A portion of the income generated upon investment of the collateral is remitted to the Borrowers, and the remainder is allocated between the fund and the lending agent. On loans collateralized by U.S. Treasury and/or federal agency obligations, a fee is received from the Borrower, and is allocated between the fund and the lending agent. Income from securities lending is separately reported in the Statement of Operations. The dividend and interest income earned on the securities loaned is accounted for in the same manner as other dividend and interest income.
Indemnifications — Under the fund's organizational documents, its officers and Trustees may be indemnified against certain liabilities and expenses arising out of the performance of their duties to the fund. Additionally, in the normal course of business, the fund enters into agreements with service providers that may contain indemnification clauses. The fund's maximum exposure under these agreements is unknown as this would involve future claims that may be made against the fund that have not yet occurred.
Investment Transactions and Income — Investment transactions are recorded on the trade date. Interest income is recorded on the accrual basis. Dividends received in cash are recorded on the ex-dividend date. Certain dividends from foreign securities will be recorded when the fund is informed of the dividend if such information is obtained subsequent to the ex-dividend date. Dividend payments received in additional securities are recorded on the ex-dividend date in an amount equal to the value of the security on such date.
The fund may receive proceeds from litigation settlements. Any proceeds received from litigation involving portfolio holdings are reflected in the Statement of Operations in realized gain/loss if the security has been disposed of by the fund or in unrealized gain/loss if the security is still held by the fund. Any other proceeds from litigation not related to portfolio holdings are reflected as other income in the Statement of Operations.
Tax Matters and Distributions — The fund intends to qualify as a regulated investment company, as defined under Subchapter M of the Internal Revenue Code, and to distribute all of its taxable income, including realized capital gains. As a result, no provision for federal income tax is required. The fund’s federal tax returns, when filed, will remain subject to examination by the Internal Revenue Service for a three year period. Management has analyzed the fund’s tax positions taken on federal and state tax returns for all open tax years and does not believe that there are any uncertain tax positions that require recognition of a tax liability. Foreign taxes, if any, have been accrued by the fund in the accompanying financial statements in accordance with the applicable foreign tax law. Foreign income taxes may be withheld by certain countries in which the fund invests. Additionally, capital gains realized by the fund on securities issued in or by certain foreign countries may be subject to capital gains tax imposed by those countries.
Distributions to shareholders are recorded on the ex-dividend date. Income and capital gain distributions are determined in accordance with income tax regulations, which may differ from U.S. generally accepted accounting principles. Certain capital accounts in the financial statements are periodically adjusted for permanent differences in order to reflect their tax character. These adjustments have no impact on net assets or net asset value per share. Temporary differences which arise from recognizing certain items of income, expense, gain or loss in different periods for financial statement and tax purposes will reverse at some time in the future.
Book/tax differences primarily relate to wash sale loss deferrals.
The tax character of distributions declared to shareholders for the last two fiscal years is as follows:
| | Year ended
12/31/20 | Year ended
12/31/19 |
| Ordinary income (including any short-term capital gains) | $24,424,056 | $47,170,114 |
| Long-term capital gains | 56,871,112 | 92,955,347 |
| Total distributions | $81,295,168 | $140,125,461 |
The federal tax cost and the tax basis components of distributable earnings were as follows:
Notes to Financial Statements - continued
| As of 12/31/20 | |
| Cost of investments | $708,612,372 |
| Gross appreciation | 359,213,969 |
| Gross depreciation | (15,412,599) |
| Net unrealized appreciation (depreciation) | $343,801,370 |
| Undistributed ordinary income | 67,761,486 |
| Undistributed long-term capital gain | 112,268,925 |
| Other temporary differences | 10,649 |
Multiple Classes of Shares of Beneficial Interest — The fund offers multiple classes of shares, which differ in their respective distribution and/or service fees. The fund's income, realized and unrealized gain (loss), and common expenses are allocated to shareholders based on the daily net assets of each class. Dividends are declared separately for each class. Differences in per share dividend rates are generally due to differences in separate class expenses. The fund’s distributions declared to shareholders as reported in the Statements of Changes in Net Assets are presented by class as follows:
| | Year ended
12/31/20 | | Year ended
12/31/19 |
| Initial Class | $31,864,295 | | $57,060,289 |
| Service Class | 49,430,873 | | 83,065,172 |
| Total | $81,295,168 | | $140,125,461 |
(3) Transactions with Affiliates
Investment Adviser — The fund has an investment advisory agreement with MFS to provide overall investment management and related administrative services and facilities to the fund. The management fee is computed daily and paid monthly at the following annual rates based on the fund's average daily net assets:
| Up to $1 billion | 0.90% |
| In excess of $1 billion | 0.80% |
MFS has agreed in writing to reduce its management fee by a specified amount if certain MFS mutual fund assets exceed thresholds agreed to by MFS and the fund's Board of Trustees. For the year ended December 31, 2020, this management fee reduction amounted to $89,337, which is included in the reduction of total expenses in the Statement of Operations. The management fee incurred for the year ended December 31, 2020 was equivalent to an annual effective rate of 0.89% of the fund's average daily net assets.
For the period from January 1, 2020 through July 31, 2020, the investment adviser had agreed in writing to pay a portion of the fund’s total annual operating expenses, excluding interest, taxes, extraordinary expenses, brokerage and transaction costs, and investment-related expenses, such that total annual operating expenses did not exceed 0.94% of average daily net assets for the Initial Class shares and 1.19% of average daily net assets for the Service Class shares. This written agreement terminated on July 31, 2020. For the period from January 1, 2020 through July 31, 2020, this reduction amounted to $16,269, which is included in the reduction of total expenses in the Statement of Operations. Effective August 1, 2020, the investment adviser has agreed in writing to pay a portion of the fund’s total annual operating expenses, excluding interest, taxes, extraordinary expenses, brokerage and transaction costs, and investment-related expenses, such that total annual operating expenses do not exceed 0.87% of average daily net assets for the Initial Class shares and 1.12% of average daily net assets for the Service Class shares. This written agreement will continue until modified by the fund’s Board of Trustees, but such agreement will continue at least until April 30, 2022. For the period from August 1, 2020 through December 31, 2020, this reduction amounted to $251,698, which is included in the reduction of total expenses in the Statement of Operations.
Distributor — MFS Fund Distributors, Inc. (MFD), a wholly-owned subsidiary of MFS, is the distributor of shares of the fund. The Trustees have adopted a distribution plan for the Service Class shares pursuant to Rule 12b-1 under the Investment Company Act of 1940.
The fund's distribution plan provides that the fund will pay MFD distribution and/or service fees equal to 0.25% per annum of its average daily net assets attributable to Service Class shares as partial consideration for services performed and expenses incurred by MFD and financial intermediaries (including participating insurance companies that invest in the fund to fund variable annuity and
Notes to Financial Statements - continued
variable life insurance contracts, sponsors of qualified retirement and pension plans that invest in the fund, and affiliates of these participating insurance companies and plan sponsors) in connection with the sale and distribution of the Service Class shares. MFD may subsequently pay all, or a portion, of the distribution and/or service fees to financial intermediaries.
Shareholder Servicing Agent — MFS Service Center, Inc. (MFSC), a wholly-owned subsidiary of MFS, receives a fee from the fund for its services as shareholder servicing agent. For the year ended December 31, 2020, the fee was $34,955, which equated to 0.0043% annually of the fund's average daily net assets. MFSC also receives reimbursement from the fund for out-of-pocket expenses paid by MFSC on behalf of the fund. For the year ended December 31, 2020, these costs amounted to $3,060.
Administrator — MFS provides certain financial, legal, shareholder communications, compliance, and other administrative services to the fund. Under an administrative services agreement, the fund reimburses MFS the costs incurred to provide these services. The fund is charged an annual fixed amount of $17,500 plus a fee based on average daily net assets. The administrative services fee incurred for the year ended December 31, 2020 was equivalent to an annual effective rate of 0.0144% of the fund's average daily net assets.
Trustees’ and Officers’ Compensation — The fund pays compensation to independent Trustees in the form of a retainer, attendance fees, and additional compensation to Board and Committee chairpersons. The fund does not pay compensation directly to Trustees or officers of the fund who are also officers of the investment adviser, all of whom receive remuneration from MFS for their services to the fund. Certain officers and Trustees of the fund are officers or directors of MFS, MFD, and MFSC.
Other — The fund invests in the MFS Institutional Money Market Portfolio which is managed by MFS and seeks current income consistent with preservation of capital and liquidity. This money market fund does not pay a management fee to MFS but does incur investment and operating costs.
The fund is permitted to engage in purchase and sale transactions with funds and accounts for which MFS serves as investment adviser or sub-adviser (“cross-trades”) pursuant to a policy adopted by the Board of Trustees. This policy has been designed to ensure that cross-trades conducted by the fund comply with Rule 17a-7 under the Investment Company Act of 1940. During the year ended December 31, 2020, the fund engaged in purchase and sale transactions pursuant to this policy, which amounted to $169,830 and $539,353, respectively. The sales transactions resulted in net realized gains (losses) of $(28,615).
The adviser has voluntarily undertaken to reimburse the fund from its own resources on a quarterly basis for the cost of investment research embedded in the cost of the fund’s securities trades. This agreement may be rescinded at any time. For the year ended December 31, 2020, this reimbursement amounted to $80,433, which is included in “Other” income in the Statement of Operations.
(4) Portfolio Securities
For the year ended December 31, 2020, purchases and sales of investments, other than short-term obligations, aggregated $643,788,423 and $759,162,965, respectively.
(5) Shares of Beneficial Interest
The fund's Declaration of Trust permits the Trustees to issue an unlimited number of full and fractional shares of beneficial interest. Transactions in fund shares were as follows:
| | Year ended
12/31/20 | | Year ended
12/31/19 |
| | Shares | Amount | | Shares | Amount |
| Shares sold | | | | | |
| Initial Class | 3,294,260 | $68,896,127 | | 1,458,759 | $29,581,160 |
| Service Class | 3,845,873 | 70,163,983 | | 3,433,407 | 62,530,706 |
| | 7,140,133 | $139,060,110 | | 4,892,166 | $92,111,866 |
Shares issued to shareholders
in reinvestment of distributions | | | | | |
| Initial Class | 1,481,371 | $31,864,295 | | 3,140,358 | $57,060,289 |
| Service Class | 2,622,328 | 49,430,873 | | 5,140,172 | 83,065,172 |
| | 4,103,699 | $81,295,168 | | 8,280,530 | $140,125,461 |
Notes to Financial Statements - continued
| | Year ended
12/31/20 | | Year ended
12/31/19 |
| | Shares | Amount | | Shares | Amount |
| Shares reacquired | | | | | |
| Initial Class | (4,425,268) | $(93,651,928) | | (3,255,470) | $(67,473,742) |
| Service Class | (7,901,694) | (146,885,455) | | (4,923,843) | (91,929,496) |
| | (12,326,962) | $(240,537,383) | | (8,179,313) | $(159,403,238) |
| Net change | | | | | |
| Initial Class | 350,363 | $7,108,494 | | 1,343,647 | $19,167,707 |
| Service Class | (1,433,493) | (27,290,599) | | 3,649,736 | 53,666,382 |
| | (1,083,130) | $(20,182,105) | | 4,993,383 | $72,834,089 |
The fund is one of several mutual funds in which certain MFS funds may invest. The MFS funds do not invest in the underlying funds for the purpose of exercising management or control. At the end of the period, the MFS Moderate Allocation Portfolio was the owner of record of approximately 2% of the value of outstanding voting shares of the fund. In addition, the MFS Growth Allocation Portfolio and the MFS Conservative Allocation Portfolio were the owners of record of less than 1% of the value of outstanding voting shares of the fund.
(6) Line of Credit
The fund and certain other funds managed by MFS participate in a $1.25 billion unsecured committed line of credit of which $1 billion is reserved for use by the fund and certain other U.S. funds. The line of credit is provided by a syndicate of banks under a credit agreement. Borrowings may be made for temporary financing needs. Interest is charged to each fund, based on its borrowings, generally at a rate equal to the highest of one month LIBOR, the Federal Funds Effective Rate and the Overnight Bank Funding Rate, plus an agreed upon spread. A commitment fee, based on the average daily, unused portion of the committed line of credit, is allocated among the participating funds. In addition, the fund and other funds managed by MFS have established unsecured uncommitted borrowing arrangements with certain banks for temporary financing needs. Interest is charged to each fund, based on its borrowings, at rates equal to customary reference rates plus an agreed upon spread. For the year ended December 31, 2020, the fund’s commitment fee and interest expense were $3,501 and $0, respectively, and are included in “Miscellaneous” expense in the Statement of Operations.
(7) Investments in Affiliated Issuers
An affiliated issuer may be considered one in which the fund owns 5% or more of the outstanding voting securities, or a company which is under common control. For the purposes of this report, the following were affiliated issuers:
| Affiliated Issuers | Beginning
Value | Purchases | Sales
Proceeds | Realized
Gain
(Loss) | Change in
Unrealized
Appreciation or
Depreciation | Ending
Value |
| MFS Institutional Money Market Portfolio | $20,765,476 | $392,976,506 | $381,839,601 | $(3,037) | $(38) | $31,899,306 |
| Affiliated Issuers | Dividend
Income | Capital Gain
Distributions |
| MFS Institutional Money Market Portfolio | $80,837 | $— |
(8) Impacts of COVID-19
The pandemic related to the global spread of novel coronavirus disease (COVID-19), which was first detected in December 2019, has resulted in significant disruptions to global business activity and the global economy, as well as the economies of individual countries, the financial performance of individual companies and sectors, and the securities and commodities markets in general. This pandemic, the full effects of which are still unknown, has resulted in substantial market volatility and may have adversely impacted the prices and liquidity of the fund's investments and the fund's performance.
Report of Independent Registered Public Accounting Firm
To the Board of Trustees of MFS Variable Insurance Trust and the Shareholders of MFS New Discovery Series:
Opinion on the Financial Statements and Financial Highlights
We have audited the accompanying statement of assets and liabilities of MFS New Discovery Series (the “Fund”), including the portfolio of investments, as of December 31, 2020, the related statement of operations for the year then ended, the statements of changes in net assets for each of the two years in the period then ended, the financial highlights for each of the five years in the period then ended, and the related notes. In our opinion, the financial statements and financial highlights present fairly, in all material respects, the financial position of the Fund as of December 31, 2020, and the results of its operations for the year then ended, the changes in its net assets for each of the two years in the period then ended, and the financial highlights for each of the five years in the period then ended, in conformity with accounting principles generally accepted in the United States of America.
Basis for Opinion
These financial statements and financial highlights are the responsibility of the Fund's management. Our responsibility is to express an opinion on the Fund's financial statements and financial highlights based on our audits. We are a public accounting firm registered with the Public Company Accounting Oversight Board (United States) (PCAOB) and are required to be independent with respect to the Fund in accordance with the U.S. federal securities laws and the applicable rules and regulations of the Securities and Exchange Commission and the PCAOB.
We conducted our audits in accordance with the standards of the PCAOB. Those standards require that we plan and perform the audit to obtain reasonable assurance about whether the financial statements and financial highlights are free of material misstatement, whether due to error or fraud. The Fund is not required to have, nor were we engaged to perform, an audit of its internal control over financial reporting. As part of our audits, we are required to obtain an understanding of internal control over financial reporting but not for the purpose of expressing an opinion on the effectiveness of the Fund’s internal control over financial reporting. Accordingly, we express no such opinion.
Our audits included performing procedures to assess the risks of material misstatement of the financial statements and financial highlights, whether due to error or fraud, and performing procedures that respond to those risks. Such procedures included examining, on a test basis, evidence regarding the amounts and disclosures in the financial statements and financial highlights. Our audits also included evaluating the accounting principles used and significant estimates made by management, as well as evaluating the overall presentation of the financial statements and financial highlights. Our procedures included confirmation of securities owned as of December 31, 2020, by correspondence with the custodian and brokers; when replies were not received from brokers, we performed other auditing procedures. We believe that our audits provide a reasonable basis for our opinion.
DELOITTE & TOUCHE LLP
Boston, Massachusetts
February 16, 2021
We have served as the auditor of one or more of the MFS investment companies since 1924.
Trustees and Officers — Identification and Background
The Trustees and Officers of the Trust, as of February 1, 2021, are listed below, together with their principal occupations during the past five years. (Their titles may have varied during that period.) The address of each Trustee and Officer is 111 Huntington Avenue, Boston, Massachusetts 02199-7618.
| Name, Age | | Position(s) Held with Fund | | Trustee/Officer Since(h) | | Number of MFS Funds overseen by the Trustee | | Principal Occupations During
the Past Five Years | | Other Directorships During
the Past Five Years (j) |
| INTERESTED TRUSTEES | | |
Robert J. Manning (k)
(age 57) | | Trustee | | February 2004 | | 134 | | Massachusetts Financial Services Company, Non-Executive Chairman (since January 2021); Director; Chairman of the Board; Executive Chairman (January 2017-2020); Co-Chief Executive Officer (2015-2016) | | N/A |
Michael W. Roberge (k)
(age 54) | | Trustee | | January 2021 | | 134 | | Massachusetts Financial Services Company, Chairman (since January 2021); Chief Executive Officer (since January 2017); Director; President (until December 2018); Chief Investment Officer (until December 2018); Co-Chief Executive Officer (until December 2016) | | N/A |
| INDEPENDENT TRUSTEES | | |
John P. Kavanaugh
(age 66) | | Trustee and Chair of Trustees | | January 2009 | | 134 | | Private investor | | N/A |
Steven E. Buller
(age 69) | | Trustee | | February 2014 | | 134 | | Private investor | | N/A |
John A. Caroselli
(age 66) | | Trustee | | March 2017 | | 134 | | Private investor; JC Global Advisors, LLC (management consulting), President (since 2015) | | N/A |
Maureen R. Goldfarb
(age 65) | | Trustee | | January 2009 | | 134 | | Private investor | | N/A |
Peter D. Jones
(age 65) | | Trustee | | January 2019 | | 134 | | Private investor | | N/A |
James W. Kilman, Jr.
(age 59) | | Trustee | | January 2019 | | 134 | | Burford Capital Limited (finance and investment management), Chief Financial Officer (since 2019); KielStrand Capital LLC (family office), Chief Executive Officer (since 2016); Morgan Stanley & Co. (financial services), Vice Chairman of Investment Banking, Co-Head of Diversified Financials Coverage – Financial Institutions Investment Banking Group (until 2016) | | Alpha-En Corporation, Director (2016-2019) |
Clarence Otis, Jr.
(age 64) | | Trustee | | March 2017 | | 134 | | Private investor | | VF Corporation, Director; Verizon Communications, Inc., Director; The Travelers Companies, Director |
Trustees and Officers - continued
| Name, Age | | Position(s) Held with Fund | | Trustee/Officer Since(h) | | Number of MFS Funds overseen by the Trustee | | Principal Occupations During
the Past Five Years | | Other Directorships During
the Past Five Years (j) |
Maryanne L. Roepke
(age 64) | | Trustee | | May 2014 | | 134 | | Private investor | | N/A |
Laurie J. Thomsen
(age 63) | | Trustee | | March 2005 | | 134 | | Private investor | | The Travelers Companies, Director; Dycom Industries, Inc., Director |
| Name, Age | | Position(s) Held with
Fund | | Trustee/Officer Since(h) | | Number of MFS Funds for which the Person is an Officer | | Principal Occupations During
the Past Five Years |
| OFFICERS | | | | | | | | |
Christopher R. Bohane (k)
(age 47) | | Assistant Secretary and Assistant Clerk | | July 2005 | | 134 | | Massachusetts Financial Services Company, Senior Vice President and Associate General Counsel |
Kino Clark (k)
(age 52) | | Assistant Treasurer | | January 2012 | | 134 | | Massachusetts Financial Services Company, Vice President |
John W. Clark, Jr. (k)
(age 53) | | Assistant Treasurer | | April 2017 | | 134 | | Massachusetts Financial Services Company, Vice President (since March 2017); Deutsche Bank (financial services), Department Head - Treasurer's Office (until February 2017) |
Thomas H. Connors (k)
(age 61) | | Assistant Secretary and Assistant Clerk | | September 2012 | | 134 | | Massachusetts Financial Services Company, Vice President and Senior Counsel |
David L. DiLorenzo (k)
(age 52) | | President | | July 2005 | | 134 | | Massachusetts Financial Services Company, Senior Vice President |
Heidi W. Hardin (k)
(age 53) | | Secretary and Clerk | | April 2017 | | 134 | | Massachusetts Financial Services Company, Executive Vice President and General Counsel (since March 2017); Harris Associates (investment management), General Counsel (until January 2017) |
Brian E. Langenfeld (k)
(age 47) | | Assistant Secretary and Assistant Clerk | | June 2006 | | 134 | | Massachusetts Financial Services Company, Vice President and Senior Counsel |
Amanda S. Mooradian (k)
(age 41) | | Assistant Secretary and Assistant Clerk | | September 2018 | | 134 | | Massachusetts Financial Services Company, Assistant Vice President and Senior Counsel |
Susan A. Pereira (k)
(age 50) | | Assistant Secretary and Assistant Clerk | | July 2005 | | 134 | | Massachusetts Financial Services Company, Vice President and Assistant General Counsel |
Kasey L. Phillips (k)
(age 50) | | Assistant Treasurer | | September 2012 | | 134 | | Massachusetts Financial Services Company, Vice President |
Matthew A. Stowe (k)
(age 46) | | Assistant Secretary and Assistant Clerk | | October 2014 | | 134 | | Massachusetts Financial Services Company, Vice President and Assistant General Counsel |
Martin J. Wolin (k)
(age 53) | | Chief Compliance Officer | | July 2015 | | 134 | | Massachusetts Financial Services Company, Senior Vice President and Chief Compliance Officer |
Trustees and Officers - continued
| Name, Age | | Position(s) Held with
Fund | | Trustee/Officer Since(h) | | Number of MFS Funds for which the Person is an Officer | | Principal Occupations During
the Past Five Years |
James O. Yost (k)
(age 60) | | Treasurer | | September 1990 | | 134 | | Massachusetts Financial Services Company, Senior Vice President |
| (h) | Date first appointed to serve as Trustee/officer of an MFS Fund. Each Trustee has served continuously since appointment unless indicated otherwise. For the period from December 15, 2004 until February 22, 2005, Mr. Manning served as Advisory Trustee. From January 2012 through December 2016, Messrs. DiLorenzo and Yost served as Treasurer and Deputy Treasurer of the Funds, respectively. |
| (j) | Directorships or trusteeships of companies required to report to the Securities and Exchange Commission (i.e., “public companies”). |
| (k) | “Interested person” of the Trust within the meaning of the Investment Company Act of 1940 (referred to as the 1940 Act), which is the principal federal law governing investment companies like the fund, as a result of a position with MFS. The address of MFS is 111 Huntington Avenue, Boston, Massachusetts 02199-7618. |
Each Trustee (other than Messrs. Jones, Kilman and Roberge) has been elected by shareholders and each Trustee and Officer holds office until his or her successor is chosen and qualified or until his or her earlier death, resignation, retirement or removal. Mr. Roberge became a Trustee of the Funds on January 1, 2021 and Messrs. Jones and Kilman became Trustees of the Funds on January 1, 2019. The Trust does not hold annual meetings for the purpose of electing Trustees, and Trustees are not elected for fixed terms. Under the terms of the Board's retirement policy, an Independent Trustee shall retire at the end of the calendar year in which he or she reaches the earlier of 75 years of age or 15 years of service on the Board (or, in the case of any Independent Trustee who joined the Board prior to 2015, 20 years of service on the Board).
Messrs. Buller, Kilman and Otis and Ms. Roepke are members of the Trust’s Audit Committee.
Each of the Interested Trustees and certain Officers hold comparable officer positions with certain affiliates of MFS.
The Statement of Additional Information for a Fund includes further information about the Trustees and is available without charge upon request by calling 1-800-225-2606.
| Investment Adviser | Custodian |
Massachusetts Financial Services Company
111 Huntington Avenue
Boston, MA 02199-7618 | State Street Bank and Trust Company
1 Lincoln Street
Boston, MA 02111-2900 |
| Distributor | Independent Registered Public Accounting Firm |
MFS Fund Distributors, Inc.
111 Huntington Avenue
Boston, MA 02199-7618 | Deloitte & Touche LLP
200 Berkeley Street
Boston, MA 02116 |
| Portfolio Manager(s) | |
| Michael Grossman | |
Board Review of Investment Advisory Agreement
MFS New Discovery Series
The Investment Company Act of 1940 requires that both the full Board of Trustees and a majority of the non-interested (“independent”) Trustees, voting separately, annually approve the continuation of the Fund’s investment advisory agreement with MFS. The Trustees consider matters bearing on the Fund and its advisory arrangements at their meetings throughout the year, including a review of performance data at each regular meeting. In addition, the independent Trustees met several times by videoconference (in accordance with Securities and Exchange Commission relief) over the course of three months beginning in May and ending in July, 2020 (“contract review meetings”) for the specific purpose of considering whether to approve the continuation of the investment advisory agreement for the Fund and the other investment companies that the Board oversees (the “MFS Funds”). The independent Trustees were assisted in their evaluation of the Fund’s investment advisory agreement by independent legal counsel, from whom they received separate legal advice and with whom they met separately from MFS during various contract review meetings. The independent Trustees were also assisted in this process by an independent consultant who was retained by and reported to the independent Trustees.
In connection with their deliberations regarding the continuation of the investment advisory agreement, the Trustees, including the independent Trustees, considered such information and factors as they believed, in light of the legal advice furnished to them and their own business judgment, to be relevant. The investment advisory agreement for the Fund was considered separately, although the Trustees also took into account the common interests of all MFS Funds in their review. As described below, the Trustees considered the nature, quality, and extent of the various investment advisory, administrative, and shareholder services performed by MFS under the existing investment advisory agreement and other arrangements with the Fund.
In connection with their contract review meetings, the Trustees received and relied upon materials that included, among other items: (i) information provided by Broadridge Financial Solutions, Inc. (“Broadridge”), an independent third party, on the investment performance of the Fund for various time periods ended December 31, 2019 and the investment performance of a group of funds with substantially similar investment classifications/objectives (the “Broadridge performance universe”), (ii) information provided by Broadridge on the Fund’s advisory fees and other expenses and the advisory fees and other expenses of comparable funds identified by Broadridge as well as all other funds in the same investment classification/category (the “Broadridge expense group and universe”), (iii) information provided by MFS on the advisory fees of portfolios of other clients of MFS, including institutional separate accounts and other clients, (iv) information as to whether and to what extent applicable expense waivers, reimbursements or fee “breakpoints” are observed for the Fund, (v) information regarding MFS’ financial results and financial condition, including MFS’ and certain of its affiliates’ estimated profitability from services performed for the Fund and the MFS Funds as a whole, and compared to MFS’ institutional business, (vi) MFS’ views regarding the outlook for the mutual fund industry and the strategic business plans of MFS, (vii) descriptions of various functions performed by MFS for the Funds, such as compliance monitoring and portfolio trading practices, and (viii) information regarding the overall organization of MFS, including information about MFS’ senior management and other personnel providing investment advisory, administrative and other services to the Fund and the other MFS Funds. The comparative performance, fee and expense information prepared and provided by Broadridge was not independently verified and the independent Trustees did not independently verify any information provided to them by MFS.
The Trustees’ conclusion as to the continuation of the investment advisory agreement was based on a comprehensive consideration of all information provided to the Trustees and not the result of any single factor. Some of the factors that figured particularly in the Trustees’ deliberations are described below, although individual Trustees may have evaluated the information presented differently from one another, giving different weights to various factors. It is also important to recognize that the fee arrangements for the Fund and other MFS Funds are the result of years of review and discussion between the independent Trustees and MFS, that certain aspects of such arrangements may receive greater scrutiny in some years than in others, and that the Trustees’ conclusions may be based, in part, on their consideration of these same arrangements during the course of the year and in prior years.
Based on information provided by Broadridge and MFS, the Trustees reviewed the Fund’s total return investment performance as well as the Broadridge performance universe over various time periods. The Trustees placed particular emphasis on the total return performance of the Fund’s Initial Class shares in comparison to the performance of funds in its Broadridge performance universe over the five-year period ended December 31, 2019, which the Trustees believed was a long enough period to reflect differing market conditions. The total return performance of the Fund’s Initial Class shares was in the 1st quintile relative to the other funds in the universe for this five-year period (the 1st quintile being the best performers and the 5th quintile being the worst performers). The total return performance of the Fund’s Initial Class shares was in the 1st quintile for each of the one- and three-year periods ended December 31, 2019 relative to the Broadridge performance universe. Because of the passage of time, these performance results may differ from the performance results for more recent periods, including those shown elsewhere in this report.
Board Review of Investment Advisory Agreement - continued
In the course of their deliberations, the Trustees took into account information provided by MFS in connection with the contract review meetings, as well as during investment review meetings conducted with portfolio management personnel during the course of the year regarding the Fund’s performance. After reviewing these and related factors, the Trustees concluded, within the context of their overall conclusions regarding the investment advisory agreement, that they were satisfied with MFS’ responses and efforts relating to investment performance.
In assessing the reasonableness of the Fund’s advisory fee, the Trustees considered, among other information, the Fund’s advisory fee and the total expense ratio of the Fund’s Initial Class shares as a percentage of average daily net assets and the advisory fee and total expense ratios of the Broadridge expense group based on information provided by Broadridge. The Trustees considered that MFS currently observes an expense limitation for the Fund, which may not be changed without the Trustees’ approval. The Trustees also considered that, according to the data provided by Broadridge (which takes into account any fee reductions or expense limitations that were in effect during the Fund’s last fiscal year), the Fund’s effective advisory fee rate and total expense ratio were each higher than the Broadridge expense group median. The Trustees also noted that MFS has agreed to further reduce such expense limitation for the Fund effective August 1, 2020, which may not be changed without the Trustees’ approval.
The Trustees also considered the advisory fees charged by MFS to any institutional separate accounts advised by MFS (“separate accounts”) and unaffiliated investment companies for which MFS serves as subadviser (“subadvised funds”) that have comparable investment strategies to the Fund, if any. In comparing these fees, the Trustees considered information provided by MFS as to the generally broader scope of services provided by MFS to the Fund, as well as the more extensive regulatory burdens imposed on MFS in managing the Fund, in comparison to separate accounts and subadvised funds. The Trustees also considered the higher demands placed on MFS’ investment personnel and trading infrastructure as a result of the daily cash in-flows and out-flows of the Fund in comparison to separate accounts.
The Trustees also considered whether the Fund may benefit from any economies of scale in the management of the Fund in the event of growth in assets of the Fund and/or growth in assets of the MFS Funds as a whole. They noted that the Fund’s advisory fee rate schedule is subject to a contractual breakpoint that reduces the Fund’s advisory fee rate on average daily net assets over $1 billion. The Trustees also noted that MFS has agreed in writing to waive a portion of the management fees of certain MFS Funds, including the Fund, if the total combined assets of certain funds within the MFS Funds’ complex increase above agreed upon thresholds (the “group fee waiver”), enabling the Fund’s shareholders to share in the benefits from any economies of scale at the complex level. The group fee waiver is reviewed and renewed annually between the Board and MFS. The Trustees concluded that the breakpoint and the group fee waiver were sufficient to allow the Fund to benefit from economies of scale as its assets and overall complex assets grow.
The Trustees also considered information prepared by MFS relating to MFS’ costs and profits with respect to the Fund, the MFS Funds considered as a group, and other investment companies and accounts advised by MFS, as well as MFS’ methodologies used to determine and allocate its costs to the MFS Funds, the Fund and other accounts and products for purposes of estimating profitability.
After reviewing these and other factors described herein, the Trustees concluded, within the context of their overall conclusions regarding the investment advisory agreement, that the advisory fees charged to the Fund represent reasonable compensation in light of the services being provided by MFS to the Fund.
In addition, the Trustees considered MFS’ resources and related efforts to continue to retain, attract and motivate capable personnel to serve the Fund. The Trustees also considered current and developing conditions in the financial services industry, including the presence of large and well-capitalized companies which are spending, and appear to be prepared to continue to spend, substantial sums to engage personnel and to provide services to competing investment companies. In this regard, the Trustees also considered the financial resources of MFS and its ultimate parent, Sun Life Financial Inc. The Trustees also considered the advantages and possible disadvantages to the Fund of having an adviser that also serves other investment companies as well as other accounts.
The Trustees also considered the nature, quality, cost, and extent of administrative, transfer agency, and distribution services provided to the Fund by MFS and its affiliates under agreements and plans other than the investment advisory agreement, including any 12b-1 fees the Fund pays to MFS Fund Distributors, Inc., an affiliate of MFS. The Trustees also considered the nature, extent and quality of certain other services MFS performs or arranges for on the Fund’s behalf, which may include securities lending programs, directed expense payment programs, class action recovery programs, and MFS’ interaction with third-party service providers, principally custodians and sub-custodians. The Trustees concluded that the various non-advisory services provided by MFS and its affiliates on behalf of the Fund were satisfactory.
The Trustees considered so-called “fall-out benefits” to MFS such as reputational value derived from serving as investment manager to the MFS Funds. The Trustees also considered that MFS discontinued its historic practice of obtaining investment research from portfolio brokerage commissions paid by certain MFS Funds effective January 2018, and directly pays or voluntarily reimburses a Fund, if applicable, for the costs of external research acquired through the use of the Fund’s portfolio brokerage commissions.
Board Review of Investment Advisory Agreement - continued
Based on their evaluation of factors that they deemed to be material, including those factors described above, the Board of Trustees, including the independent Trustees, concluded that the Fund’s investment advisory agreement with MFS should be continued for an additional one-year period, commencing August 1, 2020.
Proxy Voting Policies and Information
MFS votes proxies on behalf of the fund pursuant to proxy voting policies and procedures that are available without charge, upon request, by calling 1-800-225-2606, by visiting mfs.com/proxyvoting, or by visiting the SEC’s Web site at http://www.sec.gov.
Information regarding how the fund voted proxies relating to portfolio securities during the most recent twelve-month period ended June 30 is available by August 31 of each year without charge by visiting mfs.com/proxyvoting, or by visiting the SEC’s Web site at http://www.sec.gov.
Quarterly Portfolio Disclosure
The fund files a complete schedule of portfolio holdings with the SEC for the first and third quarters of each fiscal year as an exhibit to its reports on Form N-PORT. The fund’s Form N-PORT reports are available on the SEC’s Web site at http://www.sec.gov. A shareholder can obtain the portfolio holdings report for the first and third quarters of the fund's fiscal year at mfs.com/vit1 by choosing the fund's name and then scrolling to the “Resources” section and clicking on the “Prospectus and Reports” tab.
FURTHER INFORMATION
From time to time, MFS may post important information about the fund or the MFS funds on the MFS Web site (mfs.com). This information is available at https://www.mfs.com/announcements or at mfs.com/vit1 by choosing the fund's name and then scrolling to the “Resources” section and clicking on the “Announcements” tab, if any.
Information About Fund Contracts and Legal Claims
The fund has entered into contractual arrangements with an investment adviser, administrator, distributor, shareholder servicing agent, 529 program manager (if applicable), and custodian who each provide services to the fund. Unless expressly stated otherwise, shareholders are not parties to, or intended beneficiaries of these contractual arrangements, and these contractual arrangements are not intended to create any shareholder right to enforce them against the service providers or to seek any remedy under them against the service providers, either directly or on behalf of the fund.
Under the Trust’s By-Laws and Declaration of Trust, any claims asserted against or on behalf of the MFS Funds, including claims against Trustees and Officers, must be brought in state and federal courts located within the Commonwealth of Massachusetts.
Federal Tax Information (unaudited)
The following information is provided pursuant to provisions of the Internal Revenue Code.
The fund designates $62,559,000 as capital gain dividends paid during the fiscal year.
For corporate shareholders, 7.62% of the ordinary income dividends paid during the fiscal year qualify for the corporate dividends received deduction.
| FACTS | WHAT DOES MFS DO WITH YOUR PERSONAL INFORMATION? |
| Why? | Financial companies choose how they share your personal information. Federal law gives consumers the right to limit some but not all sharing. Federal law also requires us to tell you how we collect, share, and protect your personal information. Please read this notice carefully to understand what we do. |
| What? | The types of personal information we collect and share depend on the product or service you have with us. This information can include: |
| • Social Security number and account balances |
| • Account transactions and transaction history |
| • Checking account information and wire transfer instructions |
| When you are no longer our customer, we continue to share your information as described in this notice. |
| How? | All financial companies need to share customers' personal information to run their everyday business. In the section below, we list the reasons financial companies can share their customers' personal information; the reasons MFS chooses to share; and whether you can limit this sharing. |
Reasons we can share your
personal information | Does MFS share? | Can you limit
this sharing? |
For our everyday business purposes –
such as to process your transactions, maintain your
account(s), respond to court orders and legal
investigations, or report to credit bureaus | Yes | No |
For our marketing purposes –
to offer our products and services to you | No | We don't share |
For joint marketing with other
financial companies | No | We don't share |
For our affiliates' everyday business purposes –
information about your transactions and experiences | No | We don't share |
For our affiliates' everyday business purposes –
information about your creditworthiness | No | We don't share |
| For nonaffiliates to market to you | No | We don't share |
| Questions? | Call 800-225-2606 or go to mfs.com. |
| Who we are |
| Who is providing this notice? | MFS Funds, MFS Investment Management, MFS Institutional Advisors, Inc., and MFS Heritage Trust Company. |
| What we do |
How does MFS
protect my personal
information? | To protect your personal information from unauthorized access and use, we use security measures that comply with federal law. These measures include procedural, electronic, and physical safeguards for the protection of the personal information we collect about you. |
How does MFS
collect my personal
information? | We collect your personal information, for example, when you |
| • open an account or provide account information |
| • direct us to buy securities or direct us to sell your securities |
| • make a wire transfer |
| We also collect your personal information from others, such as credit bureaus, affiliates, or other companies. |
| Why can't I limit all sharing? | Federal law gives you the right to limit only |
| • sharing for affiliates' everyday business purposes – information about your creditworthiness |
| • affiliates from using your information to market to you |
| • sharing for nonaffiliates to market to you |
| State laws and individual companies may give you additional rights to limit sharing. |
| Definitions |
| Affiliates | Companies related by common ownership or control. They can be financial and nonfinancial companies. |
| • MFS does not share personal information with affiliates, except for everyday business purposes as described on page one of this notice. |
| Nonaffiliates | Companies not related by common ownership or control. They can be financial and nonfinancial companies. |
| • MFS does not share with nonaffiliates so they can market to you. |
| Joint marketing | A formal agreement between nonaffiliated financial companies that together market financial products or services to you. |
| • MFS doesn't jointly market. |
| Other important information |
| If you own an MFS product or receive an MFS service in the name of a third party such as a bank or broker-dealer, their privacy policy may apply to you instead of ours. |
Annual Report
December 31, 2020
MFS® Total Return Bond Series
MFS® Variable Insurance Trust
MFS® Total Return Bond Series
| 1 |
| 2 |
| 3 |
| 5 |
| 7 |
| 8 |
| 19 |
| 20 |
| 21 |
| 22 |
| 24 |
| 33 |
| 34 |
| 37 |
| 39 |
| 39 |
| 39 |
| 39 |
| 39 |
| 40 |
The report is prepared for the general information of contract owners. It is authorized for distribution to prospective investors only when preceded or accompanied by a current prospectus.
NOT FDIC INSURED • MAY LOSE VALUE • NO BANK OR CREDIT UNION GUARANTEE •
NOT A DEPOSIT • NOT INSURED BY ANY FEDERAL GOVERNMENT AGENCY OR NCUA/NCUSIF
MFS Total Return Bond Series
Dear Contract Owners:
Markets experienced dramatic swings this year as the coronavirus pandemic brought the global economy to a standstill for several months early in the year. The speedy development of vaccines and therapeutics later brightened the economic and market outlook, but a great deal of uncertainty remains as case counts remain high, new variants of the virus are appearing and questions persist over how fast the vaccine can be made widely available. In the United States, political uncertainty eased after former Vice President Joe Biden won the presidential election and the Democrats gained control of a closely divided Senate.
Global central banks have taken aggressive steps to cushion the economic and market fallout related to the virus, and governments are deploying unprecedented levels of fiscal support. Additional U.S. stimulus is anticipated with the Democrats in the White House and in control of both houses of Congress. The measures already put in place have helped build a supportive environment and are encouraging economic recovery; however, if markets disconnect from fundamentals, they can sow the seeds of instability. As such, dramatic increases in speculative retail trading bear watching.
In the aftermath of the crisis, we could see societal changes as households, businesses, and governments adjust to a new reality, and any such alterations could affect the investment landscape. For investors, events such as the COVID-19 outbreak demonstrate the importance of having a deep understanding of company fundamentals, and we have built our global research platform to do just that.
At MFS®, we put our clients’ assets to work responsibly by carefully navigating the increasing complexity of our global markets and economies. Guided by our long-term philosophy and adhering to our commitment to sustainable investing, we tune out the noise and aim to uncover what we believe are the best, most durable investment opportunities in the market. Our unique global investment platform combines collective expertise, long-term discipline and thoughtful risk management to create sustainable value for investors.
Respectfully,
Michael W. Roberge
Chief Executive Officer
MFS Investment Management
February 16, 2021
The opinions expressed in this letter are subject to change and may not be relied upon for investment advice. No forecasts can be guaranteed.
MFS Total Return Bond Series
Portfolio structure reflecting equivalent exposure of derivative positions (i)
Fixed income sectors (i)
| Investment Grade Corporates | 39.4% |
| Mortgage-Backed Securities | 20.6% |
| Commercial Mortgage-Backed Securities | 10.1% |
| U.S. Treasury Securities | 9.0% |
| Collateralized Debt Obligations | 8.7% |
| High Yield Corporates | 6.4% |
| Municipal Bonds | 3.3% |
| Asset-Backed Securities | 2.0% |
| U.S. Government Agencies | 1.4% |
| Emerging Markets Bonds | 1.3% |
| Residential Mortgage-Backed Securities | 0.5% |
| Non-U.S. Government Bonds | 0.2% |
Composition including fixed income credit quality (a)(i)
| AAA | 13.2% |
| AA | 6.6% |
| A | 14.7% |
| BBB | 28.2% |
| BB | 6.3% |
| B | 1.0% |
| CCC | 0.2% |
| D (o) | 0.0% |
| U.S. Government | 2.4% |
| Federal Agencies | 22.0% |
| Not Rated | 8.3% |
| Cash & Cash Equivalents | 3.7% |
| Other | (6.6)% |
Portfolio facts (i)
| Average Duration (d) | 6.1 |
| Average Effective Maturity (m) | 7.8 yrs. |
| (a) | For all securities other than those specifically described below, ratings are assigned to underlying securities utilizing ratings from Moody’s, Fitch, and Standard & Poor’s rating agencies and applying the following hierarchy: If all three agencies provide a rating, the middle rating (after dropping the highest and lowest ratings) is assigned; if two of the three agencies rate a security, the lower of the two is assigned. If none of the 3 rating agencies above assign a rating, but the security is rated by DBRS Morningstar, then the DBRS Morningstar rating is assigned. Ratings are shown in the S&P and Fitch scale (e.g., AAA). Securities rated BBB or higher are considered investment grade. All ratings are subject to change.U.S. Government includes securities issued by the U.S. Department of the Treasury. Federal Agencies includes rated and unrated U.S. Agency fixed-income securities, U.S. Agency mortgage-backed securities, and collateralized mortgage obligations of U.S. Agency mortgage-backed securities.Not Rated includes fixed income securities and fixed income derivatives that have not been rated by any rating agency.The fund may or may not have held all of these instruments on this date. The fund is not rated by these agencies. |
| (d) | Duration is a measure of how much a bond’s price is likely to fluctuate with general changes in interest rates, e.g., if rates rise 1.00%, a bond with a 5-year duration is likely to lose about 5.00% of its value due to the interest rate move. |
| (i) | For purposes of this presentation, the components include the value of securities, and reflect the impact of the equivalent exposure of derivative positions, if any. These amounts may be negative from time to time. Equivalent exposure is a calculated amount that translates the derivative position into a reasonable approximation of the amount of the underlying asset that the portfolio would have to hold at a given point in time to have the same price sensitivity that results from the portfolio’s ownership of the derivative contract. When dealing with derivatives, equivalent exposure is a more representative measure of the potential impact of a position on portfolio performance than value. The bond component will include any accrued interest amounts. |
| (m) | In determining each instrument’s effective maturity for purposes of calculating the fund’s dollar-weighted average effective maturity, MFS uses the instrument’s stated maturity or, if applicable, an earlier date on which MFS believes it is probable that a maturity-shortening device (such as a put, pre-refunding or prepayment) will cause the instrument to be repaid. Such an earlier date can be substantially shorter than the instrument’s stated maturity. |
Cash & Cash Equivalents includes any cash, investments in money market funds, short-term securities, and other assets less liabilities. Please see the Statement of Assets and Liabilities for additional information related to the fund’s cash position and other assets and liabilities.
Other includes equivalent exposure from currency derivatives and/or any offsets to derivative positions and may be negative.
Percentages are based on net assets as of December 31, 2020.
The portfolio is actively managed and current holdings may be different.
MFS Total Return Bond Series
Management Review
Summary of Results
For the twelve months ended December 31, 2020, Initial Class shares of the MFS Total Return Bond Series (fund) provided a total return of 8.47%, while Service Class shares of the fund provided a total return of 8.17%. These compare with a return of 7.51% over the same period for the fund’s benchmark, the Bloomberg Barclays U.S. Aggregate Bond Index.
Market Environment
Markets experienced an extraordinarily sharp selloff early in the period and, in many cases, an unusually rapid recovery later. Central banks and fiscal authorities undertook astonishing levels of stimulus to offset the economic effects of government-imposed social-distancing measures implemented to slow the spread of the COVID-19 virus. At this point, the global economy looks to have experienced the shortest — albeit the deepest and steepest — recession in the postwar period. However, the recovery remains subject to more than the usual number of uncertainties due to questions about the evolution of the virus, what its continued impact will be and how quickly vaccines to guard against it can be manufactured and distributed at scale. There are also worries over the public's willingness to be inoculated.
Around the world, central banks responded quickly and massively to the crisis with programs to improve liquidity and support markets. These programs proved largely successful in helping to restore market function, ease volatility and stimulate a continued market rebound. Late in the period, the US Federal Reserve adopted a new, flexible, average-inflation-targeting framework, which is expected to result in the federal funds rate remaining at low levels longer than under its previous model. In developed countries, monetary easing measures were complemented by unusually large fiscal stimulus initiatives. Due to relatively manageable external liabilities and balances of payments in many countries and persistently low inflation, even emerging market countries were able to implement countercyclical policies — a departure from the usual market-dictated response to risk-off crises.
Compounding market uncertainty earlier in the pandemic was a crash in the price of crude oil due to a sharp drop in global demand and a disagreement between Saudi Arabia and Russia over production cuts, which resulted in an oil price war. The subsequent decline in prices undercut oil exporters, many of which are in emerging markets, as well as a large segment of the high-yield credit market. The OPEC+ group later agreed on output cuts, with shale oil producers in the US also decreasing production, which, along with the gradual reopening of some major economies and the resultant boost in demand, helped stabilize the price of crude oil.
In the immediate aftermath of the market disruption that accompanied the initial phases of the pandemic, many companies that had added significant leverage to their balance sheets in recent years by borrowing to fund dividend payments and stock buybacks halted those activities, and some companies were forced to recapitalize. As markets and the economy stabilized later in the period, in many cases dividend payments and buybacks resumed. Conversely, some companies found themselves flush with liquidity, having borrowed preemptively during the worst of the crisis only to end up with excess cash on their balance sheets.
Factors Affecting Performance
Relative to the Bloomberg Barclays U.S. Aggregate Bond Index, the fund’s overweight allocation to both the industrials and utilities sectors, and its underweight allocation to the MBS agency fixed rate sector, boosted relative performance. The fund's out-of-benchmark exposure to derivatives, particularly its long exposure to the Markit CDX North America High Yield Index, further supported relative results. Strong bond selection within the industrials and financial institutions sectors, and the fund's favorable bond selection within “BBB” and “A” rated(r) securities, were also areas of relative strength.
Conversely, the fund’s yield curve(y) positioning, particularly its greater exposure to shifts in the long end (centered around maturities of 20 or more years) of the yield curve, detracted from relative returns. The fund’s out-of-benchmark allocation to “BB” rated securities also held back relative performance as this credit quality segment turned in weak performance during the reporting period.
Respectfully,
Portfolio Manager(s)
Alexander Mackey, Joshua Marston, and Robert Persons
Note to Contract Owners: Effective June 30, 2021, Robert Persons will no longer be a Portfolio Manager of the fund.
| (r) | Bonds rated “BBB”, “Baa”, or higher are considered investment grade; bonds rated “BB”, “Ba”, or below are considered non-investment grade. The source for bond quality ratings is Moody's Investors Service, Standard & Poor's, and Fitch, Inc. and are applied using the following hierarchy: If all three |
MFS Total Return Bond Series
Management Review - continued
agencies provide a rating, the middle rating (after dropping the highest and lowest ratings) is assigned; if two of the three agencies rate a security, the lower of the two is assigned. If none of the 3 Rating Agencies above assign a rating, but the security is rated by DBRS Morningstar, then the DBRS Morningstar rating is assigned. Ratings are shown in the S&P and Fitch scale (e.g., AAA). For securities that are not rated by any of the rating agencies, the security is considered Not Rated.
| (y) | A yield curve graphically depicts the yields of different maturity bonds of the same credit quality and type; a normal yield curve is upward sloping, with short-term rates lower than long-term rates. |
The views expressed in this report are those of the portfolio manager(s) only through the end of the period of the report as stated on the cover and do not necessarily reflect the views of MFS or any other person in the MFS organization. These views are subject to change at any time based on market or other conditions, and MFS disclaims any responsibility to update such views. These views may not be relied upon as investment advice or an indication of trading intent on behalf of any MFS portfolio. References to specific securities are not recommendations of such securities, and may not be representative of any MFS portfolio’s current or future investments.
MFS Total Return Bond Series
Performance Summary Through 12/31/20
The following chart illustrates the historical performance of the fund in comparison to its benchmark(s). Benchmarks are unmanaged and may not be invested in directly. Benchmark returns do not reflect any fees or expenses. The performance of other share classes will be greater than or less than that of the class depicted below. (See Notes to Performance Summary.)
Performance data shown represents past performance and is no guarantee of future results. Investment return and principal value fluctuate so your units, when sold, may be worth more or less than the original cost; current performance may be lower or higher than quoted. The performance shown does not reflect the deduction of taxes, if any, that a contract holder would pay on fund distributions or the redemption of contract units. The returns for the fund shown also do not reflect the deduction of expenses associated with variable products, such as mortality and expense risk charges, separate account charges, and sales charges imposed by the insurance company separate accounts. Such expenses would reduce the overall returns shown.
Growth of a Hypothetical $10,000 Investment
Total Returns through 12/31/20
Average annual total returns
| Share Class | Class Inception Date | 1-yr | 5-yr | 10-yr |
| Initial Class | 10/24/95 | 8.47% | 5.18% | 4.42% |
| Service Class | 5/01/00 | 8.17% | 4.92% | 4.15% |
Comparative benchmark(s)
| Bloomberg Barclays U.S. Aggregate Bond Index (f) | 7.51% | 4.44% | 3.84% |
| (f) | Source: FactSet Research Systems Inc. |
Benchmark Definition(s)
Bloomberg Barclays U.S. Aggregate Bond Index(a) – a market capitalization-weighted index that measures the performance of the U.S. investment-grade, fixed rate bond market, with index components for government and corporate securities, mortgage pass-through securities, and asset-backed securities with at least one year to final maturity.
It is not possible to invest directly in an index.
| (a) | BLOOMBERG ® is a trademark and service mark of Bloomberg Finance L.P. and its affiliates (collectively “Bloomberg”). BARCLAYS® is a trademark and service mark of Barclays Bank Plc (collectively with its affiliates, “Barclays”), used under license. Bloomberg or Bloomberg's licensors, including Barclays, own all proprietary rights in the Bloomberg Barclays Indices. Neither Bloomberg nor Barclays approves or endorses this material, or guarantees the accuracy or completeness of any information herein, or makes any warranty, express or implied, as to the results to be obtained therefrom, and, to the maximum extent allowed by law, neither shall have any liability or responsibility for injury or damages arising in connection therewith. |
Notes to Performance Summary
Average annual total return represents the average annual change in value for each share class for the periods presented.
Performance results reflect any applicable expense subsidies and waivers in effect during the periods shown. Without such subsidies and waivers the fund's performance results would be less favorable. Please see the prospectus and financial statements for complete details. All results are historical and assume the reinvestment of any dividends and capital gains distributions.
MFS Total Return Bond Series
Performance Summary – continued
Performance results do not include adjustments made for financial reporting purposes in accordance with U.S. generally accepted accounting principles and may differ from amounts reported in the financial highlights.
From time to time the fund may receive proceeds from litigation settlements, without which performance would be lower.
MFS Total Return Bond Series
Expense Table
Fund Expenses Borne by the Contract Holders during the Period,
July 1, 2020 through December 31, 2020
As a contract holder of the fund, you incur ongoing costs, including management fees; distribution and/or service (12b-1) fees; and other fund expenses. This example is intended to help you understand your ongoing costs (in dollars) of investing in the fund and to compare these costs with the ongoing costs of investing in other mutual funds.
The example is based on an investment of $1,000 invested at the beginning of the period and held for the entire period July 1, 2020 through December 31, 2020.
Actual Expenses
The first line for each share class in the following table provides information about actual account values and actual expenses. You may use the information in this line, together with the amount you invested, to estimate the expenses that you paid over the period. Simply divide your account value by $1,000 (for example, an $8,600 account value divided by $1,000 = 8.6), then multiply the result by the number in the first line under the heading entitled “Expenses Paid During Period” to estimate the expenses you paid on your account during this period.
Hypothetical Example for Comparison Purposes
The second line for each share class in the following table provides information about hypothetical account values and hypothetical expenses based on the fund’s actual expense ratio and an assumed rate of return of 5% per year before expenses, which is not the fund’s actual return. The hypothetical account values and expenses may not be used to estimate the actual ending account balance or expenses you paid for the period. You may use this information to compare the ongoing costs of investing in the fund and other funds. To do so, compare this 5% hypothetical example with the 5% hypothetical examples that appear in the shareholder reports of the other funds.
Please note that the expenses shown in the table are meant to highlight the fund's ongoing costs only and do not take into account the fees and expenses imposed under the variable contracts through which your investment in the fund is made. Therefore, the second line for each share class in the table is useful in comparing ongoing costs associated with an investment in vehicles (such as the fund) which fund benefits under variable annuity and variable life insurance contracts and to qualified pension and retirement plans only, and will not help you determine the relative total costs of investing in the fund through variable annuity and variable life insurance contracts. If the fees and expenses imposed under the variable contracts were included, your costs would have been higher.
Share
Class | | Annualized
Expense
Ratio | Beginning
Account Value
7/01/20 | Ending
Account Value
12/31/20 | Expenses
Paid During
Period (p)
7/01/20-12/31/20 |
| Initial Class | Actual | 0.53% | $1,000.00 | $1,041.42 | $2.72 |
| Hypothetical (h) | 0.53% | $1,000.00 | $1,022.47 | $2.69 |
| Service Class | Actual | 0.78% | $1,000.00 | $1,040.10 | $4.00 |
| Hypothetical (h) | 0.78% | $1,000.00 | $1,021.22 | $3.96 |
| (h) | 5% class return per year before expenses. |
| (p) | “Expenses Paid During Period” are equal to each class's annualized expense ratio, as shown above, multiplied by the average account value over the period, multiplied by 184/366 (to reflect the one-half year period). |
MFS Total Return Bond Series
Portfolio of Investments − 12/31/20
The Portfolio of Investments is a complete list of all securities owned by your fund. It is categorized by broad-based asset classes.
| Issuer | | | Shares/Par | Value ($) |
| Bonds – 95.6% |
| Aerospace – 0.5% |
| Raytheon Technologies Corp., 4.125%, 11/16/2028 | | $ | 2,100,000 | $ 2,502,434 |
| Raytheon Technologies Corp., 4.05%, 5/04/2047 | | | 3,608,000 | 4,487,139 |
| TransDigm, Inc., 6.5%, 7/15/2024 | | | 3,485,000 | 3,546,754 |
| | | | | $10,536,327 |
| Asset-Backed & Securitized – 21.1% |
| Allegro CLO Ltd., 2014-1RA, “A2”, FLR, 1.809% (LIBOR - 3mo. + 1.6%), 10/21/2028 (n) | | $ | 5,554,267 | $ 5,540,365 |
| ALM Loan Funding, CLO, 2015-16A, “AAR2”, FLR, 1.137% (LIBOR - 3mo. + 0.90%), 7/15/2027 (n) | | | 1,371,541 | 1,366,883 |
| Arbor Realty Trust, Inc., CLO, 2018-FL1, “A”, FLR, 1.309% (LIBOR - 1mo. + 1.15%), 6/15/2028 (n) | | | 7,720,000 | 7,690,409 |
| Arbor Realty Trust, Inc., CLO, 2019-FL1, “C”, FLR, 2.258% (LIBOR - 1mo. + 2.1%), 5/15/2037 (n) | | | 808,000 | 775,795 |
| Arbor Realty Trust, Inc., CLO, 2019-FL1, “D”, FLR, 2.658% (LIBOR - 1mo. + 2.5%), 5/15/2037 (n) | | | 6,995,000 | 6,681,323 |
| Arbor Realty Trust, Inc., CLO, 2019-FL2, “AS” FLR, 1.608% (LIBOR - 1mo. + 1.45%), 9/15/2034 (n) | | | 980,500 | 969,512 |
| Arbor Realty Trust, Inc., CLO, 2019-FL2, “B”, FLR, 1.908% (LIBOR - 1mo. + 1.75%), 9/15/2034 (n) | | | 784,500 | 770,819 |
| Arbor Realty Trust, Inc., CLO, 2020-FL1, “C”, FLR, 2.209% (LIBOR - 1mo. + 2.05%), 2/15/2035 (n) | | | 3,529,000 | 3,449,862 |
| AREIT CRE Trust, 2019-CRE3, “A”, FLR, 1.173% (LIBOR - 1mo. + 1.02%), 9/14/2036 (n) | | | 1,230,000 | 1,208,565 |
| AREIT CRE Trust, 2019-CRE3, “B”, FLR, 1.703% (LIBOR - 1mo. + 1.55%), 9/14/2036 (n) | | | 2,569,500 | 2,481,960 |
| AREIT CRE Trust, 2019-CRE3, “C”, FLR, 2.053% (LIBOR - 1mo. + 1.9%), 9/14/2036 (n) | | | 2,242,500 | 2,177,337 |
| AREIT CRE Trust, 2019-CRE3, “D”, FLR, 2.803% (LIBOR - 1mo. + 2.65%), 9/14/2036 (n) | | | 1,849,000 | 1,764,288 |
| Atrium XII Corp., 2012-A, “B1R”, FLR, 1.566% (LIBOR - 3mo. + 1.35%), 4/22/2027 (n) | | | 7,430,000 | 7,414,293 |
| Bancorp Commercial Mortgage Trust, 2017-CRE2, “B”, FLR, 1.759% (LIBOR - 1mo. + 1.6%), 8/15/2032 (z) | | | 2,312,000 | 2,324,235 |
| Bancorp Commercial Mortgage Trust, 2018-CRE3, “AS”, FLR, 1.408% (LIBOR - 1mo. + 1.25%), 1/15/2033 (n) | | | 2,292,853 | 2,286,751 |
| Issuer | | | Shares/Par | Value ($) |
| Bonds – continued |
| Asset-Backed & Securitized – continued |
| Bancorp Commercial Mortgage Trust, 2018-CRE3, “D”, FLR, 2.859% (LIBOR - 1mo. + 2.7%), 1/15/2033 (n) | | $ | 1,668,091 | $ 1,616,046 |
| Bancorp Commercial Mortgage Trust, 2018-CRE4, “AS”, FLR, 1.258% (LIBOR - 1mo. + 1.1%), 9/15/2035 (n) | | | 2,255,000 | 2,230,186 |
| Bancorp Commercial Mortgage Trust, 2018-CRE4, “B”, FLR, 1.409% (LIBOR - 1mo. + 1.25%), 9/15/2035 (n) | | | 2,030,000 | 1,981,161 |
| Bancorp Commercial Mortgage Trust, 2018-CRE4, “D”, FLR, 2.258% (LIBOR - 1mo. + 2.1%), 9/15/2035 (n) | | | 1,465,000 | 1,421,233 |
| Bancorp Commercial Mortgage Trust, 2019-CRE5, “A”, FLR, 1.159% (LIBOR - 1mo. + 1%), 3/15/2036 (n) | | | 1,755,037 | 1,733,980 |
| Bancorp Commercial Mortgage Trust, 2019-CRE5, “AS”, FLR, 1.508% (LIBOR - 1mo. + 1.35%), 3/15/2036 (n) | | | 1,394,437 | 1,376,081 |
| Bancorp Commercial Mortgage Trust, 2019-CRE6, “B”, FLR, 1.708% (LIBOR - 1mo. + 1.55%), 9/15/2036 (n) | | | 8,289,572 | 8,163,944 |
| Bancorp Commercial Mortgage Trust, 2019-CRE6, “D”, FLR, 2.458% (LIBOR - 1mo. + 2.54%), 9/15/2036 (n) | | | 545,000 | 515,131 |
| Barclays Commercial Mortgage Securities LLC, 2019-C5, “A4”, 3.063%, 11/15/2052 | | | 2,755,000 | 3,092,087 |
| Bayview Commercial Asset Trust, 0%, 12/25/2036 (i)(n) | | | 93,969 | 9 |
| Bayview Financial Revolving Mortgage Loan Trust, FLR, 1.746% (LIBOR - 1mo. + 1.6%), 12/28/2040 (n) | | | 49,715 | 51,689 |
| BDS Ltd., 2019-FL4, “A”, FLR, 1.253% (LIBOR - 1mo. + 1.10%), 8/15/2036 (n) | | | 5,165,000 | 5,158,544 |
| Bear Stearns Cos., Inc., “A2”, FLR, 1.048% (LIBOR - 1mo. + 0.45%), 12/25/2042 | | | 267,570 | 264,025 |
| Benchmark Mortgage Trust, 2020-B18, “A5”, 1.925%, 7/15/2053 | | | 2,133,596 | 2,200,177 |
| BSPRT Ltd., 2019-FL5, “C”, FLR, 2.159% (LIBOR - 1mo. + 2%), 5/15/2029 (n) | | | 3,295,000 | 3,200,229 |
| Business Jet Securities LLC, 2020-1A, “A”, 2.981%, 11/15/2035 (n) | | | 2,161,950 | 2,192,457 |
| BXMT Ltd., 2020-FL2, “B”, FLR, 1.552% (LIBOR - 1mo. + 1.4%), 2/16/2037 (n) | | | 1,731,000 | 1,707,287 |
MFS Total Return Bond Series
Portfolio of Investments – continued
| Issuer | | | Shares/Par | Value ($) |
| Bonds – continued |
| Asset-Backed & Securitized – continued |
| Cantor Commercial Real Estate, 2019-CF2, “A5”, 2.874%, 11/15/2052 | | $ | 6,645,635 | $ 7,309,370 |
| Capital Automotive, 2020-1A, “A4”, REIT, 3.19%, 2/15/2050 (n) | | | 2,408,050 | 2,481,513 |
| Chesapeake Funding II LLC, 2017-4A, “A1”, 2.12%, 11/15/2029 (n) | | | 1,216,947 | 1,223,900 |
| Chesapeake Funding II LLC, 2018-1A, “A1”, 3.04%, 4/15/2030 (n) | | | 1,970,651 | 1,990,738 |
| Citigroup Commercial Mortgage Trust, 2014-GC25, “A4”, 3.635%, 10/10/2047 | | | 3,128,793 | 3,428,636 |
| Citigroup Commercial Mortgage Trust, 2016-P6, “A5”, 3.72%, 12/10/2049 | | | 1,754,000 | 2,009,254 |
| Citigroup Commercial Mortgage Trust, 2019-C7, “A4”, 3.102%, 12/15/2072 | | | 790,000 | 891,262 |
| CLNC Ltd., 2019-FL1, “B”, FLR, 2.051% (LIBOR - 1mo. + 1.9%), 8/20/2035 (n) | | | 1,850,000 | 1,817,183 |
| CLNC Ltd., 2019-FL1, “C”, FLR, 2.551% (LIBOR - 1mo. + 2.4%), 8/20/2035 (n) | | | 3,006,500 | 2,894,287 |
| Commercial Mortgage Trust, 2012-CR2, “A4”, 3.147%, 8/15/2045 | | | 3,950,000 | 4,076,716 |
| Commercial Mortgage Trust, 2015-LC21, “A4”, 3.708%, 7/10/2048 | | | 10,000,000 | 11,185,972 |
| Commercial Mortgage Trust, 2015-PC1, “A5”, 3.902%, 7/10/2050 | | | 2,888,848 | 3,231,102 |
| CPS Auto Trust, 2019-B, “B”, 3.09%, 4/17/2023 (n) | | | 1,610,195 | 1,620,016 |
| CSAIL Commercial Mortgage Trust, 2015-C2, “A4”, 3.504%, 6/15/2057 | | | 2,695,346 | 2,966,498 |
| Cutwater Ltd., 2014-1A, “BR”, FLR, 2.637% (LIBOR - 3mo. + 2.4%), 7/15/2026 (n) | | | 3,135,000 | 3,107,744 |
| Cutwater Ltd., 2015-1A, “BR”, FLR, 2.036% (LIBOR - 3mo. + 1.8%), 1/15/2029 (n) | | | 10,770,000 | 10,533,275 |
| DT Auto Owner Trust, 2019-2A, “C”, 3.18%, 2/18/2025 (n) | | | 3,392,000 | 3,461,848 |
| Exantas Capital Corp. CLO Ltd., 2019-RS07, “B”, FLR, 1.852% (LIBOR - 1mo. + 1.7%), 4/15/2036 (n) | | | 2,753,500 | 2,691,819 |
| Exeter Automobile Receivables Trust, 2020-1A, 2.49%, 1/15/2025 (n) | | | 1,905,000 | 1,946,997 |
| Flatiron CLO Ltd., 2015-1A, “BR”, FLR, 1.636% (LIBOR - 3mo. + 1.4%), 4/15/2027 (n) | | | 10,675,817 | 10,611,754 |
| Flatiron CLO Ltd., 2015-1A, “CR”, FLR, 2.136% (LIBOR - 3mo. + 1.9%), 4/15/2027 (n) | | | 1,970,000 | 1,948,090 |
| Issuer | | | Shares/Par | Value ($) |
| Bonds – continued |
| Asset-Backed & Securitized – continued |
| Fort CRE LLC, 2018-1A, “A1”, FLR, 1.495% (LIBOR - 1mo. + 1.35%), 11/16/2035 (n) | | $ | 6,199,500 | $ 6,150,660 |
| Galaxy CLO Ltd., 2018-29A, “A”, FLR, 1.011% (LIBOR - 3mo. + 0.79%), 11/15/2026 (n) | | | 4,451,128 | 4,434,926 |
| Galaxy CLO Ltd., 2018-29A, “B”, FLR, 1.621% (LIBOR - 3mo. + 1.4%), 11/15/2026 (n) | | | 2,878,803 | 2,878,639 |
| GLS Auto Receivables Trust, 2020-1A, “A”, 2.17%, 2/15/2024 (n) | | | 1,261,568 | 1,275,085 |
| Grand Avenue CRE Ltd., 2019-FL1, “A”, FLR, 1.278% (LIBOR - 1mo. + 1.12%), 6/15/2037 (n) | | | 5,172,500 | 5,147,320 |
| Granite Point Mortgage Trust, Inc., 2018-FL1, “A” FLR, 1.051% (LIBOR - 1mo. + 0.9%), 11/21/2035 (n) | | | 616,306 | 612,510 |
| GS Mortgage Securities Trust, 2015-GC30, “A4”, 3.382%, 5/10/2050 | | | 7,904,407 | 8,726,253 |
| GS Mortgage Securities Trust, 2019-GSA1, “A4”, 3.047%, 11/10/2052 | | | 10,169,944 | 11,378,394 |
| HarbourView CLO VII Ltd., 7RA, “B”, FLR, 1.918% (LIBOR - 3mo. + 1.7%), 7/18/2031 (n) | | | 6,545,000 | 6,350,011 |
| Hunt CRE Ltd., 2018-FL2, “AS”, FLR, 1.609% (LIBOR - 1mo. + 1.45%), 8/15/2028 (n) | | | 875,000 | 856,864 |
| Hunt CRE Ltd., 2018-FL2, “B”, FLR, 1.808% (LIBOR - 1mo. + 1.65%), 8/15/2028 (n) | | | 1,800,000 | 1,739,774 |
| Hunt CRE Ltd., 2018-FL2, “C”, FLR, 2.509% (LIBOR - 1mo. + 2.35%), 8/15/2028 (n) | | | 595,000 | 578,678 |
| Invitation Homes Trust, 2018-SFR1, “B”, FLR, 0.853% (LIBOR - 1mo. + 0.7%), 3/17/2037 (n) | | | 8,869,171 | 8,795,369 |
| Invitation Homes Trust, 2018-SFR2, “A”, FLR, 1.003% (LIBOR - 1mo. + 0.85%), 12/17/2036 (n) | | | 1,236,679 | 1,233,663 |
| JPMBB Commercial Mortgage Securities Trust, 2015-C28, “A4”, 3.227%, 10/15/2048 | | | 12,188,428 | 13,279,641 |
| JPMorgan Chase Commercial Mortgage Securities Corp., 5.654%, 7/15/2042 (n) | | | 20,169 | 14,074 |
| JPMorgan Chase Commercial Mortgage Securities Corp., 3.454%, 9/15/2050 | | | 7,520,623 | 8,510,301 |
| JPMorgan Chase Commercial Mortgage Securities Corp., “A3”, 4.171%, 8/15/2046 | | | 92,601 | 93,800 |
| JPMorgan Mortgage Trust, “A1”, 2.374%, 10/25/2033 | | | 97,442 | 99,164 |
| KKR Real Estate Financial Trust, Inc., 2018-FL1, “C”, FLR, 2.153% (LIBOR - 1mo. + 2%), 6/15/2036 (n) | | | 5,197,500 | 5,107,183 |
MFS Total Return Bond Series
Portfolio of Investments – continued
| Issuer | | | Shares/Par | Value ($) |
| Bonds – continued |
| Asset-Backed & Securitized – continued |
| Lehman Brothers Commercial Conduit Mortgage Trust, 0.934%, 2/18/2030 (i) | | $ | 2,163 | $ 0 |
| LoanCore Ltd., 2018-CRE1, “AS”, FLR, 1.658% (LIBOR - 1mo. + 1.5%), 5/15/2028 (n) | | | 8,900,000 | 8,846,440 |
| LoanCore Ltd., 2018-CRE1, “C”, FLR, 2.709% (LIBOR - 1mo. + 2.55%), 5/15/2028 (n) | | | 2,340,000 | 2,270,399 |
| LoanCore Ltd., 2018-CRE1, “C”, FLR, 2.109% (LIBOR - 1mo. + 1.95%), 4/15/2034 (n) | | | 1,919,165 | 1,814,085 |
| LoanCore Ltd., 2018-CRE1/CRE3, “B”, FLR, 1.758% (LIBOR - 1mo. + 1.6%), 4/15/2034 (n) | | | 1,957,717 | 1,877,343 |
| LoanCore Ltd., 2019-CRE2, “D”, FLR, 2.609% (LIBOR - 1mo. + 2.45%), 5/15/2036 (n) | | | 1,121,500 | 1,000,007 |
| LoanCore Ltd., 2019-CRE3, “AS”, FLR, 1.529% (LIBOR - 1mo. + 1.37%), 4/15/2034 (n) | | | 1,521,415 | 1,491,151 |
| Loomis, Sayles & Co., CLO, 2015-2A, “A1R”, FLR, 1.137% (LIBOR - 3mo. + 0.9%), 4/15/2028 (n) | | | 2,523,630 | 2,516,665 |
| Merrill Lynch Mortgage Investors, Inc., “A”, 2.403%, 5/25/2036 | | | 109,391 | 109,767 |
| Merrill Lynch Mortgage Investors, Inc., “A5”, 2.483%, 4/25/2035 | | | 128,672 | 125,852 |
| MF1 CLO Ltd., 2019-FL2, “AS”, FLR, 1.58% (LIBOR - 1mo. + 1.43%), 12/25/2034 (n) | | | 11,245,000 | 11,133,090 |
| Morgan Stanley Bank of America/Merrill Lynch Trust, “A4”, 3.176%, 8/15/2045 | | | 5,000,000 | 5,154,046 |
| Navistar Financial Dealer Note Master Owner Trust, 2019-1, “A”, FLR, 0.785% (LIBOR - 1mo. + 0.64%), 5/25/2024 (n) | | | 6,175,000 | 6,183,599 |
| Neuberger Berman CLO Ltd., 2017-16SA, “B”, FLR, 1.487% (LIBOR - 3mo. + 1.25%), 1/15/2028 (n) | | | 4,360,000 | 4,350,486 |
| NextGear Floorplan Master Owner Trust, 2018-1A, “A2”, 3.22%, 2/15/2023 (n) | | | 3,250,000 | 3,260,666 |
| NextGear Floorplan Master Owner Trust, 2019-2A, “A2”, 2.07%, 10/15/2024 (n) | | | 2,465,000 | 2,534,175 |
| OCP CLO Ltd., 2015-9A, “A2R”, FLR, 1.586% (LIBOR - 3mo. + 1.35%), 7/15/2027 (n) | | | 6,280,000 | 6,296,209 |
| Palmer Square Loan Funding Ltd., 2020-1A, “A2”, FLR, 1.574% (LIBOR - 3mo. + 1.35%), 2/20/2028 (n) | | | 3,930,000 | 3,876,564 |
| Palmer Square Loan Funding Ltd., 2020-1A, “B”, FLR, 2.123% (LIBOR - 3mo. + 1.9%), 2/20/2028 (n) | | | 3,453,628 | 3,327,615 |
| Parallel Ltd., 2015-1A, “C1R”, FLR, 1.968% (LIBOR - 3mo. + 1.75%), 7/20/2027 (n) | | | 1,680,000 | 1,634,605 |
| Issuer | | | Shares/Par | Value ($) |
| Bonds – continued |
| Asset-Backed & Securitized – continued |
| Parallel Ltd., 2015-1A, “C2R”, FLR, 1.968% (LIBOR - 3mo. + 1.75%), 7/20/2027 (n) | | $ | 1,810,000 | $ 1,776,495 |
| Preferred Term Securities XIX Ltd., CDO, FLR, 0.566% (LIBOR - 3mo. + 0.35%), 12/22/2035 (n) | | | 244,799 | 205,631 |
| Race Point CLO Ltd., 2013-8A, “AR-2”, FLR, 1.264% (LIBOR - 3mo. + 1.04%), 2/20/2030 (n) | | | 3,697,038 | 3,693,988 |
| Residential Funding Mortgage Securities, Inc., FGIC, 5.32%, 12/25/2035 | | | 6,451 | 6,553 |
| Santander Retail Auto Lease Trust, 2019-A, “B”, 3.01%, 5/22/2023 (n) | | | 3,222,000 | 3,305,012 |
| Santander Retail Auto Lease Trust, 2020-A, “C”, 2.08%, 3/20/2024 (n) | | | 2,276,000 | 2,334,775 |
| Securitized Term Auto Receivable Trust, 2019-CRTA, “B”, 2.453%, 3/25/2026 (n) | | | 1,369,321 | 1,394,687 |
| Securitized Term Auto Receivable Trust, 2019-CRTA, “C”, 2.849%, 3/25/2026 (n) | | | 1,632,961 | 1,669,739 |
| TICP CLO Ltd., 2018-IA, “A2”, FLR, 1.714% (LIBOR - 3mo. + 1.5%), 4/26/2028 (n) | | | 6,750,828 | 6,703,460 |
| UBS Commercial Mortgage Trust, 2017-C8, “A4”, 3.983%, 2/15/2051 | | | 5,865,766 | 6,813,988 |
| UBS Commercial Mortgage Trust, 2019-C17, “A4”, 2.921%, 10/15/2052 | | | 12,215,133 | 13,377,360 |
| Veros Auto Receivables Trust, 2020-1, “A”, 1.67%, 9/15/2023 (n) | | | 2,347,212 | 2,354,307 |
| Voya CLO Ltd., 2012-4A, “A2AR”, FLR, 2.136% (LIBOR - 3mo. + 1.90%), 10/15/2030 (n) | | | 1,940,000 | 1,941,921 |
| Wells Fargo Commercial Mortgage Trust, 2016-LC25, “A4”, 3.64%, 12/15/2059 | | | 13,071,416 | 14,886,896 |
| Wells Fargo Commercial Mortgage Trust, 2017-C42, “A5”, 3.589%, 12/15/2050 | | | 3,970,000 | 4,558,606 |
| Wells Fargo Commercial Mortgage Trust, 2018-C46, “A4”, 4.152%, 8/15/2051 | | | 1,430,000 | 1,684,991 |
| Wells Fargo Commercial Mortgage Trust, 2019-C53, “A4”, 3.04%, 10/15/2052 | | | 10,239,837 | 11,457,691 |
| Wells Fargo Commercial Mortgage Trust, 2019-C54, “A4”, 3.146%, 12/15/2052 | | | 4,898,000 | 5,515,381 |
| Wells Fargo Commercial Mortgage Trust, 2020-C58, “A4”, 2.092%, 7/15/2053 | | | 3,745,000 | 3,896,549 |
| West CLO Ltd., 2014-1A, “A2R”, FLR, 1.567% (LIBOR - 3mo. + 1.35%), 7/18/2026 (n) | | | 7,938,599 | 7,939,052 |
| West CLO Ltd., 2014-1A, “CR”, FLR, 3.217% (LIBOR - 3mo. + 3%), 7/18/2026 (n) | | | 1,680,000 | 1,661,238 |
MFS Total Return Bond Series
Portfolio of Investments – continued
| Issuer | | | Shares/Par | Value ($) |
| Bonds – continued |
| Asset-Backed & Securitized – continued |
| Wind River CLO Ltd., 2012-1A, “CR2”, FLR, 2.287% (LIBOR - 3mo. + 2.05%), 1/15/2026 (n) | | $ | 5,112,331 | $ 5,112,944 |
| Wind River CLO Ltd., 2015-2A, “CR”, FLR, 1.936% (LIBOR - 3mo. + 1.7%), 10/15/2027 (n) | | | 975,000 | 955,152 |
| | | | | $423,546,126 |
| Automotive – 1.1% |
| Allison Transmission, Inc., 4.75%, 10/01/2027 (n) | | $ | 3,775,000 | $ 3,954,312 |
| Allison Transmission, Inc., 3.75%, 1/30/2031 (n) | | | 2,087,000 | 2,135,262 |
| General Motors Co., 3.6%, 6/21/2030 | | | 4,150,000 | 4,630,122 |
| Hyundai Capital America, 2.375%, 10/15/2027 (n) | | | 2,150,000 | 2,253,267 |
| KAR Auction Services, Inc., 5.125%, 6/01/2025 (n) | | | 3,035,000 | 3,123,106 |
| Volkswagen Group of America LLC, 3.2%, 9/26/2026 (n) | | | 3,881,000 | 4,287,791 |
| Volkswagen Group of America LLC, 3.75%, 5/13/2030 (n) | | | 2,426,000 | 2,797,170 |
| | | | | $23,181,030 |
| Broadcasting – 1.2% |
| Discovery, Inc., 4.65%, 5/15/2050 | | $ | 4,190,000 | $ 5,231,817 |
| Fox Corp., 4.709%, 1/25/2029 | | | 3,554,000 | 4,310,150 |
| Netflix, Inc., 4.875%, 4/15/2028 | | | 1,185,000 | 1,336,324 |
| Prosus N.V., 3.68%, 1/21/2030 (n) | | | 4,905,000 | 5,334,698 |
| Walt Disney Co., 3.6%, 1/13/2051 | | | 7,385,000 | 8,946,957 |
| | | | | $25,159,946 |
| Brokerage & Asset Managers – 1.7% |
| Charles Schwab Corp., 3.2%, 1/25/2028 | | $ | 2,607,000 | $ 2,951,054 |
| E*TRADE Financial Corp., 3.8%, 8/24/2027 | | | 5,435,000 | 6,266,304 |
| E*TRADE Financial Corp., 4.5%, 6/20/2028 | | | 3,485,000 | 4,187,983 |
| Intercontinental Exchange, Inc., 3.75%, 9/21/2028 | | | 2,412,000 | 2,816,468 |
| Intercontinental Exchange, Inc., 2.1%, 6/15/2030 | | | 1,170,000 | 1,223,937 |
| Intercontinental Exchange, Inc., 3%, 6/15/2050 | | | 3,160,000 | 3,355,446 |
| Intercontinental Exchange, Inc., 3%, 9/15/2060 | | | 4,680,000 | 4,885,728 |
| Raymond James Financial, Inc., 4.95%, 7/15/2046 | | | 4,683,000 | 6,407,712 |
| TD Ameritrade Holding Corp., 3.3%, 4/01/2027 | | | 1,271,000 | 1,423,629 |
| | | | | $33,518,261 |
| Issuer | | | Shares/Par | Value ($) |
| Bonds – continued |
| Building – 1.0% |
| ABC Supply Co., Inc., 4%, 1/15/2028 (n) | | $ | 2,975,000 | $ 3,079,125 |
| Martin Marietta Materials, Inc., 3.45%, 6/01/2027 | | | 1,407,000 | 1,575,097 |
| Martin Marietta Materials, Inc., 4.25%, 12/15/2047 | | | 819,000 | 977,169 |
| Masco Corp., 4.375%, 4/01/2026 | | | 6,170,000 | 7,242,683 |
| Standard Industries, Inc., 3.375%, 1/15/2031 (n) | | | 3,295,000 | 3,311,475 |
| Vulcan Materials Co., 3.5%, 6/01/2030 | | | 3,356,000 | 3,852,703 |
| | | | | $20,038,252 |
| Business Services – 2.1% |
| Equinix, Inc., 5.375%, 5/15/2027 | | $ | 6,006,000 | $ 6,546,294 |
| Equinix, Inc., 2.15%, 7/15/2030 | | | 4,950,000 | 5,032,084 |
| Fidelity National Information Services, Inc., 3%, 8/15/2026 | | | 7,885,000 | 8,780,361 |
| Fiserv, Inc., 3.5%, 7/01/2029 | | | 3,911,000 | 4,463,648 |
| Fiserv, Inc., 2.65%, 6/01/2030 | | | 4,000,000 | 4,325,323 |
| Iron Mountain, Inc., 4.5%, 2/15/2031 (n) | | | 5,315,000 | 5,567,462 |
| NXP Semiconductors N.V., 2.7%, 5/01/2025 (n) | | | 508,000 | 546,654 |
| Tencent Holdings Ltd., 3.24%, 6/03/2050 (n) | | | 6,379,000 | 6,604,963 |
| | | | | $41,866,789 |
| Cable TV – 1.4% |
| CCO Holdings LLC/CCO Holdings Capital Corp., 5%, 2/01/2028 (n) | | $ | 4,470,000 | $ 4,727,025 |
| Charter Communications Operating LLC/Charter Communications Operating Capital Corp., 4.908%, 7/23/2025 | | | 7,676,000 | 8,918,371 |
| CSC Holdings LLC, 5.5%, 5/15/2026 (n) | | | 3,265,000 | 3,395,600 |
| Sirius XM Holdings, Inc., 5.5%, 7/01/2029 (n) | | | 1,880,000 | 2,068,588 |
| Sirius XM Radio, Inc., 5.375%, 7/15/2026 (n) | | | 3,615,000 | 3,768,637 |
| Time Warner Cable, Inc., 4.5%, 9/15/2042 | | | 3,721,000 | 4,354,210 |
| Time Warner Entertainment Co. LP, 8.375%, 7/15/2033 | | | 290,000 | 448,338 |
| | | | | $27,680,769 |
| Computer Software – 0.8% |
| Dell Investments LLC/EMC Corp., 5.3%, 10/01/2029 (n) | | $ | 10,112,000 | $ 12,383,895 |
| Microsoft Corp., 4.1%, 2/06/2037 | | | 3,664,000 | 4,803,090 |
| | | | | $17,186,985 |
| Computer Software - Systems – 0.9% |
| Apple, Inc., 4.375%, 5/13/2045 | | $ | 4,792,000 | $ 6,556,753 |
| Apple, Inc., 3.85%, 8/04/2046 | | | 881,000 | 1,131,035 |
| Apple, Inc., 2.55%, 8/20/2060 | | | 6,363,000 | 6,528,388 |
MFS Total Return Bond Series
Portfolio of Investments – continued
| Issuer | | | Shares/Par | Value ($) |
| Bonds – continued |
| Computer Software - Systems – continued |
| SS&C Technologies Holdings, Inc., 5.5%, 9/30/2027 (n) | | $ | 3,935,000 | $ 4,202,659 |
| | | | | $18,418,835 |
| Conglomerates – 1.0% |
| BWX Technologies, Inc., 4.125%, 6/30/2028 (n) | | $ | 2,327,000 | $ 2,422,989 |
| Carrier Global Corp., 3.577%, 4/05/2050 | | | 9,991,000 | 11,077,760 |
| Westinghouse Air Brake Technologies Corp., 4.95%, 9/15/2028 | | | 4,993,000 | 5,921,306 |
| | | | | $19,422,055 |
| Consumer Products – 1.1% |
| Reckitt Benckiser Treasury Services PLC, 3.625%, 9/21/2023 (n) | | $ | 6,765,000 | $ 7,282,939 |
| Reckitt Benckiser Treasury Services PLC, 2.75%, 6/26/2024 (n) | | | 13,673,000 | 14,620,549 |
| | | | | $21,903,488 |
| Consumer Services – 0.7% |
| Booking Holdings, Inc., 3.65%, 3/15/2025 | | $ | 3,610,000 | $ 3,994,100 |
| Booking Holdings, Inc., 4.5%, 4/13/2027 | | | 2,084,000 | 2,484,126 |
| Toll Road Investors Partnership II LP, Capital Appreciation, NATL, 0%, 2/15/2026 (n) | | | 2,145,000 | 1,780,357 |
| Toll Road Investors Partnership II LP, Capital Appreciation, NATL, 0%, 2/15/2029 (n) | | | 6,221,000 | 4,029,935 |
| Toll Road Investors Partnership II LP, Capital Appreciation, NATL, 0%, 2/15/2031 (n) | | | 2,145,000 | 1,259,665 |
| Toll Road Investors Partnership II LP, Capital Appreciation, NATL, 0%, 2/15/2043 (n) | | | 5,600,000 | 1,612,923 |
| | | | | $15,161,106 |
| Containers – 0.4% |
| Crown Americas LLC/Crown Americas Capital Corp. VI, 4.75%, 2/01/2026 | | $ | 7,030,000 | $ 7,293,625 |
| Electronics – 1.2% |
| Broadcom Corp./Broadcom Cayman Finance Ltd., 3.875%, 1/15/2027 | | $ | 6,969,000 | $ 7,830,572 |
| Broadcom, Inc., 4.75%, 4/15/2029 | | | 3,794,000 | 4,535,026 |
| Broadcom, Inc., 4.15%, 11/15/2030 | | | 5,906,000 | 6,827,124 |
| Sensata Technologies B.V., 5%, 10/01/2025 (n) | | | 3,740,000 | 4,160,750 |
| | | | | $23,353,472 |
| Emerging Market Quasi-Sovereign – 0.1% |
| Power Finance Corp. Ltd. (Republic of India), 3.95%, 4/23/2030 | | $ | 2,856,000 | $ 3,044,582 |
| Issuer | | | Shares/Par | Value ($) |
| Bonds – continued |
| Energy - Independent – 0.3% |
| Leviathan Bond Ltd., 6.5%, 6/30/2027 (n) | | $ | 2,675,000 | $ 3,002,687 |
| Leviathan Bond Ltd., 6.75%, 6/30/2030 (n) | | | 2,670,000 | 3,030,450 |
| | | | | $6,033,137 |
| Energy - Integrated – 0.8% |
| Eni S.p.A., 4%, 9/12/2023 (n) | | $ | 5,485,000 | $ 5,969,155 |
| Exxon Mobil Corp., 4.227%, 3/19/2040 | | | 1,700,000 | 2,113,056 |
| Exxon Mobil Corp., 3.452%, 4/15/2051 | | | 673,000 | 767,721 |
| Total Capital International S.A., 2.986%, 6/29/2041 | | | 2,835,000 | 3,096,084 |
| Total Capital International S.A., 3.127%, 5/29/2050 | | | 4,177,000 | 4,518,317 |
| | | | | $16,464,333 |
| Financial Institutions – 1.3% |
| AerCap Ireland Capital DAC, 4.5%, 9/15/2023 | | $ | 5,027,000 | $ 5,450,026 |
| AerCap Ireland Capital DAC, 6.5%, 7/15/2025 | | | 3,419,000 | 4,086,464 |
| Avolon Holdings Funding Ltd., 5.25%, 5/15/2024 (n) | | | 5,845,000 | 6,356,251 |
| Avolon Holdings Funding Ltd., 3.95%, 7/01/2024 (n) | | | 4,754,000 | 5,020,284 |
| Avolon Holdings Funding Ltd., 4.25%, 4/15/2026 (n) | | | 1,940,000 | 2,089,624 |
| Global Aircraft Leasing Co. Ltd., 6.5%, (6.5% cash or 7.25% PIK) 9/15/2024 (n)(p) | | | 3,714,956 | 3,315,598 |
| | | | | $26,318,247 |
| Food & Beverages – 1.0% |
| Anheuser-Busch Cos. LLC/Anheuser-Busch InBev Worldwide, Inc., 4.9%, 2/01/2046 | | $ | 3,064,000 | $ 3,987,629 |
| Anheuser-Busch InBev Worldwide, Inc., 5.45%, 1/23/2039 | | | 2,702,000 | 3,648,021 |
| Constellation Brands, Inc., 2.875%, 5/01/2030 | | | 817,000 | 894,773 |
| Constellation Brands, Inc., 3.75%, 5/01/2050 | | | 1,188,000 | 1,396,287 |
| Diageo Capital PLC, 2.125%, 4/29/2032 | | | 4,571,000 | 4,825,470 |
| JBS USA Lux S.A./JBS USA Finance, Inc., 5.5%, 1/15/2030 (n) | | | 2,595,000 | 2,981,032 |
| Keurig Dr Pepper, Inc., 3.2%, 5/01/2030 | | | 671,000 | 759,320 |
| Mondelez International, Inc., 2.625%, 9/04/2050 | | | 1,966,000 | 1,978,400 |
| | | | | $20,470,932 |
MFS Total Return Bond Series
Portfolio of Investments – continued
| Issuer | | | Shares/Par | Value ($) |
| Bonds – continued |
| Gaming & Lodging – 0.8% |
| GLP Capital LP/GLP Financing II, Inc., 5.375%, 11/01/2023 | | $ | 4,350,000 | $ 4,752,288 |
| GLP Capital LP/GLP Financing II, Inc., 5.25%, 6/01/2025 | | | 2,257,000 | 2,539,306 |
| Las Vegas Sands Corp., 3.5%, 8/18/2026 | | | 3,415,000 | 3,653,495 |
| Marriott International, Inc., 4.625%, 6/15/2030 | | | 1,503,000 | 1,762,842 |
| Marriott International, Inc., 3.5%, 10/15/2032 | | | 3,491,000 | 3,817,217 |
| | | | | $16,525,148 |
| Insurance – 0.7% |
| American International Group, Inc., 3.75%, 7/10/2025 | | $ | 4,804,000 | $ 5,396,234 |
| American International Group, Inc., 3.9%, 4/01/2026 | | | 5,113,000 | 5,829,012 |
| American International Group, Inc., 4.7%, 7/10/2035 | | | 2,777,000 | 3,581,434 |
| | | | | $14,806,680 |
| Insurance - Property & Casualty – 2.5% |
| Allied World Assurance Co. Holdings Ltd., 4.35%, 10/29/2025 | | $ | 6,835,000 | $ 7,422,749 |
| Aon Corp., 3.75%, 5/02/2029 | | | 7,982,000 | 9,307,438 |
| Berkshire Hathaway Finance Corp., 2.85%, 10/15/2050 | | | 1,429,000 | 1,529,294 |
| Fairfax Financial Holdings Ltd., 4.85%, 4/17/2028 | | | 5,854,000 | 6,549,271 |
| Hartford Financial Services Group, Inc., 2.8%, 8/19/2029 | | | 6,063,000 | 6,583,356 |
| Hartford Financial Services Group, Inc., 3.6%, 8/19/2049 | | | 3,624,000 | 4,244,935 |
| Liberty Mutual Group, Inc., 3.951%, 10/15/2050 (n) | | | 2,900,000 | 3,466,542 |
| Marsh & McLennan Cos., Inc., 4.2%, 3/01/2048 | | | 6,949,000 | 9,126,044 |
| Progressive Corp., 3.2%, 3/26/2030 | | | 533,000 | 613,503 |
| Swiss Re Ltd., 4.25%, 12/06/2042 (n) | | | 926,000 | 1,164,551 |
| | | | | $50,007,683 |
| International Market Quasi-Sovereign – 0.2% |
| Electricite de France S.A., 4.875%, 9/21/2038 (n) | | $ | 2,687,000 | $ 3,346,849 |
| Machinery & Tools – 0.4% |
| CNH Industrial Capital LLC, 1.95%, 7/02/2023 | | $ | 2,514,000 | $ 2,587,859 |
| CNH Industrial Capital LLC, 4.2%, 1/15/2024 | | | 1,209,000 | 1,326,002 |
| CNH Industrial Capital LLC, 3.85%, 11/15/2027 | | | 3,385,000 | 3,811,994 |
| | | | | $7,725,855 |
| Issuer | | | Shares/Par | Value ($) |
| Bonds – continued |
| Major Banks – 7.9% |
| Bank of America Corp., 3.419% to 12/20/2027, FLR (LIBOR - 3mo. + 1.04%) to 12/20/2028 | | $ | 8,376,000 | $ 9,470,357 |
| Bank of America Corp., 2.496% to 2/13/2030, FLR (LIBOR - 3mo. + 0.99%) to 2/13/2031 | | | 10,000,000 | 10,614,900 |
| Bank of America Corp., 2.676% to 6/19/2040, FLR (SOFR + 1.93%) to 6/19/2041 | | | 3,810,000 | 3,963,561 |
| Bank of America Corp., 4.443%, 1/20/2048 | | | 6,670,000 | 8,813,910 |
| Bank of America Corp., 6.1%, 12/29/2049 | | | 8,260,000 | 9,358,993 |
| Bank of America Corp., 5.875%, 12/31/2059 | | | 6,088,000 | 6,879,440 |
| Bank of America Corp., FLR, 6.5% (LIBOR - 3mo. + 4.174%), 10/23/2049 | | | 4,004,000 | 4,574,570 |
| Barclays PLC, 4.972% to 5/16/2028, FLR (LIBOR - 3mo. + 1.902%) to 5/16/2029 | | | 3,499,000 | 4,195,681 |
| Credit Suisse Group Fund (Guernsey) Ltd., 3.75%, 3/26/2025 | | | 3,355,000 | 3,724,045 |
| Goldman Sachs Group, Inc., 2.6%, 2/07/2030 | | | 6,000,000 | 6,453,360 |
| JPMorgan Chase & Co., 3.125%, 1/23/2025 | | | 374,000 | 409,556 |
| JPMorgan Chase & Co., 3.509%, 1/23/2029 | | | 2,455,000 | 2,799,670 |
| JPMorgan Chase & Co., 4.005% to 4/23/2028, FLR (LIBOR - 3mo. + 1.12%) to 4/23/2029 | | | 11,547,000 | 13,550,825 |
| JPMorgan Chase & Co., 4.203% to 7/23/2028, FLR (LIBOR - 3mo. + 1.26%) to 7/23/2029 | | | 4,743,000 | 5,668,185 |
| JPMorgan Chase & Co., 2.956% to 5/13/2030, FLR (SOFR + 2.515%) to 5/13/2031 | | | 4,435,000 | 4,861,805 |
| JPMorgan Chase & Co., 3.109% to 4/22/2050, FLR (SOFR + 2.44%) to 4/22/2051 | | | 2,068,000 | 2,298,122 |
| Lloyds Bank PLC, 3.75%, 1/11/2027 | | | 5,639,000 | 6,392,421 |
| Mitsubishi UFJ Financial Group, Inc., 2.048%, 7/17/2030 | | | 10,057,000 | 10,511,639 |
| Morgan Stanley, 5.597% to 3/24/2050, FLR (SOFR + 4.84%) to 3/24/2051 | | | 5,000,000 | 8,036,000 |
| PNC Bank N.A., 3.1%, 10/25/2027 | | | 4,157,000 | 4,655,191 |
| Sumitomo Mitsui Financial Group, Inc., 2.13%, 7/08/2030 | | | 10,025,000 | 10,506,600 |
| UBS Group Funding (Jersey) Ltd., 4.125%, 9/24/2025 (n) | | | 4,836,000 | 5,536,340 |
| Wachovia Corp., 6.605%, 10/01/2025 | | | 1,764,000 | 2,204,945 |
| Wells Fargo & Co., 3.068% to 4/30/2040, FLR (SOFR + 2.53%) to 4/30/2041 | | | 7,635,000 | 8,305,595 |
MFS Total Return Bond Series
Portfolio of Investments – continued
| Issuer | | | Shares/Par | Value ($) |
| Bonds – continued |
| Major Banks – continued |
| Westpac Banking Corp., 2.894% to 2/4/2025, FLR (CMT - 5yr. + 1.35%) to 2/04/2030 | | $ | 5,518,000 | $ 5,783,634 |
| | | | | $159,569,345 |
| Medical & Health Technology & Services – 3.0% |
| Alcon Finance Corp., 2.75%, 9/23/2026 (n) | | $ | 901,000 | $ 985,874 |
| Alcon, Inc., 2.6%, 5/27/2030 (n) | | | 1,096,000 | 1,167,272 |
| Becton, Dickinson and Co., 3.794%, 5/20/2050 | | | 4,961,000 | 5,882,371 |
| Berks County, PA, Industrial Development Authority (Tower Health Project), 4.451%, 2/01/2050 | | | 6,211,000 | 5,180,406 |
| Cigna Corp., 2.4%, 3/15/2030 | | | 3,463,000 | 3,690,342 |
| CommonSpirit Health, 2.95%, 11/01/2022 | | | 6,666,000 | 6,962,041 |
| Hackensack Meridian Health, Inc., 4.211%, 7/01/2048 | | | 3,555,000 | 4,504,920 |
| HCA, Inc., 5.25%, 6/15/2026 | | | 3,026,000 | 3,580,509 |
| HCA, Inc., 5.625%, 9/01/2028 | | | 5,840,000 | 6,898,500 |
| HCA, Inc., 4.125%, 6/15/2029 | | | 4,743,000 | 5,499,681 |
| Laboratory Corp. of America Holdings, 4.7%, 2/01/2045 | | | 2,518,000 | 3,300,135 |
| Northwell Healthcare, Inc., 3.979%, 11/01/2046 | | | 1,503,000 | 1,720,280 |
| ProMedica Toledo Hospital, “B”, 5.325%, 11/15/2028 | | | 7,120,000 | 8,390,546 |
| ProMedica Toledo Hospital, “B”, AGM, 5.75%, 11/15/2038 | | | 2,562,000 | 3,070,023 |
| | | | | $60,832,900 |
| Medical Equipment – 0.3% |
| Abbott Laboratories, 3.4%, 11/30/2023 | | $ | 2,684,000 | $ 2,908,767 |
| Abbott Laboratories, 1.15%, 1/30/2028 | | | 1,891,000 | 1,917,265 |
| Boston Scientific Corp., 4%, 3/01/2029 | | | 2,000,000 | 2,355,940 |
| | | | | $7,181,972 |
| Metals & Mining – 0.5% |
| Anglo American Capital PLC, 3.95%, 9/10/2050 (n) | | $ | 3,000,000 | $ 3,360,058 |
| Glencore Funding LLC, 4.125%, 5/30/2023 (n) | | | 2,796,000 | 3,023,734 |
| Novelis Corp., 5.875%, 9/30/2026 (n) | | | 3,515,000 | 3,673,175 |
| | | | | $10,056,967 |
| Midstream – 2.7% |
| Cheniere Energy Partners LP, 4.5%, 10/01/2029 | | $ | 3,845,000 | $ 4,067,164 |
| Enbridge, Inc., 4.25%, 12/01/2026 | | | 7,802,000 | 9,125,173 |
| Kinder Morgan (Delaware), Inc., 7.75%, 1/15/2032 | | | 6,550,000 | 9,498,797 |
| Kinder Morgan Energy Partners LP, 6.375%, 3/01/2041 | | | 2,240,000 | 2,938,196 |
| Kinder Morgan Energy Partners LP, 5.4%, 9/01/2044 | | | 2,778,000 | 3,460,038 |
| Issuer | | | Shares/Par | Value ($) |
| Bonds – continued |
| Midstream – continued |
| ONEOK, Inc., 5.2%, 7/15/2048 | | $ | 5,276,000 | $ 6,148,934 |
| Plains All American Pipeline LP/PAA Finance Corp., 3.55%, 12/15/2029 | | | 3,000,000 | 3,137,950 |
| Sabine Pass Liquefaction LLC, 5.75%, 5/15/2024 | | | 5,449,000 | 6,228,932 |
| Sabine Pass Liquefaction LLC, 4.2%, 3/15/2028 | | | 2,847,000 | 3,266,517 |
| Sabine Pass Liquefaction LLC, 4.5%, 5/15/2030 (n) | | | 1,975,000 | 2,339,761 |
| Targa Resources Partners LP/Targa Resources Finance Corp., 5.875%, 4/15/2026 | | | 3,333,000 | 3,533,713 |
| | | | | $53,745,175 |
| Mortgage-Backed – 20.6% | |
| Fannie Mae, 5.5%, 3/01/2021-4/01/2040 | | $ | 6,343,216 | $ 7,415,226 |
| Fannie Mae, 3.89%, 7/01/2021 | | | 1,054,182 | 1,056,720 |
| Fannie Mae, 2.56%, 10/01/2021 | | | 753,785 | 758,135 |
| Fannie Mae, 2.75%, 3/01/2022 | | | 1,048,733 | 1,070,983 |
| Fannie Mae, 6%, 8/01/2022-3/01/2039 | | | 1,568,327 | 1,847,645 |
| Fannie Mae, 2.525%, 10/01/2022 | | | 1,679,173 | 1,721,382 |
| Fannie Mae, 2.68%, 3/01/2023 | | | 1,616,627 | 1,674,194 |
| Fannie Mae, 2.41%, 5/01/2023 | | | 1,884,708 | 1,948,510 |
| Fannie Mae, 2.55%, 5/01/2023 | | | 964,978 | 1,000,163 |
| Fannie Mae, 5%, 7/01/2023-3/01/2042 | | | 4,505,991 | 5,206,665 |
| Fannie Mae, 4.5%, 5/01/2024-6/01/2044 | | | 16,131,472 | 18,069,353 |
| Fannie Mae, 3.5%, 5/25/2025-5/01/2049 | | | 14,144,119 | 15,247,657 |
| Fannie Mae, 3.95%, 1/01/2027 | | | 335,783 | 384,594 |
| Fannie Mae, 3%, 11/01/2028-9/01/2050 | | | 19,048,668 | 20,418,552 |
| Fannie Mae, 2.5%, 11/01/2031-12/01/2050 | | | 10,983,055 | 11,646,327 |
| Fannie Mae, 6.5%, 7/01/2032-1/01/2033 | | | 3,384 | 3,940 |
| Fannie Mae, 3%, 2/25/2033 (i) | | | 600,179 | 63,633 |
| Fannie Mae, 4%, 12/01/2039-1/01/2047 | | | 25,852,160 | 28,318,819 |
| Fannie Mae, 3.25%, 5/25/2040 | | | 263,977 | 286,246 |
| Fannie Mae, 2%, 10/25/2040-4/25/2046 | | | 673,854 | 693,655 |
| Fannie Mae, 4%, 7/25/2046 (i) | | | 550,744 | 103,194 |
| Fannie Mae, 3.5%, 12/01/2046 (f) | | | 2,869,697 | 3,061,606 |
| Fannie Mae, TBA, 1.5%, 1/16/2036-2/12/2051 | | | 12,200,000 | 12,452,553 |
| Fannie Mae, TBA, 3%, 1/16/2036-2/12/2051 | | | 14,275,000 | 14,969,505 |
| Fannie Mae, TBA, 2%, 1/25/2036-2/12/2051 | | | 53,150,000 | 55,209,141 |
| Fannie Mae, TBA, 2.5%, 1/14/2051-2/25/2051 | | | 24,425,000 | 25,734,265 |
| Fannie Mae, TBA, 3.5%, 1/14/2051 | | | 5,950,000 | 6,288,709 |
| Fannie Mae, TBA, 4%, 1/25/2051 | | | 3,000,000 | 3,203,667 |
| Federal Home Loan Bank, 5%, 7/01/2035 | | | 1,319,525 | 1,534,134 |
MFS Total Return Bond Series
Portfolio of Investments – continued
| Issuer | | | Shares/Par | Value ($) |
| Bonds – continued |
| Mortgage-Backed – continued | |
| Freddie Mac, 2.791%, 1/25/2022 | | $ | 4,439,000 | $ 4,528,744 |
| Freddie Mac, 3.32%, 2/25/2023 | | | 3,956,000 | 4,183,559 |
| Freddie Mac, 3.531%, 7/25/2023 | | | 2,401,000 | 2,580,724 |
| Freddie Mac, 2.67%, 12/25/2024 | | | 2,784,000 | 3,007,547 |
| Freddie Mac, 2.811%, 1/25/2025 | | | 4,169,000 | 4,533,037 |
| Freddie Mac, 4%, 7/01/2025-4/01/2044 | | | 2,662,825 | 2,909,162 |
| Freddie Mac, 4.5%, 7/01/2025-5/01/2042 | | | 4,049,351 | 4,530,866 |
| Freddie Mac, 3.3%, 10/25/2026 | | | 2,958,000 | 3,367,061 |
| Freddie Mac, 3%, 6/15/2028-2/25/2059 | | | 25,833,703 | 27,761,752 |
| Freddie Mac, 4.06%, 10/25/2028 | | | 2,129,000 | 2,569,895 |
| Freddie Mac, 1.089%, 7/25/2029 (i) | | | 4,054,068 | 336,525 |
| Freddie Mac, 1.144%, 8/25/2029 (i) | | | 7,019,521 | 610,027 |
| Freddie Mac, 1.868%, 4/25/2030 (i) | | | 1,901,414 | 292,846 |
| Freddie Mac, 5.5%, 5/01/2034-1/01/2038 | | | 281,203 | 329,034 |
| Freddie Mac, 6%, 8/01/2034-7/01/2038 | | | 82,643 | 96,250 |
| Freddie Mac, 5%, 11/01/2035-7/01/2041 | | | 1,578,595 | 1,817,727 |
| Freddie Mac, 5.5%, 2/15/2036 (i) | | | 124,892 | 23,734 |
| Freddie Mac, 3.5%, 11/01/2037-10/25/2058 | | | 24,103,482 | 25,962,622 |
| Freddie Mac, 4.5%, 12/15/2040 (i) | | | 124,774 | 11,879 |
| Freddie Mac, 4%, 8/15/2044 (i) | | | 154,017 | 18,547 |
| Ginnie Mae, 5.5%, 5/15/2033-1/20/2042 | | | 1,474,473 | 1,700,037 |
| Ginnie Mae, 6%, 1/20/2036-1/15/2039 | | | 166,162 | 195,798 |
| Ginnie Mae, 4.5%, 4/15/2039-9/20/2041 | | | 6,833,986 | 7,652,287 |
| Ginnie Mae, 4%, 10/20/2040-3/20/2048 | | | 2,299,777 | 2,541,099 |
| Ginnie Mae, 3.5%, 11/15/2040-9/20/2048 | | | 16,662,952 | 17,915,166 |
| Ginnie Mae, 3%, 11/20/2044-1/20/2048 | | | 19,876,171 | 21,087,126 |
| Ginnie Mae, 2.5%, 11/20/2050-12/20/2050 | | | 7,266,141 | 7,697,266 |
| Ginnie Mae, TBA, 2.5%, 1/21/2051-2/20/2051 | | | 6,875,000 | 7,268,723 |
| Ginnie Mae, TBA, 3.5%, 1/21/2051 | | | 4,500,000 | 4,768,980 |
| Ginnie Mae, TBA, 4%, 1/21/2051 | | | 5,325,000 | 5,677,067 |
| Ginnie Mae, TBA, 2%, 2/20/2051 | | | 5,950,000 | 6,211,234 |
| | | | | $413,575,494 |
| Municipals – 3.3% |
| Bridgeview, IL, Stadium and Redevelopment Projects, AAC, 5.06%, 12/01/2025 | | $ | 910,000 | $ 905,941 |
| Bridgeview, IL, Stadium and Redevelopment Projects, AAC, 5.14%, 12/01/2036 | | | 8,850,000 | 8,640,786 |
| Escambia County, FL, Health Facilities Authority Rev. (Baptist Health Care Corp.), “B”, AGM, 3.607%, 8/15/2040 | | | 1,295,000 | 1,359,232 |
| Issuer | | | Shares/Par | Value ($) |
| Bonds – continued |
| Municipals – continued |
| New Jersey Economic Development Authority State Pension Funding Rev., “A”, NATL, 7.425%, 2/15/2029 | | $ | 8,019,000 | $ 10,335,769 |
| New Jersey Economic Development Authority State Pension Funding Rev., Capital Appreciation, “B”, AGM, 0%, 2/15/2023 | | | 13,215,000 | 13,015,586 |
| Oklahoma Development Finance Authority, Health System Rev. (OU Medicine Project), “C”, 5.45%, 8/15/2028 | | | 3,770,000 | 4,377,837 |
| Philadelphia, PA, School District, “B”, AGM, 6.615%, 6/01/2030 | | | 3,250,000 | 4,111,933 |
| Philadelphia, PA, School District, “B”, AGM, 6.765%, 6/01/2040 | | | 2,195,000 | 2,889,366 |
| State of California (Build America Bonds), 7.625%, 3/01/2040 | | | 860,000 | 1,492,556 |
| State of California (Build America Bonds), 7.6%, 11/01/2040 | | | 5,010,000 | 9,061,988 |
| State of Florida, “A”, 2.154%, 7/01/2030 | | | 7,272,000 | 7,651,744 |
| University of California Limited Project Rev., “J”, 4.131%, 5/15/2045 | | | 2,260,000 | 2,736,069 |
| | | | | $66,578,807 |
| Natural Gas - Distribution – 0.8% |
| Boston Gas Co., 3.15%, 8/01/2027 (n) | | $ | 9,294,000 | $ 10,315,091 |
| NiSource, Inc., 3.6%, 5/01/2030 | | | 5,378,000 | 6,220,026 |
| | | | | $16,535,117 |
| Network & Telecom – 0.2% |
| Verizon Communications, Inc., 4.272%, 1/15/2036 | | $ | 2,647,000 | $ 3,279,331 |
| Oils – 0.3% |
| Marathon Petroleum Corp., 4.75%, 9/15/2044 | | $ | 2,350,000 | $ 2,693,220 |
| Marathon Petroleum Corp., 5.85%, 12/15/2045 | | | 2,683,000 | 3,309,851 |
| | | | | $6,003,071 |
| Other Banks & Diversified Financials – 0.8% |
| BBVA Bancomer S.A. de C.V., 6.75%, 9/30/2022 (n) | | $ | 2,570,000 | $ 2,778,170 |
| Branch Banking & Trust Co., 2.25%, 3/11/2030 | | | 910,000 | 954,211 |
| Groupe BPCE S.A., 4.5%, 3/15/2025 (n) | | | 5,771,000 | 6,522,376 |
| Macquarie Bank Ltd. of London, 6.125% to 3/08/2027, FLR (Swap Rate - 5yr. + 4.332%) to 12/31/2165 (n) | | | 5,003,000 | 5,353,210 |
| | | | | $15,607,967 |
| Pollution Control – 0.2% |
| Republic Services, Inc., 3.95%, 5/15/2028 | | $ | 2,924,000 | $ 3,427,513 |
MFS Total Return Bond Series
Portfolio of Investments – continued
| Issuer | | | Shares/Par | Value ($) |
| Bonds – continued |
| Railroad & Shipping – 0.0% |
| CSX Corp., 3.8%, 4/15/2050 | | $ | 869,000 | $ 1,072,685 |
| Real Estate - Apartment – 0.3% |
| MF1 Multi-Family Housing Mortgage Loan Trust, 2020-FL4, FLR, 2.259% (LIBOR - 1mo. + 2.1%), 11/15/2035 (n) | | $ | 2,602,500 | $ 2,605,580 |
| Mid-America Apartment Communities, Inc., REIT, 4.3%, 10/15/2023 | | | 2,417,000 | 2,635,990 |
| | | | | $5,241,570 |
| Real Estate - Healthcare – 0.1% |
| MPT Operating Partnership LP/MPT Financial Co., REIT, 5%, 10/15/2027 | | $ | 2,730,000 | $ 2,904,037 |
| Real Estate - Retail – 0.4% |
| VEREIT Operating Partnership LP, REIT, 3.1%, 12/15/2029 | | $ | 7,508,000 | $ 8,096,236 |
| Retailers – 0.2% |
| Home Depot, Inc., 3.35%, 4/15/2050 | | $ | 3,476,000 | $ 4,128,901 |
| Specialty Chemicals – 0.1% |
| Univar Solutions USA, Inc., 5.125%, 12/01/2027 (n) | | $ | 1,165,000 | $ 1,230,531 |
| Specialty Stores – 0.3% |
| Penske Automotive Group Co., 5.5%, 5/15/2026 | | $ | 1,170,000 | $ 1,215,337 |
| TJX Cos., Inc., 3.875%, 4/15/2030 | | | 1,446,000 | 1,734,188 |
| TJX Cos., Inc., 4.5%, 4/15/2050 | | | 1,731,000 | 2,436,162 |
| | | | | $5,385,687 |
| Telecommunications - Wireless – 2.3% |
| American Tower Corp., REIT, 3.55%, 7/15/2027 | | $ | 12,018,000 | $ 13,588,521 |
| American Tower Corp., REIT, 3.8%, 8/15/2029 | | | 1,564,000 | 1,817,485 |
| American Tower Corp., REIT, 3.1%, 6/15/2050 | | | 2,905,000 | 2,986,645 |
| Crown Castle International Corp., 3.2%, 9/01/2024 | | | 2,497,000 | 2,712,411 |
| Crown Castle International Corp., 3.7%, 6/15/2026 | | | 2,419,000 | 2,725,328 |
| Crown Castle International Corp., 4%, 3/01/2027 | | | 984,000 | 1,129,709 |
| Crown Castle International Corp., 3.8%, 2/15/2028 | | | 4,000,000 | 4,608,230 |
| Crown Castle International Corp., 3.25%, 1/15/2051 | | | 1,110,000 | 1,168,970 |
| SBA Communications Corp., 3.875%, 2/15/2027 | | | 4,485,000 | 4,709,250 |
| T-Mobile USA, Inc., 2.55%, 2/15/2031 (n) | | | 8,299,000 | 8,714,531 |
| T-Mobile USA, Inc., 4.375%, 4/15/2040 (n) | | | 1,518,000 | 1,852,522 |
| | | | | $46,013,602 |
| Issuer | | | Shares/Par | Value ($) |
| Bonds – continued |
| Tobacco – 0.3% |
| B.A.T. Capital Corp., 3.222%, 8/15/2024 | | $ | 6,134,000 | $ 6,640,698 |
| Transportation - Services – 0.6% |
| Adani Ports & Special Economic Zone Ltd., 4.375%, 7/03/2029 | | $ | 1,847,000 | $ 2,002,404 |
| Adani Ports and Special Economic Zone Ltd., 4%, 7/30/2027 (n) | | | 1,851,000 | 1,973,518 |
| ERAC USA Finance LLC, 3.85%, 11/15/2024 (n) | | | 1,612,000 | 1,792,093 |
| ERAC USA Finance LLC, 7%, 10/15/2037 (n) | | | 3,603,000 | 5,581,901 |
| | | | | $11,349,916 |
| U.S. Government Agencies and Equivalents – 1.4% |
| Small Business Administration, 4.93%, 1/01/2024 | | $ | 3,388 | $ 3,526 |
| Small Business Administration, 4.34%, 3/01/2024 | | | 7,697 | 7,972 |
| Small Business Administration, 4.99%, 9/01/2024 | | | 6,005 | 6,289 |
| Small Business Administration, 4.86%, 1/01/2025 | | | 14,868 | 15,609 |
| Small Business Administration, 4.625%, 2/01/2025 | | | 15,490 | 16,256 |
| Small Business Administration, 5.11%, 4/01/2025 | | | 7,938 | 8,385 |
| Small Business Administration, 4.43%, 5/01/2029 | | | 193,607 | 214,019 |
| Small Business Administration, 3.21%, 9/01/2030 | | | 2,808,897 | 2,942,877 |
| Small Business Administration, 3.25%, 11/01/2030 | | | 245,794 | 261,687 |
| Small Business Administration, 2.85%, 9/01/2031 | | | 587,133 | 620,952 |
| Small Business Administration, 2.37%, 8/01/2032 | | | 399,135 | 413,042 |
| Small Business Administration, 2.13%, 1/01/2033 | | | 1,789,006 | 1,847,288 |
| Small Business Administration, 2.21%, 2/01/2033 | | | 537,689 | 556,814 |
| Small Business Administration, 2.22%, 3/01/2033 | | | 1,812,371 | 1,877,642 |
| Small Business Administration, 2.08%, 4/01/2033 | | | 2,750,855 | 2,833,975 |
| Small Business Administration, 2.45%, 6/01/2033 | | | 2,910,974 | 3,043,699 |
| Small Business Administration, 3.15%, 7/01/2033 | | | 4,419,261 | 4,717,021 |
| Small Business Administration, 3.16%, 8/01/2033 | | | 4,539,900 | 4,849,296 |
| Small Business Administration, 3.62%, 9/01/2033 | | | 4,260,251 | 4,683,304 |
| | | | | $28,919,653 |
MFS Total Return Bond Series
Portfolio of Investments – continued
| Issuer | | | Shares/Par | Value ($) |
| Bonds – continued |
| U.S. Treasury Obligations – 2.4% |
| U.S. Treasury Bonds, 2.375%, 11/15/2049 | | $ | 6,000,000 | $ 7,033,828 |
| U.S. Treasury Notes, 1.375%, 1/31/2022 | | | 40,000,000 | 40,537,500 |
| | | | | $47,571,328 |
| Utilities - Electric Power – 2.2% |
| AEP Transmission Co. LLC, 3.1%, 12/01/2026 | | $ | 2,539,000 | $ 2,855,603 |
| AEP Transmission Co. LLC, 3.65%, 4/01/2050 | | | 1,627,000 | 1,968,949 |
| Clearway Energy Operating LLC, 4.75%, 3/15/2028 (n) | | | 1,195,000 | 1,281,637 |
| Dominion Resources, Inc., 3.9%, 10/01/2025 | | | 2,048,000 | 2,326,418 |
| Enel Finance International N.V., 3.625%, 5/25/2027 (n) | | | 7,433,000 | 8,431,130 |
| Enel Finance International N.V., 3.5%, 4/06/2028 (n) | | | 6,000,000 | 6,830,439 |
| Exelon Corp., 3.497%, 6/01/2022 | | | 1,184,000 | 1,231,554 |
| FirstEnergy Corp., 4.85%, 7/15/2047 | | | 6,249,000 | 7,764,769 |
| FirstEnergy Corp., 3.4%, 3/01/2050 | | | 2,429,000 | 2,322,470 |
| NextEra Energy Operating Co., 4.5%, 9/15/2027 (n) | | | 570,000 | 637,984 |
| Issuer | | | Shares/Par | Value ($) |
| Bonds – continued |
| Utilities - Electric Power – continued |
| Pacific Gas & Electric Co., 3.3%, 8/01/2040 | | $ | 8,840,000 | $ 8,801,885 |
| | | | | $44,452,838 |
| Utilities - Gas – 0.1% |
| East Ohio Gas Co., 3%, 6/15/2050 (n) | | $ | 1,606,000 | $ 1,742,682 |
| Total Bonds (Identified Cost, $1,793,790,647) | | $ 1,924,154,535 |
| Investment Companies (h) – 8.0% |
| Money Market Funds – 8.0% | |
| MFS Institutional Money Market Portfolio, 0.1% (v) (Identified Cost, $160,402,628) | | | 160,402,628 | $ 160,402,627 |
| Other Assets, Less Liabilities – (3.6)% | | (73,206,672) |
| Net Assets – 100.0% | $ 2,011,350,490 |
| (f) | All or a portion of the security has been segregated as collateral for open futures contracts. |
| (h) | An affiliated issuer, which may be considered one in which the fund owns 5% or more of the outstanding voting securities, or a company which is under common control. At period end, the aggregate values of the fund's investments in affiliated issuers and in unaffiliated issuers were $160,402,627 and $1,924,154,535, respectively. |
| (i) | Interest only security for which the fund receives interest on notional principal (Par amount). Par amount shown is the notional principal and does not reflect the cost of the security. |
| (n) | Securities exempt from registration under Rule 144A of the Securities Act of 1933. These securities may be sold in the ordinary course of business in transactions exempt from registration, normally to qualified institutional buyers. At period end, the aggregate value of these securities was $509,075,987, representing 25.3% of net assets. |
| (p) | Payment-in-kind (PIK) security for which interest income may be received in additional securities and/or cash. |
| (v) | Affiliated issuer that is available only to investment companies managed by MFS. The rate quoted for the MFS Institutional Money Market Portfolio is the annualized seven-day yield of the fund at period end. |
| (z) | Restricted securities are not registered under the Securities Act of 1933 and are subject to legal restrictions on resale. These securities generally may be resold in transactions exempt from registration or to the public if the securities are subsequently registered. Disposal of these securities may involve time-consuming negotiations and prompt sale at an acceptable price may be difficult. The fund holds the following restricted securities: |
| Restricted Securities | Acquisition
Date | Cost | Value |
| Bancorp Commercial Mortgage Trust, 2017-CRE2, “B”, FLR, 1.759% (LIBOR - 1mo. + 1.6%), 8/15/2032 | 2/15/19 | $2,303,129 | $2,324,235 |
| % of Net assets | | | 0.1% |
| The following abbreviations are used in this report and are defined: |
| AAC | Ambac Assurance Corp. |
| AGM | Assured Guaranty Municipal |
| CDO | Collateralized Debt Obligation |
| CLO | Collateralized Loan Obligation |
| CMT | Constant Maturity Treasury |
| FGIC | Financial Guaranty Insurance Co. |
| FLR | Floating Rate. Interest rate resets periodically based on the parenthetically disclosed reference rate plus a spread (if any). The period-end rate reported may not be the current rate. All reference rates are USD unless otherwise noted. |
| LIBOR | London Interbank Offered Rate |
| NATL | National Public Finance Guarantee Corp. |
MFS Total Return Bond Series
Portfolio of Investments – continued
| REIT | Real Estate Investment Trust |
| SOFR | Secured Overnight Financing Rate |
| TBA | To Be Announced |
| Abbreviations indicate amounts shown in currencies other than the U.S. dollar. All amounts are stated in U.S. dollars unless otherwise indicated. A list of abbreviations is shown below: |
| JPY | Japanese Yen |
| Derivative Contracts at 12/31/20 |
| Forward Foreign Currency Exchange Contracts |
Currency
Purchased | Currency
Sold | Counterparty | Settlement
Date | Unrealized
Appreciation
(Depreciation) |
| Liability Derivatives |
| USD | 58,684,859 | JPY | 6,099,000,000 | Goldman Sachs International | 1/07/2021 | $(384,133) |
| Futures Contracts |
| Description | Long/
Short | Currency | Contracts | Notional
Amount | Expiration
Date | Value/Unrealized
Appreciation
(Depreciation) |
| Asset Derivatives |
| Interest Rate Futures | | |
| U.S. Treasury Note 2 yr | Long | USD | 538 | $118,885,390 | March – 2021 | $98,966 |
| U.S. Treasury Ultra Bond | Long | USD | 462 | 98,665,875 | March – 2021 | 74,799 |
| U.S. Treasury Ultra Note 10 yr | Short | USD | 543 | 84,903,140 | March – 2021 | 65,904 |
| | | | | | | $239,669 |
At December 31, 2020, the fund had cash collateral of $1,802,642 and other liquid securities with an aggregate value of $1,730,397 to cover any collateral or margin obligations for certain derivative contracts. Restricted cash and/or deposits with brokers in the Statement of Assets and Liabilities are comprised of cash collateral.
See Notes to Financial Statements
MFS Total Return Bond Series
| Financial Statements | Statement of Assets and Liabilities |
This statement represents your fund’s balance sheet, which details the assets and liabilities comprising the total value of the fund.
| At 12/31/20Assets | |
| Investments in unaffiliated issuers, at value (identified cost, $1,793,790,647) | $1,924,154,535 |
| Investments in affiliated issuers, at value (identified cost, $160,402,628) | 160,402,627 |
| Foreign currency, at value (identified cost, $58,850,496) | 59,066,173 |
| Restricted cash for | |
| Forward foreign currency exchange contracts | 200,000 |
| Deposits with brokers for | |
| Futures contracts | 1,602,642 |
| Receivables for | |
| Net daily variation margin on open futures contracts | 282,737 |
| TBA sale commitments | 8,812,904 |
| Fund shares sold | 826,620 |
| Interest | 12,087,650 |
| Other assets | 7,527 |
| Total assets | $2,167,443,415 |
| Liabilities | |
| Payable to custodian | $2,816,431 |
| Payables for | |
| Forward foreign currency exchange contracts | 384,133 |
| TBA purchase commitments | 150,134,399 |
| Fund shares reacquired | 2,505,984 |
| Payable to affiliates | |
| Investment adviser | 53,699 |
| Administrative services fee | 1,329 |
| Shareholder servicing costs | 411 |
| Distribution and/or service fees | 14,868 |
| Payable for independent Trustees' compensation | 6 |
| Accrued expenses and other liabilities | 181,665 |
| Total liabilities | $156,092,925 |
| Net assets | $2,011,350,490 |
| Net assets consist of | |
| Paid-in capital | $1,831,732,247 |
| Total distributable earnings (loss) | 179,618,243 |
| Net assets | $2,011,350,490 |
| Shares of beneficial interest outstanding | 143,923,165 |
| | Net assets | Shares
outstanding | Net asset value
per share |
| Initial Class | $921,341,526 | 65,268,381 | $14.12 |
| Service Class | 1,090,008,964 | 78,654,784 | 13.86 |
See Notes to Financial Statements
MFS Total Return Bond Series
| Financial Statements | Statement of Operations |
This statement describes how much your fund earned in investment income and accrued in expenses. It also describes any gains and/or losses generated by fund operations.
| Year ended 12/31/20 | |
| Net investment income (loss) | |
| Income | |
| Interest | $61,600,927 |
| Dividends from affiliated issuers | 475,609 |
| Other | 10,603 |
| Total investment income | $62,087,139 |
| Expenses | |
| Management fee | $9,578,467 |
| Distribution and/or service fees | 2,623,338 |
| Shareholder servicing costs | 39,356 |
| Administrative services fee | 263,426 |
| Independent Trustees' compensation | 36,580 |
| Custodian fee | 97,675 |
| Shareholder communications | 121,392 |
| Audit and tax fees | 78,949 |
| Legal fees | 14,041 |
| Miscellaneous | 97,114 |
| Total expenses | $12,950,338 |
| Reduction of expenses by investment adviser | (210,382) |
| Net expenses | $12,739,956 |
| Net investment income (loss) | $49,347,183 |
| Realized and unrealized gain (loss) | |
| Realized gain (loss) (identified cost basis) | |
| Unaffiliated issuers | $39,231,709 |
| Affiliated issuers | 40,538 |
| Futures contracts | 10,944,754 |
| Swap agreements | (4,292,569) |
| Forward foreign currency exchange contracts | 142,184 |
| Foreign currency | (71,601) |
| Net realized gain (loss) | $45,995,015 |
| Change in unrealized appreciation or depreciation | |
| Unaffiliated issuers | $50,106,777 |
| Affiliated issuers | (141) |
| Futures contracts | 1,549,952 |
| Forward foreign currency exchange contracts | (543,041) |
| Translation of assets and liabilities in foreign currencies | 232,376 |
| Net unrealized gain (loss) | $51,345,923 |
| Net realized and unrealized gain (loss) | $97,340,938 |
| Change in net assets from operations | $146,688,121 |
See Notes to Financial Statements
MFS Total Return Bond Series
| Financial Statements | Statements of Changes in Net Assets |
These statements describe the increases and/or decreases in net assets resulting from operations, any distributions, and any shareholder transactions.
| | Year ended |
| | 12/31/20 | 12/31/19 |
| Change in net assets | | |
| From operations | | |
| Net investment income (loss) | $49,347,183 | $61,197,882 |
| Net realized gain (loss) | 45,995,015 | 13,890,726 |
| Net unrealized gain (loss) | 51,345,923 | 119,677,493 |
| Change in net assets from operations | $146,688,121 | $194,766,101 |
| Total distributions to shareholders | $(63,395,758) | $(66,623,045) |
| Change in net assets from fund share transactions | $(116,126,286) | $(83,743,514) |
| Total change in net assets | $(32,833,923) | $44,399,542 |
| Net assets | | |
| At beginning of period | 2,044,184,413 | 1,999,784,871 |
| At end of period | $2,011,350,490 | $2,044,184,413 |
See Notes to Financial Statements
MFS Total Return Bond Series
| Financial Statements | Financial Highlights |
The financial highlights table is intended to help you understand the fund's financial performance for the past 5 years. Certain information reflects financial results for a single fund share. The total returns in the table represent the rate that an investor would have earned (or lost) on an investment in the fund share class (assuming reinvestment of all distributions) held for the entire period.
| Initial Class | Year ended |
| | 12/31/20 | 12/31/19 | 12/31/18 | 12/31/17 | 12/31/16 |
| Net asset value, beginning of period | $13.48 | $12.65 | $13.22 | $13.09 | $13.00 |
| Income (loss) from investment operations | | | | | |
| Net investment income (loss) (d) | $0.37 | $0.42 | $0.39 | $0.36 | $0.40(c) |
| Net realized and unrealized gain (loss) | 0.76 | 0.87 | (0.53) | 0.22 | 0.16 |
| Total from investment operations | $1.13 | $1.29 | $(0.14) | $0.58 | $0.56 |
| Less distributions declared to shareholders | | | | | |
| From net investment income | $(0.49) | $(0.46) | $(0.43) | $(0.45) | $(0.47) |
| Net asset value, end of period (x) | $14.12 | $13.48 | $12.65 | $13.22 | $13.09 |
| Total return (%) (k)(r)(s)(x) | 8.47 | 10.21 | (1.09) | 4.46 | 4.23(c) |
Ratios (%) (to average net assets)
and Supplemental data: | | | | | |
| Expenses before expense reductions (f) | 0.54 | 0.54 | 0.54 | 0.54 | 0.53(c) |
| Expenses after expense reductions (f) | 0.53 | 0.53 | 0.53 | 0.53 | 0.52(c) |
| Net investment income (loss) | 2.71 | 3.14 | 3.04 | 2.70 | 2.98(c) |
| Portfolio turnover | 112 | 79 | 48 | 47 | 37 |
| Net assets at end of period (000 omitted) | $921,342 | $939,179 | $862,752 | $997,415 | $986,877 |
| Service Class | Year ended |
| | 12/31/20 | 12/31/19 | 12/31/18 | 12/31/17 | 12/31/16 |
| Net asset value, beginning of period | $13.24 | $12.43 | $12.99 | $12.87 | $12.78 |
| Income (loss) from investment operations | | | | | |
| Net investment income (loss) (d) | $0.33 | $0.38 | $0.35 | $0.32 | $0.36(c) |
| Net realized and unrealized gain (loss) | 0.74 | 0.85 | (0.52) | 0.22 | 0.16 |
| Total from investment operations | $1.07 | $1.23 | $(0.17) | $0.54 | $0.52 |
| Less distributions declared to shareholders | | | | | |
| From net investment income | $(0.45) | $(0.42) | $(0.39) | $(0.42) | $(0.43) |
| Net asset value, end of period (x) | $13.86 | $13.24 | $12.43 | $12.99 | $12.87 |
| Total return (%) (k)(r)(s)(x) | 8.17 | 9.92 | (1.33) | 4.18 | 4.01(c) |
Ratios (%) (to average net assets)
and Supplemental data: | | | | | |
| Expenses before expense reductions (f) | 0.79 | 0.79 | 0.79 | 0.79 | 0.78(c) |
| Expenses after expense reductions (f) | 0.78 | 0.78 | 0.78 | 0.78 | 0.77(c) |
| Net investment income (loss) | 2.46 | 2.89 | 2.79 | 2.45 | 2.73(c) |
| Portfolio turnover | 112 | 79 | 48 | 47 | 37 |
| Net assets at end of period (000 omitted) | $1,090,009 | $1,105,005 | $1,137,033 | $1,449,260 | $1,457,118 |
See Notes to Financial Statements
MFS Total Return Bond Series
Financial Highlights - continued
| (c) | Amount reflects a one-time reimbursement of expenses by the custodian (or former custodian) without which net investment income and performance would be lower and expenses would be higher. |
| (d) | Per share data is based on average shares outstanding. |
| (f) | Ratios do not reflect reductions from fees paid indirectly, if applicable. |
| (k) | The total return does not reflect expenses that apply to separate accounts. Inclusion of these charges would reduce the total return figures for all periods shown. |
| (r) | Certain expenses have been reduced without which performance would have been lower. |
| (s) | From time to time the fund may receive proceeds from litigation settlements, without which performance would be lower. |
| (x) | The net asset values and total returns have been calculated on net assets which include adjustments made in accordance with U.S. generally accepted accounting principles required at period end for financial reporting purposes. |
See Notes to Financial Statements
MFS Total Return Bond Series
Notes to Financial Statements
(1) Business and Organization
MFS Total Return Bond Series (the fund) is a diversified series of MFS Variable Insurance Trust (the trust). The trust is organized as a Massachusetts business trust and is registered under the Investment Company Act of 1940, as amended, as an open-end management investment company. The shareholders of each series of the trust are separate accounts of insurance companies, which offer variable annuity and/or life insurance products, and qualified retirement and pension plans.
The fund is an investment company and accordingly follows the investment company accounting and reporting guidance of the Financial Accounting Standards Board (FASB) Accounting Standards Codification Topic 946 Financial Services - Investment Companies.
(2) Significant Accounting Policies
General — The preparation of financial statements in conformity with U.S. generally accepted accounting principles requires management to make estimates and assumptions that affect the reported amounts of assets and liabilities, and disclosure of contingent assets and liabilities at the date of the financial statements and the reported amounts of increases and decreases in net assets from operations during the reporting period. Actual results could differ from those estimates. In the preparation of these financial statements, management has evaluated subsequent events occurring after the date of the fund’s Statement of Assets and Liabilities through the date that the financial statements were issued. The fund invests in foreign securities. Investments in foreign securities are vulnerable to the effects of changes in the relative values of the local currency and the U.S. dollar and to the effects of changes in each country’s market, economic, industrial, political, regulatory, geopolitical, environmental, public health, and other conditions.
In March 2020, the FASB issued Accounting Standards Update 2020-04, Reference Rate Reform (Topic 848) – Facilitation of the Effects of Reference Rate Reform on Financial Reporting (“ASU 2020-04”), which provides optional, temporary relief with respect to the financial reporting of contracts subject to certain types of modifications due to the planned discontinuation of the London Interbank Offered Rate (LIBOR) and other IBOR-based reference rates as of the end of 2021. The temporary relief provided by ASU 2020-04 is effective for certain reference rate-related contract modifications that occur during the period from March 12, 2020 through December 31, 2022. Management is evaluating the impact of ASU 2020-04 on the fund's investments, derivatives, debt and other contracts that will undergo reference rate-related modifications as a result of the reference rate reform.
Balance Sheet Offsetting — The fund's accounting policy with respect to balance sheet offsetting is that, absent an event of default by the counterparty or a termination of the agreement, the International Swaps and Derivatives Association (ISDA) Master Agreement, or similar agreement, does not result in an offset of reported amounts of financial assets and financial liabilities in the Statement of Assets and Liabilities across transactions between the fund and the applicable counterparty. The fund's right to setoff may be restricted or prohibited by the bankruptcy or insolvency laws of the particular jurisdiction to which a specific master netting agreement counterparty is subject. Balance sheet offsetting disclosures, to the extent applicable to the fund, have been included in the fund’s Significant Accounting Policies note under the captions for each of the fund’s in-scope financial instruments and transactions.
Investment Valuations — Debt instruments and floating rate loans, including restricted debt instruments, are generally valued at an evaluated or composite bid as provided by a third-party pricing service. Short-term instruments with a maturity at issuance of 60 days or less may be valued at amortized cost, which approximates market value. Exchange-traded options are generally valued at the last sale or official closing price on their primary exchange as provided by a third-party pricing service. Exchange-traded options for which there were no sales reported that day are generally valued at the last daily bid quotation on their primary exchange as provided by a third-party pricing service. For put options, the position may be valued at the last daily ask quotation if there are no trades reported during the day. Options not traded on an exchange are generally valued at a broker/dealer bid quotation. Foreign currency options are generally valued at valuations provided by a third-party pricing service. Futures contracts are generally valued at last posted settlement price on their primary exchange as provided by a third-party pricing service. Futures contracts for which there were no trades that day for a particular position are generally valued at the closing bid quotation on their primary exchange as provided by a third-party pricing service. Forward foreign currency exchange contracts are generally valued at the mean of bid and asked prices for the time period interpolated from rates provided by a third-party pricing service for proximate time periods. Swap agreements are generally valued using valuations provided by a third-party pricing service, which for cleared swaps includes an evaluation of any trading activity at the clearinghouses. Open-end investment companies are generally valued at net asset value per share. Securities and other assets generally valued on the basis of information from a third-party pricing service may also be valued at a broker/dealer bid quotation. In determining values, third-party pricing services can utilize both transaction data and market information such as yield, quality, coupon rate, maturity, type of issue, trading characteristics, and other market data. The values of foreign securities and other assets and liabilities expressed in foreign currencies are converted to U.S. dollars using the mean of bid and asked prices for rates provided by a third-party pricing service.
MFS Total Return Bond Series
Notes to Financial Statements - continued
The Board of Trustees has delegated primary responsibility for determining or causing to be determined the value of the fund’s investments (including any fair valuation) to the adviser pursuant to valuation policies and procedures approved by the Board. If the adviser determines that reliable market quotations are not readily available, investments are valued at fair value as determined in good faith by the adviser in accordance with such procedures under the oversight of the Board of Trustees. Under the fund’s valuation policies and procedures, market quotations are not considered to be readily available for most types of debt instruments and floating rate loans and many types of derivatives. These investments are generally valued at fair value based on information from third-party pricing services. In addition, investments may be valued at fair value if the adviser determines that an investment’s value has been materially affected by events occurring after the close of the exchange or market on which the investment is principally traded (such as foreign exchange or market) and prior to the determination of the fund’s net asset value, or after the halt of trading of a specific security where trading does not resume prior to the close of the exchange or market on which the security is principally traded. The adviser generally relies on third-party pricing services or other information (such as the correlation with price movements of similar securities in the same or other markets; the type, cost and investment characteristics of the security; the business and financial condition of the issuer; and trading and other market data) to assist in determining whether to fair value and at what value to fair value an investment. The value of an investment for purposes of calculating the fund’s net asset value can differ depending on the source and method used to determine value. When fair valuation is used, the value of an investment used to determine the fund’s net asset value may differ from quoted or published prices for the same investment. There can be no assurance that the fund could obtain the fair value assigned to an investment if it were to sell the investment at the same time at which the fund determines its net asset value per share.
Various inputs are used in determining the value of the fund's assets or liabilities. These inputs are categorized into three broad levels. In certain cases, the inputs used to measure fair value may fall into different levels of the fair value hierarchy. In such cases, an investment's level within the fair value hierarchy is based on the lowest level of input that is significant to the fair value measurement. The fund's assessment of the significance of a particular input to the fair value measurement in its entirety requires judgment, and considers factors specific to the investment. Level 1 includes unadjusted quoted prices in active markets for identical assets or liabilities. Level 2 includes other significant observable market-based inputs (including quoted prices for similar securities, interest rates, prepayment speed, and credit risk). Level 3 includes unobservable inputs, which may include the adviser's own assumptions in determining the fair value of investments. Other financial instruments are derivative instruments, such as futures contracts and forward foreign currency exchange contracts. The following is a summary of the levels used as of December 31, 2020 in valuing the fund's assets or liabilities:
| Financial Instruments | Level 1 | Level 2 | Level 3 | Total |
| U.S. Treasury Bonds & U.S. Government Agencies & Equivalents | $— | $76,490,981 | $— | $76,490,981 |
| Non - U.S. Sovereign Debt | — | 6,391,431 | — | 6,391,431 |
| Municipal Bonds | — | 66,578,807 | — | 66,578,807 |
| U.S. Corporate Bonds | — | 718,725,060 | — | 718,725,060 |
| Residential Mortgage-Backed Securities | — | 424,209,887 | — | 424,209,887 |
| Commercial Mortgage-Backed Securities | — | 202,347,237 | — | 202,347,237 |
| Asset-Backed Securities (including CDOs) | — | 213,170,076 | — | 213,170,076 |
| Foreign Bonds | — | 216,241,056 | — | 216,241,056 |
| Mutual Funds | 160,402,627 | — | — | 160,402,627 |
| Total | $160,402,627 | $1,924,154,535 | $— | $2,084,557,162 |
| Other Financial Instruments | | | | |
| Futures Contracts – Assets | $239,669 | $— | $— | $239,669 |
| Forward Foreign Currency Exchange Contracts – Liabilities | — | (384,133) | — | (384,133) |
For further information regarding security characteristics, see the Portfolio of Investments.
Foreign Currency Translation — Purchases and sales of foreign investments, income, and expenses are converted into U.S. dollars based upon currency exchange rates prevailing on the respective dates of such transactions or on the reporting date for foreign denominated receivables and payables. Gains and losses attributable to foreign currency exchange rates on sales of securities are recorded for financial statement purposes as net realized gains and losses on investments. Gains and losses attributable to foreign exchange rate movements on receivables, payables, income and expenses are recorded for financial statement purposes as foreign currency transaction gains and losses. That portion of both realized and unrealized gains and losses on investments that results from fluctuations in foreign currency exchange rates is not separately disclosed.
MFS Total Return Bond Series
Notes to Financial Statements - continued
Derivatives — The fund uses derivatives primarily to increase or decrease exposure to a particular market or segment of the market, or security, to increase or decrease interest rate or currency exposure, or as alternatives to direct investments. Derivatives are used for hedging or non-hedging purposes. While hedging can reduce or eliminate losses, it can also reduce or eliminate gains. When the fund uses derivatives as an investment to increase market exposure, or for hedging purposes, gains and losses from derivative instruments may be substantially greater than the derivative’s original cost.
The derivative instruments used by the fund during the period were purchased options, futures contracts, forward foreign currency exchange contracts, and swap agreements. Depending on the type of derivative, the fund may exit a derivative position by entering into an offsetting transaction with a counterparty or exchange, negotiating an agreement with the derivative counterparty, or novating the position to a third party. The fund may be unable to promptly close out a futures position in instances where the daily fluctuation in the price for that type of future exceeds the daily limit set by the exchange. The fund's period end derivatives, as presented in the Portfolio of Investments and the associated Derivative Contract tables, generally are indicative of the volume of its derivative activity during the period.
The following table presents, by major type of derivative contract, the fair value, on a gross basis, of the asset and liability components of derivatives held by the fund at December 31, 2020 as reported in the Statement of Assets and Liabilities:
| | | Fair Value (a) |
| Risk | Derivative Contracts | Asset Derivatives | Liability Derivatives |
| Interest Rate | Interest Rate Futures | $239,669 | $— |
| Foreign Exchange | Forward Foreign Currency Exchange Contracts | — | $(384,133) |
| Total | | $239,669 | $(384,133) |
(a) Values presented in this table for futures contracts correspond to the values reported in the fund's Portfolio of Investments. Only the current day net variation margin for futures contracts is separately reported within the fund's Statement of Assets and Liabilities.
The following table presents, by major type of derivative contract, the realized gain (loss) on derivatives held by the fund for the year ended December 31, 2020 as reported in the Statement of Operations:
| Risk | Futures
Contracts | Swap
Agreements | Forward Foreign
Currency
Exchange
Contracts | Unaffiliated Issuers
(Purchased
Options) |
| Interest Rate | $10,944,754 | $— | $— | $— |
| Foreign Exchange | — | — | 142,184 | — |
| Credit | — | (4,292,569) | — | 1,480,005 |
| Total | $10,944,754 | $(4,292,569) | $142,184 | $1,480,005 |
The following table presents, by major type of derivative contract, the change in unrealized appreciation or depreciation on derivatives held by the fund for the year ended December 31, 2020 as reported in the Statement of Operations:
| Risk | Futures
Contracts | Forward Foreign
Currency
Exchange
Contracts | Unaffiliated Issuers
(Purchased
Options) |
| Interest Rate | $1,549,952 | $— | $— |
| Foreign Exchange | — | (543,041) | — |
| Credit | — | — | 388,278 |
| Total | $1,549,952 | $(543,041) | $388,278 |
Derivative counterparty credit risk is managed through formal evaluation of the creditworthiness of all potential counterparties. On certain, but not all, uncleared derivatives, the fund attempts to reduce its exposure to counterparty credit risk whenever possible by entering into an ISDA Master Agreement on a bilateral basis. The ISDA Master Agreement gives each party to the agreement the right to terminate all transactions traded under such agreement if there is a specified deterioration in the credit quality of the other party. Upon an event of default or a termination of the ISDA Master Agreement, the non-defaulting party has the right to close out all transactions traded under such agreement and to net amounts owed under each agreement to one net amount payable by one party to the other. This right to close out and net payments across all transactions traded under the ISDA Master Agreement could result in a reduction of the fund's credit risk to such counterparty equal to any amounts payable by the fund under the applicable transactions, if any.
MFS Total Return Bond Series
Notes to Financial Statements - continued
Collateral and margin requirements differ by type of derivative. For cleared derivatives (e.g., futures contracts, cleared swaps, and exchange-traded options), margin requirements are set by the clearing broker and the clearing house and collateral, in the form of cash or securities, is posted by the fund directly with the clearing broker. Collateral terms are counterparty agreement specific for uncleared derivatives (e.g., forward foreign currency exchange contracts, uncleared swap agreements, and uncleared options) and collateral, in the form of cash and securities, is held in segregated accounts with the fund's custodian in connection with these agreements. For derivatives traded under an ISDA Master Agreement, which contains a collateral support annex, the collateral requirements are netted across all transactions traded under such counterparty-specific agreement and an amount is posted from one party to the other to collateralize such obligations. Cash that has been segregated or delivered to cover the fund's collateral or margin obligations under derivative contracts, if any, will be reported separately in the Statement of Assets and Liabilities as restricted cash for uncleared derivatives and/or deposits with brokers for cleared derivatives. Securities pledged as collateral or margin for the same purpose, if any, are noted in the Portfolio of Investments. The fund may be required to make payments of interest on uncovered collateral or margin obligations with the broker. Any such payments are included in “Miscellaneous” expense in the Statement of Operations.
Purchased Options — The fund purchased put options for a premium. Purchased put options entitle the holder to sell a specified number of shares or units of a particular security, currency or index at a specified price at a specified date or within a specified period of time. Purchasing put options may hedge against an anticipated decline in the value of portfolio securities or currency or decrease the fund’s exposure to an underlying instrument.
The premium paid is initially recorded as an investment in the Statement of Assets and Liabilities. That investment is subsequently marked-to-market daily with the difference between the premium paid and the market value of the purchased option being recorded as unrealized appreciation or depreciation. Premiums paid for purchased put options which have expired are treated as realized losses on investments in the Statement of Operations. Upon the exercise or closing of a purchased put option, the premium paid is offset against the proceeds on the sale of the underlying security or financial instrument in order to determine the realized gain or loss on investments.
Whether or not the option is exercised, the fund’s maximum risk of loss from purchasing an option is the amount of premium paid. All option contracts involve credit risk if the counterparty to the option contract fails to perform. For uncleared options, this risk is mitigated in cases where there is an ISDA Master Agreement between the fund and the counterparty providing for netting as described above and, where applicable, by the posting of collateral by the counterparty to the fund to cover the fund’s exposure to the counterparty under such ISDA Master Agreement.
Futures Contracts — The fund entered into futures contracts which may be used to hedge against or obtain broad market exposure, interest rate exposure, currency exposure, or to manage duration. A futures contract represents a commitment for the future purchase or sale of an asset at a specified price on a specified date.
Upon entering into a futures contract, the fund is required to deposit with the broker, either in cash or securities, an initial margin in an amount equal to a specified percentage of the notional amount of the contract. Subsequent payments (variation margin) are made or received by the fund each day, depending on the daily fluctuations in the value of the contract, and are recorded for financial statement purposes as unrealized gain or loss by the fund until the contract is closed or expires at which point the gain or loss on futures contracts is realized.
The fund bears the risk of interest rates, exchange rates or securities prices moving unexpectedly, in which case, the fund may not achieve the anticipated benefits of the futures contracts and may realize a loss. While futures contracts may present less counterparty risk to the fund since the contracts are exchange traded and the exchange’s clearinghouse guarantees payments to the broker, there is still counterparty credit risk due to the insolvency of the broker. The fund’s maximum risk of loss due to counterparty credit risk is equal to the margin posted by the fund to the broker plus any gains or minus any losses on the outstanding futures contracts.
Forward Foreign Currency Exchange Contracts — The fund entered into forward foreign currency exchange contracts for the purchase or sale of a specific foreign currency at a fixed price on a future date. These contracts may be used to hedge the fund’s currency risk or for non-hedging purposes. For hedging purposes, the fund may enter into contracts to deliver or receive foreign currency that the fund will receive from or use in its normal investment activities. The fund may also use contracts to hedge against declines in the value of foreign currency denominated securities due to unfavorable exchange rate movements. For non-hedging purposes, the fund may enter into contracts with the intent of changing the relative exposure of the fund’s portfolio of securities to different currencies to take advantage of anticipated exchange rate changes.
Forward foreign currency exchange contracts are adjusted by the daily exchange rate of the underlying currency and any unrealized gains or losses are recorded as a receivable or payable for forward foreign currency exchange contracts until the contract settlement date. On contract settlement date, any gain or loss on the contract is recorded as realized gains or losses on forward foreign currency exchange contracts.
MFS Total Return Bond Series
Notes to Financial Statements - continued
Risks may arise upon entering into these contracts from unanticipated movements in the value of the contract and from the potential inability of counterparties to meet the terms of their contracts. Generally, the fund’s maximum risk due to counterparty credit risk is the unrealized gain on the contract due to the use of Continuous Linked Settlement, a multicurrency cash settlement system for the centralized settlement of foreign transactions. This risk is mitigated in cases where there is an ISDA Master Agreement between the fund and the counterparty providing for netting as described above and, where applicable, by the posting of collateral by the counterparty to the fund to cover the fund’s exposure to the counterparty under such ISDA Master Agreement.
Swap Agreements — During the period the fund entered into swap agreements. Swap agreements generally involve a periodic exchange of cash payments on a net basis, at specified intervals or upon the occurrence of specified events, between the fund and a counterparty. Certain swap agreements may be entered into as a bilateral contract (“uncleared swaps”) while others are required to be centrally cleared (“cleared swaps”). In a cleared swap transaction, the ultimate counterparty to the transaction is a clearinghouse (the “clearinghouse”). The contract is transferred and accepted by the clearinghouse immediately following execution of the swap contract with an executing broker. Thereafter, throughout the term of the cleared swap, the fund interfaces indirectly with the clearinghouse through a clearing broker and has counterparty risk to the clearing broker as well.
Both cleared and uncleared swap agreements are marked to market daily. The value of uncleared swap agreements is reported in the Statement of Assets and Liabilities as “Uncleared swaps, at value” which includes any related interest accruals to be paid or received by the fund. For cleared swaps, payments (variation margin) are made or received by the fund each day, depending on the daily fluctuations in the value of the cleared swap, such that only the current day net receivable or payable for variation margin is reported in the Statement of Assets and Liabilities.
For both cleared and uncleared swaps, the periodic exchange of net cash payments, at specified intervals or upon the occurrence of specified events as stipulated by the agreement, is recorded as realized gain or loss on swap agreements in the Statement of Operations. Premiums paid or received at the inception of the agreements are amortized using the effective interest method over the term of the agreement as realized gain or loss on swap agreements in the Statement of Operations. A liquidation payment received or made upon early termination is recorded as a realized gain or loss on swap agreements in the Statement of Operations. The change in unrealized appreciation or depreciation on swap agreements in the Statement of Operations reflects the aggregate change over the reporting period in the value of swaps net of any unamortized premiums paid or received.
Risks related to swap agreements include the possible lack of a liquid market, unfavorable market and interest rate movements of the underlying instrument and the failure of the counterparty to perform under the terms of the agreements. The fund's maximum risk of loss from counterparty credit risk is the discounted net value of the cash flows to be received from/paid to the counterparty over the contract's remaining life, to the extent that the amount is positive. To address counterparty risk, uncleared swap agreements are limited to only highly-rated counterparties. Risk is further reduced by having an ISDA Master Agreement between the fund and the counterparty providing for netting as described above and, where applicable, by the posting of collateral by the counterparty to the fund to cover the fund’s exposure to the counterparty under such ISDA Master Agreement. The fund's counterparty risk due to cleared swaps is mitigated by the fact that the clearinghouse is the true counterparty to the transaction and the regulatory requirement safeguards in the event of a clearing broker bankruptcy.
The fund entered into credit default swap agreements in order to manage its exposure to the market or certain sectors of the market, to reduce its credit risk exposure to defaults of corporate and sovereign issuers or to create exposure to corporate or sovereign issuers to which it is not otherwise exposed. In a credit default swap agreement, the protection buyer can make an upfront payment and will make a stream of payments to the protection seller based on a fixed percentage applied to the agreement notional amount in exchange for the right to receive a specified return upon the occurrence of a defined credit event on the reference obligation (which may be either a single security or a basket of securities issued by corporate or sovereign issuers) and, with respect to the cases where physical settlement applies, the delivery by the buyer to the seller of a defined deliverable obligation. Although agreement-specific, credit events generally consist of a combination of the following: bankruptcy, failure to pay, restructuring, obligation acceleration, obligation default, or repudiation/moratorium, each as defined in the 2003 ISDA Credit Derivatives Definitions as amended by the relevant agreement. Restructuring is generally not applicable when the reference obligation is issued by a North American corporation and obligation acceleration, obligation default, or repudiation/moratorium are generally only applicable when the reference obligation is issued by a sovereign entity or an entity in an emerging country. Upon determination of the final price for the deliverable obligation (or upon delivery of the deliverable obligation in the case of physical settlement), the difference between the value of the deliverable obligation and the swap agreement’s notional amount is recorded as realized gain or loss on swap agreements in the Statement of Operations.
Indemnifications — Under the fund's organizational documents, its officers and Trustees may be indemnified against certain liabilities and expenses arising out of the performance of their duties to the fund. Additionally, in the normal course of business, the fund enters into agreements with service providers that may contain indemnification clauses. The fund's maximum exposure under these agreements is unknown as this would involve future claims that may be made against the fund that have not yet occurred.
MFS Total Return Bond Series
Notes to Financial Statements - continued
Investment Transactions and Income — Investment transactions are recorded on the trade date. Some securities may be purchased or sold on an extended settlement basis, which means that the receipt or delivery of the securities by the fund and related payments occur at a future date, usually beyond the customary settlement period. Interest income is recorded on the accrual basis. All premium and discount is amortized or accreted for financial statement purposes in accordance with U.S. generally accepted accounting principles. Interest payments received in additional securities are recorded on the ex-interest date in an amount equal to the value of the security on such date.
The fund may receive proceeds from litigation settlements. Any proceeds received from litigation involving portfolio holdings are reflected in the Statement of Operations in realized gain/loss if the security has been disposed of by the fund or in unrealized gain/loss if the security is still held by the fund. Any other proceeds from litigation not related to portfolio holdings are reflected as other income in the Statement of Operations.
The fund invests a significant portion of its assets in asset-backed and/or mortgage-backed securities. For these securities, the value of the debt instrument also depends on the credit quality and adequacy of the underlying assets or collateral as well as whether there is a security interest in the underlying assets or collateral. Enforcing rights, if any, against the underlying assets or collateral may be difficult. U.S. Government securities not supported as to the payment of principal or interest by the U.S. Treasury, such as those issued by Fannie Mae, Freddie Mac, and the Federal Home Loan Banks, are subject to greater credit risk than are U.S. Government securities supported by the U.S. Treasury, such as those issued by Ginnie Mae.
The fund may purchase or sell mortgage-backed securities on a “To Be Announced” (TBA) basis. A TBA transaction is subject to extended settlement and typically does not designate the actual security to be delivered, but instead includes an approximate principal amount. The price of the TBA security and the date that it will be settled are fixed at the time the transaction is negotiated. The value of the security varies with market fluctuations and no interest accrues to the fund until settlement takes place. TBA purchase and sale commitments are held at carrying amount, which approximates fair value and are categorized as level 2 within the fair value hierarchy and included in TBA purchase and TBA sale commitments in the Statement of Assets and Liabilities. Losses may arise as a result of changes in the value of the TBA investment prior to settlement date or due to counterparty non-performance. At the time that it enters into a TBA transaction, the fund is required to have sufficient cash and/or liquid securities to cover its commitments.
The fund may also enter into mortgage dollar rolls, typically TBA dollar rolls, in which the fund sells TBA mortgage-backed securities to financial institutions and simultaneously agrees to repurchase similar (same issuer, type and coupon) securities at a later date at an agreed-upon price. During the period between the sale and repurchase, the fund will not be entitled to receive interest and principal payments on the securities sold. The fund accounts for dollar roll transactions as purchases and sales and realizes gains and losses on these transactions. Dollar roll transactions involve the risk that the market value of the securities that the fund is required to purchase may decline below the agreed upon repurchase price of those securities.
To mitigate the counterparty credit risk on TBA transactions, mortgage dollar rolls, and other types of forward settling mortgage-backed and asset-backed security transactions, the fund whenever possible enters into a Master Securities Forward Transaction Agreement (��MSFTA”) on a bilateral basis with each of the counterparties with whom it undertakes a significant volume of transactions. The MSFTA gives each party to the agreement the right to terminate all transactions traded under such agreement if there is a specified deterioration in the credit quality of the other party. Upon an event of default or a termination of the MSFTA, the non-defaulting party has the right to close out all transactions traded under such agreement and to net amounts owed under each transaction to one net amount payable by one party to the other. This right to close out and net payments across all transactions traded under the MSFTA could result in a reduction of the fund's credit risk to such counterparty equal to any amounts payable by the fund under the applicable transactions, if any.
For mortgage-backed and asset-backed securities traded under a MSFTA, the collateral and margining requirements are contract specific. Collateral amounts across all transactions traded under such agreement are netted and an amount is posted from one party to the other to collateralize such obligations. Cash that has been pledged to cover the fund's collateral or margin obligations under a MSFTA, if any, will be reported separately on the Statement of Assets and Liabilities as restricted cash. Securities pledged as collateral or margin for the same purpose, if any, are noted in the Portfolio of Investments.
Tax Matters and Distributions — The fund intends to qualify as a regulated investment company, as defined under Subchapter M of the Internal Revenue Code, and to distribute all of its taxable income, including realized capital gains. As a result, no provision for federal income tax is required. The fund’s federal tax returns, when filed, will remain subject to examination by the Internal Revenue Service for a three year period. Management has analyzed the fund’s tax positions taken on federal and state tax returns for all open tax years and does not believe that there are any uncertain tax positions that require recognition of a tax liability. Foreign taxes, if any, have been accrued by the fund in the accompanying financial statements in accordance with the applicable foreign tax law. Foreign income taxes may be withheld by certain countries in which the fund invests. Additionally, capital gains realized by the fund on securities issued in or by certain foreign countries may be subject to capital gains tax imposed by those countries.
MFS Total Return Bond Series
Notes to Financial Statements - continued
Distributions to shareholders are recorded on the ex-dividend date. Income and capital gain distributions are determined in accordance with income tax regulations, which may differ from U.S. generally accepted accounting principles. Certain capital accounts in the financial statements are periodically adjusted for permanent differences in order to reflect their tax character. These adjustments have no impact on net assets or net asset value per share. Temporary differences which arise from recognizing certain items of income, expense, gain or loss in different periods for financial statement and tax purposes will reverse at some time in the future.
Book/tax differences primarily relate to amortization and accretion of debt securities.
The tax character of distributions declared to shareholders for the last two fiscal years is as follows:
| | Year ended
12/31/20 | Year ended
12/31/19 |
| Ordinary income (including any short-term capital gains) | $63,395,758 | $66,623,045 |
The federal tax cost and the tax basis components of distributable earnings were as follows:
| As of 12/31/20 | |
| Cost of investments | $1,957,878,103 |
| Gross appreciation | 131,957,898 |
| Gross depreciation | (5,423,303) |
| Net unrealized appreciation (depreciation) | $126,534,595 |
| Undistributed ordinary income | 52,720,492 |
| Undistributed long-term capital gain | 147,479 |
| Other temporary differences | 215,677 |
Multiple Classes of Shares of Beneficial Interest — The fund offers multiple classes of shares, which differ in their respective distribution and/or service fees. The fund's income, realized and unrealized gain (loss), and common expenses are allocated to shareholders based on the daily net assets of each class. Dividends are declared separately for each class. Differences in per share dividend rates are generally due to differences in separate class expenses. The fund’s distributions declared to shareholders as reported in the Statements of Changes in Net Assets are presented by class as follows:
| | Year ended
12/31/20 | | Year ended
12/31/19 |
| Initial Class | $29,795,683 | | $31,038,442 |
| Service Class | 33,600,075 | | 35,584,603 |
| Total | $63,395,758 | | $66,623,045 |
(3) Transactions with Affiliates
Investment Adviser — The fund has an investment advisory agreement with MFS to provide overall investment management and related administrative services and facilities to the fund. The management fee is computed daily and paid monthly at the following annual rates based on the fund's average daily net assets:
| Up to $2.5 billion | 0.50% |
| In excess of $2.5 billion and up to $5 billion | 0.45% |
| In excess of $5 billion | 0.40% |
MFS has agreed in writing to reduce its management fee by a specified amount if certain MFS mutual fund assets exceed thresholds agreed to by MFS and the fund's Board of Trustees. For the year ended December 31, 2020, this management fee reduction amounted to $210,382, which is included in the reduction of total expenses in the Statement of Operations. The management fee incurred for the year ended December 31, 2020 was equivalent to an annual effective rate of 0.49% of the fund's average daily net assets.
Distributor — MFS Fund Distributors, Inc. (MFD), a wholly-owned subsidiary of MFS, is the distributor of shares of the fund. The Trustees have adopted a distribution plan for the Service Class shares pursuant to Rule 12b-1 under the Investment Company Act of 1940.
The fund's distribution plan provides that the fund will pay MFD distribution and/or service fees equal to 0.25% per annum of its average daily net assets attributable to Service Class shares as partial consideration for services performed and expenses incurred by MFD and financial intermediaries (including participating insurance companies that invest in the fund to fund variable annuity and
MFS Total Return Bond Series
Notes to Financial Statements - continued
variable life insurance contracts, sponsors of qualified retirement and pension plans that invest in the fund, and affiliates of these participating insurance companies and plan sponsors) in connection with the sale and distribution of the Service Class shares. MFD may subsequently pay all, or a portion, of the distribution and/or service fees to financial intermediaries.
Shareholder Servicing Agent — MFS Service Center, Inc. (MFSC), a wholly-owned subsidiary of MFS, receives a fee from the fund for its services as shareholder servicing agent. For the year ended December 31, 2020, the fee was $38,161, which equated to 0.0020% annually of the fund's average daily net assets. MFSC also receives reimbursement from the fund for out-of-pocket expenses paid by MFSC on behalf of the fund. For the year ended December 31, 2020, these costs amounted to $1,195.
Administrator — MFS provides certain financial, legal, shareholder communications, compliance, and other administrative services to the fund. Under an administrative services agreement, the fund reimburses MFS the costs incurred to provide these services. The fund is charged an annual fixed amount of $17,500 plus a fee based on average daily net assets. The administrative services fee incurred for the year ended December 31, 2020 was equivalent to an annual effective rate of 0.0137% of the fund's average daily net assets.
Trustees’ and Officers’ Compensation — The fund pays compensation to independent Trustees in the form of a retainer, attendance fees, and additional compensation to Board and Committee chairpersons. The fund does not pay compensation directly to Trustees or officers of the fund who are also officers of the investment adviser, all of whom receive remuneration from MFS for their services to the fund. Certain officers and Trustees of the fund are officers or directors of MFS, MFD, and MFSC.
Other — The fund invests in the MFS Institutional Money Market Portfolio which is managed by MFS and seeks current income consistent with preservation of capital and liquidity. This money market fund does not pay a management fee to MFS but does incur investment and operating costs.
(4) Portfolio Securities
For the year ended December 31, 2020, purchases and sales of investments, other than purchased option transactions and short-term obligations, were as follows:
| | Purchases | Sales |
| U.S. Government securities | $1,598,482,982 | $1,776,306,600 |
| Non-U.S. Government securities | 550,178,702 | 604,660,455 |
(5) Shares of Beneficial Interest
The fund's Declaration of Trust permits the Trustees to issue an unlimited number of full and fractional shares of beneficial interest. Transactions in fund shares were as follows:
| | Year ended
12/31/20 | | Year ended
12/31/19 |
| | Shares | Amount | | Shares | Amount |
| Shares sold | | | | | |
| Initial Class | 13,168,136 | $181,339,136 | | 8,456,171 | $112,135,400 |
| Service Class | 10,980,723 | 150,262,829 | | 5,257,057 | 68,444,844 |
| | 24,148,859 | $331,601,965 | | 13,713,228 | $180,580,244 |
Shares issued to shareholders
in reinvestment of distributions | | | | | |
| Initial Class | 2,116,668 | $29,167,687 | | 2,247,912 | $30,369,288 |
| Service Class | 2,481,542 | 33,600,075 | | 2,679,563 | 35,584,603 |
| | 4,598,210 | $62,767,762 | | 4,927,475 | $65,953,891 |
| Shares reacquired | | | | | |
| Initial Class | (19,695,908) | $(267,503,154) | | (9,216,617) | $(122,502,428) |
| Service Class | (18,285,133) | (242,992,859) | | (15,939,795) | (207,775,221) |
| | (37,981,041) | $(510,496,013) | | (25,156,412) | $(330,277,649) |
| Net change | | | | | |
| Initial Class | (4,411,104) | $(56,996,331) | | 1,487,466 | $20,002,260 |
| Service Class | (4,822,868) | (59,129,955) | | (8,003,175) | (103,745,774) |
| | (9,233,972) | $(116,126,286) | | (6,515,709) | $(83,743,514) |
MFS Total Return Bond Series
Notes to Financial Statements - continued
The fund is one of several mutual funds in which certain MFS funds may invest. The MFS funds do not invest in the underlying funds for the purpose of exercising management or control. At the end of the period, the MFS Moderate Allocation Portfolio and the MFS Conservative Allocation Portfolio were the owners of record of approximately 8% and 4%, respectively, of the value of outstanding voting shares of the fund. In addition, the MFS Growth Allocation Portfolio was the owner of record of less than 1% of the value of the outstanding voting shares of the fund.
(6) Line of Credit
The fund and certain other funds managed by MFS participate in a $1.25 billion unsecured committed line of credit of which $1 billion is reserved for use by the fund and certain other U.S. funds. The line of credit is provided by a syndicate of banks under a credit agreement. Borrowings may be made for temporary financing needs. Interest is charged to each fund, based on its borrowings, generally at a rate equal to the highest of one month LIBOR, the Federal Funds Effective Rate and the Overnight Bank Funding Rate, plus an agreed upon spread. A commitment fee, based on the average daily, unused portion of the committed line of credit, is allocated among the participating funds. In addition, the fund and other funds managed by MFS have established unsecured uncommitted borrowing arrangements with certain banks for temporary financing needs. Interest is charged to each fund, based on its borrowings, at rates equal to customary reference rates plus an agreed upon spread. For the year ended December 31, 2020, the fund’s commitment fee and interest expense were $9,501 and $318, respectively, and are included in “Miscellaneous” expense in the Statement of Operations.
(7) Investments in Affiliated Issuers
An affiliated issuer may be considered one in which the fund owns 5% or more of the outstanding voting securities, or a company which is under common control. For the purposes of this report, the following were affiliated issuers:
| Affiliated Issuers | Beginning
Value | Purchases | Sales
Proceeds | Realized
Gain
(Loss) | Change in
Unrealized
Appreciation or
Depreciation | Ending
Value |
| MFS Institutional Money Market Portfolio | $23,060,848 | $851,374,823 | $714,073,441 | $40,538 | $(141) | $160,402,627 |
| Affiliated Issuers | Dividend
Income | Capital Gain
Distributions |
| MFS Institutional Money Market Portfolio | $475,609 | $— |
(8) Impacts of COVID-19
The pandemic related to the global spread of novel coronavirus disease (COVID-19), which was first detected in December 2019, has resulted in significant disruptions to global business activity and the global economy, as well as the economies of individual countries, the financial performance of individual companies and sectors, and the securities and commodities markets in general. This pandemic, the full effects of which are still unknown, has resulted in substantial market volatility and may have adversely impacted the prices and liquidity of the fund's investments and the fund's performance.
MFS Total Return Bond Series
Report of Independent Registered Public Accounting Firm
To the Board of Trustees of MFS Variable Insurance Trust and the Shareholders of MFS Total Return Bond Series:
Opinion on the Financial Statements and Financial Highlights
We have audited the accompanying statement of assets and liabilities of MFS Total Return Bond Series (the “Fund”), including the portfolio of investments, as of December 31, 2020, the related statement of operations for the year then ended, the statements of changes in net assets for each of the two years in the period then ended, the financial highlights for each of the five years in the period then ended, and the related notes. In our opinion, the financial statements and financial highlights present fairly, in all material respects, the financial position of the Fund as of December 31, 2020, and the results of its operations for the year then ended, the changes in its net assets for each of the two years in the period then ended, and the financial highlights for each of the five years in the period then ended, in conformity with accounting principles generally accepted in the United States of America.
Basis for Opinion
These financial statements and financial highlights are the responsibility of the Fund's management. Our responsibility is to express an opinion on the Fund's financial statements and financial highlights based on our audits. We are a public accounting firm registered with the Public Company Accounting Oversight Board (United States) (PCAOB) and are required to be independent with respect to the Fund in accordance with the U.S. federal securities laws and the applicable rules and regulations of the Securities and Exchange Commission and the PCAOB.
We conducted our audits in accordance with the standards of the PCAOB. Those standards require that we plan and perform the audit to obtain reasonable assurance about whether the financial statements and financial highlights are free of material misstatement, whether due to error or fraud. The Fund is not required to have, nor were we engaged to perform, an audit of its internal control over financial reporting. As part of our audits, we are required to obtain an understanding of internal control over financial reporting but not for the purpose of expressing an opinion on the effectiveness of the Fund's internal control over financial reporting. Accordingly, we express no such opinion.
Our audits included performing procedures to assess the risks of material misstatement of the financial statements and financial highlights, whether due to error or fraud, and performing procedures that respond to those risks. Such procedures included examining, on a test basis, evidence regarding the amounts and disclosures in the financial statements and financial highlights. Our audits also included evaluating the accounting principles used and significant estimates made by management, as well as evaluating the overall presentation of the financial statements and financial highlights. Our procedures included confirmation of securities owned as of December 31, 2020, by correspondence with the custodian and brokers; when replies were not received from brokers, we performed other auditing procedures. We believe that our audits provide a reasonable basis for our opinion.
DELOITTE & TOUCHE LLP
Boston, Massachusetts
February 16, 2021
We have served as the auditor of one or more of the MFS investment companies since 1924.
MFS Total Return Bond Series
Trustees and Officers — Identification and Background
The Trustees and Officers of the Trust, as of February 1, 2021, are listed below, together with their principal occupations during the past five years. (Their titles may have varied during that period.) The address of each Trustee and Officer is 111 Huntington Avenue, Boston, Massachusetts 02199-7618.
| Name, Age | | Position(s) Held with Fund | | Trustee/Officer Since(h) | | Number of MFS Funds overseen by the Trustee | | Principal Occupations During
the Past Five Years | | Other Directorships During
the Past Five Years (j) |
| INTERESTED TRUSTEES | | |
Robert J. Manning (k)
(age 57) | | Trustee | | February 2004 | | 134 | | Massachusetts Financial Services Company, Non-Executive Chairman (since January 2021); Director; Chairman of the Board; Executive Chairman (January 2017-2020); Co-Chief Executive Officer (2015-2016) | | N/A |
Michael W. Roberge (k)
(age 54) | | Trustee | | January 2021 | | 134 | | Massachusetts Financial Services Company, Chairman (since January 2021); Chief Executive Officer (since January 2017); Director; President (until December 2018); Chief Investment Officer (until December 2018); Co-Chief Executive Officer (until December 2016) | | N/A |
| INDEPENDENT TRUSTEES | | |
John P. Kavanaugh
(age 66) | | Trustee and Chair of Trustees | | January 2009 | | 134 | | Private investor | | N/A |
Steven E. Buller
(age 69) | | Trustee | | February 2014 | | 134 | | Private investor | | N/A |
John A. Caroselli
(age 66) | | Trustee | | March 2017 | | 134 | | Private investor; JC Global Advisors, LLC (management consulting), President (since 2015) | | N/A |
Maureen R. Goldfarb
(age 65) | | Trustee | | January 2009 | | 134 | | Private investor | | N/A |
Peter D. Jones
(age 65) | | Trustee | | January 2019 | | 134 | | Private investor | | N/A |
James W. Kilman, Jr.
(age 59) | | Trustee | | January 2019 | | 134 | | Burford Capital Limited (finance and investment management), Chief Financial Officer (since 2019); KielStrand Capital LLC (family office), Chief Executive Officer (since 2016); Morgan Stanley & Co. (financial services), Vice Chairman of Investment Banking, Co-Head of Diversified Financials Coverage – Financial Institutions Investment Banking Group (until 2016) | | Alpha-En Corporation, Director (2016-2019) |
Clarence Otis, Jr.
(age 64) | | Trustee | | March 2017 | | 134 | | Private investor | | VF Corporation, Director; Verizon Communications, Inc., Director; The Travelers Companies, Director |
MFS Total Return Bond Series
Trustees and Officers - continued
| Name, Age | | Position(s) Held with Fund | | Trustee/Officer Since(h) | | Number of MFS Funds overseen by the Trustee | | Principal Occupations During
the Past Five Years | | Other Directorships During
the Past Five Years (j) |
Maryanne L. Roepke
(age 64) | | Trustee | | May 2014 | | 134 | | Private investor | | N/A |
Laurie J. Thomsen
(age 63) | | Trustee | | March 2005 | | 134 | | Private investor | | The Travelers Companies, Director; Dycom Industries, Inc., Director |
| Name, Age | | Position(s) Held with
Fund | | Trustee/Officer Since(h) | | Number of MFS Funds for which the Person is an Officer | | Principal Occupations During
the Past Five Years |
| OFFICERS | | | | | | | | |
Christopher R. Bohane (k)
(age 47) | | Assistant Secretary and Assistant Clerk | | July 2005 | | 134 | | Massachusetts Financial Services Company, Senior Vice President and Associate General Counsel |
Kino Clark (k)
(age 52) | | Assistant Treasurer | | January 2012 | | 134 | | Massachusetts Financial Services Company, Vice President |
John W. Clark, Jr. (k)
(age 53) | | Assistant Treasurer | | April 2017 | | 134 | | Massachusetts Financial Services Company, Vice President (since March 2017); Deutsche Bank (financial services), Department Head - Treasurer's Office (until February 2017) |
Thomas H. Connors (k)
(age 61) | | Assistant Secretary and Assistant Clerk | | September 2012 | | 134 | | Massachusetts Financial Services Company, Vice President and Senior Counsel |
David L. DiLorenzo (k)
(age 52) | | President | | July 2005 | | 134 | | Massachusetts Financial Services Company, Senior Vice President |
Heidi W. Hardin (k)
(age 53) | | Secretary and Clerk | | April 2017 | | 134 | | Massachusetts Financial Services Company, Executive Vice President and General Counsel (since March 2017); Harris Associates (investment management), General Counsel (until January 2017) |
Brian E. Langenfeld (k)
(age 47) | | Assistant Secretary and Assistant Clerk | | June 2006 | | 134 | | Massachusetts Financial Services Company, Vice President and Senior Counsel |
Amanda S. Mooradian (k)
(age 41) | | Assistant Secretary and Assistant Clerk | | September 2018 | | 134 | | Massachusetts Financial Services Company, Assistant Vice President and Senior Counsel |
Susan A. Pereira (k)
(age 50) | | Assistant Secretary and Assistant Clerk | | July 2005 | | 134 | | Massachusetts Financial Services Company, Vice President and Assistant General Counsel |
Kasey L. Phillips (k)
(age 50) | | Assistant Treasurer | | September 2012 | | 134 | | Massachusetts Financial Services Company, Vice President |
Matthew A. Stowe (k)
(age 46) | | Assistant Secretary and Assistant Clerk | | October 2014 | | 134 | | Massachusetts Financial Services Company, Vice President and Assistant General Counsel |
Martin J. Wolin (k)
(age 53) | | Chief Compliance Officer | | July 2015 | | 134 | | Massachusetts Financial Services Company, Senior Vice President and Chief Compliance Officer |
MFS Total Return Bond Series
Trustees and Officers - continued
| Name, Age | | Position(s) Held with
Fund | | Trustee/Officer Since(h) | | Number of MFS Funds for which the Person is an Officer | | Principal Occupations During
the Past Five Years |
James O. Yost (k)
(age 60) | | Treasurer | | September 1990 | | 134 | | Massachusetts Financial Services Company, Senior Vice President |
| (h) | Date first appointed to serve as Trustee/officer of an MFS Fund. Each Trustee has served continuously since appointment unless indicated otherwise. For the period from December 15, 2004 until February 22, 2005, Mr. Manning served as Advisory Trustee. From January 2012 through December 2016, Messrs. DiLorenzo and Yost served as Treasurer and Deputy Treasurer of the Funds, respectively. |
| (j) | Directorships or trusteeships of companies required to report to the Securities and Exchange Commission (i.e., “public companies”). |
| (k) | “Interested person” of the Trust within the meaning of the Investment Company Act of 1940 (referred to as the 1940 Act), which is the principal federal law governing investment companies like the fund, as a result of a position with MFS. The address of MFS is 111 Huntington Avenue, Boston, Massachusetts 02199-7618. |
Each Trustee (other than Messrs. Jones, Kilman and Roberge) has been elected by shareholders and each Trustee and Officer holds office until his or her successor is chosen and qualified or until his or her earlier death, resignation, retirement or removal. Mr. Roberge became a Trustee of the Funds on January 1, 2021 and Messrs. Jones and Kilman became Trustees of the Funds on January 1, 2019. The Trust does not hold annual meetings for the purpose of electing Trustees, and Trustees are not elected for fixed terms. Under the terms of the Board's retirement policy, an Independent Trustee shall retire at the end of the calendar year in which he or she reaches the earlier of 75 years of age or 15 years of service on the Board (or, in the case of any Independent Trustee who joined the Board prior to 2015, 20 years of service on the Board).
Messrs. Buller, Kilman and Otis and Ms. Roepke are members of the Trust’s Audit Committee.
Each of the Interested Trustees and certain Officers hold comparable officer positions with certain affiliates of MFS.
The Statement of Additional Information for a Fund includes further information about the Trustees and is available without charge upon request by calling 1-800-225-2606.
| Investment Adviser | Custodian |
Massachusetts Financial Services Company
111 Huntington Avenue
Boston, MA 02199-7618 | State Street Bank and Trust Company
1 Lincoln Street
Boston, MA 02111-2900 |
| Distributor | Independent Registered Public Accounting Firm |
MFS Fund Distributors, Inc.
111 Huntington Avenue
Boston, MA 02199-7618 | Deloitte & Touche LLP
200 Berkeley Street
Boston, MA 02116 |
| Portfolio Manager(s) | |
Alexander Mackey
Joshua Marston
Robert Persons | |
MFS Total Return Bond Series
Board Review of Investment Advisory Agreement
MFS Total Return Bond Series
The Investment Company Act of 1940 requires that both the full Board of Trustees and a majority of the non-interested (“independent”) Trustees, voting separately, annually approve the continuation of the Fund’s investment advisory agreement with MFS. The Trustees consider matters bearing on the Fund and its advisory arrangements at their meetings throughout the year, including a review of performance data at each regular meeting. In addition, the independent Trustees met several times by videoconference (in accordance with Securities and Exchange Commission relief) over the course of three months beginning in May and ending in July, 2020 (“contract review meetings”) for the specific purpose of considering whether to approve the continuation of the investment advisory agreement for the Fund and the other investment companies that the Board oversees (the “MFS Funds”). The independent Trustees were assisted in their evaluation of the Fund’s investment advisory agreement by independent legal counsel, from whom they received separate legal advice and with whom they met separately from MFS during various contract review meetings. The independent Trustees were also assisted in this process by an independent consultant who was retained by and reported to the independent Trustees.
In connection with their deliberations regarding the continuation of the investment advisory agreement, the Trustees, including the independent Trustees, considered such information and factors as they believed, in light of the legal advice furnished to them and their own business judgment, to be relevant. The investment advisory agreement for the Fund was considered separately, although the Trustees also took into account the common interests of all MFS Funds in their review. As described below, the Trustees considered the nature, quality, and extent of the various investment advisory, administrative, and shareholder services performed by MFS under the existing investment advisory agreement and other arrangements with the Fund.
In connection with their contract review meetings, the Trustees received and relied upon materials that included, among other items: (i) information provided by Broadridge Financial Solutions, Inc. (“Broadridge”), an independent third party, on the investment performance of the Fund for various time periods ended December 31, 2019 and the investment performance of a group of funds with substantially similar investment classifications/objectives (the “Broadridge performance universe”), (ii) information provided by Broadridge on the Fund’s advisory fees and other expenses and the advisory fees and other expenses of comparable funds identified by Broadridge as well as all other funds in the same investment classification/category (the “Broadridge expense group and universe”), (iii) information provided by MFS on the advisory fees of portfolios of other clients of MFS, including institutional separate accounts and other clients, (iv) information as to whether and to what extent applicable expense waivers, reimbursements or fee “breakpoints” are observed for the Fund, (v) information regarding MFS’ financial results and financial condition, including MFS’ and certain of its affiliates’ estimated profitability from services performed for the Fund and the MFS Funds as a whole, and compared to MFS’ institutional business, (vi) MFS’ views regarding the outlook for the mutual fund industry and the strategic business plans of MFS, (vii) descriptions of various functions performed by MFS for the Funds, such as compliance monitoring and portfolio trading practices, and (viii) information regarding the overall organization of MFS, including information about MFS’ senior management and other personnel providing investment advisory, administrative and other services to the Fund and the other MFS Funds. The comparative performance, fee and expense information prepared and provided by Broadridge was not independently verified and the independent Trustees did not independently verify any information provided to them by MFS.
The Trustees’ conclusion as to the continuation of the investment advisory agreement was based on a comprehensive consideration of all information provided to the Trustees and not the result of any single factor. Some of the factors that figured particularly in the Trustees’ deliberations are described below, although individual Trustees may have evaluated the information presented differently from one another, giving different weights to various factors. It is also important to recognize that the fee arrangements for the Fund and other MFS Funds are the result of years of review and discussion between the independent Trustees and MFS, that certain aspects of such arrangements may receive greater scrutiny in some years than in others, and that the Trustees’ conclusions may be based, in part, on their consideration of these same arrangements during the course of the year and in prior years.
Based on information provided by Broadridge and MFS, the Trustees reviewed the Fund’s total return investment performance as well as the Broadridge performance universe over various time periods. The Trustees placed particular emphasis on the total return performance of the Fund’s Initial Class shares in comparison to the performance of funds in its Broadridge performance universe over the five-year period ended December 31, 2019, which the Trustees believed was a long enough period to reflect differing market conditions. The total return performance of the Fund’s Initial Class shares was in the 1st quintile relative to the other funds in the universe for this five-year period (the 1st quintile being the best performers and the 5th quintile being the worst performers). The total return performance of the Fund’s Initial Class shares was in the 1st quintile for each of the one- and three-year periods ended December 31, 2019 relative to the Broadridge performance universe. Because of the passage of time, these performance results may differ from the performance results for more recent periods, including those shown elsewhere in this report.
MFS Total Return Bond Series
Board Review of Investment Advisory Agreement - continued
In the course of their deliberations, the Trustees took into account information provided by MFS in connection with the contract review meetings, as well as during investment review meetings conducted with portfolio management personnel during the course of the year regarding the Fund’s performance. After reviewing these and related factors, the Trustees concluded, within the context of their overall conclusions regarding the investment advisory agreement, that they were satisfied with MFS’ responses and efforts relating to investment performance.
In assessing the reasonableness of the Fund’s advisory fee, the Trustees considered, among other information, the Fund’s advisory fee and the total expense ratio of the Fund’s Initial Class shares as a percentage of average daily net assets and the advisory fee and total expense ratios of the Broadridge expense group based on information provided by Broadridge. The Trustees considered that, according to the data provided by Broadridge (which takes into account any fee reductions or expense limitations that were in effect during the Fund’s last fiscal year), the Fund’s effective advisory fee rate and total expense ratio were each approximately at the Broadridge expense group median.
The Trustees also considered the advisory fees charged by MFS to any institutional separate accounts advised by MFS (“separate accounts”) and unaffiliated investment companies for which MFS serves as subadviser (“subadvised funds”) that have comparable investment strategies to the Fund, if any. In comparing these fees, the Trustees considered information provided by MFS as to the generally broader scope of services provided by MFS to the Fund, as well as the more extensive regulatory burdens imposed on MFS in managing the Fund, in comparison to separate accounts and subadvised funds. The Trustees also considered the higher demands placed on MFS’ investment personnel and trading infrastructure as a result of the daily cash in-flows and out-flows of the Fund in comparison to separate accounts.
The Trustees also considered whether the Fund may benefit from any economies of scale in the management of the Fund in the event of growth in assets of the Fund and/or growth in assets of the MFS Funds as a whole. They noted that the Fund’s advisory fee rate schedule is subject to contractual breakpoints that reduce the Fund’s advisory fee rate on average daily net assets over $2.5 billion and $5 billion. The Trustees also noted that MFS has agreed in writing to waive a portion of the management fees of certain MFS Funds, including the Fund, if the total combined assets of certain funds within the MFS Funds’ complex increase above agreed upon thresholds (the “group fee waiver”), enabling the Fund’s shareholders to share in the benefits from any economies of scale at the complex level. The group fee waiver is reviewed and renewed annually between the Board and MFS. The Trustees concluded that the breakpoints and the group fee waiver were sufficient to allow the Fund to benefit from economies of scale as its assets and overall complex assets grow.
The Trustees also considered information prepared by MFS relating to MFS’ costs and profits with respect to the Fund, the MFS Funds considered as a group, and other investment companies and accounts advised by MFS, as well as MFS’ methodologies used to determine and allocate its costs to the MFS Funds, the Fund and other accounts and products for purposes of estimating profitability.
After reviewing these and other factors described herein, the Trustees concluded, within the context of their overall conclusions regarding the investment advisory agreement, that the advisory fees charged to the Fund represent reasonable compensation in light of the services being provided by MFS to the Fund.
In addition, the Trustees considered MFS’ resources and related efforts to continue to retain, attract and motivate capable personnel to serve the Fund. The Trustees also considered current and developing conditions in the financial services industry, including the presence of large and well-capitalized companies which are spending, and appear to be prepared to continue to spend, substantial sums to engage personnel and to provide services to competing investment companies. In this regard, the Trustees also considered the financial resources of MFS and its ultimate parent, Sun Life Financial Inc. The Trustees also considered the advantages and possible disadvantages to the Fund of having an adviser that also serves other investment companies as well as other accounts.
The Trustees also considered the nature, quality, cost, and extent of administrative, transfer agency, and distribution services provided to the Fund by MFS and its affiliates under agreements and plans other than the investment advisory agreement, including any 12b-1 fees the Fund pays to MFS Fund Distributors, Inc., an affiliate of MFS. The Trustees also considered the nature, extent and quality of certain other services MFS performs or arranges for on the Fund’s behalf, which may include securities lending programs, directed expense payment programs, class action recovery programs, and MFS’ interaction with third-party service providers, principally custodians and sub-custodians. The Trustees concluded that the various non-advisory services provided by MFS and its affiliates on behalf of the Fund were satisfactory.
The Trustees considered so-called “fall-out benefits” to MFS such as reputational value derived from serving as investment manager to the MFS Funds. The Trustees also considered that MFS discontinued its historic practice of obtaining investment research from portfolio brokerage commissions paid by certain MFS Funds effective January 2018, and directly pays or voluntarily reimburses a Fund, if applicable, for the costs of external research acquired through the use of the Fund’s portfolio brokerage commissions.
Based on their evaluation of factors that they deemed to be material, including those factors described above, the Board of Trustees, including the independent Trustees, concluded that the Fund’s investment advisory agreement with MFS should be continued for an additional one-year period, commencing August 1, 2020.
MFS Total Return Bond Series
Proxy Voting Policies and Information
MFS votes proxies on behalf of the fund pursuant to proxy voting policies and procedures that are available without charge, upon request, by calling 1-800-225-2606, by visiting mfs.com/proxyvoting, or by visiting the SEC’s Web site at http://www.sec.gov.
Information regarding how the fund voted proxies relating to portfolio securities during the most recent twelve-month period ended June 30 is available by August 31 of each year without charge by visiting mfs.com/proxyvoting, or by visiting the SEC’s Web site at http://www.sec.gov.
Quarterly Portfolio Disclosure
The fund files a complete schedule of portfolio holdings with the SEC for the first and third quarters of each fiscal year as an exhibit to its reports on Form N-PORT. The fund’s Form N-PORT reports are available on the SEC’s Web site at http://www.sec.gov. A shareholder can obtain the portfolio holdings report for the first and third quarters of the fund's fiscal year at mfs.com/vit1 by choosing the fund's name and then scrolling to the “Resources” section and clicking on the “Prospectus and Reports” tab.
FURTHER INFORMATION
From time to time, MFS may post important information about the fund or the MFS funds on the MFS Web site (mfs.com). This information is available at https://www.mfs.com/announcements or at mfs.com/vit1 by choosing the fund's name and then scrolling to the “Resources” section and clicking on the “Announcements” tab, if any.
Information About Fund Contracts and Legal Claims
The fund has entered into contractual arrangements with an investment adviser, administrator, distributor, shareholder servicing agent, 529 program manager (if applicable), and custodian who each provide services to the fund. Unless expressly stated otherwise, shareholders are not parties to, or intended beneficiaries of these contractual arrangements, and these contractual arrangements are not intended to create any shareholder right to enforce them against the service providers or to seek any remedy under them against the service providers, either directly or on behalf of the fund.
Under the Trust’s By-Laws and Declaration of Trust, any claims asserted against or on behalf of the MFS Funds, including claims against Trustees and Officers, must be brought in state and federal courts located within the Commonwealth of Massachusetts.
Federal Tax Information (unaudited)
The following information is provided pursuant to provisions of the Internal Revenue Code.
The fund intends to pass through the maximum amount allowable as Section 163(j) Interest Dividends as defined in Treasury Regulation §1.163(j)-1(b).
| FACTS | WHAT DOES MFS DO WITH YOUR PERSONAL INFORMATION? |
| Why? | Financial companies choose how they share your personal information. Federal law gives consumers the right to limit some but not all sharing. Federal law also requires us to tell you how we collect, share, and protect your personal information. Please read this notice carefully to understand what we do. |
| What? | The types of personal information we collect and share depend on the product or service you have with us. This information can include: |
| • Social Security number and account balances |
| • Account transactions and transaction history |
| • Checking account information and wire transfer instructions |
| When you are no longer our customer, we continue to share your information as described in this notice. |
| How? | All financial companies need to share customers' personal information to run their everyday business. In the section below, we list the reasons financial companies can share their customers' personal information; the reasons MFS chooses to share; and whether you can limit this sharing. |
Reasons we can share your
personal information | Does MFS share? | Can you limit
this sharing? |
For our everyday business purposes –
such as to process your transactions, maintain your
account(s), respond to court orders and legal
investigations, or report to credit bureaus | Yes | No |
For our marketing purposes –
to offer our products and services to you | No | We don't share |
For joint marketing with other
financial companies | No | We don't share |
For our affiliates' everyday business purposes –
information about your transactions and experiences | No | We don't share |
For our affiliates' everyday business purposes –
information about your creditworthiness | No | We don't share |
| For nonaffiliates to market to you | No | We don't share |
| Questions? | Call 800-225-2606 or go to mfs.com. |
| Who we are |
| Who is providing this notice? | MFS Funds, MFS Investment Management, MFS Institutional Advisors, Inc., and MFS Heritage Trust Company. |
| What we do |
How does MFS
protect my personal
information? | To protect your personal information from unauthorized access and use, we use security measures that comply with federal law. These measures include procedural, electronic, and physical safeguards for the protection of the personal information we collect about you. |
How does MFS
collect my personal
information? | We collect your personal information, for example, when you |
| • open an account or provide account information |
| • direct us to buy securities or direct us to sell your securities |
| • make a wire transfer |
| We also collect your personal information from others, such as credit bureaus, affiliates, or other companies. |
| Why can't I limit all sharing? | Federal law gives you the right to limit only |
| • sharing for affiliates' everyday business purposes – information about your creditworthiness |
| • affiliates from using your information to market to you |
| • sharing for nonaffiliates to market to you |
| State laws and individual companies may give you additional rights to limit sharing. |
| Definitions |
| Affiliates | Companies related by common ownership or control. They can be financial and nonfinancial companies. |
| • MFS does not share personal information with affiliates, except for everyday business purposes as described on page one of this notice. |
| Nonaffiliates | Companies not related by common ownership or control. They can be financial and nonfinancial companies. |
| • MFS does not share with nonaffiliates so they can market to you. |
| Joint marketing | A formal agreement between nonaffiliated financial companies that together market financial products or services to you. |
| • MFS doesn't jointly market. |
| Other important information |
| If you own an MFS product or receive an MFS service in the name of a third party such as a bank or broker-dealer, their privacy policy may apply to you instead of ours. |
Annual Report
December 31, 2020

MFS® Research Series

MFS® Variable Insurance Trust
VFR-ANN
MFS® Research Series
CONTENTS
The report is prepared for the general information of contract owners. It is authorized for distribution to prospective investors only when preceded or accompanied by a current prospectus.
NOT FDIC INSURED • MAY LOSE VALUE • NO BANK OR CREDIT UNION GUARANTEE • NOT A DEPOSIT • NOT INSURED BY ANY FEDERAL GOVERNMENT AGENCY OR NCUA/NCUSIF
MFS Research Series
LETTER FROM THE CEO

Dear Contract Owners:
Markets experienced dramatic swings this year as the coronavirus pandemic brought the global economy to a standstill for several months early in the year. The speedy development of vaccines and therapeutics later brightened the economic and market outlook, but a great deal of uncertainty remains as case counts remain high, new variants of the virus are appearing and questions persist over how fast the vaccine can be made widely available. In the United States, political uncertainty eased after former Vice President Joe Biden won the presidential election and the Democrats gained control of a closely divided Senate.
Global central banks have taken aggressive steps to cushion the economic and market fallout related to the virus, and governments are deploying unprecedented levels of fiscal support. Additional U.S. stimulus is anticipated with the Democrats in the White House and in control of both houses of Congress. The measures already put in place have helped build a supportive environment and are encouraging economic recovery; however, if markets disconnect from fundamentals, they can sow the seeds of instability. As such, dramatic increases in speculative retail trading bear watching.
In the aftermath of the crisis, we could see societal changes as households, businesses, and governments adjust to a new reality, and any such alterations could affect the investment landscape. For investors, events such as the COVID-19 outbreak demonstrate the importance of having a deep understanding of company fundamentals, and we have built our global research platform to do just that.
At MFS®, we put our clients’ assets to work responsibly by carefully navigating the increasing complexity of our global markets and economies. Guided by our long-term philosophy and adhering to our commitment to sustainable investing, we tune out the noise and aim to uncover what we believe are the best, most durable investment opportunities in the market. Our unique global investment platform combines collective expertise, long-term discipline and thoughtful risk management to create sustainable value for investors.
Respectfully,

Michael W. Roberge
Chief Executive Officer
MFS Investment Management
February 16, 2021
The opinions expressed in this letter are subject to change and may not be relied upon for investment advice. No forecasts can be guaranteed.
1
MFS Research Series
PORTFOLIO COMPOSITION
Portfolio structure

| | | | |
| Top ten holdings | | | | |
| Microsoft Corp. | | | 6.4% | |
| Amazon.com, Inc. | | | 5.3% | |
| Alphabet, Inc., “A” | | | 3.8% | |
| Apple, Inc. | | | 3.2% | |
| Facebook, Inc., “A“ | | | 2.7% | |
| Visa, Inc., “A” | | | 2.3% | |
| Adobe Systems, Inc. | | | 1.9% | |
| Salesforce.com, Inc. | | | 1.7% | |
| Danaher Corp. | | | 1.4% | |
| Bank of America Corp. | | | 1.4% | |
| | | | |
| Global equity sectors (k) | | | | |
| Technology | | | 31.0% | |
| Consumer Cyclicals | | | 14.5% | |
| Health Care (s) | | | 13.5% | |
| Financial Services | | | 13.4% | |
| Capital Goods | | | 13.2% | |
| Energy | | | 5.1% | |
| Consumer Staples | | | 5.0% | |
| Telecommunications/Cable Television (s) | | | 3.5% | |
| (k) | The sectors set forth above and the associated portfolio composition are based on MFS’ own custom sector classification methodology. |
| (s) | Includes securities sold short. |
Cash & Cash Equivalents includes any cash, investments in money market funds, short-term securities, and other assets less liabilities. Please see the Statement of Assets and Liabilities for additional information related to the fund’s cash position and other assets and liabilities.
Percentages are based on net assets as of December 31, 2020.
The portfolio is actively managed and current holdings may be different.
2
MFS Research Series
MANAGEMENT REVIEW
Summary of Results
For the twelve months ended December 31, 2020, Initial Class shares of the MFS Research Series (fund) provided a total return of 16.59%, while Service Class shares of the fund provided a total return of 16.31%. These compare with a return of 18.40% over the same period for the fund’s benchmark, the Standard & Poor’s 500 Stock Index (S&P 500 Index).
Market Environment
Markets experienced an extraordinarily sharp selloff early in the period and, in many cases, an unusually rapid recovery later. Central banks and fiscal authorities undertook astonishing levels of stimulus to offset the economic effects of government-imposed social-distancing measures implemented to slow the spread of the COVID-19 virus. At this point, the global economy looks to have experienced the shortest – albeit the deepest and steepest – recession in the postwar period. However, the recovery remains subject to more than the usual number of uncertainties due to questions about the evolution of the virus, what its continued impact will be and how quickly vaccines to guard against it can be manufactured and distributed at scale. There are also worries over the public’s willingness to be inoculated.
Around the world, central banks responded quickly and massively to the crisis with programs to improve liquidity and support markets. These programs proved largely successful in helping to restore market function, ease volatility and stimulate a continued market rebound. Late in the period, the US Federal Reserve adopted a new, flexible, average-inflation-targeting framework, which is expected to result in the federal funds rate remaining at low levels longer than under its previous model. In developed countries, monetary easing measures were complemented by unusually large fiscal stimulus initiatives. Due to relatively manageable external liabilities and balances of payments in many countries and persistently low inflation, even emerging market countries were able to implement countercyclical policies – a departure from the usual market-dictated response to risk-off crises.
Compounding market uncertainty earlier in the pandemic was a crash in the price of crude oil due to a sharp drop in global demand and a disagreement between Saudi Arabia and Russia over production cuts, which resulted in an oil price war. The subsequent decline in prices undercut oil exporters, many of which are in emerging markets, as well as a large segment of the high-yield credit market. The OPEC+ group later agreed on output cuts, with shale oil producers in the US also decreasing production, which, along with the gradual reopening of some major economies and the resultant boost in demand, helped stabilize the price of crude oil.
In the immediate aftermath of the market disruption that accompanied the initial phases of the pandemic, many companies that had added significant leverage to their balance sheets in recent years by borrowing to fund dividend payments and stock buybacks halted those activities, and some companies were forced to recapitalize. As markets and the economy stabilized later in the period, in many cases dividend payments and buybacks resumed. Conversely, some companies found themselves flush with liquidity, having borrowed preemptively during the worst of the crisis only to end up with excess cash on their balance sheets.
Detractors from Performance
Stock selection in both the technology and health care sectors detracted from the fund’s performance relative to the S&P 500 Index. Within the technology sector, underweighting shares of computer and personal electronics maker Apple, the timing of the fund’s position in semiconductor company Intel (h), and not holding shares of both computer graphics processor maker NVIDIA and digital payment technology developer PayPal, weakened relative results. Despite headwinds related to COVID-19, the share price of Apple appreciated as product demand recovered more rapidly than expected and the shift toward work-from-home and remote learning supported strong iPhone and iPad sales. Additionally, shares of Apple reacted positively to the announcement of a new line of its flagship iPhone product with 5G compatibility. Although security selection within the health care sector held back relative returns, there were no individual stocks within this sector, either in the fund or in the benchmark, that were among the fund’s top relative detractors over the reporting period.
In other sectors, holding shares of integrated oil company BP (b)(h) (United Kingdom), and the timing of the fund’s ownership in shares of diversified financial services firm Citigroup (h), wireless communications infrastructure firm SBA Communications, financial services company U.S. Bancorp (h) and electric utility company FirstEnergy (h) hurt relative performance. Shares of SBA Communications were held in the portfolio the entire period, but exited the benchmark as a constituent at the end of June. Over the entire reporting period, the stock price of SBA Communications rose, but lagged the overall performance of the benchmark, as weaker-than-expected international leasing activity, stemming from changed customer spending patterns in light of the pandemic, appeared to have dampened investor sentiment. Lastly, the fund’s overweight position in banking services provider Truist Financial also hindered relative results.
Contributors to Performance
Security selection in the consumer cyclicals, financial services and capital goods sectors was a primary factor that lifted relative performance over the reporting period. Within the consumer cyclicals sector, the fund’s overweight position in Amazon.com benefited relative returns. The share price of Amazon.com rose over the reporting period, benefiting from increased demand for
3
MFS Research Series
Management Review – continued
cloud-computing services and at-home retail demand. Within the financial services sector, not holding shares of financial services firms Wells Fargo and JPMorgan Chase, and the timing of the fund’s position in shares of banking services provider Bank of America, contributed to relative results. Within the capital goods sector, not holding shares of aerospace company Boeing supported relative performance. The share price of Boeing declined as the travel and airline industries came under intense pressure amid the outbreak of the COVID-19 virus, which resulted in widespread travel restrictions across the globe and ultimately led the company to suspend production.
Elsewhere, not holding shares of weak-performing integrated oil and gas company Exxon Mobil, telecommunication services provider AT&T and energy company Chevron aided relative returns. The share price of Exxon Mobil suffered as oil and gas prices came under significant pressure during the period due to lower volumes and production caused by the COVID-19 virus and the price war between Saudi Arabia and Russia. Lastly, overweighting shares of both integrated circuits and electronic devices developer Cadence Design Systems and software company Adobe Systems helped relative results.
Respectfully,
Portfolio Manager(s)
Joseph MacDougall
| (b) | Security is not a benchmark constituent. |
| (h) | Security was not held in the portfolio at period end. |
The views expressed in this report are those of the portfolio manager(s) only through the end of the period of the report as stated on the cover and do not necessarily reflect the views of MFS or any other person in the MFS organization. These views are subject to change at any time based on market or other conditions, and MFS disclaims any responsibility to update such views. These views may not be relied upon as investment advice or an indication of trading intent on behalf of any MFS portfolio. References to specific securities are not recommendations of such securities, and may not be representative of any MFS portfolio’s current or future investments.
4
MFS Research Series
PERFORMANCE SUMMARY THROUGH 12/31/20
The following chart illustrates the historical performance of the fund in comparison to its benchmark(s). Benchmarks are unmanaged and may not be invested in directly. Benchmark returns do not reflect any fees or expenses. The performance of other share classes will be greater than or less than that of the class depicted below. (See Notes to Performance Summary.)
Performance data shown represents past performance and is no guarantee of future results. Investment return and principal value fluctuate so your units, when sold, may be worth more or less than the original cost; current performance may be lower or higher than quoted. The performance shown does not reflect the deduction of taxes, if any, that a contract holder would pay on fund distributions or the redemption of contract units. The returns for the fund shown also do not reflect the deduction of expenses associated with variable products, such as mortality and expense risk charges, separate account charges, and sales charges imposed by the insurance company separate accounts. Such expenses would reduce the overall returns shown.
Growth of a Hypothetical $10,000 Investment
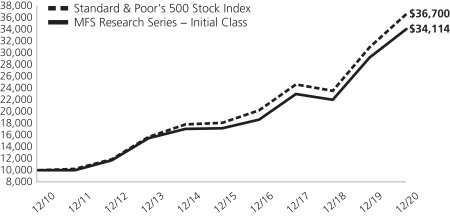
Total Returns through 12/31/20
Average annual total returns
| | | | | | | | | | | | |
| | | Share Class | | Class Inception Date | | 1-yr | | 5-yr | | 10-yr | | |
| | | Initial Class | | 7/26/95 | | 16.59% | | 14.74% | | 13.06% | | |
| | | Service Class | | 5/01/00 | | 16.31% | | 14.45% | | 12.77% | | |
| | | | |
| Comparative benchmark(s) | | | | | | | | |
| | | Standard & Poor’s 500 Stock Index (f) | | 18.40% | | 15.22% | | 13.88% | | |
| (f) | Source: FactSet Research Systems Inc. |
Benchmark Definition(s)
Standard & Poor’s 500 Stock Index (g) – a market capitalization-weighted index of 500 widely held equity securities, designed to measure broad U.S. equity performance.
It is not possible to invest directly in an index.
| (g) | “Standard & Poor’s®” and “S&P®” are registered trademarks of Standard & Poor’s Financial Services LLC (“S&P”) and Dow Jones is a registered trademark of Dow Jones Trademark Holdings LLC (“Dow Jones”) and have been licensed for use by S&P Dow Jones Indices LLC and sublicensed for certain purposes by MFS. The S&P 500® is a product of S&P Dow Jones Indices LLC, and has been licensed for use by MFS. MFS’s product(s) is not sponsored, endorsed, sold, or promoted by S&P Dow Jones Indices LLC, Dow Jones, S&P, or their respective affiliates, and neither S&P Dow Jones Indices LLC, Dow Jones, S&P, nor their respective affiliates make any representation regarding the advisability of investing in such product(s). |
Notes to Performance Summary
Average annual total return represents the average annual change in value for each share class for the periods presented.
Performance results reflect any applicable expense subsidies and waivers in effect during the periods shown. Without such subsidies and waivers the fund’s performance results would be less favorable. Please see the prospectus and financial statements for complete details. All results are historical and assume the reinvestment of any dividends and capital gains distributions.
Performance results do not include adjustments made for financial reporting purposes in accordance with U.S. generally accepted accounting principles and may differ from amounts reported in the financial highlights.
From time to time the fund may receive proceeds from litigation settlements, without which performance would be lower.
5
MFS Research Series
EXPENSE TABLE
Fund Expenses Borne by the Contract Holders during the Period,
July 1, 2020 through December 31, 2020
As a contract holder of the fund, you incur ongoing costs, including management fees; distribution and/or service (12b-1) fees; and other fund expenses. This example is intended to help you understand your ongoing costs (in dollars) of investing in the fund and to compare these costs with the ongoing costs of investing in other mutual funds.
The example is based on an investment of $1,000 invested at the beginning of the period and held for the entire period July 1, 2020 through December 31, 2020.
Actual Expenses
The first line for each share class in the following table provides information about actual account values and actual expenses. You may use the information in this line, together with the amount you invested, to estimate the expenses that you paid over the period. Simply divide your account value by $1,000 (for example, an $8,600 account value divided by $1,000 = 8.6), then multiply the result by the number in the first line under the heading entitled “Expenses Paid During Period” to estimate the expenses you paid on your account during this period.
Hypothetical Example for Comparison Purposes
The second line for each share class in the following table provides information about hypothetical account values and hypothetical expenses based on the fund’s actual expense ratio and an assumed rate of return of 5% per year before expenses, which is not the fund’s actual return. The hypothetical account values and expenses may not be used to estimate the actual ending account balance or expenses you paid for the period. You may use this information to compare the ongoing costs of investing in the fund and other funds. To do so, compare this 5% hypothetical example with the 5% hypothetical examples that appear in the shareholder reports of the other funds.
Please note that the expenses shown in the table are meant to highlight the fund’s ongoing costs only and do not take into account the fees and expenses imposed under the variable contracts through which your investment in the fund is made. Therefore, the second line for each share class in the table is useful in comparing ongoing costs associated with an investment in vehicles (such as the fund) which fund benefits under variable annuity and variable life insurance contracts and to qualified pension and retirement plans only, and will not help you determine the relative total costs of investing in the fund through variable annuity and variable life insurance contracts. If the fees and expenses imposed under the variable contracts were included, your costs would have been higher.
| | | | | | | | | | | | | | | | | | |
| Share Class | | | | Annualized
Expense Ratio | | | Beginning
Account Value
7/01/20 | | | Ending Account Value
12/31/20 | | | Expenses Paid
During Period (p)
7/01/20-12/31/20 | |
| Initial Class | | Actual | | | 0.79% | | | | $1,000.00 | | | | $1,197.19 | | | | $4.36 | |
| | Hypothetical (h) | | | 0.79% | | | | $1,000.00 | | | | $1,021.17 | | | | $4.01 | |
| Service Class | | Actual | | | 1.04% | | | | $1,000.00 | | | | $1,195.65 | | | | $5.74 | |
| | Hypothetical (h) | | | 1.04% | | | | $1,000.00 | | | | $1,019.91 | | | | $5.28 | |
| (h) | 5% class return per year before expenses. |
| (p) | “Expenses Paid During Period” are equal to each class’s annualized expense ratio, as shown above, multiplied by the average account value over the period, multiplied by 184/366 (to reflect the one-half year period). |
Notes to Expense Table
Expense ratios include 0.02% of investment related expenses from short sales (See Note 2 of the Notes to Financial Statements) that are outside of the expense limitation arrangement (See Note 3 of the Notes to Financial Statements).
6
MFS Research Series
PORTFOLIO OF INVESTMENTS – 12/31/20
The Portfolio of Investments is a complete list of all securities owned by your fund. It is categorized by broad-based asset classes.
| | | | | | | | |
| Issuer | | Shares/Par | | | Value ($) | |
| COMMON STOCKS – 99.6% | | | | | |
| Aerospace – 3.3% | | | | | |
| Honeywell International, Inc. | | | 49,610 | | | $ | 10,552,047 | |
| L3Harris Technologies, Inc. | | | 25,862 | | | | 4,888,435 | |
| Northrop Grumman Corp. | | | 11,011 | | | | 3,355,272 | |
| Raytheon Technologies Corp. | | | 86,257 | | | | 6,168,238 | |
| | | | | | | | |
| | | | | | $ | 24,963,992 | |
| | | | | | | | |
| Alcoholic Beverages – 0.5% | | | | | |
| Constellation Brands, Inc., “A” | | | 16,861 | | | $ | 3,693,402 | |
| | | | | | | | |
| Apparel Manufacturers – 1.4% | | | | | |
| NIKE, Inc., “B” | | | 72,460 | | | $ | 10,250,916 | |
| | | | | | | | |
| Biotechnology – 1.1% | | | | | |
| Adaptive Biotechnologies Corp. (a) | | | 16,280 | | | $ | 962,636 | |
| Illumina, Inc. (a) | | | 10,496 | | | | 3,883,520 | |
| Vertex Pharmaceuticals, Inc. (a) | | | 15,856 | | | | 3,747,407 | |
| | | | | | | | |
| | | | | | $ | 8,593,563 | |
| | | | | | | | |
| Brokerage & Asset Managers – 1.7% | | | | | |
| Cboe Global Markets, Inc. | | | 36,379 | | | $ | 3,387,612 | |
| Charles Schwab Corp. | | | 178,500 | | | | 9,467,640 | |
| | | | | | | | |
| | | | | | $ | 12,855,252 | |
| | | | | | | | |
| Business Services – 4.8% | | | | | |
| Accenture PLC, “A” | | | 25,390 | | | $ | 6,632,122 | |
| Fidelity National Information Services, Inc. | | | 65,635 | | | | 9,284,727 | |
| Fiserv, Inc. (a) | | | 73,856 | | | | 8,409,244 | |
| Global Payments, Inc. | | | 34,023 | | | | 7,329,234 | |
| Verisk Analytics, Inc., “A” | | | 22,113 | | | | 4,590,438 | |
| | | | | | | | |
| | | | | | $ | 36,245,765 | |
| | | | | | | | |
| Cable TV – 1.7% | | | | | |
| Cable One, Inc. | | | 1,446 | | | $ | 3,221,283 | |
| Charter Communications, Inc., “A” (a) | | | 14,710 | | | | 9,731,401 | |
| | | | | | | | |
| | | | | | $ | 12,952,684 | |
| | | | | | | | |
| Chemicals – 0.6% | | | | | |
| FMC Corp. | | | 38,472 | | | $ | 4,421,587 | |
| | | | | | | | |
| Computer Software – 11.6% | | | | | |
| Adobe Systems, Inc. (a) | | | 28,942 | | | $ | 14,474,473 | |
| Atlassian Corp. PLC, “A” (a) | | | 17,320 | | | | 4,050,628 | |
| Cadence Design Systems, Inc. (a) | | | 56,093 | | | | 7,652,768 | |
| Microsoft Corp. (s) | | | 216,808 | | | | 48,222,435 | |
| salesforce.com, inc. (a) | | | 55,709 | | | | 12,396,924 | |
| Topicus.com, Inc. (a) | | | 7,331 | | | | 27,716 | |
| | | | | | | | |
| | | | | | $ | 86,824,944 | |
| | | | | | | | |
| Computer Software – Systems – 4.5% | | | | | |
| Apple, Inc. | | | 182,331 | | | $ | 24,193,501 | |
| Constellation Software, Inc. | | | 3,904 | | | | 5,069,526 | |
| EPAM Systems, Inc. (a) | | | 12,361 | | | | 4,429,564 | |
| | | | | | | | |
| | | | | | $ | 33,692,591 | |
| | | | | | | | |
| | | | | | | | |
| Issuer | | Shares/Par | | | Value ($) | |
| COMMON STOCKS – continued | | | | | |
| Construction – 2.7% | | | | | |
| AZEK Co. LLC (a) | | | 63,579 | | | $ | 2,444,613 | |
| Masco Corp. | | | 86,342 | | | | 4,742,766 | |
| Otis Worldwide Corp. | | | 59,426 | | | | 4,014,226 | |
| Sherwin-Williams Co. | | | 7,005 | | | | 5,148,045 | |
| Vulcan Materials Co. | | | 25,355 | | | | 3,760,400 | |
| | | | | | | | |
| | | | | | $ | 20,110,050 | |
| | | | | | | | |
| Consumer Products – 1.5% | | | | | |
| Colgate-Palmolive Co. | | | 72,500 | | | $ | 6,199,475 | |
| Kimberly-Clark Corp. | | | 34,983 | | | | 4,716,758 | |
| | | | | | | | |
| | | | | | $ | 10,916,233 | |
| | | | | | | | |
| Electrical Equipment – 1.0% | | | | | |
| Sensata Technologies Holding PLC (a) | | | 73,763 | | | $ | 3,890,260 | |
| TE Connectivity Ltd. | | | 28,068 | | | | 3,398,193 | |
| | | | | | | | |
| | | | | | $ | 7,288,453 | |
| | | | | | | | |
| Electronics – 3.0% | | | | | |
| Applied Materials, Inc. | | | 89,882 | | | $ | 7,756,817 | |
| Lam Research Corp. | | | 13,099 | | | | 6,186,265 | |
| NXP Semiconductors N.V. | | | 51,630 | | | | 8,209,686 | |
| | | | | | | | |
| | | | | | $ | 22,152,768 | |
| | | | | | | | |
| Energy – Independent – 1.6% | | | | | |
| ConocoPhillips | | | 116,047 | | | $ | 4,640,720 | |
| Diamondback Energy, Inc. | | | 36,161 | | | | 1,750,192 | |
| Pioneer Natural Resources Co. | | | 30,956 | | | | 3,525,579 | |
| Valero Energy Corp. | | | 36,332 | | | | 2,055,301 | |
| | | | | | | | |
| | | | | | $ | 11,971,792 | |
| | | | | | | | |
| Food & Beverages – 2.3% | | | | | |
| Hostess Brands, Inc. (a) | | | 155,344 | | | $ | 2,274,236 | |
| Mondelez International, Inc. | | | 111,979 | | | | 6,547,412 | |
| PepsiCo, Inc. | | | 56,012 | | | | 8,306,580 | |
| | | | | | | | |
| | | | | | $ | 17,128,228 | |
| | | | | | | | |
| Food & Drug Stores – 1.3% | | | | | |
| Wal-Mart Stores, Inc. | | | 65,727 | | | $ | 9,474,547 | |
| | | | | | | | |
| Gaming & Lodging – 0.3% | | | | | |
| Wyndham Hotels & Resorts, Inc. | | | 42,077 | | | $ | 2,501,057 | |
| | | | | | | | |
| General Merchandise – 1.0% | | | | | |
| Dollar General Corp. | | | 35,693 | | | $ | 7,506,238 | |
| | | | | | | | |
| Health Maintenance Organizations – 1.7% | | | | | |
| Cigna Corp. | | | 34,319 | | | $ | 7,144,530 | |
| Humana, Inc. | | | 13,412 | | | | 5,502,541 | |
| | | | | | | | |
| | | | | | $ | 12,647,071 | |
| | | | | | | | |
| Insurance – 2.9% | | | | | |
| Aon PLC | | | 49,267 | | | $ | 10,408,639 | |
| Chubb Ltd. | | | 44,139 | | | | 6,793,875 | |
| Reinsurance Group of America, Inc. | | | 33,080 | | | | 3,833,972 | |
| Willis Towers Watson PLC | | | 3,374 | | | | 710,834 | |
| | | | | | | | |
| | | | | | $ | 21,747,320 | |
| | | | | | | | |
7
MFS Research Series
Portfolio of Investments – continued
| | | | | | | | |
| Issuer | | Shares/Par | | | Value ($) | |
| COMMON STOCKS – continued | | | | | |
| Internet – 6.5% | | | | | |
| Alphabet, Inc., “A” (a)(s) | | | 16,066 | | | $ | 28,157,914 | |
| Facebook, Inc., “A” (a) | | | 74,583 | | | | 20,373,093 | |
| | | | | | | | |
| | | | | | $ | 48,531,007 | |
| | | | | | | | |
| Leisure & Toys – 1.2% | | | | | |
| Electronic Arts, Inc. | | | 61,189 | | | $ | 8,786,740 | |
| | | | | | | | |
| Machinery & Tools – 2.0% | | | | | |
| Ingersoll Rand, Inc. (a) | | | 115,860 | | | $ | 5,278,582 | |
| Roper Technologies, Inc. | | | 14,383 | | | | 6,200,368 | |
| Trane Technologies PLC | | | 22,234 | | | | 3,227,487 | |
| | | | | | | | |
| | | | | | $ | 14,706,437 | |
| | | | | | | | |
| Major Banks – 3.7% | | | | | |
| Bank of America Corp. | | | 349,061 | | | $ | 10,580,039 | |
| Goldman Sachs Group, Inc. | | | 34,795 | | | | 9,175,789 | |
| PNC Financial Services Group, Inc. | | | 50,760 | | | | 7,563,240 | |
| | | | | | | | |
| | | | | | $ | 27,319,068 | |
| | | | | | | | |
| Medical & Health Technology & Services – 1.8% | | | | | |
| ICON PLC (a) | | | 21,912 | | | $ | 4,272,402 | |
| Laboratory Corp. of America Holdings (a) | | | 23,445 | | | | 4,772,229 | |
| McKesson Corp. | | | 25,053 | | | | 4,357,218 | |
| | | | | | | | |
| | | | | | $ | 13,401,849 | |
| | | | | | | | |
| Medical Equipment – 4.7% | | | | | |
| Becton, Dickinson and Co. | | | 26,384 | | | $ | 6,601,805 | |
| Boston Scientific Corp. (a) | | | 141,893 | | | | 5,101,053 | |
| Danaher Corp. | | | 47,966 | | | | 10,655,167 | |
| Medtronic PLC | | | 77,148 | | | | 9,037,117 | |
| STERIS PLC | | | 21,050 | | | | 3,989,817 | |
| | | | | | | | |
| | | | | | $ | 35,384,959 | |
| | | | | | | | |
| Natural Gas – Pipeline – 0.4% | | | | | |
| Enterprise Products Partners LP | | | 169,489 | | | $ | 3,320,290 | |
| | | | | | | | |
| Network & Telecom – 0.6% | | | | | |
| Equinix, Inc., REIT | | | 6,426 | | | $ | 4,589,321 | |
| | | | | | | | |
| Other Banks & Diversified Financials – 4.1% | | | | | |
| Northern Trust Corp. | | | 52,780 | | | $ | 4,915,929 | |
| Truist Financial Corp. | | | 164,946 | | | | 7,905,862 | |
| Visa, Inc., “A” | | | 79,899 | | | | 17,476,308 | |
| | | | | | | | |
| | | | | | $ | 30,298,099 | |
| | | | | | | | |
| Pharmaceuticals – 4.3% | | | | | |
| Eli Lilly & Co. | | | 42,015 | | | $ | 7,093,813 | |
| Johnson & Johnson | | | 65,949 | | | | 10,379,054 | |
| Merck & Co., Inc. | | | 111,703 | | | | 9,137,305 | |
| Zoetis, Inc. | | | 31,878 | | | | 5,275,809 | |
| | | | | | | | |
| | | | | | $ | 31,885,981 | |
| | | | | | | | |
| Railroad & Shipping – 1.8% | | | | | |
| Canadian Pacific Railway Ltd. | | | 20,849 | | | $ | 7,228,140 | |
| Kansas City Southern Co. | | | 31,596 | | | | 6,449,691 | |
| | | | | | | | |
| | | | | | $ | 13,677,831 | |
| | | | | | | | |
| | | | | | | | |
| Issuer | | Shares/Par | | | Value ($) | |
| COMMON STOCKS – continued | | | | | |
| Real Estate – 1.1% | | | | | |
| Public Storage, Inc., REIT | | | 15,098 | | | $ | 3,486,581 | |
| STORE Capital Corp., REIT | | | 139,732 | | | | 4,748,093 | |
| | | | | | | | |
| | | | | | $ | 8,234,674 | |
| | | | | | | | |
| Restaurants – 1.7% | | | | | |
| Starbucks Corp. | | | 98,125 | | | $ | 10,497,413 | |
| Texas Roadhouse, Inc. | | | 33,076 | | | | 2,585,220 | |
| | | | | | | | |
| | | | | | $ | 13,082,633 | |
| | | | | | | | |
| Specialty Chemicals – 1.8% | | | | | |
| Air Products & Chemicals, Inc. | | | 16,956 | | | $ | 4,632,718 | |
| Axalta Coating Systems Ltd. (a) | | | 89,447 | | | | 2,553,712 | |
| DuPont de Nemours, Inc. | | | 87,464 | | | | 6,219,565 | |
| | | | | | | | |
| | | | | | $ | 13,405,995 | |
| | | | | | | | |
| Specialty Stores – 7.6% | | | | | |
| Amazon.com, Inc. (a)(s) | | | 12,094 | | | $ | 39,389,311 | |
| AutoZone, Inc. (a) | | | 4,122 | | | | 4,886,384 | |
| Home Depot, Inc. | | | 21,834 | | | | 5,799,547 | |
| Ross Stores, Inc. | | | 52,331 | | | | 6,426,770 | |
| | | | | | | | |
| | | | | | $ | 56,502,012 | |
| | | | | | | | |
| Telecommunications – Wireless – 2.0% | | | | | |
| SBA Communications Corp., REIT | | | 28,649 | | | $ | 8,082,742 | |
| T-Mobile USA, Inc. (a) | | | 51,042 | | | | 6,883,014 | |
| | | | | | | | |
| | | | | | $ | 14,965,756 | |
| | | | | | | | |
| Tobacco – 0.7% | | | | | |
| Philip Morris International, Inc. | | | 66,608 | | | $ | 5,514,476 | |
| | | | | | | | |
| Utilities – Electric Power – 3.1% | | | | | |
| American Electric Power Co., Inc. | | | 38,336 | | | $ | 3,192,239 | |
| Duke Energy Corp. | | | 62,038 | | | | 5,680,199 | |
| NextEra Energy, Inc. | | | 79,642 | | | | 6,144,381 | |
| PG&E Corp. (a) | | | 263,935 | | | | 3,288,630 | |
| Southern Co. | | | 77,391 | | | | 4,754,129 | |
| | | | | | | | |
| | | | | | $ | 23,059,578 | |
| | | | | | | | |
Total Common Stocks
(Identified Cost, $438,767,727) | | | | | | $ | 744,605,159 | |
| | | | | | | | |
|
| INVESTMENT COMPANIES (h) – 0.8% | |
| Money Market Funds – 0.8% | | | | | |
| MFS Institutional Money Market Portfolio, 0.1% (v) (Identified Cost, $6,109,175) | | | 6,109,231 | | | $ | 6,109,231 | |
| | | | | | | | |
| |
| SECURITIES SOLD SHORT – (0.4)% | | | | | |
| Medical & Health Technology & Services – (0.1)% | |
| Healthcare Services Group, Inc. | | | (44,372 | ) | | $ | (1,246,853 | ) |
| | | | | | | | |
| Telecommunications – Wireless – (0.3)% | | | | | |
| Crown Castle International Corp., REIT | | | (12,776 | ) | | $ | (2,033,811 | ) |
| | | | | | | | |
| Total Securities Sold Short (Proceeds Received, $2,490,023) | | | | | | $ | (3,280,664 | ) |
| | | | | | | | |
OTHER ASSETS, LESS
LIABILITIES – 0.0% | | | | | | | 292,719 | |
| | | | | | | | |
| NET ASSETS – 100.0% | | | | | | $ | 747,726,445 | |
| | | | | | | | |
8
MFS Research Series
Portfolio of Investments – continued
| (a) | | Non-income producing security. |
| (h) | | An affiliated issuer, which may be considered one in which the fund owns 5% or more of the outstanding voting securities, or a company which is under common control. At period end, the aggregate values of the fund’s investments in affiliated issuers and in unaffiliated issuers were $6,109,231 and $744,605,159, respectively. |
| (s) | | Security or a portion of the security was pledged to cover collateral requirements for securities sold short. |
| (v) | | Affiliated issuer that is available only to investment companies managed by MFS. The rate quoted for the MFS Institutional Money Market Portfolio is the annualized seven-day yield of the fund at period end. |
The following abbreviations are used in this report and are defined:
| REIT | | Real Estate Investment Trust |
At December 31, 2020, the fund had cash collateral of $17,836 and other liquid securities with an aggregate value of $7,250,093 to cover any collateral or margin obligations for securities sold short. Restricted cash and/or deposits with brokers in the Statement of Assets and Liabilities are comprised of cash collateral.
See Notes to Financial Statements
9
MFS Research Series
FINANCIAL STATEMENTS | STATEMENT OF ASSETS AND LIABILITIES
This statement represents your fund’s balance sheet, which details the assets and liabilities comprising the total value of the fund.
| | | | |
At 12/31/20 | | | | |
| |
Assets | | | | |
Investments in unaffiliated issuers, at value (identified cost, $438,767,727) | | | $744,605,159 | |
Investments in affiliated issuers, at value (identified cost, $6,109,175) | | | 6,109,231 | |
Cash | | | 10,896 | |
Deposits with brokers for | | | | |
Securities sold short | | | 17,836 | |
Receivables for | | | | |
Fund shares sold | | | 117,168 | |
Dividends | | | 673,231 | |
Other assets | | | 2,892 | |
Total assets | | | $751,536,413 | |
| |
Liabilities | | | | |
Payables for | | | | |
Securities sold short, at value (proceeds received, $2,490,023) | | | $3,280,664 | |
Investments purchased | | | 27,416 | |
Fund shares reacquired | | | 372,386 | |
Payable to affiliates | | | | |
Investment adviser | | | 18,275 | |
Administrative services fee | | | 532 | |
Shareholder servicing costs | | | 466 | |
Distribution and/or service fees | | | 5,095 | |
Payable for independent Trustees’ compensation | | | 12 | |
Accrued expenses and other liabilities | | | 105,122 | |
Total liabilities | | | $3,809,968 | |
Net assets | | | $747,726,445 | |
| |
Net assets consist of | | | | |
Paid-in capital | | | $396,481,123 | |
Total distributable earnings (loss) | | | 351,245,322 | |
Net assets | | | $747,726,445 | |
Shares of beneficial interest outstanding | | | 22,933,005 | |
| | | | | | | | | | | | |
| | | |
| | | Net assets | | | Shares
outstanding | | | Net asset value
per share | |
Initial Class | | | $372,404,569 | | | | 11,328,820 | | | | $32.87 | |
Service Class | | | 375,321,876 | | | | 11,604,185 | | | | 32.34 | |
See Notes to Financial Statements
10
MFS Research Series
FINANCIAL STATEMENTS | STATEMENT OF OPERATIONS
This statement describes how much your fund earned in investment income and accrued in expenses. It also describes any gains and/or losses generated by fund operations.
| | | | |
Year ended 12/31/20 | | | | |
| |
Net investment income (loss) | | | | |
Income | | | | |
Dividends | | | $9,481,283 | |
Other | | | 49,625 | |
Dividends from affiliated issuers | | | 40,490 | |
Income on securities loaned | | | 30,726 | |
Foreign taxes withheld | | | (24,443 | ) |
Total investment income | | | $9,577,681 | |
Expenses | | | | |
Management fee | | | $5,084,599 | |
Distribution and/or service fees | | | 835,442 | |
Shareholder servicing costs | | | 28,682 | |
Administrative services fee | | | 100,150 | |
Independent Trustees’ compensation | | | 14,184 | |
Custodian fee | | | 36,162 | |
Shareholder communications | | | 49,896 | |
Audit and tax fees | | | 60,829 | |
Legal fees | | | 6,762 | |
Dividend and interest expense on securities sold short | | | 147,000 | |
Interest expense and fees | | | 3,328 | |
Miscellaneous | | | 32,099 | |
Total expenses | | | $6,399,133 | |
Reduction of expenses by investment adviser | | | (190,787 | ) |
Net expenses | | | $6,208,346 | |
Net investment income (loss) | | | $3,369,335 | |
| |
Realized and unrealized gain (loss) | | | | |
Realized gain (loss) (identified cost basis) | | | | |
Unaffiliated issuers | | | $43,018,300 | |
Affiliated issuers | | | (639 | ) |
Foreign currency | | | (448 | ) |
Net realized gain (loss) | | | $43,017,213 | |
Change in unrealized appreciation or depreciation | | | | |
Unaffiliated issuers | | | $66,177,212 | |
Affiliated issuers | | | (1 | ) |
Securities sold short | | | (154,964 | ) |
Translation of assets and liabilities in foreign currencies | | | (102 | ) |
Net unrealized gain (loss) | | | $66,022,145 | |
Net realized and unrealized gain (loss) | | | $109,039,358 | |
Change in net assets from operations | | | $112,408,693 | |
See Notes to Financial Statements
11
MFS Research Series
FINANCIAL STATEMENTS | STATEMENTS OF CHANGES IN NET ASSETS
These statements describe the increases and/or decreases in net assets resulting from operations, any distributions, and any shareholder transactions.
| | | | | | | | |
| | | Year ended | |
| | | 12/31/20 | | | 12/31/19 | |
Change in net assets | | | | | | | | |
| | |
From operations | | | | | | | | |
Net investment income (loss) | | | $3,369,335 | | | | $4,427,864 | |
Net realized gain (loss) | | | 43,017,213 | | | | 27,940,886 | |
Net unrealized gain (loss) | | | 66,022,145 | | | | 141,393,667 | |
Change in net assets from operations | | | $112,408,693 | | | | $173,762,417 | |
Total distributions to shareholders | | | $(31,733,190 | ) | | | $(69,043,322 | ) |
Change in net assets from fund share transactions | | | $(14,633,535 | ) | | | $41,645,153 | |
Total change in net assets | | | $66,041,968 | | | | $146,364,248 | |
| | |
Net assets | | | | | | | | |
At beginning of period | | | 681,684,477 | | | | 535,320,229 | |
At end of period | | | $747,726,445 | | | | $681,684,477 | |
See Notes to Financial Statements
12
MFS Research Series
FINANCIAL STATEMENTS | FINANCIAL HIGHLIGHTS
The financial highlights table is intended to help you understand the fund’s financial performance for the past 5 years. Certain information reflects financial results for a single fund share. The total returns in the table represent the rate that an investor would have earned (or lost) on an investment in the fund share class (assuming reinvestment of all distributions) held for the entire period.
| | | | | | | | | | | | | | | | | | | | |
| Initial Class | | Year ended | |
| | | | | |
| | | 12/31/20 | | | 12/31/19 | | | 12/31/18 | | | 12/31/17 | | | 12/31/16 | |
| | | | | |
Net asset value, beginning of period | | | $29.49 | | | | $24.93 | | | | $29.50 | | | | $26.00 | | | | $26.68 | |
| | | | | |
| Income (loss) from investment operations | | | | | | | | | | | | | | | | | | | | |
Net investment income (loss) (d) | | | $0.18 | | | | $0.23 | | | | $0.26 | | | | $0.20 | | | | $0.36 | (c) |
Net realized and unrealized gain (loss) | | | 4.62 | | | | 7.66 | | | | (1.04 | ) | | | 5.67 | | | | 1.98 | |
Total from investment operations | | | $4.80 | | | | $7.89 | | | | $(0.78 | ) | | | $5.87 | | | | $2.34 | |
| | | | | |
| Less distributions declared to shareholders | | | | | | | | | | | | | | | | | | | | |
From net investment income | | | $(0.22 | ) | | | $(0.24 | ) | | | $(0.22 | ) | | | $(0.40 | ) | | | $(0.22 | ) |
From net realized gain | | | (1.20 | ) | | | (3.09 | ) | | | (3.57 | ) | | | (1.97 | ) | | | (2.80 | ) |
Total distributions declared to shareholders | | | $(1.42 | ) | | | $(3.33 | ) | | | $(3.79 | ) | | | $(2.37 | ) | | | $(3.02 | ) |
Net asset value, end of period (x) | | | $32.87 | | | | $29.49 | | | | $24.93 | | | | $29.50 | | | | $26.00 | |
Total return (%) (k)(r)(s)(x) | | | 16.59 | | | | 32.95 | | | | (4.37 | ) | | | 23.37 | | | | 8.74 | (c) |
| | | | | |
Ratios (%) (to average net assets)
and Supplemental data: | | | | | | | | | | | | | | | | | | | | |
Expenses before expense reductions (f) | | | 0.82 | | | | 0.83 | | | | 0.82 | | | | 0.83 | | | | 0.80 | (c) |
Expenses after expense reductions (f) | | | 0.79 | | | | 0.81 | | | | 0.81 | | | | 0.81 | | | | 0.79 | (c) |
Net investment income (loss) | | | 0.62 | | | | 0.82 | | | | 0.88 | | | | 0.70 | | | | 1.36 | (c) |
Portfolio turnover | | | 39 | | | | 35 | | | | 31 | | | | 37 | | | | 45 | |
Net assets at end of period (000 omitted) | | | $372,405 | | | | $361,842 | | | | $319,422 | | | | $394,867 | | | | $386,256 | |
| | | | | |
| Supplemental Ratios (%): | | | | | | | | | | | | | | | | | | | | |
Ratios of expenses to average net assets after expense reductions excluding short sale expenses and interest expense and fees (f) | | | 0.77 | | | | 0.78 | | | | 0.79 | | | | 0.79 | | | | 0.78 | (c) |
See Notes to Financial Statements
13
MFS Research Series
Financial Highlights – continued
| | | | | | | | | | | | | | | | | | | | |
| Service Class | | Year ended | |
| | | | | |
| | | 12/31/20 | | | 12/31/19 | | | 12/31/18 | | | 12/31/17 | | | 12/31/16 | |
| | | | | |
Net asset value, beginning of period | | | $29.05 | | | | $24.61 | | | | $29.17 | | | | $25.73 | | | | $26.42 | |
| | | | | |
| Income (loss) from investment operations | | | | | | | | | | | | | | | | | | | | |
Net investment income (loss) (d) | | | $0.11 | | | | $0.16 | | | | $0.18 | | | | $0.13 | | | | $0.29 | (c) |
Net realized and unrealized gain (loss) | | | 4.54 | | | | 7.55 | | | | (1.03 | ) | | | 5.61 | | | | 1.96 | |
Total from investment operations | | | $4.65 | | | | $7.71 | | | | $(0.85 | ) | | | $5.74 | | | | $2.25 | |
| | | | | |
| Less distributions declared to shareholders | | | | | | | | | | | | | | | | | | | | |
From net investment income | | | $(0.16 | ) | | | $(0.18 | ) | | | $(0.14 | ) | | | $(0.33 | ) | | | $(0.14 | ) |
From net realized gain | | | (1.20 | ) | | | (3.09 | ) | | | (3.57 | ) | | | (1.97 | ) | | | (2.80 | ) |
Total distributions declared to shareholders | | | $(1.36 | ) | | | $(3.27 | ) | | | $(3.71 | ) | | | $(2.30 | ) | | | $(2.94 | ) |
Net asset value, end of period (x) | | | $32.34 | | | | $29.05 | | | | $24.61 | | | | $29.17 | | | | $25.73 | |
Total return (%) (k)(r)(s)(x) | | | 16.31 | | | | 32.60 | | | | (4.62 | ) | | | 23.07 | | | | 8.49 | (c) |
| | | | | |
Ratios (%) (to average net assets)
and Supplemental data: | | | | | | | | | | | | | | | | | | | | |
Expenses before expense reductions (f) | | | 1.07 | | | | 1.08 | | | | 1.07 | | | | 1.08 | | | | 1.05 | (c) |
Expenses after expense reductions (f) | | | 1.04 | | | | 1.06 | | | | 1.06 | | | | 1.06 | | | | 1.04 | (c) |
Net investment income (loss) | | | 0.37 | | | | 0.57 | | | | 0.63 | | | | 0.47 | | | | 1.11 | (c) |
Portfolio turnover | | | 39 | | | | 35 | | | | 31 | | | | 37 | | | | 45 | |
Net assets at end of period (000 omitted) | | | $375,322 | | | | $319,842 | | | | $215,898 | | | | $228,102 | | | | $220,341 | |
| | | | | |
| Supplemental Ratios (%): | | | | | | | | | | | | | | | | | | | | |
Ratios of expenses to average net assets after expense reductions excluding short sale expenses and interest expense and fees (f) | | | 1.02 | | | | 1.03 | | | | 1.04 | | | | 1.04 | | | | 1.03 | (c) |
| (c) | Amount reflects a one-time reimbursement of expenses by the custodian (or former custodian) without which net investment income and performance would be lower and expenses would be higher. |
| (d) | Per share data is based on average shares outstanding. |
| (f) | Ratios do not reflect reductions from fees paid indirectly, if applicable. |
| (k) | The total return does not reflect expenses that apply to separate accounts. Inclusion of these charges would reduce the total return figures for all periods shown. |
| (r) | Certain expenses have been reduced without which performance would have been lower. |
| (s) | From time to time the fund may receive proceeds from litigation settlements, without which performance would be lower. |
| (x) | The net asset values and total returns have been calculated on net assets which include adjustments made in accordance with U.S. generally accepted accounting principles required at period end for financial reporting purposes. |
See Notes to Financial Statements
14
MFS Research Series
NOTES TO FINANCIAL STATEMENTS
| (1) | | Business and Organization |
MFS Research Series (the fund) is a diversified series of MFS Variable Insurance Trust (the trust). The trust is organized as a Massachusetts business trust and is registered under the Investment Company Act of 1940, as amended, as an open-end management investment company. The shareholders of each series of the trust are separate accounts of insurance companies, which offer variable annuity and/or life insurance products, and qualified retirement and pension plans.
The fund is an investment company and accordingly follows the investment company accounting and reporting guidance of the Financial Accounting Standards Board (FASB) Accounting Standards Codification Topic 946 Financial Services – Investment Companies.
| (2) | | Significant Accounting Policies |
General – The preparation of financial statements in conformity with U.S. generally accepted accounting principles requires management to make estimates and assumptions that affect the reported amounts of assets and liabilities, and disclosure of contingent assets and liabilities at the date of the financial statements and the reported amounts of increases and decreases in net assets from operations during the reporting period. Actual results could differ from those estimates. In the preparation of these financial statements, management has evaluated subsequent events occurring after the date of the fund’s Statement of Assets and Liabilities through the date that the financial statements were issued.
In March 2020, the FASB issued Accounting Standards Update 2020-04, Reference Rate Reform (Topic 848) – Facilitation of the Effects of Reference Rate Reform on Financial Reporting (“ASU 2020-04”), which provides optional, temporary relief with respect to the financial reporting of contracts subject to certain types of modifications due to the planned discontinuation of the London Interbank Offered Rate (LIBOR) and other IBOR-based reference rates as of the end of 2021. The temporary relief provided by ASU 2020-04 is effective for certain reference rate-related contract modifications that occur during the period from March 12, 2020 through December 31, 2022. Management is evaluating the impact of ASU 2020-04 on the fund’s investments, derivatives, debt and other contracts that will undergo reference rate-related modifications as a result of the reference rate reform.
Balance Sheet Offsetting – The fund’s accounting policy with respect to balance sheet offsetting is that, absent an event of default by the counterparty or a termination of the agreement, the International Swaps and Derivatives Association (ISDA) Master Agreement, or similar agreement, does not result in an offset of reported amounts of financial assets and financial liabilities in the Statement of Assets and Liabilities across transactions between the fund and the applicable counterparty. The fund’s right to setoff may be restricted or prohibited by the bankruptcy or insolvency laws of the particular jurisdiction to which a specific master netting agreement counterparty is subject. Balance sheet offsetting disclosures, to the extent applicable to the fund, have been included in the fund’s Significant Accounting Policies note under the captions for each of the fund’s in-scope financial instruments and transactions.
Investment Valuations – Equity securities, including restricted equity securities and equity securities sold short, are generally valued at the last sale or official closing price on their primary market or exchange as provided by a third-party pricing service. Equity securities, for which there were no sales reported that day, are generally valued at the last quoted daily bid quotation on their primary market or exchange as provided by a third-party pricing service. Equity securities sold short, for which there were no sales reported that day, are generally valued at the last quoted daily ask quotation on their primary market or exchange as provided by a third-party pricing service. Short-term instruments with a maturity at issuance of 60 days or less may be valued at amortized cost, which approximates market value. Open-end investment companies are generally valued at net asset value per share. Securities and other assets generally valued on the basis of information from a third-party pricing service may also be valued at a broker/dealer bid quotation. In determining values, third-party pricing services can utilize both transaction data and market information such as yield, quality, coupon rate, maturity, type of issue, trading characteristics, and other market data. The values of foreign securities and other assets and liabilities expressed in foreign currencies are converted to U.S. dollars using the mean of bid and asked prices for rates provided by a third-party pricing service.
The Board of Trustees has delegated primary responsibility for determining or causing to be determined the value of the fund’s investments (including any fair valuation) to the adviser pursuant to valuation policies and procedures approved by the Board. If the adviser determines that reliable market quotations are not readily available, investments are valued at fair value as determined in good faith by the adviser in accordance with such procedures under the oversight of the Board of Trustees. Under the fund’s valuation policies and procedures, market quotations are not considered to be readily available for most types of debt instruments and floating rate loans and many types of derivatives. These investments are generally valued at fair value based on information from third-party pricing services. In addition, investments may be valued at fair value if the adviser determines that an investment’s value has been materially affected by events occurring after the close of the exchange or market on which the investment is principally traded (such as foreign exchange or market) and prior to the determination of the fund’s net asset value, or after the halt of trading of a specific security where trading does not resume prior to the close of the exchange or market on which the security is principally traded. Events that occur after foreign markets close (such as developments in foreign markets and significant movements in the U.S.
15
MFS Research Series
Notes to Financial Statements – continued
markets) and prior to the determination of the fund’s net asset value may be deemed to have a material effect on the value of securities traded in foreign markets. Accordingly, the fund’s foreign equity securities may often be valued at fair value. The adviser generally relies on third-party pricing services or other information (such as the correlation with price movements of similar securities in the same or other markets; the type, cost and investment characteristics of the security; the business and financial condition of the issuer; and trading and other market data) to assist in determining whether to fair value and at what value to fair value an investment. The value of an investment for purposes of calculating the fund’s net asset value can differ depending on the source and method used to determine value. When fair valuation is used, the value of an investment used to determine the fund’s net asset value may differ from quoted or published prices for the same investment. There can be no assurance that the fund could obtain the fair value assigned to an investment if it were to sell the investment at the same time at which the fund determines its net asset value per share.
Various inputs are used in determining the value of the fund’s assets or liabilities. These inputs are categorized into three broad levels. In certain cases, the inputs used to measure fair value may fall into different levels of the fair value hierarchy. In such cases, an investment’s level within the fair value hierarchy is based on the lowest level of input that is significant to the fair value measurement. The fund’s assessment of the significance of a particular input to the fair value measurement in its entirety requires judgment, and considers factors specific to the investment. Level 1 includes unadjusted quoted prices in active markets for identical assets or liabilities. Level 2 includes other significant observable market-based inputs (including quoted prices for similar securities, interest rates, prepayment speed, and credit risk). Level 3 includes unobservable inputs, which may include the adviser’s own assumptions in determining the fair value of investments. The following is a summary of the levels used as of December 31, 2020 in valuing the fund’s assets or liabilities:
| | | | | | | | | | | | | | | | |
| Financial Instruments | | Level 1 | | | Level 2 | | | Level 3 | | | Total | |
| Equity Securities: | | | | | | | | | | | | | | | | |
United States | | | $719,797,689 | | | | $— | | | | $— | | | | $719,797,689 | |
Canada | | | 12,297,666 | | | | 27,716 | | | | — | | | | 12,325,382 | |
Netherlands | | | 8,209,686 | | | | — | | | | — | | | | 8,209,686 | |
Ireland | | | 4,272,402 | | | | — | | | | — | | | | 4,272,402 | |
| Mutual Funds | | | 6,109,231 | | | | — | | | | — | | | | 6,109,231 | |
| Total | | | $750,686,674 | | | | $27,716 | | | | $— | | | | $750,714,390 | |
| | | | |
| Securities Sold Short | | | $(3,280,664 | ) | | | $— | | | | $— | | | | $(3,280,664 | ) |
For further information regarding security characteristics, see the Portfolio of Investments.
Foreign Currency Translation – Purchases and sales of foreign investments, income, and expenses are converted into U.S. dollars based upon currency exchange rates prevailing on the respective dates of such transactions or on the reporting date for foreign denominated receivables and payables. Gains and losses attributable to foreign currency exchange rates on sales of securities are recorded for financial statement purposes as net realized gains and losses on investments. Gains and losses attributable to foreign exchange rate movements on receivables, payables, income and expenses are recorded for financial statement purposes as foreign currency transaction gains and losses. That portion of both realized and unrealized gains and losses on investments that results from fluctuations in foreign currency exchange rates is not separately disclosed.
Short Sales – The fund entered into short sales whereby it sells a security it does not own in anticipation of a decline in the value of that security. The fund will realize a gain if the security price decreases and a loss if the security price increases between the date of the short sale and the date on which the fund replaces the borrowed security. Losses from short sales can exceed the proceeds of the security sold; and they can also exceed the potential loss from an ordinary buy and sell transaction. The amount of any premium, dividends, or interest the fund may be required to pay in connection with a short sale will be recognized as a fund expense. During the year ended December 31, 2020, this expense amounted to $147,000. The fund segregates cash or marketable securities in an amount that, when combined with the amount of proceeds from the short sale deposited with the broker, at least equals the current market value of the security sold short.
Security Loans – Under its Securities Lending Agency Agreement with the fund, State Street Bank and Trust Company, as lending agent, loans the securities of the fund to certain qualified institutions (the “Borrowers”) approved by the fund. Security loans can be terminated at the discretion of either the lending agent or the fund and the related securities must be returned within the earlier of the standard trade settlement period for such securities or within three business days. The loans are collateralized by cash and/or U.S. Treasury and federal agency obligations in an amount typically at least equal to the market value of the securities loaned. On loans collateralized by cash, the cash collateral is invested in a money market fund. The market value of the loaned securities is determined at the close of business of the fund and any additional required collateral is delivered to the fund on the next business day. The lending agent provides the fund with indemnification against Borrower default. In the event of Borrower default, the lending agent will, for the benefit of the fund, either purchase securities identical to those loaned or, when such purchase is commercially
16
MFS Research Series
Notes to Financial Statements – continued
impracticable, pay the fund the market value of the loaned securities. In return, the lending agent assumes the fund’s rights to the related collateral. If the collateral value is less than the cost to purchase identical securities, the lending agent is responsible for the shortfall, but only to the extent that such shortfall is not due to a decline in collateral value resulting from collateral reinvestment for which the fund bears the risk of loss. A portion of the income generated upon investment of the collateral is remitted to the Borrowers, and the remainder is allocated between the fund and the lending agent. On loans collateralized by U.S. Treasury and/or federal agency obligations, a fee is received from the Borrower, and is allocated between the fund and the lending agent. Income from securities lending is separately reported in the Statement of Operations. The dividend and interest income earned on the securities loaned is accounted for in the same manner as other dividend and interest income. At December 31, 2020, there were no securities on loan or collateral outstanding.
Indemnifications – Under the fund’s organizational documents, its officers and Trustees may be indemnified against certain liabilities and expenses arising out of the performance of their duties to the fund. Additionally, in the normal course of business, the fund enters into agreements with service providers that may contain indemnification clauses. The fund’s maximum exposure under these agreements is unknown as this would involve future claims that may be made against the fund that have not yet occurred.
Investment Transactions and Income – Investment transactions are recorded on the trade date. Dividends received in cash are recorded on the ex-dividend date. Certain dividends from foreign securities will be recorded when the fund is informed of the dividend if such information is obtained subsequent to the ex-dividend date. Dividend payments received in additional securities are recorded on the ex-dividend date in an amount equal to the value of the security on such date.
The fund may receive proceeds from litigation settlements. Any proceeds received from litigation involving portfolio holdings are reflected in the Statement of Operations in realized gain/loss if the security has been disposed of by the fund or in unrealized gain/loss if the security is still held by the fund. Any other proceeds from litigation not related to portfolio holdings are reflected as other income in the Statement of Operations.
Tax Matters and Distributions – The fund intends to qualify as a regulated investment company, as defined under Subchapter M of the Internal Revenue Code, and to distribute all of its taxable income, including realized capital gains. As a result, no provision for federal income tax is required. The fund’s federal tax returns, when filed, will remain subject to examination by the Internal Revenue Service for a three year period. Management has analyzed the fund’s tax positions taken on federal and state tax returns for all open tax years and does not believe that there are any uncertain tax positions that require recognition of a tax liability. Foreign taxes, if any, have been accrued by the fund in the accompanying financial statements in accordance with the applicable foreign tax law. Foreign income taxes may be withheld by certain countries in which the fund invests. Additionally, capital gains realized by the fund on securities issued in or by certain foreign countries may be subject to capital gains tax imposed by those countries.
Distributions to shareholders are recorded on the ex-dividend date. Income and capital gain distributions are determined in accordance with income tax regulations, which may differ from U.S. generally accepted accounting principles. Certain capital accounts in the financial statements are periodically adjusted for permanent differences in order to reflect their tax character. These adjustments have no impact on net assets or net asset value per share. Temporary differences which arise from recognizing certain items of income, expense, gain or loss in different periods for financial statement and tax purposes will reverse at some time in the future.
Book/tax differences primarily relate to wash sale loss deferrals and partnership adjustments.
The tax character of distributions declared to shareholders for the last two fiscal years is as follows:
| | | | | | | | |
| | | Year ended
12/31/20 | | | Year ended
12/31/19 | |
| Ordinary income (including any short-term capital gains) | | | $6,781,157 | | | | $8,055,147 | |
| Long-term capital gains | | | 24,952,033 | | | | 60,988,175 | |
| Total distributions | | | $31,733,190 | | | | $69,043,322 | |
The federal tax cost and the tax basis components of distributable earnings were as follows:
| | | | |
| As of 12/31/20 | | | | |
| |
| Cost of investments | | | $444,594,632 | |
| Gross appreciation | | | 308,060,380 | |
| Gross depreciation | | | (5,221,286 | ) |
| Net unrealized appreciation (depreciation) | | | $302,839,094 | |
| |
| Undistributed ordinary income | | | 6,770,939 | |
| Undistributed long-term capital gain | | | 40,139,242 | |
| Other temporary differences | | | 1,496,047 | |
17
MFS Research Series
Notes to Financial Statements – continued
Multiple Classes of Shares of Beneficial Interest – The fund offers multiple classes of shares, which differ in their respective distribution and/or service fees. The fund’s income, realized and unrealized gain (loss), and common expenses are allocated to shareholders based on the daily net assets of each class. Dividends are declared separately for each class. Differences in per share dividend rates are generally due to differences in separate class expenses. The fund’s distributions declared to shareholders as reported in the Statements of Changes in Net Assets are presented by class as follows:
| | | | | | | | |
| | |
| | | Year ended
12/31/20 | | | Year ended
12/31/19 | |
| Initial Class | | | $16,028,106 | | | | $38,326,191 | |
| Service Class | | | 15,705,084 | | | | 30,717,131 | |
| Total | | | $31,733,190 | | | | $69,043,322 | |
| (3) | | Transactions with Affiliates |
Investment Adviser – The fund has an investment advisory agreement with MFS to provide overall investment management and related administrative services and facilities to the fund. The management fee is computed daily and paid monthly at the following annual rates based on the fund’s average daily net assets:
| | | | |
| Up to $1 billion | | | 0.75% | |
| In excess of $1 billion | | | 0.65% | |
MFS has agreed in writing to reduce its management fee by a specified amount if certain MFS mutual fund assets exceed thresholds agreed to by MFS and the fund’s Board of Trustees. For the year ended December 31, 2020, this management fee reduction amounted to $74,554, which is included in the reduction of total expenses in the Statement of Operations. The management fee incurred for the year ended December 31, 2020 was equivalent to an annual effective rate of 0.74% of the fund’s average daily net assets.
The investment adviser has agreed in writing to pay a portion of the fund’s total annual operating expenses, excluding interest, taxes, extraordinary expenses, brokerage and transaction costs, and investment-related expenses (such as short sale dividend and interest expenses incurred in connection with the fund’s investment activity), such that total annual operating expenses do not exceed 0.77% of average daily net assets for the Initial Class shares and 1.02% of average daily net assets for the Service Class shares. This written agreement will continue until modified by the fund’s Board of Trustees, but such agreement will continue at least until April 30, 2022. For the year ended December 31, 2020, this reduction amounted to $116,233, which is included in the reduction of total expenses in the Statement of Operations.
Distributor – MFS Fund Distributors, Inc. (MFD), a wholly-owned subsidiary of MFS, is the distributor of shares of the fund. The Trustees have adopted a distribution plan for the Service Class shares pursuant to Rule 12b-1 under the Investment Company Act of 1940.
The fund’s distribution plan provides that the fund will pay MFD distribution and/or service fees equal to 0.25% per annum of its average daily net assets attributable to Service Class shares as partial consideration for services performed and expenses incurred by MFD and financial intermediaries (including participating insurance companies that invest in the fund to fund variable annuity and variable life insurance contracts, sponsors of qualified retirement and pension plans that invest in the fund, and affiliates of these participating insurance companies and plan sponsors) in connection with the sale and distribution of the Service Class shares. MFD may subsequently pay all, or a portion, of the distribution and/or service fees to financial intermediaries.
Shareholder Servicing Agent – MFS Service Center, Inc. (MFSC), a wholly-owned subsidiary of MFS, receives a fee from the fund for its services as shareholder servicing agent. For the year ended December 31, 2020, the fee was $26,983, which equated to 0.0040% annually of the fund’s average daily net assets. MFSC also receives reimbursement from the fund for out-of-pocket expenses paid by MFSC on behalf of the fund. For the year ended December 31, 2020, these costs amounted to $1,699.
Administrator – MFS provides certain financial, legal, shareholder communications, compliance, and other administrative services to the fund. Under an administrative services agreement, the fund reimburses MFS the costs incurred to provide these services. The fund is charged an annual fixed amount of $17,500 plus a fee based on average daily net assets. The administrative services fee incurred for the year ended December 31, 2020 was equivalent to an annual effective rate of 0.0148% of the fund’s average daily net assets.
Trustees’ and Officers’ Compensation – The fund pays compensation to independent Trustees in the form of a retainer, attendance fees, and additional compensation to Board and Committee chairpersons. The fund does not pay compensation directly to Trustees or officers of the fund who are also officers of the investment adviser, all of whom receive remuneration from MFS for their services to the fund. Certain officers and Trustees of the fund are officers or directors of MFS, MFD, and MFSC.
Other – The fund invests in the MFS Institutional Money Market Portfolio which is managed by MFS and seeks current income consistent with preservation of capital and liquidity. This money market fund does not pay a management fee to MFS but does incur investment and operating costs.
18
MFS Research Series
Notes to Financial Statements – continued
The fund is permitted to engage in purchase and sale transactions with funds and accounts for which MFS serves as investment adviser or sub-adviser (“cross-trades”) pursuant to a policy adopted by the Board of Trustees. This policy has been designed to ensure that cross-trades conducted by the fund comply with Rule 17a-7 under the Investment Company Act of 1940. During the year ended December 31, 2020, the fund engaged in purchase and sale transactions pursuant to this policy, which amounted to $449,800 and $831,053, respectively. The sales transactions resulted in net realized gains (losses) of $(44,584).
The adviser has voluntarily undertaken to reimburse the fund from its own resources on a quarterly basis for the cost of investment research embedded in the cost of the fund’s securities trades. This agreement may be rescinded at any time. For the year ended December 31, 2020, this reimbursement amounted to $40,164, which is included in “Other” income in the Statement of Operations.
For the year ended December 31, 2020, purchases and sales of investments, other than short sales and short-term obligations, aggregated $263,359,652 and $305,724,343, respectively.
| (5) | | Shares of Beneficial Interest |
The fund’s Declaration of Trust permits the Trustees to issue an unlimited number of full and fractional shares of beneficial interest. Transactions in fund shares were as follows:
| | | | | | | | | | | | | | | | |
| | | Year ended 12/31/20 | | | Year ended 12/31/19 | |
| | | | |
| | | Shares | | | Amount | | | Shares | | | Amount | |
| Shares sold | | | | | | | | | | | | | | | | |
Initial Class | | | 764,523 | | | | $19,867,933 | | | | 633,043 | | | | $17,785,306 | |
Service Class | | | 2,051,974 | | | | 55,469,934 | | | | 2,518,541 | | | | 70,524,436 | |
| | | 2,816,497 | | | | $75,337,867 | | | | 3,151,584 | | | | $88,309,742 | |
| | | | |
| Shares issued to shareholders in reinvestment of distributions | | | | | | | | | | | | | | | | |
Initial Class | | | 522,599 | | | | $16,028,106 | | | | 1,429,548 | | | | $38,326,191 | |
Service Class | | | 520,036 | | | | 15,705,084 | | | | 1,161,767 | | | | 30,717,131 | |
| | | 1,042,635 | | | | $31,733,190 | | | | 2,591,315 | | | | $69,043,322 | |
| | | | |
| Shares reacquired | | | | | | | | | | | | | | | | |
Initial Class | | | (2,228,768 | ) | | | $(65,370,350 | ) | | | (2,606,676 | ) | | | $(74,894,897 | ) |
Service Class | | | (1,976,828 | ) | | | (56,334,242 | ) | | | (1,444,916 | ) | | | (40,813,014 | ) |
| | | (4,205,596 | ) | | | $(121,704,592 | ) | | | (4,051,592 | ) | | | $(115,707,911 | ) |
| | | | |
| Net change | | | | | | | | | | | | | | | | |
Initial Class | | | (941,646 | ) | | | $(29,474,311 | ) | | | (544,085 | ) | | | $(18,783,400 | ) |
Service Class | | | 595,182 | | | | 14,840,776 | | | | 2,235,392 | | | | 60,428,553 | |
| | | (346,464 | ) | | | $(14,633,535 | ) | | | 1,691,307 | | | | $41,645,153 | |
The fund is one of several mutual funds in which certain MFS funds may invest. The MFS funds do not invest in the underlying funds for the purpose of exercising management or control. At the end of the period, the MFS Moderate Allocation Portfolio, the MFS Growth Allocation Portfolio, and the MFS Conservative Allocation Portfolio were the owners of record of approximately 16%, 5%, and 3%, respectively, of the value of outstanding voting shares of the fund.
The fund and certain other funds managed by MFS participate in a $1.25 billion unsecured committed line of credit of which $1 billion is reserved for use by the fund and certain other U.S. funds. The line of credit is provided by a syndicate of banks under a credit agreement. Borrowings may be made for temporary financing needs. Interest is charged to each fund, based on its borrowings, generally at a rate equal to the highest of one month LIBOR, the Federal Funds Effective Rate and the Overnight Bank Funding Rate, plus an agreed upon spread. A commitment fee, based on the average daily, unused portion of the committed line of credit, is allocated among the participating funds. In addition, the fund and other funds managed by MFS have established unsecured uncommitted borrowing arrangements with certain banks for temporary financing needs. Interest is charged to each fund, based on its borrowings, at rates equal to customary reference rates plus an agreed upon spread. For the year ended December 31, 2020, the fund’s commitment fee and interest expense were $3,328 and $0, respectively, and are included in “Interest expense and fees” in the Statement of Operations.
19
MFS Research Series
Notes to Financial Statements – continued
| (7) | | Investments in Affiliated Issuers |
An affiliated issuer may be considered one in which the fund owns 5% or more of the outstanding voting securities, or a company which is under common control. For the purposes of this report, the following were affiliated issuers:
| | | | | | | | | | | | | | | | | | | | | | | | |
| Affiliated Issuers | | Beginning
Value | | | Purchases | | | Sales
Proceeds | | | Realized
Gain
(Loss) | | | Change in
Unrealized
Appreciation or
Depreciation | | | Ending
Value | |
| MFS Institutional Money Market Portfolio | | | $1,194,880 | | | | $118,554,827 | | | | $113,639,836 | | | | $(639 | ) | | | $(1 | ) | | | $6,109,231 | |
| | | | | | |
| Affiliated Issuers | | | | | | | | | | | | | | Dividend
Income | | | Capital Gain
Distributions | |
| MFS Institutional Money Market Portfolio | | | | | | | | | | | | $40,490 | | | | $— | |
The pandemic related to the global spread of novel coronavirus disease (COVID-19), which was first detected in December 2019, has resulted in significant disruptions to global business activity and the global economy, as well as the economies of individual countries, the financial performance of individual companies and sectors, and the securities and commodities markets in general. This pandemic, the full effects of which are still unknown, has resulted in substantial market volatility and may have adversely impacted the prices and liquidity of the fund’s investments and the fund’s performance.
20
MFS Research Series
REPORT OF INDEPENDENT REGISTERED PUBLIC ACCOUNTING FIRM
To the Board of Trustees of MFS Variable Insurance Trust and the Shareholders of
MFS Research Series:
Opinion on the Financial Statements and Financial Highlights
We have audited the accompanying statement of assets and liabilities of MFS Research Series (the “Fund”), including the portfolio of investments, as of December 31, 2020, the related statement of operations for the year then ended, the statements of changes in net assets for each of the two years in the period then ended, the financial highlights for each of the five years in the period then ended, and the related notes. In our opinion, the financial statements and financial highlights present fairly, in all material respects, the financial position of the Fund as of December 31, 2020, and the results of its operations for the year then ended, the changes in its net assets for each of the two years in the period then ended, and the financial highlights for each of the five years in the period then ended, in conformity with accounting principles generally accepted in the United States of America.
Basis for Opinion
These financial statements and financial highlights are the responsibility of the Fund’s management. Our responsibility is to express an opinion on the Fund’s financial statements and financial highlights based on our audits. We are a public accounting firm registered with the Public Company Accounting Oversight Board (United States) (PCAOB) and are required to be independent with respect to the Fund in accordance with the U.S. federal securities laws and the applicable rules and regulations of the Securities and Exchange Commission and the PCAOB.
We conducted our audits in accordance with the standards of the PCAOB. Those standards require that we plan and perform the audit to obtain reasonable assurance about whether the financial statements and financial highlights are free of material misstatement, whether due to error or fraud. The Fund is not required to have, nor were we engaged to perform, an audit of its internal control over financial reporting. As part of our audits, we are required to obtain an understanding of internal control over financial reporting but not for the purpose of expressing an opinion on the effectiveness of the Fund’s internal control over financial reporting. Accordingly, we express no such opinion.
Our audits included performing procedures to assess the risks of material misstatement of the financial statements and financial highlights, whether due to error or fraud, and performing procedures that respond to those risks. Such procedures included examining, on a test basis, evidence regarding the amounts and disclosures in the financial statements and financial highlights. Our audits also included evaluating the accounting principles used and significant estimates made by management, as well as evaluating the overall presentation of the financial statements and financial highlights. Our procedures included confirmation of securities owned as of December 31, 2020, by correspondence with the custodian and brokers; when replies were not received from brokers, we performed other auditing procedures. We believe that our audits provide a reasonable basis for our opinion.
DELOITTE & TOUCHE LLP
Boston, Massachusetts
February 16, 2021
We have served as the auditor of one or more of the MFS investment companies since 1924.
21
MFS Research Series
TRUSTEES AND OFFICERS – IDENTIFICATION AND BACKGROUND
The Trustees and Officers of the Trust, as of February 1, 2021, are listed below, together with their principal occupations during the past five years. (Their titles may have varied during that period.) The address of each Trustee and Officer is 111 Huntington Avenue, Boston, Massachusetts 02199-7618.
| | | | | | | | | | |
Name, Age | | Position(s)
Held with Fund | | Trustee/Officer
Since (h) | | Number of
MFS Funds
overseen by the
Trustee | | Principal Occupations
During the Past Five Years | | Other Directorships During the Past Five Years (j) |
| INTERESTED TRUSTEES |
Robert J. Manning (k)
(age 57) | | Trustee | | February 2004 | | 134 | | Massachusetts Financial Services Company, Non-Executive Chairman (since January 2021); Director; Chairman of the Board; Executive Chairman (January 2017-2020); Co-Chief Executive Officer (2015-2016) | | N/A |
| | | | | |
Michael W. Roberge (k) (age 54) | | Trustee | | January 2021 | | 134 | | Massachusetts Financial Services Company, Chairman (since January 2021); Chief Executive Officer (since January 2017); Director; President (until December 2018); Chief Investment Officer (until December 2018); Co-Chief Executive Officer (until December 2016) | | N/A |
|
| INDEPENDENT TRUSTEES |
John P. Kavanaugh
(age 66) | | Trustee and Chair of Trustees | | January 2009 | | 134 | | Private investor | | N/A |
| | | | | |
Steven E. Buller
(age 69) | | Trustee | | February 2014 | | 134 | | Private investor | | N/A |
| | | | | |
John A. Caroselli
(age 66) | | Trustee | | March 2017 | | 134 | | Private investor; JC Global Advisors, LLC (management consulting), President (since 2015) | | N/A |
| | | | | |
Maureen R. Goldfarb
(age 65) | | Trustee | | January 2009 | | 134 | | Private investor | | N/A |
| | | | | |
Peter D. Jones
(age 65) | | Trustee | | January 2019 | | 134 | | Private investor | | N/A |
| | | | | |
James W. Kilman, Jr.
(age 59) | | Trustee | | January 2019 | | 134 | | Burford Capital Limited (finance and investment management), Chief Financial Officer (since 2019); KielStrand Capital LLC (family office), Chief Executive Officer (since 2016); Morgan Stanley & Co. (financial services), Vice Chairman of Investment Banking, Co-Head of Diversified Financials Coverage – Financial Institutions Investment Banking Group (until 2016) | | Alpha-En Corporation, Director (2016-2019) |
| | | | | |
Clarence Otis, Jr. (age 64) | | Trustee | | March 2017 | | 134 | | Private investor | | VF Corporation, Director; Verizon Communications, Inc., Director; The Travelers Companies, Director |
| | | | | |
Maryanne L. Roepke (age 64) | | Trustee | | May 2014 | | 134 | | Private investor | | N/A |
| | | | | |
Laurie J. Thomsen
(age 63) | | Trustee | | March 2005 | | 134 | | Private investor | | The Travelers Companies, Director; Dycom Industries, Inc., Director |
22
MFS Research Series
Trustees and Officers – continued
| | | | | | | | |
Name, Age | | Position(s)
Held with Fund | | Trustee/Officer
Since (h) | | Number of
MFS Funds
for which the
Person is an
Officer | | Principal Occupations
During the Past Five Years |
| OFFICERS | | | | | | |
Christopher R. Bohane (k)
(age 47) | | Assistant Secretary and Assistant Clerk | | July 2005 | | 134 | | Massachusetts Financial Services Company, Senior Vice President and Associate General Counsel |
| | | | |
Kino Clark (k) (age 52) | | Assistant Treasurer | | January 2012 | | 134 | | Massachusetts Financial Services Company, Vice President |
| | | | |
John W. Clark, Jr. (k) (age 53) | | Assistant Treasurer | | April 2017 | | 134 | | Massachusetts Financial Services Company, Vice President (since March 2017); Deutsche Bank (financial services), Department Head – Treasurer’s Office (until February 2017) |
| | | | |
Thomas H. Connors (k) (age 61) | | Assistant Secretary and Assistant Clerk | | September 2012 | | 134 | | Massachusetts Financial Services Company, Vice President and Senior Counsel |
| | | | |
David L. DiLorenzo (k)
(age 52) | | President | | July 2005 | | 134 | | Massachusetts Financial Services Company, Senior Vice President |
| | | | |
Heidi W. Hardin (k) (age 53) | | Secretary and Clerk | | April 2017 | | 134 | | Massachusetts Financial Services Company, Executive Vice President and General Counsel (since March 2017); Harris Associates (investment management), General Counsel (until January 2017) |
| | | | |
Brian E. Langenfeld (k) (age 47) | | Assistant
Secretary and Assistant Clerk | | June 2006 | | 134 | | Massachusetts Financial Services Company, Vice President and Senior Counsel |
| | | | |
Amanda S. Mooradian (k) (age 41) | | Assistant
Secretary and Assistant Clerk | | September 2018 | | 134 | | Massachusetts Financial Services Company, Assistant Vice President and Senior Counsel |
| | | | |
Susan A. Pereira (k)
(age 50) | | Assistant
Secretary and Assistant Clerk | | July 2005 | | 134 | | Massachusetts Financial Services Company, Vice President and Assistant General Counsel |
| | | | |
Kasey L. Phillips (k) (age 50) | | Assistant Treasurer | | September 2012 | | 134 | | Massachusetts Financial Services Company, Vice President |
| | | | |
Matthew A. Stowe (k) (age 46) | | Assistant Secretary and Assistant Clerk | | October 2014 | | 134 | | Massachusetts Financial Services Company, Vice President and Assistant General Counsel |
| | | | |
Martin J. Wolin (k) (age 53) | | Chief Compliance Officer | | July 2015 | | 134 | | Massachusetts Financial Services Company, Senior Vice President and Chief Compliance Officer |
| | | | |
James O. Yost (k)
(age 60) | | Treasurer | | September 1990 | | 134 | | Massachusetts Financial Services Company, Senior Vice President |
| (h) | Date first appointed to serve as Trustee/officer of an MFS Fund. Each Trustee has served continuously since appointment unless indicated otherwise. For the period from December 15, 2004 until February 22, 2005, Mr. Manning served as Advisory Trustee. From January 2012 through December 2016, Messrs. DiLorenzo and Yost served as Treasurer and Deputy Treasurer of the Funds, respectively. |
| (j) | Directorships or trusteeships of companies required to report to the Securities and Exchange Commission (i.e., “public companies”). |
| (k) | “Interested person” of the Trust within the meaning of the Investment Company Act of 1940 (referred to as the 1940 Act), which is the principal federal law governing investment companies like the fund, as a result of a position with MFS. The address of MFS is 111 Huntington Avenue, Boston, Massachusetts 02199-7618. |
Each Trustee (other than Messrs. Jones, Kilman and Roberge) has been elected by shareholders and each Trustee and Officer holds office until his or her successor is chosen and qualified or until his or her earlier death, resignation, retirement or removal. Mr. Roberge became a Trustee of the Funds on January 1, 2021 and Messrs. Jones and Kilman became Trustees of the Funds on January 1, 2019. The Trust does not hold annual meetings for the purpose of electing Trustees, and Trustees are not elected for fixed terms. Under the terms of the Board’s retirement policy, an Independent Trustee shall retire at the end of the calendar year in which he or she reaches the earlier of 75 years of age or 15 years of service on the Board (or, in the case of any Independent Trustee who joined the Board prior to 2015, 20 years of service on the Board).
Messrs. Buller, Kilman and Otis and Ms. Roepke are members of the Trust’s Audit Committee.
23
MFS Research Series
Trustees and Officers – continued
Each of the Interested Trustees and certain Officers hold comparable officer positions with certain affiliates of MFS.
The Statement of Additional Information for a Fund includes further information about the Trustees and is available without charge upon request by calling 1-800-225-2606.
| | |
Investment Adviser Massachusetts Financial Services Company 111 Huntington Avenue Boston, MA 02199-7618 | | Custodian State Street Bank and Trust Company 1 Lincoln Street Boston, MA 02111-2900 |
| |
Distributor MFS Fund Distributors, Inc. 111 Huntington Avenue Boston, MA 02199-7618 | | Independent Registered Public Accounting Firm Deloitte & Touche LLP 200 Berkeley Street Boston, MA 02116 |
| |
Portfolio Manager(s) Joseph MacDougall | | |
24
MFS Research Series
BOARD REVIEW OF INVESTMENT ADVISORY AGREEMENT
MFS Research Series
The Investment Company Act of 1940 requires that both the full Board of Trustees and a majority of the non-interested (“independent”) Trustees, voting separately, annually approve the continuation of the Fund’s investment advisory agreement with MFS. The Trustees consider matters bearing on the Fund and its advisory arrangements at their meetings throughout the year, including a review of performance data at each regular meeting. In addition, the independent Trustees met several times by videoconference (in accordance with Securities and Exchange Commission relief) over the course of three months beginning in May and ending in July, 2020 (“contract review meetings”) for the specific purpose of considering whether to approve the continuation of the investment advisory agreement for the Fund and the other investment companies that the Board oversees (the “MFS Funds”). The independent Trustees were assisted in their evaluation of the Fund’s investment advisory agreement by independent legal counsel, from whom they received separate legal advice and with whom they met separately from MFS during various contract review meetings. The independent Trustees were also assisted in this process by an independent consultant who was retained by and reported to the independent Trustees.
In connection with their deliberations regarding the continuation of the investment advisory agreement, the Trustees, including the independent Trustees, considered such information and factors as they believed, in light of the legal advice furnished to them and their own business judgment, to be relevant. The investment advisory agreement for the Fund was considered separately, although the Trustees also took into account the common interests of all MFS Funds in their review. As described below, the Trustees considered the nature, quality, and extent of the various investment advisory, administrative, and shareholder services performed by MFS under the existing investment advisory agreement and other arrangements with the Fund.
In connection with their contract review meetings, the Trustees received and relied upon materials that included, among other items: (i) information provided by Broadridge Financial Solutions, Inc. (“Broadridge”), an independent third party, on the investment performance of the Fund for various time periods ended December 31, 2019 and the investment performance of a group of funds with substantially similar investment classifications/objectives (the “Broadridge performance universe”), (ii) information provided by Broadridge on the Fund’s advisory fees and other expenses and the advisory fees and other expenses of comparable funds identified by Broadridge as well as all other funds in the same investment classification/category (the “Broadridge expense group and universe”), (iii) information provided by MFS on the advisory fees of portfolios of other clients of MFS, including institutional separate accounts and other clients, (iv) information as to whether and to what extent applicable expense waivers, reimbursements or fee “breakpoints” are observed for the Fund, (v) information regarding MFS’ financial results and financial condition, including MFS’ and certain of its affiliates’ estimated profitability from services performed for the Fund and the MFS Funds as a whole, and compared to MFS’ institutional business, (vi) MFS’ views regarding the outlook for the mutual fund industry and the strategic business plans of MFS, (vii) descriptions of various functions performed by MFS for the Funds, such as compliance monitoring and portfolio trading practices, and (viii) information regarding the overall organization of MFS, including information about MFS’ senior management and other personnel providing investment advisory, administrative and other services to the Fund and the other MFS Funds. The comparative performance, fee and expense information prepared and provided by Broadridge was not independently verified and the independent Trustees did not independently verify any information provided to them by MFS.
The Trustees’ conclusion as to the continuation of the investment advisory agreement was based on a comprehensive consideration of all information provided to the Trustees and not the result of any single factor. Some of the factors that figured particularly in the Trustees’ deliberations are described below, although individual Trustees may have evaluated the information presented differently from one another, giving different weights to various factors. It is also important to recognize that the fee arrangements for the Fund and other MFS Funds are the result of years of review and discussion between the independent Trustees and MFS, that certain aspects of such arrangements may receive greater scrutiny in some years than in others, and that the Trustees’ conclusions may be based, in part, on their consideration of these same arrangements during the course of the year and in prior years.
Based on information provided by Broadridge and MFS, the Trustees reviewed the Fund’s total return investment performance as well as the Broadridge performance universe over various time periods. The Trustees placed particular emphasis on the total return performance of the Fund’s Initial Class shares in comparison to the performance of funds in its Broadridge performance universe over the five-year period ended December 31, 2019, which the Trustees believed was a long enough period to reflect differing market conditions. The total return performance of the Fund’s Initial Class shares was in the 1st quintile relative to the other funds in the universe for this five-year period (the 1st quintile being the best performers and the 5th quintile being the worst performers). The total return performance of the Fund’s Initial Class shares was in the 1st quintile for each of the one- and three-year periods ended December 31, 2019 relative to the Broadridge performance universe. Because of the passage of time, these performance results may differ from the performance results for more recent periods, including those shown elsewhere in this report.
In the course of their deliberations, the Trustees took into account information provided by MFS in connection with the contract review meetings, as well as during investment review meetings conducted with portfolio management personnel during the course
25
MFS Research Series
Board Review of Investment Advisory Agreement – continued
of the year regarding the Fund’s performance. After reviewing these and related factors, the Trustees concluded, within the context of their overall conclusions regarding the investment advisory agreement, that they were satisfied with MFS’ responses and efforts relating to investment performance.
In assessing the reasonableness of the Fund’s advisory fee, the Trustees considered, among other information, the Fund’s advisory fee and the total expense ratio of the Fund’s Initial Class shares as a percentage of average daily net assets and the advisory fee and total expense ratios of the Broadridge expense group based on information provided by Broadridge. The Trustees considered that MFS currently observes an expense limitation for the Fund, which may not be changed without the Trustees’ approval. The Trustees also considered that, according to the data provided by Broadridge (which takes into account any fee reductions or expense limitations that were in effect during the Fund’s last fiscal year), the Fund’s effective advisory fee rate and total expense ratio were each higher than the Broadridge expense group median.
The Trustees also considered the advisory fees charged by MFS to any institutional separate accounts advised by MFS (“separate accounts”) and unaffiliated investment companies for which MFS serves as subadviser (“subadvised funds”) that have comparable investment strategies to the Fund, if any. In comparing these fees, the Trustees considered information provided by MFS as to the generally broader scope of services provided by MFS to the Fund, as well as the more extensive regulatory burdens imposed on MFS in managing the Fund, in comparison to separate accounts and subadvised funds. The Trustees also considered the higher demands placed on MFS’ investment personnel and trading infrastructure as a result of the daily cash in-flows and out-flows of the Fund in comparison to separate accounts.
The Trustees also considered whether the Fund may benefit from any economies of scale in the management of the Fund in the event of growth in assets of the Fund and/or growth in assets of the MFS Funds as a whole. They noted that the Fund’s advisory fee rate schedule is subject to a contractual breakpoint that reduces the Fund’s advisory fee rate on average daily net assets over $1 billion. The Trustees also noted that MFS has agreed in writing to waive a portion of the management fees of certain MFS Funds, including the Fund, if the total combined assets of certain funds within the MFS Funds’ complex increase above agreed upon thresholds (the “group fee waiver”), enabling the Fund’s shareholders to share in the benefits from any economies of scale at the complex level. The group fee waiver is reviewed and renewed annually between the Board and MFS. The Trustees concluded that the breakpoint and the group fee waiver were sufficient to allow the Fund to benefit from economies of scale as its assets and overall complex assets grow.
The Trustees also considered information prepared by MFS relating to MFS’ costs and profits with respect to the Fund, the MFS Funds considered as a group, and other investment companies and accounts advised by MFS, as well as MFS’ methodologies used to determine and allocate its costs to the MFS Funds, the Fund and other accounts and products for purposes of estimating profitability.
After reviewing these and other factors described herein, the Trustees concluded, within the context of their overall conclusions regarding the investment advisory agreement, that the advisory fees charged to the Fund represent reasonable compensation in light of the services being provided by MFS to the Fund.
In addition, the Trustees considered MFS’ resources and related efforts to continue to retain, attract and motivate capable personnel to serve the Fund. The Trustees also considered current and developing conditions in the financial services industry, including the presence of large and well-capitalized companies which are spending, and appear to be prepared to continue to spend, substantial sums to engage personnel and to provide services to competing investment companies. In this regard, the Trustees also considered the financial resources of MFS and its ultimate parent, Sun Life Financial Inc. The Trustees also considered the advantages and possible disadvantages to the Fund of having an adviser that also serves other investment companies as well as other accounts.
The Trustees also considered the nature, quality, cost, and extent of administrative, transfer agency, and distribution services provided to the Fund by MFS and its affiliates under agreements and plans other than the investment advisory agreement, including any 12b-1 fees the Fund pays to MFS Fund Distributors, Inc., an affiliate of MFS. The Trustees also considered the nature, extent and quality of certain other services MFS performs or arranges for on the Fund’s behalf, which may include securities lending programs, directed expense payment programs, class action recovery programs, and MFS’ interaction with third-party service providers, principally custodians and sub-custodians. The Trustees concluded that the various non-advisory services provided by MFS and its affiliates on behalf of the Fund were satisfactory.
The Trustees considered so-called “fall-out benefits” to MFS such as reputational value derived from serving as investment manager to the MFS Funds. The Trustees also considered that MFS discontinued its historic practice of obtaining investment research from portfolio brokerage commissions paid by certain MFS Funds effective January 2018, and directly pays or voluntarily reimburses a Fund, if applicable, for the costs of external research acquired through the use of the Fund’s portfolio brokerage commissions.
Based on their evaluation of factors that they deemed to be material, including those factors described above, the Board of Trustees, including the independent Trustees, concluded that the Fund’s investment advisory agreement with MFS should be continued for an additional one-year period, commencing August 1, 2020.
26
MFS Research Series
PROXY VOTING POLICIES AND INFORMATION
MFS votes proxies on behalf of the fund pursuant to proxy voting policies and procedures that are available without charge, upon request, by calling 1-800-225-2606, by visiting mfs.com/proxyvoting, or by visiting the SEC Web site at http://www.sec.gov.
Information regarding how the fund voted proxies relating to portfolio securities during the most recent twelve-month period ended June 30 is available by August 31 of each year without charge by visiting mfs.com/proxyvoting, or by visiting the SEC’s Web site at http://www.sec.gov.
QUARTERLY PORTFOLIO DISCLOSURE
The fund files a complete schedule of portfolio holdings with the SEC for the first and third quarters of each fiscal year as an exhibit to its reports on Form N-PORT. The fund’s Form N-PORT reports are available on the SEC’s Web site at http://www.sec.gov. A shareholder can obtain the portfolio holdings report for the first and third quarters of the fund’s fiscal year at mfs.com/vit1 by choosing the fund’s name and then scrolling to the “Resources” section and clicking on the “Prospectus and Reports” tab.
FURTHER INFORMATION
From time to time, MFS may post important information about the fund or the MFS funds on the MFS Web site (mfs.com). This information is available at https://www.mfs.com/announcements or at mfs.com/vit1 by choosing the fund’s name and then scrolling to the “Resources” section and clicking on the “Announcements” tab, if any.
INFORMATION ABOUT FUND CONTRACTS AND LEGAL CLAIMS
The fund has entered into contractual arrangements with an investment adviser, administrator, distributor, shareholder servicing agent, 529 program manager (if applicable), and custodian who each provide services to the fund. Unless expressly stated otherwise, shareholders are not parties to, or intended beneficiaries of these contractual arrangements, and these contractual arrangements are not intended to create any shareholder right to enforce them against the service providers or to seek any remedy under them against the service providers, either directly or on behalf of the fund.
Under the Trust’s By-Laws and Declaration of Trust, any claims asserted against or on behalf of the MFS Funds, including claims against Trustees and Officers, must be brought in state and federal courts located within the Commonwealth of Massachusetts.
FEDERAL TAX INFORMATION (unaudited)
The following information is provided pursuant to provisions of the Internal Revenue Code.
The fund designates $27,448,000 as capital gain dividends paid during the fiscal year.
For corporate shareholders, 100% of the ordinary income dividends paid during the fiscal year qualify for the corporate dividends received deduction.
27
rev. 3/16
| | | | |
| | | |
| FACTS | | WHAT DOES MFS DO WITH YOUR
PERSONAL INFORMATION? | |  |
| | |
| Why? | | Financial companies choose how they share your personal information. Federal law gives consumers the right to limit some but not all sharing. Federal law also requires us to tell you how we collect, share, and protect your personal information. Please read this notice carefully to understand what we do. |
| | |
| What? | | The types of personal information we collect and share depend on the product or service you have with us. This information can include: • Social Security number and account balances • Account transactions and transaction history • Checking account information and wire transfer instructions When you are no longer our customer, we continue to share your information as described in this notice. |
| | |
| How? | | All financial companies need to share customers’ personal information to run their everyday business. In the section below, we list the reasons financial companies can share their customers’ personal information; the reasons MFS chooses to share; and whether you can limit this sharing. |
| | | | |
Reasons we can share your
personal information | | Does MFS share? | | Can you limit this
sharing? |
For our everyday business purposes – such as to process your transactions, maintain your account(s), respond to court orders and legal investigations, or report to credit bureaus | | Yes | | No |
For our marketing purposes – to offer our products and services to you | | No | | We don’t share |
| For joint marketing with other financial companies | | No | | We don’t share |
For our affiliates’ everyday business purposes – information about your transactions and experiences | | No | | We don’t share |
For our affiliates’ everyday business purposes – information about your creditworthiness | | No | | We don’t share |
| For nonaffiliates to market to you | | No | | We don’t share |
| | |
| | |
| Questions? | | Call 800-225-2606 or go to mfs.com. |
28
| | |
| Who we are |
| Who is providing this notice? | | MFS Funds, MFS Investment Management, MFS Institutional Advisors, Inc., and MFS Heritage Trust Company. |
| | |
| What we do |
| How does MFS protect my personal information? | | To protect your personal information from unauthorized access and use, we use security measures that comply with federal law. These measures include procedural, electronic, and physical safeguards for the protection of the personal information we collect about you. |
How does MFS
collect my personal information? | | We collect your personal information, for example, when you • open an account or provide account information • direct us to buy securities or direct us to sell your securities • make a wire transfer We also collect your personal information from others, such as credit bureaus, affiliates, or other companies. |
| Why can’t I limit all sharing? | | Federal law gives you the right to limit only • sharing for affiliates’ everyday business purposes – information about your creditworthiness • affiliates from using your information to market to you • sharing for nonaffiliates to market to you State laws and individual companies may give you additional rights to limit sharing. |
| | |
| Definitions |
| Affiliates | | Companies related by common ownership or control. They can be financial and nonfinancial companies. • MFS does not share personal information with affiliates, except for everyday business purposes as described on page one of this notice. |
| Nonaffiliates | | Companies not related by common ownership or control. They can be financial and nonfinancial companies. • MFS does not share with nonaffiliates so they can market to you. |
| Joint marketing | | A formal agreement between nonaffiliated financial companies that together market financial products or services to you. • MFS doesn’t jointly market. |
| | |
| Other important information |
| If you own an MFS product or receive an MFS service in the name of a third party such as a bank or broker-dealer, their privacy policy may apply to you instead of ours. |
29
Annual Report
December 31, 2020
MFS® Variable Insurance Trust
| 1 |
| 2 |
| 4 |
| 6 |
| 8 |
| 9 |
| 19 |
| 20 |
| 21 |
| 22 |
| 24 |
| 31 |
| 32 |
| 35 |
| 38 |
| 38 |
| 38 |
| 38 |
| 38 |
| 39 |
The report is prepared for the general information of contract owners. It is authorized for distribution to prospective investors only when preceded or accompanied by a current prospectus.
NOT FDIC INSURED • MAY LOSE VALUE • NO BANK OR CREDIT UNION GUARANTEE •
NOT A DEPOSIT • NOT INSURED BY ANY FEDERAL GOVERNMENT AGENCY OR NCUA/NCUSIF
Dear Contract Owners:
Markets experienced dramatic swings this year as the coronavirus pandemic brought the global economy to a standstill for several months early in the year. The speedy development of vaccines and therapeutics later brightened the economic and market outlook, but a great deal of uncertainty remains as case counts remain high, new variants of the virus are appearing and questions persist over how fast the vaccine can be made widely available. In the United States, political uncertainty eased after former Vice President Joe Biden won the presidential election and the Democrats gained control of a closely divided Senate.
Global central banks have taken aggressive steps to cushion the economic and market fallout related to the virus, and governments are deploying unprecedented levels of fiscal support. Additional U.S. stimulus is anticipated with the Democrats in the White House and in control of both houses of Congress. The measures already put in place have helped build a supportive environment and are encouraging economic recovery; however, if markets disconnect from fundamentals, they can sow the seeds of instability. As such, dramatic increases in speculative retail trading bear watching.
In the aftermath of the crisis, we could see societal changes as households, businesses, and governments adjust to a new reality, and any such alterations could affect the investment landscape. For investors, events such as the COVID-19 outbreak demonstrate the importance of having a deep understanding of company fundamentals, and we have built our global research platform to do just that.
At MFS®, we put our clients’ assets to work responsibly by carefully navigating the increasing complexity of our global markets and economies. Guided by our long-term philosophy and adhering to our commitment to sustainable investing, we tune out the noise and aim to uncover what we believe are the best, most durable investment opportunities in the market. Our unique global investment platform combines collective expertise, long-term discipline and thoughtful risk management to create sustainable value for investors.
Respectfully,
Michael W. Roberge
Chief Executive Officer
MFS Investment Management
February 16, 2021
The opinions expressed in this letter are subject to change and may not be relied upon for investment advice. No forecasts can be guaranteed.
Portfolio structure (i)
Top ten holdings (i)
| Comcast Corp., “A” | 2.2% |
| Microsoft Corp. | 2.0% |
| U.S. Treasury Notes, 1.375%, 1/31/2025 | 2.0% |
| Johnson & Johnson | 1.9% |
| Goldman Sachs Group, Inc. | 1.9% |
| U.S. Treasury Notes, 1.375%, 1/31/2022 | 1.6% |
| JPMorgan Chase & Co. | 1.6% |
| Cigna Corp. | 1.5% |
| Charles Schwab Corp. | 1.3% |
| Eaton Corp. PLC | 1.3% |
Composition including fixed income credit quality (a)(i)
| AAA | 4.0% |
| AA | 1.3% |
| A | 5.0% |
| BBB | 9.7% |
| BB | 0.3% |
| B (o) | 0.0% |
| CCC (o) | 0.0% |
| U.S. Government | 6.3% |
| Federal Agencies | 12.3% |
| Not Rated | 0.2% |
| Non-Fixed Income | 60.1% |
| Cash & Cash Equivalents | 0.8% |
GICS equity sectors (g)
| Financials | 13.7% |
| Health Care | 10.4% |
| Industrials | 9.4% |
| Information Technology | 9.1% |
| Consumer Staples | 5.2% |
| Communication Services | 3.7% |
| Utilities | 2.8% |
| Consumer Discretionary | 2.3% |
| Materials | 1.8% |
| Energy | 1.2% |
| Real Estate | 0.5% |
Fixed income sectors (i)
| Investment Grade Corporates | 15.0% |
| Mortgage-Backed Securities | 12.3% |
| U.S. Treasury Securities | 6.3% |
| Commercial Mortgage-Backed Securities | 2.4% |
| Collateralized Debt Obligations | 1.5% |
| Asset-Backed Securities | 0.5% |
| Municipal Bonds | 0.4% |
| Non-U.S. Government Bonds | 0.3% |
| High Yield Corporates | 0.2% |
| Emerging Markets Bonds | 0.2% |
| U.S. Government Agencies (o) | 0.0% |
| (a) | For all securities other than those specifically described below, ratings are assigned to underlying securities utilizing ratings from Moody’s, Fitch, and Standard & Poor’s rating agencies and applying the following hierarchy: If all three agencies provide a rating, the middle rating (after dropping the highest and lowest ratings) is assigned; if two of the three agencies rate a security, the lower of the two is assigned. If none of the 3 rating agencies above assign a rating, but the security is rated by DBRS Morningstar, then the DBRS Morningstar rating is assigned. Ratings are shown in the S&P and Fitch scale (e.g., AAA). Securities rated BBB or higher are considered investment grade. All ratings are subject to change.U.S. Government includes securities issued by the U.S. Department of the Treasury. Federal Agencies includes rated and unrated U.S. Agency fixed-income securities, U.S. Agency mortgage-backed securities, and collateralized mortgage obligations of U.S. Agency mortgage-backed securities.Not Rated includes fixed income securities and fixed income derivatives that have not been rated by any rating agency.Non-Fixed Income includes any equity securities (including convertible bonds and equity derivatives) and/or commodity-linked derivatives.The fund may or may not have held all of these instruments on this date. The fund is not rated by these agencies. |
Portfolio Composition - continued
| (g) | The Global Industry Classification Standard (GICS®) was developed by and/or is the exclusive property of MSCI, Inc. and S&P Global Market Intelligence Inc. (“S&P Global Market Intelligence”). GICS is a service mark of MSCI and S&P Global Market Intelligence and has been licensed for use by MFS. MFS has applied its own internal sector/industry classification methodology for equity securities and non-equity securities that are unclassified by GICS. |
| (i) | For purposes of this presentation, the components include the value of securities, and reflect the impact of the equivalent exposure of derivative positions, if any. These amounts may be negative from time to time. Equivalent exposure is a calculated amount that translates the derivative position into a reasonable approximation of the amount of the underlying asset that the portfolio would have to hold at a given point in time to have the same price sensitivity that results from the portfolio’s ownership of the derivative contract. When dealing with derivatives, equivalent exposure is a more representative measure of the potential impact of a position on portfolio performance than value. The bond component will include any accrued interest amounts. |
Where the fund holds convertible bonds, they are treated as part of the equity portion of the portfolio.
Cash & Cash Equivalents includes any cash, investments in money market funds, short-term securities, and other assets less liabilities. Please see the Statement of Assets and Liabilities for additional information related to the fund’s cash position and other assets and liabilities.
Percentages are based on net assets as of December 31, 2020.
The portfolio is actively managed and current holdings may be different.
Management Review
Summary of Results
For the twelve months ended December 31, 2020, Initial Class shares of the MFS Total Return Series (fund) provided a total return of 9.81%, while Service Class shares of the fund provided a total return of 9.52%. These compare with returns of 18.40% and 7.51% over the same period for the fund’s benchmarks, the Standard & Poor's 500 Stock Index (S&P 500 Index) and the Bloomberg Barclays U.S. Aggregate Bond Index, respectively. The fund’s other benchmark, the MFS Total Return Blended Index (Blended Index), generated a return of 14.73%. The Blended Index reflects the blended returns of the equity and fixed income market indices, with percentage allocations to each index designed to resemble the equity and fixed income allocations of the fund. The market indices and related percentage allocations used to compile the Blended Index are set forth in the Performance Summary.
Market Environment
Markets experienced an extraordinarily sharp selloff early in the period and, in many cases, an unusually rapid recovery later. Central banks and fiscal authorities undertook astonishing levels of stimulus to offset the economic effects of government-imposed social-distancing measures implemented to slow the spread of the COVID-19 virus. At this point, the global economy looks to have experienced the shortest — albeit the deepest and steepest — recession in the postwar period. However, the recovery remains subject to more than the usual number of uncertainties due to questions about the evolution of the virus, what its continued impact will be and how quickly vaccines to guard against it can be manufactured and distributed at scale. There are also worries over the public's willingness to be inoculated.
Around the world, central banks responded quickly and massively to the crisis with programs to improve liquidity and support markets. These programs proved largely successful in helping to restore market function, ease volatility and stimulate a continued market rebound. Late in the period, the US Federal Reserve adopted a new, flexible, average-inflation-targeting framework, which is expected to result in the federal funds rate remaining at low levels longer than under its previous model. In developed countries, monetary easing measures were complemented by unusually large fiscal stimulus initiatives. Due to relatively manageable external liabilities and balances of payments in many countries and persistently low inflation, even emerging market countries were able to implement countercyclical policies — a departure from the usual market-dictated response to risk-off crises.
Compounding market uncertainty earlier in the pandemic was a crash in the price of crude oil due to a sharp drop in global demand and a disagreement between Saudi Arabia and Russia over production cuts, which resulted in an oil price war. The subsequent decline in prices undercut oil exporters, many of which are in emerging markets, as well as a large segment of the high-yield credit market. The OPEC+ group later agreed on output cuts, with shale oil producers in the US also decreasing production, which, along with the gradual reopening of some major economies and the resultant boost in demand, helped stabilize the price of crude oil.
In the immediate aftermath of the market disruption that accompanied the initial phases of the pandemic, many companies that had added significant leverage to their balance sheets in recent years by borrowing to fund dividend payments and stock buybacks halted those activities, and some companies were forced to recapitalize. As markets and the economy stabilized later in the period, in many cases dividend payments and buybacks resumed. Conversely, some companies found themselves flush with liquidity, having borrowed preemptively during the worst of the crisis only to end up with excess cash on their balance sheets.
Detractors from Performance
Within the equity portion of the fund, both an underweight position and stock selection in the information technology sector weighed on performance relative to the S&P 500 Index. Within this sector, the fund's underweight positions in both computer and personal electronics maker Apple and software giant Microsoft, not holding shares of computer graphics processor maker NVIDIA and digital payment technology developer PayPal, and its overweight position in semiconductor company Intel, weakened relative returns. Despite headwinds related to COVID-19, the share price of Apple appreciated as product demand recovered more rapidly than expected. The shift toward work-from-home and remote learning helped to support strong iPhone and iPad sales. Additionally, shares of Apple reacted positively to the announcement of a new line of its flagship iPhone product with 5G compatibility.
An overweight allocation to the poor-performing financials sector also detracted from relative results. Here, the timing of the fund's position in shares of diversified financial services firm Citigroup(h), and overweight positions in banking services providers U.S. Bancorp and JPMorgan Chase, hurt relative returns.
Elsewhere, the timing of the fund's underweight position in strong-performing internet retailer Amazon.com(h), and holding of Canadian integrated energy company Suncor Energy(b)(h), held back relative results. The share price of Amazon.com rose over the reporting period, benefiting from increased demand for cloud-computing services and at-home retail demand.
Within the fixed income portion of the fund, the fund's yield curve(y) positioning, notably a greater exposure to U.S. Government swap spreads at the 5, 10, 20 and 30 year key rates, was a primary factor that detracted from performance relative to the Bloomberg Barclays U.S. Aggregate Bond Index, as swap spreads widened over the reporting period. A shorter exposure to the 2 and 10 year key rates also held back relative results, as interest rates declined over the reporting period.
Management Review - continued
Contributors to Performance
Within the equity portion of the fund, stock selection within the industrials sector was a primary factor lifting performance relative to the S&P 500 Index. Within this sector, not holding shares of aerospace company Boeing, and an overweight position in leading diversified industrial manufacturer Eaton (Ireland), benefited relative returns. The share price of Boeing declined as the travel and airline industries came under intense pressure amid the outbreak of the COVID-19 virus, which resulted in widespread travel restrictions across the globe and ultimately led the company to suspend production.
Stocks in other sectors that were among the fund's top relative contributors included holding shares of semiconductor firm Taiwan Semiconductor Manufacturing(b) (Taiwan) and residential home building company Toll Brothers(b)(h), as well as the timing of the fund's positons in integrated energy companies Exxon Mobil(h) and Chevron(h). Not holding shares of telecommunications firm AT&T and insurance and investment firm Berkshire Hathaway, and overweight positions in healthcare equipment manufacturer Danaher and financial services provider Charles Schwab, also supported relative results. The stock price for Taiwan Semiconductor Manufacturing advanced after the company delivered quarterly earnings per share results that were well ahead of market expectations. Management noted that the better-than-expected quarterly strength was primarily driven by strong demand across all application platforms, with revenue growth in smartphones leading the way.
Within the fixed income portion of the fund, asset allocation decisions were a primary driver of performance relative to the Bloomberg Barclays U.S. Aggregate Bond Index. Here, from a sector perspective, overweight allocations to the industrials, financial institutions and utilities sectors, as well as an underweight allocation to the Treasury sector, lifted relative returns. From a quality perspective, the fund's out-of-benchmark allocations to “CCC” and “B” rated bonds also supported relative results.
Bond selection was another factor that benefited relative performance in the fixed income portion of the fund. From a sector perspective, security selection within the industrials, financial institutions and fixed-rate agency mortgage back security (MBS) sectors contributed to relative returns. From a quality perspective, issuer selection within the “A”, “BBB” and “AAA” rated bonds aided relative results.
Respectfully,
Portfolio Manager(s)
Steven Gorham, Alexander Mackey, Joshua Marston, Johnathan Munko, Henry Peabody, and Robert Persons
Note to Contract Owners: Effective December 31, 2020, Jonathan Sage and Brooks Taylor were no longer Portfolio Managers of the fund. Effective June 30, 2021, Robert Persons will no longer be a Portfolio Manager of the fund.
| (b) | Security is not a benchmark constituent. |
| (h) | Security was not held in the portfolio at period end. |
| (y) | A yield curve graphically depicts the yields of different maturity bonds of the same credit quality and type; a normal yield curve is upward sloping, with short-term rates lower than long-term rates. |
The views expressed in this report are those of the portfolio manager(s) only through the end of the period of the report as stated on the cover and do not necessarily reflect the views of MFS or any other person in the MFS organization. These views are subject to change at any time based on market or other conditions, and MFS disclaims any responsibility to update such views. These views may not be relied upon as investment advice or an indication of trading intent on behalf of any MFS portfolio. References to specific securities are not recommendations of such securities, and may not be representative of any MFS portfolio’s current or future investments.
Performance Summary Through 12/31/20
The following chart illustrates the historical performance of the fund in comparison to its benchmark(s). Benchmarks are unmanaged and may not be invested in directly. Benchmark returns do not reflect any fees or expenses. The performance of other share classes will be greater than or less than that of the class depicted below. (See Notes to Performance Summary.)
Performance data shown represents past performance and is no guarantee of future results. Investment return and principal value fluctuate so your units, when sold, may be worth more or less than the original cost; current performance may be lower or higher than quoted. The performance shown does not reflect the deduction of taxes, if any, that a contract holder would pay on fund distributions or the redemption of contract units. The returns for the fund shown also do not reflect the deduction of expenses associated with variable products, such as mortality and expense risk charges, separate account charges, and sales charges imposed by the insurance company separate accounts. Such expenses would reduce the overall returns shown.
Growth of a Hypothetical $10,000 Investment
Total Returns through 12/31/20
Average annual total returns
| Share Class | Class Inception Date | 1-yr | 5-yr | 10-yr |
| Initial Class | 1/03/95 | 9.81% | 8.86% | 8.34% |
| Service Class | 5/01/00 | 9.52% | 8.58% | 8.07% |
Comparative benchmark(s)
| Standard & Poor's 500 Stock Index (f) | 18.40% | 15.22% | 13.88% |
| Bloomberg Barclays U.S. Aggregate Bond Index (f) | 7.51% | 4.44% | 3.84% |
| MFS Total Return Blended Index (f)(w) | 14.73% | 11.11% | 10.02% |
| (f) | Source: FactSet Research Systems Inc. |
| (w) | As of December 31, 2020, the MFS Total Return Blended Index (a custom index) was comprised of 60% Standard & Poor’s 500 Stock Index and 40% Bloomberg Barclays U.S. Aggregate Bond Index. |
Benchmark Definition(s)
Bloomberg Barclays U.S. Aggregate Bond Index(a) – a market capitalization-weighted index that measures the performance of the U.S. investment-grade, fixed rate bond market, with index components for government and corporate securities, mortgage pass-through securities, and asset-backed securities with at least one year to final maturity.
Standard & Poor's 500 Stock Index(g) – a market capitalization-weighted index of 500 widely held equity securities, designed to measure broad U.S. equity performance.
It is not possible to invest directly in an index.
| (a) | BLOOMBERG ® is a trademark and service mark of Bloomberg Finance L.P. and its affiliates (collectively “Bloomberg”). BARCLAYS® is a trademark and service mark of Barclays Bank Plc (collectively with its affiliates, “Barclays”), used under license. Bloomberg or Bloomberg's licensors, including Barclays, own all proprietary rights in the Bloomberg Barclays Indices. Neither Bloomberg nor Barclays approves or endorses this material, or guarantees the accuracy or completeness of any information herein, or makes any warranty, express or implied, as to the results to be obtained therefrom, and, to the maximum extent allowed by law, neither shall have any liability or responsibility for injury or damages arising in connection therewith. |
Performance Summary – continued
| (g) | “Standard & Poor's®” and “S&P®” are registered trademarks of Standard & Poor's Financial Services LLC (“S&P”) and Dow Jones is a registered trademark of Dow Jones Trademark Holdings LLC (“Dow Jones”) and have been licensed for use by S&P Dow Jones Indices LLC and sublicensed for certain purposes by MFS. The S&P 500® is a product of S&P Dow Jones Indices LLC, and has been licensed for use by MFS. MFS's product(s) is not sponsored, endorsed, sold, or promoted by S&P Dow Jones Indices LLC, Dow Jones, S&P, or their respective affiliates, and neither S&P Dow Jones Indices LLC, Dow Jones, S&P, nor their respective affiliates make any representation regarding the advisability of investing in such product(s). |
Notes to Performance Summary
Average annual total return represents the average annual change in value for each share class for the periods presented.
Performance results reflect any applicable expense subsidies and waivers in effect during the periods shown. Without such subsidies and waivers the fund's performance results would be less favorable. Please see the prospectus and financial statements for complete details. All results are historical and assume the reinvestment of any dividends and capital gains distributions.
Performance results do not include adjustments made for financial reporting purposes in accordance with U.S. generally accepted accounting principles and may differ from amounts reported in the financial highlights.
From time to time the fund may receive proceeds from litigation settlements, without which performance would be lower.
Expense Table
Fund Expenses Borne by the Contract Holders during the Period,
July 1, 2020 through December 31, 2020
As a contract holder of the fund, you incur ongoing costs, including management fees; distribution and/or service (12b-1) fees; and other fund expenses. This example is intended to help you understand your ongoing costs (in dollars) of investing in the fund and to compare these costs with the ongoing costs of investing in other mutual funds.
The example is based on an investment of $1,000 invested at the beginning of the period and held for the entire period July 1, 2020 through December 31, 2020.
Actual Expenses
The first line for each share class in the following table provides information about actual account values and actual expenses. You may use the information in this line, together with the amount you invested, to estimate the expenses that you paid over the period. Simply divide your account value by $1,000 (for example, an $8,600 account value divided by $1,000 = 8.6), then multiply the result by the number in the first line under the heading entitled “Expenses Paid During Period” to estimate the expenses you paid on your account during this period.
Hypothetical Example for Comparison Purposes
The second line for each share class in the following table provides information about hypothetical account values and hypothetical expenses based on the fund’s actual expense ratio and an assumed rate of return of 5% per year before expenses, which is not the fund’s actual return. The hypothetical account values and expenses may not be used to estimate the actual ending account balance or expenses you paid for the period. You may use this information to compare the ongoing costs of investing in the fund and other funds. To do so, compare this 5% hypothetical example with the 5% hypothetical examples that appear in the shareholder reports of the other funds.
Please note that the expenses shown in the table are meant to highlight the fund's ongoing costs only and do not take into account the fees and expenses imposed under the variable contracts through which your investment in the fund is made. Therefore, the second line for each share class in the table is useful in comparing ongoing costs associated with an investment in vehicles (such as the fund) which fund benefits under variable annuity and variable life insurance contracts and to qualified pension and retirement plans only, and will not help you determine the relative total costs of investing in the fund through variable annuity and variable life insurance contracts. If the fees and expenses imposed under the variable contracts were included, your costs would have been higher.
Share
Class | | Annualized
Expense
Ratio | Beginning
Account Value
7/01/20 | Ending
Account Value
12/31/20 | Expenses
Paid During
Period (p)
7/01/20-12/31/20 |
| Initial Class | Actual | 0.61% | $1,000.00 | $1,143.12 | $3.29 |
| Hypothetical (h) | 0.61% | $1,000.00 | $1,022.07 | $3.10 |
| Service Class | Actual | 0.86% | $1,000.00 | $1,141.90 | $4.63 |
| Hypothetical (h) | 0.86% | $1,000.00 | $1,020.81 | $4.37 |
| (h) | 5% class return per year before expenses. |
| (p) | “Expenses Paid During Period” are equal to each class's annualized expense ratio, as shown above, multiplied by the average account value over the period, multiplied by 184/366 (to reflect the one-half year period). |
Portfolio of Investments − 12/31/20
The Portfolio of Investments is a complete list of all securities owned by your fund. It is categorized by broad-based asset classes.
| Issuer | | | Shares/Par | Value ($) |
| Common Stocks – 58.7% |
| Aerospace – 2.4% | |
| Honeywell International, Inc. | | 141,773 | $ 30,155,117 |
| L3Harris Technologies, Inc. | | 59,825 | 11,308,121 |
| Lockheed Martin Corp. | | 25,271 | 8,970,700 |
| Northrop Grumman Corp. | | 34,743 | 10,586,887 |
| | | | | $61,020,825 |
| Alcoholic Beverages – 0.4% | |
| Diageo PLC | | 260,757 | $ 10,305,405 |
| Automotive – 1.1% | |
| Aptiv PLC | | 43,491 | $ 5,666,442 |
| Lear Corp. | | 95,036 | 15,113,575 |
| LKQ Corp. (a) | | 200,041 | 7,049,445 |
| | | | | $27,829,462 |
| Broadcasting – 0.1% | |
| Omnicom Group, Inc. | | 37,504 | $ 2,339,124 |
| Brokerage & Asset Managers – 3.2% | |
| BlackRock, Inc. | | 11,739 | $ 8,470,158 |
| Blackstone Group, Inc. | | 117,331 | 7,604,222 |
| Cboe Global Markets, Inc. | | 87,471 | 8,145,300 |
| Charles Schwab Corp. | | 646,021 | 34,264,954 |
| Invesco Ltd. | | 347,117 | 6,050,249 |
| NASDAQ, Inc. | | 61,354 | 8,144,130 |
| T. Rowe Price Group, Inc. | | 50,451 | 7,637,777 |
| | | | | $80,316,790 |
| Business Services – 2.9% | |
| Accenture PLC, “A” | | 97,369 | $ 25,433,757 |
| Amdocs Ltd. | | 150,626 | 10,683,902 |
| Equifax, Inc. | | 48,187 | 9,292,381 |
| Fidelity National Information Services, Inc. | | 99,094 | 14,017,837 |
| Fiserv, Inc. (a) | | 120,729 | 13,746,204 |
| | | | | $73,174,081 |
| Cable TV – 2.2% | |
| Comcast Corp., “A” | | 1,047,905 | $ 54,910,222 |
| Chemicals – 1.2% | |
| 3M Co. | | 72,203 | $ 12,620,362 |
| PPG Industries, Inc. | | 127,675 | 18,413,289 |
| | | | | $31,033,651 |
| Computer Software – 2.8% | |
| Adobe Systems, Inc. (a) | | 22,252 | $ 11,128,671 |
| Microsoft Corp. | | 229,267 | 50,993,566 |
| Oracle Corp. | | 141,138 | 9,130,217 |
| | | | | $71,252,454 |
| Computer Software - Systems – 0.3% | |
| Apple, Inc. | | 54,252 | $ 7,198,698 |
| Issuer | | | Shares/Par | Value ($) |
| Common Stocks – continued |
| Construction – 1.5% | |
| Masco Corp. | | 364,655 | $ 20,030,499 |
| Otis Worldwide Corp. | | 58,523 | 3,953,229 |
| Stanley Black & Decker, Inc. | | 49,393 | 8,819,614 |
| Vulcan Materials Co. | | 34,897 | 5,175,574 |
| | | | | $37,978,916 |
| Consumer Products – 0.8% | |
| Colgate-Palmolive Co. | | 134,676 | $ 11,516,145 |
| Kimberly-Clark Corp. | | 65,822 | 8,874,780 |
| | | | | $20,390,925 |
| Electrical Equipment – 1.0% | |
| Johnson Controls International PLC | | 527,831 | $ 24,591,646 |
| Electronics – 3.2% | |
| Applied Materials, Inc. | | 125,029 | $ 10,790,003 |
| Intel Corp. | | 407,962 | 20,324,667 |
| NXP Semiconductors N.V. | | 69,035 | 10,977,255 |
| Taiwan Semiconductor Manufacturing Co. Ltd., ADR | | 154,925 | 16,893,022 |
| Texas Instruments, Inc. | | 130,459 | 21,412,236 |
| | | | | $80,397,183 |
| Energy - Independent – 0.9% | |
| ConocoPhillips | | 146,376 | $ 5,853,576 |
| Hess Corp. | | 176,648 | 9,325,248 |
| Pioneer Natural Resources Co. | | 29,148 | 3,319,666 |
| Valero Energy Corp. | | 69,324 | 3,921,659 |
| | | | | $22,420,149 |
| Food & Beverages – 2.4% | |
| Archer Daniels Midland Co. | | 177,205 | $ 8,932,904 |
| Danone S.A. | | 132,712 | 8,715,981 |
| General Mills, Inc. | | 144,184 | 8,478,019 |
| J.M. Smucker Co. | | 41,099 | 4,751,045 |
| Mondelez International, Inc. | | 118,930 | 6,953,837 |
| Nestle S.A. | | 119,865 | 14,116,260 |
| PepsiCo, Inc. | | 56,270 | 8,344,841 |
| | | | | $60,292,887 |
| Food & Drug Stores – 0.6% | |
| Wal-Mart Stores, Inc. | | 105,763 | $ 15,245,736 |
| Health Maintenance Organizations – 1.5% | |
| Cigna Corp. | | 188,747 | $ 39,293,350 |
| Insurance – 3.2% | |
| Aon PLC | | 98,595 | $ 20,830,166 |
| Chubb Ltd. | | 156,222 | 24,045,690 |
| Marsh & McLennan Cos., Inc. | | 67,523 | 7,900,191 |
| Reinsurance Group of America, Inc. | | 40,760 | 4,724,084 |
| Travelers Cos., Inc. | | 106,417 | 14,937,754 |
| Willis Towers Watson PLC | | 37,547 | 7,910,402 |
| | | | | $80,348,287 |
| Internet – 0.4% | |
| Alphabet, Inc., “A” (a) | | 5,741 | $ 10,061,906 |
Portfolio of Investments – continued
| Issuer | | | Shares/Par | Value ($) |
| Common Stocks – continued |
| Leisure & Toys – 0.4% | |
| Electronic Arts, Inc. | | 68,298 | $ 9,807,593 |
| Machinery & Tools – 2.4% | |
| Caterpillar, Inc. | | 59,812 | $ 10,886,980 |
| Eaton Corp. PLC | | 270,966 | 32,553,855 |
| Ingersoll Rand, Inc. (a) | | 208,472 | 9,497,985 |
| Trane Technologies PLC | | 61,742 | 8,962,469 |
| | | | | $61,901,289 |
| Major Banks – 5.1% | |
| Bank of America Corp. | | 907,031 | $ 27,492,109 |
| Goldman Sachs Group, Inc. | | 179,963 | 47,458,043 |
| JPMorgan Chase & Co. | | 323,869 | 41,154,034 |
| PNC Financial Services Group, Inc. | | 86,363 | 12,868,087 |
| | | | | $128,972,273 |
| Medical & Health Technology & Services – 1.2% | |
| McKesson Corp. | | 87,383 | $ 15,197,651 |
| Quest Diagnostics, Inc. | | 128,941 | 15,365,899 |
| | | | | $30,563,550 |
| Medical Equipment – 3.2% | |
| Becton, Dickinson and Co. | | 35,806 | $ 8,959,377 |
| Danaher Corp. | | 116,793 | 25,944,397 |
| Medtronic PLC | | 249,620 | 29,240,487 |
| Thermo Fisher Scientific, Inc. | | 38,251 | 17,816,551 |
| | | | | $81,960,812 |
| Metals & Mining – 0.2% | |
| Rio Tinto PLC | | 76,395 | $ 5,714,521 |
| Natural Gas - Distribution – 0.1% | |
| Sempra Energy | | 27,055 | $ 3,447,078 |
| Natural Gas - Pipeline – 0.3% | |
| Enterprise Products Partners LP | | 395,491 | $ 7,747,669 |
| Other Banks & Diversified Financials – 2.3% | |
| Northern Trust Corp. | | 87,784 | $ 8,176,202 |
| Truist Financial Corp. | | 659,698 | 31,619,325 |
| U.S. Bancorp | | 383,442 | 17,864,563 |
| | | | | $57,660,090 |
| Pharmaceuticals – 4.1% | |
| Bayer AG | | 77,796 | $ 4,576,627 |
| Eli Lilly & Co. | | 67,236 | 11,352,126 |
| Johnson & Johnson | | 304,259 | 47,884,282 |
| Merck & Co., Inc. | | 321,683 | 26,313,669 |
| Roche Holding AG | | 38,315 | 13,373,246 |
| | | | | $103,499,950 |
| Railroad & Shipping – 1.1% | |
| Union Pacific Corp. | | 140,146 | $ 29,181,200 |
| Real Estate – 0.5% | |
| Public Storage, Inc., REIT | | 17,692 | $ 4,085,613 |
| STORE Capital Corp., REIT | | 289,905 | 9,850,972 |
| | | | | $13,936,585 |
| Issuer | | | Shares/Par | Value ($) |
| Common Stocks – continued |
| Specialty Chemicals – 0.7% | |
| Axalta Coating Systems Ltd. (a) | | 278,343 | $ 7,946,692 |
| DuPont de Nemours, Inc. | | 132,071 | 9,391,569 |
| | | | | $17,338,261 |
| Specialty Stores – 1.0% | |
| Home Depot, Inc. | | 36,294 | $ 9,640,412 |
| Target Corp. | | 83,813 | 14,795,509 |
| | | | | $24,435,921 |
| Telecommunications - Wireless – 0.4% | |
| T-Mobile USA, Inc. (a) | | 78,141 | $ 10,537,314 |
| Tobacco – 1.0% | |
| Philip Morris International, Inc. | | 314,901 | $ 26,070,654 |
| Trucking – 0.2% | |
| United Parcel Service, Inc., “B” | | 35,942 | $ 6,052,633 |
| Utilities - Electric Power – 2.4% | |
| Duke Energy Corp. | | 225,081 | $ 20,608,416 |
| Exelon Corp. | | 251,327 | 10,611,026 |
| PG&E Corp. (a) | | 438,478 | 5,463,436 |
| Pinnacle West Capital Corp. | | 71,579 | 5,722,741 |
| Southern Co. | | 287,906 | 17,686,066 |
| | | | | $60,091,685 |
| Total Common Stocks (Identified Cost, $882,340,041) | | $ 1,489,320,775 |
| Bonds – 38.9% |
| Aerospace – 0.3% |
| BAE Systems PLC, 3.4%, 4/15/2030 (n) | | $ | 1,108,000 | $ 1,254,569 |
| Huntington Ingalls Industries, Inc., 3.844%, 5/01/2025 | | | 591,000 | 657,194 |
| L3Harris Technologies, Inc., 3.85%, 6/15/2023 | | | 2,506,000 | 2,706,686 |
| Raytheon Technologies Corp., 4.125%, 11/16/2028 | | | 1,778,000 | 2,118,727 |
| | | | | $6,737,176 |
| Apparel Manufacturers – 0.0% |
| NIKE, Inc., “B”, 3.25%, 3/27/2040 | | $ | 880,000 | $ 1,022,170 |
| Asset-Backed & Securitized – 4.3% |
| ALM Loan Funding, CLO, 2013-7R2A, “A1B2”, FLR, 1.636% (LIBOR - 3mo. + 1.4%), 10/15/2027 (n) | | $ | 4,410,000 | $ 4,313,765 |
| Arbor Realty Trust, Inc., CLO, 2020-FL1, “AS”, FLR, 1.559% (LIBOR - 1mo. + 1.4%), 2/15/2035 (n) | | | 1,150,000 | 1,134,245 |
| AREIT CRE Trust, 2018-CRE2, “A”, FLR, 1.133% (LIBOR - 1mo. + 0.98%), 11/14/2035 (n) | | | 1,562,971 | 1,547,494 |
| AREIT CRE Trust, 2019-CRE3, “AS”, FLR, 1.453% (LIBOR - 1mo. + 1.3%), 9/14/2036 (n) | | | 3,366,000 | 3,298,932 |
| Avis Budget Rental Car Funding LLC, 2019-1A, “A”, 3.45%, 3/20/2023 (n) | | | 3,880,000 | 3,982,376 |
Portfolio of Investments – continued
| Issuer | | | Shares/Par | Value ($) |
| Bonds – continued |
| Asset-Backed & Securitized – continued |
| Bancorp Commercial Mortgage Trust, 2018-CRE4, “A”, FLR, 1.059% (LIBOR - 1mo. + 0.9%), 9/15/2035 (n) | | $ | 114,740 | $ 113,845 |
| Bancorp Commercial Mortgage Trust, 2019-CRE6, “AS”, FLR, 1.458% (LIBOR - 1mo. + 1.3%), 9/15/2036 (n) | | | 3,469,924 | 3,348,209 |
| Bayview Financial Revolving Mortgage Loan Trust, FLR, 1.746% (LIBOR - 1mo. + 1.6%), 12/28/2040 (n) | | | 1,015,973 | 1,056,307 |
| BDS Ltd., 2019-FL4, “A”, FLR, 1.253% (LIBOR - 1mo. + 1.10%), 8/15/2036 (n) | | | 2,416,000 | 2,412,980 |
| Chesapeake Funding II LLC, 2018-1A, “A1”, 3.04%, 4/15/2030 (n) | | | 553,388 | 559,029 |
| Commercial Mortgage Pass-Through Certificates, 2019-BN17, “A4”, 3.714%, 4/15/2052 | | | 2,789,000 | 3,236,035 |
| Commercial Mortgage Trust, 2015-LC21, “A4”, 3.708%, 7/10/2048 | | | 3,980,975 | 4,453,107 |
| CSAIL Commercial Mortgage Trust, 2015-C2, “A4”, 3.504%, 6/15/2057 | | | 2,316,427 | 2,549,460 |
| Cutwater Ltd., 2015-1A, “AR”, FLR, 1.457% (LIBOR - 3mo. + 1.22%), 1/15/2029 (n) | | | 4,318,599 | 4,301,450 |
| Dryden Senior Loan Fund, 2013-26A, “AR”, CLO, FLR, 1.137% (LIBOR - 3mo. + 0.9%), 4/15/2029 (n) | | | 2,088,000 | 2,076,769 |
| Dryden Senior Loan Fund, 2018-55A, “A1”, CLO, FLR, 1.256% (LIBOR - 3mo. + 1.02%), 4/15/2031 (n) | | | 4,414,000 | 4,388,081 |
| Exantas Capital Corp. CLO Ltd., 2019-RS07, “A”, FLR, 1.153% (LIBOR - 1mo. + 1%), 4/15/2036 (n) | | | 285,735 | 282,099 |
| Exeter Automobile Receivables Trust, 2020-1, 2.26%, 4/15/2024 (n) | | | 720,000 | 729,913 |
| Figueroa CLO Ltd., 2014-1A, “BR”, FLR, 1.737% (LIBOR - 3mo. + 1.5%), 1/15/2027 (n) | | | 1,330,000 | 1,333,325 |
| Fort CRE LLC, 2018-1A, “A1”, FLR, 1.495% (LIBOR - 1mo. + 1.35%), 11/16/2035 (n) | | | 1,638,500 | 1,625,592 |
| GLS Auto Receivables Trust, 2020-1A, “A”, 2.17%, 2/15/2024 (n) | | | 626,704 | 633,419 |
| GMAC Mortgage Corp. Loan Trust, FGIC, 5.805%, 10/25/2036 | | | 237,114 | 248,487 |
| GS Mortgage Securities Trust, 2015-GC30, “A4”, 3.382%, 5/10/2050 | | | 4,243,101 | 4,684,269 |
| GS Mortgage Securities Trust, 2019-GSA1, “A4”, 3.047%, 11/10/2052 | | | 2,182,474 | 2,441,808 |
| GS Mortgage Securities Trust, 2020-GC45, “A5”, 2.91%, 2/13/2053 | | | 2,001,659 | 2,215,706 |
| JPMBB Commercial Mortgage Securities Trust, 2014-C26, 3.494%, 1/15/2048 | | | 4,880,000 | 5,365,417 |
| Issuer | | | Shares/Par | Value ($) |
| Bonds – continued |
| Asset-Backed & Securitized – continued |
| JPMBB Commercial Mortgage Securities Trust, 2015-C28, “A4”, 3.227%, 10/15/2048 | | $ | 3,256,792 | $ 3,548,368 |
| KKR Real Estate Financial Trust, Inc., 2018-FL1, “A”, FLR, 1.252% (LIBOR - 1mo. + 1.1%), 6/15/2036 (n) | | | 2,180,000 | 2,175,991 |
| MF1 CLO Ltd., 2019-FL2, “A”, FLR, 1.278% (LIBOR - 1mo. + 1.13%), 12/25/2034 (n) | | | 4,395,000 | 4,353,981 |
| MF1 Multi-Family Housing Mortgage Loan Trust, 2020-FL4, “A”, FLR, 1.858% (LIBOR - 1mo. + 1.7%), 11/15/2035 (n) | | | 1,701,000 | 1,702,456 |
| Morgan Stanley Bank of America Merrill Lynch Trust, 2017-C34, “A4”, 3.536%, 11/15/2052 | | | 1,600,004 | 1,816,234 |
| Morgan Stanley Capital I Trust, 2017-H1, “A5”, 3.53%, 6/15/2050 | | | 1,456,742 | 1,652,069 |
| Mountain Hawk CLO Ltd., 2014-3A, “BR”, FLR, 2.018% (LIBOR - 3mo. + 1.8%), 4/18/2025 (n) | | | 4,534,203 | 4,545,158 |
| Neuberger Berman CLO Ltd., 2015-20, “AR”, FLR, 1.036% (LIBOR - 3mo. + 0.8%), 1/15/2028 (n) | | | 1,694,770 | 1,685,615 |
| Oaktree CLO Ltd., 2015-1A, “A2AR”, FLR, 1.568% (LIBOR - 3mo. + 1.35%), 10/20/2027 (n) | | | 809,537 | 802,246 |
| Residential Funding Mortgage Securities, Inc., FGIC, 5.32%, 12/25/2035 | | | 137,100 | 139,275 |
| Santander Retail Auto Lease Trust, 2020-A, “B”, 1.88%, 3/20/2024 (n) | | | 1,631,000 | 1,674,662 |
| Sound Point CLO Ltd., 2015-3A, “AR”, FLR, 1.108% (LIBOR - 3mo. + 0.89%), 1/20/2028 (n) | | | 354,244 | 353,704 |
| UBS Commercial Mortgage Trust, 2017-C8, “A4”, 3.983%, 2/15/2051 | | | 2,950,000 | 3,426,878 |
| UBS Commercial Mortgage Trust, 2019-C17, “A4”, 2.921%, 10/15/2052 | | | 2,461,404 | 2,695,598 |
| Venture Corp. Ltd., FLR, 1.424% (LIBOR - 3mo. + 1.2%), 2/28/2026 (n) | | | 4,608,000 | 4,583,158 |
| Verizon Owner Trust, 2020-A, “B”, 1.98%, 7/22/2024 | | | 2,616,000 | 2,701,474 |
| Veros Auto Receivables Trust, 2020-1, “A”, 1.67%, 9/15/2023 (n) | | | 1,135,277 | 1,138,709 |
| Wells Fargo Commercial Mortgage Trust, 2015-C28, “A4”, 3.54%, 5/15/2048 | | | 4,315,766 | 4,792,359 |
| Wells Fargo Commercial Mortgage Trust, 2019-C54, “A4”, 3.146%, 12/15/2052 | | | 3,579,870 | 4,031,104 |
| | | | | $110,151,158 |
Portfolio of Investments – continued
| Issuer | | | Shares/Par | Value ($) |
| Bonds – continued |
| Automotive – 0.8% |
| General Motors Co., 6.75%, 4/01/2046 | | $ | 1,124,000 | $ 1,621,425 |
| General Motors Financial Co., Inc., 4.35%, 4/09/2025 | | | 640,000 | 714,358 |
| General Motors Financial Co., Inc., 2.75%, 6/20/2025 | | | 1,174,000 | 1,255,112 |
| Hyundai Capital America, 2.65%, 2/10/2025 (n) | | | 1,073,000 | 1,136,570 |
| Hyundai Capital America, 3%, 2/10/2027 (n) | | | 1,846,000 | 2,003,213 |
| Lear Corp., 3.8%, 9/15/2027 | | | 2,474,000 | 2,774,331 |
| Lear Corp., 4.25%, 5/15/2029 | | | 875,000 | 999,395 |
| Magna International, Inc., 2.45%, 6/15/2030 | | | 2,523,000 | 2,712,465 |
| Toyota Motor Credit Corp., 3.375%, 4/01/2030 | | | 1,286,000 | 1,503,728 |
| Volkswagen Group of America Finance LLC, 3.35%, 5/13/2025 (n) | | | 4,482,000 | 4,926,339 |
| | | | | $19,646,936 |
| Broadcasting – 0.2% |
| RELX Capital, Inc., 3%, 5/22/2030 | | $ | 707,000 | $ 784,649 |
| Walt Disney Co., 3.5%, 5/13/2040 | | | 1,654,000 | 1,941,571 |
| Walt Disney Co., 3.6%, 1/13/2051 | | | 1,015,000 | 1,229,677 |
| | | | | $3,955,897 |
| Brokerage & Asset Managers – 0.5% |
| E*TRADE Financial Corp., 2.95%, 8/24/2022 | | $ | 750,000 | $ 778,936 |
| E*TRADE Financial Corp., 4.5%, 6/20/2028 | | | 1,107,000 | 1,330,300 |
| Intercontinental Exchange, Inc., 2.35%, 9/15/2022 | | | 410,000 | 423,235 |
| Intercontinental Exchange, Inc., 4%, 10/15/2023 | | | 1,061,000 | 1,165,880 |
| Intercontinental Exchange, Inc., 2.1%, 6/15/2030 | | | 2,439,000 | 2,551,438 |
| Intercontinental Exchange, Inc., 1.85%, 9/15/2032 | | | 723,000 | 728,847 |
| National Securities Clearing Corp., 1.5%, 4/23/2025 (n) | | | 1,462,000 | 1,513,101 |
| Raymond James Financial, Inc., 4.95%, 7/15/2046 | | | 2,325,000 | 3,181,279 |
| | | | | $11,673,016 |
| Building – 0.2% |
| CRH America Finance, Inc., 4.5%, 4/04/2048 (n) | | $ | 1,146,000 | $ 1,441,934 |
| Martin Marietta Materials, Inc., 3.5%, 12/15/2027 | | | 927,000 | 1,050,010 |
| Martin Marietta Materials, Inc., 2.5%, 3/15/2030 | | | 258,000 | 276,046 |
| Masco Corp., 4.375%, 4/01/2026 | | | 1,938,000 | 2,274,930 |
| Vulcan Materials Co., 3.5%, 6/01/2030 | | | 437,000 | 501,678 |
| | | | | $5,544,598 |
| Issuer | | | Shares/Par | Value ($) |
| Bonds – continued |
| Business Services – 0.5% |
| Equinix, Inc., 2.625%, 11/18/2024 | | $ | 3,239,000 | $ 3,461,949 |
| Equinix, Inc., 1.8%, 7/15/2027 | | | 2,070,000 | 2,129,952 |
| Fiserv, Inc., 2.65%, 6/01/2030 | | | 489,000 | 528,771 |
| Fiserv, Inc., 4.4%, 7/01/2049 | | | 1,654,000 | 2,211,666 |
| Tencent Holdings Ltd., 2.39%, 6/03/2030 (n) | | | 1,814,000 | 1,859,713 |
| Verisk Analytics, Inc., 4.125%, 3/15/2029 | | | 2,462,000 | 2,957,275 |
| | | | | $13,149,326 |
| Cable TV – 0.3% |
| Charter Communications Operating LLC/Charter Communications Operating Capital Corp., 5.375%, 5/01/2047 | | $ | 491,000 | $ 611,913 |
| Comcast Corp., 2.8%, 1/15/2051 | | | 1,055,000 | 1,096,654 |
| Cox Communications, Inc., 1.8%, 10/01/2030 (n) | | | 1,514,000 | 1,511,535 |
| Time Warner Entertainment Co. LP, 8.375%, 7/15/2033 | | | 2,855,000 | 4,413,807 |
| | | | | $7,633,909 |
| Chemicals – 0.1% |
| Sherwin-Williams Co., 4.5%, 6/01/2047 | | $ | 1,201,000 | $ 1,603,860 |
| Computer Software – 0.2% |
| Dell International LLC/EMC Corp., 4.9%, 10/01/2026 (n) | | $ | 1,857,000 | $ 2,192,291 |
| Microsoft Corp., 2.525%, 6/01/2050 | | | 2,278,000 | 2,397,415 |
| | | | | $4,589,706 |
| Computer Software - Systems – 0.2% |
| Apple, Inc., 2.85%, 5/11/2024 | | $ | 2,162,000 | $ 2,330,681 |
| Apple, Inc., 2.05%, 9/11/2026 | | | 432,000 | 461,829 |
| Apple, Inc., 3.35%, 2/09/2027 | | | 647,000 | 737,818 |
| Apple, Inc., 3.85%, 5/04/2043 | | | 1,303,000 | 1,643,662 |
| | | | | $5,173,990 |
| Conglomerates – 0.4% |
| Carrier Global Corp., 3.377%, 4/05/2040 | | $ | 3,320,000 | $ 3,622,270 |
| Roper Technologies, Inc., 4.2%, 9/15/2028 | | | 900,000 | 1,072,977 |
| Roper Technologies, Inc., 2.95%, 9/15/2029 | | | 551,000 | 605,049 |
| Roper Technologies, Inc., 2%, 6/30/2030 | | | 1,731,000 | 1,768,294 |
| Westinghouse Air Brake Technologies Corp., 3.2%, 6/15/2025 | | | 920,000 | 992,355 |
| Westinghouse Air Brake Technologies Corp., 4.95%, 9/15/2028 | | | 2,041,000 | 2,420,466 |
| | | | | $10,481,411 |
Portfolio of Investments – continued
| Issuer | | | Shares/Par | Value ($) |
| Bonds – continued |
| Consumer Products – 0.3% |
| Estee Lauder Cos., Inc., 2.6%, 4/15/2030 | | $ | 1,048,000 | $ 1,150,432 |
| Kimberly-Clark Corp., 3.1%, 3/26/2030 | | | 290,000 | 333,782 |
| Reckitt Benckiser Treasury Services PLC, 3.625%, 9/21/2023 (n) | | | 3,463,000 | 3,728,132 |
| Reckitt Benckiser Treasury Services PLC, 2.75%, 6/26/2024 (n) | | | 1,097,000 | 1,173,023 |
| | | | | $6,385,369 |
| Consumer Services – 0.7% |
| Amazon.com, Inc., 2.5%, 6/03/2050 | | $ | 1,806,000 | $ 1,870,082 |
| Booking Holdings, Inc., 2.75%, 3/15/2023 | | | 3,809,000 | 3,994,856 |
| Booking Holdings, Inc., 4.5%, 4/13/2027 | | | 524,000 | 624,608 |
| Experian Finance PLC, 4.25%, 2/01/2029 (n) | | | 1,699,000 | 2,044,524 |
| IHS Markit Ltd., 3.625%, 5/01/2024 | | | 385,000 | 419,950 |
| IHS Markit Ltd., 4.75%, 2/15/2025 (n) | | | 634,000 | 727,578 |
| IHS Markit Ltd., 4%, 3/01/2026 (n) | | | 1,991,000 | 2,280,890 |
| IHS Markit Ltd., 4.25%, 5/01/2029 | | | 578,000 | 702,189 |
| Visa, Inc., 3.15%, 12/14/2025 | | | 4,677,000 | 5,245,755 |
| Western Union Co., 2.85%, 1/10/2025 | | | 660,000 | 708,886 |
| | | | | $18,619,318 |
| Electronics – 0.4% |
| Broadcom Corp./Broadcom Cayman Finance Ltd., 3.5%, 1/15/2028 | | $ | 3,096,000 | $ 3,411,057 |
| Broadcom, Inc., 4.25%, 4/15/2026 | | | 1,367,000 | 1,565,887 |
| Broadcom, Inc., 4.15%, 11/15/2030 | | | 678,000 | 783,743 |
| Broadcom, Inc., 4.3%, 11/15/2032 | | | 1,765,000 | 2,091,084 |
| Intel Corp., 4.75%, 3/25/2050 | | | 2,420,000 | 3,371,435 |
| | | | | $11,223,206 |
| Energy - Integrated – 0.2% |
| Eni S.p.A., 4.75%, 9/12/2028 (n) | | $ | 1,944,000 | $ 2,376,153 |
| Total Capital International S.A., 3.127%, 5/29/2050 | | | 1,962,000 | 2,122,322 |
| | | | | $4,498,475 |
| Financial Institutions – 0.3% |
| AerCap Ireland Capital DAC, 4.875%, 1/16/2024 | | $ | 362,000 | $ 395,080 |
| AerCap Ireland Capital DAC, 3.65%, 7/21/2027 | | | 2,789,000 | 3,038,317 |
| Avolon Holdings Funding Ltd., 4.375%, 5/01/2026 (n) | | | 776,000 | 840,414 |
| Avolon Holdings Funding Ltd., 3.25%, 2/15/2027 (n) | | | 830,000 | 846,547 |
| Park Aerospace Holdings Ltd., 5.5%, 2/15/2024 (n) | | | 2,584,000 | 2,817,820 |
| | | | | $7,938,178 |
| Issuer | | | Shares/Par | Value ($) |
| Bonds – continued |
| Food & Beverages – 0.7% |
| Anheuser-Busch InBev S.A., 8%, 11/15/2039 | | $ | 2,610,000 | $ 4,416,673 |
| Constellation Brands, Inc., 3.5%, 5/09/2027 | | | 3,365,000 | 3,794,842 |
| Diageo Capital PLC, 2.375%, 10/24/2029 | | | 3,022,000 | 3,251,601 |
| General Mills, Inc., 4%, 4/17/2025 | | | 2,414,000 | 2,728,506 |
| General Mills, Inc., 2.875%, 4/15/2030 | | | 499,000 | 552,992 |
| Keurig Dr Pepper, Inc., 3.2%, 5/01/2030 | | | 409,000 | 462,835 |
| Keurig Dr Pepper, Inc., 3.8%, 5/01/2050 | | | 833,000 | 995,894 |
| Mondelez International, Inc., 1.5%, 2/04/2031 | | | 574,000 | 566,760 |
| PepsiCo, Inc., 3.5%, 3/19/2040 | | | 646,000 | 773,809 |
| | | | | $17,543,912 |
| Gaming & Lodging – 0.2% |
| GLP Capital LP/GLP Financing II, Inc., 5.3%, 1/15/2029 | | $ | 1,804,000 | $ 2,099,171 |
| Las Vegas Sands Corp., 3.9%, 8/08/2029 | | | 1,044,000 | 1,122,228 |
| Marriott International, Inc., 4%, 4/15/2028 | | | 2,208,000 | 2,441,471 |
| Marriott International, Inc., 4.625%, 6/15/2030 | | | 287,000 | 336,617 |
| | | | | $5,999,487 |
| Insurance – 0.3% |
| AIA Group Ltd., 3.375%, 4/07/2030 (n) | | $ | 731,000 | $ 818,943 |
| American International Group, Inc., 4.875%, 6/01/2022 | | | 3,566,000 | 3,783,284 |
| American International Group, Inc., 4.125%, 2/15/2024 | | | 2,620,000 | 2,900,535 |
| | | | | $7,502,762 |
| Insurance - Health – 0.0% |
| UnitedHealth Group, Inc., 3.5%, 8/15/2039 | | $ | 833,000 | $ 989,620 |
| Insurance - Property & Casualty – 0.3% |
| Aon Corp., 3.75%, 5/02/2029 | | $ | 2,594,000 | $ 3,024,742 |
| Hartford Financial Services Group, Inc., 3.6%, 8/19/2049 | | | 1,068,000 | 1,250,991 |
| Liberty Mutual Group, Inc., 3.951%, 10/15/2050 (n) | | | 1,233,000 | 1,473,878 |
| Marsh & McLennan Cos., Inc., 4.75%, 3/15/2039 | | | 944,000 | 1,269,009 |
| | | | | $7,018,620 |
| International Market Quasi-Sovereign – 0.3% |
| Temasek Financial I Ltd. (Republic of Singapore), 2.375%, 1/23/2023 (n) | | $ | 6,400,000 | $ 6,660,151 |
| Internet – 0.0% |
| Alphabet, Inc., 1.9%, 8/15/2040 | | $ | 1,079,000 | $ 1,057,321 |
Portfolio of Investments – continued
| Issuer | | | Shares/Par | Value ($) |
| Bonds – continued |
| Machinery & Tools – 0.1% |
| CNH Industrial Capital LLC, 4.2%, 1/15/2024 | | $ | 1,901,000 | $ 2,084,971 |
| CNH Industrial Capital LLC, 1.875%, 1/15/2026 | | | 513,000 | 537,115 |
| | | | | $2,622,086 |
| Major Banks – 2.0% |
| Bank of America Corp., 4.1%, 7/24/2023 | | $ | 3,870,000 | $ 4,235,133 |
| Bank of America Corp., 4.125%, 1/22/2024 | | | 5,102,000 | 5,664,818 |
| Bank of America Corp., 3.366% to 1/23/2025, FLR (LIBOR - 3mo. + 0.81%) to 1/23/2026 | | | 1,842,000 | 2,027,485 |
| Bank of America Corp., 3.5%, 4/19/2026 | | | 1,542,000 | 1,747,182 |
| Bank of America Corp., 2.676% to 6/19/2040, FLR (SOFR + 1.93%) to 6/19/2041 | | | 2,249,000 | 2,339,645 |
| Bank of New York Mellon Corp., 1.6%, 4/24/2025 | | | 2,086,000 | 2,180,430 |
| Goldman Sachs Group, Inc., 2.6%, 2/07/2030 | | | 3,245,000 | 3,490,192 |
| JPMorgan Chase & Co., 3.2%, 1/25/2023 | | | 5,489,000 | 5,810,415 |
| JPMorgan Chase & Co., 3.782% to 2/01/2027, FLR (LIBOR - 3mo. + 1.337%) to 2/01/2028 | | | 4,188,000 | 4,814,380 |
| JPMorgan Chase & Co., 2.956% to 5/13/2030, FLR (SOFR + 2.515%) to 5/13/2031 | | | 637,000 | 698,302 |
| JPMorgan Chase & Co., 3.109% to 4/22/2040, FLR (SOFR + 2.46%) to 4/22/2041 | | | 3,251,000 | 3,628,633 |
| JPMorgan Chase & Co., 3.897% to 1/23/2048, FLR (LIBOR - 3mo. + 1.22%) to 1/23/2049 | | | 1,248,000 | 1,570,577 |
| Morgan Stanley, 3.125%, 1/23/2023 | | | 424,000 | 447,453 |
| Morgan Stanley, 3.875%, 4/29/2024 | | | 1,539,000 | 1,703,676 |
| Morgan Stanley, 4%, 7/23/2025 | | | 1,206,000 | 1,380,445 |
| Morgan Stanley, 2.699% to 1/22/2030, FLR (SOFR + 1.143%) to 1/22/2031 | | | 4,760,000 | 5,164,545 |
| PNC Bank N.A., 2.7%, 10/22/2029 | | | 835,000 | 912,497 |
| Royal Bank of Canada, 1.15%, 6/10/2025 | | | 3,142,000 | 3,210,058 |
| State Street Corp., 2.901% to 3/30/2025, FLR (SOFR + 2.6%) to 3/30/2026 | | | 464,000 | 505,347 |
| | | | | $51,531,213 |
| Medical & Health Technology & Services – 0.8% |
| Alcon, Inc., 2.6%, 5/27/2030 (n) | | $ | 302,000 | $ 321,639 |
| Alcon, Inc., 3.8%, 9/23/2049 (n) | | | 1,564,000 | 1,841,857 |
| Becton, Dickinson and Co., 3.125%, 11/08/2021 | | | 1,075,000 | 1,098,816 |
| Becton, Dickinson and Co., 4.669%, 6/06/2047 | | | 2,043,000 | 2,678,276 |
| Cigna Corp., 3.2%, 3/15/2040 | | | 635,000 | 695,368 |
| HCA, Inc., 5.125%, 6/15/2039 | | | 2,562,000 | 3,274,307 |
| Issuer | | | Shares/Par | Value ($) |
| Bonds – continued |
| Medical & Health Technology & Services – continued |
| Laboratory Corp. of America Holdings, 3.2%, 2/01/2022 | | $ | 660,000 | $ 679,629 |
| Laboratory Corp. of America Holdings, 3.25%, 9/01/2024 | | | 1,672,000 | 1,819,512 |
| Laboratory Corp. of America Holdings, 4.7%, 2/01/2045 | | | 1,590,000 | 2,083,882 |
| Northwell Healthcare, Inc., 3.979%, 11/01/2046 | | | 171,000 | 195,721 |
| Northwell Healthcare, Inc., 4.26%, 11/01/2047 | | | 1,367,000 | 1,637,456 |
| Thermo Fisher Scientific, Inc., 2.95%, 9/19/2026 | | | 1,333,000 | 1,485,626 |
| Thermo Fisher Scientific, Inc., 3.2%, 8/15/2027 | | | 2,566,000 | 2,883,369 |
| | | | | $20,695,458 |
| Medical Equipment – 0.3% |
| Boston Scientific Corp., 3.75%, 3/01/2026 | | $ | 2,680,000 | $ 3,040,696 |
| Zimmer Biomet Holdings, Inc., 3.55%, 4/01/2025 | | | 2,940,000 | 3,246,918 |
| | | | | $6,287,614 |
| Metals & Mining – 0.2% |
| Anglo American Capital PLC, 5.625%, 4/01/2030 (n) | | $ | 1,071,000 | $ 1,363,276 |
| Anglo American Capital PLC, 2.625%, 9/10/2030 (n) | | | 3,071,000 | 3,209,524 |
| Glencore Funding LLC, 4.125%, 5/30/2023 (n) | | | 1,412,000 | 1,527,007 |
| | | | | $6,099,807 |
| Midstream – 0.6% |
| Cheniere Corpus Christi Holdings LLC, 3.7%, 11/15/2029 | | $ | 1,727,000 | $ 1,921,677 |
| Enbridge, Inc., 2.5%, 1/15/2025 | | | 1,100,000 | 1,177,589 |
| Enterprise Products Operating LLC, 4.2%, 1/31/2050 | | | 882,000 | 1,034,404 |
| Kinder Morgan Energy Partners LP, 4.15%, 2/01/2024 | | | 1,369,000 | 1,495,002 |
| ONEOK, Inc., 4.95%, 7/13/2047 | | | 2,637,000 | 2,941,916 |
| Plains All American Pipeline LP, 3.8%, 9/15/2030 | | | 1,781,000 | 1,913,651 |
| Sabine Pass Liquefaction LLC, 5%, 3/15/2027 | | | 1,769,000 | 2,085,066 |
| Sabine Pass Liquefaction LLC, 4.5%, 5/15/2030 (n) | | | 585,000 | 693,043 |
| Spectra Energy Partners LP, 3.375%, 10/15/2026 | | | 942,000 | 1,055,773 |
| | | | | $14,318,121 |
| Mortgage-Backed – 12.2% | |
| Fannie Mae, 5.5%, 1/01/2021-4/01/2040 | | $ | 7,024,578 | $ 8,102,706 |
| Fannie Mae, 6%, 1/01/2021-7/01/2037 | | | 3,751,473 | 4,386,156 |
| Fannie Mae, 2.59%, 5/01/2023 | | | 431,768 | 447,855 |
| Fannie Mae, 5%, 12/01/2023-3/01/2041 | | | 2,916,298 | 3,366,080 |
Portfolio of Investments – continued
| Issuer | | | Shares/Par | Value ($) |
| Bonds – continued |
| Mortgage-Backed – continued | |
| Fannie Mae, 3.5%, 5/25/2025-7/01/2046 | | $ | 19,138,553 | $ 20,712,338 |
| Fannie Mae, 2.7%, 7/01/2025 | | | 367,000 | 397,666 |
| Fannie Mae, 3.43%, 6/01/2026 | | | 557,231 | 622,455 |
| Fannie Mae, 2.28%, 11/01/2026 | | | 464,465 | 497,982 |
| Fannie Mae, 2.583%, 12/25/2026 | | | 1,585,000 | 1,738,706 |
| Fannie Mae, 3%, 11/01/2028-9/01/2050 | | | 16,939,300 | 18,007,281 |
| Fannie Mae, 6.5%, 6/01/2031-7/01/2037 | | | 1,239,095 | 1,435,540 |
| Fannie Mae, 2.5%, 11/01/2031-12/01/2050 | | | 6,443,403 | 6,822,406 |
| Fannie Mae, 3%, 2/25/2033 (i) | | | 466,990 | 49,552 |
| Fannie Mae, 4.5%, 8/01/2033-6/01/2044 | | | 7,126,335 | 7,968,273 |
| Fannie Mae, 3.25%, 5/25/2040 | | | 186,198 | 201,906 |
| Fannie Mae, 4%, 9/01/2040-6/01/2047 | | | 13,794,196 | 15,072,282 |
| Fannie Mae, 2%, 10/25/2040-4/25/2046 | | | 751,440 | 771,753 |
| Fannie Mae, 4%, 7/25/2046 (i) | | | 417,810 | 78,286 |
| Fannie Mae, TBA, 1.5%, 1/16/2036-1/14/2051 | | | 6,075,000 | 6,171,271 |
| Fannie Mae, TBA, 3%, 1/16/2036-2/12/2051 | | | 16,150,000 | 16,926,599 |
| Fannie Mae, TBA, 2%, 1/25/2036-2/12/2051 | | | 28,150,000 | 29,253,135 |
| Fannie Mae, TBA, 2.5%, 1/25/2036-2/25/2051 | | | 20,025,000 | 21,026,327 |
| Fannie Mae, TBA, 3.5%, 1/14/2051 | | | 3,850,000 | 4,069,165 |
| Fannie Mae, TBA, 4%, 1/25/2051 | | | 1,275,000 | 1,361,558 |
| Freddie Mac, 6%, 5/01/2021-6/01/2037 | | | 1,428,257 | 1,674,580 |
| Freddie Mac, 5.5%, 10/01/2021-2/01/2037 | | | 1,100,826 | 1,269,237 |
| Freddie Mac, 5%, 12/01/2021-1/15/2040 | | | 1,819,355 | 2,105,351 |
| Freddie Mac, 2.791%, 1/25/2022 | | | 1,485,000 | 1,515,023 |
| Freddie Mac, 2.51%, 11/25/2022 | | | 1,503,000 | 1,551,993 |
| Freddie Mac, 3.111%, 2/25/2023 | | | 2,136,000 | 2,247,079 |
| Freddie Mac, 3.32%, 2/25/2023 | | | 745,000 | 787,854 |
| Freddie Mac, 3.25%, 4/25/2023 | | | 2,474,000 | 2,617,776 |
| Freddie Mac, 3.06%, 7/25/2023 | | | 175,000 | 185,868 |
| Freddie Mac, 3.458%, 8/25/2023 | | | 1,642,000 | 1,762,339 |
| Freddie Mac, 0.879%, 4/25/2024 (i) | | | 5,291,250 | 121,505 |
| Freddie Mac, 0.503%, 7/25/2024 (i) | | | 14,179,000 | 249,652 |
| Freddie Mac, 0.604%, 7/25/2024 (i) | | | 5,069,632 | 83,467 |
| Freddie Mac, 4.5%, 8/01/2024-5/01/2042 | | | 1,367,502 | 1,518,031 |
| Freddie Mac, 0.315%, 8/25/2024 (i) | | | 15,246,000 | 193,923 |
| Freddie Mac, 0.412%, 8/25/2024 (i) | | | 27,879,628 | 342,855 |
| Freddie Mac, 3.064%, 8/25/2024 | | | 794,000 | 859,191 |
| Freddie Mac, 0.362%, 10/25/2024 (i) | | | 20,156,212 | 226,058 |
| Freddie Mac, 3.171%, 10/25/2024 | | | 1,304,000 | 1,429,811 |
| Freddie Mac, 0.276%, 11/25/2024 (i) | | | 15,385,000 | 168,418 |
| Freddie Mac, 2.67%, 12/25/2024 | | | 1,561,000 | 1,686,344 |
| Freddie Mac, 3.329%, 5/25/2025 | | | 2,660,000 | 2,962,679 |
| Freddie Mac, 3.01%, 7/25/2025 | | | 423,000 | 466,620 |
| Freddie Mac, 3.151%, 11/25/2025 | | | 1,001,000 | 1,115,438 |
| Issuer | | | Shares/Par | Value ($) |
| Bonds – continued |
| Mortgage-Backed – continued | |
| Freddie Mac, 0.635%, 6/25/2027 (i) | | $ | 13,682,000 | $ 570,772 |
| Freddie Mac, 0.75%, 6/25/2027 (i) | | | 4,683,606 | 201,540 |
| Freddie Mac, 3.117%, 6/25/2027 | | | 1,114,000 | 1,265,357 |
| Freddie Mac, 0.576%, 7/25/2027 (i) | | | 12,049,056 | 417,415 |
| Freddie Mac, 0.329%, 8/25/2027 (i) | | | 9,650,000 | 222,939 |
| Freddie Mac, 0.432%, 8/25/2027 (i) | | | 6,687,613 | 177,519 |
| Freddie Mac, 0.279%, 9/25/2027 (i) | | | 10,419,000 | 206,658 |
| Freddie Mac, 3.187%, 9/25/2027 | | | 754,000 | 863,456 |
| Freddie Mac, 0.197%, 11/25/2027 (i) | | | 16,290,000 | 239,500 |
| Freddie Mac, 0.29%, 11/25/2027 (i) | | | 11,632,980 | 213,823 |
| Freddie Mac, 0.325%, 11/25/2027 (i) | | | 10,431,293 | 224,809 |
| Freddie Mac, 0.241%, 12/25/2027 (i) | | | 10,109,000 | 183,703 |
| Freddie Mac, 0.287%, 12/25/2027 (i) | | | 11,210,000 | 237,229 |
| Freddie Mac, 0.368%, 12/25/2027 (i) | | | 17,817,089 | 423,400 |
| Freddie Mac, 3.65%, 2/25/2028 | | | 904,000 | 1,065,934 |
| Freddie Mac, 3.9%, 4/25/2028 | | | 1,667,000 | 1,992,108 |
| Freddie Mac, 1.089%, 7/25/2029 (i) | | | 829,838 | 68,884 |
| Freddie Mac, 1.144%, 8/25/2029 (i) | | | 5,224,757 | 454,054 |
| Freddie Mac, 1.799%, 4/25/2030 (i) | | | 900,000 | 136,392 |
| Freddie Mac, 1.868%, 4/25/2030 (i) | | | 2,701,417 | 416,059 |
| Freddie Mac, 1.662%, 5/25/2030 (i) | | | 1,301,002 | 181,136 |
| Freddie Mac, 1.796%, 5/25/2030 (i) | | | 3,334,078 | 497,086 |
| Freddie Mac, 1.342%, 6/25/2030 (i) | | | 1,327,631 | 152,973 |
| Freddie Mac, 1.6%, 8/25/2030 (i) | | | 1,191,673 | 163,917 |
| Freddie Mac, 1.169%, 9/25/2030 (i) | | | 775,587 | 80,428 |
| Freddie Mac, 1.081%, 11/25/2030 (i) | | | 1,356,411 | 131,926 |
| Freddie Mac, 0.306%, 11/25/2032 (i) | | | 8,846,186 | 252,916 |
| Freddie Mac, 6.5%, 5/01/2034-7/01/2037 | | | 714,973 | 814,640 |
| Freddie Mac, 5.5%, 2/15/2036 (i) | | | 94,849 | 18,025 |
| Freddie Mac, 4%, 8/01/2037-8/01/2047 | | | 7,053,904 | 7,670,034 |
| Freddie Mac, 3.5%, 11/01/2037-10/25/2058 | | | 13,468,772 | 14,600,342 |
| Freddie Mac, 3%, 1/01/2038-2/25/2059 | | | 16,533,441 | 17,864,407 |
| Freddie Mac, 4.5%, 12/15/2040 (i) | | | 94,736 | 9,019 |
| Freddie Mac, 4%, 8/15/2044 (i) | | | 116,969 | 14,086 |
| Ginnie Mae, 6%, 9/15/2032-1/15/2038 | | | 1,488,493 | 1,756,929 |
| Ginnie Mae, 5.5%, 5/15/2033-10/15/2035 | | | 919,496 | 1,056,190 |
| Ginnie Mae, 4.5%, 7/20/2033-9/20/2041 | | | 2,299,408 | 2,594,610 |
| Ginnie Mae, 5%, 7/20/2033-12/15/2034 | | | 301,803 | 344,975 |
| Ginnie Mae, 4%, 1/20/2041-2/20/2042 | | | 2,559,668 | 2,828,131 |
| Ginnie Mae, 3.5%, 12/15/2041-3/20/2048 | | | 9,190,750 | 9,968,807 |
| Ginnie Mae, 3%, 4/20/2045-9/20/2050 | | | 13,193,623 | 13,982,472 |
| Ginnie Mae, 2.5%, 11/20/2050-12/20/2050 | | | 7,293,131 | 7,725,858 |
| Ginnie Mae, 0.617%, 2/16/2059 (i) | | | 5,008,625 | 239,996 |
| Ginnie Mae, TBA, 2.5%, 1/21/2051-2/20/2051 | | | 7,900,000 | 8,355,664 |
| Ginnie Mae, TBA, 3%, 1/21/2051 | | | 1,500,000 | 1,568,364 |
| Ginnie Mae, TBA, 3.5%, 1/21/2051 | | | 3,450,000 | 3,656,218 |
Portfolio of Investments – continued
| Issuer | | | Shares/Par | Value ($) |
| Bonds – continued |
| Mortgage-Backed – continued | |
| Ginnie Mae, TBA, 4%, 1/21/2051 | | $ | 1,425,000 | $ 1,519,215 |
| Ginnie Mae, TBA, 2%, 2/20/2051 | | | 6,050,000 | 6,315,625 |
| | | | | $310,573,910 |
| Municipals – 0.4% |
| New Jersey Economic Development Authority State Pension Funding Rev., “A”, NATL, 7.425%, 2/15/2029 | | $ | 2,750,000 | $ 3,544,503 |
| New Jersey Turnpike Authority Rev. (Build America Bonds), “F”, 7.414%, 1/01/2040 | | | 3,685,000 | 6,179,745 |
| State of Florida, “A”, 2.154%, 7/01/2030 | | | 1,437,000 | 1,512,040 |
| | | | | $11,236,288 |
| Natural Gas - Distribution – 0.0% |
| NiSource, Inc., 5.65%, 2/01/2045 | | $ | 554,000 | $ 795,704 |
| Natural Gas - Pipeline – 0.2% |
| APT Pipelines Ltd., 4.2%, 3/23/2025 (n) | | $ | 3,780,000 | $ 4,168,982 |
| APT Pipelines Ltd., 4.25%, 7/15/2027 (n) | | | 280,000 | 318,024 |
| | | | | $4,487,006 |
| Network & Telecom – 0.3% |
| AT&T, Inc., 3.65%, 9/15/2059 (n) | | $ | 2,028,000 | $ 2,033,928 |
| Verizon Communications, Inc., 4.272%, 1/15/2036 | | | 2,164,000 | 2,680,949 |
| Verizon Communications, Inc., 4.812%, 3/15/2039 | | | 2,616,000 | 3,408,577 |
| | | | | $8,123,454 |
| Oils – 0.3% |
| Marathon Petroleum Corp., 4.75%, 9/15/2044 | | $ | 1,264,000 | $ 1,448,609 |
| Phillips 66 Co., 2.15%, 12/15/2030 | | | 3,897,000 | 3,953,825 |
| Valero Energy Corp., 4.9%, 3/15/2045 | | | 2,669,000 | 3,106,079 |
| | | | | $8,508,513 |
| Other Banks & Diversified Financials – 0.5% |
| BBVA Bancomer S.A. de C.V., 6.75%, 9/30/2022 (n) | | $ | 2,890,000 | $ 3,124,090 |
| Branch Banking & Trust Co., 2.25%, 3/11/2030 | | | 2,707,000 | 2,838,517 |
| Capital One Financial Corp., 3.75%, 3/09/2027 | | | 1,956,000 | 2,231,407 |
| Citigroup, Inc., 2.666% to 1/29/2030, FLR (SOFR + 1.146%) to 1/29/2031 | | | 3,245,000 | 3,479,358 |
| | | | | $11,673,372 |
| Pollution Control – 0.1% |
| Republic Services, Inc., 3.95%, 5/15/2028 | | $ | 1,412,000 | $ 1,655,146 |
| Republic Services, Inc., 1.45%, 2/15/2031 | | | 1,135,000 | 1,110,138 |
| | | | | $2,765,284 |
| Issuer | | | Shares/Par | Value ($) |
| Bonds – continued |
| Real Estate - Other – 0.0% |
| Prologis LP, REIT, 2.25%, 4/15/2030 | | $ | 816,000 | $ 873,920 |
| Real Estate - Retail – 0.2% |
| Brixmor Operating Partnership LP, REIT, 4.125%, 5/15/2029 | | $ | 200,000 | $ 229,956 |
| Brixmor Operating Partnership LP, REIT, 4.05%, 7/01/2030 | | | 1,903,000 | 2,183,078 |
| Realty Income Corp., REIT, 3.25%, 1/15/2031 | | | 649,000 | 735,306 |
| VEREIT Operating Partnership LP, REIT, 3.1%, 12/15/2029 | | | 1,759,000 | 1,896,814 |
| | | | | $5,045,154 |
| Retailers – 0.4% |
| Best Buy Co., Inc., 4.45%, 10/01/2028 | | $ | 2,306,000 | $ 2,757,844 |
| Costco Wholesale Corp., 1.75%, 4/20/2032 | | | 2,168,000 | 2,251,751 |
| Home Depot, Inc., 3.9%, 6/15/2047 | | | 1,262,000 | 1,608,949 |
| Target Corp., 2.25%, 4/15/2025 | | | 3,248,000 | 3,482,547 |
| | | | | $10,101,091 |
| Specialty Stores – 0.1% |
| TJX Cos., Inc., 3.75%, 4/15/2027 | | $ | 433,000 | $ 500,552 |
| TJX Cos., Inc., 3.875%, 4/15/2030 | | | 519,000 | 622,437 |
| | | | | $1,122,989 |
| Telecommunications - Wireless – 0.7% |
| American Tower Corp., REIT, 3%, 6/15/2023 | | $ | 1,065,000 | $ 1,128,331 |
| American Tower Corp., REIT, 3.6%, 1/15/2028 | | | 1,291,000 | 1,466,097 |
| American Tower Corp., REIT, 3.1%, 6/15/2050 | | | 1,779,000 | 1,828,999 |
| American Tower Trust I, REIT, 3.07%, 3/15/2023 (n) | | | 3,240,000 | 3,303,592 |
| Crown Castle International Corp., 1.35%, 7/15/2025 | | | 798,000 | 814,413 |
| Crown Castle International Corp., 3.65%, 9/01/2027 | | | 2,901,000 | 3,273,929 |
| T-Mobile USA, Inc., 2.05%, 2/15/2028 (n) | | | 1,801,000 | 1,873,328 |
| T-Mobile USA, Inc., 4.5%, 4/15/2050 (n) | | | 2,538,000 | 3,130,331 |
| | | | | $16,819,020 |
| Telephone Services – 0.1% |
| Deutsche Telekom AG, 3.625%, 1/21/2050 (n) | | $ | 1,281,000 | $ 1,469,738 |
| Transportation - Services – 0.1% |
| ERAC USA Finance LLC, 7%, 10/15/2037 (n) | | $ | 2,064,000 | $ 3,197,625 |
Portfolio of Investments – continued
| Issuer | | | Shares/Par | Value ($) |
| Bonds – continued |
| U.S. Government Agencies and Equivalents – 0.0% |
| Small Business Administration, 4.35%, 7/01/2023 | | $ | 1,101 | $ 1,136 |
| Small Business Administration, 4.77%, 4/01/2024 | | | 71,125 | 74,260 |
| Small Business Administration, 5.18%, 5/01/2024 | | | 93,654 | 98,799 |
| Small Business Administration, 5.52%, 6/01/2024 | | | 5,695 | 6,033 |
| Small Business Administration, 4.99%, 9/01/2024 | | | 127,346 | 133,361 |
| Small Business Administration, 4.95%, 3/01/2025 | | | 4,538 | 4,760 |
| Small Business Administration, 5.11%, 8/01/2025 | | | 421,636 | 447,316 |
| | | | | $765,665 |
| U.S. Treasury Obligations – 6.3% |
| U.S. Treasury Bonds, 2.875%, 5/15/2043 | | $ | 9,096,000 | $ 11,479,436 |
| U.S. Treasury Bonds, 2.5%, 2/15/2045 | | | 9,797,000 | 11,661,492 |
| U.S. Treasury Bonds, 3%, 11/15/2045 | | | 3,638,000 | 4,725,563 |
| U.S. Treasury Bonds, 3%, 2/15/2048 | | | 8,760,000 | 11,477,311 |
| U.S. Treasury Bonds, 2.875%, 5/15/2049 | | | 900,000 | 1,159,664 |
| U.S. Treasury Bonds, 2.375%, 11/15/2049 | | | 22,865,000 | 26,804,747 |
| U.S. Treasury Notes, 1.375%, 1/31/2022 | | | 41,000,000 | 41,550,937 |
| U.S. Treasury Notes, 1.375%, 1/31/2025 | | | 48,500,000 | 50,674,922 |
| | | | | $159,534,072 |
| Utilities - Electric Power – 1.2% |
| Berkshire Hathaway Energy Co., 3.75%, 11/15/2023 | | $ | 1,930,000 | $ 2,101,420 |
| Berkshire Hathaway Energy Co., 4.25%, 10/15/2050 (n) | | | 296,000 | 382,752 |
| Duke Energy Corp., 2.65%, 9/01/2026 | | | 397,000 | 432,465 |
| Enel Finance International N.V., 2.65%, 9/10/2024 | | | 1,020,000 | 1,086,331 |
| Enel Finance International N.V., 4.875%, 6/14/2029 (n) | | | 1,916,000 | 2,391,075 |
| Enel Finance International N.V., 4.75%, 5/25/2047 (n) | | | 392,000 | 521,127 |
| Evergy, Inc., 2.9%, 9/15/2029 | | | 1,863,000 | 2,041,071 |
| Exelon Corp., 4.05%, 4/15/2030 | | | 2,165,000 | 2,560,496 |
| FirstEnergy Corp., 3.4%, 3/01/2050 | | | 1,229,000 | 1,175,099 |
| Georgia Power Co., 3.7%, 1/30/2050 | | | 171,000 | 204,266 |
| Jersey Central Power & Light Co., 4.3%, 1/15/2026 (n) | | | 1,511,000 | 1,689,301 |
| Northern States Power Co., 2.6%, 6/01/2051 | | | 2,166,000 | 2,289,763 |
| Issuer | | | Shares/Par | Value ($) |
| Bonds – continued |
| Utilities - Electric Power – continued |
| Oncor Electric Delivery Co. LLC, 5.75%, 3/15/2029 | | $ | 2,810,000 | $ 3,703,902 |
| Pacific Gas & Electric Co., 2.1%, 8/01/2027 | | | 549,000 | 557,098 |
| Pacific Gas & Electric Co., 3.3%, 8/01/2040 | | | 1,053,000 | 1,048,460 |
| PPL Capital Funding, Inc., 5%, 3/15/2044 | | | 870,000 | 1,121,578 |
| PPL Corp., 3.4%, 6/01/2023 | | | 2,940,000 | 3,122,080 |
| Xcel Energy, Inc., 3.4%, 6/01/2030 | | | 1,099,000 | 1,261,064 |
| Xcel Energy, Inc., 3.5%, 12/01/2049 | | | 1,310,000 | 1,528,619 |
| | | | | $29,217,967 |
| Utilities - Gas – 0.1% |
| East Ohio Gas Co., 2%, 6/15/2030 (n) | | $ | 1,509,000 | $ 1,563,025 |
| Total Bonds (Identified Cost, $914,792,246) | | $ 986,227,668 |
| Convertible Preferred Stocks – 1.1% |
| Automotive – 0.2% | |
| Aptiv PLC, 5.5% | | 39,000 | $ 6,017,700 |
| Medical Equipment – 0.4% | |
| Boston Scientific Corp., 5.5% | | 71,398 | $ 7,823,079 |
| Danaher Corp., 4.75% | | 1,324 | 2,009,355 |
| | | | | $9,832,434 |
| Telecommunications - Wireless – 0.2% | |
| T-Mobile USA, Inc., 5.25% | | 5,432 | $ 6,524,756 |
| Utilities - Electric Power – 0.3% | |
| CenterPoint Energy, Inc., 7% | | 162,120 | $ 6,614,496 |
| Total Convertible Preferred Stocks (Identified Cost, $26,155,537) | $ 28,989,386 |
| Preferred Stocks – 0.3% |
| Computer Software - Systems – 0.3% | | | | |
| Samsung Electronics Co. Ltd. (Identified Cost, $4,609,920) | | 122,708 | $ 8,313,826 |
| Investment Companies (h) – 4.7% |
| Money Market Funds – 4.7% | |
| MFS Institutional Money Market Portfolio, 0.1% (v) (Identified Cost, $118,744,977) | | | 118,744,977 | $ 118,744,977 |
| Other Assets, Less Liabilities – (3.7)% | | (92,838,089) |
| Net Assets – 100.0% | $ 2,538,758,543 |
Portfolio of Investments – continued
| (a) | Non-income producing security. | | | |
| (h) | An affiliated issuer, which may be considered one in which the fund owns 5% or more of the outstanding voting securities, or a company which is under common control. At period end, the aggregate values of the fund's investments in affiliated issuers and in unaffiliated issuers were $118,744,977 and $2,512,851,655, respectively. | | | |
| (i) | Interest only security for which the fund receives interest on notional principal (Par amount). Par amount shown is the notional principal and does not reflect the cost of the security. | | | |
| (n) | Securities exempt from registration under Rule 144A of the Securities Act of 1933. These securities may be sold in the ordinary course of business in transactions exempt from registration, normally to qualified institutional buyers. At period end, the aggregate value of these securities was $141,904,092, representing 5.6% of net assets. | | | |
| (v) | Affiliated issuer that is available only to investment companies managed by MFS. The rate quoted for the MFS Institutional Money Market Portfolio is the annualized seven-day yield of the fund at period end. | | | |
| The following abbreviations are used in this report and are defined: |
| ADR | American Depositary Receipt |
| CLO | Collateralized Loan Obligation |
| FGIC | Financial Guaranty Insurance Co. |
| FLR | Floating Rate. Interest rate resets periodically based on the parenthetically disclosed reference rate plus a spread (if any). The period-end rate reported may not be the current rate. All reference rates are USD unless otherwise noted. |
| LIBOR | London Interbank Offered Rate |
| NATL | National Public Finance Guarantee Corp. |
| REIT | Real Estate Investment Trust |
| SOFR | Secured Overnight Financing Rate |
| TBA | To Be Announced |
See Notes to Financial Statements
| Financial Statements | Statement of Assets and Liabilities |
This statement represents your fund’s balance sheet, which details the assets and liabilities comprising the total value of the fund.
| At 12/31/20Assets | |
| Investments in unaffiliated issuers, at value (identified cost, $1,827,897,744) | $2,512,851,655 |
| Investments in affiliated issuers, at value (identified cost, $118,744,977) | 118,744,977 |
| Cash | 33,957 |
| Receivables for | |
| TBA sale commitments | 10,858,600 |
| Fund shares sold | 601,652 |
| Interest and dividends | 7,811,708 |
| Receivable from investment adviser | 111,553 |
| Other assets | 8,773 |
| Total assets | $2,651,022,875 |
| Liabilities | |
| Payables for | |
| TBA purchase commitments | $110,759,501 |
| Fund shares reacquired | 1,250,984 |
| Payable to affiliates | |
| Administrative services fee | 1,652 |
| Shareholder servicing costs | 750 |
| Distribution and/or service fees | 17,899 |
| Payable for independent Trustees' compensation | 11 |
| Accrued expenses and other liabilities | 233,535 |
| Total liabilities | $112,264,332 |
| Net assets | $2,538,758,543 |
| Net assets consist of | |
| Paid-in capital | $1,690,420,032 |
| Total distributable earnings (loss) | 848,338,511 |
| Net assets | $2,538,758,543 |
| Shares of beneficial interest outstanding | 98,604,213 |
| | Net assets | Shares
outstanding | Net asset value
per share |
| Initial Class | $1,219,438,197 | 46,864,180 | $26.02 |
| Service Class | 1,319,320,346 | 51,740,033 | 25.50 |
See Notes to Financial Statements
| Financial Statements | Statement of Operations |
This statement describes how much your fund earned in investment income and accrued in expenses. It also describes any gains and/or losses generated by fund operations.
| Year ended 12/31/20 | |
| Net investment income (loss) | |
| Income | |
| Dividends | $35,189,067 |
| Interest | 26,060,626 |
| Dividends from affiliated issuers | 209,530 |
| Income on securities loaned | 108,407 |
| Other | 89,813 |
| Foreign taxes withheld | (349,667) |
| Total investment income | $61,307,776 |
| Expenses | |
| Management fee | $16,017,283 |
| Distribution and/or service fees | 3,104,309 |
| Shareholder servicing costs | 55,986 |
| Administrative services fee | 325,669 |
| Independent Trustees' compensation | 37,229 |
| Custodian fee | 128,491 |
| Shareholder communications | 187,756 |
| Audit and tax fees | 79,510 |
| Legal fees | 17,234 |
| Miscellaneous | 77,222 |
| Total expenses | $20,030,689 |
| Reduction of expenses by investment adviser | (2,334,685) |
| Net expenses | $17,696,004 |
| Net investment income (loss) | $43,611,772 |
| Realized and unrealized gain (loss) | |
| Realized gain (loss) (identified cost basis) | |
| Unaffiliated issuers | $132,759,189 |
| Affiliated issuers | (3,264) |
| Foreign currency | (83,026) |
| Net realized gain (loss) | $132,672,899 |
| Change in unrealized appreciation or depreciation | |
| Unaffiliated issuers | $42,942,986 |
| Affiliated issuers | (837) |
| Translation of assets and liabilities in foreign currencies | 42,791 |
| Net unrealized gain (loss) | $42,984,940 |
| Net realized and unrealized gain (loss) | $175,657,839 |
| Change in net assets from operations | $219,269,611 |
See Notes to Financial Statements
| Financial Statements | Statements of Changes in Net Assets |
These statements describe the increases and/or decreases in net assets resulting from operations, any distributions, and any shareholder transactions.
| | Year ended |
| | 12/31/20 | 12/31/19 |
| Change in net assets | | |
| From operations | | |
| Net investment income (loss) | $43,611,772 | $50,698,568 |
| Net realized gain (loss) | 132,672,899 | 66,327,737 |
| Net unrealized gain (loss) | 42,984,940 | 335,264,447 |
| Change in net assets from operations | $219,269,611 | $452,290,752 |
| Total distributions to shareholders | $(115,929,697) | $(121,022,024) |
| Change in net assets from fund share transactions | $(111,560,917) | $(109,812,128) |
| Total change in net assets | $(8,221,003) | $221,456,600 |
| Net assets | | |
| At beginning of period | 2,546,979,546 | 2,325,522,946 |
| At end of period | $2,538,758,543 | $2,546,979,546 |
See Notes to Financial Statements
| Financial Statements | Financial Highlights |
The financial highlights table is intended to help you understand the fund's financial performance for the past 5 years. Certain information reflects financial results for a single fund share. The total returns in the table represent the rate that an investor would have earned (or lost) on an investment in the fund share class (assuming reinvestment of all distributions) held for the entire period.
| Initial Class | Year ended |
| | 12/31/20 | 12/31/19 | 12/31/18 | 12/31/17 | 12/31/16 |
| Net asset value, beginning of period | $24.90 | $21.78 | $24.70 | $23.18 | $22.60 |
| Income (loss) from investment operations | | | | | |
| Net investment income (loss) (d) | $0.47 | $0.52 | $0.53 | $0.49 | $0.54(c) |
| Net realized and unrealized gain (loss) | 1.88 | 3.83 | (1.80) | 2.29 | 1.51 |
| Total from investment operations | $2.35 | $4.35 | $(1.27) | $2.78 | $2.05 |
| Less distributions declared to shareholders | | | | | |
| From net investment income | $(0.57) | $(0.58) | $(0.54) | $(0.58) | $(0.69) |
| From net realized gain | (0.66) | (0.65) | (1.11) | (0.68) | (0.78) |
| Total distributions declared to shareholders | $(1.23) | $(1.23) | $(1.65) | $(1.26) | $(1.47) |
| Net asset value, end of period (x) | $26.02 | $24.90 | $21.78 | $24.70 | $23.18 |
| Total return (%) (k)(r)(s)(x) | 9.81 | 20.38 | (5.61) | 12.30 | 9.09(c) |
Ratios (%) (to average net assets)
and Supplemental data: | | | | | |
| Expenses before expense reductions (f) | 0.71 | 0.70 | 0.70 | 0.71 | 0.71(c) |
| Expenses after expense reductions (f) | 0.61 | 0.62 | 0.62 | 0.63 | 0.62(c) |
| Net investment income (loss) | 1.95 | 2.18 | 2.20 | 2.04 | 2.33(c) |
| Portfolio turnover | 84 | 42 | 26 | 34 | 35 |
| Net assets at end of period (000 omitted) | $1,219,438 | $1,223,166 | $1,134,301 | $1,350,737 | $1,359,943 |
| Service Class | Year ended |
| | 12/31/20 | 12/31/19 | 12/31/18 | 12/31/17 | 12/31/16 |
| Net asset value, beginning of period | $24.43 | $21.38 | $24.28 | $22.81 | $22.26 |
| Income (loss) from investment operations | | | | | |
| Net investment income (loss) (d) | $0.40 | $0.45 | $0.46 | $0.43 | $0.47(c) |
| Net realized and unrealized gain (loss) | 1.83 | 3.76 | (1.77) | 2.25 | 1.49 |
| Total from investment operations | $2.23 | $4.21 | $(1.31) | $2.68 | $1.96 |
| Less distributions declared to shareholders | | | | | |
| From net investment income | $(0.50) | $(0.51) | $(0.48) | $(0.53) | $(0.63) |
| From net realized gain | (0.66) | (0.65) | (1.11) | (0.68) | (0.78) |
| Total distributions declared to shareholders | $(1.16) | $(1.16) | $(1.59) | $(1.21) | $(1.41) |
| Net asset value, end of period (x) | $25.50 | $24.43 | $21.38 | $24.28 | $22.81 |
| Total return (%) (k)(r)(s)(x) | 9.52 | 20.12 | (5.87) | 12.02 | 8.81(c) |
Ratios (%) (to average net assets)
and Supplemental data: | | | | | |
| Expenses before expense reductions (f) | 0.96 | 0.95 | 0.95 | 0.96 | 0.96(c) |
| Expenses after expense reductions (f) | 0.86 | 0.87 | 0.87 | 0.88 | 0.87(c) |
| Net investment income (loss) | 1.71 | 1.93 | 1.95 | 1.79 | 2.08(c) |
| Portfolio turnover | 84 | 42 | 26 | 34 | 35 |
| Net assets at end of period (000 omitted) | $1,319,320 | $1,323,813 | $1,191,222 | $1,427,824 | $1,276,603 |
See Notes to Financial Statements
Financial Highlights - continued
| (c) | Amount reflects a one-time reimbursement of expenses by the custodian (or former custodian) without which net investment income and performance would be lower and expenses would be higher. |
| (d) | Per share data is based on average shares outstanding. |
| (f) | Ratios do not reflect reductions from fees paid indirectly, if applicable. |
| (k) | The total return does not reflect expenses that apply to separate accounts. Inclusion of these charges would reduce the total return figures for all periods shown. |
| (r) | Certain expenses have been reduced without which performance would have been lower. |
| (s) | From time to time the fund may receive proceeds from litigation settlements, without which performance would be lower. |
| (x) | The net asset values and total returns have been calculated on net assets which include adjustments made in accordance with U.S. generally accepted accounting principles required at period end for financial reporting purposes. |
See Notes to Financial Statements
Notes to Financial Statements
(1) Business and Organization
MFS Total Return Series (the fund) is a diversified series of MFS Variable Insurance Trust (the trust). The trust is organized as a Massachusetts business trust and is registered under the Investment Company Act of 1940, as amended, as an open-end management investment company. The shareholders of each series of the trust are separate accounts of insurance companies, which offer variable annuity and/or life insurance products, and qualified retirement and pension plans.
The fund is an investment company and accordingly follows the investment company accounting and reporting guidance of the Financial Accounting Standards Board (FASB) Accounting Standards Codification Topic 946 Financial Services - Investment Companies.
(2) Significant Accounting Policies
General — The preparation of financial statements in conformity with U.S. generally accepted accounting principles requires management to make estimates and assumptions that affect the reported amounts of assets and liabilities, and disclosure of contingent assets and liabilities at the date of the financial statements and the reported amounts of increases and decreases in net assets from operations during the reporting period. Actual results could differ from those estimates. In the preparation of these financial statements, management has evaluated subsequent events occurring after the date of the fund’s Statement of Assets and Liabilities through the date that the financial statements were issued.
In March 2020, the FASB issued Accounting Standards Update 2020-04, Reference Rate Reform (Topic 848) – Facilitation of the Effects of Reference Rate Reform on Financial Reporting (“ASU 2020-04”), which provides optional, temporary relief with respect to the financial reporting of contracts subject to certain types of modifications due to the planned discontinuation of the London Interbank Offered Rate (LIBOR) and other IBOR-based reference rates as of the end of 2021. The temporary relief provided by ASU 2020-04 is effective for certain reference rate-related contract modifications that occur during the period from March 12, 2020 through December 31, 2022. Management is evaluating the impact of ASU 2020-04 on the fund's investments, derivatives, debt and other contracts that will undergo reference rate-related modifications as a result of the reference rate reform.
Balance Sheet Offsetting — The fund's accounting policy with respect to balance sheet offsetting is that, absent an event of default by the counterparty or a termination of the agreement, the International Swaps and Derivatives Association (ISDA) Master Agreement, or similar agreement, does not result in an offset of reported amounts of financial assets and financial liabilities in the Statement of Assets and Liabilities across transactions between the fund and the applicable counterparty. The fund's right to setoff may be restricted or prohibited by the bankruptcy or insolvency laws of the particular jurisdiction to which a specific master netting agreement counterparty is subject. Balance sheet offsetting disclosures, to the extent applicable to the fund, have been included in the fund’s Significant Accounting Policies note under the captions for each of the fund’s in-scope financial instruments and transactions.
Investment Valuations — Equity securities, including restricted equity securities, are generally valued at the last sale or official closing price on their primary market or exchange as provided by a third-party pricing service. Equity securities, for which there were no sales reported that day, are generally valued at the last quoted daily bid quotation on their primary market or exchange as provided by a third-party pricing service. Debt instruments and floating rate loans, including restricted debt instruments, are generally valued at an evaluated or composite bid as provided by a third-party pricing service. Debt instruments sold short are generally valued at an evaluated or composite mean as provided by a third-party pricing service. Short-term instruments with a maturity at issuance of 60 days or less may be valued at amortized cost, which approximates market value. Open-end investment companies are generally valued at net asset value per share. Securities and other assets generally valued on the basis of information from a third-party pricing service may also be valued at a broker/dealer bid quotation. In determining values, third-party pricing services can utilize both transaction data and market information such as yield, quality, coupon rate, maturity, type of issue, trading characteristics, and other market data. The values of foreign securities and other assets and liabilities expressed in foreign currencies are converted to U.S. dollars using the mean of bid and asked prices for rates provided by a third-party pricing service.
The Board of Trustees has delegated primary responsibility for determining or causing to be determined the value of the fund’s investments (including any fair valuation) to the adviser pursuant to valuation policies and procedures approved by the Board. If the adviser determines that reliable market quotations are not readily available, investments are valued at fair value as determined in good faith by the adviser in accordance with such procedures under the oversight of the Board of Trustees. Under the fund’s valuation policies and procedures, market quotations are not considered to be readily available for most types of debt instruments and floating rate loans and many types of derivatives. These investments are generally valued at fair value based on information from third-party pricing services. In addition, investments may be valued at fair value if the adviser determines that an investment’s value has been materially affected by events occurring after the close of the exchange or market on which the investment is principally traded (such as foreign exchange or market) and prior to the determination of the fund’s net asset value, or after the halt of trading of a specific security where trading does not resume prior to the close of the exchange or market on which the security is principally
Notes to Financial Statements - continued
traded. Events that occur after foreign markets close (such as developments in foreign markets and significant movements in the U.S. markets) and prior to the determination of the fund’s net asset value may be deemed to have a material effect on the value of securities traded in foreign markets. Accordingly, the fund’s foreign equity securities may often be valued at fair value. The adviser generally relies on third-party pricing services or other information (such as the correlation with price movements of similar securities in the same or other markets; the type, cost and investment characteristics of the security; the business and financial condition of the issuer; and trading and other market data) to assist in determining whether to fair value and at what value to fair value an investment. The value of an investment for purposes of calculating the fund’s net asset value can differ depending on the source and method used to determine value. When fair valuation is used, the value of an investment used to determine the fund’s net asset value may differ from quoted or published prices for the same investment. There can be no assurance that the fund could obtain the fair value assigned to an investment if it were to sell the investment at the same time at which the fund determines its net asset value per share.
Various inputs are used in determining the value of the fund's assets or liabilities. These inputs are categorized into three broad levels. In certain cases, the inputs used to measure fair value may fall into different levels of the fair value hierarchy. In such cases, an investment's level within the fair value hierarchy is based on the lowest level of input that is significant to the fair value measurement. The fund's assessment of the significance of a particular input to the fair value measurement in its entirety requires judgment, and considers factors specific to the investment. Level 1 includes unadjusted quoted prices in active markets for identical assets or liabilities. Level 2 includes other significant observable market-based inputs (including quoted prices for similar securities, interest rates, prepayment speed, and credit risk). Level 3 includes unobservable inputs, which may include the adviser's own assumptions in determining the fair value of investments. The following is a summary of the levels used as of December 31, 2020 in valuing the fund's assets or liabilities:
| Financial Instruments | Level 1 | Level 2 | Level 3 | Total |
| Equity Securities: | | | | |
| United States | $1,427,113,088 | $6,524,756 | $— | $1,433,637,844 |
| Switzerland | 27,489,506 | — | — | 27,489,506 |
| Taiwan | 16,893,022 | — | — | 16,893,022 |
| United Kingdom | 5,714,521 | 10,305,405 | — | 16,019,926 |
| Netherlands | 10,977,255 | — | — | 10,977,255 |
| France | 8,715,981 | — | — | 8,715,981 |
| South Korea | 8,313,826 | — | — | 8,313,826 |
| Germany | 4,576,627 | — | — | 4,576,627 |
| U.S. Treasury Bonds & U.S. Government Agencies & Equivalents | — | 160,299,737 | — | 160,299,737 |
| Non - U.S. Sovereign Debt | — | 6,660,151 | — | 6,660,151 |
| Municipal Bonds | — | 11,236,288 | — | 11,236,288 |
| U.S. Corporate Bonds | — | 320,726,889 | — | 320,726,889 |
| Residential Mortgage-Backed Securities | — | 310,961,672 | — | 310,961,672 |
| Commercial Mortgage-Backed Securities | — | 59,852,972 | — | 59,852,972 |
| Asset-Backed Securities (including CDOs) | — | 49,910,424 | — | 49,910,424 |
| Foreign Bonds | — | 66,579,535 | — | 66,579,535 |
| Mutual Funds | 118,744,977 | — | — | 118,744,977 |
| Total | $1,628,538,803 | $1,003,057,829 | $— | $2,631,596,632 |
For further information regarding security characteristics, see the Portfolio of Investments.
Foreign Currency Translation — Purchases and sales of foreign investments, income, and expenses are converted into U.S. dollars based upon currency exchange rates prevailing on the respective dates of such transactions or on the reporting date for foreign denominated receivables and payables. Gains and losses attributable to foreign currency exchange rates on sales of securities are recorded for financial statement purposes as net realized gains and losses on investments. Gains and losses attributable to foreign exchange rate movements on receivables, payables, income and expenses are recorded for financial statement purposes as foreign currency transaction gains and losses. That portion of both realized and unrealized gains and losses on investments that results from fluctuations in foreign currency exchange rates is not separately disclosed.
Security Loans — Under its Securities Lending Agency Agreement with the fund, State Street Bank and Trust Company, as lending agent, loans the securities of the fund to certain qualified institutions (the “Borrowers”) approved by the fund. Security loans can be terminated at the discretion of either the lending agent or the fund and the related securities must be returned within the earlier of the standard trade settlement period for such securities or within three business days. The loans are collateralized by cash and/or U.S. Treasury and federal agency obligations in an amount typically at least equal to the market value of the securities loaned. On loans collateralized by cash, the cash collateral is invested in a money market fund. The market value of the loaned securities is determined at the close of business of the fund and any additional required collateral is delivered to the fund on the next business
Notes to Financial Statements - continued
day. The lending agent provides the fund with indemnification against Borrower default. In the event of Borrower default, the lending agent will, for the benefit of the fund, either purchase securities identical to those loaned or, when such purchase is commercially impracticable, pay the fund the market value of the loaned securities. In return, the lending agent assumes the fund's rights to the related collateral. If the collateral value is less than the cost to purchase identical securities, the lending agent is responsible for the shortfall, but only to the extent that such shortfall is not due to a decline in collateral value resulting from collateral reinvestment for which the fund bears the risk of loss. A portion of the income generated upon investment of the collateral is remitted to the Borrowers, and the remainder is allocated between the fund and the lending agent. On loans collateralized by U.S. Treasury and/or federal agency obligations, a fee is received from the Borrower, and is allocated between the fund and the lending agent. Income from securities lending is separately reported in the Statement of Operations. The dividend and interest income earned on the securities loaned is accounted for in the same manner as other dividend and interest income. At December 31, 2020, there were no securities on loan or collateral outstanding.
Indemnifications — Under the fund's organizational documents, its officers and Trustees may be indemnified against certain liabilities and expenses arising out of the performance of their duties to the fund. Additionally, in the normal course of business, the fund enters into agreements with service providers that may contain indemnification clauses. The fund's maximum exposure under these agreements is unknown as this would involve future claims that may be made against the fund that have not yet occurred.
Investment Transactions and Income — Investment transactions are recorded on the trade date. Some securities may be purchased or sold on an extended settlement basis, which means that the receipt or delivery of the securities by the fund and related payments occur at a future date, usually beyond the customary settlement period. Interest income is recorded on the accrual basis. All premium and discount is amortized or accreted for financial statement purposes in accordance with U.S. generally accepted accounting principles. Dividends received in cash are recorded on the ex-dividend date. Certain dividends from foreign securities will be recorded when the fund is informed of the dividend if such information is obtained subsequent to the ex-dividend date. Dividend and interest payments received in additional securities are recorded on the ex-dividend or ex-interest date in an amount equal to the value of the security on such date.
The fund may receive proceeds from litigation settlements. Any proceeds received from litigation involving portfolio holdings are reflected in the Statement of Operations in realized gain/loss if the security has been disposed of by the fund or in unrealized gain/loss if the security is still held by the fund. Any other proceeds from litigation not related to portfolio holdings are reflected as other income in the Statement of Operations.
The fund invests a significant portion of its assets in asset-backed and/or mortgage-backed securities. For these securities, the value of the debt instrument also depends on the credit quality and adequacy of the underlying assets or collateral as well as whether there is a security interest in the underlying assets or collateral. Enforcing rights, if any, against the underlying assets or collateral may be difficult. U.S. Government securities not supported as to the payment of principal or interest by the U.S. Treasury, such as those issued by Fannie Mae, Freddie Mac, and the Federal Home Loan Banks, are subject to greater credit risk than are U.S. Government securities supported by the U.S. Treasury, such as those issued by Ginnie Mae.
The fund may purchase or sell mortgage-backed securities on a “To Be Announced” (TBA) basis. A TBA transaction is subject to extended settlement and typically does not designate the actual security to be delivered, but instead includes an approximate principal amount. The price of the TBA security and the date that it will be settled are fixed at the time the transaction is negotiated. The value of the security varies with market fluctuations and no interest accrues to the fund until settlement takes place. TBA purchase and sale commitments are held at carrying amount, which approximates fair value and are categorized as level 2 within the fair value hierarchy and included in TBA purchase and TBA sale commitments in the Statement of Assets and Liabilities. Losses may arise as a result of changes in the value of the TBA investment prior to settlement date or due to counterparty non-performance. At the time that it enters into a TBA transaction, the fund is required to have sufficient cash and/or liquid securities to cover its commitments.
The fund may also enter into mortgage dollar rolls, typically TBA dollar rolls, in which the fund sells TBA mortgage-backed securities to financial institutions and simultaneously agrees to repurchase similar (same issuer, type and coupon) securities at a later date at an agreed-upon price. During the period between the sale and repurchase, the fund will not be entitled to receive interest and principal payments on the securities sold. The fund accounts for dollar roll transactions as purchases and sales and realizes gains and losses on these transactions. Dollar roll transactions involve the risk that the market value of the securities that the fund is required to purchase may decline below the agreed upon repurchase price of those securities.
To mitigate the counterparty credit risk on TBA transactions, mortgage dollar rolls, and other types of forward settling mortgage-backed and asset-backed security transactions, the fund whenever possible enters into a Master Securities Forward Transaction Agreement (“MSFTA”) on a bilateral basis with each of the counterparties with whom it undertakes a significant volume of transactions. The MSFTA gives each party to the agreement the right to terminate all transactions traded under such agreement if there is a specified deterioration in the credit quality of the other party. Upon an event of default or a termination of the MSFTA, the
Notes to Financial Statements - continued
non-defaulting party has the right to close out all transactions traded under such agreement and to net amounts owed under each transaction to one net amount payable by one party to the other. This right to close out and net payments across all transactions traded under the MSFTA could result in a reduction of the fund's credit risk to such counterparty equal to any amounts payable by the fund under the applicable transactions, if any.
For mortgage-backed and asset-backed securities traded under a MSFTA, the collateral and margining requirements are contract specific. Collateral amounts across all transactions traded under such agreement are netted and an amount is posted from one party to the other to collateralize such obligations. Cash that has been pledged to cover the fund's collateral or margin obligations under a MSFTA, if any, will be reported separately on the Statement of Assets and Liabilities as restricted cash. Securities pledged as collateral or margin for the same purpose, if any, are noted in the Portfolio of Investments.
Tax Matters and Distributions — The fund intends to qualify as a regulated investment company, as defined under Subchapter M of the Internal Revenue Code, and to distribute all of its taxable income, including realized capital gains. As a result, no provision for federal income tax is required. The fund’s federal tax returns, when filed, will remain subject to examination by the Internal Revenue Service for a three year period. Management has analyzed the fund’s tax positions taken on federal and state tax returns for all open tax years and does not believe that there are any uncertain tax positions that require recognition of a tax liability. Foreign taxes, if any, have been accrued by the fund in the accompanying financial statements in accordance with the applicable foreign tax law. Foreign income taxes may be withheld by certain countries in which the fund invests. Additionally, capital gains realized by the fund on securities issued in or by certain foreign countries may be subject to capital gains tax imposed by those countries.
Distributions to shareholders are recorded on the ex-dividend date. Income and capital gain distributions are determined in accordance with income tax regulations, which may differ from U.S. generally accepted accounting principles. Certain capital accounts in the financial statements are periodically adjusted for permanent differences in order to reflect their tax character. These adjustments have no impact on net assets or net asset value per share. Temporary differences which arise from recognizing certain items of income, expense, gain or loss in different periods for financial statement and tax purposes will reverse at some time in the future.
Book/tax differences primarily relate to amortization and accretion of debt securities, wash sale loss deferrals and partnership adjustments.
The tax character of distributions declared to shareholders for the last two fiscal years is as follows:
| | Year ended
12/31/20 | Year ended
12/31/19 |
| Ordinary income (including any short-term capital gains) | $52,307,667 | $54,824,164 |
| Long-term capital gains | 63,622,030 | 66,197,860 |
| Total distributions | $115,929,697 | $121,022,024 |
The federal tax cost and the tax basis components of distributable earnings were as follows:
| As of 12/31/20 | |
| Cost of investments | $1,960,308,758 |
| Gross appreciation | 684,344,992 |
| Gross depreciation | (13,057,118) |
| Net unrealized appreciation (depreciation) | $671,287,874 |
| Undistributed ordinary income | 54,306,299 |
| Undistributed long-term capital gain | 118,976,833 |
| Other temporary differences | 3,767,505 |
Multiple Classes of Shares of Beneficial Interest — The fund offers multiple classes of shares, which differ in their respective distribution and/or service fees. The fund's income, realized and unrealized gain (loss), and common expenses are allocated to shareholders based on the daily net assets of each class. Dividends are declared separately for each class. Differences in per share dividend rates are generally due to differences in separate class expenses. The fund’s distributions declared to shareholders as reported in the Statements of Changes in Net Assets are presented by class as follows:
Notes to Financial Statements - continued
| | Year
ended
12/31/20 | | Year
ended
12/31/19 |
| Initial Class | $56,532,062 | | $59,383,887 |
| Service Class | 59,397,635 | | 61,638,137 |
| Total | $115,929,697 | | $121,022,024 |
(3) Transactions with Affiliates
Investment Adviser — The fund has an investment advisory agreement with MFS to provide overall investment management and related administrative services and facilities to the fund. The management fee is computed daily and paid monthly at the following annual rates based on the fund's average daily net assets:
| Up to $1 billion | 0.70% |
| In excess of $1 billion and up to $2.5 billion | 0.65% |
| In excess of $2.5 billion and up to $5 billion | 0.55% |
| In excess of $5 billion | 0.50% |
MFS has agreed in writing to reduce its management fee by a specified amount if certain MFS mutual fund assets exceed thresholds agreed to by MFS and the fund's Board of Trustees. For the year ended December 31, 2020, this management fee reduction amounted to $262,449, which is included in the reduction of total expenses in the Statement of Operations. The management fee incurred for the year ended December 31, 2020 was equivalent to an annual effective rate of 0.66% of the fund's average daily net assets.
The investment adviser has agreed in writing to pay a portion of the fund’s total annual operating expenses, excluding interest, taxes, extraordinary expenses, brokerage and transaction costs, and investment-related expenses, such that total annual operating expenses do not exceed 0.61% of average daily net assets for the Initial Class shares and 0.86% of average daily net assets for the Service Class shares. This written agreement will continue until modified by the fund’s Board of Trustees, but such agreement will continue at least until April 30, 2022. For the year ended December 31, 2020, this reduction amounted to $2,072,236, which is included in the reduction of total expenses in the Statement of Operations.
Distributor — MFS Fund Distributors, Inc. (MFD), a wholly-owned subsidiary of MFS, is the distributor of shares of the fund. The Trustees have adopted a distribution plan for the Service Class shares pursuant to Rule 12b-1 under the Investment Company Act of 1940.
The fund's distribution plan provides that the fund will pay MFD distribution and/or service fees equal to 0.25% per annum of its average daily net assets attributable to Service Class shares as partial consideration for services performed and expenses incurred by MFD and financial intermediaries (including participating insurance companies that invest in the fund to fund variable annuity and variable life insurance contracts, sponsors of qualified retirement and pension plans that invest in the fund, and affiliates of these participating insurance companies and plan sponsors) in connection with the sale and distribution of the Service Class shares. MFD may subsequently pay all, or a portion, of the distribution and/or service fees to financial intermediaries.
Shareholder Servicing Agent — MFS Service Center, Inc. (MFSC), a wholly-owned subsidiary of MFS, receives a fee from the fund for its services as shareholder servicing agent. For the year ended December 31, 2020, the fee was $53,549, which equated to 0.0022% annually of the fund's average daily net assets. MFSC also receives reimbursement from the fund for out-of-pocket expenses paid by MFSC on behalf of the fund. For the year ended December 31, 2020, these costs amounted to $2,437.
Administrator — MFS provides certain financial, legal, shareholder communications, compliance, and other administrative services to the fund. Under an administrative services agreement, the fund reimburses MFS the costs incurred to provide these services. The fund is charged an annual fixed amount of $17,500 plus a fee based on average daily net assets. The administrative services fee incurred for the year ended December 31, 2020 was equivalent to an annual effective rate of 0.0136% of the fund's average daily net assets.
Trustees’ and Officers’ Compensation — The fund pays compensation to independent Trustees in the form of a retainer, attendance fees, and additional compensation to Board and Committee chairpersons. The fund does not pay compensation directly to Trustees or officers of the fund who are also officers of the investment adviser, all of whom receive remuneration from MFS for their services to the fund. Certain officers and Trustees of the fund are officers or directors of MFS, MFD, and MFSC.
Notes to Financial Statements - continued
Other — The fund invests in the MFS Institutional Money Market Portfolio which is managed by MFS and seeks current income consistent with preservation of capital and liquidity. This money market fund does not pay a management fee to MFS but does incur investment and operating costs.
The fund is permitted to engage in purchase and sale transactions with funds and accounts for which MFS serves as investment adviser or sub-adviser (“cross-trades”) pursuant to a policy adopted by the Board of Trustees. This policy has been designed to ensure that cross-trades conducted by the fund comply with Rule 17a-7 under the Investment Company Act of 1940. During the year ended December 31, 2020, the fund engaged in purchase and sale transactions pursuant to this policy, which amounted to $3,876,362 and $701,009, respectively. The sales transactions resulted in net realized gains (losses) of $(146,767).
The adviser has voluntarily undertaken to reimburse the fund from its own resources on a quarterly basis for the cost of investment research embedded in the cost of the fund’s securities trades. This agreement may be rescinded at any time. For the year ended December 31, 2020, this reimbursement amounted to $85,794, which is included in “Other” income in the Statement of Operations.
(4) Portfolio Securities
For the year ended December 31, 2020, purchases and sales of investments, other than short-term obligations, were as follows:
| | Purchases | Sales |
| U.S. Government securities | $1,274,953,521 | $1,464,785,871 |
| Non-U.S. Government securities | 732,394,732 | 786,781,950 |
(5) Shares of Beneficial Interest
The fund's Declaration of Trust permits the Trustees to issue an unlimited number of full and fractional shares of beneficial interest. Transactions in fund shares were as follows:
| | Year ended
12/31/20 | | Year ended
12/31/19 |
| | Shares | Amount | | Shares | Amount |
| Shares sold | | | | | |
| Initial Class | 1,626,873 | $38,823,750 | | 1,735,912 | $41,322,525 |
| Service Class | 2,911,465 | 68,599,977 | | 3,594,794 | 83,324,924 |
| | 4,538,338 | $107,423,727 | | 5,330,706 | $124,647,449 |
Shares issued to shareholders
in reinvestment of distributions | | | | | |
| Initial Class | 2,349,629 | $56,532,062 | | 2,558,547 | $59,383,887 |
| Service Class | 2,516,849 | 59,397,635 | | 2,704,613 | 61,638,137 |
| | 4,866,478 | $115,929,697 | | 5,263,160 | $121,022,024 |
| Shares reacquired | | | | | |
| Initial Class | (6,227,705) | $(149,473,288) | | (7,253,162) | $(172,852,561) |
| Service Class | (7,882,515) | (185,441,053) | | (7,815,403) | (182,629,040) |
| | (14,110,220) | $(334,914,341) | | (15,068,565) | $(355,481,601) |
| Net change | | | | | |
| Initial Class | (2,251,203) | $(54,117,476) | | (2,958,703) | $(72,146,149) |
| Service Class | (2,454,201) | (57,443,441) | | (1,515,996) | (37,665,979) |
| | (4,705,404) | $(111,560,917) | | (4,474,699) | $(109,812,128) |
(6) Line of Credit
The fund and certain other funds managed by MFS participate in a $1.25 billion unsecured committed line of credit of which $1 billion is reserved for use by the fund and certain other U.S. funds. The line of credit is provided by a syndicate of banks under a credit agreement. Borrowings may be made for temporary financing needs. Interest is charged to each fund, based on its borrowings, generally at a rate equal to the highest of one month LIBOR, the Federal Funds Effective Rate and the Overnight Bank Funding Rate, plus an agreed upon spread. A commitment fee, based on the average daily, unused portion of the committed line of credit, is allocated among the participating funds. In addition, the fund and other funds managed by MFS have established
Notes to Financial Statements - continued
unsecured uncommitted borrowing arrangements with certain banks for temporary financing needs. Interest is charged to each fund, based on its borrowings, at rates equal to customary reference rates plus an agreed upon spread. For the year ended December 31, 2020, the fund’s commitment fee and interest expense were $11,494 and $0, respectively, and are included in “Miscellaneous” expense in the Statement of Operations.
(7) Investments in Affiliated Issuers
An affiliated issuer may be considered one in which the fund owns 5% or more of the outstanding voting securities, or a company which is under common control. For the purposes of this report, the following were affiliated issuers:
| Affiliated Issuers | Beginning
Value | Purchases | Sales
Proceeds | Realized
Gain
(Loss) | Change in
Unrealized
Appreciation or
Depreciation | Ending
Value |
| MFS Institutional Money Market Portfolio | $40,930,012 | $507,317,766 | $429,498,700 | $(3,264) | $(837) | $118,744,977 |
| Affiliated Issuers | Dividend
Income | Capital Gain
Distributions |
| MFS Institutional Money Market Portfolio | $209,530 | $— |
(8) Impacts of COVID-19
The pandemic related to the global spread of novel coronavirus disease (COVID-19), which was first detected in December 2019, has resulted in significant disruptions to global business activity and the global economy, as well as the economies of individual countries, the financial performance of individual companies and sectors, and the securities and commodities markets in general. This pandemic, the full effects of which are still unknown, has resulted in substantial market volatility and may have adversely impacted the prices and liquidity of the fund's investments and the fund's performance.
Report of Independent Registered Public Accounting Firm
To the Board of Trustees of MFS Variable Insurance Trust and the Shareholders of MFS Total Return Series:
Opinion on the Financial Statements and Financial Highlights
We have audited the accompanying statement of assets and liabilities of MFS Total Return Series (the “Fund”), including the portfolio of investments, as of December 31, 2020, the related statement of operations for the year then ended, the statements of changes in net assets for each of the two years in the period then ended, the financial highlights for each of the five years in the period then ended, and the related notes. In our opinion, the financial statements and financial highlights present fairly, in all material respects, the financial position of the Fund as of December 31, 2020, and the results of its operations for the year then ended, the changes in its net assets for each of the two years in the period then ended, and the financial highlights for each of the five years in the period then ended, in conformity with accounting principles generally accepted in the United States of America.
Basis for Opinion
These financial statements and financial highlights are the responsibility of the Fund's management. Our responsibility is to express an opinion on the Fund's financial statements and financial highlights based on our audits. We are a public accounting firm registered with the Public Company Accounting Oversight Board (United States) (PCAOB) and are required to be independent with respect to the Fund in accordance with the U.S. federal securities laws and the applicable rules and regulations of the Securities and Exchange Commission and the PCAOB.
We conducted our audits in accordance with the standards of the PCAOB. Those standards require that we plan and perform the audit to obtain reasonable assurance about whether the financial statements and financial highlights are free of material misstatement, whether due to error or fraud. The Fund is not required to have, nor were we engaged to perform, an audit of its internal control over financial reporting. As part of our audits, we are required to obtain an understanding of internal control over financial reporting but not for the purpose of expressing an opinion on the effectiveness of the Fund’s internal control over financial reporting. Accordingly, we express no such opinion.
Our audits included performing procedures to assess the risks of material misstatement of the financial statements and financial highlights, whether due to error or fraud, and performing procedures that respond to those risks. Such procedures included examining, on a test basis, evidence regarding the amounts and disclosures in the financial statements and financial highlights. Our audits also included evaluating the accounting principles used and significant estimates made by management, as well as evaluating the overall presentation of the financial statements and financial highlights. Our procedures included confirmation of securities owned as of December 31, 2020, by correspondence with the custodian and brokers; when replies were not received from brokers, we performed other auditing procedures. We believe that our audits provide a reasonable basis for our opinion.
DELOITTE & TOUCHE LLP
Boston, Massachusetts
February 16, 2021
We have served as the auditor of one or more of the MFS investment companies since 1924.
Trustees and Officers — Identification and Background
The Trustees and Officers of the Trust, as of February 1, 2021, are listed below, together with their principal occupations during the past five years. (Their titles may have varied during that period.) The address of each Trustee and Officer is 111 Huntington Avenue, Boston, Massachusetts 02199-7618.
| Name, Age | | Position(s) Held with Fund | | Trustee/Officer Since(h) | | Number of MFS Funds overseen by the Trustee | | Principal Occupations During
the Past Five Years | | Other Directorships During
the Past Five Years (j) |
| INTERESTED TRUSTEES | | |
Robert J. Manning (k)
(age 57) | | Trustee | | February 2004 | | 134 | | Massachusetts Financial Services Company, Non-Executive Chairman (since January 2021); Director; Chairman of the Board; Executive Chairman (January 2017-2020); Co-Chief Executive Officer (2015-2016) | | N/A |
Michael W. Roberge (k)
(age 54) | | Trustee | | January 2021 | | 134 | | Massachusetts Financial Services Company, Chairman (since January 2021); Chief Executive Officer (since January 2017); Director; President (until December 2018); Chief Investment Officer (until December 2018); Co-Chief Executive Officer (until December 2016) | | N/A |
| INDEPENDENT TRUSTEES | | |
John P. Kavanaugh
(age 66) | | Trustee and Chair of Trustees | | January 2009 | | 134 | | Private investor | | N/A |
Steven E. Buller
(age 69) | | Trustee | | February 2014 | | 134 | | Private investor | | N/A |
John A. Caroselli
(age 66) | | Trustee | | March 2017 | | 134 | | Private investor; JC Global Advisors, LLC (management consulting), President (since 2015) | | N/A |
Maureen R. Goldfarb
(age 65) | | Trustee | | January 2009 | | 134 | | Private investor | | N/A |
Peter D. Jones
(age 65) | | Trustee | | January 2019 | | 134 | | Private investor | | N/A |
James W. Kilman, Jr.
(age 59) | | Trustee | | January 2019 | | 134 | | Burford Capital Limited (finance and investment management), Chief Financial Officer (since 2019); KielStrand Capital LLC (family office), Chief Executive Officer (since 2016); Morgan Stanley & Co. (financial services), Vice Chairman of Investment Banking, Co-Head of Diversified Financials Coverage – Financial Institutions Investment Banking Group (until 2016) | | Alpha-En Corporation, Director (2016-2019) |
Clarence Otis, Jr.
(age 64) | | Trustee | | March 2017 | | 134 | | Private investor | | VF Corporation, Director; Verizon Communications, Inc., Director; The Travelers Companies, Director |
Trustees and Officers - continued
| Name, Age | | Position(s) Held with Fund | | Trustee/Officer Since(h) | | Number of MFS Funds overseen by the Trustee | | Principal Occupations During
the Past Five Years | | Other Directorships During
the Past Five Years (j) |
Maryanne L. Roepke
(age 64) | | Trustee | | May 2014 | | 134 | | Private investor | | N/A |
Laurie J. Thomsen
(age 63) | | Trustee | | March 2005 | | 134 | | Private investor | | The Travelers Companies, Director; Dycom Industries, Inc., Director |
| Name, Age | | Position(s) Held with
Fund | | Trustee/Officer Since(h) | | Number of MFS Funds for which the Person is an Officer | | Principal Occupations During
the Past Five Years |
| OFFICERS | | | | | | | | |
Christopher R. Bohane (k)
(age 47) | | Assistant Secretary and Assistant Clerk | | July 2005 | | 134 | | Massachusetts Financial Services Company, Senior Vice President and Associate General Counsel |
Kino Clark (k)
(age 52) | | Assistant Treasurer | | January 2012 | | 134 | | Massachusetts Financial Services Company, Vice President |
John W. Clark, Jr. (k)
(age 53) | | Assistant Treasurer | | April 2017 | | 134 | | Massachusetts Financial Services Company, Vice President (since March 2017); Deutsche Bank (financial services), Department Head - Treasurer's Office (until February 2017) |
Thomas H. Connors (k)
(age 61) | | Assistant Secretary and Assistant Clerk | | September 2012 | | 134 | | Massachusetts Financial Services Company, Vice President and Senior Counsel |
David L. DiLorenzo (k)
(age 52) | | President | | July 2005 | | 134 | | Massachusetts Financial Services Company, Senior Vice President |
Heidi W. Hardin (k)
(age 53) | | Secretary and Clerk | | April 2017 | | 134 | | Massachusetts Financial Services Company, Executive Vice President and General Counsel (since March 2017); Harris Associates (investment management), General Counsel (until January 2017) |
Brian E. Langenfeld (k)
(age 47) | | Assistant Secretary and Assistant Clerk | | June 2006 | | 134 | | Massachusetts Financial Services Company, Vice President and Senior Counsel |
Amanda S. Mooradian (k)
(age 41) | | Assistant Secretary and Assistant Clerk | | September 2018 | | 134 | | Massachusetts Financial Services Company, Assistant Vice President and Senior Counsel |
Susan A. Pereira (k)
(age 50) | | Assistant Secretary and Assistant Clerk | | July 2005 | | 134 | | Massachusetts Financial Services Company, Vice President and Assistant General Counsel |
Kasey L. Phillips (k)
(age 50) | | Assistant Treasurer | | September 2012 | | 134 | | Massachusetts Financial Services Company, Vice President |
Matthew A. Stowe (k)
(age 46) | | Assistant Secretary and Assistant Clerk | | October 2014 | | 134 | | Massachusetts Financial Services Company, Vice President and Assistant General Counsel |
Martin J. Wolin (k)
(age 53) | | Chief Compliance Officer | | July 2015 | | 134 | | Massachusetts Financial Services Company, Senior Vice President and Chief Compliance Officer |
Trustees and Officers - continued
| Name, Age | | Position(s) Held with
Fund | | Trustee/Officer Since(h) | | Number of MFS Funds for which the Person is an Officer | | Principal Occupations During
the Past Five Years |
James O. Yost (k)
(age 60) | | Treasurer | | September 1990 | | 134 | | Massachusetts Financial Services Company, Senior Vice President |
| (h) | Date first appointed to serve as Trustee/officer of an MFS Fund. Each Trustee has served continuously since appointment unless indicated otherwise. For the period from December 15, 2004 until February 22, 2005, Mr. Manning served as Advisory Trustee. From January 2012 through December 2016, Messrs. DiLorenzo and Yost served as Treasurer and Deputy Treasurer of the Funds, respectively. |
| (j) | Directorships or trusteeships of companies required to report to the Securities and Exchange Commission (i.e., “public companies”). |
| (k) | “Interested person” of the Trust within the meaning of the Investment Company Act of 1940 (referred to as the 1940 Act), which is the principal federal law governing investment companies like the fund, as a result of a position with MFS. The address of MFS is 111 Huntington Avenue, Boston, Massachusetts 02199-7618. |
Each Trustee (other than Messrs. Jones, Kilman and Roberge) has been elected by shareholders and each Trustee and Officer holds office until his or her successor is chosen and qualified or until his or her earlier death, resignation, retirement or removal. Mr. Roberge became a Trustee of the Funds on January 1, 2021 and Messrs. Jones and Kilman became Trustees of the Funds on January 1, 2019. The Trust does not hold annual meetings for the purpose of electing Trustees, and Trustees are not elected for fixed terms. Under the terms of the Board's retirement policy, an Independent Trustee shall retire at the end of the calendar year in which he or she reaches the earlier of 75 years of age or 15 years of service on the Board (or, in the case of any Independent Trustee who joined the Board prior to 2015, 20 years of service on the Board).
Messrs. Buller, Kilman and Otis and Ms. Roepke are members of the Trust’s Audit Committee.
Each of the Interested Trustees and certain Officers hold comparable officer positions with certain affiliates of MFS.
The Statement of Additional Information for a Fund includes further information about the Trustees and is available without charge upon request by calling 1-800-225-2606.
| Investment Adviser | Custodian |
Massachusetts Financial Services Company
111 Huntington Avenue
Boston, MA 02199-7618 | State Street Bank and Trust Company
1 Lincoln Street
Boston, MA 02111-2900 |
| Distributor | Independent Registered Public Accounting Firm |
MFS Fund Distributors, Inc.
111 Huntington Avenue
Boston, MA 02199-7618 | Deloitte & Touche LLP
200 Berkeley Street
Boston, MA 02116 |
| Portfolio Manager(s) | |
Steven Gorham
Alexander Mackey
Joshua Marston
Johnathan Munko
Henry Peabody
Robert Persons | |
Board Review of Investment Advisory Agreement
MFS Total Return Series
The Investment Company Act of 1940 requires that both the full Board of Trustees and a majority of the non-interested (“independent”) Trustees, voting separately, annually approve the continuation of the Fund’s investment advisory agreement with MFS. The Trustees consider matters bearing on the Fund and its advisory arrangements at their meetings throughout the year, including a review of performance data at each regular meeting. In addition, the independent Trustees met several times by videoconference (in accordance with Securities and Exchange Commission relief) over the course of three months beginning in May and ending in July, 2020 (“contract review meetings”) for the specific purpose of considering whether to approve the continuation of the investment advisory agreement for the Fund and the other investment companies that the Board oversees (the “MFS Funds”). The independent Trustees were assisted in their evaluation of the Fund’s investment advisory agreement by independent legal counsel, from whom they received separate legal advice and with whom they met separately from MFS during various contract review meetings. The independent Trustees were also assisted in this process by an independent consultant who was retained by and reported to the independent Trustees.
In connection with their deliberations regarding the continuation of the investment advisory agreement, the Trustees, including the independent Trustees, considered such information and factors as they believed, in light of the legal advice furnished to them and their own business judgment, to be relevant. The investment advisory agreement for the Fund was considered separately, although the Trustees also took into account the common interests of all MFS Funds in their review. As described below, the Trustees considered the nature, quality, and extent of the various investment advisory, administrative, and shareholder services performed by MFS under the existing investment advisory agreement and other arrangements with the Fund.
In connection with their contract review meetings, the Trustees received and relied upon materials that included, among other items: (i) information provided by Broadridge Financial Solutions, Inc. (“Broadridge”), an independent third party, on the investment performance of the Fund for various time periods ended December 31, 2019 and the investment performance of a group of funds with substantially similar investment classifications/objectives (the “Broadridge performance universe”), (ii) information provided by Broadridge on the Fund’s advisory fees and other expenses and the advisory fees and other expenses of comparable funds identified by Broadridge as well as all other funds in the same investment classification/category (the “Broadridge expense group and universe”), (iii) information provided by MFS on the advisory fees of portfolios of other clients of MFS, including institutional separate accounts and other clients, (iv) information as to whether and to what extent applicable expense waivers, reimbursements or fee “breakpoints” are observed for the Fund, (v) information regarding MFS’ financial results and financial condition, including MFS’ and certain of its affiliates’ estimated profitability from services performed for the Fund and the MFS Funds as a whole, and compared to MFS’ institutional business, (vi) MFS’ views regarding the outlook for the mutual fund industry and the strategic business plans of MFS, (vii) descriptions of various functions performed by MFS for the Funds, such as compliance monitoring and portfolio trading practices, and (viii) information regarding the overall organization of MFS, including information about MFS’ senior management and other personnel providing investment advisory, administrative and other services to the Fund and the other MFS Funds. The comparative performance, fee and expense information prepared and provided by Broadridge was not independently verified and the independent Trustees did not independently verify any information provided to them by MFS.
The Trustees’ conclusion as to the continuation of the investment advisory agreement was based on a comprehensive consideration of all information provided to the Trustees and not the result of any single factor. Some of the factors that figured particularly in the Trustees’ deliberations are described below, although individual Trustees may have evaluated the information presented differently from one another, giving different weights to various factors. It is also important to recognize that the fee arrangements for the Fund and other MFS Funds are the result of years of review and discussion between the independent Trustees and MFS, that certain aspects of such arrangements may receive greater scrutiny in some years than in others, and that the Trustees’ conclusions may be based, in part, on their consideration of these same arrangements during the course of the year and in prior years.
Based on information provided by Broadridge and MFS, the Trustees reviewed the Fund’s total return investment performance as well as the Broadridge performance universe over various time periods. The Trustees placed particular emphasis on the total return performance of the Fund’s Initial Class shares in comparison to the performance of funds in its Broadridge performance universe over the five-year period ended December 31, 2019, which the Trustees believed was a long enough period to reflect differing market conditions. The total return performance of the Fund’s Initial Class shares was in the 1st quintile relative to the other funds in the universe for this five-year period (the 1st quintile being the best performers and the 5th quintile being the worst performers). The total return performance of the Fund’s Initial Class shares was in the 1st quintile for the one-year period and the 2nd quintile for the three-year period ended December 31, 2019 relative to the Broadridge performance universe. Because of the passage of time, these performance results may differ from the performance results for more recent periods, including those shown elsewhere in this report.
Board Review of Investment Advisory Agreement - continued
In the course of their deliberations, the Trustees took into account information provided by MFS in connection with the contract review meetings, as well as during investment review meetings conducted with portfolio management personnel during the course of the year regarding the Fund’s performance. After reviewing these and related factors, the Trustees concluded, within the context of their overall conclusions regarding the investment advisory agreement, that they were satisfied with MFS’ responses and efforts relating to investment performance.
In assessing the reasonableness of the Fund’s advisory fee, the Trustees considered, among other information, the Fund’s advisory fee and the total expense ratio of the Fund’s Initial Class shares as a percentage of average daily net assets and the advisory fee and total expense ratios of the Broadridge expense group based on information provided by Broadridge. The Trustees considered that MFS currently observes an expense limitation for the Fund, which may not be changed without the Trustees’ approval. The Trustees also considered that, according to the data provided by Broadridge (which takes into account any fee reductions or expense limitations that were in effect during the Fund’s last fiscal year), the Fund’s effective advisory fee rate and total expense ratio were each approximately at the Broadridge expense group median.
The Trustees also considered the advisory fees charged by MFS to any institutional separate accounts advised by MFS (“separate accounts”) and unaffiliated investment companies for which MFS serves as subadviser (“subadvised funds”) that have comparable investment strategies to the Fund, if any. In comparing these fees, the Trustees considered information provided by MFS as to the generally broader scope of services provided by MFS to the Fund, as well as the more extensive regulatory burdens imposed on MFS in managing the Fund, in comparison to separate accounts and subadvised funds. The Trustees also considered the higher demands placed on MFS’ investment personnel and trading infrastructure as a result of the daily cash in-flows and out-flows of the Fund in comparison to separate accounts.
The Trustees also considered whether the Fund may benefit from any economies of scale in the management of the Fund in the event of growth in assets of the Fund and/or growth in assets of the MFS Funds as a whole. They noted that the Fund’s advisory fee rate schedule is subject to contractual breakpoints that reduce the Fund’s advisory fee rate on average daily net assets over $1 billion, $2.5 billion, and $5 billion. The Trustees also noted that MFS has agreed in writing to waive a portion of the management fees of certain MFS Funds, including the Fund, if the total combined assets of certain funds within the MFS Funds’ complex increase above agreed upon thresholds (the “group fee waiver”), enabling the Fund’s shareholders to share in the benefits from any economies of scale at the complex level. The group fee waiver is reviewed and renewed annually between the Board and MFS. The Trustees concluded that the breakpoints and the group fee waiver were sufficient to allow the Fund to benefit from economies of scale as its assets and overall complex assets grow.
The Trustees also considered information prepared by MFS relating to MFS’ costs and profits with respect to the Fund, the MFS Funds considered as a group, and other investment companies and accounts advised by MFS, as well as MFS’ methodologies used to determine and allocate its costs to the MFS Funds, the Fund and other accounts and products for purposes of estimating profitability.
After reviewing these and other factors described herein, the Trustees concluded, within the context of their overall conclusions regarding the investment advisory agreement, that the advisory fees charged to the Fund represent reasonable compensation in light of the services being provided by MFS to the Fund.
In addition, the Trustees considered MFS’ resources and related efforts to continue to retain, attract and motivate capable personnel to serve the Fund. The Trustees also considered current and developing conditions in the financial services industry, including the presence of large and well-capitalized companies which are spending, and appear to be prepared to continue to spend, substantial sums to engage personnel and to provide services to competing investment companies. In this regard, the Trustees also considered the financial resources of MFS and its ultimate parent, Sun Life Financial Inc. The Trustees also considered the advantages and possible disadvantages to the Fund of having an adviser that also serves other investment companies as well as other accounts.
The Trustees also considered the nature, quality, cost, and extent of administrative, transfer agency, and distribution services provided to the Fund by MFS and its affiliates under agreements and plans other than the investment advisory agreement, including any 12b-1 fees the Fund pays to MFS Fund Distributors, Inc., an affiliate of MFS. The Trustees also considered the nature, extent and quality of certain other services MFS performs or arranges for on the Fund’s behalf, which may include securities lending programs, directed expense payment programs, class action recovery programs, and MFS’ interaction with third-party service providers, principally custodians and sub-custodians. The Trustees concluded that the various non-advisory services provided by MFS and its affiliates on behalf of the Fund were satisfactory.
The Trustees considered so-called “fall-out benefits” to MFS such as reputational value derived from serving as investment manager to the MFS Funds. The Trustees also considered that MFS discontinued its historic practice of obtaining investment research from portfolio brokerage commissions paid by certain MFS Funds effective January 2018, and directly pays or voluntarily reimburses a Fund, if applicable, for the costs of external research acquired through the use of the Fund’s portfolio brokerage commissions.
Board Review of Investment Advisory Agreement - continued
Based on their evaluation of factors that they deemed to be material, including those factors described above, the Board of Trustees, including the independent Trustees, concluded that the Fund’s investment advisory agreement with MFS should be continued for an additional one-year period, commencing August 1, 2020.
Proxy Voting Policies and Information
MFS votes proxies on behalf of the fund pursuant to proxy voting policies and procedures that are available without charge, upon request, by calling 1-800-225-2606, by visiting mfs.com/proxyvoting, or by visiting the SEC’s Web site at http://www.sec.gov.
Information regarding how the fund voted proxies relating to portfolio securities during the most recent twelve-month period ended June 30 is available by August 31 of each year without charge by visiting mfs.com/proxyvoting, or by visiting the SEC’s Web site at http://www.sec.gov.
Quarterly Portfolio Disclosure
The fund files a complete schedule of portfolio holdings with the SEC for the first and third quarters of each fiscal year as an exhibit to its reports on Form N-PORT. The fund’s Form N-PORT reports are available on the SEC’s Web site at http://www.sec.gov. A shareholder can obtain the portfolio holdings report for the first and third quarters of the fund's fiscal year at mfs.com/vit1 by choosing the fund's name and then scrolling to the “Resources” section and clicking on the “Prospectus and Reports” tab.
FURTHER INFORMATION
From time to time, MFS may post important information about the fund or the MFS funds on the MFS Web site (mfs.com). This information is available at https://www.mfs.com/announcements or at mfs.com/vit1 by choosing the fund's name and then scrolling to the “Resources” section and clicking on the “Announcements” tab, if any.
Information About Fund Contracts and Legal Claims
The fund has entered into contractual arrangements with an investment adviser, administrator, distributor, shareholder servicing agent, 529 program manager (if applicable), and custodian who each provide services to the fund. Unless expressly stated otherwise, shareholders are not parties to, or intended beneficiaries of these contractual arrangements, and these contractual arrangements are not intended to create any shareholder right to enforce them against the service providers or to seek any remedy under them against the service providers, either directly or on behalf of the fund.
Under the Trust’s By-Laws and Declaration of Trust, any claims asserted against or on behalf of the MFS Funds, including claims against Trustees and Officers, must be brought in state and federal courts located within the Commonwealth of Massachusetts.
Federal Tax Information (unaudited)
The following information is provided pursuant to provisions of the Internal Revenue Code.
The fund designates $69,985,000 as capital gain dividends paid during the fiscal year.
For corporate shareholders, 51.66% of the ordinary income dividends paid during the fiscal year qualify for the corporate dividends received deduction.
The fund intends to pass through the maximum amount allowable as Section 163(j) Interest Dividends as defined in Treasury Regulation §1.163(j)-1(b).
| FACTS | WHAT DOES MFS DO WITH YOUR PERSONAL INFORMATION? |
| Why? | Financial companies choose how they share your personal information. Federal law gives consumers the right to limit some but not all sharing. Federal law also requires us to tell you how we collect, share, and protect your personal information. Please read this notice carefully to understand what we do. |
| What? | The types of personal information we collect and share depend on the product or service you have with us. This information can include: |
| • Social Security number and account balances |
| • Account transactions and transaction history |
| • Checking account information and wire transfer instructions |
| When you are no longer our customer, we continue to share your information as described in this notice. |
| How? | All financial companies need to share customers' personal information to run their everyday business. In the section below, we list the reasons financial companies can share their customers' personal information; the reasons MFS chooses to share; and whether you can limit this sharing. |
Reasons we can share your
personal information | Does MFS share? | Can you limit
this sharing? |
For our everyday business purposes –
such as to process your transactions, maintain your
account(s), respond to court orders and legal
investigations, or report to credit bureaus | Yes | No |
For our marketing purposes –
to offer our products and services to you | No | We don't share |
For joint marketing with other
financial companies | No | We don't share |
For our affiliates' everyday business purposes –
information about your transactions and experiences | No | We don't share |
For our affiliates' everyday business purposes –
information about your creditworthiness | No | We don't share |
| For nonaffiliates to market to you | No | We don't share |
| Questions? | Call 800-225-2606 or go to mfs.com. |
| Who we are |
| Who is providing this notice? | MFS Funds, MFS Investment Management, MFS Institutional Advisors, Inc., and MFS Heritage Trust Company. |
| What we do |
How does MFS
protect my personal
information? | To protect your personal information from unauthorized access and use, we use security measures that comply with federal law. These measures include procedural, electronic, and physical safeguards for the protection of the personal information we collect about you. |
How does MFS
collect my personal
information? | We collect your personal information, for example, when you |
| • open an account or provide account information |
| • direct us to buy securities or direct us to sell your securities |
| • make a wire transfer |
| We also collect your personal information from others, such as credit bureaus, affiliates, or other companies. |
| Why can't I limit all sharing? | Federal law gives you the right to limit only |
| • sharing for affiliates' everyday business purposes – information about your creditworthiness |
| • affiliates from using your information to market to you |
| • sharing for nonaffiliates to market to you |
| State laws and individual companies may give you additional rights to limit sharing. |
| Definitions |
| Affiliates | Companies related by common ownership or control. They can be financial and nonfinancial companies. |
| • MFS does not share personal information with affiliates, except for everyday business purposes as described on page one of this notice. |
| Nonaffiliates | Companies not related by common ownership or control. They can be financial and nonfinancial companies. |
| • MFS does not share with nonaffiliates so they can market to you. |
| Joint marketing | A formal agreement between nonaffiliated financial companies that together market financial products or services to you. |
| • MFS doesn't jointly market. |
| Other important information |
| If you own an MFS product or receive an MFS service in the name of a third party such as a bank or broker-dealer, their privacy policy may apply to you instead of ours. |
Annual Report
December 31, 2020

MFS® Utilities Series

MFS® Variable Insurance Trust
VUF-ANN
MFS® Utilities Series
CONTENTS
The report is prepared for the general information of contract owners. It is authorized for distribution to prospective investors only when preceded or accompanied by a current prospectus.
NOT FDIC INSURED • MAY LOSE VALUE • NO BANK OR CREDIT UNION GUARANTEE • NOT A DEPOSIT • NOT INSURED BY ANY FEDERAL GOVERNMENT AGENCY OR NCUA/NCUSIF
MFS Utilities Series
LETTER FROM THE CEO

Dear Contract Owners:
Markets experienced dramatic swings this year as the coronavirus pandemic brought the global economy to a standstill for several months early in the year. The speedy development of vaccines and therapeutics later brightened the economic and market outlook, but a great deal of uncertainty remains as case counts remain high, new variants of the virus are appearing and questions persist over how fast the vaccine can be made widely available. In the United States, political uncertainty eased after former Vice President Joe Biden won the presidential election and the Democrats gained control of a closely divided Senate.
Global central banks have taken aggressive steps to cushion the economic and market fallout related to the virus, and governments are deploying unprecedented levels of fiscal support. Additional U.S. stimulus is anticipated with the Democrats in the White House and in control of both houses of Congress. The measures already put in place have helped build a supportive environment and are encouraging economic recovery; however, if markets disconnect from fundamentals, they can sow the seeds of instability. As such, dramatic increases in speculative retail trading bear watching.
In the aftermath of the crisis, we could see societal changes as households, businesses, and governments adjust to a new reality, and any such alterations could affect the investment landscape. For investors, events such as the COVID-19 outbreak demonstrate the importance of having a deep understanding of company fundamentals, and we have built our global research platform to do just that.
At MFS®, we put our clients’ assets to work responsibly by carefully navigating the increasing complexity of our global markets and economies. Guided by our long-term philosophy and adhering to our commitment to sustainable investing, we tune out the noise and aim to uncover what we believe are the best, most durable investment opportunities in the market. Our unique global investment platform combines collective expertise, long-term discipline and thoughtful risk management to create sustainable value for investors.
Respectfully,

Michael W. Roberge
Chief Executive Officer
MFS Investment Management
February 16, 2021
The opinions expressed in this letter are subject to change and may not be relied upon for investment advice. No forecasts can be guaranteed.
1
MFS Utilities Series
PORTFOLIO COMPOSITION
Portfolio structure (i)
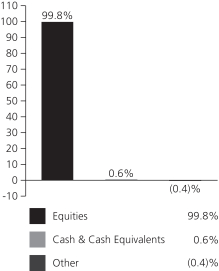
| | | | |
| Top ten holdings (i) | | | | |
| NextEra Energy, Inc. | | | 8.1% | |
| EDP Renovaveis S.A. | | | 6.6% | |
| Southern Co. | | | 5.1% | |
| Exelon Corp. | | | 4.8% | |
| Duke Energy Corp. | | | 4.7% | |
| Dominion Energy, Inc. | | | 4.0% | |
| Enel S.p.A. | | | 3.4% | |
| Edison International | | | 3.0% | |
| Iberdrola S.A. | | | 2.8% | |
| PG&E Corp. | | | 2.7% | |
| | | | |
| Top five industries (i) | | | | |
| Utilities – Electric Power | | | 77.6% | |
| Natural Gas – Distribution | | | 6.6% | |
| Telecommunications – Wireless | | | 6.5% | |
| Natural Gas – Pipeline | | | 4.5% | |
| Cable TV | | | 2.4% | |
| |
| Issuer country weightings (i)(x) | | | | |
| United States | | | 67.5% | |
| Portugal | | | 8.5% | |
| Spain | | | 4.5% | |
| United Kingdom | | | 4.1% | |
| Canada | | | 3.8% | |
| Italy | | | 3.4% | |
| Germany | | | 2.5% | |
| China | | | 0.8% | |
| Thailand | | | 0.8% | |
| Other Countries | | | 4.1% | |
| (i) | For purposes of this presentation, the components include the value of securities, and reflect the impact of the equivalent exposure of derivative positions, if any. These amounts may be negative from time to time. Equivalent exposure is a calculated amount that translates the derivative position into a reasonable approximation of the amount of the underlying asset that the portfolio would have to hold at a given point in time to have the same price sensitivity that results from the portfolio’s ownership of the derivative contract. When dealing with derivatives, equivalent exposure is a more representative measure of the potential impact of a position on portfolio performance than value. The bond component will include any accrued interest amounts. |
| (x) | Represents the portfolio’s exposure to issuer countries as a percentage of a portfolio’s net assets. For purposes of this presentation, United States includes Cash & Cash Equivalents and Other. |
Where the fund holds convertible bonds, they are treated as part of the equity portion of the portfolio.
Cash & Cash Equivalents includes any cash, investments in money market funds, short-term securities, and other assets less liabilities. Please see the Statement of Assets and Liabilities for additional information related to the fund’s cash position and other assets and liabilities.
Other includes equivalent exposure from currency derivatives and/or any offsets to derivative positions and may be negative.
Percentages are based on net assets as of December 31, 2020.
The portfolio is actively managed and current holdings may be different.
2
MFS Utilities Series
MANAGEMENT REVIEW
Summary of Results
For the twelve months ended December 31, 2020, Initial Class shares of the MFS Utilities Series (fund) provided a total return of 5.90%, while Service Class shares of the fund provided a total return of 5.62%. These compare with a return of 18.40% over the same period for the fund’s benchmark, the Standard & Poor’s 500 Stock Index, and a return of 0.48% for the fund’s other benchmark, the Standard & Poor’s 500 Utilities Index (S&P Utilities Index).
Market Environment
Markets experienced an extraordinarily sharp selloff early in the period and, in many cases, an unusually rapid recovery later. Central banks and fiscal authorities undertook astonishing levels of stimulus to offset the economic effects of government-imposed social-distancing measures implemented to slow the spread of the COVID-19 virus. At this point, the global economy looks to have experienced the shortest – albeit the deepest and steepest – recession in the postwar period. However, the recovery remains subject to more than the usual number of uncertainties due to questions about the evolution of the virus, what its continued impact will be and how quickly vaccines to guard against it can be manufactured and distributed at scale. There are also worries over the public’s willingness to be inoculated.
Around the world, central banks responded quickly and massively to the crisis with programs to improve liquidity and support markets. These programs proved largely successful in helping to restore market function, ease volatility and stimulate a continued market rebound. Late in the period, the US Federal Reserve adopted a new, flexible, average-inflation-targeting framework, which is expected to result in the federal funds rate remaining at low levels longer than under its previous model. In developed countries, monetary easing measures were complemented by unusually large fiscal stimulus initiatives. Due to relatively manageable external liabilities and balances of payments in many countries and persistently low inflation, even emerging market countries were able to implement countercyclical policies – a departure from the usual market-dictated response to risk-off crises.
Compounding market uncertainty earlier in the pandemic was a crash in the price of crude oil due to a sharp drop in global demand and a disagreement between Saudi Arabia and Russia over production cuts, which resulted in an oil price war. The subsequent decline in prices undercut oil exporters, many of which are in emerging markets, as well as a large segment of the high-yield credit market. The OPEC+ group later agreed on output cuts, with shale oil producers in the US also decreasing production, which, along with the gradual reopening of some major economies and the resultant boost in demand, helped stabilize the price of crude oil.
In the immediate aftermath of the market disruption that accompanied the initial phases of the pandemic, many companies that had added significant leverage to their balance sheets in recent years by borrowing to fund dividend payments and stock buybacks halted those activities, and some companies were forced to recapitalize. As markets and the economy stabilized later in the period, in many cases dividend payments and buybacks resumed. Conversely, some companies found themselves flush with liquidity, having borrowed preemptively during the worst of the crisis only to end up with excess cash on their balance sheets.
Detractors from Performance
The fund’s out-of-benchmark exposure to the natural gas pipeline industry weakened performance relative to the S&P Utilities Index. Here, notable relative detractors included the fund’s holdings of oil and natural gas pipelines operator Plains All American Pipeline (b), natural gas and petrochemical products manufacturer Enterprise Products Partners (b) and natural gas gathering firm Equitrans Midsteam (b).
Elsewhere, the fund’s underweight positions in electricity provider NextEra Energy and power & natural gas distributor Duke Energy (b) held back relative performance. The share price of NextEra rose as the company delivered earnings per share results that beat market expectations, driven by strong earnings contributions from its NEER competitive generation business, and its Florida Power and Light and Gulf Power divisions. Not owning shares of water services provider American Water Works and power & natural gas distributor Xcel Energy also detracted from relative performance. The fund’s holdings of electricity provider Vistra (b), television, internet and telephone services company NOS, SGPS (b) (Portugal) and electricity distributor Neoenergia (b) (Brazil) also weighed on relative results.
Contributors to Performance
Security selection within the electric power industry contributed to relative performance, led by the fund’s holdings of renewable energy company EDP Renovaveis (b) (Portugal), electricity and gas distributor Enel (b) (Italy), electric utility company Iberdrola (b) (Spain), integrated utility company Energias De Portugal (b) (Portugal) and electricity and gas distributor RWE (b) (Germany). The stock price for EDP Renovaveis rose after the company reported that its balance sheet benefited from the disposal of significant assets. Additionally, EDP Renovaveis secured a vast majority of the capacity additions targeted for next year, which appeared to have further boosted investors’ sentiment. Avoiding shares of poor-performing energy products and services supplier Consolidated Edison and utility company PPL also benefited relative returns. The timing of the fund’s ownership in shares of diversified energy company DTE Energy further bolstered relative performance.
3
MFS Utilities Series
Management Review – continued
Elsewhere, the fund’s holdings of cable services provider Charter Communications and telecommunications services provider Cellnex Telecom (b) (Spain) further supported relative performance.
Respectfully,
Portfolio Manager(s)
Claud Davis and J. Scott Walker
| (b) | Security is not a benchmark constituent. |
The views expressed in this report are those of the portfolio manager(s) only through the end of the period of the report as stated on the cover and do not necessarily reflect the views of MFS or any other person in the MFS organization. These views are subject to change at any time based on market or other conditions, and MFS disclaims any responsibility to update such views. These views may not be relied upon as investment advice or an indication of trading intent on behalf of any MFS portfolio. References to specific securities are not recommendations of such securities, and may not be representative of any MFS portfolio’s current or future investments.
4
MFS Utilities Series
PERFORMANCE SUMMARY THROUGH 12/31/20
The following chart illustrates the historical performance of the fund in comparison to its benchmark(s). Benchmarks are unmanaged and may not be invested in directly. Benchmark returns do not reflect any fees or expenses. The performance of other share classes will be greater than or less than that of the class depicted below. (See Notes to Performance Summary.)
Performance data shown represents past performance and is no guarantee of future results. Investment return and principal value fluctuate so your units, when sold, may be worth more or less than the original cost; current performance may be lower or higher than quoted. The performance shown does not reflect the deduction of taxes, if any, that a contract holder would pay on fund distributions or the redemption of contract units. The returns for the fund shown also do not reflect the deduction of expenses associated with variable products, such as mortality and expense risk charges, separate account charges, and sales charges imposed by the insurance company separate accounts. Such expenses would reduce the overall returns shown.
Growth of a Hypothetical $10,000 Investment
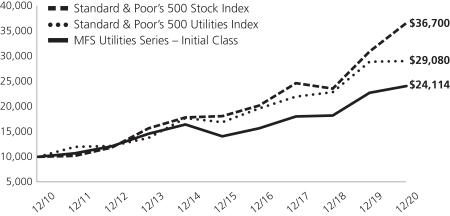
Total Returns through 12/31/20
Average annual total returns
| | | | | | | | | | | | |
| | | Share Class | | Class Inception Date | | 1-yr | | 5-yr | | 10-yr | | |
| | | Initial Class | | 1/03/95 | | 5.90% | | 11.37% | | 9.20% | | |
| | | Service Class | | 5/01/00 | | 5.62% | | 11.10% | | 8.93% | | |
| | | | |
| Comparative benchmark(s) | | | | | | | | |
| | | Standard & Poor’s 500 Stock Index (f) | | 18.40% | | 15.22% | | 13.88% | | |
| | | Standard & Poor’s 500 Utilities Index (f) | | 0.48% | | 11.50% | | 11.27% | | |
| (f) | Source: FactSet Research Systems Inc. |
Benchmark Definition(s)
Standard & Poor’s 500 Stock Index (g) – a market capitalization-weighted index of 500 widely held equity securities, designed to measure broad U.S. equity performance.
Standard & Poor’s 500 Utilities Index (g) – a market capitalization-weighted index designed to measure the utilities sector, including those companies considered electric, gas or water utilities, or companies that operate as independent producers and/or distributors of power.
It is not possible to invest directly in an index.
| (g) | “Standard & Poor’s®” and “S&P®” are registered trademarks of Standard & Poor’s Financial Services LLC (“S&P”) and Dow Jones is a registered trademark of Dow Jones Trademark Holdings LLC (“Dow Jones”) and have been licensed for use by S&P Dow Jones Indices LLC and sublicensed for certain purposes by MFS. The S&P 500® is a product of S&P Dow Jones Indices LLC, and has been licensed for use by MFS. MFS’s product(s) is not sponsored, endorsed, sold, or promoted by S&P Dow Jones Indices LLC, Dow Jones, S&P, or their respective affiliates, and neither S&P Dow Jones Indices LLC, Dow Jones, S&P, nor their respective affiliates make any representation regarding the advisability of investing in such product(s). |
Notes to Performance Summary
Average annual total return represents the average annual change in value for each share class for the periods presented.
5
MFS Utilities Series
Performance Summary – continued
Performance results reflect any applicable expense subsidies and waivers in effect during the periods shown. Without such subsidies and waivers the fund’s performance results would be less favorable. Please see the prospectus and financial statements for complete details. All results are historical and assume the reinvestment of any dividends and capital gains distributions.
Performance results do not include adjustments made for financial reporting purposes in accordance with U.S. generally accepted accounting principles and may differ from amounts reported in the financial highlights.
From time to time the fund may receive proceeds from litigation settlements, without which performance would be lower.
6
MFS Utilities Series
EXPENSE TABLE
Fund Expenses Borne by the Contract Holders during the Period,
July 1, 2020 through December 31, 2020
As a contract holder of the fund, you incur ongoing costs, including management fees; distribution and/or service (12b-1) fees; and other fund expenses. This example is intended to help you understand your ongoing costs (in dollars) of investing in the fund and to compare these costs with the ongoing costs of investing in other mutual funds.
The example is based on an investment of $1,000 invested at the beginning of the period and held for the entire period July 1, 2020 through December 31, 2020.
Actual Expenses
The first line for each share class in the following table provides information about actual account values and actual expenses. You may use the information in this line, together with the amount you invested, to estimate the expenses that you paid over the period. Simply divide your account value by $1,000 (for example, an $8,600 account value divided by $1,000 = 8.6), then multiply the result by the number in the first line under the heading entitled “Expenses Paid During Period” to estimate the expenses you paid on your account during this period.
Hypothetical Example for Comparison Purposes
The second line for each share class in the following table provides information about hypothetical account values and hypothetical expenses based on the fund’s actual expense ratio and an assumed rate of return of 5% per year before expenses, which is not the fund’s actual return. The hypothetical account values and expenses may not be used to estimate the actual ending account balance or expenses you paid for the period. You may use this information to compare the ongoing costs of investing in the fund and other funds. To do so, compare this 5% hypothetical example with the 5% hypothetical examples that appear in the shareholder reports of the other funds.
Please note that the expenses shown in the table are meant to highlight the fund’s ongoing costs only and do not take into account the fees and expenses imposed under the variable contracts through which your investment in the fund is made. Therefore, the second line for each share class in the table is useful in comparing ongoing costs associated with an investment in vehicles (such as the fund) which fund benefits under variable annuity and variable life insurance contracts and to qualified pension and retirement plans only, and will not help you determine the relative total costs of investing in the fund through variable annuity and variable life insurance contracts. If the fees and expenses imposed under the variable contracts were included, your costs would have been higher.
| | | | | | | | | | | | | | | | | | |
Share Class | | | | Annualized
Expense Ratio | | | Beginning
Account Value
7/01/20 | | | Ending
Account Value
12/31/20 | | | Expenses Paid
During Period (p)
7/01/20-12/31/20 | |
| Initial Class | | Actual | | | 0.78% | | | | $1,000.00 | | | | $1,172.70 | | | | $4.26 | |
| | Hypothetical (h) | | | 0.78% | | | | $1,000.00 | | | | $1,021.22 | | | | $3.96 | |
| Service Class | | Actual | | | 1.03% | | | | $1,000.00 | | | | $1,171.47 | | | | $5.62 | |
| | Hypothetical (h) | | | 1.03% | | | | $1,000.00 | | | | $1,019.96 | | | | $5.23 | |
| (h) | 5% class return per year before expenses. |
| (p) | “Expenses Paid During Period” are equal to each class’s annualized expense ratio, as shown above, multiplied by the average account value over the period, multiplied by 184/366 (to reflect the one-half year period). |
7
MFS Utilities Series
PORTFOLIO OF INVESTMENTS – 12/31/20
The Portfolio of Investments is a complete list of all securities owned by your fund. It is categorized by broad-based asset classes.
| | | | | | | | |
| Issuer | | Shares/Par | | | Value ($) | |
| COMMON STOCKS – 96.7% | | | | | | | | |
| Cable TV – 2.4% | | | | | |
| Charter Communications, Inc., “A” (a) | | | 34,634 | | | $ | 22,912,123 | |
| NOS, SGPS S.A. | | | 1,787,471 | | | | 6,261,600 | |
| | | | | | | | |
| | | | | | $ | 29,173,723 | |
| | | | | | | | |
| Natural Gas – Distribution – 5.5% | | | | | |
| Atmos Energy Corp. | | | 207,829 | | | $ | 19,833,121 | |
| China Resources Gas Group Ltd. | | | 1,926,000 | | | | 10,248,051 | |
| Sempra Energy | | | 237,600 | | | | 30,272,616 | |
| UGI Corp. | | | 180,530 | | | | 6,311,329 | |
| | | | | | | | |
| | | | | | $ | 66,665,117 | |
| | | | | | | | |
| Natural Gas – Pipeline – 4.5% | | | | | |
| Cheniere Energy, Inc. (a) | | | 245,285 | | | $ | 14,724,459 | |
| Enterprise Products Partners LP | | | 1,022,777 | | | | 20,036,201 | |
| Equitrans Midstream Corp. | | | 591,260 | | | | 4,753,730 | |
| Magellan Midstream Partners LP | | | 149,722 | | | | 6,354,202 | |
| Plains All American Pipeline LP | | | 404,450 | | | | 3,332,668 | |
| Plains GP Holdings LP | | | 697,291 | | | | 5,892,109 | |
| | | | | | | | |
| | | | | | $ | 55,093,369 | |
| | | | | | | | |
| Telecommunications – Wireless – 6.5% | | | | | |
| Advanced Info Service Public Co. Ltd. | | | 1,601,700 | | | $ | 9,409,186 | |
| Cellnex Telecom S.A. | | | 348,273 | | | | 20,898,975 | |
| KDDI Corp. | | | 308,000 | | | | 9,145,591 | |
| Mobile TeleSystems PJSC, ADR | | | 567,487 | | | | 5,079,009 | |
| Rogers Communications, Inc., “B” | | | 250,526 | | | | 11,663,265 | |
| SBA Communications Corp., REIT | | | 35,236 | | | | 9,941,133 | |
| T-Mobile USA, Inc. (a) | | | 94,859 | | | | 12,791,736 | |
| | | | | | | | |
| | | | | | $ | 78,928,895 | |
| | | | | | | | |
| Telephone Services – 2.2% | | | | | |
| Hellenic Telecommunications Organization S.A. | | | 453,506 | | | $ | 7,302,058 | |
| Telesites S.A.B. de C.V. (a) | | | 5,753,700 | | | | 6,222,248 | |
| TELUS Corp. | | | 667,665 | | | | 13,223,218 | |
| | | | | | | | |
| | | | | | $ | 26,747,524 | |
| | | | | | | | |
| Utilities – Electric Power – 75.6% | | | | | |
| AES Corp. | | | 1,045,842 | | | $ | 24,577,287 | |
| ALLETE, Inc. | | | 115,846 | | | | 7,175,501 | |
| Alliant Energy Corp. | | | 317,712 | | | | 16,371,699 | |
| AltaGas Ltd. (l) | | | 501,540 | | | | 7,375,936 | |
| American Electric Power Co., Inc. | | | 229,480 | | | | 19,108,800 | |
| CenterPoint Energy, Inc. (a)(z) | | | 572,130 | | | | 12,380,893 | |
| CLP Holdings Ltd. | | | 707,000 | | | | 6,544,898 | |
| Dominion Energy, Inc. | | | 644,373 | | | | 48,456,850 | |
| DTE Energy Co. | | | 250,221 | | | | 30,379,332 | |
| Duke Energy Corp. | | | 624,554 | | | | 57,184,164 | |
| E.ON SE | | | 1,137,650 | | | | 12,597,240 | |
| Edison International | | | 586,417 | | | | 36,838,716 | |
| EDP Renovaveis S.A. | | | 2,902,561 | | | | 80,580,769 | |
| | | | | | | | |
| Issuer | | Shares/Par | | | Value ($) | |
| COMMON STOCKS – continued | | | | | |
| Utilities – Electric Power – continued | | | | | |
| Electricite de France S.A. (a) | | | 487,526 | | | $ | 7,721,902 | |
| Emera, Inc. | | | 320,667 | | | | 13,628,788 | |
| Enel S.p.A. | | | 4,088,633 | | | | 41,337,617 | |
| Energias de Portugal S.A. | | | 2,587,132 | | | | 16,295,899 | |
| Entergy Corp. | | | 84,356 | | | | 8,422,103 | |
| Equatorial Energia S.A. | | | 1,101,100 | | | | 4,928,307 | |
| Evergy, Inc. | | | 355,066 | | | | 19,709,714 | |
| Exelon Corp. | | | 1,380,728 | | | | 58,294,336 | |
| FirstEnergy Corp. | | | 696,751 | | | | 21,327,548 | |
| Iberdrola S.A. | | | 2,358,554 | | | | 33,711,534 | |
| National Grid PLC | | | 1,811,502 | | | | 21,576,048 | |
| Neoenergia S.A. | | | 873,100 | | | | 2,984,862 | |
| NextEra Energy Partners LP | | | 77,448 | | | | 5,192,888 | |
| NextEra Energy, Inc. | | | 1,284,370 | | | | 99,089,145 | |
| PG&E Corp. (a) | | | 2,590,048 | | | | 32,271,998 | |
| Pinnacle West Capital Corp. | | | 153,730 | | | | 12,290,713 | |
| Portland General Electric Co. | | | 137,219 | | | | 5,868,857 | |
| Public Service Enterprise Group, Inc. | | | 351,403 | | | | 20,486,795 | |
| RWE AG | | | 423,775 | | | | 17,897,054 | |
| Southern Co. | | | 1,018,742 | | | | 62,581,321 | |
| SSE PLC | | | 1,366,528 | | | | 28,165,639 | |
| Vistra Corp. | | | 1,362,993 | | | | 26,796,442 | |
| | | | | | | | |
| | | | | | $ | 920,151,595 | |
| | | | | | | | |
Total Common Stocks
(Identified Cost, $868,836,652) | | | | | | $ | 1,176,760,223 | |
| | | | | | | | |
|
| CONVERTIBLE PREFERRED STOCKS – 3.1% | |
| Natural Gas – Distribution – 1.1% | | | | | |
| Sempra Energy, 6% | | | 64,703 | | | $ | 6,454,771 | |
| Sempra Energy, 6.75% | | | 64,868 | | | | 6,728,758 | |
| | | | | | | | |
| | | | | | $ | 13,183,529 | |
| | | | | | | | |
| Utilities – Electric Power – 2.0% | | | | | |
| CenterPoint Energy, Inc., 7% | | | 431,280 | | | $ | 17,596,224 | |
| DTE Energy Co., 6.25% | | | 64,750 | | | | 3,117,065 | |
| NextEra Energy, Inc., 5.279% | | | 64,600 | | | | 3,284,264 | |
| | | | | | | | |
| | | | | | $ | 23,997,553 | |
| | | | | | | | |
Total Convertible Preferred Stocks
(Identified Cost, $35,506,820) | | | $ | 37,181,082 | |
| | | | | | | | |
| |
| INVESTMENT COMPANIES (h) – 0.4% | | | | | |
| Money Market Funds – 0.4% | | | | | | | | |
| MFS Institutional Money Market Portfolio, 0.1% (v) (Identified Cost, $4,847,086) | | | 4,847,086 | | | $ | 4,847,086 | |
| | | | | | | | |
OTHER ASSETS, LESS
LIABILITIES – (0.2)% | | | | | | | (1,919,046 | ) |
| | | | | | | | |
| NET ASSETS – 100.0% | | | | | | $ | 1,216,869,345 | |
| | | | | | | | |
8
MFS Utilities Series
Portfolio of Investments – continued
| (a) | | Non-income producing security. |
| (h) | | An affiliated issuer, which may be considered one in which the fund owns 5% or more of the outstanding voting securities, or a company which is under common control. At period end, the aggregate values of the fund’s investments in affiliated issuers and in unaffiliated issuers were $4,847,086 and $1,213,941,305, respectively. |
| (l) | | A portion of this security is on loan. See Note 2 for additional information. |
| (v) | | Affiliated issuer that is available only to investment companies managed by MFS. The rate quoted for the MFS Institutional Money Market Portfolio is the annualized seven-day yield of the fund at period end. |
| (z) | | Restricted securities are not registered under the Securities Act of 1933 and are subject to legal restrictions on resale. These securities generally may be resold in transactions exempt from registration or to the public if the securities are subsequently registered. Disposal of these securities may involve time-consuming negotiations and prompt sale at an acceptable price may be difficult. The fund holds the following restricted securities: |
| | | | | | | | | | |
| Restricted Securities | | Acquisition
Date | | Cost | | | Value | |
| | | |
| CenterPoint Energy, Inc. | | 5/07/20 | | | $9,199,850 | | | | $12,380,893 | |
| | | |
| % of Net assets | | | | | | | | | 1.0% | |
The following abbreviations are used in this report and are defined:
| ADR | | American Depositary Receipt |
| REIT | | Real Estate Investment Trust |
Abbreviations indicate amounts shown in currencies other than the U.S. dollar. All amounts are stated in U.S. dollars unless otherwise indicated. A list of abbreviations is shown below:
Derivative Contracts at 12/31/20
Forward Foreign Currency Exchange Contracts
| | | | | | | | | | | | | | | | | | | | | | | | |
| Currency Purchased | | | | | | Currency Sold | | Counterparty | | Settlement Date | | | Unrealized
Appreciation
(Depreciation) | |
| Asset Derivatives | | | | | | | | | | | | | | | | | | | | | |
| CAD | | | 22,088 | | | | | | | | USD | | | 16,743 | | BNP Paribas S.A. | | | 1/15/2021 | | | | $611 | |
| CAD | | | 98,292 | | | | | | | | USD | | | 75,155 | | Brown Brothers Harriman | | | 1/15/2021 | | | | 2,068 | |
| CAD | | | 92,993 | | | | | | | | USD | | | 70,518 | | Citibank N.A. | | | 1/15/2021 | | | | 2,543 | |
| CAD | | | 85,378 | | | | | | | | USD | | | 64,767 | | HSBC Bank | | | 1/15/2021 | | | | 2,311 | |
| CAD | | | 115,758 | | | | | | | | USD | | | 88,068 | | JPMorgan Chase Bank N.A. | | | 1/15/2021 | | | | 2,878 | |
| CAD | | | 52,925 | | | | | | | | USD | | | 40,118 | | Merrill Lynch International | | | 1/15/2021 | | | | 1,463 | |
| CAD | | | 253,452 | | | | | | | | USD | | | 193,489 | | State Street Bank Corp. | | | 1/15/2021 | | | | 5,637 | |
| EUR | | | 11,360 | | | | | | | | USD | | | 13,457 | | Brown Brothers Harriman | | | 1/15/2021 | | | | 425 | |
| EUR | | | 318,696 | | | | | | | | USD | | | 375,241 | | Citibank N.A. | | | 1/15/2021 | | | | 14,200 | |
| EUR | | | 644,559 | | | | | | | | USD | | | 781,645 | | HSBC Bank | | | 1/15/2021 | | | | 5,994 | |
| EUR | | | 418,924 | | | | | | | | USD | | | 496,823 | | JPMorgan Chase Bank N.A. | | | 1/15/2021 | | | | 15,094 | |
| EUR | | | 724,624 | | | | | | | | USD | | | 881,450 | | Merrill Lynch International | | | 1/15/2021 | | | | 4,027 | |
| EUR | | | 122,095 | | | | | | | | USD | | | 143,600 | | Morgan Stanley Capital Services, Inc. | | | 1/15/2021 | | | | 5,599 | |
| EUR | | | 1,250,488 | | | | | | | | USD | | | 1,498,823 | | State Street Bank Corp. | | | 1/15/2021 | | | | 29,251 | |
| EUR | | | 646,525 | | | | | | | | USD | | | 761,627 | | UBS AG | | | 1/15/2021 | | | | 28,415 | |
| GBP | | | 73,376 | | | | | | | | USD | | | 96,599 | | Merrill Lynch International | | | 1/15/2021 | | | | 3,752 | |
| GBP | | | 83,610 | | | | | | | | USD | | | 110,340 | | Morgan Stanley Capital Services, Inc. | | | 1/15/2021 | | | | 4,008 | |
| SEK | | | 3,437,782 | | | | | | | | USD | | | 394,595 | | Brown Brothers Harriman | | | 1/15/2021 | | | | 23,305 | |
| SEK | | | 1,966,931 | | | | | | | | USD | | | 228,424 | | HSBC Bank | | | 1/15/2021 | | | | 10,678 | |
| SEK | | | 12,649,639 | | | | | | | | USD | | | 1,467,059 | | Morgan Stanley Capital Services, Inc. | | | 1/15/2021 | | | | 70,643 | |
| USD | | | 10,920,527 | | | | | | | | EUR | | | 8,903,000 | | BNP Paribas S.A. | | | 1/15/2021 | | | | 41,216 | |
| USD | | | 579,071 | | | | | | | | EUR | | | 472,731 | | Brown Brothers Harriman | | | 1/15/2021 | | | | 1,403 | |
| USD | | | 5,669,424 | | | | | | | | EUR | | | 4,631,000 | | Citibank N.A. | | | 1/15/2021 | | | | 10,422 | |
| | | | | | | | | | | | | | | | | | | | | | | | |
| | | | | | | | | | | | | | | | | | | | | | | $285,943 | |
| | | | | | | | | | | | | | | | | | | | | | | | |
9
MFS Utilities Series
Portfolio of Investments – continued
Forward Foreign Currency Exchange Contracts - continued
| | | | | | | | | | | | | | | | | | | | |
| Currency Purchased | | | | | Currency Sold | | Counterparty | | Settlement Date | | | Unrealized
Appreciation
(Depreciation) | |
| Liability Derivatives | | | | | | | | | | | | |
| EUR | | | 535,937 | | | | | USD | | 656,635 | | Brown Brothers Harriman | | | 1/15/2021 | | | | $(1,730 | ) |
| USD | | | 2,352,602 | | | | | CAD | | 3,106,000 | | Citibank N.A. | | | 1/15/2021 | | | | (87,642 | ) |
| USD | | | 26,281,916 | | | | | CAD | | 34,499,431 | | HSBC Bank | | | 1/15/2021 | | | | (822,733 | ) |
| USD | | | 19,119 | | | | | CAD | | 25,055 | | State Street Bank Corp. | | | 1/15/2021 | | | | (566 | ) |
| USD | | | 11,765,766 | | | | | EUR | | 9,965,000 | | BNP Paribas S.A. | | | 1/15/2021 | | | | (411,290 | ) |
| USD | | | 396,920 | | | | | EUR | | 325,656 | | Brown Brothers Harriman | | | 1/15/2021 | | | | (1,026 | ) |
| USD | | | 2,120,168 | | | | | EUR | | 1,762,690 | | Citibank N.A. | | | 1/15/2021 | | | | (33,808 | ) |
| USD | | | 39,401,706 | | | | | EUR | | 33,292,668 | | HSBC Bank | | | 1/15/2021 | | | | (1,281,353 | ) |
| USD | | | 71,615,635 | | | | | EUR | | 58,647,884 | | HSBC Bank | | | 2/12/2021 | | | | (95,918 | ) |
| USD | | | 15,232,433 | | | | | EUR | | 12,845,702 | | JPMorgan Chase Bank N.A. | | | 1/15/2021 | | | | (464,790 | ) |
| USD | | | 2,168,736 | | | | | EUR | | 1,825,614 | | State Street Bank Corp. | | | 1/15/2021 | | | | (62,133 | ) |
| USD | | | 1,655,753 | | | | | GBP | | 1,273,000 | | Citibank N.A. | | | 1/15/2021 | | | | (85,251 | ) |
| USD | | | 27,524,029 | | | | | GBP | | 21,256,625 | | Goldman Sachs International | | | 1/15/2021 | | | | (1,547,346 | ) |
| USD | | | 2,046,898 | | | | | SEK | | 18,012,703 | | Brown Brothers Harriman | | | 1/15/2021 | | | | (142,743 | ) |
| USD | | | 4,742 | | | | | SEK | | 41,650 | | State Street Bank Corp. | | | 1/15/2021 | | | | (321 | ) |
| | | | | | | | | | | | | | | | | | | | |
| | | | | | | | | | | | | | | | | | | $(5,038,650 | ) |
| | | | | | | | | | | | | | | | | | | | |
At December 31, 2020, the fund had cash collateral of $1,740,000 to cover any collateral or margin obligations for certain derivative contracts. Restricted cash and/or deposits with brokers in the Statement of Assets and Liabilities are comprised of cash collateral.
See Notes to Financial Statements
10
MFS Utilities Series
FINANCIAL STATEMENTS | STATEMENT OF ASSETS AND LIABILITIES
This statement represents your fund’s balance sheet, which details the assets and liabilities comprising the total value of the fund.
| | | | |
At 12/31/20 | | | | |
| |
Assets | | | | |
Investments in unaffiliated issuers, at value, including $3,678,194 of securities on loan (identified cost, $904,343,472) | | | $1,213,941,305 | |
Investments in affiliated issuers, at value (identified cost, $4,847,086) | | | 4,847,086 | |
Restricted cash for | | | | |
Forward foreign currency exchange contracts | | | 1,740,000 | |
Receivables for | | | | |
Forward foreign currency exchange contracts | | | 285,943 | |
Fund shares sold | | | 93,912 | |
Interest and dividends | | | 2,811,867 | |
Other assets | | | 9,124 | |
Total assets | | | $1,223,729,237 | |
| |
Liabilities | | | | |
Payable to custodian | | | $4,565 | |
Payables for | | | | |
Forward foreign currency exchange contracts | | | 5,038,650 | |
Fund shares reacquired | | | 1,547,715 | |
Payable to affiliates | | | | |
Investment adviser | | | 48,240 | |
Administrative services fee | | | 825 | |
Shareholder servicing costs | | | 760 | |
Distribution and/or service fees | | | 9,225 | |
Payable for independent Trustees’ compensation | | | 11 | |
Deferred country tax expense payable | | | 11,101 | |
Accrued expenses and other liabilities | | | 198,800 | |
Total liabilities | | | $6,859,892 | |
Net assets | | | $1,216,869,345 | |
| |
Net assets consist of | | | | |
Paid-in capital | | | $842,440,332 | |
Total distributable earnings (loss) | | | 374,429,013 | |
Net assets | | | $1,216,869,345 | |
Shares of beneficial interest outstanding | | | 34,801,638 | |
| | | | | | | | | | | | |
| | | |
| | | Net assets | | | Shares
outstanding | | | Net asset value
per share | |
Initial Class | | | $537,239,875 | | | | 15,207,700 | | | | $35.33 | |
Service Class | | | 679,629,470 | | | | 19,593,938 | | | | 34.69 | |
See Notes to Financial Statements
11
MFS Utilities Series
FINANCIAL STATEMENTS | STATEMENT OF OPERATIONS
This statement describes how much your fund earned in investment income and accrued in expenses. It also describes any gains and/or losses generated by fund operations.
| | | | |
Year ended 12/31/20 | | | | |
| |
Net investment income (loss) | | | | |
Income | | | | |
Dividends | | | $40,670,138 | |
Other | | | 97,292 | |
Dividends from affiliated issuers | | | 68,273 | |
Income on securities loaned | | | 27,675 | |
Interest | | | 6,395 | |
Foreign taxes withheld | | | (1,238,614 | ) |
Total investment income | | | $39,631,159 | |
Expenses | | | | |
Management fee | | | $8,610,291 | |
Distribution and/or service fees | | | 1,632,856 | |
Shareholder servicing costs | | | 43,834 | |
Administrative services fee | | | 163,567 | |
Independent Trustees’ compensation | | | 21,832 | |
Custodian fee | | | 150,689 | |
Shareholder communications | | | 134,161 | |
Audit and tax fees | | | 65,740 | |
Legal fees | | | 8,620 | |
Miscellaneous | | | 37,637 | |
Total expenses | | | $10,869,227 | |
Reduction of expenses by investment adviser | | | (127,136 | ) |
Net expenses | | | $10,742,091 | |
Net investment income (loss) | | | $28,889,068 | |
| |
Realized and unrealized gain (loss) | | | | |
Realized gain (loss) (identified cost basis) | | | | |
Unaffiliated issuers (net of $11,586 country tax) | | | $36,535,195 | |
Affiliated issuers | | | 1,518 | |
Forward foreign currency exchange contracts | | | (6,107,059 | ) |
Foreign currency | | | 33,534 | |
Net realized gain (loss) | | | $30,463,188 | |
Change in unrealized appreciation or depreciation | | | | |
Unaffiliated issuers (net of $305,025 decrease in deferred country tax) | | | $949,660 | |
Forward foreign currency exchange contracts | | | (1,553,802 | ) |
Translation of assets and liabilities in foreign currencies | | | 55,125 | |
Net unrealized gain (loss) | | | $(549,017 | ) |
Net realized and unrealized gain (loss) | | | $29,914,171 | |
Change in net assets from operations | | | $58,803,239 | |
See Notes to Financial Statements
12
MFS Utilities Series
FINANCIAL STATEMENTS | STATEMENTS OF CHANGES IN NET ASSETS
These statements describe the increases and/or decreases in net assets resulting from operations, any distributions, and any shareholder transactions.
| | | | | | | | |
| | | Year ended | |
| | | 12/31/20 | | | 12/31/19 | |
Change in net assets | | | | | | | | |
| | |
From operations | | | | | | | | |
Net investment income (loss) | | | $28,889,068 | | | | $33,385,933 | |
Net realized gain (loss) | | | 30,463,188 | | | | 51,790,915 | |
Net unrealized gain (loss) | | | (549,017 | ) | | | 204,485,158 | |
Change in net assets from operations | | | $58,803,239 | | | | $289,662,006 | |
Total distributions to shareholders | | | $(56,937,274 | ) | | | $(55,125,457 | ) |
Change in net assets from fund share transactions | | | $(75,290,012 | ) | | | $(164,373,912 | ) |
Total change in net assets | | | $(73,424,047 | ) | | | $70,162,637 | |
| | |
Net assets | | | | | | | | |
At beginning of period | | | 1,290,293,392 | | | | 1,220,130,755 | |
At end of period | | | $1,216,869,345 | | | | $1,290,293,392 | |
See Notes to Financial Statements
13
MFS Utilities Series
FINANCIAL STATEMENTS | FINANCIAL HIGHLIGHTS
The financial highlights table is intended to help you understand the fund’s financial performance for the past 5 years. Certain information reflects financial results for a single fund share. The total returns in the table represent the rate that an investor would have earned (or lost) on an investment in the fund share class (assuming reinvestment of all distributions) held for the entire period.
| | | | | | | | | | | | | | | | | | | | |
| Initial Class | | Year ended | |
| | | | | |
| | | 12/31/20 | | | 12/31/19 | | | 12/31/18 | | | 12/31/17 | | | 12/31/16 | |
| | | | | |
Net asset value, beginning of period | | | $35.18 | | | | $29.38 | | | | $29.50 | | | | $26.81 | | | | $25.56 | |
| | | | | |
| Income (loss) from investment operations | | | | | | | | | | | | | | | | | | | | |
Net investment income (loss) (d) | | | $0.90 | | | | $0.90 | | | | $0.89 | | | | $0.81 | | | | $1.06 | (c) |
Net realized and unrealized gain (loss) | | | 0.96 | | | | 6.37 | | | | (0.56 | ) | | | 3.17 | | | | 1.91 | |
Total from investment operations | | | $1.86 | | | | $7.27 | | | | $0.33 | | | | $3.98 | | | | $2.97 | |
| | | | | |
| Less distributions declared to shareholders | | | | | | | | | | | | | | | | | | | | |
From net investment income | | | $(0.84 | ) | | | $(1.37 | ) | | | $(0.33 | ) | | | $(1.29 | ) | | | $(1.08 | ) |
From net realized gain | | | (0.87 | ) | | | (0.10 | ) | | | (0.12 | ) | | | — | | | | (0.64 | ) |
Total distributions declared to shareholders | | | $(1.71 | ) | | | $(1.47 | ) | | | $(0.45 | ) | | | $(1.29 | ) | | | $(1.72 | ) |
Net asset value, end of period (x) | | | $35.33 | | | | $35.18 | | | | $29.38 | | | | $29.50 | | | | $26.81 | |
Total return (%) (k)(r)(s)(x) | | | 5.90 | | | | 25.07 | | | | 1.06 | | | | 14.83 | | | | 11.47 | (c) |
| | | | | |
Ratios (%) (to average net assets)
and Supplemental data: | | | | | | | | | | | | | | | | | | | | |
Expenses before expense reductions (f) | | | 0.80 | | | | 0.79 | | | | 0.78 | | | | 0.80 | | | | 0.77 | (c) |
Expenses after expense reductions (f) | | | 0.79 | | | | 0.78 | | | | 0.78 | | | | 0.79 | | | | 0.77 | (c) |
Net investment income (loss) | | | 2.75 | | | | 2.69 | | | | 2.98 | | | | 2.78 | | | | 3.89 | (c) |
Portfolio turnover | | | 32 | | | | 28 | | | | 27 | | | | 27 | | | | 33 | |
Net assets at end of period (000 omitted) | | | $537,240 | | | | $556,301 | | | | $492,930 | | | | $561,744 | | | | $556,607 | |
| |
| Service Class | | Year ended | |
| | | | | |
| | | 12/31/20 | | | 12/31/19 | | | 12/31/18 | | | 12/31/17 | | | 12/31/16 | |
| | | | | |
Net asset value, beginning of period | | | $34.56 | | | | $28.86 | | | | $28.98 | | | | $26.37 | | | | $25.15 | |
| | | | | |
| Income (loss) from investment operations | | | | | | | | | | | | | | | | | | | | |
Net investment income (loss) (d) | | | $0.81 | | | | $0.80 | | | | $0.81 | | | | $0.73 | | | | $0.97 | (c) |
Net realized and unrealized gain (loss) | | | 0.93 | | | | 6.27 | | | | (0.56 | ) | | | 3.09 | | | | 1.90 | |
Total from investment operations | | | $1.74 | | | | $7.07 | | | | $0.25 | | | | $3.82 | | | | $2.87 | |
| | | | | |
| Less distributions declared to shareholders | | | | | | | | | | | | | | | | | | | | |
From net investment income | | | $(0.74 | ) | | | $(1.27 | ) | | | $(0.25 | ) | | | $(1.21 | ) | | | $(1.01 | ) |
From net realized gain | | | (0.87 | ) | | | (0.10 | ) | | | (0.12 | ) | | | — | | | | (0.64 | ) |
Total distributions declared to shareholders | | | $(1.61 | ) | | | $(1.37 | ) | | | $(0.37 | ) | | | $(1.21 | ) | | | $(1.65 | ) |
Net asset value, end of period (x) | | | $34.69 | | | | $34.56 | | | | $28.86 | | | | $28.98 | | | | $26.37 | |
Total return (%) (k)(r)(s)(x) | | | 5.62 | | | | 24.80 | | | | 0.81 | | | | 14.49 | | | | 11.24 | (c) |
| | | | | |
Ratios (%) (to average net assets)
and Supplemental data: | | | | | | | | | | | | | | | | | | | | |
Expenses before expense reductions (f) | | | 1.05 | | | | 1.04 | | | | 1.04 | | | | 1.05 | | | | 1.02 | (c) |
Expenses after expense reductions (f) | | | 1.04 | | | | 1.03 | | | | 1.03 | | | | 1.04 | | | | 1.02 | (c) |
Net investment income (loss) | | | 2.50 | | | | 2.44 | | | | 2.76 | | | | 2.53 | | | | 3.64 | (c) |
Portfolio turnover | | | 32 | | | | 28 | | | | 27 | | | | 27 | | | | 33 | |
Net assets at end of period (000 omitted) | | | $679,629 | | | | $733,992 | | | | $727,201 | | | | $1,021,211 | | | | $998,836 | |
See Notes to Financial Statements
14
MFS Utilities Series
Financial Highlights – continued
| (c) | Amount reflects a one-time reimbursement of expenses by the custodian (or former custodian) without which net investment income and performance would be lower and expenses would be higher. |
| (d) | Per share data is based on average shares outstanding. |
| (f) | Ratios do not reflect reductions from fees paid indirectly, if applicable. |
| (k) | The total return does not reflect expenses that apply to separate accounts. Inclusion of these charges would reduce the total return figures for all periods shown. |
| (r) | Certain expenses have been reduced without which performance would have been lower. |
| (s) | From time to time the fund may receive proceeds from litigation settlements, without which performance would be lower. |
| (x) | The net asset values and total returns have been calculated on net assets which include adjustments made in accordance with U.S. generally accepted accounting principles required at period end for financial reporting purposes. |
See Notes to Financial Statements
15
MFS Utilities Series
NOTES TO FINANCIAL STATEMENTS
| (1) | | Business and Organization |
MFS Utilities Series (the fund) is a diversified series of MFS Variable Insurance Trust (the trust). The trust is organized as a Massachusetts business trust and is registered under the Investment Company Act of 1940, as amended, as an open-end management investment company. The shareholders of each series of the trust are separate accounts of insurance companies, which offer variable annuity and/or life insurance products, and qualified retirement and pension plans.
The fund is an investment company and accordingly follows the investment company accounting and reporting guidance of the Financial Accounting Standards Board (FASB) Accounting Standards Codification Topic 946 Financial Services – Investment Companies.
| (2) | | Significant Accounting Policies |
General – The preparation of financial statements in conformity with U.S. generally accepted accounting principles requires management to make estimates and assumptions that affect the reported amounts of assets and liabilities, and disclosure of contingent assets and liabilities at the date of the financial statements and the reported amounts of increases and decreases in net assets from operations during the reporting period. Actual results could differ from those estimates. In the preparation of these financial statements, management has evaluated subsequent events occurring after the date of the fund’s Statement of Assets and Liabilities through the date that the financial statements were issued. The fund invests primarily in securities of issuers in the utility industry. Issuers in a single industry can react similarly to market, currency, political, economic, regulatory, geopolitical, environmental, public health, and other conditions. The value of stocks in the utilities sector can be very volatile due to supply and/or demand for services or fuel, financing costs, conservation efforts, the negative impact of regulation, and other factors. The fund invests in foreign securities. Investments in foreign securities are vulnerable to the effects of changes in the relative values of the local currency and the U.S. dollar and to the effects of changes in each country’s market, economic, industrial, political, regulatory, geopolitical, environmental, public health, and other conditions.
In March 2020, the FASB issued Accounting Standards Update 2020-04, Reference Rate Reform (Topic 848) – Facilitation of the Effects of Reference Rate Reform on Financial Reporting (“ASU 2020-04”), which provides optional, temporary relief with respect to the financial reporting of contracts subject to certain types of modifications due to the planned discontinuation of the London Interbank Offered Rate (LIBOR) and other IBOR-based reference rates as of the end of 2021. The temporary relief provided by ASU 2020-04 is effective for certain reference rate-related contract modifications that occur during the period from March 12, 2020 through December 31, 2022. Management is evaluating the impact of ASU 2020-04 on the fund’s investments, derivatives, debt and other contracts that will undergo reference rate-related modifications as a result of the reference rate reform.
Balance Sheet Offsetting – The fund’s accounting policy with respect to balance sheet offsetting is that, absent an event of default by the counterparty or a termination of the agreement, the International Swaps and Derivatives Association (ISDA) Master Agreement, or similar agreement, does not result in an offset of reported amounts of financial assets and financial liabilities in the Statement of Assets and Liabilities across transactions between the fund and the applicable counterparty. The fund’s right to setoff may be restricted or prohibited by the bankruptcy or insolvency laws of the particular jurisdiction to which a specific master netting agreement counterparty is subject. Balance sheet offsetting disclosures, to the extent applicable to the fund, have been included in the fund’s Significant Accounting Policies note under the captions for each of the fund’s in-scope financial instruments and transactions.
Investment Valuations – Equity securities, including restricted equity securities, are generally valued at the last sale or official closing price on their primary market or exchange as provided by a third-party pricing service. Equity securities, for which there were no sales reported that day, are generally valued at the last quoted daily bid quotation on their primary market or exchange as provided by a third-party pricing service. Short-term instruments with a maturity at issuance of 60 days or less may be valued at amortized cost, which approximates market value. Forward foreign currency exchange contracts are generally valued at the mean of bid and asked prices for the time period interpolated from rates provided by a third-party pricing service for proximate time periods. Open-end investment companies are generally valued at net asset value per share. Securities and other assets generally valued on the basis of information from a third-party pricing service may also be valued at a broker/dealer bid quotation. In determining values, third-party pricing services can utilize both transaction data and market information such as yield, quality, coupon rate, maturity, type of issue, trading characteristics, and other market data. The values of foreign securities and other assets and liabilities expressed in foreign currencies are converted to U.S. dollars using the mean of bid and asked prices for rates provided by a third-party pricing service.
The Board of Trustees has delegated primary responsibility for determining or causing to be determined the value of the fund’s investments (including any fair valuation) to the adviser pursuant to valuation policies and procedures approved by the Board. If the adviser determines that reliable market quotations are not readily available, investments are valued at fair value as determined in good faith by the adviser in accordance with such procedures under the oversight of the Board of Trustees. Under the fund’s valuation policies and procedures, market quotations are not considered to be readily available for most types of debt instruments
16
MFS Utilities Series
Notes to Financial Statements – continued
and floating rate loans and many types of derivatives. These investments are generally valued at fair value based on information from third-party pricing services. In addition, investments may be valued at fair value if the adviser determines that an investment’s value has been materially affected by events occurring after the close of the exchange or market on which the investment is principally traded (such as foreign exchange or market) and prior to the determination of the fund’s net asset value, or after the halt of trading of a specific security where trading does not resume prior to the close of the exchange or market on which the security is principally traded. Events that occur after foreign markets close (such as developments in foreign markets and significant movements in the U.S. markets) and prior to the determination of the fund’s net asset value may be deemed to have a material effect on the value of securities traded in foreign markets. Accordingly, the fund’s foreign equity securities may often be valued at fair value. The adviser generally relies on third-party pricing services or other information (such as the correlation with price movements of similar securities in the same or other markets; the type, cost and investment characteristics of the security; the business and financial condition of the issuer; and trading and other market data) to assist in determining whether to fair value and at what value to fair value an investment. The value of an investment for purposes of calculating the fund’s net asset value can differ depending on the source and method used to determine value. When fair valuation is used, the value of an investment used to determine the fund’s net asset value may differ from quoted or published prices for the same investment. There can be no assurance that the fund could obtain the fair value assigned to an investment if it were to sell the investment at the same time at which the fund determines its net asset value per share.
Various inputs are used in determining the value of the fund’s assets or liabilities. These inputs are categorized into three broad levels. In certain cases, the inputs used to measure fair value may fall into different levels of the fair value hierarchy. In such cases, an investment’s level within the fair value hierarchy is based on the lowest level of input that is significant to the fair value measurement. The fund’s assessment of the significance of a particular input to the fair value measurement in its entirety requires judgment, and considers factors specific to the investment. Level 1 includes unadjusted quoted prices in active markets for identical assets or liabilities. Level 2 includes other significant observable market-based inputs (including quoted prices for similar securities, interest rates, prepayment speed, and credit risk). Level 3 includes unobservable inputs, which may include the adviser’s own assumptions in determining the fair value of investments. Other financial instruments are derivative instruments, such as forward foreign currency exchange contracts. The following is a summary of the levels used as of December 31, 2020 in valuing the fund’s assets or liabilities:
| | | | | | | | | | | | | | | | |
| Financial Instruments | | Level 1 | | | Level 2 | | | Level 3 | | | Total | |
| Equity Securities: | | | | | | | | | | | | | | | | |
United States | | | $806,760,718 | | | | $12,380,893 | | | | $— | | | | $819,141,611 | |
Portugal | | | 16,295,899 | | | | 86,842,369 | | | | — | | | | 103,138,268 | |
Spain | | | 54,610,509 | | | | — | | | | — | | | | 54,610,509 | |
United Kingdom | | | — | | | | 49,741,687 | | | | — | | | | 49,741,687 | |
Canada | | | 45,891,207 | | | | — | | | | — | | | | 45,891,207 | |
Italy | | | 41,337,617 | | | | — | | | | — | | | | 41,337,617 | |
Germany | | | 30,494,294 | | | | — | | | | — | | | | 30,494,294 | |
China | | | 10,248,051 | | | | — | | | | — | | | | 10,248,051 | |
Thailand | | | — | | | | 9,409,186 | | | | — | | | | 9,409,186 | |
Other Countries | | | 27,748,906 | | | | 22,179,969 | | | | — | | | | 49,928,875 | |
| Mutual Funds | | | 4,847,086 | | | | — | | | | — | | | | 4,847,086 | |
| Total | | | $1,038,234,287 | | | | $180,554,104 | | | | $— | | | | $1,218,788,391 | |
| | | | |
| Other Financial Instruments | | | | | | | | | | | | |
| Forward Foreign Currency Exchange Contracts – Assets | | | $— | | | | $285,943 | | | | $— | | | | $285,943 | |
| Forward Foreign Currency Exchange Contracts – Liabilities | | | — | | | | (5,038,650 | ) | | | — | | | | (5,038,650 | ) |
For further information regarding security characteristics, see the Portfolio of Investments.
Foreign Currency Translation – Purchases and sales of foreign investments, income, and expenses are converted into U.S. dollars based upon currency exchange rates prevailing on the respective dates of such transactions or on the reporting date for foreign denominated receivables and payables. Gains and losses attributable to foreign currency exchange rates on sales of securities are recorded for financial statement purposes as net realized gains and losses on investments. Gains and losses attributable to foreign exchange rate movements on receivables, payables, income and expenses are recorded for financial statement purposes as foreign currency transaction gains and losses. That portion of both realized and unrealized gains and losses on investments that results from fluctuations in foreign currency exchange rates is not separately disclosed.
Derivatives – The fund uses derivatives primarily to increase or decrease exposure to a particular market or segment of the market, or security, to increase or decrease interest rate or currency exposure, or as alternatives to direct investments. Derivatives are used for hedging or non-hedging purposes. While hedging can reduce or eliminate losses, it can also reduce or eliminate gains. When the
17
MFS Utilities Series
Notes to Financial Statements – continued
fund uses derivatives as an investment to increase market exposure, or for hedging purposes, gains and losses from derivative instruments may be substantially greater than the derivative’s original cost.
The derivative instruments used by the fund during the period were forward foreign currency exchange contracts. Depending on the type of derivative, the fund may exit a derivative position by entering into an offsetting transaction with a counterparty or exchange, negotiating an agreement with the derivative counterparty, or novating the position to a third party. The fund’s period end derivatives, as presented in the Portfolio of Investments and the associated Derivative Contract tables, generally are indicative of the volume of its derivative activity during the period.
The following table presents, by major type of derivative contract, the fair value, on a gross basis, of the asset and liability components of derivatives held by the fund at December 31, 2020 as reported in the Statement of Assets and Liabilities:
| | | | | | | | | | |
| | | | | Fair Value | |
| Risk | | Derivative Contracts | | Asset Derivatives | | | Liability Derivatives | |
| Foreign Exchange | | Forward Foreign Currency Exchange Contracts | | | $285,943 | | | | $(5,038,650 | ) |
The following table presents, by major type of derivative contract, the realized gain (loss) on derivatives held by the fund for the year ended December 31, 2020 as reported in the Statement of Operations:
| | | | |
| Risk | | Forward Foreign
Currency Exchange
Contracts | |
| Foreign Exchange | | | $(6,107,059 | ) |
The following table presents, by major type of derivative contract, the change in unrealized appreciation or depreciation on derivatives held by the fund for the year ended December 31, 2020 as reported in the Statement of Operations:
| | | | |
| Risk | | Forward Foreign
Currency Exchange
Contracts | |
| Foreign Exchange | | | $(1,553,802 | ) |
Derivative counterparty credit risk is managed through formal evaluation of the creditworthiness of all potential counterparties. On certain, but not all, uncleared derivatives, the fund attempts to reduce its exposure to counterparty credit risk whenever possible by entering into an ISDA Master Agreement on a bilateral basis. The ISDA Master Agreement gives each party to the agreement the right to terminate all transactions traded under such agreement if there is a specified deterioration in the credit quality of the other party. Upon an event of default or a termination of the ISDA Master Agreement, the non-defaulting party has the right to close out all transactions traded under such agreement and to net amounts owed under each agreement to one net amount payable by one party to the other. This right to close out and net payments across all transactions traded under the ISDA Master Agreement could result in a reduction of the fund’s credit risk to such counterparty equal to any amounts payable by the fund under the applicable transactions, if any.
Collateral and margin requirements differ by type of derivative. For cleared derivatives (e.g., futures contracts, cleared swaps, and exchange-traded options), margin requirements are set by the clearing broker and the clearing house and collateral, in the form of cash or securities, is posted by the fund directly with the clearing broker. Collateral terms are counterparty agreement specific for uncleared derivatives (e.g., forward foreign currency exchange contracts, uncleared swap agreements, and uncleared options) and collateral, in the form of cash and securities, is held in segregated accounts with the fund’s custodian in connection with these agreements. For derivatives traded under an ISDA Master Agreement, which contains a collateral support annex, the collateral requirements are netted across all transactions traded under such counterparty-specific agreement and an amount is posted from one party to the other to collateralize such obligations. Cash that has been segregated or delivered to cover the fund’s collateral or margin obligations under derivative contracts, if any, will be reported separately in the Statement of Assets and Liabilities as restricted cash for uncleared derivatives and/or deposits with brokers for cleared derivatives. Securities pledged as collateral or margin for the same purpose, if any, are noted in the Portfolio of Investments. The fund may be required to make payments of interest on uncovered collateral or margin obligations with the broker. Any such payments are included in “Miscellaneous” expense in the Statement of Operations.
Forward Foreign Currency Exchange Contracts – The fund entered into forward foreign currency exchange contracts for the purchase or sale of a specific foreign currency at a fixed price on a future date. These contracts may be used to hedge the fund’s currency risk or for non-hedging purposes. For hedging purposes, the fund may enter into contracts to deliver or receive foreign currency that the fund will receive from or use in its normal investment activities. The fund may also use contracts to hedge against declines in the value of foreign currency denominated securities due to unfavorable exchange rate movements. For non-hedging purposes, the fund may enter into contracts with the intent of changing the relative exposure of the fund’s portfolio of securities to different currencies to take advantage of anticipated exchange rate changes.
18
MFS Utilities Series
Notes to Financial Statements – continued
Forward foreign currency exchange contracts are adjusted by the daily exchange rate of the underlying currency and any unrealized gains or losses are recorded as a receivable or payable for forward foreign currency exchange contracts until the contract settlement date. On contract settlement date, any gain or loss on the contract is recorded as realized gains or losses on forward foreign currency exchange contracts.
Risks may arise upon entering into these contracts from unanticipated movements in the value of the contract and from the potential inability of counterparties to meet the terms of their contracts. Generally, the fund’s maximum risk due to counterparty credit risk is the unrealized gain on the contract due to the use of Continuous Linked Settlement, a multicurrency cash settlement system for the centralized settlement of foreign transactions. This risk is mitigated in cases where there is an ISDA Master Agreement between the fund and the counterparty providing for netting as described above and, where applicable, by the posting of collateral by the counterparty to the fund to cover the fund’s exposure to the counterparty under such ISDA Master Agreement.
Security Loans – Under its Securities Lending Agency Agreement with the fund, State Street Bank and Trust Company, as lending agent, loans the securities of the fund to certain qualified institutions (the “Borrowers”) approved by the fund. Security loans can be terminated at the discretion of either the lending agent or the fund and the related securities must be returned within the earlier of the standard trade settlement period for such securities or within three business days. The loans are collateralized by cash and/or U.S. Treasury and federal agency obligations in an amount typically at least equal to the market value of the securities loaned. On loans collateralized by cash, the cash collateral is invested in a money market fund. The market value of the loaned securities is determined at the close of business of the fund and any additional required collateral is delivered to the fund on the next business day. The lending agent provides the fund with indemnification against Borrower default. In the event of Borrower default, the lending agent will, for the benefit of the fund, either purchase securities identical to those loaned or, when such purchase is commercially impracticable, pay the fund the market value of the loaned securities. In return, the lending agent assumes the fund’s rights to the related collateral. If the collateral value is less than the cost to purchase identical securities, the lending agent is responsible for the shortfall, but only to the extent that such shortfall is not due to a decline in collateral value resulting from collateral reinvestment for which the fund bears the risk of loss. At period end, the fund had investment securities on loan, all of which were classified as equity securities in the fund’s Portfolio of Investments, with a fair value of $3,678,194. The fair value of the fund’s investment securities on loan is presented gross in the Statement of Assets and Liabilities. These loans were collateralized by U.S. Treasury Obligations of $3,896,099 held by the lending agent. The collateral on securities loaned exceeded the value of securities on loan at period end. A portion of the income generated upon investment of the collateral is remitted to the Borrowers, and the remainder is allocated between the fund and the lending agent. On loans collateralized by U.S. Treasury and/or federal agency obligations, a fee is received from the Borrower, and is allocated between the fund and the lending agent. Income from securities lending is separately reported in the Statement of Operations. The dividend and interest income earned on the securities loaned is accounted for in the same manner as other dividend and interest income.
Indemnifications – Under the fund’s organizational documents, its officers and Trustees may be indemnified against certain liabilities and expenses arising out of the performance of their duties to the fund. Additionally, in the normal course of business, the fund enters into agreements with service providers that may contain indemnification clauses. The fund’s maximum exposure under these agreements is unknown as this would involve future claims that may be made against the fund that have not yet occurred.
Investment Transactions and Income – Investment transactions are recorded on the trade date. Interest income is recorded on the accrual basis. All premium and discount is amortized or accreted for financial statement purposes in accordance with U.S. generally accepted accounting principles. Dividends received in cash are recorded on the ex-dividend date. Certain dividends from foreign securities will be recorded when the fund is informed of the dividend if such information is obtained subsequent to the ex-dividend date. Dividend and interest payments received in additional securities are recorded on the ex-dividend or ex-interest date in an amount equal to the value of the security on such date.
The fund may receive proceeds from litigation settlements. Any proceeds received from litigation involving portfolio holdings are reflected in the Statement of Operations in realized gain/loss if the security has been disposed of by the fund or in unrealized gain/loss if the security is still held by the fund. Any other proceeds from litigation not related to portfolio holdings are reflected as other income in the Statement of Operations.
Tax Matters and Distributions – The fund intends to qualify as a regulated investment company, as defined under Subchapter M of the Internal Revenue Code, and to distribute all of its taxable income, including realized capital gains. As a result, no provision for federal income tax is required. The fund’s federal tax returns, when filed, will remain subject to examination by the Internal Revenue Service for a three year period. Management has analyzed the fund’s tax positions taken on federal and state tax returns for all open tax years and does not believe that there are any uncertain tax positions that require recognition of a tax liability. Foreign taxes, if any, have been accrued by the fund in the accompanying financial statements in accordance with the applicable foreign tax law. Foreign income taxes may be withheld by certain countries in which the fund invests. Additionally, capital gains realized by the fund on securities issued in or by certain foreign countries may be subject to capital gains tax imposed by those countries.
19
MFS Utilities Series
Notes to Financial Statements – continued
Distributions to shareholders are recorded on the ex-dividend date. Income and capital gain distributions are determined in accordance with income tax regulations, which may differ from U.S. generally accepted accounting principles. Certain capital accounts in the financial statements are periodically adjusted for permanent differences in order to reflect their tax character. These adjustments have no impact on net assets or net asset value per share. Temporary differences which arise from recognizing certain items of income, expense, gain or loss in different periods for financial statement and tax purposes will reverse at some time in the future.
Book/tax differences primarily relate to wash sale loss deferrals, derivative transactions, partnership adjustments, and certain preferred stock treated as debt for tax purposes.
The tax character of distributions declared to shareholders for the last two fiscal years is as follows:
| | | | | | | | |
| | | Year ended
12/31/20 | | | Year ended
12/31/19 | |
| Ordinary income (including any short-term capital gains) | | | $35,969,261 | | | | $51,291,242 | |
| Long-term capital gains | | | 20,968,013 | | | | 3,834,215 | |
| Total distributions | | | $56,937,274 | | | | $55,125,457 | |
The federal tax cost and the tax basis components of distributable earnings were as follows:
| | | | |
| As of 12/31/20 | | | | |
| |
| Cost of investments | | | $874,463,382 | |
| Gross appreciation | | | 370,712,647 | |
| Gross depreciation | | | (31,140,345 | ) |
| Net unrealized appreciation (depreciation) | | | $339,572,302 | |
| |
| Undistributed ordinary income | | | 21,343,618 | |
| Undistributed long-term capital gain | | | 35,823,036 | |
| Other temporary differences | | | (22,309,943 | ) |
Multiple Classes of Shares of Beneficial Interest – The fund offers multiple classes of shares, which differ in their respective distribution and/or service fees. The fund’s income, realized and unrealized gain (loss), and common expenses are allocated to shareholders based on the daily net assets of each class. Dividends are declared separately for each class. Differences in per share dividend rates are generally due to differences in separate class expenses. The fund’s distributions declared to shareholders as reported in the Statements of Changes in Net Assets are presented by class as follows:
| | | | | | | | |
| | |
| | | Year ended
12/31/20 | | | Year ended
12/31/19 | |
| Initial Class | | | $25,547,426 | | | | $22,976,155 | |
| Service Class | | | 31,389,848 | | | | 32,149,302 | |
| Total | | | $56,937,274 | | | | $55,125,457 | |
| (3) | | Transactions with Affiliates |
Investment Adviser – The fund has an investment advisory agreement with MFS to provide overall investment management and related administrative services and facilities to the fund. The management fee is computed daily and paid monthly at the following annual rates based on the fund’s average daily net assets:
| | | | |
| Up to $1 billion | | | 0.75% | |
| In excess of $1 billion and up to $3 billion | | | 0.70% | |
| In excess of $3 billion | | | 0.65% | |
MFS has agreed in writing to reduce its management fee by a specified amount if certain MFS mutual fund assets exceed thresholds agreed to by MFS and the fund’s Board of Trustees. For the year ended December 31, 2020, this management fee reduction amounted to $127,136, which is included in the reduction of total expenses in the Statement of Operations. The management fee incurred for the year ended December 31, 2020 was equivalent to an annual effective rate of 0.73% of the fund’s average daily net assets.
Distributor – MFS Fund Distributors, Inc. (MFD), a wholly-owned subsidiary of MFS, is the distributor of shares of the fund. The Trustees have adopted a distribution plan for the Service Class shares pursuant to Rule 12b-1 under the Investment Company Act of 1940.
The fund’s distribution plan provides that the fund will pay MFD distribution and/or service fees equal to 0.25% per annum of its average daily net assets attributable to Service Class shares as partial consideration for services performed and expenses incurred by MFD and financial intermediaries (including participating insurance companies that invest in the fund to fund variable annuity and
20
MFS Utilities Series
Notes to Financial Statements – continued
variable life insurance contracts, sponsors of qualified retirement and pension plans that invest in the fund, and affiliates of these participating insurance companies and plan sponsors) in connection with the sale and distribution of the Service Class shares. MFD may subsequently pay all, or a portion, of the distribution and/or service fees to financial intermediaries.
Shareholder Servicing Agent – MFS Service Center, Inc. (MFSC), a wholly-owned subsidiary of MFS, receives a fee from the fund for its services as shareholder servicing agent. For the year ended December 31, 2020, the fee was $40,954, which equated to 0.0035% annually of the fund’s average daily net assets. MFSC also receives reimbursement from the fund for out-of-pocket expenses paid by MFSC on behalf of the fund. For the year ended December 31, 2020, these costs amounted to $2,880.
Administrator – MFS provides certain financial, legal, shareholder communications, compliance, and other administrative services to the fund. Under an administrative services agreement, the fund reimburses MFS the costs incurred to provide these services. The fund is charged an annual fixed amount of $17,500 plus a fee based on average daily net assets. The administrative services fee incurred for the year ended December 31, 2020 was equivalent to an annual effective rate of 0.0141% of the fund’s average daily net assets.
Trustees’ and Officers’ Compensation – The fund pays compensation to independent Trustees in the form of a retainer, attendance fees, and additional compensation to Board and Committee chairpersons. The fund does not pay compensation directly to Trustees or officers of the fund who are also officers of the investment adviser, all of whom receive remuneration from MFS for their services to the fund. Certain officers and Trustees of the fund are officers or directors of MFS, MFD, and MFSC.
Other – The fund invests in the MFS Institutional Money Market Portfolio which is managed by MFS and seeks current income consistent with preservation of capital and liquidity. This money market fund does not pay a management fee to MFS but does incur investment and operating costs.
The fund is permitted to engage in purchase and sale transactions with funds and accounts for which MFS serves as investment adviser or sub-adviser (“cross-trades”) pursuant to a policy adopted by the Board of Trustees. This policy has been designed to ensure that cross-trades conducted by the fund comply with Rule 17a-7 under the Investment Company Act of 1940. During the year ended December 31, 2020, the fund engaged in sale transactions pursuant to this policy, which amounted to $2,028,388. The sales transactions resulted in net realized gains (losses) of $182,155.
The adviser has voluntarily undertaken to reimburse the fund from its own resources on a quarterly basis for the cost of investment research embedded in the cost of the fund’s securities trades. This agreement may be rescinded at any time. For the year ended December 31, 2020, this reimbursement amounted to $97,111, which is included in “Other” income in the Statement of Operations.
For the year ended December 31, 2020, purchases and sales of investments, other than short-term obligations, aggregated $371,599,805 and $469,912,122, respectively.
| (5) | | Shares of Beneficial Interest |
The fund’s Declaration of Trust permits the Trustees to issue an unlimited number of full and fractional shares of beneficial interest. Transactions in fund shares were as follows:
| | | | | | | | | | | | | | | | |
| | | Year ended 12/31/20 | | | Year ended 12/31/19 | |
| | | | |
| | | Shares | | | Amount | | | Shares | | | Amount | |
| Shares sold | | | | | | | | | | | | | | | | |
Initial Class | | | 693,191 | | | | $22,914,614 | | | | 575,639 | | | | $19,334,145 | |
Service Class | | | 1,582,964 | | | | 49,564,692 | | | | 1,744,019 | | | | 57,235,971 | |
| | | 2,276,155 | | | | $72,479,306 | | | | 2,319,658 | | | | $76,570,116 | |
| | | | |
| Shares issued to shareholders in reinvestment of distributions | | | | | | | | | | | | | | | | |
Initial Class | | | 813,353 | | | | $25,547,426 | | | | 693,515 | | | | $22,976,155 | |
Service Class | | | 1,016,840 | | | | 31,389,848 | | | | 987,083 | | | | 32,149,302 | |
| | | 1,830,193 | | | | $56,937,274 | | | | 1,680,598 | | | | $55,125,457 | |
| | | | |
| Shares reacquired | | | | | | | | | | | | | | | | |
Initial Class | | | (2,109,750 | ) | | | $(69,285,092 | ) | | | (2,237,515 | ) | | | $(74,404,174 | ) |
Service Class | | | (4,245,334 | ) | | | (135,421,500 | ) | | | (6,687,020 | ) | | | (221,665,311 | ) |
| | | (6,355,084 | ) | | | $(204,706,592 | ) | | | (8,924,535 | ) | | | $(296,069,485 | ) |
| | | | |
| Net change | | | | | | | | | | | | | | | | |
Initial Class | | | (603,206 | ) | | | $(20,823,052 | ) | | | (968,361 | ) | | | $(32,093,874 | ) |
Service Class | | | (1,645,530 | ) | | | (54,466,960 | ) | | | (3,955,918 | ) | | | (132,280,038 | ) |
| | | (2,248,736 | ) | | | $(75,290,012 | ) | | | (4,924,279 | ) | | | $(164,373,912 | ) |
21
MFS Utilities Series
Notes to Financial Statements – continued
The fund and certain other funds managed by MFS participate in a $1.25 billion unsecured committed line of credit of which $1 billion is reserved for use by the fund and certain other U.S. funds. The line of credit is provided by a syndicate of banks under a credit agreement. Borrowings may be made for temporary financing needs. Interest is charged to each fund, based on its borrowings, generally at a rate equal to the highest of one month LIBOR, the Federal Funds Effective Rate and the Overnight Bank Funding Rate, plus an agreed upon spread. A commitment fee, based on the average daily, unused portion of the committed line of credit, is allocated among the participating funds. In addition, the fund and other funds managed by MFS have established unsecured uncommitted borrowing arrangements with certain banks for temporary financing needs. Interest is charged to each fund, based on its borrowings, at rates equal to customary reference rates plus an agreed upon spread. For the year ended December 31, 2020, the fund’s commitment fee and interest expense were $5,398 and $0, respectively, and are included in “Miscellaneous” expense in the Statement of Operations.
| (7) | | Investments in Affiliated Issuers |
An affiliated issuer may be considered one in which the fund owns 5% or more of the outstanding voting securities, or a company which is under common control. For the purposes of this report, the following were affiliated issuers:
| | | | | | | | | | | | | | | | | | | | | | | | |
| Affiliated Issuers | | Beginning
Value | | | Purchases | | | Sales
Proceeds | | | Realized
Gain
(Loss) | | | Change in
Unrealized
Appreciation or
Depreciation | | | Ending
Value | |
| MFS Institutional Money Market Portfolio | | | $13,336,599 | | | | $187,852,516 | | | | $196,343,547 | | | | $1,518 | | | | $— | | | | $4,847,086 | |
| | | | | | |
| Affiliated Issuers | | | | | | | | | | | | | | Dividend
Income | | | Capital Gain
Distributions | |
| MFS Institutional Money Market Portfolio | | | | | | | | | | | | $68,273 | | | | $— | |
The pandemic related to the global spread of novel coronavirus disease (COVID-19), which was first detected in December 2019, has resulted in significant disruptions to global business activity and the global economy, as well as the economies of individual countries, the financial performance of individual companies and sectors, and the securities and commodities markets in general. This pandemic, the full effects of which are still unknown, has resulted in substantial market volatility and may have adversely impacted the prices and liquidity of the fund’s investments and the fund’s performance.
22
MFS Utilities Series
REPORT OF INDEPENDENT REGISTERED PUBLIC ACCOUNTING FIRM
To the Board of Trustees of MFS Variable Insurance Trust and the Shareholders of
MFS Utilities Series:
Opinion on the Financial Statements and Financial Highlights
We have audited the accompanying statement of assets and liabilities of MFS Utilities Series (the “Fund”), including the portfolio of investments, as of December 31, 2020, the related statement of operations for the year then ended, the statements of changes in net assets for each of the two years in the period then ended, the financial highlights for each of the five years in the period then ended, and the related notes. In our opinion, the financial statements and financial highlights present fairly, in all material respects, the financial position of the Fund as of December 31, 2020, and the results of its operations for the year then ended, the changes in its net assets for each of the two years in the period then ended, and the financial highlights for each of the five years in the period then ended, in conformity with accounting principles generally accepted in the United States of America.
Basis for Opinion
These financial statements and financial highlights are the responsibility of the Fund’s management. Our responsibility is to express an opinion on the Fund’s financial statements and financial highlights based on our audits. We are a public accounting firm registered with the Public Company Accounting Oversight Board (United States) (PCAOB) and are required to be independent with respect to the Fund in accordance with the U.S. federal securities laws and the applicable rules and regulations of the Securities and Exchange Commission and the PCAOB.
We conducted our audits in accordance with the standards of the PCAOB. Those standards require that we plan and perform the audit to obtain reasonable assurance about whether the financial statements and financial highlights are free of material misstatement, whether due to error or fraud. The Fund is not required to have, nor were we engaged to perform, an audit of its internal control over financial reporting. As part of our audits, we are required to obtain an understanding of internal control over financial reporting but not for the purpose of expressing an opinion on the effectiveness of the Fund’s internal control over financial reporting. Accordingly, we express no such opinion.
Our audits included performing procedures to assess the risks of material misstatement of the financial statements and financial highlights, whether due to error or fraud, and performing procedures that respond to those risks. Such procedures included examining, on a test basis, evidence regarding the amounts and disclosures in the financial statements and financial highlights. Our audits also included evaluating the accounting principles used and significant estimates made by management, as well as evaluating the overall presentation of the financial statements and financial highlights. Our procedures included confirmation of securities owned as of December 31, 2020, by correspondence with the custodian and brokers. We believe that our audits provide a reasonable basis for our opinion.
DELOITTE & TOUCHE LLP
Boston, Massachusetts
February 16, 2021
We have served as the auditor of one or more of the MFS investment companies since 1924.
23
MFS Utilities Series
TRUSTEES AND OFFICERS – IDENTIFICATION AND BACKGROUND
The Trustees and Officers of the Trust, as of February 1, 2021, are listed below, together with their principal occupations during the past five years. (Their titles may have varied during that period.) The address of each Trustee and Officer is 111 Huntington Avenue, Boston, Massachusetts 02199-7618.
| | | | | | | | | | |
Name, Age | | Position(s)
Held with Fund | | Trustee/Officer
Since (h) | | Number of
MFS Funds
overseen by the
Trustee | | Principal Occupations During the Past Five Years | | Other Directorships During the Past Five Years (j) |
| INTERESTED TRUSTEES |
Robert J. Manning (k)
(age 57) | | Trustee | | February 2004 | | 134 | | Massachusetts Financial Services Company, Non-Executive Chairman (since January 2021); Director; Chairman of the Board; Executive Chairman (January 2017-2020); Co-Chief Executive Officer (2015-2016) | | N/A |
| | | | | |
Michael W. Roberge (k) (age 54) | | Trustee | | January 2021 | | 134 | | Massachusetts Financial Services Company, Chairman (since January 2021); Chief Executive Officer (since January 2017); Director; President (until December 2018); Chief Investment Officer (until December 2018); Co-Chief Executive Officer (until December 2016) | | N/A |
|
| INDEPENDENT TRUSTEES |
John P. Kavanaugh (age 66) | | Trustee and Chair of Trustees | | January 2009 | | 134 | | Private investor | | N/A |
| | | | | |
Steven E. Buller (age 69) | | Trustee | | February 2014 | | 134 | | Private investor | | N/A |
| | | | | |
John A. Caroselli (age 66) | | Trustee | | March 2017 | | 134 | | Private investor; JC Global Advisors, LLC (management consulting), President (since 2015) | | N/A |
| | | | | |
Maureen R. Goldfarb (age 65) | | Trustee | | January 2009 | | 134 | | Private investor | | N/A |
| | | | | |
Peter D. Jones
(age 65) | | Trustee | | January 2019 | | 134 | | Private investor | | N/A |
| | | | | |
James W. Kilman, Jr.
(age 59) | | Trustee | | January 2019 | | 134 | | Burford Capital Limited (finance and investment management), Chief Financial Officer (since 2019); KielStrand Capital LLC (family office), Chief Executive Officer (since 2016); Morgan Stanley & Co. (financial services), Vice Chairman of Investment Banking, Co-Head of Diversified Financials Coverage – Financial Institutions Investment Banking Group (until 2016) | | Alpha-En Corporation, Director (2016-2019) |
| | | | | |
Clarence Otis, Jr. (age 64) | | Trustee | | March 2017 | | 134 | | Private investor | | VF Corporation, Director; Verizon Communications, Inc., Director; The Travelers Companies, Director |
| | | | | |
Maryanne L. Roepke (age 64) | | Trustee | | May 2014 | | 134 | | Private investor | | N/A |
| | | | | |
Laurie J. Thomsen
(age 63) | | Trustee | | March 2005 | | 134 | | Private investor | | The Travelers Companies, Director; Dycom Industries, Inc., Director |
24
MFS Utilities Series
Trustees and Officers – continued
| | | | | | | | |
Name, Age | | Position(s)
Held with Fund | | Trustee/Officer
Since (h) | | Number of
MFS Funds
for which the
Person is an
Officer | | Principal Occupations During the Past Five Years |
| OFFICERS | | | | | | |
Christopher R. Bohane (k)
(age 47) | | Assistant Secretary and Assistant Clerk | | July 2005 | | 134 | | Massachusetts Financial Services Company, Senior Vice President and Associate General Counsel |
| | | | |
Kino Clark (k) (age 52) | | Assistant Treasurer | | January 2012 | | 134 | | Massachusetts Financial Services Company, Vice President |
| | | | |
John W. Clark, Jr. (k) (age 53) | | Assistant Treasurer | | April 2017 | | 134 | | Massachusetts Financial Services Company, Vice President (since March 2017); Deutsche Bank (financial services), Department Head –Treasurer’s Office (until February 2017) |
| | | | |
Thomas H. Connors (k) (age 61) | | Assistant Secretary and Assistant Clerk | | September 2012 | | 134 | | Massachusetts Financial Services Company, Vice President and Senior Counsel |
| | | | |
David L. DiLorenzo (k)
(age 52) | | President | | July 2005 | | 134 | | Massachusetts Financial Services Company, Senior Vice President |
| | | | |
Heidi W. Hardin (k) (age 53) | | Secretary and Clerk | | April 2017 | | 134 | | Massachusetts Financial Services Company, Executive Vice President and General Counsel (since March 2017); Harris Associates (investment management), General Counsel (until January 2017) |
| | | | |
Brian E. Langenfeld (k) (age 47) | | Assistant
Secretary and Assistant Clerk | | June 2006 | | 134 | | Massachusetts Financial Services Company, Vice President and Senior Counsel |
| | | | |
Amanda S. Mooradian (k) (age 41) | | Assistant
Secretary and Assistant Clerk | | September 2018 | | 134 | | Massachusetts Financial Services Company, Assistant Vice President and Senior Counsel |
| | | | |
Susan A. Pereira (k)
(age 50) | | Assistant
Secretary and Assistant Clerk | | July 2005 | | 134 | | Massachusetts Financial Services Company, Vice President and Assistant General Counsel |
| | | | |
Kasey L. Phillips (k) (age 50) | | Assistant Treasurer | | September 2012 | | 134 | | Massachusetts Financial Services Company, Vice President |
| | | | |
Matthew A. Stowe (k) (age 46) | | Assistant Secretary and Assistant Clerk | | October 2014 | | 134 | | Massachusetts Financial Services Company, Vice President and Assistant General Counsel |
| | | | |
Martin J. Wolin (k) (age 53) | | Chief Compliance Officer | | July 2015 | | 134 | | Massachusetts Financial Services Company, Senior Vice President and Chief Compliance Officer |
| | | | |
James O. Yost (k)
(age 60) | | Treasurer | | September 1990 | | 134 | | Massachusetts Financial Services Company, Senior Vice President |
| (h) | Date first appointed to serve as Trustee/officer of an MFS Fund. Each Trustee has served continuously since appointment unless indicated otherwise. For the period from December 15, 2004 until February 22, 2005, Mr. Manning served as Advisory Trustee. From January 2012 through December 2016, Messrs. DiLorenzo and Yost served as Treasurer and Deputy Treasurer of the Funds, respectively. |
| (j) | Directorships or trusteeships of companies required to report to the Securities and Exchange Commission (i.e., “public companies”). |
| (k) | “Interested person” of the Trust within the meaning of the Investment Company Act of 1940 (referred to as the 1940 Act), which is the principal federal law governing investment companies like the fund, as a result of a position with MFS. The address of MFS is 111 Huntington Avenue, Boston, Massachusetts 02199-7618. |
Each Trustee (other than Messrs. Jones, Kilman and Roberge) has been elected by shareholders and each Trustee and Officer holds office until his or her successor is chosen and qualified or until his or her earlier death, resignation, retirement or removal. Mr. Roberge became a Trustee of the Funds on January 1, 2021 and Messrs. Jones and Kilman became Trustees of the Funds on January 1, 2019. The Trust does not hold annual meetings for the purpose of electing Trustees, and Trustees are not elected for fixed terms. Under the terms of the Board’s retirement policy, an Independent Trustee shall retire at the end of the calendar year in which he or she reaches the earlier of 75 years of age or 15 years of service on the Board (or, in the case of any Independent Trustee who joined the Board prior to 2015, 20 years of service on the Board).
Messrs. Buller, Kilman and Otis and Ms. Roepke are members of the Trust’s Audit Committee.
25
MFS Utilities Series
Trustees and Officers – continued
Each of the Interested Trustees and certain Officers hold comparable officer positions with certain affiliates of MFS.
The Statement of Additional Information for a Fund includes further information about the Trustees and is available without charge upon request by calling 1-800-225-2606.
| | |
Investment Adviser Massachusetts Financial Services Company 111 Huntington Avenue Boston, MA 02199-7618 | | Custodian State Street Bank and Trust Company 1 Lincoln Street Boston, MA 02111-2900 |
| |
Distributor MFS Fund Distributors, Inc. 111 Huntington Avenue Boston, MA 02199-7618 | | Independent Registered Public Accounting Firm Deloitte & Touche LLP 200 Berkeley Street Boston, MA 02116 |
| |
Portfolio Manager(s) Claud Davis J. Scott Walker | | |
26
MFS Utilities Series
BOARD REVIEW OF INVESTMENT ADVISORY AGREEMENT
MFS Utilities Series
The Investment Company Act of 1940 requires that both the full Board of Trustees and a majority of the non-interested (“independent”) Trustees, voting separately, annually approve the continuation of the Fund’s investment advisory agreement with MFS. The Trustees consider matters bearing on the Fund and its advisory arrangements at their meetings throughout the year, including a review of performance data at each regular meeting. In addition, the independent Trustees met several times by videoconference (in accordance with Securities and Exchange Commission relief) over the course of three months beginning in May and ending in July, 2020 (“contract review meetings”) for the specific purpose of considering whether to approve the continuation of the investment advisory agreement for the Fund and the other investment companies that the Board oversees (the “MFS Funds”). The independent Trustees were assisted in their evaluation of the Fund’s investment advisory agreement by independent legal counsel, from whom they received separate legal advice and with whom they met separately from MFS during various contract review meetings. The independent Trustees were also assisted in this process by an independent consultant who was retained by and reported to the independent Trustees.
In connection with their deliberations regarding the continuation of the investment advisory agreement, the Trustees, including the independent Trustees, considered such information and factors as they believed, in light of the legal advice furnished to them and their own business judgment, to be relevant. The investment advisory agreement for the Fund was considered separately, although the Trustees also took into account the common interests of all MFS Funds in their review. As described below, the Trustees considered the nature, quality, and extent of the various investment advisory, administrative, and shareholder services performed by MFS under the existing investment advisory agreement and other arrangements with the Fund.
In connection with their contract review meetings, the Trustees received and relied upon materials that included, among other items: (i) information provided by Broadridge Financial Solutions, Inc. (“Broadridge”), an independent third party, on the investment performance of the Fund for various time periods ended December 31, 2019 and the investment performance of a group of funds with substantially similar investment classifications/objectives (the “Broadridge performance universe”), (ii) information provided by Broadridge on the Fund’s advisory fees and other expenses and the advisory fees and other expenses of comparable funds identified by Broadridge as well as all other funds in the same investment classification/category (the “Broadridge expense group and universe”), (iii) information provided by MFS on the advisory fees of portfolios of other clients of MFS, including institutional separate accounts and other clients, (iv) information as to whether and to what extent applicable expense waivers, reimbursements or fee “breakpoints” are observed for the Fund, (v) information regarding MFS’ financial results and financial condition, including MFS’ and certain of its affiliates’ estimated profitability from services performed for the Fund and the MFS Funds as a whole, and compared to MFS’ institutional business, (vi) MFS’ views regarding the outlook for the mutual fund industry and the strategic business plans of MFS, (vii) descriptions of various functions performed by MFS for the Funds, such as compliance monitoring and portfolio trading practices, and (viii) information regarding the overall organization of MFS, including information about MFS’ senior management and other personnel providing investment advisory, administrative and other services to the Fund and the other MFS Funds. The comparative performance, fee and expense information prepared and provided by Broadridge was not independently verified and the independent Trustees did not independently verify any information provided to them by MFS.
The Trustees’ conclusion as to the continuation of the investment advisory agreement was based on a comprehensive consideration of all information provided to the Trustees and not the result of any single factor. Some of the factors that figured particularly in the Trustees’ deliberations are described below, although individual Trustees may have evaluated the information presented differently from one another, giving different weights to various factors. It is also important to recognize that the fee arrangements for the Fund and other MFS Funds are the result of years of review and discussion between the independent Trustees and MFS, that certain aspects of such arrangements may receive greater scrutiny in some years than in others, and that the Trustees’ conclusions may be based, in part, on their consideration of these same arrangements during the course of the year and in prior years.
Based on information provided by Broadridge and MFS, the Trustees reviewed the Fund’s total return investment performance as well as the Broadridge performance universe over various time periods. The Trustees placed particular emphasis on the total return performance of the Fund’s Initial Class shares in comparison to the performance of funds in its Broadridge performance universe over the five-year period ended December 31, 2019, which the Trustees believed was a long enough period to reflect differing market conditions. The total return performance of the Fund’s Initial Class shares was in the 4th quintile relative to the other funds in the universe for this five-year period (the 1st quintile being the best performers and the 5th quintile being the worst performers). The total return performance of the Fund’s Initial Class shares was in the 1st quintile for the one-year period and the 2nd quintile for the three-year period ended December 31, 2019 relative to the Broadridge performance universe. Because of the passage of time, these performance results may differ from the performance results for more recent periods, including those shown elsewhere in this report.
The Trustees expressed concern to MFS about the substandard investment performance of the Fund and the Fund’s retail counterpart, MFS Utilities Fund, which has substantially similar investment strategies and experienced substantially similar investment performance as the Fund. In the course of their deliberations, the Trustees took into account information provided by MFS in connection with the contract review meetings, as well as during investment review meetings conducted with portfolio management
27
MFS Utilities Series
Board Review of Investment Advisory Agreement – continued
personnel during the course of the year as to MFS’ efforts to improve the performance of the Fund and the Fund’s retail counterpart. In addition, the Trustees requested that they receive a separate update on the Fund’s retail counterpart at each of their regular meetings. After reviewing these and related factors, the Trustees concluded, within the context of their overall conclusions regarding the investment advisory agreement, that MFS’ responses and efforts and plans to improve investment performance were sufficient to support approval of the continuance of the investment advisory agreement for an additional one-year period, but that they would continue to closely monitor the performance of the Fund’s retail counterpart.
In assessing the reasonableness of the Fund’s advisory fee, the Trustees considered, among other information, the Fund’s advisory fee and the total expense ratio of the Fund’s Initial Class shares as a percentage of average daily net assets and the advisory fee and total expense ratios of the Broadridge expense group based on information provided by Broadridge. The Trustees considered that, according to the data provided by Broadridge (which takes into account any fee reductions or expense limitations that were in effect during the Fund’s last fiscal year), the Fund’s effective advisory fee rate and total expense ratio were each approximately at the Broadridge expense group median.
The Trustees also considered the advisory fees charged by MFS to any institutional separate accounts advised by MFS (“separate accounts”) and unaffiliated investment companies for which MFS serves as subadviser (“subadvised funds”) that have comparable investment strategies to the Fund, if any. In comparing these fees, the Trustees considered information provided by MFS as to the generally broader scope of services provided by MFS to the Fund, as well as the more extensive regulatory burdens imposed on MFS in managing the Fund, in comparison to separate accounts and subadvised funds. The Trustees also considered the higher demands placed on MFS’ investment personnel and trading infrastructure as a result of the daily cash in-flows and out-flows of the Fund in comparison to separate accounts.
The Trustees also considered whether the Fund may benefit from any economies of scale in the management of the Fund in the event of growth in assets of the Fund and/or growth in assets of the MFS Funds as a whole. They noted that the Fund’s advisory fee rate schedule is subject to contractual breakpoints that reduce the Fund’s advisory fee rate on average daily net assets over $1 billion and $3 billion. The Trustees also noted that MFS has agreed in writing to waive a portion of the management fees of certain MFS Funds, including the Fund, if the total combined assets of certain funds within the MFS Funds’ complex increase above agreed upon thresholds (the “group fee waiver”), enabling the Fund’s shareholders to share in the benefits from any economies of scale at the complex level. The group fee waiver is reviewed and renewed annually between the Board and MFS. The Trustees concluded that the breakpoints and the group fee waiver were sufficient to allow the Fund to benefit from economies of scale as its assets and overall complex assets grow.
The Trustees also considered information prepared by MFS relating to MFS’ costs and profits with respect to the Fund, the MFS Funds considered as a group, and other investment companies and accounts advised by MFS, as well as MFS’ methodologies used to determine and allocate its costs to the MFS Funds, the Fund and other accounts and products for purposes of estimating profitability.
After reviewing these and other factors described herein, the Trustees concluded, within the context of their overall conclusions regarding the investment advisory agreement, that the advisory fees charged to the Fund represent reasonable compensation in light of the services being provided by MFS to the Fund.
In addition, the Trustees considered MFS’ resources and related efforts to continue to retain, attract and motivate capable personnel to serve the Fund. The Trustees also considered current and developing conditions in the financial services industry, including the presence of large and well-capitalized companies which are spending, and appear to be prepared to continue to spend, substantial sums to engage personnel and to provide services to competing investment companies. In this regard, the Trustees also considered the financial resources of MFS and its ultimate parent, Sun Life Financial Inc. The Trustees also considered the advantages and possible disadvantages to the Fund of having an adviser that also serves other investment companies as well as other accounts.
The Trustees also considered the nature, quality, cost, and extent of administrative, transfer agency, and distribution services provided to the Fund by MFS and its affiliates under agreements and plans other than the investment advisory agreement, including any 12b-1 fees the Fund pays to MFS Fund Distributors, Inc., an affiliate of MFS. The Trustees also considered the nature, extent and quality of certain other services MFS performs or arranges for on the Fund’s behalf, which may include securities lending programs, directed expense payment programs, class action recovery programs, and MFS’ interaction with third-party service providers, principally custodians and sub-custodians. The Trustees concluded that the various non-advisory services provided by MFS and its affiliates on behalf of the Fund were satisfactory.
The Trustees considered so-called “fall-out benefits” to MFS such as reputational value derived from serving as investment manager to the MFS Funds. The Trustees also considered that MFS discontinued its historic practice of obtaining investment research from portfolio brokerage commissions paid by certain MFS Funds effective January 2018, and directly pays or voluntarily reimburses a Fund, if applicable, for the costs of external research acquired through the use of the Fund’s portfolio brokerage commissions.
Based on their evaluation of factors that they deemed to be material, including those factors described above, the Board of Trustees, including the independent Trustees, concluded that the Fund’s investment advisory agreement with MFS should be continued for an additional one-year period, commencing August 1, 2020.
28
MFS Utilities Series
PROXY VOTING POLICIES AND INFORMATION
MFS votes proxies on behalf of the fund pursuant to proxy voting policies and procedures that are available without charge, upon request, by calling 1-800-225-2606, by visiting mfs.com/proxyvoting, or by visiting the SEC Web site at http://www.sec.gov.
Information regarding how the fund voted proxies relating to portfolio securities during the most recent twelve-month period ended June 30 is available by August 31 of each year without charge by visiting mfs.com/proxyvoting, or by visiting the SEC’s Web site at http://www.sec.gov.
QUARTERLY PORTFOLIO DISCLOSURE
The fund files a complete schedule of portfolio holdings with the SEC for the first and third quarters of each fiscal year as an exhibit to its reports on Form N-PORT. The fund’s Form N-PORT reports are available on the SEC’s Web site at http://www.sec.gov. A shareholder can obtain the portfolio holdings report for the first and third quarters of the fund’s fiscal year at mfs.com/vit1 by choosing the fund’s name and then scrolling to the “Resources” section and clicking on the “Prospectus and Reports” tab.
FURTHER INFORMATION
From time to time, MFS may post important information about the fund or the MFS funds on the MFS Web site (mfs.com). This information is available at https://www.mfs.com/announcements or at mfs.com/vit1 by choosing the fund’s name and then scrolling to the “Resources” section and clicking on the “Announcements” tab, if any.
INFORMATION ABOUT FUND CONTRACTS AND LEGAL CLAIMS
The fund has entered into contractual arrangements with an investment adviser, administrator, distributor, shareholder servicing agent, 529 program manager (if applicable), and custodian who each provide services to the fund. Unless expressly stated otherwise, shareholders are not parties to, or intended beneficiaries of these contractual arrangements, and these contractual arrangements are not intended to create any shareholder right to enforce them against the service providers or to seek any remedy under them against the service providers, either directly or on behalf of the fund.
Under the Trust’s By-Laws and Declaration of Trust, any claims asserted against or on behalf of the MFS Funds, including claims against Trustees and Officers, must be brought in state and federal courts located within the Commonwealth of Massachusetts.
FEDERAL TAX INFORMATION (unaudited)
The following information is provided pursuant to provisions of the Internal Revenue Code.
The fund designates $23,065,000 as capital gain dividends paid during the fiscal year.
For corporate shareholders, 55.23% of the ordinary income dividends paid during the fiscal year qualify for the corporate dividends received deduction.
29
rev. 3/16
| | | | |
| | | |
| FACTS | | WHAT DOES MFS DO WITH YOUR
PERSONAL INFORMATION? | |  |
| | |
| Why? | | Financial companies choose how they share your personal information. Federal law gives consumers the right to limit some but not all sharing. Federal law also requires us to tell you how we collect, share, and protect your personal information. Please read this notice carefully to understand what we do. |
| | |
| What? | | The types of personal information we collect and share depend on the product or service you have with us. This information can include: • Social Security number and account balances • Account transactions and transaction history • Checking account information and wire transfer instructions When you are no longer our customer, we continue to share your information as described in this notice. |
| | |
| How? | | All financial companies need to share customers’ personal information to run their everyday business. In the section below, we list the reasons financial companies can share their customers’ personal information; the reasons MFS chooses to share; and whether you can limit this sharing. |
| | | | |
Reasons we can share your
personal information | | Does MFS share? | | Can you limit this
sharing? |
For our everyday business purposes – such as to process your transactions, maintain your account(s), respond to court orders and legal investigations, or report to credit bureaus | | Yes | | No |
For our marketing purposes – to offer our products and services to you | | No | | We don’t share |
| For joint marketing with other financial companies | | No | | We don’t share |
For our affiliates’ everyday business purposes – information about your transactions and experiences | | No | | We don’t share |
For our affiliates’ everyday business purposes – information about your creditworthiness | | No | | We don’t share |
| For nonaffiliates to market to you | | No | | We don’t share |
| | |
| | |
| Questions? | | Call 800-225-2606 or go to mfs.com. |
30
| | |
| Who we are |
| Who is providing this notice? | | MFS Funds, MFS Investment Management, MFS Institutional Advisors, Inc., and MFS Heritage Trust Company. |
| | |
| What we do |
| How does MFS protect my personal information? | | To protect your personal information from unauthorized access and use, we use security measures that comply with federal law. These measures include procedural, electronic, and physical safeguards for the protection of the personal information we collect about you. |
How does MFS
collect my personal information? | | We collect your personal information, for example, when you • open an account or provide account information • direct us to buy securities or direct us to sell your securities • make a wire transfer We also collect your personal information from others, such as credit bureaus, affiliates, or other companies. |
| Why can’t I limit all sharing? | | Federal law gives you the right to limit only • sharing for affiliates’ everyday business purposes – information about your creditworthiness • affiliates from using your information to market to you • sharing for nonaffiliates to market to you State laws and individual companies may give you additional rights to limit sharing. |
| | |
| Definitions |
| Affiliates | | Companies related by common ownership or control. They can be financial and nonfinancial companies. • MFS does not share personal information with affiliates, except for everyday business purposes as described on page one of this notice. |
| Nonaffiliates | | Companies not related by common ownership or control. They can be financial and nonfinancial companies. • MFS does not share with nonaffiliates so they can market to you. |
| Joint marketing | | A formal agreement between nonaffiliated financial companies that together market financial products or services to you. • MFS doesn’t jointly market. |
| | |
| Other important information |
| If you own an MFS product or receive an MFS service in the name of a third party such as a bank or broker-dealer, their privacy policy may apply to you instead of ours. |
31
Annual Report
December 31, 2020

MFS® Value Series

MFS® Variable Insurance Trust
VLU-ANN
MFS® Value Series
CONTENTS
The report is prepared for the general information of contract owners. It is authorized for distribution to prospective investors only when preceded or accompanied by a current prospectus.
NOT FDIC INSURED • MAY LOSE VALUE • NO BANK OR CREDIT UNION GUARANTEE • NOT A DEPOSIT • NOT INSURED BY ANY FEDERAL GOVERNMENT AGENCY OR NCUA/NCUSIF
MFS Value Series
LETTER FROM THE CEO

Dear Contract Owners:
Markets experienced dramatic swings this year as the coronavirus pandemic brought the global economy to a standstill for several months early in the year. The speedy development of vaccines and therapeutics later brightened the economic and market outlook, but a great deal of uncertainty remains as case counts remain high, new variants of the virus are appearing and questions persist over how fast the vaccine can be made widely available. In the United States, political uncertainty eased after former Vice President Joe Biden won the presidential election and the Democrats gained control of a closely divided Senate.
Global central banks have taken aggressive steps to cushion the economic and market fallout related to the virus, and governments are deploying unprecedented levels of fiscal support. Additional U.S. stimulus is anticipated with the Democrats in the White House and in control of both houses of Congress. The measures already put in place have helped build a supportive environment and are encouraging economic recovery; however, if markets disconnect from fundamentals, they can sow the seeds of instability. As such, dramatic increases in speculative retail trading bear watching.
In the aftermath of the crisis, we could see societal changes as households, businesses, and governments adjust to a new reality, and any such alterations could affect the investment landscape. For investors, events such as the COVID-19 outbreak demonstrate the importance of having a deep understanding of company fundamentals, and we have built our global research platform to do just that.
At MFS®, we put our clients’ assets to work responsibly by carefully navigating the increasing complexity of our global markets and economies. Guided by our long-term philosophy and adhering to our commitment to sustainable investing, we tune out the noise and aim to uncover what we believe are the best, most durable investment opportunities in the market. Our unique global investment platform combines collective expertise, long-term discipline and thoughtful risk management to create sustainable value for investors.
Respectfully,

Michael W. Roberge
Chief Executive Officer
MFS Investment Management
February 16, 2021
The opinions expressed in this letter are subject to change and may not be relied upon for investment advice. No forecasts can be guaranteed.
1
MFS Value Series
PORTFOLIO COMPOSITION
Portfolio structure
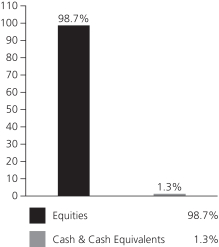
| | | | |
| Top ten holdings | | | | |
| JPMorgan Chase & Co. | | | 4.4% | |
| Johnson & Johnson | | | 3.9% | |
| Comcast Corp., “A” | | | 3.4% | |
| Medtronic PLC | | | 3.0% | |
| Honeywell International, Inc. | | | 2.8% | |
| Accenture PLC, “A” | | | 2.7% | |
| Texas Instruments, Inc. | | | 2.6% | |
| Aon PLC | | | 2.3% | |
| Duke Energy Corp. | | | 2.2% | |
| Cigna Corp. | | | 2.2% | |
| | | | |
| GICS equity sectors (g) | | | | |
| Financials | | | 25.9% | |
| Health Care | | | 19.3% | |
| Industrials | | | 17.4% | |
| Information Technology | | | 10.7% | |
| Consumer Staples | | | 7.1% | |
| Utilities | | | 6.6% | |
| Materials | | | 3.9% | |
| Communication Services | | | 3.8% | |
| Energy | | | 2.0% | |
| Consumer Discretionary | | | 1.6% | |
| Real Estate | | | 0.4% | |
| (g) | The Global Industry Classification Standard (GICS®) was developed by and/or is the exclusive property of MSCI, Inc. and S&P Global Market Intelligence Inc. (“S&P Global Market Intelligence”). GICS is a service mark of MSCI and S&P Global Market Intelligence and has been licensed for use by MFS. MFS has applied its own internal sector/industry classification methodology for equity securities and non-equity securities that are unclassified by GICS. |
Cash & Cash Equivalents includes any cash, investments in money market funds, short-term securities, and other assets less liabilities. Please see the Statement of Assets and Liabilities for additional information related to the fund’s cash position and other assets and liabilities.
Percentages are based on net assets as of December 31, 2020.
The portfolio is actively managed and current holdings may be different.
2
MFS Value Series
MANAGEMENT REVIEW
Summary of Results
For the twelve months ended December 31, 2020, Initial Class shares of the MFS Value Series (fund) provided a total return of 3.48%, while Service Class shares of the fund provided a total return of 3.22%. These compare with a return of 2.80% for the fund’s benchmark, the Russell 1000® Value Index.
Market Environment
Markets experienced an extraordinarily sharp selloff early in the period and, in many cases, an unusually rapid recovery later. Central banks and fiscal authorities undertook astonishing levels of stimulus to offset the economic effects of government-imposed social-distancing measures implemented to slow the spread of the COVID-19 virus. At this point, the global economy looks to have experienced the shortest – albeit the deepest and steepest – recession in the postwar period. However, the recovery remains subject to more than the usual number of uncertainties due to questions about the evolution of the virus, what its continued impact will be and how quickly vaccines to guard against it can be manufactured and distributed at scale. There are also worries over the public’s willingness to be inoculated.
Around the world, central banks responded quickly and massively to the crisis with programs to improve liquidity and support markets. These programs proved largely successful in helping to restore market function, ease volatility and stimulate a continued market rebound. Late in the period, the US Federal Reserve adopted a new, flexible, average-inflation-targeting framework, which is expected to result in the federal funds rate remaining at low levels longer than under its previous model. In developed countries, monetary easing measures were complemented by unusually large fiscal stimulus initiatives. Due to relatively manageable external liabilities and balances of payments in many countries and persistently low inflation, even emerging market countries were able to implement countercyclical policies – a departure from the usual market-dictated response to risk-off crises.
Compounding market uncertainty earlier in the pandemic was a crash in the price of crude oil due to a sharp drop in global demand and a disagreement between Saudi Arabia and Russia over production cuts, which resulted in an oil price war. The subsequent decline in prices undercut oil exporters, many of which are in emerging markets, as well as a large segment of the high-yield credit market. The OPEC+ group later agreed on output cuts, with shale oil producers in the US also decreasing production, which, along with the gradual reopening of some major economies and the resultant boost in demand, helped stabilize the price of crude oil.
In the immediate aftermath of the market disruption that accompanied the initial phases of the pandemic, many companies that had added significant leverage to their balance sheets in recent years by borrowing to fund dividend payments and stock buybacks halted those activities, and some companies were forced to recapitalize. As markets and the economy stabilized later in the period, in many cases dividend payments and buybacks resumed. Conversely, some companies found themselves flush with liquidity, having borrowed preemptively during the worst of the crisis only to end up with excess cash on their balance sheets.
Contributors to Performance
Underweight allocations to both the energy and real estate sectors contributed to the fund’s performance relative to the Russell 1000® Value Index. Within the energy sector, an underweight position in integrated oil and gas company Exxon Mobil (h) helped relative results. The share price of Exxon suffered as oil and gas prices came under significant pressure during the period due to lower volumes and production caused by the COVID-19 virus and the price war between Saudi Arabia and Russia. There were no individual stocks within the real estate sector, either in the fund or in the benchmark, that were among the fund’s largest relative contributors during the period.
The combination of an overweight allocation and stock selection within the information technology sector also supported relative returns, led by the fund’s overweight position in semiconductor company Texas Instruments. The share price of Texas Instruments increased during the period due to strong revenue figures and better-than-expected gross margin growth. Holdings of IT servicing firm Accenture (b), and not owning shares of network equipment company Cisco Systems, bolstered relative performance.
Stock selection in the financials sector further boosted relative returns, although there were no individual stocks within this sector, either in the fund or in the benchmark, that were among the fund’s largest relative contributors during the period.
Stocks in other sectors that aided relative performance included the fund’s overweight positions in life sciences supply company Thermo Fisher Scientific, healthcare equipment manufacturer Danaher, diversified technology and manufacturing company Honeywell International, cable services provider Comcast and consumer credit reporting agency Equifax. The share price of Thermo Fisher Scientific advanced on the back of better-than-expected results throughout the period driven by strong organic revenue growth. The company also benefited from the high demand for testing and supplies related to COVID-19. Additionally, not owning shares of telecommunication services provider AT&T further supported relative returns.
3
MFS Value Series
Management Review – continued
Detractors from Performance
Security selection in the utilities sector detracted from relative performance, led by the fund’s overweight positions in power provider FirstEnergy (h) and energy products and services supplier Dominion Energy. The share price of FirstEnergy declined after allegations that a former subsidiary had bribed state officials in order to pass legislation favorable to the company. Although First Energy was not directly implicated, its share price sold off on concerns that it could have been involved.
An underweight allocation to the consumer discretionary sector also weakened relative results. There were no individual stocks within this sector, either in the fund or in the benchmark, that were among the fund’s largest relative detractors during the period.
Stock selection in the consumer staples sector held back relative performance. Here, not owning shares of retail giant Walmart, and an underweight position in household products maker Procter & Gamble (h), dampened relative results. Walmart’s stock price benefited from growth in grocery sales, as consumers stocked up their pantries, and strong performance from the company’s pickup and delivery services amid the coronavirus crisis.
Elsewhere, the fund’s position in integrated energy company Suncor Energy (b)(h), and not owning shares of media conglomerate Walt Disney, weighed on relative returns. The share price of Suncor Energy declined on severely damaged oil market fundamentals, given the combined economic demand shock from the COVID-19 outbreak and supply shock related to increased oil supply as Saudi Arabia and Russia failed to reach an agreement on curtailing oil production levels. The fund’s overweight positions in financial services firms Citigroup and U.S. Bancorp and global security company Northrop Grumman, and the timing of its ownership in shares of semiconductor company Intel, further detracted from relative performance.
Respectfully,
Portfolio Manager(s)
Katherine Cannan and Nevin Chitkara
Note to Contract Owners: Effective December 31, 2020, Steven Gorham was no longer a Portfolio Manager of the fund.
| (b) | Security is not a benchmark constituent. |
| (h) | Security was not held in the portfolio at period end. |
The views expressed in this report are those of the portfolio manager(s) only through the end of the period of the report as stated on the cover and do not necessarily reflect the views of MFS or any other person in the MFS organization. These views are subject to change at any time based on market or other conditions, and MFS disclaims any responsibility to update such views. These views may not be relied upon as investment advice or an indication of trading intent on behalf of any MFS portfolio. References to specific securities are not recommendations of such securities, and may not be representative of any MFS portfolio’s current or future investments.
4
MFS Value Series
PERFORMANCE SUMMARY THROUGH 12/31/20
The following chart illustrates the historical performance of the fund in comparison to its benchmark(s). Benchmarks are unmanaged and may not be invested in directly. Benchmark returns do not reflect any fees or expenses. The performance of other share classes will be greater than or less than that of the class depicted below. (See Notes to Performance Summary.)
Performance data shown represents past performance and is no guarantee of future results. Investment return and principal value fluctuate so your units, when sold, may be worth more or less than the original cost; current performance may be lower or higher than quoted. The performance shown does not reflect the deduction of taxes, if any, that a contract holder would pay on fund distributions or the redemption of contract units. The returns for the fund shown also do not reflect the deduction of expenses associated with variable products, such as mortality and expense risk charges, separate account charges, and sales charges imposed by the insurance company separate accounts. Such expenses would reduce the overall returns shown.
Growth of a Hypothetical $10,000 Investment
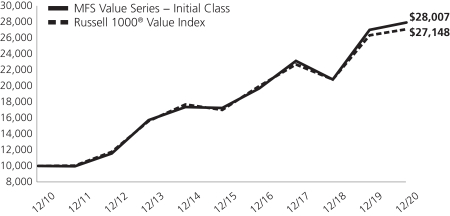
Total Returns through 12/31/20
Average annual total returns
| | | | | | | | | | | | |
| | | Share Class | | Class Inception Date | | 1-yr | | 5-yr | | 10-yr | | |
| | | Initial Class | | 1/02/02 | | 3.48% | | 10.14% | | 10.85% | | |
| | | Service Class | | 1/02/02 | | 3.22% | | 9.86% | | 10.57% | | |
| | | | |
| Comparative benchmark(s) | | | | | | | | |
| | | Russell 1000® Value Index (f) | | 2.80% | | 9.74% | | 10.50% | | |
| (f) | Source: FactSet Research Systems Inc. |
Benchmark Definition(s)
Russell 1000® Value Index (h) – constructed to provide a comprehensive barometer for the value securities in the large-cap segment of the U.S. equity universe. Companies in this index generally have lower price-to-book ratios and lower forecasted growth values.
It is not possible to invest directly in an index.
| (h) | Frank Russell Company (“Russell”) is the source and owner of the trademarks, service marks, and copyrights related to the Russell Indexes. Russell® is a trademark of Frank Russell Company. Neither Russell nor its licensors accept any liability for any errors or omissions in the Russell Indexes and/or Russell ratings or underlying data and no party may rely on any Russell Indexes and/or Russell ratings and/or underlying data contained in this document. No further distribution of Russell Data is permitted without Russell’s express written consent. Russell does not promote, sponsor, or endorse the content of this document. |
Notes to Performance Summary
Average annual total return represents the average annual change in value for each share class for the periods presented.
Performance results reflect any applicable expense subsidies and waivers in effect during the periods shown. Without such subsidies and waivers the fund’s performance results would be less favorable. Please see the prospectus and financial statements for complete details. All results are historical and assume the reinvestment of any dividends and capital gains distributions.
Performance results do not include adjustments made for financial reporting purposes in accordance with U.S. generally accepted accounting principles and may differ from amounts reported in the financial highlights.
From time to time the fund may receive proceeds from litigation settlements, without which performance would be lower.
5
MFS Value Series
EXPENSE TABLE
Fund Expenses Borne by the Contract Holders during the Period,
July 1, 2020 through December 31, 2020
As a contract holder of the fund, you incur ongoing costs, including management fees; distribution and/or service (12b-1) fees; and other fund expenses. This example is intended to help you understand your ongoing costs (in dollars) of investing in the fund and to compare these costs with the ongoing costs of investing in other mutual funds.
The example is based on an investment of $1,000 invested at the beginning of the period and held for the entire period July 1, 2020 through December 31, 2020.
Actual Expenses
The first line for each share class in the following table provides information about actual account values and actual expenses. You may use the information in this line, together with the amount you invested, to estimate the expenses that you paid over the period. Simply divide your account value by $1,000 (for example, an $8,600 account value divided by $1,000 = 8.6), then multiply the result by the number in the first line under the heading entitled “Expenses Paid During Period” to estimate the expenses you paid on your account during this period.
Hypothetical Example for Comparison Purposes
The second line for each share class in the following table provides information about hypothetical account values and hypothetical expenses based on the fund’s actual expense ratio and an assumed rate of return of 5% per year before expenses, which is not the fund’s actual return. The hypothetical account values and expenses may not be used to estimate the actual ending account balance or expenses you paid for the period. You may use this information to compare the ongoing costs of investing in the fund and other funds. To do so, compare this 5% hypothetical example with the 5% hypothetical examples that appear in the shareholder reports of the other funds.
Please note that the expenses shown in the table are meant to highlight the fund’s ongoing costs only and do not take into account the fees and expenses imposed under the variable contracts through which your investment in the fund is made. Therefore, the second line for each share class in the table is useful in comparing ongoing costs associated with an investment in vehicles (such as the fund) which fund benefits under variable annuity and variable life insurance contracts and to qualified pension and retirement plans only, and will not help you determine the relative total costs of investing in the fund through variable annuity and variable life insurance contracts. If the fees and expenses imposed under the variable contracts were included, your costs would have been higher.
| | | | | | | | | | | | | | | | | | |
| Share Class | | | | Annualized
Expense Ratio | | | Beginning Account Value 7/01/20 | | | Ending Account Value 12/31/20 | | | Expenses Paid
During Period (p)
7/01/20-12/31/20 | |
| Initial Class | | Actual | | | 0.71% | | | | $1,000.00 | | | | $1,193.07 | | | | $3.91 | |
| | Hypothetical (h) | | | 0.71% | | | | $1,000.00 | | | | $1,021.57 | | | | $3.61 | |
| Service Class | | Actual | | | 0.96% | | | | $1,000.00 | | | | $1,191.28 | | | | $5.29 | |
| | Hypothetical (h) | | | 0.96% | | | | $1,000.00 | | | | $1,020.31 | | | | $4.88 | |
| (h) | 5% class return per year before expenses. |
| (p) | “Expenses Paid During Period” are equal to each class’s annualized expense ratio, as shown above, multiplied by the average account value over the period, multiplied by 184/366 (to reflect the one-half year period). |
6
MFS Value Series
PORTFOLIO OF INVESTMENTS – 12/31/20
The Portfolio of Investments is a complete list of all securities owned by your fund. It is categorized by broad-based asset classes.
| | | | | | | | |
| Issuer | | Shares/Par | | | Value ($) | |
| COMMON STOCKS – 98.7% | | | | | | | | |
| Aerospace – 6.4% | | | | | |
| Honeywell International, Inc. | | | 325,379 | | | $ | 69,208,113 | |
| Lockheed Martin Corp. | | | 67,253 | | | | 23,873,470 | |
| Northrop Grumman Corp. | | | 156,573 | | | | 47,710,925 | |
| Raytheon Technologies Corp. | | | 230,540 | | | | 16,485,915 | |
| | | | | | | | |
| | | | | | $ | 157,278,423 | |
| | | | | | | | |
| Alcoholic Beverages – 1.4% | | | | | |
| Diageo PLC | | | 886,204 | | | $ | 35,023,762 | |
| | | | | | | | |
| Brokerage & Asset Managers – 3.5% | | | | | |
| BlackRock, Inc. | | | 48,955 | | | $ | 35,322,991 | |
| NASDAQ, Inc. | | | 270,415 | | | | 35,894,887 | |
| T. Rowe Price Group, Inc. | | | 97,292 | | | | 14,729,036 | |
| | | | | | | | |
| | | | | | $ | 85,946,914 | |
| | | | | | | | |
| Business Services – 6.4% | | | | | |
| Accenture PLC, “A” | | | 251,667 | | | $ | 65,737,937 | |
| Equifax, Inc. | | | 122,026 | | | | 23,531,494 | |
| Fidelity National Information Services, Inc. | | | 227,362 | | | | 32,162,628 | |
| Fiserv, Inc. (a) | | | 312,550 | | | | 35,586,943 | |
| | | | | | | | |
| | | | | | $ | 157,019,002 | |
| | | | | | | | |
| Cable TV – 3.4% | | | | | |
| Comcast Corp., “A” | | | 1,569,472 | | | $ | 82,240,333 | |
| | | | | | | | |
| Chemicals – 1.8% | | | | | |
| PPG Industries, Inc. | | | 304,893 | | | $ | 43,971,668 | |
| | | | | | | | |
| Construction – 3.6% | | | | | |
| Masco Corp. | | | 368,140 | | | $ | 20,221,930 | |
| Otis Worldwide Corp. | | | 115,269 | | | | 7,786,421 | |
| Sherwin-Williams Co. | | | 40,479 | | | | 29,748,422 | |
| Stanley Black & Decker, Inc. | | | 164,756 | | | | 29,418,831 | |
| | | | | | | | |
| | | | | | $ | 87,175,604 | |
| | | | | | | | |
| Consumer Products – 1.5% | | | | | |
| Colgate-Palmolive Co. | | | 64,453 | | | $ | 5,511,376 | |
| Kimberly-Clark Corp. | | | 150,056 | | | | 20,232,051 | |
| Reckitt Benckiser Group PLC | | | 124,044 | | | | 11,097,212 | |
| | | | | | | | |
| | | | | | $ | 36,840,639 | |
| | | | | | | | |
| Electrical Equipment – 1.1% | | | | | |
| Johnson Controls International PLC | | | 576,054 | | | $ | 26,838,356 | |
| | | | | | | | |
| Electronics – 5.2% | | | | | |
| Analog Devices, Inc. | | | 128,767 | | | $ | 19,022,749 | |
| Intel Corp. | | | 409,089 | | | | 20,380,814 | |
| NXP Semiconductors N.V. | | | 160,555 | | | | 25,529,851 | |
| Texas Instruments, Inc. | | | 386,186 | | | | 63,384,708 | |
| | | | | | | | |
| | | | | | $ | 128,318,122 | |
| | | | | | | | |
| Energy – Independent – 1.5% | | | | | |
| ConocoPhillips | | | 388,333 | | | $ | 15,529,437 | |
| EOG Resources, Inc. | | | 205,446 | | | | 10,245,592 | |
| Pioneer Natural Resources Co. | | | 86,728 | | | | 9,877,452 | |
| | | | | | | | |
| | | | | | $ | 35,652,481 | |
| | | | | | | | |
| | | | | | | | |
| Issuer | | Shares/Par | | | Value ($) | |
| COMMON STOCKS – continued | | | | | |
| Energy – Integrated – 0.5% | | | | | |
| Chevron Corp. | | | 151,757 | | | $ | 12,815,879 | |
| | | | | | | | |
| Food & Beverages – 3.7% | | | | | |
| Archer Daniels Midland Co. | | | 291,225 | | | $ | 14,680,653 | |
| Danone S.A. | | | 126,128 | | | | 8,283,571 | |
| J.M. Smucker Co. | | | 56,077 | | | | 6,482,501 | |
| Nestle S.A. | | | 367,662 | | | | 43,298,814 | |
| PepsiCo, Inc. | | | 119,390 | | | | 17,705,537 | |
| | | | | | | | |
| | | | | | $ | 90,451,076 | |
| | | | | | | | |
| Gaming & Lodging – 0.4% | | | | | |
| Marriott International, Inc., “A” | | | 72,121 | | | $ | 9,514,202 | |
| | | | | | | | |
| Health Maintenance Organizations – 2.2% | | | | | |
| Cigna Corp. | | | 260,200 | | | $ | 54,168,436 | |
| | | | | | | | |
| Insurance – 8.2% | | | | | |
| Aon PLC | | | 268,579 | | | $ | 56,742,685 | |
| Chubb Ltd. | | | 341,392 | | | | 52,547,057 | |
| Marsh & McLennan Cos., Inc. | | | 393,423 | | | | 46,030,491 | |
| Travelers Cos., Inc. | | | 325,132 | | | | 45,638,779 | |
| | | | | | | | |
| | | | | | $ | 200,959,012 | |
| | | | | | | | |
| Machinery & Tools – 4.3% | | | | | |
| Eaton Corp. PLC | | | 305,691 | | | $ | 36,725,717 | |
| Illinois Tool Works, Inc. | | | 210,366 | | | | 42,889,420 | |
| Trane Technologies PLC | | | 185,422 | | | | 26,915,857 | |
| | | | | | | | |
| | | | | | $ | 106,530,994 | |
| | | | | | | | |
| Major Banks – 8.0% | | | | | |
| Goldman Sachs Group, Inc. | | | 129,821 | | | $ | 34,235,096 | |
| JPMorgan Chase & Co. | | | 855,921 | | | | 108,761,882 | |
| Morgan Stanley | | | 131,861 | | | | 9,036,434 | |
| PNC Financial Services Group, Inc. | | | 189,734 | | | | 28,270,366 | |
| State Street Corp. | | | 203,799 | | | | 14,832,491 | |
| | | | | | | | |
| | | | | | $ | 195,136,269 | |
| | | | | | | | |
| Medical & Health Technology & Services – 0.9% | |
| McKesson Corp. | | | 130,308 | | | $ | 22,663,167 | |
| | | | | | | | |
| Medical Equipment – 8.9% | | | | | |
| Abbott Laboratories | | | 332,364 | | | $ | 36,390,534 | |
| Boston Scientific Corp. (a) | | | 579,824 | | | | 20,844,673 | |
| Danaher Corp. | | | 187,014 | | | | 41,543,290 | |
| Medtronic PLC | | | 621,051 | | | | 72,749,914 | |
| Thermo Fisher Scientific, Inc. | | | 99,732 | | | | 46,453,171 | |
| | | | | | | | |
| | | | | | $ | 217,981,582 | |
| | | | | | | | |
| Other Banks & Diversified Financials – 6.3% | | | | | |
| American Express Co. | | | 244,553 | | | $ | 29,568,903 | |
| Citigroup, Inc. | | | 815,494 | | | | 50,283,360 | |
| Moody’s Corp. | | | 47,274 | | | | 13,720,806 | |
| Truist Financial Corp. | | | 503,464 | | | | 24,131,030 | |
| U.S. Bancorp | | | 767,797 | | | | 35,771,662 | |
| | | | | | | | |
| | | | | | $ | 153,475,761 | |
| | | | | | | | |
7
MFS Value Series
Portfolio of Investments – continued
| | | | | | | | |
| Issuer | | Shares/Par | | | Value ($) | |
| COMMON STOCKS – continued | | | | | |
| Pharmaceuticals – 7.3% | | | | | | | | |
| Johnson & Johnson | | | 601,324 | | | $ | 94,636,371 | |
| Merck & Co., Inc. | | | 391,596 | | | | 32,032,553 | |
| Pfizer, Inc. | | | 1,109,951 | | | | 40,857,296 | |
| Roche Holding AG | | | 33,890 | | | | 11,828,770 | |
| | | | | | | | |
| | | | | | $ | 179,354,990 | |
| | | | | | | | |
| Railroad & Shipping – 2.2% | | | | | | | | |
| Canadian National Railway Co. | | | 145,458 | | | $ | 15,978,561 | |
| Union Pacific Corp. | | | 182,605 | | | | 38,022,013 | |
| | | | | | | | |
| | | | | | $ | 54,000,574 | |
| | | | | | | | |
| Real Estate – 0.3% | | | | | | | | |
| Public Storage, Inc., REIT | | | 37,507 | | | $ | 8,661,492 | |
| | | | | | | | |
| Specialty Chemicals – 0.9% | | | | | | | | |
| DuPont de Nemours, Inc. | | | 294,722 | | | $ | 20,957,681 | |
| | | | | | | | |
| Specialty Stores – 1.3% | | | | | | | | |
| Lowe’s Cos., Inc. | | | 193,614 | | | $ | 31,076,983 | |
| | | | | | | | |
| Telephone Services – 0.4% | | | | | | | | |
| Verizon Communications, Inc. | | | 181,307 | | | $ | 10,651,786 | |
| | | | | | | | |
| Tobacco – 0.5% | | | | | | | | |
| Philip Morris International, Inc. | | | 144,361 | | | $ | 11,951,647 | |
| | | | | | | | |
| Utilities – Electric Power – 6.6% | | | | | |
| American Electric Power Co., Inc. | | | 236,029 | | | $ | 19,654,135 | |
| Dominion Energy, Inc. | | | 392,291 | | | | 29,500,283 | |
| Duke Energy Corp. | | | 594,548 | | | | 54,436,815 | |
| | | | | | | | |
| Issuer | | Shares/Par | | | Value ($) | |
| COMMON STOCKS – continued | | | | | |
| Utilities – Electric Power – continued | | | | | |
| Southern Co. | | | 728,753 | | | $ | 44,767,297 | |
| Xcel Energy, Inc. | | | 204,673 | | | | 13,645,549 | |
| | | | | | | | |
| | | | | | $ | 162,004,079 | |
| | | | | | | | |
Total Common Stocks
(Identified Cost, $1,306,321,948) | | | | | | $ | 2,418,660,914 | |
| | | | | | | | |
| |
| INVESTMENT COMPANIES (h) – 1.2% | | | | | |
| Money Market Funds – 1.2% | | | | | | | | |
| MFS Institutional Money Market Portfolio, 0.1% (v) (Identified Cost, $30,323,177) | | | 30,323,177 | | | $ | 30,323,177 | |
| | | | | | | | |
OTHER ASSETS, LESS
LIABILITIES – 0.1% | | | | | | | 1,585,369 | |
| | | | | | | | |
| NET ASSETS – 100.0% | | | | | | $ | 2,450,569,460 | |
| | | | | | | | |
| (a) | | Non-income producing security. |
| (h) | | An affiliated issuer, which may be considered one in which the fund owns 5% or more of the outstanding voting securities, or a company which is under common control. At period end, the aggregate values of the fund’s investments in affiliated issuers and in unaffiliated issuers were $30,323,177 and $2,418,660,914, respectively. |
| (v) | | Affiliated issuer that is available only to investment companies managed by MFS. The rate quoted for the MFS Institutional Money Market Portfolio is the annualized seven-day yield of the fund at period end. |
The following abbreviations are used in this report and are defined:
| REIT | | Real Estate Investment Trust |
See Notes to Financial Statements
8
MFS Value Series
FINANCIAL STATEMENTS | STATEMENT OF ASSETS AND LIABILITIES
This statement represents your fund’s balance sheet, which details the assets and liabilities comprising the total value of the fund.
| | | | |
At 12/31/20 | | | | |
| |
Assets | | | | |
Investments in unaffiliated issuers, at value (identified cost, $1,306,321,948) | | | $2,418,660,914 | |
Investments in affiliated issuers, at value (identified cost, $30,323,177) | | | 30,323,177 | |
Cash | | | 98,274 | |
Receivables for | | | | |
Investments sold | | | 207,867 | |
Fund shares sold | | | 526,601 | |
Dividends | | | 3,736,954 | |
Other assets | | | 8,313 | |
Total assets | | | $2,453,562,100 | |
| |
Liabilities | | | | |
Payables for | | | | |
Investments purchased | | | $229,268 | |
Fund shares reacquired | | | 2,473,682 | |
Payable to affiliates | | | | |
Investment adviser | | | 72,672 | |
Administrative services fee | | | 1,590 | |
Shareholder servicing costs | | | 609 | |
Distribution and/or service fees | | | 17,119 | |
Payable for independent Trustees’ compensation | | | 11 | |
Accrued expenses and other liabilities | | | 197,689 | |
Total liabilities | | | $2,992,640 | |
Net assets | | | $2,450,569,460 | |
| |
Net assets consist of | | | | |
Paid-in capital | | | $1,252,265,178 | |
Total distributable earnings (loss) | | | 1,198,304,282 | |
Net assets | | | $2,450,569,460 | |
Shares of beneficial interest outstanding | | | 121,493,571 | |
| | | | | | | | | | | | |
| | | |
| | | Net assets | | | Shares
outstanding | | | Net asset value
per share | |
Initial Class | | | $1,183,318,002 | | | | 58,010,800 | | | | $20.40 | |
Service Class | | | 1,267,251,458 | | | | 63,482,771 | | | | 19.96 | |
See Notes to Financial Statements
9
MFS Value Series
FINANCIAL STATEMENTS | STATEMENT OF OPERATIONS
This statement describes how much your fund earned in investment income and accrued in expenses. It also describes any gains and/or losses generated by fund operations.
| | | | |
Year ended 12/31/20 | | | | |
| |
Net investment income (loss) | | | | |
Income | | | | |
Dividends | | | $51,126,892 | |
Income on securities loaned | | | 158,599 | |
Dividends from affiliated issuers | | | 153,247 | |
Other | | | 53,726 | |
Foreign taxes withheld | | | (408,412 | ) |
Total investment income | | | $51,084,052 | |
Expenses | | | | |
Management fee | | | $15,144,489 | |
Distribution and/or service fees | | | 2,877,807 | |
Shareholder servicing costs | | | 48,487 | |
Administrative services fee | | | 297,290 | |
Independent Trustees’ compensation | | | 36,964 | |
Custodian fee | | | 116,789 | |
Shareholder communications | | | 182,986 | |
Audit and tax fees | | | 59,338 | |
Legal fees | | | 15,629 | |
Miscellaneous | | | 48,324 | |
Total expenses | | | $18,828,103 | |
Reduction of expenses by investment adviser | | | (476,806 | ) |
Net expenses | | | $18,351,297 | |
Net investment income (loss) | | | $32,732,755 | |
| |
Realized and unrealized gain (loss) | | | | |
Realized gain (loss) (identified cost basis) | | | | |
Unaffiliated issuers | | | $59,484,158 | |
Affiliated issuers | | | (9,521 | ) |
Foreign currency | | | (39,830 | ) |
Net realized gain (loss) | | | $59,434,807 | |
Change in unrealized appreciation or depreciation | | | | |
Unaffiliated issuers | | | $16,522,871 | |
Translation of assets and liabilities in foreign currencies | | | 111,665 | |
Net unrealized gain (loss) | | | $16,634,536 | |
Net realized and unrealized gain (loss) | | | $76,069,343 | |
Change in net assets from operations | | | $108,802,098 | |
See Notes to Financial Statements
10
MFS Value Series
FINANCIAL STATEMENTS | STATEMENTS OF CHANGES IN NET ASSETS
These statements describe the increases and/or decreases in net assets resulting from operations, any distributions, and any shareholder transactions.
| | | | | | | | |
| | | Year ended | |
| | | 12/31/20 | | | 12/31/19 | |
Change in net assets | | | | | | | | |
| | |
From operations | | | | | | | | |
Net investment income (loss) | | | $32,732,755 | | | | $32,574,207 | |
Net realized gain (loss) | | | 59,434,807 | | | | 103,173,679 | |
Net unrealized gain (loss) | | | 16,634,536 | | | | 413,709,693 | |
Change in net assets from operations | | | $108,802,098 | | | | $549,457,579 | |
Total distributions to shareholders | | | $(132,057,054 | ) | | | $(138,541,235 | ) |
Change in net assets from fund share transactions | | | $249,518,336 | | | | $(138,202,942 | ) |
Total change in net assets | | | $226,263,380 | | | | $272,713,402 | |
| | |
Net assets | | | | | | | | |
At beginning of period | | | 2,224,306,080 | | | | 1,951,592,678 | |
At end of period | | | $2,450,569,460 | | | | $2,224,306,080 | |
See Notes to Financial Statements
11
MFS Value Series
FINANCIAL STATEMENTS | FINANCIAL HIGHLIGHTS
The financial highlights table is intended to help you understand the fund’s financial performance for the past 5 years. Certain information reflects financial results for a single fund share. The total returns in the table represent the rate that an investor would have earned (or lost) on an investment in the fund share class (assuming reinvestment of all distributions) held for the entire period.
| | | | | | | | | | | | | | | | | | | | |
| Initial Class | | Year ended | |
| | | | | |
| | | 12/31/20 | | | 12/31/19 | | | 12/31/18 | | | 12/31/17 | | | 12/31/16 | |
| | | | | |
Net asset value, beginning of period | | | $20.95 | | | | $17.30 | | | | $20.92 | | | | $18.90 | | | | $18.39 | |
| | | | | |
| Income (loss) from investment operations | | | | | | | | | | | | | | | | | | | | |
Net investment income (loss) (d) | | | $0.31 | | | | $0.33 | | | | $0.41 | | | | $0.30 | | | | $0.38 | (c) |
Net realized and unrealized gain (loss) | | | 0.29 | | | | 4.68 | | | | (2.32 | ) | | | 2.93 | | | | 2.16 | |
Total from investment operations | | | $0.60 | | | | $5.01 | | | | $(1.91 | ) | | | $3.23 | | | | $2.54 | |
| | | | | |
| Less distributions declared to shareholders | | | | | | | | | | | | | | | | | | | | |
From net investment income | | | $(0.30 | ) | | | $(0.44 | ) | | | $(0.32 | ) | | | $(0.40 | ) | | | $(0.42 | ) |
From net realized gain | | | (0.85 | ) | | | (0.92 | ) | | | (1.39 | ) | | | (0.81 | ) | | | (1.61 | ) |
Total distributions declared to shareholders | | | $(1.15 | ) | | | $(1.36 | ) | | | $(1.71 | ) | | | $(1.21 | ) | | | $(2.03 | ) |
Net asset value, end of period (x) | | | $20.40 | | | | $20.95 | | | | $17.30 | | | | $20.92 | | | | $18.90 | |
Total return (%) (k)(r)(s)(x) | | | 3.48 | | | | 29.80 | | | | (10.09 | ) | | | 17.65 | | | | 14.09 | (c) |
| | | | | |
Ratios (%) (to average net assets)
and Supplemental data: | | | | | | | | | | | | | | | | | | | | |
Expenses before expense reductions (f) | | | 0.73 | | | | 0.73 | | | | 0.73 | | | | 0.74 | | | | 0.73 | (c) |
Expenses after expense reductions (f) | | | 0.71 | | | | 0.72 | | | | 0.72 | | | | 0.73 | | | | 0.72 | (c) |
Net investment income (loss) | | | 1.64 | | | | 1.67 | | | | 2.02 | | | | 1.51 | | | | 2.02 | (c) |
Portfolio turnover | | | 17 | | | | 13 | | | | 8 | | | | 10 | | | | 15 | |
Net assets at end of period (000 omitted) | | | $1,183,318 | | | | $945,183 | | | | $823,744 | | | | $996,794 | | | | $968,078 | |
| |
| Service Class | | Year ended | |
| | | | | |
| | | 12/31/20 | | | 12/31/19 | | | 12/31/18 | | | 12/31/17 | | | 12/31/16 | |
| | | | | |
Net asset value, beginning of period | | | $20.52 | | | | $16.96 | | | | $20.55 | | | | $18.59 | | | | $18.12 | |
| | | | | |
| Income (loss) from investment operations | | | | | | | | | | | | | | | | | | | | |
Net investment income (loss) (d) | | | $0.25 | | | | $0.27 | | | | $0.35 | | | | $0.25 | | | | $0.33 | (c) |
Net realized and unrealized gain (loss) | | | 0.29 | | | | 4.59 | | | | (2.28 | ) | | | 2.87 | | | | 2.11 | |
Total from investment operations | | | $0.54 | | | | $4.86 | | | | $(1.93 | ) | | | $3.12 | | | | $2.44 | |
| | | | | |
| Less distributions declared to shareholders | | | | | | | | | | | | | | | | | | | | |
From net investment income | | | $(0.25 | ) | | | $(0.38 | ) | | | $(0.27 | ) | | | $(0.35 | ) | | | $(0.36 | ) |
From net realized gain | | | (0.85 | ) | | | (0.92 | ) | | | (1.39 | ) | | | (0.81 | ) | | | (1.61 | ) |
Total distributions declared to shareholders | | | $(1.10 | ) | | | $(1.30 | ) | | | $(1.66 | ) | | | $(1.16 | ) | | | $(1.97 | ) |
Net asset value, end of period (x) | | | $19.96 | | | | $20.52 | | | | $16.96 | | | | $20.55 | | | | $18.59 | |
Total return (%) (k)(r)(s)(x) | | | 3.22 | | | | 29.51 | | | | (10.36 | ) | | | 17.35 | | | | 13.78 | (c) |
| | | | | |
Ratios (%) (to average net assets)
and Supplemental data: | | | | | | | | | | | | | | | | | | | | |
Expenses before expense reductions (f) | | | 0.98 | | | | 0.98 | | | | 0.98 | | | | 0.99 | | | | 0.98 | (c) |
Expenses after expense reductions (f) | | | 0.96 | | | | 0.97 | | | | 0.97 | | | | 0.98 | | | | 0.97 | (c) |
Net investment income (loss) | | | 1.38 | | | | 1.42 | | | | 1.77 | | | | 1.26 | | | | 1.78 | (c) |
Portfolio turnover | | | 17 | | | | 13 | | | | 8 | | | | 10 | | | | 15 | |
Net assets at end of period (000 omitted) | | | $1,267,251 | | | | $1,279,123 | | | | $1,127,848 | | | | $1,398,374 | | | | $1,302,307 | |
See Notes to Financial Statements
12
MFS Value Series
Financial Highlights – continued
| (c) | Amount reflects a one-time reimbursement of expenses by the custodian (or former custodian) without which net investment income and performance would be lower and expenses would be higher. |
| (d) | Per share data is based on average shares outstanding. |
| (f) | Ratios do not reflect reductions from fees paid indirectly, if applicable. |
| (k) | The total return does not reflect expenses that apply to separate accounts. Inclusion of these charges would reduce the total return figures for all periods shown. |
| (r) | Certain expenses have been reduced without which performance would have been lower. |
| (s) | From time to time the fund may receive proceeds from litigation settlements, without which performance would be lower. |
| (x) | The net asset values and total returns have been calculated on net assets which include adjustments made in accordance with U.S. generally accepted accounting principles required at period end for financial reporting purposes. |
See Notes to Financial Statements
13
MFS Value Series
NOTES TO FINANCIAL STATEMENTS
| (1) | | Business and Organization |
MFS Value Series (the fund) is a diversified series of MFS Variable Insurance Trust (the trust). The trust is organized as a Massachusetts business trust and is registered under the Investment Company Act of 1940, as amended, as an open-end management investment company. The shareholders of each series of the trust are separate accounts of insurance companies, which offer variable annuity and/or life insurance products, and qualified retirement and pension plans.
The fund is an investment company and accordingly follows the investment company accounting and reporting guidance of the Financial Accounting Standards Board (FASB) Accounting Standards Codification Topic 946 Financial Services – Investment Companies.
| (2) | | Significant Accounting Policies |
General – The preparation of financial statements in conformity with U.S. generally accepted accounting principles requires management to make estimates and assumptions that affect the reported amounts of assets and liabilities, and disclosure of contingent assets and liabilities at the date of the financial statements and the reported amounts of increases and decreases in net assets from operations during the reporting period. Actual results could differ from those estimates. In the preparation of these financial statements, management has evaluated subsequent events occurring after the date of the fund’s Statement of Assets and Liabilities through the date that the financial statements were issued.
In March 2020, the FASB issued Accounting Standards Update 2020-04, Reference Rate Reform (Topic 848) – Facilitation of the Effects of Reference Rate Reform on Financial Reporting (“ASU 2020-04”), which provides optional, temporary relief with respect to the financial reporting of contracts subject to certain types of modifications due to the planned discontinuation of the London Interbank Offered Rate (LIBOR) and other IBOR-based reference rates as of the end of 2021. The temporary relief provided by ASU 2020-04 is effective for certain reference rate-related contract modifications that occur during the period from March 12, 2020 through December 31, 2022. Management is evaluating the impact of ASU 2020-04 on the fund’s investments, derivatives, debt and other contracts that will undergo reference rate-related modifications as a result of the reference rate reform.
Balance Sheet Offsetting – The fund’s accounting policy with respect to balance sheet offsetting is that, absent an event of default by the counterparty or a termination of the agreement, the International Swaps and Derivatives Association (ISDA) Master Agreement, or similar agreement, does not result in an offset of reported amounts of financial assets and financial liabilities in the Statement of Assets and Liabilities across transactions between the fund and the applicable counterparty. The fund’s right to setoff may be restricted or prohibited by the bankruptcy or insolvency laws of the particular jurisdiction to which a specific master netting agreement counterparty is subject. Balance sheet offsetting disclosures, to the extent applicable to the fund, have been included in the fund’s Significant Accounting Policies note under the captions for each of the fund’s in-scope financial instruments and transactions.
Investment Valuations – Equity securities, including restricted equity securities, are generally valued at the last sale or official closing price on their primary market or exchange as provided by a third-party pricing service. Equity securities, for which there were no sales reported that day, are generally valued at the last quoted daily bid quotation on their primary market or exchange as provided by a third-party pricing service. Short-term instruments with a maturity at issuance of 60 days or less may be valued at amortized cost, which approximates market value. Open-end investment companies are generally valued at net asset value per share. Securities and other assets generally valued on the basis of information from a third-party pricing service may also be valued at a broker/dealer bid quotation. In determining values, third-party pricing services can utilize both transaction data and market information such as yield, quality, coupon rate, maturity, type of issue, trading characteristics, and other market data. The values of foreign securities and other assets and liabilities expressed in foreign currencies are converted to U.S. dollars using the mean of bid and asked prices for rates provided by a third-party pricing service.
The Board of Trustees has delegated primary responsibility for determining or causing to be determined the value of the fund’s investments (including any fair valuation) to the adviser pursuant to valuation policies and procedures approved by the Board. If the adviser determines that reliable market quotations are not readily available, investments are valued at fair value as determined in good faith by the adviser in accordance with such procedures under the oversight of the Board of Trustees. Under the fund’s valuation policies and procedures, market quotations are not considered to be readily available for most types of debt instruments and floating rate loans and many types of derivatives. These investments are generally valued at fair value based on information from third-party pricing services. In addition, investments may be valued at fair value if the adviser determines that an investment’s value has been materially affected by events occurring after the close of the exchange or market on which the investment is principally traded (such as foreign exchange or market) and prior to the determination of the fund’s net asset value, or after the halt of trading of a specific security where trading does not resume prior to the close of the exchange or market on which the security is principally traded. Events that occur after foreign markets close (such as developments in foreign markets and significant movements in the U.S. markets) and prior to the determination of the fund’s net asset value may be deemed to have a material effect on the value of
securities traded in foreign markets. Accordingly, the fund’s foreign equity securities may often be valued at fair value. The adviser generally relies on third-party pricing services or other information (such as the correlation with price movements of similar securities
14
MFS Value Series
Notes to Financial Statements – continued
in the same or other markets; the type, cost and investment characteristics of the security; the business and financial condition of the issuer; and trading and other market data) to assist in determining whether to fair value and at what value to fair value an investment. The value of an investment for purposes of calculating the fund’s net asset value can differ depending on the source and method used to determine value. When fair valuation is used, the value of an investment used to determine the fund’s net asset value may differ from quoted or published prices for the same investment. There can be no assurance that the fund could obtain the fair value assigned to an investment if it were to sell the investment at the same time at which the fund determines its net asset value per share.
Various inputs are used in determining the value of the fund’s assets or liabilities. These inputs are categorized into three broad levels. In certain cases, the inputs used to measure fair value may fall into different levels of the fair value hierarchy. In such cases, an investment’s level within the fair value hierarchy is based on the lowest level of input that is significant to the fair value measurement. The fund’s assessment of the significance of a particular input to the fair value measurement in its entirety requires judgment, and considers factors specific to the investment. Level 1 includes unadjusted quoted prices in active markets for identical assets or liabilities. Level 2 includes other significant observable market-based inputs (including quoted prices for similar securities, interest rates, prepayment speed, and credit risk). Level 3 includes unobservable inputs, which may include the adviser’s own assumptions in determining the fair value of investments. The following is a summary of the levels used as of December 31, 2020 in valuing the fund’s assets or liabilities:
| | | | | | | | | | | | | | | | |
| Financial Instruments | | Level 1 | | | Level 2 | | | Level 3 | | | Total | |
| Equity Securities: | | | | | | | | | | | | | | | | |
United States | | | $2,267,620,373 | | | | $— | | | | $— | | | | $2,267,620,373 | |
Switzerland | | | 55,127,584 | | | | — | | | | — | | | | 55,127,584 | |
United Kingdom | | | 11,097,212 | | | | 35,023,762 | | | | — | | | | 46,120,974 | |
Netherlands | | | 25,529,851 | | | | — | | | | — | | | | 25,529,851 | |
Canada | | | 15,978,561 | | | | — | | | | — | | | | 15,978,561 | |
France | | | 8,283,571 | | | | — | | | | — | | | | 8,283,571 | |
| Mutual Funds | | | 30,323,177 | | | | — | | | | — | | | | 30,323,177 | |
| Total | | | $2,413,960,329 | | | | $35,023,762 | | | | $— | | | | $2,448,984,091 | |
For further information regarding security characteristics, see the Portfolio of Investments.
Foreign Currency Translation – Purchases and sales of foreign investments, income, and expenses are converted into U.S. dollars based upon currency exchange rates prevailing on the respective dates of such transactions or on the reporting date for foreign denominated receivables and payables. Gains and losses attributable to foreign currency exchange rates on sales of securities are recorded for financial statement purposes as net realized gains and losses on investments. Gains and losses attributable to foreign exchange rate movements on receivables, payables, income and expenses are recorded for financial statement purposes as foreign currency transaction gains and losses. That portion of both realized and unrealized gains and losses on investments that results from fluctuations in foreign currency exchange rates is not separately disclosed.
Security Loans – Under its Securities Lending Agency Agreement with the fund, State Street Bank and Trust Company, as lending agent, loans the securities of the fund to certain qualified institutions (the “Borrowers”) approved by the fund. Security loans can be terminated at the discretion of either the lending agent or the fund and the related securities must be returned within the earlier of the standard trade settlement period for such securities or within three business days. The loans are collateralized by cash and/or U.S. Treasury and federal agency obligations in an amount typically at least equal to the market value of the securities loaned. On loans collateralized by cash, the cash collateral is invested in a money market fund. The market value of the loaned securities is determined at the close of business of the fund and any additional required collateral is delivered to the fund on the next business day. The lending agent provides the fund with indemnification against Borrower default. In the event of Borrower default, the lending agent will, for the benefit of the fund, either purchase securities identical to those loaned or, when such purchase is commercially impracticable, pay the fund the market value of the loaned securities. In return, the lending agent assumes the fund’s rights to the related collateral. If the collateral value is less than the cost to purchase identical securities, the lending agent is responsible for the shortfall, but only to the extent that such shortfall is not due to a decline in collateral value resulting from collateral reinvestment for which the fund bears the risk of loss. A portion of the income generated upon investment of the collateral is remitted to the Borrowers, and the remainder is allocated between the fund and the lending agent. On loans collateralized by U.S. Treasury and/or federal agency obligations, a fee is received from the Borrower, and is allocated between the fund and the lending agent. Income from securities lending is separately reported in the Statement of Operations. The dividend and interest income earned on the securities loaned is accounted for in the same manner as other dividend and interest income. At December 31, 2020, there were no securities on loan or collateral outstanding.
Indemnifications – Under the fund’s organizational documents, its officers and Trustees may be indemnified against certain liabilities and expenses arising out of the performance of their duties to the fund. Additionally, in the normal course of business, the
15
MFS Value Series
Notes to Financial Statements – continued
fund enters into agreements with service providers that may contain indemnification clauses. The fund’s maximum exposure under these agreements is unknown as this would involve future claims that may be made against the fund that have not yet occurred.
Investment Transactions and Income – Investment transactions are recorded on the trade date. Interest income is recorded on the accrual basis. Dividends received in cash are recorded on the ex-dividend date. Certain dividends from foreign securities will be recorded when the fund is informed of the dividend if such information is obtained subsequent to the ex-dividend date. Dividend payments received in additional securities are recorded on the ex-dividend date in an amount equal to the value of the security on such date.
The fund may receive proceeds from litigation settlements. Any proceeds received from litigation involving portfolio holdings are reflected in the Statement of Operations in realized gain/loss if the security has been disposed of by the fund or in unrealized gain/loss if the security is still held by the fund. Any other proceeds from litigation not related to portfolio holdings are reflected as other income in the Statement of Operations.
Tax Matters and Distributions – The fund intends to qualify as a regulated investment company, as defined under Subchapter M of the Internal Revenue Code, and to distribute all of its taxable income, including realized capital gains. As a result, no provision for federal income tax is required. The fund’s federal tax returns, when filed, will remain subject to examination by the Internal Revenue Service for a three year period. Management has analyzed the fund’s tax positions taken on federal and state tax returns for all open tax years and does not believe that there are any uncertain tax positions that require recognition of a tax liability. Foreign taxes, if any, have been accrued by the fund in the accompanying financial statements in accordance with the applicable foreign tax law. Foreign income taxes may be withheld by certain countries in which the fund invests. Additionally, capital gains realized by the fund on securities issued in or by certain foreign countries may be subject to capital gains tax imposed by those countries.
Distributions to shareholders are recorded on the ex-dividend date. Income and capital gain distributions are determined in accordance with income tax regulations, which may differ from U.S. generally accepted accounting principles. Certain capital accounts in the financial statements are periodically adjusted for permanent differences in order to reflect their tax character. These adjustments have no impact on net assets or net asset value per share. Temporary differences which arise from recognizing certain items of income, expense, gain or loss in different periods for financial statement and tax purposes will reverse at some time in the future.
Book/tax differences primarily relate to wash sale loss deferrals.
The tax character of distributions declared to shareholders for the last two fiscal years is as follows:
| | | | | | | | |
| | | Year ended
12/31/20 | | | Year ended
12/31/19 | |
| Ordinary income (including any short-term capital gains) | | | $34,922,070 | | | | $42,575,241 | |
| Long-term capital gains | | | 97,134,984 | | | | 95,965,994 | |
| Total distributions | | | $132,057,054 | | | | $138,541,235 | |
The federal tax cost and the tax basis components of distributable earnings were as follows:
| | | | |
| As of 12/31/20 | | | | |
| |
| Cost of investments | | | $1,342,733,510 | |
| Gross appreciation | | | 1,119,654,614 | |
| Gross depreciation | | | (13,404,033 | ) |
| Net unrealized appreciation (depreciation) | | | $1,106,250,581 | |
| |
| Undistributed ordinary income | | | 32,690,653 | |
| Undistributed long-term capital gain | | | 59,232,794 | |
| Other temporary differences | | | 130,254 | |
Multiple Classes of Shares of Beneficial Interest – The fund offers multiple classes of shares, which differ in their respective distribution and/or service fees. The fund’s income, realized and unrealized gain (loss), and common expenses are allocated to shareholders based on the daily net assets of each class. Dividends are declared separately for each class. Differences in per share dividend rates are generally due to differences in separate class expenses. The fund’s distributions declared to shareholders as reported in the Statements of Changes in Net Assets are presented by class as follows:
| | | | | | | | |
| | |
| | | Year ended
12/31/20 | | | Year ended
12/31/19 | |
| Initial Class | | | $64,613,595 | | | | $59,678,116 | |
| Service Class | | | 67,443,459 | | | | 78,863,119 | |
| Total | | | $132,057,054 | | | | $138,541,235 | |
16
MFS Value Series
Notes to Financial Statements – continued
| (3) | | Transactions with Affiliates |
Investment Adviser – The fund has an investment advisory agreement with MFS to provide overall investment management and related administrative services and facilities to the fund. The management fee is computed daily and paid monthly at the following annual rates based on the fund’s average daily net assets:
| | | | |
| Up to $1 billion | | | 0.75% | |
| In excess of $1 billion and up to $2.5 billion | | | 0.65% | |
| In excess of $2.5 billion | | | 0.60% | |
MFS has agreed in writing to reduce its management fee by a specified amount if certain MFS mutual fund assets exceed thresholds agreed to by MFS and the fund’s Board of Trustees. For the year ended December 31, 2020, this management fee reduction amounted to $239,237, which is included in the reduction of total expenses in the Statement of Operations. The management fee incurred for the year ended December 31, 2020 was equivalent to an annual effective rate of 0.68% of the fund’s average daily net assets.
The investment adviser has agreed in writing to pay a portion of the fund’s total annual operating expenses, excluding interest, taxes, extraordinary expenses, brokerage and transaction costs, and investment-related expenses, such that total annual operating expenses do not exceed 0.71% of average daily net assets for the Initial Class shares and 0.96% of average daily net assets for the Service Class shares. This written agreement will continue until modified by the fund’s Board of Trustees, but such agreement will continue at least until April 30, 2022. For the year ended December 31, 2020, this reduction amounted to $237,569, which is included in the reduction of total expenses in the Statement of Operations.
Distributor – MFS Fund Distributors, Inc. (MFD), a wholly-owned subsidiary of MFS, is the distributor of shares of the fund. The Trustees have adopted a distribution plan for the Service Class shares pursuant to Rule 12b-1 under the Investment Company Act of 1940.
The fund’s distribution plan provides that the fund will pay MFD distribution and/or service fees equal to 0.25% per annum of its average daily net assets attributable to Service Class shares as partial consideration for services performed and expenses incurred by MFD and financial intermediaries (including participating insurance companies that invest in the fund to fund variable annuity and variable life insurance contracts, sponsors of qualified retirement and pension plans that invest in the fund, and affiliates of these participating insurance companies and plan sponsors) in connection with the sale and distribution of the Service Class shares. MFD may subsequently pay all, or a portion, of the distribution and/or service fees to financial intermediaries.
Shareholder Servicing Agent – MFS Service Center, Inc. (MFSC), a wholly-owned subsidiary of MFS, receives a fee from the fund for its services as shareholder servicing agent. For the year ended December 31, 2020, the fee was $46,583, which equated to 0.0021% annually of the fund’s average daily net assets. MFSC also receives reimbursement from the fund for out-of-pocket expenses paid by MFSC on behalf of the fund. For the year ended December 31, 2020, these costs amounted to $1,904.
Administrator – MFS provides certain financial, legal, shareholder communications, compliance, and other administrative services to the fund. Under an administrative services agreement, the fund reimburses MFS the costs incurred to provide these services. The fund is charged an annual fixed amount of $17,500 plus a fee based on average daily net assets. The administrative services fee incurred for the year ended December 31, 2020 was equivalent to an annual effective rate of 0.0137% of the fund’s average daily net assets.
Trustees’ and Officers’ Compensation – The fund pays compensation to independent Trustees in the form of a retainer, attendance fees, and additional compensation to Board and Committee chairpersons. The fund does not pay compensation directly to Trustees or officers of the fund who are also officers of the investment adviser, all of whom receive remuneration from MFS for their services to the fund. Certain officers and Trustees of the fund are officers or directors of MFS, MFD, and MFSC.
Other – The fund invests in the MFS Institutional Money Market Portfolio which is managed by MFS and seeks current income consistent with preservation of capital and liquidity. This money market fund does not pay a management fee to MFS but does incur investment and operating costs.
The fund is permitted to engage in purchase and sale transactions with funds and accounts for which MFS serves as investment adviser or sub-adviser (“cross-trades”) pursuant to a policy adopted by the Board of Trustees. This policy has been designed to ensure that cross-trades conducted by the fund comply with Rule 17a-7 under the Investment Company Act of 1940. During the year ended December 31, 2020, the fund engaged in purchase and sale transactions pursuant to this policy, which amounted to $4,972,645 and $2,086,055, respectively. The sales transactions resulted in net realized gains (losses) of $379,954.
The adviser has voluntarily undertaken to reimburse the fund from its own resources on a quarterly basis for the cost of investment research embedded in the cost of the fund’s securities trades. This agreement may be rescinded at any time. For the year ended December 31, 2020, this reimbursement amounted to $53,436, which is included in “Other” income in the Statement of Operations.
17
MFS Value Series
Notes to Financial Statements – continued
For the year ended December 31, 2020, purchases and sales of investments, other than short-term obligations, aggregated $506,931,656 and $359,728,785, respectively.
| (5) | | Shares of Beneficial Interest |
The fund’s Declaration of Trust permits the Trustees to issue an unlimited number of full and fractional shares of beneficial interest. Transactions in fund shares were as follows:
| | | | | | | | | | | | | | | | |
| | | Year ended 12/31/20 | | | Year ended 12/31/19 | |
| | | | |
| | | Shares | | | Amount | | | Shares | | | Amount | |
| Shares sold | | | | | | | | | | | | | | | | |
Initial Class | | | 17,458,957 | | | | $326,082,166 | | | | 3,030,553 | | | | $59,564,452 | |
Service Class | | | 10,385,417 | | | | 178,855,955 | | | | 4,216,291 | | | | 80,005,530 | |
| | | 27,844,374 | | | | $504,938,121 | | | | 7,246,844 | | | | $139,569,982 | |
| | | | |
| Shares issued to shareholders in reinvestment of distributions | | | | | | | | | | | | | | | | |
Initial Class | | | 3,496,407 | | | | $64,613,595 | | | | 3,169,311 | | | | $59,678,116 | |
Service Class | | | 3,726,158 | | | | 67,443,459 | | | | 4,272,108 | | | | 78,863,119 | |
| | | 7,222,565 | | | | $132,057,054 | | | | 7,441,419 | | | | $138,541,235 | |
| | | | |
| Shares reacquired | | | | | | | | | | | | | | | | |
Initial Class | | | (8,069,039 | ) | | | $(151,590,113 | ) | | | (8,697,665 | ) | | | $(171,759,644 | ) |
Service Class | | | (12,963,112 | ) | | | (235,886,726 | ) | | | (12,637,014 | ) | | | (244,554,515 | ) |
| | | (21,032,151 | ) | | | $(387,476,839 | ) | | | (21,334,679 | ) | | | $(416,314,159 | ) |
| | | | |
| Net change | | | | | | | | | | | | | | | | |
Initial Class | | | 12,886,325 | | | | $239,105,648 | | | | (2,497,801 | ) | | | $(52,517,076 | ) |
Service Class | | | 1,148,463 | | | | 10,412,688 | | | | (4,148,615 | ) | | | (85,685,866 | ) |
| | | 14,034,788 | | | | $249,518,336 | | | | (6,646,416 | ) | | | $(138,202,942 | ) |
The fund is one of several mutual funds in which certain MFS funds may invest. The MFS funds do not invest in the underlying funds for the purpose of exercising management or control. At the end of the period, the MFS Moderate Allocation Portfolio, the MFS Growth Allocation Portfolio, and the MFS Conservative Allocation Portfolio were the owners of record of approximately 5%, 2%, and 1%, respectively, of the value of outstanding voting shares of the fund.
The fund and certain other funds managed by MFS participate in a $1.25 billion unsecured committed line of credit of which $1 billion is reserved for use by the fund and certain other U.S. funds. The line of credit is provided by a syndicate of banks under a credit agreement. Borrowings may be made for temporary financing needs. Interest is charged to each fund, based on its borrowings, generally at a rate equal to the highest of one month LIBOR, the Federal Funds Effective Rate and the Overnight Bank Funding Rate, plus an agreed upon spread. A commitment fee, based on the average daily, unused portion of the committed line of credit, is allocated among the participating funds. In addition, the fund and other funds managed by MFS have established unsecured uncommitted borrowing arrangements with certain banks for temporary financing needs. Interest is charged to each fund, based on its borrowings, at rates equal to customary reference rates plus an agreed upon spread. For the year ended December 31, 2020, the fund’s commitment fee and interest expense were $10,009 and $0, respectively, and are included in “Miscellaneous” expense in the Statement of Operations.
| (7) | | Investments in Affiliated Issuers |
An affiliated issuer may be considered one in which the fund owns 5% or more of the outstanding voting securities, or a company which is under common control. For the purposes of this report, the following were affiliated issuers:
| | | | | | | | | | | | | | | | | | | | | | | | |
| Affiliated Issuers | | Beginning
Value | | | Purchases | | | Sales
Proceeds | | | Realized
Gain
(Loss) | | | Change in
Unrealized
Appreciation or
Depreciation | | | Ending
Value | |
| MFS Institutional Money Market Portfolio | | | $25,583,427 | | | | $455,496,437 | | | | $450,747,166 | | | | $(9,521 | ) | | | $— | | | | $30,323,177 | |
| | | | | | |
| Affiliated Issuers | | | | | | | | | | | | | | Dividend
Income | | | Capital Gain
Distributions | |
| MFS Institutional Money Market Portfolio | | | | | | | | | | | | $153,247 | | | | $— | |
18
MFS Value Series
Notes to Financial Statements – continued
The pandemic related to the global spread of novel coronavirus disease (COVID-19), which was first detected in December 2019, has resulted in significant disruptions to global business activity and the global economy, as well as the economies of individual countries, the financial performance of individual companies and sectors, and the securities and commodities markets in general. This pandemic, the full effects of which are still unknown, has resulted in substantial market volatility and may have adversely impacted the prices and liquidity of the fund’s investments and the fund’s performance.
19
MFS Value Series
REPORT OF INDEPENDENT REGISTERED PUBLIC ACCOUNTING FIRM
To the Board of Trustees of MFS Variable Insurance Trust and the Shareholders of
MFS Value Series:
Opinion on the Financial Statements and Financial Highlights
We have audited the accompanying statement of assets and liabilities of MFS Value Series (the “Fund”), including the portfolio of investments, as of December 31, 2020, the related statement of operations for the year then ended, the statements of changes in net assets for each of the two years in the period then ended, the financial highlights for each of the five years in the period then ended, and the related notes. In our opinion, the financial statements and financial highlights present fairly, in all material respects, the financial position of the Fund as of December 31, 2020, and the results of its operations for the year then ended, the changes in its net assets for each of the two years in the period then ended, and the financial highlights for each of the five years in the period then ended, in conformity with accounting principles generally accepted in the United States of America.
Basis for Opinion
These financial statements and financial highlights are the responsibility of the Fund’s management. Our responsibility is to express an opinion on the Fund’s financial statements and financial highlights based on our audits. We are a public accounting firm registered with the Public Company Accounting Oversight Board (United States) (PCAOB) and are required to be independent with respect to the Fund in accordance with the U.S. federal securities laws and the applicable rules and regulations of the Securities and Exchange Commission and the PCAOB.
We conducted our audits in accordance with the standards of the PCAOB. Those standards require that we plan and perform the audit to obtain reasonable assurance about whether the financial statements and financial highlights are free of material misstatement, whether due to error or fraud. The Fund is not required to have, nor were we engaged to perform, an audit of its internal control over financial reporting. As part of our audits, we are required to obtain an understanding of internal control over financial reporting but not for the purpose of expressing an opinion on the effectiveness of the Fund’s internal control over financial reporting. Accordingly, we express no such opinion.
Our audits included performing procedures to assess the risks of material misstatement of the financial statements and financial highlights, whether due to error or fraud, and performing procedures that respond to those risks. Such procedures included examining, on a test basis, evidence regarding the amounts and disclosures in the financial statements and financial highlights. Our audits also included evaluating the accounting principles used and significant estimates made by management, as well as evaluating the overall presentation of the financial statements and financial highlights. Our procedures included confirmation of securities owned as of December 31, 2020, by correspondence with the custodian and brokers; when replies were not received from brokers, we performed other auditing procedures. We believe that our audits provide a reasonable basis for our opinion.
DELOITTE & TOUCHE LLP
Boston, Massachusetts
February 16, 2021
We have served as the auditor of one or more of the MFS investment companies since 1924.
20
MFS Value Series
TRUSTEES AND OFFICERS – IDENTIFICATION AND BACKGROUND
The Trustees and Officers of the Trust, as of February 1, 2021, are listed below, together with their principal occupations during the past five years. (Their titles may have varied during that period.) The address of each Trustee and Officer is 111 Huntington Avenue, Boston, Massachusetts 02199-7618.
| | | | | | | | | | |
Name, Age | | Position(s)
Held with Fund | | Trustee/Officer
Since (h) | | Number of MFS Funds
overseen by the
Trustee | | Principal Occupations
During the Past Five Years | | Other Directorships During the Past Five Years (j) |
| INTERESTED TRUSTEES |
Robert J. Manning (k)
(age 57) | | Trustee | | February 2004 | | 134 | | Massachusetts Financial Services Company, Non-Executive Chairman (since January 2021); Director; Chairman of the Board; Executive Chairman (January 2017-2020); Co-Chief Executive Officer (2015-2016) | | N/A |
| | | | | |
Michael W. Roberge (k) (age 54) | | Trustee | | January 2021 | | 134 | | Massachusetts Financial Services Company, Chairman (since January 2021); Chief Executive Officer (since January 2017); Director; President (until December 2018); Chief Investment Officer (until December 2018); Co-Chief Executive Officer (until December 2016) | | N/A |
|
| INDEPENDENT TRUSTEES |
John P. Kavanaugh (age 66) | | Trustee and Chair of Trustees | | January 2009 | | 134 | | Private investor | | N/A |
| | | | | |
Steven E. Buller (age 69) | | Trustee | | February 2014 | | 134 | | Private investor | | N/A |
| | | | | |
John A. Caroselli (age 66) | | Trustee | | March 2017 | | 134 | | Private investor; JC Global Advisors, LLC (management consulting), President (since 2015) | | N/A |
| | | | | |
Maureen R. Goldfarb (age 65) | | Trustee | | January 2009 | | 134 | | Private investor | | N/A |
| | | | | |
Peter D. Jones
(age 65) | | Trustee | | January 2019 | | 134 | | Private investor | | N/A |
| | | | | |
James W. Kilman, Jr.
(age 59) | | Trustee | | January 2019 | | 134 | | Burford Capital Limited (finance and investment management), Chief Financial Officer (since 2019); KielStrand Capital LLC (family office), Chief Executive Officer (since 2016); Morgan Stanley & Co. (financial services), Vice Chairman of Investment Banking, Co-Head of Diversified Financials Coverage – Financial Institutions Investment Banking Group (until 2016) | | Alpha-En Corporation, Director (2016-2019) |
| | | | | |
Clarence Otis, Jr. (age 64) | | Trustee | | March 2017 | | 134 | | Private investor | | VF Corporation, Director; Verizon Communications, Inc., Director; The Travelers Companies, Director |
| | | | | |
Maryanne L. Roepke (age 64) | | Trustee | | May 2014 | | 134 | | Private investor | | N/A |
| | | | | |
Laurie J. Thomsen
(age 63) | | Trustee | | March 2005 | | 134 | | Private investor | | The Travelers Companies, Director; Dycom Industries, Inc., Director |
21
MFS Value Series
Trustees and Officers – continued
| | | | | | | | |
Name, Age | | Position(s) Held with Fund | | Trustee/Officer
Since (h) | | Number of
MFS Funds
for which the
Person is an
Officer | | Principal Occupations During the Past Five Years |
| OFFICERS | | | | | | |
Christopher R. Bohane (k)
(age 47) | | Assistant Secretary and Assistant Clerk | | July 2005 | | 134 | | Massachusetts Financial Services Company, Senior Vice President and Associate General Counsel |
| | | | |
Kino Clark (k) (age 52) | | Assistant Treasurer | | January 2012 | | 134 | | Massachusetts Financial Services Company, Vice President |
| | | | |
John W. Clark, Jr. (k) (age 53) | | Assistant Treasurer | | April 2017 | | 134 | | Massachusetts Financial Services Company, Vice President (since March 2017); Deutsche Bank (financial services), Department Head – Treasurer’s Office (until February 2017) |
| | | | |
Thomas H. Connors (k) (age 61) | | Assistant Secretary and Assistant Clerk | | September 2012 | | 134 | | Massachusetts Financial Services Company, Vice President and Senior Counsel |
| | | | |
David L. DiLorenzo (k)
(age 52) | | President | | July 2005 | | 134 | | Massachusetts Financial Services Company, Senior Vice President |
| | | | |
Heidi W. Hardin (k) (age 53) | | Secretary and Clerk | | April 2017 | | 134 | | Massachusetts Financial Services Company, Executive Vice President and General Counsel (since March 2017); Harris Associates (investment management), General Counsel (until January 2017) |
| | | | |
Brian E. Langenfeld (k) (age 47) | | Assistant
Secretary and Assistant Clerk | | June 2006 | | 134 | | Massachusetts Financial Services Company, Vice President and Senior Counsel |
| | | | |
Amanda S. Mooradian (k) (age 41) | | Assistant
Secretary and Assistant Clerk | | September 2018 | | 134 | | Massachusetts Financial Services Company, Assistant Vice President and Senior Counsel |
| | | | |
Susan A. Pereira (k)
(age 50) | | Assistant
Secretary and Assistant Clerk | | July 2005 | | 134 | | Massachusetts Financial Services Company, Vice President and Assistant General Counsel |
| | | | |
Kasey L. Phillips (k) (age 50) | | Assistant Treasurer | | September 2012 | | 134 | | Massachusetts Financial Services Company, Vice President |
| | | | |
Matthew A. Stowe (k) (age 46) | | Assistant Secretary and Assistant Clerk | | October 2014 | | 134 | | Massachusetts Financial Services Company, Vice President and Assistant General Counsel |
| | | | |
Martin J. Wolin (k) (age 53) | | Chief Compliance Officer | | July 2015 | | 134 | | Massachusetts Financial Services Company, Senior Vice President and Chief Compliance Officer |
| | | | |
James O. Yost (k)
(age 60) | | Treasurer | | September 1990 | | 134 | | Massachusetts Financial Services Company, Senior Vice President |
| (h) | Date first appointed to serve as Trustee/officer of an MFS Fund. Each Trustee has served continuously since appointment unless indicated otherwise. For the period from December 15, 2004 until February 22, 2005, Mr. Manning served as Advisory Trustee. From January 2012 through December 2016, Messrs. DiLorenzo and Yost served as Treasurer and Deputy Treasurer of the Funds, respectively. |
| (j) | Directorships or trusteeships of companies required to report to the Securities and Exchange Commission (i.e., “public companies”). |
| (k) | “Interested person” of the Trust within the meaning of the Investment Company Act of 1940 (referred to as the 1940 Act), which is the principal federal law governing investment companies like the fund, as a result of a position with MFS. The address of MFS is 111 Huntington Avenue, Boston, Massachusetts 02199-7618. |
Each Trustee (other than Messrs. Jones, Kilman and Roberge) has been elected by shareholders and each Trustee and Officer holds office until his or her successor is chosen and qualified or until his or her earlier death, resignation, retirement or removal. Mr. Roberge became a Trustee of the Funds on January 1, 2021 and Messrs. Jones and Kilman became Trustees of the Funds on January 1, 2019. The Trust does not hold annual meetings for the purpose of electing Trustees, and Trustees are not elected for fixed terms. Under the terms of the Board’s retirement policy, an Independent Trustee shall retire at the end of the calendar year in which he or she reaches the earlier of 75 years of age or 15 years of service on the Board (or, in the case of any Independent Trustee who joined the Board prior to 2015, 20 years of service on the Board).
Messrs. Buller, Kilman and Otis and Ms. Roepke are members of the Trust’s Audit Committee.
22
MFS Value Series
Trustees and Officers – continued
Each of the Interested Trustees and certain Officers hold comparable officer positions with certain affiliates of MFS.
The Statement of Additional Information for a Fund includes further information about the Trustees and is available without charge upon request by calling 1-800-225-2606.
| | |
Investment Adviser Massachusetts Financial Services Company 111 Huntington Avenue Boston, MA 02199-7618 | | Custodian State Street Bank and Trust Company 1 Lincoln Street Boston, MA 02111-2900 |
| |
Distributor MFS Fund Distributors, Inc. 111 Huntington Avenue Boston, MA 02199-7618 | | Independent Registered Public Accounting Firm Deloitte & Touche LLP 200 Berkeley Street Boston, MA 02116 |
| |
Portfolio Manager(s) Katherine Cannan Nevin Chitkara | | |
23
MFS Value Series
BOARD REVIEW OF INVESTMENT ADVISORY AGREEMENT
MFS Value Series
The Investment Company Act of 1940 requires that both the full Board of Trustees and a majority of the non-interested (“independent”) Trustees, voting separately, annually approve the continuation of the Fund’s investment advisory agreement with MFS. The Trustees consider matters bearing on the Fund and its advisory arrangements at their meetings throughout the year, including a review of performance data at each regular meeting. In addition, the independent Trustees met several times by videoconference (in accordance with Securities and Exchange Commission relief) over the course of three months beginning in May and ending in July, 2020 (“contract review meetings”) for the specific purpose of considering whether to approve the continuation of the investment advisory agreement for the Fund and the other investment companies that the Board oversees (the “MFS Funds”). The independent Trustees were assisted in their evaluation of the Fund’s investment advisory agreement by independent legal counsel, from whom they received separate legal advice and with whom they met separately from MFS during various contract review meetings. The independent Trustees were also assisted in this process by an independent consultant who was retained by and reported to the independent Trustees.
In connection with their deliberations regarding the continuation of the investment advisory agreement, the Trustees, including the independent Trustees, considered such information and factors as they believed, in light of the legal advice furnished to them and their own business judgment, to be relevant. The investment advisory agreement for the Fund was considered separately, although the Trustees also took into account the common interests of all MFS Funds in their review. As described below, the Trustees considered the nature, quality, and extent of the various investment advisory, administrative, and shareholder services performed by MFS under the existing investment advisory agreement and other arrangements with the Fund.
In connection with their contract review meetings, the Trustees received and relied upon materials that included, among other items: (i) information provided by Broadridge Financial Solutions, Inc. (“Broadridge”), an independent third party, on the investment performance of the Fund for various time periods ended December 31, 2019 and the investment performance of a group of funds with substantially similar investment classifications/objectives (the “Broadridge performance universe”), (ii) information provided by Broadridge on the Fund’s advisory fees and other expenses and the advisory fees and other expenses of comparable funds identified by Broadridge as well as all other funds in the same investment classification/category (the “Broadridge expense group and universe”), (iii) information provided by MFS on the advisory fees of portfolios of other clients of MFS, including institutional separate accounts and other clients, (iv) information as to whether and to what extent applicable expense waivers, reimbursements or fee “breakpoints” are observed for the Fund, (v) information regarding MFS’ financial results and financial condition, including MFS’ and certain of its affiliates’ estimated profitability from services performed for the Fund and the MFS Funds as a whole, and compared to MFS’ institutional business, (vi) MFS’ views regarding the outlook for the mutual fund industry and the strategic business plans of MFS, (vii) descriptions of various functions performed by MFS for the Funds, such as compliance monitoring and portfolio trading practices, and (viii) information regarding the overall organization of MFS, including information about MFS’ senior management and other personnel providing investment advisory, administrative and other services to the Fund and the other MFS Funds. The comparative performance, fee and expense information prepared and provided by Broadridge was not independently verified and the independent Trustees did not independently verify any information provided to them by MFS.
The Trustees’ conclusion as to the continuation of the investment advisory agreement was based on a comprehensive consideration of all information provided to the Trustees and not the result of any single factor. Some of the factors that figured particularly in the Trustees’ deliberations are described below, although individual Trustees may have evaluated the information presented differently from one another, giving different weights to various factors. It is also important to recognize that the fee arrangements for the Fund and other MFS Funds are the result of years of review and discussion between the independent Trustees and MFS, that certain aspects of such arrangements may receive greater scrutiny in some years than in others, and that the Trustees’ conclusions may be based, in part, on their consideration of these same arrangements during the course of the year and in prior years.
Based on information provided by Broadridge and MFS, the Trustees reviewed the Fund’s total return investment performance as well as the Broadridge performance universe over various time periods. The Trustees placed particular emphasis on the total return performance of the Fund’s Initial Class shares in comparison to the performance of funds in its Broadridge performance universe over the five-year period ended December 31, 2019, which the Trustees believed was a long enough period to reflect differing market conditions. The total return performance of the Fund’s Initial Class shares was in the 1st quintile relative to the other funds in the universe for this five-year period (the 1st quintile being the best performers and the 5th quintile being the worst performers). The total return performance of the Fund’s Initial Class shares was in the 1st quintile for each of the one- and three-year periods ended December 31, 2019 relative to the Broadridge performance universe. Because of the passage of time, these performance results may differ from the performance results for more recent periods, including those shown elsewhere in this report.
In the course of their deliberations, the Trustees took into account information provided by MFS in connection with the contract review meetings, as well as during investment review meetings conducted with portfolio management personnel during the course
24
MFS Value Series
Board Review of Investment Advisory Agreement – continued
of the year regarding the Fund’s performance. After reviewing these and related factors, the Trustees concluded, within the context of their overall conclusions regarding the investment advisory agreement, that they were satisfied with MFS’ responses and efforts relating to investment performance.
In assessing the reasonableness of the Fund’s advisory fee, the Trustees considered, among other information, the Fund’s advisory fee and the total expense ratio of the Fund’s Initial Class shares as a percentage of average daily net assets and the advisory fee and total expense ratios of the Broadridge expense group based on information provided by Broadridge. The Trustees considered that MFS currently observes an expense limitation for the Fund, which may not be changed without the Trustees’ approval. The Trustees also considered that, according to the data provided by Broadridge (which takes into account any fee reductions or expense limitations that were in effect during the Fund’s last fiscal year), the Fund’s effective advisory fee rate was higher than the Broadridge expense group median and the Fund’s total expense ratio was approximately at the Broadridge expense group median.
The Trustees also considered the advisory fees charged by MFS to any institutional separate accounts advised by MFS (“separate accounts”) and unaffiliated investment companies for which MFS serves as subadviser (“subadvised funds”) that have comparable investment strategies to the Fund, if any. In comparing these fees, the Trustees considered information provided by MFS as to the generally broader scope of services provided by MFS to the Fund, as well as the more extensive regulatory burdens imposed on MFS in managing the Fund, in comparison to separate accounts and subadvised funds. The Trustees also considered the higher demands placed on MFS’ investment personnel and trading infrastructure as a result of the daily cash in-flows and out-flows of the Fund in comparison to separate accounts.
The Trustees also considered whether the Fund may benefit from any economies of scale in the management of the Fund in the event of growth in assets of the Fund and/or growth in assets of the MFS Funds as a whole. They noted that the Fund’s advisory fee rate schedule is subject to contractual breakpoints that reduce the Fund’s advisory fee rate on average daily net assets over $1 billion and $2.5 billion. The Trustees also noted that MFS has agreed in writing to waive a portion of the management fees of certain MFS Funds, including the Fund, if the total combined assets of certain funds within the MFS Funds’ complex increase above agreed upon thresholds (the “group fee waiver”), enabling the Fund’s shareholders to share in the benefits from any economies of scale at the complex level. The group fee waiver is reviewed and renewed annually between the Board and MFS. The Trustees concluded that the breakpoints and the group fee waiver were sufficient to allow the Fund to benefit from economies of scale as its assets and overall complex assets grow.
The Trustees also considered information prepared by MFS relating to MFS’ costs and profits with respect to the Fund, the MFS Funds considered as a group, and other investment companies and accounts advised by MFS, as well as MFS’ methodologies used to determine and allocate its costs to the MFS Funds, the Fund and other accounts and products for purposes of estimating profitability.
After reviewing these and other factors described herein, the Trustees concluded, within the context of their overall conclusions regarding the investment advisory agreement, that the advisory fees charged to the Fund represent reasonable compensation in light of the services being provided by MFS to the Fund.
In addition, the Trustees considered MFS’ resources and related efforts to continue to retain, attract and motivate capable personnel to serve the Fund. The Trustees also considered current and developing conditions in the financial services industry, including the presence of large and well-capitalized companies which are spending, and appear to be prepared to continue to spend, substantial sums to engage personnel and to provide services to competing investment companies. In this regard, the Trustees also considered the financial resources of MFS and its ultimate parent, Sun Life Financial Inc. The Trustees also considered the advantages and possible disadvantages to the Fund of having an adviser that also serves other investment companies as well as other accounts.
The Trustees also considered the nature, quality, cost, and extent of administrative, transfer agency, and distribution services provided to the Fund by MFS and its affiliates under agreements and plans other than the investment advisory agreement, including any 12b-1 fees the Fund pays to MFS Fund Distributors, Inc., an affiliate of MFS. The Trustees also considered the nature, extent and quality of certain other services MFS performs or arranges for on the Fund’s behalf, which may include securities lending programs, directed expense payment programs, class action recovery programs, and MFS’ interaction with third-party service providers, principally custodians and sub-custodians. The Trustees concluded that the various non-advisory services provided by MFS and its affiliates on behalf of the Fund were satisfactory.
The Trustees considered so-called “fall-out benefits” to MFS such as reputational value derived from serving as investment manager to the MFS Funds. The Trustees also considered that MFS discontinued its historic practice of obtaining investment research from portfolio brokerage commissions paid by certain MFS Funds effective January 2018, and directly pays or voluntarily reimburses a Fund, if applicable, for the costs of external research acquired through the use of the Fund’s portfolio brokerage commissions.
Based on their evaluation of factors that they deemed to be material, including those factors described above, the Board of Trustees, including the independent Trustees, concluded that the Fund’s investment advisory agreement with MFS should be continued for an additional one-year period, commencing August 1, 2020.
25
MFS Value Series
PROXY VOTING POLICIES AND INFORMATION
MFS votes proxies on behalf of the fund pursuant to proxy voting policies and procedures that are available without charge, upon request, by calling 1-800-225-2606, by visiting mfs.com/proxyvoting, or by visiting the SEC Web site at http://www.sec.gov.
Information regarding how the fund voted proxies relating to portfolio securities during the most recent twelve-month period ended June 30 is available by August 31 of each year without charge by visiting mfs.com/proxyvoting, or by visiting the SEC’s Web site at http://www.sec.gov.
QUARTERLY PORTFOLIO DISCLOSURE
The fund files a complete schedule of portfolio holdings with the SEC for the first and third quarters of each fiscal year as an exhibit to its reports on Form N-PORT. The fund’s Form N-PORT reports are available on the SEC’s Web site at http://www.sec.gov. A shareholder can obtain the portfolio holdings report for the first and third quarters of the fund’s fiscal year at mfs.com/vit1 by choosing the fund’s name and then scrolling to the “Resources” section and clicking on the “Prospectus and Reports” tab.
FURTHER INFORMATION
From time to time, MFS may post important information about the fund or the MFS funds on the MFS Web site (mfs.com). This information is available at https://www.mfs.com/announcements or at mfs.com/vit1 by choosing the fund’s name and then scrolling to the “Resources” section and clicking on the “Announcements” tab, if any.
INFORMATION ABOUT FUND CONTRACTS AND LEGAL CLAIMS
The fund has entered into contractual arrangements with an investment adviser, administrator, distributor, shareholder servicing agent, 529 program manager (if applicable), and custodian who each provide services to the fund. Unless expressly stated otherwise, shareholders are not parties to, or intended beneficiaries of these contractual arrangements, and these contractual arrangements are not intended to create any shareholder right to enforce them against the service providers or to seek any remedy under them against the service providers, either directly or on behalf of the fund.
Under the Trust’s By-Laws and Declaration of Trust, any claims asserted against or on behalf of the MFS Funds, including claims against Trustees and Officers, must be brought in state and federal courts located within the Commonwealth of Massachusetts.
FEDERAL TAX INFORMATION (unaudited)
The following information is provided pursuant to provisions of the Internal Revenue Code.
The fund designates $106,849,000 as capital gain dividends paid during the fiscal year.
For corporate shareholders, 100% of the ordinary income dividends paid during the fiscal year qualify for the corporate dividends received deduction.
26
rev. 3/16
| | | | |
| | | |
| FACTS | | WHAT DOES MFS DO WITH YOUR
PERSONAL INFORMATION? | |  |
| | |
| Why? | | Financial companies choose how they share your personal information. Federal law gives consumers the right to limit some but not all sharing. Federal law also requires us to tell you how we collect, share, and protect your personal information. Please read this notice carefully to understand what we do. |
| | |
| What? | | The types of personal information we collect and share depend on the product or service you have with us. This information can include: • Social Security number and account balances • Account transactions and transaction history • Checking account information and wire transfer instructions When you are no longer our customer, we continue to share your information as described in this notice. |
| | |
| How? | | All financial companies need to share customers’ personal information to run their everyday business. In the section below, we list the reasons financial companies can share their customers’ personal information; the reasons MFS chooses to share; and whether you can limit this sharing. |
| | | | |
Reasons we can share your
personal information | | Does MFS share? | | Can you limit this
sharing? |
For our everyday business purposes – such as to process your transactions, maintain your account(s), respond to court orders and legal investigations, or report to credit bureaus | | Yes | | No |
For our marketing purposes – to offer our products and services to you | | No | | We don’t share |
| For joint marketing with other financial companies | | No | | We don’t share |
For our affiliates’ everyday business purposes – information about your transactions and experiences | | No | | We don’t share |
For our affiliates’ everyday business purposes – information about your creditworthiness | | No | | We don’t share |
| For nonaffiliates to market to you | | No | | We don’t share |
| | |
| | |
| Questions? | | Call 800-225-2606 or go to mfs.com. |
27
| | |
| Who we are |
| Who is providing this notice? | | MFS Funds, MFS Investment Management, MFS Institutional Advisors, Inc., and MFS Heritage Trust Company. |
| | |
| What we do |
| How does MFS protect my personal information? | | To protect your personal information from unauthorized access and use, we use security measures that comply with federal law. These measures include procedural, electronic, and physical safeguards for the protection of the personal information we collect about you. |
How does MFS
collect my personal information? | | We collect your personal information, for example, when you • open an account or provide account information • direct us to buy securities or direct us to sell your securities • make a wire transfer We also collect your personal information from others, such as credit bureaus, affiliates, or other companies. |
| Why can’t I limit all sharing? | | Federal law gives you the right to limit only • sharing for affiliates’ everyday business purposes – information about your creditworthiness • affiliates from using your information to market to you • sharing for nonaffiliates to market to you State laws and individual companies may give you additional rights to limit sharing. |
| | |
| Definitions |
| Affiliates | | Companies related by common ownership or control. They can be financial and nonfinancial companies. • MFS does not share personal information with affiliates, except for everyday business purposes as described on page one of this notice. |
| Nonaffiliates | | Companies not related by common ownership or control. They can be financial and nonfinancial companies. • MFS does not share with nonaffiliates so they can market to you. |
| Joint marketing | | A formal agreement between nonaffiliated financial companies that together market financial products or services to you. • MFS doesn’t jointly market. |
| | |
| Other important information |
| If you own an MFS product or receive an MFS service in the name of a third party such as a bank or broker-dealer, their privacy policy may apply to you instead of ours. |
28
Item 1(b):
Not applicable.
The Registrant has adopted a Code of Ethics (the “Code”) pursuant to Section 406 of the Sarbanes-Oxley Act and as defined in Form N-CSR that applies to the Registrant’s principal executive officer and principal financial and accounting officer. During the period covered by this report, the Registrant has not amended any provision in the Code that relates to an element of the Code’s definition enumerated in paragraph (b) of Item 2 of this Form N-CSR. During the period covered by this report, the Registrant did not grant a waiver, including an implicit waiver, from any provision of the Code.
A copy of the Code is filed as an exhibit to this Form N-CSR.
| ITEM 3. | AUDIT COMMITTEE FINANCIAL EXPERT. |
Messrs. Steven E. Buller, James Kilman, and Clarence Otis, Jr. and Ms. Maryanne L. Roepke, members of the Audit Committee, have been determined by the Board of Trustees in their reasonable business judgment to meet the definition of “audit committee financial expert” as such term is defined in Form N-CSR. In addition, Messrs. Buller, Kilman, and Otis and Ms. Roepke are “independent” members of the Audit Committee (as such term has been defined by the Securities and Exchange Commission in regulations implementing Section 407 of the Sarbanes-Oxley Act of 2002). The Securities and Exchange Commission has stated that the designation of a person as an audit committee financial expert pursuant to this Item 3 on the Form N-CSR does not impose on such a person any duties, obligations or liability that are greater than the duties, obligations or liability imposed on such person as a member of the Audit Committee and the Board of Trustees in the absence of such designation or identification.
| ITEM 4. | PRINCIPAL ACCOUNTANT FEES AND SERVICES. |
Items 4(a) through 4(d) and 4(g):
The Board of Trustees has appointed Deloitte & Touche LLP (“Deloitte”) to serve as independent accountants to the Registrant (hereinafter the “Registrant” or the “Fund”). The tables below set forth the audit fees billed to the Fund as well as fees for non-audit services provided to the Fund and/or to the Fund’s investment adviser, Massachusetts Financial Services Company (“MFS”), and to various entities either controlling, controlled by, or under common control with MFS that provide ongoing services to the Fund (“MFS Related Entities”).
For the fiscal years ended December 31, 2020 and 2019, audit fees billed to the Fund by Deloitte were as follows:
| | | | | | | | |
| | | Audit Fees | |
| | 2020 | | | 2019 | |
Fees billed by Deloitte: | | | | | | | | |
MFS Global Equity Series | | | 47,930 | | | | 47,102 | |
MFS Growth Series | | | 48,788 | | | | 47,946 | |
MFS Investors Trust Series | | | 47,930 | | | | 47,102 | |
MFS Mid Cap Growth Series | | | 47,930 | | | | 47,102 | |
MFS New Discovery Series | | | 47,930 | | | | 47,102 | |
MFS Research Series | | | 48,896 | | | | 48,052 | |
MFS Total Return Bond Series | | | 68,598 | �� | | | 67,425 | |
MFS Total Return Series | | | 67,571 | | | | 66,415 | |
MFS Utilities Series | | | 48,039 | | | | 47,209 | |
MFS Value Series | | | 48,788 | | | | 47,946 | |
| | | | | | | | |
Total | | | 522,400 | | | | 513,401 | |
For the fiscal years ended December 31, 2020 and 2019, fees billed by Deloitte for audit-related, tax and other services provided to each Fund and for audit-related, tax and other services provided to MFS and MFS Related Entities were as follows:
| | | | | | | | | | | | | | | | | | | | | | | | |
| | | Audit-Related Fees1 | | | Tax Fees2 | | | All Other Fees3 | |
| | 2020 | | | 2019 | | | 2020 | | | 2019 | | | 2020 | | | 2019 | |
Fees billed by Deloitte: | | | | | | | | | | | | | | | | | | | | | | | | |
To MFS Global Equity Series | | | 2,400 | | | | 2,400 | | | | 5,951 | | | | 5,458 | | | | 0 | | | | 0 | |
To MFS Growth Series | | | 2,400 | | | | 2,400 | | | | 6,201 | | | | 5,458 | | | | 0 | | | | 0 | |
To MFS Investors Trust Series | | | 2,400 | | | | 2,400 | | | | 6,201 | | | | 5,458 | | | | 0 | | | | 0 | |
To MFS Mid Cap Growth Series | | | 2,400 | | | | 2,400 | | | | 5,951 | | | | 5,458 | | | | 0 | | | | 0 | |
To MFS New Discovery Series | | | 2,400 | | | | 2,400 | | | | 5,951 | | | | 5,458 | | | | 0 | | | | 0 | |
To MFS Research Series | | | 2,400 | | | | 2,400 | | | | 6,201 | | | | 5,458 | | | | 0 | | | | 0 | |
To MFS Total Return Bond Series | | | 2,400 | | | | 2,400 | | | | 6,201 | | | | 5,458 | | | | 0 | | | | 0 | |
To MFS Total Return Series | | | 2,400 | | | | 2,400 | | | | 6,201 | | | | 5,458 | | | | 0 | | | | 0 | |
To MFS Utilities Series | | | 2,400 | | | | 2,400 | | | | 5,951 | | | | 5,458 | | | | 0 | | | | 0 | |
To MFS Value Series | | | 2,400 | | | | 2,400 | | | | 5,951 | | | | 5,458 | | | | 0 | | | | 0 | |
Total fees billed by Deloitte to above Funds: | | | 24,000 | | | | 24,000 | | | | 60,760 | | | | 54,580 | | | | 0 | | | | 0 | |
| | | | | | | | | | | | | | | | | | | | | | | | |
| | | Audit-Related Fees1 | | | Tax Fees2 | | | All Other Fees3 | |
| | 2020 | | | 2019 | | | 2020 | | | 2019 | | | 2020 | | | 2019 | |
Fees billed by Deloitte: | | | | | | | | | | | | | | | | | | | | | | | | |
To MFS and MFS Related Entities of MFS Global Equity Series* | | | 0 | | | | 0 | | | | 0 | | | | 0 | | | | 5,390 | | | | 3,790 | |
To MFS and MFS Related Entities of MFS Growth Series* | | | 0 | | | | 0 | | | | 0 | | | | 0 | | | | 5,390 | | | | 3,790 | |
To MFS and MFS Related Entities of MFS Investors Trust Series* | | | 0 | | | | 0 | | | | 0 | | | | 0 | | | | 5,390 | | | | 3,790 | |
To MFS and MFS Related Entities of MFS Mid Cap Growth Series* | | | 0 | | | | 0 | | | | 0 | | | | 0 | | | | 5,390 | | | | 3,790 | |
To MFS and MFS Related Entities of MFS New Discovery Series* | | | 0 | | | | 0 | | | | 0 | | | | 0 | | | | 5,390 | | | | 3,790 | |
To MFS and MFS Related Entities of MFS Research Series* | | | 0 | | | | 0 | | | | 0 | | | | 0 | | | | 5,390 | | | | 3,790 | |
To MFS and MFS Related Entities of MFS Total Return Bond Series* | | | 0 | | | | 0 | | | | 0 | | | | 0 | | | | 5,390 | | | | 3,790 | |
To MFS and MFS Related Entities of MFS Total Return Series* | | | 0 | | | | 0 | | | | 0 | | | | 0 | | | | 5,390 | | | | 3,790 | |
To MFS and MFS Related Entities of MFS Utilities Series* | | | 0 | | | | 0 | | | | 0 | | | | 0 | | | | 5,390 | | | | 3,790 | |
To MFS and MFS Related Entities of MFS Value Series* | | | 0 | | | | 0 | | | | 0 | | | | 0 | | | | 5,390 | | | | 3,790 | |
| | | | | | | | |
| | | Aggregate fees for non-audit
services: | |
| | 2020 | | | 2019 | |
Fees billed by Deloitte: | | | | | | | | |
To MFS Global Equity Series, MFS and MFS Related Entities# | | | 557,491 | | | | 361,648 | |
To MFS Growth Series, MFS and MFS Related Entities# | | | 557,741 | | | | 361,648 | |
To MFS Investors Trust Series, MFS and MFS Related Entities# | | | 557,741 | | | | 361,648 | |
To MFS Mid Cap Growth Series, MFS and MFS Related Entities# | | | 557,491 | | | | 361,648 | |
To MFS New Discovery Series, MFS and MFS Related Entities# | | | 557,491 | | | | 361,648 | |
To MFS Research Series, MFS and MFS Related Entities# | | | 557,741 | | | | 361,648 | |
To MFS Total Return Bond Series, MFS and MFS Related Entities# | | | 557,741 | | | | 361,648 | |
To MFS Total Return Series, MFS and MFS Related Entities# | | | 557,741 | | | | 361,648 | |
To MFS Utilities Series, MFS and MFS Related Entities# | | | 557,491 | | | | 361,648 | |
To MFS Value Series, MFS and MFS Related Entities# | | | 557,491 | | | | 361,648 | |
| * | This amount reflects the fees billed to MFS and MFS Related Entities for non-audit services relating directly to the operations and financial reporting of the Fund (portions of which services also related to the operations and financial reporting of other funds within the MFS Funds complex). |
| # | This amount reflects the aggregate fees billed by Deloitte for non-audit services rendered to the Fund and for non-audit services rendered to MFS and the MFS Related Entities. |
| 1 | The fees included under “Audit-Related Fees” are fees related to assurance and related services that are reasonably related to the performance of the audit or review of financial statements, but not reported under ‘‘Audit Fees,’’ including accounting consultations, agreed-upon procedure reports, attestation reports, comfort letters and internal control reviews. |
| 2 | The fees included under “Tax Fees” are fees associated with tax compliance, tax advice and tax planning, including services relating to the filing or amendment of federal, state or local income tax returns, regulated investment company qualification reviews and tax distribution and analysis. |
| 3 | The fees included under “All Other Fees” are fees for products and services provided by Deloitte other than those reported under “Audit Fees,” “Audit-Related Fees” and “Tax Fees”. |
Item 4(e)(1):
Set forth below are the policies and procedures established by the Audit Committee of the Board of Trustees relating to the pre-approval of audit and non-audit related services:
To the extent required by applicable law, pre-approval by the Audit Committee of the Board is needed for all audit and permissible non-audit services rendered to the Fund and all permissible non-audit services rendered to MFS or MFS Related Entities if the services relate directly to the operations and financial reporting of the Registrant. Pre-approval is currently on an engagement-by-engagement basis. In the event pre-approval of such services is necessary between regular meetings of the Audit Committee and it is not practical to wait to seek pre-approval at the next regular meeting of the Audit Committee, pre-approval of such services may be referred to the Chair of the Audit Committee for approval; provided that the Chair may not pre-approve any individual engagement for such services exceeding $50,000 or multiple engagements for such services in the aggregate exceeding $100,000 between such regular meetings of the Audit Committee. Any engagement pre-approved by the Chair between regular meetings of the Audit Committee shall be presented for ratification by the entire Audit Committee at its next regularly scheduled meeting.
Item 4(e)(2):
None, or 0%, of the services relating to the Audit-Related Fees, Tax Fees and All Other Fees paid by the Fund and MFS and MFS Related Entities relating directly to the operations and financial reporting of the Registrant disclosed above were approved by the audit committee pursuant to paragraphs (c)(7)(i)(C) of Rule 2-01 of Regulation S-X (which permits audit committee approval after the start of the engagement with respect to services other than audit, review or attest services, if certain conditions are satisfied).
Item 4(f):
Not applicable.
Item 4(h):
The Registrant’s Audit Committee has considered whether the provision by a Registrant’s independent registered public accounting firm of non-audit services to MFS and MFS Related Entities that were not pre-approved by the Committee (because such services were provided prior to the effectiveness of SEC rules requiring pre-approval or because such services did not relate directly to the operations and financial reporting of the Registrant) was compatible with maintaining the independence of the independent registered public accounting firm as the Registrant’s principal auditors.
| ITEM 5. | AUDIT COMMITTEE OF LISTED REGISTRANTS. |
Not applicable to the Registrant.
A schedule of investments of each series of the Registrant is included as part of the report to shareholders of such series under Item 1(a) of this Form N-CSR.
| ITEM 7. | DISCLOSURE OF PROXY VOTING POLICIES AND PROCEDURES FOR CLOSED-END MANAGEMENT INVESTMENT COMPANIES. |
Not applicable to the Registrant.
| ITEM 8. | PORTFOLIO MANAGERS OF CLOSED-END MANAGEMENT INVESTMENT COMPANIES. |
Not applicable to the Registrant.
| ITEM 9. | PURCHASES OF EQUITY SECURITIES BY CLOSED-END MANAGEMENT INVESTMENT COMPANY AND AFFILIATED PURCHASERS. |
Not applicable to the Registrant.
| ITEM 10. | SUBMISSION OF MATTERS TO A VOTE OF SECURITY HOLDERS. |
There were no material changes to the procedures by which shareholders may send recommendations to the Board for nominees to the Registrant’s Board since the Registrant last provided disclosure as to such procedures in response to the requirements of Item 407 (c)(2)(iv) of Regulation S-K or this Item.
| ITEM 11. | CONTROLS AND PROCEDURES. |
| (a) | Based upon their evaluation of the effectiveness of the registrant’s disclosure controls and procedures (as defined in Rule 30a-3(c) under the Investment Company Act of 1940 (the “Act”)) as conducted within 90 days of the filing date of this report on Form N-CSR, the registrant’s principal financial officer and principal executive officer have concluded that those disclosure controls and procedures provide reasonable assurance that the material information required to be disclosed by the registrant on this report is recorded, processed, summarized and reported within the time periods specified in the Securities and Exchange Commission’s rules and forms. |
| (b) | There were no changes in the registrant’s internal controls over financial reporting (as defined in Rule 30a-3(d) under the Act) that occurred during the period covered by the report that have materially affected, or are reasonably likely to materially affect, the registrant’s internal control over financial reporting. |
| ITEM 12. | DISCLOSURE OF SECURITIES LENDING ACTIVITIES FOR CLOSED-END MANAGEMENT INVESTMENT COMPANIES. |
Not applicable to the Registrant.
| (a) (1) | Any code of ethics, or amendment thereto, that is the subject of the disclosure required by Item 2, to the extent that the registrant intends to satisfy the Item 2 requirements through filing of an exhibit: Attached hereto as EX-99.COE. |
| | (2) | A separate certification for each principal executive officer and principal financial officer of the registrant as required by Rule 30a-2(a) under the Act (17 CFR 270.30a-2): Attached hereto as EX-99.302CERT. |
| | (3) | Any written solicitation to purchase securities under Rule 23c-1 under the Act (17 CFR 270.23c-1) sent or given during the period covered by the report by or on behalf of the registrant to 10 or more persons. Not applicable. |
| | (4) | Change in the registrant’s independent public accountant. Not applicable. |
| (b) | If the report is filed under Section 13(a) or 15(d) of the Exchange Act, provide the certifications required by Rule 30a-2(b) under the Act (17 CFR 270.30a-2(b)), Rule 13a-14(b) or Rule 15d-14(b) under the Exchange Act (17 CFR 240.13a-14(b) or 240.15d-14(b)) and Section 1350 of Chapter 63 of Title 18 of the United States Code (18 U.S.C. 1350) as an exhibit. A certification furnished pursuant to this paragraph will not be deemed “filed” for the purposes of Section 18 of the Exchange Act (15 U.S.C. 78r), or otherwise subject to the liability of that section. Such certification will not be deemed to be incorporated by reference into any filing under the Securities Act of 1933 or the Exchange Act, except to the extent that the registrant specifically incorporates it by reference. Attached hereto as EX-99.906CERT. |
Notice
A copy of the Amended and Restated Declaration of Trust, as amended, of the Registrant is on file with the Secretary of State of The Commonwealth of Massachusetts and notice is hereby given that this instrument is executed on behalf of the Registrant by an officer of the Registrant as an officer and not individually and the obligations of or arising out of this instrument are not binding upon any of the Trustees or shareholders individually, but are binding only upon the assets and property of the respective constituent series of the Registrant.
SIGNATURES
Pursuant to the requirements of the Securities Exchange Act of 1934 and the Investment Company Act of 1940, the registrant has duly caused this report to be signed on its behalf by the undersigned, thereunto duly authorized.
(Registrant) MFS VARIABLE INSURANCE TRUST
| | |
| By (Signature and Title)* | | /S/ DAVID L. DILORENZO |
| | David L. DiLorenzo, President |
Date: February 16, 2021
Pursuant to the requirements of the Securities Exchange Act of 1934 and the Investment Company Act of 1940, this report has been signed below by the following persons on behalf of the registrant and in the capacities and on the dates indicated.
| | |
| By (Signature and Title)* | | /S/ DAVID L. DILORENZO |
| | David L. DiLorenzo, President (Principal Executive Officer) |
Date: February 16, 2021
| | |
| By (Signature and Title)* | | /S/ JAMES O. YOST |
| | James O. Yost, Treasurer (Principal Financial Officer and Accounting Officer) |
Date: February 16, 2021
| * | Print name and title of each signing officer under his or her signature. |