UNITED STATES
SECURITIES AND EXCHANGE COMMISSION Washington, D.C. 20549
FORM N-CSR
CERTIFIED SHAREHOLDER REPORT OF REGISTERED MANAGEMENT INVESTMENT COMPANIES
Investment Company Act file number 811-08326
MFS VARIABLE INSURANCE TRUST
(Exact name of registrant as specified in charter)
111 Huntington Avenue, Boston, Massachusetts 02199 (Address of principal executive offices) (Zip code)
Christopher R. Bohane
Massachusetts Financial Services Company
111Huntington Avenue Boston, Massachusetts 02199
(Name and address of agents for service)
Registrant's telephone number, including area code: (617) 954-5000
Date of fiscal year end: December 31
Date of reporting period: December 31, 2022
ITEM 1. REPORTS TO STOCKHOLDERS.
Item 1(a):
Annual Report
December 31, 2022
MFS® Global Equity Series
MFS® Variable Insurance Trust
MFS® Global Equity Series
| 1 |
| 2 |
| 4 |
| 6 |
| 8 |
| 9 |
| 13 |
| 14 |
| 15 |
| 16 |
| 18 |
| 24 |
| 25 |
| 28 |
| 30 |
| 30 |
| 30 |
| 30 |
| 30 |
| 31 |
The report is prepared for the general information of shareholders. It is authorized for distribution to prospective investors only when preceded or accompanied by a current prospectus.
NOT FDIC INSURED • MAY LOSE VALUE • NO BANK OR CREDIT UNION GUARANTEE •
NOT A DEPOSIT • NOT INSURED BY ANY FEDERAL GOVERNMENT AGENCY OR NCUA/NCUSIF
LETTER FROM THE CHAIR AND CEO
Dear Shareholders:
Signs of peaking inflation, hopes that monetary policy tightening cycles may be nearing an end and a rapid reopening of China’s economy in late-2022 and early-2023 have combined to bolster investor sentiment in recent months. Markets have largely adjusted to the challenges posed by Russia’s invasion of Ukraine, thanks in part to mild European winter weather which has alleviated concerns over potential shortages of natural gas. Resilient labor markets in much of the developed world have further contributed to a brighter-than-expected economic backdrop. However, many investors are mindful that the lagged effects of ongoing policy tightening have yet to work their way through the global economy.
Tighter global financial conditions have been a particular headwind for richly valued growth equities and interest rate-sensitive parts of the economy, such as housing. Over the near term, companies may face a challenging earnings backdrop as they are forced to absorb higher input and labor costs at a time of dwindling pricing power. For fixed income, the rise in interest rates has made bonds more attractive than they have been in years, which may provide balance to an overall portfolio.
During times of market transition, it is important to have a deep understanding of company fundamentals, and we have built our unique global research platform to do just that.
At MFS®, we put our clients’ assets to work responsibly by carefully navigating increasingly complex global capital markets. Our investment team is guided by a commitment to long-term fundamental investing. Our global investment platform — combining collective expertise, long-term discipline, and thoughtful risk management — seeks to uncover what we believe are the best, most durable investment ideas in markets around the world, enabling us to potentially create value for investors.
Respectfully,
Michael W. Roberge
Chair and Chief Executive Officer
MFS Investment Management
February 15, 2023
The opinions expressed in this letter are subject to change and may not be relied upon for investment advice. No forecasts can be guaranteed.
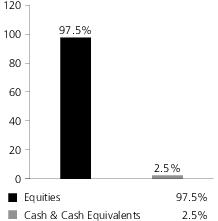
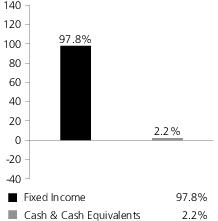
Portfolio structure (i)
Top ten holdings
| Thermo Fisher Scientific, Inc. | 3.1% |
| Visa, Inc., “A” | 3.1% |
| Schneider Electric SE | 2.9% |
| Roche Holding AG | 2.6% |
| LVMH Moet Hennessy Louis Vuitton SE | 2.5% |
| Honeywell International, Inc. | 2.4% |
| Medtronic PLC | 2.3% |
| Nestle S.A. | 2.3% |
| Accenture PLC, “A” | 2.3% |
| Comcast Corp., “A” | 2.3% |
GICS equity sectors (g)(i)
| Health Care | 19.9% |
| Industrials | 18.5% |
| Information Technology | 14.2% |
| Consumer Staples | 13.0% |
| Financials | 12.0% |
| Consumer Discretionary | 8.0% |
| Materials | 7.0% |
| Communication Services | 6.8% |
| Equity Warrants | 0.1% |
Issuer country weightings (i)(x)
| United States | 55.3% |
| France | 11.4% |
| Switzerland | 9.2% |
| United Kingdom | 6.8% |
| Germany | 4.0% |
| Canada | 3.8% |
| Netherlands | 2.3% |
| Japan | 1.8% |
| Sweden | 1.5% |
| Other Countries | 3.9% |
Currency exposure weightings (i)(y)
| United States Dollar | 57.9% |
| Euro | 21.1% |
| Swiss Franc | 9.2% |
| British Pound Sterling | 6.8% |
| Japanese Yen | 1.8% |
| Swedish Krona | 1.5% |
| South Korean Won | 0.9% |
| Danish Krone | 0.5% |
| Mexican Peso | 0.3% |
| (g) | The Global Industry Classification Standard (GICS®) was developed by and/or is the exclusive property of MSCI, Inc. and S&P Global Market Intelligence Inc. (“S&P Global Market Intelligence”). GICS is a service mark of MSCI and S&P Global Market Intelligence and has been licensed for use by MFS. MFS has applied its own internal sector/industry classification methodology for equity securities and non-equity securities that are unclassified by GICS. |
| (i) | For purposes of this presentation, the components include the value of securities, less any securities sold short, and reflect the impact of the equivalent exposure of derivative positions. These amounts may be negative from time to time. Equivalent exposure is a calculated amount that translates the derivative position into a reasonable approximation of the amount of the underlying asset that the portfolio would have to hold at a given point in time to have the same price sensitivity that results from the portfolio’s ownership of the derivative contract. When dealing with derivatives, equivalent exposure is a more representative measure of the potential impact of a position on portfolio performance than value. |
| (x) | Represents the portfolio’s exposure to issuer countries as a percentage of a portfolio’s net assets. For purposes of this presentation, United States includes Cash & Cash Equivalents and Other. |
| (y) | Represents the portfolio’s exposure to a particular currency as a percentage of a portfolio's net assets. For purposes of this presentation, United States Dollar includes Cash & Cash Equivalents. |
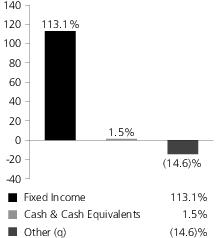
Portfolio Composition - continued
Cash & Cash Equivalents includes any cash, investments in money market funds, short-term securities, and other assets less liabilities. Please see the Statement of Assets and Liabilities for additional information related to the fund’s cash position and other assets and liabilities.
Other includes equivalent exposure from currency derivatives and/or any offsets to derivative positions and may be negative.
Percentages are based on net assets as of December 31, 2022.
The portfolio is actively managed and current holdings may be different.
Management Review
Summary of Results
For the twelve months ended December 31, 2022, Initial Class shares of the MFS Global Equity Series (fund) provided a total return of -17.73%, while Service Class shares of the fund provided a total return of -17.94%. These compare with a return of -18.14% over the same period for the fund’s benchmark, the MSCI World Index (net div).
Market Environment
During the reporting period, markets continued to grapple with the strongest global inflationary pressures in decades along with signs of slowing economic growth. Intermittent coronavirus flareups, particularly in China, where home-grown vaccines have proved less effective than elsewhere, kept supply chains stretched for a considerable period. At the same time, the reopening of the economy in the parts of the world where the virus has been better contained has led to a shift in consumption patterns in favor of services, straining already tight labor markets in most developed economies, while reducing demand for manufactured goods, primarily from Asia. As a result of Russia’s invasion of Ukraine, geopolitical considerations, such as sanctions and trade bans, have resulted in additional supply chain disruptions and volatile global energy prices. Taken together, these factors have contributed to market volatility.
The ripple effects from the Russian invasion further complicated the mission central banks must undertake to rein in surging inflation. Energy shocks have historically resulted in global growth slowdowns, if not pullbacks, so policymakers will find themselves in the difficult position of trying to restrain inflation without tipping economies into recession. Despite the challenging macroeconomic and geopolitical environment, policymakers remained focused on controlling inflation, although investors appeared to have expected varying degrees of action from the central banks. The Fed has been among the most aggressive developed market central banks, tightening policy at the fastest rate in decades, although it slowed its hiking pace at the end of the period, as did the European Central Bank. After remaining on the monetary sidelines for much of the period, the Bank of Japan widened its Yield Curve Control band, capping the yield on its 10-year bond at 0.5%, up from 0.25%, an action investors interpreted as a first step toward monetary policy normalization.
Against an environment of still-tight labor markets, tighter global financial conditions and volatile materials prices, investor anxiety appeared to have increased over the potential that corporate profit margins may be past peak for this cycle. That said, tentative signs that supply chain bottlenecks (particularly semiconductors) may be moderating, the easing of COVID restrictions in China, low levels of unemployment across developed markets and hopes that inflation levels may be near a peak were supportive factors for the macroeconomic backdrop.
Contributors to Performance
The combination of favorable security selection and underweight positions in both the information technology and consumer discretionary sectors contributed to the fund’s performance relative to the MSCI World Index. Within the information technology sector, not owning shares of personal electronics maker Apple, software giant Microsoft and computer graphics processor maker NVIDIA aided relative results. The stock price of Microsoft declined after the company’s revenue guidance came in below market expectations. The broader selloff among large-cap technology shares also weighed on the stock. Within the consumer discretionary sector, not owning shares of internet retailer Amazon.com and electric vehicle manufacturer Tesla strengthened relative performance. The stock price of Amazon declined during the period as the company reported softer-than-expected revenue and operating profits, driven by weaker-than-expected performance in Amazon Web Services (AWS) and a softening in consumer demand.
Elsewhere, not owning shares of social networking service provider Meta Platforms contributed to relative performance. The fund’s overweight positions in railway operator Canadian Pacific Railway, diversified technology and manufacturing company Honeywell International and medical devices maker Boston Scientific also aided relative returns. An underweight position in technology company Alphabet further benefited the fund’s relative performance.
Detractors from Performance
Not holding any stocks within the strong-performing energy sector detracted from relative performance. Within this sector, not owning shares of integrated energy companies ExxonMobil and Chevron hurt relative returns. The share price of ExxonMobil advanced during the period owing to a strong energy price environment reflecting global energy shortages and better margin expansion in its refining segment. Additionally, increased returns to shareholders through stock repurchases and dividends, paired with greater debt reduction, further supported the stock.
Stock selection in the health care sector also weakened relative results. However, there were no individual stocks within this sector, either in the fund or in the benchmark, that were among the fund's largest relative detractors during the period.
Management Review - continued
Stocks in other sectors that dampened relative performance included the fund’s overweight positions in cable and broadband companies, Liberty Broadband and Comcast, consulting and information technology services provider Accenture, diversified entertainment company Walt Disney, electrical distribution equipment manufacturer Schneider Electric (France), global banking and payments technology provider Fidelity National Information Services, machinery and industrial products manufacturer Kubota (Japan) and digital payment technology developer PayPal Holdings. The stock price of Liberty Broadband declined as the company reported larger-than-expected corporate losses.
Respectfully,
Portfolio Manager(s)
Ryan McAllister and Roger Morley
The views expressed in this report are those of the portfolio manager(s) only through the end of the period of the report as stated on the cover and do not necessarily reflect the views of MFS or any other person in the MFS organization. These views are subject to change at any time based on market or other conditions, and MFS disclaims any responsibility to update such views. These views may not be relied upon as investment advice or an indication of trading intent on behalf of any MFS portfolio. References to specific securities are not recommendations of such securities, and may not be representative of any MFS portfolio’s current or future investments.
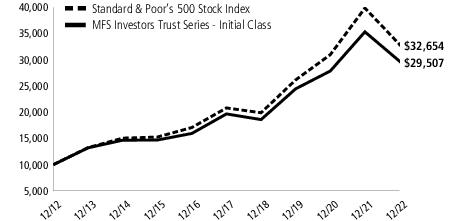
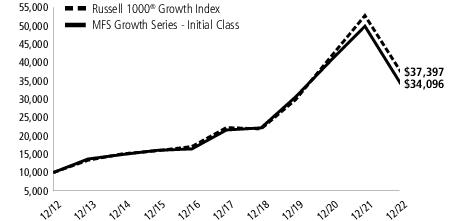
Performance Summary Through 12/31/22
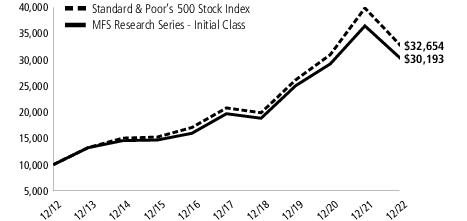
The following chart illustrates the historical performance of the fund in comparison to its benchmark(s). Benchmarks are unmanaged and may not be invested in directly. Benchmark returns do not reflect any fees or expenses. The performance of other share classes will be greater than or less than that of the class depicted below. (See Notes to Performance Summary.)
Performance data shown represents past performance and is no guarantee of future results. Investment return and principal value fluctuate so your shares, when sold, may be worth more or less than the original cost; current performance may be lower or higher than quoted. The performance shown does not reflect the deduction of taxes, if any, that a shareholder would pay on fund distributions or the redemption of fund shares. The returns for the fund shown also do not reflect the deduction of expenses associated with variable products, such as mortality and expense risk charges, separate account charges, and sales charges imposed by the insurance company separate accounts. Such expenses would reduce the overall returns shown.
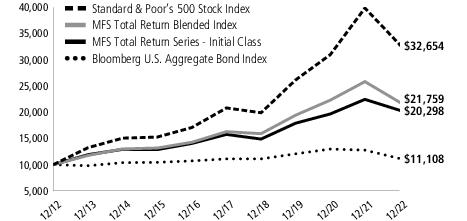
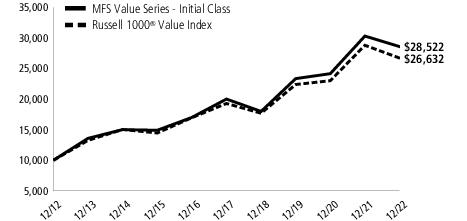
Growth of a Hypothetical $10,000 Investment
Total Returns through 12/31/22
Average annual total returns
| Share Class | Class Inception Date | 1-yr | 5-yr | 10-yr |
| Initial Class | 5/03/99 | (17.73)% | 5.18% | 8.42% |
| Service Class | 5/01/00 | (17.94)% | 4.92% | 8.15% |
Comparative benchmark(s)
| MSCI World Index (net div) (f) | (18.14)% | 6.14% | 8.85% |
| (f) | Source: FactSet Research Systems Inc. |
Benchmark Definition(s)
MSCI World Index(e) (net div) – a market capitalization-weighted index that is designed to measure equity market performance in the global developed markets.
It is not possible to invest directly in an index.
| (e) | Morgan Stanley Capital International (“MSCI”) makes no express or implied warranties or representations and shall have no liability whatsoever with respect to any MSCI data contained herein. The MSCI data may not be further redistributed or used as a basis for other indices or any securities or financial products. This report is not approved, reviewed, or produced by MSCI. |
Notes to Performance Summary
Average annual total return represents the average annual change in value for each share class for the periods presented.
Performance results reflect any applicable expense subsidies and waivers in effect during the periods shown. Without such subsidies and waivers the fund's performance results would be less favorable. Please see the prospectus and financial statements for complete details. All results are historical and assume the reinvestment of any dividends and capital gains distributions.
Performance results do not include adjustments made for financial reporting purposes in accordance with U.S. generally accepted accounting principles and may differ from amounts reported in the financial highlights.
Performance Summary – continued
From time to time the fund may receive proceeds from litigation settlements, without which performance would be lower.
Expense Table
Fund expenses borne by the shareholders during the period,
July 1, 2022 through December 31, 2022
As a shareholder of the fund, you incur ongoing costs, including management fees; distribution and/or service (12b-1) fees; and other fund expenses. This example is intended to help you understand your ongoing costs (in dollars) of investing in the fund and to compare these costs with the ongoing costs of investing in other mutual funds.
The example is based on an investment of $1,000 invested at the beginning of the period and held for the entire period July 1, 2022 through December 31, 2022.
Actual Expenses
The first line for each share class in the following table provides information about actual account values and actual expenses. You may use the information in this line, together with the amount you invested, to estimate the expenses that you paid over the period. Simply divide your account value by $1,000 (for example, an $8,600 account value divided by $1,000 = 8.6), then multiply the result by the number in the first line under the heading entitled “Expenses Paid During Period” to estimate the expenses you paid on your account during this period.
Hypothetical Example for Comparison Purposes
The second line for each share class in the following table provides information about hypothetical account values and hypothetical expenses based on the fund’s actual expense ratio and an assumed rate of return of 5% per year before expenses, which is not the fund’s actual return. The hypothetical account values and expenses may not be used to estimate the actual ending account balance or expenses you paid for the period. You may use this information to compare the ongoing costs of investing in the fund and other funds. To do so, compare this 5% hypothetical example with the 5% hypothetical examples that appear in the shareholder reports of the other funds.
Please note that the expenses shown in the table are meant to highlight the fund's ongoing costs only and do not take into account the fees and expenses imposed under the variable contracts through which your investment in the fund is made. Therefore, the second line for each share class in the table is useful in comparing ongoing costs associated with an investment in vehicles (such as the fund) which fund benefits under variable annuity and variable life insurance contracts and to qualified pension and retirement plans only, and will not help you determine the relative total costs of investing in the fund through variable annuity and variable life insurance contracts. If the fees and expenses imposed under the variable contracts were included, your costs would have been higher.
Share
Class | | Annualized
Expense
Ratio | Beginning
Account Value
7/01/22 | Ending
Account Value
12/31/22 | Expenses
Paid During
Period (p)
7/01/22-12/31/22 |
| Initial Class | Actual | 0.92% | $1,000.00 | $1,044.40 | $4.74 |
| Hypothetical (h) | 0.92% | $1,000.00 | $1,020.57 | $4.69 |
| Service Class | Actual | 1.17% | $1,000.00 | $1,042.99 | $6.02 |
| Hypothetical (h) | 1.17% | $1,000.00 | $1,019.31 | $5.96 |
| (h) | 5% class return per year before expenses. |
| (p) | “Expenses Paid During Period” are equal to each class's annualized expense ratio, as shown above, multiplied by the average account value over the period, multiplied by 184/365 (to reflect the one-half year period). |
Portfolio of Investments − 12/31/22
The Portfolio of Investments is a complete list of all securities owned by your fund. It is categorized by broad-based asset classes.
| Issuer | | | Shares/Par | Value ($) |
| Common Stocks – 99.4% |
| Aerospace & Defense – 3.3% | |
| Honeywell International, Inc. | | 5,454 | $ 1,168,792 |
| MTU Aero Engines Holding AG | | 1,100 | 238,089 |
| Rolls-Royce Holdings PLC (a) | | 208,122 | 234,500 |
| | | | | $1,641,381 |
| Airlines – 0.8% | |
| Aena S.A. (a) | | 2,940 | $ 370,265 |
| Alcoholic Beverages – 5.6% | |
| Carlsberg A.S., “B” | | 1,976 | $ 262,602 |
| Diageo PLC | | 23,433 | 1,034,021 |
| Heineken N.V. | | 7,818 | 735,448 |
| Pernod Ricard S.A. | | 3,761 | 739,770 |
| | | | | $2,771,841 |
| Apparel Manufacturers – 5.0% | |
| Burberry Group PLC | | 15,194 | $ 372,886 |
| Compagnie Financiere Richemont S.A. | | 6,590 | 852,783 |
| LVMH Moet Hennessy Louis Vuitton SE | | 1,708 | 1,240,768 |
| | | | | $2,466,437 |
| Automotive – 0.4% | |
| Aptiv PLC (a) | | 1,966 | $ 183,094 |
| Broadcasting – 2.1% | |
| Omnicom Group, Inc. | | 1,786 | $ 145,684 |
| Walt Disney Co. (a) | | 6,615 | 574,711 |
| WPP Group PLC | | 31,627 | 313,607 |
| | | | | $1,034,002 |
| Brokerage & Asset Managers – 3.1% | |
| Charles Schwab Corp. | | 11,479 | $ 955,741 |
| Deutsche Boerse AG | | 1,549 | 267,622 |
| London Stock Exchange Group PLC | | 3,346 | 288,662 |
| | | | | $1,512,025 |
| Business Services – 8.6% | |
| Accenture PLC, “A” | | 4,298 | $ 1,146,878 |
| Adecco S.A. | | 3,462 | 113,846 |
| Brenntag AG | | 3,225 | 206,165 |
| Cognizant Technology Solutions Corp., “A” | | 7,923 | 453,116 |
| Compass Group PLC | | 12,080 | 280,034 |
| Equifax, Inc. | | 3,005 | 584,052 |
| Fidelity National Information Services, Inc. | | 8,217 | 557,524 |
| Fiserv, Inc. (a) | | 7,038 | 711,331 |
| PayPal Holdings, Inc. (a) | | 2,574 | 183,320 |
| | | | | $4,236,266 |
| Cable TV – 2.3% | |
| Comcast Corp., “A” | | 32,545 | $ 1,138,099 |
Portfolio of Investments – continued
| Issuer | | | Shares/Par | Value ($) |
| Common Stocks – continued |
| Chemicals – 2.1% | |
| 3M Co. | | 4,179 | $ 501,145 |
| PPG Industries, Inc. | | 4,370 | 549,484 |
| | | | | $1,050,629 |
| Computer Software – 2.8% | |
| Check Point Software Technologies Ltd. (a) | | 3,882 | $ 489,753 |
| Oracle Corp. | | 10,922 | 892,764 |
| | | | | $1,382,517 |
| Computer Software - Systems – 0.9% | |
| Samsung Electronics Co. Ltd. | | 10,318 | $ 455,004 |
| Construction – 0.6% | |
| Otis Worldwide Corp. | | 3,677 | $ 287,946 |
| Consumer Products – 4.9% | |
| Colgate-Palmolive Co. | | 3,851 | $ 303,420 |
| Essity AB | | 28,885 | 758,172 |
| International Flavors & Fragrances, Inc. | | 6,692 | 701,589 |
| Reckitt Benckiser Group PLC | | 9,562 | 665,162 |
| | | | | $2,428,343 |
| Electrical Equipment – 4.8% | |
| Amphenol Corp., “A” | | 4,623 | $ 351,995 |
| Legrand S.A. | | 7,208 | 580,370 |
| Schneider Electric SE | | 10,229 | 1,438,601 |
| | | | | $2,370,966 |
| Electronics – 1.1% | |
| Hoya Corp. | | 2,700 | $ 261,380 |
| Microchip Technology, Inc. | | 3,781 | 265,615 |
| | | | | $526,995 |
| Food & Beverages – 3.8% | |
| Danone S.A. | | 14,185 | $ 747,524 |
| Nestle S.A. | | 9,961 | 1,150,351 |
| | | | | $1,897,875 |
| Gaming & Lodging – 1.0% | |
| Marriott International, Inc., “A” | | 1,936 | $ 288,251 |
| Whitbread PLC | | 6,014 | 186,855 |
| | | | | $475,106 |
| Insurance – 3.3% | |
| Aon PLC | | 2,418 | $ 725,738 |
| Willis Towers Watson PLC | | 3,655 | 893,940 |
| | | | | $1,619,678 |
| Internet – 2.0% | |
| Alphabet, Inc., “A” (a) | | 7,219 | $ 636,933 |
| eBay, Inc. | | 8,339 | 345,818 |
| | | | | $982,751 |
Portfolio of Investments – continued
| Issuer | | | Shares/Par | Value ($) |
| Common Stocks – continued |
| Machinery & Tools – 1.2% | |
| Carrier Global Corp. | | 3,040 | $ 125,400 |
| Kubota Corp. | | 32,300 | 444,943 |
| | | | | $570,343 |
| Major Banks – 3.7% | |
| Erste Group Bank AG | | 6,104 | $ 195,367 |
| Goldman Sachs Group, Inc. | | 2,818 | 967,645 |
| UBS Group AG | | 35,585 | 663,290 |
| | | | | $1,826,302 |
| Medical Equipment – 14.2% | |
| Abbott Laboratories | | 6,953 | $ 763,370 |
| Boston Scientific Corp. (a) | | 18,787 | 869,275 |
| Cooper Cos., Inc. | | 1,376 | 455,002 |
| EssilorLuxottica | | 1,222 | 222,521 |
| Medtronic PLC | | 14,855 | 1,154,531 |
| Olympus Corp. | | 9,000 | 159,081 |
| Sonova Holding AG | | 938 | 223,185 |
| Stryker Corp. | | 3,792 | 927,106 |
| Thermo Fisher Scientific, Inc. | | 2,753 | 1,516,050 |
| Waters Corp. (a) | | 1,349 | 462,140 |
| Zimmer Biomet Holdings, Inc. | | 2,024 | 258,060 |
| | | | | $7,010,321 |
| Other Banks & Diversified Financials – 5.0% | |
| American Express Co. | | 4,124 | $ 609,321 |
| Grupo Financiero Banorte S.A. de C.V. | | 18,772 | 134,780 |
| Julius Baer Group Ltd. | | 3,799 | 220,820 |
| Visa, Inc., “A” | | 7,268 | 1,510,000 |
| | | | | $2,474,921 |
| Pharmaceuticals – 5.2% | |
| Bayer AG | | 10,087 | $ 521,795 |
| Merck KGaA | | 3,851 | 745,724 |
| Roche Holding AG | | 4,068 | 1,278,056 |
| | | | | $2,545,575 |
| Railroad & Shipping – 4.7% | |
| Canadian National Railway Co. | | 7,314 | $ 869,488 |
| Canadian Pacific Railway Ltd. | | 13,603 | 1,014,648 |
| Union Pacific Corp. | | 2,167 | 448,721 |
| | | | | $2,332,857 |
| Specialty Chemicals – 4.4% | |
| Akzo Nobel N.V. | | 5,887 | $ 394,237 |
| L'Air Liquide S.A. | | 3,122 | 444,071 |
| Linde PLC | | 685 | 223,433 |
| Linde PLC | | 3,444 | 1,126,081 |
| | | | | $2,187,822 |
| Specialty Stores – 0.4% | |
| Hermes International | | 128 | $ 197,522 |
| Telecommunications - Wireless – 1.1% | |
| Liberty Broadband Corp. (a) | | 7,281 | $ 555,322 |
Portfolio of Investments – continued
| Issuer | | | Shares/Par | Value ($) |
| Common Stocks – continued |
| Trucking – 1.0% | |
| United Parcel Service, Inc., “B” | | 2,906 | $ 505,179 |
| Total Common Stocks (Identified Cost, $26,610,479) | | $49,037,384 |
| | Strike
Price | First
Exercise | | |
| Warrants – 0.0% | | | | |
| Apparel Manufacturers – 0.0% |
| Compagnie Financiere Richemont S.A. (1 share for 2 warrants, Expiration 12/04/23) (a) (Identified Cost, $0) | CHF 67.00 | 11/20/23 | 14,904 | $ 12,412 |
| | | | | |
| Investment Companies (h) – 0.4% |
| Money Market Funds – 0.4% | |
| MFS Institutional Money Market Portfolio, 4.02% (v) (Identified Cost, $182,587) | | | 182,586 | $ 182,641 |
| Other Assets, Less Liabilities – 0.2% | | 80,259 |
| Net Assets – 100.0% | $49,312,696 |
| (a) | Non-income producing security. | | | |
| (h) | An affiliated issuer, which may be considered one in which the fund owns 5% or more of the outstanding voting securities, or a company which is under common control. At period end, the aggregate values of the fund's investments in affiliated issuers and in unaffiliated issuers were $182,641 and $49,049,796, respectively. | | | |
| (v) | Affiliated issuer that is available only to investment companies managed by MFS. The rate quoted for the MFS Institutional Money Market Portfolio is the annualized seven-day yield of the fund at period end. | | | |
| Abbreviations indicate amounts shown in currencies other than the U.S. dollar. All amounts are stated in U.S. dollars unless otherwise indicated. A list of abbreviations is shown below: |
| CHF | Swiss Franc |
See Notes to Financial Statements
| Financial Statements | Statement of Assets and Liabilities |
This statement represents your fund’s balance sheet, which details the assets and liabilities comprising the total value of the fund.
| At 12/31/22Assets | |
| Investments in unaffiliated issuers, at value (identified cost, $26,610,479) | $49,049,796 |
| Investments in affiliated issuers, at value (identified cost, $182,587) | 182,641 |
| Cash | 3,487 |
| Receivables for | |
| Fund shares sold | 17,142 |
| Interest and dividends | 160,682 |
| Receivable from investment adviser | 6,974 |
| Other assets | 427 |
| Total assets | $49,421,149 |
| Liabilities | |
| Payables for | |
| Fund shares reacquired | $41,923 |
| Payable to affiliates | |
| Administrative services fee | 144 |
| Shareholder servicing costs | 98 |
| Distribution and/or service fees | 195 |
| Payable for independent Trustees' compensation | 11 |
| Accrued expenses and other liabilities | 66,082 |
| Total liabilities | $108,453 |
| Net assets | $49,312,696 |
| Net assets consist of | |
| Paid-in capital | $24,847,252 |
| Total distributable earnings (loss) | 24,465,444 |
| Net assets | $49,312,696 |
| Shares of beneficial interest outstanding | 2,493,330 |
| | Net assets | Shares
outstanding | Net asset value
per share |
| Initial Class | $39,839,756 | 2,010,448 | $19.82 |
| Service Class | 9,472,940 | 482,882 | 19.62 |
See Notes to Financial Statements
| Financial Statements | Statement of Operations |
This statement describes how much your fund earned in investment income and accrued in expenses. It also describes any gains and/or losses generated by fund operations.
| Year ended 12/31/22 | |
| Net investment income (loss) | |
| Income | |
| Dividends | $966,460 |
| Dividends from affiliated issuers | 5,802 |
| Income on securities loaned | 1,314 |
| Other | 19 |
| Foreign taxes withheld | (63,914) |
| Total investment income | $909,681 |
| Expenses | |
| Management fee | $493,942 |
| Distribution and/or service fees | 29,562 |
| Shareholder servicing costs | 8,561 |
| Administrative services fee | 18,297 |
| Independent Trustees' compensation | 3,074 |
| Custodian fee | 13,651 |
| Shareholder communications | 10,888 |
| Audit and tax fees | 63,905 |
| Legal fees | 257 |
| Miscellaneous | 27,065 |
| Total expenses | $669,202 |
| Reduction of expenses by investment adviser | (134,518) |
| Net expenses | $534,684 |
| Net investment income (loss) | $374,997 |
| Realized and unrealized gain (loss) | |
| Realized gain (loss) (identified cost basis) | |
| Unaffiliated issuers | $2,137,664 |
| Affiliated issuers | 63 |
| Foreign currency | (4,268) |
| Net realized gain (loss) | $2,133,459 |
| Change in unrealized appreciation or depreciation | |
| Unaffiliated issuers | $(14,522,200) |
| Affiliated issuers | 54 |
| Translation of assets and liabilities in foreign currencies | (3,198) |
| Net unrealized gain (loss) | $(14,525,344) |
| Net realized and unrealized gain (loss) | $(12,391,885) |
| Change in net assets from operations | $(12,016,888) |
See Notes to Financial Statements
| Financial Statements | Statements of Changes in Net Assets |
These statements describe the increases and/or decreases in net assets resulting from operations, any distributions, and any shareholder transactions.
| | Year ended |
| | 12/31/22 | 12/31/21 |
| Change in net assets | | |
| From operations | | |
| Net investment income (loss) | $374,997 | $249,387 |
| Net realized gain (loss) | 2,133,459 | 5,424,572 |
| Net unrealized gain (loss) | (14,525,344) | 4,291,189 |
| Change in net assets from operations | $(12,016,888) | $9,965,148 |
| Total distributions to shareholders | $(5,629,118) | $(4,406,036) |
| Change in net assets from fund share transactions | $249,205 | $802,515 |
| Total change in net assets | $(17,396,801) | $6,361,627 |
| Net assets | | |
| At beginning of period | 66,709,497 | 60,347,870 |
| At end of period | $49,312,696 | $66,709,497 |
See Notes to Financial Statements
| Financial Statements | Financial Highlights |
The financial highlights table is intended to help you understand the fund's financial performance for the past 5 years. Certain information reflects financial results for a single fund share. The total returns in the table represent the rate that an investor would have earned (or lost) on an investment in the fund share class (assuming reinvestment of all distributions) held for the entire period.
| Initial Class | Year ended |
| | 12/31/22 | 12/31/21 | 12/31/20 | 12/31/19 | 12/31/18 |
| Net asset value, beginning of period | $26.90 | $24.57 | $22.79 | $18.82 | $22.00 |
| Income (loss) from investment operations | | | | | |
| Net investment income (loss) (d) | $0.16 | $0.12 | $0.16 | $0.25 | $0.23 |
| Net realized and unrealized gain (loss) | (4.91) | 4.07 | 2.73 | 5.35 | (2.23) |
| Total from investment operations | $(4.75) | $4.19 | $2.89 | $5.60 | $(2.00) |
| Less distributions declared to shareholders | | | | | |
| From net investment income | $(0.12) | $(0.17) | $(0.26) | $(0.25) | $(0.21) |
| From net realized gain | (2.21) | (1.69) | (0.85) | (1.38) | (0.97) |
| Total distributions declared to shareholders | $(2.33) | $(1.86) | $(1.11) | $(1.63) | $(1.18) |
| Net asset value, end of period (x) | $19.82 | $26.90 | $24.57 | $22.79 | $18.82 |
| Total return (%) (k)(r)(s)(x) | (17.73) | 17.21 | 13.29 | 30.57 | (9.74) |
Ratios (%) (to average net assets)
and Supplemental data: | | | | | |
| Expenses before expense reductions | 1.17 | 1.13 | 1.16 | 1.16 | 1.13 |
| Expenses after expense reductions | 0.92 | 0.92 | 0.92 | 0.95 | 0.97 |
| Net investment income (loss) | 0.74 | 0.45 | 0.75 | 1.16 | 1.07 |
| Portfolio turnover | 7 | 12 | 12 | 11 | 15 |
| Net assets at end of period (000 omitted) | $39,840 | $51,966 | $46,879 | $49,771 | $45,219 |
| Service Class | Year ended |
| | 12/31/22 | 12/31/21 | 12/31/20 | 12/31/19 | 12/31/18 |
| Net asset value, beginning of period | $26.64 | $24.37 | $22.62 | $18.70 | $21.86 |
| Income (loss) from investment operations | | | | | |
| Net investment income (loss) (d) | $0.11 | $0.05 | $0.10 | $0.18 | $0.18 |
| Net realized and unrealized gain (loss) | (4.87) | 4.03 | 2.71 | 5.32 | (2.21) |
| Total from investment operations | $(4.76) | $4.08 | $2.81 | $5.50 | $(2.03) |
| Less distributions declared to shareholders | | | | | |
| From net investment income | $(0.05) | $(0.12) | $(0.21) | $(0.20) | $(0.16) |
| From net realized gain | (2.21) | (1.69) | (0.85) | (1.38) | (0.97) |
| Total distributions declared to shareholders | $(2.26) | $(1.81) | $(1.06) | $(1.58) | $(1.13) |
| Net asset value, end of period (x) | $19.62 | $26.64 | $24.37 | $22.62 | $18.70 |
| Total return (%) (k)(r)(s)(x) | (17.94) | 16.88 | 13.04 | 30.20 | (9.92) |
Ratios (%) (to average net assets)
and Supplemental data: | | | | | |
| Expenses before expense reductions | 1.42 | 1.38 | 1.41 | 1.41 | 1.38 |
| Expenses after expense reductions | 1.17 | 1.17 | 1.17 | 1.20 | 1.22 |
| Net investment income (loss) | 0.49 | 0.19 | 0.48 | 0.85 | 0.86 |
| Portfolio turnover | 7 | 12 | 12 | 11 | 15 |
| Net assets at end of period (000 omitted) | $9,473 | $14,744 | $13,469 | $11,319 | $7,139 |
See Notes to Financial Statements
Financial Highlights - continued
| (d) | Per share data is based on average shares outstanding. |
| (k) | The total return does not reflect expenses that apply to separate accounts. Inclusion of these charges would reduce the total return figures for all periods shown. |
| (r) | Certain expenses have been reduced without which performance would have been lower. |
| (s) | From time to time the fund may receive proceeds from litigation settlements, without which performance would be lower. |
| (x) | The net asset values and total returns have been calculated on net assets which include adjustments made in accordance with U.S. generally accepted accounting principles required at period end for financial reporting purposes. |
See Notes to Financial Statements
Notes to Financial Statements
(1) Business and Organization
MFS Global Equity Series (the fund) is a diversified series of MFS Variable Insurance Trust (the trust). The trust is organized as a Massachusetts business trust and is registered under the Investment Company Act of 1940, as amended, as an open-end management investment company. The shareholders of each series of the trust are separate accounts of insurance companies, which offer variable annuity and/or life insurance products, and qualified retirement and pension plans.
The fund is an investment company and accordingly follows the investment company accounting and reporting guidance of the Financial Accounting Standards Board (FASB) Accounting Standards Codification Topic 946 Financial Services - Investment Companies.
(2) Significant Accounting Policies
General — The preparation of financial statements in conformity with U.S. generally accepted accounting principles requires management to make estimates and assumptions that affect the reported amounts of assets and liabilities, and disclosure of contingent assets and liabilities at the date of the financial statements and the reported amounts of increases and decreases in net assets from operations during the reporting period. Actual results could differ from those estimates. In the preparation of these financial statements, management has evaluated subsequent events occurring after the date of the fund’s Statement of Assets and Liabilities through the date that the financial statements were issued. The fund invests in foreign securities. Investments in foreign securities are vulnerable to the effects of changes in the relative values of the local currency and the U.S. dollar and to the effects of changes in each country’s market, economic, industrial, political, regulatory, geopolitical, environmental, public health, and other conditions.
Balance Sheet Offsetting — The fund's accounting policy with respect to balance sheet offsetting is that, absent an event of default by the counterparty or a termination of the agreement, the International Swaps and Derivatives Association (ISDA) Master Agreement, or similar agreement, does not result in an offset of reported amounts of financial assets and financial liabilities in the Statement of Assets and Liabilities across transactions between the fund and the applicable counterparty. The fund's right to setoff may be restricted or prohibited by the bankruptcy or insolvency laws of the particular jurisdiction to which a specific master netting agreement counterparty is subject. Balance sheet offsetting disclosures, to the extent applicable to the fund, have been included in the fund’s Significant Accounting Policies note under the captions for each of the fund’s in-scope financial instruments and transactions.
Investment Valuations — Subject to its oversight, the fund's Board of Trustees has delegated primary responsibility for determining or causing to be determined the value of the fund’s investments to MFS as the fund's adviser, pursuant to the fund’s valuation policy and procedures which have been adopted by the adviser and approved by the Board. Effective September 8, 2022, and in accordance with Rule 2a-5 under the Investment Company Act of 1940, the Board of Trustees designated the adviser as the “valuation designee” of the fund. If the adviser, as valuation designee, determines that reliable market quotations are not readily available for an investment, the investment is valued at fair value as determined in good faith by the adviser in accordance with the adviser’s fair valuation policy and procedures.
Under the fund's valuation policy and procedures, equity securities, including restricted equity securities, are generally valued at the last sale or official closing price on their primary market or exchange as provided by a third-party pricing service. Equity securities, for which there were no sales reported that day, are generally valued at the last quoted daily bid quotation on their primary market or exchange as provided by a third-party pricing service. Short-term instruments with a maturity at issuance of 60 days or less may be valued at amortized cost, which approximates market value. Open-end investment companies are generally valued at net asset value per share. The values of foreign securities and other assets and liabilities expressed in foreign currencies are converted to U.S. dollars using the mean of bid and asked prices for rates provided by a third-party pricing service.
Under the fund’s valuation policy and procedures, market quotations are not considered to be readily available for debt instruments, floating rate loans, and many types of derivatives. These investments are generally valued at fair value based on information from third-party pricing services or otherwise determined by the adviser in accordance with the adviser’s fair valuation policy and procedures. Securities and other assets generally valued on the basis of information from a third-party pricing service may also be valued at a broker/dealer bid quotation. In determining values, third-party pricing services can utilize both transaction data and market information such as yield, quality, coupon rate, maturity, type of issue, trading characteristics, spreads and other market data. An investment may also be valued at fair value if the adviser determines that the investment’s value has been materially affected by events occurring after the close of the exchange or market on which the investment is principally traded (such as foreign exchange or market) and prior to the determination of the fund’s net asset value, or after the halt of trading of a specific security where trading does not resume prior to the close of the exchange or market on which the security is principally traded. Events that occur after foreign markets close (such as developments in foreign markets and significant movements in the U.S. markets) and prior to the determination of the fund’s net asset value may be deemed to have a material effect on the value of securities traded in foreign
Notes to Financial Statements - continued
markets. Accordingly, the fund’s foreign equity securities may often be valued at fair value. The adviser generally relies on third-party pricing services or other information (such as the correlation with price movements of similar securities in the same or other markets; the type, cost and investment characteristics of the security; the business and financial condition of the issuer; and trading and other market data) to assist in determining whether to fair value and at what value to fair value an investment. The value of an investment for purposes of calculating the fund’s net asset value can differ depending on the source and method used to determine value. When fair valuation is used, the value of an investment used to determine the fund’s net asset value may differ from quoted or published prices for the same investment. There can be no assurance that the fund could obtain the fair value assigned to an investment if it were to sell the investment at the same time at which the fund determines its net asset value per share.
Various inputs are used in determining the value of the fund's assets or liabilities. These inputs are categorized into three broad levels. In certain cases, the inputs used to measure fair value may fall into different levels of the fair value hierarchy. In such cases, an investment's level within the fair value hierarchy is based on the lowest level of input that is significant to the fair value measurement. The fund's assessment of the significance of a particular input to the fair value measurement in its entirety requires judgment, and considers factors specific to the investment. Level 1 includes unadjusted quoted prices in active markets for identical assets or liabilities. Level 2 includes other significant observable market-based inputs (including quoted prices for similar securities, interest rates, prepayment speed, and credit risk). Level 3 includes significant unobservable inputs, which may include the adviser's own assumptions in determining the fair value of investments. The following is a summary of the levels used as of December 31, 2022 in valuing the fund's assets and liabilities:
| Financial Instruments | Level 1 | Level 2 | Level 3 | Total |
| Equity Securities: | | | | |
| United States | $27,023,616 | $— | $— | $27,023,616 |
| France | 1,487,294 | 4,123,853 | — | 5,611,147 |
| Switzerland | 1,290,468 | 3,224,275 | — | 4,514,743 |
| United Kingdom | 3,375,727 | — | — | 3,375,727 |
| Germany | 1,979,395 | — | — | 1,979,395 |
| Canada | 1,884,136 | — | — | 1,884,136 |
| Netherlands | 1,129,685 | — | — | 1,129,685 |
| Japan | 261,380 | 604,024 | — | 865,404 |
| Sweden | — | 758,172 | — | 758,172 |
| Other Countries | 1,082,502 | 825,269 | — | 1,907,771 |
| Mutual Funds | 182,641 | — | — | 182,641 |
| Total | $39,696,844 | $9,535,593 | $— | $49,232,437 |
For further information regarding security characteristics, see the Portfolio of Investments.
Foreign Currency Translation — Purchases and sales of foreign investments, income, and expenses are converted into U.S. dollars based upon currency exchange rates prevailing on the respective dates of such transactions or on the reporting date for foreign denominated receivables and payables. Gains and losses attributable to foreign currency exchange rates on sales of securities are recorded for financial statement purposes as net realized gains and losses on investments. Gains and losses attributable to foreign exchange rate movements on receivables, payables, income and expenses are recorded for financial statement purposes as foreign currency transaction gains and losses. That portion of both realized and unrealized gains and losses on investments that results from fluctuations in foreign currency exchange rates is not separately disclosed.
Security Loans — Under its Securities Lending Agency Agreement with the fund, State Street Bank and Trust Company, as lending agent, loans the securities of the fund to certain qualified institutions (the “Borrowers”) approved by the fund. Security loans can be terminated at the discretion of either the lending agent or the fund and the related securities must be returned within the earlier of the standard trade settlement period for such securities or within three business days. The loans are collateralized by cash and/or U.S. Treasury and federal agency obligations in an amount typically at least equal to the market value of the securities loaned. On loans collateralized by cash, the cash collateral is invested in a money market fund. The market value of the loaned securities is determined at the close of business of the fund and any additional required collateral is delivered to the fund on the next business day. The lending agent provides the fund with indemnification against Borrower default. In the event of Borrower default, the lending agent will, for the benefit of the fund, either purchase securities identical to those loaned or, when such purchase is commercially impracticable, pay the fund the market value of the loaned securities. In return, the lending agent assumes the fund's rights to the related collateral. If the collateral value is less than the cost to purchase identical securities, the lending agent is responsible for the shortfall, but only to the extent that such shortfall is not due to a decline in collateral value resulting from collateral reinvestment for which the fund bears the risk of loss. A portion of the income generated upon investment of the collateral is remitted to the Borrowers, and the remainder is allocated between the fund and the lending agent. On loans collateralized by
Notes to Financial Statements - continued
U.S. Treasury and/or federal agency obligations, a fee is received from the Borrower, and is allocated between the fund and the lending agent. Income from securities lending is separately reported in the Statement of Operations. The dividend and interest income earned on the securities loaned is accounted for in the same manner as other dividend and interest income. At December 31, 2022, there were no securities on loan or collateral outstanding.
Indemnifications — Under the fund's organizational documents, its officers and Trustees may be indemnified against certain liabilities and expenses arising out of the performance of their duties to the fund. Additionally, in the normal course of business, the fund enters into agreements with service providers that may contain indemnification clauses. The fund's maximum exposure under these agreements is unknown as this would involve future claims that may be made against the fund that have not yet occurred.
Investment Transactions and Income — Investment transactions are recorded on the trade date. Dividends received in cash are recorded on the ex-dividend date. Certain dividends from foreign securities will be recorded when the fund is informed of the dividend if such information is obtained subsequent to the ex-dividend date. Dividend payments received in additional securities are recorded on the ex-dividend date in an amount equal to the value of the security on such date. In determining the net gain or loss on securities sold, the cost of securities is determined on the identified cost basis.
The fund may receive proceeds from litigation settlements. Any proceeds received from litigation involving portfolio holdings are reflected in the Statement of Operations in realized gain/loss if the security has been disposed of by the fund or in unrealized gain/loss if the security is still held by the fund. Any other proceeds from litigation not related to portfolio holdings are reflected as other income in the Statement of Operations.
Tax Matters and Distributions — The fund intends to qualify as a regulated investment company, as defined under Subchapter M of the Internal Revenue Code, and to distribute all of its taxable income, including realized capital gains. As a result, no provision for federal income tax is required. The fund’s federal tax returns, when filed, will remain subject to examination by the Internal Revenue Service for a three year period. Management has analyzed the fund’s tax positions taken on federal and state tax returns for all open tax years and does not believe that there are any uncertain tax positions that require recognition of a tax liability. Foreign taxes, if any, have been accrued by the fund in the accompanying financial statements in accordance with the applicable foreign tax law. Foreign income taxes may be withheld by certain countries in which the fund invests. Additionally, capital gains realized by the fund on securities issued in or by certain foreign countries may be subject to capital gains tax imposed by those countries.
Distributions to shareholders are recorded on the ex-dividend date. Income and capital gain distributions are determined in accordance with income tax regulations, which may differ from U.S. generally accepted accounting principles. Certain capital accounts in the financial statements are periodically adjusted for permanent differences in order to reflect their tax character. These adjustments have no impact on net assets or net asset value per share. Temporary differences which arise from recognizing certain items of income, expense, gain or loss in different periods for financial statement and tax purposes will reverse at some time in the future.
Book/tax differences primarily relate to wash sale loss deferrals.
The tax character of distributions declared to shareholders for the last two fiscal years is as follows:
| | Year ended
12/31/22 | Year ended
12/31/21 |
| Ordinary income (including any short-term capital gains) | $383,057 | $464,015 |
| Long-term capital gains | 5,246,061 | 3,942,021 |
| Total distributions | $5,629,118 | $4,406,036 |
The federal tax cost and the tax basis components of distributable earnings were as follows:
| As of 12/31/22 | |
| Cost of investments | $27,334,572 |
| Gross appreciation | 23,843,469 |
| Gross depreciation | (1,945,604) |
| Net unrealized appreciation (depreciation) | $21,897,865 |
| Undistributed ordinary income | 368,585 |
| Undistributed long-term capital gain | 2,202,445 |
| Other temporary differences | (3,451) |
| Total distributable earnings (loss) | $24,465,444 |
Notes to Financial Statements - continued
Multiple Classes of Shares of Beneficial Interest — The fund offers multiple classes of shares, which differ in their respective distribution and/or service fees. The fund's income, realized and unrealized gain (loss), and common expenses are allocated to shareholders based on the daily net assets of each class. Dividends are declared separately for each class. Differences in per share dividend rates are generally due to differences in separate class expenses. The fund’s distributions declared to shareholders as reported in the Statements of Changes in Net Assets are presented by class as follows:
| | Year
ended
12/31/22 | | Year
ended
12/31/21 |
| Initial Class | $4,432,765 | | $3,418,938 |
| Service Class | 1,196,353 | | 987,098 |
| Total | $5,629,118 | | $4,406,036 |
(3) Transactions with Affiliates
Investment Adviser — The fund has an investment advisory agreement with MFS to provide overall investment management and related administrative services and facilities to the fund. The management fee is computed daily and paid monthly at the following annual rates based on the fund's average daily net assets:
| Up to $1 billion | 0.90% |
| In excess of $1 billion and up to $2.5 billion | 0.75% |
| In excess of $2.5 billion | 0.65% |
MFS has agreed in writing to reduce its management fee by a specified amount if certain MFS mutual fund assets exceed thresholds agreed to by MFS and the fund's Board of Trustees. Effective March 1, 2022, MFS has also agreed in writing to waive at least 0.01% of its management fee as part of this agreement. The agreement to waive at least 0.01% of the management fee will continue until modified by the fund's Board of Trustees, but such agreement will continue at least until April 30, 2024. For the year ended December 31, 2022, this management fee reduction amounted to $7,638, which is included in the reduction of total expenses in the Statement of Operations. The management fee incurred for the year ended December 31, 2022 was equivalent to an annual effective rate of 0.89% of the fund's average daily net assets.
The investment adviser has agreed in writing to pay a portion of the fund’s total annual operating expenses, excluding interest, taxes, extraordinary expenses, brokerage and transaction costs, certain tax reclaim recovery expenses (including contingency fees and closing agreement expenses), and investment-related expenses, such that total annual operating expenses do not exceed 0.92% of average daily net assets for the Initial Class shares and 1.17% of average daily net assets for the Service Class shares. This written agreement will continue until modified by the fund’s Board of Trustees, but such agreement will continue at least until April 30, 2024. For the year ended December 31, 2022, this reduction amounted to $126,880, which is included in the reduction of total expenses in the Statement of Operations.
Distributor — MFS Fund Distributors, Inc. (MFD), a wholly-owned subsidiary of MFS, is the distributor of shares of the fund. The Trustees have adopted a distribution plan for the Service Class shares pursuant to Rule 12b-1 under the Investment Company Act of 1940.
The fund's distribution plan provides that the fund will pay MFD distribution and/or service fees equal to 0.25% per annum of its average daily net assets attributable to Service Class shares as partial consideration for services performed and expenses incurred by MFD and financial intermediaries (including participating insurance companies that invest in the fund to fund variable annuity and variable life insurance contracts, sponsors of qualified retirement and pension plans that invest in the fund, and affiliates of these participating insurance companies and plan sponsors) in connection with the sale and distribution of the Service Class shares. MFD may subsequently pay all, or a portion, of the distribution and/or service fees to financial intermediaries.
Shareholder Servicing Agent — MFS Service Center, Inc. (MFSC), a wholly-owned subsidiary of MFS, receives a fee from the fund for its services as shareholder servicing agent. For the year ended December 31, 2022, the fee was $8,248, which equated to 0.0150% annually of the fund's average daily net assets. MFSC also receives reimbursement from the fund for out-of-pocket expenses paid by MFSC on behalf of the fund. For the year ended December 31, 2022, these costs amounted to $313.
Administrator — MFS provides certain financial, legal, shareholder communications, compliance, and other administrative services to the fund. Under an administrative services agreement, the fund reimburses MFS the costs incurred to provide these services. The fund is charged an annual fixed amount of $17,500 plus a fee based on average daily net assets. The administrative services fee incurred for the year ended December 31, 2022 was equivalent to an annual effective rate of 0.0333% of the fund's average daily net assets.
Notes to Financial Statements - continued
Trustees’ and Officers’ Compensation — The fund pays compensation to independent Trustees in the form of a retainer, attendance fees, and additional compensation to Board and Committee chairpersons. The fund does not pay compensation directly to Trustees or officers of the fund who are also officers of the investment adviser, all of whom receive remuneration from MFS for their services to the fund. Certain officers and Trustees of the fund are officers or directors of MFS, MFD, and MFSC.
Other — The fund invests in the MFS Institutional Money Market Portfolio which is managed by MFS and seeks current income consistent with preservation of capital and liquidity. This money market fund does not pay a management fee to MFS but does incur investment and operating costs.
The fund is permitted to engage in purchase and sale transactions with funds and accounts for which MFS serves as investment adviser or sub-adviser (“cross-trades”) pursuant to a policy adopted by the Board of Trustees. This policy has been designed to ensure that cross-trades conducted by the fund comply with Rule 17a-7 under the Investment Company Act of 1940. During the year ended December 31, 2022, the fund engaged in sale transactions pursuant to this policy, which amounted to $54,891. The sales transactions resulted in net realized gains (losses) of $9,889.
(4) Portfolio Securities
For the year ended December 31, 2022, purchases and sales of investments, other than short-term obligations, aggregated $3,615,891 and $8,465,376, respectively.
(5) Shares of Beneficial Interest
The fund's Declaration of Trust permits the Trustees to issue an unlimited number of full and fractional shares of beneficial interest. Transactions in fund shares were as follows:
| | Year ended
12/31/22 | | Year ended
12/31/21 |
| | Shares | Amount | | Shares | Amount |
| Shares sold | | | | | |
| Initial Class | 212,890 | $4,784,619 | | 292,702 | $7,779,587 |
| Service Class | 80,213 | 1,744,781 | | 105,795 | 2,743,776 |
| | 293,103 | $6,529,400 | | 398,497 | $10,523,363 |
Shares issued to shareholders
in reinvestment of distributions | | | | | |
| Initial Class | 221,860 | $4,432,765 | | 129,653 | $3,418,938 |
| Service Class | 60,452 | 1,196,353 | | 37,762 | 987,098 |
| | 282,312 | $5,629,118 | | 167,415 | $4,406,036 |
| Shares reacquired | | | | | |
| Initial Class | (356,010) | $(7,569,275) | | (398,296) | $(10,442,200) |
| Service Class | (211,201) | (4,340,038) | | (142,899) | (3,684,684) |
| | (567,211) | $(11,909,313) | | (541,195) | $(14,126,884) |
| Net change | | | | | |
| Initial Class | 78,740 | $1,648,109 | | 24,059 | $756,325 |
| Service Class | (70,536) | (1,398,904) | | 658 | 46,190 |
| | 8,204 | $249,205 | | 24,717 | $802,515 |
(6) Line of Credit
The fund and certain other funds managed by MFS participate in a $1.45 billion unsecured committed line of credit of which $1.2 billion is reserved for use by the fund and certain other MFS U.S. funds. The line of credit is provided by a syndicate of banks under a credit agreement. Borrowings may be made for temporary financing needs. Interest is charged to each fund, based on its borrowings, generally at a rate equal to the highest of 1) Daily Simple SOFR (Secured Overnight Financing Rate) plus 0.10%, 2) the Federal Funds Effective Rate, or 3) the Overnight Bank Funding Rate, each plus an agreed upon spread. A commitment fee, based on the average daily unused portion of the committed line of credit, is allocated among the participating funds. The line of credit expires on March 16, 2023 unless extended or renewed. In addition, the fund and other funds managed by MFS have established unsecured
Notes to Financial Statements - continued
uncommitted borrowing arrangements with certain banks for temporary financing needs. Interest is charged to each fund, based on its borrowings, at rates equal to customary reference rates plus an agreed upon spread. For the year ended December 31, 2022, the fund’s commitment fee and interest expense were $254 and $0, respectively, and are included in “Miscellaneous” expense in the Statement of Operations.
(7) Investments in Affiliated Issuers
An affiliated issuer may be considered one in which the fund owns 5% or more of the outstanding voting securities, or a company which is under common control. For the purposes of this report, the following were affiliated issuers:
| Affiliated Issuers | Beginning
Value | Purchases | Sales
Proceeds | Realized
Gain
(Loss) | Change in
Unrealized
Appreciation or
Depreciation | Ending
Value |
| MFS Institutional Money Market Portfolio | $483,861 | $7,400,367 | $7,701,704 | $63 | $54 | $182,641 |
| Affiliated Issuers | Dividend
Income | Capital Gain
Distributions |
| MFS Institutional Money Market Portfolio | $5,802 | $— |
(8) LIBOR Transition
Certain of the fund's investments, including investments in certain debt instruments and derivatives (if any), as well as borrowings by the fund and certain other contractual arrangements of the fund, may be based on the London Interbank Offered Rate (“LIBOR”). In 2017, the regulatory authority that oversees financial services firms in the United Kingdom announced plans to transition away from LIBOR by the end of 2021. In March 2021, the administrator of LIBOR announced the extension of the publication of the more commonly used U.S. dollar LIBOR settings to the end of June 2023. Although the full impacts of the transition away from LIBOR are not fully known, the transition may result in, among other things, an increase in volatility or illiquidity of the markets for instruments that currently rely on LIBOR to determine interest rates and this could have an adverse impact on the fund's performance. With respect to the fund's accounting for investments, including investments in certain debt instruments and derivatives, as well as borrowings by the fund and any other contractual arrangements of the fund that undergo reference rate-related modifications as a result of the transition, management will rely upon the relief provided by FASB Codification Topic 848 – Reference Rate Reform (Topic 848). The guidance in Topic 848 permits the fund to account for those modified contracts as a continuation of the existing contracts. Management is still evaluating the impact to the fund of the June 30, 2023 planned discontinuation of the more commonly used U.S. dollar LIBOR settings.
(9) Russia and Ukraine Conflict
The market disruptions, which began in late February 2022, associated with geopolitical events related to the conflict between Russia and Ukraine may adversely affect the value of the fund’s assets and thus the fund’s performance. Management continues to monitor these events and to evaluate the related impacts, if any, to the fund.
Report of Independent Registered Public Accounting Firm
To the Board of Trustees of MFS Variable Insurance Trust and the Shareholders of MFS Global Equity Series:
Opinion on the Financial Statements and Financial Highlights
We have audited the accompanying statement of assets and liabilities of MFS Global Equity Series (the “Fund”), including the portfolio of investments, as of December 31, 2022, the related statement of operations for the year then ended, the statements of changes in net assets for each of the two years in the period then ended, the financial highlights for each of the five years in the period then ended, and the related notes. In our opinion, the financial statements and financial highlights present fairly, in all material respects, the financial position of the Fund as of December 31, 2022, and the results of its operations for the year then ended, the changes in its net assets for each of the two years in the period then ended, and the financial highlights for each of the five years in the period then ended, in conformity with accounting principles generally accepted in the United States of America.
Basis for Opinion
These financial statements and financial highlights are the responsibility of the Fund's management. Our responsibility is to express an opinion on the Fund's financial statements and financial highlights based on our audits. We are a public accounting firm registered with the Public Company Accounting Oversight Board (United States) (PCAOB) and are required to be independent with respect to the Fund in accordance with the U.S. federal securities laws and the applicable rules and regulations of the Securities and Exchange Commission and the PCAOB.
We conducted our audits in accordance with the standards of the PCAOB. Those standards require that we plan and perform the audit to obtain reasonable assurance about whether the financial statements and financial highlights are free of material misstatement, whether due to error or fraud. The Fund is not required to have, nor were we engaged to perform, an audit of its internal control over financial reporting. As part of our audits, we are required to obtain an understanding of internal control over financial reporting but not for the purpose of expressing an opinion on the effectiveness of the Fund's internal control over financial reporting. Accordingly, we express no such opinion.
Our audits included performing procedures to assess the risks of material misstatement of the financial statements and financial highlights, whether due to error or fraud, and performing procedures that respond to those risks. Such procedures included examining, on a test basis, evidence regarding the amounts and disclosures in the financial statements and financial highlights. Our audits also included evaluating the accounting principles used and significant estimates made by management, as well as evaluating the overall presentation of the financial statements and financial highlights. Our procedures included confirmation of securities owned as of December 31, 2022, by correspondence with the custodian. We believe that our audits provide a reasonable basis for our opinion.
DELOITTE & TOUCHE LLP
Boston, Massachusetts
February 15, 2023
We have served as the auditor of one or more of the MFS investment companies since 1924.
Trustees and Officers — Identification and Background
The Trustees and Officers of the Trust, as of February 1, 2023, are listed below, together with their principal occupations during the past five years. (Their titles may have varied during that period.) The address of each Trustee and Officer is 111 Huntington Avenue, Boston, Massachusetts 02199-7618.
| Name, Age | | Position(s) Held with Fund | | Trustee/Officer Since(h) | | Number of MFS Funds overseen by the Trustee | | Principal Occupations During
the Past Five Years | | Other Directorships During
the Past Five Years (j) |
| INTERESTED TRUSTEE | | | | | | | | | | |
Michael W. Roberge (k)
(age 56) | | Trustee | | January 2021 | | 136 | | Massachusetts Financial Services Company, Chairman (since January 2021); Chief Executive Officer (since January 2017); Director; Chairman of the Board (since January 2022); President (until December 2018); Chief Investment Officer (until December 2018) | | N/A |
| INDEPENDENT TRUSTEES | | | | | | | | | | |
John P. Kavanaugh
(age 68) | | Trustee and Chair of Trustees | | January 2009 | | 136 | | Private investor | | N/A |
Steven E. Buller
(age 71) | | Trustee | | February 2014 | | 136 | | Private investor | | N/A |
John A. Caroselli
(age 68) | | Trustee | | March 2017 | | 136 | | Private investor; JC Global Advisors, LLC (management consulting), President (since 2015) | | N/A |
Maureen R. Goldfarb
(age 67) | | Trustee | | January 2009 | | 136 | | Private investor | | N/A |
Peter D. Jones
(age 67) | | Trustee | | January 2019 | | 136 | | Private investor | | N/A |
James W. Kilman, Jr.
(age 61) | | Trustee | | January 2019 | | 136 | | Burford Capital Limited (finance and investment management), Senior Advisor (since May 3, 2021), Chief Financial Officer (2019 - May 2, 2021); KielStrand Capital LLC (family office), Chief Executive Officer (since 2016) | | Alpha-En Corporation, Director (2016-2019) |
Clarence Otis, Jr.
(age 66) | | Trustee | | March 2017 | | 136 | | Private investor | | VF Corporation, Director; Verizon Communications, Inc., Director; The Travelers Companies, Director |
Maryanne L. Roepke
(age 66) | | Trustee | | May 2014 | | 136 | | Private investor | | N/A |
Laurie J. Thomsen
(age 65) | | Trustee | | March 2005 | | 136 | | Private investor | | The Travelers Companies, Director; Dycom Industries, Inc., Director |
Trustees and Officers - continued
| Name, Age | | Position(s) Held with
Fund | | Trustee/Officer Since(h) | | Number of MFS Funds for which the Person is an Officer | | Principal Occupations During
the Past Five Years |
| OFFICERS | | | | | | | | |
Christopher R. Bohane (k)
(age 49) | | Assistant Secretary and Assistant Clerk | | July 2005 | | 136 | | Massachusetts Financial Services Company, Senior Vice President and Senior Managing Counsel |
Kino Clark (k)
(age 54) | | Assistant Treasurer | | January 2012 | | 136 | | Massachusetts Financial Services Company, Vice President |
John W. Clark, Jr. (k)
(age 55) | | Assistant Treasurer | | April 2017 | | 136 | | Massachusetts Financial Services Company, Vice President |
David L. DiLorenzo (k)
(age 54) | | President | | July 2005 | | 136 | | Massachusetts Financial Services Company, Senior Vice President |
Heidi W. Hardin (k)
(age 55) | | Secretary and Clerk | | April 2017 | | 136 | | Massachusetts Financial Services Company, Executive Vice President and General Counsel |
Brian E. Langenfeld (k)
(age 49) | | Assistant Secretary and Assistant Clerk | | June 2006 | | 136 | | Massachusetts Financial Services Company, Vice President and Managing Counsel |
Rosa E. Licea-Mailloux (k)
(age 46) | | Chief Compliance Officer | | March 2022 | | 136 | | Massachusetts Financial Services Company, Vice President (since 2018); Director of Corporate Compliance (2018-2021), Senior Director Compliance (2021-2022), Senior Managing Director of North American Compliance & Chief Compliance Officer (since March 2022); Natixis Investment Managers (investment management), Funds Chief Compliance Officer, Deputy General Counsel & Senior Vice President (until 2018) |
Amanda S. Mooradian (k)
(age 43) | | Assistant Secretary and Assistant Clerk | | September 2018 | | 136 | | Massachusetts Financial Services Company, Assistant Vice President and Senior Counsel |
Susan A. Pereira (k)
(age 52) | | Assistant Secretary and Assistant Clerk | | July 2005 | | 136 | | Massachusetts Financial Services Company, Vice President and Managing Counsel |
Kasey L. Phillips (k)
(age 52) | | Assistant Treasurer | | September 2012 | | 136 | | Massachusetts Financial Services Company, Vice President |
Matthew A. Stowe (k)
(age 48) | | Assistant Secretary and Assistant Clerk | | October 2014 | | 136 | | Massachusetts Financial Services Company, Vice President and Senior Managing Counsel |
William B. Wilson (k)
(age 40) | | Assistant Secretary and Assistant Clerk | | October 2022 | | 136 | | Massachusetts Financial Services Company, Assistant Vice President and Counsel |
James O. Yost (k)
(age 62) | | Treasurer | | September 1990 | | 136 | | Massachusetts Financial Services Company, Senior Vice President |
| (h) | Date first appointed to serve as Trustee/Officer of an MFS Fund. Each Trustee has served continuously since appointment unless indicated otherwise. From January 2012 through December 2016, Messrs. DiLorenzo and Yost served as Treasurer and Deputy Treasurer of the Funds, respectively. |
| (j) | Directorships or trusteeships of companies required to report to the Securities and Exchange Commission (i.e., “public companies”). |
| (k) | “Interested person” of the Trust within the meaning of the Investment Company Act of 1940 (referred to as the 1940 Act), which is the principal federal law governing investment companies like the fund, as a result of a position with MFS. The address of MFS is 111 Huntington Avenue, Boston, Massachusetts 02199-7618. |
Each Trustee (other than Messrs. Jones, Kilman and Roberge) has been elected by shareholders and each Trustee and Officer holds office until his or her successor is chosen and qualified or until his or her earlier death, resignation, retirement or removal. Mr. Roberge became a Trustee of the Funds on January 1, 2021 and Messrs. Jones and Kilman became Trustees of the Funds on January 1, 2019. The Trust does not hold annual meetings for the purpose of electing Trustees, and Trustees are not elected for fixed terms. Under the terms of the Board's retirement policy, an Independent Trustee shall retire at the end of the calendar year in which he or she reaches the earlier of 75 years of age or 15 years of service on the Board (or, in the case of any Independent Trustee who joined the Board prior to 2015, 20 years of service on the Board).
Trustees and Officers - continued
Messrs. Buller, Kilman and Otis and Ms. Roepke are members of the Trust’s Audit Committee.
Each of the Interested Trustees and certain Officers hold comparable officer positions with certain affiliates of MFS.
The Statement of Additional Information for a Fund includes further information about the Trustees and is available without charge upon request by calling 1-800-225-2606.
| Investment Adviser | Custodian |
Massachusetts Financial Services Company
111 Huntington Avenue
Boston, MA 02199-7618 | State Street Bank and Trust Company
1 Lincoln Street
Boston, MA 02111-2900 |
| Distributor | Independent Registered Public Accounting Firm |
MFS Fund Distributors, Inc.
111 Huntington Avenue
Boston, MA 02199-7618 | Deloitte & Touche LLP
200 Berkeley Street
Boston, MA 02116 |
| Portfolio Manager(s) | |
Ryan McAllister
Roger Morley
| |
Board Review of Investment Advisory Agreement
MFS Global Equity Series
The Investment Company Act of 1940 requires that both the full Board of Trustees and a majority of the non-interested (“independent”) Trustees, voting separately, annually approve the continuation of the Fund’s investment advisory agreement with MFS. The Trustees consider matters bearing on the Fund and its advisory arrangements at their meetings throughout the year, including a review of performance data at each regular meeting. In addition, the independent Trustees met several times over the course of three months beginning in May and ending in July, 2022 (“contract review meetings”) for the specific purpose of considering whether to approve the continuation of the investment advisory agreement for the Fund and the other investment companies that the Board oversees (the “MFS Funds”). The independent Trustees were assisted in their evaluation of the Fund’s investment advisory agreement by independent legal counsel, from whom they received separate legal advice and with whom they met separately from MFS during various contract review meetings. The independent Trustees were also assisted in this process by an independent consultant who was retained by and reported to the independent Trustees.
In connection with their deliberations regarding the continuation of the investment advisory agreement, the Trustees, including the independent Trustees, considered such information and factors as they believed, in light of the legal advice furnished to them and their own business judgment, to be relevant. The investment advisory agreement for the Fund was considered separately, although the Trustees also took into account the common interests of all MFS Funds in their review. As described below, the Trustees considered the nature, quality, and extent of the various investment advisory, administrative, and shareholder services performed by MFS under the existing investment advisory agreement and other arrangements with the Fund.
In connection with their contract review meetings, the Trustees received and relied upon materials that included, among other items: (i) information provided by Broadridge Financial Solutions, Inc. (“Broadridge”), an independent third party, on the investment performance of the Fund for various time periods ended December 31, 2021 and the investment performance of a group of funds with substantially similar investment classifications/objectives (the “Broadridge performance universe”), (ii) information provided by Broadridge on the Fund’s advisory fees and other expenses and the advisory fees and other expenses of comparable funds identified by Broadridge as well as all other funds in the same investment classification/category (the “Broadridge expense group and universe”), (iii) information provided by MFS on the advisory fees of portfolios of other clients of MFS, including institutional separate accounts and other clients, (iv) information as to whether and to what extent applicable expense waivers, reimbursements or fee “breakpoints” are observed for the Fund, (v) information regarding MFS’ financial results and financial condition, including MFS’ and certain of its affiliates’ estimated profitability from services performed for the Fund and the MFS Funds as a whole, and compared to MFS’ institutional business, (vi) MFS’ views regarding the outlook for the mutual fund industry and the strategic business plans of MFS, (vii) descriptions of various functions performed by MFS for the Funds, such as compliance monitoring and portfolio trading practices, and (viii) information regarding the overall organization of MFS, including information about MFS’ senior management and other personnel providing investment advisory, administrative and other services to the Fund and the other MFS Funds. The comparative performance, fee and expense information prepared and provided by Broadridge was not independently verified and the independent Trustees did not independently verify any information provided to them by MFS.
The Trustees’ conclusion as to the continuation of the investment advisory agreement was based on a comprehensive consideration of all information provided to the Trustees and not the result of any single factor. Some of the factors that figured particularly in the Trustees’ deliberations are described below, although individual Trustees may have evaluated the information presented differently from one another, giving different weights to various factors. It is also important to recognize that the fee arrangements for the Fund and other MFS Funds are the result of years of review and discussion between the independent Trustees and MFS, that certain aspects of such arrangements may receive greater scrutiny in some years than in others, and that the Trustees’ conclusions may be based, in part, on their consideration of these same arrangements during the course of the year and in prior years.
Based on information provided by Broadridge and MFS, the Trustees reviewed the Fund’s total return investment performance as well as the Broadridge performance universe over various time periods. The Trustees placed particular emphasis on the total return performance of the Fund’s Initial Class shares in comparison to the performance of funds in its Broadridge performance universe over the five-year period ended December 31, 2021, which the Trustees believed was a long enough period to reflect differing market conditions. The total return performance of the Fund’s Initial Class shares was in the 3rd quintile relative to the other funds in the universe for this five-year period (the 1st quintile being the best performers and the 5th quintile being the worst performers). The total return performance of the Fund’s Initial Class shares was in the 3rd quintile for each of the one- and three-year periods ended December 31, 2021 relative to the Broadridge performance universe. Because of the passage of time, these performance results may differ from the performance results for more recent periods, including those shown elsewhere in this report.
In the course of their deliberations, the Trustees took into account information provided by MFS in connection with the contract review meetings, as well as during investment review meetings conducted with portfolio management personnel during the course of the year regarding the Fund’s performance. After reviewing these and related factors, the Trustees concluded, within the context of their overall conclusions regarding the investment advisory agreement, that they were satisfied with MFS’ responses and efforts relating to investment performance.
Board Review of Investment Advisory Agreement - continued
In assessing the reasonableness of the Fund’s advisory fee, the Trustees considered, among other information, the Fund’s advisory fee and the total expense ratio of the Fund’s Initial Class shares as a percentage of average daily net assets and the advisory fee and total expense ratios of the Broadridge expense group based on information provided by Broadridge. The Trustees considered that MFS currently observes an expense limitation for the Fund, which may not be changed without the Trustees’ approval. The Trustees also considered that, according to the data provided by Broadridge (which takes into account any fee reductions or expense limitations that were in effect during the Fund’s last fiscal year), the Fund’s effective advisory fee rate was approximately at the Broadridge expense group median and the Fund’s total expense ratio was higher than the Broadridge expense group median.
The Trustees also considered the advisory fees charged by MFS to any institutional separate accounts advised by MFS (“separate accounts”) and unaffiliated investment companies for which MFS serves as subadviser (“subadvised funds”) that have comparable investment strategies to the Fund, if any. In comparing these fees, the Trustees considered information provided by MFS as to the generally broader scope of services provided by MFS to the Fund, as well as the more extensive regulatory burdens imposed on MFS in managing the Fund, in comparison to separate accounts and subadvised funds. The Trustees also considered the higher demands placed on MFS’ investment personnel and trading infrastructure as a result of the daily cash in-flows and out-flows of the Fund in comparison to separate accounts.
The Trustees also considered whether the Fund may benefit from any economies of scale in the management of the Fund in the event of growth in assets of the Fund and/or growth in assets of the MFS Funds as a whole. They noted that the Fund’s advisory fee rate schedule is subject to contractual breakpoints that reduce the Fund’s advisory fee rate on average daily net assets over $1 billion and $2.5 billion. The Trustees also noted that MFS has agreed in writing to waive a portion of the management fees of certain MFS Funds, including the Fund, if the total combined assets of certain funds within the MFS Funds’ complex increase above agreed upon thresholds (the “group fee waiver”), enabling the Fund’s shareholders to share in the benefits from any economies of scale at the complex level. The group fee waiver is reviewed and renewed annually between the Board and MFS. The Trustees concluded that the breakpoints and the group fee waiver were sufficient to allow the Fund to benefit from economies of scale as its assets and overall complex assets grow.
The Trustees also considered information prepared by MFS relating to MFS’ costs and profits with respect to the Fund, the MFS Funds considered as a group, and other investment companies and accounts advised by MFS, as well as MFS’ methodologies used to determine and allocate its costs to the MFS Funds, the Fund and other accounts and products for purposes of estimating profitability.
After reviewing these and other factors described herein, the Trustees concluded, within the context of their overall conclusions regarding the investment advisory agreement, that the advisory fees charged to the Fund represent reasonable compensation in light of the services being provided by MFS to the Fund.
In addition, the Trustees considered MFS’ resources and related efforts to continue to retain, attract and motivate capable personnel to serve the Fund. The Trustees also considered current and developing conditions in the financial services industry, including the presence of large and well-capitalized companies which are spending, and appear to be prepared to continue to spend, substantial sums to engage personnel and to provide services to competing investment companies. In this regard, the Trustees also considered the financial resources of MFS and its ultimate parent, Sun Life Financial Inc. The Trustees also considered the advantages and possible disadvantages to the Fund of having an adviser that also serves other investment companies as well as other accounts.
The Trustees also considered the nature, quality, cost, and extent of administrative, transfer agency, and distribution services provided to the Fund by MFS and its affiliates under agreements and plans other than the investment advisory agreement, including any 12b-1 fees the Fund pays to MFS Fund Distributors, Inc., an affiliate of MFS. The Trustees also considered the nature, extent and quality of certain other services MFS performs or arranges for on the Fund’s behalf, which may include securities lending programs, directed expense payment programs, class action recovery programs, and MFS’ interaction with third-party service providers, principally custodians and sub-custodians. The Trustees concluded that the various non-advisory services provided by MFS and its affiliates on behalf of the Fund were satisfactory.
The Trustees considered so-called “fall-out benefits” to MFS such as reputational value derived from serving as investment manager to the MFS Funds. The Trustees also considered that MFS discontinued its historic practice of obtaining investment research from portfolio brokerage commissions paid by certain MFS Funds effective January 2018, and directly pays or voluntarily reimburses a Fund, if applicable, for the costs of external research acquired through the use of the Fund’s portfolio brokerage commissions.
Based on their evaluation of factors that they deemed to be material, including those factors described above, the Board of Trustees, including the independent Trustees, concluded that the Fund’s investment advisory agreement with MFS should be continued for an additional one-year period, commencing August 1, 2022.
Proxy Voting Policies and Information
MFS votes proxies on behalf of the fund pursuant to proxy voting policies and procedures that are available without charge, upon request, by calling 1-800-225-2606, by visiting mfs.com/proxyvoting, or by visiting the SEC’s Web site at http://www.sec.gov.
Information regarding how the fund voted proxies relating to portfolio securities during the most recent twelve-month period ended June 30 is available by August 31 of each year without charge by visiting mfs.com/proxyvoting, or by visiting the SEC’s Web site at http://www.sec.gov.
Quarterly Portfolio Disclosure
The fund files a complete schedule of portfolio holdings with the SEC for the first and third quarters of each fiscal year as an exhibit to its reports on Form N-PORT. The fund’s Form N-PORT reports are available on the SEC’s Web site at http://www.sec.gov. A shareholder can obtain the portfolio holdings report for the first and third quarters of the fund's fiscal year at mfs.com/vit1 by choosing the fund's name and then scrolling to the “Resources” section and clicking on the “Prospectus and Reports” tab.
FURTHER INFORMATION
From time to time, MFS may post important information about the fund or the MFS Funds on the MFS Web site (mfs.com). This information is available at https://www.mfs.com/announcements or at mfs.com/vit1 by choosing the fund's name and then scrolling to the “Resources” section and clicking on the “Announcements” tab, if any.
Information About Fund Contracts and Legal Claims
The fund has entered into contractual arrangements with an investment adviser, administrator, distributor, shareholder servicing agent, and custodian who each provide services to the fund. Unless expressly stated otherwise, shareholders are not parties to, or intended beneficiaries of these contractual arrangements, and these contractual arrangements are not intended to create any shareholder right to enforce them against the service providers or to seek any remedy under them against the service providers, either directly or on behalf of the fund.
Under the Trust’s By-Laws and Declaration of Trust, any claims asserted against or on behalf of the MFS Funds, including claims against Trustees and Officers, must be brought in state and federal courts located within the Commonwealth of Massachusetts.
Federal Tax Information (unaudited)
The following information is provided pursuant to provisions of the Internal Revenue Code.
The fund designates $5,771,000 as capital gain dividends paid during the fiscal year.
For corporate shareholders, 70.37% of the ordinary income dividends paid during the fiscal year qualify for the corporate dividends received deduction.
Income derived from foreign sources was $638,800. The fund intends to pass through foreign tax credits of $60,436 for the fiscal year.
| FACTS | WHAT DOES MFS DO WITH YOUR PERSONAL INFORMATION? |
| Why? | Financial companies choose how they share your personal information. Federal law gives consumers the right to limit some but not all sharing. Federal law also requires us to tell you how we collect, share, and protect your personal information. Please read this notice carefully to understand what we do. |
| What? | The types of personal information we collect and share depend on the product or service you have with us. This information can include: |
| • Social Security number and account balances |
| • Account transactions and transaction history |
| • Checking account information and wire transfer instructions |
| When you are no longer our customer, we continue to share your information as described in this notice. |
| How? | All financial companies need to share customers' personal information to run their everyday business. In the section below, we list the reasons financial companies can share their customers' personal information; the reasons MFS chooses to share; and whether you can limit this sharing. |
Reasons we can share your
personal information | Does MFS share? | Can you limit
this sharing? |
For our everyday business purposes –
such as to process your transactions, maintain your
account(s), respond to court orders and legal
investigations, or report to credit bureaus | Yes | No |
For our marketing purposes –
to offer our products and services to you | No | We don't share |
For joint marketing with other
financial companies | No | We don't share |
For our affiliates' everyday business purposes –
information about your transactions and experiences | No | We don't share |
For our affiliates' everyday business purposes –
information about your creditworthiness | No | We don't share |
| For nonaffiliates to market to you | No | We don't share |
| Questions? | Call 800-225-2606 or go to mfs.com. |
| Who we are |
| Who is providing this notice? | MFS Funds, MFS Investment Management, MFS Institutional Advisors, Inc., and MFS Heritage Trust Company. |
| What we do |
How does MFS
protect my personal
information? | To protect your personal information from unauthorized access and use, we use security measures that comply with federal law. These measures include procedural, electronic, and physical safeguards for the protection of the personal information we collect about you. |
How does MFS
collect my personal
information? | We collect your personal information, for example, when you |
| • open an account or provide account information |
| • direct us to buy securities or direct us to sell your securities |
| • make a wire transfer |
| We also collect your personal information from others, such as credit bureaus, affiliates, or other companies. |
| Why can't I limit all sharing? | Federal law gives you the right to limit only |
| • sharing for affiliates' everyday business purposes – information about your creditworthiness |
| • affiliates from using your information to market to you |
| • sharing for nonaffiliates to market to you |
| State laws and individual companies may give you additional rights to limit sharing. |
| Definitions |
| Affiliates | Companies related by common ownership or control. They can be financial and nonfinancial companies. |
| • MFS does not share personal information with affiliates, except for everyday business purposes as described on page one of this notice. |
| Nonaffiliates | Companies not related by common ownership or control. They can be financial and nonfinancial companies. |
| • MFS does not share with nonaffiliates so they can market to you. |
| Joint marketing | A formal agreement between nonaffiliated financial companies that together market financial products or services to you. |
| • MFS doesn't jointly market. |
| Other important information |
| If you own an MFS product or receive an MFS service in the name of a third party such as a bank or broker-dealer, their privacy policy may apply to you instead of ours. |
Annual Report
December 31, 2022
MFS® Investors Trust Series
MFS® Variable Insurance Trust
MFS® Investors Trust Series
| 1 |
| 2 |
| 3 |
| 5 |
| 7 |
| 8 |
| 12 |
| 13 |
| 14 |
| 15 |
| 17 |
| 23 |
| 24 |
| 27 |
| 29 |
| 29 |
| 29 |
| 29 |
| 29 |
| 30 |
The report is prepared for the general information of shareholders. It is authorized for distribution to prospective investors only when preceded or accompanied by a current prospectus.
NOT FDIC INSURED • MAY LOSE VALUE • NO BANK OR CREDIT UNION GUARANTEE •
NOT A DEPOSIT • NOT INSURED BY ANY FEDERAL GOVERNMENT AGENCY OR NCUA/NCUSIF
MFS Investors Trust Series
LETTER FROM THE CHAIR AND CEO
Dear Shareholders:
Signs of peaking inflation, hopes that monetary policy tightening cycles may be nearing an end and a rapid reopening of China’s economy in late-2022 and early-2023 have combined to bolster investor sentiment in recent months. Markets have largely adjusted to the challenges posed by Russia’s invasion of Ukraine, thanks in part to mild European winter weather which has alleviated concerns over potential shortages of natural gas. Resilient labor markets in much of the developed world have further contributed to a brighter-than-expected economic backdrop. However, many investors are mindful that the lagged effects of ongoing policy tightening have yet to work their way through the global economy.
Tighter global financial conditions have been a particular headwind for richly valued growth equities and interest rate-sensitive parts of the economy, such as housing. Over the near term, companies may face a challenging earnings backdrop as they are forced to absorb higher input and labor costs at a time of dwindling pricing power. For fixed income, the rise in interest rates has made bonds more attractive than they have been in years, which may provide balance to an overall portfolio.
During times of market transition, it is important to have a deep understanding of company fundamentals, and we have built our unique global research platform to do just that.
At MFS®, we put our clients’ assets to work responsibly by carefully navigating increasingly complex global capital markets. Our investment team is guided by a commitment to long-term fundamental investing. Our global investment platform — combining collective expertise, long-term discipline, and thoughtful risk management — seeks to uncover what we believe are the best, most durable investment ideas in markets around the world, enabling us to potentially create value for investors.
Respectfully,
Michael W. Roberge
Chair and Chief Executive Officer
MFS Investment Management
February 15, 2023
The opinions expressed in this letter are subject to change and may not be relied upon for investment advice. No forecasts can be guaranteed.
MFS Investors Trust Series
Portfolio structure
Top ten holdings
| Microsoft Corp. | 6.2% |
| Alphabet, Inc., “A” | 3.9% |
| ConocoPhillips | 3.0% |
| JPMorgan Chase & Co. | 2.6% |
| Apple, Inc. | 2.4% |
| Honeywell International, Inc. | 2.2% |
| Visa, Inc., “A” | 2.2% |
| Merck & Co., Inc. | 2.1% |
| Bank of America Corp. | 2.1% |
| Thermo Fisher Scientific, Inc. | 2.0% |
GICS equity sectors (g)
| Information Technology | 24.0% |
| Health Care | 18.5% |
| Financials | 11.2% |
| Industrials | 10.1% |
| Communication Services | 8.9% |
| Consumer Discretionary | 8.0% |
| Consumer Staples | 6.5% |
| Materials | 4.1% |
| Real Estate | 3.4% |
| Energy | 3.0% |
| Utilities | 1.0% |
| (g) | The Global Industry Classification Standard (GICS®) was developed by and/or is the exclusive property of MSCI, Inc. and S&P Global Market Intelligence Inc. (“S&P Global Market Intelligence”). GICS is a service mark of MSCI and S&P Global Market Intelligence and has been licensed for use by MFS. MFS has applied its own internal sector/industry classification methodology for equity securities and non-equity securities that are unclassified by GICS. |
Cash & Cash Equivalents includes any cash, investments in money market funds, short-term securities, and other assets less liabilities. Please see the Statement of Assets and Liabilities for additional information related to the fund’s cash position and other assets and liabilities.
Percentages are based on net assets as of December 31, 2022.
The portfolio is actively managed and current holdings may be different.
MFS Investors Trust Series
Management Review
Summary of Results
For the twelve months ended December 31, 2022, Initial Class shares of the MFS Investors Trust Series (fund) provided a total return of -16.49%, while Service Class shares of the fund provided a total return of -16.69%. These compare with a return of -18.11% over the same period for the fund’s benchmark, the Standard & Poor’s 500 Stock Index (S&P 500 Index).
Market Environment
During the reporting period, markets continued to grapple with the strongest global inflationary pressures in decades along with signs of slowing economic growth. Intermittent coronavirus flareups, particularly in China, where home-grown vaccines have proved less effective than elsewhere, kept supply chains stretched for a considerable period. At the same time, the reopening of the economy in the parts of the world where the virus has been better contained has led to a shift in consumption patterns in favor of services, straining already tight labor markets in most developed economies, while reducing demand for manufactured goods, primarily from Asia. As a result of Russia’s invasion of Ukraine, geopolitical considerations, such as sanctions and trade bans, have resulted in additional supply chain disruptions and volatile global energy prices. Taken together, these factors have contributed to market volatility.
The ripple effects from the Russian invasion further complicated the mission central banks must undertake to rein in surging inflation. Energy shocks have historically resulted in global growth slowdowns, if not pullbacks, so policymakers will find themselves in the difficult position of trying to restrain inflation without tipping economies into recession. Despite the challenging macroeconomic and geopolitical environment, policymakers remained focused on controlling inflation, although investors appeared to have expected varying degrees of action from the central banks. The Fed has been among the most aggressive developed market central banks, tightening policy at the fastest rate in decades, although it slowed its hiking pace at the end of the period, as did the European Central Bank. After remaining on the monetary sidelines for much of the period, the Bank of Japan widened its Yield Curve Control band, capping the yield on its 10-year bond at 0.5%, up from 0.25%, an action investors interpreted as a first step toward monetary policy normalization.
Against an environment of still-tight labor markets, tighter global financial conditions and volatile materials prices, investor anxiety appeared to have increased over the potential that corporate profit margins may be past peak for this cycle. That said, tentative signs that supply chain bottlenecks (particularly semiconductors) may be moderating, the easing of COVID restrictions in China, low levels of unemployment across developed markets and hopes that inflation levels may be near a peak were supportive factors for the macroeconomic backdrop.
Contributors to Performance
During the reporting period, a combination of favorable stock selection and underweight positions in both the information technology and consumer discretionary sectors contributed to the fund’s performance relative to the S&P 500 Index. Within the information technology sector, not owning shares of poor-performing computer graphics processor maker NVIDIA and the fund’s holdings of billing software company Amdocs(b) aided relative returns. The stock price of NVIDIA declined as the company reported lower revenue derived from its gaming segment as demand in crypto mining subsided and inventory levels swelled. Within the consumer discretionary sector, not owning shares of electric vehicle manufacturer Tesla and an underweight position in internet retailer Amazon.com also strengthened relative results as both stocks underperformed the benchmark. The stock price of Tesla declined due to uncertainty surrounding production shutdowns at the company's Shanghai manufacturing plant, reduced vehicle deliveries, increased competitive concerns and questions regarding Tesla CEO Elon Musk’s acquisition of social media platform Twitter.
Stock selection in the communication services sector also benefited relative performance, driven by the fund’s avoidance of weak-performing social networking service provider Meta Platforms. Although the company reported in-line revenue results, its forward-looking guidance for higher-than-expected expenses and capital expenditures weighed on the stock price of Meta Platforms.
Elsewhere, the fund's overweight holdings of oil and gas company ConocoPhillips, biotechnology company Vertex Pharmaceuticals, pharmaceutical company Merck, global health services provider Cigna and engineering solutions provider Howmet Aerospace strengthened relative returns. The share price of ConocoPhillips rose as the company reported above-consensus earnings, helped by better production volumes, and increased its targeted capital return to investors.
Detractors from Performance
The fund’s underweight allocation to the energy sector detracted from relative performance as this sector generated strong returns for the reporting period. Within this sector, not owning shares of integrated oil and gas company ExxonMobil and integrated energy company Chevron held back the fund’s relative returns. The share price of ExxonMobil advanced during the period owing to a strong energy price environment reflecting global energy shortages and better margin expansion in its refining segment. Additionally, increased returns to shareholders through stock repurchases and dividends, paired with greater debt reduction, further supported the stock.
MFS Investors Trust Series
Management Review - continued
Stock selection within both the consumer staples and materials sectors detracted from relative performance. Within both sectors, there were no individual securities, either in the fund or in the benchmark, that were among the fund's top relative detractors for the reporting period.
In other sectors, the fund's overweight positions in technology company Alphabet and global banking and payments technology provider Fidelity National Information Services hindered relative results. The stock price of Alphabet declined as the company reported financial results below expectations, driven by lower-than-expected revenue growth and weak performance in its search, YouTube and ad network segments. The fund’s holdings of clinical research provider ICON(b) (Ireland), electricity and natural gas provider Maravai Lifesciences Holdings(b) and cable service provider Cable One(b) also held back relative performance. Additionally, not owning shares of health insurance and Medicare/Medicaid provider UnitedHealth Group, insurance and investment firm Berkshire Hathaway and pharmaceutical company AbbVie weakened the fund’s relative returns as all three stocks outperformed the benchmark.
Respectfully,
Portfolio Manager(s)
Jude Jason, Alison O’Neill Mackey, and Ted Maloney
Note to Shareholders: Effective May 1, 2023, Ted Maloney will no longer be a Portfolio Manager of the fund.
| (b) | Security is not a benchmark constituent. |
The views expressed in this report are those of the portfolio manager(s) only through the end of the period of the report as stated on the cover and do not necessarily reflect the views of MFS or any other person in the MFS organization. These views are subject to change at any time based on market or other conditions, and MFS disclaims any responsibility to update such views. These views may not be relied upon as investment advice or an indication of trading intent on behalf of any MFS portfolio. References to specific securities are not recommendations of such securities, and may not be representative of any MFS portfolio’s current or future investments.
MFS Investors Trust Series
Performance Summary Through 12/31/22
The following chart illustrates the historical performance of the fund in comparison to its benchmark(s). Benchmarks are unmanaged and may not be invested in directly. Benchmark returns do not reflect any fees or expenses. The performance of other share classes will be greater than or less than that of the class depicted below. (See Notes to Performance Summary.)
Performance data shown represents past performance and is no guarantee of future results. Investment return and principal value fluctuate so your shares, when sold, may be worth more or less than the original cost; current performance may be lower or higher than quoted. The performance shown does not reflect the deduction of taxes, if any, that a shareholder would pay on fund distributions or the redemption of fund shares. The returns for the fund shown also do not reflect the deduction of expenses associated with variable products, such as mortality and expense risk charges, separate account charges, and sales charges imposed by the insurance company separate accounts. Such expenses would reduce the overall returns shown.
Growth of a Hypothetical $10,000 Investment
Total Returns through 12/31/22
Average annual total returns
| Share Class | Class Inception Date | 1-yr | 5-yr | 10-yr |
| Initial Class | 10/09/95 | (16.49)% | 8.44% | 11.43% |
| Service Class | 5/01/00 | (16.69)% | 8.18% | 11.15% |
Comparative benchmark(s)
| Standard & Poor's 500 Stock Index (f) | (18.11)% | 9.42% | 12.56% |
| (f) | Source: FactSet Research Systems Inc. |
Benchmark Definition(s)
Standard & Poor's 500 Stock Index(g) – a market capitalization-weighted index of 500 widely held equity securities, designed to measure broad U.S. equity performance.
It is not possible to invest directly in an index.
| (g) | “Standard & Poor's®” and “S&P®” are registered trademarks of Standard & Poor's Financial Services LLC (“S&P”) and Dow Jones is a registered trademark of Dow Jones Trademark Holdings LLC (“Dow Jones”) and have been licensed for use by S&P Dow Jones Indices LLC and sublicensed for certain purposes by MFS. The S&P 500® is a product of S&P Dow Jones Indices LLC, and has been licensed for use by MFS. MFS's product(s) is not sponsored, endorsed, sold, or promoted by S&P Dow Jones Indices LLC, Dow Jones, S&P, or their respective affiliates, and neither S&P Dow Jones Indices LLC, Dow Jones, S&P, nor their respective affiliates make any representation regarding the advisability of investing in such product(s). |
MFS Investors Trust Series
Performance Summary – continued
Notes to Performance Summary
Average annual total return represents the average annual change in value for each share class for the periods presented.
Performance results reflect any applicable expense subsidies and waivers in effect during the periods shown. Without such subsidies and waivers the fund's performance results would be less favorable. Please see the prospectus and financial statements for complete details. All results are historical and assume the reinvestment of any dividends and capital gains distributions.
Performance results do not include adjustments made for financial reporting purposes in accordance with U.S. generally accepted accounting principles and may differ from amounts reported in the financial highlights.
From time to time the fund may receive proceeds from litigation settlements, without which performance would be lower.
MFS Investors Trust Series
Expense Table
Fund expenses borne by the shareholders during the period,
July 1, 2022 through December 31, 2022
As a shareholder of the fund, you incur ongoing costs, including management fees; distribution and/or service (12b-1) fees; and other fund expenses. This example is intended to help you understand your ongoing costs (in dollars) of investing in the fund and to compare these costs with the ongoing costs of investing in other mutual funds.
The example is based on an investment of $1,000 invested at the beginning of the period and held for the entire period July 1, 2022 through December 31, 2022.
Actual Expenses
The first line for each share class in the following table provides information about actual account values and actual expenses. You may use the information in this line, together with the amount you invested, to estimate the expenses that you paid over the period. Simply divide your account value by $1,000 (for example, an $8,600 account value divided by $1,000 = 8.6), then multiply the result by the number in the first line under the heading entitled “Expenses Paid During Period” to estimate the expenses you paid on your account during this period.
Hypothetical Example for Comparison Purposes
The second line for each share class in the following table provides information about hypothetical account values and hypothetical expenses based on the fund’s actual expense ratio and an assumed rate of return of 5% per year before expenses, which is not the fund’s actual return. The hypothetical account values and expenses may not be used to estimate the actual ending account balance or expenses you paid for the period. You may use this information to compare the ongoing costs of investing in the fund and other funds. To do so, compare this 5% hypothetical example with the 5% hypothetical examples that appear in the shareholder reports of the other funds.
Please note that the expenses shown in the table are meant to highlight the fund's ongoing costs only and do not take into account the fees and expenses imposed under the variable contracts through which your investment in the fund is made. Therefore, the second line for each share class in the table is useful in comparing ongoing costs associated with an investment in vehicles (such as the fund) which fund benefits under variable annuity and variable life insurance contracts and to qualified pension and retirement plans only, and will not help you determine the relative total costs of investing in the fund through variable annuity and variable life insurance contracts. If the fees and expenses imposed under the variable contracts were included, your costs would have been higher.
Share
Class | | Annualized
Expense
Ratio | Beginning
Account Value
7/01/22 | Ending
Account Value
12/31/22 | Expenses
Paid During
Period (p)
7/01/22-12/31/22 |
| Initial Class | Actual | 0.78% | $1,000.00 | $1,022.90 | $3.98 |
| Hypothetical (h) | 0.78% | $1,000.00 | $1,021.27 | $3.97 |
| Service Class | Actual | 1.03% | $1,000.00 | $1,021.82 | $5.25 |
| Hypothetical (h) | 1.03% | $1,000.00 | $1,020.01 | $5.24 |
| (h) | 5% class return per year before expenses. |
| (p) | “Expenses Paid During Period” are equal to each class's annualized expense ratio, as shown above, multiplied by the average account value over the period, multiplied by 184/365 (to reflect the one-half year period). |
MFS Investors Trust Series
Portfolio of Investments − 12/31/22
The Portfolio of Investments is a complete list of all securities owned by your fund. It is categorized by broad-based asset classes.
| Issuer | | | Shares/Par | Value ($) |
| Common Stocks – 98.7% |
| Aerospace & Defense – 3.8% | |
| Honeywell International, Inc. | | 79,029 | $ 16,935,915 |
| Howmet Aerospace, Inc. | | 311,028 | 12,257,613 |
| | | | | $29,193,528 |
| Alcoholic Beverages – 2.3% | |
| Diageo PLC | | 203,319 | $ 8,971,792 |
| Pernod Ricard S.A. | | 44,593 | 8,771,225 |
| | | | | $17,743,017 |
| Apparel Manufacturers – 1.3% | |
| LVMH Moet Hennessy Louis Vuitton SE | | 13,210 | $ 9,596,337 |
| Biotechnology – 0.4% | |
| Illumina, Inc. (a) | | 14,842 | $ 3,001,052 |
| Brokerage & Asset Managers – 2.7% | |
| Charles Schwab Corp. | | 90,433 | $ 7,529,452 |
| NASDAQ, Inc. | | 215,264 | 13,206,446 |
| | | | | $20,735,898 |
| Business Services – 4.6% | |
| Accenture PLC, “A” | | 9,031 | $ 2,409,832 |
| Amdocs Ltd. | | 139,293 | 12,661,734 |
| Fidelity National Information Services, Inc. | | 133,283 | 9,043,251 |
| Fiserv, Inc. (a) | | 103,911 | 10,502,285 |
| | | | | $34,617,102 |
| Cable TV – 1.8% | |
| Cable One, Inc. | | 3,988 | $ 2,838,897 |
| Comcast Corp., “A” | | 312,442 | 10,926,097 |
| | | | | $13,764,994 |
| Chemicals – 0.5% | |
| PPG Industries, Inc. | | 33,094 | $ 4,161,240 |
| Computer Software – 9.3% | |
| Adobe Systems, Inc. (a) | | 28,116 | $ 9,461,877 |
| Check Point Software Technologies Ltd. (a) | | 66,172 | 8,348,260 |
| Microsoft Corp. | | 196,191 | 47,050,526 |
| Salesforce, Inc. (a) | | 42,172 | 5,591,585 |
| | | | | $70,452,248 |
| Computer Software - Systems – 2.4% | |
| Apple, Inc. | | 140,911 | $ 18,308,566 |
| Construction – 1.6% | |
| Masco Corp. | | 154,763 | $ 7,222,789 |
| Sherwin-Williams Co. | | 22,385 | 5,312,632 |
| | | | | $12,535,421 |
MFS Investors Trust Series
Portfolio of Investments – continued
| Issuer | | | Shares/Par | Value ($) |
| Common Stocks – continued |
| Consumer Products – 2.3% | |
| Colgate-Palmolive Co. | | 91,609 | $ 7,217,873 |
| International Flavors & Fragrances, Inc. | | 23,780 | 2,493,095 |
| Kimberly-Clark Corp. | | 56,706 | 7,697,840 |
| | | | | $17,408,808 |
| Containers – 1.3% | |
| Ball Corp. | | 47,803 | $ 2,444,645 |
| Crown Holdings, Inc. | | 94,603 | 7,777,313 |
| | | | | $10,221,958 |
| Electrical Equipment – 5.0% | |
| AMETEK, Inc. | | 63,076 | $ 8,812,979 |
| Fortive Corp. | | 118,169 | 7,592,358 |
| Johnson Controls International PLC | | 217,197 | 13,900,608 |
| TE Connectivity Ltd. | | 67,919 | 7,797,101 |
| | | | | $38,103,046 |
| Electronics – 2.6% | |
| Analog Devices, Inc. | | 53,646 | $ 8,799,553 |
| Texas Instruments, Inc. | | 65,320 | 10,792,171 |
| | | | | $19,591,724 |
| Energy - Independent – 3.0% | |
| ConocoPhillips | | 196,420 | $ 23,177,560 |
| Food & Beverages – 1.0% | |
| Mondelez International, Inc. | | 110,605 | $ 7,371,823 |
| Forest & Paper Products – 0.6% | |
| Rayonier, Inc., REIT | | 148,317 | $ 4,888,528 |
| General Merchandise – 1.3% | |
| Dollar General Corp. | | 38,578 | $ 9,499,833 |
| Health Maintenance Organizations – 1.8% | |
| Cigna Corp. | | 41,575 | $ 13,775,460 |
| Insurance – 1.9% | |
| Chubb Ltd. | | 36,192 | $ 7,983,955 |
| Willis Towers Watson PLC | | 26,905 | 6,580,425 |
| | | | | $14,564,380 |
| Internet – 5.3% | |
| Alphabet, Inc., “A” (a) | | 339,282 | $ 29,934,851 |
| Alphabet, Inc., “C” (a) | | 118,297 | 10,496,493 |
| | | | | $40,431,344 |
| Leisure & Toys – 1.8% | |
| Electronic Arts, Inc. | | 110,649 | $ 13,519,095 |
MFS Investors Trust Series
Portfolio of Investments – continued
| Issuer | | | Shares/Par | Value ($) |
| Common Stocks – continued |
| Major Banks – 6.6% | |
| Bank of America Corp. | | 473,779 | $ 15,691,560 |
| Goldman Sachs Group, Inc. | | 41,312 | 14,185,715 |
| JPMorgan Chase & Co. | | 148,692 | 19,939,597 |
| | | | | $49,816,872 |
| Medical & Health Technology & Services – 1.3% | |
| ICON PLC (a) | | 52,423 | $ 10,183,168 |
| Medical Equipment – 6.7% | |
| Becton, Dickinson and Co. | | 50,877 | $ 12,938,021 |
| Danaher Corp. | | 33,934 | 9,006,762 |
| Maravai Lifesciences Holdings, Inc., “A” (a) | | 146,644 | 2,098,476 |
| Medtronic PLC | | 150,666 | 11,709,762 |
| Thermo Fisher Scientific, Inc. | | 27,574 | 15,184,726 |
| | | | | $50,937,747 |
| Network & Telecom – 1.2% | |
| Equinix, Inc., REIT | | 13,858 | $ 9,077,406 |
| Other Banks & Diversified Financials – 4.2% | |
| Mastercard, Inc., “A” | | 43,349 | $ 15,073,748 |
| Visa, Inc., “A” | | 80,118 | 16,645,315 |
| | | | | $31,719,063 |
| Pharmaceuticals – 8.3% | |
| Eli Lilly & Co. | | 31,016 | $ 11,346,893 |
| Johnson & Johnson | | 80,507 | 14,221,562 |
| Merck & Co., Inc. | | 145,487 | 16,141,783 |
| Vertex Pharmaceuticals, Inc. (a) | | 51,083 | 14,751,749 |
| Zoetis, Inc. | | 44,179 | 6,474,432 |
| | | | | $62,936,419 |
| Railroad & Shipping – 1.1% | |
| Canadian Pacific Railway Ltd. | | 106,909 | $ 7,974,342 |
| Specialty Chemicals – 1.1% | |
| DuPont de Nemours, Inc. | | 127,252 | $ 8,733,305 |
| Specialty Stores – 6.7% | |
| Amazon.com, Inc. (a) | | 130,637 | $ 10,973,508 |
| Costco Wholesale Corp. | | 19,758 | 9,019,527 |
| Home Depot, Inc. | | 40,449 | 12,776,221 |
| Target Corp. | | 72,569 | 10,815,684 |
| Tractor Supply Co. | | 31,725 | 7,137,173 |
| | | | | $50,722,113 |
| Telecommunications - Wireless – 1.6% | |
| American Tower Corp., REIT | | 57,378 | $ 12,156,103 |
| Trucking – 0.3% | |
| Old Dominion Freight Line, Inc. | | 8,242 | $ 2,338,915 |
MFS Investors Trust Series
Portfolio of Investments – continued
| Issuer | | | Shares/Par | Value ($) |
| Common Stocks – continued |
| Utilities - Electric Power – 1.0% | |
| American Electric Power Co., Inc. | | 79,783 | $ 7,575,396 |
| Total Common Stocks (Identified Cost, $461,480,332) | | $750,833,811 |
| Investment Companies (h) – 1.2% |
| Money Market Funds – 1.2% | |
| MFS Institutional Money Market Portfolio, 4.02% (v) (Identified Cost, $9,387,686) | | | 9,387,576 | $ 9,390,392 |
| Other Assets, Less Liabilities – 0.1% | | 380,850 |
| Net Assets – 100.0% | $760,605,053 |
| (a) | Non-income producing security. | | | |
| (h) | An affiliated issuer, which may be considered one in which the fund owns 5% or more of the outstanding voting securities, or a company which is under common control. At period end, the aggregate values of the fund's investments in affiliated issuers and in unaffiliated issuers were $9,390,392 and $750,833,811, respectively. | | | |
| (v) | Affiliated issuer that is available only to investment companies managed by MFS. The rate quoted for the MFS Institutional Money Market Portfolio is the annualized seven-day yield of the fund at period end. | | | |
| The following abbreviations are used in this report and are defined: |
| REIT | Real Estate Investment Trust |
See Notes to Financial Statements
MFS Investors Trust Series
| Financial Statements | Statement of Assets and Liabilities |
This statement represents your fund’s balance sheet, which details the assets and liabilities comprising the total value of the fund.
| At 12/31/22Assets | |
| Investments in unaffiliated issuers, at value (identified cost, $461,480,332) | $750,833,811 |
| Investments in affiliated issuers, at value (identified cost, $9,387,686) | 9,390,392 |
| Receivables for | |
| Fund shares sold | 31,672 |
| Dividends | 840,982 |
| Other assets | 3,257 |
| Total assets | $761,100,114 |
| Liabilities | |
| Payables for | |
| Fund shares reacquired | $321,321 |
| Payable to affiliates | |
| Investment adviser | 45,984 |
| Administrative services fee | 947 |
| Shareholder servicing costs | 473 |
| Distribution and/or service fees | 8,271 |
| Payable for independent Trustees' compensation | 10 |
| Accrued expenses and other liabilities | 118,055 |
| Total liabilities | $495,061 |
| Net assets | $760,605,053 |
| Net assets consist of | |
| Paid-in capital | $426,866,161 |
| Total distributable earnings (loss) | 333,738,892 |
| Net assets | $760,605,053 |
| Shares of beneficial interest outstanding | 23,805,900 |
| | Net assets | Shares
outstanding | Net asset value
per share |
| Initial Class | $357,428,059 | 11,074,655 | $32.27 |
| Service Class | 403,176,994 | 12,731,245 | 31.67 |
See Notes to Financial Statements
MFS Investors Trust Series
| Financial Statements | Statement of Operations |
This statement describes how much your fund earned in investment income and accrued in expenses. It also describes any gains and/or losses generated by fund operations.
| Year ended 12/31/22 | |
| Net investment income (loss) | |
| Income | |
| Dividends | $11,369,409 |
| Dividends from affiliated issuers | 120,812 |
| Other | 12,086 |
| Foreign taxes withheld | (61,043) |
| Total investment income | $11,441,264 |
| Expenses | |
| Management fee | $5,751,087 |
| Distribution and/or service fees | 1,106,518 |
| Shareholder servicing costs | 33,396 |
| Administrative services fee | 128,113 |
| Independent Trustees' compensation | 13,696 |
| Custodian fee | 42,389 |
| Shareholder communications | 30,708 |
| Audit and tax fees | 59,543 |
| Legal fees | 3,161 |
| Miscellaneous | 32,152 |
| Total expenses | $7,200,763 |
| Reduction of expenses by investment adviser | (106,532) |
| Net expenses | $7,094,231 |
| Net investment income (loss) | $4,347,033 |
| Realized and unrealized gain (loss) | |
| Realized gain (loss) (identified cost basis) | |
| Unaffiliated issuers | $40,737,283 |
| Affiliated issuers | 315 |
| Foreign currency | 29,564 |
| Net realized gain (loss) | $40,767,162 |
| Change in unrealized appreciation or depreciation | |
| Unaffiliated issuers | $(185,010,789) |
| Affiliated issuers | 2,706 |
| Translation of assets and liabilities in foreign currencies | (2,836) |
| Net unrealized gain (loss) | $(185,010,919) |
| Net realized and unrealized gain (loss) | $(144,243,757) |
| Change in net assets from operations | $(139,896,724) |
See Notes to Financial Statements
MFS Investors Trust Series
| Financial Statements | Statements of Changes in Net Assets |
These statements describe the increases and/or decreases in net assets resulting from operations, any distributions, and any shareholder transactions.
| | Year ended |
| | 12/31/22 | 12/31/21 |
| Change in net assets | | |
| From operations | | |
| Net investment income (loss) | $4,347,033 | $2,717,392 |
| Net realized gain (loss) | 40,767,162 | 104,102,223 |
| Net unrealized gain (loss) | (185,010,919) | 83,097,778 |
| Change in net assets from operations | $(139,896,724) | $189,917,393 |
| Total distributions to shareholders | $(109,065,257) | $(29,217,089) |
| Change in net assets from fund share transactions | $177,975,178 | $(95,053,942) |
| Total change in net assets | $(70,986,803) | $65,646,362 |
| Net assets | | |
| At beginning of period | 831,591,856 | 765,945,494 |
| At end of period | $760,605,053 | $831,591,856 |
See Notes to Financial Statements
MFS Investors Trust Series
| Financial Statements | Financial Highlights |
The financial highlights table is intended to help you understand the fund's financial performance for the past 5 years. Certain information reflects financial results for a single fund share. The total returns in the table represent the rate that an investor would have earned (or lost) on an investment in the fund share class (assuming reinvestment of all distributions) held for the entire period.
| Initial Class | Year ended |
| | 12/31/22 | 12/31/21 | 12/31/20 | 12/31/19 | 12/31/18 |
| Net asset value, beginning of period | $44.72 | $36.57 | $33.27 | $27.05 | $30.07 |
| Income (loss) from investment operations | | | | | |
| Net investment income (loss) (d) | $0.27 | $0.21 | $0.25 | $0.25 | $0.26 |
| Net realized and unrealized gain (loss) | (7.41) | 9.53 | 4.26 | 8.08 | (1.71) |
| Total from investment operations | $(7.14) | $9.74 | $4.51 | $8.33 | $(1.45) |
| Less distributions declared to shareholders | | | | | |
| From net investment income | $(0.26) | $(0.26) | $(0.21) | $(0.22) | $(0.20) |
| From net realized gain | (5.05) | (1.33) | (1.00) | (1.89) | (1.37) |
| Total distributions declared to shareholders | $(5.31) | $(1.59) | $(1.21) | $(2.11) | $(1.57) |
| Net asset value, end of period (x) | $32.27 | $44.72 | $36.57 | $33.27 | $27.05 |
| Total return (%) (k)(r)(s)(x) | (16.49) | 26.81 | 13.87 | 31.58 | (5.49) |
Ratios (%) (to average net assets)
and Supplemental data: | | | | | |
| Expenses before expense reductions | 0.80 | 0.79 | 0.80 | 0.80 | 0.80 |
| Expenses after expense reductions | 0.78 | 0.78 | 0.79 | 0.79 | 0.79 |
| Net investment income (loss) | 0.74 | 0.50 | 0.78 | 0.80 | 0.86 |
| Portfolio turnover | 17 | 13 | 19 | 18 | 16 |
| Net assets at end of period (000 omitted) | $357,428 | $296,678 | $269,852 | $265,499 | $231,900 |
| Service Class | Year ended |
| | 12/31/22 | 12/31/21 | 12/31/20 | 12/31/19 | 12/31/18 |
| Net asset value, beginning of period | $43.97 | $35.99 | $32.77 | $26.68 | $29.69 |
| Income (loss) from investment operations | | | | | |
| Net investment income (loss) (d) | $0.16 | $0.10 | $0.17 | $0.17 | $0.18 |
| Net realized and unrealized gain (loss) | (7.26) | 9.38 | 4.19 | 7.97 | (1.68) |
| Total from investment operations | $(7.10) | $9.48 | $4.36 | $8.14 | $(1.50) |
| Less distributions declared to shareholders | | | | | |
| From net investment income | $(0.15) | $(0.17) | $(0.14) | $(0.16) | $(0.14) |
| From net realized gain | (5.05) | (1.33) | (1.00) | (1.89) | (1.37) |
| Total distributions declared to shareholders | $(5.20) | $(1.50) | $(1.14) | $(2.05) | $(1.51) |
| Net asset value, end of period (x) | $31.67 | $43.97 | $35.99 | $32.77 | $26.68 |
| Total return (%) (k)(r)(s)(x) | (16.69) | 26.51 | 13.60 | 31.25 | (5.71) |
Ratios (%) (to average net assets)
and Supplemental data: | | | | | |
| Expenses before expense reductions | 1.05 | 1.04 | 1.05 | 1.05 | 1.05 |
| Expenses after expense reductions | 1.03 | 1.03 | 1.04 | 1.04 | 1.04 |
| Net investment income (loss) | 0.44 | 0.24 | 0.53 | 0.55 | 0.62 |
| Portfolio turnover | 17 | 13 | 19 | 18 | 16 |
| Net assets at end of period (000 omitted) | $403,177 | $534,914 | $496,093 | $453,132 | $325,159 |
See Notes to Financial Statements
MFS Investors Trust Series
Financial Highlights - continued
| (d) | Per share data is based on average shares outstanding. |
| (k) | The total return does not reflect expenses that apply to separate accounts. Inclusion of these charges would reduce the total return figures for all periods shown. |
| (r) | Certain expenses have been reduced without which performance would have been lower. |
| (s) | From time to time the fund may receive proceeds from litigation settlements, without which performance would be lower. |
| (x) | The net asset values and total returns have been calculated on net assets which include adjustments made in accordance with U.S. generally accepted accounting principles required at period end for financial reporting purposes. |
See Notes to Financial Statements
MFS Investors Trust Series
Notes to Financial Statements
(1) Business and Organization
MFS Investors Trust Series (the fund) is a diversified series of MFS Variable Insurance Trust (the trust). The trust is organized as a Massachusetts business trust and is registered under the Investment Company Act of 1940, as amended, as an open-end management investment company. The shareholders of each series of the trust are separate accounts of insurance companies, which offer variable annuity and/or life insurance products, and qualified retirement and pension plans.
The fund is an investment company and accordingly follows the investment company accounting and reporting guidance of the Financial Accounting Standards Board (FASB) Accounting Standards Codification Topic 946 Financial Services - Investment Companies.
(2) Significant Accounting Policies
General — The preparation of financial statements in conformity with U.S. generally accepted accounting principles requires management to make estimates and assumptions that affect the reported amounts of assets and liabilities, and disclosure of contingent assets and liabilities at the date of the financial statements and the reported amounts of increases and decreases in net assets from operations during the reporting period. Actual results could differ from those estimates. In the preparation of these financial statements, management has evaluated subsequent events occurring after the date of the fund’s Statement of Assets and Liabilities through the date that the financial statements were issued.
Balance Sheet Offsetting — The fund's accounting policy with respect to balance sheet offsetting is that, absent an event of default by the counterparty or a termination of the agreement, the International Swaps and Derivatives Association (ISDA) Master Agreement, or similar agreement, does not result in an offset of reported amounts of financial assets and financial liabilities in the Statement of Assets and Liabilities across transactions between the fund and the applicable counterparty. The fund's right to setoff may be restricted or prohibited by the bankruptcy or insolvency laws of the particular jurisdiction to which a specific master netting agreement counterparty is subject. Balance sheet offsetting disclosures, to the extent applicable to the fund, have been included in the fund’s Significant Accounting Policies note under the captions for each of the fund’s in-scope financial instruments and transactions.
Investment Valuations — Subject to its oversight, the fund's Board of Trustees has delegated primary responsibility for determining or causing to be determined the value of the fund’s investments to MFS as the fund's adviser, pursuant to the fund’s valuation policy and procedures which have been adopted by the adviser and approved by the Board. Effective September 8, 2022, and in accordance with Rule 2a-5 under the Investment Company Act of 1940, the Board of Trustees designated the adviser as the “valuation designee” of the fund. If the adviser, as valuation designee, determines that reliable market quotations are not readily available for an investment, the investment is valued at fair value as determined in good faith by the adviser in accordance with the adviser’s fair valuation policy and procedures.
Under the fund's valuation policy and procedures, equity securities, including restricted equity securities, are generally valued at the last sale or official closing price on their primary market or exchange as provided by a third-party pricing service. Equity securities, for which there were no sales reported that day, are generally valued at the last quoted daily bid quotation on their primary market or exchange as provided by a third-party pricing service. Short-term instruments with a maturity at issuance of 60 days or less may be valued at amortized cost, which approximates market value. Open-end investment companies are generally valued at net asset value per share. The values of foreign securities and other assets and liabilities expressed in foreign currencies are converted to U.S. dollars using the mean of bid and asked prices for rates provided by a third-party pricing service.
Under the fund’s valuation policy and procedures, market quotations are not considered to be readily available for debt instruments, floating rate loans, and many types of derivatives. These investments are generally valued at fair value based on information from third-party pricing services or otherwise determined by the adviser in accordance with the adviser’s fair valuation policy and procedures. Securities and other assets generally valued on the basis of information from a third-party pricing service may also be valued at a broker/dealer bid quotation. In determining values, third-party pricing services can utilize both transaction data and market information such as yield, quality, coupon rate, maturity, type of issue, trading characteristics, spreads and other market data. An investment may also be valued at fair value if the adviser determines that the investment’s value has been materially affected by events occurring after the close of the exchange or market on which the investment is principally traded (such as foreign exchange or market) and prior to the determination of the fund’s net asset value, or after the halt of trading of a specific security where trading does not resume prior to the close of the exchange or market on which the security is principally traded. Events that occur after foreign markets close (such as developments in foreign markets and significant movements in the U.S. markets) and prior to the determination of the fund’s net asset value may be deemed to have a material effect on the value of securities traded in foreign markets. Accordingly, the fund’s foreign equity securities may often be valued at fair value. The adviser generally relies on third-party pricing services or other information (such as the correlation with price movements of similar securities in the same or other markets; the type, cost and investment characteristics of the security; the business and financial condition of the issuer; and trading and other
MFS Investors Trust Series
Notes to Financial Statements - continued
market data) to assist in determining whether to fair value and at what value to fair value an investment. The value of an investment for purposes of calculating the fund’s net asset value can differ depending on the source and method used to determine value. When fair valuation is used, the value of an investment used to determine the fund’s net asset value may differ from quoted or published prices for the same investment. There can be no assurance that the fund could obtain the fair value assigned to an investment if it were to sell the investment at the same time at which the fund determines its net asset value per share.
Various inputs are used in determining the value of the fund's assets or liabilities. These inputs are categorized into three broad levels. In certain cases, the inputs used to measure fair value may fall into different levels of the fair value hierarchy. In such cases, an investment's level within the fair value hierarchy is based on the lowest level of input that is significant to the fair value measurement. The fund's assessment of the significance of a particular input to the fair value measurement in its entirety requires judgment, and considers factors specific to the investment. Level 1 includes unadjusted quoted prices in active markets for identical assets or liabilities. Level 2 includes other significant observable market-based inputs (including quoted prices for similar securities, interest rates, prepayment speed, and credit risk). Level 3 includes significant unobservable inputs, which may include the adviser's own assumptions in determining the fair value of investments. The following is a summary of the levels used as of December 31, 2022 in valuing the fund's assets and liabilities:
| Financial Instruments | Level 1 | Level 2 | Level 3 | Total |
| Equity Securities: | | | | |
| United States | $707,171,855 | $— | $— | $707,171,855 |
| France | 8,771,225 | 9,596,337 | — | 18,367,562 |
| United Kingdom | 8,971,792 | — | — | 8,971,792 |
| Israel | 8,348,260 | — | — | 8,348,260 |
| Canada | 7,974,342 | — | — | 7,974,342 |
| Mutual Funds | 9,390,392 | — | — | 9,390,392 |
| Total | $750,627,866 | $9,596,337 | $— | $760,224,203 |
For further information regarding security characteristics, see the Portfolio of Investments.
Foreign Currency Translation — Purchases and sales of foreign investments, income, and expenses are converted into U.S. dollars based upon currency exchange rates prevailing on the respective dates of such transactions or on the reporting date for foreign denominated receivables and payables. Gains and losses attributable to foreign currency exchange rates on sales of securities are recorded for financial statement purposes as net realized gains and losses on investments. Gains and losses attributable to foreign exchange rate movements on receivables, payables, income and expenses are recorded for financial statement purposes as foreign currency transaction gains and losses. That portion of both realized and unrealized gains and losses on investments that results from fluctuations in foreign currency exchange rates is not separately disclosed.
Indemnifications — Under the fund's organizational documents, its officers and Trustees may be indemnified against certain liabilities and expenses arising out of the performance of their duties to the fund. Additionally, in the normal course of business, the fund enters into agreements with service providers that may contain indemnification clauses. The fund's maximum exposure under these agreements is unknown as this would involve future claims that may be made against the fund that have not yet occurred.
Investment Transactions and Income — Investment transactions are recorded on the trade date. Dividends received in cash are recorded on the ex-dividend date. Certain dividends from foreign securities will be recorded when the fund is informed of the dividend if such information is obtained subsequent to the ex-dividend date. Dividend payments received in additional securities are recorded on the ex-dividend date in an amount equal to the value of the security on such date. In determining the net gain or loss on securities sold, the cost of securities is determined on the identified cost basis.
The fund may receive proceeds from litigation settlements. Any proceeds received from litigation involving portfolio holdings are reflected in the Statement of Operations in realized gain/loss if the security has been disposed of by the fund or in unrealized gain/loss if the security is still held by the fund. Any other proceeds from litigation not related to portfolio holdings are reflected as other income in the Statement of Operations.
Tax Matters and Distributions — The fund intends to qualify as a regulated investment company, as defined under Subchapter M of the Internal Revenue Code, and to distribute all of its taxable income, including realized capital gains. As a result, no provision for federal income tax is required. The fund’s federal tax returns, when filed, will remain subject to examination by the Internal Revenue Service for a three year period. Management has analyzed the fund’s tax positions taken on federal and state tax returns for all open tax years and does not believe that there are any uncertain tax positions that require recognition of a tax liability. Foreign taxes, if any, have been accrued by the fund in the accompanying financial statements in accordance with the applicable foreign tax law. Foreign income taxes may be withheld by certain countries in which the fund invests. Additionally, capital gains realized by the fund on securities issued in or by certain foreign countries may be subject to capital gains tax imposed by those countries.
MFS Investors Trust Series
Notes to Financial Statements - continued
Distributions to shareholders are recorded on the ex-dividend date. Income and capital gain distributions are determined in accordance with income tax regulations, which may differ from U.S. generally accepted accounting principles. Certain capital accounts in the financial statements are periodically adjusted for permanent differences in order to reflect their tax character. These adjustments have no impact on net assets or net asset value per share. Temporary differences which arise from recognizing certain items of income, expense, gain or loss in different periods for financial statement and tax purposes will reverse at some time in the future.
Book/tax differences primarily relate to wash sale loss deferrals.
The tax character of distributions declared to shareholders for the last two fiscal years is as follows:
| | Year ended
12/31/22 | Year ended
12/31/21 |
| Ordinary income (including any short-term capital gains) | $11,904,201 | $3,914,032 |
| Long-term capital gains | 97,161,056 | 25,303,057 |
| Total distributions | $109,065,257 | $29,217,089 |
The federal tax cost and the tax basis components of distributable earnings were as follows:
| As of 12/31/22 | |
| Cost of investments | $473,030,162 |
| Gross appreciation | 319,387,285 |
| Gross depreciation | (32,193,244) |
| Net unrealized appreciation (depreciation) | $287,194,041 |
| Undistributed ordinary income | 4,373,737 |
| Undistributed long-term capital gain | 42,176,512 |
| Other temporary differences | (5,398) |
| Total distributable earnings (loss) | $333,738,892 |
Multiple Classes of Shares of Beneficial Interest — The fund offers multiple classes of shares, which differ in their respective distribution and/or service fees. The fund's income, realized and unrealized gain (loss), and common expenses are allocated to shareholders based on the daily net assets of each class. Dividends are declared separately for each class. Differences in per share dividend rates are generally due to differences in separate class expenses. The fund’s distributions declared to shareholders as reported in the Statements of Changes in Net Assets are presented by class as follows:
| | Year
ended
12/31/22 | | Year
ended
12/31/21 |
| Initial Class | $49,941,824 | | $10,689,350 |
| Service Class | 59,123,433 | | 18,527,739 |
| Total | $109,065,257 | | $29,217,089 |
(3) Transactions with Affiliates
Investment Adviser — The fund has an investment advisory agreement with MFS to provide overall investment management and related administrative services and facilities to the fund. The management fee is computed daily and paid monthly at the following annual rates based on the fund's average daily net assets:
| Up to $1 billion | 0.75% |
| In excess of $1 billion and up to $2.5 billion | 0.65% |
| In excess of $2.5 billion | 0.60% |
MFS has agreed in writing to reduce its management fee by a specified amount if certain MFS mutual fund assets exceed thresholds agreed to by MFS and the fund's Board of Trustees. Effective March 1, 2022, MFS has also agreed in writing to waive at least 0.01% of its management fee as part of this agreement. The agreement to waive at least 0.01% of the management fee will continue until modified by the fund's Board of Trustees, but such agreement will continue at least until April 30, 2024. For the year ended December 31, 2022, this management fee reduction amounted to $106,532, which is included in the reduction of total expenses in the Statement of Operations. The management fee incurred for the year ended December 31, 2022 was equivalent to an annual effective rate of 0.74% of the fund's average daily net assets.
MFS Investors Trust Series
Notes to Financial Statements - continued
The investment adviser has agreed in writing to pay a portion of the fund’s total annual operating expenses, excluding interest, taxes, extraordinary expenses, brokerage and transaction costs, certain tax reclaim recovery expenses (including contingency fees and closing agreement expenses), and investment-related expenses, such that total annual operating expenses do not exceed 0.79% of average daily net assets for the Initial Class shares and 1.04% of average daily net assets for the Service Class shares. This written agreement will continue until modified by the fund’s Board of Trustees, but such agreement will continue at least until April 30, 2024. For the year ended December 31, 2022, the fund’s actual operating expenses did not exceed the limit and therefore, the investment adviser did not pay any portion of the fund’s expenses related to this agreement.
Distributor — MFS Fund Distributors, Inc. (MFD), a wholly-owned subsidiary of MFS, is the distributor of shares of the fund. The Trustees have adopted a distribution plan for the Service Class shares pursuant to Rule 12b-1 under the Investment Company Act of 1940.
The fund's distribution plan provides that the fund will pay MFD distribution and/or service fees equal to 0.25% per annum of its average daily net assets attributable to Service Class shares as partial consideration for services performed and expenses incurred by MFD and financial intermediaries (including participating insurance companies that invest in the fund to fund variable annuity and variable life insurance contracts, sponsors of qualified retirement and pension plans that invest in the fund, and affiliates of these participating insurance companies and plan sponsors) in connection with the sale and distribution of the Service Class shares. MFD may subsequently pay all, or a portion, of the distribution and/or service fees to financial intermediaries.
Shareholder Servicing Agent — MFS Service Center, Inc. (MFSC), a wholly-owned subsidiary of MFS, receives a fee from the fund for its services as shareholder servicing agent. For the year ended December 31, 2022, the fee was $31,677, which equated to 0.0041% annually of the fund's average daily net assets. MFSC also receives reimbursement from the fund for out-of-pocket expenses paid by MFSC on behalf of the fund. For the year ended December 31, 2022, these costs amounted to $1,719.
Administrator — MFS provides certain financial, legal, shareholder communications, compliance, and other administrative services to the fund. Under an administrative services agreement, the fund reimburses MFS the costs incurred to provide these services. The fund is charged an annual fixed amount of $17,500 plus a fee based on average daily net assets. The administrative services fee incurred for the year ended December 31, 2022 was equivalent to an annual effective rate of 0.0167% of the fund's average daily net assets.
Trustees’ and Officers’ Compensation — The fund pays compensation to independent Trustees in the form of a retainer, attendance fees, and additional compensation to Board and Committee chairpersons. The fund does not pay compensation directly to Trustees or officers of the fund who are also officers of the investment adviser, all of whom receive remuneration from MFS for their services to the fund. Certain officers and Trustees of the fund are officers or directors of MFS, MFD, and MFSC.
Other — The fund invests in the MFS Institutional Money Market Portfolio which is managed by MFS and seeks current income consistent with preservation of capital and liquidity. This money market fund does not pay a management fee to MFS but does incur investment and operating costs.
The adviser has voluntarily undertaken to reimburse the fund from its own resources on a quarterly basis for the cost of investment research embedded in the cost of the fund’s securities trades. This agreement may be rescinded at any time. For the year ended December 31, 2022, this reimbursement amounted to $11,993, which is included in “Other” income in the Statement of Operations.
(4) Portfolio Securities
For the year ended December 31, 2022, purchases and sales of investments, other than short-term obligations, aggregated $199,003,968 and $131,650,521, respectively.
(5) Shares of Beneficial Interest
The fund's Declaration of Trust permits the Trustees to issue an unlimited number of full and fractional shares of beneficial interest. Transactions in fund shares were as follows:
| | Year ended
12/31/22 | | Year ended
12/31/21 |
| | Shares | Amount | | Shares | Amount |
| Shares sold | | | | | |
| Initial Class | 4,180,159 | $160,083,504 | | 241,331 | $10,343,575 |
| Service Class | 388,092 | 14,141,886 | | 424,823 | 17,614,977 |
| | 4,568,251 | $174,225,390 | | 666,154 | $27,958,552 |
MFS Investors Trust Series
Notes to Financial Statements - continued
| | Year ended
12/31/22 | | Year ended
12/31/21 |
| | Shares | Amount | | Shares | Amount |
Shares issued to shareholders
in reinvestment of distributions | | | | | |
| Initial Class | 1,477,569 | $49,941,824 | | 248,705 | $10,689,350 |
| Service Class | 1,780,826 | 59,123,433 | | 438,112 | 18,527,739 |
| | 3,258,395 | $109,065,257 | | 686,817 | $29,217,089 |
| Shares reacquired | | | | | |
| Initial Class | (1,216,784) | $(46,566,318) | | (1,234,645) | $(51,496,591) |
| Service Class | (1,603,763) | (58,749,151) | | (2,480,055) | (100,732,992) |
| | (2,820,547) | $(105,315,469) | | (3,714,700) | $(152,229,583) |
| Net change | | | | | |
| Initial Class | 4,440,944 | $163,459,010 | | (744,609) | $(30,463,666) |
| Service Class | 565,155 | 14,516,168 | | (1,617,120) | (64,590,276) |
| | 5,006,099 | $177,975,178 | | (2,361,729) | $(95,053,942) |
(6) Line of Credit
The fund and certain other funds managed by MFS participate in a $1.45 billion unsecured committed line of credit of which $1.2 billion is reserved for use by the fund and certain other MFS U.S. funds. The line of credit is provided by a syndicate of banks under a credit agreement. Borrowings may be made for temporary financing needs. Interest is charged to each fund, based on its borrowings, generally at a rate equal to the highest of 1) Daily Simple SOFR (Secured Overnight Financing Rate) plus 0.10%, 2) the Federal Funds Effective Rate, or 3) the Overnight Bank Funding Rate, each plus an agreed upon spread. A commitment fee, based on the average daily unused portion of the committed line of credit, is allocated among the participating funds. The line of credit expires on March 16, 2023 unless extended or renewed. In addition, the fund and other funds managed by MFS have established unsecured uncommitted borrowing arrangements with certain banks for temporary financing needs. Interest is charged to each fund, based on its borrowings, at rates equal to customary reference rates plus an agreed upon spread. For the year ended December 31, 2022, the fund’s commitment fee and interest expense were $3,410 and $0, respectively, and are included in “Miscellaneous” expense in the Statement of Operations.
(7) Investments in Affiliated Issuers
An affiliated issuer may be considered one in which the fund owns 5% or more of the outstanding voting securities, or a company which is under common control. For the purposes of this report, the following were affiliated issuers:
| Affiliated Issuers | Beginning
Value | Purchases | Sales
Proceeds | Realized
Gain
(Loss) | Change in
Unrealized
Appreciation or
Depreciation | Ending
Value |
| MFS Institutional Money Market Portfolio | $3,181,407 | $205,905,050 | $199,699,086 | $315 | $2,706 | $9,390,392 |
| Affiliated Issuers | Dividend
Income | Capital Gain
Distributions |
| MFS Institutional Money Market Portfolio | $120,812 | $— |
(8) LIBOR Transition
Certain of the fund's investments, including investments in certain debt instruments and derivatives (if any), as well as borrowings by the fund and certain other contractual arrangements of the fund, may be based on the London Interbank Offered Rate (“LIBOR”). In 2017, the regulatory authority that oversees financial services firms in the United Kingdom announced plans to transition away from LIBOR by the end of 2021. In March 2021, the administrator of LIBOR announced the extension of the publication of the more commonly used U.S. dollar LIBOR settings to the end of June 2023. Although the full impacts of the transition away from LIBOR are not fully known, the transition may result in, among other things, an increase in volatility or illiquidity of the markets for instruments that currently rely on LIBOR to determine interest rates and this could have an adverse impact on the fund's performance. With
MFS Investors Trust Series
Notes to Financial Statements - continued
respect to the fund's accounting for investments, including investments in certain debt instruments and derivatives, as well as borrowings by the fund and any other contractual arrangements of the fund that undergo reference rate-related modifications as a result of the transition, management will rely upon the relief provided by FASB Codification Topic 848 – Reference Rate Reform (Topic 848). The guidance in Topic 848 permits the fund to account for those modified contracts as a continuation of the existing contracts. Management is still evaluating the impact to the fund of the June 30, 2023 planned discontinuation of the more commonly used U.S. dollar LIBOR settings.
(9) Russia and Ukraine Conflict
The market disruptions, which began in late February 2022, associated with geopolitical events related to the conflict between Russia and Ukraine may adversely affect the value of the fund’s assets and thus the fund’s performance. Management continues to monitor these events and to evaluate the related impacts, if any, to the fund.
MFS Investors Trust Series
Report of Independent Registered Public Accounting Firm
To the Board of Trustees of MFS Variable Insurance Trust and the Shareholders of MFS Investors Trust Series:
Opinion on the Financial Statements and Financial Highlights
We have audited the accompanying statement of assets and liabilities of MFS Investors Trust Series (the “Fund”), including the portfolio of investments, as of December 31, 2022, the related statement of operations for the year then ended, the statements of changes in net assets for each of the two years in the period then ended, the financial highlights for each of the five years in the period then ended, and the related notes. In our opinion, the financial statements and financial highlights present fairly, in all material respects, the financial position of the Fund as of December 31, 2022, and the results of its operations for the year then ended, the changes in its net assets for each of the two years in the period then ended, and the financial highlights for each of the five years in the period then ended, in conformity with accounting principles generally accepted in the United States of America.
Basis for Opinion
These financial statements and financial highlights are the responsibility of the Fund's management. Our responsibility is to express an opinion on the Fund's financial statements and financial highlights based on our audits. We are a public accounting firm registered with the Public Company Accounting Oversight Board (United States) (PCAOB) and are required to be independent with respect to the Fund in accordance with the U.S. federal securities laws and the applicable rules and regulations of the Securities and Exchange Commission and the PCAOB.
We conducted our audits in accordance with the standards of the PCAOB. Those standards require that we plan and perform the audit to obtain reasonable assurance about whether the financial statements and financial highlights are free of material misstatement, whether due to error or fraud. The Fund is not required to have, nor were we engaged to perform, an audit of its internal control over financial reporting. As part of our audits, we are required to obtain an understanding of internal control over financial reporting but not for the purpose of expressing an opinion on the effectiveness of the Fund's internal control over financial reporting. Accordingly, we express no such opinion.
Our audits included performing procedures to assess the risks of material misstatement of the financial statements and financial highlights, whether due to error or fraud, and performing procedures that respond to those risks. Such procedures included examining, on a test basis, evidence regarding the amounts and disclosures in the financial statements and financial highlights. Our audits also included evaluating the accounting principles used and significant estimates made by management, as well as evaluating the overall presentation of the financial statements and financial highlights. Our procedures included confirmation of securities owned as of December 31, 2022, by correspondence with the custodian. We believe that our audits provide a reasonable basis for our opinion.
DELOITTE & TOUCHE LLP
Boston, Massachusetts
February 15, 2023
We have served as the auditor of one or more of the MFS investment companies since 1924.
MFS Investors Trust Series
Trustees and Officers — Identification and Background
The Trustees and Officers of the Trust, as of February 1, 2023, are listed below, together with their principal occupations during the past five years. (Their titles may have varied during that period.) The address of each Trustee and Officer is 111 Huntington Avenue, Boston, Massachusetts 02199-7618.
| Name, Age | | Position(s) Held with Fund | | Trustee/Officer Since(h) | | Number of MFS Funds overseen by the Trustee | | Principal Occupations During
the Past Five Years | | Other Directorships During
the Past Five Years (j) |
| INTERESTED TRUSTEE | | | | | | | | | | |
Michael W. Roberge (k)
(age 56) | | Trustee | | January 2021 | | 136 | | Massachusetts Financial Services Company, Chairman (since January 2021); Chief Executive Officer (since January 2017); Director; Chairman of the Board (since January 2022); President (until December 2018); Chief Investment Officer (until December 2018) | | N/A |
| INDEPENDENT TRUSTEES | | | | | | | | | | |
John P. Kavanaugh
(age 68) | | Trustee and Chair of Trustees | | January 2009 | | 136 | | Private investor | | N/A |
Steven E. Buller
(age 71) | | Trustee | | February 2014 | | 136 | | Private investor | | N/A |
John A. Caroselli
(age 68) | | Trustee | | March 2017 | | 136 | | Private investor; JC Global Advisors, LLC (management consulting), President (since 2015) | | N/A |
Maureen R. Goldfarb
(age 67) | | Trustee | | January 2009 | | 136 | | Private investor | | N/A |
Peter D. Jones
(age 67) | | Trustee | | January 2019 | | 136 | | Private investor | | N/A |
James W. Kilman, Jr.
(age 61) | | Trustee | | January 2019 | | 136 | | Burford Capital Limited (finance and investment management), Senior Advisor (since May 3, 2021), Chief Financial Officer (2019 - May 2, 2021); KielStrand Capital LLC (family office), Chief Executive Officer (since 2016) | | Alpha-En Corporation, Director (2016-2019) |
Clarence Otis, Jr.
(age 66) | | Trustee | | March 2017 | | 136 | | Private investor | | VF Corporation, Director; Verizon Communications, Inc., Director; The Travelers Companies, Director |
Maryanne L. Roepke
(age 66) | | Trustee | | May 2014 | | 136 | | Private investor | | N/A |
Laurie J. Thomsen
(age 65) | | Trustee | | March 2005 | | 136 | | Private investor | | The Travelers Companies, Director; Dycom Industries, Inc., Director |
MFS Investors Trust Series
Trustees and Officers - continued
| Name, Age | | Position(s) Held with
Fund | | Trustee/Officer Since(h) | | Number of MFS Funds for which the Person is an Officer | | Principal Occupations During
the Past Five Years |
| OFFICERS | | | | | | | | |
Christopher R. Bohane (k)
(age 49) | | Assistant Secretary and Assistant Clerk | | July 2005 | | 136 | | Massachusetts Financial Services Company, Senior Vice President and Senior Managing Counsel |
Kino Clark (k)
(age 54) | | Assistant Treasurer | | January 2012 | | 136 | | Massachusetts Financial Services Company, Vice President |
John W. Clark, Jr. (k)
(age 55) | | Assistant Treasurer | | April 2017 | | 136 | | Massachusetts Financial Services Company, Vice President |
David L. DiLorenzo (k)
(age 54) | | President | | July 2005 | | 136 | | Massachusetts Financial Services Company, Senior Vice President |
Heidi W. Hardin (k)
(age 55) | | Secretary and Clerk | | April 2017 | | 136 | | Massachusetts Financial Services Company, Executive Vice President and General Counsel |
Brian E. Langenfeld (k)
(age 49) | | Assistant Secretary and Assistant Clerk | | June 2006 | | 136 | | Massachusetts Financial Services Company, Vice President and Managing Counsel |
Rosa E. Licea-Mailloux (k)
(age 46) | | Chief Compliance Officer | | March 2022 | | 136 | | Massachusetts Financial Services Company, Vice President (since 2018); Director of Corporate Compliance (2018-2021), Senior Director Compliance (2021-2022), Senior Managing Director of North American Compliance & Chief Compliance Officer (since March 2022); Natixis Investment Managers (investment management), Funds Chief Compliance Officer, Deputy General Counsel & Senior Vice President (until 2018) |
Amanda S. Mooradian (k)
(age 43) | | Assistant Secretary and Assistant Clerk | | September 2018 | | 136 | | Massachusetts Financial Services Company, Assistant Vice President and Senior Counsel |
Susan A. Pereira (k)
(age 52) | | Assistant Secretary and Assistant Clerk | | July 2005 | | 136 | | Massachusetts Financial Services Company, Vice President and Managing Counsel |
Kasey L. Phillips (k)
(age 52) | | Assistant Treasurer | | September 2012 | | 136 | | Massachusetts Financial Services Company, Vice President |
Matthew A. Stowe (k)
(age 48) | | Assistant Secretary and Assistant Clerk | | October 2014 | | 136 | | Massachusetts Financial Services Company, Vice President and Senior Managing Counsel |
William B. Wilson (k)
(age 40) | | Assistant Secretary and Assistant Clerk | | October 2022 | | 136 | | Massachusetts Financial Services Company, Assistant Vice President and Counsel |
James O. Yost (k)
(age 62) | | Treasurer | | September 1990 | | 136 | | Massachusetts Financial Services Company, Senior Vice President |
| (h) | Date first appointed to serve as Trustee/Officer of an MFS Fund. Each Trustee has served continuously since appointment unless indicated otherwise. From January 2012 through December 2016, Messrs. DiLorenzo and Yost served as Treasurer and Deputy Treasurer of the Funds, respectively. |
| (j) | Directorships or trusteeships of companies required to report to the Securities and Exchange Commission (i.e., “public companies”). |
| (k) | “Interested person” of the Trust within the meaning of the Investment Company Act of 1940 (referred to as the 1940 Act), which is the principal federal law governing investment companies like the fund, as a result of a position with MFS. The address of MFS is 111 Huntington Avenue, Boston, Massachusetts 02199-7618. |
Each Trustee (other than Messrs. Jones, Kilman and Roberge) has been elected by shareholders and each Trustee and Officer holds office until his or her successor is chosen and qualified or until his or her earlier death, resignation, retirement or removal. Mr. Roberge became a Trustee of the Funds on January 1, 2021 and Messrs. Jones and Kilman became Trustees of the Funds on January 1, 2019. The Trust does not hold annual meetings for the purpose of electing Trustees, and Trustees are not elected for fixed terms. Under the terms of the Board's retirement policy, an Independent Trustee shall retire at the end of the calendar year in which he or she reaches the earlier of 75 years of age or 15 years of service on the Board (or, in the case of any Independent Trustee who joined the Board prior to 2015, 20 years of service on the Board).
MFS Investors Trust Series
Trustees and Officers - continued
Messrs. Buller, Kilman and Otis and Ms. Roepke are members of the Trust’s Audit Committee.
Each of the Interested Trustees and certain Officers hold comparable officer positions with certain affiliates of MFS.
The Statement of Additional Information for a Fund includes further information about the Trustees and is available without charge upon request by calling 1-800-225-2606.
| Investment Adviser | Custodian |
Massachusetts Financial Services Company
111 Huntington Avenue
Boston, MA 02199-7618 | State Street Bank and Trust Company
1 Lincoln Street
Boston, MA 02111-2900 |
| Distributor | Independent Registered Public Accounting Firm |
MFS Fund Distributors, Inc.
111 Huntington Avenue
Boston, MA 02199-7618 | Deloitte & Touche LLP
200 Berkeley Street
Boston, MA 02116 |
| Portfolio Manager(s) | |
Jude Jason
Alison O'Neill Mackey
Ted Maloney | |
MFS Investors Trust Series
Board Review of Investment Advisory Agreement
MFS Investors Trust Series
The Investment Company Act of 1940 requires that both the full Board of Trustees and a majority of the non-interested (“independent”) Trustees, voting separately, annually approve the continuation of the Fund’s investment advisory agreement with MFS. The Trustees consider matters bearing on the Fund and its advisory arrangements at their meetings throughout the year, including a review of performance data at each regular meeting. In addition, the independent Trustees met several times over the course of three months beginning in May and ending in July, 2022 (“contract review meetings”) for the specific purpose of considering whether to approve the continuation of the investment advisory agreement for the Fund and the other investment companies that the Board oversees (the “MFS Funds”). The independent Trustees were assisted in their evaluation of the Fund’s investment advisory agreement by independent legal counsel, from whom they received separate legal advice and with whom they met separately from MFS during various contract review meetings. The independent Trustees were also assisted in this process by an independent consultant who was retained by and reported to the independent Trustees.
In connection with their deliberations regarding the continuation of the investment advisory agreement, the Trustees, including the independent Trustees, considered such information and factors as they believed, in light of the legal advice furnished to them and their own business judgment, to be relevant. The investment advisory agreement for the Fund was considered separately, although the Trustees also took into account the common interests of all MFS Funds in their review. As described below, the Trustees considered the nature, quality, and extent of the various investment advisory, administrative, and shareholder services performed by MFS under the existing investment advisory agreement and other arrangements with the Fund.
In connection with their contract review meetings, the Trustees received and relied upon materials that included, among other items: (i) information provided by Broadridge Financial Solutions, Inc. (“Broadridge”), an independent third party, on the investment performance of the Fund for various time periods ended December 31, 2021 and the investment performance of a group of funds with substantially similar investment classifications/objectives (the “Broadridge performance universe”), (ii) information provided by Broadridge on the Fund’s advisory fees and other expenses and the advisory fees and other expenses of comparable funds identified by Broadridge as well as all other funds in the same investment classification/category (the “Broadridge expense group and universe”), (iii) information provided by MFS on the advisory fees of portfolios of other clients of MFS, including institutional separate accounts and other clients, (iv) information as to whether and to what extent applicable expense waivers, reimbursements or fee “breakpoints” are observed for the Fund, (v) information regarding MFS’ financial results and financial condition, including MFS’ and certain of its affiliates’ estimated profitability from services performed for the Fund and the MFS Funds as a whole, and compared to MFS’ institutional business, (vi) MFS’ views regarding the outlook for the mutual fund industry and the strategic business plans of MFS, (vii) descriptions of various functions performed by MFS for the Funds, such as compliance monitoring and portfolio trading practices, and (viii) information regarding the overall organization of MFS, including information about MFS’ senior management and other personnel providing investment advisory, administrative and other services to the Fund and the other MFS Funds. The comparative performance, fee and expense information prepared and provided by Broadridge was not independently verified and the independent Trustees did not independently verify any information provided to them by MFS.
The Trustees’ conclusion as to the continuation of the investment advisory agreement was based on a comprehensive consideration of all information provided to the Trustees and not the result of any single factor. Some of the factors that figured particularly in the Trustees’ deliberations are described below, although individual Trustees may have evaluated the information presented differently from one another, giving different weights to various factors. It is also important to recognize that the fee arrangements for the Fund and other MFS Funds are the result of years of review and discussion between the independent Trustees and MFS, that certain aspects of such arrangements may receive greater scrutiny in some years than in others, and that the Trustees’ conclusions may be based, in part, on their consideration of these same arrangements during the course of the year and in prior years.
Based on information provided by Broadridge and MFS, the Trustees reviewed the Fund’s total return investment performance as well as the Broadridge performance universe over various time periods. The Trustees placed particular emphasis on the total return performance of the Fund’s Initial Class shares in comparison to the performance of funds in its Broadridge performance universe over the five-year period ended December 31, 2021, which the Trustees believed was a long enough period to reflect differing market conditions. The total return performance of the Fund’s Initial Class shares was in the 3rd quintile relative to the other funds in the universe for this five-year period (the 1st quintile being the best performers and the 5th quintile being the worst performers). The total return performance of the Fund’s Initial Class shares was in the 3rd quintile for the one-year period and the 4th quintile for the three-year period ended December 31, 2021 relative to the Broadridge performance universe. Because of the passage of time, these performance results may differ from the performance results for more recent periods, including those shown elsewhere in this report.
In the course of their deliberations, the Trustees took into account information provided by MFS in connection with the contract review meetings, as well as during investment review meetings conducted with portfolio management personnel during the course of the year regarding the Fund’s performance. After reviewing these and related factors, the Trustees concluded, within the context of their overall conclusions regarding the investment advisory agreement, that they were satisfied with MFS’ responses and efforts relating to investment performance.
MFS Investors Trust Series
Board Review of Investment Advisory Agreement - continued
In assessing the reasonableness of the Fund’s advisory fee, the Trustees considered, among other information, the Fund’s advisory fee and the total expense ratio of the Fund’s Initial Class shares as a percentage of average daily net assets and the advisory fee and total expense ratios of the Broadridge expense group based on information provided by Broadridge. The Trustees considered that MFS currently observes an expense limitation for the Fund, which may not be changed without the Trustees’ approval. The Trustees also considered that, according to the data provided by Broadridge (which takes into account any fee reductions or expense limitations that were in effect during the Fund’s last fiscal year), the Fund’s effective advisory fee rate and total expense ratio were each higher than the Broadridge expense group median.
The Trustees also considered the advisory fees charged by MFS to any institutional separate accounts advised by MFS (“separate accounts”) and unaffiliated investment companies for which MFS serves as subadviser (“subadvised funds”) that have comparable investment strategies to the Fund, if any. In comparing these fees, the Trustees considered information provided by MFS as to the generally broader scope of services provided by MFS to the Fund, as well as the more extensive regulatory burdens imposed on MFS in managing the Fund, in comparison to separate accounts and subadvised funds. The Trustees also considered the higher demands placed on MFS’ investment personnel and trading infrastructure as a result of the daily cash in-flows and out-flows of the Fund in comparison to separate accounts.
The Trustees also considered whether the Fund may benefit from any economies of scale in the management of the Fund in the event of growth in assets of the Fund and/or growth in assets of the MFS Funds as a whole. They noted that the Fund’s advisory fee rate schedule is subject to contractual breakpoints that reduce the Fund’s advisory fee rate on average daily net assets over $1 billion and $2.5 billion. The Trustees also noted that MFS has agreed in writing to waive a portion of the management fees of certain MFS Funds, including the Fund, if the total combined assets of certain funds within the MFS Funds’ complex increase above agreed upon thresholds (the “group fee waiver”), enabling the Fund’s shareholders to share in the benefits from any economies of scale at the complex level. The group fee waiver is reviewed and renewed annually between the Board and MFS. The Trustees concluded that the breakpoints and the group fee waiver were sufficient to allow the Fund to benefit from economies of scale as its assets and overall complex assets grow.
The Trustees also considered information prepared by MFS relating to MFS’ costs and profits with respect to the Fund, the MFS Funds considered as a group, and other investment companies and accounts advised by MFS, as well as MFS’ methodologies used to determine and allocate its costs to the MFS Funds, the Fund and other accounts and products for purposes of estimating profitability.
After reviewing these and other factors described herein, the Trustees concluded, within the context of their overall conclusions regarding the investment advisory agreement, that the advisory fees charged to the Fund represent reasonable compensation in light of the services being provided by MFS to the Fund.
In addition, the Trustees considered MFS’ resources and related efforts to continue to retain, attract and motivate capable personnel to serve the Fund. The Trustees also considered current and developing conditions in the financial services industry, including the presence of large and well-capitalized companies which are spending, and appear to be prepared to continue to spend, substantial sums to engage personnel and to provide services to competing investment companies. In this regard, the Trustees also considered the financial resources of MFS and its ultimate parent, Sun Life Financial Inc. The Trustees also considered the advantages and possible disadvantages to the Fund of having an adviser that also serves other investment companies as well as other accounts.
The Trustees also considered the nature, quality, cost, and extent of administrative, transfer agency, and distribution services provided to the Fund by MFS and its affiliates under agreements and plans other than the investment advisory agreement, including any 12b-1 fees the Fund pays to MFS Fund Distributors, Inc., an affiliate of MFS. The Trustees also considered the nature, extent and quality of certain other services MFS performs or arranges for on the Fund’s behalf, which may include securities lending programs, directed expense payment programs, class action recovery programs, and MFS’ interaction with third-party service providers, principally custodians and sub-custodians. The Trustees concluded that the various non-advisory services provided by MFS and its affiliates on behalf of the Fund were satisfactory.
The Trustees considered so-called “fall-out benefits” to MFS such as reputational value derived from serving as investment manager to the MFS Funds. The Trustees also considered that MFS discontinued its historic practice of obtaining investment research from portfolio brokerage commissions paid by certain MFS Funds effective January 2018, and directly pays or voluntarily reimburses a Fund, if applicable, for the costs of external research acquired through the use of the Fund’s portfolio brokerage commissions.
Based on their evaluation of factors that they deemed to be material, including those factors described above, the Board of Trustees, including the independent Trustees, concluded that the Fund’s investment advisory agreement with MFS should be continued for an additional one-year period, commencing August 1, 2022.
MFS Investors Trust Series
Proxy Voting Policies and Information
MFS votes proxies on behalf of the fund pursuant to proxy voting policies and procedures that are available without charge, upon request, by calling 1-800-225-2606, by visiting mfs.com/proxyvoting, or by visiting the SEC’s Web site at http://www.sec.gov.
Information regarding how the fund voted proxies relating to portfolio securities during the most recent twelve-month period ended June 30 is available by August 31 of each year without charge by visiting mfs.com/proxyvoting, or by visiting the SEC’s Web site at http://www.sec.gov.
Quarterly Portfolio Disclosure
The fund files a complete schedule of portfolio holdings with the SEC for the first and third quarters of each fiscal year as an exhibit to its reports on Form N-PORT. The fund’s Form N-PORT reports are available on the SEC’s Web site at http://www.sec.gov. A shareholder can obtain the portfolio holdings report for the first and third quarters of the fund's fiscal year at mfs.com/vit1 by choosing the fund's name and then scrolling to the “Resources” section and clicking on the “Prospectus and Reports” tab.
FURTHER INFORMATION
From time to time, MFS may post important information about the fund or the MFS Funds on the MFS Web site (mfs.com). This information is available at https://www.mfs.com/announcements or at mfs.com/vit1 by choosing the fund's name and then scrolling to the “Resources” section and clicking on the “Announcements” tab, if any.
Information About Fund Contracts and Legal Claims
The fund has entered into contractual arrangements with an investment adviser, administrator, distributor, shareholder servicing agent, and custodian who each provide services to the fund. Unless expressly stated otherwise, shareholders are not parties to, or intended beneficiaries of these contractual arrangements, and these contractual arrangements are not intended to create any shareholder right to enforce them against the service providers or to seek any remedy under them against the service providers, either directly or on behalf of the fund.
Under the Trust’s By-Laws and Declaration of Trust, any claims asserted against or on behalf of the MFS Funds, including claims against Trustees and Officers, must be brought in state and federal courts located within the Commonwealth of Massachusetts.
Federal Tax Information (unaudited)
The following information is provided pursuant to provisions of the Internal Revenue Code.
The fund designates $106,878,000 as capital gain dividends paid during the fiscal year.
For corporate shareholders, 64.64% of the ordinary income dividends paid during the fiscal year qualify for the corporate dividends received deduction.
| FACTS | WHAT DOES MFS DO WITH YOUR PERSONAL INFORMATION? |
| Why? | Financial companies choose how they share your personal information. Federal law gives consumers the right to limit some but not all sharing. Federal law also requires us to tell you how we collect, share, and protect your personal information. Please read this notice carefully to understand what we do. |
| What? | The types of personal information we collect and share depend on the product or service you have with us. This information can include: |
| • Social Security number and account balances |
| • Account transactions and transaction history |
| • Checking account information and wire transfer instructions |
| When you are no longer our customer, we continue to share your information as described in this notice. |
| How? | All financial companies need to share customers' personal information to run their everyday business. In the section below, we list the reasons financial companies can share their customers' personal information; the reasons MFS chooses to share; and whether you can limit this sharing. |
Reasons we can share your
personal information | Does MFS share? | Can you limit
this sharing? |
For our everyday business purposes –
such as to process your transactions, maintain your
account(s), respond to court orders and legal
investigations, or report to credit bureaus | Yes | No |
For our marketing purposes –
to offer our products and services to you | No | We don't share |
For joint marketing with other
financial companies | No | We don't share |
For our affiliates' everyday business purposes –
information about your transactions and experiences | No | We don't share |
For our affiliates' everyday business purposes –
information about your creditworthiness | No | We don't share |
| For nonaffiliates to market to you | No | We don't share |
| Questions? | Call 800-225-2606 or go to mfs.com. |
| Who we are |
| Who is providing this notice? | MFS Funds, MFS Investment Management, MFS Institutional Advisors, Inc., and MFS Heritage Trust Company. |
| What we do |
How does MFS
protect my personal
information? | To protect your personal information from unauthorized access and use, we use security measures that comply with federal law. These measures include procedural, electronic, and physical safeguards for the protection of the personal information we collect about you. |
How does MFS
collect my personal
information? | We collect your personal information, for example, when you |
| • open an account or provide account information |
| • direct us to buy securities or direct us to sell your securities |
| • make a wire transfer |
| We also collect your personal information from others, such as credit bureaus, affiliates, or other companies. |
| Why can't I limit all sharing? | Federal law gives you the right to limit only |
| • sharing for affiliates' everyday business purposes – information about your creditworthiness |
| • affiliates from using your information to market to you |
| • sharing for nonaffiliates to market to you |
| State laws and individual companies may give you additional rights to limit sharing. |
| Definitions |
| Affiliates | Companies related by common ownership or control. They can be financial and nonfinancial companies. |
| • MFS does not share personal information with affiliates, except for everyday business purposes as described on page one of this notice. |
| Nonaffiliates | Companies not related by common ownership or control. They can be financial and nonfinancial companies. |
| • MFS does not share with nonaffiliates so they can market to you. |
| Joint marketing | A formal agreement between nonaffiliated financial companies that together market financial products or services to you. |
| • MFS doesn't jointly market. |
| Other important information |
| If you own an MFS product or receive an MFS service in the name of a third party such as a bank or broker-dealer, their privacy policy may apply to you instead of ours. |
Annual Report
December 31, 2022
MFS® Variable Insurance Trust
| 1 |
| 2 |
| 3 |
| 5 |
| 7 |
| 8 |
| 12 |
| 13 |
| 14 |
| 15 |
| 17 |
| 23 |
| 24 |
| 27 |
| 29 |
| 29 |
| 29 |
| 29 |
| 29 |
| 30 |
The report is prepared for the general information of shareholders. It is authorized for distribution to prospective investors only when preceded or accompanied by a current prospectus.
NOT FDIC INSURED • MAY LOSE VALUE • NO BANK OR CREDIT UNION GUARANTEE •
NOT A DEPOSIT • NOT INSURED BY ANY FEDERAL GOVERNMENT AGENCY OR NCUA/NCUSIF
LETTER FROM THE CHAIR AND CEO
Dear Shareholders:
Signs of peaking inflation, hopes that monetary policy tightening cycles may be nearing an end and a rapid reopening of China’s economy in late-2022 and early-2023 have combined to bolster investor sentiment in recent months. Markets have largely adjusted to the challenges posed by Russia’s invasion of Ukraine, thanks in part to mild European winter weather which has alleviated concerns over potential shortages of natural gas. Resilient labor markets in much of the developed world have further contributed to a brighter-than-expected economic backdrop. However, many investors are mindful that the lagged effects of ongoing policy tightening have yet to work their way through the global economy.
Tighter global financial conditions have been a particular headwind for richly valued growth equities and interest rate-sensitive parts of the economy, such as housing. Over the near term, companies may face a challenging earnings backdrop as they are forced to absorb higher input and labor costs at a time of dwindling pricing power. For fixed income, the rise in interest rates has made bonds more attractive than they have been in years, which may provide balance to an overall portfolio.
During times of market transition, it is important to have a deep understanding of company fundamentals, and we have built our unique global research platform to do just that.
At MFS®, we put our clients’ assets to work responsibly by carefully navigating increasingly complex global capital markets. Our investment team is guided by a commitment to long-term fundamental investing. Our global investment platform — combining collective expertise, long-term discipline, and thoughtful risk management — seeks to uncover what we believe are the best, most durable investment ideas in markets around the world, enabling us to potentially create value for investors.
Respectfully,
Michael W. Roberge
Chair and Chief Executive Officer
MFS Investment Management
February 15, 2023
The opinions expressed in this letter are subject to change and may not be relied upon for investment advice. No forecasts can be guaranteed.
Portfolio structure
Top ten holdings
| Microsoft Corp. | 11.8% |
| Amazon.com, Inc. | 5.3% |
| Alphabet, Inc., “A” | 5.0% |
| Apple, Inc. | 5.0% |
| Mastercard, Inc., “A” | 3.9% |
| Visa, Inc., “A” | 3.3% |
| Thermo Fisher Scientific, Inc. | 2.3% |
| UnitedHealth Group, Inc. | 2.3% |
| Intuit, Inc. | 2.3% |
| Danaher Corp. | 2.3% |
GICS equity sectors (g)
| Information Technology | 36.8% |
| Health Care | 16.9% |
| Consumer Discretionary | 9.9% |
| Communication Services | 8.3% |
| Industrials | 8.1% |
| Financials | 6.7% |
| Materials | 5.6% |
| Consumer Staples | 2.7% |
| Energy | 1.3% |
| Real Estate | 1.2% |
| (g) | The Global Industry Classification Standard (GICS®) was developed by and/or is the exclusive property of MSCI, Inc. and S&P Global Market Intelligence Inc. (“S&P Global Market Intelligence”). GICS is a service mark of MSCI and S&P Global Market Intelligence and has been licensed for use by MFS. MFS has applied its own internal sector/industry classification methodology for equity securities and non-equity securities that are unclassified by GICS. |
Cash & Cash Equivalents includes any cash, investments in money market funds, short-term securities, and other assets less liabilities. Please see the Statement of Assets and Liabilities for additional information related to the fund’s cash position and other assets and liabilities.
Percentages are based on net assets as of December 31, 2022.
The portfolio is actively managed and current holdings may be different.
Management Review
Summary of Results
For the twelve months ended December 31, 2022, Initial Class shares of the MFS Growth Series (fund) provided a total return of -31.63%, while Service Class shares of the fund provided a total return of -31.80%. These compare with a return of -29.14% over the same period for the fund’s benchmark, the Russell 1000® Growth Index.
Market Environment
During the reporting period, markets continued to grapple with the strongest global inflationary pressures in decades along with signs of slowing economic growth. Intermittent coronavirus flareups, particularly in China, where home-grown vaccines have proved less effective than elsewhere, kept supply chains stretched for a considerable period. At the same time, the reopening of the economy in the parts of the world where the virus has been better contained has led to a shift in consumption patterns in favor of services, straining already tight labor markets in most developed economies, while reducing demand for manufactured goods, primarily from Asia. As a result of Russia’s invasion of Ukraine, geopolitical considerations, such as sanctions and trade bans, have resulted in additional supply chain disruptions and volatile global energy prices. Taken together, these factors have contributed to market volatility.
The ripple effects from the Russian invasion further complicated the mission central banks must undertake to rein in surging inflation. Energy shocks have historically resulted in global growth slowdowns, if not pullbacks, so policymakers will find themselves in the difficult position of trying to restrain inflation without tipping economies into recession. Despite the challenging macroeconomic and geopolitical environment, policymakers remained focused on controlling inflation, although investors appeared to have expected varying degrees of action from the central banks. The Fed has been among the most aggressive developed market central banks, tightening policy at the fastest rate in decades, although it slowed its hiking pace at the end of the period, as did the European Central Bank. After remaining on the monetary sidelines for much of the period, the Bank of Japan widened its Yield Curve Control band, capping the yield on its 10-year bond at 0.5%, up from 0.25%, an action investors interpreted as a first step toward monetary policy normalization.
Against an environment of still-tight labor markets, tighter global financial conditions and volatile materials prices, investor anxiety appeared to have increased over the potential that corporate profit margins may be past peak for this cycle. That said, tentative signs that supply chain bottlenecks (particularly semiconductors) may be moderating, the easing of COVID restrictions in China, low levels of unemployment across developed markets and hopes that inflation levels may be near a peak were supportive factors for the macroeconomic backdrop.
Detractors from Performance
Stock selection in the industrials sectors weighed on the fund’s performance relative to the Russell 1000® Growth Index. Within this sector, not owning shares of defense contractor Lockheed Martin weakened relative returns. The share price of Lockheed Martin, along with other defense related stocks, reacted positively to defense budget increases following the war in Ukraine and expectations of heightened demand in the medium term.
A combination of the fund’s underweight position and stock selection in the consumer staples sector also held back relative returns. Within this sector, not owning shares of beverages, food and snacks producer PepsiCo and beverage maker Coca-Cola dampened relative results as both stocks outperformed the benchmark. The share prices of Pepisco and Coca-Cola gained during the period as uncertainty over inflation, interest rates and earnings led to a rotation into defensive names.
Security selection in the information technology sector further weighed on relative performance, led by the fund’s overweight position in Adobe Systems. The stock price of Adobe Systems fell as the company announced its intention to acquire privately-owned design and collaboration tool company Figma, which was not well received by the markets. Additionally, an underweight position in computer and personal electronics maker Apple also weakened relative results.
Elsewhere, not owning shares of pharmaceutical companies Abbvie and Eli Lilly, the fund’s overweight positions in internet retailer Amazon.com and dating products provider Match Group, and the timing of the fund’s ownership in shares of internet TV shows and movie subscription services provider Netflix(h) further hampered relative returns.
Contributors to Performance
An underweight position in the consumer discretionary sector contributed to the fund’s relative performance. Within this sector, not owning shares of electric vehicle manufacturer Tesla boosted relative returns. The share price of Tesla declined due to uncertainty surrounding production shutdowns at the company's Shanghai manufacturing plant, reduced vehicle deliveries, increased competitive concerns and uncertainties regarding Tesla CEO Elon Musk’s acquisition of social media platform Twitter.
Stocks in other sectors that benefited relative results included the fund’s holdings of medical devices maker Boston Scientific(b) and electronic instruments manufacturer AMETEK(b)(h). The share price of Boston Scientific benefited from better-than-anticipated organic sales growth and revenue within its Interventional Cardiology and Watchmen segments. The fund’s overweight positions in
Management Review - continued
debit and credit transaction processing company Mastercard, biotechnology company Vertex Pharmaceuticals(h), risk management and human capital consulting services provider Aon and life sciences supply company Thermo Fisher Scientific also bolstered relative returns. The share price of Mastercard appreciated on the back of above-consensus earnings growth led by better cross-border revenues and higher-than-expected transaction processing fees. Additionally, an underweight position in social networking service provider Meta Platforms(h) and the timing of the fund’s ownership in shares of financial services provider Charles Schwab further aided relative returns.
The fund’s cash and/or cash equivalents position during the period was also a contributor to relative performance. Under normal market conditions, the fund strives to be fully invested and generally holds cash to buy new holdings and to provide liquidity. In a period when equity markets fell, as measured by the fund’s benchmark, holding cash helped performance versus the benchmark, which has no cash position.
Respectfully,
Portfolio Manager(s)
Eric Fischman, Paul Gordon, and Bradford Mak
| (b) | Security is not a benchmark constituent. |
| (h) | Security was not held in the portfolio at period end. |
The views expressed in this report are those of the portfolio manager(s) only through the end of the period of the report as stated on the cover and do not necessarily reflect the views of MFS or any other person in the MFS organization. These views are subject to change at any time based on market or other conditions, and MFS disclaims any responsibility to update such views. These views may not be relied upon as investment advice or an indication of trading intent on behalf of any MFS portfolio. References to specific securities are not recommendations of such securities, and may not be representative of any MFS portfolio’s current or future investments.
Performance Summary Through 12/31/22
The following chart illustrates the historical performance of the fund in comparison to its benchmark(s). Benchmarks are unmanaged and may not be invested in directly. Benchmark returns do not reflect any fees or expenses. The performance of other share classes will be greater than or less than that of the class depicted below. (See Notes to Performance Summary.)
Performance data shown represents past performance and is no guarantee of future results. Investment return and principal value fluctuate so your shares, when sold, may be worth more or less than the original cost; current performance may be lower or higher than quoted. The performance shown does not reflect the deduction of taxes, if any, that a shareholder would pay on fund distributions or the redemption of fund shares. The returns for the fund shown also do not reflect the deduction of expenses associated with variable products, such as mortality and expense risk charges, separate account charges, and sales charges imposed by the insurance company separate accounts. Such expenses would reduce the overall returns shown.
Growth of a Hypothetical $10,000 Investment
Total Returns through 12/31/22
Average annual total returns
| Share Class | Class Inception Date | 1-yr | 5-yr | 10-yr |
| Initial Class | 7/24/95 | (31.63)% | 9.57% | 13.05% |
| Service Class | 5/01/00 | (31.80)% | 9.30% | 12.77% |
Comparative benchmark(s)
| Russell 1000® Growth Index (f) | (29.14)% | 10.96% | 14.10% |
| (f) | Source: FactSet Research Systems Inc. |
Benchmark Definition(s)
Russell 1000® Growth Index(h) – constructed to provide a comprehensive barometer for growth securities in the large-cap segment of the U.S. equity universe. Companies in this index generally have higher price-to-book ratios and higher forecasted growth values.
It is not possible to invest directly in an index.
| (h) | Frank Russell Company (“Russell”) is the source and owner of the trademarks, service marks, and copyrights related to the Russell Indexes. Russell® is a trademark of Frank Russell Company. Neither Russell nor its licensors accept any liability for any errors or omissions in the Russell Indexes and/or Russell ratings or underlying data and no party may rely on any Russell Indexes and/or Russell ratings and/or underlying data contained in this document. No further distribution of Russell Data is permitted without Russell's express written consent. Russell does not promote, sponsor, or endorse the content of this document. |
Performance Summary – continued
Notes to Performance Summary
Average annual total return represents the average annual change in value for each share class for the periods presented.
Performance results reflect any applicable expense subsidies and waivers in effect during the periods shown. Without such subsidies and waivers the fund's performance results would be less favorable. Please see the prospectus and financial statements for complete details. All results are historical and assume the reinvestment of any dividends and capital gains distributions.
Performance results do not include adjustments made for financial reporting purposes in accordance with U.S. generally accepted accounting principles and may differ from amounts reported in the financial highlights.
From time to time the fund may receive proceeds from litigation settlements, without which performance would be lower.
Expense Table
Fund expenses borne by the shareholders during the period,
July 1, 2022 through December 31, 2022
As a shareholder of the fund, you incur ongoing costs, including management fees; distribution and/or service (12b-1) fees; and other fund expenses. This example is intended to help you understand your ongoing costs (in dollars) of investing in the fund and to compare these costs with the ongoing costs of investing in other mutual funds.
The example is based on an investment of $1,000 invested at the beginning of the period and held for the entire period July 1, 2022 through December 31, 2022.
Actual Expenses
The first line for each share class in the following table provides information about actual account values and actual expenses. You may use the information in this line, together with the amount you invested, to estimate the expenses that you paid over the period. Simply divide your account value by $1,000 (for example, an $8,600 account value divided by $1,000 = 8.6), then multiply the result by the number in the first line under the heading entitled “Expenses Paid During Period” to estimate the expenses you paid on your account during this period.
Hypothetical Example for Comparison Purposes
The second line for each share class in the following table provides information about hypothetical account values and hypothetical expenses based on the fund’s actual expense ratio and an assumed rate of return of 5% per year before expenses, which is not the fund’s actual return. The hypothetical account values and expenses may not be used to estimate the actual ending account balance or expenses you paid for the period. You may use this information to compare the ongoing costs of investing in the fund and other funds. To do so, compare this 5% hypothetical example with the 5% hypothetical examples that appear in the shareholder reports of the other funds.
Please note that the expenses shown in the table are meant to highlight the fund's ongoing costs only and do not take into account the fees and expenses imposed under the variable contracts through which your investment in the fund is made. Therefore, the second line for each share class in the table is useful in comparing ongoing costs associated with an investment in vehicles (such as the fund) which fund benefits under variable annuity and variable life insurance contracts and to qualified pension and retirement plans only, and will not help you determine the relative total costs of investing in the fund through variable annuity and variable life insurance contracts. If the fees and expenses imposed under the variable contracts were included, your costs would have been higher.
Share
Class | | Annualized
Expense
Ratio | Beginning
Account Value
7/01/22 | Ending
Account Value
12/31/22 | Expenses
Paid During
Period (p)
7/01/22-12/31/22 |
| Initial Class | Actual | 0.73% | $1,000.00 | $968.84 | $3.62 |
| Hypothetical (h) | 0.73% | $1,000.00 | $1,021.53 | $3.72 |
| Service Class | Actual | 0.98% | $1,000.00 | $967.52 | $4.86 |
| Hypothetical (h) | 0.98% | $1,000.00 | $1,020.27 | $4.99 |
| (h) | 5% class return per year before expenses. |
| (p) | “Expenses Paid During Period” are equal to each class's annualized expense ratio, as shown above, multiplied by the average account value over the period, multiplied by 184/365 (to reflect the one-half year period). |
Portfolio of Investments − 12/31/22
The Portfolio of Investments is a complete list of all securities owned by your fund. It is categorized by broad-based asset classes.
| Issuer | | | Shares/Par | Value ($) |
| Common Stocks – 97.5% |
| Apparel Manufacturers – 1.0% | |
| LVMH Moet Hennessy Louis Vuitton SE | | 22,005 | $ 15,985,420 |
| Brokerage & Asset Managers – 2.2% | |
| Charles Schwab Corp. | | 271,582 | $ 22,611,917 |
| CME Group, Inc. | | 68,387 | 11,499,958 |
| | | | | $34,111,875 |
| Business Services – 6.3% | |
| Accenture PLC, “A” | | 16,608 | $ 4,431,679 |
| CoStar Group, Inc. (a) | | 240,330 | 18,572,702 |
| Equifax, Inc. | | 51,071 | 9,926,160 |
| MSCI, Inc. | | 67,249 | 31,282,217 |
| TransUnion | | 124,265 | 7,052,039 |
| Verisk Analytics, Inc., “A” | | 146,244 | 25,800,366 |
| | | | | $97,065,163 |
| Computer Software – 18.0% | |
| Adobe Systems, Inc. (a) | | 100,330 | $ 33,764,055 |
| Autodesk, Inc. (a) | | 20,055 | 3,747,678 |
| Black Knight, Inc. (a) | | 64,943 | 4,010,230 |
| Cadence Design Systems, Inc. (a) | | 76,327 | 12,261,169 |
| Intuit, Inc. | | 90,118 | 35,075,728 |
| Microsoft Corp. | | 760,218 | 182,315,481 |
| Synopsys, Inc. (a) | | 19,939 | 6,366,323 |
| | | | | $277,540,664 |
| Computer Software - Systems – 6.1% | |
| Apple, Inc. | | 591,516 | $ 76,855,674 |
| Block, Inc., “A” (a) | | 67,146 | 4,219,455 |
| ServiceNow, Inc. (a) | | 31,796 | 12,345,433 |
| | | | | $93,420,562 |
| Construction – 3.7% | |
| Martin Marietta Materials, Inc. | | 13,360 | $ 4,515,279 |
| Sherwin-Williams Co. | | 106,910 | 25,372,950 |
| Vulcan Materials Co. | | 155,496 | 27,228,905 |
| | | | | $57,117,134 |
| Consumer Products – 2.7% | |
| Colgate-Palmolive Co. | | 225,375 | $ 17,757,296 |
| Estee Lauder Cos., Inc., “A” | | 94,771 | 23,513,633 |
| | | | | $41,270,929 |
| Electrical Equipment – 3.1% | |
| AMETEK, Inc. | | 143,342 | $ 20,027,744 |
| Amphenol Corp., “A” | | 70,608 | 5,376,093 |
| Johnson Controls International PLC | | 285,717 | 18,285,888 |
| Rockwell Automation, Inc. | | 18,279 | 4,708,122 |
| | | | | $48,397,847 |
Portfolio of Investments – continued
| Issuer | | | Shares/Par | Value ($) |
| Common Stocks – continued |
| Electronics – 3.9% | |
| Applied Materials, Inc. | | 47,292 | $ 4,605,295 |
| ASML Holding N.V., ADR | | 29,148 | 15,926,467 |
| Lam Research Corp. | | 27,670 | 11,629,701 |
| NVIDIA Corp. | | 193,190 | 28,232,787 |
| | | | | $60,394,250 |
| Energy - Independent – 1.4% | |
| EOG Resources, Inc. | | 74,793 | $ 9,687,189 |
| Hess Corp. | | 80,568 | 11,426,154 |
| | | | | $21,113,343 |
| Energy - Renewables – 0.2% | |
| Enphase Energy, Inc. (a) | | 12,340 | $ 3,269,606 |
| Gaming & Lodging – 1.1% | |
| Hilton Worldwide Holdings, Inc. | | 133,730 | $ 16,898,123 |
| General Merchandise – 0.5% | |
| Dollar Tree, Inc. (a) | | 55,336 | $ 7,826,724 |
| Health Maintenance Organizations – 2.3% | |
| UnitedHealth Group, Inc. | | 67,211 | $ 35,633,928 |
| Insurance – 2.2% | |
| Aon PLC | | 87,424 | $ 26,239,439 |
| Arthur J. Gallagher & Co. | | 40,733 | 7,679,800 |
| | | | | $33,919,239 |
| Internet – 7.8% | |
| Alphabet, Inc., “A” (a) | | 882,928 | $ 77,900,737 |
| Alphabet, Inc., “C” (a) | | 279,361 | 24,787,702 |
| Gartner, Inc. (a) | | 36,413 | 12,239,866 |
| Match Group, Inc. (a) | | 125,124 | 5,191,395 |
| | | | | $120,119,700 |
| Leisure & Toys – 1.3% | |
| Electronic Arts, Inc. | | 120,552 | $ 14,729,043 |
| Take-Two Interactive Software, Inc. (a) | | 54,315 | 5,655,821 |
| | | | | $20,384,864 |
| Machinery & Tools – 0.4% | |
| Eaton Corp. PLC | | 40,263 | $ 6,319,278 |
| Medical & Health Technology & Services – 0.9% | |
| ICON PLC (a) | | 63,441 | $ 12,323,414 |
| Veeva Systems, Inc. (a) | | 9,402 | 1,517,295 |
| | | | | $13,840,709 |
| Medical Equipment – 10.2% | |
| Abbott Laboratories | | 275,320 | $ 30,227,383 |
| Agilent Technologies, Inc. | | 39,443 | 5,902,645 |
| Becton, Dickinson and Co. | | 51,524 | 13,102,553 |
| Boston Scientific Corp. (a) | | 654,823 | 30,298,660 |
| Danaher Corp. | | 131,768 | 34,973,863 |
Portfolio of Investments – continued
| Issuer | | | Shares/Par | Value ($) |
| Common Stocks – continued |
| Medical Equipment – continued | |
| STERIS PLC | | 37,332 | $ 6,894,847 |
| Thermo Fisher Scientific, Inc. | | 65,634 | 36,143,987 |
| | | | | $157,543,938 |
| Other Banks & Diversified Financials – 7.5% | |
| American Express Co. | | 26,186 | $ 3,868,982 |
| Mastercard, Inc., “A” | | 172,570 | 60,007,766 |
| Visa, Inc., “A” | | 247,692 | 51,460,490 |
| | | | | $115,337,238 |
| Pharmaceuticals – 3.4% | |
| Regeneron Pharmaceuticals, Inc. (a) | | 18,247 | $ 13,165,028 |
| Vertex Pharmaceuticals, Inc. (a) | | 85,471 | 24,682,315 |
| Zoetis, Inc. | | 105,170 | 15,412,664 |
| | | | | $53,260,007 |
| Railroad & Shipping – 0.9% | |
| Canadian Pacific Railway Ltd. | | 192,524 | $ 14,360,365 |
| Restaurants – 0.6% | |
| Chipotle Mexican Grill, Inc., “A” (a) | | 6,128 | $ 8,502,539 |
| Specialty Chemicals – 1.9% | |
| Air Products & Chemicals, Inc. | | 71,565 | $ 22,060,627 |
| Linde PLC | | 21,512 | 7,016,784 |
| | | | | $29,077,411 |
| Specialty Stores – 6.7% | |
| Amazon.com, Inc. (a) | | 967,230 | $ 81,247,320 |
| Lululemon Athletica, Inc. (a) | | 26,940 | 8,631,037 |
| O'Reilly Automotive, Inc. (a) | | 15,741 | 13,285,877 |
| | | | | $103,164,234 |
| Telecommunications - Wireless – 1.2% | |
| American Tower Corp., REIT | | 89,008 | $ 18,857,235 |
| Total Common Stocks (Identified Cost, $734,753,505) | | $1,504,732,325 |
| Investment Companies (h) – 2.7% |
| Money Market Funds – 2.7% | |
| MFS Institutional Money Market Portfolio, 4.02% (v) (Identified Cost, $42,283,263) | | | 42,284,602 | $ 42,297,287 |
| Other Assets, Less Liabilities – (0.2)% | | (3,117,732) |
| Net Assets – 100.0% | $1,543,911,880 |
| (a) | Non-income producing security. | | | |
| (h) | An affiliated issuer, which may be considered one in which the fund owns 5% or more of the outstanding voting securities, or a company which is under common control. At period end, the aggregate values of the fund's investments in affiliated issuers and in unaffiliated issuers were $42,297,287 and $1,504,732,325, respectively. | | | |
| (v) | Affiliated issuer that is available only to investment companies managed by MFS. The rate quoted for the MFS Institutional Money Market Portfolio is the annualized seven-day yield of the fund at period end. | | | |
Portfolio of Investments – continued
| The following abbreviations are used in this report and are defined: |
| ADR | American Depositary Receipt |
| REIT | Real Estate Investment Trust |
See Notes to Financial Statements
| Financial Statements | Statement of Assets and Liabilities |
This statement represents your fund’s balance sheet, which details the assets and liabilities comprising the total value of the fund.
| At 12/31/22Assets | |
| Investments in unaffiliated issuers, at value (identified cost, $734,753,505) | $1,504,732,325 |
| Investments in affiliated issuers, at value (identified cost, $42,283,263) | 42,297,287 |
| Receivables for | |
| Fund shares sold | 147,753 |
| Dividends | 817,240 |
| Other assets | 6,136 |
| Total assets | $1,548,000,741 |
| Liabilities | |
| Payables for | |
| Fund shares reacquired | $3,789,958 |
| Payable to affiliates | |
| Investment adviser | 88,971 |
| Administrative services fee | 1,833 |
| Shareholder servicing costs | 769 |
| Distribution and/or service fees | 7,868 |
| Payable for independent Trustees' compensation | 5 |
| Accrued expenses and other liabilities | 199,457 |
| Total liabilities | $4,088,861 |
| Net assets | $1,543,911,880 |
| Net assets consist of | |
| Paid-in capital | $639,850,986 |
| Total distributable earnings (loss) | 904,060,894 |
| Net assets | $1,543,911,880 |
| Shares of beneficial interest outstanding | 32,735,769 |
| | Net assets | Shares
outstanding | Net asset value
per share |
| Initial Class | $1,160,107,968 | 24,157,610 | $48.02 |
| Service Class | 383,803,912 | 8,578,159 | 44.74 |
See Notes to Financial Statements
| Financial Statements | Statement of Operations |
This statement describes how much your fund earned in investment income and accrued in expenses. It also describes any gains and/or losses generated by fund operations.
| Year ended 12/31/22 | |
| Net investment income (loss) | |
| Income | |
| Dividends | $10,815,081 |
| Dividends from affiliated issuers | 655,743 |
| Other | 18,880 |
| Foreign taxes withheld | (57,120) |
| Total investment income | $11,432,584 |
| Expenses | |
| Management fee | $12,585,052 |
| Distribution and/or service fees | 1,089,017 |
| Shareholder servicing costs | 49,450 |
| Administrative services fee | 283,769 |
| Independent Trustees' compensation | 28,101 |
| Custodian fee | 95,006 |
| Shareholder communications | 59,687 |
| Audit and tax fees | 65,017 |
| Legal fees | 7,263 |
| Miscellaneous | 48,382 |
| Total expenses | $14,310,744 |
| Reduction of expenses by investment adviser | (248,242) |
| Net expenses | $14,062,502 |
| Net investment income (loss) | $(2,629,918) |
| Realized and unrealized gain (loss) | |
| Realized gain (loss) (identified cost basis) | |
| Unaffiliated issuers | $135,457,429 |
| Affiliated issuers | (59) |
| Foreign currency | 6,406 |
| Net realized gain (loss) | $135,463,776 |
| Change in unrealized appreciation or depreciation | |
| Unaffiliated issuers | $(872,256,030) |
| Affiliated issuers | 14,024 |
| Translation of assets and liabilities in foreign currencies | 31 |
| Net unrealized gain (loss) | $(872,241,975) |
| Net realized and unrealized gain (loss) | $(736,778,199) |
| Change in net assets from operations | $(739,408,117) |
See Notes to Financial Statements
| Financial Statements | Statements of Changes in Net Assets |
These statements describe the increases and/or decreases in net assets resulting from operations, any distributions, and any shareholder transactions.
| | Year ended |
| | 12/31/22 | 12/31/21 |
| Change in net assets | | |
| From operations | | |
| Net investment income (loss) | $(2,629,918) | $(8,712,024) |
| Net realized gain (loss) | 135,463,776 | 216,129,503 |
| Net unrealized gain (loss) | (872,241,975) | 279,529,796 |
| Change in net assets from operations | $(739,408,117) | $486,947,275 |
| Total distributions to shareholders | $(206,493,057) | $(317,188,320) |
| Change in net assets from fund share transactions | $109,659,888 | $14,964,640 |
| Total change in net assets | $(836,241,286) | $184,723,595 |
| Net assets | | |
| At beginning of period | 2,380,153,166 | 2,195,429,571 |
| At end of period | $1,543,911,880 | $2,380,153,166 |
See Notes to Financial Statements
| Financial Statements | Financial Highlights |
The financial highlights table is intended to help you understand the fund's financial performance for the past 5 years. Certain information reflects financial results for a single fund share. The total returns in the table represent the rate that an investor would have earned (or lost) on an investment in the fund share class (assuming reinvestment of all distributions) held for the entire period.
| Initial Class | Year ended |
| | 12/31/22 | 12/31/21 | 12/31/20 | 12/31/19 | 12/31/18 |
| Net asset value, beginning of period | $79.36 | $73.81 | $59.40 | $47.01 | $48.90 |
| Income (loss) from investment operations | | | | | |
| Net investment income (loss) (d) | $(0.05) | $(0.25) | $(0.14) | $(0.04) | $0.00(w) |
| Net realized and unrealized gain (loss) | (24.26) | 17.21 | 18.88 | 17.53 | 1.81 |
| Total from investment operations | $(24.31) | $16.96 | $18.74 | $17.49 | $1.81 |
| Less distributions declared to shareholders | | | | | |
| From net investment income | $— | $— | $— | $— | $(0.05) |
| From net realized gain | (7.03) | (11.41) | (4.33) | (5.10) | (3.65) |
| Total distributions declared to shareholders | $(7.03) | $(11.41) | $(4.33) | $(5.10) | $(3.70) |
| Net asset value, end of period (x) | $48.02 | $79.36 | $73.81 | $59.40 | $47.01 |
| Total return (%) (k)(r)(s)(x) | (31.63) | 23.53 | 31.86 | 38.15 | 2.67 |
Ratios (%) (to average net assets)
and Supplemental data: | | | | | |
| Expenses before expense reductions | 0.74 | 0.72 | 0.74 | 0.74 | 0.75 |
| Expenses after expense reductions | 0.73 | 0.71 | 0.72 | 0.73 | 0.74 |
| Net investment income (loss) | (0.09) | (0.32) | (0.21) | (0.06) | 0.00(w) |
| Portfolio turnover | 18 | 12 | 29 | 11 | 15 |
| Net assets at end of period (000 omitted) | $1,160,108 | $1,805,385 | $1,681,327 | $1,467,280 | $1,226,217 |
| Service Class | Year ended |
| | 12/31/22 | 12/31/21 | 12/31/20 | 12/31/19 | 12/31/18 |
| Net asset value, beginning of period | $74.74 | $70.23 | $56.82 | $45.26 | $47.27 |
| Income (loss) from investment operations | | | | | |
| Net investment income (loss) (d) | $(0.18) | $(0.42) | $(0.29) | $(0.17) | $(0.13) |
| Net realized and unrealized gain (loss) | (22.79) | 16.34 | 18.03 | 16.83 | 1.77 |
| Total from investment operations | $(22.97) | $15.92 | $17.74 | $16.66 | $1.64 |
| Less distributions declared to shareholders | | | | | |
| From net investment income | $— | $— | $— | $— | $— |
| From net realized gain | (7.03) | (11.41) | (4.33) | (5.10) | (3.65) |
| Total distributions declared to shareholders | $(7.03) | $(11.41) | $(4.33) | $(5.10) | $(3.65) |
| Net asset value, end of period (x) | $44.74 | $74.74 | $70.23 | $56.82 | $45.26 |
| Total return (%) (k)(r)(s)(x) | (31.80) | 23.24 | 31.54 | 37.78 | 2.41 |
Ratios (%) (to average net assets)
and Supplemental data: | | | | | |
| Expenses before expense reductions | 0.99 | 0.97 | 0.99 | 0.99 | 1.00 |
| Expenses after expense reductions | 0.98 | 0.96 | 0.97 | 0.98 | 0.99 |
| Net investment income (loss) | (0.34) | (0.57) | (0.46) | (0.31) | (0.25) |
| Portfolio turnover | 18 | 12 | 29 | 11 | 15 |
| Net assets at end of period (000 omitted) | $383,804 | $574,768 | $514,102 | $401,008 | $287,412 |
See Notes to Financial Statements
Financial Highlights - continued
| (d) | Per share data is based on average shares outstanding. |
| (k) | The total return does not reflect expenses that apply to separate accounts. Inclusion of these charges would reduce the total return figures for all periods shown. |
| (r) | Certain expenses have been reduced without which performance would have been lower. |
| (s) | From time to time the fund may receive proceeds from litigation settlements, without which performance would be lower. |
| (w) | Per share amount was less than $0.01 and total return or ratio was less than 0.01%, as applicable. |
| (x) | The net asset values and total returns have been calculated on net assets which include adjustments made in accordance with U.S. generally accepted accounting principles required at period end for financial reporting purposes. |
See Notes to Financial Statements
Notes to Financial Statements
(1) Business and Organization
MFS Growth Series (the fund) is a diversified series of MFS Variable Insurance Trust (the trust). The trust is organized as a Massachusetts business trust and is registered under the Investment Company Act of 1940, as amended, as an open-end management investment company. The shareholders of each series of the trust are separate accounts of insurance companies, which offer variable annuity and/or life insurance products, and qualified retirement and pension plans.
The fund is an investment company and accordingly follows the investment company accounting and reporting guidance of the Financial Accounting Standards Board (FASB) Accounting Standards Codification Topic 946 Financial Services - Investment Companies.
(2) Significant Accounting Policies
General — The preparation of financial statements in conformity with U.S. generally accepted accounting principles requires management to make estimates and assumptions that affect the reported amounts of assets and liabilities, and disclosure of contingent assets and liabilities at the date of the financial statements and the reported amounts of increases and decreases in net assets from operations during the reporting period. Actual results could differ from those estimates. In the preparation of these financial statements, management has evaluated subsequent events occurring after the date of the fund’s Statement of Assets and Liabilities through the date that the financial statements were issued.
Balance Sheet Offsetting — The fund's accounting policy with respect to balance sheet offsetting is that, absent an event of default by the counterparty or a termination of the agreement, the International Swaps and Derivatives Association (ISDA) Master Agreement, or similar agreement, does not result in an offset of reported amounts of financial assets and financial liabilities in the Statement of Assets and Liabilities across transactions between the fund and the applicable counterparty. The fund's right to setoff may be restricted or prohibited by the bankruptcy or insolvency laws of the particular jurisdiction to which a specific master netting agreement counterparty is subject. Balance sheet offsetting disclosures, to the extent applicable to the fund, have been included in the fund’s Significant Accounting Policies note under the captions for each of the fund’s in-scope financial instruments and transactions.
Investment Valuations — Subject to its oversight, the fund's Board of Trustees has delegated primary responsibility for determining or causing to be determined the value of the fund’s investments to MFS as the fund's adviser, pursuant to the fund’s valuation policy and procedures which have been adopted by the adviser and approved by the Board. Effective September 8, 2022, and in accordance with Rule 2a-5 under the Investment Company Act of 1940, the Board of Trustees designated the adviser as the “valuation designee” of the fund. If the adviser, as valuation designee, determines that reliable market quotations are not readily available for an investment, the investment is valued at fair value as determined in good faith by the adviser in accordance with the adviser’s fair valuation policy and procedures.
Under the fund's valuation policy and procedures, equity securities, including restricted equity securities, are generally valued at the last sale or official closing price on their primary market or exchange as provided by a third-party pricing service. Equity securities, for which there were no sales reported that day, are generally valued at the last quoted daily bid quotation on their primary market or exchange as provided by a third-party pricing service. Short-term instruments with a maturity at issuance of 60 days or less may be valued at amortized cost, which approximates market value. Open-end investment companies are generally valued at net asset value per share. The values of foreign securities and other assets and liabilities expressed in foreign currencies are converted to U.S. dollars using the mean of bid and asked prices for rates provided by a third-party pricing service.
Under the fund’s valuation policy and procedures, market quotations are not considered to be readily available for debt instruments, floating rate loans, and many types of derivatives. These investments are generally valued at fair value based on information from third-party pricing services or otherwise determined by the adviser in accordance with the adviser’s fair valuation policy and procedures. Securities and other assets generally valued on the basis of information from a third-party pricing service may also be valued at a broker/dealer bid quotation. In determining values, third-party pricing services can utilize both transaction data and market information such as yield, quality, coupon rate, maturity, type of issue, trading characteristics, spreads and other market data. An investment may also be valued at fair value if the adviser determines that the investment’s value has been materially affected by events occurring after the close of the exchange or market on which the investment is principally traded (such as foreign exchange or market) and prior to the determination of the fund’s net asset value, or after the halt of trading of a specific security where trading does not resume prior to the close of the exchange or market on which the security is principally traded. Events that occur after foreign markets close (such as developments in foreign markets and significant movements in the U.S. markets) and prior to the determination of the fund’s net asset value may be deemed to have a material effect on the value of securities traded in foreign markets. Accordingly, the fund’s foreign equity securities may often be valued at fair value. The adviser generally relies on third-party pricing services or other information (such as the correlation with price movements of similar securities in the same or other markets; the type, cost and investment characteristics of the security; the business and financial condition of the issuer; and trading and other
Notes to Financial Statements - continued
market data) to assist in determining whether to fair value and at what value to fair value an investment. The value of an investment for purposes of calculating the fund’s net asset value can differ depending on the source and method used to determine value. When fair valuation is used, the value of an investment used to determine the fund’s net asset value may differ from quoted or published prices for the same investment. There can be no assurance that the fund could obtain the fair value assigned to an investment if it were to sell the investment at the same time at which the fund determines its net asset value per share.
Various inputs are used in determining the value of the fund's assets or liabilities. These inputs are categorized into three broad levels. In certain cases, the inputs used to measure fair value may fall into different levels of the fair value hierarchy. In such cases, an investment's level within the fair value hierarchy is based on the lowest level of input that is significant to the fair value measurement. The fund's assessment of the significance of a particular input to the fair value measurement in its entirety requires judgment, and considers factors specific to the investment. Level 1 includes unadjusted quoted prices in active markets for identical assets or liabilities. Level 2 includes other significant observable market-based inputs (including quoted prices for similar securities, interest rates, prepayment speed, and credit risk). Level 3 includes significant unobservable inputs, which may include the adviser's own assumptions in determining the fair value of investments. The following is a summary of the levels used as of December 31, 2022 in valuing the fund's assets and liabilities:
| Financial Instruments | Level 1 | Level 2 | Level 3 | Total |
| Equity Securities: | | | | |
| United States | $1,458,460,073 | $— | $— | $1,458,460,073 |
| France | — | 15,985,420 | — | 15,985,420 |
| Netherlands | 15,926,467 | — | — | 15,926,467 |
| Canada | 14,360,365 | — | — | 14,360,365 |
| Mutual Funds | 42,297,287 | — | — | 42,297,287 |
| Total | $1,531,044,192 | $15,985,420 | $— | $1,547,029,612 |
For further information regarding security characteristics, see the Portfolio of Investments.
Foreign Currency Translation — Purchases and sales of foreign investments, income, and expenses are converted into U.S. dollars based upon currency exchange rates prevailing on the respective dates of such transactions or on the reporting date for foreign denominated receivables and payables. Gains and losses attributable to foreign currency exchange rates on sales of securities are recorded for financial statement purposes as net realized gains and losses on investments. Gains and losses attributable to foreign exchange rate movements on receivables, payables, income and expenses are recorded for financial statement purposes as foreign currency transaction gains and losses. That portion of both realized and unrealized gains and losses on investments that results from fluctuations in foreign currency exchange rates is not separately disclosed.
Indemnifications — Under the fund's organizational documents, its officers and Trustees may be indemnified against certain liabilities and expenses arising out of the performance of their duties to the fund. Additionally, in the normal course of business, the fund enters into agreements with service providers that may contain indemnification clauses. The fund's maximum exposure under these agreements is unknown as this would involve future claims that may be made against the fund that have not yet occurred.
Investment Transactions and Income — Investment transactions are recorded on the trade date. Interest income is recorded on the accrual basis. Dividends received in cash are recorded on the ex-dividend date. Certain dividends from foreign securities will be recorded when the fund is informed of the dividend if such information is obtained subsequent to the ex-dividend date. Dividend payments received in additional securities are recorded on the ex-dividend date in an amount equal to the value of the security on such date. In determining the net gain or loss on securities sold, the cost of securities is determined on the identified cost basis.
The fund may receive proceeds from litigation settlements. Any proceeds received from litigation involving portfolio holdings are reflected in the Statement of Operations in realized gain/loss if the security has been disposed of by the fund or in unrealized gain/loss if the security is still held by the fund. Any other proceeds from litigation not related to portfolio holdings are reflected as other income in the Statement of Operations.
Tax Matters and Distributions — The fund intends to qualify as a regulated investment company, as defined under Subchapter M of the Internal Revenue Code, and to distribute all of its taxable income, including realized capital gains. As a result, no provision for federal income tax is required. The fund’s federal tax returns, when filed, will remain subject to examination by the Internal Revenue Service for a three year period. Management has analyzed the fund’s tax positions taken on federal and state tax returns for all open tax years and does not believe that there are any uncertain tax positions that require recognition of a tax liability. Foreign taxes, if any, have been accrued by the fund in the accompanying financial statements in accordance with the applicable foreign tax law. Foreign income taxes may be withheld by certain countries in which the fund invests. Additionally, capital gains realized by the fund on securities issued in or by certain foreign countries may be subject to capital gains tax imposed by those countries.
Notes to Financial Statements - continued
Distributions to shareholders are recorded on the ex-dividend date. Income and capital gain distributions are determined in accordance with income tax regulations, which may differ from U.S. generally accepted accounting principles. Certain capital accounts in the financial statements are periodically adjusted for permanent differences in order to reflect their tax character. These adjustments have no impact on net assets or net asset value per share. Temporary differences which arise from recognizing certain items of income, expense, gain or loss in different periods for financial statement and tax purposes will reverse at some time in the future.
Book/tax differences primarily relate to net operating losses and wash sale loss deferrals.
The tax character of distributions declared to shareholders for the last two fiscal years is as follows:
| | Year ended
12/31/22 | Year ended
12/31/21 |
| Ordinary income (including any short-term capital gains) | $8,852,271 | $1,693,158 |
| Long-term capital gains | 197,640,786 | 315,495,162 |
| Total distributions | $206,493,057 | $317,188,320 |
The federal tax cost and the tax basis components of distributable earnings were as follows:
| As of 12/31/22 | |
| Cost of investments | $778,729,548 |
| Gross appreciation | 798,588,478 |
| Gross depreciation | (30,288,414) |
| Net unrealized appreciation (depreciation) | $768,300,064 |
| Undistributed long-term capital gain | 135,760,625 |
| Other temporary differences | 205 |
| Total distributable earnings (loss) | $904,060,894 |
Multiple Classes of Shares of Beneficial Interest — The fund offers multiple classes of shares, which differ in their respective distribution and/or service fees. The fund's income, realized and unrealized gain (loss), and common expenses are allocated to shareholders based on the daily net assets of each class. Dividends are declared separately for each class. Differences in per share dividend rates are generally due to differences in separate class expenses. The fund’s distributions declared to shareholders as reported in the Statements of Changes in Net Assets are presented by class as follows:
| | Year
ended
12/31/22 | | Year
ended
12/31/21 |
| Initial Class | $153,225,412 | | $238,278,350 |
| Service Class | 53,267,645 | | 78,909,970 |
| Total | $206,493,057 | | $317,188,320 |
(3) Transactions with Affiliates
Investment Adviser — The fund has an investment advisory agreement with MFS to provide overall investment management and related administrative services and facilities to the fund. The management fee is computed daily and paid monthly at the following annual rates based on the fund's average daily net assets:
| Up to $1 billion | 0.75% |
| In excess of $1 billion | 0.65% |
MFS has agreed in writing to reduce its management fee by a specified amount if certain MFS mutual fund assets exceed thresholds agreed to by MFS and the fund's Board of Trustees. Effective March 1, 2022, MFS has also agreed in writing to waive at least 0.01% of its management fee as part of this agreement. The agreement to waive at least 0.01% of the management fee will continue until modified by the fund's Board of Trustees, but such agreement will continue at least until April 30, 2024. For the year ended December 31, 2022, this management fee reduction amounted to $248,242, which is included in the reduction of total expenses in the Statement of Operations. The management fee incurred for the year ended December 31, 2022 was equivalent to an annual effective rate of 0.69% of the fund's average daily net assets.
Notes to Financial Statements - continued
Distributor — MFS Fund Distributors, Inc. (MFD), a wholly-owned subsidiary of MFS, is the distributor of shares of the fund. The Trustees have adopted a distribution plan for the Service Class shares pursuant to Rule 12b-1 under the Investment Company Act of 1940.
The fund's distribution plan provides that the fund will pay MFD distribution and/or service fees equal to 0.25% per annum of its average daily net assets attributable to Service Class shares as partial consideration for services performed and expenses incurred by MFD and financial intermediaries (including participating insurance companies that invest in the fund to fund variable annuity and variable life insurance contracts, sponsors of qualified retirement and pension plans that invest in the fund, and affiliates of these participating insurance companies and plan sponsors) in connection with the sale and distribution of the Service Class shares. MFD may subsequently pay all, or a portion, of the distribution and/or service fees to financial intermediaries.
Shareholder Servicing Agent — MFS Service Center, Inc. (MFSC), a wholly-owned subsidiary of MFS, receives a fee from the fund for its services as shareholder servicing agent. For the year ended December 31, 2022, the fee was $46,491, which equated to 0.0026% annually of the fund's average daily net assets. MFSC also receives reimbursement from the fund for out-of-pocket expenses paid by MFSC on behalf of the fund. For the year ended December 31, 2022, these costs amounted to $2,959.
Administrator — MFS provides certain financial, legal, shareholder communications, compliance, and other administrative services to the fund. Under an administrative services agreement, the fund reimburses MFS the costs incurred to provide these services. The fund is charged an annual fixed amount of $17,500 plus a fee based on average daily net assets. The administrative services fee incurred for the year ended December 31, 2022 was equivalent to an annual effective rate of 0.0159% of the fund's average daily net assets.
Trustees’ and Officers’ Compensation — The fund pays compensation to independent Trustees in the form of a retainer, attendance fees, and additional compensation to Board and Committee chairpersons. The fund does not pay compensation directly to Trustees or officers of the fund who are also officers of the investment adviser, all of whom receive remuneration from MFS for their services to the fund. Certain officers and Trustees of the fund are officers or directors of MFS, MFD, and MFSC.
Other — The fund invests in the MFS Institutional Money Market Portfolio which is managed by MFS and seeks current income consistent with preservation of capital and liquidity. This money market fund does not pay a management fee to MFS but does incur investment and operating costs.
The fund is permitted to engage in purchase and sale transactions with funds and accounts for which MFS serves as investment adviser or sub-adviser (“cross-trades”) pursuant to a policy adopted by the Board of Trustees. This policy has been designed to ensure that cross-trades conducted by the fund comply with Rule 17a-7 under the Investment Company Act of 1940. During the year ended December 31, 2022, the fund engaged in purchase transactions pursuant to this policy, which amounted to $2,759,535.
The adviser has voluntarily undertaken to reimburse the fund from its own resources on a quarterly basis for the cost of investment research embedded in the cost of the fund’s securities trades. This agreement may be rescinded at any time. For the year ended December 31, 2022, this reimbursement amounted to $18,642, which is included in “Other” income in the Statement of Operations.
(4) Portfolio Securities
For the year ended December 31, 2022, purchases and sales of investments, other than short-term obligations, aggregated $322,922,593 and $441,972,712, respectively.
(5) Shares of Beneficial Interest
The fund's Declaration of Trust permits the Trustees to issue an unlimited number of full and fractional shares of beneficial interest. Transactions in fund shares were as follows:
| | Year ended
12/31/22 | | Year ended
12/31/21 |
| | Shares | Amount | | Shares | Amount |
| Shares sold | | | | | |
| Initial Class | 1,752,561 | $104,011,257 | | 1,093,782 | $84,897,255 |
| Service Class | 1,084,357 | 60,672,539 | | 937,570 | 69,147,302 |
| | 2,836,918 | $164,683,796 | | 2,031,352 | $154,044,557 |
Notes to Financial Statements - continued
| | Year ended
12/31/22 | | Year ended
12/31/21 |
| | Shares | Amount | | Shares | Amount |
Shares issued to shareholders
in reinvestment of distributions | | | | | |
| Initial Class | 2,803,820 | $151,742,716 | | 3,080,612 | $236,098,096 |
| Service Class | 1,055,432 | 53,267,645 | | 1,092,331 | 78,909,970 |
| | 3,859,252 | $205,010,361 | | 4,172,943 | $315,008,066 |
| Shares reacquired | | | | | |
| Initial Class | (3,148,754) | $(188,392,601) | | (4,204,800) | $(331,398,633) |
| Service Class | (1,252,072) | (71,641,668) | | (1,659,384) | (122,689,350) |
| | (4,400,826) | $(260,034,269) | | (5,864,184) | $(454,087,983) |
| Net change | | | | | |
| Initial Class | 1,407,627 | $67,361,372 | | (30,406) | $(10,403,282) |
| Service Class | 887,717 | 42,298,516 | | 370,517 | 25,367,922 |
| | 2,295,344 | $109,659,888 | | 340,111 | $14,964,640 |
The fund is one of several mutual funds in which certain MFS funds may invest. The MFS funds do not invest in the underlying funds for the purpose of exercising management or control. At the end of the period, the MFS Moderate Allocation Portfolio, the MFS Growth Allocation Portfolio, and the MFS Conservative Allocation Portfolio were the owners of record of approximately 6%, 2%, and 1%, respectively, of the value of outstanding voting shares of the fund.
(6) Line of Credit
The fund and certain other funds managed by MFS participate in a $1.45 billion unsecured committed line of credit of which $1.2 billion is reserved for use by the fund and certain other MFS U.S. funds. The line of credit is provided by a syndicate of banks under a credit agreement. Borrowings may be made for temporary financing needs. Interest is charged to each fund, based on its borrowings, generally at a rate equal to the highest of 1) Daily Simple SOFR (Secured Overnight Financing Rate) plus 0.10%, 2) the Federal Funds Effective Rate, or 3) the Overnight Bank Funding Rate, each plus an agreed upon spread. A commitment fee, based on the average daily unused portion of the committed line of credit, is allocated among the participating funds. The line of credit expires on March 16, 2023 unless extended or renewed. In addition, the fund and other funds managed by MFS have established unsecured uncommitted borrowing arrangements with certain banks for temporary financing needs. Interest is charged to each fund, based on its borrowings, at rates equal to customary reference rates plus an agreed upon spread. For the year ended December 31, 2022, the fund’s commitment fee and interest expense were $8,564 and $0, respectively, and are included in “Miscellaneous” expense in the Statement of Operations.
(7) Investments in Affiliated Issuers
An affiliated issuer may be considered one in which the fund owns 5% or more of the outstanding voting securities, or a company which is under common control. For the purposes of this report, the following were affiliated issuers:
| Affiliated Issuers | Beginning
Value | Purchases | Sales
Proceeds | Realized
Gain
(Loss) | Change in
Unrealized
Appreciation or
Depreciation | Ending
Value |
| MFS Institutional Money Market Portfolio | $597,603 | $213,628,728 | $171,943,009 | $(59) | $14,024 | $42,297,287 |
| Affiliated Issuers | Dividend
Income | Capital Gain
Distributions |
| MFS Institutional Money Market Portfolio | $655,743 | $— |
Notes to Financial Statements - continued
(8) LIBOR Transition
Certain of the fund's investments, including investments in certain debt instruments and derivatives (if any), as well as borrowings by the fund and certain other contractual arrangements of the fund, may be based on the London Interbank Offered Rate (“LIBOR”). In 2017, the regulatory authority that oversees financial services firms in the United Kingdom announced plans to transition away from LIBOR by the end of 2021. In March 2021, the administrator of LIBOR announced the extension of the publication of the more commonly used U.S. dollar LIBOR settings to the end of June 2023. Although the full impacts of the transition away from LIBOR are not fully known, the transition may result in, among other things, an increase in volatility or illiquidity of the markets for instruments that currently rely on LIBOR to determine interest rates and this could have an adverse impact on the fund's performance. With respect to the fund's accounting for investments, including investments in certain debt instruments and derivatives, as well as borrowings by the fund and any other contractual arrangements of the fund that undergo reference rate-related modifications as a result of the transition, management will rely upon the relief provided by FASB Codification Topic 848 – Reference Rate Reform (Topic 848). The guidance in Topic 848 permits the fund to account for those modified contracts as a continuation of the existing contracts. Management is still evaluating the impact to the fund of the June 30, 2023 planned discontinuation of the more commonly used U.S. dollar LIBOR settings.
(9) Russia and Ukraine Conflict
The market disruptions, which began in late February 2022, associated with geopolitical events related to the conflict between Russia and Ukraine may adversely affect the value of the fund’s assets and thus the fund’s performance. Management continues to monitor these events and to evaluate the related impacts, if any, to the fund.
Report of Independent Registered Public Accounting Firm
To the Board of Trustees of MFS Variable Insurance Trust and the Shareholders of MFS Growth Series:
Opinion on the Financial Statements and Financial Highlights
We have audited the accompanying statement of assets and liabilities of MFS Growth Series (the “Fund”), including the portfolio of investments, as of December 31, 2022, the related statement of operations for the year then ended, the statements of changes in net assets for each of the two years in the period then ended, the financial highlights for each of the five years in the period then ended, and the related notes. In our opinion, the financial statements and financial highlights present fairly, in all material respects, the financial position of the Fund as of December 31, 2022, and the results of its operations for the year then ended, the changes in its net assets for each of the two years in the period then ended, and the financial highlights for each of the five years in the period then ended, in conformity with accounting principles generally accepted in the United States of America.
Basis for Opinion
These financial statements and financial highlights are the responsibility of the Fund's management. Our responsibility is to express an opinion on the Fund's financial statements and financial highlights based on our audits. We are a public accounting firm registered with the Public Company Accounting Oversight Board (United States) (PCAOB) and are required to be independent with respect to the Fund in accordance with the U.S. federal securities laws and the applicable rules and regulations of the Securities and Exchange Commission and the PCAOB.
We conducted our audits in accordance with the standards of the PCAOB. Those standards require that we plan and perform the audit to obtain reasonable assurance about whether the financial statements and financial highlights are free of material misstatement, whether due to error or fraud. The Fund is not required to have, nor were we engaged to perform, an audit of its internal control over financial reporting. As part of our audits, we are required to obtain an understanding of internal control over financial reporting but not for the purpose of expressing an opinion on the effectiveness of the Fund's internal control over financial reporting. Accordingly, we express no such opinion.
Our audits included performing procedures to assess the risks of material misstatement of the financial statements and financial highlights, whether due to error or fraud, and performing procedures that respond to those risks. Such procedures included examining, on a test basis, evidence regarding the amounts and disclosures in the financial statements and financial highlights. Our audits also included evaluating the accounting principles used and significant estimates made by management, as well as evaluating the overall presentation of the financial statements and financial highlights. Our procedures included confirmation of securities owned as of December 31, 2022, by correspondence with the custodian. We believe that our audits provide a reasonable basis for our opinion.
DELOITTE & TOUCHE LLP
Boston, Massachusetts
February 15, 2023
We have served as the auditor of one or more of the MFS investment companies since 1924.
Trustees and Officers — Identification and Background
The Trustees and Officers of the Trust, as of February 1, 2023, are listed below, together with their principal occupations during the past five years. (Their titles may have varied during that period.) The address of each Trustee and Officer is 111 Huntington Avenue, Boston, Massachusetts 02199-7618.
| Name, Age | | Position(s) Held with Fund | | Trustee/Officer Since(h) | | Number of MFS Funds overseen by the Trustee | | Principal Occupations During
the Past Five Years | | Other Directorships During
the Past Five Years (j) |
| INTERESTED TRUSTEE | | | | | | | | | | |
Michael W. Roberge (k)
(age 56) | | Trustee | | January 2021 | | 136 | | Massachusetts Financial Services Company, Chairman (since January 2021); Chief Executive Officer (since January 2017); Director; Chairman of the Board (since January 2022); President (until December 2018); Chief Investment Officer (until December 2018) | | N/A |
| INDEPENDENT TRUSTEES | | | | | | | | | | |
John P. Kavanaugh
(age 68) | | Trustee and Chair of Trustees | | January 2009 | | 136 | | Private investor | | N/A |
Steven E. Buller
(age 71) | | Trustee | | February 2014 | | 136 | | Private investor | | N/A |
John A. Caroselli
(age 68) | | Trustee | | March 2017 | | 136 | | Private investor; JC Global Advisors, LLC (management consulting), President (since 2015) | | N/A |
Maureen R. Goldfarb
(age 67) | | Trustee | | January 2009 | | 136 | | Private investor | | N/A |
Peter D. Jones
(age 67) | | Trustee | | January 2019 | | 136 | | Private investor | | N/A |
James W. Kilman, Jr.
(age 61) | | Trustee | | January 2019 | | 136 | | Burford Capital Limited (finance and investment management), Senior Advisor (since May 3, 2021), Chief Financial Officer (2019 - May 2, 2021); KielStrand Capital LLC (family office), Chief Executive Officer (since 2016) | | Alpha-En Corporation, Director (2016-2019) |
Clarence Otis, Jr.
(age 66) | | Trustee | | March 2017 | | 136 | | Private investor | | VF Corporation, Director; Verizon Communications, Inc., Director; The Travelers Companies, Director |
Maryanne L. Roepke
(age 66) | | Trustee | | May 2014 | | 136 | | Private investor | | N/A |
Laurie J. Thomsen
(age 65) | | Trustee | | March 2005 | | 136 | | Private investor | | The Travelers Companies, Director; Dycom Industries, Inc., Director |
Trustees and Officers - continued
| Name, Age | | Position(s) Held with
Fund | | Trustee/Officer Since(h) | | Number of MFS Funds for which the Person is an Officer | | Principal Occupations During
the Past Five Years |
| OFFICERS | | | | | | | | |
Christopher R. Bohane (k)
(age 49) | | Assistant Secretary and Assistant Clerk | | July 2005 | | 136 | | Massachusetts Financial Services Company, Senior Vice President and Senior Managing Counsel |
Kino Clark (k)
(age 54) | | Assistant Treasurer | | January 2012 | | 136 | | Massachusetts Financial Services Company, Vice President |
John W. Clark, Jr. (k)
(age 55) | | Assistant Treasurer | | April 2017 | | 136 | | Massachusetts Financial Services Company, Vice President |
David L. DiLorenzo (k)
(age 54) | | President | | July 2005 | | 136 | | Massachusetts Financial Services Company, Senior Vice President |
Heidi W. Hardin (k)
(age 55) | | Secretary and Clerk | | April 2017 | | 136 | | Massachusetts Financial Services Company, Executive Vice President and General Counsel |
Brian E. Langenfeld (k)
(age 49) | | Assistant Secretary and Assistant Clerk | | June 2006 | | 136 | | Massachusetts Financial Services Company, Vice President and Managing Counsel |
Rosa E. Licea-Mailloux (k)
(age 46) | | Chief Compliance Officer | | March 2022 | | 136 | | Massachusetts Financial Services Company, Vice President (since 2018); Director of Corporate Compliance (2018-2021), Senior Director Compliance (2021-2022), Senior Managing Director of North American Compliance & Chief Compliance Officer (since March 2022); Natixis Investment Managers (investment management), Funds Chief Compliance Officer, Deputy General Counsel & Senior Vice President (until 2018) |
Amanda S. Mooradian (k)
(age 43) | | Assistant Secretary and Assistant Clerk | | September 2018 | | 136 | | Massachusetts Financial Services Company, Assistant Vice President and Senior Counsel |
Susan A. Pereira (k)
(age 52) | | Assistant Secretary and Assistant Clerk | | July 2005 | | 136 | | Massachusetts Financial Services Company, Vice President and Managing Counsel |
Kasey L. Phillips (k)
(age 52) | | Assistant Treasurer | | September 2012 | | 136 | | Massachusetts Financial Services Company, Vice President |
Matthew A. Stowe (k)
(age 48) | | Assistant Secretary and Assistant Clerk | | October 2014 | | 136 | | Massachusetts Financial Services Company, Vice President and Senior Managing Counsel |
William B. Wilson (k)
(age 40) | | Assistant Secretary and Assistant Clerk | | October 2022 | | 136 | | Massachusetts Financial Services Company, Assistant Vice President and Counsel |
James O. Yost (k)
(age 62) | | Treasurer | | September 1990 | | 136 | | Massachusetts Financial Services Company, Senior Vice President |
| (h) | Date first appointed to serve as Trustee/Officer of an MFS Fund. Each Trustee has served continuously since appointment unless indicated otherwise. From January 2012 through December 2016, Messrs. DiLorenzo and Yost served as Treasurer and Deputy Treasurer of the Funds, respectively. |
| (j) | Directorships or trusteeships of companies required to report to the Securities and Exchange Commission (i.e., “public companies”). |
| (k) | “Interested person” of the Trust within the meaning of the Investment Company Act of 1940 (referred to as the 1940 Act), which is the principal federal law governing investment companies like the fund, as a result of a position with MFS. The address of MFS is 111 Huntington Avenue, Boston, Massachusetts 02199-7618. |
Each Trustee (other than Messrs. Jones, Kilman and Roberge) has been elected by shareholders and each Trustee and Officer holds office until his or her successor is chosen and qualified or until his or her earlier death, resignation, retirement or removal. Mr. Roberge became a Trustee of the Funds on January 1, 2021 and Messrs. Jones and Kilman became Trustees of the Funds on January 1, 2019. The Trust does not hold annual meetings for the purpose of electing Trustees, and Trustees are not elected for fixed terms. Under the terms of the Board's retirement policy, an Independent Trustee shall retire at the end of the calendar year in which he or she reaches the earlier of 75 years of age or 15 years of service on the Board (or, in the case of any Independent Trustee who joined the Board prior to 2015, 20 years of service on the Board).
Trustees and Officers - continued
Messrs. Buller, Kilman and Otis and Ms. Roepke are members of the Trust’s Audit Committee.
Each of the Interested Trustees and certain Officers hold comparable officer positions with certain affiliates of MFS.
The Statement of Additional Information for a Fund includes further information about the Trustees and is available without charge upon request by calling 1-800-225-2606.
| Investment Adviser | Custodian |
Massachusetts Financial Services Company
111 Huntington Avenue
Boston, MA 02199-7618 | State Street Bank and Trust Company
1 Lincoln Street
Boston, MA 02111-2900 |
| Distributor | Independent Registered Public Accounting Firm |
MFS Fund Distributors, Inc.
111 Huntington Avenue
Boston, MA 02199-7618 | Deloitte & Touche LLP
200 Berkeley Street
Boston, MA 02116 |
| Portfolio Manager(s) | |
Eric Fischman
Paul Gordon
Bradford Mak | |
Board Review of Investment Advisory Agreement
MFS Growth Series
The Investment Company Act of 1940 requires that both the full Board of Trustees and a majority of the non-interested (“independent”) Trustees, voting separately, annually approve the continuation of the Fund’s investment advisory agreement with MFS. The Trustees consider matters bearing on the Fund and its advisory arrangements at their meetings throughout the year, including a review of performance data at each regular meeting. In addition, the independent Trustees met several times over the course of three months beginning in May and ending in July, 2022 (“contract review meetings”) for the specific purpose of considering whether to approve the continuation of the investment advisory agreement for the Fund and the other investment companies that the Board oversees (the “MFS Funds”). The independent Trustees were assisted in their evaluation of the Fund’s investment advisory agreement by independent legal counsel, from whom they received separate legal advice and with whom they met separately from MFS during various contract review meetings. The independent Trustees were also assisted in this process by an independent consultant who was retained by and reported to the independent Trustees.
In connection with their deliberations regarding the continuation of the investment advisory agreement, the Trustees, including the independent Trustees, considered such information and factors as they believed, in light of the legal advice furnished to them and their own business judgment, to be relevant. The investment advisory agreement for the Fund was considered separately, although the Trustees also took into account the common interests of all MFS Funds in their review. As described below, the Trustees considered the nature, quality, and extent of the various investment advisory, administrative, and shareholder services performed by MFS under the existing investment advisory agreement and other arrangements with the Fund.
In connection with their contract review meetings, the Trustees received and relied upon materials that included, among other items: (i) information provided by Broadridge Financial Solutions, Inc. (“Broadridge”), an independent third party, on the investment performance of the Fund for various time periods ended December 31, 2021 and the investment performance of a group of funds with substantially similar investment classifications/objectives (the “Broadridge performance universe”), (ii) information provided by Broadridge on the Fund’s advisory fees and other expenses and the advisory fees and other expenses of comparable funds identified by Broadridge as well as all other funds in the same investment classification/category (the “Broadridge expense group and universe”), (iii) information provided by MFS on the advisory fees of portfolios of other clients of MFS, including institutional separate accounts and other clients, (iv) information as to whether and to what extent applicable expense waivers, reimbursements or fee “breakpoints” are observed for the Fund, (v) information regarding MFS’ financial results and financial condition, including MFS’ and certain of its affiliates’ estimated profitability from services performed for the Fund and the MFS Funds as a whole, and compared to MFS’ institutional business, (vi) MFS’ views regarding the outlook for the mutual fund industry and the strategic business plans of MFS, (vii) descriptions of various functions performed by MFS for the Funds, such as compliance monitoring and portfolio trading practices, and (viii) information regarding the overall organization of MFS, including information about MFS’ senior management and other personnel providing investment advisory, administrative and other services to the Fund and the other MFS Funds. The comparative performance, fee and expense information prepared and provided by Broadridge was not independently verified and the independent Trustees did not independently verify any information provided to them by MFS.
The Trustees’ conclusion as to the continuation of the investment advisory agreement was based on a comprehensive consideration of all information provided to the Trustees and not the result of any single factor. Some of the factors that figured particularly in the Trustees’ deliberations are described below, although individual Trustees may have evaluated the information presented differently from one another, giving different weights to various factors. It is also important to recognize that the fee arrangements for the Fund and other MFS Funds are the result of years of review and discussion between the independent Trustees and MFS, that certain aspects of such arrangements may receive greater scrutiny in some years than in others, and that the Trustees’ conclusions may be based, in part, on their consideration of these same arrangements during the course of the year and in prior years.
Based on information provided by Broadridge and MFS, the Trustees reviewed the Fund’s total return investment performance as well as the Broadridge performance universe over various time periods. The Trustees placed particular emphasis on the total return performance of the Fund’s Initial Class shares in comparison to the performance of funds in its Broadridge performance universe over the five-year period ended December 31, 2021, which the Trustees believed was a long enough period to reflect differing market conditions. The total return performance of the Fund’s Initial Class shares was in the 2nd quintile relative to the other funds in the universe for this five-year period (the 1st quintile being the best performers and the 5th quintile being the worst performers). The total return performance of the Fund’s Initial Class shares was in the 2nd quintile for the one-year period and the 3rd quintile for the three-year period ended December 31, 2021 relative to the Broadridge performance universe. Because of the passage of time, these performance results may differ from the performance results for more recent periods, including those shown elsewhere in this report.
In the course of their deliberations, the Trustees took into account information provided by MFS in connection with the contract review meetings, as well as during investment review meetings conducted with portfolio management personnel during the course of the year regarding the Fund’s performance. After reviewing these and related factors, the Trustees concluded, within the context of their overall conclusions regarding the investment advisory agreement, that they were satisfied with MFS’ responses and efforts relating to investment performance.
Board Review of Investment Advisory Agreement - continued
In assessing the reasonableness of the Fund’s advisory fee, the Trustees considered, among other information, the Fund’s advisory fee and the total expense ratio of the Fund’s Initial Class shares as a percentage of average daily net assets and the advisory fee and total expense ratios of the Broadridge expense group based on information provided by Broadridge. The Trustees considered that, according to the data provided by Broadridge (which takes into account any fee reductions or expense limitations that were in effect during the Fund’s last fiscal year), the Fund’s effective advisory fee rate was higher than the Broadridge expense group median and the Fund’s total expense ratio was approximately at the Broadridge expense group median.
The Trustees also considered the advisory fees charged by MFS to any institutional separate accounts advised by MFS (“separate accounts”) and unaffiliated investment companies for which MFS serves as subadviser (“subadvised funds”) that have comparable investment strategies to the Fund, if any. In comparing these fees, the Trustees considered information provided by MFS as to the generally broader scope of services provided by MFS to the Fund, as well as the more extensive regulatory burdens imposed on MFS in managing the Fund, in comparison to separate accounts and subadvised funds. The Trustees also considered the higher demands placed on MFS’ investment personnel and trading infrastructure as a result of the daily cash in-flows and out-flows of the Fund in comparison to separate accounts.
The Trustees also considered whether the Fund may benefit from any economies of scale in the management of the Fund in the event of growth in assets of the Fund and/or growth in assets of the MFS Funds as a whole. They noted that the Fund’s advisory fee rate schedule is subject to a contractual breakpoint that reduces the Fund’s advisory fee rate on average daily net assets over $1 billion. The Trustees also noted that MFS has agreed in writing to waive a portion of the management fees of certain MFS Funds, including the Fund, if the total combined assets of certain funds within the MFS Funds’ complex increase above agreed upon thresholds (the “group fee waiver”), enabling the Fund’s shareholders to share in the benefits from any economies of scale at the complex level. The group fee waiver is reviewed and renewed annually between the Board and MFS. The Trustees concluded that the breakpoint and the group fee waiver were sufficient to allow the Fund to benefit from economies of scale as its assets and overall complex assets grow.
The Trustees also considered information prepared by MFS relating to MFS’ costs and profits with respect to the Fund, the MFS Funds considered as a group, and other investment companies and accounts advised by MFS, as well as MFS’ methodologies used to determine and allocate its costs to the MFS Funds, the Fund and other accounts and products for purposes of estimating profitability.
After reviewing these and other factors described herein, the Trustees concluded, within the context of their overall conclusions regarding the investment advisory agreement, that the advisory fees charged to the Fund represent reasonable compensation in light of the services being provided by MFS to the Fund.
In addition, the Trustees considered MFS’ resources and related efforts to continue to retain, attract and motivate capable personnel to serve the Fund. The Trustees also considered current and developing conditions in the financial services industry, including the presence of large and well-capitalized companies which are spending, and appear to be prepared to continue to spend, substantial sums to engage personnel and to provide services to competing investment companies. In this regard, the Trustees also considered the financial resources of MFS and its ultimate parent, Sun Life Financial Inc. The Trustees also considered the advantages and possible disadvantages to the Fund of having an adviser that also serves other investment companies as well as other accounts.
The Trustees also considered the nature, quality, cost, and extent of administrative, transfer agency, and distribution services provided to the Fund by MFS and its affiliates under agreements and plans other than the investment advisory agreement, including any 12b-1 fees the Fund pays to MFS Fund Distributors, Inc., an affiliate of MFS. The Trustees also considered the nature, extent and quality of certain other services MFS performs or arranges for on the Fund’s behalf, which may include securities lending programs, directed expense payment programs, class action recovery programs, and MFS’ interaction with third-party service providers, principally custodians and sub-custodians. The Trustees concluded that the various non-advisory services provided by MFS and its affiliates on behalf of the Fund were satisfactory.
The Trustees considered so-called “fall-out benefits” to MFS such as reputational value derived from serving as investment manager to the MFS Funds. The Trustees also considered that MFS discontinued its historic practice of obtaining investment research from portfolio brokerage commissions paid by certain MFS Funds effective January 2018, and directly pays or voluntarily reimburses a Fund, if applicable, for the costs of external research acquired through the use of the Fund’s portfolio brokerage commissions.
Based on their evaluation of factors that they deemed to be material, including those factors described above, the Board of Trustees, including the independent Trustees, concluded that the Fund’s investment advisory agreement with MFS should be continued for an additional one-year period, commencing August 1, 2022.
Proxy Voting Policies and Information
MFS votes proxies on behalf of the fund pursuant to proxy voting policies and procedures that are available without charge, upon request, by calling 1-800-225-2606, by visiting mfs.com/proxyvoting, or by visiting the SEC’s Web site at http://www.sec.gov.
Information regarding how the fund voted proxies relating to portfolio securities during the most recent twelve-month period ended June 30 is available by August 31 of each year without charge by visiting mfs.com/proxyvoting, or by visiting the SEC’s Web site at http://www.sec.gov.
Quarterly Portfolio Disclosure
The fund files a complete schedule of portfolio holdings with the SEC for the first and third quarters of each fiscal year as an exhibit to its reports on Form N-PORT. The fund’s Form N-PORT reports are available on the SEC’s Web site at http://www.sec.gov. A shareholder can obtain the portfolio holdings report for the first and third quarters of the fund's fiscal year at mfs.com/vit1 by choosing the fund's name and then scrolling to the “Resources” section and clicking on the “Prospectus and Reports” tab.
FURTHER INFORMATION
From time to time, MFS may post important information about the fund or the MFS Funds on the MFS Web site (mfs.com). This information is available at https://www.mfs.com/announcements or at mfs.com/vit1 by choosing the fund's name and then scrolling to the “Resources” section and clicking on the “Announcements” tab, if any.
Information About Fund Contracts and Legal Claims
The fund has entered into contractual arrangements with an investment adviser, administrator, distributor, shareholder servicing agent, and custodian who each provide services to the fund. Unless expressly stated otherwise, shareholders are not parties to, or intended beneficiaries of these contractual arrangements, and these contractual arrangements are not intended to create any shareholder right to enforce them against the service providers or to seek any remedy under them against the service providers, either directly or on behalf of the fund.
Under the Trust’s By-Laws and Declaration of Trust, any claims asserted against or on behalf of the MFS Funds, including claims against Trustees and Officers, must be brought in state and federal courts located within the Commonwealth of Massachusetts.
Federal Tax Information (unaudited)
The following information is provided pursuant to provisions of the Internal Revenue Code.
The fund designates $217,405,000 as capital gain dividends paid during the fiscal year.
For corporate shareholders, 90.69% of the ordinary income dividends paid during the fiscal year qualify for the corporate dividends received deduction.
| FACTS | WHAT DOES MFS DO WITH YOUR PERSONAL INFORMATION? |
| Why? | Financial companies choose how they share your personal information. Federal law gives consumers the right to limit some but not all sharing. Federal law also requires us to tell you how we collect, share, and protect your personal information. Please read this notice carefully to understand what we do. |
| What? | The types of personal information we collect and share depend on the product or service you have with us. This information can include: |
| • Social Security number and account balances |
| • Account transactions and transaction history |
| • Checking account information and wire transfer instructions |
| When you are no longer our customer, we continue to share your information as described in this notice. |
| How? | All financial companies need to share customers' personal information to run their everyday business. In the section below, we list the reasons financial companies can share their customers' personal information; the reasons MFS chooses to share; and whether you can limit this sharing. |
Reasons we can share your
personal information | Does MFS share? | Can you limit
this sharing? |
For our everyday business purposes –
such as to process your transactions, maintain your
account(s), respond to court orders and legal
investigations, or report to credit bureaus | Yes | No |
For our marketing purposes –
to offer our products and services to you | No | We don't share |
For joint marketing with other
financial companies | No | We don't share |
For our affiliates' everyday business purposes –
information about your transactions and experiences | No | We don't share |
For our affiliates' everyday business purposes –
information about your creditworthiness | No | We don't share |
| For nonaffiliates to market to you | No | We don't share |
| Questions? | Call 800-225-2606 or go to mfs.com. |
| Who we are |
| Who is providing this notice? | MFS Funds, MFS Investment Management, MFS Institutional Advisors, Inc., and MFS Heritage Trust Company. |
| What we do |
How does MFS
protect my personal
information? | To protect your personal information from unauthorized access and use, we use security measures that comply with federal law. These measures include procedural, electronic, and physical safeguards for the protection of the personal information we collect about you. |
How does MFS
collect my personal
information? | We collect your personal information, for example, when you |
| • open an account or provide account information |
| • direct us to buy securities or direct us to sell your securities |
| • make a wire transfer |
| We also collect your personal information from others, such as credit bureaus, affiliates, or other companies. |
| Why can't I limit all sharing? | Federal law gives you the right to limit only |
| • sharing for affiliates' everyday business purposes – information about your creditworthiness |
| • affiliates from using your information to market to you |
| • sharing for nonaffiliates to market to you |
| State laws and individual companies may give you additional rights to limit sharing. |
| Definitions |
| Affiliates | Companies related by common ownership or control. They can be financial and nonfinancial companies. |
| • MFS does not share personal information with affiliates, except for everyday business purposes as described on page one of this notice. |
| Nonaffiliates | Companies not related by common ownership or control. They can be financial and nonfinancial companies. |
| • MFS does not share with nonaffiliates so they can market to you. |
| Joint marketing | A formal agreement between nonaffiliated financial companies that together market financial products or services to you. |
| • MFS doesn't jointly market. |
| Other important information |
| If you own an MFS product or receive an MFS service in the name of a third party such as a bank or broker-dealer, their privacy policy may apply to you instead of ours. |
Annual Report
December 31, 2022
MFS® Mid Cap Growth Series
MFS® Variable Insurance Trust
MFS® Mid Cap Growth Series
| 1 |
| 2 |
| 3 |
| 5 |
| 7 |
| 8 |
| 12 |
| 13 |
| 14 |
| 15 |
| 16 |
| 22 |
| 23 |
| 26 |
| 28 |
| 28 |
| 28 |
| 28 |
| 28 |
| 29 |
The report is prepared for the general information of shareholders. It is authorized for distribution to prospective investors only when preceded or accompanied by a current prospectus.
NOT FDIC INSURED • MAY LOSE VALUE • NO BANK OR CREDIT UNION GUARANTEE •
NOT A DEPOSIT • NOT INSURED BY ANY FEDERAL GOVERNMENT AGENCY OR NCUA/NCUSIF
MFS Mid Cap Growth Series
LETTER FROM THE CHAIR AND CEO
Dear Shareholders:
Signs of peaking inflation, hopes that monetary policy tightening cycles may be nearing an end and a rapid reopening of China’s economy in late-2022 and early-2023 have combined to bolster investor sentiment in recent months. Markets have largely adjusted to the challenges posed by Russia’s invasion of Ukraine, thanks in part to mild European winter weather which has alleviated concerns over potential shortages of natural gas. Resilient labor markets in much of the developed world have further contributed to a brighter-than-expected economic backdrop. However, many investors are mindful that the lagged effects of ongoing policy tightening have yet to work their way through the global economy.
Tighter global financial conditions have been a particular headwind for richly valued growth equities and interest rate-sensitive parts of the economy, such as housing. Over the near term, companies may face a challenging earnings backdrop as they are forced to absorb higher input and labor costs at a time of dwindling pricing power. For fixed income, the rise in interest rates has made bonds more attractive than they have been in years, which may provide balance to an overall portfolio.
During times of market transition, it is important to have a deep understanding of company fundamentals, and we have built our unique global research platform to do just that.
At MFS®, we put our clients’ assets to work responsibly by carefully navigating increasingly complex global capital markets. Our investment team is guided by a commitment to long-term fundamental investing. Our global investment platform — combining collective expertise, long-term discipline, and thoughtful risk management — seeks to uncover what we believe are the best, most durable investment ideas in markets around the world, enabling us to potentially create value for investors.
Respectfully,
Michael W. Roberge
Chair and Chief Executive Officer
MFS Investment Management
February 15, 2023
The opinions expressed in this letter are subject to change and may not be relied upon for investment advice. No forecasts can be guaranteed.
MFS Mid Cap Growth Series
Portfolio structure
Top ten holdings
| Arthur J. Gallagher & Co. | 3.1% |
| Cadence Design Systems, Inc. | 2.9% |
| MSCI, Inc. | 2.9% |
| AMETEK, Inc. | 2.7% |
| O'Reilly Automotive, Inc. | 2.5% |
| Monolithic Power Systems, Inc. | 2.4% |
| Verisk Analytics, Inc., “A” | 2.4% |
| STERIS PLC | 2.3% |
| NASDAQ, Inc. | 2.2% |
| Vulcan Materials Co. | 2.1% |
GICS equity sectors (g)
| Industrials | 21.1% |
| Information Technology | 21.0% |
| Health Care | 18.3% |
| Consumer Discretionary | 15.6% |
| Financials | 9.9% |
| Communication Services | 2.9% |
| Energy | 2.7% |
| Real Estate | 2.6% |
| Materials | 2.4% |
| Consumer Staples | 1.0% |
| (g) | The Global Industry Classification Standard (GICS®) was developed by and/or is the exclusive property of MSCI, Inc. and S&P Global Market Intelligence Inc. (“S&P Global Market Intelligence”). GICS is a service mark of MSCI and S&P Global Market Intelligence and has been licensed for use by MFS. MFS has applied its own internal sector/industry classification methodology for equity securities and non-equity securities that are unclassified by GICS. |
Cash & Cash Equivalents includes any cash, investments in money market funds, short-term securities, and other assets less liabilities. Please see the Statement of Assets and Liabilities for additional information related to the fund’s cash position and other assets and liabilities.
Percentages are based on net assets as of December 31, 2022.
The portfolio is actively managed and current holdings may be different.
MFS Mid Cap Growth Series
Management Review
Summary of Results
For the twelve months ended December 31, 2022, Initial Class shares of the MFS Mid Cap Growth Series (fund) provided a total return of -28.70%, while Service Class shares of the fund provided a total return of -28.79%. These compare with a return of -26.72% over the same period for the fund’s benchmark, the Russell Midcap® Growth Index.
Market Environment
During the reporting period, markets continued to grapple with the strongest global inflationary pressures in decades along with signs of slowing economic growth. Intermittent coronavirus flareups, particularly in China, where home-grown vaccines have proved less effective than elsewhere, kept supply chains stretched for a considerable period. At the same time, the reopening of the economy in the parts of the world where the virus has been better contained has led to a shift in consumption patterns in favor of services, straining already tight labor markets in most developed economies, while reducing demand for manufactured goods, primarily from Asia. As a result of Russia’s invasion of Ukraine, geopolitical considerations, such as sanctions and trade bans, have resulted in additional supply chain disruptions and volatile global energy prices. Taken together, these factors have contributed to market volatility.
The ripple effects from the Russian invasion further complicated the mission central banks must undertake to rein in surging inflation. Energy shocks have historically resulted in global growth slowdowns, if not pullbacks, so policymakers will find themselves in the difficult position of trying to restrain inflation without tipping economies into recession. Despite the challenging macroeconomic and geopolitical environment, policymakers remained focused on controlling inflation, although investors appeared to have expected varying degrees of action from the central banks. The Fed has been among the most aggressive developed market central banks, tightening policy at the fastest rate in decades, although it slowed its hiking pace at the end of the period, as did the European Central Bank. After remaining on the monetary sidelines for much of the period, the Bank of Japan widened its Yield Curve Control band, capping the yield on its 10-year bond at 0.5%, up from 0.25%, an action investors interpreted as a first step toward monetary policy normalization.
Against an environment of still-tight labor markets, tighter global financial conditions and volatile materials prices, investor anxiety appeared to have increased over the potential that corporate profit margins may be past peak for this cycle. That said, tentative signs that supply chain bottlenecks (particularly semiconductors) may be moderating, the easing of COVID restrictions in China, low levels of unemployment across developed markets and hopes that inflation levels may be near a peak were supportive factors for the macroeconomic backdrop.
Detractors from Performance
Security selection in the health care sector detracted from performance relative to the Russell Midcap® Growth Index, led by the timing of the fund's ownership in shares of aesthetic dentistry product manufacturer Align Technology(h) and global medical technology company Masimo(h). The fund’s overweight positions in contract research company Charles River Laboratories(h) and drug and diagnostic company Maravai Lifesciences also held back relative returns. The stock price of Maravai Lifesciences fell as the company lowered its guidance for 2023, notably lowering its COVID CleanCap outlook given the slower uptake of bivalent boosters.
Elsewhere, the timing of the fund’s ownership in shares of energy services provider Enphase Energy, its holdings of analytics services provider Clarivate(h)(b) (United Kingdom), and not owning shares of natural gas services provider Cheniere Energy weighed on relative results. The stock price of Clarivate declined as the company reported weaker-than-expected revenue and lowered its growth guidance due to currency exchange headwinds and a challenging economic environment. Additionally, the fund’s overweight positions in education services provider Bright Horizons Family Solutions, dating products provider Match Group and information and risk management solutions provider TransUnion detracted from relative returns.
Contributors to Performance
Stock selection in the consumer discretionary sector contributed to the fund’s relative performance. Within this sector, the fund’s overweight holdings of automotive parts retailer O'Reilly Automotive helped relative returns.
Stocks in other sectors that strengthened relative results included the fund’s overweight positions in insurance services provider Arthur J Gallagher and engineering solutions providers, Howmet Aerospace and IDEX. The fund’s holding of electronic instruments manufacturer Ametek(b) also contributed to relative returns. Avoiding shares of poor-performing analytics platform developer Datadog, cloud-based security services provider Cloudflare and digital music service provider Spotify Technology further benefited the fund’s relative performance.
MFS Mid Cap Growth Series
Management Review - continued
The fund's cash and/or cash equivalents position during the period also contributed to relative performance. Under normal market conditions, the fund strives to be fully invested and generally holds cash to buy new holdings and to provide liquidity. In a period when equity markets declined, as measured by the fund's benchmark, holding cash helped performance versus the benchmark, which has no cash position.
Respectfully,
Portfolio Manager(s)
Eric Braz, Eric Fischman, and Paul Gordon
| (b) | Security is not a benchmark constituent. |
| (h) | Security was not held in the portfolio at period end. |
The views expressed in this report are those of the portfolio manager(s) only through the end of the period of the report as stated on the cover and do not necessarily reflect the views of MFS or any other person in the MFS organization. These views are subject to change at any time based on market or other conditions, and MFS disclaims any responsibility to update such views. These views may not be relied upon as investment advice or an indication of trading intent on behalf of any MFS portfolio. References to specific securities are not recommendations of such securities, and may not be representative of any MFS portfolio’s current or future investments.
MFS Mid Cap Growth Series
Performance Summary Through 12/31/22
The following chart illustrates the historical performance of the fund in comparison to its benchmark(s). Benchmarks are unmanaged and may not be invested in directly. Benchmark returns do not reflect any fees or expenses. The performance of other share classes will be greater than or less than that of the class depicted below. (See Notes to Performance Summary.)
Performance data shown represents past performance and is no guarantee of future results. Investment return and principal value fluctuate so your shares, when sold, may be worth more or less than the original cost; current performance may be lower or higher than quoted. The performance shown does not reflect the deduction of taxes, if any, that a shareholder would pay on fund distributions or the redemption of fund shares. The returns for the fund shown also do not reflect the deduction of expenses associated with variable products, such as mortality and expense risk charges, separate account charges, and sales charges imposed by the insurance company separate accounts. Such expenses would reduce the overall returns shown.
Growth of a Hypothetical $10,000 Investment
Total Returns through 12/31/22
Average annual total returns
| Share Class | Class Inception Date | 1-yr | 5-yr | 10-yr |
| Initial Class | 4/28/00 | (28.70)% | 9.28% | 12.53% |
| Service Class | 5/01/00 | (28.79)% | 9.03% | 12.25% |
Comparative benchmark(s)
| Russell Midcap® Growth Index (f) | (26.72)% | 7.64% | 11.41% |
| (f) | Source: FactSet Research Systems Inc. |
Benchmark Definition(s)
Russell Midcap® Growth Index(h) - constructed to provide a comprehensive barometer for growth securities in the mid-cap segment of the U.S. equity universe. Companies in this index generally have higher price-to-book ratios and higher forecasted growth values.
It is not possible to invest directly in an index.
| (h) | Frank Russell Company (“Russell”) is the source and owner of the trademarks, service marks, and copyrights related to the Russell Indexes. Russell® is a trademark of Frank Russell Company. Neither Russell nor its licensors accept any liability for any errors or omissions in the Russell Indexes and/or Russell ratings or underlying data and no party may rely on any Russell Indexes and/or Russell ratings and/or underlying data contained in this document. No further distribution of Russell Data is permitted without Russell's express written consent. Russell does not promote, sponsor, or endorse the content of this document. |
MFS Mid Cap Growth Series
Performance Summary – continued
Notes to Performance Summary
Average annual total return represents the average annual change in value for each share class for the periods presented.
Performance results reflect any applicable expense subsidies and waivers in effect during the periods shown. Without such subsidies and waivers the fund's performance results would be less favorable. Please see the prospectus and financial statements for complete details. All results are historical and assume the reinvestment of any dividends and capital gains distributions.
Performance results do not include adjustments made for financial reporting purposes in accordance with U.S. generally accepted accounting principles and may differ from amounts reported in the financial highlights.
From time to time the fund may receive proceeds from litigation settlements, without which performance would be lower.
MFS Mid Cap Growth Series
Expense Table
Fund expenses borne by the shareholders during the period,
July 1, 2022 through December 31, 2022
As a shareholder of the fund, you incur ongoing costs, including management fees; distribution and/or service (12b-1) fees; and other fund expenses. This example is intended to help you understand your ongoing costs (in dollars) of investing in the fund and to compare these costs with the ongoing costs of investing in other mutual funds.
The example is based on an investment of $1,000 invested at the beginning of the period and held for the entire period July 1, 2022 through December 31, 2022.
Actual Expenses
The first line for each share class in the following table provides information about actual account values and actual expenses. You may use the information in this line, together with the amount you invested, to estimate the expenses that you paid over the period. Simply divide your account value by $1,000 (for example, an $8,600 account value divided by $1,000 = 8.6), then multiply the result by the number in the first line under the heading entitled “Expenses Paid During Period” to estimate the expenses you paid on your account during this period.
Hypothetical Example for Comparison Purposes
The second line for each share class in the following table provides information about hypothetical account values and hypothetical expenses based on the fund’s actual expense ratio and an assumed rate of return of 5% per year before expenses, which is not the fund’s actual return. The hypothetical account values and expenses may not be used to estimate the actual ending account balance or expenses you paid for the period. You may use this information to compare the ongoing costs of investing in the fund and other funds. To do so, compare this 5% hypothetical example with the 5% hypothetical examples that appear in the shareholder reports of the other funds.
Please note that the expenses shown in the table are meant to highlight the fund's ongoing costs only and do not take into account the fees and expenses imposed under the variable contracts through which your investment in the fund is made. Therefore, the second line for each share class in the table is useful in comparing ongoing costs associated with an investment in vehicles (such as the fund) which fund benefits under variable annuity and variable life insurance contracts and to qualified pension and retirement plans only, and will not help you determine the relative total costs of investing in the fund through variable annuity and variable life insurance contracts. If the fees and expenses imposed under the variable contracts were included, your costs would have been higher.
Share
Class | | Annualized
Expense
Ratio | Beginning
Account Value
7/01/22 | Ending
Account Value
12/31/22 | Expenses
Paid During
Period (p)
7/01/22-12/31/22 |
| Initial Class | Actual | 0.80% | $1,000.00 | $1,024.10 | $4.08 |
| Hypothetical (h) | 0.80% | $1,000.00 | $1,021.17 | $4.08 |
| Service Class | Actual | 1.05% | $1,000.00 | $1,022.99 | $5.35 |
| Hypothetical (h) | 1.05% | $1,000.00 | $1,019.91 | $5.35 |
| (h) | 5% class return per year before expenses. |
| (p) | “Expenses Paid During Period” are equal to each class's annualized expense ratio, as shown above, multiplied by the average account value over the period, multiplied by 184/365 (to reflect the one-half year period). |
MFS Mid Cap Growth Series
Portfolio of Investments − 12/31/22
The Portfolio of Investments is a complete list of all securities owned by your fund. It is categorized by broad-based asset classes.
| Issuer | | | Shares/Par | Value ($) |
| Common Stocks – 97.5% |
| Aerospace & Defense – 1.9% | |
| Howmet Aerospace, Inc. | | 127,243 | $ 5,014,646 |
| Teledyne Technologies, Inc. (a) | | 2,436 | 974,181 |
| | | | | $5,988,827 |
| Automotive – 2.7% | |
| Copart, Inc. (a) | | 75,642 | $ 4,605,842 |
| LKQ Corp. | | 71,059 | 3,795,261 |
| | | | | $8,401,103 |
| Brokerage & Asset Managers – 2.2% | |
| NASDAQ, Inc. | | 111,607 | $ 6,847,089 |
| Business Services – 12.3% | |
| CoStar Group, Inc. (a) | | 74,420 | $ 5,751,178 |
| Endava PLC, ADR (a) | | 6,763 | 517,370 |
| Equifax, Inc. | | 22,184 | 4,311,682 |
| Factset Research Systems, Inc. | | 6,445 | 2,585,798 |
| Morningstar, Inc. | | 10,666 | 2,310,149 |
| MSCI, Inc. | | 19,421 | 9,034,067 |
| Thoughtworks Holding, Inc. (a) | | 40,918 | 416,954 |
| TransUnion | | 44,250 | 2,511,187 |
| Tyler Technologies, Inc. (a) | | 12,244 | 3,947,588 |
| Verisk Analytics, Inc., “A” | | 42,100 | 7,427,282 |
| | | | | $38,813,255 |
| Computer Software – 10.2% | |
| Autodesk, Inc. (a) | | 13,559 | $ 2,533,770 |
| Black Knight, Inc. (a) | | 69,813 | 4,310,953 |
| Bumble, Inc., “A” (a) | | 23,502 | 494,717 |
| Cadence Design Systems, Inc. (a) | | 57,206 | 9,189,572 |
| CCC Intelligent Holdings, Inc. (a) | | 19,262 | 167,580 |
| CCC Intelligent Holdings, Inc. (PIPE) (a) | | 5,792 | 50,390 |
| Dun & Bradstreet Holdings, Inc. | | 188,830 | 2,315,056 |
| NICE Systems Ltd., ADR (a) | | 26,619 | 5,118,834 |
| Paylocity Holding Corp. (a) | | 17,845 | 3,466,570 |
| Synopsys, Inc. (a) | | 13,818 | 4,411,949 |
| Topicus.com, Inc. (a) | | 3,755 | 197,151 |
| | | | | $32,256,542 |
| Computer Software - Systems – 2.3% | |
| Constellation Software, Inc. | | 3,009 | $ 4,697,862 |
| ServiceNow, Inc. (a) | | 6,922 | 2,687,605 |
| | | | | $7,385,467 |
| Construction – 3.7% | |
| AZEK Co., Inc. (a) | | 79,161 | $ 1,608,552 |
| Martin Marietta Materials, Inc. | | 2,770 | 936,177 |
| Pool Corp. | | 8,115 | 2,453,408 |
| Vulcan Materials Co. | | 37,483 | 6,563,648 |
| | | | | $11,561,785 |
| Consumer Products – 1.0% | |
| Church & Dwight Co., Inc. | | 38,769 | $ 3,125,169 |
MFS Mid Cap Growth Series
Portfolio of Investments – continued
| Issuer | | | Shares/Par | Value ($) |
| Common Stocks – continued |
| Consumer Services – 1.2% | |
| Bright Horizons Family Solutions, Inc. (a) | | 57,828 | $ 3,648,947 |
| Electrical Equipment – 4.2% | |
| AMETEK, Inc. | | 61,964 | $ 8,657,610 |
| Hubbell, Inc. | | 3,968 | 931,210 |
| Littlefuse, Inc. | | 11,706 | 2,577,661 |
| Rockwell Automation, Inc. | | 3,792 | 976,706 |
| | | | | $13,143,187 |
| Electronics – 3.9% | |
| ASM International N.V. | | 10,515 | $ 2,652,424 |
| Entegris, Inc. | | 31,743 | 2,082,023 |
| Monolithic Power Systems, Inc. | | 21,633 | 7,649,645 |
| | | | | $12,384,092 |
| Energy - Independent – 2.7% | |
| Chesapeake Energy Corp. | | 28,452 | $ 2,685,015 |
| Diamondback Energy, Inc. | | 20,395 | 2,789,628 |
| Hess Corp. | | 21,040 | 2,983,893 |
| | | | | $8,458,536 |
| Energy - Renewables – 0.9% | |
| Enphase Energy, Inc. (a) | | 11,287 | $ 2,990,604 |
| Gaming & Lodging – 2.0% | |
| Hyatt Hotels Corp. (a) | | 40,933 | $ 3,702,390 |
| Red Rock Resorts, Inc. | | 66,811 | 2,673,108 |
| | | | | $6,375,498 |
| General Merchandise – 1.0% | |
| Five Below, Inc. (a) | | 17,210 | $ 3,043,933 |
| Insurance – 3.1% | |
| Arthur J. Gallagher & Co. | | 52,431 | $ 9,885,341 |
| Internet – 2.4% | |
| Gartner, Inc. (a) | | 17,212 | $ 5,785,642 |
| Match Group, Inc. (a) | | 40,229 | 1,669,101 |
| | | | | $7,454,743 |
| Leisure & Toys – 1.7% | |
| Electronic Arts, Inc. | | 11,644 | $ 1,422,664 |
| Take-Two Interactive Software, Inc. (a) | | 38,085 | 3,965,791 |
| | | | | $5,388,455 |
| Machinery & Tools – 3.3% | |
| IDEX Corp. | | 26,602 | $ 6,074,035 |
| Ingersoll Rand, Inc. | | 18,513 | 967,304 |
| Wabtec Corp. | | 35,351 | 3,528,383 |
| | | | | $10,569,722 |
MFS Mid Cap Growth Series
Portfolio of Investments – continued
| Issuer | | | Shares/Par | Value ($) |
| Common Stocks – continued |
| Medical & Health Technology & Services – 3.9% | |
| Henry Schein, Inc. (a) | | 40,201 | $ 3,210,854 |
| ICON PLC (a) | | 28,320 | 5,501,160 |
| IDEXX Laboratories, Inc. (a) | | 6,184 | 2,522,825 |
| Veeva Systems, Inc. (a) | | 7,477 | 1,206,638 |
| | | | | $12,441,477 |
| Medical Equipment – 11.9% | |
| Agilent Technologies, Inc. | | 43,203 | $ 6,465,329 |
| Bio-Techne Corp. | | 21,295 | 1,764,930 |
| Bruker BioSciences Corp. | | 54,850 | 3,748,997 |
| Envista Holdings Corp. (a) | | 101,591 | 3,420,569 |
| Maravai Lifesciences Holdings, Inc., “A” (a) | | 43,892 | 628,095 |
| Mettler-Toledo International, Inc. (a) | | 2,172 | 3,139,517 |
| PerkinElmer, Inc. | | 45,316 | 6,354,210 |
| Repligen Corp. (a) | | 5,382 | 911,226 |
| STERIS PLC | | 38,659 | 7,139,931 |
| Waters Corp. (a) | | 11,621 | 3,981,122 |
| | | | | $37,553,926 |
| Other Banks & Diversified Financials – 0.2% | |
| S&P Global, Inc. | | 1,700 | $ 569,398 |
| Pharmaceuticals – 2.5% | |
| Alnylam Pharmaceuticals, Inc. (a) | | 14,966 | $ 3,556,670 |
| Ascendis Pharma, ADR (a) | | 27,635 | 3,375,062 |
| Legend Biotech Corp., ADR (a) | | 19,964 | 996,603 |
| | | | | $7,928,335 |
| Pollution Control – 1.7% | |
| Waste Connections, Inc. | | 40,722 | $ 5,398,108 |
| Printing & Publishing – 2.4% | |
| Warner Music Group Corp. | | 51,477 | $ 1,802,724 |
| Wolters Kluwer N.V. | | 56,749 | 5,938,621 |
| | | | | $7,741,345 |
| Railroad & Shipping – 0.2% | |
| Canadian Pacific Railway Ltd. | | 7,378 | $ 550,325 |
| Real Estate – 1.2% | |
| Extra Space Storage, Inc., REIT | | 26,016 | $ 3,829,035 |
| Restaurants – 1.8% | |
| Chipotle Mexican Grill, Inc., “A” (a) | | 2,818 | $ 3,909,947 |
| Domino's Pizza, Inc. | | 4,724 | 1,636,393 |
| | | | | $5,546,340 |
| Specialty Stores – 7.7% | |
| Burlington Stores, Inc. (a) | | 10,615 | $ 2,152,297 |
| Lululemon Athletica, Inc. (a) | | 12,883 | 4,127,455 |
| O'Reilly Automotive, Inc. (a) | | 9,273 | 7,826,690 |
| Tractor Supply Co. | | 18,845 | 4,239,560 |
| Ulta Beauty, Inc. (a) | | 12,723 | 5,967,978 |
| | | | | $24,313,980 |
MFS Mid Cap Growth Series
Portfolio of Investments – continued
| Issuer | | | Shares/Par | Value ($) |
| Common Stocks – continued |
| Telecommunications - Wireless – 1.3% | |
| SBA Communications Corp., REIT | | 15,257 | $ 4,276,690 |
| Total Common Stocks (Identified Cost, $200,673,419) | | $307,871,254 |
| Investment Companies (h) – 2.5% |
| Money Market Funds – 2.5% | |
| MFS Institutional Money Market Portfolio, 4.02% (v) (Identified Cost, $7,778,549) | | | 7,778,910 | $ 7,781,244 |
| Other Assets, Less Liabilities – 0.0% | | 51,781 |
| Net Assets – 100.0% | $315,704,279 |
| (a) | Non-income producing security. | | | |
| (h) | An affiliated issuer, which may be considered one in which the fund owns 5% or more of the outstanding voting securities, or a company which is under common control. At period end, the aggregate values of the fund's investments in affiliated issuers and in unaffiliated issuers were $7,781,244 and $307,871,254, respectively. | | | |
| (v) | Affiliated issuer that is available only to investment companies managed by MFS. The rate quoted for the MFS Institutional Money Market Portfolio is the annualized seven-day yield of the fund at period end. | | | |
| The following abbreviations are used in this report and are defined: |
| ADR | American Depositary Receipt |
| PIPE | Private Investment in Public Equity |
| REIT | Real Estate Investment Trust |
See Notes to Financial Statements
MFS Mid Cap Growth Series
| Financial Statements | Statement of Assets and Liabilities |
This statement represents your fund’s balance sheet, which details the assets and liabilities comprising the total value of the fund.
| At 12/31/22Assets | |
| Investments in unaffiliated issuers, at value (identified cost, $200,673,419) | $307,871,254 |
| Investments in affiliated issuers, at value (identified cost, $7,778,549) | 7,781,244 |
| Receivables for | |
| Investments sold | 64,485 |
| Fund shares sold | 115,521 |
| Dividends | 77,963 |
| Other assets | 1,600 |
| Total assets | $315,912,067 |
| Liabilities | |
| Payables for | |
| Fund shares reacquired | $115,385 |
| Payable to affiliates | |
| Investment adviser | 19,108 |
| Administrative services fee | 444 |
| Shareholder servicing costs | 316 |
| Distribution and/or service fees | 2,154 |
| Payable for independent Trustees' compensation | 15 |
| Accrued expenses and other liabilities | 70,366 |
| Total liabilities | $207,788 |
| Net assets | $315,704,279 |
| Net assets consist of | |
| Paid-in capital | $204,716,257 |
| Total distributable earnings (loss) | 110,988,022 |
| Net assets | $315,704,279 |
| Shares of beneficial interest outstanding | 46,266,043 |
| | Net assets | Shares
outstanding | Net asset value
per share |
| Initial Class | $210,790,246 | 29,420,903 | $7.16 |
| Service Class | 104,914,033 | 16,845,140 | 6.23 |
See Notes to Financial Statements
MFS Mid Cap Growth Series
| Financial Statements | Statement of Operations |
This statement describes how much your fund earned in investment income and accrued in expenses. It also describes any gains and/or losses generated by fund operations.
| Year ended 12/31/22 | |
| Net investment income (loss) | |
| Income | |
| Dividends | $2,024,306 |
| Dividends from affiliated issuers | 155,049 |
| Other | 7,014 |
| Income on securities loaned | 5,684 |
| Foreign taxes withheld | (26,004) |
| Total investment income | $2,166,049 |
| Expenses | |
| Management fee | $2,571,108 |
| Distribution and/or service fees | 278,001 |
| Shareholder servicing costs | 19,417 |
| Administrative services fee | 62,578 |
| Independent Trustees' compensation | 7,260 |
| Custodian fee | 23,817 |
| Shareholder communications | 13,366 |
| Audit and tax fees | 63,108 |
| Legal fees | 1,373 |
| Miscellaneous | 27,582 |
| Total expenses | $3,067,610 |
| Reduction of expenses by investment adviser | (47,745) |
| Net expenses | $3,019,865 |
| Net investment income (loss) | $(853,816) |
| Realized and unrealized gain (loss) | |
| Realized gain (loss) (identified cost basis) | |
| Unaffiliated issuers | $4,209,559 |
| Affiliated issuers | (69) |
| Foreign currency | (152) |
| Net realized gain (loss) | $4,209,338 |
| Change in unrealized appreciation or depreciation | |
| Unaffiliated issuers | $(131,622,401) |
| Affiliated issuers | 2,695 |
| Translation of assets and liabilities in foreign currencies | (3,106) |
| Net unrealized gain (loss) | $(131,622,812) |
| Net realized and unrealized gain (loss) | $(127,413,474) |
| Change in net assets from operations | $(128,267,290) |
See Notes to Financial Statements
MFS Mid Cap Growth Series
| Financial Statements | Statements of Changes in Net Assets |
These statements describe the increases and/or decreases in net assets resulting from operations, any distributions, and any shareholder transactions.
| | Year ended |
| | 12/31/22 | 12/31/21 |
| Change in net assets | | |
| From operations | | |
| Net investment income (loss) | $(853,816) | $(2,260,530) |
| Net realized gain (loss) | 4,209,338 | 53,345,166 |
| Net unrealized gain (loss) | (131,622,812) | 7,698,109 |
| Change in net assets from operations | $(128,267,290) | $58,782,745 |
| Total distributions to shareholders | $(51,377,023) | $(88,068,256) |
| Change in net assets from fund share transactions | $46,656,883 | $34,144,282 |
| Total change in net assets | $(132,987,430) | $4,858,771 |
| Net assets | | |
| At beginning of period | 448,691,709 | 443,832,938 |
| At end of period | $315,704,279 | $448,691,709 |
See Notes to Financial Statements
MFS Mid Cap Growth Series
| Financial Statements | Financial Highlights |
The financial highlights table is intended to help you understand the fund's financial performance for the past 5 years. Certain information reflects financial results for a single fund share. The total returns in the table represent the rate that an investor would have earned (or lost) on an investment in the fund share class (assuming reinvestment of all distributions) held for the entire period.
| Initial Class | Year ended |
| | 12/31/22 | 12/31/21 | 12/31/20 | 12/31/19 | 12/31/18 |
| Net asset value, beginning of period | $11.72 | $12.64 | $9.96 | $8.23 | $9.51 |
| Income (loss) from investment operations | | | | | |
| Net investment income (loss) (d) | $(0.01) | $(0.05) | $(0.03) | $(0.01) | $(0.02) |
| Net realized and unrealized gain (loss) | (3.28) | 1.78 | 3.53 | 3.10 | 0.39 |
| Total from investment operations | $(3.29) | $1.73 | $3.50 | $3.09 | $0.37 |
| Less distributions declared to shareholders | | | | | |
| From net realized gain | $(1.27) | $(2.65) | $(0.82) | $(1.36) | $(1.65) |
| Net asset value, end of period (x) | $7.16 | $11.72 | $12.64 | $9.96 | $8.23 |
| Total return (%) (k)(r)(s)(x) | (28.70) | 14.11 | 36.48 | 38.66 | 1.24 |
Ratios (%) (to average net assets)
and Supplemental data: | | | | | |
| Expenses before expense reductions | 0.81 | 0.81 | 0.81 | 0.81 | 0.81 |
| Expenses after expense reductions | 0.80 | 0.79 | 0.80 | 0.80 | 0.80 |
| Net investment income (loss) | (0.17) | (0.44) | (0.26) | (0.07) | (0.18) |
| Portfolio turnover | 27 | 18 | 40 | 17 | 21 |
| Net assets at end of period (000 omitted) | $210,790 | $306,174 | $311,988 | $290,512 | $247,614 |
| Service Class | Year ended |
| | 12/31/22 | 12/31/21 | 12/31/20 | 12/31/19 | 12/31/18 |
| Net asset value, beginning of period | $10.43 | $11.53 | $9.17 | $7.68 | $8.99 |
| Income (loss) from investment operations | | | | | |
| Net investment income (loss) (d) | $(0.03) | $(0.08) | $(0.05) | $(0.03) | $(0.04) |
| Net realized and unrealized gain (loss) | (2.90) | 1.63 | 3.23 | 2.88 | 0.38 |
| Total from investment operations | $(2.93) | $1.55 | $3.18 | $2.85 | $0.34 |
| Less distributions declared to shareholders | | | | | |
| From net realized gain | $(1.27) | $(2.65) | $(0.82) | $(1.36) | $(1.65) |
| Net asset value, end of period (x) | $6.23 | $10.43 | $11.53 | $9.17 | $7.68 |
| Total return (%) (k)(r)(s)(x) | (28.79) | 13.88 | 36.12 | 38.28 | 0.95 |
Ratios (%) (to average net assets)
and Supplemental data: | | | | | |
| Expenses before expense reductions | 1.06 | 1.06 | 1.06 | 1.06 | 1.06 |
| Expenses after expense reductions | 1.05 | 1.04 | 1.05 | 1.05 | 1.05 |
| Net investment income (loss) | (0.41) | (0.68) | (0.51) | (0.32) | (0.43) |
| Portfolio turnover | 27 | 18 | 40 | 17 | 21 |
| Net assets at end of period (000 omitted) | $104,914 | $142,517 | $131,845 | $103,504 | $86,560 |
| (d) | Per share data is based on average shares outstanding. |
| (k) | The total return does not reflect expenses that apply to separate accounts. Inclusion of these charges would reduce the total return figures for all periods shown. |
| (r) | Certain expenses have been reduced without which performance would have been lower. |
| (s) | From time to time the fund may receive proceeds from litigation settlements, without which performance would be lower. |
| (x) | The net asset values and total returns have been calculated on net assets which include adjustments made in accordance with U.S. generally accepted accounting principles required at period end for financial reporting purposes. |
See Notes to Financial Statements
MFS Mid Cap Growth Series
Notes to Financial Statements
(1) Business and Organization
MFS Mid Cap Growth Series (the fund) is a diversified series of MFS Variable Insurance Trust (the trust). The trust is organized as a Massachusetts business trust and is registered under the Investment Company Act of 1940, as amended, as an open-end management investment company. The shareholders of each series of the trust are separate accounts of insurance companies, which offer variable annuity and/or life insurance products, and qualified retirement and pension plans.
The fund is an investment company and accordingly follows the investment company accounting and reporting guidance of the Financial Accounting Standards Board (FASB) Accounting Standards Codification Topic 946 Financial Services - Investment Companies.
(2) Significant Accounting Policies
General — The preparation of financial statements in conformity with U.S. generally accepted accounting principles requires management to make estimates and assumptions that affect the reported amounts of assets and liabilities, and disclosure of contingent assets and liabilities at the date of the financial statements and the reported amounts of increases and decreases in net assets from operations during the reporting period. Actual results could differ from those estimates. In the preparation of these financial statements, management has evaluated subsequent events occurring after the date of the fund’s Statement of Assets and Liabilities through the date that the financial statements were issued.
Balance Sheet Offsetting — The fund's accounting policy with respect to balance sheet offsetting is that, absent an event of default by the counterparty or a termination of the agreement, the International Swaps and Derivatives Association (ISDA) Master Agreement, or similar agreement, does not result in an offset of reported amounts of financial assets and financial liabilities in the Statement of Assets and Liabilities across transactions between the fund and the applicable counterparty. The fund's right to setoff may be restricted or prohibited by the bankruptcy or insolvency laws of the particular jurisdiction to which a specific master netting agreement counterparty is subject. Balance sheet offsetting disclosures, to the extent applicable to the fund, have been included in the fund’s Significant Accounting Policies note under the captions for each of the fund’s in-scope financial instruments and transactions.
Investment Valuations — Subject to its oversight, the fund's Board of Trustees has delegated primary responsibility for determining or causing to be determined the value of the fund’s investments to MFS as the fund's adviser, pursuant to the fund’s valuation policy and procedures which have been adopted by the adviser and approved by the Board. Effective September 8, 2022, and in accordance with Rule 2a-5 under the Investment Company Act of 1940, the Board of Trustees designated the adviser as the “valuation designee” of the fund. If the adviser, as valuation designee, determines that reliable market quotations are not readily available for an investment, the investment is valued at fair value as determined in good faith by the adviser in accordance with the adviser’s fair valuation policy and procedures.
Under the fund's valuation policy and procedures, equity securities, including restricted equity securities, are generally valued at the last sale or official closing price on their primary market or exchange as provided by a third-party pricing service. Equity securities, for which there were no sales reported that day, are generally valued at the last quoted daily bid quotation on their primary market or exchange as provided by a third-party pricing service. Short-term instruments with a maturity at issuance of 60 days or less may be valued at amortized cost, which approximates market value. Open-end investment companies are generally valued at net asset value per share. The values of foreign securities and other assets and liabilities expressed in foreign currencies are converted to U.S. dollars using the mean of bid and asked prices for rates provided by a third-party pricing service.
Under the fund’s valuation policy and procedures, market quotations are not considered to be readily available for debt instruments, floating rate loans, and many types of derivatives. These investments are generally valued at fair value based on information from third-party pricing services or otherwise determined by the adviser in accordance with the adviser’s fair valuation policy and procedures. Securities and other assets generally valued on the basis of information from a third-party pricing service may also be valued at a broker/dealer bid quotation. In determining values, third-party pricing services can utilize both transaction data and market information such as yield, quality, coupon rate, maturity, type of issue, trading characteristics, spreads and other market data. An investment may also be valued at fair value if the adviser determines that the investment’s value has been materially affected by events occurring after the close of the exchange or market on which the investment is principally traded (such as foreign exchange or market) and prior to the determination of the fund’s net asset value, or after the halt of trading of a specific security where trading does not resume prior to the close of the exchange or market on which the security is principally traded. Events that occur after foreign markets close (such as developments in foreign markets and significant movements in the U.S. markets) and prior to the determination of the fund’s net asset value may be deemed to have a material effect on the value of securities traded in foreign markets. Accordingly, the fund’s foreign equity securities may often be valued at fair value. The adviser generally relies on third-party pricing services or other information (such as the correlation with price movements of similar securities in the same or other markets; the type, cost and investment characteristics of the security; the business and financial condition of the issuer; and trading and other
MFS Mid Cap Growth Series
Notes to Financial Statements - continued
market data) to assist in determining whether to fair value and at what value to fair value an investment. The value of an investment for purposes of calculating the fund’s net asset value can differ depending on the source and method used to determine value. When fair valuation is used, the value of an investment used to determine the fund’s net asset value may differ from quoted or published prices for the same investment. There can be no assurance that the fund could obtain the fair value assigned to an investment if it were to sell the investment at the same time at which the fund determines its net asset value per share.
Various inputs are used in determining the value of the fund's assets or liabilities. These inputs are categorized into three broad levels. In certain cases, the inputs used to measure fair value may fall into different levels of the fair value hierarchy. In such cases, an investment's level within the fair value hierarchy is based on the lowest level of input that is significant to the fair value measurement. The fund's assessment of the significance of a particular input to the fair value measurement in its entirety requires judgment, and considers factors specific to the investment. Level 1 includes unadjusted quoted prices in active markets for identical assets or liabilities. Level 2 includes other significant observable market-based inputs (including quoted prices for similar securities, interest rates, prepayment speed, and credit risk). Level 3 includes significant unobservable inputs, which may include the adviser's own assumptions in determining the fair value of investments. The following is a summary of the levels used as of December 31, 2022 in valuing the fund's assets and liabilities:
| Financial Instruments | Level 1 | Level 2 | Level 3 | Total |
| Equity Securities: | | | | |
| United States | $278,378,504 | $50,390 | $— | $278,428,894 |
| Canada | 10,843,446 | — | — | 10,843,446 |
| Netherlands | 8,591,045 | — | — | 8,591,045 |
| Israel | 5,118,834 | — | — | 5,118,834 |
| Denmark | 3,375,062 | — | — | 3,375,062 |
| China | 996,603 | — | — | 996,603 |
| United Kingdom | 517,370 | — | — | 517,370 |
| Mutual Funds | 7,781,244 | — | — | 7,781,244 |
| Total | $315,602,108 | $50,390 | $— | $315,652,498 |
For further information regarding security characteristics, see the Portfolio of Investments.
Foreign Currency Translation — Purchases and sales of foreign investments, income, and expenses are converted into U.S. dollars based upon currency exchange rates prevailing on the respective dates of such transactions or on the reporting date for foreign denominated receivables and payables. Gains and losses attributable to foreign currency exchange rates on sales of securities are recorded for financial statement purposes as net realized gains and losses on investments. Gains and losses attributable to foreign exchange rate movements on receivables, payables, income and expenses are recorded for financial statement purposes as foreign currency transaction gains and losses. That portion of both realized and unrealized gains and losses on investments that results from fluctuations in foreign currency exchange rates is not separately disclosed.
Security Loans — Under its Securities Lending Agency Agreement with the fund, State Street Bank and Trust Company, as lending agent, loans the securities of the fund to certain qualified institutions (the “Borrowers”) approved by the fund. Security loans can be terminated at the discretion of either the lending agent or the fund and the related securities must be returned within the earlier of the standard trade settlement period for such securities or within three business days. The loans are collateralized by cash and/or U.S. Treasury and federal agency obligations in an amount typically at least equal to the market value of the securities loaned. On loans collateralized by cash, the cash collateral is invested in a money market fund. The market value of the loaned securities is determined at the close of business of the fund and any additional required collateral is delivered to the fund on the next business day. The lending agent provides the fund with indemnification against Borrower default. In the event of Borrower default, the lending agent will, for the benefit of the fund, either purchase securities identical to those loaned or, when such purchase is commercially impracticable, pay the fund the market value of the loaned securities. In return, the lending agent assumes the fund's rights to the related collateral. If the collateral value is less than the cost to purchase identical securities, the lending agent is responsible for the shortfall, but only to the extent that such shortfall is not due to a decline in collateral value resulting from collateral reinvestment for which the fund bears the risk of loss. A portion of the income generated upon investment of the collateral is remitted to the Borrowers, and the remainder is allocated between the fund and the lending agent. On loans collateralized by U.S. Treasury and/or federal agency obligations, a fee is received from the Borrower, and is allocated between the fund and the lending agent. Income from securities lending is separately reported in the Statement of Operations. The dividend and interest income earned on the securities loaned is accounted for in the same manner as other dividend and interest income. At December 31, 2022, there were no securities on loan or collateral outstanding.
MFS Mid Cap Growth Series
Notes to Financial Statements - continued
Indemnifications — Under the fund's organizational documents, its officers and Trustees may be indemnified against certain liabilities and expenses arising out of the performance of their duties to the fund. Additionally, in the normal course of business, the fund enters into agreements with service providers that may contain indemnification clauses. The fund's maximum exposure under these agreements is unknown as this would involve future claims that may be made against the fund that have not yet occurred.
Investment Transactions and Income — Investment transactions are recorded on the trade date. Dividends received in cash are recorded on the ex-dividend date. Certain dividends from foreign securities will be recorded when the fund is informed of the dividend if such information is obtained subsequent to the ex-dividend date. Dividend payments received in additional securities are recorded on the ex-dividend date in an amount equal to the value of the security on such date. In determining the net gain or loss on securities sold, the cost of securities is determined on the identified cost basis.
The fund may receive proceeds from litigation settlements. Any proceeds received from litigation involving portfolio holdings are reflected in the Statement of Operations in realized gain/loss if the security has been disposed of by the fund or in unrealized gain/loss if the security is still held by the fund. Any other proceeds from litigation not related to portfolio holdings are reflected as other income in the Statement of Operations.
Tax Matters and Distributions — The fund intends to qualify as a regulated investment company, as defined under Subchapter M of the Internal Revenue Code, and to distribute all of its taxable income, including realized capital gains. As a result, no provision for federal income tax is required. The fund’s federal tax returns, when filed, will remain subject to examination by the Internal Revenue Service for a three year period. Management has analyzed the fund’s tax positions taken on federal and state tax returns for all open tax years and does not believe that there are any uncertain tax positions that require recognition of a tax liability. Foreign taxes, if any, have been accrued by the fund in the accompanying financial statements in accordance with the applicable foreign tax law. Foreign income taxes may be withheld by certain countries in which the fund invests. Additionally, capital gains realized by the fund on securities issued in or by certain foreign countries may be subject to capital gains tax imposed by those countries.
Distributions to shareholders are recorded on the ex-dividend date. Income and capital gain distributions are determined in accordance with income tax regulations, which may differ from U.S. generally accepted accounting principles. Certain capital accounts in the financial statements are periodically adjusted for permanent differences in order to reflect their tax character. These adjustments have no impact on net assets or net asset value per share. Temporary differences which arise from recognizing certain items of income, expense, gain or loss in different periods for financial statement and tax purposes will reverse at some time in the future.
Book/tax differences primarily relate to net operating losses and wash sale loss deferrals.
The tax character of distributions declared to shareholders for the last two fiscal years is as follows:
| | Year ended
12/31/22 | Year ended
12/31/21 |
| Ordinary income (including any short-term capital gains) | $— | $1,064,357 |
| Long-term capital gains | 51,377,023 | 87,003,899 |
| Total distributions | $51,377,023 | $88,068,256 |
The federal tax cost and the tax basis components of distributable earnings were as follows:
| As of 12/31/22 | |
| Cost of investments | $209,319,227 |
| Gross appreciation | 117,959,870 |
| Gross depreciation | (11,626,599) |
| Net unrealized appreciation (depreciation) | $106,333,271 |
| Undistributed long-term capital gain | 4,656,283 |
| Other temporary differences | (1,532) |
| Total distributable earnings (loss) | $110,988,022 |
Multiple Classes of Shares of Beneficial Interest — The fund offers multiple classes of shares, which differ in their respective distribution and/or service fees. The fund's income, realized and unrealized gain (loss), and common expenses are allocated to shareholders based on the daily net assets of each class. Dividends are declared separately for each class. Differences in per share dividend rates are generally due to differences in separate class expenses. The fund’s distributions declared to shareholders as reported in the Statements of Changes in Net Assets are presented by class as follows:
MFS Mid Cap Growth Series
Notes to Financial Statements - continued
| | Year
ended
12/31/22 | | Year
ended
12/31/21 |
| Initial Class | $33,177,661 | | $58,981,786 |
| Service Class | 18,199,362 | | 29,086,470 |
| Total | $51,377,023 | | $88,068,256 |
(3) Transactions with Affiliates
Investment Adviser — The fund has an investment advisory agreement with MFS to provide overall investment management and related administrative services and facilities to the fund. The management fee is computed daily and paid monthly at the following annual rates based on the fund's average daily net assets:
| Up to $1 billion | 0.75% |
| In excess of $1 billion | 0.70% |
MFS has agreed in writing to reduce its management fee by a specified amount if certain MFS mutual fund assets exceed thresholds agreed to by MFS and the fund's Board of Trustees. Effective March 1, 2022, MFS has also agreed in writing to waive at least 0.01% of its management fee as part of this agreement. The agreement to waive at least 0.01% of the management fee will continue until modified by the fund's Board of Trustees, but such agreement will continue at least until April 30, 2024. For the year ended December 31, 2022, this management fee reduction amounted to $47,745, which is included in the reduction of total expenses in the Statement of Operations. The management fee incurred for the year ended December 31, 2022 was equivalent to an annual effective rate of 0.74% of the fund's average daily net assets.
Distributor — MFS Fund Distributors, Inc. (MFD), a wholly-owned subsidiary of MFS, is the distributor of shares of the fund. The Trustees have adopted a distribution plan for the Service Class shares pursuant to Rule 12b-1 under the Investment Company Act of 1940.
The fund's distribution plan provides that the fund will pay MFD distribution and/or service fees equal to 0.25% per annum of its average daily net assets attributable to Service Class shares as partial consideration for services performed and expenses incurred by MFD and financial intermediaries (including participating insurance companies that invest in the fund to fund variable annuity and variable life insurance contracts, sponsors of qualified retirement and pension plans that invest in the fund, and affiliates of these participating insurance companies and plan sponsors) in connection with the sale and distribution of the Service Class shares. MFD may subsequently pay all, or a portion, of the distribution and/or service fees to financial intermediaries.
Shareholder Servicing Agent — MFS Service Center, Inc. (MFSC), a wholly-owned subsidiary of MFS, receives a fee from the fund for its services as shareholder servicing agent. For the year ended December 31, 2022, the fee was $18,195, which equated to 0.0053% annually of the fund's average daily net assets. MFSC also receives reimbursement from the fund for out-of-pocket expenses paid by MFSC on behalf of the fund. For the year ended December 31, 2022, these costs amounted to $1,222.
Administrator — MFS provides certain financial, legal, shareholder communications, compliance, and other administrative services to the fund. Under an administrative services agreement, the fund reimburses MFS the costs incurred to provide these services. The fund is charged an annual fixed amount of $17,500 plus a fee based on average daily net assets. The administrative services fee incurred for the year ended December 31, 2022 was equivalent to an annual effective rate of 0.0183% of the fund's average daily net assets.
Trustees’ and Officers’ Compensation — The fund pays compensation to independent Trustees in the form of a retainer, attendance fees, and additional compensation to Board and Committee chairpersons. The fund does not pay compensation directly to Trustees or officers of the fund who are also officers of the investment adviser, all of whom receive remuneration from MFS for their services to the fund. Certain officers and Trustees of the fund are officers or directors of MFS, MFD, and MFSC.
Other — The fund invests in the MFS Institutional Money Market Portfolio which is managed by MFS and seeks current income consistent with preservation of capital and liquidity. This money market fund does not pay a management fee to MFS but does incur investment and operating costs.
The fund is permitted to engage in purchase and sale transactions with funds and accounts for which MFS serves as investment adviser or sub-adviser (“cross-trades”) pursuant to a policy adopted by the Board of Trustees. This policy has been designed to ensure that cross-trades conducted by the fund comply with Rule 17a-7 under the Investment Company Act of 1940. During the year ended December 31, 2022, the fund engaged in purchase transactions pursuant to this policy, which amounted to $318,129.
MFS Mid Cap Growth Series
Notes to Financial Statements - continued
The adviser has voluntarily undertaken to reimburse the fund from its own resources on a quarterly basis for the cost of investment research embedded in the cost of the fund’s securities trades. This agreement may be rescinded at any time. For the year ended December 31, 2022, this reimbursement amounted to $6,948, which is included in “Other” income in the Statement of Operations.
(4) Portfolio Securities
For the year ended December 31, 2022, purchases and sales of investments, other than short-term obligations, aggregated $91,196,245 and $99,112,579, respectively.
(5) Shares of Beneficial Interest
The fund's Declaration of Trust permits the Trustees to issue an unlimited number of full and fractional shares of beneficial interest. Transactions in fund shares were as follows:
| | Year ended
12/31/22 | | Year ended
12/31/21 |
| | Shares | Amount | | Shares | Amount |
| Shares sold | | | | | |
| Initial Class | 2,834,622 | $24,426,303 | | 1,674,624 | $20,742,554 |
| Service Class | 3,913,069 | 29,932,462 | | 2,631,304 | 29,113,983 |
| | 6,747,691 | $54,358,765 | | 4,305,928 | $49,856,537 |
Shares issued to shareholders
in reinvestment of distributions | | | | | |
| Initial Class | 4,314,495 | $32,833,305 | | 5,081,448 | $58,385,837 |
| Service Class | 2,749,148 | 18,199,362 | | 2,840,476 | 29,086,470 |
| | 7,063,643 | $51,032,667 | | 7,921,924 | $87,472,307 |
| Shares reacquired | | | | | |
| Initial Class | (3,856,490) | $(32,740,496) | | (5,317,486) | $(66,831,580) |
| Service Class | (3,480,324) | (25,994,053) | | (3,239,455) | (36,352,982) |
| | (7,336,814) | $(58,734,549) | | (8,556,941) | $(103,184,562) |
| Net change | | | | | |
| Initial Class | 3,292,627 | $24,519,112 | | 1,438,586 | $12,296,811 |
| Service Class | 3,181,893 | 22,137,771 | | 2,232,325 | 21,847,471 |
| | 6,474,520 | $46,656,883 | | 3,670,911 | $34,144,282 |
The fund is one of several mutual funds in which certain MFS funds may invest. The MFS funds do not invest in the underlying funds for the purpose of exercising management or control. At the end of the period, the MFS Moderate Allocation Portfolio, the MFS Growth Allocation Portfolio, and the MFS Conservative Allocation Portfolio were the owners of record of approximately 22%, 7%, and 4%, respectively, of the value of outstanding voting shares of the fund.
(6) Line of Credit
The fund and certain other funds managed by MFS participate in a $1.45 billion unsecured committed line of credit of which $1.2 billion is reserved for use by the fund and certain other MFS U.S. funds. The line of credit is provided by a syndicate of banks under a credit agreement. Borrowings may be made for temporary financing needs. Interest is charged to each fund, based on its borrowings, generally at a rate equal to the highest of 1) Daily Simple SOFR (Secured Overnight Financing Rate) plus 0.10%, 2) the Federal Funds Effective Rate, or 3) the Overnight Bank Funding Rate, each plus an agreed upon spread. A commitment fee, based on the average daily unused portion of the committed line of credit, is allocated among the participating funds. The line of credit expires on March 16, 2023 unless extended or renewed. In addition, the fund and other funds managed by MFS have established unsecured uncommitted borrowing arrangements with certain banks for temporary financing needs. Interest is charged to each fund, based on its borrowings, at rates equal to customary reference rates plus an agreed upon spread. For the year ended December 31, 2022, the fund’s commitment fee and interest expense were $1,556 and $0, respectively, and are included in “Miscellaneous” expense in the Statement of Operations.
(7) Investments in Affiliated Issuers
An affiliated issuer may be considered one in which the fund owns 5% or more of the outstanding voting securities, or a company which is under common control. For the purposes of this report, the following were affiliated issuers:
MFS Mid Cap Growth Series
Notes to Financial Statements - continued
| Affiliated Issuers | Beginning
Value | Purchases | Sales
Proceeds | Realized
Gain
(Loss) | Change in
Unrealized
Appreciation or
Depreciation | Ending
Value |
| MFS Institutional Money Market Portfolio | $5,353,682 | $53,177,301 | $50,752,365 | $(69) | $2,695 | $7,781,244 |
| Affiliated Issuers | Dividend
Income | Capital Gain
Distributions |
| MFS Institutional Money Market Portfolio | $155,049 | $— |
(8) LIBOR Transition
Certain of the fund's investments, including investments in certain debt instruments and derivatives (if any), as well as borrowings by the fund and certain other contractual arrangements of the fund, may be based on the London Interbank Offered Rate (“LIBOR”). In 2017, the regulatory authority that oversees financial services firms in the United Kingdom announced plans to transition away from LIBOR by the end of 2021. In March 2021, the administrator of LIBOR announced the extension of the publication of the more commonly used U.S. dollar LIBOR settings to the end of June 2023. Although the full impacts of the transition away from LIBOR are not fully known, the transition may result in, among other things, an increase in volatility or illiquidity of the markets for instruments that currently rely on LIBOR to determine interest rates and this could have an adverse impact on the fund's performance. With respect to the fund's accounting for investments, including investments in certain debt instruments and derivatives, as well as borrowings by the fund and any other contractual arrangements of the fund that undergo reference rate-related modifications as a result of the transition, management will rely upon the relief provided by FASB Codification Topic 848 – Reference Rate Reform (Topic 848). The guidance in Topic 848 permits the fund to account for those modified contracts as a continuation of the existing contracts. Management is still evaluating the impact to the fund of the June 30, 2023 planned discontinuation of the more commonly used U.S. dollar LIBOR settings.
(9) Russia and Ukraine Conflict
The market disruptions, which began in late February 2022, associated with geopolitical events related to the conflict between Russia and Ukraine may adversely affect the value of the fund’s assets and thus the fund’s performance. Management continues to monitor these events and to evaluate the related impacts, if any, to the fund.
MFS Mid Cap Growth Series
Report of Independent Registered Public Accounting Firm
To the Board of Trustees of MFS Variable Insurance Trust and the Shareholders of MFS Mid Cap Growth Series:
Opinion on the Financial Statements and Financial Highlights
We have audited the accompanying statement of assets and liabilities of MFS Mid Cap Growth Series (the “Fund”), including the portfolio of investments, as of December 31, 2022, the related statement of operations for the year then ended, the statements of changes in net assets for each of the two years in the period then ended, the financial highlights for each of the five years in the period then ended, and the related notes. In our opinion, the financial statements and financial highlights present fairly, in all material respects, the financial position of the Fund as of December 31, 2022, and the results of its operations for the year then ended, the changes in its net assets for each of the two years in the period then ended, and the financial highlights for each of the five years in the period then ended, in conformity with accounting principles generally accepted in the United States of America.
Basis for Opinion
These financial statements and financial highlights are the responsibility of the Fund's management. Our responsibility is to express an opinion on the Fund's financial statements and financial highlights based on our audits. We are a public accounting firm registered with the Public Company Accounting Oversight Board (United States) (PCAOB) and are required to be independent with respect to the Fund in accordance with the U.S. federal securities laws and the applicable rules and regulations of the Securities and Exchange Commission and the PCAOB.
We conducted our audits in accordance with the standards of the PCAOB. Those standards require that we plan and perform the audit to obtain reasonable assurance about whether the financial statements and financial highlights are free of material misstatement, whether due to error or fraud. The Fund is not required to have, nor were we engaged to perform, an audit of its internal control over financial reporting. As part of our audits, we are required to obtain an understanding of internal control over financial reporting but not for the purpose of expressing an opinion on the effectiveness of the Fund's internal control over financial reporting. Accordingly, we express no such opinion.
Our audits included performing procedures to assess the risks of material misstatement of the financial statements and financial highlights, whether due to error or fraud, and performing procedures that respond to those risks. Such procedures included examining, on a test basis, evidence regarding the amounts and disclosures in the financial statements and financial highlights. Our audits also included evaluating the accounting principles used and significant estimates made by management, as well as evaluating the overall presentation of the financial statements and financial highlights. Our procedures included confirmation of securities owned as of December 31, 2022, by correspondence with the custodian. We believe that our audits provide a reasonable basis for our opinion.
DELOITTE & TOUCHE LLP
Boston, Massachusetts
February 15, 2023
We have served as the auditor of one or more of the MFS investment companies since 1924.
MFS Mid Cap Growth Series
Trustees and Officers — Identification and Background
The Trustees and Officers of the Trust, as of February 1, 2023, are listed below, together with their principal occupations during the past five years. (Their titles may have varied during that period.) The address of each Trustee and Officer is 111 Huntington Avenue, Boston, Massachusetts 02199-7618.
| Name, Age | | Position(s) Held with Fund | | Trustee/Officer Since(h) | | Number of MFS Funds overseen by the Trustee | | Principal Occupations During
the Past Five Years | | Other Directorships During
the Past Five Years (j) |
| INTERESTED TRUSTEE | | | | | | | | | | |
Michael W. Roberge (k)
(age 56) | | Trustee | | January 2021 | | 136 | | Massachusetts Financial Services Company, Chairman (since January 2021); Chief Executive Officer (since January 2017); Director; Chairman of the Board (since January 2022); President (until December 2018); Chief Investment Officer (until December 2018) | | N/A |
| INDEPENDENT TRUSTEES | | | | | | | | | | |
John P. Kavanaugh
(age 68) | | Trustee and Chair of Trustees | | January 2009 | | 136 | | Private investor | | N/A |
Steven E. Buller
(age 71) | | Trustee | | February 2014 | | 136 | | Private investor | | N/A |
John A. Caroselli
(age 68) | | Trustee | | March 2017 | | 136 | | Private investor; JC Global Advisors, LLC (management consulting), President (since 2015) | | N/A |
Maureen R. Goldfarb
(age 67) | | Trustee | | January 2009 | | 136 | | Private investor | | N/A |
Peter D. Jones
(age 67) | | Trustee | | January 2019 | | 136 | | Private investor | | N/A |
James W. Kilman, Jr.
(age 61) | | Trustee | | January 2019 | | 136 | | Burford Capital Limited (finance and investment management), Senior Advisor (since May 3, 2021), Chief Financial Officer (2019 - May 2, 2021); KielStrand Capital LLC (family office), Chief Executive Officer (since 2016) | | Alpha-En Corporation, Director (2016-2019) |
Clarence Otis, Jr.
(age 66) | | Trustee | | March 2017 | | 136 | | Private investor | | VF Corporation, Director; Verizon Communications, Inc., Director; The Travelers Companies, Director |
Maryanne L. Roepke
(age 66) | | Trustee | | May 2014 | | 136 | | Private investor | | N/A |
Laurie J. Thomsen
(age 65) | | Trustee | | March 2005 | | 136 | | Private investor | | The Travelers Companies, Director; Dycom Industries, Inc., Director |
MFS Mid Cap Growth Series
Trustees and Officers - continued
| Name, Age | | Position(s) Held with
Fund | | Trustee/Officer Since(h) | | Number of MFS Funds for which the Person is an Officer | | Principal Occupations During
the Past Five Years |
| OFFICERS | | | | | | | | |
Christopher R. Bohane (k)
(age 49) | | Assistant Secretary and Assistant Clerk | | July 2005 | | 136 | | Massachusetts Financial Services Company, Senior Vice President and Senior Managing Counsel |
Kino Clark (k)
(age 54) | | Assistant Treasurer | | January 2012 | | 136 | | Massachusetts Financial Services Company, Vice President |
John W. Clark, Jr. (k)
(age 55) | | Assistant Treasurer | | April 2017 | | 136 | | Massachusetts Financial Services Company, Vice President |
David L. DiLorenzo (k)
(age 54) | | President | | July 2005 | | 136 | | Massachusetts Financial Services Company, Senior Vice President |
Heidi W. Hardin (k)
(age 55) | | Secretary and Clerk | | April 2017 | | 136 | | Massachusetts Financial Services Company, Executive Vice President and General Counsel |
Brian E. Langenfeld (k)
(age 49) | | Assistant Secretary and Assistant Clerk | | June 2006 | | 136 | | Massachusetts Financial Services Company, Vice President and Managing Counsel |
Rosa E. Licea-Mailloux (k)
(age 46) | | Chief Compliance Officer | | March 2022 | | 136 | | Massachusetts Financial Services Company, Vice President (since 2018); Director of Corporate Compliance (2018-2021), Senior Director Compliance (2021-2022), Senior Managing Director of North American Compliance & Chief Compliance Officer (since March 2022); Natixis Investment Managers (investment management), Funds Chief Compliance Officer, Deputy General Counsel & Senior Vice President (until 2018) |
Amanda S. Mooradian (k)
(age 43) | | Assistant Secretary and Assistant Clerk | | September 2018 | | 136 | | Massachusetts Financial Services Company, Assistant Vice President and Senior Counsel |
Susan A. Pereira (k)
(age 52) | | Assistant Secretary and Assistant Clerk | | July 2005 | | 136 | | Massachusetts Financial Services Company, Vice President and Managing Counsel |
Kasey L. Phillips (k)
(age 52) | | Assistant Treasurer | | September 2012 | | 136 | | Massachusetts Financial Services Company, Vice President |
Matthew A. Stowe (k)
(age 48) | | Assistant Secretary and Assistant Clerk | | October 2014 | | 136 | | Massachusetts Financial Services Company, Vice President and Senior Managing Counsel |
William B. Wilson (k)
(age 40) | | Assistant Secretary and Assistant Clerk | | October 2022 | | 136 | | Massachusetts Financial Services Company, Assistant Vice President and Counsel |
James O. Yost (k)
(age 62) | | Treasurer | | September 1990 | | 136 | | Massachusetts Financial Services Company, Senior Vice President |
| (h) | Date first appointed to serve as Trustee/Officer of an MFS Fund. Each Trustee has served continuously since appointment unless indicated otherwise. From January 2012 through December 2016, Messrs. DiLorenzo and Yost served as Treasurer and Deputy Treasurer of the Funds, respectively. |
| (j) | Directorships or trusteeships of companies required to report to the Securities and Exchange Commission (i.e., “public companies”). |
| (k) | “Interested person” of the Trust within the meaning of the Investment Company Act of 1940 (referred to as the 1940 Act), which is the principal federal law governing investment companies like the fund, as a result of a position with MFS. The address of MFS is 111 Huntington Avenue, Boston, Massachusetts 02199-7618. |
Each Trustee (other than Messrs. Jones, Kilman and Roberge) has been elected by shareholders and each Trustee and Officer holds office until his or her successor is chosen and qualified or until his or her earlier death, resignation, retirement or removal. Mr. Roberge became a Trustee of the Funds on January 1, 2021 and Messrs. Jones and Kilman became Trustees of the Funds on January 1, 2019. The Trust does not hold annual meetings for the purpose of electing Trustees, and Trustees are not elected for fixed terms. Under the terms of the Board's retirement policy, an Independent Trustee shall retire at the end of the calendar year in which he or she reaches the earlier of 75 years of age or 15 years of service on the Board (or, in the case of any Independent Trustee who joined the Board prior to 2015, 20 years of service on the Board).
MFS Mid Cap Growth Series
Trustees and Officers - continued
Messrs. Buller, Kilman and Otis and Ms. Roepke are members of the Trust’s Audit Committee.
Each of the Interested Trustees and certain Officers hold comparable officer positions with certain affiliates of MFS.
The Statement of Additional Information for a Fund includes further information about the Trustees and is available without charge upon request by calling 1-800-225-2606.
| Investment Adviser | Custodian |
Massachusetts Financial Services Company
111 Huntington Avenue
Boston, MA 02199-7618 | State Street Bank and Trust Company
1 Lincoln Street
Boston, MA 02111-2900 |
| Distributor | Independent Registered Public Accounting Firm |
MFS Fund Distributors, Inc.
111 Huntington Avenue
Boston, MA 02199-7618 | Deloitte & Touche LLP
200 Berkeley Street
Boston, MA 02116 |
| Portfolio Manager(s) | |
Eric Braz
Eric Fischman
Paul Gordon | |
MFS Mid Cap Growth Series
Board Review of Investment Advisory Agreement
MFS Mid Cap Growth Series
The Investment Company Act of 1940 requires that both the full Board of Trustees and a majority of the non-interested (“independent”) Trustees, voting separately, annually approve the continuation of the Fund’s investment advisory agreement with MFS. The Trustees consider matters bearing on the Fund and its advisory arrangements at their meetings throughout the year, including a review of performance data at each regular meeting. In addition, the independent Trustees met several times over the course of three months beginning in May and ending in July, 2022 (“contract review meetings”) for the specific purpose of considering whether to approve the continuation of the investment advisory agreement for the Fund and the other investment companies that the Board oversees (the “MFS Funds”). The independent Trustees were assisted in their evaluation of the Fund’s investment advisory agreement by independent legal counsel, from whom they received separate legal advice and with whom they met separately from MFS during various contract review meetings. The independent Trustees were also assisted in this process by an independent consultant who was retained by and reported to the independent Trustees.
In connection with their deliberations regarding the continuation of the investment advisory agreement, the Trustees, including the independent Trustees, considered such information and factors as they believed, in light of the legal advice furnished to them and their own business judgment, to be relevant. The investment advisory agreement for the Fund was considered separately, although the Trustees also took into account the common interests of all MFS Funds in their review. As described below, the Trustees considered the nature, quality, and extent of the various investment advisory, administrative, and shareholder services performed by MFS under the existing investment advisory agreement and other arrangements with the Fund.
In connection with their contract review meetings, the Trustees received and relied upon materials that included, among other items: (i) information provided by Broadridge Financial Solutions, Inc. (“Broadridge”), an independent third party, on the investment performance of the Fund for various time periods ended December 31, 2021 and the investment performance of a group of funds with substantially similar investment classifications/objectives (the “Broadridge performance universe”), (ii) information provided by Broadridge on the Fund’s advisory fees and other expenses and the advisory fees and other expenses of comparable funds identified by Broadridge as well as all other funds in the same investment classification/category (the “Broadridge expense group and universe”), (iii) information provided by MFS on the advisory fees of portfolios of other clients of MFS, including institutional separate accounts and other clients, (iv) information as to whether and to what extent applicable expense waivers, reimbursements or fee “breakpoints” are observed for the Fund, (v) information regarding MFS’ financial results and financial condition, including MFS’ and certain of its affiliates’ estimated profitability from services performed for the Fund and the MFS Funds as a whole, and compared to MFS’ institutional business, (vi) MFS’ views regarding the outlook for the mutual fund industry and the strategic business plans of MFS, (vii) descriptions of various functions performed by MFS for the Funds, such as compliance monitoring and portfolio trading practices, and (viii) information regarding the overall organization of MFS, including information about MFS’ senior management and other personnel providing investment advisory, administrative and other services to the Fund and the other MFS Funds. The comparative performance, fee and expense information prepared and provided by Broadridge was not independently verified and the independent Trustees did not independently verify any information provided to them by MFS.
The Trustees’ conclusion as to the continuation of the investment advisory agreement was based on a comprehensive consideration of all information provided to the Trustees and not the result of any single factor. Some of the factors that figured particularly in the Trustees’ deliberations are described below, although individual Trustees may have evaluated the information presented differently from one another, giving different weights to various factors. It is also important to recognize that the fee arrangements for the Fund and other MFS Funds are the result of years of review and discussion between the independent Trustees and MFS, that certain aspects of such arrangements may receive greater scrutiny in some years than in others, and that the Trustees’ conclusions may be based, in part, on their consideration of these same arrangements during the course of the year and in prior years.
Based on information provided by Broadridge and MFS, the Trustees reviewed the Fund’s total return investment performance as well as the Broadridge performance universe over various time periods. The Trustees placed particular emphasis on the total return performance of the Fund’s Initial Class shares in comparison to the performance of funds in its Broadridge performance universe over the five-year period ended December 31, 2021, which the Trustees believed was a long enough period to reflect differing market conditions. The total return performance of the Fund’s Initial Class shares was in the 2nd quintile relative to the other funds in the universe for this five-year period (the 1st quintile being the best performers and the 5th quintile being the worst performers). The total return performance of the Fund’s Initial Class shares was in the 2nd quintile for each of the one- and three-year periods ended December 31, 2021 relative to the Broadridge performance universe. Because of the passage of time, these performance results may differ from the performance results for more recent periods, including those shown elsewhere in this report.
In the course of their deliberations, the Trustees took into account information provided by MFS in connection with the contract review meetings, as well as during investment review meetings conducted with portfolio management personnel during the course of the year regarding the Fund’s performance. After reviewing these and related factors, the Trustees concluded, within the context of their overall conclusions regarding the investment advisory agreement, that they were satisfied with MFS’ responses and efforts relating to investment performance.
MFS Mid Cap Growth Series
Board Review of Investment Advisory Agreement - continued
In assessing the reasonableness of the Fund’s advisory fee, the Trustees considered, among other information, the Fund’s advisory fee and the total expense ratio of the Fund’s Initial Class shares as a percentage of average daily net assets and the advisory fee and total expense ratios of the Broadridge expense group based on information provided by Broadridge. The Trustees considered that, according to the data provided by Broadridge (which takes into account any fee reductions or expense limitations that were in effect during the Fund’s last fiscal year), the Fund’s effective advisory fee rate and total expense ratio were each approximately at the Broadridge expense group median.
The Trustees also considered the advisory fees charged by MFS to any institutional separate accounts advised by MFS (“separate accounts”) and unaffiliated investment companies for which MFS serves as subadviser (“subadvised funds”) that have comparable investment strategies to the Fund, if any. In comparing these fees, the Trustees considered information provided by MFS as to the generally broader scope of services provided by MFS to the Fund, as well as the more extensive regulatory burdens imposed on MFS in managing the Fund, in comparison to separate accounts and subadvised funds. The Trustees also considered the higher demands placed on MFS’ investment personnel and trading infrastructure as a result of the daily cash in-flows and out-flows of the Fund in comparison to separate accounts.
The Trustees also considered whether the Fund may benefit from any economies of scale in the management of the Fund in the event of growth in assets of the Fund and/or growth in assets of the MFS Funds as a whole. They noted that the Fund’s advisory fee rate schedule is subject to a contractual breakpoint that reduces the Fund’s advisory fee rate on average daily net assets over $1 billion. The Trustees also noted that MFS has agreed in writing to waive a portion of the management fees of certain MFS Funds, including the Fund, if the total combined assets of certain funds within the MFS Funds’ complex increase above agreed upon thresholds (the “group fee waiver”), enabling the Fund’s shareholders to share in the benefits from any economies of scale at the complex level. The group fee waiver is reviewed and renewed annually between the Board and MFS. The Trustees concluded that the breakpoint and the group fee waiver were sufficient to allow the Fund to benefit from economies of scale as its assets and overall complex assets grow.
The Trustees also considered information prepared by MFS relating to MFS’ costs and profits with respect to the Fund, the MFS Funds considered as a group, and other investment companies and accounts advised by MFS, as well as MFS’ methodologies used to determine and allocate its costs to the MFS Funds, the Fund and other accounts and products for purposes of estimating profitability.
After reviewing these and other factors described herein, the Trustees concluded, within the context of their overall conclusions regarding the investment advisory agreement, that the advisory fees charged to the Fund represent reasonable compensation in light of the services being provided by MFS to the Fund.
In addition, the Trustees considered MFS’ resources and related efforts to continue to retain, attract and motivate capable personnel to serve the Fund. The Trustees also considered current and developing conditions in the financial services industry, including the presence of large and well-capitalized companies which are spending, and appear to be prepared to continue to spend, substantial sums to engage personnel and to provide services to competing investment companies. In this regard, the Trustees also considered the financial resources of MFS and its ultimate parent, Sun Life Financial Inc. The Trustees also considered the advantages and possible disadvantages to the Fund of having an adviser that also serves other investment companies as well as other accounts.
The Trustees also considered the nature, quality, cost, and extent of administrative, transfer agency, and distribution services provided to the Fund by MFS and its affiliates under agreements and plans other than the investment advisory agreement, including any 12b-1 fees the Fund pays to MFS Fund Distributors, Inc., an affiliate of MFS. The Trustees also considered the nature, extent and quality of certain other services MFS performs or arranges for on the Fund’s behalf, which may include securities lending programs, directed expense payment programs, class action recovery programs, and MFS’ interaction with third-party service providers, principally custodians and sub-custodians. The Trustees concluded that the various non-advisory services provided by MFS and its affiliates on behalf of the Fund were satisfactory.
The Trustees considered so-called “fall-out benefits” to MFS such as reputational value derived from serving as investment manager to the MFS Funds. The Trustees also considered that MFS discontinued its historic practice of obtaining investment research from portfolio brokerage commissions paid by certain MFS Funds effective January 2018, and directly pays or voluntarily reimburses a Fund, if applicable, for the costs of external research acquired through the use of the Fund’s portfolio brokerage commissions.
Based on their evaluation of factors that they deemed to be material, including those factors described above, the Board of Trustees, including the independent Trustees, concluded that the Fund’s investment advisory agreement with MFS should be continued for an additional one-year period, commencing August 1, 2022.
MFS Mid Cap Growth Series
Proxy Voting Policies and Information
MFS votes proxies on behalf of the fund pursuant to proxy voting policies and procedures that are available without charge, upon request, by calling 1-800-225-2606, by visiting mfs.com/proxyvoting, or by visiting the SEC’s Web site at http://www.sec.gov.
Information regarding how the fund voted proxies relating to portfolio securities during the most recent twelve-month period ended June 30 is available by August 31 of each year without charge by visiting mfs.com/proxyvoting, or by visiting the SEC’s Web site at http://www.sec.gov.
Quarterly Portfolio Disclosure
The fund files a complete schedule of portfolio holdings with the SEC for the first and third quarters of each fiscal year as an exhibit to its reports on Form N-PORT. The fund’s Form N-PORT reports are available on the SEC’s Web site at http://www.sec.gov. A shareholder can obtain the portfolio holdings report for the first and third quarters of the fund's fiscal year at mfs.com/vit1 by choosing the fund's name and then scrolling to the “Resources” section and clicking on the “Prospectus and Reports” tab.
FURTHER INFORMATION
From time to time, MFS may post important information about the fund or the MFS Funds on the MFS Web site (mfs.com). This information is available at https://www.mfs.com/announcements or at mfs.com/vit1 by choosing the fund's name and then scrolling to the “Resources” section and clicking on the “Announcements” tab, if any.
Information About Fund Contracts and Legal Claims
The fund has entered into contractual arrangements with an investment adviser, administrator, distributor, shareholder servicing agent, and custodian who each provide services to the fund. Unless expressly stated otherwise, shareholders are not parties to, or intended beneficiaries of these contractual arrangements, and these contractual arrangements are not intended to create any shareholder right to enforce them against the service providers or to seek any remedy under them against the service providers, either directly or on behalf of the fund.
Under the Trust’s By-Laws and Declaration of Trust, any claims asserted against or on behalf of the MFS Funds, including claims against Trustees and Officers, must be brought in state and federal courts located within the Commonwealth of Massachusetts.
Federal Tax Information (unaudited)
The following information is provided pursuant to provisions of the Internal Revenue Code.
The fund designates $56,515,000 as capital gain dividends paid during the fiscal year.
| FACTS | WHAT DOES MFS DO WITH YOUR PERSONAL INFORMATION? |
| Why? | Financial companies choose how they share your personal information. Federal law gives consumers the right to limit some but not all sharing. Federal law also requires us to tell you how we collect, share, and protect your personal information. Please read this notice carefully to understand what we do. |
| What? | The types of personal information we collect and share depend on the product or service you have with us. This information can include: |
| • Social Security number and account balances |
| • Account transactions and transaction history |
| • Checking account information and wire transfer instructions |
| When you are no longer our customer, we continue to share your information as described in this notice. |
| How? | All financial companies need to share customers' personal information to run their everyday business. In the section below, we list the reasons financial companies can share their customers' personal information; the reasons MFS chooses to share; and whether you can limit this sharing. |
Reasons we can share your
personal information | Does MFS share? | Can you limit
this sharing? |
For our everyday business purposes –
such as to process your transactions, maintain your
account(s), respond to court orders and legal
investigations, or report to credit bureaus | Yes | No |
For our marketing purposes –
to offer our products and services to you | No | We don't share |
For joint marketing with other
financial companies | No | We don't share |
For our affiliates' everyday business purposes –
information about your transactions and experiences | No | We don't share |
For our affiliates' everyday business purposes –
information about your creditworthiness | No | We don't share |
| For nonaffiliates to market to you | No | We don't share |
| Questions? | Call 800-225-2606 or go to mfs.com. |
| Who we are |
| Who is providing this notice? | MFS Funds, MFS Investment Management, MFS Institutional Advisors, Inc., and MFS Heritage Trust Company. |
| What we do |
How does MFS
protect my personal
information? | To protect your personal information from unauthorized access and use, we use security measures that comply with federal law. These measures include procedural, electronic, and physical safeguards for the protection of the personal information we collect about you. |
How does MFS
collect my personal
information? | We collect your personal information, for example, when you |
| • open an account or provide account information |
| • direct us to buy securities or direct us to sell your securities |
| • make a wire transfer |
| We also collect your personal information from others, such as credit bureaus, affiliates, or other companies. |
| Why can't I limit all sharing? | Federal law gives you the right to limit only |
| • sharing for affiliates' everyday business purposes – information about your creditworthiness |
| • affiliates from using your information to market to you |
| • sharing for nonaffiliates to market to you |
| State laws and individual companies may give you additional rights to limit sharing. |
| Definitions |
| Affiliates | Companies related by common ownership or control. They can be financial and nonfinancial companies. |
| • MFS does not share personal information with affiliates, except for everyday business purposes as described on page one of this notice. |
| Nonaffiliates | Companies not related by common ownership or control. They can be financial and nonfinancial companies. |
| • MFS does not share with nonaffiliates so they can market to you. |
| Joint marketing | A formal agreement between nonaffiliated financial companies that together market financial products or services to you. |
| • MFS doesn't jointly market. |
| Other important information |
| If you own an MFS product or receive an MFS service in the name of a third party such as a bank or broker-dealer, their privacy policy may apply to you instead of ours. |
Annual Report
December 31, 2022
MFS® New Discovery Series
MFS® Variable Insurance Trust
MFS® New Discovery Series
| 1 |
| 2 |
| 3 |
| 5 |
| 7 |
| 8 |
| 13 |
| 14 |
| 15 |
| 16 |
| 17 |
| 23 |
| 24 |
| 27 |
| 29 |
| 29 |
| 29 |
| 29 |
| 29 |
| 30 |
The report is prepared for the general information of shareholders. It is authorized for distribution to prospective investors only when preceded or accompanied by a current prospectus.
NOT FDIC INSURED • MAY LOSE VALUE • NO BANK OR CREDIT UNION GUARANTEE •
NOT A DEPOSIT • NOT INSURED BY ANY FEDERAL GOVERNMENT AGENCY OR NCUA/NCUSIF
LETTER FROM THE CHAIR AND CEO
Dear Shareholders:
Signs of peaking inflation, hopes that monetary policy tightening cycles may be nearing an end and a rapid reopening of China’s economy in late-2022 and early-2023 have combined to bolster investor sentiment in recent months. Markets have largely adjusted to the challenges posed by Russia’s invasion of Ukraine, thanks in part to mild European winter weather which has alleviated concerns over potential shortages of natural gas. Resilient labor markets in much of the developed world have further contributed to a brighter-than-expected economic backdrop. However, many investors are mindful that the lagged effects of ongoing policy tightening have yet to work their way through the global economy.
Tighter global financial conditions have been a particular headwind for richly valued growth equities and interest rate-sensitive parts of the economy, such as housing. Over the near term, companies may face a challenging earnings backdrop as they are forced to absorb higher input and labor costs at a time of dwindling pricing power. For fixed income, the rise in interest rates has made bonds more attractive than they have been in years, which may provide balance to an overall portfolio.
During times of market transition, it is important to have a deep understanding of company fundamentals, and we have built our unique global research platform to do just that.
At MFS®, we put our clients’ assets to work responsibly by carefully navigating increasingly complex global capital markets. Our investment team is guided by a commitment to long-term fundamental investing. Our global investment platform — combining collective expertise, long-term discipline, and thoughtful risk management — seeks to uncover what we believe are the best, most durable investment ideas in markets around the world, enabling us to potentially create value for investors.
Respectfully,
Michael W. Roberge
Chair and Chief Executive Officer
MFS Investment Management
February 15, 2023
The opinions expressed in this letter are subject to change and may not be relied upon for investment advice. No forecasts can be guaranteed.
Top ten holdings
| ChampionX Corp. | 2.6% |
| Manchester United PLC, “A” | 2.3% |
| WNS (Holdings) Ltd., ADR | 2.2% |
| GFL Environmental, Inc. | 2.2% |
| ExlService Holdings, Inc. | 2.0% |
| Element Solutions, Inc. | 2.0% |
| Sensata Technologies Holding PLC | 2.0% |
| Skechers USA, Inc., “A” | 1.8% |
| Ingevity Corp. | 1.8% |
| Axalta Coating Systems Ltd. | 1.8% |
GICS equity sectors (g)(i)
| Information Technology | 23.1% |
| Health Care | 16.9% |
| Industrials | 14.4% |
| Consumer Discretionary | 14.3% |
| Financials | 9.3% |
| Energy | 7.2% |
| Materials | 5.5% |
| Communication Services | 2.3% |
| Real Estate | 1.4% |
| Consumer Staples | 1.3% |
| Equity Warrants | 0.1% |
| (g) | The Global Industry Classification Standard (GICS®) was developed by and/or is the exclusive property of MSCI, Inc. and S&P Global Market Intelligence Inc. (“S&P Global Market Intelligence”). GICS is a service mark of MSCI and S&P Global Market Intelligence and has been licensed for use by MFS. MFS has applied its own internal sector/industry classification methodology for equity securities and non-equity securities that are unclassified by GICS. |
| (i) | For purposes of this presentation, the components include the value of securities, less any securities sold short, and reflect the impact of the equivalent exposure of derivative positions. These amounts may be negative from time to time. Equivalent exposure is a calculated amount that translates the derivative position into a reasonable approximation of the amount of the underlying asset that the portfolio would have to hold at a given point in time to have the same price sensitivity that results from the portfolio’s ownership of the derivative contract. When dealing with derivatives, equivalent exposure is a more representative measure of the potential impact of a position on portfolio performance than value. |
Cash & Cash Equivalents includes any cash, investments in money market funds, short-term securities, and other assets less liabilities. Please see the Statement of Assets and Liabilities for additional information related to the fund’s cash position and other assets and liabilities.
Other includes equivalent exposure from currency derivatives and/or any offsets to derivative positions and may be negative.
Percentages are based on net assets as of December 31, 2022.
The portfolio is actively managed and current holdings may be different.
Management Review
Summary of Results
For the twelve months ended December 31, 2022, Initial Class shares of the MFS New Discovery Series (fund) provided a total return of -29.76%, while Service Class shares of the fund provided a total return of -29.99%. These compare with a return of -26.36% over the same period for the fund’s benchmark, the Russell 2000® Growth Index.
Market Environment
During the reporting period, markets continued to grapple with the strongest global inflationary pressures in decades along with signs of slowing economic growth. Intermittent coronavirus flareups, particularly in China, where home-grown vaccines have proved less effective than elsewhere, kept supply chains stretched for a considerable period. At the same time, the reopening of the economy in the parts of the world where the virus has been better contained has led to a shift in consumption patterns in favor of services, straining already tight labor markets in most developed economies, while reducing demand for manufactured goods, primarily from Asia. As a result of Russia’s invasion of Ukraine, geopolitical considerations, such as sanctions and trade bans, have resulted in additional supply chain disruptions and volatile global energy prices. Taken together, these factors have contributed to market volatility.
The ripple effects from the Russian invasion further complicated the mission central banks must undertake to rein in surging inflation. Energy shocks have historically resulted in global growth slowdowns, if not pullbacks, so policymakers will find themselves in the difficult position of trying to restrain inflation without tipping economies into recession. Despite the challenging macroeconomic and geopolitical environment, policymakers remained focused on controlling inflation, although investors appeared to have expected varying degrees of action from the central banks. The Fed has been among the most aggressive developed market central banks, tightening policy at the fastest rate in decades, although it slowed its hiking pace at the end of the period, as did the European Central Bank. After remaining on the monetary sidelines for much of the period, the Bank of Japan widened its Yield Curve Control band, capping the yield on its 10-year bond at 0.5%, up from 0.25%, an action investors interpreted as a first step toward monetary policy normalization.
Against an environment of still-tight labor markets, tighter global financial conditions and volatile materials prices, investor anxiety appeared to have increased over the potential that corporate profit margins may be past peak for this cycle. That said, tentative signs that supply chain bottlenecks (particularly semiconductors) may be moderating, the easing of COVID restrictions in China, low levels of unemployment across developed markets and hopes that inflation levels may be near a peak were supportive factors for the macroeconomic backdrop.
Detractors from Performance
Stock selection in the industrials sector detracted from performance relative to the Russell 2000® Growth Index, led by the fund’s holdings of building products manufacturer AZEK(b) and an overweight position in agriculture equipment supplier Hydrofarm(h). The timing of the fund’s overweight position in mobile auction platform provider ACV Auctions also hindered relative returns. Although ACV Auctions posted solid financial results, its subdued revenue guidance, owing to new car supply constraints and weaker retail vehicle purchases, weighed on the stock price.
The fund’s underweight allocation to the strong-performing energy sector held back relative performance, however, there were no individual securities within this sector, either in the fund or in the benchmark, that were among the fund's top relative detractors for the reporting period.
The fund’s overweight position and, to a lesser degree, security selection in the information technology sector also weakened relative performance. Here, the fund’s overweight positions in security risk intelligence solutions provider Rapid7 and cloud-based virtual banking solutions provider Q2 Holdings, and its holdings of global technology consultancy company Thoughtworks Holding(b) and digital outsourcing services provider TaskUs(b), dampened relative results. The stock price of Rapid7 declined as the company noted that sales were held back as customers appeared to be hesitant to justify the costs of information security spending.
Elsewhere, the fund’s holdings of outsourced clinical development company Syneos Health(b) and life sciences company Maravai Lifesciences Holdings(b), and an overweight position in lending risk software solutions company Open Lending, detracted from relative returns. The stock price of Syneos Health fell as the company reported lower-than-expected revenue and depressed margins.
Contributors to Performance
Stock selection in the communication services sector contributed to relative results, led by the fund’s holdings of soccer club Manchester United(b) (United Kingdom). The stock price of Manchester United jumped after the company announced it was exploring strategic alternatives including the sale of the club.
Management Review - continued
Stocks in other sectors that strengthened relative results included the fund’s overweight positions in operations management and analytics company ExlService Holdings, commerce payment solutions manager EVO Payments(h), specialty chemicals and energy equipment provider ChampionX, surgical robotics company PROCEPT BioRobotics and custody services provider for health care plans and saving accounts HealthEquity. Additionally, the fund’s holdings of national security information solutions company CACI International(b), auction company Ritchie Bros. Auctioneers(b), footwear company Skechers USA(b) and discount retailer Five Below(b) were also among the fund’s top relative contributors.
The fund’s cash and/or cash equivalents position during the period also benefited relative performance. Under normal market conditions, the fund strives to be fully invested and generally holds cash to buy new holdings and to provide liquidity. In a period when equity markets declined, as measured by the fund’s benchmark, holding cash benefited performance versus the benchmark, which has no cash position.
Respectfully,
Portfolio Manager(s)
Michael Grossman
| (b) | Security is not a benchmark constituent. |
| (h) | Security was not held in the portfolio at period end. |
The views expressed in this report are those of the portfolio manager(s) only through the end of the period of the report as stated on the cover and do not necessarily reflect the views of MFS or any other person in the MFS organization. These views are subject to change at any time based on market or other conditions, and MFS disclaims any responsibility to update such views. These views may not be relied upon as investment advice or an indication of trading intent on behalf of any MFS portfolio. References to specific securities are not recommendations of such securities, and may not be representative of any MFS portfolio’s current or future investments.
Performance Summary Through 12/31/22
The following chart illustrates the historical performance of the fund in comparison to its benchmark(s). Benchmarks are unmanaged and may not be invested in directly. Benchmark returns do not reflect any fees or expenses. The performance of other share classes will be greater than or less than that of the class depicted below. (See Notes to Performance Summary.)
Performance data shown represents past performance and is no guarantee of future results. Investment return and principal value fluctuate so your shares, when sold, may be worth more or less than the original cost; current performance may be lower or higher than quoted. The performance shown does not reflect the deduction of taxes, if any, that a shareholder would pay on fund distributions or the redemption of fund shares. The returns for the fund shown also do not reflect the deduction of expenses associated with variable products, such as mortality and expense risk charges, separate account charges, and sales charges imposed by the insurance company separate accounts. Such expenses would reduce the overall returns shown.
Growth of a Hypothetical $10,000 Investment
Total Returns through 12/31/22
Average annual total returns
| Share Class | Class Inception Date | 1-yr | 5-yr | 10-yr |
| Initial Class | 5/01/98 | (29.76)% | 7.81% | 9.99% |
| Service Class | 5/01/00 | (29.99)% | 7.53% | 9.71% |
Comparative benchmark(s)
| Russell 2000® Growth Index (f) | (26.36)% | 3.51% | 9.20% |
| (f) | Source: FactSet Research Systems Inc. |
Benchmark Definition(s)
Russell 2000® Growth Index(h) - constructed to provide a comprehensive barometer for growth securities in the small-cap segment of the U.S. equity universe. Companies in this index generally have higher price-to-book ratios and higher forecasted growth values.
It is not possible to invest directly in an index.
| (h) | Frank Russell Company (“Russell”) is the source and owner of the trademarks, service marks, and copyrights related to the Russell Indexes. Russell® is a trademark of Frank Russell Company. Neither Russell nor its licensors accept any liability for any errors or omissions in the Russell Indexes and/or Russell ratings or underlying data and no party may rely on any Russell Indexes and/or Russell ratings and/or underlying data contained in this document. No further distribution of Russell Data is permitted without Russell's express written consent. Russell does not promote, sponsor, or endorse the content of this document. |
Notes to Performance Summary
Average annual total return represents the average annual change in value for each share class for the periods presented.
Performance results reflect any applicable expense subsidies and waivers in effect during the periods shown. Without such subsidies and waivers the fund's performance results would be less favorable. Please see the prospectus and financial statements for complete details. All results are historical and assume the reinvestment of any dividends and capital gains distributions.
Performance Summary – continued
Performance results do not include adjustments made for financial reporting purposes in accordance with U.S. generally accepted accounting principles and may differ from amounts reported in the financial highlights.
From time to time the fund may receive proceeds from litigation settlements, without which performance would be lower.
Expense Table
Fund expenses borne by the shareholders during the period,
July 1, 2022 through December 31, 2022
As a shareholder of the fund, you incur ongoing costs, including management fees; distribution and/or service (12b-1) fees; and other fund expenses. This example is intended to help you understand your ongoing costs (in dollars) of investing in the fund and to compare these costs with the ongoing costs of investing in other mutual funds.
The example is based on an investment of $1,000 invested at the beginning of the period and held for the entire period July 1, 2022 through December 31, 2022.
Actual Expenses
The first line for each share class in the following table provides information about actual account values and actual expenses. You may use the information in this line, together with the amount you invested, to estimate the expenses that you paid over the period. Simply divide your account value by $1,000 (for example, an $8,600 account value divided by $1,000 = 8.6), then multiply the result by the number in the first line under the heading entitled “Expenses Paid During Period” to estimate the expenses you paid on your account during this period.
Hypothetical Example for Comparison Purposes
The second line for each share class in the following table provides information about hypothetical account values and hypothetical expenses based on the fund’s actual expense ratio and an assumed rate of return of 5% per year before expenses, which is not the fund’s actual return. The hypothetical account values and expenses may not be used to estimate the actual ending account balance or expenses you paid for the period. You may use this information to compare the ongoing costs of investing in the fund and other funds. To do so, compare this 5% hypothetical example with the 5% hypothetical examples that appear in the shareholder reports of the other funds.
Please note that the expenses shown in the table are meant to highlight the fund's ongoing costs only and do not take into account the fees and expenses imposed under the variable contracts through which your investment in the fund is made. Therefore, the second line for each share class in the table is useful in comparing ongoing costs associated with an investment in vehicles (such as the fund) which fund benefits under variable annuity and variable life insurance contracts and to qualified pension and retirement plans only, and will not help you determine the relative total costs of investing in the fund through variable annuity and variable life insurance contracts. If the fees and expenses imposed under the variable contracts were included, your costs would have been higher.
Share
Class | | Annualized
Expense
Ratio | Beginning
Account Value
7/01/22 | Ending
Account Value
12/31/22 | Expenses
Paid During
Period (p)
7/01/22-12/31/22 |
| Initial Class | Actual | 0.87% | $1,000.00 | $1,029.34 | $4.45 |
| Hypothetical (h) | 0.87% | $1,000.00 | $1,020.82 | $4.43 |
| Service Class | Actual | 1.12% | $1,000.00 | $1,027.30 | $5.72 |
| Hypothetical (h) | 1.12% | $1,000.00 | $1,019.56 | $5.70 |
| (h) | 5% class return per year before expenses. |
| (p) | “Expenses Paid During Period” are equal to each class's annualized expense ratio, as shown above, multiplied by the average account value over the period, multiplied by 184/365 (to reflect the one-half year period). |
Portfolio of Investments − 12/31/22
The Portfolio of Investments is a complete list of all securities owned by your fund. It is categorized by broad-based asset classes.
| Issuer | | | Shares/Par | Value ($) |
| Common Stocks – 95.8% |
| Aerospace & Defense – 1.9% | |
| AeroVironment, Inc. (a) | | 40,236 | $ 3,446,616 |
| CACI International, Inc., “A” (a) | | 22,451 | 6,748,546 |
| Kratos Defense & Security Solutions, Inc. (a) | | 194,494 | 2,007,178 |
| | | | | $12,202,340 |
| Airlines – 0.5% | |
| JetBlue Airways Corp. (a) | | 506,334 | $ 3,281,044 |
| Apparel Manufacturers – 2.6% | |
| On Holding AG (a) | | 284,859 | $ 4,888,180 |
| Skechers USA, Inc., “A” (a) | | 288,946 | 12,121,285 |
| | | | | $17,009,465 |
| Automotive – 2.4% | |
| Methode Electronics, Inc. | | 177,212 | $ 7,862,896 |
| Visteon Corp. (a) | | 58,555 | 7,660,751 |
| | | | | $15,523,647 |
| Biotechnology – 3.4% | |
| Abcam PLC, ADR (a) | | 449,113 | $ 6,988,198 |
| Adaptive Biotechnologies Corp. (a) | | 211,523 | 1,616,036 |
| AlloVir, Inc. (a) | | 165,962 | 851,385 |
| BioAtla, Inc. (a) | | 105,598 | 871,184 |
| BioXcel Therapeutics, Inc. (a) | | 89,597 | 1,924,544 |
| Immunocore Holdings PLC, ADR (a) | | 72,000 | 4,109,040 |
| Lyell Immunopharma, Inc. (a) | | 210,617 | 730,841 |
| MaxCyte, Inc. (a) | | 379,301 | 2,070,983 |
| Oxford Nanopore Technologies PLC (a) | | 663,620 | 1,977,629 |
| Prelude Therapeutics, Inc. (a) | | 101,925 | 615,627 |
| Sana Biotechnology, Inc. (a)(l) | | 162,437 | 641,626 |
| | | | | $22,397,093 |
| Brokerage & Asset Managers – 4.6% | |
| Focus Financial Partners, “A” (a) | | 192,854 | $ 7,187,669 |
| GCM Grosvenor, Inc., “A” (l) | | 637,985 | 4,855,066 |
| Hamilton Lane, Inc., “A” | | 147,346 | 9,412,462 |
| WisdomTree Investments, Inc. | | 1,693,312 | 9,228,550 |
| | | | | $30,683,747 |
| Business Services – 10.3% | |
| ExlService Holdings, Inc. (a) | | 79,458 | $ 13,462,569 |
| Keywords Studios PLC | | 264,835 | 8,721,493 |
| Payoneer Global, Inc. (a) | | 945,380 | 5,171,229 |
| Remitly Global, Inc. (a) | | 795,084 | 9,103,712 |
| TaskUs, Inc., “A” (a) | | 420,366 | 7,104,185 |
| Thoughtworks Holding, Inc. (a) | | 1,011,173 | 10,303,853 |
| WNS (Holdings) Ltd., ADR (a) | | 181,214 | 14,495,308 |
| | | | | $68,362,349 |
| Chemicals – 3.8% | |
| Element Solutions, Inc. | | 716,134 | $ 13,026,478 |
| Ingevity Corp. (a) | | 168,707 | 11,883,721 |
| | | | | $24,910,199 |
Portfolio of Investments – continued
| Issuer | | | Shares/Par | Value ($) |
| Common Stocks – continued |
| Computer Software – 6.9% | |
| Alkami Technology, Inc. (a)(l) | | 480,771 | $ 7,014,449 |
| Definitive Healthcare Corp. (a) | | 380,897 | 4,186,058 |
| DoubleVerify Holdings, Inc. (a) | | 239,476 | 5,258,893 |
| Kinaxis, Inc. (a) | | 29,548 | 3,315,094 |
| nCino, Inc. (a) | | 118,337 | 3,128,830 |
| Open Lending Corp., “A” (a) | | 309,157 | 2,086,810 |
| Paycor HCM, Inc. (a) | | 219,934 | 5,381,785 |
| Paylocity Holding Corp. (a) | | 15,111 | 2,935,463 |
| Procore Technologies, Inc. (a) | | 137,360 | 6,480,645 |
| Sabre Corp. (a) | | 973,230 | 6,014,561 |
| | | | | $45,802,588 |
| Computer Software - Systems – 3.8% | |
| Five9, Inc. (a) | | 106,635 | $ 7,236,251 |
| Nuvei Corp. (a) | | 200,553 | 5,096,052 |
| Q2 Holdings, Inc. (a) | | 242,542 | 6,517,103 |
| Rapid7, Inc. (a) | | 176,702 | 6,004,334 |
| | | | | $24,853,740 |
| Construction – 2.0% | |
| AZEK Co., Inc. (a) | | 522,730 | $ 10,621,873 |
| Trex Co., Inc. (a) | | 65,511 | 2,773,081 |
| | | | | $13,394,954 |
| Consumer Services – 2.9% | |
| Boyd Group Services, Inc. | | 49,988 | $ 7,721,928 |
| Bright Horizons Family Solutions, Inc. (a) | | 98,205 | 6,196,735 |
| European Wax Center, Inc., “A” | | 414,004 | 5,154,350 |
| | | | | $19,073,013 |
| Electrical Equipment – 2.6% | |
| Littlefuse, Inc. | | 18,864 | $ 4,153,853 |
| Sensata Technologies Holding PLC | | 320,262 | 12,932,179 |
| | | | | $17,086,032 |
| Electronics – 0.8% | |
| Advanced Energy Industries, Inc. | | 63,756 | $ 5,468,990 |
| Energy - Independent – 3.1% | |
| Magnolia Oil & Gas Corp., “A” | | 461,794 | $ 10,829,069 |
| Matador Resources Co. | | 169,818 | 9,720,383 |
| | | | | $20,549,452 |
| Entertainment – 3.1% | |
| Manchester United PLC, “A” | | 658,483 | $ 15,362,408 |
| Vivid Seats, Inc., “A” (a)(l) | | 717,498 | 5,237,736 |
| | | | | $20,600,144 |
| Food & Beverages – 1.3% | |
| Duckhorn Portfolio, Inc. (a) | | 463,164 | $ 7,674,627 |
| Oatly Group AB, ADR (a)(l) | | 620,375 | 1,079,453 |
| | | | | $8,754,080 |
Portfolio of Investments – continued
| Issuer | | | Shares/Par | Value ($) |
| Common Stocks – continued |
| Gaming & Lodging – 2.0% | |
| Genius Sports Ltd. (a) | | 774,772 | $ 2,765,936 |
| Penn Entertainment, Inc. (a) | | 353,123 | 10,487,753 |
| | | | | $13,253,689 |
| General Merchandise – 2.9% | |
| Five Below, Inc. (a) | | 47,165 | $ 8,342,073 |
| Ollie's Bargain Outlet Holdings, Inc. (a) | | 225,377 | 10,556,659 |
| | | | | $18,898,732 |
| Leisure & Toys – 2.2% | |
| Brunswick Corp. | | 132,451 | $ 9,547,068 |
| Corsair Gaming, Inc. (a) | | 167,422 | 2,271,917 |
| Funko, Inc., “A” (a) | | 275,169 | 3,002,094 |
| | | | | $14,821,079 |
| Machinery & Tools – 1.7% | |
| Ritchie Bros. Auctioneers, Inc. | | 195,558 | $ 11,309,119 |
| Medical & Health Technology & Services – 3.5% | |
| Certara, Inc. (a) | | 534,220 | $ 8,584,915 |
| HealthEquity, Inc. (a) | | 83,978 | 5,176,404 |
| Syneos Health, Inc. (a) | | 253,029 | 9,281,104 |
| | | | | $23,042,423 |
| Medical Equipment – 6.5% | |
| Bruker BioSciences Corp. | | 137,691 | $ 9,411,180 |
| Envista Holdings Corp. (a) | | 326,091 | 10,979,484 |
| Gerresheimer AG | | 122,024 | 8,202,969 |
| Maravai Lifesciences Holdings, Inc., “A” (a) | | 208,685 | 2,986,282 |
| OptiNose, Inc. (a) | | 581,679 | 1,076,106 |
| Outset Medical, Inc. (a) | | 137,227 | 3,543,201 |
| PROCEPT BioRobotics Corp. (a) | | 70,924 | 2,946,183 |
| Silk Road Medical, Inc. (a) | | 74,631 | 3,944,249 |
| | | | | $43,089,654 |
| Oil Services – 4.1% | |
| Cactus, Inc., “A” | | 192,967 | $ 9,698,521 |
| ChampionX Corp. | | 603,630 | 17,499,234 |
| | | | | $27,197,755 |
| Other Banks & Diversified Financials – 4.3% | |
| First Interstate BancSystem, Inc. | | 165,373 | $ 6,391,667 |
| Pacific Premier Bancorp, Inc. | | 148,824 | 4,696,885 |
| Prosperity Bancshares, Inc. | | 93,893 | 6,824,143 |
| Umpqua Holdings Corp. | | 336,577 | 6,007,900 |
| United Community Bank, Inc. | | 140,169 | 4,737,712 |
| | | | | $28,658,307 |
| Pharmaceuticals – 2.2% | |
| Annexon, Inc. (a) | | 157,851 | $ 816,090 |
| Collegium Pharmaceutical, Inc. (a) | | 162,847 | 3,778,050 |
| Harmony Biosciences Holdings (a) | | 65,388 | 3,602,879 |
| Neurocrine Biosciences, Inc. (a) | | 34,908 | 4,169,411 |
Portfolio of Investments – continued
| Issuer | | | Shares/Par | Value ($) |
| Common Stocks – continued |
| Pharmaceuticals – continued | |
| SpringWorks Therapeutics, Inc. (a) | | 86,179 | $ 2,241,516 |
| | | | | $14,607,946 |
| Pollution Control – 2.2% | |
| GFL Environmental, Inc. | | 491,979 | $ 14,380,546 |
| Real Estate – 1.5% | |
| STAG Industrial, Inc., REIT | | 296,248 | $ 9,571,773 |
| Specialty Chemicals – 1.8% | |
| Axalta Coating Systems Ltd. (a) | | 460,737 | $ 11,734,971 |
| Specialty Stores – 2.3% | |
| ACV Auctions, Inc. (a) | | 794,643 | $ 6,524,019 |
| Leslie's, Inc. (a) | | 273,331 | 3,337,371 |
| Petco Health & Wellness Co., Inc. (a) | | 581,072 | 5,508,563 |
| | | | | $15,369,953 |
| Trucking – 2.6% | |
| CryoPort, Inc. (a) | | 236,958 | $ 4,111,221 |
| Knight-Swift Transportation Holdings, Inc. | | 168,298 | 8,820,498 |
| Saia, Inc. (a) | | 20,886 | 4,379,377 |
| | | | | $17,311,096 |
| Total Common Stocks (Identified Cost, $710,435,328) | | $633,199,920 |
| | Strike
Price | First
Exercise | | |
| Warrants – 0.0% | | | | |
| Medical Equipment – 0.0% |
| OptiNose, Inc. (1 share for 1 warrant, Expiration 11/23/27) (a) (Identified Cost, $1,867) | $2.57 | 11/23/22 | 186,662 | $ 0 |
| | | | | |
| Investment Companies (h) – 4.5% |
| Money Market Funds – 4.5% | |
| MFS Institutional Money Market Portfolio, 4.02% (v) (Identified Cost, $29,970,329) | | | 29,971,406 | $ 29,980,397 |
| Collateral for Securities Loaned – 0.2% |
| State Street Navigator Securities Lending Government Money Market Portfolio, 4.33% (j) (Identified Cost, $1,203,212) | | | 1,203,212 | $ 1,203,212 |
| Other Assets, Less Liabilities – (0.5)% | | (3,034,773) |
| Net Assets – 100.0% | $661,348,756 |
| (a) | Non-income producing security. | | | |
| (h) | An affiliated issuer, which may be considered one in which the fund owns 5% or more of the outstanding voting securities, or a company which is under common control. At period end, the aggregate values of the fund's investments in affiliated issuers and in unaffiliated issuers were $29,980,397 and $634,403,132, respectively. | | | |
| (j) | The rate quoted is the annualized seven-day yield of the fund at period end. | | | |
| (l) | A portion of this security is on loan. See Note 2 for additional information. | | | |
| (v) | Affiliated issuer that is available only to investment companies managed by MFS. The rate quoted for the MFS Institutional Money Market Portfolio is the annualized seven-day yield of the fund at period end. | | | |
Portfolio of Investments – continued
| The following abbreviations are used in this report and are defined: |
| ADR | American Depositary Receipt |
| REIT | Real Estate Investment Trust |
See Notes to Financial Statements
| Financial Statements | Statement of Assets and Liabilities |
This statement represents your fund’s balance sheet, which details the assets and liabilities comprising the total value of the fund.
| At 12/31/22Assets | |
| Investments in unaffiliated issuers, at value, including $1,411,721 of securities on loan (identified cost, $711,640,407) | $634,403,132 |
| Investments in affiliated issuers, at value (identified cost, $29,970,329) | 29,980,397 |
| Receivables for | |
| Fund shares sold | 80,819 |
| Interest and dividends | 332,317 |
| Other assets | 2,754 |
| Total assets | $664,799,419 |
| Liabilities | |
| Payables for | |
| Investments purchased | $1,090,269 |
| Fund shares reacquired | 938,150 |
| Collateral for securities loaned, at value (c) | 1,203,212 |
| Payable to affiliates | |
| Investment adviser | 46,888 |
| Administrative services fee | 830 |
| Shareholder servicing costs | 820 |
| Distribution and/or service fees | 7,637 |
| Payable for independent Trustees' compensation | 14 |
| Accrued expenses and other liabilities | 162,843 |
| Total liabilities | $3,450,663 |
| Net assets | $661,348,756 |
| Net assets consist of | |
| Paid-in capital | $839,381,665 |
| Total distributable earnings (loss) | (178,032,909) |
| Net assets | $661,348,756 |
| Shares of beneficial interest outstanding | 67,721,752 |
| | Net assets | Shares
outstanding | Net asset value
per share |
| Initial Class | $286,746,989 | 25,359,618 | $11.31 |
| Service Class | 374,601,767 | 42,362,134 | 8.84 |
| (c) | Non-cash collateral is not included. |
See Notes to Financial Statements
| Financial Statements | Statement of Operations |
This statement describes how much your fund earned in investment income and accrued in expenses. It also describes any gains and/or losses generated by fund operations.
| Year ended 12/31/22 | |
| Net investment income (loss) | |
| Income | |
| Dividends | $4,091,133 |
| Dividends from affiliated issuers | 480,323 |
| Income on securities loaned | 125,890 |
| Other | 102,244 |
| Foreign taxes withheld | (71,271) |
| Total investment income | $4,728,319 |
| Expenses | |
| Management fee | $6,649,253 |
| Distribution and/or service fees | 1,054,302 |
| Shareholder servicing costs | 37,871 |
| Administrative services fee | 123,352 |
| Independent Trustees' compensation | 12,719 |
| Custodian fee | 50,521 |
| Shareholder communications | 6,756 |
| Audit and tax fees | 62,400 |
| Legal fees | 2,817 |
| Miscellaneous | 37,160 |
| Total expenses | $8,037,151 |
| Reduction of expenses by investment adviser | (550,868) |
| Net expenses | $7,486,283 |
| Net investment income (loss) | $(2,757,964) |
| Realized and unrealized gain (loss) | |
| Realized gain (loss) (identified cost basis) | |
| Unaffiliated issuers | $(88,704,735) |
| Affiliated issuers | (245) |
| Foreign currency | (20,355) |
| Net realized gain (loss) | $(88,725,335) |
| Change in unrealized appreciation or depreciation | |
| Unaffiliated issuers | $(207,357,539) |
| Affiliated issuers | 10,068 |
| Translation of assets and liabilities in foreign currencies | (10,600) |
| Net unrealized gain (loss) | $(207,358,071) |
| Net realized and unrealized gain (loss) | $(296,083,406) |
| Change in net assets from operations | $(298,841,370) |
See Notes to Financial Statements
| Financial Statements | Statements of Changes in Net Assets |
These statements describe the increases and/or decreases in net assets resulting from operations, any distributions, and any shareholder transactions.
| | Year ended |
| | 12/31/22 | 12/31/21 |
| Change in net assets | | |
| From operations | | |
| Net investment income (loss) | $(2,757,964) | $(5,975,158) |
| Net realized gain (loss) | (88,725,335) | 250,738,974 |
| Net unrealized gain (loss) | (207,358,071) | (225,003,293) |
| Change in net assets from operations | $(298,841,370) | $19,760,523 |
| Total distributions to shareholders | $(245,542,542) | $(180,031,167) |
| Change in net assets from fund share transactions | $200,448,615 | $114,963,905 |
| Total change in net assets | $(343,935,297) | $(45,306,739) |
| Net assets | | |
| At beginning of period | 1,005,284,053 | 1,050,590,792 |
| At end of period | $661,348,756 | $1,005,284,053 |
See Notes to Financial Statements
| Financial Statements | Financial Highlights |
The financial highlights table is intended to help you understand the fund's financial performance for the past 5 years. Certain information reflects financial results for a single fund share. The total returns in the table represent the rate that an investor would have earned (or lost) on an investment in the fund share class (assuming reinvestment of all distributions) held for the entire period.
| Initial Class | Year ended |
| | 12/31/22 | 12/31/21 | 12/31/20 | 12/31/19 | 12/31/18 |
| Net asset value, beginning of period | $23.30 | $26.96 | $20.28 | $17.46 | $20.10 |
| Income (loss) from investment operations | | | | | |
| Net investment income (loss) (d) | $(0.04) | $(0.11) | $(0.06) | $(0.07) | $(0.09) |
| Net realized and unrealized gain (loss) | (6.56) | 0.92 | 8.84 | 6.89 | 0.35 |
| Total from investment operations | $(6.60) | $0.81 | $8.78 | $6.82 | $0.26 |
| Less distributions declared to shareholders | | | | | |
| From net realized gain | $(5.39) | $(4.47) | $(2.10) | $(4.00) | $(2.90) |
| Net asset value, end of period (x) | $11.31 | $23.30 | $26.96 | $20.28 | $17.46 |
| Total return (%) (k)(r)(s)(x) | (29.76) | 1.80 | 45.89 | 41.70 | (1.48) |
Ratios (%) (to average net assets)
and Supplemental data: | | | | | |
| Expenses before expense reductions | 0.95 | 0.94 | 0.95 | 0.95 | 0.96 |
| Expenses after expense reductions | 0.87 | 0.87 | 0.91 | 0.94 | 0.94 |
| Net investment income (loss) | (0.23) | (0.42) | (0.30) | (0.33) | (0.43) |
| Portfolio turnover | 48 | 79 | 80 | 54 | 71 |
| Net assets at end of period (000 omitted) | $286,747 | $433,168 | $465,663 | $343,133 | $272,039 |
| Service Class | Year ended |
| | 12/31/22 | 12/31/21 | 12/31/20 | 12/31/19 | 12/31/18 |
| Net asset value, beginning of period | $19.84 | $23.61 | $18.02 | $15.91 | $18.57 |
| Income (loss) from investment operations | | | | | |
| Net investment income (loss) (d) | $(0.06) | $(0.16) | $(0.10) | $(0.11) | $(0.13) |
| Net realized and unrealized gain (loss) | (5.55) | 0.86 | 7.79 | 6.22 | 0.37 |
| Total from investment operations | $(5.61) | $0.70 | $7.69 | $6.11 | $0.24 |
| Less distributions declared to shareholders | | | | | |
| From net realized gain | $(5.39) | $(4.47) | $(2.10) | $(4.00) | $(2.90) |
| Net asset value, end of period (x) | $8.84 | $19.84 | $23.61 | $18.02 | $15.91 |
| Total return (%) (k)(r)(s)(x) | (29.99) | 1.57 | 45.58 | 41.27 | (1.72) |
Ratios (%) (to average net assets)
and Supplemental data: | | | | | |
| Expenses before expense reductions | 1.20 | 1.19 | 1.20 | 1.20 | 1.21 |
| Expenses after expense reductions | 1.12 | 1.12 | 1.16 | 1.19 | 1.19 |
| Net investment income (loss) | (0.48) | (0.66) | (0.56) | (0.58) | (0.68) |
| Portfolio turnover | 48 | 79 | 80 | 54 | 71 |
| Net assets at end of period (000 omitted) | $374,602 | $572,116 | $584,928 | $472,393 | $358,912 |
| (d) | Per share data is based on average shares outstanding. |
| (k) | The total return does not reflect expenses that apply to separate accounts. Inclusion of these charges would reduce the total return figures for all periods shown. |
| (r) | Certain expenses have been reduced without which performance would have been lower. |
| (s) | From time to time the fund may receive proceeds from litigation settlements, without which performance would be lower. |
| (x) | The net asset values and total returns have been calculated on net assets which include adjustments made in accordance with U.S. generally accepted accounting principles required at period end for financial reporting purposes. |
See Notes to Financial Statements
Notes to Financial Statements
(1) Business and Organization
MFS New Discovery Series (the fund) is a diversified series of MFS Variable Insurance Trust (the trust). The trust is organized as a Massachusetts business trust and is registered under the Investment Company Act of 1940, as amended, as an open-end management investment company. The shareholders of each series of the trust are separate accounts of insurance companies, which offer variable annuity and/or life insurance products, and qualified retirement and pension plans.
The fund is an investment company and accordingly follows the investment company accounting and reporting guidance of the Financial Accounting Standards Board (FASB) Accounting Standards Codification Topic 946 Financial Services - Investment Companies.
(2) Significant Accounting Policies
General — The preparation of financial statements in conformity with U.S. generally accepted accounting principles requires management to make estimates and assumptions that affect the reported amounts of assets and liabilities, and disclosure of contingent assets and liabilities at the date of the financial statements and the reported amounts of increases and decreases in net assets from operations during the reporting period. Actual results could differ from those estimates. In the preparation of these financial statements, management has evaluated subsequent events occurring after the date of the fund’s Statement of Assets and Liabilities through the date that the financial statements were issued. The fund will generally focus on securities of small size companies which may be more volatile than those of larger companies. The fund invests in foreign securities. Investments in foreign securities are vulnerable to the effects of changes in the relative values of the local currency and the U.S. dollar and to the effects of changes in each country’s market, economic, industrial, political, regulatory, geopolitical, environmental, public health, and other conditions.
Balance Sheet Offsetting — The fund's accounting policy with respect to balance sheet offsetting is that, absent an event of default by the counterparty or a termination of the agreement, the International Swaps and Derivatives Association (ISDA) Master Agreement, or similar agreement, does not result in an offset of reported amounts of financial assets and financial liabilities in the Statement of Assets and Liabilities across transactions between the fund and the applicable counterparty. The fund's right to setoff may be restricted or prohibited by the bankruptcy or insolvency laws of the particular jurisdiction to which a specific master netting agreement counterparty is subject. Balance sheet offsetting disclosures, to the extent applicable to the fund, have been included in the fund’s Significant Accounting Policies note under the captions for each of the fund’s in-scope financial instruments and transactions.
Investment Valuations — Subject to its oversight, the fund's Board of Trustees has delegated primary responsibility for determining or causing to be determined the value of the fund’s investments to MFS as the fund's adviser, pursuant to the fund’s valuation policy and procedures which have been adopted by the adviser and approved by the Board. Effective September 8, 2022, and in accordance with Rule 2a-5 under the Investment Company Act of 1940, the Board of Trustees designated the adviser as the “valuation designee” of the fund. If the adviser, as valuation designee, determines that reliable market quotations are not readily available for an investment, the investment is valued at fair value as determined in good faith by the adviser in accordance with the adviser’s fair valuation policy and procedures.
Under the fund's valuation policy and procedures, equity securities, including restricted equity securities, are generally valued at the last sale or official closing price on their primary market or exchange as provided by a third-party pricing service. Equity securities, for which there were no sales reported that day, are generally valued at the last quoted daily bid quotation on their primary market or exchange as provided by a third-party pricing service. Short-term instruments with a maturity at issuance of 60 days or less may be valued at amortized cost, which approximates market value. Open-end investment companies are generally valued at net asset value per share. The values of foreign securities and other assets and liabilities expressed in foreign currencies are converted to U.S. dollars using the mean of bid and asked prices for rates provided by a third-party pricing service.
Under the fund’s valuation policy and procedures, market quotations are not considered to be readily available for debt instruments, floating rate loans, and many types of derivatives. These investments are generally valued at fair value based on information from third-party pricing services or otherwise determined by the adviser in accordance with the adviser’s fair valuation policy and procedures. Securities and other assets generally valued on the basis of information from a third-party pricing service may also be valued at a broker/dealer bid quotation. In determining values, third-party pricing services can utilize both transaction data and market information such as yield, quality, coupon rate, maturity, type of issue, trading characteristics, spreads and other market data. An investment may also be valued at fair value if the adviser determines that the investment’s value has been materially affected by events occurring after the close of the exchange or market on which the investment is principally traded (such as foreign exchange or market) and prior to the determination of the fund’s net asset value, or after the halt of trading of a specific security where trading does not resume prior to the close of the exchange or market on which the security is principally traded. Events that occur after foreign markets close (such as developments in foreign markets and significant movements in the U.S. markets) and prior to the
Notes to Financial Statements - continued
determination of the fund’s net asset value may be deemed to have a material effect on the value of securities traded in foreign markets. Accordingly, the fund’s foreign equity securities may often be valued at fair value. The adviser generally relies on third-party pricing services or other information (such as the correlation with price movements of similar securities in the same or other markets; the type, cost and investment characteristics of the security; the business and financial condition of the issuer; and trading and other market data) to assist in determining whether to fair value and at what value to fair value an investment. The value of an investment for purposes of calculating the fund’s net asset value can differ depending on the source and method used to determine value. When fair valuation is used, the value of an investment used to determine the fund’s net asset value may differ from quoted or published prices for the same investment. There can be no assurance that the fund could obtain the fair value assigned to an investment if it were to sell the investment at the same time at which the fund determines its net asset value per share.
Various inputs are used in determining the value of the fund's assets or liabilities. These inputs are categorized into three broad levels. In certain cases, the inputs used to measure fair value may fall into different levels of the fair value hierarchy. In such cases, an investment's level within the fair value hierarchy is based on the lowest level of input that is significant to the fair value measurement. The fund's assessment of the significance of a particular input to the fair value measurement in its entirety requires judgment, and considers factors specific to the investment. Level 1 includes unadjusted quoted prices in active markets for identical assets or liabilities. Level 2 includes other significant observable market-based inputs (including quoted prices for similar securities, interest rates, prepayment speed, and credit risk). Level 3 includes significant unobservable inputs, which may include the adviser's own assumptions in determining the fair value of investments. The following is a summary of the levels used as of December 31, 2022 in valuing the fund's assets and liabilities:
| Financial Instruments | Level 1 | Level 2 | Level 3 | Total |
| Equity Securities: | | | | |
| United States | $523,866,020 | $0 | $— | $523,866,020 |
| Canada | 41,822,739 | — | — | 41,822,739 |
| United Kingdom | 39,924,704 | — | — | 39,924,704 |
| India | 14,495,308 | — | — | 14,495,308 |
| Germany | 8,202,969 | — | — | 8,202,969 |
| Switzerland | 4,888,180 | — | — | 4,888,180 |
| Mutual Funds | 31,183,609 | — | — | 31,183,609 |
| Total | $664,383,529 | $0 | $— | $664,383,529 |
For further information regarding security characteristics, see the Portfolio of Investments.
Foreign Currency Translation — Purchases and sales of foreign investments, income, and expenses are converted into U.S. dollars based upon currency exchange rates prevailing on the respective dates of such transactions or on the reporting date for foreign denominated receivables and payables. Gains and losses attributable to foreign currency exchange rates on sales of securities are recorded for financial statement purposes as net realized gains and losses on investments. Gains and losses attributable to foreign exchange rate movements on receivables, payables, income and expenses are recorded for financial statement purposes as foreign currency transaction gains and losses. That portion of both realized and unrealized gains and losses on investments that results from fluctuations in foreign currency exchange rates is not separately disclosed.
Security Loans — Under its Securities Lending Agency Agreement with the fund, State Street Bank and Trust Company, as lending agent, loans the securities of the fund to certain qualified institutions (the “Borrowers”) approved by the fund. Security loans can be terminated at the discretion of either the lending agent or the fund and the related securities must be returned within the earlier of the standard trade settlement period for such securities or within three business days. The loans are collateralized by cash and/or U.S. Treasury and federal agency obligations in an amount typically at least equal to the market value of the securities loaned. On loans collateralized by cash, the cash collateral is invested in a money market fund. The market value of the loaned securities is determined at the close of business of the fund and any additional required collateral is delivered to the fund on the next business day. The lending agent provides the fund with indemnification against Borrower default. In the event of Borrower default, the lending agent will, for the benefit of the fund, either purchase securities identical to those loaned or, when such purchase is commercially impracticable, pay the fund the market value of the loaned securities. In return, the lending agent assumes the fund's rights to the related collateral. If the collateral value is less than the cost to purchase identical securities, the lending agent is responsible for the shortfall, but only to the extent that such shortfall is not due to a decline in collateral value resulting from collateral reinvestment for which the fund bears the risk of loss. At period end, the fund had investment securities on loan, all of which were classified as equity securities in the fund's Portfolio of Investments, with a fair value of $1,411,721. The fair value of the fund's investment securities on loan and a related liability of $1,203,212 for cash collateral received on securities loaned are both presented gross in the Statement of Assets and Liabilities. Additionally, these loans were collateralized by U.S. Treasury Obligations of $316,408 held by the lending agent. The collateral on securities loaned exceeded the value of securities on loan at period end. The liability for cash collateral for securities loaned is carried at fair value, which is categorized as level 2 within the fair value hierarchy. A portion of the income generated upon investment of the collateral is remitted to the Borrowers, and the remainder is allocated
Notes to Financial Statements - continued
between the fund and the lending agent. On loans collateralized by U.S. Treasury and/or federal agency obligations, a fee is received from the Borrower, and is allocated between the fund and the lending agent. Income from securities lending is separately reported in the Statement of Operations. The dividend and interest income earned on the securities loaned is accounted for in the same manner as other dividend and interest income.
Indemnifications — Under the fund's organizational documents, its officers and Trustees may be indemnified against certain liabilities and expenses arising out of the performance of their duties to the fund. Additionally, in the normal course of business, the fund enters into agreements with service providers that may contain indemnification clauses. The fund's maximum exposure under these agreements is unknown as this would involve future claims that may be made against the fund that have not yet occurred.
Investment Transactions and Income — Investment transactions are recorded on the trade date. Interest income is recorded on the accrual basis. Dividends received in cash are recorded on the ex-dividend date. Certain dividends from foreign securities will be recorded when the fund is informed of the dividend if such information is obtained subsequent to the ex-dividend date. Dividend payments received in additional securities are recorded on the ex-dividend date in an amount equal to the value of the security on such date. In determining the net gain or loss on securities sold, the cost of securities is determined on the identified cost basis.
The fund may receive proceeds from litigation settlements. Any proceeds received from litigation involving portfolio holdings are reflected in the Statement of Operations in realized gain/loss if the security has been disposed of by the fund or in unrealized gain/loss if the security is still held by the fund. Any other proceeds from litigation not related to portfolio holdings are reflected as other income in the Statement of Operations.
Tax Matters and Distributions — The fund intends to qualify as a regulated investment company, as defined under Subchapter M of the Internal Revenue Code, and to distribute all of its taxable income, including realized capital gains. As a result, no provision for federal income tax is required. The fund’s federal tax returns, when filed, will remain subject to examination by the Internal Revenue Service for a three year period. Management has analyzed the fund’s tax positions taken on federal and state tax returns for all open tax years and does not believe that there are any uncertain tax positions that require recognition of a tax liability. Foreign taxes, if any, have been accrued by the fund in the accompanying financial statements in accordance with the applicable foreign tax law. Foreign income taxes may be withheld by certain countries in which the fund invests. Additionally, capital gains realized by the fund on securities issued in or by certain foreign countries may be subject to capital gains tax imposed by those countries.
Distributions to shareholders are recorded on the ex-dividend date. Income and capital gain distributions are determined in accordance with income tax regulations, which may differ from U.S. generally accepted accounting principles. Certain capital accounts in the financial statements are periodically adjusted for permanent differences in order to reflect their tax character. These adjustments have no impact on net assets or net asset value per share. Temporary differences which arise from recognizing certain items of income, expense, gain or loss in different periods for financial statement and tax purposes will reverse at some time in the future.
Book/tax differences primarily relate to net operating losses, passive foreign investment companies, and wash sale loss deferrals.
The tax character of distributions declared to shareholders for the last two fiscal years is as follows:
| | Year ended
12/31/22 | Year ended
12/31/21 |
| Ordinary income (including any short-term capital gains) | $79,285,102 | $67,762,150 |
| Long-term capital gains | 166,257,440 | 112,269,017 |
| Total distributions | $245,542,542 | $180,031,167 |
The federal tax cost and the tax basis components of distributable earnings were as follows:
| As of 12/31/22 | |
| Cost of investments | $760,977,345 |
| Gross appreciation | 101,215,700 |
| Gross depreciation | (197,809,516) |
| Net unrealized appreciation (depreciation) | $(96,593,816) |
| Capital loss carryforwards | (81,431,515) |
| Other temporary differences | (7,578) |
| Total distributable earnings (loss) | $(178,032,909) |
Notes to Financial Statements - continued
As of December 31, 2022, the fund had capital loss carryforwards available to offset future realized gains. These net capital losses may be carried forward indefinitely and their character is retained as short-term and/or long-term losses. Such losses are characterized as follows:
| Short-Term | $(58,685,511) |
| Long-Term | (22,746,004) |
| Total | $(81,431,515) |
Multiple Classes of Shares of Beneficial Interest — The fund offers multiple classes of shares, which differ in their respective distribution and/or service fees. The fund's income, realized and unrealized gain (loss), and common expenses are allocated to shareholders based on the daily net assets of each class. Dividends are declared separately for each class. Differences in per share dividend rates are generally due to differences in separate class expenses. The fund’s distributions declared to shareholders as reported in the Statements of Changes in Net Assets are presented by class as follows:
| | Year ended
12/31/22 | | Year ended
12/31/21 |
| Initial Class | $97,259,181 | | $72,327,744 |
| Service Class | 148,283,361 | | 107,703,423 |
| Total | $245,542,542 | | $180,031,167 |
(3) Transactions with Affiliates
Investment Adviser — The fund has an investment advisory agreement with MFS to provide overall investment management and related administrative services and facilities to the fund. The management fee is computed daily and paid monthly at the following annual rates based on the fund's average daily net assets:
| Up to $1 billion | 0.90% |
| In excess of $1 billion | 0.80% |
MFS has agreed in writing to reduce its management fee by a specified amount if certain MFS mutual fund assets exceed thresholds agreed to by MFS and the fund's Board of Trustees. Effective March 1, 2022, MFS has also agreed in writing to waive at least 0.01% of its management fee as part of this agreement. The agreement to waive at least 0.01% of the management fee will continue until modified by the fund's Board of Trustees, but such agreement will continue at least until April 30, 2024. For the year ended December 31, 2022, this management fee reduction amounted to $103,011, which is included in the reduction of total expenses in the Statement of Operations. The management fee incurred for the year ended December 31, 2022 was equivalent to an annual effective rate of 0.89% of the fund's average daily net assets.
The investment adviser has agreed in writing to pay a portion of the fund’s total annual operating expenses, excluding interest, taxes, extraordinary expenses, brokerage and transaction costs, certain tax reclaim recovery expenses (including contingency fees and closing agreement expenses), and investment-related expenses, such that total annual operating expenses do not exceed 0.87% of average daily net assets for the Initial Class shares and 1.12% of average daily net assets for the Service Class shares. This written agreement will continue until modified by the fund’s Board of Trustees, but such agreement will continue at least until April 30, 2024. For the year ended December 31, 2022, this reduction amounted to $447,857, which is included in the reduction of total expenses in the Statement of Operations.
Distributor — MFS Fund Distributors, Inc. (MFD), a wholly-owned subsidiary of MFS, is the distributor of shares of the fund. The Trustees have adopted a distribution plan for the Service Class shares pursuant to Rule 12b-1 under the Investment Company Act of 1940.
The fund's distribution plan provides that the fund will pay MFD distribution and/or service fees equal to 0.25% per annum of its average daily net assets attributable to Service Class shares as partial consideration for services performed and expenses incurred by MFD and financial intermediaries (including participating insurance companies that invest in the fund to fund variable annuity and variable life insurance contracts, sponsors of qualified retirement and pension plans that invest in the fund, and affiliates of these participating insurance companies and plan sponsors) in connection with the sale and distribution of the Service Class shares. MFD may subsequently pay all, or a portion, of the distribution and/or service fees to financial intermediaries.
Shareholder Servicing Agent — MFS Service Center, Inc. (MFSC), a wholly-owned subsidiary of MFS, receives a fee from the fund for its services as shareholder servicing agent. For the year ended December 31, 2022, the fee was $34,377, which equated to 0.0047% annually of the fund's average daily net assets. MFSC also receives reimbursement from the fund for out-of-pocket expenses paid by MFSC on behalf of the fund. For the year ended December 31, 2022, these costs amounted to $3,494.
Notes to Financial Statements - continued
Administrator — MFS provides certain financial, legal, shareholder communications, compliance, and other administrative services to the fund. Under an administrative services agreement, the fund reimburses MFS the costs incurred to provide these services. The fund is charged an annual fixed amount of $17,500 plus a fee based on average daily net assets. The administrative services fee incurred for the year ended December 31, 2022 was equivalent to an annual effective rate of 0.0167% of the fund's average daily net assets.
Trustees’ and Officers’ Compensation — The fund pays compensation to independent Trustees in the form of a retainer, attendance fees, and additional compensation to Board and Committee chairpersons. The fund does not pay compensation directly to Trustees or officers of the fund who are also officers of the investment adviser, all of whom receive remuneration from MFS for their services to the fund. Certain officers and Trustees of the fund are officers or directors of MFS, MFD, and MFSC.
Other — The fund invests in the MFS Institutional Money Market Portfolio which is managed by MFS and seeks current income consistent with preservation of capital and liquidity. This money market fund does not pay a management fee to MFS but does incur investment and operating costs.
The fund is permitted to engage in purchase and sale transactions with funds and accounts for which MFS serves as investment adviser or sub-adviser (“cross-trades”) pursuant to a policy adopted by the Board of Trustees. This policy has been designed to ensure that cross-trades conducted by the fund comply with Rule 17a-7 under the Investment Company Act of 1940. During the year ended December 31, 2022, the fund engaged in purchase transactions pursuant to this policy, which amounted to $3,035,940.
The adviser has voluntarily undertaken to reimburse the fund from its own resources on a quarterly basis for the cost of investment research embedded in the cost of the fund’s securities trades. This agreement may be rescinded at any time. For the year ended December 31, 2022, this reimbursement amounted to $97,878, which is included in “Other” income in the Statement of Operations.
(4) Portfolio Securities
For the year ended December 31, 2022, purchases and sales of investments, other than short-term obligations, aggregated $345,756,253 and $385,491,961, respectively.
(5) Shares of Beneficial Interest
The fund's Declaration of Trust permits the Trustees to issue an unlimited number of full and fractional shares of beneficial interest. Transactions in fund shares were as follows:
| | Year ended
12/31/22 | | Year ended
12/31/21 |
| | Shares | Amount | | Shares | Amount |
| Shares sold | | | | | |
| Initial Class | 2,032,873 | $34,222,306 | | 1,685,787 | $45,986,516 |
| Service Class | 11,519,641 | 168,576,091 | | 5,330,620 | 125,627,263 |
| | 13,552,514 | $202,798,397 | | 7,016,407 | $171,613,779 |
Shares issued to shareholders
in reinvestment of distributions | | | | | |
| Initial Class | 8,064,609 | $97,259,181 | | 2,879,289 | $72,327,744 |
| Service Class | 15,707,983 | 148,283,361 | | 5,030,520 | 107,703,423 |
| | 23,772,592 | $245,542,542 | | 7,909,809 | $180,031,167 |
| Shares reacquired | | | | | |
| Initial Class | (3,327,692) | $(53,400,187) | | (3,248,656) | $(88,338,013) |
| Service Class | (13,705,736) | (194,492,137) | | (6,295,130) | (148,343,028) |
| | (17,033,428) | $(247,892,324) | | (9,543,786) | $(236,681,041) |
| Net change | | | | | |
| Initial Class | 6,769,790 | $78,081,300 | | 1,316,420 | $29,976,247 |
| Service Class | 13,521,888 | 122,367,315 | | 4,066,010 | 84,987,658 |
| | 20,291,678 | $200,448,615 | | 5,382,430 | $114,963,905 |
Notes to Financial Statements - continued
The fund is one of several mutual funds in which certain MFS funds may invest. The MFS funds do not invest in the underlying funds for the purpose of exercising management or control. At the end of the period, the MFS Moderate Allocation Portfolio was the owner of record of approximately 2% of the value of outstanding voting shares of the fund. In addition, the MFS Growth Allocation Portfolio and the MFS Conservative Allocation Portfolio were the owners of record of less than 1% of the value of outstanding voting shares of the fund.
(6) Line of Credit
The fund and certain other funds managed by MFS participate in a $1.45 billion unsecured committed line of credit of which $1.2 billion is reserved for use by the fund and certain other MFS U.S. funds. The line of credit is provided by a syndicate of banks under a credit agreement. Borrowings may be made for temporary financing needs. Interest is charged to each fund, based on its borrowings, generally at a rate equal to the highest of 1) Daily Simple SOFR (Secured Overnight Financing Rate) plus 0.10%, 2) the Federal Funds Effective Rate, or 3) the Overnight Bank Funding Rate, each plus an agreed upon spread. A commitment fee, based on the average daily unused portion of the committed line of credit, is allocated among the participating funds. The line of credit expires on March 16, 2023 unless extended or renewed. In addition, the fund and other funds managed by MFS have established unsecured uncommitted borrowing arrangements with certain banks for temporary financing needs. Interest is charged to each fund, based on its borrowings, at rates equal to customary reference rates plus an agreed upon spread. For the year ended December 31, 2022, the fund’s commitment fee and interest expense were $3,580 and $2,911, respectively, and are included in “Miscellaneous” expense in the Statement of Operations.
(7) Investments in Affiliated Issuers
An affiliated issuer may be considered one in which the fund owns 5% or more of the outstanding voting securities, or a company which is under common control. For the purposes of this report, the following were affiliated issuers:
| Affiliated Issuers | Beginning
Value | Purchases | Sales
Proceeds | Realized
Gain
(Loss) | Change in
Unrealized
Appreciation or
Depreciation | Ending
Value |
| MFS Institutional Money Market Portfolio | $34,793,849 | $225,722,332 | $230,545,607 | $(245) | $10,068 | $29,980,397 |
| Affiliated Issuers | Dividend
Income | Capital Gain
Distributions |
| MFS Institutional Money Market Portfolio | $480,323 | $— |
(8) LIBOR Transition
Certain of the fund's investments, including investments in certain debt instruments and derivatives (if any), as well as borrowings by the fund and certain other contractual arrangements of the fund, may be based on the London Interbank Offered Rate (“LIBOR”). In 2017, the regulatory authority that oversees financial services firms in the United Kingdom announced plans to transition away from LIBOR by the end of 2021. In March 2021, the administrator of LIBOR announced the extension of the publication of the more commonly used U.S. dollar LIBOR settings to the end of June 2023. Although the full impacts of the transition away from LIBOR are not fully known, the transition may result in, among other things, an increase in volatility or illiquidity of the markets for instruments that currently rely on LIBOR to determine interest rates and this could have an adverse impact on the fund's performance. With respect to the fund's accounting for investments, including investments in certain debt instruments and derivatives, as well as borrowings by the fund and any other contractual arrangements of the fund that undergo reference rate-related modifications as a result of the transition, management will rely upon the relief provided by FASB Codification Topic 848 – Reference Rate Reform (Topic 848). The guidance in Topic 848 permits the fund to account for those modified contracts as a continuation of the existing contracts. Management is still evaluating the impact to the fund of the June 30, 2023 planned discontinuation of the more commonly used U.S. dollar LIBOR settings.
(9) Russia and Ukraine Conflict
The market disruptions, which began in late February 2022, associated with geopolitical events related to the conflict between Russia and Ukraine may adversely affect the value of the fund’s assets and thus the fund’s performance. Management continues to monitor these events and to evaluate the related impacts, if any, to the fund.
Report of Independent Registered Public Accounting Firm
To the Board of Trustees of MFS Variable Insurance Trust and the Shareholders of MFS New Discovery Series:
Opinion on the Financial Statements and Financial Highlights
We have audited the accompanying statement of assets and liabilities of MFS New Discovery Series (the “Fund”), including the portfolio of investments, as of December 31, 2022, the related statement of operations for the year then ended, the statements of changes in net assets for each of the two years in the period then ended, the financial highlights for each of the five years in the period then ended, and the related notes. In our opinion, the financial statements and financial highlights present fairly, in all material respects, the financial position of the Fund as of December 31, 2022, and the results of its operations for the year then ended, the changes in its net assets for each of the two years in the period then ended, and the financial highlights for each of the five years in the period then ended, in conformity with accounting principles generally accepted in the United States of America.
Basis for Opinion
These financial statements and financial highlights are the responsibility of the Fund's management. Our responsibility is to express an opinion on the Fund's financial statements and financial highlights based on our audits. We are a public accounting firm registered with the Public Company Accounting Oversight Board (United States) (PCAOB) and are required to be independent with respect to the Fund in accordance with the U.S. federal securities laws and the applicable rules and regulations of the Securities and Exchange Commission and the PCAOB.
We conducted our audits in accordance with the standards of the PCAOB. Those standards require that we plan and perform the audit to obtain reasonable assurance about whether the financial statements and financial highlights are free of material misstatement, whether due to error or fraud. The Fund is not required to have, nor were we engaged to perform, an audit of its internal control over financial reporting. As part of our audits, we are required to obtain an understanding of internal control over financial reporting but not for the purpose of expressing an opinion on the effectiveness of the Fund's internal control over financial reporting. Accordingly, we express no such opinion.
Our audits included performing procedures to assess the risks of material misstatement of the financial statements and financial highlights, whether due to error or fraud, and performing procedures that respond to those risks. Such procedures included examining, on a test basis, evidence regarding the amounts and disclosures in the financial statements and financial highlights. Our audits also included evaluating the accounting principles used and significant estimates made by management, as well as evaluating the overall presentation of the financial statements and financial highlights. Our procedures included confirmation of securities owned as of December 31, 2022, by correspondence with the custodian and brokers; when replies were not received from brokers, we performed other auditing procedures. We believe that our audits provide a reasonable basis for our opinion.
DELOITTE & TOUCHE LLP
Boston, Massachusetts
February 15, 2023
We have served as the auditor of one or more of the MFS investment companies since 1924.
Trustees and Officers — Identification and Background
The Trustees and Officers of the Trust, as of February 1, 2023, are listed below, together with their principal occupations during the past five years. (Their titles may have varied during that period.) The address of each Trustee and Officer is 111 Huntington Avenue, Boston, Massachusetts 02199-7618.
| Name, Age | | Position(s) Held with Fund | | Trustee/Officer Since(h) | | Number of MFS Funds overseen by the Trustee | | Principal Occupations During
the Past Five Years | | Other Directorships During
the Past Five Years (j) |
| INTERESTED TRUSTEE | | | | | | | | | | |
Michael W. Roberge (k)
(age 56) | | Trustee | | January 2021 | | 136 | | Massachusetts Financial Services Company, Chairman (since January 2021); Chief Executive Officer (since January 2017); Director; Chairman of the Board (since January 2022); President (until December 2018); Chief Investment Officer (until December 2018) | | N/A |
| INDEPENDENT TRUSTEES | | | | | | | | | | |
John P. Kavanaugh
(age 68) | | Trustee and Chair of Trustees | | January 2009 | | 136 | | Private investor | | N/A |
Steven E. Buller
(age 71) | | Trustee | | February 2014 | | 136 | | Private investor | | N/A |
John A. Caroselli
(age 68) | | Trustee | | March 2017 | | 136 | | Private investor; JC Global Advisors, LLC (management consulting), President (since 2015) | | N/A |
Maureen R. Goldfarb
(age 67) | | Trustee | | January 2009 | | 136 | | Private investor | | N/A |
Peter D. Jones
(age 67) | | Trustee | | January 2019 | | 136 | | Private investor | | N/A |
James W. Kilman, Jr.
(age 61) | | Trustee | | January 2019 | | 136 | | Burford Capital Limited (finance and investment management), Senior Advisor (since May 3, 2021), Chief Financial Officer (2019 - May 2, 2021); KielStrand Capital LLC (family office), Chief Executive Officer (since 2016) | | Alpha-En Corporation, Director (2016-2019) |
Clarence Otis, Jr.
(age 66) | | Trustee | | March 2017 | | 136 | | Private investor | | VF Corporation, Director; Verizon Communications, Inc., Director; The Travelers Companies, Director |
Maryanne L. Roepke
(age 66) | | Trustee | | May 2014 | | 136 | | Private investor | | N/A |
Laurie J. Thomsen
(age 65) | | Trustee | | March 2005 | | 136 | | Private investor | | The Travelers Companies, Director; Dycom Industries, Inc., Director |
Trustees and Officers - continued
| Name, Age | | Position(s) Held with
Fund | | Trustee/Officer Since(h) | | Number of MFS Funds for which the Person is an Officer | | Principal Occupations During
the Past Five Years |
| OFFICERS | | | | | | | | |
Christopher R. Bohane (k)
(age 49) | | Assistant Secretary and Assistant Clerk | | July 2005 | | 136 | | Massachusetts Financial Services Company, Senior Vice President and Senior Managing Counsel |
Kino Clark (k)
(age 54) | | Assistant Treasurer | | January 2012 | | 136 | | Massachusetts Financial Services Company, Vice President |
John W. Clark, Jr. (k)
(age 55) | | Assistant Treasurer | | April 2017 | | 136 | | Massachusetts Financial Services Company, Vice President |
David L. DiLorenzo (k)
(age 54) | | President | | July 2005 | | 136 | | Massachusetts Financial Services Company, Senior Vice President |
Heidi W. Hardin (k)
(age 55) | | Secretary and Clerk | | April 2017 | | 136 | | Massachusetts Financial Services Company, Executive Vice President and General Counsel |
Brian E. Langenfeld (k)
(age 49) | | Assistant Secretary and Assistant Clerk | | June 2006 | | 136 | | Massachusetts Financial Services Company, Vice President and Managing Counsel |
Rosa E. Licea-Mailloux (k)
(age 46) | | Chief Compliance Officer | | March 2022 | | 136 | | Massachusetts Financial Services Company, Vice President (since 2018); Director of Corporate Compliance (2018-2021), Senior Director Compliance (2021-2022), Senior Managing Director of North American Compliance & Chief Compliance Officer (since March 2022); Natixis Investment Managers (investment management), Funds Chief Compliance Officer, Deputy General Counsel & Senior Vice President (until 2018) |
Amanda S. Mooradian (k)
(age 43) | | Assistant Secretary and Assistant Clerk | | September 2018 | | 136 | | Massachusetts Financial Services Company, Assistant Vice President and Senior Counsel |
Susan A. Pereira (k)
(age 52) | | Assistant Secretary and Assistant Clerk | | July 2005 | | 136 | | Massachusetts Financial Services Company, Vice President and Managing Counsel |
Kasey L. Phillips (k)
(age 52) | | Assistant Treasurer | | September 2012 | | 136 | | Massachusetts Financial Services Company, Vice President |
Matthew A. Stowe (k)
(age 48) | | Assistant Secretary and Assistant Clerk | | October 2014 | | 136 | | Massachusetts Financial Services Company, Vice President and Senior Managing Counsel |
William B. Wilson (k)
(age 40) | | Assistant Secretary and Assistant Clerk | | October 2022 | | 136 | | Massachusetts Financial Services Company, Assistant Vice President and Counsel |
James O. Yost (k)
(age 62) | | Treasurer | | September 1990 | | 136 | | Massachusetts Financial Services Company, Senior Vice President |
| (h) | Date first appointed to serve as Trustee/Officer of an MFS Fund. Each Trustee has served continuously since appointment unless indicated otherwise. From January 2012 through December 2016, Messrs. DiLorenzo and Yost served as Treasurer and Deputy Treasurer of the Funds, respectively. |
| (j) | Directorships or trusteeships of companies required to report to the Securities and Exchange Commission (i.e., “public companies”). |
| (k) | “Interested person” of the Trust within the meaning of the Investment Company Act of 1940 (referred to as the 1940 Act), which is the principal federal law governing investment companies like the fund, as a result of a position with MFS. The address of MFS is 111 Huntington Avenue, Boston, Massachusetts 02199-7618. |
Each Trustee (other than Messrs. Jones, Kilman and Roberge) has been elected by shareholders and each Trustee and Officer holds office until his or her successor is chosen and qualified or until his or her earlier death, resignation, retirement or removal. Mr. Roberge became a Trustee of the Funds on January 1, 2021 and Messrs. Jones and Kilman became Trustees of the Funds on January 1, 2019. The Trust does not hold annual meetings for the purpose of electing Trustees, and Trustees are not elected for fixed terms. Under the terms of the Board's retirement policy, an Independent Trustee shall retire at the end of the calendar year in which he or she reaches the earlier of 75 years of age or 15 years of service on the Board (or, in the case of any Independent Trustee who joined the Board prior to 2015, 20 years of service on the Board).
Trustees and Officers - continued
Messrs. Buller, Kilman and Otis and Ms. Roepke are members of the Trust’s Audit Committee.
Each of the Interested Trustees and certain Officers hold comparable officer positions with certain affiliates of MFS.
The Statement of Additional Information for a Fund includes further information about the Trustees and is available without charge upon request by calling 1-800-225-2606.
| Investment Adviser | Custodian |
Massachusetts Financial Services Company
111 Huntington Avenue
Boston, MA 02199-7618 | State Street Bank and Trust Company
1 Lincoln Street
Boston, MA 02111-2900 |
| Distributor | Independent Registered Public Accounting Firm |
MFS Fund Distributors, Inc.
111 Huntington Avenue
Boston, MA 02199-7618 | Deloitte & Touche LLP
200 Berkeley Street
Boston, MA 02116 |
| Portfolio Manager(s) | |
| Michael Grossman | |
Board Review of Investment Advisory Agreement
MFS New Discovery Series
The Investment Company Act of 1940 requires that both the full Board of Trustees and a majority of the non-interested (“independent”) Trustees, voting separately, annually approve the continuation of the Fund’s investment advisory agreement with MFS. The Trustees consider matters bearing on the Fund and its advisory arrangements at their meetings throughout the year, including a review of performance data at each regular meeting. In addition, the independent Trustees met several times over the course of three months beginning in May and ending in July, 2022 (“contract review meetings”) for the specific purpose of considering whether to approve the continuation of the investment advisory agreement for the Fund and the other investment companies that the Board oversees (the “MFS Funds”). The independent Trustees were assisted in their evaluation of the Fund’s investment advisory agreement by independent legal counsel, from whom they received separate legal advice and with whom they met separately from MFS during various contract review meetings. The independent Trustees were also assisted in this process by an independent consultant who was retained by and reported to the independent Trustees.
In connection with their deliberations regarding the continuation of the investment advisory agreement, the Trustees, including the independent Trustees, considered such information and factors as they believed, in light of the legal advice furnished to them and their own business judgment, to be relevant. The investment advisory agreement for the Fund was considered separately, although the Trustees also took into account the common interests of all MFS Funds in their review. As described below, the Trustees considered the nature, quality, and extent of the various investment advisory, administrative, and shareholder services performed by MFS under the existing investment advisory agreement and other arrangements with the Fund.
In connection with their contract review meetings, the Trustees received and relied upon materials that included, among other items: (i) information provided by Broadridge Financial Solutions, Inc. (“Broadridge”), an independent third party, on the investment performance of the Fund for various time periods ended December 31, 2021 and the investment performance of a group of funds with substantially similar investment classifications/objectives (the “Broadridge performance universe”), (ii) information provided by Broadridge on the Fund’s advisory fees and other expenses and the advisory fees and other expenses of comparable funds identified by Broadridge as well as all other funds in the same investment classification/category (the “Broadridge expense group and universe”), (iii) information provided by MFS on the advisory fees of portfolios of other clients of MFS, including institutional separate accounts and other clients, (iv) information as to whether and to what extent applicable expense waivers, reimbursements or fee “breakpoints” are observed for the Fund, (v) information regarding MFS’ financial results and financial condition, including MFS’ and certain of its affiliates’ estimated profitability from services performed for the Fund and the MFS Funds as a whole, and compared to MFS’ institutional business, (vi) MFS’ views regarding the outlook for the mutual fund industry and the strategic business plans of MFS, (vii) descriptions of various functions performed by MFS for the Funds, such as compliance monitoring and portfolio trading practices, and (viii) information regarding the overall organization of MFS, including information about MFS’ senior management and other personnel providing investment advisory, administrative and other services to the Fund and the other MFS Funds. The comparative performance, fee and expense information prepared and provided by Broadridge was not independently verified and the independent Trustees did not independently verify any information provided to them by MFS.
The Trustees’ conclusion as to the continuation of the investment advisory agreement was based on a comprehensive consideration of all information provided to the Trustees and not the result of any single factor. Some of the factors that figured particularly in the Trustees’ deliberations are described below, although individual Trustees may have evaluated the information presented differently from one another, giving different weights to various factors. It is also important to recognize that the fee arrangements for the Fund and other MFS Funds are the result of years of review and discussion between the independent Trustees and MFS, that certain aspects of such arrangements may receive greater scrutiny in some years than in others, and that the Trustees’ conclusions may be based, in part, on their consideration of these same arrangements during the course of the year and in prior years.
Based on information provided by Broadridge and MFS, the Trustees reviewed the Fund’s total return investment performance as well as the Broadridge performance universe over various time periods. The Trustees placed particular emphasis on the total return performance of the Fund’s Initial Class shares in comparison to the performance of funds in its Broadridge performance universe over the five-year period ended December 31, 2021, which the Trustees believed was a long enough period to reflect differing market conditions. The total return performance of the Fund’s Initial Class shares was in the 1st quintile relative to the other funds in the universe for this five-year period (the 1st quintile being the best performers and the 5th quintile being the worst performers). The total return performance of the Fund’s Initial Class shares was in the 5th quintile for the one-year period and the 2nd quintile for the three-year period ended December 31, 2021 relative to the Broadridge performance universe. Because of the passage of time, these performance results may differ from the performance results for more recent periods, including those shown elsewhere in this report.
In the course of their deliberations, the Trustees took into account information provided by MFS in connection with the contract review meetings, as well as during investment review meetings conducted with portfolio management personnel during the course of the year regarding the Fund’s performance. After reviewing these and related factors, the Trustees concluded, within the context of their overall conclusions regarding the investment advisory agreement, that they were satisfied with MFS’ responses and efforts relating to investment performance.
Board Review of Investment Advisory Agreement - continued
In assessing the reasonableness of the Fund’s advisory fee, the Trustees considered, among other information, the Fund’s advisory fee and the total expense ratio of the Fund’s Initial Class shares as a percentage of average daily net assets and the advisory fee and total expense ratios of the Broadridge expense group based on information provided by Broadridge. The Trustees considered that MFS currently observes an expense limitation for the Fund, which may not be changed without the Trustees’ approval. The Trustees also considered that, according to the data provided by Broadridge (which takes into account any fee reductions or expense limitations that were in effect during the Fund’s last fiscal year), the Fund’s effective advisory fee rate and total expense ratio were each higher than the Broadridge expense group median.
The Trustees also considered the advisory fees charged by MFS to any institutional separate accounts advised by MFS (“separate accounts”) and unaffiliated investment companies for which MFS serves as subadviser (“subadvised funds”) that have comparable investment strategies to the Fund, if any. In comparing these fees, the Trustees considered information provided by MFS as to the generally broader scope of services provided by MFS to the Fund, as well as the more extensive regulatory burdens imposed on MFS in managing the Fund, in comparison to separate accounts and subadvised funds. The Trustees also considered the higher demands placed on MFS’ investment personnel and trading infrastructure as a result of the daily cash in-flows and out-flows of the Fund in comparison to separate accounts.
The Trustees also considered whether the Fund may benefit from any economies of scale in the management of the Fund in the event of growth in assets of the Fund and/or growth in assets of the MFS Funds as a whole. They noted that the Fund’s advisory fee rate schedule is subject to a contractual breakpoint that reduces the Fund’s advisory fee rate on average daily net assets over $1 billion. The Trustees also noted that MFS has agreed in writing to waive a portion of the management fees of certain MFS Funds, including the Fund, if the total combined assets of certain funds within the MFS Funds’ complex increase above agreed upon thresholds (the “group fee waiver”), enabling the Fund’s shareholders to share in the benefits from any economies of scale at the complex level. The group fee waiver is reviewed and renewed annually between the Board and MFS. The Trustees concluded that the breakpoint and the group fee waiver were sufficient to allow the Fund to benefit from economies of scale as its assets and overall complex assets grow.
The Trustees also considered information prepared by MFS relating to MFS’ costs and profits with respect to the Fund, the MFS Funds considered as a group, and other investment companies and accounts advised by MFS, as well as MFS’ methodologies used to determine and allocate its costs to the MFS Funds, the Fund and other accounts and products for purposes of estimating profitability.
After reviewing these and other factors described herein, the Trustees concluded, within the context of their overall conclusions regarding the investment advisory agreement, that the advisory fees charged to the Fund represent reasonable compensation in light of the services being provided by MFS to the Fund.
In addition, the Trustees considered MFS’ resources and related efforts to continue to retain, attract and motivate capable personnel to serve the Fund. The Trustees also considered current and developing conditions in the financial services industry, including the presence of large and well-capitalized companies which are spending, and appear to be prepared to continue to spend, substantial sums to engage personnel and to provide services to competing investment companies. In this regard, the Trustees also considered the financial resources of MFS and its ultimate parent, Sun Life Financial Inc. The Trustees also considered the advantages and possible disadvantages to the Fund of having an adviser that also serves other investment companies as well as other accounts.
The Trustees also considered the nature, quality, cost, and extent of administrative, transfer agency, and distribution services provided to the Fund by MFS and its affiliates under agreements and plans other than the investment advisory agreement, including any 12b-1 fees the Fund pays to MFS Fund Distributors, Inc., an affiliate of MFS. The Trustees also considered the nature, extent and quality of certain other services MFS performs or arranges for on the Fund’s behalf, which may include securities lending programs, directed expense payment programs, class action recovery programs, and MFS’ interaction with third-party service providers, principally custodians and sub-custodians. The Trustees concluded that the various non-advisory services provided by MFS and its affiliates on behalf of the Fund were satisfactory.
The Trustees considered so-called “fall-out benefits” to MFS such as reputational value derived from serving as investment manager to the MFS Funds. The Trustees also considered that MFS discontinued its historic practice of obtaining investment research from portfolio brokerage commissions paid by certain MFS Funds effective January 2018, and directly pays or voluntarily reimburses a Fund, if applicable, for the costs of external research acquired through the use of the Fund’s portfolio brokerage commissions.
Based on their evaluation of factors that they deemed to be material, including those factors described above, the Board of Trustees, including the independent Trustees, concluded that the Fund’s investment advisory agreement with MFS should be continued for an additional one-year period, commencing August 1, 2022.
Proxy Voting Policies and Information
MFS votes proxies on behalf of the fund pursuant to proxy voting policies and procedures that are available without charge, upon request, by calling 1-800-225-2606, by visiting mfs.com/proxyvoting, or by visiting the SEC’s Web site at http://www.sec.gov.
Information regarding how the fund voted proxies relating to portfolio securities during the most recent twelve-month period ended June 30 is available by August 31 of each year without charge by visiting mfs.com/proxyvoting, or by visiting the SEC’s Web site at http://www.sec.gov.
Quarterly Portfolio Disclosure
The fund files a complete schedule of portfolio holdings with the SEC for the first and third quarters of each fiscal year as an exhibit to its reports on Form N-PORT. The fund’s Form N-PORT reports are available on the SEC’s Web site at http://www.sec.gov. A shareholder can obtain the portfolio holdings report for the first and third quarters of the fund's fiscal year at mfs.com/vit1 by choosing the fund's name and then scrolling to the “Resources” section and clicking on the “Prospectus and Reports” tab.
FURTHER INFORMATION
From time to time, MFS may post important information about the fund or the MFS Funds on the MFS Web site (mfs.com). This information is available at https://www.mfs.com/announcements or at mfs.com/vit1 by choosing the fund's name and then scrolling to the “Resources” section and clicking on the “Announcements” tab, if any.
Information About Fund Contracts and Legal Claims
The fund has entered into contractual arrangements with an investment adviser, administrator, distributor, shareholder servicing agent, and custodian who each provide services to the fund. Unless expressly stated otherwise, shareholders are not parties to, or intended beneficiaries of these contractual arrangements, and these contractual arrangements are not intended to create any shareholder right to enforce them against the service providers or to seek any remedy under them against the service providers, either directly or on behalf of the fund.
Under the Trust’s By-Laws and Declaration of Trust, any claims asserted against or on behalf of the MFS Funds, including claims against Trustees and Officers, must be brought in state and federal courts located within the Commonwealth of Massachusetts.
Federal Tax Information (unaudited)
The following information is provided pursuant to provisions of the Internal Revenue Code.
The fund designates $182,884,000 as capital gain dividends paid during the fiscal year.
For corporate shareholders, 3.66% of the ordinary income dividends paid during the fiscal year qualify for the corporate dividends received deduction.
| FACTS | WHAT DOES MFS DO WITH YOUR PERSONAL INFORMATION? |
| Why? | Financial companies choose how they share your personal information. Federal law gives consumers the right to limit some but not all sharing. Federal law also requires us to tell you how we collect, share, and protect your personal information. Please read this notice carefully to understand what we do. |
| What? | The types of personal information we collect and share depend on the product or service you have with us. This information can include: |
| • Social Security number and account balances |
| • Account transactions and transaction history |
| • Checking account information and wire transfer instructions |
| When you are no longer our customer, we continue to share your information as described in this notice. |
| How? | All financial companies need to share customers' personal information to run their everyday business. In the section below, we list the reasons financial companies can share their customers' personal information; the reasons MFS chooses to share; and whether you can limit this sharing. |
Reasons we can share your
personal information | Does MFS share? | Can you limit
this sharing? |
For our everyday business purposes –
such as to process your transactions, maintain your
account(s), respond to court orders and legal
investigations, or report to credit bureaus | Yes | No |
For our marketing purposes –
to offer our products and services to you | No | We don't share |
For joint marketing with other
financial companies | No | We don't share |
For our affiliates' everyday business purposes –
information about your transactions and experiences | No | We don't share |
For our affiliates' everyday business purposes –
information about your creditworthiness | No | We don't share |
| For nonaffiliates to market to you | No | We don't share |
| Questions? | Call 800-225-2606 or go to mfs.com. |
| Who we are |
| Who is providing this notice? | MFS Funds, MFS Investment Management, MFS Institutional Advisors, Inc., and MFS Heritage Trust Company. |
| What we do |
How does MFS
protect my personal
information? | To protect your personal information from unauthorized access and use, we use security measures that comply with federal law. These measures include procedural, electronic, and physical safeguards for the protection of the personal information we collect about you. |
How does MFS
collect my personal
information? | We collect your personal information, for example, when you |
| • open an account or provide account information |
| • direct us to buy securities or direct us to sell your securities |
| • make a wire transfer |
| We also collect your personal information from others, such as credit bureaus, affiliates, or other companies. |
| Why can't I limit all sharing? | Federal law gives you the right to limit only |
| • sharing for affiliates' everyday business purposes – information about your creditworthiness |
| • affiliates from using your information to market to you |
| • sharing for nonaffiliates to market to you |
| State laws and individual companies may give you additional rights to limit sharing. |
| Definitions |
| Affiliates | Companies related by common ownership or control. They can be financial and nonfinancial companies. |
| • MFS does not share personal information with affiliates, except for everyday business purposes as described on page one of this notice. |
| Nonaffiliates | Companies not related by common ownership or control. They can be financial and nonfinancial companies. |
| • MFS does not share with nonaffiliates so they can market to you. |
| Joint marketing | A formal agreement between nonaffiliated financial companies that together market financial products or services to you. |
| • MFS doesn't jointly market. |
| Other important information |
| If you own an MFS product or receive an MFS service in the name of a third party such as a bank or broker-dealer, their privacy policy may apply to you instead of ours. |
Annual Report
December 31, 2022
MFS® Total Return Bond Series
MFS® Variable Insurance Trust
MFS® Total Return Bond Series
| 1 |
| 2 |
| 4 |
| 6 |
| 8 |
| 9 |
| 20 |
| 21 |
| 22 |
| 23 |
| 25 |
| 33 |
| 34 |
| 37 |
| 39 |
| 39 |
| 39 |
| 39 |
| 39 |
| 40 |
The report is prepared for the general information of shareholders. It is authorized for distribution to prospective investors only when preceded or accompanied by a current prospectus.
NOT FDIC INSURED • MAY LOSE VALUE • NO BANK OR CREDIT UNION GUARANTEE •
NOT A DEPOSIT • NOT INSURED BY ANY FEDERAL GOVERNMENT AGENCY OR NCUA/NCUSIF
MFS Total Return Bond Series
LETTER FROM THE CHAIR AND CEO
Dear Shareholders:
Signs of peaking inflation, hopes that monetary policy tightening cycles may be nearing an end and a rapid reopening of China’s economy in late-2022 and early-2023 have combined to bolster investor sentiment in recent months. Markets have largely adjusted to the challenges posed by Russia’s invasion of Ukraine, thanks in part to mild European winter weather which has alleviated concerns over potential shortages of natural gas. Resilient labor markets in much of the developed world have further contributed to a brighter-than-expected economic backdrop. However, many investors are mindful that the lagged effects of ongoing policy tightening have yet to work their way through the global economy.
Tighter global financial conditions have been a particular headwind for richly valued growth equities and interest rate-sensitive parts of the economy, such as housing. Over the near term, companies may face a challenging earnings backdrop as they are forced to absorb higher input and labor costs at a time of dwindling pricing power. For fixed income, the rise in interest rates has made bonds more attractive than they have been in years, which may provide balance to an overall portfolio.
During times of market transition, it is important to have a deep understanding of company fundamentals, and we have built our unique global research platform to do just that.
At MFS®, we put our clients’ assets to work responsibly by carefully navigating increasingly complex global capital markets. Our investment team is guided by a commitment to long-term fundamental investing. Our global investment platform — combining collective expertise, long-term discipline, and thoughtful risk management — seeks to uncover what we believe are the best, most durable investment ideas in markets around the world, enabling us to potentially create value for investors.
Respectfully,
Michael W. Roberge
Chair and Chief Executive Officer
MFS Investment Management
February 15, 2023
The opinions expressed in this letter are subject to change and may not be relied upon for investment advice. No forecasts can be guaranteed.
MFS Total Return Bond Series
Portfolio structure at value (v)
Portfolio structure reflecting equivalent exposure of derivative positions (i)
Fixed income sectors (i)
| Investment Grade Corporates | 32.5% |
| U.S. Treasury Securities | 28.6% |
| Mortgage-Backed Securities | 21.7% |
| Collateralized Debt Obligations | 10.0% |
| Commercial Mortgage-Backed Securities | 7.6% |
| High Yield Corporates | 6.5% |
| Municipal Bonds | 3.0% |
| Emerging Markets Bonds | 1.4% |
| U.S. Government Agencies | 1.0% |
| Asset-Backed Securities | 0.7% |
| Non-U.S. Government Bonds | 0.1% |
| Residential Mortgage-Backed Securities (o) | 0.0% |
Composition including fixed income credit quality (a)(i)
| AAA | 8.1% |
| AA | 4.6% |
| A | 14.2% |
| BBB | 27.0% |
| BB | 6.2% |
| B | 1.5% |
| CCC | 0.2% |
| C (o) | 0.0% |
| U.S. Government | 14.0% |
| Federal Agencies | 22.7% |
| Not Rated | 14.6% |
| Cash & Cash Equivalents | 1.5% |
| Other (q) | (14.6)% |
Portfolio facts
| Average Duration (d) | 6.1 | |
| Average Effective Maturity (m) | 7.4 yrs. | |
MFS Total Return Bond Series
Portfolio Composition - continued
| (a) | For all securities other than those specifically described below, ratings are assigned to underlying securities utilizing ratings from Moody’s, Fitch, and Standard & Poor’s rating agencies and applying the following hierarchy: If all three agencies provide a rating, the middle rating (after dropping the highest and lowest ratings) is assigned; if two of the three agencies rate a security, the lower of the two is assigned. If none of the 3 rating agencies above assign a rating, but the security is rated by DBRS Morningstar, then the DBRS Morningstar rating is assigned. If none of the 4 rating agencies listed above rate the security, but the security is rated by the Kroll Bond Rating Agency (KBRA), then the KBRA rating is assigned. Ratings are shown in the S&P and Fitch scale (e.g., AAA). Securities rated BBB or higher are considered investment grade. All ratings are subject to change. U.S. Government includes securities issued by the U.S. Department of the Treasury. Federal Agencies includes rated and unrated U.S. Agency fixed-income securities, U.S. Agency mortgage-backed securities, and collateralized mortgage obligations of U.S. Agency mortgage-backed securities. Not Rated includes fixed income securities and fixed income derivatives that have not been rated by any rating agency. The fund may or may not have held all of these instruments on this date. The fund is not rated by these agencies. |
| (d) | Duration is a measure of how much a bond’s price is likely to fluctuate with general changes in interest rates, e.g., if rates rise 1.00%, a bond with a 5-year duration is likely to lose about 5.00% of its value due to the interest rate move. The Average Duration calculation reflects the impact of the equivalent exposure of derivative positions, if any. |
| (i) | For purposes of this presentation, the components include the value of securities, and reflect the impact of the equivalent exposure of derivative positions, if any. These amounts may be negative from time to time. Equivalent exposure is a calculated amount that translates the derivative position into a reasonable approximation of the amount of the underlying asset that the portfolio would have to hold at a given point in time to have the same price sensitivity that results from the portfolio’s ownership of the derivative contract. When dealing with derivatives, equivalent exposure is a more representative measure of the potential impact of a position on portfolio performance than value. The bond component will include any accrued interest amounts. |
| (m) | In determining each instrument’s effective maturity for purposes of calculating the fund’s dollar-weighted average effective maturity, MFS uses the instrument’s stated maturity or, if applicable, an earlier date on which MFS believes it is probable that a maturity-shortening device (such as a put, pre-refunding or prepayment) will cause the instrument to be repaid. Such an earlier date can be substantially shorter than the instrument’s stated maturity. |
| (q) | For purposes of this presentation, Other includes equivalent exposure from currency derivatives and/or any offsets to derivative positions and may be negative. |
| (v) | For purposes of this presentation, market value of fixed income and/or equity derivatives, if any, is included in Cash & Cash Equivalents. |
Cash & Cash Equivalents includes any cash, investments in money market funds, short-term securities, and other assets less liabilities. Please see the Statement of Assets and Liabilities for additional information related to the fund’s cash position and other assets and liabilities.
Percentages are based on net assets as of December 31, 2022.
The portfolio is actively managed and current holdings may be different.
MFS Total Return Bond Series
Management Review
Summary of Results
For the twelve months ended December 31, 2022, Initial Class shares of the MFS Total Return Bond Series (fund) provided a total return of -13.93%, while Service Class shares of the fund provided a total return of -14.18%. These compare with a return of -13.01% over the same period for the fund’s benchmark, the Bloomberg U.S. Aggregate Bond Index.
Market Environment
During the reporting period, markets continued to grapple with the strongest global inflationary pressures in decades along with signs of slowing economic growth. Intermittent coronavirus flareups, particularly in China, where home-grown vaccines have proved less effective than elsewhere, kept supply chains stretched for a considerable period. At the same time, the reopening of the economy in the parts of the world where the virus has been better contained has led to a shift in consumption patterns in favor of services, straining already tight labor markets in most developed economies, while reducing demand for manufactured goods, primarily from Asia. As a result of Russia’s invasion of Ukraine, geopolitical considerations, such as sanctions and trade bans, have resulted in additional supply chain disruptions and volatile global energy prices. Taken together, these factors have contributed to market volatility.
The ripple effects from the Russian invasion further complicated the mission central banks must undertake to rein in surging inflation. Energy shocks have historically resulted in global growth slowdowns, if not pullbacks, so policymakers will find themselves in the difficult position of trying to restrain inflation without tipping economies into recession. Despite the challenging macroeconomic and geopolitical environment, policymakers remained focused on controlling inflation, although investors appeared to have expected varying degrees of action from the central banks. The Fed has been among the most aggressive developed market central banks, tightening policy at the fastest rate in decades, although it slowed its hiking pace at the end of the period, as did the European Central Bank. After remaining on the monetary sidelines for much of the period, the Bank of Japan widened its Yield Curve Control band, capping the yield on its 10-year bond at 0.5%, up from 0.25%, an action investors interpreted as a first step toward monetary policy normalization.
Against an environment of still-tight labor markets, tighter global financial conditions and volatile materials prices, investor anxiety appeared to have increased over the potential that corporate profit margins may be past peak for this cycle. That said, tentative signs that supply chain bottlenecks (particularly semiconductors) may be moderating, the easing of COVID restrictions in China, low levels of unemployment across developed markets and hopes that inflation levels may be near a peak were supportive factors for the macroeconomic backdrop.
Factors Affecting Performance
Relative to the Bloomberg U.S. Aggregate Bond Index, the fund’s asset allocation decisions detracted from relative performance. From a sector perspective, the fund's underweight exposure to the treasury sector combined with its exposure to the collateralized mortgage obligation (CMO) sector, for which the benchmark has no exposure, held back relative returns. From a quality perspective, the fund's overweight exposure to both 'A' and ‘BBB’ rated(r) bonds weighed on relative results. The fund’s yield curve(y) positioning was another detractor from relative returns. Additionally, bond selection in the industrials sector weakened relative performance.
Conversely, the fund's shorter relative duration(d) stance was a primary contributor to relative performance as interest rates rose during the reporting period. An underweight exposure to 'AAA' rated(r) bonds and the fund’s exposure to ‘BB’ rated bonds, for which the benchmark has no exposure, further supported relative results.
Respectfully,
Portfolio Manager(s)
Alexander Mackey and Joshua Marston
| (d) | Duration is a measure of how much a bond’s price is likely to fluctuate with general changes in interest rates, e.g., if rates rise 1.00%, a bond with a 5-year duration is likely to lose about 5.00% of its value. |
| (r) | Securities rated “BBB”, “Baa”, or higher are considered investment grade; securities rated “BB”, “Ba”, or below are considered non-investment grade. Ratings are assigned to underlying securities utilizing ratings from Moody's, Fitch, and Standard & Poor's and applying the following hierarchy: If all three agencies provide a rating, the middle rating (after dropping the highest and lowest ratings) is assigned; if two of the three agencies rate a security, the |
MFS Total Return Bond Series
Management Review - continued
lower of the two is assigned. If none of the 3 rating agencies above assign a rating, but the security is rated by DBRS Morningstar, then the DBRS Morningstar rating is assigned. If none of the 4 rating agencies listed above rate the security, but the security is rated by the Kroll Bond Rating Agency (KBRA), then the KBRA rating is assigned. Ratings are shown in the S&P and Fitch scale (e.g., AAA). For securities that are not rated by any of the rating agencies, the security is considered Not Rated.
| (y) | A yield curve graphically depicts the yields of different maturity bonds of the same credit quality and type; a normal yield curve is upward sloping, with short-term rates lower than long-term rates. |
The views expressed in this report are those of the portfolio manager(s) only through the end of the period of the report as stated on the cover and do not necessarily reflect the views of MFS or any other person in the MFS organization. These views are subject to change at any time based on market or other conditions, and MFS disclaims any responsibility to update such views. These views may not be relied upon as investment advice or an indication of trading intent on behalf of any MFS portfolio. References to specific securities are not recommendations of such securities, and may not be representative of any MFS portfolio’s current or future investments.
MFS Total Return Bond Series
Performance Summary Through 12/31/22
The following chart illustrates the historical performance of the fund in comparison to its benchmark(s). Benchmarks are unmanaged and may not be invested in directly. Benchmark returns do not reflect any fees or expenses. The performance of other share classes will be greater than or less than that of the class depicted below. (See Notes to Performance Summary.)
Performance data shown represents past performance and is no guarantee of future results. Investment return and principal value fluctuate so your shares, when sold, may be worth more or less than the original cost; current performance may be lower or higher than quoted. The performance shown does not reflect the deduction of taxes, if any, that a shareholder would pay on fund distributions or the redemption of fund shares. The returns for the fund shown also do not reflect the deduction of expenses associated with variable products, such as mortality and expense risk charges, separate account charges, and sales charges imposed by the insurance company separate accounts. Such expenses would reduce the overall returns shown.
Growth of a Hypothetical $10,000 Investment
Total Returns through 12/31/22
Average annual total returns
| Share Class | Class Inception Date | 1-yr | 5-yr | 10-yr |
| Initial Class | 10/24/95 | (13.93)% | 0.19% | 1.39% |
| Service Class | 5/01/00 | (14.18)% | (0.08)% | 1.13% |
Comparative benchmark(s)
| Bloomberg U.S. Aggregate Bond Index (f) | (13.01)% | 0.02% | 1.06% |
| (f) | Source: FactSet Research Systems Inc. |
Benchmark Definition(s)
Bloomberg U.S. Aggregate Bond Index(a) – a market capitalization-weighted index that measures the performance of the U.S. investment-grade, fixed rate bond market, with index components for government and corporate securities, mortgage pass-through securities, and asset-backed securities with at least one year to final maturity.
It is not possible to invest directly in an index.
| (a) | Source: Bloomberg Index Services Limited. BLOOMBERG® is a trademark and service mark of Bloomberg Finance L.P. and its affiliates (collectively “Bloomberg”). Bloomberg or Bloomberg's licensors own all proprietary rights in the Bloomberg Indices. Bloomberg neither approves or endorses this material, or guarantees the accuracy or completeness of any information herein, or makes any warranty, express or implied, as to the results to be obtained therefrom and, to the maximum extent allowed by law, neither shall have any liability or responsibility for injury or damages arising in connection therewith. |
Notes to Performance Summary
Average annual total return represents the average annual change in value for each share class for the periods presented.
Performance results reflect any applicable expense subsidies and waivers in effect during the periods shown. Without such subsidies and waivers the fund's performance results would be less favorable. Please see the prospectus and financial statements for complete details. All results are historical and assume the reinvestment of any dividends and capital gains distributions.
MFS Total Return Bond Series
Performance Summary – continued
Performance results do not include adjustments made for financial reporting purposes in accordance with U.S. generally accepted accounting principles and may differ from amounts reported in the financial highlights.
From time to time the fund may receive proceeds from litigation settlements, without which performance would be lower.
MFS Total Return Bond Series
Expense Table
Fund expenses borne by the shareholders during the period,
July 1, 2022 through December 31, 2022
As a shareholder of the fund, you incur ongoing costs, including management fees; distribution and/or service (12b-1) fees; and other fund expenses. This example is intended to help you understand your ongoing costs (in dollars) of investing in the fund and to compare these costs with the ongoing costs of investing in other mutual funds.
The example is based on an investment of $1,000 invested at the beginning of the period and held for the entire period July 1, 2022 through December 31, 2022.
Actual Expenses
The first line for each share class in the following table provides information about actual account values and actual expenses. You may use the information in this line, together with the amount you invested, to estimate the expenses that you paid over the period. Simply divide your account value by $1,000 (for example, an $8,600 account value divided by $1,000 = 8.6), then multiply the result by the number in the first line under the heading entitled “Expenses Paid During Period” to estimate the expenses you paid on your account during this period.
Hypothetical Example for Comparison Purposes
The second line for each share class in the following table provides information about hypothetical account values and hypothetical expenses based on the fund’s actual expense ratio and an assumed rate of return of 5% per year before expenses, which is not the fund’s actual return. The hypothetical account values and expenses may not be used to estimate the actual ending account balance or expenses you paid for the period. You may use this information to compare the ongoing costs of investing in the fund and other funds. To do so, compare this 5% hypothetical example with the 5% hypothetical examples that appear in the shareholder reports of the other funds.
Please note that the expenses shown in the table are meant to highlight the fund's ongoing costs only and do not take into account the fees and expenses imposed under the variable contracts through which your investment in the fund is made. Therefore, the second line for each share class in the table is useful in comparing ongoing costs associated with an investment in vehicles (such as the fund) which fund benefits under variable annuity and variable life insurance contracts and to qualified pension and retirement plans only, and will not help you determine the relative total costs of investing in the fund through variable annuity and variable life insurance contracts. If the fees and expenses imposed under the variable contracts were included, your costs would have been higher.
Share
Class | | Annualized
Expense
Ratio | Beginning
Account Value
7/01/22 | Ending
Account Value
12/31/22 | Expenses
Paid During
Period (p)
7/01/22-12/31/22 |
| Initial Class | Actual | 0.52% | $1,000.00 | $972.69 | $2.59 |
| Hypothetical (h) | 0.52% | $1,000.00 | $1,022.58 | $2.65 |
| Service Class | Actual | 0.77% | $1,000.00 | $971.52 | $3.83 |
| Hypothetical (h) | 0.77% | $1,000.00 | $1,021.32 | $3.92 |
| (h) | 5% class return per year before expenses. |
| (p) | “Expenses Paid During Period” are equal to each class's annualized expense ratio, as shown above, multiplied by the average account value over the period, multiplied by 184/365 (to reflect the one-half year period). |
MFS Total Return Bond Series
Portfolio of Investments − 12/31/22
The Portfolio of Investments is a complete list of all securities owned by your fund. It is categorized by broad-based asset classes.
| Issuer | | | Shares/Par | Value ($) |
| Bonds – 97.8% |
| Aerospace & Defense – 1.1% |
| Boeing Co., 2.196%, 2/04/2026 | | $ | 6,236,000 | $ 5,665,797 |
| Boeing Co., 5.15%, 5/01/2030 | | | 1,704,000 | 1,662,489 |
| Boeing Co., 5.705%, 5/01/2040 | | | 1,595,000 | 1,520,932 |
| Boeing Co., 5.805%, 5/01/2050 | | | 3,159,000 | 2,928,948 |
| TransDigm, Inc., 4.625%, 1/15/2029 | | | 5,158,000 | 4,535,275 |
| | | | | $16,313,441 |
| Asset-Backed & Securitized – 18.1% |
| ACREC 2021-FL1 Ltd., “C”, FLR, 6.476% (LIBOR - 1mo. + 2.15%), 10/16/2036 (n) | | $ | 2,546,000 | $ 2,348,155 |
| ACREC 2021-FL1 Ltd., “D”, FLR, 6.976% (LIBOR - 1mo. + 2.65%), 10/16/2036 (n) | | | 3,070,500 | 2,827,519 |
| ACRES 2021-FL2 Issuer Ltd., “C”, FLR, 6.976% (LIBOR - 1mo. + 2.65%), 1/15/2037 (n) | | | 3,129,000 | 2,899,927 |
| Allegro CLO Ltd., 2014-1RA, “A2”, FLR, 5.877% (LIBOR - 3mo. + 1.6%), 10/21/2028 (n) | | | 5,554,267 | 5,450,808 |
| Arbor Realty Trust, Inc., CLO, 2019-FL2, “AS”, FLR, 5.9% (LIBOR - 1mo. + 1.45%), 9/15/2034 (n) | | | 980,500 | 965,169 |
| Arbor Realty Trust, Inc., CLO, 2019-FL2, “B”, FLR, 6.2% (LIBOR - 1mo. + 1.75%), 9/15/2034 (n) | | | 784,500 | 755,272 |
| Arbor Realty Trust, Inc., CLO, 2020-FL1, “C”, FLR, 6.5% (LIBOR - 1mo. + 2.05%), 2/15/2035 (n) | | | 3,529,000 | 3,386,510 |
| Arbor Realty Trust, Inc., CLO, 2021-FL1, “C”, FLR, 6.27% (LIBOR - 1mo. + 2%), 12/15/2035 (n) | | | 905,000 | 844,014 |
| Arbor Realty Trust, Inc., CLO, 2021-FL1, “D”, FLR, 7.22% (LIBOR - 1mo. + 2.95%), 12/15/2035 (n) | | | 831,500 | 769,512 |
| Arbor Realty Trust, Inc., CLO, 2021-FL2, “B”, FLR, 5.917% (LIBOR - 1mo. + 1.6%), 5/15/2036 (n) | | | 1,152,500 | 1,085,913 |
| Arbor Realty Trust, Inc., CLO, 2021-FL3, “C”, FLR, 6.168% (LIBOR - 1mo. + 1.85%), 8/15/2034 (n) | | | 1,740,000 | 1,570,409 |
| Arbor Realty Trust, Inc., CLO, 2021-FL3, “D”, FLR, 6.517% (LIBOR - 1mo. + 2.2%), 8/15/2034 (n) | | | 964,500 | 895,958 |
| Arbor Realty Trust, Inc., CLO, 2021-FL4, “C”, FLR, 6.618% (LIBOR - 1mo. + 2.3%), 11/15/2036 (n) | | | 3,443,500 | 3,168,388 |
| Arbor Realty Trust, Inc., CLO, 2022-FL1, “D”, FLR, 6.807% (SOFR - 30 day + 3%), 1/15/2037 (n) | | | 9,290,000 | 8,545,984 |
| AREIT 2019-CRE3 Trust, “A”, FLR, 5.71% (LIBOR - 1mo. + 1.02%), 9/14/2036 (n) | | | 57,750 | 57,110 |
| AREIT 2019-CRE3 Trust, “B”, FLR, 5.99% (LIBOR - 1mo. + 1.55%), 9/14/2036 (n) | | | 2,569,500 | 2,468,036 |
| AREIT 2019-CRE3 Trust, “C”, FLR, 6.34% (SOFR - 1mo. + 2.014%), 9/14/2036 (n) | | | 2,242,500 | 2,123,154 |
| AREIT 2019-CRE3 Trust, “D”, FLR, 7.09% (LIBOR - 1mo. + 2.65%), 9/14/2036 (n) | | | 1,849,000 | 1,715,375 |
| AREIT 2022-CRE6 Trust, “B”, FLR, 5.675% (SOFR - 30 day + 1.85%), 1/16/2037 (n) | | | 1,126,000 | 1,034,435 |
| AREIT 2022-CRE6 Trust, “C”, FLR, 5.975% (SOFR - 30 day + 2.15%), 1/16/2037 (n) | | | 2,322,000 | 2,158,262 |
| AREIT 2022-CRE6 Trust, “D”, FLR, 6.676% (SOFR - 30 day + 2.85%), 1/16/2037 (n) | | | 987,000 | 911,812 |
| Atrium XII Corp., 2012-A, “B1R”, FLR, 5.674% (LIBOR - 3mo. + 1.35%), 4/22/2027 (n) | | | 7,430,000 | 7,276,949 |
| Bayview Commercial Asset Trust, 0%, 12/25/2036 (i)(z) | | | 67,085 | 7 |
| Bayview Financial Revolving Mortgage Loan Trust, FLR, 5.988% (LIBOR - 1mo. + 1.6%), 12/28/2040 (n) | | | 27,665 | 34,000 |
| BBCMS Mortgage Trust, 2019-C5, “A4”, 3.063%, 11/15/2052 | | | 2,755,000 | 2,423,037 |
| BDS 2019-FL4 Ltd., “A”, FLR, 5.426% (LIBOR - 1mo. + 1.10%), 8/15/2036 (n) | | | 96,777 | 96,777 |
| BDS 2021-FL7 Ltd., “B”, FLR, 5.839% (LIBOR - 1mo. + 1.5%), 6/16/2036 (n) | | | 1,259,500 | 1,181,668 |
| Bear Stearns Cos., Inc., “A2”, FLR, 5.288% (LIBOR - 1mo. + 0.45%), 12/25/2042 | | | 25,121 | 25,095 |
| Brazos Securitization LLC, 5.413%, 9/01/2052 (n) | | | 3,427,000 | 3,233,483 |
| BSPDF 2021-FL1 Issuer Ltd., “B”, FLR, 6.117% (LIBOR - 1mo. + 1.8%), 10/15/2036 (n) | | | 4,380,500 | 4,120,929 |
| BSPRT 2019-FL5 Issuer Ltd., “C”, FLR, 6.317% (LIBOR - 1mo. + 2%), 5/15/2029 (n) | | | 3,295,000 | 3,202,213 |
| BSPRT 2021-FL6 Issuer Ltd., “B”, FLR, 5.917% (LIBOR - 1mo. + 1.6%), 3/15/2036 (n) | | | 3,669,500 | 3,367,963 |
| BSPRT 2021-FL6 Issuer Ltd., “C”, FLR, 6.367% (LIBOR - 1mo. + 2.05%), 3/15/2036 (n) | | | 1,288,000 | 1,191,947 |
| BSPRT 2021-FL7 Issuer Ltd., “C”, FLR, 6.617% (LIBOR - 1mo. + 2.3%), 12/15/2038 (n) | | | 836,500 | 770,567 |
| BSPRT 2021-FL7 Issuer Ltd., “D”, FLR, 7.068% (LIBOR - 1mo. + 2.75%), 12/15/2038 (n) | | | 952,500 | 880,320 |
| Business Jet Securities LLC, 2020-1A, “A”, 2.981%, 11/15/2035 (n) | | | 952,337 | 867,425 |
| Business Jet Securities LLC, 2021-1A, “B”, 2.918%, 4/15/2036 (n) | | | 470,686 | 398,932 |
| BXMT 2020-FL2 Ltd., “B”, FLR, 5.84% (LIBOR - 1mo. + 1.4%), 2/15/2038 (n) | | | 1,731,000 | 1,632,795 |
| Cantor Commercial Real Estate, 2019-CF2, “A5”, 2.874%, 11/15/2052 | | | 6,645,635 | 5,711,658 |
| Capital Automotive, 2020-1A, “A4”, REIT, 3.19%, 2/15/2050 (n) | | | 2,390,484 | 2,233,486 |
| CHCP 2021-FL1 Ltd., “B”, FLR, 6.09% (LIBOR - 1mo. + 1.65%), 2/15/2038 (n) | | | 1,102,500 | 1,042,747 |
| CHCP 2021-FL1 Ltd., “C”, FLR, 6.54% (LIBOR - 1mo. + 2.1%), 2/15/2038 (n) | | | 1,249,000 | 1,155,765 |
| Citigroup Commercial Mortgage Trust, 2014-GC25, “A4”, 3.635%, 10/10/2047 | | | 3,128,793 | 3,009,259 |
| Citigroup Commercial Mortgage Trust, 2016-P6, “A5”, 3.72%, 12/10/2049 | | | 1,754,000 | 1,646,813 |
| CLNC 2019-FL1 Ltd., “B”, FLR, 6.339% (LIBOR - 1mo. + 1.9%), 8/20/2035 (n) | | | 1,850,000 | 1,767,259 |
| CLNC 2019-FL1 Ltd., “C”, FLR, 6.839% (LIBOR - 1mo. + 2.4%), 8/20/2035 (n) | | | 3,006,500 | 2,800,655 |
| Commercial Mortgage Trust, 2015-LC21, “A4”, 3.708%, 7/10/2048 | | | 10,000,000 | 9,517,394 |
MFS Total Return Bond Series
Portfolio of Investments – continued
| Issuer | | | Shares/Par | Value ($) |
| Bonds – continued |
| Asset-Backed & Securitized – continued |
| Commercial Mortgage Trust, 2015-PC1, “A5”, 3.902%, 7/10/2050 | | $ | 2,888,848 | $ 2,767,535 |
| Credit Acceptance Auto Loan Trust, 2021-3A, “C”, 1.63%, 9/16/2030 (n) | | | 523,000 | 471,524 |
| CSAIL Commercial Mortgage Trust, 2015-C2, “A4”, 3.504%, 6/15/2057 | | | 2,695,346 | 2,557,642 |
| Cutwater 2014-1A Ltd., “BR”, FLR, 6.479% (LIBOR - 3mo. + 2.4%), 7/15/2026 (n) | | | 1,177,498 | 1,170,834 |
| Cutwater 2015-1A Ltd., “BR”, FLR, 5.879% (LIBOR - 3mo. + 1.8%), 1/15/2029 (n) | | | 10,770,000 | 10,551,229 |
| GS Mortgage Securities Trust, 2015-GC30, “A4”, 3.382%, 5/10/2050 | | | 7,904,407 | 7,495,172 |
| HarbourView CLO VII Ltd., 7RA, “B”, FLR, 5.894% (LIBOR - 3mo. + 1.7%), 7/18/2031 (n) | | | 6,545,000 | 6,155,913 |
| JPMBB Commercial Mortgage Securities Trust, 2015-C28, “A4”, 3.227%, 10/15/2048 | | | 12,188,428 | 11,529,626 |
| JPMorgan Chase Commercial Mortgage Securities Corp., 5.639%, 7/15/2042 (n) | | | 13,513 | 10,996 |
| JPMorgan Mortgage Trust, “A1”, 2.918%, 10/25/2033 | | | 49,291 | 43,959 |
| LCCM 2021-FL2 Trust, “C”, FLR, 6.467% (LIBOR - 1mo. + 2.15%), 12/13/2038 (n) | | | 1,985,500 | 1,885,397 |
| Lehman Brothers Commercial Conduit Mortgage Trust, 0.764%, 2/18/2030 (i) | | | 456 | 0 |
| LoanCore 2018-CRE1 Ltd., “AS”, FLR, 5.817% (LIBOR - 1mo. + 1.5%), 5/15/2028 (n) | | | 5,271,577 | 5,252,310 |
| LoanCore 2018-CRE1 Ltd., “C”, FLR, 6.867% (LIBOR - 1mo. + 2.55%), 5/15/2028 (n) | | | 2,340,000 | 2,246,568 |
| LoanCore 2018-CRE1 Ltd., “C”, FLR, 6.267% (LIBOR - 1mo. + 1.95%), 4/15/2034 (n) | | | 1,836,900 | 1,801,885 |
| LoanCore 2018-CRE3 Ltd., “B”, FLR, 5.918% (LIBOR - 1mo. + 1.6%), 4/15/2034 (n) | | | 1,873,800 | 1,857,395 |
| LoanCore 2019-CRE2 Ltd., “D”, FLR, 6.767% (LIBOR - 1mo. + 2.45%), 5/15/2036 (n) | | | 1,121,500 | 1,092,895 |
| LoanCore 2019-CRE3 Ltd., “AS”, FLR, 5.687% (LIBOR - 1mo. + 1.37%), 4/15/2034 (n) | | | 1,329,137 | 1,323,225 |
| LoanCore 2021-CRE5 Ltd., “AS”, FLR, 6.067% (LIBOR - 1mo. + 1.75%), 7/15/2036 (n) | | | 5,666,000 | 5,326,009 |
| LoanCore 2021-CRE5 Ltd., “B”, FLR, 6.317% (LIBOR - 1mo. + 2%), 7/15/2036 (n) | | | 5,318,000 | 4,979,902 |
| LoanCore 2021-CRE6 Ltd., “B”, FLR, 6.218% (LIBOR - 1mo. + 1.9%), 11/15/2038 (n) | | | 9,970,000 | 9,298,082 |
| Madison Park Funding Ltd., 2017- 23A, “CR”, FLR, 6.358% (LIBOR - 3mo. + 2%), 7/27/2031 (n) | | | 5,894,060 | 5,635,128 |
| Merrill Lynch Mortgage Investors, Inc., “A”, 3.674%, 5/25/2036 | | | 50,625 | 48,865 |
| Merrill Lynch Mortgage Investors, Inc., “A5”, 2.847%, 4/25/2035 | | | 76,620 | 67,109 |
| MF1 2020-FL4 Ltd., “AS”, FLR, 6.55% (LIBOR - 1mo. + 2.1%), 11/15/2035 (n) | | | 2,602,500 | 2,524,745 |
| MF1 2021-FL5 Ltd., “C”, FLR, 6.15% (LIBOR - 1mo. + 1.7%), 7/15/2036 (n) | | | 2,589,000 | 2,411,736 |
| MF1 2022-FL8 Ltd., “C”, FLR, 6.026% (SOFR - 30 day + 2.2%), 2/19/2037 (n) | | | 2,433,741 | 2,250,486 |
| MF1 2022-FL8 Ltd., “D”, FLR, 6.476% (SOFR - 30 day + 2.65%), 2/19/2037 (n) | | | 1,407,473 | 1,294,592 |
| Neuberger Berman CLO Ltd., 2013-15A, “CR2”, FLR, 5.929% (LIBOR - 3mo. + 1.85%), 10/15/2029 (n) | | | 7,481,614 | 7,067,462 |
| Oaktree CLO 2019-1A Ltd., “BR”, FLR, 6.074% (LIBOR - 3mo. + 1.75%), 4/22/2030 (n) | | | 5,000,000 | 4,787,410 |
| Oaktree CLO 2019-1A Ltd., “CR”, FLR, 6.674% (LIBOR - 3mo. + 2.35%), 4/22/2030 (n) | | | 5,744,568 | 5,369,396 |
| Palmer Square Loan Funding 2020-1A Ltd., “A2”, FLR, 6.025% (LIBOR - 3mo. + 1.35%), 2/20/2028 (n) | | | 3,930,000 | 3,862,369 |
| Palmer Square Loan Funding 2020-1A Ltd., “B”, FLR, 6.575% (LIBOR - 3mo. + 1.9%), 2/20/2028 (n) | | | 3,453,628 | 3,394,899 |
| Parallel 2015-1A Ltd., “C1R”, FLR, 5.992% (LIBOR - 3mo. + 1.75%), 7/20/2027 (n) | | | 1,680,000 | 1,658,881 |
| Parallel 2015-1A Ltd., “C2R”, FLR, 5.992% (LIBOR - 3mo. + 1.75%), 7/20/2027 (n) | | | 1,810,000 | 1,768,162 |
| PFP III 2021-7 Ltd., “B”, FLR, 5.726% (LIBOR - 1mo. + 1.4%), 4/14/2038 (n) | | | 935,953 | 874,832 |
| PFP III 2021-7 Ltd., “C”, FLR, 5.976% (LIBOR - 1mo. + 1.65%), 4/14/2038 (n) | | | 1,640,418 | 1,522,121 |
| PFP III 2021-8 Ltd., “D”, FLR, 6.476% (LIBOR - 1mo. + 2.15%), 8/09/2037 (n) | | | 3,737,500 | 3,480,089 |
| Preferred Term Securities XIX Ltd., CDO, FLR, 5.119% (LIBOR - 3mo. + 0.35%), 12/22/2035 (n) | | | 131,341 | 117,564 |
| Race Point CLO Ltd., 2013-8A, “AR-2”, FLR, 5.715% (LIBOR - 3mo. + 1.04%), 2/20/2030 (n) | | | 3,506,066 | 3,456,070 |
| ReadyCap Commercial Mortgage Trust, 2021-FL7, “C”, FLR, 6.588% (LIBOR - 1mo. + 2.2%), 11/25/2036 (n) | | | 1,340,000 | 1,235,136 |
| ReadyCap Commercial Mortgage Trust, 2021-FL7, “D”, FLR, 7.338% (LIBOR - 1mo. + 2.95%), 11/25/2036 (n) | | | 1,575,000 | 1,451,495 |
| Residential Funding Mortgage Securities, Inc., FGIC, 4.223%, 12/25/2035 | | | 2,975 | 2,950 |
| Santander Retail Auto Lease Trust, 2020-A, “C”, 2.08%, 3/20/2024 (n) | | | 2,276,000 | 2,264,032 |
| Securitized Term Auto Receivable Trust, 2019-CRTA, “B”, 2.453%, 3/25/2026 (n) | | | 314,121 | 311,985 |
| Securitized Term Auto Receivable Trust, 2019-CRTA, “C”, 2.849%, 3/25/2026 (n) | | | 374,600 | 372,272 |
| Starwood Commercial Mortgage, 2021-FL2, “C”, FLR, 6.426% (LIBOR - 1mo. + 2.1%), 4/18/2038 (n) | | | 2,027,000 | 1,876,871 |
| Starwood Commercial Mortgage, 2022-FL3, “B”, FLR, 5.757% (SOFR - 30 day + 1.95%), 11/15/2038 (n) | | | 1,391,000 | 1,312,961 |
| Starwood Commercial Mortgage, 2022-FL3, “C”, FLR, 6.007% (SOFR - 30 day + 2.2%), 11/15/2038 (n) | | | 2,632,000 | 2,442,251 |
| TICP CLO 2018-IA Ltd., “A2”, FLR, 5.826% (LIBOR - 3mo. + 1.5%), 4/26/2028 (n) | | | 6,750,828 | 6,637,437 |
| UBS Commercial Mortgage Trust, 2017-C8, “A4”, 3.983%, 2/15/2051 | | | 5,865,766 | 5,480,808 |
| Voya CLO 2012-4A Ltd., “A2R3”, FLR, 5.529% (LIBOR - 3mo. + 1.45%), 10/15/2030 (n) | | | 1,957,793 | 1,859,408 |
| Voya CLO 2012-4A Ltd., “BR3”, FLR, 6.029% (LIBOR - 3mo. + 1.95%), 10/15/2030 (n) | | | 828,265 | 754,491 |
| Voya CLO 2012-4A Ltd., “C1R3”, FLR, 7.379% (LIBOR - 3mo. + 3.3%), 10/15/2030 (n) | | | 1,187,823 | 1,058,017 |
| Wells Fargo Commercial Mortgage Trust, 2016-LC25, “A4”, 3.64%, 12/15/2059 | | | 13,071,416 | 12,235,275 |
| Wells Fargo Commercial Mortgage Trust, 2017-C42, “A5”, 3.589%, 12/15/2050 | | | 3,970,000 | 3,651,236 |
| | | | | $277,927,504 |
MFS Total Return Bond Series
Portfolio of Investments – continued
| Issuer | | | Shares/Par | Value ($) |
| Bonds – continued |
| Automotive – 0.1% |
| Volkswagen Group of America Finance LLC, 3.75%, 5/13/2030 (n) | | $ | 2,118,000 | $ 1,861,217 |
| Broadcasting – 1.2% |
| Discovery, Inc., 4.65%, 5/15/2050 | | $ | 4,028,000 | $ 2,770,122 |
| Prosus N.V., 3.68%, 1/21/2030 (n) | | | 4,905,000 | 4,078,245 |
| Warnermedia Holdings, Inc., 5.05%, 3/15/2042 (n) | | | 5,334,000 | 4,080,949 |
| Warnermedia Holdings, Inc., 5.141%, 3/15/2052 (n) | | | 4,694,000 | 3,412,380 |
| Warnermedia Holdings, Inc., 5.391%, 3/15/2062 (n) | | | 1,915,000 | 1,397,976 |
| WMG Acquisition Corp., 3%, 2/15/2031 (n) | | | 3,382,000 | 2,702,522 |
| | | | | $18,442,194 |
| Brokerage & Asset Managers – 1.4% |
| Charles Schwab Corp., 5% to 6/01/2027, FLR (CMT - 5yr. + 3.256%) to 6/01/2170 | | $ | 6,058,000 | $ 5,530,945 |
| LPL Holdings, Inc., 4%, 3/15/2029 (n) | | | 4,555,000 | 3,963,305 |
| Morgan Stanley Domestic Holdings, Inc., 3.8%, 8/24/2027 | | | 5,272,000 | 4,959,700 |
| Morgan Stanley Domestic Holdings, Inc., 4.5%, 6/20/2028 | | | 3,485,000 | 3,388,809 |
| Raymond James Financial, Inc., 4.95%, 7/15/2046 | | | 4,683,000 | 4,163,297 |
| | | | | $22,006,056 |
| Building – 0.6% |
| Standard Industries, Inc., 4.375%, 7/15/2030 (n) | | $ | 5,875,000 | $ 4,787,682 |
| Standard Industries, Inc., 3.375%, 1/15/2031 (n) | | | 2,760,000 | 2,076,909 |
| Vulcan Materials Co., 3.5%, 6/01/2030 | | | 3,356,000 | 2,956,084 |
| | | | | $9,820,675 |
| Business Services – 1.0% |
| Equinix, Inc., 2.15%, 7/15/2030 | | $ | 4,789,000 | $ 3,809,838 |
| Fiserv, Inc., 3.5%, 7/01/2029 | | | 2,280,000 | 2,054,093 |
| Global Payments, Inc., 2.9%, 5/15/2030 | | | 5,153,000 | 4,222,200 |
| Global Payments, Inc., 2.9%, 11/15/2031 | | | 1,508,000 | 1,189,161 |
| Iron Mountain, Inc., 4.5%, 2/15/2031 (n) | | | 5,315,000 | 4,368,611 |
| | | | | $15,643,903 |
| Cable TV – 1.6% |
| CCO Holdings LLC/CCO Holdings Capital Corp., 4.5%, 8/15/2030 (n) | | $ | 4,025,000 | $ 3,325,274 |
| Charter Communications Operating LLC/Charter Communications Operating Capital Corp., 4.908%, 7/23/2025 | | | 3,177,000 | 3,113,781 |
| Charter Communications Operating LLC/Charter Communications Operating Capital Corp., 5.25%, 4/01/2053 | | | 6,586,000 | 5,083,357 |
| CSC Holdings LLC, 4.125%, 12/01/2030 (n) | | | 2,940,000 | 2,075,140 |
| CSC Holdings LLC, 4.5%, 11/15/2031 (n) | | | 4,065,000 | 2,820,354 |
| Sirius XM Radio, Inc., 5.5%, 7/01/2029 (n) | | | 2,184,000 | 1,993,511 |
| Sirius XM Radio, Inc., 4.125%, 7/01/2030 (n) | | | 3,995,000 | 3,296,714 |
| Time Warner Cable, Inc., 4.5%, 9/15/2042 | | | 3,558,000 | 2,604,828 |
| Time Warner Entertainment Co. LP, 8.375%, 7/15/2033 | | | 290,000 | 322,146 |
| | | | | $24,635,105 |
| Chemicals – 0.2% |
| Axalta Coating Systems Ltd., 3.375%, 2/15/2029 (n) | | $ | 3,100,000 | $ 2,558,012 |
| Computer Software – 0.6% |
| Dell International LLC/EMC Corp., 5.3%, 10/01/2029 | | $ | 7,950,000 | $ 7,775,116 |
| Oracle Corp., 6.15%, 11/09/2029 | | | 1,732,000 | 1,797,757 |
| | | | | $9,572,873 |
| Computer Software - Systems – 0.1% |
| SS&C Technologies Holdings, Inc., 5.5%, 9/30/2027 (n) | | $ | 2,079,000 | $ 1,946,768 |
MFS Total Return Bond Series
Portfolio of Investments – continued
| Issuer | | | Shares/Par | Value ($) |
| Bonds – continued |
| Conglomerates – 0.7% |
| BWX Technologies, Inc., 4.125%, 6/30/2028 (n) | | $ | 1,627,000 | $ 1,462,266 |
| Carrier Global Corp., 3.577%, 4/05/2050 | | | 6,276,000 | 4,475,134 |
| Westinghouse Air Brake Technologies Corp., 4.95%, 9/15/2028 | | | 4,993,000 | 4,793,549 |
| | | | | $10,730,949 |
| Consumer Products – 0.3% |
| GSK Consumer Healthcare Capital US LLC, 3.375%, 3/24/2029 | | $ | 1,510,000 | $ 1,357,847 |
| GSK Consumer Healthcare Capital US LLC, 3.625%, 3/24/2032 | | | 3,229,000 | 2,834,669 |
| | | | | $4,192,516 |
| Consumer Services – 0.9% |
| Match Group Holdings II LLC, 3.625%, 10/01/2031 (n) | | $ | 4,782,000 | $ 3,667,143 |
| Meituan, 3.05%, 10/28/2030 | | | 2,568,000 | 1,980,232 |
| Toll Road Investors Partnership II LP, Capital Appreciation, NPFG, 0%, 2/15/2026 (n) | | | 2,145,000 | 1,707,839 |
| Toll Road Investors Partnership II LP, Capital Appreciation, NPFG, 0%, 2/15/2029 (n) | | | 6,221,000 | 3,955,250 |
| Toll Road Investors Partnership II LP, Capital Appreciation, NPFG, 0%, 2/15/2031 (n) | | | 2,145,000 | 1,175,981 |
| Toll Road Investors Partnership II LP, Capital Appreciation, NPFG, 0%, 2/15/2043 (n) | | | 5,511,321 | 1,398,531 |
| | | | | $13,884,976 |
| Containers – 0.2% |
| Crown Americas LLC/Crown Americas Capital Corp. VI, 4.75%, 2/01/2026 | | $ | 3,086,000 | $ 2,995,735 |
| Electrical Equipment – 0.3% |
| Arrow Electronics, Inc., 2.95%, 2/15/2032 | | $ | 4,838,000 | $ 3,814,431 |
| Electronics – 0.8% |
| Broadcom, Inc., 4.15%, 11/15/2030 | | $ | 2,376,000 | $ 2,129,257 |
| Broadcom, Inc., 3.469%, 4/15/2034 (n) | | | 3,589,000 | 2,863,062 |
| Broadcom, Inc., 3.137%, 11/15/2035 (n) | | | 3,219,000 | 2,366,822 |
| Broadcom, Inc., 3.187%, 11/15/2036 (n) | | | 3,936,000 | 2,827,181 |
| Broadcom, Inc., 4.926%, 5/15/2037 (n) | | | 3,219,000 | 2,808,144 |
| | | | | $12,994,466 |
| Emerging Market Quasi-Sovereign – 0.1% |
| Indian Railway Finance Corp., 2.8%, 2/10/2031 (n) | | $ | 1,268,000 | $ 1,036,906 |
| Energy - Independent – 1.0% |
| Energean Israel Finance Ltd., 4.875%, 3/30/2026 | | $ | 3,943,000 | $ 3,638,995 |
| EQT Corp., 3.9%, 10/01/2027 | | | 2,315,000 | 2,137,127 |
| EQT Corp., 5%, 1/15/2029 | | | 1,294,000 | 1,214,753 |
| EQT Corp., 3.625%, 5/15/2031 (n) | | | 1,506,000 | 1,276,239 |
| Leviathan Bond Ltd., 6.5%, 6/30/2027 (n) | | | 2,197,000 | 2,125,817 |
| Leviathan Bond Ltd., 6.75%, 6/30/2030 (n) | | | 2,670,000 | 2,513,036 |
| Tengizchevroil Finance Co. International Ltd., 3.25%, 8/15/2030 | | | 3,294,000 | 2,329,418 |
| | | | | $15,235,385 |
| Energy - Integrated – 0.2% |
| Eni S.p.A., 4%, 9/12/2023 (n) | | $ | 2,526,000 | $ 2,490,670 |
| Financial Institutions – 2.3% |
| AerCap Ireland Capital DAC/AerCap Global Aviation Trust, 4.5%, 9/15/2023 | | $ | 4,803,000 | $ 4,771,451 |
| AerCap Ireland Capital DAC/AerCap Global Aviation Trust, 6.5%, 7/15/2025 | | | 3,195,000 | 3,237,423 |
| AerCap Ireland Capital DAC/AerCap Global Aviation Trust, 3%, 10/29/2028 | | | 2,329,000 | 1,951,179 |
| AerCap Ireland Capital DAC/AerCap Global Aviation Trust, 3.3%, 1/30/2032 | | | 2,763,000 | 2,160,005 |
| Air Lease Corp., 5.85%, 12/15/2027 | | | 3,066,000 | 3,062,514 |
MFS Total Return Bond Series
Portfolio of Investments – continued
| Issuer | | | Shares/Par | Value ($) |
| Bonds – continued |
| Financial Institutions – continued |
| Avolon Holdings Funding Ltd., 5.25%, 5/15/2024 (n) | | $ | 5,681,000 | $ 5,567,835 |
| Avolon Holdings Funding Ltd., 3.95%, 7/01/2024 (n) | | | 4,592,000 | 4,395,925 |
| Avolon Holdings Funding Ltd., 2.125%, 2/21/2026 (n) | | | 2,890,000 | 2,487,353 |
| Avolon Holdings Funding Ltd., 4.25%, 4/15/2026 (n) | | | 1,779,000 | 1,612,755 |
| Avolon Holdings Funding Ltd., 2.75%, 2/21/2028 (n) | | | 2,615,000 | 2,099,149 |
| Global Aircraft Leasing Co. Ltd., 6.5% (6.5% cash or 7.25% PIK), 9/15/2024 (n)(p) | | | 3,989,171 | 3,390,795 |
| | | | | $34,736,384 |
| Food & Beverages – 0.7% |
| Anheuser-Busch InBev Worldwide, Inc., 5.45%, 1/23/2039 | | $ | 1,299,000 | $ 1,296,153 |
| JBS USA Lux S.A./JBS USA Finance, Inc., 5.5%, 1/15/2030 (n) | | | 4,965,000 | 4,724,297 |
| PT Indofood CBP Sukses Makmur Tbk, 3.541%, 4/27/2032 | | | 5,223,000 | 4,258,393 |
| | | | | $10,278,843 |
| Gaming & Lodging – 0.2% |
| Marriott International, Inc., 3.5%, 10/15/2032 | | $ | 3,330,000 | $ 2,770,105 |
| Insurance – 0.3% |
| Corebridge Financial, Inc., 3.9%, 4/05/2032 (n) | | $ | 3,293,000 | $ 2,875,999 |
| Corebridge Financial, Inc., 4.35%, 4/05/2042 (n) | | | 442,000 | 362,594 |
| Corebridge Financial, Inc., 4.4%, 4/05/2052 (n) | | | 1,291,000 | 1,023,222 |
| | | | | $4,261,815 |
| Insurance - Health – 0.3% |
| Humana, Inc., 5.875%, 3/01/2033 | | $ | 4,453,000 | $ 4,596,848 |
| Insurance - Property & Casualty – 1.9% |
| Allied World Assurance Co. Holdings Ltd., 4.35%, 10/29/2025 | | $ | 6,835,000 | $ 6,544,912 |
| American International Group, Inc., 3.9%, 4/01/2026 | | | 2,462,000 | 2,384,838 |
| Aon Corp., 3.75%, 5/02/2029 | | | 7,982,000 | 7,362,945 |
| Berkshire Hathaway Finance Corp., 2.85%, 10/15/2050 | | | 1,429,000 | 954,404 |
| Brown & Brown, Inc., 4.95%, 3/17/2052 | | | 3,943,000 | 3,200,627 |
| Fairfax Financial Holdings Ltd., 4.85%, 4/17/2028 | | | 5,692,000 | 5,379,455 |
| Fairfax Financial Holdings Ltd., 3.375%, 3/03/2031 | | | 1,060,000 | 868,492 |
| Liberty Mutual Group, Inc., 3.951%, 10/15/2050 (n) | | | 2,900,000 | 2,022,977 |
| | | | | $28,718,650 |
| International Market Quasi-Sovereign – 0.1% |
| Electricite de France S.A., 4.875%, 9/21/2038 (n) | | $ | 2,687,000 | $ 2,185,012 |
| Machinery & Tools – 0.1% |
| CNH Industrial Capital LLC, 3.85%, 11/15/2027 | | $ | 1,328,000 | $ 1,243,868 |
| Major Banks – 8.0% |
| Bank of America Corp., 3.419% to 12/20/2027, FLR (LIBOR - 3mo. + 1.04%) to 12/20/2028 | | $ | 8,192,000 | $ 7,418,097 |
| Bank of America Corp., 2.496% to 2/13/2030, FLR (LIBOR - 3mo. + 0.99%) to 2/13/2031 | | | 9,824,000 | 7,984,865 |
| Bank of America Corp., 2.572% to 10/20/2031, FLR (SOFR + 1.21%) to 10/20/2032 | | | 10,928,000 | 8,558,835 |
| Bank of America Corp., 6.5% to 10/23/2024, FLR (LIBOR - 3mo. + 4.174%) to 10/23/2049 | | | 3,843,000 | 3,790,473 |
| Bank of America Corp., 6.1%, 12/29/2049 | | | 6,096,000 | 5,882,640 |
| Bank of America Corp., 5.875% to 3/15/2028, FLR (LIBOR - 3mo. + 2.931%) to 12/31/2059 | | | 3,924,000 | 3,455,710 |
| Barclays PLC, 4.972% to 5/16/2028, FLR (LIBOR - 3mo. + 1.902%) to 5/16/2029 | | | 3,191,000 | 2,996,764 |
| Barclays PLC, 2.894% to 11/24/2031, FLR (CMT - 1yr. + 1.3%) to 11/24/2032 | | | 3,776,000 | 2,875,739 |
| Deutsche Bank AG, 2.311% to 11/16/2026, FLR (SOFR - 1 day + 1.219%) to 11/16/2027 | | | 5,055,000 | 4,286,046 |
| Goldman Sachs Group, Inc., 2.6%, 2/07/2030 | | | 6,000,000 | 5,007,115 |
| HSBC Holdings PLC, 4.7% to 9/09/2031, FLR (CMT - 1yr. + 3.25%) to 9/09/2169 | | | 6,176,000 | 4,893,817 |
MFS Total Return Bond Series
Portfolio of Investments – continued
| Issuer | | | Shares/Par | Value ($) |
| Bonds – continued |
| Major Banks – continued |
| HSBC Holdings PLC, 4% to 9/09/2026, FLR (CMT - 1yr. + 3.222%) to 9/09/2170 | | $ | 2,447,000 | $ 2,116,542 |
| JPMorgan Chase & Co., 3.509%, 1/23/2029 | | | 2,290,000 | 2,078,246 |
| JPMorgan Chase & Co., 4.005% to 4/23/2028, FLR (LIBOR - 3mo. + 1.12%) to 4/23/2029 | | | 11,383,000 | 10,530,823 |
| JPMorgan Chase & Co., 4.203% to 7/23/2028, FLR (LIBOR - 3mo. + 1.26%) to 7/23/2029 | | | 2,576,000 | 2,400,324 |
| JPMorgan Chase & Co., 2.956% to 5/13/2030, FLR (SOFR - 1 day + 2.515%) to 5/13/2031 | | | 4,435,000 | 3,654,244 |
| JPMorgan Chase & Co., 2.545% to 11/08/2031, FLR (SOFR - 1 day + 1.18%) to 11/08/2032 | | | 6,741,000 | 5,328,295 |
| Lloyds Bank PLC, 3.75%, 1/11/2027 | | | 2,765,000 | 2,572,023 |
| Mitsubishi UFJ Financial Group, Inc., 2.048%, 7/17/2030 | | | 8,031,000 | 6,334,855 |
| Morgan Stanley, 2.511% to 10/20/2031, FLR (SOFR - 1 day + 1.2%) to 10/20/2032 | | | 6,985,000 | 5,466,190 |
| Sumitomo Mitsui Financial Group, Inc., 2.13%, 7/08/2030 | | | 9,717,000 | 7,678,960 |
| Sumitomo Mitsui Trust Bank Ltd., 0.85%, 3/25/2024 (n) | | | 1,311,000 | 1,239,950 |
| UBS Group AG, 4.375% to 2/10/2031, FLR (CMT - 1yr. + 3.313%) to 8/10/2171 (n) | | | 7,084,000 | 5,382,130 |
| UBS Group Funding (Jersey) Ltd., 4.125%, 9/24/2025 (n) | | | 4,524,000 | 4,398,797 |
| Wells Fargo & Co., 2.572% to 2/11/2030, FLR (LIBOR - 3mo. +1%) to 2/11/2031 | | | 4,514,000 | 3,737,891 |
| Westpac Banking Corp., 2.894% to 2/4/2025, FLR (CMT - 5yr. + 1.35%) to 2/04/2030 | | | 2,633,000 | 2,413,885 |
| | | | | $122,483,256 |
| Medical & Health Technology & Services – 2.1% |
| Adventist Health System/West, 5.43%, 3/01/2032 | | $ | 4,476,000 | $ 4,408,685 |
| Alcon Finance Corp., 2.6%, 5/27/2030 (n) | | | 1,096,000 | 930,849 |
| Alcon Finance Corp., 5.375%, 12/06/2032 (n) | | | 1,318,000 | 1,324,694 |
| Alcon, Inc., 2.75%, 9/23/2026 (n) | | | 593,000 | 542,627 |
| DaVita, Inc., 4.625%, 6/01/2030 (n) | | | 2,840,000 | 2,284,572 |
| HCA Healthcare, Inc., 4.375%, 3/15/2042 (n) | | | 3,251,000 | 2,588,473 |
| HCA Healthcare, Inc., 4.625%, 3/15/2052 (n) | | | 2,141,000 | 1,666,331 |
| HCA, Inc., 5.25%, 6/15/2026 | | | 1,458,000 | 1,440,401 |
| HCA, Inc., 4.125%, 6/15/2029 | | | 4,581,000 | 4,181,954 |
| Northwell Healthcare, Inc., 3.979%, 11/01/2046 | | | 1,503,000 | 1,151,763 |
| ProMedica Toledo Hospital, “B”, 5.325%, 11/15/2028 | | | 7,120,000 | 5,561,432 |
| ProMedica Toledo Hospital, “B”, AGM, 5.75%, 11/15/2038 | | | 2,562,000 | 2,409,291 |
| Tower Health, 4.451%, 2/01/2050 | | | 6,211,000 | 2,984,752 |
| | | | | $31,475,824 |
| Metals & Mining – 1.3% |
| Anglo American Capital PLC, 2.25%, 3/17/2028 (n) | | $ | 2,504,000 | $ 2,105,743 |
| Anglo American Capital PLC, 3.875%, 3/16/2029 (n) | | | 3,434,000 | 3,082,997 |
| Anglo American Capital PLC, 2.875%, 3/17/2031 (n) | | | 2,927,000 | 2,389,924 |
| Anglo American Capital PLC, 4.75%, 3/16/2052 (n) | | | 4,511,000 | 3,745,328 |
| FMG Resources Ltd., 4.375%, 4/01/2031 (n) | | | 3,018,000 | 2,510,021 |
| Glencore Funding LLC, 2.85%, 4/27/2031 (n) | | | 4,010,000 | 3,281,484 |
| Novelis Corp., 3.25%, 11/15/2026 (n) | | | 759,000 | 680,451 |
| Novelis Corp., 3.875%, 8/15/2031 (n) | | | 2,661,000 | 2,172,420 |
| | | | | $19,968,368 |
| Midstream – 2.6% |
| Cheniere Corpus Christi Holdings LLC, 2.742%, 12/31/2039 | | $ | 3,855,000 | $ 2,980,933 |
| Cheniere Energy Partners LP, 4.5%, 10/01/2029 | | | 2,483,000 | 2,232,767 |
| Enbridge, Inc., 4.25%, 12/01/2026 | | | 4,734,000 | 4,551,318 |
| Energy Transfer LP, 5.55%, 2/15/2028 | | | 1,261,000 | 1,250,824 |
| Energy Transfer LP, 5.75%, 2/15/2033 | | | 3,863,000 | 3,779,405 |
| Kinder Morgan (Delaware), Inc., 7.75%, 1/15/2032 | | | 3,350,000 | 3,766,400 |
| Kinder Morgan Energy Partners LP, 6.375%, 3/01/2041 | | | 2,040,000 | 2,017,856 |
| Kinder Morgan Energy Partners LP, 5.4%, 9/01/2044 | | | 2,612,000 | 2,346,890 |
| MPLX LP, 4.95%, 3/14/2052 | | | 6,323,000 | 5,164,904 |
| ONEOK, Inc., 5.2%, 7/15/2048 | | | 2,708,000 | 2,255,696 |
| Plains All American Pipeline LP/PAA Finance Corp., 3.55%, 12/15/2029 | | | 2,839,000 | 2,461,600 |
MFS Total Return Bond Series
Portfolio of Investments – continued
| Issuer | | | Shares/Par | Value ($) |
| Bonds – continued |
| Midstream – continued |
| Sabine Pass Liquefaction LLC, 4.2%, 3/15/2028 | | $ | 2,675,000 | $ 2,514,422 |
| Sabine Pass Liquefaction LLC, 4.5%, 5/15/2030 | | | 1,975,000 | 1,830,660 |
| Targa Resources Corp., 4.2%, 2/01/2033 | | | 930,000 | 800,138 |
| Targa Resources Corp., 4.95%, 4/15/2052 | | | 1,533,000 | 1,212,764 |
| | | | | $39,166,577 |
| Mortgage-Backed – 21.7% | |
| Fannie Mae, 2.41%, 5/01/2023 | | $ | 1,781,518 | $ 1,761,155 |
| Fannie Mae, 5.5%, 6/01/2023 - 4/01/2040 | | | 3,788,605 | 3,907,767 |
| Fannie Mae, 5%, 7/01/2023 - 3/01/2042 | | | 2,601,596 | 2,641,282 |
| Fannie Mae, 4.5%, 5/01/2024 - 6/01/2044 | | | 8,461,188 | 8,359,717 |
| Fannie Mae, 3.5%, 3/01/2026 - 7/01/2046 | | | 6,781,207 | 6,335,996 |
| Fannie Mae, 3.95%, 1/01/2027 | | | 318,666 | 311,329 |
| Fannie Mae, 3%, 11/01/2028 - 8/01/2047 | | | 6,140,142 | 5,588,436 |
| Fannie Mae, 2.5%, 11/01/2031 - 11/01/2046 | | | 780,855 | 679,389 |
| Fannie Mae, 6.5%, 7/01/2032 - 1/01/2033 | | | 2,145 | 2,221 |
| Fannie Mae, 3%, 2/25/2033 (i) | | | 393,931 | 36,026 |
| Fannie Mae, 6%, 10/01/2035 - 3/01/2039 | | | 956,604 | 989,908 |
| Fannie Mae, 4%, 12/01/2039 - 1/01/2047 | | | 14,010,433 | 13,444,561 |
| Fannie Mae, 3.25%, 5/25/2040 | | | 140,803 | 130,356 |
| Fannie Mae, 2%, 10/25/2040 - 4/25/2046 | | | 298,753 | 270,672 |
| Fannie Mae, 4%, 7/25/2046 (i) | | | 406,386 | 77,727 |
| Fannie Mae, 3.5%, 12/01/2046 (f) | | | 1,394,251 | 1,297,503 |
| Fannie Mae, UMBS, 2.5%, 11/01/2036 - 9/01/2052 | | | 46,786,993 | 40,153,095 |
| Fannie Mae, UMBS, 2%, 5/01/2037 - 3/01/2052 | | | 30,894,354 | 26,052,573 |
| Fannie Mae, UMBS, 1.5%, 2/01/2042 | | | 179,944 | 145,424 |
| Fannie Mae, UMBS, 3%, 6/01/2051 - 10/01/2052 | | | 11,162,627 | 9,842,312 |
| Fannie Mae, UMBS, 3.5%, 5/01/2052 | | | 899,703 | 817,648 |
| Fannie Mae, UMBS, 4.5%, 9/01/2052 | | | 836,649 | 807,806 |
| Fannie Mae, UMBS, 5%, 9/01/2052 | | | 2,932,070 | 2,891,521 |
| Fannie Mae, UMBS, 6%, 12/01/2052 | | | 800,000 | 812,325 |
| Fannie Mae, UMBS, 5.5%, 1/01/2053 | | | 4,999,500 | 5,012,919 |
| Federal Home Loan Bank, 5%, 7/01/2035 | | | 803,859 | 821,827 |
| Freddie Mac, 3.32%, 2/25/2023 | | | 2,646,920 | 2,638,308 |
| Freddie Mac, 3.531%, 7/25/2023 | | | 2,389,716 | 2,368,977 |
| Freddie Mac, 2.67%, 12/25/2024 | | | 2,784,000 | 2,669,520 |
| Freddie Mac, 2.811%, 1/25/2025 | | | 3,456,068 | 3,324,800 |
| Freddie Mac, 4%, 7/01/2025 - 4/01/2044 | | | 1,460,627 | 1,403,952 |
| Freddie Mac, 4.5%, 7/01/2025 - 5/01/2042 | | | 2,235,598 | 2,216,200 |
| Freddie Mac, 3.3%, 10/25/2026 | | | 2,958,000 | 2,829,748 |
| Freddie Mac, 3%, 6/15/2028 - 2/25/2059 | | | 10,723,879 | 9,709,324 |
| Freddie Mac, 1.09%, 7/25/2029 (i) | | | 4,041,104 | 230,076 |
| Freddie Mac, 1.143%, 8/25/2029 (i) | | | 6,976,640 | 415,509 |
| Freddie Mac, 1.868%, 4/25/2030 (i) | | | 1,901,414 | 202,578 |
| Freddie Mac, 5.5%, 5/01/2034 - 1/01/2038 | | | 171,153 | 176,605 |
| Freddie Mac, 6%, 8/01/2034 - 7/01/2038 | | | 48,253 | 49,507 |
| Freddie Mac, 5%, 11/01/2035 - 7/01/2041 | | | 805,180 | 817,858 |
| Freddie Mac, 5.5%, 2/15/2036 (i) | | | 77,362 | 12,715 |
| Freddie Mac, 3.5%, 11/01/2037 - 10/25/2058 | | | 11,794,575 | 11,010,126 |
| Freddie Mac, 4.5%, 12/15/2040 (i) | | | 60,739 | 5,414 |
| Freddie Mac, 4%, 8/15/2044 (i) | | | 83,140 | 9,991 |
| Freddie Mac, 3.25%, 11/25/2061 | | | 804,340 | 709,356 |
| Freddie Mac, UMBS, 2%, 4/01/2037 - 5/01/2052 | | | 42,422,720 | 35,070,183 |
| Freddie Mac, UMBS, 3%, 11/01/2037 - 6/01/2052 | | | 6,414,457 | 5,876,022 |
| Freddie Mac, UMBS, 3.5%, 12/01/2046 - 9/01/2052 | | | 1,577,124 | 1,443,831 |
| Freddie Mac, UMBS, 2.5%, 2/01/2051 - 10/01/2052 | | | 21,680,469 | 18,394,594 |
| Freddie Mac, UMBS, 5%, 8/01/2052 | | | 697,792 | 688,142 |
MFS Total Return Bond Series
Portfolio of Investments – continued
| Issuer | | | Shares/Par | Value ($) |
| Bonds – continued |
| Mortgage-Backed – continued | |
| Freddie Mac, UMBS, 5.5%, 1/01/2053 | | $ | 2,075,000 | $ 2,080,570 |
| Ginnie Mae, 5.5%, 5/15/2033 - 1/20/2042 | | | 983,551 | 1,021,955 |
| Ginnie Mae, 6%, 1/20/2036 - 1/15/2039 | | | 89,455 | 93,642 |
| Ginnie Mae, 4.5%, 4/15/2039 - 12/20/2052 | | | 13,728,694 | 13,421,389 |
| Ginnie Mae, 4%, 10/20/2040 - 10/20/2052 | | | 9,520,673 | 9,036,742 |
| Ginnie Mae, 3.5%, 11/15/2040 - 11/20/2052 | | | 10,740,848 | 9,957,151 |
| Ginnie Mae, 3%, 11/20/2044 - 10/20/2052 | | | 16,092,537 | 14,455,162 |
| Ginnie Mae, 2.5%, 8/20/2051 - 6/20/2052 | | | 13,006,922 | 11,280,802 |
| Ginnie Mae, 2%, 1/20/2052 | | | 4,168,074 | 3,492,821 |
| Ginnie Mae, 5%, 8/20/2052 - 11/20/2052 | | | 12,141,062 | 12,033,478 |
| Ginnie Mae, TBA, 6%, 1/15/2053 | | | 1,375,000 | 1,396,847 |
| Ginnie Mae, TBA, 2%, 1/23/2053 | | | 5,900,000 | 4,943,228 |
| Ginnie Mae, TBA, 5.5%, 1/23/2053 | | | 3,175,000 | 3,192,753 |
| UMBS, TBA, 2%, 1/12/2053 | | | 12,425,000 | 10,107,244 |
| | | | | $331,978,615 |
| Municipals – 3.0% |
| Bridgeview, IL, Stadium and Redevelopment Projects, Taxable, AAC, 5.06%, 12/01/2025 | | $ | 610,000 | $ 588,507 |
| Bridgeview, IL, Stadium and Redevelopment Projects, Taxable, AAC, 5.14%, 12/01/2036 | | | 8,850,000 | 7,852,666 |
| Escambia County, FL, Health Facilities Authority Rev., Taxable (Baptist Health Care Corp.), “B”, AGM, 3.607%, 8/15/2040 | | | 1,295,000 | 976,925 |
| New Jersey Economic Development Authority State Pension Funding Rev., Capital Appreciation, Taxable, “B”, AGM, 0%, 2/15/2023 | | | 13,215,000 | 13,142,785 |
| New Jersey Economic Development Authority State Pension Funding Rev., Taxable, “A”, NPFG, 7.425%, 2/15/2029 | | | 8,019,000 | 8,632,473 |
| Oklahoma Development Finance Authority, Health System Rev., Taxable (OU Medicine Project), “C”, 5.45%, 8/15/2028 | | | 3,770,000 | 3,024,851 |
| Philadelphia, PA, School District, Taxable, “B”, AGM, 6.615%, 6/01/2030 | | | 3,250,000 | 3,460,772 |
| Philadelphia, PA, School District, Taxable, “B”, AGM, 6.765%, 6/01/2040 | | | 2,195,000 | 2,427,760 |
| State of Florida, Taxable, “A”, 2.154%, 7/01/2030 | | | 7,272,000 | 5,954,404 |
| | | | | $46,061,143 |
| Natural Gas - Distribution – 0.7% |
| Boston Gas Co., 3.15%, 8/01/2027 (n) | | $ | 9,122,000 | $ 8,197,733 |
| NiSource, Inc., 3.6%, 5/01/2030 | | | 2,622,000 | 2,334,681 |
| | | | | $10,532,414 |
| Network & Telecom – 0.2% |
| Verizon Communications, Inc., 4.272%, 1/15/2036 | | $ | 2,647,000 | $ 2,356,319 |
| Oils – 0.1% |
| Marathon Petroleum Corp., 5.85%, 12/15/2045 | | $ | 2,507,000 | $ 2,268,814 |
| Other Banks & Diversified Financials – 1.9% |
| Bangkok Bank (Hong Kong), 3.733% to 9/25/2029, FLR (CMT - 5yr. + 1.9%) to 9/25/2034 (n) | | $ | 4,138,000 | $ 3,457,220 |
| Discover Financial Services, 6.7%, 11/29/2032 | | | 6,459,000 | 6,565,422 |
| Groupe BPCE S.A., 4.5%, 3/15/2025 (n) | | | 5,458,000 | 5,242,500 |
| Macquarie Bank Ltd. of London, 6.125% to 3/08/2027, FLR (Swap Rate - 5yr. + 4.332%) to 12/31/2165 (n) | | | 4,694,000 | 4,045,557 |
| Macquarie Group Ltd., 4.442% to 6/21/2032, FLR (SOFR - 1 day + 2.405%) to 6/21/2033 (n) | | | 11,447,000 | 9,934,797 |
| | | | | $29,245,496 |
| Real Estate - Office – 0.4% |
| Boston Properties Ltd. LP, REIT, 2.55%, 4/01/2032 | | $ | 7,238,000 | $ 5,502,701 |
| Specialty Chemicals – 0.2% |
| International Flavors & Fragrances, Inc., 2.3%, 11/01/2030 (n) | | $ | 4,745,000 | $ 3,764,552 |
MFS Total Return Bond Series
Portfolio of Investments – continued
| Issuer | | | Shares/Par | Value ($) |
| Bonds – continued |
| Specialty Stores – 0.4% |
| DICK'S Sporting Goods, 3.15%, 1/15/2032 | | $ | 3,801,000 | $ 2,966,637 |
| Penske Automotive Group Co., 3.75%, 6/15/2029 | | | 4,605,000 | 3,737,620 |
| | | | | $6,704,257 |
| Telecommunications - Wireless – 1.4% |
| American Tower Corp., REIT, 3.55%, 7/15/2027 | | $ | 3,449,000 | $ 3,193,773 |
| Crown Castle, Inc., REIT, 3.8%, 2/15/2028 | | | 3,824,000 | 3,553,897 |
| Crown Castle, Inc., REIT, 3.25%, 1/15/2051 | | | 146,000 | 94,925 |
| Rogers Communications, Inc., 4.5%, 3/15/2042 (n) | | | 6,129,000 | 4,995,546 |
| Rogers Communications, Inc., 4.55%, 3/15/2052 (n) | | | 6,129,000 | 4,751,728 |
| SBA Communications Corp., 3.125%, 2/01/2029 | | | 4,025,000 | 3,346,747 |
| T-Mobile USA, Inc., 2.55%, 2/15/2031 | | | 1,939,000 | 1,584,008 |
| T-Mobile USA, Inc., 4.375%, 4/15/2040 | | | 635,000 | 541,909 |
| | | | | $22,062,533 |
| Tobacco – 0.8% |
| B.A.T. Capital Corp., 4.742%, 3/16/2032 | | $ | 5,611,000 | $ 4,978,777 |
| B.A.T. International Finance PLC, 4.448%, 3/16/2028 | | | 4,936,000 | 4,571,532 |
| Philip Morris International, Inc., 5.125%, 11/17/2027 | | | 2,140,000 | 2,155,629 |
| Philip Morris International, Inc., 5.625%, 11/17/2029 | | | 922,000 | 935,349 |
| | | | | $12,641,287 |
| Transportation - Services – 0.3% |
| ERAC USA Finance LLC, 7%, 10/15/2037 (n) | | $ | 3,603,000 | $ 3,914,344 |
| U.S. Government Agencies and Equivalents – 0.9% |
| Small Business Administration, 4.93%, 1/01/2024 | | $ | 1,047 | $ 1,039 |
| Small Business Administration, 4.34%, 3/01/2024 | | | 1,776 | 1,760 |
| Small Business Administration, 4.99%, 9/01/2024 | | | 1,975 | 1,941 |
| Small Business Administration, 4.86%, 1/01/2025 | | | 5,017 | 5,014 |
| Small Business Administration, 4.625%, 2/01/2025 | | | 6,777 | 6,630 |
| Small Business Administration, 5.11%, 4/01/2025 | | | 2,881 | 2,823 |
| Small Business Administration, 4.43%, 5/01/2029 | | | 90,293 | 87,564 |
| Small Business Administration, 3.21%, 9/01/2030 | | | 1,505,861 | 1,413,943 |
| Small Business Administration, 3.25%, 11/01/2030 | | | 138,267 | 129,823 |
| Small Business Administration, 2.85%, 9/01/2031 | | | 309,410 | 286,438 |
| Small Business Administration, 2.37%, 8/01/2032 | | | 233,815 | 212,373 |
| Small Business Administration, 2.13%, 1/01/2033 | | | 1,140,058 | 1,033,864 |
| Small Business Administration, 2.21%, 2/01/2033 | | | 302,940 | 274,502 |
| Small Business Administration, 2.22%, 3/01/2033 | | | 946,781 | 856,494 |
| Small Business Administration, 2.08%, 4/01/2033 | | | 1,637,347 | 1,478,381 |
| Small Business Administration, 2.45%, 6/01/2033 | | | 1,679,188 | 1,526,722 |
| Small Business Administration, 3.15%, 7/01/2033 | | | 2,506,983 | 2,367,645 |
| Small Business Administration, 3.16%, 8/01/2033 | | | 2,780,343 | 2,634,848 |
| Small Business Administration, 3.62%, 9/01/2033 | | | 2,291,945 | 2,200,777 |
| | | | | $14,522,581 |
| U.S. Treasury Obligations – 13.9% |
| U.S. Treasury Bonds, 1.375%, 11/15/2040 (f) | | $ | 30,300,000 | $ 19,698,551 |
| U.S. Treasury Bonds, 1.75%, 8/15/2041 | | | 9,700,000 | 6,638,059 |
| U.S. Treasury Bonds, 2.375%, 2/15/2042 | | | 9,900,000 | 7,558,805 |
| U.S. Treasury Bonds, 2.375%, 11/15/2049 | | | 14,700,000 | 10,624,195 |
| U.S. Treasury Bonds, 1.625%, 11/15/2050 | | | 3,500,000 | 2,082,500 |
| U.S. Treasury Bonds, 2.25%, 2/15/2052 | | | 4,100,000 | 2,851,101 |
| U.S. Treasury Notes, 0.75%, 12/31/2023 | | | 7,600,000 | 7,305,608 |
| U.S. Treasury Notes, 2.25%, 3/31/2024 | | | 79,500,000 | 77,133,633 |
MFS Total Return Bond Series
Portfolio of Investments – continued
| Issuer | | | Shares/Par | Value ($) |
| Bonds – continued |
| U.S. Treasury Obligations – continued |
| U.S. Treasury Notes, 4.25%, 9/30/2024 | | $ | 70,000,000 | $ 69,641,797 |
| U.S. Treasury Notes, 2.5%, 3/31/2027 | | | 10,400,000 | 9,759,344 |
| | | | | $213,293,593 |
| Utilities - Electric Power – 1.5% |
| American Electric Power Co., Inc., 5.95%, 11/01/2032 | | $ | 2,985,000 | $ 3,116,691 |
| Calpine Corp., 3.75%, 3/01/2031 (n) | | | 3,680,000 | 2,962,974 |
| Enel Finance International N.V., 7.5%, 10/14/2032 (n) | | | 746,000 | 788,349 |
| FirstEnergy Corp., 5.35%, 7/15/2047 | | | 2,074,000 | 1,851,644 |
| FirstEnergy Corp., 3.4%, 3/01/2050 | | | 2,429,000 | 1,602,654 |
| Jersey Central Power & Light Co., 2.75%, 3/01/2032 (n) | | | 5,303,000 | 4,282,361 |
| Pacific Gas & Electric Co., 3%, 6/15/2028 | | | 2,630,000 | 2,273,643 |
| Pacific Gas & Electric Co., 3.3%, 8/01/2040 | | | 8,840,000 | 5,985,279 |
| | | | | $22,863,595 |
| Total Bonds (Identified Cost, $1,667,660,725) | | $1,497,701,576 |
| Investment Companies (h) – 2.8% |
| Money Market Funds – 2.8% | |
| MFS Institutional Money Market Portfolio, 4.02% (v) (Identified Cost, $43,131,094) | | | 43,131,107 | $ 43,144,046 |
| Other Assets, Less Liabilities – (0.6)% | | (8,732,775) |
| Net Assets – 100.0% | $1,532,112,847 |
| (f) | All or a portion of the security has been segregated as collateral for open futures contracts. |
| (h) | An affiliated issuer, which may be considered one in which the fund owns 5% or more of the outstanding voting securities, or a company which is under common control. At period end, the aggregate values of the fund's investments in affiliated issuers and in unaffiliated issuers were $43,144,046 and $1,497,701,576, respectively. |
| (i) | Interest only security for which the fund receives interest on notional principal (Par amount). Par amount shown is the notional principal and does not reflect the cost of the security. |
| (n) | Securities exempt from registration under Rule 144A of the Securities Act of 1933. These securities may be sold in the ordinary course of business in transactions exempt from registration, normally to qualified institutional buyers. At period end, the aggregate value of these securities was $423,546,885, representing 27.6% of net assets. |
| (p) | Payment-in-kind (PIK) security for which interest income may be received in additional securities and/or cash. |
| (v) | Affiliated issuer that is available only to investment companies managed by MFS. The rate quoted for the MFS Institutional Money Market Portfolio is the annualized seven-day yield of the fund at period end. |
| (z) | Restricted securities are not registered under the Securities Act of 1933 and are subject to legal restrictions on resale. These securities generally may be resold in transactions exempt from registration or to the public if the securities are subsequently registered. Disposal of these securities may involve time-consuming negotiations and prompt sale at an acceptable price may be difficult. The fund holds the following restricted securities: |
| Restricted Securities | Acquisition
Date | Cost | Value |
| Bayview Commercial Asset Trust, 0%, 12/25/2036 | 1/08/20 | $7 | $7 |
| % of Net assets | | | 0.0% |
| The following abbreviations are used in this report and are defined: |
| AAC | Ambac Assurance Corp. |
| AGM | Assured Guaranty Municipal |
| CDO | Collateralized Debt Obligation |
| CLO | Collateralized Loan Obligation |
| CMT | Constant Maturity Treasury |
| FGIC | Financial Guaranty Insurance Co. |
| FLR | Floating Rate. Interest rate resets periodically based on the parenthetically disclosed reference rate plus a spread (if any). The period-end rate reported may not be the current rate. All reference rates are USD unless otherwise noted. |
MFS Total Return Bond Series
Portfolio of Investments – continued
| LIBOR | London Interbank Offered Rate |
| NPFG | National Public Finance Guarantee Corp. |
| REIT | Real Estate Investment Trust |
| SOFR | Secured Overnight Financing Rate |
| TBA | To Be Announced |
| UMBS | Uniform Mortgage-Backed Security |
| Derivative Contracts at 12/31/22 |
| Futures Contracts |
| Description | Long/
Short | Currency | Contracts | Notional
Amount | Expiration
Date | Value/Unrealized
Appreciation
(Depreciation) |
| Asset Derivatives |
| Interest Rate Futures | | |
| U.S. Treasury Note 2 yr | Long | USD | 337 | $69,111,329 | March – 2023 | $49,899 |
| U.S. Treasury Ultra Note 10 yr | Short | USD | 464 | 54,882,500 | March – 2023 | 669,017 |
| | | | | | | $718,916 |
| Liability Derivatives |
| Interest Rate Futures | | |
| U.S. Treasury Note 5 yr | Long | USD | 925 | $99,834,961 | March – 2023 | $(104,436) |
| U.S. Treasury Ultra Bond | Long | USD | 816 | 109,599,000 | March – 2023 | (1,762,328) |
| | | | | | | $(1,866,764) |
At December 31, 2022, the fund had liquid securities with an aggregate value of $6,694,150 to cover any collateral or margin obligations for securities sold short and certain derivative contracts.
See Notes to Financial Statements
MFS Total Return Bond Series
| Financial Statements | Statement of Assets and Liabilities |
This statement represents your fund’s balance sheet, which details the assets and liabilities comprising the total value of the fund.
| At 12/31/22Assets | |
| Investments in unaffiliated issuers, at value (identified cost, $1,667,660,725) | $1,497,701,576 |
| Investments in affiliated issuers, at value (identified cost, $43,131,094) | 43,144,046 |
| Cash | 72,010 |
| Receivables for | |
| Fund shares sold | 575,189 |
| Interest | 12,346,089 |
| Other assets | 6,054 |
| Total assets | $1,553,844,964 |
| Liabilities | |
| Payables for | |
| Net daily variation margin on open futures contracts | $511,095 |
| TBA purchase commitments | 20,074,668 |
| Fund shares reacquired | 871,112 |
| Payable to affiliates | |
| Investment adviser | 61,440 |
| Administrative services fee | 1,825 |
| Shareholder servicing costs | 451 |
| Distribution and/or service fees | 16,521 |
| Payable for independent Trustees' compensation | 46 |
| Accrued expenses and other liabilities | 194,959 |
| Total liabilities | $21,732,117 |
| Net assets | $1,532,112,847 |
| Net assets consist of | |
| Paid-in capital | $1,755,960,651 |
| Total distributable earnings (loss) | (223,847,804) |
| Net assets | $1,532,112,847 |
| Shares of beneficial interest outstanding | 137,491,352 |
| | Net assets | Shares
outstanding | Net asset value
per share |
| Initial Class | $730,323,451 | 64,883,006 | $11.26 |
| Service Class | 801,789,396 | 72,608,346 | 11.04 |
See Notes to Financial Statements
MFS Total Return Bond Series
| Financial Statements | Statement of Operations |
This statement describes how much your fund earned in investment income and accrued in expenses. It also describes any gains and/or losses generated by fund operations.
| Year ended 12/31/22 | |
| Net investment income (loss) | |
| Income | |
| Interest | $56,349,912 |
| Dividends from affiliated issuers | 1,046,539 |
| Other | 773,172 |
| Total investment income | $58,169,623 |
| Expenses | |
| Management fee | $8,414,124 |
| Distribution and/or service fees | 2,216,007 |
| Shareholder servicing costs | 39,047 |
| Administrative services fee | 268,368 |
| Independent Trustees' compensation | 27,427 |
| Custodian fee | 93,771 |
| Shareholder communications | 20,842 |
| Audit and tax fees | 83,113 |
| Legal fees | 6,856 |
| Miscellaneous | 108,628 |
| Total expenses | $11,278,183 |
| Reduction of expenses by investment adviser | (233,966) |
| Net expenses | $11,044,217 |
| Net investment income (loss) | $47,125,406 |
| Realized and unrealized gain (loss) | |
| Realized gain (loss) (identified cost basis) | |
| Unaffiliated issuers | $(45,214,470) |
| Affiliated issuers | (1,637) |
| Futures contracts | (47,393,848) |
| Forward foreign currency exchange contracts | 782,264 |
| Foreign currency | (629) |
| Net realized gain (loss) | $(91,828,320) |
| Change in unrealized appreciation or depreciation | |
| Unaffiliated issuers | $(221,808,973) |
| Affiliated issuers | 12,952 |
| Futures contracts | (2,801,290) |
| Forward foreign currency exchange contracts | (2,206,397) |
| Translation of assets and liabilities in foreign currencies | 1,424,018 |
| Net unrealized gain (loss) | $(225,379,690) |
| Net realized and unrealized gain (loss) | $(317,208,010) |
| Change in net assets from operations | $(270,082,604) |
See Notes to Financial Statements
MFS Total Return Bond Series
| Financial Statements | Statements of Changes in Net Assets |
These statements describe the increases and/or decreases in net assets resulting from operations, any distributions, and any shareholder transactions.
| | Year ended |
| | 12/31/22 | 12/31/21 |
| Change in net assets | | |
| From operations | | |
| Net investment income (loss) | $47,125,406 | $39,629,635 |
| Net realized gain (loss) | (91,828,320) | 18,916,024 |
| Net unrealized gain (loss) | (225,379,690) | (76,149,455) |
| Change in net assets from operations | $(270,082,604) | $(17,603,796) |
| Total distributions to shareholders | $(62,907,525) | $(52,872,122) |
| Change in net assets from fund share transactions | $(106,813,226) | $31,041,630 |
| Total change in net assets | $(439,803,355) | $(39,434,288) |
| Net assets | | |
| At beginning of period | 1,971,916,202 | 2,011,350,490 |
| At end of period | $1,532,112,847 | $1,971,916,202 |
See Notes to Financial Statements
MFS Total Return Bond Series
| Financial Statements | Financial Highlights |
The financial highlights table is intended to help you understand the fund's financial performance for the past 5 years. Certain information reflects financial results for a single fund share. The total returns in the table represent the rate that an investor would have earned (or lost) on an investment in the fund share class (assuming reinvestment of all distributions) held for the entire period.
| Initial Class | Year ended |
| | 12/31/22 | 12/31/21 | 12/31/20 | 12/31/19 | 12/31/18 |
| Net asset value, beginning of period | $13.63 | $14.12 | $13.48 | $12.65 | $13.22 |
| Income (loss) from investment operations | | | | | |
| Net investment income (loss) (d) | $0.36 | $0.29 | $0.37 | $0.42 | $0.39 |
| Net realized and unrealized gain (loss) | (2.25) | (0.40) | 0.76 | 0.87 | (0.53) |
| Total from investment operations | $(1.89) | $(0.11) | $1.13 | $1.29 | $(0.14) |
| Less distributions declared to shareholders | | | | | |
| From net investment income | $(0.34) | $(0.38) | $(0.49) | $(0.46) | $(0.43) |
| From net realized gain | (0.14) | (0.00)(w) | — | — | — |
| Total distributions declared to shareholders | $(0.48) | $(0.38) | $(0.49) | $(0.46) | $(0.43) |
| Net asset value, end of period (x) | $11.26 | $13.63 | $14.12 | $13.48 | $12.65 |
| Total return (%) (k)(r)(s)(x) | (13.93) | (0.81) | 8.47 | 10.21 | (1.09) |
Ratios (%) (to average net assets)
and Supplemental data: | | | | | |
| Expenses before expense reductions | 0.54 | 0.54 | 0.54 | 0.54 | 0.54 |
| Expenses after expense reductions | 0.53 | 0.53 | 0.53 | 0.53 | 0.53 |
| Net investment income (loss) | 2.94 | 2.10 | 2.71 | 3.14 | 3.04 |
| Portfolio turnover | 120 | 161 | 112 | 79 | 48 |
| Net assets at end of period (000 omitted) | $730,323 | $928,578 | $921,342 | $939,179 | $862,752 |
| Service Class | Year ended |
| | 12/31/22 | 12/31/21 | 12/31/20 | 12/31/19 | 12/31/18 |
| Net asset value, beginning of period | $13.37 | $13.86 | $13.24 | $12.43 | $12.99 |
| Income (loss) from investment operations | | | | | |
| Net investment income (loss) (d) | $0.32 | $0.25 | $0.33 | $0.38 | $0.35 |
| Net realized and unrealized gain (loss) | (2.21) | (0.40) | 0.74 | 0.85 | (0.52) |
| Total from investment operations | $(1.89) | $(0.15) | $1.07 | $1.23 | $(0.17) |
| Less distributions declared to shareholders | | | | | |
| From net investment income | $(0.30) | $(0.34) | $(0.45) | $(0.42) | $(0.39) |
| From net realized gain | (0.14) | (0.00)(w) | — | — | — |
| Total distributions declared to shareholders | $(0.44) | $(0.34) | $(0.45) | $(0.42) | $(0.39) |
| Net asset value, end of period (x) | $11.04 | $13.37 | $13.86 | $13.24 | $12.43 |
| Total return (%) (k)(r)(s)(x) | (14.18) | (1.07) | 8.17 | 9.92 | (1.33) |
Ratios (%) (to average net assets)
and Supplemental data: | | | | | |
| Expenses before expense reductions | 0.79 | 0.79 | 0.79 | 0.79 | 0.79 |
| Expenses after expense reductions | 0.78 | 0.78 | 0.78 | 0.78 | 0.78 |
| Net investment income (loss) | 2.68 | 1.85 | 2.46 | 2.89 | 2.79 |
| Portfolio turnover | 120 | 161 | 112 | 79 | 48 |
| Net assets at end of period (000 omitted) | $801,789 | $1,043,338 | $1,090,009 | $1,105,005 | $1,137,033 |
See Notes to Financial Statements
MFS Total Return Bond Series
Financial Highlights - continued
| (d) | Per share data is based on average shares outstanding. |
| (k) | The total return does not reflect expenses that apply to separate accounts. Inclusion of these charges would reduce the total return figures for all periods shown. |
| (r) | Certain expenses have been reduced without which performance would have been lower. |
| (s) | From time to time the fund may receive proceeds from litigation settlements, without which performance would be lower. |
| (w) | Per share amount was less than $0.01. |
| (x) | The net asset values and total returns have been calculated on net assets which include adjustments made in accordance with U.S. generally accepted accounting principles required at period end for financial reporting purposes. |
See Notes to Financial Statements
MFS Total Return Bond Series
Notes to Financial Statements
(1) Business and Organization
MFS Total Return Bond Series (the fund) is a diversified series of MFS Variable Insurance Trust (the trust). The trust is organized as a Massachusetts business trust and is registered under the Investment Company Act of 1940, as amended, as an open-end management investment company. The shareholders of each series of the trust are separate accounts of insurance companies, which offer variable annuity and/or life insurance products, and qualified retirement and pension plans.
The fund is an investment company and accordingly follows the investment company accounting and reporting guidance of the Financial Accounting Standards Board (FASB) Accounting Standards Codification Topic 946 Financial Services - Investment Companies.
(2) Significant Accounting Policies
General — The preparation of financial statements in conformity with U.S. generally accepted accounting principles requires management to make estimates and assumptions that affect the reported amounts of assets and liabilities, and disclosure of contingent assets and liabilities at the date of the financial statements and the reported amounts of increases and decreases in net assets from operations during the reporting period. Actual results could differ from those estimates. In the preparation of these financial statements, management has evaluated subsequent events occurring after the date of the fund’s Statement of Assets and Liabilities through the date that the financial statements were issued. The fund invests in foreign securities. Investments in foreign securities are vulnerable to the effects of changes in the relative values of the local currency and the U.S. dollar and to the effects of changes in each country’s market, economic, industrial, political, regulatory, geopolitical, environmental, public health, and other conditions.
Balance Sheet Offsetting — The fund's accounting policy with respect to balance sheet offsetting is that, absent an event of default by the counterparty or a termination of the agreement, the International Swaps and Derivatives Association (ISDA) Master Agreement, or similar agreement, does not result in an offset of reported amounts of financial assets and financial liabilities in the Statement of Assets and Liabilities across transactions between the fund and the applicable counterparty. The fund's right to setoff may be restricted or prohibited by the bankruptcy or insolvency laws of the particular jurisdiction to which a specific master netting agreement counterparty is subject. Balance sheet offsetting disclosures, to the extent applicable to the fund, have been included in the fund’s Significant Accounting Policies note under the captions for each of the fund’s in-scope financial instruments and transactions.
Investment Valuations — Subject to its oversight, the fund's Board of Trustees has delegated primary responsibility for determining or causing to be determined the value of the fund’s investments to MFS as the fund's adviser, pursuant to the fund’s valuation policy and procedures which have been adopted by the adviser and approved by the Board. Effective September 8, 2022, and in accordance with Rule 2a-5 under the Investment Company Act of 1940, the Board of Trustees designated the adviser as the “valuation designee” of the fund. If the adviser, as valuation designee, determines that reliable market quotations are not readily available for an investment, the investment is valued at fair value as determined in good faith by the adviser in accordance with the adviser’s fair valuation policy and procedures.
Under the fund's valuation policy and procedures, debt instruments and floating rate loans, including restricted debt instruments, are generally valued at an evaluated or composite bid as provided by a third-party pricing service. Short-term instruments with a maturity at issuance of 60 days or less may be valued at amortized cost, which approximates market value. Futures contracts are generally valued at last posted settlement price on their primary exchange as provided by a third-party pricing service. Futures contracts for which there were no trades that day for a particular position are generally valued at the closing bid quotation on their primary exchange as provided by a third-party pricing service. Forward foreign currency exchange contracts are generally valued at the mean of bid and asked prices for the time period interpolated from rates provided by a third-party pricing service for proximate time periods. Open-end investment companies are generally valued at net asset value per share. The values of foreign securities and other assets and liabilities expressed in foreign currencies are converted to U.S. dollars using the mean of bid and asked prices for rates provided by a third-party pricing service.
Under the fund’s valuation policy and procedures, market quotations are not considered to be readily available for debt instruments, floating rate loans, and many types of derivatives. These investments are generally valued at fair value based on information from third-party pricing services or otherwise determined by the adviser in accordance with the adviser’s fair valuation policy and procedures. Securities and other assets generally valued on the basis of information from a third-party pricing service may also be valued at a broker/dealer bid quotation. In determining values, third-party pricing services can utilize both transaction data and market information such as yield, quality, coupon rate, maturity, type of issue, trading characteristics, spreads and other market data. An investment may also be valued at fair value if the adviser determines that the investment’s value has been materially affected by events occurring after the close of the exchange or market on which the investment is principally traded (such as foreign exchange or market) and prior to the determination of the fund’s net asset value, or after the halt of trading of a specific security where trading
MFS Total Return Bond Series
Notes to Financial Statements - continued
does not resume prior to the close of the exchange or market on which the security is principally traded. The adviser generally relies on third-party pricing services or other information (such as the correlation with price movements of similar securities in the same or other markets; the type, cost and investment characteristics of the security; the business and financial condition of the issuer; and trading and other market data) to assist in determining whether to fair value and at what value to fair value an investment. The value of an investment for purposes of calculating the fund’s net asset value can differ depending on the source and method used to determine value. When fair valuation is used, the value of an investment used to determine the fund’s net asset value may differ from quoted or published prices for the same investment. There can be no assurance that the fund could obtain the fair value assigned to an investment if it were to sell the investment at the same time at which the fund determines its net asset value per share.
Various inputs are used in determining the value of the fund's assets or liabilities. These inputs are categorized into three broad levels. In certain cases, the inputs used to measure fair value may fall into different levels of the fair value hierarchy. In such cases, an investment's level within the fair value hierarchy is based on the lowest level of input that is significant to the fair value measurement. The fund's assessment of the significance of a particular input to the fair value measurement in its entirety requires judgment, and considers factors specific to the investment. Level 1 includes unadjusted quoted prices in active markets for identical assets or liabilities. Level 2 includes other significant observable market-based inputs (including quoted prices for similar securities, interest rates, prepayment speed, and credit risk). Level 3 includes significant unobservable inputs, which may include the adviser's own assumptions in determining the fair value of investments. Other financial instruments are derivative instruments, such as futures contracts. The following is a summary of the levels used as of December 31, 2022 in valuing the fund's assets and liabilities:
| Financial Instruments | Level 1 | Level 2 | Level 3 | Total |
| U.S. Treasury Bonds & U.S. Government Agencies & Equivalents | $— | $227,816,174 | $— | $227,816,174 |
| Non - U.S. Sovereign Debt | — | 3,221,918 | — | 3,221,918 |
| Municipal Bonds | — | 46,061,143 | — | 46,061,143 |
| U.S. Corporate Bonds | — | 430,537,862 | — | 430,537,862 |
| Residential Mortgage-Backed Securities | — | 332,166,593 | — | 332,166,593 |
| Commercial Mortgage-Backed Securities | — | 115,776,651 | — | 115,776,651 |
| Asset-Backed Securities (including CDOs) | — | 161,962,875 | — | 161,962,875 |
| Foreign Bonds | — | 180,158,360 | — | 180,158,360 |
| Mutual Funds | 43,144,046 | — | — | 43,144,046 |
| Total | $43,144,046 | $1,497,701,576 | $— | $1,540,845,622 |
| Other Financial Instruments | | | | |
| Futures Contracts – Assets | $718,916 | $— | $— | $718,916 |
| Futures Contracts – Liabilities | (1,866,764) | — | — | (1,866,764) |
For further information regarding security characteristics, see the Portfolio of Investments.
Foreign Currency Translation — Purchases and sales of foreign investments, income, and expenses are converted into U.S. dollars based upon currency exchange rates prevailing on the respective dates of such transactions or on the reporting date for foreign denominated receivables and payables. Gains and losses attributable to foreign currency exchange rates on sales of securities are recorded for financial statement purposes as net realized gains and losses on investments. Gains and losses attributable to foreign exchange rate movements on receivables, payables, income and expenses are recorded for financial statement purposes as foreign currency transaction gains and losses. That portion of both realized and unrealized gains and losses on investments that results from fluctuations in foreign currency exchange rates is not separately disclosed.
Derivatives — The fund uses derivatives primarily to increase or decrease exposure to a particular market or segment of the market, or security, to increase or decrease interest rate or currency exposure, or as alternatives to direct investments. Derivatives are used for hedging or non-hedging purposes. While hedging can reduce or eliminate losses, it can also reduce or eliminate gains. When the fund uses derivatives as an investment to increase market exposure, or for hedging purposes, gains and losses from derivative instruments may be substantially greater than the derivative’s original cost.
The derivative instruments used by the fund during the period were futures contracts and forward foreign currency exchange contracts. Depending on the type of derivative, a fund may exit a derivative position by entering into an offsetting transaction with a counterparty or exchange, negotiating an agreement with the derivative counterparty, or novating the position to a third party. The fund may be unable to promptly close out a futures position in instances where the daily fluctuation in the price for that type of future exceeds the daily limit set by the exchange. The fund's period end derivatives, as presented in the Portfolio of Investments and the associated Derivative Contract tables, generally are indicative of the volume of its derivative activity during the period.
The following table presents, by major type of derivative contract, the fair value, on a gross basis, of the asset and liability components of derivatives held by the fund at December 31, 2022 as reported in the Statement of Assets and Liabilities:
MFS Total Return Bond Series
Notes to Financial Statements - continued
| | | Fair Value (a) |
| Risk | Derivative Contracts | Asset Derivatives | Liability Derivatives |
| Interest Rate | Futures Contracts | $718,916 | $(1,866,764) |
(a) Values presented in this table for futures contracts correspond to the values reported in the Portfolio of Investments. Only the current day net variation margin for futures contracts is reported separately within the Statement of Assets and Liabilities.
The following table presents, by major type of derivative contract, the realized gain (loss) on derivatives held by the fund for the year ended December 31, 2022 as reported in the Statement of Operations:
| Risk | Futures
Contracts | Forward Foreign
Currency
Exchange
Contracts |
| Interest Rate | $(47,393,848) | $— |
| Foreign Exchange | — | 782,264 |
| Total | $(47,393,848) | $782,264 |
The following table presents, by major type of derivative contract, the change in unrealized appreciation or depreciation on derivatives held by the fund for the year ended December 31, 2022 as reported in the Statement of Operations:
| Risk | Futures
Contracts | Forward Foreign
Currency
Exchange
Contracts |
| Interest Rate | $(2,801,290) | $— |
| Foreign Exchange | — | (2,206,397) |
| Total | $(2,801,290) | $(2,206,397) |
Derivative counterparty credit risk is managed through formal evaluation of the creditworthiness of all potential counterparties. On certain, but not all, uncleared derivatives, the fund attempts to reduce its exposure to counterparty credit risk whenever possible by entering into an ISDA Master Agreement on a bilateral basis. The ISDA Master Agreement gives each party to the agreement the right to terminate all transactions traded under such agreement if there is a specified deterioration in the credit quality of the other party. Upon an event of default or a termination of the ISDA Master Agreement, the non-defaulting party has the right to close out all transactions traded under such agreement and to net amounts owed under each agreement to one net amount payable by one party to the other. This right to close out and net payments across all transactions traded under the ISDA Master Agreement could result in a reduction of the fund's credit risk to such counterparty equal to any amounts payable by the fund under the applicable transactions, if any.
Collateral and margin requirements differ by type of derivative. For cleared derivatives (e.g., futures contracts, cleared swaps, and exchange-traded options), margin requirements are set by the clearing broker and the clearing house and collateral, in the form of cash or securities, is posted by the fund directly with the clearing broker. Collateral terms are counterparty agreement specific for uncleared derivatives (e.g., forward foreign currency exchange contracts, uncleared swap agreements, and uncleared options) and collateral, in the form of cash and securities, is held in segregated accounts with the fund's custodian in connection with these agreements. For derivatives traded under an ISDA Master Agreement, which contains a credit support annex, the collateral requirements are netted across all transactions traded under such counterparty-specific agreement and an amount is posted from one party to the other to collateralize such obligations. Cash that has been segregated or delivered to cover the fund's collateral or margin obligations under derivative contracts, if any, will be reported separately in the Statement of Assets and Liabilities as restricted cash for uncleared derivatives and/or deposits with brokers for cleared derivatives. Securities pledged as collateral or margin for the same purpose, if any, are noted in the Portfolio of Investments. The fund may be required to make payments of interest on uncovered collateral or margin obligations with the broker. Any such payments are included in “Miscellaneous” expense in the Statement of Operations.
Futures Contracts — The fund entered into futures contracts which may be used to hedge against or obtain broad market exposure, interest rate exposure, currency exposure, or to manage duration. A futures contract represents a commitment for the future purchase or sale of an asset at a specified price on a specified date.
MFS Total Return Bond Series
Notes to Financial Statements - continued
Upon entering into a futures contract, the fund is required to deposit with the broker, either in cash or securities, an initial margin in an amount equal to a specified percentage of the notional amount of the contract. Subsequent payments (variation margin) are made or received by the fund each day, depending on the daily fluctuations in the value of the contract, and are recorded for financial statement purposes as unrealized gain or loss by the fund until the contract is closed or expires at which point the gain or loss on futures contracts is realized.
The fund bears the risk of interest rates, exchange rates or securities prices moving unexpectedly, in which case, the fund may not achieve the anticipated benefits of the futures contracts and may realize a loss. While futures contracts may present less counterparty risk to the fund since the contracts are exchange traded and the exchange’s clearinghouse guarantees payments to the broker, there is still counterparty credit risk due to the insolvency of the broker. The fund’s maximum risk of loss due to counterparty credit risk is equal to the margin posted by the fund to the broker plus any gains or minus any losses on the outstanding futures contracts.
Forward Foreign Currency Exchange Contracts — The fund entered into forward foreign currency exchange contracts for the purchase or sale of a specific foreign currency at a fixed price on a future date. These contracts may be used to hedge the fund’s currency risk or for non-hedging purposes. For hedging purposes, the fund may enter into contracts to deliver or receive foreign currency that the fund will receive from or use in its normal investment activities. The fund may also use contracts to hedge against declines in the value of foreign currency denominated securities due to unfavorable exchange rate movements. For non-hedging purposes, the fund may enter into contracts with the intent of changing the relative exposure of the fund’s portfolio of securities to different currencies to take advantage of anticipated exchange rate changes.
Forward foreign currency exchange contracts are adjusted by the daily exchange rate of the underlying currency and any unrealized gains or losses are recorded as a receivable or payable for forward foreign currency exchange contracts until the contract settlement date. On contract settlement date, any gain or loss on the contract is recorded as realized gains or losses on forward foreign currency exchange contracts.
Risks may arise upon entering into these contracts from unanticipated movements in the value of the contract and from the potential inability of counterparties to meet the terms of their contracts. Generally, the fund’s maximum risk due to counterparty credit risk is the unrealized gain on the contract due to the use of Continuous Linked Settlement, a multicurrency cash settlement system for the centralized settlement of foreign transactions. This risk is mitigated in cases where there is an ISDA Master Agreement between the fund and the counterparty providing for netting as described above and, where applicable, by the posting of collateral by the counterparty to the fund to cover the fund’s exposure to the counterparty under such ISDA Master Agreement.
Indemnifications — Under the fund's organizational documents, its officers and Trustees may be indemnified against certain liabilities and expenses arising out of the performance of their duties to the fund. Additionally, in the normal course of business, the fund enters into agreements with service providers that may contain indemnification clauses. The fund's maximum exposure under these agreements is unknown as this would involve future claims that may be made against the fund that have not yet occurred.
Investment Transactions and Income — Investment transactions are recorded on the trade date. Some securities may be purchased or sold on an extended settlement basis, which means that the receipt or delivery of the securities by the fund and related payments occur at a future date, usually beyond the customary settlement period. Interest income is recorded on the accrual basis.
All premium and discount is amortized or accreted for financial statement purposes in accordance with U.S. generally accepted accounting principles. Interest payments received in additional securities are recorded on the ex-interest date in an amount equal to the value of the security on such date. In determining the net gain or loss on securities sold, the cost of securities is determined on the identified cost basis.
The fund may receive proceeds from litigation settlements. Any proceeds received from litigation involving portfolio holdings are reflected in the Statement of Operations in realized gain/loss if the security has been disposed of by the fund or in unrealized gain/loss if the security is still held by the fund. Any other proceeds from litigation not related to portfolio holdings are reflected as other income in the Statement of Operations.
The fund invests a significant portion of its assets in asset-backed and/or mortgage-backed securities. For these securities, the value of the debt instrument also depends on the credit quality and adequacy of the underlying assets or collateral as well as whether there is a security interest in the underlying assets or collateral. Enforcing rights, if any, against the underlying assets or collateral may be difficult. U.S. Government securities not supported as to the payment of principal or interest by the U.S. Treasury, such as those issued by Fannie Mae, Freddie Mac, and the Federal Home Loan Banks, are subject to greater credit risk than are U.S. Government securities supported by the U.S. Treasury, such as those issued by Ginnie Mae.
The fund may purchase or sell mortgage-backed securities on a “To Be Announced” (TBA) basis. A TBA transaction is subject to extended settlement and typically does not designate the actual security to be delivered, but instead includes an approximate principal amount. The price of the TBA security and the date that it will be settled are fixed at the time the transaction is negotiated. The value of the security varies with market fluctuations and no interest accrues to the fund until settlement takes place. TBA
MFS Total Return Bond Series
Notes to Financial Statements - continued
purchase and sale commitments are held at carrying amount, which approximates fair value and are categorized as level 2 within the fair value hierarchy and included in TBA purchase commitments in the Statement of Assets and Liabilities. Losses may arise as a result of changes in the value of the TBA investment prior to settlement date or due to counterparty non-performance.
The fund may also enter into mortgage dollar rolls, typically TBA dollar rolls, in which the fund sells TBA mortgage-backed securities to financial institutions and simultaneously agrees to repurchase similar (same issuer, type and coupon) securities at a later date at an agreed-upon price. During the period between the sale and repurchase, the fund will not be entitled to receive interest and principal payments on the securities sold. The fund accounts for dollar roll transactions as purchases and sales and realizes gains and losses on these transactions. Dollar roll transactions involve the risk that the market value of the securities that the fund is required to purchase may decline below the agreed upon repurchase price of those securities.
To mitigate the counterparty credit risk on TBA transactions, mortgage dollar rolls, and other types of forward settling mortgage-backed and asset-backed security transactions, the fund whenever possible enters into a Master Securities Forward Transaction Agreement (“MSFTA”) on a bilateral basis with each of the counterparties with whom it undertakes a significant volume of transactions. The MSFTA gives each party to the agreement the right to terminate all transactions traded under such agreement if there is a specified deterioration in the credit quality of the other party. Upon an event of default or a termination of the MSFTA, the non-defaulting party has the right to close out all transactions traded under such agreement and to net amounts owed under each transaction to one net amount payable by one party to the other. This right to close out and net payments across all transactions traded under the MSFTA could result in a reduction of the fund's credit risk to such counterparty equal to any amounts payable by the fund under the applicable transactions, if any.
For mortgage-backed and asset-backed securities traded under a MSFTA, the collateral and margining requirements are contract specific. Collateral amounts across all transactions traded under such agreement are netted and an amount is posted from one party to the other to collateralize such obligations. Cash that has been pledged to cover the fund's collateral or margin obligations under a MSFTA, if any, will be reported separately on the Statement of Assets and Liabilities as restricted cash. Securities pledged as collateral or margin for the same purpose, if any, are noted in the Portfolio of Investments.
Tax Matters and Distributions — The fund intends to qualify as a regulated investment company, as defined under Subchapter M of the Internal Revenue Code, and to distribute all of its taxable income, including realized capital gains. As a result, no provision for federal income tax is required. The fund’s federal tax returns, when filed, will remain subject to examination by the Internal Revenue Service for a three year period. Management has analyzed the fund’s tax positions taken on federal and state tax returns for all open tax years and does not believe that there are any uncertain tax positions that require recognition of a tax liability. Foreign taxes, if any, have been accrued by the fund in the accompanying financial statements in accordance with the applicable foreign tax law. Foreign income taxes may be withheld by certain countries in which the fund invests. Additionally, capital gains realized by the fund on securities issued in or by certain foreign countries may be subject to capital gains tax imposed by those countries.
Distributions to shareholders are recorded on the ex-dividend date. Income and capital gain distributions are determined in accordance with income tax regulations, which may differ from U.S. generally accepted accounting principles. Certain capital accounts in the financial statements are periodically adjusted for permanent differences in order to reflect their tax character. These adjustments have no impact on net assets or net asset value per share. Temporary differences which arise from recognizing certain items of income, expense, gain or loss in different periods for financial statement and tax purposes will reverse at some time in the future.
Book/tax differences primarily relate to amortization and accretion of debt securities and derivative transactions.
The tax character of distributions declared to shareholders for the last two fiscal years is as follows:
| | Year ended
12/31/22 | Year ended
12/31/21 |
| Ordinary income (including any short-term capital gains) | $43,461,158 | $52,722,119 |
| Long-term capital gains | 19,446,367 | 150,003 |
| Total distributions | $62,907,525 | $52,872,122 |
The federal tax cost and the tax basis components of distributable earnings were as follows:
MFS Total Return Bond Series
Notes to Financial Statements - continued
| As of 12/31/22 | |
| Cost of investments | $1,713,228,538 |
| Gross appreciation | 2,281,503 |
| Gross depreciation | (175,812,267) |
| Net unrealized appreciation (depreciation) | $(173,530,764) |
| Undistributed ordinary income | 47,031,722 |
| Capital loss carryforwards | (97,348,762) |
| Total distributable earnings (loss) | $(223,847,804) |
As of December 31, 2022, the fund had capital loss carryforwards available to offset future realized gains. These net capital losses may be carried forward indefinitely and their character is retained as short-term and/or long-term losses. Such losses are characterized as follows:
| Short-Term | $(41,517,725) |
| Long-Term | (55,831,037) |
| Total | $(97,348,762) |
Multiple Classes of Shares of Beneficial Interest — The fund offers multiple classes of shares, which differ in their respective distribution and/or service fees. The fund's income, realized and unrealized gain (loss), and common expenses are allocated to shareholders based on the daily net assets of each class. Dividends are declared separately for each class. Differences in per share dividend rates are generally due to differences in separate class expenses. The fund’s distributions declared to shareholders as reported in the Statements of Changes in Net Assets are presented by class as follows:
| | Year
ended
12/31/22 | | Year
ended
12/31/21 |
| Initial Class | $30,812,385 | | $25,516,208 |
| Service Class | 32,095,140 | | 27,355,914 |
| Total | $62,907,525 | | $52,872,122 |
(3) Transactions with Affiliates
Investment Adviser — The fund has an investment advisory agreement with MFS to provide overall investment management and related administrative services and facilities to the fund. The management fee is computed daily and paid monthly at the following annual rates based on the fund's average daily net assets:
| Up to $2.5 billion | 0.50% |
| In excess of $2.5 billion and up to $5 billion | 0.45% |
| In excess of $5 billion | 0.40% |
MFS has agreed in writing to reduce its management fee by a specified amount if certain MFS mutual fund assets exceed thresholds agreed to by MFS and the fund's Board of Trustees. Effective March 1, 2022, MFS has also agreed in writing to waive at least 0.01% of its management fee as part of this agreement. The agreement to waive at least 0.01% of the management fee will continue until modified by the fund's Board of Trustees, but such agreement will continue at least until April 30, 2024. For the year ended December 31, 2022, this management fee reduction amounted to $233,966, which is included in the reduction of total expenses in the Statement of Operations. The management fee incurred for the year ended December 31, 2022 was equivalent to an annual effective rate of 0.49% of the fund's average daily net assets.
Distributor — MFS Fund Distributors, Inc. (MFD), a wholly-owned subsidiary of MFS, is the distributor of shares of the fund. The Trustees have adopted a distribution plan for the Service Class shares pursuant to Rule 12b-1 under the Investment Company Act of 1940.
The fund's distribution plan provides that the fund will pay MFD distribution and/or service fees equal to 0.25% per annum of its average daily net assets attributable to Service Class shares as partial consideration for services performed and expenses incurred by MFD and financial intermediaries (including participating insurance companies that invest in the fund to fund variable annuity and variable life insurance contracts, sponsors of qualified retirement and pension plans that invest in the fund, and affiliates of these participating insurance companies and plan sponsors) in connection with the sale and distribution of the Service Class shares. MFD may subsequently pay all, or a portion, of the distribution and/or service fees to financial intermediaries.
MFS Total Return Bond Series
Notes to Financial Statements - continued
Shareholder Servicing Agent — MFS Service Center, Inc. (MFSC), a wholly-owned subsidiary of MFS, receives a fee from the fund for its services as shareholder servicing agent. For the year ended December 31, 2022, the fee was $37,579, which equated to 0.0022% annually of the fund's average daily net assets. MFSC also receives reimbursement from the fund for out-of-pocket expenses paid by MFSC on behalf of the fund. For the year ended December 31, 2022, these costs amounted to $1,468.
Administrator — MFS provides certain financial, legal, shareholder communications, compliance, and other administrative services to the fund. Under an administrative services agreement, the fund reimburses MFS the costs incurred to provide these services. The fund is charged an annual fixed amount of $17,500 plus a fee based on average daily net assets. The administrative services fee incurred for the year ended December 31, 2022 was equivalent to an annual effective rate of 0.0160% of the fund's average daily net assets.
Trustees’ and Officers’ Compensation — The fund pays compensation to independent Trustees in the form of a retainer, attendance fees, and additional compensation to Board and Committee chairpersons. The fund does not pay compensation directly to Trustees or officers of the fund who are also officers of the investment adviser, all of whom receive remuneration from MFS for their services to the fund. Certain officers and Trustees of the fund are officers or directors of MFS, MFD, and MFSC.
Other — The fund invests in the MFS Institutional Money Market Portfolio which is managed by MFS and seeks current income consistent with preservation of capital and liquidity. This money market fund does not pay a management fee to MFS but does incur investment and operating costs.
(4) Portfolio Securities
For the year ended December 31, 2022, purchases and sales of investments, other than and short-term obligations, were as follows:
| | Purchases | Sales |
| U.S. Government securities | $1,801,478,273 | $1,772,788,268 |
| Non-U.S. Government securities | 192,133,874 | 397,100,070 |
(5) Shares of Beneficial Interest
The fund's Declaration of Trust permits the Trustees to issue an unlimited number of full and fractional shares of beneficial interest. Transactions in fund shares were as follows:
| | Year ended
12/31/22 | | Year ended
12/31/21 |
| | Shares | Amount | | Shares | Amount |
| Shares sold | | | | | |
| Initial Class | 5,320,660 | $64,038,372 | | 9,966,924 | $138,196,906 |
| Service Class | 5,776,933 | 68,112,867 | | 11,172,713 | 151,938,632 |
| | 11,097,593 | $132,151,239 | | 21,139,637 | $290,135,538 |
Shares issued to shareholders
in reinvestment of distributions | | | | | |
| Initial Class | 2,598,960 | $30,225,899 | | 1,825,002 | $25,020,775 |
| Service Class | 2,810,433 | 32,095,140 | | 2,032,386 | 27,355,914 |
| | 5,409,393 | $62,321,039 | | 3,857,388 | $52,376,689 |
| Shares reacquired | | | | | |
| Initial Class | (11,162,526) | $(135,116,602) | | (8,934,395) | $(123,643,623) |
| Service Class | (13,997,512) | (166,168,902) | | (13,841,391) | (187,826,974) |
| | (25,160,038) | $(301,285,504) | | (22,775,786) | $(311,470,597) |
| Net change | | | | | |
| Initial Class | (3,242,906) | $(40,852,331) | | 2,857,531 | $39,574,058 |
| Service Class | (5,410,146) | (65,960,895) | | (636,292) | (8,532,428) |
| | (8,653,052) | $(106,813,226) | | 2,221,239 | $31,041,630 |
The fund is one of several mutual funds in which certain MFS funds may invest. The MFS funds do not invest in the underlying funds for the purpose of exercising management or control. At the end of the period, the MFS Moderate Allocation Portfolio and the MFS Conservative Allocation Portfolio were the owners of record of approximately 8% and 3%, respectively, of the value of outstanding voting shares of the fund. In addition, the MFS Growth Allocation Portfolio was the owner of record of less than 1% of the value of the outstanding voting shares of the fund.
MFS Total Return Bond Series
Notes to Financial Statements - continued
(6) Line of Credit
The fund and certain other funds managed by MFS participate in a $1.45 billion unsecured committed line of credit of which $1.2 billion is reserved for use by the fund and certain other MFS U.S. funds. The line of credit is provided by a syndicate of banks under a credit agreement. Borrowings may be made for temporary financing needs. Interest is charged to each fund, based on its borrowings, generally at a rate equal to the highest of 1) Daily Simple SOFR (Secured Overnight Financing Rate) plus 0.10%, 2) the Federal Funds Effective Rate, or 3) the Overnight Bank Funding Rate, each plus an agreed upon spread. A commitment fee, based on the average daily unused portion of the committed line of credit, is allocated among the participating funds. The line of credit expires on March 16, 2023 unless extended or renewed. In addition, the fund and other funds managed by MFS have established unsecured uncommitted borrowing arrangements with certain banks for temporary financing needs. Interest is charged to each fund, based on its borrowings, at rates equal to customary reference rates plus an agreed upon spread. For the year ended December 31, 2022, the fund’s commitment fee and interest expense were $7,870 and $0, respectively, and are included in “Miscellaneous” expense in the Statement of Operations.
(7) Investments in Affiliated Issuers
An affiliated issuer may be considered one in which the fund owns 5% or more of the outstanding voting securities, or a company which is under common control. For the purposes of this report, the following were affiliated issuers:
| Affiliated Issuers | Beginning
Value | Purchases | Sales
Proceeds | Realized
Gain
(Loss) | Change in
Unrealized
Appreciation or
Depreciation | Ending
Value |
| MFS Institutional Money Market Portfolio | $124,732,002 | $692,759,678 | $774,358,949 | $(1,637) | $12,952 | $43,144,046 |
| Affiliated Issuers | Dividend
Income | Capital Gain
Distributions |
| MFS Institutional Money Market Portfolio | $1,046,539 | $— |
(8) LIBOR Transition
Certain of the fund's investments, including investments in certain debt instruments and derivatives (if any), as well as borrowings by the fund and certain other contractual arrangements of the fund, may be based on the London Interbank Offered Rate (“LIBOR”). In 2017, the regulatory authority that oversees financial services firms in the United Kingdom announced plans to transition away from LIBOR by the end of 2021. In March 2021, the administrator of LIBOR announced the extension of the publication of the more commonly used U.S. dollar LIBOR settings to the end of June 2023. Although the full impacts of the transition away from LIBOR are not fully known, the transition may result in, among other things, an increase in volatility or illiquidity of the markets for instruments that currently rely on LIBOR to determine interest rates and this could have an adverse impact on the fund's performance. With respect to the fund's accounting for investments, including investments in certain debt instruments and derivatives, as well as borrowings by the fund and any other contractual arrangements of the fund that undergo reference rate-related modifications as a result of the transition, management will rely upon the relief provided by FASB Codification Topic 848 – Reference Rate Reform (Topic 848). The guidance in Topic 848 permits the fund to account for those modified contracts as a continuation of the existing contracts. Management is still evaluating the impact to the fund of the June 30, 2023 planned discontinuation of the more commonly used U.S. dollar LIBOR settings.
(9) Russia and Ukraine Conflict
The market disruptions, which began in late February 2022, associated with geopolitical events related to the conflict between Russia and Ukraine may adversely affect the value of the fund’s assets and thus the fund’s performance. Management continues to monitor these events and to evaluate the related impacts, if any, to the fund.
MFS Total Return Bond Series
Report of Independent Registered Public Accounting Firm
To the Board of Trustees of MFS Variable Insurance Trust and the Shareholders of MFS Total Return Bond Series:
Opinion on the Financial Statements and Financial Highlights
We have audited the accompanying statement of assets and liabilities of MFS Total Return Bond Series (the “Fund”), including the portfolio of investments, as of December 31, 2022, the related statement of operations for the year then ended, the statements of changes in net assets for each of the two years in the period then ended, the financial highlights for each of the five years in the period then ended, and the related notes. In our opinion, the financial statements and financial highlights present fairly, in all material respects, the financial position of the Fund as of December 31, 2022, and the results of its operations for the year then ended, the changes in its net assets for each of the two years in the period then ended, and the financial highlights for each of the five years in the period then ended, in conformity with accounting principles generally accepted in the United States of America.
Basis for Opinion
These financial statements and financial highlights are the responsibility of the Fund's management. Our responsibility is to express an opinion on the Fund's financial statements and financial highlights based on our audits. We are a public accounting firm registered with the Public Company Accounting Oversight Board (United States) (PCAOB) and are required to be independent with respect to the Fund in accordance with the U.S. federal securities laws and the applicable rules and regulations of the Securities and Exchange Commission and the PCAOB.
We conducted our audits in accordance with the standards of the PCAOB. Those standards require that we plan and perform the audit to obtain reasonable assurance about whether the financial statements and financial highlights are free of material misstatement, whether due to error or fraud. The Fund is not required to have, nor were we engaged to perform, an audit of its internal control over financial reporting. As part of our audits, we are required to obtain an understanding of internal control over financial reporting but not for the purpose of expressing an opinion on the effectiveness of the Fund's internal control over financial reporting. Accordingly, we express no such opinion.
Our audits included performing procedures to assess the risks of material misstatement of the financial statements and financial highlights, whether due to error or fraud, and performing procedures that respond to those risks. Such procedures included examining, on a test basis, evidence regarding the amounts and disclosures in the financial statements and financial highlights. Our audits also included evaluating the accounting principles used and significant estimates made by management, as well as evaluating the overall presentation of the financial statements and financial highlights. Our procedures included confirmation of securities owned as of December 31, 2022, by correspondence with the custodian and brokers; when replies were not received from brokers, we performed other auditing procedures. We believe that our audits provide a reasonable basis for our opinion.
DELOITTE & TOUCHE LLP
Boston, Massachusetts
February 15, 2023
We have served as the auditor of one or more of the MFS investment companies since 1924.
MFS Total Return Bond Series
Trustees and Officers — Identification and Background
The Trustees and Officers of the Trust, as of February 1, 2023, are listed below, together with their principal occupations during the past five years. (Their titles may have varied during that period.) The address of each Trustee and Officer is 111 Huntington Avenue, Boston, Massachusetts 02199-7618.
| Name, Age | | Position(s) Held with Fund | | Trustee/Officer Since(h) | | Number of MFS Funds overseen by the Trustee | | Principal Occupations During
the Past Five Years | | Other Directorships During
the Past Five Years (j) |
| INTERESTED TRUSTEE | | | | | | | | | | |
Michael W. Roberge (k)
(age 56) | | Trustee | | January 2021 | | 136 | | Massachusetts Financial Services Company, Chairman (since January 2021); Chief Executive Officer (since January 2017); Director; Chairman of the Board (since January 2022); President (until December 2018); Chief Investment Officer (until December 2018) | | N/A |
| INDEPENDENT TRUSTEES | | | | | | | | | | |
John P. Kavanaugh
(age 68) | | Trustee and Chair of Trustees | | January 2009 | | 136 | | Private investor | | N/A |
Steven E. Buller
(age 71) | | Trustee | | February 2014 | | 136 | | Private investor | | N/A |
John A. Caroselli
(age 68) | | Trustee | | March 2017 | | 136 | | Private investor; JC Global Advisors, LLC (management consulting), President (since 2015) | | N/A |
Maureen R. Goldfarb
(age 67) | | Trustee | | January 2009 | | 136 | | Private investor | | N/A |
Peter D. Jones
(age 67) | | Trustee | | January 2019 | | 136 | | Private investor | | N/A |
James W. Kilman, Jr.
(age 61) | | Trustee | | January 2019 | | 136 | | Burford Capital Limited (finance and investment management), Senior Advisor (since May 3, 2021), Chief Financial Officer (2019 - May 2, 2021); KielStrand Capital LLC (family office), Chief Executive Officer (since 2016) | | Alpha-En Corporation, Director (2016-2019) |
Clarence Otis, Jr.
(age 66) | | Trustee | | March 2017 | | 136 | | Private investor | | VF Corporation, Director; Verizon Communications, Inc., Director; The Travelers Companies, Director |
Maryanne L. Roepke
(age 66) | | Trustee | | May 2014 | | 136 | | Private investor | | N/A |
Laurie J. Thomsen
(age 65) | | Trustee | | March 2005 | | 136 | | Private investor | | The Travelers Companies, Director; Dycom Industries, Inc., Director |
MFS Total Return Bond Series
Trustees and Officers - continued
| Name, Age | | Position(s) Held with
Fund | | Trustee/Officer Since(h) | | Number of MFS Funds for which the Person is an Officer | | Principal Occupations During
the Past Five Years |
| OFFICERS | | | | | | | | |
Christopher R. Bohane (k)
(age 49) | | Assistant Secretary and Assistant Clerk | | July 2005 | | 136 | | Massachusetts Financial Services Company, Senior Vice President and Senior Managing Counsel |
Kino Clark (k)
(age 54) | | Assistant Treasurer | | January 2012 | | 136 | | Massachusetts Financial Services Company, Vice President |
John W. Clark, Jr. (k)
(age 55) | | Assistant Treasurer | | April 2017 | | 136 | | Massachusetts Financial Services Company, Vice President |
David L. DiLorenzo (k)
(age 54) | | President | | July 2005 | | 136 | | Massachusetts Financial Services Company, Senior Vice President |
Heidi W. Hardin (k)
(age 55) | | Secretary and Clerk | | April 2017 | | 136 | | Massachusetts Financial Services Company, Executive Vice President and General Counsel |
Brian E. Langenfeld (k)
(age 49) | | Assistant Secretary and Assistant Clerk | | June 2006 | | 136 | | Massachusetts Financial Services Company, Vice President and Managing Counsel |
Rosa E. Licea-Mailloux (k)
(age 46) | | Chief Compliance Officer | | March 2022 | | 136 | | Massachusetts Financial Services Company, Vice President (since 2018); Director of Corporate Compliance (2018-2021), Senior Director Compliance (2021-2022), Senior Managing Director of North American Compliance & Chief Compliance Officer (since March 2022); Natixis Investment Managers (investment management), Funds Chief Compliance Officer, Deputy General Counsel & Senior Vice President (until 2018) |
Amanda S. Mooradian (k)
(age 43) | | Assistant Secretary and Assistant Clerk | | September 2018 | | 136 | | Massachusetts Financial Services Company, Assistant Vice President and Senior Counsel |
Susan A. Pereira (k)
(age 52) | | Assistant Secretary and Assistant Clerk | | July 2005 | | 136 | | Massachusetts Financial Services Company, Vice President and Managing Counsel |
Kasey L. Phillips (k)
(age 52) | | Assistant Treasurer | | September 2012 | | 136 | | Massachusetts Financial Services Company, Vice President |
Matthew A. Stowe (k)
(age 48) | | Assistant Secretary and Assistant Clerk | | October 2014 | | 136 | | Massachusetts Financial Services Company, Vice President and Senior Managing Counsel |
William B. Wilson (k)
(age 40) | | Assistant Secretary and Assistant Clerk | | October 2022 | | 136 | | Massachusetts Financial Services Company, Assistant Vice President and Counsel |
James O. Yost (k)
(age 62) | | Treasurer | | September 1990 | | 136 | | Massachusetts Financial Services Company, Senior Vice President |
| (h) | Date first appointed to serve as Trustee/Officer of an MFS Fund. Each Trustee has served continuously since appointment unless indicated otherwise. From January 2012 through December 2016, Messrs. DiLorenzo and Yost served as Treasurer and Deputy Treasurer of the Funds, respectively. |
| (j) | Directorships or trusteeships of companies required to report to the Securities and Exchange Commission (i.e., “public companies”). |
| (k) | “Interested person” of the Trust within the meaning of the Investment Company Act of 1940 (referred to as the 1940 Act), which is the principal federal law governing investment companies like the fund, as a result of a position with MFS. The address of MFS is 111 Huntington Avenue, Boston, Massachusetts 02199-7618. |
Each Trustee (other than Messrs. Jones, Kilman and Roberge) has been elected by shareholders and each Trustee and Officer holds office until his or her successor is chosen and qualified or until his or her earlier death, resignation, retirement or removal. Mr. Roberge became a Trustee of the Funds on January 1, 2021 and Messrs. Jones and Kilman became Trustees of the Funds on January 1, 2019. The Trust does not hold annual meetings for the purpose of electing Trustees, and Trustees are not elected for fixed terms. Under the terms of the Board's retirement policy, an Independent Trustee shall retire at the end of the calendar year in which he or she reaches the earlier of 75 years of age or 15 years of service on the Board (or, in the case of any Independent Trustee who joined the Board prior to 2015, 20 years of service on the Board).
MFS Total Return Bond Series
Trustees and Officers - continued
Messrs. Buller, Kilman and Otis and Ms. Roepke are members of the Trust’s Audit Committee.
Each of the Interested Trustees and certain Officers hold comparable officer positions with certain affiliates of MFS.
The Statement of Additional Information for a Fund includes further information about the Trustees and is available without charge upon request by calling 1-800-225-2606.
| Investment Adviser | Custodian |
Massachusetts Financial Services Company
111 Huntington Avenue
Boston, MA 02199-7618 | State Street Bank and Trust Company
1 Lincoln Street
Boston, MA 02111-2900 |
| Distributor | Independent Registered Public Accounting Firm |
MFS Fund Distributors, Inc.
111 Huntington Avenue
Boston, MA 02199-7618 | Deloitte & Touche LLP
200 Berkeley Street
Boston, MA 02116 |
| Portfolio Manager(s) | |
Alexander Mackey
Joshua Marston | |
MFS Total Return Bond Series
Board Review of Investment Advisory Agreement
MFS Total Return Bond Series
The Investment Company Act of 1940 requires that both the full Board of Trustees and a majority of the non-interested (“independent”) Trustees, voting separately, annually approve the continuation of the Fund’s investment advisory agreement with MFS. The Trustees consider matters bearing on the Fund and its advisory arrangements at their meetings throughout the year, including a review of performance data at each regular meeting. In addition, the independent Trustees met several times over the course of three months beginning in May and ending in July, 2022 (“contract review meetings”) for the specific purpose of considering whether to approve the continuation of the investment advisory agreement for the Fund and the other investment companies that the Board oversees (the “MFS Funds”). The independent Trustees were assisted in their evaluation of the Fund’s investment advisory agreement by independent legal counsel, from whom they received separate legal advice and with whom they met separately from MFS during various contract review meetings. The independent Trustees were also assisted in this process by an independent consultant who was retained by and reported to the independent Trustees.
In connection with their deliberations regarding the continuation of the investment advisory agreement, the Trustees, including the independent Trustees, considered such information and factors as they believed, in light of the legal advice furnished to them and their own business judgment, to be relevant. The investment advisory agreement for the Fund was considered separately, although the Trustees also took into account the common interests of all MFS Funds in their review. As described below, the Trustees considered the nature, quality, and extent of the various investment advisory, administrative, and shareholder services performed by MFS under the existing investment advisory agreement and other arrangements with the Fund.
In connection with their contract review meetings, the Trustees received and relied upon materials that included, among other items: (i) information provided by Broadridge Financial Solutions, Inc. (“Broadridge”), an independent third party, on the investment performance of the Fund for various time periods ended December 31, 2021 and the investment performance of a group of funds with substantially similar investment classifications/objectives (the “Broadridge performance universe”), (ii) information provided by Broadridge on the Fund’s advisory fees and other expenses and the advisory fees and other expenses of comparable funds identified by Broadridge as well as all other funds in the same investment classification/category (the “Broadridge expense group and universe”), (iii) information provided by MFS on the advisory fees of portfolios of other clients of MFS, including institutional separate accounts and other clients, (iv) information as to whether and to what extent applicable expense waivers, reimbursements or fee “breakpoints” are observed for the Fund, (v) information regarding MFS’ financial results and financial condition, including MFS’ and certain of its affiliates’ estimated profitability from services performed for the Fund and the MFS Funds as a whole, and compared to MFS’ institutional business, (vi) MFS’ views regarding the outlook for the mutual fund industry and the strategic business plans of MFS, (vii) descriptions of various functions performed by MFS for the Funds, such as compliance monitoring and portfolio trading practices, and (viii) information regarding the overall organization of MFS, including information about MFS’ senior management and other personnel providing investment advisory, administrative and other services to the Fund and the other MFS Funds. The comparative performance, fee and expense information prepared and provided by Broadridge was not independently verified and the independent Trustees did not independently verify any information provided to them by MFS.
The Trustees’ conclusion as to the continuation of the investment advisory agreement was based on a comprehensive consideration of all information provided to the Trustees and not the result of any single factor. Some of the factors that figured particularly in the Trustees’ deliberations are described below, although individual Trustees may have evaluated the information presented differently from one another, giving different weights to various factors. It is also important to recognize that the fee arrangements for the Fund and other MFS Funds are the result of years of review and discussion between the independent Trustees and MFS, that certain aspects of such arrangements may receive greater scrutiny in some years than in others, and that the Trustees’ conclusions may be based, in part, on their consideration of these same arrangements during the course of the year and in prior years.
Based on information provided by Broadridge and MFS, the Trustees reviewed the Fund’s total return investment performance as well as the Broadridge performance universe over various time periods. The Trustees placed particular emphasis on the total return performance of the Fund’s Initial Class shares in comparison to the performance of funds in its Broadridge performance universe over the five-year period ended December 31, 2021, which the Trustees believed was a long enough period to reflect differing market conditions. The total return performance of the Fund’s Initial Class shares was in the 3rd quintile relative to the other funds in the universe for this five-year period (the 1st quintile being the best performers and the 5th quintile being the worst performers). The total return performance of the Fund’s Initial Class shares was in the 3rd quintile for the one-year period and the 2nd quintile for the three-year period ended December 31, 2021 relative to the Broadridge performance universe. Because of the passage of time, these performance results may differ from the performance results for more recent periods, including those shown elsewhere in this report.
In the course of their deliberations, the Trustees took into account information provided by MFS in connection with the contract review meetings, as well as during investment review meetings conducted with portfolio management personnel during the course of the year regarding the Fund’s performance. After reviewing these and related factors, the Trustees concluded, within the context of their overall conclusions regarding the investment advisory agreement, that they were satisfied with MFS’ responses and efforts relating to investment performance.
MFS Total Return Bond Series
Board Review of Investment Advisory Agreement - continued
In assessing the reasonableness of the Fund’s advisory fee, the Trustees considered, among other information, the Fund’s advisory fee and the total expense ratio of the Fund’s Initial Class shares as a percentage of average daily net assets and the advisory fee and total expense ratios of the Broadridge expense group based on information provided by Broadridge. The Trustees considered that, according to the data provided by Broadridge (which takes into account any fee reductions or expense limitations that were in effect during the Fund’s last fiscal year), the Fund’s effective advisory fee rate and total expense ratio were each approximately at the Broadridge expense group median.
The Trustees also considered the advisory fees charged by MFS to any institutional separate accounts advised by MFS (“separate accounts”) and unaffiliated investment companies for which MFS serves as subadviser (“subadvised funds”) that have comparable investment strategies to the Fund, if any. In comparing these fees, the Trustees considered information provided by MFS as to the generally broader scope of services provided by MFS to the Fund, as well as the more extensive regulatory burdens imposed on MFS in managing the Fund, in comparison to separate accounts and subadvised funds. The Trustees also considered the higher demands placed on MFS’ investment personnel and trading infrastructure as a result of the daily cash in-flows and out-flows of the Fund in comparison to separate accounts.
The Trustees also considered whether the Fund may benefit from any economies of scale in the management of the Fund in the event of growth in assets of the Fund and/or growth in assets of the MFS Funds as a whole. They noted that the Fund’s advisory fee rate schedule is subject to contractual breakpoints that reduce the Fund’s advisory fee rate on average daily net assets over $2.5 billion and $5 billion. The Trustees also noted that MFS has agreed in writing to waive a portion of the management fees of certain MFS Funds, including the Fund, if the total combined assets of certain funds within the MFS Funds’ complex increase above agreed upon thresholds (the “group fee waiver”), enabling the Fund’s shareholders to share in the benefits from any economies of scale at the complex level. The group fee waiver is reviewed and renewed annually between the Board and MFS. The Trustees concluded that the breakpoints and the group fee waiver were sufficient to allow the Fund to benefit from economies of scale as its assets and overall complex assets grow.
The Trustees also considered information prepared by MFS relating to MFS’ costs and profits with respect to the Fund, the MFS Funds considered as a group, and other investment companies and accounts advised by MFS, as well as MFS’ methodologies used to determine and allocate its costs to the MFS Funds, the Fund and other accounts and products for purposes of estimating profitability.
After reviewing these and other factors described herein, the Trustees concluded, within the context of their overall conclusions regarding the investment advisory agreement, that the advisory fees charged to the Fund represent reasonable compensation in light of the services being provided by MFS to the Fund.
In addition, the Trustees considered MFS’ resources and related efforts to continue to retain, attract and motivate capable personnel to serve the Fund. The Trustees also considered current and developing conditions in the financial services industry, including the presence of large and well-capitalized companies which are spending, and appear to be prepared to continue to spend, substantial sums to engage personnel and to provide services to competing investment companies. In this regard, the Trustees also considered the financial resources of MFS and its ultimate parent, Sun Life Financial Inc. The Trustees also considered the advantages and possible disadvantages to the Fund of having an adviser that also serves other investment companies as well as other accounts.
The Trustees also considered the nature, quality, cost, and extent of administrative, transfer agency, and distribution services provided to the Fund by MFS and its affiliates under agreements and plans other than the investment advisory agreement, including any 12b-1 fees the Fund pays to MFS Fund Distributors, Inc., an affiliate of MFS. The Trustees also considered the nature, extent and quality of certain other services MFS performs or arranges for on the Fund’s behalf, which may include securities lending programs, directed expense payment programs, class action recovery programs, and MFS’ interaction with third-party service providers, principally custodians and sub-custodians. The Trustees concluded that the various non-advisory services provided by MFS and its affiliates on behalf of the Fund were satisfactory.
The Trustees considered so-called “fall-out benefits” to MFS such as reputational value derived from serving as investment manager to the MFS Funds. The Trustees also considered that MFS discontinued its historic practice of obtaining investment research from portfolio brokerage commissions paid by certain MFS Funds effective January 2018, and directly pays or voluntarily reimburses a Fund, if applicable, for the costs of external research acquired through the use of the Fund’s portfolio brokerage commissions.
Based on their evaluation of factors that they deemed to be material, including those factors described above, the Board of Trustees, including the independent Trustees, concluded that the Fund’s investment advisory agreement with MFS should be continued for an additional one-year period, commencing August 1, 2022.
MFS Total Return Bond Series
Proxy Voting Policies and Information
MFS votes proxies on behalf of the fund pursuant to proxy voting policies and procedures that are available without charge, upon request, by calling 1-800-225-2606, by visiting mfs.com/proxyvoting, or by visiting the SEC’s Web site at http://www.sec.gov.
Information regarding how the fund voted proxies relating to portfolio securities during the most recent twelve-month period ended June 30 is available by August 31 of each year without charge by visiting mfs.com/proxyvoting, or by visiting the SEC’s Web site at http://www.sec.gov.
Quarterly Portfolio Disclosure
The fund files a complete schedule of portfolio holdings with the SEC for the first and third quarters of each fiscal year as an exhibit to its reports on Form N-PORT. The fund’s Form N-PORT reports are available on the SEC’s Web site at http://www.sec.gov. A shareholder can obtain the portfolio holdings report for the first and third quarters of the fund's fiscal year at mfs.com/vit1 by choosing the fund's name and then scrolling to the “Resources” section and clicking on the “Prospectus and Reports” tab.
FURTHER INFORMATION
From time to time, MFS may post important information about the fund or the MFS Funds on the MFS Web site (mfs.com). This information is available at https://www.mfs.com/announcements or at mfs.com/vit1 by choosing the fund's name and then scrolling to the “Resources” section and clicking on the “Announcements” tab, if any.
Information About Fund Contracts and Legal Claims
The fund has entered into contractual arrangements with an investment adviser, administrator, distributor, shareholder servicing agent, and custodian who each provide services to the fund. Unless expressly stated otherwise, shareholders are not parties to, or intended beneficiaries of these contractual arrangements, and these contractual arrangements are not intended to create any shareholder right to enforce them against the service providers or to seek any remedy under them against the service providers, either directly or on behalf of the fund.
Under the Trust’s By-Laws and Declaration of Trust, any claims asserted against or on behalf of the MFS Funds, including claims against Trustees and Officers, must be brought in state and federal courts located within the Commonwealth of Massachusetts.
Federal Tax Information (unaudited)
The following information is provided pursuant to provisions of the Internal Revenue Code.
The fund designates $21,392,000 as capital gain dividends paid during the fiscal year.
The fund intends to pass through the maximum amount allowable as Section 163(j) Interest Dividends as defined in Treasury Regulation §1.163(j)-1(b).
| FACTS | WHAT DOES MFS DO WITH YOUR PERSONAL INFORMATION? |
| Why? | Financial companies choose how they share your personal information. Federal law gives consumers the right to limit some but not all sharing. Federal law also requires us to tell you how we collect, share, and protect your personal information. Please read this notice carefully to understand what we do. |
| What? | The types of personal information we collect and share depend on the product or service you have with us. This information can include: |
| • Social Security number and account balances |
| • Account transactions and transaction history |
| • Checking account information and wire transfer instructions |
| When you are no longer our customer, we continue to share your information as described in this notice. |
| How? | All financial companies need to share customers' personal information to run their everyday business. In the section below, we list the reasons financial companies can share their customers' personal information; the reasons MFS chooses to share; and whether you can limit this sharing. |
Reasons we can share your
personal information | Does MFS share? | Can you limit
this sharing? |
For our everyday business purposes –
such as to process your transactions, maintain your
account(s), respond to court orders and legal
investigations, or report to credit bureaus | Yes | No |
For our marketing purposes –
to offer our products and services to you | No | We don't share |
For joint marketing with other
financial companies | No | We don't share |
For our affiliates' everyday business purposes –
information about your transactions and experiences | No | We don't share |
For our affiliates' everyday business purposes –
information about your creditworthiness | No | We don't share |
| For nonaffiliates to market to you | No | We don't share |
| Questions? | Call 800-225-2606 or go to mfs.com. |
| Who we are |
| Who is providing this notice? | MFS Funds, MFS Investment Management, MFS Institutional Advisors, Inc., and MFS Heritage Trust Company. |
| What we do |
How does MFS
protect my personal
information? | To protect your personal information from unauthorized access and use, we use security measures that comply with federal law. These measures include procedural, electronic, and physical safeguards for the protection of the personal information we collect about you. |
How does MFS
collect my personal
information? | We collect your personal information, for example, when you |
| • open an account or provide account information |
| • direct us to buy securities or direct us to sell your securities |
| • make a wire transfer |
| We also collect your personal information from others, such as credit bureaus, affiliates, or other companies. |
| Why can't I limit all sharing? | Federal law gives you the right to limit only |
| • sharing for affiliates' everyday business purposes – information about your creditworthiness |
| • affiliates from using your information to market to you |
| • sharing for nonaffiliates to market to you |
| State laws and individual companies may give you additional rights to limit sharing. |
| Definitions |
| Affiliates | Companies related by common ownership or control. They can be financial and nonfinancial companies. |
| • MFS does not share personal information with affiliates, except for everyday business purposes as described on page one of this notice. |
| Nonaffiliates | Companies not related by common ownership or control. They can be financial and nonfinancial companies. |
| • MFS does not share with nonaffiliates so they can market to you. |
| Joint marketing | A formal agreement between nonaffiliated financial companies that together market financial products or services to you. |
| • MFS doesn't jointly market. |
| Other important information |
| If you own an MFS product or receive an MFS service in the name of a third party such as a bank or broker-dealer, their privacy policy may apply to you instead of ours. |
Annual Report
December 31, 2022
MFS® Variable Insurance Trust
| 1 |
| 2 |
| 3 |
| 5 |
| 7 |
| 8 |
| 13 |
| 14 |
| 15 |
| 16 |
| 18 |
| 24 |
| 25 |
| 28 |
| 30 |
| 30 |
| 30 |
| 30 |
| 30 |
| 31 |
The report is prepared for the general information of shareholders. It is authorized for distribution to prospective investors only when preceded or accompanied by a current prospectus.
NOT FDIC INSURED • MAY LOSE VALUE • NO BANK OR CREDIT UNION GUARANTEE •
NOT A DEPOSIT • NOT INSURED BY ANY FEDERAL GOVERNMENT AGENCY OR NCUA/NCUSIF
LETTER FROM THE CHAIR AND CEO
Dear Shareholders:
Signs of peaking inflation, hopes that monetary policy tightening cycles may be nearing an end and a rapid reopening of China’s economy in late-2022 and early-2023 have combined to bolster investor sentiment in recent months. Markets have largely adjusted to the challenges posed by Russia’s invasion of Ukraine, thanks in part to mild European winter weather which has alleviated concerns over potential shortages of natural gas. Resilient labor markets in much of the developed world have further contributed to a brighter-than-expected economic backdrop. However, many investors are mindful that the lagged effects of ongoing policy tightening have yet to work their way through the global economy.
Tighter global financial conditions have been a particular headwind for richly valued growth equities and interest rate-sensitive parts of the economy, such as housing. Over the near term, companies may face a challenging earnings backdrop as they are forced to absorb higher input and labor costs at a time of dwindling pricing power. For fixed income, the rise in interest rates has made bonds more attractive than they have been in years, which may provide balance to an overall portfolio.
During times of market transition, it is important to have a deep understanding of company fundamentals, and we have built our unique global research platform to do just that.
At MFS®, we put our clients’ assets to work responsibly by carefully navigating increasingly complex global capital markets. Our investment team is guided by a commitment to long-term fundamental investing. Our global investment platform — combining collective expertise, long-term discipline, and thoughtful risk management — seeks to uncover what we believe are the best, most durable investment ideas in markets around the world, enabling us to potentially create value for investors.
Respectfully,
Michael W. Roberge
Chair and Chief Executive Officer
MFS Investment Management
February 15, 2023
The opinions expressed in this letter are subject to change and may not be relied upon for investment advice. No forecasts can be guaranteed.
Portfolio structure
Top ten holdings
| Microsoft Corp. | 6.9% |
| Alphabet, Inc., “A” | 3.7% |
| Apple, Inc. | 3.0% |
| Amazon.com, Inc. | 2.8% |
| Visa, Inc., “A” | 2.7% |
| JPMorgan Chase & Co. | 2.0% |
| ConocoPhillips | 1.9% |
| Accenture PLC, “A” | 1.6% |
| Cigna Corp. | 1.6% |
| Charles Schwab Corp. | 1.5% |
Global equity sectors (k)
| Technology | 27.1% |
| Health Care | 16.0% |
| Financial Services | 14.5% |
| Capital Goods | 14.1% |
| Consumer Cyclicals | 11.3% |
| Energy | 8.3% |
| Consumer Staples | 5.3% |
| Telecommunications/Cable Television (s) | 2.3% |
| (k) | The sectors set forth above and the associated portfolio composition are based on MFS’ own custom sector classification methodology. |
| (s) | Includes securities sold short. |
Cash & Cash Equivalents includes any cash, investments in money market funds, short-term securities, and other assets less liabilities. Please see the Statement of Assets and Liabilities for additional information related to the fund’s cash position and other assets and liabilities.
Percentages are based on net assets as of December 31, 2022.
The portfolio is actively managed and current holdings may be different.
Management Review
Summary of Results
For the twelve months ended December 31, 2022, Initial Class shares of the MFS Research Series (fund) provided a total return of -17.21%, while Service Class shares of the fund provided a total return of -17.43%. These compare with a return of -18.11% over the same period for the fund’s benchmark, the Standard & Poor’s 500 Stock Index (S&P 500 Index).
Market Environment
During the reporting period, markets continued to grapple with the strongest global inflationary pressures in decades along with signs of slowing economic growth. Intermittent coronavirus flareups, particularly in China, where home-grown vaccines have proved less effective than elsewhere, kept supply chains stretched for a considerable period. At the same time, the reopening of the economy in the parts of the world where the virus has been better contained has led to a shift in consumption patterns in favor of services, straining already tight labor markets in most developed economies, while reducing demand for manufactured goods, primarily from Asia. As a result of Russia’s invasion of Ukraine, geopolitical considerations, such as sanctions and trade bans, have resulted in additional supply chain disruptions and volatile global energy prices. Taken together, these factors have contributed to market volatility.
The ripple effects from the Russian invasion further complicated the mission central banks must undertake to rein in surging inflation. Energy shocks have historically resulted in global growth slowdowns, if not pullbacks, so policymakers will find themselves in the difficult position of trying to restrain inflation without tipping economies into recession. Despite the challenging macroeconomic and geopolitical environment, policymakers remained focused on controlling inflation, although investors appeared to have expected varying degrees of action from the central banks. The Fed has been among the most aggressive developed market central banks, tightening policy at the fastest rate in decades, although it slowed its hiking pace at the end of the period, as did the European Central Bank. After remaining on the monetary sidelines for much of the period, the Bank of Japan widened its Yield Curve Control band, capping the yield on its 10-year bond at 0.5%, up from 0.25%, an action investors interpreted as a first step toward monetary policy normalization.
Against an environment of still-tight labor markets, tighter global financial conditions and volatile materials prices, investor anxiety appeared to have increased over the potential that corporate profit margins may be past peak for this cycle. That said, tentative signs that supply chain bottlenecks (particularly semiconductors) may be moderating, the easing of COVID restrictions in China, low levels of unemployment across developed markets and hopes that inflation levels may be near a peak were supportive factors for the macroeconomic backdrop.
Contributors to Performance
Stock selection within both the capital goods and health care sectors contributed to the fund’s performance relative to the S&P 500 Index. Within the capital goods sector, not owning shares of electric vehicle manufacturer Tesla contributed to relative performance. The stock price of Tesla declined due to uncertainty surrounding production shutdowns at the company's Shanghai manufacturing plant, reduced vehicle deliveries, increased competitive concerns and questions regarding Tesla CEO Elon Musk’s acquisition of social media platform Twitter. Within the health care sector, the fund’s overweight holdings of global health services provider Cigna, biotechnology company Vertex Pharmaceuticals, health services company McKesson and pharmaceutical company Merck aided relative performance.
In other sectors, the fund’s overweight holdings of oil and gas company ConocoPhillips and global integrated oil and gas company Hess benefited relative performance as both stocks outperformed the benchmark. Not owning shares of weak-performing computer graphics processor maker NVIDIA also contributed to relative performance. The fund’s underweight positions in both social networking service provider Meta Platforms(h) and computer and personal electronics maker Apple further supported relative returns. The stock price of Apple came under pressure due to concerns over supply chain disruptions and slowing iPhone volumes.
Detractors from Performance
Security selection in the telecommunications/cable television sector detracted from the fund’s relative performance, led by its overweight position in cable services provider Charter Communications. The stock price of Charter Communications declined as the company reported below-consensus financial results, primarily driven by residential video subscriber net losses that were greater than expected.
Stock selection within the energy sector also weakened the fund’s relative performance. Here, not owning shares of strong-performing integrated energy companies, ExxonMobil and Chevron, detracted from relative returns. The stock price of Chevron climbed as the company posted above-consensus earnings due to strength in global LNG demand and better-than-expected upstream earnings.
Management Review - continued
Elsewhere, the fund’s overweight holdings of technology company Alphabet and customer information software manager Salesforce(h) held back relative returns as both stocks underperformed the benchmark. The fund’s holdings of software development company Atlassian(b) and drug and diagnostic company Maravai Lifesciences Holdings(b) also weakened relative performance. The stock price of Maravai Lifesciences Holdings declined after the company lowered its guidance for 2023, notably lowering its COVID CleanCap outlook given the slower uptake of bivalent boosters. Not owning shares of health insurance and Medicare/Medicaid provider UnitedHealth Group, insurance and investment firm Berkshire Hathaway and pharmaceutical company Abbvie further weighed on the fund’s relative performance.
Respectfully,
Portfolio Manager(s)
Joseph MacDougall
| (b) | Security is not a benchmark constituent. |
| (h) | Security was not held in the portfolio at period end. |
The views expressed in this report are those of the portfolio manager(s) only through the end of the period of the report as stated on the cover and do not necessarily reflect the views of MFS or any other person in the MFS organization. These views are subject to change at any time based on market or other conditions, and MFS disclaims any responsibility to update such views. These views may not be relied upon as investment advice or an indication of trading intent on behalf of any MFS portfolio. References to specific securities are not recommendations of such securities, and may not be representative of any MFS portfolio’s current or future investments.
Performance Summary Through 12/31/22
The following chart illustrates the historical performance of the fund in comparison to its benchmark(s). Benchmarks are unmanaged and may not be invested in directly. Benchmark returns do not reflect any fees or expenses. The performance of other share classes will be greater than or less than that of the class depicted below. (See Notes to Performance Summary.)
Performance data shown represents past performance and is no guarantee of future results. Investment return and principal value fluctuate so your shares, when sold, may be worth more or less than the original cost; current performance may be lower or higher than quoted. The performance shown does not reflect the deduction of taxes, if any, that a shareholder would pay on fund distributions or the redemption of fund shares. The returns for the fund shown also do not reflect the deduction of expenses associated with variable products, such as mortality and expense risk charges, separate account charges, and sales charges imposed by the insurance company separate accounts. Such expenses would reduce the overall returns shown.
Growth of a Hypothetical $10,000 Investment
Total Returns through 12/31/22
Average annual total returns
| Share Class | Class Inception Date | 1-yr | 5-yr | 10-yr |
| Initial Class | 7/26/95 | (17.21)% | 8.90% | 11.68% |
| Service Class | 5/01/00 | (17.43)% | 8.62% | 11.41% |
Comparative benchmark(s)
| Standard & Poor's 500 Stock Index (f) | (18.11)% | 9.42% | 12.56% |
| (f) | Source: FactSet Research Systems Inc. |
Benchmark Definition(s)
Standard & Poor's 500 Stock Index(g) – a market capitalization-weighted index of 500 widely held equity securities, designed to measure broad U.S. equity performance.
It is not possible to invest directly in an index.
| (g) | “Standard & Poor's®” and “S&P®” are registered trademarks of Standard & Poor's Financial Services LLC (“S&P”) and Dow Jones is a registered trademark of Dow Jones Trademark Holdings LLC (“Dow Jones”) and have been licensed for use by S&P Dow Jones Indices LLC and sublicensed for certain purposes by MFS. The S&P 500® is a product of S&P Dow Jones Indices LLC, and has been licensed for use by MFS. MFS's product(s) is not sponsored, endorsed, sold, or promoted by S&P Dow Jones Indices LLC, Dow Jones, S&P, or their respective affiliates, and neither S&P Dow Jones Indices LLC, Dow Jones, S&P, nor their respective affiliates make any representation regarding the advisability of investing in such product(s). |
Performance Summary – continued
Notes to Performance Summary
Average annual total return represents the average annual change in value for each share class for the periods presented.
Performance results reflect any applicable expense subsidies and waivers in effect during the periods shown. Without such subsidies and waivers the fund's performance results would be less favorable. Please see the prospectus and financial statements for complete details. All results are historical and assume the reinvestment of any dividends and capital gains distributions.
Performance results do not include adjustments made for financial reporting purposes in accordance with U.S. generally accepted accounting principles and may differ from amounts reported in the financial highlights.
From time to time the fund may receive proceeds from litigation settlements, without which performance would be lower.
Expense Table
Fund expenses borne by the shareholders during the period,
July 1, 2022 through December 31, 2022
As a shareholder of the fund, you incur ongoing costs, including management fees; distribution and/or service (12b-1) fees; and other fund expenses. This example is intended to help you understand your ongoing costs (in dollars) of investing in the fund and to compare these costs with the ongoing costs of investing in other mutual funds.
The example is based on an investment of $1,000 invested at the beginning of the period and held for the entire period July 1, 2022 through December 31, 2022.
Actual Expenses
The first line for each share class in the following table provides information about actual account values and actual expenses. You may use the information in this line, together with the amount you invested, to estimate the expenses that you paid over the period. Simply divide your account value by $1,000 (for example, an $8,600 account value divided by $1,000 = 8.6), then multiply the result by the number in the first line under the heading entitled “Expenses Paid During Period” to estimate the expenses you paid on your account during this period.
Hypothetical Example for Comparison Purposes
The second line for each share class in the following table provides information about hypothetical account values and hypothetical expenses based on the fund’s actual expense ratio and an assumed rate of return of 5% per year before expenses, which is not the fund’s actual return. The hypothetical account values and expenses may not be used to estimate the actual ending account balance or expenses you paid for the period. You may use this information to compare the ongoing costs of investing in the fund and other funds. To do so, compare this 5% hypothetical example with the 5% hypothetical examples that appear in the shareholder reports of the other funds.
Please note that the expenses shown in the table are meant to highlight the fund's ongoing costs only and do not take into account the fees and expenses imposed under the variable contracts through which your investment in the fund is made. Therefore, the second line for each share class in the table is useful in comparing ongoing costs associated with an investment in vehicles (such as the fund) which fund benefits under variable annuity and variable life insurance contracts and to qualified pension and retirement plans only, and will not help you determine the relative total costs of investing in the fund through variable annuity and variable life insurance contracts. If the fees and expenses imposed under the variable contracts were included, your costs would have been higher.
Share
Class | | Annualized
Expense
Ratio | Beginning
Account Value
7/01/22 | Ending
Account Value
12/31/22 | Expenses
Paid During
Period (p)
7/01/22-12/31/22 |
| Initial Class | Actual | 0.79% | $1,000.00 | $1,027.94 | $4.04 |
| Hypothetical (h) | 0.79% | $1,000.00 | $1,021.22 | $4.02 |
| Service Class | Actual | 1.04% | $1,000.00 | $1,026.55 | $5.31 |
| Hypothetical (h) | 1.04% | $1,000.00 | $1,019.96 | $5.30 |
| (h) | 5% class return per year before expenses. |
| (p) | “Expenses Paid During Period” are equal to each class's annualized expense ratio, as shown above, multiplied by the average account value over the period, multiplied by 184/365 (to reflect the one-half year period). |
Notes to Expense Table
Expense ratios include 0.02% of investment related expenses from short sales (See Note 2 of the Notes to Financial Statements) that are outside of the expense limitation arrangement (See Note 3 of the Notes to Financial Statements).
Portfolio of Investments − 12/31/22
The Portfolio of Investments is a complete list of all securities owned by your fund. It is categorized by broad-based asset classes.
| Issuer | | | Shares/Par | Value ($) |
| Common Stocks – 99.3% |
| Aerospace & Defense – 4.5% | |
| General Dynamics Corp. | | 20,476 | $ 5,080,300 |
| Honeywell International, Inc. | | 38,617 | 8,275,623 |
| Howmet Aerospace, Inc. | | 117,212 | 4,619,325 |
| Leidos Holdings, Inc. | | 16,193 | 1,703,342 |
| Northrop Grumman Corp. | | 8,365 | 4,564,028 |
| Raytheon Technologies Corp. | | 70,455 | 7,110,318 |
| | | | | $31,352,936 |
| Alcoholic Beverages – 0.6% | |
| Constellation Brands, Inc., “A” | | 18,018 | $ 4,175,671 |
| Apparel Manufacturers – 1.0% | |
| NIKE, Inc., “B” | | 60,107 | $ 7,033,120 |
| Automotive – 0.4% | |
| Aptiv PLC (a) | | 26,290 | $ 2,448,388 |
| Biotechnology – 0.2% | |
| Illumina, Inc. (a) | | 8,480 | $ 1,714,656 |
| Broadcasting – 0.1% | |
| Warner Bros. Discovery, Inc. (a) | | 78,346 | $ 742,720 |
| Brokerage & Asset Managers – 2.2% | |
| Charles Schwab Corp. | | 128,840 | $ 10,727,219 |
| CME Group, Inc. | | 28,426 | 4,780,116 |
| | | | | $15,507,335 |
| Business Services – 3.5% | |
| Accenture PLC, “A” | | 42,994 | $ 11,472,519 |
| Equifax, Inc. | | 15,048 | 2,924,729 |
| Fidelity National Information Services, Inc. | | 83,280 | 5,650,548 |
| Fiserv, Inc. (a) | | 33,978 | 3,434,157 |
| Thoughtworks Holding, Inc. (a) | | 105,342 | 1,073,435 |
| | | | | $24,555,388 |
| Cable TV – 1.0% | |
| Cable One, Inc. | | 4,959 | $ 3,530,114 |
| Charter Communications, Inc., “A” (a) | | 10,360 | 3,513,076 |
| | | | | $7,043,190 |
| Computer Software – 11.5% | |
| Adobe Systems, Inc. (a) | | 18,193 | $ 6,122,490 |
| Atlassian Corp. (a) | | 15,264 | 1,964,172 |
| Black Knight, Inc. (a) | | 74,432 | 4,596,176 |
| Cadence Design Systems, Inc. (a) | | 36,625 | 5,883,440 |
| Elastic N.V. (a) | | 27,619 | 1,422,378 |
| Microsoft Corp. (s) | | 200,044 | 47,974,552 |
| NICE Systems Ltd., ADR (a) | | 15,786 | 3,035,648 |
| Palo Alto Networks, Inc. (a) | | 12,316 | 1,718,575 |
| Salesforce, Inc. (a) | | 57,236 | 7,588,921 |
| | | | | $80,306,352 |
Portfolio of Investments – continued
| Issuer | | | Shares/Par | Value ($) |
| Common Stocks – continued |
| Computer Software - Systems – 3.8% | |
| Apple, Inc. (s) | | 160,313 | $ 20,829,468 |
| Constellation Software, Inc. | | 3,435 | 5,362,964 |
| | | | | $26,192,432 |
| Construction – 2.2% | |
| AZEK Co., Inc. (a) | | 102,918 | $ 2,091,293 |
| Masco Corp. | | 76,958 | 3,591,630 |
| Sherwin-Williams Co. | | 19,824 | 4,704,830 |
| Vulcan Materials Co. | | 26,790 | 4,691,197 |
| | | | | $15,078,950 |
| Consumer Products – 1.7% | |
| Colgate-Palmolive Co. | | 68,984 | $ 5,435,250 |
| International Flavors & Fragrances, Inc. | | 17,969 | 1,883,870 |
| Kimberly-Clark Corp. | | 30,771 | 4,177,163 |
| | | | | $11,496,283 |
| Consumer Services – 0.3% | |
| Bright Horizons Family Solutions, Inc. (a) | | 37,467 | $ 2,364,168 |
| Electrical Equipment – 1.7% | |
| Johnson Controls International PLC | | 109,434 | $ 7,003,776 |
| TE Connectivity Ltd. | | 32,010 | 3,674,748 |
| Vertiv Holdings Co. | | 100,673 | 1,375,193 |
| | | | | $12,053,717 |
| Electronics – 2.8% | |
| Applied Materials, Inc. | | 64,512 | $ 6,282,178 |
| Lam Research Corp. | | 9,719 | 4,084,896 |
| Marvell Technology, Inc. | | 43,793 | 1,622,093 |
| NXP Semiconductors N.V. | | 47,006 | 7,428,358 |
| | | | | $19,417,525 |
| Energy - Independent – 4.8% | |
| ConocoPhillips | | 113,639 | $ 13,409,402 |
| Diamondback Energy, Inc. | | 31,161 | 4,262,202 |
| Hess Corp. | | 52,324 | 7,420,590 |
| Pioneer Natural Resources Co. | | 17,909 | 4,090,236 |
| Valero Energy Corp. | | 31,463 | 3,991,396 |
| | | | | $33,173,826 |
| Energy - Renewables – 0.1% | |
| Generac Holdings, Inc. (a) | | 4,738 | $ 476,927 |
| Food & Beverages – 2.3% | |
| Hostess Brands, Inc. (a) | | 74,974 | $ 1,682,417 |
| Mondelez International, Inc. | | 80,993 | 5,398,183 |
| Oatly Group AB, ADR (a)(l) | | 248,053 | 431,612 |
| PepsiCo, Inc. | | 48,367 | 8,737,982 |
| | | | | $16,250,194 |
| Gaming & Lodging – 0.4% | |
| Marriott International, Inc., “A” | | 19,441 | $ 2,894,570 |
Portfolio of Investments – continued
| Issuer | | | Shares/Par | Value ($) |
| Common Stocks – continued |
| General Merchandise – 1.6% | |
| Dollar General Corp. | | 17,974 | $ 4,426,097 |
| Dollar Tree, Inc. (a) | | 23,424 | 3,313,091 |
| Five Below, Inc. (a) | | 18,362 | 3,247,687 |
| | | | | $10,986,875 |
| Health Maintenance Organizations – 2.2% | |
| Cigna Corp. | | 33,583 | $ 11,127,391 |
| Humana, Inc. | | 8,028 | 4,111,861 |
| | | | | $15,239,252 |
| Insurance – 3.1% | |
| Aon PLC | | 26,711 | $ 8,017,039 |
| Chubb Ltd. | | 39,398 | 8,691,199 |
| Willis Towers Watson PLC | | 18,591 | 4,546,987 |
| | | | | $21,255,225 |
| Internet – 4.8% | |
| Alphabet, Inc., “A” (a)(s) | | 290,135 | $ 25,598,611 |
| Alphabet, Inc., “C” (a) | | 53,612 | 4,756,993 |
| Gartner, Inc. (a) | | 8,153 | 2,740,549 |
| | | | | $33,096,153 |
| Leisure & Toys – 0.8% | |
| Electronic Arts, Inc. | | 43,516 | $ 5,316,785 |
| Machinery & Tools – 1.9% | |
| Ingersoll Rand, Inc. | | 45,524 | $ 2,378,629 |
| PACCAR, Inc. | | 37,493 | 3,710,682 |
| Regal Rexnord Corp. | | 21,503 | 2,579,930 |
| Wabtec Corp. | | 45,369 | 4,528,280 |
| | | | | $13,197,521 |
| Major Banks – 4.6% | |
| JPMorgan Chase & Co. (s) | | 101,723 | $ 13,641,054 |
| Morgan Stanley | | 91,967 | 7,819,034 |
| PNC Financial Services Group, Inc. | | 34,275 | 5,413,394 |
| Wells Fargo & Co. | | 129,075 | 5,329,507 |
| | | | | $32,202,989 |
| Medical & Health Technology & Services – 1.4% | |
| ICON PLC (a) | | 22,242 | $ 4,320,508 |
| McKesson Corp. | | 14,405 | 5,403,604 |
| | | | | $9,724,112 |
| Medical Equipment – 5.5% | |
| Becton, Dickinson and Co. | | 21,250 | $ 5,403,875 |
| Boston Scientific Corp. (a) | | 172,477 | 7,980,511 |
| Danaher Corp. | | 38,177 | 10,132,939 |
| Envista Holdings Corp. (a) | | 85,965 | 2,894,442 |
| Maravai Lifesciences Holdings, Inc., “A” (a) | | 111,572 | 1,596,595 |
| Medtronic PLC | | 80,063 | 6,222,496 |
| STERIS PLC | | 22,210 | 4,101,965 |
| | | | | $38,332,823 |
Portfolio of Investments – continued
| Issuer | | | Shares/Par | Value ($) |
| Common Stocks – continued |
| Network & Telecom – 0.7% | |
| Equinix, Inc., REIT | | 7,286 | $ 4,772,549 |
| Other Banks & Diversified Financials – 3.7% | |
| Moody's Corp. | | 11,998 | $ 3,342,883 |
| Northern Trust Corp. | | 43,843 | 3,879,667 |
| Visa, Inc., “A” | | 89,017 | 18,494,172 |
| | | | | $25,716,722 |
| Pharmaceuticals – 6.6% | |
| Eli Lilly & Co. | | 26,969 | $ 9,866,339 |
| Johnson & Johnson | | 40,223 | 7,105,393 |
| Merck & Co., Inc. | | 87,044 | 9,657,532 |
| Pfizer, Inc. | | 126,854 | 6,499,999 |
| Vertex Pharmaceuticals, Inc. (a) | | 27,678 | 7,992,853 |
| Zoetis, Inc. | | 32,612 | 4,779,288 |
| | | | | $45,901,404 |
| Railroad & Shipping – 1.4% | |
| Canadian Pacific Railway Ltd. | | 85,291 | $ 6,361,856 |
| CSX Corp. | | 112,044 | 3,471,123 |
| | | | | $9,832,979 |
| Real Estate – 0.9% | |
| Extra Space Storage, Inc., REIT | | 16,708 | $ 2,459,083 |
| Jones Lang LaSalle, Inc. (a) | | 8,362 | 1,332,652 |
| STORE Capital Corp., REIT | | 83,784 | 2,686,115 |
| | | | | $6,477,850 |
| Restaurants – 1.4% | |
| Starbucks Corp. | | 59,318 | $ 5,884,346 |
| Wendy's Co. | | 156,056 | 3,531,547 |
| | | | | $9,415,893 |
| Specialty Chemicals – 1.9% | |
| Air Products & Chemicals, Inc. | | 16,708 | $ 5,150,408 |
| Axalta Coating Systems Ltd. (a) | | 84,105 | 2,142,155 |
| DuPont de Nemours, Inc. | | 90,513 | 6,211,907 |
| | | | | $13,504,470 |
| Specialty Stores – 5.7% | |
| Amazon.com, Inc. (a)(s) | | 233,962 | $ 19,652,808 |
| Home Depot, Inc. | | 32,515 | 10,270,188 |
| Ross Stores, Inc. | | 44,276 | 5,139,115 |
| Target Corp. | | 30,191 | 4,499,667 |
| | | | | $39,561,778 |
| Telecommunications - Wireless – 1.8% | |
| SBA Communications Corp., REIT | | 32,440 | $ 9,093,256 |
| T-Mobile US, Inc. (a) | | 22,478 | 3,146,920 |
| | | | | $12,240,176 |
| Tobacco – 0.7% | |
| Philip Morris International, Inc. | | 51,484 | $ 5,210,696 |
Portfolio of Investments – continued
| Issuer | | | Shares/Par | Value ($) |
| Common Stocks – continued |
| Utilities - Electric Power – 3.5% | |
| Alliant Energy Corp. | | 77,613 | $ 4,285,014 |
| American Electric Power Co., Inc. | | 35,216 | 3,343,759 |
| Duke Energy Corp. | | 56,059 | 5,773,516 |
| NextEra Energy, Inc. | | 71,811 | 6,003,400 |
| PG&E Corp. (a) | | 301,558 | 4,903,333 |
| | | | | $24,309,022 |
| Total Common Stocks (Identified Cost, $489,720,492) | | $690,573,622 |
| Investment Companies (h) – 1.1% |
| Money Market Funds – 1.1% | |
| MFS Institutional Money Market Portfolio, 4.02% (v) (Identified Cost, $7,720,196) | | | 7,719,773 | $ 7,722,089 |
| Collateral for Securities Loaned – 0.0% |
| State Street Navigator Securities Lending Government Money Market Portfolio, 4.33% (j) (Identified Cost, $232,852) | | | 232,852 | $ 232,852 |
| Securities Sold Short – (0.4)% |
| Telecommunications - Wireless – (0.4)% |
| Crown Castle, Inc., REIT (Proceeds Received, $2,964,530) | | | (23,778) | $ (3,225,248) |
| Other Assets, Less Liabilities – 0.0% | | 296,496 |
| Net Assets – 100.0% | $695,599,811 |
| (a) | Non-income producing security. | | | |
| (h) | An affiliated issuer, which may be considered one in which the fund owns 5% or more of the outstanding voting securities, or a company which is under common control. At period end, the aggregate values of the fund's investments in affiliated issuers and in unaffiliated issuers were $7,722,089 and $690,806,474, respectively. | | | |
| (j) | The rate quoted is the annualized seven-day yield of the fund at period end. | | | |
| (l) | A portion of this security is on loan. See Note 2 for additional information. | | | |
| (s) | Security or a portion of the security was pledged to cover collateral requirements for securities sold short. | | | |
| (v) | Affiliated issuer that is available only to investment companies managed by MFS. The rate quoted for the MFS Institutional Money Market Portfolio is the annualized seven-day yield of the fund at period end. | | | |
| The following abbreviations are used in this report and are defined: |
| ADR | American Depositary Receipt |
| REIT | Real Estate Investment Trust |
At December 31, 2022, the fund had cash collateral of $97,361 and other liquid securities with an aggregate value of $9,620,254 to cover any collateral or margin obligations for securities sold short. Restricted cash and/or deposits with brokers in the Statement of Assets and Liabilities are comprised of cash collateral.
See Notes to Financial Statements
| Financial Statements | Statement of Assets and Liabilities |
This statement represents your fund’s balance sheet, which details the assets and liabilities comprising the total value of the fund.
| At 12/31/22Assets | |
| Investments in unaffiliated issuers, at value, including $215,805 of securities on loan (identified cost, $489,953,344) | $690,806,474 |
| Investments in affiliated issuers, at value (identified cost, $7,720,196) | 7,722,089 |
| Deposits with brokers for | |
| Securities sold short | 97,361 |
| Receivables for | |
| Fund shares sold | 73,696 |
| Interest and dividends | 883,851 |
| Other assets | 3,081 |
| Total assets | $699,586,552 |
| Liabilities | |
| Payables for | |
| Securities sold short, at value (proceeds received, $2,964,530) | $3,225,248 |
| Fund shares reacquired | 373,223 |
| Collateral for securities loaned, at value (c) | 232,852 |
| Payable to affiliates | |
| Investment adviser | 34,736 |
| Administrative services fee | 873 |
| Shareholder servicing costs | 473 |
| Distribution and/or service fees | 5,953 |
| Payable for independent Trustees' compensation | 13 |
| Accrued expenses and other liabilities | 113,370 |
| Total liabilities | $3,986,741 |
| Net assets | $695,599,811 |
| Net assets consist of | |
| Paid-in capital | $456,725,627 |
| Total distributable earnings (loss) | 238,874,184 |
| Net assets | $695,599,811 |
| Shares of beneficial interest outstanding | 25,287,369 |
| | Net assets | Shares
outstanding | Net asset value
per share |
| Initial Class | $405,178,482 | 14,608,881 | $27.74 |
| Service Class | 290,421,329 | 10,678,488 | 27.20 |
| (c) | Non-cash collateral is not included. |
See Notes to Financial Statements
| Financial Statements | Statement of Operations |
This statement describes how much your fund earned in investment income and accrued in expenses. It also describes any gains and/or losses generated by fund operations.
| Year ended 12/31/22 | |
| Net investment income (loss) | |
| Income | |
| Dividends | $10,361,781 |
| Dividends from affiliated issuers | 77,737 |
| Other | 10,837 |
| Income on securities loaned | 1,412 |
| Foreign taxes withheld | (33,480) |
| Total investment income | $10,418,287 |
| Expenses | |
| Management fee | $5,368,398 |
| Distribution and/or service fees | 815,570 |
| Shareholder servicing costs | 29,571 |
| Administrative services fee | 120,258 |
| Independent Trustees' compensation | 12,936 |
| Custodian fee | 38,815 |
| Shareholder communications | 22,144 |
| Audit and tax fees | 63,898 |
| Legal fees | 2,926 |
| Dividend and interest expense on securities sold short | 161,891 |
| Interest expense and fees | 3,176 |
| Miscellaneous | 30,713 |
| Total expenses | $6,670,296 |
| Reduction of expenses by investment adviser | (183,598) |
| Net expenses | $6,486,698 |
| Net investment income (loss) | $3,931,589 |
| Realized and unrealized gain (loss) | |
| Realized gain (loss) (identified cost basis) | |
| Unaffiliated issuers | $35,481,848 |
| Affiliated issuers | (2,063) |
| Foreign currency | 1,532 |
| Net realized gain (loss) | $35,481,317 |
| Change in unrealized appreciation or depreciation | |
| Unaffiliated issuers | $(177,395,305) |
| Affiliated issuers | 1,885 |
| Securities sold short | 1,345,978 |
| Translation of assets and liabilities in foreign currencies | (120) |
| Net unrealized gain (loss) | $(176,047,562) |
| Net realized and unrealized gain (loss) | $(140,566,245) |
| Change in net assets from operations | $(136,634,656) |
See Notes to Financial Statements
| Financial Statements | Statements of Changes in Net Assets |
These statements describe the increases and/or decreases in net assets resulting from operations, any distributions, and any shareholder transactions.
| | Year ended |
| | 12/31/22 | 12/31/21 |
| Change in net assets | | |
| From operations | | |
| Net investment income (loss) | $3,931,589 | $1,718,115 |
| Net realized gain (loss) | 35,481,317 | 96,790,234 |
| Net unrealized gain (loss) | (176,047,562) | 71,595,011 |
| Change in net assets from operations | $(136,634,656) | $170,103,360 |
| Total distributions to shareholders | $(99,101,437) | $(46,739,322) |
| Change in net assets from fund share transactions | $149,469,874 | $(89,224,453) |
| Total change in net assets | $(86,266,219) | $34,139,585 |
| Net assets | | |
| At beginning of period | 781,866,030 | 747,726,445 |
| At end of period | $695,599,811 | $781,866,030 |
See Notes to Financial Statements
| Financial Statements | Financial Highlights |
The financial highlights table is intended to help you understand the fund's financial performance for the past 5 years. Certain information reflects financial results for a single fund share. The total returns in the table represent the rate that an investor would have earned (or lost) on an investment in the fund share class (assuming reinvestment of all distributions) held for the entire period.
| Initial Class | Year ended |
| | 12/31/22 | 12/31/21 | 12/31/20 | 12/31/19 | 12/31/18 |
| Net asset value, beginning of period | $38.59 | $32.87 | $29.49 | $24.93 | $29.50 |
| Income (loss) from investment operations | | | | | |
| Net investment income (loss) (d) | $0.21 | $0.13 | $0.18 | $0.23 | $0.26 |
| Net realized and unrealized gain (loss) | (6.62) | 7.92 | 4.62 | 7.66 | (1.04) |
| Total from investment operations | $(6.41) | $8.05 | $4.80 | $7.89 | $(0.78) |
| Less distributions declared to shareholders | | | | | |
| From net investment income | $(0.16) | $(0.20) | $(0.22) | $(0.24) | $(0.22) |
| From net realized gain | (4.28) | (2.13) | (1.20) | (3.09) | (3.57) |
| Total distributions declared to shareholders | $(4.44) | $(2.33) | $(1.42) | $(3.33) | $(3.79) |
| Net asset value, end of period (x) | $27.74 | $38.59 | $32.87 | $29.49 | $24.93 |
| Total return (%) (k)(r)(s)(x) | (17.21) | 24.80 | 16.59 | 32.95 | (4.37) |
Ratios (%) (to average net assets)
and Supplemental data: | | | | | |
| Expenses before expense reductions | 0.82 | 0.80 | 0.82 | 0.83 | 0.82 |
| Expenses after expense reductions | 0.79 | 0.78 | 0.79 | 0.81 | 0.81 |
| Net investment income (loss) | 0.68 | 0.35 | 0.62 | 0.82 | 0.88 |
| Portfolio turnover | 24 | 19 | 39 | 35 | 31 |
| Net assets at end of period (000 omitted) | $405,178 | $384,928 | $372,405 | $361,842 | $319,422 |
| Supplemental Ratios (%): | | | | | |
| Ratios of expenses to average net assets after expense reductions excluding short sale expenses and interest expense and fees | 0.77 | 0.77 | 0.77 | 0.78 | 0.79 |
See Notes to Financial Statements
Financial Highlights - continued
| Service Class | Year ended |
| | 12/31/22 | 12/31/21 | 12/31/20 | 12/31/19 | 12/31/18 |
| Net asset value, beginning of period | $37.92 | $32.34 | $29.05 | $24.61 | $29.17 |
| Income (loss) from investment operations | | | | | |
| Net investment income (loss) (d) | $0.12 | $0.04 | $0.11 | $0.16 | $0.18 |
| Net realized and unrealized gain (loss) | (6.50) | 7.79 | 4.54 | 7.55 | (1.03) |
| Total from investment operations | $(6.38) | $7.83 | $4.65 | $7.71 | $(0.85) |
| Less distributions declared to shareholders | | | | | |
| From net investment income | $(0.06) | $(0.12) | $(0.16) | $(0.18) | $(0.14) |
| From net realized gain | (4.28) | (2.13) | (1.20) | (3.09) | (3.57) |
| Total distributions declared to shareholders | $(4.34) | $(2.25) | $(1.36) | $(3.27) | $(3.71) |
| Net asset value, end of period (x) | $27.20 | $37.92 | $32.34 | $29.05 | $24.61 |
| Total return (%) (k)(r)(s)(x) | (17.43) | 24.51 | 16.31 | 32.60 | (4.62) |
Ratios (%) (to average net assets)
and Supplemental data: | | | | | |
| Expenses before expense reductions | 1.07 | 1.05 | 1.07 | 1.08 | 1.07 |
| Expenses after expense reductions | 1.04 | 1.03 | 1.04 | 1.06 | 1.06 |
| Net investment income (loss) | 0.39 | 0.10 | 0.37 | 0.57 | 0.63 |
| Portfolio turnover | 24 | 19 | 39 | 35 | 31 |
| Net assets at end of period (000 omitted) | $290,421 | $396,938 | $375,322 | $319,842 | $215,898 |
| Supplemental Ratios (%): | | | | | |
| Ratios of expenses to average net assets after expense reductions excluding short sale expenses and interest expense and fees | 1.02 | 1.02 | 1.02 | 1.03 | 1.04 |
| (d) | Per share data is based on average shares outstanding. |
| (k) | The total return does not reflect expenses that apply to separate accounts. Inclusion of these charges would reduce the total return figures for all periods shown. |
| (r) | Certain expenses have been reduced without which performance would have been lower. |
| (s) | From time to time the fund may receive proceeds from litigation settlements, without which performance would be lower. |
| (x) | The net asset values and total returns have been calculated on net assets which include adjustments made in accordance with U.S. generally accepted accounting principles required at period end for financial reporting purposes. |
See Notes to Financial Statements
Notes to Financial Statements
(1) Business and Organization
MFS Research Series (the fund) is a diversified series of MFS Variable Insurance Trust (the trust). The trust is organized as a Massachusetts business trust and is registered under the Investment Company Act of 1940, as amended, as an open-end management investment company. The shareholders of each series of the trust are separate accounts of insurance companies, which offer variable annuity and/or life insurance products, and qualified retirement and pension plans.
The fund is an investment company and accordingly follows the investment company accounting and reporting guidance of the Financial Accounting Standards Board (FASB) Accounting Standards Codification Topic 946 Financial Services - Investment Companies.
(2) Significant Accounting Policies
General — The preparation of financial statements in conformity with U.S. generally accepted accounting principles requires management to make estimates and assumptions that affect the reported amounts of assets and liabilities, and disclosure of contingent assets and liabilities at the date of the financial statements and the reported amounts of increases and decreases in net assets from operations during the reporting period. Actual results could differ from those estimates. In the preparation of these financial statements, management has evaluated subsequent events occurring after the date of the fund’s Statement of Assets and Liabilities through the date that the financial statements were issued.
Balance Sheet Offsetting — The fund's accounting policy with respect to balance sheet offsetting is that, absent an event of default by the counterparty or a termination of the agreement, the International Swaps and Derivatives Association (ISDA) Master Agreement, or similar agreement, does not result in an offset of reported amounts of financial assets and financial liabilities in the Statement of Assets and Liabilities across transactions between the fund and the applicable counterparty. The fund's right to setoff may be restricted or prohibited by the bankruptcy or insolvency laws of the particular jurisdiction to which a specific master netting agreement counterparty is subject. Balance sheet offsetting disclosures, to the extent applicable to the fund, have been included in the fund’s Significant Accounting Policies note under the captions for each of the fund’s in-scope financial instruments and transactions.
Investment Valuations — Subject to its oversight, the fund's Board of Trustees has delegated primary responsibility for determining or causing to be determined the value of the fund’s investments to MFS as the fund's adviser, pursuant to the fund’s valuation policy and procedures which have been adopted by the adviser and approved by the Board. Effective September 8, 2022, and in accordance with Rule 2a-5 under the Investment Company Act of 1940, the Board of Trustees designated the adviser as the “valuation designee” of the fund. If the adviser, as valuation designee, determines that reliable market quotations are not readily available for an investment, the investment is valued at fair value as determined in good faith by the adviser in accordance with the adviser’s fair valuation policy and procedures.
Under the fund's valuation policy and procedures, equity securities, including restricted equity securities and equity securities sold short, are generally valued at the last sale or official closing price on their primary market or exchange as provided by a third-party pricing service. Equity securities, for which there were no sales reported that day, are generally valued at the last quoted daily bid quotation on their primary market or exchange as provided by a third-party pricing service. Equity securities sold short, for which there were no sales reported that day, are generally valued at the last quoted daily ask quotation on their primary market or exchange as provided by a third-party pricing service. Short-term instruments with a maturity at issuance of 60 days or less may be valued at amortized cost, which approximates market value. Open-end investment companies are generally valued at net asset value per share. The values of foreign securities and other assets and liabilities expressed in foreign currencies are converted to U.S. dollars using the mean of bid and asked prices for rates provided by a third-party pricing service.
Under the fund’s valuation policy and procedures, market quotations are not considered to be readily available for debt instruments, floating rate loans, and many types of derivatives. These investments are generally valued at fair value based on information from third-party pricing services or otherwise determined by the adviser in accordance with the adviser’s fair valuation policy and procedures. Securities and other assets generally valued on the basis of information from a third-party pricing service may also be valued at a broker/dealer bid quotation. In determining values, third-party pricing services can utilize both transaction data and market information such as yield, quality, coupon rate, maturity, type of issue, trading characteristics, spreads and other market data. An investment may also be valued at fair value if the adviser determines that the investment’s value has been materially affected by events occurring after the close of the exchange or market on which the investment is principally traded (such as foreign exchange or market) and prior to the determination of the fund’s net asset value, or after the halt of trading of a specific security where trading does not resume prior to the close of the exchange or market on which the security is principally traded. Events that occur after foreign markets close (such as developments in foreign markets and significant movements in the U.S. markets) and prior to the determination of the fund’s net asset value may be deemed to have a material effect on the value of securities traded in foreign markets. Accordingly, the fund’s foreign equity securities may often be valued at fair value. The adviser generally relies on third-party
Notes to Financial Statements - continued
pricing services or other information (such as the correlation with price movements of similar securities in the same or other markets; the type, cost and investment characteristics of the security; the business and financial condition of the issuer; and trading and other market data) to assist in determining whether to fair value and at what value to fair value an investment. The value of an investment for purposes of calculating the fund’s net asset value can differ depending on the source and method used to determine value. When fair valuation is used, the value of an investment used to determine the fund’s net asset value may differ from quoted or published prices for the same investment. There can be no assurance that the fund could obtain the fair value assigned to an investment if it were to sell the investment at the same time at which the fund determines its net asset value per share.
Various inputs are used in determining the value of the fund's assets or liabilities. These inputs are categorized into three broad levels. In certain cases, the inputs used to measure fair value may fall into different levels of the fair value hierarchy. In such cases, an investment's level within the fair value hierarchy is based on the lowest level of input that is significant to the fair value measurement. The fund's assessment of the significance of a particular input to the fair value measurement in its entirety requires judgment, and considers factors specific to the investment. Level 1 includes unadjusted quoted prices in active markets for identical assets or liabilities. Level 2 includes other significant observable market-based inputs (including quoted prices for similar securities, interest rates, prepayment speed, and credit risk). Level 3 includes significant unobservable inputs, which may include the adviser's own assumptions in determining the fair value of investments. The following is a summary of the levels used as of December 31, 2022 in valuing the fund's assets and liabilities:
| Financial Instruments | Level 1 | Level 2 | Level 3 | Total |
| Equity Securities | $690,573,622 | $— | $— | $690,573,622 |
| Mutual Funds | 7,954,941 | — | — | 7,954,941 |
| Total | $698,528,563 | $— | $— | $698,528,563 |
| Securities Sold Short | $(3,225,248) | $— | $— | $(3,225,248) |
For further information regarding security characteristics, see the Portfolio of Investments.
Foreign Currency Translation — Purchases and sales of foreign investments, income, and expenses are converted into U.S. dollars based upon currency exchange rates prevailing on the respective dates of such transactions or on the reporting date for foreign denominated receivables and payables. Gains and losses attributable to foreign currency exchange rates on sales of securities are recorded for financial statement purposes as net realized gains and losses on investments. Gains and losses attributable to foreign exchange rate movements on receivables, payables, income and expenses are recorded for financial statement purposes as foreign currency transaction gains and losses. That portion of both realized and unrealized gains and losses on investments that results from fluctuations in foreign currency exchange rates is not separately disclosed.
Short Sales — The fund entered into short sales whereby it sells a security it does not own in anticipation of a decline in the value of that security. The fund will realize a gain if the security price decreases and a loss if the security price increases between the date of the short sale and the date on which the fund replaces the borrowed security. Losses from short sales can exceed the proceeds of the security sold; and they can also exceed the potential loss from an ordinary buy and sell transaction. The amount of any premium, dividends, or interest the fund may be required to pay in connection with a short sale will be recognized as a fund expense. During the year ended December 31, 2022, this expense amounted to $161,891.
Security Loans — Under its Securities Lending Agency Agreement with the fund, State Street Bank and Trust Company, as lending agent, loans the securities of the fund to certain qualified institutions (the “Borrowers”) approved by the fund. Security loans can be terminated at the discretion of either the lending agent or the fund and the related securities must be returned within the earlier of the standard trade settlement period for such securities or within three business days. The loans are collateralized by cash and/or U.S. Treasury and federal agency obligations in an amount typically at least equal to the market value of the securities loaned. On loans collateralized by cash, the cash collateral is invested in a money market fund. The market value of the loaned securities is determined at the close of business of the fund and any additional required collateral is delivered to the fund on the next business day. The lending agent provides the fund with indemnification against Borrower default. In the event of Borrower default, the lending agent will, for the benefit of the fund, either purchase securities identical to those loaned or, when such purchase is commercially impracticable, pay the fund the market value of the loaned securities. In return, the lending agent assumes the fund's rights to the related collateral. If the collateral value is less than the cost to purchase identical securities, the lending agent is responsible for the shortfall, but only to the extent that such shortfall is not due to a decline in collateral value resulting from collateral reinvestment for which the fund bears the risk of loss. At period end, the fund had investment securities on loan, all of which were classified as equity securities in the fund's Portfolio of Investments, with a fair value of $215,805. The fair value of the fund's investment securities on loan and a related liability of $232,852 for cash collateral received on securities loaned are both presented gross in the Statement of Assets and Liabilities. Additionally, these loans were collateralized by U.S. Treasury Obligations of $13,643 held by the lending agent. The collateral on securities loaned exceeded the value of securities on loan at period end. The liability for cash collateral for securities loaned is carried at fair value, which is categorized as level 2 within the fair value hierarchy. A
Notes to Financial Statements - continued
portion of the income generated upon investment of the collateral is remitted to the Borrowers, and the remainder is allocated between the fund and the lending agent. On loans collateralized by U.S. Treasury and/or federal agency obligations, a fee is received from the Borrower, and is allocated between the fund and the lending agent. Income from securities lending is separately reported in the Statement of Operations. The dividend and interest income earned on the securities loaned is accounted for in the same manner as other dividend and interest income.
Indemnifications — Under the fund's organizational documents, its officers and Trustees may be indemnified against certain liabilities and expenses arising out of the performance of their duties to the fund. Additionally, in the normal course of business, the fund enters into agreements with service providers that may contain indemnification clauses. The fund's maximum exposure under these agreements is unknown as this would involve future claims that may be made against the fund that have not yet occurred.
Investment Transactions and Income — Investment transactions are recorded on the trade date. Dividends received in cash are recorded on the ex-dividend date. Certain dividends from foreign securities will be recorded when the fund is informed of the dividend if such information is obtained subsequent to the ex-dividend date. Dividend payments received in additional securities are recorded on the ex-dividend date in an amount equal to the value of the security on such date. In determining the net gain or loss on securities sold, the cost of securities is determined on the identified cost basis.
The fund may receive proceeds from litigation settlements. Any proceeds received from litigation involving portfolio holdings are reflected in the Statement of Operations in realized gain/loss if the security has been disposed of by the fund or in unrealized gain/loss if the security is still held by the fund. Any other proceeds from litigation not related to portfolio holdings are reflected as other income in the Statement of Operations.
Tax Matters and Distributions — The fund intends to qualify as a regulated investment company, as defined under Subchapter M of the Internal Revenue Code, and to distribute all of its taxable income, including realized capital gains. As a result, no provision for federal income tax is required. The fund’s federal tax returns, when filed, will remain subject to examination by the Internal Revenue Service for a three year period. Management has analyzed the fund’s tax positions taken on federal and state tax returns for all open tax years and does not believe that there are any uncertain tax positions that require recognition of a tax liability. Foreign taxes, if any, have been accrued by the fund in the accompanying financial statements in accordance with the applicable foreign tax law. Foreign income taxes may be withheld by certain countries in which the fund invests. Additionally, capital gains realized by the fund on securities issued in or by certain foreign countries may be subject to capital gains tax imposed by those countries.
Distributions to shareholders are recorded on the ex-dividend date. Income and capital gain distributions are determined in accordance with income tax regulations, which may differ from U.S. generally accepted accounting principles. Certain capital accounts in the financial statements are periodically adjusted for permanent differences in order to reflect their tax character. These adjustments have no impact on net assets or net asset value per share. Temporary differences which arise from recognizing certain items of income, expense, gain or loss in different periods for financial statement and tax purposes will reverse at some time in the future.
Book/tax differences primarily relate to wash sale loss deferrals.
The tax character of distributions declared to shareholders for the last two fiscal years is as follows:
| | Year ended
12/31/22 | Year ended
12/31/21 |
| Ordinary income (including any short-term capital gains) | $14,039,255 | $6,675,285 |
| Long-term capital gains | 85,062,182 | 40,064,037 |
| Total distributions | $99,101,437 | $46,739,322 |
The federal tax cost and the tax basis components of distributable earnings were as follows:
| As of 12/31/22 | |
| Cost of investments | $497,117,079 |
| Gross appreciation | 238,318,911 |
| Gross depreciation | (40,132,675) |
| Net unrealized appreciation (depreciation) | $198,186,236 |
| Undistributed ordinary income | 1,902,699 |
| Undistributed long-term capital gain | 38,785,228 |
| Other temporary differences | 21 |
| Total distributable earnings (loss) | $238,874,184 |
Notes to Financial Statements - continued
Multiple Classes of Shares of Beneficial Interest — The fund offers multiple classes of shares, which differ in their respective distribution and/or service fees. The fund's income, realized and unrealized gain (loss), and common expenses are allocated to shareholders based on the daily net assets of each class. Dividends are declared separately for each class. Differences in per share dividend rates are generally due to differences in separate class expenses. The fund’s distributions declared to shareholders as reported in the Statements of Changes in Net Assets are presented by class as follows:
| | Year
ended
12/31/22 | | Year
ended
12/31/21 |
| Initial Class | $56,469,294 | | $23,181,009 |
| Service Class | 42,632,143 | | 23,558,313 |
| Total | $99,101,437 | | $46,739,322 |
(3) Transactions with Affiliates
Investment Adviser — The fund has an investment advisory agreement with MFS to provide overall investment management and related administrative services and facilities to the fund. The management fee is computed daily and paid monthly at the following annual rates based on the fund's average daily net assets:
| Up to $1 billion | 0.75% |
| In excess of $1 billion | 0.65% |
MFS has agreed in writing to reduce its management fee by a specified amount if certain MFS mutual fund assets exceed thresholds agreed to by MFS and the fund's Board of Trustees. Effective March 1, 2022, MFS has also agreed in writing to waive at least 0.01% of its management fee as part of this agreement. The agreement to waive at least 0.01% of the management fee will continue until modified by the fund's Board of Trustees, but such agreement will continue at least until April 30, 2024. For the year ended December 31, 2022, this management fee reduction amounted to $99,482, which is included in the reduction of total expenses in the Statement of Operations. The management fee incurred for the year ended December 31, 2022 was equivalent to an annual effective rate of 0.74% of the fund's average daily net assets.
The investment adviser has agreed in writing to pay a portion of the fund’s total annual operating expenses, excluding interest, taxes, extraordinary expenses, brokerage and transaction costs, certain tax reclaim recovery expenses (including contingency fees and closing agreement expenses), and investment-related expenses (such as short sale dividend and interest expenses incurred in connection with the fund's investment activity), such that total annual operating expenses do not exceed 0.77% of average daily net assets for the Initial Class shares and 1.02% of average daily net assets for the Service Class shares. This written agreement will continue until modified by the fund’s Board of Trustees, but such agreement will continue at least until April 30, 2024. For the year ended December 31, 2022, this reduction amounted to $84,116, which is included in the reduction of total expenses in the Statement of Operations.
Distributor — MFS Fund Distributors, Inc. (MFD), a wholly-owned subsidiary of MFS, is the distributor of shares of the fund. The Trustees have adopted a distribution plan for the Service Class shares pursuant to Rule 12b-1 under the Investment Company Act of 1940.
The fund's distribution plan provides that the fund will pay MFD distribution and/or service fees equal to 0.25% per annum of its average daily net assets attributable to Service Class shares as partial consideration for services performed and expenses incurred by MFD and financial intermediaries (including participating insurance companies that invest in the fund to fund variable annuity and variable life insurance contracts, sponsors of qualified retirement and pension plans that invest in the fund, and affiliates of these participating insurance companies and plan sponsors) in connection with the sale and distribution of the Service Class shares. MFD may subsequently pay all, or a portion, of the distribution and/or service fees to financial intermediaries.
Shareholder Servicing Agent — MFS Service Center, Inc. (MFSC), a wholly-owned subsidiary of MFS, receives a fee from the fund for its services as shareholder servicing agent. For the year ended December 31, 2022, the fee was $27,783, which equated to 0.0039% annually of the fund's average daily net assets. MFSC also receives reimbursement from the fund for out-of-pocket expenses paid by MFSC on behalf of the fund. For the year ended December 31, 2022, these costs amounted to $1,788.
Administrator — MFS provides certain financial, legal, shareholder communications, compliance, and other administrative services to the fund. Under an administrative services agreement, the fund reimburses MFS the costs incurred to provide these services. The fund is charged an annual fixed amount of $17,500 plus a fee based on average daily net assets. The administrative services fee incurred for the year ended December 31, 2022 was equivalent to an annual effective rate of 0.0168% of the fund's average daily net assets.
Notes to Financial Statements - continued
Trustees’ and Officers’ Compensation — The fund pays compensation to independent Trustees in the form of a retainer, attendance fees, and additional compensation to Board and Committee chairpersons. The fund does not pay compensation directly to Trustees or officers of the fund who are also officers of the investment adviser, all of whom receive remuneration from MFS for their services to the fund. Certain officers and Trustees of the fund are officers or directors of MFS, MFD, and MFSC.
Other — The fund invests in the MFS Institutional Money Market Portfolio which is managed by MFS and seeks current income consistent with preservation of capital and liquidity. This money market fund does not pay a management fee to MFS but does incur investment and operating costs.
The fund is permitted to engage in purchase and sale transactions with funds and accounts for which MFS serves as investment adviser or sub-adviser (“cross-trades”) pursuant to a policy adopted by the Board of Trustees. This policy has been designed to ensure that cross-trades conducted by the fund comply with Rule 17a-7 under the Investment Company Act of 1940. During the year ended December 31, 2022, the fund engaged in purchase transactions pursuant to this policy, which amounted to $77,603.
The adviser has voluntarily undertaken to reimburse the fund from its own resources on a quarterly basis for the cost of investment research embedded in the cost of the fund’s securities trades. This agreement may be rescinded at any time. For the year ended December 31, 2022, this reimbursement amounted to $12,754, which is included in “Other” income in the Statement of Operations.
(4) Portfolio Securities
For the year ended December 31, 2022, purchases and sales of investments, other than short sales and short-term obligations, aggregated $223,482,735 and $169,774,841, respectively.
(5) Shares of Beneficial Interest
The fund's Declaration of Trust permits the Trustees to issue an unlimited number of full and fractional shares of beneficial interest. Transactions in fund shares were as follows:
| | Year ended
12/31/22 | | Year ended
12/31/21 |
| | Shares | Amount | | Shares | Amount |
| Shares sold | | | | | |
| Initial Class | 4,166,754 | $136,162,513 | | 297,691 | $10,769,839 |
| Service Class | 546,740 | 17,085,861 | | 359,379 | 12,740,685 |
| | 4,713,494 | $153,248,374 | | 657,070 | $23,510,524 |
Shares issued to shareholders
in reinvestment of distributions | | | | | |
| Initial Class | 1,929,255 | $56,469,294 | | 625,837 | $23,181,009 |
| Service Class | 1,483,889 | 42,632,143 | | 646,851 | 23,558,313 |
| | 3,413,144 | $99,101,437 | | 1,272,688 | $46,739,322 |
| Shares reacquired | | | | | |
| Initial Class | (1,460,747) | $(46,824,246) | | (2,278,729) | $(82,861,036) |
| Service Class | (1,820,168) | (56,055,691) | | (2,142,388) | (76,613,263) |
| | (3,280,915) | $(102,879,937) | | (4,421,117) | $(159,474,299) |
| Net change | | | | | |
| Initial Class | 4,635,262 | $145,807,561 | | (1,355,201) | $(48,910,188) |
| Service Class | 210,461 | 3,662,313 | | (1,136,158) | (40,314,265) |
| | 4,845,723 | $149,469,874 | | (2,491,359) | $(89,224,453) |
The fund is one of several mutual funds in which certain MFS funds may invest. The MFS funds do not invest in the underlying funds for the purpose of exercising management or control. At the end of the period, the MFS Moderate Allocation Portfolio, the MFS Growth Allocation Portfolio, and the MFS Conservative Allocation Portfolio were the owners of record of approximately 12%, 4%, and 3%, respectively, of the value of outstanding voting shares of the fund.
Notes to Financial Statements - continued
(6) Line of Credit
The fund and certain other funds managed by MFS participate in a $1.45 billion unsecured committed line of credit of which $1.2 billion is reserved for use by the fund and certain other MFS U.S. funds. The line of credit is provided by a syndicate of banks under a credit agreement. Borrowings may be made for temporary financing needs. Interest is charged to each fund, based on its borrowings, generally at a rate equal to the highest of 1) Daily Simple SOFR (Secured Overnight Financing Rate) plus 0.10%, 2) the Federal Funds Effective Rate, or 3) the Overnight Bank Funding Rate, each plus an agreed upon spread. A commitment fee, based on the average daily unused portion of the committed line of credit, is allocated among the participating funds. The line of credit expires on March 16, 2023 unless extended or renewed. In addition, the fund and other funds managed by MFS have established unsecured uncommitted borrowing arrangements with certain banks for temporary financing needs. Interest is charged to each fund, based on its borrowings, at rates equal to customary reference rates plus an agreed upon spread. For the year ended December 31, 2022, the fund’s commitment fee and interest expense were $3,176 and $0, respectively, and are included in “Interest expense and fees” in the Statement of Operations.
(7) Investments in Affiliated Issuers
An affiliated issuer may be considered one in which the fund owns 5% or more of the outstanding voting securities, or a company which is under common control. For the purposes of this report, the following were affiliated issuers:
| Affiliated Issuers | Beginning
Value | Purchases | Sales
Proceeds | Realized
Gain
(Loss) | Change in
Unrealized
Appreciation or
Depreciation | Ending
Value |
| MFS Institutional Money Market Portfolio | $5,954,476 | $93,074,503 | $91,306,712 | $(2,063) | $1,885 | $7,722,089 |
| Affiliated Issuers | Dividend
Income | Capital Gain
Distributions |
| MFS Institutional Money Market Portfolio | $77,737 | $— |
(8) LIBOR Transition
Certain of the fund's investments, including investments in certain debt instruments and derivatives (if any), as well as borrowings by the fund and certain other contractual arrangements of the fund, may be based on the London Interbank Offered Rate (“LIBOR”). In 2017, the regulatory authority that oversees financial services firms in the United Kingdom announced plans to transition away from LIBOR by the end of 2021. In March 2021, the administrator of LIBOR announced the extension of the publication of the more commonly used U.S. dollar LIBOR settings to the end of June 2023. Although the full impacts of the transition away from LIBOR are not fully known, the transition may result in, among other things, an increase in volatility or illiquidity of the markets for instruments that currently rely on LIBOR to determine interest rates and this could have an adverse impact on the fund's performance. With respect to the fund's accounting for investments, including investments in certain debt instruments and derivatives, as well as borrowings by the fund and any other contractual arrangements of the fund that undergo reference rate-related modifications as a result of the transition, management will rely upon the relief provided by FASB Codification Topic 848 – Reference Rate Reform (Topic 848). The guidance in Topic 848 permits the fund to account for those modified contracts as a continuation of the existing contracts. Management is still evaluating the impact to the fund of the June 30, 2023 planned discontinuation of the more commonly used U.S. dollar LIBOR settings.
(9) Russia and Ukraine Conflict
The market disruptions, which began in late February 2022, associated with geopolitical events related to the conflict between Russia and Ukraine may adversely affect the value of the fund’s assets and thus the fund’s performance. Management continues to monitor these events and to evaluate the related impacts, if any, to the fund.
Report of Independent Registered Public Accounting Firm
To the Board of Trustees of MFS Variable Insurance Trust and the Shareholders of MFS Research Series:
Opinion on the Financial Statements and Financial Highlights
We have audited the accompanying statement of assets and liabilities of MFS Research Series (the “Fund”), including the portfolio of investments, as of December 31, 2022, the related statement of operations for the year then ended, the statements of changes in net assets for each of the two years in the period then ended, the financial highlights for each of the five years in the period then ended, and the related notes. In our opinion, the financial statements and financial highlights present fairly, in all material respects, the financial position of the Fund as of December 31, 2022, and the results of its operations for the year then ended, the changes in its net assets for each of the two years in the period then ended, and the financial highlights for each of the five years in the period then ended, in conformity with accounting principles generally accepted in the United States of America.
Basis for Opinion
These financial statements and financial highlights are the responsibility of the Fund's management. Our responsibility is to express an opinion on the Fund's financial statements and financial highlights based on our audits. We are a public accounting firm registered with the Public Company Accounting Oversight Board (United States) (PCAOB) and are required to be independent with respect to the Fund in accordance with the U.S. federal securities laws and the applicable rules and regulations of the Securities and Exchange Commission and the PCAOB.
We conducted our audits in accordance with the standards of the PCAOB. Those standards require that we plan and perform the audit to obtain reasonable assurance about whether the financial statements and financial highlights are free of material misstatement, whether due to error or fraud. The Fund is not required to have, nor were we engaged to perform, an audit of its internal control over financial reporting. As part of our audits, we are required to obtain an understanding of internal control over financial reporting but not for the purpose of expressing an opinion on the effectiveness of the Fund's internal control over financial reporting. Accordingly, we express no such opinion.
Our audits included performing procedures to assess the risks of material misstatement of the financial statements and financial highlights, whether due to error or fraud, and performing procedures that respond to those risks. Such procedures included examining, on a test basis, evidence regarding the amounts and disclosures in the financial statements and financial highlights. Our audits also included evaluating the accounting principles used and significant estimates made by management, as well as evaluating the overall presentation of the financial statements and financial highlights. Our procedures included confirmation of securities owned as of December 31, 2022, by correspondence with the custodian and brokers; when replies were not received from brokers, we performed other auditing procedures. We believe that our audits provide a reasonable basis for our opinion.
DELOITTE & TOUCHE LLP
Boston, Massachusetts
February 15, 2023
We have served as the auditor of one or more of the MFS investment companies since 1924.
Trustees and Officers — Identification and Background
The Trustees and Officers of the Trust, as of February 1, 2023, are listed below, together with their principal occupations during the past five years. (Their titles may have varied during that period.) The address of each Trustee and Officer is 111 Huntington Avenue, Boston, Massachusetts 02199-7618.
| Name, Age | | Position(s) Held with Fund | | Trustee/Officer Since(h) | | Number of MFS Funds overseen by the Trustee | | Principal Occupations During
the Past Five Years | | Other Directorships During
the Past Five Years (j) |
| INTERESTED TRUSTEE | | | | | | | | | | |
Michael W. Roberge (k)
(age 56) | | Trustee | | January 2021 | | 136 | | Massachusetts Financial Services Company, Chairman (since January 2021); Chief Executive Officer (since January 2017); Director; Chairman of the Board (since January 2022); President (until December 2018); Chief Investment Officer (until December 2018) | | N/A |
| INDEPENDENT TRUSTEES | | | | | | | | | | |
John P. Kavanaugh
(age 68) | | Trustee and Chair of Trustees | | January 2009 | | 136 | | Private investor | | N/A |
Steven E. Buller
(age 71) | | Trustee | | February 2014 | | 136 | | Private investor | | N/A |
John A. Caroselli
(age 68) | | Trustee | | March 2017 | | 136 | | Private investor; JC Global Advisors, LLC (management consulting), President (since 2015) | | N/A |
Maureen R. Goldfarb
(age 67) | | Trustee | | January 2009 | | 136 | | Private investor | | N/A |
Peter D. Jones
(age 67) | | Trustee | | January 2019 | | 136 | | Private investor | | N/A |
James W. Kilman, Jr.
(age 61) | | Trustee | | January 2019 | | 136 | | Burford Capital Limited (finance and investment management), Senior Advisor (since May 3, 2021), Chief Financial Officer (2019 - May 2, 2021); KielStrand Capital LLC (family office), Chief Executive Officer (since 2016) | | Alpha-En Corporation, Director (2016-2019) |
Clarence Otis, Jr.
(age 66) | | Trustee | | March 2017 | | 136 | | Private investor | | VF Corporation, Director; Verizon Communications, Inc., Director; The Travelers Companies, Director |
Maryanne L. Roepke
(age 66) | | Trustee | | May 2014 | | 136 | | Private investor | | N/A |
Laurie J. Thomsen
(age 65) | | Trustee | | March 2005 | | 136 | | Private investor | | The Travelers Companies, Director; Dycom Industries, Inc., Director |
Trustees and Officers - continued
| Name, Age | | Position(s) Held with
Fund | | Trustee/Officer Since(h) | | Number of MFS Funds for which the Person is an Officer | | Principal Occupations During
the Past Five Years |
| OFFICERS | | | | | | | | |
Christopher R. Bohane (k)
(age 49) | | Assistant Secretary and Assistant Clerk | | July 2005 | | 136 | | Massachusetts Financial Services Company, Senior Vice President and Senior Managing Counsel |
Kino Clark (k)
(age 54) | | Assistant Treasurer | | January 2012 | | 136 | | Massachusetts Financial Services Company, Vice President |
John W. Clark, Jr. (k)
(age 55) | | Assistant Treasurer | | April 2017 | | 136 | | Massachusetts Financial Services Company, Vice President |
David L. DiLorenzo (k)
(age 54) | | President | | July 2005 | | 136 | | Massachusetts Financial Services Company, Senior Vice President |
Heidi W. Hardin (k)
(age 55) | | Secretary and Clerk | | April 2017 | | 136 | | Massachusetts Financial Services Company, Executive Vice President and General Counsel |
Brian E. Langenfeld (k)
(age 49) | | Assistant Secretary and Assistant Clerk | | June 2006 | | 136 | | Massachusetts Financial Services Company, Vice President and Managing Counsel |
Rosa E. Licea-Mailloux (k)
(age 46) | | Chief Compliance Officer | | March 2022 | | 136 | | Massachusetts Financial Services Company, Vice President (since 2018); Director of Corporate Compliance (2018-2021), Senior Director Compliance (2021-2022), Senior Managing Director of North American Compliance & Chief Compliance Officer (since March 2022); Natixis Investment Managers (investment management), Funds Chief Compliance Officer, Deputy General Counsel & Senior Vice President (until 2018) |
Amanda S. Mooradian (k)
(age 43) | | Assistant Secretary and Assistant Clerk | | September 2018 | | 136 | | Massachusetts Financial Services Company, Assistant Vice President and Senior Counsel |
Susan A. Pereira (k)
(age 52) | | Assistant Secretary and Assistant Clerk | | July 2005 | | 136 | | Massachusetts Financial Services Company, Vice President and Managing Counsel |
Kasey L. Phillips (k)
(age 52) | | Assistant Treasurer | | September 2012 | | 136 | | Massachusetts Financial Services Company, Vice President |
Matthew A. Stowe (k)
(age 48) | | Assistant Secretary and Assistant Clerk | | October 2014 | | 136 | | Massachusetts Financial Services Company, Vice President and Senior Managing Counsel |
William B. Wilson (k)
(age 40) | | Assistant Secretary and Assistant Clerk | | October 2022 | | 136 | | Massachusetts Financial Services Company, Assistant Vice President and Counsel |
James O. Yost (k)
(age 62) | | Treasurer | | September 1990 | | 136 | | Massachusetts Financial Services Company, Senior Vice President |
| (h) | Date first appointed to serve as Trustee/Officer of an MFS Fund. Each Trustee has served continuously since appointment unless indicated otherwise. From January 2012 through December 2016, Messrs. DiLorenzo and Yost served as Treasurer and Deputy Treasurer of the Funds, respectively. |
| (j) | Directorships or trusteeships of companies required to report to the Securities and Exchange Commission (i.e., “public companies”). |
| (k) | “Interested person” of the Trust within the meaning of the Investment Company Act of 1940 (referred to as the 1940 Act), which is the principal federal law governing investment companies like the fund, as a result of a position with MFS. The address of MFS is 111 Huntington Avenue, Boston, Massachusetts 02199-7618. |
Each Trustee (other than Messrs. Jones, Kilman and Roberge) has been elected by shareholders and each Trustee and Officer holds office until his or her successor is chosen and qualified or until his or her earlier death, resignation, retirement or removal. Mr. Roberge became a Trustee of the Funds on January 1, 2021 and Messrs. Jones and Kilman became Trustees of the Funds on January 1, 2019. The Trust does not hold annual meetings for the purpose of electing Trustees, and Trustees are not elected for fixed terms. Under the terms of the Board's retirement policy, an Independent Trustee shall retire at the end of the calendar year in which he or she reaches the earlier of 75 years of age or 15 years of service on the Board (or, in the case of any Independent Trustee who joined the Board prior to 2015, 20 years of service on the Board).
Trustees and Officers - continued
Messrs. Buller, Kilman and Otis and Ms. Roepke are members of the Trust’s Audit Committee.
Each of the Interested Trustees and certain Officers hold comparable officer positions with certain affiliates of MFS.
The Statement of Additional Information for a Fund includes further information about the Trustees and is available without charge upon request by calling 1-800-225-2606.
| Investment Adviser | Custodian |
Massachusetts Financial Services Company
111 Huntington Avenue
Boston, MA 02199-7618 | State Street Bank and Trust Company
1 Lincoln Street
Boston, MA 02111-2900 |
| Distributor | Independent Registered Public Accounting Firm |
MFS Fund Distributors, Inc.
111 Huntington Avenue
Boston, MA 02199-7618 | Deloitte & Touche LLP
200 Berkeley Street
Boston, MA 02116 |
| Portfolio Manager(s) | |
| Joseph MacDougall | |
Board Review of Investment Advisory Agreement
MFS Research Series
The Investment Company Act of 1940 requires that both the full Board of Trustees and a majority of the non-interested (“independent”) Trustees, voting separately, annually approve the continuation of the Fund’s investment advisory agreement with MFS. The Trustees consider matters bearing on the Fund and its advisory arrangements at their meetings throughout the year, including a review of performance data at each regular meeting. In addition, the independent Trustees met several times over the course of three months beginning in May and ending in July, 2022 (“contract review meetings”) for the specific purpose of considering whether to approve the continuation of the investment advisory agreement for the Fund and the other investment companies that the Board oversees (the “MFS Funds”). The independent Trustees were assisted in their evaluation of the Fund’s investment advisory agreement by independent legal counsel, from whom they received separate legal advice and with whom they met separately from MFS during various contract review meetings. The independent Trustees were also assisted in this process by an independent consultant who was retained by and reported to the independent Trustees.
In connection with their deliberations regarding the continuation of the investment advisory agreement, the Trustees, including the independent Trustees, considered such information and factors as they believed, in light of the legal advice furnished to them and their own business judgment, to be relevant. The investment advisory agreement for the Fund was considered separately, although the Trustees also took into account the common interests of all MFS Funds in their review. As described below, the Trustees considered the nature, quality, and extent of the various investment advisory, administrative, and shareholder services performed by MFS under the existing investment advisory agreement and other arrangements with the Fund.
In connection with their contract review meetings, the Trustees received and relied upon materials that included, among other items: (i) information provided by Broadridge Financial Solutions, Inc. (“Broadridge”), an independent third party, on the investment performance of the Fund for various time periods ended December 31, 2021 and the investment performance of a group of funds with substantially similar investment classifications/objectives (the “Broadridge performance universe”), (ii) information provided by Broadridge on the Fund’s advisory fees and other expenses and the advisory fees and other expenses of comparable funds identified by Broadridge as well as all other funds in the same investment classification/category (the “Broadridge expense group and universe”), (iii) information provided by MFS on the advisory fees of portfolios of other clients of MFS, including institutional separate accounts and other clients, (iv) information as to whether and to what extent applicable expense waivers, reimbursements or fee “breakpoints” are observed for the Fund, (v) information regarding MFS’ financial results and financial condition, including MFS’ and certain of its affiliates’ estimated profitability from services performed for the Fund and the MFS Funds as a whole, and compared to MFS’ institutional business, (vi) MFS’ views regarding the outlook for the mutual fund industry and the strategic business plans of MFS, (vii) descriptions of various functions performed by MFS for the Funds, such as compliance monitoring and portfolio trading practices, and (viii) information regarding the overall organization of MFS, including information about MFS’ senior management and other personnel providing investment advisory, administrative and other services to the Fund and the other MFS Funds. The comparative performance, fee and expense information prepared and provided by Broadridge was not independently verified and the independent Trustees did not independently verify any information provided to them by MFS.
The Trustees’ conclusion as to the continuation of the investment advisory agreement was based on a comprehensive consideration of all information provided to the Trustees and not the result of any single factor. Some of the factors that figured particularly in the Trustees’ deliberations are described below, although individual Trustees may have evaluated the information presented differently from one another, giving different weights to various factors. It is also important to recognize that the fee arrangements for the Fund and other MFS Funds are the result of years of review and discussion between the independent Trustees and MFS, that certain aspects of such arrangements may receive greater scrutiny in some years than in others, and that the Trustees’ conclusions may be based, in part, on their consideration of these same arrangements during the course of the year and in prior years.
Based on information provided by Broadridge and MFS, the Trustees reviewed the Fund’s total return investment performance as well as the Broadridge performance universe over various time periods. The Trustees placed particular emphasis on the total return performance of the Fund’s Initial Class shares in comparison to the performance of funds in its Broadridge performance universe over the five-year period ended December 31, 2021, which the Trustees believed was a long enough period to reflect differing market conditions. The total return performance of the Fund’s Initial Class shares was in the 2nd quintile relative to the other funds in the universe for this five-year period (the 1st quintile being the best performers and the 5th quintile being the worst performers). The total return performance of the Fund’s Initial Class shares was in the 4th quintile for the one-year period and the 3rd quintile for the three-year period ended December 31, 2021 relative to the Broadridge performance universe. Because of the passage of time, these performance results may differ from the performance results for more recent periods, including those shown elsewhere in this report.
In the course of their deliberations, the Trustees took into account information provided by MFS in connection with the contract review meetings, as well as during investment review meetings conducted with portfolio management personnel during the course of the year regarding the Fund’s performance. After reviewing these and related factors, the Trustees concluded, within the context of their overall conclusions regarding the investment advisory agreement, that they were satisfied with MFS’ responses and efforts relating to investment performance.
Board Review of Investment Advisory Agreement - continued
In assessing the reasonableness of the Fund’s advisory fee, the Trustees considered, among other information, the Fund’s advisory fee and the total expense ratio of the Fund’s Initial Class shares as a percentage of average daily net assets and the advisory fee and total expense ratios of the Broadridge expense group based on information provided by Broadridge. The Trustees considered that MFS currently observes an expense limitation for the Fund, which may not be changed without the Trustees’ approval. The Trustees also considered that, according to the data provided by Broadridge (which takes into account any fee reductions or expense limitations that were in effect during the Fund’s last fiscal year), the Fund’s effective advisory fee rate and total expense ratio were each higher than the Broadridge expense group median.
The Trustees also considered the advisory fees charged by MFS to any institutional separate accounts advised by MFS (“separate accounts”) and unaffiliated investment companies for which MFS serves as subadviser (“subadvised funds”) that have comparable investment strategies to the Fund, if any. In comparing these fees, the Trustees considered information provided by MFS as to the generally broader scope of services provided by MFS to the Fund, as well as the more extensive regulatory burdens imposed on MFS in managing the Fund, in comparison to separate accounts and subadvised funds. The Trustees also considered the higher demands placed on MFS’ investment personnel and trading infrastructure as a result of the daily cash in-flows and out-flows of the Fund in comparison to separate accounts.
The Trustees also considered whether the Fund may benefit from any economies of scale in the management of the Fund in the event of growth in assets of the Fund and/or growth in assets of the MFS Funds as a whole. They noted that the Fund’s advisory fee rate schedule is subject to a contractual breakpoint that reduces the Fund’s advisory fee rate on average daily net assets over $1 billion. The Trustees also noted that MFS has agreed in writing to waive a portion of the management fees of certain MFS Funds, including the Fund, if the total combined assets of certain funds within the MFS Funds’ complex increase above agreed upon thresholds (the “group fee waiver”), enabling the Fund’s shareholders to share in the benefits from any economies of scale at the complex level. The group fee waiver is reviewed and renewed annually between the Board and MFS. The Trustees concluded that the breakpoint and the group fee waiver were sufficient to allow the Fund to benefit from economies of scale as its assets and overall complex assets grow.
The Trustees also considered information prepared by MFS relating to MFS’ costs and profits with respect to the Fund, the MFS Funds considered as a group, and other investment companies and accounts advised by MFS, as well as MFS’ methodologies used to determine and allocate its costs to the MFS Funds, the Fund and other accounts and products for purposes of estimating profitability.
After reviewing these and other factors described herein, the Trustees concluded, within the context of their overall conclusions regarding the investment advisory agreement, that the advisory fees charged to the Fund represent reasonable compensation in light of the services being provided by MFS to the Fund.
In addition, the Trustees considered MFS’ resources and related efforts to continue to retain, attract and motivate capable personnel to serve the Fund. The Trustees also considered current and developing conditions in the financial services industry, including the presence of large and well-capitalized companies which are spending, and appear to be prepared to continue to spend, substantial sums to engage personnel and to provide services to competing investment companies. In this regard, the Trustees also considered the financial resources of MFS and its ultimate parent, Sun Life Financial Inc. The Trustees also considered the advantages and possible disadvantages to the Fund of having an adviser that also serves other investment companies as well as other accounts.
The Trustees also considered the nature, quality, cost, and extent of administrative, transfer agency, and distribution services provided to the Fund by MFS and its affiliates under agreements and plans other than the investment advisory agreement, including any 12b-1 fees the Fund pays to MFS Fund Distributors, Inc., an affiliate of MFS. The Trustees also considered the nature, extent and quality of certain other services MFS performs or arranges for on the Fund’s behalf, which may include securities lending programs, directed expense payment programs, class action recovery programs, and MFS’ interaction with third-party service providers, principally custodians and sub-custodians. The Trustees concluded that the various non-advisory services provided by MFS and its affiliates on behalf of the Fund were satisfactory.
The Trustees considered so-called “fall-out benefits” to MFS such as reputational value derived from serving as investment manager to the MFS Funds. The Trustees also considered that MFS discontinued its historic practice of obtaining investment research from portfolio brokerage commissions paid by certain MFS Funds effective January 2018, and directly pays or voluntarily reimburses a Fund, if applicable, for the costs of external research acquired through the use of the Fund’s portfolio brokerage commissions.
Based on their evaluation of factors that they deemed to be material, including those factors described above, the Board of Trustees, including the independent Trustees, concluded that the Fund’s investment advisory agreement with MFS should be continued for an additional one-year period, commencing August 1, 2022.
Proxy Voting Policies and Information
MFS votes proxies on behalf of the fund pursuant to proxy voting policies and procedures that are available without charge, upon request, by calling 1-800-225-2606, by visiting mfs.com/proxyvoting, or by visiting the SEC’s Web site at http://www.sec.gov.
Information regarding how the fund voted proxies relating to portfolio securities during the most recent twelve-month period ended June 30 is available by August 31 of each year without charge by visiting mfs.com/proxyvoting, or by visiting the SEC’s Web site at http://www.sec.gov.
Quarterly Portfolio Disclosure
The fund files a complete schedule of portfolio holdings with the SEC for the first and third quarters of each fiscal year as an exhibit to its reports on Form N-PORT. The fund’s Form N-PORT reports are available on the SEC’s Web site at http://www.sec.gov. A shareholder can obtain the portfolio holdings report for the first and third quarters of the fund's fiscal year at mfs.com/vit1 by choosing the fund's name and then scrolling to the “Resources” section and clicking on the “Prospectus and Reports” tab.
FURTHER INFORMATION
From time to time, MFS may post important information about the fund or the MFS Funds on the MFS Web site (mfs.com). This information is available at https://www.mfs.com/announcements or at mfs.com/vit1 by choosing the fund's name and then scrolling to the “Resources” section and clicking on the “Announcements” tab, if any.
Information About Fund Contracts and Legal Claims
The fund has entered into contractual arrangements with an investment adviser, administrator, distributor, shareholder servicing agent, and custodian who each provide services to the fund. Unless expressly stated otherwise, shareholders are not parties to, or intended beneficiaries of these contractual arrangements, and these contractual arrangements are not intended to create any shareholder right to enforce them against the service providers or to seek any remedy under them against the service providers, either directly or on behalf of the fund.
Under the Trust’s By-Laws and Declaration of Trust, any claims asserted against or on behalf of the MFS Funds, including claims against Trustees and Officers, must be brought in state and federal courts located within the Commonwealth of Massachusetts.
Federal Tax Information (unaudited)
The following information is provided pursuant to provisions of the Internal Revenue Code.
The fund designates $93,569,000 as capital gain dividends paid during the fiscal year.
For corporate shareholders, 50.85% of the ordinary income dividends paid during the fiscal year qualify for the corporate dividends received deduction.
| FACTS | WHAT DOES MFS DO WITH YOUR PERSONAL INFORMATION? |
| Why? | Financial companies choose how they share your personal information. Federal law gives consumers the right to limit some but not all sharing. Federal law also requires us to tell you how we collect, share, and protect your personal information. Please read this notice carefully to understand what we do. |
| What? | The types of personal information we collect and share depend on the product or service you have with us. This information can include: |
| • Social Security number and account balances |
| • Account transactions and transaction history |
| • Checking account information and wire transfer instructions |
| When you are no longer our customer, we continue to share your information as described in this notice. |
| How? | All financial companies need to share customers' personal information to run their everyday business. In the section below, we list the reasons financial companies can share their customers' personal information; the reasons MFS chooses to share; and whether you can limit this sharing. |
Reasons we can share your
personal information | Does MFS share? | Can you limit
this sharing? |
For our everyday business purposes –
such as to process your transactions, maintain your
account(s), respond to court orders and legal
investigations, or report to credit bureaus | Yes | No |
For our marketing purposes –
to offer our products and services to you | No | We don't share |
For joint marketing with other
financial companies | No | We don't share |
For our affiliates' everyday business purposes –
information about your transactions and experiences | No | We don't share |
For our affiliates' everyday business purposes –
information about your creditworthiness | No | We don't share |
| For nonaffiliates to market to you | No | We don't share |
| Questions? | Call 800-225-2606 or go to mfs.com. |
| Who we are |
| Who is providing this notice? | MFS Funds, MFS Investment Management, MFS Institutional Advisors, Inc., and MFS Heritage Trust Company. |
| What we do |
How does MFS
protect my personal
information? | To protect your personal information from unauthorized access and use, we use security measures that comply with federal law. These measures include procedural, electronic, and physical safeguards for the protection of the personal information we collect about you. |
How does MFS
collect my personal
information? | We collect your personal information, for example, when you |
| • open an account or provide account information |
| • direct us to buy securities or direct us to sell your securities |
| • make a wire transfer |
| We also collect your personal information from others, such as credit bureaus, affiliates, or other companies. |
| Why can't I limit all sharing? | Federal law gives you the right to limit only |
| • sharing for affiliates' everyday business purposes – information about your creditworthiness |
| • affiliates from using your information to market to you |
| • sharing for nonaffiliates to market to you |
| State laws and individual companies may give you additional rights to limit sharing. |
| Definitions |
| Affiliates | Companies related by common ownership or control. They can be financial and nonfinancial companies. |
| • MFS does not share personal information with affiliates, except for everyday business purposes as described on page one of this notice. |
| Nonaffiliates | Companies not related by common ownership or control. They can be financial and nonfinancial companies. |
| • MFS does not share with nonaffiliates so they can market to you. |
| Joint marketing | A formal agreement between nonaffiliated financial companies that together market financial products or services to you. |
| • MFS doesn't jointly market. |
| Other important information |
| If you own an MFS product or receive an MFS service in the name of a third party such as a bank or broker-dealer, their privacy policy may apply to you instead of ours. |
Annual Report
December 31, 2022
MFS® Variable Insurance Trust
| 1 |
| 2 |
| 4 |
| 6 |
| 8 |
| 9 |
| 23 |
| 24 |
| 25 |
| 26 |
| 28 |
| 37 |
| 38 |
| 41 |
| 43 |
| 43 |
| 43 |
| 43 |
| 43 |
| 44 |
The report is prepared for the general information of shareholders. It is authorized for distribution to prospective investors only when preceded or accompanied by a current prospectus.
NOT FDIC INSURED • MAY LOSE VALUE • NO BANK OR CREDIT UNION GUARANTEE •
NOT A DEPOSIT • NOT INSURED BY ANY FEDERAL GOVERNMENT AGENCY OR NCUA/NCUSIF
LETTER FROM THE CHAIR AND CEO
Dear Shareholders:
Signs of peaking inflation, hopes that monetary policy tightening cycles may be nearing an end and a rapid reopening of China’s economy in late-2022 and early-2023 have combined to bolster investor sentiment in recent months. Markets have largely adjusted to the challenges posed by Russia’s invasion of Ukraine, thanks in part to mild European winter weather which has alleviated concerns over potential shortages of natural gas. Resilient labor markets in much of the developed world have further contributed to a brighter-than-expected economic backdrop. However, many investors are mindful that the lagged effects of ongoing policy tightening have yet to work their way through the global economy.
Tighter global financial conditions have been a particular headwind for richly valued growth equities and interest rate-sensitive parts of the economy, such as housing. Over the near term, companies may face a challenging earnings backdrop as they are forced to absorb higher input and labor costs at a time of dwindling pricing power. For fixed income, the rise in interest rates has made bonds more attractive than they have been in years, which may provide balance to an overall portfolio.
During times of market transition, it is important to have a deep understanding of company fundamentals, and we have built our unique global research platform to do just that.
At MFS®, we put our clients’ assets to work responsibly by carefully navigating increasingly complex global capital markets. Our investment team is guided by a commitment to long-term fundamental investing. Our global investment platform — combining collective expertise, long-term discipline, and thoughtful risk management — seeks to uncover what we believe are the best, most durable investment ideas in markets around the world, enabling us to potentially create value for investors.
Respectfully,
Michael W. Roberge
Chair and Chief Executive Officer
MFS Investment Management
February 15, 2023
The opinions expressed in this letter are subject to change and may not be relied upon for investment advice. No forecasts can be guaranteed.
Portfolio structure (i)
Top ten holdings (i)
| U.S. Treasury Note 5 yr Future - MAR 2023 | 3.1% |
| U.S. Treasury Notes, 0.375%, 11/30/2025 | 2.6% |
| Goldman Sachs Group, Inc. | 2.2% |
| UMBS, 2.5%, 30 year (h) | 1.9% |
| Charles Schwab Corp. | 1.9% |
| Microsoft Corp. | 1.9% |
| JPMorgan Chase & Co. | 1.9% |
| Cigna Corp. | 1.8% |
| Johnson & Johnson | 1.6% |
| U.S. Treasury Ultra Note 10 yr Future - MAR 2023 | (1.9)% |
Composition including fixed income credit quality (a)(i)
| AAA | 4.6% |
| AA | 1.8% |
| A | 4.2% |
| BBB | 9.0% |
| BB | 0.1% |
| B (o) | 0.0% |
| CCC (o) | 0.0% |
| U.S. Government | 7.0% |
| Federal Agencies | 12.6% |
| Not Rated | 2.7% |
| Non-Fixed Income | 60.1% |
| Cash & Cash Equivalents | 0.6% |
| Other | (2.7)% |
GICS equity sectors (g)
| Financials | 14.8% |
| Health Care | 10.3% |
| Industrials | 8.6% |
| Information Technology | 7.1% |
| Communication Services | 4.1% |
| Consumer Staples | 4.0% |
| Energy | 3.2% |
| Utilities | 2.4% |
| Consumer Discretionary | 2.3% |
| Materials | 2.2% |
| Convertible Debt | 0.8% |
| Real Estate | 0.3% |
Fixed income sectors (i)
| Investment Grade Corporates | 12.9% |
| Mortgage-Backed Securities | 12.6% |
| U.S. Treasury Securities | 9.7% |
| Collateralized Debt Obligations | 3.4% |
| Commercial Mortgage-Backed Securities | 2.0% |
| Asset-Backed Securities | 0.4% |
| Municipal Bonds | 0.4% |
| Non-U.S. Government Bonds | 0.3% |
| Emerging Markets Bonds | 0.2% |
| High Yield Corporates | 0.1% |
| U.S. Government Agencies (o) | 0.0% |
| (a) | For all securities other than those specifically described below, ratings are assigned to underlying securities utilizing ratings from Moody’s, Fitch, and Standard & Poor’s rating agencies and applying the following hierarchy: If all three agencies provide a rating, the middle rating (after dropping the highest and lowest ratings) is assigned; if two of the three agencies rate a security, the lower of the two is assigned. If none of the 3 rating agencies above assign a rating, but the security is rated by DBRS Morningstar, then the DBRS Morningstar rating is assigned. If none of the 4 rating agencies listed above rate the security, but the security is rated by the Kroll Bond Rating Agency (KBRA), then the KBRA rating is assigned. Ratings are shown in the S&P and Fitch scale (e.g., AAA). Securities rated BBB or higher are considered investment grade. All ratings are subject to change. U.S. Government includes securities issued by the U.S. Department of the Treasury. Federal Agencies includes rated and unrated U.S. Agency fixed-income securities, U.S. Agency mortgage-backed securities, |
Portfolio Composition - continued
and collateralized mortgage obligations of U.S. Agency mortgage-backed securities. Not Rated includes fixed income securities and fixed income derivatives that have not been rated by any rating agency. Non-Fixed Income includes equity securities (including convertible bonds and equity derivatives), ETFs, and/or commodity-linked derivatives. The fund may or may not have held all of these instruments on this date. The fund is not rated by these agencies.
| (g) | The Global Industry Classification Standard (GICS®) was developed by and/or is the exclusive property of MSCI, Inc. and S&P Global Market Intelligence Inc. (“S&P Global Market Intelligence”). GICS is a service mark of MSCI and S&P Global Market Intelligence and has been licensed for use by MFS. MFS has applied its own internal sector/industry classification methodology for equity securities and non-equity securities that are unclassified by GICS. |
| (h) | UMBS may include both Fannie Mae and Freddie Mac securities. |
| (i) | For purposes of this presentation, the components include the value of securities, and reflect the impact of the equivalent exposure of derivative positions, if any. These amounts may be negative from time to time. Equivalent exposure is a calculated amount that translates the derivative position into a reasonable approximation of the amount of the underlying asset that the portfolio would have to hold at a given point in time to have the same price sensitivity that results from the portfolio’s ownership of the derivative contract. When dealing with derivatives, equivalent exposure is a more representative measure of the potential impact of a position on portfolio performance than value. The bond component will include any accrued interest amounts. |
Where the fund holds convertible bonds, they are treated as part of the equity portion of the portfolio.
Cash & Cash Equivalents includes any cash, investments in money market funds, short-term securities, and other assets less liabilities. Please see the Statement of Assets and Liabilities for additional information related to the fund’s cash position and other assets and liabilities.
Other includes equivalent exposure from currency derivatives and/or any offsets to derivative positions and may be negative.
Percentages are based on net assets as of December 31, 2022.
The portfolio is actively managed and current holdings may be different.
Management Review
Summary of Results
For the twelve months ended December 31, 2022, Initial Class shares of the MFS Total Return Series (fund) provided a total return of -9.58%, while Service Class shares of the fund provided a total return of -9.84%. These compare with returns of -18.11% and –13.01% over the same period for the fund’s benchmarks, the Standard & Poor’s 500 Stock Index (S&P 500 Index) and the Bloomberg U.S. Aggregate Bond Index, respectively. The fund’s other benchmark, the MFS Total Return Blended Index (Blended Index), generated a return of -15.79%. The Blended Index reflects the blended returns of the equity and fixed income market indices, with percentage allocations to each index designed to resemble the equity and fixed income allocations of the fund. The market indices and related percentage allocations used to compile the Blended Index are set forth in the Performance Summary.
Market Environment
During the reporting period, markets continued to grapple with the strongest global inflationary pressures in decades along with signs of slowing economic growth. Intermittent coronavirus flareups, particularly in China, where home-grown vaccines have proved less effective than elsewhere, kept supply chains stretched for a considerable period. At the same time, the reopening of the economy in the parts of the world where the virus has been better contained has led to a shift in consumption patterns in favor of services, straining already tight labor markets in most developed economies, while reducing demand for manufactured goods, primarily from Asia. As a result of Russia’s invasion of Ukraine, geopolitical considerations, such as sanctions and trade bans, have resulted in additional supply chain disruptions and volatile global energy prices. Taken together, these factors have contributed to market volatility.
The ripple effects from the Russian invasion further complicated the mission central banks must undertake to rein in surging inflation. Energy shocks have historically resulted in global growth slowdowns, if not pullbacks, so policymakers will find themselves in the difficult position of trying to restrain inflation without tipping economies into recession. Despite the challenging macroeconomic and geopolitical environment, policymakers remained focused on controlling inflation, although investors appeared to have expected varying degrees of action from the central banks. The Fed has been among the most aggressive developed market central banks, tightening policy at the fastest rate in decades, although it slowed its hiking pace at the end of the period, as did the European Central Bank. After remaining on the monetary sidelines for much of the period, the Bank of Japan widened its Yield Curve Control band, capping the yield on its 10-year bond at 0.5%, up from 0.25%, an action investors interpreted as a first step toward monetary policy normalization.
Against an environment of still-tight labor markets, tighter global financial conditions and volatile materials prices, investor anxiety appeared to have increased over the potential that corporate profit margins may be past peak for this cycle. That said, tentative signs that supply chain bottlenecks (particularly semiconductors) may be moderating, the easing of COVID restrictions in China, low levels of unemployment across developed markets and hopes that inflation levels may be near a peak were supportive factors for the macroeconomic backdrop.
Contributors to Performance
Within the equity portion of the fund, a combination of the fund’s underweight position and stock selection within both the consumer discretionary and communication services sectors contributed to performance relative to the S&P 500 Index. Within the consumer discretionary sector, not owning shares of both internet retailer Amazon.com and electric vehicle manufacturer Tesla aided relative results. The share price of Amazon.com declined amid the broader market sell-off within technology stocks due to the sharp rise in interest rates that appeared to have reduced investor’s appetite for long-duration growth stocks. Additionally, weaker revenue and operating profit growth, driven by softer-than-anticipated performance in Amazon Web Services (AWS) and a subdued consumer demand, further weakened Amazon.com’s stock price performance during the reporting period. Within the communication services sector, not owning shares of Meta Platforms, and the fund’s underweight position in technology company Alphabet, lifted relative performance. The stock price of Meta Platforms fell during the reporting period due to a reduction in the company’s forward-looking guidance, led by higher-than-anticipated expenses, uncertain macroeconomic conditions and weakening of online advertising demand.
Favorable stock selection and, to a lesser extent, an overweight position in the health care sector also boosted relative returns, led by the fund’s overweight positions in global health services provider Cigna, pharmaceutical company Merck and health care services company McKesson. The share price of Cigna appreciated steadily during the period as the company delivered above-consensus financial results, led by strong performance in Cigna Healthcare, particularly better-than-anticipated medical loss ratio (MLR) rebates and stronger operating income growth.
Stocks in other sectors that supported relative performance included the fund’s overweight positions in global integrated energy company Hess and oil and gas company ConocoPhillips. Additionally, not owning shares of weak-performing computer and personal electronics maker Apple further boosted relative returns.
Management Review - continued
Within the fixed income portion of the fund, a shorter duration(d) stance, relative to the Bloomberg U.S. Aggregate Bond Index, was a primary contributor to relative returns as interest rates rose throughout the reporting period.
Detractors from Performance
Within the equity portion of the fund, stock selection in the industrials sector weighed on performance relative to the S&P 500 Index, led by the fund’s overweight positions in power and hand tools manufacturer Stanley Black & Decker and home improvement and building product manufacturer Masco. The share price of Stanley Black & Decker fell as the company’s financial results came under pressure due to weaker-than-anticipated margins within its tools and storage segments. Additionally, management lowered its revenue guidance owing to a slowdown in consumer demand and global supply chain headwinds, which further pressured the stock.
Elsewhere, not owning shares of integrated energy companies ExxonMobil and Chevron, health insurance and Medicare/Medicaid provider UnitedHealth Group, insurance and investment firm Berkshire Hathaway, pharmaceutical products manufacturer Eli Lilly and biopharmaceutical company AbbVie held back relative returns. The share price of ExxonMobil advanced during the period, owing to a strong energy price environment reflecting global energy shortages and better margins expansion in its refining segment. Additionally, increased return to shareholders through stock repurchases and dividends, and greater debt reduction, further supported the stock. Additionally, overweight positions in both cable services provider Comcast and semiconductor company Intel further weighed on relative results. The share price of Comcast declined, primarily over higher-than-expected broadband and video subscriber losses paired with softer advertising income.
Within the fixed income portion of the fund, asset allocation decisions detracted from the fund’s performance relative to the Bloomberg U.S. Aggregate Bond Index. From a sector perspective, the fund’s exposure to the Collateralized Mortgage Obligations (CMO) sector, for which the benchmark has no exposure, and an underweight exposure to the treasury sector, hindered relative returns.
Unfavorable security selection within both the financial institutions sector, particularly within “A” rated(r) bonds, and the industrials sector also dampened relative returns.
Respectfully,
Portfolio Manager(s)
Steven Gorham, Alexander Mackey, Joshua Marston, Johnathan Munko, and Henry Peabody
Note to Shareholders: Effective January 20, 2023, Henry Peabody is no longer a Portfolio Manager of the fund.
| (d) | Duration is a measure of how much a bond’s price is likely to fluctuate with general changes in interest rates, e.g., if rates rise 1.00%, a bond with a 5-year duration is likely to lose about 5.00% of its value. |
| (r) | Securities rated “BBB”, “Baa”, or higher are considered investment grade; securities rated “BB”, “Ba”, or below are considered non-investment grade. Ratings are assigned to underlying securities utilizing ratings from Moody's, Fitch, and Standard & Poor's and applying the following hierarchy: If all three agencies provide a rating, the middle rating (after dropping the highest and lowest ratings) is assigned; if two of the three agencies rate a security, the lower of the two is assigned. If none of the 3 rating agencies above assign a rating, but the security is rated by DBRS Morningstar, then the DBRS Morningstar rating is assigned. If none of the 4 ratings agencies listed above rate the security, but the security is rated by the Kroll Bond Rating Agency (KBRA), then the KBRA rating is assigned. Ratings are shown in the S&P and Fitch scale (e.g., AAA). For securities that are not rated by any of the rating agencies, the security is considered Not Rated |
The views expressed in this report are those of the portfolio manager(s) only through the end of the period of the report as stated on the cover and do not necessarily reflect the views of MFS or any other person in the MFS organization. These views are subject to change at any time based on market or other conditions, and MFS disclaims any responsibility to update such views. These views may not be relied upon as investment advice or an indication of trading intent on behalf of any MFS portfolio. References to specific securities are not recommendations of such securities, and may not be representative of any MFS portfolio’s current or future investments.
Performance Summary Through 12/31/22
The following chart illustrates the historical performance of the fund in comparison to its benchmark(s). Benchmarks are unmanaged and may not be invested in directly. Benchmark returns do not reflect any fees or expenses. The performance of other share classes will be greater than or less than that of the class depicted below. (See Notes to Performance Summary.)
Performance data shown represents past performance and is no guarantee of future results. Investment return and principal value fluctuate so your shares, when sold, may be worth more or less than the original cost; current performance may be lower or higher than quoted. The performance shown does not reflect the deduction of taxes, if any, that a shareholder would pay on fund distributions or the redemption of fund shares. The returns for the fund shown also do not reflect the deduction of expenses associated with variable products, such as mortality and expense risk charges, separate account charges, and sales charges imposed by the insurance company separate accounts. Such expenses would reduce the overall returns shown.
Growth of a Hypothetical $10,000 Investment
Total Returns through 12/31/22
Average annual total returns
| Share Class | Class Inception Date | 1-yr | 5-yr | 10-yr |
| Initial Class | 1/03/95 | (9.58)% | 5.18% | 7.34% |
| Service Class | 5/01/00 | (9.84)% | 4.91% | 7.07% |
Comparative benchmark(s)
| Standard & Poor's 500 Stock Index (f) | (18.11)% | 9.42% | 12.56% |
| Bloomberg U.S. Aggregate Bond Index (f) | (13.01)% | 0.02% | 1.06% |
| MFS Total Return Blended Index (f)(w) | (15.79)% | 5.96% | 8.08% |
| (f) | Source: FactSet Research Systems Inc. |
| (w) | The MFS Total Return Blended Index (a custom index) was comprised of the following at the beginning and at the end of the reporting period: |
| | 12/31/22 |
| Standard & Poor's 500 Stock Index | 60% |
| Bloomberg U.S. Aggregate Bond Index | 40% |
Benchmark Definition(s)
Bloomberg U.S. Aggregate Bond Index(a) – a market capitalization-weighted index that measures the performance of the U.S. investment-grade, fixed rate bond market, with index components for government and corporate securities, mortgage pass-through securities, and asset-backed securities with at least one year to final maturity.
Standard & Poor's 500 Stock Index(g) – a market capitalization-weighted index of 500 widely held equity securities, designed to measure broad U.S. equity performance.
It is not possible to invest directly in an index.
Performance Summary – continued
| (a) | Source: Bloomberg Index Services Limited. BLOOMBERG® is a trademark and service mark of Bloomberg Finance L.P. and its affiliates (collectively “Bloomberg”). Bloomberg or Bloomberg's licensors own all proprietary rights in the Bloomberg Indices. Bloomberg neither approves or endorses this material, or guarantees the accuracy or completeness of any information herein, or makes any warranty, express or implied, as to the results to be obtained therefrom and, to the maximum extent allowed by law, neither shall have any liability or responsibility for injury or damages arising in connection therewith. |
| (g) | “Standard & Poor's®” and “S&P®” are registered trademarks of Standard & Poor's Financial Services LLC (“S&P”) and Dow Jones is a registered trademark of Dow Jones Trademark Holdings LLC (“Dow Jones”) and have been licensed for use by S&P Dow Jones Indices LLC and sublicensed for certain purposes by MFS. The S&P 500® is a product of S&P Dow Jones Indices LLC, and has been licensed for use by MFS. MFS's product(s) is not sponsored, endorsed, sold, or promoted by S&P Dow Jones Indices LLC, Dow Jones, S&P, or their respective affiliates, and neither S&P Dow Jones Indices LLC, Dow Jones, S&P, nor their respective affiliates make any representation regarding the advisability of investing in such product(s). |
Notes to Performance Summary
Average annual total return represents the average annual change in value for each share class for the periods presented.
Performance results reflect any applicable expense subsidies and waivers in effect during the periods shown. Without such subsidies and waivers the fund's performance results would be less favorable. Please see the prospectus and financial statements for complete details. All results are historical and assume the reinvestment of any dividends and capital gains distributions.
Performance results do not include adjustments made for financial reporting purposes in accordance with U.S. generally accepted accounting principles and may differ from amounts reported in the financial highlights.
From time to time the fund may receive proceeds from litigation settlements, without which performance would be lower.
Expense Table
Fund expenses borne by the shareholders during the period,
July 1, 2022 through December 31, 2022
As a shareholder of the fund, you incur ongoing costs, including management fees; distribution and/or service (12b-1) fees; and other fund expenses. This example is intended to help you understand your ongoing costs (in dollars) of investing in the fund and to compare these costs with the ongoing costs of investing in other mutual funds.
The example is based on an investment of $1,000 invested at the beginning of the period and held for the entire period July 1, 2022 through December 31, 2022.
Actual Expenses
The first line for each share class in the following table provides information about actual account values and actual expenses. You may use the information in this line, together with the amount you invested, to estimate the expenses that you paid over the period. Simply divide your account value by $1,000 (for example, an $8,600 account value divided by $1,000 = 8.6), then multiply the result by the number in the first line under the heading entitled “Expenses Paid During Period” to estimate the expenses you paid on your account during this period.
Hypothetical Example for Comparison Purposes
The second line for each share class in the following table provides information about hypothetical account values and hypothetical expenses based on the fund’s actual expense ratio and an assumed rate of return of 5% per year before expenses, which is not the fund’s actual return. The hypothetical account values and expenses may not be used to estimate the actual ending account balance or expenses you paid for the period. You may use this information to compare the ongoing costs of investing in the fund and other funds. To do so, compare this 5% hypothetical example with the 5% hypothetical examples that appear in the shareholder reports of the other funds.
Please note that the expenses shown in the table are meant to highlight the fund's ongoing costs only and do not take into account the fees and expenses imposed under the variable contracts through which your investment in the fund is made. Therefore, the second line for each share class in the table is useful in comparing ongoing costs associated with an investment in vehicles (such as the fund) which fund benefits under variable annuity and variable life insurance contracts and to qualified pension and retirement plans only, and will not help you determine the relative total costs of investing in the fund through variable annuity and variable life insurance contracts. If the fees and expenses imposed under the variable contracts were included, your costs would have been higher.
Share
Class | | Annualized
Expense
Ratio | Beginning
Account Value
7/01/22 | Ending
Account Value
12/31/22 | Expenses
Paid During
Period (p)
7/01/22-12/31/22 |
| Initial Class | Actual | 0.61% | $1,000.00 | $1,036.65 | $3.13 |
| Hypothetical (h) | 0.61% | $1,000.00 | $1,022.13 | $3.11 |
| Service Class | Actual | 0.86% | $1,000.00 | $1,035.31 | $4.41 |
| Hypothetical (h) | 0.86% | $1,000.00 | $1,020.87 | $4.38 |
| (h) | 5% class return per year before expenses. |
| (p) | “Expenses Paid During Period” are equal to each class's annualized expense ratio, as shown above, multiplied by the average account value over the period, multiplied by 184/365 (to reflect the one-half year period). |
Portfolio of Investments − 12/31/22
The Portfolio of Investments is a complete list of all securities owned by your fund. It is categorized by broad-based asset classes.
| Issuer | | | Shares/Par | Value ($) |
| Common Stocks – 58.5% |
| Aerospace & Defense – 2.2% | |
| Honeywell International, Inc. | | 69,997 | $ 15,000,357 |
| Howmet Aerospace, Inc. | | 259,071 | 10,209,988 |
| L3Harris Technologies, Inc. | | 65,654 | 13,669,819 |
| Northrop Grumman Corp. | | 15,370 | 8,386,026 |
| | | | | $47,266,190 |
| Alcoholic Beverages – 0.3% | |
| Constellation Brands, Inc., “A” | | 33,099 | $ 7,670,693 |
| Automotive – 1.6% | |
| Aptiv PLC (a) | | 114,636 | $ 10,676,050 |
| Lear Corp. | | 82,397 | 10,218,876 |
| LKQ Corp. | | 252,524 | 13,487,307 |
| | | | | $34,382,233 |
| Broadcasting – 0.7% | |
| Omnicom Group, Inc. | | 163,053 | $ 13,300,233 |
| Warner Bros. Discovery, Inc. (a) | | 184,110 | 1,745,363 |
| | | | | $15,045,596 |
| Brokerage & Asset Managers – 3.0% | |
| Cboe Global Markets, Inc. | | 66,763 | $ 8,376,754 |
| Charles Schwab Corp. | | 506,716 | 42,189,175 |
| Invesco Ltd. | | 285,388 | 5,134,130 |
| NASDAQ, Inc. | | 163,760 | 10,046,676 |
| | | | | $65,746,735 |
| Business Services – 2.5% | |
| Accenture PLC, “A” | | 39,461 | $ 10,529,773 |
| Amdocs Ltd. | | 135,584 | 12,324,586 |
| Cognizant Technology Solutions Corp., “A” | | 118,448 | 6,774,041 |
| Equifax, Inc. | | 25,658 | 4,986,889 |
| Fidelity National Information Services, Inc. | | 129,560 | 8,790,646 |
| Fiserv, Inc. (a) | | 100,575 | 10,165,115 |
| | | | | $53,571,050 |
| Cable TV – 1.6% | |
| Comcast Corp., “A” | | 972,588 | $ 34,011,402 |
| Chemicals – 0.6% | |
| PPG Industries, Inc. | | 108,210 | $ 13,606,325 |
| Computer Software – 2.2% | |
| Microsoft Corp. | | 174,989 | $ 41,965,862 |
| Oracle Corp. | | 77,320 | 6,320,137 |
| | | | | $48,285,999 |
| Computer Software - Systems – 0.2% | |
| Seagate Technology Holdings PLC | | 101,943 | $ 5,363,221 |
Portfolio of Investments – continued
| Issuer | | | Shares/Par | Value ($) |
| Common Stocks – continued |
| Construction – 1.6% | |
| Masco Corp. | | 413,579 | $ 19,301,732 |
| Stanley Black & Decker, Inc. | | 123,002 | 9,239,910 |
| Vulcan Materials Co. | | 42,291 | 7,405,577 |
| | | | | $35,947,219 |
| Consumer Products – 0.2% | |
| Kimberly-Clark Corp. | | 31,974 | $ 4,340,470 |
| Consumer Services – 0.2% | |
| Booking Holdings, Inc. (a) | | 1,828 | $ 3,683,932 |
| Electrical Equipment – 1.2% | |
| Johnson Controls International PLC | | 399,301 | $ 25,555,264 |
| Electronics – 2.2% | |
| Applied Materials, Inc. | | 100,650 | $ 9,801,297 |
| Intel Corp. | | 376,110 | 9,940,587 |
| NXP Semiconductors N.V. | | 89,593 | 14,158,382 |
| Taiwan Semiconductor Manufacturing Co. Ltd., ADR | | 89,429 | 6,661,566 |
| Texas Instruments, Inc. | | 50,002 | 8,261,331 |
| | | | | $48,823,163 |
| Energy - Independent – 2.9% | |
| ConocoPhillips | | 221,743 | $ 26,165,674 |
| Hess Corp. | | 152,635 | 21,646,696 |
| Pioneer Natural Resources Co. | | 64,928 | 14,828,906 |
| | | | | $62,641,276 |
| Energy - Integrated – 0.4% | |
| Suncor Energy, Inc. | | 244,273 | $ 7,748,542 |
| Food & Beverages – 1.3% | |
| Archer Daniels Midland Co. | | 89,387 | $ 8,299,583 |
| Danone S.A. | | 101,293 | 5,337,962 |
| General Mills, Inc. | | 79,157 | 6,637,314 |
| J.M. Smucker Co. | | 31,368 | 4,970,573 |
| Mondelez International, Inc. | | 47,120 | 3,140,548 |
| | | | | $28,385,980 |
| General Merchandise – 0.1% | |
| Dollar Tree, Inc. (a) | | 20,649 | $ 2,920,595 |
| Health Maintenance Organizations – 1.8% | |
| Cigna Corp. | | 118,086 | $ 39,126,615 |
| Insurance – 3.4% | |
| Aon PLC | | 78,271 | $ 23,492,258 |
| Chubb Ltd. | | 97,104 | 21,421,142 |
| Travelers Cos., Inc. | | 59,759 | 11,204,215 |
| Willis Towers Watson PLC | | 76,710 | 18,761,732 |
| | | | | $74,879,347 |
| Internet – 0.8% | |
| Alphabet, Inc., “A” (a) | | 189,731 | $ 16,739,966 |
Portfolio of Investments – continued
| Issuer | | | Shares/Par | Value ($) |
| Common Stocks – continued |
| Leisure & Toys – 0.3% | |
| Electronic Arts, Inc. | | 52,127 | $ 6,368,877 |
| Machinery & Tools – 2.7% | |
| Eaton Corp. PLC | | 206,815 | $ 32,459,614 |
| Ingersoll Rand, Inc. | | 227,034 | 11,862,527 |
| Regal Rexnord Corp. | | 126,412 | 15,166,912 |
| | | | | $59,489,053 |
| Major Banks – 6.6% | |
| Bank of America Corp. | | 808,620 | $ 26,781,495 |
| Goldman Sachs Group, Inc. | | 137,133 | 47,088,730 |
| JPMorgan Chase & Co. | | 308,913 | 41,425,233 |
| Morgan Stanley | | 199,509 | 16,962,255 |
| PNC Financial Services Group, Inc. | | 69,930 | 11,044,744 |
| | | | | $143,302,457 |
| Medical & Health Technology & Services – 1.4% | |
| ICON PLC (a) | | 45,557 | $ 8,849,447 |
| McKesson Corp. | | 47,115 | 17,673,779 |
| Quest Diagnostics, Inc. | | 30,174 | 4,720,421 |
| | | | | $31,243,647 |
| Medical Equipment – 2.3% | |
| Becton, Dickinson and Co. | | 27,330 | $ 6,950,019 |
| Danaher Corp. | | 74,167 | 19,685,405 |
| Medtronic PLC | | 220,155 | 17,110,446 |
| Thermo Fisher Scientific, Inc. | | 10,246 | 5,642,370 |
| | | | | $49,388,240 |
| Metals & Mining – 0.2% | |
| Rio Tinto PLC | | 58,307 | $ 4,087,025 |
| Other Banks & Diversified Financials – 1.7% | |
| Northern Trust Corp. | | 142,793 | $ 12,635,752 |
| Truist Financial Corp. | | 592,493 | 25,494,974 |
| | | | | $38,130,726 |
| Pharmaceuticals – 4.8% | |
| Bayer AG | | 197,276 | $ 10,204,983 |
| Johnson & Johnson | | 203,780 | 35,997,737 |
| Merck & Co., Inc. | | 270,006 | 29,957,166 |
| Organon & Co. | | 161,885 | 4,521,448 |
| Pfizer, Inc. | | 197,029 | 10,095,766 |
| Roche Holding AG | | 29,245 | 9,187,987 |
| Vertex Pharmaceuticals, Inc. (a) | | 18,457 | 5,330,013 |
| | | | | $105,295,100 |
| Railroad & Shipping – 1.0% | |
| Union Pacific Corp. | | 101,238 | $ 20,963,353 |
| Real Estate – 0.3% | |
| STORE Capital Corp., REIT | | 180,342 | $ 5,781,765 |
| Restaurants – 0.2% | |
| Wendy's Co. | | 240,815 | $ 5,449,643 |
Portfolio of Investments – continued
| Issuer | | | Shares/Par | Value ($) |
| Common Stocks – continued |
| Specialty Chemicals – 1.0% | |
| Axalta Coating Systems Ltd. (a) | | 444,206 | $ 11,313,927 |
| DuPont de Nemours, Inc. | | 156,772 | 10,759,262 |
| | | | | $22,073,189 |
| Specialty Stores – 0.8% | |
| Ross Stores, Inc. | | 30,103 | $ 3,494,055 |
| Wal-Mart Stores, Inc. | | 102,333 | 14,509,796 |
| | | | | $18,003,851 |
| Telecommunications - Wireless – 0.8% | |
| T-Mobile US, Inc. (a) | | 122,506 | $ 17,150,840 |
| Tobacco – 1.0% | |
| Philip Morris International, Inc. | | 219,998 | $ 22,265,998 |
| Utilities - Electric Power – 2.4% | |
| Duke Energy Corp. | | 121,147 | $ 12,476,930 |
| Exelon Corp. | | 235,781 | 10,192,813 |
| PG&E Corp. (a) | | 866,132 | 14,083,306 |
| Southern Co. | | 212,920 | 15,204,617 |
| | | | | $51,957,666 |
| Total Common Stocks (Identified Cost, $769,088,956) | | $1,276,693,243 |
| Bonds – 39.1% |
| Aerospace & Defense – 0.1% |
| BAE Systems PLC, 3.4%, 4/15/2030 (n) | | $ | 1,108,000 | $ 977,714 |
| Huntington Ingalls Industries, Inc., 3.844%, 5/01/2025 | | | 504,000 | 486,969 |
| Raytheon Technologies Corp., 4.125%, 11/16/2028 | | | 1,570,000 | 1,502,659 |
| | | | | $2,967,342 |
| Asset-Backed & Securitized – 5.8% |
| ACRES 2021-FL2 Issuer Ltd., “AS”, FLR, 6.076% (LIBOR - 1mo. + 1.75%), 1/15/2037 (n) | | $ | 1,851,500 | $ 1,739,528 |
| Allegro CLO Ltd., 2016-1A, “BR2”, FLR, 5.629% (LIBOR - 3mo. + 1.55%), 1/15/2030 (n) | | | 2,407,803 | 2,343,727 |
| Arbor Realty Trust, Inc., CLO, 2020-FL1, “AS”, FLR, 5.85% (LIBOR - 1mo. + 1.4%), 2/15/2035 (n) | | | 1,150,000 | 1,118,883 |
| Arbor Realty Trust, Inc., CLO, 2021-FL1, “AS”, FLR, 5.47% (LIBOR - 1mo. + 1.2%), 12/15/2035 (n) | | | 2,115,000 | 1,940,826 |
| Arbor Realty Trust, Inc., CLO, 2021-FL3, “B”, FLR, 5.917% (LIBOR - 1mo. + 1.6%), 8/15/2034 (n) | | | 1,807,500 | 1,644,925 |
| Arbor Realty Trust, Inc., CLO, 2022-FL1, “B”, FLR, 5.907% (SOFR - 30 day + 2.1%), 1/15/2037 (n) | | | 5,076,500 | 4,853,241 |
| AREIT 2019-CRE3 Trust, “AS”, FLR, 5.74% (LIBOR - 1mo. + 1.3%), 9/14/2036 (n) | | | 3,366,000 | 3,278,147 |
| AREIT 2022-CRE6 Trust, “B”, FLR, 5.675% (SOFR - 30 day + 1.85%), 1/16/2037 (n) | | | 3,088,500 | 2,837,346 |
| Bayview Financial Revolving Mortgage Loan Trust, FLR, 5.988% (LIBOR - 1mo. + 1.6%), 12/28/2040 (n) | | | 565,350 | 694,832 |
| BDS 2019-FL4 Ltd., “A”, FLR, 5.426% (LIBOR - 1mo. + 1.10%), 8/15/2036 (n) | | | 45,269 | 45,269 |
| Brazos Securitization LLC, 5.243%, 3/01/2041 (n) | | | 1,552,000 | 1,491,231 |
| BSPRT 2021-FL6 Issuer Ltd., “AS”, FLR, 5.617% (LIBOR - 1mo. + 1.3%), 3/15/2036 (n) | | | 4,964,000 | 4,697,498 |
| BSPRT 2021-FL7 Issuer Ltd., “B”, FLR, 6.368% (LIBOR - 1mo. + 2.05%), 12/15/2038 (n) | | | 849,500 | 788,589 |
| BSPRT 2022-FL8 Issuer Ltd., “B”, FLR, 5.857% (SOFR - 30 day + 2.05%), 2/15/2037 (n) | | | 1,817,000 | 1,732,816 |
| Business Jet Securities LLC, 2021-1A, “A”, 2.162%, 4/15/2036 (n) | | | 1,097,217 | 963,416 |
| BXMT 2021-FL4 Ltd., “AS”, FLR, 5.617% (LIBOR - 1mo. + 1.3%), 5/15/2038 (n) | | | 5,214,000 | 4,974,328 |
| CHCP 2021-FL1 Ltd., “AS”, FLR, 5.74% (LIBOR - 1mo. + 1.3%) 2/15/2038 (n) | | | 2,203,500 | 2,127,618 |
| Columbia Cent CLO 28 Ltd., “A-2-R”, 6.231%, 11/07/2030 (n) | | | 3,492,733 | 3,345,724 |
| Commercial Mortgage Trust, 2015-LC21, “A4”, 3.708%, 7/10/2048 | | | 3,980,975 | 3,788,851 |
| Credit Acceptance Auto Loan Trust, 2021-3A, “B”, 1.38%, 7/15/2030 (n) | | | 1,118,000 | 1,025,746 |
| CSAIL Commercial Mortgage Trust, 2015-C2, “A4”, 3.504%, 6/15/2057 | | | 2,316,427 | 2,198,082 |
| Cutwater 2015-1A Ltd., “AR”, FLR, 5.299% (LIBOR - 3mo. + 1.22%), 1/15/2029 (n) | | | 1,582,610 | 1,571,965 |
| Dryden Senior Loan Fund, 2013-26A, “AR”, CLO, FLR, 4.979% (LIBOR - 3mo. + 0.9%), 4/15/2029 (n) | | | 1,880,829 | 1,858,169 |
Portfolio of Investments – continued
| Issuer | | | Shares/Par | Value ($) |
| Bonds – continued |
| Asset-Backed & Securitized – continued |
| Dryden Senior Loan Fund, 2018-55A, “A1”, CLO, FLR, 5.099% (LIBOR - 3mo. + 1.02%), 4/15/2031 (n) | | $ | 4,414,000 | $ 4,354,160 |
| GMAC Mortgage Corp. Loan Trust, FGIC, 5.805%, 10/25/2036 | | | 105,074 | 103,280 |
| GS Mortgage Securities Trust, 2015-GC30, “A4”, 3.382%, 5/10/2050 | | | 4,243,101 | 4,023,423 |
| JPMBB Commercial Mortgage Securities Trust, 2014-C26, “A4”, 3.494%, 1/15/2048 | | | 4,880,000 | 4,672,585 |
| JPMBB Commercial Mortgage Securities Trust, 2015-C28, “A4”, 3.227%, 10/15/2048 | | | 3,256,792 | 3,080,758 |
| LCCM 2021-FL2 Trust, “B”, FLR, 6.217% (LIBOR - 1mo. + 1.9%), 12/13/2038 (n) | | | 2,562,000 | 2,459,699 |
| LoanCore 2021-CRE5 Ltd., “AS”, FLR, 6.067% (LIBOR - 1mo. + 1.75%), 7/15/2036 (n) | | | 5,288,000 | 4,970,691 |
| MF1 2020-FL4 Ltd., “A”, FLR, 6.15% (LIBOR - 1mo. + 1.7%), 11/15/2035 (n) | | | 1,231,738 | 1,207,244 |
| MF1 2021-FL5 Ltd., “AS”, FLR, 5.65% (LIBOR - 1mo. + 1.2%), 7/15/2036 (n) | | | 5,459,500 | 5,264,055 |
| MF1 2022-FL8 Ltd., “B”, FLR, 5.775% (SOFR - 30 day + 1.95%), 2/19/2037 (n) | | | 2,251,053 | 2,127,113 |
| MidOcean Credit CLO, 2013-2A, “BR”, FLR, 6.064% (LIBOR - 3mo. + 1.65%), 1/29/2030 (n) | | | 3,932,725 | 3,797,923 |
| Morgan Stanley Bank of America Merrill Lynch Trust, 2017-C34, “A4”, 3.536%, 11/15/2052 | | | 1,600,004 | 1,478,844 |
| Neuberger Berman CLO Ltd., 2013-15A, “BR2”, FLR, 5.429% (LIBOR - 3mo. + 1.35%), 10/15/2029 (n) | | | 1,750,540 | 1,693,198 |
| Neuberger Berman CLO Ltd., 2015-20A, “ARR”, FLR, 5.239% (LIBOR - 3mo. + 1.16%), 7/15/2034 (n) | | | 1,900,000 | 1,850,518 |
| Oaktree CLO 2019-1A Ltd., “BR”, FLR, 6.074% (LIBOR - 3mo. + 1.75%), 4/22/2030 (n) | | | 5,195,227 | 4,974,336 |
| OneMain Financial Issuance Trust 2022-3A, “A”, 5.94%, 5/15/2034 (n) | | | 2,137,000 | 2,122,461 |
| PFP III 2021-7 Ltd., “AS”, FLR, 5.467% (LIBOR - 1mo. + 1.15%), 4/14/2038 (n) | | | 3,912,305 | 3,683,662 |
| ReadyCap Commercial Mortgage Trust, 2021-FL5, “A”, FLR, 5.389% (LIBOR - 1mo. + 1%), 4/25/2038 (n) | | | 2,297,208 | 2,230,141 |
| ReadyCap Commercial Mortgage Trust, 2021-FL7, “B”, FLR, 6.188% (LIBOR - 1mo. + 1.8%), 11/25/2036 (n) | | | 1,130,000 | 1,064,885 |
| Residential Funding Mortgage Securities, Inc., FGIC, 4.223%, 12/25/2035 | | | 63,221 | 62,695 |
| Santander Drive Auto Receivables Trust, 2022-6, “A2”, 4.37%, 5/15/2025 | | | 449,000 | 446,934 |
| Santander Retail Auto Lease Trust, 2020-A, “B”, 1.88%, 3/20/2024 (n) | | | 313,426 | 312,913 |
| Starwood Commercial Mortgage, 2022-FL3, “AS”, FLR, 5.607% (SOFR - 30 day + 1.8%), 11/15/2038 (n) | | | 5,210,500 | 4,934,245 |
| TPG Real Estate Finance, 2021-FL4, “A”, FLR, 5.526% (LIBOR - 1mo. + 1.2%), 3/15/2038 (n) | | | 5,181,500 | 5,007,251 |
| Verizon Owner Trust, 2020-A, “B”, 1.98%, 7/22/2024 | | | 2,616,000 | 2,591,047 |
| Voya CLO 2012-4A Ltd., “A2R3”, FLR, 5.529% (LIBOR - 3mo. + 1.45%), 10/15/2030 (n) | | | 2,010,166 | 1,909,149 |
| Wells Fargo Commercial Mortgage Trust, 2015-C28, “A4”, 3.54%, 5/15/2048 | | | 4,315,766 | 4,109,356 |
| | | | | $125,593,323 |
| Automotive – 0.4% |
| General Motors Co., 6.75%, 4/01/2046 | | $ | 846,000 | $ 811,063 |
| Hyundai Capital America, 2.65%, 2/10/2025 (n) | | | 804,000 | 756,077 |
| Lear Corp., 4.25%, 5/15/2029 | | | 656,000 | 589,116 |
| Magna International, Inc., 2.45%, 6/15/2030 | | | 1,902,000 | 1,571,675 |
| Stellantis N.V., 2.691%, 9/15/2031 (n) | | | 2,944,000 | 2,246,279 |
| Volkswagen Group of America Finance LLC, 3.35%, 5/13/2025 (n) | | | 3,607,000 | 3,444,718 |
| | | | | $9,418,928 |
| Broadcasting – 0.3% |
| Walt Disney Co., 3.5%, 5/13/2040 | | $ | 3,478,000 | $ 2,799,821 |
| Warnermedia Holdings, Inc., 5.05%, 3/15/2042 (n) | | | 1,937,000 | 1,481,964 |
| Warnermedia Holdings, Inc., 5.141%, 3/15/2052 (n) | | | 1,692,000 | 1,230,027 |
| | | | | $5,511,812 |
| Brokerage & Asset Managers – 0.2% |
| Intercontinental Exchange, Inc., 2.1%, 6/15/2030 | | $ | 2,155,000 | $ 1,757,295 |
| Morgan Stanley Domestic Holdings, Inc., 4.5%, 6/20/2028 | | | 975,000 | 948,088 |
| Raymond James Financial, Inc., 4.95%, 7/15/2046 | | | 2,057,000 | 1,828,721 |
| | | | | $4,534,104 |
| Building – 0.2% |
| Martin Marietta Materials, Inc., 2.5%, 3/15/2030 | | $ | 190,000 | $ 156,538 |
| Masco Corp., 2%, 2/15/2031 | | | 3,622,000 | 2,786,752 |
| Vulcan Materials Co., 3.5%, 6/01/2030 | | | 380,000 | 334,718 |
| | | | | $3,278,008 |
Portfolio of Investments – continued
| Issuer | | | Shares/Par | Value ($) |
| Bonds – continued |
| Business Services – 0.6% |
| Equinix, Inc., 2.625%, 11/18/2024 | | $ | 2,863,000 | $ 2,726,417 |
| Equinix, Inc., 1.8%, 7/15/2027 | | | 1,829,000 | 1,565,526 |
| Equinix, Inc., 2.5%, 5/15/2031 | | | 2,363,000 | 1,898,650 |
| Experian Finance PLC, 4.25%, 2/01/2029 (n) | | | 1,450,000 | 1,337,672 |
| Fiserv, Inc., 2.65%, 6/01/2030 | | | 730,000 | 613,663 |
| Global Payments, Inc., 1.2%, 3/01/2026 | | | 2,011,000 | 1,752,903 |
| Global Payments, Inc., 2.9%, 11/15/2031 | | | 1,699,000 | 1,339,778 |
| RELX Capital, Inc., 3%, 5/22/2030 | | | 620,000 | 528,331 |
| Verisk Analytics, Inc., 4.125%, 3/15/2029 | | | 1,857,000 | 1,738,397 |
| | | | | $13,501,337 |
| Cable TV – 0.4% |
| Charter Communications Operating LLC/Charter Communications Operating Capital Corp., 6.384%, 10/23/2035 | | $ | 1,053,000 | $ 1,026,449 |
| Charter Communications Operating LLC/Charter Communications Operating Capital Corp., 3.5%, 6/01/2041 | | | 2,122,000 | 1,382,684 |
| Charter Communications Operating LLC/Charter Communications Operating Capital Corp., 5.375%, 5/01/2047 | | | 430,000 | 337,310 |
| Charter Communications Operating LLC/Charter Communications Operating Capital Corp., 5.25%, 4/01/2053 | | | 1,734,000 | 1,338,376 |
| Cox Communications, Inc., 1.8%, 10/01/2030 (n) | | | 1,333,000 | 1,013,729 |
| Time Warner Entertainment Co. LP, 8.375%, 7/15/2033 | | | 2,526,000 | 2,805,998 |
| | | | | $7,904,546 |
| Chemicals – 0.1% |
| RPM International, Inc., 2.95%, 1/15/2032 | | $ | 1,427,000 | $ 1,124,357 |
| Sherwin-Williams Co., 2.3%, 5/15/2030 | | | 1,542,000 | 1,267,675 |
| | | | | $2,392,032 |
| Computer Software – 0.0% |
| Oracle Corp., 6.15%, 11/09/2029 | | $ | 947,000 | $ 982,954 |
| Conglomerates – 0.3% |
| Carrier Global Corp., 3.377%, 4/05/2040 | | $ | 3,222,000 | $ 2,445,410 |
| Roper Technologies, Inc., 4.2%, 9/15/2028 | | | 675,000 | 651,945 |
| Roper Technologies, Inc., 2.95%, 9/15/2029 | | | 411,000 | 357,438 |
| Roper Technologies, Inc., 2%, 6/30/2030 | | | 1,302,000 | 1,043,417 |
| Westinghouse Air Brake Technologies Corp., 3.2%, 6/15/2025 | | | 808,000 | 760,690 |
| Westinghouse Air Brake Technologies Corp., 4.95%, 9/15/2028 | | | 2,112,000 | 2,027,634 |
| | | | | $7,286,534 |
| Consumer Products – 0.1% |
| GSK Consumer Healthcare Capital US LLC, 3.375%, 3/24/2029 | | $ | 1,861,000 | $ 1,673,479 |
| Consumer Services – 0.1% |
| Booking Holdings, Inc., 4.625%, 4/13/2030 | | $ | 1,430,000 | $ 1,381,063 |
| Electrical Equipment – 0.1% |
| Arrow Electronics, Inc., 2.95%, 2/15/2032 | | $ | 2,690,000 | $ 2,120,881 |
| Electronics – 0.4% |
| Broadcom, Inc., 4.15%, 11/15/2030 | | $ | 505,000 | $ 452,557 |
| Broadcom, Inc., 4.3%, 11/15/2032 | | | 1,329,000 | 1,171,302 |
| Broadcom, Inc., 3.469%, 4/15/2034 (n) | | | 1,184,000 | 944,515 |
| Broadcom, Inc., 3.187%, 11/15/2036 (n) | | | 2,359,000 | 1,694,441 |
| Broadcom, Inc., 4.926%, 5/15/2037 (n) | | | 683,000 | 595,825 |
| NXP B.V./NXP Funding LLC/NXP USA, Inc., 2.5%, 5/11/2031 | | | 2,212,000 | 1,761,814 |
| NXP B.V./NXP Funding LLC/NXP USA, Inc., 3.25%, 5/11/2041 | | | 1,896,000 | 1,322,918 |
| | | | | $7,943,372 |
Portfolio of Investments – continued
| Issuer | | | Shares/Par | Value ($) |
| Bonds – continued |
| Energy - Integrated – 0.3% |
| BP Capital Markets America, Inc., 2.721%, 1/12/2032 | | $ | 4,182,000 | $ 3,485,529 |
| Eni S.p.A., 4.75%, 9/12/2028 (n) | | | 3,564,000 | 3,449,122 |
| | | | | $6,934,651 |
| Financial Institutions – 0.6% |
| AerCap Ireland Capital DAC/AerCap Global Aviation Trust, 4.875%, 1/16/2024 | | $ | 362,000 | $ 358,546 |
| AerCap Ireland Capital DAC/AerCap Global Aviation Trust, 2.45%, 10/29/2026 | | | 4,225,000 | 3,694,516 |
| AerCap Ireland Capital DAC/AerCap Global Aviation Trust, 3.65%, 7/21/2027 | | | 2,329,000 | 2,105,394 |
| Air Lease Corp., 2.2%, 1/15/2027 | | | 1,394,000 | 1,214,813 |
| Air Lease Corp., 2.875%, 1/15/2032 | | | 1,830,000 | 1,453,808 |
| Avolon Holdings Funding Ltd., 4.375%, 5/01/2026 (n) | | | 682,000 | 621,401 |
| Avolon Holdings Funding Ltd., 3.25%, 2/15/2027 (n) | | | 2,183,000 | 1,868,178 |
| Avolon Holdings Funding Ltd., 2.528%, 11/18/2027 (n) | | | 1,821,000 | 1,455,515 |
| Park Aerospace Holdings Ltd., 5.5%, 2/15/2024 (n) | | | 639,000 | 630,667 |
| | | | | $13,402,838 |
| Food & Beverages – 0.4% |
| Anheuser-Busch InBev S.A., 8%, 11/15/2039 | | $ | 2,950,000 | $ 3,623,226 |
| Anheuser-Busch InBev Worldwide, Inc., 4.375%, 4/15/2038 | | | 737,000 | 658,812 |
| Constellation Brands, Inc., 3.5%, 5/09/2027 | | | 1,544,000 | 1,445,553 |
| Diageo Capital PLC, 2.375%, 10/24/2029 | | | 2,618,000 | 2,233,403 |
| Keurig Dr Pepper, Inc., 3.2%, 5/01/2030 | | | 304,000 | 264,919 |
| | | | | $8,225,913 |
| Gaming & Lodging – 0.3% |
| GLP Capital LP/GLP Financing II, Inc., 5.3%, 1/15/2029 | | $ | 1,593,000 | $ 1,507,520 |
| Las Vegas Sands Corp., 3.9%, 8/08/2029 | | | 783,000 | 659,648 |
| Marriott International, Inc., 4%, 4/15/2028 | | | 1,731,000 | 1,607,550 |
| Marriott International, Inc., 4.625%, 6/15/2030 | | | 1,979,000 | 1,846,632 |
| Marriott International, Inc., 2.85%, 4/15/2031 | | | 7,000 | 5,668 |
| Marriott International, Inc., 2.75%, 10/15/2033 | | | 1,600,000 | 1,220,653 |
| | | | | $6,847,671 |
| Insurance – 0.4% |
| AIA Group Ltd., 3.375%, 4/07/2030 (n) | | $ | 2,338,000 | $ 2,055,107 |
| Corebridge Financial, Inc., 3.9%, 4/05/2032 (n) | | | 3,078,000 | 2,688,225 |
| Metropolitan Life Global Funding I, 3.3%, 3/21/2029 (n) | | | 4,200,000 | 3,760,576 |
| | | | | $8,503,908 |
| Insurance - Health – 0.2% |
| Humana, Inc., 3.7%, 3/23/2029 | | $ | 1,850,000 | $ 1,693,747 |
| Humana, Inc., 5.875%, 3/01/2033 | | | 1,686,000 | 1,740,464 |
| | | | | $3,434,211 |
| Insurance - Property & Casualty – 0.4% |
| Aon Corp., 3.75%, 5/02/2029 | | $ | 4,102,000 | $ 3,783,864 |
| Aon Corp./Aon Global Holdings PLC, 2.6%, 12/02/2031 | | | 172,000 | 140,388 |
| Brown & Brown, Inc., 4.2%, 3/17/2032 | | | 2,124,000 | 1,841,427 |
| Fairfax Financial Holdings Ltd., 5.625%, 8/16/2032 (n) | | | 3,006,000 | 2,821,470 |
| Liberty Mutual Group, Inc., 3.951%, 10/15/2050 (n) | | | 1,087,000 | 758,268 |
| | | | | $9,345,417 |
| International Market Quasi-Sovereign – 0.3% |
| Temasek Financial I Ltd. (Republic of Singapore), 2.375%, 1/23/2023 (n) | | $ | 6,400,000 | $ 6,392,904 |
Portfolio of Investments – continued
| Issuer | | | Shares/Par | Value ($) |
| Bonds – continued |
| Machinery & Tools – 0.2% |
| Ashtead Capital, Inc., 5.5%, 8/11/2032 (n) | | $ | 2,832,000 | $ 2,708,721 |
| CNH Industrial Capital LLC, 4.2%, 1/15/2024 | | | 1,679,000 | 1,654,894 |
| CNH Industrial Capital LLC, 1.875%, 1/15/2026 | | | 448,000 | 406,243 |
| | | | | $4,769,858 |
| Major Banks – 2.4% |
| Bank of America Corp., 3.366% to 1/23/2025, FLR (LIBOR - 3mo. + 0.81%) to 1/23/2026 | | $ | 1,626,000 | $ 1,550,361 |
| Bank of America Corp., 3.5%, 4/19/2026 | | | 1,361,000 | 1,298,859 |
| Bank of America Corp., 2.572% to 10/20/2031, FLR (SOFR + 1.21%) to 10/20/2032 | | | 3,452,000 | 2,703,614 |
| Barclays PLC, 2.894% to 11/24/2031, FLR (CMT - 1yr. + 1.3%) to 11/24/2032 | | | 877,000 | 667,909 |
| Capital One Financial Corp., 3.75%, 3/09/2027 | | | 1,728,000 | 1,641,964 |
| Capital One Financial Corp., 3.273% to 3/01/2029, FLR (SOFR - 1 day + 1.79%) to 3/01/2030 | | | 3,742,000 | 3,199,297 |
| Deutsche Bank AG, 2.311% to 11/16/2026, FLR (SOFR - 1 day + 1.219%) to 11/16/2027 | | | 880,000 | 746,136 |
| Goldman Sachs Group, Inc., 2.6%, 2/07/2030 | | | 2,258,000 | 1,884,344 |
| Goldman Sachs Group, Inc., 2.383% to 7/21/2031, FLR (SOFR - 1 day + 1.248%) to 7/21/2032 | | | 2,831,000 | 2,196,597 |
| HSBC Holdings PLC, 4.7% to 9/09/2031, FLR (CMT - 1yr. + 3.25%) to 9/09/2169 | | | 922,000 | 730,586 |
| HSBC Holdings PLC, 4% to 9/09/2026, FLR (CMT - 1yr. + 3.222%) to 9/09/2170 | | | 442,000 | 382,309 |
| JPMorgan Chase & Co., 3.782% to 2/01/2027, FLR (LIBOR - 3mo. + 1.337%) to 2/01/2028 | | | 3,163,000 | 2,955,176 |
| JPMorgan Chase & Co., 2.739% to 10/15/2029, FLR (SOFR - 1 day + 1.51%) to 10/15/2030 | | | 897,000 | 752,239 |
| JPMorgan Chase & Co., 2.956% to 5/13/2030, FLR (SOFR - 1 day + 2.515%) to 5/13/2031 | | | 476,000 | 392,203 |
| JPMorgan Chase & Co., 2.545% to 11/08/2031, FLR (SOFR - 1 day + 1.18%) to 11/08/2032 | | | 4,631,000 | 3,660,486 |
| JPMorgan Chase & Co., 2.963% to 1/25/2032, FLR (SOFR - 1 day + 1.26%) to 1/25/2033 | | | 1,781,000 | 1,449,560 |
| JPMorgan Chase & Co., 3.897% to 1/23/2048, FLR (LIBOR - 3mo. + 1.22%) to 1/23/2049 | | | 938,000 | 718,675 |
| Mitsubishi UFJ Financial Group, Inc., 2.852% to 1/19/2032, FLR (CMT - 1yr. + 1.1%) to 1/19/2033 | | | 2,674,000 | 2,128,576 |
| Morgan Stanley, 3.875%, 4/29/2024 | | | 522,000 | 513,891 |
| Morgan Stanley, 4%, 7/23/2025 | | | 1,063,000 | 1,038,009 |
| Morgan Stanley, 2.699% to 1/22/2030, FLR (SOFR - 1 day + 1.143%) to 1/22/2031 | | | 2,483,000 | 2,051,819 |
| Morgan Stanley, 2.943% to 1/21/2032, FLR (SOFR - 1 day + 1.29%) to 1/21/2033 | | | 3,130,000 | 2,532,102 |
| Royal Bank of Canada, 1.15%, 6/10/2025 | | | 2,774,000 | 2,539,130 |
| State Street Corp., 2.901% to 3/30/2025, FLR (SOFR + 2.6%) to 3/30/2026 | | | 344,000 | 327,159 |
| Sumitomo Mitsui Financial Group, Inc., 2.472%, 1/14/2029 | | | 5,230,000 | 4,404,972 |
| UBS Group AG, 2.095% to 2/11/2031, FLR (CMT - 1yr. + 1.0%) to 2/11/2032 (n) | | | 6,416,000 | 4,830,561 |
| Wells Fargo & Co., 3.35% to 3/02/2032, FLR (SOFR - 1 day + 1.5%) to 3/02/2033 | | | 5,150,000 | 4,338,349 |
| | | | | $51,634,883 |
| Medical & Health Technology & Services – 0.4% |
| Adventist Health System/West, 5.43%, 3/01/2032 | | $ | 2,533,000 | $ 2,494,906 |
| Alcon Finance Corp., 2.6%, 5/27/2030 (n) | | | 302,000 | 256,493 |
| Cigna Corp., 3.2%, 3/15/2040 | | | 474,000 | 357,610 |
| HCA Healthcare, Inc., 4.375%, 3/15/2042 (n) | | | 1,202,000 | 957,042 |
| HCA, Inc., 4.125%, 6/15/2029 | | | 1,809,000 | 1,651,420 |
| HCA, Inc., 5.125%, 6/15/2039 | | | 1,932,000 | 1,728,722 |
| Laboratory Corp. of America Holdings, 4.7%, 2/01/2045 | | | 980,000 | 839,702 |
| Northwell Healthcare, Inc., 3.979%, 11/01/2046 | | | 153,000 | 117,245 |
| Northwell Healthcare, Inc., 4.26%, 11/01/2047 | | | 1,205,000 | 957,071 |
| | | | | $9,360,211 |
| Medical Equipment – 0.1% |
| Boston Scientific Corp., 2.65%, 6/01/2030 | | $ | 1,590,000 | $ 1,358,160 |
| Metals & Mining – 0.4% |
| Anglo American Capital PLC, 3.875%, 3/16/2029 (n) | | $ | 496,000 | $ 445,302 |
| Anglo American Capital PLC, 5.625%, 4/01/2030 (n) | | | 1,394,000 | 1,383,874 |
| Anglo American Capital PLC, 2.625%, 9/10/2030 (n) | | | 4,564,000 | 3,709,094 |
| Glencore Funding LLC, 4.125%, 5/30/2023 (n) | | | 1,244,000 | 1,237,512 |
| Glencore Funding LLC, 2.5%, 9/01/2030 (n) | | | 1,695,000 | 1,375,814 |
Portfolio of Investments – continued
| Issuer | | | Shares/Par | Value ($) |
| Bonds – continued |
| Metals & Mining – continued |
| Glencore Funding LLC, 2.85%, 4/27/2031 (n) | | $ | 709,000 | $ 580,193 |
| | | | | $8,731,789 |
| Midstream – 0.5% |
| Cheniere Corpus Christi Holdings LLC, 3.7%, 11/15/2029 | | $ | 1,833,000 | $ 1,656,888 |
| Enbridge, Inc., 2.5%, 1/15/2025 | | | 969,000 | 916,726 |
| Energy Transfer LP, 5.75%, 2/15/2033 | | | 2,187,000 | 2,139,673 |
| Kinder Morgan Energy Partners LP, 4.15%, 2/01/2024 | | | 1,030,000 | 1,016,077 |
| ONEOK, Inc., 4.95%, 7/13/2047 | | | 2,331,000 | 1,877,443 |
| Plains All American Pipeline LP, 3.8%, 9/15/2030 | | | 1,881,000 | 1,634,742 |
| Sabine Pass Liquefaction LLC, 4.5%, 5/15/2030 | | | 512,000 | 474,581 |
| Spectra Energy Partners LP, 3.375%, 10/15/2026 | | | 828,000 | 770,472 |
| Targa Resources Corp., 4.2%, 2/01/2033 | | | 746,000 | 641,831 |
| | | | | $11,128,433 |
| Mortgage-Backed – 12.5% | |
| Fannie Mae, 5%, 12/01/2023 - 3/01/2041 | | $ | 1,743,587 | $ 1,770,690 |
| Fannie Mae, 3%, 11/01/2028 - 9/01/2046 | | | 3,223,540 | 3,037,381 |
| Fannie Mae, 6.5%, 6/01/2031 - 7/01/2037 | | | 689,504 | 712,188 |
| Fannie Mae, 2.5%, 11/01/2031 | | | 63,739 | 59,477 |
| Fannie Mae, 5.5%, 2/01/2033 - 4/01/2040 | | | 4,168,081 | 4,245,872 |
| Fannie Mae, 3%, 2/25/2033 (i) | | | 306,560 | 28,042 |
| Fannie Mae, 4.5%, 8/01/2033 - 6/01/2044 | | | 3,882,103 | 3,841,380 |
| Fannie Mae, 6%, 1/01/2034 - 7/01/2037 | | | 2,400,890 | 2,456,661 |
| Fannie Mae, 3.5%, 4/01/2038 - 7/01/2046 | | | 10,335,539 | 9,639,211 |
| Fannie Mae, 3.25%, 5/25/2040 | | | 99,317 | 91,948 |
| Fannie Mae, 4%, 9/01/2040 - 6/01/2047 | | | 7,149,735 | 6,861,794 |
| Fannie Mae, 2%, 10/25/2040 - 4/25/2046 | | | 260,725 | 239,009 |
| Fannie Mae, 4%, 7/25/2046 (i) | | | 308,296 | 58,966 |
| Fannie Mae, UMBS, 2%, 9/01/2036 - 4/01/2052 | | | 25,214,736 | 21,257,720 |
| Fannie Mae, UMBS, 2.5%, 11/01/2036 - 8/01/2052 | | | 45,046,202 | 38,585,350 |
| Fannie Mae, UMBS, 1.5%, 2/01/2042 - 9/01/2051 | | | 1,730,369 | 1,340,751 |
| Fannie Mae, UMBS, 3%, 6/01/2051 - 11/01/2052 | | | 11,719,744 | 10,320,052 |
| Fannie Mae, UMBS, 3.5%, 5/01/2052 - 10/01/2052 | | | 1,572,375 | 1,428,960 |
| Fannie Mae, UMBS, 4.5%, 7/01/2052 - 10/01/2052 | | | 4,923,107 | 4,740,818 |
| Fannie Mae, UMBS, 5%, 9/01/2052 | | | 1,954,713 | 1,927,681 |
| Fannie Mae, UMBS, 5.5%, 11/01/2052 - 1/01/2053 | | | 3,999,897 | 4,011,002 |
| Fannie Mae, UMBS, 6%, 12/01/2052 | | | 2,650,001 | 2,689,921 |
| Freddie Mac, 3.111%, 2/25/2023 | | | 458,662 | 457,230 |
| Freddie Mac, 3.32%, 2/25/2023 | | | 498,472 | 496,850 |
| Freddie Mac, 3.25%, 4/25/2023 - 11/25/2061 | | | 2,491,864 | 2,410,769 |
| Freddie Mac, 3.06%, 7/25/2023 | | | 175,000 | 173,279 |
| Freddie Mac, 3.458%, 8/25/2023 | | | 1,616,963 | 1,601,890 |
| Freddie Mac, 0.903%, 4/25/2024 (i) | | | 4,033,202 | 37,771 |
| Freddie Mac, 0.505%, 7/25/2024 (i) | | | 14,179,000 | 111,294 |
| Freddie Mac, 0.6%, 7/25/2024 (i) | | | 4,239,335 | 28,504 |
| Freddie Mac, 4.5%, 8/01/2024 - 5/01/2042 | | | 687,080 | 681,976 |
| Freddie Mac, 0.318%, 8/25/2024 (i) | | | 15,246,000 | 112,075 |
| Freddie Mac, 0.387%, 8/25/2024 (i) | | | 24,839,753 | 154,508 |
| Freddie Mac, 3.064%, 8/25/2024 | | | 773,837 | 752,581 |
| Freddie Mac, 0.341%, 10/25/2024 (i) | | | 17,976,086 | 82,997 |
| Freddie Mac, 0.274%, 11/25/2024 (i) | | | 15,385,000 | 72,826 |
| Freddie Mac, 2.67%, 12/25/2024 | | | 1,261,000 | 1,209,147 |
| Freddie Mac, 0.639%, 6/25/2027 (i) | | | 13,682,000 | 358,581 |
| Freddie Mac, 0.749%, 6/25/2027 (i) | | | 4,611,328 | 123,730 |
| Freddie Mac, 0.574%, 7/25/2027 (i) | | | 11,836,697 | 256,095 |
Portfolio of Investments – continued
| Issuer | | | Shares/Par | Value ($) |
| Bonds – continued |
| Mortgage-Backed – continued | |
| Freddie Mac, 0.328%, 8/25/2027 (i) | | $ | 9,650,000 | $ 142,186 |
| Freddie Mac, 0.424%, 8/25/2027 (i) | | | 6,516,976 | 108,841 |
| Freddie Mac, 0.279%, 9/25/2027 (i) | | | 10,419,000 | 135,139 |
| Freddie Mac, 0.196%, 11/25/2027 (i) | | | 16,290,000 | 157,624 |
| Freddie Mac, 0.287%, 11/25/2027 (i) | | | 11,503,401 | 134,328 |
| Freddie Mac, 0.327%, 11/25/2027 (i) | | | 10,271,130 | 140,614 |
| Freddie Mac, 0.246%, 12/25/2027 (i) | | | 10,109,000 | 120,188 |
| Freddie Mac, 0.29%, 12/25/2027 (i) | | | 11,210,000 | 156,594 |
| Freddie Mac, 0.368%, 12/25/2027 (i) | | | 17,547,881 | 269,372 |
| Freddie Mac, 1.09%, 7/25/2029 (i) | | | 827,184 | 47,095 |
| Freddie Mac, 1.143%, 8/25/2029 (i) | | | 5,192,840 | 309,271 |
| Freddie Mac, 1.8%, 4/25/2030 (i) | | | 900,000 | 94,760 |
| Freddie Mac, 1.868%, 4/25/2030 (i) | | | 2,701,417 | 287,811 |
| Freddie Mac, 1.665%, 5/25/2030 (i) | | | 1,301,002 | 128,172 |
| Freddie Mac, 1.797%, 5/25/2030 (i) | | | 3,334,078 | 355,863 |
| Freddie Mac, 1.341%, 6/25/2030 (i) | | | 1,327,631 | 107,324 |
| Freddie Mac, 1.599%, 8/25/2030 (i) | | | 1,191,673 | 116,638 |
| Freddie Mac, 1.169%, 9/25/2030 (i) | | | 775,587 | 55,842 |
| Freddie Mac, 1.08%, 11/25/2030 (i) | | | 1,356,411 | 92,169 |
| Freddie Mac, 0.329%, 1/25/2031 (i) | | | 5,324,015 | 106,235 |
| Freddie Mac, 0.781%, 1/25/2031 (i) | | | 2,233,850 | 111,479 |
| Freddie Mac, 0.936%, 1/25/2031 (i) | | | 1,493,151 | 89,257 |
| Freddie Mac, 0.516%, 3/25/2031 (i) | | | 4,290,794 | 138,091 |
| Freddie Mac, 0.732%, 3/25/2031 (i) | | | 1,837,683 | 88,721 |
| Freddie Mac, 1.22%, 5/25/2031 (i) | | | 822,353 | 65,397 |
| Freddie Mac, 0.937%, 7/25/2031 (i) | | | 1,237,840 | 78,372 |
| Freddie Mac, 0.508%, 8/25/2031 (i) | | | 1,665,092 | 57,226 |
| Freddie Mac, 0.536%, 9/25/2031 (i) | | | 5,442,448 | �� 207,044 |
| Freddie Mac, 0.855%, 9/25/2031 (i) | | | 1,567,181 | 92,009 |
| Freddie Mac, 0.349%, 11/25/2031 (i) | | | 8,030,040 | 206,231 |
| Freddie Mac, 0.497%, 12/25/2031 (i) | | | 7,179,988 | 254,515 |
| Freddie Mac, 0.567%, 12/25/2031 (i) | | | 12,162,189 | 480,149 |
| Freddie Mac, 0.297%, 11/25/2032 (i) | | | 8,376,335 | 173,046 |
| Freddie Mac, 5%, 9/01/2033 - 1/15/2040 | | | 945,636 | 960,160 |
| Freddie Mac, 5.5%, 12/01/2033 - 2/01/2037 | | | 660,372 | 673,461 |
| Freddie Mac, 6%, 4/01/2034 - 6/01/2037 | | | 869,182 | 893,582 |
| Freddie Mac, 6.5%, 5/01/2034 - 7/01/2037 | | | 411,007 | 424,116 |
| Freddie Mac, 5.5%, 2/15/2036 (i) | | | 58,753 | 9,656 |
| Freddie Mac, 4%, 8/01/2037 - 4/01/2044 | | | 2,387,795 | 2,294,982 |
| Freddie Mac, 3.5%, 11/01/2037 - 10/25/2058 | | | 6,479,244 | 6,060,561 |
| Freddie Mac, 3%, 1/01/2038 - 2/25/2059 | | | 8,982,591 | 8,144,090 |
| Freddie Mac, 4.5%, 12/15/2040 (i) | | | 46,117 | 4,110 |
| Freddie Mac, 4%, 8/15/2044 (i) | | | 63,141 | 7,588 |
| Freddie Mac, UMBS, 2%, 12/01/2031 - 4/01/2052 | | | 33,642,273 | 27,865,027 |
| Freddie Mac, UMBS, 6.5%, 10/01/2034 | | | 24,406 | 25,255 |
| Freddie Mac, UMBS, 5%, 10/01/2035 - 8/01/2052 | | | 632,852 | 629,217 |
| Freddie Mac, UMBS, 6%, 1/01/2036 - 3/01/2036 | | | 67,313 | 68,462 |
| Freddie Mac, UMBS, 2.5%, 5/01/2037 - 8/01/2052 | | | 12,250,539 | 10,450,237 |
| Freddie Mac, UMBS, 3%, 11/01/2037 - 10/01/2052 | | | 6,895,330 | 6,064,978 |
| Freddie Mac, UMBS, 3.5%, 12/01/2046 - 9/01/2052 | | | 3,838,293 | 3,509,992 |
| Freddie Mac, UMBS, 4%, 8/01/2047 - 10/01/2052 | | | 3,416,614 | 3,217,413 |
| Freddie Mac, UMBS, 1.5%, 3/01/2051 - 2/01/2052 | | | 2,287,567 | 1,766,318 |
| Freddie Mac, UMBS, 5.5%, 1/01/2053 | | | 2,775,000 | 2,782,448 |
| Ginnie Mae, 6%, 9/15/2032 - 1/15/2038 | | | 1,012,125 | 1,061,415 |
| Ginnie Mae, 5.5%, 5/15/2033 - 10/15/2035 | | | 588,814 | 614,150 |
| Ginnie Mae, 4.5%, 7/20/2033 - 12/20/2052 | | | 8,346,407 | 8,121,902 |
| Ginnie Mae, 5%, 7/20/2033 - 11/20/2052 | | | 8,789,062 | 8,716,611 |
Portfolio of Investments – continued
| Issuer | | | Shares/Par | Value ($) |
| Bonds – continued |
| Mortgage-Backed – continued | |
| Ginnie Mae, 4%, 1/20/2041 - 10/20/2052 | | $ | 5,396,296 | $ 5,133,690 |
| Ginnie Mae, 3.5%, 12/15/2041 - 11/20/2052 | | | 5,404,200 | 5,034,950 |
| Ginnie Mae, 3%, 4/20/2045 - 10/20/2052 | | | 9,234,303 | 8,299,202 |
| Ginnie Mae, 2.5%, 8/20/2051 - 6/20/2052 | | | 16,362,845 | 14,186,521 |
| Ginnie Mae, 2%, 1/20/2052 | | | 2,778,716 | 2,328,547 |
| Ginnie Mae, 0.586%, 2/16/2059 (i) | | | 2,445,619 | 85,062 |
| Ginnie Mae, TBA, 2%, 1/23/2053 | | | 4,500,000 | 3,770,259 |
| Ginnie Mae, TBA, 5.5%, 1/23/2053 | | | 2,750,000 | 2,765,377 |
| UMBS, TBA, 2%, 1/12/2053 | | | 4,750,000 | 3,863,936 |
| | | | | $273,407,855 |
| Municipals – 0.4% |
| New Jersey Economic Development Authority State Pension Funding Rev., Taxable, “A”, NPFG, 7.425%, 2/15/2029 | | $ | 2,750,000 | $ 2,960,382 |
| New Jersey Turnpike Authority Rev., Taxable (Build America Bonds), “F”, 7.414%, 1/01/2040 | | | 3,685,000 | 4,568,050 |
| State of Florida, Taxable, “A”, 2.154%, 7/01/2030 | | | 1,437,000 | 1,176,633 |
| | | | | $8,705,065 |
| Natural Gas - Distribution – 0.0% |
| NiSource, Inc., 5.65%, 2/01/2045 | | $ | 414,000 | $ 403,942 |
| Natural Gas - Pipeline – 0.2% |
| APA Infrastructure Ltd., 4.2%, 3/23/2025 (n) | | $ | 3,344,000 | $ 3,228,877 |
| APT Pipelines Ltd., 4.25%, 7/15/2027 (n) | | | 253,000 | 236,259 |
| | | | | $3,465,136 |
| Network & Telecom – 0.2% |
| Verizon Communications, Inc., 3.15%, 3/22/2030 | | $ | 1,053,000 | $ 928,578 |
| Verizon Communications, Inc., 4.272%, 1/15/2036 | | | 1,477,000 | 1,314,803 |
| Verizon Communications, Inc., 4.812%, 3/15/2039 | | | 1,877,000 | 1,719,318 |
| | | | | $3,962,699 |
| Oils – 0.2% |
| Phillips 66 Co., 2.15%, 12/15/2030 | | $ | 2,934,000 | $ 2,349,183 |
| Valero Energy Corp., 6.625%, 6/15/2037 | | | 2,124,000 | 2,260,225 |
| | | | | $4,609,408 |
| Other Banks & Diversified Financials – 0.4% |
| Macquarie Group Ltd., 4.442% to 6/21/2032, FLR (SOFR - 1 day + 2.405%) to 6/21/2033 (n) | | $ | 5,881,000 | $ 5,104,092 |
| Northern Trust Corp., 6.125%, 11/02/2032 | | | 2,959,000 | 3,120,094 |
| | | | | $8,224,186 |
| Pollution Control – 0.0% |
| Republic Services, Inc., 1.45%, 2/15/2031 | | $ | 851,000 | $ 656,054 |
| Real Estate - Office – 0.1% |
| Boston Properties Ltd. LP, REIT, 2.55%, 4/01/2032 | | $ | 1,316,000 | $ 1,000,491 |
| Real Estate - Retail – 0.1% |
| Brixmor Operating Partnership LP, REIT, 4.125%, 5/15/2029 | | $ | 172,000 | $ 153,779 |
| Brixmor Operating Partnership LP, REIT, 4.05%, 7/01/2030 | | | 1,681,000 | 1,470,547 |
| Realty Income Corp., REIT, 3.25%, 1/15/2031 | | | 485,000 | 420,575 |
| | | | | $2,044,901 |
Portfolio of Investments – continued
| Issuer | | | Shares/Par | Value ($) |
| Bonds – continued |
| Retailers – 0.2% |
| Alimentation Couche-Tard, Inc., 3.439%, 5/13/2041 (n) | | $ | 2,106,000 | $ 1,499,101 |
| Best Buy Co., Inc., 4.45%, 10/01/2028 | | | 1,738,000 | 1,672,788 |
| | | | | $3,171,889 |
| Specialty Stores – 0.1% |
| Genuine Parts Co., 2.75%, 2/01/2032 | | $ | 2,771,000 | $ 2,224,082 |
| Telecommunications - Wireless – 0.6% |
| American Tower Trust I, REIT, 3.07%, 3/15/2023 (n) | | $ | 3,121,000 | $ 3,103,526 |
| Crown Castle, Inc., REIT, 1.35%, 7/15/2025 | | | 701,000 | 637,705 |
| Crown Castle, Inc., REIT, 3.65%, 9/01/2027 | | | 2,565,000 | 2,382,468 |
| Rogers Communications, Inc., 3.8%, 3/15/2032 (n) | | | 5,197,000 | 4,484,769 |
| T-Mobile USA, Inc., 2.05%, 2/15/2028 | | | 1,892,000 | 1,624,910 |
| T-Mobile USA, Inc., 4.5%, 4/15/2050 | | | 2,244,000 | 1,844,877 |
| | | | | $14,078,255 |
| Tobacco – 0.2% |
| B.A.T. International Finance PLC, 4.448%, 3/16/2028 | | $ | 4,200,000 | $ 3,889,877 |
| Philip Morris International, Inc., 5.125%, 11/17/2027 | | | 869,000 | 875,347 |
| Philip Morris International, Inc., 5.625%, 11/17/2029 | | | 374,000 | 379,415 |
| | | | | $5,144,639 |
| Transportation - Services – 0.1% |
| ERAC USA Finance LLC, 7%, 10/15/2037 (n) | | $ | 1,826,000 | $ 1,983,789 |
| U.S. Government Agencies and Equivalents – 0.0% |
| Small Business Administration, 4.35%, 7/01/2023 | | $ | 280 | $ 279 |
| Small Business Administration, 4.77%, 4/01/2024 | | | 22,934 | 22,598 |
| Small Business Administration, 5.18%, 5/01/2024 | | | 30,398 | 30,077 |
| Small Business Administration, 5.52%, 6/01/2024 | | | 1,493 | 1,494 |
| Small Business Administration, 4.99%, 9/01/2024 | | | 41,884 | 41,160 |
| Small Business Administration, 4.95%, 3/01/2025 | | | 1,780 | 1,781 |
| Small Business Administration, 5.11%, 8/01/2025 | | | 167,807 | 166,202 |
| | | | | $263,591 |
| U.S. Treasury Obligations – 7.0% |
| U.S. Treasury Bonds, 1.375%, 11/15/2040 | | $ | 5,500,000 | $ 3,575,644 |
| U.S. Treasury Bonds, 1.75%, 8/15/2041 | | | 4,700,000 | 3,216,379 |
| U.S. Treasury Bonds, 2.375%, 2/15/2042 | | | 6,600,000 | 5,039,203 |
| U.S. Treasury Bonds, 2.875%, 5/15/2043 | | | 9,096,000 | 7,424,255 |
| U.S. Treasury Bonds, 2.5%, 2/15/2045 | | | 9,797,000 | 7,375,687 |
| U.S. Treasury Bonds, 3%, 11/15/2045 | | | 3,638,000 | 2,992,539 |
| U.S. Treasury Bonds, 3%, 2/15/2048 | | | 7,000,000 | 5,737,539 |
| U.S. Treasury Bonds, 2.875%, 5/15/2049 | | | 900,000 | 724,184 |
| U.S. Treasury Bonds, 2.375%, 11/15/2049 (f) | | | 43,390,000 | 31,359,445 |
| U.S. Treasury Bonds, 2.25%, 2/15/2052 | | | 6,300,000 | 4,380,961 |
| U.S. Treasury Notes, 1.375%, 1/31/2025 | | | 11,200,000 | 10,526,250 |
| U.S. Treasury Notes, 0.375%, 11/30/2025 | | | 62,900,000 | 56,261,101 |
| U.S. Treasury Notes, 2.5%, 3/31/2027 | | | 15,300,000 | 14,357,496 |
| | | | | $152,970,683 |
| Utilities - Electric Power – 0.8% |
| American Electric Power Co., Inc., 5.95%, 11/01/2032 | | $ | 1,273,000 | $ 1,329,162 |
| American Transmission Systems, Inc., 2.65%, 1/15/2032 (n) | | | 250,000 | 205,165 |
| Duke Energy Corp., 2.65%, 9/01/2026 | | | 294,000 | 271,543 |
Portfolio of Investments – continued
| Issuer | | | Shares/Par | Value ($) |
| Bonds – continued |
| Utilities - Electric Power – continued |
| Duke Energy Corp., 4.5%, 8/15/2032 | | $ | 3,023,000 | $ 2,831,647 |
| Enel Finance International N.V., 6.8%, 10/14/2025 (n) | | | 926,000 | 950,843 |
| Enel Finance International N.V., 4.75%, 5/25/2047 (n) | | | 392,000 | 307,447 |
| Evergy, Inc., 2.9%, 9/15/2029 | | | 1,644,000 | 1,419,658 |
| Exelon Corp., 4.05%, 4/15/2030 | | | 1,632,000 | 1,515,145 |
| FirstEnergy Corp., 3.4%, 3/01/2050 | | | 1,078,000 | 711,264 |
| Georgia Power Co., 3.7%, 1/30/2050 | | | 147,000 | 109,441 |
| Jersey Central Power & Light Co., 4.3%, 1/15/2026 (n) | | | 1,333,000 | 1,287,487 |
| Jersey Central Power & Light Co., 2.75%, 3/01/2032 (n) | | | 924,000 | 746,163 |
| Oncor Electric Delivery Co. LLC, 5.75%, 3/15/2029 | | | 2,121,000 | 2,199,747 |
| Pacific Gas & Electric Co., 2.1%, 8/01/2027 | | | 480,000 | 409,935 |
| Pacific Gas & Electric Co., 3%, 6/15/2028 | | | 1,410,000 | 1,218,949 |
| Pacific Gas & Electric Co., 2.5%, 2/01/2031 | | | 1,738,000 | 1,348,491 |
| Pacific Gas & Electric Co., 3.3%, 8/01/2040 | | | 926,000 | 626,965 |
| Xcel Energy, Inc., 3.4%, 6/01/2030 | | | 968,000 | 863,508 |
| | | | | $18,352,560 |
| Utilities - Gas – 0.0% |
| East Ohio Gas Co., 2%, 6/15/2030 (n) | | $ | 1,135,000 | $ 892,691 |
| Total Bonds (Identified Cost, $953,542,243) | | $852,122,478 |
| Convertible Preferred Stocks – 0.8% |
| Automotive – 0.2% | |
| Aptiv PLC, 5.5% | | 39,000 | $ 4,185,480 |
| Medical Equipment – 0.3% | |
| Boston Scientific Corp., 5.5% | | 66,836 | $ 7,674,109 |
| Telecommunications - Wireless – 0.3% | |
| T-Mobile USA, Inc., 5.25% (a) | | 5,432 | $ 6,223,068 |
| Total Convertible Preferred Stocks (Identified Cost, $16,057,351) | $18,082,657 |
| Preferred Stocks – 0.7% |
| Computer Software - Systems – 0.2% | | | | |
| Samsung Electronics Co. Ltd. | | 125,210 | $ 5,038,182 |
| Consumer Products – 0.5% | | | | |
| Henkel AG & Co. KGaA | | 153,041 | $ 10,651,749 |
| Total Preferred Stocks (Identified Cost, $17,574,595) | | $15,689,931 |
| Investment Companies (h) – 1.1% |
| Money Market Funds – 1.1% | |
| MFS Institutional Money Market Portfolio, 4.02% (v) (Identified Cost, $23,632,341) | | | 23,633,266 | $ 23,640,356 |
| Other Assets, Less Liabilities – (0.2)% | | (4,533,467) |
| Net Assets – 100.0% | $2,181,695,198 |
Portfolio of Investments – continued
| (a) | Non-income producing security. | | | |
| (f) | All or a portion of the security has been segregated as collateral for open futures contracts. | | | |
| (h) | An affiliated issuer, which may be considered one in which the fund owns 5% or more of the outstanding voting securities, or a company which is under common control. At period end, the aggregate values of the fund's investments in affiliated issuers and in unaffiliated issuers were $23,640,356 and $2,162,588,309, respectively. | | | |
| (i) | Interest only security for which the fund receives interest on notional principal (Par amount). Par amount shown is the notional principal and does not reflect the cost of the security. | | | |
| (n) | Securities exempt from registration under Rule 144A of the Securities Act of 1933. These securities may be sold in the ordinary course of business in transactions exempt from registration, normally to qualified institutional buyers. At period end, the aggregate value of these securities was $182,776,677, representing 8.4% of net assets. | | | |
| (v) | Affiliated issuer that is available only to investment companies managed by MFS. The rate quoted for the MFS Institutional Money Market Portfolio is the annualized seven-day yield of the fund at period end. | | | |
| The following abbreviations are used in this report and are defined: |
| ADR | American Depositary Receipt |
| CLO | Collateralized Loan Obligation |
| CMT | Constant Maturity Treasury |
| FGIC | Financial Guaranty Insurance Co. |
| FLR | Floating Rate. Interest rate resets periodically based on the parenthetically disclosed reference rate plus a spread (if any). The period-end rate reported may not be the current rate. All reference rates are USD unless otherwise noted. |
| LIBOR | London Interbank Offered Rate |
| NPFG | National Public Finance Guarantee Corp. |
| REIT | Real Estate Investment Trust |
| SOFR | Secured Overnight Financing Rate |
| TBA | To Be Announced |
| UMBS | Uniform Mortgage-Backed Security |
| Derivative Contracts at 12/31/22 |
| Futures Contracts |
| Description | Long/
Short | Currency | Contracts | Notional
Amount | Expiration
Date | Value/Unrealized
Appreciation
(Depreciation) |
| Asset Derivatives |
| Interest Rate Futures | | |
| U.S. Treasury Note 2 yr | Long | USD | 55 | $11,279,297 | March – 2023 | $8,143 |
| U.S. Treasury Ultra Note 10 yr | Short | USD | 345 | 40,807,031 | March – 2023 | 357,603 |
| | | | | | | $365,746 |
| Liability Derivatives |
| Interest Rate Futures | | |
| U.S. Treasury Note 5 yr | Long | USD | 617 | $66,592,617 | March – 2023 | $(69,662) |
| U.S. Treasury Ultra Bond | Long | USD | 162 | 21,758,625 | March – 2023 | (771,797) |
| | | | | | | $(841,459) |
At December 31, 2022, the fund had liquid securities with an aggregate value of $1,480,151 to cover any collateral or margin obligations for certain derivative contracts.
See Notes to Financial Statements
| Financial Statements | Statement of Assets and Liabilities |
This statement represents your fund’s balance sheet, which details the assets and liabilities comprising the total value of the fund.
| At 12/31/22Assets | |
| Investments in unaffiliated issuers, at value (identified cost, $1,756,263,145) | $2,162,588,309 |
| Investments in affiliated issuers, at value (identified cost, $23,632,341) | 23,640,356 |
| Cash | 126,509 |
| Receivables for | |
| Investments sold | 2,675,202 |
| Fund shares sold | 74,759 |
| Interest and dividends | 7,828,113 |
| Receivable from investment adviser | 34,228 |
| Other assets | 8,472 |
| Total assets | $2,196,975,948 |
| Liabilities | |
| Payables for | |
| Net daily variation margin on open futures contracts | $121,001 |
| Investments purchased | 2,702,842 |
| TBA purchase commitments | 10,633,302 |
| Fund shares reacquired | 1,526,378 |
| Payable to affiliates | |
| Administrative services fee | 2,558 |
| Shareholder servicing costs | 736 |
| Distribution and/or service fees | 24,249 |
| Payable for independent Trustees' compensation | 13 |
| Accrued expenses and other liabilities | 269,671 |
| Total liabilities | $15,280,750 |
| Net assets | $2,181,695,198 |
| Net assets consist of | |
| Paid-in capital | $1,656,495,046 |
| Total distributable earnings (loss) | 525,200,152 |
| Net assets | $2,181,695,198 |
| Shares of beneficial interest outstanding | 98,301,126 |
| | Net assets | Shares
outstanding | Net asset value
per share |
| Initial Class | $1,001,860,060 | 44,554,281 | $22.49 |
| Service Class | 1,179,835,138 | 53,746,845 | 21.95 |
See Notes to Financial Statements
| Financial Statements | Statement of Operations |
This statement describes how much your fund earned in investment income and accrued in expenses. It also describes any gains and/or losses generated by fund operations.
| Year ended 12/31/22 | |
| Net investment income (loss) | |
| Income | |
| Dividends | $31,134,915 |
| Interest | 25,096,321 |
| Dividends from affiliated issuers | 815,844 |
| Other | 237,140 |
| Income on securities loaned | 2,997 |
| Foreign taxes withheld | (269,279) |
| Total investment income | $57,017,938 |
| Expenses | |
| Management fee | $15,599,626 |
| Distribution and/or service fees | 3,104,650 |
| Shareholder servicing costs | 58,028 |
| Administrative services fee | 367,014 |
| Independent Trustees' compensation | 36,726 |
| Custodian fee | 133,611 |
| Shareholder communications | 26,288 |
| Audit and tax fees | 81,844 |
| Legal fees | 9,572 |
| Miscellaneous | 75,942 |
| Total expenses | $19,493,301 |
| Reduction of expenses by investment adviser | (2,199,837) |
| Net expenses | $17,293,464 |
| Net investment income (loss) | $39,724,474 |
| Realized and unrealized gain (loss) | |
| Realized gain (loss) (identified cost basis) | |
| Unaffiliated issuers | $99,053,574 |
| Affiliated issuers | (8,331) |
| Futures contracts | (6,990,554) |
| Foreign currency | (50,346) |
| Net realized gain (loss) | $92,004,343 |
| Change in unrealized appreciation or depreciation | |
| Unaffiliated issuers | $(389,396,626) |
| Affiliated issuers | 8,015 |
| Futures contracts | (261,746) |
| Translation of assets and liabilities in foreign currencies | (33,296) |
| Net unrealized gain (loss) | $(389,683,653) |
| Net realized and unrealized gain (loss) | $(297,679,310) |
| Change in net assets from operations | $(257,954,836) |
See Notes to Financial Statements
| Financial Statements | Statements of Changes in Net Assets |
These statements describe the increases and/or decreases in net assets resulting from operations, any distributions, and any shareholder transactions.
| | Year ended |
| | 12/31/22 | 12/31/21 |
| Change in net assets | | |
| From operations | | |
| Net investment income (loss) | $39,724,474 | $34,332,222 |
| Net realized gain (loss) | 92,004,343 | 199,577,748 |
| Net unrealized gain (loss) | (389,683,653) | 110,529,875 |
| Change in net assets from operations | $(257,954,836) | $344,439,845 |
| Total distributions to shareholders | $(236,287,143) | $(173,338,152) |
| Change in net assets from fund share transactions | $(5,860,762) | $(28,062,297) |
| Total change in net assets | $(500,102,741) | $143,039,396 |
| Net assets | | |
| At beginning of period | 2,681,797,939 | 2,538,758,543 |
| At end of period | $2,181,695,198 | $2,681,797,939 |
See Notes to Financial Statements
| Financial Statements | Financial Highlights |
The financial highlights table is intended to help you understand the fund's financial performance for the past 5 years. Certain information reflects financial results for a single fund share. The total returns in the table represent the rate that an investor would have earned (or lost) on an investment in the fund share class (assuming reinvestment of all distributions) held for the entire period.
| Initial Class | Year ended |
| | 12/31/22 | 12/31/21 | 12/31/20 | 12/31/19 | 12/31/18 |
| Net asset value, beginning of period | $27.78 | $26.02 | $24.90 | $21.78 | $24.70 |
| Income (loss) from investment operations | | | | | |
| Net investment income (loss) (d) | $0.45 | $0.39 | $0.47 | $0.52 | $0.53 |
| Net realized and unrealized gain (loss) | (3.10) | 3.24 | 1.88 | 3.83 | (1.80) |
| Total from investment operations | $(2.65) | $3.63 | $2.35 | $4.35 | $(1.27) |
| Less distributions declared to shareholders | | | | | |
| From net investment income | $(0.44) | $(0.51) | $(0.57) | $(0.58) | $(0.54) |
| From net realized gain | (2.20) | (1.36) | (0.66) | (0.65) | (1.11) |
| Total distributions declared to shareholders | $(2.64) | $(1.87) | $(1.23) | $(1.23) | $(1.65) |
| Net asset value, end of period (x) | $22.49 | $27.78 | $26.02 | $24.90 | $21.78 |
| Total return (%) (k)(r)(s)(x) | (9.58) | 14.12 | 9.81 | 20.38 | (5.61) |
Ratios (%) (to average net assets)
and Supplemental data: | | | | | |
| Expenses before expense reductions | 0.71 | 0.70 | 0.71 | 0.70 | 0.70 |
| Expenses after expense reductions | 0.61 | 0.61 | 0.61 | 0.62 | 0.62 |
| Net investment income (loss) | 1.84 | 1.43 | 1.95 | 2.18 | 2.20 |
| Portfolio turnover | 67 | 98 | 84 | 42 | 26 |
| Net assets at end of period (000 omitted) | $1,001,860 | $1,274,331 | $1,219,438 | $1,223,166 | $1,134,301 |
| Service Class | Year ended |
| | 12/31/22 | 12/31/21 | 12/31/20 | 12/31/19 | 12/31/18 |
| Net asset value, beginning of period | $27.18 | $25.50 | $24.43 | $21.38 | $24.28 |
| Income (loss) from investment operations | | | | | |
| Net investment income (loss) (d) | $0.38 | $0.32 | $0.40 | $0.45 | $0.46 |
| Net realized and unrealized gain (loss) | (3.04) | 3.17 | 1.83 | 3.76 | (1.77) |
| Total from investment operations | $(2.66) | $3.49 | $2.23 | $4.21 | $(1.31) |
| Less distributions declared to shareholders | | | | | |
| From net investment income | $(0.37) | $(0.45) | $(0.50) | $(0.51) | $(0.48) |
| From net realized gain | (2.20) | (1.36) | (0.66) | (0.65) | (1.11) |
| Total distributions declared to shareholders | $(2.57) | $(1.81) | $(1.16) | $(1.16) | $(1.59) |
| Net asset value, end of period (x) | $21.95 | $27.18 | $25.50 | $24.43 | $21.38 |
| Total return (%) (k)(r)(s)(x) | (9.84) | 13.84 | 9.52 | 20.12 | (5.87) |
Ratios (%) (to average net assets)
and Supplemental data: | | | | | |
| Expenses before expense reductions | 0.96 | 0.95 | 0.96 | 0.95 | 0.95 |
| Expenses after expense reductions | 0.86 | 0.86 | 0.86 | 0.87 | 0.87 |
| Net investment income (loss) | 1.60 | 1.17 | 1.71 | 1.93 | 1.95 |
| Portfolio turnover | 67 | 98 | 84 | 42 | 26 |
| Net assets at end of period (000 omitted) | $1,179,835 | $1,407,467 | $1,319,320 | $1,323,813 | $1,191,222 |
See Notes to Financial Statements
Financial Highlights - continued
| (d) | Per share data is based on average shares outstanding. |
| (k) | The total return does not reflect expenses that apply to separate accounts. Inclusion of these charges would reduce the total return figures for all periods shown. |
| (r) | Certain expenses have been reduced without which performance would have been lower. |
| (s) | From time to time the fund may receive proceeds from litigation settlements, without which performance would be lower. |
| (x) | The net asset values and total returns have been calculated on net assets which include adjustments made in accordance with U.S. generally accepted accounting principles required at period end for financial reporting purposes. |
See Notes to Financial Statements
Notes to Financial Statements
(1) Business and Organization
MFS Total Return Series (the fund) is a diversified series of MFS Variable Insurance Trust (the trust). The trust is organized as a Massachusetts business trust and is registered under the Investment Company Act of 1940, as amended, as an open-end management investment company. The shareholders of each series of the trust are separate accounts of insurance companies, which offer variable annuity and/or life insurance products, and qualified retirement and pension plans.
The fund is an investment company and accordingly follows the investment company accounting and reporting guidance of the Financial Accounting Standards Board (FASB) Accounting Standards Codification Topic 946 Financial Services - Investment Companies.
(2) Significant Accounting Policies
General — The preparation of financial statements in conformity with U.S. generally accepted accounting principles requires management to make estimates and assumptions that affect the reported amounts of assets and liabilities, and disclosure of contingent assets and liabilities at the date of the financial statements and the reported amounts of increases and decreases in net assets from operations during the reporting period. Actual results could differ from those estimates. In the preparation of these financial statements, management has evaluated subsequent events occurring after the date of the fund’s Statement of Assets and Liabilities through the date that the financial statements were issued.
Balance Sheet Offsetting — The fund's accounting policy with respect to balance sheet offsetting is that, absent an event of default by the counterparty or a termination of the agreement, the International Swaps and Derivatives Association (ISDA) Master Agreement, or similar agreement, does not result in an offset of reported amounts of financial assets and financial liabilities in the Statement of Assets and Liabilities across transactions between the fund and the applicable counterparty. The fund's right to setoff may be restricted or prohibited by the bankruptcy or insolvency laws of the particular jurisdiction to which a specific master netting agreement counterparty is subject. Balance sheet offsetting disclosures, to the extent applicable to the fund, have been included in the fund’s Significant Accounting Policies note under the captions for each of the fund’s in-scope financial instruments and transactions.
Investment Valuations — Subject to its oversight, the fund's Board of Trustees has delegated primary responsibility for determining or causing to be determined the value of the fund’s investments to MFS as the fund's adviser, pursuant to the fund’s valuation policy and procedures which have been adopted by the adviser and approved by the Board. Effective September 8, 2022, and in accordance with Rule 2a-5 under the Investment Company Act of 1940, the Board of Trustees designated the adviser as the “valuation designee” of the fund. If the adviser, as valuation designee, determines that reliable market quotations are not readily available for an investment, the investment is valued at fair value as determined in good faith by the adviser in accordance with the adviser’s fair valuation policy and procedures.
Under the fund's valuation policy and procedures, equity securities, including restricted equity securities, are generally valued at the last sale or official closing price on their primary market or exchange as provided by a third-party pricing service. Equity securities, for which there were no sales reported that day, are generally valued at the last quoted daily bid quotation on their primary market or exchange as provided by a third-party pricing service. Debt instruments and floating rate loans, including restricted debt instruments, are generally valued at an evaluated or composite bid as provided by a third-party pricing service. Debt instruments sold short are generally valued at an evaluated or composite mean as provided by a third-party pricing service. Short-term instruments with a maturity at issuance of 60 days or less may be valued at amortized cost, which approximates market value. Futures contracts are generally valued at last posted settlement price on their primary exchange as provided by a third-party pricing service. Futures contracts for which there were no trades that day for a particular position are generally valued at the closing bid quotation on their primary exchange as provided by a third-party pricing service. Open-end investment companies are generally valued at net asset value per share. The values of foreign securities and other assets and liabilities expressed in foreign currencies are converted to U.S. dollars using the mean of bid and asked prices for rates provided by a third-party pricing service.
Under the fund’s valuation policy and procedures, market quotations are not considered to be readily available for debt instruments, floating rate loans, and many types of derivatives. These investments are generally valued at fair value based on information from third-party pricing services or otherwise determined by the adviser in accordance with the adviser’s fair valuation policy and procedures. Securities and other assets generally valued on the basis of information from a third-party pricing service may also be valued at a broker/dealer bid quotation. In determining values, third-party pricing services can utilize both transaction data and market information such as yield, quality, coupon rate, maturity, type of issue, trading characteristics, spreads and other market data. An investment may also be valued at fair value if the adviser determines that the investment’s value has been materially affected by events occurring after the close of the exchange or market on which the investment is principally traded (such as foreign exchange or market) and prior to the determination of the fund’s net asset value, or after the halt of trading of a specific security where trading does not resume prior to the close of the exchange or market on which the security is principally traded. Events that occur after
Notes to Financial Statements - continued
foreign markets close (such as developments in foreign markets and significant movements in the U.S. markets) and prior to the determination of the fund’s net asset value may be deemed to have a material effect on the value of securities traded in foreign markets. Accordingly, the fund’s foreign equity securities may often be valued at fair value. The adviser generally relies on third-party pricing services or other information (such as the correlation with price movements of similar securities in the same or other markets; the type, cost and investment characteristics of the security; the business and financial condition of the issuer; and trading and other market data) to assist in determining whether to fair value and at what value to fair value an investment. The value of an investment for purposes of calculating the fund’s net asset value can differ depending on the source and method used to determine value. When fair valuation is used, the value of an investment used to determine the fund’s net asset value may differ from quoted or published prices for the same investment. There can be no assurance that the fund could obtain the fair value assigned to an investment if it were to sell the investment at the same time at which the fund determines its net asset value per share.
Various inputs are used in determining the value of the fund's assets or liabilities. These inputs are categorized into three broad levels. In certain cases, the inputs used to measure fair value may fall into different levels of the fair value hierarchy. In such cases, an investment's level within the fair value hierarchy is based on the lowest level of input that is significant to the fair value measurement. The fund's assessment of the significance of a particular input to the fair value measurement in its entirety requires judgment, and considers factors specific to the investment. Level 1 includes unadjusted quoted prices in active markets for identical assets or liabilities. Level 2 includes other significant observable market-based inputs (including quoted prices for similar securities, interest rates, prepayment speed, and credit risk). Level 3 includes significant unobservable inputs, which may include the adviser's own assumptions in determining the fair value of investments. Other financial instruments are derivative instruments, such as futures contracts. The following is a summary of the levels used as of December 31, 2022 in valuing the fund's assets and liabilities:
| Financial Instruments | Level 1 | Level 2 | Level 3 | Total |
| Equity Securities: | | | | |
| United States | $1,245,324,767 | $6,223,068 | $— | $1,251,547,835 |
| Germany | 20,856,732 | — | — | 20,856,732 |
| Switzerland | 9,187,987 | — | — | 9,187,987 |
| Canada | 7,748,542 | — | — | 7,748,542 |
| Taiwan | 6,661,566 | — | — | 6,661,566 |
| France | 5,337,962 | — | — | 5,337,962 |
| South Korea | — | 5,038,182 | — | 5,038,182 |
| United Kingdom | 4,087,025 | — | — | 4,087,025 |
| U.S. Treasury Bonds & U.S. Government Agencies & Equivalents | — | 153,234,274 | — | 153,234,274 |
| Non - U.S. Sovereign Debt | — | 6,392,904 | — | 6,392,904 |
| Municipal Bonds | — | 8,705,065 | — | 8,705,065 |
| U.S. Corporate Bonds | — | 199,523,685 | — | 199,523,685 |
| Residential Mortgage-Backed Securities | — | 273,573,830 | — | 273,573,830 |
| Commercial Mortgage-Backed Securities | — | 43,096,073 | — | 43,096,073 |
| Asset-Backed Securities (including CDOs) | — | 82,331,275 | — | 82,331,275 |
| Foreign Bonds | — | 85,265,372 | — | 85,265,372 |
| Mutual Funds | 23,640,356 | — | — | 23,640,356 |
| Total | $1,322,844,937 | $863,383,728 | $— | $2,186,228,665 |
| Other Financial Instruments | | | | |
| Futures Contracts – Assets | $365,746 | $— | $— | $365,746 |
| Futures Contracts – Liabilities | (841,459) | — | — | (841,459) |
For further information regarding security characteristics, see the Portfolio of Investments.
Foreign Currency Translation — Purchases and sales of foreign investments, income, and expenses are converted into U.S. dollars based upon currency exchange rates prevailing on the respective dates of such transactions or on the reporting date for foreign denominated receivables and payables. Gains and losses attributable to foreign currency exchange rates on sales of securities are recorded for financial statement purposes as net realized gains and losses on investments. Gains and losses attributable to foreign exchange rate movements on receivables, payables, income and expenses are recorded for financial statement purposes as foreign currency transaction gains and losses. That portion of both realized and unrealized gains and losses on investments that results from fluctuations in foreign currency exchange rates is not separately disclosed.
Derivatives — The fund uses derivatives primarily to increase or decrease exposure to a particular market or segment of the market, or security, to increase or decrease interest rate or currency exposure, or as alternatives to direct investments. Derivatives are used for hedging or non-hedging purposes. While hedging can reduce or eliminate losses, it can also reduce or eliminate gains. When the fund uses derivatives as an investment to increase market exposure, or for hedging purposes, gains and losses from derivative instruments may be substantially greater than the derivative’s original cost.
Notes to Financial Statements - continued
The derivative instruments used by the fund during the period were futures contracts. Depending on the type of derivative, a fund may exit a derivative position by entering into an offsetting transaction with a counterparty or exchange, negotiating an agreement with the derivative counterparty, or novating the position to a third party. The fund may be unable to promptly close out a futures position in instances where the daily fluctuation in the price for that type of future exceeds the daily limit set by the exchange. The fund's period end derivatives, as presented in the Portfolio of Investments and the associated Derivative Contract tables, generally are indicative of the volume of its derivative activity during the period.
The following table presents, by major type of derivative contract, the fair value, on a gross basis, of the asset and liability components of derivatives held by the fund at December 31, 2022 as reported in the Statement of Assets and Liabilities:
| | | Fair Value (a) |
| Risk | Derivative Contracts | Asset Derivatives | Liability Derivatives |
| Interest Rate | Futures Contracts | $365,746 | $(841,459) |
(a) Values presented in this table for futures contracts correspond to the values reported in the Portfolio of Investments. Only the current day net variation margin for futures contracts is reported separately within the Statement of Assets and Liabilities.
The following table presents, by major type of derivative contract, the realized gain (loss) on derivatives held by the fund for the year ended December 31, 2022 as reported in the Statement of Operations:
| Risk | Futures
Contracts |
| Interest Rate | $(6,990,554) |
The following table presents, by major type of derivative contract, the change in unrealized appreciation or depreciation on derivatives held by the fund for the year ended December 31, 2022 as reported in the Statement of Operations:
| Risk | Futures
Contracts |
| Interest Rate | $(261,746) |
Derivative counterparty credit risk is managed through formal evaluation of the creditworthiness of all potential counterparties. On certain, but not all, uncleared derivatives, the fund attempts to reduce its exposure to counterparty credit risk whenever possible by entering into an ISDA Master Agreement on a bilateral basis. The ISDA Master Agreement gives each party to the agreement the right to terminate all transactions traded under such agreement if there is a specified deterioration in the credit quality of the other party. Upon an event of default or a termination of the ISDA Master Agreement, the non-defaulting party has the right to close out all transactions traded under such agreement and to net amounts owed under each agreement to one net amount payable by one party to the other. This right to close out and net payments across all transactions traded under the ISDA Master Agreement could result in a reduction of the fund's credit risk to such counterparty equal to any amounts payable by the fund under the applicable transactions, if any.
Collateral and margin requirements differ by type of derivative. For cleared derivatives (e.g., futures contracts, cleared swaps, and exchange-traded options), margin requirements are set by the clearing broker and the clearing house and collateral, in the form of cash or securities, is posted by the fund directly with the clearing broker. Collateral terms are counterparty agreement specific for uncleared derivatives (e.g., forward foreign currency exchange contracts, uncleared swap agreements, and uncleared options) and collateral, in the form of cash and securities, is held in segregated accounts with the fund's custodian in connection with these agreements. For derivatives traded under an ISDA Master Agreement, which contains a credit support annex, the collateral requirements are netted across all transactions traded under such counterparty-specific agreement and an amount is posted from one party to the other to collateralize such obligations. Cash that has been segregated or delivered to cover the fund's collateral or margin obligations under derivative contracts, if any, will be reported separately in the Statement of Assets and Liabilities as restricted cash for uncleared derivatives and/or deposits with brokers for cleared derivatives. Securities pledged as collateral or margin for the same purpose, if any, are noted in the Portfolio of Investments. The fund may be required to make payments of interest on uncovered collateral or margin obligations with the broker. Any such payments are included in “Miscellaneous” expense in the Statement of Operations.
Futures Contracts — The fund entered into futures contracts which may be used to hedge against or obtain broad market exposure, interest rate exposure, currency exposure, or to manage duration. A futures contract represents a commitment for the future purchase or sale of an asset at a specified price on a specified date.
Notes to Financial Statements - continued
Upon entering into a futures contract, the fund is required to deposit with the broker, either in cash or securities, an initial margin in an amount equal to a specified percentage of the notional amount of the contract. Subsequent payments (variation margin) are made or received by the fund each day, depending on the daily fluctuations in the value of the contract, and are recorded for financial statement purposes as unrealized gain or loss by the fund until the contract is closed or expires at which point the gain or loss on futures contracts is realized.
The fund bears the risk of interest rates, exchange rates or securities prices moving unexpectedly, in which case, the fund may not achieve the anticipated benefits of the futures contracts and may realize a loss. While futures contracts may present less counterparty risk to the fund since the contracts are exchange traded and the exchange’s clearinghouse guarantees payments to the broker, there is still counterparty credit risk due to the insolvency of the broker. The fund’s maximum risk of loss due to counterparty credit risk is equal to the margin posted by the fund to the broker plus any gains or minus any losses on the outstanding futures contracts.
Security Loans — Under its Securities Lending Agency Agreement with the fund, State Street Bank and Trust Company, as lending agent, loans the securities of the fund to certain qualified institutions (the “Borrowers”) approved by the fund. Security loans can be terminated at the discretion of either the lending agent or the fund and the related securities must be returned within the earlier of the standard trade settlement period for such securities or within three business days. The loans are collateralized by cash and/or U.S. Treasury and federal agency obligations in an amount typically at least equal to the market value of the securities loaned. On loans collateralized by cash, the cash collateral is invested in a money market fund. The market value of the loaned securities is determined at the close of business of the fund and any additional required collateral is delivered to the fund on the next business day. The lending agent provides the fund with indemnification against Borrower default. In the event of Borrower default, the lending agent will, for the benefit of the fund, either purchase securities identical to those loaned or, when such purchase is commercially impracticable, pay the fund the market value of the loaned securities. In return, the lending agent assumes the fund's rights to the related collateral. If the collateral value is less than the cost to purchase identical securities, the lending agent is responsible for the shortfall, but only to the extent that such shortfall is not due to a decline in collateral value resulting from collateral reinvestment for which the fund bears the risk of loss. A portion of the income generated upon investment of the collateral is remitted to the Borrowers, and the remainder is allocated between the fund and the lending agent. On loans collateralized by U.S. Treasury and/or federal agency obligations, a fee is received from the Borrower, and is allocated between the fund and the lending agent. Income from securities lending is separately reported in the Statement of Operations. The dividend and interest income earned on the securities loaned is accounted for in the same manner as other dividend and interest income. At December 31, 2022, there were no securities on loan or collateral outstanding.
Indemnifications — Under the fund's organizational documents, its officers and Trustees may be indemnified against certain liabilities and expenses arising out of the performance of their duties to the fund. Additionally, in the normal course of business, the fund enters into agreements with service providers that may contain indemnification clauses. The fund's maximum exposure under these agreements is unknown as this would involve future claims that may be made against the fund that have not yet occurred.
Investment Transactions and Income — Investment transactions are recorded on the trade date. Some securities may be purchased or sold on an extended settlement basis, which means that the receipt or delivery of the securities by the fund and related payments occur at a future date, usually beyond the customary settlement period. Interest income is recorded on the accrual basis.
All premium and discount is amortized or accreted for financial statement purposes in accordance with U.S. generally accepted accounting principles. Dividends received in cash are recorded on the ex-dividend date. Certain dividends from foreign securities will be recorded when the fund is informed of the dividend if such information is obtained subsequent to the ex-dividend date. Dividend and interest payments received in additional securities are recorded on the ex-dividend or ex-interest date in an amount equal to the value of the security on such date. In determining the net gain or loss on securities sold, the cost of securities is determined on the identified cost basis.
The fund may receive proceeds from litigation settlements. Any proceeds received from litigation involving portfolio holdings are reflected in the Statement of Operations in realized gain/loss if the security has been disposed of by the fund or in unrealized gain/loss if the security is still held by the fund. Any other proceeds from litigation not related to portfolio holdings are reflected as other income in the Statement of Operations.
The fund invests a significant portion of its assets in asset-backed and/or mortgage-backed securities. For these securities, the value of the debt instrument also depends on the credit quality and adequacy of the underlying assets or collateral as well as whether there is a security interest in the underlying assets or collateral. Enforcing rights, if any, against the underlying assets or collateral may be difficult. U.S. Government securities not supported as to the payment of principal or interest by the U.S. Treasury, such as those issued by Fannie Mae, Freddie Mac, and the Federal Home Loan Banks, are subject to greater credit risk than are U.S. Government securities supported by the U.S. Treasury, such as those issued by Ginnie Mae.
Notes to Financial Statements - continued
The fund may purchase or sell mortgage-backed securities on a “To Be Announced” (TBA) basis. A TBA transaction is subject to extended settlement and typically does not designate the actual security to be delivered, but instead includes an approximate principal amount. The price of the TBA security and the date that it will be settled are fixed at the time the transaction is negotiated. The value of the security varies with market fluctuations and no interest accrues to the fund until settlement takes place. TBA purchase and sale commitments are held at carrying amount, which approximates fair value and are categorized as level 2 within the fair value hierarchy and included in TBA purchase commitments in the Statement of Assets and Liabilities. Losses may arise as a result of changes in the value of the TBA investment prior to settlement date or due to counterparty non-performance.
The fund may also enter into mortgage dollar rolls, typically TBA dollar rolls, in which the fund sells TBA mortgage-backed securities to financial institutions and simultaneously agrees to repurchase similar (same issuer, type and coupon) securities at a later date at an agreed-upon price. During the period between the sale and repurchase, the fund will not be entitled to receive interest and principal payments on the securities sold. The fund accounts for dollar roll transactions as purchases and sales and realizes gains and losses on these transactions. Dollar roll transactions involve the risk that the market value of the securities that the fund is required to purchase may decline below the agreed upon repurchase price of those securities.
To mitigate the counterparty credit risk on TBA transactions, mortgage dollar rolls, and other types of forward settling mortgage-backed and asset-backed security transactions, the fund whenever possible enters into a Master Securities Forward Transaction Agreement (“MSFTA”) on a bilateral basis with each of the counterparties with whom it undertakes a significant volume of transactions. The MSFTA gives each party to the agreement the right to terminate all transactions traded under such agreement if there is a specified deterioration in the credit quality of the other party. Upon an event of default or a termination of the MSFTA, the non-defaulting party has the right to close out all transactions traded under such agreement and to net amounts owed under each transaction to one net amount payable by one party to the other. This right to close out and net payments across all transactions traded under the MSFTA could result in a reduction of the fund's credit risk to such counterparty equal to any amounts payable by the fund under the applicable transactions, if any.
For mortgage-backed and asset-backed securities traded under a MSFTA, the collateral and margining requirements are contract specific. Collateral amounts across all transactions traded under such agreement are netted and an amount is posted from one party to the other to collateralize such obligations. Cash that has been pledged to cover the fund's collateral or margin obligations under a MSFTA, if any, will be reported separately on the Statement of Assets and Liabilities as restricted cash. Securities pledged as collateral or margin for the same purpose, if any, are noted in the Portfolio of Investments.
Tax Matters and Distributions — The fund intends to qualify as a regulated investment company, as defined under Subchapter M of the Internal Revenue Code, and to distribute all of its taxable income, including realized capital gains. As a result, no provision for federal income tax is required. The fund’s federal tax returns, when filed, will remain subject to examination by the Internal Revenue Service for a three year period. Management has analyzed the fund’s tax positions taken on federal and state tax returns for all open tax years and does not believe that there are any uncertain tax positions that require recognition of a tax liability. Foreign taxes, if any, have been accrued by the fund in the accompanying financial statements in accordance with the applicable foreign tax law. Foreign income taxes may be withheld by certain countries in which the fund invests. Additionally, capital gains realized by the fund on securities issued in or by certain foreign countries may be subject to capital gains tax imposed by those countries.
Distributions to shareholders are recorded on the ex-dividend date. Income and capital gain distributions are determined in accordance with income tax regulations, which may differ from U.S. generally accepted accounting principles. Certain capital accounts in the financial statements are periodically adjusted for permanent differences in order to reflect their tax character. These adjustments have no impact on net assets or net asset value per share. Temporary differences which arise from recognizing certain items of income, expense, gain or loss in different periods for financial statement and tax purposes will reverse at some time in the future.
Book/tax differences primarily relate to amortization and accretion of debt securities, wash sale loss deferrals, and derivative transactions.
The tax character of distributions declared to shareholders for the last two fiscal years is as follows:
| | Year ended
12/31/22 | Year ended
12/31/21 |
| Ordinary income (including any short-term capital gains) | $50,184,261 | $54,055,887 |
| Long-term capital gains | 186,102,882 | 119,282,265 |
| Total distributions | $236,287,143 | $173,338,152 |
The federal tax cost and the tax basis components of distributable earnings were as follows:
Notes to Financial Statements - continued
| As of 12/31/22 | |
| Cost of investments | $1,794,200,982 |
| Gross appreciation | 537,013,846 |
| Gross depreciation | (145,461,876) |
| Net unrealized appreciation (depreciation) | $391,551,970 |
| Undistributed ordinary income | 41,339,241 |
| Undistributed long-term capital gain | 92,309,620 |
| Other temporary differences | (679) |
| Total distributable earnings (loss) | $525,200,152 |
Multiple Classes of Shares of Beneficial Interest — The fund offers multiple classes of shares, which differ in their respective distribution and/or service fees. The fund's income, realized and unrealized gain (loss), and common expenses are allocated to shareholders based on the daily net assets of each class. Dividends are declared separately for each class. Differences in per share dividend rates are generally due to differences in separate class expenses. The fund’s distributions declared to shareholders as reported in the Statements of Changes in Net Assets are presented by class as follows:
| | Year
ended
12/31/22 | | Year
ended
12/31/21 |
| Initial Class | $109,061,121 | | $83,092,525 |
| Service Class | 127,226,022 | | 90,245,627 |
| Total | $236,287,143 | | $173,338,152 |
(3) Transactions with Affiliates
Investment Adviser — The fund has an investment advisory agreement with MFS to provide overall investment management and related administrative services and facilities to the fund. The management fee is computed daily and paid monthly at the following annual rates based on the fund's average daily net assets:
| Up to $1 billion | 0.70% |
| In excess of $1 billion and up to $2.5 billion | 0.65% |
| In excess of $2.5 billion and up to $5 billion | 0.55% |
| In excess of $5 billion | 0.50% |
MFS has agreed in writing to reduce its management fee by a specified amount if certain MFS mutual fund assets exceed thresholds agreed to by MFS and the fund's Board of Trustees. Effective March 1, 2022, MFS has also agreed in writing to waive at least 0.01% of its management fee as part of this agreement. The agreement to waive at least 0.01% of the management fee will continue until modified by the fund's Board of Trustees, but such agreement will continue at least until April 30, 2024. For the year ended December 31, 2022, this management fee reduction amounted to $323,214, which is included in the reduction of total expenses in the Statement of Operations. The management fee incurred for the year ended December 31, 2022 was equivalent to an annual effective rate of 0.66% of the fund's average daily net assets.
The investment adviser has agreed in writing to pay a portion of the fund’s total annual operating expenses, excluding interest, taxes, extraordinary expenses, brokerage and transaction costs, certain tax reclaim recovery expenses (including contingency fees and closing agreement expenses), and investment-related expenses, such that total annual operating expenses do not exceed 0.61% of average daily net assets for the Initial Class shares and 0.86% of average daily net assets for the Service Class shares. This written agreement will continue until modified by the fund’s Board of Trustees, but such agreement will continue at least until April 30, 2024. For the year ended December 31, 2022, this reduction amounted to $1,876,623, which is included in the reduction of total expenses in the Statement of Operations.
Distributor — MFS Fund Distributors, Inc. (MFD), a wholly-owned subsidiary of MFS, is the distributor of shares of the fund. The Trustees have adopted a distribution plan for the Service Class shares pursuant to Rule 12b-1 under the Investment Company Act of 1940.
The fund's distribution plan provides that the fund will pay MFD distribution and/or service fees equal to 0.25% per annum of its average daily net assets attributable to Service Class shares as partial consideration for services performed and expenses incurred by MFD and financial intermediaries (including participating insurance companies that invest in the fund to fund variable annuity and
Notes to Financial Statements - continued
variable life insurance contracts, sponsors of qualified retirement and pension plans that invest in the fund, and affiliates of these participating insurance companies and plan sponsors) in connection with the sale and distribution of the Service Class shares. MFD may subsequently pay all, or a portion, of the distribution and/or service fees to financial intermediaries.
Shareholder Servicing Agent — MFS Service Center, Inc. (MFSC), a wholly-owned subsidiary of MFS, receives a fee from the fund for its services as shareholder servicing agent. For the year ended December 31, 2022, the fee was $55,452, which equated to 0.0024% annually of the fund's average daily net assets. MFSC also receives reimbursement from the fund for out-of-pocket expenses paid by MFSC on behalf of the fund. For the year ended December 31, 2022, these costs amounted to $2,576.
Administrator — MFS provides certain financial, legal, shareholder communications, compliance, and other administrative services to the fund. Under an administrative services agreement, the fund reimburses MFS the costs incurred to provide these services. The fund is charged an annual fixed amount of $17,500 plus a fee based on average daily net assets. The administrative services fee incurred for the year ended December 31, 2022 was equivalent to an annual effective rate of 0.0158% of the fund's average daily net assets.
Trustees’ and Officers’ Compensation — The fund pays compensation to independent Trustees in the form of a retainer, attendance fees, and additional compensation to Board and Committee chairpersons. The fund does not pay compensation directly to Trustees or officers of the fund who are also officers of the investment adviser, all of whom receive remuneration from MFS for their services to the fund. Certain officers and Trustees of the fund are officers or directors of MFS, MFD, and MFSC.
Other — The fund invests in the MFS Institutional Money Market Portfolio which is managed by MFS and seeks current income consistent with preservation of capital and liquidity. This money market fund does not pay a management fee to MFS but does incur investment and operating costs.
The fund is permitted to engage in purchase and sale transactions with funds and accounts for which MFS serves as investment adviser or sub-adviser (“cross-trades”) pursuant to a policy adopted by the Board of Trustees. This policy has been designed to ensure that cross-trades conducted by the fund comply with Rule 17a-7 under the Investment Company Act of 1940. During the year ended December 31, 2022, the fund engaged in purchase and sale transactions pursuant to this policy, which amounted to $907,492 and $722,324, respectively. The sales transactions resulted in net realized gains (losses) of $46,039.
The adviser has voluntarily undertaken to reimburse the fund from its own resources on a quarterly basis for the cost of investment research embedded in the cost of the fund’s securities trades. This agreement may be rescinded at any time. For the year ended December 31, 2022, this reimbursement amounted to $19,702, which is included in “Other” income in the Statement of Operations.
(4) Portfolio Securities
For the year ended December 31, 2022, purchases and sales of investments, other than short-term obligations, were as follows:
| | Purchases | Sales |
| U.S. Government securities | $1,211,131,898 | $1,241,502,212 |
| Non-U.S. Government securities | 346,601,419 | 530,585,773 |
(5) Shares of Beneficial Interest
The fund's Declaration of Trust permits the Trustees to issue an unlimited number of full and fractional shares of beneficial interest. Transactions in fund shares were as follows:
| | Year ended
12/31/22 | | Year ended
12/31/21 |
| | Shares | Amount | | Shares | Amount |
| Shares sold | | | | | |
| Initial Class | 1,216,820 | $28,906,952 | | 1,346,454 | $36,950,675 |
| Service Class | 3,979,494 | 96,027,646 | | 3,578,860 | 96,647,907 |
| | 5,196,314 | $124,934,598 | | 4,925,314 | $133,598,582 |
Shares issued to shareholders
in reinvestment of distributions | | | | | |
| Initial Class | 4,817,187 | $109,061,121 | | 3,053,750 | $83,092,525 |
| Service Class | 5,751,628 | 127,226,022 | | 3,387,599 | 90,245,627 |
| | 10,568,815 | $236,287,143 | | 6,441,349 | $173,338,152 |
Notes to Financial Statements - continued
| | Year ended
12/31/22 | | Year ended
12/31/21 |
| | Shares | Amount | | Shares | Amount |
| Shares reacquired | | | | | |
| Initial Class | (7,347,668) | $(180,956,671) | | (5,396,442) | $(148,714,749) |
| Service Class | (7,768,222) | (186,125,832) | | (6,922,547) | (186,284,282) |
| | (15,115,890) | $(367,082,503) | | (12,318,989) | $(334,999,031) |
| Net change | | | | | |
| Initial Class | (1,313,661) | $(42,988,598) | | (996,238) | $(28,671,549) |
| Service Class | 1,962,900 | 37,127,836 | | 43,912 | 609,252 |
| | 649,239 | $(5,860,762) | | (952,326) | $(28,062,297) |
(6) Line of Credit
The fund and certain other funds managed by MFS participate in a $1.45 billion unsecured committed line of credit of which $1.2 billion is reserved for use by the fund and certain other MFS U.S. funds. The line of credit is provided by a syndicate of banks under a credit agreement. Borrowings may be made for temporary financing needs. Interest is charged to each fund, based on its borrowings, generally at a rate equal to the highest of 1) Daily Simple SOFR (Secured Overnight Financing Rate) plus 0.10%, 2) the Federal Funds Effective Rate, or 3) the Overnight Bank Funding Rate, each plus an agreed upon spread. A commitment fee, based on the average daily unused portion of the committed line of credit, is allocated among the participating funds. The line of credit expires on March 16, 2023 unless extended or renewed. In addition, the fund and other funds managed by MFS have established unsecured uncommitted borrowing arrangements with certain banks for temporary financing needs. Interest is charged to each fund, based on its borrowings, at rates equal to customary reference rates plus an agreed upon spread. For the year ended December 31, 2022, the fund’s commitment fee and interest expense were $10,822 and $0, respectively, and are included in “Miscellaneous” expense in the Statement of Operations.
(7) Investments in Affiliated Issuers
An affiliated issuer may be considered one in which the fund owns 5% or more of the outstanding voting securities, or a company which is under common control. For the purposes of this report, the following were affiliated issuers:
| Affiliated Issuers | Beginning
Value | Purchases | Sales
Proceeds | Realized
Gain
(Loss) | Change in
Unrealized
Appreciation or
Depreciation | Ending
Value |
| MFS Institutional Money Market Portfolio | $146,917,118 | $551,884,186 | $675,160,632 | $(8,331) | $8,015 | $23,640,356 |
| Affiliated Issuers | Dividend
Income | Capital Gain
Distributions |
| MFS Institutional Money Market Portfolio | $815,844 | $— |
(8) LIBOR Transition
Certain of the fund's investments, including investments in certain debt instruments and derivatives (if any), as well as borrowings by the fund and certain other contractual arrangements of the fund, may be based on the London Interbank Offered Rate (“LIBOR”). In 2017, the regulatory authority that oversees financial services firms in the United Kingdom announced plans to transition away from LIBOR by the end of 2021. In March 2021, the administrator of LIBOR announced the extension of the publication of the more commonly used U.S. dollar LIBOR settings to the end of June 2023. Although the full impacts of the transition away from LIBOR are not fully known, the transition may result in, among other things, an increase in volatility or illiquidity of the markets for instruments that currently rely on LIBOR to determine interest rates and this could have an adverse impact on the fund's performance. With respect to the fund's accounting for investments, including investments in certain debt instruments and derivatives, as well as borrowings by the fund and any other contractual arrangements of the fund that undergo reference rate-related modifications as a
Notes to Financial Statements - continued
result of the transition, management will rely upon the relief provided by FASB Codification Topic 848 – Reference Rate Reform (Topic 848). The guidance in Topic 848 permits the fund to account for those modified contracts as a continuation of the existing contracts. Management is still evaluating the impact to the fund of the June 30, 2023 planned discontinuation of the more commonly used U.S. dollar LIBOR settings.
(9) Russia and Ukraine Conflict
The market disruptions, which began in late February 2022, associated with geopolitical events related to the conflict between Russia and Ukraine may adversely affect the value of the fund’s assets and thus the fund’s performance. Management continues to monitor these events and to evaluate the related impacts, if any, to the fund.
Report of Independent Registered Public Accounting Firm
To the Board of Trustees of MFS Variable Insurance Trust and the Shareholders of MFS Total Return Series:
Opinion on the Financial Statements and Financial Highlights
We have audited the accompanying statement of assets and liabilities of MFS Total Return Series (the “Fund”), including the portfolio of investments, as of December 31, 2022, the related statement of operations for the year then ended, the statements of changes in net assets for each of the two years in the period then ended, the financial highlights for each of the five years in the period then ended, and the related notes. In our opinion, the financial statements and financial highlights present fairly, in all material respects, the financial position of the Fund as of December 31, 2022, and the results of its operations for the year then ended, the changes in its net assets for each of the two years in the period then ended, and the financial highlights for each of the five years in the period then ended, in conformity with accounting principles generally accepted in the United States of America.
Basis for Opinion
These financial statements and financial highlights are the responsibility of the Fund's management. Our responsibility is to express an opinion on the Fund's financial statements and financial highlights based on our audits. We are a public accounting firm registered with the Public Company Accounting Oversight Board (United States) (PCAOB) and are required to be independent with respect to the Fund in accordance with the U.S. federal securities laws and the applicable rules and regulations of the Securities and Exchange Commission and the PCAOB.
We conducted our audits in accordance with the standards of the PCAOB. Those standards require that we plan and perform the audit to obtain reasonable assurance about whether the financial statements and financial highlights are free of material misstatement, whether due to error or fraud. The Fund is not required to have, nor were we engaged to perform, an audit of its internal control over financial reporting. As part of our audits, we are required to obtain an understanding of internal control over financial reporting but not for the purpose of expressing an opinion on the effectiveness of the Fund's internal control over financial reporting. Accordingly, we express no such opinion.
Our audits included performing procedures to assess the risks of material misstatement of the financial statements and financial highlights, whether due to error or fraud, and performing procedures that respond to those risks. Such procedures included examining, on a test basis, evidence regarding the amounts and disclosures in the financial statements and financial highlights. Our audits also included evaluating the accounting principles used and significant estimates made by management, as well as evaluating the overall presentation of the financial statements and financial highlights. Our procedures included confirmation of securities owned as of December 31, 2022, by correspondence with the custodian and brokers; when replies were not received from brokers, we performed other auditing procedures. We believe that our audits provide a reasonable basis for our opinion.
DELOITTE & TOUCHE LLP
Boston, Massachusetts
February 15, 2023
We have served as the auditor of one or more of the MFS investment companies since 1924.
Trustees and Officers — Identification and Background
The Trustees and Officers of the Trust, as of February 1, 2023, are listed below, together with their principal occupations during the past five years. (Their titles may have varied during that period.) The address of each Trustee and Officer is 111 Huntington Avenue, Boston, Massachusetts 02199-7618.
| Name, Age | | Position(s) Held with Fund | | Trustee/Officer Since(h) | | Number of MFS Funds overseen by the Trustee | | Principal Occupations During
the Past Five Years | | Other Directorships During
the Past Five Years (j) |
| INTERESTED TRUSTEE | | | | | | | | | | |
Michael W. Roberge (k)
(age 56) | | Trustee | | January 2021 | | 136 | | Massachusetts Financial Services Company, Chairman (since January 2021); Chief Executive Officer (since January 2017); Director; Chairman of the Board (since January 2022); President (until December 2018); Chief Investment Officer (until December 2018) | | N/A |
| INDEPENDENT TRUSTEES | | | | | | | | | | |
John P. Kavanaugh
(age 68) | | Trustee and Chair of Trustees | | January 2009 | | 136 | | Private investor | | N/A |
Steven E. Buller
(age 71) | | Trustee | | February 2014 | | 136 | | Private investor | | N/A |
John A. Caroselli
(age 68) | | Trustee | | March 2017 | | 136 | | Private investor; JC Global Advisors, LLC (management consulting), President (since 2015) | | N/A |
Maureen R. Goldfarb
(age 67) | | Trustee | | January 2009 | | 136 | | Private investor | | N/A |
Peter D. Jones
(age 67) | | Trustee | | January 2019 | | 136 | | Private investor | | N/A |
James W. Kilman, Jr.
(age 61) | | Trustee | | January 2019 | | 136 | | Burford Capital Limited (finance and investment management), Senior Advisor (since May 3, 2021), Chief Financial Officer (2019 - May 2, 2021); KielStrand Capital LLC (family office), Chief Executive Officer (since 2016) | | Alpha-En Corporation, Director (2016-2019) |
Clarence Otis, Jr.
(age 66) | | Trustee | | March 2017 | | 136 | | Private investor | | VF Corporation, Director; Verizon Communications, Inc., Director; The Travelers Companies, Director |
Maryanne L. Roepke
(age 66) | | Trustee | | May 2014 | | 136 | | Private investor | | N/A |
Laurie J. Thomsen
(age 65) | | Trustee | | March 2005 | | 136 | | Private investor | | The Travelers Companies, Director; Dycom Industries, Inc., Director |
Trustees and Officers - continued
| Name, Age | | Position(s) Held with
Fund | | Trustee/Officer Since(h) | | Number of MFS Funds for which the Person is an Officer | | Principal Occupations During
the Past Five Years |
| OFFICERS | | | | | | | | |
Christopher R. Bohane (k)
(age 49) | | Assistant Secretary and Assistant Clerk | | July 2005 | | 136 | | Massachusetts Financial Services Company, Senior Vice President and Senior Managing Counsel |
Kino Clark (k)
(age 54) | | Assistant Treasurer | | January 2012 | | 136 | | Massachusetts Financial Services Company, Vice President |
John W. Clark, Jr. (k)
(age 55) | | Assistant Treasurer | | April 2017 | | 136 | | Massachusetts Financial Services Company, Vice President |
David L. DiLorenzo (k)
(age 54) | | President | | July 2005 | | 136 | | Massachusetts Financial Services Company, Senior Vice President |
Heidi W. Hardin (k)
(age 55) | | Secretary and Clerk | | April 2017 | | 136 | | Massachusetts Financial Services Company, Executive Vice President and General Counsel |
Brian E. Langenfeld (k)
(age 49) | | Assistant Secretary and Assistant Clerk | | June 2006 | | 136 | | Massachusetts Financial Services Company, Vice President and Managing Counsel |
Rosa E. Licea-Mailloux (k)
(age 46) | | Chief Compliance Officer | | March 2022 | | 136 | | Massachusetts Financial Services Company, Vice President (since 2018); Director of Corporate Compliance (2018-2021), Senior Director Compliance (2021-2022), Senior Managing Director of North American Compliance & Chief Compliance Officer (since March 2022); Natixis Investment Managers (investment management), Funds Chief Compliance Officer, Deputy General Counsel & Senior Vice President (until 2018) |
Amanda S. Mooradian (k)
(age 43) | | Assistant Secretary and Assistant Clerk | | September 2018 | | 136 | | Massachusetts Financial Services Company, Assistant Vice President and Senior Counsel |
Susan A. Pereira (k)
(age 52) | | Assistant Secretary and Assistant Clerk | | July 2005 | | 136 | | Massachusetts Financial Services Company, Vice President and Managing Counsel |
Kasey L. Phillips (k)
(age 52) | | Assistant Treasurer | | September 2012 | | 136 | | Massachusetts Financial Services Company, Vice President |
Matthew A. Stowe (k)
(age 48) | | Assistant Secretary and Assistant Clerk | | October 2014 | | 136 | | Massachusetts Financial Services Company, Vice President and Senior Managing Counsel |
William B. Wilson (k)
(age 40) | | Assistant Secretary and Assistant Clerk | | October 2022 | | 136 | | Massachusetts Financial Services Company, Assistant Vice President and Counsel |
James O. Yost (k)
(age 62) | | Treasurer | | September 1990 | | 136 | | Massachusetts Financial Services Company, Senior Vice President |
| (h) | Date first appointed to serve as Trustee/Officer of an MFS Fund. Each Trustee has served continuously since appointment unless indicated otherwise. From January 2012 through December 2016, Messrs. DiLorenzo and Yost served as Treasurer and Deputy Treasurer of the Funds, respectively. |
| (j) | Directorships or trusteeships of companies required to report to the Securities and Exchange Commission (i.e., “public companies”). |
| (k) | “Interested person” of the Trust within the meaning of the Investment Company Act of 1940 (referred to as the 1940 Act), which is the principal federal law governing investment companies like the fund, as a result of a position with MFS. The address of MFS is 111 Huntington Avenue, Boston, Massachusetts 02199-7618. |
Each Trustee (other than Messrs. Jones, Kilman and Roberge) has been elected by shareholders and each Trustee and Officer holds office until his or her successor is chosen and qualified or until his or her earlier death, resignation, retirement or removal. Mr. Roberge became a Trustee of the Funds on January 1, 2021 and Messrs. Jones and Kilman became Trustees of the Funds on January 1, 2019. The Trust does not hold annual meetings for the purpose of electing Trustees, and Trustees are not elected for fixed terms. Under the terms of the Board's retirement policy, an Independent Trustee shall retire at the end of the calendar year in which he or she reaches the earlier of 75 years of age or 15 years of service on the Board (or, in the case of any Independent Trustee who joined the Board prior to 2015, 20 years of service on the Board).
Trustees and Officers - continued
Messrs. Buller, Kilman and Otis and Ms. Roepke are members of the Trust’s Audit Committee.
Each of the Interested Trustees and certain Officers hold comparable officer positions with certain affiliates of MFS.
The Statement of Additional Information for a Fund includes further information about the Trustees and is available without charge upon request by calling 1-800-225-2606.
| Investment Adviser | Custodian |
Massachusetts Financial Services Company
111 Huntington Avenue
Boston, MA 02199-7618 | State Street Bank and Trust Company
1 Lincoln Street
Boston, MA 02111-2900 |
| Distributor | Independent Registered Public Accounting Firm |
MFS Fund Distributors, Inc.
111 Huntington Avenue
Boston, MA 02199-7618 | Deloitte & Touche LLP
200 Berkeley Street
Boston, MA 02116 |
| Portfolio Manager(s) | |
Steven Gorham
Alexander Mackey
Joshua Marston
Johnathan Munko
Henry Peabody | |
Board Review of Investment Advisory Agreement
MFS Total Return Series
The Investment Company Act of 1940 requires that both the full Board of Trustees and a majority of the non-interested (“independent”) Trustees, voting separately, annually approve the continuation of the Fund’s investment advisory agreement with MFS. The Trustees consider matters bearing on the Fund and its advisory arrangements at their meetings throughout the year, including a review of performance data at each regular meeting. In addition, the independent Trustees met several times over the course of three months beginning in May and ending in July, 2022 (“contract review meetings”) for the specific purpose of considering whether to approve the continuation of the investment advisory agreement for the Fund and the other investment companies that the Board oversees (the “MFS Funds”). The independent Trustees were assisted in their evaluation of the Fund’s investment advisory agreement by independent legal counsel, from whom they received separate legal advice and with whom they met separately from MFS during various contract review meetings. The independent Trustees were also assisted in this process by an independent consultant who was retained by and reported to the independent Trustees.
In connection with their deliberations regarding the continuation of the investment advisory agreement, the Trustees, including the independent Trustees, considered such information and factors as they believed, in light of the legal advice furnished to them and their own business judgment, to be relevant. The investment advisory agreement for the Fund was considered separately, although the Trustees also took into account the common interests of all MFS Funds in their review. As described below, the Trustees considered the nature, quality, and extent of the various investment advisory, administrative, and shareholder services performed by MFS under the existing investment advisory agreement and other arrangements with the Fund.
In connection with their contract review meetings, the Trustees received and relied upon materials that included, among other items: (i) information provided by Broadridge Financial Solutions, Inc. (“Broadridge”), an independent third party, on the investment performance of the Fund for various time periods ended December 31, 2021 and the investment performance of a group of funds with substantially similar investment classifications/objectives (the “Broadridge performance universe”), (ii) information provided by Broadridge on the Fund’s advisory fees and other expenses and the advisory fees and other expenses of comparable funds identified by Broadridge as well as all other funds in the same investment classification/category (the “Broadridge expense group and universe”), (iii) information provided by MFS on the advisory fees of portfolios of other clients of MFS, including institutional separate accounts and other clients, (iv) information as to whether and to what extent applicable expense waivers, reimbursements or fee “breakpoints” are observed for the Fund, (v) information regarding MFS’ financial results and financial condition, including MFS’ and certain of its affiliates’ estimated profitability from services performed for the Fund and the MFS Funds as a whole, and compared to MFS’ institutional business, (vi) MFS’ views regarding the outlook for the mutual fund industry and the strategic business plans of MFS, (vii) descriptions of various functions performed by MFS for the Funds, such as compliance monitoring and portfolio trading practices, and (viii) information regarding the overall organization of MFS, including information about MFS’ senior management and other personnel providing investment advisory, administrative and other services to the Fund and the other MFS Funds. The comparative performance, fee and expense information prepared and provided by Broadridge was not independently verified and the independent Trustees did not independently verify any information provided to them by MFS.
The Trustees’ conclusion as to the continuation of the investment advisory agreement was based on a comprehensive consideration of all information provided to the Trustees and not the result of any single factor. Some of the factors that figured particularly in the Trustees’ deliberations are described below, although individual Trustees may have evaluated the information presented differently from one another, giving different weights to various factors. It is also important to recognize that the fee arrangements for the Fund and other MFS Funds are the result of years of review and discussion between the independent Trustees and MFS, that certain aspects of such arrangements may receive greater scrutiny in some years than in others, and that the Trustees’ conclusions may be based, in part, on their consideration of these same arrangements during the course of the year and in prior years.
Based on information provided by Broadridge and MFS, the Trustees reviewed the Fund’s total return investment performance as well as the Broadridge performance universe over various time periods. The Trustees placed particular emphasis on the total return performance of the Fund’s Initial Class shares in comparison to the performance of funds in its Broadridge performance universe over the five-year period ended December 31, 2021, which the Trustees believed was a long enough period to reflect differing market conditions. The total return performance of the Fund’s Initial Class shares was in the 3rd quintile relative to the other funds in the universe for this five-year period (the 1st quintile being the best performers and the 5th quintile being the worst performers). The total return performance of the Fund’s Initial Class shares was in the 2nd quintile for the one-year period and the 3rd quintile for the three-year period ended December 31, 2021 relative to the Broadridge performance universe. Because of the passage of time, these performance results may differ from the performance results for more recent periods, including those shown elsewhere in this report.
In the course of their deliberations, the Trustees took into account information provided by MFS in connection with the contract review meetings, as well as during investment review meetings conducted with portfolio management personnel during the course of the year regarding the Fund’s performance. After reviewing these and related factors, the Trustees concluded, within the context of their overall conclusions regarding the investment advisory agreement, that they were satisfied with MFS’ responses and efforts relating to investment performance.
Board Review of Investment Advisory Agreement - continued
In assessing the reasonableness of the Fund’s advisory fee, the Trustees considered, among other information, the Fund’s advisory fee and the total expense ratio of the Fund’s Initial Class shares as a percentage of average daily net assets and the advisory fee and total expense ratios of the Broadridge expense group based on information provided by Broadridge. The Trustees considered that MFS currently observes an expense limitation for the Fund, which may not be changed without the Trustees’ approval. The Trustees also considered that, according to the data provided by Broadridge (which takes into account any fee reductions or expense limitations that were in effect during the Fund’s last fiscal year), the Fund’s effective advisory fee rate and total expense ratio were each approximately at the Broadridge expense group median.
The Trustees also considered the advisory fees charged by MFS to any institutional separate accounts advised by MFS (“separate accounts”) and unaffiliated investment companies for which MFS serves as subadviser (“subadvised funds”) that have comparable investment strategies to the Fund, if any. In comparing these fees, the Trustees considered information provided by MFS as to the generally broader scope of services provided by MFS to the Fund, as well as the more extensive regulatory burdens imposed on MFS in managing the Fund, in comparison to separate accounts and subadvised funds. The Trustees also considered the higher demands placed on MFS’ investment personnel and trading infrastructure as a result of the daily cash in-flows and out-flows of the Fund in comparison to separate accounts.
The Trustees also considered whether the Fund may benefit from any economies of scale in the management of the Fund in the event of growth in assets of the Fund and/or growth in assets of the MFS Funds as a whole. They noted that the Fund’s advisory fee rate schedule is subject to contractual breakpoints that reduce the Fund’s advisory fee rate on average daily net assets over $1 billion, $2.5 billion, and $5 billion. The Trustees also noted that MFS has agreed in writing to waive a portion of the management fees of certain MFS Funds, including the Fund, if the total combined assets of certain funds within the MFS Funds’ complex increase above agreed upon thresholds (the “group fee waiver”), enabling the Fund’s shareholders to share in the benefits from any economies of scale at the complex level. The group fee waiver is reviewed and renewed annually between the Board and MFS. The Trustees concluded that the breakpoints and the group fee waiver were sufficient to allow the Fund to benefit from economies of scale as its assets and overall complex assets grow.
The Trustees also considered information prepared by MFS relating to MFS’ costs and profits with respect to the Fund, the MFS Funds considered as a group, and other investment companies and accounts advised by MFS, as well as MFS’ methodologies used to determine and allocate its costs to the MFS Funds, the Fund and other accounts and products for purposes of estimating profitability.
After reviewing these and other factors described herein, the Trustees concluded, within the context of their overall conclusions regarding the investment advisory agreement, that the advisory fees charged to the Fund represent reasonable compensation in light of the services being provided by MFS to the Fund.
In addition, the Trustees considered MFS’ resources and related efforts to continue to retain, attract and motivate capable personnel to serve the Fund. The Trustees also considered current and developing conditions in the financial services industry, including the presence of large and well-capitalized companies which are spending, and appear to be prepared to continue to spend, substantial sums to engage personnel and to provide services to competing investment companies. In this regard, the Trustees also considered the financial resources of MFS and its ultimate parent, Sun Life Financial Inc. The Trustees also considered the advantages and possible disadvantages to the Fund of having an adviser that also serves other investment companies as well as other accounts.
The Trustees also considered the nature, quality, cost, and extent of administrative, transfer agency, and distribution services provided to the Fund by MFS and its affiliates under agreements and plans other than the investment advisory agreement, including any 12b-1 fees the Fund pays to MFS Fund Distributors, Inc., an affiliate of MFS. The Trustees also considered the nature, extent and quality of certain other services MFS performs or arranges for on the Fund’s behalf, which may include securities lending programs, directed expense payment programs, class action recovery programs, and MFS’ interaction with third-party service providers, principally custodians and sub-custodians. The Trustees concluded that the various non-advisory services provided by MFS and its affiliates on behalf of the Fund were satisfactory.
The Trustees considered so-called “fall-out benefits” to MFS such as reputational value derived from serving as investment manager to the MFS Funds. The Trustees also considered that MFS discontinued its historic practice of obtaining investment research from portfolio brokerage commissions paid by certain MFS Funds effective January 2018, and directly pays or voluntarily reimburses a Fund, if applicable, for the costs of external research acquired through the use of the Fund’s portfolio brokerage commissions.
Based on their evaluation of factors that they deemed to be material, including those factors described above, the Board of Trustees, including the independent Trustees, concluded that the Fund’s investment advisory agreement with MFS should be continued for an additional one-year period, commencing August 1, 2022.
Proxy Voting Policies and Information
MFS votes proxies on behalf of the fund pursuant to proxy voting policies and procedures that are available without charge, upon request, by calling 1-800-225-2606, by visiting mfs.com/proxyvoting, or by visiting the SEC’s Web site at http://www.sec.gov.
Information regarding how the fund voted proxies relating to portfolio securities during the most recent twelve-month period ended June 30 is available by August 31 of each year without charge by visiting mfs.com/proxyvoting, or by visiting the SEC’s Web site at http://www.sec.gov.
Quarterly Portfolio Disclosure
The fund files a complete schedule of portfolio holdings with the SEC for the first and third quarters of each fiscal year as an exhibit to its reports on Form N-PORT. The fund’s Form N-PORT reports are available on the SEC’s Web site at http://www.sec.gov. A shareholder can obtain the portfolio holdings report for the first and third quarters of the fund's fiscal year at mfs.com/vit1 by choosing the fund's name and then scrolling to the “Resources” section and clicking on the “Prospectus and Reports” tab.
FURTHER INFORMATION
From time to time, MFS may post important information about the fund or the MFS Funds on the MFS Web site (mfs.com). This information is available at https://www.mfs.com/announcements or at mfs.com/vit1 by choosing the fund's name and then scrolling to the “Resources” section and clicking on the “Announcements” tab, if any.
Information About Fund Contracts and Legal Claims
The fund has entered into contractual arrangements with an investment adviser, administrator, distributor, shareholder servicing agent, and custodian who each provide services to the fund. Unless expressly stated otherwise, shareholders are not parties to, or intended beneficiaries of these contractual arrangements, and these contractual arrangements are not intended to create any shareholder right to enforce them against the service providers or to seek any remedy under them against the service providers, either directly or on behalf of the fund.
Under the Trust’s By-Laws and Declaration of Trust, any claims asserted against or on behalf of the MFS Funds, including claims against Trustees and Officers, must be brought in state and federal courts located within the Commonwealth of Massachusetts.
Federal Tax Information (unaudited)
The following information is provided pursuant to provisions of the Internal Revenue Code.
The fund designates $204,714,000 as capital gain dividends paid during the fiscal year.
For corporate shareholders, 50.40% of the ordinary income dividends paid during the fiscal year qualify for the corporate dividends received deduction.
The fund intends to pass through the maximum amount allowable as Section 163(j) Interest Dividends as defined in Treasury Regulation §1.163(j)-1(b).
| FACTS | WHAT DOES MFS DO WITH YOUR PERSONAL INFORMATION? |
| Why? | Financial companies choose how they share your personal information. Federal law gives consumers the right to limit some but not all sharing. Federal law also requires us to tell you how we collect, share, and protect your personal information. Please read this notice carefully to understand what we do. |
| What? | The types of personal information we collect and share depend on the product or service you have with us. This information can include: |
| • Social Security number and account balances |
| • Account transactions and transaction history |
| • Checking account information and wire transfer instructions |
| When you are no longer our customer, we continue to share your information as described in this notice. |
| How? | All financial companies need to share customers' personal information to run their everyday business. In the section below, we list the reasons financial companies can share their customers' personal information; the reasons MFS chooses to share; and whether you can limit this sharing. |
Reasons we can share your
personal information | Does MFS share? | Can you limit
this sharing? |
For our everyday business purposes –
such as to process your transactions, maintain your
account(s), respond to court orders and legal
investigations, or report to credit bureaus | Yes | No |
For our marketing purposes –
to offer our products and services to you | No | We don't share |
For joint marketing with other
financial companies | No | We don't share |
For our affiliates' everyday business purposes –
information about your transactions and experiences | No | We don't share |
For our affiliates' everyday business purposes –
information about your creditworthiness | No | We don't share |
| For nonaffiliates to market to you | No | We don't share |
| Questions? | Call 800-225-2606 or go to mfs.com. |
| Who we are |
| Who is providing this notice? | MFS Funds, MFS Investment Management, MFS Institutional Advisors, Inc., and MFS Heritage Trust Company. |
| What we do |
How does MFS
protect my personal
information? | To protect your personal information from unauthorized access and use, we use security measures that comply with federal law. These measures include procedural, electronic, and physical safeguards for the protection of the personal information we collect about you. |
How does MFS
collect my personal
information? | We collect your personal information, for example, when you |
| • open an account or provide account information |
| • direct us to buy securities or direct us to sell your securities |
| • make a wire transfer |
| We also collect your personal information from others, such as credit bureaus, affiliates, or other companies. |
| Why can't I limit all sharing? | Federal law gives you the right to limit only |
| • sharing for affiliates' everyday business purposes – information about your creditworthiness |
| • affiliates from using your information to market to you |
| • sharing for nonaffiliates to market to you |
| State laws and individual companies may give you additional rights to limit sharing. |
| Definitions |
| Affiliates | Companies related by common ownership or control. They can be financial and nonfinancial companies. |
| • MFS does not share personal information with affiliates, except for everyday business purposes as described on page one of this notice. |
| Nonaffiliates | Companies not related by common ownership or control. They can be financial and nonfinancial companies. |
| • MFS does not share with nonaffiliates so they can market to you. |
| Joint marketing | A formal agreement between nonaffiliated financial companies that together market financial products or services to you. |
| • MFS doesn't jointly market. |
| Other important information |
| If you own an MFS product or receive an MFS service in the name of a third party such as a bank or broker-dealer, their privacy policy may apply to you instead of ours. |
Annual Report
December 31, 2022
MFS® Variable Insurance Trust
| 1 |
| 2 |
| 3 |
| 5 |
| 7 |
| 8 |
| 11 |
| 12 |
| 13 |
| 14 |
| 16 |
| 24 |
| 25 |
| 28 |
| 30 |
| 30 |
| 30 |
| 30 |
| 30 |
| 31 |
The report is prepared for the general information of shareholders. It is authorized for distribution to prospective investors only when preceded or accompanied by a current prospectus.
NOT FDIC INSURED • MAY LOSE VALUE • NO BANK OR CREDIT UNION GUARANTEE •
NOT A DEPOSIT • NOT INSURED BY ANY FEDERAL GOVERNMENT AGENCY OR NCUA/NCUSIF
LETTER FROM THE CHAIR AND CEO
Dear Shareholders:
Signs of peaking inflation, hopes that monetary policy tightening cycles may be nearing an end and a rapid reopening of China’s economy in late-2022 and early-2023 have combined to bolster investor sentiment in recent months. Markets have largely adjusted to the challenges posed by Russia’s invasion of Ukraine, thanks in part to mild European winter weather which has alleviated concerns over potential shortages of natural gas. Resilient labor markets in much of the developed world have further contributed to a brighter-than-expected economic backdrop. However, many investors are mindful that the lagged effects of ongoing policy tightening have yet to work their way through the global economy.
Tighter global financial conditions have been a particular headwind for richly valued growth equities and interest rate-sensitive parts of the economy, such as housing. Over the near term, companies may face a challenging earnings backdrop as they are forced to absorb higher input and labor costs at a time of dwindling pricing power. For fixed income, the rise in interest rates has made bonds more attractive than they have been in years, which may provide balance to an overall portfolio.
During times of market transition, it is important to have a deep understanding of company fundamentals, and we have built our unique global research platform to do just that.
At MFS®, we put our clients’ assets to work responsibly by carefully navigating increasingly complex global capital markets. Our investment team is guided by a commitment to long-term fundamental investing. Our global investment platform — combining collective expertise, long-term discipline, and thoughtful risk management — seeks to uncover what we believe are the best, most durable investment ideas in markets around the world, enabling us to potentially create value for investors.
Respectfully,
Michael W. Roberge
Chair and Chief Executive Officer
MFS Investment Management
February 15, 2023
The opinions expressed in this letter are subject to change and may not be relied upon for investment advice. No forecasts can be guaranteed.
Portfolio structure
Top ten holdings
| NextEra Energy, Inc. | 12.1% |
| PG&E Corp. | 6.0% |
| Dominion Energy, Inc. | 5.3% |
| Southern Co. | 4.9% |
| Sempra Energy | 4.6% |
| DTE Energy Co. | 3.7% |
| American Electric Power Co., Inc. | 3.4% |
| RWE AG | 3.3% |
| Edison International | 3.1% |
| Ameren Corp. | 3.0% |
Top five industries
| Utilities-Electric Power | 84.1% |
| Energy - Renewables | 5.6% |
| Telecommunications - Wireless | 4.8% |
| Natural Gas - Distribution | 2.0% |
| Utilities - Water | 1.0% |
Issuer country weightings (x)
| United States | 73.2% |
| Spain | 5.7% |
| Germany | 5.3% |
| Portugal | 4.2% |
| United Kingdom | 3.9% |
| Italy | 2.3% |
| Brazil | 1.0% |
| France | 1.0% |
| Canada | 0.9% |
| Other Countries | 2.5% |
| (x) | Represents the portfolio’s exposure to issuer countries as a percentage of a portfolio’s net assets. For purposes of this presentation, United States includes Cash & Cash Equivalents and Other. |
Where the fund holds convertible bonds, they are treated as part of the equity portion of the portfolio.
Cash & Cash Equivalents includes any cash, investments in money market funds, short-term securities, and other assets less liabilities. Please see the Statement of Assets and Liabilities for additional information related to the fund’s cash position and other assets and liabilities.
Other includes equivalent exposure from currency derivatives and/or any offsets to derivative positions and may be negative.
Percentages are based on net assets as of December 31, 2022.
The portfolio is actively managed and current holdings may be different.
Management Review
Summary of Results
For the twelve months ended December 31, 2022, Initial Class shares of the MFS Utilities Series (fund) provided a total return of 0.76%, while Service Class shares of the fund provided a total return of 0.48%. These compare with a return of -18.11% over the same period for the fund’s benchmark, the Standard & Poor’s 500 Stock Index, and a return of 1.57% for the fund’s other benchmark, the Standard & Poor’s 500 Utilities Index (S&P Utilities Index).
Market Environment
During the reporting period, markets continued to grapple with the strongest global inflationary pressures in decades along with signs of slowing economic growth. Intermittent coronavirus flareups, particularly in China, where home-grown vaccines have proved less effective than elsewhere, kept supply chains stretched for a considerable period. At the same time, the reopening of the economy in the parts of the world where the virus has been better contained has led to a shift in consumption patterns in favor of services, straining already tight labor markets in most developed economies, while reducing demand for manufactured goods, primarily from Asia. As a result of Russia’s invasion of Ukraine, geopolitical considerations, such as sanctions and trade bans, have resulted in additional supply chain disruptions and volatile global energy prices. Taken together, these factors have contributed to market volatility.
The ripple effects from the Russian invasion further complicated the mission central banks must undertake to rein in surging inflation. Energy shocks have historically resulted in global growth slowdowns, if not pullbacks, so policymakers will find themselves in the difficult position of trying to restrain inflation without tipping economies into recession. Despite the challenging macroeconomic and geopolitical environment, policymakers remained focused on controlling inflation, although investors appeared to have expected varying degrees of action from the central banks. The Fed has been among the most aggressive developed market central banks, tightening policy at the fastest rate in decades, although it slowed its hiking pace at the end of the period, as did the European Central Bank. After remaining on the monetary sidelines for much of the period, the Bank of Japan widened its Yield Curve Control band, capping the yield on its 10-year bond at 0.5%, up from 0.25%, an action investors interpreted as a first step toward monetary policy normalization.
Against an environment of still-tight labor markets, tighter global financial conditions and volatile materials prices, investor anxiety appeared to have increased over the potential that corporate profit margins may be past peak for this cycle. That said, tentative signs that supply chain bottlenecks (particularly semiconductors) may be moderating, the easing of COVID restrictions in China, low levels of unemployment across developed markets and hopes that inflation levels may be near a peak were supportive factors for the macroeconomic backdrop.
Detractors from Performance
The fund’s exposure to both the diversified telecommunication services and media industries, for which the benchmark has no exposure, weakened performance relative to the S&P Utilities Index. Within the diversified telecommunication services industry, the fund’s holdings of telecommunications services provider Cellnex Telecom(b) (Spain) weighed on relative returns. The share price of Cellnex Telecom came under pressure due to market concerns over increased interest expense and a perceived lack of future acquisition opportunities. Within the media industry, the fund’s position in cable services provider Charter Communications(b) detracted from relative results. The share price of Charter Communications fell as the company reported subdued financial results, primarily driven by residential broadband subscriber net additions that were smaller than expected.
Stocks in other industries that held back relative performance included the fund’s holdings of electricity and gas distributor Enel(b) (Italy), real estate investment trust SBA Communications(b), renewable energy company EDP Renovaveis(b) (Portugal), gas distributor China Resources Gas(b) (Hong Kong) and natural gas gatherer and transportation services provider Equitrans Midstream(b)(h). The share price of Enel detracted as the company posted softer-than-expected results in its domestic market due to a combination of very low hydro production and a large shift of clients from the regulated market to the free market. Foreign currency headwinds, the sale of the company’s stake in PJSC Enel Russia and concerns over the Spanish government's introduction of regulatory measures to reduce energy bill inflation, further pressured Enel’s stock price. Additionally, not owning shares of energy products and services supplier Consolidated Edison, and the fund’s underweight positions in power & natural gas distributor Xcel Energy and utility company American Electric Power, further weighed on relative results.
During the reporting period, the fund's relative currency exposure, resulting primarily from differences between the fund's and the benchmark's exposures to holdings of securities denominated in foreign currencies, was a detractor from relative performance. All of MFS' investment decisions are driven by the fundamentals of each individual opportunity and as such, it is common for our funds to have different currency exposure than the benchmark.
Management Review - continued
Contributors to Performance
Favorable security selection within the electric utilities industry benefited relative performance, led by the fund’s underweight positions in electricity provider NextEra Energy and utility company PPL. The share price of NextEra Energy came under pressure due to inflation and supply chain headwinds and the announcement of the earlier-than-expected resignation of the company's chief executive officer. Additionally, the fund’s overweight position in utility company PG&E, not owning shares of power generation company NRG Energy and natural gas and electricity distributor Eversource Energy, and the fund’s holdings of energy-based holding company Equatorial Energia(b) (Brazil), further supported relative returns.
Avoiding the weak-performing water utilities industry also benefited the fund’s relative performance. Here, not owning shares of complementary water and wastewater services provider American Water Works boosted relative results. The share price of American Water Works suffered from softer-than-anticipated earnings, led by an increase in operations and maintenance expenses due to higher inflationary pressures. This, together with a conservative full-year earnings guidance and the announcement of a dividend increase at the lower end of investor expectations, further weighed on the share price growth.
Elsewhere, an underweight position in energy products and services supplier Dominion Energy, and the fund’s holdings of electricity and gas provider RWE(b) (Germany), strengthened relative performance. The share price of Dominion Energy declined due to the announcement of an in-depth strategic review of the company’s businesses, which clouded its strong operational results.
The fund’s cash and/or cash equivalents position during the period was also a contributor to relative performance. Under normal market conditions, the fund strives to be fully invested and generally holds cash to buy new holdings and to provide liquidity. In a period when equity markets fell or delivered flat performance, as measured by the fund’s benchmark, holding cash bolstered performance versus the benchmark, which has no cash position.
Respectfully,
Portfolio Manager(s)
Claud Davis and J. Scott Walker
| (b) | Security is not a benchmark constituent. |
| (h) | Security was not held in the portfolio at period end. |
The views expressed in this report are those of the portfolio manager(s) only through the end of the period of the report as stated on the cover and do not necessarily reflect the views of MFS or any other person in the MFS organization. These views are subject to change at any time based on market or other conditions, and MFS disclaims any responsibility to update such views. These views may not be relied upon as investment advice or an indication of trading intent on behalf of any MFS portfolio. References to specific securities are not recommendations of such securities, and may not be representative of any MFS portfolio’s current or future investments.
Performance Summary Through 12/31/22
The following chart illustrates the historical performance of the fund in comparison to its benchmark(s). Benchmarks are unmanaged and may not be invested in directly. Benchmark returns do not reflect any fees or expenses. The performance of other share classes will be greater than or less than that of the class depicted below. (See Notes to Performance Summary.)
Performance data shown represents past performance and is no guarantee of future results. Investment return and principal value fluctuate so your shares, when sold, may be worth more or less than the original cost; current performance may be lower or higher than quoted. The performance shown does not reflect the deduction of taxes, if any, that a shareholder would pay on fund distributions or the redemption of fund shares. The returns for the fund shown also do not reflect the deduction of expenses associated with variable products, such as mortality and expense risk charges, separate account charges, and sales charges imposed by the insurance company separate accounts. Such expenses would reduce the overall returns shown.
Growth of a Hypothetical $10,000 Investment
Total Returns through 12/31/22
Average annual total returns
| Share Class | Class Inception Date | 1-yr | 5-yr | 10-yr |
| Initial Class | 1/03/95 | 0.76% | 9.00% | 8.63% |
| Service Class | 5/01/00 | 0.48% | 8.73% | 8.35% |
Comparative benchmark(s)
| Standard & Poor's 500 Stock Index (f) | (18.11)% | 9.42% | 12.56% |
| Standard & Poor's 500 Utilities Index (f) | 1.57% | 9.58% | 11.09% |
| (f) | Source: FactSet Research Systems Inc. |
Benchmark Definition(s)
Standard & Poor's 500 Stock Index(g) – a market capitalization-weighted index of 500 widely held equity securities, designed to measure broad U.S. equity performance.
Standard & Poor's 500 Utilities Index(g) – a market capitalization-weighted index designed to measure the utilities sector, including those companies considered electric, gas or water utilities, or companies that operate as independent producers and/or distributors of power.
It is not possible to invest directly in an index.
| (g) | “Standard & Poor's®” and “S&P®” are registered trademarks of Standard & Poor's Financial Services LLC (“S&P”) and Dow Jones is a registered trademark of Dow Jones Trademark Holdings LLC (“Dow Jones”) and have been licensed for use by S&P Dow Jones Indices LLC and sublicensed for certain purposes by MFS. The S&P 500® is a product of S&P Dow Jones Indices LLC, and has been licensed for use by MFS. MFS's product(s) is not sponsored, endorsed, sold, or promoted by S&P Dow Jones Indices LLC, Dow Jones, S&P, or their respective affiliates, and neither S&P Dow Jones Indices LLC, Dow Jones, S&P, nor their respective affiliates make any representation regarding the advisability of investing in such product(s). |
Performance Summary – continued
Notes to Performance Summary
Average annual total return represents the average annual change in value for each share class for the periods presented.
Performance results reflect any applicable expense subsidies and waivers in effect during the periods shown. Without such subsidies and waivers the fund's performance results would be less favorable. Please see the prospectus and financial statements for complete details. All results are historical and assume the reinvestment of any dividends and capital gains distributions.
Performance results do not include adjustments made for financial reporting purposes in accordance with U.S. generally accepted accounting principles and may differ from amounts reported in the financial highlights.
From time to time the fund may receive proceeds from litigation settlements, without which performance would be lower.
Expense Table
Fund expenses borne by the shareholders during the period,
July 1, 2022 through December 31, 2022
As a shareholder of the fund, you incur ongoing costs, including management fees; distribution and/or service (12b-1) fees; and other fund expenses. This example is intended to help you understand your ongoing costs (in dollars) of investing in the fund and to compare these costs with the ongoing costs of investing in other mutual funds.
The example is based on an investment of $1,000 invested at the beginning of the period and held for the entire period July 1, 2022 through December 31, 2022.
Actual Expenses
The first line for each share class in the following table provides information about actual account values and actual expenses. You may use the information in this line, together with the amount you invested, to estimate the expenses that you paid over the period. Simply divide your account value by $1,000 (for example, an $8,600 account value divided by $1,000 = 8.6), then multiply the result by the number in the first line under the heading entitled “Expenses Paid During Period” to estimate the expenses you paid on your account during this period.
Hypothetical Example for Comparison Purposes
The second line for each share class in the following table provides information about hypothetical account values and hypothetical expenses based on the fund’s actual expense ratio and an assumed rate of return of 5% per year before expenses, which is not the fund’s actual return. The hypothetical account values and expenses may not be used to estimate the actual ending account balance or expenses you paid for the period. You may use this information to compare the ongoing costs of investing in the fund and other funds. To do so, compare this 5% hypothetical example with the 5% hypothetical examples that appear in the shareholder reports of the other funds.
Please note that the expenses shown in the table are meant to highlight the fund's ongoing costs only and do not take into account the fees and expenses imposed under the variable contracts through which your investment in the fund is made. Therefore, the second line for each share class in the table is useful in comparing ongoing costs associated with an investment in vehicles (such as the fund) which fund benefits under variable annuity and variable life insurance contracts and to qualified pension and retirement plans only, and will not help you determine the relative total costs of investing in the fund through variable annuity and variable life insurance contracts. If the fees and expenses imposed under the variable contracts were included, your costs would have been higher.
Share
Class | | Annualized
Expense
Ratio | Beginning
Account Value
7/01/22 | Ending
Account Value
12/31/22 | Expenses
Paid During
Period (p)
7/01/22-12/31/22 |
| Initial Class | Actual | 0.77% | $1,000.00 | $1,050.04 | $3.98 |
| Hypothetical (h) | 0.77% | $1,000.00 | $1,021.32 | $3.92 |
| Service Class | Actual | 1.02% | $1,000.00 | $1,048.60 | $5.27 |
| Hypothetical (h) | 1.02% | $1,000.00 | $1,020.06 | $5.19 |
| (h) | 5% class return per year before expenses. |
| (p) | “Expenses Paid During Period” are equal to each class's annualized expense ratio, as shown above, multiplied by the average account value over the period, multiplied by 184/365 (to reflect the one-half year period). |
Notes to Expense Table
Expense ratios include 0.01% of tax reclaim recovery expenses.
Portfolio of Investments − 12/31/22
The Portfolio of Investments is a complete list of all securities owned by your fund. It is categorized by broad-based asset classes.
| Issuer | | | Shares/Par | Value ($) |
| Common Stocks – 98.5% |
| Cable TV – 0.7% | |
| Charter Communications, Inc., “A” (a) | | 24,295 | $ 8,238,434 |
| Energy - Renewables – 5.6% | |
| AES Corp. | | 952,838 | $ 27,403,621 |
| EDP Renovaveis S.A. | | 1,650,091 | 36,476,742 |
| Orsted A/S | | 72,239 | 6,564,819 |
| | | | | $70,445,182 |
| Natural Gas - Distribution – 2.0% | |
| Atmos Energy Corp. | | 152,746 | $ 17,118,244 |
| China Resources Gas Group Ltd. | | 2,041,200 | 7,601,968 |
| | | | | $24,720,212 |
| Telecommunications - Wireless – 4.8% | |
| Cellnex Telecom S.A. | | 1,065,099 | $ 35,420,522 |
| Rogers Communications, Inc., “B” | | 255,015 | 11,935,229 |
| SBA Communications Corp., REIT | | 46,656 | 13,078,144 |
| | | | | $60,433,895 |
| Telephone Services – 0.6% | |
| Hellenic Telecommunications Organization S.A. | | 434,682 | $ 6,788,802 |
| Utilities - Electric Power – 83.8% | |
| ALLETE, Inc. | | 184,532 | $ 11,904,159 |
| Alliant Energy Corp. | | 534,282 | 29,497,709 |
| Ameren Corp. | | 416,907 | 37,071,370 |
| American Electric Power Co., Inc. | | 446,698 | 42,413,975 |
| CenterPoint Energy, Inc. | | 674,074 | 20,215,479 |
| CLP Holdings Ltd. | | 1,346,000 | 9,820,664 |
| Constellation Energy | | 346,203 | 29,846,161 |
| Dominion Energy, Inc. | | 1,072,206 | 65,747,672 |
| DTE Energy Co. | | 395,138 | 46,440,569 |
| E.ON SE | | 2,505,074 | 25,029,636 |
| Edison International | | 600,567 | 38,208,072 |
| Enel S.p.A. | | 5,418,922 | 29,177,432 |
| Energias de Portugal S.A. | | 3,168,293 | 15,790,813 |
| Energisa S.A., IEU | | 775,100 | 6,490,302 |
| Entergy Corp. | | 160,720 | 18,081,000 |
| Equatorial Energia S.A. | | 1,282,800 | 6,564,943 |
| Evergy, Inc. | | 405,974 | 25,547,944 |
| Exelon Corp. | | 491,423 | 21,244,219 |
| Iberdrola S.A. | | 3,065,330 | 35,864,401 |
| National Grid PLC | | 1,688,461 | 20,359,578 |
| NextEra Energy, Inc. | | 1,815,639 | 151,787,421 |
| PG&E Corp. (a) | | 4,612,911 | 75,005,933 |
| Pinnacle West Capital Corp. | | 217,757 | 16,558,242 |
| Portland General Electric Co. | | 300,301 | 14,714,749 |
| PPL Corp. | | 1,122,563 | 32,801,291 |
| Public Service Enterprise Group, Inc. | | 296,983 | 18,196,148 |
| RWE AG | | 923,778 | 41,126,591 |
| Sempra Energy | | 372,698 | 57,596,750 |
| Southern Co. | | 859,088 | 61,347,474 |
| SSE PLC | | 1,361,807 | 28,185,627 |
Portfolio of Investments – continued
| Issuer | | | Shares/Par | Value ($) |
| Common Stocks – continued |
| Utilities - Electric Power – continued | |
| Xcel Energy, Inc. | | 226,606 | $ 15,887,347 |
| | | | | $1,048,523,671 |
| Utilities - Water – 1.0% | |
| Veolia Environnement S.A. | | 488,733 | $ 12,555,936 |
| Total Common Stocks (Identified Cost, $927,366,329) | | $1,231,706,132 |
| Convertible Preferred Stocks – 0.3% |
| Utilities - Electric Power – 0.3% | |
| NextEra Energy, Inc., 5.279% (Identified Cost, $2,860,140) | | 64,600 | $ 3,275,220 |
| Investment Companies (h) – 1.2% |
| Money Market Funds – 1.2% | |
| MFS Institutional Money Market Portfolio, 4.02% (v) (Identified Cost, $15,428,682) | | | 15,426,866 | $ 15,431,494 |
| Other Assets, Less Liabilities – 0.0% | | 261,688 |
| Net Assets – 100.0% | $1,250,674,534 |
| (a) | Non-income producing security. | | | |
| (h) | An affiliated issuer, which may be considered one in which the fund owns 5% or more of the outstanding voting securities, or a company which is under common control. At period end, the aggregate values of the fund's investments in affiliated issuers and in unaffiliated issuers were $15,431,494 and $1,234,981,352, respectively. | | | |
| (v) | Affiliated issuer that is available only to investment companies managed by MFS. The rate quoted for the MFS Institutional Money Market Portfolio is the annualized seven-day yield of the fund at period end. | | | |
| The following abbreviations are used in this report and are defined: |
| IEU | International Equity Unit |
| REIT | Real Estate Investment Trust |
| Abbreviations indicate amounts shown in currencies other than the U.S. dollar. All amounts are stated in U.S. dollars unless otherwise indicated. A list of abbreviations is shown below: |
| CAD | Canadian Dollar |
| EUR | Euro |
| GBP | British Pound |
| SEK | Swedish Krona |
| Derivative Contracts at 12/31/22 |
| Forward Foreign Currency Exchange Contracts |
Currency
Purchased | Currency
Sold | Counterparty | Settlement
Date | Unrealized
Appreciation
(Depreciation) |
| Asset Derivatives |
| CAD | 6,148 | USD | 4,505 | Deutsche Bank AG | 1/20/2023 | $36 |
| EUR | 16,038,495 | USD | 15,952,742 | BNP Paribas S.A. | 1/20/2023 | 1,234,194 |
| EUR | 2,114,468 | USD | 2,188,495 | State Street Bank Corp. | 1/20/2023 | 77,380 |
| GBP | 3,256,628 | USD | 3,685,100 | State Street Bank Corp. | 1/20/2023 | 253,655 |
| USD | 3,272,425 | GBP | 2,665,910 | Brown Brothers Harriman | 1/20/2023 | 48,119 |
| USD | 72,199 | GBP | 59,002 | HSBC Bank | 1/20/2023 | 838 |
| | | | | | | $1,614,222 |
| Liability Derivatives |
| GBP | 1,137,776 | USD | 1,388,030 | Merrill Lynch International | 1/20/2023 | $(11,937) |
Portfolio of Investments – continued
| Forward Foreign Currency Exchange Contracts - continued |
Currency
Purchased | Currency
Sold | Counterparty | Settlement
Date | Unrealized
Appreciation
(Depreciation) |
| Liability Derivatives - continued |
| SEK | 1,133,113 | USD | 109,165 | Brown Brothers Harriman | 1/20/2023 | $(476) |
| USD | 6,011,843 | CAD | 8,272,314 | HSBC Bank | 1/20/2023 | (98,196) |
| USD | 1,359,112 | CAD | 1,854,168 | Morgan Stanley Capital Services, Inc. | 1/20/2023 | (10,402) |
| USD | 264,525 | EUR | 250,720 | Brown Brothers Harriman | 1/20/2023 | (4,148) |
| USD | 2,108,820 | EUR | 2,019,924 | Citibank N.A. | 1/20/2023 | (55,741) |
| USD | 3,576,430 | EUR | 3,606,911 | HSBC Bank | 1/20/2023 | (288,755) |
| USD | 136,930,631 | EUR | 139,109,080 | Merrill Lynch International | 1/20/2023 | (12,139,391) |
| USD | 20,331,581 | EUR | 19,641,230 | State Street Bank Corp. | 1/20/2023 | (716,064) |
| USD | 27,664,505 | GBP | 24,623,292 | HSBC Bank | 1/20/2023 | (2,116,337) |
| USD | 2,530,333 | GBP | 2,238,748 | Morgan Stanley Capital Services, Inc. | 1/20/2023 | (177,339) |
| USD | 1,133,767 | GBP | 986,045 | State Street Bank Corp. | 1/20/2023 | (58,814) |
| | | | | | | $(15,677,600) |
At December 31, 2022, the fund had cash collateral of $11,890,000 to cover any collateral or margin obligations for certain derivative contracts. Restricted cash and/or deposits with brokers in the Statement of Assets and Liabilities are comprised of cash collateral.
See Notes to Financial Statements
| Financial Statements | Statement of Assets and Liabilities |
This statement represents your fund’s balance sheet, which details the assets and liabilities comprising the total value of the fund.
| At 12/31/22Assets | |
| Investments in unaffiliated issuers, at value (identified cost, $930,226,469) | $1,234,981,352 |
| Investments in affiliated issuers, at value (identified cost, $15,428,682) | 15,431,494 |
| Foreign currency, at value (identified cost, $158,932) | 158,480 |
| Restricted cash for | |
| Forward foreign currency exchange contracts | 11,890,000 |
| Receivables for | |
| Forward foreign currency exchange contracts | 1,614,222 |
| Fund shares sold | 164,322 |
| Dividends | 3,231,077 |
| Other assets | 5,047 |
| Total assets | $1,267,475,994 |
| Liabilities | |
| Payable to custodian | $220,000 |
| Payables for | |
| Forward foreign currency exchange contracts | 15,677,600 |
| Fund shares reacquired | 562,151 |
| Payable to affiliates | |
| Investment adviser | 75,119 |
| Administrative services fee | 1,511 |
| Shareholder servicing costs | 820 |
| Distribution and/or service fees | 14,494 |
| Payable for independent Trustees' compensation | 14 |
| Accrued expenses and other liabilities | 249,751 |
| Total liabilities | $16,801,460 |
| Net assets | $1,250,674,534 |
| Net assets consist of | |
| Paid-in capital | $849,596,285 |
| Total distributable earnings (loss) | 401,078,249 |
| Net assets | $1,250,674,534 |
| Shares of beneficial interest outstanding | 34,840,453 |
| | Net assets | Shares
outstanding | Net asset value
per share |
| Initial Class | $549,238,207 | 15,122,139 | $36.32 |
| Service Class | 701,436,327 | 19,718,314 | 35.57 |
See Notes to Financial Statements
| Financial Statements | Statement of Operations |
This statement describes how much your fund earned in investment income and accrued in expenses. It also describes any gains and/or losses generated by fund operations.
| Year ended 12/31/22 | |
| Net investment income (loss) | |
| Income | |
| Dividends | $33,991,855 |
| Dividends from affiliated issuers | 216,524 |
| Other | 62,790 |
| Income on securities loaned | 9,000 |
| Foreign taxes withheld | (606,220) |
| Total investment income | $33,673,949 |
| Expenses | |
| Management fee | $9,273,337 |
| Distribution and/or service fees | 1,739,918 |
| Shareholder servicing costs | 50,072 |
| Administrative services fee | 203,279 |
| Independent Trustees' compensation | 21,233 |
| Custodian fee | 131,825 |
| Shareholder communications | 13,393 |
| Audit and tax fees | 64,608 |
| Legal fees | 5,243 |
| Miscellaneous | 76,660 |
| Total expenses | $11,579,568 |
| Reduction of expenses by investment adviser | (174,189) |
| Net expenses | $11,405,379 |
| Net investment income (loss) | $22,268,570 |
| Realized and unrealized gain (loss) | |
| Realized gain (loss) (identified cost basis) | |
| Unaffiliated issuers (net of $273,402 country tax) | $61,999,481 |
| Affiliated issuers | (957) |
| Forward foreign currency exchange contracts | 34,625,020 |
| Foreign currency | (183,870) |
| Net realized gain (loss) | $96,439,674 |
| Change in unrealized appreciation or depreciation | |
| Unaffiliated issuers (net of $311,433 decrease in deferred country tax) | $(96,989,794) |
| Affiliated issuers | 2,812 |
| Forward foreign currency exchange contracts | (17,597,137) |
| Translation of assets and liabilities in foreign currencies | (61,572) |
| Net unrealized gain (loss) | $(114,645,691) |
| Net realized and unrealized gain (loss) | $(18,206,017) |
| Change in net assets from operations | $4,062,553 |
See Notes to Financial Statements
| Financial Statements | Statements of Changes in Net Assets |
These statements describe the increases and/or decreases in net assets resulting from operations, any distributions, and any shareholder transactions.
| | Year ended |
| | 12/31/22 | 12/31/21 |
| Change in net assets | | |
| From operations | | |
| Net investment income (loss) | $22,268,570 | $24,809,395 |
| Net realized gain (loss) | 96,439,674 | 37,084,768 |
| Net unrealized gain (loss) | (114,645,691) | 100,375,768 |
| Change in net assets from operations | $4,062,553 | $162,269,931 |
| Total distributions to shareholders | $(77,825,621) | $(61,909,232) |
| Change in net assets from fund share transactions | $28,354,613 | $(21,147,055) |
| Total change in net assets | $(45,408,455) | $79,213,644 |
| Net assets | | |
| At beginning of period | 1,296,082,989 | 1,216,869,345 |
| At end of period | $1,250,674,534 | $1,296,082,989 |
See Notes to Financial Statements
| Financial Statements | Financial Highlights |
The financial highlights table is intended to help you understand the fund's financial performance for the past 5 years. Certain information reflects financial results for a single fund share. The total returns in the table represent the rate that an investor would have earned (or lost) on an investment in the fund share class (assuming reinvestment of all distributions) held for the entire period.
| Initial Class | Year ended |
| | 12/31/22 | 12/31/21 | 12/31/20 | 12/31/19 | 12/31/18 |
| Net asset value, beginning of period | $38.31 | $35.33 | $35.18 | $29.38 | $29.50 |
| Income (loss) from investment operations | | | | | |
| Net investment income (loss) (d) | $0.71 | $0.78 | $0.87 | $0.90 | $0.89 |
| Net realized and unrealized gain (loss) | (0.32) | 4.11 | 0.99 | 6.37 | (0.56) |
| Total from investment operations | $0.39 | $4.89 | $1.86 | $7.27 | $0.33 |
| Less distributions declared to shareholders | | | | | |
| From net investment income | $(0.92) | $(0.65) | $(0.84) | $(1.37) | $(0.33) |
| From net realized gain | (1.46) | (1.26) | (0.87) | (0.10) | (0.12) |
| Total distributions declared to shareholders | $(2.38) | $(1.91) | $(1.71) | $(1.47) | $(0.45) |
| Net asset value, end of period (x) | $36.32 | $38.31 | $35.33 | $35.18 | $29.38 |
| Total return (%) (k)(r)(s)(x) | 0.76 | 14.09 | 5.90 | 25.07 | 1.06 |
Ratios (%) (to average net assets)
and Supplemental data: | | | | | |
| Expenses before expense reductions | 0.78 | 0.79 | 0.80 | 0.79 | 0.78 |
| Expenses after expense reductions | 0.77 | 0.77 | 0.79 | 0.78 | 0.78 |
| Net investment income (loss) | 1.92 | 2.16 | 2.63 | 2.69 | 2.98 |
| Portfolio turnover | 29 | 16 | 32 | 28 | 27 |
| Net assets at end of period (000 omitted) | $549,238 | $584,216 | $537,240 | $556,301 | $492,930 |
| Service Class | Year ended |
| | 12/31/22 | 12/31/21 | 12/31/20 | 12/31/19 | 12/31/18 |
| Net asset value, beginning of period | $37.58 | $34.69 | $34.56 | $28.86 | $28.98 |
| Income (loss) from investment operations | | | | | |
| Net investment income (loss) (d) | $0.60 | $0.68 | $0.77 | $0.80 | $0.81 |
| Net realized and unrealized gain (loss) | (0.32) | 4.03 | 0.97 | 6.27 | (0.56) |
| Total from investment operations | $0.28 | $4.71 | $1.74 | $7.07 | $0.25 |
| Less distributions declared to shareholders | | | | | |
| From net investment income | $(0.83) | $(0.56) | $(0.74) | $(1.27) | $(0.25) |
| From net realized gain | (1.46) | (1.26) | (0.87) | (0.10) | (0.12) |
| Total distributions declared to shareholders | $(2.29) | $(1.82) | $(1.61) | $(1.37) | $(0.37) |
| Net asset value, end of period (x) | $35.57 | $37.58 | $34.69 | $34.56 | $28.86 |
| Total return (%) (k)(r)(s)(x) | 0.48 | 13.82 | 5.62 | 24.80 | 0.81 |
Ratios (%) (to average net assets)
and Supplemental data: | | | | | |
| Expenses before expense reductions | 1.03 | 1.04 | 1.05 | 1.04 | 1.04 |
| Expenses after expense reductions | 1.02 | 1.02 | 1.04 | 1.03 | 1.03 |
| Net investment income (loss) | 1.66 | 1.91 | 2.38 | 2.44 | 2.76 |
| Portfolio turnover | 29 | 16 | 32 | 28 | 27 |
| Net assets at end of period (000 omitted) | $701,436 | $711,867 | $679,629 | $733,992 | $727,201 |
See Notes to Financial Statements
Financial Highlights - continued
| (d) | Per share data is based on average shares outstanding. |
| (k) | The total return does not reflect expenses that apply to separate accounts. Inclusion of these charges would reduce the total return figures for all periods shown. |
| (r) | Certain expenses have been reduced without which performance would have been lower. |
| (s) | From time to time the fund may receive proceeds from litigation settlements, without which performance would be lower. |
| (x) | The net asset values and total returns have been calculated on net assets which include adjustments made in accordance with U.S. generally accepted accounting principles required at period end for financial reporting purposes. |
See Notes to Financial Statements
Notes to Financial Statements
(1) Business and Organization
MFS Utilities Series (the fund) is a diversified series of MFS Variable Insurance Trust (the trust). The trust is organized as a Massachusetts business trust and is registered under the Investment Company Act of 1940, as amended, as an open-end management investment company. The shareholders of each series of the trust are separate accounts of insurance companies, which offer variable annuity and/or life insurance products, and qualified retirement and pension plans.
The fund is an investment company and accordingly follows the investment company accounting and reporting guidance of the Financial Accounting Standards Board (FASB) Accounting Standards Codification Topic 946 Financial Services - Investment Companies.
(2) Significant Accounting Policies
General — The preparation of financial statements in conformity with U.S. generally accepted accounting principles requires management to make estimates and assumptions that affect the reported amounts of assets and liabilities, and disclosure of contingent assets and liabilities at the date of the financial statements and the reported amounts of increases and decreases in net assets from operations during the reporting period. Actual results could differ from those estimates. In the preparation of these financial statements, management has evaluated subsequent events occurring after the date of the fund’s Statement of Assets and Liabilities through the date that the financial statements were issued. The fund invests primarily in securities of issuers in the utility industry. Issuers in a single industry can react similarly to market, currency, political, economic, regulatory, geopolitical, environmental, public health, and other conditions. The value of stocks in the utilities sector can be very volatile due to supply and/or demand for services or fuel, financing costs, conservation efforts, the negative impact of regulation, and other factors. The fund invests in foreign securities. Investments in foreign securities are vulnerable to the effects of changes in the relative values of the local currency and the U.S. dollar and to the effects of changes in each country’s market, economic, industrial, political, regulatory, geopolitical, environmental, public health, and other conditions.
Balance Sheet Offsetting — The fund's accounting policy with respect to balance sheet offsetting is that, absent an event of default by the counterparty or a termination of the agreement, the International Swaps and Derivatives Association (ISDA) Master Agreement, or similar agreement, does not result in an offset of reported amounts of financial assets and financial liabilities in the Statement of Assets and Liabilities across transactions between the fund and the applicable counterparty. The fund's right to setoff may be restricted or prohibited by the bankruptcy or insolvency laws of the particular jurisdiction to which a specific master netting agreement counterparty is subject. Balance sheet offsetting disclosures, to the extent applicable to the fund, have been included in the fund’s Significant Accounting Policies note under the captions for each of the fund’s in-scope financial instruments and transactions.
Investment Valuations — Subject to its oversight, the fund's Board of Trustees has delegated primary responsibility for determining or causing to be determined the value of the fund’s investments to MFS as the fund's adviser, pursuant to the fund’s valuation policy and procedures which have been adopted by the adviser and approved by the Board. Effective September 8, 2022, and in accordance with Rule 2a-5 under the Investment Company Act of 1940, the Board of Trustees designated the adviser as the “valuation designee” of the fund. If the adviser, as valuation designee, determines that reliable market quotations are not readily available for an investment, the investment is valued at fair value as determined in good faith by the adviser in accordance with the adviser’s fair valuation policy and procedures.
Under the fund's valuation policy and procedures, equity securities, including restricted equity securities, are generally valued at the last sale or official closing price on their primary market or exchange as provided by a third-party pricing service. Equity securities, for which there were no sales reported that day, are generally valued at the last quoted daily bid quotation on their primary market or exchange as provided by a third-party pricing service. Short-term instruments with a maturity at issuance of 60 days or less may be valued at amortized cost, which approximates market value. Forward foreign currency exchange contracts are generally valued at the mean of bid and asked prices for the time period interpolated from rates provided by a third-party pricing service for proximate time periods. Open-end investment companies are generally valued at net asset value per share. The values of foreign securities and other assets and liabilities expressed in foreign currencies are converted to U.S. dollars using the mean of bid and asked prices for rates provided by a third-party pricing service.
Under the fund’s valuation policy and procedures, market quotations are not considered to be readily available for debt instruments, floating rate loans, and many types of derivatives. These investments are generally valued at fair value based on information from third-party pricing services or otherwise determined by the adviser in accordance with the adviser’s fair valuation policy and procedures. Securities and other assets generally valued on the basis of information from a third-party pricing service may also be valued at a broker/dealer bid quotation. In determining values, third-party pricing services can utilize both transaction data and market information such as yield, quality, coupon rate, maturity, type of issue, trading characteristics, spreads and other market data. An investment may also be valued at fair value if the adviser determines that the investment’s value has been materially affected by
Notes to Financial Statements - continued
events occurring after the close of the exchange or market on which the investment is principally traded (such as foreign exchange or market) and prior to the determination of the fund’s net asset value, or after the halt of trading of a specific security where trading does not resume prior to the close of the exchange or market on which the security is principally traded. Events that occur after foreign markets close (such as developments in foreign markets and significant movements in the U.S. markets) and prior to the determination of the fund’s net asset value may be deemed to have a material effect on the value of securities traded in foreign markets. Accordingly, the fund’s foreign equity securities may often be valued at fair value. The adviser generally relies on third-party pricing services or other information (such as the correlation with price movements of similar securities in the same or other markets; the type, cost and investment characteristics of the security; the business and financial condition of the issuer; and trading and other market data) to assist in determining whether to fair value and at what value to fair value an investment. The value of an investment for purposes of calculating the fund’s net asset value can differ depending on the source and method used to determine value. When fair valuation is used, the value of an investment used to determine the fund’s net asset value may differ from quoted or published prices for the same investment. There can be no assurance that the fund could obtain the fair value assigned to an investment if it were to sell the investment at the same time at which the fund determines its net asset value per share.
Various inputs are used in determining the value of the fund's assets or liabilities. These inputs are categorized into three broad levels. In certain cases, the inputs used to measure fair value may fall into different levels of the fair value hierarchy. In such cases, an investment's level within the fair value hierarchy is based on the lowest level of input that is significant to the fair value measurement. The fund's assessment of the significance of a particular input to the fair value measurement in its entirety requires judgment, and considers factors specific to the investment. Level 1 includes unadjusted quoted prices in active markets for identical assets or liabilities. Level 2 includes other significant observable market-based inputs (including quoted prices for similar securities, interest rates, prepayment speed, and credit risk). Level 3 includes significant unobservable inputs, which may include the adviser's own assumptions in determining the fair value of investments. Other financial instruments are derivative instruments, such as forward foreign currency exchange contracts. The following is a summary of the levels used as of December 31, 2022 in valuing the fund's assets and liabilities:
| Financial Instruments | Level 1 | Level 2 | Level 3 | Total |
| Equity Securities: | | | | |
| United States | $899,227,347 | $— | $— | $899,227,347 |
| Spain | 35,864,401 | 35,420,522 | — | 71,284,923 |
| Germany | 66,156,227 | — | — | 66,156,227 |
| Portugal | 15,790,813 | 36,476,742 | — | 52,267,555 |
| United Kingdom | 48,545,205 | — | — | 48,545,205 |
| Italy | 29,177,432 | — | — | 29,177,432 |
| Brazil | 13,055,245 | — | — | 13,055,245 |
| France | 12,555,936 | — | — | 12,555,936 |
| Canada | 11,935,229 | — | — | 11,935,229 |
| Other Countries | 23,174,285 | 7,601,968 | — | 30,776,253 |
| Mutual Funds | 15,431,494 | — | — | 15,431,494 |
| Total | $1,170,913,614 | $79,499,232 | $— | $1,250,412,846 |
| Other Financial Instruments | | | | |
| Forward Foreign Currency Exchange Contracts – Assets | $— | $1,614,222 | $— | $1,614,222 |
| Forward Foreign Currency Exchange Contracts – Liabilities | — | (15,677,600) | — | (15,677,600) |
For further information regarding security characteristics, see the Portfolio of Investments.
Foreign Currency Translation — Purchases and sales of foreign investments, income, and expenses are converted into U.S. dollars based upon currency exchange rates prevailing on the respective dates of such transactions or on the reporting date for foreign denominated receivables and payables. Gains and losses attributable to foreign currency exchange rates on sales of securities are recorded for financial statement purposes as net realized gains and losses on investments. Gains and losses attributable to foreign exchange rate movements on receivables, payables, income and expenses are recorded for financial statement purposes as foreign currency transaction gains and losses. That portion of both realized and unrealized gains and losses on investments that results from fluctuations in foreign currency exchange rates is not separately disclosed.
Derivatives — The fund uses derivatives primarily to increase or decrease exposure to a particular market or segment of the market, or security, to increase or decrease interest rate or currency exposure, or as alternatives to direct investments. Derivatives are used for hedging or non-hedging purposes. While hedging can reduce or eliminate losses, it can also reduce or eliminate gains. When the fund uses derivatives as an investment to increase market exposure, or for hedging purposes, gains and losses from derivative instruments may be substantially greater than the derivative’s original cost.
Notes to Financial Statements - continued
The derivative instruments used by the fund during the period were forward foreign currency exchange contracts. Depending on the type of derivative, a fund may exit a derivative position by entering into an offsetting transaction with a counterparty or exchange, negotiating an agreement with the derivative counterparty, or novating the position to a third party. The fund's period end derivatives, as presented in the Portfolio of Investments and the associated Derivative Contract tables, generally are indicative of the volume of its derivative activity during the period.
The following table presents, by major type of derivative contract, the fair value, on a gross basis, of the asset and liability components of derivatives held by the fund at December 31, 2022 as reported in the Statement of Assets and Liabilities:
| | | Fair Value |
| Risk | Derivative Contracts | Asset Derivatives | Liability Derivatives |
| Foreign Exchange | Forward Foreign Currency Exchange Contracts | $1,614,222 | $(15,677,600) |
The following table presents, by major type of derivative contract, the realized gain (loss) on derivatives held by the fund for the year ended December 31, 2022 as reported in the Statement of Operations:
| Risk | Forward Foreign
Currency
Exchange
Contracts |
| Foreign Exchange | $34,625,020 |
The following table presents, by major type of derivative contract, the change in unrealized appreciation or depreciation on derivatives held by the fund for the year ended December 31, 2022 as reported in the Statement of Operations:
| Risk | Forward Foreign
Currency
Exchange
Contracts |
| Foreign Exchange | $(17,597,137) |
Derivative counterparty credit risk is managed through formal evaluation of the creditworthiness of all potential counterparties. On certain, but not all, uncleared derivatives, the fund attempts to reduce its exposure to counterparty credit risk whenever possible by entering into an ISDA Master Agreement on a bilateral basis. The ISDA Master Agreement gives each party to the agreement the right to terminate all transactions traded under such agreement if there is a specified deterioration in the credit quality of the other party. Upon an event of default or a termination of the ISDA Master Agreement, the non-defaulting party has the right to close out all transactions traded under such agreement and to net amounts owed under each agreement to one net amount payable by one party to the other. This right to close out and net payments across all transactions traded under the ISDA Master Agreement could result in a reduction of the fund's credit risk to such counterparty equal to any amounts payable by the fund under the applicable transactions, if any.
Collateral and margin requirements differ by type of derivative. For cleared derivatives (e.g., futures contracts, cleared swaps, and exchange-traded options), margin requirements are set by the clearing broker and the clearing house and collateral, in the form of cash or securities, is posted by the fund directly with the clearing broker. Collateral terms are counterparty agreement specific for uncleared derivatives (e.g., forward foreign currency exchange contracts, uncleared swap agreements, and uncleared options) and collateral, in the form of cash and securities, is held in segregated accounts with the fund's custodian in connection with these agreements. For derivatives traded under an ISDA Master Agreement, which contains a credit support annex, the collateral requirements are netted across all transactions traded under such counterparty-specific agreement and an amount is posted from one party to the other to collateralize such obligations. Cash that has been segregated or delivered to cover the fund's collateral or margin obligations under derivative contracts, if any, will be reported separately in the Statement of Assets and Liabilities as restricted cash for uncleared derivatives and/or deposits with brokers for cleared derivatives. Securities pledged as collateral or margin for the same purpose, if any, are noted in the Portfolio of Investments. The fund may be required to make payments of interest on uncovered collateral or margin obligations with the broker. Any such payments are included in “Miscellaneous” expense in the Statement of Operations.
Forward Foreign Currency Exchange Contracts — The fund entered into forward foreign currency exchange contracts for the purchase or sale of a specific foreign currency at a fixed price on a future date. These contracts may be used to hedge the fund’s currency risk or for non-hedging purposes. For hedging purposes, the fund may enter into contracts to deliver or receive foreign currency that the fund will receive from or use in its normal investment activities. The fund may also use contracts to hedge against
Notes to Financial Statements - continued
declines in the value of foreign currency denominated securities due to unfavorable exchange rate movements. For non-hedging purposes, the fund may enter into contracts with the intent of changing the relative exposure of the fund’s portfolio of securities to different currencies to take advantage of anticipated exchange rate changes.
Forward foreign currency exchange contracts are adjusted by the daily exchange rate of the underlying currency and any unrealized gains or losses are recorded as a receivable or payable for forward foreign currency exchange contracts until the contract settlement date. On contract settlement date, any gain or loss on the contract is recorded as realized gains or losses on forward foreign currency exchange contracts.
Risks may arise upon entering into these contracts from unanticipated movements in the value of the contract and from the potential inability of counterparties to meet the terms of their contracts. Generally, the fund’s maximum risk due to counterparty credit risk is the unrealized gain on the contract due to the use of Continuous Linked Settlement, a multicurrency cash settlement system for the centralized settlement of foreign transactions. This risk is mitigated in cases where there is an ISDA Master Agreement between the fund and the counterparty providing for netting as described above and, where applicable, by the posting of collateral by the counterparty to the fund to cover the fund’s exposure to the counterparty under such ISDA Master Agreement.
Security Loans — Under its Securities Lending Agency Agreement with the fund, State Street Bank and Trust Company, as lending agent, loans the securities of the fund to certain qualified institutions (the “Borrowers”) approved by the fund. Security loans can be terminated at the discretion of either the lending agent or the fund and the related securities must be returned within the earlier of the standard trade settlement period for such securities or within three business days. The loans are collateralized by cash and/or U.S. Treasury and federal agency obligations in an amount typically at least equal to the market value of the securities loaned. On loans collateralized by cash, the cash collateral is invested in a money market fund. The market value of the loaned securities is determined at the close of business of the fund and any additional required collateral is delivered to the fund on the next business day. The lending agent provides the fund with indemnification against Borrower default. In the event of Borrower default, the lending agent will, for the benefit of the fund, either purchase securities identical to those loaned or, when such purchase is commercially impracticable, pay the fund the market value of the loaned securities. In return, the lending agent assumes the fund's rights to the related collateral. If the collateral value is less than the cost to purchase identical securities, the lending agent is responsible for the shortfall, but only to the extent that such shortfall is not due to a decline in collateral value resulting from collateral reinvestment for which the fund bears the risk of loss. A portion of the income generated upon investment of the collateral is remitted to the Borrowers, and the remainder is allocated between the fund and the lending agent. On loans collateralized by U.S. Treasury and/or federal agency obligations, a fee is received from the Borrower, and is allocated between the fund and the lending agent. Income from securities lending is separately reported in the Statement of Operations. The dividend and interest income earned on the securities loaned is accounted for in the same manner as other dividend and interest income. At December 31, 2022, there were no securities on loan or collateral outstanding.
Indemnifications — Under the fund's organizational documents, its officers and Trustees may be indemnified against certain liabilities and expenses arising out of the performance of their duties to the fund. Additionally, in the normal course of business, the fund enters into agreements with service providers that may contain indemnification clauses. The fund's maximum exposure under these agreements is unknown as this would involve future claims that may be made against the fund that have not yet occurred.
Investment Transactions and Income — Investment transactions are recorded on the trade date. Interest income is recorded on the accrual basis. Dividends received in cash are recorded on the ex-dividend date. Certain dividends from foreign securities will be recorded when the fund is informed of the dividend if such information is obtained subsequent to the ex-dividend date. Dividend payments received in additional securities are recorded on the ex-dividend date in an amount equal to the value of the security on such date. In determining the net gain or loss on securities sold, the cost of securities is determined on the identified cost basis.
The fund may receive proceeds from litigation settlements. Any proceeds received from litigation involving portfolio holdings are reflected in the Statement of Operations in realized gain/loss if the security has been disposed of by the fund or in unrealized gain/loss if the security is still held by the fund. Any other proceeds from litigation not related to portfolio holdings are reflected as other income in the Statement of Operations.
Tax Matters and Distributions — The fund intends to qualify as a regulated investment company, as defined under Subchapter M of the Internal Revenue Code, and to distribute all of its taxable income, including realized capital gains. As a result, no provision for federal income tax is required. The fund’s federal tax returns, when filed, will remain subject to examination by the Internal Revenue Service for a three year period. Management has analyzed the fund’s tax positions taken on federal and state tax returns for all open tax years and does not believe that there are any uncertain tax positions that require recognition of a tax liability. Foreign taxes, if any, have been accrued by the fund in the accompanying financial statements in accordance with the applicable foreign tax law. Foreign income taxes may be withheld by certain countries in which the fund invests. Additionally, capital gains realized by the fund on securities issued in or by certain foreign countries may be subject to capital gains tax imposed by those countries.
Notes to Financial Statements - continued
Distributions to shareholders are recorded on the ex-dividend date. Income and capital gain distributions are determined in accordance with income tax regulations, which may differ from U.S. generally accepted accounting principles. Certain capital accounts in the financial statements are periodically adjusted for permanent differences in order to reflect their tax character. These adjustments have no impact on net assets or net asset value per share. Temporary differences which arise from recognizing certain items of income, expense, gain or loss in different periods for financial statement and tax purposes will reverse at some time in the future.
Book/tax differences primarily relate to wash sale loss deferrals, derivative transactions, and certain preferred stock treated as debt for tax purposes.
The tax character of distributions declared to shareholders for the last two fiscal years is as follows:
| | Year ended
12/31/22 | Year ended
12/31/21 |
| Ordinary income (including any short-term capital gains) | $42,430,357 | $19,917,214 |
| Long-term capital gains | 35,395,264 | 41,992,018 |
| Total distributions | $77,825,621 | $61,909,232 |
The federal tax cost and the tax basis components of distributable earnings were as follows:
| As of 12/31/22 | |
| Cost of investments | $936,684,741 |
| Gross appreciation | 328,670,283 |
| Gross depreciation | (29,005,556) |
| Net unrealized appreciation (depreciation) | $299,664,727 |
| Undistributed ordinary income | 38,927,153 |
| Undistributed long-term capital gain | 62,554,400 |
| Other temporary differences | (68,031) |
| Total distributable earnings (loss) | $401,078,249 |
Multiple Classes of Shares of Beneficial Interest — The fund offers multiple classes of shares, which differ in their respective distribution and/or service fees. The fund's income, realized and unrealized gain (loss), and common expenses are allocated to shareholders based on the daily net assets of each class. Dividends are declared separately for each class. Differences in per share dividend rates are generally due to differences in separate class expenses. The fund’s distributions declared to shareholders as reported in the Statements of Changes in Net Assets are presented by class as follows:
| | Year
ended
12/31/22 | | Year
ended
12/31/21 |
| Initial Class | $34,761,572 | | $28,006,297 |
| Service Class | 43,064,049 | | 33,902,935 |
| Total | $77,825,621 | | $61,909,232 |
(3) Transactions with Affiliates
Investment Adviser — The fund has an investment advisory agreement with MFS to provide overall investment management and related administrative services and facilities to the fund. The management fee is computed daily and paid monthly at the following annual rates based on the fund's average daily net assets:
| Up to $1 billion | 0.75% |
| In excess of $1 billion and up to $3 billion | 0.70% |
| In excess of $3 billion | 0.65% |
MFS has agreed in writing to reduce its management fee by a specified amount if certain MFS mutual fund assets exceed thresholds agreed to by MFS and the fund's Board of Trustees. Effective March 1, 2022, MFS has also agreed in writing to waive at least 0.01% of its management fee as part of this agreement. The agreement to waive at least 0.01% of the management fee will continue until
Notes to Financial Statements - continued
modified by the fund's Board of Trustees, but such agreement will continue at least until April 30, 2024. For the year ended December 31, 2022, this management fee reduction amounted to $174,189, which is included in the reduction of total expenses in the Statement of Operations. The management fee incurred for the year ended December 31, 2022 was equivalent to an annual effective rate of 0.73% of the fund's average daily net assets.
Distributor — MFS Fund Distributors, Inc. (MFD), a wholly-owned subsidiary of MFS, is the distributor of shares of the fund. The Trustees have adopted a distribution plan for the Service Class shares pursuant to Rule 12b-1 under the Investment Company Act of 1940.
The fund's distribution plan provides that the fund will pay MFD distribution and/or service fees equal to 0.25% per annum of its average daily net assets attributable to Service Class shares as partial consideration for services performed and expenses incurred by MFD and financial intermediaries (including participating insurance companies that invest in the fund to fund variable annuity and variable life insurance contracts, sponsors of qualified retirement and pension plans that invest in the fund, and affiliates of these participating insurance companies and plan sponsors) in connection with the sale and distribution of the Service Class shares. MFD may subsequently pay all, or a portion, of the distribution and/or service fees to financial intermediaries.
Shareholder Servicing Agent — MFS Service Center, Inc. (MFSC), a wholly-owned subsidiary of MFS, receives a fee from the fund for its services as shareholder servicing agent. For the year ended December 31, 2022, the fee was $46,895, which equated to 0.0037% annually of the fund's average daily net assets. MFSC also receives reimbursement from the fund for out-of-pocket expenses paid by MFSC on behalf of the fund. For the year ended December 31, 2022, these costs amounted to $3,177.
Administrator — MFS provides certain financial, legal, shareholder communications, compliance, and other administrative services to the fund. Under an administrative services agreement, the fund reimburses MFS the costs incurred to provide these services. The fund is charged an annual fixed amount of $17,500 plus a fee based on average daily net assets. The administrative services fee incurred for the year ended December 31, 2022 was equivalent to an annual effective rate of 0.0162% of the fund's average daily net assets.
Trustees’ and Officers’ Compensation — The fund pays compensation to independent Trustees in the form of a retainer, attendance fees, and additional compensation to Board and Committee chairpersons. The fund does not pay compensation directly to Trustees or officers of the fund who are also officers of the investment adviser, all of whom receive remuneration from MFS for their services to the fund. Certain officers and Trustees of the fund are officers or directors of MFS, MFD, and MFSC.
Other — The fund invests in the MFS Institutional Money Market Portfolio which is managed by MFS and seeks current income consistent with preservation of capital and liquidity. This money market fund does not pay a management fee to MFS but does incur investment and operating costs.
The fund is permitted to engage in purchase and sale transactions with funds and accounts for which MFS serves as investment adviser or sub-adviser (“cross-trades”) pursuant to a policy adopted by the Board of Trustees. This policy has been designed to ensure that cross-trades conducted by the fund comply with Rule 17a-7 under the Investment Company Act of 1940. During the year ended December 31, 2022, the fund engaged in purchase and sale transactions pursuant to this policy, which amounted to $1,872,714 and $1,862,568, respectively. The sales transactions resulted in net realized gains (losses) of $118,958.
The adviser has voluntarily undertaken to reimburse the fund from its own resources on a quarterly basis for the cost of investment research embedded in the cost of the fund’s securities trades. This agreement may be rescinded at any time. For the year ended December 31, 2022, this reimbursement amounted to $62,394, which is included in “Other” income in the Statement of Operations.
(4) Portfolio Securities
For the year ended December 31, 2022, purchases and sales of investments, other than short-term obligations, aggregated $362,400,092 and $368,172,522, respectively.
(5) Shares of Beneficial Interest
The fund's Declaration of Trust permits the Trustees to issue an unlimited number of full and fractional shares of beneficial interest. Transactions in fund shares were as follows:
Notes to Financial Statements - continued
| | Year ended
12/31/22 | | Year ended
12/31/21 |
| | Shares | Amount | | Shares | Amount |
| Shares sold | | | | | |
| Initial Class | 1,003,536 | $37,516,319 | | 847,836 | $30,773,859 |
| Service Class | 2,874,003 | 106,408,790 | | 1,266,913 | 45,089,704 |
| | 3,877,539 | $143,925,109 | | 2,114,749 | $75,863,563 |
Shares issued to shareholders
in reinvestment of distributions | | | | | |
| Initial Class | 917,434 | $34,761,572 | | 763,739 | $28,006,297 |
| Service Class | 1,159,194 | 43,064,049 | | 941,748 | 33,902,935 |
| | 2,076,628 | $77,825,621 | | 1,705,487 | $61,909,232 |
| Shares reacquired | | | | | |
| Initial Class | (2,047,407) | $(75,308,977) | | (1,570,699) | $(57,115,573) |
| Service Class | (3,259,548) | (118,087,140) | | (2,857,934) | (101,804,277) |
| | (5,306,955) | $(193,396,117) | | (4,428,633) | $(158,919,850) |
| Net change | | | | | |
| Initial Class | (126,437) | $(3,031,086) | | 40,876 | $1,664,583 |
| Service Class | 773,649 | 31,385,699 | | (649,273) | (22,811,638) |
| | 647,212 | $28,354,613 | | (608,397) | $(21,147,055) |
(6) Line of Credit
The fund and certain other funds managed by MFS participate in a $1.45 billion unsecured committed line of credit of which $1.2 billion is reserved for use by the fund and certain other MFS U.S. funds. The line of credit is provided by a syndicate of banks under a credit agreement. Borrowings may be made for temporary financing needs. Interest is charged to each fund, based on its borrowings, generally at a rate equal to the highest of 1) Daily Simple SOFR (Secured Overnight Financing Rate) plus 0.10%, 2) the Federal Funds Effective Rate, or 3) the Overnight Bank Funding Rate, each plus an agreed upon spread. A commitment fee, based on the average daily unused portion of the committed line of credit, is allocated among the participating funds. The line of credit expires on March 16, 2023 unless extended or renewed. In addition, the fund and other funds managed by MFS have established unsecured uncommitted borrowing arrangements with certain banks for temporary financing needs. Interest is charged to each fund, based on its borrowings, at rates equal to customary reference rates plus an agreed upon spread. For the year ended December 31, 2022, the fund’s commitment fee and interest expense were $5,640 and $0, respectively, and are included in “Miscellaneous” expense in the Statement of Operations.
(7) Investments in Affiliated Issuers
An affiliated issuer may be considered one in which the fund owns 5% or more of the outstanding voting securities, or a company which is under common control. For the purposes of this report, the following were affiliated issuers:
| Affiliated Issuers | Beginning
Value | Purchases | Sales
Proceeds | Realized
Gain
(Loss) | Change in
Unrealized
Appreciation or
Depreciation | Ending
Value |
| MFS Institutional Money Market Portfolio | $13,091,908 | $179,000,018 | $176,662,287 | $(957) | $2,812 | $15,431,494 |
| Affiliated Issuers | Dividend
Income | Capital Gain
Distributions |
| MFS Institutional Money Market Portfolio | $216,524 | $— |
Notes to Financial Statements - continued
(8) LIBOR Transition
Certain of the fund's investments, including investments in certain debt instruments and derivatives (if any), as well as borrowings by the fund and certain other contractual arrangements of the fund, may be based on the London Interbank Offered Rate (“LIBOR”). In 2017, the regulatory authority that oversees financial services firms in the United Kingdom announced plans to transition away from LIBOR by the end of 2021. In March 2021, the administrator of LIBOR announced the extension of the publication of the more commonly used U.S. dollar LIBOR settings to the end of June 2023. Although the full impacts of the transition away from LIBOR are not fully known, the transition may result in, among other things, an increase in volatility or illiquidity of the markets for instruments that currently rely on LIBOR to determine interest rates and this could have an adverse impact on the fund's performance. With respect to the fund's accounting for investments, including investments in certain debt instruments and derivatives, as well as borrowings by the fund and any other contractual arrangements of the fund that undergo reference rate-related modifications as a result of the transition, management will rely upon the relief provided by FASB Codification Topic 848 – Reference Rate Reform (Topic 848). The guidance in Topic 848 permits the fund to account for those modified contracts as a continuation of the existing contracts. Management is still evaluating the impact to the fund of the June 30, 2023 planned discontinuation of the more commonly used U.S. dollar LIBOR settings.
(9) Russia and Ukraine Conflict
The market disruptions, which began in late February 2022, associated with geopolitical events related to the conflict between Russia and Ukraine may adversely affect the value of the fund’s assets and thus the fund’s performance. Management continues to monitor these events and to evaluate the related impacts, if any, to the fund.
Report of Independent Registered Public Accounting Firm
To the Board of Trustees of MFS Variable Insurance Trust and the Shareholders of MFS Utilities Series:
Opinion on the Financial Statements and Financial Highlights
We have audited the accompanying statement of assets and liabilities of MFS Utilities Series (the “Fund”), including the portfolio of investments, as of December 31, 2022, the related statement of operations for the year then ended, the statements of changes in net assets for each of the two years in the period then ended, the financial highlights for each of the five years in the period then ended, and the related notes. In our opinion, the financial statements and financial highlights present fairly, in all material respects, the financial position of the Fund as of December 31, 2022, and the results of its operations for the year then ended, the changes in its net assets for each of the two years in the period then ended, and the financial highlights for each of the five years in the period then ended, in conformity with accounting principles generally accepted in the United States of America.
Basis for Opinion
These financial statements and financial highlights are the responsibility of the Fund's management. Our responsibility is to express an opinion on the Fund's financial statements and financial highlights based on our audits. We are a public accounting firm registered with the Public Company Accounting Oversight Board (United States) (PCAOB) and are required to be independent with respect to the Fund in accordance with the U.S. federal securities laws and the applicable rules and regulations of the Securities and Exchange Commission and the PCAOB.
We conducted our audits in accordance with the standards of the PCAOB. Those standards require that we plan and perform the audit to obtain reasonable assurance about whether the financial statements and financial highlights are free of material misstatement, whether due to error or fraud. The Fund is not required to have, nor were we engaged to perform, an audit of its internal control over financial reporting. As part of our audits, we are required to obtain an understanding of internal control over financial reporting but not for the purpose of expressing an opinion on the effectiveness of the Fund's internal control over financial reporting. Accordingly, we express no such opinion.
Our audits included performing procedures to assess the risks of material misstatement of the financial statements and financial highlights, whether due to error or fraud, and performing procedures that respond to those risks. Such procedures included examining, on a test basis, evidence regarding the amounts and disclosures in the financial statements and financial highlights. Our audits also included evaluating the accounting principles used and significant estimates made by management, as well as evaluating the overall presentation of the financial statements and financial highlights. Our procedures included confirmation of securities owned as of December 31, 2022, by correspondence with the custodian and brokers; when replies were not received from brokers, we performed other auditing procedures. We believe that our audits provide a reasonable basis for our opinion.
DELOITTE & TOUCHE LLP
Boston, Massachusetts
February 15, 2023
We have served as the auditor of one or more of the MFS investment companies since 1924.
Trustees and Officers — Identification and Background
The Trustees and Officers of the Trust, as of February 1, 2023, are listed below, together with their principal occupations during the past five years. (Their titles may have varied during that period.) The address of each Trustee and Officer is 111 Huntington Avenue, Boston, Massachusetts 02199-7618.
| Name, Age | | Position(s) Held with Fund | | Trustee/Officer Since(h) | | Number of MFS Funds overseen by the Trustee | | Principal Occupations During
the Past Five Years | | Other Directorships During
the Past Five Years (j) |
| INTERESTED TRUSTEE | | | | | | | | | | |
Michael W. Roberge (k)
(age 56) | | Trustee | | January 2021 | | 136 | | Massachusetts Financial Services Company, Chairman (since January 2021); Chief Executive Officer (since January 2017); Director; Chairman of the Board (since January 2022); President (until December 2018); Chief Investment Officer (until December 2018) | | N/A |
| INDEPENDENT TRUSTEES | | | | | | | | | | |
John P. Kavanaugh
(age 68) | | Trustee and Chair of Trustees | | January 2009 | | 136 | | Private investor | | N/A |
Steven E. Buller
(age 71) | | Trustee | | February 2014 | | 136 | | Private investor | | N/A |
John A. Caroselli
(age 68) | | Trustee | | March 2017 | | 136 | | Private investor; JC Global Advisors, LLC (management consulting), President (since 2015) | | N/A |
Maureen R. Goldfarb
(age 67) | | Trustee | | January 2009 | | 136 | | Private investor | | N/A |
Peter D. Jones
(age 67) | | Trustee | | January 2019 | | 136 | | Private investor | | N/A |
James W. Kilman, Jr.
(age 61) | | Trustee | | January 2019 | | 136 | | Burford Capital Limited (finance and investment management), Senior Advisor (since May 3, 2021), Chief Financial Officer (2019 - May 2, 2021); KielStrand Capital LLC (family office), Chief Executive Officer (since 2016) | | Alpha-En Corporation, Director (2016-2019) |
Clarence Otis, Jr.
(age 66) | | Trustee | | March 2017 | | 136 | | Private investor | | VF Corporation, Director; Verizon Communications, Inc., Director; The Travelers Companies, Director |
Maryanne L. Roepke
(age 66) | | Trustee | | May 2014 | | 136 | | Private investor | | N/A |
Laurie J. Thomsen
(age 65) | | Trustee | | March 2005 | | 136 | | Private investor | | The Travelers Companies, Director; Dycom Industries, Inc., Director |
Trustees and Officers - continued
| Name, Age | | Position(s) Held with
Fund | | Trustee/Officer Since(h) | | Number of MFS Funds for which the Person is an Officer | | Principal Occupations During
the Past Five Years |
| OFFICERS | | | | | | | | |
Christopher R. Bohane (k)
(age 49) | | Assistant Secretary and Assistant Clerk | | July 2005 | | 136 | | Massachusetts Financial Services Company, Senior Vice President and Senior Managing Counsel |
Kino Clark (k)
(age 54) | | Assistant Treasurer | | January 2012 | | 136 | | Massachusetts Financial Services Company, Vice President |
John W. Clark, Jr. (k)
(age 55) | | Assistant Treasurer | | April 2017 | | 136 | | Massachusetts Financial Services Company, Vice President |
David L. DiLorenzo (k)
(age 54) | | President | | July 2005 | | 136 | | Massachusetts Financial Services Company, Senior Vice President |
Heidi W. Hardin (k)
(age 55) | | Secretary and Clerk | | April 2017 | | 136 | | Massachusetts Financial Services Company, Executive Vice President and General Counsel |
Brian E. Langenfeld (k)
(age 49) | | Assistant Secretary and Assistant Clerk | | June 2006 | | 136 | | Massachusetts Financial Services Company, Vice President and Managing Counsel |
Rosa E. Licea-Mailloux (k)
(age 46) | | Chief Compliance Officer | | March 2022 | | 136 | | Massachusetts Financial Services Company, Vice President (since 2018); Director of Corporate Compliance (2018-2021), Senior Director Compliance (2021-2022), Senior Managing Director of North American Compliance & Chief Compliance Officer (since March 2022); Natixis Investment Managers (investment management), Funds Chief Compliance Officer, Deputy General Counsel & Senior Vice President (until 2018) |
Amanda S. Mooradian (k)
(age 43) | | Assistant Secretary and Assistant Clerk | | September 2018 | | 136 | | Massachusetts Financial Services Company, Assistant Vice President and Senior Counsel |
Susan A. Pereira (k)
(age 52) | | Assistant Secretary and Assistant Clerk | | July 2005 | | 136 | | Massachusetts Financial Services Company, Vice President and Managing Counsel |
Kasey L. Phillips (k)
(age 52) | | Assistant Treasurer | | September 2012 | | 136 | | Massachusetts Financial Services Company, Vice President |
Matthew A. Stowe (k)
(age 48) | | Assistant Secretary and Assistant Clerk | | October 2014 | | 136 | | Massachusetts Financial Services Company, Vice President and Senior Managing Counsel |
William B. Wilson (k)
(age 40) | | Assistant Secretary and Assistant Clerk | | October 2022 | | 136 | | Massachusetts Financial Services Company, Assistant Vice President and Counsel |
James O. Yost (k)
(age 62) | | Treasurer | | September 1990 | | 136 | | Massachusetts Financial Services Company, Senior Vice President |
| (h) | Date first appointed to serve as Trustee/Officer of an MFS Fund. Each Trustee has served continuously since appointment unless indicated otherwise. From January 2012 through December 2016, Messrs. DiLorenzo and Yost served as Treasurer and Deputy Treasurer of the Funds, respectively. |
| (j) | Directorships or trusteeships of companies required to report to the Securities and Exchange Commission (i.e., “public companies”). |
| (k) | “Interested person” of the Trust within the meaning of the Investment Company Act of 1940 (referred to as the 1940 Act), which is the principal federal law governing investment companies like the fund, as a result of a position with MFS. The address of MFS is 111 Huntington Avenue, Boston, Massachusetts 02199-7618. |
Each Trustee (other than Messrs. Jones, Kilman and Roberge) has been elected by shareholders and each Trustee and Officer holds office until his or her successor is chosen and qualified or until his or her earlier death, resignation, retirement or removal. Mr. Roberge became a Trustee of the Funds on January 1, 2021 and Messrs. Jones and Kilman became Trustees of the Funds on January 1, 2019. The Trust does not hold annual meetings for the purpose of electing Trustees, and Trustees are not elected for fixed terms. Under the terms of the Board's retirement policy, an Independent Trustee shall retire at the end of the calendar year in which he or she reaches the earlier of 75 years of age or 15 years of service on the Board (or, in the case of any Independent Trustee who joined the Board prior to 2015, 20 years of service on the Board).
Trustees and Officers - continued
Messrs. Buller, Kilman and Otis and Ms. Roepke are members of the Trust’s Audit Committee.
Each of the Interested Trustees and certain Officers hold comparable officer positions with certain affiliates of MFS.
The Statement of Additional Information for a Fund includes further information about the Trustees and is available without charge upon request by calling 1-800-225-2606.
| Investment Adviser | Custodian |
Massachusetts Financial Services Company
111 Huntington Avenue
Boston, MA 02199-7618 | State Street Bank and Trust Company
1 Lincoln Street
Boston, MA 02111-2900 |
| Distributor | Independent Registered Public Accounting Firm |
MFS Fund Distributors, Inc.
111 Huntington Avenue
Boston, MA 02199-7618 | Deloitte & Touche LLP
200 Berkeley Street
Boston, MA 02116 |
| Portfolio Manager(s) | |
Claud Davis
J. Scott Walker | |
Board Review of Investment Advisory Agreement
MFS Utilities Series
The Investment Company Act of 1940 requires that both the full Board of Trustees and a majority of the non-interested (“independent”) Trustees, voting separately, annually approve the continuation of the Fund’s investment advisory agreement with MFS. The Trustees consider matters bearing on the Fund and its advisory arrangements at their meetings throughout the year, including a review of performance data at each regular meeting. In addition, the independent Trustees met several times over the course of three months beginning in May and ending in July, 2022 (“contract review meetings”) for the specific purpose of considering whether to approve the continuation of the investment advisory agreement for the Fund and the other investment companies that the Board oversees (the “MFS Funds”). The independent Trustees were assisted in their evaluation of the Fund’s investment advisory agreement by independent legal counsel, from whom they received separate legal advice and with whom they met separately from MFS during various contract review meetings. The independent Trustees were also assisted in this process by an independent consultant who was retained by and reported to the independent Trustees.
In connection with their deliberations regarding the continuation of the investment advisory agreement, the Trustees, including the independent Trustees, considered such information and factors as they believed, in light of the legal advice furnished to them and their own business judgment, to be relevant. The investment advisory agreement for the Fund was considered separately, although the Trustees also took into account the common interests of all MFS Funds in their review. As described below, the Trustees considered the nature, quality, and extent of the various investment advisory, administrative, and shareholder services performed by MFS under the existing investment advisory agreement and other arrangements with the Fund.
In connection with their contract review meetings, the Trustees received and relied upon materials that included, among other items: (i) information provided by Broadridge Financial Solutions, Inc. (“Broadridge”), an independent third party, on the investment performance of the Fund for various time periods ended December 31, 2021 and the investment performance of a group of funds with substantially similar investment classifications/objectives (the “Broadridge performance universe”), (ii) information provided by Broadridge on the Fund’s advisory fees and other expenses and the advisory fees and other expenses of comparable funds identified by Broadridge as well as all other funds in the same investment classification/category (the “Broadridge expense group and universe”), (iii) information provided by MFS on the advisory fees of portfolios of other clients of MFS, including institutional separate accounts and other clients, (iv) information as to whether and to what extent applicable expense waivers, reimbursements or fee “breakpoints” are observed for the Fund, (v) information regarding MFS’ financial results and financial condition, including MFS’ and certain of its affiliates’ estimated profitability from services performed for the Fund and the MFS Funds as a whole, and compared to MFS’ institutional business, (vi) MFS’ views regarding the outlook for the mutual fund industry and the strategic business plans of MFS, (vii) descriptions of various functions performed by MFS for the Funds, such as compliance monitoring and portfolio trading practices, and (viii) information regarding the overall organization of MFS, including information about MFS’ senior management and other personnel providing investment advisory, administrative and other services to the Fund and the other MFS Funds. The comparative performance, fee and expense information prepared and provided by Broadridge was not independently verified and the independent Trustees did not independently verify any information provided to them by MFS.
The Trustees’ conclusion as to the continuation of the investment advisory agreement was based on a comprehensive consideration of all information provided to the Trustees and not the result of any single factor. Some of the factors that figured particularly in the Trustees’ deliberations are described below, although individual Trustees may have evaluated the information presented differently from one another, giving different weights to various factors. It is also important to recognize that the fee arrangements for the Fund and other MFS Funds are the result of years of review and discussion between the independent Trustees and MFS, that certain aspects of such arrangements may receive greater scrutiny in some years than in others, and that the Trustees’ conclusions may be based, in part, on their consideration of these same arrangements during the course of the year and in prior years.
Based on information provided by Broadridge and MFS, the Trustees reviewed the Fund’s total return investment performance as well as the Broadridge performance universe over various time periods. The Trustees placed particular emphasis on the total return performance of the Fund’s Initial Class shares in comparison to the performance of funds in its Broadridge performance universe over the five-year period ended December 31, 2021, which the Trustees believed was a long enough period to reflect differing market conditions. The total return performance of the Fund’s Initial Class shares was in the 2nd quintile relative to the other funds in the universe for this five-year period (the 1st quintile being the best performers and the 5th quintile being the worst performers). The total return performance of the Fund’s Initial Class shares was in the 5th quintile for the one-year period and the 1st quintile for the three-year period ended December 31, 2021 relative to the Broadridge performance universe. Because of the passage of time, these performance results may differ from the performance results for more recent periods, including those shown elsewhere in this report.
In the course of their deliberations, the Trustees took into account information provided by MFS in connection with the contract review meetings, as well as during investment review meetings conducted with portfolio management personnel during the course of the year regarding the Fund’s performance. After reviewing these and related factors, the Trustees concluded, within the context of their overall conclusions regarding the investment advisory agreement, that they were satisfied with MFS’ responses and efforts relating to investment performance.
Board Review of Investment Advisory Agreement - continued
In assessing the reasonableness of the Fund’s advisory fee, the Trustees considered, among other information, the Fund’s advisory fee and the total expense ratio of the Fund’s Initial Class shares as a percentage of average daily net assets and the advisory fee and total expense ratios of the Broadridge expense group based on information provided by Broadridge. The Trustees considered that, according to the data provided by Broadridge (which takes into account any fee reductions or expense limitations that were in effect during the Fund’s last fiscal year), the Fund’s effective advisory fee rate was higher than the Broadridge expense group median and the total expense ratio was approximately at the Broadridge expense group median.
The Trustees also considered the advisory fees charged by MFS to any institutional separate accounts advised by MFS (“separate accounts”) and unaffiliated investment companies for which MFS serves as subadviser (“subadvised funds”) that have comparable investment strategies to the Fund, if any. In comparing these fees, the Trustees considered information provided by MFS as to the generally broader scope of services provided by MFS to the Fund, as well as the more extensive regulatory burdens imposed on MFS in managing the Fund, in comparison to separate accounts and subadvised funds. The Trustees also considered the higher demands placed on MFS’ investment personnel and trading infrastructure as a result of the daily cash in-flows and out-flows of the Fund in comparison to separate accounts.
The Trustees also considered whether the Fund may benefit from any economies of scale in the management of the Fund in the event of growth in assets of the Fund and/or growth in assets of the MFS Funds as a whole. They noted that the Fund’s advisory fee rate schedule is subject to contractual breakpoints that reduce the Fund’s advisory fee rate on average daily net assets over $1 billion and $3 billion. The Trustees also noted that MFS has agreed in writing to waive a portion of the management fees of certain MFS Funds, including the Fund, if the total combined assets of certain funds within the MFS Funds’ complex increase above agreed upon thresholds (the “group fee waiver”), enabling the Fund’s shareholders to share in the benefits from any economies of scale at the complex level. The group fee waiver is reviewed and renewed annually between the Board and MFS. The Trustees concluded that the breakpoints and the group fee waiver were sufficient to allow the Fund to benefit from economies of scale as its assets and overall complex assets grow.
The Trustees also considered information prepared by MFS relating to MFS’ costs and profits with respect to the Fund, the MFS Funds considered as a group, and other investment companies and accounts advised by MFS, as well as MFS’ methodologies used to determine and allocate its costs to the MFS Funds, the Fund and other accounts and products for purposes of estimating profitability.
After reviewing these and other factors described herein, the Trustees concluded, within the context of their overall conclusions regarding the investment advisory agreement, that the advisory fees charged to the Fund represent reasonable compensation in light of the services being provided by MFS to the Fund.
In addition, the Trustees considered MFS’ resources and related efforts to continue to retain, attract and motivate capable personnel to serve the Fund. The Trustees also considered current and developing conditions in the financial services industry, including the presence of large and well-capitalized companies which are spending, and appear to be prepared to continue to spend, substantial sums to engage personnel and to provide services to competing investment companies. In this regard, the Trustees also considered the financial resources of MFS and its ultimate parent, Sun Life Financial Inc. The Trustees also considered the advantages and possible disadvantages to the Fund of having an adviser that also serves other investment companies as well as other accounts.
The Trustees also considered the nature, quality, cost, and extent of administrative, transfer agency, and distribution services provided to the Fund by MFS and its affiliates under agreements and plans other than the investment advisory agreement, including any 12b-1 fees the Fund pays to MFS Fund Distributors, Inc., an affiliate of MFS. The Trustees also considered the nature, extent and quality of certain other services MFS performs or arranges for on the Fund’s behalf, which may include securities lending programs, directed expense payment programs, class action recovery programs, and MFS’ interaction with third-party service providers, principally custodians and sub-custodians. The Trustees concluded that the various non-advisory services provided by MFS and its affiliates on behalf of the Fund were satisfactory.
The Trustees considered so-called “fall-out benefits” to MFS such as reputational value derived from serving as investment manager to the MFS Funds. The Trustees also considered that MFS discontinued its historic practice of obtaining investment research from portfolio brokerage commissions paid by certain MFS Funds effective January 2018, and directly pays or voluntarily reimburses a Fund, if applicable, for the costs of external research acquired through the use of the Fund’s portfolio brokerage commissions.
Based on their evaluation of factors that they deemed to be material, including those factors described above, the Board of Trustees, including the independent Trustees, concluded that the Fund’s investment advisory agreement with MFS should be continued for an additional one-year period, commencing August 1, 2022.
Proxy Voting Policies and Information
MFS votes proxies on behalf of the fund pursuant to proxy voting policies and procedures that are available without charge, upon request, by calling 1-800-225-2606, by visiting mfs.com/proxyvoting, or by visiting the SEC’s Web site at http://www.sec.gov.
Information regarding how the fund voted proxies relating to portfolio securities during the most recent twelve-month period ended June 30 is available by August 31 of each year without charge by visiting mfs.com/proxyvoting, or by visiting the SEC’s Web site at http://www.sec.gov.
Quarterly Portfolio Disclosure
The fund files a complete schedule of portfolio holdings with the SEC for the first and third quarters of each fiscal year as an exhibit to its reports on Form N-PORT. The fund’s Form N-PORT reports are available on the SEC’s Web site at http://www.sec.gov. A shareholder can obtain the portfolio holdings report for the first and third quarters of the fund's fiscal year at mfs.com/vit1 by choosing the fund's name and then scrolling to the “Resources” section and clicking on the “Prospectus and Reports” tab.
FURTHER INFORMATION
From time to time, MFS may post important information about the fund or the MFS Funds on the MFS Web site (mfs.com). This information is available at https://www.mfs.com/announcements or at mfs.com/vit1 by choosing the fund's name and then scrolling to the “Resources” section and clicking on the “Announcements” tab, if any.
Information About Fund Contracts and Legal Claims
The fund has entered into contractual arrangements with an investment adviser, administrator, distributor, shareholder servicing agent, and custodian who each provide services to the fund. Unless expressly stated otherwise, shareholders are not parties to, or intended beneficiaries of these contractual arrangements, and these contractual arrangements are not intended to create any shareholder right to enforce them against the service providers or to seek any remedy under them against the service providers, either directly or on behalf of the fund.
Under the Trust’s By-Laws and Declaration of Trust, any claims asserted against or on behalf of the MFS Funds, including claims against Trustees and Officers, must be brought in state and federal courts located within the Commonwealth of Massachusetts.
Federal Tax Information (unaudited)
The following information is provided pursuant to provisions of the Internal Revenue Code.
The fund designates $38,935,000 as capital gain dividends paid during the fiscal year.
For corporate shareholders, 55.22% of the ordinary income dividends paid during the fiscal year qualify for the corporate dividends received deduction.
| FACTS | WHAT DOES MFS DO WITH YOUR PERSONAL INFORMATION? |
| Why? | Financial companies choose how they share your personal information. Federal law gives consumers the right to limit some but not all sharing. Federal law also requires us to tell you how we collect, share, and protect your personal information. Please read this notice carefully to understand what we do. |
| What? | The types of personal information we collect and share depend on the product or service you have with us. This information can include: |
| • Social Security number and account balances |
| • Account transactions and transaction history |
| • Checking account information and wire transfer instructions |
| When you are no longer our customer, we continue to share your information as described in this notice. |
| How? | All financial companies need to share customers' personal information to run their everyday business. In the section below, we list the reasons financial companies can share their customers' personal information; the reasons MFS chooses to share; and whether you can limit this sharing. |
Reasons we can share your
personal information | Does MFS share? | Can you limit
this sharing? |
For our everyday business purposes –
such as to process your transactions, maintain your
account(s), respond to court orders and legal
investigations, or report to credit bureaus | Yes | No |
For our marketing purposes –
to offer our products and services to you | No | We don't share |
For joint marketing with other
financial companies | No | We don't share |
For our affiliates' everyday business purposes –
information about your transactions and experiences | No | We don't share |
For our affiliates' everyday business purposes –
information about your creditworthiness | No | We don't share |
| For nonaffiliates to market to you | No | We don't share |
| Questions? | Call 800-225-2606 or go to mfs.com. |
| Who we are |
| Who is providing this notice? | MFS Funds, MFS Investment Management, MFS Institutional Advisors, Inc., and MFS Heritage Trust Company. |
| What we do |
How does MFS
protect my personal
information? | To protect your personal information from unauthorized access and use, we use security measures that comply with federal law. These measures include procedural, electronic, and physical safeguards for the protection of the personal information we collect about you. |
How does MFS
collect my personal
information? | We collect your personal information, for example, when you |
| • open an account or provide account information |
| • direct us to buy securities or direct us to sell your securities |
| • make a wire transfer |
| We also collect your personal information from others, such as credit bureaus, affiliates, or other companies. |
| Why can't I limit all sharing? | Federal law gives you the right to limit only |
| • sharing for affiliates' everyday business purposes – information about your creditworthiness |
| • affiliates from using your information to market to you |
| • sharing for nonaffiliates to market to you |
| State laws and individual companies may give you additional rights to limit sharing. |
| Definitions |
| Affiliates | Companies related by common ownership or control. They can be financial and nonfinancial companies. |
| • MFS does not share personal information with affiliates, except for everyday business purposes as described on page one of this notice. |
| Nonaffiliates | Companies not related by common ownership or control. They can be financial and nonfinancial companies. |
| • MFS does not share with nonaffiliates so they can market to you. |
| Joint marketing | A formal agreement between nonaffiliated financial companies that together market financial products or services to you. |
| • MFS doesn't jointly market. |
| Other important information |
| If you own an MFS product or receive an MFS service in the name of a third party such as a bank or broker-dealer, their privacy policy may apply to you instead of ours. |
Annual Report
December 31, 2022
MFS® Variable Insurance Trust
| 1 |
| 2 |
| 3 |
| 5 |
| 7 |
| 8 |
| 12 |
| 13 |
| 14 |
| 15 |
| 17 |
| 23 |
| 24 |
| 27 |
| 29 |
| 29 |
| 29 |
| 29 |
| 29 |
| 30 |
The report is prepared for the general information of shareholders. It is authorized for distribution to prospective investors only when preceded or accompanied by a current prospectus.
NOT FDIC INSURED • MAY LOSE VALUE • NO BANK OR CREDIT UNION GUARANTEE •
NOT A DEPOSIT • NOT INSURED BY ANY FEDERAL GOVERNMENT AGENCY OR NCUA/NCUSIF
LETTER FROM THE CHAIR AND CEO
Dear Shareholders:
Signs of peaking inflation, hopes that monetary policy tightening cycles may be nearing an end and a rapid reopening of China’s economy in late-2022 and early-2023 have combined to bolster investor sentiment in recent months. Markets have largely adjusted to the challenges posed by Russia’s invasion of Ukraine, thanks in part to mild European winter weather which has alleviated concerns over potential shortages of natural gas. Resilient labor markets in much of the developed world have further contributed to a brighter-than-expected economic backdrop. However, many investors are mindful that the lagged effects of ongoing policy tightening have yet to work their way through the global economy.
Tighter global financial conditions have been a particular headwind for richly valued growth equities and interest rate-sensitive parts of the economy, such as housing. Over the near term, companies may face a challenging earnings backdrop as they are forced to absorb higher input and labor costs at a time of dwindling pricing power. For fixed income, the rise in interest rates has made bonds more attractive than they have been in years, which may provide balance to an overall portfolio.
During times of market transition, it is important to have a deep understanding of company fundamentals, and we have built our unique global research platform to do just that.
At MFS®, we put our clients’ assets to work responsibly by carefully navigating increasingly complex global capital markets. Our investment team is guided by a commitment to long-term fundamental investing. Our global investment platform — combining collective expertise, long-term discipline, and thoughtful risk management — seeks to uncover what we believe are the best, most durable investment ideas in markets around the world, enabling us to potentially create value for investors.
Respectfully,
Michael W. Roberge
Chair and Chief Executive Officer
MFS Investment Management
February 15, 2023
The opinions expressed in this letter are subject to change and may not be relied upon for investment advice. No forecasts can be guaranteed.
Portfolio structure
Top ten holdings
| JPMorgan Chase & Co. | 3.8% |
| Johnson & Johnson | 3.1% |
| Cigna Corp. | 3.0% |
| Northrop Grumman Corp. | 2.7% |
| Pfizer, Inc. | 2.6% |
| Honeywell International, Inc. | 2.5% |
| Aon PLC | 2.4% |
| Texas Instruments, Inc. | 2.3% |
| Progressive Corp. | 2.3% |
| Marsh & McLennan Cos., Inc. | 2.3% |
GICS equity sectors (g)
| Financials | 25.3% |
| Health Care | 19.1% |
| Industrials | 17.8% |
| Information Technology | 7.0% |
| Utilities | 6.8% |
| Consumer Staples | 5.7% |
| Energy | 4.7% |
| Materials | 4.3% |
| Consumer Discretionary | 4.2% |
| Communication Services | 3.1% |
| Real Estate | 1.3% |
| (g) | The Global Industry Classification Standard (GICS®) was developed by and/or is the exclusive property of MSCI, Inc. and S&P Global Market Intelligence Inc. (“S&P Global Market Intelligence”). GICS is a service mark of MSCI and S&P Global Market Intelligence and has been licensed for use by MFS. MFS has applied its own internal sector/industry classification methodology for equity securities and non-equity securities that are unclassified by GICS. |
Cash & Cash Equivalents includes any cash, investments in money market funds, short-term securities, and other assets less liabilities. Please see the Statement of Assets and Liabilities for additional information related to the fund’s cash position and other assets and liabilities.
Percentages are based on net assets as of December 31, 2022.
The portfolio is actively managed and current holdings may be different.
Management Review
Summary of Results
For the twelve months ended December 31, 2022, Initial Class shares of the MFS Value Series (fund) provided a total return of -5.91%, while Service Class shares of the fund provided a total return of -6.14%. These compare with a return of -7.54% over the same period for the fund’s benchmark, the Russell 1000® Value Index.
Market Environment
During the reporting period, markets continued to grapple with the strongest global inflationary pressures in decades along with signs of slowing economic growth. Intermittent coronavirus flareups, particularly in China, where home-grown vaccines have proved less effective than elsewhere, kept supply chains stretched for a considerable period. At the same time, the reopening of the economy in the parts of the world where the virus has been better contained has led to a shift in consumption patterns in favor of services, straining already tight labor markets in most developed economies, while reducing demand for manufactured goods, primarily from Asia. As a result of Russia’s invasion of Ukraine, geopolitical considerations, such as sanctions and trade bans, have resulted in additional supply chain disruptions and volatile global energy prices. Taken together, these factors have contributed to market volatility.
The ripple effects from the Russian invasion further complicated the mission central banks must undertake to rein in surging inflation. Energy shocks have historically resulted in global growth slowdowns, if not pullbacks, so policymakers will find themselves in the difficult position of trying to restrain inflation without tipping economies into recession. Despite the challenging macroeconomic and geopolitical environment, policymakers remained focused on controlling inflation, although investors appeared to have expected varying degrees of action from the central banks. The Fed has been among the most aggressive developed market central banks, tightening policy at the fastest rate in decades, although it slowed its hiking pace at the end of the period, as did the European Central Bank. After remaining on the monetary sidelines for much of the period, the Bank of Japan widened its Yield Curve Control band, capping the yield on its 10-year bond at 0.5%, up from 0.25%, an action investors interpreted as a first step toward monetary policy normalization.
Against an environment of still-tight labor markets, tighter global financial conditions and volatile materials prices, investor anxiety appeared to have increased over the potential that corporate profit margins may be past peak for this cycle. That said, tentative signs that supply chain bottlenecks (particularly semiconductors) may be moderating, the easing of COVID restrictions in China, low levels of unemployment across developed markets and hopes that inflation levels may be near a peak were supportive factors for the macroeconomic backdrop.
Contributors to Performance
Stock selection and an underweight position in the information technology sector contributed to the fund’s performance relative to the Russell 1000® Value Index. Within this sector, not owning shares of customer information software manager Salesforce.com, and an underweight position in semiconductor company Intel(h), aided relative returns. The share price of Salesforce.com fell after the company delivered subdued financial results, driven by larger-than-anticipated macroeconomic headwinds. Management cited longer sales cycles and deal size compression as key drivers behind its weaker financials. Additionally, the announcement of the departure of the company’s Co-CEO appeared to have put pressure on the stock price performance.
Security selection in both the financials and health care sectors also supported relative returns. Within the financials sector, the fund’s overweight positions in insurance services providers, Progressive and Chubb, bolstered relative performance. The share price of Progressive advanced due to lower-than-expected catastrophe losses and more favorable reserve development. Within the health care sector, overweight positions in global health services provider Cigna and health services company McKesson helped in relative terms. The share price of Cigna benefited from strong performance in its Cigna Healthcare segment, particularly better-than-anticipated medical loss ratio rebates and stronger operating income growth.
The fund’s underweight position in the weak-performing real estate sector further boosted relative results. However, there were no individual stocks within this sector, either in the fund or in the benchmark, that were among the fund's largest relative contributors during the reporting period.
Stocks in other sectors that aided relative performance included the fund’s overweight positions in global security company Northrop Grumman and oil and gas company ConocoPhillips. Additionally, not owning shares of social networking service provider Meta Platforms and diversified entertainment company Walt Disney further supported relative results as both stocks underperformed the benchmark.
Management Review - continued
Detractors from Performance
The fund’s underweight position in the energy sector detracted from relative performance. Here, not owning shares of integrated energy companies Exxon Mobil and Chevron weakened relative returns. The share price of ExxonMobil advanced during the period owing to a strong energy price environment reflecting global energy shortages and better margin expansion in its refining segment. Additionally, increased returns to shareholders through stock repurchases and dividends, paired with greater debt reduction, further supported the stock.
Stock selection in the materials sector also dampened relative results, led by the fund’s holdings of paint and coating manufacturer Sherwin-Williams(b) and an overweight position in coatings company PPG Industries. The share price of Sherwin-Williams declined as the company delivered weaker-than-anticipated financial results reflecting numerous supply chain issues and higher raw materials costs.
Elsewhere, the fund’s overweight positions in consulting and information technology services provider Accenture, cable services provider Charter Communications, power and hand tools manufacturer Stanley Black & Decker(h), cable services provider Comcast and consumer credit reporting agency Equifax hindered relative performance. Despite posting robust financial results, the share price of Accenture dropped along with broad equity markets as macroeconomic uncertainties and raising inflationary pressures weighed on Accenture’s overall results. Additionally, not owning shares of insurance and investment firm Berkshire Hathaway further weakened relative returns.
Respectfully,
Portfolio Manager(s)
Katherine Cannan and Nevin Chitkara
| (b) | Security is not a benchmark constituent. |
| (h) | Security was not held in the portfolio at period end. |
The views expressed in this report are those of the portfolio manager(s) only through the end of the period of the report as stated on the cover and do not necessarily reflect the views of MFS or any other person in the MFS organization. These views are subject to change at any time based on market or other conditions, and MFS disclaims any responsibility to update such views. These views may not be relied upon as investment advice or an indication of trading intent on behalf of any MFS portfolio. References to specific securities are not recommendations of such securities, and may not be representative of any MFS portfolio’s current or future investments.
Performance Summary Through 12/31/22
The following chart illustrates the historical performance of the fund in comparison to its benchmark(s). Benchmarks are unmanaged and may not be invested in directly. Benchmark returns do not reflect any fees or expenses. The performance of other share classes will be greater than or less than that of the class depicted below. (See Notes to Performance Summary.)
Performance data shown represents past performance and is no guarantee of future results. Investment return and principal value fluctuate so your shares, when sold, may be worth more or less than the original cost; current performance may be lower or higher than quoted. The performance shown does not reflect the deduction of taxes, if any, that a shareholder would pay on fund distributions or the redemption of fund shares. The returns for the fund shown also do not reflect the deduction of expenses associated with variable products, such as mortality and expense risk charges, separate account charges, and sales charges imposed by the insurance company separate accounts. Such expenses would reduce the overall returns shown.
Growth of a Hypothetical $10,000 Investment
Total Returns through 12/31/22
Average annual total returns
| Share Class | Class Inception Date | 1-yr | 5-yr | 10-yr |
| Initial Class | 1/02/02 | (5.91)% | 7.35% | 11.05% |
| Service Class | 1/02/02 | (6.14)% | 7.08% | 10.77% |
Comparative benchmark(s)
| Russell 1000® Value Index (f) | (7.54)% | 6.67% | 10.29% |
| (f) | Source: FactSet Research Systems Inc. |
Benchmark Definition(s)
Russell 1000® Value Index(h) – constructed to provide a comprehensive barometer for the value securities in the large-cap segment of the U.S. equity universe. Companies in this index generally have lower price-to-book ratios and lower forecasted growth values.
It is not possible to invest directly in an index.
| (h) | Frank Russell Company (“Russell”) is the source and owner of the trademarks, service marks, and copyrights related to the Russell Indexes. Russell® is a trademark of Frank Russell Company. Neither Russell nor its licensors accept any liability for any errors or omissions in the Russell Indexes and/or Russell ratings or underlying data and no party may rely on any Russell Indexes and/or Russell ratings and/or underlying data contained in this document. No further distribution of Russell Data is permitted without Russell's express written consent. Russell does not promote, sponsor, or endorse the content of this document. |
Notes to Performance Summary
Average annual total return represents the average annual change in value for each share class for the periods presented.
Performance results reflect any applicable expense subsidies and waivers in effect during the periods shown. Without such subsidies and waivers the fund's performance results would be less favorable. Please see the prospectus and financial statements for complete details. All results are historical and assume the reinvestment of any dividends and capital gains distributions.
Performance Summary – continued
Performance results do not include adjustments made for financial reporting purposes in accordance with U.S. generally accepted accounting principles and may differ from amounts reported in the financial highlights.
From time to time the fund may receive proceeds from litigation settlements, without which performance would be lower.
Expense Table
Fund expenses borne by the shareholders during the period,
July 1, 2022 through December 31, 2022
As a shareholder of the fund, you incur ongoing costs, including management fees; distribution and/or service (12b-1) fees; and other fund expenses. This example is intended to help you understand your ongoing costs (in dollars) of investing in the fund and to compare these costs with the ongoing costs of investing in other mutual funds.
The example is based on an investment of $1,000 invested at the beginning of the period and held for the entire period July 1, 2022 through December 31, 2022.
Actual Expenses
The first line for each share class in the following table provides information about actual account values and actual expenses. You may use the information in this line, together with the amount you invested, to estimate the expenses that you paid over the period. Simply divide your account value by $1,000 (for example, an $8,600 account value divided by $1,000 = 8.6), then multiply the result by the number in the first line under the heading entitled “Expenses Paid During Period” to estimate the expenses you paid on your account during this period.
Hypothetical Example for Comparison Purposes
The second line for each share class in the following table provides information about hypothetical account values and hypothetical expenses based on the fund’s actual expense ratio and an assumed rate of return of 5% per year before expenses, which is not the fund’s actual return. The hypothetical account values and expenses may not be used to estimate the actual ending account balance or expenses you paid for the period. You may use this information to compare the ongoing costs of investing in the fund and other funds. To do so, compare this 5% hypothetical example with the 5% hypothetical examples that appear in the shareholder reports of the other funds.
Please note that the expenses shown in the table are meant to highlight the fund's ongoing costs only and do not take into account the fees and expenses imposed under the variable contracts through which your investment in the fund is made. Therefore, the second line for each share class in the table is useful in comparing ongoing costs associated with an investment in vehicles (such as the fund) which fund benefits under variable annuity and variable life insurance contracts and to qualified pension and retirement plans only, and will not help you determine the relative total costs of investing in the fund through variable annuity and variable life insurance contracts. If the fees and expenses imposed under the variable contracts were included, your costs would have been higher.
Share
Class | | Annualized
Expense
Ratio | Beginning
Account Value
7/01/22 | Ending
Account Value
12/31/22 | Expenses
Paid During
Period (p)
7/01/22-12/31/22 |
| Initial Class | Actual | 0.69% | $1,000.00 | $1082.85 | $3.62 |
| Hypothetical (h) | 0.69% | $1,000.00 | $1021.73 | $3.52 |
| Service Class | Actual | 0.94% | $1,000.00 | $1081.86 | $4.93 |
| Hypothetical (h) | 0.94% | $1,000.00 | $1020.47 | $4.79 |
| (h) | 5% class return per year before expenses. |
| (p) | “Expenses Paid During Period” are equal to each class's annualized expense ratio, as shown above, multiplied by the average account value over the period, multiplied by 184/365 (to reflect the one-half year period). |
Portfolio of Investments − 12/31/22
The Portfolio of Investments is a complete list of all securities owned by your fund. It is categorized by broad-based asset classes.
| Issuer | | | Shares/Par | Value ($) |
| Common Stocks – 99.3% |
| Aerospace & Defense – 7.6% | |
| General Dynamics Corp. | | 175,928 | $ 43,649,496 |
| Honeywell International, Inc. | | 279,840 | 59,969,712 |
| Northrop Grumman Corp. | | 119,141 | 65,004,521 |
| Raytheon Technologies Corp. | | 166,467 | 16,799,850 |
| | | | | $185,423,579 |
| Alcoholic Beverages – 1.6% | |
| Diageo PLC | | 862,284 | $ 38,049,729 |
| Brokerage & Asset Managers – 4.5% | |
| BlackRock, Inc. | | 45,693 | $ 32,379,430 |
| Citigroup, Inc. | | 551,321 | 24,936,249 |
| KKR & Co., Inc. | | 274,161 | 12,726,554 |
| NASDAQ, Inc. | | 666,167 | 40,869,345 |
| | | | | $110,911,578 |
| Business Services – 3.0% | |
| Accenture PLC, “A” | | 163,361 | $ 43,591,249 |
| Equifax, Inc. | | 150,465 | 29,244,378 |
| | | | | $72,835,627 |
| Cable TV – 3.1% | |
| Charter Communications, Inc., “A” (a) | | 69,920 | $ 23,709,872 |
| Comcast Corp., “A” | | 1,519,320 | 53,130,620 |
| | | | | $76,840,492 |
| Chemicals – 1.4% | |
| PPG Industries, Inc. | | 269,975 | $ 33,946,657 |
| Construction – 2.0% | |
| Masco Corp. | | 290,583 | $ 13,561,509 |
| Otis Worldwide Corp. | | 99,133 | 7,763,105 |
| Sherwin-Williams Co. | | 112,323 | 26,657,617 |
| | | | | $47,982,231 |
| Consumer Products – 1.7% | |
| International Flavors & Fragrances, Inc. | | 91,616 | $ 9,605,022 |
| Kimberly-Clark Corp. | | 154,876 | 21,024,417 |
| Reckitt Benckiser Group PLC | | 169,357 | 11,780,979 |
| | | | | $42,410,418 |
| Electrical Equipment – 1.4% | |
| Johnson Controls International PLC | | 528,640 | $ 33,832,960 |
| Electronics – 5.3% | |
| Analog Devices, Inc. | | 110,743 | $ 18,165,174 |
| KLA Corp. | | 78,664 | 29,658,688 |
| NXP Semiconductors N.V. | | 152,030 | 24,025,301 |
| Texas Instruments, Inc. | | 346,667 | 57,276,322 |
| | | | | $129,125,485 |
Portfolio of Investments – continued
| Issuer | | | Shares/Par | Value ($) |
| Common Stocks – continued |
| Energy - Independent – 4.7% | |
| ConocoPhillips | | 446,722 | $ 52,713,196 |
| EOG Resources, Inc. | | 176,690 | 22,884,889 |
| Pioneer Natural Resources Co. | | 174,075 | 39,756,989 |
| | | | | $115,355,074 |
| Food & Beverages – 2.8% | |
| Archer Daniels Midland Co. | | 97,029 | $ 9,009,143 |
| Nestle S.A. | | 316,143 | 36,509,927 |
| PepsiCo, Inc. | | 128,854 | 23,278,763 |
| | | | | $68,797,833 |
| Gaming & Lodging – 1.0% | |
| Marriott International, Inc., “A” | | 168,601 | $ 25,103,003 |
| Health Maintenance Organizations – 3.0% | |
| Cigna Corp. | | 223,781 | $ 74,147,597 |
| Insurance – 10.8% | |
| Aon PLC | | 195,450 | $ 58,662,363 |
| Chubb Ltd. | | 248,239 | 54,761,523 |
| Marsh & McLennan Cos., Inc. | | 338,359 | 55,991,647 |
| Progressive Corp. | | 441,101 | 57,215,211 |
| Travelers Cos., Inc. | | 200,659 | 37,621,556 |
| | | | | $264,252,300 |
| Machinery & Tools – 4.4% | |
| Eaton Corp. PLC | | 218,067 | $ 34,225,616 |
| Illinois Tool Works, Inc. | | 173,332 | 38,185,039 |
| PACCAR, Inc. | | 120,172 | 11,893,423 |
| Trane Technologies PLC | | 141,703 | 23,818,857 |
| | | | | $108,122,935 |
| Major Banks – 7.2% | |
| Goldman Sachs Group, Inc. | | 39,153 | $ 13,444,357 |
| JPMorgan Chase & Co. | | 693,514 | 93,000,228 |
| Morgan Stanley | | 522,093 | 44,388,347 |
| PNC Financial Services Group, Inc. | | 163,178 | 25,772,333 |
| | | | | $176,605,265 |
| Medical & Health Technology & Services – 1.6% | |
| McKesson Corp. | | 101,634 | $ 38,124,946 |
| Medical Equipment – 6.5% | |
| Abbott Laboratories | | 335,421 | $ 36,825,872 |
| Boston Scientific Corp. (a) | | 629,104 | 29,108,642 |
| Danaher Corp. | | 76,223 | 20,231,109 |
| Medtronic PLC | | 325,691 | 25,312,704 |
| Thermo Fisher Scientific, Inc. | | 85,773 | 47,234,333 |
| | | | | $158,712,660 |
Portfolio of Investments – continued
| Issuer | | | Shares/Par | Value ($) |
| Common Stocks – continued |
| Other Banks & Diversified Financials – 2.7% | |
| American Express Co. | | 255,257 | $ 37,714,222 |
| Moody's Corp. | | 58,619 | 16,332,426 |
| Truist Financial Corp. | | 300,057 | 12,911,452 |
| | | | | $66,958,100 |
| Pharmaceuticals – 8.0% | |
| Johnson & Johnson | | 430,840 | $ 76,107,886 |
| Merck & Co., Inc. | | 431,991 | 47,929,401 |
| Pfizer, Inc. | | 1,235,977 | 63,331,462 |
| Roche Holding AG | | 28,193 | 8,857,477 |
| | | | | $196,226,226 |
| Railroad & Shipping – 2.3% | |
| Canadian National Railway Co. | | 125,098 | $ 14,871,650 |
| Union Pacific Corp. | | 205,963 | 42,648,759 |
| | | | | $57,520,409 |
| Real Estate – 1.3% | |
| Prologis, Inc., REIT | | 193,496 | $ 21,812,804 |
| Public Storage, Inc., REIT | | 32,258 | 9,038,369 |
| | | | | $30,851,173 |
| Specialty Chemicals – 1.4% | |
| DuPont de Nemours, Inc. | | 496,641 | $ 34,084,472 |
| Specialty Stores – 3.2% | |
| Lowe's Cos., Inc. | | 235,174 | $ 46,856,068 |
| Target Corp. | | 203,858 | 30,382,996 |
| | | | | $77,239,064 |
| Utilities - Electric Power – 6.8% | |
| American Electric Power Co., Inc. | | 153,108 | $ 14,537,605 |
| Dominion Energy, Inc. | | 551,944 | 33,845,206 |
| Duke Energy Corp. | | 489,016 | 50,363,758 |
| Exelon Corp. | | 153,974 | 6,656,296 |
| Southern Co. | | 626,755 | 44,756,574 |
| Xcel Energy, Inc. | | 219,072 | 15,359,138 |
| | | | | $165,518,577 |
| Total Common Stocks (Identified Cost, $1,288,032,825) | | $2,428,978,390 |
| Investment Companies (h) – 1.2% |
| Money Market Funds – 1.2% | |
| MFS Institutional Money Market Portfolio, 4.02% (v) (Identified Cost, $29,654,136) | | | 29,648,306 | $ 29,657,201 |
| Other Assets, Less Liabilities – (0.5)% | | (12,070,396) |
| Net Assets – 100.0% | $2,446,565,195 |
| (a) | Non-income producing security. | | | |
| (h) | An affiliated issuer, which may be considered one in which the fund owns 5% or more of the outstanding voting securities, or a company which is under common control. At period end, the aggregate values of the fund's investments in affiliated issuers and in unaffiliated issuers were $29,657,201 and $2,428,978,390, respectively. | | | |
| (v) | Affiliated issuer that is available only to investment companies managed by MFS. The rate quoted for the MFS Institutional Money Market Portfolio is the annualized seven-day yield of the fund at period end. | | | |
Portfolio of Investments – continued
| The following abbreviations are used in this report and are defined: |
| REIT | Real Estate Investment Trust |
See Notes to Financial Statements
| Financial Statements | Statement of Assets and Liabilities |
This statement represents your fund’s balance sheet, which details the assets and liabilities comprising the total value of the fund.
| At 12/31/22Assets | |
| Investments in unaffiliated issuers, at value (identified cost, $1,288,032,825) | $2,428,978,390 |
| Investments in affiliated issuers, at value (identified cost, $29,654,136) | 29,657,201 |
| Cash | 164,171 |
| Receivables for | |
| Fund shares sold | 697,317 |
| Interest and dividends | 3,421,525 |
| Other assets | 9,494 |
| Total assets | $2,462,928,098 |
| Liabilities | |
| Payables for | |
| Fund shares reacquired | $15,977,374 |
| Payable to affiliates | |
| Investment adviser | 121,347 |
| Administrative services fee | 2,873 |
| Shareholder servicing costs | 671 |
| Distribution and/or service fees | 25,475 |
| Payable for independent Trustees' compensation | 14 |
| Accrued expenses and other liabilities | 235,149 |
| Total liabilities | $16,362,903 |
| Net assets | $2,446,565,195 |
| Net assets consist of | |
| Paid-in capital | $1,105,563,804 |
| Total distributable earnings (loss) | 1,341,001,391 |
| Net assets | $2,446,565,195 |
| Shares of beneficial interest outstanding | 114,954,868 |
| | Net assets | Shares
outstanding | Net asset value
per share |
| Initial Class | $1,207,158,494 | 56,017,089 | $21.55 |
| Service Class | 1,239,406,701 | 58,937,779 | 21.03 |
See Notes to Financial Statements
| Financial Statements | Statement of Operations |
This statement describes how much your fund earned in investment income and accrued in expenses. It also describes any gains and/or losses generated by fund operations.
| Year ended 12/31/22 | |
| Net investment income (loss) | |
| Income | |
| Dividends | $57,867,109 |
| Dividends from affiliated issuers | 403,277 |
| Other | 36,880 |
| Income on securities loaned | 393 |
| Foreign taxes withheld | (303,337) |
| Total investment income | $58,004,322 |
| Expenses | |
| Management fee | $17,380,382 |
| Distribution and/or service fees | 3,218,881 |
| Shareholder servicing costs | 56,611 |
| Administrative services fee | 398,143 |
| Independent Trustees' compensation | 39,211 |
| Custodian fee | 122,811 |
| Shareholder communications | 41,411 |
| Audit and tax fees | 62,465 |
| Legal fees | 10,549 |
| Miscellaneous | 65,577 |
| Total expenses | $21,396,041 |
| Reduction of expenses by investment adviser | (511,911) |
| Net expenses | $20,884,130 |
| Net investment income (loss) | $37,120,192 |
| Realized and unrealized gain (loss) | |
| Realized gain (loss) (identified cost basis) | |
| Unaffiliated issuers | $168,461,525 |
| Affiliated issuers | (1,030) |
| Foreign currency | (35,538) |
| Net realized gain (loss) | $168,424,957 |
| Change in unrealized appreciation or depreciation | |
| Unaffiliated issuers | $(384,363,583) |
| Affiliated issuers | 3,065 |
| Translation of assets and liabilities in foreign currencies | (6,892) |
| Net unrealized gain (loss) | $(384,367,410) |
| Net realized and unrealized gain (loss) | $(215,942,453) |
| Change in net assets from operations | $(178,822,261) |
See Notes to Financial Statements
| Financial Statements | Statements of Changes in Net Assets |
These statements describe the increases and/or decreases in net assets resulting from operations, any distributions, and any shareholder transactions.
| | Year ended |
| | 12/31/22 | 12/31/21 |
| Change in net assets | | |
| From operations | | |
| Net investment income (loss) | $37,120,192 | $32,069,015 |
| Net realized gain (loss) | 168,424,957 | 152,258,102 |
| Net unrealized gain (loss) | (384,367,410) | 412,863,015 |
| Change in net assets from operations | $(178,822,261) | $597,190,132 |
| Total distributions to shareholders | $(183,745,122) | $(91,925,640) |
| Change in net assets from fund share transactions | $(23,553,592) | $(123,147,782) |
| Total change in net assets | $(386,120,975) | $382,116,710 |
| Net assets | | |
| At beginning of period | 2,832,686,170 | 2,450,569,460 |
| At end of period | $2,446,565,195 | $2,832,686,170 |
See Notes to Financial Statements
| Financial Statements | Financial Highlights |
The financial highlights table is intended to help you understand the fund's financial performance for the past 5 years. Certain information reflects financial results for a single fund share. The total returns in the table represent the rate that an investor would have earned (or lost) on an investment in the fund share class (assuming reinvestment of all distributions) held for the entire period.
| Initial Class | Year ended |
| | 12/31/22 | 12/31/21 | 12/31/20 | 12/31/19 | 12/31/18 |
| Net asset value, beginning of period | $24.72 | $20.40 | $20.95 | $17.30 | $20.92 |
| Income (loss) from investment operations | | | | | |
| Net investment income (loss) (d) | $0.35 | $0.31 | $0.31 | $0.33 | $0.41 |
| Net realized and unrealized gain (loss) | (1.83) | 4.84 | 0.29 | 4.68 | (2.32) |
| Total from investment operations | $(1.48) | $5.15 | $0.60 | $5.01 | $(1.91) |
| Less distributions declared to shareholders | | | | | |
| From net investment income | $(0.32) | $(0.31) | $(0.30) | $(0.44) | $(0.32) |
| From net realized gain | (1.37) | (0.52) | (0.85) | (0.92) | (1.39) |
| Total distributions declared to shareholders | $(1.69) | $(0.83) | $(1.15) | $(1.36) | $(1.71) |
| Net asset value, end of period (x) | $21.55 | $24.72 | $20.40 | $20.95 | $17.30 |
| Total return (%) (k)(r)(s)(x) | (5.91) | 25.45 | 3.48 | 29.80 | (10.09) |
Ratios (%) (to average net assets)
and Supplemental data: | | | | | |
| Expenses before expense reductions | 0.72 | 0.72 | 0.73 | 0.73 | 0.73 |
| Expenses after expense reductions | 0.70 | 0.70 | 0.71 | 0.72 | 0.72 |
| Net investment income (loss) | 1.60 | 1.33 | 1.64 | 1.67 | 2.02 |
| Portfolio turnover | 13 | 9 | 17 | 13 | 8 |
| Net assets at end of period (000 omitted) | $1,207,158 | $1,363,583 | $1,183,318 | $945,183 | $823,744 |
| Service Class | Year ended |
| | 12/31/22 | 12/31/21 | 12/31/20 | 12/31/19 | 12/31/18 |
| Net asset value, beginning of period | $24.16 | $19.96 | $20.52 | $16.96 | $20.55 |
| Income (loss) from investment operations | | | | | |
| Net investment income (loss) (d) | $0.29 | $0.24 | $0.25 | $0.27 | $0.35 |
| Net realized and unrealized gain (loss) | (1.79) | 4.75 | 0.29 | 4.59 | (2.28) |
| Total from investment operations | $(1.50) | $4.99 | $0.54 | $4.86 | $(1.93) |
| Less distributions declared to shareholders | | | | | |
| From net investment income | $(0.26) | $(0.27) | $(0.25) | $(0.38) | $(0.27) |
| From net realized gain | (1.37) | (0.52) | (0.85) | (0.92) | (1.39) |
| Total distributions declared to shareholders | $(1.63) | $(0.79) | $(1.10) | $(1.30) | $(1.66) |
| Net asset value, end of period (x) | $21.03 | $24.16 | $19.96 | $20.52 | $16.96 |
| Total return (%) (k)(r)(s)(x) | (6.14) | 25.16 | 3.22 | 29.51 | (10.36) |
Ratios (%) (to average net assets)
and Supplemental data: | | | | | |
| Expenses before expense reductions | 0.97 | 0.97 | 0.98 | 0.98 | 0.98 |
| Expenses after expense reductions | 0.95 | 0.95 | 0.96 | 0.97 | 0.97 |
| Net investment income (loss) | 1.35 | 1.08 | 1.38 | 1.42 | 1.77 |
| Portfolio turnover | 13 | 9 | 17 | 13 | 8 |
| Net assets at end of period (000 omitted) | $1,239,407 | $1,469,104 | $1,267,251 | $1,279,123 | $1,127,848 |
See Notes to Financial Statements
Financial Highlights - continued
| (d) | Per share data is based on average shares outstanding. |
| (k) | The total return does not reflect expenses that apply to separate accounts. Inclusion of these charges would reduce the total return figures for all periods shown. |
| (r) | Certain expenses have been reduced without which performance would have been lower. |
| (s) | From time to time the fund may receive proceeds from litigation settlements, without which performance would be lower. |
| (x) | The net asset values and total returns have been calculated on net assets which include adjustments made in accordance with U.S. generally accepted accounting principles required at period end for financial reporting purposes. |
See Notes to Financial Statements
Notes to Financial Statements
(1) Business and Organization
MFS Value Series (the fund) is a diversified series of MFS Variable Insurance Trust (the trust). The trust is organized as a Massachusetts business trust and is registered under the Investment Company Act of 1940, as amended, as an open-end management investment company. The shareholders of each series of the trust are separate accounts of insurance companies, which offer variable annuity and/or life insurance products, and qualified retirement and pension plans.
The fund is an investment company and accordingly follows the investment company accounting and reporting guidance of the Financial Accounting Standards Board (FASB) Accounting Standards Codification Topic 946 Financial Services - Investment Companies.
(2) Significant Accounting Policies
General — The preparation of financial statements in conformity with U.S. generally accepted accounting principles requires management to make estimates and assumptions that affect the reported amounts of assets and liabilities, and disclosure of contingent assets and liabilities at the date of the financial statements and the reported amounts of increases and decreases in net assets from operations during the reporting period. Actual results could differ from those estimates. In the preparation of these financial statements, management has evaluated subsequent events occurring after the date of the fund’s Statement of Assets and Liabilities through the date that the financial statements were issued.
Balance Sheet Offsetting — The fund's accounting policy with respect to balance sheet offsetting is that, absent an event of default by the counterparty or a termination of the agreement, the International Swaps and Derivatives Association (ISDA) Master Agreement, or similar agreement, does not result in an offset of reported amounts of financial assets and financial liabilities in the Statement of Assets and Liabilities across transactions between the fund and the applicable counterparty. The fund's right to setoff may be restricted or prohibited by the bankruptcy or insolvency laws of the particular jurisdiction to which a specific master netting agreement counterparty is subject. Balance sheet offsetting disclosures, to the extent applicable to the fund, have been included in the fund’s Significant Accounting Policies note under the captions for each of the fund’s in-scope financial instruments and transactions.
Investment Valuations — Subject to its oversight, the fund's Board of Trustees has delegated primary responsibility for determining or causing to be determined the value of the fund’s investments to MFS as the fund's adviser, pursuant to the fund’s valuation policy and procedures which have been adopted by the adviser and approved by the Board. Effective September 8, 2022, and in accordance with Rule 2a-5 under the Investment Company Act of 1940, the Board of Trustees designated the adviser as the “valuation designee” of the fund. If the adviser, as valuation designee, determines that reliable market quotations are not readily available for an investment, the investment is valued at fair value as determined in good faith by the adviser in accordance with the adviser’s fair valuation policy and procedures.
Under the fund's valuation policy and procedures, equity securities, including restricted equity securities, are generally valued at the last sale or official closing price on their primary market or exchange as provided by a third-party pricing service. Equity securities, for which there were no sales reported that day, are generally valued at the last quoted daily bid quotation on their primary market or exchange as provided by a third-party pricing service. Short-term instruments with a maturity at issuance of 60 days or less may be valued at amortized cost, which approximates market value. Open-end investment companies are generally valued at net asset value per share. The values of foreign securities and other assets and liabilities expressed in foreign currencies are converted to U.S. dollars using the mean of bid and asked prices for rates provided by a third-party pricing service.
Under the fund’s valuation policy and procedures, market quotations are not considered to be readily available for debt instruments, floating rate loans, and many types of derivatives. These investments are generally valued at fair value based on information from third-party pricing services or otherwise determined by the adviser in accordance with the adviser’s fair valuation policy and procedures. Securities and other assets generally valued on the basis of information from a third-party pricing service may also be valued at a broker/dealer bid quotation. In determining values, third-party pricing services can utilize both transaction data and market information such as yield, quality, coupon rate, maturity, type of issue, trading characteristics, spreads and other market data. An investment may also be valued at fair value if the adviser determines that the investment’s value has been materially affected by events occurring after the close of the exchange or market on which the investment is principally traded (such as foreign exchange or market) and prior to the determination of the fund’s net asset value, or after the halt of trading of a specific security where trading does not resume prior to the close of the exchange or market on which the security is principally traded. Events that occur after foreign markets close (such as developments in foreign markets and significant movements in the U.S. markets) and prior to the determination of the fund’s net asset value may be deemed to have a material effect on the value of securities traded in foreign markets. Accordingly, the fund’s foreign equity securities may often be valued at fair value. The adviser generally relies on third-party pricing services or other information (such as the correlation with price movements of similar securities in the same or other markets; the type, cost and investment characteristics of the security; the business and financial condition of the issuer; and trading and other
Notes to Financial Statements - continued
market data) to assist in determining whether to fair value and at what value to fair value an investment. The value of an investment for purposes of calculating the fund’s net asset value can differ depending on the source and method used to determine value. When fair valuation is used, the value of an investment used to determine the fund’s net asset value may differ from quoted or published prices for the same investment. There can be no assurance that the fund could obtain the fair value assigned to an investment if it were to sell the investment at the same time at which the fund determines its net asset value per share.
Various inputs are used in determining the value of the fund's assets or liabilities. These inputs are categorized into three broad levels. In certain cases, the inputs used to measure fair value may fall into different levels of the fair value hierarchy. In such cases, an investment's level within the fair value hierarchy is based on the lowest level of input that is significant to the fair value measurement. The fund's assessment of the significance of a particular input to the fair value measurement in its entirety requires judgment, and considers factors specific to the investment. Level 1 includes unadjusted quoted prices in active markets for identical assets or liabilities. Level 2 includes other significant observable market-based inputs (including quoted prices for similar securities, interest rates, prepayment speed, and credit risk). Level 3 includes significant unobservable inputs, which may include the adviser's own assumptions in determining the fair value of investments. The following is a summary of the levels used as of December 31, 2022 in valuing the fund's assets and liabilities:
| Financial Instruments | Level 1 | Level 2 | Level 3 | Total |
| Equity Securities: | | | | |
| United States | $2,318,908,628 | $— | $— | $2,318,908,628 |
| United Kingdom | 49,830,708 | — | — | 49,830,708 |
| Switzerland | 8,857,477 | 36,509,927 | — | 45,367,404 |
| Canada | 14,871,650 | — | — | 14,871,650 |
| Mutual Funds | 29,657,201 | — | — | 29,657,201 |
| Total | $2,422,125,664 | $36,509,927 | $— | $2,458,635,591 |
For further information regarding security characteristics, see the Portfolio of Investments.
Foreign Currency Translation — Purchases and sales of foreign investments, income, and expenses are converted into U.S. dollars based upon currency exchange rates prevailing on the respective dates of such transactions or on the reporting date for foreign denominated receivables and payables. Gains and losses attributable to foreign currency exchange rates on sales of securities are recorded for financial statement purposes as net realized gains and losses on investments. Gains and losses attributable to foreign exchange rate movements on receivables, payables, income and expenses are recorded for financial statement purposes as foreign currency transaction gains and losses. That portion of both realized and unrealized gains and losses on investments that results from fluctuations in foreign currency exchange rates is not separately disclosed.
Security Loans — Under its Securities Lending Agency Agreement with the fund, State Street Bank and Trust Company, as lending agent, loans the securities of the fund to certain qualified institutions (the “Borrowers”) approved by the fund. Security loans can be terminated at the discretion of either the lending agent or the fund and the related securities must be returned within the earlier of the standard trade settlement period for such securities or within three business days. The loans are collateralized by cash and/or U.S. Treasury and federal agency obligations in an amount typically at least equal to the market value of the securities loaned. On loans collateralized by cash, the cash collateral is invested in a money market fund. The market value of the loaned securities is determined at the close of business of the fund and any additional required collateral is delivered to the fund on the next business day. The lending agent provides the fund with indemnification against Borrower default. In the event of Borrower default, the lending agent will, for the benefit of the fund, either purchase securities identical to those loaned or, when such purchase is commercially impracticable, pay the fund the market value of the loaned securities. In return, the lending agent assumes the fund's rights to the related collateral. If the collateral value is less than the cost to purchase identical securities, the lending agent is responsible for the shortfall, but only to the extent that such shortfall is not due to a decline in collateral value resulting from collateral reinvestment for which the fund bears the risk of loss. A portion of the income generated upon investment of the collateral is remitted to the Borrowers, and the remainder is allocated between the fund and the lending agent. On loans collateralized by U.S. Treasury and/or federal agency obligations, a fee is received from the Borrower, and is allocated between the fund and the lending agent. Income from securities lending is separately reported in the Statement of Operations. The dividend and interest income earned on the securities loaned is accounted for in the same manner as other dividend and interest income. At December 31, 2022, there were no securities on loan or collateral outstanding.
Indemnifications — Under the fund's organizational documents, its officers and Trustees may be indemnified against certain liabilities and expenses arising out of the performance of their duties to the fund. Additionally, in the normal course of business, the fund enters into agreements with service providers that may contain indemnification clauses. The fund's maximum exposure under these agreements is unknown as this would involve future claims that may be made against the fund that have not yet occurred.
Notes to Financial Statements - continued
Investment Transactions and Income — Investment transactions are recorded on the trade date. Interest income is recorded on the accrual basis. Dividends received in cash are recorded on the ex-dividend date. Certain dividends from foreign securities will be recorded when the fund is informed of the dividend if such information is obtained subsequent to the ex-dividend date. Dividend payments received in additional securities are recorded on the ex-dividend date in an amount equal to the value of the security on such date. In determining the net gain or loss on securities sold, the cost of securities is determined on the identified cost basis.
The fund may receive proceeds from litigation settlements. Any proceeds received from litigation involving portfolio holdings are reflected in the Statement of Operations in realized gain/loss if the security has been disposed of by the fund or in unrealized gain/loss if the security is still held by the fund. Any other proceeds from litigation not related to portfolio holdings are reflected as other income in the Statement of Operations.
Tax Matters and Distributions — The fund intends to qualify as a regulated investment company, as defined under Subchapter M of the Internal Revenue Code, and to distribute all of its taxable income, including realized capital gains. As a result, no provision for federal income tax is required. The fund’s federal tax returns, when filed, will remain subject to examination by the Internal Revenue Service for a three year period. Management has analyzed the fund’s tax positions taken on federal and state tax returns for all open tax years and does not believe that there are any uncertain tax positions that require recognition of a tax liability. Foreign taxes, if any, have been accrued by the fund in the accompanying financial statements in accordance with the applicable foreign tax law. Foreign income taxes may be withheld by certain countries in which the fund invests. Additionally, capital gains realized by the fund on securities issued in or by certain foreign countries may be subject to capital gains tax imposed by those countries.
Distributions to shareholders are recorded on the ex-dividend date. Income and capital gain distributions are determined in accordance with income tax regulations, which may differ from U.S. generally accepted accounting principles. Certain capital accounts in the financial statements are periodically adjusted for permanent differences in order to reflect their tax character. These adjustments have no impact on net assets or net asset value per share. Temporary differences which arise from recognizing certain items of income, expense, gain or loss in different periods for financial statement and tax purposes will reverse at some time in the future.
Book/tax differences primarily relate to wash sale loss deferrals.
The tax character of distributions declared to shareholders for the last two fiscal years is as follows:
| | Year ended
12/31/22 | Year ended
12/31/21 |
| Ordinary income (including any short-term capital gains) | $43,571,664 | $32,692,062 |
| Long-term capital gains | 140,173,458 | 59,233,578 |
| Total distributions | $183,745,122 | $91,925,640 |
The federal tax cost and the tax basis components of distributable earnings were as follows:
| As of 12/31/22 | |
| Cost of investments | $1,324,110,306 |
| Gross appreciation | 1,178,434,206 |
| Gross depreciation | (43,908,921) |
| Net unrealized appreciation (depreciation) | $1,134,525,285 |
| Undistributed ordinary income | 37,784,723 |
| Undistributed long-term capital gain | 168,675,190 |
| Other temporary differences | 16,193 |
| Total distributable earnings (loss) | $1,341,001,391 |
Multiple Classes of Shares of Beneficial Interest — The fund offers multiple classes of shares, which differ in their respective distribution and/or service fees. The fund's income, realized and unrealized gain (loss), and common expenses are allocated to shareholders based on the daily net assets of each class. Dividends are declared separately for each class. Differences in per share dividend rates are generally due to differences in separate class expenses. The fund’s distributions declared to shareholders as reported in the Statements of Changes in Net Assets are presented by class as follows:
Notes to Financial Statements - continued
| | Year
ended
12/31/22 | | Year
ended
12/31/21 |
| Initial Class | $91,353,058 | | $44,596,694 |
| Service Class | 92,392,064 | | 47,328,946 |
| Total | $183,745,122 | | $91,925,640 |
(3) Transactions with Affiliates
Investment Adviser — The fund has an investment advisory agreement with MFS to provide overall investment management and related administrative services and facilities to the fund. The management fee is computed daily and paid monthly at the following annual rates based on the fund's average daily net assets:
| Up to $1 billion | 0.75% |
| In excess of $1 billion and up to $2.5 billion | 0.65% |
| In excess of $2.5 billion | 0.60% |
MFS has agreed in writing to reduce its management fee by a specified amount if certain MFS mutual fund assets exceed thresholds agreed to by MFS and the fund's Board of Trustees. Effective March 1, 2022, MFS has also agreed in writing to waive at least 0.01% of its management fee as part of this agreement. The agreement to waive at least 0.01% of the management fee will continue until modified by the fund's Board of Trustees, but such agreement will continue at least until April 30, 2024. For the year ended December 31, 2022, this management fee reduction amounted to $350,822, which is included in the reduction of total expenses in the Statement of Operations. The management fee incurred for the year ended December 31, 2022 was equivalent to an annual effective rate of 0.67% of the fund's average daily net assets.
For the period from January 1, 2022 through July 31, 2022, the investment adviser had agreed in writing to pay a portion of the fund’s total annual operating expenses, excluding interest, taxes, extraordinary expenses, brokerage and transaction costs, certain tax reclaim recovery expenses (including contingency fees and closing agreement expenses), and investment-related expenses, such that total annual operating expenses did not exceed 0.71% of average daily net assets for the Initial Class shares and 0.96% of average daily net assets for the Service Class. This written agreement terminated on July 31, 2022. For the period from January 1, 2022 through July 31, 2022, the fund’s actual operating expenses did not exceed the limit and therefore, the investment adviser did not pay any portion of the fund’s expenses related to this agreement.
Effective August 1, 2022, investment adviser has agreed in writing to pay a portion of the fund’s total annual operating expenses, excluding interest, taxes, extraordinary expenses, brokerage and transaction costs, certain tax reclaim recovery expenses (including contingency fees and closing agreement expenses), and investment-related expenses, such that total annual operating expenses do not exceed 0.69% of average daily net assets for the Initial Class shares and 0.94% of average daily net assets for the Service Class shares. This written agreement will continue until modified by the fund’s Board of Trustees, but such agreement will continue at least until April 30, 2024. For the period from August 1, 2022, through December 31, 2022, this reduction amounted to $161,089, which is included in the reduction of total expenses in the Statement of Operations.
Distributor — MFS Fund Distributors, Inc. (MFD), a wholly-owned subsidiary of MFS, is the distributor of shares of the fund. The Trustees have adopted a distribution plan for the Service Class shares pursuant to Rule 12b-1 under the Investment Company Act of 1940.
The fund's distribution plan provides that the fund will pay MFD distribution and/or service fees equal to 0.25% per annum of its average daily net assets attributable to Service Class shares as partial consideration for services performed and expenses incurred by MFD and financial intermediaries (including participating insurance companies that invest in the fund to fund variable annuity and variable life insurance contracts, sponsors of qualified retirement and pension plans that invest in the fund, and affiliates of these participating insurance companies and plan sponsors) in connection with the sale and distribution of the Service Class shares. MFD may subsequently pay all, or a portion, of the distribution and/or service fees to financial intermediaries.
Shareholder Servicing Agent — MFS Service Center, Inc. (MFSC), a wholly-owned subsidiary of MFS, receives a fee from the fund for its services as shareholder servicing agent. For the year ended December 31, 2022, the fee was $54,404, which equated to 0.0022% annually of the fund's average daily net assets. MFSC also receives reimbursement from the fund for out-of-pocket expenses paid by MFSC on behalf of the fund. For the year ended December 31, 2022, these costs amounted to $2,207.
Notes to Financial Statements - continued
Administrator — MFS provides certain financial, legal, shareholder communications, compliance, and other administrative services to the fund. Under an administrative services agreement, the fund reimburses MFS the costs incurred to provide these services. The fund is charged an annual fixed amount of $17,500 plus a fee based on average daily net assets. The administrative services fee incurred for the year ended December 31, 2022 was equivalent to an annual effective rate of 0.0158% of the fund's average daily net assets.
Trustees’ and Officers’ Compensation — The fund pays compensation to independent Trustees in the form of a retainer, attendance fees, and additional compensation to Board and Committee chairpersons. The fund does not pay compensation directly to Trustees or officers of the fund who are also officers of the investment adviser, all of whom receive remuneration from MFS for their services to the fund. Certain officers and Trustees of the fund are officers or directors of MFS, MFD, and MFSC.
Other — The fund invests in the MFS Institutional Money Market Portfolio which is managed by MFS and seeks current income consistent with preservation of capital and liquidity. This money market fund does not pay a management fee to MFS but does incur investment and operating costs.
The fund is permitted to engage in purchase and sale transactions with funds and accounts for which MFS serves as investment adviser or sub-adviser (“cross-trades”) pursuant to a policy adopted by the Board of Trustees. This policy has been designed to ensure that cross-trades conducted by the fund comply with Rule 17a-7 under the Investment Company Act of 1940. During the year ended December 31, 2022, the fund engaged in purchase and sale transactions pursuant to this policy, which amounted to $97,540 and $1,334,845, respectively. The sales transactions resulted in net realized gains (losses) of $202,376.
The adviser has voluntarily undertaken to reimburse the fund from its own resources on a quarterly basis for the cost of investment research embedded in the cost of the fund’s securities trades. This agreement may be rescinded at any time. For the year ended December 31, 2022, this reimbursement amounted to $22,786, which is included in “Other” income in the Statement of Operations.
(4) Portfolio Securities
For the year ended December 31, 2022, purchases and sales of investments, other than short-term obligations, aggregated $334,019,010 and $479,345,988, respectively.
(5) Shares of Beneficial Interest
The fund's Declaration of Trust permits the Trustees to issue an unlimited number of full and fractional shares of beneficial interest. Transactions in fund shares were as follows:
| | Year ended
12/31/22 | | Year ended
12/31/21 |
| | Shares | Amount | | Shares | Amount |
| Shares sold | | | | | |
| Initial Class | 6,563,655 | $146,371,031 | | 6,770,909 | $152,854,221 |
| Service Class | 24,366,893 | 539,149,730 | | 6,371,855 | 143,168,312 |
| | 30,930,548 | $685,520,761 | | 13,142,764 | $296,022,533 |
Shares issued to shareholders
in reinvestment of distributions | | | | | |
| Initial Class | 4,288,876 | $91,353,058 | | 1,886,493 | $44,596,694 |
| Service Class | 4,439,792 | 92,392,064 | | 2,046,215 | 47,328,946 |
| | 8,728,668 | $183,745,122 | | 3,932,708 | $91,925,640 |
| Shares reacquired | | | | | |
| Initial Class | (9,999,661) | $(220,090,375) | | (11,503,983) | $(262,149,729) |
| Service Class | (30,676,378) | (672,729,100) | | (11,093,369) | (248,946,226) |
| | (40,676,039) | $(892,819,475) | | (22,597,352) | $(511,095,955) |
| Net change | | | | | |
| Initial Class | 852,870 | $17,633,714 | | (2,846,581) | $(64,698,814) |
| Service Class | (1,869,693) | (41,187,306) | | (2,675,299) | (58,448,968) |
| | (1,016,823) | $(23,553,592) | | (5,521,880) | $(123,147,782) |
Notes to Financial Statements - continued
The fund is one of several mutual funds in which certain MFS funds may invest. The MFS funds do not invest in the underlying funds for the purpose of exercising management or control. At the end of the period, the MFS Moderate Allocation Portfolio and the MFS Growth Allocation Portfolio were the owners of record of approximately 4% and 1%, respectively, of the value of outstanding voting shares of the fund. In addition, the MFS Conservative Allocation Portfolio was the owner of record of less than 1% of the value of outstanding voting shares of the fund.
(6) Line of Credit
The fund and certain other funds managed by MFS participate in a $1.45 billion unsecured committed line of credit of which $1.2 billion is reserved for use by the fund and certain other MFS U.S. funds. The line of credit is provided by a syndicate of banks under a credit agreement. Borrowings may be made for temporary financing needs. Interest is charged to each fund, based on its borrowings, generally at a rate equal to the highest of 1) Daily Simple SOFR (Secured Overnight Financing Rate) plus 0.10%, 2) the Federal Funds Effective Rate, or 3) the Overnight Bank Funding Rate, each plus an agreed upon spread. A commitment fee, based on the average daily unused portion of the committed line of credit, is allocated among the participating funds. The line of credit expires on March 16, 2023 unless extended or renewed. In addition, the fund and other funds managed by MFS have established unsecured uncommitted borrowing arrangements with certain banks for temporary financing needs. Interest is charged to each fund, based on its borrowings, at rates equal to customary reference rates plus an agreed upon spread. For the year ended December 31, 2022, the fund’s commitment fee and interest expense were $11,066 and $13,615, respectively, and are included in “Miscellaneous” expense in the Statement of Operations.
(7) Investments in Affiliated Issuers
An affiliated issuer may be considered one in which the fund owns 5% or more of the outstanding voting securities, or a company which is under common control. For the purposes of this report, the following were affiliated issuers:
| Affiliated Issuers | Beginning
Value | Purchases | Sales
Proceeds | Realized
Gain
(Loss) | Change in
Unrealized
Appreciation or
Depreciation | Ending
Value |
| MFS Institutional Money Market Portfolio | $38,380,359 | $323,322,309 | $332,047,502 | $(1,030) | $3,065 | $29,657,201 |
| Affiliated Issuers | Dividend
Income | Capital Gain
Distributions |
| MFS Institutional Money Market Portfolio | $403,277 | $— |
(8) LIBOR Transition
Certain of the fund's investments, including investments in certain debt instruments and derivatives (if any), as well as borrowings by the fund and certain other contractual arrangements of the fund, may be based on the London Interbank Offered Rate (“LIBOR”). In 2017, the regulatory authority that oversees financial services firms in the United Kingdom announced plans to transition away from LIBOR by the end of 2021. In March 2021, the administrator of LIBOR announced the extension of the publication of the more commonly used U.S. dollar LIBOR settings to the end of June 2023. Although the full impacts of the transition away from LIBOR are not fully known, the transition may result in, among other things, an increase in volatility or illiquidity of the markets for instruments that currently rely on LIBOR to determine interest rates and this could have an adverse impact on the fund's performance. With respect to the fund's accounting for investments, including investments in certain debt instruments and derivatives, as well as borrowings by the fund and any other contractual arrangements of the fund that undergo reference rate-related modifications as a result of the transition, management will rely upon the relief provided by FASB Codification Topic 848 – Reference Rate Reform (Topic 848). The guidance in Topic 848 permits the fund to account for those modified contracts as a continuation of the existing contracts. Management is still evaluating the impact to the fund of the June 30, 2023 planned discontinuation of the more commonly used U.S. dollar LIBOR settings.
(9) Russia and Ukraine Conflict
The market disruptions, which began in late February 2022, associated with geopolitical events related to the conflict between Russia and Ukraine may adversely affect the value of the fund’s assets and thus the fund’s performance. Management continues to monitor these events and to evaluate the related impacts, if any, to the fund.
Report of Independent Registered Public Accounting Firm
To the Board of Trustees of MFS Variable Insurance Trust and the Shareholders of MFS Value Series:
Opinion on the Financial Statements and Financial Highlights
We have audited the accompanying statement of assets and liabilities of MFS Value Series (the “Fund”), including the portfolio of investments, as of December 31, 2022, the related statement of operations for the year then ended, the statements of changes in net assets for each of the two years in the period then ended, the financial highlights for each of the five years in the period then ended, and the related notes. In our opinion, the financial statements and financial highlights present fairly, in all material respects, the financial position of the Fund as of December 31, 2022, and the results of its operations for the year then ended, the changes in its net assets for each of the two years in the period then ended, and the financial highlights for each of the five years in the period then ended, in conformity with accounting principles generally accepted in the United States of America.
Basis for Opinion
These financial statements and financial highlights are the responsibility of the Fund's management. Our responsibility is to express an opinion on the Fund's financial statements and financial highlights based on our audits. We are a public accounting firm registered with the Public Company Accounting Oversight Board (United States) (PCAOB) and are required to be independent with respect to the Fund in accordance with the U.S. federal securities laws and the applicable rules and regulations of the Securities and Exchange Commission and the PCAOB.
We conducted our audits in accordance with the standards of the PCAOB. Those standards require that we plan and perform the audit to obtain reasonable assurance about whether the financial statements and financial highlights are free of material misstatement, whether due to error or fraud. The Fund is not required to have, nor were we engaged to perform, an audit of its internal control over financial reporting. As part of our audits, we are required to obtain an understanding of internal control over financial reporting but not for the purpose of expressing an opinion on the effectiveness of the Fund's internal control over financial reporting. Accordingly, we express no such opinion.
Our audits included performing procedures to assess the risks of material misstatement of the financial statements and financial highlights, whether due to error or fraud, and performing procedures that respond to those risks. Such procedures included examining, on a test basis, evidence regarding the amounts and disclosures in the financial statements and financial highlights. Our audits also included evaluating the accounting principles used and significant estimates made by management, as well as evaluating the overall presentation of the financial statements and financial highlights. Our procedures included confirmation of securities owned as of December 31, 2022, by correspondence with the custodian. We believe that our audits provide a reasonable basis for our opinion.
DELOITTE & TOUCHE LLP
Boston, Massachusetts
February 15, 2023
We have served as the auditor of one or more of the MFS investment companies since 1924.
Trustees and Officers — Identification and Background
The Trustees and Officers of the Trust, as of February 1, 2023, are listed below, together with their principal occupations during the past five years. (Their titles may have varied during that period.) The address of each Trustee and Officer is 111 Huntington Avenue, Boston, Massachusetts 02199-7618.
| Name, Age | | Position(s) Held with Fund | | Trustee/Officer Since(h) | | Number of MFS Funds overseen by the Trustee | | Principal Occupations During
the Past Five Years | | Other Directorships During
the Past Five Years (j) |
| INTERESTED TRUSTEE | | | | | | | | | | |
Michael W. Roberge (k)
(age 56) | | Trustee | | January 2021 | | 136 | | Massachusetts Financial Services Company, Chairman (since January 2021); Chief Executive Officer (since January 2017); Director; Chairman of the Board (since January 2022); President (until December 2018); Chief Investment Officer (until December 2018) | | N/A |
| INDEPENDENT TRUSTEES | | | | | | | | | | |
John P. Kavanaugh
(age 68) | | Trustee and Chair of Trustees | | January 2009 | | 136 | | Private investor | | N/A |
Steven E. Buller
(age 71) | | Trustee | | February 2014 | | 136 | | Private investor | | N/A |
John A. Caroselli
(age 68) | | Trustee | | March 2017 | | 136 | | Private investor; JC Global Advisors, LLC (management consulting), President (since 2015) | | N/A |
Maureen R. Goldfarb
(age 67) | | Trustee | | January 2009 | | 136 | | Private investor | | N/A |
Peter D. Jones
(age 67) | | Trustee | | January 2019 | | 136 | | Private investor | | N/A |
James W. Kilman, Jr.
(age 61) | | Trustee | | January 2019 | | 136 | | Burford Capital Limited (finance and investment management), Senior Advisor (since May 3, 2021), Chief Financial Officer (2019 - May 2, 2021); KielStrand Capital LLC (family office), Chief Executive Officer (since 2016) | | Alpha-En Corporation, Director (2016-2019) |
Clarence Otis, Jr.
(age 66) | | Trustee | | March 2017 | | 136 | | Private investor | | VF Corporation, Director; Verizon Communications, Inc., Director; The Travelers Companies, Director |
Maryanne L. Roepke
(age 66) | | Trustee | | May 2014 | | 136 | | Private investor | | N/A |
Laurie J. Thomsen
(age 65) | | Trustee | | March 2005 | | 136 | | Private investor | | The Travelers Companies, Director; Dycom Industries, Inc., Director |
Trustees and Officers - continued
| Name, Age | | Position(s) Held with
Fund | | Trustee/Officer Since(h) | | Number of MFS Funds for which the Person is an Officer | | Principal Occupations During
the Past Five Years |
| OFFICERS | | | | | | | | |
Christopher R. Bohane (k)
(age 49) | | Assistant Secretary and Assistant Clerk | | July 2005 | | 136 | | Massachusetts Financial Services Company, Senior Vice President and Senior Managing Counsel |
Kino Clark (k)
(age 54) | | Assistant Treasurer | | January 2012 | | 136 | | Massachusetts Financial Services Company, Vice President |
John W. Clark, Jr. (k)
(age 55) | | Assistant Treasurer | | April 2017 | | 136 | | Massachusetts Financial Services Company, Vice President |
David L. DiLorenzo (k)
(age 54) | | President | | July 2005 | | 136 | | Massachusetts Financial Services Company, Senior Vice President |
Heidi W. Hardin (k)
(age 55) | | Secretary and Clerk | | April 2017 | | 136 | | Massachusetts Financial Services Company, Executive Vice President and General Counsel |
Brian E. Langenfeld (k)
(age 49) | | Assistant Secretary and Assistant Clerk | | June 2006 | | 136 | | Massachusetts Financial Services Company, Vice President and Managing Counsel |
Rosa E. Licea-Mailloux (k)
(age 46) | | Chief Compliance Officer | | March 2022 | | 136 | | Massachusetts Financial Services Company, Vice President (since 2018); Director of Corporate Compliance (2018-2021), Senior Director Compliance (2021-2022), Senior Managing Director of North American Compliance & Chief Compliance Officer (since March 2022); Natixis Investment Managers (investment management), Funds Chief Compliance Officer, Deputy General Counsel & Senior Vice President (until 2018) |
Amanda S. Mooradian (k)
(age 43) | | Assistant Secretary and Assistant Clerk | | September 2018 | | 136 | | Massachusetts Financial Services Company, Assistant Vice President and Senior Counsel |
Susan A. Pereira (k)
(age 52) | | Assistant Secretary and Assistant Clerk | | July 2005 | | 136 | | Massachusetts Financial Services Company, Vice President and Managing Counsel |
Kasey L. Phillips (k)
(age 52) | | Assistant Treasurer | | September 2012 | | 136 | | Massachusetts Financial Services Company, Vice President |
Matthew A. Stowe (k)
(age 48) | | Assistant Secretary and Assistant Clerk | | October 2014 | | 136 | | Massachusetts Financial Services Company, Vice President and Senior Managing Counsel |
William B. Wilson (k)
(age 40) | | Assistant Secretary and Assistant Clerk | | October 2022 | | 136 | | Massachusetts Financial Services Company, Assistant Vice President and Counsel |
James O. Yost (k)
(age 62) | | Treasurer | | September 1990 | | 136 | | Massachusetts Financial Services Company, Senior Vice President |
| (h) | Date first appointed to serve as Trustee/Officer of an MFS Fund. Each Trustee has served continuously since appointment unless indicated otherwise. From January 2012 through December 2016, Messrs. DiLorenzo and Yost served as Treasurer and Deputy Treasurer of the Funds, respectively. |
| (j) | Directorships or trusteeships of companies required to report to the Securities and Exchange Commission (i.e., “public companies”). |
| (k) | “Interested person” of the Trust within the meaning of the Investment Company Act of 1940 (referred to as the 1940 Act), which is the principal federal law governing investment companies like the fund, as a result of a position with MFS. The address of MFS is 111 Huntington Avenue, Boston, Massachusetts 02199-7618. |
Each Trustee (other than Messrs. Jones, Kilman and Roberge) has been elected by shareholders and each Trustee and Officer holds office until his or her successor is chosen and qualified or until his or her earlier death, resignation, retirement or removal. Mr. Roberge became a Trustee of the Funds on January 1, 2021 and Messrs. Jones and Kilman became Trustees of the Funds on January 1, 2019. The Trust does not hold annual meetings for the purpose of electing Trustees, and Trustees are not elected for fixed terms. Under the terms of the Board's retirement policy, an Independent Trustee shall retire at the end of the calendar year in which he or she reaches the earlier of 75 years of age or 15 years of service on the Board (or, in the case of any Independent Trustee who joined the Board prior to 2015, 20 years of service on the Board).
Trustees and Officers - continued
Messrs. Buller, Kilman and Otis and Ms. Roepke are members of the Trust’s Audit Committee.
Each of the Interested Trustees and certain Officers hold comparable officer positions with certain affiliates of MFS.
The Statement of Additional Information for a Fund includes further information about the Trustees and is available without charge upon request by calling 1-800-225-2606.
| Investment Adviser | Custodian |
Massachusetts Financial Services Company
111 Huntington Avenue
Boston, MA 02199-7618 | State Street Bank and Trust Company
1 Lincoln Street
Boston, MA 02111-2900 |
| Distributor | Independent Registered Public Accounting Firm |
MFS Fund Distributors, Inc.
111 Huntington Avenue
Boston, MA 02199-7618 | Deloitte & Touche LLP
200 Berkeley Street
Boston, MA 02116 |
| Portfolio Manager(s) | |
Katherine Cannan
Nevin Chitkara | |
Board Review of Investment Advisory Agreement
MFS Value Series
The Investment Company Act of 1940 requires that both the full Board of Trustees and a majority of the non-interested (“independent”) Trustees, voting separately, annually approve the continuation of the Fund’s investment advisory agreement with MFS. The Trustees consider matters bearing on the Fund and its advisory arrangements at their meetings throughout the year, including a review of performance data at each regular meeting. In addition, the independent Trustees met several times over the course of three months beginning in May and ending in July, 2022 (“contract review meetings”) for the specific purpose of considering whether to approve the continuation of the investment advisory agreement for the Fund and the other investment companies that the Board oversees (the “MFS Funds”). The independent Trustees were assisted in their evaluation of the Fund’s investment advisory agreement by independent legal counsel, from whom they received separate legal advice and with whom they met separately from MFS during various contract review meetings. The independent Trustees were also assisted in this process by an independent consultant who was retained by and reported to the independent Trustees.
In connection with their deliberations regarding the continuation of the investment advisory agreement, the Trustees, including the independent Trustees, considered such information and factors as they believed, in light of the legal advice furnished to them and their own business judgment, to be relevant. The investment advisory agreement for the Fund was considered separately, although the Trustees also took into account the common interests of all MFS Funds in their review. As described below, the Trustees considered the nature, quality, and extent of the various investment advisory, administrative, and shareholder services performed by MFS under the existing investment advisory agreement and other arrangements with the Fund.
In connection with their contract review meetings, the Trustees received and relied upon materials that included, among other items: (i) information provided by Broadridge Financial Solutions, Inc. (“Broadridge”), an independent third party, on the investment performance of the Fund for various time periods ended December 31, 2021 and the investment performance of a group of funds with substantially similar investment classifications/objectives (the “Broadridge performance universe”), (ii) information provided by Broadridge on the Fund’s advisory fees and other expenses and the advisory fees and other expenses of comparable funds identified by Broadridge as well as all other funds in the same investment classification/category (the “Broadridge expense group and universe”), (iii) information provided by MFS on the advisory fees of portfolios of other clients of MFS, including institutional separate accounts and other clients, (iv) information as to whether and to what extent applicable expense waivers, reimbursements or fee “breakpoints” are observed for the Fund, (v) information regarding MFS’ financial results and financial condition, including MFS’ and certain of its affiliates’ estimated profitability from services performed for the Fund and the MFS Funds as a whole, and compared to MFS’ institutional business, (vi) MFS’ views regarding the outlook for the mutual fund industry and the strategic business plans of MFS, (vii) descriptions of various functions performed by MFS for the Funds, such as compliance monitoring and portfolio trading practices, and (viii) information regarding the overall organization of MFS, including information about MFS’ senior management and other personnel providing investment advisory, administrative and other services to the Fund and the other MFS Funds. The comparative performance, fee and expense information prepared and provided by Broadridge was not independently verified and the independent Trustees did not independently verify any information provided to them by MFS.
The Trustees’ conclusion as to the continuation of the investment advisory agreement was based on a comprehensive consideration of all information provided to the Trustees and not the result of any single factor. Some of the factors that figured particularly in the Trustees’ deliberations are described below, although individual Trustees may have evaluated the information presented differently from one another, giving different weights to various factors. It is also important to recognize that the fee arrangements for the Fund and other MFS Funds are the result of years of review and discussion between the independent Trustees and MFS, that certain aspects of such arrangements may receive greater scrutiny in some years than in others, and that the Trustees’ conclusions may be based, in part, on their consideration of these same arrangements during the course of the year and in prior years.
Based on information provided by Broadridge and MFS, the Trustees reviewed the Fund’s total return investment performance as well as the Broadridge performance universe over various time periods. The Trustees placed particular emphasis on the total return performance of the Fund’s Initial Class shares in comparison to the performance of funds in its Broadridge performance universe over the five-year period ended December 31, 2021, which the Trustees believed was a long enough period to reflect differing market conditions. The total return performance of the Fund’s Initial Class shares was in the 2nd quintile relative to the other funds in the universe for this five-year period (the 1st quintile being the best performers and the 5th quintile being the worst performers). The total return performance of the Fund’s Initial Class shares was in the 3rd quintile for the one-year period and the 2nd quintile for three-year period ended December 31, 2021 relative to the Broadridge performance universe. Because of the passage of time, these performance results may differ from the performance results for more recent periods, including those shown elsewhere in this report.
In the course of their deliberations, the Trustees took into account information provided by MFS in connection with the contract review meetings, as well as during investment review meetings conducted with portfolio management personnel during the course of the year regarding the Fund’s performance. After reviewing these and related factors, the Trustees concluded, within the context of their overall conclusions regarding the investment advisory agreement, that they were satisfied with MFS’ responses and efforts relating to investment performance.
Board Review of Investment Advisory Agreement - continued
In assessing the reasonableness of the Fund’s advisory fee, the Trustees considered, among other information, the Fund’s advisory fee and the total expense ratio of the Fund’s Initial Class shares as a percentage of average daily net assets and the advisory fee and total expense ratios of the Broadridge expense group based on information provided by Broadridge. The Trustees considered that MFS currently observes an expense limitation for the Fund, which may not be changed without the Trustees’ approval. The Trustees also considered that, according to the data provided by Broadridge (which takes into account any fee reductions or expense limitations that were in effect during the Fund’s last fiscal year), the Fund’s effective advisory fee rate and total expense ratio were each higher than the Broadridge expense group median. The Trustees also noted that MFS has agreed to further reduce the expense limitation for the Fund effective August 1, 2022.
The Trustees also considered the advisory fees charged by MFS to any institutional separate accounts advised by MFS (“separate accounts”) and unaffiliated investment companies for which MFS serves as subadviser (“subadvised funds”) that have comparable investment strategies to the Fund, if any. In comparing these fees, the Trustees considered information provided by MFS as to the generally broader scope of services provided by MFS to the Fund, as well as the more extensive regulatory burdens imposed on MFS in managing the Fund, in comparison to separate accounts and subadvised funds. The Trustees also considered the higher demands placed on MFS’ investment personnel and trading infrastructure as a result of the daily cash in-flows and out-flows of the Fund in comparison to separate accounts.
The Trustees also considered whether the Fund may benefit from any economies of scale in the management of the Fund in the event of growth in assets of the Fund and/or growth in assets of the MFS Funds as a whole. They noted that the Fund’s advisory fee rate schedule is subject to contractual breakpoints that reduce the Fund’s advisory fee rate on average daily net assets over $1 billion and $2.5 billion. The Trustees also noted that MFS has agreed in writing to waive a portion of the management fees of certain MFS Funds, including the Fund, if the total combined assets of certain funds within the MFS Funds’ complex increase above agreed upon thresholds (the “group fee waiver”), enabling the Fund’s shareholders to share in the benefits from any economies of scale at the complex level. The group fee waiver is reviewed and renewed annually between the Board and MFS. The Trustees concluded that the breakpoints and the group fee waiver were sufficient to allow the Fund to benefit from economies of scale as its assets and overall complex assets grow.
The Trustees also considered information prepared by MFS relating to MFS’ costs and profits with respect to the Fund, the MFS Funds considered as a group, and other investment companies and accounts advised by MFS, as well as MFS’ methodologies used to determine and allocate its costs to the MFS Funds, the Fund and other accounts and products for purposes of estimating profitability.
After reviewing these and other factors described herein, the Trustees concluded, within the context of their overall conclusions regarding the investment advisory agreement, that the advisory fees charged to the Fund represent reasonable compensation in light of the services being provided by MFS to the Fund.
In addition, the Trustees considered MFS’ resources and related efforts to continue to retain, attract and motivate capable personnel to serve the Fund. The Trustees also considered current and developing conditions in the financial services industry, including the presence of large and well-capitalized companies which are spending, and appear to be prepared to continue to spend, substantial sums to engage personnel and to provide services to competing investment companies. In this regard, the Trustees also considered the financial resources of MFS and its ultimate parent, Sun Life Financial Inc. The Trustees also considered the advantages and possible disadvantages to the Fund of having an adviser that also serves other investment companies as well as other accounts.
The Trustees also considered the nature, quality, cost, and extent of administrative, transfer agency, and distribution services provided to the Fund by MFS and its affiliates under agreements and plans other than the investment advisory agreement, including any 12b-1 fees the Fund pays to MFS Fund Distributors, Inc., an affiliate of MFS. The Trustees also considered the nature, extent and quality of certain other services MFS performs or arranges for on the Fund’s behalf, which may include securities lending programs, directed expense payment programs, class action recovery programs, and MFS’ interaction with third-party service providers, principally custodians and sub-custodians. The Trustees concluded that the various non-advisory services provided by MFS and its affiliates on behalf of the Fund were satisfactory.
The Trustees considered so-called “fall-out benefits” to MFS such as reputational value derived from serving as investment manager to the MFS Funds. The Trustees also considered that MFS discontinued its historic practice of obtaining investment research from portfolio brokerage commissions paid by certain MFS Funds effective January 2018, and directly pays or voluntarily reimburses a Fund, if applicable, for the costs of external research acquired through the use of the Fund’s portfolio brokerage commissions.
Based on their evaluation of factors that they deemed to be material, including those factors described above, the Board of Trustees, including the independent Trustees, concluded that the Fund’s investment advisory agreement with MFS should be continued for an additional one-year period, commencing August 1, 2022.
Proxy Voting Policies and Information
MFS votes proxies on behalf of the fund pursuant to proxy voting policies and procedures that are available without charge, upon request, by calling 1-800-225-2606, by visiting mfs.com/proxyvoting, or by visiting the SEC’s Web site at http://www.sec.gov.
Information regarding how the fund voted proxies relating to portfolio securities during the most recent twelve-month period ended June 30 is available by August 31 of each year without charge by visiting mfs.com/proxyvoting, or by visiting the SEC’s Web site at http://www.sec.gov.
Quarterly Portfolio Disclosure
The fund files a complete schedule of portfolio holdings with the SEC for the first and third quarters of each fiscal year as an exhibit to its reports on Form N-PORT. The fund’s Form N-PORT reports are available on the SEC’s Web site at http://www.sec.gov. A shareholder can obtain the portfolio holdings report for the first and third quarters of the fund's fiscal year at mfs.com/vit1 by choosing the fund's name and then scrolling to the “Resources” section and clicking on the “Prospectus and Reports” tab.
FURTHER INFORMATION
From time to time, MFS may post important information about the fund or the MFS Funds on the MFS Web site (mfs.com). This information is available at https://www.mfs.com/announcements or at mfs.com/vit1 by choosing the fund's name and then scrolling to the “Resources” section and clicking on the “Announcements” tab, if any.
Information About Fund Contracts and Legal Claims
The fund has entered into contractual arrangements with an investment adviser, administrator, distributor, shareholder servicing agent, and custodian who each provide services to the fund. Unless expressly stated otherwise, shareholders are not parties to, or intended beneficiaries of these contractual arrangements, and these contractual arrangements are not intended to create any shareholder right to enforce them against the service providers or to seek any remedy under them against the service providers, either directly or on behalf of the fund.
Under the Trust’s By-Laws and Declaration of Trust, any claims asserted against or on behalf of the MFS Funds, including claims against Trustees and Officers, must be brought in state and federal courts located within the Commonwealth of Massachusetts.
Federal Tax Information (unaudited)
The following information is provided pursuant to provisions of the Internal Revenue Code.
The fund designates $154,191,000 as capital gain dividends paid during the fiscal year.
For corporate shareholders, 100% of the ordinary income dividends paid during the fiscal year qualify for the corporate dividends received deduction.
| FACTS | WHAT DOES MFS DO WITH YOUR PERSONAL INFORMATION? |
| Why? | Financial companies choose how they share your personal information. Federal law gives consumers the right to limit some but not all sharing. Federal law also requires us to tell you how we collect, share, and protect your personal information. Please read this notice carefully to understand what we do. |
| What? | The types of personal information we collect and share depend on the product or service you have with us. This information can include: |
| • Social Security number and account balances |
| • Account transactions and transaction history |
| • Checking account information and wire transfer instructions |
| When you are no longer our customer, we continue to share your information as described in this notice. |
| How? | All financial companies need to share customers' personal information to run their everyday business. In the section below, we list the reasons financial companies can share their customers' personal information; the reasons MFS chooses to share; and whether you can limit this sharing. |
Reasons we can share your
personal information | Does MFS share? | Can you limit
this sharing? |
For our everyday business purposes –
such as to process your transactions, maintain your
account(s), respond to court orders and legal
investigations, or report to credit bureaus | Yes | No |
For our marketing purposes –
to offer our products and services to you | No | We don't share |
For joint marketing with other
financial companies | No | We don't share |
For our affiliates' everyday business purposes –
information about your transactions and experiences | No | We don't share |
For our affiliates' everyday business purposes –
information about your creditworthiness | No | We don't share |
| For nonaffiliates to market to you | No | We don't share |
| Questions? | Call 800-225-2606 or go to mfs.com. |
| Who we are |
| Who is providing this notice? | MFS Funds, MFS Investment Management, MFS Institutional Advisors, Inc., and MFS Heritage Trust Company. |
| What we do |
How does MFS
protect my personal
information? | To protect your personal information from unauthorized access and use, we use security measures that comply with federal law. These measures include procedural, electronic, and physical safeguards for the protection of the personal information we collect about you. |
How does MFS
collect my personal
information? | We collect your personal information, for example, when you |
| • open an account or provide account information |
| • direct us to buy securities or direct us to sell your securities |
| • make a wire transfer |
| We also collect your personal information from others, such as credit bureaus, affiliates, or other companies. |
| Why can't I limit all sharing? | Federal law gives you the right to limit only |
| • sharing for affiliates' everyday business purposes – information about your creditworthiness |
| • affiliates from using your information to market to you |
| • sharing for nonaffiliates to market to you |
| State laws and individual companies may give you additional rights to limit sharing. |
| Definitions |
| Affiliates | Companies related by common ownership or control. They can be financial and nonfinancial companies. |
| • MFS does not share personal information with affiliates, except for everyday business purposes as described on page one of this notice. |
| Nonaffiliates | Companies not related by common ownership or control. They can be financial and nonfinancial companies. |
| • MFS does not share with nonaffiliates so they can market to you. |
| Joint marketing | A formal agreement between nonaffiliated financial companies that together market financial products or services to you. |
| • MFS doesn't jointly market. |
| Other important information |
| If you own an MFS product or receive an MFS service in the name of a third party such as a bank or broker-dealer, their privacy policy may apply to you instead of ours. |
Item 1(b):
Not applicable.
ITEM 2. CODE OF ETHICS.
The Registrant has adopted a Code of Ethics (the "Code") pursuant to Section 406 of the Sarbanes-Oxley Act and as defined in Form N-CSR that applies to the Registrant's principal executive officer and principal financial and accounting officer. During the period covered by this report, the Registrant has not amended any provision in the Code that relates to an element of the Code's definition enumerated in paragraph
(b)of Item 2 of this Form N-CSR. During the period covered by this report, the Registrant did not grant a waiver, including an implicit waiver, from any provision of the Code.
A copy of the Code is attached hereto as EX-99.COE.
ITEM 3. AUDIT COMMITTEE FINANCIAL EXPERT.
Messrs. Steven E. Buller, James Kilman, and Clarence Otis, Jr. and Ms. Maryanne L. Roepke, members of the Audit Committee, have been determined by the Board of Trustees in their reasonable business judgment to meet the definition of "audit committee financial expert" as such term is defined in Form N-CSR. In addition, Messrs. Buller, Kilman, and Otis and Ms. Roepke are "independent" members of the Audit Committee (as such term has been defined by the Securities and Exchange Commission in regulations implementing Section 407 of the Sarbanes-Oxley Act of 2002). The Securities and Exchange Commission has stated that the designation of a person as an audit committee financial expert pursuant to this Item 3 on the Form N-CSR does not impose on such a person any duties, obligations or liability that are greater than the duties, obligations or liability imposed on such person as a member of the Audit Committee and the Board of Trustees in the absence of such designation or identification.
ITEM 4. PRINCIPAL ACCOUNTANT FEES AND SERVICES.
Items 4(a) through 4(d) and 4(g):
The Board of Trustees has appointed Deloitte & Touche LLP ("Deloitte") to serve as independent accountants to the Registrant (hereinafter the "Registrant" or the "Fund"). The tables below set forth the audit fees billed to the Fund as well as fees for non-audit services provided to the Fund and/or to the Fund's investment adviser, Massachusetts Financial Services Company ("MFS"), and to various entities either controlling, controlled by, or under common control with MFS that provide ongoing services to the Fund ("MFS Related Entities").
For the fiscal years ended December 31, 2022 and 2021, audit fees billed to the Fund by Deloitte were as follows:
Fees billed by Deloitte: | | Audit Fees |
| 2022 | | 2021 |
MFS Global Equity Series | 51,335 | | 48,623 |
MFS Growth Series | 52,252 | | 49,493 |
MFS Investors Trust Series | 51,335 | | 48,623 |
MFS Mid Cap Growth Series | 51,335 | | 48,623 |
MFS New Discovery Series | 51,335 | | 48,623 |
MFS Research Series | 52,368 | | 49,603 |
MFS Total Return Bond Series | 73,425 | | 69,581 |
MFS Total Return Series | 72,327 | | 68,539 |
MFS Utilities Series | 51,452 | | 48,734 |
MFS Value Series | 52,252 | | 49,493 |
Total | 559,416 | | 529,935 |
For the fiscal years ended December 31, 2022 and 2021, fees billed by Deloitte for audit-related, tax and other services provided to each Fund and for audit-related, tax and other services provided to MFS and MFS Related Entities were as follows:
Fees billed by Deloitte: | | Audit-Related Fees1 | | Tax Fees2 | | All Other Fees3 |
| 2022 | 2021 | 2022 | 20214 | 2022 | 2021 |
To MFS Global Equity Series | 2,400 | 2,400 | 0 | 732 | 0 | 0 |
| | | | | | | | | | | | |
To MFS Growth Series | 2,400 | 2,400 | 0 | 732 | 0 | 0 |
| | | | | | | | | | | | |
To MFS Investors Trust Series | 2,400 | 2,400 | 0 | 747 | 0 | 0 |
| | | | | | | | | | | | |
To MFS Mid Cap Growth | 2,400 | 2,400 | 0 | 732 | 0 | 0 |
Series | | | | | | | | | | | | |
To MFS New Discovery Series | 2,400 | 2,400 | 0 | 732 | 0 | 0 |
| | | | | | | | | | | | |
To MFS Research Series | 2,400 | 2,400 | 0 | 747 | 0 | 0 |
| | | | | | | | | | | | |
To MFS Total Return Bond | 2,400 | 2,400 | 0 | 732 | 0 | 0 |
Series | | | | | | | | | | | | |
To MFS Total Return Series | 2,400 | 2,400 | 0 | 747 | 0 | 0 |
| | | | | | | | | | | | |
To MFS Utilities Series | 2,400 | 2,400 | 0 | 769 | 0 | 0 |
| | | | | | | | | | | | |
To MFS Value Series | 2,400 | 2,400 | 0 | 732 | 0 | 0 |
| | | | | | | | | | | | |
Total fees billed by | | | | | | | | | | | | |
Deloitte to above Funds: | 24,000 | 24,000 | 0 | 7,402 | 0 | 0 |
| | | | | | | | | |
Fees billed by Deloitte: | | Audit-Related Fees1 | | Tax Fees2 | | All Other Fees3 |
| | 2022 | | 2021 | | 2022 | | 2021 | | 2022 | | 2021 |
| | | | | | | | | | | | |
To MFS and MFS Related | | 0 | | 0 | | 0 | | 0 | | 3,790 | | 5,390 |
Entities of MFS Global Equity | | | | | | | | | | | | |
Series* | | | | | | | | | | | | |
To MFS and MFS Related | 0 | | 0 | 0 | | 0 | 3,790 | | 5,390 |
Entities of MFS Growth Series* | | | | | | | | | | | |
To MFS and MFS Related | 0 | | 0 | 0 | | 0 | 3,790 | | 5,390 |
Entities of MFS Investors Trust | | | | | | | | | | | |
Series* | | | | | | | | | | | |
To MFS and MFS Related | 0 | | 0 | 0 | | 0 | 3,790 | | 5,390 |
Entities of MFS Mid Cap | | | | | | | | | | | |
Growth Series* | | | | | | | | | | | |
To MFS and MFS Related | 0 | | 0 | 0 | | 0 | 3,790 | | 5,390 |
Entities of MFS New Discovery | | | | | | | | | | | |
Series* | | | | | | | | | | | |
To MFS and MFS Related | 0 | | 0 | 0 | | 0 | 3,790 | | 5,390 |
Entities of MFS Research | | | | | | | | | | | |
Series* | | | | | | | | | | | |
To MFS and MFS Related | 0 | | 0 | 0 | | 0 | 3,790 | | 5,390 |
Entities of MFS Total Return | | | | | | | | | | | |
Bond Series* | | | | | | | | | | | |
To MFS and MFS Related | 0 | | 0 | 0 | | 0 | 3,790 | | 5,390 |
Entities of MFS Total Return | | | | | | | | | | | |
Series* | | | | | | | | | | | |
To MFS and MFS Related | 0 | | 0 | 0 | | 0 | 3,790 | | 5,390 |
Entities of MFS Utilities | | | | | | | | | | | |
Series* | | | | | | | | | | | |
To MFS and MFS Related | 0 | | 0 | 0 | | 0 | 3,790 | | 5,390 |
Entities of MFS Value | | | | | | | | | | | |
Series* | | | | | | | | | | | |
| | | | | | | | | |
| | | | | | |
Fees billed by Deloitte: | | | | | Aggregate fees for non-audit services: |
| | | | | 2022 | | | | 20214 |
To MFS Global Equity Series, MFS and MFS Related | | | | | | | | | |
Entities# | | | | | 6,190 | | | | 8,522 |
To MFS Growth Series, MFS and MFS Related Entities# | | | 6,190 | | | | 8,522 |
To MFS Investors Trust Series, MFS and MFS Related | | | | | | | | | |
Entities# | | | | | 6,190 | | | | 8,537 |
To MFS Mid Cap Growth Series, MFS and MFS Related | | | | | | | | |
Entities# | | | | | 6,190 | | | | 8,522 |
To MFS New Discovery Series, MFS and MFS Related | | | | | | | | | |
Entities# | | | | | 6,190 | | | | 8,522 |
To MFS Research Series, MFS and MFS Related Entities# | | 6,190 | | | | 8,537 |
To MFS Total Return Bond Series, MFS and MFS Related | | | | | | | | |
Entities# | | | | | 6,190 | | | | 8,522 |
To MFS Total Return Series, MFS and MFS Related | | | | | | | | | |
Entities# | | | | | 6,190 | | | | 8,537 |
To MFS Utilities Series, MFS and MFS Related Entities# | | 6,190 | | | | 8,559 |
To MFS Value Series, MFS and MFS Related Entities# | | | 6,190 | | | | 8,522 |
*This amount reflects the fees billed to MFS and MFS Related Entities for non-audit services relating directly to the operations and financial reporting of the Fund (portions of which services also related to the operations and financial reporting of other funds within the MFS Funds complex).
# This amount reflects the aggregate fees billed by Deloitte for non-audit services rendered to the Fund and for non-audit services rendered to MFS and the MFS Related Entities.
1 The fees included under "Audit-Related Fees" are fees related to assurance and related services that are reasonably related to the performance of the audit or review of financial statements, but not reported under ''Audit Fees,'' including accounting consultations, agreed- upon procedure reports, attestation reports, comfort letters and internal control reviews.
2The fees included under "Tax Fees" are fees associated with tax compliance, tax advice and tax planning, including services relating to the filing or amendment of federal, state or local income tax returns, regulated investment company qualification reviews and tax distribution and analysis.
3The fees included under "All Other Fees" are fees for products and services provided by Deloitte other than those reported under "Audit Fees," "Audit-Related Fees" and "Tax Fees".
4Certain fees reported in 2021 have been restated in this filing from those reported in the Registrant's filing for the reporting period ended December 31, 2021.
Item 4(e)(1):
Set forth below are the policies and procedures established by the Audit Committee of the Board of Trustees relating to the pre-approval of audit and non-audit related services:
To the extent required by applicable law, pre-approval by the Audit Committee of the Board is needed for all audit and permissible non-audit services rendered to the Fund and all permissible non-audit services rendered to MFS or MFS Related Entities if the services relate directly to the operations and financial reporting of the Registrant. Pre-approval is currently on an engagement-by-engagement basis. In the event pre- approval of such services is necessary between regular meetings of the Audit Committee and it is not practical to wait to seek pre-approval at the next regular meeting of the Audit Committee, pre-approval of such services may be referred to the Chair of the Audit Committee for approval; provided that the Chair may not pre-approve any individual engagement for such services exceeding $50,000 or multiple engagements for such services in the aggregate exceeding $100,000 between such regular meetings of the Audit Committee. Any engagement pre-approved by the Chair between regular meetings of the Audit Committee shall be presented for ratification by the entire Audit Committee at its next regularly scheduled meeting.
Item 4(e)(2):
None, or 0%, of the services relating to the Audit-Related Fees, Tax Fees and All Other Fees paid by the Fund and MFS and MFS Related Entities relating directly to the operations and financial reporting of the Registrant disclosed above were approved by the audit committee pursuant to paragraphs (c)(7)(i)(C) of Rule 2-01 of Regulation S-X (which permits audit committee approval after the start of the engagement with respect to services other than audit, review or attest services, if certain conditions are satisfied).
Item 4(f):
Not applicable.
Item 4(h):
The Registrant's Audit Committee has considered whether the provision by a Registrant's independent registered public accounting firm of non-audit services to MFS and MFS Related Entities that were not pre-approved by the Committee (because such services were provided prior to the effectiveness of SEC rules requiring pre-approval or because such services did not relate directly to the operations and financial reporting of the Registrant) was compatible with maintaining the independence of the independent registered public accounting firm as the Registrant's principal auditors.
ITEM 5. AUDIT COMMITTEE OF LISTED REGISTRANTS.
Not applicable to the Registrant.
ITEM 6. INVESTMENTS
A schedule of investments for each series covered by this Form N-CSR is included as part of the report to shareholders of such series under Item 1(a) of this Form N-CSR.
ITEM 7. DISCLOSURE OF PROXY VOTING POLICIES AND PROCEDURES FOR CLOSED-END MANAGEMENT INVESTMENT COMPANIES.
Not applicable to the Registrant.
ITEM 8. PORTFOLIO MANAGERS OF CLOSED-END MANAGEMENT INVESTMENT COMPANIES.
Not applicable to the Registrant.
ITEM 9. PURCHASES OF EQUITY SECURITIES BY CLOSED-END MANAGEMENT INVESTMENT COMPANY AND AFFILIATED PURCHASERS.
Not applicable to the Registrant.
ITEM 10. SUBMISSION OF MATTERS TO A VOTE OF SECURITY HOLDERS.
There were no material changes to the procedures by which shareholders may send recommendations to the Board for nominees to the Registrant's Board since the Registrant last provided disclosure as to such procedures in response to the requirements of Item 407 (c)(2)(iv) of Regulation S-K or this Item.
ITEM 11. CONTROLS AND PROCEDURES.
(a)Based upon their evaluation of the effectiveness of the registrant's disclosure controls and procedures (as defined in Rule 30a-3(c) under the Investment Company Act of 1940 (the "Act")) as conducted within 90 days of the filing date of this report on Form N-CSR, the Registrant's principal financial officer and principal executive officer have concluded that those disclosure controls and procedures provide reasonable assurance that the material information required to be disclosed by the Registrant on this report is recorded, processed, summarized and reported within the time periods specified in the Securities and Exchange Commission's rules and forms.
(b)There were no changes in the Registrant's internal controls over financial reporting (as defined in Rule 30a-3(d) under the Act) that occurred during the period covered by the report that have materially affected, or are reasonably likely to materially affect, the Registrant's internal control over financial reporting.
ITEM 12. DISCLOSURE OF SECURITIES LENDING ACTIVITIES FOR CLOSED-END MANAGEMENT INVESTMENT COMPANIES.
Not applicable to the Registrant.
ITEM 13. EXHIBITS.
(a)(1) Any code of ethics, or amendment thereto, that is the subject of the disclosure required by Item 2, to the extent that the registrant intends to satisfy the Item 2 requirements through filing of an exhibit: Attached hereto as EX-99.COE.
(2)A separate certification for each principal executive officer and principal financial officer of the registrant as required by Rule 30a-2(a) under the Act (17 CFR 270.30a-2): Attached hereto as EX-99.302CERT.
(3)Any written solicitation to purchase securities under Rule 23c-1 under the Act (17 CFR 270.23c-1) sent or given during the period covered by the report by or on behalf of the registrant to 10 or more persons. Not applicable.
(4)Change in the registrant's independent public accountant. Not applicable.
(b)If the report is filed under Section 13(a) or 15(d) of the Exchange Act, provide the certifications required by Rule 30a-2(b) under the Act (17 CFR 270.30a-2(b)), Rule 13a-14(b) or Rule 15d-14(b) under the Exchange Act (17 CFR 240.13a-14(b) or 240.15d-14(b)) and Section 1350 of Chapter 63 of Title 18 of the United States Code (18 U.S.C. 1350) as an exhibit. A certification furnished pursuant to this paragraph will not be deemed "filed" for the purposes of Section 18 of the Exchange Act (15 U.S.C. 78r), or otherwise subject to the liability of that section. Such certification will not be deemed to be incorporated by reference into any filing under the Securities Act of 1933 or the Exchange Act, except to the extent that the registrant specifically incorporates it by reference. Attached hereto as EX-99.906CERT.
Notice
A copy of the Amended and Restated Declaration of Trust, as amended, of the Registrant is on file with the Secretary of State of The Commonwealth of Massachusetts and notice is hereby given that this instrument is executed on behalf of the Registrant by an officer of the Registrant as an officer and not individually and the obligations of or arising out of this instrument are not binding upon any of the Trustees or shareholders individually, but are binding only upon the assets and property of the respective constituent series of the Registrant.
SIGNATURES
Pursuant to the requirements of the Securities Exchange Act of 1934 and the Investment Company Act of 1940, the registrant has duly caused this report to be signed on its behalf by the undersigned, thereunto duly authorized.
(Registrant) MFS VARIABLE INSURANCE TRUST
By (Signature and Title)*
/S/ DAVID L. DILORENZO
David L. DiLorenzo, President
Date: February 15, 2023
Pursuant to the requirements of the Securities Exchange Act of 1934 and the Investment Company Act of 1940, this report has been signed below by the following persons on behalf of the registrant and in the capacities and on the dates indicated.
By (Signature and Title)*
/S/ DAVID L. DILORENZO
David L. DiLorenzo, President (Principal Executive Officer)
Date: February 15, 2023
By (Signature and Title)*
/S/ JAMES O. YOST
James O. Yost, Treasurer (Principal Financial Officer and Accounting Officer) Date: February 15, 2023
* Print name and title of each signing officer under his or her signature.