UNITED STATES
SECURITIES AND EXCHANGE COMMISSION
Washington, D.C. 20549
FORM N-CSR
CERTIFIED SHAREHOLDER REPORT OF
REGISTERED MANAGEMENT INVESTMENT COMPANIES
Investment Company Act file number 811-08326
MFS VARIABLE INSURANCE TRUST
(Exact name of registrant as specified in charter)
111 Huntington Avenue, Boston, Massachusetts 02199
(Address of principal executive offices) (Zip code)
Christopher R. Bohane
Massachusetts Financial Services Company
111 Huntington Avenue
Boston, Massachusetts 02199
(Name and address of agents for service)
Registrant’s telephone number, including area code: (617) 954-5000
Date of fiscal year end: December 31
Date of reporting period: December 31, 2021
| ITEM 1. | REPORTS TO STOCKHOLDERS. |
Item 1(a):


| 1 | |
| 2 | |
| 3 | |
| 5 | |
| 7 | |
| 8 | |
| 12 | |
| 13 | |
| 14 | |
| 15 | |
| 17 | |
| 23 | |
| 24 | |
| 27 | |
| 30 | |
| 30 | |
| 30 | |
| 30 | |
| 30 | |
| 31 |


| Thermo Fisher Scientific, Inc. | 3.4% |
| Schneider Electric SE | 3.3% |
| Accenture PLC, “A” | 3.0% |
| Visa, Inc., “A” | 2.8% |
| Comcast Corp., “A” | 2.8% |
| Roche Holding AG | 2.6% |
| Nestle S.A. | 2.6% |
| LVMH Moet Hennessy Louis Vuitton SE | 2.5% |
| Diageo PLC | 2.5% |
| Medtronic PLC | 2.4% |
| Health Care | 19.6% |
| Industrials | 19.6% |
| Information Technology | 15.5% |
| Consumer Staples | 13.9% |
| Financials | 9.1% |
| Consumer Discretionary | 8.5% |
| Communication Services | 7.0% |
| Materials | 6.2% |
| Equity Warrants (o) | 0.0% |
| United States | 55.1% |
| France | 11.7% |
| Switzerland | 8.7% |
| United Kingdom | 6.9% |
| Germany | 3.8% |
| Canada | 3.7% |
| Netherlands | 2.7% |
| Japan | 2.2% |
| Sweden | 1.6% |
| Other Countries | 3.6% |
| United States Dollar | 57.7% |
| Euro | 21.3% |
| Swiss Franc | 8.7% |
| British Pound Sterling | 6.9% |
| Japanese Yen | 2.2% |
| Swedish Krona | 1.6% |
| South Korean Won | 0.9% |
| Danish Krone | 0.5% |
| Mexican Peso | 0.2% |
| (g) | The Global Industry Classification Standard (GICS®) was developed by and/or is the exclusive property of MSCI, Inc. and S&P Global Market Intelligence Inc. (“S&P Global Market Intelligence”). GICS is a service mark of MSCI and S&P Global Market Intelligence and has been licensed for use by MFS. MFS has applied its own internal sector/industry classification methodology for equity securities and non-equity securities that are unclassified by GICS. |
| (o) | Less than 0.1%. |
| (x) | Represents the portfolio’s exposure to issuer countries as a percentage of a portfolio’s net assets. For purposes of this presentation, United States includes Cash & Cash Equivalents and Other. |
| (y) | Represents the portfolio’s exposure to a particular currency as a percentage of a portfolio's net assets. For purposes of this presentation, United States Dollar includes Cash & Cash Equivalents. |
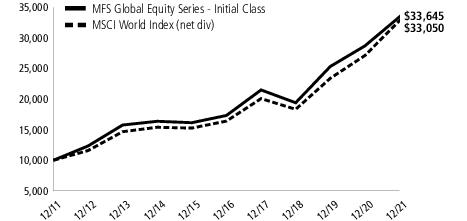
| Share Class | Class Inception Date | 1-yr | 5-yr | 10-yr |
| Initial Class | 5/03/99 | 17.21% | 14.19% | 12.90% |
| Service Class | 5/01/00 | 16.88% | 13.90% | 12.61% |
| MSCI World Index (net div) (f) | 21.82% | 15.03% | 12.70% |
| (f) | Source: FactSet Research Systems Inc. |
| (e) | Morgan Stanley Capital International (“MSCI”) makes no express or implied warranties or representations and shall have no liability whatsoever with respect to any MSCI data contained herein. The MSCI data may not be further redistributed or used as a basis for other indices or any securities or financial products. This report is not approved, reviewed, or produced by MSCI. |
July 1, 2021 through December 31, 2021
| Share Class | Annualized Expense Ratio | Beginning Account Value 7/01/21 | Ending Account Value 12/31/21 | Expenses Paid During Period (p) 7/01/21-12/31/21 | |
| Initial Class | Actual | 0.92% | $1,000.00 | $1,048.36 | $4.75 |
| Hypothetical (h) | 0.92% | $1,000.00 | $1,020.57 | $4.69 | |
| Service Class | Actual | 1.17% | $1,000.00 | $1,046.80 | $6.04 |
| Hypothetical (h) | 1.17% | $1,000.00 | $1,019.31 | $5.96 |
| (h) | 5% class return per year before expenses. |
| (p) | “Expenses Paid During Period” are equal to each class's annualized expense ratio, as shown above, multiplied by the average account value over the period, multiplied by 184/365 (to reflect the one-half year period). |
| Issuer | Shares/Par | Value ($) | ||
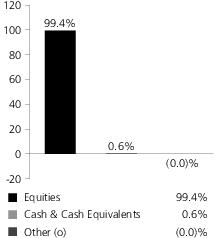
| Common Stocks – 99.4% | ||||
| Aerospace & Defense – 3.0% | ||||
| Honeywell International, Inc. | 6,379 | $ 1,330,085 | ||
| MTU Aero Engines Holding AG | 1,232 | 250,486 | ||
| Rolls-Royce Holdings PLC (a) | 233,325 | 388,076 | ||
| $1,968,647 | ||||
| Airlines – 0.8% | ||||
| Aena S.A. (a) | 3,296 | $ 520,846 | ||
| Alcoholic Beverages – 6.0% | ||||
| Carlsberg A.S., “B” | 1,967 | $ 337,883 | ||
| Diageo PLC | 29,931 | 1,635,109 | ||
| Heineken N.V. | 8,765 | 986,519 | ||
| Pernod Ricard S.A. | 4,217 | 1,015,422 | ||
| $3,974,933 | ||||
| Apparel Manufacturers – 4.5% | ||||
| Burberry Group PLC | 15,487 | $ 380,992 | ||
| Compagnie Financiere Richemont S.A. | 6,493 | 969,555 | ||
| LVMH Moet Hennessy Louis Vuitton SE | 1,995 | 1,651,240 | ||
| $3,001,787 | ||||
| Automotive – 0.5% | ||||
| Aptiv PLC (a) | 2,204 | $ 363,550 | ||
| Broadcasting – 2.7% | ||||
| Omnicom Group, Inc. | 2,002 | $ 146,686 | ||
| Walt Disney Co. (a) | 7,100 | 1,099,719 | ||
| WPP Group PLC | 35,458 | 537,295 | ||
| $1,783,700 | ||||
| Brokerage & Asset Managers – 2.0% | ||||
| Charles Schwab Corp. | 12,657 | $ 1,064,454 | ||
| Deutsche Boerse AG | 1,737 | 290,901 | ||
| $1,355,355 | ||||
| Business Services – 10.6% | ||||
| Accenture PLC, “A” | 4,823 | $ 1,999,375 | ||
| Adecco S.A. | 3,880 | 198,428 | ||
| Brenntag AG | 3,615 | 327,525 | ||
| Cognizant Technology Solutions Corp., “A” | 8,883 | 788,100 | ||
| Compass Group PLC (a) | 20,015 | 447,277 | ||
| Equifax, Inc. | 3,326 | 973,820 | ||
| Fidelity National Information Services, Inc. | 7,939 | 866,542 | ||
| Fiserv, Inc. (a) | 8,802 | 913,560 | ||
| PayPal Holdings, Inc. (a) | 2,885 | 544,053 | ||
| $7,058,680 | ||||
| Cable TV – 2.8% | ||||
| Comcast Corp., “A” | 36,701 | $ 1,847,161 | ||
| Issuer | Shares/Par | Value ($) | ||
| Common Stocks – continued | ||||
| Chemicals – 2.4% | ||||
| 3M Co. | 4,684 | $ 832,019 | ||
| PPG Industries, Inc. | 4,335 | 747,527 | ||
| $1,579,546 | ||||
| Computer Software – 2.5% | ||||
| Check Point Software Technologies Ltd. (a) | 5,203 | $ 606,462 | ||
| Oracle Corp. | 12,245 | 1,067,886 | ||
| $1,674,348 | ||||
| Computer Software - Systems – 1.3% | ||||
| Cisco Systems, Inc. | 4,769 | $ 302,211 | ||
| Samsung Electronics Co. Ltd. | 8,704 | 573,311 | ||
| $875,522 | ||||
| Construction – 0.5% | ||||
| Otis Worldwide Corp. | 4,122 | $ 358,903 | ||
| Consumer Products – 4.4% | ||||
| Colgate-Palmolive Co. | 6,891 | $ 588,078 | ||
| Essity AB | 32,383 | 1,056,667 | ||
| International Flavors & Fragrances, Inc. | 2,486 | 374,516 | ||
| Reckitt Benckiser Group PLC | 10,720 | 920,228 | ||
| $2,939,489 | ||||
| Electrical Equipment – 5.2% | ||||
| Amphenol Corp., “A” | 5,182 | $ 453,218 | ||
| Legrand S.A. | 6,955 | 814,789 | ||
| Schneider Electric SE | 11,085 | 2,176,492 | ||
| $3,444,499 | ||||
| Electronics – 1.2% | ||||
| Hoya Corp. | 2,900 | $ 431,357 | ||
| Microchip Technology, Inc. | 4,239 | 369,047 | ||
| $800,404 | ||||
| Food & Beverages – 4.1% | ||||
| Danone S.A. | 15,903 | $ 988,383 | ||
| Nestle S.A. | 12,316 | 1,722,510 | ||
| $2,710,893 | ||||
| Gaming & Lodging – 1.0% | ||||
| Marriott International, Inc., “A” (a) | 2,485 | $ 410,621 | ||
| Whitbread PLC (a) | 6,744 | 273,394 | ||
| $684,015 | ||||
| Insurance – 2.4% | ||||
| Aon PLC | 2,881 | $ 865,913 | ||
| Willis Towers Watson PLC | 3,167 | 752,131 | ||
| $1,618,044 | ||||
| Internet – 0.9% | ||||
| eBay, Inc. | 9,348 | $ 621,642 | ||
| Issuer | Shares/Par | Value ($) | ||
| Common Stocks – continued | ||||
| Machinery & Tools – 1.4% | ||||
| Carrier Global Corp. | 3,407 | $ 184,796 | ||
| Kubota Corp. | 34,700 | 770,290 | ||
| $955,086 | ||||
| Major Banks – 2.9% | ||||
| Erste Group Bank AG | 4,886 | $ 229,684 | ||
| Goldman Sachs Group, Inc. | 2,767 | 1,058,516 | ||
| UBS Group AG | 34,900 | 626,389 | ||
| $1,914,589 | ||||
| Medical Equipment – 14.2% | ||||
| Abbott Laboratories | 7,794 | $ 1,096,928 | ||
| Boston Scientific Corp. (a) | 21,002 | 892,165 | ||
| Cooper Cos., Inc. | 1,544 | 646,843 | ||
| EssilorLuxottica | 1,369 | 291,833 | ||
| Medtronic PLC | 15,231 | 1,575,647 | ||
| Olympus Corp. | 11,600 | 267,184 | ||
| Sonova Holding AG | 572 | 223,406 | ||
| Stryker Corp. | 4,251 | 1,136,802 | ||
| Thermo Fisher Scientific, Inc. | 3,427 | 2,286,632 | ||
| Waters Corp. (a) | 1,624 | 605,102 | ||
| Zimmer Biomet Holdings, Inc. | 3,724 | 473,097 | ||
| $9,495,639 | ||||
| Other Banks & Diversified Financials – 4.6% | ||||
| American Express Co. | 4,881 | $ 798,532 | ||
| Grupo Financiero Banorte S.A. de C.V. | 21,044 | 136,713 | ||
| Julius Baer Group Ltd. | 4,206 | 281,068 | ||
| Visa, Inc., “A” | 8,656 | 1,875,842 | ||
| $3,092,155 | ||||
| Pharmaceuticals – 5.2% | ||||
| Bayer AG | 11,307 | $ 605,032 | ||
| Merck KGaA | 4,176 | 1,079,243 | ||
| Roche Holding AG | 4,251 | 1,762,190 | ||
| $3,446,465 | ||||
| Printing & Publishing – 0.2% | ||||
| Wolters Kluwer N.V. | 951 | $ 112,169 | ||
| Railroad & Shipping – 4.6% | ||||
| Canadian National Railway Co. | 9,446 | $ 1,160,536 | ||
| Canadian Pacific Railway Ltd. | 18,279 | 1,314,991 | ||
| Union Pacific Corp. | 2,429 | 611,938 | ||
| $3,087,465 | ||||
| Specialty Chemicals – 4.5% | ||||
| Akzo Nobel N.V. | 6,445 | $ 708,081 | ||
| L'Air Liquide S.A. | 3,359 | 586,329 | ||
| Linde PLC | 1,023 | 354,398 | ||
| Linde PLC | 3,861 | 1,345,099 | ||
| $2,993,907 | ||||
| Specialty Stores – 0.4% | ||||
| Hermes International | 145 | $ 253,567 | ||
| Issuer | Shares/Par | Value ($) | ||
| Common Stocks – continued | ||||
| Telecommunications - Wireless – 1.5% | ||||
| Liberty Broadband Corp. (a) | 6,244 | $ 1,005,909 | ||
| Trucking – 1.1% | ||||
| United Parcel Service, Inc., “B” | 3,401 | $ 728,970 | ||
| Total Common Stocks (Identified Cost, $29,322,724) | $66,267,885 | |||
| Strike Price | First Exercise | |||
| Warrants – 0.0% | ||||
| Apparel Manufacturers – 0.0% | ||||
| Compagnie Financiere Richemont S.A. (1 share for 2 warrants, Expiration 12/04/23) (a) (Identified Cost, $0) | CHF 67.00 | 11/20/23 | 14,904 | $ 16,356 |
| Investment Companies (h) – 0.7% | ||||
| Money Market Funds – 0.7% | ||||
| MFS Institutional Money Market Portfolio, 0.07% (v) (Identified Cost, $483,861) | 483,861 | $ 483,861 | ||
| Other Assets, Less Liabilities – (0.1)% | (58,605) | |||
| Net Assets – 100.0% | $66,709,497 | |||
| (a) | Non-income producing security. | |||
| (h) | An affiliated issuer, which may be considered one in which the fund owns 5% or more of the outstanding voting securities, or a company which is under common control. At period end, the aggregate values of the fund's investments in affiliated issuers and in unaffiliated issuers were $483,861 and $66,284,241, respectively. | |||
| (v) | Affiliated issuer that is available only to investment companies managed by MFS. The rate quoted for the MFS Institutional Money Market Portfolio is the annualized seven-day yield of the fund at period end. |
| Abbreviations indicate amounts shown in currencies other than the U.S. dollar. All amounts are stated in U.S. dollars unless otherwise indicated. A list of abbreviations is shown below: | |
| CHF | Swiss Franc |
| Financial Statements | Statement of Assets and Liabilities |
| At 12/31/21Assets | |
| Investments in unaffiliated issuers, at value (identified cost, $29,322,724) | $66,284,241 |
| Investments in affiliated issuers, at value (identified cost, $483,861) | 483,861 |
| Receivables for | |
| Fund shares sold | 91,212 |
| Dividends | 128,112 |
| Receivable from investment adviser | 11,538 |
| Other assets | 475 |
| Total assets | $66,999,439 |
| Liabilities | |
| Payables for | |
| Investments purchased | $117,781 |
| Fund shares reacquired | 113,466 |
| Payable to affiliates | |
| Administrative services fee | 108 |
| Shareholder servicing costs | 122 |
| Distribution and/or service fees | 202 |
| Accrued expenses and other liabilities | 58,263 |
| Total liabilities | $289,942 |
| Net assets | $66,709,497 |
| Net assets consist of | |
| Paid-in capital | $24,598,047 |
| Total distributable earnings (loss) | 42,111,450 |
| Net assets | $66,709,497 |
| Shares of beneficial interest outstanding | 2,485,126 |
| Net assets | Shares outstanding | Net asset value per share | |
| Initial Class | $51,965,829 | 1,931,708 | $26.90 |
| Service Class | 14,743,668 | 553,418 | 26.64 |
| Financial Statements | Statement of Operations |
| Year ended 12/31/21 | |
| Net investment income (loss) | |
| Income | |
| Dividends | $937,971 |
| Income on securities loaned | 686 |
| Dividends from affiliated issuers | 263 |
| Other | 17 |
| Foreign taxes withheld | (64,448) |
| Total investment income | $874,489 |
| Expenses | |
| Management fee | $575,119 |
| Distribution and/or service fees | 36,609 |
| Shareholder servicing costs | 11,352 |
| Administrative services fee | 19,308 |
| Independent Trustees' compensation | 3,186 |
| Custodian fee | 14,597 |
| Shareholder communications | 14,439 |
| Audit and tax fees | 59,834 |
| Legal fees | 486 |
| Miscellaneous | 24,639 |
| Total expenses | $759,569 |
| Reduction of expenses by investment adviser | (134,467) |
| Net expenses | $625,102 |
| Net investment income (loss) | $249,387 |
| Realized and unrealized gain (loss) | |
| Realized gain (loss) (identified cost basis) | |
| Unaffiliated issuers | $5,424,657 |
| Foreign currency | (85) |
| Net realized gain (loss) | $5,424,572 |
| Change in unrealized appreciation or depreciation | |
| Unaffiliated issuers | $4,298,627 |
| Translation of assets and liabilities in foreign currencies | (7,438) |
| Net unrealized gain (loss) | $4,291,189 |
| Net realized and unrealized gain (loss) | $9,715,761 |
| Change in net assets from operations | $9,965,148 |
| Financial Statements | Statements of Changes in Net Assets |
| Year ended | ||
| 12/31/21 | 12/31/20 | |
| Change in net assets | ||
| From operations | ||
| Net investment income (loss) | $249,387 | $386,667 |
| Net realized gain (loss) | 5,424,572 | 3,963,044 |
| Net unrealized gain (loss) | 4,291,189 | 2,750,961 |
| Change in net assets from operations | $9,965,148 | $7,100,672 |
| Total distributions to shareholders | $(4,406,036) | $(2,767,021) |
| Change in net assets from fund share transactions | $802,515 | $(5,075,552) |
| Total change in net assets | $6,361,627 | $(741,901) |
| Net assets | ||
| At beginning of period | 60,347,870 | 61,089,771 |
| At end of period | $66,709,497 | $60,347,870 |
| Financial Statements | Financial Highlights |
| Initial Class | Year ended | ||||
| 12/31/21 | 12/31/20 | 12/31/19 | 12/31/18 | 12/31/17 | |
| Net asset value, beginning of period | $24.57 | $22.79 | $18.82 | $22.00 | $18.59 |
| Income (loss) from investment operations | |||||
| Net investment income (loss) (d) | $0.12 | $0.16 | $0.25 | $0.23 | $0.20 |
| Net realized and unrealized gain (loss) | 4.07 | 2.73 | 5.35 | (2.23) | 4.20 |
| Total from investment operations | $4.19 | $2.89 | $5.60 | $(2.00) | $4.40 |
| Less distributions declared to shareholders | |||||
| From net investment income | $(0.17) | $(0.26) | $(0.25) | $(0.21) | $(0.18) |
| From net realized gain | (1.69) | (0.85) | (1.38) | (0.97) | (0.81) |
| Total distributions declared to shareholders | $(1.86) | $(1.11) | $(1.63) | $(1.18) | $(0.99) |
| Net asset value, end of period (x) | $26.90 | $24.57 | $22.79 | $18.82 | $22.00 |
| Total return (%) (k)(r)(s)(x) | 17.21 | 13.29 | 30.57 | (9.74) | 24.07 |
| Ratios (%) (to average net assets) and Supplemental data: | |||||
| Expenses before expense reductions | 1.13 | 1.16 | 1.16 | 1.13 | 1.16 |
| Expenses after expense reductions | 0.92 | 0.92 | 0.95 | 0.97 | 0.97 |
| Net investment income (loss) | 0.45 | 0.75 | 1.16 | 1.07 | 0.95 |
| Portfolio turnover | 12 | 12 | 11 | 15 | 11 |
| Net assets at end of period (000 omitted) | $51,966 | $46,879 | $49,771 | $45,219 | $52,850 |
| Service Class | Year ended | ||||
| 12/31/21 | 12/31/20 | 12/31/19 | 12/31/18 | 12/31/17 | |
| Net asset value, beginning of period | $24.37 | $22.62 | $18.70 | $21.86 | $18.49 |
| Income (loss) from investment operations | |||||
| Net investment income (loss) (d) | $0.05 | $0.10 | $0.18 | $0.18 | $0.14 |
| Net realized and unrealized gain (loss) | 4.03 | 2.71 | 5.32 | (2.21) | 4.18 |
| Total from investment operations | $4.08 | $2.81 | $5.50 | $(2.03) | $4.32 |
| Less distributions declared to shareholders | |||||
| From net investment income | $(0.12) | $(0.21) | $(0.20) | $(0.16) | $(0.14) |
| From net realized gain | (1.69) | (0.85) | (1.38) | (0.97) | (0.81) |
| Total distributions declared to shareholders | $(1.81) | $(1.06) | $(1.58) | $(1.13) | $(0.95) |
| Net asset value, end of period (x) | $26.64 | $24.37 | $22.62 | $18.70 | $21.86 |
| Total return (%) (k)(r)(s)(x) | 16.88 | 13.04 | 30.20 | (9.92) | 23.75 |
| Ratios (%) (to average net assets) and Supplemental data: | |||||
| Expenses before expense reductions | 1.38 | 1.41 | 1.41 | 1.38 | 1.42 |
| Expenses after expense reductions | 1.17 | 1.17 | 1.20 | 1.22 | 1.22 |
| Net investment income (loss) | 0.19 | 0.48 | 0.85 | 0.86 | 0.68 |
| Portfolio turnover | 12 | 12 | 11 | 15 | 11 |
| Net assets at end of period (000 omitted) | $14,744 | $13,469 | $11,319 | $7,139 | $10,162 |
| (d) | Per share data is based on average shares outstanding. |
| (k) | The total return does not reflect expenses that apply to separate accounts. Inclusion of these charges would reduce the total return figures for all periods shown. |
| (r) | Certain expenses have been reduced without which performance would have been lower. |
| (s) | From time to time the fund may receive proceeds from litigation settlements, without which performance would be lower. |
| (x) | The net asset values and total returns have been calculated on net assets which include adjustments made in accordance with U.S. generally accepted accounting principles required at period end for financial reporting purposes. |
| Financial Instruments | Level 1 | Level 2 | Level 3 | Total |
| Equity Securities: | ||||
| United States | $36,358,033 | $— | $— | $36,358,033 |
| France | 7,778,055 | — | — | 7,778,055 |
| Switzerland | 1,937,294 | 3,862,608 | — | 5,799,902 |
| United Kingdom | 4,582,371 | — | — | 4,582,371 |
| Germany | 2,302,701 | 250,486 | — | 2,553,187 |
| Canada | 2,475,527 | — | — | 2,475,527 |
| Netherlands | 1,806,769 | — | — | 1,806,769 |
| Japan | 1,468,831 | — | — | 1,468,831 |
| Sweden | — | 1,056,667 | — | 1,056,667 |
| Other Countries | 1,837,332 | 567,567 | — | 2,404,899 |
| Mutual Funds | 483,861 | — | — | 483,861 |
| Total | $61,030,774 | $5,737,328 | $— | $66,768,102 |
| Year ended 12/31/21 | Year ended 12/31/20 | |
| Ordinary income (including any short-term capital gains) | $464,015 | $699,005 |
| Long-term capital gains | 3,942,021 | 2,068,016 |
| Total distributions | $4,406,036 | $2,767,021 |
| As of 12/31/21 | |
| Cost of investments | $30,283,214 |
| Gross appreciation | 36,888,993 |
| Gross depreciation | (404,105) |
| Net unrealized appreciation (depreciation) | $36,484,888 |
| Undistributed ordinary income | 381,130 |
| Undistributed long-term capital gain | 5,245,887 |
| Other temporary differences | (455) |
| Total distributable earnings (loss) | $42,111,450 |
| Year ended 12/31/21 | Year ended 12/31/20 | ||
| Initial Class | $3,418,938 | $2,194,634 | |
| Service Class | 987,098 | 572,387 | |
| Total | $4,406,036 | $2,767,021 |
| Up to $1 billion | 0.90% |
| In excess of $1 billion and up to $2.5 billion | 0.75% |
| In excess of $2.5 billion | 0.65% |
| Year ended 12/31/21 | Year ended 12/31/20 | ||||
| Shares | Amount | Shares | Amount | ||
| Shares sold | |||||
| Initial Class | 292,702 | $7,779,587 | 374,120 | $7,560,367 | |
| Service Class | 105,795 | 2,743,776 | 195,660 | 4,034,412 | |
| 398,497 | $10,523,363 | 569,780 | $11,594,779 | ||
| Shares issued to shareholders in reinvestment of distributions | |||||
| Initial Class | 129,653 | $3,418,938 | 100,487 | $2,194,634 | |
| Service Class | 37,762 | 987,098 | 26,402 | 572,387 | |
| 167,415 | $4,406,036 | 126,889 | $2,767,021 | ||
| Shares reacquired | |||||
| Initial Class | (398,296) | $(10,442,200) | (750,977) | $(15,997,296) | |
| Service Class | (142,899) | (3,684,684) | (169,724) | (3,440,056) | |
| (541,195) | $(14,126,884) | (920,701) | $(19,437,352) | ||
| Net change | |||||
| Initial Class | 24,059 | $756,325 | (276,370) | $(6,242,295) | |
| Service Class | 658 | 46,190 | 52,338 | 1,166,743 | |
| 24,717 | $802,515 | (224,032) | $(5,075,552) | ||
| Affiliated Issuers | Beginning Value | Purchases | Sales Proceeds | Realized Gain (Loss) | Change in Unrealized Appreciation or Depreciation | Ending Value |
| MFS Institutional Money Market Portfolio | $651,977 | $12,115,822 | $12,283,938 | $— | $— | $483,861 |
| Affiliated Issuers | Dividend Income | Capital Gain Distributions |
| MFS Institutional Money Market Portfolio | $263 | $— |
February 15, 2022
| Name, Age | Position(s) Held with Fund | Trustee/Officer Since(h) | Number of MFS Funds overseen by the Trustee | Principal Occupations During the Past Five Years | Other Directorships During the Past Five Years (j) | |||||
| INTERESTED TRUSTEES | ||||||||||
| Michael W. Roberge (k) (age 55) | Trustee | January 2021 | 135 | Massachusetts Financial Services Company, Chairman (since January 2021); Chief Executive Officer (since January 2017); Director; Chairman of the Board (since January 2022); President (until December 2018); Chief Investment Officer (until December 2018) | N/A | |||||
| INDEPENDENT TRUSTEES | ||||||||||
| John P. Kavanaugh (age 67) | Trustee and Chair of Trustees | January 2009 | 135 | Private investor | N/A | |||||
| Steven E. Buller (age 70) | Trustee | February 2014 | 135 | Private investor | N/A | |||||
| John A. Caroselli (age 67) | Trustee | March 2017 | 135 | Private investor; JC Global Advisors, LLC (management consulting), President (since 2015) | N/A | |||||
| Maureen R. Goldfarb (age 66) | Trustee | January 2009 | 135 | Private investor | N/A | |||||
| Peter D. Jones (age 66) | Trustee | January 2019 | 135 | Private investor | N/A | |||||
| James W. Kilman, Jr. (age 60) | Trustee | January 2019 | 135 | Burford Capital Limited (finance and investment management), Senior Advisor (since May 3, 2021), Chief Financial Officer (2019 - May 2, 2021); KielStrand Capital LLC (family office), Chief Executive Officer (since 2016) | Alpha-En Corporation, Director (2016-2019) | |||||
| Clarence Otis, Jr. (age 65) | Trustee | March 2017 | 135 | Private investor | VF Corporation, Director; Verizon Communications, Inc., Director; The Travelers Companies, Director | |||||
| Maryanne L. Roepke (age 65) | Trustee | May 2014 | 135 | Private investor | N/A | |||||
| Laurie J. Thomsen (age 64) | Trustee | March 2005 | 135 | Private investor | The Travelers Companies, Director; Dycom Industries, Inc., Director |
| Name, Age | Position(s) Held with Fund | Trustee/Officer Since(h) | Number of MFS Funds for which the Person is an Officer | Principal Occupations During the Past Five Years | ||||
| OFFICERS | ||||||||
| Christopher R. Bohane (k) (age 48) | Assistant Secretary and Assistant Clerk | July 2005 | 135 | Massachusetts Financial Services Company, Senior Vice President and Associate General Counsel | ||||
| Kino Clark (k) (age 53) | Assistant Treasurer | January 2012 | 135 | Massachusetts Financial Services Company, Vice President | ||||
| John W. Clark, Jr. (k) (age 54) | Assistant Treasurer | April 2017 | 135 | Massachusetts Financial Services Company, Vice President (since March 2017); Deutsche Bank (financial services), Department Head - Treasurer's Office (until February 2017) | ||||
| Thomas H. Connors (k) (age 62) | Assistant Secretary and Assistant Clerk | September 2012 | 135 | Massachusetts Financial Services Company, Vice President and Senior Counsel | ||||
| David L. DiLorenzo (k) (age 53) | President | July 2005 | 135 | Massachusetts Financial Services Company, Senior Vice President | ||||
| Heidi W. Hardin (k) (age 54) | Secretary and Clerk | April 2017 | 135 | Massachusetts Financial Services Company, Executive Vice President and General Counsel (since March 2017); Harris Associates (investment management), General Counsel (until January 2017) | ||||
| Brian E. Langenfeld (k) (age 48) | Assistant Secretary and Assistant Clerk | June 2006 | 135 | Massachusetts Financial Services Company, Vice President and Senior Counsel | ||||
| Amanda S. Mooradian (k) (age 42) | Assistant Secretary and Assistant Clerk | September 2018 | 135 | Massachusetts Financial Services Company, Assistant Vice President and Senior Counsel | ||||
| Susan A. Pereira (k) (age 51) | Assistant Secretary and Assistant Clerk | July 2005 | 135 | Massachusetts Financial Services Company, Vice President and Assistant General Counsel | ||||
| Kasey L. Phillips (k) (age 51) | Assistant Treasurer | September 2012 | 135 | Massachusetts Financial Services Company, Vice President | ||||
| Matthew A. Stowe (k) (age 47) | Assistant Secretary and Assistant Clerk | October 2014 | 135 | Massachusetts Financial Services Company, Vice President and Assistant General Counsel | ||||
| Martin J. Wolin (k) (age 54) | Chief Compliance Officer | July 2015 | 135 | Massachusetts Financial Services Company, Senior Vice President and Chief Compliance Officer | ||||
| James O. Yost (k) (age 61) | Treasurer | September 1990 | 135 | Massachusetts Financial Services Company, Senior Vice President |
| (h) | Date first appointed to serve as Trustee/Officer of an MFS Fund. Each Trustee has served continuously since appointment unless indicated otherwise. From January 2012 through December 2016, Messrs. DiLorenzo and Yost served as Treasurer and Deputy Treasurer of the Funds, respectively. |
| (j) | Directorships or trusteeships of companies required to report to the Securities and Exchange Commission (i.e., “public companies”). |
| (k) | “Interested person” of the Trust within the meaning of the Investment Company Act of 1940 (referred to as the 1940 Act), which is the principal federal law governing investment companies like the fund, as a result of a position with MFS. The address of MFS is 111 Huntington Avenue, Boston, Massachusetts 02199-7618. |
| Investment Adviser | Custodian |
| Massachusetts Financial Services Company 111 Huntington Avenue Boston, MA 02199-7618 | State Street Bank and Trust Company 1 Lincoln Street Boston, MA 02111-2900 |
| Distributor | Independent Registered Public Accounting Firm |
| MFS Fund Distributors, Inc. 111 Huntington Avenue Boston, MA 02199-7618 | Deloitte & Touche LLP 200 Berkeley Street Boston, MA 02116 |
| Portfolio Manager(s) | |
| Ryan McAllister Roger Morley |

| FACTS | WHAT DOES MFS DO WITH YOUR PERSONAL INFORMATION? |
| Why? | Financial companies choose how they share your personal information. Federal law gives consumers the right to limit some but not all sharing. Federal law also requires us to tell you how we collect, share, and protect your personal information. Please read this notice carefully to understand what we do. |
| What? | The types of personal information we collect and share depend on the product or service you have with us. This information can include: |
| • Social Security number and account balances | |
| • Account transactions and transaction history | |
| • Checking account information and wire transfer instructions | |
| When you are no longer our customer, we continue to share your information as described in this notice. |
| How? | All financial companies need to share customers' personal information to run their everyday business. In the section below, we list the reasons financial companies can share their customers' personal information; the reasons MFS chooses to share; and whether you can limit this sharing. |
| Reasons we can share your personal information | Does MFS share? | Can you limit this sharing? |
| For our everyday business purposes – such as to process your transactions, maintain your account(s), respond to court orders and legal investigations, or report to credit bureaus | Yes | No |
| For our marketing purposes – to offer our products and services to you | No | We don't share |
| For joint marketing with other financial companies | No | We don't share |
| For our affiliates' everyday business purposes – information about your transactions and experiences | No | We don't share |
| For our affiliates' everyday business purposes – information about your creditworthiness | No | We don't share |
| For nonaffiliates to market to you | No | We don't share |
| Questions? | Call 800-225-2606 or go to mfs.com. |
| Who we are | |
| Who is providing this notice? | MFS Funds, MFS Investment Management, MFS Institutional Advisors, Inc., and MFS Heritage Trust Company. |
| What we do | |
| How does MFS protect my personal information? | To protect your personal information from unauthorized access and use, we use security measures that comply with federal law. These measures include procedural, electronic, and physical safeguards for the protection of the personal information we collect about you. |
| How does MFS collect my personal information? | We collect your personal information, for example, when you |
| • open an account or provide account information | |
| • direct us to buy securities or direct us to sell your securities | |
| • make a wire transfer | |
| We also collect your personal information from others, such as credit bureaus, affiliates, or other companies. | |
| Why can't I limit all sharing? | Federal law gives you the right to limit only |
| • sharing for affiliates' everyday business purposes – information about your creditworthiness | |
| • affiliates from using your information to market to you | |
| • sharing for nonaffiliates to market to you | |
| State laws and individual companies may give you additional rights to limit sharing. | |
| Definitions | |
| Affiliates | Companies related by common ownership or control. They can be financial and nonfinancial companies. |
| • MFS does not share personal information with affiliates, except for everyday business purposes as described on page one of this notice. | |
| Nonaffiliates | Companies not related by common ownership or control. They can be financial and nonfinancial companies. |
| • MFS does not share with nonaffiliates so they can market to you. | |
| Joint marketing | A formal agreement between nonaffiliated financial companies that together market financial products or services to you. |
| • MFS doesn't jointly market. | |
| Other important information |
| If you own an MFS product or receive an MFS service in the name of a third party such as a bank or broker-dealer, their privacy policy may apply to you instead of ours. |


| 1 | |
| 2 | |
| 3 | |
| 5 | |
| 7 | |
| 8 | |
| 12 | |
| 13 | |
| 14 | |
| 15 | |
| 17 | |
| 23 | |
| 24 | |
| 27 | |
| 29 | |
| 29 | |
| 29 | |
| 29 | |
| 29 | |
| 30 |


| Microsoft Corp. | 11.6% |
| Amazon.com, Inc. | 7.2% |
| Alphabet, Inc., “A” | 5.9% |
| Apple, Inc. | 4.4% |
| Adobe Systems, Inc. | 3.6% |
| NVIDIA Corp. | 3.2% |
| Meta Platforms, Inc., “A” | 2.8% |
| Intuit, Inc. | 2.8% |
| Mastercard, Inc., “A” | 2.7% |
| Danaher Corp. | 2.3% |
| Information Technology | 42.2% |
| Communication Services | 16.1% |
| Health Care | 11.9% |
| Consumer Discretionary | 10.8% |
| Industrials | 7.3% |
| Financials | 3.9% |
| Materials | 3.4% |
| Consumer Staples | 2.5% |
| Real Estate | 1.1% |
| (g) | The Global Industry Classification Standard (GICS®) was developed by and/or is the exclusive property of MSCI, Inc. and S&P Global Market Intelligence Inc. (“S&P Global Market Intelligence”). GICS is a service mark of MSCI and S&P Global Market Intelligence and has been licensed for use by MFS. MFS has applied its own internal sector/industry classification methodology for equity securities and non-equity securities that are unclassified by GICS. |
| (b) | Security is not a benchmark constituent. |
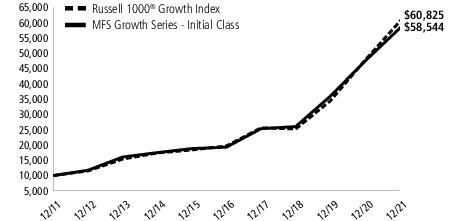
| Share Class | Class Inception Date | 1-yr | 5-yr | 10-yr |
| Initial Class | 7/24/95 | 23.53% | 24.87% | 19.33% |
| Service Class | 5/01/00 | 23.24% | 24.56% | 19.03% |
| Russell 1000® Growth Index (f) | 27.60% | 25.32% | 19.79% |
| (f) | Source: FactSet Research Systems Inc. |
| (h) | Frank Russell Company (“Russell”) is the source and owner of the trademarks, service marks, and copyrights related to the Russell Indexes. Russell® is a trademark of Frank Russell Company. Neither Russell nor its licensors accept any liability for any errors or omissions in the Russell Indexes and/or Russell ratings or underlying data and no party may rely on any Russell Indexes and/or Russell ratings and/or underlying data contained in this document. No further distribution of Russell Data is permitted without Russell's express written consent. Russell does not promote, sponsor, or endorse the content of this document. |
July 1, 2021 through December 31, 2021
| Share Class | Annualized Expense Ratio | Beginning Account Value 7/01/21 | Ending Account Value 12/31/21 | Expenses Paid During Period (p) 7/01/21-12/31/21 | |
| Initial Class | Actual | 0.71% | $1,000.00 | $1,094.20 | $3.75 |
| Hypothetical (h) | 0.71% | $1,000.00 | $1,021.63 | $3.62 | |
| Service Class | Actual | 0.96% | $1,000.00 | $1,092.80 | $5.06 |
| Hypothetical (h) | 0.96% | $1,000.00 | $1,020.37 | $4.89 |
| (h) | 5% class return per year before expenses. |
| (p) | “Expenses Paid During Period” are equal to each class's annualized expense ratio, as shown above, multiplied by the average account value over the period, multiplied by 184/365 (to reflect the one-half year period). |
| Issuer | Shares/Par | Value ($) | ||
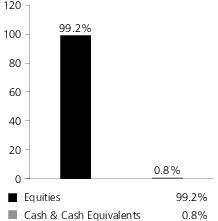
| Common Stocks – 99.2% | ||||
| Apparel Manufacturers – 0.9% | ||||
| NIKE, Inc., “B” | 127,063 | $ 21,177,590 | ||
| Biotechnology – 0.7% | ||||
| Alnylam Pharmaceuticals, Inc. (a) | 24,822 | $ 4,209,315 | ||
| Vertex Pharmaceuticals, Inc. (a) | 53,200 | 11,682,720 | ||
| $15,892,035 | ||||
| Broadcasting – 1.4% | ||||
| Netflix, Inc. (a) | 57,024 | $ 34,353,538 | ||
| Brokerage & Asset Managers – 1.5% | ||||
| Charles Schwab Corp. | 312,058 | $ 26,244,078 | ||
| CME Group, Inc. | 37,226 | 8,504,652 | ||
| $34,748,730 | ||||
| Business Services – 6.8% | ||||
| Clarivate PLC (a) | 513,907 | $ 12,087,093 | ||
| CoStar Group, Inc. (a) | 198,970 | 15,724,599 | ||
| Equifax, Inc. | 70,602 | 20,671,560 | ||
| MSCI, Inc. | 70,560 | 43,231,406 | ||
| PayPal Holdings, Inc. (a) | 190,937 | 36,006,899 | ||
| Verisk Analytics, Inc., “A” | 153,446 | 35,097,704 | ||
| $162,819,261 | ||||
| Cable TV – 1.1% | ||||
| Charter Communications, Inc., “A” (a) | 38,776 | $ 25,280,789 | ||
| Computer Software – 22.7% | ||||
| Adobe Systems, Inc. (a) | 151,981 | $ 86,182,346 | ||
| Atlassian Corp. PLC, “A” (a) | 31,595 | 12,046,858 | ||
| Autodesk, Inc. (a) | 95,786 | 26,934,065 | ||
| Black Knight, Inc. (a) | 68,141 | 5,648,207 | ||
| Bumble, Inc., “A” (a) | 75,007 | 2,539,737 | ||
| Cadence Design Systems, Inc. (a) | 100,790 | 18,782,217 | ||
| Intuit, Inc. | 102,823 | 66,137,810 | ||
| Microsoft Corp. | 823,128 | 276,834,409 | ||
| salesforce.com, inc. (a) | 117,465 | 29,851,380 | ||
| Synopsys, Inc. (a) | 39,719 | 14,636,452 | ||
| $539,593,481 | ||||
| Computer Software - Systems – 7.6% | ||||
| Apple, Inc. | 592,893 | $ 105,280,010 | ||
| Block, Inc., “A” (a) | 95,942 | 15,495,592 | ||
| ServiceNow, Inc. (a) | 41,689 | 27,060,747 | ||
| Shopify, Inc. (a) | 7,437 | 10,243,650 | ||
| TransUnion | 189,978 | 22,527,591 | ||
| $180,607,590 | ||||
| Construction – 3.2% | ||||
| Sherwin-Williams Co. | 119,985 | $ 42,253,917 | ||
| Vulcan Materials Co. | 158,577 | 32,917,414 | ||
| $75,171,331 | ||||
| Issuer | Shares/Par | Value ($) | ||
| Common Stocks – continued | ||||
| Consumer Products – 2.5% | ||||
| Colgate-Palmolive Co. | 248,318 | $ 21,191,458 | ||
| Estee Lauder Cos., Inc., “A” | 103,989 | 38,496,728 | ||
| $59,688,186 | ||||
| Consumer Services – 0.4% | ||||
| Airbnb, Inc., “A” (a) | 3,151 | $ 524,610 | ||
| Uber Technologies, Inc. (a) | 232,232 | 9,737,488 | ||
| $10,262,098 | ||||
| Electrical Equipment – 1.5% | ||||
| AMETEK, Inc. | 144,396 | $ 21,231,988 | ||
| Johnson Controls International PLC | 169,613 | 13,791,233 | ||
| $35,023,221 | ||||
| Electronics – 6.6% | ||||
| Applied Materials, Inc. | 116,975 | $ 18,407,186 | ||
| ASML Holding N.V., ADR | 31,176 | 24,820,461 | ||
| Lam Research Corp. | 51,770 | 37,230,395 | ||
| NVIDIA Corp. | 259,614 | 76,355,074 | ||
| $156,813,116 | ||||
| Gaming & Lodging – 0.8% | ||||
| Hilton Worldwide Holdings, Inc. (a) | 79,982 | $ 12,476,392 | ||
| MGM Resorts International | 123,196 | 5,529,037 | ||
| $18,005,429 | ||||
| General Merchandise – 0.4% | ||||
| Dollar General Corp. | 36,185 | $ 8,533,508 | ||
| Insurance – 0.6% | ||||
| Aon PLC | 50,132 | $ 15,067,674 | ||
| Internet – 11.3% | ||||
| Alphabet, Inc., “A” (a) | 48,644 | $ 140,923,614 | ||
| Alphabet, Inc., “C” (a) | 14,656 | 42,408,455 | ||
| Match Group, Inc. (a) | 149,599 | 19,784,468 | ||
| Meta Platforms, Inc., “A” (a) | 199,286 | 67,029,846 | ||
| $270,146,383 | ||||
| Leisure & Toys – 1.6% | ||||
| Activision Blizzard, Inc. | 112,982 | $ 7,516,693 | ||
| Electronic Arts, Inc. | 119,959 | 15,822,592 | ||
| Roblox Corp., “A” (a) | 82,921 | 8,554,130 | ||
| Take-Two Interactive Software, Inc. (a) | 32,967 | 5,858,895 | ||
| $37,752,310 | ||||
| Machinery & Tools – 0.5% | ||||
| Roper Technologies, Inc. | 26,449 | $ 13,009,205 | ||
| Medical & Health Technology & Services – 1.1% | ||||
| ICON PLC (a) | 83,371 | $ 25,819,999 | ||
| Issuer | Shares/Par | Value ($) | ||
| Common Stocks – continued | ||||
| Medical Equipment – 8.6% | ||||
| Abbott Laboratories | 272,277 | $ 38,320,265 | ||
| Becton, Dickinson and Co. | 24,490 | 6,158,745 | ||
| Boston Scientific Corp. (a) | 618,122 | 26,257,823 | ||
| Danaher Corp. | 169,805 | 55,867,543 | ||
| Edwards Lifesciences Corp. (a) | 162,796 | 21,090,222 | ||
| STERIS PLC | 34,436 | 8,382,067 | ||
| Thermo Fisher Scientific, Inc. | 74,823 | 49,924,898 | ||
| $206,001,563 | ||||
| Network & Telecom – 0.5% | ||||
| Equinix, Inc., REIT | 13,250 | $ 11,207,380 | ||
| Other Banks & Diversified Financials – 4.9% | ||||
| Mastercard, Inc., “A” | 178,182 | $ 64,024,356 | ||
| Visa, Inc., “A” | 242,037 | 52,451,838 | ||
| $116,476,194 | ||||
| Pharmaceuticals – 1.5% | ||||
| Zoetis, Inc. | 143,604 | $ 35,043,684 | ||
| Railroad & Shipping – 0.4% | ||||
| Canadian Pacific Railway Ltd. | 124,857 | $ 8,982,213 | ||
| Restaurants – 0.8% | ||||
| Chipotle Mexican Grill, Inc., “A” (a) | 7,576 | $ 13,244,742 | ||
| Starbucks Corp. | 59,552 | 6,965,797 | ||
| $20,210,539 | ||||
| Specialty Chemicals – 0.2% | ||||
| Air Products & Chemicals, Inc. | 15,091 | $ 4,591,588 | ||
| Specialty Stores – 8.5% | ||||
| Amazon.com, Inc. (a) | 51,678 | $ 172,312,022 | ||
| Lululemon Athletica, Inc. (a) | 23,644 | 9,255,444 | ||
| Ross Stores, Inc. | 66,906 | 7,646,018 | ||
| Sea Ltd., ADR (a) | 63,843 | 14,282,317 | ||
| $203,495,801 | ||||
| Telecommunications - Wireless – 0.6% | ||||
| American Tower Corp., REIT | 50,875 | $ 14,880,937 | ||
| Total Common Stocks (Identified Cost, $718,420,523) | $2,360,655,373 | |||
| Investment Companies (h) – 0.0% | ||||
| Money Market Funds – 0.0% | ||||
| MFS Institutional Money Market Portfolio, 0.07% (v) (Identified Cost, $597,603) | 597,603 | $ 597,603 | ||
| Other Assets, Less Liabilities – 0.8% | 18,900,190 | |||
| Net Assets – 100.0% | $2,380,153,166 | |||
| (a) | Non-income producing security. | |||
| (h) | An affiliated issuer, which may be considered one in which the fund owns 5% or more of the outstanding voting securities, or a company which is under common control. At period end, the aggregate values of the fund's investments in affiliated issuers and in unaffiliated issuers were $597,603 and $2,360,655,373, respectively. | |||
| (v) | Affiliated issuer that is available only to investment companies managed by MFS. The rate quoted for the MFS Institutional Money Market Portfolio is the annualized seven-day yield of the fund at period end. |
| The following abbreviations are used in this report and are defined: | |
| ADR | American Depositary Receipt |
| REIT | Real Estate Investment Trust |
| Financial Statements | Statement of Assets and Liabilities |
| At 12/31/21Assets | |
| Investments in unaffiliated issuers, at value (identified cost, $718,420,523) | $2,360,655,373 |
| Investments in affiliated issuers, at value (identified cost, $597,603) | 597,603 |
| Receivables for | |
| Investments sold | 23,216,750 |
| Fund shares sold | 629,891 |
| Dividends | 424,586 |
| Other assets | 7,355 |
| Total assets | $2,385,531,558 |
| Liabilities | |
| Payables for | |
| Fund shares reacquired | $5,070,141 |
| Payable to affiliates | |
| Investment adviser | 89,131 |
| Administrative services fee | 1,814 |
| Shareholder servicing costs | 893 |
| Distribution and/or service fees | 7,924 |
| Payable for independent Trustees' compensation | 12 |
| Accrued expenses and other liabilities | 208,477 |
| Total liabilities | $5,378,392 |
| Net assets | $2,380,153,166 |
| Net assets consist of | |
| Paid-in capital | $532,814,610 |
| Total distributable earnings (loss) | 1,847,338,556 |
| Net assets | $2,380,153,166 |
| Shares of beneficial interest outstanding | 30,440,425 |
| Net assets | Shares outstanding | Net asset value per share | |
| Initial Class | $1,805,385,027 | 22,749,983 | $79.36 |
| Service Class | 574,768,139 | 7,690,442 | 74.74 |
| Financial Statements | Statement of Operations |
| Year ended 12/31/21 | |
| Net investment income (loss) | |
| Income | |
| Dividends | $9,051,743 |
| Other | 31,956 |
| Dividends from affiliated issuers | 6,354 |
| Foreign taxes withheld | (34,968) |
| Total investment income | $9,055,085 |
| Expenses | |
| Management fee | $15,988,251 |
| Distribution and/or service fees | 1,368,840 |
| Shareholder servicing costs | 65,409 |
| Administrative services fee | 309,616 |
| Independent Trustees' compensation | 33,101 |
| Custodian fee | 105,047 |
| Shareholder communications | 64,214 |
| Audit and tax fees | 61,831 |
| Legal fees | 11,661 |
| Miscellaneous | 51,863 |
| Total expenses | $18,059,833 |
| Reduction of expenses by investment adviser | (292,724) |
| Net expenses | $17,767,109 |
| Net investment income (loss) | $(8,712,024) |
| Realized and unrealized gain (loss) | |
| Realized gain (loss) (identified cost basis) | |
| Unaffiliated issuers | $216,129,139 |
| Foreign currency | 364 |
| Net realized gain (loss) | $216,129,503 |
| Change in unrealized appreciation or depreciation | |
| Unaffiliated issuers | $279,529,685 |
| Translation of assets and liabilities in foreign currencies | 111 |
| Net unrealized gain (loss) | $279,529,796 |
| Net realized and unrealized gain (loss) | $495,659,299 |
| Change in net assets from operations | $486,947,275 |
| Financial Statements | Statements of Changes in Net Assets |
| Year ended | ||
| 12/31/21 | 12/31/20 | |
| Change in net assets | ||
| From operations | ||
| Net investment income (loss) | $(8,712,024) | $(5,258,847) |
| Net realized gain (loss) | 216,129,503 | 321,361,876 |
| Net unrealized gain (loss) | 279,529,796 | 234,350,980 |
| Change in net assets from operations | $486,947,275 | $550,454,009 |
| Total distributions to shareholders | $(317,188,320) | $(127,591,165) |
| Change in net assets from fund share transactions | $14,964,640 | $(95,720,771) |
| Total change in net assets | $184,723,595 | $327,142,073 |
| Net assets | ||
| At beginning of period | 2,195,429,571 | 1,868,287,498 |
| At end of period | $2,380,153,166 | $2,195,429,571 |
| Financial Statements | Financial Highlights |
| Initial Class | Year ended | ||||
| 12/31/21 | 12/31/20 | 12/31/19 | 12/31/18 | 12/31/17 | |
| Net asset value, beginning of period | $73.81 | $59.40 | $47.01 | $48.90 | $38.76 |
| Income (loss) from investment operations | |||||
| Net investment income (loss) (d) | $(0.25) | $(0.14) | $(0.04) | $0.00(w) | $0.06 |
| Net realized and unrealized gain (loss) | 17.21 | 18.88 | 17.53 | 1.81 | 11.95 |
| Total from investment operations | $16.96 | $18.74 | $17.49 | $1.81 | $12.01 |
| Less distributions declared to shareholders | |||||
| From net investment income | $— | $— | $— | $(0.05) | $(0.05) |
| From net realized gain | (11.41) | (4.33) | (5.10) | (3.65) | (1.82) |
| Total distributions declared to shareholders | $(11.41) | $(4.33) | $(5.10) | $(3.70) | $(1.87) |
| Net asset value, end of period (x) | $79.36 | $73.81 | $59.40 | $47.01 | $48.90 |
| Total return (%) (k)(r)(s)(x) | 23.53 | 31.86 | 38.15 | 2.67 | 31.40 |
| Ratios (%) (to average net assets) and Supplemental data: | |||||
| Expenses before expense reductions | 0.72 | 0.74 | 0.74 | 0.75 | 0.76 |
| Expenses after expense reductions | 0.71 | 0.72 | 0.73 | 0.74 | 0.75 |
| Net investment income (loss) | (0.32) | (0.21) | (0.06) | 0.00(w) | 0.13 |
| Portfolio turnover | 12 | 29 | 11 | 15 | 14 |
| Net assets at end of period (000 omitted) | $1,805,385 | $1,681,327 | $1,467,280 | $1,226,217 | $1,332,128 |
| Service Class | Year ended | ||||
| 12/31/21 | 12/31/20 | 12/31/19 | 12/31/18 | 12/31/17 | |
| Net asset value, beginning of period | $70.23 | $56.82 | $45.26 | $47.27 | $37.57 |
| Income (loss) from investment operations | |||||
| Net investment income (loss) (d) | $(0.42) | $(0.29) | $(0.17) | $(0.13) | $(0.05) |
| Net realized and unrealized gain (loss) | 16.34 | 18.03 | 16.83 | 1.77 | 11.57 |
| Total from investment operations | $15.92 | $17.74 | $16.66 | $1.64 | $11.52 |
| Less distributions declared to shareholders | |||||
| From net investment income | $— | $— | $— | $— | $— |
| From net realized gain | (11.41) | (4.33) | (5.10) | (3.65) | (1.82) |
| Total distributions declared to shareholders | $(11.41) | $(4.33) | $(5.10) | $(3.65) | $(1.82) |
| Net asset value, end of period (x) | $74.74 | $70.23 | $56.82 | $45.26 | $47.27 |
| Total return (%) (k)(r)(s)(x) | 23.24 | 31.54 | 37.78 | 2.41 | 31.08 |
| Ratios (%) (to average net assets) and Supplemental data: | |||||
| Expenses before expense reductions | 0.97 | 0.99 | 0.99 | 1.00 | 1.01 |
| Expenses after expense reductions | 0.96 | 0.97 | 0.98 | 0.99 | 1.00 |
| Net investment income (loss) | (0.57) | (0.46) | (0.31) | (0.25) | (0.12) |
| Portfolio turnover | 12 | 29 | 11 | 15 | 14 |
| Net assets at end of period (000 omitted) | $574,768 | $514,102 | $401,008 | $287,412 | $289,733 |
| (d) | Per share data is based on average shares outstanding. |
| (k) | The total return does not reflect expenses that apply to separate accounts. Inclusion of these charges would reduce the total return figures for all periods shown. |
| (r) | Certain expenses have been reduced without which performance would have been lower. |
| (s) | From time to time the fund may receive proceeds from litigation settlements, without which performance would be lower. |
| (w) | Per share amount was less than $0.01 and total return or ratio was less than 0.01%, as applicable. |
| (x) | The net asset values and total returns have been calculated on net assets which include adjustments made in accordance with U.S. generally accepted accounting principles required at period end for financial reporting purposes. |
| Financial Instruments | Level 1 | Level 2 | Level 3 | Total |
| Equity Securities | $2,360,655,373 | $— | $— | $2,360,655,373 |
| Mutual Funds | 597,603 | — | — | 597,603 |
| Total | $2,361,252,976 | $— | $— | $2,361,252,976 |
| Year ended 12/31/21 | Year ended 12/31/20 | |
| Ordinary income (including any short-term capital gains) | $1,693,158 | $— |
| Long-term capital gains | 315,495,162 | 127,591,165 |
| Total distributions | $317,188,320 | $127,591,165 |
| As of 12/31/21 | |
| Cost of investments | $720,375,253 |
| Gross appreciation | 1,648,244,981 |
| Gross depreciation | (7,367,258) |
| Net unrealized appreciation (depreciation) | $1,640,877,723 |
| Undistributed ordinary income | 8,838,825 |
| Undistributed long-term capital gain | 197,621,834 |
| Other temporary differences | 174 |
| Total distributable earnings (loss) | $1,847,338,556 |
| Year ended 12/31/21 | Year ended 12/31/20 | ||
| Initial Class | $238,278,350 | $97,613,169 | |
| Service Class | 78,909,970 | 29,977,996 | |
| Total | $317,188,320 | $127,591,165 |
| Up to $1 billion | 0.75% |
| In excess of $1 billion | 0.65% |
| Year ended 12/31/21 | Year ended 12/31/20 | ||||
| Shares | Amount | Shares | Amount | ||
| Shares sold | |||||
| Initial Class | 1,093,782 | $84,897,255 | 1,476,731 | $92,793,470 | |
| Service Class | 937,570 | 69,147,302 | 1,452,278 | 89,443,781 | |
| 2,031,352 | $154,044,557 | 2,929,009 | $182,237,251 | ||
| Shares issued to shareholders in reinvestment of distributions | |||||
| Initial Class | 3,080,612 | $236,098,096 | 1,364,516 | $96,648,663 | |
| Service Class | 1,092,331 | 78,909,970 | 444,382 | 29,977,996 | |
| 4,172,943 | $315,008,066 | 1,808,898 | $126,626,659 | ||
| Shares reacquired | |||||
| Initial Class | (4,204,800) | $(331,398,633) | (4,764,482) | $(305,550,308) | |
| Service Class | (1,659,384) | (122,689,350) | (1,633,664) | (99,034,373) | |
| (5,864,184) | $(454,087,983) | (6,398,146) | $(404,584,681) | ||
| Year ended 12/31/21 | Year ended 12/31/20 | ||||
| Shares | Amount | Shares | Amount | ||
| Net change | |||||
| Initial Class | (30,406) | $(10,403,282) | (1,923,235) | $(116,108,175) | |
| Service Class | 370,517 | 25,367,922 | 262,996 | 20,387,404 | |
| 340,111 | $14,964,640 | (1,660,239) | $(95,720,771) | ||
| Affiliated Issuers | Beginning Value | Purchases | Sales Proceeds | Realized Gain (Loss) | Change in Unrealized Appreciation or Depreciation | Ending Value |
| MFS Institutional Money Market Portfolio | $18,169,621 | $331,651,518 | $349,223,536 | $— | $— | $597,603 |
| Affiliated Issuers | Dividend Income | Capital Gain Distributions |
| MFS Institutional Money Market Portfolio | $6,354 | $— |
February 15, 2022
| Name, Age | Position(s) Held with Fund | Trustee/Officer Since(h) | Number of MFS Funds overseen by the Trustee | Principal Occupations During the Past Five Years | Other Directorships During the Past Five Years (j) | |||||
| INTERESTED TRUSTEES | ||||||||||
| Michael W. Roberge (k) (age 55) | Trustee | January 2021 | 135 | Massachusetts Financial Services Company, Chairman (since January 2021); Chief Executive Officer (since January 2017); Director; Chairman of the Board (since January 2022); President (until December 2018); Chief Investment Officer (until December 2018) | N/A | |||||
| INDEPENDENT TRUSTEES | ||||||||||
| John P. Kavanaugh (age 67) | Trustee and Chair of Trustees | January 2009 | 135 | Private investor | N/A | |||||
| Steven E. Buller (age 70) | Trustee | February 2014 | 135 | Private investor | N/A | |||||
| John A. Caroselli (age 67) | Trustee | March 2017 | 135 | Private investor; JC Global Advisors, LLC (management consulting), President (since 2015) | N/A | |||||
| Maureen R. Goldfarb (age 66) | Trustee | January 2009 | 135 | Private investor | N/A | |||||
| Peter D. Jones (age 66) | Trustee | January 2019 | 135 | Private investor | N/A | |||||
| James W. Kilman, Jr. (age 60) | Trustee | January 2019 | 135 | Burford Capital Limited (finance and investment management), Senior Advisor (since May 3, 2021), Chief Financial Officer (2019 - May 2, 2021); KielStrand Capital LLC (family office), Chief Executive Officer (since 2016) | Alpha-En Corporation, Director (2016-2019) | |||||
| Clarence Otis, Jr. (age 65) | Trustee | March 2017 | 135 | Private investor | VF Corporation, Director; Verizon Communications, Inc., Director; The Travelers Companies, Director | |||||
| Maryanne L. Roepke (age 65) | Trustee | May 2014 | 135 | Private investor | N/A | |||||
| Laurie J. Thomsen (age 64) | Trustee | March 2005 | 135 | Private investor | The Travelers Companies, Director; Dycom Industries, Inc., Director |
| Name, Age | Position(s) Held with Fund | Trustee/Officer Since(h) | Number of MFS Funds for which the Person is an Officer | Principal Occupations During the Past Five Years | ||||
| OFFICERS | ||||||||
| Christopher R. Bohane (k) (age 48) | Assistant Secretary and Assistant Clerk | July 2005 | 135 | Massachusetts Financial Services Company, Senior Vice President and Associate General Counsel | ||||
| Kino Clark (k) (age 53) | Assistant Treasurer | January 2012 | 135 | Massachusetts Financial Services Company, Vice President | ||||
| John W. Clark, Jr. (k) (age 54) | Assistant Treasurer | April 2017 | 135 | Massachusetts Financial Services Company, Vice President (since March 2017); Deutsche Bank (financial services), Department Head - Treasurer's Office (until February 2017) | ||||
| Thomas H. Connors (k) (age 62) | Assistant Secretary and Assistant Clerk | September 2012 | 135 | Massachusetts Financial Services Company, Vice President and Senior Counsel | ||||
| David L. DiLorenzo (k) (age 53) | President | July 2005 | 135 | Massachusetts Financial Services Company, Senior Vice President | ||||
| Heidi W. Hardin (k) (age 54) | Secretary and Clerk | April 2017 | 135 | Massachusetts Financial Services Company, Executive Vice President and General Counsel (since March 2017); Harris Associates (investment management), General Counsel (until January 2017) | ||||
| Brian E. Langenfeld (k) (age 48) | Assistant Secretary and Assistant Clerk | June 2006 | 135 | Massachusetts Financial Services Company, Vice President and Senior Counsel | ||||
| Amanda S. Mooradian (k) (age 42) | Assistant Secretary and Assistant Clerk | September 2018 | 135 | Massachusetts Financial Services Company, Assistant Vice President and Senior Counsel | ||||
| Susan A. Pereira (k) (age 51) | Assistant Secretary and Assistant Clerk | July 2005 | 135 | Massachusetts Financial Services Company, Vice President and Assistant General Counsel | ||||
| Kasey L. Phillips (k) (age 51) | Assistant Treasurer | September 2012 | 135 | Massachusetts Financial Services Company, Vice President | ||||
| Matthew A. Stowe (k) (age 47) | Assistant Secretary and Assistant Clerk | October 2014 | 135 | Massachusetts Financial Services Company, Vice President and Assistant General Counsel | ||||
| Martin J. Wolin (k) (age 54) | Chief Compliance Officer | July 2015 | 135 | Massachusetts Financial Services Company, Senior Vice President and Chief Compliance Officer | ||||
| James O. Yost (k) (age 61) | Treasurer | September 1990 | 135 | Massachusetts Financial Services Company, Senior Vice President |
| (h) | Date first appointed to serve as Trustee/Officer of an MFS Fund. Each Trustee has served continuously since appointment unless indicated otherwise. From January 2012 through December 2016, Messrs. DiLorenzo and Yost served as Treasurer and Deputy Treasurer of the Funds, respectively. |
| (j) | Directorships or trusteeships of companies required to report to the Securities and Exchange Commission (i.e., “public companies”). |
| (k) | “Interested person” of the Trust within the meaning of the Investment Company Act of 1940 (referred to as the 1940 Act), which is the principal federal law governing investment companies like the fund, as a result of a position with MFS. The address of MFS is 111 Huntington Avenue, Boston, Massachusetts 02199-7618. |
| Investment Adviser | Custodian |
| Massachusetts Financial Services Company 111 Huntington Avenue Boston, MA 02199-7618 | State Street Bank and Trust Company 1 Lincoln Street Boston, MA 02111-2900 |
| Distributor | Independent Registered Public Accounting Firm |
| MFS Fund Distributors, Inc. 111 Huntington Avenue Boston, MA 02199-7618 | Deloitte & Touche LLP 200 Berkeley Street Boston, MA 02116 |
| Portfolio Manager(s) | |
| Eric Fischman Paul Gordon Bradford Mak |

| FACTS | WHAT DOES MFS DO WITH YOUR PERSONAL INFORMATION? |
| Why? | Financial companies choose how they share your personal information. Federal law gives consumers the right to limit some but not all sharing. Federal law also requires us to tell you how we collect, share, and protect your personal information. Please read this notice carefully to understand what we do. |
| What? | The types of personal information we collect and share depend on the product or service you have with us. This information can include: |
| • Social Security number and account balances | |
| • Account transactions and transaction history | |
| • Checking account information and wire transfer instructions | |
| When you are no longer our customer, we continue to share your information as described in this notice. |
| How? | All financial companies need to share customers' personal information to run their everyday business. In the section below, we list the reasons financial companies can share their customers' personal information; the reasons MFS chooses to share; and whether you can limit this sharing. |
| Reasons we can share your personal information | Does MFS share? | Can you limit this sharing? |
| For our everyday business purposes – such as to process your transactions, maintain your account(s), respond to court orders and legal investigations, or report to credit bureaus | Yes | No |
| For our marketing purposes – to offer our products and services to you | No | We don't share |
| For joint marketing with other financial companies | No | We don't share |
| For our affiliates' everyday business purposes – information about your transactions and experiences | No | We don't share |
| For our affiliates' everyday business purposes – information about your creditworthiness | No | We don't share |
| For nonaffiliates to market to you | No | We don't share |
| Questions? | Call 800-225-2606 or go to mfs.com. |
| Who we are | |
| Who is providing this notice? | MFS Funds, MFS Investment Management, MFS Institutional Advisors, Inc., and MFS Heritage Trust Company. |
| What we do | |
| How does MFS protect my personal information? | To protect your personal information from unauthorized access and use, we use security measures that comply with federal law. These measures include procedural, electronic, and physical safeguards for the protection of the personal information we collect about you. |
| How does MFS collect my personal information? | We collect your personal information, for example, when you |
| • open an account or provide account information | |
| • direct us to buy securities or direct us to sell your securities | |
| • make a wire transfer | |
| We also collect your personal information from others, such as credit bureaus, affiliates, or other companies. | |
| Why can't I limit all sharing? | Federal law gives you the right to limit only |
| • sharing for affiliates' everyday business purposes – information about your creditworthiness | |
| • affiliates from using your information to market to you | |
| • sharing for nonaffiliates to market to you | |
| State laws and individual companies may give you additional rights to limit sharing. | |
| Definitions | |
| Affiliates | Companies related by common ownership or control. They can be financial and nonfinancial companies. |
| • MFS does not share personal information with affiliates, except for everyday business purposes as described on page one of this notice. | |
| Nonaffiliates | Companies not related by common ownership or control. They can be financial and nonfinancial companies. |
| • MFS does not share with nonaffiliates so they can market to you. | |
| Joint marketing | A formal agreement between nonaffiliated financial companies that together market financial products or services to you. |
| • MFS doesn't jointly market. | |
| Other important information |
| If you own an MFS product or receive an MFS service in the name of a third party such as a bank or broker-dealer, their privacy policy may apply to you instead of ours. |


| 1 | |
| 2 | |
| 3 | |
| 5 | |
| 7 | |
| 8 | |
| 12 | |
| 13 | |
| 14 | |
| 15 | |
| 17 | |
| 23 | |
| 24 | |
| 27 | |
| 29 | |
| 29 | |
| 29 | |
| 29 | |
| 29 | |
| 30 |


| Microsoft Corp. | 6.1% |
| Alphabet, Inc., “A” | 5.4% |
| Apple, Inc. | 2.8% |
| JPMorgan Chase & Co. | 2.6% |
| Bank of America Corp. | 2.4% |
| Thermo Fisher Scientific, Inc. | 2.1% |
| Johnson & Johnson | 2.0% |
| American Tower Corp., REIT | 2.0% |
| Visa, Inc., “A” | 1.9% |
| Alphabet, Inc., “C” | 1.9% |
| Information Technology | 23.9% |
| Health Care | 17.1% |
| Financials | 11.9% |
| Communication Services | 10.5% |
| Consumer Discretionary | 9.4% |
| Industrials | 8.4% |
| Consumer Staples | 7.7% |
| Materials | 4.8% |
| Real Estate | 3.9% |
| Energy | 1.4% |
| Utilities | 0.5% |
| (g) | The Global Industry Classification Standard (GICS®) was developed by and/or is the exclusive property of MSCI, Inc. and S&P Global Market Intelligence Inc. (“S&P Global Market Intelligence”). GICS is a service mark of MSCI and S&P Global Market Intelligence and has been licensed for use by MFS. MFS has applied its own internal sector/industry classification methodology for equity securities and non-equity securities that are unclassified by GICS. |
| (b) | Security is not a benchmark constituent. |
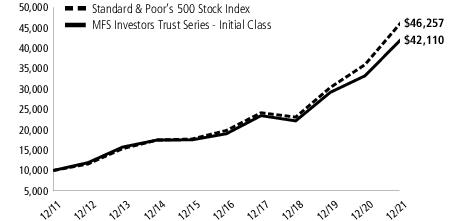
| Share Class | Class Inception Date | 1-yr | 5-yr | 10-yr |
| Initial Class | 10/09/95 | 26.81% | 17.24% | 15.46% |
| Service Class | 5/01/00 | 26.51% | 16.95% | 15.17% |
| Standard & Poor's 500 Stock Index (f) | 28.71% | 18.47% | 16.55% |
| (f) | Source: FactSet Research Systems Inc. |
| (g) | “Standard & Poor's®” and “S&P®” are registered trademarks of Standard & Poor's Financial Services LLC (“S&P”) and Dow Jones is a registered trademark of Dow Jones Trademark Holdings LLC (“Dow Jones”) and have been licensed for use by S&P Dow Jones Indices LLC and sublicensed for certain purposes by MFS. The S&P 500® is a product of S&P Dow Jones Indices LLC, and has been licensed for use by MFS. MFS's product(s) is not sponsored, endorsed, sold, or promoted by S&P Dow Jones Indices LLC, Dow Jones, S&P, or their respective affiliates, and neither S&P Dow Jones Indices LLC, Dow Jones, S&P, nor their respective affiliates make any representation regarding the advisability of investing in such product(s). |
July 1, 2021 through December 31, 2021
| Share Class | Annualized Expense Ratio | Beginning Account Value 7/01/21 | Ending Account Value 12/31/21 | Expenses Paid During Period (p) 7/01/21-12/31/21 | |
| Initial Class | Actual | 0.77% | $1,000.00 | $1,093.24 | $4.06 |
| Hypothetical (h) | 0.77% | $1,000.00 | $1,021.32 | $3.92 | |
| Service Class | Actual | 1.02% | $1,000.00 | $1,091.85 | $5.38 |
| Hypothetical (h) | 1.02% | $1,000.00 | $1,020.06 | $5.19 |
| (h) | 5% class return per year before expenses. |
| (p) | “Expenses Paid During Period” are equal to each class's annualized expense ratio, as shown above, multiplied by the average account value over the period, multiplied by 184/365 (to reflect the one-half year period). |
| Issuer | Shares/Par | Value ($) | ||
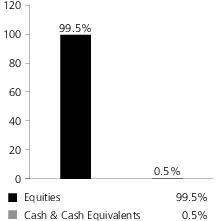
| Common Stocks – 99.5% | ||||
| Aerospace & Defense – 2.9% | ||||
| Honeywell International, Inc. | 68,402 | $ 14,262,501 | ||
| Howmet Aerospace, Inc. | 306,193 | 9,746,123 | ||
| $24,008,624 | ||||
| Alcoholic Beverages – 2.5% | ||||
| Diageo PLC | 208,843 | $ 11,408,942 | ||
| Pernod Ricard S.A. | 40,535 | 9,760,531 | ||
| $21,169,473 | ||||
| Apparel Manufacturers – 2.4% | ||||
| LVMH Moet Hennessy Louis Vuitton SE | 14,523 | $ 12,020,531 | ||
| NIKE, Inc., “B” | 45,905 | 7,650,986 | ||
| $19,671,517 | ||||
| Biotechnology – 1.7% | ||||
| Illumina, Inc. (a) | 13,565 | $ 5,160,668 | ||
| Vertex Pharmaceuticals, Inc. (a) | 42,403 | 9,311,699 | ||
| $14,472,367 | ||||
| Brokerage & Asset Managers – 3.1% | ||||
| Blackstone, Inc. | 39,979 | $ 5,172,883 | ||
| Charles Schwab Corp. | 82,623 | 6,948,594 | ||
| NASDAQ, Inc. | 65,561 | 13,768,466 | ||
| $25,889,943 | ||||
| Business Services – 4.9% | ||||
| Accenture PLC, “A” | 31,060 | $ 12,875,923 | ||
| Amdocs Ltd. | 121,824 | 9,117,308 | ||
| Fidelity National Information Services, Inc. | 104,919 | 11,451,909 | ||
| Fiserv, Inc. (a) | 71,622 | 7,433,647 | ||
| $40,878,787 | ||||
| Cable TV – 1.9% | ||||
| Cable One, Inc. | 2,280 | $ 4,020,666 | ||
| Comcast Corp., “A” | 231,919 | 11,672,483 | ||
| $15,693,149 | ||||
| Chemicals – 0.6% | ||||
| PPG Industries, Inc. | 30,238 | $ 5,214,241 | ||
| Computer Software – 8.9% | ||||
| Adobe Systems, Inc. (a) | 23,514 | $ 13,333,849 | ||
| Microsoft Corp. | 151,820 | 51,060,102 | ||
| salesforce.com, inc. (a) | 38,532 | 9,792,137 | ||
| $74,186,088 | ||||
| Computer Software - Systems – 2.7% | ||||
| Apple, Inc. | 128,742 | $ 22,860,717 | ||
| Issuer | Shares/Par | Value ($) | ||
| Common Stocks – continued | ||||
| Construction – 2.3% | ||||
| Masco Corp. | 122,833 | $ 8,625,333 | ||
| Sherwin-Williams Co. | 29,233 | 10,294,694 | ||
| $18,920,027 | ||||
| Consumer Products – 2.4% | ||||
| Colgate-Palmolive Co. | 92,328 | $ 7,879,271 | ||
| Estee Lauder Cos., Inc., “A” | 14,565 | 5,391,963 | ||
| Kimberly-Clark Corp. | 45,493 | 6,501,860 | ||
| $19,773,094 | ||||
| Containers – 2.0% | ||||
| Ball Corp. | 70,337 | $ 6,771,343 | ||
| Crown Holdings, Inc. | 86,434 | 9,561,329 | ||
| $16,332,672 | ||||
| Electrical Equipment – 4.4% | ||||
| AMETEK, Inc. | 52,638 | $ 7,739,891 | ||
| Fortive Corp. | 85,178 | 6,498,230 | ||
| Johnson Controls International PLC | 160,382 | 13,040,660 | ||
| TE Connectivity Ltd. | 56,293 | 9,082,313 | ||
| $36,361,094 | ||||
| Electronics – 2.6% | ||||
| Analog Devices, Inc. | 49,014 | $ 8,615,191 | ||
| Texas Instruments, Inc. | 68,403 | 12,891,913 | ||
| $21,507,104 | ||||
| Energy - Independent – 1.5% | ||||
| ConocoPhillips | 167,559 | $ 12,094,409 | ||
| Food & Beverages – 1.3% | ||||
| Danone S.A. | 84,195 | $ 5,232,778 | ||
| Mondelez International, Inc. | 88,690 | 5,881,034 | ||
| $11,113,812 | ||||
| Forest & Paper Products – 0.6% | ||||
| Rayonier, Inc., REIT | 118,804 | $ 4,794,929 | ||
| General Merchandise – 2.5% | ||||
| Costco Wholesale Corp. | 20,776 | $ 11,794,535 | ||
| Dollar General Corp. | 39,667 | 9,354,669 | ||
| $21,149,204 | ||||
| Health Maintenance Organizations – 0.9% | ||||
| Cigna Corp. | 31,251 | $ 7,176,167 | ||
| Insurance – 1.0% | ||||
| Chubb Ltd. | 43,747 | $ 8,456,733 | ||
| Internet – 7.3% | ||||
| Alphabet, Inc., “A” (a) | 15,501 | $ 44,907,017 | ||
| Alphabet, Inc., “C” (a) | 5,404 | 15,636,960 | ||
| $60,543,977 | ||||
| Issuer | Shares/Par | Value ($) | ||
| Common Stocks – continued | ||||
| Leisure & Toys – 1.3% | ||||
| Electronic Arts, Inc. | 83,226 | $ 10,977,509 | ||
| Major Banks – 6.7% | ||||
| Bank of America Corp. | 452,848 | $ 20,147,207 | ||
| Goldman Sachs Group, Inc. | 37,754 | 14,442,793 | ||
| JPMorgan Chase & Co. | 135,854 | 21,512,481 | ||
| $56,102,481 | ||||
| Medical & Health Technology & Services – 1.8% | ||||
| ICON PLC (a) | 47,899 | $ 14,834,320 | ||
| Medical Equipment – 7.0% | ||||
| Becton, Dickinson and Co. | 50,687 | $ 12,746,767 | ||
| Danaher Corp. | 39,170 | 12,887,321 | ||
| Maravai Lifesciences Holdings, Inc., “A” (a) | 55,173 | 2,311,749 | ||
| Medtronic PLC | 119,602 | 12,372,827 | ||
| Thermo Fisher Scientific, Inc. | 26,605 | 17,751,920 | ||
| $58,070,584 | ||||
| Network & Telecom – 1.3% | ||||
| Equinix, Inc., REIT | 12,659 | $ 10,707,489 | ||
| Other Banks & Diversified Financials – 4.7% | ||||
| Mastercard, Inc., “A” | 39,615 | $ 14,234,462 | ||
| Truist Financial Corp. | 154,322 | 9,035,553 | ||
| Visa, Inc., “A” | 73,197 | 15,862,522 | ||
| $39,132,537 | ||||
| Pharmaceuticals – 5.7% | ||||
| Eli Lilly & Co. | 36,828 | $ 10,172,630 | ||
| Johnson & Johnson | 99,444 | 17,011,885 | ||
| Merck & Co., Inc. | 139,697 | 10,706,378 | ||
| Zoetis, Inc. | 39,501 | 9,639,429 | ||
| $47,530,322 | ||||
| Railroad & Shipping – 0.9% | ||||
| Canadian Pacific Railway Ltd. | 102,515 | $ 7,374,929 | ||
| Restaurants – 0.4% | ||||
| Starbucks Corp. | 26,658 | $ 3,118,186 | ||
| Specialty Chemicals – 1.0% | ||||
| DuPont de Nemours, Inc. | 100,763 | $ 8,139,635 | ||
| Specialty Stores – 5.5% | ||||
| Amazon.com, Inc. (a) | 2,359 | $ 7,865,708 | ||
| Home Depot, Inc. | 35,828 | 14,868,978 | ||
| Target Corp. | 56,361 | 13,044,190 | ||
| Tractor Supply Co. | 42,099 | 10,044,822 | ||
| $45,823,698 | ||||
| Telecommunications - Wireless – 2.0% | ||||
| American Tower Corp., REIT | 57,311 | $ 16,763,468 | ||
| Issuer | Shares/Par | Value ($) | ||
| Common Stocks – continued | ||||
| Trucking – 0.3% | ||||
| Old Dominion Freight Line, Inc. | 7,526 | $ 2,697,168 | ||
| Utilities - Electric Power – 0.5% | ||||
| American Electric Power Co., Inc. | 50,041 | $ 4,452,148 | ||
| Total Common Stocks (Identified Cost, $353,628,334) | $827,992,602 | |||
| Investment Companies (h) – 0.4% | ||||
| Money Market Funds – 0.4% | ||||
| MFS Institutional Money Market Portfolio, 0.07% (v) (Identified Cost, $3,181,407) | 3,181,407 | $ 3,181,407 | ||
| Other Assets, Less Liabilities – 0.1% | 417,847 | |||
| Net Assets – 100.0% | $831,591,856 | |||
| (a) | Non-income producing security. | |||
| (h) | An affiliated issuer, which may be considered one in which the fund owns 5% or more of the outstanding voting securities, or a company which is under common control. At period end, the aggregate values of the fund's investments in affiliated issuers and in unaffiliated issuers were $3,181,407 and $827,992,602, respectively. | |||
| (v) | Affiliated issuer that is available only to investment companies managed by MFS. The rate quoted for the MFS Institutional Money Market Portfolio is the annualized seven-day yield of the fund at period end. |
| The following abbreviations are used in this report and are defined: | |
| REIT | Real Estate Investment Trust |
| Financial Statements | Statement of Assets and Liabilities |
| At 12/31/21Assets | |
| Investments in unaffiliated issuers, at value (identified cost, $353,628,334) | $827,992,602 |
| Investments in affiliated issuers, at value (identified cost, $3,181,407) | 3,181,407 |
| Cash | 95,098 |
| Receivables for | |
| Fund shares sold | 521,441 |
| Dividends | 570,345 |
| Other assets | 2,887 |
| Total assets | $832,363,780 |
| Liabilities | |
| Payables for | |
| Fund shares reacquired | $608,614 |
| Payable to affiliates | |
| Investment adviser | 33,616 |
| Administrative services fee | 669 |
| Shareholder servicing costs | 529 |
| Distribution and/or service fees | 7,345 |
| Payable for independent Trustees' compensation | 12 |
| Accrued expenses and other liabilities | 121,139 |
| Total liabilities | $771,924 |
| Net assets | $831,591,856 |
| Net assets consist of | |
| Paid-in capital | $248,891,409 |
| Total distributable earnings (loss) | 582,700,447 |
| Net assets | $831,591,856 |
| Shares of beneficial interest outstanding | 18,799,801 |
| Net assets | Shares outstanding | Net asset value per share | |
| Initial Class | $296,678,160 | 6,633,711 | $44.72 |
| Service Class | 534,913,696 | 12,166,090 | 43.97 |
| Financial Statements | Statement of Operations |
| Year ended 12/31/21 | |
| Net investment income (loss) | |
| Income | |
| Dividends | $10,421,209 |
| Other | 10,890 |
| Income on securities loaned | 9,708 |
| Dividends from affiliated issuers | 2,456 |
| Foreign taxes withheld | (110,706) |
| Total investment income | $10,333,557 |
| Expenses | |
| Management fee | $6,077,582 |
| Distribution and/or service fees | 1,304,213 |
| Shareholder servicing costs | 42,388 |
| Administrative services fee | 115,965 |
| Independent Trustees' compensation | 13,172 |
| Custodian fee | 38,969 |
| Shareholder communications | 32,106 |
| Audit and tax fees | 58,739 |
| Legal fees | 3,921 |
| Miscellaneous | 31,921 |
| Total expenses | $7,718,976 |
| Reduction of expenses by investment adviser | (102,811) |
| Net expenses | $7,616,165 |
| Net investment income (loss) | $2,717,392 |
| Realized and unrealized gain (loss) | |
| Realized gain (loss) (identified cost basis) | |
| Unaffiliated issuers | $104,108,048 |
| Foreign currency | (5,825) |
| Net realized gain (loss) | $104,102,223 |
| Change in unrealized appreciation or depreciation | |
| Unaffiliated issuers | $83,100,340 |
| Translation of assets and liabilities in foreign currencies | (2,562) |
| Net unrealized gain (loss) | $83,097,778 |
| Net realized and unrealized gain (loss) | $187,200,001 |
| Change in net assets from operations | $189,917,393 |
| Financial Statements | Statements of Changes in Net Assets |
| Year ended | ||
| 12/31/21 | 12/31/20 | |
| Change in net assets | ||
| From operations | ||
| Net investment income (loss) | $2,717,392 | $4,322,833 |
| Net realized gain (loss) | 104,102,223 | 25,229,917 |
| Net unrealized gain (loss) | 83,097,778 | 66,669,474 |
| Change in net assets from operations | $189,917,393 | $96,222,224 |
| Total distributions to shareholders | $(29,217,089) | $(25,105,390) |
| Change in net assets from fund share transactions | $(95,053,942) | $(23,803,177) |
| Total change in net assets | $65,646,362 | $47,313,657 |
| Net assets | ||
| At beginning of period | 765,945,494 | 718,631,837 |
| At end of period | $831,591,856 | $765,945,494 |
| Financial Statements | Financial Highlights |
| Initial Class | Year ended | ||||
| 12/31/21 | 12/31/20 | 12/31/19 | 12/31/18 | 12/31/17 | |
| Net asset value, beginning of period | $36.57 | $33.27 | $27.05 | $30.07 | $25.57 |
| Income (loss) from investment operations | |||||
| Net investment income (loss) (d) | $0.21 | $0.25 | $0.25 | $0.26 | $0.22 |
| Net realized and unrealized gain (loss) | 9.53 | 4.26 | 8.08 | (1.71) | 5.62 |
| Total from investment operations | $9.74 | $4.51 | $8.33 | $(1.45) | $5.84 |
| Less distributions declared to shareholders | |||||
| From net investment income | $(0.26) | $(0.21) | $(0.22) | $(0.20) | $(0.21) |
| From net realized gain | (1.33) | (1.00) | (1.89) | (1.37) | (1.13) |
| Total distributions declared to shareholders | $(1.59) | $(1.21) | $(2.11) | $(1.57) | $(1.34) |
| Net asset value, end of period (x) | $44.72 | $36.57 | $33.27 | $27.05 | $30.07 |
| Total return (%) (k)(r)(s)(x) | 26.81 | 13.87 | 31.58 | (5.49) | 23.35 |
| Ratios (%) (to average net assets) and Supplemental data: | |||||
| Expenses before expense reductions | 0.79 | 0.80 | 0.80 | 0.80 | 0.82 |
| Expenses after expense reductions | 0.78 | 0.79 | 0.79 | 0.79 | 0.79 |
| Net investment income (loss) | 0.50 | 0.78 | 0.80 | 0.86 | 0.79 |
| Portfolio turnover | 13 | 19 | 18 | 16 | 18 |
| Net assets at end of period (000 omitted) | $296,678 | $269,852 | $265,499 | $231,900 | $283,237 |
| Service Class | Year ended | ||||
| 12/31/21 | 12/31/20 | 12/31/19 | 12/31/18 | 12/31/17 | |
| Net asset value, beginning of period | $35.99 | $32.77 | $26.68 | $29.69 | $25.28 |
| Income (loss) from investment operations | |||||
| Net investment income (loss) (d) | $0.10 | $0.17 | $0.17 | $0.18 | $0.15 |
| Net realized and unrealized gain (loss) | 9.38 | 4.19 | 7.97 | (1.68) | 5.55 |
| Total from investment operations | $9.48 | $4.36 | $8.14 | $(1.50) | $5.70 |
| Less distributions declared to shareholders | |||||
| From net investment income | $(0.17) | $(0.14) | $(0.16) | $(0.14) | $(0.16) |
| From net realized gain | (1.33) | (1.00) | (1.89) | (1.37) | (1.13) |
| Total distributions declared to shareholders | $(1.50) | $(1.14) | $(2.05) | $(1.51) | $(1.29) |
| Net asset value, end of period (x) | $43.97 | $35.99 | $32.77 | $26.68 | $29.69 |
| Total return (%) (k)(r)(s)(x) | 26.51 | 13.60 | 31.25 | (5.71) | 23.03 |
| Ratios (%) (to average net assets) and Supplemental data: | |||||
| Expenses before expense reductions | 1.04 | 1.05 | 1.05 | 1.05 | 1.07 |
| Expenses after expense reductions | 1.03 | 1.04 | 1.04 | 1.04 | 1.04 |
| Net investment income (loss) | 0.24 | 0.53 | 0.55 | 0.62 | 0.55 |
| Portfolio turnover | 13 | 19 | 18 | 16 | 18 |
| Net assets at end of period (000 omitted) | $534,914 | $496,093 | $453,132 | $325,159 | $318,611 |
| (d) | Per share data is based on average shares outstanding. |
| (k) | The total return does not reflect expenses that apply to separate accounts. Inclusion of these charges would reduce the total return figures for all periods shown. |
| (r) | Certain expenses have been reduced without which performance would have been lower. |
| (s) | From time to time the fund may receive proceeds from litigation settlements, without which performance would be lower. |
| (x) | The net asset values and total returns have been calculated on net assets which include adjustments made in accordance with U.S. generally accepted accounting principles required at period end for financial reporting purposes. |
| Financial Instruments | Level 1 | Level 2 | Level 3 | Total |
| Equity Securities | $827,992,602 | $— | $— | $827,992,602 |
| Mutual Funds | 3,181,407 | — | — | 3,181,407 |
| Total | $831,174,009 | $— | $— | $831,174,009 |
| Year ended 12/31/21 | Year ended 12/31/20 | |
| Ordinary income (including any short-term capital gains) | $3,914,032 | $3,919,176 |
| Long-term capital gains | 25,303,057 | 21,186,214 |
| Total distributions | $29,217,089 | $25,105,390 |
| As of 12/31/21 | |
| Cost of investments | $357,532,232 |
| Gross appreciation | 475,673,477 |
| Gross depreciation | (2,031,700) |
| Net unrealized appreciation (depreciation) | $473,641,777 |
| Undistributed ordinary income | 12,036,943 |
| Undistributed long-term capital gain | 97,024,289 |
| Other temporary differences | (2,562) |
| Total distributable earnings (loss) | $582,700,447 |
| Year ended 12/31/21 | Year ended 12/31/20 | ||
| Initial Class | $10,689,350 | $9,047,272 | |
| Service Class | 18,527,739 | 16,058,118 | |
| Total | $29,217,089 | $25,105,390 |
| Up to $1 billion | 0.75% |
| In excess of $1 billion and up to $2.5 billion | 0.65% |
| In excess of $2.5 billion | 0.60% |
| Year ended 12/31/21 | Year ended 12/31/20 | ||||
| Shares | Amount | Shares | Amount | ||
| Shares sold | |||||
| Initial Class | 241,331 | $10,343,575 | 284,529 | $8,347,359 | |
| Service Class | 424,823 | 17,614,977 | 1,666,170 | 49,859,186 | |
| 666,154 | $27,958,552 | 1,950,699 | $58,206,545 | ||
| Shares issued to shareholders in reinvestment of distributions | |||||
| Initial Class | 248,705 | $10,689,350 | 267,829 | $9,047,272 | |
| Service Class | 438,112 | 18,527,739 | 482,660 | 16,058,118 | |
| 686,817 | $29,217,089 | 750,489 | $25,105,390 | ||
| Shares reacquired | |||||
| Initial Class | (1,234,645) | $(51,496,591) | (1,154,860) | $(37,139,929) | |
| Service Class | (2,480,055) | (100,732,992) | (2,192,948) | (69,975,183) | |
| (3,714,700) | $(152,229,583) | (3,347,808) | $(107,115,112) | ||
| Net change | |||||
| Initial Class | (744,609) | $(30,463,666) | (602,502) | $(19,745,298) | |
| Service Class | (1,617,120) | (64,590,276) | (44,118) | (4,057,879) | |
| (2,361,729) | $(95,053,942) | (646,620) | $(23,803,177) | ||
| Affiliated Issuers | Beginning Value | Purchases | Sales Proceeds | Realized Gain (Loss) | Change in Unrealized Appreciation or Depreciation | Ending Value |
| MFS Institutional Money Market Portfolio | $2,722,233 | $125,271,523 | $124,812,349 | $— | $— | $3,181,407 |
| Affiliated Issuers | Dividend Income | Capital Gain Distributions |
| MFS Institutional Money Market Portfolio | $2,456 | $— |
February 15, 2022
| Name, Age | Position(s) Held with Fund | Trustee/Officer Since(h) | Number of MFS Funds overseen by the Trustee | Principal Occupations During the Past Five Years | Other Directorships During the Past Five Years (j) | |||||
| INTERESTED TRUSTEES | ||||||||||
| Michael W. Roberge (k) (age 55) | Trustee | January 2021 | 135 | Massachusetts Financial Services Company, Chairman (since January 2021); Chief Executive Officer (since January 2017); Director; Chairman of the Board (since January 2022); President (until December 2018); Chief Investment Officer (until December 2018) | N/A | |||||
| INDEPENDENT TRUSTEES | ||||||||||
| John P. Kavanaugh (age 67) | Trustee and Chair of Trustees | January 2009 | 135 | Private investor | N/A | |||||
| Steven E. Buller (age 70) | Trustee | February 2014 | 135 | Private investor | N/A | |||||
| John A. Caroselli (age 67) | Trustee | March 2017 | 135 | Private investor; JC Global Advisors, LLC (management consulting), President (since 2015) | N/A | |||||
| Maureen R. Goldfarb (age 66) | Trustee | January 2009 | 135 | Private investor | N/A | |||||
| Peter D. Jones (age 66) | Trustee | January 2019 | 135 | Private investor | N/A | |||||
| James W. Kilman, Jr. (age 60) | Trustee | January 2019 | 135 | Burford Capital Limited (finance and investment management), Senior Advisor (since May 3, 2021), Chief Financial Officer (2019 - May 2, 2021); KielStrand Capital LLC (family office), Chief Executive Officer (since 2016) | Alpha-En Corporation, Director (2016-2019) | |||||
| Clarence Otis, Jr. (age 65) | Trustee | March 2017 | 135 | Private investor | VF Corporation, Director; Verizon Communications, Inc., Director; The Travelers Companies, Director | |||||
| Maryanne L. Roepke (age 65) | Trustee | May 2014 | 135 | Private investor | N/A | |||||
| Laurie J. Thomsen (age 64) | Trustee | March 2005 | 135 | Private investor | The Travelers Companies, Director; Dycom Industries, Inc., Director |
| Name, Age | Position(s) Held with Fund | Trustee/Officer Since(h) | Number of MFS Funds for which the Person is an Officer | Principal Occupations During the Past Five Years | ||||
| OFFICERS | ||||||||
| Christopher R. Bohane (k) (age 48) | Assistant Secretary and Assistant Clerk | July 2005 | 135 | Massachusetts Financial Services Company, Senior Vice President and Associate General Counsel | ||||
| Kino Clark (k) (age 53) | Assistant Treasurer | January 2012 | 135 | Massachusetts Financial Services Company, Vice President | ||||
| John W. Clark, Jr. (k) (age 54) | Assistant Treasurer | April 2017 | 135 | Massachusetts Financial Services Company, Vice President (since March 2017); Deutsche Bank (financial services), Department Head - Treasurer's Office (until February 2017) | ||||
| Thomas H. Connors (k) (age 62) | Assistant Secretary and Assistant Clerk | September 2012 | 135 | Massachusetts Financial Services Company, Vice President and Senior Counsel | ||||
| David L. DiLorenzo (k) (age 53) | President | July 2005 | 135 | Massachusetts Financial Services Company, Senior Vice President | ||||
| Heidi W. Hardin (k) (age 54) | Secretary and Clerk | April 2017 | 135 | Massachusetts Financial Services Company, Executive Vice President and General Counsel (since March 2017); Harris Associates (investment management), General Counsel (until January 2017) | ||||
| Brian E. Langenfeld (k) (age 48) | Assistant Secretary and Assistant Clerk | June 2006 | 135 | Massachusetts Financial Services Company, Vice President and Senior Counsel | ||||
| Amanda S. Mooradian (k) (age 42) | Assistant Secretary and Assistant Clerk | September 2018 | 135 | Massachusetts Financial Services Company, Assistant Vice President and Senior Counsel | ||||
| Susan A. Pereira (k) (age 51) | Assistant Secretary and Assistant Clerk | July 2005 | 135 | Massachusetts Financial Services Company, Vice President and Assistant General Counsel | ||||
| Kasey L. Phillips (k) (age 51) | Assistant Treasurer | September 2012 | 135 | Massachusetts Financial Services Company, Vice President | ||||
| Matthew A. Stowe (k) (age 47) | Assistant Secretary and Assistant Clerk | October 2014 | 135 | Massachusetts Financial Services Company, Vice President and Assistant General Counsel | ||||
| Martin J. Wolin (k) (age 54) | Chief Compliance Officer | July 2015 | 135 | Massachusetts Financial Services Company, Senior Vice President and Chief Compliance Officer | ||||
| James O. Yost (k) (age 61) | Treasurer | September 1990 | 135 | Massachusetts Financial Services Company, Senior Vice President |
| (h) | Date first appointed to serve as Trustee/Officer of an MFS Fund. Each Trustee has served continuously since appointment unless indicated otherwise. From January 2012 through December 2016, Messrs. DiLorenzo and Yost served as Treasurer and Deputy Treasurer of the Funds, respectively. |
| (j) | Directorships or trusteeships of companies required to report to the Securities and Exchange Commission (i.e., “public companies”). |
| (k) | “Interested person” of the Trust within the meaning of the Investment Company Act of 1940 (referred to as the 1940 Act), which is the principal federal law governing investment companies like the fund, as a result of a position with MFS. The address of MFS is 111 Huntington Avenue, Boston, Massachusetts 02199-7618. |
| Investment Adviser | Custodian |
| Massachusetts Financial Services Company 111 Huntington Avenue Boston, MA 02199-7618 | State Street Bank and Trust Company 1 Lincoln Street Boston, MA 02111-2900 |
| Distributor | Independent Registered Public Accounting Firm |
| MFS Fund Distributors, Inc. 111 Huntington Avenue Boston, MA 02199-7618 | Deloitte & Touche LLP 200 Berkeley Street Boston, MA 02116 |
| Portfolio Manager(s) | |
| Jude Jason Alison O'Neill Mackey Ted Maloney |

| FACTS | WHAT DOES MFS DO WITH YOUR PERSONAL INFORMATION? |
| Why? | Financial companies choose how they share your personal information. Federal law gives consumers the right to limit some but not all sharing. Federal law also requires us to tell you how we collect, share, and protect your personal information. Please read this notice carefully to understand what we do. |
| What? | The types of personal information we collect and share depend on the product or service you have with us. This information can include: |
| • Social Security number and account balances | |
| • Account transactions and transaction history | |
| • Checking account information and wire transfer instructions | |
| When you are no longer our customer, we continue to share your information as described in this notice. |
| How? | All financial companies need to share customers' personal information to run their everyday business. In the section below, we list the reasons financial companies can share their customers' personal information; the reasons MFS chooses to share; and whether you can limit this sharing. |
| Reasons we can share your personal information | Does MFS share? | Can you limit this sharing? |
| For our everyday business purposes – such as to process your transactions, maintain your account(s), respond to court orders and legal investigations, or report to credit bureaus | Yes | No |
| For our marketing purposes – to offer our products and services to you | No | We don't share |
| For joint marketing with other financial companies | No | We don't share |
| For our affiliates' everyday business purposes – information about your transactions and experiences | No | We don't share |
| For our affiliates' everyday business purposes – information about your creditworthiness | No | We don't share |
| For nonaffiliates to market to you | No | We don't share |
| Questions? | Call 800-225-2606 or go to mfs.com. |
| Who we are | |
| Who is providing this notice? | MFS Funds, MFS Investment Management, MFS Institutional Advisors, Inc., and MFS Heritage Trust Company. |
| What we do | |
| How does MFS protect my personal information? | To protect your personal information from unauthorized access and use, we use security measures that comply with federal law. These measures include procedural, electronic, and physical safeguards for the protection of the personal information we collect about you. |
| How does MFS collect my personal information? | We collect your personal information, for example, when you |
| • open an account or provide account information | |
| • direct us to buy securities or direct us to sell your securities | |
| • make a wire transfer | |
| We also collect your personal information from others, such as credit bureaus, affiliates, or other companies. | |
| Why can't I limit all sharing? | Federal law gives you the right to limit only |
| • sharing for affiliates' everyday business purposes – information about your creditworthiness | |
| • affiliates from using your information to market to you | |
| • sharing for nonaffiliates to market to you | |
| State laws and individual companies may give you additional rights to limit sharing. | |
| Definitions | |
| Affiliates | Companies related by common ownership or control. They can be financial and nonfinancial companies. |
| • MFS does not share personal information with affiliates, except for everyday business purposes as described on page one of this notice. | |
| Nonaffiliates | Companies not related by common ownership or control. They can be financial and nonfinancial companies. |
| • MFS does not share with nonaffiliates so they can market to you. | |
| Joint marketing | A formal agreement between nonaffiliated financial companies that together market financial products or services to you. |
| • MFS doesn't jointly market. | |
| Other important information |
| If you own an MFS product or receive an MFS service in the name of a third party such as a bank or broker-dealer, their privacy policy may apply to you instead of ours. |


| 1 | |
| 2 | |
| 3 | |
| 5 | |
| 7 | |
| 8 | |
| 12 | |
| 13 | |
| 14 | |
| 15 | |
| 17 | |
| 23 | |
| 24 | |
| 27 | |
| 29 | |
| 29 | |
| 29 | |
| 29 | |
| 29 | |
| 30 |


| PerkinElmer, Inc. | 3.0% |
| Cadence Design Systems, Inc. | 2.7% |
| Monolithic Power Systems, Inc. | 2.7% |
| MSCI, Inc. | 2.6% |
| Charles River Laboratories International, Inc. | 2.2% |
| AMETEK, Inc. | 2.1% |
| STERIS PLC | 2.0% |
| Verisk Analytics, Inc., “A” | 2.0% |
| ICON PLC | 1.9% |
| Arthur J. Gallagher & Co. | 1.9% |
| Information Technology | 25.2% |
| Health Care | 20.3% |
| Industrials | 19.7% |
| Consumer Discretionary | 14.7% |
| Financials | 7.9% |
| Communication Services | 5.5% |
| Materials | 3.0% |
| Real Estate | 2.4% |
| Consumer Staples | 0.1% |
| (g) | The Global Industry Classification Standard (GICS®) was developed by and/or is the exclusive property of MSCI, Inc. and S&P Global Market Intelligence Inc. (“S&P Global Market Intelligence”). GICS is a service mark of MSCI and S&P Global Market Intelligence and has been licensed for use by MFS. MFS has applied its own internal sector/industry classification methodology for equity securities and non-equity securities that are unclassified by GICS. |
| (b) | Security is not a benchmark constituent. |
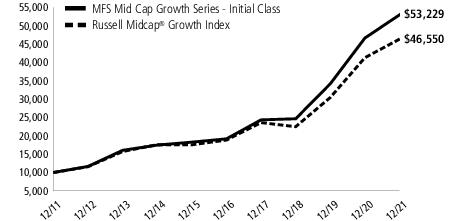
| Share Class | Class Inception Date | 1-yr | 5-yr | 10-yr |
| Initial Class | 4/28/00 | 14.11% | 22.66% | 18.20% |
| Service Class | 5/01/00 | 13.88% | 22.34% | 17.91% |
| Russell Midcap® Growth Index (f) | 12.73% | 19.83% | 16.63% |
| (f) | Source: FactSet Research Systems Inc. |
| (h) | Frank Russell Company (“Russell”) is the source and owner of the trademarks, service marks, and copyrights related to the Russell Indexes. Russell® is a trademark of Frank Russell Company. Neither Russell nor its licensors accept any liability for any errors or omissions in the Russell Indexes and/or Russell ratings or underlying data and no party may rely on any Russell Indexes and/or Russell ratings and/or underlying data contained in this document. No further distribution of Russell Data is permitted without Russell's express written consent. Russell does not promote, sponsor, or endorse the content of this document. |
July 1, 2021 through December 31, 2021
| Share Class | Annualized Expense Ratio | Beginning Account Value 7/01/21 | Ending Account Value 12/31/21 | Expenses Paid During Period (p) 7/01/21-12/31/21 | |
| Initial Class | Actual | 0.79% | $1,000.00 | $1,083.68 | $4.15 |
| Hypothetical (h) | 0.79% | $1,000.00 | $1,021.22 | $4.02 | |
| Service Class | Actual | 1.04% | $1,000.00 | $1,082.44 | $5.46 |
| Hypothetical (h) | 1.04% | $1,000.00 | $1,019.96 | $5.30 |
| (h) | 5% class return per year before expenses. |
| (p) | “Expenses Paid During Period” are equal to each class's annualized expense ratio, as shown above, multiplied by the average account value over the period, multiplied by 184/365 (to reflect the one-half year period). |
| Issuer | Shares/Par | Value ($) | ||
| Common Stocks – 98.8% | ||||
| Aerospace & Defense – 0.8% | ||||
| Howmet Aerospace, Inc. | 112,237 | $ 3,572,504 | ||
| Automotive – 2.2% | ||||
| Copart, Inc. (a) | 44,065 | $ 6,681,135 | ||
| LKQ Corp. | 54,547 | 3,274,457 | ||
| $9,955,592 | ||||
| Biotechnology – 0.7% | ||||
| Adaptive Biotechnologies Corp. (a) | 34,284 | $ 962,009 | ||
| Alnylam Pharmaceuticals, Inc. (a) | 13,383 | 2,269,489 | ||
| $3,231,498 | ||||
| Brokerage & Asset Managers – 3.2% | ||||
| Morningstar, Inc. | 7,400 | $ 2,530,726 | ||
| NASDAQ, Inc. | 35,922 | 7,543,979 | ||
| Tradeweb Markets, Inc. | 41,034 | 4,109,145 | ||
| $14,183,850 | ||||
| Business Services – 11.3% | ||||
| Clarivate PLC (a) | 230,560 | $ 5,422,771 | ||
| CoStar Group, Inc. (a) | 68,294 | 5,397,275 | ||
| Endava PLC, ADR (a) | 13,615 | 2,286,231 | ||
| Equifax, Inc. | 23,645 | 6,923,019 | ||
| IHS Markit Ltd. | 9,140 | 1,214,889 | ||
| MSCI, Inc. | 19,221 | 11,776,514 | ||
| Thoughtworks Holding, Inc. (a) | 82,751 | 2,218,554 | ||
| Tyler Technologies, Inc. (a) | 11,822 | 6,359,645 | ||
| Verisk Analytics, Inc., “A” | 39,672 | 9,074,177 | ||
| $50,673,075 | ||||
| Cable TV – 0.3% | ||||
| Cable One, Inc. | 722 | $ 1,273,211 | ||
| Computer Software – 11.3% | ||||
| Autodesk, Inc. (a) | 19,485 | $ 5,478,987 | ||
| Black Knight, Inc. (a) | 64,965 | 5,384,949 | ||
| Bumble, Inc., “A” (a) | 30,599 | 1,036,082 | ||
| Cadence Design Systems, Inc. (a) | 64,544 | 12,027,774 | ||
| CCC Intelligent Holdings, Inc. (a)(l) | 78,281 | 891,621 | ||
| CCC Intelligent Holdings, Inc. (PIPE) (a) | 13,884 | 158,139 | ||
| Coupa Software, Inc. (a) | 8,231 | 1,300,910 | ||
| DocuSign, Inc. (a) | 11,402 | 1,736,639 | ||
| Dun & Bradstreet Holdings, Inc. (a) | 164,883 | 3,378,453 | ||
| Eventbrite, Inc. (a) | 73,623 | 1,283,985 | ||
| Everbridge, Inc. (a) | 19,540 | 1,315,628 | ||
| Okta, Inc. (a) | 13,191 | 2,957,026 | ||
| Paylocity Holding Corp. (a) | 23,085 | 5,451,754 | ||
| Qualtrics International, “A” (a) | 19,509 | 690,619 | ||
| Synopsys, Inc. (a) | 17,267 | 6,362,889 | ||
| Topicus.com, Inc. (a) | 5,577 | 511,870 | ||
| Unity Software, Inc. (a) | 3,962 | 566,526 | ||
| $50,533,851 | ||||
| Issuer | Shares/Par | Value ($) | ||
| Common Stocks – continued | ||||
| Computer Software - Systems – 7.0% | ||||
| Block, Inc., “A” (a) | 13,748 | $ 2,220,439 | ||
| Constellation Software, Inc. | 2,905 | 5,389,826 | ||
| NICE Systems Ltd., ADR (a) | 25,703 | 7,803,431 | ||
| ServiceNow, Inc. (a) | 7,397 | 4,801,467 | ||
| SS&C Technologies Holdings, Inc. | 27,646 | 2,266,419 | ||
| TransUnion | 65,486 | 7,765,330 | ||
| Wix.com Ltd. (a) | 7,087 | 1,118,258 | ||
| $31,365,170 | ||||
| Construction – 5.7% | ||||
| AZEK Co., Inc. (a) | 76,435 | $ 3,534,354 | ||
| Builders FirstSource, Inc. (a) | 56,885 | 4,875,613 | ||
| Pool Corp. | 14,560 | 8,240,960 | ||
| SiteOne Landscape Supply, Inc. (a) | 6,642 | 1,609,224 | ||
| Vulcan Materials Co. | 36,191 | 7,512,528 | ||
| $25,772,679 | ||||
| Consumer Products – 0.6% | ||||
| Scotts Miracle-Gro Co. | 17,376 | $ 2,797,536 | ||
| Consumer Services – 1.5% | ||||
| Bright Horizons Family Solutions, Inc. (a) | 52,258 | $ 6,578,237 | ||
| Containers – 0.7% | ||||
| Ball Corp. | 33,509 | $ 3,225,911 | ||
| Electrical Equipment – 3.1% | ||||
| AMETEK, Inc. | 62,660 | $ 9,213,527 | ||
| Fortive Corp. | 13,244 | 1,010,385 | ||
| Littlefuse, Inc. | 11,302 | 3,556,513 | ||
| $13,780,425 | ||||
| Electronics – 5.7% | ||||
| ASM International N.V. | 8,847 | $ 3,915,105 | ||
| Entegris, Inc. | 54,870 | 7,603,885 | ||
| Monolithic Power Systems, Inc. | 24,367 | 12,020,972 | ||
| Silicon Laboratories, Inc. (a) | 10,026 | 2,069,567 | ||
| $25,609,529 | ||||
| Food & Beverages – 0.0% | ||||
| Dutch Bros, Inc., “A” (a) | 4,940 | $ 251,495 | ||
| Gaming & Lodging – 2.0% | ||||
| Caesars Entertainment, Inc. (a) | 32,937 | $ 3,080,598 | ||
| Penn National Gaming, Inc. (a) | 9,045 | 468,983 | ||
| Red Rock Resorts, Inc. | 69,902 | 3,845,309 | ||
| Vail Resorts, Inc. | 4,353 | 1,427,349 | ||
| $8,822,239 | ||||
| General Merchandise – 0.7% | ||||
| Five Below, Inc. (a) | 14,454 | $ 2,990,388 | ||
| Insurance – 1.9% | ||||
| Arthur J. Gallagher & Co. | 49,442 | $ 8,388,824 | ||
| Issuer | Shares/Par | Value ($) | ||
| Common Stocks – continued | ||||
| Internet – 3.5% | ||||
| Gartner, Inc. (a) | 13,348 | $ 4,462,503 | ||
| IAC/InterActiveCorp (a) | 23,192 | 3,031,426 | ||
| Match Group, Inc. (a) | 54,356 | 7,188,581 | ||
| Toast, Inc., “A” (a) | 7,863 | 272,925 | ||
| Vimeo, Inc. (a) | 37,652 | 676,230 | ||
| $15,631,665 | ||||
| Leisure & Toys – 1.8% | ||||
| Electronic Arts, Inc. | 11,243 | $ 1,482,952 | ||
| Roblox Corp., “A” (a) | 16,267 | 1,678,104 | ||
| Take-Two Interactive Software, Inc. (a) | 27,835 | 4,946,836 | ||
| $8,107,892 | ||||
| Machinery & Tools – 1.4% | ||||
| IDEX Corp. | 27,704 | $ 6,547,009 | ||
| Medical & Health Technology & Services – 5.4% | ||||
| Charles River Laboratories International, Inc. (a) | 26,709 | $ 10,063,417 | ||
| Guardant Health, Inc. (a) | 19,786 | 1,978,996 | ||
| ICON PLC (a) | 27,344 | 8,468,437 | ||
| IDEXX Laboratories, Inc. (a) | 5,971 | 3,931,664 | ||
| $24,442,514 | ||||
| Medical Equipment – 13.7% | ||||
| Agilent Technologies, Inc. | 33,917 | $ 5,414,849 | ||
| Align Technology, Inc. (a) | 7,442 | 4,890,734 | ||
| Bio-Techne Corp. | 14,436 | 7,468,320 | ||
| Envista Holdings Corp. (a) | 69,109 | 3,114,052 | ||
| Maravai Lifesciences Holdings, Inc., “A” (a) | 68,952 | 2,889,089 | ||
| Masimo Corp. (a) | 18,283 | 5,352,897 | ||
| Mettler-Toledo International, Inc. (a) | 1,330 | 2,257,289 | ||
| PerkinElmer, Inc. | 67,500 | 13,571,550 | ||
| STERIS PLC | 37,328 | 9,086,008 | ||
| West Pharmaceutical Services, Inc. | 15,576 | 7,305,300 | ||
| $61,350,088 | ||||
| Other Banks & Diversified Financials – 0.2% | ||||
| Altimeter Growth Corp. 2 (SPAC) (a) | 56,604 | $ 558,115 | ||
| Catalyst Partners Acquisition Corp. (SPAC Units) (a) | 38,855 | 388,939 | ||
| $947,054 | ||||
| Pharmaceuticals – 0.5% | ||||
| Ascendis Pharma (a) | 16,846 | $ 2,266,292 | ||
| Pollution Control – 1.0% | ||||
| Waste Connections, Inc. | 32,476 | $ 4,425,505 | ||
| Printing & Publishing – 1.9% | ||||
| Warner Music Group Corp. | 49,704 | $ 2,146,219 | ||
| Wolters Kluwer N.V. | 54,796 | 6,463,109 | ||
| $8,609,328 | ||||
| Railroad & Shipping – 0.3% | ||||
| Canadian Pacific Railway Ltd. | 18,953 | $ 1,363,479 | ||
| Issuer | Shares/Par | Value ($) | ||
| Common Stocks – continued | ||||
| Real Estate – 1.5% | ||||
| Extra Space Storage, Inc., REIT | 29,470 | $ 6,681,733 | ||
| Restaurants – 2.3% | ||||
| Chipotle Mexican Grill, Inc., “A” (a) | 3,166 | $ 5,534,960 | ||
| Domino's Pizza, Inc. | 8,276 | 4,670,395 | ||
| Sweetgreen, Inc. (a) | 3,489 | 111,648 | ||
| $10,317,003 | ||||
| Specialty Stores – 5.7% | ||||
| Burlington Stores, Inc. (a) | 19,321 | $ 5,632,265 | ||
| Chewy, Inc., “A” (a)(l) | 24,795 | 1,462,161 | ||
| Farfetch Ltd., “A” (a) | 28,497 | 952,655 | ||
| Lululemon Athletica, Inc. (a) | 12,438 | 4,868,855 | ||
| O'Reilly Automotive, Inc. (a) | 5,811 | 4,103,902 | ||
| Tractor Supply Co. | 17,242 | 4,113,941 | ||
| Ulta Beauty, Inc. (a) | 10,676 | 4,402,142 | ||
| $25,535,921 | ||||
| Telecommunications - Wireless – 0.9% | ||||
| SBA Communications Corp., REIT | 10,275 | $ 3,997,181 | ||
| Total Common Stocks (Identified Cost, $204,408,442) | $443,228,678 | |||
| Investment Companies (h) – 1.2% | ||||
| Money Market Funds – 1.2% | ||||
| MFS Institutional Money Market Portfolio, 0.07% (v) (Identified Cost, $5,353,682) | 5,353,682 | $ 5,353,682 | ||
| Collateral for Securities Loaned – 0.1% | ||||
| State Street Navigator Securities Lending Government Money Market Portfolio, 0.03% (j) (Identified Cost, $449,544) | 449,544 | $ 449,544 | ||
| Other Assets, Less Liabilities – (0.1)% | (340,195) | |||
| Net Assets – 100.0% | $448,691,709 | |||
| (a) | Non-income producing security. | |||
| (h) | An affiliated issuer, which may be considered one in which the fund owns 5% or more of the outstanding voting securities, or a company which is under common control. At period end, the aggregate values of the fund's investments in affiliated issuers and in unaffiliated issuers were $5,353,682 and $443,678,222, respectively. | |||
| (j) | The rate quoted is the annualized seven-day yield of the fund at period end. | |||
| (l) | A portion of this security is on loan. See Note 2 for additional information. | |||
| (v) | Affiliated issuer that is available only to investment companies managed by MFS. The rate quoted for the MFS Institutional Money Market Portfolio is the annualized seven-day yield of the fund at period end. |
| The following abbreviations are used in this report and are defined: | |
| ADR | American Depositary Receipt |
| PIPE | Private Investment in Public Equity |
| REIT | Real Estate Investment Trust |
| SPAC | Special Purpose Acquisition Company |
| Financial Statements | Statement of Assets and Liabilities |
| At 12/31/21Assets | |
| Investments in unaffiliated issuers, at value, including $1,157,743 of securities on loan (identified cost, $204,857,986) | $443,678,222 |
| Investments in affiliated issuers, at value (identified cost, $5,353,682) | 5,353,682 |
| Receivables for | |
| Fund shares sold | 414,811 |
| Interest and dividends | 75,228 |
| Other assets | 1,714 |
| Total assets | $449,523,657 |
| Liabilities | |
| Payables for | |
| Fund shares reacquired | $278,842 |
| Collateral for securities loaned, at value (c) | 449,544 |
| Payable to affiliates | |
| Investment adviser | 18,077 |
| Administrative services fee | 387 |
| Shareholder servicing costs | 331 |
| Distribution and/or service fees | 1,951 |
| Payable for independent Trustees' compensation | 12 |
| Accrued expenses and other liabilities | 82,804 |
| Total liabilities | $831,948 |
| Net assets | $448,691,709 |
| Net assets consist of | |
| Paid-in capital | $158,913,732 |
| Total distributable earnings (loss) | 289,777,977 |
| Net assets | $448,691,709 |
| Shares of beneficial interest outstanding | 39,791,523 |
| Net assets | Shares outstanding | Net asset value per share | |
| Initial Class | $306,174,493 | 26,128,276 | $11.72 |
| Service Class | 142,517,216 | 13,663,247 | 10.43 |
| (c) | Non-cash collateral is not included. |
| Financial Statements | Statement of Operations |
| Year ended 12/31/21 | |
| Net investment income (loss) | |
| Income | |
| Dividends | $1,573,635 |
| Other | 13,101 |
| Income on securities loaned | 2,240 |
| Dividends from affiliated issuers | 1,361 |
| Foreign taxes withheld | (23,059) |
| Total investment income | $1,567,278 |
| Expenses | |
| Management fee | $3,302,399 |
| Distribution and/or service fees | 337,094 |
| Shareholder servicing costs | 25,496 |
| Administrative services fee | 68,011 |
| Independent Trustees' compensation | 8,187 |
| Custodian fee | 23,916 |
| Shareholder communications | 27,411 |
| Audit and tax fees | 59,915 |
| Legal fees | 2,840 |
| Miscellaneous | 28,333 |
| Total expenses | $3,883,602 |
| Reduction of expenses by investment adviser | (55,794) |
| Net expenses | $3,827,808 |
| Net investment income (loss) | $(2,260,530) |
| Realized and unrealized gain (loss) | |
| Realized gain (loss) (identified cost basis) | |
| Unaffiliated issuers | $53,344,147 |
| Foreign currency | 1,019 |
| Net realized gain (loss) | $53,345,166 |
| Change in unrealized appreciation or depreciation | |
| Unaffiliated issuers | $7,701,811 |
| Translation of assets and liabilities in foreign currencies | (3,702) |
| Net unrealized gain (loss) | $7,698,109 |
| Net realized and unrealized gain (loss) | $61,043,275 |
| Change in net assets from operations | $58,782,745 |
| Financial Statements | Statements of Changes in Net Assets |
| Year ended | ||
| 12/31/21 | 12/31/20 | |
| Change in net assets | ||
| From operations | ||
| Net investment income (loss) | $(2,260,530) | $(1,271,494) |
| Net realized gain (loss) | 53,345,166 | 88,862,036 |
| Net unrealized gain (loss) | 7,698,109 | 39,918,078 |
| Change in net assets from operations | $58,782,745 | $127,508,620 |
| Total distributions to shareholders | $(88,068,256) | $(29,460,280) |
| Change in net assets from fund share transactions | $34,144,282 | $(48,232,077) |
| Total change in net assets | $4,858,771 | $49,816,263 |
| Net assets | ||
| At beginning of period | 443,832,938 | 394,016,675 |
| At end of period | $448,691,709 | $443,832,938 |
| Financial Statements | Financial Highlights |
| Initial Class | Year ended | ||||
| 12/31/21 | 12/31/20 | 12/31/19 | 12/31/18 | 12/31/17 | |
| Net asset value, beginning of period | $12.64 | $9.96 | $8.23 | $9.51 | $7.96 |
| Income (loss) from investment operations | |||||
| Net investment income (loss) (d) | $(0.05) | $(0.03) | $(0.01) | $(0.02) | $(0.01) |
| Net realized and unrealized gain (loss) | 1.78 | 3.53 | 3.10 | 0.39 | 2.11 |
| Total from investment operations | $1.73 | $3.50 | $3.09 | $0.37 | $2.10 |
| Less distributions declared to shareholders | |||||
| From net investment income | $— | $— | $— | $— | $(0.01) |
| From net realized gain | (2.65) | (0.82) | (1.36) | (1.65) | (0.54) |
| Total distributions declared to shareholders | $(2.65) | $(0.82) | $(1.36) | $(1.65) | $(0.55) |
| Net asset value, end of period (x) | $11.72 | $12.64 | $9.96 | $8.23 | $9.51 |
| Total return (%) (k)(r)(s)(x) | 14.11 | 36.48 | 38.66 | 1.24 | 27.00 |
| Ratios (%) (to average net assets) and Supplemental data: | |||||
| Expenses before expense reductions | 0.81 | 0.81 | 0.81 | 0.81 | 0.81 |
| Expenses after expense reductions | 0.79 | 0.80 | 0.80 | 0.80 | 0.80 |
| Net investment income (loss) | (0.44) | (0.26) | (0.07) | (0.18) | (0.15) |
| Portfolio turnover | 18 | 40 | 17 | 21 | 32 |
| Net assets at end of period (000 omitted) | $306,174 | $311,988 | $290,512 | $247,614 | $297,463 |
| Service Class | Year ended | ||||
| 12/31/21 | 12/31/20 | 12/31/19 | 12/31/18 | 12/31/17 | |
| Net asset value, beginning of period | $11.53 | $9.17 | $7.68 | $8.99 | $7.56 |
| Income (loss) from investment operations | |||||
| Net investment income (loss) (d) | $(0.08) | $(0.05) | $(0.03) | $(0.04) | $(0.03) |
| Net realized and unrealized gain (loss) | 1.63 | 3.23 | 2.88 | 0.38 | 2.00 |
| Total from investment operations | $1.55 | $3.18 | $2.85 | $0.34 | $1.97 |
| Less distributions declared to shareholders | |||||
| From net investment income | $— | $— | $— | $— | $— |
| From net realized gain | (2.65) | (0.82) | (1.36) | (1.65) | (0.54) |
| Total distributions declared to shareholders | $(2.65) | $(0.82) | $(1.36) | $(1.65) | $(0.54) |
| Net asset value, end of period (x) | $10.43 | $11.53 | $9.17 | $7.68 | $8.99 |
| Total return (%) (k)(r)(s)(x) | 13.88 | 36.12 | 38.28 | 0.95 | 26.68 |
| Ratios (%) (to average net assets) and Supplemental data: | |||||
| Expenses before expense reductions | 1.06 | 1.06 | 1.06 | 1.06 | 1.06 |
| Expenses after expense reductions | 1.04 | 1.05 | 1.05 | 1.05 | 1.05 |
| Net investment income (loss) | (0.68) | (0.51) | (0.32) | (0.43) | (0.40) |
| Portfolio turnover | 18 | 40 | 17 | 21 | 32 |
| Net assets at end of period (000 omitted) | $142,517 | $131,845 | $103,504 | $86,560 | $100,052 |
| (d) | Per share data is based on average shares outstanding. |
| (k) | The total return does not reflect expenses that apply to separate accounts. Inclusion of these charges would reduce the total return figures for all periods shown. |
| (r) | Certain expenses have been reduced without which performance would have been lower. |
| (s) | From time to time the fund may receive proceeds from litigation settlements, without which performance would be lower. |
| (x) | The net asset values and total returns have been calculated on net assets which include adjustments made in accordance with U.S. generally accepted accounting principles required at period end for financial reporting purposes. |
| Financial Instruments | Level 1 | Level 2 | Level 3 | Total |
| Equity Securities: | ||||
| United States | $392,683,570 | $158,139 | $— | $392,841,709 |
| Canada | 11,690,680 | — | — | 11,690,680 |
| Netherlands | 10,378,214 | — | — | 10,378,214 |
| Israel | 8,921,689 | — | — | 8,921,689 |
| United Kingdom | 8,661,657 | — | — | 8,661,657 |
| Ireland | 8,468,437 | — | — | 8,468,437 |
| Denmark | 2,266,292 | — | — | 2,266,292 |
| Mutual Funds | 5,803,226 | — | — | 5,803,226 |
| Total | $448,873,765 | $158,139 | $— | $449,031,904 |
| Year ended 12/31/21 | Year ended 12/31/20 | |
| Ordinary income (including any short-term capital gains) | $1,064,357 | $1,520,227 |
| Long-term capital gains | 87,003,899 | 27,940,053 |
| Total distributions | $88,068,256 | $29,460,280 |
| As of 12/31/21 | |
| Cost of investments | $210,631,555 |
| Gross appreciation | 240,895,351 |
| Gross depreciation | (2,495,002) |
| Net unrealized appreciation (depreciation) | $238,400,349 |
| Undistributed long-term capital gain | 51,376,055 |
| Other temporary differences | 1,573 |
| Total distributable earnings (loss) | $289,777,977 |
| Year ended 12/31/21 | Year ended 12/31/20 | ||
| Initial Class | $58,981,786 | $20,588,572 | |
| Service Class | 29,086,470 | 8,871,708 | |
| Total | $88,068,256 | $29,460,280 |
| Up to $1 billion | 0.75% |
| In excess of $1 billion | 0.70% |
| Year ended 12/31/21 | Year ended 12/31/20 | ||||
| Shares | Amount | Shares | Amount | ||
| Shares sold | |||||
| Initial Class | 1,674,624 | $20,742,554 | 2,228,807 | $21,405,127 | |
| Service Class | 2,631,304 | 29,113,983 | 3,158,059 | 30,335,847 | |
| 4,305,928 | $49,856,537 | 5,386,866 | $51,740,974 | ||
| Shares issued to shareholders in reinvestment of distributions | |||||
| Initial Class | 5,081,448 | $58,385,837 | 1,877,652 | $20,372,526 | |
| Service Class | 2,840,476 | 29,086,470 | 895,228 | 8,871,708 | |
| 7,921,924 | $87,472,307 | 2,772,880 | $29,244,234 | ||
| Shares reacquired | |||||
| Initial Class | (5,317,486) | $(66,831,580) | (8,598,413) | $(91,175,151) | |
| Service Class | (3,239,455) | (36,352,982) | (3,909,750) | (38,042,134) | |
| (8,556,941) | $(103,184,562) | (12,508,163) | $(129,217,285) | ||
| Net change | |||||
| Initial Class | 1,438,586 | $12,296,811 | (4,491,954) | $(49,397,498) | |
| Service Class | 2,232,325 | 21,847,471 | 143,537 | 1,165,421 | |
| 3,670,911 | $34,144,282 | (4,348,417) | $(48,232,077) | ||
| Affiliated Issuers | Beginning Value | Purchases | Sales Proceeds | Realized Gain (Loss) | Change in Unrealized Appreciation or Depreciation | Ending Value |
| MFS Institutional Money Market Portfolio | $2,635,619 | $77,829,935 | $75,111,872 | $— | $— | $5,353,682 |
| Affiliated Issuers | Dividend Income | Capital Gain Distributions |
| MFS Institutional Money Market Portfolio | $1,361 | $— |
February 15, 2022
| Name, Age | Position(s) Held with Fund | Trustee/Officer Since(h) | Number of MFS Funds overseen by the Trustee | Principal Occupations During the Past Five Years | Other Directorships During the Past Five Years (j) | |||||
| INTERESTED TRUSTEES | ||||||||||
| Michael W. Roberge (k) (age 55) | Trustee | January 2021 | 135 | Massachusetts Financial Services Company, Chairman (since January 2021); Chief Executive Officer (since January 2017); Director; Chairman of the Board (since January 2022); President (until December 2018); Chief Investment Officer (until December 2018) | N/A | |||||
| INDEPENDENT TRUSTEES | ||||||||||
| John P. Kavanaugh (age 67) | Trustee and Chair of Trustees | January 2009 | 135 | Private investor | N/A | |||||
| Steven E. Buller (age 70) | Trustee | February 2014 | 135 | Private investor | N/A | |||||
| John A. Caroselli (age 67) | Trustee | March 2017 | 135 | Private investor; JC Global Advisors, LLC (management consulting), President (since 2015) | N/A | |||||
| Maureen R. Goldfarb (age 66) | Trustee | January 2009 | 135 | Private investor | N/A | |||||
| Peter D. Jones (age 66) | Trustee | January 2019 | 135 | Private investor | N/A | |||||
| James W. Kilman, Jr. (age 60) | Trustee | January 2019 | 135 | Burford Capital Limited (finance and investment management), Senior Advisor (since May 3, 2021), Chief Financial Officer (2019 - May 2, 2021); KielStrand Capital LLC (family office), Chief Executive Officer (since 2016) | Alpha-En Corporation, Director (2016-2019) | |||||
| Clarence Otis, Jr. (age 65) | Trustee | March 2017 | 135 | Private investor | VF Corporation, Director; Verizon Communications, Inc., Director; The Travelers Companies, Director | |||||
| Maryanne L. Roepke (age 65) | Trustee | May 2014 | 135 | Private investor | N/A | |||||
| Laurie J. Thomsen (age 64) | Trustee | March 2005 | 135 | Private investor | The Travelers Companies, Director; Dycom Industries, Inc., Director |
| Name, Age | Position(s) Held with Fund | Trustee/Officer Since(h) | Number of MFS Funds for which the Person is an Officer | Principal Occupations During the Past Five Years | ||||
| OFFICERS | ||||||||
| Christopher R. Bohane (k) (age 48) | Assistant Secretary and Assistant Clerk | July 2005 | 135 | Massachusetts Financial Services Company, Senior Vice President and Associate General Counsel | ||||
| Kino Clark (k) (age 53) | Assistant Treasurer | January 2012 | 135 | Massachusetts Financial Services Company, Vice President | ||||
| John W. Clark, Jr. (k) (age 54) | Assistant Treasurer | April 2017 | 135 | Massachusetts Financial Services Company, Vice President (since March 2017); Deutsche Bank (financial services), Department Head - Treasurer's Office (until February 2017) | ||||
| Thomas H. Connors (k) (age 62) | Assistant Secretary and Assistant Clerk | September 2012 | 135 | Massachusetts Financial Services Company, Vice President and Senior Counsel | ||||
| David L. DiLorenzo (k) (age 53) | President | July 2005 | 135 | Massachusetts Financial Services Company, Senior Vice President | ||||
| Heidi W. Hardin (k) (age 54) | Secretary and Clerk | April 2017 | 135 | Massachusetts Financial Services Company, Executive Vice President and General Counsel (since March 2017); Harris Associates (investment management), General Counsel (until January 2017) | ||||
| Brian E. Langenfeld (k) (age 48) | Assistant Secretary and Assistant Clerk | June 2006 | 135 | Massachusetts Financial Services Company, Vice President and Senior Counsel | ||||
| Amanda S. Mooradian (k) (age 42) | Assistant Secretary and Assistant Clerk | September 2018 | 135 | Massachusetts Financial Services Company, Assistant Vice President and Senior Counsel | ||||
| Susan A. Pereira (k) (age 51) | Assistant Secretary and Assistant Clerk | July 2005 | 135 | Massachusetts Financial Services Company, Vice President and Assistant General Counsel | ||||
| Kasey L. Phillips (k) (age 51) | Assistant Treasurer | September 2012 | 135 | Massachusetts Financial Services Company, Vice President | ||||
| Matthew A. Stowe (k) (age 47) | Assistant Secretary and Assistant Clerk | October 2014 | 135 | Massachusetts Financial Services Company, Vice President and Assistant General Counsel | ||||
| Martin J. Wolin (k) (age 54) | Chief Compliance Officer | July 2015 | 135 | Massachusetts Financial Services Company, Senior Vice President and Chief Compliance Officer | ||||
| James O. Yost (k) (age 61) | Treasurer | September 1990 | 135 | Massachusetts Financial Services Company, Senior Vice President |
| (h) | Date first appointed to serve as Trustee/Officer of an MFS Fund. Each Trustee has served continuously since appointment unless indicated otherwise. From January 2012 through December 2016, Messrs. DiLorenzo and Yost served as Treasurer and Deputy Treasurer of the Funds, respectively. |
| (j) | Directorships or trusteeships of companies required to report to the Securities and Exchange Commission (i.e., “public companies”). |
| (k) | “Interested person” of the Trust within the meaning of the Investment Company Act of 1940 (referred to as the 1940 Act), which is the principal federal law governing investment companies like the fund, as a result of a position with MFS. The address of MFS is 111 Huntington Avenue, Boston, Massachusetts 02199-7618. |
| Investment Adviser | Custodian |
| Massachusetts Financial Services Company 111 Huntington Avenue Boston, MA 02199-7618 | State Street Bank and Trust Company 1 Lincoln Street Boston, MA 02111-2900 |
| Distributor | Independent Registered Public Accounting Firm |
| MFS Fund Distributors, Inc. 111 Huntington Avenue Boston, MA 02199-7618 | Deloitte & Touche LLP 200 Berkeley Street Boston, MA 02116 |
| Portfolio Manager(s) | |
| Eric Braz Eric Fischman Paul Gordon |

| FACTS | WHAT DOES MFS DO WITH YOUR PERSONAL INFORMATION? |
| Why? | Financial companies choose how they share your personal information. Federal law gives consumers the right to limit some but not all sharing. Federal law also requires us to tell you how we collect, share, and protect your personal information. Please read this notice carefully to understand what we do. |
| What? | The types of personal information we collect and share depend on the product or service you have with us. This information can include: |
| • Social Security number and account balances | |
| • Account transactions and transaction history | |
| • Checking account information and wire transfer instructions | |
| When you are no longer our customer, we continue to share your information as described in this notice. |
| How? | All financial companies need to share customers' personal information to run their everyday business. In the section below, we list the reasons financial companies can share their customers' personal information; the reasons MFS chooses to share; and whether you can limit this sharing. |
| Reasons we can share your personal information | Does MFS share? | Can you limit this sharing? |
| For our everyday business purposes – such as to process your transactions, maintain your account(s), respond to court orders and legal investigations, or report to credit bureaus | Yes | No |
| For our marketing purposes – to offer our products and services to you | No | We don't share |
| For joint marketing with other financial companies | No | We don't share |
| For our affiliates' everyday business purposes – information about your transactions and experiences | No | We don't share |
| For our affiliates' everyday business purposes – information about your creditworthiness | No | We don't share |
| For nonaffiliates to market to you | No | We don't share |
| Questions? | Call 800-225-2606 or go to mfs.com. |
| Who we are | |
| Who is providing this notice? | MFS Funds, MFS Investment Management, MFS Institutional Advisors, Inc., and MFS Heritage Trust Company. |
| What we do | |
| How does MFS protect my personal information? | To protect your personal information from unauthorized access and use, we use security measures that comply with federal law. These measures include procedural, electronic, and physical safeguards for the protection of the personal information we collect about you. |
| How does MFS collect my personal information? | We collect your personal information, for example, when you |
| • open an account or provide account information | |
| • direct us to buy securities or direct us to sell your securities | |
| • make a wire transfer | |
| We also collect your personal information from others, such as credit bureaus, affiliates, or other companies. | |
| Why can't I limit all sharing? | Federal law gives you the right to limit only |
| • sharing for affiliates' everyday business purposes – information about your creditworthiness | |
| • affiliates from using your information to market to you | |
| • sharing for nonaffiliates to market to you | |
| State laws and individual companies may give you additional rights to limit sharing. | |
| Definitions | |
| Affiliates | Companies related by common ownership or control. They can be financial and nonfinancial companies. |
| • MFS does not share personal information with affiliates, except for everyday business purposes as described on page one of this notice. | |
| Nonaffiliates | Companies not related by common ownership or control. They can be financial and nonfinancial companies. |
| • MFS does not share with nonaffiliates so they can market to you. | |
| Joint marketing | A formal agreement between nonaffiliated financial companies that together market financial products or services to you. |
| • MFS doesn't jointly market. | |
| Other important information |
| If you own an MFS product or receive an MFS service in the name of a third party such as a bank or broker-dealer, their privacy policy may apply to you instead of ours. |


| 1 | |
| 2 | |
| 3 | |
| 5 | |
| 7 | |
| 8 | |
| 12 | |
| 13 | |
| 14 | |
| 15 | |
| 16 | |
| 22 | |
| 23 | |
| 26 | |
| 29 | |
| 29 | |
| 29 | |
| 29 | |
| 29 | |
| 30 |


| Leslie's, Inc. | 2.1% |
| AZEK Co., Inc. | 2.1% |
| Rapid7, Inc. | 2.1% |
| CACI International, Inc., “A” | 2.0% |
| EVO Payments, Inc., “A” | 2.0% |
| STAG Industrial, Inc., REIT | 1.9% |
| ExlService Holdings, Inc. | 1.8% |
| Q2 Holdings, Inc. | 1.7% |
| Hamilton Lane, Inc., “A” | 1.7% |
| WNS (Holdings) Ltd., ADR | 1.7% |
| Information Technology | 31.1% |
| Industrials | 18.5% |
| Health Care | 16.3% |
| Consumer Discretionary | 10.9% |
| Financials | 7.9% |
| Materials | 4.1% |
| Real Estate | 3.7% |
| Communication Services | 2.3% |
| Consumer Staples | 1.6% |
| (g) | The Global Industry Classification Standard (GICS®) was developed by and/or is the exclusive property of MSCI, Inc. and S&P Global Market Intelligence Inc. (“S&P Global Market Intelligence”). GICS is a service mark of MSCI and S&P Global Market Intelligence and has been licensed for use by MFS. MFS has applied its own internal sector/industry classification methodology for equity securities and non-equity securities that are unclassified by GICS. |
| (b) | Security is not a benchmark constituent. |
| (h) | Security was not held in the portfolio at period end. |
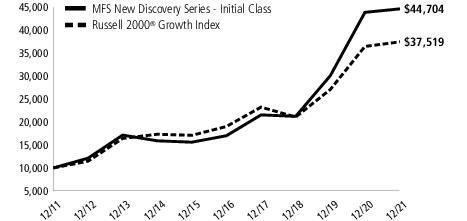
| Share Class | Class Inception Date | 1-yr | 5-yr | 10-yr |
| Initial Class | 5/01/98 | 1.80% | 21.30% | 16.15% |
| Service Class | 5/01/00 | 1.57% | 21.00% | 15.87% |
| Russell 2000® Growth Index (f) | 2.83% | 14.53% | 14.14% |
| (f) | Source: FactSet Research Systems Inc. |
| (h) | Frank Russell Company (“Russell”) is the source and owner of the trademarks, service marks, and copyrights related to the Russell Indexes. Russell® is a trademark of Frank Russell Company. Neither Russell nor its licensors accept any liability for any errors or omissions in the Russell Indexes and/or Russell ratings or underlying data and no party may rely on any Russell Indexes and/or Russell ratings and/or underlying data contained in this document. No further distribution of Russell Data is permitted without Russell's express written consent. Russell does not promote, sponsor, or endorse the content of this document. |
July 1, 2021 through December 31, 2021
| Share Class | Annualized Expense Ratio | Beginning Account Value 7/01/21 | Ending Account Value 12/31/21 | Expenses Paid During Period (p) 7/01/21-12/31/21 | |
| Initial Class | Actual | 0.87% | $1,000.00 | $935.10 | $4.24 |
| Hypothetical (h) | 0.87% | $1,000.00 | $1,020.82 | $4.43 | |
| Service Class | Actual | 1.12% | $1,000.00 | $933.85 | $5.46 |
| Hypothetical (h) | 1.12% | $1,000.00 | $1,019.56 | $5.70 |
| (h) | 5% class return per year before expenses. |
| (p) | “Expenses Paid During Period” are equal to each class's annualized expense ratio, as shown above, multiplied by the average account value over the period, multiplied by 184/365 (to reflect the one-half year period). |
| Issuer | Shares/Par | Value ($) | ||
| Common Stocks – 96.4% | ||||
| Aerospace & Defense – 2.0% | ||||
| CACI International, Inc., “A” (a) | 75,712 | $ 20,382,427 | ||
| Airlines – 1.3% | ||||
| JetBlue Airways Corp. (a) | 929,583 | $ 13,237,262 | ||
| Apparel Manufacturers – 2.1% | ||||
| Allbirds, Inc., “A” (a) | 244,147 | $ 3,681,737 | ||
| On Holding AG (a) | 70,405 | 2,662,013 | ||
| Skechers USA, Inc., “A” (a) | 346,726 | 15,047,908 | ||
| $21,391,658 | ||||
| Automotive – 0.8% | ||||
| Visteon Corp. (a) | 70,997 | $ 7,890,607 | ||
| Biotechnology – 5.0% | ||||
| Abcam PLC (a) | 409,932 | $ 9,615,783 | ||
| Adaptive Biotechnologies Corp. (a) | 132,983 | 3,731,503 | ||
| AlloVir, Inc. (a) | 172,795 | 2,235,967 | ||
| BioAtla, Inc. (a) | 109,945 | 2,158,220 | ||
| BioXcel Therapeutics, Inc. (a) | 93,286 | 1,896,504 | ||
| Immunocore Holdings PLC, ADR (a) | 74,965 | 2,566,802 | ||
| Lyell Immunopharma, Inc. (a) | 219,289 | 1,697,297 | ||
| MaxCyte, Inc. (a) | 399,634 | 4,072,270 | ||
| Neurocrine Biosciences, Inc. (a) | 46,259 | 3,939,879 | ||
| Olink Holding AB (a)(l) | 109,318 | 1,989,588 | ||
| Oxford Nanopore Technologies PLC (a) | 314,472 | 2,971,062 | ||
| Prelude Therapeutics, Inc. (a) | 106,122 | 1,321,219 | ||
| Recursion Pharmaceuticals, Inc. (a) | 285,781 | 4,895,429 | ||
| Sana Biotechnology, Inc. (a) | 169,125 | 2,618,055 | ||
| Twist Bioscience Corp. (a) | 52,699 | 4,078,376 | ||
| $49,787,954 | ||||
| Brokerage & Asset Managers – 4.7% | ||||
| Focus Financial Partners, “A” (a) | 223,350 | $ 13,338,462 | ||
| GCM Grosvenor, Inc. | 246,377 | 2,586,959 | ||
| GCM Grosvenor, Inc. (PIPE) (a) | 409,801 | 4,302,910 | ||
| Hamilton Lane, Inc., “A” | 165,981 | 17,198,951 | ||
| WisdomTree Investments, Inc. | 1,657,707 | 10,145,167 | ||
| $47,572,449 | ||||
| Business Services – 14.0% | ||||
| Endava PLC, ADR (a) | 58,004 | $ 9,740,032 | ||
| EVO Payments, Inc., “A” (a) | 780,539 | 19,981,798 | ||
| ExlService Holdings, Inc. (a) | 122,826 | 17,781,520 | ||
| Keywords Studios PLC | 363,386 | 14,470,554 | ||
| LegalZoom.com, Inc. (a) | 409,285 | 6,577,210 | ||
| Payoneer Global, Inc. (a) | 1,220,758 | 8,972,571 | ||
| Remitly Global, Inc. (a) | 698,566 | 14,404,431 | ||
| TaskUs, Inc., “A” (a) | 203,819 | 10,998,073 | ||
| Thoughtworks Holding, Inc. (a) | 499,134 | 13,381,783 | ||
| TriNet Group, Inc. (a) | 82,090 | 7,819,893 | ||
| WNS (Holdings) Ltd., ADR (a) | 191,672 | 16,909,304 | ||
| $141,037,169 | ||||
| Issuer | Shares/Par | Value ($) | ||
| Common Stocks – continued | ||||
| Chemicals – 2.5% | ||||
| Element Solutions, Inc. | 590,661 | $ 14,341,249 | ||
| Ingevity Corp. (a) | 153,501 | 11,006,022 | ||
| $25,347,271 | ||||
| Computer Software – 11.2% | ||||
| 8x8, Inc. (a) | 349,477 | $ 5,857,234 | ||
| Alkami Technology, Inc. (a) | 500,568 | 10,041,394 | ||
| Avalara, Inc. (a) | 50,052 | 6,462,214 | ||
| Definitive Healthcare Corp. (a) | 151,225 | 4,132,979 | ||
| DoubleVerify Holdings, Inc. (a) | 297,030 | 9,885,158 | ||
| Everbridge, Inc. (a) | 156,623 | 10,545,427 | ||
| Expensify, Inc., “A” (a) | 102,904 | 4,527,776 | ||
| nCino, Inc. (a) | 134,953 | 7,403,521 | ||
| Open Lending Corp., “A” (a) | 579,006 | 13,016,055 | ||
| Pagerduty, Inc. (a) | 233,477 | 8,113,326 | ||
| Paycor HCM, Inc. (a) | 507,675 | 14,626,117 | ||
| Paylocity Holding Corp. (a) | 25,693 | 6,067,659 | ||
| Ping Identity Holding Corp. (a) | 164,059 | 3,753,670 | ||
| Procore Technologies, Inc. (a) | 107,528 | 8,599,014 | ||
| $113,031,544 | ||||
| Computer Software - Systems – 5.6% | ||||
| Five9, Inc. (a) | 52,596 | $ 7,222,482 | ||
| Nuvei Corp. (a) | 164,258 | 10,673,485 | ||
| Q2 Holdings, Inc. (a) | 218,434 | 17,352,397 | ||
| Rapid7, Inc. (a) | 176,823 | 20,810,299 | ||
| $56,058,663 | ||||
| Construction – 3.5% | ||||
| AZEK Co., Inc. (a) | 459,588 | $ 21,251,349 | ||
| Latch, Inc. (a)(l) | 909,833 | 6,887,436 | ||
| Trex Co., Inc. (a) | 49,393 | 6,669,537 | ||
| $34,808,322 | ||||
| Consumer Services – 2.6% | ||||
| Boyd Group Services, Inc. | 39,725 | $ 6,268,947 | ||
| Bright Horizons Family Solutions, Inc. (a) | 55,280 | 6,958,646 | ||
| European Wax Center, Inc., “A” (a) | 176,714 | 5,363,270 | ||
| F45 Training Holdings, Inc. (a) | 696,367 | 7,583,437 | ||
| $26,174,300 | ||||
| Electrical Equipment – 3.3% | ||||
| Advanced Drainage Systems, Inc. | 68,969 | $ 9,388,750 | ||
| Littlefuse, Inc. | 24,051 | 7,568,368 | ||
| Sensata Technologies Holding PLC (a) | 259,133 | 15,985,915 | ||
| $32,943,033 | ||||
| Electronics – 1.5% | ||||
| Advanced Energy Industries, Inc. | 166,652 | $ 15,175,331 | ||
| Entertainment – 1.7% | ||||
| Manchester United PLC, “A” | 693,362 | $ 9,873,475 | ||
| Vivid Seats, Inc., “A” (l) | 699,218 | 7,607,492 | ||
| $17,480,967 | ||||
| Issuer | Shares/Par | Value ($) | ||
| Common Stocks – continued | ||||
| Food & Beverages – 1.6% | ||||
| Duckhorn Portfolio, Inc. (a) | 309,231 | $ 7,217,452 | ||
| Dutch Bros, Inc., “A” (a) | 65,230 | 3,320,859 | ||
| Laird Superfood, Inc. (a) | 31,975 | 416,954 | ||
| Oatly Group AB, ADR (a) | 645,921 | 5,141,531 | ||
| $16,096,796 | ||||
| Gaming & Lodging – 1.4% | ||||
| Genius Sports Ltd. (a) | 806,676 | $ 6,130,738 | ||
| Penn National Gaming, Inc. (a) | 145,559 | 7,547,234 | ||
| $13,677,972 | ||||
| Leisure & Toys – 1.3% | ||||
| Malibu Boats, Inc., “A” (a) | 196,061 | $ 13,475,273 | ||
| Machinery & Tools – 2.3% | ||||
| Hydrofarm Holdings Group, Inc. (a) | 300,198 | $ 8,492,601 | ||
| Ritchie Bros. Auctioneers, Inc. | 241,689 | 14,793,784 | ||
| $23,286,385 | ||||
| Medical & Health Technology & Services – 5.0% | ||||
| Certara, Inc. (a) | 509,452 | $ 14,478,626 | ||
| Guardant Health, Inc. (a) | 42,125 | 4,213,342 | ||
| HealthEquity, Inc. (a) | 157,443 | 6,965,278 | ||
| ICON PLC (a) | 20,437 | 6,329,339 | ||
| Syneos Health, Inc. (a) | 160,190 | 16,448,309 | ||
| Talkspace, Inc. (a)(l) | 773,811 | 1,524,408 | ||
| $49,959,302 | ||||
| Medical Equipment – 3.8% | ||||
| Gerresheimer AG | 135,291 | $ 13,046,235 | ||
| Maravai Lifesciences Holdings, Inc., “A” (a) | 204,829 | 8,582,335 | ||
| Nevro Corp. (a) | 70,716 | 5,732,946 | ||
| OptiNose, Inc. (a)(l) | 411,282 | 666,277 | ||
| Outset Medical, Inc. (a) | 104,603 | 4,821,152 | ||
| PROCEPT BioRobotics Corp. (a) | 119,979 | 3,000,675 | ||
| Silk Road Medical, Inc. (a) | 61,960 | 2,640,116 | ||
| $38,489,736 | ||||
| Other Banks & Diversified Financials – 1.9% | ||||
| First Interstate BancSystem, Inc. | 238,373 | $ 9,694,630 | ||
| Prosperity Bancshares, Inc. | 126,719 | 9,161,784 | ||
| $18,856,414 | ||||
| Pharmaceuticals – 2.0% | ||||
| Annexon, Inc. (a) | 164,351 | $ 1,888,393 | ||
| Collegium Pharmaceutical, Inc. (a) | 169,553 | 3,167,250 | ||
| Harmony Biosciences Holdings (a) | 123,261 | 5,255,849 | ||
| SpringWorks Therapeutics, Inc. (a) | 89,727 | 5,561,279 | ||
| Turning Point Therapeutics, Inc. (a) | 78,914 | 3,764,198 | ||
| $19,636,969 | ||||
| Pollution Control – 1.0% | ||||
| GFL Environmental, Inc. | 274,561 | $ 10,392,134 | ||
| Issuer | Shares/Par | Value ($) | ||
| Common Stocks – continued | ||||
| Real Estate – 3.8% | ||||
| Big Yellow Group PLC, REIT | 331,910 | $ 7,668,813 | ||
| Innovative Industrial Properties, Inc., REIT | 42,370 | 11,139,497 | ||
| STAG Industrial, Inc., REIT | 395,604 | 18,973,168 | ||
| $37,781,478 | ||||
| Specialty Chemicals – 1.5% | ||||
| Axalta Coating Systems Ltd. (a) | 468,134 | $ 15,504,598 | ||
| Specialty Stores – 5.5% | ||||
| ACV Auctions, Inc. (a) | 827,366 | $ 15,587,574 | ||
| Leslie's, Inc. (a) | 907,840 | 21,479,494 | ||
| Petco Health & Wellness Co., Inc. (a) | 357,139 | 7,067,781 | ||
| ThredUp, Inc. (a) | 401,029 | 5,117,130 | ||
| Vroom, Inc. (a) | 521,726 | 5,629,424 | ||
| $54,881,403 | ||||
| Trucking – 2.7% | ||||
| CryoPort, Inc. (a) | 95,552 | $ 5,653,812 | ||
| Knight-Swift Transportation Holdings, Inc. | 244,210 | 14,882,157 | ||
| Schneider National, Inc. | 243,069 | 6,540,987 | ||
| $27,076,956 | ||||
| Utilities - Electric Power – 0.8% | ||||
| Shoals Technologies Group, Inc. (a) | 321,092 | $ 7,802,536 | ||
| Total Common Stocks (Identified Cost, $839,116,645) | $ 969,236,909 | |||
| Investment Companies (h) – 3.5% | ||||
| Money Market Funds – 3.5% | ||||
| MFS Institutional Money Market Portfolio, 0.07% (v) (Identified Cost, $34,793,849) | 34,793,849 | $ 34,793,849 | ||
| Collateral for Securities Loaned – 0.3% | ||||
| State Street Navigator Securities Lending Government Money Market Portfolio, 0.03% (j) (Identified Cost, $2,949,700) | 2,949,700 | $ 2,949,700 | ||
| Other Assets, Less Liabilities – (0.2)% | (1,696,405) | |||
| Net Assets – 100.0% | $1,005,284,053 | |||
| (a) | Non-income producing security. | |||
| (h) | An affiliated issuer, which may be considered one in which the fund owns 5% or more of the outstanding voting securities, or a company which is under common control. At period end, the aggregate values of the fund's investments in affiliated issuers and in unaffiliated issuers were $34,793,849 and $972,186,609, respectively. | |||
| (j) | The rate quoted is the annualized seven-day yield of the fund at period end. | |||
| (l) | A portion of this security is on loan. See Note 2 for additional information. | |||
| (v) | Affiliated issuer that is available only to investment companies managed by MFS. The rate quoted for the MFS Institutional Money Market Portfolio is the annualized seven-day yield of the fund at period end. |
| The following abbreviations are used in this report and are defined: | |
| ADR | American Depositary Receipt |
| PIPE | Private Investment in Public Equity |
| REIT | Real Estate Investment Trust |
| Financial Statements | Statement of Assets and Liabilities |
| At 12/31/21Assets | |
| Investments in unaffiliated issuers, at value, including $3,716,342 of securities on loan (identified cost, $842,066,345) | $972,186,609 |
| Investments in affiliated issuers, at value (identified cost, $34,793,849) | 34,793,849 |
| Cash | 1,331,914 |
| Receivables for | |
| Fund shares sold | 481,129 |
| Interest and dividends | 722,489 |
| Receivable from investment adviser | 32,591 |
| Other assets | 3,790 |
| Total assets | $1,009,552,371 |
| Liabilities | |
| Payables for | |
| Fund shares reacquired | $1,087,957 |
| Collateral for securities loaned, at value (c) | 2,949,700 |
| Payable to affiliates | |
| Administrative services fee | 794 |
| Shareholder servicing costs | 820 |
| Distribution and/or service fees | 7,834 |
| Payable for independent Trustees' compensation | 126 |
| Accrued expenses and other liabilities | 221,087 |
| Total liabilities | $4,268,318 |
| Net assets | $1,005,284,053 |
| Net assets consist of | |
| Paid-in capital | $641,712,267 |
| Total distributable earnings (loss) | 363,571,786 |
| Net assets | $1,005,284,053 |
| Shares of beneficial interest outstanding | 47,430,074 |
| Net assets | Shares outstanding | Net asset value per share | |
| Initial Class | $433,168,146 | 18,589,828 | $23.30 |
| Service Class | 572,115,907 | 28,840,246 | 19.84 |
| (c) | Non-cash collateral is not included. |
| Financial Statements | Statement of Operations |
| Year ended 12/31/21 | |
| Net investment income (loss) | |
| Income | |
| Dividends | $4,628,647 |
| Income on securities loaned | 239,120 |
| Other | 142,728 |
| Dividends from affiliated issuers | 12,022 |
| Foreign taxes withheld | (131,270) |
| Total investment income | $4,891,247 |
| Expenses | |
| Management fee | $9,600,020 |
| Distribution and/or service fees | 1,513,901 |
| Shareholder servicing costs | 54,789 |
| Administrative services fee | 150,108 |
| Independent Trustees' compensation | 16,779 |
| Custodian fee | 64,854 |
| Shareholder communications | 124,985 |
| Audit and tax fees | 60,685 |
| Legal fees | 6,377 |
| Miscellaneous | 34,995 |
| Total expenses | $11,627,493 |
| Reduction of expenses by investment adviser | (761,088) |
| Net expenses | $10,866,405 |
| Net investment income (loss) | $(5,975,158) |
| Realized and unrealized gain (loss) | |
| Realized gain (loss) (identified cost basis) | |
| Unaffiliated issuers | $250,727,927 |
| Affiliated issuers | 30 |
| Foreign currency | 11,017 |
| Net realized gain (loss) | $250,738,974 |
| Change in unrealized appreciation or depreciation | |
| Unaffiliated issuers | $(224,995,635) |
| Affiliated issuers | (31) |
| Translation of assets and liabilities in foreign currencies | (7,627) |
| Net unrealized gain (loss) | $(225,003,293) |
| Net realized and unrealized gain (loss) | $25,735,681 |
| Change in net assets from operations | $19,760,523 |
| Financial Statements | Statements of Changes in Net Assets |
| Year ended | ||
| 12/31/21 | 12/31/20 | |
| Change in net assets | ||
| From operations | ||
| Net investment income (loss) | $(5,975,158) | $(3,663,059) |
| Net realized gain (loss) | 250,738,974 | 176,399,666 |
| Net unrealized gain (loss) | (225,003,293) | 163,806,112 |
| Change in net assets from operations | $19,760,523 | $336,542,719 |
| Total distributions to shareholders | $(180,031,167) | $(81,295,168) |
| Change in net assets from fund share transactions | $114,963,905 | $(20,182,105) |
| Total change in net assets | $(45,306,739) | $235,065,446 |
| Net assets | ||
| At beginning of period | 1,050,590,792 | 815,525,346 |
| At end of period | $1,005,284,053 | $1,050,590,792 |
| Financial Statements | Financial Highlights |
| Initial Class | Year ended | ||||
| 12/31/21 | 12/31/20 | 12/31/19 | 12/31/18 | 12/31/17 | |
| Net asset value, beginning of period | $26.96 | $20.28 | $17.46 | $20.10 | $16.18 |
| Income (loss) from investment operations | |||||
| Net investment income (loss) (d) | $(0.11) | $(0.06) | $(0.07) | $(0.09) | $(0.07) |
| Net realized and unrealized gain (loss) | 0.92 | 8.84 | 6.89 | 0.35 | 4.34 |
| Total from investment operations | $0.81 | $8.78 | $6.82 | $0.26 | $4.27 |
| Less distributions declared to shareholders | |||||
| From net realized gain | $(4.47) | $(2.10) | $(4.00) | $(2.90) | $(0.35) |
| Net asset value, end of period (x) | $23.30 | $26.96 | $20.28 | $17.46 | $20.10 |
| Total return (%) (k)(r)(s)(x) | 1.80 | 45.89 | 41.70 | (1.48) | 26.65 |
| Ratios (%) (to average net assets) and Supplemental data: | |||||
| Expenses before expense reductions | 0.94 | 0.95 | 0.95 | 0.96 | 0.97 |
| Expenses after expense reductions | 0.87 | 0.91 | 0.94 | 0.94 | 0.94 |
| Net investment income (loss) | (0.42) | (0.30) | (0.33) | (0.43) | (0.37) |
| Portfolio turnover | 79 | 80 | 54 | 71 | 58 |
| Net assets at end of period (000 omitted) | $433,168 | $465,663 | $343,133 | $272,039 | $316,949 |
| Service Class | Year ended | ||||
| 12/31/21 | 12/31/20 | 12/31/19 | 12/31/18 | 12/31/17 | |
| Net asset value, beginning of period | $23.61 | $18.02 | $15.91 | $18.57 | $15.01 |
| Income (loss) from investment operations | |||||
| Net investment income (loss) (d) | $(0.16) | $(0.10) | $(0.11) | $(0.13) | $(0.10) |
| Net realized and unrealized gain (loss) | 0.86 | 7.79 | 6.22 | 0.37 | 4.01 |
| Total from investment operations | $0.70 | $7.69 | $6.11 | $0.24 | $3.91 |
| Less distributions declared to shareholders | |||||
| From net realized gain | $(4.47) | $(2.10) | $(4.00) | $(2.90) | $(0.35) |
| Net asset value, end of period (x) | $19.84 | $23.61 | $18.02 | $15.91 | $18.57 |
| Total return (%) (k)(r)(s)(x) | 1.57 | 45.58 | 41.27 | (1.72) | 26.33 |
| Ratios (%) (to average net assets) and Supplemental data: | |||||
| Expenses before expense reductions | 1.19 | 1.20 | 1.20 | 1.21 | 1.22 |
| Expenses after expense reductions | 1.12 | 1.16 | 1.19 | 1.19 | 1.19 |
| Net investment income (loss) | (0.66) | (0.56) | (0.58) | (0.68) | (0.62) |
| Portfolio turnover | 79 | 80 | 54 | 71 | 58 |
| Net assets at end of period (000 omitted) | $572,116 | $584,928 | $472,393 | $358,912 | $432,897 |
| (d) | Per share data is based on average shares outstanding. |
| (k) | The total return does not reflect expenses that apply to separate accounts. Inclusion of these charges would reduce the total return figures for all periods shown. |
| (r) | Certain expenses have been reduced without which performance would have been lower. |
| (s) | From time to time the fund may receive proceeds from litigation settlements, without which performance would be lower. |
| (x) | The net asset values and total returns have been calculated on net assets which include adjustments made in accordance with U.S. generally accepted accounting principles required at period end for financial reporting purposes. |
| Financial Instruments | Level 1 | Level 2 | Level 3 | Total |
| Equity Securities: | ||||
| United States | $807,833,838 | $4,302,910 | $— | $812,136,748 |
| United Kingdom | 63,037,259 | — | — | 63,037,259 |
| Canada | 42,128,350 | — | — | 42,128,350 |
| India | 16,909,304 | — | — | 16,909,304 |
| Germany | 13,046,235 | — | — | 13,046,235 |
| Philippines | 10,998,073 | — | — | 10,998,073 |
| Ireland | 6,329,339 | — | — | 6,329,339 |
| Switzerland | 2,662,013 | — | — | 2,662,013 |
| Sweden | 1,989,588 | — | — | 1,989,588 |
| Mutual Funds | 37,743,549 | — | — | 37,743,549 |
| Total | $1,002,677,548 | $4,302,910 | $— | $1,006,980,458 |
| Year ended 12/31/21 | Year ended 12/31/20 | |
| Ordinary income (including any short-term capital gains) | $67,762,150 | $24,424,056 |
| Long-term capital gains | 112,269,017 | 56,871,112 |
| Total distributions | $180,031,167 | $81,295,168 |
| As of 12/31/21 | |
| Cost of investments | $888,953,339 |
| Gross appreciation | 222,302,488 |
| Gross depreciation | (104,275,369) |
| Net unrealized appreciation (depreciation) | $118,027,119 |
| Undistributed ordinary income | 79,284,962 |
| Undistributed long-term capital gain | 166,256,683 |
| Other temporary differences | 3,022 |
| Total distributable earnings (loss) | $363,571,786 |
| Year ended 12/31/21 | Year ended 12/31/20 | ||
| Initial Class | $72,327,744 | $31,864,295 | |
| Service Class | 107,703,423 | 49,430,873 | |
| Total | $180,031,167 | $81,295,168 |
| Up to $1 billion | 0.90% |
| In excess of $1 billion | 0.80% |
| Year ended 12/31/21 | Year ended 12/31/20 | ||||
| Shares | Amount | Shares | Amount | ||
| Shares sold | |||||
| Initial Class | 1,685,787 | $45,986,516 | 3,294,260 | $68,896,127 | |
| Service Class | 5,330,620 | 125,627,263 | 3,845,873 | 70,163,983 | |
| 7,016,407 | $171,613,779 | 7,140,133 | $139,060,110 | ||
| Shares issued to shareholders in reinvestment of distributions | |||||
| Initial Class | 2,879,289 | $72,327,744 | 1,481,371 | $31,864,295 | |
| Service Class | 5,030,520 | 107,703,423 | 2,622,328 | 49,430,873 | |
| 7,909,809 | $180,031,167 | 4,103,699 | $81,295,168 | ||
| Shares reacquired | |||||
| Initial Class | (3,248,656) | $(88,338,013) | (4,425,268) | $(93,651,928) | |
| Service Class | (6,295,130) | (148,343,028) | (7,901,694) | (146,885,455) | |
| (9,543,786) | $(236,681,041) | (12,326,962) | $(240,537,383) | ||
| Net change | |||||
| Initial Class | 1,316,420 | $29,976,247 | 350,363 | $7,108,494 | |
| Service Class | 4,066,010 | 84,987,658 | (1,433,493) | (27,290,599) | |
| 5,382,430 | $114,963,905 | (1,083,130) | $(20,182,105) | ||
| Affiliated Issuers | Beginning Value | Purchases | Sales Proceeds | Realized Gain (Loss) | Change in Unrealized Appreciation or Depreciation | Ending Value |
| MFS Institutional Money Market Portfolio | $31,899,306 | $414,499,554 | $411,605,010 | $30 | $(31) | $34,793,849 |
| Affiliated Issuers | Dividend Income | Capital Gain Distributions |
| MFS Institutional Money Market Portfolio | $12,022 | $— |
February 15, 2022
| Name, Age | Position(s) Held with Fund | Trustee/Officer Since(h) | Number of MFS Funds overseen by the Trustee | Principal Occupations During the Past Five Years | Other Directorships During the Past Five Years (j) | |||||
| INTERESTED TRUSTEES | ||||||||||
| Michael W. Roberge (k) (age 55) | Trustee | January 2021 | 135 | Massachusetts Financial Services Company, Chairman (since January 2021); Chief Executive Officer (since January 2017); Director; Chairman of the Board (since January 2022); President (until December 2018); Chief Investment Officer (until December 2018) | N/A | |||||
| INDEPENDENT TRUSTEES | ||||||||||
| John P. Kavanaugh (age 67) | Trustee and Chair of Trustees | January 2009 | 135 | Private investor | N/A | |||||
| Steven E. Buller (age 70) | Trustee | February 2014 | 135 | Private investor | N/A | |||||
| John A. Caroselli (age 67) | Trustee | March 2017 | 135 | Private investor; JC Global Advisors, LLC (management consulting), President (since 2015) | N/A | |||||
| Maureen R. Goldfarb (age 66) | Trustee | January 2009 | 135 | Private investor | N/A | |||||
| Peter D. Jones (age 66) | Trustee | January 2019 | 135 | Private investor | N/A | |||||
| James W. Kilman, Jr. (age 60) | Trustee | January 2019 | 135 | Burford Capital Limited (finance and investment management), Senior Advisor (since May 3, 2021), Chief Financial Officer (2019 - May 2, 2021); KielStrand Capital LLC (family office), Chief Executive Officer (since 2016) | Alpha-En Corporation, Director (2016-2019) | |||||
| Clarence Otis, Jr. (age 65) | Trustee | March 2017 | 135 | Private investor | VF Corporation, Director; Verizon Communications, Inc., Director; The Travelers Companies, Director | |||||
| Maryanne L. Roepke (age 65) | Trustee | May 2014 | 135 | Private investor | N/A | |||||
| Laurie J. Thomsen (age 64) | Trustee | March 2005 | 135 | Private investor | The Travelers Companies, Director; Dycom Industries, Inc., Director |
| Name, Age | Position(s) Held with Fund | Trustee/Officer Since(h) | Number of MFS Funds for which the Person is an Officer | Principal Occupations During the Past Five Years | ||||
| OFFICERS | ||||||||
| Christopher R. Bohane (k) (age 48) | Assistant Secretary and Assistant Clerk | July 2005 | 135 | Massachusetts Financial Services Company, Senior Vice President and Associate General Counsel | ||||
| Kino Clark (k) (age 53) | Assistant Treasurer | January 2012 | 135 | Massachusetts Financial Services Company, Vice President | ||||
| John W. Clark, Jr. (k) (age 54) | Assistant Treasurer | April 2017 | 135 | Massachusetts Financial Services Company, Vice President (since March 2017); Deutsche Bank (financial services), Department Head - Treasurer's Office (until February 2017) | ||||
| Thomas H. Connors (k) (age 62) | Assistant Secretary and Assistant Clerk | September 2012 | 135 | Massachusetts Financial Services Company, Vice President and Senior Counsel | ||||
| David L. DiLorenzo (k) (age 53) | President | July 2005 | 135 | Massachusetts Financial Services Company, Senior Vice President | ||||
| Heidi W. Hardin (k) (age 54) | Secretary and Clerk | April 2017 | 135 | Massachusetts Financial Services Company, Executive Vice President and General Counsel (since March 2017); Harris Associates (investment management), General Counsel (until January 2017) | ||||
| Brian E. Langenfeld (k) (age 48) | Assistant Secretary and Assistant Clerk | June 2006 | 135 | Massachusetts Financial Services Company, Vice President and Senior Counsel | ||||
| Amanda S. Mooradian (k) (age 42) | Assistant Secretary and Assistant Clerk | September 2018 | 135 | Massachusetts Financial Services Company, Assistant Vice President and Senior Counsel | ||||
| Susan A. Pereira (k) (age 51) | Assistant Secretary and Assistant Clerk | July 2005 | 135 | Massachusetts Financial Services Company, Vice President and Assistant General Counsel | ||||
| Kasey L. Phillips (k) (age 51) | Assistant Treasurer | September 2012 | 135 | Massachusetts Financial Services Company, Vice President | ||||
| Matthew A. Stowe (k) (age 47) | Assistant Secretary and Assistant Clerk | October 2014 | 135 | Massachusetts Financial Services Company, Vice President and Assistant General Counsel | ||||
| Martin J. Wolin (k) (age 54) | Chief Compliance Officer | July 2015 | 135 | Massachusetts Financial Services Company, Senior Vice President and Chief Compliance Officer | ||||
| James O. Yost (k) (age 61) | Treasurer | September 1990 | 135 | Massachusetts Financial Services Company, Senior Vice President |
| (h) | Date first appointed to serve as Trustee/Officer of an MFS Fund. Each Trustee has served continuously since appointment unless indicated otherwise. From January 2012 through December 2016, Messrs. DiLorenzo and Yost served as Treasurer and Deputy Treasurer of the Funds, respectively. |
| (j) | Directorships or trusteeships of companies required to report to the Securities and Exchange Commission (i.e., “public companies”). |
| (k) | “Interested person” of the Trust within the meaning of the Investment Company Act of 1940 (referred to as the 1940 Act), which is the principal federal law governing investment companies like the fund, as a result of a position with MFS. The address of MFS is 111 Huntington Avenue, Boston, Massachusetts 02199-7618. |
| Investment Adviser | Custodian |
| Massachusetts Financial Services Company 111 Huntington Avenue Boston, MA 02199-7618 | State Street Bank and Trust Company 1 Lincoln Street Boston, MA 02111-2900 |
| Distributor | Independent Registered Public Accounting Firm |
| MFS Fund Distributors, Inc. 111 Huntington Avenue Boston, MA 02199-7618 | Deloitte & Touche LLP 200 Berkeley Street Boston, MA 02116 |
| Portfolio Manager(s) | |
| Michael Grossman |

| FACTS | WHAT DOES MFS DO WITH YOUR PERSONAL INFORMATION? |
| Why? | Financial companies choose how they share your personal information. Federal law gives consumers the right to limit some but not all sharing. Federal law also requires us to tell you how we collect, share, and protect your personal information. Please read this notice carefully to understand what we do. |
| What? | The types of personal information we collect and share depend on the product or service you have with us. This information can include: |
| • Social Security number and account balances | |
| • Account transactions and transaction history | |
| • Checking account information and wire transfer instructions | |
| When you are no longer our customer, we continue to share your information as described in this notice. |
| How? | All financial companies need to share customers' personal information to run their everyday business. In the section below, we list the reasons financial companies can share their customers' personal information; the reasons MFS chooses to share; and whether you can limit this sharing. |
| Reasons we can share your personal information | Does MFS share? | Can you limit this sharing? |
| For our everyday business purposes – such as to process your transactions, maintain your account(s), respond to court orders and legal investigations, or report to credit bureaus | Yes | No |
| For our marketing purposes – to offer our products and services to you | No | We don't share |
| For joint marketing with other financial companies | No | We don't share |
| For our affiliates' everyday business purposes – information about your transactions and experiences | No | We don't share |
| For our affiliates' everyday business purposes – information about your creditworthiness | No | We don't share |
| For nonaffiliates to market to you | No | We don't share |
| Questions? | Call 800-225-2606 or go to mfs.com. |
| Who we are | |
| Who is providing this notice? | MFS Funds, MFS Investment Management, MFS Institutional Advisors, Inc., and MFS Heritage Trust Company. |
| What we do | |
| How does MFS protect my personal information? | To protect your personal information from unauthorized access and use, we use security measures that comply with federal law. These measures include procedural, electronic, and physical safeguards for the protection of the personal information we collect about you. |
| How does MFS collect my personal information? | We collect your personal information, for example, when you |
| • open an account or provide account information | |
| • direct us to buy securities or direct us to sell your securities | |
| • make a wire transfer | |
| We also collect your personal information from others, such as credit bureaus, affiliates, or other companies. | |
| Why can't I limit all sharing? | Federal law gives you the right to limit only |
| • sharing for affiliates' everyday business purposes – information about your creditworthiness | |
| • affiliates from using your information to market to you | |
| • sharing for nonaffiliates to market to you | |
| State laws and individual companies may give you additional rights to limit sharing. | |
| Definitions | |
| Affiliates | Companies related by common ownership or control. They can be financial and nonfinancial companies. |
| • MFS does not share personal information with affiliates, except for everyday business purposes as described on page one of this notice. | |
| Nonaffiliates | Companies not related by common ownership or control. They can be financial and nonfinancial companies. |
| • MFS does not share with nonaffiliates so they can market to you. | |
| Joint marketing | A formal agreement between nonaffiliated financial companies that together market financial products or services to you. |
| • MFS doesn't jointly market. | |
| Other important information |
| If you own an MFS product or receive an MFS service in the name of a third party such as a bank or broker-dealer, their privacy policy may apply to you instead of ours. |


| 1 | |
| 2 | |
| 4 | |
| 5 | |
| 7 | |
| 8 | |
| 20 | |
| 21 | |
| 22 | |
| 23 | |
| 25 | |
| 33 | |
| 34 | |
| 37 | |
| 39 | |
| 39 | |
| 39 | |
| 39 | |
| 39 | |
| 40 |


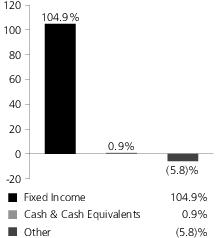
| Investment Grade Corporates | 31.7% |
| Mortgage-Backed Securities | 19.6% |
| U.S. Treasury Securities | 16.4% |
| High Yield Corporates | 10.3% |
| Commercial Mortgage-Backed Securities | 9.9% |
| Collateralized Debt Obligations | 8.7% |
| Emerging Markets Bonds | 3.0% |
| Municipal Bonds | 2.7% |
| U.S. Government Agencies | 1.1% |
| Asset-Backed Securities | 0.8% |
| Residential Mortgage-Backed Securities | 0.5% |
| Non-U.S. Government Bonds | 0.2% |
| AAA | 11.4% |
| AA | 4.9% |
| A | 12.2% |
| BBB | 26.9% |
| BB | 9.6% |
| B | 2.8% |
| C (o) | 0.0% |
| U.S. Government | 10.5% |
| Federal Agencies | 20.7% |
| Not Rated | 5.9% |
| Cash & Cash Equivalents | 0.9% |
| Other | (5.8)% |
| Average Duration (d) | 6.3 |
| Average Effective Maturity (m) | 7.0 yrs. |
| (a) | For all securities other than those specifically described below, ratings are assigned to underlying securities utilizing ratings from Moody’s, Fitch, and Standard & Poor’s rating agencies and applying the following hierarchy: If all three agencies provide a rating, the middle rating (after dropping the highest and lowest ratings) is assigned; if two of the three agencies rate a security, the lower of the two is assigned. If none of the 3 rating agencies above assign a rating, but the security is rated by DBRS Morningstar, then the DBRS Morningstar rating is assigned. If none of the 4 rating agencies listed above rate the security, but the security is rated by the Kroll Bond Rating Agency (KBRA), then the KBRA rating is assigned. Ratings are shown in the S&P and Fitch scale (e.g., AAA). Securities rated BBB or higher are considered investment grade. All ratings are subject to change. U.S. Government includes securities issued by the U.S. Department of the Treasury. Federal Agencies includes rated and unrated U.S. Agency fixed-income securities, U.S. Agency mortgage-backed securities, and collateralized mortgage obligations of U.S. Agency mortgage-backed securities. Not Rated includes fixed income securities and fixed income derivatives that have not been rated by any rating agency. The fund may or may not have held all of these instruments on this date. The fund is not rated by these agencies. |
| (d) | Duration is a measure of how much a bond’s price is likely to fluctuate with general changes in interest rates, e.g., if rates rise 1.00%, a bond with a 5-year duration is likely to lose about 5.00% of its value due to the interest rate move. |
| (i) | For purposes of this presentation, the components include the value of securities, and reflect the impact of the equivalent exposure of derivative positions, if any. These amounts may be negative from time to time. Equivalent exposure is a calculated amount that translates the derivative position into a reasonable approximation of the amount of the underlying asset that the portfolio would have to hold at a given point in time to have the same price sensitivity that results from the portfolio’s ownership of the derivative contract. When dealing with derivatives, equivalent exposure is a more representative measure of the potential impact of a position on portfolio performance than value. The bond component will include any accrued interest amounts. |
| (m) | In determining each instrument’s effective maturity for purposes of calculating the fund’s dollar-weighted average effective maturity, MFS uses the instrument’s stated maturity or, if applicable, an earlier date on which MFS believes it is probable that a maturity-shortening device (such as a put, pre-refunding or prepayment) will cause the instrument to be repaid. Such an earlier date can be substantially shorter than the instrument’s stated maturity. |
| (o) | Less than 0.1%. |
| (d) | Duration is a measure of how much a bond’s price is likely to fluctuate with general changes in interest rates, e.g., if rates rise 1.00%, a bond with a 5-year duration is likely to lose about 5.00% of its value. |
| (r) | Securities rated “BBB”, “Baa”, or higher are considered investment grade; securities rated “BB”, “Ba”, or below are considered non-investment grade. Ratings are assigned to underlying securities utilizing ratings from Moody's, Fitch, and Standard & Poor's and applying the following hierarchy: If all three agencies provide a rating, the middle rating (after dropping the highest and lowest ratings) is assigned; if two of the three agencies rate a security, the lower of the two is assigned. If none of the 3 rating agencies above assign a rating, but the security is rated by DBRS Morningstar, then the DBRS Morningstar rating is assigned. If none of the 4 rating agencies listed above rate the security, but the security is rated by the Kroll Bond Rating Agency (KBRA), then the KBRA rating is assigned. Ratings are shown in the S&P and Fitch scale (e.g., AAA). For securities that are not rated by any of the rating agencies, the security is considered Not Rated. |
| (y) | A yield curve graphically depicts the yields of different maturity bonds of the same credit quality and type; a normal yield curve is upward sloping, with short-term rates lower than long-term rates. |
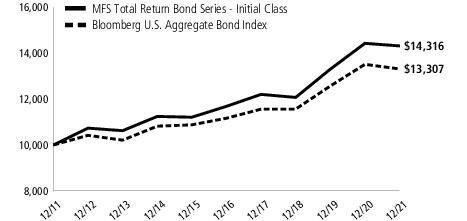
| Share Class | Class Inception Date | 1-yr | 5-yr | 10-yr |
| Initial Class | 10/24/95 | (0.81)% | 4.14% | 3.65% |
| Service Class | 5/01/00 | (1.07)% | 3.87% | 3.39% |
| Bloomberg U.S. Aggregate Bond Index (f) | (1.54)% | 3.57% | 2.90% |
| (f) | Source: FactSet Research Systems Inc. |
| (a) | Source: Bloomberg Index Services Limited. BLOOMBERG® is a trademark and service mark of Bloomberg Finance L.P. and its affiliates (collectively “Bloomberg”). Bloomberg or Bloomberg's licensors own all proprietary rights in the Bloomberg Indices. Bloomberg neither approves or endorses this material, or guarantees the accuracy or completeness of any information herein, or makes any warranty, express or implied, as to the results to be obtained therefrom and, to the maximum extent allowed by law, neither shall have any liability or responsibility for injury or damages arising in connection therewith. |
July 1, 2021 through December 31, 2021
| Share Class | Annualized Expense Ratio | Beginning Account Value 7/01/21 | Ending Account Value 12/31/21 | Expenses Paid During Period (p) 7/01/21-12/31/21 | |
| Initial Class | Actual | 0.53% | $1,000.00 | $1,001.08 | $2.67 |
| Hypothetical (h) | 0.53% | $1,000.00 | $1,022.53 | $2.70 | |
| Service Class | Actual | 0.78% | $1,000.00 | $999.42 | $3.93 |
| Hypothetical (h) | 0.78% | $1,000.00 | $1,021.27 | $3.97 |
| (h) | 5% class return per year before expenses. |
| (p) | “Expenses Paid During Period” are equal to each class's annualized expense ratio, as shown above, multiplied by the average account value over the period, multiplied by 184/365 (to reflect the one-half year period). |
| Issuer | Shares/Par | Value ($) | ||
| Bonds – 98.4% | ||||
| Aerospace & Defense – 0.9% | ||||
| Boeing Co., 2.196%, 2/04/2026 | $ | 6,236,000 | $ 6,234,514 | |
| Boeing Co., 5.15%, 5/01/2030 | 1,704,000 | 1,985,332 | ||
| Boeing Co., 5.705%, 5/01/2040 | 1,595,000 | 2,048,630 | ||
| Boeing Co., 5.805%, 5/01/2050 | 1,550,000 | 2,098,895 | ||
| TransDigm, Inc., 4.625%, 1/15/2029 | 5,462,000 | 5,443,866 | ||
| $17,811,237 | ||||
| Asset-Backed & Securitized – 19.8% | ||||
| ACREC 2021-FL1 Ltd., “C”, FLR, 2.253% (LIBOR - 1mo. + 2.15%), 10/16/2036 (n) | $ | 2,546,000 | $ 2,534,383 | |
| ACREC 2021-FL1 Ltd., “D”, FLR, 2.753% (LIBOR - 1mo. + 2.65%), 10/16/2036 (n) | 3,070,500 | 3,056,323 | ||
| Acres PLC, 2021-FL2, “C”, FLR, 2.743% (LIBOR - 1mo. + 2.65%), 1/15/2037 (z) | 3,129,000 | 3,129,013 | ||
| Allegro CLO Ltd., 2014-1RA, “A2”, FLR, 1.729% (LIBOR - 3mo. + 1.6%), 10/21/2028 (n) | 5,554,267 | 5,570,669 | ||
| Arbor Realty Trust, Inc., CLO, 2021-FL4, “C”, FLR, 2.39% (LIBOR - 1mo. + 2.3%), 11/15/2036 (n) | 3,443,500 | 3,440,271 | ||
| Arbor Realty Trust, Inc., CLO, 2018-FL1, “A”, FLR, 1.259% (LIBOR - 1mo. + 1.15%), 6/15/2028 (n) | 7,720,000 | 7,717,584 | ||
| Arbor Realty Trust, Inc., CLO, 2019-FL2, “AS”, FLR, 1.614% (LIBOR - 1mo. + 1.45%), 9/15/2034 (n) | 980,500 | 980,194 | ||
| Arbor Realty Trust, Inc., CLO, 2019-FL2, “B”, FLR, 1.914% (LIBOR - 1mo. + 1.75%), 9/15/2034 (n) | 784,500 | 784,254 | ||
| Arbor Realty Trust, Inc., CLO, 2020-FL1, “C”, FLR, 2.214% (LIBOR - 1mo. + 2.05%), 2/15/2035 (n) | 3,529,000 | 3,524,589 | ||
| Arbor Realty Trust, Inc., CLO, 2021-FL1, “C”, FLR, 2.109% (LIBOR - 1mo. + 2%), 12/15/2035 (n) | 905,000 | 902,172 | ||
| Arbor Realty Trust, Inc., CLO, 2021-FL1, “D”, FLR, 3.059% (LIBOR - 1mo. + 2.95%), 12/15/2035 (n) | 831,500 | 829,422 | ||
| Arbor Realty Trust, Inc., CLO, 2021-FL2, “B”, FLR, 1.71% (LIBOR - 1mo. + 1.6%), 5/15/2036 (n) | 1,152,500 | 1,147,458 | ||
| Arbor Realty Trust, Inc., CLO, 2021-FL3, “C”, FLR, 1.959% (LIBOR - 1mo. + 1.85%), 8/15/2034 (n) | 1,740,000 | 1,732,483 | ||
| Arbor Realty Trust, Inc., CLO, 2021-FL3, “D”, FLR, 2.31% (LIBOR - 1mo. + 2.2%), 8/15/2034 (n) | 964,500 | 957,352 | ||
| AREIT CRE Trust, 2019-CRE3, “A”, FLR, 1.184% (LIBOR - 1mo. + 1.02%), 9/14/2036 (n) | 514,893 | 514,348 | ||
| AREIT CRE Trust, 2019-CRE3, “B”, FLR, 1.714% (LIBOR - 1mo. + 1.55%), 9/14/2036 (n) | 2,569,500 | 2,560,476 | ||
| AREIT CRE Trust, 2019-CRE3, “C”, FLR, 2.064% (LIBOR - 1mo. + 1.9%), 9/14/2036 (n) | 2,242,500 | 2,231,978 | ||
| AREIT CRE Trust, 2019-CRE3, “D”, FLR, 2.814% (LIBOR - 1mo. + 2.65%), 9/14/2036 (n) | 1,849,000 | 1,831,571 | ||
| Atrium XII Corp., 2012-A, “B1R”, FLR, 1.478% (LIBOR - 3mo. + 1.35%), 4/22/2027 (n) | 7,430,000 | 7,426,270 | ||
| Bancorp Commercial Mortgage Trust, 2018-CRE3, “D”, FLR, 2.81% (LIBOR - 1mo. + 2.7%), 1/15/2033 (n) | 1,510,706 | 1,503,455 | ||
| Bancorp Commercial Mortgage Trust, 2019-CRE6, “B”, FLR, 1.714% (LIBOR - 1mo. + 1.55%), 9/15/2036 (n) | 8,289,572 | 8,258,134 | ||
| Bancorp Commercial Mortgage Trust, 2019-CRE6, “D”, FLR, 2.464% (LIBOR - 1mo. + 2.54%), 9/15/2036 (n) | 545,000 | 542,678 | ||
| Barclays Commercial Mortgage Securities LLC, 2019-C5, “A4”, 3.063%, 11/15/2052 | 2,755,000 | 2,925,891 | ||
| Bayview Commercial Asset Trust, 0%, 12/25/2036 (i)(z) | 77,531 | 8 | ||
| Bayview Financial Revolving Mortgage Loan Trust, FLR, 1.701% (LIBOR - 1mo. + 1.6%), 12/28/2040 (n) | 37,269 | 41,484 | ||
| BDS Ltd., 2019-FL4, “A”, FLR, 1.209% (LIBOR - 1mo. + 1.10%), 8/15/2036 (n) | 3,868,703 | 3,866,912 | ||
| BDS Ltd., 2021-FL7, “B”, FLR, 1.607% (LIBOR - 1mo. + 1.5%), 6/16/2036 (n) | 1,259,500 | 1,253,655 | ||
| Bear Stearns Cos., Inc., “A2”, FLR, 1.001% (LIBOR - 1mo. + 0.45%), 12/25/2042 | 96,393 | 96,260 | ||
| Benchmark Mortgage Trust, 2020-B18, “A5”, 1.925%, 7/15/2053 | 2,133,596 | 2,086,998 | ||
| BSPDF 2021-FL1 Issuer Ltd., “B”, FLR, 1.909% (LIBOR - 1mo. + 1.8%), 10/15/2036 (n) | 4,380,500 | 4,387,399 | ||
| BSPRT Issuer Ltd., 2019-FL5, “C”, FLR, 2.109% (LIBOR - 1mo. + 2%), 5/15/2029 (n) | 3,295,000 | 3,279,780 | ||
| BSPRT Issuer Ltd., 2021-FL6, “B”, FLR, 1.709% (LIBOR - 1mo. + 1.6%), 3/15/2036 (n) | 3,669,500 | 3,656,209 | ||
| BSPRT Issuer Ltd., 2021-FL6, “C”, FLR, 2.159% (LIBOR - 1mo. + 2.05%), 3/15/2036 (n) | 1,288,000 | 1,284,886 | ||
| BSPRT Issuer Ltd., 2021-FL7, “C”, FLR, 2.4% (LIBOR - 1mo. + 2.3%), 12/15/2038 (n) | 836,500 | 836,500 | ||
| BSPRT Issuer, Ltd., 2021-FL7, “D”, FLR, 2.85% (LIBOR - 1mo. + 2.75%), 12/15/2038 (n) | 952,500 | 952,500 | ||
| Business Jet Securities LLC, 2020-1A, “A”, 2.981%, 11/15/2035 (n) | 1,546,425 | 1,544,095 | ||
| Business Jet Securities LLC, 2021-1A, “B”, 2.918%, 4/15/2036 (n) | 546,603 | 535,301 | ||
| BXMT Ltd., 2020-FL2, “B”, FLR, 1.564% (LIBOR - 1mo. + 1.4%), 2/15/2038 (n) | 1,731,000 | 1,725,049 | ||
| Cantor Commercial Real Estate, 2019-CF2, “A5”, 2.874%, 11/15/2052 | 6,645,635 | 6,905,819 | ||
| Capital Automotive, 2020-1A, “A4”, REIT, 3.19%, 2/15/2050 (n) | 2,402,028 | 2,446,683 | ||
| CHCP 2021-FL1 Ltd., “B”, FLR, 1.814% (LIBOR - 1mo. + 1.65%), 2/15/2038 (n) | 1,102,500 | 1,098,446 | ||
| CHCP 2021-FL1 Ltd., “C”, FLR, 2.264% (LIBOR - 1mo. + 2.1%), 2/15/2038 (n) | 1,249,000 | 1,245,854 | ||
| Citigroup Commercial Mortgage Trust, 2014-GC25, “A4”, 3.635%, 10/10/2047 | 3,128,793 | 3,289,457 | ||
| Citigroup Commercial Mortgage Trust, 2016-P6, “A5”, 3.72%, 12/10/2049 | 1,754,000 | 1,894,719 | ||
| Citigroup Commercial Mortgage Trust, 2019-C7, “A4”, 3.102%, 12/15/2072 | 790,000 | 840,546 | ||
| CLNC Ltd., 2019-FL1, “B”, FLR, 2.064% (LIBOR - 1mo. + 1.9%), 8/20/2035 (n) | 1,850,000 | 1,843,484 | ||
| CLNC Ltd., 2019-FL1, “C”, FLR, 2.564% (LIBOR - 1mo. + 2.4%), 8/20/2035 (n) | 3,006,500 | 2,989,798 | ||
| Issuer | Shares/Par | Value ($) | ||
| Bonds – continued | ||||
| Asset-Backed & Securitized – continued | ||||
| Commercial Mortgage Trust, 2012-CR2, “A4”, 3.147%, 8/15/2045 | $ | 3,950,000 | $ 3,960,571 | |
| Commercial Mortgage Trust, 2015-LC21, “A4”, 3.708%, 7/10/2048 | 10,000,000 | 10,630,423 | ||
| Commercial Mortgage Trust, 2015-PC1, “A5”, 3.902%, 7/10/2050 | 2,888,848 | 3,078,718 | ||
| Credit Acceptance Auto Loan Trust, 2021-3A, “C”, 1.63%, 9/16/2030 (n) | 523,000 | 515,571 | ||
| CSAIL Commercial Mortgage Trust, 2015-C2, “A4”, 3.504%, 6/15/2057 | 2,695,346 | 2,840,559 | ||
| Cutwater Ltd., 2014-1A, “BR”, FLR, 2.523% (LIBOR - 3mo. + 2.4%), 7/15/2026 (n) | 3,135,000 | 3,121,288 | ||
| Cutwater Ltd., 2015-1A, “BR”, FLR, 1.924% (LIBOR - 3mo. + 1.8%), 1/15/2029 (n) | 10,770,000 | 10,659,823 | ||
| DT Auto Owner Trust, 2019-2A, “C”, 3.18%, 2/18/2025 (n) | 1,840,845 | 1,852,314 | ||
| Exeter Automobile Receivables Trust, 2020-1A, 2.49%, 1/15/2025 (n) | 1,905,000 | 1,920,306 | ||
| GLS Auto Receivables Trust, 2020-1A, “A”, 2.17%, 2/15/2024 (n) | 174,934 | 175,189 | ||
| GS Mortgage Securities Trust, 2015-GC30, “A4”, 3.382%, 5/10/2050 | 7,904,407 | 8,331,570 | ||
| GS Mortgage Securities Trust, 2019-GSA1, “A4”, 3.047%, 11/10/2052 | 10,169,944 | 10,770,981 | ||
| HarbourView CLO VII Ltd., 7RA, “B”, FLR, 1.822% (LIBOR - 3mo. + 1.7%), 7/18/2031 (n) | 6,545,000 | 6,474,085 | ||
| Invitation Homes Trust, 2018-SFR1, “B”, FLR, 0.809% (LIBOR - 1mo. + 0.7%), 3/17/2037 (n) | 8,643,857 | 8,643,856 | ||
| JPMBB Commercial Mortgage Securities Trust, 2015-C28, “A4”, 3.227%, 10/15/2048 | 12,188,428 | 12,726,014 | ||
| JPMorgan Chase Commercial Mortgage Securities Corp., 5.65%, 7/15/2042 (n) | 16,765 | 13,735 | ||
| JPMorgan Chase Commercial Mortgage Securities Corp., 3.454%, 9/15/2050 | 7,520,623 | 8,072,123 | ||
| JPMorgan Mortgage Trust, “A1”, 1.81%, 10/25/2033 | 75,206 | 76,288 | ||
| LCCM 2021-FL2 Trust, “C”, FLR, 2.259% (LIBOR - 1mo. + 2.15%), 12/13/2038 (n) | 1,985,500 | 1,985,492 | ||
| Lehman Brothers Commercial Conduit Mortgage Trust, 0.904%, 2/18/2030 (i) | 1,336 | 0 | ||
| LoanCore Ltd., 2018-CRE1, “AS”, FLR, 1.609% (LIBOR - 1mo. + 1.5%), 5/15/2028 (n) | 8,900,000 | 8,882,227 | ||
| LoanCore Ltd., 2018-CRE1, “C”, FLR, 2.659% (LIBOR - 1mo. + 2.55%), 5/15/2028 (n) | 2,340,000 | 2,336,481 | ||
| LoanCore Ltd., 2018-CRE1, “C”, FLR, 2.059% (LIBOR - 1mo. + 1.95%), 4/15/2034 (n) | 1,836,900 | 1,830,732 | ||
| LoanCore Ltd., 2018-CRE1/CRE3, “B”, FLR, 1.709% (LIBOR - 1mo. + 1.6%), 4/15/2034 (n) | 1,873,800 | 1,869,706 | ||
| LoanCore Ltd., 2019-CRE2, “D”, FLR, 2.56% (LIBOR - 1mo. + 2.45%), 5/15/2036 (n) | 1,121,500 | 1,105,805 | ||
| LoanCore Ltd., 2019-CRE3, “AS”, FLR, 1.48% (LIBOR - 1mo. + 1.37%), 4/15/2034 (n) | 1,456,200 | 1,455,405 | ||
| LoanCore Ltd., 2021-CRE5, “AS”, FLR, 1.859% (LIBOR - 1mo. + 1.75%), 7/15/2036 (n) | 5,666,000 | 5,659,014 | ||
| LoanCore Ltd., 2021-CRE5, “B”, FLR, 2.11% (LIBOR - 1mo. + 2%), 7/15/2036 (n) | 5,318,000 | 5,307,782 | ||
| LoanCore Ltd., 2021-CRE6, “B”, FLR, 2.01% (LIBOR - 1mo. + 1.9%), 11/15/2038 (n) | 9,970,000 | 9,969,472 | ||
| Madison Park Funding Ltd., 2017- 23A, “CR”, FLR, 2.134% (LIBOR - 3mo. + 2%), 7/27/2031 (n) | 5,894,060 | 5,891,078 | ||
| Merrill Lynch Mortgage Investors, Inc., “A”, 2.021%, 5/25/2036 | 79,139 | 80,704 | ||
| Merrill Lynch Mortgage Investors, Inc., “A5”, 1.915%, 4/25/2035 | 98,720 | 97,586 | ||
| MF1 CLO Ltd., 2021-FL5, “C”, FLR, 1.864% (LIBOR - 1mo. + 1.7%), 7/15/2036 (n) | 2,589,000 | 2,588,234 | ||
| MF1 Multi-Family Housing Mortgage Loan Trust, 2020-FL4, FLR, 2.264% (LIBOR - 1mo. + 2.1%), 11/15/2035 (n) | 2,602,500 | 2,612,144 | ||
| Morgan Stanley Bank of America/Merrill Lynch Trust, “A4”, 3.176%, 8/15/2045 | 4,668,180 | 4,683,875 | ||
| Neuberger Berman CLO Ltd., 2013-15A, “CR2”, FLR, 1.974% (LIBOR - 3mo. + 1.85%), 10/15/2029 (n) | 7,481,614 | 7,459,745 | ||
| NextGear Floorplan Master Owner Trust, 2019-2A, “A2”, 2.07%, 10/15/2024 (n) | 2,465,000 | 2,491,820 | ||
| Oaktree CLO Ltd., 2019-1A, “BR”, FLR, 1.878% (LIBOR - 3mo. + 1.75%), 4/22/2030 (n) | 5,000,000 | 4,991,515 | ||
| Oaktree CLO Ltd., 2019-1A, “CR”, FLR, 2.478% (LIBOR - 3mo. + 2.35%), 4/22/2030 (n) | 5,744,568 | 5,723,916 | ||
| OCP CLO Ltd., 2015-9A, “A2R”, FLR, 1.474% (LIBOR - 3mo. + 1.35%), 7/15/2027 (n) | 6,280,000 | 6,276,847 | ||
| Palmer Square Loan Funding Ltd., 2020-1A, “A2”, FLR, 1.509% (LIBOR - 3mo. + 1.35%), 2/20/2028 (n) | 3,930,000 | 3,913,219 | ||
| Palmer Square Loan Funding Ltd., 2020-1A, “B”, FLR, 2.059% (LIBOR - 3mo. + 1.9%), 2/20/2028 (n) | 3,453,628 | 3,394,056 | ||
| Parallel Ltd., 2015-1A, “C1R”, FLR, 1.881% (LIBOR - 3mo. + 1.75%), 7/20/2027 (n) | 1,680,000 | 1,680,270 | ||
| Parallel Ltd., 2015-1A, “C2R”, FLR, 1.881% (LIBOR - 3mo. + 1.75%), 7/20/2027 (n) | 1,810,000 | 1,799,520 | ||
| PFP III Ltd., 2021-7, “B”, FLR, 1.507% (LIBOR - 1mo. + 1.4%), 4/14/2038 (n) | 935,953 | 927,456 | ||
| PFP III Ltd., 2021-7, “C”, FLR, 1.757% (LIBOR - 1mo. + 1.65%), 4/14/2038 (n) | 1,640,418 | 1,630,549 | ||
| Preferred Term Securities XIX Ltd., CDO, FLR, 0.552% (LIBOR - 3mo. + 0.35%), 12/22/2035 (n) | 173,108 | 155,797 | ||
| Race Point CLO Ltd., 2013-8A, “AR-2”, FLR, 1.199% (LIBOR - 3mo. + 1.04%), 2/20/2030 (n) | 3,697,038 | 3,698,376 | ||
| ReadyCap Commercial Mortgage Trust, 2021-FL7, “C”, FLR, 2.302% (LIBOR - 1mo. + 2.2%), 11/25/2036 (z) | 1,340,000 | 1,337,926 | ||
| ReadyCap Commercial Mortgage Trust, 2021-FL7, “D”, FLR, 3.052% (LIBOR - 1mo. + 2.95%), 11/25/2036 (z) | 1,575,000 | 1,572,070 | ||
| Residential Funding Mortgage Securities, Inc., FGIC, 4.481%, 12/25/2035 | 3,031 | 3,026 | ||
| Santander Retail Auto Lease Trust, 2020-A, “C”, 2.08%, 3/20/2024 (n) | 2,276,000 | 2,300,105 | ||
| Securitized Term Auto Receivable Trust, 2019-CRTA, “B”, 2.453%, 3/25/2026 (n) | 703,883 | 710,744 | ||
| Securitized Term Auto Receivable Trust, 2019-CRTA, “C”, 2.849%, 3/25/2026 (n) | 839,404 | 848,887 | ||
| Starwood Commercial Mortgage, 2021-FL2, “C”, FLR, 2.208% (LIBOR - 1mo. + 2.1%), 4/18/2038 (n) | 2,027,000 | 2,025,091 | ||
| TICP CLO Ltd., 2018-IA, “A2”, FLR, 1.624% (LIBOR - 3mo. + 1.5%), 4/26/2028 (n) | 6,750,828 | 6,750,931 | ||
| UBS Commercial Mortgage Trust, 2017-C8, “A4”, 3.983%, 2/15/2051 | 5,865,766 | 6,491,782 | ||
| Issuer | Shares/Par | Value ($) | ||
| Bonds – continued | ||||
| Asset-Backed & Securitized – continued | ||||
| UBS Commercial Mortgage Trust, 2019-C17, “A4”, 2.921%, 10/15/2052 | $ | 12,215,133 | $ 12,793,786 | |
| Veros Auto Receivables Trust, 2020-1, “A”, 1.67%, 9/15/2023 (n) | 179,014 | 179,088 | ||
| Voya CLO Ltd., 2012-4A, “A2R3”, FLR, 1.574% (LIBOR - 3mo. + 1.45%), 10/15/2030 (n) | 1,957,793 | 1,953,406 | ||
| Voya CLO Ltd., 2012-4A, “BR3”, FLR, 2.074% (LIBOR - 3mo. + 1.95%), 10/15/2030 (n) | 828,265 | 824,826 | ||
| Voya CLO Ltd., 2012-4A, “C1R3”, FLR, 3.423% (LIBOR - 3mo. + 3.3%), 10/15/2030 (n) | 1,187,823 | 1,169,755 | ||
| Voya CLO Ltd., 2016-4A, “CR”, FLR, 2.281% (LIBOR - 3mo. + 2.15%), 7/20/2029 (n) | 4,904,782 | 4,902,305 | ||
| Wells Fargo Commercial Mortgage Trust, 2016-LC25, “A4”, 3.64%, 12/15/2059 | 13,071,416 | 14,122,983 | ||
| Wells Fargo Commercial Mortgage Trust, 2017-C42, “A5”, 3.589%, 12/15/2050 | 3,970,000 | 4,316,237 | ||
| Wells Fargo Commercial Mortgage Trust, 2018-C46, “A4”, 4.152%, 8/15/2051 | 1,430,000 | 1,600,598 | ||
| Wells Fargo Commercial Mortgage Trust, 2019-C53, “A4”, 3.04%, 10/15/2052 | 10,239,837 | 10,865,420 | ||
| Wells Fargo Commercial Mortgage Trust, 2019-C54, “A4”, 3.146%, 12/15/2052 | 4,898,000 | 5,235,913 | ||
| Wells Fargo Commercial Mortgage Trust, 2020-C58, “A4”, 2.092%, 7/15/2053 | 3,745,000 | 3,706,611 | ||
| Wind River CLO Ltd., 2015-2A, “CR”, FLR, 1.823% (LIBOR - 3mo. + 1.7%), 10/15/2027 (n) | 975,000 | 976,216 | ||
| $391,252,753 | ||||
| Automotive – 0.2% | ||||
| Hyundai Capital America, 2.375%, 10/15/2027 (n) | $ | 1,982,000 | $ 1,970,873 | |
| Volkswagen Group of America Finance LLC, 3.75%, 5/13/2030 (n) | 2,118,000 | 2,314,325 | ||
| $4,285,198 | ||||
| Broadcasting – 0.9% | ||||
| Discovery, Inc., 4.65%, 5/15/2050 | $ | 4,028,000 | $ 4,725,268 | |
| Prosus N.V., 3.68%, 1/21/2030 (n) | 4,905,000 | 5,048,031 | ||
| WMG Acquisition Corp., 3%, 2/15/2031 (n) | 8,700,000 | 8,330,250 | ||
| $18,103,549 | ||||
| Brokerage & Asset Managers – 1.3% | ||||
| E*TRADE Financial Corp., 3.8%, 8/24/2027 | $ | 5,272,000 | $ 5,729,663 | |
| E*TRADE Financial Corp., 4.5%, 6/20/2028 | 3,485,000 | 3,920,951 | ||
| Intercontinental Exchange, Inc., 3.75%, 9/21/2028 | 2,249,000 | 2,483,656 | ||
| Intercontinental Exchange, Inc., 2.1%, 6/15/2030 | 1,170,000 | 1,162,524 | ||
| LPL Holdings, Inc., 4%, 3/15/2029 (n) | 6,500,000 | 6,654,375 | ||
| Raymond James Financial, Inc., 4.95%, 7/15/2046 | 4,683,000 | 5,960,084 | ||
| $25,911,253 | ||||
| Building – 0.8% | ||||
| ABC Supply Co., Inc., 4%, 1/15/2028 (n) | $ | 2,975,000 | $ 3,044,109 | |
| Martin Marietta Materials, Inc., 3.45%, 6/01/2027 | 1,243,000 | 1,325,071 | ||
| Standard Industries, Inc., 4.375%, 7/15/2030 (n) | 4,065,000 | 4,148,353 | ||
| Standard Industries, Inc., 3.375%, 1/15/2031 (n) | 3,660,000 | 3,525,642 | ||
| Vulcan Materials Co., 3.5%, 6/01/2030 | 3,356,000 | 3,624,820 | ||
| $15,667,995 | ||||
| Business Services – 1.1% | ||||
| Equinix, Inc., 2.15%, 7/15/2030 | $ | 4,789,000 | $ 4,655,347 | |
| Fiserv, Inc., 3.5%, 7/01/2029 | 3,750,000 | 4,032,902 | ||
| Fiserv, Inc., 2.65%, 6/01/2030 | 4,000,000 | 4,058,781 | ||
| Iron Mountain, Inc., 4.5%, 2/15/2031 (n) | 5,315,000 | 5,371,817 | ||
| NXP Semiconductors N.V., 2.7%, 5/01/2025 (n) | 508,000 | 524,804 | ||
| Switch Ltd., 4.125%, 6/15/2029 (n) | 3,175,000 | 3,246,437 | ||
| $21,890,088 | ||||
| Issuer | Shares/Par | Value ($) | ||
| Bonds – continued | ||||
| Cable TV – 2.0% | ||||
| CCO Holdings LLC/CCO Holdings Capital Corp., 5%, 2/01/2028 (n) | $ | 4,470,000 | $ 4,648,800 | |
| CCO Holdings LLC/CCO Holdings Capital Corp., 4.5%, 8/15/2030 (n) | 4,025,000 | 4,118,340 | ||
| Charter Communications Operating LLC/Charter Communications Operating Capital Corp., 4.908%, 7/23/2025 | 7,676,000 | 8,452,107 | ||
| CSC Holdings LLC, 4.125%, 12/01/2030 (n) | 5,940,000 | 5,798,925 | ||
| CSC Holdings LLC, 4.5%, 11/15/2031 (n) | 4,065,000 | 4,014,187 | ||
| Sirius XM Radio, Inc., 5.5%, 7/01/2029 (n) | 4,005,000 | 4,315,387 | ||
| Sirius XM Radio, Inc., 4.125%, 7/01/2030 (n) | 3,995,000 | 3,995,000 | ||
| Time Warner Cable, Inc., 4.5%, 9/15/2042 | 3,558,000 | 3,878,975 | ||
| Time Warner Entertainment Co. LP, 8.375%, 7/15/2033 | 290,000 | 422,245 | ||
| $39,643,966 | ||||
| Chemicals – 0.2% | ||||
| Axalta Coating Systems Ltd., 3.375%, 2/15/2029 (n) | $ | 3,100,000 | $ 2,999,250 | |
| Computer Software – 0.6% | ||||
| Dell International LLC/EMC Corp., 5.3%, 10/01/2029 | $ | 9,950,000 | $ 11,663,330 | |
| Computer Software - Systems – 0.3% | ||||
| SS&C Technologies Holdings, Inc., 5.5%, 9/30/2027 (n) | $ | 6,040,000 | $ 6,311,800 | |
| Conglomerates – 0.8% | ||||
| BWX Technologies, Inc., 4.125%, 6/30/2028 (n) | $ | 2,327,000 | $ 2,361,905 | |
| Carrier Global Corp., 3.577%, 4/05/2050 | 6,276,000 | 6,672,814 | ||
| Westinghouse Air Brake Technologies Corp., 4.95%, 9/15/2028 | 4,993,000 | 5,675,597 | ||
| $14,710,316 | ||||
| Consumer Services – 0.6% | ||||
| Match Group Holdings II LLC, 3.625%, 10/01/2031 (n) | $ | 2,970,000 | $ 2,884,613 | |
| Toll Road Investors Partnership II LP, Capital Appreciation, NPFG, 0%, 2/15/2026 (n) | 2,145,000 | 1,817,611 | ||
| Toll Road Investors Partnership II LP, Capital Appreciation, NPFG, 0%, 2/15/2029 (n) | 6,221,000 | 4,557,568 | ||
| Toll Road Investors Partnership II LP, Capital Appreciation, NPFG, 0%, 2/15/2031 (n) | 2,145,000 | 1,433,348 | ||
| Toll Road Investors Partnership II LP, Capital Appreciation, NPFG, 0%, 2/15/2043 (n) | 5,600,000 | 1,822,157 | ||
| $12,515,297 | ||||
| Containers – 0.4% | ||||
| Crown Americas LLC/Crown Americas Capital Corp. VI, 4.75%, 2/01/2026 | $ | 7,030,000 | $ 7,205,750 | |
| Electrical Equipment – 0.3% | ||||
| Arrow Electronics, Inc., 2.95%, 2/15/2032 | $ | 4,838,000 | $ 4,885,605 | |
| Electronics – 1.2% | ||||
| Broadcom, Inc., 4.15%, 11/15/2030 | $ | 5,602,000 | $ 6,212,933 | |
| Broadcom, Inc., 3.469%, 4/15/2034 (n) | 3,589,000 | 3,756,497 | ||
| Broadcom, Inc., 3.137%, 11/15/2035 (n) | 3,219,000 | 3,238,180 | ||
| Broadcom, Inc., 3.187%, 11/15/2036 (n) | 3,936,000 | 3,929,144 | ||
| Sensata Technologies B.V., 5%, 10/01/2025 (n) | 3,740,000 | 4,057,900 | ||
| Sensata Technologies B.V., 4%, 4/15/2029 (n) | 2,670,000 | 2,726,737 | ||
| $23,921,391 | ||||
| Emerging Market Quasi-Sovereign – 0.7% | ||||
| Indian Railway Finance Corp., 2.8%, 2/10/2031 (n) | $ | 6,055,000 | $ 5,886,021 | |
| Office Cherifien des Phosphates S.A. (Kingdom of Morocco), 3.75%, 6/23/2031 (n) | 5,063,000 | 4,913,135 | ||
| Power Finance Corp. Ltd. (Republic of India), 3.95%, 4/23/2030 | 2,856,000 | 2,951,001 | ||
| $13,750,157 | ||||
| Issuer | Shares/Par | Value ($) | ||
| Bonds – continued | ||||
| Emerging Market Sovereign – 0.2% | ||||
| Dominican Republic, 4.5%, 1/30/2030 (n) | $ | 4,675,000 | $ 4,750,969 | |
| Energy - Independent – 0.9% | ||||
| Diamondback Energy, Inc., 4.4%, 3/24/2051 | $ | 1,999,000 | $ 2,291,274 | |
| Energean Israel Finance Ltd., 4.875%, 3/30/2026 | 3,943,000 | 3,908,499 | ||
| Energean Israel Finance Ltd., 5.375%, 3/30/2028 | 901,000 | 887,485 | ||
| Leviathan Bond Ltd., 6.5%, 6/30/2027 (n) | 2,675,000 | 2,865,246 | ||
| Leviathan Bond Ltd., 6.75%, 6/30/2030 (n) | 2,670,000 | 2,864,429 | ||
| Tengizchevroil Finance Co. International Ltd., 3.25%, 8/15/2030 | 4,908,000 | 4,900,393 | ||
| $17,717,326 | ||||
| Energy - Integrated – 0.3% | ||||
| Eni S.p.A., 4%, 9/12/2023 (n) | $ | 5,176,000 | $ 5,412,466 | |
| Financial Institutions – 1.8% | ||||
| AerCap Ireland Capital DAC/AerCap Global Aviation Trust, 4.5%, 9/15/2023 | $ | 4,803,000 | $ 5,037,975 | |
| AerCap Ireland Capital DAC/AerCap Global Aviation Trust, 6.5%, 7/15/2025 | 3,195,000 | 3,651,053 | ||
| AerCap Ireland Capital DAC/AerCap Global Aviation Trust, 3%, 10/29/2028 | 2,329,000 | 2,361,922 | ||
| AerCap Ireland Capital DAC/AerCap Global Aviation Trust, 3.3%, 1/30/2032 | 2,763,000 | 2,814,866 | ||
| Avolon Holdings Funding Ltd., 5.25%, 5/15/2024 (n) | 5,681,000 | 6,094,536 | ||
| Avolon Holdings Funding Ltd., 3.95%, 7/01/2024 (n) | 4,592,000 | 4,811,492 | ||
| Avolon Holdings Funding Ltd., 2.125%, 2/21/2026 (n) | 2,890,000 | 2,836,469 | ||
| Avolon Holdings Funding Ltd., 4.25%, 4/15/2026 (n) | 1,779,000 | 1,885,197 | ||
| Avolon Holdings Funding Ltd., 2.75%, 2/21/2028 (n) | 2,615,000 | 2,565,869 | ||
| Global Aircraft Leasing Co. Ltd., 6.5% (6.5% cash or 7.25% PIK), 9/15/2024 (n)(p) | 3,849,623 | 3,714,886 | ||
| $35,774,265 | ||||
| Food & Beverages – 0.9% | ||||
| Anheuser-Busch InBev Worldwide, Inc., 5.45%, 1/23/2039 | $ | 2,539,000 | $ 3,322,932 | |
| Aramark Services, Inc., 5%, 2/01/2028 (n) | 3,825,000 | 3,954,094 | ||
| Indofood CBP, 3.541%, 4/27/2032 | 5,223,000 | 5,262,285 | ||
| JBS USA Lux S.A./JBS USA Finance, Inc., 5.5%, 1/15/2030 (n) | 4,965,000 | 5,399,437 | ||
| $17,938,748 | ||||
| Gaming & Lodging – 0.9% | ||||
| Hilton Domestic Operating Co., Inc., 3.625%, 2/15/2032 (n) | $ | 7,185,000 | $ 7,147,207 | |
| Las Vegas Sands Corp., 3.5%, 8/18/2026 | 3,253,000 | 3,292,647 | ||
| Marriott International, Inc., 4.625%, 6/15/2030 | 1,503,000 | 1,690,793 | ||
| Marriott International, Inc., 2.85%, 4/15/2031 | 1,650,000 | 1,644,951 | ||
| Marriott International, Inc., 3.5%, 10/15/2032 | 3,330,000 | 3,487,357 | ||
| $17,262,955 | ||||
| Insurance - Property & Casualty – 2.8% | ||||
| Allied World Assurance Co. Holdings Ltd., 4.35%, 10/29/2025 | $ | 6,835,000 | $ 7,333,838 | |
| American International Group, Inc., 3.75%, 7/10/2025 | 4,641,000 | 4,965,960 | ||
| American International Group, Inc., 3.9%, 4/01/2026 | 4,923,000 | 5,335,574 | ||
| American International Group, Inc., 4.7%, 7/10/2035 | 2,600,000 | 3,100,948 | ||
| Aon Corp., 3.75%, 5/02/2029 | 7,982,000 | 8,749,938 | ||
| Berkshire Hathaway Finance Corp., 2.85%, 10/15/2050 | 1,429,000 | 1,407,990 | ||
| Fairfax Financial Holdings Ltd., 4.85%, 4/17/2028 | 5,692,000 | 6,331,340 | ||
| Fairfax Financial Holdings Ltd., 3.375%, 3/03/2031 | 1,060,000 | 1,091,069 | ||
| Hartford Financial Services Group, Inc., 2.8%, 8/19/2029 | 5,901,000 | 6,119,310 | ||
| Hartford Financial Services Group, Inc., 3.6%, 8/19/2049 | 1,463,000 | 1,601,319 | ||
| Liberty Mutual Group, Inc., 3.951%, 10/15/2050 (n) | 2,900,000 | 3,209,909 | ||
| Marsh & McLennan Cos., Inc., 4.2%, 3/01/2048 | 4,851,000 | 5,887,811 | ||
| Issuer | Shares/Par | Value ($) | ||
| Bonds – continued | ||||
| Insurance - Property & Casualty – continued | ||||
| Swiss Re Ltd., 4.25%, 12/06/2042 (n) | $ | 736,000 | $ 901,698 | |
| $56,036,704 | ||||
| International Market Quasi-Sovereign – 0.2% | ||||
| Electricite de France S.A., 4.875%, 9/21/2038 (n) | $ | 2,687,000 | $ 3,250,505 | |
| Machinery & Tools – 0.3% | ||||
| CNH Industrial Capital LLC, 4.2%, 1/15/2024 | $ | 1,209,000 | $ 1,276,045 | |
| CNH Industrial Capital LLC, 3.85%, 11/15/2027 | 3,223,000 | 3,508,409 | ||
| $4,784,454 | ||||
| Major Banks – 8.9% | ||||
| Bank of America Corp., 3.419% to 12/20/2027, FLR (LIBOR - 3mo. + 1.04%) to 12/20/2028 | $ | 8,192,000 | $ 8,746,310 | |
| Bank of America Corp., 2.496% to 2/13/2030, FLR (LIBOR - 3mo. + 0.99%) to 2/13/2031 | 9,824,000 | 9,849,038 | ||
| Bank of America Corp., 2.572%, 10/20/2032 | 10,928,000 | 10,980,499 | ||
| Bank of America Corp., 6.5% to 10/23/2024, FLR (LIBOR - 3mo. + 4.174%) to 10/23/2049 | 3,843,000 | 4,207,970 | ||
| Bank of America Corp., 6.1%, 12/29/2049 | 8,096,000 | 8,774,040 | ||
| Bank of America Corp., 5.875% to 3/15/2028, FLR (LIBOR - 3mo. + 2.931%) to 12/31/2059 | 5,924,000 | 6,590,450 | ||
| Barclays PLC, 4.972% to 5/16/2028, FLR (LIBOR - 3mo. + 1.902%) to 5/16/2029 | 3,191,000 | 3,639,718 | ||
| Barclays PLC, 2.894% to 11/24/2031, FLR (CMT - 1yr. + 1.3%) to 11/24/2032 | 3,776,000 | 3,802,749 | ||
| Credit Suisse Group AG, 3.091% to 5/14/2031, FLR (SOFR + 1.73%) to 5/14/2032 (n) | 1,689,000 | 1,718,645 | ||
| Credit Suisse Group Fund (Guernsey) Ltd., 3.75%, 3/26/2025 | 3,021,000 | 3,205,596 | ||
| Deutsche Bank, 2.311% to 11/16/2026, FLR (SOFR + 1.219%) to 11/16/2027 | 5,055,000 | 5,052,749 | ||
| Goldman Sachs Group, Inc., 2.6%, 2/07/2030 | 6,000,000 | 6,100,475 | ||
| HSBC Holdings PLC, 4.7% to 9/09/2031, FLR (CMT - 1yr. + 3.25%) to 9/09/2169 | 6,176,000 | 6,176,000 | ||
| HSBC Holdings PLC, 4% to 9/09/2026, FLR (CMT - 1yr. + 3.222%) to 9/09/2170 | 2,447,000 | 2,431,706 | ||
| JPMorgan Chase & Co., 3.125%, 1/23/2025 | 211,000 | 221,556 | ||
| JPMorgan Chase & Co., 3.509%, 1/23/2029 | 2,290,000 | 2,453,141 | ||
| JPMorgan Chase & Co., 4.005% to 4/23/2028, FLR (LIBOR - 3mo. + 1.12%) to 4/23/2029 | 11,383,000 | 12,564,044 | ||
| JPMorgan Chase & Co., 4.203% to 7/23/2028, FLR (LIBOR - 3mo. + 1.26%) to 7/23/2029 | 4,579,000 | 5,122,215 | ||
| JPMorgan Chase & Co., 2.956% to 5/13/2030, FLR (SOFR + 2.515%) to 5/13/2031 | 4,435,000 | 4,591,882 | ||
| JPMorgan Chase & Co., 2.545% to 11/08/2031, FLR (SOFR + 1.18%) to 11/08/2032 | 6,741,000 | 6,778,897 | ||
| Lloyds Bank PLC, 3.75%, 1/11/2027 | 5,328,000 | 5,765,565 | ||
| Mitsubishi UFJ Financial Group, Inc., 2.048%, 7/17/2030 | 9,749,000 | 9,468,700 | ||
| Morgan Stanley, 2.511% to 10/20/2031, FLR (SOFR + 1.2%) to 10/20/2032 | 6,985,000 | 6,977,572 | ||
| Sumitomo Mitsui Financial Group, Inc., 2.13%, 7/08/2030 | 9,717,000 | 9,440,461 | ||
| Sumitomo Mitsui Trust Bank Ltd., 0.85%, 3/25/2024 (n) | 7,868,000 | 7,792,386 | ||
| UBS Group AG, 4.375% to 2/10/2031, FLR (CMT - 1yr. + 3.313%) to 8/10/2069 (n) | 7,084,000 | 6,997,575 | ||
| UBS Group Funding (Jersey) Ltd., 4.125%, 9/24/2025 (n) | 4,524,000 | 4,884,343 | ||
| Wells Fargo & Co., 2.572% to 2/11/2030, FLR (LIBOR - 3mo. +1%) to 2/11/2031 | 4,514,000 | 4,608,167 | ||
| Westpac Banking Corp., 2.894% to 2/4/2025, FLR (CMT - 5yr. + 1.35%) to 2/04/2030 | 5,356,000 | 5,470,857 | ||
| $174,413,306 | ||||
| Medical & Health Technology & Services – 2.7% | ||||
| Alcon Finance Corp., 2.75%, 9/23/2026 (n) | $ | 593,000 | $ 612,855 | |
| Alcon, Inc., 2.6%, 5/27/2030 (n) | 1,096,000 | 1,106,034 | ||
| Charles River Laboratories International, Inc., 4%, 3/15/2031 (n) | 3,905,000 | 4,001,102 | ||
| CommonSpirit Health, 2.95%, 11/01/2022 | 6,666,000 | 6,790,857 | ||
| DaVita, Inc., 4.625%, 6/01/2030 (n) | 4,230,000 | 4,330,463 | ||
| HCA, Inc., 5.25%, 6/15/2026 | 3,026,000 | 3,402,962 | ||
| HCA, Inc., 5.625%, 9/01/2028 | 6,840,000 | 7,992,472 | ||
| HCA, Inc., 4.125%, 6/15/2029 | 4,581,000 | 5,040,824 | ||
| Laboratory Corp. of America Holdings, 4.7%, 2/01/2045 | 2,056,000 | 2,502,174 | ||
| Northwell Healthcare, Inc., 3.979%, 11/01/2046 | 1,503,000 | 1,706,852 | ||
| ProMedica Toledo Hospital, “B”, 5.325%, 11/15/2028 | 7,120,000 | 7,978,881 | ||
| ProMedica Toledo Hospital, “B”, AGM, 5.75%, 11/15/2038 | 2,562,000 | 2,989,639 | ||
| Issuer | Shares/Par | Value ($) | ||
| Bonds – continued | ||||
| Medical & Health Technology & Services – continued | ||||
| Tower Health, 4.451%, 2/01/2050 | $ | 6,211,000 | $ 5,620,955 | |
| $54,076,070 | ||||
| Medical Equipment – 0.1% | ||||
| Boston Scientific Corp., 4%, 3/01/2029 | $ | 1,837,000 | $ 2,039,942 | |
| Metals & Mining – 0.8% | ||||
| Anglo American Capital PLC, 2.25%, 3/17/2028 (n) | $ | 2,504,000 | $ 2,459,010 | |
| Anglo American Capital PLC, 2.875%, 3/17/2031 (n) | 2,927,000 | 2,913,194 | ||
| Glencore Funding LLC, 4.125%, 5/30/2023 (n) | 2,796,000 | 2,907,616 | ||
| Glencore Funding LLC, 2.85%, 4/27/2031 (n) | 4,010,000 | 3,963,797 | ||
| Novelis Corp., 3.25%, 11/15/2026 (n) | 759,000 | 765,641 | ||
| Novelis Corp., 3.875%, 8/15/2031 (n) | 2,661,000 | 2,644,369 | ||
| $15,653,627 | ||||
| Midstream – 2.8% | ||||
| Cheniere Corpus Christi Holdings LLC, 2.742%, 12/31/2039 (n) | $ | 3,855,000 | $ 3,760,920 | |
| Cheniere Energy Partners LP, 4.5%, 10/01/2029 | 3,683,000 | 3,903,980 | ||
| Enbridge, Inc., 4.25%, 12/01/2026 | 7,640,000 | 8,396,918 | ||
| Galaxy Pipeline Assets Bidco Ltd., 2.16%, 3/31/2034 (n) | 7,022,000 | 6,882,404 | ||
| Kinder Morgan (Delaware), Inc., 7.75%, 1/15/2032 | 6,350,000 | 8,919,801 | ||
| Kinder Morgan Energy Partners LP, 6.375%, 3/01/2041 | 2,040,000 | 2,703,343 | ||
| Kinder Morgan Energy Partners LP, 5.4%, 9/01/2044 | 2,612,000 | 3,176,591 | ||
| ONEOK, Inc., 5.2%, 7/15/2048 | 5,104,000 | 6,168,145 | ||
| Plains All American Pipeline LP/PAA Finance Corp., 3.55%, 12/15/2029 | 2,839,000 | 2,940,994 | ||
| Sabine Pass Liquefaction LLC, 4.2%, 3/15/2028 | 2,675,000 | 2,930,118 | ||
| Sabine Pass Liquefaction LLC, 4.5%, 5/15/2030 | 1,975,000 | 2,227,845 | ||
| Targa Resources Partners LP/Targa Resources Finance Corp., 5.875%, 4/15/2026 | 3,333,000 | 3,477,869 | ||
| $55,488,928 | ||||
| Mortgage-Backed – 19.6% | ||||
| Fannie Mae, 5.5%, 5/01/2022 - 4/01/2040 | $ | 4,765,091 | $ 5,392,258 | |
| Fannie Mae, 6%, 8/01/2022 - 3/01/2039 | 1,197,367 | 1,373,859 | ||
| Fannie Mae, 2.68%, 3/01/2023 | 1,572,860 | 1,595,707 | ||
| Fannie Mae, 2.41%, 5/01/2023 | 1,834,183 | 1,861,045 | ||
| Fannie Mae, 2.55%, 5/01/2023 | 938,566 | 953,508 | ||
| Fannie Mae, 5%, 7/01/2023 - 3/01/2042 | 3,236,652 | 3,651,463 | ||
| Fannie Mae, 4.5%, 5/01/2024 - 6/01/2044 | 10,638,527 | 11,729,116 | ||
| Fannie Mae, 3.5%, 3/01/2026 - 7/01/2046 | 8,333,694 | 8,950,274 | ||
| Fannie Mae, 3.95%, 1/01/2027 | 327,456 | 361,668 | ||
| Fannie Mae, 3%, 11/01/2028 - 8/01/2047 | 7,398,711 | 7,793,975 | ||
| Fannie Mae, 2.5%, 11/01/2031 - 11/01/2046 | 901,066 | 924,449 | ||
| Fannie Mae, 6.5%, 7/01/2032 - 1/01/2033 | 2,643 | 2,967 | ||
| Fannie Mae, 3%, 2/25/2033 (i) | 480,229 | 46,700 | ||
| Fannie Mae, 4%, 12/01/2039 - 1/01/2047 | 17,072,403 | 18,720,634 | ||
| Fannie Mae, 3.25%, 5/25/2040 | 171,742 | 181,940 | ||
| Fannie Mae, 2%, 10/25/2040 - 4/25/2046 | 427,007 | 431,561 | ||
| Fannie Mae, 4%, 7/25/2046 (i) | 474,029 | 85,208 | ||
| Fannie Mae, 3.5%, 12/01/2046 (f) | 1,722,491 | 1,835,584 | ||
| Fannie Mae, UMBS, 2.5%, 2/01/2050 - 12/01/2051 | 9,070,690 | 9,330,332 | ||
| Fannie Mae, UMBS, 2%, 1/01/2051 - 2/01/2051 | 698,873 | 699,737 | ||
| Fannie Mae, UMBS, 3%, 12/01/2051 | 2,985,983 | 3,129,074 | ||
| Federal Home Loan Bank, 5%, 7/01/2035 | 1,002,998 | 1,134,823 | ||
| Freddie Mac, 2.791%, 1/25/2022 | 95,909 | 95,881 | ||
| Freddie Mac, 3.32%, 2/25/2023 | 3,844,426 | 3,940,022 | ||
| Freddie Mac, 3.531%, 7/25/2023 | 2,401,000 | 2,488,239 | ||
| Issuer | Shares/Par | Value ($) | ||
| Bonds – continued | ||||
| Mortgage-Backed – continued | ||||
| Freddie Mac, 2.67%, 12/25/2024 | $ | 2,784,000 | $ 2,892,041 | |
| Freddie Mac, 2.811%, 1/25/2025 | 4,169,000 | 4,350,299 | ||
| Freddie Mac, 4%, 7/01/2025 - 4/01/2044 | 1,845,138 | 2,017,369 | ||
| Freddie Mac, 4.5%, 7/01/2025 - 5/01/2042 | 2,726,800 | 3,007,689 | ||
| Freddie Mac, 3.3%, 10/25/2026 | 2,958,000 | 3,200,045 | ||
| Freddie Mac, 3%, 6/15/2028 - 2/25/2059 | 13,778,149 | 14,527,034 | ||
| Freddie Mac, 4.06%, 10/25/2028 | 2,129,000 | 2,430,984 | ||
| Freddie Mac, 1.089%, 7/25/2029 (i) | 4,049,832 | 297,554 | ||
| Freddie Mac, 1.143%, 8/25/2029 (i) | 7,000,025 | 539,581 | ||
| Freddie Mac, 1.868%, 4/25/2030 (i) | 1,901,414 | 268,367 | ||
| Freddie Mac, 5.5%, 5/01/2034 - 1/01/2038 | 204,809 | 232,349 | ||
| Freddie Mac, 6%, 8/01/2034 - 7/01/2038 | 58,755 | 66,071 | ||
| Freddie Mac, 5%, 11/01/2035 - 7/01/2041 | 1,013,358 | 1,139,730 | ||
| Freddie Mac, 5.5%, 2/15/2036 (i) | 94,475 | 16,945 | ||
| Freddie Mac, 3.5%, 11/01/2037 - 10/25/2058 | 14,530,818 | 15,564,581 | ||
| Freddie Mac, 4.5%, 12/15/2040 (i) | 84,622 | 8,109 | ||
| Freddie Mac, 4%, 8/15/2044 (i) | 115,563 | 11,551 | ||
| Freddie Mac, UMBS, 3.5%, 5/01/2049 | 254,371 | 269,975 | ||
| Freddie Mac, UMBS, 3%, 2/01/2050 - 6/01/2050 | 1,980,164 | 2,079,459 | ||
| Freddie Mac, UMBS, 2.5%, 10/01/2051 - 12/01/2051 | 3,627,388 | 3,729,242 | ||
| Ginnie Mae, 5.5%, 5/15/2033 - 1/20/2042 | 1,177,951 | 1,342,192 | ||
| Ginnie Mae, 6%, 1/20/2036 - 1/15/2039 | 117,819 | 135,092 | ||
| Ginnie Mae, 4.5%, 4/15/2039 - 9/20/2041 | 5,016,051 | 5,583,764 | ||
| Ginnie Mae, 4%, 10/20/2040 - 3/20/2048 | 1,596,227 | 1,727,255 | ||
| Ginnie Mae, 3.5%, 11/15/2040 - 9/20/2048 | 8,205,360 | 8,672,540 | ||
| Ginnie Mae, 3%, 11/20/2044 - 11/20/2051 | 13,798,585 | 14,372,336 | ||
| Ginnie Mae, 2.5%, 8/20/2051 - 11/20/2051 | 9,806,883 | 10,055,334 | ||
| Ginnie Mae, TBA, 3%, 7/20/2049 | 1,475,000 | 1,526,113 | ||
| Ginnie Mae, TBA, 4%, 1/20/2052 | 5,325,000 | 5,607,404 | ||
| Ginnie Mae, TBA, 2%, 1/21/2052 | 4,425,000 | 4,464,950 | ||
| Ginnie Mae, TBA, 2.5%, 1/21/2052 | 3,100,000 | 3,174,590 | ||
| Ginnie Mae, TBA, 3.5%, 1/21/2052 | 6,025,000 | 6,273,505 | ||
| UMBS, TBA, 2%, 1/16/2036 - 7/25/2051 | 100,675,000 | 100,715,902 | ||
| UMBS, TBA, 2.5%, 1/18/2037 - 7/25/2051 | 57,775,000 | 59,061,220 | ||
| UMBS, TBA, 1.5%, 1/19/2037 | 8,050,000 | 8,071,542 | ||
| UMBS, TBA, 3%, 1/19/2037 - 1/13/2052 | 10,900,000 | 11,326,911 | ||
| $385,469,649 | ||||
| Municipals – 2.7% | ||||
| Bridgeview, IL, Stadium and Redevelopment Projects, AAC, 5.06%, 12/01/2025 | $ | 765,000 | $ 786,909 | |
| Bridgeview, IL, Stadium and Redevelopment Projects, AAC, 5.14%, 12/01/2036 | 8,850,000 | 9,467,126 | ||
| Escambia County, FL, Health Facilities Authority Rev. (Baptist Health Care Corp.), “B”, AGM, 3.607%, 8/15/2040 | 1,295,000 | 1,375,233 | ||
| New Jersey Economic Development Authority State Pension Funding Rev., “A”, NPFG, 7.425%, 2/15/2029 | 8,019,000 | 10,078,536 | ||
| New Jersey Economic Development Authority State Pension Funding Rev., Capital Appreciation, “B”, AGM, 0%, 2/15/2023 | 13,215,000 | 13,085,762 | ||
| Oklahoma Development Finance Authority, Health System Rev. (OU Medicine Project), “C”, 5.45%, 8/15/2028 | 3,770,000 | 4,219,272 | ||
| Philadelphia, PA, School District, “B”, AGM, 6.615%, 6/01/2030 | 3,250,000 | 4,119,997 | ||
| Philadelphia, PA, School District, “B”, AGM, 6.765%, 6/01/2040 | 2,195,000 | 3,192,218 | ||
| State of Florida, “A”, 2.154%, 7/01/2030 | 7,272,000 | 7,254,834 | ||
| $53,579,887 | ||||
| Natural Gas - Distribution – 0.7% | ||||
| Boston Gas Co., 3.15%, 8/01/2027 (n) | $ | 9,122,000 | $ 9,463,950 | |
| NiSource, Inc., 3.6%, 5/01/2030 | 4,171,000 | 4,495,598 | ||
| $13,959,548 | ||||
| Issuer | Shares/Par | Value ($) | ||
| Bonds – continued | ||||
| Network & Telecom – 0.6% | ||||
| Verizon Communications, Inc., 2.1%, 3/22/2028 | $ | 1,510,000 | $ 1,512,876 | |
| Verizon Communications, Inc., 2.55%, 3/21/2031 | 7,326,000 | 7,391,297 | ||
| Verizon Communications, Inc., 4.272%, 1/15/2036 | 2,647,000 | 3,104,891 | ||
| $12,009,064 | ||||
| Oils – 0.3% | ||||
| Marathon Petroleum Corp., 4.75%, 9/15/2044 | $ | 2,350,000 | $ 2,765,501 | |
| Marathon Petroleum Corp., 5.85%, 12/15/2045 | 2,507,000 | 3,164,326 | ||
| $5,929,827 | ||||
| Other Banks & Diversified Financials – 1.0% | ||||
| Bangkok Bank (Hong Kong), 3.733% to 9/25/2029, FLR (CMT - 5yr. + 1.9%) to 9/25/2034 (n) | $ | 5,693,000 | $ 5,812,553 | |
| BBVA Bancomer S.A. de C.V., 6.75%, 9/30/2022 (n) | 2,570,000 | 2,659,976 | ||
| Branch Banking & Trust Co., 2.25%, 3/11/2030 | 910,000 | 907,628 | ||
| Groupe BPCE S.A., 4.5%, 3/15/2025 (n) | 5,458,000 | 5,881,270 | ||
| Macquarie Bank Ltd. of London, 6.125% to 3/08/2027, FLR (Swap Rate - 5yr. + 4.332%) to 12/31/2165 (n) | 4,694,000 | 5,008,873 | ||
| $20,270,300 | ||||
| Real Estate - Apartment – 0.1% | ||||
| Mid-America Apartment Communities, Inc., REIT, 4.3%, 10/15/2023 | $ | 2,217,000 | $ 2,319,886 | |
| Real Estate - Healthcare – 0.1% | ||||
| MPT Operating Partnership LP/MPT Financial Co., REIT, 5%, 10/15/2027 | $ | 1,033,000 | $ 1,080,776 | |
| Real Estate - Office – 0.4% | ||||
| Boston Properties, Inc., REIT, 2.55%, 4/01/2032 | $ | 7,238,000 | $ 7,183,877 | |
| Retailers – 0.2% | ||||
| MercadoLibre, Inc., 3.125%, 1/14/2031 | $ | 5,002,000 | $ 4,726,940 | |
| Specialty Chemicals – 0.0% | ||||
| Univar Solutions USA, Inc., 5.125%, 12/01/2027 (n) | $ | 330,000 | $ 344,345 | |
| Specialty Stores – 0.3% | ||||
| Penske Automotive Group Co., 3.75%, 6/15/2029 | $ | 5,155,000 | $ 5,109,894 | |
| TJX Cos., Inc., 3.875%, 4/15/2030 | 661,000 | 741,296 | ||
| $5,851,190 | ||||
| Telecommunications - Wireless – 2.0% | ||||
| American Tower Corp., REIT, 3.55%, 7/15/2027 | $ | 11,856,000 | $ 12,664,299 | |
| American Tower Corp., REIT, 3.8%, 8/15/2029 | 1,403,000 | 1,526,333 | ||
| Crown Castle International Corp., 3.7%, 6/15/2026 | 2,255,000 | 2,416,684 | ||
| Crown Castle International Corp., 4%, 3/01/2027 | 820,000 | 891,197 | ||
| Crown Castle International Corp., 3.8%, 2/15/2028 | 3,824,000 | 4,160,870 | ||
| Crown Castle International Corp., 3.25%, 1/15/2051 | 146,000 | 143,463 | ||
| SBA Communications Corp., 3.875%, 2/15/2027 | 3,930,000 | 4,047,900 | ||
| SBA Communications Corp., 3.125%, 2/01/2029 (n) | 4,025,000 | 3,864,000 | ||
| T-Mobile USA, Inc., 2.55%, 2/15/2031 | 8,138,000 | 8,097,101 | ||
| T-Mobile USA, Inc., 4.375%, 4/15/2040 | 1,357,000 | 1,551,302 | ||
| $39,363,149 | ||||
| Tobacco – 0.3% | ||||
| B.A.T. Capital Corp., 3.222%, 8/15/2024 | $ | 5,968,000 | $ 6,202,804 | |
| Issuer | Shares/Par | Value ($) | ||
| Bonds – continued | ||||
| Transportation - Services – 0.4% | ||||
| Element Fleet Management Corp., 1.6%, 4/06/2024 (n) | $ | 3,162,000 | $ 3,164,528 | |
| ERAC USA Finance LLC, 7%, 10/15/2037 (n) | 3,603,000 | 5,307,990 | ||
| $8,472,518 | ||||
| U.S. Government Agencies and Equivalents – 1.1% | ||||
| Small Business Administration, 4.93%, 1/01/2024 | $ | 2,128 | $ 2,183 | |
| Small Business Administration, 4.34%, 3/01/2024 | 4,223 | 4,299 | ||
| Small Business Administration, 4.99%, 9/01/2024 | 3,792 | 3,888 | ||
| Small Business Administration, 4.86%, 1/01/2025 | 9,334 | 9,634 | ||
| Small Business Administration, 4.625%, 2/01/2025 | 10,590 | 10,924 | ||
| Small Business Administration, 5.11%, 4/01/2025 | 4,998 | 5,192 | ||
| Small Business Administration, 4.43%, 5/01/2029 | 138,471 | 148,527 | ||
| Small Business Administration, 3.21%, 9/01/2030 | 2,050,193 | 2,126,401 | ||
| Small Business Administration, 3.25%, 11/01/2030 | 178,287 | 185,821 | ||
| Small Business Administration, 2.85%, 9/01/2031 | 420,705 | 432,755 | ||
| Small Business Administration, 2.37%, 8/01/2032 | 312,421 | 317,258 | ||
| Small Business Administration, 2.13%, 1/01/2033 | 1,505,921 | 1,522,810 | ||
| Small Business Administration, 2.21%, 2/01/2033 | 400,810 | 405,749 | ||
| Small Business Administration, 2.22%, 3/01/2033 | 1,282,960 | 1,299,690 | ||
| Small Business Administration, 2.08%, 4/01/2033 | 2,154,188 | 2,183,423 | ||
| Small Business Administration, 2.45%, 6/01/2033 | 2,298,030 | 2,341,967 | ||
| Small Business Administration, 3.15%, 7/01/2033 | 3,368,954 | 3,524,225 | ||
| Small Business Administration, 3.16%, 8/01/2033 | 3,592,619 | 3,756,984 | ||
| Small Business Administration, 3.62%, 9/01/2033 | 3,434,388 | 3,634,120 | ||
| $21,915,850 | ||||
| U.S. Treasury Obligations – 10.5% | ||||
| U.S. Treasury Bonds, 1.375%, 11/15/2040 (f) | $ | 30,300,000 | $ 27,613,242 | |
| U.S. Treasury Bonds, 1.75%, 8/15/2041 | 7,200,000 | 6,980,625 | ||
| U.S. Treasury Bonds, 2.375%, 11/15/2049 | 18,550,000 | 20,377,465 | ||
| U.S. Treasury Bonds, 1.625%, 11/15/2050 | 11,500,000 | 10,714,316 | ||
| U.S. Treasury Notes, 0.125%, 12/31/2022 | 81,800,000 | 81,547,554 | ||
| U.S. Treasury Notes, 0.375%, 10/31/2023 | 60,000,000 | 59,646,094 | ||
| $206,879,296 | ||||
| Utilities - Electric Power – 2.4% | ||||
| AEP Transmission Co. LLC, 3.1%, 12/01/2026 | $ | 2,375,000 | $ 2,505,505 | |
| Calpine Corp., 3.75%, 3/01/2031 (n) | 6,120,000 | 5,898,150 | ||
| Clearway Energy Operating LLC, 4.75%, 3/15/2028 (n) | 6,630,000 | 6,969,788 | ||
| Enel Finance International N.V., 3.5%, 4/06/2028 (n) | 5,692,000 | 6,084,047 | ||
| FirstEnergy Corp., 5.35%, 7/15/2047 | 6,088,000 | 7,237,140 | ||
| FirstEnergy Corp., 3.4%, 3/01/2050 | 2,429,000 | 2,380,420 | ||
| Jersey Central Power & Light Co., 2.75%, 3/01/2032 (n) | 5,303,000 | 5,374,069 | ||
| NextEra Energy, Inc., 4.5%, 9/15/2027 (n) | 300,000 | 324,000 | ||
| Pacific Gas & Electric Co., 3%, 6/15/2028 | 2,630,000 | 2,649,093 | ||
| Pacific Gas & Electric Co., 3.3%, 8/01/2040 | 8,840,000 | 8,194,799 | ||
| $47,617,011 | ||||
| Total Bonds (Identified Cost, $1,888,455,293) | $ 1,940,305,117 | |||
| Issuer | Shares/Par | Value ($) | ||
| Investment Companies (h) – 6.3% | ||||
| Money Market Funds – 6.3% | ||||
| MFS Institutional Money Market Portfolio, 0.07% (v) (Identified Cost, $124,732,002) | 124,732,002 | $ 124,732,002 | ||
| Other Assets, Less Liabilities – (4.7)% | (93,120,917) | |||
| Net Assets – 100.0% | $ 1,971,916,202 | |||
| (f) | All or a portion of the security has been segregated as collateral for open futures contracts. |
| (h) | An affiliated issuer, which may be considered one in which the fund owns 5% or more of the outstanding voting securities, or a company which is under common control. At period end, the aggregate values of the fund's investments in affiliated issuers and in unaffiliated issuers were $124,732,002 and $1,940,305,117, respectively. |
| (i) | Interest only security for which the fund receives interest on notional principal (Par amount). Par amount shown is the notional principal and does not reflect the cost of the security. |
| (n) | Securities exempt from registration under Rule 144A of the Securities Act of 1933. These securities may be sold in the ordinary course of business in transactions exempt from registration, normally to qualified institutional buyers. At period end, the aggregate value of these securities was $552,016,101, representing 28.0% of net assets. |
| (p) | Payment-in-kind (PIK) security for which interest income may be received in additional securities and/or cash. |
| (v) | Affiliated issuer that is available only to investment companies managed by MFS. The rate quoted for the MFS Institutional Money Market Portfolio is the annualized seven-day yield of the fund at period end. |
| (z) | Restricted securities are not registered under the Securities Act of 1933 and are subject to legal restrictions on resale. These securities generally may be resold in transactions exempt from registration or to the public if the securities are subsequently registered. Disposal of these securities may involve time-consuming negotiations and prompt sale at an acceptable price may be difficult. The fund holds the following restricted securities: |
| Restricted Securities | Acquisition Date | Cost | Value |
| Acres PLC, 2021-FL2, “C”, FLR, 2.743% (LIBOR - 1mo. + 2.65%), 1/15/2037 | 12/07/21 | $3,129,000 | $3,129,013 |
| Bayview Commercial Asset Trust, 0%, 12/25/2036 | 10/25/06 | 8 | 8 |
| ReadyCap Commercial Mortgage Trust, 2021-FL7, “C”, FLR, 2.302% (LIBOR - 1mo. + 2.2%), 11/25/2036 | 11/12/21 | 1,340,000 | 1,337,926 |
| ReadyCap Commercial Mortgage Trust, 2021-FL7, “D”, FLR, 3.052% (LIBOR - 1mo. + 2.95%), 11/25/2036 | 11/12/21 | 1,575,000 | 1,572,070 |
| Total Restricted Securities | $6,039,017 | ||
| % of Net assets | 0.3% |
| The following abbreviations are used in this report and are defined: | |
| AAC | Ambac Assurance Corp. |
| AGM | Assured Guaranty Municipal |
| CDO | Collateralized Debt Obligation |
| CLO | Collateralized Loan Obligation |
| CMT | Constant Maturity Treasury |
| FGIC | Financial Guaranty Insurance Co. |
| FLR | Floating Rate. Interest rate resets periodically based on the parenthetically disclosed reference rate plus a spread (if any). The period-end rate reported may not be the current rate. All reference rates are USD unless otherwise noted. |
| LIBOR | London Interbank Offered Rate |
| NPFG | National Public Finance Guarantee Corp. |
| REIT | Real Estate Investment Trust |
| SOFR | Secured Overnight Financing Rate |
| TBA | To Be Announced |
| UMBS | Uniform Mortgage-Backed Security |
| Abbreviations indicate amounts shown in currencies other than the U.S. dollar. All amounts are stated in U.S. dollars unless otherwise indicated. A list of abbreviations is shown below: | |
| JPY | Japanese Yen |
| Derivative Contracts at 12/31/21 | ||||||
| Forward Foreign Currency Exchange Contracts | ||||||
| Currency Purchased | Currency Sold | Counterparty | Settlement Date | Unrealized Appreciation (Depreciation) | ||
| Asset Derivatives | ||||||
| USD | 197,572,280 | JPY | 22,380,000,000 | State Street Bank Corp. | 1/04/2022 | $3,014,338 |
| Liability Derivatives | ||||||
| JPY | 4,203,413,000 | USD | 36,825,492 | HSBC Bank | 1/04/2022 | $ (283,607) |
| JPY | 7,262,980,000 | USD | 63,664,211 | JPMorgan Chase Bank N.A. | 1/04/2022 | (524,334) |
| $ (807,941) | ||||||
| Futures Contracts | ||||||
| Description | Long/ Short | Currency | Contracts | Notional Amount | Expiration Date | Value/Unrealized Appreciation (Depreciation) |
| Asset Derivatives | ||||||
| Interest Rate Futures | ||||||
| U.S. Treasury Ultra Bond | Long | USD | 875 | $172,484,375 | March – 2022 | $4,176,923 |
| Liability Derivatives | ||||||
| Interest Rate Futures | ||||||
| U.S. Treasury Note 2 yr | Long | USD | 352 | $76,796,500 | March – 2022 | $(25,874) |
| U.S. Treasury Ultra Note 10 yr | Short | USD | 909 | 133,111,687 | March – 2022 | (2,497,607) |
| $(2,523,481) | ||||||
| Financial Statements | Statement of Assets and Liabilities |
| At 12/31/21Assets | |
| Investments in unaffiliated issuers, at value (identified cost, $1,888,455,293) | $1,940,305,117 |
| Investments in affiliated issuers, at value (identified cost, $124,732,002) | 124,732,002 |
| Cash | 62,000 |
| Foreign currency, at value (identified cost, $96,355,775) | 94,931,757 |
| Restricted cash for | |
| Forward foreign currency exchange contracts | 430,000 |
| Receivables for | |
| Forward foreign currency exchange contracts | 3,014,338 |
| Net daily variation margin on open futures contracts | 1,142,272 |
| TBA sale commitments | 5,802,868 |
| Fund shares sold | 119,648 |
| Interest | 11,854,902 |
| Other assets | 6,137 |
| Total assets | $2,182,401,041 |
| Liabilities | |
| Payables for | |
| Forward foreign currency exchange contracts | $807,941 |
| Investments purchased | 2,288,304 |
| TBA purchase commitments | 206,351,479 |
| Fund shares reacquired | 681,200 |
| Payable to affiliates | |
| Investment adviser | 52,441 |
| Administrative services fee | 1,499 |
| Shareholder servicing costs | 562 |
| Distribution and/or service fees | 14,273 |
| Payable for independent Trustees' compensation | 121 |
| Accrued expenses and other liabilities | 287,019 |
| Total liabilities | $210,484,839 |
| Net assets | $1,971,916,202 |
| Net assets consist of | |
| Paid-in capital | $1,862,773,877 |
| Total distributable earnings (loss) | 109,142,325 |
| Net assets | $1,971,916,202 |
| Shares of beneficial interest outstanding | 146,144,404 |
| Net assets | Shares outstanding | Net asset value per share | |
| Initial Class | $928,577,938 | 68,125,912 | $13.63 |
| Service Class | 1,043,338,264 | 78,018,492 | 13.37 |
| Financial Statements | Statement of Operations |
| Year ended 12/31/21 | |
| Net investment income (loss) | |
| Income | |
| Interest | $52,822,826 |
| Dividends from affiliated issuers | 86,358 |
| Other | 6,456 |
| Total investment income | $52,915,640 |
| Expenses | |
| Management fee | $10,059,301 |
| Distribution and/or service fees | 2,684,870 |
| Shareholder servicing costs | 48,126 |
| Administrative services fee | 271,626 |
| Independent Trustees' compensation | 29,426 |
| Custodian fee | 100,351 |
| Shareholder communications | 169,026 |
| Audit and tax fees | 79,362 |
| Legal fees | 11,024 |
| Miscellaneous | 87,846 |
| Total expenses | $13,540,958 |
| Reduction of expenses by investment adviser | (254,953) |
| Net expenses | $13,286,005 |
| Net investment income (loss) | $39,629,635 |
| Realized and unrealized gain (loss) | |
| Realized gain (loss) (identified cost basis) | |
| Unaffiliated issuers | $19,194,719 |
| Futures contracts | 602,747 |
| Forward foreign currency exchange contracts | (881,454) |
| Foreign currency | 12 |
| Net realized gain (loss) | $18,916,024 |
| Change in unrealized appreciation or depreciation | |
| Unaffiliated issuers | $(78,514,064) |
| Affiliated issuers | 1 |
| Futures contracts | 1,413,773 |
| Forward foreign currency exchange contracts | 2,590,530 |
| Translation of assets and liabilities in foreign currencies | (1,639,695) |
| Net unrealized gain (loss) | $(76,149,455) |
| Net realized and unrealized gain (loss) | $(57,233,431) |
| Change in net assets from operations | $(17,603,796) |
| Financial Statements | Statements of Changes in Net Assets |
| Year ended | ||
| 12/31/21 | 12/31/20 | |
| Change in net assets | ||
| From operations | ||
| Net investment income (loss) | $39,629,635 | $49,347,183 |
| Net realized gain (loss) | 18,916,024 | 45,995,015 |
| Net unrealized gain (loss) | (76,149,455) | 51,345,923 |
| Change in net assets from operations | $(17,603,796) | $146,688,121 |
| Total distributions to shareholders | $(52,872,122) | $(63,395,758) |
| Change in net assets from fund share transactions | $31,041,630 | $(116,126,286) |
| Total change in net assets | $(39,434,288) | $(32,833,923) |
| Net assets | ||
| At beginning of period | 2,011,350,490 | 2,044,184,413 |
| At end of period | $1,971,916,202 | $2,011,350,490 |
| Financial Statements | Financial Highlights |
| Initial Class | Year ended | ||||
| 12/31/21 | 12/31/20 | 12/31/19 | 12/31/18 | 12/31/17 | |
| Net asset value, beginning of period | $14.12 | $13.48 | $12.65 | $13.22 | $13.09 |
| Income (loss) from investment operations | |||||
| Net investment income (loss) (d) | $0.29 | $0.37 | $0.42 | $0.39 | $0.36 |
| Net realized and unrealized gain (loss) | (0.40) | 0.76 | 0.87 | (0.53) | 0.22 |
| Total from investment operations | $(0.11) | $1.13 | $1.29 | $(0.14) | $0.58 |
| Less distributions declared to shareholders | |||||
| From net investment income | $(0.38) | $(0.49) | $(0.46) | $(0.43) | $(0.45) |
| From net realized gain | (0.00)(w) | — | — | — | — |
| Total distributions declared to shareholders | $(0.38) | $(0.49) | $(0.46) | $(0.43) | $(0.45) |
| Net asset value, end of period (x) | $13.63 | $14.12 | $13.48 | $12.65 | $13.22 |
| Total return (%) (k)(r)(s)(x) | (0.81) | 8.47 | 10.21 | (1.09) | 4.46 |
| Ratios (%) (to average net assets) and Supplemental data: | |||||
| Expenses before expense reductions | 0.54 | 0.54 | 0.54 | 0.54 | 0.54 |
| Expenses after expense reductions | 0.53 | 0.53 | 0.53 | 0.53 | 0.53 |
| Net investment income (loss) | 2.10 | 2.71 | 3.14 | 3.04 | 2.70 |
| Portfolio turnover | 161 | 112 | 79 | 48 | 47 |
| Net assets at end of period (000 omitted) | $928,578 | $921,342 | $939,179 | $862,752 | $997,415 |
| Service Class | Year ended | ||||
| 12/31/21 | 12/31/20 | 12/31/19 | 12/31/18 | 12/31/17 | |
| Net asset value, beginning of period | $13.86 | $13.24 | $12.43 | $12.99 | $12.87 |
| Income (loss) from investment operations | |||||
| Net investment income (loss) (d) | $0.25 | $0.33 | $0.38 | $0.35 | $0.32 |
| Net realized and unrealized gain (loss) | (0.40) | 0.74 | 0.85 | (0.52) | 0.22 |
| Total from investment operations | $(0.15) | $1.07 | $1.23 | $(0.17) | $0.54 |
| Less distributions declared to shareholders | |||||
| From net investment income | $(0.34) | $(0.45) | $(0.42) | $(0.39) | $(0.42) |
| From net realized gain | (0.00)(w) | — | — | — | — |
| Total distributions declared to shareholders | $(0.34) | $(0.45) | $(0.42) | $(0.39) | $(0.42) |
| Net asset value, end of period (x) | $13.37 | $13.86 | $13.24 | $12.43 | $12.99 |
| Total return (%) (k)(r)(s)(x) | (1.07) | 8.17 | 9.92 | (1.33) | 4.18 |
| Ratios (%) (to average net assets) and Supplemental data: | |||||
| Expenses before expense reductions | 0.79 | 0.79 | 0.79 | 0.79 | 0.79 |
| Expenses after expense reductions | 0.78 | 0.78 | 0.78 | 0.78 | 0.78 |
| Net investment income (loss) | 1.85 | 2.46 | 2.89 | 2.79 | 2.45 |
| Portfolio turnover | 161 | 112 | 79 | 48 | 47 |
| Net assets at end of period (000 omitted) | $1,043,338 | $1,090,009 | $1,105,005 | $1,137,033 | $1,449,260 |
| (d) | Per share data is based on average shares outstanding. |
| (k) | The total return does not reflect expenses that apply to separate accounts. Inclusion of these charges would reduce the total return figures for all periods shown. |
| (r) | Certain expenses have been reduced without which performance would have been lower. |
| (s) | From time to time the fund may receive proceeds from litigation settlements, without which performance would be lower. |
| (w) | Per share amount was less than $0.01. |
| (x) | The net asset values and total returns have been calculated on net assets which include adjustments made in accordance with U.S. generally accepted accounting principles required at period end for financial reporting purposes. |
| Financial Instruments | Level 1 | Level 2 | Level 3 | Total |
| U.S. Treasury Bonds & U.S. Government Agencies & Equivalents | $— | $228,795,146 | $— | $228,795,146 |
| Non - U.S. Sovereign Debt | — | 21,751,631 | — | 21,751,631 |
| Municipal Bonds | — | 53,579,887 | — | 53,579,887 |
| U.S. Corporate Bonds | — | 629,908,506 | — | 629,908,506 |
| Residential Mortgage-Backed Securities | — | 394,467,369 | — | 394,467,369 |
| Commercial Mortgage-Backed Securities | — | 195,593,848 | — | 195,593,848 |
| Asset-Backed Securities (including CDOs) | — | 186,661,185 | — | 186,661,185 |
| Foreign Bonds | — | 229,547,545 | — | 229,547,545 |
| Mutual Funds | 124,732,002 | — | — | 124,732,002 |
| Total | $124,732,002 | $1,940,305,117 | $— | $2,065,037,119 |
| Other Financial Instruments | ||||
| Futures Contracts – Assets | $4,176,923 | $— | $— | $4,176,923 |
| Futures Contracts – Liabilities | (2,523,481) | — | — | (2,523,481) |
| Forward Foreign Currency Exchange Contracts – Assets | — | 3,014,338 | — | 3,014,338 |
| Forward Foreign Currency Exchange Contracts – Liabilities | — | (807,941) | — | (807,941) |
| Fair Value (a) | |||
| Risk | Derivative Contracts | Asset Derivatives | Liability Derivatives |
| Interest Rate | Futures Contracts | $4,176,923 | $(2,523,481) |
| Foreign Exchange | Forward Foreign Currency Exchange Contracts | 3,014,338 | (807,941) |
| Total | $7,191,261 | $(3,331,422) | |
| Risk | Futures Contracts | Forward Foreign Currency Exchange Contracts |
| Interest Rate | $602,747 | $— |
| Foreign Exchange | — | (881,454) |
| Total | $602,747 | $(881,454) |
| Risk | Futures Contracts | Forward Foreign Currency Exchange Contracts |
| Interest Rate | $1,413,773 | $— |
| Foreign Exchange | — | 2,590,530 |
| Total | $1,413,773 | $2,590,530 |
| Year ended 12/31/21 | Year ended 12/31/20 | |
| Ordinary income (including any short-term capital gains) | $52,722,119 | $63,395,758 |
| Long-term capital gains | 150,003 | — |
| Total distributions | $52,872,122 | $63,395,758 |
| As of 12/31/21 | |
| Cost of investments | $2,021,235,937 |
| Gross appreciation | 57,394,794 |
| Gross depreciation | (9,733,773) |
| Net unrealized appreciation (depreciation) | $47,661,021 |
| Undistributed ordinary income | 43,458,955 |
| Undistributed long-term capital gain | 19,446,367 |
| Other temporary differences | (1,424,018) |
| Total distributable earnings (loss) | $109,142,325 |
| Year ended 12/31/21 | Year ended 12/31/20 | ||
| Initial Class | $25,516,208 | $29,795,683 | |
| Service Class | 27,355,914 | 33,600,075 | |
| Total | $52,872,122 | $63,395,758 |
| Up to $2.5 billion | 0.50% |
| In excess of $2.5 billion and up to $5 billion | 0.45% |
| In excess of $5 billion | 0.40% |
| Purchases | Sales | |
| U.S. Government securities | $2,853,751,215 | $2,709,549,234 |
| Non-U.S. Government securities | 411,902,110 | 477,748,912 |
| Year ended 12/31/21 | Year ended 12/31/20 | ||||
| Shares | Amount | Shares | Amount | ||
| Shares sold | |||||
| Initial Class | 9,966,924 | $138,196,906 | 13,168,136 | $181,339,136 | |
| Service Class | 11,172,713 | 151,938,632 | 10,980,723 | 150,262,829 | |
| 21,139,637 | $290,135,538 | 24,148,859 | $331,601,965 | ||
| Shares issued to shareholders in reinvestment of distributions | |||||
| Initial Class | 1,825,002 | $25,020,775 | 2,116,668 | $29,167,687 | |
| Service Class | 2,032,386 | 27,355,914 | 2,481,542 | 33,600,075 | |
| 3,857,388 | $52,376,689 | 4,598,210 | $62,767,762 | ||
| Shares reacquired | |||||
| Initial Class | (8,934,395) | $(123,643,623) | (19,695,908) | $(267,503,154) | |
| Service Class | (13,841,391) | (187,826,974) | (18,285,133) | (242,992,859) | |
| (22,775,786) | $(311,470,597) | (37,981,041) | $(510,496,013) | ||
| Net change | |||||
| Initial Class | 2,857,531 | $39,574,058 | (4,411,104) | $(56,996,331) | |
| Service Class | (636,292) | (8,532,428) | (4,822,868) | (59,129,955) | |
| 2,221,239 | $31,041,630 | (9,233,972) | $(116,126,286) | ||
| Affiliated Issuers | Beginning Value | Purchases | Sales Proceeds | Realized Gain (Loss) | Change in Unrealized Appreciation or Depreciation | Ending Value |
| MFS Institutional Money Market Portfolio | $160,402,627 | $776,273,572 | $811,944,198 | $— | $1 | $124,732,002 |
| Affiliated Issuers | Dividend Income | Capital Gain Distributions |
| MFS Institutional Money Market Portfolio | $86,358 | $— |
February 15, 2022
| Name, Age | Position(s) Held with Fund | Trustee/Officer Since(h) | Number of MFS Funds overseen by the Trustee | Principal Occupations During the Past Five Years | Other Directorships During the Past Five Years (j) | |||||
| INTERESTED TRUSTEES | ||||||||||
| Michael W. Roberge (k) (age 55) | Trustee | January 2021 | 135 | Massachusetts Financial Services Company, Chairman (since January 2021); Chief Executive Officer (since January 2017); Director; Chairman of the Board (since January 2022); President (until December 2018); Chief Investment Officer (until December 2018) | N/A | |||||
| INDEPENDENT TRUSTEES | ||||||||||
| John P. Kavanaugh (age 67) | Trustee and Chair of Trustees | January 2009 | 135 | Private investor | N/A | |||||
| Steven E. Buller (age 70) | Trustee | February 2014 | 135 | Private investor | N/A | |||||
| John A. Caroselli (age 67) | Trustee | March 2017 | 135 | Private investor; JC Global Advisors, LLC (management consulting), President (since 2015) | N/A | |||||
| Maureen R. Goldfarb (age 66) | Trustee | January 2009 | 135 | Private investor | N/A | |||||
| Peter D. Jones (age 66) | Trustee | January 2019 | 135 | Private investor | N/A | |||||
| James W. Kilman, Jr. (age 60) | Trustee | January 2019 | 135 | Burford Capital Limited (finance and investment management), Senior Advisor (since May 3, 2021), Chief Financial Officer (2019 - May 2, 2021); KielStrand Capital LLC (family office), Chief Executive Officer (since 2016) | Alpha-En Corporation, Director (2016-2019) | |||||
| Clarence Otis, Jr. (age 65) | Trustee | March 2017 | 135 | Private investor | VF Corporation, Director; Verizon Communications, Inc., Director; The Travelers Companies, Director | |||||
| Maryanne L. Roepke (age 65) | Trustee | May 2014 | 135 | Private investor | N/A | |||||
| Laurie J. Thomsen (age 64) | Trustee | March 2005 | 135 | Private investor | The Travelers Companies, Director; Dycom Industries, Inc., Director |
| Name, Age | Position(s) Held with Fund | Trustee/Officer Since(h) | Number of MFS Funds for which the Person is an Officer | Principal Occupations During the Past Five Years | ||||
| OFFICERS | ||||||||
| Christopher R. Bohane (k) (age 48) | Assistant Secretary and Assistant Clerk | July 2005 | 135 | Massachusetts Financial Services Company, Senior Vice President and Associate General Counsel | ||||
| Kino Clark (k) (age 53) | Assistant Treasurer | January 2012 | 135 | Massachusetts Financial Services Company, Vice President | ||||
| John W. Clark, Jr. (k) (age 54) | Assistant Treasurer | April 2017 | 135 | Massachusetts Financial Services Company, Vice President (since March 2017); Deutsche Bank (financial services), Department Head - Treasurer's Office (until February 2017) | ||||
| Thomas H. Connors (k) (age 62) | Assistant Secretary and Assistant Clerk | September 2012 | 135 | Massachusetts Financial Services Company, Vice President and Senior Counsel | ||||
| David L. DiLorenzo (k) (age 53) | President | July 2005 | 135 | Massachusetts Financial Services Company, Senior Vice President | ||||
| Heidi W. Hardin (k) (age 54) | Secretary and Clerk | April 2017 | 135 | Massachusetts Financial Services Company, Executive Vice President and General Counsel (since March 2017); Harris Associates (investment management), General Counsel (until January 2017) | ||||
| Brian E. Langenfeld (k) (age 48) | Assistant Secretary and Assistant Clerk | June 2006 | 135 | Massachusetts Financial Services Company, Vice President and Senior Counsel | ||||
| Amanda S. Mooradian (k) (age 42) | Assistant Secretary and Assistant Clerk | September 2018 | 135 | Massachusetts Financial Services Company, Assistant Vice President and Senior Counsel | ||||
| Susan A. Pereira (k) (age 51) | Assistant Secretary and Assistant Clerk | July 2005 | 135 | Massachusetts Financial Services Company, Vice President and Assistant General Counsel | ||||
| Kasey L. Phillips (k) (age 51) | Assistant Treasurer | September 2012 | 135 | Massachusetts Financial Services Company, Vice President | ||||
| Matthew A. Stowe (k) (age 47) | Assistant Secretary and Assistant Clerk | October 2014 | 135 | Massachusetts Financial Services Company, Vice President and Assistant General Counsel | ||||
| Martin J. Wolin (k) (age 54) | Chief Compliance Officer | July 2015 | 135 | Massachusetts Financial Services Company, Senior Vice President and Chief Compliance Officer | ||||
| James O. Yost (k) (age 61) | Treasurer | September 1990 | 135 | Massachusetts Financial Services Company, Senior Vice President |
| (h) | Date first appointed to serve as Trustee/Officer of an MFS Fund. Each Trustee has served continuously since appointment unless indicated otherwise. From January 2012 through December 2016, Messrs. DiLorenzo and Yost served as Treasurer and Deputy Treasurer of the Funds, respectively. |
| (j) | Directorships or trusteeships of companies required to report to the Securities and Exchange Commission (i.e., “public companies”). |
| (k) | “Interested person” of the Trust within the meaning of the Investment Company Act of 1940 (referred to as the 1940 Act), which is the principal federal law governing investment companies like the fund, as a result of a position with MFS. The address of MFS is 111 Huntington Avenue, Boston, Massachusetts 02199-7618. |
| Investment Adviser | Custodian |
| Massachusetts Financial Services Company 111 Huntington Avenue Boston, MA 02199-7618 | State Street Bank and Trust Company 1 Lincoln Street Boston, MA 02111-2900 |
| Distributor | Independent Registered Public Accounting Firm |
| MFS Fund Distributors, Inc. 111 Huntington Avenue Boston, MA 02199-7618 | Deloitte & Touche LLP 200 Berkeley Street Boston, MA 02116 |
| Portfolio Manager(s) | |
| Alexander Mackey Joshua Marston |

| FACTS | WHAT DOES MFS DO WITH YOUR PERSONAL INFORMATION? |
| Why? | Financial companies choose how they share your personal information. Federal law gives consumers the right to limit some but not all sharing. Federal law also requires us to tell you how we collect, share, and protect your personal information. Please read this notice carefully to understand what we do. |
| What? | The types of personal information we collect and share depend on the product or service you have with us. This information can include: |
| • Social Security number and account balances | |
| • Account transactions and transaction history | |
| • Checking account information and wire transfer instructions | |
| When you are no longer our customer, we continue to share your information as described in this notice. |
| How? | All financial companies need to share customers' personal information to run their everyday business. In the section below, we list the reasons financial companies can share their customers' personal information; the reasons MFS chooses to share; and whether you can limit this sharing. |
| Reasons we can share your personal information | Does MFS share? | Can you limit this sharing? |
| For our everyday business purposes – such as to process your transactions, maintain your account(s), respond to court orders and legal investigations, or report to credit bureaus | Yes | No |
| For our marketing purposes – to offer our products and services to you | No | We don't share |
| For joint marketing with other financial companies | No | We don't share |
| For our affiliates' everyday business purposes – information about your transactions and experiences | No | We don't share |
| For our affiliates' everyday business purposes – information about your creditworthiness | No | We don't share |
| For nonaffiliates to market to you | No | We don't share |
| Questions? | Call 800-225-2606 or go to mfs.com. |
| Who we are | |
| Who is providing this notice? | MFS Funds, MFS Investment Management, MFS Institutional Advisors, Inc., and MFS Heritage Trust Company. |
| What we do | |
| How does MFS protect my personal information? | To protect your personal information from unauthorized access and use, we use security measures that comply with federal law. These measures include procedural, electronic, and physical safeguards for the protection of the personal information we collect about you. |
| How does MFS collect my personal information? | We collect your personal information, for example, when you |
| • open an account or provide account information | |
| • direct us to buy securities or direct us to sell your securities | |
| • make a wire transfer | |
| We also collect your personal information from others, such as credit bureaus, affiliates, or other companies. | |
| Why can't I limit all sharing? | Federal law gives you the right to limit only |
| • sharing for affiliates' everyday business purposes – information about your creditworthiness | |
| • affiliates from using your information to market to you | |
| • sharing for nonaffiliates to market to you | |
| State laws and individual companies may give you additional rights to limit sharing. | |
| Definitions | |
| Affiliates | Companies related by common ownership or control. They can be financial and nonfinancial companies. |
| • MFS does not share personal information with affiliates, except for everyday business purposes as described on page one of this notice. | |
| Nonaffiliates | Companies not related by common ownership or control. They can be financial and nonfinancial companies. |
| • MFS does not share with nonaffiliates so they can market to you. | |
| Joint marketing | A formal agreement between nonaffiliated financial companies that together market financial products or services to you. |
| • MFS doesn't jointly market. | |
| Other important information |
| If you own an MFS product or receive an MFS service in the name of a third party such as a bank or broker-dealer, their privacy policy may apply to you instead of ours. |


| 1 | |
| 2 | |
| 3 | |
| 5 | |
| 7 | |
| 8 | |
| 13 | |
| 14 | |
| 15 | |
| 16 | |
| 18 | |
| 24 | |
| 25 | |
| 28 | |
| 31 | |
| 31 | |
| 31 | |
| 31 | |
| 31 | |
| 32 |


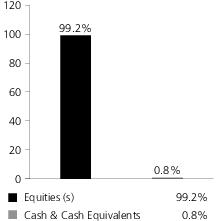
| Microsoft Corp. | 7.6% |
| Alphabet, Inc., “A” | 5.0% |
| Amazon.com, Inc. | 4.4% |
| Apple, Inc. | 3.4% |
| Meta Platforms, Inc., “A” | 2.2% |
| Visa, Inc., “A” | 2.1% |
| Adobe Systems, Inc. | 1.7% |
| JPMorgan Chase & Co. | 1.7% |
| Home Depot, Inc. | 1.6% |
| Danaher Corp. | 1.6% |
| Technology | 33.8% |
| Capital Goods | 13.6% |
| Financial Services | 13.4% |
| Health Care | 13.2% |
| Consumer Cyclicals | 12.8% |
| Energy | 5.1% |
| Consumer Staples | 4.6% |
| Telecommunications/Cable Television (s) | 2.7% |
| (k) | The sectors set forth above and the associated portfolio composition are based on MFS’ own custom sector classification methodology. |
| (s) | Includes securities sold short. |
| (b) | Security is not a benchmark constituent. |
| (h) | Security was not held in the portfolio at period end. |

| Share Class | Class Inception Date | 1-yr | 5-yr | 10-yr |
| Initial Class | 7/26/95 | 24.80% | 17.94% | 15.64% |
| Service Class | 5/01/00 | 24.51% | 17.65% | 15.35% |
| Standard & Poor's 500 Stock Index (f) | 28.71% | 18.47% | 16.55% |
| (f) | Source: FactSet Research Systems Inc. |
| (g) | “Standard & Poor's®” and “S&P®” are registered trademarks of Standard & Poor's Financial Services LLC (“S&P”) and Dow Jones is a registered trademark of Dow Jones Trademark Holdings LLC (“Dow Jones”) and have been licensed for use by S&P Dow Jones Indices LLC and sublicensed for certain purposes by MFS. The S&P 500® is a product of S&P Dow Jones Indices LLC, and has been licensed for use by MFS. MFS's product(s) is not sponsored, endorsed, sold, or promoted by S&P Dow Jones Indices LLC, Dow Jones, S&P, or their respective affiliates, and neither S&P Dow Jones Indices LLC, Dow Jones, S&P, nor their respective affiliates make any representation regarding the advisability of investing in such product(s). |
July 1, 2021 through December 31, 2021
| Share Class | Annualized Expense Ratio | Beginning Account Value 7/01/21 | Ending Account Value 12/31/21 | Expenses Paid During Period (p) 7/01/21-12/31/21 | |
| Initial Class | Actual | 0.78% | $1,000.00 | $1,088.42 | $4.11 |
| Hypothetical (h) | 0.78% | $1,000.00 | $1,021.27 | $3.97 | |
| Service Class | Actual | 1.03% | $1,000.00 | $1,087.14 | $5.42 |
| Hypothetical (h) | 1.03% | $1,000.00 | $1,020.01 | $5.24 |
| (h) | 5% class return per year before expenses. |
| (p) | “Expenses Paid During Period” are equal to each class's annualized expense ratio, as shown above, multiplied by the average account value over the period, multiplied by 184/365 (to reflect the one-half year period). |
| Issuer | Shares/Par | Value ($) | ||
| Common Stocks – 99.6% | ||||
| Aerospace & Defense – 3.2% | ||||
| Honeywell International, Inc. | 37,282 | $ 7,773,670 | ||
| Howmet Aerospace, Inc. | 87,431 | 2,782,929 | ||
| L3Harris Technologies, Inc. | 21,261 | 4,533,695 | ||
| Northrop Grumman Corp. | 9,052 | 3,503,758 | ||
| Raytheon Technologies Corp. | 70,912 | 6,102,687 | ||
| $24,696,739 | ||||
| Alcoholic Beverages – 0.6% | ||||
| Constellation Brands, Inc., “A” | 18,254 | $ 4,581,206 | ||
| Apparel Manufacturers – 1.1% | ||||
| NIKE, Inc., “B” | 50,638 | $ 8,439,835 | ||
| Automotive – 0.5% | ||||
| Aptiv PLC (a) | 22,149 | $ 3,653,478 | ||
| Biotechnology – 1.2% | ||||
| Illumina, Inc. (a) | 7,927 | $ 3,015,748 | ||
| Vertex Pharmaceuticals, Inc. (a) | 30,344 | 6,663,542 | ||
| $9,679,290 | ||||
| Broadcasting – 0.2% | ||||
| Discovery Communications, Inc., “C” (a) | 72,922 | $ 1,669,914 | ||
| Brokerage & Asset Managers – 1.9% | ||||
| Charles Schwab Corp. | 132,794 | $ 11,167,975 | ||
| CME Group, Inc. | 16,987 | 3,880,850 | ||
| $15,048,825 | ||||
| Business Services – 4.3% | ||||
| Accenture PLC, “A” | 29,845 | $ 12,372,245 | ||
| Cognizant Technology Solutions Corp., “A” | 45,357 | 4,024,073 | ||
| Fidelity National Information Services, Inc. | 53,956 | 5,889,297 | ||
| Fiserv, Inc. (a) | 60,716 | 6,301,714 | ||
| Global Payments, Inc. | 29,614 | 4,003,220 | ||
| Thoughtworks Holding, Inc. (a) | 34,352 | 920,977 | ||
| $33,511,526 | ||||
| Cable TV – 1.2% | ||||
| Cable One, Inc. | 1,937 | $ 3,415,802 | ||
| Charter Communications, Inc., “A” (a) | 9,242 | 6,025,507 | ||
| $9,441,309 | ||||
| Computer Software – 13.3% | ||||
| Adobe Systems, Inc. (a) | 24,080 | $ 13,654,805 | ||
| Atlassian Corp. PLC, “A” (a) | 14,237 | 5,428,426 | ||
| Black Knight, Inc. (a) | 62,892 | 5,213,118 | ||
| Cadence Design Systems, Inc. (a) | 46,114 | 8,593,344 | ||
| Microsoft Corp. (s) | 175,686 | 59,086,715 | ||
| salesforce.com, inc. (a) | 45,678 | 11,608,150 | ||
| $ 103,584,558 | ||||
| Issuer | Shares/Par | Value ($) | ||
| Common Stocks – continued | ||||
| Computer Software - Systems – 4.7% | ||||
| Apple, Inc. (s) | 149,894 | $ 26,616,678 | ||
| Constellation Software, Inc. | 3,209 | 5,953,856 | ||
| NICE Systems Ltd., ADR (a) | 13,153 | 3,993,251 | ||
| $36,563,785 | ||||
| Construction – 3.1% | ||||
| AvalonBay Communities, Inc., REIT | 8,827 | $ 2,229,612 | ||
| AZEK Co., Inc. (a) | 69,717 | 3,223,714 | ||
| Masco Corp. | 65,245 | 4,581,504 | ||
| Otis Worldwide Corp. | 48,855 | 4,253,805 | ||
| Sherwin-Williams Co. | 15,943 | 5,614,487 | ||
| Vulcan Materials Co. | 18,955 | 3,934,679 | ||
| $23,837,801 | ||||
| Consumer Products – 1.2% | ||||
| Colgate-Palmolive Co. | 59,601 | $ 5,086,349 | ||
| Kimberly-Clark Corp. | 28,758 | 4,110,094 | ||
| $9,196,443 | ||||
| Consumer Services – 0.2% | ||||
| Bright Horizons Family Solutions, Inc. (a) | 14,994 | $ 1,887,445 | ||
| Electrical Equipment – 1.8% | ||||
| Johnson Controls International PLC | 89,258 | $ 7,257,568 | ||
| TE Connectivity Ltd. | 29,927 | 4,828,422 | ||
| Vertiv Holdings Co. | 93,829 | 2,342,910 | ||
| $14,428,900 | ||||
| Electronics – 3.3% | ||||
| Applied Materials, Inc. | 60,237 | $ 9,478,894 | ||
| Lam Research Corp. | 9,044 | 6,503,993 | ||
| NXP Semiconductors N.V. | 43,861 | 9,990,658 | ||
| $25,973,545 | ||||
| Energy - Independent – 2.0% | ||||
| ConocoPhillips | 95,399 | $ 6,885,900 | ||
| Diamondback Energy, Inc. | 22,699 | 2,448,087 | ||
| Pioneer Natural Resources Co. | 22,734 | 4,134,860 | ||
| Valero Energy Corp. | 29,867 | 2,243,310 | ||
| $15,712,157 | ||||
| Food & Beverages – 2.2% | ||||
| Hostess Brands, Inc. (a) | 86,073 | $ 1,757,611 | ||
| Mondelez International, Inc. | 87,078 | 5,774,142 | ||
| Oatly Group AB, ADR (a) | 154,004 | 1,225,872 | ||
| PepsiCo, Inc. | 48,955 | 8,503,973 | ||
| $17,261,598 | ||||
| Food & Drug Stores – 0.9% | ||||
| Wal-Mart Stores, Inc. | 48,337 | $ 6,993,881 | ||
| Issuer | Shares/Par | Value ($) | ||
| Common Stocks – continued | ||||
| Gaming & Lodging – 0.4% | ||||
| Penn National Gaming, Inc. (a) | 14,284 | $ 740,625 | ||
| Wyndham Hotels & Resorts, Inc. | 25,380 | 2,275,317 | ||
| $3,015,942 | ||||
| General Merchandise – 0.9% | ||||
| Dollar General Corp. | 29,342 | $ 6,919,724 | ||
| Health Maintenance Organizations – 1.5% | ||||
| Cigna Corp. | 31,359 | $ 7,200,967 | ||
| Humana, Inc. | 9,317 | 4,321,784 | ||
| $11,522,751 | ||||
| Insurance – 2.7% | ||||
| Aon PLC | 35,754 | $ 10,746,222 | ||
| Chubb Ltd. | 36,285 | 7,014,253 | ||
| Reinsurance Group of America, Inc. | 27,195 | 2,977,581 | ||
| Willis Towers Watson PLC | 2,777 | 659,510 | ||
| $21,397,566 | ||||
| Internet – 7.6% | ||||
| Alphabet, Inc., “A” (a)(s) | 13,552 | $ 39,260,686 | ||
| Alphabet, Inc., “C” (a) | 1,035 | 2,994,866 | ||
| Meta Platforms, Inc., “A” (a) | 52,026 | 17,498,945 | ||
| $59,754,497 | ||||
| Leisure & Toys – 0.9% | ||||
| Electronic Arts, Inc. | 50,302 | $ 6,634,834 | ||
| Machinery & Tools – 2.1% | ||||
| Ingersoll Rand, Inc. | 117,422 | $ 7,264,899 | ||
| PACCAR, Inc. | 31,014 | 2,737,296 | ||
| Roper Technologies, Inc. | 12,643 | 6,218,586 | ||
| $16,220,781 | ||||
| Major Banks – 3.9% | ||||
| JPMorgan Chase & Co. (s) | 82,884 | $ 13,124,682 | ||
| Morgan Stanley | 97,690 | 9,589,250 | ||
| PNC Financial Services Group, Inc. | 38,240 | 7,667,885 | ||
| $30,381,817 | ||||
| Medical & Health Technology & Services – 1.4% | ||||
| ICON PLC (a) | 20,742 | $ 6,423,797 | ||
| McKesson Corp. | 18,892 | 4,695,985 | ||
| $11,119,782 | ||||
| Medical Equipment – 5.4% | ||||
| Becton, Dickinson and Co. | 21,691 | $ 5,454,853 | ||
| Boston Scientific Corp. (a) | 150,968 | 6,413,121 | ||
| Danaher Corp. | 38,210 | 12,571,472 | ||
| Envista Holdings Corp. (a) | 64,205 | 2,893,077 | ||
| Maravai Lifesciences Holdings, Inc., “A” (a) | 81,471 | 3,413,635 | ||
| Medtronic PLC | 63,422 | 6,561,006 | ||
| STERIS PLC | 20,747 | 5,050,027 | ||
| $42,357,191 | ||||
| Issuer | Shares/Par | Value ($) | ||
| Common Stocks – continued | ||||
| Natural Gas - Pipeline – 0.2% | ||||
| Enterprise Products Partners LP | 61,698 | $ 1,354,888 | ||
| Network & Telecom – 0.6% | ||||
| Equinix, Inc., REIT | 5,286 | $ 4,471,110 | ||
| Other Banks & Diversified Financials – 3.8% | ||||
| Northern Trust Corp. | 43,389 | $ 5,189,758 | ||
| Truist Financial Corp. | 148,768 | 8,710,366 | ||
| Visa, Inc., “A” | 74,287 | 16,098,736 | ||
| $29,998,860 | ||||
| Pharmaceuticals – 3.7% | ||||
| Eli Lilly & Co. | 29,936 | $ 8,268,922 | ||
| Johnson & Johnson | 37,560 | 6,425,389 | ||
| Merck & Co., Inc. | 101,121 | 7,749,914 | ||
| Zoetis, Inc. | 26,207 | 6,395,294 | ||
| $28,839,519 | ||||
| Railroad & Shipping – 1.2% | ||||
| Canadian Pacific Railway Ltd. | 102,271 | $ 7,357,376 | ||
| CSX Corp. | 52,455 | 1,972,308 | ||
| $9,329,684 | ||||
| Real Estate – 1.0% | ||||
| Extra Space Storage, Inc., REIT | 17,526 | $ 3,973,670 | ||
| STORE Capital Corp., REIT | 120,421 | 4,142,482 | ||
| $8,116,152 | ||||
| Restaurants – 1.5% | ||||
| Starbucks Corp. | 68,404 | $ 8,001,216 | ||
| Wendy's Co. | 162,506 | 3,875,768 | ||
| $11,876,984 | ||||
| Specialty Chemicals – 1.9% | ||||
| Air Products & Chemicals, Inc. | 13,941 | $ 4,241,689 | ||
| Axalta Coating Systems Ltd. (a) | 118,419 | 3,922,037 | ||
| DuPont de Nemours, Inc. | 78,608 | 6,349,954 | ||
| $14,513,680 | ||||
| Specialty Stores – 6.7% | ||||
| Amazon.com, Inc. (a)(s) | 10,363 | $ 34,553,766 | ||
| Farfetch Ltd., “A” (a) | 38,805 | 1,297,251 | ||
| Home Depot, Inc. | 30,328 | 12,586,423 | ||
| Ross Stores, Inc. | 37,205 | 4,251,787 | ||
| $52,689,227 | ||||
| Telecommunications - Wireless – 1.8% | ||||
| SBA Communications Corp., REIT | 25,316 | $ 9,848,430 | ||
| T-Mobile US, Inc. (a) | 39,299 | 4,557,898 | ||
| $14,406,328 | ||||
| Tobacco – 0.6% | ||||
| Philip Morris International, Inc. | 51,482 | $ 4,890,790 | ||
| Issuer | Shares/Par | Value ($) | ||
| Common Stocks – continued | ||||
| Utilities - Electric Power – 2.9% | ||||
| American Electric Power Co., Inc. | 31,518 | $ 2,804,157 | ||
| Duke Energy Corp. | 51,001 | 5,350,005 | ||
| Generac Holdings, Inc. (a) | 4,453 | 1,567,100 | ||
| NextEra Energy, Inc. | 65,476 | 6,112,839 | ||
| PG&E Corp. (a) | 216,981 | 2,634,149 | ||
| Southern Co. | 63,624 | 4,363,334 | ||
| $22,831,584 | ||||
| Total Common Stocks (Identified Cost, $400,557,491) | $778,805,926 | |||
| Investment Companies (h) – 0.8% | ||||
| Money Market Funds – 0.8% | ||||
| MFS Institutional Money Market Portfolio, 0.07% (v) (Identified Cost, $5,954,468) | 5,954,476 | $ 5,954,476 | ||
| Securities Sold Short – (0.4)% | ||||
| Telecommunications - Wireless – (0.4)% | ||||
| Crown Castle International Corp., REIT (Proceeds Received, $1,060,166) | (12,776) | $ (2,666,862) | ||
| Other Assets, Less Liabilities – (0.0)% | (227,510) | |||
| Net Assets – 100.0% | $781,866,030 | |||
| (a) | Non-income producing security. | |||
| (h) | An affiliated issuer, which may be considered one in which the fund owns 5% or more of the outstanding voting securities, or a company which is under common control. At period end, the aggregate values of the fund's investments in affiliated issuers and in unaffiliated issuers were $5,954,476 and $778,805,926, respectively. | |||
| (s) | Security or a portion of the security was pledged to cover collateral requirements for securities sold short. | |||
| (v) | Affiliated issuer that is available only to investment companies managed by MFS. The rate quoted for the MFS Institutional Money Market Portfolio is the annualized seven-day yield of the fund at period end. |
| The following abbreviations are used in this report and are defined: | |
| ADR | American Depositary Receipt |
| REIT | Real Estate Investment Trust |
| Financial Statements | Statement of Assets and Liabilities |
| At 12/31/21Assets | |
| Investments in unaffiliated issuers, at value (identified cost, $400,557,491) | $778,805,926 |
| Investments in affiliated issuers, at value (identified cost, $5,954,468) | 5,954,476 |
| Deposits with brokers for | |
| Securities sold short | 8,889 |
| Receivables for | |
| Fund shares sold | 67,430 |
| Dividends | 705,375 |
| Other assets | 2,655 |
| Total assets | $785,544,751 |
| Liabilities | |
| Payable to custodian | $15,000 |
| Payables for | |
| Securities sold short, at value (proceeds received, $1,060,166) | 2,666,862 |
| Fund shares reacquired | 848,391 |
| Payable to affiliates | |
| Investment adviser | 37,798 |
| Administrative services fee | 633 |
| Shareholder servicing costs | 528 |
| Distribution and/or service fees | 5,460 |
| Payable for independent Trustees' compensation | 10 |
| Accrued expenses and other liabilities | 104,039 |
| Total liabilities | $3,678,721 |
| Net assets | $781,866,030 |
| Net assets consist of | |
| Paid-in capital | $307,256,198 |
| Total distributable earnings (loss) | 474,609,832 |
| Net assets | $781,866,030 |
| Shares of beneficial interest outstanding | 20,441,646 |
| Net assets | Shares outstanding | Net asset value per share | |
| Initial Class | $384,927,969 | 9,973,619 | $38.59 |
| Service Class | 396,938,061 | 10,468,027 | 37.92 |
| Financial Statements | Statement of Operations |
| Year ended 12/31/21 | |
| Net investment income (loss) | |
| Income | |
| Dividends | $8,744,482 |
| Other | 28,305 |
| Dividends from affiliated issuers | 2,306 |
| Income on securities loaned | 39 |
| Foreign taxes withheld | (24,534) |
| Total investment income | $8,750,598 |
| Expenses | |
| Management fee | $5,802,334 |
| Distribution and/or service fees | 977,831 |
| Shareholder servicing costs | 38,059 |
| Administrative services fee | 111,197 |
| Independent Trustees' compensation | 12,688 |
| Custodian fee | 36,615 |
| Shareholder communications | 18,636 |
| Audit and tax fees | 61,214 |
| Legal fees | 4,814 |
| Dividend and interest expense on securities sold short | 92,646 |
| Interest expense and fees | 2,781 |
| Miscellaneous | 34,032 |
| Total expenses | $7,192,847 |
| Reduction of expenses by investment adviser | (160,364) |
| Net expenses | $7,032,483 |
| Net investment income (loss) | $1,718,115 |
| Realized and unrealized gain (loss) | |
| Realized gain (loss) (identified cost basis) | |
| Unaffiliated issuers | $96,789,414 |
| Affiliated issuers | 48 |
| Foreign currency | 772 |
| Net realized gain (loss) | $96,790,234 |
| Change in unrealized appreciation or depreciation | |
| Unaffiliated issuers | $72,411,003 |
| Affiliated issuers | (48) |
| Securities sold short | (816,055) |
| Translation of assets and liabilities in foreign currencies | 111 |
| Net unrealized gain (loss) | $71,595,011 |
| Net realized and unrealized gain (loss) | $168,385,245 |
| Change in net assets from operations | $170,103,360 |
| Financial Statements | Statements of Changes in Net Assets |
| Year ended | ||
| 12/31/21 | 12/31/20 | |
| Change in net assets | ||
| From operations | ||
| Net investment income (loss) | $1,718,115 | $3,369,335 |
| Net realized gain (loss) | 96,790,234 | 43,017,213 |
| Net unrealized gain (loss) | 71,595,011 | 66,022,145 |
| Change in net assets from operations | $170,103,360 | $112,408,693 |
| Total distributions to shareholders | $(46,739,322) | $(31,733,190) |
| Change in net assets from fund share transactions | $(89,224,453) | $(14,633,535) |
| Total change in net assets | $34,139,585 | $66,041,968 |
| Net assets | ||
| At beginning of period | 747,726,445 | 681,684,477 |
| At end of period | $781,866,030 | $747,726,445 |
| Financial Statements | Financial Highlights |
| Initial Class | Year ended | ||||
| 12/31/21 | 12/31/20 | 12/31/19 | 12/31/18 | 12/31/17 | |
| Net asset value, beginning of period | $32.87 | $29.49 | $24.93 | $29.50 | $26.00 |
| Income (loss) from investment operations | |||||
| Net investment income (loss) (d) | $0.13 | $0.18 | $0.23 | $0.26 | $0.20 |
| Net realized and unrealized gain (loss) | 7.92 | 4.62 | 7.66 | (1.04) | 5.67 |
| Total from investment operations | $8.05 | $4.80 | $7.89 | $(0.78) | $5.87 |
| Less distributions declared to shareholders | |||||
| From net investment income | $(0.20) | $(0.22) | $(0.24) | $(0.22) | $(0.40) |
| From net realized gain | (2.13) | (1.20) | (3.09) | (3.57) | (1.97) |
| Total distributions declared to shareholders | $(2.33) | $(1.42) | $(3.33) | $(3.79) | $(2.37) |
| Net asset value, end of period (x) | $38.59 | $32.87 | $29.49 | $24.93 | $29.50 |
| Total return (%) (k)(r)(s)(x) | 24.80 | 16.59 | 32.95 | (4.37) | 23.37 |
| Ratios (%) (to average net assets) and Supplemental data: | |||||
| Expenses before expense reductions | 0.80 | 0.82 | 0.83 | 0.82 | 0.83 |
| Expenses after expense reductions | 0.78 | 0.79 | 0.81 | 0.81 | 0.81 |
| Net investment income (loss) | 0.35 | 0.62 | 0.82 | 0.88 | 0.70 |
| Portfolio turnover | 19 | 39 | 35 | 31 | 37 |
| Net assets at end of period (000 omitted) | $384,928 | $372,405 | $361,842 | $319,422 | $394,867 |
| Supplemental Ratios (%): | |||||
| Ratios of expenses to average net assets after expense reductions excluding short sale expenses and interest expense and fees | 0.77 | 0.77 | 0.78 | 0.79 | 0.79 |
| Service Class | Year ended | ||||
| 12/31/21 | 12/31/20 | 12/31/19 | 12/31/18 | 12/31/17 | |
| Net asset value, beginning of period | $32.34 | $29.05 | $24.61 | $29.17 | $25.73 |
| Income (loss) from investment operations | |||||
| Net investment income (loss) (d) | $0.04 | $0.11 | $0.16 | $0.18 | $0.13 |
| Net realized and unrealized gain (loss) | 7.79 | 4.54 | 7.55 | (1.03) | 5.61 |
| Total from investment operations | $7.83 | $4.65 | $7.71 | $(0.85) | $5.74 |
| Less distributions declared to shareholders | |||||
| From net investment income | $(0.12) | $(0.16) | $(0.18) | $(0.14) | $(0.33) |
| From net realized gain | (2.13) | (1.20) | (3.09) | (3.57) | (1.97) |
| Total distributions declared to shareholders | $(2.25) | $(1.36) | $(3.27) | $(3.71) | $(2.30) |
| Net asset value, end of period (x) | $37.92 | $32.34 | $29.05 | $24.61 | $29.17 |
| Total return (%) (k)(r)(s)(x) | 24.51 | 16.31 | 32.60 | (4.62) | 23.07 |
| Ratios (%) (to average net assets) and Supplemental data: | |||||
| Expenses before expense reductions | 1.05 | 1.07 | 1.08 | 1.07 | 1.08 |
| Expenses after expense reductions | 1.03 | 1.04 | 1.06 | 1.06 | 1.06 |
| Net investment income (loss) | 0.10 | 0.37 | 0.57 | 0.63 | 0.47 |
| Portfolio turnover | 19 | 39 | 35 | 31 | 37 |
| Net assets at end of period (000 omitted) | $396,938 | $375,322 | $319,842 | $215,898 | $228,102 |
| Supplemental Ratios (%): | |||||
| Ratios of expenses to average net assets after expense reductions excluding short sale expenses and interest expense and fees | 1.02 | 1.02 | 1.03 | 1.04 | 1.04 |
| (d) | Per share data is based on average shares outstanding. |
| (k) | The total return does not reflect expenses that apply to separate accounts. Inclusion of these charges would reduce the total return figures for all periods shown. |
| (r) | Certain expenses have been reduced without which performance would have been lower. |
| (s) | From time to time the fund may receive proceeds from litigation settlements, without which performance would be lower. |
| (x) | The net asset values and total returns have been calculated on net assets which include adjustments made in accordance with U.S. generally accepted accounting principles required at period end for financial reporting purposes. |
| Financial Instruments | Level 1 | Level 2 | Level 3 | Total |
| Equity Securities | $778,805,926 | $— | $— | $778,805,926 |
| Mutual Funds | 5,954,476 | — | — | 5,954,476 |
| Total | $784,760,402 | $— | $— | $784,760,402 |
| Securities Sold Short | $(2,666,862) | $— | $— | $(2,666,862) |
| Year ended 12/31/21 | Year ended 12/31/20 | |
| Ordinary income (including any short-term capital gains) | $6,675,285 | $6,781,157 |
| Long-term capital gains | 40,064,037 | 24,952,033 |
| Total distributions | $46,739,322 | $31,733,190 |
| As of 12/31/21 | |
| Cost of investments | $407,947,444 |
| Gross appreciation | 380,373,289 |
| Gross depreciation | (6,227,193) |
| Net unrealized appreciation (depreciation) | $374,146,096 |
| Undistributed ordinary income | 13,039,388 |
| Undistributed long-term capital gain | 85,615,313 |
| Other temporary differences | 1,809,035 |
| Total distributable earnings (loss) | $474,609,832 |
| Year ended 12/31/21 | Year ended 12/31/20 | ||
| Initial Class | $23,181,009 | $16,028,106 | |
| Service Class | 23,558,313 | 15,705,084 | |
| Total | $46,739,322 | $31,733,190 |
| Up to $1 billion | 0.75% |
| In excess of $1 billion | 0.65% |
| Year ended 12/31/21 | Year ended 12/31/20 | ||||
| Shares | Amount | Shares | Amount | ||
| Shares sold | |||||
| Initial Class | 297,691 | $10,769,839 | 764,523 | $19,867,933 | |
| Service Class | 359,379 | 12,740,685 | 2,051,974 | 55,469,934 | |
| 657,070 | $23,510,524 | 2,816,497 | $75,337,867 | ||
| Shares issued to shareholders in reinvestment of distributions | |||||
| Initial Class | 625,837 | $23,181,009 | 522,599 | $16,028,106 | |
| Service Class | 646,851 | 23,558,313 | 520,036 | 15,705,084 | |
| 1,272,688 | $46,739,322 | 1,042,635 | $31,733,190 | ||
| Shares reacquired | |||||
| Initial Class | (2,278,729) | $(82,861,036) | (2,228,768) | $(65,370,350) | |
| Service Class | (2,142,388) | (76,613,263) | (1,976,828) | (56,334,242) | |
| (4,421,117) | $(159,474,299) | (4,205,596) | $(121,704,592) | ||
| Net change | |||||
| Initial Class | (1,355,201) | $(48,910,188) | (941,646) | $(29,474,311) | |
| Service Class | (1,136,158) | (40,314,265) | 595,182 | 14,840,776 | |
| (2,491,359) | $(89,224,453) | (346,464) | $(14,633,535) | ||
| Affiliated Issuers | Beginning Value | Purchases | Sales Proceeds | Realized Gain (Loss) | Change in Unrealized Appreciation or Depreciation | Ending Value |
| MFS Institutional Money Market Portfolio | $6,109,231 | $156,556,273 | $156,711,028 | $48 | $(48) | $5,954,476 |
| Affiliated Issuers | Dividend Income | Capital Gain Distributions |
| MFS Institutional Money Market Portfolio | $2,306 | $— |
February 15, 2022
| Name, Age | Position(s) Held with Fund | Trustee/Officer Since(h) | Number of MFS Funds overseen by the Trustee | Principal Occupations During the Past Five Years | Other Directorships During the Past Five Years (j) | |||||
| INTERESTED TRUSTEES | ||||||||||
| Michael W. Roberge (k) (age 55) | Trustee | January 2021 | 135 | Massachusetts Financial Services Company, Chairman (since January 2021); Chief Executive Officer (since January 2017); Director; Chairman of the Board (since January 2022); President (until December 2018); Chief Investment Officer (until December 2018) | N/A | |||||
| INDEPENDENT TRUSTEES | ||||||||||
| John P. Kavanaugh (age 67) | Trustee and Chair of Trustees | January 2009 | 135 | Private investor | N/A | |||||
| Steven E. Buller (age 70) | Trustee | February 2014 | 135 | Private investor | N/A | |||||
| John A. Caroselli (age 67) | Trustee | March 2017 | 135 | Private investor; JC Global Advisors, LLC (management consulting), President (since 2015) | N/A | |||||
| Maureen R. Goldfarb (age 66) | Trustee | January 2009 | 135 | Private investor | N/A | |||||
| Peter D. Jones (age 66) | Trustee | January 2019 | 135 | Private investor | N/A | |||||
| James W. Kilman, Jr. (age 60) | Trustee | January 2019 | 135 | Burford Capital Limited (finance and investment management), Senior Advisor (since May 3, 2021), Chief Financial Officer (2019 - May 2, 2021); KielStrand Capital LLC (family office), Chief Executive Officer (since 2016) | Alpha-En Corporation, Director (2016-2019) | |||||
| Clarence Otis, Jr. (age 65) | Trustee | March 2017 | 135 | Private investor | VF Corporation, Director; Verizon Communications, Inc., Director; The Travelers Companies, Director | |||||
| Maryanne L. Roepke (age 65) | Trustee | May 2014 | 135 | Private investor | N/A | |||||
| Laurie J. Thomsen (age 64) | Trustee | March 2005 | 135 | Private investor | The Travelers Companies, Director; Dycom Industries, Inc., Director |
| Name, Age | Position(s) Held with Fund | Trustee/Officer Since(h) | Number of MFS Funds for which the Person is an Officer | Principal Occupations During the Past Five Years | ||||
| OFFICERS | ||||||||
| Christopher R. Bohane (k) (age 48) | Assistant Secretary and Assistant Clerk | July 2005 | 135 | Massachusetts Financial Services Company, Senior Vice President and Associate General Counsel | ||||
| Kino Clark (k) (age 53) | Assistant Treasurer | January 2012 | 135 | Massachusetts Financial Services Company, Vice President | ||||
| John W. Clark, Jr. (k) (age 54) | Assistant Treasurer | April 2017 | 135 | Massachusetts Financial Services Company, Vice President (since March 2017); Deutsche Bank (financial services), Department Head - Treasurer's Office (until February 2017) | ||||
| Thomas H. Connors (k) (age 62) | Assistant Secretary and Assistant Clerk | September 2012 | 135 | Massachusetts Financial Services Company, Vice President and Senior Counsel | ||||
| David L. DiLorenzo (k) (age 53) | President | July 2005 | 135 | Massachusetts Financial Services Company, Senior Vice President | ||||
| Heidi W. Hardin (k) (age 54) | Secretary and Clerk | April 2017 | 135 | Massachusetts Financial Services Company, Executive Vice President and General Counsel (since March 2017); Harris Associates (investment management), General Counsel (until January 2017) | ||||
| Brian E. Langenfeld (k) (age 48) | Assistant Secretary and Assistant Clerk | June 2006 | 135 | Massachusetts Financial Services Company, Vice President and Senior Counsel | ||||
| Amanda S. Mooradian (k) (age 42) | Assistant Secretary and Assistant Clerk | September 2018 | 135 | Massachusetts Financial Services Company, Assistant Vice President and Senior Counsel | ||||
| Susan A. Pereira (k) (age 51) | Assistant Secretary and Assistant Clerk | July 2005 | 135 | Massachusetts Financial Services Company, Vice President and Assistant General Counsel | ||||
| Kasey L. Phillips (k) (age 51) | Assistant Treasurer | September 2012 | 135 | Massachusetts Financial Services Company, Vice President | ||||
| Matthew A. Stowe (k) (age 47) | Assistant Secretary and Assistant Clerk | October 2014 | 135 | Massachusetts Financial Services Company, Vice President and Assistant General Counsel | ||||
| Martin J. Wolin (k) (age 54) | Chief Compliance Officer | July 2015 | 135 | Massachusetts Financial Services Company, Senior Vice President and Chief Compliance Officer | ||||
| James O. Yost (k) (age 61) | Treasurer | September 1990 | 135 | Massachusetts Financial Services Company, Senior Vice President |
| (h) | Date first appointed to serve as Trustee/Officer of an MFS Fund. Each Trustee has served continuously since appointment unless indicated otherwise. From January 2012 through December 2016, Messrs. DiLorenzo and Yost served as Treasurer and Deputy Treasurer of the Funds, respectively. |
| (j) | Directorships or trusteeships of companies required to report to the Securities and Exchange Commission (i.e., “public companies”). |
| (k) | “Interested person” of the Trust within the meaning of the Investment Company Act of 1940 (referred to as the 1940 Act), which is the principal federal law governing investment companies like the fund, as a result of a position with MFS. The address of MFS is 111 Huntington Avenue, Boston, Massachusetts 02199-7618. |
| Investment Adviser | Custodian |
| Massachusetts Financial Services Company 111 Huntington Avenue Boston, MA 02199-7618 | State Street Bank and Trust Company 1 Lincoln Street Boston, MA 02111-2900 |
| Distributor | Independent Registered Public Accounting Firm |
| MFS Fund Distributors, Inc. 111 Huntington Avenue Boston, MA 02199-7618 | Deloitte & Touche LLP 200 Berkeley Street Boston, MA 02116 |
| Portfolio Manager(s) | |
| Joseph MacDougall |

| FACTS | WHAT DOES MFS DO WITH YOUR PERSONAL INFORMATION? |
| Why? | Financial companies choose how they share your personal information. Federal law gives consumers the right to limit some but not all sharing. Federal law also requires us to tell you how we collect, share, and protect your personal information. Please read this notice carefully to understand what we do. |
| What? | The types of personal information we collect and share depend on the product or service you have with us. This information can include: |
| • Social Security number and account balances | |
| • Account transactions and transaction history | |
| • Checking account information and wire transfer instructions | |
| When you are no longer our customer, we continue to share your information as described in this notice. |
| How? | All financial companies need to share customers' personal information to run their everyday business. In the section below, we list the reasons financial companies can share their customers' personal information; the reasons MFS chooses to share; and whether you can limit this sharing. |
| Reasons we can share your personal information | Does MFS share? | Can you limit this sharing? |
| For our everyday business purposes – such as to process your transactions, maintain your account(s), respond to court orders and legal investigations, or report to credit bureaus | Yes | No |
| For our marketing purposes – to offer our products and services to you | No | We don't share |
| For joint marketing with other financial companies | No | We don't share |
| For our affiliates' everyday business purposes – information about your transactions and experiences | No | We don't share |
| For our affiliates' everyday business purposes – information about your creditworthiness | No | We don't share |
| For nonaffiliates to market to you | No | We don't share |
| Questions? | Call 800-225-2606 or go to mfs.com. |
| Who we are | |
| Who is providing this notice? | MFS Funds, MFS Investment Management, MFS Institutional Advisors, Inc., and MFS Heritage Trust Company. |
| What we do | |
| How does MFS protect my personal information? | To protect your personal information from unauthorized access and use, we use security measures that comply with federal law. These measures include procedural, electronic, and physical safeguards for the protection of the personal information we collect about you. |
| How does MFS collect my personal information? | We collect your personal information, for example, when you |
| • open an account or provide account information | |
| • direct us to buy securities or direct us to sell your securities | |
| • make a wire transfer | |
| We also collect your personal information from others, such as credit bureaus, affiliates, or other companies. | |
| Why can't I limit all sharing? | Federal law gives you the right to limit only |
| • sharing for affiliates' everyday business purposes – information about your creditworthiness | |
| • affiliates from using your information to market to you | |
| • sharing for nonaffiliates to market to you | |
| State laws and individual companies may give you additional rights to limit sharing. | |
| Definitions | |
| Affiliates | Companies related by common ownership or control. They can be financial and nonfinancial companies. |
| • MFS does not share personal information with affiliates, except for everyday business purposes as described on page one of this notice. | |
| Nonaffiliates | Companies not related by common ownership or control. They can be financial and nonfinancial companies. |
| • MFS does not share with nonaffiliates so they can market to you. | |
| Joint marketing | A formal agreement between nonaffiliated financial companies that together market financial products or services to you. |
| • MFS doesn't jointly market. | |
| Other important information |
| If you own an MFS product or receive an MFS service in the name of a third party such as a bank or broker-dealer, their privacy policy may apply to you instead of ours. |


| 1 | |
| 2 | |
| 4 | |
| 6 | |
| 8 | |
| 9 | |
| 24 | |
| 25 | |
| 26 | |
| 27 | |
| 29 | |
| 38 | |
| 39 | |
| 42 | |
| 45 | |
| 45 | |
| 45 | |
| 45 | |
| 45 | |
| 46 |


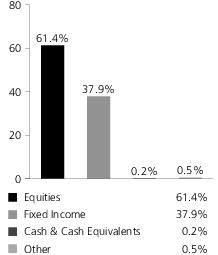
| U.S. Treasury Notes, 1.375%, 1/31/2025 | 2.7% |
| Microsoft Corp. | 2.5% |
| U.S. Treasury Notes, 0.375%, 11/30/2025 | 2.5% |
| UMBS, TBA, 2%, 1/16/2036 - 7/25/2051 | 2.3% |
| Goldman Sachs Group, Inc. | 2.2% |
| U.S. Treasury Bonds, 2.375%, 11/15/2049 | 1.8% |
| Charles Schwab Corp. | 1.7% |
| Comcast Corp., “A” | 1.7% |
| Johnson & Johnson | 1.7% |
| JPMorgan Chase & Co. | 1.6% |
| AAA | 4.4% |
| AA | 1.4% |
| A | 3.6% |
| BBB | 8.5% |
| BB | 0.3% |
| B (o) | 0.0% |
| CCC (o) | 0.0% |
| U.S. Government | 9.3% |
| Federal Agencies | 10.9% |
| Not Rated | (0.5)% |
| Non-Fixed Income | 61.4% |
| Cash & Cash Equivalents | 0.2% |
| Other | 0.5% |
| Financials | 15.2% |
| Health Care | 9.9% |
| Industrials | 9.5% |
| Information Technology | 8.5% |
| Consumer Staples | 5.2% |
| Communication Services | 3.3% |
| Utilities | 2.4% |
| Consumer Discretionary | 2.4% |
| Materials | 2.2% |
| Energy | 1.6% |
| Convertible Debt | 0.9% |
| Real Estate | 0.3% |
| Investment Grade Corporates | 11.6% |
| Mortgage-Backed Securities | 10.9% |
| U.S. Treasury Securities | 8.8% |
| Commercial Mortgage-Backed Securities | 2.5% |
| Collateralized Debt Obligations | 2.5% |
| Asset-Backed Securities | 0.4% |
| Emerging Markets Bonds | 0.4% |
| Municipal Bonds | 0.4% |
| High Yield Corporates | 0.2% |
| Non-U.S. Government Bonds | 0.2% |
| U.S. Government Agencies (o) | 0.0% |
| (a) | For all securities other than those specifically described below, ratings are assigned to underlying securities utilizing ratings from Moody’s, Fitch, and Standard & Poor’s rating agencies and applying the following hierarchy: If all three agencies provide a rating, the middle rating (after dropping the highest and lowest ratings) is assigned; if two of the three agencies rate a security, the lower of the two is assigned. If none of the 3 rating agencies above assign a rating, but the security is rated by DBRS Morningstar, then the DBRS Morningstar rating is assigned. If none of the 4 rating agencies listed above rate the security, but the security is rated by the Kroll Bond Rating Agency (KBRA), then the KBRA rating is assigned. Ratings are shown in the S&P and Fitch scale (e.g., AAA). Securities rated BBB or higher are considered investment grade. All ratings are subject to change. U.S. Government includes securities issued by the U.S. Department of the Treasury. Federal Agencies includes rated and unrated U.S. Agency fixed-income securities, U.S. Agency mortgage-backed securities, |
| (g) | The Global Industry Classification Standard (GICS®) was developed by and/or is the exclusive property of MSCI, Inc. and S&P Global Market Intelligence Inc. (“S&P Global Market Intelligence”). GICS is a service mark of MSCI and S&P Global Market Intelligence and has been licensed for use by MFS. MFS has applied its own internal sector/industry classification methodology for equity securities and non-equity securities that are unclassified by GICS. |
| (i) | For purposes of this presentation, the components include the value of securities, and reflect the impact of the equivalent exposure of derivative positions, if any. These amounts may be negative from time to time. Equivalent exposure is a calculated amount that translates the derivative position into a reasonable approximation of the amount of the underlying asset that the portfolio would have to hold at a given point in time to have the same price sensitivity that results from the portfolio’s ownership of the derivative contract. When dealing with derivatives, equivalent exposure is a more representative measure of the potential impact of a position on portfolio performance than value. The bond component will include any accrued interest amounts. |
| (o) | Less than 0.1%. |
| (h) | Security was not held in the portfolio at period end. |
| (r) | Securities rated “BBB”, “Baa”, or higher are considered investment grade; securities rated “BB”, “Ba”, or below are considered non-investment grade. Ratings are assigned to underlying securities utilizing ratings from Moody's, Fitch, and Standard & Poor's and applying the following hierarchy: If all three agencies provide a rating, the middle rating (after dropping the highest and lowest ratings) is assigned; if two of the three agencies rate a security, the lower of the two is assigned. If none of the 3 rating agencies above assign a rating, but the security is rated by DBRS Morningstar, then the DBRS Morningstar rating is assigned. If none of the 4 ratings agencies listed above rate the security, but the security is rated by the Kroll Bond Rating Agency (KBRA), then the KBRA rating is assigned. Ratings are shown in the S&P and Fitch scale (e.g., AAA). For securities that are not rated by any of the rating agencies, the security is considered Not Rated. |
| (y) | A yield curve graphically depicts the yields of different maturity bonds of the same credit quality and type; a normal yield curve is upward sloping, with short-term rates lower than long-term rates. |
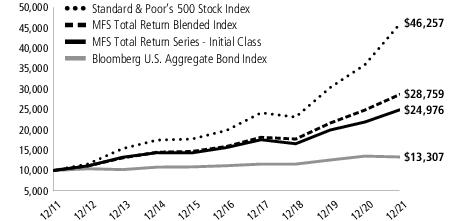
| Share Class | Class Inception Date | 1-yr | 5-yr | 10-yr |
| Initial Class | 1/03/95 | 14.12% | 9.84% | 9.59% |
| Service Class | 5/01/00 | 13.84% | 9.57% | 9.31% |
| Standard & Poor's 500 Stock Index (f) | 28.71% | 18.47% | 16.55% |
| Bloomberg U.S. Aggregate Bond Index (f) | (1.54)% | 3.57% | 2.90% |
| MFS Total Return Blended Index (f)(w) | 15.86% | 12.62% | 11.14% |
| (f) | Source: FactSet Research Systems Inc. |
| (w) | As of December 31, 2021, the MFS Total Return Blended Index (a custom index) was comprised of 60% Standard & Poor’s 500 Stock Index and 40% Bloomberg U.S. Aggregate Bond Index. |
| (a) | Source: Bloomberg Index Services Limited. BLOOMBERG® is a trademark and service mark of Bloomberg Finance L.P. and its affiliates (collectively “Bloomberg”). Bloomberg or Bloomberg's licensors own all proprietary rights in the Bloomberg Indices. Bloomberg neither approves or endorses this material, or guarantees the accuracy or completeness of any information herein, or makes any warranty, express or implied, as to the results to be obtained therefrom and, to the maximum extent allowed by law, neither shall have any liability or responsibility for injury or damages arising in connection therewith. |
| (g) | “Standard & Poor's®” and “S&P®” are registered trademarks of Standard & Poor's Financial Services LLC (“S&P”) and Dow Jones is a registered trademark of Dow Jones Trademark Holdings LLC (“Dow Jones”) and have been licensed for use by S&P Dow Jones Indices LLC and sublicensed for certain purposes by MFS. The S&P 500® is a product of S&P Dow Jones Indices LLC, and has been licensed for use by MFS. MFS's product(s) is not sponsored, endorsed, sold, or promoted by S&P Dow Jones Indices LLC, Dow Jones, S&P, or their respective affiliates, and neither S&P Dow Jones Indices LLC, Dow Jones, S&P, nor their respective affiliates make any representation regarding the advisability of investing in such product(s). |
July 1, 2021 through December 31, 2021
| Share Class | Annualized Expense Ratio | Beginning Account Value 7/01/21 | Ending Account Value 12/31/21 | Expenses Paid During Period (p) 7/01/21-12/31/21 | |
| Initial Class | Actual | 0.61% | $1,000.00 | $1,043.69 | $3.14 |
| Hypothetical (h) | 0.61% | $1,000.00 | $1,022.13 | $3.11 | |
| Service Class | Actual | 0.86% | $1,000.00 | $1,042.68 | $4.43 |
| Hypothetical (h) | 0.86% | $1,000.00 | $1,020.87 | $4.38 |
| (h) | 5% class return per year before expenses. |
| (p) | “Expenses Paid During Period” are equal to each class's annualized expense ratio, as shown above, multiplied by the average account value over the period, multiplied by 184/365 (to reflect the one-half year period). |
| Issuer | Shares/Par | Value ($) | ||
| Common Stocks – 60.1% | ||||
| Aerospace & Defense – 2.6% | ||||
| Honeywell International, Inc. | 122,278 | $ 25,496,186 | ||
| Howmet Aerospace, Inc. | 291,315 | 9,272,556 | ||
| L3Harris Technologies, Inc. | 74,216 | 15,825,820 | ||
| Lockheed Martin Corp. | 17,395 | 6,182,357 | ||
| Northrop Grumman Corp. | 29,964 | 11,598,166 | ||
| $68,375,085 | ||||
| Alcoholic Beverages – 0.7% | ||||
| Constellation Brands, Inc., “A” | 38,701 | $ 9,712,790 | ||
| Diageo PLC | 172,315 | 9,413,444 | ||
| $19,126,234 | ||||
| Automotive – 1.3% | ||||
| Aptiv PLC (a) | 28,061 | $ 4,628,662 | ||
| Lear Corp. | 81,968 | 14,996,046 | ||
| LKQ Corp. | 254,520 | 15,278,835 | ||
| $34,903,543 | ||||
| Biotechnology – 0.4% | ||||
| Vertex Pharmaceuticals, Inc. (a) | 42,811 | $ 9,401,296 | ||
| Broadcasting – 0.3% | ||||
| Discovery Communications, Inc., “C” (a) | 208,413 | $ 4,772,658 | ||
| Omnicom Group, Inc. | 32,347 | 2,370,064 | ||
| $7,142,722 | ||||
| Brokerage & Asset Managers – 2.9% | ||||
| Cboe Global Markets, Inc. | 75,443 | $ 9,837,767 | ||
| Charles Schwab Corp. | 557,190 | 46,859,680 | ||
| Invesco Ltd. | 440,708 | 10,145,098 | ||
| NASDAQ, Inc. | 52,918 | 11,113,309 | ||
| $77,955,854 | ||||
| Business Services – 2.3% | ||||
| Accenture PLC, “A” | 44,635 | $ 18,503,439 | ||
| Amdocs Ltd. | 129,915 | 9,722,839 | ||
| Cognizant Technology Solutions Corp., “A” | 106,857 | 9,480,353 | ||
| Fidelity National Information Services, Inc. | 118,546 | 12,939,296 | ||
| Fiserv, Inc. (a) | 113,651 | 11,795,837 | ||
| $62,441,764 | ||||
| Cable TV – 1.7% | ||||
| Comcast Corp., “A” | 903,814 | $ 45,488,959 | ||
| Chemicals – 0.7% | ||||
| PPG Industries, Inc. | 110,118 | $ 18,988,748 | ||
| Computer Software – 2.8% | ||||
| Microsoft Corp. | 197,740 | $ 66,503,917 | ||
| Oracle Corp. | 87,436 | 7,625,293 | ||
| $74,129,210 | ||||
| Issuer | Shares/Par | Value ($) | ||
| Common Stocks – continued | ||||
| Construction – 2.0% | ||||
| Masco Corp. | 363,468 | $ 25,522,723 | ||
| Otis Worldwide Corp. | 31,441 | 2,737,568 | ||
| Stanley Black & Decker, Inc. | 79,287 | 14,955,114 | ||
| Vulcan Materials Co. | 47,829 | 9,928,344 | ||
| $53,143,749 | ||||
| Consumer Products – 0.7% | ||||
| Colgate-Palmolive Co. | 116,158 | $ 9,912,924 | ||
| Kimberly-Clark Corp. | 56,771 | 8,113,711 | ||
| $18,026,635 | ||||
| Consumer Services – 0.2% | ||||
| Booking Holdings, Inc. (a) | 2,063 | $ 4,949,611 | ||
| Electrical Equipment – 1.5% | ||||
| Johnson Controls International PLC | 455,253 | $ 37,016,621 | ||
| TE Connectivity Ltd. | 20,509 | 3,308,922 | ||
| $40,325,543 | ||||
| Electronics – 3.0% | ||||
| Applied Materials, Inc. | 102,018 | $ 16,053,552 | ||
| Intel Corp. | 351,867 | 18,121,150 | ||
| NXP Semiconductors N.V. | 59,543 | 13,562,705 | ||
| Taiwan Semiconductor Manufacturing Co. Ltd., ADR | 115,544 | 13,901,099 | ||
| Texas Instruments, Inc. | 104,024 | 19,605,403 | ||
| $81,243,909 | ||||
| Energy - Independent – 1.6% | ||||
| ConocoPhillips | 241,011 | $ 17,396,174 | ||
| Hess Corp. | 161,781 | 11,976,647 | ||
| Pioneer Natural Resources Co. | 74,970 | 13,635,544 | ||
| $43,008,365 | ||||
| Food & Beverages – 2.0% | ||||
| Archer Daniels Midland Co. | 152,838 | $ 10,330,320 | ||
| Danone S.A. | 114,464 | 7,114,017 | ||
| General Mills, Inc. | 124,358 | 8,379,242 | ||
| J.M. Smucker Co. | 35,447 | 4,814,412 | ||
| Mondelez International, Inc. | 102,576 | 6,801,815 | ||
| Nestle S.A. | 59,953 | 8,384,998 | ||
| PepsiCo, Inc. | 48,534 | 8,430,841 | ||
| $54,255,645 | ||||
| Food & Drug Stores – 0.6% | ||||
| Wal-Mart Stores, Inc. | 116,138 | $ 16,804,007 | ||
| Health Maintenance Organizations – 1.4% | ||||
| Cigna Corp. | 168,365 | $ 38,661,655 | ||
| Insurance – 3.3% | ||||
| Aon PLC | 89,017 | $ 26,754,949 | ||
| Chubb Ltd. | 134,742 | 26,046,976 | ||
| Travelers Cos., Inc. | 91,785 | 14,357,928 | ||
| Issuer | Shares/Par | Value ($) | ||
| Common Stocks – continued | ||||
| Insurance – continued | ||||
| Willis Towers Watson PLC | 87,693 | $ 20,826,211 | ||
| $87,986,064 | ||||
| Internet – 0.5% | ||||
| Alphabet, Inc., “A” (a) | 4,951 | $ 14,343,245 | ||
| Leisure & Toys – 0.3% | ||||
| Electronic Arts, Inc. | 58,905 | $ 7,769,570 | ||
| Machinery & Tools – 2.8% | ||||
| Eaton Corp. PLC | 233,706 | $ 40,389,071 | ||
| Ingersoll Rand, Inc. | 301,558 | 18,657,393 | ||
| PACCAR, Inc. | 99,322 | 8,766,160 | ||
| Regal Rexnord Corp. | 43,680 | 7,433,462 | ||
| $75,246,086 | ||||
| Major Banks – 6.8% | ||||
| Bank of America Corp. | 920,652 | $ 40,959,808 | ||
| Goldman Sachs Group, Inc. | 155,217 | 59,378,263 | ||
| JPMorgan Chase & Co. | 279,337 | 44,233,014 | ||
| Morgan Stanley | 188,814 | 18,533,982 | ||
| PNC Financial Services Group, Inc. | 93,104 | 18,669,214 | ||
| $181,774,281 | ||||
| Medical & Health Technology & Services – 1.7% | ||||
| ICON PLC (a) | 28,843 | $ 8,932,677 | ||
| McKesson Corp. | 75,367 | 18,733,975 | ||
| Quest Diagnostics, Inc. | 111,211 | 19,240,615 | ||
| $46,907,267 | ||||
| Medical Equipment – 2.6% | ||||
| Becton, Dickinson and Co. | 30,882 | $ 7,766,205 | ||
| Danaher Corp. | 75,389 | 24,803,735 | ||
| Medtronic PLC | 215,297 | 22,272,475 | ||
| Thermo Fisher Scientific, Inc. | 22,340 | 14,906,142 | ||
| $69,748,557 | ||||
| Metals & Mining – 0.2% | ||||
| Rio Tinto PLC | 65,889 | $ 4,362,884 | ||
| Other Banks & Diversified Financials – 2.3% | ||||
| Northern Trust Corp. | 89,530 | $ 10,708,683 | ||
| Truist Financial Corp. | 624,050 | 36,538,128 | ||
| U.S. Bancorp | 241,311 | 13,554,439 | ||
| $60,801,250 | ||||
| Pharmaceuticals – 3.7% | ||||
| Bayer AG | 67,098 | $ 3,590,379 | ||
| Johnson & Johnson | 262,423 | 44,892,703 | ||
| Merck & Co., Inc. | 424,330 | 32,520,651 | ||
| Organon & Co. | 183,873 | 5,598,933 | ||
| Roche Holding AG | 33,047 | 13,699,150 | ||
| $100,301,816 | ||||
| Issuer | Shares/Par | Value ($) | ||
| Common Stocks – continued | ||||
| Railroad & Shipping – 1.1% | ||||
| Union Pacific Corp. | 120,874 | $ 30,451,787 | ||
| Real Estate – 0.3% | ||||
| STORE Capital Corp., REIT | 250,043 | $ 8,601,479 | ||
| Restaurants – 0.2% | ||||
| Wendy's Co. | 271,845 | $ 6,483,503 | ||
| Specialty Chemicals – 1.0% | ||||
| Axalta Coating Systems Ltd. (a) | 361,124 | $ 11,960,427 | ||
| DuPont de Nemours, Inc. | 175,992 | 14,216,634 | ||
| $26,177,061 | ||||
| Specialty Stores – 0.7% | ||||
| Home Depot, Inc. | 42,973 | $ 17,834,225 | ||
| Telecommunications - Wireless – 0.5% | ||||
| T-Mobile US, Inc. (a) | 123,233 | $ 14,292,563 | ||
| Tobacco – 1.0% | ||||
| Philip Morris International, Inc. | 271,602 | $ 25,802,190 | ||
| Utilities - Electric Power – 2.4% | ||||
| Duke Energy Corp. | 194,130 | $ 20,364,237 | ||
| Exelon Corp. | 216,768 | 12,520,520 | ||
| PG&E Corp. (a) | 861,825 | 10,462,555 | ||
| Pinnacle West Capital Corp. | 54,023 | 3,813,484 | ||
| Southern Co. | 248,319 | 17,029,717 | ||
| $64,190,513 | ||||
| Total Common Stocks (Identified Cost, $853,155,024) | $ 1,611,446,875 | |||
| Bonds – 38.1% | ||||
| Aerospace & Defense – 0.1% | ||||
| BAE Systems PLC, 3.4%, 4/15/2030 (n) | $ | 1,108,000 | $ 1,182,633 | |
| Huntington Ingalls Industries, Inc., 3.844%, 5/01/2025 | 591,000 | 625,024 | ||
| Raytheon Technologies Corp., 4.125%, 11/16/2028 | 1,570,000 | 1,756,112 | ||
| $3,563,769 | ||||
| Apparel Manufacturers – 0.0% | ||||
| NIKE, Inc., “B”, 3.25%, 3/27/2040 | $ | 773,000 | $ 840,897 | |
| Asset-Backed & Securitized – 5.3% | ||||
| Acres PLC, 2021-FL2, “AS”, FLR, 1.84% (LIBOR - 1mo. + 1.75%), 1/15/2037 (z) | $ | 1,851,500 | $ 1,851,509 | |
| Allegro CLO Ltd., 2016-1A, “BR2”, FLR, 1.673% (LIBOR - 3mo. + 1.55%), 1/15/2030 (n) | 2,407,803 | 2,407,856 | ||
| Arbor Realty Trust, Inc., CLO, 2020-FL1, “AS”, FLR, 1.564% (LIBOR - 1mo. + 1.4%), 2/15/2035 (n) | 1,150,000 | 1,149,281 | ||
| Arbor Realty Trust, Inc., CLO, 2021-FL1, “AS”, FLR, 1.309% (LIBOR - 1mo. + 1.2%) 12/15/2035 (n) | 2,115,000 | 2,105,087 | ||
| Arbor Realty Trust, Inc., CLO, 2021-FL3, “B”, FLR, 1.709% (LIBOR - 1mo. + 1.6%), 8/15/2034 (n) | 1,807,500 | 1,800,250 | ||
| AREIT CRE Trust, 2019-CRE3, “AS”, FLR, 1.464% (LIBOR - 1mo. + 1.3%), 9/14/2036 (n) | 3,366,000 | 3,362,072 | ||
| Avis Budget Rental Car Funding LLC, 2019-1A, “A”, 3.45%, 3/20/2023 (n) | 1,940,000 | 1,947,621 | ||
| Bancorp Commercial Mortgage Trust, 2019-CRE6, “AS”, FLR, 1.464% (LIBOR - 1mo. + 1.3%), 9/15/2036 (n) | 2,748,344 | 2,746,346 | ||
| Bayview Financial Revolving Mortgage Loan Trust, FLR, 1.701% (LIBOR - 1mo. + 1.6%), 12/28/2040 (n) | 761,629 | 847,766 | ||
| BDS Ltd., 2019-FL4, “A”, FLR, 1.209% (LIBOR - 1mo. + 1.10%), 8/15/2036 (n) | 1,809,639 | 1,808,801 | ||
| BPCRE Holder LLC, FLR, 0.958% (LIBOR - 1mo. + 0.85%), 2/15/2037 (n) | 650,047 | 649,304 | ||
| Issuer | Shares/Par | Value ($) | ||
| Bonds – continued | ||||
| Asset-Backed & Securitized – continued | ||||
| BSPRT Issuer Ltd., 2021-FL6, “AS”, FLR, 1.409% (LIBOR - 1mo. + 1.3%), 3/15/2036 (n) | $ | 4,964,000 | $ 4,946,075 | |
| BSPRT Issuer Ltd., 2021-FL7, “B”, FLR, 2.15% (LIBOR - 1mo. + 2.05%), 12/15/2038 (n) | 849,500 | 849,500 | ||
| Business Jet Securities LLC, 2021-1A, “A”, 2.162%, 4/15/2036 (n) | 1,317,242 | 1,293,272 | ||
| BXMT Ltd., 2021-FL4, “AS”, FLR, 1.409% (LIBOR - 1mo. + 1.3%), 5/15/2038 (n) | 5,214,000 | 5,197,706 | ||
| CHCP 2021-FL1 Ltd., “AS”, FLR, 1.464% (LIBOR - 1mo. + 1.3%) 2/15/2038 (n) | 2,203,500 | 2,197,545 | ||
| Columbia Cent CLO 28 Ltd., “A-2-R”, 1.844%, 11/07/2030 (n) | 3,492,733 | 3,489,705 | ||
| Commercial Mortgage Pass-Through Certificates, 2019-BN17, “A4”, 3.714%, 4/15/2052 | 2,789,000 | 3,075,842 | ||
| Commercial Mortgage Trust, 2015-LC21, “A4”, 3.708%, 7/10/2048 | 3,980,975 | 4,231,945 | ||
| Credit Acceptance Auto Loan Trust, 2021-3A, “B”, 1.38%, 7/15/2030 (n) | 1,118,000 | 1,104,431 | ||
| CSAIL Commercial Mortgage Trust, 2015-C2, “A4”, 3.504%, 6/15/2057 | 2,316,427 | 2,441,225 | ||
| Cutwater Ltd., 2015-1A, “AR”, FLR, 1.344% (LIBOR - 3mo. + 1.22%), 1/15/2029 (n) | 2,643,724 | 2,643,684 | ||
| Dryden Senior Loan Fund, 2013-26A, “AR”, CLO, FLR, 1.024% (LIBOR - 3mo. + 0.9%), 4/15/2029 (n) | 2,024,654 | 2,024,462 | ||
| Dryden Senior Loan Fund, 2018-55A, “A1”, CLO, FLR, 1.143% (LIBOR - 3mo. + 1.02%), 4/15/2031 (n) | 4,414,000 | 4,417,659 | ||
| Exeter Automobile Receivables Trust, 2020-1A, “B”, 2.26%, 4/15/2024 (n) | 89,511 | 89,573 | ||
| GLS Auto Receivables Trust, 2020-1A, “A”, 2.17%, 2/15/2024 (n) | 86,901 | 87,028 | ||
| GMAC Mortgage Corp. Loan Trust, FGIC, 5.805%, 10/25/2036 | 141,786 | 152,036 | ||
| GS Mortgage Securities Trust, 2015-GC30, “A4”, 3.382%, 5/10/2050 | 4,243,101 | 4,472,403 | ||
| GS Mortgage Securities Trust, 2019-GSA1, “A4”, 3.047%, 11/10/2052 | 2,182,474 | 2,311,457 | ||
| GS Mortgage Securities Trust, 2020-GC45, “A5”, 2.91%, 2/13/2053 | 2,001,659 | 2,103,986 | ||
| JPMBB Commercial Mortgage Securities Trust, 2014-C26, “A4”, 3.494%, 1/15/2048 | 4,880,000 | 5,135,197 | ||
| JPMBB Commercial Mortgage Securities Trust, 2015-C28, “A4”, 3.227%, 10/15/2048 | 3,256,792 | 3,400,437 | ||
| Ladder Capital Commercial Mortgage Securities LLC, “B”, FLR, 2.01% (LIBOR - 1mo. + 1.9%), 12/13/2038 (n) | 2,562,000 | 2,562,000 | ||
| LoanCore Ltd., 2021-CRE5, “AS”, FLR, 1.859% (LIBOR - 1mo. + 1.75%), 7/15/2036 (n) | 5,288,000 | 5,281,480 | ||
| MF1 CLO Ltd., 2021-FL5, “AS”, FLR, 1.364% (LIBOR - 1mo. + 1.2%), 7/15/2036 (n) | 5,459,500 | 5,454,663 | ||
| MF1 Multi-Family Housing Mortgage Loan Trust, 2020-FL4, “A”, FLR, 1.864% (LIBOR - 1mo. + 1.7%), 11/15/2035 (n) | 1,701,000 | 1,706,978 | ||
| MidOcean Credit CLO, 2013-2A, “BR”, FLR, 1.779% (LIBOR - 3mo. + 1.65%), 1/29/2030 (n) | 3,932,725 | 3,929,949 | ||
| Morgan Stanley Bank of America Merrill Lynch Trust, 2017-C34, “A4”, 3.536%, 11/15/2052 | 1,600,004 | 1,730,123 | ||
| Morgan Stanley Capital I Trust, 2017-H1, “A5”, 3.53%, 6/15/2050 | 1,456,742 | 1,568,914 | ||
| Neuberger Berman CLO Ltd., 2013-15A, “BR2”, FLR, 1.473% (LIBOR - 3mo. + 1.35%), 10/15/2029 (n) | 1,750,540 | 1,748,306 | ||
| Neuberger Berman CLO Ltd., 2015-20A, “ARR”, FLR, 1.284% (LIBOR - 3mo. + 1.16%), 7/15/2034 (n) | 1,900,000 | 1,900,581 | ||
| Oaktree CLO Ltd., 2015-1A, “A2AR”, FLR, 1.481% (LIBOR - 3mo. + 1.35%), 10/20/2027 (n) | 809,537 | 809,131 | ||
| Oaktree CLO Ltd., 2019-1A, “BR”, FLR, 1.878% (LIBOR - 3mo. + 1.75%), 4/22/2030 (n) | 5,195,227 | 5,186,411 | ||
| PFP III Ltd., 2021-7, “AS”, FLR, 1.259% (LIBOR - 1mo. + 1.15%), 4/14/2038 (n) | 3,912,305 | 3,893,483 | ||
| ReadyCap Commercial Mortgage Trust, 2021-FL5, “A”, FLR, 1.102% (LIBOR - 1mo. + 1%), 4/25/2038 (z) | 3,102,744 | 3,085,291 | ||
| ReadyCap Commercial Mortgage Trust, 2021-FL7, “B”, FLR, 1.902% (LIBOR - 1mo. + 1.8%), 11/25/2036 (z) | 1,130,000 | 1,128,603 | ||
| Residential Funding Mortgage Securities, Inc., FGIC, 4.481%, 12/25/2035 | 64,417 | 64,309 | ||
| Santander Retail Auto Lease Trust, 2020-A, “B”, 1.88%, 3/20/2024 (n) | 1,631,000 | 1,646,965 | ||
| TPG Real Estate Finance, 2021-FL4, “A”, FLR, 1.309% (LIBOR - 1mo. + 1.2%), 3/15/2038 (n) | 5,181,500 | 5,178,262 | ||
| UBS Commercial Mortgage Trust, 2017-C8, “A4”, 3.983%, 2/15/2051 | 2,950,000 | 3,264,835 | ||
| UBS Commercial Mortgage Trust, 2019-C17, “A4”, 2.921%, 10/15/2052 | 2,461,404 | 2,578,005 | ||
| Verizon Owner Trust, 2020-A, “B”, 1.98%, 7/22/2024 | 2,616,000 | 2,648,587 | ||
| Veros Auto Receivables Trust, 2020-1, “A”, 1.67%, 9/15/2023 (n) | 86,584 | 86,619 | ||
| Voya CLO Ltd., 2012-4A, “A2R3”, FLR, 1.574% (LIBOR - 3mo. + 1.45%), 10/15/2030 (n) | 2,010,166 | 2,005,661 | ||
| Wells Fargo Commercial Mortgage Trust, 2015-C28, “A4”, 3.54%, 5/15/2048 | 4,315,766 | 4,565,401 | ||
| Wells Fargo Commercial Mortgage Trust, 2019-C54, “A4”, 3.146%, 12/15/2052 | 3,579,870 | 3,826,846 | ||
| $142,192,464 | ||||
| Automotive – 0.6% | ||||
| General Motors Co., 6.75%, 4/01/2046 | $ | 992,000 | $ 1,417,457 | |
| Hyundai Capital America, 2.65%, 2/10/2025 (n) | 943,000 | 966,385 | ||
| Hyundai Capital America, 3%, 2/10/2027 (n) | 1,959,000 | 2,027,028 | ||
| Lear Corp., 3.8%, 9/15/2027 | 891,000 | 971,220 | ||
| Lear Corp., 4.25%, 5/15/2029 | 769,000 | 847,049 | ||
| Magna International, Inc., 2.45%, 6/15/2030 | 2,229,000 | 2,261,632 | ||
| Stellantis N.V., 2.691%, 9/15/2031 (n) | 2,635,000 | 2,591,167 | ||
| Issuer | Shares/Par | Value ($) | ||
| Bonds – continued | ||||
| Automotive – continued | ||||
| Volkswagen Group of America Finance LLC, 3.35%, 5/13/2025 (n) | $ | 3,867,000 | $ 4,068,465 | |
| $15,150,403 | ||||
| Broadcasting – 0.1% | ||||
| Walt Disney Co., 3.5%, 5/13/2040 | $ | 3,478,000 | $ 3,809,083 | |
| Brokerage & Asset Managers – 0.2% | ||||
| E*TRADE Financial Corp., 4.5%, 6/20/2028 | $ | 975,000 | $ 1,096,966 | |
| Intercontinental Exchange, Inc., 2.1%, 6/15/2030 | 2,155,000 | 2,141,229 | ||
| Intercontinental Exchange, Inc., 1.85%, 9/15/2032 | 634,000 | 606,856 | ||
| Raymond James Financial, Inc., 4.95%, 7/15/2046 | 2,057,000 | 2,617,957 | ||
| $6,463,008 | ||||
| Building – 0.2% | ||||
| Martin Marietta Materials, Inc., 3.5%, 12/15/2027 | $ | 815,000 | $ 876,505 | |
| Martin Marietta Materials, Inc., 2.5%, 3/15/2030 | 223,000 | 224,973 | ||
| Masco Corp., 2%, 2/15/2031 | 4,244,000 | 4,067,142 | ||
| Vulcan Materials Co., 3.5%, 6/01/2030 | 380,000 | 410,439 | ||
| $5,579,059 | ||||
| Business Services – 0.9% | ||||
| Equinix, Inc., 2.625%, 11/18/2024 | $ | 2,863,000 | $ 2,949,945 | |
| Equinix, Inc., 1.8%, 7/15/2027 | 1,829,000 | 1,799,251 | ||
| Experian Finance PLC, 4.25%, 2/01/2029 (n) | 1,699,000 | 1,886,198 | ||
| Fiserv, Inc., 2.65%, 6/01/2030 | 730,000 | 740,728 | ||
| Global Payments, Inc., 1.2%, 3/01/2026 | 2,357,000 | 2,287,851 | ||
| IHS Markit Ltd., 3.625%, 5/01/2024 | 336,000 | 352,380 | ||
| IHS Markit Ltd., 4.75%, 2/15/2025 (n) | 555,000 | 604,256 | ||
| IHS Markit Ltd., 4%, 3/01/2026 (n) | 1,759,000 | 1,900,898 | ||
| IHS Markit Ltd., 4.25%, 5/01/2029 | 795,000 | 904,312 | ||
| NXP B.V./NXP Funding LLC/NXP USA, Inc., 2.5%, 5/11/2031 (n) | 2,212,000 | 2,217,648 | ||
| NXP B.V./NXP Funding LLC/NXP USA, Inc., 3.25%, 5/11/2041 (n) | 1,896,000 | 1,959,638 | ||
| RELX Capital, Inc., 3%, 5/22/2030 | 620,000 | 649,982 | ||
| Tencent Holdings Ltd., 2.39%, 6/03/2030 (n) | 1,814,000 | 1,777,262 | ||
| Verisk Analytics, Inc., 4.125%, 3/15/2029 | 2,176,000 | 2,426,154 | ||
| Western Union Co., 2.85%, 1/10/2025 | 578,000 | 598,178 | ||
| $23,054,681 | ||||
| Cable TV – 0.3% | ||||
| Charter Communications Operating LLC/Charter Communications Operating Capital Corp., 6.384%, 10/23/2035 | $ | 1,053,000 | $ 1,360,208 | |
| Charter Communications Operating LLC/Charter Communications Operating Capital Corp., 3.5%, 6/01/2041 | 2,122,000 | 2,068,916 | ||
| Charter Communications Operating LLC/Charter Communications Operating Capital Corp., 5.375%, 5/01/2047 | 430,000 | 513,250 | ||
| Cox Communications, Inc., 1.8%, 10/01/2030 (n) | 1,333,000 | 1,255,733 | ||
| Time Warner Entertainment Co. LP, 8.375%, 7/15/2033 | 2,526,000 | 3,677,899 | ||
| $8,876,006 | ||||
| Chemicals – 0.1% | ||||
| Sherwin-Williams Co., 2.3%, 5/15/2030 | $ | 1,590,000 | $ 1,585,582 | |
| Computer Software – 0.1% | ||||
| Dell International LLC/EMC Corp., 4.9%, 10/01/2026 | $ | 1,640,000 | $ 1,847,170 | |
| Issuer | Shares/Par | Value ($) | ||
| Bonds – continued | ||||
| Conglomerates – 0.4% | ||||
| Carrier Global Corp., 3.377%, 4/05/2040 | $ | 3,222,000 | $ 3,366,402 | |
| Roper Technologies, Inc., 4.2%, 9/15/2028 | 791,000 | 887,970 | ||
| Roper Technologies, Inc., 2.95%, 9/15/2029 | 482,000 | 498,529 | ||
| Roper Technologies, Inc., 2%, 6/30/2030 | 1,526,000 | 1,467,063 | ||
| Westinghouse Air Brake Technologies Corp., 3.2%, 6/15/2025 | 808,000 | 840,917 | ||
| Westinghouse Air Brake Technologies Corp., 4.95%, 9/15/2028 | 2,112,000 | 2,400,733 | ||
| $9,461,614 | ||||
| Consumer Services – 0.1% | ||||
| Booking Holdings, Inc., 4.625%, 4/13/2030 | $ | 1,430,000 | $ 1,671,267 | |
| Electrical Equipment – 0.0% | ||||
| Arrow Electronics, Inc., 2.95%, 2/15/2032 | $ | 838,000 | $ 846,246 | |
| Electronics – 0.3% | ||||
| Broadcom, Inc., 4.15%, 11/15/2030 | $ | 1,395,000 | $ 1,547,134 | |
| Broadcom, Inc., 4.3%, 11/15/2032 | 1,558,000 | 1,750,843 | ||
| Broadcom, Inc., 3.469%, 4/15/2034 (n) | 1,205,000 | 1,261,237 | ||
| Broadcom, Inc., 3.187%, 11/15/2036 (n) | 2,767,000 | 2,762,180 | ||
| Intel Corp., 4.75%, 3/25/2050 | 1,053,000 | 1,402,262 | ||
| $8,723,656 | ||||
| Energy - Independent – 0.0% | ||||
| Diamondback Energy, Inc., 4.4%, 3/24/2051 | $ | 360,000 | $ 412,636 | |
| Energy - Integrated – 0.2% | ||||
| Cenovus Energy, Inc., 5.375%, 7/15/2025 | $ | 504,000 | $ 556,176 | |
| Eni S.p.A., 4.75%, 9/12/2028 (n) | 3,564,000 | 4,105,622 | ||
| $4,661,798 | ||||
| Financial Institutions – 0.5% | ||||
| AerCap Ireland Capital DAC/AerCap Global Aviation Trust, 4.875%, 1/16/2024 | $ | 362,000 | $ 384,972 | |
| AerCap Ireland Capital DAC/AerCap Global Aviation Trust, 2.45%, 10/29/2026 | 4,225,000 | 4,259,645 | ||
| AerCap Ireland Capital DAC/AerCap Global Aviation Trust, 3.65%, 7/21/2027 | 2,329,000 | 2,454,348 | ||
| Avolon Holdings Funding Ltd., 4.375%, 5/01/2026 (n) | 682,000 | 730,462 | ||
| Avolon Holdings Funding Ltd., 3.25%, 2/15/2027 (n) | 2,183,000 | 2,198,244 | ||
| Avolon Holdings Funding Ltd., 2.528%, 11/18/2027 (n) | 1,821,000 | 1,768,940 | ||
| Park Aerospace Holdings Ltd., 5.5%, 2/15/2024 (n) | 639,000 | 685,216 | ||
| $12,481,827 | ||||
| Food & Beverages – 0.5% | ||||
| Anheuser-Busch InBev S.A., 8%, 11/15/2039 | $ | 2,950,000 | $ 4,766,281 | |
| Anheuser-Busch InBev Worldwide, Inc., 4.375%, 4/15/2038 | 737,000 | 863,068 | ||
| Constellation Brands, Inc., 3.5%, 5/09/2027 | 2,322,000 | 2,495,188 | ||
| Diageo Capital PLC, 2.375%, 10/24/2029 | 2,618,000 | 2,673,617 | ||
| General Mills, Inc., 4%, 4/17/2025 | 2,134,000 | 2,291,383 | ||
| General Mills, Inc., 2.875%, 4/15/2030 | 435,000 | 453,975 | ||
| Keurig Dr Pepper, Inc., 3.2%, 5/01/2030 | 357,000 | 377,414 | ||
| $13,920,926 | ||||
| Gaming & Lodging – 0.3% | ||||
| GLP Capital LP/GLP Financing II, Inc., 5.3%, 1/15/2029 | $ | 1,593,000 | $ 1,808,374 | |
| Las Vegas Sands Corp., 3.9%, 8/08/2029 | 918,000 | 924,400 | ||
| Marriott International, Inc., 4%, 4/15/2028 | 1,950,000 | 2,104,262 | ||
| Marriott International, Inc., 4.625%, 6/15/2030 | 1,979,000 | 2,226,267 | ||
| Issuer | Shares/Par | Value ($) | ||
| Bonds – continued | ||||
| Gaming & Lodging – continued | ||||
| Marriott International, Inc., 2.85%, 4/15/2031 | $ | 7,000 | $ 6,979 | |
| Marriott International, Inc., 2.75%, 10/15/2033 | 1,600,000 | 1,552,066 | ||
| $8,622,348 | ||||
| Insurance – 0.1% | ||||
| AIA Group Ltd., 3.375%, 4/07/2030 (n) | $ | 2,740,000 | $ 2,960,546 | |
| Insurance - Health – 0.0% | ||||
| UnitedHealth Group, Inc., 3.5%, 8/15/2039 | $ | 732,000 | $ 811,636 | |
| Insurance - Property & Casualty – 0.4% | ||||
| American International Group, Inc., 4.125%, 2/15/2024 | $ | 2,315,000 | $ 2,458,056 | |
| Aon Corp., 3.75%, 5/02/2029 | 4,102,000 | 4,496,648 | ||
| Aon Corp./Aon Global Holdings PLC, 2.6%, 12/02/2031 | 172,000 | 174,992 | ||
| Hartford Financial Services Group, Inc., 3.6%, 8/19/2049 | 384,000 | 420,305 | ||
| Liberty Mutual Group, Inc., 3.951%, 10/15/2050 (n) | 1,087,000 | 1,203,162 | ||
| Marsh & McLennan Cos., Inc., 4.75%, 3/15/2039 | 832,000 | 1,037,492 | ||
| $9,790,655 | ||||
| International Market Quasi-Sovereign – 0.2% | ||||
| Temasek Financial I Ltd. (Republic of Singapore), 2.375%, 1/23/2023 (n) | $ | 6,400,000 | $ 6,504,900 | |
| Machinery & Tools – 0.1% | ||||
| CNH Industrial Capital LLC, 4.2%, 1/15/2024 | $ | 1,679,000 | $ 1,772,108 | |
| CNH Industrial Capital LLC, 1.875%, 1/15/2026 | 448,000 | 448,191 | ||
| $2,220,299 | ||||
| Major Banks – 2.2% | ||||
| Bank of America Corp., 3.366% to 1/23/2025, FLR (LIBOR - 3mo. + 0.81%) to 1/23/2026 | $ | 1,626,000 | $ 1,710,545 | |
| Bank of America Corp., 3.5%, 4/19/2026 | 1,361,000 | 1,466,053 | ||
| Bank of America Corp., 2.572%, 10/20/2032 | 3,452,000 | 3,468,584 | ||
| Barclays PLC, 2.894% to 11/24/2031, FLR (CMT - 1yr. + 1.3%) to 11/24/2032 | 3,083,000 | 3,104,840 | ||
| Capital One Financial Corp., 3.75%, 3/09/2027 | 1,728,000 | 1,870,735 | ||
| Credit Suisse Group AG, 3.091% to 5/14/2031, FLR (SOFR + 1.73%) to 5/14/2032 (n) | 1,508,000 | 1,534,468 | ||
| Deutsche Bank, 2.311% to 11/16/2026, FLR (SOFR + 1.219%) to 11/16/2027 | 880,000 | 879,608 | ||
| Goldman Sachs Group, Inc., 2.6%, 2/07/2030 | 6,003,000 | 6,103,525 | ||
| Goldman Sachs Group, Inc., 2.383% to 7/21/2031, FLR (SOFR + 1.248%) to 7/21/2032 | 3,317,000 | 3,265,905 | ||
| HSBC Holdings PLC, 4.7% to 9/09/2031, FLR (CMT - 1yr. + 3.25%) to 9/09/2169 | 1,122,000 | 1,122,000 | ||
| HSBC Holdings PLC, 4% to 9/09/2026, FLR (CMT - 1yr. + 3.222%) to 9/09/2170 | 442,000 | 439,237 | ||
| JPMorgan Chase & Co., 3.782% to 2/01/2027, FLR (LIBOR - 3mo. + 1.337%) to 2/01/2028 | 3,707,000 | 4,012,949 | ||
| JPMorgan Chase & Co., 2.739% to 10/15/2029, FLR (SOFR + 1.51%) to 10/15/2030 | 1,052,000 | 1,080,912 | ||
| JPMorgan Chase & Co., 2.956% to 5/13/2030, FLR (SOFR + 2.515%) to 5/13/2031 | 558,000 | 577,738 | ||
| JPMorgan Chase & Co., 2.545% to 11/08/2031, FLR (SOFR + 1.18%) to 11/08/2032 | 5,426,000 | 5,456,504 | ||
| JPMorgan Chase & Co., 3.109% to 4/22/2040, FLR (SOFR + 2.46%) to 4/22/2041 | 2,876,000 | 2,978,528 | ||
| JPMorgan Chase & Co., 3.897% to 1/23/2048, FLR (LIBOR - 3mo. + 1.22%) to 1/23/2049 | 1,100,000 | 1,274,340 | ||
| Morgan Stanley, 3.875%, 4/29/2024 | 1,358,000 | 1,439,603 | ||
| Morgan Stanley, 4%, 7/23/2025 | 1,063,000 | 1,152,016 | ||
| Morgan Stanley, 2.699% to 1/22/2030, FLR (SOFR + 1.143%) to 1/22/2031 | 6,047,000 | 6,186,592 | ||
| PNC Bank N.A., 2.7%, 10/22/2029 | 835,000 | 862,611 | ||
| Royal Bank of Canada, 1.15%, 6/10/2025 | 2,774,000 | 2,750,026 | ||
| State Street Corp., 2.901% to 3/30/2025, FLR (SOFR + 2.6%) to 3/30/2026 | 404,000 | 422,408 | ||
| UBS Group AG, 2.095% to 2/11/2031, FLR (CMT - 1yr. + 1.0%) to 2/11/2032 (n) | 6,416,000 | 6,209,098 | ||
| $59,368,825 | ||||
| Issuer | Shares/Par | Value ($) | ||
| Bonds – continued | ||||
| Medical & Health Technology & Services – 0.5% | ||||
| Alcon, Inc., 2.6%, 5/27/2030 (n) | $ | 302,000 | $ 304,765 | |
| Alcon, Inc., 3.8%, 9/23/2049 (n) | 1,564,000 | 1,741,516 | ||
| Becton, Dickinson and Co., 4.669%, 6/06/2047 | 1,805,000 | 2,275,800 | ||
| Cigna Corp., 3.2%, 3/15/2040 | 556,000 | 575,975 | ||
| HCA, Inc., 4.125%, 6/15/2029 | 2,120,000 | 2,332,798 | ||
| HCA, Inc., 5.125%, 6/15/2039 | 2,264,000 | 2,788,182 | ||
| Laboratory Corp. of America Holdings, 4.7%, 2/01/2045 | 1,404,000 | 1,708,683 | ||
| Northwell Healthcare, Inc., 3.979%, 11/01/2046 | 153,000 | 173,751 | ||
| Northwell Healthcare, Inc., 4.26%, 11/01/2047 | 1,205,000 | 1,422,590 | ||
| $13,324,060 | ||||
| Medical Equipment – 0.2% | ||||
| Boston Scientific Corp., 3.75%, 3/01/2026 | $ | 2,370,000 | $ 2,545,991 | |
| Boston Scientific Corp., 2.65%, 6/01/2030 | 1,590,000 | 1,620,862 | ||
| $4,166,853 | ||||
| Metals & Mining – 0.4% | ||||
| Anglo American Capital PLC, 5.625%, 4/01/2030 (n) | $ | 1,394,000 | $ 1,651,677 | |
| Anglo American Capital PLC, 2.625%, 9/10/2030 (n) | 4,564,000 | 4,475,276 | ||
| Glencore Funding LLC, 4.125%, 5/30/2023 (n) | 1,244,000 | 1,293,660 | ||
| Glencore Funding LLC, 2.5%, 9/01/2030 (n) | 1,695,000 | 1,641,477 | ||
| Glencore Funding LLC, 2.85%, 4/27/2031 (n) | 709,000 | 700,831 | ||
| $9,762,921 | ||||
| Midstream – 0.6% | ||||
| Cheniere Corpus Christi Holdings LLC, 3.7%, 11/15/2029 | $ | 1,833,000 | $ 1,963,429 | |
| Enbridge, Inc., 2.5%, 1/15/2025 | 969,000 | 995,772 | ||
| Enterprise Products Operating LLC, 4.2%, 1/31/2050 | 774,000 | 867,648 | ||
| Galaxy Pipeline Assets Bidco Ltd., 2.16%, 3/31/2034 (n) | 2,495,000 | 2,445,400 | ||
| Kinder Morgan Energy Partners LP, 4.15%, 2/01/2024 | 1,207,000 | 1,269,662 | ||
| ONEOK, Inc., 4.95%, 7/13/2047 | 2,331,000 | 2,693,210 | ||
| Plains All American Pipeline LP, 3.8%, 9/15/2030 | 1,881,000 | 1,964,220 | ||
| Sabine Pass Liquefaction LLC, 5%, 3/15/2027 | 1,561,000 | 1,753,277 | ||
| Sabine Pass Liquefaction LLC, 4.5%, 5/15/2030 | 512,000 | 577,548 | ||
| Spectra Energy Partners LP, 3.375%, 10/15/2026 | 828,000 | 877,822 | ||
| $15,407,988 | ||||
| Mortgage-Backed – 10.8% | ||||
| Fannie Mae, 5.5%, 5/01/2022 - 4/01/2040 | $ | 5,297,189 | $ 5,934,729 | |
| Fannie Mae, 5%, 12/01/2023 - 3/01/2041 | 2,131,345 | 2,397,309 | ||
| Fannie Mae, 2.7%, 7/01/2025 | 367,000 | 382,351 | ||
| Fannie Mae, 2.568%, 12/25/2026 | 1,318,661 | 1,381,501 | ||
| Fannie Mae, 3%, 11/01/2028 - 9/01/2046 | 4,118,005 | 4,335,080 | ||
| Fannie Mae, 6.5%, 6/01/2031 - 7/01/2037 | 858,759 | 968,879 | ||
| Fannie Mae, 2.5%, 11/01/2031 | 79,914 | 83,007 | ||
| Fannie Mae, 3%, 2/25/2033 (i) | 373,682 | 36,349 | ||
| Fannie Mae, 4.5%, 8/01/2033 - 6/01/2044 | 4,827,807 | 5,321,188 | ||
| Fannie Mae, 6%, 1/01/2034 - 7/01/2037 | 2,900,633 | 3,262,838 | ||
| Fannie Mae, 3.5%, 4/01/2038 - 7/01/2046 | 12,406,073 | 13,353,552 | ||
| Fannie Mae, 3.25%, 5/25/2040 | 121,140 | 128,333 | ||
| Fannie Mae, 4%, 9/01/2040 - 6/01/2047 | 8,813,937 | 9,645,422 | ||
| Fannie Mae, 2%, 10/25/2040 - 4/25/2046 | 416,621 | 420,432 | ||
| Fannie Mae, 4%, 7/25/2046 (i) | 359,612 | 64,641 | ||
| Fannie Mae, UMBS, 2.5%, 2/01/2050 - 12/01/2051 | 5,474,348 | 5,636,297 | ||
| Fannie Mae, UMBS, 2%, 1/01/2051 - 2/01/2051 | 523,740 | 524,387 | ||
| Fannie Mae, UMBS, 3%, 12/01/2051 | 2,463,130 | 2,576,524 | ||
| Issuer | Shares/Par | Value ($) | ||
| Bonds – continued | ||||
| Mortgage-Backed – continued | ||||
| Freddie Mac, 2.791%, 1/25/2022 | $ | 32,085 | $ 32,076 | |
| Freddie Mac, 2.51%, 11/25/2022 | 1,503,000 | 1,523,476 | ||
| Freddie Mac, 3.111%, 2/25/2023 | 2,120,927 | 2,166,709 | ||
| Freddie Mac, 3.32%, 2/25/2023 | 723,988 | 741,991 | ||
| Freddie Mac, 3.25%, 4/25/2023 | 2,464,602 | 2,528,617 | ||
| Freddie Mac, 3.06%, 7/25/2023 | 175,000 | 180,222 | ||
| Freddie Mac, 3.458%, 8/25/2023 | 1,642,000 | 1,702,339 | ||
| Freddie Mac, 0.893%, 4/25/2024 (i) | 4,821,442 | 82,619 | ||
| Freddie Mac, 0.506%, 7/25/2024 (i) | 14,179,000 | 179,346 | ||
| Freddie Mac, 0.603%, 7/25/2024 (i) | 4,998,640 | 52,910 | ||
| Freddie Mac, 4.5%, 8/01/2024 - 5/01/2042 | 895,440 | 981,555 | ||
| Freddie Mac, 0.316%, 8/25/2024 (i) | 15,246,000 | 148,281 | ||
| Freddie Mac, 0.384%, 8/25/2024 (i) | 25,223,404 | 228,506 | ||
| Freddie Mac, 3.064%, 8/25/2024 | 785,789 | 819,665 | ||
| Freddie Mac, 0.348%, 10/25/2024 (i) | 18,760,105 | 150,621 | ||
| Freddie Mac, 3.171%, 10/25/2024 | 1,304,000 | 1,370,644 | ||
| Freddie Mac, 0.274%, 11/25/2024 (i) | 15,385,000 | 123,040 | ||
| Freddie Mac, 2.67%, 12/25/2024 | 1,561,000 | 1,621,579 | ||
| Freddie Mac, 3.329%, 5/25/2025 | 2,610,000 | 2,774,968 | ||
| Freddie Mac, 3.01%, 7/25/2025 | 423,000 | 446,198 | ||
| Freddie Mac, 3.151%, 11/25/2025 | 1,001,000 | 1,064,000 | ||
| Freddie Mac, 0.635%, 6/25/2027 (i) | 13,682,000 | 477,502 | ||
| Freddie Mac, 0.749%, 6/25/2027 (i) | 4,660,461 | 168,334 | ||
| Freddie Mac, 3.117%, 6/25/2027 | 1,114,000 | 1,201,729 | ||
| Freddie Mac, 0.576%, 7/25/2027 (i) | 11,989,002 | 348,387 | ||
| Freddie Mac, 0.328%, 8/25/2027 (i) | 9,650,000 | 189,593 | ||
| Freddie Mac, 0.429%, 8/25/2027 (i) | 6,619,165 | 148,479 | ||
| Freddie Mac, 0.279%, 9/25/2027 (i) | 10,419,000 | 178,490 | ||
| Freddie Mac, 3.187%, 9/25/2027 | 754,000 | 819,297 | ||
| Freddie Mac, 0.196%, 11/25/2027 (i) | 16,290,000 | 206,429 | ||
| Freddie Mac, 0.288%, 11/25/2027 - 12/25/2027 (i) | 22,787,441 | 380,855 | ||
| Freddie Mac, 0.325%, 11/25/2027 (i) | 10,363,027 | 188,636 | ||
| Freddie Mac, 0.242%, 12/25/2027 (i) | 10,109,000 | 158,366 | ||
| Freddie Mac, 0.368%, 12/25/2027 (i) | 17,695,748 | 358,180 | ||
| Freddie Mac, 3.65%, 2/25/2028 | 904,000 | 1,009,612 | ||
| Freddie Mac, 3.9%, 4/25/2028 | 1,667,000 | 1,888,796 | ||
| Freddie Mac, 1.089%, 7/25/2029 (i) | 828,971 | 60,907 | ||
| Freddie Mac, 1.143%, 8/25/2029 (i) | 5,210,246 | 401,620 | ||
| Freddie Mac, 1.798%, 4/25/2030 (i) | 900,000 | 122,326 | ||
| Freddie Mac, 1.868%, 4/25/2030 (i) | 2,701,417 | 381,279 | ||
| Freddie Mac, 1.662%, 5/25/2030 (i) | 1,301,002 | 165,771 | ||
| Freddie Mac, 1.796%, 5/25/2030 (i) | 3,334,078 | 456,779 | ||
| Freddie Mac, 1.341%, 6/25/2030 (i) | 1,327,631 | 137,838 | ||
| Freddie Mac, 1.599%, 8/25/2030 (i) | 1,191,673 | 149,209 | ||
| Freddie Mac, 1.169%, 9/25/2030 (i) | 775,587 | 72,340 | ||
| Freddie Mac, 1.081%, 11/25/2030 (i) | 1,356,411 | 119,212 | ||
| Freddie Mac, 0.33%, 1/25/2031 (i) | 5,330,351 | 137,693 | ||
| Freddie Mac, 0.781%, 1/25/2031 (i) | 2,233,850 | 146,429 | ||
| Freddie Mac, 0.936%, 1/25/2031 (i) | 1,493,151 | 115,739 | ||
| Freddie Mac, 0.529%, 3/25/2031 (i) | 4,316,422 | 182,718 | ||
| Freddie Mac, 0.74%, 3/25/2031 (i) | 1,837,683 | 115,960 | ||
| Freddie Mac, 1.224%, 5/25/2031 (i) | 822,353 | 85,524 | ||
| Freddie Mac, 0.937%, 7/25/2031 (i) | 1,237,840 | 102,009 | ||
| Freddie Mac, 0.508%, 8/25/2031 (i) | 1,665,384 | 73,760 | ||
| Freddie Mac, 0.536%, 9/25/2031 (i) | 5,442,448 | 264,894 | ||
| Freddie Mac, 0.855%, 9/25/2031 (i) | 1,567,181 | 118,286 | ||
| Freddie Mac, 0.349%, 11/25/2031 (i) | 8,030,040 | 261,536 | ||
| Issuer | Shares/Par | Value ($) | ||
| Bonds – continued | ||||
| Mortgage-Backed – continued | ||||
| Freddie Mac, 0.567%, 12/25/2031 (i) | $ | 12,162,189 | $ 606,181 | |
| Freddie Mac, 0.299%, 11/25/2032 (i) | 8,578,158 | 226,320 | ||
| Freddie Mac, 5%, 9/01/2033 - 1/15/2040 | 1,180,820 | 1,332,537 | ||
| Freddie Mac, 5.5%, 12/01/2033 - 2/01/2037 | 869,325 | 975,184 | ||
| Freddie Mac, 6%, 4/01/2034 - 6/01/2037 | 1,006,466 | 1,140,897 | ||
| Freddie Mac, 6.5%, 5/01/2034 - 7/01/2037 | 542,781 | 605,038 | ||
| Freddie Mac, 5.5%, 2/15/2036 (i) | 71,750 | 12,869 | ||
| Freddie Mac, 4%, 8/01/2037 - 8/01/2047 | 4,273,704 | 4,642,536 | ||
| Freddie Mac, 3.5%, 11/01/2037 - 10/25/2058 | 8,860,880 | 9,516,377 | ||
| Freddie Mac, 3%, 1/01/2038 - 2/25/2059 | 10,813,447 | 11,433,608 | ||
| Freddie Mac, 4.5%, 12/15/2040 (i) | 64,250 | 6,157 | ||
| Freddie Mac, 4%, 8/15/2044 (i) | 87,765 | 8,772 | ||
| Freddie Mac, UMBS, 6.5%, 10/01/2034 | 29,965 | 33,793 | ||
| Freddie Mac, UMBS, 5%, 10/01/2035 | 176,608 | 199,846 | ||
| Freddie Mac, UMBS, 6%, 1/01/2036 - 3/01/2036 | 71,125 | 78,548 | ||
| Freddie Mac, UMBS, 3%, 7/01/2050 | 84,484 | 88,947 | ||
| Freddie Mac, UMBS, 2.5%, 10/01/2051 - 12/01/2051 | 2,459,982 | 2,528,942 | ||
| Ginnie Mae, 6%, 9/15/2032 - 1/15/2038 | 1,223,456 | 1,404,534 | ||
| Ginnie Mae, 5.5%, 5/15/2033 - 10/15/2035 | 729,703 | 830,307 | ||
| Ginnie Mae, 4.5%, 7/20/2033 - 9/20/2041 | 1,659,224 | 1,860,771 | ||
| Ginnie Mae, 5%, 7/20/2033 - 12/15/2034 | 235,686 | 271,522 | ||
| Ginnie Mae, 4%, 1/20/2041 - 2/20/2042 | 1,779,953 | 1,928,232 | ||
| Ginnie Mae, 3.5%, 12/15/2041 - 3/20/2048 | 4,488,200 | 4,808,820 | ||
| Ginnie Mae, 3%, 4/20/2045 - 11/20/2051 | 9,670,798 | 10,064,870 | ||
| Ginnie Mae, 2.5%, 8/20/2051 - 11/20/2051 | 9,305,898 | 9,541,657 | ||
| Ginnie Mae, 0.585%, 2/16/2059 (i) | 2,701,572 | 113,773 | ||
| Ginnie Mae, TBA, 3%, 7/20/2049 | 1,225,000 | 1,267,450 | ||
| Ginnie Mae, TBA, 4%, 1/20/2052 | 1,425,000 | 1,500,573 | ||
| Ginnie Mae, TBA, 2%, 1/21/2052 | 2,950,000 | 2,976,633 | ||
| Ginnie Mae, TBA, 2.5%, 1/21/2052 | 450,000 | 460,828 | ||
| Ginnie Mae, TBA, 3.5%, 1/21/2052 | 4,300,000 | 4,477,357 | ||
| UMBS, TBA, 2%, 1/16/2036 - 7/25/2051 | 69,450,000 | 69,445,998 | ||
| UMBS, TBA, 2.5%, 1/18/2037 - 7/25/2051 | 41,625,000 | 42,581,494 | ||
| UMBS, TBA, 1.5%, 1/19/2037 | 3,400,000 | 3,409,098 | ||
| UMBS, TBA, 3%, 1/19/2037 - 1/13/2052 | 11,925,000 | 12,361,566 | ||
| UMBS, TBA, 4%, 1/14/2052 | 975,000 | 1,037,077 | ||
| $290,545,807 | ||||
| Municipals – 0.4% | ||||
| New Jersey Economic Development Authority State Pension Funding Rev., “A”, NPFG, 7.425%, 2/15/2029 | $ | 2,750,000 | $ 3,456,288 | |
| New Jersey Turnpike Authority Rev. (Build America Bonds), “F”, 7.414%, 1/01/2040 | 3,685,000 | 5,931,847 | ||
| State of Florida, “A”, 2.154%, 7/01/2030 | 1,437,000 | 1,433,608 | ||
| $10,821,743 | ||||
| Natural Gas - Distribution – 0.0% | ||||
| NiSource, Inc., 5.65%, 2/01/2045 | $ | 486,000 | $ 656,281 | |
| Natural Gas - Pipeline – 0.1% | ||||
| APT Pipelines Ltd., 4.2%, 3/23/2025 (n) | $ | 3,344,000 | $ 3,576,280 | |
| APT Pipelines Ltd., 4.25%, 7/15/2027 (n) | 253,000 | 278,493 | ||
| $3,854,773 | ||||
| Network & Telecom – 0.4% | ||||
| AT&T, Inc., 2.75%, 6/01/2031 | $ | 2,106,000 | $ 2,148,653 | |
| AT&T, Inc., 3.65%, 9/15/2059 | 1,786,000 | 1,803,662 | ||
| Verizon Communications, Inc., 2.1%, 3/22/2028 | 273,000 | 273,520 | ||
| Issuer | Shares/Par | Value ($) | ||
| Bonds – continued | ||||
| Network & Telecom – continued | ||||
| Verizon Communications, Inc., 3.15%, 3/22/2030 | $ | 1,053,000 | $ 1,114,023 | |
| Verizon Communications, Inc., 2.55%, 3/21/2031 | 1,294,000 | 1,305,533 | ||
| Verizon Communications, Inc., 4.272%, 1/15/2036 | 1,477,000 | 1,732,499 | ||
| Verizon Communications, Inc., 4.812%, 3/15/2039 | 1,877,000 | 2,353,342 | ||
| $10,731,232 | ||||
| Oils – 0.3% | ||||
| Marathon Petroleum Corp., 4.75%, 9/15/2044 | $ | 1,114,000 | $ 1,310,965 | |
| Phillips 66 Co., 2.15%, 12/15/2030 | 3,438,000 | 3,308,625 | ||
| Valero Energy Corp., 3.65%, 12/01/2051 | 626,000 | 621,984 | ||
| Valero Energy, Corp., 6.625%, 6/15/2037 | 2,124,000 | 2,861,371 | ||
| $8,102,945 | ||||
| Other Banks & Diversified Financials – 0.2% | ||||
| BBVA Bancomer S.A. de C.V., 6.75%, 9/30/2022 (n) | $ | 2,890,000 | $ 2,991,179 | |
| Citigroup, Inc., 2.666% to 1/29/2030, FLR (SOFR + 1.146%) to 1/29/2031 | 2,869,000 | 2,912,425 | ||
| $5,903,604 | ||||
| Pollution Control – 0.1% | ||||
| Republic Services, Inc., 3.95%, 5/15/2028 | $ | 1,245,000 | $ 1,378,847 | |
| Republic Services, Inc., 1.45%, 2/15/2031 | 998,000 | 928,036 | ||
| $2,306,883 | ||||
| Real Estate - Office – 0.1% | ||||
| Boston Properties, Inc., REIT, 2.55%, 4/01/2032 | $ | 1,316,000 | $ 1,306,160 | |
| Real Estate - Retail – 0.1% | ||||
| Brixmor Operating Partnership LP, REIT, 4.125%, 5/15/2029 | $ | 172,000 | $ 190,547 | |
| Brixmor Operating Partnership LP, REIT, 4.05%, 7/01/2030 | 1,681,000 | 1,834,279 | ||
| Realty Income Corp., REIT, 3.25%, 1/15/2031 | 569,000 | 611,824 | ||
| $2,636,650 | ||||
| Retailers – 0.2% | ||||
| Alimentation Couche-Tard, Inc., 3.439%, 5/13/2041 (n) | $ | 2,106,000 | $ 2,167,581 | |
| Best Buy Co., Inc., 4.45%, 10/01/2028 | 2,037,000 | 2,297,411 | ||
| Home Depot, Inc., 3.9%, 6/15/2047 | 1,113,000 | 1,300,283 | ||
| $5,765,275 | ||||
| Specialty Stores – 0.0% | ||||
| TJX Cos., Inc., 3.875%, 4/15/2030 | $ | 453,000 | $ 508,029 | |
| Telecommunications - Wireless – 0.5% | ||||
| American Tower Corp., REIT, 3%, 6/15/2023 | $ | 938,000 | $ 964,440 | |
| American Tower Corp., REIT, 3.6%, 1/15/2028 | 1,138,000 | 1,225,964 | ||
| American Tower Trust I, REIT, 3.07%, 3/15/2023 (n) | 3,121,000 | 3,123,558 | ||
| Crown Castle International Corp., 1.35%, 7/15/2025 | 701,000 | 691,511 | ||
| Crown Castle International Corp., 3.65%, 9/01/2027 | 2,565,000 | 2,755,494 | ||
| T-Mobile USA, Inc., 2.05%, 2/15/2028 | 1,892,000 | 1,878,013 | ||
| T-Mobile USA, Inc., 4.5%, 4/15/2050 | 2,244,000 | 2,626,385 | ||
| $13,265,365 | ||||
| Transportation - Services – 0.1% | ||||
| ERAC USA Finance LLC, 7%, 10/15/2037 (n) | $ | 1,826,000 | $ 2,690,089 | |
| Issuer | Shares/Par | Value ($) | ||
| Bonds – continued | ||||
| U.S. Government Agencies and Equivalents – 0.0% | ||||
| Small Business Administration, 4.35%, 7/01/2023 | $ | 675 | $ 688 | |
| Small Business Administration, 4.77%, 4/01/2024 | 43,820 | 45,059 | ||
| Small Business Administration, 5.18%, 5/01/2024 | 57,933 | 60,214 | ||
| Small Business Administration, 5.52%, 6/01/2024 | 3,394 | 3,516 | ||
| Small Business Administration, 4.99%, 9/01/2024 | 80,413 | 82,438 | ||
| Small Business Administration, 4.95%, 3/01/2025 | 2,968 | 3,045 | ||
| Small Business Administration, 5.11%, 8/01/2025 | 287,843 | 299,967 | ||
| $494,927 | ||||
| U.S. Treasury Obligations – 9.3% | ||||
| U.S. Treasury Bonds, 1.375%, 11/15/2040 | $ | 5,500,000 | $ 5,012,305 | |
| U.S. Treasury Bonds, 1.75%, 8/15/2041 | 4,700,000 | 4,556,797 | ||
| U.S. Treasury Bonds, 2.875%, 5/15/2043 | 9,096,000 | 10,569,836 | ||
| U.S. Treasury Bonds, 2.5%, 2/15/2045 | 9,797,000 | 10,774,021 | ||
| U.S. Treasury Bonds, 3%, 11/15/2045 | 3,638,000 | 4,370,432 | ||
| U.S. Treasury Bonds, 3%, 2/15/2048 | 8,760,000 | 10,691,991 | ||
| U.S. Treasury Bonds, 2.875%, 5/15/2049 | 900,000 | 1,084,148 | ||
| U.S. Treasury Bonds, 2.375%, 11/15/2049 (f) | 43,390,000 | 47,664,593 | ||
| U.S. Treasury Notes, 0.125%, 12/31/2022 | 16,450,000 | 16,399,233 | ||
| U.S. Treasury Notes, 1.375%, 1/31/2025 | 70,000,000 | 70,798,437 | ||
| U.S. Treasury Notes, 0.375%, 11/30/2025 | 68,500,000 | 66,431,621 | ||
| $248,353,414 | ||||
| Utilities - Electric Power – 0.6% | ||||
| American Transmission Systems, Inc., 2.65%, 1/15/2032 (n) | $ | 250,000 | $ 252,322 | |
| Duke Energy Corp., 2.65%, 9/01/2026 | 345,000 | 357,180 | ||
| Enel Finance International N.V., 2.65%, 9/10/2024 | 1,020,000 | 1,050,375 | ||
| Enel Finance International N.V., 4.75%, 5/25/2047 (n) | 392,000 | 480,766 | ||
| Evergy, Inc., 2.9%, 9/15/2029 | 1,644,000 | 1,682,743 | ||
| Exelon Corp., 4.05%, 4/15/2030 | 1,913,000 | 2,125,461 | ||
| FirstEnergy Corp., 3.4%, 3/01/2050 | 1,078,000 | 1,056,440 | ||
| Georgia Power Co., 3.7%, 1/30/2050 | 147,000 | 156,286 | ||
| Jersey Central Power & Light Co., 4.3%, 1/15/2026 (n) | 1,333,000 | 1,445,550 | ||
| Jersey Central Power & Light Co., 2.75%, 3/01/2032 (n) | 924,000 | 936,383 | ||
| Oncor Electric Delivery Co. LLC, 5.75%, 3/15/2029 | 2,486,000 | 3,041,954 | ||
| Pacific Gas & Electric Co., 2.1%, 8/01/2027 | 480,000 | 463,413 | ||
| Pacific Gas & Electric Co., 3%, 6/15/2028 | 1,410,000 | 1,420,236 | ||
| Pacific Gas & Electric Co., 3.3%, 8/01/2040 | 926,000 | 858,415 | ||
| Xcel Energy, Inc., 3.4%, 6/01/2030 | 968,000 | 1,038,663 | ||
| $16,366,187 | ||||
| Utilities - Gas – 0.0% | ||||
| East Ohio Gas Co., 2%, 6/15/2030 (n) | $ | 1,330,000 | $ 1,285,813 | |
| Total Bonds (Identified Cost, $994,448,562) | $ 1,023,678,300 | |||
| Convertible Preferred Stocks – 0.9% | ||||
| Automotive – 0.3% | ||||
| Aptiv PLC, 5.5% | 39,000 | $ 7,179,510 | ||
| Medical Equipment – 0.4% | ||||
| Boston Scientific Corp., 5.5% | 66,836 | $ 7,663,416 | ||
| Danaher Corp., 4.75% | 1,324 | 2,904,856 | ||
| $10,568,272 | ||||
| Issuer | Shares/Par | Value ($) | ||
| Convertible Preferred Stocks – continued | ||||
| Telecommunications - Wireless – 0.2% | ||||
| T-Mobile USA, Inc., 5.25% (a) | 5,432 | $ 5,676,711 | ||
| Total Convertible Preferred Stocks (Identified Cost, $17,381,351) | $ 23,424,493 | |||
| Preferred Stocks – 0.4% | ||||
| Computer Software - Systems – 0.2% | ||||
| Samsung Electronics Co. Ltd. | 105,835 | $ 6,338,971 | ||
| Consumer Products – 0.2% | ||||
| Henkel AG & Co. KGaA | 66,065 | $ 5,350,794 | ||
| Total Preferred Stocks (Identified Cost, $9,532,706) | $ 11,689,765 | |||
| Investment Companies (h) – 5.5% | ||||
| Money Market Funds – 5.5% | ||||
| MFS Institutional Money Market Portfolio, 0.07% (v) (Identified Cost, $146,917,118) | 146,917,118 | $ 146,917,118 | ||
| Other Assets, Less Liabilities – (5.0)% | (135,358,612) | |||
| Net Assets – 100.0% | $ 2,681,797,939 | |||
| (a) | Non-income producing security. |
| (f) | All or a portion of the security has been segregated as collateral for open futures contracts. |
| (h) | An affiliated issuer, which may be considered one in which the fund owns 5% or more of the outstanding voting securities, or a company which is under common control. At period end, the aggregate values of the fund's investments in affiliated issuers and in unaffiliated issuers were $146,917,118 and $2,670,239,433, respectively. |
| (i) | Interest only security for which the fund receives interest on notional principal (Par amount). Par amount shown is the notional principal and does not reflect the cost of the security. |
| (n) | Securities exempt from registration under Rule 144A of the Securities Act of 1933. These securities may be sold in the ordinary course of business in transactions exempt from registration, normally to qualified institutional buyers. At period end, the aggregate value of these securities was $176,399,515, representing 6.6% of net assets. |
| (v) | Affiliated issuer that is available only to investment companies managed by MFS. The rate quoted for the MFS Institutional Money Market Portfolio is the annualized seven-day yield of the fund at period end. |
| (z) | Restricted securities are not registered under the Securities Act of 1933 and are subject to legal restrictions on resale. These securities generally may be resold in transactions exempt from registration or to the public if the securities are subsequently registered. Disposal of these securities may involve time-consuming negotiations and prompt sale at an acceptable price may be difficult. The fund holds the following restricted securities: |
| Restricted Securities | Acquisition Date | Cost | Value |
| Acres PLC, 2021-FL2, “AS”, FLR, 1.84% (LIBOR - 1mo. + 1.75%), 1/15/2037 | 12/07/21 | $1,851,500 | $1,851,509 |
| ReadyCap Commercial Mortgage Trust, 2021-FL5, “A”, FLR, 1.102% (LIBOR - 1mo. + 1%), 4/25/2038 | 3/19/21 | 3,102,744 | 3,085,291 |
| ReadyCap Commercial Mortgage Trust, 2021-FL7, “B”, FLR, 1.902% (LIBOR - 1mo. + 1.8%), 11/25/2036 | 11/12/21 | 1,130,000 | 1,128,603 |
| Total Restricted Securities | $6,065,403 | ||
| % of Net assets | 0.2% |
| The following abbreviations are used in this report and are defined: | |
| ADR | American Depositary Receipt |
| CLO | Collateralized Loan Obligation |
| CMT | Constant Maturity Treasury |
| FGIC | Financial Guaranty Insurance Co. |
| FLR | Floating Rate. Interest rate resets periodically based on the parenthetically disclosed reference rate plus a spread (if any). The period-end rate reported may not be the current rate. All reference rates are USD unless otherwise noted. |
| LIBOR | London Interbank Offered Rate |
| NPFG | National Public Finance Guarantee Corp. |
| REIT | Real Estate Investment Trust |
| SOFR | Secured Overnight Financing Rate |
| TBA | To Be Announced |
| UMBS | Uniform Mortgage-Backed Security |
| Derivative Contracts at 12/31/21 | ||||||
| Futures Contracts | ||||||
| Description | Long/ Short | Currency | Contracts | Notional Amount | Expiration Date | Value/Unrealized Appreciation (Depreciation) |
| Asset Derivatives | ||||||
| Interest Rate Futures | ||||||
| U.S. Treasury Ultra Bond | Long | USD | 84 | $16,558,500 | March – 2022 | $273,576 |
| Liability Derivatives | ||||||
| Interest Rate Futures | ||||||
| U.S. Treasury Note 10 yr | Short | USD | 71 | $9,263,281 | March – 2022 | $(102,873) |
| U.S. Treasury Ultra Note 10 yr | Short | USD | 140 | 20,501,250 | March – 2022 | (384,670) |
| $(487,543) | ||||||
| Financial Statements | Statement of Assets and Liabilities |
| At 12/31/21Assets | |
| Investments in unaffiliated issuers, at value (identified cost, $1,874,517,643) | $2,670,239,433 |
| Investments in affiliated issuers, at value (identified cost, $146,917,118) | 146,917,118 |
| Cash | 202,337 |
| Receivables for | |
| Net daily variation margin on open futures contracts | 89,625 |
| TBA sale commitments | 4,408,436 |
| Fund shares sold | 395,924 |
| Interest and dividends | 7,466,121 |
| Receivable from investment adviser | 81,641 |
| Other assets | 8,197 |
| Total assets | $2,829,808,832 |
| Liabilities | |
| Payables for | |
| Investments purchased | $1,499,234 |
| TBA purchase commitments | 144,166,111 |
| Fund shares reacquired | 1,995,101 |
| Payable to affiliates | |
| Administrative services fee | 2,021 |
| Shareholder servicing costs | 861 |
| Distribution and/or service fees | 19,283 |
| Payable for independent Trustees' compensation | 18 |
| Accrued expenses and other liabilities | 328,264 |
| Total liabilities | $148,010,893 |
| Net assets | $2,681,797,939 |
| Net assets consist of | |
| Paid-in capital | $1,662,356,218 |
| Total distributable earnings (loss) | 1,019,441,721 |
| Net assets | $2,681,797,939 |
| Shares of beneficial interest outstanding | 97,651,887 |
| Net assets | Shares outstanding | Net asset value per share | |
| Initial Class | $1,274,331,361 | 45,867,942 | $27.78 |
| Service Class | 1,407,466,578 | 51,783,945 | 27.18 |
| Financial Statements | Statement of Operations |
| Year ended 12/31/21 | |
| Net investment income (loss) | |
| Income | |
| Dividends | $32,232,495 |
| Interest | 21,935,543 |
| Dividends from affiliated issuers | 67,681 |
| Other | 33,778 |
| Income on securities loaned | 9,565 |
| Foreign taxes withheld | (293,905) |
| Total investment income | $53,985,157 |
| Expenses | |
| Management fee | $17,582,462 |
| Distribution and/or service fees | 3,462,166 |
| Shareholder servicing costs | 69,968 |
| Administrative services fee | 354,589 |
| Independent Trustees' compensation | 37,902 |
| Custodian fee | 125,038 |
| Shareholder communications | 144,914 |
| Audit and tax fees | 79,085 |
| Legal fees | 14,355 |
| Miscellaneous | 74,075 |
| Total expenses | $21,944,554 |
| Reduction of expenses by investment adviser | (2,291,619) |
| Net expenses | $19,652,935 |
| Net investment income (loss) | $34,332,222 |
| Realized and unrealized gain (loss) | |
| Realized gain (loss) (identified cost basis) | |
| Unaffiliated issuers | $199,551,406 |
| Futures contracts | 45,113 |
| Foreign currency | (18,771) |
| Net realized gain (loss) | $199,577,748 |
| Change in unrealized appreciation or depreciation | |
| Unaffiliated issuers | $110,767,879 |
| Futures contracts | (213,967) |
| Translation of assets and liabilities in foreign currencies | (24,037) |
| Net unrealized gain (loss) | $110,529,875 |
| Net realized and unrealized gain (loss) | $310,107,623 |
| Change in net assets from operations | $344,439,845 |
| Financial Statements | Statements of Changes in Net Assets |
| Year ended | ||
| 12/31/21 | 12/31/20 | |
| Change in net assets | ||
| From operations | ||
| Net investment income (loss) | $34,332,222 | $43,611,772 |
| Net realized gain (loss) | 199,577,748 | 132,672,899 |
| Net unrealized gain (loss) | 110,529,875 | 42,984,940 |
| Change in net assets from operations | $344,439,845 | $219,269,611 |
| Total distributions to shareholders | $(173,338,152) | $(115,929,697) |
| Change in net assets from fund share transactions | $(28,062,297) | $(111,560,917) |
| Total change in net assets | $143,039,396 | $(8,221,003) |
| Net assets | ||
| At beginning of period | 2,538,758,543 | 2,546,979,546 |
| At end of period | $2,681,797,939 | $2,538,758,543 |
| Financial Statements | Financial Highlights |
| Initial Class | Year ended | ||||
| 12/31/21 | 12/31/20 | 12/31/19 | 12/31/18 | 12/31/17 | |
| Net asset value, beginning of period | $26.02 | $24.90 | $21.78 | $24.70 | $23.18 |
| Income (loss) from investment operations | |||||
| Net investment income (loss) (d) | $0.39 | $0.47 | $0.52 | $0.53 | $0.49 |
| Net realized and unrealized gain (loss) | 3.24 | 1.88 | 3.83 | (1.80) | 2.29 |
| Total from investment operations | $3.63 | $2.35 | $4.35 | $(1.27) | $2.78 |
| Less distributions declared to shareholders | |||||
| From net investment income | $(0.51) | $(0.57) | $(0.58) | $(0.54) | $(0.58) |
| From net realized gain | (1.36) | (0.66) | (0.65) | (1.11) | (0.68) |
| Total distributions declared to shareholders | $(1.87) | $(1.23) | $(1.23) | $(1.65) | $(1.26) |
| Net asset value, end of period (x) | $27.78 | $26.02 | $24.90 | $21.78 | $24.70 |
| Total return (%) (k)(r)(s)(x) | 14.12 | 9.81 | 20.38 | (5.61) | 12.30 |
| Ratios (%) (to average net assets) and Supplemental data: | |||||
| Expenses before expense reductions | 0.70 | 0.71 | 0.70 | 0.70 | 0.71 |
| Expenses after expense reductions | 0.61 | 0.61 | 0.62 | 0.62 | 0.63 |
| Net investment income (loss) | 1.43 | 1.95 | 2.18 | 2.20 | 2.04 |
| Portfolio turnover | 98 | 84 | 42 | 26 | 34 |
| Net assets at end of period (000 omitted) | $1,274,331 | $1,219,438 | $1,223,166 | $1,134,301 | $1,350,737 |
| Service Class | Year ended | ||||
| 12/31/21 | 12/31/20 | 12/31/19 | 12/31/18 | 12/31/17 | |
| Net asset value, beginning of period | $25.50 | $24.43 | $21.38 | $24.28 | $22.81 |
| Income (loss) from investment operations | |||||
| Net investment income (loss) (d) | $0.32 | $0.40 | $0.45 | $0.46 | $0.43 |
| Net realized and unrealized gain (loss) | 3.17 | 1.83 | 3.76 | (1.77) | 2.25 |
| Total from investment operations | $3.49 | $2.23 | $4.21 | $(1.31) | $2.68 |
| Less distributions declared to shareholders | |||||
| From net investment income | $(0.45) | $(0.50) | $(0.51) | $(0.48) | $(0.53) |
| From net realized gain | (1.36) | (0.66) | (0.65) | (1.11) | (0.68) |
| Total distributions declared to shareholders | $(1.81) | $(1.16) | $(1.16) | $(1.59) | $(1.21) |
| Net asset value, end of period (x) | $27.18 | $25.50 | $24.43 | $21.38 | $24.28 |
| Total return (%) (k)(r)(s)(x) | 13.84 | 9.52 | 20.12 | (5.87) | 12.02 |
| Ratios (%) (to average net assets) and Supplemental data: | |||||
| Expenses before expense reductions | 0.95 | 0.96 | 0.95 | 0.95 | 0.96 |
| Expenses after expense reductions | 0.86 | 0.86 | 0.87 | 0.87 | 0.88 |
| Net investment income (loss) | 1.17 | 1.71 | 1.93 | 1.95 | 1.79 |
| Portfolio turnover | 98 | 84 | 42 | 26 | 34 |
| Net assets at end of period (000 omitted) | $1,407,467 | $1,319,320 | $1,323,813 | $1,191,222 | $1,427,824 |
| (d) | Per share data is based on average shares outstanding. |
| (k) | The total return does not reflect expenses that apply to separate accounts. Inclusion of these charges would reduce the total return figures for all periods shown. |
| (r) | Certain expenses have been reduced without which performance would have been lower. |
| (s) | From time to time the fund may receive proceeds from litigation settlements, without which performance would be lower. |
| (x) | The net asset values and total returns have been calculated on net assets which include adjustments made in accordance with U.S. generally accepted accounting principles required at period end for financial reporting purposes. |
| Financial Instruments | Level 1 | Level 2 | Level 3 | Total |
| Equity Securities: | ||||
| United States | $1,559,796,009 | $5,676,711 | $— | $1,565,472,720 |
| Switzerland | 8,384,998 | 13,699,150 | — | 22,084,148 |
| Taiwan | 13,901,099 | — | — | 13,901,099 |
| United Kingdom | 13,776,328 | — | — | 13,776,328 |
| Germany | 8,941,173 | — | — | 8,941,173 |
| Ireland | 8,932,677 | — | — | 8,932,677 |
| France | 7,114,017 | — | — | 7,114,017 |
| South Korea | 6,338,971 | — | — | 6,338,971 |
| U.S. Treasury Bonds & U.S. Government Agencies & Equivalents | — | 248,848,341 | — | 248,848,341 |
| Non - U.S. Sovereign Debt | — | 6,504,900 | — | 6,504,900 |
| Municipal Bonds | — | 10,821,743 | — | 10,821,743 |
| U.S. Corporate Bonds | — | 238,520,125 | — | 238,520,125 |
| Residential Mortgage-Backed Securities | — | 290,762,152 | — | 290,762,152 |
| Commercial Mortgage-Backed Securities | — | 65,837,007 | — | 65,837,007 |
| Asset-Backed Securities (including CDOs) | — | 76,139,112 | — | 76,139,112 |
| Foreign Bonds | — | 86,244,920 | — | 86,244,920 |
| Mutual Funds | 146,917,118 | — | — | 146,917,118 |
| Total | $1,774,102,390 | $1,043,054,161 | $— | $2,817,156,551 |
| Other Financial Instruments | ||||
| Futures Contracts – Assets | $273,576 | $— | $— | $273,576 |
| Futures Contracts – Liabilities | (487,543) | — | — | (487,543) |
| Fair Value (a) | |||
| Risk | Derivative Contracts | Asset Derivatives | Liability Derivatives |
| Interest Rate | Futures Contracts | $273,576 | $(487,543) |
| Risk | Futures Contracts |
| Interest Rate | $45,113 |
| Risk | Futures Contracts |
| Interest Rate | $(213,967) |
| Year ended 12/31/21 | Year ended 12/31/20 | |
| Ordinary income (including any short-term capital gains) | $54,055,887 | $52,307,667 |
| Long-term capital gains | 119,282,265 | 63,622,030 |
| Total distributions | $173,338,152 | $115,929,697 |
| As of 12/31/21 | |
| Cost of investments | $2,033,813,624 |
| Gross appreciation | 794,497,256 |
| Gross depreciation | (11,368,296) |
| Net unrealized appreciation (depreciation) | $783,128,960 |
| Undistributed ordinary income | 50,553,384 |
| Undistributed long-term capital gain | 185,726,760 |
| Other temporary differences | 32,617 |
| Total distributable earnings (loss) | $1,019,441,721 |
| Year ended 12/31/21 | Year ended 12/31/20 | ||
| Initial Class | $83,092,525 | $56,532,062 | |
| Service Class | 90,245,627 | 59,397,635 | |
| Total | $173,338,152 | $115,929,697 |
| Up to $1 billion | 0.70% |
| In excess of $1 billion and up to $2.5 billion | 0.65% |
| In excess of $2.5 billion and up to $5 billion | 0.55% |
| In excess of $5 billion | 0.50% |
| Purchases | Sales | |
| U.S. Government securities | $2,160,095,490 | $2,073,652,399 |
| Non-U.S. Government securities | 402,257,572 | 638,171,899 |
| Year ended 12/31/21 | Year ended 12/31/20 | ||||
| Shares | Amount | Shares | Amount | ||
| Shares sold | |||||
| Initial Class | 1,346,454 | $36,950,675 | 1,626,873 | $38,823,750 | |
| Service Class | 3,578,860 | 96,647,907 | 2,911,465 | 68,599,977 | |
| 4,925,314 | $133,598,582 | 4,538,338 | $107,423,727 | ||
| Shares issued to shareholders in reinvestment of distributions | |||||
| Initial Class | 3,053,750 | $83,092,525 | 2,349,629 | $56,532,062 | |
| Service Class | 3,387,599 | 90,245,627 | 2,516,849 | 59,397,635 | |
| 6,441,349 | $173,338,152 | 4,866,478 | $115,929,697 | ||
| Year ended 12/31/21 | Year ended 12/31/20 | ||||
| Shares | Amount | Shares | Amount | ||
| Shares reacquired | |||||
| Initial Class | (5,396,442) | $(148,714,749) | (6,227,705) | $(149,473,288) | |
| Service Class | (6,922,547) | (186,284,282) | (7,882,515) | (185,441,053) | |
| (12,318,989) | $(334,999,031) | (14,110,220) | $(334,914,341) | ||
| Net change | |||||
| Initial Class | (996,238) | $(28,671,549) | (2,251,203) | $(54,117,476) | |
| Service Class | 43,912 | 609,252 | (2,454,201) | (57,443,441) | |
| (952,326) | $(28,062,297) | (4,705,404) | $(111,560,917) | ||
| Affiliated Issuers | Beginning Value | Purchases | Sales Proceeds | Realized Gain (Loss) | Change in Unrealized Appreciation or Depreciation | Ending Value |
| MFS Institutional Money Market Portfolio | $118,744,977 | $611,862,663 | $583,690,522 | $— | $— | $146,917,118 |
| Affiliated Issuers | Dividend Income | Capital Gain Distributions |
| MFS Institutional Money Market Portfolio | $67,681 | $— |
February 15, 2022
| Name, Age | Position(s) Held with Fund | Trustee/Officer Since(h) | Number of MFS Funds overseen by the Trustee | Principal Occupations During the Past Five Years | Other Directorships During the Past Five Years (j) | |||||
| INTERESTED TRUSTEES | ||||||||||
| Michael W. Roberge (k) (age 55) | Trustee | January 2021 | 135 | Massachusetts Financial Services Company, Chairman (since January 2021); Chief Executive Officer (since January 2017); Director; Chairman of the Board (since January 2022); President (until December 2018); Chief Investment Officer (until December 2018) | N/A | |||||
| INDEPENDENT TRUSTEES | ||||||||||
| John P. Kavanaugh (age 67) | Trustee and Chair of Trustees | January 2009 | 135 | Private investor | N/A | |||||
| Steven E. Buller (age 70) | Trustee | February 2014 | 135 | Private investor | N/A | |||||
| John A. Caroselli (age 67) | Trustee | March 2017 | 135 | Private investor; JC Global Advisors, LLC (management consulting), President (since 2015) | N/A | |||||
| Maureen R. Goldfarb (age 66) | Trustee | January 2009 | 135 | Private investor | N/A | |||||
| Peter D. Jones (age 66) | Trustee | January 2019 | 135 | Private investor | N/A | |||||
| James W. Kilman, Jr. (age 60) | Trustee | January 2019 | 135 | Burford Capital Limited (finance and investment management), Senior Advisor (since May 3, 2021), Chief Financial Officer (2019 - May 2, 2021); KielStrand Capital LLC (family office), Chief Executive Officer (since 2016) | Alpha-En Corporation, Director (2016-2019) | |||||
| Clarence Otis, Jr. (age 65) | Trustee | March 2017 | 135 | Private investor | VF Corporation, Director; Verizon Communications, Inc., Director; The Travelers Companies, Director | |||||
| Maryanne L. Roepke (age 65) | Trustee | May 2014 | 135 | Private investor | N/A | |||||
| Laurie J. Thomsen (age 64) | Trustee | March 2005 | 135 | Private investor | The Travelers Companies, Director; Dycom Industries, Inc., Director |
| Name, Age | Position(s) Held with Fund | Trustee/Officer Since(h) | Number of MFS Funds for which the Person is an Officer | Principal Occupations During the Past Five Years | ||||
| OFFICERS | ||||||||
| Christopher R. Bohane (k) (age 48) | Assistant Secretary and Assistant Clerk | July 2005 | 135 | Massachusetts Financial Services Company, Senior Vice President and Associate General Counsel | ||||
| Kino Clark (k) (age 53) | Assistant Treasurer | January 2012 | 135 | Massachusetts Financial Services Company, Vice President | ||||
| John W. Clark, Jr. (k) (age 54) | Assistant Treasurer | April 2017 | 135 | Massachusetts Financial Services Company, Vice President (since March 2017); Deutsche Bank (financial services), Department Head - Treasurer's Office (until February 2017) | ||||
| Thomas H. Connors (k) (age 62) | Assistant Secretary and Assistant Clerk | September 2012 | 135 | Massachusetts Financial Services Company, Vice President and Senior Counsel | ||||
| David L. DiLorenzo (k) (age 53) | President | July 2005 | 135 | Massachusetts Financial Services Company, Senior Vice President | ||||
| Heidi W. Hardin (k) (age 54) | Secretary and Clerk | April 2017 | 135 | Massachusetts Financial Services Company, Executive Vice President and General Counsel (since March 2017); Harris Associates (investment management), General Counsel (until January 2017) | ||||
| Brian E. Langenfeld (k) (age 48) | Assistant Secretary and Assistant Clerk | June 2006 | 135 | Massachusetts Financial Services Company, Vice President and Senior Counsel | ||||
| Amanda S. Mooradian (k) (age 42) | Assistant Secretary and Assistant Clerk | September 2018 | 135 | Massachusetts Financial Services Company, Assistant Vice President and Senior Counsel | ||||
| Susan A. Pereira (k) (age 51) | Assistant Secretary and Assistant Clerk | July 2005 | 135 | Massachusetts Financial Services Company, Vice President and Assistant General Counsel | ||||
| Kasey L. Phillips (k) (age 51) | Assistant Treasurer | September 2012 | 135 | Massachusetts Financial Services Company, Vice President | ||||
| Matthew A. Stowe (k) (age 47) | Assistant Secretary and Assistant Clerk | October 2014 | 135 | Massachusetts Financial Services Company, Vice President and Assistant General Counsel | ||||
| Martin J. Wolin (k) (age 54) | Chief Compliance Officer | July 2015 | 135 | Massachusetts Financial Services Company, Senior Vice President and Chief Compliance Officer | ||||
| James O. Yost (k) (age 61) | Treasurer | September 1990 | 135 | Massachusetts Financial Services Company, Senior Vice President |
| (h) | Date first appointed to serve as Trustee/Officer of an MFS Fund. Each Trustee has served continuously since appointment unless indicated otherwise. From January 2012 through December 2016, Messrs. DiLorenzo and Yost served as Treasurer and Deputy Treasurer of the Funds, respectively. |
| (j) | Directorships or trusteeships of companies required to report to the Securities and Exchange Commission (i.e., “public companies”). |
| (k) | “Interested person” of the Trust within the meaning of the Investment Company Act of 1940 (referred to as the 1940 Act), which is the principal federal law governing investment companies like the fund, as a result of a position with MFS. The address of MFS is 111 Huntington Avenue, Boston, Massachusetts 02199-7618. |
| Investment Adviser | Custodian |
| Massachusetts Financial Services Company 111 Huntington Avenue Boston, MA 02199-7618 | State Street Bank and Trust Company 1 Lincoln Street Boston, MA 02111-2900 |
| Distributor | Independent Registered Public Accounting Firm |
| MFS Fund Distributors, Inc. 111 Huntington Avenue Boston, MA 02199-7618 | Deloitte & Touche LLP 200 Berkeley Street Boston, MA 02116 |
| Portfolio Manager(s) | |
| Steven Gorham Alexander Mackey Joshua Marston Johnathan Munko Henry Peabody |

| FACTS | WHAT DOES MFS DO WITH YOUR PERSONAL INFORMATION? |
| Why? | Financial companies choose how they share your personal information. Federal law gives consumers the right to limit some but not all sharing. Federal law also requires us to tell you how we collect, share, and protect your personal information. Please read this notice carefully to understand what we do. |
| What? | The types of personal information we collect and share depend on the product or service you have with us. This information can include: |
| • Social Security number and account balances | |
| • Account transactions and transaction history | |
| • Checking account information and wire transfer instructions | |
| When you are no longer our customer, we continue to share your information as described in this notice. |
| How? | All financial companies need to share customers' personal information to run their everyday business. In the section below, we list the reasons financial companies can share their customers' personal information; the reasons MFS chooses to share; and whether you can limit this sharing. |
| Reasons we can share your personal information | Does MFS share? | Can you limit this sharing? |
| For our everyday business purposes – such as to process your transactions, maintain your account(s), respond to court orders and legal investigations, or report to credit bureaus | Yes | No |
| For our marketing purposes – to offer our products and services to you | No | We don't share |
| For joint marketing with other financial companies | No | We don't share |
| For our affiliates' everyday business purposes – information about your transactions and experiences | No | We don't share |
| For our affiliates' everyday business purposes – information about your creditworthiness | No | We don't share |
| For nonaffiliates to market to you | No | We don't share |
| Questions? | Call 800-225-2606 or go to mfs.com. |
| Who we are | |
| Who is providing this notice? | MFS Funds, MFS Investment Management, MFS Institutional Advisors, Inc., and MFS Heritage Trust Company. |
| What we do | |
| How does MFS protect my personal information? | To protect your personal information from unauthorized access and use, we use security measures that comply with federal law. These measures include procedural, electronic, and physical safeguards for the protection of the personal information we collect about you. |
| How does MFS collect my personal information? | We collect your personal information, for example, when you |
| • open an account or provide account information | |
| • direct us to buy securities or direct us to sell your securities | |
| • make a wire transfer | |
| We also collect your personal information from others, such as credit bureaus, affiliates, or other companies. | |
| Why can't I limit all sharing? | Federal law gives you the right to limit only |
| • sharing for affiliates' everyday business purposes – information about your creditworthiness | |
| • affiliates from using your information to market to you | |
| • sharing for nonaffiliates to market to you | |
| State laws and individual companies may give you additional rights to limit sharing. | |
| Definitions | |
| Affiliates | Companies related by common ownership or control. They can be financial and nonfinancial companies. |
| • MFS does not share personal information with affiliates, except for everyday business purposes as described on page one of this notice. | |
| Nonaffiliates | Companies not related by common ownership or control. They can be financial and nonfinancial companies. |
| • MFS does not share with nonaffiliates so they can market to you. | |
| Joint marketing | A formal agreement between nonaffiliated financial companies that together market financial products or services to you. |
| • MFS doesn't jointly market. | |
| Other important information |
| If you own an MFS product or receive an MFS service in the name of a third party such as a bank or broker-dealer, their privacy policy may apply to you instead of ours. |


| 1 | |
| 2 | |
| 3 | |
| 5 | |
| 7 | |
| 8 | |
| 11 | |
| 12 | |
| 13 | |
| 14 | |
| 16 | |
| 24 | |
| 25 | |
| 28 | |
| 30 | |
| 30 | |
| 30 | |
| 30 | |
| 30 | |
| 31 |


| NextEra Energy, Inc. | 9.6% |
| Southern Co. | 5.8% |
| Exelon Corp. | 5.6% |
| Dominion Energy, Inc. | 4.9% |
| Sempra Energy | 4.0% |
| EDP Renovaveis S.A. | 4.0% |
| PG&E Corp. | 3.6% |
| Edison International | 3.2% |
| Iberdrola S.A. | 3.2% |
| Enel S.p.A. | 3.0% |
| Utilities-Electric Power | 84.7% |
| Telecommunications - Wireless | 7.3% |
| Natural Gas - Distribution | 3.2% |
| Cable TV | 1.8% |
| Telephone Services | 1.0% |
| United States | 70.7% |
| Spain | 5.6% |
| Portugal | 5.3% |
| United Kingdom | 4.3% |
| Germany | 4.1% |
| Italy | 3.0% |
| Canada | 2.0% |
| Brazil | 0.9% |
| China | 0.7% |
| Other Countries | 3.4% |
| (x) | Represents the portfolio’s exposure to issuer countries as a percentage of a portfolio’s net assets. For purposes of this presentation, United States includes Cash & Cash Equivalents and Other. |
| (b) | Security is not a benchmark constituent. |
| (h) | Security was not held in the portfolio at period end. |
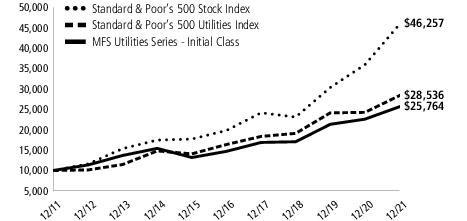
| Share Class | Class Inception Date | 1-yr | 5-yr | 10-yr |
| Initial Class | 1/03/95 | 14.09% | 11.89% | 9.93% |
| Service Class | 5/01/00 | 13.82% | 11.61% | 9.65% |
| Standard & Poor's 500 Stock Index (f) | 28.71% | 18.47% | 16.55% |
| Standard & Poor's 500 Utilities Index (f) | 17.67% | 11.76% | 11.06% |
| (f) | Source: FactSet Research Systems Inc. |
| (g) | “Standard & Poor's®” and “S&P®” are registered trademarks of Standard & Poor's Financial Services LLC (“S&P”) and Dow Jones is a registered trademark of Dow Jones Trademark Holdings LLC (“Dow Jones”) and have been licensed for use by S&P Dow Jones Indices LLC and sublicensed for certain purposes by MFS. The S&P 500® is a product of S&P Dow Jones Indices LLC, and has been licensed for use by MFS. MFS's product(s) is not sponsored, endorsed, sold, or promoted by S&P Dow Jones Indices LLC, Dow Jones, S&P, or their respective affiliates, and neither S&P Dow Jones Indices LLC, Dow Jones, S&P, nor their respective affiliates make any representation regarding the advisability of investing in such product(s). |
July 1, 2021 through December 31, 2021
| Share Class | Annualized Expense Ratio | Beginning Account Value 7/01/21 | Ending Account Value 12/31/21 | Expenses Paid During Period (p) 7/01/21-12/31/21 | |
| Initial Class | Actual | 0.77% | $1,000.00 | $1,107.38 | $4.09 |
| Hypothetical (h) | 0.77% | $1,000.00 | $1,021.32 | $3.92 | |
| Service Class | Actual | 1.02% | $1,000.00 | $1,106.03 | $5.41 |
| Hypothetical (h) | 1.02% | $1,000.00 | $1,020.06 | $5.19 |
| (h) | 5% class return per year before expenses. |
| (p) | “Expenses Paid During Period” are equal to each class's annualized expense ratio, as shown above, multiplied by the average account value over the period, multiplied by 184/365 (to reflect the one-half year period). |
| Issuer | Shares/Par | Value ($) | ||
| Common Stocks – 98.1% | ||||
| Cable TV – 1.8% | ||||
| Charter Communications, Inc., “A” (a) | 36,487 | $ 23,788,430 | ||
| Natural Gas - Distribution – 3.2% | ||||
| Atmos Energy Corp. | 241,435 | $ 25,295,145 | ||
| China Resources Gas Group Ltd. | 1,592,000 | 8,993,543 | ||
| UGI Corp. | 156,167 | 7,169,627 | ||
| $41,458,315 | ||||
| Natural Gas - Pipeline – 0.5% | ||||
| Equitrans Midstream Corp. | 616,699 | $ 6,376,668 | ||
| Telecommunications - Wireless – 7.3% | ||||
| Advanced Info Service Public Co. Ltd. | 1,242,600 | $ 8,555,546 | ||
| Cellnex Telecom S.A. | 548,207 | 31,828,922 | ||
| KDDI Corp. | 229,600 | 6,710,555 | ||
| Rogers Communications, Inc., “B” | 250,540 | 11,929,344 | ||
| SBA Communications Corp., REIT | 63,156 | 24,568,947 | ||
| T-Mobile US, Inc. (a) | 98,940 | 11,475,061 | ||
| $95,068,375 | ||||
| Telephone Services – 1.1% | ||||
| Hellenic Telecommunications Organization S.A. | 478,598 | $ 8,857,083 | ||
| Telesites S.A.B. de C.V. | 4,604,800 | 4,713,761 | ||
| $13,570,844 | ||||
| Utilities - Electric Power – 84.2% | ||||
| AES Corp. | 1,019,067 | $ 24,763,328 | ||
| ALLETE, Inc. | 103,490 | 6,866,562 | ||
| Alliant Energy Corp. | 402,330 | 24,731,225 | ||
| Ameren Corp. | 68,262 | 6,076,001 | ||
| American Electric Power Co., Inc. | 309,362 | 27,523,937 | ||
| CenterPoint Energy, Inc. | 1,072,860 | 29,943,523 | ||
| CLP Holdings Ltd. | 705,000 | 7,120,025 | ||
| Dominion Energy, Inc. | 809,130 | 63,565,253 | ||
| DTE Energy Co. | 265,625 | 31,752,812 | ||
| Duke Energy Corp. | 350,313 | 36,747,834 | ||
| E.ON SE | 1,404,454 | 19,494,646 | ||
| Edison International | 611,646 | 41,744,839 | ||
| EDP Renovaveis S.A. | 2,069,767 | 51,605,794 | ||
| Electricite de France S.A. | 640,653 | 7,534,528 | ||
| Emera, Inc. | 290,051 | 14,496,244 | ||
| Enel S.p.A. | 4,824,363 | 38,421,065 | ||
| Energias de Portugal S.A. | 3,185,812 | 17,525,885 | ||
| Energisa S.A., IEU | 393,800 | 3,136,967 | ||
| Entergy Corp. | 130,614 | 14,713,667 | ||
| Equatorial Energia S.A. | 1,309,700 | 5,316,394 | ||
| Evergy, Inc. | 394,342 | 27,055,805 | ||
| Exelon Corp. | 1,259,808 | 72,766,513 | ||
| FirstEnergy Corp. | 654,104 | 27,204,185 | ||
| Iberdrola S.A. | 3,495,418 | 40,960,957 | ||
| National Grid PLC | 1,455,082 | 20,873,038 | ||
| Neoenergia S.A. | 1,139,000 | 3,312,711 | ||
| NextEra Energy Partners LP | 40,075 | 3,382,330 | ||
| NextEra Energy, Inc. | 1,336,902 | 124,813,172 | ||
| Issuer | Shares/Par | Value ($) | ||
| Common Stocks – continued | ||||
| Utilities - Electric Power – continued | ||||
| PG&E Corp. (a) | 3,837,586 | $ 46,588,294 | ||
| Pinnacle West Capital Corp. | 226,528 | 15,990,612 | ||
| Portland General Electric Co. | 130,249 | 6,892,777 | ||
| Public Service Enterprise Group, Inc. | 366,769 | 24,474,495 | ||
| RWE AG | 841,301 | 34,181,475 | ||
| Sempra Energy | 392,646 | 51,939,214 | ||
| Southern Co. | 1,103,733 | 75,694,009 | ||
| SSE PLC | 1,555,348 | 34,715,428 | ||
| Vistra Corp. | 288,416 | 6,567,233 | ||
| $ 1,090,492,777 | ||||
| Total Common Stocks (Identified Cost, $870,259,776) | $1,270,755,409 | |||
| Convertible Preferred Stocks – 0.5% | ||||
| Utilities - Electric Power – 0.5% | ||||
| DTE Energy Co., 6.25% | 64,750 | $ 3,324,265 | ||
| NextEra Energy, Inc., 5.279% | 64,600 | 3,717,084 | ||
| Total Convertible Preferred Stocks (Identified Cost, $5,480,872) | $ 7,041,349 | |||
| Investment Companies (h) – 1.0% | ||||
| Money Market Funds – 1.0% | ||||
| MFS Institutional Money Market Portfolio, 0.07% (v) (Identified Cost, $13,091,908) | 13,091,908 | $ 13,091,908 | ||
| Other Assets, Less Liabilities – 0.4% | 5,194,323 | |||
| Net Assets – 100.0% | $1,296,082,989 | |||
| (a) | Non-income producing security. | |||
| (h) | An affiliated issuer, which may be considered one in which the fund owns 5% or more of the outstanding voting securities, or a company which is under common control. At period end, the aggregate values of the fund's investments in affiliated issuers and in unaffiliated issuers were $13,091,908 and $1,277,796,758, respectively. | |||
| (v) | Affiliated issuer that is available only to investment companies managed by MFS. The rate quoted for the MFS Institutional Money Market Portfolio is the annualized seven-day yield of the fund at period end. |
| The following abbreviations are used in this report and are defined: | |
| IEU | International Equity Unit |
| REIT | Real Estate Investment Trust |
| Abbreviations indicate amounts shown in currencies other than the U.S. dollar. All amounts are stated in U.S. dollars unless otherwise indicated. A list of abbreviations is shown below: | |
| CAD | Canadian Dollar |
| EUR | Euro |
| GBP | British Pound |
| Derivative Contracts at 12/31/21 | ||||||
| Forward Foreign Currency Exchange Contracts | ||||||
| Currency Purchased | Currency Sold | Counterparty | Settlement Date | Unrealized Appreciation (Depreciation) | ||
| Asset Derivatives | ||||||
| CAD | 1,440,215 | USD | 1,120,764 | HSBC Bank | 1/14/2022 | $ 17,782 |
| CAD | 216,316 | USD | 168,541 | Merrill Lynch International | 1/14/2022 | 2,465 |
| CAD | 148,726 | USD | 116,115 | Morgan Stanley Capital Services, Inc. | 1/14/2022 | 1,459 |
| EUR | 18,547 | USD | 21,040 | Citibank N.A. | 1/14/2022 | 80 |
| EUR | 76,045 | USD | 86,067 | Credit Suisse Group | 1/14/2022 | 528 |
| Forward Foreign Currency Exchange Contracts - continued | ||||||
| Currency Purchased | Currency Sold | Counterparty | Settlement Date | Unrealized Appreciation (Depreciation) | ||
| Asset Derivatives - continued | ||||||
| EUR | 160,496 | USD | 181,758 | HSBC Bank | 1/14/2022 | $ 1,003 |
| EUR | 1,527,019 | USD | 1,724,982 | Morgan Stanley Capital Services, Inc. | 1/14/2022 | 13,870 |
| EUR | 2,861,383 | USD | 3,227,841 | State Street Bank Corp. | 1/14/2022 | 30,483 |
| GBP | 1,265,953 | USD | 1,677,786 | BNP Paribas S.A. | 1/14/2022 | 35,711 |
| GBP | 667,781 | USD | 885,741 | HSBC Bank | 1/14/2022 | 18,117 |
| GBP | 918,335 | USD | 1,213,277 | Morgan Stanley Capital Services, Inc. | 1/14/2022 | 29,711 |
| USD | 17,133,870 | CAD | 21,545,756 | JPMorgan Chase Bank N.A. | 1/14/2022 | 101,105 |
| USD | 68,183,150 | EUR | 58,647,884 | Barclays Bank PLC | 4/12/2022 | 1,269,485 |
| USD | 461,328 | EUR | 398,069 | Credit Suisse Group | 1/14/2022 | 8,038 |
| USD | 4,202,863 | EUR | 3,615,485 | Merrill Lynch International | 1/14/2022 | 85,824 |
| USD | 84,616,747 | EUR | 72,796,615 | State Street Bank Corp. | 1/14/2022 | 1,721,524 |
| USD | 3,948,600 | EUR | 3,408,941 | UBS AG | 1/14/2022 | 66,759 |
| USD | 37,567,455 | GBP | 27,587,063 | JPMorgan Chase Bank N.A. | 1/14/2022 | 227,707 |
| $3,631,651 | ||||||
| Liability Derivatives | ||||||
| EUR | 569,482 | USD | 658,468 | HSBC Bank | 1/14/2022 | $ (9,985) |
| EUR | 168,301 | USD | 196,958 | Merrill Lynch International | 1/14/2022 | (5,309) |
| EUR | 974,384 | USD | 1,134,725 | Morgan Stanley Capital Services, Inc. | 1/14/2022 | (25,171) |
| EUR | 136,758 | USD | 158,338 | State Street Bank Corp. | 1/14/2022 | (2,609) |
| EUR | 421,991 | USD | 488,219 | UBS AG | 1/14/2022 | (7,688) |
| GBP | 362,139 | USD | 493,036 | Citibank N.A. | 1/14/2022 | (2,873) |
| USD | 226,190 | CAD | 287,186 | Citibank N.A. | 1/14/2022 | (841) |
| USD | 1,423,033 | EUR | 1,262,623 | BNP Paribas S.A. | 1/14/2022 | (14,746) |
| USD | 806,636 | EUR | 716,139 | Citibank N.A. | 1/14/2022 | (8,849) |
| USD | 474,343 | EUR | 418,621 | Credit Suisse Group | 1/14/2022 | (2,351) |
| USD | 423,642 | EUR | 373,575 | HSBC Bank | 1/14/2022 | (1,757) |
| USD | 1,254,485 | EUR | 1,106,874 | Morgan Stanley Capital Services, Inc. | 1/14/2022 | (5,938) |
| USD | 471,819 | GBP | 352,628 | HSBC Bank | 1/14/2022 | (5,471) |
| USD | 159,471 | GBP | 119,437 | Morgan Stanley Capital Services, Inc. | 1/14/2022 | (2,190) |
| USD | 251,298 | GBP | 187,224 | State Street Bank Corp. | 1/14/2022 | (2,114) |
| $ (97,892) | ||||||
| Financial Statements | Statement of Assets and Liabilities |
| At 12/31/21Assets | |
| Investments in unaffiliated issuers, at value (identified cost, $875,740,648) | $1,277,796,758 |
| Investments in affiliated issuers, at value (identified cost, $13,091,908) | 13,091,908 |
| Cash | 4,657 |
| Foreign currency, at value (identified cost, $46,746) | 46,826 |
| Receivables for | |
| Forward foreign currency exchange contracts | 3,631,651 |
| Investments sold | 659,841 |
| Fund shares sold | 144,757 |
| Interest and dividends | 2,596,480 |
| Other assets | 4,018 |
| Total assets | $1,297,976,896 |
| Liabilities | |
| Payables for | |
| Forward foreign currency exchange contracts | $97,892 |
| Fund shares reacquired | 1,155,888 |
| Payable to affiliates | |
| Investment adviser | 51,282 |
| Administrative services fee | 1,004 |
| Shareholder servicing costs | 860 |
| Distribution and/or service fees | 9,712 |
| Payable for independent Trustees' compensation | 11 |
| Deferred country tax expense payable | 347,927 |
| Accrued expenses and other liabilities | 229,331 |
| Total liabilities | $1,893,907 |
| Net assets | $1,296,082,989 |
| Net assets consist of | |
| Paid-in capital | $821,243,494 |
| Total distributable earnings (loss) | 474,839,495 |
| Net assets | $1,296,082,989 |
| Shares of beneficial interest outstanding | 34,193,241 |
| Net assets | Shares outstanding | Net asset value per share | |
| Initial Class | $584,215,734 | 15,248,576 | $38.31 |
| Service Class | 711,867,255 | 18,944,665 | 37.58 |
| Financial Statements | Statement of Operations |
| Year ended 12/31/21 | |
| Net investment income (loss) | |
| Income | |
| Dividends | $34,578,610 |
| Non-cash dividends | 2,394,693 |
| Other | 56,389 |
| Income on securities loaned | 30,292 |
| Dividends from affiliated issuers | 5,551 |
| Foreign taxes withheld | (1,023,692) |
| Total investment income | $36,041,843 |
| Expenses | |
| Management fee | $9,107,138 |
| Distribution and/or service fees | 1,706,097 |
| Shareholder servicing costs | 57,191 |
| Administrative services fee | 170,340 |
| Independent Trustees' compensation | 18,759 |
| Custodian fee | 139,821 |
| Shareholder communications | 77,072 |
| Audit and tax fees | 68,093 |
| Legal fees | 7,366 |
| Miscellaneous | 36,574 |
| Total expenses | $11,388,451 |
| Reduction of expenses by investment adviser | (156,003) |
| Net expenses | $11,232,448 |
| Net investment income (loss) | $24,809,395 |
| Realized and unrealized gain (loss) | |
| Realized gain (loss) (identified cost basis) | |
| Unaffiliated issuers (net of $89,159 country tax) | $32,757,394 |
| Forward foreign currency exchange contracts | 4,375,212 |
| Foreign currency | (47,838) |
| Net realized gain (loss) | $37,084,768 |
| Change in unrealized appreciation or depreciation | |
| Unaffiliated issuers (net of $300,332 increase in deferred country tax) | $92,157,945 |
| Forward foreign currency exchange contracts | 8,286,466 |
| Translation of assets and liabilities in foreign currencies | (68,643) |
| Net unrealized gain (loss) | $100,375,768 |
| Net realized and unrealized gain (loss) | $137,460,536 |
| Change in net assets from operations | $162,269,931 |
| Financial Statements | Statements of Changes in Net Assets |
| Year ended | ||
| 12/31/21 | 12/31/20 | |
| Change in net assets | ||
| From operations | ||
| Net investment income (loss) | $24,809,395 | $28,889,068 |
| Net realized gain (loss) | 37,084,768 | 30,463,188 |
| Net unrealized gain (loss) | 100,375,768 | (549,017) |
| Change in net assets from operations | $162,269,931 | $58,803,239 |
| Total distributions to shareholders | $(61,909,232) | $(56,937,274) |
| Change in net assets from fund share transactions | $(21,147,055) | $(75,290,012) |
| Total change in net assets | $79,213,644 | $(73,424,047) |
| Net assets | ||
| At beginning of period | 1,216,869,345 | 1,290,293,392 |
| At end of period | $1,296,082,989 | $1,216,869,345 |
| Financial Statements | Financial Highlights |
| Initial Class | Year ended | ||||
| 12/31/21 | 12/31/20 | 12/31/19 | 12/31/18 | 12/31/17 | |
| Net asset value, beginning of period | $35.33 | $35.18 | $29.38 | $29.50 | $26.81 |
| Income (loss) from investment operations | |||||
| Net investment income (loss) (d) | $0.78 | $0.87 | $0.90 | $0.89 | $0.81 |
| Net realized and unrealized gain (loss) | 4.11 | 0.99 | 6.37 | (0.56) | 3.17 |
| Total from investment operations | $4.89 | $1.86 | $7.27 | $0.33 | $3.98 |
| Less distributions declared to shareholders | |||||
| From net investment income | $(0.65) | $(0.84) | $(1.37) | $(0.33) | $(1.29) |
| From net realized gain | (1.26) | (0.87) | (0.10) | (0.12) | — |
| Total distributions declared to shareholders | $(1.91) | $(1.71) | $(1.47) | $(0.45) | $(1.29) |
| Net asset value, end of period (x) | $38.31 | $35.33 | $35.18 | $29.38 | $29.50 |
| Total return (%) (k)(r)(s)(x) | 14.09 | 5.90 | 25.07 | 1.06 | 14.83 |
| Ratios (%) (to average net assets) and Supplemental data: | |||||
| Expenses before expense reductions | 0.79 | 0.80 | 0.79 | 0.78 | 0.80 |
| Expenses after expense reductions | 0.77 | 0.79 | 0.78 | 0.78 | 0.79 |
| Net investment income (loss) | 2.16 | 2.63 | 2.69 | 2.98 | 2.78 |
| Portfolio turnover | 16 | 32 | 28 | 27 | 27 |
| Net assets at end of period (000 omitted) | $584,216 | $537,240 | $556,301 | $492,930 | $561,744 |
| Service Class | Year ended | ||||
| 12/31/21 | 12/31/20 | 12/31/19 | 12/31/18 | 12/31/17 | |
| Net asset value, beginning of period | $34.69 | $34.56 | $28.86 | $28.98 | $26.37 |
| Income (loss) from investment operations | |||||
| Net investment income (loss) (d) | $0.68 | $0.77 | $0.80 | $0.81 | $0.73 |
| Net realized and unrealized gain (loss) | 4.03 | 0.97 | 6.27 | (0.56) | 3.09 |
| Total from investment operations | $4.71 | $1.74 | $7.07 | $0.25 | $3.82 |
| Less distributions declared to shareholders | |||||
| From net investment income | $(0.56) | $(0.74) | $(1.27) | $(0.25) | $(1.21) |
| From net realized gain | (1.26) | (0.87) | (0.10) | (0.12) | — |
| Total distributions declared to shareholders | $(1.82) | $(1.61) | $(1.37) | $(0.37) | $(1.21) |
| Net asset value, end of period (x) | $37.58 | $34.69 | $34.56 | $28.86 | $28.98 |
| Total return (%) (k)(r)(s)(x) | 13.82 | 5.62 | 24.80 | 0.81 | 14.49 |
| Ratios (%) (to average net assets) and Supplemental data: | |||||
| Expenses before expense reductions | 1.04 | 1.05 | 1.04 | 1.04 | 1.05 |
| Expenses after expense reductions | 1.02 | 1.04 | 1.03 | 1.03 | 1.04 |
| Net investment income (loss) | 1.91 | 2.38 | 2.44 | 2.76 | 2.53 |
| Portfolio turnover | 16 | 32 | 28 | 27 | 27 |
| Net assets at end of period (000 omitted) | $711,867 | $679,629 | $733,992 | $727,201 | $1,021,211 |
| (d) | Per share data is based on average shares outstanding. |
| (k) | The total return does not reflect expenses that apply to separate accounts. Inclusion of these charges would reduce the total return figures for all periods shown. |
| (r) | Certain expenses have been reduced without which performance would have been lower. |
| (s) | From time to time the fund may receive proceeds from litigation settlements, without which performance would be lower. |
| (x) | The net asset values and total returns have been calculated on net assets which include adjustments made in accordance with U.S. generally accepted accounting principles required at period end for financial reporting purposes. |
| Financial Instruments | Level 1 | Level 2 | Level 3 | Total |
| Equity Securities: | ||||
| United States | $897,512,847 | $— | $— | $897,512,847 |
| Spain | — | 72,789,879 | — | 72,789,879 |
| Portugal | 69,131,679 | — | — | 69,131,679 |
| United Kingdom | 55,588,466 | — | — | 55,588,466 |
| Germany | 19,494,646 | 34,181,475 | — | 53,676,121 |
| Italy | — | 38,421,065 | — | 38,421,065 |
| Canada | 26,425,588 | — | — | 26,425,588 |
| Brazil | 11,766,072 | — | — | 11,766,072 |
| China | 8,993,543 | — | — | 8,993,543 |
| Other Countries | 34,935,952 | 8,555,546 | — | 43,491,498 |
| Mutual Funds | 13,091,908 | — | — | 13,091,908 |
| Total | $1,136,940,701 | $153,947,965 | $— | $1,290,888,666 |
| Other Financial Instruments | ||||
| Forward Foreign Currency Exchange Contracts – Assets | $— | $3,631,651 | $— | $3,631,651 |
| Forward Foreign Currency Exchange Contracts – Liabilities | — | (97,892) | — | (97,892) |
| Fair Value | |||
| Risk | Derivative Contracts | Asset Derivatives | Liability Derivatives |
| Foreign Exchange | Forward Foreign Currency Exchange Contracts | $3,631,651 | $(97,892) |
| Risk | Forward Foreign Currency Exchange Contracts |
| Foreign Exchange | $4,375,212 |
| Risk | Forward Foreign Currency Exchange Contracts |
| Foreign Exchange | $8,286,466 |
| Year ended 12/31/21 | Year ended 12/31/20 | |
| Ordinary income (including any short-term capital gains) | $19,917,214 | $35,969,261 |
| Long-term capital gains | 41,992,018 | 20,968,013 |
| Total distributions | $61,909,232 | $56,937,274 |
| As of 12/31/21 | |
| Cost of investments | $897,395,513 |
| Gross appreciation | 399,663,045 |
| Gross depreciation | (2,636,133) |
| Net unrealized appreciation (depreciation) | $397,026,912 |
| Undistributed ordinary income | 41,785,964 |
| Undistributed long-term capital gain | 36,033,078 |
| Other temporary differences | (6,459) |
| Total distributable earnings (loss) | $474,839,495 |
| Year ended 12/31/21 | Year ended 12/31/20 | ||
| Initial Class | $28,006,297 | $25,547,426 | |
| Service Class | 33,902,935 | 31,389,848 | |
| Total | $61,909,232 | $56,937,274 |
| Up to $1 billion | 0.75% |
| In excess of $1 billion and up to $3 billion | 0.70% |
| In excess of $3 billion | 0.65% |
| Year ended 12/31/21 | Year ended 12/31/20 | ||||
| Shares | Amount | Shares | Amount | ||
| Shares sold | |||||
| Initial Class | 847,836 | $30,773,859 | 693,191 | $22,914,614 | |
| Service Class | 1,266,913 | 45,089,704 | 1,582,964 | 49,564,692 | |
| 2,114,749 | $75,863,563 | 2,276,155 | $72,479,306 | ||
| Year ended 12/31/21 | Year ended 12/31/20 | ||||
| Shares | Amount | Shares | Amount | ||
| Shares issued to shareholders in reinvestment of distributions | |||||
| Initial Class | 763,739 | $28,006,297 | 813,353 | $25,547,426 | |
| Service Class | 941,748 | 33,902,935 | 1,016,840 | 31,389,848 | |
| 1,705,487 | $61,909,232 | 1,830,193 | $56,937,274 | ||
| Shares reacquired | |||||
| Initial Class | (1,570,699) | $(57,115,573) | (2,109,750) | $(69,285,092) | |
| Service Class | (2,857,934) | (101,804,277) | (4,245,334) | (135,421,500) | |
| (4,428,633) | $(158,919,850) | (6,355,084) | $(204,706,592) | ||
| Net change | |||||
| Initial Class | 40,876 | $1,664,583 | (603,206) | $(20,823,052) | |
| Service Class | (649,273) | (22,811,638) | (1,645,530) | (54,466,960) | |
| (608,397) | $(21,147,055) | (2,248,736) | $(75,290,012) | ||
| Affiliated Issuers | Beginning Value | Purchases | Sales Proceeds | Realized Gain (Loss) | Change in Unrealized Appreciation or Depreciation | Ending Value |
| MFS Institutional Money Market Portfolio | $4,847,086 | $132,474,221 | $124,229,399 | $— | $— | $13,091,908 |
| Affiliated Issuers | Dividend Income | Capital Gain Distributions |
| MFS Institutional Money Market Portfolio | $5,551 | $— |
February 15, 2022
| Name, Age | Position(s) Held with Fund | Trustee/Officer Since(h) | Number of MFS Funds overseen by the Trustee | Principal Occupations During the Past Five Years | Other Directorships During the Past Five Years (j) | |||||
| INTERESTED TRUSTEES | ||||||||||
| Michael W. Roberge (k) (age 55) | Trustee | January 2021 | 135 | Massachusetts Financial Services Company, Chairman (since January 2021); Chief Executive Officer (since January 2017); Director; Chairman of the Board (since January 2022); President (until December 2018); Chief Investment Officer (until December 2018) | N/A | |||||
| INDEPENDENT TRUSTEES | ||||||||||
| John P. Kavanaugh (age 67) | Trustee and Chair of Trustees | January 2009 | 135 | Private investor | N/A | |||||
| Steven E. Buller (age 70) | Trustee | February 2014 | 135 | Private investor | N/A | |||||
| John A. Caroselli (age 67) | Trustee | March 2017 | 135 | Private investor; JC Global Advisors, LLC (management consulting), President (since 2015) | N/A | |||||
| Maureen R. Goldfarb (age 66) | Trustee | January 2009 | 135 | Private investor | N/A | |||||
| Peter D. Jones (age 66) | Trustee | January 2019 | 135 | Private investor | N/A | |||||
| James W. Kilman, Jr. (age 60) | Trustee | January 2019 | 135 | Burford Capital Limited (finance and investment management), Senior Advisor (since May 3, 2021), Chief Financial Officer (2019 - May 2, 2021); KielStrand Capital LLC (family office), Chief Executive Officer (since 2016) | Alpha-En Corporation, Director (2016-2019) | |||||
| Clarence Otis, Jr. (age 65) | Trustee | March 2017 | 135 | Private investor | VF Corporation, Director; Verizon Communications, Inc., Director; The Travelers Companies, Director | |||||
| Maryanne L. Roepke (age 65) | Trustee | May 2014 | 135 | Private investor | N/A | |||||
| Laurie J. Thomsen (age 64) | Trustee | March 2005 | 135 | Private investor | The Travelers Companies, Director; Dycom Industries, Inc., Director |
| Name, Age | Position(s) Held with Fund | Trustee/Officer Since(h) | Number of MFS Funds for which the Person is an Officer | Principal Occupations During the Past Five Years | ||||
| OFFICERS | ||||||||
| Christopher R. Bohane (k) (age 48) | Assistant Secretary and Assistant Clerk | July 2005 | 135 | Massachusetts Financial Services Company, Senior Vice President and Associate General Counsel | ||||
| Kino Clark (k) (age 53) | Assistant Treasurer | January 2012 | 135 | Massachusetts Financial Services Company, Vice President | ||||
| John W. Clark, Jr. (k) (age 54) | Assistant Treasurer | April 2017 | 135 | Massachusetts Financial Services Company, Vice President (since March 2017); Deutsche Bank (financial services), Department Head - Treasurer's Office (until February 2017) | ||||
| Thomas H. Connors (k) (age 62) | Assistant Secretary and Assistant Clerk | September 2012 | 135 | Massachusetts Financial Services Company, Vice President and Senior Counsel | ||||
| David L. DiLorenzo (k) (age 53) | President | July 2005 | 135 | Massachusetts Financial Services Company, Senior Vice President | ||||
| Heidi W. Hardin (k) (age 54) | Secretary and Clerk | April 2017 | 135 | Massachusetts Financial Services Company, Executive Vice President and General Counsel (since March 2017); Harris Associates (investment management), General Counsel (until January 2017) | ||||
| Brian E. Langenfeld (k) (age 48) | Assistant Secretary and Assistant Clerk | June 2006 | 135 | Massachusetts Financial Services Company, Vice President and Senior Counsel | ||||
| Amanda S. Mooradian (k) (age 42) | Assistant Secretary and Assistant Clerk | September 2018 | 135 | Massachusetts Financial Services Company, Assistant Vice President and Senior Counsel | ||||
| Susan A. Pereira (k) (age 51) | Assistant Secretary and Assistant Clerk | July 2005 | 135 | Massachusetts Financial Services Company, Vice President and Assistant General Counsel | ||||
| Kasey L. Phillips (k) (age 51) | Assistant Treasurer | September 2012 | 135 | Massachusetts Financial Services Company, Vice President | ||||
| Matthew A. Stowe (k) (age 47) | Assistant Secretary and Assistant Clerk | October 2014 | 135 | Massachusetts Financial Services Company, Vice President and Assistant General Counsel | ||||
| Martin J. Wolin (k) (age 54) | Chief Compliance Officer | July 2015 | 135 | Massachusetts Financial Services Company, Senior Vice President and Chief Compliance Officer | ||||
| James O. Yost (k) (age 61) | Treasurer | September 1990 | 135 | Massachusetts Financial Services Company, Senior Vice President |
| (h) | Date first appointed to serve as Trustee/Officer of an MFS Fund. Each Trustee has served continuously since appointment unless indicated otherwise. From January 2012 through December 2016, Messrs. DiLorenzo and Yost served as Treasurer and Deputy Treasurer of the Funds, respectively. |
| (j) | Directorships or trusteeships of companies required to report to the Securities and Exchange Commission (i.e., “public companies”). |
| (k) | “Interested person” of the Trust within the meaning of the Investment Company Act of 1940 (referred to as the 1940 Act), which is the principal federal law governing investment companies like the fund, as a result of a position with MFS. The address of MFS is 111 Huntington Avenue, Boston, Massachusetts 02199-7618. |
| Investment Adviser | Custodian |
| Massachusetts Financial Services Company 111 Huntington Avenue Boston, MA 02199-7618 | State Street Bank and Trust Company 1 Lincoln Street Boston, MA 02111-2900 |
| Distributor | Independent Registered Public Accounting Firm |
| MFS Fund Distributors, Inc. 111 Huntington Avenue Boston, MA 02199-7618 | Deloitte & Touche LLP 200 Berkeley Street Boston, MA 02116 |
| Portfolio Manager(s) | |
| Claud Davis J. Scott Walker |

| FACTS | WHAT DOES MFS DO WITH YOUR PERSONAL INFORMATION? |
| Why? | Financial companies choose how they share your personal information. Federal law gives consumers the right to limit some but not all sharing. Federal law also requires us to tell you how we collect, share, and protect your personal information. Please read this notice carefully to understand what we do. |
| What? | The types of personal information we collect and share depend on the product or service you have with us. This information can include: |
| • Social Security number and account balances | |
| • Account transactions and transaction history | |
| • Checking account information and wire transfer instructions | |
| When you are no longer our customer, we continue to share your information as described in this notice. |
| How? | All financial companies need to share customers' personal information to run their everyday business. In the section below, we list the reasons financial companies can share their customers' personal information; the reasons MFS chooses to share; and whether you can limit this sharing. |
| Reasons we can share your personal information | Does MFS share? | Can you limit this sharing? |
| For our everyday business purposes – such as to process your transactions, maintain your account(s), respond to court orders and legal investigations, or report to credit bureaus | Yes | No |
| For our marketing purposes – to offer our products and services to you | No | We don't share |
| For joint marketing with other financial companies | No | We don't share |
| For our affiliates' everyday business purposes – information about your transactions and experiences | No | We don't share |
| For our affiliates' everyday business purposes – information about your creditworthiness | No | We don't share |
| For nonaffiliates to market to you | No | We don't share |
| Questions? | Call 800-225-2606 or go to mfs.com. |
| Who we are | |
| Who is providing this notice? | MFS Funds, MFS Investment Management, MFS Institutional Advisors, Inc., and MFS Heritage Trust Company. |
| What we do | |
| How does MFS protect my personal information? | To protect your personal information from unauthorized access and use, we use security measures that comply with federal law. These measures include procedural, electronic, and physical safeguards for the protection of the personal information we collect about you. |
| How does MFS collect my personal information? | We collect your personal information, for example, when you |
| • open an account or provide account information | |
| • direct us to buy securities or direct us to sell your securities | |
| • make a wire transfer | |
| We also collect your personal information from others, such as credit bureaus, affiliates, or other companies. | |
| Why can't I limit all sharing? | Federal law gives you the right to limit only |
| • sharing for affiliates' everyday business purposes – information about your creditworthiness | |
| • affiliates from using your information to market to you | |
| • sharing for nonaffiliates to market to you | |
| State laws and individual companies may give you additional rights to limit sharing. | |
| Definitions | |
| Affiliates | Companies related by common ownership or control. They can be financial and nonfinancial companies. |
| • MFS does not share personal information with affiliates, except for everyday business purposes as described on page one of this notice. | |
| Nonaffiliates | Companies not related by common ownership or control. They can be financial and nonfinancial companies. |
| • MFS does not share with nonaffiliates so they can market to you. | |
| Joint marketing | A formal agreement between nonaffiliated financial companies that together market financial products or services to you. |
| • MFS doesn't jointly market. | |
| Other important information |
| If you own an MFS product or receive an MFS service in the name of a third party such as a bank or broker-dealer, their privacy policy may apply to you instead of ours. |


| 1 | |
| 2 | |
| 3 | |
| 5 | |
| 7 | |
| 8 | |
| 11 | |
| 12 | |
| 13 | |
| 14 | |
| 16 | |
| 22 | |
| 23 | |
| 26 | |
| 29 | |
| 29 | |
| 29 | |
| 29 | |
| 29 | |
| 30 |


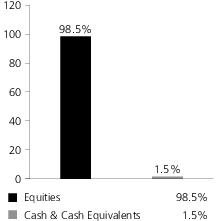
| JPMorgan Chase & Co. | 4.1% |
| Johnson & Johnson | 3.3% |
| Accenture PLC, “A” | 2.8% |
| Aon PLC | 2.7% |
| Comcast Corp., “A” | 2.6% |
| Texas Instruments, Inc. | 2.4% |
| Marsh & McLennan Cos., Inc. | 2.2% |
| Honeywell International, Inc. | 2.2% |
| Thermo Fisher Scientific, Inc. | 2.2% |
| Chubb Ltd. | 2.1% |
| Financials | 27.4% |
| Health Care | 18.6% |
| Industrials | 18.2% |
| Information Technology | 8.8% |
| Consumer Staples | 7.0% |
| Utilities | 6.2% |
| Materials | 4.4% |
| Communication Services | 2.9% |
| Energy | 2.5% |
| Consumer Discretionary | 2.0% |
| Real Estate | 0.5% |
| (g) | The Global Industry Classification Standard (GICS®) was developed by and/or is the exclusive property of MSCI, Inc. and S&P Global Market Intelligence Inc. (“S&P Global Market Intelligence”). GICS is a service mark of MSCI and S&P Global Market Intelligence and has been licensed for use by MFS. MFS has applied its own internal sector/industry classification methodology for equity securities and non-equity securities that are unclassified by GICS. |
Katherine Cannan and Nevin Chitkara
| (b) | Security is not a benchmark constituent. |
| (h) | Security was not held in the portfolio at period end. |
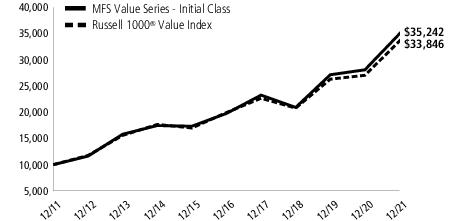
| Share Class | Class Inception Date | 1-yr | 5-yr | 10-yr |
| Initial Class | 1/02/02 | 25.45% | 12.25% | 13.42% |
| Service Class | 1/02/02 | 25.16% | 11.97% | 13.13% |
| Russell 1000® Value Index (f) | 25.16% | 11.16% | 12.97% |
| (f) | Source: FactSet Research Systems Inc. |
| (h) | Frank Russell Company (“Russell”) is the source and owner of the trademarks, service marks, and copyrights related to the Russell Indexes. Russell® is a trademark of Frank Russell Company. Neither Russell nor its licensors accept any liability for any errors or omissions in the Russell Indexes and/or Russell ratings or underlying data and no party may rely on any Russell Indexes and/or Russell ratings and/or underlying data contained in this document. No further distribution of Russell Data is permitted without Russell's express written consent. Russell does not promote, sponsor, or endorse the content of this document. |
July 1, 2021 through December 31, 2021
| Share Class | Annualized Expense Ratio | Beginning Account Value 7/01/21 | Ending Account Value 12/31/21 | Expenses Paid During Period (p) 7/01/21-12/31/21 | |
| Initial Class | Actual | 0.70% | $1,000.00 | $1,092.76 | $3.69 |
| Hypothetical (h) | 0.70% | $1,000.00 | $1,021.68 | $3.57 | |
| Service Class | Actual | 0.95% | $1,000.00 | $1,091.37 | $5.01 |
| Hypothetical (h) | 0.95% | $1,000.00 | $1,020.42 | $4.84 |
| (h) | 5% class return per year before expenses. |
| (p) | “Expenses Paid During Period” are equal to each class's annualized expense ratio, as shown above, multiplied by the average account value over the period, multiplied by 184/365 (to reflect the one-half year period). |
| Issuer | Shares/Par | Value ($) | ||
| Common Stocks – 98.5% | ||||
| Aerospace & Defense – 5.8% | ||||
| Honeywell International, Inc. | 298,918 | $ 62,327,392 | ||
| Lockheed Martin Corp. | 61,783 | 21,958,296 | ||
| Northrop Grumman Corp. | 151,205 | 58,526,919 | ||
| Raytheon Technologies Corp. | 243,248 | 20,933,923 | ||
| $163,746,530 | ||||
| Alcoholic Beverages – 1.6% | ||||
| Diageo PLC | 814,135 | $ 44,475,606 | ||
| Brokerage & Asset Managers – 3.7% | ||||
| BlackRock, Inc. | 44,974 | $ 41,176,395 | ||
| KKR & Co., Inc. | 230,501 | 17,172,325 | ||
| NASDAQ, Inc. | 227,945 | 47,870,729 | ||
| $106,219,449 | ||||
| Business Services – 5.4% | ||||
| Accenture PLC, “A” | 194,223 | $ 80,515,145 | ||
| Equifax, Inc. | 119,321 | 34,935,995 | ||
| Fidelity National Information Services, Inc. | 208,871 | 22,798,270 | ||
| Fiserv, Inc. (a) | 146,504 | 15,205,650 | ||
| $153,455,060 | ||||
| Cable TV – 2.9% | ||||
| Charter Communications, Inc., “A” (a) | 13,231 | $ 8,626,215 | ||
| Comcast Corp., “A” | 1,441,834 | 72,567,505 | ||
| $81,193,720 | ||||
| Chemicals – 1.7% | ||||
| PPG Industries, Inc. | 278,502 | $ 48,024,885 | ||
| Construction – 3.5% | ||||
| Masco Corp. | 370,248 | $ 25,998,815 | ||
| Otis Worldwide Corp. | 105,893 | 9,220,103 | ||
| Sherwin-Williams Co. | 102,668 | 36,155,563 | ||
| Stanley Black & Decker, Inc. | 151,357 | 28,548,957 | ||
| $99,923,438 | ||||
| Consumer Products – 2.5% | ||||
| Colgate-Palmolive Co. | 248,169 | $ 21,178,743 | ||
| International Flavors & Fragrances, Inc. | 68,188 | 10,272,522 | ||
| Kimberly-Clark Corp. | 165,435 | 23,643,970 | ||
| Reckitt Benckiser Group PLC | 177,306 | 15,220,326 | ||
| $70,315,561 | ||||
| Electrical Equipment – 1.5% | ||||
| Johnson Controls International PLC | 529,207 | $ 43,029,821 | ||
| Electronics – 4.7% | ||||
| Analog Devices, Inc. | 118,294 | $ 20,792,536 | ||
| Intel Corp. | 375,819 | 19,354,678 | ||
| NXP Semiconductors N.V. | 110,096 | 25,077,667 | ||
| Texas Instruments, Inc. | 354,778 | 66,865,010 | ||
| $132,089,891 | ||||
| Issuer | Shares/Par | Value ($) | ||
| Common Stocks – continued | ||||
| Energy - Independent – 2.0% | ||||
| ConocoPhillips | 356,753 | $ 25,750,431 | ||
| EOG Resources, Inc. | 188,738 | 16,765,597 | ||
| Pioneer Natural Resources Co. | 79,675 | 14,491,289 | ||
| $57,007,317 | ||||
| Food & Beverages – 3.1% | ||||
| Archer Daniels Midland Co. | 151,115 | $ 10,213,863 | ||
| Nestle S.A. | 337,763 | 47,239,373 | ||
| PepsiCo, Inc. | 179,615 | 31,200,922 | ||
| $88,654,158 | ||||
| Gaming & Lodging – 0.7% | ||||
| Marriott International, Inc., “A” (a) | 126,546 | $ 20,910,461 | ||
| Health Maintenance Organizations – 1.9% | ||||
| Cigna Corp. | 239,038 | $ 54,890,296 | ||
| Insurance – 9.9% | ||||
| Aon PLC | 252,071 | $ 75,762,460 | ||
| Chubb Ltd. | 313,628 | 60,627,429 | ||
| Marsh & McLennan Cos., Inc. | 361,427 | 62,823,241 | ||
| Progressive Corp. | 471,175 | 48,366,114 | ||
| Travelers Cos., Inc. | 214,340 | 33,529,206 | ||
| $281,108,450 | ||||
| Machinery & Tools – 5.0% | ||||
| Eaton Corp. PLC | 280,829 | $ 48,532,868 | ||
| Illinois Tool Works, Inc. | 193,258 | 47,696,074 | ||
| PACCAR, Inc. | 116,699 | 10,299,854 | ||
| Trane Technologies PLC | 170,341 | 34,413,992 | ||
| $140,942,788 | ||||
| Major Banks – 8.3% | ||||
| Goldman Sachs Group, Inc. | 85,606 | $ 32,748,575 | ||
| JPMorgan Chase & Co. | 740,799 | 117,305,522 | ||
| Morgan Stanley | 497,243 | 48,809,373 | ||
| PNC Financial Services Group, Inc. | 174,303 | 34,951,237 | ||
| $233,814,707 | ||||
| Medical & Health Technology & Services – 1.1% | ||||
| McKesson Corp. | 119,710 | $ 29,756,315 | ||
| Medical Equipment – 8.4% | ||||
| Abbott Laboratories | 353,019 | $ 49,683,894 | ||
| Boston Scientific Corp. (a) | 594,794 | 25,266,849 | ||
| Danaher Corp. | 146,572 | 48,223,654 | ||
| Medtronic PLC | 515,367 | 53,314,716 | ||
| Thermo Fisher Scientific, Inc. | 91,620 | 61,132,529 | ||
| $237,621,642 | ||||
| Other Banks & Diversified Financials – 5.5% | ||||
| American Express Co. | 272,663 | $ 44,607,667 | ||
| Citigroup, Inc. | 749,175 | 45,242,678 | ||
| Moody's Corp. | 35,203 | 13,749,588 | ||
| Truist Financial Corp. | 360,485 | 21,106,397 | ||
| Issuer | Shares/Par | Value ($) | ||
| Common Stocks – continued | ||||
| Other Banks & Diversified Financials – continued | ||||
| U.S. Bancorp | 561,335 | $ 31,530,187 | ||
| $156,236,517 | ||||
| Pharmaceuticals – 7.2% | ||||
| Johnson & Johnson | 552,421 | $ 94,502,660 | ||
| Merck & Co., Inc. | 513,819 | 39,379,088 | ||
| Pfizer, Inc. | 1,013,878 | 59,869,496 | ||
| Roche Holding AG | 23,262 | 9,642,922 | ||
| $203,394,166 | ||||
| Railroad & Shipping – 2.4% | ||||
| Canadian National Railway Co. | 133,628 | $ 16,417,536 | ||
| Union Pacific Corp. | 208,933 | 52,636,491 | ||
| $69,054,027 | ||||
| Real Estate – 0.5% | ||||
| Public Storage, Inc., REIT | 34,457 | $ 12,906,214 | ||
| Specialty Chemicals – 1.0% | ||||
| DuPont de Nemours, Inc. | 365,366 | $ 29,514,266 | ||
| Specialty Stores – 1.8% | ||||
| Lowe's Cos., Inc. | 195,414 | $ 50,510,611 | ||
| Tobacco – 0.2% | ||||
| Philip Morris International, Inc. | 62,081 | $ 5,897,695 | ||
| Utilities - Electric Power – 6.2% | ||||
| American Electric Power Co., Inc. | 216,834 | $ 19,291,721 | ||
| Dominion Energy, Inc. | 518,311 | 40,718,512 | ||
| Duke Energy Corp. | 546,197 | 57,296,065 | ||
| Southern Co. | 669,487 | 45,913,419 | ||
| Xcel Energy, Inc. | 188,027 | 12,729,428 | ||
| $175,949,145 | ||||
| Total Common Stocks (Identified Cost, $1,265,333,588) | $2,790,642,736 | |||
| Investment Companies (h) – 1.4% | ||||
| Money Market Funds – 1.4% | ||||
| MFS Institutional Money Market Portfolio, 0.07% (v) (Identified Cost, $38,380,359) | 38,380,359 | $ 38,380,359 | ||
| Other Assets, Less Liabilities – 0.1% | 3,663,075 | |||
| Net Assets – 100.0% | $2,832,686,170 | |||
| (a) | Non-income producing security. | |||
| (h) | An affiliated issuer, which may be considered one in which the fund owns 5% or more of the outstanding voting securities, or a company which is under common control. At period end, the aggregate values of the fund's investments in affiliated issuers and in unaffiliated issuers were $38,380,359 and $2,790,642,736, respectively. | |||
| (v) | Affiliated issuer that is available only to investment companies managed by MFS. The rate quoted for the MFS Institutional Money Market Portfolio is the annualized seven-day yield of the fund at period end. |
| The following abbreviations are used in this report and are defined: | |
| REIT | Real Estate Investment Trust |
| Financial Statements | Statement of Assets and Liabilities |
| At 12/31/21Assets | |
| Investments in unaffiliated issuers, at value (identified cost, $1,265,333,588) | $2,790,642,736 |
| Investments in affiliated issuers, at value (identified cost, $38,380,359) | 38,380,359 |
| Cash | 103,912 |
| Receivables for | |
| Fund shares sold | 1,494,146 |
| Dividends | 3,281,219 |
| Other assets | 8,552 |
| Total assets | $2,833,910,924 |
| Liabilities | |
| Payables for | |
| Fund shares reacquired | $821,131 |
| Payable to affiliates | |
| Investment adviser | 103,247 |
| Administrative services fee | 2,129 |
| Shareholder servicing costs | 772 |
| Distribution and/or service fees | 20,114 |
| Payable for independent Trustees' compensation | 12 |
| Accrued expenses and other liabilities | 277,349 |
| Total liabilities | $1,224,754 |
| Net assets | $2,832,686,170 |
| Net assets consist of | |
| Paid-in capital | $1,129,117,396 |
| Total distributable earnings (loss) | 1,703,568,774 |
| Net assets | $2,832,686,170 |
| Shares of beneficial interest outstanding | 115,971,691 |
| Net assets | Shares outstanding | Net asset value per share | |
| Initial Class | $1,363,582,559 | 55,164,219 | $24.72 |
| Service Class | 1,469,103,611 | 60,807,472 | 24.16 |
| Financial Statements | Statement of Operations |
| Year ended 12/31/21 | |
| Net investment income (loss) | |
| Income | |
| Dividends | $54,522,373 |
| Other | 31,735 |
| Income on securities loaned | 24,114 |
| Dividends from affiliated issuers | 11,011 |
| Foreign taxes withheld | (290,062) |
| Total investment income | $54,299,171 |
| Expenses | |
| Management fee | $18,255,539 |
| Distribution and/or service fees | 3,468,220 |
| Shareholder servicing costs | 64,367 |
| Administrative services fee | 356,901 |
| Independent Trustees' compensation | 38,068 |
| Custodian fee | 116,249 |
| Shareholder communications | 146,530 |
| Audit and tax fees | 59,721 |
| Legal fees | 14,295 |
| Miscellaneous | 49,338 |
| Total expenses | $22,569,228 |
| Reduction of expenses by investment adviser | (339,072) |
| Net expenses | $22,230,156 |
| Net investment income (loss) | $32,069,015 |
| Realized and unrealized gain (loss) | |
| Realized gain (loss) (identified cost basis) | |
| Unaffiliated issuers | $152,218,224 |
| Foreign currency | 39,878 |
| Net realized gain (loss) | $152,258,102 |
| Change in unrealized appreciation or depreciation | |
| Unaffiliated issuers | $412,970,182 |
| Translation of assets and liabilities in foreign currencies | (107,167) |
| Net unrealized gain (loss) | $412,863,015 |
| Net realized and unrealized gain (loss) | $565,121,117 |
| Change in net assets from operations | $597,190,132 |
| Financial Statements | Statements of Changes in Net Assets |
| Year ended | ||
| 12/31/21 | 12/31/20 | |
| Change in net assets | ||
| From operations | ||
| Net investment income (loss) | $32,069,015 | $32,732,755 |
| Net realized gain (loss) | 152,258,102 | 59,434,807 |
| Net unrealized gain (loss) | 412,863,015 | 16,634,536 |
| Change in net assets from operations | $597,190,132 | $108,802,098 |
| Total distributions to shareholders | $(91,925,640) | $(132,057,054) |
| Change in net assets from fund share transactions | $(123,147,782) | $249,518,336 |
| Total change in net assets | $382,116,710 | $226,263,380 |
| Net assets | ||
| At beginning of period | 2,450,569,460 | 2,224,306,080 |
| At end of period | $2,832,686,170 | $2,450,569,460 |
| Financial Statements | Financial Highlights |
| Initial Class | Year ended | ||||
| 12/31/21 | 12/31/20 | 12/31/19 | 12/31/18 | 12/31/17 | |
| Net asset value, beginning of period | $20.40 | $20.95 | $17.30 | $20.92 | $18.90 |
| Income (loss) from investment operations | |||||
| Net investment income (loss) (d) | $0.31 | $0.31 | $0.33 | $0.41 | $0.30 |
| Net realized and unrealized gain (loss) | 4.84 | 0.29 | 4.68 | (2.32) | 2.93 |
| Total from investment operations | $5.15 | $0.60 | $5.01 | $(1.91) | $3.23 |
| Less distributions declared to shareholders | |||||
| From net investment income | $(0.31) | $(0.30) | $(0.44) | $(0.32) | $(0.40) |
| From net realized gain | (0.52) | (0.85) | (0.92) | (1.39) | (0.81) |
| Total distributions declared to shareholders | $(0.83) | $(1.15) | $(1.36) | $(1.71) | $(1.21) |
| Net asset value, end of period (x) | $24.72 | $20.40 | $20.95 | $17.30 | $20.92 |
| Total return (%) (k)(r)(s)(x) | 25.45 | 3.48 | 29.80 | (10.09) | 17.65 |
| Ratios (%) (to average net assets) and Supplemental data: | |||||
| Expenses before expense reductions | 0.72 | 0.73 | 0.73 | 0.73 | 0.74 |
| Expenses after expense reductions | 0.70 | 0.71 | 0.72 | 0.72 | 0.73 |
| Net investment income (loss) | 1.33 | 1.64 | 1.67 | 2.02 | 1.51 |
| Portfolio turnover | 9 | 17 | 13 | 8 | 10 |
| Net assets at end of period (000 omitted) | $1,363,583 | $1,183,318 | $945,183 | $823,744 | $996,794 |
| Service Class | Year ended | ||||
| 12/31/21 | 12/31/20 | 12/31/19 | 12/31/18 | 12/31/17 | |
| Net asset value, beginning of period | $19.96 | $20.52 | $16.96 | $20.55 | $18.59 |
| Income (loss) from investment operations | |||||
| Net investment income (loss) (d) | $0.24 | $0.25 | $0.27 | $0.35 | $0.25 |
| Net realized and unrealized gain (loss) | 4.75 | 0.29 | 4.59 | (2.28) | 2.87 |
| Total from investment operations | $4.99 | $0.54 | $4.86 | $(1.93) | $3.12 |
| Less distributions declared to shareholders | |||||
| From net investment income | $(0.27) | $(0.25) | $(0.38) | $(0.27) | $(0.35) |
| From net realized gain | (0.52) | (0.85) | (0.92) | (1.39) | (0.81) |
| Total distributions declared to shareholders | $(0.79) | $(1.10) | $(1.30) | $(1.66) | $(1.16) |
| Net asset value, end of period (x) | $24.16 | $19.96 | $20.52 | $16.96 | $20.55 |
| Total return (%) (k)(r)(s)(x) | 25.16 | 3.22 | 29.51 | (10.36) | 17.35 |
| Ratios (%) (to average net assets) and Supplemental data: | |||||
| Expenses before expense reductions | 0.97 | 0.98 | 0.98 | 0.98 | 0.99 |
| Expenses after expense reductions | 0.95 | 0.96 | 0.97 | 0.97 | 0.98 |
| Net investment income (loss) | 1.08 | 1.38 | 1.42 | 1.77 | 1.26 |
| Portfolio turnover | 9 | 17 | 13 | 8 | 10 |
| Net assets at end of period (000 omitted) | $1,469,104 | $1,267,251 | $1,279,123 | $1,127,848 | $1,398,374 |
| (d) | Per share data is based on average shares outstanding. |
| (k) | The total return does not reflect expenses that apply to separate accounts. Inclusion of these charges would reduce the total return figures for all periods shown. |
| (r) | Certain expenses have been reduced without which performance would have been lower. |
| (s) | From time to time the fund may receive proceeds from litigation settlements, without which performance would be lower. |
| (x) | The net asset values and total returns have been calculated on net assets which include adjustments made in accordance with U.S. generally accepted accounting principles required at period end for financial reporting purposes. |
| Financial Instruments | Level 1 | Level 2 | Level 3 | Total |
| Equity Securities: | ||||
| United States | $2,657,646,973 | $— | $— | $2,657,646,973 |
| United Kingdom | 59,695,932 | — | — | 59,695,932 |
| Switzerland | 47,239,373 | 9,642,922 | — | 56,882,295 |
| Canada | 16,417,536 | — | — | 16,417,536 |
| Mutual Funds | 38,380,359 | — | — | 38,380,359 |
| Total | $2,819,380,173 | $9,642,922 | $— | $2,829,023,095 |
| Year ended 12/31/21 | Year ended 12/31/20 | |
| Ordinary income (including any short-term capital gains) | $32,692,062 | $34,922,070 |
| Long-term capital gains | 59,233,578 | 97,134,984 |
| Total distributions | $91,925,640 | $132,057,054 |
| As of 12/31/21 | |
| Cost of investments | $1,309,217,600 |
| Gross appreciation | 1,523,184,728 |
| Gross depreciation | (3,379,233) |
| Net unrealized appreciation (depreciation) | $1,519,805,495 |
| Undistributed ordinary income | 43,568,093 |
| Undistributed long-term capital gain | 140,172,099 |
| Other temporary differences | 23,087 |
| Total distributable earnings (loss) | $1,703,568,774 |
| Year ended 12/31/21 | Year ended 12/31/20 | ||
| Initial Class | $44,596,694 | $64,613,595 | |
| Service Class | 47,328,946 | 67,443,459 | |
| Total | $91,925,640 | $132,057,054 |
| Up to $1 billion | 0.75% |
| In excess of $1 billion and up to $2.5 billion | 0.65% |
| In excess of $2.5 billion | 0.60% |
| Year ended 12/31/21 | Year ended 12/31/20 | ||||
| Shares | Amount | Shares | Amount | ||
| Shares sold | |||||
| Initial Class | 6,770,909 | $152,854,221 | 17,458,957 | $326,082,166 | |
| Service Class | 6,371,855 | 143,168,312 | 10,385,417 | 178,855,955 | |
| 13,142,764 | $296,022,533 | 27,844,374 | $504,938,121 | ||
| Shares issued to shareholders in reinvestment of distributions | |||||
| Initial Class | 1,886,493 | $44,596,694 | 3,496,407 | $64,613,595 | |
| Service Class | 2,046,215 | 47,328,946 | 3,726,158 | 67,443,459 | |
| 3,932,708 | $91,925,640 | 7,222,565 | $132,057,054 | ||
| Shares reacquired | |||||
| Initial Class | (11,503,983) | $(262,149,729) | (8,069,039) | $(151,590,113) | |
| Service Class | (11,093,369) | (248,946,226) | (12,963,112) | (235,886,726) | |
| (22,597,352) | $(511,095,955) | (21,032,151) | $(387,476,839) | ||
| Net change | |||||
| Initial Class | (2,846,581) | $(64,698,814) | 12,886,325 | $239,105,648 | |
| Service Class | (2,675,299) | (58,448,968) | 1,148,463 | 10,412,688 | |
| (5,521,880) | $(123,147,782) | 14,034,788 | $249,518,336 | ||
| Affiliated Issuers | Beginning Value | Purchases | Sales Proceeds | Realized Gain (Loss) | Change in Unrealized Appreciation or Depreciation | Ending Value |
| MFS Institutional Money Market Portfolio | $30,323,177 | $334,905,251 | $326,848,069 | $— | $— | $38,380,359 |
| Affiliated Issuers | Dividend Income | Capital Gain Distributions |
| MFS Institutional Money Market Portfolio | $11,011 | $— |
February 15, 2022
| Name, Age | Position(s) Held with Fund | Trustee/Officer Since(h) | Number of MFS Funds overseen by the Trustee | Principal Occupations During the Past Five Years | Other Directorships During the Past Five Years (j) | |||||
| INTERESTED TRUSTEES | ||||||||||
| Michael W. Roberge (k) (age 55) | Trustee | January 2021 | 135 | Massachusetts Financial Services Company, Chairman (since January 2021); Chief Executive Officer (since January 2017); Director; Chairman of the Board (since January 2022); President (until December 2018); Chief Investment Officer (until December 2018) | N/A | |||||
| INDEPENDENT TRUSTEES | ||||||||||
| John P. Kavanaugh (age 67) | Trustee and Chair of Trustees | January 2009 | 135 | Private investor | N/A | |||||
| Steven E. Buller (age 70) | Trustee | February 2014 | 135 | Private investor | N/A | |||||
| John A. Caroselli (age 67) | Trustee | March 2017 | 135 | Private investor; JC Global Advisors, LLC (management consulting), President (since 2015) | N/A | |||||
| Maureen R. Goldfarb (age 66) | Trustee | January 2009 | 135 | Private investor | N/A | |||||
| Peter D. Jones (age 66) | Trustee | January 2019 | 135 | Private investor | N/A | |||||
| James W. Kilman, Jr. (age 60) | Trustee | January 2019 | 135 | Burford Capital Limited (finance and investment management), Senior Advisor (since May 3, 2021), Chief Financial Officer (2019 - May 2, 2021); KielStrand Capital LLC (family office), Chief Executive Officer (since 2016) | Alpha-En Corporation, Director (2016-2019) | |||||
| Clarence Otis, Jr. (age 65) | Trustee | March 2017 | 135 | Private investor | VF Corporation, Director; Verizon Communications, Inc., Director; The Travelers Companies, Director | |||||
| Maryanne L. Roepke (age 65) | Trustee | May 2014 | 135 | Private investor | N/A | |||||
| Laurie J. Thomsen (age 64) | Trustee | March 2005 | 135 | Private investor | The Travelers Companies, Director; Dycom Industries, Inc., Director |
| Name, Age | Position(s) Held with Fund | Trustee/Officer Since(h) | Number of MFS Funds for which the Person is an Officer | Principal Occupations During the Past Five Years | ||||
| OFFICERS | ||||||||
| Christopher R. Bohane (k) (age 48) | Assistant Secretary and Assistant Clerk | July 2005 | 135 | Massachusetts Financial Services Company, Senior Vice President and Associate General Counsel | ||||
| Kino Clark (k) (age 53) | Assistant Treasurer | January 2012 | 135 | Massachusetts Financial Services Company, Vice President | ||||
| John W. Clark, Jr. (k) (age 54) | Assistant Treasurer | April 2017 | 135 | Massachusetts Financial Services Company, Vice President (since March 2017); Deutsche Bank (financial services), Department Head - Treasurer's Office (until February 2017) | ||||
| Thomas H. Connors (k) (age 62) | Assistant Secretary and Assistant Clerk | September 2012 | 135 | Massachusetts Financial Services Company, Vice President and Senior Counsel | ||||
| David L. DiLorenzo (k) (age 53) | President | July 2005 | 135 | Massachusetts Financial Services Company, Senior Vice President | ||||
| Heidi W. Hardin (k) (age 54) | Secretary and Clerk | April 2017 | 135 | Massachusetts Financial Services Company, Executive Vice President and General Counsel (since March 2017); Harris Associates (investment management), General Counsel (until January 2017) | ||||
| Brian E. Langenfeld (k) (age 48) | Assistant Secretary and Assistant Clerk | June 2006 | 135 | Massachusetts Financial Services Company, Vice President and Senior Counsel | ||||
| Amanda S. Mooradian (k) (age 42) | Assistant Secretary and Assistant Clerk | September 2018 | 135 | Massachusetts Financial Services Company, Assistant Vice President and Senior Counsel | ||||
| Susan A. Pereira (k) (age 51) | Assistant Secretary and Assistant Clerk | July 2005 | 135 | Massachusetts Financial Services Company, Vice President and Assistant General Counsel | ||||
| Kasey L. Phillips (k) (age 51) | Assistant Treasurer | September 2012 | 135 | Massachusetts Financial Services Company, Vice President | ||||
| Matthew A. Stowe (k) (age 47) | Assistant Secretary and Assistant Clerk | October 2014 | 135 | Massachusetts Financial Services Company, Vice President and Assistant General Counsel | ||||
| Martin J. Wolin (k) (age 54) | Chief Compliance Officer | July 2015 | 135 | Massachusetts Financial Services Company, Senior Vice President and Chief Compliance Officer | ||||
| James O. Yost (k) (age 61) | Treasurer | September 1990 | 135 | Massachusetts Financial Services Company, Senior Vice President |
| (h) | Date first appointed to serve as Trustee/Officer of an MFS Fund. Each Trustee has served continuously since appointment unless indicated otherwise. From January 2012 through December 2016, Messrs. DiLorenzo and Yost served as Treasurer and Deputy Treasurer of the Funds, respectively. |
| (j) | Directorships or trusteeships of companies required to report to the Securities and Exchange Commission (i.e., “public companies”). |
| (k) | “Interested person” of the Trust within the meaning of the Investment Company Act of 1940 (referred to as the 1940 Act), which is the principal federal law governing investment companies like the fund, as a result of a position with MFS. The address of MFS is 111 Huntington Avenue, Boston, Massachusetts 02199-7618. |
| Investment Adviser | Custodian |
| Massachusetts Financial Services Company 111 Huntington Avenue Boston, MA 02199-7618 | State Street Bank and Trust Company 1 Lincoln Street Boston, MA 02111-2900 |
| Distributor | Independent Registered Public Accounting Firm |
| MFS Fund Distributors, Inc. 111 Huntington Avenue Boston, MA 02199-7618 | Deloitte & Touche LLP 200 Berkeley Street Boston, MA 02116 |
| Portfolio Manager(s) | |
| Katherine Cannan Nevin Chitkara |

| FACTS | WHAT DOES MFS DO WITH YOUR PERSONAL INFORMATION? |
| Why? | Financial companies choose how they share your personal information. Federal law gives consumers the right to limit some but not all sharing. Federal law also requires us to tell you how we collect, share, and protect your personal information. Please read this notice carefully to understand what we do. |
| What? | The types of personal information we collect and share depend on the product or service you have with us. This information can include: |
| • Social Security number and account balances | |
| • Account transactions and transaction history | |
| • Checking account information and wire transfer instructions | |
| When you are no longer our customer, we continue to share your information as described in this notice. |
| How? | All financial companies need to share customers' personal information to run their everyday business. In the section below, we list the reasons financial companies can share their customers' personal information; the reasons MFS chooses to share; and whether you can limit this sharing. |
| Reasons we can share your personal information | Does MFS share? | Can you limit this sharing? |
| For our everyday business purposes – such as to process your transactions, maintain your account(s), respond to court orders and legal investigations, or report to credit bureaus | Yes | No |
| For our marketing purposes – to offer our products and services to you | No | We don't share |
| For joint marketing with other financial companies | No | We don't share |
| For our affiliates' everyday business purposes – information about your transactions and experiences | No | We don't share |
| For our affiliates' everyday business purposes – information about your creditworthiness | No | We don't share |
| For nonaffiliates to market to you | No | We don't share |
| Questions? | Call 800-225-2606 or go to mfs.com. |
| Who we are | |
| Who is providing this notice? | MFS Funds, MFS Investment Management, MFS Institutional Advisors, Inc., and MFS Heritage Trust Company. |
| What we do | |
| How does MFS protect my personal information? | To protect your personal information from unauthorized access and use, we use security measures that comply with federal law. These measures include procedural, electronic, and physical safeguards for the protection of the personal information we collect about you. |
| How does MFS collect my personal information? | We collect your personal information, for example, when you |
| • open an account or provide account information | |
| • direct us to buy securities or direct us to sell your securities | |
| • make a wire transfer | |
| We also collect your personal information from others, such as credit bureaus, affiliates, or other companies. | |
| Why can't I limit all sharing? | Federal law gives you the right to limit only |
| • sharing for affiliates' everyday business purposes – information about your creditworthiness | |
| • affiliates from using your information to market to you | |
| • sharing for nonaffiliates to market to you | |
| State laws and individual companies may give you additional rights to limit sharing. | |
| Definitions | |
| Affiliates | Companies related by common ownership or control. They can be financial and nonfinancial companies. |
| • MFS does not share personal information with affiliates, except for everyday business purposes as described on page one of this notice. | |
| Nonaffiliates | Companies not related by common ownership or control. They can be financial and nonfinancial companies. |
| • MFS does not share with nonaffiliates so they can market to you. | |
| Joint marketing | A formal agreement between nonaffiliated financial companies that together market financial products or services to you. |
| • MFS doesn't jointly market. | |
| Other important information |
| If you own an MFS product or receive an MFS service in the name of a third party such as a bank or broker-dealer, their privacy policy may apply to you instead of ours. |
Item 1(b):
Not applicable.
| ITEM 2. | CODE OF ETHICS. |
The Registrant has adopted a Code of Ethics (the “Code”) pursuant to Section 406 of the Sarbanes-Oxley Act and as defined in Form N-CSR that applies to the Registrant’s principal executive officer and principal financial and accounting officer. During the period covered by this report, the Registrant has not amended any provision in the Code that relates to an element of the Code’s definition enumerated in paragraph (b) of Item 2 of this Form N-CSR. During the period covered by this report, the Registrant did not grant a waiver, including an implicit waiver, from any provision of the Code.
A copy of the Code is filed as an exhibit to this Form N-CSR.
| ITEM 3. | AUDIT COMMITTEE FINANCIAL EXPERT. |
Messrs. Steven E. Buller, James Kilman, and Clarence Otis, Jr. and Ms. Maryanne L. Roepke, members of the Audit Committee, have been determined by the Board of Trustees in their reasonable business judgment to meet the definition of “audit committee financial expert” as such term is defined in Form N-CSR. In addition, Messrs. Buller, Kilman, and Otis and Ms. Roepke are “independent” members of the Audit Committee (as such term has been defined by the Securities and Exchange Commission in regulations implementing Section 407 of the Sarbanes-Oxley Act of 2002). The Securities and Exchange Commission has stated that the designation of a person as an audit committee financial expert pursuant to this Item 3 on the Form N-CSR does not impose on such a person any duties, obligations or liability that are greater than the duties, obligations or liability imposed on such person as a member of the Audit Committee and the Board of Trustees in the absence of such designation or identification.
| ITEM 4. | PRINCIPAL ACCOUNTANT FEES AND SERVICES. |
Items 4(a) through 4(d) and 4(g):
The Board of Trustees has appointed Deloitte & Touche LLP (“Deloitte”) to serve as independent accountants to the Registrant (hereinafter the “Registrant” or the “Fund”). The tables below set forth the audit fees billed to the Fund as well as fees for non-audit services provided to the Fund and/or to the Fund’s investment adviser, Massachusetts Financial Services Company (“MFS”), and to various entities either controlling, controlled by, or under common control with MFS that provide ongoing services to the Fund (“MFS Related Entities”).
For the fiscal years ended December 31, 2021 and 2020, audit fees billed to the Fund by Deloitte were as follows:
| Audit Fees | ||||||||
| 2021 | 2020 | |||||||
Fees billed by Deloitte: | ||||||||
MFS Global Equity Series | 48,623 | 47,930 | ||||||
MFS Growth Series | 49,493 | 48,788 | ||||||
MFS Investors Trust Series | 48,623 | 47,930 | ||||||
MFS Mid Cap Growth Series | 48,623 | 47,930 | ||||||
MFS New Discovery Series | 48,623 | 47,930 | ||||||
MFS Research Series | 49,603 | 48,896 | ||||||
MFS Total Return Bond Series | 69,581 | 68,598 | ||||||
MFS Total Return Series | 68,539 | 67,571 | ||||||
MFS Utilities Series | 48,734 | 48,039 | ||||||
MFS Value Series | 49,493 | 48,788 | ||||||
|
|
|
| |||||
Total | 529,935 | 522,400 | ||||||
For the fiscal years ended December 31, 2021 and 2020, fees billed by Deloitte for audit-related, tax and other services provided to each Fund and for audit-related, tax and other services provided to MFS and MFS Related Entities were as follows:
| Audit-Related Fees1 | Tax Fees2 | All Other Fees3 | ||||||||||||||||||||||
| 2021 | 2020 | 2021 | 2020 | 2021 | 2020 | |||||||||||||||||||
Fees billed by Deloitte: | ||||||||||||||||||||||||
To MFS Global Equity Series | 2,400 | 2,400 | 6,029 | 5,951 | 0 | 0 | ||||||||||||||||||
To MFS Growth Series | 2,400 | 2,400 | 6,029 | 6,201 | 0 | 0 | ||||||||||||||||||
To MFS Investors Trust Series | 2,400 | 2,400 | 6,279 | 6,201 | 0 | 0 | ||||||||||||||||||
To MFS Mid Cap Growth Series | 2,400 | 2,400 | 6,029 | 5,951 | 0 | 0 | ||||||||||||||||||
To MFS New Discovery Series | 2,400 | 2,400 | 6,029 | 5,951 | 0 | 0 | ||||||||||||||||||
To MFS Research Series | 2,400 | 2,400 | 6,279 | 6,201 | 0 | 0 | ||||||||||||||||||
To MFS Total Return Bond Series | 2,400 | 2,400 | 6,029 | 6,201 | 0 | 0 | ||||||||||||||||||
To MFS Total Return Series | 2,400 | 2,400 | 6,279 | 6,201 | 0 | 0 | ||||||||||||||||||
To MFS Utilities Series | 2,400 | 2,400 | 6,656 | 5,951 | 0 | 0 | ||||||||||||||||||
To MFS Value Series | 2,400 | 2,400 | 6,029 | 5,951 | 0 | 0 | ||||||||||||||||||
Total fees billed by Deloitte to above Funds: | 24,000 | 24,000 | 61,667 | 60,760 | 0 | 0 | ||||||||||||||||||
| Audit-Related Fees1 | Tax Fees2 | All Other Fees3 | ||||||||||||||||||||||
| 2021 | 2020 | 2021 | 2020 | 2021 | 2020 | |||||||||||||||||||
Fees billed by Deloitte: | ||||||||||||||||||||||||
To MFS and MFS Related Entities of MFS Global Equity Series* | 0 | 0 | 0 | 0 | 5,390 | 5,390 | ||||||||||||||||||
To MFS and MFS Related Entities of MFS Growth Series* | 0 | 0 | 0 | 0 | 5,390 | 5,390 | ||||||||||||||||||
To MFS and MFS Related Entities of MFS Investors Trust Series* | 0 | 0 | 0 | 0 | 5,390 | 5,390 | ||||||||||||||||||
To MFS and MFS Related Entities of MFS Mid Cap Growth Series* | 0 | 0 | 0 | 0 | 5,390 | 5,390 | ||||||||||||||||||
To MFS and MFS Related Entities of MFS New Discovery Series* | 0 | 0 | 0 | 0 | 5,390 | 5,390 | ||||||||||||||||||
To MFS and MFS Related Entities of MFS Research Series* | 0 | 0 | 0 | 0 | 5,390 | 5,390 | ||||||||||||||||||
To MFS and MFS Related Entities of MFS Total Return Bond Series* | 0 | 0 | 0 | 0 | 5,390 | 5,390 | ||||||||||||||||||
To MFS and MFS Related Entities of MFS Total Return Series* | 0 | 0 | 0 | 0 | 5,390 | 5,390 | ||||||||||||||||||
To MFS and MFS Related Entities of MFS Utilities Series* | 0 | 0 | 0 | 0 | 5,390 | 5,390 | ||||||||||||||||||
To MFS and MFS Related Entities of MFS Value Series* | 0 | 0 | 0 | 0 | 5,390 | 5,390 | ||||||||||||||||||
| Aggregate fees for non-audit services: | ||||||||
| 2021 | 2020 | |||||||
Fees billed by Deloitte: | ||||||||
To MFS Global Equity Series, MFS and MFS Related Entities# | 13,819 | 557,491 | ||||||
To MFS Growth Series, MFS and MFS Related Entities# | 13,819 | 557,741 | ||||||
To MFS Investors Trust Series, MFS and MFS Related Entities# | 14,069 | 557,741 | ||||||
To MFS Mid Cap Growth Series, MFS and MFS Related Entities# | 13,819 | 557,491 | ||||||
To MFS New Discovery Series, MFS and MFS Related Entities# | 13,819 | 557,491 | ||||||
To MFS Research Series, MFS and MFS Related Entities# | 14,069 | 557,741 | ||||||
To MFS Total Return Bond Series, MFS and MFS Related Entities# | 13,819 | 557,741 | ||||||
To MFS Total Return Series, MFS and MFS Related Entities# | 14,069 | 557,741 | ||||||
To MFS Utilities Series, MFS and MFS Related Entities# | 14,446 | 557,491 | ||||||
To MFS Value Series, MFS and MFS Related Entities# | 13,819 | 557,491 | ||||||
| * | This amount reflects the fees billed to MFS and MFS Related Entities for non-audit services relating directly to the operations and financial reporting of the Fund (portions of which services also related to the operations and financial reporting of other funds within the MFS Funds complex). |
| # | This amount reflects the aggregate fees billed by Deloitte for non-audit services rendered to the Fund and for non-audit services rendered to MFS and the MFS Related Entities. |
| 1 | The fees included under “Audit-Related Fees” are fees related to assurance and related services that are reasonably related to the performance of the audit or review of financial statements, but not reported under ‘‘Audit Fees,’’ including accounting consultations, agreed-upon procedure reports, attestation reports, comfort letters and internal control reviews. |
| 2 | The fees included under “Tax Fees” are fees associated with tax compliance, tax advice and tax planning, including services relating to the filing or amendment of federal, state or local income tax returns, regulated investment company qualification reviews and tax distribution and analysis. |
| 3 | The fees included under “All Other Fees” are fees for products and services provided by Deloitte other than those reported under “Audit Fees,” “Audit-Related Fees” and “Tax Fees”. |
Item 4(e)(1):
Set forth below are the policies and procedures established by the Audit Committee of the Board of Trustees relating to the pre-approval of audit and non-audit related services:
To the extent required by applicable law, pre-approval by the Audit Committee of the Board is needed for all audit and permissible non-audit services rendered to the Fund and all permissible non-audit services rendered to MFS or MFS Related Entities if the services relate directly to the operations and financial reporting of the Registrant. Pre-approval is currently on an engagement-by-engagement basis. In the event pre-approval of such services is necessary between regular meetings of the Audit Committee and it is not practical to wait to seek pre-approval at the next regular meeting of the Audit Committee, pre-approval of such services may be referred to the Chair of the Audit Committee for approval; provided that the Chair may not pre-approve any individual engagement for such services exceeding $50,000 or multiple engagements for such services in the aggregate exceeding $100,000 between such regular meetings of the Audit Committee. Any engagement pre-approved by the Chair between regular meetings of the Audit Committee shall be presented for ratification by the entire Audit Committee at its next regularly scheduled meeting.
Item 4(e)(2):
None, or 0%, of the services relating to the Audit-Related Fees, Tax Fees and All Other Fees paid by the Fund and MFS and MFS Related Entities relating directly to the operations and financial reporting of the Registrant disclosed above were approved by the audit committee pursuant to paragraphs (c)(7)(i)(C) of Rule 2-01 of Regulation S-X (which permits audit committee approval after the start of the engagement with respect to services other than audit, review or attest services, if certain conditions are satisfied).
Item 4(f):
Not applicable.
Item 4(h):
The Registrant’s Audit Committee has considered whether the provision by a Registrant’s independent registered public accounting firm of non-audit services to MFS and MFS Related Entities that were not pre-approved by the Committee (because such services were provided prior to the effectiveness of SEC rules requiring pre-approval or because such services did not relate directly to the operations and financial reporting of the Registrant) was compatible with maintaining the independence of the independent registered public accounting firm as the Registrant’s principal auditors.
| ITEM 5. | AUDIT COMMITTEE OF LISTED REGISTRANTS. |
Not applicable to the Registrant.
| ITEM 6. | INVESTMENTS |
A schedule of investments of each series of the Registrant is included as part of the report to shareholders of such series under Item 1(a) of this Form N-CSR.
| ITEM 7. | DISCLOSURE OF PROXY VOTING POLICIES AND PROCEDURES FOR CLOSED-END MANAGEMENT INVESTMENT COMPANIES. |
Not applicable to the Registrant.
| ITEM 8. | PORTFOLIO MANAGERS OF CLOSED-END MANAGEMENT INVESTMENT COMPANIES. |
Not applicable to the Registrant.
| ITEM 9. | PURCHASES OF EQUITY SECURITIES BY CLOSED-END MANAGEMENT INVESTMENT COMPANY AND AFFILIATED PURCHASERS. |
Not applicable to the Registrant.
| ITEM 10. | SUBMISSION OF MATTERS TO A VOTE OF SECURITY HOLDERS. |
There were no material changes to the procedures by which shareholders may send recommendations to the Board for nominees to the Registrant’s Board since the Registrant last provided disclosure as to such procedures in response to the requirements of Item 407 (c)(2)(iv) of Regulation S-K or this Item.
| ITEM 11. | CONTROLS AND PROCEDURES. |
| (a) | Based upon their evaluation of the effectiveness of the registrant’s disclosure controls and procedures (as defined in Rule 30a-3(c) under the Investment Company Act of 1940 (the “Act”)) as conducted within 90 days of the filing date of this report on Form N-CSR, the registrant’s principal financial officer and principal executive officer have concluded that those disclosure controls and procedures provide reasonable assurance that the material information required to be disclosed by the registrant on this report is recorded, processed, summarized and reported within the time periods specified in the Securities and Exchange Commission’s rules and forms. |
| (b) | There were no changes in the registrant’s internal controls over financial reporting (as defined in Rule 30a-3(d) under the Act) that occurred during the period covered by the report that have materially affected, or are reasonably likely to materially affect, the registrant’s internal control over financial reporting. |
| ITEM 12. | DISCLOSURE OF SECURITIES LENDING ACTIVITIES FOR CLOSED-END MANAGEMENT INVESTMENT COMPANIES. |
Not applicable to the Registrant.
| ITEM 13. | EXHIBITS. |
| (a) (1) | Any code of ethics, or amendment thereto, that is the subject of the disclosure required by Item 2, to the extent that the registrant intends to satisfy the Item 2 requirements through filing of an exhibit: Attached hereto as EX-99.COE. |
| (2) | A separate certification for each principal executive officer and principal financial officer of the registrant as required by Rule 30a-2(a) under the Act (17 CFR 270.30a-2): Attached hereto as EX-99.302CERT. |
| (3) | Any written solicitation to purchase securities under Rule 23c-1 under the Act (17 CFR 270.23c-1) sent or given during the period covered by the report by or on behalf of the registrant to 10 or more persons. Not applicable. |
| (4) | Change in the registrant’s independent public accountant. Not applicable. |
| (b) | If the report is filed under Section 13(a) or 15(d) of the Exchange Act, provide the certifications required by Rule 30a-2(b) under the Act (17 CFR 270.30a-2(b)), Rule 13a-14(b) or Rule 15d-14(b) under the Exchange Act (17 CFR 240.13a-14(b) or 240.15d-14(b)) and Section 1350 of Chapter 63 of Title 18 of the United States Code (18 U.S.C. 1350) as an exhibit. A certification furnished pursuant to this paragraph will not be deemed “filed” for the purposes of Section 18 of the Exchange Act (15 U.S.C. 78r), or otherwise subject to the liability of that section. Such certification will not be deemed to be incorporated by reference into any filing under the Securities Act of 1933 or the Exchange Act, except to the extent that the registrant specifically incorporates it by reference. Attached hereto as EX-99.906CERT. |
Notice
A copy of the Amended and Restated Declaration of Trust, as amended, of the Registrant is on file with the Secretary of State of The Commonwealth of Massachusetts and notice is hereby given that this instrument is executed on behalf of the Registrant by an officer of the Registrant as an officer and not individually and the obligations of or arising out of this instrument are not binding upon any of the Trustees or shareholders individually, but are binding only upon the assets and property of the respective constituent series of the Registrant.
SIGNATURES
Pursuant to the requirements of the Securities Exchange Act of 1934 and the Investment Company Act of 1940, the registrant has duly caused this report to be signed on its behalf by the undersigned, thereunto duly authorized.
(Registrant) MFS VARIABLE INSURANCE TRUST
| By (Signature and Title)* | /S/ DAVID L. DILORENZO | |
| David L. DiLorenzo, President |
Date: February 15, 2022
Pursuant to the requirements of the Securities Exchange Act of 1934 and the Investment Company Act of 1940, this report has been signed below by the following persons on behalf of the registrant and in the capacities and on the dates indicated.
| By (Signature and Title)* | /S/ DAVID L. DILORENZO | |
David L. DiLorenzo, President (Principal Executive Officer) |
Date: February 15, 2022
| By (Signature and Title)* | /S/ JAMES O. YOST | |
James O. Yost, Treasurer (Principal Financial Officer and Accounting Officer) |
Date: February 15, 2022
| * | Print name and title of each signing officer under his or her signature. |