LKCM
FUNDS
LKCM SMALL CAP EQUITY FUND
LKCM SMALL-MID CAP EQUITY FUND
LKCM EQUITY FUND
LKCM BALANCED FUND
LKCM FIXED INCOME FUND
LKCM INTERNATIONAL EQUITY FUND
Annual Financial Statements and Other Information
December 31, 2024
UNITED STATES
SECURITIES AND EXCHANGE COMMISSION
Washington, D.C. 20549
FORM N-CSR
CERTIFIED SHAREHOLDER REPORT OF REGISTERED
MANAGEMENT INVESTMENT COMPANIES
Investment Company Act file number 811-08352
LKCM Funds
(Exact name of registrant as specified in charter)
c/o Luther King Capital Management Corporation
301 Commerce Street, Suite 1600
Fort Worth, TX 76102
(Address of principal executive offices) (Zip code)
K&L Gates LLP
1601 K Street, NW
Washington, DC 20006
(Name and address of agent for service)
1-800-688-LKCM and 1-800-423-6369
Registrant’s telephone number, including area code
Date of fiscal year end: December 31
Date of reporting period: December 31, 2024
Item 1. Reports to Stockholders.
The Registrant’s Annual Shareholder Reports for the fiscal year ended December 31, 2024, which were transmitted to shareholders pursuant to Rule 30e-1 under the Investment Company Act of 1940, as amended, are as follows:
(a)
 | LKCM Small Cap Equity Fund |  |
| LKSCX | ||
| Annual Shareholder Report | December 31, 2024 |
Fund Name | Costs of a $10,000 investment | Costs paid as a percentage of a $10,000 investment |
| LKCM Small Cap Equity Fund | $106 | 1.00% |
| LKCM Small Cap Equity Fund | PAGE 1 | TSR-AR-501885107 |
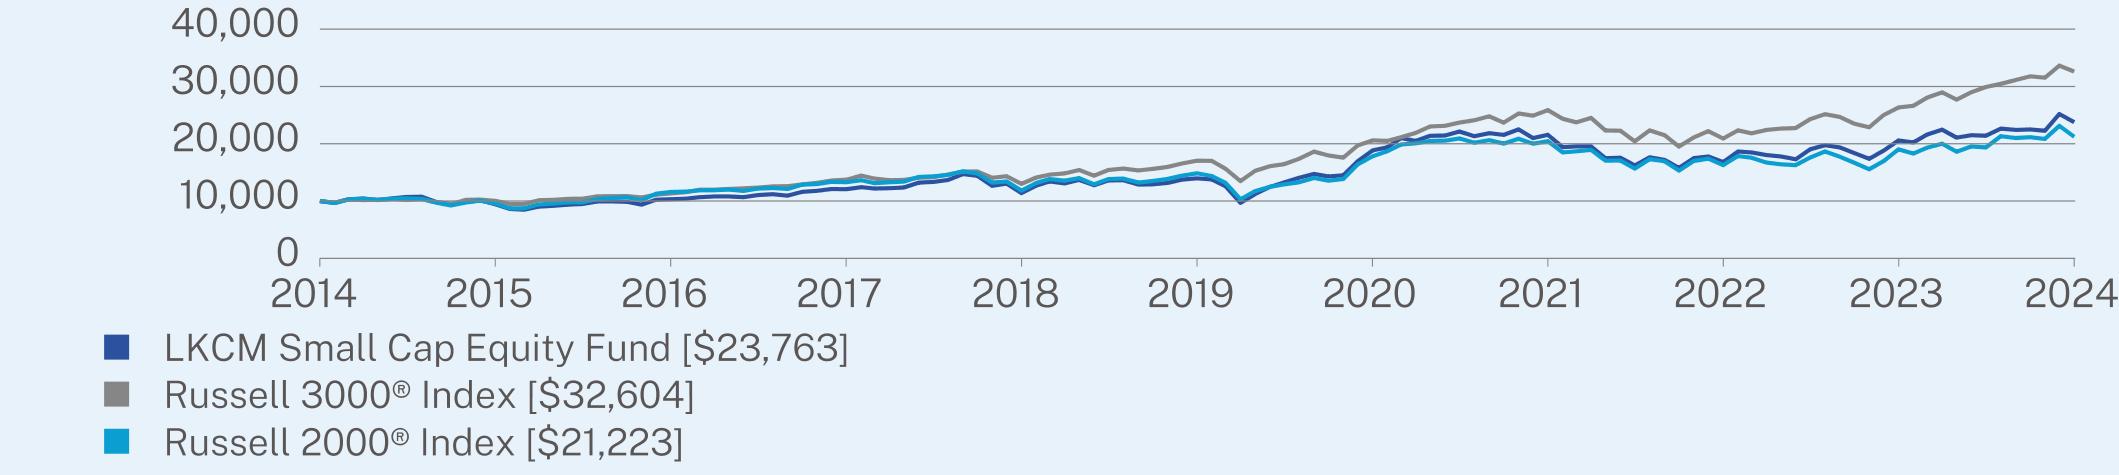
1 Year | 5 Year | 10 Year | |
LKCM Small Cap Equity Fund | 15.45 | 11.21 | 9.04 |
Russell 3000® Index ** | 23.81 | 13.86 | 12.55 |
Russell 2000® Index | 11.54 | 7.40 | 7.82 |
| * | The Fund’s past performance is not a good predictor of how the Fund will perform in the future. The graph and table do not reflect the deduction of taxes that a shareholder would pay on Fund distributions or redemption of Fund shares. Performance information reflects fee waivers in effect. In the absence of such waivers, total return would be reduced. |
| ** | In accordance with new regulatory requirements, the Fund has selected a new broad-based securities market index. The former performance index is being maintained as an additional index as it shows how the Fund’s performance compares to an index with characteristics that are more representative of the Fund’s investment strategy. |
Net Assets | $283,014,030 |
Number of Holdings | 75 |
Net Advisory Fee | $1,814,814 |
Portfolio Turnover | 29% |
Top Sectors | (% of Net Assets) |
Financials | 19.9% |
Industrials | 19.2% |
Information Technology | 15.1% |
Consumer Discretionary | 11.2% |
Health Care | 10.3% |
Energy | 6.2% |
Consumer Staples | 5.8% |
Materials | 5.3% |
Communication Services | 3.1% |
Cash & Other | 2.4% |
Real Estate | 1.5% |
Top 10 Issuers | (% of Net Assets) |
Primo Brands Corp. | 2.4% |
ESAB Corp. | 2.3% |
Q2 Holdings, Inc. | 2.2% |
Altair Engineering, Inc. - Class A | 2.2% |
Tower Semiconductor Ltd. | 2.2% |
Hawkins, Inc. | 2.1% |
Palomar Holdings, Inc. | 2.1% |
BellRing Brands, Inc. | 2.0% |
Piper Sandler Cos. | 1.9% |
Pinnacle Financial Partners Inc. | 1.9% |
| LKCM Small Cap Equity Fund | PAGE 2 | TSR-AR-501885107 |
 | LKCM Small-Mid Cap Equity Fund |  |
| LKSMX | ||
| Annual Shareholder Report | December 31, 2024 |
Fund Name | Costs of a $10,000 investment | Costs paid as a percentage of a $10,000 investment |
| LKCM Small-Mid Cap Equity Fund | $108 | 1.00% |
| LKCM Small-Mid Cap Equity Fund | PAGE 1 | TSR-AR-501885859 |
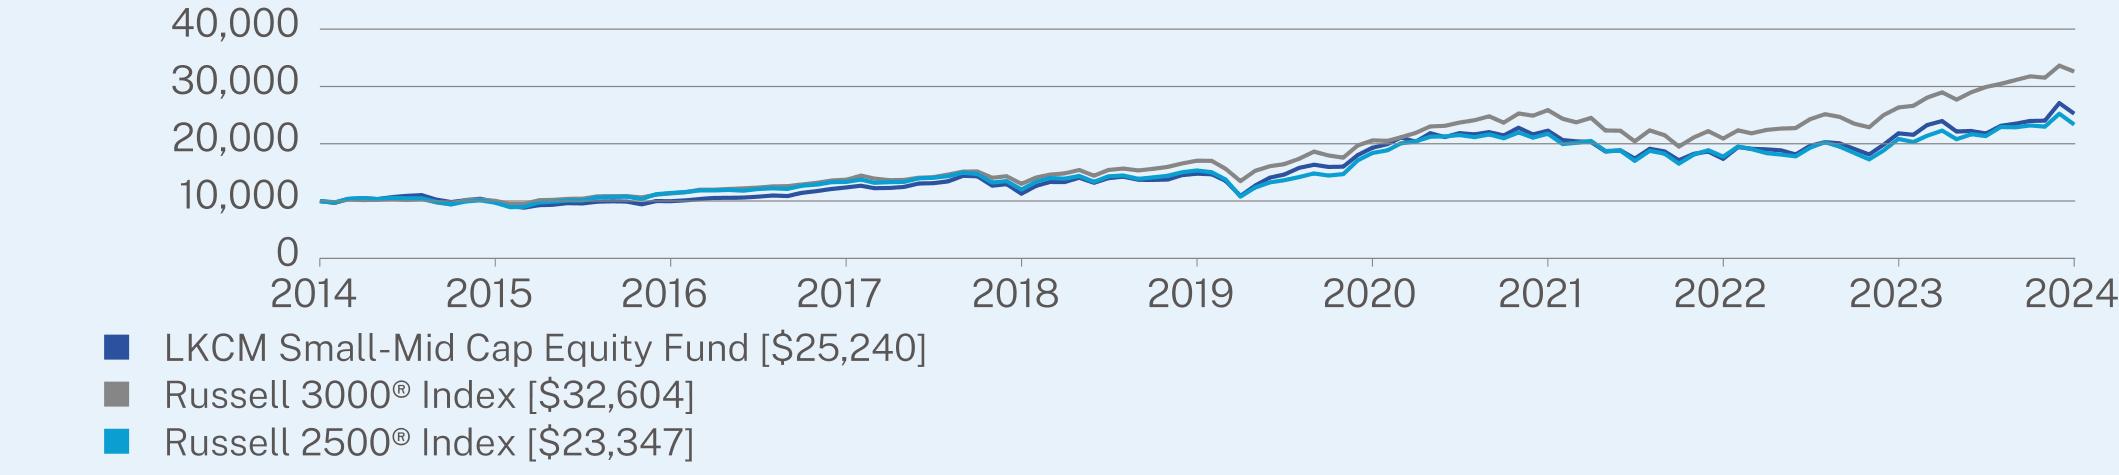
1 Year | 5 Year | 10 Year | |
LKCM Small-Mid Cap Equity Fund | 15.64 | 11.29 | 9.70 |
Russell 3000® Index** | 23.81 | 13.86 | 12.55 |
Russell 2500® Index | 12.00 | 8.77 | 8.85 |
| * | The Fund’s past performance is not a good predictor of how the Fund will perform in the future. The graph and table do not reflect the deduction of taxes that a shareholder would pay on Fund distributions or redemption of Fund shares. Performance information reflects fee waivers in effect. In the absence of such waivers, total return would be reduced. |
| ** | In accordance with new regulatory requirements, the Fund has selected a new broad-based securities market index. The former performance index is being maintained as an additional index as it shows how the Fund’s performance compares to an index with characteristics that are more representative of the Fund’s investment strategy. |
Net Assets | $39,019,871 |
Number of Holdings | 54 |
Net Advisory Fee | $118,002 |
Portfolio Turnover | 31% |
Top Sectors | (% of Net Assets) |
Industrials | 26.4% |
Financials | 21.0% |
Information Technology | 14.1% |
Consumer Discretionary | 9.9% |
Health Care | 8.8% |
Cash & Other | 5.4% |
Real Estate | 3.9% |
Materials | 3.6% |
Energy | 3.3% |
Consumer Staples | 2.4% |
Communication Services | 1.2% |
Top 10 Issuers | (% of Net Assets) |
Q2 Holdings, Inc. | 4.8% |
Axon Enterprise, Inc. | 2.9% |
Palomar Holdings, Inc. | 2.7% |
Twilio Inc. - Class A | 2.6% |
Natera, Inc. | 2.6% |
Tower Semiconductor Ltd. | 2.6% |
CBIZ, Inc. | 2.5% |
Goosehead Insurance, Inc. - Class A | 2.4% |
LPL Financial Holdings, Inc. | 2.3% |
MSILF Government Portfolio | 2.3% |
| LKCM Small-Mid Cap Equity Fund | PAGE 2 | TSR-AR-501885859 |
 | LKCM Equity Fund |  |
| LKEQX | ||
| Annual Shareholder Report | December 31, 2024 |
Fund Name | Costs of a $10,000 investment | Costs paid as a percentage of a $10,000 investment |
| LKCM Equity Fund | $81 | 0.80% |
| LKCM Equity Fund | PAGE 1 | TSR-AR-501885206 |
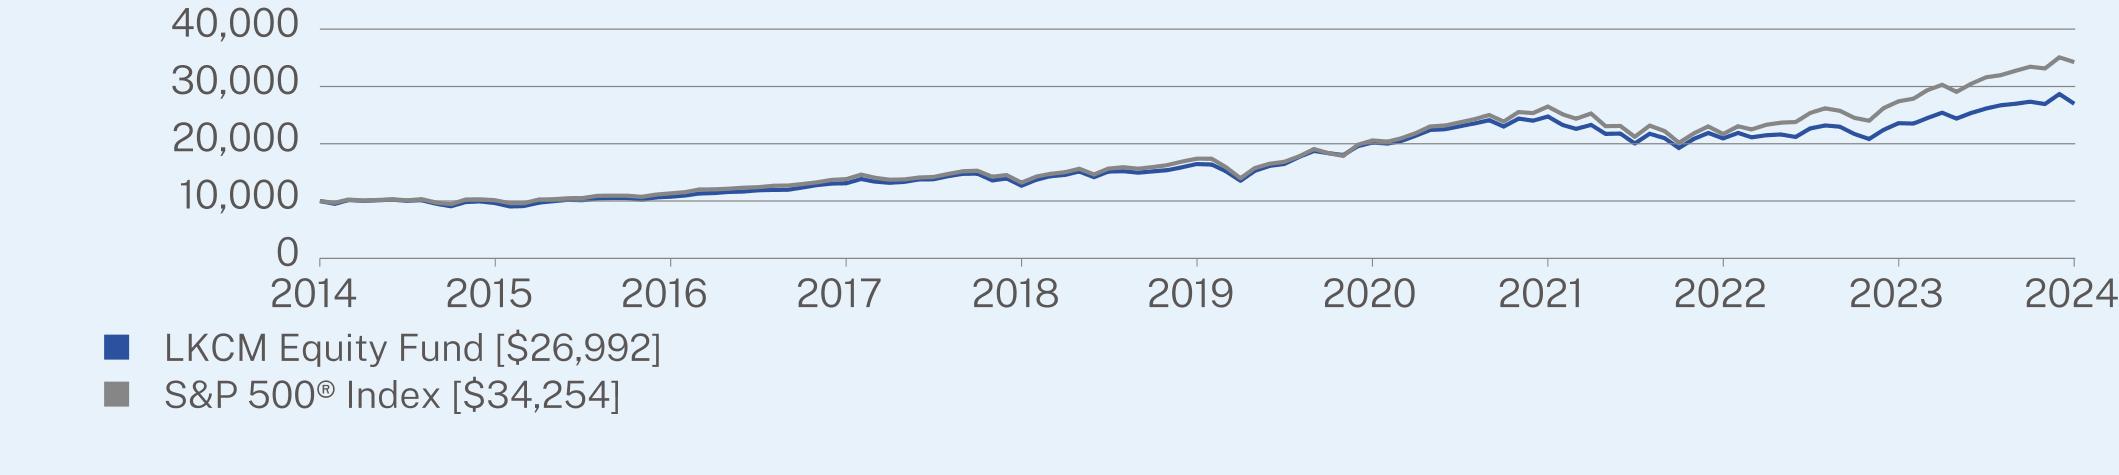
1 Year | 5 Year | 10 Year | |
LKCM Equity Fund | 14.44 | 10.40 | 10.44 |
S&P 500® Index | 25.02 | 14.53 | 13.10 |
| * | The Fund’s past performance is not a good predictor of how the Fund will perform in the future. The graph and table do not reflect the deduction of taxes that a shareholder would pay on Fund distributions or redemption of Fund shares. Performance information reflects fee waivers in effect. In the absence of such waivers, total return would be reduced. |
Net Assets | $508,483,159 |
Number of Holdings | 55 |
Net Advisory Fee | $2,662,788 |
Portfolio Turnover | 9% |
Top Sectors | (% of Net Assets) |
Information Technology | 25.4% |
Industrials | 23.8% |
Health Care | 11.9% |
Consumer Discretionary | 7.5% |
Materials | 6.8% |
Financials | 6.6% |
Energy | 6.6% |
Communication Services | 4.1% |
Consumer Staples | 4.0% |
Cash & Other | 3.3% |
Top 10 Issuers | (% of Net Assets) |
Microsoft Corp. | 6.6% |
Apple Inc. | 4.7% |
Alphabet, Inc. - Class A | 4.1% |
NVIDIA Corp. | 4.0% |
Oracle Corp. | 3.9% |
Waste Connections, Inc. | 3.0% |
FTAI Aviation Ltd. | 2.7% |
Ecolab, Inc. | 2.5% |
Trimble, Inc. | 2.4% |
JPMorgan Chase & Co. | 2.4% |
| LKCM Equity Fund | PAGE 2 | TSR-AR-501885206 |
 | LKCM Balanced Fund |  |
| LKBAX | ||
| Annual Shareholder Report | December 31, 2024 |
Fund Name | Costs of a $10,000 investment | Costs paid as a percentage of a $10,000 investment |
| LKCM Balanced Fund | $82 | 0.80% |
| LKCM Balanced Fund | PAGE 1 | TSR-AR-501885305 |
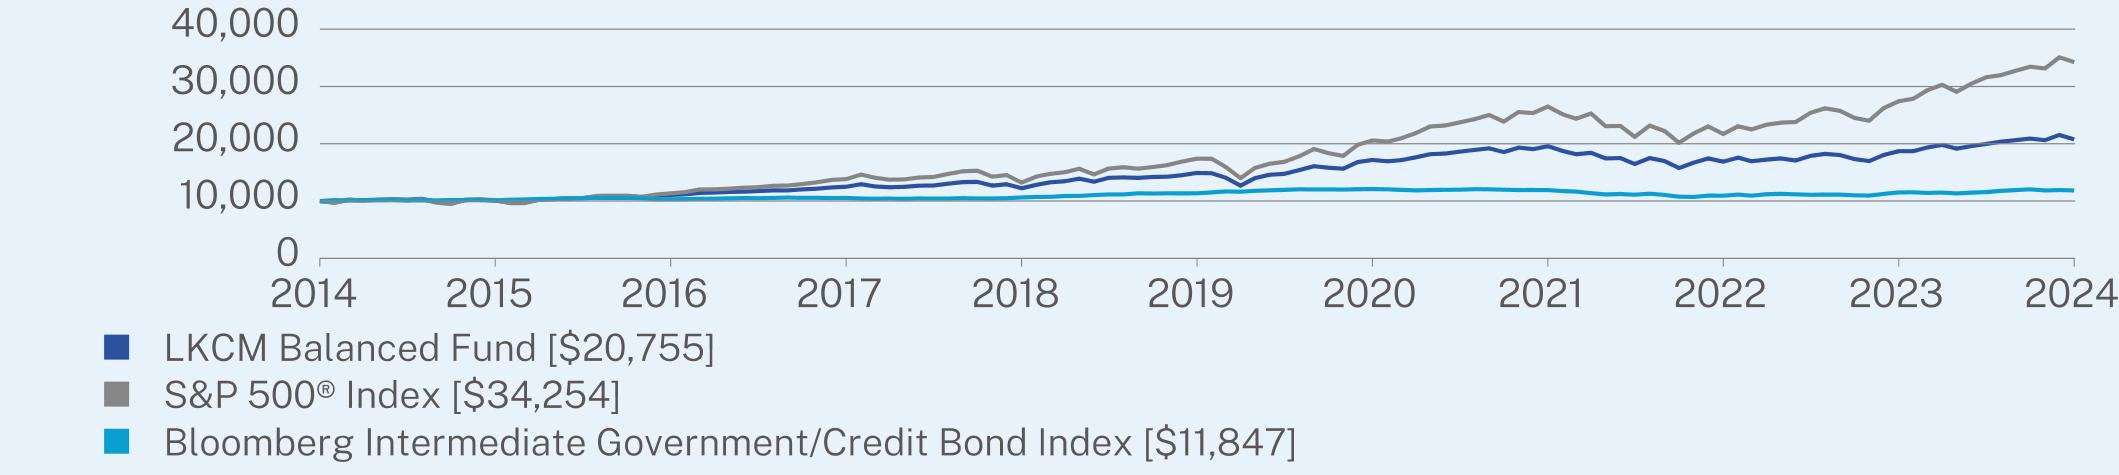
1 Year | 5 Year | 10 Year | |
LKCM Balanced Fund | 10.99 | 6.86 | 7.58 |
S&P 500® Index | 25.02 | 14.53 | 13.10 |
Bloomberg Intermediate Government/Credit Bond Index | 3.00 | 0.86 | 1.71 |
| * | The Fund’s past performance is not a good predictor of how the Fund will perform in the future. The graph and table do not reflect the deduction of taxes that a shareholder would pay on Fund distributions or redemption of Fund shares. Performance information reflects fee waivers in effect. In the absence of such waivers, total return would be reduced. |
Net Assets | $114,922,770 |
Number of Holdings | 141 |
Net Advisory Fee | $502,832 |
Portfolio Turnover | 15% |
Top Sectors (% of Net Assets) | |
Information Technology | 21.7% |
Industrials | 14.6% |
Health Care | 11.4% |
Financials | 9.9% |
Consumer Staples | 9.3% |
Energy | 8.8% |
Communication Services | 7.4% |
Materials | 7.2% |
Consumer Discretionary | 6.8% |
Cash & Other | 2.9% |
Security Type (% of Net Assets) | |
Common Stocks | 69.5% |
Corporate Bonds | 29.8% |
Cash & Other | 0.7% |
Top 10 Issuers (% of Net Assets) | |
Apple Inc. | 3.5% |
Amazon.com, Inc. | 2.9% |
Meta Platforms, Inc. | 2.8% |
NVIDIA Corp. | 2.7% |
Microsoft Corp. | 2.7% |
Oracle Corp. | 2.6% |
Alphabet Inc. - Class C | 2.3% |
Home Depot, Inc. | 2.1% |
Cullen/Frost Bankers, Inc. | 1.8% |
Waste Management, Inc. | 1.8% |
| LKCM Balanced Fund | PAGE 2 | TSR-AR-501885305 |
 | LKCM Fixed Income Fund |  |
| LKFIX | ||
| Annual Shareholder Report | December 31, 2024 |
Fund Name | Costs of a $10,000 investment | Costs paid as a percentage of a $10,000 investment |
| LKCM Fixed Income Fund | $51 | 0.50% |
| LKCM Fixed Income Fund | PAGE 1 | TSR-AR-501885404 |
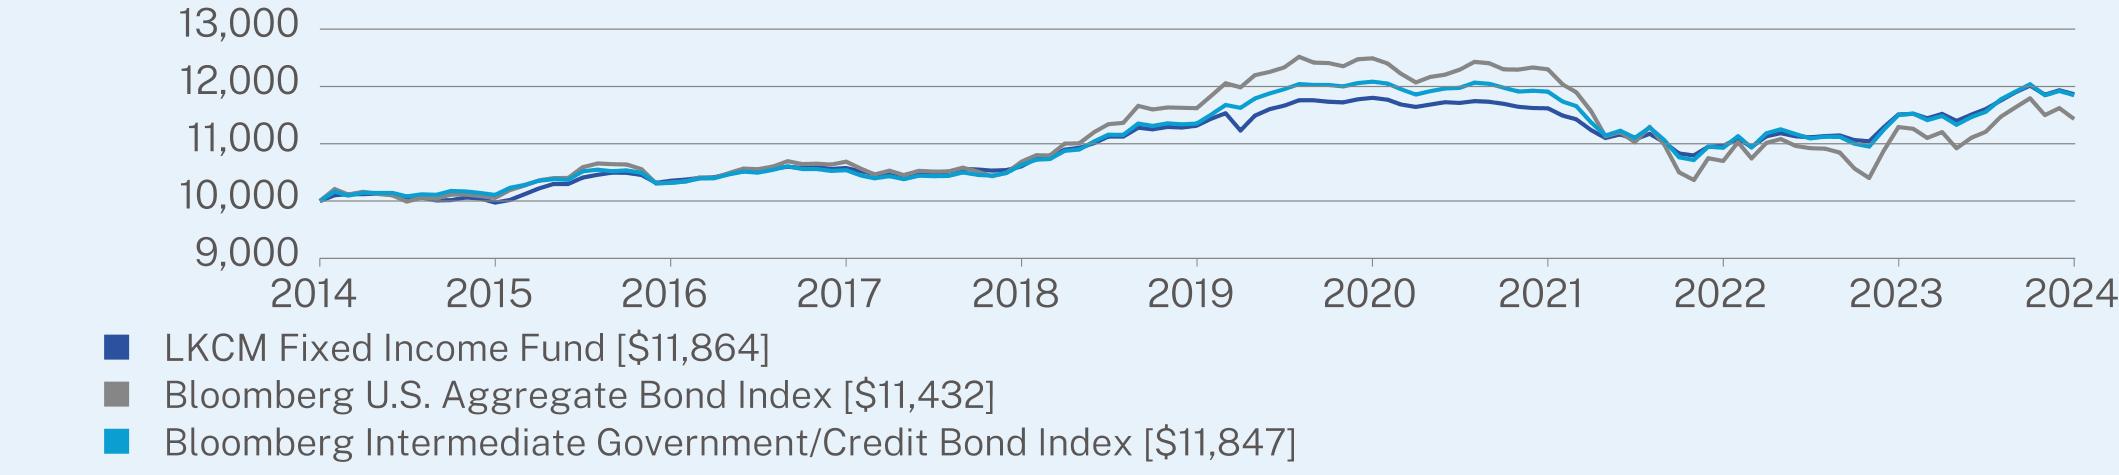
1 Year | 5 Year | 10 Year | |
LKCM Fixed Income Fund | 3.06 | 0.95 | 1.72 |
Bloomberg U.S. Aggregate Bond Index ** | 1.25 | -0.33 | 1.35 |
Bloomberg Intermediate Government/Credit Bond Index | 3.00 | 0.86 | 1.71 |
| * | The Fund’s past performance is not a good predictor of how the Fund will perform in the future. The graph and table do not reflect the deduction of taxes that a shareholder would pay on Fund distributions or redemption of Fund shares. Performance information reflects fee waivers in effect. In the absence of such waivers, total return would be reduced. |
| ** | In accordance with new regulatory requirements, the Fund has selected a new broad-based securities market index. The former performance index is being maintained as an additional index as it shows how the Fund’s performance compares to an index with characteristics that are more representative of the Fund’s investment strategy. |
Net Assets | $277,122,376 |
Number of Holdings | 94 |
Net Advisory Fee | $529,058 |
Portfolio Turnover | 25% |
Effective Duration | 3.49 years |
30-Day SEC Yield | 4.07% |
Top Sectors | (% of Net Assets) |
U.S. Government Sponsored Entities | 22.2% |
Industrials | 12.0% |
Health Care | 11.5% |
Government Bonds | 10.9% |
Information Technology | 10.7% |
Energy | 9.1% |
Consumer Discretionary | 5.1% |
Communication Services | 5.1% |
Financials | 4.3% |
Cash & Other | 4.2% |
Real Estate | 2.5% |
Materials | 2.4% |
Top 10 Issuers | (% of Net Assets) |
United States Treasury Note/Bond, 4.13%, 11/15/32 | 3.0% |
Intuit Inc., 5.20%, 09/15/33 | 2.7% |
Emerson Electric Co., 3.15%, 06/01/25 | 2.7% |
Kinder Morgan Inc., 5.20%, 06/01/33 | 2.6% |
L3Harris Technologies Inc., 5.40%, 07/31/33 | 2.0% |
Danaher Corp., 3.35%, 09/15/25 | 2.0% |
Trimble Inc., 6.10%, 03/15/33 | 1.9% |
ONEOK Inc., 6.05%, 09/01/33 | 1.9% |
Tractor Supply Co., 5.25%, 05/15/33 | 1.8% |
Federal Home Loan Banks, 4.00%, 04/14/25 | 1.8% |
| LKCM Fixed Income Fund | PAGE 2 | TSR-AR-501885404 |
 | LKCM International Equity Fund |  |
| LKINX | ||
| Annual Shareholder Report | December 31, 2024 |
Fund Name | Costs of a $10,000 investment | Costs paid as a percentage of a $10,000 investment |
| LKCM International Equity Fund | $100 | 1.00% |
| LKCM International Equity Fund | PAGE 1 | TSR-AR-501885834 |
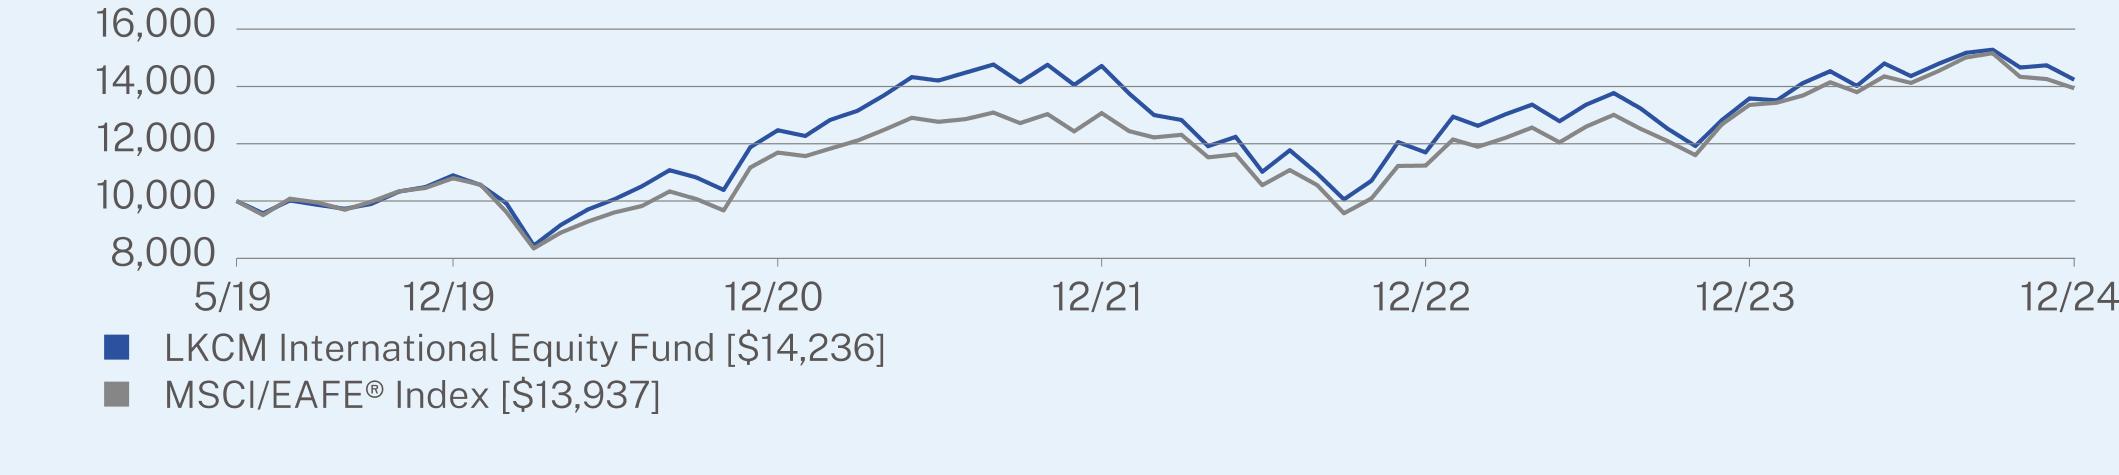
1 Year | 5 Year | Since Inception (05/01/2019) | |
LKCM International Equity Fund | 4.83 | 5.49 | 6.43 |
MSCI/EAFE® Index | 4.35 | 5.24 | 6.03 |
| * | The Fund’s past performance is not a good predictor of how the Fund will perform in the future. The graph and table do not reflect the deduction of taxes that a shareholder would pay on Fund distributions or redemption of Fund shares. Performance information reflects fee waivers in effect. In the absence of such waivers, total return would be reduced. |
Net Assets | $60,328,858 |
Number of Holdings | 49 |
Net Advisory Fee | $324,873 |
Portfolio Turnover | 17% |
Top Sectors (% of Net Assets) | |
Industrials | 21.2% |
Financials | 20.2% |
Information Technology | 12.8% |
Consumer Discretionary | 10.9% |
Health Care | 9.0% |
Consumer Staples | 7.6% |
Energy | 6.2% |
Materials | 6.0% |
Communication Services | 4.8% |
Cash & Other | 1.3% |
Top 10 Issuers (% of Net Assets) | |
Deutsche Telekom AG | 2.9% |
Barclays PLC | 2.8% |
SAP SE | 2.8% |
Euronext NV | 2.8% |
Lonza Group AG | 2.7% |
Air Liquide SA | 2.7% |
Alcon AG | 2.7% |
Sage Group PLC | 2.6% |
Unilever PLC | 2.6% |
Fluidra SA | 2.6% |
Top Ten Countries (% of Net Assets) | |
United Kingdom | 25.8% |
Germany | 13.6% |
France | 13.0% |
Netherlands | 10.0% |
Switzerland | 9.6% |
Canada | 6.4% |
Japan | 4.4% |
Australia | 3.7% |
Spain | 2.6% |
United States | 2.6% |
| LKCM International Equity Fund | PAGE 2 | TSR-AR-501885834 |
 | LKCM Aquinas Catholic Equity Fund |  |
| AQEIX | ||
| Annual Shareholder Report | December 31, 2024 |
Fund Name | Costs of a $10,000 investment | Costs paid as a percentage of a $10,000 investment |
| LKCM Aquinas Catholic Equity Fund | $102 | 1.00% |
| LKCM Aquinas Catholic Equity Fund | PAGE 1 | TSR-AR-501885883 |
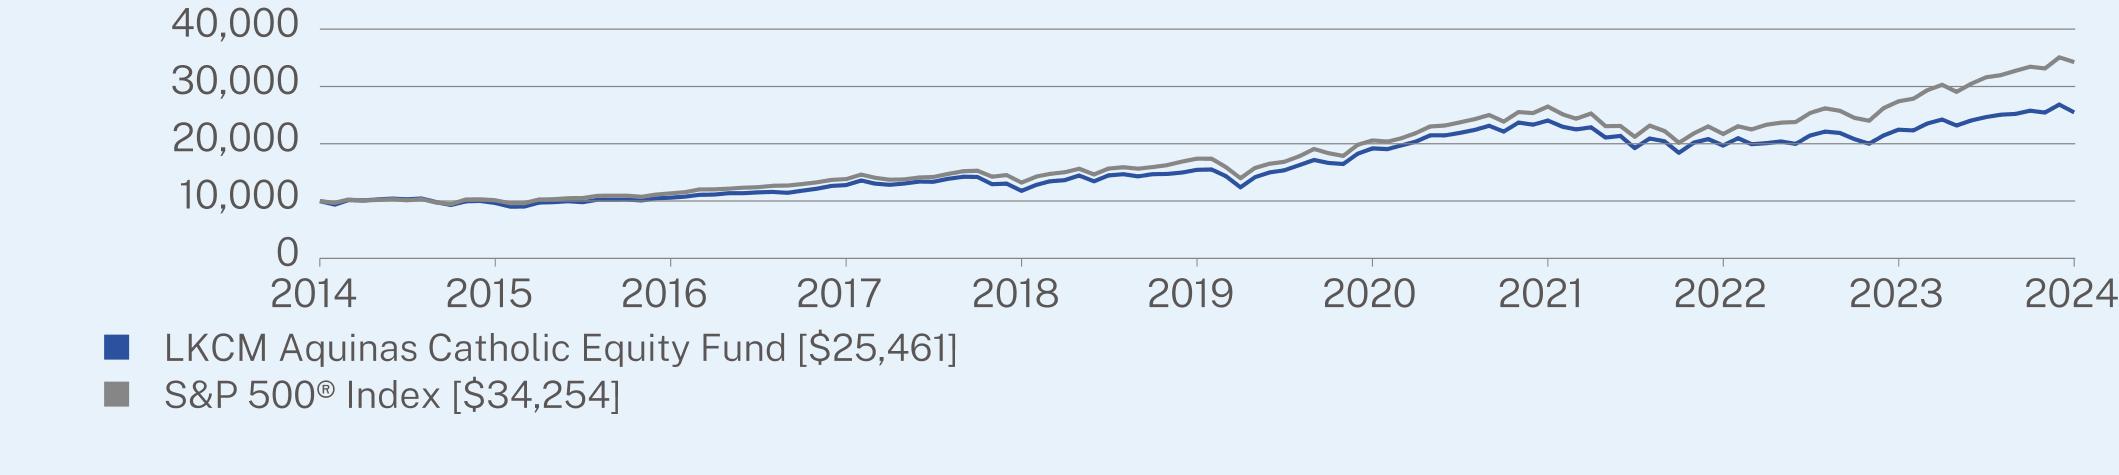
1 Year | 5 Year | 10 Year | |
LKCM Aquinas Catholic Equity Fund | 13.37 | 10.51 | 9.80 |
S&P 500® Index | 25.02 | 14.53 | 13.10 |
| * | The Fund’s past performance is not a good predictor of how the Fund will perform in the future. The graph and table do not reflect the deduction of taxes that a shareholder would pay on Fund distributions or redemption of Fund shares. Performance information reflects fee waivers in effect. In the absence of such waivers, total return would be reduced. |
Net Assets | $60,109,295 |
Number of Holdings | 44 |
Net Advisory Fee | $258,774 |
Portfolio Turnover | 11% |
Top Sectors | (% of Net Assets) |
Information Technology | 31.0% |
Industrials | 13.2% |
Materials | 12.0% |
Consumer Discretionary | 10.4% |
Energy | 8.5% |
Health Care | 7.9% |
Consumer Staples | 5.5% |
Communication Services | 4.9% |
Financials | 4.3% |
Cash & Other | 2.3% |
Top 10 Issuers | (% of Net Assets) |
NVIDIA Corp. | 5.1% |
Alphabet, Inc. - Class A | 4.9% |
Microsoft Corp. | 4.6% |
Oracle Corp. | 4.2% |
Apple Inc. | 3.7% |
Roper Technologies, Inc. | 3.5% |
Stryker Corp. | 3.3% |
Trimble, Inc. | 2.9% |
Amazon.com, Inc. | 2.9% |
Sherwin-Williams Co. | 2.8% |
| LKCM Aquinas Catholic Equity Fund | PAGE 2 | TSR-AR-501885883 |
Item 2. Code of Ethics.
The Registrant has adopted a code of ethics that applies to the registrant’s principal executive officer and principal financial officer. The registrant has not made any amendments to its code of ethics during the period covered by this report. The registrant has not granted any waivers from any provisions of the code of ethics during the period covered by this report.
A copy of the registrant’s Code of Ethics is filed herewith.
Item 3. Audit Committee Financial Expert.
The Registrant’s board of trustees has determined that there is at least one audit committee financial expert serving on its audit committee. Richard J. Howell is the “audit committee financial expert” and is considered to be “independent” as each term is defined in Item 3 of Form N-CSR.
Item 4. Principal Accountant Fees and Services.
The Registrant has engaged its principal accountant to perform audit services, audit-related services, tax services and other services during the past two fiscal years. “Audit services” refer to performing an audit of the Registrant’s annual financial statements or services that are normally provided by the accountant in connection with statutory and regulatory filings or engagements for those fiscal years. “Audit-related services” refer to the assurance and related services by the principal accountant that are reasonably related to the performance of the audit. “Tax services” refer to professional services rendered by the principal accountant for tax compliance, tax advice, and tax planning. The following table details the aggregate fees billed or expected to be billed by the principal accountant for each of the last two fiscal years for audit services (which are reflected under “Audit Fees”), audit-related services (which are reflected under “Audit-Related Fee”), tax services (which are reflected under “Tax Fees”), and other services fees (which are reflected under “All Other Fees”).
| FYE 12/31/2024 | FYE 12/31/2023 | |
| Audit Fees | $175,000 | $172,470 |
| Audit-Related Fees | — | — |
| Tax Fees | 38,396 | 37,820 |
| All Other Fees | — | — |
The audit committee has adopted pre-approval policies and procedures that require the audit committee to pre-approve all audit and non-audit services of the Registrant, including services provided to any entity affiliated with the Registrant.
The percentage of fees billed by the principal accountant applicable to non-audit services pursuant to a waiver of pre-approval requirements were as follows:
| FYE 12/31/2024 | FYE 12/31/2023 | |
| Audit-Related Fees | 0% | 0% |
| Tax Fees | 0% | 0% |
| All Other Fees | 0% | 0% |
All of the principal accountant’s hours spent on auditing the Registrant’s financial statements were attributed to work performed by full-time permanent employees of the principal accountant.
The following table indicates the non-audit fees billed or expected to be billed by the Registrant’s principal accountant for services to the Registrant and to the Registrant’s investment adviser (and any other controlling entity, etc.—not sub-adviser) for the last two years.
| Non-Audit Related Fees | FYE 12/31/2024 | FYE 12/31/2023 |
| Registrant | $38,396 | $37,820 |
| Registrant’s Investment Adviser | — | — |
The audit committee of the board of trustees has considered whether the provision of non-audit services that were rendered to the Registrant’s investment adviser is compatible with maintaining the principal accountant’s independence and has concluded that the provision of such non-audit services by the accountant has not compromised the accountant’s independence.
The Registrant has not been identified by the U.S. Securities and Exchange Commission as having filed an annual report issued by a registered public accounting firm branch or office that is located in a foreign jurisdiction where the Public Company Accounting Oversight Board is unable to inspect or completely investigate because of a position taken by an authority in that jurisdiction.
The Registrant is not a foreign issuer.
Item 5. Audit Committee of Listed Registrants.
Not applicable to registrants who are not listed issuers (as defined in Rule 10A-3 under the Securities Exchange Act of 1934).
Item 6. Investments.
| (a) | The Schedule of Investments is included within the financial statements filed under Item 7 of this Form N-CSR. |
| (b) | Not applicable |
Item 7. Financial Statements and Financial Highlights for Open-End Investment Companies.
(a)
Page | |||
Schedules of Investments | |||
Financial Highlights | |||
Shares | Value | |||||
COMMON STOCKS - 97.4% | ||||||
Aerospace & Defense - 0.9% | ||||||
Mercury Systems, Inc.(a) | 60,778 | $2,552,676 | ||||
Banks - 8.7% | ||||||
Cadence Bank | 106,080 | 3,654,456 | ||||
Cullen/Frost Bankers, Inc. | 9,622 | 1,291,753 | ||||
Hilltop Holdings, Inc. | 72,049 | 2,062,763 | ||||
Home BancShares, Inc. | 162,789 | 4,606,929 | ||||
Pinnacle Financial Partners, Inc. | 47,082 | 5,385,710 | ||||
UMB Financial Corp. | 34,624 | 3,907,665 | ||||
Webster Financial Corp. | 64,812 | 3,578,918 | ||||
24,488,194 | ||||||
Beverages - 2.4% | ||||||
Primo Brands Corp. | 219,278 | 6,747,184 | ||||
Broadline Retail - 1.7% | ||||||
Ollie's Bargain Outlet Holdings, Inc.(a) | 44,941 | 4,931,376 | ||||
Building Products - 2.5% | ||||||
CSW Industrials, Inc. | 7,748 | 2,733,495 | ||||
Zurn Elkay Water Solutions Corp. | 117,884 | 4,397,073 | ||||
7,130,568 | ||||||
Capital Markets - 1.9% | ||||||
Piper Sandler Cos. | 18,161 | 5,447,392 | ||||
Chemicals - 3.0% | ||||||
Hawkins, Inc. | 48,811 | 5,987,645 | ||||
Quaker Chemical Corp. | 17,138 | 2,412,345 | ||||
8,399,990 | ||||||
Communications Equipment - 1.4% | ||||||
Lumentum Holdings, Inc.(a) | 47,993 | 4,029,012 | ||||
Construction Materials - 1.2% | ||||||
Eagle Materials, Inc. | 14,319 | 3,533,356 | ||||
Consumer Finance - 1.1% | ||||||
FirstCash Holdings, Inc. | 29,091 | 3,013,828 | ||||
Electrical Equipment - 0.9% | ||||||
Generac Holdings, Inc.(a) | 16,020 | 2,483,901 | ||||
Energy Equipment & Services - 2.2% | ||||||
Archrock, Inc. | 150,259 | 3,739,946 | ||||
Weatherford International PLC | 35,852 | 2,568,079 | ||||
6,308,025 | ||||||
Financial Services - 4.8% | ||||||
AvidXchange Holdings, Inc.(a) | 401,642 | 4,152,978 | ||||
Euronet Worldwide, Inc.(a) | 33,688 | 3,464,474 | ||||
Repay Holdings Corp.(a) | 119,937 | 915,119 | ||||
Shift4 Payments, Inc. - Class A(a) | 47,429 | 4,922,182 | ||||
13,454,753 | ||||||
Shares | Value | |||||
Food Products - 1.3% | ||||||
Utz Brands, Inc. | 241,022 | $3,774,405 | ||||
Health Care Equipment & Supplies - 4.7% | ||||||
Alphatec Holdings, Inc.(a) | 423,269 | 3,885,610 | ||||
Enovis Corp.(a) | 85,780 | 3,764,026 | ||||
Merit Medical Systems, Inc.(a) | 39,861 | 3,855,356 | ||||
Neogen Corp.(a) | 146,272 | 1,775,742 | ||||
13,280,734 | ||||||
Health Care Providers & Services - 3.9% | ||||||
Addus HomeCare Corp.(a) | 21,456 | 2,689,509 | ||||
Ensign Group, Inc. | 30,087 | 3,997,359 | ||||
HealthEquity, Inc.(a) | 44,387 | 4,258,933 | ||||
10,945,801 | ||||||
Hotels, Restaurants & Leisure - 6.8% | ||||||
Everi Holdings, Inc.(a) | 342,821 | 4,631,511 | ||||
Kura Sushi USA, Inc. - Class A(a) | 18,460 | 1,672,107 | ||||
Lucky Strike Entertainment Corp. | 223,885 | 2,241,089 | ||||
Playa Hotels & Resorts NV(a) | 378,895 | 4,793,022 | ||||
Red Rock Resorts, Inc. - Class A | 62,227 | 2,877,376 | ||||
Wingstop, Inc. | 10,484 | 2,979,553 | ||||
19,194,658 | ||||||
Insurance - 3.8% | ||||||
Goosehead Insurance, Inc. - Class A(a) | 44,511 | 4,772,469 | ||||
Palomar Holdings, Inc.(a) | 56,625 | 5,979,034 | ||||
10,751,503 | ||||||
Life Sciences Tools & Services - 1.7% | ||||||
Medpace Holdings, Inc.(a) | 14,794 | 4,915,011 | ||||
Machinery - 9.6% | ||||||
Alamo Group, Inc. | 19,787 | 3,678,601 | ||||
Chart Industries, Inc.(a) | 20,882 | 3,985,121 | ||||
ESAB Corp. | 53,383 | 6,402,757 | ||||
Franklin Electric Co., Inc. | 30,970 | 3,018,026 | ||||
Helios Technologies, Inc. | 54,993 | 2,454,888 | ||||
ITT, Inc. | 31,035 | 4,434,281 | ||||
Watts Water Technologies, Inc. - Class A | 16,359 | 3,325,785 | ||||
27,299,459 | ||||||
Media - 3.1% | ||||||
Magnite, Inc.(a) | 334,804 | 5,330,080 | ||||
Nexstar Media Group, Inc. - Class A | 21,672 | 3,423,526 | ||||
8,753,606 | ||||||
Metals & Mining - 1.1% | ||||||
Materion Corp. | 31,279 | 3,092,868 | ||||
Oil, Gas & Consumable Fuels - 4.0% | ||||||
CNX Resources Corp.(a) | 136,350 | 4,999,955 | ||||
Magnolia Oil & Gas Corp. - Class A | 152,130 | 3,556,799 | ||||
Northern Oil and Gas, Inc. | 41,056 | 1,525,641 | ||||
Permian Resources Corp. | 79,941 | 1,149,552 | ||||
11,231,947 | ||||||
1 |
Shares | Value | |||||
COMMON STOCKS - (Continued) | ||||||
Personal Care Products - 2.0% | ||||||
BellRing Brands, Inc.(a) | 76,977 | $5,799,447 | ||||
Professional Services - 3.6% | ||||||
CBIZ, Inc.(a) | 46,306 | 3,789,220 | ||||
NV5 Global, Inc.(a) | 135,684 | 2,556,286 | ||||
Upwork, Inc.(a) | 229,376 | 3,750,298 | ||||
10,095,804 | ||||||
Real Estate Management & Development - 1.5% | ||||||
FirstService Corp. | 23,654 | 4,281,847 | ||||
Semiconductors & Semiconductor Equipment - 2.2% | ||||||
Tower Semiconductor Ltd.(a) | 118,777 | 6,118,203 | ||||
Software - 11.1% | ||||||
Altair Engineering, Inc. - Class A(a) | 56,148 | 6,126,308 | ||||
Appian Corp. - Class A(a) | 89,506 | 2,951,908 | ||||
Braze, Inc. - Class A(a) | 68,112 | 2,852,531 | ||||
Five9, Inc.(a) | 50,122 | 2,036,958 | ||||
LiveRamp Holdings, Inc.(a) | 110,777 | 3,364,297 | ||||
Onestream, Inc.(a) | 90,831 | 2,590,500 | ||||
Q2 Holdings, Inc.(a) | 61,906 | 6,230,839 | ||||
Workiva Inc.(a) | 48,843 | 5,348,309 | ||||
31,501,650 | ||||||
Specialty Retail - 1.5% | ||||||
Academy Sports & Outdoors, Inc. | 71,776 | 4,129,273 | ||||
Textiles, Apparel & Luxury Goods - 1.2% | ||||||
Crocs, Inc.(a) | 31,208 | 3,418,212 | ||||
Trading Companies & Distributors - 1.6% | ||||||
Global Industrial Co. | 78,793 | 1,953,278 | ||||
SiteOne Landscape Supply, Inc.(a) | 20,432 | 2,692,325 | ||||
4,645,603 | ||||||
TOTAL COMMON STOCKS (Cost $186,217,791) | 275,750,286 | |||||
Shares | Value | |||||
SHORT-TERM INVESTMENTS - 2.5% | ||||||
Money Market Funds - 2.5% | ||||||
Invesco Short-Term Investments Trust - Government & Agency Portfolio - Institutional Shares, 4.43%(b) | 6,941,861 | $6,941,861 | ||||
TOTAL SHORT-TERM INVESTMENTS (Cost $6,941,861) | 6,941,861 | |||||
TOTAL INVESTMENTS - 99.9% (Cost $193,159,652) | $282,692,147 | |||||
Other Assets in Excess of Liabilities - 0.1% | 321,883 | |||||
TOTAL NET ASSETS - 100.0% | $283,014,030 | |||||
(a) | Non-income producing security. |
(b) | The rate shown represents the 7-day annualized effective yield as of December 31, 2024. |
2 |
Shares | Value | |||||
COMMON STOCKS - 94.8% | ||||||
Aerospace & Defense - 4.5% | ||||||
Axon Enterprise, Inc. (a) | 1,883 | $1,119,105 | ||||
BWX Technologies, Inc. | 5,621 | 626,123 | ||||
1,745,228 | ||||||
Banks - 5.2% | ||||||
Pinnacle Financial Partners, Inc. | 6,315 | 722,373 | ||||
UMB Financial Corp. | 6,087 | 686,979 | ||||
Webster Financial Corp. | 11,236 | 620,452 | ||||
2,029,804 | ||||||
Beverages - 0.3% | ||||||
Celsius Holdings, Inc.(a) | 4,149 | 109,285 | ||||
Biotechnology - 2.6% | ||||||
Natera, Inc. (a) | 6,383 | 1,010,429 | ||||
Building Products - 5.9% | ||||||
A O Smith Corp. | 6,893 | 470,171 | ||||
Builders FirstSource, Inc.(a) | 4,347 | 621,317 | ||||
CSW Industrials, Inc. | 2,130 | 751,464 | ||||
Zurn Elkay Water Solutions Corp. | 11,940 | 445,362 | ||||
2,288,314 | ||||||
Capital Markets - 4.6% | ||||||
LPL Financial Holdings, Inc. | 2,798 | 913,575 | ||||
SEI Investments Co. | 10,635 | 877,175 | ||||
1,790,750 | ||||||
Chemicals - 0.7% | ||||||
Quaker Chemical Corp. | 1,838 | 258,717 | ||||
Commercial Services & Supplies - 2.0% | ||||||
Tetra Tech, Inc. | 19,363 | 771,422 | ||||
Construction & Engineering - 2.0% | ||||||
AECOM | 7,255 | 774,979 | ||||
Construction Materials - 1.5% | ||||||
Eagle Materials, Inc. | 2,373 | 585,562 | ||||
Distributors - 1.0% | ||||||
Pool Corp. | 1,121 | 382,194 | ||||
Electronic Equipment, Instruments & Components - 2.0% | ||||||
Trimble, Inc.(a) | 11,038 | 779,945 | ||||
Financial Services - 5.1% | ||||||
AvidXchange Holdings, Inc.(a) | 45,965 | 475,278 | ||||
Corpay, Inc.(a) | 2,438 | 825,068 | ||||
Euronet Worldwide, Inc.(a) | 6,623 | 681,109 | ||||
1,981,455 | ||||||
Health Care Equipment & Supplies - 1.7% | ||||||
Merit Medical Systems, Inc.(a) | 6,846 | 662,145 | ||||
Shares | Value | |||||
Health Care Providers & Services - 3.2% | ||||||
Addus HomeCare Corp.(a) | 3,911 | $490,244 | ||||
Ensign Group, Inc. | 5,833 | 774,972 | ||||
1,265,216 | ||||||
Hotels, Restaurants & Leisure - 1.6% | ||||||
Wingstop, Inc. | 2,225 | 632,345 | ||||
Insurance - 6.2% | ||||||
Baldwin Insurance Group, Inc. - Class A(a) | 11,142 | 431,864 | ||||
Goosehead Insurance, Inc. - Class A(a) | 8,862 | 950,184 | ||||
Palomar Holdings, Inc.(a) | 9,799 | 1,034,676 | ||||
2,416,724 | ||||||
IT Services - 2.6% | ||||||
Twilio Inc. - Class A(a) | 9,465 | 1,022,977 | ||||
Life Sciences Tools & Services - 1.3% | ||||||
Medpace Holdings, Inc.(a) | 1,522 | 505,654 | ||||
Machinery - 3.3% | ||||||
ITT, Inc. | 4,712 | 673,250 | ||||
Kadant, Inc. | 1,811 | 624,777 | ||||
1,298,027 | ||||||
Media - 1.1% | ||||||
Nexstar Media Group, Inc. - Class A | 2,719 | 429,520 | ||||
Metals & Mining - 1.5% | ||||||
Reliance, Inc. | 2,144 | 577,293 | ||||
Oil, Gas & Consumable Fuels - 3.3% | ||||||
Expand Energy Corp. | 6,482 | 645,283 | ||||
Permian Resources Corp. | 45,711 | 657,324 | ||||
1,302,607 | ||||||
Personal Care Products - 2.1% | ||||||
BellRing Brands, Inc.(a) | 11,131 | 838,610 | ||||
Professional Services - 6.3% | ||||||
Broadridge Financial Solutions, Inc. | 3,063 | 692,514 | ||||
CBIZ, Inc.(a) | 12,135 | 993,007 | ||||
Paylocity Holding Corp.(a) | 3,820 | 761,975 | ||||
2,447,496 | ||||||
Real Estate Management & Development - 3.9% | ||||||
Colliers International Group, Inc. | 6,075 | 826,018 | ||||
FirstService Corp. | 3,873 | 701,090 | ||||
1,527,108 | ||||||
Semiconductors & Semiconductor Equipment - 2.6% | ||||||
Tower Semiconductor Ltd.(a) | 19,580 | 1,008,566 | ||||
Software - 6.9% | ||||||
Altair Engineering, Inc. - Class A(a) | 7,562 | 825,090 | ||||
Q2 Holdings, Inc.(a) | 18,543 | 1,866,353 | ||||
2,691,443 | ||||||
3 |
Shares | Value | |||||
COMMON STOCKS - (Continued) | ||||||
Specialty Retail - 5.0% | ||||||
Academy Sports & Outdoors, Inc. | 10,829 | $622,993 | ||||
Floor & Decor Holdings, Inc. - Class A(a) | 4,429 | 441,571 | ||||
Murphy USA, Inc. | 1,775 | 890,606 | ||||
1,955,170 | ||||||
Textiles, Apparel & Luxury Goods - 2.3% | ||||||
On Holding AG - Class A(a) | 16,351 | 895,544 | ||||
Trading Companies & Distributors - 2.5% | ||||||
SiteOne Landscape Supply, Inc.(a) | 2,695 | 355,120 | ||||
Watsco, Inc. | 1,350 | 639,752 | ||||
994,872 | ||||||
TOTAL COMMON STOCKS (Cost $26,472,496) | 36,979,401 | |||||
SHORT-TERM INVESTMENTS - 5.3% | ||||||
Money Market Funds - 5.3% | ||||||
Invesco Short-Term Investments Trust - Government & Agency Portfolio - Institutional Shares, 4.43%(b) | 1,170,795 | 1,170,795 | ||||
MSILF Government Portfolio - Class Institutional, 4.43%(b) | 904,837 | 904,837 | ||||
TOTAL SHORT-TERM INVESTMENTS (Cost $2,075,632) | 2,075,632 | |||||
TOTAL INVESTMENTS - 100.1% (Cost $28,548,128) | $39,055,033 | |||||
Liabilities in Excess of Other Assets - (0.1)% | (35,162) | |||||
TOTAL NET ASSETS - 100.0% | $39,019,871 | |||||
(a) | Non-income producing security. |
(b) | The rate shown represents the 7-day annualized effective yield as of December 31, 2024. |
4 |
Shares | Value | |||||
COMMON STOCKS - 97.0% | ||||||
Banks - 5.1% | ||||||
Bank of America Corp. | 160,000 | $7,032,000 | ||||
Cullen/Frost Bankers, Inc. | 50,000 | 6,712,500 | ||||
JPMorgan Chase & Co. | 50,000 | 11,985,500 | ||||
25,730,000 | ||||||
Beverages - 1.2% | ||||||
Coca-Cola Co. | 95,000 | 5,914,700 | ||||
Biotechnology - 1.4% | ||||||
Amgen, Inc. | 28,000 | 7,297,920 | ||||
Broadline Retail - 1.6% | ||||||
Amazon.com, Inc.(a) | 38,000 | 8,336,820 | ||||
Chemicals - 4.4% | ||||||
Ecolab, Inc. | 55,000 | 12,887,600 | ||||
Linde PLC | 22,000 | 9,210,740 | ||||
22,098,340 | ||||||
Commercial Services & Supplies - 5.3% | ||||||
Cintas Corp. | 64,000 | 11,692,800 | ||||
Waste Connections, Inc. | 90,000 | 15,442,200 | ||||
27,135,000 | ||||||
Construction & Engineering - 3.3% | ||||||
Fluor Corp.(a) | 125,000 | 6,165,000 | ||||
Valmont Industries, Inc. | 35,000 | 10,733,450 | ||||
16,898,450 | ||||||
Construction Materials - 1.8% | ||||||
Martin Marietta Materials, Inc. | 18,000 | 9,297,000 | ||||
Electrical Equipment - 2.9% | ||||||
Emerson Electric Co. | 75,000 | 9,294,750 | ||||
Generac Holdings, Inc.(a) | 35,000 | 5,426,750 | ||||
14,721,500 | ||||||
Electronic Equipment, Instruments & Components - 4.6% | ||||||
Teledyne Technologies, Inc.(a) | 25,000 | 11,603,250 | ||||
Trimble, Inc.(a) | 170,000 | 12,012,200 | ||||
23,615,450 | ||||||
Financial Services - 1.6% | ||||||
Mastercard, Inc. - Class A | 15,000 | 7,898,550 | ||||
Food Products - 0.6% | ||||||
Kraft Heinz Co. | 100,000 | 3,071,000 | ||||
Ground Transportation - 1.1% | ||||||
Union Pacific Corp. | 24,000 | 5,472,960 | ||||
Health Care Equipment & Supplies - 3.5% | ||||||
Alcon AG | 60,000 | 5,093,400 | ||||
Neogen Corp.(a) | 450,000 | 5,463,000 | ||||
Stryker Corp. | 20,000 | 7,201,000 | ||||
17,757,400 | ||||||
Shares | Value | |||||
Household Durables - 1.0% | ||||||
Newell Brands, Inc. | 500,000 | $4,980,000 | ||||
Household Products - 2.3% | ||||||
Kimberly-Clark Corp. | 50,000 | 6,552,000 | ||||
Procter & Gamble Co. | 30,000 | 5,029,500 | ||||
11,581,500 | ||||||
Interactive Media & Services - 4.1% | ||||||
Alphabet, Inc. - Class A | 110,000 | 20,823,000 | ||||
Life Sciences Tools & Services - 2.8% | ||||||
Danaher Corp. | 32,750 | 7,517,763 | ||||
Thermo Fisher Scientific, Inc. | 13,000 | 6,762,990 | ||||
14,280,753 | ||||||
Machinery - 7.0% | ||||||
Chart Industries, Inc.(a) | 40,000 | 7,633,600 | ||||
Franklin Electric Co., Inc. | 85,000 | 8,283,250 | ||||
IDEX Corp. | 30,000 | 6,278,700 | ||||
Toro Co. | 80,000 | 6,408,000 | ||||
Xylem, Inc. | 60,000 | 6,961,200 | ||||
35,564,750 | ||||||
Marine Transportation - 1.6% | ||||||
Kirby Corp.(a) | 75,000 | 7,935,000 | ||||
Metals & Mining - 0.6% | ||||||
Wheaton Precious Metals Corp. | 55,000 | 3,093,200 | ||||
Oil, Gas & Consumable Fuels - 6.6% | ||||||
Cameco Corp. | 90,000 | 4,625,100 | ||||
Chevron Corp. | 42,500 | 6,155,700 | ||||
ConocoPhillips Co. | 100,000 | 9,917,000 | ||||
Coterra Energy, Inc. | 384,000 | 9,807,360 | ||||
Kimbell Royalty Partners LP | 180,000 | 2,921,400 | ||||
33,426,560 | ||||||
Pharmaceuticals - 4.2% | ||||||
Merck & Co., Inc. | 80,000 | 7,958,400 | ||||
Pfizer Inc. | 220,000 | 5,836,600 | ||||
Zoetis, Inc. | 47,000 | 7,657,710 | ||||
21,452,710 | ||||||
Semiconductors & Semiconductor Equipment - 4.0% | ||||||
NVIDIA Corp. | 150,000 | 20,143,500 | ||||
Software - 12.1% | ||||||
Adobe, Inc.(a) | 18,000 | 8,004,240 | ||||
Microsoft Corp. | 80,000 | 33,720,000 | ||||
Oracle Corp. | 120,000 | 19,996,800 | ||||
61,721,040 | ||||||
Specialty Retail - 4.9% | ||||||
Academy Sports & Outdoors, Inc. | 90,000 | 5,177,700 | ||||
O'Reilly Automotive, Inc.(a) | 8,000 | 9,486,400 | ||||
The Home Depot, Inc. | 26,500 | 10,308,235 | ||||
24,972,335 | ||||||
5 |
Shares | Value | |||||
COMMON STOCKS - (Continued) | ||||||
Technology Hardware, Storage & Peripherals - 4.7% | ||||||
Apple Inc. | 96,000 | $24,040,320 | ||||
Trading Companies & Distributors - 2.7% | ||||||
FTAI Aviation Ltd. | 95,000 | 13,683,800 | ||||
TOTAL COMMON STOCKS (Cost $229,438,538) | 492,943,558 | |||||
SHORT-TERM INVESTMENTS - 3.2% | ||||||
Money Market Funds - 3.2% | ||||||
Invesco Short-Term Investments Trust - Government & Agency Portfolio - Institutional Shares, 4.43%(b) | 15,244,132 | 15,244,132 | ||||
MSILF Government Portfolio - Class Institutional, 4.43%(b) | 1,105,082 | 1,105,082 | ||||
TOTAL SHORT-TERM INVESTMENTS (Cost $16,349,214) | 16,349,214 | |||||
TOTAL INVESTMENTS - 100.2% (Cost $245,787,752) | $509,292,772 | |||||
Liabilities in Excess of Other Assets - (0.2)% | (809,613) | |||||
TOTAL NET ASSETS - 100.0% | $508,483,159 | |||||
(a) | Non-income producing security. |
(b) | The rate shown represents the 7-day annualized effective yield as of December 31, 2024. |
6 |
Shares | Value | |||||
COMMON STOCKS - 68.6% | ||||||
Aerospace & Defense - 1.1% | ||||||
L3Harris Technologies, Inc. | 5,850 | $1,230,138 | ||||
Banks - 3.8% | ||||||
Bank of America Corp. | 33,100 | 1,454,745 | ||||
Cullen/Frost Bankers, Inc. | 9,700 | 1,302,225 | ||||
JPMorgan Chase & Co. | 6,700 | 1,606,057 | ||||
4,363,027 | ||||||
Beverages - 2.9% | ||||||
Coca-Cola Co. | 21,400 | 1,332,364 | ||||
Keurig Dr Pepper, Inc. | 35,000 | 1,124,200 | ||||
PepsiCo, Inc. | 5,750 | 874,345 | ||||
3,330,909 | ||||||
Broadline Retail - 2.1% | ||||||
Amazon.com, Inc.(a) | 11,200 | 2,457,168 | ||||
Capital Markets - 1.1% | ||||||
Moody's Corp. | 2,650 | 1,254,431 | ||||
Chemicals - 3.3% | ||||||
Air Products and Chemicals, Inc. | 800 | 232,032 | ||||
Corteva, Inc. | 7,658 | 436,200 | ||||
DuPont de Nemours, Inc. | 9,658 | 736,422 | ||||
Ecolab Inc. | 3,600 | 843,552 | ||||
Linde PLC | 3,600 | 1,507,212 | ||||
3,755,418 | ||||||
Commercial Services & Supplies - 3.5% | ||||||
Cintas Corp. | 8,800 | 1,607,760 | ||||
Waste Connections, Inc. | 8,100 | 1,389,798 | ||||
Waste Management, Inc. | 5,250 | 1,059,398 | ||||
4,056,956 | ||||||
Construction Materials - 1.4% | ||||||
Martin Marietta Materials, Inc. | 3,100 | 1,601,150 | ||||
Consumer Staples Distribution & Retail - 1.4% | ||||||
Walmart, Inc. | 17,300 | 1,563,055 | ||||
Diversified Telecommunication Services - 0.8% | ||||||
Verizon Communications Inc. | 23,841 | 953,402 | ||||
Electrical Equipment - 1.8% | ||||||
Emerson Electric Co. | 8,800 | 1,090,584 | ||||
Rockwell Automation, Inc. | 3,325 | 950,252 | ||||
2,040,836 | ||||||
Electronic Equipment, Instruments & Components - 2.0% | ||||||
Teledyne Technologies, Inc.(a) | 2,450 | 1,137,118 | ||||
Trimble Inc.(a) | 17,150 | 1,211,819 | ||||
2,348,937 | ||||||
Shares | Value | |||||
Entertainment - 1.0% | ||||||
Netflix, Inc.(a) | 900 | $802,188 | ||||
Walt Disney Co. | 2,800 | 311,780 | ||||
1,113,968 | ||||||
Financial Services - 1.6% | ||||||
Visa, Inc. - Class A | 5,650 | 1,785,626 | ||||
Ground Transportation - 0.6% | ||||||
Union Pacific Corp. | 3,200 | 729,728 | ||||
Health Care Equipment & Supplies - 2.0% | ||||||
Abbott Laboratories | 6,800 | 769,148 | ||||
Alcon AG | 17,900 | 1,519,531 | ||||
2,288,679 | ||||||
Health Care Providers & Services - 0.8% | ||||||
UnitedHealth Group, Inc. | 1,700 | 859,962 | ||||
Household Products - 2.1% | ||||||
Colgate-Palmolive Co. | 13,400 | 1,218,194 | ||||
Kimberly-Clark Corp. | 5,100 | 668,304 | ||||
Procter & Gamble Co. | 3,250 | 544,862 | ||||
2,431,360 | ||||||
Industrial Conglomerates - 1.0% | ||||||
Honeywell International Inc. | 5,200 | 1,174,628 | ||||
Insurance - 0.8% | ||||||
Arthur J Gallagher & Co. | 3,400 | 965,090 | ||||
Interactive Media & Services - 4.0% | ||||||
Alphabet Inc. - Class C | 13,800 | 2,628,072 | ||||
Meta Platforms, Inc. - Class A | 3,275 | 1,917,545 | ||||
4,545,617 | ||||||
IT Services - 0.8% | ||||||
Accenture PLC - Class A | 2,600 | 914,654 | ||||
Life Sciences Tools & Services - 2.1% | ||||||
Danaher Corp. | 5,800 | 1,331,390 | ||||
Thermo Fisher Scientific, Inc. | 2,000 | 1,040,460 | ||||
2,371,850 | ||||||
Machinery - 1.8% | ||||||
Chart Industries, Inc.(a) | 3,000 | 572,520 | ||||
Fortive Corp. | 9,350 | 701,250 | ||||
IDEX Corp. | 4,000 | 837,160 | ||||
2,110,930 | ||||||
Metals & Mining - 0.6% | ||||||
Newmont Goldcorp Corp. | 17,700 | 658,794 | ||||
Oil, Gas & Consumable Fuels - 5.3% | ||||||
Chevron Corp. | 8,695 | 1,259,384 | ||||
ConocoPhillips Co. | 10,900 | 1,080,953 | ||||
Coterra Energy, Inc. | 25,000 | 638,500 | ||||
EOG Resources, Inc. | 4,450 | 545,481 | ||||
7 |
Shares | Value | |||||||||||
COMMON STOCKS - (Continued) | ||||||||||||
Oil, Gas & Consumable Fuels - (Continued) | ||||||||||||
Exxon Mobil Corp. | 12,127 | $1,304,501 | ||||||||||
Kinder Morgan, Inc. | 48,000 | 1,315,200 | ||||||||||
6,144,019 | ||||||||||||
Pharmaceuticals - 2.2% | ||||||||||||
Merck & Co., Inc. | 12,500 | 1,243,500 | ||||||||||
Zoetis Inc. | 8,026 | 1,307,676 | ||||||||||
2,551,176 | ||||||||||||
Professional Services - 1.0% | ||||||||||||
Broadridge Financial Solutions, Inc. | 5,250 | 1,186,973 | ||||||||||
Semiconductors & Semiconductor Equipment - 3.3% | ||||||||||||
NVIDIA Corp. | 20,000 | 2,685,800 | ||||||||||
QUALCOMM, Inc. | 7,000 | 1,075,340 | ||||||||||
3,761,140 | ||||||||||||
Software - 7.4% | ||||||||||||
Adobe Inc.(a) | 1,850 | 822,658 | ||||||||||
Microsoft Corp. | 6,750 | 2,845,125 | ||||||||||
Oracle Corp. | 11,900 | 1,983,016 | ||||||||||
Roper Technologies, Inc. | 2,600 | 1,351,610 | ||||||||||
Salesforce, Inc. | 4,550 | 1,521,201 | ||||||||||
8,523,610 | ||||||||||||
Specialty Retail - 1.5% | ||||||||||||
Home Depot, Inc. | 4,500 | 1,750,455 | ||||||||||
Technology Hardware, Storage & Peripherals - 3.5% | ||||||||||||
Apple Inc. | 15,950 | 3,994,199 | ||||||||||
TOTAL COMMON STOCKS (Cost $38,579,771) | 78,817,885 | |||||||||||
Par | ||||||||||||
CORPORATE BONDS - 29.7% | ||||||||||||
Aerospace & Defense - 2.0% | ||||||||||||
L3Harris Technologies, Inc., 5.40%, 07/31/2033 (Callable 04/30/2033) | $750,000 | 748,849 | ||||||||||
Lockheed Martin Corp., 4.50%, 02/15/2029 (Callable 01/15/2029) | 785,000 | 776,730 | ||||||||||
RTX Corp., 5.15%, 02/27/2033 (Callable 11/27/2032) | 800,000 | 793,819 | ||||||||||
2,319,398 | ||||||||||||
Banks - 0.8% | ||||||||||||
Cullen/Frost Bankers, Inc., 4.50%, 03/17/2027 (Callable 02/17/2027) | 750,000 | 730,529 | ||||||||||
JPMorgan Chase & Co., 3.20%, 06/15/2026 (Callable 03/15/2026) | 200,000 | 196,317 | ||||||||||
926,846 | ||||||||||||
Par | Value | |||||
Beverages - 1.0% | ||||||
Keurig Dr Pepper, Inc., 2.55%, 09/15/2026 (Callable 06/15/2026) | $750,000 | $725,139 | ||||
PepsiCo, Inc., 2.38%, 10/06/2026 (Callable 07/06/2026) | 435,000 | 420,629 | ||||
1,145,768 | ||||||
Biotechnology - 1.5% | ||||||
AbbVie, Inc. | ||||||
3.20%, 05/14/2026 (Callable 02/14/2026) | 600,000 | 589,661 | ||||
4.95%, 03/15/2031 (Callable 01/15/2031) | 250,000 | 250,070 | ||||
Amgen, Inc. | ||||||
2.60%, 08/19/2026 (Callable 05/19/2026) | 450,000 | 435,513 | ||||
5.25%, 03/02/2030 (Callable 01/02/2030) | 450,000 | 454,382 | ||||
1,729,626 | ||||||
Broadline Retail - 0.8% | ||||||
Amazon.com, Inc. | ||||||
1.20%, 06/03/2027 (Callable 04/03/2027) | 260,000 | 241,096 | ||||
4.55%, 12/01/2027 (Callable 11/01/2027) | 550,000 | 553,442 | ||||
4.65%, 12/01/2029 (Callable 10/01/2029) | 125,000 | 125,860 | ||||
920,398 | ||||||
Chemicals - 2.0% | ||||||
Air Products and Chemicals, Inc., 1.85%, 05/15/2027 (Callable 03/15/2027) | 675,000 | 634,747 | ||||
DuPont de Nemours, Inc., 4.73%, 11/15/2028 (Callable 08/15/2028) | 650,000 | 647,325 | ||||
Ecolab, Inc. | ||||||
2.70%, 11/01/2026 (Callable 08/01/2026) | 500,000 | 484,591 | ||||
5.25%, 01/15/2028 (Callable 12/15/2027) | 475,000 | 484,114 | ||||
2,250,777 | ||||||
Commercial Services & Supplies - 1.5% | ||||||
Republic Services, Inc., 4.88%, 04/01/2029 (Callable 03/01/2029) | 750,000 | 748,466 | ||||
Waste Management, Inc. | ||||||
4.63%, 02/15/2030 (Callable 12/15/2029) | 500,000 | 495,389 | ||||
4.15%, 04/15/2032 (Callable 01/15/2032) | 500,000 | 472,793 | ||||
1,716,648 | ||||||
8 |
Par | Value | |||||
CORPORATE BONDS - (Continued) | ||||||
Communications Equipment - 0.6% | ||||||
Cisco Systems, Inc., 5.05%, 02/26/2034 (Callable 11/26/2033) | $750,000 | $748,394 | ||||
Consumer Finance - 0.7% | ||||||
American Express Co., 4.05%, 05/03/2029 (Callable 03/03/2029) | 850,000 | 830,173 | ||||
Consumer Staples Distribution & Retail - 1.3% | ||||||
Costco Wholesale Corp., 1.38%, 06/20/2027 (Callable 04/20/2027) | 690,000 | 641,659 | ||||
Dollar Tree, Inc., 4.00%, 05/15/2025 (Callable 03/15/2025) | 825,000 | 822,092 | ||||
1,463,751 | ||||||
Diversified Telecommunication Services - 0.2% | ||||||
Verizon Communications Inc., 2.63%, 08/15/2026 | 250,000 | 242,673 | ||||
Electric Utilities - 0.7% | ||||||
Duke Energy Corp. | ||||||
5.00%, 12/08/2027 (Callable 11/08/2027) | 345,000 | 347,662 | ||||
4.50%, 08/15/2032 (Callable 05/15/2032) | 500,000 | 476,619 | ||||
824,281 | ||||||
Financial Services - 1.1% | ||||||
Mastercard, Inc., 4.85%, 03/09/2033 (Callable 12/09/2032) | 500,000 | 495,931 | ||||
Visa Inc. | ||||||
3.15%, 12/14/2025 (Callable 09/14/2025) | 300,000 | 296,652 | ||||
1.90%, 04/15/2027 (Callable 02/15/2027) | 500,000 | 472,816 | ||||
1,265,399 | ||||||
Health Care Equipment & Supplies - 0.5% | ||||||
Abbott Laboratories | ||||||
3.88%, 09/15/2025 (Callable 06/15/2025) | 255,000 | 253,962 | ||||
3.75%, 11/30/2026 (Callable 08/30/2026) | 355,000 | 350,911 | ||||
604,873 | ||||||
Household Products - 0.5% | ||||||
Colgate-Palmolive Co., 3.10%, 08/15/2027 (Callable 07/15/2027) | 595,000 | 575,710 | ||||
Par | Value | |||||
Industrial Conglomerates - 0.1% | ||||||
Honeywell International, Inc., 4.88%, 09/01/2029 (Callable 08/01/2029) | $150,000 | $150,962 | ||||
Interactive Media & Services - 1.3% | ||||||
Alphabet, Inc., 2.00%, 08/15/2026 (Callable 05/15/2026) | 200,000 | 192,686 | ||||
Meta Platforms, Inc. | ||||||
3.50%, 08/15/2027 (Callable 07/15/2027) | 250,000 | 244,440 | ||||
4.60%, 05/15/2028 (Callable 04/15/2028) | 250,000 | 250,367 | ||||
4.55%, 08/15/2031 (Callable 06/15/2031) | 550,000 | 541,166 | ||||
4.75%, 08/15/2034 (Callable 05/15/2034) | 250,000 | 243,627 | ||||
1,472,286 | ||||||
IT Services - 0.1% | ||||||
International Business Machines Corp., 4.75%, 02/06/2033 (Callable 11/06/2032) | 125,000 | 122,463 | ||||
Life Sciences Tools & Services - 0.9% | ||||||
Danaher Corp., 3.35%, 09/15/2025 (Callable 06/15/2025) | 250,000 | 248,219 | ||||
Thermo Fisher Scientific, Inc., 4.95%, 11/21/2032 (Callable 08/21/2032) | 750,000 | 745,533 | ||||
993,752 | ||||||
Oil, Gas & Consumable Fuels - 3.4% | ||||||
Chevron Corp., 2.00%, 05/11/2027 (Callable 03/11/2027) | 400,000 | 378,218 | ||||
ConocoPhillips Co. | ||||||
6.95%, 04/15/2029 | 500,000 | 542,571 | ||||
5.05%, 09/15/2033 (Callable 06/15/2033) | 250,000 | 246,939 | ||||
Devon Energy Corp., 4.50%, 01/15/2030 (Callable 01/15/2025) | 500,000 | 484,048 | ||||
Enterprise Products Operating LLC, 5.05%, 01/10/2026 | 100,000 | 100,544 | ||||
EOG Resources, Inc., 4.38%, 04/15/2030 (Callable 01/15/2030) | 750,000 | 729,572 | ||||
Exxon Mobil Corp., 3.04%, 03/01/2026 (Callable 12/01/2025) | 400,000 | 393,896 | ||||
Kinder Morgan, Inc., 5.20%, 06/01/2033 (Callable 03/01/2033) | 325,000 | 317,840 | ||||
9 |
Par | Value | |||||
CORPORATE BONDS - (Continued) | ||||||
Oil, Gas & Consumable Fuels - (Continued) | ||||||
ONEOK, Inc., 5.80%, 11/01/2030 (Callable 09/01/2030) | $750,000 | $773,454 | ||||
3,967,082 | ||||||
Personal Care Products - 0.1% | ||||||
Kenvue, Inc., 5.00%, 03/22/2030 (Callable 01/22/2030) | 120,000 | 121,020 | ||||
Pharmaceuticals - 1.5% | ||||||
Eli Lilly & Co. | ||||||
5.00%, 02/27/2026 (Callable 01/13/2025) | 545,000 | 545,012 | ||||
4.50%, 02/09/2029 (Callable 01/09/2029) | 575,000 | 571,933 | ||||
Zoetis Inc., 4.50%, 11/13/2025 (Callable 08/13/2025) | 600,000 | 599,654 | ||||
1,716,599 | ||||||
Semiconductors & Semiconductor Equipment - 1.0% | ||||||
Broadcom, Inc., 5.05%, 07/12/2029 (Callable 06/12/2029) | 250,000 | 250,961 | ||||
Intel Corp., 3.70%, 07/29/2025 (Callable 04/29/2025) | 500,000 | 496,804 | ||||
NVIDIA Corp., 3.20%, 09/16/2026 (Callable 06/16/2026) | 400,000 | 392,558 | ||||
1,140,323 | ||||||
Software - 2.9% | ||||||
Adobe, Inc., 4.80%, 04/04/2029 (Callable 03/04/2029) | 850,000 | 854,772 | ||||
Intuit, Inc. | ||||||
5.13%, 09/15/2028 (Callable 08/15/2028) | 550,000 | 558,363 | ||||
5.20%, 09/15/2033 (Callable 06/15/2033) | 275,000 | 275,617 | ||||
Microsoft Corp., 3.13%, 11/03/2025 (Callable 08/03/2025) | 230,000 | 227,687 | ||||
Oracle Corp. | ||||||
4.65%, 05/06/2030 (Callable 03/06/2030) | 220,000 | 216,942 | ||||
4.90%, 02/06/2033 (Callable 11/06/2032) | 750,000 | 730,797 | ||||
Roper Technologies, Inc., 4.90%, 10/15/2034 (Callable 07/15/2034) | 500,000 | 481,018 | ||||
3,345,196 | ||||||
Specialized REITs - 0.6% | ||||||
American Tower Corp. | ||||||
3.38%, 10/15/2026 (Callable 07/15/2026) | 635,000 | 620,705 | ||||
Par | Value | |||||
5.80%, 11/15/2028 (Callable 10/15/2028) | $75,000 | $77,065 | ||||
697,770 | ||||||
Specialty Retail - 2.4% | ||||||
Home Depot, Inc. | ||||||
2.80%, 09/14/2027 (Callable 06/14/2027) | 500,000 | 479,180 | ||||
4.90%, 04/15/2029 (Callable 03/15/2029) | 220,000 | 222,012 | ||||
Lowe's Cos., Inc., 2.50%, 04/15/2026 (Callable 01/15/2026) | 800,000 | 779,986 | ||||
O'Reilly Automotive, Inc. | ||||||
4.20%, 04/01/2030 (Callable 01/01/2030) | 500,000 | 481,033 | ||||
4.70%, 06/15/2032 (Callable 03/15/2032) | 250,000 | 242,019 | ||||
Tractor Supply Co., 5.25%, 05/15/2033 (Callable 02/15/2033) | 500,000 | 500,550 | ||||
2,704,780 | ||||||
Wireless Telecommunications Carriers (except Satellite) - 0.2% | ||||||
T-Mobile USA, Inc. | ||||||
3.75%, 04/15/2027 (Callable 02/15/2027) | 100,000 | 97,715 | ||||
4.75%, 02/01/2028 (Callable 01/13/2025) | 100,000 | 99,420 | ||||
197,135 | ||||||
TOTAL CORPORATE BONDS (Cost $34,850,983) | 34,194,083 | |||||
Shares | ||||||
REAL ESTATE INVESTMENT TRUSTS - 0.9% | ||||||
Specialized REITs - 0.9% | ||||||
American Tower Corp. | 5,500 | 1,008,755 | ||||
TOTAL REAL ESTATE INVESTMENT TRUSTS (Cost $946,791) | 1,008,755 | |||||
SHORT-TERM INVESTMENTS - 0.6% | ||||||
Money Market Funds - 0.6% | ||||||
Invesco Short-Term Investments Trust - Government & Agency Portfolio -Institutional Shares , 4.43%(b) | 726,921 | 726,921 | ||||
TOTAL SHORT-TERM INVESTMENTS (Cost $726,921) | 726,921 | |||||
TOTAL INVESTMENTS - 99.8% (Cost $75,104,466) | $114,747,644 | |||||
Other Assets in Excess of Liabilities - 0.2% | 175,126 | |||||
TOTAL NET ASSETS - 100.0% | $114,922,770 | |||||
10 |
(a) | Non-income producing security. |
(b) | The rate shown represents the 7-day annualized effective yield as of December 31, 2024. |
11 |
Par | Value | |||||
CORPORATE BONDS - 65.1% | ||||||
Aerospace & Defense - 5.9% | ||||||
L3Harris Technologies, Inc. | ||||||
5.05%, 06/01/2029 (Callable 05/01/2029) | $4,000,000 | $4,000,621 | ||||
5.40%, 07/31/2033 (Callable 04/30/2033) | 5,525,000 | 5,516,522 | ||||
RTX Corp. | ||||||
5.75%, 01/15/2029 (Callable 12/15/2028) | 4,000,000 | 4,130,531 | ||||
5.15%, 02/27/2033 (Callable 11/27/2032) | 2,750,000 | 2,728,752 | ||||
16,376,426 | ||||||
Banks - 3.6% | ||||||
Bank of America Corp., 4.45%, 03/03/2026 | 2,000,000 | 1,992,699 | ||||
Cullen/Frost Bankers, Inc., 4.50%, 03/17/2027 (Callable 02/17/2027) | 3,942,000 | 3,839,660 | ||||
JPMorgan Chase & Co. | ||||||
3.30%, 04/01/2026 (Callable 01/01/2026) | 3,500,000 | 3,448,576 | ||||
3.20%, 06/15/2026 (Callable 03/15/2026) | 636,000 | 624,289 | ||||
9,905,224 | ||||||
Beverages - 0.8% | ||||||
Keurig Dr Pepper, Inc., 2.55%, 09/15/2026 (Callable 06/15/2026) | 2,225,000 | 2,151,244 | ||||
Biotechnology - 3.0% | ||||||
AbbVie, Inc., 4.95%, 03/15/2031 (Callable 01/15/2031) | 4,000,000 | 4,001,116 | ||||
Amgen, Inc. | ||||||
2.60%, 08/19/2026 (Callable 05/19/2026) | 1,000,000 | 967,807 | ||||
5.25%, 03/02/2033 (Callable 12/02/2032) | 3,500,000 | 3,477,164 | ||||
8,446,087 | ||||||
Chemicals - 0.9% | ||||||
Ecolab, Inc. | ||||||
2.70%, 11/01/2026 (Callable 08/01/2026) | 2,000,000 | 1,938,364 | ||||
4.80%, 03/24/2030 (Callable 12/24/2029) | 500,000 | 500,892 | ||||
2,439,256 | ||||||
Commercial Services & Supplies - 1.7% | ||||||
Republic Services, Inc., 5.00%, 04/01/2034 (Callable 01/01/2034) | 2,500,000 | 2,440,365 | ||||
Waste Management, Inc., 4.63%, 02/15/2030 (Callable 12/15/2029) | 2,370,000 | 2,348,145 | ||||
4,788,510 | ||||||
Par | Value | |||||
Consumer Finance - 0.7% | ||||||
American Express Co., 4.20%, 11/06/2025 (Callable 10/06/2025) | $2,000,000 | $1,996,190 | ||||
Consumer Staples Distribution & Retail - 1.1% | ||||||
Dollar Tree, Inc., 4.00%, 05/15/2025 (Callable 03/15/2025) | 3,000,000 | 2,989,425 | ||||
Containers & Packaging - 1.5% | ||||||
Ball Corp., 5.25%, 07/01/2025 | 4,252,000 | 4,264,028 | ||||
Crude Petroleum Extraction - 1.1% | ||||||
Enterprise Products Operating LLC, 3.75%, 02/15/2025 (Callable 02/02/2025) | 2,963,000 | 2,958,914 | ||||
Diversified Telecommunication Services - 3.2% | ||||||
AT&T, Inc., 4.25%, 03/01/2027 (Callable 12/01/2026) | 4,235,000 | 4,197,507 | ||||
Verizon Communications, Inc. | ||||||
4.13%, 03/16/2027 | 2,000,000 | 1,977,820 | ||||
2.10%, 03/22/2028 (Callable 01/22/2028) | 3,000,000 | 2,760,361 | ||||
8,935,688 | ||||||
Electric Utilities - 0.7% | ||||||
Duke Energy Corp., 4.50%, 08/15/2032 (Callable 05/15/2032) | 2,000,000 | 1,906,477 | ||||
Electrical Equipment - 2.7% | ||||||
Emerson Electric Co., 3.15%, 06/01/2025 (Callable 03/01/2025) | 7,500,000 | 7,463,690 | ||||
Electronic Equipment, Instruments & Components - 1.9% | ||||||
Trimble, Inc., 6.10%, 03/15/2033 (Callable 12/15/2032) | 5,000,000 | 5,194,996 | ||||
Food Products - 0.5% | ||||||
Kraft Heinz Food Co., 4.63%, 01/30/2029 (Callable 10/30/2028) | 1,353,000 | 1,339,704 | ||||
Ground Transportation - 1.5% | ||||||
Union Pacific Corp. | ||||||
3.25%, 01/15/2025 | 1,295,000 | 1,294,251 | ||||
3.75%, 07/15/2025 (Callable 05/15/2025) | 3,025,000 | 3,012,068 | ||||
4,306,319 | ||||||
Health Care Equipment & Supplies - 1.5% | ||||||
Abbott Laboratories | ||||||
2.95%, 03/15/2025 (Callable 02/02/2025) | 3,925,000 | 3,911,799 | ||||
12 |
Par | Value | |||||
CORPORATE BONDS - (Continued) | ||||||
Health Care Equipment & Supplies - (Continued) | ||||||
4.75%, 11/30/2036 (Callable 05/30/2036) | $200,000 | $193,438 | ||||
4,105,237 | ||||||
Health Care Providers & Services - 3.4% | ||||||
CVS Health Corp. | ||||||
3.75%, 04/01/2030 (Callable 01/01/2030) | 2,000,000 | 1,832,458 | ||||
5.30%, 06/01/2033 (Callable 03/01/2033) | 4,000,000 | 3,837,010 | ||||
UnitedHealth Group, Inc., 4.25%, 01/15/2029 (Callable 12/15/2028) | 4,000,000 | 3,920,144 | ||||
9,589,612 | ||||||
Hotels, Restaurants & Leisure - 0.9% | ||||||
McDonald's Corp., 3.50%, 07/01/2027 (Callable 05/01/2027) | 2,500,000 | 2,436,550 | ||||
Interactive Media & Services - 1.8% | ||||||
Meta Platforms, Inc. | ||||||
4.80%, 05/15/2030 (Callable 03/15/2030) | 2,950,000 | 2,976,283 | ||||
4.75%, 08/15/2034 (Callable 05/15/2034) | 2,000,000 | 1,949,019 | ||||
4,925,302 | ||||||
Life Sciences Tools & Services - 3.4% | ||||||
Danaher Corp., 3.35%, 09/15/2025 (Callable 06/15/2025) | 5,500,000 | 5,460,821 | ||||
Thermo Fisher Scientific, Inc., 5.09%, 08/10/2033 (Callable 05/10/2033) | 4,000,000 | 3,980,637 | ||||
9,441,458 | ||||||
Oil, Gas & Consumable Fuels - 8.0% | ||||||
Chevron Corp., 2.95%, 05/16/2026 (Callable 02/16/2026) | 1,870,000 | 1,834,690 | ||||
ConocoPhillips Co., 5.05%, 09/15/2033 (Callable 06/15/2033) | 2,000,000 | 1,975,511 | ||||
Devon Energy Corp., 4.50%, 01/15/2030 (Callable 01/15/2025) | 4,000,000 | 3,872,388 | ||||
Kinder Morgan, Inc., 5.20%, 06/01/2033 (Callable 03/01/2033) | 7,300,000 | 7,139,175 | ||||
ONEOK, Inc. | ||||||
6.35%, 01/15/2031 (Callable 10/15/2030) | 2,000,000 | 2,105,553 | ||||
6.05%, 09/01/2033 (Callable 06/01/2033) | 5,000,000 | 5,149,083 | ||||
22,076,400 | ||||||
Par | Value | |||||
Other Management Consulting Services - 0.7% | ||||||
Accenture Capital, Inc., 4.50%, 10/04/2034 (Callable 07/04/2034) | $2,000,000 | $1,901,572 | ||||
Semiconductors & Semiconductor Equipment - 0.8% | ||||||
Intel Corp., 3.70%, 07/29/2025 (Callable 04/29/2025) | 2,250,000 | 2,235,619 | ||||
Software - 7.2% | ||||||
Adobe, Inc., 4.80%, 04/04/2029 (Callable 03/04/2029) | 700,000 | 703,930 | ||||
Intuit, Inc., 5.20%, 09/15/2033 (Callable 06/15/2033) | 7,500,000 | 7,516,819 | ||||
Oracle Corp. | ||||||
2.65%, 07/15/2026 (Callable 04/15/2026) | 2,000,000 | 1,940,950 | ||||
6.15%, 11/09/2029 (Callable 09/09/2029) | 3,000,000 | 3,147,383 | ||||
4.90%, 02/06/2033 (Callable 11/06/2032) | 3,000,000 | 2,923,188 | ||||
Roper Technologies, Inc., 4.90%, 10/15/2034 (Callable 07/15/2034) | 4,000,000 | 3,848,144 | ||||
20,080,414 | ||||||
Specialized REITs - 2.4% | ||||||
American Tower Corp. | ||||||
3.38%, 10/15/2026 (Callable 07/15/2026) | 4,030,000 | 3,939,274 | ||||
4.05%, 03/15/2032 (Callable 12/15/2031) | 3,000,000 | 2,785,075 | ||||
6,724,349 | ||||||
Specialty Retail - 4.2% | ||||||
Lowe’s Cos., Inc., 2.50%, 04/15/2026 (Callable 01/15/2026) | 1,000,000 | 974,982 | ||||
O'Reilly Automotive, Inc. | ||||||
4.35%, 06/01/2028 (Callable 03/01/2028) | 675,000 | 663,314 | ||||
4.20%, 04/01/2030 (Callable 01/01/2030) | 2,325,000 | 2,236,804 | ||||
4.70%, 06/15/2032 (Callable 03/15/2032) | 2,750,000 | 2,662,209 | ||||
Tractor Supply Co.,5.25%, 05/15/2033 (Callable 02/15/2033) | 5,000,000 | 5,005,504 | ||||
11,542,813 | ||||||
TOTAL CORPORATE BONDS (Cost $182,899,760) | 180,521,504 | |||||
U.S. GOVERNMENT SPONSORED ENTITIES - 22.0% | ||||||
Federal Home Loan Banks | ||||||
3.00%, 01/27/2025 | 2,200,000 | 2,197,816 | ||||
4.00%, 04/14/2025(a) | 5,000,000 | 4,993,536 | ||||
13 |
Par | Value | |||||
CORPORATE BONDS - (Continued) | ||||||
U.S. GOVERNMENT SPONSORED ENTITIES - (Continued) | ||||||
3.25%, 06/09/2025 (Callable 03/09/2025) | $1,000,000 | $994,892 | ||||
1.75%, 10/28/2025 (Callable 01/28/2025)(a) | 3,000,000 | 2,944,202 | ||||
4.50%, 11/12/2025(a) | 1,505,000 | 1,506,795 | ||||
0.75%, 01/27/2026(a) | 3,000,000 | 2,889,657 | ||||
2.25%, 02/17/2026 (Callable 02/17/2025)(a) | 2,500,000 | 2,461,431 | ||||
2.38%, 03/13/2026 | 3,575,000 | 3,495,915 | ||||
1.25%, 03/30/2026 (Callable 03/30/2025)(a) | 3,000,000 | 2,909,914 | ||||
2.00%, 05/26/2026(a) | 2,500,000 | 2,421,663 | ||||
1.50%, 10/28/2026 (Callable 01/28/2025)(a) | 3,000,000 | 2,897,008 | ||||
1.25%, 11/10/2026 (Callable 11/10/2025) | 3,000,000 | 2,836,939 | ||||
2.13%, 01/25/2027 (Callable 01/25/2025)(a) | 2,500,000 | 2,425,631 | ||||
4.00%, 03/10/2027 (Callable 03/10/2025)(a) | 3,150,000 | 3,142,573 | ||||
4.00%, 05/24/2027 (Callable 02/24/2025)(a) | 2,650,000 | 2,641,807 | ||||
4.50%, 09/29/2027 | 1,750,000 | 1,758,458 | ||||
1.00%, 01/27/2028(a) | 4,000,000 | 3,618,242 | ||||
1.75%, 11/16/2028 (Callable 02/16/2025)(a) | 3,000,000 | 2,775,735 | ||||
2.82%, 06/27/2029 (Callable 01/09/2025) | 4,000,000 | 3,715,903 | ||||
1.50%, 09/30/2031 (Callable 03/30/2025)(a) | 3,000,000 | 2,613,027 | ||||
2.00%, 12/15/2033 (Callable 03/15/2025)(a) | 2,500,000 | 2,154,092 | ||||
Federal Home Loan Mortgage Corp, 0.75%, 05/28/2025 | 3,500,000 | 3,450,334 | ||||
TOTAL U.S. GOVERNMENT SPONSORED ENTITIES (Cost $63,368,442) | 60,845,570 | |||||
U.S. GOVERNMENT ISSUES - 9.0% | ||||||
United States Treasury Note/Bond | ||||||
4.63%, 06/30/2025 | 2,000,000 | 2,004,910 | ||||
5.00%, 08/31/2025 | 4,000,000 | 4,019,571 | ||||
4.25%, 01/31/2026 | 2,000,000 | 2,000,352 | ||||
4.63%, 11/15/2026 | 500,000 | 503,311 | ||||
4.13%, 09/30/2027 | 400,000 | 398,437 | ||||
4.00%, 10/31/2029 | 2,000,000 | 1,966,445 | ||||
4.13%, 11/15/2032 | 8,500,000 | 8,292,480 | ||||
4.50%, 11/15/2033 | 3,000,000 | 2,987,812 | ||||
4.00%, 02/15/2034 | 3,000,000 | 2,873,555 | ||||
TOTAL U.S. GOVERNMENT ISSUES (Cost $25,727,570) | 25,046,873 | |||||
Par | Value | |||||
U.S. TREASURY SECURITIES - 1.8% | ||||||
United States Treasury Note/Bond | ||||||
4.50%, 05/15/2027 | $2,300,000 | $2,311,590 | ||||
5.38%, 02/15/2031 | 2,500,000 | 2,621,973 | ||||
TOTAL U.S. TREASURY SECURITIES (Cost $4,868,677) | 4,933,563 | |||||
Shares | ||||||
SHORT-TERM INVESTMENTS - 1.1% | ||||||
Money Market Funds - 1.1% | ||||||
Invesco Short-Term Investments Trust - Government & Agency Portfolio - Institutional Shares, 4.43%(b) | 3,092,187 | 3,092,187 | ||||
TOTAL SHORT-TERM INVESTMENTS (Cost $3,092,187) | 3,092,187 | |||||
TOTAL INVESTMENTS - 99.0% (Cost $279,956,636) | $274,439,697 | |||||
Other Assets in Excess of Liabilities - 1.0% | 2,682,679 | |||||
TOTAL NET ASSETS - 100.0% | $277,122,376 | |||||
(a) | Step coupon bond. The rate disclosed is as of December 31, 2024. |
(b) | The rate shown represents the 7-day annualized effective yield as of December 31, 2024. |
14 |
Shares | Value | |||||
COMMON STOCKS - 97.2% | ||||||
Australia - 3.7% | ||||||
Biotechnology - 2.1% | ||||||
CSL Ltd. | 7,143 | $1,246,102 | ||||
Capital Markets - 0.9% | ||||||
Macquarie Group Ltd. | 4,007 | 548,009 | ||||
Metals & Mining - 0.7% | ||||||
BHP Billiton Ltd. | 18,232 | 444,765 | ||||
Total Australia | 2,238,876 | |||||
Canada - 6.4% | ||||||
Banks - 2.5% | ||||||
Royal Bank of Canada | 12,691 | 1,530,212 | ||||
Oil, Gas & Consumable Fuels - 3.9% | ||||||
Cameco Corp. | 22,693 | 1,166,816 | ||||
Canadian Natural Resources Ltd. | 37,911 | 1,170,469 | ||||
2,337,285 | ||||||
Total Canada | 3,867,497 | |||||
Finland - 1.9% | ||||||
Banks - 1.9% | ||||||
Nordea Bank Abp | 105,105 | 1,144,923 | ||||
France - 13.0% | ||||||
Aerospace & Defense - 2.4% | ||||||
Safran SA | 6,500 | 1,424,201 | ||||
Chemicals - 2.7% | ||||||
Air Liquide SA | 9,874 | 1,605,116 | ||||
Electrical Equipment - 2.5% | ||||||
Schneider Electric SA | 6,138 | 1,528,093 | ||||
IT Services - 1.8% | ||||||
Capgemini SE | 6,766 | 1,105,076 | ||||
Personal Care Products - 1.7% | ||||||
L’Oreal SA | 2,913 | 1,031,212 | ||||
Textiles, Apparel & Luxury Goods - 1.9% | ||||||
LVMH Moet Hennessy Louis Vuitton SE | 1,737 | 1,142,588 | ||||
Total France | 7,836,286 | |||||
Germany - 12.1% | ||||||
Diversified Telecommunication Services - 2.9% | ||||||
Deutsche Telekom AG | 58,438 | 1,750,985 | ||||
Insurance - 2.5% | ||||||
Allianz SE | 4,862 | 1,494,401 | ||||
Semiconductors & Semiconductor Equipment - 2.0% | ||||||
Infineon Technologies AG | 36,500 | 1,191,425 | ||||
Shares | Value | |||||
Software - 2.8% | ||||||
SAP SE | 6,889 | $1,694,518 | ||||
Textiles, Apparel & Luxury Goods - 1.9% | ||||||
Adidas AG | 4,750 | 1,168,332 | ||||
Total Germany | 7,299,661 | |||||
Italy - 0.8% | ||||||
Textiles, Apparel & Luxury Goods - 0.8% | ||||||
Moncler SpA | 9,372 | 494,754 | ||||
Japan - 4.4% | ||||||
Building Products - 1.2% | ||||||
Daikin Industries Ltd. | 6,126 | 714,787 | ||||
Electrical Equipment - 1.8% | ||||||
NIDEC CORP | 60,842 | 1,092,823 | ||||
Insurance - 1.4% | ||||||
Tokio Marine Holdings, Inc. | 24,009 | 861,638 | ||||
Total Japan | 2,669,248 | |||||
Netherlands - 10.0% | ||||||
Banks - 2.3% | ||||||
ING Groep NV | 88,756 | 1,390,949 | ||||
Capital Markets - 2.8% | ||||||
Euronext NV(a) | 14,878 | 1,669,120 | ||||
Professional Services - 2.4% | ||||||
Wolters Kluwer NV | 8,750 | 1,453,764 | ||||
Semiconductors & Semiconductor Equipment - 2.5% | ||||||
ASML Holding NV | 2,171 | 1,520,645 | ||||
Total Netherlands | 6,034,478 | |||||
Norway - 1.9% | ||||||
Diversified Telecommunication Services - 1.9% | ||||||
Telenor ASA | 103,807 | 1,158,192 | ||||
Spain - 2.6% | ||||||
Machinery - 2.6% | ||||||
Fluidra SA | 63,820 | 1,553,806 | ||||
Sweden - 2.4% | ||||||
Financial Services - 0.9% | ||||||
Investor AB(b) | 20,900 | 553,577 | ||||
Hotels, Restaurants & Leisure - 1.5% | ||||||
Evolution AB(a) | 11,846 | 913,514 | ||||
Total Sweden | 1,467,091 | |||||
Switzerland - 9.6% | ||||||
Capital Markets - 2.1% | ||||||
Julius Baer Group Ltd. | 19,807 | 1,284,907 | ||||
15 |
Shares | Value | |||||
COMMON STOCKS - (Continued) | ||||||
Switzerland - (Continued) | ||||||
Electrical Equipment - 2.1% | ||||||
ABB Ltd. | 23,792 | $1,284,733 | ||||
Health Care Equipment & Supplies - 2.7% | ||||||
Alcon AG | 18,908 | 1,603,163 | ||||
Life Sciences Tools & Services - 2.7% | ||||||
Lonza Group AG | 2,756 | 1,626,698 | ||||
Total Switzerland | 5,799,501 | |||||
United Kingdom - 25.8%(c) | ||||||
Aerospace & Defense - 2.1% | ||||||
BAE Systems PLC | 90,023 | 1,291,399 | ||||
Banks - 2.9% | ||||||
Barclays PLC | 513,737 | 1,718,543 | ||||
Beverages - 1.7% | ||||||
Diageo PLC | 31,382 | 997,247 | ||||
Commercial Services & Supplies - 2.2% | ||||||
Rentokil Initial PLC | 267,905 | 1,337,234 | ||||
Electronic Equipment, Instruments & Components - 1.1% | ||||||
Halma PLC | 18,971 | 636,454 | ||||
Hotels, Restaurants & Leisure - 4.8% | ||||||
Compass Group PLC | 45,674 | 1,519,723 | ||||
InterContinental Hotels Group PLC | 11,125 | 1,384,206 | ||||
2,903,929 | ||||||
Oil, Gas & Consumable Fuels - 2.3% | ||||||
Shell PLC | 44,956 | 1,401,316 | ||||
Personal Care Products - 4.2% | ||||||
Haleon PLC | 202,212 | 953,456 | ||||
Unilever PLC | 27,510 | 1,563,127 | ||||
2,516,583 | ||||||
Software - 2.6% | ||||||
Sage Group PLC | 100,140 | 1,591,064 | ||||
Trading Companies & Distributors - 1.9% | ||||||
Ashtead Group PLC | 18,538 | 1,146,905 | ||||
Total United Kingdom | 15,540,674 | |||||
United States - 2.6% | ||||||
Construction Materials - 2.6% | ||||||
CRH PLC | 16,771 | 1,551,653 | ||||
TOTAL COMMON STOCKS (Cost $49,518,116) | 58,656,640 | |||||
Shares | Value | |||||
PREFERRED STOCKS - 1.5% | ||||||
Germany - 1.5% | ||||||
Life Sciences Tools & Services - 1.5% | ||||||
Sartorius AG 0.00%, | 4,070 | $904,492 | ||||
TOTAL PREFERRED STOCKS (Cost $1,304,702) | 904,492 | |||||
SHORT-TERM INVESTMENTS - 1.1% | ||||||
Money Market Funds - 1.1% | ||||||
Invesco Short-Term Investments Trust - Government & Agency Portfolio - Institutional Shares, 4.43%(d) | 671,459 | 671,459 | ||||
TOTAL SHORT-TERM INVESTMENTS (Cost $671,459) | 671,459 | |||||
TOTAL INVESTMENTS - 99.8% (Cost $51,494,277) | $60,232,591 | |||||
Other Assets in Excess of Liabilities - 0.2% | 96,267 | |||||
TOTAL NET ASSETS - 100.0% | $60,328,858 | |||||
(a) | Security is exempt from registration pursuant to Rule 144A under the Securities Act of 1933, as amended. These securities may only be resold in transactions exempt from registration to qualified institutional investors. As of December 31, 2024, the value of these securities total $2,582,634 or 4.3% of the Fund’s net assets. |
(b) | Non-income producing security. |
(c) | To the extent that the Fund invests a significant portion of its assets in the securities of companies of a single country or region, it is more likely to be impacted by events or conditions affecting the country or region. |
(d) | The rate shown represents the 7-day annualized effective yield as of December 31, 2024. |
16 |
LKCM Small Cap Equity Fund | LKCM Small-Mid Cap Equity Fund | LKCM Equity Fund | LKCM Balanced Fund | LKCM Fixed Income Fund | LKCM International Equity Fund | |||||||||||||
Assets | ||||||||||||||||||
Investments, at value* | $282,692,147 | $39,055,033 | $509,292,772 | $114,747,644 | $274,439,697 | $60,232,591 | ||||||||||||
Dividends and interest receivable | 124,572 | 22,414 | 330,690 | 435,134 | 2,959,496 | 218,475 | ||||||||||||
Receivable for Fund shares sold | 770,854 | — | 15,397 | 685 | — | — | ||||||||||||
Prepaid expenses and other assets | 26,030 | 10,347 | 16,027 | 9,896 | 13,726 | 5,903 | ||||||||||||
Total assets | 283,613,603 | 39,087,794 | 509,654,886 | 115,193,359 | 277,412,919 | 60,456,969 | ||||||||||||
Liabilities | ||||||||||||||||||
Payable for investment advisory fees | 497,867 | 40,350 | 734,107 | 149,070 | 175,559 | 88,327 | ||||||||||||
Payable for administrative fees | 24,304 | 5,422 | 42,935 | 10,964 | 24,468 | 7,319 | ||||||||||||
Payable for accounting and transfer agent fees and expenses | 20,326 | 6,557 | 34,581 | 11,018 | 19,950 | 9,064 | ||||||||||||
Payable for trustees’ fees and officer compensation (Note B) | 3,876 | 400 | 8,927 | 2,134 | 5,094 | 1,137 | ||||||||||||
Payable for professional fees | 36,829 | 13,970 | 67,032 | 24,414 | 43,315 | 17,229 | ||||||||||||
Payable for custody fees and expenses | 5,052 | 934 | 9,077 | 2,090 | 4,734 | 4,713 | ||||||||||||
Payable for reports to shareholders | 1,829 | 282 | 2,564 | 954 | 1,160 | 308 | ||||||||||||
Payable for Fund shares redeemed | 9,429 | — | 272,387 | 69,795 | 15,500 | — | ||||||||||||
Accrued expenses and other liabilities | 61 | 8 | 117 | 150 | 763 | 14 | ||||||||||||
Total liabilities | 599,573 | 67,923 | 1,171,727 | 270,589 | 290,543 | 128,111 | ||||||||||||
Commitments and Contingencies (Note A) | ||||||||||||||||||
Net assets | $283,014,030 | $39,019,871 | $508,483,159 | $114,922,770 | $277,122,376 | $60,328,858 | ||||||||||||
Net Assets Consist of: | ||||||||||||||||||
Paid-in capital | $193,462,667 | $28,707,622 | $227,378,872 | $75,255,772 | $286,552,632 | $53,807,026 | ||||||||||||
Total distributable earnings | 89,551,363 | 10,312,249 | 281,104,287 | 39,666,998 | (9,430,256) | 6,521,832 | ||||||||||||
Net assets | $283,014,030 | $39,019,871 | $508,483,159 | $114,922,770 | $277,122,376 | $60,328,858 | ||||||||||||
Shares of beneficial interest outstanding (unlimited shares of no par value authorized) | 13,456,966 | 3,406,198 | 13,786,012 | 4,165,985 | 26,749,147 | 4,602,856 | ||||||||||||
Net asset value per share (offering and redemption price) | $21.03 | $11.46 | $36.88 | $27.59 | $10.36 | $13.11 | ||||||||||||
* Cost of Investments | $193,159,652 | $28,548,128 | $245,787,752 | $75,104,466 | $279,956,636 | $51,494,277 | ||||||||||||
17 |
LKCM Small Cap Equity Fund | LKCM Small-Mid Cap Equity Fund | LKCM Equity Fund | LKCM Balanced Fund | LKCM Fixed Income Fund | LKCM International Equity Fund | |||||||||||||
Investment Income: | ||||||||||||||||||
Dividends* | $1,860,193 | $201,511 | $6,292,512 | $1,137,501 | $— | $1,389,326 | ||||||||||||
Interest | 781,955 | 88,599 | 512,506 | 1,183,969 | 9,834,327 | 88,120 | ||||||||||||
Total investment income | 2,642,148 | 290,110 | 6,805,018 | 2,321,470 | 9,834,327 | 1,477,446 | ||||||||||||
Expenses: | ||||||||||||||||||
Investment advisory fees (Note B) | 1,967,460 | 256,313 | 3,619,177 | 753,744 | 1,401,125 | 562,561 | ||||||||||||
Administrative fees | 271,601 | 67,223 | 497,636 | 131,578 | 289,756 | 79,077 | ||||||||||||
Accounting and transfer agent fees and expenses | 195,647 | 78,860 | 338,737 | 130,885 | 212,220 | 100,239 | ||||||||||||
Professional fees | 118,415 | 24,521 | 226,013 | 59,417 | 131,202 | 37,377 | ||||||||||||
Trustees’ fees and officer compensation (Note B) | 123,808 | 14,349 | 268,242 | 61,899 | 154,325 | 32,570 | ||||||||||||
Federal and state registration | 49,870 | 28,121 | 55,679 | 18,305 | 32,488 | 16,483 | ||||||||||||
Custody fees and expenses | 31,116 | 7,657 | 57,493 | 13,431 | 32,282 | 29,748 | ||||||||||||
Reports to shareholders | 10,063 | 2,278 | 10,015 | 4,324 | 8,440 | 2,632 | ||||||||||||
Other | 7,946 | 740 | 19,599 | 5,013 | 11,353 | 2,070 | ||||||||||||
Total expenses | 2,775,926 | 480,062 | 5,092,591 | 1,178,596 | 2,273,191 | 862,757 | ||||||||||||
Less, expense waiver and/or reimbursement (Note B) | (152,646) | (138,311) | (956,389) | (250,912) | (872,067) | (237,688) | ||||||||||||
Net expenses | 2,623,280 | 341,751 | 4,136,202 | 927,684 | 1,401,124 | 625,069 | ||||||||||||
Net investment income (loss) | 18,868 | (51,641) | 2,668,816 | 1,393,786 | 8,433,203 | 852,377 | ||||||||||||
Realized and Unrealized Gain (Loss): | ||||||||||||||||||
Net realized gain (loss) on: | ||||||||||||||||||
Investments | $19,792,543 | $(10,246) | $51,295,433 | $3,901,702 | $(1,889,890) | $966,096 | ||||||||||||
Foreign currency translation | — | — | — | — | — | (14,315) | ||||||||||||
Net change in unrealized appreciation (depreciation) on: | ||||||||||||||||||
Investments | 18,672,498 | 4,941,304 | 15,478,919 | 6,701,230 | 1,750,631 | 1,122,977 | ||||||||||||
Foreign currency translation | — | — | (313) | (73) | — | (16,404) | ||||||||||||
Net Realized and Unrealized Gain (Loss) | 38,465,041 | 4,931,058 | 66,774,039 | 10,602,859 | (139,259) | 2,058,354 | ||||||||||||
Net Increase (Decrease) in Net Assets Resulting from Operations | $38,483,909 | $4,879,417 | $69,442,855 | $11,996,645 | $8,293,944 | $2,910,731 | ||||||||||||
* Net of foreign taxes withheld and/or issuance fees | $39,264 | $853 | $22,815 | $2,230 | $— | $161,901 | ||||||||||||
18 |
LKCM Small Cap Equity Fund | LKCM Small-Mid Cap Equity Fund | |||||||||||
Year Ended December 31, | Year Ended December 31, | |||||||||||
2024 | 2023 | 2024 | 2023 | |||||||||
Operations: | ||||||||||||
Net investment gain (loss) | $18,868 | $(165,518) | $(51,641) | $(5,872) | ||||||||
Net realized gain (loss) | 19,792,543 | 5,580,782 | (10,246) | (184,433) | ||||||||
Net change in unrealized appreciation | 18,672,498 | 35,113,618 | 4,941,304 | 5,055,154 | ||||||||
Net increase in net assets resulting from operations | 38,483,909 | 40,528,882 | 4,879,417 | 4,864,849 | ||||||||
Net Dividends and Distributions to Shareholders | ||||||||||||
Capital Gain Distribution | (19,098,420) | (6,260,272) | — | — | ||||||||
Net Dividends and Distributions to Shareholders | (19,098,420) | (6,260,272) | — | — | ||||||||
Net increase in net assets from | ||||||||||||
Fund share transactions (Note C) | 32,078,444 | 27,242,557 | 5,646,683 | 8,395,246 | ||||||||
Total increase in net assets | 51,463,933 | 61,511,167 | 10,526,100 | 13,260,095 | ||||||||
Net Assets: | ||||||||||||
Beginning of year | 231,550,097 | 170,038,930 | 28,493,771 | 15,233,676 | ||||||||
End of year | $283,014,030 | $231,550,097 | $39,019,871 | $28,493,771 | ||||||||
19 |
LKCM Equity Fund | LKCM Balanced Fund | |||||||||||
Year Ended December 31, | Year Ended December 31, | |||||||||||
2024 | 2023 | 2024 | 2023 | |||||||||
Operations: | ||||||||||||
Net investment income | $2,668,816 | $4,364,687 | $1,393,786 | $1,225,184 | ||||||||
Net realized gain | 51,295,433 | 1,256,854 | 3,901,702 | 2,484,536 | ||||||||
Net change in unrealized appreciation | 15,478,606 | 50,924,521 | 6,701,157 | 7,619,477 | ||||||||
Net increase in net assets resulting from operations | 69,442,855 | 56,546,062 | 11,996,645 | 11,329,197 | ||||||||
Net Dividends and Distributions to Shareholders | ||||||||||||
Investment income | (2,500,301) | (4,375,883) | (1,364,595) | (1,238,189) | ||||||||
Capital Gain Distribution | (30,192,384) | (2,741,827) | (3,782,676) | (2,673,192) | ||||||||
Net Dividends and Distributions to Shareholders | (32,692,685) | (7,117,710) | (5,147,271) | (3,911,381) | ||||||||
Net decrease in net assets from | ||||||||||||
Fund share transactions (Note C) | (22,943,692) | (15,393,523) | (5,593,729) | (2,496,735) | ||||||||
Total increase in net assets | 13,806,478 | 34,034,829 | 1,255,645 | 4,921,081 | ||||||||
Net Assets: | ||||||||||||
Beginning of year | 494,676,681 | 460,641,852 | 113,667,125 | 108,746,044 | ||||||||
End of year | $ 508,483,159 | $494,676,681 | $114,922,770 | $113,667,125 | ||||||||
20 |
LKCM Fixed Income Fund | LKCM International Equity Fund | |||||||||||
Year Ended December 31, | Year Ended December 31, | |||||||||||
2024 | 2023 | 2024 | 2023 | |||||||||
Operations: | ||||||||||||
Net investment income | $8,433,203 | $6,489,076 | $852,377 | $890,446 | ||||||||
Net realized gain (loss) | (1,889,890) | (1,597,482) | 951,781 | (1,257,811) | ||||||||
Net change in unrealized appreciation | 1,750,631 | 8,670,167 | 1,106,573 | 8,085,267 | ||||||||
Net increase in net assets resulting from operations | 8,293,944 | 13,561,761 | 2,910,731 | 7,717,902 | ||||||||
Net Dividends and Distributions to Shareholders: | ||||||||||||
Investment income | (8,412,958) | (6,485,802) | (834,475) | (862,131) | ||||||||
Net Dividends and Distributions to Shareholders | (8,412,958) | (6,485,802) | (834,475) | (862,131) | ||||||||
Net increase (decrease) in net assets from | ||||||||||||
Fund share transactions (Note C) | (9,250,785) | 4,029,672 | (1,992,887) | 8,380,677 | ||||||||
Total increase (decrease) in net assets | (9,369,799) | 11,105,631 | 83,369 | 15,236,448 | ||||||||
Net Assets: | ||||||||||||
Beginning of year | 286,492,175 | 275,386,544 | 60,245,489 | 45,009,041 | ||||||||
End of year | $ 277,122,376 | $286,492,175 | $60,328,858 | $60,245,489 | ||||||||
21 |
Year Ended December 31 | |||||||||||||||
2024 | 2023 | 2022 | 2021 | 2020 | |||||||||||
Net asset value, beginning of period | $19.53 | $16.37 | $21.54 | $21.77 | $16.78 | ||||||||||
Income (loss) from investment operations: | |||||||||||||||
Net investment income (loss) | —(1) | (0.01)(1) | (0.04)(1) | (0.08)(1) | (0.02)(1) | ||||||||||
Net realized and unrealized gains (losses) | 3.03 | 3.71 | (4.73) | 3.23 | 5.85 | ||||||||||
Total from investment operations | 3.03 | 3.70 | (4.77) | 3.15 | 5.83 | ||||||||||
Less distributions: | |||||||||||||||
From realized capital gain distribution | (1.53) | (0.54) | (0.40) | (3.38) | (0.84) | ||||||||||
Total distributions | (1.53) | (0.54) | (0.40) | (3.38) | (0.84) | ||||||||||
Redemption fees | 0.00(2) | — | — | — | — | ||||||||||
Net asset value, end of period | $21.03 | $19.53 | $16.37 | $21.54 | $21.77 | ||||||||||
Total return | 15.45% | 22.57% | −22.11% | 14.49% | 34.79% | ||||||||||
Ratios and Supplemental Data: | |||||||||||||||
Net assets, end of period ($000’s) | $283,014 | $231,550 | $170,039 | $229,199 | $202,678 | ||||||||||
Ratio of expenses to average net assets: | |||||||||||||||
Before expense waiver and/or reimbursement | 1.06% | 1.07% | 1.07% | 1.03% | 1.07% | ||||||||||
After expense waiver and/or reimbursement | 1.00% | 1.00% | 1.00% | 1.00% | 1.00% | ||||||||||
Ratio of net investment income (loss) to average net assets: | |||||||||||||||
Before expense waiver and/or reimbursement | (0.05)% | (0.15)% | (0.30)% | (0.35)% | (0.20)% | ||||||||||
After expense waiver and/or reimbursement | 0.01% | (0.08)% | (0.23)% | (0.32)% | (0.13)% | ||||||||||
Portfolio turnover rate | 29% | 28% | 42% | 42% | 60% | ||||||||||
(1) | Net investment income (loss) per share represents net investment loss divided by the average shares outstanding throughout the period. |
(2) | Amount rounds to less than $0.005 per share. |
22 |
Year Ended December 31 | |||||||||||||||
2024 | 2023 | 2022 | 2021 | 2020 | |||||||||||
Net asset value, beginning of period | $9.91 | $7.88 | $10.97 | $11.15 | $9.09 | ||||||||||
Income (loss) from investment operations: | |||||||||||||||
Net investment income (loss) | (0.02)(1) | (0.00)(1) | (0.01)(1) | (0.06)(1) | (0.02)(1) | ||||||||||
Net realized and unrealized gains (losses) | 1.57 | 2.03 | (2.43) | 1.77 | 2.80 | ||||||||||
Total from investment operations | 1.55 | 2.03 | (2.44) | 1.71 | 2.78 | ||||||||||
Less distributions: | |||||||||||||||
From realized capital gain distribution | — | — | (0.65) | (1.89) | (0.72) | ||||||||||
Total distributions | — | — | (0.65) | (1.89) | (0.72) | ||||||||||
Redemption fees | 0.00(2) | 0.00(2) | — | — | — | ||||||||||
Net asset value, end of period | $11.46 | $9.91 | $7.88 | $10.97 | $11.15 | ||||||||||
Total return | 15.64% | 25.76% | −22.12% | 15.37% | 30.66% | ||||||||||
Ratios and Supplemental Data: | |||||||||||||||
Net assets, end of period ($000’s) | $39,020 | $28,494 | $15,234 | $14,355 | $15,108 | ||||||||||
Ratio of expenses to average net assets: | |||||||||||||||
Before expense waiver and/or reimbursement | 1.40% | 1.74% | 1.80% | 1.74% | 1.98% | ||||||||||
After expense waiver and/or reimbursement | 1.00% | 1.00% | 1.00% | 1.00% | 1.00% | ||||||||||
Ratio of net investment income (loss) to average net assets: | |||||||||||||||
Before expense waiver and/or reimbursement | (0.56)% | (0.77)% | (0.92)% | (1.23)% | (1.25)% | ||||||||||
After expense waiver and/or reimbursement | (0.15)% | (0.03)% | (0.11)% | (0.49)% | (0.27)% | ||||||||||
Portfolio turnover rate | 31% | 32% | 50% | 50% | 76% | ||||||||||
(1) | Net investment income (loss) per share represents net investment loss divided by the average shares outstanding throughout the period. |
(2) | Amount rounds to less than $0.005 per share. |
23 |
Year Ended December 31 | |||||||||||||||
2024 | 2023 | 2022 | 2021 | 2020 | |||||||||||
Net asset value, beginning of period | $34.41 | $30.99 | $38.69 | $33.74 | $29.02 | ||||||||||
Income (loss) from investment operations: | |||||||||||||||
Net investment income | 0.19(1) | 0.30(1) | 0.31(1) | 0.16(1) | 0.17(1) | ||||||||||
Net realized and unrealized gains (losses) | 4.79 | 3.62 | (6.31) | 7.43 | 6.44 | ||||||||||
Total from investment operations | 4.98 | 3.92 | (6.00) | 7.59 | 6.61 | ||||||||||
Less distributions: | |||||||||||||||
From net investment income | (0.19) | (0.31) | (0.30) | (0.17) | (0.17) | ||||||||||
From realized capital gain distribution | (2.32) | (0.19) | (1.40) | (2.47) | (1.72) | ||||||||||
Total distributions | (2.51) | (0.50) | (1.70) | (2.64) | (1.89) | ||||||||||
Redemption fees | 0.00(2) | — | 0.00(2) | — | — | ||||||||||
Net asset value, end of period | $36.88 | $34.41 | $30.99 | $38.69 | $33.74 | ||||||||||
Total return | 14.44% | 12.65% | −15.44% | 22.48% | 22.83% | ||||||||||
Ratios and Supplemental Data: | |||||||||||||||
Net assets, end of period ($000’s) | $508,483 | $494,677 | $460,642 | $542,696 | $449,653 | ||||||||||
Ratio of expenses to average net assets: | |||||||||||||||
Before expense waiver and/or reimbursement | 0.98% | 1.00% | 0.97% | 0.96% | 0.98% | ||||||||||
After expense waiver and/or reimbursement | 0.80% | 0.80% | 0.80% | 0.80% | 0.80% | ||||||||||
Ratio of net investment income (loss) to average net assets: | |||||||||||||||
Before expense waiver and/or reimbursement | 0.33% | 0.73% | 0.74% | 0.27% | 0.37% | ||||||||||
After expense waiver and/or reimbursement | 0.52% | 0.93% | 0.91% | 0.43% | 0.55% | ||||||||||
Portfolio turnover rate | 9% | 10% | 11% | 11% | 10% | ||||||||||
(1) | Net investment income (loss) per share represents net investment loss divided by the average shares outstanding throughout the period. |
(2) | Amount rounds to less than $0.005 per share. |
24 |
Year Ended December 31 | |||||||||||||||
2024 | 2023 | 2022 | 2021 | 2020 | |||||||||||
Net asset value, beginning of period | $26.00 | $24.29 | $29.21 | $26.76 | $24.22 | ||||||||||
Income (loss) from investment operations: | |||||||||||||||
Net investment income | 0.33(1) | 0.28(1) | 0.26(1) | 0.20(1) | 0.24(1) | ||||||||||
Net realized and unrealized gains (losses) | 2.53 | 2.34 | (4.30) | 3.54 | 3.42 | ||||||||||
Total from investment operations | 2.86 | 2.62 | (4.04) | 3.74 | 3.66 | ||||||||||
Less distributions: | |||||||||||||||
From net investment income | (0.33) | (0.29) | (0.27) | (0.20) | (0.24) | ||||||||||
From realized capital gain distribution | (0.94) | (0.62) | (0.61) | (1.09) | (0.88) | ||||||||||
Total distributions | (1.27) | (0.91) | (0.88) | (1.29) | (1.12) | ||||||||||
Redemption fees | 0.00(2) | 0.00(2) | 0.00(2) | — | — | ||||||||||
Net asset value, end of period | $27.59 | $26.00 | $24.29 | $29.21 | $26.76 | ||||||||||
Total return | 10.99% | 10.84% | −13.84% | 14.01% | 15.28% | ||||||||||
Ratios and Supplemental Data: | |||||||||||||||
Net assets, end of period ($000’s) | $114,923 | $113,667 | $108,746 | $144,901 | $125,507 | ||||||||||
Ratio of expenses to average net assets: | |||||||||||||||
Before expense waiver and/or reimbursement | 1.02% | 1.04% | 0.99% | 0.96% | 0.99% | ||||||||||
After expense waiver and/or reimbursement | 0.80% | 0.80% | 0.80% | 0.80% | 0.80% | ||||||||||
Ratio of net investment income (loss) to average net assets: | |||||||||||||||
Before expense waiver and/or reimbursement | 0.99% | 0.87% | 0.82% | 0.53% | 0.78% | ||||||||||
After expense waiver and/or reimbursement | 1.20% | 1.11% | 1.01% | 0.69% | 0.97% | ||||||||||
Portfolio turnover rate | 15% | 11% | 13% | 11% | 18% | ||||||||||
(1) | Net investment income (loss) per share represents net investment loss divided by the average shares outstanding throughout the period. |
(2) | Amount rounds to less than $0.005 per share. |
25 |
Year Ended December 31 | |||||||||||||||
2024 | 2023 | 2022 | 2021 | 2020 | |||||||||||
Net asset value, beginning of period | $10.36 | $10.10 | $10.87 | $11.19 | $10.92 | ||||||||||
Income (loss) from investment operations: | |||||||||||||||
Net investment income | 0.31(1) | 0.24(1) | 0.16(1) | 0.15(1) | 0.19(1) | ||||||||||
Net realized and unrealized gains (losses) | 0.00 | 0.26 | (0.77) | (0.32) | 0.27 | ||||||||||
Total from investment operations | 0.31 | 0.50 | (0.61) | (0.17) | 0.46 | ||||||||||
Less distributions: | |||||||||||||||
From net investment income | (0.31) | (0.24) | (0.15) | (0.15) | (0.19) | ||||||||||
From realized capital gain distribution | — | — | (0.01) | (0.00) (2) | — | ||||||||||
Total distributions | (0.31) | (0.24) | (0.16) | (0.15) | (0.19) | ||||||||||
Redemption fees | — | 0.00(2) | — | — | — | ||||||||||
Net asset value, end of period | $10.36 | $10.36 | $10.10 | $10.87 | $11.19 | ||||||||||
Total return | 3.06% | 4.98% | −5.63% | −1.54% | 4.29% | ||||||||||
Ratios and Supplemental Data: | |||||||||||||||
Net assets, end of period ($000’s) | $277,122 | $286,492 | $275,387 | $295,745 | $289,857 | ||||||||||
Ratio of expenses to average net assets: | |||||||||||||||
Before expense waiver and/or reimbursement | 0.81% | 0.81% | 0.79% | 0.78% | 0.79% | ||||||||||
After expense waiver and/or reimbursement | 0.50% | 0.50% | 0.50% | 0.50% | 0.50% | ||||||||||
Ratio of net investment income (loss) to average net assets: | |||||||||||||||
Before expense waiver and/or reimbursement | 2.70% | 2.02% | 1.25% | 1.05% | 1.46% | ||||||||||
After expense waiver and/or reimbursement | 3.01% | 2.33% | 1.54% | 1.33% | 1.75% | ||||||||||
Portfolio turnover rate | 25% | 23% | 21% | 31% | 46% | ||||||||||
(1) | Net investment income (loss) per share represents net investment loss divided by the average shares outstanding throughout the period. |
(2) | Amount rounds to less than $0.005 per share. |
26 |
Year Ended December 31 | |||||||||||||||
2024 | 2023 | 2022 | 2021 | 2020 | |||||||||||
Net asset value, beginning of period | $12.68 | $11.08 | $14.50 | $12.44 | $10.89 | ||||||||||
Income (loss) from investment operations: | |||||||||||||||
Net investment income (loss) | 0.18(1) | 0.19(1) | 0.45(1) | 0.10(1) | 0.03(1) | ||||||||||
Net realized and unrealized gains (losses) | 0.43 | 1.59 | (3.42) | 2.14 | 1.54 | ||||||||||
Total from investment operations | 0.61 | 1.78 | (2.97) | 2.24 | 1.57 | ||||||||||
Less distributions: | |||||||||||||||
From net investment income | (0.18) | (0.18) | (0.30) | (0.08) | (0.02) | ||||||||||
From return of capital | — | — | — | — | (0.00) (2) | ||||||||||
From realized capital gain distribution | — | — | (0.15) | (0.10) | — | ||||||||||
Total distributions | (0.18) | (0.18) | (0.45) | (0.18) | (0.02) | ||||||||||
Net asset value, end of period | $13.11 | $12.68 | $11.08 | $14.50 | $12.44 | ||||||||||
Total return | 4.83% | 16.09% | −20.51% | 18.00% | 14.45% | ||||||||||
Ratios and Supplemental Data: | |||||||||||||||
Net assets, end of period ($000’s) | $60,329 | $60,245 | $45,009 | $55,504 | $32,295 | ||||||||||
Ratio of expenses to average net assets: | |||||||||||||||
Before expense waiver and/or reimbursement | 1.38% | 1.41% | 1.45% | 1.40% | 1.88% | ||||||||||
After expense waiver and/or reimbursement | 1.00% | 1.00% | 1.00% | 1.00% | 1.00% | ||||||||||
Ratio of net investment income (loss) to average net assets: | |||||||||||||||
Before expense waiver and/or reimbursement | 0.98% | 1.17% | 3.35% | 0.29% | (0.55)% | ||||||||||
After expense waiver and/or reimbursement | 1.36% | 1.58% | 3.80% | 0.69% | 0.33% | ||||||||||
Portfolio turnover rate | 17% | 11% | 26% | 15% | 6% | ||||||||||
(1) | Net investment income (loss) per share represents net investment loss divided by the average shares outstanding throughout the period. |
(2) | Amount rounds to less than $0.005 per share. |
27 |
| 1. | Security Valuation: Equity securities listed or traded on a U.S. securities exchange for which market quotations are readily available are valued at the last quoted sale price on the exchange on which the security is primarily traded. Nasdaq Global Market securities are valued at the Nasdaq Official Closing Price (“NOCP”). Unlisted U.S. equity securities and listed U.S. equity securities not traded on a particular valuation date are valued at the mean of the most recent quoted bid and ask price on the relevant exchanges or markets. Equity securities listed on a foreign exchange for which market quotations are readily available are valued at the last quoted sales price on the exchange on which the security is primarily traded. Debt securities are normally valued at the mean of the closing bid and ask price and/or by using a combination of broker quotations or evaluated prices provided by an independent pricing service. Futures contracts and options on futures contracts are valued at the settlement prices established each day on the principal exchange on which they are traded. Forward contracts are valued based on the forward rate using information provided by an independent pricing service. Other assets and securities for which no market or broker quotations or evaluated prices are readily available are valued by the Adviser in good faith at fair value. Rule 2a-5 under the Investment Company Act of 1940 (the “Valuation Rule”) establishes requirements for determining fair value |
28 |
| Level 1 – | Quoted unadjusted prices for identical instruments in active markets to which the Trust has access at the date of measurement. |
| Level 2 – | Quoted prices for similar instruments in active markets; quoted prices for identical or similar instruments in markets that are not active; and model-derived valuations in which all significant inputs and significant value drivers are observable in active markets. Level 2 inputs are those in markets for which there are few transactions, the prices are not current, little public information exists or instances where prices vary substantially over time or among brokered market makers. |
| Level 3 – | Model derived valuations in which one or more significant inputs or significant value drivers are unobservable. Unobservable inputs are those inputs that reflect the Trust’s own assumptions that market participants would use to price the asset or liability based on the best available information. |
Description | Level 1 | Level 2 | Level 3 | Total | ||||||||
Common Stocks | $275,750,286 | $ — | $ 0 | $275,750,286 | ||||||||
Short-Term Investments | 6,941,861 | — | — | 6,941,861 | ||||||||
Total Investments* | $282,692,147 | $— | $0 | $282,692,147 | ||||||||
29 |
Description | Level 1 | Level 2 | Level 3 | Total | ||||||||
Common Stocks | $36,979,401 | $ — | $ — | $36,979,401 | ||||||||
Short-Term Investments | 2,075,632 | — | — | 2,075,632 | ||||||||
Total Investments* | $39,055,033 | $— | $— | $39,055,033 | ||||||||
Description | Level 1 | Level 2 | Level 3 | Total | ||||||||
Common Stocks | $492,943,558 | $ — | $ — | $492,943,558 | ||||||||
Short-Term Investments | 16,349,214 | — | — | 16,349,214 | ||||||||
Total Investments* | $509,292,772 | $— | $— | $509,292,772 | ||||||||
Description | Level 1 | Level 2 | Level 3 | Total | ||||||||
Common Stocks | $78,817,885 | $— | $ — | $78,817,885 | ||||||||
Corporate Bonds | — | 34,194,083 | — | 34,194,083 | ||||||||
REITs | 1,008,755 | — | — | 1,008,755 | ||||||||
Short-Term Investment | 726,921 | — | — | 726,921 | ||||||||
Total Investments* | $80,553,561 | $34,194,083 | $— | $114,747,644 | ||||||||
Description | Level 1 | Level 2 | Level 3 | Total | ||||||||
Corporate Bonds | $— | $180,521,504 | $ — | $180,521,504 | ||||||||
U.S. Government Sponsored Entities | — | 60,845,570 | — | 60,845,570 | ||||||||
U.S. Government Issues | — | 25,046,873 | — | 25,046,873 | ||||||||
U.S. Treasury Obligations | — | 4,933,563 | — | 4,933,563 | ||||||||
Short-Term Investment | 3,092,187 | — | — | 3,092,187 | ||||||||
Total Investments* | $3,092,187 | $271,347,510 | $— | $274,439,697 | ||||||||
Description | Level 1 | Level 2 | Level 3 | Total | ||||||||
Common Stocks | $5,419,150 | $53,237,490 | $ — | $58,656,640 | ||||||||
Preferred Stock | — | 904,492 | — | 904,492 | ||||||||
Short-Term Investments | 671,459 | — | — | 671,459 | ||||||||
Total Investments* | $6,090,609 | $54,141,982 | $— | $60,232,591 | ||||||||
| * | Additional information regarding the industry classifications of these investments is disclosed in the Schedule of Investments. |
30 |
| 2. | Federal Income Taxes: The Funds have elected to be treated as “regulated investment companies” under Subchapter M of the Internal Revenue Code and each Fund intends to distribute all of its investment company net taxable income and net capital gains to shareholders. Therefore, no federal income tax provision is recorded. |
| 3. | Distributions to Shareholders: The LKCM Small Cap Equity Fund, LKCM Small-Mid Cap Equity Fund, LKCM Equity Fund and LKCM International Equity Fund generally intend to declare and pay income dividends and distribute net capital gains, if any, at least on an annual basis. The LKCM Balanced Fund and LKCM Fixed Income Fund generally intend to declare and pay income dividends on a quarterly basis and distribute net capital gains, if any, at least on an annual basis. |
| 4. | Foreign Securities: Investing in securities of foreign companies and foreign governments involves special risks and considerations not typically associated with investing in securities of U.S. issuers. These risks include devaluation of currencies and future adverse political and economic developments. Moreover, securities of many foreign companies and foreign governments and their markets may be less liquid and their prices more volatile than those of securities of comparable U.S. companies and securities of the U.S. government. |
| 5. | Expense Allocation: Expenses incurred by the Funds are allocated among the Funds based upon (i) relative average net assets, (ii) a specific identification basis as incurred, or (iii) evenly among the Funds, depending on the nature of the expense. |
| 6. | Use of Estimates: The preparation of financial statements in conformity with accounting principles generally accepted in the United States of America requires management to make estimates and assumptions that affect the reported amounts of assets and liabilities and disclosure of contingent assets and liabilities at the date of the financial statements and the reported amounts of revenues and expenses during the reporting period. Actual results could differ from those estimates. |
| 7. | Guarantees and Indemnifications: In the normal course of business, the Funds enter into contracts with service providers that contain general indemnification clauses. The Funds’ maximum exposure under these arrangements is unknown as this would involve future claims against the Funds that have not yet occurred. Based on experience, the Funds expect the risk of loss to be remote. |
| 8. | Security Transactions and Investment Income: Security and shareholder transactions are recorded on the trade date. Realized gains and losses on sales of investments are calculated on the identified cost basis. Dividend income and dividends and distributions to shareholders are recorded on the ex-dividend date. Withholding taxes on foreign dividends have been provided for in accordance with the Funds’ understanding of the applicable jurisdiction’s tax rules and rates. Interest income is recognized on the accrual basis. All discounts and premiums are amortized based on the effective interest method for tax and financial reporting purposes. The Funds may hold the securities of real estate investment trusts (“REITs”). Distributions from such investments may include income, capital gains and return of capital. |
| 9. | Other: Distributions from net investment income and realized capital gains are determined in accordance with income tax regulations, which may differ from U.S. GAAP. Certain capital accounts in the financial statements are periodically adjusted for permanent differences in order to reflect their tax character. These permanent differences are primarily due to the varying treatment of income and gain/loss on portfolio securities held by the Fund and have no impact on net assets or NAV per share. |
LKCM Small Cap Equity Fund | LKCM Small-Mid Cap Equity Fund | LKCM Equity Fund | LKCM Balanced Fund | LKCM Fixed Income Fund | LKCM International Equity Fund | |||||||||||||
Paid-in capital | $603,736 | $(51,641) | $2,796,635 | $146,933 | $ — | $ — | ||||||||||||
Total distributable earnings | (603,736) | 51,641 | (2,796,635) | (146,933) | — | — | ||||||||||||
31 |
| 10. | Restricted and Illiquid Securities: The Funds are permitted to invest in securities that are subject to legal or contractual restrictions on resale including investments considered by the Funds to be illiquid. Restricted securities generally may be resold in transactions exempt from registration. Illiquid investments are investments that the Funds reasonably expect cannot be sold or disposed of in current market conditions within seven calendar days or less in the ordinary course of business without the sale or disposition significantly changing the market value of the investment. A security may be considered illiquid if it lacks a readily available market or if its valuation has not changed for a certain period of time. Disposal of these securities may involve time-consuming negotiations and expense, and prompt sale at the current valuation may be difficult. |
| 11. | Segment Reporting: During the reporting period, the Funds adopted FASB Accounting Standards Update 2023-07, Segment Reporting (Topic 280) - Improvements to Reportable Segment Disclosures (“ASU 2023-07”). Adoption of the new standard impacted financial statement disclosures only and did not affect each Fund’s financial position or the results of its operations. An operating segment is defined in Topic 280 as a component of a public entity that engages in business activities from which it may recognize revenues and incur expenses, has operating results that are regularly reviewed by the public entity’s chief operating decision maker (CODM) to make decisions about resources to be allocated to the segment and assess its performance, and has discrete financial information available. The Trust’s principal executive officer and principal financial officer act as the CODM. Each Fund within the Trust represents a single operating segment, as the CODM monitors the operating results of each Fund as a whole and each Fund’s long-term strategic asset allocation is pre-determined in accordance with the terms of its prospectus, based on a defined investment strategy which is executed by each Fund’s portfolio managers as a team. The financial information in the form of a Fund’s total returns, expense ratios, changes in net assets resulting from operations, subscriptions and redemptions and profitability to the advisor, which are used by the CODM to assess the segment’s performance versus each Fund’s comparative benchmarks and peers to make resource allocation decisions for each Fund’s single segment, is consistent with that presented within each Fund’s financial statements. Segment assets are reflected on the accompanying statement of assets and liabilities as “total assets” and significant segment expenses are listed on the accompanying statement of operations. |
LKCM Small Cap Equity Fund | LKCM Small-Mid Cap Equity Fund | LKCM Equity Fund | LKCM Balanced Fund | LKCM Fixed Income Fund | LKCM International Equity Fund | |||||||||||||
Annual Management Fee Rate | 0.75% | 0.75% | 0.70% | 0.65% | 0.50% | 0.90% | ||||||||||||
Annual Cap on Expenses | 1.00% | 1.00% | 0.80% | 0.80% | 0.50% | 1.00% | ||||||||||||
Fees Waived and/or Expenses Reimbursed in 2024 | $152,646 | $138,311 | $956,389 | $250,912 | $872,067 | $237,688 | ||||||||||||
32 |
Year Ended December 31, 2024 | Year Ended December 31, 2023 | |||||||||||
Shares | Amount | Shares | Amount | |||||||||
Shares sold | 1,932,643 | $39,616,847 | 1,894,299 | $34,598,154 | ||||||||
Shares issued to shareholders in reinvestment of distributions | 840,316 | 17,814,706 | 298,750 | 5,909,267 | ||||||||
Shares redeemed | (1,172,132) | (25,353,567) | (726,227) | (13,264,864) | ||||||||
Redemption fee | 458 | — | ||||||||||
Net increase (decrease) | 1,600,827 | $32,078,444 | 1,466,822 | $27,242,557 | ||||||||
Shares Outstanding: | ||||||||||||
Beginning of period | 11,856,139 | 10,389,317 | ||||||||||
End of period | 13,456,966 | 11,856,139 | ||||||||||
Year Ended December 31, 2024 | Year Ended December 31, 2023 | |||||||||||
Shares | Amount | Shares | Amount | |||||||||
Shares sold | 670,022 | $7,098,560 | 1,099,254 | $9,759,202 | ||||||||
Shares issued to shareholders in reinvestment of distributions | — | — | — | — | ||||||||
Shares redeemed | (140,386) | (1,451,877) | (156,022) | (1,363,990) | ||||||||
Redemption fee | — | 34 | ||||||||||
Net increase (decrease) | 529,636 | $5,646,683 | 943,232 | $8,395,246 | ||||||||
Shares Outstanding: | ||||||||||||
Beginning of period | 2,876,562 | 1,933,330 | ||||||||||
End of period | 3,406,198 | 2,876,562 | ||||||||||
33 |
Year Ended December 31, 2024 | Year Ended December 31, 2023 | |||||||||||
Shares | Amount | Shares | Amount | |||||||||
Shares sold | 404,257 | $14,933,764 | 814,797 | $26,594,117 | ||||||||
Shares issued to shareholders in reinvestment of distributions | 843,664 | 31,325,241 | 196,635 | 6,783,890 | ||||||||
Shares redeemed | (1,839,762) | (69,204,555) | (1,497,101) | (48,771,530) | ||||||||
Redemption fee | 1,858 | — | ||||||||||
Net increase (decrease) | (591,841) | $(22,943,692) | (485,669) | $(15,393,523) | ||||||||
Shares Outstanding: | ||||||||||||
Beginning of period | 14,377,853 | 14,863,522 | ||||||||||
End of period | 13,786,012 | 14,377,853 | ||||||||||
Year Ended December 31, 2024 | Year Ended December 31, 2023 | |||||||||||
Shares | Amount | Shares | Amount | |||||||||
Shares sold | 140,455 | $4,030,087 | 147,353 | $3,704,312 | ||||||||
Shares issued to shareholders in reinvestment of distributions | 179,311 | 4,985,889 | 147,221 | 3,793,144 | ||||||||
Shares redeemed | (526,267) | (14,609,707) | (399,213) | (9,994,292) | ||||||||
Redemption fee | 2 | 101 | ||||||||||
Net increase (decrease) | (206,501) | $(5,593,729) | (104,639) | $(2,496,735) | ||||||||
Shares Outstanding: | ||||||||||||
Beginning of period | 4,372,486 | 4,477,125 | ||||||||||
End of period | 4,165,985 | 4,372,486 | ||||||||||
Year Ended December 31, 2024 | Year Ended December 31, 2023 | |||||||||||
Shares | Amount | Shares | Amount | |||||||||
Shares sold | 2,037,482 | $21,176,820 | 2,781,717 | $28,384,982 | ||||||||
Shares issued to shareholders in reinvestment of distributions | 739,156 | 7,670,885 | 587,310 | 5,958,494 | ||||||||
Shares redeemed | (3,690,233) | (38,098,490) | (2,977,320) | (30,313,904) | ||||||||
Redemption fee | — | 100 | ||||||||||
Net increase (decrease) | (913,595) | $(9,250,785) | 391,707 | $4,029,672 | ||||||||
Shares Outstanding: | ||||||||||||
Beginning of period | 27,662,742 | 27,271,035 | ||||||||||
End of period | 26,749,147 | 27,662,742 | ||||||||||
34 |
Year Ended December 31, 2024 | Year Ended December 31, 2023 | |||||||||||
Shares | Amount | Shares | Amount | |||||||||
Shares sold | 147,145 | $2,007,875 | 756,956 | $9,166,966 | ||||||||
Shares issued to shareholders in reinvestment of distributions | 49,109 | 647,743 | 51,557 | 656,838 | ||||||||
Shares redeemed | (346,336) | (4,648,505) | (118,345) | (1,443,127) | ||||||||
Net increase (decrease) | (150,082) | $(1,992,887) | 690,168 | $8,380,677 | ||||||||
Shares Outstanding: | ||||||||||||
Beginning of period | 4,752,938 | 4,062,770 | ||||||||||
End of period | 4,602,856 | 4,752,938 | ||||||||||
Purchases | Sales | |||||||||||
U.S. Government | Other | U.S. Government | Other | |||||||||
LKCM Small Cap Equity Fund | $— | $80,834,647 | $— | $71,218,761 | ||||||||
LKCM Small-Mid Cap Equity Fund | — | 15,082,561 | — | 10,035,093 | ||||||||
LKCM Equity Fund | — | 43,840,642 | — | 107,616,675 | ||||||||
LKCM Balanced Fund | — | 16,711,266 | — | 26,305,551 | ||||||||
LKCM Fixed Income Fund | 12,316,742 | 57,447,622 | 23,203,533 | 55,221,533 | ||||||||
LKCM International Equity Fund | — | 10,127,320 | — | 10,251,124 | ||||||||
| E. | TAX INFORMATION |
LKCM Small Cap Equity Fund | LKCM Small-Mid Cap Equity Fund | LKCM Equity Fund | LKCM Balanced Fund | LKCM Fixed Income Fund | LKCM International Equity Fund | |||||||||||||
Tax cost | $193,159,652 | $28,548,524 | $245,586,036 | $75,104,466 | $279,956,636 | $51,499,815 | ||||||||||||
Gross unrealized appreciation | $95,618,646 | $11,250,044 | $269,818,427 | $41,219,525 | $836,817 | $13,518,411 | ||||||||||||
Gross unrealized depreciation | (6,086,151) | (743,535) | 6,111,508) | (1,576,286) | (6,353,756) | (4,794,628) | ||||||||||||
Net unrealized appreciation | $89,532,495 | $10,506,509 | $263,706,919 | $39,643,239 | $(5,516,939) | $8,723,783 | ||||||||||||
Undistributed ordinary income | 18,868 | — | — | 29,191 | 348,984 | 581,990 | ||||||||||||
Undistributed long-term capital gain | — | — | 17,397,368 | — | — | — | ||||||||||||
Distributable earnings | $18,868 | $— | $17,397,368 | $29,191 | $348,984 | $581,990 | ||||||||||||
Other accumulated losses | — | (194,260) | — | (5,432) | (4,262,301) | (2,783,941) | ||||||||||||
Total distributable earnings | $89,551,363 | $10,312,249 | $281,104,287 | $39,666,998 | $(9,430,256) | $6,521,832 | ||||||||||||
35 |
Short-Term | Long-Term | Capital Loss Carryover Utilized | |||||||
LKCM Small-Mid Cap Equity Fund | $194,260 | $— | $— | ||||||
LKCM Fixed Income Fund | 463,294 | 3,799,007 | — | ||||||
LKCM International Equity Fund | 841,195 | 1,942,746 | 967,548 | ||||||
LKCM Balanced Fund | $5,432 | ||
Year Ended December 31, 2024 | Year Ended December 31, 2023 | |||||||||||
Ordinary Income | Long-Term Capital Gains | Ordinary Income | Long-Term Capital Gains | |||||||||
LKCM Small Cap Equity Fund | $— | $19,098,420 | $— | $6,260,272 | ||||||||
LKCM Small-Mid Cap Equity Fund | — | — | — | — | ||||||||
LKCM Equity Fund | 2,500,301 | 30,192,384 | 4,375,883 | 2,741,827 | ||||||||
LKCM Balanced Fund | 1,364,595 | 3,782,676 | 1,233,982 | 2,677,399 | ||||||||
LKCM Fixed Income Fund | 8,412,958 | — | 6,485,802 | — | ||||||||
LKCM International Equity Fund | 834,475 | — | 862,131 | — | ||||||||
36 |
37 |

38 |
LKCM Small Cap Equity Fund | 0.00% | ||
LKCM Small-Mid Cap Equity Fund | 0.00% | ||
LKCM Equity Fund | 100.00% | ||
LKCM Balanced Fund | 79.28% | ||
LKCM Fixed Income Fund | 0.00% | ||
LKCM International Equity Fund | 100.00% | ||
LKCM Small Cap Equity Fund | 0.00% | ||
LKCM Small-Mid Cap Equity Fund | 0.00% | ||
LKCM Equity Fund | 100.00% | ||
LKCM Balanced Fund | 75.90% | ||
LKCM Fixed Income Fund | 0.00% | ||
LKCM International Equity Fund | 0.00% | ||
LKCM Small Cap Equity Fund | 0.00% | ||
LKCM Small-Mid Cap Equity Fund | 0.00% | ||
LKCM Equity Fund | 0.00% | ||
LKCM Balanced Fund | 51.00% | ||
LKCM Fixed Income Fund | 99.93% | ||
LKCM International Equity Fund | 0.00% | ||
LKCM Small Cap Equity Fund | 0.00% | ||
LKCM Small-Mid Cap Equity Fund | 0.00% | ||
LKCM Equity Fund | 0.00% | ||
LKCM Balanced Fund | 0.00% | ||
LKCM Fixed Income Fund | 0.00% | ||
LKCM International Equity Fund | 0.00% | ||
39 |
40 |
Shares | Value | ||||||||
COMMON STOCKS - 99.6% | |||||||||
Aerospace & Defense - 2.2% | |||||||||
L3Harris Technologies, Inc. | 6,300 | $1,324,764 | |||||||
Banks - 0.9% | |||||||||
Cullen/Frost Bankers, Inc. | 4,000 | 537,000 | |||||||
Beverages - 3.9% | |||||||||
Keurig Dr Pepper, Inc. | 25,000 | 803,000 | |||||||
PepsiCo, Inc. | 10,000 | 1,520,600 | |||||||
2,323,600 | |||||||||
Broadline Retail - 2.9% | |||||||||
Amazon.com, Inc.(a) | 8,000 | 1,755,120 | |||||||
Capital Markets - 1.7% | |||||||||
Intercontinental Exchange, Inc. | 7,000 | 1,043,070 | |||||||
Chemicals - 10.3% | |||||||||
Corteva, Inc. | 22,500 | 1,281,600 | |||||||
DuPont de Nemours, Inc. | 10,000 | 762,500 | |||||||
Ecolab, Inc. | 5,000 | 1,171,600 | |||||||
Linde PLC | 3,000 | 1,256,010 | |||||||
Sherwin-Williams Co. | 5,000 | 1,699,650 | |||||||
6,171,360 | |||||||||
Construction Materials - 1.7% | |||||||||
Martin Marietta Materials, Inc. | 2,000 | 1,033,000 | |||||||
Electronic Equipment, Instruments & Components - 5.3% | |||||||||
Teledyne Technologies, Inc.(a) | 3,000 | 1,392,390 | |||||||
Trimble, Inc.(a) | 25,000 | 1,766,500 | |||||||
3,158,890 | |||||||||
Financial Services - 1.7% | |||||||||
Fiserv, Inc.(a) | 5,000 | 1,027,100 | |||||||
Food Products - 1.7% | |||||||||
Kraft Heinz Co. | 32,500 | 998,075 | |||||||
Health Care Equipment & Supplies - 5.2% | |||||||||
Alcon AG | 13,500 | 1,146,015 | |||||||
Stryker Corp. | 5,500 | 1,980,275 | |||||||
3,126,290 | |||||||||
Independent Power and Renewable Electricity Producers - 1.7% | |||||||||
Clearway Energy, Inc. - Class C | 40,000 | 1,040,000 | |||||||
Interactive Media & Services - 4.9% | |||||||||
Alphabet, Inc. - Class A | 15,500 | 2,934,150 | |||||||
IT Services - 2.0% | |||||||||
Akamai Technologies, Inc.(a) | 12,500 | 1,195,625 | |||||||
Shares | Value | |||||
Machinery - 3.8% | ||||||
Chart Industries, Inc.(a) | 2,700 | $515,268 | ||||
IDEX Corp. | 5,300 | 1,109,237 | ||||
Illinois Tool Works Inc. | 2,500 | 633,900 | ||||
2,258,405 | ||||||
Marine Transportation - 2.5% | ||||||
Kirby Corp.(a) | 14,000 | 1,481,200 | ||||
Oil, Gas & Consumable Fuels - 8.6% | ||||||
Chevron Corp. | 6,500 | 941,460 | ||||
Devon Energy Corp. | 28,000 | 916,440 | ||||
Diamondback Energy Inc. | 5,000 | 819,150 | ||||
Expand Energy Corp. | 8,500 | 846,175 | ||||
Kinder Morgan, Inc. | 27,500 | 753,500 | ||||
Permian Resources Corp. | 60,000 | 862,800 | ||||
5,139,525 | ||||||
Pharmaceuticals - 2.7% | ||||||
Zoetis, Inc. | 10,000 | 1,629,300 | ||||
Professional Services - 4.8% | ||||||
Broadridge Financial Solutions, Inc. | 5,500 | 1,243,495 | ||||
Verisk Analytics, Inc. | 6,000 | 1,652,580 | ||||
2,896,075 | ||||||
Semiconductors & Semiconductor Equipment - 5.1% | ||||||
NVIDIA Corp. | 23,000 | 3,088,670 | ||||
Software - 14.9% | ||||||
Adobe, Inc.(a) | 3,700 | 1,645,316 | ||||
Microsoft Corp. | 6,500 | 2,739,750 | ||||
Oracle Corp. | 15,000 | 2,499,600 | ||||
Roper Technologies, Inc. | 4,000 | 2,079,400 | ||||
8,964,066 | ||||||
Specialty Retail - 5.2% | ||||||
Academy Sports & Outdoors, Inc. | 27,500 | 1,582,075 | ||||
Home Depot, Inc. | 4,000 | 1,555,960 | ||||
3,138,035 | ||||||
Technology Hardware, Storage & Peripherals - 3.7% | ||||||
Apple Inc. | 9,000 | 2,253,780 | ||||
Textiles, Apparel & Luxury Goods - 2.2% | ||||||
Ralph Lauren Corp. | 5,800 | 1,339,684 | ||||
TOTAL COMMON STOCKS (Cost $29,045,169) | 59,856,784 | |||||
1 |
Shares | Value | |||||
SHORT-TERM INVESTMENTS - 0.6% | ||||||
Money Market Funds - 0.6% | ||||||
Invesco Short-Term Investments Trust - Government & Agency Portfolio - Institutional Shares, 4.43%(b) | 344,011 | $344,011 | ||||
TOTAL SHORT-TERM INVESTMENTS (Cost $344,011) | 344,011 | |||||
TOTAL INVESTMENTS - 100.2% (Cost $29,389,180) | $60,200,795 | |||||
Liabilities in Excess of Other Assets - (0.2)% | (91,500) | |||||
TOTAL NET ASSETS - 100.0% | $60,109,295 | |||||
(a) | Non-income producing security. |
(b) | The rate shown represents the 7-day annualized effective yield as of December 31, 2024. |
2 |
ASSETS | |||
Investments, at value* | $60,200,795 | ||
Dividends and interest receivable | 40,899 | ||
Receivable for Fund shares sold | 3,476 | ||
Prepaid expenses and other assets | 10,253 | ||
Total assets | 60,255,423 | ||
Liabilities | |||
Payable for investment advisory fees | 82,190 | ||
Payable for distribution expense | 28,835 | ||
Payable for administrative fees | 6,324 | ||
Payable for accounting and transfer agent fees and expenses | 7,989 | ||
Payable for trustees’ fees and officer compensation (Note B) | 1,011 | ||
Payable for professional fees | 17,714 | ||
Payable for custody fees and expenses | 1,169 | ||
Payable for reports to shareholders | 871 | ||
Payable for Fund shares redeemed | 12 | ||
Accrued expenses and other liabilities | 13 | ||
Total liabilities | 146,128 | ||
Commitments and Contingencies (Note A) | | ||
Net assets | $60,109,295 | ||
Net assets consist of: | |||
Paid-in capital | $29,262,626 | ||
Total distributable earnings | 30,846,669 | ||
Net assets | $60,109,295 | ||
Shares of beneficial interest outstanding (unlimited shares of no par value authorized) | 3,417,390 | ||
Net asset value per share(offering and redemption price) | $17.59 | ||
* Cost of Investments | $29,389,180 | ||
3 |
Investment Income: | |||
Dividends* | $727,767 | ||
Interest | 46,124 | ||
Total investment income | 773,891 | ||
Expenses: | |||
Investment advisory fees (Note B) | 535,838 | ||
Administrative fees | 75,114 | ||
Accounting and transfer agent fees and expenses | 89,741 | ||
Distribution expense (Note B) | 59,538 | ||
Professional fees | 35,886 | ||
Trustees’ fees and officer compensation (Note B) | 30,886 | ||
Federal and state registration | 28,973 | ||
Custody fees and expenses | 8,140 | ||
Reports to shareholders | 6,060 | ||
Other | 2,262 | ||
Total expenses | 872,438 | ||
Less, expense waiver and/or reimbursement (Note B) | (277,064) | ||
Net expenses | 595,374 | ||
Net investment income (loss) | 178,517 | ||
Realized and Unrealized Gain (Loss): | |||
Net realized gain (loss) on: | |||
Investments | $4,380,108 | ||
Net change in unrealized appreciation (depreciation) on: | |||
Investments | 2,743,520 | ||
Net Realized and Unrealized Gain (Loss) | 7,123,628 | ||
Net Increase (Decrease) in Net Assets Resulting from Operations | $7,302,145 | ||
* Net of foreign taxes withheld and/or issuance fees | $1,249 | ||
4 |
Year Ended December 31, | ||||||
2024 | 2023 | |||||
Operations: | ||||||
Net investment income | $178,517 | $420,759 | ||||
Net realized gain | 4,380,108 | 1,138,747 | ||||
Net change in unrealized appreciation | 2,743,520 | 5,515,457 | ||||
Net increase in net assets resulting from operations | 7,302,145 | 7,074,963 | ||||
Net Dividends and Distributions to Shareholders: | ||||||
Investment income | (153,095) | (416,560) | ||||
Capital Gain Distribution | (4,272,939) | (1,078,666) | ||||
Net Dividends and Distributions to Shareholders | (4,426,034) | (1,495,226) | ||||
Net increase (decrease) in net assets from fund share transactions | (989,966) | 2,560,047 | ||||
Total increase in net assets | 1,886,145 | 8,139,784 | ||||
NET ASSETS: | ||||||
Beginning of period | 58,223,150 | 50,083,366 | ||||
End of period | $ 60,109,295 | $58,223,150 | ||||
5 |
Year Ended December 31 | |||||||||||||||
2024 | 2023 | 2022 | 2021 | 2020 | |||||||||||
Net asset value, beginning of period | $16.73 | $15.05 | $19.52 | $17.53 | $15.06 | ||||||||||
Income (loss) from investment operations: | |||||||||||||||
Net investment income (loss) | 0.05(1) | 0.12(1) | 0.17(1) | 0.05(1) | 0.06(1) | ||||||||||
Net realized and unrealized gains (losses) | 2.20 | 2.00 | (3.72) | 4.40 | 3.59 | ||||||||||
Total from investment operations | 2.25 | 2.12 | (3.55) | 4.45 | 3.65 | ||||||||||
Less distributions: | |||||||||||||||
From net investment income | (0.05) | (0.12) | (0.18) | (0.05) | (0.06) | ||||||||||
From realized capital gains | (1.34) | (0.32) | (0.74) | (2.41) | (1.12) | ||||||||||
Total distributions | (1.39) | (0.44) | (0.92) | (2.46) | (1.18) | ||||||||||
Redemption fees | 0.00(2) | 0.00(2) | — | — | — | ||||||||||
Net asset value, end of period | $17.59 | $16.73 | $15.05 | $19.52 | $17.53 | ||||||||||
Total return | 13.37% | 14.07% | −18.17% | 25.34% | 24.28% | ||||||||||
Ratios and Supplemental Data: | |||||||||||||||
Net assets, end of period ($000’s) | $60,109 | $58,223 | $50,083 | $63,916 | $53,862 | ||||||||||
Ratio of expenses to average net assets: | |||||||||||||||
Before expense waiver and/or reimbursement | 1.47% | 1.53% | 1.45% | 1.40% | 1.48% | ||||||||||
After expense waiver and/or reimbursement | 1.00% | 1.00% | 1.00% | 1.00% | 1.00% | ||||||||||
Ratio of net investment income (loss) to average net assets: | |||||||||||||||
Before expense waiver and/or reimbursement | (0.17)% | 0.24% | 0.57% | (0.15)% | (0.12)% | ||||||||||
After expense waiver and/or reimbursement | 0.30% | 0.77% | 1.02% | 0.25% | 0.36% | ||||||||||
Portfolio turnover rate | 11% | 16% | 23% | 18% | 17% | ||||||||||
(1) | Net investment income (loss) per share represents net investment loss divided by the average shares outstanding throughout the period. |
(2) | Amount rounds to less than $0.005 per share. |
6 |
| 1. | Security Valuation: Equity securities listed or traded on a U.S. securities exchange for which market quotations are readily available are valued at the last quoted sale price on the exchange on which the security is primarily traded. Nasdaq Global Market securities are valued at the Nasdaq Official Closing Price (“NOCP”). Unlisted U.S. equity securities and listed U.S. equity securities not traded on a particular valuation date are valued at the mean of the most recent quoted bid and ask price on the relevant exchanges or markets. Equity securities listed on a foreign exchange for which market quotations are readily available are valued at the last quoted sales price on the exchange on which the security is primarily traded. Debt securities are normally valued at the mean of the closing bid and ask price and/or by using a combination of broker quotations or evaluated prices provided by an independent pricing service. Futures contracts and options on futures contracts are valued at the settlement prices established each day on the principal exchange on which they are traded. Forward contracts are valued based on the forward rate using information provided by an independent pricing service. Other assets and securities for which no market or broker quotations or evaluated prices are readily available are valued by the Adviser in good faith at fair value. Rule 2a-5 under the Investment Company Act of 1940 (the “Valuation Rule”) establishes requirements for determining fair value in good faith for purposes of the 1940 Act, including related oversight and reporting requirements. The Valuation Rule also defines when market quotations are “readily available” for purposes of the 1940 Act, the threshold for determining whether a security must be fair valued. In many cases, fixed-income and foreign securities are not considered to have a “readily available market quotation” under the Valuation Rule. Accordingly, such securities typically are fair valued. The Valuation Rule permits the Fund’s board to designate the Fund’s primary investment adviser as “valuation designee” to perform the Fund’s fair value determinations subject to board oversight and certain reporting and other requirements intended to ensure that the registered investment company’s board receives the information it needs to oversee the investment adviser’s fair value determinations. The Board has designated the Adviser as valuation designee under the |
7 |
| Level 1 – | Quoted unadjusted prices for identical instruments in active markets to which the Trust has access at the date of measurement. |
| Level 2 – | Quoted prices for similar instruments in active markets; quoted prices for identical or similar instruments in markets that are not active; and model-derived valuations in which all significant inputs and significant value drivers are observable in active markets. Level 2 inputs are those in markets for which there are few transactions, the prices are not current, little public information exists or instances where prices vary substantially over time or among brokered market makers. |
| Level 3 – | Model derived valuations in which one or more significant inputs or significant value drivers are unobservable. Unobservable inputs are those inputs that reflect the Trust’s own assumptions that market participants would use to price the asset or liability based on the best available information. |
Description | Level 1 | Level 2 | Level 3 | Total | ||||||||
Common Stocks | $59,856,784 | $ — | $ — | $59,856,784 | ||||||||
Short-Term Investment | 344,011 | — | — | 344,011 | ||||||||
Total Investments* | $60,200,795 | $— | $— | $60,200,795 | ||||||||
| * | Additional information regarding the industry classifications of these investments is disclosed in the Schedule of Investments. |
| 2. | Federal Income Taxes: The Fund has elected to be treated as a “regulated investment company” under Subchapter M of the Internal Revenue Code and the Fund intends to distribute all of its investment company net taxable income and net capital gains to shareholders. Therefore, no federal income tax provision is recorded. |
| 3. | Distributions to Shareholders: The Fund generally intends to declare and pay income dividends and distribute net capital gain, if any, at least on an annual basis. |
| 4. | Foreign Securities: Investing in securities of foreign companies and foreign governments involves special risks and considerations not typically associated with investing in securities of U.S. issuers. These risks |
8 |
| 5. | Expense Allocation: Expenses incurred by the Funds in the Trust are allocated among the Funds based upon (i) relative average net assets, (ii) a specific identification basis as incurred, or (iii) evenly among the Funds, depending on the nature of the expense. |
| 6. | Use of Estimates: The preparation of financial statements in conformity with accounting principles generally accepted in the United States of America requires management to make estimates and assumptions that affect the reported amounts of assets and liabilities and disclosure of contingent assets and liabilities at the date of the financial statements and the reported amounts of revenues and expenses during the reporting period. Actual results could differ from those estimates. |
| 7. | Guarantees and Indemnifications: In the normal course of business, the Fund enters into contracts with service providers that contain general indemnification clauses. The Fund’s maximum exposure under these arrangements is unknown as this would involve future claims against the Fund that have not yet occurred. Based on experience, the Fund expects the risk of loss to be remote. |
| 8. | Security Transactions and Investment Income: Security and shareholder transactions are recorded on the trade date. Realized gains and losses on sales of investments are calculated on the identified cost basis. Dividend income and dividends and distributions to shareholders are recorded on the ex-dividend date. Withholding taxes on foreign dividends have been provided for in accordance with the Fund’s understanding of the applicable jurisdiction’s tax rules and rates. Interest income is recognized on the accrual basis. All discounts and premiums are amortized based on the effective interest method for tax and financial reporting purposes. The Fund may hold the securities of real estate investment trusts (“REITs”). Distributions from such investments may include income, capital gains and return of capital. |
| 9. | Other: Distributions from net investment income and realized capital gains are determined in accordance with income tax regulations, which may differ from U.S. GAAP. Certain capital accounts in the consolidated financial statements are periodically adjusted for permanent differences in order to reflect their tax character. These permanent differences are primarily due to the varying treatment of income and gain/loss on portfolio securities held by the Fund and have no impact on net assets or NAV per share. |
Paid-in capital | $101,595 | ||
Total distributable earnings | (101,595) | ||
| 10. | Restricted and Illiquid Securities: The Fund is permitted to invest in securities that are subject to legal or contractual restrictions on resale including investments considered by the Fund to be illiquid. Restricted securities generally may be resold in transactions exempt from registration. Illiquid investments are investments that the Fund reasonably expects cannot be sold or disposed of in current market conditions within seven calendar days or less in the ordinary course of business without the sale or disposition significantly changing the market value of the investment. A security may be considered illiquid if it lacks a readily available market or if its valuation has not changed for a certain period of time. Disposal of these securities may involve time-consuming negotiations and expense, and prompt sale at the current valuation may be difficult. |
| 11. | Segment Reporting: During the reporting period, the Funds adopted FASB Accounting Standards Update 2023-07, Segment Reporting (Topic 280) - Improvements to Reportable Segment Disclosures (“ASU 2023-07”). Adoption of the new standard impacted financial statement disclosures only and did not affect each Fund’s financial position or the results of its operations. An operating segment is defined in Topic 280 as a component of a public entity that engages in business activities from which it may recognize revenues and incur expenses, has operating results that are regularly reviewed by the public entity’s chief |
9 |
LKCM Aquinas Catholic Equity Fund | |||
Annual Management Fee Rate | 0.90% | ||
Annual Cap on Expenses | 1.00% | ||
Fees Waived and/or Expenses Reimbursed in 2024 | $277,064 | ||
10 |
Year Ended December 31, 2024 | Year Ended December 31, 2023 | |||||||||||
Shares | Amount | Shares | Amount | |||||||||
Shares sold | 94,402 | $1,689,787 | 435,470 | $6,902,249 | ||||||||
Shares issued to shareholders in reinvestment of distributions | 233,056 | 4,136,741 | 81,975 | 1,375,552 | ||||||||
Shares redeemed | (390,153) | (6,816,546) | (365,131) | (5,718,058) | ||||||||
Redemption fee | 52 | 304 | ||||||||||
Net increase (decrease) | (62,695) | $(989,966) | 152,314 | $2,560,047 | ||||||||
Shares Outstanding: | ||||||||||||
Beginning of period | 3,480,085 | 3,327,771 | ||||||||||
End of period | 3,417,390 | 3,480,085 | ||||||||||
Purchases | Sales | ||||||||
U.S. Government | Other | U.S. Government | Other | ||||||
$ — | $6,314,253 | $ — | $10,667,705 | ||||||
Tax cost | $29,389,180 | ||
Gross unrealized appreciation | $31,215,615 | ||
Gross unrealized depreciation | (404,000) | ||
Net unrealized appreciation | $30,811,615 | ||
Undistributed ordinary income | 35,054 | ||
Undistributed long-term capital gain | — | ||
Distributable earnings | $35,054 | ||
Other accumulated losses | — | ||
Total distributable earnings | $30,846,669 | ||
11 |
Year Ended December 31, 2024 | Year Ended December 31, 2023 | |||||||||||
Ordinary Income | Long-Term Capital Gains | Ordinary Income | Long-Term Capital Gains | |||||||||
LKCM Aquinas Catholic Equity Fund | $153,095 | $4,272,939 | $416,560 | $1,078,666 | ||||||||
12 |

13 |
14 |
15 |
| (b) | Financial Highlights are included within the financial statements filed under Item 7 of this Form N-CSR. |
Item 8. Changes in and Disagreements with Accountants for Open-End Investment Companies.
There were no changes in or disagreements with accountants during the period covered by this report.
Item 9. Proxy Disclosure for Open-End Investment Companies.
There were no matters submitted to a vote of shareholders during the period covered by this report.
Item 10. Remuneration Paid to Directors, Officers, and Others of Open-End Investment Companies.
Information regarding remuneration paid by the Registrant to its directors, officers and affiliated persons is included in the financial statements filed under Item 7 of this Form N-CSR.
Item 11. Statement Regarding Basis for Approval of Investment Advisory Contract.
Not applicable.
Item 12. Disclosure of Proxy Voting Policies and Procedures for Closed-End Management Investment Companies.
Not applicable.
Item 13. Portfolio Managers of Closed-End Management Investment Companies.
Not applicable.
Item 14. Purchases of Equity Securities by Closed-End Management Investment Company and Affiliated Purchasers.
Not applicable.
Item 15. Submission of Matters to a Vote of Security Holders.
There have been no material changes to the procedures by which shareholders may recommend nominees to the Registrant’s board of trustees.
Item 16. Controls and Procedures.
| (a) | The Registrant’s Principal Executive Officer and Principal Financial Officer have reviewed the Registrant’s disclosure controls and procedures (as defined in Rule 30a-3(c) under the Investment Company Act of 1940 (the “Act”)) as of a date within 90 days of the filing of this report, as required by Rule 30a-3(b) under the Act and Rules 13a-15(b) or 15d-15(b) under the Securities Exchange Act of 1934. Based on their review, such officers have concluded that the disclosure controls and procedures are effective in ensuring that information required to be disclosed in this report is appropriately recorded, processed, summarized and reported and made known to them by others within the Registrant and by the Registrant’s service provider. |
| (b) | There were no changes in the Registrant’s internal control over financial reporting (as defined in Rule 30a-3(d) under the Act) that occurred during the period covered by this report that have materially affected, or are reasonably likely to materially affect, the Registrant’s internal control over financial reporting. |
Item 17. Disclosure of Securities Lending Activities for Closed-End Management Investment Companies
Not applicable.
Item 18. Recovery of Erroneously Awarded Compensation.
Not applicable
Item 19. Exhibits.
(2) Any policy required by the listing standards adopted pursuant to Rule 10D-1 under the Exchange Act (17 CFR 240.10D-1) by the registered national securities exchange or registered national securities association upon which the registrant’s securities are listed. Not applicable.
(4) Any written solicitation to purchase securities under Rule 23c-1 under the Act sent or given during the period covered by the report by or on behalf of the registrant to 10 or more persons. Not applicable.
| (5) | Change in the registrant’s independent public accountant. Provide the information called for by Item 4 of Form 8-K under the Exchange Act (17 CFR 249.308). Unless otherwise specified by Item 4, or related to and necessary for a complete understanding of information not previously disclosed, the information should relate to events occurring during the reporting period. Not applicable. |
| (b) | Certifications pursuant to Section 906 of the Sarbanes-Oxley Act of 2002. The certifications pursuant to Section 906 of the Sarbanes-Oxley Act of 2002 are furnished herewith as EX.99.906CERT. |
SIGNATURES
Pursuant to the requirements of the Securities Exchange Act of 1934, as amended, and the Investment Company Act of 1940, as amended, the Registrant has duly caused this report to be signed on its behalf by the undersigned, thereunto duly authorized.
| LKCM Funds | ||
| By | /s/ J. Luther King, Jr. | |
| J. Luther King, Jr., | ||
| President / Principal Executive Officer | ||
| Date | 2/25/2025 |
Pursuant to the requirements of the Securities Exchange Act of 1934, as amended, and the Investment Company Act of 1940, as amended, this report has been signed below by the following persons on behalf of the Registrant and in the capacities and on the dates indicated.
| By | /s/ J. Luther King, Jr. | |
| J. Luther King, Jr., | ||
| President / Principal Executive Officer |
| Date | 2/25/2025 |
| By | /s/ Jacob D. Smith | |
| Jacob D. Smith, | ||
| Chief Financial Officer / Principal Financial Officer |
| Date | 2/25/2025 |