As filed with the Securities and Exchange Commission on July 7th, 2016
UNITED STATES
SECURITIES AND EXCHANGE COMMISSION
Washington, D.C. 20549
FORM N-CSR
CERTIFIED SHAREHOLDER REPORT OF REGISTERED
MANAGEMENT INVESTMENT COMPANIES
Investment Company Act file number 811-08348
LORD ASSET MANAGEMENT TRUST
(Exact name of Registrant as specified in charter)
440 South LaSalle Street
Chicago, Illinois 60605-1028
(Address of principal executive offices) (Zip code)
Thomas S. White, Jr.
Thomas White International, Ltd.
440 South LaSalle Street
Chicago, Illinois 60605-1028
(Name and address of agent for service)
(312) 663-8300
Registrant’s telephone number, including area code
Date of fiscal year end: 10/31
Date of reporting period: 11/1/2015-4/30/2016
Item 1. Reports to Stockholders.


SEMI-ANNUAL REPORT
APRIL 30, 2016
THE INTERNATIONAL FUND
THE EMERGING MARKETS FUND
THE AMERICAN OPPORTUNITIES FUND

The world economy is continuously evolving in ways we could have hardly imagined even a few years earlier. At Thomas White, we always ask ourselves “What is the big picture?” In other words, we always try to analyze local or regional trends from a broader global context.
We invite you to visit our websites as well as our YouTube channel for added insights into the transformative changes that make global investing more complex, but at the same time open up fascinating prospects for those who have the ability to spot them, and the discipline to focus on long-term trends.

President, Thomas White Funds
| | |
| |

| | thomaswhite.com The Thomas White website offers a panorama of the trends, economic indicators and policy changes occurring in the world economy that are of interest to global investors. |
| |

| | thomaswhitefunds.com The Thomas White Funds website provides important information on our three fund offerings, including performance, rankings, and commentaries. |
| |

| | thenewglobal.com Our New Global website is a highly informative resource for investors and their advisors, offering an in-depth understanding of the dramatic changes and trends in the world economy from a broader global context. |
| |

| | youtube.com/user/ThomasWhiteIntl Our YouTube channel features videos with CIO Thomas S. White, Jr. and his take on evolving global market trends. |
Thomas White: Empowering the InvestorSM
(This page is not part of the Semi-Annual Report.)

CONTENTS
Message to Shareholders
Dear Shareholders and Friends,
I wish to welcome our new shareholders and thank all shareholders for the confidence you have placed in the Thomas White Funds. I appreciate you selecting the Thomas White Funds to help achieve your long term investment goals, given that available investment options are numerous and expanding.
As our current shareholders know very well, we at Thomas White do not base our portfolio decisions on short-term macroeconomic trends that are unpredictable and often misleading. Instead, we prefer to identify well-run corporations whose managements are continuously adjusting their strategies, and trying out new ones, to expand earnings and build shareholder wealth. Even when the economic environment is uncertain, as it is now, better managed corporations with good balance sheets are often able to find opportunities to limit short-term damage and position for faster growth in the future. We are well-equipped to analyze how corporations respond to economic and competitive stimuli, and make a subjective assessment of how effective their responses would be in sustaining future earnings growth. Our team of portfolio managers and research analysts continues to work diligently to identify these corporations that are also attractively valued. We are confident that this approach will help us deliver improved long-term returns for the Funds’ shareholders.
Quantitative Easing Has Become Less Effective in Stimulating Growth
One of the major economic developments in recent months is the introduction of negative interest rates in the Euro-zone and Japan. It is true that the quantitative easing policies by the world’s central banks after the 2008 global financial crisis helped stabilize the major developed economies, and facilitated the recovery. However, the rates of growth across all these economies in recent years have been below their historical averages. It appears that quantitative easing has gradually become less effective, when compared to the early stages of the recovery. Hence it is possible that the most recent measures could be ineffective in producing accelerated growth rates.
The aggregate value of sovereign debt with negative yields has increased appreciably after the policy decisions by the European Central Bank and the Bank of Japan, pushing down the average yield of the global sovereign debt market to all-time lows. Some of the large global corporations are now able to issue debt at almost no cost. While this is good for the corporations, such low rates for an extended period are bound to change savings and consumption trends. It is uncertain what these changes would mean to the financial markets, and investment returns, in the future.
In the short term, negative rates could hurt the margins of the banking industry, especially when credit demand is only
| | | | |
| www.thomaswhitefunds.com | | | 1 | |
expanding at a modest rate. Banks in Europe have not yet started charging their retail customers for deposits. If interest rates on deposits with the central bank move deeper into the negative, it is possible that banks would struggle to attract deposits from retail customers. This could limit credit availability and reduce the effectiveness of monetary policy even further.
Political Risks and Uncertainties Could Limit Europe’s Recovery
First quarter growth in some of the Eurozone’s largest economies was modestly above expectations, despite the weakness in exports caused by slow global demand and the stronger currency. Consumers in Europe appear to be fairly optimistic and their spending has supported the region’s economy recently. However, the expansion is much slower than previous economic recoveries. Businesses are not investing in new capacities, even when borrowing costs are at record lows, as they do not appear confident about demand growth. Governments in the region have also not increased their fiscal spending to boost domestic demand.
The risk of Britain exiting the European Union in a referendum scheduled for the last week of June has also weakened the region’s economic climate. Some opinion polls suggest that the campaign to leave the EU has gained more support. If Britain decides to leave the EU, we would expect short-term volatility in the financial and currency markets. We also expect companies in the Eurozone and the U.K. to react to a possible ‘Brexit’ mostly by reducing their future capital investments in Britain.
Japan Needs More Fiscal Policy Measures
The Japanese economy continues to underperform as the monetary measures by the Bank of Japan have not been effective enough to lift growth and inflation. Several Japanese companies have increased their share buy backs and dividend payments, after the new policies were launched by Prime Minister Abe in 2014. However, wage growth remains slower than the government’s expectations. This has limited consumer spending and yet again forced the government to delay the second round of retail tax increases. The government needs to boost tax revenues to service Japan’s aggregate debt levels that appear unsustainably high.
To revive economic growth and place it on a sustainable path, the Japanese government needs to implement reforms that were promised earlier. Streamlining the country’s tax laws and making the labor market more flexible could attract more investments, improve wage growth and boost domestic demand.
Our Portfolio Strategy
We are confident that our analysts are able to find attractive investment opportunities, even in a low growth environment. For the Thomas White International Fund, we invest in major markets all over the world, diversifying the holdings across regions and sectors. This approach controls exposure to geopolitical and economic risks in a region or country in a manner that does not require frequent adjustments to the holdings. The broader universe of companies also provides us more opportunities to identify companies we believe are well positioned to survive this
| | |
| 2 | | www.thomaswhitefunds.com |
period of slow growth, and thrive during an economic upswing.
At Thomas White, we continuously review and evaluate our portfolio strategies based on our investment performance and the evolving global industry trends. We believe this disciplined process is essential to achieve sustained long-term returns, and also to strengthen the capabilities of our team of portfolio managers and investment analysts.
I look forward to a long association as shareholders and assure you that our professionals remain committed to improving the Fund’s long-term performance. You are invited to visit our websites www.thomaswhitefunds.com, www.thomaswhite.com, and www.thenewglobal.com, for our thoughts on current global market trends.

Thomas S. White, Jr.
Chairman
Thomas White Funds
Chief Investment Officer
Thomas White International
| | | | |
| www.thomaswhitefunds.com | | | 3 | |
Past performance is not a guarantee of future results.
Opinions expressed are subject to change, are not guaranteed and should not be considered recommendations to buy or sell any security.
Must be preceded or accompanied by a prospectus.
Mutual fund investing involves risk. Principal loss is possible. Investing in international markets may involve additional risks such as social and political instability, market illiquidity, exchange-rate fluctuations, a high level of volatility and limited regulation. These risks are greater for emerging markets. Investing in small and mid-cap companies can involve more risk than investing in larger companies.
Diversification does not assure a profit nor protect against loss in a declining market.
Earnings growth for a Fund holding does not guarantee a corresponding increase in the market value of the holding of the Fund.
The Thomas White Funds are distributed by Quasar Distributors, LLC.
It is not possible to invest directly in an index.
| | |
| 4 | | www.thomaswhitefunds.com |
THE WORLD HAS CHANGED
The number of stocks in the world has surged 132% since the end of the Cold War in 1989. As of April 2016, America’s 5,227 exchange-traded stocks now only represent 10.14% of the 51,538 stocks on the world’s 80 exchanges.1
| | | | | | | | | | | | |
| The Growth of World Stock Markets: Regional Weights |
| 1960 to April 30, 20162 | | 1960 | | 1970 | | 1980 | | 1990 | | 2000 | | 2016 |
| Developed Markets | | 99.9% | | 99.8% | | 99.2% | | 97% | | 96% | | 90% |
| | | | | | | |
United States | | 72% | | 66% | | 57% | | 43% | | 51% | | 53% |
| | | | | | | |
Canada | | 3% | | 3% | | 3% | | 2% | | 2% | | 3% |
| | | | | | | |
Europe | | 22% | | 23% | | 23% | | 25% | | 28% | | 22% |
| | | | | | | |
Asia Pacific | | 3% | | 8% | | 16% | | 27% | | 15% | | 12% |
| | | | | | | |
| Emerging Markets | | 0.1% | | 0.2% | | 0.8% | | 3% | | 4% | | 10% |
| The World Market | | 100% | | 100% | | 100% | | 100% | | 100% | | 100% |
Market Value
($ trillions) | | $0.5 | | $2.0 | | $4.1 | | $8.2 | | $26.9 | | $44.5 |
1World Federation of Exchanges, Focus-April 2016
2Source: Thomas White International (Data for 1960-2000); MSCI (Data for 2016)
Globalization has spurred growth in every region of the world. International stocks now represent over half of the total world stock market value, including, for example, Sony, Nokia, Toyota, BMW, L’Oreal, Unilever, Heineken, Volvo, Nestle, UBS, Volkswagen, Honda and Royal Dutch Shell. Emerging market companies include Samsung, LG and Hyundai.
Given their quality, diversity and long- term growth potential, it only makes common sense that investors search for opportunities worldwide. The Thomas
White American Opportunities, International and Emerging Markets Funds are managed by the same portfolio managers and analysts who adhere to an identical valuation-oriented investment style. The three portfolios complement one another in that, when combined, they seek to have the profile of the MSCI All Country World Index.
Shareholders who want to adopt a global investment strategy for their savings and investment program should consider owning all three Thomas White Funds.
Fund holdings are subject to change and should not be considered a recommendation to buy or sell any securities. For a complete list of Fund holdings, please refer to the Investment Portfolio section of this report.
| | | | |
| www.thomaswhitefunds.com | | | 5 | |
THOMAS WHITE INTERNATIONAL FUND
| | | | | | | | | | | | | | |
| | | | | | | | |
| | | Unaudited
Sales
Charge | | Deferred
Sales
Charge | | Administrative
Services Fee | | 12b-1 Fees | | Operating
Expenses1,3 | | Prospectus
Gross
Annual
Operating
Expense2 | | Prospectus
Net Annual
Operating
Expense2,3 |
| Investor Class | | None | | None | | Up to 0.25% | | None | | 1.24% | | 1.32% | | 1.24% |
| Class I | | None | | None | | None | | None | | 0.99% | | 1.08% | | 0.99% |
| Class A | | 5.75% | | None | | Up to 0.25% | | 0.25% | | 1.43% | | 1.42% | | 1.42% |
| Class C | | None | | 1.00% within 12 months | | None | | 1.00% | | 1.99% | | 2.08% | | 1.99% |
1 In the absence of the fee deferral/expense reimbursement arrangement for the International Fund, the ratio of expenses to average net assets would have been 1.34% for Investor Class shares, 1.11% for Class I shares, 1.43% for Class A shares and 2.11% for Class C shares.
2 Gross Annual Operating Expense and Net Annual Operating Expense are based on the most recent prospectus and may differ from other expense ratios appearing in this report.
3 Thomas White International, Ltd. (“Advisor”) has agreed to defer its fees and/or reimburse the Fund to the extent that the operating expenses for Investor Class, Class I, Class A and Class C shares exceed (as a percentage of average daily net assets) 1.24%, 0.99%, 1.49% and 1.99%, respectively. The fee deferral/expense reimbursement agreement expires February 28, 2017. The Fund has agreed to repay the Advisor for amounts deferred or reimbursed by the Advisor pursuant to the agreement provided that such repayment does not cause the Fund to exceed the above limits and the repayment is made within three years after the year in which the Advisor incurred the expense. The fee deferral/expense reimbursement agreement may only be amended or terminated by the Fund’s Board of Trustees.
| | | | | | | | |
| | | | | |
| | | NAV | | Net Assets | | Redemption Fee | | Portfolio Turnover |
| Investor Class | | $15.01 | | $203.2 million | | 2.00% within 60 days | | 28% |
| Class I | | $15.05 | | $370.5 million | | |
| Class A | | $14.94 | | $844.9 thousand | | |
| Class C | | $14.92 | | $259.4 thousand | | |
| | |
| 6 | | www.thomaswhitefunds.com |
| | | | | | | | | | | | | | | | | | | | | | | | | | | | | | | | |
| |
| Average Annual Returns as of April 30, 2016 (Unaudited) | |
| Class | | Sales Charge | | | | 6 month | | | Calendar YTD | | | 1 Yr | | | 3 Yrs | | | 5 Yrs | | | 10 Yrs | | | Since
Inception (6/28/1994)* | |
| Investor Class shares (TWWDX) | | None | | | | | -4.82% | | | | -2.47% | | | | -11.82% | | | | -3.37% | | | | -1.25% | | | | 1.10% | | | | 6.54% | |
| Class I shares1 (TWWIX) | | None | | | | | -4.63% | | | | -2.34% | | | | -11.55% | | | | -3.11% | | | | -1.05% | | | | 1.20% | | | | 6.59% | |
| Class A shares2 (TWWAX) | | Maximum 5.75% initial sales charge | | With sales charge | | | -10.38% | | | | -8.17% | | | | -17.02% | | | | -5.42% | | | | -2.51% | | | | 0.45% | | | | 6.23% | |
| | | | | Excluding sales charge | | | -4.90% | | | | -2.54% | | | | -11.95% | | | | -3.53% | | | | -1.35% | | | | 1.05% | | | | 6.52% | |
| Class C shares3 (TWWCX) | | Maximum 1% deferred sales charge | | With sales charge | | | -6.09% | | | | -3.67% | | | | -13.43% | | | | -4.04% | | | | -1.75% | | | | 0.84% | | | | 6.42% | |
| | | | | Excluding sales charge | | | -5.09% | | | | -2.67% | | | | -12.43% | | | | -4.04% | | | | -1.75% | | | | 0.84% | | | | 6.42% | |
| MSCI All Country World ex US Index4 | | N/A | | | | | -1.75% | | | | 2.25% | | | | -11.28% | | | | -0.02% | | | | -0.13% | | | | 1.70% | | | | 4.80% | |
* The inception date of the Investor Class shares.
1 Performance figures for Class I shares, first offered on August 31, 2012, include the historical performance of Investor Class shares through August 30, 2012.
2 Performance figures for Class A shares, first offered on August 31, 2012, include the historical performance of Investor Class shares through August 30, 2012.
3 Performance figures for Class C shares, first offered on August 31, 2012, include the historical performance of Investor Class shares through August 30, 2012.
4 The MSCI All Country World ex US Index is a free float-adjusted market capitalization-weighted index of both developed and emerging markets. The index is unmanaged and returns assume the reinvestment of dividends. It is not possible to invest directly in an index.
Returns of each share class reflect differences in sales charges and expenses applicable to each class which are primarily differences in distribution and service fees.
The returns do not reflect the deduction of taxes that a shareholder would pay on Fund distributions or the redemption of Fund shares. The returns reflect the actual performance for each period and do not include the impacts of trades executed on the last business day of the period that were recorded on the first business day of the next period.
Performance data is based upon past performance, which is no guarantee of future results. The investment return and principal value of an investment will fluctuate so that an investor’s shares, when redeemed, may be worth more or less than their original cost. Current performance may be higher or lower than the performance data quoted. Please call 1-800-811-0535 to obtain performance data as of the most recent month-end. The Fund imposes a 2% redemption fee on shares held less than 60 days. Performance data does not reflect the redemption fee. If reflected, total returns would be lower. Investment performance reflects any fee waivers that were in effect. In the absence of such waivers, total return would have been reduced. The Gross Expense Ratios, based on the most recent prospectus, are 1.32% (Investor Class), 1.08% (Class I), 1.42% (Class A) and 2.08% (Class C).
| | | | |
| www.thomaswhitefunds.com | | | 7 | |
THOMAS WHITE INTERNATIONAL FUND
GROWTH OF A $10,000 INVESTMENT WITH DIVIDENDS REINVESTED (Unaudited)
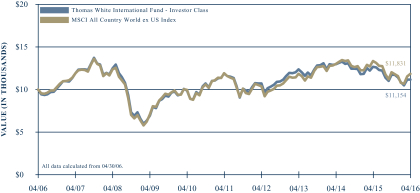
This chart illustrates the performance of a hypothetical $10,000 investment made in the Fund’s Investor Class shares and its benchmark, the MSCI All Country World ex US Index, for the past 10 years through April 30, 2016. It assumes reinvestment of dividends and capital gains, but does not reflect the effect of any applicable redemption fees. This chart does not imply future performance. Past performance does not guarantee future results. The cumulative ten year return was +11.54% for the Fund’s Investor Class shares and +18.31% for the benchmark. The Fund’s Investor Class shares average annual total return since inception on June 28, 1994 was 6.54%. The MSCI All Country World ex US Index is a free float-adjusted market capitalization-weighted index of both developed and emerging markets. The index is unmanaged and returns assume the reinvestment of dividends. It is not possible to invest directly in an index. During the periods shown, the Fund’s manager reimbursed certain Fund expenses. Absent this reimbursement, performance would have been lower. Performance will vary from class to class based on differences in class-specific expenses and sales charges.
| | |
| 8 | | www.thomaswhitefunds.com |
APRIL 30, 2016
The Thomas White International Fund primarily invests in equity securities of companies located in the world’s developed countries outside of the U.S. There may also be portion of the Fund’s assets invested in companies from emerging market countries.
Portfolio Managers
Thomas S. White, Jr.
Jinwen Zhang, Ph.D., CFA
Douglas M. Jackman, CFA
Wei Li, Ph.D., CFA
John Wu, Ph.D., CFA
Rishabh Halakhandi, CFA
Ramkumar Venkatramani, CFA
Performance Review
The Thomas White International Fund Investor Class shares returned -4.82% for the six-month period ended April 30, 2016, compared to -1.75% for the benchmark MSCI All Country World ex-U.S. Index. Since its inception on June 28, 1994, the Fund’s Investor Class shares have returned +6.54% annualized while the benchmark index returned +4.80% for the same period.
Uncertain Growth Outlook and Central Bank Policy Direction Create Volatility
International equity prices were volatile during the six-month review period as concerns about slower global growth and the effectiveness of central bank policies made investors cautious. Weaker than expected U.S. economic growth trends and fears of a further slowdown in China clouded the global economic outlook at the beginning of this year. As energy and commodity prices weakened again, most equity markets dipped
sharply on concerns about reduced capital investments and the potential rise in debt defaults. Nevertheless, equity prices recovered swiftly in the subsequent months after the European Central Bank expanded its quantitative easing and the U.S. Federal Reserve indicated that rate hikes this year could be fewer than expected. Prices of crude oil and most industrial commodities bounced back, helping equity markets in resource exporting countries outperform.
Growth in global trade volumes remained subdued during the review period, hurt by lower demand for commodities. Export volume growth has also been weak for most countries in Asia, Europe and Latin America, as increased currency volatility has made the global trade outlook more uncertain. Global industrial output growth also slowed during the review period as a result, though global services activity, which is generally driven more by domestic demand, remained relatively healthy. Despite the recent rebound in oil and commodity prices, inflation trends continue to be benign in most major economies. Corporate earnings growth has been stable, except in sectors such as energy and materials. Mergers and acquisitions activity slowed during the first quarter due to market volatility and increased political opposition to corporate deals structured to lower taxes, but is now seeing a revival.
Portfolio Review
During the six-month review period, the International Fund underperformed its benchmark due to weak stock selection in Asia and Europe as well as lower exposure to emerging markets. The Fund had higher exposure to developed markets in Europe,
| | | | |
| www.thomaswhitefunds.com | | | 9 | |
THOMAS WHITE INTERNATIONAL FUND
53.9% average weight for the period, compared to 47.2% for the benchmark, which declined and detracted from returns. Lower exposure to emerging markets, 15.6% compared to 20.9% for the benchmark, also negatively affected the Fund’s relative returns. Stock selection was positive in Japan as well as certain emerging markets in Asia, but the gains were offset by a weak selection effect in other regions. From a sector perspective, positive stock selection in consumer discretionary, consumer staples and utilities was insufficient to erase weak selection in financials, industrials and healthcare.
Japanese drug store and discount retailer Sundrug Co. Ltd. was the biggest contributor to Fund returns during the review period after its earnings for the last quarter of 2015 exceeded expectations and the company maintained its guidance. Sundrug continues to benefit from healthy same store sales gains and higher operating margins achieved through cost cuts. Japan Tobacco Inc. advanced as the company continues to see healthy volume growth for its flagship global brands and profit margin expansion in the Japanese domestic market. Japanese telecom operator Nippon Telegraph & Telephone gained from expectations of stable earnings growth, as well as higher dividends and share buybacks. Better than expected revenue and earnings growth helped Danish jewelry retailer Pandora A/S during the review period. Pandora has successfully expanded into additional overseas markets recently, which has helped the company sustain revenue growth. German construction group Hochtief AG benefited from the strong housing demand
outlook in the country, as the government said 350,000 new homes need to be built every year for the growing number of immigrants.
The Fund’s Japanese and European financial holdings detracted from returns for the review period on concerns of slowing revenue growth in major businesses as well as weaker margins. They included Mitsubishi UFJ Financial Group as well as Nomura Holdings, which was also impacted by higher than expected losses in its overseas business. In Europe, Italian bank Intesa Sanpaolo declined as credit demand remained weak in the region. European biopharmaceuticals manufacturer UCB SA underperformed on concerns that growing competition from biosimilar products could erode margins. However, UCB reported better than expected revenue and earnings growth for the 2015 fiscal year. CK Hutchison Holdings, an industrial conglomerate based in Hong Kong, declined on concerns over slower earnings growth in its telecom businesses while its ports business continues to be hurt by weak global trade volumes.
Global Growth Outlook Appears to Have Stabilized
The global economic outlook appears to be improving after the relatively weak trends during the initial months of this year, mirroring the pattern seen in recent years. First quarter economic growth in the Eurozone as well as Japan bettered forecasts, though the pace of U.S. expansion was subdued as expected. Healthy domestic demand, helped by the strengthening labor markets and relatively low oil prices,
| | |
| 10 | | www.thomaswhitefunds.com |
APRIL 30, 2016
continues to support the economies of major developed countries. We believe the U.S. economy is likely to gather pace during the second half as further growth in wages ease consumer anxieties. However, increased political uncertainties created by the referendum in the U.K. about continuing in the European Union, as well as the U.S. presidential elections later this year, could hurt sentiment in the short term.
Though there are lingering doubts about the effectiveness of negative interest rate policies in the Eurozone and Japan, concerns that these monetary policy measures could be counterproductive have eased. While these policies seem likely to hurt the banking industry, we believe that lower borrowing costs should help consumers and businesses and support economic growth in both regions. Better than expected first quarter growth in Japan has reduced expectations of additional government stimulus measures. However, the Japanese government could consider a fiscal stimulus package later this year if growth and inflation trends fall short of targets.
In China, measured policy steps from the government and the central bank seem likely
to stabilize economic growth around the current pace of 6% to 6.5%. Targeted fiscal measures, such as last year’s tax cuts for small cars, have helped support consumer demand that continues to expand at a healthy pace. The central bank’s rate cuts and liquidity infusions have boosted credit growth so far this year. The Chinese real estate market has also seen a recovery, though the large price gains seen in some cities appear unsustainable.
Among the other major emerging markets, we believe India is likely to see faster growth as higher government spending lifts consumer demand. India’s farm economy is also expected to see a revival, if the average rainfall improves this year as forecast. Indonesia should also see healthy growth of around 5%, as the central bank’s recent rate cuts are expected to increase domestic consumption. Brazil, Russia and other resource exporting economies seem likely to remain in recession this year, though the recent recovery in commodity prices may prevent further downside risks.
We sincerely appreciate the trust you have kept in the Thomas White International Fund.
| | | | |
| www.thomaswhitefunds.com | | | 11 | |
THOMAS WHITE INTERNATIONAL FUND
Portfolio Country and Industry Allocation as of April 30, 2016 (Unaudited)
| | | | |
| | |
| Country Allocation | | % of TNA | |
| Belgium | | | 2.6% | |
| Canada | | | 1.2% | |
| China | | | 3.2% | |
| Denmark | | | 3.5% | |
| France | | | 8.8% | |
| Germany | | | 7.5% | |
| Hong Kong | | | 6.3% | |
| India | | | 2.3% | |
| Ireland | | | 2.3% | |
| Japan | | | 20.8% | |
| Mexico | | | 1.0% | |
| Netherlands | | | 11.3% | |
| Panama | | | 0.6% | |
| South Africa | | | 2.6% | |
| South Korea | | | 1.7% | |
| Spain | | | 1.0% | |
| Sweden | | | 0.9% | |
| Switzerland | | | 2.6% | |
| Taiwan | | | 1.9% | |
| Turkey | | | 0.5% | |
| United Kingdom | | | 16.0% | |
| Cash & Other | | | 1.4% | |
| | | | | |
| | | | |
| | |
| Industry Allocation | | % of TNA | |
| Automobiles & Components | | | 4.6% | |
| Banks | | | 5.4% | |
| Capital Goods | | | 6.7% | |
| Commercial & Professional Services | | | 3.1% | |
| Consumer Durables & Apparel | | | 11.4% | |
| Diversified Financials | | | 7.1% | |
| Energy | | | 6.0% | |
| Food & Staples Retailing | | | 5.4% | |
| Food, Beverage & Tobacco | | | 8.2% | |
| Health Care Equipment & Services | | | 2.5% | |
| Household & Personal Products | | | 2.7% | |
| Insurance | | | 5.7% | |
| Materials | | | 3.7% | |
| Media | | | 1.1% | |
| Pharmaceuticals, Biotechnology & Life Sciences | | | 4.0% | |
| Retailing | | | 2.3% | |
| Semiconductors & Semiconductor Equipment | | | 1.1% | |
| Software & Services | | | 5.2% | |
| Technology Hardware & Equipment | | | 2.3% | |
| Telecommunication Services | | | 6.0% | |
| Transportation | | | 2.9% | |
| Utilities | | | 1.2% | |
| Cash & Other | | | 1.4% | |
TNA - Total Net Assets
Fund holdings and industry allocations are subject to change and should not be considered a recommendation to buy or sell any securities. For a complete list of Fund holdings, please refer to the Investment Portfolio section of this report.
| | |
| 12 | | www.thomaswhitefunds.com |
| | |
| Investment Portfolio (Unaudited) | | April 30, 2016 |
| | | | | | | | | | | | |
| Country | | Issue | | Industry | | Shares | | | Value (US$) | |
| | | | | | | | | | | |
COMMON
STOCKS (97.0%) | | | | | | | | | | | | |
|
| |
| BELGIUM (2.6%) | | | | | | | | | | |
| | Ageas + | | Insurance | | | 160,000 | | | | $6,283,215 | |
| | UCB S.A. + | | Pharmaceuticals, Biotechnology & Life Sciences | | | 114,600 | | | | 8,609,852 | |
| | | | | | | | | | | | |
| | | | | | | | | | | 14,893,067 | |
|
| |
| CANADA (1.2%) | | | | | | | | | | |
| | Royal Bank of Canada | | Banks | | | 112,000 | | | | 6,955,479 | |
|
| |
| CHINA (3.2%) | | | | | | | | | | |
| | Alibaba Group Holding Ltd. ADR * # | | Software & Services | | | 33,200 | | | | 2,554,408 | |
| | Baidu, Inc. ADR * | | Software & Services | | | 15,100 | | | | 2,933,930 | |
| | Bank of China Limited - H Shares + | | Banks | | | 9,293,100 | | | | 3,760,043 | |
| | NetEase, Inc. ADR | | Software & Services | | | 16,600 | | | | 2,335,620 | |
| | Ping An Insurance (Group) Company of China Limited -
H Shares + | | Insurance | | | 853,000 | | | | 3,970,926 | |
| | Tencent Holdings Limited + | | Software & Services | | | 149,500 | | | | 3,033,703 | |
| | | | | | | | | | | | |
| | | | | | | | | | | 18,588,630 | |
|
| |
| DENMARK (3.5%) | | | | | | | | | | |
| | PANDORA A/S + | | Consumer Durables & Apparel | | | 156,200 | | | | 20,314,040 | |
|
| |
| FRANCE (8.8%) | | | | | | | | | | |
| | Airbus Group SE + | | Capital Goods | | | 112,400 | | | | 7,033,754 | |
| | Cap Gemini SA + | | Software & Services | | | 86,400 | | | | 8,071,307 | |
| | Christian Dior SA + | | Consumer Durables & Apparel | | | 46,850 | | | | 8,213,043 | |
| | Compagnie Generale des Etablissements Michelin + | | Automobiles & Components | | | 29,900 | | | | 3,122,478 | |
| | Eiffage + | | Capital Goods | | | 62,500 | | | | 4,973,243 | |
| | Safran SA + | | Capital Goods | | | 86,000 | | | | 5,928,807 | |
| | Societe BIC SA + | | Commercial & Professional Services | | | 36,900 | | | | 5,232,176 | |
| | Total SA + | | Energy | | | 161,000 | | | | 8,141,536 | |
| | | | | | | | | | | | |
| | | | | | | | | | | 50,716,344 | |
|
| |
| GERMANY (5.9%) | | | | | | | | | | |
| | Bayer Aktiengesellschaft + | | Materials | | | 58,900 | | | | 6,796,802 | |
| | Continental Aktiengesellschaft + | | Automobiles & Components | | | 21,300 | | | | 4,678,512 | |
| | Deutsche Boerse AG + | | Diversified Financials | | | 32,800 | | | | 2,690,814 | |
| | Deutsche Telekom AG + | | Telecommunication Services | | | 332,500 | | | | 5,814,446 | |
| | Fresenius SE & Co KGaA + | | Health Care Equipment & Services | | | 43,400 | | | | 3,158,790 | |
| | Hochtief AG + | | Banks | | | 43,100 | | | | 5,531,503 | |
| | Muenchener Rueckversicherungs-Gesellschaft AG + | | Insurance | | | 28,100 | | | | 5,212,758 | |
| | | | | | | | | | | | |
| | | | | | | | | | | 33,883,625 | |
|
| |
The accompanying notes are an integral part of these financial statements
| | | | |
| www.thomaswhitefunds.com | | | 13 | |
| | |
| Thomas White International Fund | | |
| | | | | | | | | | | | |
| Country | | Issue | | Industry | | Shares | | | Value (US$) | |
| | | | | | | | | | | |
| HONG KONG (6.3%) | | | | | | | | |
| | AIA Group Limited + | | Insurance | | | 754,000 | | | | $ 4,511,023 | |
| | CK Hutchison Holdings Limited + | | Capital Goods | | | 1,172,232 | | | | 14,018,489 | |
| | Haier Electronics Group Co., Ltd. + | | Consumer Durables & Apparel | | | 1,308,000 | | | | 2,179,996 | |
| | Techtronic Industries Company Limited + | | Consumer Durables & Apparel | | | 4,074,000 | | | | 15,232,903 | |
| | | | | | | | | | | | |
| | | | | | | | | | | 35,942,411 | |
|
| |
| INDIA (2.3%) | | | | | | | | |
| | Infosys Limited ADR # | | Software & Services | | | 565,700 | | | | 10,635,160 | |
| | Tata Motors Limited * + | | Automobiles & Components | | | 397,700 | | | | 2,439,738 | |
| | | | | | | | | | | | |
| | | | | | | | | | | 13,074,898 | |
|
| |
| IRELAND (2.3%) | | | | | | | | |
| | CRH PLC + | | Materials | | | 174,600 | | | | 5,064,888 | |
| | Ryanair Holdings PLC + | | Transportation | | | 526,890 | | | | 7,965,531 | |
| | | | | | | | | | | | |
| | | | | | | | | | | 13,030,419 | |
|
| |
| JAPAN (20.8%) | | | | | | | | |
| | Astellas Pharma Inc. + | | Pharmaceuticals, Biotechnology & Life Sciences | | | 473,500 | | | | 6,389,458 | |
| | HONDA MOTOR CO., LTD. + | | Automobiles & Components | | | 215,600 | | | | 5,729,146 | |
| | Hoya Corp + | | Technology Hardware & Equipment | | | 145,500 | | | | 5,539,557 | |
| | ITOCHU Corporation + | | Capital Goods | | | 498,500 | | | | 6,281,002 | |
| | Japan Tobacco Inc. + | | Food, Beverage & Tobacco | | | 336,500 | | | | 13,783,532 | |
| | Kansai Paint Co., Ltd. + | | Materials | | | 384,400 | | | | 6,636,414 | |
| | Mitsubishi UFJ Financial Group, Inc. + | | Banks | | | 1,286,100 | | | | 5,864,523 | |
| | NIPPON TELEGRAPH AND TELEPHONE CORPORATION + | | Telecommunication Services | | | 223,500 | | | | 9,893,903 | |
| | Nissan Motor Co., Ltd. + | | Automobiles & Components | | | 845,400 | | | | 7,525,602 | |
| | Nomura Holdings, Inc. + | | Diversified Financials | | | 1,369,800 | | | | 5,753,657 | |
| | ORIX Corporation + | | Diversified Financials | | | 402,700 | | | | 5,616,441 | |
| | Sekisui House, Ltd. + | | Consumer Durables & Apparel | | | 418,400 | | | | 7,222,246 | |
| | SoftBank Corp. + | | Telecommunication Services | | | 149,800 | | | | 7,879,365 | |
| | Sundrug Co., Ltd. + | | Food & Staples Retailing | | | 203,600 | | | | 14,423,238 | |
| | TDK CORPORATION + | | Technology Hardware & Equipment | | | 62,700 | | | | 3,638,320 | |
| | Tokio Marine Holdings, Inc. + | | Insurance | | | 140,400 | | | | 4,528,792 | |
| | West Japan Railway Company + | | Transportation | | | 50,400 | | | | 3,033,633 | |
| | | | | | | | | | | | |
| | | | | | | | | | | 119,738,829 | |
|
| |
| MEXICO (1.0%) | | | | | | | | |
| | Grupo Financiero Banorte, S.A.B. de C.V. | | Banks | | | 986,700 | | | | 5,610,053 | |
|
| |
The accompanying notes are an integral part of these financial statements
| | |
| 14 | | www.thomaswhitefunds.com |
| | |
| Investment Portfolio (Unaudited) | | April 30, 2016 |
| | | | | | | | | | | | |
| Country | | Issue | | Industry | | Shares | | | Value (US$) | |
| | | | | | | | | | | |
| NETHERLANDS (11.3%) | | | | | | | | |
| | Heineken NV + | | Food, Beverage & Tobacco | | | 101,600 | | | | $ 9,525,722 | |
| | ING Groep N.V. GDR + | | Diversified Financials | | | 468,200 | | | | 5,741,801 | |
| | Koninklijke Ahold N.V. + | | Food & Staples Retailing | | | 760,300 | | | | 16,555,901 | |
| | NN Group NV + | | Insurance | | | 244,300 | | | | 8,468,967 | |
| | Randstad Holding nv + | | Commercial & Professional Services | | | 107,000 | | | | 5,750,512 | |
| | Royal Dutch Shell PLC + | | Energy | | | 711,000 | | | | 18,668,809 | |
| | | | | | | | | | | | |
| | | | | | | | | | | 64,711,712 | |
|
| |
| PANAMA (0.6%) | | | | | | | | |
| | Banco Latinoamericano de Comercio Exterior, S.A. | | Banks | | | 137,300 | | | | 3,550,578 | |
|
| |
| SOUTH AFRICA (2.6%) | | | | | | | | |
| | Mondi Ltd + | | Materials | | | 152,800 | | | | 2,940,024 | |
| | Remgro Limited + | | Diversified Financials | | | 459,700 | | | | 8,235,357 | |
| | Steinhoff International Holdings N.V. + | | Consumer Durables & Apparel | | | 610,700 | | | | 3,827,244 | |
| | | | | | | | | | | | |
| | | | | | | | | | | 15,002,625 | |
|
| |
| SOUTH KOREA (1.7%) | | | | | | | | |
| | Korea Electric Power Corporation + | | Utilities | | | 128,000 | | | | 6,929,063 | |
| | SK Telecom Co., Ltd. + | | Telecommunication Services | | | 15,800 | | | | 2,863,673 | |
| | | | | | | | | | | | |
| | | | | | | | | | | 9,792,736 | |
|
| |
| SPAIN (1.0%) | | | | | | | | |
| | Grifols, S.A. + # | | Pharmaceuticals, Biotechnology & Life Sciences | | | 269,600 | | | | 5,872,996 | |
|
| |
| SWEDEN (0.9%) | | | | | | | | |
| | Swedish Match AB + | | Food, Beverage & Tobacco | | | 164,600 | | | | 5,219,047 | |
|
| |
| SWITZERLAND (2.6%) | | | | | | | | |
| | Roche Holding AG + | | Pharmaceuticals, Biotechnology & Life Sciences | | | 32,100 | | | | 8,119,485 | |
| | UBS Group AG + | | Diversified Financials | | | 383,200 | | | | 6,616,804 | |
| | | | | | | | | | | | |
| | | | | | | | | | | 14,736,289 | |
|
| |
| TAIWAN (1.9%) | | | | | | | | |
| | Catcher Technology Co., Ltd + | | Technology Hardware & Equipment | | | 231,000 | | | | 1,615,483 | |
| | Pegatron Corporation + | | Technology Hardware & Equipment | | | 1,270,000 | | | | 2,674,112 | |
| | Taiwan Semiconductor Manufacturing Company Ltd. ADR # | | Semiconductors & Semiconductor Equipment | | | 275,100 | | | | 6,489,609 | |
| | | | | | | | | | | | |
| | | | | | | | | | | 10,779,204 | |
|
| |
The accompanying notes are an integral part of these financial statements
| | | | |
| www.thomaswhitefunds.com | | | 15 | |
| | |
| Thomas White International Fund | | |
| | | | | | | | | | | | |
| Country | | Issue | | Industry | | Shares | | | Value (US$) | |
| | | | | | | | | | | |
| TURKEY (0.5%) | | | | | | | | |
| | Tofas Turk Otomobil Fabrikasi A.S. + | | Automobiles & Components | | | 373,900 | | | | $ 2,958,937 | |
|
| |
| UNITED KINGDOM (16.0%) | | | | | | | | |
| | BP p.l.c. + | | Energy | | | 1,341,500 | | | | 7,399,708 | |
| | British American Tobacco p.l.c. + | | Food, Beverage & Tobacco | | | 299,800 | | | | 18,295,873 | |
| | BT Group plc + | | Telecommunication Services | | | 1,225,200 | | | | 7,960,755 | |
| | Carnival plc + | | Consumer Services | | | 103,800 | | | | 5,167,894 | |
| | Experian PLC + | | Commercial & Professional Services | | | 367,900 | | | | 6,742,852 | |
| | International Consolidated Airlines Group SA + | | Transportation | | | 724,900 | | | | 5,575,240 | |
| | Provident Financial plc + | | Diversified Financials | | | 149,500 | | | | 6,381,989 | |
| | RELX NV + | | Media | | | 374,904 | | | | 6,294,167 | |
| | Smith & Nephew PLC + | | Health Care Equipment & Services | | | 321,200 | | | | 5,437,467 | |
| | Taylor Wimpey plc + | | Consumer Durables & Apparel | | | 1,208,300 | | | | 3,261,520 | |
| | Unilever NV + | | Household & Personal Products | | | 140,400 | | | | 6,170,655 | |
| | WH Smith PLC + | | Retailing | | | 542,400 | | | | 13,285,932 | |
| | | | | | | | | | | | |
| | | | | | | | | | | 91,974,052 | |
|
| |
| Total Common Stocks | | | | (Cost $518,722,036) | | | | | | | 557,345,971 | |
| | | | | | | | | | | | |
|
| |
| PREFERRED STOCKS (1.6%) | | | | | | | | | | | | |
|
| |
| GERMANY (1.6%) | | | | | | | | | | |
| | Henkel AG & Co. KGaA + | | Household & Personal Products | | | 82,400 | | | | 9,410,794 | |
|
| |
| Total Preferred Stocks | | | | (Cost $6,877,404) | | | | | | | 9,410,794 | |
| | | | | | | | | | | | |
|
| |
| | | | |
HELD AS COLLATERAL
FOR SECURITIES LENDING (2.6%) | | | | | | | | | | | | |
|
| |
| | | | | | | Principal
Amount | | | | |
| U.S. GOVERNMENT OBLIGATIONS (2.4%) | | | | | | | | |
| | U.S. Treasury Notes: | | | | | | | | | | |
| | 0.625% due 06/30/2017 | | | | | $553,084 | | | | $553,084 | |
| | 0.875% due 07/15/2017 | | | | | 8,488 | | | | 8,488 | |
| | 0.625% due 07/31/2017 | | | | | 155,290 | | | | 155,290 | |
| | 4.750% due 08/15/2017 | | | | | 60,007 | | | | 60,007 | |
| | 0.625% due 08/31/2017 | | | | | 231,441 | | | | 231,441 | |
| | 0.625% due 11/30/2017 | | | | | 7,696 | | | | 7,696 | |
| | 0.750% due 12/31/2017 | | | | | 1,331,534 | | | | 1,331,534 | |
| | 3.500% due 02/15/2018 | | | | | 201,285 | | | | 201,285 | |
| | 2.750% due 02/28/2018 | | | | | 21,972 | | | | 21,972 | |
| | 2.375% due 05/31/2018 | | | | | 82,229 | | | | 82,229 | |
The accompanying notes are an integral part of these financial statements
| | |
| 16 | | www.thomaswhitefunds.com |
| | |
| Investment Portfolio (Unaudited) | | April 30, 2016 |
| | | | | | | | | | | | |
| Country | | Issue | | Industry | | Principal
Amount | | | Value (US$) | |
| | | | | | | | | | | |
| U.S. GOVERNMENT OBLIGATIONS (CONT.) | | | | | | | | |
| | 1.250% due 11/15/2018 | | | | | $5,278 | | | | $ 5,278 | |
| | 1.250% due 04/30/2019 | | | | | 398,171 | | | | 398,171 | |
| | 3.625% due 08/15/2019 | | | | | 17,011 | | | | 17,011 | |
| | 1.625% due 08/31/2019 | | | | | 26,900 | | | | 26,900 | |
| | 1.625% due 12/31/2019 | | | | | 271,867 | | | | 271,867 | |
| | 3.625% due 02/15/2020 | | | | | 144,860 | | | | 144,860 | |
| | 1.625% due 07/31/2020 | | | | | 248,434 | | | | 248,434 | |
| | 2.125% due 08/31/2020 | | | | | 686,505 | | | | 686,505 | |
| | 2.000% due 11/30/2020 | | | | | 380,087 | | | | 380,087 | |
| | 1.750% due 12/31/2020 | | | | | 14,428 | | | | 14,428 | |
| | 3.625% due 02/15/2021 | | | | | 79,242 | | | | 79,242 | |
| | 2.000% due 02/28/2021 | | | | | 43,611 | | | | 43,611 | |
| | 2.250% due 07/31/2021 | | | | | 2,515,265 | | | | 2,515,265 | |
| | 2.125% due 08/15/2021 | | | | | 87,808 | | | | 87,808 | |
| | 1.500% due 01/31/2022 | | | | | 211,822 | | | | 211,822 | |
| | 2.000% due 02/15/2022 | | | | | 61,288 | | | | 61,288 | |
| | 1.750% due 02/28/2022 | | | | | 84,416 | | | | 84,416 | |
| | 1.750% due 05/15/2022 | | | | | 16,982 | | | | 16,982 | |
| | 1.875% due 05/31/2022 | | | | | 120,475 | | | | 120,475 | |
| | 2.125% due 06/30/2022 | | | | | 272,980 | | | | 272,980 | |
| | 2.125% due 12/31/2022 | | | | | 211,631 | | | | 211,631 | |
| | 1.750% due 05/15/2023 | | | | | 1,155,405 | | | | 1,155,405 | |
| | 2.750% due 11/15/2023 | | | | | 18,002 | | | | 18,002 | |
| | 2.500% due 05/15/2024 | | | | | 7,046 | | | | 7,046 | |
| | 2.375% due 08/15/2024 | | | | | 10,071 | | | | 10,071 | |
| | 2.250% due 11/15/2024 | | | | | 5,522 | | | | 5,522 | |
| | 2.000% due 02/15/2025 | | | | | 244,725 | | | | 244,725 | |
| | 2.125% due 05/15/2025 | | | | | 102,906 | | | | 102,906 | |
| | 2.000% due 08/15/2025 | | | | | 15,361 | | | | 15,361 | |
| | 1.625% due 02/15/2026 | | | | | 119,958 | | | | 119,958 | |
| | | | | | | | | | | | |
| | | | | | | | | | | 10,231,083 | |
| | U.S. TIPS: | | | | | | | | | | |
| | 2.125% due 01/15/2019 | | | | | 1,267,673 | | | | 1,267,673 | |
| | 0.625% due 07/15/2021 | | | | | 41,522 | | | | 41,522 | |
| | 2.125% due 02/15/2040 | | | | | 486,239 | | | | 486,239 | |
| | | | | | | | | | | | |
| | | | | | | | | | | 1,795,434 | |
| | U.S. Treasury Bonds: | | | | | | | | | | |
| | 8.750% due 08/15/2020 | | | | | 235,032 | | | | 235,032 | |
| | 7.625% due 02/15/2025 | | | | | 689,468 | | | | 689,468 | |
| | 6.000% due 02/15/2026 | | | | | 51,236 | | | | 51,236 | |
| | 5.250% due 02/15/2029 | | | | | 144,809 | | | | 144,809 | |
| | 5.375% due 02/15/2031 | | | | | 282,792 | | | | 282,792 | |
| | 2.750% due 08/15/2042 | | | | | 348,323 | | | | 348,323 | |
| | 3.125% due 02/15/2043 | | | | | 248,484 | | | | 248,484 | |
| | 3.625% due 08/15/2043 | | | | | 1,593 | | | | 1,593 | |
| | 3.625% due 02/15/2044 | | | | | 11,138 | | | | 11,138 | |
| | 3.000% due 05/15/2045 | | | | | 1,425 | | | | 1,425 | |
| | 2.875% due 08/15/2045 | | | | | 17,934 | | | | 17,934 | |
| | | | | | | | | | | | |
| | | | | | | | | | | 2,032,234 | |
|
| |
| Total U.S. Government Obligations | | | | (Cost $14,058,751) | | | | | | | 14,058,751 | |
| | | | | | | | | | | | |
|
| |
The accompanying notes are an integral part of these financial statements
| | | | |
| www.thomaswhitefunds.com | | | 17 | |
| | |
| Thomas White International Fund | | |
| | | | | | | | | | | | |
| Country | | Issue | | Industry | | Principal
Amount | | | Value (US$) | |
| | | | | | | | | | | |
SHORT TERM
INVESTMENTS (0.2%) | | | | | | | | | | |
|
| |
| U.S. GOVERNMENT OBLIGATIONS (0.2%) | | | | | | | | |
| | U.S. Treasury Bill: | | | | | | | | | | |
| | 0.488% due 09/01/2016 | | | | | $581,830 | | | | $581,830 | |
| | | | |
| | U.S. Treasury Notes: | | | | | | | | | | |
| | 0.500% due 08/31/2016 | | | | | 421,193 | | | | 421,193 | |
| | 0.875% due 02/28/2017 | | | | | 106,877 | | | | 106,877 | |
| | | | | | | | | | | | |
| | | | | | | | | | | 528,070 | |
|
| |
| Total Short Term Investments | | | | (Cost $1,109,900) | | | | | | | 1,109,900 | |
|
| |
| Total held as collateral for securities lending | | | | (Cost $15,168,651) | | | | | | | $15,168,651 | |
|
| |
| Total Investments | | 101.2% | | (Cost $540,768,091) | | | | | | | $581,925,416 | |
Other Assets,
Less Liabilities | | (1.2)% | | | | | | | | | (7,172,343 | ) |
| Total Net Assets: | | 100.0% | | | | | | | | | $574,753,073 | |
|
| |
| * | Non-Income Producing Securities |
| # | All or a portion of securities on loan at April 30, 2016 - See Note 1(I) to Financial Statements |
| + | Fair Valued Security - See Note 1(A) to Financial Statements |
| ADR | - American Depositary Receipt |
| GDR | - Global Depositary Receipt |
Industry classications shown in the Investment Portfolio are based off of the Global Industry Classification Standard (GICS®). GICS was developed by and/or is the exclusive property of MSCI, Inc. and Standard & Poor’s Financial Services LLC (“S&P”). GICS is a service mark of MSCI and S&P and has been licensed for use by U.S. Bancorp Fund Services, LLC.
The accompanying notes are an integral part of these financial statements
| | |
| 18 | | www.thomaswhitefunds.com |
| | |
| Investment Portfolio (Unaudited) | | April 30, 2016 |
The following table summarizes the inputs used, as of April 30, 2016, in valuing the Fund’s assets:
| | | | | | | | | | | | | | | | |
| | | Level 1 | | | Level 2 | | | Level 3 | | | Total | |
| Common Stocks | | | | | | | | | | | | | | | | |
| Belgium | | | $------- | | | | $14,893,067 | | | | $------- | | | | $14,893,067 | |
| Canada | | | 6,955,479 | | | | ------- | | | | ------- | | | | 6,955,479 | |
| China | | | 7,823,958 | | | | 10,764,672 | | | | ------- | | | | 18,588,630 | |
| Denmark | | | ------- | | | | 20,314,040 | | | | ------- | | | | 20,314,040 | |
| France | | | ------- | | | | 50,716,344 | | | | ------- | | | | 50,716,344 | |
| Germany | | | ------- | | | | 33,883,625 | | | | ------- | | | | 33,883,625 | |
| Hong Kong | | | ------- | | | | 35,942,411 | | | | ------- | | | | 35,942,411 | |
| India | | | 10,635,160 | | | | 2,439,738 | | | | ------- | | | | 13,074,898 | |
| Ireland | | | ------- | | | | 13,030,419 | | | | ------- | | | | 13,030,419 | |
| Japan | | | ------- | | | | 119,738,829 | | | | ------- | | | | 119,738,829 | |
| Mexico | | | 5,610,053 | | | | ------- | | | | ------- | | | | 5,610,053 | |
| Netherlands | | | ------- | | | | 64,711,712 | | | | ------- | | | | 64,711,712 | |
| Panama | | | 3,550,578 | | | | ------- | | | | ------- | | | | 3,550,578 | |
| South Africa | | | ------- | | | | 15,002,625 | | | | ------- | | | | 15,002,625 | |
| South Korea | | | ------- | | | | 9,792,736 | | | | ------- | | | | 9,792,736 | |
| Spain | | | ------- | | | | 5,872,996 | | | | ------- | | | | 5,872,996 | |
| Sweden | | | ------- | | | | 5,219,047 | | | | ------- | | | | 5,219,047 | |
| Switzerland | | | ------- | | | | 14,736,289 | | | | ------- | | | | 14,736,289 | |
| Taiwan | | | 6,489,609 | | | | 4,289,595 | | | | ------- | | | | 10,779,204 | |
| Turkey | | | ------- | | | | 2,958,937 | | | | ------- | | | | 2,958,937 | |
| United Kingdom | | | ------- | | | | 91,974,052 | | | | ------- | | | | 91,974,052 | |
| Total Common Stocks | | | $41,064,837 | | | | $516,281,134 | | | | $------- | | | | $557,345,971 | |
| Preferred Stocks | | | | | | | | | | | | | | | | |
| Germany | | | $------- | | | | $9,410,794 | | | | $------- | | | | $9,410,794 | |
| Total Preferred Stocks | | | $------- | | | | $9,410,794 | | | | $------- | | | | $9,410,794 | |
| U.S. Government Obligations | | | $------- | | | | $14,058,751 | | | | $------- | | | | $14,058,751 | |
| Short Term Investments | | | $------- | | | | $1,109,900 | | | | $------- | | | | $1,109,900 | |
| Total Investments | | | $41,064,837 | | | | $540,860,579 | | | | $------- | | | | $581,925,416 | |
For more information on valuation inputs, please refer to Note 1(A) of the accompanying Notes to Financial Statements.
The Fund’s assets assigned to Level 2 include certain foreign securities for which a third party statistical pricing service may be employed for purposes of fair market valuation. In addition, no transfers in and/or out between Levels 1, 2 or 3 were observed during the reporting period, as compared to their classification from the prior annual report.
The accompanying notes are an integral part of these financial statements
| | | | |
| www.thomaswhitefunds.com | | | 19 | |
| | |
| THOMAS WHITE EMERGING MARKETS FUND | | |
| | | | | | | | | | | | | | |
| | | | | | | | |
| | | Unaudited
Sales
Charge | | Deferred
Sales
Charge | | Administrative
Services Fee | | 12b-1 Fees | | Operating
Expenses1,3 | | Prospectus
Gross
Annual
Operating
Expense2 | | Prospectus
Net Annual
Operating
Expense2,3 |
| Investor Class | | None | | None | | Up to 0.25% | | None | | 1.34% | | 1.27% | | 1.34% |
| Class I | | None | | None | | None | | None | | 1.09% | | 1.26% | | 1.10% |
| Class A | | 5.75% | | None | | Up to 0.25% | | 0.25% | | 1.59% | | 1.67% | | 1.60% |
| Class C | | None | | 1.00% within 12 months | | None | | 1.00% | | 2.09% | | 2.27% | | 2.10% |
1 In the absence of the fee deferral/expense reimbursement arrangement for the Emerging Markets Fund, the ratio of expenses to average net assets would have been 1.31% for Investor Class shares, 1.30% for Class I shares, 1.66% for Class A shares and 2.30% for Class C shares.
2 Gross Annual Operating Expense and Net Annual Operating Expense are based on the most recent prospectus and may differ from other expense ratios appearing in this report.
3 Thomas White International, Ltd. (“Advisor”) has agreed to defer its fees and/or reimburse the Fund to the extent that the operating expenses for Investor Class, Class I, Class A and Class C shares exceed (as a percentage of average daily net assets) 1.34%, 1.09%, 1.59% and 2.09%, respectively. The fee deferral/expense reimbursement agreement expires February 28, 2017. The Fund has agreed to repay the Advisor for amounts deferred or reimbursed by the Advisor pursuant to the agreement provided that such repayment does not cause the Fund to exceed the above limits and the repayment is made within three years after the year in which the Advisor incurred the expense. The fee deferral/expense reimbursement agreement may only be amended or terminated by the Fund’s Board of Trustees.
| | | | | | | | |
| | | | | |
| | | NAV | | Net Assets | | Redemption Fee | | Portfolio Turnover |
| Investor Class | | $9.26 | | $1.7 million | | 2.00% within 60 days | | 30% |
| Class I | | $9.33 | | $76.9 million | | |
| Class A | | $9.25 | | $76.9 thousand | | |
| Class C | | $9.19 | | $227.0 thousand | | |
| | |
| 20 | | www.thomaswhitefunds.com |
| | | | | | | | | | | | | | | | | | | | | | | | | | | | |
| |
| Average Annual Returns as of April 30, 2016 (Unaudited) | |
| Class | | Sales Charge | | | | 6 month | | | Calendar
YTD | | | 1 Yr | | | 3 Yrs | | | 5 Yrs | | | Since
Inception (6/28/2010)* | |
| Investor Class shares (TWEMX) | | None | | | | | -2.11% | | | | 1.31% | | | | -18.07% | | | | -8.16% | | | | -5.65% | | | | -0.23% | |
| Class I shares1 (TWIIX) | | None | | | | | -2.00% | | | | 1.41% | | | | -17.87% | | | | -7.91% | | | | -5.49% | | | | -0.09% | |
| Class A shares2 (TWIAX) | | Maximum 5.75% initial sales charge | | With sales charge | | | -7.87% | | | | -4.64% | | | | -22.93% | | | | -10.17% | | | | -6.93% | | | | -1.40% | |
| | | | | | | | | | | | | | | | | | | | | | | | | | | | | |
| | | | | Excluding sales charge | | | -2.22% | | | | 1.20% | | | | -18.26% | | | | -8.37% | | | | -5.83% | | | | -0.39% | |
| Class C shares3 (TWICX) | | Maximum 1% deferred sales charge | | With sales charge | | | -3.44% | | | | 0.10% | | | | -19.65% | | | | -8.74% | | | | -6.11% | | | | -0.65% | |
| | | | | | | | | | | | | | | | | | | | | | | | | | | | | |
| | | | | Excluding sales charge | | | -2.44% | | | | 1.10% | | | | -18.65% | | | | -8.74% | | | | -6.11% | | | | -0.65% | |
| MSCI Emerging Markets Index4 | | N/A | | | | | -0.13% | | | | 6.29% | | | | -17.87% | | | | -4.57% | | | | -4.61% | | | | 0.27% | |
* The inception date of the Investor Class shares.
1 Performance figures for Class I shares, first offered on August 31, 2012, include the historical performance of Investor Class shares through August 30, 2012.
2 Performance figures for Class A shares, first offered on August 31, 2012, include the historical performance of Investor Class shares through August 30, 2012.
3 Performance figures for Class C shares, first offered on August 31, 2012, include the historical performance of Investor Class shares through August 30, 2012.
4 The MSCI Emerging Markets Index is a free float-adjusted market capitalization index that is designed to measure equity market performance of emerging markets. The index is unmanaged and returns assume the reinvestment of dividends. It is not possible to invest directly in an index.
Returns of each share class reflect differences in sales charges and expenses applicable to each class which are primarily differences in distribution and service fees.
The returns do not reflect the deduction of taxes that a shareholder would pay on Fund distributions or the redemption of Fund shares. The returns reflect the actual performance for each period and do not include the impacts of trades executed on the last business day of the period that were recorded on the first business day of the next period.
Performance data is based upon past performance, which is no guarantee of future results. The investment return and principal value of an investment will fluctuate so that an investor’s shares, when redeemed, may be worth more or less than their original cost. Current performance may be higher or lower than the performance data quoted. Please call 1-800-811-0535 to obtain performance data as of the most recent month-end. The Fund imposes a 2% redemption fee on shares held less than 60 days. Performance data does not reflect the redemption fee. If reflected, total returns would be lower. Investment performance reflects any fee waivers that were in effect. In the absence of such waivers, total return would have been reduced. The Gross Expense Ratios, based on the most recent prospectus, are 1.27% (Investor Class), 1.26% (Class I), 1.67% (Class A) and 2.27% (Class C).
| | | | |
| www.thomaswhitefunds.com | | | 21 | |
THOMAS WHITE EMERGING MARKETS FUND
GROWTH OF A $10,000 INVESTMENT WITH DIVIDENDS REINVESTED (Unaudited)

This chart illustrates the performance of a hypothetical $10,000 investment made in the Fund’s Investor Class shares and its benchmark, the MSCI Emerging Markets Index, since inception on June 28, 2010 through April 30, 2016. It assumes reinvestment of dividends and capital gains, but does not reflect the effect of any applicable redemption fees. This chart does not imply future performance. Past performance does not guarantee future results. The cumulative return since inception was -1.36% for the Fund’s Investor Class shares and +1.58% for the benchmark. The Fund’s Investor Class shares average annual total return since inception on June 28, 2010 was -0.23%. The MSCI Emerging Markets Index is a free float-adjusted market capitalization index that is designed to measure equity market performance of emerging markets. The index is unmanaged and returns assume the reinvestment of dividends. It is not possible to invest directly in an index. During the periods shown, the Fund’s manager reimbursed certain Fund expenses. Absent this reimbursement, performance would have been lower. Performance will vary from class to class based on differences in class-specific expenses and sales charges.
| | |
| 22 | | www.thomaswhitefunds.com |
The Thomas White Emerging Markets Fund invests primarily in securities of companies located in or whose businesses are closely associated with the world’s emerging markets countries.
Portfolio Managers
Thomas S. White, Jr.
Jinwen Zhang, Ph.D., CFA
Douglas M. Jackman, CFA
Wei Li, Ph.D., CFA
John Wu, Ph.D., CFA
Rishabh Halakhandi, CFA
Ramkumar Venkatramani, CFA
Performance Review
During the six-month period ended April 30, 2016, the Thomas White Emerging Markets Fund Investor Class shares returned -2.11%, compared to -0.13% for its benchmark MSCI Emerging Markets Index. Since its inception on June 28, 2010, the Fund’s Investor Class shares have returned -0.23% annualized, against +0.27% for the benchmark index.
Oil and Commodity Price Swings Intensify Market Volatility
Emerging market equity prices saw increased volatility during the six-month review period, but ended mostly unchanged from the close of the previous period. Concerns about a deeper slowdown in China weakened the demand outlook for commodities and led to further declines in the price of energy and industrial commodities. The weaker commodity markets worsened the economic outlook for countries such as Brazil and Russia that are in recession, and triggered a substantial decline in equity prices in
January. Apprehensions about the negative impact of rate hikes by the U.S. Federal Reserve on global capital flows also hurt investor sentiment.
Markets bounced back strongly during the second half of the review period, and erased most of the earlier losses. The steep recovery in the price of crude oil and industrial commodities such as iron ore lifted equity markets in Brazil, Russia, South Africa and other resource exporting countries. Further monetary easing, including negative interest rates, by the European Central bank and Bank of Japan, as well as expectations of fewer rate hikes by the U.S. Fed, also helped revive investor optimism. China and India, which are among the largest importers of energy and commodities, underperformed during this period when markets were more favorable towards the resource exporters.
Portfolio Review
The Fund underperformed relative to the benchmark due to lower exposure to resource exporting countries such as Brazil and Russia that were among the top gainers during the review period. Positive stock selection in Asia Pacific was offset by weak stock selection in Latin America, Europe and South Africa. From a sector perspective, stock selection was positive in utilities, technology, consumer discretionary and consumer staples. However, stock selection in sectors such as industrials, financials and materials detracted from Fund returns for the period, relative to the benchmark.
Electric utility Korea Electric Power (KEPCO) was the biggest contributor to Fund returns for the period after the company’s net income for the last quarter of
| | | | |
| www.thomaswhitefunds.com | | | 23 | |
THOMAS WHITE EMERGING MARKETS FUND
2015 exceeded expectations, helped by lower fuel costs. KEPCO is also expected to see healthy growth in overseas revenues in the coming quarters. Brazilian retailer Hypermarcas SA outperformed after the company announced the sale of its contraceptives unit and reported robust earnings. Hypermarcas also announced a share buyback program during the quarter. Brazilian lender Itau Unibanco advanced on expectations that the improvement in the country’s political environment could help revive aggregate growth and credit demand. Taiwan Semiconductor, one of the largest semiconductor manufacturers, gained as strong demand for chips used in mobile phones and other handheld devices lifted earnings growth. Korean manufacturer of water purifiers Coway Co. Limited benefited from healthy demand for its products in overseas markets.
The Fund’s Chinese holdings detracted the most from returns during the review period on persistent concerns about slower economic growth. Investors turned more cautious even on Chinese companies with revenue models driven by domestic demand. Bank of China, one of the largest government controlled banks, and Ping An Insurance declined on doubts that demand growth for credit and insurance products could weaken. Beijing Enterprises Holdings, which has businesses in water and sanitation utilities, retail and property development, also underperformed. CK Hutchison Holdings, an industrial conglomerate based in Hong Kong, declined on concerns about slower earnings growth in its telecom businesses while its ports business continues to be hurt by weak global
trade volumes. Catcher Technologies, a Taiwanese manufacturer of metal cases for mobile phones, was negatively affected by slower volume sales growth for smartphones.
Emerging Markets Outlook Could Improve on Domestic Demand Growth
Investor apprehensions about economic growth in China have eased somewhat after the country’s pace of expansion matched forecasts for the most recent two quarters. Though doubts about the quality of data persist, it appears that domestic demand in China is holding up reasonably well. The rate cuts and other measures by the central bank to lower borrowing costs have helped consumers. In addition, the government’s modest fiscal measures such as the tax cuts on small cars announced last year have also been a boost. These policy initiatives are necessary when the external demand environment remains diminished, and continues to restrict Chinese exports. Helped by the relatively healthy fiscal and current account balances, as well as benign inflation, Chinese policymakers have sufficient flexibility to pursue additional fiscal and monetary support, if necessary.
At the same time, high levels of aggregate debt in China and the prospect of further currency declines continue to make investors cautious. Total Chinese debt as a percentage of Gross Domestic Product (GDP) has increased substantially since the 2008 global financial crisis. Though most of the debt is denominated in the yuan, limiting the risks to the economy in the event of an external crisis, bringing it down to more comfortable levels could turn out to be very challenging. Nevertheless, the relatively higher growth
| | |
| 24 | | www.thomaswhitefunds.com |
APRIL 30, 2016
rates in China and the government’s larger role in the economy could offset some of the potential risks from high aggregate debt levels.
Among the other large emerging economies, India appears to be gaining speed. The pace of growth for the first quarter of this year exceeded expectations, though part of the gains were likely from statistical differences when compared to prior periods. India’s farm sector is expected to recover this year after two years of weakness and the government is also expected to support growth through higher spending on wages and infrastructure. Inflation remains contained, and is likely to allow India’s central banks to lower interest rates further over the next year.
The recovery in prices of energy and commodities should limit the downside risk for the large resource exporting countries such as Brazil and Russia. Though equity prices in these countries have recovered sharply, the economies of both Russia and Brazil are expected to decline further this year. If commodity prices remain at current levels, these countries could see a modest expansion next year. However, elevated political risks could keep these markets volatile, especially in Brazil where a new government is in place after the previous president’s impeachment.
We thank you for confidence in the Thomas White Emerging Markets Fund.
| | | | |
| www.thomaswhitefunds.com | | | 25 | |
THOMAS WHITE EMERGING MARKETS FUND
Portfolio Country and Industry Allocation as of April 30, 2016 (Unaudited)
| | | | |
| | |
| Country Allocation | | % of TNA | |
| Brazil | | | 4.6% | |
| Chile | | | 0.5% | |
| China | | | 24.6% | |
| Hong Kong | | | 17.2% | |
| India | | | 9.1% | |
| Indonesia | | | 1.1% | |
| Mexico | | | 4.3% | |
| Panama | | | 1.8% | |
| Philippines | | | 2.7% | |
| Poland | | | 0.6% | |
| Russia | | | 0.7% | |
| South Africa | | | 8.2% | |
| South Korea | | | 12.7% | |
| Taiwan | | | 5.8% | |
| Thailand | | | 3.0% | |
| Turkey | | | 1.1% | |
| Cash & Other | | | 2.0% | |
| | | | | |
| | | | | |
| | | | | |
| | | | |
| | |
| Industry Allocation | | % of TNA | |
| Automobiles & Components | | | 6.0% | |
| Banks | | | 9.8% | |
| Capital Goods | | | 4.2% | |
| Consumer Durables & Apparel | | | 8.7% | |
| Diversified Financials | | | 3.9% | |
| Energy | | | 6.7% | |
| Food & Staples Retailing | | | 0.7% | |
| Food, Beverage & Tobacco | | | 3.8% | |
| Health Care Equipment & Services | | | 1.5% | |
| Household & Personal Products | | | 1.2% | |
| Insurance | | | 7.4% | |
| Materials | | | 1.6% | |
| Pharmaceuticals, Biotechnology & Life Sciences | | | 1.5% | |
| Real Estate | | | 1.4% | |
| Retailing | | | 0.8% | |
| Semiconductors & Semiconductor Equipment | | | 5.0% | |
| Software & Services | | | 17.1% | |
| Technology Hardware & Equipment | | | 4.6% | |
| Telecommunication Services | | | 3.6% | |
| Utilities | | | 8.5% | |
| Cash & Other | | | 2.0% | |
TNA - Total Net Assets
Fund holdings and industry allocations are subject to change and should not be considered a recommendation to buy or sell any securities. For a complete list of Fund holdings, please refer to the Investment Portfolio section of this report.
| | |
| 26 | | www.thomaswhitefunds.com |
| | |
| Investment Portfolio (Unaudited) | | April 30, 2016 |
| | | | | | | | | | | | |
| Country | | Issue | | Industry | | Shares | | | Value (US$) | |
| | | | | | | | | | | |
COMMON
STOCKS (97.1%) | | | | | | | | | | |
|
| |
| BRAZIL (3.7%) | | | | | | | | | | |
| | Embraer S.A. | | Capital Goods | | | 105,500 | | | | $612,586 | |
| | Hypermarcas S.A. | | Household & Personal Products | | | 103,600 | | | | 921,759 | |
| | JBS SA | | Food, Beverage & Tobacco | | | 195,800 | | | | 516,364 | |
| | Ultrapar Participacoes S.A. | | Energy | | | 40,800 | | | | 860,902 | |
| | | | | | | | | | | | |
| | | | | | | | | | | 2,911,611 | |
|
| |
| CHILE (0.5%) | | | | | | | | | | |
| | Banco de Chile | | Banks | | | 3,585,506 | | | | 393,080 | |
|
| |
| CHINA (24.6%) | | | | | | | | | | |
| | Alibaba Group Holding Ltd. ADR * # | | Software & Services | | | 27,100 | | | | 2,085,074 | |
| | Baidu, Inc. ADR * | | Software & Services | | | 12,900 | | | | 2,506,470 | |
| | Bank of China Limited - H Shares + | | Banks | | | 5,000,100 | | | | 2,023,070 | |
| | China Biologic Products Inc. * # | | Pharmaceuticals, Biotechnology & Life Sciences | | | 9,900 | | | | 1,158,300 | |
| | China Petroleum and Chemical Corporation (Sinopec) -
H Shares + | | Energy | | | 1,994,000 | | | | 1,415,446 | |
| | Dongfeng Motor Group Company Limited - H Shares + | | Automobiles & Components | | | 600,000 | | | | 653,770 | |
| | Hollysys Automation Technologies Ltd. | | Technology Hardware & Equipment | | | 49,800 | | | | 954,666 | |
| | NetEase, Inc. ADR # | | Software & Services | | | 15,900 | | | | 2,237,130 | |
| | PICC Property and Casualty Company Limited - H Shares + | | Insurance | | | 574,000 | | | | 1,036,571 | |
| | Ping An Insurance (Group) Company of China Limited -
H Shares + | | Insurance | | | 294,200 | | | | 1,369,574 | |
| | Sinopharm Group Co. Ltd. - H Shares + | | Health Care Equipment & Services | | | 286,800 | | | | 1,217,196 | |
| | Tencent Holdings Limited + | | Software & Services | | | 133,900 | | | | 2,717,142 | |
| | | | | | | | | | | | |
| | | | | | | | | | | 19,374,409 | |
|
| |
| HONG KONG (17.2%) | | | | | | | | |
| | AIA Group Limited + | | Insurance | | | 579,000 | | | | 3,464,035 | |
| | Beijing Enterprises Holdings Limited + | | Capital Goods | | | 189,400 | | | | 979,015 | |
| | China Overseas Land & Investment Limited + | | Real Estate | | | 354,000 | | | | 1,123,122 | |
| | China Unicom (Hong Kong) Limited + | | Telecommunication Services | | | 1,123,700 | | | | 1,312,953 | |
| | CK Hutchison Holdings Limited + | | Capital Goods | | | 105,500 | | | | 1,261,654 | |
| | Guangdong Investment Limited + | | Utilities | | | 1,182,500 | | | | 1,663,861 | |
| | Haier Electronics Group Co., Ltd. + | | Consumer Durables & Apparel | | | 427,000 | | | | 711,665 | |
| | Techtronic Industries Company Limited + | | Consumer Durables & Apparel | | | 819,000 | | | | 3,062,285 | |
| | | | | | | | | | | | |
| | | | | | | | | | | 13,578,590 | |
|
| |
The accompanying notes are an integral part of these financial statements
| | | | |
| www.thomaswhitefunds.com | | | 27 | |
| | |
| Thomas White Emerging Markets Fund | | |
| | | | | | | | | | | | |
| Country | | Issue | | Industry | | Shares | | | Value (US$) | |
| | | | | | | | | | | |
| INDIA (9.1%) | | | | | | | | | | |
| | Axis Bank Limited + | | Banks | | | 113,300 | | | | $ 803,134 | |
| | Infosys Limited + | | Software & Services | | | 99,800 | | | | 1,813,135 | |
| | Infosys Limited ADR # | | Software & Services | | | 77,600 | | | | 1,458,880 | |
| | Mahindra & Mahindra Ltd. GDR + | | Automobiles & Components | | | 50,549 | | | | 999,226 | |
| | NTPC Limited + | | Utilities | | | 350,300 | | | | 732,204 | |
| | Tata Motors Limited * + | | Automobiles & Components | | | 221,517 | | | | 1,358,925 | |
| | | | | | | | | | | | |
| | | | | | | | | | | 7,165,504 | |
|
| |
| INDONESIA (1.1%) | | | | | | | | | | |
| | PT Astra International Tbk + | | Automobiles & Components | | | 1,696,500 | | | | 862,819 | |
|
| |
| MEXICO (4.3%) | | | | | | |
| | Gentera S.A.B. de C.V. | | Diversified Financials | | | 438,800 | | | | 870,732 | |
| | Grupo Financiero Banorte, S.A.B. de C.V. | | Banks | | | 333,800 | | | | 1,897,877 | |
| | Grupo Sanborns S.A.B. de C.V. | | Retailing | | | 442,100 | | | | 610,807 | |
| | | | | | | | | | | | |
| | | | | | | | | | | 3,379,416 | |
|
| |
| PANAMA (1.8%) | | | | | | | | | | |
| | Banco Latinoamericano de Comercio Exterior, S.A. # | | Banks | | | 54,500 | | | | 1,409,370 | |
|
| |
| PHILIPPINES (2.7%) | | | | | | | | |
| | Alliance Global Group, Inc. + | | Capital Goods | | | 1,408,200 | | | | 434,928 | |
| | Universal Robina Corporation + | | Food, Beverage & Tobacco | | | 391,800 | | | | 1,737,842 | |
| | | | | | | | | | | | |
| | | | | | | | | | | 2,172,770 | |
|
| |
| POLAND (0.6%) | | | | | | | | | | |
| | ING Bank Slaski S.A. + | | Banks | | | 15,200 | | | | 485,757 | |
|
| |
| RUSSIA (0.7%) | | | | | | | | | | |
| | Magnit OJSC GDR + | | Food & Staples Retailing | | | 15,700 | | | | 543,796 | |
|
| |
| SOUTH AFRICA (8.2%) | | | | | | | | |
| | Mediclinic International plc * + | | Health Care Equipment & Services | | | 1 | | | | 13 | |
| | Mondi Ltd + | | Materials | | | 67,400 | | | | 1,296,843 | |
| | Remgro Limited + | | Diversified Financials | | | 122,100 | | | | 2,187,377 | |
| | Sasol Ltd + | | Energy | | | 44,100 | | | | 1,446,619 | |
| | Steinhoff International Holdings N.V. + | | Consumer Durables & Apparel | | | 247,577 | | | | 1,551,561 | |
| | | | | | | | | | | | |
| | | | | | | | | | | 6,482,413 | |
|
| |
| SOUTH KOREA (12.7%) | | | | | | | | |
| | Coway Co Ltd + | | Consumer Durables & Apparel | | | 17,700 | | | | 1,529,623 | |
| | Korea Electric Power Corporation + | | Utilities | | | 79,200 | | | | 4,287,358 | |
The accompanying notes are an integral part of these financial statements
| | |
| 28 | | www.thomaswhitefunds.com |
| | |
| Investment Portfolio (Unaudited) | | April 30, 2016 |
| | | | | | | | | | | | |
| Country | | Issue | | Industry | | Shares | | | Value (US$) | |
| | | | | | | | | | | |
| SOUTH KOREA (CONT.) | | | | | | | | |
| | LG Display Co., Ltd. + | | Technology Hardware & Equipment | | | 62,200 | | | | $ 1,300,979 | |
| | NAVER Corporation + | | Software & Services | | | 1,118 | | | | 662,717 | |
| | Samsung Electronics Co., Ltd. + | | Semiconductors & Semiconductor Equipment | | | 690 | | | | 750,303 | |
| | SK Telecom Co., Ltd. + | | Telecommunication Services | | | 8,450 | | | | 1,531,521 | |
| | | | | | | | | | | | |
| | | | | | | | | | | 10,062,501 | |
|
| |
| TAIWAN (5.8%) | | | | | | | | | | |
| | Catcher Technology Co., Ltd + | | Technology Hardware & Equipment | | | 114,000 | | | | 797,251 | |
| | Pegatron Corporation + | | Technology Hardware & Equipment | | | 288,000 | | | | 606,413 | |
| | Taiwan Semiconductor Manufacturing Company Ltd. + | | Semiconductors & Semiconductor Equipment | | | 697,000 | | | | 3,193,649 | |
| | | | | | | | | | | | |
| | | | | | | | | | | 4,597,313 | |
|
| |
| THAILAND (3.0%) | | | | | | | | | | |
| | PTT Exploration and Production Public Company Limited + | | Energy | | | 754,700 | | | | 1,598,318 | |
| | Thai Union Group Public Company Limited + | | Food, Beverage & Tobacco | | | 1,338,600 | | | | 790,519 | |
| | | | | | | | | | | | |
| | | | | | | | | | | 2,388,837 | |
|
| |
| TURKEY (1.1%) | | | | | | | | | | |
| | Tofas Turk Otomobil Fabrikasi A.S. + | | Automobiles & Components | | | 107,000 | | | | 846,767 | |
|
| |
Total Common
Stocks | | (Cost $76,579,342) | | | | | | | 76,654,953 | |
| | | | | | | | | | | | |
|
| |
PREFERRED
STOCKS (0.9%) | | | | | | | | | | | | |
|
| |
| BRAZIL (0.9%) | | | | | | | | |
| | Itau Unibanco Holding S.A. | | Banks | | | 73,590 | | | | 703,965 | |
|
| |
Total Preferred
Stocks | | (Cost $907,152) | | | | | | | 703,965 | |
| | | | | | | | | | | | |
|
| |
SHORT TERM
INVESTMENT (1.9%) | | | | | | | | | | |
|
| |
| MONEY MARKET FUND (1.9%) | | | | | | | | |
| | Northern Institutional Treasury Portfolio, 0.23% (a) | | | | | 1,482,935 | | | | 1,482,935 | |
|
| |
Total Short Term
Investment | | (Cost $1,482,935) | | | | | | | 1,482,935 | |
| | | | | | | | | | | | |
|
| |
The accompanying notes are an integral part of these financial statements
| | | | |
| www.thomaswhitefunds.com | | | 29 | |
| | |
| Thomas White Emerging Markets Fund | | |
| | | | | | | | | | | | |
| Country | | Issue | | Industry | | Principal
Amount | | | Value (US$) | |
| | | | | | | | | | | |
HELD AS COLLATERAL
FOR SECURITIES LENDING (10.3%) | | | | | | | | | | | | |
|
| |
| U.S. GOVERNMENT OBLIGATIONS (0.0%) | | | | | | | | |
| | U.S. Treasury Notes: | | | | | | | | | | |
| | 0.875% due 07/15/2017 | | | | | $22 | | | | $22 | |
| | 4.750% due 08/15/2017 | | | | | 154 | | | | 154 | |
| | 0.625% due 11/30/2017 | | | | | 20 | | | | 20 | |
| | 2.750% due 02/28/2018 | | | | | 56 | | | | 56 | |
| | 1.250% due 11/15/2018 | | | | | 14 | | | | 14 | |
| | 3.625% due 08/15/2019 | | | | | 44 | | | | 44 | |
| | 1.625% due 12/31/2019 | | | | | 699 | | | | 699 | |
| | 1.750% due 12/31/2020 | | | | | 37 | | | | 37 | |
| | 1.750% due 05/15/2022 | | | | | 44 | | | | 44 | |
| | 1.875% due 05/31/2022 | | | | | 310 | | | | 310 | |
| | 2.125% due 12/31/2022 | | | | | 544 | | | | 544 | |
| | 1.750% due 05/15/2023 | | | | | 620 | | | | 620 | |
| | 2.750% due 11/15/2023 | | | | | 46 | | | | 46 | |
| | 2.375% due 08/15/2024 | | | | | 26 | | | | 26 | |
| | 2.125% due 05/15/2025 | | | | | 265 | | | | 265 | |
| | 2.000% due 08/15/2025 | | | | | 40 | | | | 40 | |
| | | | | | | | | | | | |
| | | | | | | | | | | 2,941 | |
|
| |
| Total U.S. Government Obligations | | | | (Cost $2,941) | | | | | | | 2,941 | |
| | | | | | | | | | | | |
|
| |
| | | | | | | Shares | | | | |
SHORT TERM
INVESTMENT (10.3%) | | | | | | | | | | |
|
| |
| MONEY MARKET FUND (10.3%) | | | | | | | | |
| | Northern Institutional Liquid Asset Portfolio, 0.01% (a) | | | | | 8,097,365 | | | | 8,097,365 | |
|
| |
Total Short Term
Investment | | (Cost $8,097,365) | | | | | | | 8,097,365 | |
|
| |
| Total held as collateral for securities lending | | | | (Cost $8,100,306) | | | | | | | $8,100,306 | |
| | | | | | | | | | | | |
|
| |
| Total Investments | | 110.2% | | (Cost $87,069,735) | | | | | | | $86,942,159 | |
Other Assets,
Less Liabilities | | (10.2)% | | | | | | | | | (8,039,114 | ) |
| Total Net Assets: | | 100.0% | | | | | | | | | $78,903,045 | |
|
| |
The accompanying notes are an integral part of these financial statements
| | |
| 30 | | www.thomaswhitefunds.com |
| | |
| Investment Portfolio (Unaudited) | | April 30, 2016 |
| * | Non-Income Producing Securities |
| # | All or a portion of securities on loan at April 30, 2016 - See Note 1(I) to Financial Statements |
| + | Fair Valued Security - See Note 1(A) to Financial Statements |
| ADR | - American Depositary Receipt |
| GDR | - Global Depositary Receipt |
Industry classications shown in the Investment Portfolio are based off of the Global Industry Classification Standard (GICS®). GICS was developed by and/or is the exclusive property of MSCI, Inc. and Standard & Poor’s Financial Services LLC (“S&P”). GICS is a service mark of MSCI and S&P and has been licensed for use by U.S. Bancorp Fund Services, LLC.
The accompanying notes are an integral part of these financial statements
| | | | |
| www.thomaswhitefunds.com | | | 31 | |
| | |
| Thomas White Emerging Markets Fund | | |
The following table summarizes the inputs used, as of April 30, 2016, in valuing the Fund’s assets:
| | | | | | | | | | | | | | | | |
| | | Level 1 | | | Level 2 | | | Level 3 | | | Total | |
| Common Stocks | | | | | | | | | | | | | | | | |
| Brazil | | | $2,911,611 | | | | $------- | | | | $------- | | | | $2,911,611 | |
| Chile | | | 393,080 | | | | ------- | | | | ------- | | | | 393,080 | |
| China | | | 8,941,640 | | | | 10,432,769 | | | | ------- | | | | 19,374,409 | |
| Hong Kong | | | ------- | | | | 13,578,590 | | | | ------- | | | | 13,578,590 | |
| India | | | 1,458,880 | | | | 5,706,624 | | | | ------- | | | | 7,165,504 | |
| Indonesia | | | ------- | | | | 862,819 | | | | ------- | | | | 862,819 | |
| Mexico | | | 3,379,416 | | | | ------- | | | | ------- | | | | 3,379,416 | |
| Panama | | | 1,409,370 | | | | ------- | | | | ------- | | | | 1,409,370 | |
| Philippines | | | ------- | | | | 2,172,770 | | | | ------- | | | | 2,172,770 | |
| Poland | | | ------- | | | | 485,757 | | | | ------- | | | | 485,757 | |
| Russia | | | ------- | | | | 543,796 | | | | ------- | | | | 543,796 | |
| South Africa | | | ------- | | | | 6,482,413 | | | | ------- | | | | 6,482,413 | |
| South Korea | | | ------- | | | | 10,062,501 | | | | ------- | | | | 10,062,501 | |
| Taiwan | | | ------- | | | | 4,597,313 | | | | ------- | | | | 4,597,313 | |
| Thailand | | | ------- | | | | 2,388,837 | | | | ------- | | | | 2,388,837 | |
| Turkey | | | ------- | | | | 846,767 | | | | ------- | | | | 846,767 | |
| Total Common Stocks | | | $18,493,997 | | | | $58,160,956 | | | | $------- | | | | $76,654,953 | |
| Preferred Stocks | | | | | | | | | | | | | | | | |
| Brazil | | | $703,965 | | | | $------- | | | | $------- | | | | $703,965 | |
| Total Preferred Stocks | | | $703,965 | | | | $------- | | | | $------- | | | | $703,965 | |
| U.S. Government Obligations | | | $------- | | | | $2,941 | | | | $------- | | | | $2,941 | |
| Short Term Investments | | | $9,580,300 | | | | $------- | | | | $------- | | | | $9,580,300 | |
| Total Investments | | | $28,778,262 | | | | $58,163,897 | | | | $------- | | | | $86,942,159 | |
For more information on valuation inputs, please refer to Note 1(A) of the accompanying Notes to Financial Statements.
The Fund’s assets assigned to Level 2 include certain foreign securities for which a third party statistical pricing service may be employed for purposes of fair market valuation. In addition, no transfers in and/or out between Levels 1, 2 or 3 were observed during the reporting period, as compared to their classification from the prior annual report.
The accompanying notes are an integral part of these financial statements
| | |
| 32 | | www.thomaswhitefunds.com |
THOMAS WHITE AMERICAN OPPORTUNITIES FUND
| | | | | | | | | | | | | | |
| | | | | | | | |
| | | Unaudited
Sales
Charge | | Deferred
Sales
Charge | | Administrative
Services Fee | | 12b-1 Fees | | Operating
Expenses1,3 | | Prospectus
Gross
Annual
Operating
Expense2 | | Prospectus
Net Annual
Operating
Expense2,3 |
| Investor Class | | None | | None | | Up to 0.25% | | None | | 1.22% | | 1.18% | | 1.18% |
1 In the absence of the fee deferral/expense reimbursement arrangement for the American Opportunities Fund, the ratio of expenses to average net assets would have been 1.22% for Investor Class shares.
2 Gross Annual Operating Expense and Net Annual Operating Expense are based on the most recent prospectus and may differ from other expense ratios appearing in this report.
3 Thomas White International, Ltd. (“Advisor”) has agreed to defer its fees and/or reimburse the Fund to the extent that the operating expenses for Investor Class shares exceed 1.34% of its average daily net assets. The fee deferral/expense reimbursement agreement expires February 28, 2017. The Fund has agreed to repay the Advisor for amounts deferred or reimbursed by the Advisor pursuant to the agreement provided that such repayment does not cause the Fund to exceed the above limits and the repayment is made within three years after the year in which the Advisor incurred the expense. The fee deferral/expense reimbursement agreement may only be amended or terminated by the Fund’s Board of Trustees.
| | | | | | | | |
| | | | | |
| | | NAV | | Net Assets | | Redemption Fee | | Portfolio Turnover |
| Investor Class | | $15.15 | | $34.5 million | | 2.00% within 60 days | | 43% |
| | | | |
| www.thomaswhitefunds.com | | | 33 | |
| | |
| THOMAS WHITE AMERICAN OPPORTUNITIES FUND | | |
| | | | | | | | | | | | | | | | | | | | | | | | | | | | |
| |
| Average Annual Returns as of April 30, 2016 (Unaudited) | |
| Class | | 6 month | | | Calendar YTD | | | 1 Yr | | | 3 Yrs | | | 5 Yrs | | | 10 Yrs | | | Since Inception (3/4/1999) | |
| Investor Class shares (TWAOX) | | | -2.88% | | | | -0.66% | | | | -1.96% | | | | 9.81% | | | | 8.53% | | | | 5.49% | | | | 7.67% | |
| Russell Midcap Index1 | | | 0.81% | | | | 3.33% | | | | -2.14% | | | | 10.37% | | | | 9.88% | | | | 7.49% | | | | 9.02% | |
| S&P 500 Index1 | | | 0.43% | | | | 1.74% | | | | 1.21% | | | | 11.26% | | | | 11.02% | | | | 6.91% | | | | 4.95% | |
1 The Russell Midcap Index measures the performance of the 800 smallest companies in the Russell 1000 Index. These represent approximately 31% of the total market capitalization of the Russell 1000 Index. The S&P 500 Index measures the performance of 500 leading companies in leading industries of the U.S. economy, capturing 80% coverage of U.S. equities. Both indices are unmanaged and returns assume the reinvestment of dividends. It is not possible to invest directly in an index.
The returns do not reflect the deduction of taxes that a shareholder would pay on Fund distributions or the redemption of Fund shares. The returns reflect the actual performance for each period and do not include the impacts of trades executed on the last business day of the period that were recorded on the first business day of the next period.
Performance data is based upon past performance, which is no guarantee of future results. The investment return and principal value of an investment will fluctuate so that an investor’s shares, when redeemed, may be worth more or less than their original cost. Current performance may be higher or lower than the performance data quoted. Please call 1-800-811-0535 to obtain performance data as of the most recent month-end. The Fund imposes a 2% redemption fee on shares held less than 60 days. Performance data does not reflect the redemption fee. If reflected, total returns would be lower. Investment performance reflects any fee waivers that were in effect. In the absence of such waivers, total return would have been reduced. The Investor Class Gross Expense Ratio, based on the most recent prospectus, is 1.18%.
| | |
| 34 | | www.thomaswhitefunds.com |
APRIL 30, 2016
GROWTH OF A $10,000 INVESTMENT WITH DIVIDENDS REINVESTED (Unaudited)
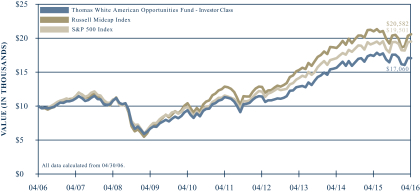
This chart illustrates the performance of a hypothetical $10,000 investment made in the Fund’s Investor Class shares, its primary benchmark, the Russell Midcap Index, and its secondary benchmark, the S&P 500 Index, for the past 10 years through April 30, 2016. It assumes reinvestment of dividends and capital gains, but does not reflect the effect of any applicable redemption fees. This chart does not imply future performance. Past performance does not guarantee future results. The cumulative ten year return was +70.60% for the Fund’s Investor Class shares, +105.82% for the primary benchmark, and +95.01% for the secondary benchmark. The Fund’s Investor Class shares average annual total return since inception on March 4, 1999 was +7.67%. The Russell Midcap Index measures the performance of the 800 smallest companies in the Russell 1000 Index. These represent approximately 31% of the total market capitalization of the Russell 1000 Index. The S&P 500 Index measures the performance of 500 leading companies in leading industries of the U.S. economy, capturing 80% coverage of U.S. equities. Both indices are unmanaged and returns assume the reinvestment of dividends. It is not possible to invest directly in an index. During the periods shown, the Fund’s manager reimbursed certain Fund expenses. Absent this reimbursement, performance would have been lower.
| | | | |
| www.thomaswhitefunds.com | | | 35 | |
| | |
| THOMAS WHITE AMERICAN OPPORTUNITIES FUND | | |
The Thomas White American Opportunities Fund primarily invests in equity securities of mid-size U.S. companies. The Fund may also invest in equity securities of smaller and larger size U.S. companies.
Portfolio Managers
Thomas S. White, Jr.
Jinwen Zhang, Ph.D., CFA
Douglas M. Jackman, CFA
Wei Li, Ph.D., CFA
John Wu, Ph.D., CFA
Rishabh Halakhandi, CFA
Ramkumar Venkatramani, CFA
Performance Review
The Thomas White American Opportunities Fund Investor Class shares returned -2.88% during the six-month period ended April 30, 2016 while the Fund’s primary benchmark, the Russell Midcap Index, returned +0.81% and the secondary benchmark S&P 500 Index returned +0.43% during the same period. Since its inception on March 4, 1999, the Fund’s annualized returns are +7.67%, compared to +9.02% for the primary benchmark and +4.95% for the secondary benchmark.
U.S. Economic Growth Slower Than Expected
U.S. domestic equity prices were mostly unchanged during the six-month review period, despite seeing increased volatility. Markets declined during the first half of the period, as energy and commodity prices came under renewed pressure on concerns over slower global growth and interest rate hikes by the Federal Reserve. Aggregate
U.S. Gross Domestic Product (GDP) growth for the last quarter of 2015 fell short of expectations and made investors more cautious. Though domestic consumer demand remained reasonably stable and the housing market continued to advance, there were doubts about the sustainability of these gains. As prices of crude oil slipped in January to the lowest level in more than a decade, concerns about potential bankruptcies by oil producers and job losses in the energy producing states increased.
Equity markets recovered strongly during the second half of the review period, helped by the rebound in the price of energy and industrial commodities such as iron ore. The Federal Reserve’s decision not to increase rates in February, as well as additional monetary support measures from the European Central Bank and the Bank of Japan, also made investors more optimistic. Though initial readings of first quarter GDP growth were below forecasts, the improvement in corporate earnings when compared to the earlier quarters brightened the outlook. After declining appreciably during the first quarter of this year, mergers and acquisitions have also picked up recently.
Portfolio Review
During the six-month review period ended April 30, 2016, the Fund underperformed both its primary and secondary benchmarks. Stock selection was weak in most sectors except healthcare, technology and utilities. Lower exposure to consumer staples and higher exposure to the utilities sector hurt the Fund’s relative performance during the period.
| | |
| 36 | | www.thomaswhitefunds.com |
APRIL 30, 2016
Shipbuilder Huntington Ingalls Industries contributed the most to Fund returns for the six-month review period after meeting its operating margin target for the year 2015. The company remains optimistic about demand for warships and does not expect significant cuts in the government’s defense budget. The recovery in oil prices during the second half of the review period helped energy explorer and producer Noble Energy, Inc. Packaged foods producer ConAgra Foods benefited from expectations of healthier earnings growth as the company is selling some of its low growth businesses, as well as restructuring others to save costs. Great Plains Energy, an electric utility, gained as its earnings outlook remained bright on healthy demand and low fuel costs, especially for natural gas. Paint manufacturer Sherwin Williams outperformed on expectations of healthier demand growth in the short to medium term. Sherwin Williams is acquiring competitor Valspar Corp. to boost its market share.
Financial services groups Ameriprise Financial, Inc. and SEI Investments Company, as well as regional bank holding company East West Bancorp, Inc., detracted the most from Fund returns for the review period on concerns that demand for credit and financial services is likely to remain restricted. Slower rate increases by the Federal Reserve could potentially weaken the net interest margins of banks, especially smaller lenders. Hertz Global, which is in the process of separating its car rental and equipment rental businesses, declined on concerns that growth of ride share services such as Uber and Lyft could hurt demand in the future. Commercial real
estate brokerage Jones Lang LaSalle declined and was sold after the company’s earnings fell short of expectations.
U.S. Economic Growth Could See Moderate Recovery
While first quarter GDP growth was slower than expected, the U.S. economy could see moderate gains in the coming months as consumer demand remains fairly healthy. Though the most recent monthly labor market data showed a decline in job additions, the unemployment rate remains low and the number of advertised job positions remains healthy. Average wages have also moved higher in recent months, at a moderate pace, which we believe should add to consumer confidence. We believe the recovery in crude oil prices should also reduce the stress on domestic energy producers and lower the prospect of further layoffs in that sector. While higher fuel prices would diminish household surpluses, the impact on consumer demand is likely to be limited as household spending did not increase as much as expected when oil prices were declining. In addition, consumers are likely to respond more positively to potential wage growth, if the current trend is sustained.
The housing market remains one of the bright spots in the economy, helped by the stronger labor markets and low mortgage rates. Sales of existing as well as new homes have largely sustained an uptrend in recent months, and the gains seem likely to continue. Construction activity has picked up and builders remain confident, though there are signs of the rental market plateauing out. Average home prices have advanced further,
| | | | |
| www.thomaswhitefunds.com | | | 37 | |
THOMAS WHITE AMERICAN OPPORTUNITIES FUND
with most of the gains in cities with strong job growth and wage increases. Mortgage rates slipped again earlier this year, though high average home prices and the shortage of housing inventory continue to discourage some buyers.
The U.S. Federal Reserve continues to maintain that further interest rate hikes will depend on the evolving economic data trends, as well as the level of global economic risks. The Fed appeared to be favoring a rate hike during the summer,
though we believe that prospect has somewhat diminished after subdued labor market data as well as the increased probability of Britain exiting the European Union. If U.S. economic growth improves during the second half, the Fed would be more likely to increase rates later this year. Nevertheless, we expect the Fed’s rate increases to be modest and spread out over the next year.
We thank you for investing in the Thomas White American Opportunities Fund.
| | |
| 38 | | www.thomaswhitefunds.com |
APRIL 30, 2016
Portfolio Industry Allocation and Market Capitalization as of April 30, 2016 (Unaudited)
| | | | |
| | |
| Industry Allocation | | % of TNA | |
| Automobiles & Components | | | 2.7% | |
| Banks | | | 1.1% | |
| Capital Goods | | | 5.6% | |
| Commercial & Professional Services | | | 2.5% | |
| Consumer Durables & Apparel | | | 5.8% | |
| Diversified Financials | | | 0.9% | |
| Energy | | | 3.6% | |
| Food & Staples Retailing | | | 1.4% | |
| Food, Beverage & Tobacco | | | 5.5% | |
| Health Care Equipment & Services | | | 10.6% | |
| Insurance | | | 4.5% | |
| Materials | | | 10.6% | |
| Media | | | 1.7% | |
| Pharmaceuticals, Biotechnology & Life Sciences | | | 1.1% | |
| REITS | | | 6.5% | |
| Retailing | | | 8.3% | |
| Semiconductors & Semiconductor Equipment | | | 1.3% | |
| Software & Services | | | 6.1% | |
| Technology Hardware & Equipment | | | 1.9% | |
| Telecommunication Services | | | 1.4% | |
| Transportation | | | 2.4% | |
| Utilities | | | 13.6% | |
| Cash & Other | | | 0.9% | |
| | | | |
| | |
| Portfolio Market Cap Mix | | % of TNA | |
| Large Cap (over $15.2 billion) | | | 37.0% | |
| Mid Cap ($2.3-$15.2 billion) | | | 62.1% | |
| Cash & Other | | | 0.9% | |
| | | | | |
| | | | | |
| | | | | |
| | | | | |
| | | | | |
| | | | | |
| | | | | |
| | | | | |
| | | | | |
| | | | | |
| | | | | |
| | | | | |
| | |
| | | | | |
TNA - Total Net Assets
Fund holdings and industry allocations are subject to change and should not be considered a recommendation to buy or sell any securities. For a complete list of Fund holdings, please refer to the Investment Portfolio section of this report.
| | | | |
| www.thomaswhitefunds.com | | | 39 | |
| | |
| Thomas White American Opportunities Fund | | |
| | | | | | | | | | |
| Industry | | Issue | | Shares | | | Value | |
| | | | | | | | | |
| COMMON STOCKS (99.1%) | | | | | | | | | | |
|
| |
| AUTOMOBILES & COMPONENTS (2.7%) | | | | | | |
| | Thor Industries, Inc. | | | 9,950 | | | | $636,999 | |
| | Visteon Corporation | | | 3,800 | | | | 302,746 | |
| | | | | | | | | | |
| | | | | | | | | 939,745 | |
|
| |
| BANKS (1.1%) | | | | | | | | |
| | Associated Banc-Corp | | | 20,400 | | | | 372,096 | |
|
| |
| CAPITAL GOODS (5.6%) | | | | | | | | |
| | Huntington Ingalls Industries, Inc. | | | 7,400 | | | | 1,071,298 | |
| | Spirit AeroSystems Holdings, Inc. - Class A * | | | 18,200 | | | | 858,130 | |
| | | | | | | | | | |
| | | | | | | | | 1,929,428 | |
|
| |
| COMMERCIAL & PROFESSIONAL SERVICES (2.5%) | | | | | | |
| | Republic Services, Inc. | | | 18,300 | | | | 861,381 | |
|
| |
| CONSUMER DURABLES & APPAREL (5.8%) | | | | | | |
| | Helen of Troy Limited * | | | 3,400 | | | | 338,402 | |
| | Lennar Corporation - Class A | | | 11,650 | | | | 527,862 | |
| | NVR, Inc. * | | | 325 | | | | 539,919 | |
| | Pandora A/S ADR | | | 17,800 | | | | 577,788 | |
| | | | | | | | | | |
| | | | | | | | | 1,983,971 | |
|
| |
| DIVERSIFIED FINANCIALS (0.9%) | | | | | | | | |
| | Intercontinental Exchange, Inc. | | | 1,300 | | | | 312,039 | |
|
| |
| ENERGY (3.6%) | | | | | | | | |
| | EQT Corporation | | | 9,400 | | | | 658,940 | |
| | Noble Energy, Inc. | | | 15,800 | | | | 570,538 | |
| | | | | | | | | | |
| | | | | | | | | 1,229,478 | |
|
| |
| FOOD & STAPLES RETAILING (1.4%) | | | | | | |
| | The Kroger Co. | | | 13,800 | | | | 488,382 | |
|
| |
| FOOD, BEVERAGE & TOBACCO (5.5%) | | | | | | |
| | ConAgra Foods Inc. | | | 21,350 | | | | 951,356 | |
| | Dr Pepper Snapple Group, Inc. | | | 4,900 | | | | 445,459 | |
| | Molson Coors Brewing Company - Class B | | | 2,400 | | | | 229,512 | |
| | Reynolds American Inc. | | | 5,410 | | | | 268,336 | |
| | | | | | | | | | |
| | | | | | | | | 1,894,663 | |
|
| |
| HEALTH CARE EQUIPMENT & SERVICES (10.6%) | | | | | | |
| | AmerisourceBergen Corporation | | | 5,600 | | | | 476,560 | |
| | Centene Corporation * | | | 11,300 | | | | 700,148 | |
| | Humana, Inc. | | | 4,800 | | | | 849,936 | |
| | Laboratory Corporation of America Holdings * | | | 6,520 | | | | 817,086 | |
| | Zimmer Biomet Holdings, Inc. | | | 6,850 | | | | 793,025 | |
| | | | | | | | | | |
| | | | | | | | | 3,636,755 | |
|
| |
The accompanying notes are an integral part of these financial statements
| | |
| 40 | | www.thomaswhitefunds.com |
| | |
| Investment Portfolio (Unaudited) | | April 30, 2016 |
| | | | | | | | | | |
| Industry | | Issue | | Shares | | | Value | |
| | | | | | | | | |
| INSURANCE (4.5%) | | | | | | | | |
| | Assurant, Inc. | | | 4,600 | | | | $389,022 | |
| | Everest Re Group, Ltd. | | | 1,700 | | | | 314,330 | |
| | The Hartford Financial Services Group, Inc. | | | 19,000 | | | | 843,220 | |
| | | | | | | | | | |
| | | | | | | | | 1,546,572 | |
|
| |
| MATERIALS (10.6%) | | | | | | | | |
| | AptarGroup, Inc. | | | 9,500 | | | | 722,000 | |
| | Ball Corporation | | | 9,400 | | | | 670,972 | |
| | The Scotts Miracle-Gro Company - Class A | | | 11,900 | | | | 842,282 | |
| | The Sherwin-Williams Company | | | 3,750 | | | | 1,077,413 | |
| | Silgan Holdings Inc. | | | 6,500 | | | | 329,810 | |
| | | | | | | | | | |
| | | | | | | | | 3,642,477 | |
|
| |
| MEDIA (1.7%) | | | | | | | | |
| | Cablevision Systems Corporation - Class A | | | 18,000 | | | | 601,020 | |
|
| |
| PHARMACEUTICALS, BIOTECHNOLOGY & LIFE SCIENCES (1.1%) | | | | | | |
| | Jazz Pharmaceuticals Public Limited Company * | | | 2,500 | | | | 376,750 | |
|
| |
| REITS (6.5%) | | | | | | | | |
| | Brixmor Property Group, Inc. | | | 24,400 | | | | 616,100 | |
| | Crown Castle International Corp. | | | 11,600 | | | | 1,007,808 | |
| | Welltower Inc. | | | 8,800 | | | | 610,896 | |
| | | | | | | | | | |
| | | | | | | | | 2,234,804 | |
|
| |
| RETAILING (8.3%) | | | | | | | | |
| | AutoNation, Inc. * | | | 10,050 | | | | 509,033 | |
| | AutoZone, Inc. * | | | 400 | | | | 306,092 | |
| | Foot Locker, Inc. | | | 8,600 | | | | 528,384 | |
| | Ross Stores, Inc. | | | 9,100 | | | | 516,698 | |
| | Tractor Supply Company | | | 5,000 | | | | 473,300 | |
| | Ulta Salon, Cosmetics & Fragrance, Inc. * | | | 2,600 | | | | 541,528 | |
| | | | | | | | | | |
| | | | | | | | | 2,875,035 | |
|
| |
| SEMICONDUCTORS & SEMICONDUCTOR EQUIPMENT (1.3%) | | | | | | |
| | Xilinx, Inc. | | | 10,650 | | | | 458,802 | |
|
| |
| SOFTWARE & SERVICES (6.1%) | | | | | | | | |
| | Cadence Design Systems, Inc. * | | | 17,900 | | | | 415,101 | |
| | DST Systems, Inc. | | | 3,250 | | | | 392,210 | |
| | Fidelity National Information Services, Inc. | | | 5,300 | | | | 348,740 | |
| | Global Payments Inc. | | | 5,800 | | | | 418,644 | |
| | PayPal Holdings, Inc. * | | | 13,700 | | | | 536,766 | |
| | | | | | | | | | |
| | | | | | | | | 2,111,461 | |
|
| |
The accompanying notes are an integral part of these financial statements
| | | | |
| www.thomaswhitefunds.com | | | 41 | |
| | |
| Thomas White American Opportunities Fund | | |
| | | | | | | | | | |
| Industry | | Issue | | Shares | | | Value | |
| | | | | | | | | |
| TECHNOLOGY HARDWARE & EQUIPMENT (1.9%) | | | | | | |
| | Arrow Electronics, Inc. * | | | 6,500 | | | | $ 403,650 | |
| | NetApp, Inc. | | | 11,250 | | | | 265,950 | |
| | | | | | | | | | |
| | | | | | | | | 669,600 | |
|
�� | |
| TELECOMMUNICATION SERVICES (1.4%) | | | | | | |
| | Telephone and Data Systems, Inc. | | | 16,800 | | | | 496,776 | |
|
| |
| TRANSPORTATION (2.4%) | | | | | | | | |
| | Alaska Air Group, Inc. | | | 5,050 | | | | 355,671 | |
| | Delta Air Lines, Inc. | | | 11,400 | | | | 475,038 | |
| | | | | | | | | | |
| | | | | | | | | 830,709 | |
|
| |
| UTILITIES (13.6%) | | | | | | | | |
| | Alliant Energy Corporation | | | 12,000 | | | | 846,240 | |
| | Ameren Corporation | | | 17,400 | | | | 835,200 | |
| | CMS Energy Corporation | | | 21,050 | | | | 856,314 | |
| | DTE Energy Company | | | 8,800 | | | | 784,608 | |
| | Great Plains Energy Incorporated | | | 22,450 | | | | 701,113 | |
| | National Fuel Gas Company | | | 11,900 | | | | 660,450 | |
| | | | | | | | | | |
| | | | | | | | | 4,683,925 | |
|
| |
| Total Common Stocks | | | | | (Cost $28,032,003 | ) | | | 34,175,869 | |
| | | | | | | | | | |
|
| |
| Total Investments | | 99.1% | | | (Cost $28,032,003 | ) | | | $34,175,869 | |
Other Assets, Less Liabilities | | 0.9% | | | | | | | 312,123 | |
| Total Net Assets: | | 100.0% | | | | | | | $34,487,992 | |
|
| |
| * | Non-Income Producing Securities |
| ADR | - American Depositary Receipt |
Industry classifications shown in the Investment Portfolio are based off of the Global Industry Classification Standard (GICS®). GICS was developed by and/or is the exclusive property of MSCI, Inc. and Standard & Poor’s Financial Services LLC (“S&P”). GICS is a service mark of MSCI and S&P and has been licensed for use by U.S. Bancorp Fund Services, LLC.
The accompanying notes are an integral part of these financial statements
| | |
| 42 | | www.thomaswhitefunds.com |
| | |
| Investment Portfolio (Unaudited) | | April 30, 2016 |
The following table summarizes the inputs used, as of April 30, 2016, in valuing the Fund’s assets:
| | | | | | | | | | | | | | | | |
| | | Level 1 | | | Level 2 | | | Level 3 | | | Total | |
| Common Stocks | | | | | | | | | | | | | | | | |
| Automobiles & Components | | | $939,745 | | | | $------- | | | | $------- | | | | $939,745 | |
| Banks | | | 372,096 | | | | ------- | | | | ------- | | | | 372,096 | |
| Capital Goods | | | 1,929,428 | | | | ------- | | | | ------- | | | | 1,929,428 | |
| Commercial & Professional Services | | | 861,381 | | | | ------- | | | | ------- | | | | 861,381 | |
| Consumer Durables & Apparel | | | 1,983,971 | | | | ------- | | | | ------- | | | | 1,983,971 | |
| Diversified Financials | | | 312,039 | | | | ------- | | | | ------- | | | | 312,039 | |
| Energy | | | 1,229,478 | | | | ------- | | | | ------- | | | | 1,229,478 | |
| Food & Staples Retailing | | | 488,382 | | | | ------- | | | | ------- | | | | 488,382 | |
| Food, Beverage & Tobacco | | | 1,894,663 | | | | ------- | | | | ------- | | | | 1,894,663 | |
| Health Care Equipment & Services | | | 3,636,755 | | | | ------- | | | | ------- | | | | 3,636,755 | |
| Insurance | | | 1,546,572 | | | | ------- | | | | ------- | | | | 1,546,572 | |
| Materials | | | 3,642,477 | | | | ------- | | | | ------- | | | | 3,642,477 | |
| Media | | | 601,020 | | | | ------- | | | | ------- | | | | 601,020 | |
| Pharmaceuticals, Biotechnology & Life Sciences | | | 376,750 | | | | ------- | | | | ------- | | | | 376,750 | |
| REITS | | | 2,234,804 | | | | ------- | | | | ------- | | | | 2,234,804 | |
| Retailing | | | 2,875,035 | | | | ------- | | | | ------- | | | | 2,875,035 | |
| Semiconductors & Semiconductor Equipment | | | 458,802 | | | | ------- | | | | ------- | | | | 458,802 | |
| Software & Services | | | 2,111,461 | | | | ------- | | | | ------- | | | | 2,111,461 | |
| Technology Hardware & Equipment | | | 669,600 | | | | ------- | | | | ------- | | | | 669,600 | |
| Telecommunication Services | | | 496,776 | | | | ------- | | | | ------- | | | | 496,776 | |
| Transportation | | | 830,709 | | | | ------- | | | | ------- | | | | 830,709 | |
| Utilities | | | 4,683,925 | | | | ------- | | | | ------- | | | | 4,683,925 | |
| Total Common Stocks | | | $34,175,869 | | | | $------- | | | | $------- | | | | $34,175,869 | |
| Total Investments | | | $34,175,869 | | | | $------- | | | | $------- | | | | $34,175,869 | |
For more information on valuation inputs, please refer to Note 1(A) of the accompanying Notes to Financial Statements.
No transfers in and/or out between Levels 1, 2 or 3 were observed during the reporting period, as compared to their classification from the prior annual report.
The accompanying notes are an integral part of these financial statements
| | | | |
| www.thomaswhitefunds.com | | | 43 | |
THOMAS WHITE FUNDS
Statements of Assets and Liabilities
April 30, 2016 (Unaudited)
| | | | | | | | | | | | | | | | | | | | | | | | |
| | | International
Fund | | | Emerging
Markets Fund | | | American
Opportunities
Fund | |
| ASSETS: | | | | | | | | | | | | | | | | | | | | | | | | |
| Investments in securities at market value 1 | | $ | | | | | 581,925,416 | | | $ | | | | | 86,942,159 | | | $ | | | | | 34,175,869 | |
| Foreign currency 2 | | | | | | | 6 | | | | | | | | ------- | | | | | | | | ------- | |
| Cash | | | | | | | 4,091,708 | | | | | | | | ------- | | | | | | | | 329,519 | |
| Receivables: | | | | | | | | | | | | | | | | | | | | | | | | |
Securities Lending | | | | | | | 17,084 | | | | | | | | 8,761 | | | | | | | | ------- | |
Dividends and interest | | | | | | | 2,937,537 | | | | | | | | 58,947 | | | | | | | | 16,804 | |
Reclaims | | | | | | | 2,107,718 | | | | | | | | 52,985 | | | | | | | | ------- | |
Fund shares sold | | | | | | | 287,608 | | | | | | | | 9,160 | | | | | | | | ------- | |
| Prepaid expenses | | | | | | | 109,140 | | | | | | | | 41,191 | | | | | | | | 14,708 | |
| Total assets | | | | | | | 591,476,217 | | | | | | | | 87,113,203 | | | | | | | | 34,536,900 | |
| | | | | | | | | | | | | | | | | | | | | | | | | |
| LIABILITIES: | | | | | | | | | | | | | | | | | | | | | | | | |
| Management and administrative fees payable | | | | | | | 435,617 | | | | | | | | 43,133 | | | | | | | | 24,257 | |
| Business management fees payable | | | | | | | 35,969 | | | | | | | | 4,034 | | | | | | | | 1,671 | |
| Accrued expenses | | | | | | | 351,400 | | | | | | | | 61,936 | | | | | | | | 22,980 | |
| Payable for fund shares redeemed | | | | | | | 725,119 | | | | | | | | ------- | | | | | | | | ------- | |
| Distribution fees (See Note 5) | | | | | | | 6,388 | | | | | | | | 749 | | | | | | | | ------- | |
| Collateral on loaned securities (See Note 1) 3 | | | | | | | 15,168,651 | | | | | | | | 8,100,306 | | | | | | | | ------- | |
| Total liabilities | | | | | | | 16,723,144 | | | | | | | | 8,210,158 | | | | | | | | 48,908 | |
| Net Assets | | $ | | | | | 574,753,073 | | | $ | | | | | 78,903,045 | | | $ | | | | | 34,487,992 | |
| | | | | | | | | | | | | | | | | | | | | | | | | |
| NET ASSETS | | | | | | | | | | | | | | | | | | | | | | | | |
| Source of Net Assets: | | | | | | | | | | | | | | | | | | | | | | | | |
| Net capital paid in on shares of beneficial interest | | $ | | | | | 589,033,521 | | | $ | | | | | 93,246,722 | | | $ | | | | | 27,817,753 | |
| Accumulated net investment income | | | | | | | 3,368,669 | | | | | | | | 205,855 | | | | | | | | 245,135 | |
| Accumulated net realized gain/(loss) | | | | | | | (58,782,168 | ) | | | | | | | (14,420,242 | ) | | | | | | | 281,238 | |
| Net unrealized appreciation/depreciation on: | | | | | | | | | | | | | | | | | | | | | | | | |
Investments and foreign currency translations | | | | | | | 41,157,325 | | | | | | | | (127,576 | ) | | | | | | | 6,143,866 | |
Other assets and liabilities denominated in foreign currency | | | | | | | (24,274 | ) | | | | | | | (1,714 | ) | | | | | | | ------- | |
| Net assets | | $ | | | | | 574,753,073 | | | $ | | | | | 78,903,045 | | | $ | | | | | 34,487,992 | |
| The accompanying notes are an integral part of these financial statements. | |
| | |
| 44 | | www.thomaswhitefunds.com |
THOMAS WHITE FUNDS
Statements of Assets and Liabilities
April 30, 2016 (Unaudited)
| | | | | | | | | | | | | | | | | | | | | | | | |
| | | International
Fund | | | Emerging
Markets Fund | | | American
Opportunities
Fund | |
| INVESTOR CLASS SHARES | | | | | | | | | | | | | | | | | | | | | | | | |
| Net assets | | $ | | | | | 203,196,590 | | | $ | | | | | 1,694,455 | | | $ | | | | | 34,487,992 | |
| Shares outstanding 4 | | | | | | | 13,533,635 | | | | | | | | 182,928 | | | | | | | | 2,277,125 | |
| Net asset value and offering price per share | | $ | | | | | 15.01 | | | $ | | | | | 9.26 | | | $ | | | | | 15.15 | |
| | | | | | | | | | | | | | | | | | | | | | | | | |
| CLASS I SHARES | | | | | | | | | | | | | | | | | | | | | | | | |
| Net assets | | $ | | | | | 370,452,193 | | | $ | | | | | 76,904,612 | | | | | | | | | |
| Shares outstanding 4 | | | | | | | 24,620,034 | | | | | | | | 8,241,509 | | | | | | | | | |
| Net asset value and offering price per share | | $ | | | | | 15.05 | | | $ | | | | | 9.33 | | | | | | | | | |
| | | | | | | | | | | | | | | | | | | | | | | | | |
| CLASS A SHARES | | | | | | | | | | | | | | | | | | | | | | | | |
| Net assets | | $ | | | | | 844,871 | | | $ | | | | | 76,938 | | | | | | | | | |
| Shares outstanding 4 | | | | | | | 56,539 | | | | | | | | 8,317 | | | | | | | | | |
| Net asset value and offering price per share | | $ | | | | | 14.94 | | | $ | | | | | 9.25 | | | | | | | | | |
| Maximum offering price per share | | $ | | | | | 15.85 | | | $ | | | | | 9.81 | | | | | | | | | |
| | | | | | | | | | | | | | | | | | | | | | | | | |
| CLASS C SHARES | | | | | | | | | | | | | | | | | | | | | | | | |
| Net assets | | $ | | | | | 259,419 | | | $ | | | | | 227,040 | | | | | | | | | |
| Shares outstanding 4 | | | | | | | 17,391 | | | | | | | | 24,714 | | | | | | | | | |
| Net asset value and offering (may be subject to contingent deferred sales charge) price per share | | $ | | | | | 14.92 | | | $ | | | | | 9.19 | | | | | | | | | |
1 Cost Basis of Investments: International Fund: $540,768,091 Emerging Markets Fund: $87,069,735 American Opportunities Fund: $28,032,003 | | | | | | | | | | | | | | | | | | | | | | | | |
2 Cost Basis of Cash denominated in foreign currencies: International Fund: $6 Emerging Markets Fund: $0 | | | | | | | | | | | | | | | | | | | | | | | | |
3 Value of securities out on loan at 4/30/2016: International Fund: $13,344,182 Emerging Markets Fund: $8,001,406 | | | | | | | | | | | | | | | | | | | | | | | | |
| 4 There are an unlimited number of $.01 par value shares of beneficial interest authorized. | | | | | | | | | | | | | | | | | | | | | | | | |
| The accompanying notes are an integral part of these financial statements. | |
| | | | |
| www.thomaswhitefunds.com | | | 45 | |
THOMAS WHITE FUNDS
Statements of Operations
Period Ended April 30, 2016 (Unaudited)
| | | | | | | | | | | | | | | | | | | | | | | | |
| | | International
Fund | | | Emerging
Markets Fund | | | American
Opportunities
Fund | |
| INVESTMENT INCOME | | | | | | | | | | | | | | | | | | | | | | | | |
| Income: | | | | | | | | | | | | | | | | | | | | | | | | |
Dividends 1 | | $ | | | | | 6,312,099 | | | $ | | | | | 637,105 | | | $ | | | | | 429,931 | |
Interest | | | | | | | 1,524 | | | | | | | | 1,300 | | | | | | | | ------- | |
Securities lending income (net of expenses) (Note 1) | | | | | | | 15,120 | | | | | | | | 2,558 | | | | | | | | ------- | |
| Total investment income | | | | | | | 6,328,743 | | | | | | | | 640,963 | | | | | | | | 429,931 | |
| Expenses: | | | | | | | | | | | | | | | | | | | | | | | | |
Investment management fees (Note 4) | | | | | | | 2,398,781 | | | | | | | | 334,227 | | | | | | | | 143,646 | |
Business management fees (Note 4) | | | | | | | 98,773 | | | | | | | | 13,762 | | | | | | | | 5,915 | |
Accounting and administration fees | | | | | | | 170,392 | | | | | | | | 29,166 | | | | | | | | 12,447 | |
Custodian fees | | | | | | | 101,250 | | | | | | | | 32,290 | | | | | | | | 4,411 | |
Transfer agent fees | | | | | | | 82,082 | | | | | | | | 28,840 | | | | | | | | 8,139 | |
Trustees’ fees and expenses | | | | | | | 55,238 | | | | | | | | 7,937 | | | | | | | | 3,365 | |
Audit fees and expenses | | | | | | | 12,012 | | | | | | | | 10,556 | | | | | | | | 7,462 | |
Registration fees | | | | | | | 32,144 | | | | | | | | 26,954 | | | | | | | | 8,460 | |
Printing expenses | | | | | | | 39,130 | | | | | | | | 4,204 | | | | | | | | 2,002 | |
Legal fees and expenses | | | | | | | 92,200 | | | | | | | | 10,110 | | | | | | | | 5,000 | |
Distribution expense (Note 5): | | | | | | | | | | | | | | | | | | | | | | | | |
Class A Shares | | | | | | | 1,061 | | | | | | | | 82 | | | | | | | | ------- | |
Class C Shares | | | | | | | 1,754 | | | | | | | | 1,050 | | | | | | | | ------- | |
Administrative Service Fee: | | | | | | | | | | | | | | | | | | | | | | | | |
Investor Class Shares | | | | | | | 262,885 | | | | | | | | 295 | | | | | | | | 1,240 | |
Class A Shares | | | | | | | 265 | | | | | | | | 37 | | | | | | | | ------- | |
Other expenses | | | | | | | 57,809 | | | | | | | | 12,371 | | | | | | | | 3,384 | |
| Total expenses | | | | | | | 3,405,776 | | | | | | | | 511,881 | | | | | | | | 205,471 | |
| Reimbursement from Investment Manager (Note 4) | | | | | | | (311,283 | ) | | | | | | | (76,431 | ) | | | | | | | ------- | |
| Net expenses | | | | | | | 3,094,493 | | | | | | | | 435,450 | | | | | | | | 205,471 | |
| Net investment income | | | | | | | 3,234,250 | | | | | | | | 205,513 | | | | | | | | 224,460 | |
| | | | | | | | | | | | | | | | | | | | | | | | | |
| REALIZED AND UNREALIZED GAIN/(LOSS) ON INVESTMENTS | | | | | |
| Net realized gain (loss) on investments & foreign currency transactions | | | | | | | (27,456,956 | ) | | | | | | | (8,615,408 | ) | | | | | | | 286,716 | |
| Net change in unrealized appreciation/depreciation on investments and foreign currency transactions | | | | | | | (2,730,492 | ) | | | | | | | 6,622,664 | | | | | | | | (1,558,027 | ) |
| Net loss on investments | | | | | | | (30,187,448 | ) | | | | | | | (1,992,744 | ) | | | | | | | (1,271,311 | ) |
| Net decrease in net assets from operations | | $ | | | | | (26,953,198 | ) | | $ | | | | | (1,787,231 | ) | | $ | | | | | (1,046,851 | ) |
1 Net of foreign taxes withheld of: International Fund: $899,368 Emerging Markets Fund: $97,100 American Opportunities Fund: $1,309 | | | | | | | | | | | | | | | | | | | | | | | | |
| The accompanying notes are an integral part of these financial statements. | |
| | |
| 46 | | www.thomaswhitefunds.com |
THOMAS WHITE FUNDS
Statements of Changes in Net Assets (Unaudited)
| | | | | | | | | | | | | | | | |
| | | International Fund | |
| | | | | | Six Months
Ended April 30,
2016 | | | | | | Year Ended
October 31,
2015 | |
| Change in net assets from operations: | | | | | | | | | | | | | | | | |
Net investment income | | $ | | | | | 3,234,250 | | | $ | | | | | 8,913,863 | |
Net realized loss on investments | | | | | | | (27,456,956 | ) | | | | | | | (32,039,924 | ) |
Net unrealized appreciation / depreciation on investments and foreign currency transactions | | | | | | | (2,730,492 | ) | | | | | | | (16,628,429 | ) |
Net decrease in net assets from operations | | | | | | | (26,953,198 | ) | | | | | | | (39,754,490 | ) |
| Distribution to Investor Class Shareholders: | | | | | | | | | | | | | | | | |
From net investment income | | | | | | | ------- | | | | | | | | (3,398,593 | ) |
| Distribution to Class I Shareholders: | | | | | | | | | | | | | | | | |
From net investment income | | | | | | | ------- | | | | | | | | (4,651,963 | ) |
| Distribution to Class A Shareholders: | | | | | | | | | | | | | | | | |
From net investment income | | | | | | | ------- | | | | | | | | (11,771 | ) |
| Distribution to Class C Shareholders: | | | | | | | | | | | | | | | | |
From net investment income | | | | | | | ------- | | | | | | | | (2,405 | ) |
| Total distributions | | | | | | | ------- | | | | | | | | (8,064,732 | ) |
| Fund share transactions (Note 3) | | | | | | | 31,523,312 | | | | | | | | (195,414,285 | ) |
| Total increase (decrease) | | | | | | | 4,570,114 | | | | | | | | (243,233,507 | ) |
| Net assets: | | | | | | | | | | | | | | | | |
| Beginning of period | | | | | | | 570,182,959 | | | | | | | | 813,416,466 | |
| End of period | | $ | | | | | 574,753,073 | | | $ | | | | | 570,182,959 | |
| Undistributed net investment income | | $ | | | | | 3,368,669 | | | $ | | | | | 134,419 | |
| The accompanying notes are an integral part of these financial statements. | |
| | | | |
| www.thomaswhitefunds.com | | | 47 | |
THOMAS WHITE FUNDS
Statements of Changes in Net Assets (Unaudited)
| | | | | | | | | | | | | | | | |
| | | Emerging Markets Fund | |
| | | | | | Six Months
Ended April 30,
2016 | | | | | | Year Ended
October 31,
2015 | |
| Change in net assets from operations: | | | | | | | | | | | | | | | | |
Net investment income | | $ | | | | | 205,513 | | | $ | | | | | 848,255 | |
Net realized loss on investments | | | | | | | (8,615,408 | ) | | | | | | | (4,730,678 | ) |
Net unrealized appreciation / depreciation on investments and foreign currency transactions | | | | | | | 6,622,664 | | | | | | | | (12,628,182 | ) |
Net decrease in net assets from operations | | | | | | | (1,787,231 | ) | | | | | | | (16,510,605 | ) |
| Distribution to Investor Class Shareholders: | | | | | | | | | | | | | | | | |
From net investment income | | | | | | | ------- | | | | | | | | (40,074 | ) |
| Distribution to Class I Shareholders: | | | | | | | | | | | | | | | | |
From net investment income | | | | | | | ------- | | | | | | | | (782,686 | ) |
| Distribution to Class A Shareholders: | | | | | | | | | | | | | | | | |
From net investment income | | | | | | | ------- | | | | | | | | (258 | ) |
| Distribution to Class C Shareholders: | | | | | | | | | | | | | | | | |
From net investment income | | | | | | | ------- | | | | | | | | (422 | ) |
| Total distributions | | | | | | | ------- | | | | | | | | (823,440 | ) |
| Fund share transactions (Note 3) | | | | | | | (3,392,034 | ) | | | | | | | 19,415,761 | |
| Total increase (decrease) | | | | | | | (5,179,265 | ) | | | | | | | 2,081,716 | |
| Net assets: | | | | | | | | | | | | | | | | |
| Beginning of period | | | | | | | 84,082,310 | | | | | | | | 82,000,594 | |
| End of period | | $ | | | | | 78,903,045 | | | $ | | | | | 84,082,310 | |
| Undistributed net investment income | | $ | | | | | 205,855 | | | $ | | | | | 342 | |
| The accompanying notes are an integral part of these financial statements. | |
| | |
| 48 | | www.thomaswhitefunds.com |
THOMAS WHITE FUNDS
Statements of Changes in Net Assets (Unaudited)
| | | | | | | | | | | | | | | | |
| | | American Opportunities Fund | |
| | | | | | Six Months
Ended April 30,
2016 | | | | | | Year Ended
October 31,
2015 | |
| Change in net assets from operations: | | | | | | | | | | | | | | | | |
Net investment income | | $ | | | | | 224,460 | | | $ | | | | | 182,196 | |
Net realized gain on investments | | | | | | | 286,716 | | | | | | | | 2,536,826 | |
Net unrealized appreciation / depreciation on investments and foreign currency transactions | | | | | | | (1,558,027 | ) | | | | | | | (462,319 | ) |
Net increase (decrease) in net assets from operations | | | | | | | (1,046,851 | ) | | | | | | | 2,256,703 | |
| Distribution to Investor Class Shareholders: | | | | | | | | | | | | | | | | |
From net investment income | | | | | | | ------- | | | | | | | | (151,429 | ) |
From realized gain | | | | | | | ------- | | | | | | | | (2,568,561 | ) |
| Total distributions | | | | | | | ------- | | | | | | | | (2,719,990 | ) |
| Fund share transactions (Note 3) | | | | | | | (340,129 | ) | | | | | | | 2,508,044 | |
| Total increase (decrease) | | | | | | | (1,386,980 | ) | | | | | | | 2,044,757 | |
| Net assets: | | | | | | | | | | | | | | | | |
| Beginning of period | | | | | | | 35,874,972 | | | | | | | | 33,830,215 | |
| End of period | | $ | | | | | 34,487,992 | | | $ | | | | | 35,874,972 | |
| Undistributed net investment income | | $ | | | | | 245,135 | | | $ | | | | | 20,675 | |
| The accompanying notes are an integral part of these financial statements. | |
| | | | |
| www.thomaswhitefunds.com | | | 49 | |
Notes to Financial Statements Period Ended April 30, 2016 (Unaudited)
NOTE 1. SUMMARY OF ACCOUNTING POLICIES
Lord Asset Management Trust (the “Trust”) was organized as a Delaware business trust on February 9, 1994, as an open-end diversified management investment company. The Trust currently has three series of shares (collectively referred to as the “Funds”) - the Thomas White International Fund (the “International Fund”), which commenced operations with the sale of Investor Class shares on June 28, 1994 and the sale of Class I shares, Class A shares and Class C shares on August 31, 2012; the Thomas White Emerging Markets Fund (the “Emerging Markets Fund”), which commenced operations with the sale of Investor Class shares on June 28, 2010 and the sale of Class I shares, Class A shares and Class C shares on August 31, 2012; and the Thomas White American Opportunities Fund (the “American Opportunities Fund”), which commenced operations with the sale of Investor Class shares on March 4, 1999. The Class A shares and Class C shares are subject to a distribution and service (12b-1) fee of 0.25% and 1.00%, respectively. Class A shares have a maximum front-end sales charge of 5.75% that is included in the offering price of the Class A shares. The Class C shares are subject to a contingent deferred sales charge (“CDSC”) for redemptions. The maximum CDSC is 1.00% based on the lesser of the original purchase price or the value of such shares at the time of redemption for Class C shares within 12 months of purchase. The investment objective of each Fund is to seek long-term capital growth. The International Fund invests in equity securities of companies located in the world’s developed countries outside of the U.S. The Emerging Markets Fund invests in securities of companies located in or whose businesses are closely associated with the world’s emerging markets countries. The American Opportunities Fund primarily invests in U.S. equity securities, with a focus on mid-size and small companies. The following is a summary of significant accounting policies followed in the preparation of the Trust’s financial statements.
(A) VALUATION OF SECURITIES
Securities listed or traded on a recognized national or foreign stock exchange or NASDAQ are valued at the last reported sales prices on the principal exchange on which the securities are traded. NASDAQ National Market securities are valued at the NASDAQ official closing price. Over-the-counter securities and listed securities for which no closing sale price is reported are valued at the mean between the last current bid and ask price. Securities for which market quotations are not readily available are valued at fair value under the Trust’s Valuation Procedures as determined by management and approved in good faith by the Board of Trustees. As of April 30, 2016, all securities within each Fund’s portfolio were valued at the last reported sales price on the principal exchange on which the securities are traded and adjusted by a fair value factor when necessary and as further described below. The Trust has retained an independent statistical fair value pricing service to assist in the fair valuation process for securities principally traded in a foreign market in order to adjust for changes in value that may occur between the close of the foreign exchange and the time at which Fund shares are priced.
| | |
| 50 | | www.thomaswhitefunds.com |
Notes to Financial Statements Period Ended April 30, 2016 (Unaudited)
Short term investments are valued at original cost, which combined with accrued interest, approximates market value.
Fair value is defined as the price that would be received to sell an asset or paid to transfer a liability (i.e., the “exit price”) in an orderly transaction between market participants at the measurement date. In determining fair value, the Fund uses various valuation approaches. A three-tiered fair value hierarchy for inputs is used in measuring fair value that maximizes the use of observable inputs and minimizes the use of unobservable inputs by generally requiring that the most observable inputs be used when available. Observable inputs are those that market participants would use in pricing the asset or liability based on market data obtained from sources independent of a Fund. Unobservable inputs reflect the Fund’s assumptions about the inputs market participants would use in pricing the asset or liability developed based on the best information available in the circumstances. The inputs or methodologies used for valuing securities are not necessarily an indication of the risks associated with investing in those securities.
The fair value hierarchy is categorized into three levels based on the inputs as follows:
Level 1 - Valuations based on unadjusted quoted prices in active markets for identical assets.
Level 2 - Valuations based on quoted prices for similar securities or in markets that are not active or for which all significant inputs are observable, either directly or indirectly.
Level 3 - Valuations based on inputs that are unobservable and significant to the overall fair value measurement.
(B) MULTI-CLASS OPERATIONS AND ALLOCATIONS
Expenses of the Funds that are not directly attributable to a specific class of shares are prorated among the classes based on the relative net assets of each class. Expenses directly attributable to a class of shares, which presently only include 12b-1 distribution fees and administrative services fees, are recorded to the specific class.
Income, realized and unrealized capital gains and losses of the Funds are prorated among the classes based on the relative net assets of each class within each specific Fund.
(C) MARKET RISK
Investing in securities of foreign companies and foreign governments involves special risks and considerations not typically associated with investing in U.S. companies and securities of the U.S. Government. These risks include revaluation of currencies and future adverse political and economic developments. Moreover, securities of many foreign companies and foreign governments and their markets may be less liquid and their prices more volatile than securities of comparable U.S. companies and securities of the U.S. Government.
| | | | |
| www.thomaswhitefunds.com | | | 51 | |
Notes to Financial Statements Period Ended April 30, 2016 (Unaudited)
(D) FOREIGN CURRENCY TRANSLATION
Portfolio securities and other assets and liabilities denominated in foreign currencies are translated into U.S. dollar amounts at date of valuation. Purchases and sales of portfolio securities and income items denominated in foreign currencies are translated into U.S. dollar amounts on the respective dates of such transactions. When a Fund purchases or sells a foreign security, it will customarily enter into a foreign exchange contract to minimize foreign exchange risk from the trade date to the settlement date of such transaction.
The Funds do not isolate the portion of the results of operations resulting from changes in foreign exchange rates on investments from the fluctuations arising from changes in market prices of securities held. Such fluctuations are included with the net realized and unrealized gain or loss from investments.
Net realized gain (loss) on investments and foreign currency transactions include those gains and losses arising from the sale of foreign currencies, currency gains or losses realized between the trade and settlement dates on securities transactions, the differences between the amounts of dividends, and foreign withholding taxes recorded on a Fund’s books, and the U.S. dollar equivalent of the amounts actually received or paid. Net unrealized appreciation (depreciation) on investments and foreign currency translation includes changes in the value of assets and liabilities resulting from exchange rates.
(E) INCOME TAXES
Each Fund is a separate taxpayer for federal income tax purposes. Each Fund intends to distribute substantially all of its net investment income and net capital gains to its shareholders and to otherwise comply with the requirements of Subchapter M of the Internal Revenue Code applicable to regulated investment companies. Therefore, no federal income tax provision is required.
All open tax years and major jurisdictions have been reviewed for the Funds and, based on this review, there are no significant uncertain tax positions that would require recognition in the financial statements. Open tax years are those that are open for exam by taxing authorities and, as of April 30, 2016, open Federal tax years include the tax years ended October 31, 2012 through 2015. The Funds have no examinations in progress and are also not aware of any tax positions for which it is reasonably possible that the total amounts of unrecognized tax benefits will significantly change in the next twelve months.
The Funds accrue for such material foreign taxes on net realized and unrealized gains at the appropriate rate for each country. Based on rates ranging from approximately 10% to 15% there were no material accruals at year end.
| | |
| 52 | | www.thomaswhitefunds.com |
Notes to Financial Statements Period Ended April 30, 2016 (Unaudited)
(F) USE OF ESTIMATES
The preparation of financial statements in conformity with generally accepted accounting principles requires management to make estimates and assumptions that affect the reported amounts of assets and liabilities and disclosure of contingent liabilities at the date of the financial statements and the reported amounts of increases and decreases in net assets from operations during the period. Actual results could differ from these estimates.
The Funds are investment companies and follow accounting and reporting guidance under the Financial Accounting Standards Board (“FASB”) Accounting Standards Codification (“ASC”) Topic 946, “Financial Services-Investment Companies”.
(G) SECURITY TRANSACTIONS AND INVESTMENT INCOME
Security transactions are accounted for on a trade date basis. Interest is accrued on a daily basis and dividend income is recorded on the ex-dividend date, except that certain dividends from foreign securities are recorded when the information is available to the Fund. Realized gains and losses are determined using specific identification.
(H) DISTRIBUTIONS TO SHAREHOLDERS
The Funds usually declare and pay dividends from net investment income annually, but may do so more frequently to avoid excise tax. Distributions of net realized capital gains, if any, will be distributed at least annually.
(I) SECURITIES LENDING
The Funds may lend investment securities to investors who borrow securities in order to complete certain transactions. By lending investment securities, a Fund attempts to increase its net investment income through the receipt of interest earned on loan collateral. Any increase or decline in the market price of the securities loaned that might occur and any interest earned or dividends declared during the term of the loan would be for the account of the Fund. Risks of delay in recovery of the securities or even loss of rights in the collateral may occur should the borrower of the securities fail financially. Risk may also arise to the extent that the value of the securities loaned increases above the value of the collateral received. It is each Fund’s policy to obtain additional collateral from or return excess collateral to the borrower by the end of the next business day. Therefore, the value of the collateral may be temporarily less than the value of the securities on loan.
Funds that lend securities receive cash, cash equivalents, or other securities as collateral. Initial collateral levels shall not be less than 102% of the market value of the borrowed securities (105% if the collateral and the borrowed securities are denominated in different currencies). Marking to market is performed every business day (subject to de minimis rules of change in market value) for each Fund and each borrower is required to deliver additional collateral when
| | | | |
| www.thomaswhitefunds.com | | | 53 | |
Notes to Financial Statements Period Ended April 30, 2016 (Unaudited)
necessary so that the total collateral held in the account for all loans of the Fund to the borrower will not be less than 100% of the market value of all the borrowed securities loaned to the borrower by the Fund. Any cash, cash equivalents, or other securities received as collateral is invested by the securities lending agent in accordance with pre-established guidelines as set forth in the securities lending agreement. The collateral is invested in the Northern Institutional Liquid Asset Portfolio (an open-end regulated investment company) and U.S. Treasury Notes/ Bonds which are shown on the investment portfolios for the International Fund and Emerging Markets Fund. The collateral is reflected in the Funds’ statements of assets and liabilities in the line item labeled “Investments in securities at market value.” A portion of the interest received on the loan collateral is retained by the Fund and the remainder is rebated to the borrower of the securities. From the interest retained by the Funds, 50% is paid to the securities lending agent for the International Fund and Emerging Markets Fund for its services. The net amount of interest earned, after the interest rebate and the allocation to the securities lending agent, is included in the statement of operations as securities lending income. The value of loaned securities and related collateral outstanding at April 30, 2016 are as follows:
| | | | | | | | |
| Fund | | Value of Loaned Securities | | | Value of Collateral | |
| Thomas White International Fund | | | $13,344,182 | | | | $15,168,651 | |
| | | |
| Thomas White Emerging Markets Fund | | | $8,001,406 | | | | $8,100,306 | |
The International Fund and the Emerging Markets Fund have earned interest income on securities lending (after rebates to borrowers and allocation to the securities lending agent) as follows:
| | | | |
| Fund | | Net Interest Earned | |
| Thomas White International Fund | | | $15,120 | |
| | |
| Thomas White Emerging Markets Fund | | | $2,558 | |
| | |
| 54 | | www.thomaswhitefunds.com |
Notes to Financial Statements Period Ended April 30, 2016 (Unaudited)
The Funds recently adopted guidance requiring entities to present gross obligations for secured borrowings by the type of collateral pledged and remaining time to maturity. The table below outlines the nature of these obligations at April 30, 2016.
| | | | | | | | | | | | | | | | | | | | |
| | | Overnight and
Continuous | | | Up to 30
Days | | | 30-90 Days | | | Greater than
90 Days | | | Total | |
| Securities lending transactions | | | | | | | | | | | | | | | | | | | | |
U.S. Treasury and agency securities | | | | | | | | | | | | | | | | | | | | |
Thomas White International Fund | | $ | 15,168,651 | | | $ | ------- | | | $ | ------- | | | $ | ------- | | | $ | 15,168,651 | |
Thomas White Emerging Markets Fund | | | 2,941 | | | | ------- | | | | ------- | | | | ------- | | | | 2,941 | |
Money Market Fund^ | | | | | | | | | | | | | | | | | | | | |
Thomas White Emerging Markets Fund | | | 8,097,365 | | | | ------- | | | | ------- | | | | ------- | | | | 8,097,365 | |
| | | | | | | | | | | | | | | | | | | | |
| Total Borrowings | | $ | 23,268,957 | | | $ | ------- | | | $ | ------- | | | $ | ------- | | | $ | 23,268,957 | �� |
| | | | | | | | | | | | | | | | | | | | |
| | ^ | Represents an interest in Northern Institutional Liquid Assets Portfolio, an investment purchased with cash proceeds from securities lending collateral received. |
(J) REDEMPTION FEE
The Funds assess a 2% fee on redemptions (including exchanges) of Fund shares held for less than sixty days. Redemption fees are paid to each Fund to help offset transaction costs and to protect the Fund’s long-term shareholders. Each Fund will use the “first-in, first-out” (FIFO) method to determine the sixty-day holding period. Under this method, the date of the redemption or exchange will be compared to the earliest purchase date of shares held in the account. If this holding period is less than sixty days, the fee will be charged. The International Fund Investor Class and Class I shares charged $1,126 and $4,879, respectively in redemption fees for the period ended April 30, 2016, which were included in net capital paid.
(K) REAL ESTATE INVESTMENT TRUSTS
The American Opportunities Fund has made certain investments in real estate investment trusts (“REITs”), which pay dividends to their shareholders based upon funds available from operations. It is quite common for these dividends to exceed the REITs’ taxable earnings and profits resulting in the excess portion of such dividends being designated as a return of capital. The American Opportunities Fund intends to include the gross dividends from such REITs in its annual distributions to its shareholders and, accordingly, a portion of the distributions received by the Fund’s shareholders may also be designated as a return of capital.
| | | | |
| www.thomaswhitefunds.com | | | 55 | |
Notes to Financial Statements Period Ended April 30, 2016 (Unaudited)
NOTE 2. SIGNIFICANT SHAREHOLDER
The following table indicates the number of shareholders who held a significant portion of the shares of each Class’s outstanding shares as of April 30, 2016. Investment activities of these shareholders could have a material effect on each Fund.
| | | | | | | | | | |
| Fund | | Share Class | | Number of
Shareholders | | | % Held | |
| International Fund | | Class A | | | 2 | | | | 30.2% | |
| | | | |
| Emerging Markets Fund | | Investor Class | | | 2 | | | | 71.4% | |
| | | | |
| Emerging Markets Fund | | Class I | | | 3 | | | | 47.1% | |
| | | | |
| Emerging Markets Fund | | Class A | | | 2 | | | | 99.5% | |
| | | | |
| Emerging Markets Fund | | Class C | | | 1 | | | | 90.7% | |
| | | | |
| American Opportunities Fund | | Investor Class | | | 3 | | | | 78.0% | |
NOTE 3. TRANSACTIONS IN SHARES OF BENEFICIAL INTEREST
As of April 30, 2016, there were an unlimited number of $0.01 par value shares of beneficial interest authorized. Transactions are summarized as follows:
| | | | | | | | | | | | | | | | | | | | | | | | |
| International Fund | |
| | | Six Months Ended
April 30, 2016 | | | Year Ended October 31, 2015 | |
| | | Investor Class | | | Investor Class | |
| | | Shares | | | | | | Amount | | | Shares | | | | | | Amount | |
| Shares sold | | | 761,791 | | | $ | | | | | 11,374,734 | | | | 4,047,694 | | | $ | | | | | 66,731,001 | |
| Shares issued on reinvestment of dividends & distributions | | | ------- | | | | | | | | ------- | | | | 212,127 | | | | | | | | 3,345,233 | |
| Shares redeemed | | | (4,257,887 | ) | | | | | | | (64,259,079 | ) | | | (8,999,408 | ) | | | | | | | (148,440,535 | ) |
| Net decrease | | | (3,496,096 | ) | | $ | | | | | (52,884,345 | ) | | | (4,739,587 | ) | | $ | | | | | (78,364,301 | ) |
| Shares outstanding: | | | | | | | | | | | | | | | | | | | | | | | | |
| Beginning of period | | | 17,029,731 | | | | | | | | | | | | 21,769,318 | | | | | | | | | |
| End of period | | | 13,533,635 | | | | | | | | | | | | 17,029,731 | | | | | | | | | |
| | |
| 56 | | www.thomaswhitefunds.com |
Notes to Financial Statements Period Ended April 30, 2016 (Unaudited)
| | | | | | | | | | | | | | | | | | | | | | | | |
| | | Six Months Ended
April 30, 2016 | | | Year Ended October 31, 2015 | |
| | | Class I | | | Class I | |
| | | Shares | | | | | | Amount | | | Shares | | | | | | Amount | |
| Shares sold | | | 9,657,844 | | | $ | | | | | 146,168,276 | | | | 3,594,961 | | | $ | | | | | 59,462,022 | |
| Shares issued on reinvestment of dividends & distributions | | | ------- | | | | | | | | ------- | | | | 214,248 | | | | | | | | 3,382,965 | |
| Shares redeemed | | | (4,067,295 | ) | | | | | | | (61,596,735 | ) | | | (10,900,809 | ) | | | | | | | (180,400,597 | ) |
| Net increase (decrease) | | | 5,590,549 | | | $ | | | | | 84,571,541 | | | | (7,091,600 | ) | | $ | | | | | (117,555,610 | ) |
| Shares outstanding: | | | | | | | | | | | | | | | | | | | | | | | | |
| Beginning of period | | | 19,029,485 | | | | | | | | | | | | 26,121,085 | | | | | | | | | |
| End of period | | | 24,620,034 | | | | | | | | | | | | 19,029,485 | | | | | | | | | |
| | | | | | | | | | | | | | | | | | | | | | | | |
| | | Six Months Ended
April 30, 2016 | | | Year Ended October 31, 2015 | |
| | | Class A | | | Class A | |
| | | Shares | | | | | | Amount | | | Shares | | | | | | Amount | |
| Shares sold | | | 2,192 | | | $ | | | | | 32,416 | | | | 44,854 | | | $ | | | | | 740,230 | |
| Shares issued on reinvestment of dividends & distributions | | | ------- | | | | | | | | ------- | | | | 301 | | | | | | | | 4,725 | |
| Shares redeemed | | | (3,375 | ) | | | | | | | (49,507 | ) | | | (4,299 | ) | | | | | | | (71,222 | ) |
| Net increase (decrease) | | | (1,183 | ) | | $ | | | | | (17,091 | ) | | | 40,856 | | | $ | | | | | 673,733 | |
| Shares outstanding: | | | | | | | | | | | | | | | | | | | | | | | | |
| Beginning of period | | | 57,722 | | | | | | | | | | | | 16,866 | | | | | | | | | |
| End of period | | | 56,539 | | | | | | | | | | | | 57,722 | | | | | | | | | |
| | | | | | | | | | | | | | | | | | | | | | | | |
| | | Six Months Ended
April 30, 2016 | | | Year Ended October 31, 2015 | |
| | | Class C | | | Class C | |
| | | Shares | | | | | | Amount | | | Shares | | | | | | Amount | |
| Shares sold | | | 35 | | | $ | | | | | 533 | | | | 8,218 | | | $ | | | | | 137,988 | |
| Shares issued on reinvestment of dividends & distributions | | | ------- | | | | | | | | ------- | | | | 116 | | | | | | | | 1,823 | |
| Shares redeemed | | | (9,808 | ) | | | | | | | (147,326 | ) | | | (18,851 | ) | | | | | | | (307,918 | ) |
| Net decrease | | | (9,773 | ) | | $ | | | | | (146,793 | ) | | | (10,517 | ) | | $ | | | | | (168,107 | ) |
| Shares outstanding: | | | | | | | | | | | | | | | | | | | | | | | | |
| Beginning of period | | | 27,164 | | | | | | | | | | | | 37,681 | | | | | | | | | |
| End of period | | | 17,391 | | | | | | | | | | | | 27,164 | | | | | | | | | |
| | | | |
| www.thomaswhitefunds.com | | | 57 | |
Notes to Financial Statements Period Ended April 30, 2016 (Unaudited)
| | | | | | | | | | | | | | | | | | | | | | | | |
| Emerging Markets Fund | |
| | | Six Months Ended
April 30, 2016 | | | Year Ended October 31, 2015 | |
| | | Investor Class | | | Investor Class | |
| | | Shares | | | | | | Amount | | | Shares | | | | | | Amount | |
| Shares sold | | | 918 | | | $ | | | | | 8,435 | | | | 4,760 | | | $ | | | | | 51,545 | |
| Shares issued on reinvestment of dividends & distributions | | | ------- | | | | | | | | ------- | | | | 3,454 | | | | | | | | 33,191 | |
| Shares redeemed | | | (258,828 | ) | | | | | | | (2,285,805 | ) | | | (16,066 | ) | | | | | | | (170,582 | ) |
| Net decrease | | | (257,910 | ) | | $ | | | | | (2,277,370 | ) | | | (7,852 | ) | | $ | | | | | (85,846 | ) |
| Shares outstanding: | | | | | | | | | | | | | | | | | | | | | | | | |
| Beginning of period | | | 440,838 | | | | | | | | | | | | 448,690 | | | | | | | | | |
| End of period | | | 182,928 | | | | | | | | | | | | 440,838 | | | | | | | | | |
| | | | | | | | | | | | | | | | | | | | | | | | |
| | | Six Months Ended
April 30, 2016 | | | Year Ended October 31, 2015 | |
| | | Class I | | | Class I | |
| | | Shares | | | | | | Amount | | | Shares | | | | | | Amount | |
| Shares sold | | | 282,755 | | | $ | | | | | 2,568,846 | | | | 2,248,411 | | | $ | | | | | 24,898,001 | |
| Shares issued on reinvestment of dividends & distributions | | | ------- | | | | | | | | ------- | | | | 55,520 | | | | | | | | 536,878 | |
| Shares redeemed | | | (406,680 | ) | | | | | | | (3,737,504 | ) | | | (555,272 | ) | | | | | | | (6,113,311 | ) |
| Net increase (decrease) | | | (123,925 | ) | | $ | | | | | (1,168,658 | ) | | | 1,748,659 | | | $ | | | | | 19,321,568 | |
| Shares outstanding: | | | | | | | | | | | | | | | | | | | | | | | | |
| Beginning of period | | | 8,365,434 | | | | | | | | | | | | 6,616,775 | | | | | | | | | |
| End of period | | | 8,241,509 | | | | | | | | | | | | 8,365,434 | | | | | | | | | |
| | | | | | | | | | | | | | | | | | | | | | | | |
| | | Six Months Ended
April 30, 2016 | | | Year Ended October 31, 2015 | |
| | | Class A | | | Class A | |
| | | Shares | | | | | | Amount | | | Shares | | | | | | Amount | |
| Shares sold | | | 2,687 | | | $ | | | | | 24,000 | | | | ------- | | | $ | | | | | ------- | |
| Shares issued on reinvestment of dividends & distributions | | | ------- | | | | | | | | ------- | | | | 27 | | | | | | | | 258 | |
| Shares redeemed | | | (0 | ) | | | | | | | (3 | ) | | | (1,965 | ) | | | | | | | (21,661 | ) |
| Net increase (decrease) | | | 2,687 | | | $ | | | | | 23,997 | | | | (1,938 | ) | | $ | | | | | (21,403 | ) |
| Shares outstanding: | | | | | | | | | | | | | | | | | | | | | | | | |
| Beginning of period | | | 5,630 | | | | | | | | | | | | 7,568 | | | | | | | | | |
| End of period | | | 8,317 | | | | | | | | | | | | 5,630 | | | | | | | | | |
| | |
| 58 | | www.thomaswhitefunds.com |
Notes to Financial Statements Period Ended April 30, 2016 (Unaudited)
| | | | | | | | | | | | | | | | | | | | | | | | |
| | | Six Months Ended
April 30, 2016 | | | Year Ended October 31, 2015 | |
| | | Class C | | | Class C | |
| | | Shares | | | | | | Amount | | | Shares | | | | | | Amount | |
| Shares sold | | | 3,376 | | | $ | | | | | 30,000 | | | | 18,990 | | | $ | | | | | 201,061 | |
| Shares issued on reinvestment of dividends & distributions | | | ------- | | | | | | | | ------- | | | | 44 | | | | | | | | 422 | |
| Shares redeemed | | | (0 | ) | | | | | | | (3 | ) | | | (4 | ) | | | | | | | (41 | ) |
| Net increase | | | 3,376 | | | $ | | | | | 29,997 | | | | 19,030 | | | $ | | | | | 201,442 | |
| Shares outstanding: | | | | | | | | | | | | | | | | | | | | | | | | |
| Beginning of period | | | 21,338 | | | | | | | | | | | | 2,308 | | | | | | | | | |
| End of period | | | 24,714 | | | | | | | | | | | | 21,338 | | | | | | | | | |
| | | | | | | | | | | | | | | | | | | | | | | | |
| American Opportunities Fund | |
| | | Six Months Ended
April 30, 2016 | | | Year Ended October 31, 2015 | |
| | | Investor Class | | | Investor Class | |
| | | Shares | | | | | | Amount | | | Shares | | | | | | Amount | |
| Shares sold | | | 14,226 | | | $ | | | | | 211,364 | | | | 44,004 | | | $ | | | | | 724,610 | |
| Shares issued on reinvestment of dividends & distributions | | | ------- | | | | | | | | ------- | | | | 167,611 | | | | | | | | 2,566,130 | |
| Shares redeemed | | | (36,166 | ) | | | | | | | (551,493 | ) | | | (48,833 | ) | | | | | | | (782,696 | ) |
| Net increase (decrease) | | | (21,940 | ) | | $ | | | | | (340,129 | ) | | | 162,782 | | | $ | | | | | 2,508,044 | |
| Shares outstanding: | | | | | | | | | | | | | | | | | | | | | | | | |
| Beginning of period | | | 2,299,065 | | | | | | | | | | | | 2,136,283 | | | | | | | | | |
| End of period | | | 2,277,125 | | | | | | | | | | | | 2,299,065 | | | | | | | | | |
NOTE 4. INVESTMENT MANAGEMENT FEES AND OTHER TRANSACTIONS WITH AFFILIATES
Each Fund pays a monthly investment management fee to Thomas White International, Ltd. (the “Advisor”) at the rate of 0.85% of the Fund’s average daily net assets annually. For the period ended April 30, 2016, the International Fund, Emerging Markets Fund and American Opportunities Fund paid the Advisor $2,398,781, $334,227 and $143,646, respectively, in investment management fees.
During the period ended April 30, 2016, the Advisor has contractually agreed to reimburse its management fee and/or reimburse the Funds’ operating expenses to the extent necessary to
| | | | |
| www.thomaswhitefunds.com | | | 59 | |
Notes to Financial Statements Period Ended April 30, 2016 (Unaudited)
ensure that each Fund’s annual operating expenses do not exceed the following percentages of average daily net assets:
| | | | | | | | | | | | | | | | |
| | | Investor Class | | | Class I | | | Class A | | | Class C | |
| International Fund | | | 1.24% | | | | 0.99% | | | | 1.49% | | | | 1.99% | |
| Emerging Markets Fund | | | 1.34% | | | | 1.09% | | | | 1.59% | | | | 2.09% | |
| American Opportunities Fund | | | 1.34% | | | | n/a | | | | n/a | | | | n/a | |
These agreements to reimburse fees renew automatically unless the Advisor gives written notice to end them.
The Advisor may recoup any previously waived amount from a Fund pursuant to the expense limitation agreements if such reimbursement does not cause the Fund to exceed either (i) the current expense limitation or (ii) the expense limitation in effect at the time the expense is waived, provided the reimbursement is made within three years after the year in which the Advisor incurred the expense. For the period ended April 30, 2016, the Advisor recouped the following amounts:
| | | | | | | | |
| Fund | | Share Class | | | Recoupment Amount | |
| Emerging Markets Fund | | | Investor Class | | | | $484 | |
As of April 30, 2016, the International and Emerging Markets Funds had the following amounts (and year of expiration) subject to repayment to the Advisor:
| | | | | | | | | | | | | | |
| Fund | | Share Class | | Year Fees Waived | | | Repayment Expires | | | Balance | |
| International Fund | | Investor Class | | | 2013 | | | | 2016 | | | | $304,097 | |
| International Fund | | Investor Class | | | 2014 | | | | 2017 | | | | $119,375 | |
| International Fund | | Investor Class | | | 2015 | | | | 2018 | | | | $235,702 | |
| International Fund | | Investor Class | | | 2016 | | | | 2019 | | | | $113,456 | |
| International Fund | | Class I | | | 2013 | | | | 2016 | | | | $352,884 | |
| International Fund | | Class I | | | 2014 | | | | 2017 | | | | $276,870 | |
| International Fund | | Class I | | | 2015 | | | | 2018 | | | | $309,206 | |
| International Fund | | Class I | | | 2016 | | | | 2019 | | | | $197,616 | |
| International Fund | | Class C | | | 2013 | | | | 2016 | | | | $316 | |
| International Fund | | Class C | | | 2014 | | | | 2017 | | | | $368 | |
| International Fund | | Class C | | | 2015 | | | | 2018 | | | | $394 | |
| International Fund | | Class C | | | 2016 | | | | 2019 | | | | $211 | |
| Emerging Markets Fund | | Investor Class | | | 2013 | | | | 2016 | | | | $15,825 | |
| Emerging Markets Fund | | Class I | | | 2013 | | | | 2016 | | | | $157,801 | |
| Emerging Markets Fund | | Class I | | | 2014 | | | | 2017 | | | | $111,683 | |
| | |
| 60 | | www.thomaswhitefunds.com |
Notes to Financial Statements Period Ended April 30, 2016 (Unaudited)
| | | | | | | | | | | | | | |
| Fund | | Share Class | | Year Fees Waived | | | Repayment Expires | | | Balance | |
| Emerging Markets Fund | | Class I | | | 2015 | | | | 2018 | | | | $126,544 | |
| Emerging Markets Fund | | Class I | | | 2016 | | | | 2019 | | | | $76,677 | |
| Emerging Markets Fund | | Class A | | | 2013 | | | | 2016 | | | | $36 | |
| Emerging Markets Fund | | Class A | | | 2014 | | | | 2017 | | | | $100 | |
| Emerging Markets Fund | | Class A | | | 2015 | | | | 2018 | | | | $44 | |
| Emerging Markets Fund | | Class A | | | 2016 | | | | 2019 | | | | $23 | |
| Emerging Markets Fund | | Class C | | | 2013 | | | | 2016 | | | | $1 | |
| Emerging Markets Fund | | Class C | | | 2014 | | | | 2017 | | | | $3 | |
| Emerging Markets Fund | | Class C | | | 2015 | | | | 2018 | | | | $266 | |
| Emerging Markets Fund | | Class C | | | 2016 | | | | 2019 | | | | $215 | |
The Funds and U.S. Bancorp Fund Services, LLC (the “Administrator”) are parties to a Fund Administration Servicing Agreement. The Administrator provides administrative and fund accounting services pursuant to this agreement.
The Advisor and the Funds have adopted a Business Management Agreement under which the Advisor provides certain business management services to the Funds, including, without limitation, monitoring of the Funds’ relationships with third-party service providers and assisting with necessary and appropriate services to the Board of Trustees of the Trust. For these services, the Advisor is entitled to receive a fee from each Fund at a rate of 0.035% of the Fund’s average daily net assets. For the period ended April 30, 2016, for the services provided under the Business Management Agreement, the International Fund, Emerging Markets Fund, and American Opportunities Fund paid the Advisor $98,773, $13,762 and $5,915, respectively.
The Funds have adopted an Administrative Services Plan pursuant to which the Class A shares and Investor Class shares are authorized to make payments to certain entities, which may include banks, broker-dealers and other types of service providers, for providing administrative services with respect to shares of the Funds attributable to or held in the name of the service provider for its clients or customers with whom they have a servicing relationship. Under the terms of the Administrative Services Plan, Class A shares and Investor Class shares are authorized to make payments up to a maximum rate of 0.25% of the average daily net assets of the shares attributable to or held in the name of the service provider for providing the types of applicable administrative services covered under the terms of the Plan. For the period ended April 30, 2016, fees incurred by the International Fund pursuant to the Administrative Services Plan were $262,885 for Investor Class and $265 for Class A shares. For the period ended April 30, 2016, fees incurred by the Emerging Markets Fund pursuant to the Administrative Services Plan were $295 for Investor Class and $37 for Class A shares. For the period ended
| | | | |
| www.thomaswhitefunds.com | | | 61 | |
Notes to Financial Statements Period Ended April 30, 2016 (Unaudited)
April 30, 2016, fees incurred by the American Opportunities Fund pursuant to the Administrative Services Plan were $1,240 for Investor Class shares.
NOTE 5. SHAREHOLDER SERVICING AND DISTRIBUTION PLANS
The International Fund and Emerging Markets Fund have adopted a distribution and shareholder service plan (the “Plan”) pursuant to Rule 12b-1 under the Investment Company Act of 1940. The Plan allows the International Fund and Emerging Markets Fund to compensate Quasar Distributors, LLC for the costs incurred in distributing the Funds’ Class A shares and Class C shares, including amounts paid to brokers or dealers, at an annual rate of 0.25% and 1.00%, respectively, of the average daily net assets of each share Class. For the period ended April 30, 2016, fees incurred by the International Fund pursuant to the Plan were $1,061 for Class A and $1,754 for Class C shares. For the period ended April 30, 2016, fees incurred by the Emerging Markets Fund were $82 for Class A and $1,050 for Class C shares.
NOTE 6. CUSTODIAN AND TRANSFER AGENT FEES
Custodian Fees - Northern Trust is the custodian for the International Fund and Emerging Markets Fund. U.S. Bank is the custodian for the American Opportunities Fund. Northern Trust bills the International Fund and the Emerging Markets Fund quarterly based on the value of their holdings as of the previous quarter end plus transaction fees. U.S. Bank bills the American Opportunities Fund monthly based on the ending value of its holdings plus transaction fees.
Transfer Agent - U.S. Bancorp serves as the Funds’ transfer agent. Under the terms of the transfer agent agreement, U.S. Bancorp is entitled to account-based fees along with reimbursement of out-of-pocket expenses incurred in providing transfer agent services.
NOTE 7. INVESTMENT TRANSACTIONS
During the period ended April 30, 2016, the cost of purchases and the proceeds from sales of investment securities, other than short-term investments, were as follows:
| | | | | | | | |
| Fund | | Purchases | | | Sales | |
| International Fund | | | $191,396,658 | | | | $157,917,694 | |
| | | |
| Emerging Markets Fund | | | 23,470,275 | | | | 23,274,301 | |
| | | |
| American Opportunities Fund | | | 14,325,741 | | | | 14,777,517 | |
The American Opportunities Fund did not purchase or sell long-term U.S. Government securities during the period ended April 30, 2016. The International Fund and Emerging Markets Fund did not directly purchase or sell long term U.S. Government securities, except for purposes of securities lending during the period ended April 30, 2016.
| | |
| 62 | | www.thomaswhitefunds.com |
Notes to Financial Statements Period Ended April 30, 2016 (Unaudited)
At October 31, 2015, the aggregate gross unrealized appreciation and depreciation of portfolio securities, based upon cost for federal income tax purposes, were as follows:
| | | | | | | | | | | | | | | | |
| Fund | | Tax Cost | | | Unrealized
Appreciation | | | Unrealized
Depreciation | | | Net Unrealized
Appreciation/
(Depreciation) | |
| International Fund | | | $538,477,883 | | | | $75,151,739 | | | | $(31,868,015) | | | | $43,283,724 | |
| | | | | |
| Emerging Markets Fund | | | 95,633,569 | | | | 7,881,493 | | | | (14,689,660) | | | | (6,808,167) | |
| | | | | |
| American Opportunities Fund | | | 27,810,518 | | | | 8,570,099 | | | | (853,008) | | | | 7,717,091 | |
Distributions to Shareholders
The Funds will distribute net investment income and net realized gains, if any, at least once a year. The amount of distributions from net investment income and net realized gains are determined in accordance with federal income tax regulations, which may differ from generally accepted accounting principles. These “book/tax” differences are either temporary or permanent in nature and are primarily due to differing treatments for passive foreign investment companies and losses deferred due to wash sales. Permanent differences, primarily due to reclassification of REIT income, resulted in reclassifications among the Funds’ components of net assets at October 31, 2015, the Funds’ tax year-end. For the International Fund, permanent differences resulted in reclassification of ($714,763) in undistributed net investment income/(loss), $714,712 in accumulated net realized gain and $51 in paid in capital. For the Emerging Markets Fund, permanent differences resulted in reclassification of ($20,871) in undistributed net investment income/(loss) and $20,871 in accumulated net realized gain/(loss). For the American Opportunities Fund, permanent differences resulted in reclassification of ($23,568) in undistributed net investment loss, $25,237 in accumulated net realized gain and ($1,669) in paid in capital.
| | | | | | | | | | | | | | | | | | | | |
| Fund | | Undistributed
Ordinary
Income | | | Undistributed
Long-term
Gains | | | Net Unrealized
Appreciation | | | Other
Accumulated
Losses | | | Total
Distributable
Earnings | |
| International Fund | | | $134,419 | | | | $------- | | | | $43,283,724 | | | | $(30,745,393) | | | | $12,672,750 | |
| | | | | | |
| Emerging Markets Fund | | | 3,607 | | | | ------- | | | | (6,808,167) | | | | (5,751,886) | | | | (12,556,446) | |
| | | | | | |
| American Opportunities Fund | | | ------- | | | | ------- | | | | 7,717,090 | | | | ------- | | | | 7,717,090 | |
During the year ended October 31, 2015, the Emerging Markets Fund utilized $1,055,031 in capital loss carryovers.
Under the Regulated Investment Company Modernization Act of 2010, the Funds are permitted to carry forward capital losses incurred in taxable years beginning after December 22, 2010 for an unlimited period, and such capital losses will retain their character as either short-term or
| | | | |
| www.thomaswhitefunds.com | | | 63 | |
Notes to Financial Statements Period Ended April 30, 2016 (Unaudited)
long-term capital losses. Capital losses incurred by the Funds in taxable years beginning before December 23, 2010 may only be carried forward eight taxable years as short-term capital losses. Any losses incurred during those future taxable years will be required to be utilized prior to the losses incurred in pre-enactment taxable years. As a result of this, pre-enactment capital loss carryforwards may be more likely to expire unused.
As of October 31, 2015, the International Fund had $30,510,210 in short-term capital loss carry forwards with no expiration. As of October 31, 2015, the Emerging Markets Fund had $4,187,687 in short-term capital loss carry forwards with no expiration, and had $1,557,835 in long-term capital loss carry forwards with no expiration.
During the period ended April 30, 2016, the Funds did not pay any dividends.
The tax character of distributions paid during the periods shown below were as follows:
| | | | | | | | | | | | | | | | |
| | | Year Ended October 31, 2015 | |
| | | Ordinary
Income | | | Return of
Capital | | | Long-Term
Capital Gains | | | Total
Distributions | |
| International Fund | | | $8,064,732 | | | | $------- | | | | $------- | | | | $8,064,732 | |
| | | | | |
| Emerging Markets Fund | | | 823,440 | | | | ------- | | | | ------- | | | | 823,440 | |
| | | | | |
| American Opportunities Fund | | | 152,611 | | | | ------- | | | | 2,567,379 | | | | 2,719,990 | |
NOTE 8. SUBSEQUENT EVENTS
In preparing these financial statements, the Trust has evaluated events after April 30, 2016 and determined that there were no significant subsequent events that would require adjustment to or additional disclosure in these financial statements.
| | |
| 64 | | www.thomaswhitefunds.com |
Six Months Ended April 30, 2016 (Unaudited)
FINANCIAL HIGHLIGHTS
| | | | | | | | | | | | | | | | | | | | | | | | | | | | | | | | | | | | | | | | | | | | | | | | |
| Thomas White International Fund - Investor Class | |
| | | | | | Six Months
Ended
April 30,
2016 | | | | | | Year
Ended
October 31,
2015 | | | | | | Year
Ended
October 31,
2014 | | | | | | Year
Ended
October 31,
2013 | | | | | | Year
Ended
October 31,
2012^ | | | | | | Year
Ended
October 31,
2011 | |
| |
| Per share operating performance (For a share outstanding throughout the period) | |
| Net asset value, beginning of period | | | $ | | | | 15.77 | | | | $ | | | | 16.95 | | | | $ | | | | 19.16 | | | | $ | | | | 16.55 | | | | $ | | | | 15.55 | | | | $ | | | | 16.75 | |
| | | | | | | | | | | | | |
| Income from investment operations: | | | | | | | | | | | | | | | | | | | | | | | | | | | | | | | | | | | | | | | | | | | | | | | | |
Net investment income 1 | | | | | | | 0.07 | | | | | | | | 0.19 | | | | | | | | 0.26 | | | | | | | | 0.26 | | | | | | | | 0.31 | | | | | | | | 0.29 | |
Net realized and unrealized gains/(losses) | | | | | | | (0.83 | ) | | | | | | | (1.17 | ) | | | | | | | (0.89 | ) | | | | | | | 2.57 | | | | | | | | 0.97 | | | | | | | | (1.20 | ) |
| Total from investment operations | | | | | | | (0.76 | ) | | | | | | | (0.98 | ) | | | | | | | (0.63 | ) | | | | | | | 2.83 | | | | | | | | 1.28 | | | | | | | | (0.91 | ) |
| | | | | | | | | | | | | |
| Distributions: | | | | | | | | | | | | | | | | | | | | | | | | | | | | | | | | | | | | | | | | | | | | | | | | |
From net investment income | | | | | | | ------- | | | | | | | | (0.20 | ) | | | | | | | (0.26 | ) | | | | | | | (0.22 | ) | | | | | | | (0.28 | ) | | | | | | | (0.29 | ) |
From net realized gains | | | | | | | ------- | | | | | | | | ------- | | | | | | | | (1.32 | ) | | | | | | | ------- | | | | | | | | ------- | | | | | | | | ------- | |
Tax return of capital | | | | | | | ------- | | | | | | | | ------- | | | | | | | | ------- | | | | | | | | (0.00 | ) 2 | | | | | | | ------- | | | | | | | | ------- | |
| Total Distributions | | | | | | | ------- | | | | | | | | (0.20 | ) | | | | | | | (1.58 | ) | | | | | | | (0.22 | ) | | | | | | | (0.28 | ) | | | | | | | (0.29 | ) |
| Change in net asset value for the period | | | | | | | (0.76 | ) | | | | | | | (1.18 | ) | | | | | | | (2.21 | ) | | | | | | | 2.61 | | | | | | | | 1.00 | | | | | | | | (1.20 | ) |
| Net asset value, end of period | | | $ | | | | 15.01 | | | | $ | | | | 15.77 | | | | $ | | | | 16.95 | | | | $ | | | | 19.16 | | | | $ | | | | 16.55 | | | | $ | | | | 15.55 | |
| Total Return | | | | | | | (4.82)% | 3 | | | | | | | (5.77)% | | | | | | | | (3.00)% | | | | | | | | 17.13% | | | | | | | | 8.25% | | | | | | | | (5.42)% | |
| | | | | | | | | | | | | |
| Ratios/supplemental data | | | | | | | | | | | | | | | | | | | | | | | | | | | | | | | | | | | | | | | | | | | | | | | | |
| Net assets, end of period (000) | | | $ | | | | 203,197 | | | | $ | | | | 268,518 | | | | $ | | | | 369,098 | | | | $ | | | | 433,483 | | | | $ | | | | 540,118 | | | | $ | | | | 478,255 | |
| | | | | | | | | | | | | |
| Ratio to average net assets: | | | | | | | | | | | | | | | | | | | | | | | | | | | | | | | | | | | | | | | | | | | | | | | | |
Expenses
(net of reimbursement) | | | | | | | 1.24% | 4 | | | | | | | 1.24% | | | | | | | | 1.24% | | | | | | | | 1.24% | | | | | | | | 1.31% | 5 | | | | | | | 1.34% | |
Expenses
(prior to reimbursement) | | | | | | | 1.34% | 4 | | | | | | | 1.32% | | | | | | | | 1.27% | | | | | | | | 1.31% | | | | | | | | 1.37% | 5 | | | | | | | 1.34% | |
Net investment income
(net of reimbursement) | | | | | | | 0.88% | 4 | | | | | | | 1.16% | | | | | | | | 1.36% | | | | | | | | 1.43% | | | | | | | | 1.94% | 5 | | | | | | | 1.70% | |
Net investment income
(prior to reimbursement) | | | | | | | 0.78% | 4 | | | | | | | 1.08% | | | | | | | | 1.33% | | | | | | | | 1.36% | | | | | | | | 1.88% | 5 | | | | | | | 1.70% | |
| Portfolio turnover rate 6 | | | | | | | 28% | | | | | | | | 57% | | | | | | | | 62% | | | | | | | | 42% | | | | | | | | 66% | | | | | | | | 41% | |
| ^ | On August 31, 2012, the initial class of shares was renamed the Investor Class. |
| (1) | Net investment income per share represents net investment income divided by the average shares outstanding throughout the period. |
| (2) | Amount is less than $0.005. |
| (5) | Effective August 31, 2012, the expense cap was decreased from 1.40% to 1.24%. |
| (6) | Portfolio turnover is calculated on the basis of the Fund as a whole without distinguishing between the classes of shares issued. |
The accompanying notes are an integral part of these financial statements
| | | | |
| www.thomaswhitefunds.com | | | 65 | |
Six Months Ended April 30, 2016 (Unaudited)
FINANCIAL HIGHLIGHTS
| | | | | | | | | | | | | | | | | | | | | | | | | | | | | | | | | | | | | | | | |
| Thomas White International Fund - Class I | |
| | | | | | Six Months
Ended
April 30,
2016 | | | | | | Year
Ended
October 31,
2015 | | | | | | Year
Ended
October 31,
2014 | | | | | | Year
Ended
October 31,
2013 | | | | | | August 31,
2012^
through
October 31,
2012 | |
| |
| Per share operating performance (For a share outstanding throughout the period) | |
| Net asset value, beginning of period | | | $ | | | | 15.78 | | | | $ | | | | 16.97 | | | | $ | | | | 19.18 | | | | $ | | | | 16.56 | | | | $ | | | | 16.23 | |
| | | | | | | | | | | |
| Income from investment operations: | | | | | | | | | | | | | | | | | | | | | | | | | | | | | | | | | | | | | | | | |
Net investment income 1 | | | | | | | 0.10 | | | | | | | | 0.23 | | | | | | | | 0.30 | | | | | | | | 0.29 | | | | | | | | 0.07 | |
Net realized and unrealized gains/(losses) | | | | | | | (0.83 | ) | | | | | | | (1.17 | ) | | | | | | | (0.89 | ) | | | | | | | 2.59 | | | | | | | | 0.55 | |
| Total from investment operations | | | | | | | (0.73 | ) | | | | | | | (0.94 | ) | | | | | | | (0.59 | ) | | | | | | | 2.88 | | | | | | | | 0.62 | |
| | | | | | | | | | | |
| Distributions: | | | | | | | | | | | | | | | | | | | | | | | | | | | | | | | | | | | | | | | | |
From net investment income | | | | | | | ------- | | | | | | | | (0.25 | ) | | | | | | | (0.30 | ) | | | | | | | (0.26 | ) | | | | | | | (0.29 | ) |
From net realized gains | | | | | | | ------- | | | | | | | | ------- | | | | | | | | (1.32 | ) | | | | | | | ------- | | | | | | | | ------- | |
Tax return of capital | | | | | | | ------- | | | | | | | | ------- | | | | | | | | ------- | | | | | | | | (0.00 | ) 2 | | | | | | | ------- | |
| Total Distributions | | | | | | | ------- | | | | | | | | (0.25 | ) | | | | | | | (1.62 | ) | | | | | | | (0.26 | ) | | | | | | | (0.29 | ) |
| Change in net asset value for the period | | | | | | | (0.73 | ) | | | | | | | (1.19 | ) | | | | | | | (2.21 | ) | | | | | | | 2.62 | | | | | | | | 0.33 | |
| Net asset value, end of period | | | $ | | | | 15.05 | | | | $ | | | | 15.78 | | | | $ | | | | 16.97 | | | | $ | | | | 19.18 | | | | $ | | | | 16.56 | |
| Total Return | | | | | | | (4.63)% | 3 | | | | | | | (5.56)% | | | | | | | | (2.76)% | | | | | | | | 17.40% | | | | | | | | 3.83% | 3 |
| | | | | | | | | | | |
| Ratios/supplemental data | | | | | | | | | | | | | | | | | | | | | | | | | | | | | | | | | | | | | | | | |
| Net assets, end of period (000) | | | $ | | | | 370,452 | | | | $ | | | | 300,331 | | | | $ | | | | 443,397 | | | | $ | | | | 453,564 | | | | $ | | | | 106,601 | |
| | | | | | | | | | | |
| Ratio to average net assets: | | | | | | | | | | | | | | | | | | | | | | | | | | | | | | | | | | | | | | | | |
| Expenses (net of reimbursement) | | | | | | | 0.99% | 4 | | | | | | | 0.99% | | | | | | | | 0.99% | | | | | | | | 0.99% | | | | | | | | 0.99% | 4 |
| Expenses (prior to reimbursement) | | | | | | | 1.11% | 4 | | | | | | | 1.08% | | | | | | | | 1.05% | | | | | | | | 1.11% | | | | | | | | 1.45% | 4 |
Net investment income
(net of reimbursement) | | | | | | | 1.33% | 4 | | | | | | | 1.40% | | | | | | | | 1.59% | | | | | | | | 1.62% | | | | | | | | 2.47% | 4 |
Net investment income
(prior to reimbursement) | | | | | | | 1.21% | 4 | | | | | | | 1.31% | | | | | | | | 1.53% | | | | | | | | 1.50% | | | | | | | | 2.01% | 4 |
| Portfolio turnover rate 5 | | | | | | | 28% | | | | | | | | 57% | | | | | | | | 62% | | | | | | | | 42% | | | | | | | | 66% | |
| ^ | On August 31, 2012, Class I shares became effective. |
| (1) | Net investment income per share represents net investment income divided by the average shares outstanding throughout the period. |
| (2) | Amount is less than $0.005. |
| (5) | Portfolio turnover is calculated on the basis of the Fund as a whole without distinguishing between the classes of shares issued. |
The accompanying notes are an integral part of these financial statements
| | |
| 66 | | www.thomaswhitefunds.com |
Six Months Ended April 30, 2016 (Unaudited)
| | | | | | | | | | | | | | | | | | | | | | | | | | | | | | | | | | | | | | | | |
| Thomas White International Fund - Class A | |
| | | | | | Six Months
Ended
April 30,
2016 | | | | | | Year
Ended
October 31,
2015 | | | | | | Year
Ended
October 31,
2014 | | | | | | Year
Ended
October 31,
2013 | | | | | | August 31,
2012^
through
October 31,
2012 | |
| |
| Per share operating performance (For a share outstanding throughout the period) | |
| Net asset value, beginning of period | | | $ | | | | 15.71 | | | | $ | | | | 16.92 | | | | $ | | | | 19.13 | | | | $ | | | | 16.56 | | | | $ | | | | 16.23 | |
| | | | | | | | | | | |
| Income from investment operations: | | | | | | | | | | | | | | | | | | | | | | | | | | | | | | | | | | | | | | | | |
Net investment income 1 | | | | | | | 0.06 | | | | | | | | 0.17 | | | | | | | | 0.23 | | | | | | | | 0.24 | | | | | | | | 0.06 | |
Net realized and unrealized gains/(losses) | | | | | | | (0.83 | ) | | | | | | | (1.17 | ) | | | | | | | (0.88 | ) | | | | | | | 2.56 | | | | | | | | 0.56 | |
| Total from investment operations | | | | | | | (0.77 | ) | | | | | | | (1.00 | ) | | | | | | | (0.65 | ) | | | | | | | 2.80 | | | | | | | | 0.62 | |
| | | | | | | | | | | |
| Distributions: | | | | | | | | | | | | | | | | | | | | | | | | | | | | | | | | | | | | | | | | |
From net investment income | | | | | | | ------- | | | | | | | | (0.21 | ) | | | | | | | (0.24 | ) | | | | | | | (0.23 | ) | | | | | | | (0.29 | ) |
From net realized gains | | | | | | | ------- | | | | | | | | ------- | | | | | | | | (1.32 | ) | | | | | | | ------- | | | | | | | | ------- | |
Tax return of capital | | | | | | | ------- | | | | | | | | ------- | | | | | | | | ------- | | | | | | | | (0.00 | ) 2 | | | | | | | ------- | |
| Total Distributions | | | | | | | ------- | | | | | | | | (0.21 | ) | | | | | | | (1.56 | ) | | | | | | | (0.23 | ) | | | | | | | (0.29 | ) |
| Change in net asset value for the period | | | | | | | (0.77 | ) | | | | | | | (1.21 | ) | | | | | | | (2.21 | ) | | | | | | | 2.57 | | | | | | | | 0.33 | |
| Net asset value, end of period | | | $ | | | | 14.94 | | | | $ | | | | 15.71 | | | | $ | | | | 16.92 | | | | $ | | | | 19.13 | | | | $ | | | | 16.56 | |
| Total Return + | | | | | | | (4.90)% 3 | | | | | | | | (5.94)% | | | | | | | | (3.13)% | | | | | | | | 16.93% | | | | | | | | 3.80% | 3 |
| | | | | | | | | | | |
| Ratios/supplemental data | | | | | | | | | | | | | | | | | | | | | | | | | | | | | | | | | | | | | | | | |
| Net assets, end of period | | | $ | | | | 844,871 | | | | $ | | | | 906,655 | | | | $ | | | | 285,347 | | | | $ | | | | 220,660 | | | | $ | | | | 519 | |
| | | | | | | | | | | |
| Ratio to average net assets: | | | | | | | | | | | | | | | | | | | | | | | | | | | | | | | | | | | | | | | | |
| Expenses (net of reimbursement) | | | | | | | 1.43% | 4 | | | | | | | 1.42% | | | | | | | | 1.41% | | | | | | | | 1.44% | | | | | | | | 1.49% | 4 |
| Expenses (prior to reimbursement) | | | | | | | 1.43% | 4 | | | | | | | 1.42% | | | | | | | | 1.41% | | | | | | | | 1.44% | | | | | | | | 1.66% | 4 |
Net investment income
(net of reimbursement) | | | | | | | 0.78% | 4 | | | | | | | 1.06% | | | | | | | | 1.23% | | | | | | | | 1.34% | | | | | | | | 1.99% | 4 |
Net investment income
(prior to reimbursement) | | | | | | | 0.78% | 4 | | | | | | | 1.06% | | | | | | | | 1.23% | | | | | | | | 1.34% | | | | | | | | 1.82% | 4 |
| Portfolio turnover rate 5 | | | | | | | 28% | | | | | | | | 57% | | | | | | | | 62% | | | | | | | | 42% | | | | | | | | 66% | |
| ^ | On August 31, 2012, Class A shares became effective. |
| + | Total return does not reflect any sales charge for Class A shares. |
| (1) | Net investment income per share represents net investment income divided by the average shares outstanding throughout the period. |
| (2) | Amount is less than $0.005. |
| (5) | Portfolio turnover is calculated on the basis of the Fund as a whole without distinguishing between the classes of shares issued. |
The accompanying notes are an integral part of these financial statements
| | | | |
| www.thomaswhitefunds.com | | | 67 | |
Six Months Ended April 30, 2016 (Unaudited)
FINANCIAL HIGHLIGHTS
| | | | | | | | | | | | | | | | | | | | | | | | | | | | | | | | | | | | | | | | |
| Thomas White International Fund - Class C | |
| | | | | | Six Months
Ended
April 30,
2016 | | | | | | Year
Ended
October 31,
2015 | | | | | | Year
Ended
October 31,
2014 | | | | | | Year
Ended
October 31,
2013 | | | | | | August 31,
2012^
through
October 31,
2012 | |
| |
| Per share operating performance (For a share outstanding throughout the period) | |
| Net asset value, beginning of period | | | $ | | | | 15.72 | | | | $ | | | | 16.88 | | | | $ | | | | 19.09 | | | | $ | | | | 16.56 | | | | $ | | | | $16.23 | |
| | | | | | | | | | | |
| Income from investment operations: | | | | | | | | | | | | | | | | | | | | | | | | | | | | | | | | | | | | | | | | |
Net investment income 1 | | | | | | | 0.00 | 2 | | | | | | | 0.06 | | | | | | | | 0.11 | | | | | | | | 0.11 | | | | | | | | 0.06 | |
Net realized and unrealized gains/(losses) | | | | | | | (0.80 | ) | | | | | | | (1.15 | ) | | | | | | | (0.88 | ) | | | | | | | 2.58 | | | | | | | | 0.54 | |
| Total from investment operations | | | | | | | (0.80 | ) | | | | | | | (1.09 | ) | | | | | | | (0.77 | ) | | | | | | | 2.69 | | | | | | | | 0.60 | |
| | | | | | | | | | | |
| Distributions: | | | | | | | | | | | | | | | | | | | | | | | | | | | | | | | | | | | | | | | | |
From net investment income | | | | | | | ------- | | | | | | | | (0.09 | ) | | | | | | | (0.12 | ) | | | | | | | (0.16 | ) | | | | | | | (0.27 | ) |
From net realized gains | | | | | | | ------- | | | | | | | | ------- | | | | | | | | (1.32 | ) | | | | | | | ------- | | | | | | | | ------- | |
Tax return of capital | | | | | | | ------- | | | | | | | | ------- | | | | | | | | ------- | | | | | | | | (0.00 | ) 2 | | | | | | | ------- | |
| Total Distributions | | | | | | | ------- | | | | | | | | (0.09 | ) | | | | | | | (1.44 | ) | | | | | | | (0.16 | ) | | | | | | | (0.27 | ) |
| Paid in capital from redemption fees | | | | | | | ------- | | | | | | | | 0.02 | | | | | | | | ------- | | | | | | | | ------- | | | | | | | | ------- | |
| Change in net asset value for the period | | | | | | | (0.80 | ) | | | | | | | (1.16 | ) | | | | | | | (2.21 | ) | | | | | | | 2.53 | | | | | | | | 0.33 | |
| Net asset value, end of period | | | $ | | | | 14.92 | | | | $ | | | | 15.72 | | | | $ | | | | 16.88 | | | | $ | | | | 19.09 | | | | $ | | | | 16.56 | |
| Total Return + | | | | | | | (5.09)% | 3 | | | | | | | (6.37)% | | | | | | | | (3.78)% | | | | | | | | 16.25% | | | | | | | | 3.68% 3 | |
| | | | | | | | | | | |
| Ratios/supplemental data | | | | | | | | | | | | | | | | | | | | | | | | | | | | | | | | | | | | | | | | |
| Net assets, end of period | | | $ | | | | 259,419 | | | | $ | | | | 427,122 | | | | $ | | | | 636,232 | | | | $ | | | | 563,144 | | | | $ | | | | 518 | |
| | | | | | | | | | | |
| Ratio to average net assets: | | | | | | | | | | | | | | | | | | | | | | | | | | | | | | | | | | | | | | | | |
| Expenses (net of reimbursement) | | | | | | | 1.99% | 4 | | | | | | | 1.99% | | | | | | | | 1.99% | | | | | | | | 1.99% | | | | | | | | 1.99% | 4 |
| Expenses (prior to reimbursement) | | | | | | | 2.11% | 4 | | | | | | | 2.08% | | | | | | | | 2.05% | | | | | | | | 2.10% | | | | | | | | 2.16% | 4 |
Net investment income
(net of reimbursement) | | | | | | | 0.02% | 4 | | | | | | | 0.36% | | | | | | | | 0.59% | | | | | | | | 0.62% | | | | | | | | 1.47% | 4 |
Net investment income (loss)
(prior to reimbursement) | | | | | | | (0.10)% | 4 | | | | | | | 0.27% | | | | | | | | 0.53% | | | | | | | | 0.51% | | | | | | | | 1.30% | 4 |
| Portfolio turnover rate 5 | | | | | | | 28% | | | | | | | | 57% | | | | | | | | 62% | | | | | | | | 42% | | | | | | | | 66% | |
| ^ | On August 31, 2012, Class C shares became effective. |
| + | Total return does not reflect any deferred sales charge for Class C shares. |
| (1) | Net investment income per share represents net investment income divided by the average shares outstanding throughout the period. |
| (2) | Amount is less than $0.005. |
| (5) | Portfolio turnover is calculated on the basis of the Fund as a whole without distinguishing between the classes of shares issued. |
The accompanying notes are an integral part of these financial statements
| | |
| 68 | | www.thomaswhitefunds.com |
Six Months Ended April 30, 2016 (Unaudited)
| | | | | | | | | | | | | | | | | | | | | | | | | | | | | | | | | | | | | | | | | | | | | | | | |
| Thomas White Emerging Markets Fund - Investor Class | |
| | | | | | Six Months
Ended
April 30,
2016 | | | | | | Year
Ended
October 31,
2015 | | | | | | Year
Ended
October 31,
2014 | | | | | | Year
Ended
October 31,
2013 | | | | | | Year
Ended
October 31,
2012^ | | | | | | Year
Ended
October 31,
2011 | |
| |
| Per share operating performance (For a share outstanding throughout the period) | |
| Net asset value, beginning of period | | | $ | | | | 9.46 | | | | $ | | | | 11.55 | | | | $ | | | | 11.72 | | | | $ | | | | 11.21 | | | | $ | | | | 10.62 | | | | $ | | | | 12.05 | |
| | | | | | | | | | | | | |
| Income from investment operations: | | | | | | | | | | | | | | | | | | | | | | | | | | | | | | | | | | | | | | | | | | | | | | | | |
Net investment income 1 | | | | | | | 0.02 | | | | | | | | 0.08 | | | | | | | | 0.13 | | | | | | | | 0.13 | | | | | | | | 0.18 | | | | | | | | 0.17 | |
Net realized and unrealized gains/(losses) | | | | | | | (0.22 | ) | | | | | | | (2.08 | ) | | | | | | | (0.18 | ) | | | | | | | 0.47 | | | | | | | | 0.58 | | | | | | | | (1.41 | ) |
| Total from investment operations | | | | | | | (0.20 | ) | | | | | | | (2.00 | ) | | | | | | | (0.05 | ) | | | | | | | 0.60 | | | | | | | | 0.76 | | | | | | | | (1.24 | ) |
| | | | | | | | | | | | | |
| Distributions: | | | | | | | | | | | | | | | | | | | | | | | | | | | | | | | | | | | | | | | | | | | | | | | | |
From net investment income | | | | | | | ------- | | | | | | | | (0.09 | ) | | | | | | | (0.12 | ) | | | | | | | (0.09 | ) | | | | | | | (0.17 | ) | | | | | | | (0.17 | ) |
From net realized gains | | | | | | | ------- | | | | | | | | ------- | | | | | | | | ------- | | | | | | | | ------- | | | | | | | | ------- | | | | | | | | (0.02 | ) |
| Total Distributions | | | | | | | ------- | | | | | | | | (0.09 | ) | | | | | | | (0.12 | ) | | | | | | | (0.09 | ) | | | | | | | (0.17 | ) | | | | | | | (0.19 | ) |
| Change in net asset value for the period | | | | | | | (0.20 | ) | | | | | | | (2.09 | ) | | | | | | | (0.17 | ) | | | | | | | 0.51 | | | | | | | | 0.59 | | | | | | | | (1.43 | ) |
| Net asset value, end of period | | | $ | | | | 9.26 | | | | $ | | | | 9.46 | | | | $ | | | | 11.55 | | | | $ | | | | 11.72 | | | | $ | | | | 11.21 | | | | $ | | | | 10.62 | |
| Total Return | | | | | | | (2.11)% | 2 | | | | | | | (17.31)% | | | | | | | | (0.40)% | | | | | | | | 5.36% | | | | | | | | 7.21% | | | | | | | | (10.26)% | |
| | | | | | | | | | | | | |
| Ratios/supplemental data | | | | | | | | | | | | | | | | | | | | | | | | | | | | | | | | | | | | | | | | | | | | | | | | |
| | | | | | | | | | | | | |
| Net assets, end of period (000) | | | $ | | | | 1,694 | | | | $ | | | | 4,172 | | | | $ | | | | 5,182 | | | | $ | | | | 5,703 | | | | $ | | | | 29,602 | | | | $ | | | | 28,377 | |
| | | | | | | | | | | | | |
| Ratio to average net assets: | | | | | | | | | | | | | | | | | | | | | | | | | | | | | | | | | | | | | | | | | | | | | | | | |
| Expenses (net of reimbursement/recoupment) | | | | | | | 1.34% | 3 | | | | | | | 1.34% | | | | | | | | 1.34% | | | | | | | | 1.34% | | | | | | | | 1.47% | 4 | | | | | | | 1.50% | |
| Expenses (prior to reimbursement/recoupment) | | | | | | | 1.31% | 3 | | | | | | | 1.27% | | | | | | | | 1.29% | | | | | | | | 1.63% | | | | | | | | 1.97% | 4 | | | | | | | 1.84% | |
Net investment income
(net of reimbursement/recoupment) | | | | | | | 0.35% | 3 | | | | | | | 0.75% | | | | | | | | 1.16% | | | | | | | | 1.14% | | | | | | | | 1.61% | 4 | | | | | | | 1.43% | |
Net investment income
(prior to reimbursement/recoupment) | | | | | | | 0.38% | 3 | | | | | | | 0.82% | | | | | | | | 1.21% | | | | | | | | 0.85% | | | | | | | | 1.11% | 4 | | | | | | | 1.10% | |
| Portfolio turnover rate 5 | | | | | | | 30% | | | | | | | | 27% | | | | | | | | 64% | | | | | | | | 54% | | | | | | | | 54% | | | | | | | | 33% | |
| ^ | On August 31, 2012, the initial class of shares was renamed the Investor Class. |
| (1) | Net investment income per share represents net investment income divided by the average shares outstanding throughout the period. |
| (4) | Effective August 31, 2012, the expense cap was decreased from 1.50% to 1.34%. |
| (5) | Portfolio turnover is calculated on the basis of the Fund as a whole without distinguishing between the classes of shares issued. |
The accompanying notes are an integral part of these financial statements
| | | | |
| www.thomaswhitefunds.com | | | 69 | |
Six Months Ended April 30, 2016 (Unaudited)
FINANCIAL HIGHLIGHTS
| | | | | | | | | | | | | | | | | | | | | | | | | | | | | | | | | | | | | | | | |
| Thomas White Emerging Markets Fund - Class I | |
| | | | | | Six Months
Ended
April 30,
2016 | | | | | | Year
Ended
October 31,
2015 | | | | | | Year
Ended
October 31,
2014 | | | | | | Year
Ended
October 31,
2013 | | | | | | August 31,
2012^
through
October 31,
2012 | |
| |
| Per share operating performance (For a share outstanding throughout the period) | |
| Net asset value, beginning of period | | | $ | | | | 9.52 | | | | $ | | | | 11.59 | | | | $ | | | | 11.73 | | | | $ | | | | 11.21 | | | | $ | | | | 10.80 | |
| | | | | | | | | | | |
| Income from investment operations: | | | | | | | | | | | | | | | | | | | | | | | | | | | | | | | | | | | | | | | | |
Net investment income 1 | | | | | | | 0.02 | | | | | | | | 0.11 | | | | | | | | 0.14 | | | | | | | | 0.13 | | | | | | | | 0.04 | |
Net realized and unrealized gains/(losses) | | | | | | | (0.21 | ) | | | | | | | (2.09 | ) | | | | | | | (0.16 | ) | | | | | | | 0.48 | | | | | | | | 0.55 | |
| Total from investment operations | | | | | | | (0.19 | ) | | | | | | | (1.98 | ) | | | | | | | (0.02 | ) | | | | | | | 0.61 | | | | | | | | 0.59 | |
| Distributions from net investment income | | | | | | | ------- | | | | | | | | (0.09 | ) | | | | | | | (0.12 | ) | | | | | | | (0.09 | ) | | | | | | | (0.18 | ) |
| Change in net asset value for the period | | | | | | | (0.19 | ) | | | | | | | (2.07 | ) | | | | | | | (0.14 | ) | | | | | | | 0.52 | | | | | | | | 0.41 | |
| Net asset value, end of period | | | $ | | | | 9.33 | | | | $ | | | | 9.52 | | | | $ | | | | 11.59 | | | | $ | | | | 11.73 | | | | $ | | | | 11.21 | |
| Total Return | | | | | | | (2.00)% | 2 | | | | | | | (17.06)% | | | | | | | | (0.12 | )% | | | | | | | 5.48% | | | | | | | | 5.47% 2 | |
| | | | | | | | | | | |
| Ratios/supplemental data | | | | | | | | | | | | | | | | | | | | | | | | | | | | | | | | | | | | | | | | |
| Net assets, end of period (000) | | | $ | | | | 76,905 | | | | $ | | | | 79,656 | | | | $ | | | | 76,705 | | | | $ | | | | 34,733 | | | | $ | | | | 956 | |
| | | | | | | | | | | |
| Ratio to average net assets: | | | | | | | | | | | | | | | | | | | | | | | | | | | | | | | | | | | | | | | | |
| Expenses (net of reimbursement) | | | | | | | 1.09% | 3 | | | | | | | 1.09% | | | | | | | | 1.09% | | | | | | | | 1.09% | | | | | | | | 1.09% | 3 |
| Expenses (prior to reimbursement) | | | | | | | 1.30% | 3 | | | | | | | 1.25% | | | | | | | | 1.25% | | | | | | | | 1.66% | | | | | | | | 3.31% | 3 |
Net investment income
(net of reimbursement) | | | | | | | 0.54% | 3 | | | | | | | 1.04% | | | | | | | | 1.18% | | | | | | | | 1.15% | | | | | | | | 1.68% | 3 |
Net investment income (loss)
(prior to reimbursement) | | | | | | | 0.33% | 3 | | | | | | | 0.88% | | | | | | | | 1.02% | | | | | | | | 0.58% | | | | | | | | (0.54)% | 3 |
| Portfolio turnover rate 4 | | | | | | | 30% | | | | | | | | 27% | | | | | | | | 64% | | | | | | | | 54% | | | | | | | | 54% | |
| ^ | On August 31, 2012, Class I shares became effective. |
| (1) | Net investment income per share represents net investment income divided by the average shares outstanding throughout the period. |
| (4) | Portfolio turnover is calculated on the basis of the Fund as a whole without distinguishing between the classes of shares issued. |
The accompanying notes are an integral part of these financial statements
| | |
| 70 | | www.thomaswhitefunds.com |
Six Months Ended April 30, 2016 (Unaudited)
| | | | | | | | | | | | | | | | | | | | | | | | | | | | | | | | | | | | | | | | |
| Thomas White Emerging Markets Fund - Class A | |
| | | | | | Six Months
Ended
April 30,
2016 | | | | | | Year
Ended
October 31,
2015 | | | | | | Year
Ended
October 31,
2014 | | | | | | Year
Ended
October 31,
2013 | | | | | | August 31,
2012^
through
October 31,
2012 | |
| |
| Per share operating performance (For a share outstanding throughout the period) | |
| Net asset value, beginning of period | | | $ | | | | 9.46 | | | | $ | | | | 11.52 | | | | $ | | | | 11.68 | | | | $ | | | | 11.20 | | | | $ | | | | 10.80 | |
| | | | | | | | | | | |
| Income from investment operations: | | | | | | | | | | | | | | | | | | | | | | | | | | | | | | | | | | | | | | | | |
Net investment income 1 | | | | | | | 0.00 | 2 | | | | | | | 0.05 | | | | | | | | 0.08 | | | | | | | | 0.10 | | | | | | | | 0.03 | |
Net realized and unrealized gains/(losses) | | | | | | | (0.21 | ) | | | | | | | (2.06 | ) | | | | | | | (0.16 | ) | | | | | | | 0.47 | | | | | | | | 0.55 | |
| Total from investment operations | | | | | | | (0.21 | ) | | | | | | | (2.01 | ) | | | | | | | (0.08 | ) | | | | | | | 0.57 | | | | | | | | 0.58 | |
| Distributions from net investment income | | | | | | | ------- | | | | | | | | (0.05 | ) | | | | | | | (0.08 | ) | | | | | | | (0.09 | ) | | | | | | | (0.18 | ) |
| Change in net asset value for the period | | | | | | | (0.21 | ) | | | | | | | (2.06 | ) | | | | | | | (0.16 | ) | | | | | | | 0.48 | | | | | | | | 0.40 | |
| Net asset value, end of period | | | $ | | | | 9.25 | | | | $ | | | | 9.46 | | | | $ | | | | 11.52 | | | | $ | | | | 11.68 | | | | $ | | | | 11.20 | |
| Total Return + | | | | | | | (2.22)% | 3 | | | | | | | (17.49)% | | | | | | | | (0.67)% | | | | | | | | 5.07% | | | | | | | | 5.35% | 3 |
| | | | | | | | | | | |
| Ratios/supplemental data | | | | | | | | | | | | | | | | | | | | | | | | | | | | | | | | | | | | | | | | |
| Net assets, end of period | | | $ | | | | 76,938 | | | | $ | | | | 53,267 | | | | $ | | | | 87,195 | | | | $ | | | | 87,911 | | | | $ | | | | 527 | |
| | | | | | | | | | | |
| Ratio to average net assets: | | | | | | | | | | | | | | | | | | | | | | | | | | | | | | | | | | | | | | | | |
| Expenses (net of reimbursement) | | | | | | | 1.59% | 4 | | | | | | | 1.59% | | | | | | | | 1.59% | | | | | | | | 1.59% | | | | | | | | 1.59% | 4 |
| Expenses (prior to reimbursement) | | | | | | | 1.66% | 4 | | | | | | | 1.66% | | | | | | | | 1.71% | | | | | | | | 1.77% | | | | | | | | 2.32% | 4 |
Net investment income
(net of reimbursement) | | | | | | | 0.03% | 4 | | | | | | | 0.47% | | | | | | | | 0.74% | | | | | | | | 0.89% | | | | | | | | 1.19% | 4 |
Net investment income (loss)
(prior to reimbursement) | | | | | | | (0.04)% | 4 | | | | | | | 0.40% | | | | | | | | 0.62% | | | | | | | | 0.71% | | | | | | | | 0.46% | 4 |
| Portfolio turnover rate 5 | | | | | | | 30% | | | | | | | | 27% | | | | | | | | 64% | | | | | | | | 54% | | | | | | | | 54% | |
| ^ | On August 31, 2012, Class A shares became effective. |
| + | Total return does not reflect any sales charge for Class A shares. |
| (1) | Net investment income per share represents net investment income divided by the average shares outstanding throughout the period. |
| (2) | Amount is less than $0.005. |
| (5) | Portfolio turnover is calculated on the basis of the Fund as a whole without distinguishing between the classes of shares issued. |
The accompanying notes are an integral part of these financial statements
| | | | |
| www.thomaswhitefunds.com | | | 71 | |
Six Months Ended April 30, 2016 (Unaudited)
FINANCIAL HIGHLIGHTS
| | | | | | | | | | | | | | | | | | | | | | | | | | | | | | | | | | | | | | | | |
| Thomas White Emerging Markets Fund - Class C | |
| | | | | | Six Months
Ended
April 30,
2016 | | | | | | Year
Ended
October 31,
2015 | | | | | | Year
Ended
October 31,
2014 | | | | | | Year
Ended
October 31,
2013 | | | | | | August 31,
2012^
through
October 31,
2012 | |
| |
| Per share operating performance (For a share outstanding throughout the period) | |
| Net asset value, beginning of period | | | $ | | | | 9.42 | | | | $ | | | | 11.50 | | | | $ | | | | 11.72 | | | | $ | | | | 11.21 | | | | $ | | | | 10.80 | |
| | | | | | | | | | | |
| Income from investment operations: | | | | | | | | | | | | | | | | | | | | | | | | | | | | | | | | | | | | | | | | |
Net investment income (loss) 1 | | | | | | | (0.02 | ) | | | | | | | 0.02 | | | | | | | | 0.02 | | | | | | | | 0.03 | | | | | | | | 0.02 | |
Net realized and unrealized gains/(losses) | | | | | | | (0.21 | ) | | | | | | | (2.08 | ) | | | | | | | (0.13 | ) | | | | | | | 0.48 | | | | | | | | 0.55 | |
| Total from investment operations | | | | | | | (0.23 | ) | | | | | | | (2.06 | ) | | | | | | | (0.11 | ) | | | | | | | 0.51 | | | | | | | | 0.57 | |
| Distributions from net investment income | | | | | | | ------- | | | | | | | | (0.02 | ) | | | | | | | (0.11 | ) | | | | | | | ------- | | | | | | | | (0.16 | ) |
| Change in net asset value for the period | | | | | | | (0.23 | ) | | | | | | | (2.08 | ) | | | | | | | (0.22 | ) | | | | | | | 0.51 | | | | | | | | 0.41 | |
| Net asset value, end of period | | | $ | | | | 9.19 | | | | $ | | | | 9.42 | | | | $ | | | | 11.50 | | | | $ | | | | 11.72 | | | | $ | | | | 11.21 | |
| Total Return + | | | | | | | (2.44)% | 2 | | | | | | | (17.92)% | | | | | | | | (0.88)% | | | | | | | | 4.55% | | | | | | | | 5.32% | 2 |
| | | | | | | | | | | |
| Ratios/supplemental data | | | | | | | | | | | | | | | | | | | | | | | | | | | | | | | | | | | | | | | | |
| Net assets, end of period | | | $ | | | | 227,040 | | | | $ | | | | 201,038 | | | | $ | | | | 26,542 | | | | $ | | | | 547 | | | | $ | | | | 526 | |
| | | | | | | | | | | |
| Ratio to average net assets: | | | | | | | | | | | | | | | | | | | | | | | | | | | | | | | | | | | | | | | | |
| Expenses (net of reimbursement) | | | | | | | 2.09% | 3 | | | | | | | 2.09% | | | | | | | | 2.09% | | | | | | | | 2.09% | | | | | | | | 2.09% | 3 |
| Expenses (prior to reimbursement) | | | | | | | 2.30% | 3 | | | | | | | 2.26% | | | | | | | | 2.25% | | | | | | | | 2.29% | | | | | | | | 2.85% | 3 |
Net investment income (loss)
(net of reimbursement) | | | | | | | (0.44)% | 3 | | | | | | | 0.16% | | | | | | | | 0.18% | | | | | | | | 0.23% | | | | | | | | 0.67% | 3 |
Net investment income (loss)
(prior to reimbursement) | | | | | | | (0.65)% | 3 | | | | | | | (0.01)% | | | | | | | | 0.02% | | | | | | | | 0.03% | | | | | | | | (0.09)% | 3 |
| Portfolio turnover rate 4 | | | | | | | 30% | | | | | | | | 27% | | | | | | | | 64% | | | | | | | | 54% | | | | | | | | 54% | |
| ^ | On August 31, 2012, Class C shares became effective. |
| + | Total return does not reflect any deferred sales charge for Class C shares. |
| (1) | Net investment income (loss) per share represents net investment income (loss) divided by the average shares outstanding throughout the period. |
| (4) | Portfolio turnover is calculated on the basis of the Fund as a whole without distinguishing between the classes of shares issued. |
The accompanying notes are an integral part of these financial statements
| | |
| 72 | | www.thomaswhitefunds.com |
Six Months Ended April 30, 2016 (Unaudited)
| | | | | | | | | | | | | | | | | | | | | | | | | | | | | | | | | | | | | | | | | | | | | | | | |
| Thomas White American Opportunities Fund - Investor Class | |
| | | | | | Six Months
Ended
April 30,
2016 | | | | | | Year
Ended
October 31,
2015 | | | | | | Year
Ended
October 31,
2014 | | | | | | Year
Ended
October 31,
2013 | | | | | | Year
Ended
October 31,
2012^ | | | | | | Year
Ended
October 31,
2011 | |
| |
| Per share operating performance (For a share outstanding throughout the period) | |
| Net asset value, beginning of period | | | $ | | | | 15.60 | | | | $ | | | | 15.84 | | | | $ | | | | 15.12 | | | | $ | | | | 13.28 | | | | $ | | | | 12.81 | | | | $ | | | | 12.53 | |
| | | | | | | | | | | | | |
| Income from investment operations: | | | | | | | | | | | | | | | | | | | | | | | | | | | | | | | | | | | | | | | | | | | | | | | | |
Net investment income | | | | | | | 0.10 | 1 | | | | | | | 0.08 | 1 | | | | | | | 0.07 | 1 | | | | | | | 0.11 | | | | | | | | 0.11 | | | | | | | | 0.13 | |
Net realized and unrealized gains/(losses) | | | | | | | (0.55 | ) | | | | | | | 0.96 | | | | | | | | 2.21 | | | | | | | | 3.68 | | | | | | | | 0.94 | | | | | | | | 0.78 | |
| Total from investment operations | | | | | | | (0.45 | ) | | | | | | | 1.04 | | | | | | | | 2.28 | | | | | | | | 3.79 | | | | | | | | 1.05 | | | | | | | | 0.91 | |
| | | | | | | | | | | | | |
| Distributions: | | | | | | | | | | | | | | | | | | | | | | | | | | | | | | | | | | | | | | | | | | | | | | | | |
From net investment income | | | | | | | ------- | | | | | | | | (0.07 | ) | | | | | | | (0.07 | ) | | | | | | | (0.09 | ) | | | | | | | (0.09 | ) | | | | | | | (0.13 | ) |
From net realized gains | | | | | | | ------- | | | | | | | | (1.21 | ) | | | | | | | (1.49 | ) | | | | | | | (1.85 | ) | | | | | | | (0.49 | ) | | | | | | | (0.50 | ) |
Tax return of capital | | | | | | | ------- | | | | | | | | ------- | | | | | | | | ------- | | | | | | | | (0.01 | ) | | | | | | | ------- | | | | | | | | ------- | |
| Total Distributions | | | | | | | ------- | | | | | | | | (1.28 | ) | | | | | | | (1.56 | ) | | | | | | | (1.95 | ) | | | | | | | (0.58 | ) | | | | | | | (0.63 | ) |
| Change in net asset value for the period | | | | | | | (0.45 | ) | | | | | | | (0.24 | ) | | | | | | | 0.72 | | | | | | | | 1.84 | | | | | | | | 0.47 | | | | | | | | 0.28 | |
| Net asset value, end of period | | | $ | | | | 15.15 | | | | $ | | | | 15.60 | | | | $ | | | | 15.84 | | | | $ | | | | 15.12 | | | | $ | | | | 13.28 | | | | $ | | | | 12.81 | |
| Total Return | | | | | | | (2.88)% | 2 | | | | | | | 6.69% | | | | | | | | 15.38% | | | | | | | | 28.52% | | | | | | | | 8.21% | | | | | | | | 7.36% | |
| | | | | | | | | | | | | |
| Ratios/supplemental data | | | | | | | | | | | | | | | | | | | | | | | | | | | | | | | | | | | | | | | | | | | | | | | | |
| Net assets, end of period (000) | | | $ | | | | 34,488 | | | | $ | | | | 35,875 | | | | $ | | | | 33,830 | | | | $ | | | | 29,138 | | | | $ | | | | 22,870 | | | | $ | | | | 21,072 | |
| | | | | | | | | | | | | |
| Ratio to average net assets: | | | | | | | | | | | | | | | | | | | | | | | | | | | | | | | | | | | | | | | | | | | | | | | | |
| Expenses (net of reimbursement/recoupment) | | | | | | | 1.22% | 3 | | | | | | | 1.18% | | | | | | | | 1.24% | | | | | | | | 1.34% | | | | | | | | 1.35% | 4 | | | | | | | 1.35% | |
| Expenses (prior to reimbursement/recoupment) | | | | | | | 1.22% | 3 | | | | | | | 1.18% | | | | | | | | 1.15% | | | | | | | | 1.31% | | | | | | | | 1.50% | 4 | | | | | | | 1.39% | |
Net investment income
(net of reimbursement/recoupment) | | | | | | | 1.33% | 3 | | | | | | | 0.52% | | | | | | | | 0.45% | | | | | | | | 0.75% | | | | | | | | 0.73% | 4 | | | | | | | 1.02% | |
Net investment income
(prior to reimbursement/recoupment) | | | | | | | 1.33% | 3 | | | | | | | 0.52% | | | | | | | | 0.54% | | | | | | | | 0.78% | | | | | | | | 0.58% | 4 | | | | | | | 0.97% | |
| Portfolio turnover rate | | | | | | | 43% | | | | | | | | 38% | | | | | | | | 32% | | | | | | | | 60% | | | | | | | | 44% | | | | | | | | 66% | |
| ^ | On August 31, 2012, the initial class of shares was renamed the Investor Class. |
| (1) | Per share net investment income was calculated prior to tax adjustments. |
| (4) | Effective August 31, 2012, the expense cap was decreased from 1.35% to 1.34%. |
The accompanying notes are an integral part of these financial statements
| | | | |
| www.thomaswhitefunds.com | | | 73 | |
THOMAS WHITE FUNDS
DISCLOSURE OF FUND EXPENSES (Unaudited)
As a shareholder of the Funds you incur two types of costs : (1) transaction costs, including sales charges (loads) on purchase payments or contingent deferred sales charges on redemptions, if any, or redemption fees; and (2) ongoing costs, including management fees; distribution fees (12b-1); and other Fund expenses. This example is intended to help you understand your ongoing costs (in dollars) of investing in the Funds and to compare these costs with the ongoing costs of investing in other mutual funds.
The example is based on an investment of $1,000 invested at the beginning of the period and held for the entire period, November 1, 2015 through April 30, 2016 for the Funds’ Investor Class, Class I, Class A and Class C shares, as applicable.
ACTUAL EXPENSES
The third and fourth columns of the table below provide information about actual account values and actual expenses. You may use the information in this line together with the amount you invested to estimate the expenses you paid over the period. Simply divide your account value by $1,000 (for example, an $8,600 account value divided by $1,000=8.6), then multiply the result by the number in the fourth column under the heading entitled “Expenses Paid During Period” to estimate the expenses you paid on your own account during this period. IRA accounts are charged a $15.00 fee annually in September that is not reflected in the actual expense example. If you hold your Fund shares through an IRA account, you should add this cost to the expenses paid shown below.
HYPOTHETICAL EXAMPLE FOR COMPARISON PURPOSES
The fifth and sixth columns of the table below provide information about hypothetical account values and hypothetical expenses based on each Fund’s actual expense ratio and an assumed rate of return of 5% per year before expenses, which is not the Fund’s actual return. The hypothetical account values and expenses may not be used to estimate the actual ending account balance or expenses you paid for the period. You may use this information to compare the ongoing costs of investing in the Funds and other funds. To do so, compare this 5% hypothetical example with the 5% hypothetical examples that appear in the shareholder reports of the other funds. IRA accounts are charged a $15.00 fee annually in September that is not reflected in the hypothetical expense example. If you hold your Fund shares through an IRA account, you should separately compare the Funds’ IRA fees to the IRA fees of other funds.
Please note that the expenses shown in the table are meant to highlight your ongoing costs only and do not reflect any transactional costs such as sales charges (loads) or purchase payments or contingent deferred sales charges on redemptions, if any, or redemption fees. Therefore the sixth column of the table is useful in comparing ongoing costs only, and will not help you determine the relative costs of owning different funds. In addition, if these transactional costs were included, your costs may have been higher.
| | |
| 74 | | www.thomaswhitefunds.com |
THOMAS WHITE FUNDS
| | | | | | | | | | | | | | | | | | | | | | | | |
| | | | | | | | | Actual | | | Hypothetical (5% return
before expenses) | |
| | | Fund’s
Annualized
Expense
Ratio* | | | Beginning
Account
Value
November 1,
2015 | | | Ending
Account Value
April 30, 2016 | | | Expenses Paid
During
Period | | | Ending
Account Value
April 30, 2016 | | | Expenses Paid During
Period | |
| International Fund | | | | | | | | | | | | | | | | | | | | | |
| Investor Class Shares | | | 1.24% | | | | $1,000.00 | | | | $951.80 | | | | $6.02 | | | | $1,018.70 | | | | $6.22 | |
| Class I Shares | | | 0.99% | | | | $1,000.00 | | | | $953.70 | | | | $4.81 | | | | $1,019.94 | | | | $4.97 | |
| Class A Shares | | | 1.43% | | | | $1,000.00 | | | | $951.00 | | | | $6.94 | | | | $1,017.75 | | | | $7.17 | |
| Class C Shares | | | 1.99% | | | | $1,000.00 | | | | $949.10 | | | | $9.64 | | | | $1,014.97 | | | | $9.97 | |
| Emerging Markets Fund | | | | | | | | | | | | | | | | | |
| Investor Class Shares | | | 1.34% | | | | $1,000.00 | | | | $978.90 | | | | $6.59 | | | | $1,018.20 | | | | $6.72 | |
| Class I Shares | | | 1.09% | | | | $1,000.00 | | | | $980.00 | | | | $5.37 | | | | $1,019.44 | | | | $5.47 | |
| Class A Shares | | | 1.59% | | | | $1,000.00 | | | | $977.80 | | | | $7.82 | | | | $1,016.96 | | | | $7.97 | |
| Class C Shares | | | 2.09% | | | | $1,000.00 | | | | $975.60 | | | | $10.27 | | | | $1,014.47 | | | | $10.47 | |
| American Opportunities Fund | | | | | | | | | | | | | | | | | |
| Investor Class | | | 1.22% | | | | $1,000.00 | | | | $971.20 | | | | $5.98 | | | | $ 1,018.80 | | | | $6.12 | |
| | * | Expenses for the International, Emerging Markets and American Opportunities Funds’ annualized expense ratio (after waiver and reimbursement), multiplied by the average account value over the period, multiplied by 182/366 (to reflect the one-half year period). |
QUARTERLY FORM N-Q PORTFOLIO SCHEDULE
The Funds file their complete schedule of portfolio holdings with the Securities and Exchange Commission (“SEC”) for the first and third quarters of each fiscal year on Form N-Q. Each Fund’s Form N-Q is available on the SEC’s website at http://www.sec.gov. The Funds’ Forms N-Q may be reviewed and copied at the SEC’s Public Reference Room in Washington, D.C. Information on the operation of the SEC’s Public reference Room may be obtained by calling 1-800-SEC-0330. Additionally, you may obtain copies of Forms N-Q from the Funds upon request by calling 1-800-811-0535.
PROXY VOTING POLICIES, PROCEDURES AND RECORD
You may obtain a description of the Funds’ (1) proxy voting policies, (2) proxy voting procedures and (3) information regarding how the Funds voted any proxies related to portfolio securities during the most recent 12 month period ended June 30 for which an SEC filing has been made, without charge, upon request by calling the Funds at 1-800-811-0535 or on the EDGAR database on the SEC’s website (http://www.sec.gov).
ADDITIONAL INFORMATION
The Statement of Additional Information contains additional information regarding the Funds and Trustees, and is available upon request without charge by calling 1-800-811-0535.
| | | | |
| www.thomaswhitefunds.com | | | 75 | |
Approval of Investment Advisory Agreements
At an in-person meeting of the Board of Trustees (the “Board” or the “Trustees”) held on February 22, 2016, the Board considered and reviewed each of the Investment Advisory Agreements (the “Agreements”) between Lord Asset Management Trust (the “Trust”), on behalf of the Thomas White American Opportunities Fund (the “American Opportunities Fund”), the Thomas White International Fund (the “International Fund”) and the Thomas White Emerging Markets Fund (the “Emerging Markets Fund” and together with the American Opportunities Fund and the International Fund, the “Funds”), and Thomas White International, Ltd. (“TWI” or the “Advisor”), to determine whether the Agreements should be continued for a one-year period.
In accordance with the Investment Company Act of 1940, the Board of Trustees of the Funds is required, on an annual basis, to consider the continuation of each of the Agreements with the Advisor, and this must take place at an in-person meeting of the Board. The relevant provisions of the Investment Company Act of 1940 specifically provide that it is the duty of the Board to request and evaluate such information as the Board determines is necessary to allow them to properly consider the continuation of the Agreements, and it is the duty of the Advisor to furnish the Trustees with such information that is responsive to their request. Accordingly, in determining whether to renew the Agreements between the Funds and the Advisor, the Board of Trustees requested, and the Advisor provided, information and data relevant to the Board’s consideration. This included materials prepared by the Advisor for the Board that provided them with information regarding the investment performance of the Funds and information regarding the fees and expenses of the Funds, compared to other similar mutual funds.
Following their consideration and review of the Agreements, the Trustees determined that each Agreement would enable shareholders of the Fund to which it applies to obtain high quality services at a cost that is appropriate, reasonable, and in the best interests of its shareholders. Accordingly, the Board, including the Independent Trustees of the Board, unanimously approved the continuation of the Agreements. In reaching their decisions, the Trustees requested and obtained from the Advisor such information as they deemed reasonably necessary to evaluate the Agreements. The Trustees also carefully considered the information that they had received throughout the year from the Advisor as part of their regular oversight of the Funds, as well as profitability data and comparative fee, expense and performance information prepared by Trust management. In considering the continuation of the Agreements, the Trustees evaluated a number of considerations that they believed, in light of the legal advice furnished to them by Trust counsel and their own reasonable business judgment, to be relevant. They based their decisions on the following considerations, among others, although they did not identify any one specific consideration or particular information that was controlling of their decisions:
| | • | | The nature, extent and quality of the advisory services to be provided. The Trustees concluded that TWI is capable of providing high quality services to each Fund, as indicated by the nature and quality of services provided in the past, TWI’s management capabilities demonstrated with respect to the Funds, the professional qualifications and experience of Thomas White as the Funds’ portfolio manager, TWI’s investment and |
| | |
| 76 | | www.thomaswhitefunds.com |
Approval of Investment Advisory Agreements
| | management oversight processes, and the overall long-term investment performance of the Funds. The Trustees also determined that TWI proposed to provide investment advisory services that were of the same quality as services it provided to the Funds in the past, and that these services are appropriate in scope and extent in light of the Funds’ operations, the competitive landscape of the investment company business and investor needs. |
| | • | | The investment performance of the Funds. With respect to each Fund, the Trustees concluded on the basis of information derived from the performance data that TWI had achieved investment performance that was competitive relative to comparable funds over longer-term trailing periods, and the Trustees took into consideration the fact that TWI focuses on long-term performance results with respect to their management of the Funds and the Funds may have periods of underperformance when measured on a more short-term basis. |
With respect to the International Fund, the Trustees took note of the fact that the Investor Class shares of the Fund had underperformed its peer group (based on the category average) for the trailing one-, three- and five-year periods, but had outperformed its peer group (based on the category average) for the trailing ten-year period. The Trustees also noted that the Investor Class shares of the International Fund had underperformed its benchmark index, the MSCI All Country World ex US Index, for the trailing three-year period, but had outperformed its benchmark index for the trailing one-, five- and ten-year periods.
With respect to the Emerging Markets Fund (which commenced investment operations in June 2010), the Trustees noted that the Investor Class shares of the Emerging Markets Fund had underperformed its peer group (based on the category average) over the trailing one- and three-year periods, but had outperformed its peer group (based on the category average) for the trailing five-year period. The Trustees noted that the Investor Class shares of the Emerging Markets Fund had underperformed its benchmark index, the MSCI Emerging Markets Index, over the trailing three- and five-year periods, but had outperformed its benchmark index for the trailing one-year period.
With respect to the American Opportunities Fund, the Trustees noted that the Investor Class shares of the American Opportunities Fund had outperformed its peer group (based on the category average) over the one-, three-, five- and ten-year periods. The Trustees also noted that the Investor Class shares of the American Opportunities Fund had underperformed its primary benchmark index, the Russell Midcap Index, and over the trailing five- and ten-year periods, but outperformed its primary benchmark over the trailing one- and three-year periods. The Trustees also noted that the Investor Class shares of the American Opportunities Fund had underperformed its secondary
| | | | |
| www.thomaswhitefunds.com | | | 77 | |
Approval of Investment Advisory Agreements
benchmark index, the S&P 500 Index, over the trailing one-, three-, five- and ten-year periods.
On the basis of the Trustees’ assessment of the nature, extent and quality of advisory services to be provided by TWI, the Trustees concluded that TWI is capable of generating a level of long-term investment performance that is appropriate in light of the Funds’ investment objectives, policies and strategies and competitive with many other investment companies.
| | • | | The cost of advisory services provided and the level of profitability. On the basis of comparative information derived from the expense data, the Trustees determined that the overall expense ratio of each Fund, on a net basis, was competitive with industry averages, particularly with respect to mutual funds of comparable asset size. The Trustees also noted that TWI had proposed to renew its contractual commitment for the benefit of Fund shareholders to limit the operating expenses of each of the classes of shares of the Funds for an additional year. The Board took into consideration information regarding the fees that TWI charges to other accounts, non-U.S. funds and private funds for similar investment advisory services, and the Trustees noted that the fees were comparable based on the relevant circumstances of the types of accounts involved. The Board also considered TWI’s current level of profitability with respect to the Funds, and noted that TWI’s profitability was acceptable and not excessive and consistent with applicable industry averages and that TWI is committed to using its own resources to help grow the Funds. The Trustees then noted TWI’s commitment to attempting to increase the exposure of the Web site and implementing other marketing initiatives to help promote the Funds and that the costs of the Web site and marketing are being borne by TWI, which provides an additional benefit to the Funds. The Trustees also took into consideration the nature and extent of other expenses that are borne directly by TWI from its own financial resources to help to market and promote the Funds. Accordingly, on the basis of the Board’s review of the fees to be charged by TWI for investment advisory services, the investment advisory and other services provided to the Funds by TWI, and the estimated profitability of TWI’s relationship with each Fund, the Board concluded that the level of investment advisory fees and TWI’s profitability are appropriate in light of the investment advisory fees, overall expense ratios and investment performance of comparable investment companies and the historical profitability of the relationship between each Fund and TWI. The Trustees considered the profitability of TWI both before and after the impact of the marketing related expenses that TWI incurs out of its own resources in connection with its management of the Funds. |
| | • | | The extent to which economies of scale will be realized as the Funds grow and whether the advisory fees reflect economies of scale. While the Funds’ investment advisory fees do not decrease as Fund assets grow because the Funds are not currently |
| | |
| 78 | | www.thomaswhitefunds.com |
Approval of Investment Advisory Agreements
| | subject to investment advisory fee breakpoints, the Trustees concluded that the Funds’ investment advisory fees are appropriate in light of the current size of the Funds, and appropriately reflect the current economic environment for TWI and the competitive nature of the mutual fund market. The Trustees noted that TWI has continued to limit the Funds’ total annual operating expenses by waiving fees and/or reimbursing certain Fund expenses. The Trustees then noted that they will have the opportunity to periodically re-examine whether a Fund has achieved economies of scale, and the appropriateness of investment advisory fees payable to TWI, in the future. |
| | • | | Benefits to TWI from its relationship with the Funds (and any corresponding benefits to the Funds). The Trustees concluded that other benefits derived by TWI from its relationship with the Funds, including “soft dollar” benefits in connection with Fund brokerage transactions and use of the Funds’ performance track records in advertising materials, are reasonable and fair, and consistent with industry practice and the best interests of the Funds and their shareholders. In addition, the Trustees determined that the Funds benefited from their relationship to TWI by virtue of TWI’s provision of business management services, in addition to investment advisory services, at a cost to the Funds that is generally comparable to the cost of an outside service provider, which the Trustees determined to be reasonable, fair and in the best interests of Fund shareholders in light of the nature and quality of the services provided and the necessity of the services for the Funds’ operations. In considering information regarding the business management fees payable by the Funds to TWI under the terms of the Business Management Agreement, the Board members indicated that they had considered various factors with respect to the proposed business management fees, including the level and amount of these fees and the services to be provided by the Advisor in connection with the Business Management Agreement, in determining the reasonableness of the total fees payable by the Funds to the Advisor for the overall level of services that the Advisor provides to the Funds and their shareholders. In considering the nature and extent of these non-advisory business management services that are provided to the Funds by the Advisor, the Board took into consideration: (i) whether the Business Management Agreement is in the best interest of the Funds and their shareholders; (ii) whether the services to be performed under the Business Management Agreement are required for the operation of the Funds; (iii) whether the services provided are of a nature and quality at least equal to the same or similar services provided by independent third parties; and (iv) whether the fees for the services are fair and reasonable in light of the usual and customary charges made by others for services of the same nature and quality. |
| | • | | Other Considerations. In approving the Agreements, the Trustees determined that TWI has made a substantial commitment to the recruitment and retention of high quality personnel, and maintains the financial, compliance and operational resources reasonably necessary to manage the Funds in a professional manner that is consistent with the best |
| | | | |
| www.thomaswhitefunds.com | | | 79 | |
Approval of Investment Advisory Agreements
| | interests of the Funds and their shareholders. The Trustees also concluded that TWI has made a significant entrepreneurial commitment to the management and success of the Funds, which entails a substantial financial and professional commitment, including the Expense Limitation Agreements with respect to each Fund under which TWI has undertaken to waive a portion of its fees to the benefit of Fund shareholders to the extent necessary in accordance with the terms of the Expense Limitation Agreements, subject to applicable recoupment provisions. The Board also considered matters with respect to the brokerage practices of TWI, including its soft dollar arrangements and its best-execution procedures, and noted that these were reasonable and consistent with standard industry practice. The Trustees also considered, with respect to the International Fund and the Emerging Markets Fund, comments made by representatives of TWI regarding the market factors that have impacted the Funds’ performance and the actions that TWI has been taking in order to be responsive to these market developments. |
In reaching their conclusion with respect to the continuation of each of the Agreements and the level of fees paid under the Agreements, the Trustees, as noted, did not identify any one single factor as being controlling. Rather, the Board took note of a combination of factors that had influenced their decision making process. They noted the level and quality of investment advisory services provided by the Advisor to each of the Funds, and they found that these services continued to benefit the shareholders of the Funds and also reflected management’s overall commitment to the continued growth and development of the Funds. Based upon their consideration and review of these factors and other matters deemed relevant by the Board in reaching an informed business judgment, the Trustees, including a majority of the Independent Trustees, concluded that the terms of the Agreements are fair and reasonable in light of the services provided and the Board therefore voted to renew the Agreements for an additional one-year period.
| | |
| 80 | | www.thomaswhitefunds.com |
Privacy Policy
LORD ASSET MANAGEMENT TRUST
THOMAS WHITE INTERNATIONAL, LTD.
I. Commitment to Consumer* Privacy
The Thomas White Funds Family and Thomas White International, Ltd. (collectively, “we” or “us”) are committed to handling consumer information responsibly. We recognize and respect the privacy expectations of our consumers, and we believe that the confidentiality and security of consumers’ personal financial information is one of our fundamental responsibilities.
II. Collection of Consumer Information
We collect, retain and use consumer information only where we reasonably believe it would be useful to the consumer and allowed by law. Consumer information collected by us generally comes from the following sources:
| | • | | Information we receive on applications or other forms; |
| | • | | Information about consumers’ transactions with us, our affiliates, or others. |
III. Disclosure of Consumer Information
We may disclose all of the consumer information we collect to affiliated financial institutions and to third parties who are not our affiliates:
| | • | | to perform marketing services on our behalf or pursuant to a joint marketing agreement between us and another party; and |
| | • | | as otherwise permitted by law. |
We do not disclose any consumer information about our former customers* to anyone except as permitted by law.
IV. Security of Customer Information
We are committed to, and also require our service providers to:
| | • | | maintain policies and procedures designed to assure only appropriate access to, and use of information about our customers; and |
| | • | | maintain physical, electronic and procedural safeguards that comply with federal standards to guard non-public personal information of our customers. |
* As defined in Regulation S-P
| | | | |
| www.thomaswhitefunds.com | | | 81 | |
This page is intentionally left blank.
OFFICERS AND TRUSTEES
Thomas S. White, Jr.
Chairman of the Board
Arthur J. Fiocco, Jr.
Trustee
Elizabeth G. Montgomery
Trustee
Robert W. Thomas
Trustee
John N. Venson, D.P.M.
Trustee
William H. Woolverton
Trustee
Stathy M. White
President
David M. Sullivan II
Vice President, Treasurer and
Assistant Secretary
J. Ryan Conner
Secretary and Chief Compliance Officer
INVESTMENT ADVISER AND OTHER SERVICE PROVIDERS
Thomas White International, Ltd.
440 S. LaSalle Street, Suite 3900
Chicago, Illinois 60605-1028
CUSTODIANS
The Northern Trust Company
Chicago, Illinois
U.S. Bank, N.A.
Milwaukee, Wisconsin
LEGAL COUNSEL
Dechert LLP
Washington, DC
INDEPENDENT REGISTERED PUBLIC ACCOUNTING FIRM
Tait, Weller & Baker, LLP
Philadelphia, Pennsylvania
ADMINISTRATOR and TRANSFER AGENT
U.S. Bancorp Fund Services, LLC
Milwaukee, Wisconsin
DISTRIBUTOR
Quasar Distributors, LLC
Milwaukee, Wisconsin
FOR CURRENT PERFORMANCE, NET ASSET VALUE OR FOR ASSISTANCE WITH YOUR ACCOUNT, PLEASE CONTACT THE THOMAS WHITE FUNDS AT 800-811-0535 OR VISIT OUR WEB SITE AT WWW.THOMASWHITEFUNDS.COM

www.thomaswhitefunds.com
COVER PICTURE: Having favored Brexit, Britain may remain in economic twilight for a while. But the country has the potential for a quick recovery, given its strength in several key sectors, including automotive, aerospace and financial services.
Item 2. Code of Ethics.
Not Applicable for Semi-Annual Reports.
Item 3. Audit Committee Financial Expert.
Not Applicable for Semi-Annual Reports.
Item 4. Principal Accountant Fees and Services.
Not Applicable for Semi-Annual Reports.
Item 5. Audit Committee of Listed Registrants.
Not applicable to Registrants who are not listed issuers (as defined in Rule 10A-3 under the Securities Exchange Act of 1934).
Item 6. Investments.
(a) The Schedules of Investments are included as part of the reports to stockholders filed under Item 1 of this Form N-CSR.
(b) Not Applicable.
Item 7. Disclosure of Proxy Voting Policies and Procedures for Closed-End Management Investment Companies.
Not applicable to open-end investment companies.
Item 8. Portfolio Managers of Closed-End Management Investment Companies.
Not applicable to open-end investment companies.
Item 9. Purchases of Equity Securities by Closed-End Management Investment Company and Affiliated Purchasers.
Not applicable to open-end investment companies.
Item 10. Submission of Matters to a Vote of Security Holders.
There have been no material changes to the procedures by which shareholders may recommend nominees to the Registrant’s Board of Trustees.
Item 11. Controls and Procedures.
(a) Based on an evaluation of Registrant’s Disclosure Controls and Procedures (as defined in Rule 30a-3(c) under the Investment Company Act of 1940) (the “Disclosure Controls”), as of a
2
date within 90 days prior to the filing date (the “Filing Date”) of this Form N-CSR (the “Report”), the Registrant’s principal executive officer and principal financial officer have concluded that the Disclosure Controls are effectively designed to ensure that information required to be disclosed by the Registrant in the Report is recorded, processed, summarized and reported by the Filing Date, including ensuring that information required to be disclosed in the Report is accumulated and communicated to the Registrant’s management, including the Registrant’s principal executive officer and principal financial officer, as appropriate, to allow timely decisions regarding required disclosure.
(b) There were no changes in the Registrant’s internal control over financial reporting (as defined in Rule 30a-3(d) under the Act) that occurred during the most recent fiscal quarter of the period covered by this report that has materially affected, or is reasonably likely to materially affect, the Registrant’s internal control over financial reporting.
Item 12. Exhibits.
| (a) | (1) Any code of ethics or amendment thereto, that is the subject of the disclosure required by Item 2, to the extent that the registrant intends to satisfy Item 2 requirements through filing an exhibit. Not Applicable. |
(2) A separate certification for each principal executive officer and principal financial officer pursuant to Section 302 of the Sarbanes-Oxley Act of 2002. Filed herewith.
(3) Any written solicitation to purchase securities under Rule 23c-1 under the Act sent or given during the period covered by the report by or on behalf of the Registrant to 10 or more persons. Not applicable to open-end investment companies.
| (b) | Certifications pursuant to Section 906 of the Sarbanes-Oxley Act of 2002. Furnished herewith. |
3
SIGNATURES
Pursuant to the requirements of the Securities Exchange Act of 1934 and the Investment Company Act of 1940, the Registrant has duly caused this report to be signed on its behalf by the undersigned, thereunto duly authorized.
| | |
| (Registrant) LORD ASSET MANAGEMENT TRUST |
|
By (Signature and Title /s/ Stathy M. White |
| Stathy M. White |
| President (Principal Executive Officer) |
|
Date 7/6/16 |
Pursuant to the requirements of the Securities Exchange Act of 1934 and the Investment Company Act of 1940, this report has been signed below by the following persons on behalf of the Registrant and in the capacities and on the dates indicated.
| | |
| By (Signature and Title) /s/ Stathy M. White |
| Stathy M. White |
| President (Principal Executive Officer) |
|
| Date 7/6/16 |
|
| By (Signature and Title) /s/ David M. Sullivan II |
| David M. Sullivan II |
| Treasurer (Principal Financial Officer) |
|
| Date 7/6/2016 |
4