As filed with the Securities and Exchange Commission on July 10, 2017
UNITED STATES
SECURITIES AND EXCHANGE COMMISSION
Washington, D.C. 20549
FORM N-CSR
CERTIFIED SHAREHOLDER REPORT OF REGISTERED
MANAGEMENT INVESTMENT COMPANIES
Investment Company Act file number 811-08348
LORD ASSET MANAGEMENT TRUST
(Exact name of Registrant as specified in charter)
440 South LaSalle Street
Chicago, Illinois 60605-1028
(Address of principal executive offices) (Zip code)
Thomas S. White, Jr.
Thomas White International, Ltd.
440 South LaSalle Street
Chicago, Illinois 60605-1028
(Name and address of agent for service)
(312) 663-8300
Registrant’s telephone number, including area code
Date of fiscal year end: 10/31
Date of reporting period: 11/1/2016-4/30/2017
Item 1. Reports to Stockholders.


SEMI-ANNUAL REPORT
APRIL 30, 2017
THE INTERNATIONAL FUND
THE EMERGING MARKETS FUND
THE AMERICAN OPPORTUNITIES FUND

The world economy is continuously evolving in ways we could have hardly imagined even a few years earlier. At Thomas White, we always ask ourselves “What is the big picture?” In other words, we always try to analyze local or regional trends from a broader global context.
We invite you to visit our websites as well as our YouTube channel for added insights into the transformative changes that make global investing more complex, but at the same time open up fascinating prospects for those who have the ability to spot them, and the discipline to focus on long-term trends.

President, Thomas White Funds
| | |
| |

| | thomaswhite.com The Thomas White website offers a panorama of the trends, economic indicators and policy changes occurring in the world economy that are of interest to global investors. |
| |

| | thomaswhitefunds.com The Thomas White Funds website provides important information on our three fund offerings, including performance, rankings, and commentaries. |
| |

| | thenewglobal.com Our New Global website is a highly informative resource for investors and their advisors, offering an in-depth understanding of the dramatic changes and trends in the world economy from a broader global context. |
| |

| | youtube.com/user/ThomasWhiteIntl Our YouTube channel features videos with CIO Thomas S. White, Jr. and his take on evolving global market trends. |
Thomas White: Empowering the InvestorSM
(This page is not part of the Semi-Annual Report.)

CONTENTS
Message to Shareholders
Dear Shareholders and Friends,
I thank all our shareholders for keeping your trust in the Thomas White Funds and welcome new shareholders to our family. Along with my fellow professionals at Thomas White, I assure you that we shall spare no effort to help you achieve your long-term investment goals.
I write this as the surprise of last year’s unexpected political events appears to have diminished, and the world is looking forward to a period of improving economic fundamentals and growing household incomes. The political leaders across the world now have the responsibility to craft policies that will help this expansion endure, and at the same time restrain the excesses that abruptly ended previous upswings.
At Thomas White, we are encouraged by the favorable economic trends and are confident that the Fund portfolios are positioned to take advantage of the environment upswing. We have high conviction in the ability of well-run corporations and their leaders to continuously align their business strategies to survive during difficult periods and thrive when the tide turns. Such organizations build and preserve enduring competitive advantages that help them outrun competition and deliver superior returns to stakeholders. Our research analysts continue to work diligently to identify such corporations and add them to Fund portfolios when attractively valued.
World Is Benefiting From Faster Economic Growth
The current global economic environment is probably the healthiest we have had in several years. The quick rebound that followed the 2008 global financial crisis was fueled by unprecedented fiscal stimulus, and hence unsustainable. As the governments of large countries stopped the pump priming, the rate of growth dropped off. Aggressive quantitative easing by the leading central banks, another unorthodox policy measure, helped the major economies limp along without falling into recessions. To be sure, there were periods when global economic trends did look brighter or when the so called ‘green shoots’ appeared. But such episodes were limited to select regions, and were short-lived.
In contrast, the current expansion that started last year has now covered almost all major regions of the globe. For the first three months of this year, the U.S. and the U.K. were the only major economies that failed to meet growth forecasts.
The slowdown in the U.S. was likely more seasonal and short term, while in the U.K. the detractor was higher inflation caused by a weak currency. The Eurozone, China and Japan met or exceeded growth expectations at the beginning of this year, and so did several of the large emerging economies such as Korea, India and Indonesia. Higher energy and commodity prices helped Brazil
| | | | |
| www.thomaswhitefunds.com | | | 1 | |
and Russia recover from recessions, and Canada to expand faster during the first quarter.
Nevertheless, aggregate global growth remains below the pace of previous expansionary periods. Additional fiscal spending by some of the large countries could boost the growth rate in the short term. But, demographic and other challenges faced by the developed countries could limit the global growth potential in the coming years. Even then, these expansions could still have a favorable influence on business earnings and shareholder returns as we have seen so far this year.
Outlook for Europe Brighter, Despite Brexit
Europe has struggled to lift its economy for the last several years as the lack of political consensus on fiscal policies restricted possible government interventions to support growth. The European Central Bank (ECB), through its bond purchases and pledge to protect the euro, did manage to negate fears about a breakup of the common currency. However, deflationary risks persisted as labor markets in several countries remained depressed with high unemployment rates. The situation changed last year, when the Eurozone slightly outpaced the U.S. in aggregate growth. Deflation fears have eased after inflation moved closer to the ECB’s target during the first quarter of this year. The recovery in global industrial demand and the relatively inexpensive currency should continue to help the Eurozone’s exporters in the coming months.
The British economy benefited initially from the currency drop that followed last year’s
Brexit vote, but higher inflation from expensive imports has become more of a policy challenge this year. The possibility of jobs being shifted outside the U.K. may cloud the political environment as the country heads to a general election. The Brexit negotiations between the European Union and the U.K. are likely to be difficult, but, given their long history as trade and strategic partners, it is in the interest of both sides to put together an acceptable deal.
Emerging Economies Are Recovering as Well
Lower growth in the emerging economies, compared to their pre-crisis highs, has probably detracted the most from the global economy recently. Much of the slowdown has been due to softer overseas demand, for commodities as well as manufactured goods, even as domestic consumer demand in most large emerging countries remained stable. Going by recent data, the pace of growth in the emerging world is also accelerating. China reported its highest quarterly growth in nearly three years, though the government’s efforts to cool down excessive credit demand could slow the pace in the coming quarters. Most major economies in Asia benefited from double-digit export volume growth during the initial four months of this year.
Though prices of oil and industrial commodities have pared down some of their gains from last year, faster global growth should lift demand in the medium term. Resource exporters from Brazil to Russia are likely to see their cash flows continue to improve. In turn, these oil producers and mining groups could step up capital spending
| | |
| 2 | | www.thomaswhitefunds.com |
in new ventures and revive abandoned projects.
Our Portfolio Strategy
We continue to believe that bottom-up stock selection is the most effective way to deliver long-term investment returns in equity markets. Our rigorous research methodologies are designed to analyze several years of accounting and market data from across the world. This time-tested process has driven our success in the past and I am sure will help us navigate through this difficult period, marked by increased market volatility and unexpected directional moves in equity prices. Our analysts continue to use their years of experience to identify the best opportunities and build effective portfolios.
I am confident about the ability of our professionals to rebuild and sustain the Funds’ long term performance. You are invited to visit our websites www.thomaswhitefunds.com, www.thomaswhite.com, and www.thenewglobal.com, for our insights on global equity markets as well as industry trends.

Thomas S. White, Jr.
Chairman
Thomas White Funds
Chief Investment Officer
Thomas White International
| | | | |
| www.thomaswhitefunds.com | | | 3 | |
Past performance is not a guarantee of future results.
Opinions expressed are subject to change, are not guaranteed and should not be considered recommendations to buy or sell any security.
Must be preceded or accompanied by a prospectus.
Mutual fund investing involves risk. Principal loss is possible. Investing in international markets may involve additional risks such as social and political instability, market illiquidity, exchange-rate fluctuations, a high level of volatility and limited regulation. These risks are greater for emerging markets. Investing in small and mid-cap companies can involve more risk than investing in larger companies.
Diversification does not assure a profit nor protect against loss in a declining market.
Earnings growth for a Fund holding does not guarantee a corresponding increase in the market value of the holding of the Fund.
The Thomas White Funds are distributed by Quasar Distributors, LLC.
It is not possible to invest directly in an index.
Cash Flow: Measures the cash generating capability of a company by adding non-cash charges (i.e. depreciation) and interest expense to pretax income.
| | |
| 4 | | www.thomaswhitefunds.com |
THE WORLD HAS CHANGED
The number of stocks in the world has surged 132% since the end of the Cold War in 1989. As of April 2017, America’s 5,189 exchange-traded stocks now only represent 10.05% of the 51,613 stocks on the world’s 81 exchanges.1
| | | | | | | | | | | | |
| The Growth of World Stock Markets: Regional Weights |
| 1960 to April 30, 20172 | | 1960 | | 1970 | | 1980 | | 1990 | | 2000 | | 2017 |
| Developed Markets | | 99.9% | | 99.8% | | 99.2% | | 97% | | 96% | | 89% |
| | | | | | | |
United States | | 72% | | 66% | | 57% | | 43% | | 51% | | 53% |
| | | | | | | |
Canada | | 3% | | 3% | | 3% | | 2% | | 2% | | 3% |
| | | | | | | |
Europe | | 22% | | 23% | | 23% | | 25% | | 28% | | 21% |
| | | | | | | |
Asia Pacific | | 3% | | 8% | | 16% | | 27% | | 15% | | 12% |
| | | | | | | |
| Emerging Markets | | 0.1% | | 0.2% | | 0.8% | | 3% | | 4% | | 11% |
| The World Market | | 100% | | 100% | | 100% | | 100% | | 100% | | 100% |
Market Value
($ trillions) | | $0.5 | | $2.0 | | $4.1 | | $8.2 | | $26.9 | | $49.9 |
1World Federation of Exchanges, Focus-April 2017
2Source: Thomas White International (Data for 1960-2000); MSCI (Data for 2017)
Globalization has spurred growth in every region of the world. International stocks now represent over half of the total world stock market value, including, for example, Sony, Nokia, Toyota, BMW, L’Oreal, Unilever, Heineken, Volvo, Nestle, UBS, Volkswagen, Honda and Royal Dutch Shell. Emerging market companies include Samsung, LG and Hyundai.
Given their quality, diversity and long- term growth potential, it only makes common sense that investors search for opportunities worldwide. The Thomas
White American Opportunities, International and Emerging Markets Funds are managed by the same portfolio managers and analysts who adhere to an identical valuation-oriented investment style. The three portfolios complement one another in that, when combined, they seek to have the profile of the MSCI All Country World Index.
Shareholders who want to adopt a global investment strategy for their savings and investment program should consider owning all three Thomas White Funds.
Fund holdings are subject to change and should not be considered a recommendation to buy or sell any securities. For a complete list of Fund holdings, please refer to the Investment Portfolio section of this report.
| | | | |
| www.thomaswhitefunds.com | | | 5 | |
THOMAS WHITE INTERNATIONAL FUND
| | | | | | | | | | | | | | |
| | | | | | | | |
| | | Unaudited
Sales
Charge | | Deferred
Sales
Charge | | Administrative
Services Fee | | 12b-1 Fees | | Operating
Expenses1,3 | | Prospectus
Gross
Annual
Operating
Expense2 | | Prospectus
Net Annual
Operating
Expense2,3 |
| Investor Class | | None | | None | | Up to 0.25% | | None | | 1.24% | | 1.33% | | 1.24% |
| Class I | | None | | None | | None | | None | | 0.99% | | 1.10% | | 0.99% |
1 In the absence of the fee deferral/expense reimbursement arrangement for the International Fund, the ratio of expenses to average net assets would have been 1.33% for Investor Class shares and 1.11% for Class I shares.
2 Gross Annual Operating Expense and Net Annual Operating Expense are based on the most recent prospectus and may differ from other expense ratios appearing in this report.
3 Thomas White International, Ltd. (“Advisor”) has agreed to defer its fees and/or reimburse the Fund to the extent that the operating expenses for Investor Class and Class I shares exceed (as a percentage of average daily net assets) 1.24% and 0.99%, respectively. The fee deferral/expense reimbursement agreement expires February 28, 2018. The Fund has agreed to repay the Advisor for amounts deferred or reimbursed by the Advisor pursuant to the agreement provided that such repayment does not cause the Fund to exceed the above limits and the repayment is made within three years after the year in which the Advisor incurred the expense. The fee deferral/expense reimbursement agreement may only be amended or terminated by the Fund’s Board of Trustees.
| | | | | | | | |
| | | | | |
| | | NAV | | Net Assets | | Redemption Fee | | Portfolio Turnover |
| Investor Class | | $16.41 | | $77.4 million | | 2.00% within 60 days | | 31% |
| Class I | | $16.38 | | $387.0 million | | |
| | |
| 6 | | www.thomaswhitefunds.com |
| | | | | | | | | | | | | | | | | | | | | | | | | | | | |
| |
| Average Annual Returns as of April 30, 2017 (Unaudited) | |
| Class | | Sales Charge | | 6 month | | Calendar
YTD | | | 1 Yr | | | 3 Yrs | | | 5 Yrs | | | 10 Yrs | | | Since
Inception
(6/28/1994)* | |
| Investor Class shares (TWWDX) | | None | | 9.64% | | | 11.58% | | | | 10.49% | | | | -1.65% | | | | 2.83% | | | | 0.34% | | | | 6.71% | |
| Class I shares1 (TWWIX) | | None | | 9.68% | | | 11.54% | | | | 10.61% | | | | -1.44% | | | | 3.07% | | | | 0.46% | | | | 6.76% | |
| MSCI All Country World ex US Index2 | | N/A | | 10.37% | | | 10.17% | | | | 12.59% | | | | 0.83% | | | | 5.13% | | | | 1.12% | | | | 5.13% | |
* The inception date of the Investor Class shares.
1 Performance figures for Class I shares, first offered on August 31, 2012, include the historical performance of Investor Class shares through August 30, 2012.
2 The MSCI All Country World ex US Index is a free float-adjusted market capitalization-weighted index of both developed and emerging markets. The index is unmanaged and returns assume the reinvestment of dividends. It is not possible to invest directly in an index.
Returns of each share class reflect differences in sales charges and expenses applicable to each class which are primarily differences in distribution and service fees.
The returns do not reflect the deduction of taxes that a shareholder would pay on Fund distributions or the redemption of Fund shares. The returns reflect the actual performance for each period and do not include the impacts of trades executed on the last business day of the period that were recorded on the first business day of the next period.
Performance data is based upon past performance, which is no guarantee of future results. The investment return and principal value of an investment will fluctuate so that an investor’s shares, when redeemed, may be worth more or less than their original cost. Current performance may be higher or lower than the performance data quoted. Please call 1-800-811-0535 to obtain performance data as of the most recent month-end. The Fund imposes a 2% redemption fee on shares held less than 60 days. Performance data does not reflect the redemption fee. If reflected, total returns would be lower. Investment performance reflects any fee waivers that were in effect. In the absence of such waivers, total return would have been reduced. The Gross Expense Ratios, based on the most recent prospectus, are 1.33% (Investor Class) and 1.10% (Class I).
| | | | |
| www.thomaswhitefunds.com | | | 7 | |
THOMAS WHITE INTERNATIONAL FUND
GROWTH OF A $10,000 INVESTMENT WITH DIVIDENDS REINVESTED (Unaudited)

This chart illustrates the performance of a hypothetical $10,000 investment made in the Fund’s Investor Class shares and its benchmark, the MSCI All Country World ex US Index, for the past 10 years through April 30, 2017. It assumes reinvestment of dividends and capital gains, but does not reflect the effect of any applicable redemption fees. This chart does not imply future performance. Past performance does not guarantee future results. The cumulative ten year return was +3.50% for the Fund’s Investor Class shares and +11.75% for the benchmark. The Fund’s Investor Class shares average annual total return since inception on June 28, 1994 was +6.71%. The MSCI All Country World ex US Index is a free float-adjusted market capitalization-weighted index of both developed and emerging markets. The index is unmanaged and returns assume the reinvestment of dividends. It is not possible to invest directly in an index. During the periods shown, the Fund’s manager reimbursed certain Fund expenses. Absent this reimbursement, performance would have been lower. Performance will vary from class to class based on differences in class-specific expenses.
| | |
| 8 | | www.thomaswhitefunds.com |
APRIL 30, 2017
The Thomas White International Fund primarily invests in equity securities of companies located in the world’s developed countries outside of the U.S. There may also be a portion of the Fund’s assets invested in companies located in emerging market countries.
Portfolio Managers
Thomas S. White, Jr.
Jinwen Zhang, Ph.D., CFA
Douglas M. Jackman, CFA
Wei Li, Ph.D., CFA
John Wu, Ph.D., CFA
Rex Mathew, CM
Ramkumar Venkatramani, CFA
Performance Review
The Thomas White International Fund Investor Class shares returned +9.64% for the six-month period ended April 30, 2017, compared to +10.37% for the benchmark MSCI All Country World ex US Index. Since its inception on June 28, 1994, the Fund’s Investor Class shares have returned +6.71% annualized while the benchmark index returned +5.13% for the same period.
Faster Economic Growth and Favorable Policy Expectations Lift Equity Prices
International equity prices saw robust gains during the review period as the global economic growth outlook continued to brighten. While domestic demand remained healthy in most major economies, there are renewed signs of a sustainable recovery in global trade volumes. Weak export demand has weakened several economies over the last couple of years and this recovery is expected to lift aggregate growth. In
addition, the higher energy and commodity prices have also started boosting capital investments. This is reflected in the recent buoyancy in manufacturing growth as well as new order flows in several countries, especially in Asia. Though energy and commodity prices have moderated from their highs seen at the beginning of this year, they remain above last year’s levels.
Though the unexpected results from the U.S. presidential elections in November led to increased market volatility, political risks are widely perceived to have declined in recent months. Expectations of favorable fiscal policy measures from the U.S. administration have boosted business sentiment within the country as well as overseas. The U.S. Federal Reserve has signaled its preference for measured rate hikes until wage growth accelerates and inflation exceeds targets. Central banks in Europe and Japan are continuing their quantitative easing, though higher Eurozone inflation during the first quarter of this year could encourage the central bank to wind down bond purchases after this year. Emerging economies are also seeing faster growth and their central banks have paused rate cuts, except in select countries such as Brazil where inflation has trended lower.
Portfolio Review
During the six month review period, the International Fund’s relative performance against its benchmark was hurt by negative stock selection in the technology, consumer staples and financials sectors. Higher exposure to the materials and financials sectors, as well as an underweight position in the consumer staples sector, also detracted
| | | | |
| www.thomaswhitefunds.com | | | 9 | |
THOMAS WHITE INTERNATIONAL FUND
from Fund returns. On the positive side, stock selection was favorable in the healthcare, telecom and consumer discretionary sectors. At the region and country level, stock selection was positive in most developed markets except Japan. In emerging markets, stock selection added value in all regions except Asia. Higher exposure to emerging markets, relative to the benchmark, helped the Fund during the review period.
Samsung Electronics was the biggest contributor to Fund returns during the review period as the company’s semiconductor manufacturing division continues to see strong demand. British homebuilder Taylor Wimpey plc recovered from last year’s decline following the Brexit vote surprise, as the U.K. economy has recovered and housing demand has not declined as much as feared. Aerospace and defense manufacturer Airbus SE benefited from better earnings as the company has accelerated production rates. Japanese financial services group Nomura Holdings advanced as its overseas business has boosted profitability. European luxury goods retailer Christian Dior contributed to portfolio returns after the company’s controlling shareholders offered to buy out the minority shareholders.
The Fund’s consumer staples and telecom holdings detracted the most from returns during the period as investor interest shifted to businesses that could benefit from increased export demand, as opposed to Japanese domestic demand. They included drug store and discount retailer Sundrug Co. Ltd., Japan Tobacco Inc. as well as telecom operator Nippon Telegraph & Telephone. Danish jewelry retailer Pandora A/S was
hurt by weaker than expected same store sales in its larger markets, though the company continued its expansion into new markets. Food retailer Royal Ahold Delhaize also underperformed as its acquisitions in recent years have not yet yielded the expected returns.
Global Growth Outlook Remains Healthy
The global economic outlook remains bright as the ongoing expansion is more synchronized, covering most regions. The pace of growth in the Eurozone and Japan during the first three months of this year met expectations, while Chinese economic growth accelerated at an annual rate of close to 7%. Though U.S. economic growth at the beginning of the year was weaker than expected, the pace of expansion is expected to improve for the rest of the year. The International Monetary Fund (IMF) now expects the global economy to expand 3.5% this year and 3.6% in 2018, higher than the 3.1% achieved last year. Much of this growth is likely to come from the emerging economies, as well as the Eurozone and Japan.
Investor fears about the beginning of increased trade tensions between the major economies have eased after leaders and policy makers toned down their rhetoric. The U.S. administration is yet to act upon the promised trade restrictions and higher tariffs to promote domestic manufacturing. Recent comments suggest that the U.S. is now less keen on pursuing aggressive measures such as naming China a currency manipulator, or pulling out of trade treaties such as the NAFTA. It is likely that most major countries will be less enthusiastic about
| | |
| 10 | | www.thomaswhitefunds.com |
APRIL 30, 2017
multilateral agreements that require further opening up of their domestic markets or allowing easier movement of workers. However, an unwinding of trade relationships built over the last several decades appears less likely as policy makers realize the potential disruptions and costs.
At the same time, the Brexit negotiations that are scheduled to start later this year could turn out to be more difficult than currently thought. The European Union and the British government have to agree on several contentious matters for talks to yield results, such as a new trade agreement between the two sides. If the current British government retains power after the elections scheduled in June, it would have more political capital to push forward with the negotiations. However, the likely job losses from
relocation by global banks and other corporations from London to other European cities could reduce the popular support for Brexit.
Emerging markets, led by China, are also expected to expand at a faster pace, helped by better export demand for manufactured goods as well as industrial commodities. While domestic borrowing costs are likely to remain stable, select countries could see an increase in government spending, especially in infrastructure projects. Investors have also become less fearful of political risks in emerging countries, allowing markets such as Russia and Turkey to recover in recent months.
We sincerely appreciate the trust you have kept in the Thomas White International Fund.
| | | | |
| www.thomaswhitefunds.com | | | 11 | |
THOMAS WHITE INTERNATIONAL FUND
Portfolio Country and Industry Allocation as of April 30, 2017 (Unaudited)
| | | | |
| | |
| Country Allocation | | % of TNA | |
| Australia | | | 5.9% | |
| Belgium | | | 1.3% | |
| Brazil | | | 1.4% | |
| Canada | | | 4.6% | |
| China | | | 6.6% | |
| Denmark | | | 1.2% | |
| Finland | | | 1.2% | |
| France | | | 5.7% | |
| Germany | | | 5.3% | |
| Hong Kong | | | 2.2% | |
| India | | | 3.7% | |
| Indonesia | | | 2.1% | |
| Ireland | | | 1.0% | |
| Israel | | | 0.9% | |
| Japan | | | 15.2% | |
| Malaysia | | | 0.9% | |
| Mexico | | | 2.1% | |
| Netherlands | | | 5.9% | |
| Peru | | | 0.6% | |
| Republic of Korea | | | 0.7% | |
| Russia | | | 2.1% | |
| South Africa | | | 1.5% | |
| South Korea | | | 3.6% | |
| Spain | | | 1.8% | |
| Sweden | | | 4.6% | |
| Switzerland | | | 2.2% | |
| Taiwan | | | 2.6% | |
| Thailand | | | 0.8% | |
| Turkey | | | 0.7% | |
| United Kingdom | | | 10.4% | |
| Cash & Other | | | 1.2% | |
| | | | |
| | |
| Industry Allocation | | % of TNA | |
| Automobiles & Components | | | 5.0% | |
| Banks | | | 17.6% | |
| Capital Goods | | | 9.6% | |
| Commercial & Professional Services | | | 1.3% | |
| Consumer Durables & Apparel | | | 4.5% | |
| Diversified Financials | | | 3.4% | |
| Energy | | | 6.1% | |
| Food & Staples Retailing | | | 1.1% | |
| Food, Beverage & Tobacco | | | 2.0% | |
| Health Care Equipment & Services | | | 0.9% | |
| Household & Personal Products | | | 3.1% | |
| Insurance | | | 5.1% | |
| Materials | | | 13.9% | |
| Media | | | 1.3% | |
| Pharmaceuticals, Biotechnology & Life Sciences | | | 3.4% | |
| Real Estate | | | 1.3% | |
| Retailing | | | 2.3% | |
| Semiconductors & Semiconductor Equipment | | | 3.5% | |
| Software & Services | | | 4.5% | |
| Technology Hardware & Equipment | | | 4.5% | |
| Telecommunication Services | | | 2.4% | |
| Transportation | | | 2.0% | |
| Cash & Other | | | 1.2% | |
| | | | | |
| | | | | |
| | | | | |
| | | | | |
| | | | | |
| | | | | |
TNA - Total Net Assets
Fund holdings and industry allocations are subject to change and should not be considered a recommendation to buy or sell any securities. For a complete list of Fund holdings, please refer to the Investment Portfolio section of this report.
| | |
| 12 | | www.thomaswhitefunds.com |
| | |
| Investment Portfolio (Unaudited) | | April 30, 2017 |
| | | | | | | | | | | | |
Country | | Issue | | Industry | | Shares | | | Value (US$) | |
| | | | | | | | | | | |
COMMON
STOCKS (96.3%) | | | | | | | | | | |
| | | | |
| | | | | | | | | | | | |
| AUSTRALIA (5.9%) | | | | | | | | | | |
| | BHP Billiton Ltd + | | Materials | | | 355,400 | | | | $6,347,150 | |
| | CSL Limited + | | Pharmaceuticals, Biotechnology & Life Sciences | | | 46,000 | | | | 4,568,110 | |
| | Iluka Resources Ltd + | | Materials | | | 843,000 | | | | 5,298,108 | |
| | Newcrest Mining Limited + | | Materials | | | 281,300 | | | | 4,492,839 | |
| | Orica Limited + | | Materials | | | 488,900 | | | | 6,778,550 | |
| | | | | | | | | | | | |
| | | | | | | | | | | 27,484,757 | |
|
| |
| BELGIUM (1.3%) | | | | | | | | | | |
| | KBC Group NV+ | | Banks | | | 82,400 | | | | 5,948,365 | |
|
| |
| CANADA (4.6%) | | | | | | | | | | |
| | Canadian National Railway Company * | | Transportation | | | 77,900 | | | | 5,630,851 | |
| | Potash Corporation of Saskatchewan Inc. * | | Materials | | | 308,400 | | | | 5,200,812 | |
| | Royal Bank of Canada * | | Banks | | | 92,700 | | | | 6,347,510 | |
| | Suncor Energy, Inc. * | | Energy | | | 138,300 | | | | 4,334,254 | |
| | | | | | | | | | | | |
| | | | | | | | | | | 21,513,427 | |
|
| |
| CHINA (6.6%) | | | | | | | | | | |
| | Alibaba Group Holding Ltd. * # | | Software & Services | | | 65,100 | | | | 7,519,050 | |
| | Anhui Conch Cement Company Limited - H Shares + | | Materials | | | 1,077,500 | | | | 3,779,305 | |
| | Baidu, Inc. ADR * | | Software & Services | | | 31,700 | | | | 5,713,291 | |
| | China Biologic Products Inc. * | | Pharmaceuticals, Biotechnology & Life Sciences | | | 24,400 | | | | 2,879,200 | |
| | Ping An Insurance (Group) Company of China Limited - H Shares + | | Insurance | �� | | 1,161,500 | | | | 6,527,414 | |
| | Zoomlion Heavy Industry Science and Technology Co Ltd + # | | Capital Goods | | | 8,655,000 | | | | 4,098,812 | |
| | | | | | | | | | | | |
| | | | | | | | | | | 30,517,072 | |
|
| |
| DENMARK (1.2%) | | | | | | | | | | |
| | Danske Bank A/S+ | | Banks | | | 158,300 | | | | 5,748,851 | |
|
| |
| FINLAND (1.2%) | | | | | | | | | | |
| | Sampo Oyj+ | | Insurance | | | 112,200 | | | | 5,377,810 | |
|
| |
| FRANCE (5.7%) | | | | | | | | | | |
| | Airbus Group SE + | | Capital Goods | | | 71,700 | | | | 5,797,095 | |
| | Christian Dior SA + | | Consumer Durables & Apparel | | | 21,850 | | | | 6,002,817 | |
| | Eiffage + | | Capital Goods | | | 40,200 | | | | 3,404,925 | |
| | Safran SA + | | Capital Goods | | | 70,600 | | | | 5,844,572 | |
| | Total SA + | | Energy | | | 102,100 | | | | 5,233,377 | |
| | | | | | | | | | | | |
| | | | | | | | | | | 26,282,786 | |
|
| |
| GERMANY (4.2%) | | | | | | | | | | |
| | Bayerische Motoren Werke Aktiengesellschaft | | Automobiles & Components | | | 46,800 | | | | 4,468,334 | |
The accompanying notes are an integral part of these financial statements
| | | | |
| www.thomaswhitefunds.com | | | 13 | |
| | |
| Thomas White International Fund | | |
| | | | | | | | | | | | |
Country | | Issue | | Industry | | Shares | | | Value (US$) | |
| | | | | | | | | | | |
| GERMANY (CONT.) | | | | | | | | | | |
| | Continental Aktiengesellschaft | | Automobiles & Components | | | 17,900 | | | | $4,006,939 | |
| | Linde AG | | Materials | | | 21,000 | | | | 3,773,284 | |
| | Muenchener Rueckversicherungs-Gesellschaft AG + | | Insurance | | | 37,900 | | | | 7,262,570 | |
| | | | | | | | | | | | |
| | | | | | | | | | | 19,511,127 | |
|
| |
| HONG KONG (2.2%) | | | | | | | | |
| | Hang Lung Properties Ltd. + | | Real Estate | | | 2,291,000 | | | | 6,000,983 | |
| | Techtronic Industries Company Limited + | | Consumer Durables & Apparel | | | 930,000 | | | | 3,996,786 | |
| | | | | | | | | | | | |
| | | | | | | | | | | 9,997,769 | |
|
| |
| INDIA (3.7%) | | | | | | | | | | |
| | Axis Bank Limited + | | Banks | | | 766,500 | | | | 6,057,836 | |
| | Infosys Limited ADR # | | Software & Services | | | 513,700 | | | | 7,479,472 | |
| | Tata Motors Limited + | | Automobiles & Components | | | 485,800 | | | | 3,472,514 | |
| | | | | | | | | | | | |
| | | | | | | | | | | 17,009,822 | |
|
| |
| INDONESIA (2.1%) | | | | | | | | | | |
| | PT Bank Central Asia Tbk + | | Banks | | | 4,627,900 | | | | 6,135,038 | |
| | PT Telekomunikasi Indonesia Persero Tbk + | | Telecommunication Services | | | 11,165,400 | | | | 3,656,561 | |
| | | | | | | | | | | | |
| | | | | | | | | | | 9,791,599 | |
|
| |
| IRELAND (1.0%) | | | | | | | | | | |
| | CRH PLC+ | | Materials | | | 122,900 | | | | 4,480,854 | |
|
| |
| ISRAEL (0.9%) | | | | | | | | | | |
| | Elbit Systems Ltd.+ | | Capital Goods | | | 36,200 | | | | 4,308,659 | |
|
| |
| JAPAN (15.2%) | | | | | | | | | | |
| | FANUC Corporation + | | Capital Goods | | | 25,000 | | | | 5,083,012 | |
| | HONDA MOTOR CO., LTD. + | | Automobiles & Components | | | 146,900 | | | | 4,261,285 | |
| | Hoya Corp + | | Technology Hardware & Equipment | | | 141,000 | | | | 6,743,725 | |
| | Japan Tobacco Inc. + | | Food, Beverage & Tobacco | | | 118,300 | | | | 3,933,747 | |
| | Kansai Paint Co., Ltd. + | | Materials | | | 259,000 | | | | 5,739,375 | |
| | Nissan Motor Co., Ltd. + | | Automobiles & Components | | | 403,000 | | | | 3,831,836 | |
| | Nitori Holdings Co., Ltd. + | | Retailing | | | 30,000 | | | | 3,907,836 | |
| | Nomura Holdings, Inc. + | | Diversified Financials | | | 1,052,100 | | | | 6,327,686 | |
| | ORIX Corporation + | | Diversified Financials | | | 291,600 | | | | 4,455,183 | |
| | Rakuten Inc + | | Retailing | | | 227,900 | | | | 2,335,500 | |
| | SMC CORP. + | | Capital Goods | | | 15,200 | | | | 4,286,782 | |
| | SoftBank Corp. + | | Telecommunication Services | | | 96,300 | | | | 7,304,203 | |
| | Sundrug Co., Ltd. + | | Food & Staples Retailing | | | 142,200 | | | | 4,988,801 | |
The accompanying notes are an integral part of these financial statements
| | |
| 14 | | www.thomaswhitefunds.com |
| | |
| Investment Portfolio (Unaudited) | | April 30, 2017 |
| | | | | | | | | | | | |
Country | | Issue | | Industry | | Shares | | | Value (US$) | |
| | | | | | | | | | | |
| JAPAN (CONT.) | | | | | | | | | | |
| | TDK CORPORATION + | | Technology Hardware & Equipment | | | 52,700 | | | | $3,267,307 | |
| | Tokio Marine Holdings, Inc. + | | Insurance | | | 102,600 | | | | 4,326,672 | |
| | | | | | | | | | | | |
| | | | | | | | | | | 70,792,950 | |
|
| |
| MALAYSIA (0.9%) | | | | | | | | | | |
| | CIMB Group Holdings Berhad+ | | Banks | | | 3,213,000 | | | | 4,250,130 | |
|
| |
| MEXICO (2.1%) | | | | | | | | | | |
| | Cemex SAB de CV * | | Materials | | | 5,550,600 | | | | 5,109,728 | |
| | Grupo Financiero Banorte, S.A.B. de C.V. | | Banks | | | 828,800 | | | | 4,782,982 | |
| | | | | | | | | | | | |
| | | | | | | | | | | 9,892,710 | |
|
| |
| NETHERLANDS (5.9%) | | | | | | | | |
| | ING Groep N.V. + | | Banks | | | 574,300 | | | | 9,345,084 | |
| | Koninklijke DSM N.V. + | | Materials | | | 47,500 | | | | 3,394,295 | |
| | Koninklijke Philips NV + | | Capital Goods | | | 192,600 | | | | 6,675,214 | |
| | Royal Dutch Shell PLC + | | Energy | | | 303,500 | | | | 8,081,212 | |
| | | | | | | | | | | | |
| | | | | | | | | | | 27,495,805 | |
|
| |
| PERU (0.6%) | | | | | | | | | | |
| | Credicorp Ltd. | | Banks | | | 17,200 | | | | 2,642,952 | |
|
| |
| REPUBLIC OF KOREA (0.7%) | | | | | | | | |
| | POSCO+ | | Materials | | | 13,700 | | | | 3,235,447 | |
|
| |
| RUSSIA (2.1%) | | | | | | | | | | |
| | LUKOIL PJSC GDR + | | Energy | | | 86,400 | | | | 4,289,747 | |
| | Sberbank of Russia GDR + | | Banks | | | 451,000 | | | | 5,360,277 | |
| | | | | | | | | | | | |
| | | | | | | | | | | 9,650,024 | |
|
| |
| SOUTH AFRICA (1.5%) | | | | | | | | |
| | Mondi Ltd + | | Materials | | | 164,700 | | | | 4,272,563 | |
| | Sibanye Gold Limited + | | Materials | | | 1,428,800 | | | | 2,861,997 | |
| | | | | | | | | | | | |
| | | | | | | | | | | 7,134,560 | |
|
| |
| SOUTH KOREA (3.6%) | | | | | | | | |
| | KB Financial Group Inc. + | | Banks | | | 83,100 | | | | 3,643,608 | |
| | LG Household & Health Care Ltd. + | | Household & Personal Products | | | 4,400 | | | | 3,349,144 | |
| | Samsung Electronics Co., Ltd. + | | Semiconductors & Semiconductor Equipment | | | 5,075 | | | | 9,920,671 | |
| | | | | | | | | | | | |
| | | | | | | | | | | 16,913,423 | |
|
| |
| SPAIN (1.8%) | | | | | | | | | | |
| | Banco Bilbao Vizcaya Argentaria, S.A.+ | | Banks | | | 1,020,000 | | | | 8,160,462 | |
|
| |
| SWEDEN (4.6%) | | | | | | | | | | |
| | Hennes & Mauritz AB + | | Retailing | | | 177,000 | | | | 4,381,459 | |
| | Hexagon AB + | | Technology Hardware & Equipment | | | 122,100 | | | | 5,316,786 | |
| | Nordea Bank AB + | | Banks | | | 532,600 | | | | 6,549,568 | |
The accompanying notes are an integral part of these financial statements
| | | | |
| www.thomaswhitefunds.com | | | 15 | |
| | |
| Thomas White International Fund | | |
| | | | | | | | | | | | |
Country | | Issue | | Industry | | Shares | | | Value (US$) | |
| | | | | | | | | | | |
| SWEDEN (CONT.) | | | | | | | | | | |
| | SKF AB + | | Capital Goods | | | 233,900 | | | | $5,137,654 | |
| | | | | | | | | | | | |
| | | | | | | | | | | 21,385,467 | |
|
| |
| SWITZERLAND (2.2%) | | | | | | | | |
| | Roche Holding AG + | | Pharmaceuticals, Biotechnology & Life Sciences | | | 20,100 | | | | 5,257,159 | |
| | The Swatch Group AG + | | Consumer Durables & Apparel | | | 12,300 | | | | 4,922,404 | |
| | | | | | | | | | | | |
| | | | | | | | | | | 10,179,563 | |
|
| |
| TAIWAN (2.6%) | | | | | | | | | | |
| | Pegatron Corporation + | | Technology Hardware & Equipment | | | 1,929,000 | | | | 5,677,188 | |
| | Taiwan Semiconductor Manufacturing Company Ltd. ADR | | Semiconductors & Semiconductor Equipment | | | 185,500 | | | | 6,134,485 | |
| | | | | | | | | | | | |
| | | | | | | | | | | 11,811,673 | |
|
| |
| THAILAND (0.8%) | | | | | | | | | | |
| | Airports of Thailand Public Company Ltd. + | | Transportation | | | 3,324,700 | | | | 3,864,500 | |
|
| |
| TURKEY (0.7%) | | | | | | | | | | |
| | Tofas Turk Otomobil Fabrikasi A.S. + | | Automobiles & Components | | | 413,700 | | | | 3,444,902 | |
|
| |
| UNITED KINGDOM (10.4%) | | | | | | | | |
| | BP p.l.c. + | | Energy | | | 1,126,900 | | | | 6,447,842 | |
| | British American Tobacco p.l.c. + | | Food, Beverage & Tobacco | | | 79,800 | | | | 5,399,843 | |
| | Experian PLC + | | Commercial & Professional Services | | | 273,800 | | | | 5,879,082 | |
| | Provident Financial plc + | | Diversified Financials | | | 125,600 | | | | 5,210,079 | |
| | RELX NV + | | Media | | | 304,204 | | | | 5,877,197 | |
| | Shire + | | Pharmaceuticals, Biotechnology & Life Sciences | | | 53,500 | | | | 3,152,324 | |
| | Smith & Nephew PLC + | | Health Care Equipment & Services | | | 254,900 | | | | 4,190,131 | |
| | Taylor Wimpey plc + | | Consumer Durables & Apparel | | | 2,311,900 | | | | 5,987,177 | |
| | Unilever NV + | | Household & Personal Products | | | 117,900 | | | | 6,182,983 | |
| | | | | | | | | | | | |
| | | | | | | | | | | 48,326,658 | |
|
| |
| Total Common Stocks | | | | (Cost $388,458,282) | | | | | | | 447,154,124 | |
| | | | | | | | | | | | |
|
| |
The accompanying notes are an integral part of these financial statements
| | |
| 16 | | www.thomaswhitefunds.com |
| | |
| Investment Portfolio (Unaudited) | | April 30, 2017 |
| | | | | | | | | | | | |
Country | | Issue | | Industry | | Shares | | | Value (US$) | |
| | | | | | | | | | | |
| PREFERRED STOCKS (2.5%) | | | | | | | | | | | | |
|
| |
| BRAZIL (1.4%) | | | | | | | | | | |
| | Itau Unibanco Holding S.A. | | Banks | | | 541,560 | | | | $6,695,173 | |
|
| |
| GERMANY (1.1%) | | | | | | | | | | |
| | Henkel AG & Co. KGaA+ | | Household & Personal Products | | | 36,000 | | | | 4,905,800 | |
|
| |
| Total Preferred Stocks | | | | (Cost $8,073,752) | | | | | | | 11,600,973 | |
| | | | | | | | | | | | |
|
| |
| | | | |
HELD AS COLLATERAL
FOR SECURITIES LENDING (3.6%) | | | | | | | | | | | | |
|
| |
| | | | | | | Principal
Amount | | | | |
| | | |
| U.S. GOVERNMENT OBLIGATIONS (3.1%) | | | | | | | | | | |
| | U.S. Treasury Notes: | | | | | | | | | | |
| | 0.875% due 05/31/2018 | | | | | $850,848 | | | | $850,848 | |
| | 0.625% due 06/30/2018 | | | | | 164,660 | | | | 164,660 | |
| | 0.750% due 07/31/2018 | | | | | 929 | | | | 929 | |
| | 0.750% due 09/30/2018 | | | | | 112,452 | | | | 112,452 | |
| | 1.250% due 11/30/2018 | | | | | 17,775 | | | | 17,775 | |
| | 1.250% due 12/31/2018 | | | | | 23,424 | | | | 23,424 | |
| | 1.500% due 01/31/2019 | | | | | 33,519 | | | | 33,519 | |
| | 0.875% due 05/15/2019 | | | | | 911,017 | | | | 911,017 | |
| | 1.625% due 06/30/2019 | | | | | 3,187 | | | | 3,187 | |
| | 0.750% due 07/15/2019 | | | | | 117,505 | | | | 117,505 | |
| | 3.625% due 08/15/2019 | | | | | 32,037 | | | | 32,037 | |
| | 1.000% due 08/31/2019 | | | | | 5,063 | | | | 5,063 | |
| | 1.625% due 08/31/2019 | | | | | 72,103 | | | | 72,103 | |
| | 1.000% due 10/15/2019 | | | | | 4,625 | | | | 4,625 | |
| | 1.500% due 10/31/2019 | | | | | 4,779 | | | | 4,779 | |
| | 1.500% due 11/30/2019 | | | | | 21,400 | | | | 21,400 | |
| | 1.625% due 12/31/2019 | | | | | 69,123 | | | | 69,123 | |
| | 1.375% due 01/31/2020 | | | | | 153,443 | | | | 153,443 | |
| | 1.375% due 04/30/2020 | | | | | 698 | | | | 698 | |
| | 3.500% due 05/15/2020 | | | | | 45,749 | | | | 45,749 | |
| | 1.500% due 05/31/2020 | | | | | 820,815 | | | | 820,815 | |
| | 1.875% due 06/30/2020 | | | | | 27,699 | | | | 27,699 | |
| | 1.375% due 09/30/2020 | | | | | 610,682 | | | | 610,682 | |
| | 1.625% due 11/30/2020 | | | | | 4,830 | | | | 4,830 | |
| | 1.125% due 02/28/2021 | | | | | 2,638 | | | | 2,638 | |
| | 1.250% due 03/31/2021 | | | | | 9,188 | | | | 9,188 | |
| | 2.250% due 03/31/2021 | | | | | 168,321 | | | | 168,321 | |
| | 1.375% due 04/30/2021 | | | | | 23,039 | | | | 23,039 | |
| | 1.125% due 06/30/2021 | | | | | 101,289 | | | | 101,289 | |
| | 2.250% due 07/31/2021 | | | | | 58,350 | | | | 58,350 | |
| | 2.125% due 08/15/2021 | | | | | 464,370 | | | | 464,370 | |
| | 2.000% due 08/31/2021 | | | | | 4,701 | | | | 4,701 | |
The accompanying notes are an integral part of these financial statements
| | | | |
| www.thomaswhitefunds.com | | | 17 | |
| | |
| Thomas White International Fund | | |
| | | | | | | | | | | | |
Country | | Issue | | Industry | | Principal
Amount | | | Value (US$) | |
| | | | | | | | | | | |
| U.S. GOVERNMENT OBLIGATIONS (CONT.) | | | | | | | | |
| | 2.125% due 09/30/2021 | | | | | $92,174 | | | | $92,174 | |
| | 2.125% due 12/31/2021 | | | | | 953 | | | | 953 | |
| | 2.000% due 02/15/2022 | | | | | 47,290 | | | | 47,290 | |
| | 2.125% due 06/30/2022 | | | | | 22,605 | | | | 22,605 | |
| | 2.000% due 07/31/2022 | | | | | 35,844 | | | | 35,844 | |
| | 1.875% due 08/31/2022 | | | | | 94 | | | | 94 | |
| | 1.750% due 09/30/2022 | | | | | 2,687 | | | | 2,687 | |
| | 2.000% due 11/30/2022 | | | | | 10,162 | | | | 10,162 | |
| | 1.750% due 01/31/2023 | | | | | 184,053 | | | | 184,053 | |
| | 2.000% due 02/15/2023 | | | | | 23,466 | | | | 23,466 | |
| | 1.500% due 02/28/2023 | | | | | 11,115 | | | | 11,115 | |
| | 1.750% due 05/15/2023 | | | | | 6,609 | | | | 6,609 | |
| | 1.625% due 05/31/2023 | | | | | 70,838 | | | | 70,838 | |
| | 2.250% due 12/31/2023 | | | | | 19,005 | | | | 19,005 | |
| | 2.250% due 01/31/2024 | | | | | 474 | | | | 474 | |
| | 2.750% due 02/15/2024 | | | | | 167,978 | | | | 167,978 | |
| | 2.500% due 05/15/2024 | | | | | 633,669 | | | | 633,669 | |
| | 2.375% due 08/15/2024 | | | | | 169,426 | | | | 169,426 | |
| | 2.000% due 08/15/2025 | | | | | 134,109 | | | | 134,109 | |
| | 2.250% due 11/15/2025 | | | | | 136,140 | | | | 136,140 | |
| | 1.625% due 05/15/2026 | | | | | 28,901 | | | | 28,901 | |
| | | | | | | | | | | | |
| | | | | | | | | | | 6,737,850 | |
| | U.S. TIPS: | | | | | | | | | | |
| | 2.411% due 01/15/2019 | | | | | 2,780 | | | | 2,780 | |
| | 0.130% due 04/15/2019 | | | | | 42,347 | | | | 42,347 | |
| | 2.139% due 07/15/2019 | | | | | 1,581 | | | | 1,581 | |
| | 0.130% due 04/15/2020 | | | | | 226 | | | | 226 | |
| | 1.253% due 01/15/2021 | | | | | 952 | | | | 952 | |
| | 0.128% due 04/15/2021 | | | | | 32,913 | | | | 32,913 | |
| | 0.676% due 07/15/2021 | | | | | 314 | | | | 314 | |
| | 0.132% due 07/15/2022 | | | | | 115,393 | | | | 115,393 | |
| | 0.132% due 01/15/2023 | | | | | 12,334 | | | | 12,334 | |
| | 0.653% due 01/15/2024 | | | | | 35,486 | | | | 35,486 | |
| | 0.257% due 01/15/2025 | | | | | 282,170 | | | | 282,170 | |
| | 0.385% due 07/15/2025 | | | | | 16,924 | | | | 16,924 | |
| | 0.641% due 01/15/2026 | | | | | 19,991 | | | | 19,991 | |
| | 2.455% due 01/15/2026 | | | | | 224,337 | | | | 224,337 | |
| | 2.364% due 02/15/2041 | | | | | 545 | | | | 545 | |
| | 0.809% due 02/15/2042 | | | | | 331,062 | | | | 331,062 | |
| | 0.776% due 02/15/2045 | | | | | 23,694 | | | | 23,694 | |
| | | | | | | | | | | | |
| | | | | | | | | | | 1,143,049 | |
| | U.S. Treasury Bonds: | | | | | | | | | | |
| | 8.125% due 08/15/2019 | | | | | 29,839 | | | | 29,839 | |
| | 3.625% due 02/15/2020 | | | | | 95,620 | | | | 95,620 | |
| | 3.125% due 05/15/2021 | | | | | 419 | | | | 419 | |
| | 1.750% due 04/30/2022 | | | | | 1,022,399 | | | | 1,022,399 | |
| | 1.625% due 11/15/2022 | | | | | 43,239 | | | | 43,239 | |
| | 2.000% due 02/15/2025 | | | | | 376,409 | | | | 376,409 | |
| | 2.125% due 05/15/2025 | | | | | 100,088 | | | | 100,088 | |
| | 1.625% due 02/15/2026 | | | | | 2,068,611 | | | | 2,068,611 | |
| | 1.500% due 08/15/2026 | | | | | 48,135 | | | | 48,135 | |
| | 5.500% due 08/15/2028 | | | | | 46,235 | | | | 46,235 | |
The accompanying notes are an integral part of these financial statements
| | |
| 18 | | www.thomaswhitefunds.com |
| | |
| Investment Portfolio (Unaudited) | | April 30, 2017 |
| | | | | | | | | | | | |
Country | | Issue | | Industry | | Principal
Amount | | | Value (US$) | |
| | | | | | | | | | | |
| U.S. GOVERNMENT OBLIGATIONS (CONT.) | | | | | | | | |
| | 5.250% due 02/15/2029 | | | | | $974 | | | | $974 | |
| | 6.250% due 05/15/2030 | | | | | 1,905 | | | | 1,905 | |
| | 4.375% due 02/15/2038 | | | | | 11,868 | | | | 11,868 | |
| | 3.500% due 02/15/2039 | | | | | 18,324 | | | | 18,324 | |
| | 4.375% due 05/15/2041 | | | | | 10,751 | | | | 10,751 | |
| | 2.750% due 11/15/2042 | | | | | 8,313 | | | | 8,313 | |
| | 3.125% due 02/15/2043 | | | | | 13,920 | | | | 13,920 | |
| | 3.625% due 08/15/2043 | | | | | 42,547 | | | | 42,547 | |
| | 3.750% due 11/15/2043 | | | | | 112,213 | | | | 112,213 | |
| | 3.625% due 02/15/2044 | | | | | 102,405 | | | | 102,405 | |
| | 2.500% due 02/15/2045 | | | | | 54,493 | | | | 54,493 | |
| | 3.000% due 05/15/2045 | | | | | 1,092,774 | | | | 1,092,774 | |
| | 2.875% due 08/15/2045 | | | | | 461 | | | | 461 | |
| | 3.000% due 11/15/2045 | | | | | 791,820 | | | | 791,820 | |
| | 2.500% due 02/15/2046 | | | | | 2,131 | | | | 2,131 | |
| | 2.500% due 05/15/2046 | | | | | 343 | | | | 343 | |
| | 2.250% due 08/15/2046 | | | | | 135,752 | | | | 135,752 | |
| | | | | | | | | | | | |
| | | | | | | | | | | 6,231,988 | |
|
| |
| Total U.S. Government Obligations | | | | (Cost $14,112,887) | | | | | | | 14,112,887 | |
| | | | | | | | | | | | |
|
| |
SHORT TERM
INVESTMENTS (0.5%) | | | | | | | | |
|
| |
| U.S. GOVERNMENT OBLIGATIONS (0.5%) | | | | | | | | |
| | U.S. Treasury Bill: | | | | | | | | | | |
| | 0.000% due 07/13/2017 | | | | | 11,642 | | | | 11,642 | |
| | 0.000% due 07/20/2017 | | | | | 5,447 | | | | 5,447 | |
| | 0.000% due 09/21/2017 | | | | | 1,016,832 | | | | 1,016,832 | |
| | | | | | | | | | | | |
| | | | | | | | | | | 1,033,921 | |
| | U.S. Treasury Notes: | | | | | | | | | | |
| | 0.625% due 08/31/2017 | | | | | 9,141 | | | | 9,141 | |
| | 0.625% due 09/30/2017 | | | | | 94,347 | | | | 94,347 | |
| | 1.000% due 12/31/2017 | | | | | 141,728 | | | | 141,728 | |
| | 0.750% due 01/31/2018 | | | | | 23,306 | | | | 23,306 | |
| | 0.750% due 02/28/2018 | | | | | 140,912 | | | | 140,912 | |
| | 0.875% due 03/31/2018 | | | | | 30,269 | | | | 30,269 | |
| | 2.625% due 04/30/2018 | | | | | 224,904 | | | | 224,904 | |
| | | | | | | | | | | | |
| | | | | | | | | | | 664,607 | |
The accompanying notes are an integral part of these financial statements
| | | | |
| www.thomaswhitefunds.com | | | 19 | |
| | |
| Thomas White International Fund | | |
| | | | | | | | | | | | |
Country | | Issue | | Industry | | Principal
Amount | | | Value (US$) | |
| | | | | | | | | | | |
| U.S. GOVERNMENT OBLIGATIONS (CONT.) | | | | | | | | |
| | U.S. TIPS: | | | | | | | | | | |
| | 0.132% due 04/15/2018 | | | | | $679,319 | | | | $679,319 | |
|
| |
| Total Short Term Investments | | | | (Cost $2,377,847) | | | | | | | 2,377,847 | |
| | | | | | | | | | | | |
|
| |
| Total held as collateral for securities lending | | | | (Cost $16,490,734) | | | | | | | $16,490,734 | |
| | | | | | | | | | | | |
|
| |
| Total Investments | | 102.3% | | (Cost $413,022,768) | | | | | | | $475,245,831 | |
| Other Assets, Less Liabilities | | (2.3)% | | | | | | | | | (10,805,783 | ) |
| Total Net Assets: | | 100.0% | | | | | | | | | $464,440,048 | |
| | | | |
| | | | | | | | | | | | |
| * | Non-Income Producing Securities |
| # | All or a portion of securities on loan at April 30, 2017 - See Note 1(I) to Financial Statements |
| + | Fair Valued Security - See Note 1(A) to Financial Statements |
| ADR | - American Depositary Receipt |
| GDR | - Global Depositary Receipt |
Industry classifications shown in the Investment Portfolio are based off of the Global Industry Classification Standard (GICS®). GICS was developed by and/or is the exclusive property of MSCI, Inc. and Standard & Poor’s Financial Services LLC (“S&P”). GICS is a service mark of MSCI and S&P and has been licensed for use by U.S. Bancorp Fund Services, LLC.
The accompanying notes are an integral part of these financial statements
| | |
| 20 | | www.thomaswhitefunds.com |
| | |
| Investment Portfolio (Unaudited) | | April 30, 2017 |
The following table summarizes the inputs used, as of April 30, 2017, in valuating the Fund’s assets:
| | | | | | | | | | | | | | | | |
| | | Level 1 | | | Level 2 | | | Level 3 | | | Total | |
| Common Stocks | | | | | | | | | | | | | | | | |
| Australia | | | $------- | | | | $27,484,757 | | | | $------- | | | | $27,484,757 | |
| Belgium | | | ------- | | | | 5,948,365 | | | | ------- | | | | 5,948,365 | |
| Canada | | | 21,513,427 | | | | ------- | | | | ------- | | | | 21,513,427 | |
| China | | | 16,111,541 | | | | 14,405,531 | | | | ------- | | | | 30,517,072 | |
| Denmark | | | ------- | | | | 5,748,851 | | | | ------- | | | | 5,748,851 | |
| Finland | | | ------- | | | | 5,377,810 | | | | ------- | | | | 5,377,810 | |
| France | | | ------- | | | | 26,282,786 | | | | ------- | | | | 26,282,786 | |
| Germany | | | 12,248,557 | | | | 7,262,570 | | | | ------- | | | | 19,511,127 | |
| Hong Kong | | | ------- | | | | 9,997,769 | | | | ------- | | | | 9,997,769 | |
| India | | | 7,479,472 | | | | 9,530,350 | | | | ------- | | | | 17,009,822 | |
| Indonesia | | | ------- | | | | 9,791,599 | | | | ------- | | | | 9,791,599 | |
| Ireland | | | ------- | | | | 4,480,854 | | | | ------- | | | | 4,480,854 | |
| Israel | | | ------- | | | | 4,308,659 | | | | ------- | | | | 4,308,659 | |
| Japan | | | ------- | | | | 70,792,950 | | | | ------- | | | | 70,792,950 | |
| Malaysia | | | ------- | | | | 4,250,130 | | | | ------- | | | | 4,250,130 | |
| Mexico | | | 9,892,710 | | | | ------- | | | | ------- | | | | 9,892,710 | |
| Netherlands | | | ------- | | | | 27,495,805 | | | | ------- | | | | 27,495,805 | |
| Peru | | | 2,642,952 | | | | ------- | | | | ------- | | | | 2,642,952 | |
| Republic of Korea | | | ------- | | | | 3,235,447 | | | | ------- | | | | 3,235,447 | |
| Russia | | | ------- | | | | 9,650,024 | | | | ------- | | | | 9,650,024 | |
| South Africa | | | ------- | | | | 7,134,560 | | | | ------- | | | | 7,134,560 | |
| South Korea | | | ------- | | | | 16,913,423 | | | | ------- | | | | 16,913,423 | |
| Spain | | | ------- | | | | 8,160,462 | | | | ------- | | | | 8,160,462 | |
| Sweden | | | ------- | | | | 21,385,467 | | | | ------- | | | | 21,385,467 | |
| Switzerland | | | ------- | | | | 10,179,563 | | | | ------- | | | | 10,179,563 | |
| Taiwan | | | 6,134,485 | | | | 5,677,188 | | | | ------- | | | | 11,811,673 | |
| Thailand | | | ------- | | | | 3,864,500 | | | | ------- | | | | 3,864,500 | |
| Turkey | | | ------- | | | | 3,444,902 | | | | ------- | | | | 3,444,902 | |
| United Kingdom | | | ------- | | | | 48,326,658 | | | | ------- | | | | 48,326,658 | |
| Total Common Stocks | | | $76,023,144 | | | | $371,130,980 | | | | $------- | | | | $447,154,124 | |
| Preferred Stocks | | | | | | | | | | | | | | | | |
| Brazil | | | $6,695,173 | | | | $------- | | | | $------- | | | | $6,695,173 | |
| Germany | | | ------- | | | | 4,905,800 | | | | ------- | | | | 4,905,800 | |
| Total Preferred Stocks | | | $6,695,173 | | | | $4,905,800 | | | | $-------– | | | | $11,600,973 | |
| U.S Government Obligations | | | $------- | | | | $14,112,887 | | | | $------- | | | | $14,112,887 | |
| Short Term Investments | | | $------- | | | | $2,377,847 | | | | $------- | | | | $2,377,847 | |
| Total Investments | | | $82,718,317 | | | | $392,527,514 | | | | $------- | | | | $475,245,831 | |
The accompanying notes are an integral part of these financial statements
| | | | |
| www.thomaswhitefunds.com | | | 21 | |
| | |
| Thomas White International Fund | | |
For more information on valuation inputs, please refer to Note 1(A) of the accompanying Notes to Financial Statements.
The Fund’s assets assigned to Level 2 include certain foreign securities for which a third party statistical pricing service may be employed for purposes of fair market valuation. In addition, no transfers in and/or out between Levels 1, 2 or 3 were observed during the reporting period, as compared to their classification from the prior annual report.
The accompanying notes are an integral part of these financial statements
| | |
| 22 | | www.thomaswhitefunds.com |
| | | | |
| THOMAS WHITE EMERGING MARKETS FUND | | | | |
| | | | | | | | | | | | | | |
| | | | | | | | |
| | | Unaudited
Sales
Charge | | Deferred
Sales
Charge | | Administrative
Services Fee | | 12b-1 Fees | | Operating
Expenses1,3 | | Prospectus
Gross
Annual
Operating
Expense2 | | Prospectus
Net Annual
Operating
Expense2,3 |
| Investor Class | | None | | None | | Up to 0.25% | | None | | 1.32% | | 1.32% | | 1.35% |
| Class I | | None | | None | | None | | None | | 1.09% | | 1.30% | | 1.10% |
1 In the absence of the fee deferral/expense reimbursement arrangement for the Emerging Markets Fund, the ratio of expenses to average net assets would have been 1.32% for Investor Class shares and 1.30% for Class I shares.
2 Gross Annual Operating Expense and Net Annual Operating Expense are based on the most recent prospectus and may differ from other expense ratios appearing in this report.
3 Thomas White International, Ltd. (“Advisor”) has agreed to defer its fees and/or reimburse the Fund to the extent that the operating expenses for Investor Class and Class I shares exceed (as a percentage of average daily net assets) 1.34% and 1.09%, respectively. The fee deferral/expense reimbursement agreement expires February 28, 2018. The Fund has agreed to repay the Advisor for amounts deferred or reimbursed by the Advisor pursuant to the agreement provided that such repayment does not cause the Fund to exceed the above limits and the repayment is made within three years after the year in which the Advisor incurred the expense. The fee deferral/expense reimbursement agreement may only be amended or terminated by the Fund’s Board of Trustees.
| | | | | | | | |
| | | | | |
| | | NAV | | Net Assets | | Redemption Fee | | Portfolio Turnover |
| Investor Class | | $10.28 | | $1.8 million | | 2.00% within 60 days | | 37% |
| Class I | | $10.37 | | $70.1 million | | |
| | | | |
| www.thomaswhitefunds.com | | | 23 | |
THOMAS WHITE EMERGING MARKETS FUND
| | | | | | | | | | | | | | | | | | | | | | | | | | | | | | |
| |
| Average Annual Returns as of April 30, 2017 (Unaudited) | |
| Class | | | | Sales Charge | | | | 6 month | | | Calendar
YTD | | | 1 Yr | | | 3 Yrs | | | 5 Yrs | | | Since
Inception (6/28/2010)* | |
| Investor Class shares (TWEMX) | | | | None | | | | | 5.06% | | | | 11.19% | | | | 12.13% | | | | -1.72% | | | | -0.98% | | | | 1.48% | |
| Class I shares1 (TWIIX) | | | | None | | | | | 5.15% | | | | 11.11% | | | | 12.32% | | | | -1.49% | | | | -0.77% | | | | 1.64% | |
| MSCI Emerging Markets Index2 | | | | N/A | | | | | 8.88% | | | | 13.88% | | | | 19.13% | | | | 1.79% | | | | 1.49% | | | | 2.83% | |
* The inception date of the Investor Class shares.
1 Performance figures for Class I shares, first offered on August 31, 2012, include the historical performance of Investor Class shares through August 30, 2012.
2 The MSCI Emerging Markets Index is a free float-adjusted market capitalization index that is designed to measure equity market performance of emerging markets. The index is unmanaged and returns assume the reinvestment of dividends. It is not possible to invest directly in an index.
Returns of each share class reflect differences in sales charges and expenses applicable to each class which are primarily differences in distribution and service fees.
The returns do not reflect the deduction of taxes that a shareholder would pay on Fund distributions or the redemption of Fund shares. The returns reflect the actual performance for each period and do not include the impacts of trades executed on the last business day of the period that were recorded on the first business day of the next period.
Performance data is based upon past performance, which is no guarantee of future results. The investment return and principal value of an investment will fluctuate so that an investor’s shares, when redeemed, may be worth more or less than their original cost. Current performance may be higher or lower than the performance data quoted. Please call 1-800-811-0535 to obtain performance data as of the most recent month-end. The Fund imposes a 2% redemption fee on shares held less than 60 days. Performance data does not reflect the redemption fee. If reflected, total returns would be lower. Investment performance reflects any fee waivers that were in effect. In the absence of such waivers, total return would have been reduced. The Gross Expense Ratios, based on the most recent prospectus, are 1.32% (Investor Class) and 1.30% (Class I).
| | |
| 24 | | www.thomaswhitefunds.com |
APRIL 30, 2017
GROWTH OF A $10,000 INVESTMENT WITH DIVIDENDS REINVESTED (Unaudited)

This chart illustrates the performance of a hypothetical $10,000 investment made in the Fund’s Investor Class shares and its benchmark, the MSCI Emerging Markets Index, since inception on June 28, 2010 through April 30, 2017. It assumes reinvestment of dividends and capital gains, but does not reflect the effect of any applicable redemption fees. This chart does not imply future performance. Past performance does not guarantee future results. The cumulative return since inception was +10.60% for the Fund’s Investor Class shares and +21.02% for the benchmark. The Fund’s Investor Class shares average annual total return since inception on June 28, 2010 was +1.48%. The MSCI Emerging Markets Index is a free float-adjusted market capitalization index that is designed to measure equity market performance of emerging markets. The index is unmanaged and returns assume the reinvestment of dividends. It is not possible to invest directly in an index. During the periods shown, the Fund’s manager reimbursed certain Fund expenses. Absent this reimbursement, performance would have been lower. Performance will vary from class to class based on differences in class-specific expenses.
| | | | |
| www.thomaswhitefunds.com | | | 25 | |
| | | | |
| THOMAS WHITE EMERGING MARKETS FUND | | | | |
The Thomas White Emerging Markets Fund invests primarily in securities of companies located in or whose businesses are closely associated with the world’s emerging markets countries.
Portfolio Managers
Thomas S. White, Jr.
Jinwen Zhang, Ph.D., CFA
Douglas M. Jackman, CFA
Wei Li, Ph.D., CFA
John Wu, Ph.D., CFA
Rex Mathew, CM
Ramkumar Venkatramani, CFA
Performance Review
During the six-month period ended April 30, 2017, the Thomas White Emerging Markets Fund Investor Class shares returned +5.06%, compared to +8.88% for its benchmark MSCI Emerging Markets Index. Since its inception on June 28, 2010, the Fund’s Investor Class shares have returned +1.48% annualized, against +2.83% for the benchmark index.
Oil and Commodity Price Swings Intensify Market Volatility
Emerging market equity prices recovered from a sharp decline during the first half of the review period, and ended with robust gains. Most emerging markets came under pressure following the unexpected U.S. presidential election result in November, and gave up part of the gains from the second and third quarters of 2016. Investors feared aggressive import controls by the new U.S. administration as well as the cancellation or renegotiation of existing trade agreements. The U.S. Dollar’s appreciation on the
expectation of domestic fiscal stimulus also reduced investor interest in emerging market assets.
However, emerging markets bounced back in recent months as economic growth in several of these countries exceeded expectations. Domestic demand remains healthy in large emerging countries such as China and India as the earlier interest rate cuts and modest fiscal stimulus measures continue to support consumer spending. Most indicators of industrial activity and external trade recovered during the first quarter of this year, especially for Asian economies. In addition, fears about restrictive U.S. trade policies have eased while the U.S. Dollar has softened against other currencies so far this year.
Though energy and commodity prices have moderated this year, they remain above the levels seen a year ago. Increased cash flows from resource exports continue to improve the current account balances of several countries, and their currencies have stabilized at higher levels compared to last year. The currency recovery has helped ease inflation in countries such as Brazil, allowing their central banks to lower interest rates to support demand. Investors have also become less fearful of political risks in emerging countries, allowing markets such as Russia and Turkey to recover in recent months.
Portfolio Review
The Fund’s returns relative to its benchmark were weaker due to negative stock selection in the technology, industrials, financials and consumer discretionary sectors. Lower allocation to the energy and materials sectors hurt the Fund during the first part of the
| | |
| 26 | | www.thomaswhitefunds.com |
APRIL 30, 2017
review period, though the exposure to these sectors was increased subsequently. Overweight positions in the technology and healthcare sectors also detracted from the Fund’s relative returns during the period. Stock selection was also negative in most regions, except Europe.
Samsung Electronics was the biggest contributor to Fund returns during the review period as the company’s semiconductor manufacturing division continues to see strong demand. Chinese home equipment manufacturer Haier Electronics benefited from expectations of stronger revenue growth, after the company signed an agreement with ecommerce group Alibaba to provide distribution services. Thai energy producer PTT Exploration advanced after reporting improved earnings, helped by higher oil prices. Chinese ecommerce giant Alibaba Group gained after reporting better than expected revenue growth, especially in new business segments such as cloud services. Alibaba is now expanding in Asian countries outside China, which could help sustain revenue and earnings growth. Catcher Technology, a supplier of smartphone cases, outperformed on expectations of strong volume growth as Apple readies its new iPhone models.
Mexican micro lender Gentera S.A.B de C.V. detracted the most from returns during the review period and was sold on concerns about slower credit demand and higher loan loss risks. Hollysys Automation, a manufacturer of process automation equipment, declined on doubts about the scale of Chinese government spending on new infrastructure projects. South African cement producer PPC Ltd was negatively
affected by weaker than expected demand in the region as well as increased political risks that could restrict government spending. Automaker Tata Motors was hurt by weaker operating margins due to currency volatility as well as reduced demand in India following an unexpected currency exchange by the government. Indonesian department store operator Matahari underperformed as same store sales during the first quarter of this year were weaker than expected.
Emerging Markets Outlook Could Improve on Domestic Demand Growth
Barring another steep downturn in energy and commodity prices, the emerging economies are likely to see healthy growth this year as well as in 2018. The pace of growth during the first three months of the year was robust in most large emerging economies, including China, which expanded close to 7% annualized. The International Monetary Fund (IMF) now expects the emerging and developing economies to grow 4.5% this year and close to 5% in 2018. Much of the growth is expected to come from Asia, while resource exporting countries such as Brazil and Russia in other regions recover from deep recessions.
Unlike the short-lived global recoveries in recent years, the developed economies are also seeing a modest recovery, which should boost exports from emerging countries further. Several Asian economies have already seen a sharp rebound in export volumes during the first quarter of this year. While the pace is likely to moderate in the coming months, industrial sentiment surveys suggest export volume growth in the near term. Higher prices of energy and industrial
| | | | |
| www.thomaswhitefunds.com | | | 27 | |
THOMAS WHITE EMERGING MARKETS FUND
commodities should help boost demand for new equipment as well as industrial products and services. Fiscal policies remain supportive of growth, especially in Asia, while most emerging market central banks are expected to hold their benchmark rates steady for the rest of this year.
Investor concerns about U.S. Dollar gains hurting emerging market equities have eased in recent months. Collectively, the major emerging market currencies have appreciated nearly 5% against the U.S. Dollar since the beginning of the year. These currencies have
also become less volatile as global geopolitical risks have come down from last year’s elevated levels. Faster economic growth and reduced political risks in emerging countries should continue to attract capital inflows and support these currencies. Fears about restrictive U.S. trade policies have also declined, as the U.S. government appears to have turned less confrontational than feared.
We thank you for confidence in the Thomas White Emerging Markets Fund.
| | |
| 28 | | www.thomaswhitefunds.com |
APRIL 30, 2017
Portfolio Country and Industry Allocation as of April 30, 2017 (Unaudited)
| | | | |
| | |
| Country Allocation | | % of TNA | |
Brazil | | | 4.7% | |
Canada | | | 1.0% | |
Chile | | | 1.8% | |
China | | | 28.5% | |
Colombia | | | 1.0% | |
Hong Kong | | | 1.6% | |
India | | | 7.9% | |
Indonesia | | | 7.0% | |
Malaysia | | | 1.9% | |
Mexico | | | 7.2% | |
Philippines | | | 2.3% | |
Qatar | | | 1.0% | |
Republic of Korea | | | 6.4% | |
Russia | | | 4.0% | |
South Africa | | | 4.5% | |
South Korea | | | 6.0% | |
Taiwan | | | 6.2% | |
Thailand | | | 1.4% | |
Turkey | | | 3.3% | |
| United Arab Emirates | | | 1.0% | |
| Cash & Other | | | 1.3% | |
| | | | |
| | |
| Industry Allocation | | % of TNA | |
| Automobiles & Components | | | 3.6% | |
| Banks | | | 19.9% | |
| Capital Goods | | | 6.5% | |
| Consumer Durables & Apparel | | | 3.9% | |
| Energy | | | 7.3% | |
| Food & Staples Retailing | | | 1.0% | |
| Food, Beverage & Tobacco | | | 2.4% | |
| Health Care Equipment & Services | | | 1.1% | |
| Household & Personal Products | | | 2.6% | |
| Insurance | | | 2.7% | |
| Materials | | | 12.0% | |
| Media | | | 0.8% | |
| Pharmaceuticals, Biotechnology & Life Sciences | | | 1.7% | |
| Real Estate | | | 2.0% | |
| Retailing | | | 2.0% | |
| Semiconductors & Semiconductor Equipment | | | 6.5% | |
| Software & Services | | | 10.3% | |
| Technology Hardware & Equipment | | | 6.0% | |
| Telecommunication Services | | | 1.6% | |
| Transportation | | | 1.9% | |
| Utilities | | | 2.9% | |
| Cash & Other | | | 1.3% | |
TNA - Total Net Assets
Fund holdings and industry allocations are subject to change and should not be considered a recommendation to buy or sell any securities. For a complete list of Fund holdings, please refer to the Investment Portfolio section of this report.
| | | | |
| www.thomaswhitefunds.com | | | 29 | |
| | |
| Thomas White Emerging Markets Fund | | |
| | | | | | | | | | | | |
| Country | | Issue | | Industry | | Shares | | | Value (US$) | |
| | | | | | | | | | | |
COMMON
STOCKS (97.6%) | | | | | | | | | | |
| | | | |
| | | | | | | | | | | | |
| BRAZIL (3.6%) | | | | | | | | |
| | BB Seguridade Participacoes S.A. | | Insurance | | | 70,200 | | | | $659,082 | |
| | Hypermarcas S.A. | | Household & Personal Products | | | 124,300 | | | | 1,175,231 | |
| | JBS SA | | Food, Beverage & Tobacco | | | 226,500 | | | | 731,440 | |
| | | | | | | | | | | | |
| | | | | | | | | | | 2,565,753 | |
| | | | |
| | | | | | | | | | | | |
| CANADA (1.0%) | | | | | | | | |
| | Gran Tierra Energy, Inc. * # | | Energy | | | 290,000 | | | | 730,800 | |
| | | | |
| | | | | | | | | | | | |
| CHILE (1.8%) | | | | | | | | |
| | Itau CorpBanca | | Banks | | | 139,109,050 | | | | 1,268,105 | |
| | | | |
| | | | | | | | | | | | |
| CHINA (28.5%) | | | | | | | | |
| | Alibaba Group Holding Ltd. * # | | Software & Services | | | 22,100 | | | | 2,552,550 | |
| | Anhui Conch Cement Company Limited - H Shares + | | Materials | | | 310,000 | | | | 1,087,318 | |
| | Beijing Enterprises Holdings Limited + | | Capital Goods | | | 217,400 | | | | 1,060,850 | |
| | China Biologic Products Inc. * | | Pharmaceuticals, Biotechnology & Life Sciences | | | 10,750 | | | | 1,268,500 | |
| | China Everbright Bank Co Ltd + | | Banks | | | 2,187,000 | | | | 1,025,197 | |
| | China Overseas Land & Investment Limited + | | Real Estate | | | 254,000 | | | | 736,720 | |
| | China Petroleum and Chemical Corporation (Sinopec) - H Shares + | | Energy | | | 948,000 | | | | 770,560 | |
| | China State Construction International Holdings Limited + | | Capital Goods | | | 553,600 | | | | 1,003,637 | |
| | Chongqing Rural Commercial Bank Co., Ltd. + | | Banks | | | 2,494,100 | | | | 1,713,590 | |
| | Guangdong Investment Limited + | | Utilities | | | 870,500 | | | | 1,347,151 | |
| | Haier Electronics Group Co., Ltd. + | | Consumer Durables & Apparel | | | 191,000 | | | | 442,505 | |
| | Hollysys Automation Technologies Ltd. | | Technology Hardware & Equipment | | | 50,800 | | | | 814,832 | |
| | NetEase, Inc. ADR | | Software & Services | | | 6,000 | | | | 1,592,340 | |
| | Ping An Insurance (Group) Company of China Limited - H Shares + | | Insurance | | | 224,700 | | | | 1,262,772 | |
| | Sinopharm Group Co. Ltd. - H Shares + | | Health Care Equipment & Services | | | 185,600 | | | | 830,829 | |
| | Tencent Holdings Limited + | | Software & Services | | | 70,500 | | | | 2,205,187 | |
| | ZTO Express Cayman, Inc-ADR * # | | Transportation | | | 57,000 | | | | 794,010 | |
| | | | | | | | | | | | |
| | | | | | | | | | | 20,508,548 | |
| | | | |
| | | | | | | | | | | | |
| COLOMBIA (1.0%) | | | | | | | | |
| | Almacenes Exito SA | | Food & Staples Retailing | | | 136,050 | | | | 704,759 | |
| | | | |
| | | | | | | | | | | | |
| HONG KONG (1.6%) | | | | | | | | |
| | Techtronic Industries Company Limited + | | Consumer Durables & Apparel | | | 274,400 | | | | 1,179,267 | |
| | | | |
| | | | | | | | | | | | |
The accompanying notes are an integral part of these financial statements
| | |
| 30 | | www.thomaswhitefunds.com |
| | |
| Investment Portfolio (Unaudited) | | April 30, 2017 |
| | | | | | | | | | | | |
| Country | | Issue | | Industry | | Shares | | | Value (US$) | |
| | | | | | | | | | | |
| INDIA (7.9%) | | | | | | | | |
| | Axis Bank Limited + | | Banks | | | 71,500 | | | | $565,082 | |
| | Hero MotoCorp Ltd. + | | Automobiles & Components | | | 16,600 | | | | 855,308 | |
| | Infosys Limited + | | Software & Services | | | 75,600 | | | | 1,081,487 | |
| | Mahindra & Mahindra Ltd. GDR + | | Automobiles & Components | | | 41,249 | | | | 864,090 | |
| | NTPC Limited + | | Utilities | | | 291,800 | | | | 747,088 | |
| | Reliance Industries Ltd. * + | | Energy | | | 32,000 | | | | 695,285 | |
| | Tata Motors Limited + | | Automobiles & Components | | | 123,868 | | | | 885,413 | |
| | | | | | | | | | | | |
| | | | | | | | | | | 5,693,753 | |
| | | | |
| | | | | | | | | | | | |
| INDONESIA (7.0%) | | | | | | | | |
| | PT Gudang Garam Tbk + | | Food, Beverage & Tobacco | | | 199,200 | | | | 991,727 | |
| | PT Matahari Department Store Tbk + | | Retailing | | | 841,600 | | | | 922,600 | |
| | Pembangunan Perumahan Persero + | | Capital Goods | | | 2,268,500 | | | | 540,833 | |
| | PT Bank Negara Indonesia (Persero) Tbk + | | Banks | | | 1,811,100 | | | | 865,658 | |
| | PT Telekomunikasi Indonesia Persero Tbk + | | Telecommunication Services | | | 3,486,200 | | | | 1,141,697 | |
| | Wijaya Karya Persero Tbk PT + | | Capital Goods | | | 3,194,100 | | | | 567,285 | |
| | | | | | | | | | | | |
| | | | | | | | | | | 5,029,800 | |
| | | | |
| | | | | | | | | | | | |
| MALAYSIA (1.9%) | | | | | | | | |
| | Astro Malaysia Holdings Bhd + | | Media | | | 910,000 | | | | 565,987 | |
| | CIMB Group Holdings Berhad + | | Banks | | | 585,100 | | | | 773,966 | |
| | | | | | | | | | | | |
| | | | | | | | | | | 1,339,953 | |
| | | | |
| | | | | | | | | | | | |
| MEXICO (7.2%) | | | | | | | | |
| | Cemex SAB de CV * | | Materials | | | 1,791,750 | | | | 1,649,435 | |
| | Grupo Financiero Banorte, S.A.B. de C.V. | | Banks | | | 266,100 | | | | 1,535,656 | |
| | Grupo Sanborns S.A.B. de C.V. | | Retailing | | | 442,100 | | | | 506,794 | |
| | Mexichem, S.A.B. de C.V. | | Materials | | | 551,050 | | | | 1,513,647 | |
| | | | | | | | | | | | |
| | | | | | | | | | | 5,205,532 | |
| | | | |
| | | | | | | | | | | | |
| PHILIPPINES (2.3%) | | | | | | | | |
| | Metropolitan Bank & Trust Company + | | Banks | | | 978,450 | | | | 1,651,947 | |
| | | | |
| | | | | | | | | | | | |
| QATAR (1.0%) | | | | | | | | |
| | Gulf International Services + | | Energy | | | 97,300 | | | | 685,022 | |
| | | | |
| | | | | | | | | | | | |
| REPUBLIC OF KOREA (6.4%) | | | | | | | | |
| | BNK Financial Group, Inc. + | | Banks | | | 97,150 | | | | 815,490 | |
| | KCC Corporation + | | Capital Goods | | | 5,050 | | | | 1,509,782 | |
| | Korea Zinc Co Ltd + | | Materials | | | 4,200 | | | | 1,567,987 | |
| | POSCO + | | Materials | | | 3,100 | | | | 732,108 | |
| | | | | | | | | | | | |
| | | | | | | | | | | 4,625,367 | |
|
| |
| RUSSIA (4.0%) | | | | | | | | | | |
| | LUKOIL PJSC GDR + | | Energy | | | 27,400 | | | | 1,360,406 | |
| | Sberbank of Russia GDR + | | Banks | | | 129,450 | | | | 1,538,554 | |
| | | | | | | | | | | | |
| | | | | | | | | | | 2,898,960 | |
| | | | |
| | | | | | | | | | | | |
The accompanying notes are an integral part of these financial statements
| | | | |
| www.thomaswhitefunds.com | | | 31 | |
| | |
| Thomas White Emerging Markets Fund | | |
| | | | | | | | | | | | |
| Country | | Issue | | Industry | | Shares | | | Value (US$) | |
| | | | | | | | | | | |
| SOUTH AFRICA (4.5%) | | | | | | | | | | |
| | PPC Ltd * + | | Materials | | | 2,518,100 | | | | $1,180,377 | |
| | Sibanye Gold Limited + | | Materials | | | 456,500 | | | | 914,405 | |
| | Steinhoff International Holdings N.V. + | | Consumer Durables & Apparel | | | 226,877 | | | | 1,155,786 | |
| | | | | | | | | | | | |
| | | | | | | | | | | 3,250,568 | |
| | | | |
| | | | | | | | | | | | |
| SOUTH KOREA (6.0%) | | | | | | | | | | |
| | LG Display Co., Ltd. + | | Technology Hardware & Equipment | | | 47,300 | | | | 1,222,169 | |
| | LG Household & Health Care Ltd. + | | Household & Personal Products | | | 900 | | | | 685,052 | |
| | Samsung Electronics Co., Ltd. + | | Semiconductors & Semiconductor Equipment | | | 1,245 | | | | 2,433,741 | |
| | | | | | | | | | | | |
| | | | | | | | | | | 4,340,962 | |
| | | | |
| | | | | | | | | | | | |
| TAIWAN (6.2%) | | | | | | | | | | |
| | Catcher Technology Co., Ltd + | | Technology Hardware & Equipment | | | 114,000 | | | | 1,171,624 | |
| | Pegatron Corporation + | | Technology Hardware & Equipment | | | 369,200 | | | | 1,086,583 | |
| | Taiwan Semiconductor Manufacturing Company Ltd. + | | Semiconductors & Semiconductor Equipment | | | 345,400 | | | | 2,217,311 | |
| | | | | | | | | | | | |
| | | | | | | | | | | 4,475,518 | |
| | | | |
| | | | | | | | | | | | |
| THAILAND (1.4%) | | | | | | | | | | |
| | PTT Exploration and Production Public Company Limited + | | Energy | | | 351,600 | | | | 986,723 | |
| | | | |
| | | | | | | | | | | | |
| TURKEY (3.3%) | | | | | | | | | | |
| | Akbank TAS + | | Banks | | | 307,900 | | | | 823,890 | |
| | TAV Havalimanlari Holding AS + | | Transportation | | | 139,500 | | | | 581,022 | |
| | Turkiye Garanti Bankasi A.S. + | | Banks | | | 351,100 | | | | 947,657 | |
| | | | | | | | | | | | |
| | | | | | | | | | | 2,352,569 | |
| | | | |
| | | | | | | | | | | | |
| UNITED ARAB EMIRATES (1.0%) | | | | | | | | | | |
| | Emaar Properties PJSC + | | Real Estate | | | 362,200 | | | | 707,262 | |
| | | | |
| | | | | | | | | | | | |
Total Common
Stocks | | (Cost $62,888,888) | | | | | | | 70,201,168 | |
| | | | | | | | | | | | |
|
| |
PREFERRED
STOCK (1.1%) | | | | | | | | | | |
| | | | |
| | | | | | | | | | | | |
| BRAZIL (1.1%) | | | | | | | | |
| | Itau Unibanco Holding S.A. | | Banks | | | 64,149 | | | | 793,058 | |
| | | | |
| | | | | | | | | | | | |
| Total Preferred Stock | | (Cost $711,553) | | | | | | | 793,058 | |
| | | | | | | | | | | | |
| | | | |
| | | | | | | | | | | | |
The accompanying notes are an integral part of these financial statements
| | |
| 32 | | www.thomaswhitefunds.com |
| | |
| Investment Portfolio (Unaudited) | | April 30, 2017 |
| | | | | | | | | | | | |
| Country | | Issue | | Industry | | Shares | | | Value (US$) | |
| | | | | | | | | | | |
SHORT TERM
INVESTMENTS (1.0%) | | | | | | | | | | |
| | | | |
| | | | | | | | | | | | |
| MONEY MARKET FUND (1.0%) | | | | | | | | |
| | Northern Institutional Treasury Portfolio, 0.41% | | | | | 759,446 | | | | $759,446 | |
| | | | |
| | | | | | | | | | | | |
Total Short Term
Investments | | (Cost $759,446) | | | | | | | 759,446 | |
| | | | | | | | | | | | |
| | | | |
| | | | | | | | | | | | |
| | | | |
| HELD AS COLLATERAL FOR SECURITIES LENDING (6.8%) | | | | | | | | | | | | |
| | | | |
| | | | | | | | | | | | |
| | | | | | | Principal
Amount | | | | |
| U.S. GOVERNMENT OBLIGATIONS (4.3%) | | | | | | | | |
| | U.S. Treasury Notes: | | | | | | | | | | |
| | 0.875% due 05/31/2018 | | | | | $223,835 | | | | $223,835 | |
| | 0.625% due 06/30/2018 | | | | | 24,505 | | | | 24,505 | |
| | 0.750% due 07/31/2018 | | | | | 14,760 | | | | 14,760 | |
| | 0.875% due 05/15/2019 | | | | | 239,664 | | | | 239,664 | |
| | 0.750% due 07/15/2019 | | | | | 30,913 | | | | 30,913 | |
| | 1.000% due 08/31/2019 | | | | | 1,332 | | | | 1,332 | |
| | 1.625% due 08/31/2019 | | | | | 18,968 | | | | 18,968 | |
| | 1.500% due 10/31/2019 | | | | | 1,257 | | | | 1,257 | |
| | 1.375% due 01/31/2020 | | | | | 40,367 | | | | 40,367 | |
| | 3.500% due 05/15/2020 | | | | | 12,035 | | | | 12,035 | |
| | 1.875% due 06/30/2020 | | | | | 7,287 | | | | 7,287 | |
| | 1.375% due 09/30/2020 | | | | | 160,654 | | | | 160,654 | |
| | 1.625% due 11/30/2020 | | | | | 2,089 | | | | 2,089 | |
| | 1.125% due 02/28/2021 | | | | | 41,899 | | | | 41,899 | |
| | 1.125% due 06/30/2021 | | | | | 198,115 | | | | 198,115 | |
| | 2.000% due 08/31/2021 | | | | | 4,634 | | | | 4,634 | |
| | 2.125% due 09/30/2021 | | | | | 26,471 | | | | 26,471 | |
| | 2.125% due 12/31/2021 | | | | | 15,136 | | | | 15,136 | |
| | 1.875% due 08/31/2022 | | | | | 1,485 | | | | 1,485 | |
| | 1.750% due 09/30/2022 | | | | | 42,679 | | | | 42,679 | |
| | 1.750% due 01/31/2023 | | | | | 48,419 | | | | 48,419 | |
| | 1.500% due 02/28/2023 | | | | | 13,744 | | | | 13,744 | |
| | 1.750% due 05/15/2023 | | | | | 25,768 | | | | 25,768 | |
| | 2.250% due 01/31/2024 | | | | | 7,529 | | | | 7,529 | |
| | 2.500% due 05/15/2024 | | | | | 29,710 | | | | 29,710 | |
| | 2.250% due 11/15/2025 | | | | | 30,387 | | | | 30,387 | |
| | 1.625% due 05/15/2026 | | | | | 18,388 | | | | 18,388 | |
| | | | | | | | | | | | |
| | | | | | | | | | | 1,282,030 | |
| | U.S. TIPS: | | | | | | | | | | |
| | 2.411% due 01/15/2019 | | | | | 44,147 | | | | 44,147 | |
| | 0.130% due 04/15/2019 | | | | | 144,188 | | | | 144,188 | |
| | 2.139% due 07/15/2019 | | | | | 25,104 | | | | 25,104 | |
| | 0.130% due 04/15/2020 | | | | | 3,585 | | | | 3,585 | |
| | 1.253% due 01/15/2021 | | | | | 15,123 | | | | 15,123 | |
| | 0.128% due 04/15/2021 | | | | | 5,476 | | | | 5,476 | |
| | 0.676% due 07/15/2021 | | | | | 4,987 | | | | 4,987 | |
The accompanying notes are an integral part of these financial statements
| | | | |
| www.thomaswhitefunds.com | | | 33 | |
| | |
| Thomas White Emerging Markets Fund | | |
| | | | | | | | | | | | |
| Country | | Issue | | Industry | | Shares/
Principal
Amount | | | Value (US$) | |
| | | | | | | | | | | |
| U.S. GOVERNMENT OBLIGATIONS (CONT.) | | | | | | | | |
| | 0.132% due 07/15/2022 | | | | | $11,004 | | | | $11,004 | |
| | 0.653% due 01/15/2024 | | | | | 6,367 | | | | 6,367 | |
| | 0.257% due 01/15/2025 | | | | | 74,231 | | | | 74,231 | |
| | 2.455% due 01/15/2026 | | | | | 49,555 | | | | 49,555 | |
| | 2.364% due 02/15/2041 | | | | | 8,655 | | | | 8,655 | |
| | 0.776% due 02/15/2045 | | | | | 6,233 | | | | 6,233 | |
| | | | | | | | | | | | |
| | | | | | | | | | | 398,655 | |
| | U.S. Treasury Bonds: | | | | | | | | | | |
| | 8.125% due 08/15/2019 | | | | | 7,850 | | | | 7,850 | |
| | 3.625% due 02/15/2020 | | | | | 6,402 | | | | 6,402 | |
| | 3.125% due 05/15/2021 | | | | | 6,656 | | | | 6,656 | |
| | 1.750% due 04/30/2022 | | | | | 178,222 | | | | 178,222 | |
| | 2.000% due 02/15/2025 | | | | | 97,831 | | | | 97,831 | |
| | 1.625% due 02/15/2026 | | | | | 358,504 | | | | 358,504 | |
| | 5.250% due 02/15/2029 | | | | | 15,466 | | | | 15,466 | |
| | 6.250% due 05/15/2030 | | | | | 30,257 | | | | 30,257 | |
| | 2.750% due 11/15/2042 | | | | | 2,187 | | | | 2,187 | |
| | 3.125% due 02/15/2043 | | | | | 61,615 | | | | 61,615 | |
| | 3.625% due 08/15/2043 | | | | | 5,715 | | | | 5,715 | |
| | 3.750% due 11/15/2043 | | | | | 56,288 | | | | 56,288 | |
| | 3.625% due 02/15/2044 | | | | | 26,940 | | | | 26,940 | |
| | 3.000% due 05/15/2045 | | | | | 266,597 | | | | 266,597 | |
| | 2.875% due 08/15/2045 | | | | | 7,324 | | | | 7,324 | |
| | 3.000% due 11/15/2045 | | | | | 208,307 | | | | 208,307 | |
| | 2.500% due 02/15/2046 | | | | | 33,846 | | | | 33,846 | |
| | 2.500% due 05/15/2046 | | | | | 5,449 | | | | 5,449 | |
| | | | | | | | | | | | |
| | | | | | | | | | | 1,375,456 | |
| | | | |
| | | | | | | | | | | | |
Total U.S.
Government
Obligations | | (Cost $3,056,141) | | | | | | | 3,056,141 | |
| | | | | | | | | | | | |
| | | | |
| | | | | | | | | | | | |
SHORT TERM
INVESTMENTS (2.5%) | | | | | | | | |
| | | | |
| | | | | | | | | | | | |
| MONEY MARKET FUND (1.9%) | | | | | | | | |
| | Northern Institutional Liquid Assets Portfolio, 0.80% (a) | | | | | 1,361,750 | | | | 1,361,750 | |
| | | | |
| | | | | | | | | | | | |
| UNITED STATES TREASURIES (0.6%) | | | | | | | | |
| | U.S. Treasury Bills: | | | | | | | | | | |
| | 0.000% due 07/20/2017 | | | | | $1,479 | | | | $1,479 | |
| | 0.000% due 09/21/2017 | | | | | 267,501 | | | | 267,501 | |
| | | | | | | | | | | | |
| | | | | | | | | | | 268,980 | |
| | | | |
| | U.S. Treasury Note: | | | | | | | | | | |
| | 0.750% due 02/28/2018 | | | | | 37,070 | | | | 37,070 | |
| | | | |
| | U.S. TIPS: | | | | | | | | | | |
| | 0.132% due 04/15/2018 | | | | | 138,317 | | | | 138,317 | |
| | | | |
| | | | | | | | | | | | |
The accompanying notes are an integral part of these financial statements
| | |
| 34 | | www.thomaswhitefunds.com |
| | |
| Investment Portfolio (Unaudited) | | April 30, 2017 |
| | | | | | | | | | | | |
| Country | | Issue | | Industry | | Principal
Amount | | | Value (US$) | |
| | | | | | | | | | | |
Total Short Term
Investments | | (Cost $1,806,117) | | | | | | | $1,806,117 | |
| | | | | | | | | | | | |
| | | | |
| | | | | | | | | | | | |
Total held as
collateral for
securities lending | | (Cost $4,862,258) | | | | | | | $4,862,258 | |
| | | | | | | | | | | | |
| | | | |
| | | | | | | | | | | | |
| Total Investments | | 106.5% | | (Cost $69,222,145) | | | | | | | $76,615,930 | |
| Other Assets, Less Liabilities | | (6.5)% | | | | | | | | | (4,685,767 | ) |
| Total Net Assets: | | 100.0% | | | | | | | | | $71,930,163 | |
| * | Non-Income Producing Securities |
| # | All or a portion of securities on loan at April 30, 2017 - See Note 1(I) to Financial Statements |
| + | Fair Valued Security - See Note 1(A) to Financial Statements |
| ADR | - American Depositary Receipt |
| GDR | - Global Depositary Receipt |
Industry classifications shown in the Investment Portfolio are based off of the Global Industry Classification Standard (GICS®). GICS was developed by and/or is the exclusive property of MSCI, Inc. and Standard & Poor's Financial Services LLC ("S&P"). GICS is a service mark of MSCI and S&P and has been licensed for use by U.S. Bancorp Fund Services, LLC.
The accompanying notes are an integral part of these financial statements
| | | | |
| www.thomaswhitefunds.com | | | 35 | |
| | |
| Thomas White Emerging Markets Fund | | |
The following table summarizes the inputs used, as of April 30, 2017, in valuating the Fund’s assets:
| | | | | | | | | | | | | | | | |
| | | Level 1 | | | Level 2 | | | Level 3 | | | Total | |
| Common Stocks | | | | | | | | | | | | | | | | |
| Brazil | | | $2,565,753 | | | | $------- | | | | $------- | | | | $2,565,753 | |
| Canada | | | 730,800 | | | | ------- | | | | ------- | | | | 730,800 | |
| Chile | | | 1,268,105 | | | | ------- | | | | ------- | | | | 1,268,105 | |
| China | | | 7,022,232 | | | | 13,486,316 | | | | ------- | | | | 20,508,548 | |
| Colombia | | | 704,759 | | | | ------- | | | | ------- | | | | 704,759 | |
| Hong Kong | | | ------- | | | | 1,179,267 | | | | ------- | | | | 1,179,267 | |
| India | | | ------- | | | | 5,693,753 | | | | ------- | | | | 5,693,753 | |
| Indonesia | | | ------- | | | | 5,029,800 | | | | ------- | | | | 5,029,800 | |
| Malaysia | | | ------- | | | | 1,339,953 | | | | ------- | | | | 1,339,953 | |
| Mexico | | | 5,205,532 | | | | ------- | | | | ------- | | | | 5,205,532 | |
| Philippines | | | ------- | | | | 1,651,947 | | | | ------- | | | | 1,651,947 | |
| Qatar | | | ------- | | | | 685,022 | | | | ------- | | | | 685,022 | |
| Republic of Korea | | | ------- | | | | 4,625,367 | | | | ------- | | | | 4,625,367 | |
| Russia | | | ------- | | | | 2,898,960 | | | | ------- | | | | 2,898,960 | |
| South Africa | | | ------- | | | | 3,250,568 | | | | ------- | | | | 3,250,568 | |
| South Korea | | | ------- | | | | 4,340,962 | | | | ------- | | | | 4,340,962 | |
| Taiwan | | | ------- | | | | 4,475,518 | | | | ------- | | | | 4,475,518 | |
| Thailand | | | ------- | | | | 986,723 | | | | ------- | | | | 986,723 | |
| Turkey | | | ------- | | | | 2,352,569 | | | | ------- | | | | 2,352,569 | |
| United Arab Emirates | | | ------- | | | | 707,262 | | | | ------- | | | | 707,262 | |
| Total Common Stocks | | | $17,497,181 | | | | $52,703,987 | | | | $------- | | | | $70,201,168 | |
| Preferred Stock | | | | | | | | | | | | | | | | |
| Brazil | | | $793,058 | | | | $------- | | | | $------- | | | | $793,058 | |
| Total Preferred Stock | | | $793,058 | | | | $------- | | | | $------- | | | | $793,058 | |
| U.S. Government Obligations | | | $------- | | | | $3,056,141 | | | | $------- | | | | $3,056,141 | |
| Short Term Investments | | | $2,121,196 | | | | $444,367 | | | | $------- | | | | $2,565,563 | |
| Total Investments | | | $20,411,435 | | | | $56,204,495 | | | | $------- | | | | $76,615,930 | |
For more information on valuation inputs, please refer to Note 1(A) of the accompanying Notes to Financial Statements.
The Fund’s assets assigned to Level 2 include certain foreign securities for which a third party statistical pricing service may be employed for purposes of fair market valuation. In addition, no transfers in and/or out between Levels 1, 2 or 3 were observed during the reporting period, as compared to their classification from the prior annual report.
The accompanying notes are an integral part of these financial statements
| | |
| 36 | | www.thomaswhitefunds.com |
THOMAS WHITE AMERICAN OPPORTUNITIES FUND
| | | | | | | | | | | | | | |
| | | | | | | | |
| | | Unaudited
Sales
Charge | | Deferred
Sales
Charge | | Administrative
Services Fee | | 12b-1 Fees | | Operating
Expenses1,3 | | Prospectus
Gross
Annual
Operating
Expense2 | | Prospectus
Net Annual
Operating
Expense2,3 |
| Investor Class | | None | | None | | Up to 0.25% | | None | | 1.18% | | 1.20% | | 1.20% |
1 In the absence of the fee deferral/expense reimbursement arrangement for the American Opportunities Fund, the ratio of expenses to average net assets would have been 1.18% for Investor Class shares.
2 Gross Annual Operating Expense and Net Annual Operating Expense are based on the most recent prospectus and may differ from other expense ratios appearing in this report.
3 Thomas White International, Ltd. (“Advisor”) has agreed to defer its fees and/or reimburse the Fund to the extent that the operating expenses for Investor Class shares exceed 1.34% of its average daily net assets. The fee deferral/expense reimbursement agreement expires February 28, 2018. The Fund has agreed to repay the Advisor for amounts deferred or reimbursed by the Advisor pursuant to the agreement provided that such repayment does not cause the Fund to exceed the above limits and the repayment is made within three years after the year in which the Advisor incurred the expense. The fee deferral/expense reimbursement agreement may only be amended or terminated by the Fund’s Board of Trustees.
| | | | | | | | |
| | | | | |
| | | NAV | | Net Assets | | Redemption Fee | | Portfolio Turnover |
| Investor Class | | $16.76 | | $40.9 million | | 2.00% within 60 days | | 18% |
| | | | |
| www.thomaswhitefunds.com | | | 37 | |
THOMAS WHITE AMERICAN OPPORTUNITIES FUND
| | | | | | | | | | | | | | | | | | | | | | | | | | | | |
| |
| Average Annual Returns as of April 30, 2017 (Unaudited) | |
| Class | | 6 month | | | Calendar
YTD | | | 1 Yr | | | 3 Yrs | | | 5 Yrs | | | 10 Yrs | | | Since Inception
(3/4/1999) | |
| Investor Class shares (TWAOX) | | | 13.09% | | | | 5.25% | | | | 13.97% | | | | 7.48% | | | | 11.22% | | | | 5.74% | | | | 8.01% | |
| Russell Midcap Index1 | | | 12.94% | | | | 5.96% | | | | 16.70% | | | | 8.97% | | | | 13.34% | | | | 7.62% | | | | 9.43% | |
| S&P 500 Index1 | | | 13.32% | | | | 7.16% | | | | 17.92% | | | | 10.47% | | | | 13.68% | | | | 7.15% | | | | 5.62% | |
1 The Russell Midcap Index measures the performance of the 800 smallest companies in the Russell 1000 Index. These represent approximately 31% of the total market capitalization of the Russell 1000 Index. The S&P 500 Index measures the performance of 500 leading companies in leading industries of the U.S. economy, capturing 80% coverage of U.S. equities. Both indices are unmanaged and returns assume the reinvestment of dividends. It is not possible to invest directly in an index.
The returns do not reflect the deduction of taxes that a shareholder would pay on Fund distributions or the redemption of Fund shares. The returns reflect the actual performance for each period and do not include the impacts of trades executed on the last business day of the period that were recorded on the first business day of the next period.
Performance data is based upon past performance, which is no guarantee of future results. The investment return and principal value of an investment will fluctuate so that an investor’s shares, when redeemed, may be worth more or less than their original cost. Current performance may be higher or lower than the performance data quoted. Please call 1-800-811-0535 to obtain performance data as of the most recent month-end. The Fund imposes a 2% redemption fee on shares held less than 60 days. Performance data does not reflect the redemption fee. If reflected, total returns would be lower. Investment performance reflects any fee waivers that were in effect. In the absence of such waivers, total return would have been reduced. The Investor Class Gross Expense Ratio, based on the most recent prospectus, is 1.20%.
| | |
| 38 | | www.thomaswhitefunds.com |
APRIL 30, 2017
GROWTH OF A $10,000 INVESTMENT WITH DIVIDENDS REINVESTED (Unaudited)
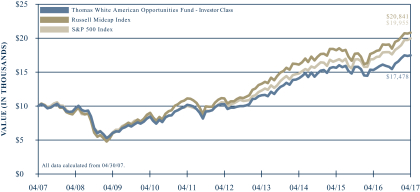
This chart illustrates the performance of a hypothetical $10,000 investment made in the Fund’s Investor Class shares, its primary benchmark, the Russell Midcap Index, and its secondary benchmark, the S&P 500 Index, for the past 10 years through April 30, 2017. It assumes reinvestment of dividends and capital gains, but does not reflect the effect of any applicable redemption fees. This chart does not imply future performance. Past performance does not guarantee future results. The cumulative ten year return was +74.78% for the Fund’s Investor Class shares, +108.41% for the primary benchmark, and +99.55% for the secondary benchmark. The Fund’s Investor Class shares average annual total return since inception on March 4, 1999 was +8.01%. The Russell Midcap Index measures the performance of the 800 smallest companies in the Russell 1000 Index. These represent approximately 31% of the total market capitalization of the Russell 1000 Index. The S&P 500 Index measures the performance of 500 leading companies in leading industries of the U.S. economy, capturing 80% coverage of U.S. equities. Both indices are unmanaged and returns assume the reinvestment of dividends. It is not possible to invest directly in an index. During the periods shown, the Fund’s manager reimbursed certain Fund expenses. Absent this reimbursement, performance would have been lower.
| | | | |
| www.thomaswhitefunds.com | | | 39 | |
| | | | |
| THOMAS WHITE AMERICAN OPPORTUNITIES FUND | | | | |
The Thomas White American Opportunities Fund primarily invests in equity securities of mid-size U.S. companies. The Fund may also invest in equity securities of smaller and larger size U.S. companies.
Portfolio Managers
Thomas S. White, Jr.
Jinwen Zhang, Ph.D., CFA
Douglas M. Jackman, CFA
Wei Li, Ph.D., CFA
John Wu, Ph.D., CFA
Rex Mathew, CM
Ramkumar Venkatramani, CFA
Performance Review
The Thomas White American Opportunities Fund Investor Class shares returned +13.09% during the six-month period ended April 30, 2017 while the Fund’s primary benchmark, the Russell Midcap Index, returned +12.94% and the secondary benchmark S&P 500 Index returned +13.32% during the same period. Since its inception in 1999, the Fund’s Investor Class shares annualized returns are +8.01%, compared to +9.43% for the Russell Midcap Index and +5.62% for the S&P 500 Index.
Fiscal Stimulus Hopes and Improved Earnings Make Investors More Optimistic
U.S. domestic equity prices advanced during the six month review period as there is growing confidence that the ongoing global expansion is more durable than the recent short-lived episodes. Though the pace of expansion during the first three months of this year fell short of expectations, the economy is projected to gather pace in the
coming months. Consumer sentiment remains robust while businesses appear more optimistic about demand trends going forward. Retail fuel prices remain affordable, benefiting household budgets, while the labor market continues to be healthy. Corporate earnings during the first quarter of this year were above forecasts, and boosted equity prices further.
While the markets saw a negative shock immediately after the unexpected presidential election result in November, the pessimism soon gave way to hopes of favorable fiscal policies from the new administration. Expectations include easier regulations for important industries such as banking and healthcare, lower taxes for businesses and individuals, as well as a large infrastructure spending program. If implemented effectively, these measures have the potential to boost domestic economic growth in the short to medium term.
In response to the healthier economic trends and tightening labor market, the U.S. Federal Reserve raised its benchmark rate in December of 2016 and followed up with another hike in March. The U.S. Dollar strengthened against other currencies during the first half of the review period on expectations of stronger growth and more Fed rate hikes, before softening in the latter half.
Portfolio Review
During the six-month review period ended April 30, 2017, the Fund’s relative performance against its primary benchmark was helped by positive stock selection in the consumer discretionary, industrials,
| | |
| 40 | | www.thomaswhitefunds.com |
APRIL 30, 2017
healthcare and consumer staples sectors. The Fund also benefited from lower exposure to the real estate sector and higher exposure to the materials and healthcare sectors. On the negative side, stock selection detracted from returns in the energy, technology and real estate sectors. Underexposure to the energy and financials sectors also hurt the Fund’s relative performance.
Fund holdings that are benefiting from the sustained gains in consumer spending, as well as the housing market uptrend, contributed the most to Fund returns for the six month review period. They included paint manufacturer Sherwin-Williams Company as well as homebuilder NVR, Inc. Cruise line operator Royal Caribbean gained on healthy demand growth, especially in new Asian markets led by China. Southwest Airlines advanced after reporting robust earnings, and also on the prospect of growing market share as the low cost carrier expands its international network in the Americas. Drug manufacturer Jazz Pharmaceuticals outperformed on expectations of robust revenue growth as its pipeline of drugs under clinical trials move closer to FDA approval.
The moderation in crude oil prices during the second half of the review period hurt the Fund’s energy holdings. They included oil and gas producers EQT Corp. and Range Resources, as well as coal and natural gas producer Consol Energy. Despite the recent decline, we remain confident that the downside risks for crude oil prices are limited as healthier growth around the world and production cuts by some of the leading exporters could tighten the market in the coming months. Commercial property REIT
Brixmor Property Group was hurt by concerns that most grocery chains, department stores and other retailers are struggling to prevent revenue declines. Jewelry retailer Pandora A/S also underperformed on doubts about the sustainability of revenue growth, though the company is expanding into new markets in Asia.
U.S. Economy Could Remain Healthy in the Medium Term
Cheerful consumer sentiment that has helped the U.S. economy expand at a modest pace in recent years should continue to support growth in the short to medium term as well. Two of the most widely followed consumer sentiment surveys indicate that consumers are more optimistic this year, when compared to last year. Sustained job gains at a robust monthly pace has been one of the major drivers of consumer confidence, and the unemployment rate remains below 5%. Wage growth has fallen short of expectations so far during this recovery, but more recent data suggest modest gains that could rise further as the labor market tightens. While fuel costs are higher than last year, the increase so far is not large enough to detract from other household consumption. At the same time, higher oil prices have encouraged new investments in production and have led to increased hiring. While automobile sales have stagnated recently, the slowdown has happened after several years of sustained gains.
The housing market also remains healthy as the slow growth in new inventory has helped sustain gains in average home prices in most major cities. Though mortgage rates have
| | | | |
| www.thomaswhitefunds.com | | | 41 | |
THOMAS WHITE AMERICAN OPPORTUNITIES FUND
hardened compared to last year, they are still very affordable by historical standards. Bank lending standards have not tightened, though better credit risk control measures introduced after the last downturn have reduced aggressive lending practices. Nevertheless, homes are becoming increasingly unaffordable for first time buyers, especially in fast growing cities.
While investors remain hopeful of meaningful tax cuts and lighter regulations, the difficulties in building political consensus could delay their implementation. The administration’s efforts to overhaul current
healthcare regulations have failed so far, while its budget proposals do not appear to have the necessary political support in Congress. The tax reform proposals remain vague, without much detail, and there appears to be division within the administration about reshaping the regulatory landscape for the banking industry. It could take longer than currently expected to resolve these differences, but such delays are unlikely to weaken the current growth pace of the economy.
We thank you for investing in the Thomas White American Opportunities Fund.
| | |
| 42 | | www.thomaswhitefunds.com |
APRIL 30, 2017
Portfolio Industry Allocation and Market Capitalization as of April 30, 2017 (Unaudited)
| | | | |
| | |
| Industry Allocation | | % of TNA | |
| Automobiles & Components | | | 1.7% | |
| Banks | | | 3.8% | |
| Capital Goods | | | 8.6% | |
| Commercial & Professional Services | | | 1.1% | |
| Consumer Durables & Apparel | | | 5.3% | |
| Consumer Services | | | 5.3% | |
| Diversified Financials | | | 2.0% | |
| Energy | | | 5.6% | |
| Food, Beverage & Tobacco | | | 3.1% | |
| Health Care Equipment & Services | | | 8.6% | |
| Insurance | | | 3.2% | |
| Materials | | | 9.9% | |
| Media | | | 1.2% | |
| Pharmaceuticals, Biotechnology & Life Sciences | | | 1.7% | |
| REITS | | | 6.0% | |
| Retailing | | | 5.5% | |
| Software & Services | | | 12.8% | |
| Technology Hardware & Equipment | | | 2.2% | |
| Telecommunication Services | | | 1.1% | |
| Transportation | | | 3.5% | |
| Utilities | | | 7.2% | |
| Cash & Other | | | 0.6% | |
| | | | |
| | |
| Portfolio Market Cap Mix | | % of TNA | |
| Large Cap (over $15.2 billion) | | | 33.3% | |
| Mid Cap ($2.3-$15.2 billion) | | | 66.1% | |
| Cash & Other | | | 0.6% | |
| | | | | |
| | | | | |
| | | | | |
| | | | | |
| | | | | |
| | | | | |
| | | | | |
| | | | | |
| | | | | |
| | | | | |
| | | | | |
| | | | | |
| | | | | |
| | | | | |
| | | | | |
TNA - Total Net Assets
Fund holdings and industry allocations are subject to change and should not be considered a recommendation to buy or sell any securities. For a complete list of Fund holdings, please refer to the Investment Portfolio section of this report.
| | | | |
| www.thomaswhitefunds.com | | | 43 | |
| | |
| Thomas White American Opportunities Fund | | |
| | | | | | | | | | |
| Industry | | Issue | | Shares | | | Value | |
| | | | | | | | | |
| COMMON STOCKS (93.4%) | |
|
| |
| AUTOMOBILES & COMPONENTS (1.7%) | | | | | | |
| | BorgWarner, Inc. | | | 12,000 | | | | $507,360 | |
| | Thor Industries, Inc. | | | 1,800 | | | | 173,124 | |
| | | | | | | | | | |
| | | | | | | | | 680,484 | |
|
| |
| BANKS (3.8%) | | | | | | | | |
| | Associated Banc-Corp | | | 20,400 | | | | 507,960 | |
| | Citizens Financial Group, Inc. | | | 15,100 | | | | 554,321 | |
| | Regions Financial Corporation | | | 37,100 | | | | 510,125 | |
| | | | | | | | | | |
| | | | | | | | | 1,572,406 | |
|
| |
| CAPITAL GOODS (8.6%) | | | | | | | | |
| | Carlisle Companies Incorporated | | | 3,530 | | | | 357,907 | |
| | Chicago Bridge & Iron Company N.V. | | | 9,855 | | | | 296,438 | |
| | Huntington Ingalls Industries, Inc. | | | 4,140 | | | | 831,684 | |
| | Orbital ATK, Inc. | | | 6,600 | | | | 653,400 | |
| | Sensata Technologies Holding N.V. * | | | 15,704 | | | | 646,691 | |
| | Spirit AeroSystems Holdings, Inc. - Class A | | | 12,600 | | | | 720,216 | |
| | | | | | | | | | |
| | | | | | | | | 3,506,336 | |
|
| |
| COMMERCIAL & PROFESSIONAL SERVICES (1.1%) | | | | |
| | Stericycle, Inc. * | | | 5,061 | | | | 431,906 | |
|
| |
| CONSUMER DURABLES & APPAREL (5.3%) | | | | | | |
| | Lennar Corporation - Class A | | | 11,650 | | | | 588,325 | |
| | NVR, Inc. * | | | 325 | | | | 686,156 | |
| | Pandora A/S ADR | | | 17,800 | | | | 481,134 | |
| | Polaris Industries Inc. | | | 4,900 | | | | 417,774 | |
| | | | | | | | | | |
| | | | | | | | | 2,173,389 | |
|
| |
| CONSUMER SERVICES (5.3%) | | | | |
| | Aramark | | | 11,987 | | | | 437,765 | |
| | The Cheesecake Factory Incorporated | | | 7,400 | | | | 474,784 | |
| | Royal Caribbean Cruises Ltd. | | | 7,400 | | | | 788,840 | |
| | Wyndham Worldwide Corporation | | | 5,000 | | | | 476,550 | |
| | | | | | | | | | |
| | | | | | | | | 2,177,939 | |
|
| |
| DIVERSIFIED FINANCIALS (2.0%) | | | | |
| | Intercontinental Exchange, Inc. | | | 6,500 | | | | 391,300 | |
| | Voya Financial, Inc. | | | 11,300 | | | | 422,394 | |
| | | | | | | | | | |
| | | | | | | | | 813,694 | |
|
| |
| ENERGY (5.6%) | | | | |
| | CONSOL Energy Inc. * | | | 21,600 | | | | 327,888 | |
| | EQT Corporation | | | 9,400 | | | | 546,516 | |
| | Noble Energy, Inc. | | | 15,800 | | | | 510,814 | |
| | Range Resources Corporation | | | 20,986 | | | | 555,919 | |
| | TechnipFMC plc * | | | 11,247 | | | | 338,872 | |
| | | | | | | | | | |
| | | | | | | | | 2,280,009 | |
|
| |
The accompanying notes are an integral part of these financial statements
| | |
| 44 | | www.thomaswhitefunds.com |
| | |
| Investment Portfolio (Unaudited) | | April 30, 2017 |
| | | | | | | | | | |
| Industry | | Issue | | Shares | | | Value | |
| | | | | | | | | |
| FOOD, BEVERAGE & TOBACCO (3.1%) | | | | |
| | Dr Pepper Snapple Group, Inc. | | | 4,900 | | | | $ 449,085 | |
| | The JM Smucker Company | | | 3,036 | | | | 384,722 | |
| | Molson Coors Brewing Company - Class B | | | 4,450 | | | | 426,710 | |
| | | | | | | | | | |
| | | | | | | | | 1,260,517 | |
|
| |
| HEALTH CARE EQUIPMENT & SERVICES (8.6%) | | | | |
| | AmerisourceBergen Corporation | | | 5,600 | | | | 459,480 | |
| | Centene Corporation * | | | 6,900 | | | | 513,360 | |
| | Cigna Corporation | | | 2,600 | | | | 406,562 | |
| | Humana, Inc. | | | 1,725 | | | | 382,915 | |
| | Laboratory Corporation of America Holdings * | | | 5,120 | | | | 717,568 | |
| | Zimmer Biomet Holdings, Inc. | | | 8,750 | | | | 1,046,938 | |
| | | | | | | | | | |
| | | | | | | | | 3,526,823 | |
|
| |
| INSURANCE (3.2%) | | | | |
| | Assurant, Inc. | | | 4,600 | | | | 442,704 | |
| | Everest Re Group, Ltd. | | | 1,700 | | | | 427,907 | |
| | The Hartford Financial Services Group, Inc. | | | 9,300 | | | | 449,748 | |
| | | | | | | | | | |
| | | | | | | | | 1,320,359 | |
|
| |
| MATERIALS (9.9%) | | | | |
| | AptarGroup, Inc. | | | 4,400 | | | | 353,320 | |
| | Ball Corporation | | | 7,050 | | | | 542,075 | |
| | Martin Marietta Materials, Inc. | | | 2,900 | | | | 638,551 | |
| | The Mosaic Company | | | 11,300 | | | | 304,309 | |
| | Owens-Illinois, Inc. * | | | 20,948 | | | | 457,085 | |
| | PPG Industries, Inc. | | | 6,460 | | | | 709,567 | |
| | The Scotts Miracle-Gro Company - Class A | | | 4,585 | | | | 442,911 | |
| | The Sherwin-Williams Company | | | 1,840 | | | | 615,811 | |
| | | | | | | | | | |
| | | | | | | | | 4,063,629 | |
|
| |
| MEDIA (1.2%) | | | | |
| | CBS Corporation | | | 7,100 | | | | 472,576 | |
|
| |
| PHARMACEUTICALS, BIOTECHNOLOGY & LIFE SCIENCES (1.7%) | | | | |
| | Jazz Pharmaceuticals Public Limited Company * | | | 4,300 | | | | 684,904 | |
|
| |
| RETAILING (5.5%) | | | | |
| | AutoNation, Inc. * | | | 10,050 | | | | 422,100 | |
| | AutoZone, Inc. * | | | 400 | | | | 276,876 | |
| | Foot Locker, Inc. | | | 8,600 | | | | 665,124 | |
| | Ross Stores, Inc. | | | 9,100 | | | | 591,500 | |
| | Tractor Supply Company | | | 5,000 | | | | 309,550 | |
| | | | | | | | | | |
| | | | | | | | | 2,265,150 | |
|
| |
| SOFTWARE & SERVICES (12.8%) | | | | |
| | Alliance Data Systems Corporation | | | 3,500 | | | | 873,705 | |
| | CA, Inc. | | | 11,600 | | | | 380,828 | |
| | Cadence Design Systems, Inc. * | | | 17,900 | | | | 583,003 | |
The accompanying notes are an integral part of these financial statements
| | | | |
| www.thomaswhitefunds.com | | | 45 | |
| | |
| Thomas White American Opportunities Fund | | |
| | | | | | | | | | |
| Industry | | Issue | | Shares | | | Value | |
| | | | | | | | | |
| SOFTWARE & SERVICES (CONT.) | | | | |
| | Check Point Software Technologies Ltd. * | | | 5,050 | | | | $ 525,251 | |
| | DST Systems, Inc. | | | 3,250 | | | | 400,107 | |
| | Fidelity National Information Services, Inc. | | | 7,800 | | | | 656,682 | |
| | Intuit Inc. | | | 5,100 | | | | 638,571 | |
| | PayPal Holdings, Inc. * | | | 13,700 | | | | 653,764 | |
| | Sabre Corporation | | | 21,500 | | | | 503,315 | |
| | | | | | | | | | |
| | | | | | | | | 5,215,226 | |
|
| |
| TECHNOLOGY HARDWARE & EQUIPMENT (2.2%) | | | | |
| | Arrow Electronics, Inc. * | | | 6,500 | | | | 458,250 | |
| | NetApp, Inc. | | | 11,250 | | | | 448,313 | |
| | | | | | | | | | |
| | | | | | | | | 906,563 | |
|
| |
| TELECOMMUNICATION SERVICES (1.1%) | | | | |
| | Telephone and Data Systems, Inc. | | | 16,800 | | | | 461,328 | |
|
| |
| TRANSPORTATION (3.5%) | | | | |
| | Old Dominion Freight Line, Inc. | | | 8,300 | | | | 734,716 | |
| | Southwest Airlines Co. | | | 12,100 | | | | 680,262 | |
| | | | | | | | | | |
| | | | | | | | | 1,414,978 | |
|
| |
| UTILITIES (7.2%) | | | | |
| | Alliant Energy Corporation | | | 14,000 | | | | 550,480 | |
| | Ameren Corporation | | | 11,300 | | | | 617,997 | |
| | CMS Energy Corporation | | | 13,050 | | | | 592,470 | |
| | DTE Energy Company | | | 5,200 | | | | 543,868 | |
| | National Fuel Gas Company | | | 11,900 | | | | 659,022 | |
| | | | | | | | | | |
| | | | | | | | | 2,963,837 | |
|
| |
| Total Common Stocks | | | | | (Cost $30,796,886 | ) | | | 38,192,053 | |
| | | | | | | | | | |
|
| |
| REAL ESTATE INVESTMENT TRUSTS (REITS) (6.0%) | |
| REITS (6.0%) | | | | | | |
| | Brixmor Property Group, Inc. | | | 24,400 | | | | 481,900 | |
| | Crown Castle International Corp. | | | 8,000 | | | | 756,800 | |
| | Omega Healthcare Investors, Inc. | | | 18,300 | | | | 603,900 | |
| | Welltower Inc. | | | 8,800 | | | | 628,672 | |
| | | | | | | | | | |
| | | | | | | | | 2,471,272 | |
|
| |
| Total REITS | | | | | (Cost $2,448,001 | ) | | | 2,471,272 | |
| | | | | | | | | | |
|
| |
| Total Investments | | 99.4% | | | (Cost $33,244,887 | ) | | | $40,663,325 | |
Other Assets,
Less Liabilities | | 0.6% | | | | | | | 245,095 | |
| Total Net Assets: | | 100.0% | | | | | | | $40,908,420 | |
|
| |
The accompanying notes are an integral part of these financial statements
| | |
| 46 | | www.thomaswhitefunds.com |
| | |
| Investment Portfolio (Unaudited) | | April 30, 2017 |
| * | Non-Income Producing Securities |
| ADR | - American Depositary Receipt |
Industry classifications shown in the Investment Portfolio are based off of the Global Industry Classification Standard (GICS®). GICS was developed by and/or is the exclusive property of MSCI, Inc. and Standard & Poor’s Financial Services LLC (“S&P”). GICS is a service mark of MSCI and S&P and has been licensed for use by U.S. Bancorp Fund Services, LLC.
The accompanying notes are an integral part of these financial statements
| | | | |
| www.thomaswhitefunds.com | | | 47 | |
| | |
| Thomas White American Opportunities Fund | | |
The following table summarizes the inputs used, as of April 30, 2017, in valuating the Fund’s assets:
| | | | | | | | | | | | | | | | |
| | | Level 1 | | | Level 2 | | | Level 3 | | | Total | |
| Common Stocks | | | | | | | | | | | | | | | | |
| Automobiles & Components | | | $680,484 | | | | $------- | | | | $------- | | | | $680,484 | |
| Banks | | | 1,572,406 | | | | ------- | | | | ------- | | | | 1,572,406 | |
| Capital Goods | | | 3,506,336 | | | | ------- | | | | ------- | | | | 3,506,336 | |
| Commercial & Professional Services | | | 431,906 | | | | ------- | | | | ------- | | | | 431,906 | |
| Consumer Durables & Apparel | | | 2,173,389 | | | | ------- | | | | ------- | | | | 2,173,389 | |
| Consumer Services | | | 2,177,939 | | | | ------- | | | | ------- | | | | 2,177,939 | |
| Diversified Financials | | | 813,694 | | | | ------- | | | | ------- | | | | 813,694 | |
| Energy | | | 2,280,009 | | | | ------- | | | | ------- | | | | 2,280,009 | |
| Food, Beverage & Tobacco | | | 1,260,517 | | | | ------- | | | | ------- | | | | 1,260,517 | |
| Health Care Equipment & Services | | | 3,526,823 | | | | ------- | | | | ------- | | | | 3,526,823 | |
| Insurance | | | 1,320,359 | | | | ------- | | | | ------- | | | | 1,320,359 | |
| Materials | | | 4,063,629 | | | | ------- | | | | ------- | | | | 4,063,629 | |
| Media | | | 472,576 | | | | ------- | | | | ------- | | | | 472,576 | |
| Pharmaceuticals, Biotechnology & Life Sciences | | | 684,904 | | | | ------- | | | | ------- | | | | 684,904 | |
| Retailing | | | 2,265,150 | | | | ------- | | | | ------- | | | | 2,265,150 | |
| Software & Services | | | 5,215,226 | | | | ------- | | | | ------- | | | | 5,215,226 | |
| Technology Hardware & Equipment | | | 906,563 | | | | ------- | | | | ------- | | | | 906,563 | |
| Telecommunication Services | | | 461,328 | | | | ------- | | | | ------- | | | | 461,328 | |
| Transportation | | | 1,414,978 | | | | ------- | | | | ------- | | | | 1,414,978 | |
| Utilities | | | 2,963,837 | | | | ------- | | | | ------- | | | | 2,963,837 | |
| Total Common Stocks | | | $38,192,053 | | | | $------- | | | | $------- | | | | $38,192,053 | |
| Real Estate Investment Trusts (REITS) | | | | | | | | | | | | | | | | |
| REITS | | | $2,471,272 | | | | $------- | | | | $------- | | | | $2,471,272 | |
| Total REITS | | | $2,471,272 | | | | $------- | | | | $------- | | | | $2,471,272 | |
| Total Investments | | | $40,663,325 | | | | $------- | | | | $------- | | | | $40,663,325 | |
For more information on valuation inputs, please refer to Note 1(A) of the accompanying Notes to Financial Statements.
No transfers in and/or out between Levels 1, 2 or 3 were observed during the reporting period, as compared to their classification from the prior annual report.
The accompanying notes are an integral part of these financial statements
| | |
| 48 | | www.thomaswhitefunds.com |
THOMAS WHITE FUNDS
Statements of Assets and Liabilities
April 30, 2017 (Unaudited)
| | | | | | | | | | | | | | | | | | | | | | | | |
| | | | | | International
Fund | | | | | | Emerging
Markets
Fund | | | | | | American
Opportunities
Fund | |
| ASSETS: | |
| Investments in securities at market value1 | | $ | | | | | 475,245,831 | | | $ | | | | | 76,615,930 | | | $ | | | | | 40,663,325 | |
| Foreign currency2 | | | | | | | 109,527 | | | | | | | | 163,378 | | | | | | | | ------- | |
| Cash | | | | | | | 2,948,615 | | | | | | | | ------- | | | | | | | | 260,773 | |
| Receivables: | | | | | | | | | | | | | | | | | | | | | | | | |
Securities Lending | | | | | | | 10,620 | | | | | | | | 4,455 | | | | | | | | ------- | |
Dividends and interest | | | | | | | 1,747,565 | | | | | | | | 24,540 | | | | | | | | 16,405 | |
Reclaims | | | | | | | 1,879,653 | | | | | | | | 16,620 | | | | | | | | 1,741 | |
Fund shares sold | | | | | | | 44,680 | | | | | | | | 9,855 | | | | | | | | ------- | |
| Prepaid expenses | | | | | | | 87,409 | | | | | | | | 46,769 | | | | | | | | 17,469 | |
| Total assets | | | | | | | 482,073,900 | | | | | | | | 76,881,547 | | | | | | | | 40,959,713 | |
| | | | | | | | | | | | | | | | | | | | | | | | | |
| LIABILITIES: | |
| Management and administrative fees payable | | | | | | | 278,054 | | | | | | | | 36,684 | | | | | | | | 29,151 | |
| Business management fees payable | | | | | | | 32,456 | | | | | | | | 3,871 | | | | | | | | 1,847 | |
| Accrued expenses | | | | | | | 213,891 | | | | | | | | 45,977 | | | | | | | | 20,295 | |
| Payable for fund shares redeemed | | | | | | | 413,895 | | | | | | | | ------- | | | | | | | | ------- | |
| Distribution fees (See Note 5) | | | | | | | 5,979 | | | | | | | | 548 | | | | | | | | ------- | |
| Other liabilities | | | | | | | 198,844 | | | | | | | | 1,846 | | | | | | | | ------- | |
| Collateral on loaned securities (See Note 1)3 | | | | | | | 16,490,733 | | | | | | | | 4,862,258 | | | | | | | | ------- | |
| Total liabilities | | | | | | | 17,633,852 | | | | | | | | 4,951,384 | | | | | | | | 51,293 | |
| Net Assets | | $ | | | | | 464,440,048 | | | $ | | | | | 71,930,163 | | | $ | | | | | 40,908,420 | |
| | | | | | | | | | | | | | | | | | | | | | | | | |
| NET ASSETS | |
| Source of Net Assets: | | | | | | | | | | | | | | | | | | | | | | | | |
| Net capital paid in on shares of beneficial interest | | $ | | | | | 438,524,465 | | | $ | | | | | 77,946,826 | | | $ | | | | | 30,259,771 | |
| Accumulated net investment income | | | | | | | 2,661,618 | | | | | | | | 217,971 | | | | | | | | 75,823 | |
| Accumulated net realized gain/(loss) | | | | | | | (38,820,047 | ) | | | | | | | (13,625,707 | ) | | | | | | | 3,154,388 | |
| Net unrealized appreciation/depreciation on: | | | | | | | | | | | | | | | | | | | | | | | | |
Investments and foreign currency translations | | | | | | | 62,222,994 | | | | | | | | 7,393,792 | | | | | | | | 7,418,438 | |
Other assets and liabilities denominated in foreign currency | | | | | | | (148,982 | ) | | | | | | | (2,719 | ) | | | | | | | ------- | |
| Net assets | | $ | | | | | 464,440,048 | | | $ | | | | | 71,930,163 | | | $ | | | | | 40,908,420 | |
| The accompanying notes are an integral part of these financial statements. | |
| | | | |
| www.thomaswhitefunds.com | | | 49 | |
THOMAS WHITE FUNDS
Statements of Assets and Liabilities
April 30, 2017 (Unaudited)
| | | | | | | | | | | | | | | | | | | | | | | | |
| | | | | | International
Fund | | | | | | Emerging
Markets
Fund | | | | | | American
Opportunities
Fund | |
| INVESTOR CLASS SHARES | | | | | | | | | | | | | | | | | | | | | | | | |
| Net assets | | $ | | | | | 77,440,989 | | | $ | | | | | 1,848,368 | | | $ | | | | | 40,908,420 | |
| Shares outstanding4 | | | | | | | 4,719,284 | | | | | | | | 179,819 | | | | | | | | 2,440,433 | |
| Net asset value and offering price per share | | $ | | | | | 16.41 | | | $ | | | | | 10.28 | | | $ | | | | | 16.76 | |
| | | | | | | | | | | | | | | | | | | | | | | | | |
| CLASS I SHARES | | | | | | | | | | | | | | | | | | | | | | | | |
| Net assets | | $ | | | | | 386,999,059 | | | $ | | | | | 70,081,795 | | | | | | | | | |
| Shares outstanding4 | | | | | | | 23,631,847 | | | | | | | | 6,755,123 | | | | | | | | | |
| Net asset value and offering price per share | | $ | | | | | 16.38 | | | $ | | | | | 10.37 | | | | | | | | | |
1 Cost Basis of Investments: International Fund: $413,022,768 including Security Lending collateral of $16,490,734 Emerging Markets Fund: $69,222,145 including Securities Lending collateral of $4,862,258 American Opportunities Fund: $33,244,887 | | | | | | | | | | | | | | | | | | | | | | | | |
2 Cost Basis of Cash denominated in foreign currencies: International Fund: $109,596 Emerging Markets Fund: $163,371 | | | | | | | | | | | | | | | | | | | | | | | | |
3 Value of securities out on loan at 4/30/2017: International Fund: $15,946,489 Emerging Markets Fund: $4,730,460 | | | | | | | | | | | | | | | | | | | | | | | | |
| 4 There are an unlimited number of $.01 par value shares of beneficial interest authorized. | | | | | | | | | | | | | | | | | | | | | | | | |
| The accompanying notes are an integral part of these financial statements. | |
| | |
| 50 | | www.thomaswhitefunds.com |
THOMAS WHITE FUNDS
Statements of Operations
Period Ended April 30, 2017 (Unaudited)
| | | | | | | | | | | | | | | | | | | | | | | | |
| | | International
Fund | | | Emerging
Markets
Fund | | | American
Opportunities
Fund | |
| INVESTMENT INCOME | | | | | | | | | | | | | | | | | | | | | | | | |
| Income: | | | | | | | | | | | | | | | | | | | | | | | | |
Dividends1 | | $ | | | | | 5,767,870 | | | $ | | | | | 697,901 | | | $ | | | | | 303,892 | |
Interest | | | | | | | 1,075 | | | | | | | | 1,570 | | | | | | | | ------- | |
Securities lending income (Note 1) | | | | | | | 3,620 | | | | | | | | 1,629 | | | | | | | | ------- | |
| Total investment income | | | | | | | 5,772,565 | | | | | | | | 701,100 | | | | | | | | 303,892 | |
| Expenses: | | | | | | | | | | | | | | | | | | | | | | | | |
Investment management fees (Note 4) | | | | | | | 2,172,338 | | | | | | | | 314,632 | | | | | | | | 168,683 | |
Business management fees (Note 4) | | | | | | | 89,449 | | | | | | | | 12,955 | | | | | | | | 6,946 | |
Accounting and administration fees | | | | | | | 156,280 | | | | | | | | 27,369 | | | | | | | | 13,367 | |
Custodian fees | | | | | | | 74,600 | | | | | | | | 24,811 | | | | | | | | 4,457 | |
Transfer agent fees | | | | | | | 81,631 | | | | | | | | 28,156 | | | | | | | | 8,328 | |
Trustees’ fees and expenses | | | | | | | 53,200 | | | | | | | | 7,364 | | | | | | | | 3,690 | |
Audit fees and expenses | | | | | | | 12,122 | | | | | | | | 10,568 | | | | | | | | 7,534 | |
Registration fees | | | | | | | 29,918 | | | | | | | | 27,693 | | | | | | | | 7,898 | |
Printing expenses | | | | | | | 56,239 | | | | | | | | 5,430 | | | | | | | | 2,715 | |
Legal fees and expenses | | | | | | | 64,175 | | | | | | | | 11,250 | | | | | | | | 5,043 | |
Distribution expense (Note 5)2 | | | | | | | 1,264 | | | | | | | | 832 | | | | | | | | ------- | |
Administrative Service Fee (Note 4): | | | | | | | | | | | | | | | | | | | | | | | | |
Investor Class Shares | | | | | | | 161,675 | | | | | | | | 150 | | | | | | | | 1,764 | |
Other expenses | | | | | | | 53,059 | | | | | | | | 12,888 | | | | | | | | 3,804 | |
| Total expenses | | | | | | | 3,005,950 | | | | | | | | 484,098 | | | | | | | | 234,229 | |
| Reimbursement/Recoupment from Investment Manager (Note 4) | | | | | | | (289,353 | ) | | | | | | | (76,218 | ) | | | | | | | ------- | |
| Net expenses | | | | | | | 2,716,597 | | | | | | | | 407,880 | | | | | | | | 234,229 | |
| Net investment income | | | | | | | 3,055,968 | | | | | | | | 293,220 | | | | | | | | 69,663 | |
| | | | | | | | | | | | | | | | | | | | | | | | | |
| REALIZED AND UNREALIZED GAIN ON INVESTMENTS | | | | | |
| Net realized gain on investments & foreign currency transactions | | | | | | | 22,282,593 | | | | | | | | 181,547 | | | | | | | | 2,061,731 | |
| Net change in unrealized appreciation on investments and foreign currency transactions | | | | | | | 18,890,455 | | | | | | | | 3,245,535 | | | | | | | | 2,682,040 | |
| Net gain on investments | | | | | | | 41,173,048 | | | | | | | | 3,427,082 | | | | | | | | 4,743,771 | |
| Net increase in net assets from operations | | | | | | $ | 44,229,016 | | | | | | | $ | 3,720,302 | | | | | | | $ | 4,813,434 | |
1 Net of foreign taxes withheld of: International Fund: $700,847 Emerging Markets Fund: $86,460 American Opportunities Fund: $970 | | | | | | | | | | | | | | | | | | | | | | | | |
| 2 Distribution expenses were incurred by Class A and Class C shares prior to their closure on February 28, 2017. The Investor Class and Class I shares do not have a 12b-1 distribution plan. | |
| The accompanying notes are an integral part of these financial statements. | |
| | | | |
| www.thomaswhitefunds.com | | | 51 | |
THOMAS WHITE FUNDS
Statements of Changes in Net Assets (Unaudited)
| | | | | | | | | | | | | | | | |
| | | International Fund | |
| | | | | | Six Months
Ended April 30,
2017 | | | | | | Year Ended
October 31,
2016 | |
| Change in net assets from operations: | | | | | | | | | | | | | | | | |
Net investment income | | $ | | | | | 3,055,968 | | | $ | | | | | 7,919,567 | |
Net realized gain (loss) on investments | | | | | | | 22,282,593 | | | | | | | | (30,069,504 | ) |
Net unrealized appreciation / depreciation on investments and foreign currency transactions | | | | | | | 18,890,455 | | | | | | | | (679,985 | ) |
Net increase (decrease) in net assets from operations | | | | | | | 44,229,016 | | | | | | | | (22,829,922 | ) |
| Distribution to Investor Class Shareholders: | | | | | | | | | | | | | | | | |
From net investment income | | | | | | | (28,599 | ) | | | | | | | (1,955,550 | ) |
| Distribution to Class I Shareholders: | | | | | | | | | | | | | | | | |
From net investment income | | | | | | | (1,095,394 | ) | | | | | | | (5,068,121 | ) |
| Distribution to Class A Shareholders: | | | | | | | | | | | | | | | | |
From net investment income | | | | | | | (252 | ) | | | | | | | (8,345 | ) |
| Distribution to Class C Shareholders: | | | | | | | | | | | | | | | | |
From net investment income | | | | | | | ------- | | | | | | | | ------- | |
| Total distributions | | | | | | | (1,124,245 | ) | | | | | | | (7,032,016 | ) |
| Fund share transactions (Note 3) | | | | | | | (151,122,089 | ) | | | | | | | 32,136,345 | |
| Total increase (decrease) | | | | | | | (108,017,318 | ) | | | | | | | 2,274,407 | |
| Net assets: | | | | | | | | | | | | | | | | |
| Beginning of period | | | | | | | 572,457,366 | | | | | | | | 570,182,959 | |
| End of period | | $ | | | | | 464,440,048 | | | $ | | | | | 572,457,366 | |
| Undistributed net investment income | | $ | | | | | 2,661,618 | | | $ | | | | | 729,894 | |
| The accompanying notes are an integral part of these financial statements. | |
| | |
| 52 | | www.thomaswhitefunds.com |
THOMAS WHITE FUNDS
Statements of Changes in Net Assets (Unaudited)
| | | | | | | | | | | | | | | | |
| | | Emerging Markets Fund | |
| | | | | | Six Months
Ended April 30,
2017 | | | | | | Year Ended
October 31,
2016 | |
| Change in net assets from operations: | | | | | | | | | | | | | | | | |
Net investment income | | $ | | | | | 293,220 | | | $ | | | | | 724,091 | |
Net realized gain (loss) on investments | | | | | | | 181,547 | | | | | | | | (7,986,636 | ) |
Net unrealized appreciation / depreciation on investments and foreign currency transactions | | | | | | | 3,245,535 | | | | | | | | 10,897,492 | |
Net increase in net assets from operations | | | | | | | 3,720,302 | | | | | | | | 3,634,947 | |
| Distribution to Investor Class Shareholders: | | | | | | | | | | | | | | | | |
From net investment income | | | | | | | (2,627 | ) | | | | | | | (15,466 | ) |
| Distribution to Class I Shareholders: | | | | | | | | | | | | | | | | |
From net investment income | | | | | | | (132,930 | ) | | | | | | | (663,996 | ) |
| Distribution to Class A Shareholders: | | | | | | | | | | | | | | | | |
From net investment income | | | | | | | ------- | | | | | | | | (447 | ) |
| Distribution to Class C Shareholders: | | | | | | | | | | | | | | | | |
From net investment income | | | | | | | ------- | | | | | | | | ------- | |
| Total distributions | | | | | | | (135,557 | ) | | | | | | | (679,909 | ) |
| Fund share transactions (Note 3) | | | | | | | (10,033,471 | ) | | | | | | | (8,658,459 | ) |
| Total decrease | | | | | | | (6,448,726 | ) | | | | | | | (5,703,421 | ) |
| Net assets: | | | | | | | | | | | | | | | | |
| Beginning of period | | | | | | | 78,378,889 | | | | | | | | 84,082,310 | |
| End of period | | $ | | | | | 71,930,163 | | | $ | | | | | 78,378,889 | |
| Undistributed net investment income | | $ | | | | | 217,971 | | | $ | | | | | 60,308 | |
| The accompanying notes are an integral part of these financial statements. | |
| | | | |
| www.thomaswhitefunds.com | | | 53 | |
THOMAS WHITE FUNDS
Statements of Changes in Net Assets (Unaudited)
| | | | | | | | | | | | | | | | |
| | | American Opportunities Fund | |
| | | | | | Six Months
Ended April 30,
2017 | | | | | | Year Ended
October 31,
2016 | |
| Change in net assets from operations: | | | | | | | | | | | | | | | | |
Net investment income | | $ | | | | | 69,663 | | | $ | | | | | 277,837 | |
Net realized gain on investments | | | | | | | 2,061,731 | | | | | | | | 1,912,387 | |
Net unrealized appreciation / depreciation on investments and foreign currency transactions | | | | | | | 2,682,040 | | | | | | | | (2,965,495 | ) |
Net increase (decrease) in net assets from operations | | | | | | | 4,813,434 | | | | | | | | (775,721 | ) |
| Distribution to Investor Class Shareholders: | | | | | | | | | | | | | | | | |
From net investment income | | | | | | | (238,400 | ) | | | | | | | (7,621 | ) |
From realized gain | | | | | | | ------- | | | | | | | | (858,464 | ) |
| Total distributions | | | | | | | (238,400 | ) | | | | | | | (866,085 | ) |
| Fund share transactions (Note 3) | | | | | | | (482,757 | ) | | | | | | | 2,582,977 | |
| Total increase | | | | | | | 4,092,277 | | | | | | | | 941,171 | |
| Net assets: | | | | | | | | | | | | | | | | |
| Beginning of period | | | | | | | 36,816,143 | | | | | | | | 35,874,972 | |
| End of period | | $ | | | | | 40,908,420 | | | $ | | | | | 36,816,143 | |
| Undistributed net investment income | | $ | | | | | 75,823 | | | $ | | | | | 244,560 | |
| The accompanying notes are an integral part of these financial statements. | |
| | |
| 54 | | www.thomaswhitefunds.com |
Notes to Financial Statements Period Ended April 30, 2017 (Unaudited)
NOTE 1. SUMMARY OF ACCOUNTING POLICIES
Lord Asset Management Trust (the “Trust”) was organized as a Delaware business trust on February 9, 1994, as an open-end diversified management investment company. The Trust currently has three series of shares (collectively referred to as the “Funds”) - the Thomas White International Fund (the “International Fund”), which commenced operations with the sale of Investor Class shares on June 28, 1994 and the sale of Class I shares on August 31, 2012; the Thomas White Emerging Markets Fund (the “Emerging Markets Fund”), which commenced operations with the sale of Investor Class shares on June 28, 2010 and the sale of Class I shares on August 31, 2012; and the Thomas White American Opportunities Fund (the “American Opportunities Fund”), which commenced operations with the sale of Investor Class shares on March 4, 1999. The investment objective of each Fund is to seek long-term capital growth. The International Fund invests in equity securities of companies located in the world’s developed countries outside of the U.S. The Emerging Markets Fund invests in securities of companies located in or whose businesses are closely associated with the world’s emerging markets countries. The American Opportunities Fund primarily invests in U.S. equity securities, with a focus on mid-size and small companies. The following is a summary of significant accounting policies followed in the preparation of the Trust’s financial statements.
(A) VALUATION OF SECURITIES
Securities listed or traded on a recognized national or foreign stock exchange or NASDAQ are valued at the last reported sales prices on the principal exchange on which the securities are traded. NASDAQ National Market securities are valued at the NASDAQ official closing price. Over-the-counter securities and listed securities for which no closing sale price is reported are valued at the mean between the last current bid and ask price. Securities for which market quotations are not readily available are valued at fair value under the Trust’s Valuation Procedures as determined by management and approved in good faith by the Board of Trustees. As of April 30, 2017, all securities within each Fund’s portfolio were valued at the last reported sales price on the principal exchange on which the securities are traded and, for the International and Emerging Markets Funds, adjusted by a fair value factor when necessary and as further described below. The Trust has retained an independent statistical fair value pricing service to assist in the fair valuation process for securities principally traded in a foreign market in order to adjust for changes in value that may occur between the close of the foreign exchange and the time at which Fund shares are priced. Short term investments are valued at original cost, which combined with accrued interest, approximates market value.
Fair value is defined as the price that would be received to sell an asset or paid to transfer a liability (i.e., the “exit price”) in an orderly transaction between market participants at the measurement date. In determining fair value, the Fund uses various valuation approaches. A three-tiered fair value hierarchy for inputs is used in measuring fair value that maximizes the use of observable inputs and minimizes the use of unobservable inputs by generally requiring that the most observable inputs be used when available. Observable inputs are those that market
| | | | |
| www.thomaswhitefunds.com | | | 55 | |
Notes to Financial Statements Period Ended April 30, 2017 (Unaudited)
participants would use in pricing the asset or liability based on market data obtained from sources independent of a Fund. Unobservable inputs reflect the Fund’s assumptions about the inputs market participants would use in pricing the asset or liability developed based on the best information available in the circumstances. The inputs or methodologies used for valuing securities are not necessarily an indication of the risks associated with investing in those securities.
The fair value hierarchy is categorized into three levels based on the inputs as follows:
Level 1 - Valuations based on unadjusted quoted prices in active markets for identical assets.
Level 2 - Valuations based on quoted prices for similar securities or in markets that are not active or for which all significant inputs are observable, either directly or indirectly.
Level 3 - Valuations based on inputs that are unobservable and significant to the overall fair value measurement.
(B) MULTI-CLASS OPERATIONS AND ALLOCATIONS
Expenses of the Funds that are not directly attributable to a specific class of shares are prorated among the classes based on the relative net assets of each class. Expenses directly attributable to a class of shares, which presently only include administrative services fees, are recorded to the specific class.
Income, realized and unrealized capital gains and losses of the Funds are prorated among the classes based on the relative net assets of each class within each specific Fund.
(C) MARKET RISK
Investing in securities of foreign companies and foreign governments involves special risks and considerations not typically associated with investing in U.S. companies and securities of the U.S. Government. These risks include revaluation of currencies and future adverse political and economic developments. Moreover, securities of many foreign companies and foreign governments and their markets may be less liquid and their prices more volatile than securities of comparable U.S. companies and securities of the U.S. Government.
(D) FOREIGN CURRENCY TRANSLATION
Portfolio securities and other assets and liabilities denominated in foreign currencies are translated into U.S. dollar amounts at date of valuation. Purchases and sales of portfolio securities and income items denominated in foreign currencies are translated into U.S. dollar amounts on the respective dates of such transactions. When a Fund purchases or sells a foreign security, it will customarily enter into a foreign exchange contract to minimize foreign exchange risk from the trade date to the settlement date of such transaction.
| | |
| 56 | | www.thomaswhitefunds.com |
Notes to Financial Statements Period Ended April 30, 2017 (Unaudited)
The Funds do not isolate the portion of the results of operations resulting from changes in foreign exchange rates on investments from the fluctuations arising from changes in market prices of securities held. Such fluctuations are included with the net realized and unrealized gain or loss from investments.
Net realized gain (loss) on investments and foreign currency transactions include those gains and losses arising from the sale of foreign currencies, currency gains or losses realized between the trade and settlement dates on securities transactions, the differences between the amounts of dividends, and foreign withholding taxes recorded on a Fund’s books, and the U.S. dollar equivalent of the amounts actually received or paid. Net unrealized appreciation (depreciation) on investments and foreign currency translation includes changes in the value of assets and liabilities resulting from exchange rates.
(E) INCOME TAXES
Each Fund is a separate taxpayer for federal income tax purposes. Each Fund intends to distribute substantially all of its net investment income and net capital gains to its shareholders and to otherwise comply with the requirements of Subchapter M of the Internal Revenue Code applicable to regulated investment companies. Therefore, no federal income tax provision is required.
All open tax years and major jurisdictions have been reviewed for the Funds and, based on this review, there are no significant uncertain tax positions that would require recognition in the financial statements. Open tax years are those that are open for exam by taxing authorities and, as of April 30, 2017, open Federal tax years include the tax years ended October 31, 2013 through 2016. The Funds have no examinations in progress and are also not aware of any tax positions for which it is reasonably possible that the total amounts of unrecognized tax benefits will significantly change in the next twelve months.
The Funds accrue for such material foreign taxes on net realized and unrealized gains at the appropriate rate for each country. Based on rates ranging from approximately 10% to 15% there were no material accruals at year end.
(F) USE OF ESTIMATES
The preparation of financial statements in conformity with generally accepted accounting principles requires management to make estimates and assumptions that affect the reported amounts of assets and liabilities and disclosure of contingent liabilities at the date of the financial statements and the reported amounts of increases and decreases in net assets from operations during the period. Actual results could differ from these estimates.
The Funds are investment companies and follow accounting and reporting guidance under the Financial Accounting Standards Board (“FASB”) Accounting Standards Codification (“ASC”) Topic 946, “Financial Services-Investment Companies”.
| | | | |
| www.thomaswhitefunds.com | | | 57 | |
Notes to Financial Statements Period Ended April 30, 2017 (Unaudited)
(G) SECURITY TRANSACTIONS AND INVESTMENT INCOME
Security transactions are accounted for on a trade date basis. Interest is accrued on a daily basis and dividend income is recorded on the ex-dividend date, except that certain dividends from foreign securities are recorded when the information is available to the Fund. Realized gains and losses are determined using specific identification.
(H) DISTRIBUTIONS TO SHAREHOLDERS
The Funds usually declare and pay dividends from net investment income annually, but may do so more frequently to avoid excise tax. Distributions of net realized capital gains, if any, will be distributed at least annually.
(I) SECURITIES LENDING
The Funds may lend investment securities to investors who borrow securities in order to complete certain transactions. By lending investment securities, a Fund attempts to increase its net investment income through the receipt of interest earned on loan collateral. Any increase or decline in the market price of the securities loaned that might occur and any interest earned or dividends declared during the term of the loan would be for the account of the Fund. Risks of delay in recovery of the securities or even loss of rights in the collateral may occur should the borrower of the securities fail financially. Risk may also arise to the extent that the value of the securities loaned increases above the value of the collateral received. It is each Fund’s policy to obtain additional collateral from or return excess collateral to the borrower by the end of the next business day. Therefore, the value of the collateral may be temporarily less than the value of the securities on loan.
Funds that lend securities receive cash, cash equivalents, or other securities as collateral. Initial collateral levels shall not be less than 102% of the market value of the borrowed securities (105% if the collateral and the borrowed securities are denominated in different currencies). Marking to market is performed every business day (subject to de minimis rules of change in market value) for each Fund and each borrower is required to deliver additional collateral when
necessary so that the total collateral held in the account for all loans of the Fund to the borrower will not be less than 100% of the market value of all the borrowed securities loaned to the borrower by the Fund. Any cash, cash equivalents, or other securities received as collateral is invested by the securities lending agent, Northern Trust, in accordance with pre-established guidelines as set forth in the securities lending agreement. The collateral is invested in the Northern Institutional Liquid Asset Portfolio (an open-end regulated investment company) and U.S. Treasury Notes/ Bonds which are shown on the investment portfolios for the International Fund and Emerging Markets Fund. The collateral is reflected in the Funds’ statements of assets and liabilities in the line item labeled “Investments in securities at market value.” A portion of the interest received on the loan collateral is retained by the Fund and the remainder is rebated to the borrower of the securities. From the interest retained by the Funds, 50% is paid to the
| | |
| 58 | | www.thomaswhitefunds.com |
Notes to Financial Statements Period Ended April 30, 2017 (Unaudited)
securities lending agent for the International Fund and Emerging Markets Fund for its services. The net amount of interest earned, after the interest rebate and the allocation to the securities lending agent, is included in the statement of operations as securities lending income. The value of loaned securities and related collateral outstanding at April 30, 2017 are as follows:
| | | | | | | | |
| Fund | | Value of Loaned Securities | | | Value of Collateral | |
| Thomas White International Fund | | | $15,946,489 | | | | $16,490,734 | |
| | | |
| Thomas White Emerging Markets Fund | | | $4,730,460 | | | | $4,862,258 | |
The International Fund and the Emerging Markets Fund have earned interest income on securities lending (after rebates to borrowers and allocation to the securities lending agent) as follows:
| | | | |
| Fund | | Net Interest Earned | |
| Thomas White International Fund | | | $3,620 | |
| | |
| Thomas White Emerging Markets Fund | | | $1,629 | |
The Funds recently adopted guidance requiring entities to present gross obligations for secured borrowings by the type of collateral pledged and remaining time to maturity. The table below outlines the nature of these obligations at April 30, 2017.
| | | | | | | | | | | | | | | | | | | | |
| | | Overnight and
Continuous | | | Up to 30
Days | | | 30-90 Days | | | Greater than
90 Days | | | Total | |
| Securities lending transactions | | | | | | | | | | | | | | | | | | | | |
U.S. Treasury and agency securities | | | | | | | | | | | | | | | | | | | | |
Thomas White International Fund | | $ | 16,490,734 | | | $ | ------- | | | $ | ------- | | | $ | ------- | | | $ | 16,490,734 | |
Thomas White Emerging Markets Fund | | | 3,500,708 | | | | ------- | | | | ------- | | | | ------- | | | | 3,500,708 | |
Money Market Fund^ | | | | | | | | | | | | | | | | | | | | |
Thomas White Emerging Markets Fund | | | 1,361,750 | | | | ------- | | | | ------- | | | | ------- | | | | 1,361,750 | |
| | | | | | | | | | | | | | | | | | | | |
| Total Borrowings | | $ | 21,353,192 | | | $ | ------- | | | $ | ------- | | | $ | ------- | | | $ | 21,353,192 | |
| | | | | | | | | | | | | | | | | | | | |
| | ^ | Represents an interest in Northern Institutional Liquid Assets Portfolio, an investment purchased with cash proceeds from securities lending collateral received. |
(J) REDEMPTION FEE
The Funds assess a 2% fee on redemptions (including exchanges) of Fund shares held for less than sixty days. Redemption fees are paid to each Fund to help offset transaction costs and to protect the Fund’s long-term shareholders. Each Fund will use the “first-in, first-out” (FIFO) method to determine the sixty-day holding period. Under this method, the date of the
| | | | |
| www.thomaswhitefunds.com | | | 59 | |
Notes to Financial Statements Period Ended April 30, 2017 (Unaudited)
redemption or exchange will be compared to the earliest purchase date of shares held in the account. If this holding period is less than sixty days, the fee will be charged. The International Fund Investor Class and Class I shares charged $11 and $531, respectively in redemption fees for the period ended April 30, 2017, which were included in net capital paid.
(K) REAL ESTATE INVESTMENT TRUSTS
The American Opportunities Fund has made certain investments in real estate investment trusts (“REITs”), which pay dividends to their shareholders based upon funds available from operations. It is quite common for these dividends to exceed the REITs’ taxable earnings and profits resulting in the excess portion of such dividends being designated as a return of capital. The American Opportunities Fund intends to include the gross dividends from such REITs in its annual distributions to its shareholders and, accordingly, a portion of the distributions received by the Fund’s shareholders may also be designated as a return of capital.
(L) RECENT ACCOUNTING PRONOUNCEMENT
In October 2016, the U.S. Securities and Exchange Commission adopted new rules and amended existing rules (together, “final rules”) intended to modernize the reporting and disclosure of information by registered investment companies. In part, the final rules amend Regulation S-X and require standardized, enhanced disclosure about derivatives in investment company financial statements, as well as other amendments. The updates to Regulation S-X are effective August 1, 2017 and may result in additional disclosure relating to the presentation of derivatives and certain other financial instruments. These updates have no impact on the Fund’s net assets or results of operations.
NOTE 2. SIGNIFICANT SHAREHOLDER
The following table indicates the number of shareholders who held a significant portion of the shares of each Class’s outstanding shares as of April 30, 2017. Investment activities of these shareholders could have a material effect on each Fund.
| | | | | | | | | | |
| Fund | | Share Class | | Number of
Shareholders | | | % Held | |
| | | | |
| Emerging Markets Fund | | Investor Class | | | 2 | | | | 71.7% | |
| | | | |
| Emerging Markets Fund | | Class I | | | 1 | | | | 11.6% | |
| | | | |
| American Opportunities Fund | | Investor Class | | | 1 | | | | 15.6% | |
| | |
| 60 | | www.thomaswhitefunds.com |
Notes to Financial Statements Period Ended April 30, 2017 (Unaudited)
NOTE 3. TRANSACTIONS IN SHARES OF BENEFICIAL INTEREST
As of April 30, 2017, there were an unlimited number of $0.01 par value shares of beneficial interest authorized. Transactions are summarized as follows:
| | | | | | | | | | | | | | | | | | | | | | | | |
| International Fund | |
| | | Six Months Ended
April 30, 2017 | | | Year Ended October 31, 2016 | |
| | | Investor Class | | | Investor Class | |
| | | Shares | | | | | | Amount | | | Shares | | | | | | Amount | |
| Shares sold | | | 219,973 | | | $ | | | | | 3,301,047 | | | | 1,506,296 | | | $ | | | | | 22,509,186 | |
| Shares issued on reinvestment of dividends & distributions | | | 1,901 | | | | | | | | 28,151 | | | | 128,636 | | | | | | | | 1,925,681 | |
| Shares redeemed | | | (8,020,160 | ) | | | | | | | (123,201,184 | )^ | | | (6,147,093 | ) | | | | | | | (92,882,894 | ) |
| Net decrease | | | (7,798,286 | ) | | $ | | | | | (119,871,986 | ) | | | (4,512,161 | ) | | $ | | | | | (68,448,027 | ) |
| Shares outstanding: | | | | | | | | | | | | | | | | | | | | | | | | |
| Beginning of period | | | 12,517,570 | | | | | | | | | | | | 17,029,731 | | | | | | | | | |
| End of period | | | 4,719,284 | | | | | | | | | | | | 12,517,570 | | | | | | | | | |
| ^ Includes redemption fees of $11 | | | | | | | | | | | | | | | | | | | | | | | | |
| | | | | | | | | | | | | | | | | | | | | | | | |
| | | Six Months Ended
April 30, 2017 | | | Year Ended October 31, 2016 | |
| | | Class I | | | Class I | |
| | | Shares | | | | | | Amount | | | Shares | | | | | | Amount | |
| Shares sold | | | 1,356,811 | | | $ | | | | | 20,388,861 | | | | 13,793,315 | | | $ | | | | | 210,036,342 | |
| Sales in connection with reorganization | | | 68,548 | | | | | | | | 1,053,314 | | | | ------- | | | | | | | | ------- | |
| Shares issued on reinvestment of dividends & distributions | | | 63,524 | | | | | | | | 939,514 | | | | 285,107 | | | | | | | | 4,270,896 | |
| Shares redeemed | | | (3,487,807 | ) | | | | | | | (52,569,191 | )^ | | | (7,477,136 | ) | | | | | | | (113,489,125 | ) |
| Net increase (decrease) | | | (1,998,924 | ) | | $ | | | | | (30,187,502 | ) | | | 6,601,286 | | | $ | | | | | 100,818,113 | |
| Shares outstanding: | | | | | | | | | | | | | | | | | | | | | | | | |
| Beginning of period | | | 25,630,771 | | | | | | | | | | | | 19,029,485 | | | | | | | | | |
| End of period | | | 23,631,847 | | | | | | | | | | | | 25,630,771 | | | | | | | | | |
| ^ Includes redemption fees of $466 | | | | | | | | | | | | | | | | | | | | | | | | |
| | | | |
| www.thomaswhitefunds.com | | | 61 | |
Notes to Financial Statements Period Ended April 30, 2017 (Unaudited)
| | | | | | | | | | | | | | | | | | | | | | | | |
| | | Six Months Ended
April 30, 2017 | | | Year Ended October 31, 2016 | |
| | | Class A | | | Class A | |
| | | Shares | | | | | | Amount | | | Shares | | | | | | Amount | |
| Shares sold | | | 12,622 | | | $ | | | | | 184,030 | | | | 4,464 | | | $ | | | | | 67,421 | |
| Shares issued on reinvestment of dividends & distributions | | | 11 | | | | | | | | 158 | | | | 313 | | | | | | | | 4,654 | |
| Shares redeemed | | | (9,221 | ) | | | | | | | (135,830 | ) | | | (6,102 | ) | | | | | | | (91,223 | ) |
| Shares exchanged in connection with reorganization | | | (59,809 | ) | | | | | | | (915,341 | ) | | | ------- | | | | | | | | ------- | |
| Net increase (decrease) | | | (56,397 | ) | | $ | | | | | (866,983 | ) | | | (1,325 | ) | | $ | | | | | (19,148 | ) |
| Shares outstanding: | | | | | | | | | | | | | | | | | | | | | | | | |
| Beginning of period | | | 56,397 | | | | | | | | | | | | 57,722 | | | | | | | | | |
| End of period | | | 0 | | | | | | | | | | | | 56,397 | | | | | | | | | |
| | | | | | | | | | | | | | | | | | | | | | | | |
| | | Six Months Ended
April 30, 2017 | | | Year Ended October 31, 2016 | |
| | | Class C | | | Class C | |
| | | Shares | | | | | | Amount | | | Shares | | | | | | Amount | |
| Shares sold | | | ------- | | | $ | | | | | ------- | | | | 483 | | | $ | | | | | 7,128 | |
| Shares issued on reinvestment of dividends & distributions | | | ------- | | | | | | | | ------- | | | | ------- | | | | | | | | ------- | |
| Shares redeemed | | | (3,843 | ) | | | | | | | (57,645 | )^ | | | (14,821 | ) | | | | | | | (221,721 | ) |
| Shares exchanged in connection with reorganization | | | (8,983 | ) | | | | | | | (137,973 | ) | | | -------- | | | | | | | | ------- | |
| Net decrease | | | (12,826 | ) | | $ | | | | | (195,618 | ) | | | (14,338 | ) | | $ | | | | | (214,593 | ) |
| Shares outstanding: | | | | | | | | | | | | | | | | | | | | | | | | |
| Beginning of period | | | 12,826 | | | | | | | | | | | | 27,164 | | | | | | | | | |
| End of period | | | 0 | | | | | | | | | | | | 12,826 | | | | | | | | | |
| ^ Includes redemption fees of $65 | | | | | | | | | | | | | | | | | | | | | | | | |
| | | | | | | | | | | | | | | | | | | | | | | | |
| Emerging Markets Fund | | | | | | | | | | | | | | | | | | |
| | | Six Months Ended
April 30, 2017 | | | Year Ended October 31, 2016 | |
| | | Investor Class | | | Investor Class | |
| | | Shares | | | | | | Amount | | | Shares | | | | | | Amount | |
| Shares sold | | | 492 | | | $ | | | | | 4,793 | | | | 2,482 | | | $ | | | | | 23,210 | |
| Shares issued on reinvestment of dividends & distributions | | | 165 | | | | | | | | 1,544 | | | | 926 | | | | | | | | 9,129 | |
| Shares redeemed | | | (6,225 | ) | | | | | | | (59,405 | ) | | | (258,859 | ) | | | | | | | (2,286,115 | ) |
| Net decrease | | | (5,568 | ) | | $ | | | | | (53,068 | ) | | | (255,451 | ) | | $ | | | | | (2,253,776 | ) |
| Shares outstanding: | | | | | | | | | | | | | | | | | | | | | | | | |
| Beginning of period | | | 185,387 | | | | | | | | | | | | 440,838 | | | | | | | | | |
| End of period | | | 179,819 | | | | | | | | | | | | 185,387 | | | | | | | | | |
| | |
| 62 | | www.thomaswhitefunds.com |
Notes to Financial Statements Period Ended April 30, 2017 (Unaudited)
| | | | | | | | | | | | | | | | | | | | | | | | |
| | | Six Months Ended
April 30, 2017 | | | Year Ended October 31, 2016 | |
| | | Class I | | | Class I | |
| | | Shares | | | | | | Amount | | | Shares | | | | | | Amount | |
| Shares sold | | | 70,749 | | | $ | | | | | 684,042 | | | | 403,747 | | | $ | | | | | 3,704,145 | |
| Sales in connection with reorganization | | | 32,678 | | | | | | | | 323,653 | | | | ------- | | | | | | | | ------- | |
| Shares issued on reinvestment of dividends & distributions | | | 9,558 | | | | | | | | 89,850 | | | | 44,953 | | | | | | | | 446,833 | |
| Shares redeemed | | | (1,075,293 | ) | | | | | | | (10,754,259 | ) | | | (1,096,703 | ) | | | | | | | (10,609,909 | ) |
| Net increase (decrease) | | | (962,308 | ) | | $ | | | | | (9,656,714 | ) | | | (648,003 | ) | | $ | | | | | (6,458,931 | ) |
| Shares outstanding: | | | | | | | | | | | | | | | | | | | | | | | | |
| Beginning of period | | | 7,717,431 | | | | | | | | | | | | 8,365,434 | | | | | | | | | |
| End of period | | | 6,755,123 | | | | | | | | | | | | 7,717,431 | | | | | | | | | |
| | | | | | | | | | | | | | | | | | | | | | | | |
| | | Six Months Ended
April 30, 2017 | | | Year Ended October 31, 2016 | |
| | | Class A | | | Class A | |
| | | Shares | | | | | | Amount | | | Shares | | | | | | Amount | |
| Shares sold | | | ------- | | | $ | | | | | ------- | | | | 2,687 | | | $ | | | | | 23,806 | |
| Shares issued on reinvestment of dividends & distributions | | | ------- | | | | | | | | ------- | | | | 45 | | | | | | | | 447 | |
| Shares redeemed | | | (2 | ) | | | | | | | (18 | ) | | | (0 | ) | | | | | | | (3 | ) |
| Shares exchanged in connection with reorganization | | | (8,360 | ) | | | | | | | (82,158 | ) | | | ------- | | | | | | | | ------- | |
| Net increase (decrease) | | | (8,362 | ) | | $ | | | | | (82,176 | ) | | | 2,732 | | | $ | | | | | 24,250 | |
| Shares outstanding: | | | | | | | | | | | | | | | | | | | | | | | | |
| Beginning of period | | | 8,362 | | | | | | | | | | | | 5,630 | | | | | | | | | |
| End of period | | | 0 | | | | | | | | | | | | 8,362 | | | | | | | | | |
| | | | | | | | | | | | | | | | | | | | | | | | |
| | | Six Months Ended
April 30, 2017 | | | Year Ended October 31, 2016 | |
| | | Class C | | | Class C | |
| | | Shares | | | | | | Amount | | | Shares | | | | | | Amount | |
| Shares sold | | | ------- | | | $ | | | | | ------- | | | | 3,376 | | | $ | | | | | 30,001 | |
| Shares issued on reinvestment of dividends & distributions | | | ------- | | | | | | | | ------- | | | | ------- | | | | | | | | ------- | |
| Shares redeemed | | | (2 | ) | | | | | | | (18 | ) | | | (0 | ) | | | | | | | (3 | ) |
| Shares exchanged in connection with reorganization | | | (24,712 | ) | | | | | | | (241,495 | ) | | | ------- | | | | | | | | ------- | |
| Net increase | | | (24,714 | ) | | $ | | | | | (241,513 | ) | | | 3,376 | | | $ | | | | | 29,998 | |
| Shares outstanding: | | | | | | | | | | | | | | | | | | | | | | | | |
| Beginning of period | | | 24,714 | | | | | | | | | | | | 21,338 | | | | | | | | | |
| End of period | | | 0 | | | | | | | | | | | | 24,714 | | | | | | | | | |
| | | | |
| www.thomaswhitefunds.com | | | 63 | |
Notes to Financial Statements Period Ended April 30, 2017 (Unaudited)
| | | | | | | | | | | | | | | | | | | | | | | | |
| American Opportunities Fund | | | | | | | | | | | | | | | | |
| | | Six Months Ended
April 30, 2017 | | | Year Ended October 31, 2016 | |
| | | Investor Class | | | Investor Class | |
| | | Shares | | | | | | Amount | | | Shares | | | | | | Amount | |
| Shares sold | | | 11,448 | | | $ | | | | | 184,523 | | | | 163,993 | | | $ | | | | | 2,516,556 | |
| Shares issued on reinvestment of dividends & distributions | | | 14,114 | | | | | | | | 225,971 | | | | 54,955 | | | | | | | | 819,929 | |
| Shares redeemed | | | (53,942 | ) | | | | | | | (893,251 | ) | | | (49,200 | ) | | | | | | | (753,508 | ) |
| Net increase (decrease) | | | (28,380 | ) | | $ | | | | | (482,757 | ) | | | 169,748 | | | $ | | | | | 2,582,977 | |
| Shares outstanding: | | | | | | | | | | | | | | | | | | | | | | | | |
| Beginning of period | | | 2,468,813 | | | | | | | | | | | | 2,299,065 | | | | | | | | | |
| End of period | | | 2,440,433 | | | | | | | | | | | | 2,468,813 | | | | | | | | | |
NOTE 4. INVESTMENT MANAGEMENT FEES AND OTHER TRANSACTIONS WITH AFFILIATES
Each Fund pays a monthly investment management fee to Thomas White International, Ltd. (the “Advisor”) at the rate of 0.85% of the Fund’s average daily net assets annually. For the period ended April 30, 2017, the International Fund, Emerging Markets Fund and American Opportunities Fund paid the Advisor $2,172,338, $314,632 and $168,683, respectively, in investment management fees.
During the period ended April 30, 2017, the Advisor has contractually agreed to reimburse its management fee and/or reimburse the Funds’ operating expenses to the extent necessary to ensure that each Fund’s annual operating expenses do not exceed the following percentages of average daily net assets:
| | | | | | | | |
| | | Investor Class | | | Class I | |
| International Fund | | | 1.24% | | | | 0.99% | |
| Emerging Markets Fund | | | 1.34% | | | | 1.09% | |
| American Opportunities Fund | | | 1.34% | | | | n/a | |
These agreements to reimburse fees renew automatically unless the Advisor gives written notice to end them.
The Advisor may recoup any previously waived amount from a Fund pursuant to the expense limitation agreements if such reimbursement does not cause the Fund to exceed either (i) the current expense limitation or (ii) the expense limitation in effect at the time the expense is waived, provided the reimbursement is made within three years after the year in which the Advisor incurred the expense. For the period ended April 30, 2017, the Advisor did not recoup any previously waived expenses.
| | |
| 64 | | www.thomaswhitefunds.com |
Notes to Financial Statements Period Ended April 30, 2017 (Unaudited)
As of April 30, 2017, the International and Emerging Markets Funds had the following amounts (and year of expiration) subject to repayment to the Advisor:
| | | | | | | | | | | | | | |
| Fund | | Share Class | | Year Fees Waived | | | Repayment Expires | | | Balance | |
| International Fund | | Investor Class | | | 2014 | | | | 2017 | | | | $119,375 | |
| | | | | |
| International Fund | | Investor Class | | | 2015 | | | | 2018 | | | | $235,702 | |
| | | | | |
| International Fund | | Investor Class | | | 2016 | | | | 2019 | | | | $185,995 | |
| | | | | |
| International Fund | | Investor Class | | | 2017 | | | | 2020 | | | | $64,563 | |
| | | | | |
| International Fund | | Class I | | | 2014 | | | | 2017 | | | | $276,870 | |
| | | | | |
| International Fund | | Class I | | | 2015 | | | | 2018 | | | | $309,206 | |
| | | | | |
| International Fund | | Class I | | | 2016 | | | | 2019 | | | | $376,987 | |
| | | | | |
| International Fund | | Class I | | | 2017 | | | | 2020 | | | | $224,790 | |
| Emerging Markets Fund | | Class I | | | 2014 | | | | 2017 | | | | $111,683 | |
| | | | | |
| Emerging Markets Fund | | Class I | | | 2015 | | | | 2018 | | | | $126,544 | |
| | | | | |
| Emerging Markets Fund | | Class I | | | 2016 | | | | 2019 | | | | $150,335 | |
| | | | | |
| Emerging Markets Fund | | Class I | | | 2017 | | | | 2020 | | | | $76,218 | |
The Funds and U.S. Bancorp Fund Services, LLC (the “Administrator”) are parties to a Fund Administration Servicing Agreement. The Administrator provides administrative and fund accounting services pursuant to this agreement.
The Advisor and the Funds have adopted a Business Management Agreement under which the Advisor provides certain business management services to the Funds, including, without limitation, monitoring of the Funds’ relationships with third-party service providers and assisting with necessary and appropriate services to the Board of Trustees of the Trust, as well as either providing the Trust with or procuring for the Trust the services of a Chief Compliance Officer in accordance with Rule 38a-1 of the 1940 Act, in the event so requested. For these services, the Advisor is entitled to receive a fee from each Fund at a rate of 0.035% of the Fund’s average daily net assets. For the period ended April 30, 2017, for the services provided under the Business Management Agreement, the International Fund, Emerging Markets Fund, and American Opportunities Fund paid the Advisor $89,449, $12,955 and $6,946, respectively.
The Funds have adopted an Administrative Services Plan pursuant to which the Investor Class shares are and, prior to its closure on February 28, 2017, the Class A shares were authorized to make payments to certain entities, which may include banks, broker-dealers and other types of service providers, for providing administrative services with respect to shares of the Funds attributable to or held in the name of the service provider for its clients or customers with whom they have a servicing relationship. Under the terms of the Administrative Services Plan, Investor Class shares are authorized to make payments up to a maximum rate of 0.25% of the average daily net assets of the shares attributable to or held in the name of the service provider for providing the types of applicable administrative services covered under the terms of the Plan.
| | | | |
| www.thomaswhitefunds.com | | | 65 | |
Notes to Financial Statements Period Ended April 30, 2017 (Unaudited)
For the period ended April 30, 2017, fees incurred by the International Fund pursuant to the Administrative Services Plan were $161,675 for Investor Class and $217 for Class A shares. For the period ended April 30, 2017, fees incurred by the Emerging Markets Fund pursuant to the Administrative Services Plan were $150 for Investor Class and $34 for Class A shares. For the period ended April 30, 2017, fees incurred by the American Opportunities Fund pursuant to the Administrative Services Plan were $1,764 for Investor Class shares.
NOTE 5. SHAREHOLDER SERVICING AND DISTRIBUTION PLANS
The International Fund and Emerging Markets Fund had adopted a distribution and shareholder service plan (the “Plan”) pursuant to Rule 12b-1 under the Investment Company Act of 1940. The Plan allowed the International Fund and Emerging Markets Fund to compensate Quasar Distributors, LLC for the costs incurred in distributing the Funds’ Class A shares and Class C shares before the share classes were closed effective February 28, 2017, including amounts paid to brokers or dealers, at an annual rate of 0.25% and 1.00%, respectively, of the average daily net assets of each share Class. For the period November 1, 2016 through February 28, 2017, fees incurred by the International Fund pursuant to the Plan were $705 for Class A and $559 for Class C shares. For the period November 1, 2016 through February 28, 2017, fees incurred by the Emerging Markets Fund were $65 for Class A and $767 for Class C shares.
NOTE 6. CUSTODIAN AND TRANSFER AGENT FEES
Custodian Fees - Northern Trust is the custodian for the International Fund and Emerging Markets Fund. U.S. Bank is the custodian for the American Opportunities Fund. Northern Trust bills the International Fund and the Emerging Markets Fund quarterly based on the value of their holdings as of the previous quarter end plus transaction fees. U.S. Bank bills the American Opportunities Fund monthly based on the ending value of its holdings plus transaction fees.
Transfer Agent - U.S. Bancorp serves as the Funds’ transfer agent. Under the terms of the transfer agent agreement, U.S. Bancorp is entitled to account-based fees along with reimbursement of out-of-pocket expenses incurred in providing transfer agent services.
NOTE 7. INVESTMENT TRANSACTIONS
During the period ended April 30, 2017, the cost of purchases and the proceeds from sales of investment securities, other than short-term investments, were as follows:
| | | | | | | | |
| Fund | | Purchases | | | Sales | |
| International Fund | | | $154,430,482 | | | | $300,704,945 | |
| | | |
| Emerging Markets Fund | | | 27,313,306 | | | | 37,390,549 | |
| | | |
| American Opportunities Fund | | | 7,116,753 | | | | 7,526,705 | |
The American Opportunities Fund did not purchase or sell long-term U.S. Government securities during the period ended April 30, 2017. The International Fund and Emerging
| | |
| 66 | | www.thomaswhitefunds.com |
Notes to Financial Statements Period Ended April 30, 2017 (Unaudited)
Markets Fund did not directly purchase or sell long term U.S. Government securities, except for purposes of securities lending during the year ended April 30, 2017.
At October 31, 2016, the aggregate gross unrealized appreciation and depreciation of portfolio securities, based upon cost for federal income tax purposes, were as follows:
| | | | | | | | | | | | | | | | |
| Fund | | Tax Cost | | | Unrealized
Appreciation | | | Unrealized
Depreciation | | | Net Unrealized
Appreciation/
(Depreciation) | |
| International Fund | | | $542,399,363 | | | | $67,113,403 | | | | $(26,622,875) | | | | $40,490,528 | |
| | | | | |
| Emerging Markets Fund | | | 76,797,603 | | | | 9,476,437 | | | | (5,346,248) | | | | 4,130,189 | |
| | | | | |
| American Opportunities Fund | | | 31,589,590 | | | | 5,611,910 | | | | (871,823) | | | | 4,740,087 | |
Distributions to Shareholders
The Funds will distribute net investment income and net realized gains, if any, at least once a year. The amount of distributions from net investment income and net realized gains are determined in accordance with federal income tax regulations, which may differ from generally accepted accounting principles. These “book/tax” differences are either temporary or permanent in nature and are primarily due to differing treatments for passive foreign investment companies and losses deferred due to wash sales. Permanent differences, primarily due to reclassification of REIT income, resulted in reclassifications among the Funds’ components of net assets at October 31, 2016, the Funds’ tax year-end. For the International Fund, permanent differences resulted in reclassification of ($292,076) in undistributed net investment income and $292,076 in accumulated net realized loss. For the Emerging Markets Fund, permanent differences resulted in reclassification of $15,784 in undistributed net investment income/(loss) and ($15,784) in accumulated net realized gain/(loss). For the American Opportunities Fund, permanent differences resulted in reclassification of ($45,881) in undistributed net investment income, $44,212 in accumulated net realized gain and $1,669 in paid in capital.
| | | | | | | | | | | | | | | | | | | | |
| Fund | | Undistributed
Ordinary
Income | | | Undistributed
Long-term
Gains | | | Net Unrealized
Appreciation | | | Other
Accumulated
Losses | | | Total
Distributable
Earnings | |
| International Fund | | | $1,124,255 | | | | $------- | | | | $40,490,528 | | | | $(58,803,971) | | | | $(17,189,188) | |
| | | | | | |
| Emerging Markets Fund | | | 63,236 | | | | ------- | | | | 4,130,189 | | | | (13,794,833) | | | | (9,601,408) | |
| | | | | | |
| American Opportunities Fund | | | 238,400 | | | | 1,095,128 | | | | 4,740,087 | | | | ------- | | | | 6,073,615 | |
Under the Regulated Investment Company Modernization Act of 2010, the Funds are permitted to carry forward capital losses incurred in taxable years beginning after December 22, 2010 for an unlimited period, and such capital losses will retain their character as either short-term or long-term capital losses.
| | | | |
| www.thomaswhitefunds.com | | | 67 | |
Notes to Financial Statements Year Ended April 30, 2017 (Unaudited)
As of October 31, 2016, the International Fund had $51,924,981 in short-term capital loss carry forwards with no expiration, and had $6,665,959 in long-term capital loss carryforwards with no expiration. As of October 31, 2016, the Emerging Markets Fund had $7,878,964 in short-term capital loss carry forwards with no expiration, and had $5,910,141 in long-term capital loss carryforwards with no expiration.
The tax character of distributions paid during the periods shown below were as follows:
| | | | | | | | | | | | | | | | |
| | | Period Ended April 30, 2017 | |
| | | Ordinary
Income | | | Return of
Capital | | | Long-Term
Capital Gains | | | Total
Distributions | |
| International Fund | | | $1,124,245 | | | | $------- | | | | $------- | | | | $1,124,245 | |
| | | | | |
| Emerging Markets Fund | | | 135,557 | | | | ------- | | | | ------- | | | | 135,557 | |
| | | | | |
| American Opportunities Fund | | | 238,400 | | | | ------- | | | | ------- | | | | 238,400 | |
| | | | | | | | | | | | | | | | | |
| | | Year Ended October 31, 2016 | |
| | | Ordinary
Income | | | Return of
Capital | | | Long-Term
Capital Gains | | | Total
Distributions | |
| International Fund | | | $7,032,016 | | | | $------- | | | | $------- | | | | $7,032,016 | |
| | | | | |
| Emerging Markets Fund | | | 679,909 | | | | ------- | | | | ------- | | | | 679,909 | |
| | | | | |
| American Opportunities Fund | | | 7,621 | | | | ------- | | | | 858,464 | | | | 866,085 | |
NOTE 8. SUBSEQUENT EVENTS
In preparing these financial statements, the Trust has evaluated events after April 30, 2017 and determined that there were no significant subsequent events that would require adjustment to or additional disclosure in these financial statements.
| | |
| 68 | | www.thomaswhitefunds.com |
Six Months Ended April 30, 2017 (Unaudited)
FINANCIAL HIGHLIGHTS
| | | | | | | | | | | | | | | | | | | | | | | | | | | | | | | | | | | | | | | | | | | | | | | | |
| Thomas White International Fund - Investor Class | |
| | | | | | Six Months
Ended
April 30,
2017 | | | | | | Year
Ended
October 31,
2016 | | | | | | Year
Ended
October 31,
2015 | | | | | | Year
Ended
October 31,
2014 | | | | | | Year
Ended
October 31,
2013 | | | | | | Year
Ended
October 31,
2012^ | |
| |
| Per share operating performance (For a share outstanding throughout the period) | |
| Net asset value, beginning of period | | | $ | | | | 14.97 | | | | $ | | | | 15.77 | | | | $ | | | | 16.95 | | | | $ | | | | 19.16 | | | | $ | | | | 16.55 | | | | $ | | | | 15.55 | |
| | | | | | | | | | | | | |
| Income from investment operations: | | | | | | | | | | | | | | | | | | | | | | | | | | | | | | | | | | | | | | | | | | | | | | | | |
Net investment income 1 | | | | | | | 0.08 | | | | | | | | 0.17 | | | | | | | | 0.19 | | | | | | | | 0.26 | | | | | | | | 0.26 | | | | | | | | 0.31 | |
Net realized and unrealized gains/(losses) | | | | | | | 1.37 | | | | | | | | (0.81 | ) | | | | | | | (1.17 | ) | | | | | | | (0.89 | ) | | | | | | | 2.57 | | | | | | | | 0.97 | |
| Total from investment operations | | | | | | | 1.45 | | | | | | | | (0.64 | ) | | | | | | | (0.98 | ) | | | | | | | (0.63 | ) | | | | | | | 2.83 | | | | | | | | 1.28 | |
| | | | | | | | | | | | | |
| Distributions: | | | | | | | | | | | | | | | | | | | | | | | | | | | | | | | | | | | | | | | | | | | | | | | | |
From net investment income | | | | | | | (0.01 | ) | | | | | | | (0.16 | ) | | | | | | | (0.20 | ) | | | | | | | (0.26 | ) | | | | | | | (0.22 | ) | | | | | | | (0.28 | ) |
From net realized gains | | | | | | | ------- | | | | | | | | ------- | | | | | | | | ------- | | | | | | | | (1.32 | ) | | | | | | | ------- | | | | | | | | ------- | |
Tax return of capital | | | | | | | ------- | | | | | | | | ------- | | | | | | | | ------- | | | | | | | | ------- | | | | | | | | (0.00 | ) 2 | | | | | | | ------- | |
| Total Distributions | | | | | | | (0.01 | ) | | | | | | | (0.16 | ) | | | | | | | (0.20 | ) | | | | | | | (1.58 | ) | | | | | | | (0.22 | ) | | | | | | | (0.28 | ) |
| Change in net asset value for the period | | | | | | | 1.44 | | | | | | | | (0.80 | ) | | | | | | | (1.18 | ) | | | | | | | (2.21 | ) | | | | | | | 2.61 | | | | | | | | 1.00 | |
| Net asset value, end of period | | | $ | | | | 16.41 | | | | $ | | | | 14.97 | | | | $ | | | | 15.77 | | | | $ | | | | 16.95 | | | | $ | | | | 19.16 | | | | $ | | | | 16.55 | |
| Total Return | | | | | | | 9.64% | 3 | | | | | | | (4.08)% | | | | | | | | (5.77)% | | | | | | | | (3.00)% | | | | | | | | 17.13% | | | | | | | | 8.25% | |
| | | | | | | | | | | | | |
| Ratios/supplemental data | | | | | | | | | | | | | | | | | | | | | | | | | | | | | | | | | | | | | | | | | | | | | | | | |
| Net assets, end of period (000) | | | $ | | | | 77,441 | | | | $ | | | | 187,408 | | | | $ | | | | 268,518 | | | | $ | | | | 369,098 | | | | $ | | | | 433,483 | | | | $ | | | | 540,118 | |
| | | | | | | | | | | | | |
| Ratio to average net assets: | | | | | | | | | | | | | | | | | | | | | | | | | | | | | | | | | | | | | | | | | | | | | | | | |
Expenses
(net of reimbursement) | | | | | | | 1.24% | 4 | | | | | | | 1.24% | | | | | | | | 1.24% | | | | | | | | 1.24% | | | | | | | | 1.24% | | | | | | | | 1.31% | 5 |
Expenses
(prior to reimbursement) | | | | | | | 1.33% | 4 | | | | | | | 1.33% | | | | | | | | 1.32% | | | | | | | | 1.27% | | | | | | | | 1.31% | | | | | | | | 1.37% | 5 |
Net investment income
(net of reimbursement) | | | | | | | 1.03% | 4 | | | | | | | 1.16% | | | | | | | | 1.16% | | | | | | | | 1.36% | | | | | | | | 1.43% | | | | | | | | 1.94% | 5 |
Net investment income
(prior to reimbursement) | | | | | | | 0.94% | 4 | | | | | | | 1.07% | | | | | | | | 1.08% | | | | | | | | 1.33% | | | | | | | | 1.36% | | | | | | | | 1.88% | 5 |
| Portfolio turnover rate 6 | | | | | | | 31% | | | | | | | | 60% | | | | | | | | 57% | | | | | | | | 62% | | | | | | | | 42% | | | | | | | | 66% | |
| ^ | On August 31, 2012, the initial class of shares was renamed the Investor Class. |
| (1) | Net investment income per share represents net investment income divided by the average shares outstanding throughout the period. |
| (2) | Amount is less than $0.005. |
| (5) | Effective August 31, 2012, the expense cap was decreased from 1.40% to 1.24%. |
| (6) | Portfolio turnover is calculated on the basis of the Fund as a whole without distinguishing between the classes of shares issued. |
The accompanying notes are an integral part of these financial statements
| | | | |
| www.thomaswhitefunds.com | | | 69 | |
Six Months Ended April 30, 2017 (Unaudited)
FINANCIAL HIGHLIGHTS
| | | | | | | | | | | | | | | | | | | | | | | | | | | | | | | | | | | | | | | | | | | | | | | | |
Thomas White International Fund - Class I | |
| | | | | | Six Months
Ended
April 30,
2017 | | | | | | Year
Ended
October 31,
2016 | | | | | | Year
Ended
October 31,
2015 | | | | | | Year
Ended
October 31,
2014 | | | | | | Year
Ended
October 31,
2013 | | | | | | August 31,
2012^
through
October 31,
2012 | |
| |
| Per share operating performance (For a share outstanding throughout the period) | |
| Net asset value, beginning of period | | | $ | | | | 14.98 | | | | $ | | | | 15.78 | | | | $ | | | | 16.97 | | | | $ | | | | 19.18 | | | | $ | | | | 16.56 | | | | $ | | | | 16.23 | |
| | | | | | | | | | | | | |
| Income from investment operations: | | | | | | | | | | | | | | | | | | | | | | | | | | | | | | | | | | | | | | | | | | | | | | | | |
Net investment income 1 | | | | | | | 0.10 | | | | | | | | 0.23 | | | | | | | | 0.23 | | | | | | | | 0.30 | | | | | | | | 0.29 | | | | | | | | 0.07 | |
Net realized and unrealized gains/(losses) | | | | | | | 1.35 | | | | | | | | (0.83 | ) | | | | | | | (1.17 | ) | | | | | | | (0.89 | ) | | | | | | | 2.59 | | | | | | | | 0.55 | |
| Total from investment operations | | | | | | | 1.45 | | | | | | | | (0.60 | ) | | | | | | | (0.94 | ) | | | | | | | (0.59 | ) | | | | | | | 2.88 | | | | | | | | 0.62 | |
| | | | | | | | | | | | | |
| Distributions: | | | | | | | | | | | | | | | | | | | | | | | | | | | | | | | | | | | | | | | | | | | | | | | | |
From net investment income | | | | | | | (0.05 | ) | | | | | | | (0.20 | ) | | | | | | | (0.25 | ) | | | | | | | (0.30 | ) | | | | | | | (0.26 | ) | | | | | | | (0.29 | ) |
From net realized gains | | | | | | | ------- | | | | | | | | ------- | | | | | | | | ------- | | | | | | | | (1.32 | ) | | | | | | | ------- | | | | | | | | ------- | |
Tax return of capital | | | | | | | ------- | | | | | | | | ------- | | | | | | | | ------- | | | | | | | | ------- | | | | | | | | (0.00 | ) 2 | | | | | | | ------- | |
| Total Distributions | | | | | | | (0.05 | ) | | | | | | | (0.20 | ) | | | | | | | (0.25 | ) | | | | | | | (1.62 | ) | | | | | | | (0.26 | ) | | | | | | | (0.29 | ) |
| Change in net asset value for the period | | | | | | | 1.40 | | | | | | | | (0.80 | ) | | | | | | | (1.19 | ) | | | | | | | (2.21 | ) | | | | | | | 2.62 | | | | | | | | 0.33 | |
| Net asset value, end of period | | | $ | | | | 16.38 | | | | $ | | | | 14.98 | | | | $ | | | | 15.78 | | | | $ | | | | 16.97 | | | | $ | | | | 19.18 | | | | $ | | | | 16.56 | |
| Total Return | | | | | | | 9.68% | 3 | | | | | | | (3.81)% | | | | | | | | (5.56)% | | | | | | | | (2.76)% | | | | | | | | 17.40% | | | | | | | | 3.83% | 3 |
| | | | | | | | | | | | | |
| Ratios/supplemental data | | | | | | | | | | | | | | | | | | | | | | | | | | | | | | | | | | | | | | | | | | | | | | | | |
| Net assets, end of period (000) | | | $ | | | | 386,999 | | | | $ | | | | 384,017 | | | | $ | | | | 300,331 | | | | $ | | | | 443,397 | | | | $ | | | | 453,564 | | | | $ | | | | 106,601 | |
| | | | | | | | | | | | | |
| Ratio to average net assets: | | | | | | | | | | | | | | | | | | | | | | | | | | | | | | | | | | | | | | | | | | | | | | | | |
Expenses
(net of reimbursement) | | | | | | | 0.99% | 4 | | | | | | | 0.99% | | | | | | | | 0.99% | | | | | | | | 0.99% | | | | | | | | 0.99% | | | | | | | | 0.99% | 4 |
Expenses
(prior to reimbursement) | | | | | | | 1.11% | 4 | | | | | | | 1.10% | | | | | | | | 1.08% | | | | | | | | 1.05% | | | | | | | | 1.11% | | | | | | | | 1.45% | 4 |
Net investment income
(net of reimbursement) | | | | | | | 1.26% | 4 | | | | | | | 1.53% | | | | | | | | 1.40% | | | | | | | | 1.59% | | | | | | | | 1.62% | | | | | | | | 2.47% | 4 |
Net investment income
(prior to reimbursement) | | | | | | | 1.14% | 4 | | | | | | | 1.42% | | | | | | | | 1.31% | | | | | | | | 1.53% | | | | | | | | 1.50% | | | | | | | | 2.01% | 4 |
| Portfolio turnover rate 5 | | | | | | | 31% | | | | | | | | 60% | | | | | | | | 57% | | | | | | | | 62% | | | | | | | | 42% | | | | | | | | 66% | |
| ^ | On August 31, 2012, Class I shares became effective. |
| (1) | Net investment income per share represents net investment income divided by the average shares outstanding throughout the period. |
| (2) | Amount is less than $0.005. |
| (5) | Portfolio turnover is calculated on the basis of the Fund as a whole without distinguishing between the classes of shares issued. |
The accompanying notes are an integral part of these financial statements
| | |
| 70 | | www.thomaswhitefunds.com |
Six Months Ended April 30, 2017 (Unaudited)
FINANCIAL HIGHLIGHTS
| | | | | | | | | | | | | | | | | | | | | | | | | | | | | | | | | | | | | | | | | | | | | | | | |
| Thomas White Emerging Markets Fund - Investor Class | |
| | | | | | Six Months
Ended
April 30,
2017 | | | | | | Year
Ended
October 31,
2016 | | | | | | Year
Ended
October 31,
2015 | | | | | | Year
Ended
October 31,
2014 | | | | | | Year
Ended
October 31,
2013 | | | | | | Year
Ended
October 31,
2012^ | |
| |
| Per share operating performance (For a share outstanding throughout the period) | |
| Net asset value, beginning of period | | | $ | | | | 9.80 | | | | $ | | | | 9.46 | | | | $ | | | | 11.55 | | | | $ | | | | 11.72 | | | | $ | | | | 11.21 | | | | $ | | | | 10.62 | |
| | | | | | | | | | | | | |
| Income from investment operations: | | | | | | | | | | | | | | | | | | | | | | | | | | | | | | | | | | | | | | | | | | | | | | | | |
Net investment income 1 | | | | | | | 0.04 | | | | | | | | 0.05 | | | | | | | | 0.08 | | | | | | | | 0.13 | | | | | | | | 0.13 | | | | | | | | 0.18 | |
Net realized and unrealized gains/(losses) | | | | | | | 0.45 | | | | | | | | 0.37 | | | | | | | | (2.08 | ) | | | | | | | (0.18 | ) | | | | | | | 0.47 | | | | | | | | 0.58 | |
| Total from investment operations | | | | | | | 0.49 | | | | | | | | 0.42 | | | | | | | | (2.00 | ) | | | | | | | (0.05 | ) | | | | | | | 0.60 | | | | | | | | 0.76 | |
| | | | | | | | | | | | | |
| Distributions: | | | | | | | | | | | | | | | | | | | | | | | | | | | | | | | | | | | | | | | | | | | | | | | | |
From net investment income | | | | | | | (0.01 | ) | | | | | | | (0.08 | ) | | | | | | | (0.09 | ) | | | | | | | (0.12 | ) | | | | | | | (0.09 | ) | | | | | | | (0.17 | ) |
| Total Distributions | | | | | | | (0.01 | ) | | | | | | | (0.08 | ) | | | | | | | (0.09 | ) | | | | | | | (0.12 | ) | | | | | | | (0.09 | ) | | | | | | | (0.17 | ) |
| Change in net asset value for the period | | | | | | | 0.48 | | | | | | | | 0.34 | | | | | | | | (2.09 | ) | | | | | | | (0.17 | ) | | | | | | | 0.51 | | | | | | | | 0.59 | |
| Net asset value, end of period | | | $ | | | | 10.28 | | | | $ | | | | 9.80 | | | | $ | | | | 9.46 | | | | $ | | | | 11.55 | | | | $ | | | | 11.72 | | | | $ | | | | 11.21 | |
| Total Return | | | | | | | 5.06% | 2 | | | | | | | 4.48% | | | | | | | | (17.31)% | | | | | | | | (0.40)% | | | | | | | | 5.36% | | | | | | | | 7.21% | |
| | | | | | | | | | | | | |
| Ratios/supplemental data | | | | | | | | | | | | | | | | | | | | | | | | | | | | | | | | | | | | | | | | | | | | | | | | |
| | | | | | | | | | | | | |
| Net assets, end of period (000) | | | $ | | | | 1,848 | | | | $ | | | | 1,816 | | | | $ | | | | 4,172 | | | | $ | | | | 5,182 | | | | $ | | | | 5,703 | | | | $ | | | | 29,602 | |
| | | | | | | | | | | | | |
| Ratio to average net assets: | | | | | | | | | | | | | | | | | | | | | | | | | | | | | | | | | | | | | | | | | | | | | | | | |
Expenses
(net of reimbursement/recoupment) | | | | | | | 1.32% | 3 | | | | | | | 1.34% | | | | | | | | 1.34% | | | | | | | | 1.34% | | | | | | | | 1.34% | | | | | | | | 1.47% | 4 |
Expenses
(prior to reimbursement/recoupment) | | | | | | | 1.32% | 3 | | | | | | | 1.31% | | | | | | | | 1.27% | | | | | | | | 1.29% | | | | | | | | 1.63% | | | | | | | | 1.97% | 4 |
Net investment income
(net of reimbursement/recoupment) | | | | | | | 0.79% | 3 | | | | | | | 0.59% | | | | | | | | 0.75% | | | | | | | | 1.16% | | | | | | | | 1.14% | | | | | | | | 1.61% | 4 |
Net investment income
(prior to reimbursement/recoupment) | | | | | | | 0.79% | 3 | | | | | | | 0.62% | | | | | | | | 0.82% | | | | | | | | 1.21% | | | | | | | | 0.85% | | | | | | | | 1.11% | 4 |
| Portfolio turnover rate 5 | | | | | | | 37% | | | | | | | | 57% | | | | | | | | 27% | | | | | | | | 64% | | | | | | | | 54% | | | | | | | | 54% | |
| ^ | On August 31, 2012, the initial class of shares was renamed the Investor Class. |
| (1) | Net investment income per share represents net investment income divided by the average shares outstanding throughout the period. |
| (4) | Effective August 31, 2012, the expense cap was decreased from 1.50% to 1.34%. |
| (5) | Portfolio turnover is calculated on the basis of the Fund as a whole without distinguishing between the classes of shares issued. |
The accompanying notes are an integral part of these financial statements
| | | | |
| www.thomaswhitefunds.com | | | 71 | |
Six Months Ended April 30, 2017 (Unaudited)
FINANCIAL HIGHLIGHTS
| | | | | | | | | | | | | | | | | | | | | | | | | | | | | | | | | | | | | | | | | | | | | | | | |
| Thomas White Emerging Markets Fund - Class I | |
| | | | | | Six Months
Ended
April 30,
2017 | | | | | | Year Ended
October 31,
2016 | | | | | | Year Ended
October 31,
2015 | | | | | | Year Ended
October 31,
2014 | | | | | | Year Ended
October 31,
2013 | | | | | | August 31,
2012^
through
October 31,
2012 | |
| |
| Per share operating performance (For a share outstanding throughout the period) | |
| Net asset value, beginning of period | | | $ | | | | 9.88 | | | | $ | | | | 9.52 | | | | $ | | | | 11.59 | | | | $ | | | | 11.73 | | | | $ | | | | 11.21 | | | | $ | | | | 10.80 | |
| | | | | | | | | | | | | |
| Income from investment operations: | | | | | | | | | | | | | | | | | | | | | | | | | | | | | | | | | | | | | | | | | | | | | | | | |
Net investment income 1 | | | | | | | 0.04 | | | | | | | | 0.09 | | | | | | | | 0.11 | | | | | | | | 0.14 | | | | | | | | 0.13 | | | | | | | | 0.04 | |
Net realized and unrealized gains/(losses) | | | | | | | 0.47 | | | | | | | | 0.36 | | | | | | | | (2.09 | ) | | | | | | | (0.16 | ) | | | | | | | 0.48 | | | | | | | | 0.55 | |
| Total from investment operations | | | | | | | 0.51 | | | | | | | | 0.45 | | | | | | | | (1.98 | ) | | | | | | | (0.02 | ) | | | | | | | 0.61 | | | | | | | | 0.59 | |
| | | | | | | | | | | | | |
| Distributions: | | | | | | | | | | | | | | | | | | | | | | | | | | | | | | | | | | | | | | | | | | | | | | | | |
From net investment income | | | | | | | (0.02 | ) | | | | | | | (0.09 | ) | | | | | | | (0.09 | ) | | | | | | | (0.12 | ) | | | | | | | (0.09 | ) | | | | | | | (0.18 | ) |
| Total Distributions | | | | | | | (0.02 | ) | | | | | | | (0.09 | ) | | | | | | | (0.09 | ) | | | | | | | (0.12 | ) | | | | | | | (0.09 | ) | | | | | | | (0.18 | ) |
| Change in net asset value for the period | | | | | | | 0.49 | | | | | | | | 0.36 | | | | | | | | (2.07 | ) | | | | | | | (0.14 | ) | | | | | | | 0.52 | | | | | | | | 0.41 | |
| Net asset value, end of period | | | | | | | $10.37 | | | | | | | | $9.88 | | | | | | | | $9.52 | | | | | | | | $11.59 | | | | | | | | $11.73 | | | | | | | | $11.21 | |
| Total Return | | | | | | | 5.15% | 2 | | | | | | | 4.69% | | | | | | | | (17.06)% | | | | | | | | (0.12 | )% | | | | | | | 5.48% | | | | | | | | 5.47% | 2 |
| | | | | | | | | | | | | |
| Ratios/supplemental data | | | | | | | | | | | | | | | | | | | | | | | | | | | | | | | | | | | | | | | | | | | | | | | | |
| Net assets, end of period (000) | | | | | | | $70,082 | | | | | | | | $76,240 | | | | | | | | $79,656 | | | | | | | | $76,705 | | | | | | | | $34,733 | | | | | | | | $956 | |
| | | | | | | | | | | | | |
| Ratio to average net assets: | | | | | | | | | | | | | | | | | | | | | | | | | | | | | | | | | | | | | | | | | | | | | | | | |
| Expenses (net of reimbursement) | | | | | | | 1.09% | 3 | | | | | | | 1.09% | | | | | | | | 1.09% | | | | | | | | 1.09% | | | | | | | | 1.09% | | | | | | | | 1.09% | 3 |
| Expenses (prior to reimbursement) | | | | | | | 1.30% | 3 | | | | | | | 1.29% | | | | | | | | 1.25% | | | | | | | | 1.25% | | | | | | | | 1.66% | | | | | | | | 3.31% | 3 |
| Net investment income (net of reimbursement) | | | | | | | 0.79% | 3 | | | | | | | 0.92% | | | | | | | | 1.04% | | | | | | | | 1.18% | | | | | | | | 1.15% | | | | | | | | 1.68% | 3 |
| Net investment income (prior to reimbursement) | | | | | | | 0.58% | 3 | | | | | | | 0.72% | | | | | | | | 0.88% | | | | | | | | 1.02% | | | | | | | | 0.58% | | | | | | | | (0.54)% | 3 |
| Portfolio turnover rate 4 | | | | | | | 37% | | | | | | | | 57% | | | | | | | | 27% | | | | | | | | 64% | | | | | | | | 54% | | | | | | | | 54% | |
| ^ | On August 31, 2012, Class I shares became effective. |
| (1) | Net investment income per share represents net investment income divided by the average shares outstanding throughout the period. |
| (4) | Portfolio turnover is calculated on the basis of the Fund as a whole without distinguishing between the classes of shares issued. |
The accompanying notes are an integral part of these financial statements
| | |
| 72 | | www.thomaswhitefunds.com |
Six Months Ended April 30, 2017 (Unaudited)
FINANCIAL HIGHLIGHTS
| | | | | | | | | | | | | | | | | | | | | | | | | | | | | | | | | | | | | | | | | | | | | | | | |
| Thomas White American Opportunities Fund - Investor Class | |
| | | | | | Six Months
Ended
April 30,
2017 | | | | | | Year
Ended
October 31,
2016 | | | | | | Year
Ended
October 31,
2015 | | | | | | Year
Ended
October 31,
2014 | | | | | | Year
Ended
October 31,
2013 | | | | | | Year
Ended
October 31,
2012^ | |
| |
| Per share operating performance (For a share outstanding throughout the period) | |
| Net asset value, beginning of period | | | $ | | | | 14.91 | | | | $ | | | | 15.60 | | | | $ | | | | 15.84 | | | | $ | | | | 15.12 | | | | $ | | | | 13.28 | | | | $ | | | | 12.81 | |
| | | | | | | | | | | | | |
| Income from investment operations: | | | | | | | | | | | | | | | | | | | | | | | | | | | | | | | | | | | | | | | | | | | | | | | | |
Net investment income | | | | | | | 0.03 | | | | | | | | 0.11 | 1 | | | | | | | 0.08 | 1 | | | | | | | 0.07 | 1 | | | | | | | 0.11 | | | | | | | | 0.11 | |
Net realized and unrealized gains/(losses) | | | | | | | 1.92 | | | | | | | | (0.44 | ) | | | | | | | 0.96 | | | | | | | | 2.21 | | | | | | | | 3.68 | | | | | | | | 0.94 | |
| Total from investment operations | | | | | | | 1.95 | | | | | | | | (0.33 | ) | | | | | | | 1.04 | | | | | | | | 2.28 | | | | | | | | 3.79 | | | | | | | | 1.05 | |
| | | | | | | | | | | | | |
| Distributions: | | | | | | | | | | | | | | | | | | | | | | | | | | | | | | | | | | | | | | | | | | | | | | | | |
From net investment income | | | | | | | (0.10 | ) | | | | | | | (0.00 | )2 | | | | | | | (0.07 | ) | | | | | | | (0.07 | ) | | | | | | | (0.09 | ) | | | | | | | (0.09 | ) |
From net realized gains | | | | | | | ------- | | | | | | | | (0.36 | ) | | | | | | | (1.21 | ) | | | | | | | (1.49 | ) | | | | | | | (1.85 | ) | | | | | | | (0.49 | ) |
Tax return of capital | | | | | | | ------- | | | | | | | | ------- | | | | | | | | ------- | | | | | | | | ------- | | | | | | | | (0.01 | ) | | | | | | | ------- | |
| Total Distributions | | | | | | | (0.10 | ) | | | | | | | (0.36 | ) | | | | | | | (1.28 | ) | | | | | | | (1.56 | ) | | | | | | | (1.95 | ) | | | | | | | (0.58 | ) |
| Change in net asset value for the period | | | | | | | 1.85 | | | | | | | | (0.69 | ) | | | | | | | (0.24 | ) | | | | | | | 0.72 | | | | | | | | 1.84 | | | | | | | | 0.47 | |
| Net asset value, end of period | | | $ | | | | 16.76 | | | | $ | | | | 14.91 | | | | $ | | | | 15.60 | | | | $ | | | | 15.84 | | | | $ | | | | 15.12 | | | | $ | | | | 13.28 | |
| Total Return | | | | | | | 13.09% | 2 | | | | | | | (2.12)% | | | | | | | | 6.69% | | | | | | | | 15.38% | | | | | | | | 28.52% | | | | | | | | 8.21% | |
| | | | | | | | | | | | | |
| Ratios/supplemental data | | | | | | | | | | | | | | | | | | | | | | | | | | | | | | | | | | | | | | | | | | | | | | | | |
| Net assets, end of period (000) | | | $ | | | | 40,908 | | | | $ | | | | 36,816 | | | | $ | | | | 35,875 | | | | $ | | | | 33,830 | | | | $ | | | | 29,138 | | | | $ | | | | 22,870 | |
| | | | | | | | | | | | | |
| Ratio to average net assets: | | | | | | | | | | | | | | | | | | | | | | | | | | | | | | | | | | | | | | | | | | | | | | | | |
| Expenses (net of reimbursement/ recoupment) | | | | | | | 1.18% | 3 | | | | | | | 1.20% | | | | | | | | 1.18% | | | | | | | | 1.24% | | | | | | | | 1.34% | | | | | | | | 1.35% | 4 |
| Expenses (prior to reimbursement/recoupment) | | | | | | | 1.18% | 3 | | | | | | | 1.20% | | | | | | | | 1.18% | | | | | | | | 1.15% | | | | | | | | 1.31% | | | | | | | | 1.50% | 4 |
| Net investment income (net of reimbursement/recoupment) | | | | | | | 0.35% | 3 | | | | | | | 0.78% | | | | | | | | 0.52% | | | | | | | | 0.45% | | | | | | | | 0.75% | | | | | | | | 0.73% | 4 |
| Net investment income (prior to reimbursement/recoupment) | | | | | | | 0.35% | 3 | | | | | | | 0.78% | | | | | | | | 0.52% | | | | | | | | 0.54% | | | | | | | | 0.78% | | | | | | | | 0.58% | 4 |
| Portfolio turnover rate | | | | | | | 18% | | | | | | | | 60% | | | | | | | | 38% | | | | | | | | 32% | | | | | | | | 60% | | | | | | | | 44% | |
| ^ | On August 31, 2012, the initial class of shares was renamed the Investor Class. |
| (1) | Per share net investment income was calculated prior to tax adjustments. |
| (4) | Effective August 31, 2012, the expense cap was decreased from 1.35% to 1.34%. |
The accompanying notes are an integral part of these financial statements
| | | | |
| www.thomaswhitefunds.com | | | 73 | |
THOMAS WHITE FUNDS
DISCLOSURE OF FUND EXPENSES (Unaudited)
As a shareholder of the Funds you incur two types of costs : (1) transaction costs, including sales charges (loads) on purchase payments or contingent deferred sales charges on redemptions, if any, or redemption fees; and (2) ongoing costs, including management fees; distribution fees (12b-1); and other Fund expenses. This example is intended to help you understand your ongoing costs (in dollars) of investing in the Funds and to compare these costs with the ongoing costs of investing in other mutual funds.
The example is based on an investment of $1,000 invested at the beginning of the period and held for the entire period, November 1, 2016 through April 30, 2017 for the Funds’ Investor Class and Class I, as applicable.
ACTUAL EXPENSES
The third and fourth columns of the table below provide information about actual account values and actual expenses. You may use the information in this line together with the amount you invested to estimate the expenses you paid over the period. Simply divide your account value by $1,000 (for example, an $8,600 account value divided by $1,000=8.6), then multiply the result by the number in the fourth column under the heading entitled “Expenses Paid During Period” to estimate the expenses you paid on your own account during this period. IRA accounts are charged a $15.00 fee annually in September that is not reflected in the actual expense example. If you hold your Fund shares through an IRA account, you should add this cost to the expenses paid shown below.
HYPOTHETICAL EXAMPLE FOR COMPARISON PURPOSES
The fifth and sixth columns of the table below provide information about hypothetical account values and hypothetical expenses based on each Fund’s actual expense ratio and an assumed rate of return of 5% per year before expenses, which is not the Fund’s actual return. The hypothetical account values and expenses may not be used to estimate the actual ending account balance or expenses you paid for the period. You may use this information to compare the ongoing costs of investing in the Funds and other funds. To do so, compare this 5% hypothetical example with the 5% hypothetical examples that appear in the shareholder reports of the other funds. IRA accounts are charged a $15.00 fee annually in September that is not reflected in the hypothetical expense example. If you hold your Fund shares through an IRA account, you should separately compare the Funds’ IRA fees to the IRA fees of other funds.
Please note that the expenses shown in the table are meant to highlight your ongoing costs only and do not reflect any transactional costs such as sales charges (loads) or purchase payments or contingent deferred sales charges on redemptions, if any, or redemption fees. Therefore the sixth column of the table is useful in comparing ongoing costs only, and will not help you determine the relative costs of owning different funds. In addition, if these transactional costs were included, your costs may have been higher.
| | |
| 74 | | www.thomaswhitefunds.com |
THOMAS WHITE FUNDS
| | | | | | | | | | | | | | | | | | | | | | | | |
| | | | | | | | | | | | Actual | | | Hypothetical (5% return
before expenses) | |
| | | Fund’s
Annualized
Expense
Ratio* | | | Beginning
Account
Value
November 1,
2016 | | | Ending
Account
Value
April 30,
2017 | | | Expenses
Paid
During
Period | | | Ending
Account
Value
April 30,
2017 | | | Expenses
Paid
During
Period | |
| International Fund | | | | | | | | | | | | | | | | | | | | | |
| Investor Class | | | 1.24% | | | | $1,000.00 | | | | $1,096.40 | | | | $6.45 | | | | $1,018.65 | | | | $6.21 | |
| Class I | | | 0.99% | | | | $1,000.00 | | | | $1,096.80 | | | | $5.15 | | | | $1,019.89 | | | | $4.96 | |
| Emerging Markets Fund | | | | | | | | | | | | | | | | | |
| Investor Class | | | 1.32% | | | | $1,000.00 | | | | $1,050.60 | | | | $6.71 | | | | $1,018.25 | | | | $6.61 | |
| Class I | | | 1.09% | | | | $1,000.00 | | | | $1,051.50 | | | | $5.54 | | | | $1,019.39 | | | | $5.46 | |
| American Opportunities Fund | | | | | | | | | | | | | | | | | |
| Investor Class | | | 1.18% | | | | $1,000.00 | | | | $1,130.90 | | | | $6.23 | | | | $1,018.94 | | | | $5.91 | |
| | * | Expenses for the International, Emerging Markets and American Opportunities Funds’ annualized expense ratio (after waiver and reimbursement), multiplied by the average account value over the period, multiplied by 181/365 (to reflect the one-half year period). |
QUARTERLY FORM N-Q PORTFOLIO SCHEDULE
The Funds file their complete schedule of portfolio holdings with the Securities and Exchange Commission (“SEC”) for the first and third quarters of each fiscal year on Form N-Q. Each Fund’s Form N-Q is available on the SEC’s website at http://www.sec.gov. The Funds’ Forms N-Q may be reviewed and copied at the SEC’s Public Reference Room in Washington, D.C. Information on the operation of the SEC’s Public reference Room may be obtained by calling 1-800-SEC-0330. Additionally, you may obtain copies of Forms N-Q from the Funds upon request by calling 1-800-811-0535.
PROXY VOTING POLICIES, PROCEDURES AND RECORD
You may obtain a description of the Funds’ (1) proxy voting policies, (2) proxy voting procedures and (3) information regarding how the Funds voted any proxies related to portfolio securities during the most recent 12 month period ended June 30 for which an SEC filing has been made, without charge, upon request by calling the Funds at 1-800-811-0535 or on the EDGAR database on the SEC’s website (http://www.sec.gov).
ADDITIONAL INFORMATION
The Statement of Additional Information contains additional information regarding the Funds and Trustees, and is available upon request without charge by calling 1-800-811-0535.
| | | | |
| www.thomaswhitefunds.com | | | 75 | |
Approval of Investment Advisory Agreements
At an in-person meeting of the Board of Trustees (the “Board” or the “Trustees”) held on February 17, 2017, the Board considered and reviewed each of the Investment Advisory Agreements (the “Agreements”) between Lord Asset Management Trust (the “Trust”), on behalf of the Thomas White American Opportunities Fund (the “American Opportunities Fund”), the Thomas White International Fund (the “International Fund”) and the Thomas White Emerging Markets Fund (the “Emerging Markets Fund” and together with the American Opportunities Fund and the International Fund, the “Funds”), and Thomas White International, Ltd. (“TWI” or the “Advisor”), to determine whether the Agreements should be continued for a one-year period.
In accordance with the Investment Company Act of 1940, the Board of Trustees of the Funds is required, on an annual basis, to consider the continuation of each of the Agreements with the Advisor, and this must take place at an in-person meeting of the Board. The relevant provisions of the Investment Company Act of 1940 specifically provide that it is the duty of the Board to request and evaluate such information as the Board determines is necessary to allow them to properly consider the continuation of the Agreements, and it is the duty of the Advisor to furnish the Trustees with such information that is responsive to their request. Accordingly, in determining whether to renew the Agreements between the Funds and the Advisor, the Board of Trustees requested, and the Advisor provided, information and data relevant to the Board’s consideration. This included materials prepared by the Advisor for the Board that provided them with information regarding the investment performance of the Funds and information regarding the fees and expenses of the Funds, compared to other similar mutual funds.
Following their consideration and review of the Agreements, the Trustees determined that each Agreement would enable shareholders of the Fund to which it applies to obtain high quality services at a cost that is appropriate, reasonable, and in the best interests of its shareholders. Accordingly, the Board, including the Independent Trustees of the Board, unanimously approved the continuation of the Agreements. In reaching their decisions, the Trustees requested and obtained from the Advisor such information as they deemed reasonably necessary to evaluate the Agreements. The Trustees also carefully considered the information that they had received throughout the year from the Advisor as part of their regular oversight of the Funds, as well as profitability data and comparative fee, expense and performance information prepared by Trust management. In considering the continuation of the Agreements, the Trustees evaluated a number of considerations that they believed, in light of the legal advice furnished to them by Trust counsel and their own reasonable business judgment, to be relevant. They based their decisions on the following considerations, among others, although they did not identify any one specific consideration or particular information that was controlling of their decisions:
| | • | | The nature, extent and quality of the advisory services to be provided. The Trustees concluded that TWI is capable of providing high quality services to each Fund, as indicated by the nature and quality of services provided in the past, TWI’s management capabilities demonstrated with respect to the Funds, the professional qualifications and experience of the Funds’ portfolio managers, TWI’s investment and management |
| | |
| 76 | | www.thomaswhitefunds.com |
Approval of Investment Advisory Agreements
| | oversight processes, and the overall long-term investment performance of the Funds. The Trustees also determined that TWI proposed to provide investment advisory services that were of the same quality as services it provided to the Funds in the past, and that these services are appropriate in scope and extent in light of the Funds’ operations, the competitive landscape of the investment company business and investor needs. |
| | • | | The investment performance of the Funds. With respect to each Fund, the Trustees concluded on the basis of information derived from the performance data that TWI had achieved investment performance that was competitive relative to comparable funds over longer-term trailing periods, and the Trustees took into consideration the fact that TWI focuses on long-term performance results with respect to their management of the Funds and the Funds may have periods of underperformance when measured on a more short-term basis. |
1. The American Opportunities Fund. With respect to the American Opportunities Fund, the Trustees noted that the Investor Class shares of the American Opportunities Fund had outperformed its peer group (based on the category average) over the three-, five- and ten-year periods, but had underperformed its peer group over the one-year period. The Trustees also noted that the Investor Class shares of the American Opportunities Fund had underperformed its primary benchmark index, the Russell Midcap Index, over the trailing one-, three-, five- and ten-year periods. The Trustees also noted that the Investor Class shares of the American Opportunities Fund had underperformed its secondary benchmark index, the S&P 500 Index, over the trailing one-, three-, five- and ten-year periods.
2. The International Fund. With respect to the International Fund, the Trustees took note of the fact that the Investor Class shares of the Fund had outperformed its peer group (based on the category average) for the trailing ten-year period, but had underperformed its peer group (based on the category average) for the trailing one-, three- and five-year periods. The Trustees also noted that the Investor Class shares of the International Fund had underperformed its benchmark index, the MSCI All Country World ex US Index, for the trailing one-, three-, five- and ten-year periods. The Trustees took into consideration their discussions with the representatives from the Advisor regarding their plans for addressing the performance results of the Fund.
3. The Emerging Markets Fund. With respect to the Emerging Markets Fund (which commenced investment operations in June 2010), the Trustees noted that the Investor Class shares of the Emerging Markets Fund had underperformed its peer group (based on the category average) over the trailing one-, three- and five-year periods. The Trustees noted that the Investor Class shares of the Emerging Markets Fund had underperformed its benchmark index, the MSCI Emerging Markets Index, over the trailing one-, three- and five-year periods. The Trustees took into consideration their
| | | | |
| www.thomaswhitefunds.com | | | 77 | |
Approval of Investment Advisory Agreements
discussions with the representatives from the Advisor regarding their plans for addressing the performance results of the Fund.
On the basis of the Trustees’ assessment of the nature, extent and quality of advisory services to be provided by TWI, the Trustees concluded that TWI is capable of generating a level of long-term investment performance that is appropriate in light of the Funds’ investment objectives, policies and strategies and competitive with many other investment companies, and they took into consideration the Advisor’s plans for addressing performance matters.
| | • | | The cost of advisory services provided and the level of profitability. On the basis of comparative information derived from the expense data, the Trustees determined that the overall expense ratio of each Fund, on a net basis, was competitive with industry averages, particularly with respect to mutual funds of comparable asset size. The Trustees also noted that TWI had proposed to renew its contractual commitment for the benefit of Fund shareholders to limit the operating expenses of each of the classes of shares of the Funds for an additional year. The Board took into consideration information regarding the fees that TWI charges to other accounts, non-U.S. funds and private funds for similar investment advisory services, and the Trustees noted that the fees were comparable based on the relevant circumstances of the types of accounts involved. The Board also considered TWI’s current level of profitability with respect to the Funds, and noted that TWI’s profitability was acceptable and not excessive and consistent with applicable industry averages and that TWI is committed to using its own resources to help grow the Funds. The Trustees also took into consideration the nature and extent of other expenses that are borne directly by TWI from its own financial resources in order to help to market and promote the Funds. Accordingly, on the basis of the Board’s review of the fees to be charged by TWI for investment advisory services, the investment advisory and other services provided to the Funds by TWI, and the estimated profitability of TWI’s relationship with each Fund, the Board concluded that the level of investment advisory fees and TWI’s profitability are appropriate in light of the investment advisory fees, overall expense ratios and investment performance of comparable investment companies and the historical profitability of the relationship between each Fund and TWI. The Trustees considered the profitability of TWI both before and after the impact of the marketing related expenses that TWI incurs out of its own resources in connection with its management of the Funds. |
| | • | | The extent to which economies of scale will be realized as the Funds grow and whether the advisory fees reflect economies of scale. While the Funds’ investment advisory fees do not decrease as Fund assets grow because the Funds are not currently subject to investment advisory fee breakpoints, the Trustees concluded that the Funds’ investment advisory fees are appropriate in light of the current size of the Funds, and appropriately reflect the current economic environment for TWI and the competitive |
| | |
| 78 | | www.thomaswhitefunds.com |
Approval of Investment Advisory Agreements
| | nature of the mutual fund market. The Trustees noted that TWI has continued to limit the Funds’ total annual operating expenses by waiving fees and/or reimbursing certain Fund expenses. The Trustees then noted that they will have the opportunity to periodically re-examine whether a Fund has achieved economies of scale, and the appropriateness of investment advisory fees payable to TWI, in the future. |
| | • | | Benefits to TWI from its relationship with the Funds (and any corresponding benefits to the Funds). The Trustees concluded that other benefits derived by TWI from its relationship with the Funds, including “soft dollar” benefits in connection with Fund brokerage transactions and use of the Funds’ performance track records in advertising materials, are reasonable and fair, and consistent with industry practice and the best interests of the Funds and their shareholders. In addition, the Trustees determined that the Funds benefited from their relationship to TWI by virtue of TWI’s provision of business management services, in addition to investment advisory services, at a cost to the Funds that is generally comparable to the cost of an outside service provider, which the Trustees determined to be reasonable, fair and in the best interests of Fund shareholders in light of the nature and quality of the services provided and the necessity of the services for the Funds’ operations. In considering information regarding the business management fees payable by the Funds to TWI under the terms of the Business Management Agreement, the Board members indicated that they had considered various factors with respect to the proposed business management fees, including the level and amount of these fees and the services to be provided by the Advisor in connection with the Business Management Agreement, in determining the reasonableness of the total fees payable by the Funds to the Advisor for the overall level of services that the Advisor provides to the Funds and their shareholders. In considering the nature and extent of these non-advisory business management services that are provided to the Funds by the Advisor, the Board took into consideration: (i) whether the Business Management Agreement is in the best interest of the Funds and their shareholders; (ii) whether the services to be performed under the Business Management Agreement are required for the operation of the Funds; (iii) whether the services provided are of a nature and quality at least equal to the same or similar services provided by independent third parties; and (iv) whether the fees for the services are fair and reasonable in light of the usual and customary charges made by others for services of the same nature and quality. |
| | • | | Other Considerations. In approving the Agreements, the Trustees determined that TWI has made a substantial commitment to the recruitment and retention of high quality personnel, and maintains the financial, compliance and operational resources reasonably necessary to manage the Funds in a professional manner that is consistent with the best interests of the Funds and their shareholders. The Trustees also concluded that TWI has made a significant entrepreneurial commitment to the management and success of the Funds, which entails a substantial financial and professional commitment, including the |
| | | | |
| www.thomaswhitefunds.com | | | 79 | |
Approval of Investment Advisory Agreements
| | Expense Limitation Agreements with respect to each Fund under which TWI has undertaken to waive a portion of its fees to the benefit of Fund shareholders to the extent necessary in accordance with the terms of the Expense Limitation Agreements, subject to applicable recoupment provisions. The Board also considered matters with respect to the brokerage practices of TWI, including its soft dollar arrangements and its best-execution procedures, and noted that these were reasonable and consistent with standard industry practice. In addition, the Trustees took into consideration their discussions with management of the Advisor regarding their plans for addressing the performance results of the Funds. |
In reaching their conclusion with respect to the continuation of each of the Agreements and the level of fees paid under the Agreements, the Trustees, as noted, did not identify any one single factor as being controlling. Rather, the Board took note of a combination of factors that had influenced their decision making process. They noted the level and quality of investment advisory services provided by the Advisor to each of the Funds, and they found that these services continued to benefit the shareholders of the Funds and also reflected management’s overall commitment to the continued growth and development of the Funds. Based upon their consideration and review of these factors and other matters deemed relevant by the Board in reaching an informed business judgment, the Trustees, including a majority of the Independent Trustees, concluded that the terms of the Agreements are fair and reasonable in light of the services provided and the Board therefore voted to renew the Agreements for an additional one-year period.
| | |
| 80 | | www.thomaswhitefunds.com |
Privacy Policy
LORD ASSET MANAGEMENT TRUST
THOMAS WHITE INTERNATIONAL, LTD.
I. Commitment to Consumer* Privacy
The Thomas White Funds Family and Thomas White International, Ltd. (collectively, “we” or “us”) are committed to handling consumer information responsibly. We recognize and respect the privacy expectations of our consumers, and we believe that the confidentiality and security of consumers’ personal financial information is one of our fundamental responsibilities.
II. Collection of Consumer Information
We collect, retain and use consumer information only where we reasonably believe it would be useful to the consumer and allowed by law. Consumer information collected by us generally comes from the following sources:
| | • | | Information we receive on applications or other forms; |
| | • | | Information about consumers’ transactions with us, our affiliates, or others. |
III. Disclosure of Consumer Information
We may disclose all of the consumer information we collect to affiliated financial institutions and to third parties who are not our affiliates:
| | • | | to perform marketing services on our behalf or pursuant to a joint marketing agreement between us and another party; and |
| | • | | as otherwise permitted by law. |
We do not disclose any consumer information about our former customers* to anyone except as permitted by law.
IV. Security of Customer Information
We are committed to, and also require our service providers to:
| | • | | maintain policies and procedures designed to assure only appropriate access to, and use of information about our customers; and |
| | • | | maintain physical, electronic and procedural safeguards that comply with federal standards to guard non-public personal information of our customers. |
* As defined in Regulation S-P
| | | | |
| www.thomaswhitefunds.com | | | 81 | |
This page is intentionally left blank.
OFFICERS AND TRUSTEES
Thomas S. White, Jr.
Chairman of the Board
Arthur J. Fiocco, Jr.
Trustee
Elizabeth G. Montgomery
Trustee
Robert W. Thomas
Trustee
John N. Venson, D.P.M.
Trustee
William H. Woolverton
Trustee
Stathy M. White
President
David M. Sullivan II
Vice President, Treasurer and
Assistant Secretary
J. Ryan Conner
Secretary and Chief Compliance Officer
INVESTMENT ADVISOR AND OTHER SERVICE PROVIDERS
Thomas White International, Ltd.
440 S. LaSalle Street, Suite 3900
Chicago, Illinois 60605-1028
CUSTODIANS
The Northern Trust Company
Chicago, Illinois
U.S. Bank, N.A.
Milwaukee, Wisconsin
LEGAL COUNSEL
Dechert LLP
Washington, DC
INDEPENDENT REGISTERED PUBLIC ACCOUNTING FIRM
Tait, Weller & Baker, LLP
Philadelphia, Pennsylvania
ADMINISTRATOR and TRANSFER AGENT
U.S. Bancorp Fund Services, LLC
Milwaukee, Wisconsin
DISTRIBUTOR
Quasar Distributors, LLC
Milwaukee, Wisconsin
FOR CURRENT PERFORMANCE, NET ASSET VALUE OR FOR ASSISTANCE WITH YOUR ACCOUNT, PLEASE CONTACT THE THOMAS WHITE FUNDS AT 800-811-0535 OR VISIT OUR WEB SITE AT WWW.THOMASWHITEFUNDS.COM

www.thomaswhitefunds.com
COVER PICTURE: The new French president Emmanuel Macron has made two key
promises - to put his country back on easy street and strengthen European integration.
Is this a sign of a resurgent Europe in the near future?
Item 2. Code of Ethics.
Not Applicable for Semi-Annual Reports.
Item 3. Audit Committee Financial Expert.
Not Applicable for Semi-Annual Reports.
Item 4. Principal Accountant Fees and Services.
Not Applicable for Semi-Annual Reports.
Item 5. Audit Committee of Listed Registrants.
Not applicable to Registrants who are not listed issuers (as defined in Rule 10A-3 under the Securities Exchange Act of 1934).
Item 6. Investments.
(a) The Schedules of Investments are included as part of the reports to stockholders filed under Item 1 of this Form N-CSR.
(b) Not Applicable.
Item 7. Disclosure of Proxy Voting Policies and Procedures for Closed-End Management Investment Companies.
Not applicable to open-end investment companies.
Item 8. Portfolio Managers of Closed-End Management Investment Companies.
Not applicable to open-end investment companies.
Item 9. Purchases of Equity Securities by Closed-End Management Investment Company and Affiliated Purchasers.
Not applicable to open-end investment companies.
Item 10. Submission of Matters to a Vote of Security Holders.
There have been no material changes to the procedures by which shareholders may recommend nominees to the Registrant’s Board of Trustees.
Item 11. Controls and Procedures.
(a) Based on an evaluation of Registrant’s Disclosure Controls and Procedures (as defined in Rule 30a-3(c) under the Investment Company Act of 1940) (the “Disclosure Controls”), as of a
2
date within 90 days prior to the filing date (the “Filing Date”) of this Form N-CSR (the “Report”), the Registrant’s principal executive officer and principal financial officer have concluded that the Disclosure Controls are effectively designed to ensure that information required to be disclosed by the Registrant in the Report is recorded, processed, summarized and reported by the Filing Date, including ensuring that information required to be disclosed in the Report is accumulated and communicated to the Registrant’s management, including the Registrant’s principal executive officer and principal financial officer, as appropriate, to allow timely decisions regarding required disclosure.
(b) There were no changes in the Registrant’s internal control over financial reporting (as defined in Rule 30a-3(d) under the Act) that occurred during the most recent fiscal quarter of the period covered by this report that has materially affected, or is reasonably likely to materially affect, the Registrant’s internal control over financial reporting.
Item 12. Exhibits.
| (a) | (1) Any code of ethics or amendment thereto, that is the subject of the disclosure required by Item 2, to the extent that the registrant intends to satisfy Item 2 requirements through filing an exhibit. Not Applicable. |
(2) A separate certification for each principal executive officer and principal financial officer pursuant to Section 302 of the Sarbanes-Oxley Act of 2002. Filed herewith.
(3) Any written solicitation to purchase securities under Rule 23c-1 under the Act sent or given during the period covered by the report by or on behalf of the Registrant to 10 or more persons. Not applicable to open-end investment companies.
| (b) | Certifications pursuant to Section 906 of the Sarbanes-Oxley Act of 2002. Furnished herewith. |
3
SIGNATURES
Pursuant to the requirements of the Securities Exchange Act of 1934 and the Investment Company Act of 1940, the Registrant has duly caused this report to be signed on its behalf by the undersigned, thereunto duly authorized.
| | |
| (Registrant) LORD ASSET MANAGEMENT TRUST |
| |
By (Signature and Title) | | 
|
| | Stathy M. White |
| | President (Principal Executive Officer) |
|
Date July 5, 2017 |
Pursuant to the requirements of the Securities Exchange Act of 1934 and the Investment Company Act of 1940, this report has been signed below by the following persons on behalf of the Registrant and in the capacities and on the dates indicated.
| | |
| |
By (Signature and Title) | |
|
| | Stathy M. White |
| | President (Principal Executive Officer) |
|
Date July 5, 2017 |
| | |
| |
By (Signature and Title) | | 
|
| | David M. Sullivan II |
| | Treasurer (Principal Financial Officer) |
|
Date July 5, 2017 |
4