As filed with the U.S. Securities and Exchange Commission on July 6, 2018
UNITED STATES
SECURITIES AND EXCHANGE COMMISSION
Washington, D.C. 20549
FORM N-CSR
CERTIFIED SHAREHOLDER REPORT OF REGISTERED
MANAGEMENT INVESTMENT COMPANIES
Investment Company Act file number 811-08348
LORD ASSET MANAGEMENT TRUST
(Exact name of registrant as specified in charter)
440 South LaSalle Street
Chicago, Illinois 60605-1028
(Address of principal executive offices) (Zip code)
Thomas S. White, Jr.
Thomas White International, Ltd.
440 South LaSalle Street
Chicago, Illinois 60605-1028
(Name and address of agent for service)
Registrant’s telephone number, including area code (312) 663-8300
Date of fiscal year end: 10/31
Date of reporting period: 4/30/2018
Item 1. Reports to Stockholders.


SEMI-ANNUAL REPORT
APRIL 30, 2018
THE INTERNATIONAL FUND
THE EMERGING MARKETS FUND
THE AMERICAN OPPORTUNITIES FUND

The world economy is continuously evolving in ways we could have hardly imagined even a few years earlier. At Thomas White, we always ask ourselves “What is the big picture?” In other words, we always try to analyze local or regional trends from a broader global context.
We invite you to visit our websites as well as our YouTube channel for added insights into the transformative changes that make global investing more complex, but at the same time open up fascinating prospects for those who have the ability to spot them, and the discipline to focus on long-term trends.

President, Thomas White Funds
| | |
| |

| | thomaswhite.com The Thomas White website offers a panorama of the trends, economic indicators and policy changes occurring in the world economy that are of interest to global investors. |
| |

| | thomaswhitefunds.com The Thomas White Funds website provides important information on our three fund offerings, including performance, rankings, and commentaries. |
| |

| | thenewglobal.com Our New Global website is a highly informative resource for investors and their advisors, offering an in-depth understanding of the dramatic changes and trends in the world economy from a broader global context. |
| |

| | youtube.com/user/ThomasWhiteIntl Our YouTube channel features videos with Thomas White spokeswoman Stathy White, reporting on our investment team’s take on evolving global market trends. |
Thomas White: Empowering the InvestorSM
(This page is not part of the Semi-Annual Report.)

CONTENTS
Message to Shareholders
Dear Shareholders and Friends,
I write this message as financial markets have turned turbulent after a rewarding year in 2017 for investors in international equities. Fears about worsening trade disputes between the major economic powers as well as additional interest rate hikes by the U.S. Federal Reserve have encouraged some investors to reduce their market exposure in recent months. Still, we haven’t seen signs of a decline in corporate earnings and cash flows that would worry long-term equity investors like ourselves.
Global Economy is Healthy Enough to Absorb Moderate U.S. Rate Hikes
The possibility of higher interest rates has made many investors uneasy, despite the reasonably healthy economic conditions in most parts of the world. Though inflation now appears to be under control, many investors worry that central banks could misjudge the evolving trends. Any monetary policy mistake by the major central banks could potentially cause increased financial market volatility and weaken the global economic expansion.
Nevertheless, the global economy does not look too fragile at this point in our view. U.S. economic growth exceeded 2% annualized during the first quarter of 2018, and most forecasts point to a faster rate for the second quarter. Aided by tax cuts and other fiscal support, this trend is likely to sustain in the
coming quarters as well. The U.S. labor market remains robust and should continue to lift consumer spending, despite rising fuel costs. All in all, the U.S. economy appears healthy enough to absorb the measured interest rate hikes as guided by the Federal Reserve and avoid a slowdown in the near future.
China and most other large emerging countries are well placed to sustain last year’s growth rate. Domestic demand in these countries continues to expand while global trade volumes remain healthy. Higher oil and commodity prices also favor several of these economies, though expensive fuel could dampen the prospects of energy importers such as China and India. Some of the emerging countries do face the risk of rising debt service costs, as their external borrowings have increased in recent years. Recent currency weakness in Indonesia, Brazil and select other countries was triggered by these concerns and their central banks have stepped in to stabilize the markets. Interest rates in other emerging countries are likely to remain at current levels, unless there are negative inflation surprises.
True, the pace of expansion has slowed in Europe and Japan when compared to last year. That is not really surprising as the moderation has come after a period of better than expected growth. The ongoing expansion in global trade, as well as any further U.S. Dollar appreciation, should help
| | | | |
| www.thomaswhitefunds.com | | | 1 | |
these economies by boosting exports. In addition, softer growth trends could allow the central banks in these regions to continue with their current policies that support economic expansion.
Risk of Worsening Trade Disputes Remains
The recovery in global trade volumes contributed handsomely to aggregate economic growth in several regions last year, especially in Europe, Japan and most emerging countries. Data from the International Monetary Fund (IMF) show that global trade continued to expand at the beginning of this year. However, the U.S. government’s decision to impose additional tariffs on select metal imports has attracted retaliatory responses from China and other trading partners. Subsequent statements from these governments have been mostly unbending and have raised the prospect of a trade standoff that could take a while to resolve. Discussions between the European Union and the U.K. over a trade agreement after Brexit have not progressed much either. These adverse policy steps could potentially derail the ongoing cyclical uptrend in global trade and weaken the global economy.
Further escalation of trade disputes could also slow the process of global economic integration, one of the most significant developments in recent decades. If businesses are unsure of future tariffs as well as the continuation of trade deals such as the North American Free Trade Agreement (NAFTA), they are likely to be reluctant to make long-term investments in production capacity and logistics.
Furthermore, any unwinding of trade relationships built over many decades is widely expected to cause significant economic pain to everyone involved. Global production networks and logistics have become so highly integrated that trade restrictions cannot be prolonged without impacting output and wages. It is expected that the dispute resolution mechanisms established by the World Trade Organization should help settle the current disagreements.
Our Portfolio Strategy
Our Fund portfolios remain positioned to benefit from the ongoing cyclical uptrend in the global economy that has revived global trade and lifted demand for commodities. We continue to see positive trends in corporate earnings, especially from businesses that were diligent in trimming costs during the last downturn. We continue to apply our rigorous bottom-up stock selection methods to identify companies that have the potential to deliver attractive long-term investment returns. As always, I remain confident about the ability of our seasoned portfolio managers to guide the Funds during uncertain market environments.
I thank all our shareholders for keeping your trust in the Thomas White Funds and welcome new shareholders to our family. Along with my fellow professionals at Thomas White International, I assure you that we are deeply committed to help you achieve your long-term investment goals.
| | |
| 2 | | www.thomaswhitefunds.com |
You are invited to visit our websites www.thomaswhitefunds.com, www.thomaswhite.com, and www.thenewglobal.com, for our insights on global equity markets as well as industry trends.

Thomas S. White, Jr.
Chairman
Thomas White Funds
Chief Investment Officer
Thomas White International
| | | | |
| www.thomaswhitefunds.com | | | 3 | |
Past performance is not a guarantee of future results.
Opinions expressed are subject to change, are not guaranteed and should not be considered recommendations to buy or sell any security.
Must be preceded or accompanied by a prospectus.
Mutual fund investing involves risk. Principal loss is possible. Investing in international markets may involve additional risks such as social and political instability, market illiquidity, exchange-rate fluctuations, a high level of volatility and limited regulation. These risks are greater for emerging markets. Investing in small and mid-cap companies can involve more risk than investing in larger companies.
Diversification does not assure a profit nor protect against loss in a declining market.
Earnings growth for a Fund holding does not guarantee a corresponding increase in the market value of the holding of the Fund.
The Thomas White Funds are distributed by Quasar Distributors, LLC.
It is not possible to invest directly in an index.
Cash Flow: Measures the cash generating capability of a company by adding non-cash charges (i.e. depreciation) and interest expense to pretax income.
| | |
| 4 | | www.thomaswhitefunds.com |
THE WORLD HAS CHANGED
The number of stocks in the world has surged 140% since the end of the Cold War in 1989. As of April 2018, America’s 5,262 exchange-traded stocks now only represent 10.18% of the 51,665 stocks on the world’s 77 exchanges.1
| | | | | | | | | | | | |
| The Growth of World Stock Markets: Regional Weights |
| 1960 to April 30, 20182 | | 1960 | | 1970 | | 1980 | | 1990 | | 2000 | | 2018 |
| Developed Markets | | 99.9% | | 99.8% | | 99.2% | | 97% | | 96% | | 88% |
| | | | | | | |
United States | | 72% | | 66% | | 57% | | 43% | | 51% | | 52% |
| | | | | | | |
Canada | | 3% | | 3% | | 3% | | 2% | | 2% | | 3% |
| | | | | | | |
Europe | | 22% | | 23% | | 23% | | 25% | | 28% | | 21% |
| | | | | | | |
Asia Pacific | | 3% | | 8% | | 16% | | 27% | | 15% | | 12% |
| | | | | | | |
| Emerging Markets | | 0.1% | | 0.2% | | 0.8% | | 3% | | 4% | | 12% |
| The World Market | | 100% | | 100% | | 100% | | 100% | | 100% | | 100% |
Market Value
($ trillions) | | $0.5 | | $2.0 | | $4.1 | | $8.2 | | $26.9 | | $56.4 |
1World Federation of Exchanges, Focus-April 2018
2Source: Thomas White International (Data for 1960-2000); MSCI (Data for 2018)
Globalization has spurred growth in every region of the world. International stocks now represent over half of the total world stock market value, including, for example, Sony, Nokia, Toyota, BMW, L’Oreal, Unilever, Heineken, Volvo, Nestle, UBS, Volkswagen, Honda and Royal Dutch Shell. Emerging market companies include Samsung, LG and Hyundai.
Given their quality, diversity and long- term growth potential, it only makes common sense that investors search for opportunities worldwide. The Thomas
White American Opportunities, International and Emerging Markets Funds are managed by the same portfolio managers and analysts who adhere to an identical valuation-oriented investment style. The three portfolios complement one another in that, when combined, they seek to have similar geographical and industry allocations to that of the MSCI All Country World Index.
Shareholders who want to adopt a global investment strategy for their savings and investment program should consider owning all three Thomas White Funds.
Fund holdings are subject to change and should not be considered a recommendation to buy or sell any securities. For a complete list of Fund holdings, please refer to the Investment Portfolio section of this report.
| | | | |
| www.thomaswhitefunds.com | | | 5 | |
THOMAS WHITE INTERNATIONAL FUND
| | | | | | | | | | | | | | |
| | | | | | | | |
| | | Unaudited
Sales
Charge | | Deferred
Sales
Charge | | Administrative
Services
Fee | | 12b-1 Fees | | Operating
Expenses1,3 | | Prospectus
Gross
Annual
Operating
Expense2 | | Prospectus
Net
Annual
Operating
Expense2,3 |
| Investor Class | | None | | None | | Up to 0.25% | | None | | 1.24% | | 1.36% | | 1.24% |
| Class I | | None | | None | | None | | None | | 0.99% | | 1.14% | | 0.99% |
1 In the absence of the fee deferral/expense reimbursement arrangement for the International Fund, the ratio of expenses to average net assets would have been 1.40% for Investor Class shares and 1.20% for Class I shares.
2 Gross Annual Operating Expense and Net Annual Operating Expense are based on the most recent prospectus and may differ from other expense ratios appearing in this report.
3 Thomas White International, Ltd. (“Advisor”) has agreed to defer its fees and/or reimburse the Fund to the extent that the operating expenses for Investor Class and Class I shares exceed (as a percentage of average daily net assets) 1.24% and 0.99%, respectively. The fee deferral/expense reimbursement agreement expires February 28, 2019. The Fund has agreed to repay the Advisor for amounts deferred or reimbursed by the Advisor pursuant to the agreement provided that such repayment does not cause the Fund to exceed the above limits and the repayment is made within three years after the year in which the Advisor incurred the expense. The fee deferral/expense reimbursement agreement may only be amended or terminated by the Fund’s Board of Trustees.
| | | | | | | | |
| | | | | |
| | | NAV | | Net Assets | | Redemption Fee | | Portfolio Turnover |
| Investor Class | | $18.33 | | $39.7 million | | 2.00% on shares held less than 60 days | | 27% |
| Class I | | $18.26 | | $244.5 million | | |
| | |
| 6 | | www.thomaswhitefunds.com |
APRIL 30, 2018
| | | | | | | | | | | | | | | | | | | | | | | | | | | | | | |
| |
| Average Annual Returns as of April 30, 2018 (Unaudited) | |
| Class | | Sales Charge | | 6 month | | | Calendar
YTD | | | 1 Yr | | | 3 Yrs | | | 5 Yrs | | | 10 Yrs | | | Since
Inception
(6/28/1994)* | |
| Investor Class shares (TWWDX) | | None | | | 2.46% | | | | 0.05% | | | | 15.01% | | | | 3.87% | | | | 2.77% | | | | 1.29% | | | | 7.05% | |
| Class I shares1 (TWWIX) | | None | | | 2.64% | | | | 0.11% | | | | 15.32% | | | | 4.11% | | | | 3.02% | | | | 1.43% | | | | 7.11% | |
| MSCI All Country World ex US Index2 | | N/A | | | 3.47% | | | | 0.40% | | | | 15.91% | | | | 5.01% | | | | 5.46% | | | | 2.26% | | | | 5.56% | |
* The inception date of the Investor Class shares.
1 Performance figures for Class I shares, first offered on August 31, 2012, include the historical performance of Investor Class shares through August 30, 2012.
2 The MSCI All Country World ex US Index is a free float-adjusted market capitalization-weighted index of both developed and emerging markets. The index is unmanaged and returns assume the reinvestment of dividends. It is not possible to invest directly in an index.
Returns of each share class reflect differences in expenses applicable to each class which are primarily differences in service fees.
The returns do not reflect the deduction of taxes that a shareholder would pay on Fund distributions or the redemption of Fund shares. The returns reflect the actual performance for each period and do not include the impacts of trades executed on the last business day of the period that were recorded on the first business day of the next period.
Performance data is based upon past performance, which is no guarantee of future results. The investment return and principal value of an investment will fluctuate so that an investor’s shares, when redeemed, may be worth more or less than their original cost. Current performance may be higher or lower than the performance data quoted. Please call 1-800-811-0535 to obtain performance data as of the most recent month-end. The Fund imposes a 2% redemption fee on shares held less than 60 days. Performance data does not reflect the redemption fee. If reflected, total returns would be lower. Investment performance reflects any fee waivers that were in effect. In the absence of such waivers, total return would have been reduced. The Gross Expense Ratios, based on the most recent prospectus, are 1.36% (Investor Class) and 1.14% (Class I).
| | | | |
| www.thomaswhitefunds.com | | | 7 | |
THOMAS WHITE INTERNATIONAL FUND
GROWTH OF A $10,000 INVESTMENT WITH DIVIDENDS REINVESTED (Unaudited)
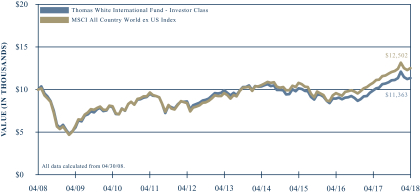
This chart illustrates the performance of a hypothetical $10,000 investment made in the Fund’s Investor Class shares and its benchmark, the MSCI All Country World ex US Index, for the past 10 years through April 30, 2018. It assumes reinvestment of dividends and capital gains, but does not reflect the effect of any applicable redemption fees. This chart does not imply future performance. Past performance does not guarantee future results. The cumulative ten year return was 13.63% for the Fund’s Investor Class shares and 25.02% for the benchmark. The Fund’s Investor Class shares average annual total return since inception on June 28, 1994 was 7.05%. The MSCI All Country World ex US Index is a free float-adjusted market capitalization-weighted index of both developed and emerging markets. The index is unmanaged and returns assume the reinvestment of dividends. It is not possible to invest directly in an index. During the periods shown, the Fund’s manager reimbursed certain Fund expenses. Absent this reimbursement, performance would have been lower. Performance will vary from class to class based on differences in class-specific expenses.
| | |
| 8 | | www.thomaswhitefunds.com |
APRIL 30, 2018
The Thomas White International Fund primarily invests in equity securities of companies located in the world’s developed countries outside of the U.S. There may also be a portion of the Fund’s assets invested in companies located in emerging market countries.
Portfolio Managers
Thomas S. White, Jr.
Jinwen Zhang, Ph.D., CFA
Douglas M. Jackman, CFA
Wei Li, Ph.D., CFA
John Wu, Ph.D., CFA
Rex Mathew, CFA, CM
Ramkumar Venkatramani, CFA
Performance Review
The Thomas White International Fund Class I shares returned +2.64% for the six-month period ended April 30, 2018, compared to +3.47% for the benchmark MSCI All Country World ex US Index. Since the Fund’s inception on June 28, 1994, the Fund’s Class I shares have returned +7.11%* annualized while the benchmark index returned +5.56% for the same period.
International Equities Continue to Attract Investor Interest
International equity prices advanced strongly during the first half of the six-month review period, before giving up part of the gains as markets turned volatile during the last three months. After the strong returns in 2017 for international equities, investors have become apprehensive about the risk of higher U.S. interest rates as well as worsening trade
disputes. If the U.S. Federal Reserve lifts its benchmark rate more than currently expected, capital inflows to international assets could decline and currencies may come under pressure. Similarly, restrictive trade policies by the leading countries including the U.S. could upset the ongoing recovery in global trade volumes.
Nevertheless, economic trends during the review period remained largely supportive of equity prices. The global economy continued to gain strength as most regions saw accelerated growth during the last quarter of 2017. Manufacturing and services sector activity surveys show sustained global expansion during the first four months of 2018 as well. Growth in the Eurozone moderated during the first quarter of this year, when compared to the previous quarter, while the Japanese economy was stagnant. Most large emerging countries, including China and India, continued to grow at a robust pace during the same period. Prices of most industrial commodities remained at higher levels while crude oil prices rallied to multi-year highs, supported by stronger than expected demand.
Portfolio Review
During the six-month review period, positive stock selection in the energy, materials, financials and healthcare sectors contributed to the Fund’s relative performance against its benchmark, offsetting weak selection in the consumer discretionary and telecom sectors. Energy and materials were the best performing sectors, as oil prices surged during the second half of the review period. Higher exposure to the materials and
| | | | |
| www.thomaswhitefunds.com | | | 9 | |
* Performance for Class I shares include the historical performance of Investor Class shares through August 30, 2012.
THOMAS WHITE INTERNATIONAL FUND
technology sectors, as well as the relative underweight in the consumer staples sector also helped the Fund’s portfolio. The Fund’s higher exposure to emerging markets continued to contribute positively to relative returns. Stock selection was also beneficial in emerging markets, especially in Asia, and helped offset the weak selection effect in developed markets.
Chinese cement manufacturer Anhui Conch was the biggest contributor to Fund returns during the review period as the company’s earnings continued to exceed estimates on higher product prices and capacity utilization. Brazilian lender Itau Unibanco advanced on expectations of improved credit demand and higher net interest margins in the coming quarters. Australian miner Iluka Resources gained as demand for most of its products, such as titanium, remained at elevated levels. Strong demand growth across product lines, especially in direct sales online, helped Chinese insurer Ping An. Airports of Thailand outperformed as traffic growth in most airports managed by the company remained healthy.
European retailer Hennes & Mauritz detracted the most from Fund returns during the period as investors remained doubtful of the company’s strategies to survive competition from online retailers. However, we believe the company’s strong brand and wide geographical spread should help revive revenue growth. Japanese telecom and online services group Rakuten declined on plans to increase investments in its telecom business and was sold. Mexican cement producer Cemex was hurt by fears of trade restrictions that could weaken revenue expansion. Japanese technology investment group
SoftBank was negatively affected by doubts about regulatory approval for the proposed sale of its U.S. telecom business. Swedish industrial products manufacturer SKF underperformed as the company is facing competition and pricing pressure in some of its product lines.
Global Economy in Good Health, Despite Growing Risks
Though some regions are facing slower growth when compared to 2017, the global economy is expected to sustain the current pace of expansion through the end of 2019. The International Monetary Fund (IMF) forecasts global expansion of close to 4% for this year as well as 2019, helped by faster growing emerging countries. Manufacturing and services activity indicators as well as global trade volumes show continued strength, as domestic demand remains favorable in most major countries. Higher energy and commodity prices should contribute positively to the economies of several countries, including Canada, Australia, Brazil, South Africa and Russia. Though more central banks are likely to start tightening, interest rates remain affordable in most countries when compared to historical trends. Inflation remains contained, except in select smaller emerging countries, and provides central banks with sufficient flexibility to support growth when necessary.
The Eurozone and Japan have seen softer economic trends so far in 2018, and aggregate growth rates are likely to moderate. However, it should be noted that the slowdown follows better-than-expected growth last year. The Eurozone economy expanded 2.3% in 2017 while Japanese
| | |
| 10 | | www.thomaswhitefunds.com |
APRIL 30, 2018
growth was at 1.7%, matching or exceeding the highs set in recent years. Central banks in the Eurozone and Japan are continuing their quantitative easing and have the flexibility to extend those programs if the need arises. Healthy global trade trends and U.S. Dollar gains should help European and Japanese exports and offset any weakness in domestic consumer demand.
Economic trends from the leading emerging countries remain healthy, and their rate of growth is expected to exceed 5% by 2019. The Chinese economy expanded 6.8% annualized while growth in India accelerated to 7.3% during the first three months of
2018. Fiscal and monetary policies are largely supportive of growth in most countries and are likely to remain so in the near term. Emerging countries that have larger external debt burdens are likely to face difficulties in a rising global interest rate environment and their currencies have come under pressure in recent months. Central banks in these countries have stepped in to stabilize the markets and it appears less likely that the volatility will spread to other emerging market currencies.
We sincerely appreciate the trust you have kept in the Thomas White International Fund.
| | | | |
| www.thomaswhitefunds.com | | | 11 | |
THOMAS WHITE INTERNATIONAL FUND
Portfolio Country and Industry Allocation as of April 30, 2018 (Unaudited)
| | | | |
| | |
| Country Allocation | | % of TNA | |
| Australia | | | 6.6% | |
| Brazil | | | 2.1% | |
| Belgium | | | 1.3% | |
| Canada | | | 4.2% | |
| China | | | 7.9% | |
| Finland | | | 2.3% | |
| France | | | 4.3% | |
| Germany | | | 2.2% | |
| Hong Kong | | | 1.0% | |
| India | | | 2.9% | |
| Indonesia | | | 2.6% | |
| Ireland | | | 1.1% | |
| Italy | | | 1.4% | |
| Japan | | | 16.5% | |
| Mexico | | | 2.1% | |
| Netherlands | | | 3.5% | |
| Peru | | | 1.2% | |
| Russia | | | 2.1% | |
| Singapore | | | 1.4% | |
| South Africa | | | 1.9% | |
| South Korea | | | 5.6% | |
| Spain | | | 2.7% | |
| Sweden | | | 3.7% | |
| Switzerland | | | 3.2% | |
| Taiwan | | | 2.4% | |
| Thailand | | | 2.7% | |
| Turkey | | | 0.6% | |
| United Kingdom | | | 8.6% | |
| Cash & Other | | | 1.9% | |
| | | | |
| | |
| Industry Allocation | | % of TNA | |
| Automobiles & Components | | | 4.7% | |
| Banks | | | 19.2% | |
| Capital Goods | | | 10.9% | |
| Commercial & Professional Services | | | 2.0% | |
| Consumer Durables & Apparel | | | 3.2% | |
| Consumer Services | | | 1.1% | |
| Diversified Financials | | | 2.3% | |
| Energy | | | 6.8% | |
| Food & Staples Retailing | | | 1.4% | |
| Food, Beverage & Tobacco | | | 1.7% | |
| Health Care Equipment & Services | | | 1.0% | |
| Household & Personal Products | | | 1.0% | |
| Insurance | | | 2.6% | |
| Materials | | | 12.3% | |
| Media | | | 2.5% | |
| Pharmaceuticals, Biotechnology & Life Sciences | | | 2.4% | |
| Retailing | | | 3.0% | |
| Semiconductors & Semiconductor Equipment | | | 4.6% | |
| Software & Services | | | 4.6% | |
| Technology Hardware & Equipment | | | 3.2% | |
| Telecommunication Services | | | 2.7% | |
| Transportation | | | 4.9% | |
| Cash & Other | | | 1.9% | |
| | | | | |
| | | | | |
| | | | | |
| | | | | |
| | | | | |
| | | | | |
TNA - Total Net Assets
Fund holdings and industry allocations are subject to change and should not be considered a recommendation to buy or sell any securities. For a complete list of Fund holdings, please refer to the Investment Portfolio section of this report.
| | |
| 12 | | www.thomaswhitefunds.com |
| | |
| Investment Portfolio (Unaudited) | | April 30, 2018 |
| | | | | | | | | | | | |
| Country | | Issue | | Industry | | Shares | | | Value (US$) | |
| | | | | | | | | | | |
COMMON
STOCKS (96.0%) | | | | | | | | | | |
|
| |
| AUSTRALIA (6.6%) | | | | | | | | |
| | Aristocrat Leisure Limited + | | Consumer Services | | | 154,400 | | | | $3,100,374 | |
| | BHP Billiton Ltd + | | Materials | | | 195,000 | | | | 4,539,212 | |
| | CSL Limited + | | Pharmaceuticals, Biotechnology & Life Sciences | | | 31,800 | | | | 4,060,527 | |
| | Iluka Resources Ltd + | | Materials | | | 432,100 | | | | 3,800,108 | |
| | Orica Limited + | | Materials | | | 226,100 | | | | 3,374,344 | |
| | | | | | | | | | | | |
| | | | | | | | | | | 18,874,565 | |
|
| |
| BELGIUM (1.3%) | | | | | | | | |
| | KBC Group NV + | | Banks | | | 41,500 | | | | 3,616,267 | |
|
| |
| CANADA (4.2%) | | | | | | | | | | |
| | Canadian National Railway Company * | | Transportation | | | 34,700 | | | | 2,680,166 | |
| | Nutrien Ltd. * | | Materials | | | 65,800 | | | | 2,995,451 | |
| | Open Text Corporation * | | Software & Services | | | 90,000 | | | | 3,177,460 | |
| | Suncor Energy, Inc. * | | Energy | | | 79,800 | | | | 3,051,661 | |
| | | | | | | | | | | | |
| | | | | | | | | | | 11,904,738 | |
|
| |
| CHINA (7.9%) | | | | | | | | |
| | Alibaba Group Holding Ltd. - ADR * # | | Software & Services | | | 30,800 | | | | 5,499,032 | |
| | Anhui Conch Cement Company Limited - H Shares + | | Materials | | | 486,500 | | | | 3,029,386 | |
| | Baidu, Inc. - ADR * | | Software & Services | | | 17,900 | | | | 4,491,110 | |
| | Kweichow Moutai Co., Ltd. - A Shares + | | Food, Beverage & Tobacco | | | 25,400 | | | | 2,660,576 | |
| | Midea Group Co., Ltd. - A Shares + | | Consumer Durables & Apparel | | | 337,500 | | | | 2,759,632 | |
| | Ping An Insurance (Group) Company of China Limited - H Shares # + | | Insurance | | | 403,500 | | | | 3,940,710 | |
| | | | | | | | | | | | |
| | | | | | | | | | | 22,380,446 | |
|
| |
| FINLAND (2.3%) | | | | | | | | |
| | Konecranes OYJ + | | Capital Goods | | | 69,600 | | | | 2,835,396 | |
| | Sampo Oyj - A Shares + | | Insurance | | | 66,600 | | | | 3,582,438 | |
| | | | | | | | | | | | |
| | | | | | | | | | | 6,417,834 | |
|
| |
| FRANCE (4.3%) | | | | | | | | | | |
| | Societe BIC SA + | | Commercial & Professional Services | | | 28,800 | | | | 2,934,411 | |
| | Eiffage + | | Capital Goods | | | 23,000 | | | | 2,731,683 | |
| | Safran SA + | | Capital Goods | | | 30,900 | | | | 3,623,971 | |
| | Total SA + | | Energy | | | 47,500 | | | | 2,982,825 | |
| | | | | | | | | | | | |
| | | | | | | | | | | 12,272,890 | |
|
| |
| GERMANY (2.2%) | | | | | | | | | | |
| | Bayerische Motoren Werke Aktiengesellschaft + | | Automobiles & Components | | | 35,200 | | | | 3,928,648 | |
The accompanying notes are an integral part of these financial statements
| | | | |
| www.thomaswhitefunds.com | | | 13 | |
| | |
| Thomas White International Fund | | |
| | | | | | | | | | | | |
| Country | | Issue | | Industry | | Shares | | | Value (US$) | |
| | | | | | | | | | | |
| GERMANY (CONT.) | | | | | | | | | | |
| | Continental Aktiengesellschaft + | | Automobiles & Components | | | 8,300 | | | | $2,217,122 | |
| | | | | | | | | | | | |
| | | | | | | | | | | 6,145,770 | |
|
| |
| HONG KONG (1.0%) | |
| | Techtronic Industries Company Limited + | | Consumer Durables & Apparel | | | 482,000 | | | | 2,818,905 | |
|
| |
| INDIA (2.9%) | | | | | | | | | | |
| | Axis Bank Limited + | | Banks | | | 347,700 | | | | 2,679,078 | |
| | Exide Industries Ltd. + | | Automobiles & Components | | | 716,000 | | | | 2,651,406 | |
| | HDFC Bank Limited - ADR | | Banks | | | 29,000 | | | | 2,778,490 | |
| | | | | | | | | | | | |
| | | | | | | | | | | 8,108,974 | |
|
| |
| INDONESIA (2.6%) | | | | | | | | | | |
| | PT Bank Central Asia Tbk + | | Banks | | | 2,897,300 | | | | 4,581,350 | |
| | PT Telekomunikasi Indonesia Persero Tbk + | | Telecommunication Services | | | 10,091,400 | | | | 2,757,477 | |
| | | | | | | | | | | | |
| | | | | | | | | | | 7,338,827 | |
|
| |
| IRELAND (1.1%) | | | | | | | | | | |
| | CRH PLC + | | Materials | | | 88,800 | | | | 3,151,510 | |
|
| |
| ITALY (1.4%) | | | | | | | | | | |
| | UniCredit S.p.A + | | Banks | | | 188,555 | | | | 4,079,985 | |
|
| |
| JAPAN (16.5%) | | | | | | | | | | |
| | DAIKIN INDUSTRIES, LTD. + | | Capital Goods | | | 31,200 | | | | 3,649,965 | |
| | FANUC Corporation + | | Capital Goods | | | 17,000 | | | | 3,658,368 | |
| | Honda Motor Co., Ltd. + | | Automobiles & Components | | | 85,600 | | | | 2,940,041 | |
| | Hoya Corp + | | Technology Hardware & Equipment | | | 68,500 | | | | 3,662,225 | |
| | Japan Tobacco Inc. + | | Food, Beverage & Tobacco | | | 79,400 | | | | 2,132,081 | |
| | Kansai Paint Co., Ltd. + | | Materials | | | 142,300 | | | | 3,199,374 | |
| | Nabtesco Corporation + | | Capital Goods | | | 92,300 | | | | 3,333,677 | |
| | Nitori Holdings Co., Ltd. + | | Retailing | | | 16,900 | | | | 2,843,985 | |
| | ORIX Corporation + | | Diversified Financials | | | 195,700 | | | | 3,440,143 | |
| | Rakuten Inc + | | Retailing | | | 354,700 | | | | 2,518,848 | |
| | Rohm Co Ltd + | | Semiconductors & Semiconductor Equipment | | | 30,000 | | | | 2,748,723 | |
| | SMC Corp/Japan + | | Capital Goods | | | 10,100 | | | | 3,848,384 | |
| | SoftBank Corp. + | | Telecommunication Services | | | 65,100 | | | | 5,046,911 | |
| | Sundrug Co., Ltd. + | | Food & Staples Retailing | | | 77,700 | | | | 3,992,033 | |
| | | | | | | | | | | | |
| | | | | | | | | | | 47,014,758 | |
|
| |
The accompanying notes are an integral part of these financial statements
| | |
| 14 | | www.thomaswhitefunds.com |
| | |
| Investment Portfolio (Unaudited) | | April 30, 2018 |
| | | | | | | | | | | | |
| Country | | Issue | | Industry | | Shares | | | Value (US$) | |
| | | | | | | | | | | |
| MEXICO (2.1%) | | | | | | | | | | |
| | Cemex SAB de CV * | | Materials | | | 3,464,724 | | | | $2,161,973 | |
| | Grupo Aeroportuario del Sureste SAB de CV - B Shares | | Transportation | | | 212,100 | | | | 3,805,020 | |
| | | | | | | | | | | | |
| | | | | | | | | | | 5,966,993 | |
|
| |
| NETHERLANDS (3.5%) | | | | | | | | |
| | ING Groep N.V. + | | Banks | | | 249,100 | | | | 4,179,114 | |
| | Royal Dutch Shell PLC - B Shares + | | Energy | | | 161,900 | | | | 5,783,409 | |
| | | | | | | | | | | | |
| | | | | | | | | | | 9,962,523 | |
|
| |
| PERU (1.2%) | | | | | | | | | | |
| | Credicorp Ltd. | | Banks | | | 15,100 | | | | 3,510,599 | |
|
| |
| RUSSIA (2.1%) | | | | | | | | | | |
| | LUKOIL PJSC - ADR + | | Energy | | | 44,200 | | | | 2,945,450 | |
| | Sberbank of Russia PJSC - ADR + | | Banks | | | 205,600 | | | | 3,039,423 | |
| | | | | | | | | | | | |
| | | | | | | | | | | 5,984,873 | |
|
| |
| SINGAPORE (1.4%) | | | | | | | | | | |
| | DBS Group Holdings Limited + | | Banks | | | 171,000 | | | | 3,950,298 | |
|
| |
| SOUTH AFRICA (1.9%) | | | | | | | | |
| | Mondi Ltd + | | Materials | | | 77,700 | | | | 2,262,790 | |
| | Naspers Limited - N Shares + | | Media | | | 12,200 | | | | 2,976,860 | |
| | | | | | | | | | | | |
| | | | | | | | | | | 5,239,650 | |
|
| |
| SOUTH KOREA (5.6%) | | | | | | | | |
| | KB Financial Group Inc. + | | Banks | | | 70,300 | | | | 4,008,887 | |
| | LG Household & Health Care Ltd. + | | Household & Personal Products | | | 2,225 | | | | 2,850,902 | |
| | POSCO + | | Materials | | | 9,650 | | | | 3,319,616 | |
| | Samsung Electronics Co., Ltd. + | | Semiconductors & Semiconductor Equipment | | | 2,375 | | | | 5,826,331 | |
| | | | | | | | | | | | |
| | | | | | | | | | | 16,005,736 | |
|
| |
| SPAIN (2.7%) | | | | | | | | | | |
| | Aena SME, S.A. + | | Transportation | | | 15,800 | | | | 3,256,569 | |
| | Banco Bilbao Vizcaya Argentaria, S.A. + | | Banks | | | 558,200 | | | | 4,521,320 | |
| | | | | | | | | | | | |
| | | | | | | | | | | 7,777,889 | |
|
| |
| SWEDEN (3.7%) | | | | | | | | | | |
| | Hennes & Mauritz AB - B Shares # + | | Retailing | | | 186,500 | | | | 3,189,050 | |
| | Hexagon AB - B Shares + | | Technology Hardware & Equipment | | | 50,100 | | | | 2,884,937 | |
| | SKF AB - B Shares + | | Capital Goods | | | 213,500 | | | | 4,332,634 | |
| | | | | | | | | | | | |
| | | | | | | | | | | 10,406,621 | |
|
| |
| SWITZERLAND (3.2%) | |
| | Credit Suisse Group AG + | | Diversified Financials | | | 180,000 | | | | 3,024,247 | |
| | IWG PLC + | | Commercial & Professional Services | | | 800,000 | | | | 2,721,022 | |
The accompanying notes are an integral part of these financial statements
| | | | |
| www.thomaswhitefunds.com | | | 15 | |
| | |
| Thomas White International Fund | | |
| | | | | | | | | | | | |
| Country | | Issue | | Industry | | Shares | | | Value (US$) | |
| | | | | | | | | | | |
| SWITZERLAND (CONT.) | |
| | The Swatch Group AG + | | Consumer Durables & Apparel | | | 7,200 | | | | $3,465,854 | |
| | | | | | | | | | | | |
| | | | | | | | | | | 9,211,123 | |
|
| |
| TAIWAN (2.4%) | | | | | | | | | | |
| | Pegatron Corporation + | | Technology Hardware & Equipment | | | 1,074,000 | | | | 2,505,529 | |
| | Taiwan Semiconductor Manufacturing Company, Ltd. + | | Semiconductors & Semiconductor Equipment | | | 104,000 | | | | 788,369 | |
| | Taiwan Semiconductor Manufacturing Company, Ltd. - ADR | | Semiconductors & Semiconductor Equipment | | | 93,000 | | | | 3,575,850 | |
| | | | | | | | | | | | |
| | | | | | | | | | | 6,869,748 | |
|
| |
| THAILAND (2.7%) | | | | | | | | | | |
| | Airports of Thailand Public Company Ltd. + | | Transportation | | | 1,853,000 | | | | 4,170,415 | |
| | Kasikornbank Public Company Limited + | | Banks | | | 547,200 | | | | 3,474,599 | |
| | | | | | | | | | | | |
| | | | | | | | | | | 7,645,014 | |
|
| |
| TURKEY (0.6%) | | | | | | | | | | |
| | Tofas Turk Otomobil Fabrikasi A.S.+ | | Automobiles & Components | | | 277,700 | | | | 1,707,905 | |
|
| |
| UNITED KINGDOM (8.6%) | | | | |
| | Antofagasta plc + | | Materials | | | 230,300 | | | | 3,063,451 | |
| | Ashtead Group Plc + | | Capital Goods | | | 108,700 | | | | 3,022,224 | |
| | BP p.l.c. + | | Energy | | | 625,200 | | | | 4,619,236 | |
| | Lloyds Banking Group plc + | | Banks | | | 4,626,800 | | | | 4,112,296 | |
| | SHIRE PLC + | | Pharmaceuticals, Biotechnology & Life Sciences | | | 49,600 | | | | 2,635,905 | |
| | Smith & Nephew plc + | | Health Care Equipment & Services | | | 151,800 | | | | 2,911,864 | |
| | WPP plc + | | Media | | | 238,500 | | | | 4,084,632 | |
| | | | | | | | | | |
| | | | | | | | | | | 24,449,608 | |
|
| |
| Total Common Stocks | | | | (Cost $222,850,676) | | | | | | | 272,814,049 | |
| | | | | | | | | | | | |
| | | | |
| | | | | | | | | | | | |
The accompanying notes are an integral part of these financial statements
| | |
| 16 | | www.thomaswhitefunds.com |
| | |
| Investment Portfolio (Unaudited) | | April 30, 2018 |
| | | | | | | | | | | | |
| Country | | Issue | | Industry | | Shares | | | Value (US$) | |
| | | | | | | | | | | |
| | | |
PREFERRED
STOCK (2.1%) | | | | | | | | | | |
| | | | |
| | | | | | | | | | | | |
| BRAZIL (2.1%) | | | | | | | | | | |
| | Itau Unibanco Holding S.A. (7/30/18, 0.38%) ^ | | Banks | | | 411,860 | | | | $5,980,623 | |
|
| |
| Total Preferred Stock | | | | (Cost $3,904,487) | | | | | | | 5,980,623 | |
| | | | | | | | | | | | |
|
| |
| Total Investments | | 98.1% | | (Cost $226,755,163) | | | | | | | $278,794,672 | |
| Other Assets, Less Liabilities | | 1.9% | | | | | | | | | 5,444,102 | |
| Total Net Assets: | | 100.0% | | | | | | | | | $284,238,774 | |
|
| |
| * | Non-Income Producing Securities |
| # | All or a portion of securities on loan at April 30, 2018. The market value of the securities loaned was $9,730,186. The loaned securities were secured with non-cash collateral with a value of $10,110,552. The non-cash collateral received consists of short term investments and long term bonds, and is held for the benefit of the Fund at the Fund’s custodian. The Fund cannot repledge or resell this collateral. Collateral is calculated based on prior day’s prices. —See Note 1(I) to Financial Statements |
| ^ | Maturity Date and Preferred Dividend Rate of Preferred Stock. |
| ADR | - American Depositary Receipt |
Industry classifications shown in the Investment Portfolio are based off of the Global Industry Classification Standard (GICS®). GICS was developed by and/or is the exclusive property of MSCI, Inc. and Standard & Poor’s Financial Services LLC (“S&P”). GICS is a service mark of MSCI and S&P and has been
licensed for use by U.S. Bancorp Fund Services, LLC.
The accompanying notes are an integral part of these financial statements
| | | | |
| www.thomaswhitefunds.com | | | 17 | |
| | |
| Thomas White International Fund | | |
The following table summarizes the inputs used, as of April 30, 2018, in valuating the Fund’s assets:
| | | | | | | | | | | | | | | | |
| | | Level 1 | | | Level 2 | | | Level 3 | | | Total | |
| Common Stocks | | | | | | | | | | | | | | | | |
| Australia | | | $------- | | | | $18,874,565 | | | | $------- | | | | $18,874,565 | |
| Belgium | | | ------- | | | | 3,616,267 | | | | ------- | | | | 3,616,267 | |
| Canada | | | 11,904,738 | | | | ------- | | | | ------- | | | | 11,904,738 | |
| China | | | 9,990,142 | | | | 12,390,304 | | | | ------- | | | | 22,380,446 | |
| Finland | | | ------- | | | | 6,417,834 | | | | ------- | | | | 6,417,834 | |
| France | | | ------- | | | | 12,272,890 | | | | ------- | | | | 12,272,890 | |
| Germany | | | ------- | | | | 6,145,770 | | | | ------- | | | | 6,145,770 | |
| Hong Kong | | | ------- | | | | 2,818,905 | | | | ------- | | | | 2,818,905 | |
| India | | | 2,778,490 | | | | 5,330,484 | | | | ------- | | | | 8,108,974 | |
| Indonesia | | | ------- | | | | 7,338,827 | | | | ------- | | | | 7,338,827 | |
| Ireland | | | ------- | | | | 3,151,510 | | | | ------- | | | | 3,151,510 | |
| Italy | | | ------- | | | | 4,079,985 | | | | ------- | | | | 4,079,985 | |
| Japan | | | ------- | | | | 47,014,758 | | | | ------- | | | | 47,014,758 | |
| Mexico | | | 5,966,993 | | | | ------- | | | | ------- | | | | 5,966,993 | |
| Netherlands | | | ------- | | | | 9,962,523 | | | | ------- | | | | 9,962,523 | |
| Peru | | | 3,510,599 | | | | ------- | | | | ------- | | | | 3,510,599 | |
| Russia | | | ------- | | | | 5,984,873 | | | | ------- | | | | 5,984,873 | |
| Singapore | | | ------- | | | | 3,950,298 | | | | ------- | | | | 3,950,298 | |
| South Africa | | | ------- | | | | 5,239,650 | | | | ------- | | | | 5,239,650 | |
| South Korea | | | ------- | | | | 16,005,736 | | | | ------- | | | | 16,005,736 | |
| Spain | | | ------- | | | | 7,777,889 | | | | ------- | | | | 7,777,889 | |
| Sweden | | | ------- | | | | 10,406,621 | | | | ------- | | | | 10,406,621 | |
| Switzerland | | | ------- | | | | 9,211,123 | | | | ------- | | | | 9,211,123 | |
| Taiwan | | | 3,575,850 | | | | 3,293,898 | | | | ------- | | | | 6,869,748 | |
| Thailand | | | ------- | | | | 7,645,014 | | | | ------- | | | | 7,645,014 | |
| Turkey | | | ------- | | | | 1,707,905 | | | | ------- | | | | 1,707,905 | |
| United Kingdom | | | ------- | | | | 24,449,608 | | | | ------- | | | | 24,449,608 | |
| Total Common Stocks | | | $37,726,812 | | | | $235,087,237 | | | | $------- | | | | $272,814,049 | |
| Preferred Stock | | | | | | | | | | | | | | | | |
| Brazil | | | $5,980,623 | | | | $------- | | | | $------- | | | | $5,980,623 | |
| Total Preferred Stock | | | $5,980,623 | | | | $------- | | | | $------- | | | | $5,980,623 | |
| Total Investments | | | $43,707,435 | | | | $235,087,237 | | | | $------- | | | | $278,794,672 | |
For more information on valuation inputs, please refer to Note 1 (A) of the accompanying Notes to Financial Statements.
The accompanying notes are an integral part of these financial statements
| | |
| 18 | | www.thomaswhitefunds.com |
| | |
| Investment Portfolio (Unaudited) | | April 30, 2018 |
The Fund’s assets assigned to Level 2 include certain foreign securities for which a third party statistical pricing service may be employed for purposes of fair market valuation. There were no transfers into or out of Level 3 during the reporting period, as compared to their classification from the prior annual report.
See below for transfers into or out of Level 1 and Level 2 during the period.
| | | | | | | | | | | | |
| | | | |
| | | Security Description | | | Country | | | Market Value | |
| Transfers into Level 1 | | | None | | | | None | | | | $------- | |
| | | | |
| Transfers out of Level 1 | | | Exide Industries Ltd. | | | | India | | | | (2,651,406 | ) |
| | | | |
| Net Transfers into Level 1 | | | | | | | | | | | $(2,651,406 | ) |
| | | | |
| | | Security Description | | | Country | | | Market Value | |
| Transfers into Level 2 | | | Exide Industries Ltd. | | | | India | | | | $2,651,406 | |
| | | | |
| Transfers out of Level 2 | | | None | | | | None | | | | ------- | |
| | | | |
| Net Transfers into Level 2 | | | | | | | | | | | $2,651,406 | |
Transfers were made out of Level 1 and into Level 2 due to one security being priced by adjusted quoted prices on April 30, 2018.
Transfers between Levels are recognized at the end of the reporting period.
The accompanying notes are an integral part of these financial statements
| | | | |
| www.thomaswhitefunds.com | | | 19 | |
THOMAS WHITE EMERGING MARKETS FUND
| | | | | | | | | | | | | | |
| | | | | | | | |
| | | Unaudited
Sales
Charge | | Deferred
Sales
Charge | | Administrative
Services
Fee | | 12b-1 Fees | | Operating
Expenses1,3 | | Prospectus
Gross
Annual
Operating
Expense2 | | Prospectus
Net Annual
Operating
Expense2,3 |
| Investor Class | | None | | None | | Up to 0.25% | | None | | 1.34% | | 1.49% | | 1.35% |
| Class I | | None | | None | | None | | None | | 1.09% | | 1.42% | | 1.10% |
1 In the absence of the fee deferral/expense reimbursement arrangement for the Emerging Markets Fund, the ratio of expenses to average net assets would have been 1.54% for Investor Class shares and 1.51% for Class I shares.
2 Gross Annual Operating Expense and Net Annual Operating Expense are based on the most recent prospectus and may differ from other expense ratios appearing in this report.
3 Thomas White International, Ltd. (“Advisor”) has agreed to defer its fees and/or reimburse the Fund to the extent that the operating expenses for Investor Class and Class I shares exceed (as a percentage of average daily net assets) 1.34% and 1.09%, respectively. The fee deferral/expense reimbursement agreement expires February 28, 2019. The Fund has agreed to repay the Advisor for amounts deferred or reimbursed by the Advisor pursuant to the agreement provided that such repayment does not cause the Fund to exceed the above limits and the repayment is made within three years after the year in which the Advisor incurred the expense. The fee deferral/expense reimbursement agreement may only be amended or terminated by the Fund’s Board of Trustees.
| | | | | | | | |
| | | | | |
| | | NAV | | Net Assets | | Redemption Fee | | Portfolio Turnover |
| Investor Class | | $11.85 | | $2.1 million | | 2.00% on shares held less than 60 days | | 27% |
| Class I | | $11.95 | | $36.9 million | | |
| | |
| 20 | | www.thomaswhitefunds.com |
APRIL 30, 2018
| | | | | | | | | | | | | | | | | | | | | | | | | | |
| |
| Average Annual Returns as of April 30, 2018 (Unaudited) | |
| Class | | Sales Charge | | 6 month | | | Calendar
YTD | | | 1 Yr | | | 3 Yrs | | | 5 Yrs | | | Since
Inception
(6/28/2010)* | |
| Investor Class shares (TWEMX) | | None | | | 4.87% | | | | 0.85% | | | | 16.81% | | | | 2.38% | | | | 0.29% | | | | 3.32% | |
| Class I shares1 (TWIIX) | | None | | | 5.01% | | | | 0.93% | | | | 17.13% | | | | 2.62% | | | | 0.55% | | | | 3.49% | |
| MSCI Emerging Markets Index2 | | N/A | | | 4.80% | | | | 0.97% | | | | 21.71% | | | | 6.00% | | | | 4.74% | | | | 5.06% | |
* The inception date of the Investor Class shares.
1 Performance figures for Class I shares, first offered on August 31, 2012, include the historical performance of Investor Class shares through August 30, 2012.
2 The MSCI Emerging Markets Index is a free float-adjusted market capitalization index that is designed to measure equity market performance of emerging markets. The index is unmanaged and returns assume the reinvestment of dividends. It is not possible to invest directly in an index.
Returns of each share class reflect differences in expenses applicable to each class which are primarily differences in service fees.
The returns do not reflect the deduction of taxes that a shareholder would pay on Fund distributions or the redemption of Fund shares. The returns reflect the actual performance for each period and do not include the impacts of trades executed on the last business day of the period that were recorded on the first business day of the next period.
Performance data is based upon past performance, which is no guarantee of future results. The investment return and principal value of an investment will fluctuate so that an investor’s shares, when redeemed, may be worth more or less than their original cost. Current performance may be higher or lower than the performance data quoted. Please call 1-800-811-0535 to obtain performance data as of the most recent month-end. The Fund imposes a 2% redemption fee on shares held less than 60 days. Performance data does not reflect the redemption fee. If reflected, total returns would be lower. Investment performance reflects any fee waivers that were in effect. In the absence of such waivers, total return would have been reduced. The Gross Expense Ratios, based on the most recent prospectus, are 1.49% (Investor Class) and 1.42% (Class I).
| | | | |
| www.thomaswhitefunds.com | | | 21 | |
THOMAS WHITE EMERGING MARKETS FUND
GROWTH OF A $10,000 INVESTMENT WITH DIVIDENDS REINVESTED (Unaudited)
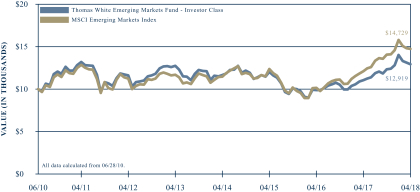
This chart illustrates the performance of a hypothetical $10,000 investment made in the Fund’s Investor Class shares and its benchmark, the MSCI Emerging Markets Index, since inception on June 28, 2010 through April 30, 2018. It assumes reinvestment of dividends and capital gains, but does not reflect the effect of any applicable redemption fees. This chart does not imply future performance. Past performance does not guarantee future results. The cumulative return since inception was 29.19% for the Fund’s Investor Class shares and 47.29% for the benchmark. The Fund’s Investor Class shares average annual total return since inception on June 28, 2010 was 3.32%. The MSCI Emerging Markets Index is a free float-adjusted market capitalization index that is designed to measure equity market performance of emerging markets. The index is unmanaged and returns assume the reinvestment of dividends. It is not possible to invest directly in an index. During the periods shown, the Fund’s manager reimbursed certain Fund expenses. Absent this reimbursement, performance would have been lower. Performance will vary from class to class based on differences in class-specific expenses.
| | |
| 22 | | www.thomaswhitefunds.com |
APRIL 30, 2018
The Thomas White Emerging Markets Fund invests primarily in securities of companies located in or whose businesses are closely associated with the world’s emerging markets countries.
Portfolio Managers
Thomas S. White, Jr.
Jinwen Zhang, Ph.D., CFA
Douglas M. Jackman, CFA
Wei Li, Ph.D., CFA
John Wu, Ph.D., CFA
Rex Mathew, CFA, CM
Ramkumar Venkatramani, CFA
Performance Review
During the trailing six-month period ended April 30, 2018, the Thomas White Emerging Markets Fund Class I shares returned +5.01%, compared to +4.80% for its benchmark MSCI Emerging Markets Index. Since its inception on June 28, 2010, the Fund’s Class I shares have returned +3.49%* annualized, against +5.06% for the benchmark index.
Emerging Market Equities Outperform, Despite Market Volatility
Emerging market equity prices continued to surge during the first half of the six-month review period as economic growth continued to accelerate and the earnings outlook brightened. Most leading indicators, such as manufacturing and services activity surveys, continued to show strength while domestic policies remained largely favorable to growth in most emerging countries. Global trade expanded further during most of the
review period and supported investor interest in emerging economies.
The U.S. government’s decision to impose higher tariffs on select imports from China and other countries made investors fearful of a global trade war. Emerging market assets declined as it was perceived that emerging countries would be worse off without the boost from increased trade. This was followed by growing apprehensions about faster interest rate increases by the U.S. Federal Reserve. The prospect of higher interest rates led investors to reduce their exposure to countries with large external debt, such as Indonesia, and some emerging currencies weakened. A number of these concerns have eased more recently, and the currencies have stabilized.
Despite the increased market volatility and equity price decline during the second half of the review period, emerging market equities generally outperformed international developed market equities as well as U.S. domestic equities. Recent data shows that earnings growth has started recovering in most emerging markets, across the majority of sectors. As the emerging countries have lagged the developed world in this economic recovery cycle, it is expected that the earnings expansion can run longer. Higher oil and commodities should also benefit emerging countries more, though large energy importers such as China and India will be negatively affected if oil prices move even higher.
Portfolio Review
Energy and materials were the best performing sectors during the review period
* Performance for Class I shares include the historical performance of Investor Class shares through August 30, 2012.
| | | | |
| www.thomaswhitefunds.com | | | 23 | |
THOMAS WHITE EMERGING MARKETS FUND
as oil prices moved to a multi-year high and demand for industrial commodities remained strong. The financials sector gained on expectations of sustained credit demand growth and margin expansion. The Fund’s returns relative to its benchmark were helped by positive stock selection in the energy, technology, materials, consumer discretionary, and industrials sectors. Higher exposure to the energy and technology sectors as well as a lower allocation to the telecom sector also benefited the Fund during the review period. Stock selection contributed positively in most markets, with the notable exception of South Africa.
Three of the top five contributors to Fund returns for the review period were from the energy and materials sectors. Cash flows from higher product prices should allow producers in these sectors to reduce debt and boost return ratios. Thai oil producer PTT Exploration & Production as well as Russian energy group Lukoil advanced strongly. Brazilian iron ore miner Vale benefited from stable iron ore prices and expectations of better pricing for the company’s nickel and cobalt output. Chinese cement manufacturer Anhui Conch gained as the company’s earnings continued to exceed estimates on higher product prices and capacity utilization. Chinese online gaming and communications group Tencent Holdings outperformed as demand for online games is growing rapidly in other Asian markets.
Taiwan Semiconductor Manufacturing, one of the largest manufacturers of chipsets for mobile devices, detracted the most from returns during the review period on doubts about the demand outlook for high end cellular phones and other devices. However, we believe this demand softness is temporary
and the company’s scale and technology leadership should help it sustain earnings growth. Turkish bank Turkiye Bankasi declined after the country’s central bank was forced to raise interest rates to defend its currency. Mexican cement producer Cemex was hurt by fears of trade restrictions that could weaken revenue expansion. China State Construction was negatively affected by concerns about reduced government spending. Online travel services group Ctrip.com International underperformed on investor skepticism of its pricing power and possible decline in margins.
Emerging Economies Are Still in Good Shape and Growing
The recent market volatility has made emerging markets appear more vulnerable to rising global interest rates. It is true that countries with large external debts, such as Indonesia, as well as countries like Turkey that have unsustainably high current account deficits could face some difficulties when global rates rise. As it has happened in recent months, their currencies could come under pressure when capital inflows decline or reverse. However, many major emerging countries are in better shape than they were during the 2008 global financial crisis or even during the 2014 market decline. Their economies are growing at a healthy pace and are less dependent on external demand. On average, their current account deficits are not as wide while central banks have the added resources and flexibility to stabilize currency markets.
Aggregate growth in emerging market countries is expected to accelerate and exceed 5% by 2019, according to the International
| | |
| 24 | | www.thomaswhitefunds.com |
APRIL 30, 2018
Monetary Fund. During the first quarter of this year, growth rates in China and India have exceeded forecasts. Domestic demand growth is expected to sustain in most emerging countries as governments can afford to offer moderate fiscal support, while domestic interest rates are likely to remain stable or rise only modestly. Higher oil and commodity prices should boost the economies of resource exporters, especially Russia, Brazil and South Africa. More remunerative commodity prices could also trigger higher capital investments in these countries.
National elections scheduled this year and in 2019 across large emerging countries could
increase market volatility as investors react to any unexpected results and policy changes. Brazil will elect a new president later this year, while national elections are scheduled in 2019 in India, Indonesia and South Africa. Similarly to Malaysia recently, national elections could yield unexpected results and force businesses and markets to revisit regulatory expectations. In emerging countries where government institutions are not as mature or well established, incoming administrations often have the ability to redraw economic policy frameworks.
We thank you for your confidence in the Thomas White Emerging Markets Fund.
| | | | |
| www.thomaswhitefunds.com | | | 25 | |
THOMAS WHITE EMERGING MARKETS FUND
Portfolio Country and Industry Allocation as of April 30, 2018 (Unaudited)
| | | | |
| | |
| Country Allocation | | % of TNA | |
| Brazil | | | 7.9% | |
| China | | | 30.4% | |
| Hong Kong | | | 2.0% | |
| India | | | 8.7% | |
| Indonesia | | | 2.1% | |
| Malaysia | | | 1.3% | |
| Mexico | | | 3.8% | |
| Peru | | | 1.2% | |
| Philippines | | | 1.3% | |
| Poland | | | 0.7% | |
| Russia | | | 5.2% | |
| South Africa | | | 4.4% | |
| South Korea | | | 15.3% | |
| Taiwan | | | 7.5% | |
| Thailand | | | 3.7% | |
| Turkey | | | 2.6% | |
| Cash & Other | | | 1.9% | |
| | | | | |
| | | | |
| | |
| Industry Allocation | | % of TNA | |
| Automobiles & Components | | | 2.9% | |
| Banks | | | 24.5% | |
| Capital Goods | | | 1.0% | |
| Consumer Durables & Apparel | | | 2.6% | |
| Diversified Financials | | | 2.1% | |
| Energy | | | 9.1% | |
| Household & Personal Products | | | 2.6% | |
| Insurance | | | 3.0% | |
| Materials | | | 9.2% | |
| Media | | | 2.7% | |
| Real Estate | | | 1.1% | |
| Retailing | | | 1.0% | |
| Semiconductors & Semiconductor Equipment | | | 10.7% | |
| Software & Services | | | 15.9% | |
| Technology Hardware & Equipment | | | 2.8% | |
| Telecommunication Services | | | 1.7% | |
| Transportation | | | 5.2% | |
| Cash & Other | | | 1.9% | |
TNA - Total Net Assets
Fund holdings and industry allocations are subject to change and should not be considered a recommendation to buy or sell any securities. For a complete list of Fund holdings, please refer to the Investment Portfolio section of this report.
| | |
| 26 | | www.thomaswhitefunds.com |
| | |
| Investment Portfolio (Unaudited) | | April 30, 2018 |
| | | | | | | | | | | | |
| Country | | Issue | | Industry | | Shares | | | Value (US$) | |
| | | | | | | | | | | |
COMMON
STOCKS (94.0%) | | | | | | | | | | | | |
|
| |
| BRAZIL (5.1%) | | | | | | | | | | |
| | Hypera SA | | Household & Personal Products | | | 36,900 | | | | $331,059 | |
| | Petroleo Brasileiro SA Petrobras * | | Energy | | | 115,400 | | | | 756,992 | |
| | Vale SA | | Materials | | | 65,122 | | | | 903,997 | |
| | | | | | | | | | | | |
| | | | | | | | | | | 1,992,048 | |
|
| |
| CHINA (30.4%) | | | | | | | | | | |
| | Alibaba Group Holding Ltd. - ADR * # | | Software & Services | | | 10,750 | | | | 1,919,305 | |
| | Anhui Conch Cement Company Limited - H Shares + | | Materials | | | 138,900 | | | | 864,916 | |
| | Baidu, Inc. - ADR * | | Software & Services | | | 2,475 | | | | 620,978 | |
| | China Construction Bank Corp. - H Shares + | | Banks | | | 1,062,000 | | | | 1,113,640 | |
| | China Overseas Land & Investment Limited + | | Real Estate | | | 130,000 | | | | 434,264 | |
| | China Petroleum and Chemical Corporation (Sinopec) - H Shares + | | Energy | | | 478,000 | | | | 465,542 | |
| | Chongqing Rural Commercial Bank Co., Ltd. - H Shares + | | Banks | | | 801,600 | | | | 612,774 | |
| | Ctrip.com International, Ltd. - ADR * | | Retailing | | | 9,600 | | | | 392,640 | |
| | Haier Electronics Group Co., Ltd. + | | Consumer Durables & Apparel | | | 93,000 | | | | 321,019 | |
| | Midea Group Co., Ltd. - A Shares + | | Consumer Durables & Apparel | | | 33,000 | | | | 269,831 | |
| | Momo Inc. - ADR * # | | Software & Services | | | 12,600 | | | | 439,740 | |
| | NetEase, Inc. - ADR | | Software & Services | | | 1,865 | | | | 479,436 | |
| | Ping An Insurance (Group) Company of China Limited - H Shares + # | | Insurance | | | 74,700 | | | | 729,544 | |
| | Shanghai International Airport Co., Ltd. - A Shares + | | Transportation | | | 37,000 | | | | 290,878 | |
| | Tencent Holdings Limited + | | Software & Services | | | 46,500 | | | | 2,282,986 | |
| | ZTO Express (Cayman) Inc. - ADR # | | Transportation | | | 37,500 | | | | 618,750 | |
| | | | | | | | | | | | |
| | | | | | | | | | | 11,856,243 | |
|
| |
| HONG KONG (2.0%) | |
| | Brilliance China Automotive Holdings Ltd. + | | Automobiles & Components | | | 188,000 | | | | 337,408 | |
| | Shenzhou International Group Holdings Ltd. + | | Consumer Durables & Apparel | | | 39,000 | | | | 424,826 | |
| | | | | | | | | | | | |
| | | | | | | | | | | 762,234 | |
|
| |
| INDIA (8.7%) | | | | | | | | | | |
| | Cholamandalam Investment and Finance Company Ltd. + | | Diversified Financials | | | 20,100 | | | | 522,210 | |
| | Eicher Motors Ltd. + | | Capital Goods | | | 800 | | | | 372,126 | |
| | Exide Industries Ltd. + | | Automobiles & Components | | | 94,300 | | | | 349,201 | |
| | HDFC Bank Limited - ADR | | Banks | | | 4,800 | | | | 459,888 | |
| | Mahindra & Mahindra Ltd. - GDR + | | Automobiles & Components | | | 33,698 | | | | 440,251 | |
| | Reliance Industries Ltd. + | | Energy | | | 28,000 | | | | 402,235 | |
| | WNS (Holdings) Ltd. - ADR * | | Software & Services | | | 8,900 | | | | 435,477 | |
The accompanying notes are an integral part of these financial statements
| | | | |
| www.thomaswhitefunds.com | | | 27 | |
| | |
| Thomas White Emerging Markets Fund | | |
| | | | | | | | | | | | |
| Country | | Issue | | Industry | | Shares | | | Value (US$) | |
| | | | | | | | | | | |
| INDIA (CONT.) | | | | | | | | | | |
| | YES BANK Limited + | | Banks | | | 78,400 | | | | $422,401 | |
| | | | | | | | | | | | |
| | | | | | | | | | | 3,403,789 | |
|
| |
| INDONESIA (2.1%) | | | | | | | | | | |
| | PT Bank Negara Indonesia (Persero) Tbk + | | Banks | | | 772,800 | | | | 445,032 | |
| | PT United Tractors Tbk + | | Energy | | | 158,400 | | | | 386,422 | |
| | | | | | | | | | | | |
| | | | | | | | | | | 831,454 | |
|
| |
| MALAYSIA (1.3%) | | | | | | | | | | |
| | CIMB Group Holdings Berhad + | | Banks | | | 274,500 | | | | 500,991 | |
|
| |
| MEXICO (3.8%) | | | | | | | | | | |
| | Cemex SAB de CV * | | Materials | | | 534,720 | | | | 333,663 | |
| | Grupo Aeroportuario del Sureste SAB de CV - Class B | | Transportation | | | 18,400 | | | | 330,091 | |
| | Grupo Financiero Banorte, S.A.B. de C.V. - Class O | | Banks | | | 129,100 | | | | 807,374 | |
| | | | | | | | | | | | |
| | | | | | | | | | | 1,471,128 | |
|
| |
| PERU (1.2%) | | | | | | | | | | |
| | Credicorp Ltd. | | Banks | | | 2,000 | | | | 464,980 | |
|
| |
| PHILIPPINES (1.3%) | | | | | | | | |
| | Metropolitan Bank & Trust Company + | | Banks | | | 308,872 | | | | 506,125 | |
|
| |
| POLAND (0.7%) | | | | | | | | |
| | KGHM Polska Miedz S.A. + | | Materials | | | 10,600 | | | | 280,685 | |
|
| |
| RUSSIA (5.2%) | | | | | | | | |
| | Mobile TeleSystems PJSC - ADR | | Telecommunication Services | | | 32,200 | | | | 338,100 | |
| | LUKOIL PJSC - ADR + | | Energy | | | 12,700 | | | | 846,317 | |
| | Sberbank of Russia PJSC - ADR + | | Banks | | | 56,075 | | | | 828,967 | |
| | | | | | | | | | | | |
| | | | | | | | | | | 2,013,384 | |
|
| |
| SOUTH AFRICA (4.4%) | | | | | | | | |
| | Barclays Africa Group Ltd. + | | Banks | | | 24,500 | | | | 357,316 | |
| | FirstRand Limited + | | Diversified Financials | | | 52,200 | | | | 278,740 | |
| | Naspers Limited - N Shares + | | Media | | | 4,375 | | | | 1,067,522 | |
| | | | | | | | | | | | |
| | | | | | | | | | | 1,703,578 | |
|
| |
| SOUTH KOREA (14.0%) | | | | | | | | |
| | KB Financial Group Inc. + | | Banks | | | 10,900 | | | | 621,577 | |
| | Korea Zinc Co Ltd + | | Materials | | | 1,075 | | | | 435,139 | |
| | LG Chem Ltd. + | | Materials | | | 875 | | | | 292,142 | |
| | LG Household & Health Care Ltd. + | | Household & Personal Products | | | 530 | | | | 679,091 | |
| | POSCO + | | Materials | | | 1,425 | | | | 490,202 | |
| | Samsung Electronics Co., Ltd. + | | Semiconductors & Semiconductor Equipment | | | 755 | | | | 1,852,160 | |
| | Samsung Life Insurance Co., Ltd. + | | Insurance | | | 4,100 | | | | 448,734 | |
| | Shinhan Financial Group Co., Ltd. + | | Banks | | | 14,025 | | | | 622,336 | |
| | | | | | | | | | | | |
| | | | | | | | | | | 5,441,381 | |
|
| |
The accompanying notes are an integral part of these financial statements
| | |
| 28 | | www.thomaswhitefunds.com |
| | |
| Investment Portfolio (Unaudited) | | April 30, 2018 |
| | | | | | | | | | | | |
| Country | | Issue | | Industry | | Shares | | | Value (US$) | |
| | | | | | | | | | | |
| TAIWAN (7.5%) | | | | | | | | |
| | Catcher Technology Co., Ltd + | | Technology Hardware & Equipment | | | 33,000 | | | | $365,962 | |
| | Largan Precision Company Limited + | | Technology Hardware & Equipment | | | 3,000 | | | | 348,066 | |
| | Pegatron Corporation + | | Technology Hardware & Equipment | | | 170,000 | | | | 396,592 | |
| | Taiwan Semiconductor Manufacturing Company, Ltd. + | | Semiconductors & Semiconductor Equipment | | | 240,700 | | | | 1,824,620 | |
| | | | | | | | | | | | |
| | | | | | | | | | | 2,935,240 | |
|
| |
| THAILAND (3.7%) | | | | | | | | |
| | Airports of Thailand Public Company Ltd. + | | Transportation | | | 199,400 | | | | 448,775 | |
| | Kasikornbank Public Company Limited + | | Banks | | | 48,400 | | | | 307,329 | |
| | PTT Exploration and Production Public Company Limited + | | Energy | | | 164,700 | | | | 698,414 | |
| | | | | | | | | | | | |
| | | | | | | | | | | 1,454,518 | |
|
| |
| TURKEY (2.6%) | | | | | | | | |
| | TAV Havalimanlari Holding AS + | | Transportation | | | 64,300 | | | | 344,167 | |
| | Turkcell Iletisim Hizmetleri AS + | | Telecommunication Services | | | 91,600 | | | | 315,351 | |
| | Turkiye Garanti Bankasi A.S. + | | Banks | | | 159,900 | | | | 360,762 | |
| | | | | | | | | | | | |
| | | | | | | | | | | 1,020,280 | |
|
| |
| Total Common Stocks | | | | (Cost $26,798,899) | | | | | | | 36,638,058 | |
| | | | | | | | | | | | |
|
| |
PREFERRED
STOCKS (4.1%) | | | | | | | | |
|
| |
| BRAZIL (2.8%) | | | | | | | | |
| | Banco Bradesco S.A. (7/26/18, N/A) ^ | | Banks | | | 33,000 | | | | 325,177 | |
| | Itau Unibanco Holding S.A. (7/30/18, 0.38%) ^ | | Banks | | | 53,949 | | | | 783,394 | |
| | | | | | | | | | | | |
| | | | | | | | | | | 1,108,571 | |
|
| |
| SOUTH KOREA (1.3%) | | | | | | |
| | Samsung Electronics Co., Ltd. (7/9/18, 2.71%) ^ + | | Semiconductors & Semiconductor Equipment | | | 250 | | | | 492,332 | |
|
| |
| Total Preferred Stocks | | | | (Cost $1,383,598) | | | | | | | 1,600,903 | |
| | | | | | | | | | | | |
|
| |
The accompanying notes are an integral part of these financial statements
| | | | |
| www.thomaswhitefunds.com | | | 29 | |
| | |
| Thomas White Emerging Markets Fund | | |
| | | | | | | | | | | | |
| Country | | Issue | | Industry | | Shares | | | Value (US$) | |
| | | | | | | | | | | |
SHORT TERM
INVESTMENT (1.8%) | | | | | | | | |
|
| |
| MONEY MARKET FUND (1.8%) | | | | | | | | |
| | Northern Institutional Treasury Portfolio, 1.48% (a) | | | | | 690,864 | | | | $690,864 | |
|
| |
| Total Short Term Investment | | | | (Cost $690,864) | | | | | | | 690,864 | |
| | | | | | | | | | | | |
|
| |
| Total Investments | | 99.9% | | (Cost $28,873,361) | | | | | | | $38,929,825 | |
| Other Assets, Less Liabilities | | 0.1% | | | | | | | | | 20,501 | |
| Total Net Assets: | | 100.0% | | | | | | | | | $38,950,326 | |
|
| |
| * | Non-Income Producing Securities |
| # | All or a portion of securities on loan at April 30, 2018. The market value of the securities loaned was $3,715,919. The loaned securities were secured with non-cash collateral with a value of $3,810,019. The non-cash collateral received consists of short term investments and long term bonds, and is held for the benefit of the Fund at the Fund’s custodian. The Fund cannot repledge or resell this collateral. Collateral is calculated based on prior day’s prices. - See Note 1(I) to Financial Statements |
| ^ | Maturity Date and Preferred Dividend Rate of Preferred Stock. |
| ADR | - American Depositary Receipt |
| GDR | - Global Depositary Receipt |
Industry classifications shown in the Investment Portfolio are based off of the Global Industry Classification Standard (GICS®). GICS was developed by and/or is the exclusive property of MSCI, Inc. and Standard & Poor’s Financial Services LLC (“S&P”). GICS is a service mark of MSCI and S&P and has been licensed for use by U.S. Bancorp Fund Services, LLC.
The accompanying notes are an integral part of these financial statements
| | |
| 30 | | www.thomaswhitefunds.com |
| | |
| Investment Portfolio (Unaudited) | | April 30, 2018 |
The following table summarizes the inputs used, as of April 30, 2018, in valuating the Fund’s assets:
| | | | | | | | | | | | | | | | |
| | | Level 1 | | | Level 2 | | | Level 3 | | | Total | |
| Common Stocks | | | | | | | | | | | | | | | | |
| Brazil | | | $1,992,048 | | | | $------- | | | | $------- | | | | $1,992,048 | |
| China | | | 4,470,849 | | | | 7,385,394 | | | | ------- | | | | 11,856,243 | |
| Hong Kong | | | ------- | | | | 762,234 | | | | ------- | | | | 762,234 | |
| India | | | 895,365 | | | | 2,508,424 | | | | ------- | | | | 3,403,789 | |
| Indonesia | | | ------- | | | | 831,454 | | | | ------- | | | | 831,454 | |
| Malaysia | | | ------- | | | | 500,991 | | | | ------- | | | | 500,991 | |
| Mexico | | | 1,471,128 | | | | ------- | | | | ------- | | | | 1,471,128 | |
| Peru | | | 464,980 | | | | ------- | | | | ------- | | | | 464,980 | |
| Philippines | | | ------- | | | | 506,125 | | | | ------- | | | | 506,125 | |
| Poland | | | ------- | | | | 280,685 | | | | ------- | | | | 280,685 | |
| Russia | | | 338,100 | | | | 1,675,284 | | | | ------- | | | | 2,013,384 | |
| South Africa | | | ------- | | | | 1,703,578 | | | | ------- | | | | 1,703,578 | |
| South Korea | | | ------- | | | | 5,441,381 | | | | ------- | | | | 5,441,381 | |
| Taiwan | | | ------- | | | | 2,935,240 | | | | ------- | | | | 2,935,240 | |
| Thailand | | | ------- | | | | 1,454,518 | | | | ------- | | | | 1,454,518 | |
| Turkey | | | ------- | | | | 1,020,280 | | | | ------- | | | | 1,020,280 | |
| Total Common Stocks | | | $9,632,470 | | | | $27,005,588 | | | | $------- | | | | $36,638,058 | |
| Preferred Stocks | | | | | | | | | | | | | | | | |
| Brazil | | | $1,108,571 | | | | $------- | | | | $------- | | | | $1,108,571 | |
| South Korea | | | ------- | | | | 492,332 | | | | ------- | | | | 492,332 | |
| Total Preferred Stocks | | | $1,108,571 | | | | $492,332 | | | | $------- | | | | $1,600,903 | |
| Short Term Investment | | | $690,864 | | | | $------- | | | | $------- | | | | $690,864 | |
| Total Investments | | | $11,431,905 | | | | $27,497,920 | | | | $------- | | | | $38,929,825 | |
For more information on valuation inputs, please refer to Note 1 (A) of the accompanying Notes to Financial Statements.
The Fund’s assets assigned to Level 2 include certain foreign securities for which a third party statistical pricing service may be employed for purposes of fair market valuation. There were no transfers into or out of Level 3 during the reporting period, as compared to their classification from the prior annual report.
The accompanying notes are an integral part of these financial statements
| | | | |
| www.thomaswhitefunds.com | | | 31 | |
| | |
| Thomas White Emerging Markets Fund | | |
See below for transfers into or out of Level 1 and Level 2 during the period.
| | | | | | | | | | | | |
| | | | |
| | | Security Description | | | Country | | | Market Value | |
| Transfers into Level 1 | | | None | | | | None | | | | $------- | |
| | | | |
| Transfers out of Level 1 | | | Reliance Industries Ltd. | | | | India | | | | (402,235 | ) |
| | | | |
| Net Transfers into Level 1 | | | | | | | | | | | $(402,235 | ) |
| | | | |
| | | Security Description | | | Country | | | Market Value | |
| Transfers into Level 2 | | | Reliance Industries Ltd. | | | | India | | | | $402,235 | |
| | | | |
| Transfers out of Level 2 | | | None | | | | None | | | | ------- | |
| | | | |
| Net Transfers into Level 2 | | | | | | | | | | | $402,235 | |
Transfers were made out of Level 1 and into Level 2 due to one security being priced by adjusted quoted prices on April 30, 2018.
Transfers between Levels are recognized at the end of the reporting period.
The accompanying notes are an integral part of these financial statements
| | |
| 32 | | www.thomaswhitefunds.com |
THOMAS WHITE AMERICAN OPPORTUNITIES FUND
| | | | | | | | | | | | | | |
| | | | | | | | |
| | | Unaudited
Sales
Charge | | Deferred
Sales
Charge | | Administrative
Services
Fee | | 12b-1 Fees | | Operating
Expenses1,3 | | Prospectus
Gross
Annual
Operating
Expense2 | | Prospectus
Net Annual
Operating
Expense2,3 |
| Investor Class | | None | | None | | Up to 0.25% | | None | | 1.33% | | 1.19% | | 1.19% |
1 In the absence of the fee deferral/expense reimbursement arrangement for the American Opportunities Fund, the ratio of expenses to average net assets would have been 1.33% for Investor Class shares.
2 Gross Annual Operating Expense and Net Annual Operating Expense are based on the most recent prospectus and may differ from other expense ratios appearing in this report.
3 Thomas White International, Ltd. (“Advisor”) has agreed to defer its fees and/or reimburse the Fund to the extent that the operating expenses for Investor Class shares exceed 1.34% of its average daily net assets. The fee deferral/expense reimbursement agreement expires February 28, 2019. The Fund has agreed to repay the Advisor for amounts deferred or reimbursed by the Advisor pursuant to the agreement provided that such repayment does not cause the Fund to exceed the above limits and the repayment is made within three years after the year in which the Advisor incurred the expense. The fee deferral/expense reimbursement agreement may only be amended or terminated by the Fund’s Board of Trustees.
| | | | | | | | |
| | | | | |
| | | NAV | | Net Assets | | Redemption Fee | | Portfolio Turnover |
Investor Class | | $16.79 | | $43.5 million | | 2.00% on shares held less than 60 days | | 24% |
| | | | |
| www.thomaswhitefunds.com | | | 33 | |
THOMAS WHITE AMERICAN OPPORTUNITIES FUND
| | | | | | | | | | | | | | | | | | | | | | | | | | |
| |
| Average Annual Returns as of April 30, 2018 (Unaudited) | |
| Class | | 6 month | | Calendar
YTD | | | 1 Yr | | | 3 Yrs | | | 5 Yrs | | | 10 Yrs | | | Since
Inception
(3/4/1999) | |
| Investor Class shares (TWAOX) | | 1.82% | | | -2.44% | | | | 8.44% | | | | 6.61% | | | | 10.35% | | | | 6.90% | | | | 8.03% | |
| Russell Midcap Index1 | | 3.69% | | | -0.61% | | | | 11.17% | | | | 8.28% | | | | 11.77% | | | | 9.48% | | | | 9.52% | |
| S&P 500 Index1 | | 3.82% | | | -0.38% | | | | 13.27% | | | | 10.57% | | | | 12.96% | | | | 9.02% | | | | 6.01% | |
1 The Russell Midcap Index measures the performance of the 800 smallest companies in the Russell 1000 Index. These represent approximately 31% of the total market capitalization of the Russell 1000 Index. The S&P 500 Index measures the performance of 500 leading companies in leading industries of the U.S. economy, capturing 80% coverage of U.S. equities. Both indices are unmanaged and returns assume the reinvestment of dividends. It is not possible to invest directly in an index.
The returns do not reflect the deduction of taxes that a shareholder would pay on Fund distributions or the redemption of Fund shares. The returns reflect the actual performance for each period and do not include the impacts of trades executed on the last business day of the period that were recorded on the first business day of the next period.
Performance data is based upon past performance, which is no guarantee of future results. The investment return and principal value of an investment will fluctuate so that an investor’s shares, when redeemed, may be worth more or less than their original cost. Current performance may be higher or lower than the performance data quoted. Please call 1-800-811-0535 to obtain performance data as of the most recent month-end. The Fund imposes a 2% redemption fee on shares held less than 60 days. Performance data does not reflect the redemption fee. If reflected, total returns would be lower. Investment performance reflects any fee waivers that were in effect. In the absence of such waivers, total return would have been reduced. The Investor Class Gross Expense Ratio, based on the most recent prospectus, is 1.19%.
| | |
| 34 | | www.thomaswhitefunds.com |
APRIL 30, 2018
GROWTH OF A $10,000 INVESTMENT WITH DIVIDENDS REINVESTED (Unaudited)
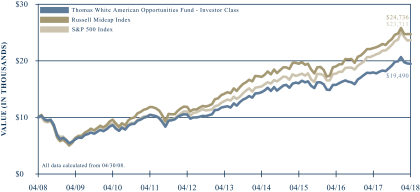
This chart illustrates the performance of a hypothetical $10,000 investment made in the Fund’s Investor Class shares, its primary benchmark, the Russell Midcap Index, and its secondary benchmark, the S&P 500 Index, for the past 10 years through April 30, 2018. It assumes reinvestment of dividends and capital gains, but does not reflect the effect of any applicable redemption fees. This chart does not imply future performance. Past performance does not guarantee future results. The cumulative ten year return was 94.90% for the Fund’s Investor Class shares, 147.36% for the primary benchmark, and 137.11% for the secondary benchmark. The Fund’s Investor Class shares average annual total return since inception on March 4, 1999 was 8.03%. The Russell Midcap Index measures the performance of the 800 smallest companies in the Russell 1000 Index. These represent approximately 31% of the total market capitalization of the Russell 1000 Index. The S&P 500 Index measures the performance of 500 leading companies in leading industries of the U.S. economy, capturing 80% coverage of U.S. equities. Both indices are unmanaged and returns assume the reinvestment of dividends. It is not possible to invest directly in an index. During the periods shown, the Fund’s manager reimbursed certain Fund expenses. Absent this reimbursement, performance would have been lower.
| | | | |
| www.thomaswhitefunds.com | | | 35 | |
THOMAS WHITE AMERICAN OPPORTUNITIES FUND
The Thomas White American Opportunities Fund primarily invests in equity securities of mid-size U.S. companies. The Fund may also invest in equity securities of smaller and larger size U.S. companies.
Portfolio Managers
Thomas S. White, Jr.
Jinwen Zhang, Ph.D., CFA
Douglas M. Jackman, CFA
Wei Li, Ph.D., CFA
John Wu, Ph.D., CFA
Rex Mathew, CFA, CM
Ramkumar Venkatramani, CFA
Performance Review
The Thomas White American Opportunities Fund Investor Class shares returned +1.82% during the six-month period ended April 30, 2018 while the Fund’s primary benchmark, the Russell Midcap Index, returned +3.69% and the secondary benchmark, the S&P 500 Index, returned +3.82% during the same period. Since its inception on March 4, 1999, the Fund’s Investor Class shares annualized returns are +8.03%, compared to +9.52% for the Russell Midcap Index and +6.01% for the S&P 500 Index.
Stronger Economy and Earnings Growth Support Investor Sentiment
U.S. domestic equity prices saw moderate gains during the six-month review period as the economy remained in good shape and corporate earnings growth accelerated. The tax cuts introduced by the Trump administration have helped lift corporate bottom lines, and companies are also
increasing share buybacks. It is also expected that some sectors could see a rise in capital investments in the coming quarters. Consumer sentiment remained healthy through the review period and continues to drive economic growth.
Equity prices came under pressure during the second half of the review period as investors became concerned about accelerated rate hikes by the U.S. Federal Reserve and worsening global trade disputes. The U.S. administration’s decision to impose additional duties on select imports from China and other countries triggered the market decline. Though the initial response from other countries was less aggressive than feared, the standoff continues without any meaningful attempts at an early resolution.
The healthier economy and declining unemployment rate encouraged the Federal Reserve to lift the target for its benchmark rate twice during the review period. The central bank’s recent communications indicate the possibility of three more rate increases before the end of this year. If the economy strengthens further or if inflation accelerates, the Federal Reserve could also speed up the unwinding of its quantitative easing program. The U.S. Dollar has strengthened against other major currencies so far this year.
Portfolio Review
During the six-month review period ended April 30, 2018, energy was the best performing sector as oil prices rallied to a multi-year high. The financials sector was helped by expectations of higher net interest margins as interest rates rise, while the
| | |
| 36 | | www.thomaswhitefunds.com |
APRIL 30, 2018
technology sector continued to be supported by strong earnings growth. The Fund’s relative performance against its primary benchmark was hurt by negative stock selection in the consumer discretionary and materials sectors. Stock selection was beneficial in the financials, consumer staples and healthcare sectors. The Fund also benefited from lower exposure to the real estate sector and higher exposure to the consumer discretionary sector.
NetApp, which provides data storage and management solutions, contributed the most to Fund returns during the review period. The company continues to see strong demand growth for its products as more users shift to cloud storage. Oil refiner Andeavor gained as the company continues to see good margins and also on expectations of stronger summer demand for gasoline. Insurer Voya Financial benefited from a recent acquisition to expand its retirement benefits service, as well as a share buyback program. Intuit, which develops software for small and medium-sized businesses as well as tax return services, outperformed after reporting better than expected earnings. Discount retailer Ross Stores was helped by healthy same store sales even as some of the larger retailers struggle against online competitors.
Check Point Software, a developer of enterprise security software, detracted the most from Fund returns during the review period on concerns about eroding pricing power as competition intensifies. Check Point also said the expected revenue growth from its larger sales network will be delayed. Natural gas distributor EQT was negatively affected by potential delays in its new
pipeline project, following a legal challenge. Cruise ship operator Royal Caribbean was hurt by rising fuel costs and growing industry capacity that could weaken pricing and capacity utilization. Skyworks Solutions, a manufacturer of radio frequency modules for cellphones, declined on concerns about softer demand growth for high end smartphones. Aramark, which provides facilities management services, underperformed as the company continues to integrate its recent acquisitions. Management remains confident of achieving its revenue growth targets and higher margins by next year.
U.S. Economy Remains a Bright Spot in the Developed World
The U.S. is likely to be the fastest growing major developed economy this year, helped by the recent tax cuts and the sustained gains in domestic consumer demand. The International Monetary Fund (IMF) estimates that U.S. growth could be around 3% this year, before a modest slowdown in 2019. Labor markets continue to tighten and the unemployment rate at around 4% is the lowest since 2000. Wage growth, though still low when compared to earlier growth cycles, has improved to 2.7% annualized in recent months. This should provide some support to domestic consumer demand as costlier fuel is likely to dampen sentiment in the coming months. Consumers have remained cheerful, and The University of Michigan’s consumer sentiment index rose to a multi-year high during the first quarter of this year.
Average housing prices have continued to rise in recent months, though existing home sales and new construction data have been uneven. While higher incomes are supporting
| | | | |
| www.thomaswhitefunds.com | | | 37 | |
THOMAS WHITE AMERICAN OPPORTUNITIES FUND
the market, more expensive homes are likely discouraging many potential buyers. Mortgage rates have also trended higher, in line with rising treasury yields, and could dampen demand in the coming quarters. Though current monthly housing starts are at multi-year highs, starts for the month of April declined. Shortages of available land for new construction as well as labor could be restricting new construction activity.
Stronger economic data has increased the possibility of faster rate increases by the Federal Reserve, and treasury yields have moved higher this year. However, it is also
widely accepted that the current economic momentum is partly built on the recent tax cuts. This is a short-term boost and its effect is likely to fade out gradually. Core consumer inflation was slightly above 2% in April, and it is expected to stay close to that level for the next several months. Unless inflation significantly overshoots the Federal Reserve’s 2% target, the central bank is likely to stick to its guided path of measured rate increases.
We thank you for investing in the Thomas White American Opportunities Fund.
| | |
| 38 | | www.thomaswhitefunds.com |
APRIL 30, 2018
Portfolio Industry Allocation and Market Capitalization as of April 30, 2018 (Unaudited)
| | | | |
| | |
| Industry Allocation | | % of TNA | |
| Automobiles & Components | | | 2.3% | |
| Banks | | | 8.0% | |
| Capital Goods | | | 11.9% | |
| Consumer Durables & Apparel | | | 3.4% | |
| Consumer Services | | | 4.2% | |
| Diversified Financials | | | 4.1% | |
| Energy | | | 6.3% | |
| Food, Beverage & Tobacco | | | 2.4% | |
| Health Care Equipment & Services | | | 6.7% | |
| Insurance | | | 3.0% | |
| Materials | | | 8.5% | |
| Media | | | 1.0% | |
| Pharmaceuticals, Biotechnology & Life Sciences | | | 2.9% | |
| REITS | | | 2.6% | |
| Retailing | | | 2.7% | |
| Semiconductors & Semiconductor Equipment | | | 3.8% | |
| Software & Services | | | 11.1% | |
| Technology Hardware & Equipment | | | 1.7% | |
| Transportation | | | 4.0% | |
| Utilities | | | 6.5% | |
| Cash & Other | | | 2.9% | |
| | | | |
| | |
| Portfolio Market Cap Mix | | % of TNA | |
| Large Cap (over $15.2 billion) | | | 53.2% | |
| Mid Cap ($2.3-$15.2 billion) | | | 43.9% | |
| Cash & Other | | | 2.9% | |
| | | | | |
| | | | | |
| | | | | |
| | | | | |
| | | | | |
| | | | | |
| | | | | |
| | | | | |
| | | | | |
| | | | | |
| | | | | |
| | | | | |
| | | | | |
| | | | | |
| | | | | |
| | | | | |
| | | | | |
| | | | | |
| | | | | |
| | | | | |
TNA - Total Net Assets
Fund holdings and industry allocations are subject to change and should not be considered a recommendation to buy or sell any securities. For a complete list of Fund holdings, please refer to the Investment Portfolio section of this report.
| | | | |
| www.thomaswhitefunds.com | | | 39 | |
| | |
| Thomas White American Opportunities Fund | | |
| | | | | | | | | | |
| Industry | | Issue | | Shares | | | Value | |
| COMMON STOCKS (94.5%) | | | | | | | | | | |
| | | |
| | | | | | | | | | |
| AUTOMOBILES & COMPONENTS (2.3%) | |
| | BorgWarner, Inc. | | | 12,000 | | | | $587,280 | |
| | Thor Industries, Inc. | | | 3,775 | | | | 400,679 | |
| | | | | | | | | | |
| | | | | | | | | 987,959 | |
| | | |
| | | | | | | | | | |
| BANKS (8.0%) | | | | | | | | |
| | Citizens Financial Group, Inc. | | | 15,100 | | | | 626,499 | |
| | Comerica Incorporated | | | 9,250 | | | | 874,865 | |
| | Fifth Third Bancorp | | | 13,600 | | | | 451,112 | |
| | Regions Financial Corporation | | | 37,100 | | | | 693,770 | |
| | Zions Bancorporation | | | 14,900 | | | | 815,775 | |
| | | | | | | | | | |
| | | | | | | | | 3,462,021 | |
| | | |
| | | | | | | | | | |
| CAPITAL GOODS (11.9%) | | | | | | | | |
| | Carlisle Companies Incorporated | | | 3,530 | | | | 380,287 | |
| | Cummins Inc. | | | 2,600 | | | | 415,636 | |
| | Huntington Ingalls Industries, Inc. | | | 4,140 | | | | 1,006,889 | |
| | Ingersoll-Rand PLC ^ | | | 5,000 | | | | 419,450 | |
| | The Middleby Corporation * | | | 3,400 | | | | 427,856 | |
| | Parker-Hannifin Corporation | | | 2,550 | | | | 419,781 | |
| | Sensata Technologies Holding plc * ^ | | | 15,704 | | | | 796,507 | |
| | Snap-on Incorporated | | | 4,350 | | | | 631,837 | |
| | Spirit AeroSystems Holdings, Inc. - Class A | | | 8,250 | | | | 663,053 | |
| | | | | | | | | | |
| | | | | | | | | 5,161,296 | |
| | | |
| | | | | | | | | | |
| | | | | | | | | | |
| CONSUMER DURABLES & APPAREL (3.4%) | |
| | Lennar Corporation - Class A | | | 8,250 | | | | 436,343 | |
| | NVR, Inc. * | | | 165 | | | | 511,500 | |
| | Polaris Industries Inc. | | | 4,900 | | | | 513,618 | |
| | | | | | | | | | |
| | | | | | | | | 1,461,461 | |
| | | |
| | | | | | | | | | |
| CONSUMER SERVICES (4.2%) | | | | | | | | |
| | Aramark | | | 11,987 | | | | 448,194 | |
| | Royal Caribbean Cruises Ltd. ^ | | | 7,400 | | | | 800,606 | |
| | Wyndham Worldwide Corporation | | | 5,000 | | | | 571,050 | |
| | | | | | | | | | |
| | | | | | | | | 1,819,850 | |
| | | |
| | | | | | | | | | |
| | | | | | | | | | |
| DIVERSIFIED FINANCIALS (4.1%) | | | | | | | | |
| | Ameriprise Financial, Inc. | | | 3,500 | | | | 490,735 | |
| | Intercontinental Exchange, Inc. | | | 6,500 | | | | 470,990 | |
| | Voya Financial, Inc. | | | 15,500 | | | | 811,425 | |
| | | | | | | | | | |
| | | | | | | | | 1,773,150 | |
| | | |
| | | | | | | | | | |
| ENERGY (6.3%) | | | | | | | | |
| | Andeavor | | | 7,410 | | | | 1,024,951 | |
| | CNX Resources Corporation * | | | 21,600 | | | | 320,976 | |
| | EQT Corporation | | | 9,400 | | | | 471,786 | |
| | Noble Energy, Inc. | | | 15,800 | | | | 534,514 | |
| | TechnipFMC plc ^ | | | 11,247 | | | | 370,701 | |
| | | | | | | | | | |
| | | | | | | | | 2,722,928 | |
| | | |
| | | | | | | | | | |
The accompanying notes are an integral part of these financial statements
| | |
| 40 | | www.thomaswhitefunds.com |
| | |
| Investment Portfolio (Unaudited) | | April 30, 2018 |
| | | | | | | | | | |
| Industry | | Issue | | Shares | | | Value | |
| FOOD, BEVERAGE & TOBACCO (2.4%) | |
| | Dr Pepper Snapple Group, Inc. | | | 4,900 | | | | $ 587,804 | |
| | Molson Coors Brewing Company - Class B | | | 6,600 | | | | 470,184 | |
| | | | | | | | | | |
| | | | | | | | | 1,057,988 | |
| | | |
| | | | | | | | | | |
| HEALTH CARE EQUIPMENT & SERVICES (6.7%) | | | | |
| | Boston Scientific Corporation * | | | 19,230 | | | | 552,285 | |
| | Centene Corporation * | | | 4,600 | | | | 499,468 | |
| | Hill-Rom Holdings, Inc. | | | 5,290 | | | | 454,041 | |
| | Laboratory Corporation of America Holdings * | | | 5,120 | | | | 874,240 | |
| | Zimmer Biomet Holdings, Inc. | | | 4,600 | | | | 529,782 | |
| | | | | | | | | | |
| | | | | | | | | 2,909,816 | |
|
| |
| INSURANCE (3.0%) | | | | | | |
| | Assurant, Inc. | | | 4,600 | | | | 426,972 | |
| | Everest Re Group, Ltd. ^ | | | 1,700 | | | | 395,539 | |
| | The Hartford Financial Services Group, Inc. | | | 9,300 | | | | 500,712 | |
| | | | | | | | | | |
| | | | | | | | | 1,323,223 | |
|
| |
| MATERIALS (8.5%) | | | | | | |
| | AptarGroup, Inc. | | | 4,400 | | | | 411,400 | |
| | Ball Corporation | | | 14,100 | | | | 565,269 | |
| | Martin Marietta Materials, Inc. | | | 2,900 | | | | 564,833 | |
| | Owens-Illinois, Inc. * | | | 20,948 | | | | 425,873 | |
| | PPG Industries, Inc. | | | 6,460 | | | | 683,985 | |
| | The Scotts Miracle-Gro Company - Class A | | | 4,585 | �� | | | 383,214 | |
| | The Sherwin-Williams Company | | | 1,840 | | | | 676,494 | |
| | | | | | | | | | |
| | | | | | | | | 3,711,068 | |
|
| |
| MEDIA (1.0%) | | | | | | |
| | CBS Corporation - Class B Non-Voting | | | 9,366 | | | | 460,807 | |
|
| |
| PHARMACEUTICALS, BIOTECHNOLOGY & LIFE SCIENCES (2.9%) | | | | | | |
| | Charles River Laboratories International, Inc. * | | | 5,890 | | | | 613,679 | |
| | Jazz Pharmaceuticals Public Limited Company * ^ | | | 4,300 | | | | 653,772 | |
| | | | | | | | | | |
| | | | | | | | | 1,267,451 | |
|
| |
| RETAILING (2.7%) | | | | | | |
| | AutoZone, Inc. * | | | 694 | | | | 433,417 | |
| | Ross Stores, Inc. | | | 9,100 | | | | 735,735 | |
| | | | | | | | | | |
| | | | | | | | | 1,169,152 | |
|
| |
| SEMICONDUCTORS & SEMICONDUCTOR EQUIPMENT (3.8%) | | | | | | |
| | Analog Devices, Inc. | | | 4,030 | | | | 352,021 | |
| | Lam Research Corporation | | | 1,870 | | | | 346,062 | |
| | Skyworks Solutions, Inc. | | | 6,300 | | | | 546,588 | |
| | Xilinx, Inc. | | | 6,200 | | | | 398,288 | |
| | | | | | | | | | |
| | | | | | | | | 1,642,959 | |
|
| |
The accompanying notes are an integral part of these financial statements
| | | | |
| www.thomaswhitefunds.com | | | 41 | |
| | |
| Thomas White American Opportunities Fund | | |
| | | | | | | | | | |
| Industry | | Issue | | Shares | | | Value | |
| SOFTWARE & SERVICES (11.1%) | | | | | | |
| | Alliance Data Systems Corporation | | | 3,500 | | | | $ 710,675 | |
| | CA, Inc. | | | 11,600 | | | | 403,680 | |
| | Cadence Design Systems, Inc. * | | | 17,900 | | | | 717,074 | |
| | Check Point Software Technologies Ltd. * ^ | | | 7,170 | | | | 691,977 | |
| | Fidelity National Information Services, Inc. | | | 7,800 | | | | 740,766 | |
| | FleetCor Technologies Inc. * | | | 2,950 | | | | 611,476 | |
| | Intuit Inc. | | | 5,100 | | | | 942,429 | |
| | | | | | | | | | |
| | | | | | | | | 4,818,077 | |
|
| |
| TECHNOLOGY HARDWARE & EQUIPMENT (1.7%) | | | | | | |
| | NetApp, Inc. | | | 11,250 | | | | 749,025 | |
|
| |
| TRANSPORTATION (4.0%) | | | | | | |
| | Old Dominion Freight Line, Inc. | | | 8,300 | | | | 1,111,038 | |
| | Southwest Airlines Co. | | | 12,100 | | | | 639,243 | |
| | | | | | | | | | |
| | | | | | | | | 1,750,281 | |
|
| |
| UTILITIES (6.5%) | | | | |
| | Alliant Energy Corporation | | | 14,000 | | | | 601,300 | |
| | Ameren Corporation | | | 11,300 | | | | 662,406 | |
| | CMS Energy Corporation | | | 13,050 | | | | 615,829 | |
| | DTE Energy Company | | | 5,200 | | | | 548,080 | |
| | Xcel Energy, Inc. | | | 9,050 | | | | 423,902 | |
| | | | | | | | | | |
| | | | | | | | | 2,851,517 | |
| |
| | | | | |
| Total Common Stocks | | | | | (Cost $31,915,086) | | | | 41,100,029 | |
| | | | | | | | | | |
| |
| | | | | |
| REAL ESTATE INVESTMENT TRUSTS (REITs) (2.6%) | | | | | | | | |
| | | |
| | | | | | | | | | |
| REITs (2.6%) | | | | | | | | |
| | Crown Castle International Corp. | | | 5,650 | | | | 569,916 | |
| | Prologis, Inc. | | | 8,400 | | | | 545,244 | |
| | | | | | | | | | |
| | | | | | | | | 1,115,160 | |
| |
| | | | | |
| Total REITs | | | (Cost $992,329 | ) | | | 1,115,160 | |
| | | | | | | | | | |
| |
| | | | | |
| Total Investments | | 97.1% | | | (Cost $32,907,415 | ) | | | $42,215,189 | |
| Other Assets, Less Liabilities | | 2.9% | | | | | | | 1,278,314 | |
| Total Net Assets: | | 100.0% | | | | | | | $43,493,503 | |
| |
| | | | | |
| * | Non-Income Producing Securities |
| ^ | Foreign Issued Securities |
Industry classifications shown in the Investment Portfolio are based off of the Global Industry Classification Standard (GICS®). GICS was developed by and/or is the exclusive property of MSCI, Inc. and Standard & Poor’s Financial Services LLC (“S&P”). GICS is a service mark of MSCI and S&P and has been licensed for use by U.S. Bancorp Fund Services, LLC.
The accompanying notes are an integral part of these financial statements
| | |
| 42 | | www.thomaswhitefunds.com |
| | |
| Investment Portfolio (Unaudited) | | April 30, 2018 |
The following table summarizes the inputs used, as of April 30, 2018, in valuating the Fund’s assets:
| | | | | | | | | | | | | | | | |
| | | Level 1 | | | Level 2 | | | Level 3 | | | Total | |
| Common Stocks | | | | | | | | | | | | | | | | |
| Automobiles & Components | | | $987,959 | | | | $------- | | | | $------- | | | | $987,959 | |
| Banks | | | 3,462,021 | | | | ------- | | | | ------- | | | | 3,462,021 | |
| Capital Goods | | | 5,161,296 | | | | ------- | | | | ------- | | | | 5,161,296 | |
| Consumer Durables & Apparel | | | 1,461,461 | | | | ------- | | | | ------- | | | | 1,461,461 | |
| Consumer Services | | | 1,819,850 | | | | ------- | | | | ------- | | | | 1,819,850 | |
| Diversified Financials | | | 1,773,150 | | | | ------- | | | | ------- | | | | 1,773,150 | |
| Energy | | | 2,722,928 | | | | ------- | | | | ------- | | | | 2,722,928 | |
| Food, Beverage & Tobacco | | | 1,057,988 | | | | ------- | | | | ------- | | | | 1,057,988 | |
| Health Care Equipment & Services | | | 2,909,816 | | | | ------- | | | | ------- | | | | 2,909,816 | |
| Insurance | | | 1,323,223 | | | | ------- | | | | ------- | | | | 1,323,223 | |
| Materials | | | 3,711,068 | | | | ------- | | | | ------- | | | | 3,711,068 | |
| Media | | | 460,807 | | | | ------- | | | | ------- | | | | 460,807 | |
| Pharmaceuticals, Biotechnology & Life Sciences | | | 1,267,451 | | | | ------- | | | | ------- | | | | 1,267,451 | |
| Retailing | | | 1,169,152 | | | | ------- | | | | ------- | | | | 1,169,152 | |
| Semiconductors & Semiconductor Equipment | | | 1,642,959 | | | | ------- | | | | ------- | | | | 1,642,959 | |
| Software & Services | | | 4,818,077 | | | | ------- | | | | ------- | | | | 4,818,077 | |
| Technology Hardware & Equipment | | | 749,025 | | | | ------- | | | | ------- | | | | 749,025 | |
| Transportation | | | 1,750,281 | | | | ------- | | | | ------- | | | | 1,750,281 | |
| Utilities | | | 2,851,517 | | | | ------- | | | | ------- | | | | 2,851,517 | |
| Total Common Stocks | | | $41,100,029 | | | | $------- | | | | $------- | | | | $41,100,029 | |
| Real Estate Investment Trusts (REITs) | | | | | | | | | | | | | | | | |
| REITs | | | $1,115,160 | | | | $------- | | | | $------- | | | | $1,115,160 | |
| Total REITs | | | $1,115,160 | | | | $------- | | | | $------- | | | | $1,115,160 | |
| Total Investments | | | $42,215,189 | | | | $------- | | | | $------- | | | | $42,215,189 | |
For more information on valuation inputs, please refer to Note 1(A) of the accompanying Notes to Financial Statements.
No transfers in and/or out between Levels 1, 2 or 3 were observed during the reporting period, as compared to their classification from the prior annual report.
The accompanying notes are an integral part of these financial statements
| | | | |
| www.thomaswhitefunds.com | | | 43 | |
THOMAS WHITE FUNDS
Statements of Assets and Liabilities
April 30, 2018 (Unaudited)
| | | | | | | | | | | | | | | | | | | | | | | | |
| | | International
Fund | | | Emerging
Markets Fund | | | American
Opportunities
Fund | |
| ASSETS: | | | | | | | | | | | | | | | | | | | | | | | | |
| Investments in securities at market value1,3 | | $ | | | | | 278,794,672 | | | $ | | | | | 38,929,825 | | | $ | | | | | 42,215,189 | |
| Foreign currency2 | | | | | | | 299,017 | | | | | | | | 8,396 | | | | | | | | ------- | |
| Cash | | | | | | | 2,780,143 | | | | | | | | ------- | | | | | | | | 1,260,484 | |
| Receivables: | | | | | | | | | | | | | | | | | | | | | | | | |
Securities Lending | | | | | | | 3,379 | | | | | | | | 3,190 | | | | | | | | ------- | |
Dividends and interest | | | | | | | 1,151,862 | | | | | | | | 51,071 | | | | | | | | 5,020 | |
Reclaims | | | | | | | 1,658,056 | | | | | | | | 13,679 | | | | | | | | 3,975 | |
Fund shares sold | | | | | | | 63,462 | | | | | | | | 4,274 | | | | | | | | 4,219 | |
| Prepaid expenses | | | | | | | 63,618 | | | | | | | | 25,020 | | | | | | | | 31,031 | |
| Total assets | | | | | | | 284,814,209 | | | | | | | | 39,035,455 | | | | | | | | 43,519,918 | |
| | | | | | | | | | | | | | | | | | | | | | | | | |
| LIABILITIES: | | | | | | | | | | | | | | | | | | | | | | | | |
| Management and administrative fees payable | | | | | | | 176,943 | | | | | | | | 10,740 | | | | | | | | 3,969 | |
| Business management fees payable | | | | | | | 27,610 | | | | | | | | 2,896 | | | | | | | | 1,926 | |
| Accrued expenses | | | | | | | 238,722 | | | | | | | | 65,113 | | | | | | | | 20,520 | |
| Payable for fund shares redeemed | | | | | | | 31,301 | | | | | | | | ------- | | | | | | | | ------- | |
| Other liabilities | | | | | | | 100,859 | | | | | | | | 6,380 | | | | | | | | ------- | |
| Total liabilities | | | | | | | 575,435 | | | | | | | | 85,129 | | | | | | | | 26,415 | |
| Net Assets | | $ | | | | | 284,238,774 | | | $ | | | | | 38,950,326 | | | $ | | | | | 43,493,503 | |
| | | | | | | | | | | | | | | | | | | | | | | | | |
| NET ASSETS | | | | | | | | | | | | | | | | | | | | | | | | |
| Source of Net Assets: | | | | | | | | | | | | | | | | | | | | | | | | |
| Net capital paid in on shares of beneficial interest | | $ | | | | | 212,809,903 | | | $ | | | | | 37,454,565 | | | $ | | | | | 32,763,641 | |
| Accumulated net investment income | | | | | | | 1,634,681 | | | | | | | | 114,158 | | | | | | | | 5,711 | |
| Accumulated net realized gain/(loss) | | | | | | | 17,772,623 | | | | | | | | (8,674,051 | ) | | | | | | | 1,416,377 | |
| Net unrealized appreciation/depreciation on: | | | | | | | | | | | | | | | | | | | | | | | | |
| Investments and foreign currency translations | | | | | | | 52,039,509 | | | | | | | | 10,056,464 | | | | | | | | 9,307,774 | |
Other assets and liabilities denominated in foregin currency | | | | | | | (17,942 | ) | | | | | | | (810 | ) | | | | | | | ------- | |
| Net assets | | $ | | | | | 284,238,774 | | | $ | | | | | 38,950,326 | | | $ | | | | | 43,493,503 | |
| The accompanying notes are an integral part of these financial statements. | |
| | |
| 44 | | www.thomaswhitefunds.com |
THOMAS WHITE FUNDS
Statements of Assets and Liabilities
April 30, 2018 (Unaudited)
| | | | | | | | | | | | | | | | | | | | | | | | |
| | | International
Fund | | | Emerging
Markets Fund | | | American
Opportunities
Fund | |
| INVESTOR CLASS SHARES | | | | | | | | | | | | | | | | | | | | | | | | |
| Net assets | | $ | | | | | 39,724,457 | | | $ | | | | | 2,086,561 | | | $ | | | | | 43,493,503 | |
| Shares outstanding4 | | | | | | | 2,167,109 | | | | | | | | 176,130 | | | | | | | | 2,590,594 | |
| Net asset value and offering price per share | | $ | | | | | 18.33 | | | $ | | | | | 11.85 | | | $ | | | | | 16.79 | |
| | | | | | | | | | | | | | | | | | | | | | | | | |
| CLASS I SHARES | | | | | | | | | | | | | | | | | | | | | | | | |
| Net assets | | $ | | | | | 244,514,317 | | | $ | | | | | 36,863,765 | | | | | | | | | |
| Shares outstanding4 | | | | | | | 13,392,278 | | | | | | | | 3,084,657 | | | | | | | | | |
| Net asset value and offering price per share | | $ | | | | | 18.26 | | | $ | | | | | 11.95 | | | | | | | | | |
1 Cost Basis of Investments: International Fund: $226,755,163 Emerging Markets Fund: $28,873,361 American Opportunities Fund: $32,907,415 | | | | | | | | | | | | | | | | | | | | | | | | |
2 Cost Basis of Cash denominated in foreign currencies: International Fund: $298,114 Emerging Markets Fund: $8,396 | | | | | | | | | | | | | | | | | | | | | | | | |
3 Value of securities out on loan at 4/30/2018: International Fund: $9,730,186 Emerging Markets Fund: $3,715,919 | | | | | | | | | | | | | | | | | | | | | | | | |
| 4 There are an unlimited number of $.01 par value shares of beneficial interest authorized. | | | | | | | | | | | | | | | | | | | | | | | | |
| The accompanying notes are an integral part of these financial statements. | |
| | | | |
| www.thomaswhitefunds.com | | | 45 | |
THOMAS WHITE FUNDS
Statements of Operations
Period Ended April 30, 2018 (Unaudited)
| | | | | | | | | | | | | | | | | | | | | | | | |
| | | International
Fund | | | Emerging
Markets Fund | | | American
Opportunities
Fund | |
| INVESTMENT INCOME | | | | | | | | | | | | | | | | | | | | | | | | |
| Income: | | | | | | | | | | | | | | | | | | | | | | | | |
Dividends1 | | $ | | | | | 3,728,000 | | | $ | | | | | 348,951 | | | $ | | | | | 273,930 | |
Interest | | | | | | | 3,220 | | | | | | | | 4,748 | | | | | | | | ------- | |
Securities lending income (Note 1) | | | | | | | 5,021 | | | | | | | | 5,627 | | | | | | | | ------- | |
| Total investment income | | | | | | | 3,736,241 | | | | | | | | 359,326 | | | | | | | | 273,930 | |
| Expenses: | | | | | | | | | | | | | | | | | | | | | | | | |
Investment management fees (Note 4) | | | | | | | 1,321,358 | | | | | | | | 186,450 | | | | | | | | 181,750 | |
Business management fees (Note 4) | | | | | | | 54,409 | | | | | | | | 7,677 | | | | | | | | 7,484 | |
Accounting and administration fees | | | | | | | 104,045 | | | | | | | | 17,362 | | | | | | | | 14,459 | |
Custodian fees | | | | | | | 77,789 | | | | | | | | 33,210 | | | | | | | | 4,719 | |
Transfer agent fees | | | | | | | | | | | | | | | | | | | | | | | | |
Class I Shares | | | | | | | 43,639 | | | | | | | | 14,219 | | | | | | | | ------- | |
Investor Class Shares | | | | | | | 6,790 | | | | | | | | 715 | | | | | | | | 8,714 | |
Trustees’ fees and expenses | | | | | | | 51,242 | | | | | | | | 7,240 | | | | | | | | 5,696 | |
Audit fees and expenses | | | | | | | 12,038 | | | | | | | | 10,507 | | | | | | | | 7,494 | |
Registration fees | | | | | | | | | | | | | | | | | | | | | | | | |
Class I Shares | | | | | | | 19,923 | | | | | | | | 19,932 | | | | | | | | ------- | |
Investor Class Shares | | | | | | | 3,106 | | | | | | | | 997 | | | | | | | | 3,638 | |
Printing expenses | | | | | | | 37,684 | | | | | | | | 6,091 | | | | | | | | 4,242 | |
Legal fees and expenses | | | | | | | 85,225 | | | | | | | | 14,876 | | | | | | | | 7,050 | |
Administrative Service Fee: | | | | | | | | | | | | | | | | | | | | | | | | |
Investor Class Shares | | | | | | | 43,234 | | | | | | | | 260 | | | | | | | | 33,690 | |
Other expenses | | | | | | | 48,486 | | | | | | | | 12,208 | | | | | | | | 4,761 | |
| Total expenses | | | | | | | 1,908,968 | | | | | | | | 331,744 | | | | | | | | 283,697 | |
| Reimbursement of Class I Expenses (Note 4) | | | | | | | (67,242 | ) | | | | | | | (45,964 | ) | | | | | | | ------- | |
| Reimbursement of Management Fees (Note 4) | | | | | | | | | | | | | | | | | | | | | | | | |
Class I Shares | | | | | | | (210,019 | ) | | | | | | | (41,133 | ) | | | | | | | ------- | |
Investor Class Shares | | | | | | | (34,070 | ) | | | | | | | (2,071 | ) | | | | | | | ------- | |
| Net expenses | | | | | | | 1,597,637 | | | | | | | | 242,576 | | | | | | | | 283,697 | |
| Net investment income (loss) | | | | | | | 2,138,604 | | | | | | | | 116,750 | | | | | | | | (9,767 | ) |
| | | | | | | | | | | | | | | | | | | | | | | | | |
| REALIZED AND UNREALIZED GAIN/(LOSS) ON INVESTMENTS | |
| Net realized gain on investments & foreign currency transactions | | | | | | | 18,276,663 | | | | | | | | 3,189,268 | | | | | | | | 989,289 | |
| Net change in unrealized depreciation on investments and foreign currency transactions | | | | | | | (11,344,742 | ) | | | | | | | (705,639 | ) | | | | | | | (225,385 | ) |
| Net gain on investments | | | | | | | 6,931,921 | | | | | | | | 2,483,629 | | | | | | | | 763,904 | |
| Net increase in net assets from operations | | $ | | | | | 9,070,525 | | | $ | | | | | 2,600,379 | | | $ | | | | | 754,137 | |
| 1 Net of foreign taxes withheld of: | | | | | | | | | | | | | | | | | | | | | | | | |
| International Fund: $393,977 | | | | | | | | | | | | | | | | | | | | | | | | |
| Emerging Markets Fund: $49,024 | | | | | | | | | | | | | | | | | | | | | | | | |
| American Opportunities Fund: $949 | | | | | | | | | | | | | | | | | | | | | | | | |
| The accompanying notes are an integral part of these financial statements. | |
| | |
| 46 | | www.thomaswhitefunds.com |
THOMAS WHITE FUNDS
Statements of Changes in Net Assets (Unaudited)
| | | | | | | | | | | | | | | | |
| | | International Fund | |
| | | | | | Six Months
Ended April 30,
2018 | | | | | | Year Ended
October 31,
2017 | |
| Change in net assets from operations: | | | | | | | | | | | | | | | | |
Net investment income | | $ | | | | | 2,138,604 | | | $ | | | | | 6,323,524 | |
Net realized gain on investments | | | | | | | 18,276,663 | | | | | | | | 64,693,543 | |
Net unrealized appreciation / depreciation on investments and foreign currency transactions | | | | | | | (11,344,742 | ) | | | | | | | 20,182,751 | |
Net increase in net assets from operations | | | | | | | 9,070,525 | | | | | | | | 91,199,818 | |
| Distribution to Investor Class Shareholders: | | | | | | | | | | | | | | | | |
From net investment income | | | | | | | ------- | | | | | | | | (694,712 | ) |
From realized gain | | | | | | | ------- | | | | | | | | (596,040 | ) |
| Distribution to Class I Shareholders: | | | | | | | | | | | | | | | | |
From net investment income | | | | | | | ------- | | | | | | | | (6,586,716 | ) |
From realized gain | | | | | | | ------- | | | | | | | | (3,774,564 | ) |
| Distribution to Class A Shareholders: | | | | | | | | | | | | | | | | |
From net investment income | | | | | | | ------- | | | | | | | | (252 | ) |
| Total distributions | | | | | | | ------- | | | | | | | | (11,652,284 | ) |
| Fund share transactions (Note 3)1 | | | | | | | (45,930,628 | ) | | | | | | | (330,906,023 | ) |
| Total decrease | | | | | | | (36,860,103 | ) | | | | | | | (251,358,489 | ) |
| Net assets: | | | | | | | | | | | | | | | | |
| Beginning of period | | | | | | | 321,098,877 | | | | | | | | 572,457,366 | |
| End of period | | $ | | | | | 284,238,774 | | | $ | | | | | 321,098,877 | |
| Undistributed net investment income (loss) | | $ | | | | | 1,634,681 | | | $ | | | | | (503,923 | ) |
| 1 Class A and Class C shares closed on February 28, 2017. | | | | | | | | | | | | | | | | |
| The accompanying notes are an integral part of these financial statements. | | | | | | | | | | | | | | | | |
| | | | |
| www.thomaswhitefunds.com | | | 47 | |
THOMAS WHITE FUNDS
Statements of Changes in Net Assets (Unaudited)
| | | | | | | | | | | | | | | | |
| | | Emerging Markets Fund | |
| | | | | | Six Months
Ended April 30,
2018 | | | | | | Year Ended
October 31,
2017 | |
| Change in net assets from operations: | | | | | | | | | | | | | | | | |
Net investment income | | $ | | | | | 116,750 | | | $ | | | | | 666,193 | |
Net realized gain on investments | | | | | | | 3,189,268 | | | | | | | | 2,104,763 | |
Net unrealized appreciation / depreciation on investments and foreign currency transactions | | | | | | | (705,639 | ) | | | | | | | 6,615,755 | |
Net increase in net assets from operations | | | | | | | 2,600,379 | | | | | | | | 9,386,711 | |
| Distribution to Investor Class Shareholders: | | | | | | | | | | | | | | | | |
From net investment income | | | | | | | ------- | | | | | | | | (29,005 | ) |
| Distribution to Class I Shareholders: | | | | | | | | | | | | | | | | |
From net investment income | | | | | | | ------- | | | | | | | | (871,551 | ) |
| Total distributions | | | | | | | ------- | | | | | | | | (900,556 | ) |
| Fund share transactions (Note 3)1 | | | | | | | (11,044,513 | ) | | | | | | | (39,470,584 | ) |
| Total decrease | | | | | | | (8,444,134 | ) | | | | | | | (30,984,429 | ) |
| Net assets: | | | | | | | | | | | | | | | | |
| Beginning of period | | | | | | | 47,394,460 | | | | | | | | 78,378,889 | |
| End of period | | $ | | | | | 38,950,326 | | | $ | | | | | 47,394,460 | |
| Undistributed net investment income (loss) | | $ | | | | | 114,158 | | | $ | | | | | (2,592 | ) |
| 1 Class A and Class C shares closed on February 28, 2017. | | | | | | | | | | | | | | | | |
| The accompanying notes are an integral part of these financial statements. | | | | | | | | | | | | | | | | |
| | |
| 48 | | www.thomaswhitefunds.com |
THOMAS WHITE FUNDS
Statements of Changes in Net Assets (Unaudited)
| | | | | | | | | | | | | | | | |
| | | American Opportunities Fund | |
| | | | | | Six Months
Ended April 30,
2018 | | | | | | Year Ended
October 31,
2017 | |
| Change in net assets from operations: | | | | | | | | | | | | | | | | |
Net investment income (loss) | | $ | | | | | (9,767 | ) | | $ | | | | | 115,757 | |
Net realized gain on investments | | | | | | | 989,289 | | | | | | | | 2,563,472 | |
Net unrealized appreciation / depreciation on investments and foreign currency transactions | | | | | | | (225,385 | ) | | | | | | | 4,796,761 | |
Net increase in net assets from operations | | | | | | | 754,137 | | | | | | | | 7,475,990 | |
| Distribution to Investor Class Shareholders: | | | | | | | | | | | | | | | | |
From net investment income | | | | | | | ------- | | | | | | | | (354,402 | ) |
From realized gain | | | | | | | ------- | | | | | | | | (3,219,478 | ) |
| Total distributions | | | | | | | ------- | | | | | | | | (3,573,880 | ) |
| Fund share transactions (Note 3) | | | | | | | 1,306,135 | | | | | | | | 714,978 | |
| Total increase | | | | | | | 2,060,272 | | | | | | | | 4,617,088 | |
| Net assets: | | | | | | | | | | | | | | | | |
| Beginning of period | | | | | | | 41,433,231 | | | | | | | | 36,816,143 | |
| End of period | | $ | | | | | 43,493,503 | | | $ | | | | | 41,433,231 | |
| Undistributed net investment income | | $ | | | | | 5,711 | | | $ | | | | | 15,478 | |
| The accompanying notes are an integral part of these financial statements. | | | | | | | | | | | | | | | | |
| | | | |
| www.thomaswhitefunds.com | | | 49 | |
Notes to Financial Statements Period Ended April 30, 2018 (Unaudited)
NOTE 1. SUMMARY OF ACCOUNTING POLICIES
Lord Asset Management Trust (the “Trust”) was organized as a Delaware business trust on February 9, 1994, as an open-end diversified management investment company. The Trust currently has three series of shares (collectively referred to as the “Funds”) - the Thomas White International Fund (the “International Fund”), which commenced operations with the sale of Investor Class shares on June 28, 1994 and the sale of Class I shares, Class A shares and Class C shares on August 31, 2012; the Thomas White Emerging Markets Fund (the “Emerging Markets Fund”), which commenced operations with the sale of Investor Class shares on June 28, 2010 and the sale of Class I shares, Class A shares and Class C shares on August 31, 2012; and the Thomas White American Opportunities Fund (the “American Opportunities Fund”), which commenced operations with the sale of Investor Class shares on March 4, 1999. Class A and Class C shares of the International Fund and Emerging Markets Fund closed on February 28, 2017 and effective at the close of business on that date, the outstanding Class A and Class C shares of those Funds were converted to Class I shares, as applicable. The investment objective of each Fund is to seek long-term capital growth. The International Fund invests in equity securities of companies located in the world’s developed countries outside of the U.S. The Emerging Markets Fund invests in securities of companies located in or whose businesses are closely associated with the world’s emerging markets countries. The American Opportunities Fund primarily invests in U.S. equity securities, with a focus on mid-size and small companies. The following is a summary of significant accounting policies followed in the preparation of the Trust’s financial statements.
(A) VALUATION OF SECURITIES
Securities listed or traded on a recognized national or foreign stock exchange or NASDAQ are valued at the last reported sales prices on the principal exchange on which the securities are traded. NASDAQ National Market securities are valued at the NASDAQ official closing price. Over-the-counter securities and listed securities for which no closing sale price is reported are valued at the mean between the last current bid and ask price. Securities for which market quotations are not readily available are valued at fair value under the Trust’s Valuation Procedures as determined by management and approved in good faith by the Board of Trustees. As of April 30, 2018, all securities within each Fund’s portfolio were valued at the last reported sales price on the principal exchange on which the securities are traded and, for the International and Emerging Markets Funds, adjusted by a fair value factor when necessary and as further described below. The Trust has retained an independent statistical fair value pricing service to assist in the fair valuation process for securities principally traded in a foreign market in order to adjust for changes in value that may occur between the close of the foreign exchange and the time at which Fund shares are priced. Short term investments are valued at original cost, which combined with accrued interest, approximates market value.
Fair value is defined as the price that would be received to sell an asset or paid to transfer a liability (i.e., the “exit price”) in an orderly transaction between market participants at the measurement date. In determining fair value, the Fund uses various valuation approaches. A
| | |
| 50 | | www.thomaswhitefunds.com |
Notes to Financial Statements Period Ended April 30, 2018 (Unaudited)
three-tiered fair value hierarchy for inputs is used in measuring fair value that maximizes the use of observable inputs and minimizes the use of unobservable inputs by generally requiring that the most observable inputs be used when available. Observable inputs are those that market participants would use in pricing the asset or liability based on market data obtained from sources independent of a Fund. Unobservable inputs reflect the Fund’s assumptions about the inputs market participants would use in pricing the asset or liability developed based on the best information available in the circumstances. The inputs or methodologies used for valuing securities are not necessarily an indication of the risks associated with investing in those securities.
The fair value hierarchy is categorized into three levels based on the inputs as follows:
Level 1 - Valuations based on unadjusted quoted prices in active markets for identical assets.
Level 2 - Valuations based on quoted prices for similar securities or in markets that are not active or for which all significant inputs are observable, either directly or indirectly.
Level 3 - Valuations based on inputs that are unobservable and significant to the overall fair value measurement.
(B) MULTI-CLASS OPERATIONS AND ALLOCATIONS
Expenses of the Funds that are not directly attributable to a specific class of shares are prorated among the classes based on the relative net assets of each class. Expenses directly attributable to a class of shares, which presently include administrative services fees, transfer agent fees and registration fees, are recorded to the specific class.
Income, realized and unrealized capital gains and losses of the Funds are prorated among the classes based on the relative net assets of each class within each specific Fund.
(C) MARKET RISK
Investing in securities of foreign companies and foreign governments involves special risks and considerations not typically associated with investing in U.S. companies and securities of the U.S. Government. These risks include revaluation of currencies and future adverse political and economic developments. Moreover, securities of many foreign companies and foreign governments and their markets may be less liquid and their prices more volatile than securities of comparable U.S. companies and securities of the U.S. Government.
(D) FOREIGN CURRENCY TRANSLATION
Portfolio securities and other assets and liabilities denominated in foreign currencies are translated into U.S. dollar amounts at date of valuation. Purchases and sales of portfolio securities and income items denominated in foreign currencies are translated into U.S. dollar amounts on the respective dates of such transactions. When a Fund purchases or sells a foreign
| | | | |
| www.thomaswhitefunds.com | | | 51 | |
Notes to Financial Statements Period Ended April 30, 2018 (Unaudited)
security, it will customarily enter into a foreign exchange contract to minimize foreign exchange risk from the trade date to the settlement date of such transaction.
The Funds do not isolate the portion of the results of operations resulting from changes in foreign exchange rates on investments from the fluctuations arising from changes in market prices of securities held. Such fluctuations are included with the net realized and unrealized gain or loss from investments.
Net realized gain (loss) on investments and foreign currency transactions include those gains and losses arising from the sale of foreign currencies, currency gains or losses realized between the trade and settlement dates on securities transactions, the differences between the amounts of dividends, and foreign withholding taxes recorded on a Fund’s books, and the U.S. dollar equivalent of the amounts actually received or paid. Net unrealized appreciation (depreciation) on investments and foreign currency translation includes changes in the value of assets and liabilities resulting from exchange rates.
(E) INCOME TAXES
Each Fund is a separate taxpayer for federal income tax purposes. Each Fund intends to distribute substantially all of its net investment income and net capital gains to its shareholders and to otherwise comply with the requirements of Subchapter M of the Internal Revenue Code applicable to regulated investment companies. Therefore, no federal income tax provision is required.
All open tax years and major jurisdictions have been reviewed for the Funds and, based on this review, there are no significant uncertain tax positions that would require recognition in the financial statements. Open tax years are those that are open for exam by taxing authorities and, as of April 30, 2018, open Federal tax years include the tax years ended October 31, 2014 through 2017. The Funds have no examinations in progress and are also not aware of any tax positions for which it is reasonably possible that the total amounts of unrecognized tax benefits will significantly change in the next twelve months.
The Funds accrue for such material foreign taxes on net realized and unrealized gains at the appropriate rate for each country. Based on rates ranging from approximately 10% to 15%, there were no material accruals at period end.
(F) USE OF ESTIMATES
The preparation of financial statements in conformity with generally accepted accounting principles requires management to make estimates and assumptions that affect the reported amounts of assets and liabilities and disclosure of contingent liabilities at the date of the financial statements and the reported amounts of increases and decreases in net assets from operations during the period. Actual results could differ from these estimates.
| | |
| 52 | | www.thomaswhitefunds.com |
Notes to Financial Statements Period Ended April 30, 2018 (Unaudited)
The Funds are investment companies and follow accounting and reporting guidance under the Financial Accounting Standards Board (“FASB”) Accounting Standards Codification (“ASC”) Topic 946, “Financial Services-Investment Companies”.
(G) SECURITY TRANSACTIONS AND INVESTMENT INCOME
Security transactions are accounted for on a trade date basis. Interest is accrued on a daily basis and dividend income is recorded on the ex-dividend date, except that certain dividends from foreign securities are recorded when the information is available to the Fund. Realized gains and losses are determined using specific identification.
(H) DISTRIBUTIONS TO SHAREHOLDERS
The Funds usually declare and pay dividends from net investment income annually, but may do so more frequently to avoid excise tax. Distributions of net realized capital gains, if any, will be distributed at least annually.
(I) SECURITIES LENDING
The Funds may lend investment securities to investors who borrow securities in order to complete certain transactions. By lending investment securities, a Fund attempts to increase its net investment income through the receipt of interest earned on loan collateral. Any increase or decline in the market price of the securities loaned that might occur and any interest earned or dividends declared during the term of the loan would be for the account of the Fund. Risks of delay in recovery of the securities or even loss of rights in the collateral may occur should the borrower of the securities fail financially. Risk may also arise to the extent that the value of the securities loaned increases above the value of the collateral received. It is each Fund’s policy to obtain additional collateral from or return excess collateral to the borrower by the end of the next business day. Therefore, the value of the collateral may be temporarily less than the value of the securities on loan.
Funds that lend securities receive cash, cash equivalents, or other securities as collateral. Initial collateral levels shall not be less than 102% of the market value of the borrowed securities (105% if the collateral and the borrowed securities are denominated in different currencies). Marking to market is performed every business day (subject to de minimis rules of change in market value) for each Fund and each borrower is required to deliver additional collateral when necessary so that the total collateral held in the account for all loans of the Fund to the borrower will not be less than 100% of the market value of all the borrowed securities loaned to the borrower by the Fund. Any cash, cash equivalents, or other securities received as collateral is invested by the securities lending agent, Northern Trust, in accordance with pre-established guidelines as set forth in the securities lending agreement. The cash collateral is invested in the Northern Institutional Liquid Asset Portfolio (an open-end regulated investment company) and is shown on the investment portfolio for the Emerging Markets Fund. The cash collateral, if any, is reflected in the Funds’ Statements of Assets and Liabilities in the line item labeled “Investments in securities at market value.” Non-cash collateral is not shown in the Funds’ investment portfolios nor disclosed in the Statements of
| | | | |
| www.thomaswhitefunds.com | | | 53 | |
Notes to Financial Statements Period Ended April 30, 2018 (Unaudited)
Assets and Liabilities as it is held by the lending agent on behalf of the Funds, and the Funds do not have the ability to re-hypthecate those securities. A portion of the interest received on the loan collateral is retained by the Fund and the remainder is rebated to the borrower of the securities. From the interest retained by the Funds, 50% is paid to the securities lending agent for the International Fund and Emerging Markets Fund for its services. The net amount of interest earned, after the interest rebate and the allocation to the securities lending agent, is included in the statement of operations as securities lending income. The value of loaned securities and related collateral outstanding at April 30, 2018 are as follows:
| | | | | | | | | | | | | | | | |
| Fund | | Value of
Loaned
Securities | | | Value of
Cash
Collateral | | | Value of
Non-Cash
Collateral* | | | Total
Collateral | |
| Thomas White International Fund | | | $9,730,186 | | | | $0 | | | | $10,110,552 | | | | $10,110,552 | |
| | | | | |
| Thomas White Emerging Markets Fund | | | $3,715,919 | | | | $0 | | | | $3,810,019 | | | | $3,810,019 | |
| | * | Funds cannot repledge or dispose of this collateral, nor do the Funds earn any income or receive dividends with respect to this collateral. |
The International Fund and the Emerging Markets Fund have earned income on securities lending (after rebates to borrowers and allocation to the securities lending agent) as follows:
| | | | |
| Fund | | Net Income Earned | |
| Thomas White International Fund | | | $5,021 | |
| | |
| Thomas White Emerging Markets Fund | | | $5,627 | |
The Funds recently adopted guidance requiring entities to present gross obligations for secured borrowings by the type of collateral pledged and remaining time to maturity. There were no such obligations at April 30, 2018.
(J) REDEMPTION FEE
The Funds assess a 2% fee on redemptions (including exchanges) of Fund shares held for less than sixty days. Redemption fees are paid to each Fund to help offset transaction costs and to protect the Fund’s long-term shareholders. Each Fund will use the “first-in, first-out” (FIFO) method to determine the sixty-day holding period. Under this method, the date of the redemption or exchange will be compared to the earliest purchase date of shares held in the account. If this holding period is less than sixty days, the fee will be charged. The International Fund Investor Class and Class I shares charged $452 and $8, respectively in redemption fees for the period ended April 30, 2018, which were included in net capital paid.
(K) REAL ESTATE INVESTMENT TRUSTS
The American Opportunities Fund has made certain investments in real estate investment trusts (“REITs”), which pay dividends to their shareholders based upon funds available from
| | |
| 54 | | www.thomaswhitefunds.com |
Notes to Financial Statements Period Ended April 30, 2018 (Unaudited)
operations. It is quite common for these dividends to exceed the REITs’ taxable earnings and profits resulting in the excess portion of such dividends being designated as a return of capital. The American Opportunities Fund intends to include the gross dividends from such REITs in its annual distributions to its shareholders and, accordingly, a portion of the distributions received by the Fund’s shareholders may also be designated as a return of capital.
(L) RECENT ACCOUNTING PRONOUNCEMENT
In October 2016, the U.S. Securities and Exchange Commission adopted new rules and amended existing rules (together, “final rules”) intended to modernize the reporting and disclosure of information by registered investment companies. In part, the final rules amended Regulation S-X and require standardized, enhanced disclosure about derivatives in investment company financial statements, as well as other amendments. The updates to Regulation S-X went into effect as of August 1, 2017 and are reflected in this report, as applicable. These updates have no impact on the Fund’s net assets or results of operations.
NOTE 2. SIGNIFICANT SHAREHOLDER
The following table indicates the number of shareholders who held a significant portion of the shares of each Class’s outstanding shares as of April 30, 2018. Investment activities of these shareholders could have a material effect on each Fund.
| | | | | | | | | | |
| Unaudited | | | | | | | | |
| Fund | | Share Class | | Number of
Shareholders | | | % Held | |
| Emerging Markets Fund | | Investor Class | | | 2 | | | | 72.6% | |
| | | | |
| Emerging Markets Fund | | Class I | | | 1 | | | | 11.6% | |
| | | | |
| American Opportunities Fund | | Investor Class | | | 1 | | | | 19.2% | |
| | | | |
| www.thomaswhitefunds.com | | | 55 | |
Notes to Financial Statements Period Ended April 30, 2018 (Unaudited)
NOTE 3. TRANSACTIONS IN SHARES OF BENEFICIAL INTEREST
As of April 30, 2018, there were an unlimited number of $0.01 par value shares of beneficial interest authorized. Transactions are summarized as follows:
| | | | | | | | | | | | | | | | | | | | | | | | |
| International Fund | |
| | | Period Ended April 30, 2018 | | | Year Ended October 31, 2017 | |
| | | Investor Class | | | Investor Class | |
| | | Shares | | | | | | Amount | | | Shares | | | | | | Amount | |
| Shares sold | | | 28,430 | | | $ | | | | | 517,155 | | | | 272,988 | | | $ | | | | | 4,206,966 | |
| Shares issued on reinvestment of dividends & distributions | | | ------- | | | | | | | | ------- | | | | 68,249 | | | | | | | | 1,205,839 | |
| Shares redeemed | | | (311,007 | ) | | | | | | | (5,703,319 | )^ | | | (10,409,121 | ) | | | | | | | (165,146,599 | ) |
| Net decrease | | | (282,577 | ) | | $ | | | | | (5,186,164 | ) | | | (10,067,884 | ) | | $ | | | | | (159,733,794 | ) |
| Shares outstanding: | | | | | | | | | | | | | | | | | | | | | | | | |
| Beginning of period | | | 2,449,686 | | | | | | | | | | | | 12,517,570 | | | | | | | | | |
| End of period | | | 2,167,109 | | | | | | | | | | | | 2,449,686 | | | | | | | | | |
| ^ Includes redemption fees of $452 | |
| | | | | | | | | | | | | | | | | | | | | | | | |
| | | Period Ended April 30, 2018 | | | Year Ended October 31, 2017 | |
| | | Class I | | | Class I | |
| | | Shares | | | | | | Amount | | | Shares | | | | | | Amount | |
| Shares sold | | | 528,180 | | | $ | | | | | 9,585,976 | | | | 2,183,721 | | | $ | | | | | 34,990,899 | |
| Sales in connection with reorganization | | | ------- | | | | | | | | ------- | | | | 68,548 | | | | | | | | 1,053,314 | |
| Shares issued on reinvestment of dividends & distributions | | | ------- | | | | | | | | ------- | | | | 482,969 | | | | | | | | 8,346,920 | |
| Shares redeemed | | | (2,721,168 | ) | | | | | | | (50,330,440 | )^ | | | (12,780,743 | ) | | | | | | | (214,500,761 | ) |
| Net decrease | | | (2,192,988 | ) | | $ | | | | | (40,744,464 | ) | | | (10,045,505 | ) | | $ | | | | | (170,109,628 | ) |
| Shares outstanding: | | | | | | | | | | | | | | | | | | | | | | | | |
| Beginning of period | | | 15,585,266 | | | | | | | | | | | | 25,630,771 | | | | | | | | | |
| End of period | | | 13,392,278 | | | | | | | | | | | | 15,585,266 | | | | | | | | | |
| ^ Includes redemption fees of $8 | |
| | | | | | | | | | | | | | | | | | | | | | | | |
| | |
| 56 | | www.thomaswhitefunds.com |
Notes to Financial Statements Period Ended April 30, 2018 (Unaudited)
| | | | | | | | | | | | | | | | | | | | | | | | |
| | | Period Ended April 30, 2018 | | | Year Ended October 31, 2017 | |
| | | Class A* | | | Class A | |
| | | Shares | | | | | | Amount | | | Shares | | | | | | Amount | |
| Shares sold | | | ------- | | | $ | | | | | ------- | | | | 12,622 | | | $ | | | | | 184,030 | |
| Shares issued on reinvestment of dividends & distributions | | | ------- | | | | | | | | ------- | | | | 11 | | | | | | | | 158 | |
| Shares redeemed | | | ------- | | | | | | | | ------- | | | | (9,221 | ) | | | | | | | (135,830 | ) |
| Shares exchanged in connection with reorganization | | | ------- | | | | | | | | ------- | | | | (59,809 | ) | | | | | | | (915,341 | ) |
| Net decrease | | | ------- | | | $ | | | | | ------- | | | | (56,397 | ) | | $ | | | | | (866,983 | ) |
| Shares outstanding: | | | | | | | | | | | | | | | | | | | | | | | | |
| Beginning of period | | | 0 | | | | | | | | | | | | 56,397 | | | | | | | | | |
| End of period | | | 0 | | | | | | | | | | | | 0 | | | | | | | | | |
| * Class Reorganized into Class I shares on February 28, 2017. | |
| | | | | | | | | | | | | | | | | | | | | | | | |
| | | Period Ended April 30, 2018 | | | Year Ended October 31, 2017 | |
| | | Class C* | | | Class C | |
| | | Shares | | | | | | Amount | | | Shares | | | | | | Amount | |
| Shares sold | | | ------- | | | $ | | | | | ------- | | | | ------- | | | $ | | | | | ------- | |
| Shares issued on reinvestment of dividends & distributions | | | ------- | | | | | | | | ------- | | | | ------- | | | | | | | | ------- | |
| Shares redeemed | | | ------- | | | | | | | | ------- | | | | (3,843 | ) | | | | | | | (57,645 | ) |
| Shares exchanged in connection with reorganization | | | ------- | | | | | | | | ------- | | | | (8,983 | ) | | | | | | | (137,973 | ) |
| Net decrease | | | ------- | | | $ | | | | | ------- | | | | (12,826 | ) | | | | | | $ | (195,618 | ) |
| Shares outstanding: | | | | | | | | | | | | | | | | | | | | | | | | |
| Beginning of period | | | 0 | | | | | | | | | | | | 12,826 | | | | | | | | | |
| End of period | | | 0 | | | | | | | | | | | | 0 | | | | | | | | | |
| * Class Reorganized into Class I shares on February 28, 2017. | |
| | | | | | | | | | | | | | | | | | | | | | | | |
| Emerging Markets Fund | |
| | | Period Ended April 30, 2018 | | | Year Ended October 31, 2017 | |
| | | Investor Class | | | Investor Class | |
| | | Shares | | | | | | Amount | | | Shares | | | | | | Amount | |
| Shares sold | | | 2,816 | | | $ | | | | | 35,050 | | | | 919 | | | $ | | | | | 9,450 | |
| Shares issued on reinvestment of dividends & distributions | | | ------- | | | | | | | | ------- | | | | 1,525 | | | | | | | | 16,822 | |
| Shares redeemed | | | (3,957 | ) | | | | | | | (48,038 | ) | | | (10,560 | ) | | | | | | | (108,272 | ) |
| Net decrease | | | (1,141 | ) | | $ | | | | | (12,988 | ) | | | (8,116 | ) | | $ | | | | | (82,000 | ) |
| Shares outstanding: | | | | | | | | | | | | | | | | | | | | | | | | |
| Beginning of period | | | 177,271 | | | | | | | | | | | | 185,387 | | | | | | | | | |
| End of period | | | 176,130 | | | | | | | | | | | | 177,271 | | | | | | | | | |
| | | | |
| www.thomaswhitefunds.com | | | 57 | |
Notes to Financial Statements Period Ended April 30, 2018 (Unaudited)
| | | | | | | | | | | | | | | | | | | | | | | | |
| | | Period Ended April 30, 2018 | | | Year Ended October 31, 2017 | |
| | | Class I | | | Class I | |
| | | Shares | | | | | | Amount | | | Shares | | | | | | Amount | |
| Shares sold | | | 81,768 | | | $ | | | | | 1,014,868 | | | | 230,984 | | | $ | | | | | 2,485,119 | |
| Sales in connection with reorganization | | | ------- | | | | | | | | ------- | | | | 32,678 | | | | | | | | 323,653 | |
| Shares issued on reinvestment of dividends & distributions | | | ------- | | | | | | | | ------- | | | | 69,841 | | | | | | | | 772,245 | |
| Shares redeemed | | | (985,524 | ) | | | | | | | (12,046,393 | ) | | | (4,062,521 | ) | | | | | | | (42,645,912 | ) |
| Net decrease | | | (903,756 | ) | | $ | | | | | (11,031,525 | ) | | | (3,729,018 | ) | | $ | | | | | (39,064,895 | ) |
| Shares outstanding: | | | | | | | | | | | | | | | | | | | | | | | | |
| Beginning of period | | | 3,988,413 | | | | | | | | | | | | 7,717,431 | | | | | | | | | |
| End of period | | | 3,084,657 | | | | | | | | | | | | 3,988,413 | | | | | | | | | |
| | | | | | | | | | | | | | | | | | | | | | | | |
| | | Period Ended April 30, 2018 | | | Year Ended October 31, 2017 | |
| | | Class A* | | | Class A | |
| | | Shares | | | | | | Amount | | | Shares | | | | | | Amount | |
| Shares sold | | | ------- | | | $ | | | | | ------- | | | | ------- | | | $ | | | | | ------- | |
| Shares issued on reinvestment of dividends & distributions | | | ------- | | | | | | | | ------- | | | | ------- | | | | | | | | ------- | |
| Shares redeemed | | | ------- | | | | | | | | ------- | | | | (2 | ) | | | | | | | (18 | ) |
| Shares exchanged in connection with reorganization | | | ------- | | | | | | | | ------- | | | | (8,360 | ) | | | | | | | (82,158 | ) |
| Net increase (decrease) | | | ------- | | | $ | | | | | ------- | | | | (8,362 | ) | | $ | | | | | (82,176 | ) |
| Shares outstanding: | | | | | | | | | | | | | | | | | | | | | | | | |
| Beginning of period | | | 0 | | | | | | | | | | | | 8,362 | | | | | | | | | |
| End of period | | | 0 | | | | | | | | | | | | 0 | | | | | | | | | |
| * Class Reorganized into Class I shares on February 28, 2017. | |
| | | | | | | | | | | | | | | | | | | | | | | | |
| | | Period Ended April 30, 2018 | | | Year Ended October 31, 2017 | |
| | | Class C* | | | Class C | |
| | | Shares | | | | | | Amount | | | Shares | | | | | | Amount | |
| Shares sold | | | ------- | | | $ | | | | | ------- | | | | ------- | | | $ | | | | | ------- | |
| Shares issued on reinvestment of dividends & distributions | | | ------- | | | | | | | | ------- | | | | ------- | | | | | | | | ------- | |
| Shares redeemed | | | ------- | | | | | | | | ------- | | | | (2 | ) | | | | | | | (18 | ) |
| Shares exchanged in connection with reorganization | | | ------- | | | | | | | | ------- | | | | (24,712 | ) | | | | | | | (241,495 | ) |
| Net increase (decrease) | | | ------- | | | $ | | | | | ------- | | | | (24,714 | ) | | $ | | | | | (241,513 | ) |
| Shares outstanding: | | | | | | | | | | | | | | | | | | | | | | | | |
| Beginning of period | | | 0 | | | | | | | | | | | | 24,714 | | | | | | | | | |
| End of period | | | 0 | | | | | | | | | | | | 0 | | | | | | | | | |
| * Class Reorganized into Class I shares on February 28, 2017. | |
| | |
| 58 | | www.thomaswhitefunds.com |
Notes to Financial Statements Period Ended April 30, 2018 (Unaudited)
| | | | | | | | | | | | | | | | | | | | | | | | |
| American Opportunities Fund | |
| | | Period Ended April 30, 2018 | | | Year Ended October 31, 2017 | |
| | | Investor Class | | | Investor Class | |
| | | Shares | | | | | | Amount | | | Shares | | | | | | Amount | |
| Shares sold | | | 92,446 | | | $ | | | | | 1,547,289 | | | | 43,875 | | | $ | | | | | 739,907 | |
| Shares issued on reinvestment of dividends & distributions | | | ------- | | | | | | | | ------- | | | | 205,012 | | | | | | | | 3,387,229 | |
| Shares redeemed | | | (14,400 | ) | | | | | | | (241,154 | ) | | | (205,152 | ) | | | | | | | (3,412,158 | ) |
| Net increase | | | 78,046 | | | $ | | | | | 1,306,135 | | | | 43,735 | | | $ | | | | | 714,978 | |
| Shares outstanding: | | | | | | | | | | | | | | | | | | | | | | | | |
| Beginning of period | | | 2,512,548 | | | | | | | | | | | | 2,468,813 | | | | | | | | | |
| End of period | | | 2,590,594 | | | | | | | | | | | | 2,512,548 | | | | | | | | | |
NOTE 4. INVESTMENT MANAGEMENT FEES AND OTHER TRANSACTIONS WITH AFFILIATES
Each Fund pays a monthly investment management fee to Thomas White International, Ltd. (the “Advisor”) at the rate of 0.85% of the Fund’s average daily net assets annually. For the period ended April 30, 2018, the International Fund, Emerging Markets Fund and American Opportunities Fund paid the Advisor $1,321,358, $186,450 and $181,750, respectively, in investment management fees.
During the period ended April 30, 2018, the Advisor has contractually agreed to reimburse its management fee and/or reimburse the Funds’ operating expenses to the extent necessary to ensure that each Fund’s annual operating expenses do not exceed the following percentages of average daily net assets:
| | | | | | | | |
| | | Investor Class | | | Class I | |
| International Fund | | | 1.24% | | | | 0.99% | |
| | | |
| Emerging Markets Fund | | | 1.34% | | | | 1.09% | |
| | | |
| American Opportunities Fund | | | 1.34% | | | | n/a | |
These agreements to reimburse fees renew automatically unless the Advisor gives written notice to end them.
The Advisor may recoup any previously waived amount from a Fund pursuant to the expense limitation agreements if such reimbursement does not cause the Fund to exceed either (i) the current expense limitation or (ii) the expense limitation in effect at the time the expense is waived, provided the reimbursement is made within three years after the year in which the Advisor incurred the expense. For the period ended April 30, 2018, the Advisor did not recoup any previously waived expenses.
| | | | |
| www.thomaswhitefunds.com | | | 59 | |
Notes to Financial Statements Period Ended April 30, 2018 (Unaudited)
As of April 30, 2018, the International and Emerging Markets Funds had the following amounts (and year of expiration) subject to repayment to the Advisor:
| | | | | | | | | | | | | | |
| Fund | | Share Class | | Year Fees Waived | | | Repayment Expires | | | Balance | |
| International Fund | | Investor Class | | | 2015 | | | | 2018 | | | | $235,702 | |
| | | | | |
| International Fund | | Investor Class | | | 2016 | | | | 2019 | | | | $185,995 | |
| | | | | |
| International Fund | | Investor Class | | | 2017 | | | | 2020 | | | | $115,940 | |
| | | | | |
| International Fund | | Investor Class | | | 2018 | | | | 2021 | | | | $34,070 | |
| | | | | |
| International Fund | | Class I | | | 2015 | | | | 2018 | | | | $309,206 | |
| | | | | |
| International Fund | | Class I | | | 2016 | | | | 2019 | | | | $376,987 | |
| | | | | |
| International Fund | | Class I | | | 2017 | | | | 2020 | | | | $535,417 | |
| | | | | |
| International Fund | | Class I | | | 2018 | | | | 2021 | | | | $277,261 | |
| | | | | |
| Emerging Markets Fund | | Investor Class | | | 2017 | | | | 2020 | | | | $2,618 | |
| | | | | |
| Emerging Markets Fund | | Investor Class | | | 2018 | | | | 2021 | | | | $2,071 | |
| | | | | |
| Emerging Markets Fund | | Class I | | | 2015 | | | | 2018 | | | | $126,544 | |
| | | | | |
| Emerging Markets Fund | | Class I | | | 2016 | | | | 2019 | | | | $150,335 | |
| | | | | |
| Emerging Markets Fund | | Class I | | | 2017 | | | | 2020 | | | | $195,908 | |
| | | | | |
| Emerging Markets Fund | | Class I | | | 2018 | | | | 2021 | | | | $87,097 | |
The Funds and U.S. Bancorp Fund Services, LLC (the “Administrator”) are parties to a Fund Administration Servicing Agreement. The Administrator provides administrative and fund accounting services pursuant to this agreement.
The Advisor and the Funds have adopted a Business Management Agreement under which the Advisor provides certain business management services to the Funds, including, without limitation, monitoring of the Funds’ relationships with third-party service providers and assisting with necessary and appropriate services to the Board of Trustees of the Trust, as well as either providing the Trust with or procuring for the Trust the services of a Chief Compliance Officer in accordance with Rule 38a-1 of the 1940 Act, in the event so requested. For these services, the Advisor is entitled to receive a fee from each Fund at a rate of 0.035% of the Fund’s average daily net assets. For the period ended April 30, 2018, for the services provided under the Business Management Agreement, the International Fund, Emerging Markets Fund, and American Opportunities Fund paid the Advisor $54,409, $7,677 and $7,484, respectively.
The Funds have adopted an Administrative Services Plan pursuant to which the Investor Class shares are authorized to make payments to certain entities, which may include banks, broker-dealers and other types of service providers, for providing administrative services with respect to shares of the Funds attributable to or held in the name of the service provider for its clients or customers with whom they have a servicing relationship. Under the terms of the Administrative Services Plan, Investor Class shares are authorized to make payments up to a maximum rate of 0.25% of the average daily net assets of the shares attributable to or held in the name of the
| | |
| 60 | | www.thomaswhitefunds.com |
Notes to Financial Statements Period Ended April 30, 2018 (Unaudited)
service provider for providing the types of applicable administrative services covered under the terms of the Plan. For the period ended April 30, 2018, fees incurred by the International Fund pursuant to the Administrative Services Plan were $43,234 for Investor Class. For the period ended April 30, 2018, fees incurred by the Emerging Markets Fund pursuant to the Administrative Services Plan were $260 for Investor Class. For the period ended April 30, 2018, fees incurred by the American Opportunities Fund pursuant to the Administrative Services Plan were $33,690 for Investor Class shares.
NOTE 5. CUSTODIAN AND TRANSFER AGENT FEES
Custodian Fees - Northern Trust is the custodian for the International Fund and Emerging Markets Fund. U.S. Bank is the custodian for the American Opportunities Fund. Northern Trust bills the International Fund and the Emerging Markets Fund quarterly based on the value of their holdings as of the previous quarter end plus transaction fees. U.S. Bank bills the American Opportunities Fund monthly based on the ending value of its holdings plus transaction fees.
Transfer Agent - U.S. Bancorp serves as the Funds’ transfer agent. Under the terms of the transfer agent agreement, U.S. Bancorp is entitled to account-based fees along with reimbursement of out-of-pocket expenses incurred in providing transfer agent services.
NOTE 6. INVESTMENT TRANSACTIONS
During the period ended April 30, 2018, the cost of purchases and the proceeds from sales of investment securities, other than short-term investments, were as follows:
| | | | | | | | |
| Fund | | Purchases | | | Sales | |
| International Fund | | | $83,053,522 | | | | $146,062,979 | |
| | | |
| Emerging Markets Fund | | | 11,737,606 | | | | 24,325,216 | |
| | | |
| American Opportunities Fund | | | 10,654,950 | | | | 10,312,323 | |
The American Opportunities Fund did not purchase or sell long-term U.S. Government securities during the period ended April 30, 2018. The International Fund and Emerging Markets Fund did not directly purchase or sell long term U.S. Government securities, except for purposes of securities lending during the period ended April 30, 2018.
At October 31, 2017, the aggregate gross unrealized appreciation and depreciation of portfolio securities, based upon cost for federal income tax purposes, were as follows:
| | | | | | | | | | | | | | | | |
| Fund | | Tax Cost | | | Unrealized
Appreciation | | | Unrealized
Depreciation | | | Net Unrealized
Appreciation/
(Depreciation) | |
| International Fund | | | $254,811,024 | | | | $68,384,262 | | | | $(6,831,733) | | | | $61,552,529 | |
| | | | | |
| Emerging Markets Fund | | | 37,811,858 | | | | 11,688,838 | | | | (957,229) | | | | 10,731,609 | |
| | | | | |
| American Opportunities Fund | | | 31,309,987 | | | | 11,349,302 | | | | (1,803,135) | | | | 9,546,167 | |
| | | | |
| www.thomaswhitefunds.com | | | 61 | |
Notes to Financial Statements Period Ended April 30, 2018 (Unaudited)
Distributions to Shareholders
The Funds will distribute net investment income and net realized gains, if any, at least once a year. The amount of distributions from net investment income and net realized gains are determined in accordance with federal income tax regulations, which may differ from generally accepted accounting principles. These “book/tax” differences are either temporary or permanent in nature and are primarily due to differing treatments for passive foreign investment companies and losses deferred due to wash sales. Permanent differences, primarily due to reclassification of REIT income, resulted in reclassifications among the Funds’ components of net assets at October 31, 2017, the Funds’ tax year-end. For the International Fund, permanent differences resulted in reclassification of ($275,660) in undistributed net investment income and $275,660 in accumulated net realized loss. For the Emerging Markets Fund, permanent differences resulted in reclassification of $171,463 in undistributed net investment income/(loss), ($160,828) in accumulated net realized gain/(loss) and ($10,635) in paid in capital. For the American Opportunities Fund, permanent differences resulted in reclassification of $9,563 in undistributed net investment income and ($9,563) in accumulated net realized gain.
| | | | | | | | | | | | | | | | | | | | |
| Fund | | Undistributed
Ordinary
Income | | | Undistributed
Long-term
Gains | | | Net
Unrealized
Appreciation | | | Other
Accumulated
Losses | | | Total
Distributable
Earnings | |
| International Fund | | | $------- | | | | $858,431 | | | | $61,552,529 | | | | $(52,614) | | | | $62,358,346 | |
| | | | | | |
| Emerging Markets Fund | | | ------- | | | | ------- | | | | 10,731,609 | | | | (11,836,227) | | | | (1,104,618) | |
| | | | | | |
| American Opportunities Fund | | | ------- | | | | 429,558 | | | | 9,546,167 | | | | ------- | | | | 9,975,725 | |
Under the Regulated Investment Company Modernization Act of 2010, the Funds are permitted to carry forward capital losses incurred in taxable years beginning after December 22, 2010 for an unlimited period, and such capital losses will retain their character as either short-term or long-term capital losses.
As of October 31, 2017, the Emerging Markets Fund had $7,526,343 in short-term capital loss carry forwards with no expiration, and had $4,306,872 in long-term capital loss carryforwards with no expiration.
During the period ended April 30, 2018, the Funds did not pay any dividends.
| | |
| 62 | | www.thomaswhitefunds.com |
Notes to Financial Statements Period Ended April 30, 2018 (Unaudited)
The tax character of distributions paid during the period shown below were as follows:
| | | | | | | | | | | | | | | | |
| | | Year Ended October 31, 2017 | |
| | | Ordinary
Income | | | Return of
Capital | | | Long-Term
Capital Gains | | | Total
Distributions | |
| International Fund | | | $7,248,662 | | | | $------- | | | | $4,403,622 | | | | $11,652,284 | |
| | | | | |
| Emerging Markets Fund | | | 900,556 | | | | ------- | | | | ------- | | | | 900,556 | |
| | | | | |
| American Opportunities Fund | | | 352,734 | | | | ------- | | | | 3,221,146 | | | | 3,573,880 | |
| | | | | | | | | | | | | | | | | |
NOTE 7. REORGANIZATION OF SHARE CLASSES
Effective upon the close of business on February 28, 2017, the outstanding Class A and Class C shares of the Thomas White International Fund and the Thomas White Emerging Markets Fund were converted into Class I shares of their respective Funds, as applicable (the “Class Conversion”) pursuant to the Supplement to the Prospectus dated January 31, 2017. The Class Conversion was completed based on the share classes’ relative net asset values on the Conversion Date, without the imposition of any sales charge or any other charge as detailed below:
| | | | | | | | | | | | | | | | |
| International Fund | | Shares
Outstanding | | | Net
Assets | | | NAV
per Share | | | Share
Conversion Ratio | |
| Class A | | | 59,809 | | | | $915,341 | | | | $15.30 | | | | 0.9954 | |
| | | | | |
| Class C | | | 8,983 | | | | $137,973 | | | | $15.36 | | | | 0.9993 | |
| | | | | |
| Class I (Before Conversion) | | | 24,117,542 | | | | $370,573,288 | | | | $15.37 | | | | ------- | |
| | | | | |
| Class I (After Conversion) | | | 24,186,090 | | | | $371,626,602 | | | | $15.37 | | | | ------- | |
| | | | | | | | | | | | | | | | |
| Emerging Markets Fund | | Shares
Outstanding | | | Net
Assets | | | NAV
per Share | | | Share
Conversion Ratio | |
| Class A | | | 8,360 | | | | $82,158 | | | | $9.83 | | | | 0.9929 | |
| | | | | |
| Class C | | | 24,712 | | | | $241,495 | | | | $9.77 | | | | 0.9869 | |
| | | | | |
| Class I (Before Conversion) | | | 7,301,169 | | | | $72,300,755 | | | | $9.90 | | | | ------- | |
| | | | | |
| Class I (After Conversion) | | | 7,333,847 | | | | $72,624,408 | | | | $9.90 | | | | ------- | |
NOTE 8. SUBSEQUENT EVENTS
In preparing these financial statements, the Trust has evaluated events after April 30, 2018 and determined that there were no significant subsequent events that would require adjustment to or additional disclosure in these financial statements.
| | | | |
| www.thomaswhitefunds.com | | | 63 | |
Six Months Ended April 30, 2018 (Unaudited)
FINANCIAL HIGHLIGHTS
| | | | | | | | | | | | | | | | | | | | | | | | | | | | | | | | | | | | | | | | | | | | | | | | |
| Thomas White International Fund - Investor Class | |
| | | | | | Six
Months
Ended
April 30,
2018 | | | | | | Year
Ended
October 31,
2017 | | | | | | Year
Ended
October 31,
2016 | | | | | | Year
Ended
October 31,
2015 | | | | | | Year
Ended
October 31,
2014 | | | | | | Year
Ended
October 31,
2013 | |
| |
| Per share operating performance (For a share outstanding throughout each period) | |
| Net asset value, beginning of period | | | $ | | | | 17.88 | | | | $ | | | | 14.97 | | | | $ | | | | 15.77 | | | | $ | | | | 16.95 | | | | $ | | | | 19.16 | | | | $ | | | | 16.55 | |
| | | | | | | | | | | | | |
| Income from investment operations: | | | | | | | | | | | | | | | | | | | | | | | | | | | | | | | | | | | | | | | | | | | | | | | | |
Net investment income 1 | | | | | | | 0.11 | | | | | | | | 0.14 | | | | | | | | 0.17 | | | | | | | | 0.19 | | | | | | | | 0.26 | | | | | | | | 0.26 | |
Net realized and unrealized gains/(losses) | | | | | | | 0.34 | | | | | | | | 3.30 | | | | | | | | (0.81 | ) | | | | | | | (1.17 | ) | | | | | | | (0.89 | ) | | | | | | | 2.57 | |
| Total from investment operations | | | | | | | 0.45 | | | | | | | | 3.44 | | | | | | | | (0.64 | ) | | | | | | | (0.98 | ) | | | | | | | (0.63 | ) | | | | | | | 2.83 | |
| | | | | | | | | | | | | |
| Distributions: | | | | | | | | | | | | | | | | | | | | | | | | | | | | | | | | | | | | | | | | | | | | | | | | |
From net investment income | | | | | | | ------- | | | | | | | | (0.28 | ) | | | | | | | (0.16 | ) | | | | | | | (0.20 | ) | | | | | | | (0.26 | ) | | | | | | | (0.22 | ) |
From net realized gains | | | | | | | ------- | | | | | | | | (0.25 | ) | | | | | | | ------- | | | | | | | | ------- | | | | | | | | (1.32 | ) | | | | | | | ------- | |
Tax return of capital | | | | | | | ------- | | | | | | | | ------- | | | | | | | | ------- | | | | | | | | ------- | | | | | | | | ------- | | | | | | | | (0.00 | ) 2 |
| Total Distributions | | | | | | | ------- | | | | | | | | (0.53 | ) | | | | | | | (0.16 | ) | | | | | | | (0.20 | ) | | | | | | | (1.58 | ) | | | | | | | (0.22 | ) |
| Change in net asset value for the period | | | | | | | 0.45 | | | | | | | | 2.91 | | | | | | | | (0.80 | ) | | | | | | | (1.18 | ) | | | | | | | (2.21 | ) | | | | | | | 2.61 | |
| Net asset value, end of period | | | $ | | | | 18.33 | | | | $ | | | | 17.88 | | | | $ | | | | 14.97 | | | | $ | | | | 15.77 | | | | $ | | | | 16.95 | | | | $ | | | | 19.16 | |
| Total Return | | | | | | | 2.46% | 3 | | | | | | | 23.06% | | | | | | | | (4.08)% | | | | | | | | (5.77)% | | | | | | | | (3.00)% | | | | | | | | 17.13% | |
| | | | | | | | | | | | | |
| Ratios/supplemental data | | | | | | | | | | | | | | | | | | | | | | | | | | | | | | | | | | | | | | | | | | | | | | | | |
| Net assets, end of period (000) | | | $ | | | | 39,724 | | | | $ | | | | 43,811 | | | | $ | | | | 187,408 | | | | $ | | | | 268,518 | | | | $ | | | | 369,098 | | | | $ | | | | 433,483 | |
| | | | | | | | | | | | | |
| Ratio to average net assets: | | | | | | | | | | | | | | | | | | | | | | | | | | | | | | | | | | | | | | | | | | | | | | | | |
| Expenses (net of reimbursement) | | | | | | | 1.24% | 4 | | | | | | | 1.24% | | | | | | | | 1.24% | | | | | | | | 1.24% | | | | | | | | 1.24% | | | | | | | | 1.24% | |
| Expenses (prior to reimbursement) | | | | | | | 1.40% | 4 | | | | | | | 1.36% | | | | | | | | 1.33% | | | | | | | | 1.32% | | | | | | | | 1.27% | | | | | | | | 1.31% | |
Net investment income
(net of reimbursement) | | | | | | | 1.19% | 4 | | | | | | | 0.90% | | | | | | | | 1.16% | | | | | | | | 1.16% | | | | | | | | 1.36% | | | | | | | | 1.43% | |
Net investment income
(prior to reimbursement) | | | | | | | 1.03% | 4 | | | | | | | 0.78% | | | | | | | | 1.07% | | | | | | | | 1.08% | | | | | | | | 1.33% | | | | | | | | 1.36% | |
| Portfolio turnover rate 5 | | | | | | | 27% | | | | | | | | 48% | | | | | | | | 60% | | | | | | | | 57% | | | | | | | | 62% | | | | | | | | 42% | |
| (1) | Net investment income per share represents net investment income divided by the average shares outstanding throughout the period. |
| (2) | Amount is less than $0.005. |
| (5) | Portfolio turnover is calculated on the basis of the Fund as a whole without distinguishing between the classes of shares issued. |
The accompanying notes are an integral part of these financial statements
| | |
| 64 | | www.thomaswhitefunds.com |
Six Months Ended April 30, 2018 (Unaudited)
FINANCIAL HIGHLIGHTS
| | | | | | | | | | | | | | | | | | | | | | | | | | | | | | | | | | | | | | | | | | | | | | | | |
| Thomas White International Fund - Class I | |
| | | | | | Six
Months
Ended
April 30,
2018 | | | | | | Year
Ended
October 31,
2017 | | | | | | Year
Ended
October 31,
2016 | | | | | | Year
Ended
October 31,
2015 | | | | | | Year
Ended
October 31,
2014 | | | | | | Year
Ended
October 31,
2013 | |
| |
| Per share operating performance (For a share outstanding throughout each period) | |
| Net asset value, beginning of period | | | $ | | | | 17.79 | | | | $ | | | | 14.98 | | | | $ | | | | 15.78 | | | | $ | | | | 16.97 | | | | $ | | | | 19.18 | | | | $ | | | | 16.56 | |
| | | | | | | | | | | | | |
| Income from investment operations: | | | | | | | | | | | | | | | | | | | | | | | | | | | | | | | | | | | | | | | | | | | | | | | | |
Net investment income 1 | | | | | | | 0.13 | | | | | | | | 0.25 | | | | | | | | 0.23 | | | | | | | | 0.23 | | | | | | | | 0.30 | | | | | | | | 0.29 | |
Net realized and unrealized gains/(losses) | | | | | | | 0.34 | | | | | | | | 3.22 | | | | | | | | (0.83 | ) | | | | | | | (1.17 | ) | | | | | | | (0.89 | ) | | | | | | | 2.59 | |
| Total from investment operations | | | | | | | 0.47 | | | | | | | | 3.47 | | | | | | | | (0.60 | ) | | | | | | | (0.94 | ) | | | | | | | (0.59 | ) | | | | | | | 2.88 | |
| | | | | | | | | | | | | |
| Distributions: | | | | | | | | | | | | | | | | | | | | | | | | | | | | | | | | | | | | | | | | | | | | | | | | |
From net investment income | | | | | | | ------- | | | | | | | | (0.41 | ) | | | | | | | (0.20 | ) | | | | | | | (0.25 | ) | | | | | | | (0.30 | ) | | | | | | | (0.26 | ) |
From net realized gains | | | | | | | ------- | | | | | | | | (0.25 | ) | | | | | | | ------- | | | | | | | | ------- | | | | | | | | (1.32 | ) | | | | | | | ------- | |
Tax return of capital | | | | | | | ------- | | | | | | | | ------- | | | | | | | | ------- | | | | | | | | ------- | | | | | | | | ------- | | | | | | | | (0.00 | ) 2 |
| Total Distributions | | | | | | | ------- | | | | | | | | (0.66 | ) | | | | | | | (0.20 | ) | | | | | | | (0.25 | ) | | | | | | | (1.62 | ) | | | | | | | (0.26 | ) |
| Change in net asset value for the period | | | | | | | 0.47 | | | | | | | | 2.81 | | | | | | | | (0.80 | ) | | | | | | | (1.19 | ) | | | | | | | (2.21 | ) | | | | | | | 2.62 | |
| Net asset value, end of period | | | $ | | | | 18.26 | | | | $ | | | | 17.79 | | | | $ | | | | 14.98 | | | | $ | | | | 15.78 | | | | $ | | | | 16.97 | | | | $ | | | | 19.18 | |
| Total Return | | | | | | | 2.64% | 3 | | | | | | | 23.23% | | | | | | | | (3.81)% | | | | | | | | (5.56)% | | | | | | | | (2.76)% | | | | | | | | 17.40% | |
| | | | | | | | | | | | | |
| Ratios/supplemental data | | | | | | | | | | | | | | | | | | | | | | | | | | | | | | | | | | | | | | | | | | | | | | | | |
| Net assets, end of period (000) | | | $ | | | | 244,514 | | | | $ | | | | 277,287 | | | | $ | | | | 384,017 | | | | $ | | | | 300,331 | | | | $ | | | | 443,397 | | | | $ | | | | 453,564 | |
| | | | | | | | | | | | | |
| Ratio to average net assets: | | | | | | | | | | | | | | | | | | | | | | | | | | | | | | | | | | | | | | | | | | | | | | | | |
| Expenses (net of reimbursement) | | | | | | | 0.99% | 4 | | | | | | | 0.99% | | | | | | | | 0.99% | | | | | | | | 0.99% | | | | | | | | 0.99% | | | | | | | | 0.99% | |
| Expenses (prior to reimbursement) | | | | | | | 1.20% | 4 | | | | | | | 1.14% | | | | | | | | 1.10% | | | | | | | | 1.08% | | | | | | | | 1.05% | | | | | | | | 1.11% | |
Net investment income
(net of reimbursement) | | | | | | | 1.41% | 4 | | | | | | | 1.53% | | | | | | | | 1.53% | | | | | | | | 1.40% | | | | | | | | 1.59% | | | | | | | | 1.62% | |
Net investment income
(prior to reimbursement) | | | | | | | 1.20% | 4 | | | | | | | 1.38% | | | | | | | | 1.42% | | | | | | | | 1.31% | | | | | | | | 1.53% | | | | | | | | 1.50% | |
| Portfolio turnover rate 5 | | | | | | | 27% | | | | | | | | 48% | | | | | | | | 60% | | | | | | | | 57% | | | | | | | | 62% | | | | | | | | 42% | |
| (1) | Net investment income per share represents net investment income divided by the average shares outstanding throughout the period. |
| (2) | Amount is less than $0.005. |
| (5) | Portfolio turnover is calculated on the basis of the Fund as a whole without distinguishing between the classes of shares issued. |
The accompanying notes are an integral part of these financial statements
| | | | |
| www.thomaswhitefunds.com | | | 65 | |
Six Months Ended April 30, 2018 (Unaudited)
FINANCIAL HIGHLIGHTS
| | | | | | | | | | | | | | | | | | | | | | | | | | | | | | | | | | | | | | | | | | | | | | | | |
| Thomas White Emerging Markets Fund - Investor Class | |
| | | | | | Six
Months
Ended
April 30,
2018 | | | | | | Year
Ended
October 31,
2017 | | | | | | Year
Ended
October 31,
2016 | | | | | | Year
Ended
October 31,
2015 | | | | | | Year
Ended
October 31,
2014 | | | | | | Year
Ended
October 31,
2013 | |
| |
| Per share operating performance (For a share outstanding throughout each period) | |
| Net asset value, beginning of period | | | $ | | | | 11.30 | | | | $ | | | | 9.80 | | | | $ | | | | 9.46 | | | | $ | | | | 11.55 | | | | $ | | | | 11.72 | | | | $ | | | | 11.21 | |
| | | | | | | | | | | | | |
| Income from investment operations: | | | | | | | | | | | | | | | | | | | | | | | | | | | | | | | | | | | | | | | | | | | | | | | | |
Net investment income 1 | | | | | | | 0.02 | | | | | | | | 0.09 | | | | | | | | 0.05 | | | | | | | | 0.08 | | | | | | | | 0.13 | | | | | | | | 0.13 | |
Net realized and unrealized gains/(losses) | | | | | | | 0.53 | | | | | | | | 1.57 | | | | | | | | 0.37 | | | | | | | | (2.08 | ) | | | | | | | (0.18 | ) | | | | | | | 0.47 | |
| Total from investment operations | | | | | | | 0.55 | | | | | | | | 1.66 | | | | | | | | 0.42 | | | | | | | | (2.00 | ) | | | | | | | (0.05 | ) | | | | | | | 0.60 | |
| Distributions from net investment income | | | | | | | ------- | | | | | | | | (0.16 | ) | | | | | | | (0.08 | ) | | | | | | | (0.09 | ) | | | | | | | (0.12 | ) | | | | | | | (0.09 | ) |
| Change in net asset value for the period | | | | | | | 0.55 | | | | | | | | 1.50 | | | | | | | | 0.34 | | | | | | | | (2.09 | ) | | | | | | | (0.17 | ) | | | | | | | 0.51 | |
| Net asset value, end of period | | | $ | | | | 11.85 | | | | $ | | | | 11.30 | | | | $ | | | | 9.80 | | | | $ | | | | 9.46 | | | | $ | | | | 11.55 | | | | $ | | | | 11.72 | |
| Total Return | | | | | | | 4.87% 2 | | | | | | | | 17.02% | | | | | | | | 4.48% | | | | | | | | (17.31)% | | | | | | | | (0.40)% | | | | | | | | 5.36% | |
| | | | | | | | | | | | | |
| Ratios/supplemental data | | | | | | | | | | | | | | | | | | | | | | | | | | | | | | | | | | | | | | | | | | | | | | | | |
| | | | | | | | | | | | | |
| Net assets, end of period (000) | | | $ | | | | 2,087 | | | | $ | | | | 2,002 | | | | $ | | | | 1,816 | | | | $ | | | | 4,172 | | | | $ | | | | 5,182 | | | | $ | | | | 5,703 | |
| | | | | | | | | | | | | |
| Ratio to average net assets: | | | | | | | | | | | | | | | | | | | | | | | | | | | | | | | | | | | | | | | | | | | | | | | | |
Expenses
(net of reimbursement/recoupment) | | | | | | | 1.34% | 3 | | | | | | | 1.34% | | | | | | | | 1.34% | | | | | | | | 1.34% | | | | | | | | 1.34% | | | | | | | | 1.34% | |
Expenses
(prior to reimbursement/recoupment) | | | | | | | 1.54% | 3 | | | | | | | 1.48% | | | | | | | | 1.31% | | | | | | | | 1.27% | | | | | | | | 1.29% | | | | | | | | 1.63% | |
Net investment income
(net of reimbursement/recoupment) | | | | | | | 0.32% | 3 | | | | | | | 0.90% | | | | | | | | 0.59% | | | | | | | | 0.75% | | | | | | | | 1.16% | | | | | | | | 1.14% | |
Net investment income
(prior to reimbursement/recoupment) | | | | | | | 0.12% | 3 | | | | | | | 0.76% | | | | | | | | 0.62% | | | | | | | | 0.82% | | | | | | | | 1.21% | | | | | | | | 0.85% | |
| Portfolio turnover rate 4 | | | | | | | 27% | | | | | | | | 67% | | | | | | | | 57% | | | | | | | | 27% | | | | | | | | 64% | | | | | | | | 54% | |
| (1) | Net investment income per share represents net investment income divided by the average shares outstanding throughout the period. |
| (4) | Portfolio turnover is calculated on the basis of the Fund as a whole without distinguishing between the classes of shares issued. |
The accompanying notes are an integral part of these financial statements
| | |
| 66 | | www.thomaswhitefunds.com |
Six Months Ended April 30, 2018 (Unaudited)
FINANCIAL HIGHLIGHTS
| | | | | | | | | | | | | | | | | | | | | | | | | | | | | | | | | | | | | | | | | | | | | | | | |
| Thomas White Emerging Markets Fund - Class I | |
| | | | | | Six
Months
Ended
April 30,
2018 | | | | | | Year
Ended
October 31,
2017 | | | | | | Year Ended
October 31,
2016 | | | | | | Year Ended
October 31,
2015 | | | | | | Year Ended
October 31,
2014 | | | | | | Year Ended
October 31,
2013 | |
| |
| Per share operating performance (For a share outstanding throughout each period) | |
| Net asset value, beginning of period | | | $ | | | | 11.38 | | | | $ | | | | 9.88 | | | | $ | | | | 9.52 | | | | $ | | | | 11.59 | | | | $ | | | | 11.73 | | | | $ | | | | 11.21 | |
| | | | | | | | | | | | | |
| Income from investment operations: | | | | | | | | | | | | | | | | | | | | | | | | | | | | | | | | | | | | | | | | | | | | | | | | |
Net investment income 1 | | | | | | | 0.03 | | | | | | | | 0.11 | | | | | | | | 0.09 | | | | | | | | 0.11 | | | | | | | | 0.14 | | | | | | | | 0.13 | |
Net realized and unrealized gains/(losses) | | | | | | | 0.54 | | | | | | | | 1.59 | | | | | | | | 0.36 | | | | | | | | (2.09 | ) | | | | | | | (0.16 | ) | | | | | | | 0.48 | |
| Total from investment operations | | | | | | | 0.57 | | | | | | | | 1.70 | | | | | | | | 0.45 | | | | | | | | (1.98 | ) | | | | | | | (0.02 | ) | | | | | | | 0.61 | |
| Distributions from net investment income | | | | | | | ------- | | | | | | | | (0.20 | ) | | | | | | | (0.09 | ) | | | | | | | (0.09 | ) | | | | | | | (0.12 | ) | | | | | | | (0.09 | ) |
| Change in net asset value for the period | | | | | | | 0.57 | | | | | | | | 1.50 | | | | | | | | 0.36 | | | | | | | | (2.07 | ) | | | | | | | (0.14 | ) | | | | | | | 0.52 | |
| Net asset value, end of period | | | $ | | | | 11.95 | | | | $ | | | | 11.38 | | | | $ | | | | 9.88 | | | | $ | | | | 9.52 | | | | $ | | | | 11.59 | | | | $ | | | | 11.73 | |
| Total Return | | | | | | | 5.01% | 2 | | | | | | | 17.29% | | | | | | | | 4.69% | | | | | | | | (17.06)% | | | | | | | | (0.12)% | | | | | | | | 5.48% | |
| | | | | | | | | | | | | |
| Ratios/supplemental data | | | | | | | | | | | | | | | | | | | | | | | | | | | | | | | | | | | | | | | | | | | | | | | | |
| Net assets, end of period (000) | | | $ | | | | 36,864 | | | | $ | | | | 45,392 | | | | $ | | | | 76,240 | | | | $ | | | | 79,656 | | | | $ | | | | 76,705 | | | | $ | | | | 34,733 | |
| | | | | | | | | | | | | |
| Ratio to average net assets: | | | | | | | | | | | | | | | | | | | | | | | | | | | | | | | | | | | | | | | | | | | | | | | | |
| Expenses (net of reimbursement) | | | | | | | 1.09% | 3 | | | | | | | 1.09% | | | | | | | | 1.09% | | | | | | | | 1.09% | | | | | | | | 1.09% | | | | | | | | 1.09% | |
| Expenses (prior to reimbursement) | | | | | | | 1.51% | 3 | | | | | | | 1.41% | | | | | | | | 1.29% | | | | | | | | 1.25% | | | | | | | | 1.25% | | | | | | | | 1.66% | |
| Net investment income (net of reimbursement) | | | | | | | 0.54% | 3 | | | | | | | 1.07% | | | | | | | | 0.92% | | | | | | | | 1.04% | | | | | | | | 1.18% | | | | | | | | 1.15% | |
| Net investment income (prior to reimbursement) | | | | | | | 0.12% | 3 | | | | | | | 0.75% | | | | | | | | 0.72% | | | | | | | | 0.88% | | | | | | | | 1.02% | | | | | | | | 0.58% | |
| Portfolio turnover rate 4 | | | | | | | 27% | | | | | | | | 67% | | | | | | | | 57% | | | | | | | | 27% | | | | | | | | 64% | | | | | | | | 54% | |
| (1) | Net investment income per share represents net investment income divided by the average shares outstanding throughout the period. |
| (4) | Portfolio turnover is calculated on the basis of the Fund as a whole without distinguishing between the classes of shares issued. |
The accompanying notes are an integral part of these financial statements
| | | | |
| www.thomaswhitefunds.com | | | 67 | |
Six Months Ended April 30, 2018 (Unaudited)
FINANCIAL HIGHLIGHTS
| | | | | | | | | | | | | | | | | | | | | | | | | | | | | | | | | | | | | | | | | | | | | | | | |
| Thomas White American Opportunities Fund - Investor Class | |
| | | | | | Six
Months
Ended
April 30,
2018 | | | | | �� | Year
Ended
October 31,
2017 | | | | | | Year
Ended
October 31,
2016 | | | | | | Year
Ended
October 31,
2015 | | | | | | Year
Ended
October 31,
2014 | | | | | | Year
Ended
October 31,
2013 | |
| |
| Per share operating performance (For a share outstanding throughout each period) | |
| Net asset value, beginning of period | | | $ | | | | 16.49 | | | | $ | | | | 14.91 | | | | $ | | | | 15.60 | | | | $ | | | | 15.84 | | | | $ | | | | 15.12 | | | | $ | | | | 13.28 | |
| | | | | | | | | | | | | |
| Income from investment operations: | | | | | | | | | | | | | | | | | | | | | | | | | | | | | | | | | | | | | | | | | | | | | | | | |
Net investment income | | | | | | | 0.00 | (2) | | | | | | | 0.04 | | | | | | | | 0.11 | 1 | | | | | | | 0.08 | 1 | | | | | | | 0.07 | 1 | | | | | | | 0.11 | |
Net realized and unrealized gains/(losses) | | | | | | | 0.30 | | | | | | | | 3.00 | | | | | | | | (0.44 | ) | | | | | | | 0.96 | | | | | | | | 2.21 | | | | | | | | 3.68 | |
| Total from investment operations | | | | | | | 0.30 | | | | | | | | 3.04 | | | | | | | | (0.33 | ) | | | | | | | 1.04 | | | | | | | | 2.28 | | | | | | | | 3.79 | |
| | | | | | | | | | | | | |
| Distributions: | | | | | | | | | | | | | | | | | | | | | | | | | | | | | | | | | | | | | | | | | | | | | | | | |
From net investment income | | | | | | | ------- | | | | | | | | (0.14 | ) | | | | | | | (0.00 | )2 | | | | | | | (0.07 | ) | | | | | | | (0.07 | ) | | | | | | | (0.09 | ) |
From net realized gains | | | | | | | ------- | | | | | | | | (1.32 | ) | | | | | | | (0.36 | ) | | | | | | | (1.21 | ) | | | | | | | (1.49 | ) | | | | | | | (1.85 | ) |
Tax return of capital | | | | | | | ------- | | | | | | | | ------- | | | | | | | | ------- | | | | | | | | ------- | | | | | | | | ------- | | | | | | | | (0.01 | ) |
| Total Distributions | | | | | | | ------- | | | | | | | | (1.46 | ) | | | | | | | (0.36 | ) | | | | | | | (1.28 | ) | | | | | | | (1.56 | ) | | | | | | | (1.95 | ) |
| Change in net asset value for the period | | | | | | | 0.30 | | | | | | | | 1.58 | | | | | | | | (0.69 | ) | | | | | | | (0.24 | ) | | | | | | | 0.72 | | | | | | | | 1.84 | |
| Net asset value, end of period | | | $ | | | | 16.79 | | | | $ | | | | 16.49 | | | | $ | | | | 14.91 | | | | $ | | | | 15.60 | | | | $ | | | | 15.84 | | | | $ | | | | 15.12 | |
| Total Return | | | | | | | 1.82% | 3 | | | | | | | 20.45% | | | | | | | | (2.12)% | | | | | | | | 6.69% | | | | | | | | 15.38% | | | | | | | | 28.52% | |
| | | | | | | | | | | | | |
| Ratios/supplemental data | | | | | | | | | | | | | | | | | | | | | | | | | | | | | | | | | | | | | | | | | | | | | | | | |
| Net assets, end of period (000) | | | $ | | | | 43,494 | | | | $ | | | | 41,433 | | | | $ | | | | 36,816 | | | | $ | | | | 35,875 | | | | $ | | | | 33,830 | | | | $ | | | | 29,138 | |
| | | | | | | | | | | | | |
| Ratio to average net assets: | | | | | | | | | | | | | | | | | | | | | | | | | | | | | | | | | | | | | | | | | | | | | | | | |
Expenses
(net of reimbursement/ recoupment) | | | | | | | 1.33% | 4 | | | | | | | 1.19% | | | | | | | | 1.20% | | | | | | | | 1.18% | | | | | | | | 1.24% | | | | | | | | 1.34% | |
Expenses
(prior to reimbursement/recoupment) | | | | | | | 1.33% | 4 | | | | | | | 1.19% | | | | | | | | 1.20% | | | | | | | | 1.18% | | | | | | | | 1.15% | | | | | | | | 1.31% | |
| Net investment income (net of reimbursement/recoupment) | | | | | | | 0.03% | 4 | | | | | | | 0.28% | | | | | | | | 0.78% | | | | | | | | 0.52% | | | | | | | | 0.45% | | | | | | | | 0.75% | |
| Net investment income (prior to reimbursement/recoupment) | | | | | | | 0.03% | 4 | | | | | | | 0.28% | | | | | | | | 0.78% | | | | | | | | 0.52% | | | | | | | | 0.54% | | | | | | | | 0.78% | |
| Portfolio turnover rate | | | | | | | 24% | | | | | | | | 29% | | | | | | | | 60% | | | | | | | | 38% | | | | | | | | 32% | | | | | | | | 60% | |
| (1) | Per share net investment income was calculated prior to tax adjustments. |
| (2) | Amount is less than $0.005. |
The accompanying notes are an integral part of these financial statements
| | |
| 68 | | www.thomaswhitefunds.com |
THOMAS WHITE FUNDS
DISCLOSURE OF FUND EXPENSES (Unaudited)
As a shareholder of the Funds you incur two types of costs : (1) transaction costs, including sales charges (loads) on purchase payments or contingent deferred sales charges on redemptions, if any, or redemption fees; and (2) ongoing costs, including management fees; distribution fees (12b-1); and other Fund expenses. This example is intended to help you understand your ongoing costs (in dollars) of investing in the Funds and to compare these costs with the ongoing costs of investing in other mutual funds.
The example is based on an investment of $1,000 invested at the beginning of the period and held for the entire period, November 1, 2017 through April 30, 2018 for the Funds’ Investor Class and Class I, as applicable.
ACTUAL EXPENSES
The third and fourth columns of the table below provide information about actual account values and actual expenses. You may use the information in this line together with the amount you invested to estimate the expenses you paid over the period. Simply divide your account value by $1,000 (for example, an $8,600 account value divided by $1,000=8.6), then multiply the result by the number in the fourth column under the heading entitled “Expenses Paid During Period” to estimate the expenses you paid on your own account during this period. IRA accounts are charged a $15.00 fee annually in September that is not reflected in the actual expense example. If you hold your Fund shares through an IRA account, you should add this cost to the expenses paid shown below.
HYPOTHETICAL EXAMPLE FOR COMPARISON PURPOSES
The fifth and sixth columns of the table below provide information about hypothetical account values and hypothetical expenses based on each Fund’s actual expense ratio and an assumed rate of return of 5% per year before expenses, which is not the Fund’s actual return. The hypothetical account values and expenses may not be used to estimate the actual ending account balance or expenses you paid for the period. You may use this information to compare the ongoing costs of investing in the Funds and other funds. To do so, compare this 5% hypothetical example with the 5% hypothetical examples that appear in the shareholder reports of the other funds. IRA accounts are charged a $15.00 fee annually in September that is not reflected in the hypothetical expense example. If you hold your Fund shares through an IRA account, you should separately compare the Funds’ IRA fees to the IRA fees of other funds.
Please note that the expenses shown in the table are meant to highlight your ongoing costs only and do not reflect any transactional costs such as sales charges (loads) or purchase payments or contingent deferred sales charges on redemptions, if any, or redemption fees. Therefore the sixth column of the table is useful in comparing ongoing costs only, and will not help you determine the relative costs of owning different funds. In addition, if these transactional costs were included, your costs may have been higher.
| | | | |
| www.thomaswhitefunds.com | | | 69 | |
THOMAS WHITE FUNDS
| | | | | | | | | | | | | | | | | | | | | | | | |
| | | | | | | | | | | | Actual | | | Hypothetical (5% return
before expenses) | |
| | | Fund’s
Annualized
Expense
Ratio* | | | Beginning
Account
Value
November 1,
2017 | | | Ending
Account
Value
April 30,
2018 | | | Expenses
Paid
During
Period | | | Ending
Account
Value
April 30,
2018 | | | Expenses
Paid
During
Period | |
| International Fund | | | | | | | | | | | | | | | | | | | | | |
| Investor Class Shares | | | 1.24% | | | | $1,000.00 | | | | $1,024.60 | | | | $6.22 | | | | $1,018.65 | | | | $6.21 | |
| Class I Shares | | | 0.99% | | | | $1,000.00 | | | | $1,026.40 | | | | $4.97 | | | | $1,019.89 | | | | $4.96 | |
| Emerging Markets Fund | | | | | | | | | | | | | | | | | | | | | |
| Investor Class Shares | | | 1.34% | | | | $1,000.00 | | | | $1,048.70 | | | | $6.81 | | | | $1,018.15 | | | | $6.71 | |
| Class I Shares | | | 1.09% | | | | $1,000.00 | | | | $1,050.10 | | | | $5.54 | | | | $1,019.39 | | | | $5.46 | |
| American Opportunities Fund | | | | | | | | | | | | | | | | | |
| Investor Class | | | 1.33% | | | | $1,000.00 | | | | $1,018.20 | | | | $6.66 | | | | $1,018.20 | | | | $6.66 | |
| | * | Expenses for the International, Emerging Markets and American Opportunities Funds’ annualized expense ratio (after waiver and reimbursement), multiplied by the average account value over the period, multiplied by 181/365 (to reflect the one-half year period). |
QUARTERLY FORM N-Q PORTFOLIO SCHEDULE
The Funds file their complete schedule of portfolio holdings with the Securities and Exchange Commission (“SEC”) for the first and third quarters of each fiscal year on Form N-Q. Each Fund’s Form N-Q is available on the SEC’s website at http://www.sec.gov. The Funds’ Forms N-Q may be reviewed and copied at the SEC’s Public Reference Room in Washington, D.C. Information on the operation of the SEC’s Public reference Room may be obtained by calling 1-800-SEC-0330. Additionally, you may obtain copies of Forms N-Q from the Funds upon request by calling 1-800-811-0535.
PROXY VOTING POLICIES, PROCEDURES AND RECORD
You may obtain a description of the Funds’ (1) proxy voting policies, (2) proxy voting procedures and (3) information regarding how the Funds voted any proxies related to portfolio securities during the most recent 12 month period ended June 30 for which an SEC filing has been made, without charge, upon request by calling the Funds at 1-800-811-0535 or on the EDGAR database on the SEC’s website (http://www.sec.gov).
ADDITIONAL INFORMATION
The Statement of Additional Information contains additional information regarding the Funds and Trustees, and is available upon request without charge by calling 1-800-811-0535.
| | |
| 70 | | www.thomaswhitefunds.com |
Approval of Investment Advisory Agreements
At an in-person meeting of the Board of Trustees (the “Board” or the “Trustees”) held on February 16, 2018, the Board considered and reviewed each of the Investment Advisory Agreements (the “Agreements”) between Lord Asset Management Trust (the “Trust”), on behalf of the Thomas White American Opportunities Fund (the “American Opportunities Fund”), the Thomas White International Fund (the “International Fund”) and the Thomas White Emerging Markets Fund (the “Emerging Markets Fund” and together with the American Opportunities Fund and the International Fund, the “Funds”), and Thomas White International, Ltd. (“TWI” or the “Advisor”), to determine whether the Agreements should be continued for a one-year period.
In accordance with the Investment Company Act of 1940, the Board of Trustees of the Funds is required, on an annual basis, to consider the continuation of each of the Agreements with the Advisor, and this must take place at an in-person meeting of the Board. The relevant provisions of the Investment Company Act of 1940 specifically provide that it is the duty of the Board to request and evaluate such information as the Board determines is necessary to allow them to properly consider the continuation of the Agreements, and it is the duty of the Advisor to furnish the Trustees with such information that is responsive to their request. Accordingly, in determining whether to renew the Agreements between the Funds and the Advisor, the Board of Trustees requested, and the Advisor provided, information and data relevant to the Board’s consideration. This included materials prepared by the Advisor for the Board that provided them with information regarding the investment performance of the Funds and information regarding the fees and expenses of the Funds, compared to other similar mutual funds.
Following their consideration and review of the Agreements, the Trustees determined that each Agreement would enable shareholders of the Fund to which it applies to obtain high quality services at a cost that is appropriate, reasonable, and in the best interests of its shareholders. Accordingly, the Board, including the Independent Trustees of the Board, unanimously approved the continuation of the Agreements. In reaching their decisions, the Trustees requested and obtained from the Advisor such information as they deemed reasonably necessary to evaluate the Agreements. The Trustees also carefully considered the information that they had received throughout the year from the Advisor as part of their regular oversight of the Funds, as well as profitability data and comparative fee, expense and performance information prepared by Trust management. In considering the continuation of the Agreements, the Trustees evaluated a number of considerations that they believed, in light of the legal advice furnished to them by Trust counsel and their own reasonable business judgment, to be relevant. They based their decisions on the following considerations, among others, although they did not identify any one specific consideration or particular information that was controlling of their decisions:
| | • | | The nature, extent and quality of the advisory services to be provided. The Trustees concluded that TWI is capable of providing high quality services to each Fund, as indicated by the nature and quality of services provided in the past, TWI’s management capabilities demonstrated with respect to the Funds, the professional qualifications and experience of the Funds’ portfolio managers, TWI’s investment and management |
| | | | |
| www.thomaswhitefunds.com | | | 71 | |
Approval of Investment Advisory Agreements
| | oversight processes, and the overall long-term investment performance of the Funds. The Trustees also determined that TWI proposed to provide investment advisory services that were of the same quality as services it provided to the Funds in the past, and that these services are appropriate in scope and extent in light of the Funds’ operations, the competitive landscape of the investment company business and investor needs. |
| | • | | The investment performance of the Funds. With respect to each Fund, the Trustees concluded on the basis of information derived from the performance data that TWI had achieved investment performance that was competitive relative to comparable funds over various trailing time periods, including over longer-term trailing time periods, and the Trustees took into consideration the fact that TWI focuses on long-term performance results with respect to their management of the Funds and the Funds may have periods of underperformance. |
1. The American Opportunities Fund. With respect to the American Opportunities Fund, the Trustees noted that the Investor Class shares of the American Opportunities Fund had outperformed its peer group (based on the category average) over the trailing ten-year period, but had underperformed its peer group (based on the category average) over the trailing one-, three- and five-year periods. The Trustees also noted that the Investor Class shares of the American Opportunities Fund had underperformed its primary benchmark index, the Russell Midcap Index, and its secondary benchmark index, the S&P 500 Index, over the trailing one-, three-, five- and ten-year periods. The Trustees took into consideration that the Fund had only slightly underperformed its peer group average over the trailing one-, three- and five-year periods.
2. The International Fund. With respect to the International Fund, the Trustees took note of the fact that the Investor Class shares of the Fund had outperformed its peer group (based on the category average) for the trailing one- and ten-year periods, but had underperformed its peer group (based on the category average) for the trailing three- and five-year periods. The Trustees also noted that the Investor Class shares of the International Fund had outperformed its benchmark index, the MSCI All Country World ex US Index, for the trailing one-year period, but had underperformed its benchmark index for the trailing three-, five- and ten-year periods. The Trustees took into consideration their discussions with the representatives from the Adviser regarding TWI’s enhancements to its research and investment analysis process.
3. The Emerging Markets Fund. With respect to the Emerging Markets Fund (which commenced investment operations in June 2010), the Trustees noted that the Investor Class shares of the Emerging Markets Fund had outperformed its peer group (based on the category average) over the trailing one-year period, but had underperformed its peer group (based on category average) over the trailing three- and five-year periods. The Trustees noted that the Investor Class shares of the Emerging Markets Fund had
| | |
| 72 | | www.thomaswhitefunds.com |
Approval of Investment Advisory Agreements
underperformed its benchmark index, the MSCI Emerging Markets Index, over the trailing one-, three- and five-year periods. The Trustees took into consideration recent performance improvements and their discussions with the representatives from the Adviser regarding TWI’s enhancements to its research and investment analysis process.
On the basis of the Trustees’ assessment of the nature, extent and quality of advisory services to be provided by TWI, the Trustees concluded that TWI is capable of generating a level of long-term investment performance that is appropriate in light of the Funds’ investment objectives, policies and strategies and competitive with many other investment companies, and they took into consideration TWI’s ongoing plans to improve Fund performance through the implementation of certain enhancements to its research and investment analysis process.
| | • | | The cost of advisory services provided and the level of profitability. On the basis of comparative information derived from the expense data, the Trustees determined that the overall expense ratio of each Fund, on a net basis, was competitive with industry averages, particularly with respect to mutual funds of comparable asset size. The Trustees also noted that TWI had proposed to renew its contractual commitment for the benefit of Fund shareholders to limit the operating expenses of each of the classes of shares of the Funds for an additional year. The Board took into consideration information regarding the fees that TWI charges to other accounts, non-U.S. funds and private funds for similar investment advisory services, and the Trustees noted that the fees were comparable based on the relevant circumstances of the types of accounts involved. The Board also considered TWI’s current level of profitability with respect to the Funds, and noted that TWI’s profitability was acceptable and not excessive and consistent with applicable industry averages and that TWI is committed to using its own resources to help grow the Funds. The Trustees also took into consideration the nature and extent of other expenses that are borne directly by TWI from its own financial resources in order to help to market and promote the Funds. Accordingly, on the basis of the Board’s review of the fees to be charged by TWI for investment advisory services, the investment advisory and other services provided to the Funds by TWI, and the estimated profitability of TWI’s relationship with each Fund, the Board concluded that the level of investment advisory fees and TWI’s profitability are appropriate in light of the investment advisory fees, overall expense ratios and investment performance of comparable investment companies and the historical profitability of the relationship between each Fund and TWI. The Trustees considered the profitability of TWI both before and after the impact of the marketing related expenses that TWI incurs out of its own resources in connection with its management of the Funds. |
| | • | | The extent to which economies of scale will be realized as the Funds grow and whether the advisory fees reflect economies of scale. While the Funds’ investment advisory fees do not decrease as Fund assets grow because the Funds are not currently |
| | | | |
| www.thomaswhitefunds.com | | | 73 | |
Approval of Investment Advisory Agreements
| | subject to investment advisory fee breakpoints, the Trustees concluded that the Funds’ investment advisory fees are appropriate in light of the current size of the Funds, and appropriately reflect the current economic environment for TWI and the competitive nature of the mutual fund market. The Trustees noted that TWI has continued to limit the Funds’ total annual operating expenses by waiving fees and/or reimbursing certain Fund expenses. The Trustees then noted that they will have the opportunity to periodically re-examine whether a Fund has achieved economies of scale, and the appropriateness of investment advisory fees payable to TWI, in the future. |
| | • | | Benefits to TWI from its relationship with the Funds (and any corresponding benefits to the Funds). The Trustees concluded that other benefits derived by TWI from its relationship with the Funds, including “soft dollar” benefits in connection with Fund brokerage transactions and use of the Funds’ performance track records in advertising materials, are reasonable and fair, and consistent with industry practice and the best interests of the Funds and their shareholders. In addition, the Trustees determined that the Funds benefited from their relationship to TWI by virtue of TWI’s provision of business management services, in addition to investment advisory services, at a cost to the Funds that is generally comparable to the cost of an outside service provider, which the Trustees determined to be reasonable, fair and in the best interests of Fund shareholders in light of the nature and quality of the services provided and the necessity of the services for the Funds’ operations. In considering information regarding the business management fees payable by the Funds to TWI under the terms of the Business Management Agreement, the Board members indicated that they had considered various factors with respect to the proposed business management fees, including the level and amount of these fees and the services to be provided by the Advisor in connection with the Business Management Agreement, in determining the reasonableness of the total fees payable by the Funds to the Advisor for the overall level of services that the Advisor provides to the Funds and their shareholders. In considering the nature and extent of these non-advisory business management services that are provided to the Funds by the Advisor, the Board took into consideration: (i) whether the Business Management Agreement is in the best interest of the Funds and their shareholders; (ii) whether the services to be performed under the Business Management Agreement are required for the operation of the Funds; (iii) whether the services provided are of a nature and quality at least equal to the same or similar services provided by independent third parties; and (iv) whether the fees for the services are fair and reasonable in light of the usual and customary charges made by others for services of the same nature and quality. |
| | • | | Other Considerations. In approving the Agreements, the Trustees determined that TWI has made a substantial commitment to the recruitment and retention of high quality personnel, and maintains the financial, compliance and operational resources reasonably necessary to manage the Funds in a professional manner that is consistent with the best |
| | |
| 74 | | www.thomaswhitefunds.com |
Approval of Investment Advisory Agreements
| | interests of the Funds and their shareholders. The Trustees also concluded that TWI has made a significant entrepreneurial commitment to the management and success of the Funds, which entails a substantial financial and professional commitment, including the Expense Limitation Agreements with respect to each Fund under which TWI has undertaken to waive a portion of its fees to the benefit of Fund shareholders to the extent necessary in accordance with the terms of the Expense Limitation Agreements, subject to applicable recoupment provisions. The Board also considered matters with respect to the brokerage practices of TWI, including its soft dollar arrangements and its best-execution procedures, and noted that these were reasonable and consistent with standard industry practice. In addition, the Trustees took into consideration their discussions with management of the Advisor regarding the Advisor’s ongoing plans to improve Fund performance through the implementation of certain enhancements to it research and investment analysis process. |
In reaching their conclusion with respect to the continuation of each of the Agreements and the level of fees paid under the Agreements, the Trustees, as noted, did not identify any one single factor as being controlling. Rather, the Board took note of a combination of factors that had influenced their decision making process. They noted the level and quality of investment advisory services provided by the Advisor to each of the Funds, and they found that these services continued to benefit the shareholders of the Funds and also reflected management’s overall commitment to the continued growth and development of the Funds. Based upon their consideration and review of these factors and other matters deemed relevant by the Board in reaching an informed business judgment, the Trustees, including a majority of the Independent Trustees, concluded that the terms of the Agreements are fair and reasonable in light of the services provided and the Board therefore voted to renew the Agreements for an additional one-year period.
| | | | |
| www.thomaswhitefunds.com | | | 75 | |
Privacy Policy
LORD ASSET MANAGEMENT TRUST
THOMAS WHITE INTERNATIONAL, LTD.
I. Commitment to Consumer* Privacy
The Thomas White Funds Family and Thomas White International, Ltd. (collectively, “we” or “us”) are committed to handling consumer information responsibly. We recognize and respect the privacy expectations of our consumers, and we believe that the confidentiality and security of consumers’ personal financial information is one of our fundamental responsibilities.
II. Collection of Consumer Information
We collect, retain and use consumer information only where we reasonably believe it would be useful to the consumer and allowed by law. Consumer information collected by us generally comes from the following sources:
| | • | | Information we receive on applications or other forms; |
| | • | | Information about consumers’ transactions with us, our affiliates, or others. |
III. Disclosure of Consumer Information
We may disclose all of the consumer information we collect to affiliated financial institutions and to third parties who are not our affiliates:
| | • | | to perform marketing services on our behalf or pursuant to a joint marketing agreement between us and another party; and |
| | • | | as otherwise permitted by law. |
We do not disclose any consumer information about our former customers* to anyone except as permitted by law.
IV. Security of Customer Information
We are committed to, and also require our service providers to:
| | • | | maintain policies and procedures designed to assure only appropriate access to, and use of information about our customers; and |
| | • | | maintain physical, electronic and procedural safeguards that comply with federal standards to guard non-public personal information of our customers. |
* As defined in Regulation S-P
| | |
| 76 | | www.thomaswhitefunds.com |
This page is intentionally left blank.
This page is intentionally left blank.
OFFICERS AND TRUSTEES
Thomas S. White, Jr.
Chairman of the Board
Arthur J. Fiocco, Jr.
Trustee
Elizabeth G. Montgomery
Trustee
Robert W. Thomas
Trustee
John N. Venson, D.P.M.
Trustee
William H. Woolverton
Trustee
Stathy M. White
President
David M. Sullivan II
Vice President, Treasurer and
Assistant Secretary
J. Ryan Conner
Secretary and Chief Compliance Officer
INVESTMENT ADVISOR AND OTHER SERVICE PROVIDERS
Thomas White International, Ltd.
440 S. LaSalle Street, Suite 3900
Chicago, Illinois 60605-1028
CUSTODIANS
The Northern Trust Company
Chicago, Illinois
U.S. Bank, N.A.
Milwaukee, Wisconsin
LEGAL COUNSEL
Dechert LLP
Washington, DC
INDEPENDENT REGISTERED PUBLIC ACCOUNTING FIRM
Tait, Weller & Baker, LLP
Philadelphia, Pennsylvania
ADMINISTRATOR and TRANSFER AGENT
U.S. Bancorp Fund Services, LLC
Milwaukee, Wisconsin
DISTRIBUTOR
Quasar Distributors, LLC
Milwaukee, Wisconsin
FOR CURRENT PERFORMANCE, NET ASSET VALUE OR FOR ASSISTANCE WITH YOUR ACCOUNT, PLEASE CONTACT THE THOMAS WHITE FUNDS AT 800-811-0535 OR VISIT OUR WEB SITE AT WWW.THOMASWHITEFUNDS.COM

www.thomaswhitefunds.com
COVER PICTURE: The Face of the New South Korea? From K-Pop and the Olympics
to diplomacy on the Korean Peninsula, South Korea is making its presence felt on the
global stage. In the first quarter of 2018, South Korea’s economic rebound, powered
by exports, have kept the emerging economy in the spotlight.
Item 2. Code of Ethics.
Not Applicable for Semi-Annual Reports.
Item 3. Audit Committee Financial Expert.
Not Applicable for Semi-Annual Reports.
Item 4. Principal Accountant Fees and Services.
Not Applicable for Semi-Annual Reports.
Item 5. Audit Committee of Listed Registrants.
Not applicable to registrants who are not listed issuers (as defined in Rule 10A-3 under the Securities Exchange Act of 1934).
Item 6. Investments.
| (a) | The Schedules of Investments are included as part of the reports to stockholders filed under Item 1 of this Form N-CSR. |
Item 7. Disclosure of Proxy Voting Policies and Procedures for Closed-End Management Investment Companies.
Not applicable to open-end investment companies.
Item 8. Portfolio Managers of Closed-End Management Investment Companies.
Not applicable to open-end investment companies.
Item 9. Purchases of Equity Securities by Closed-End Management Investment Company and Affiliated Purchasers.
Not applicable to open-end investment companies.
Item 10. Submission of Matters to a Vote of Security Holders.
There have been no material changes to the procedures by which shareholders may recommend nominees to the Registrant’s Board of Trustees.
1
Item 11. Controls and Procedures.
| (a) | Based on an evaluation of Registrant’s Disclosure Controls and Procedures (as defined in Rule 30a-3(c) under the Investment Company Act of 1940) (the “Disclosure Controls”), as of a date within 90 days prior to the filing date (the “Filing Date”) of this Form N-CSR (the “Report”), the Registrant’s principal executive officer and principal financial officer have concluded that the Disclosure Controls are effectively designed to ensure that information required to be disclosed by the Registrant in the Report is recorded, processed, summarized and reported by the Filing Date, including ensuring that information required to be disclosed in the Report is accumulated and communicated to the Registrant’s management, including the Registrant’s principal executive officer and principal financial officer, as appropriate, to allow timely decisions regarding required disclosure. |
| (b) | There were no changes in the Registrant’s internal control over financial reporting (as defined in Rule 30a-3(d) under the Act) that occurred during the second fiscal quarter of the period covered by this report that have materially affected, or are reasonably likely to materially affect, the Registrant’s internal control over financial reporting. |
Item 12. Disclosure of Securities Lending Activities for Closed-End Management Investment Companies
Not applicable to open-end investment companies.
Item 13. Exhibits.
| (a) | (1) Any code of ethics or amendment thereto, that is the subject of the disclosure required by Item 2, to the extent that the registrant intends to satisfy Item 2 requirements through filing an exhibit. Not applicable |
(2) A separate certification for each principal executive officer and principal financial officer pursuant to Section 302 of the Sarbanes-Oxley Act of 2002. Filed herewith.
(3) Any written solicitation to purchase securities under Rule 23c-1 under the Act sent or given during the period covered by the report by or on behalf of the registrant to 10 or more persons. Not applicable to open-end investment companies.
(4) Change in the registrant’s independent public accountant. There was no change in the registrant’s independent public accountant for the period covered by this report.
| (b) | Certifications pursuant to Section 906 of the Sarbanes-Oxley Act of 2002. Furnished herewith. |
2
SIGNATURES
Pursuant to the requirements of the Securities Exchange Act of 1934 and the Investment Company Act of 1940, the registrant has duly caused this report to be signed on its behalf by the undersigned, thereunto duly authorized.
| | | | | | | | |
| | (Registrant) | | | | LORD ASSET MANAGEMENT TRUST | | |
| | | | | | | | |
| | | | |
| | By (Signature and Title) | | | | /s/ Stathy M. White | | |
| | | | | | Stathy M. White President (Principal Executive Officer) | | |
Pursuant to the requirements of the Securities Exchange Act of 1934 and the Investment Company Act of 1940, this report has been signed below by the following persons on behalf of the registrant and in the capacities and on the dates indicated.
| | | | | | | | |
| | By (Signature and Title) | | | | /s/ Stathy M. White | | |
| | | | | | Stathy M. White President (Principal Executive Officer) | | |
| | | | | | | | |
| | | | |
| | By (Signature and Title) | | | | /s/ David M. Sullivan II | | |
| | | | | | David M. Sullivan II Treasurer (Principal Financial Officer) | | |
3