As filed with the U.S. Securities and Exchange Commission on July 10, 2019
UNITED STATES
SECURITIES AND EXCHANGE COMMISSION
Washington, D.C. 20549
FORMN-CSR
CERTIFIED SHAREHOLDER REPORT OF REGISTERED
MANAGEMENT INVESTMENT COMPANIES
Investment Company Act file number811-08348
LORD ASSET MANAGEMENT TRUST
(Exact name of registrant as specified in charter)
425 South Financial Place
Chicago, Illinois 60605-1028
(Address of principal executive offices) (Zip code)
Thomas S. White, Jr.
Thomas White International, Ltd.
425 South Financial Place
Chicago, Illinois 60605-1028
(Name and address of agent for service)
(312)663-8300
Registrant’s telephone number, including area code
Date of fiscal year end: 10/31
Date of reporting period: 11/1/2018 – 4/30/2019
Item 1. Reports to Stockholders.


SEMI-ANNUAL REPORT
APRIL 30, 2019
THE INTERNATIONAL FUND
THE EMERGING MARKETS FUND
THE AMERICAN OPPORTUNITIES FUND
Beginning on January 1, 2021, as permitted by regulations adopted by the U.S. Securities and Exchange Commission, paper copies of the Funds’ annual and semi-annual shareholder reports will no longer be sent by mail, unless you specifically request paper copies of the reports from the Funds or from your financial intermediary, such as a broker-dealer or bank if you hold your shares through such an institution. Instead, the reports will be made available on the Funds’ website (www.thomaswhitefunds.com/fundreports-and-literature), and you will be notified by mail each time a report is posted and provided with a website link to access the report.
If you already elected to receive shareholder reports electronically, you will not be affected by this change and you need not take any action. You may elect to receive shareholder reports and other communications from the Funds electronically anytime by contacting your financial intermediary or, if you hold your shares directly with the Funds, by calling 1-800-811-0535.
You may elect to receive all future reports in paper free of charge. If you invest through a financial intermediary, you can contact your financial intermediary to request that you continue to receive paper copies of your shareholder reports. If you invest directly with the Funds, you can call 1-800-811-0535 to let the Funds know you wish to continue receiving paper copies of your shareholder reports. Your election to receive shareholder reports in paper may apply to all funds that you hold through the financial intermediary and will apply to all Funds held directly.

CONTENTS
Message to Shareholders
Dear Shareholders and Friends:
We want to thank you for your ongoing confidence and support you have shown through your continued investments in the Thomas White Funds. As we proceed into a new era for the Thomas White Funds family, we believe our commitment to a disciplined investment process honed over the past 20+ years will allow us to navigate the global equity markets. Our firm remains focused on helping you achieve your long term investment goals.
Our industry continues to adapt to competitive pressures in the market. The Active vs. Passive debate rages on and asset flows continue to be dominated by an influx into Exchange Traded Funds (ETF) and passive index strategies. Statistics from the Investment Company Institute (ICI) show that actively managed domestic equity mutual funds have seen outflows every year since 2005 and that the passively-managed market share has doubled over the past decade from 18% to 36%. Theseon-going flows have led to further consolidation amongst both money managers and pension consultants.
Another trend that continues to be extensively debated is the integration of Environmental, Social and Governance (ESG) factors into the investment process. Our firm has researched this issue in depth and continues to analyze how to further
incorporate these factors into our security analysis which ultimately lead to the holdings selected for the portfolios of the three Thomas White Funds. Across each of our funds, these issues can have a varying impact on the companies we research. Analyzing corporate governance policies innon-U.S. developed and emerging market companies has always been part of our analysis. This includes understanding the corporate board structure, voting control, founding family relationships, cross-holdings, as well as state ownership, if any. Each of these governance issues can impact corporate decision making which typically impacts total shareholder return. Social issues can vary to how a company integrates into its local markets from hiring policies to pay practices. A company’s policies and attitudes to the environment is also relevant to our expectations of how a company should perform in the future. Integration of ESG factors across the industry and within our firm will continue to grow as our industry moves to accept these policies as the norm.
2019 Equity Markets Got Off to a Strong Start but Uncertainty Increasing
The unexpected shift by the U.S. Federal Reserve to a more accommodative monetary policy stance has lifted investor sentiment and drove strong market gains through April 30th. The pace of U.S. economic growth moderated from last year’s high base as the boost from tax cuts has started wearing off.
| | | | |
| www.thomaswhitefunds.com | | | 1 | |
While aggregate macroeconomic data in the U.S. remains healthy, other major economies continue to show the effects of political turmoil resulting from Brexit and the tariff battles. Manufacturing output declined in the Eurozone, Japan, the U.K. and Canada at the beginning of 2019. Growing uncertainties related to global trade remain a significant headwind, and relatively weaker economic expansion overseas could dampen revenue growth in U.S. businesses that operate globally. However, as core inflation remains benign and weaker than expected, it is possible that the Fed may cut its benchmark rate early in the third quarter of this year.
The European Central Bank (ECB) also pushed back its rate hike timeline and is providing additional funding support to European banks. These pronounced moves, combined with U.S. Federal Reserve actions, reduced global recessionary risks in the near term and also helped propel global equity gains seen so far in 2019. The ECB’s actions, in the continuing absence of meaningful fiscal spending in Europe, are also necessary measures to prevent further economic deceleration in the region. Similarly, the Bank of Japan is expected to continue its quantitative easing, or even expand the program if domestic consumer demand weakens ahead of the proposed consumption tax increase. In addition, easier global liquidity conditions should continue to drive capital flows into most equity markets.
Our Portfolio Strategies
Equity markets continue to be volatile, reacting to tariff wars and other macroeconomic and political events over the quarter. We believe an active investment
approach is the best way to navigate these market environments. Each of our three funds outperformed over thesix-month review period but were impacted differently by recent events as detailed in their respective fund reviews. Trade negotiations between the U.S. and China continue to drag on as both sides are negotiating final details on technology transfers and the mechanics of compliance and enforcement of a potential deal. Ultimately a U.S.-China trade deal, with the elimination of tariff threats, will likely be needed to prevent further slowing to their respective economies as well as the global economy. We believe each of the Funds are well-positioned to benefit from a successfully negotiated agreement between the U.S. and China.
Our investment analysts continue to focus on understanding the impact of these macro events on the future growth and profitability of the companies in the Funds’ portfolios. We remain broadly diversified across sectors, as well as across countries and regions for the International Fund and the Emerging Markets Fund. It is in these types of environment that we believe we can identify attractive opportunities that will benefit the portfolios over the long run.
Thank you for your continued confidence in the Thomas White Funds.

Douglas M. Jackman, CFA
President and Portfolio Manager
Thomas White International and
Thomas White Funds
| | |
| 2 | | www.thomaswhitefunds.com |
Past performance is not a guarantee of future results.
Opinions expressed are subject to change, are not guaranteed and should not be considered recommendations to buy or sell any security.
Must be preceded or accompanied by a prospectus.
Mutual fund investing involves risk. Principal loss is possible. Investing in international markets may involve additional risks such as social and political instability, market illiquidity, exchange-rate fluctuations, a high level of volatility and limited regulation. These risks are greater for emerging markets. Investing in small and mid-cap companies can involve more risk than investing in larger companies.
Diversification does not assure a profit nor protect against loss in a declining market.
Earnings growth for a Fund holding does not guarantee a corresponding increase in the market value of the holding of the Fund.
The Thomas White Funds are distributed by Quasar Distributors, LLC.
It is not possible to invest directly in an index.
Cash Flow: Measures the cash generating capability of a company by adding non-cash charges (i.e. depreciation) and interest expense to pretax income.
Dividend Yield: Dividend yield is the ratio of a company’s annual dividend compared to its share price.
G-20: The G-20 (or Group of Twenty) is an international forum for the governments and central bank governors from 19 countries and the European Union. Although membership is generally based on the size of each member’ economy in terms of Gross Domestic Product, this is not an absolute criteria. The organization has stated that “In a forum such as the G-20, it is particularly important for the number of countries involved to be restricted and fixed to ensure the effectiveness and continuity of its activity. There are no formal criteria for G-20 membership and the composition of the group has remained unchanged since it was established. In view of the objectives of the G-20, it was considered important that countries and regions of systemic significance for the international financial system be included. Aspects such as geographical balance and population representation also played a major part.”
Active investing has higher management fees because of the manager’s increased level of involvement while passive investing has lower management and operating fees. Investing in both actively and passively managed mutual funds involves risk and principal loss is possible. Both actively and passively managed mutual funds generally have daily liquidity. There are no guarantees regarding the performance of actively and passively managed mutual funds. Actively managed mutual funds may have higher portfolio turnover than passively managed funds. Excessive turnover can limit returns and can incur capital gains.
While there are no sales charges, management fees and other expenses still apply. Please refer to the prospectus for further details.
| | | | |
| www.thomaswhitefunds.com | | | 3 | |
THOMAS WHITE INTERNATIONAL FUND
| | | | | | | | | | | | | | |
| | | | | | | | |
| | | Unaudited
Sales
Charge | | Deferred
Sales
Charge | | Administrative
Services
Fee | | 12b-1 Fees | | Operating
Expenses1,3 | | Prospectus
Gross
Annual
Operating
Expense2 | | Prospectus
Net
Annual
Operating
Expense2,3 |
| Investor Class | | None | | None | | Up to 0.25% | | None | | 1.24% | | 1.34% | | 1.24% |
| Class I | | None | | None | | None | | None | | 0.99% | | 1.18% | | 0.99% |
1 In the absence of the fee deferral/expense reimbursement arrangement for the International Fund, the ratio of expenses to average net assets would have been 1.60% for Investor Class shares and 1.43% for Class I shares.
2 Gross Annual Operating Expense and Net Annual Operating Expense are based on the most recent prospectus and may differ from other expense ratios appearing in this report.
3 Thomas White International, Ltd. (“Advisor”) has agreed to defer its fees and/or reimburse the Fund to the extent that the operating expenses for Investor Class and Class I shares exceed (as a percentage of average daily net assets) 1.24% and 0.99%, respectively. The fee deferral/expense reimbursement agreement expires February 29, 2020. The Fund has agreed to repay the Advisor for amounts deferred or reimbursed by the Advisor pursuant to the agreement provided that such repayment does not cause the Fund to exceed the above limits and the repayment is made within three years after the year in which the Advisor incurred the expense. The fee deferral/expense reimbursement agreement may only be amended or terminated by the Fund’s Board of Trustees.The net expense ratio is applicable to investors.
| | | | | | | | |
| | | | | |
| | | NAV | | Net Assets | | Redemption Fee | | Portfolio Turnover |
| Investor Class | | $15.34 | | $29.3 million | | 2.00% on shares held less than 60 days | | 18% |
| Class I | | $15.31 | | $100.5 million |
| | |
| 4 | | www.thomaswhitefunds.com |
APRIL 30, 2019
| | | | | | | | | | | | | | | | | | | | | | | | | | | | | | |
| |
| Average Annual Returns as of April 30, 2019 (Unaudited) | |
| Class | | Sales Charge | | 6 month | | | Calendar
YTD | | | 1 Yr | | | 3 Yrs | | | 5 Yrs | | | 10 Yrs | | | Since
Inception
(6/28/1994)* | |
| | | | | | | | | |
| Investor Class shares (TWWDX) | | None | | | 10.68% | | | | 14.73% | | | | -4.96% | | | | 6.50% | | | | 0.78% | | | | 6.86% | | | | 6.54% | |
| | | | | | | | | |
| Class I shares1 (TWWIX) | | None | | | 10.86% | | | | 14.77% | | | | -4.74% | | | | 6.71% | | | | 1.01% | | | | 7.03% | | | | 6.61% | |
| | | | | | | | | |
| MSCI All Country World ex US Index2 | | N/A | | | 9.12% | | | | 13.22% | | | | -3.23% | | | | 8.09% | | | | 2.83% | | | | 7.75% | | | | 5.19% | |
* The inception date of the Investor Class shares.
1 Performance figures for Class I shares, first offered on August 31, 2012, include the historical performance of Investor Class shares through August 30, 2012.
2 The MSCI All Country World ex US Index is a free float-adjusted market capitalization-weighted index of both developed and emerging markets. The index is unmanaged and returns assume the reinvestment of dividends. It is not possible to invest directly in an index.
Returns of each share class reflect differences in expenses applicable to each class which are primarily differences in service fees.
The returns do not reflect the deduction of taxes that a shareholder would pay on Fund distributions or the redemption of Fund shares. The returns reflect the actual performance for each period and do not include the impacts of trades executed on the last business day of the period that were recorded on the first business day of the next period.
Performance data is based upon past performance, which is no guarantee of future results. The investment return and principal value of an investment will fluctuate so that an investor’s shares, when redeemed, may be worth more or less than their original cost. Current performance may be higher or lower than the performance data quoted. Please call 1-800-811-0535 to obtain performance data as of the most recent month-end. The Fund imposes a 2% redemption fee on shares held less than 60 days. Performance data does not reflect the redemption fee. If reflected, total returns would be lower. Investment performance reflects any fee waivers that were in effect. In the absence of such waivers, total return would have been reduced. The Gross Expense Ratios, based on the most recent prospectus, are 1.34% (Investor Class) and 1.18% (Class I).
| | | | |
| www.thomaswhitefunds.com | | | 5 | |
THOMAS WHITE INTERNATIONAL FUND
GROWTH OF A $10,000 INVESTMENT WITH DIVIDENDS REINVESTED (Unaudited)
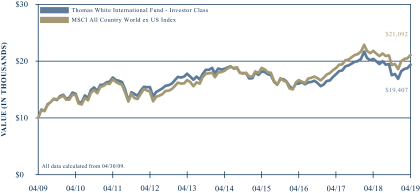
This chart illustrates the performance of a hypothetical $10,000 investment made in the Fund’s Investor Class shares and its benchmark, the MSCI All Country World ex US Index, for the past 10 years through April 30, 2019. It assumes reinvestment of dividends and capital gains, but does not reflect the effect of any applicable redemption fees. This chart does not imply future performance. Past performance does not guarantee future results. The cumulative ten year return was 94.07% for the Fund’s Investor Class shares and 110.92% for the benchmark. The Fund’s Investor Class shares average annual total return since inception on June 28, 1994 was 6.54%. The MSCI All Country World ex US Index is a free float-adjusted market capitalization-weighted index of both developed and emerging markets. The index is unmanaged and returns assume the reinvestment of dividends. It is not possible to invest directly in an index. During the periods shown, the Fund’s manager reimbursed certain Fund expenses. Absent this reimbursement, performance would have been lower. Performance will vary from class to class based on differences in class-specific expenses.
| | |
| 6 | | www.thomaswhitefunds.com |
APRIL 30, 2019
The Thomas White International Fund primarily invests in equity securities of companies located in the world’s developed countries outside of the U.S. There may also be a portion of the Fund’s assets invested in companies located in emerging market countries.
Portfolio Managers
Jinwen Zhang, Ph.D., CFA
Douglas M. Jackman, CFA
Wei Li, Ph.D., CFA
John Wu, Ph.D., CFA
Rex Mathew, CFA, CMA
Ramkumar Venkatramani, CFA
Performance Review
The Thomas White International Fund Class I shares returned +10.86% for thesix-month period ended April 30, 2019, compared to +9.12% for the benchmark MSCI All Country World ex US Index. Since the Fund’s inception on June 28, 1994, the Fund’s Class I shares have returned +6.61%* annualized while the benchmark index returned +5.19% for the same period.
International Equities Weather Growth and Trade War Noise
International equity prices rebounded strongly during the first four months of 2019 after the sharp decline at the end of the previous year. Fears about a rapid slowdown in global growth and the worrisome headlines about the ongoing U.S.-China trade dispute had eroded investor confidence during the last quarter of 2018. However, economic growth data from the large
countries at the beginning of this year turned out to be better than expected. Further, the U.S. Federal Reserve reversed its monetary policy stance and indicated that future interest rate decisions will take into consideration possible economic weakness and benign inflation. Similarly, the European Central Bank reiterated its readiness to roll out more accommodative policy steps if the need arises, and the Bank of Japan is continuing its bond purchases.
Economic growth across most large developed economies remained healthy during the first quarter of 2019. The pace of U.S. expansion exceeded expectations and remains the main driver of global growth. Eurozone growth was also above forecasts and helped allay fears of another downturn in the region. Growth in Japan also accelerated at the beginning of this year, compared to the last quarter of 2018. Among the large emerging countries, growth in China was resilient to the decline in trade while the pace slowed in India and Brazil. Global manufacturing and services output growth has decelerated in recent months, largely due to the softness in external trade. Order inflows have also slowed, especially in the manufacturing sector, which suggests softer output data in the coming months.
Portfolio Review
During thesix-month review period, positive stock selection across all sectors, with the exception of communication services, helped the International Fund outperform its benchmark. Stock selection was notably effective in the consumer staples, industrials, financials and healthcare sectors. At the
| * | Performance for Class I shares includes the historical performance of Investor Class shares through August 30, 2012. |
| | | | |
| www.thomaswhitefunds.com | | | 7 | |
THOMAS WHITE INTERNATIONAL FUND
country and region level, stock selection was positive in Japan as well as the developed markets in Europe and Asia Pacific. On the negative side, stock selection was less effective in emerging markets in Asia and Latin America. The higher allocation to emerging markets helped the relative performance of the Fund during the review period.
Kweichow Moutai, a manufacturer of premium Chinese liquor, wasthe largest contributor to Fund returns during the review period as strong earnings growth erased investor fears about slowing consumer demand in China. Kweichow is also revamping its distribution to make its products more accessible.Techtronic Industries, a manufacturer of power tools, gained on strong demand in the U.S. and elsewhere. Japanese technology and telecom holding companySoftBanksurged after announcing a large share buyback program and also on optimism about the merger of its U.S. telecom business Sprint with rivalT-Mobile.Naspers Limitedbenefited from strong earnings growth at a number of its holdings, including Tencent, a Chinese online gaming company. European luxury goods retailerKering outperformed as the company continues to report healthy earnings growth.
Japanese parking lot operatorPark24 detracted the most from Fund returns during the period on skepticism about demand for parking spaces in large cities as ride hailing services like Uber becomes more popular. Japanese retailerRyohin Keikaku was hurt by weaker than expected revenues at its stores.Exide Industries, a manufacturer of automotive and industrial batteries based in
India, was negatively affected by doubts about automobile demand in the near term. Nevertheless, we expect the company to benefit from strong replacement demand. European banking groupSociete Generale lagged after reporting weaker than expected revenues from its trading operations, though we believe the current valuation is low and the dividend yield attractive. European banks have also been hurt by the yield compression that has dragged their margins even lower. Argentinean bankBanco Macro underperformed during the period on concerns about increased political uncertainties. Banco Macro recovered after the end of the review period as investor fears have eased.
Compelling Valuations Likely Outweigh Trade and Geopolitical Risks
Prospects for the settlement of U.S.-China trade disputes continue to be uncertain as the positions on both sides appear to have hardened. The Trump administration’s willingness to use trade tariffs to achieve other goals, such as stopping illegal migration, have worsened investor sentiment even further. A comprehensive U.S.-China deal at theG-20 summit scheduled for the end of June appears unlikely at this point, given the large differences concerning the enforcement of trade agreements and structural reforms. However, it is hoped that the dispute will not escalate further and both sides will continue to negotiate for a better trade deal. Meanwhile, China is likely to buffer its economy from trade tensions with additional fiscal stimulus and liquidity boosts.
| | |
| 8 | | www.thomaswhitefunds.com |
APRIL 30, 2019
After the leadership change in the U.K., the country’s exit from the European Union (EU) appears more likely by October of this year. The exit agreement negotiated earlier in the year failed to get approved by the U.K. parliament, and it seems unlikely that the EU will be willing to make major concessions. If a new exit agreement is not reached in time, a hard Brexit is the more likely scenario. That will likely be disruptive to trade flows in the region and could hurt business sentiment. However, the expected central bank actions in such a scenario and currency weakness could offset part of the expected negative effects.
While the alarming headlines about trade wars and other geopolitical risks have unnerved investors, international equity valuations remain compelling. Although revenue growth has moderated in several sectors, well run businesses have managed to defend their margins to a large extent. They have also deliberately tried to reduce balance sheet risks, given the macro uncertainties. The continuing drop in borrowing costs is helping the more leveraged companies as the abundant market liquidity is allowing them to refinance expensive debt. Lower fixed income yields also typically make equities more attractive to investors, especially in Europe where several large companies now offer near-double digit dividend yields.
We sincerely appreciate the trust you have kept in the Thomas White International Fund.
| | | | |
| www.thomaswhitefunds.com | | | 9 | |
THOMAS WHITE INTERNATIONAL FUND
Portfolio Country and Industry Allocation as of April 30, 2019 (Unaudited)
| | | | |
| | |
Country Allocation | | % of TNA | |
Argentina | | | 0.3% | |
| | |
Australia | | | 5.6% | |
| | |
Belgium | | | 0.9% | |
| | |
Brazil | | | 1.9% | |
| | |
Canada | | | 5.1% | |
| | |
China | | | 9.1% | |
| | |
Finland | | | 2.0% | |
| | |
France | | | 6.4% | |
| | |
Germany | | | 3.4% | |
| | |
Hong Kong | | | 2.8% | |
| | |
India | | | 4.2% | |
| | |
Indonesia | | | 2.3% | |
| | |
Ireland | | | 1.1% | |
| | |
Italy | | | 1.3% | |
| | |
Japan | | | 13.8% | |
| | |
Mexico | | | 1.7% | |
| | |
Netherlands | | | 2.0% | |
| | |
Poland | | | 0.6% | |
| | |
Russia | | | 2.5% | |
| | |
Singapore | | | 1.3% | |
| | |
South Africa | | | 2.4% | |
| | |
South Korea | | | 4.5% | |
| | |
Spain | | | 1.6% | |
| | |
Sweden | | | 2.7% | |
| | |
Switzerland | | | 2.4% | |
| | |
Taiwan | | | 2.3% | |
| | |
Thailand | | | 2.0% | |
| | |
Turkey | | | 0.4% | |
| | |
United Kingdom | | | 11.5% | |
| | |
| Cash & Other | | | 1.9% | |
| | | | |
| | |
Industry Allocation | | % of TNA | |
Automobiles & Components | | | 2.5% | |
| | |
Banks | | | 18.4% | |
| | |
Capital Goods | | | 9.0% | |
| | |
Commercial & Professional Services | | | 1.6% | |
| | |
Consumer Durables & Apparel | | | 4.3% | |
| | |
Consumer Services | | | 2.4% | |
| | |
Diversified Financials | | | 3.5% | |
| | |
Energy | | | 5.9% | |
| | |
Food, Beverage & Tobacco | | | 5.4% | |
| | |
Health Care Equipment & Services | | | 3.5% | |
| | |
Household & Personal Products | | | 3.2% | |
| | |
Insurance | | | 3.4% | |
| | |
Materials | | | 10.4% | |
| | |
Media & Entertainment | | | 5.6% | |
| | |
Pharmaceuticals, Biotechnology & Life Sciences | | | 2.8% | |
| | |
Retailing | | | 1.9% | |
| | |
Semiconductors & Semiconductor Equipment | | | 2.3% | |
| | |
Software & Services | | | 2.0% | |
| | |
Technology Hardware & Equipment | | | 2.7% | |
| | |
Telecommunication Services | | | 3.4% | |
| | |
Transportation | | | 3.9% | |
| | |
Cash & Other | | | 1.9% | |
| | |
| | | | | |
| | |
| | | | | |
| | |
| | | | | |
| | |
| | | | | |
| | |
| | | | | |
| | |
| | | | | |
| | |
| | | | | |
| | |
| | | | |
TNA - Total Net Assets
Fund holdings and industry allocations are subject to change and should not be considered a recommendation to buy or sell any securities. For a complete list of Fund holdings, please refer to the Investment Portfolio section of this report.
| | |
| 10 | | www.thomaswhitefunds.com |
| | |
| Investment Portfolio (Unaudited) | | April 30, 2019 |
| | | | | | | | | | | | |
| Country | | Issue | | Industry | | Shares | | | Value (US$) | |
| | | | | | | | | | | |
COMMON
STOCKS (96.9%) | | | | | | | | | | |
|
| |
| ARGENTINA (0.3%) | | | | | | | | |
| | Banco Macro SA - ADR | | Banks | | | 10,900 | | | | $442,322 | |
|
| |
| AUSTRALIA (5.6%) | | | | | | | | |
| | Aristocrat Leisure Limited + | | Consumer Services | | | 68,600 | | | | 1,261,286 | |
| | BHP Billiton Ltd + | | Materials | | | 88,900 | | | | 2,347,941 | |
| | CSL Limited + | | Pharmaceuticals, Biotechnology & Life Sciences | | | 15,350 | | | | 2,148,802 | |
| | Treasury Wine Estates Limited + | | Food, Beverage & Tobacco | | | 120,100 | | | | 1,457,590 | |
| | | | | | | | | | | | |
| | | | | | | | | | | 7,215,619 | |
|
| |
| BELGIUM (0.9%) | | | | | | | | | | |
| | KBC Group NV + | | Banks | | | 15,400 | | | | 1,142,019 | |
|
| |
| BRAZIL (0.7%) | | | | | | | | | | |
| | Ambev SA | | Food, Beverage & Tobacco | | | 190,900 | | | | 899,218 | |
|
| |
| CANADA (5.1%) | | | | | | | | |
| | Canadian National Railway Company | | Transportation | | | 17,700 | | | | 1,644,090 | |
| | Nutrien Ltd. | | Materials | | | 23,800 | | | | 1,290,817 | |
| | Open Text Corporation | | Software & Services | | | 40,100 | | | | 1,541,502 | |
| | Suncor Energy, Inc. | | Energy | | | 34,200 | | | | 1,127,832 | |
| | The Toronto-Dominion Bank | | Banks | | | 18,300 | | | | 1,043,880 | |
| | | | | | | | | | | | |
| | | | | | | | | | | 6,648,121 | |
|
| |
| CHINA (9.1%) | | | | | | | | |
| | Alibaba Group Holding Ltd. - ADR * | | Retailing | | | 10,550 | | | | 1,957,763 | |
| | Anhui Conch Cement Company Limited - H Shares + | | Materials | | | 222,500 | | | | 1,354,413 | |
| | Baidu, Inc. - ADR * | | Media & Entertainment | | | 8,200 | | | | 1,363,086 | |
| | China Molybdenum Co., Ltd. - H Shares + | | Materials | | | 2,682,000 | | | | 1,005,427 | |
| | Kweichow Moutai Co., Ltd. - A Shares + | | Food, Beverage & Tobacco | | | 15,300 | | | | 2,211,940 | |
| | Midea Group Co., Ltd. - A Shares + | | Consumer Durables & Apparel | | | 203,800 | | | | 1,584,805 | |
| | Ping An Insurance (Group) Company of China Limited - H Shares + | | Insurance | | | 192,000 | | | | 2,313,440 | |
| | | | | | | | | | | | |
| | | | | | | | | | | 11,790,874 | |
|
| |
| FINLAND (2.0%) | | | | | | | | |
| | Konecranes OYJ + | | Capital Goods | | | 31,000 | | | | 1,293,665 | |
| | Sampo Oyj - A Shares + | | Insurance | | | 27,700 | | | | 1,268,605 | |
| | | | | | | | | | | | |
| | | | | | | | | | | 2,562,270 | |
|
| |
| FRANCE (6.4%) | | | | | | | | |
| | Danone + | | Food, Beverage & Tobacco | | | 18,500 | | | | 1,496,140 | |
| | Dassault Systemes + | | Software & Services | | | 6,900 | | | | 1,095,200 | |
The accompanying notes are an integral part of these financial statements
| | | | |
| www.thomaswhitefunds.com | | | 11 | |
| | |
| Thomas White International Fund | | |
| | | | | | | | | | | | |
| Country | | Issue | | Industry | | Shares | | | Value (US$) | |
| | | | | | | | | | | |
| FRANCE (CONT.) | | | | | | | | |
| | Eiffage + | | Capital Goods | | | 12,400 | | | | $1,297,848 | |
| | Kering + | | Consumer Durables & Apparel | | | 3,700 | | | | 2,189,341 | |
| | Safran SA + | | Capital Goods | | | 8,425 | | | | 1,227,734 | |
| | Societe Generale SA + | | Banks | | | 32,300 | | | | 1,023,334 | |
| | | | | | | | | | | | |
| | | | | | | | | | | 8,329,597 | |
|
| |
| GERMANY (3.4%) | | | | | | | | |
| | Bayer AG + | | Pharmaceuticals, Biotechnology & Life Sciences | | | 10,600 | | | | 704,507 | |
| | Bayerische Motoren Werke Aktiengesellschaft + | | Automobiles & Components | | | 18,450 | | | | 1,574,104 | |
| | Fresenius SE & Co KGaA + | | Health Care Equipment & Services | | | 15,200 | | | | 862,200 | |
| | Scout24 AG + | | Media & Entertainment | | | 25,900 | | | | 1,333,846 | |
| | | | | | | | | | | | |
| | | | | | | | | | | 4,474,657 | |
|
| |
| HONG KONG (2.8%) | | | | | | | | |
| | Hong Kong Exchanges & Clearing Limited + | | Diversified Financials | | | 34,100 | | | | 1,183,959 | |
| | Techtronic Industries Company Limited + | | Consumer Durables & Apparel | | | 245,600 | | | | 1,777,563 | |
| | United Company RUSAL Plc * + | | Materials | | | 1,450,000 | | | | 621,590 | |
| | | | | | | | | | | | |
| | | | | | | | | | | 3,583,112 | |
|
| |
| INDIA (4.2%) | | | | | | | | |
| | Exide Industries Ltd. + | | Automobiles & Components | | | 377,500 | | | | 1,162,202 | |
| | HDFC Bank Ltd. - ADR | | Banks | | | 18,300 | | | | 2,098,095 | |
| | Larsen & Toubro Ltd + | | Capital Goods | | | 64,900 | | | | 1,258,406 | |
| | Vedanta Limited + | | Materials | | | 394,200 | | | | 945,510 | |
| | | | | | | | | | | | |
| | | | | | | | | | | 5,464,213 | |
|
| |
| INDONESIA (2.3%) | | | | | | | | | | |
| | PT Bank Central Asia Tbk + | | Banks | | | 740,900 | | | | 1,494,761 | |
| | PT Telekomunikasi Indonesia Persero Tbk + | | Telecommunication Services | | | 5,625,000 | | | | 1,501,087 | |
| | | | | | | | | | | | |
| | | | | | | | | | | 2,995,848 | |
|
| |
| IRELAND (1.1%) | | | | | | | | | | |
| | CRH PLC + | | Materials | | | 42,190 | | | | 1,418,461 | |
|
| |
| ITALY (1.3%) | | | | | | | | | | |
| | Intesa Sanpaolo S.p.A. + | | Banks | | | 621,500 | | | | 1,628,761 | |
|
| |
| JAPAN (13.8%) | | | | | | | | | | |
| | East Japan Railway Company + | | Transportation | | | 9,100 | | | | 856,657 | |
| | H.I.S. Co., Ltd. + | | Consumer Services | | | 30,900 | | | | 985,271 | |
| | Kansai Paint Co., Ltd. + | | Materials | | | 65,900 | | | | 1,255,480 | |
| | KOSE Corporation + | | Household & Personal Products | | | 5,460 | | | | 1,017,663 | |
| | M3, Inc. + | | Health Care Equipment & Services | | | 76,300 | | | | 1,357,411 | |
The accompanying notes are an integral part of these financial statements
| | |
| 12 | | www.thomaswhitefunds.com |
| | |
| Investment Portfolio (Unaudited) | | April 30, 2019 |
| | | | | | | | | | | | |
| Country | | Issue | | Industry | | Shares | | | Value (US$) | |
| | | | | | | | | | | |
| JAPAN (CONT.) | | | | | | | | | | |
| | Mizuho Financial Group, Inc. + | | Banks | | | 564,400 | | | | $882,420 | |
| | Nidec Corporation + | | Capital Goods | | | 7,400 | | | | 1,056,176 | |
| | Nintendo Co., Ltd. + | | Media & Entertainment | | | 3,400 | | | | 1,165,916 | |
| | ORIX Corporation + | | Diversified Financials | | | 66,300 | | | | 932,833 | |
| | Park24 Co., Ltd. + | | Commercial & Professional Services | | | 54,200 | | | | 1,140,711 | |
| | RYOHIN KEIKAKU CO., LTD. + | | Retailing | | | 2,700 | | | | 510,516 | |
| | SMC CORPORATION + | | Capital Goods | | | 3,600 | | | | 1,496,283 | |
| | SoftBank Corp. + | | Telecommunication Services | | | 27,500 | | | | 2,870,833 | |
| | Sompo Holdings, Inc. + | | Insurance | | | 23,600 | | | | 878,910 | |
| | Sumitomo Corporation + | | Capital Goods | | | 56,700 | | | | 806,233 | |
| | Takeda Pharmaceutical Company Limited + | | Pharmaceuticals, Biotechnology & Life Sciences | | | 19,633 | | | | 727,854 | |
| | | | | | | | | | | | |
| | | | | | | | | | | 17,941,167 | |
|
| |
| MEXICO (1.7%) | | | | | | | | | | |
| | Cemex SAB de CV * | | Materials | | | 1,761,024 | | | | 815,592 | |
| | Grupo Aeroportuario del Sureste SAB de CV - Class B | | Transportation | | | 87,800 | | | | 1,441,832 | |
| | | | | | | | | | | | |
| | | | | | | | | | | 2,257,424 | |
|
| |
| NETHERLANDS (2.0%) | | | | | | | | |
| | ING Groep N.V. + | | Banks | | | 125,400 | | | | 1,597,763 | |
| | Koninklijke Philips NV + | | Health Care Equipment & Services | | | 22,600 | | | | 965,766 | |
| | | | | | | | | | | | |
| | | | | | | | | | | 2,563,529 | |
|
| |
| POLAND (0.6%) | | | | | | | | | | |
| | Bank Polska Kasa Opieki SA + | | Banks | | | 26,800 | | | | 797,754 | |
|
| |
| RUSSIA (2.5%) | | | | | | | | | | |
| | LUKOIL PJSC - ADR + | | Energy | | | 21,200 | | | | 1,803,812 | |
| | Sberbank of Russia PJSC - ADR + | | Banks | | | 101,500 | | | | 1,459,145 | |
| | | | | | | | | | | | |
| | | | | | | | | | | 3,262,957 | |
|
| |
| SINGAPORE (1.3%) | | | | | | | | | | |
| | DBS Group Holdings Limited + | | Banks | | | 81,300 | | | | 1,689,733 | |
|
| |
| SOUTH AFRICA (2.4%) | | | | | | | | |
| | FirstRand Limited + | | Diversified Financials | | | 270,600 | | | | 1,284,498 | |
| | Naspers Limited - N Shares + | | Media & Entertainment | | | 7,300 | | | | 1,864,652 | |
| | | | | | | | | | | | |
| | | | | | | | | | | 3,149,150 | |
|
| |
| SOUTH KOREA (4.5%) | | | | | | | | |
| | KB Financial Group Inc. + | | Banks | | | 44,250 | | | | 1,750,318 | |
| | LG Household & Health Care Ltd. + | | Household & Personal Products | | | 1,145 | | | | 1,394,228 | |
| | POSCO + | | Materials | | | 4,050 | | | | 884,459 | |
| | Samsung Electronics Co., Ltd. + | | Technology Hardware & Equipment | | | 46,950 | | | | 1,839,641 | |
| | | | | | | | | | | | |
| | | | | | | | | | | 5,868,646 | |
|
| |
The accompanying notes are an integral part of these financial statements
| | | | |
| www.thomaswhitefunds.com | | | 13 | |
| | |
| Thomas White International Fund | | |
| | | | | | | | | | | | |
| Country | | Issue | | Industry | | Shares | | | Value (US$) | |
| | | | | | | | | | | |
| SPAIN (1.6%) | | | | | | | | | | |
| | Banco Bilbao Vizcaya Argentaria, S.A. + | | Banks | | | 331,500 | | | | $2,020,500 | |
|
| |
| SWEDEN (2.7%) | | | | | | | | | | |
| | Hexagon AB - B Shares + | | Technology Hardware & Equipment | | | 30,300 | | | | 1,652,189 | |
| | SKF AB - B Shares + | | Capital Goods | | | 97,700 | | | | 1,807,287 | |
| | | | | | | | | | | | |
| | | | | | | | | | | 3,459,476 | |
|
| |
| SWITZERLAND (2.4%) | | | | | | | | |
| | Adecco Group AG + | | Commercial & Professional Services | | | 16,200 | | | | 930,733 | |
| | Credit Suisse Group AG + | | Diversified Financials | | | 87,700 | | | | 1,173,211 | |
| | Ems-Chemie Holding AG + | | Materials | | | 1,600 | | | | 970,502 | |
| | | | | | | | | | | | |
| | | | | | | | | | | 3,074,446 | |
|
| |
| TAIWAN (2.3%) | | | | | | | | |
| | Taiwan Semiconductor Manufacturing Company, Ltd. + | | Semiconductors & Semiconductor Equipment | | | 62,000 | | | | 523,719 | |
| | Taiwan Semiconductor Manufacturing Company, Ltd. - ADR | | Semiconductors & Semiconductor Equipment | | | 55,400 | | | | 2,427,628 | |
| | | | | | | | | | | | |
| | | | | | | | | | | 2,951,347 | |
|
| |
| THAILAND (2.0%) | | | | | | | | |
| | Airports of Thailand Public Company Ltd. + | | Transportation | | | 508,200 | | | | 1,091,242 | |
| | Kasikornbank Public Company Limited + | | Banks | | | 258,500 | | | | 1,543,146 | |
| | | | | | | | | | | | |
| | | | | | | | | | | 2,634,388 | |
|
| |
| TURKEY (0.4%) | | | | | | | | |
| | Tofas Turk Otomobil Fabrikasi A.S. + | | Automobiles & Components | | | 167,700 | | | | 503,879 | |
|
| |
| UNITED KINGDOM (11.5%) | | | | | | | | |
| | Ashtead Group Plc + | | Capital Goods | | | 50,000 | | | | 1,386,249 | |
| | BP p.l.c. + | | Energy | | | 306,900 | | | | 2,231,506 | |
| | British American Tobacco P.L.C. + | | Food, Beverage & Tobacco | | | 25,500 | | | | 1,000,215 | |
| | Carnival plc + | | Consumer Services | | | 16,600 | | | | 879,292 | |
| | Glencore plc + | | Materials | | | 158,100 | | | | 631,082 | |
| | Lloyds Banking Group plc + | | Banks | | | 2,085,600 | | | | 1,702,092 | |
| | Reckitt Benckiser Group PLC + | | Household & Personal Products | | | 20,800 | | | | 1,685,218 | |
| | Royal Dutch Shell PLC - B Shares + | | Energy | | | 79,600 | | | | 2,551,963 | |
| | Smith & Nephew plc + | | Health Care Equipment & Services | | | 69,900 | | | | 1,349,603 | |
| | WPP plc + | | Media & Entertainment | | | 123,100 | | | | 1,537,204 | |
| | | | | | | | | | | | |
| | | | | | | | | | | 14,954,424 | |
|
| |
Total Common
Stocks | | | | (Cost $112,657,321) | | | | | | | 125,723,912 | |
| | | | | | | | | | | | |
|
| |
The accompanying notes are an integral part of these financial statements
| | |
| 14 | | www.thomaswhitefunds.com |
| | |
| Investment Portfolio (Unaudited) | | April 30, 2019 |
| | | | | | | | | | | | |
| Country | | Issue | | Industry | | Shares | | | Value (US$) | |
| | | | | | | | | | | |
PREFERRED
STOCK (1.2%) | | | | | | | | | | | | |
|
| |
| BRAZIL (1.2%) | | | | | | | | | | |
| | Itau Unibanco Holding S.A. (7/29/19, 0.51%) ^ | | Banks | | | 184,740 | | | | $1,599,060 | |
|
| |
Total Preferred
Stock | | | | (Cost $1,325,082) | | | | | | | 1,599,060 | |
| | | | | | | | | | | | |
|
| |
| Total Investments | | 98.1% | | (Cost $113,982,403) | | | | | | | $127,322,972 | |
Other Assets,
Less Liabilities | | 1.9% | | | | | | | | | 2,469,144 | |
| Total Net Assets: | | 100.0% | | | | | | | | | $129,792,116 | |
|
| |
| * | Non-Income Producing Securities |
| ^ | Maturity Date and Preferred Dividend Rate of Preferred Stock |
| PLC | - Public Limited Company |
| ADR | - American Depositary Receipt |
Industry classifications shown in the Investment Portfolio are based off of the Global Industry Classification Standard (GICS®). GICS was developed by and/or is the exclusive property of MSCI, Inc. and Standard & Poor’s Financial Services LLC (“S&P”). GICS is a service mark of MSCI and S&P and has been licensed for use by U.S. Bancorp Fund Services, LLC.
The accompanying notes are an integral part of these financial statements
| | | | |
| www.thomaswhitefunds.com | | | 15 | |
| | |
| Thomas White International Fund | | |
The following table summarizes the inputs used, as of April 30, 2019, in valuating the Fund’s assets:
| | | | | | | | | | | | | | | | |
| | | | | |
| | | Level 1 | | | Level 2 | | | Level 3 | | | Total | |
| Common Stocks | | | | | | | | | | | | | | | | |
| | | | | |
| Argentina | | | $442,322 | | | | $------- | | | | $------- | | | | $442,322 | |
| | | | | |
| Australia | | | ------- | | | | 7,215,619 | | | | ------- | | | | 7,215,619 | |
| | | | | |
| Belgium | | | ------- | | | | 1,142,019 | | | | ------- | | | | 1,142,019 | |
| | | | | |
| Brazil | | | 899,218 | | | | ------- | | | | ------- | | | | 899,218 | |
| | | | | |
| Canada | | | 6,648,121 | | | | ------- | | | | ------- | | | | 6,648,121 | |
| | | | | |
| China | | | 3,320,849 | | | | 8,470,025 | | | | ------- | | | | 11,790,874 | |
| | | | | |
| Finland | | | ------- | | | | 2,562,270 | | | | ------- | | | | 2,562,270 | |
| | | | | |
| France | | | ------- | | | | 8,329,597 | | | | ------- | | | | 8,329,597 | |
| | | | | |
| Germany | | | ------- | | | | 4,474,657 | | | | ------- | | | | 4,474,657 | |
| | | | | |
| Hong Kong | | | ------- | | | | 3,583,112 | | | | ------- | | | | 3,583,112 | |
| | | | | |
| India | | | 2,098,095 | | | | 3,366,118 | | | | ------- | | | | 5,464,213 | |
| | | | | |
| Indonesia | | | ------- | | | | 2,995,848 | | | | ------- | | | | 2,995,848 | |
| | | | | |
| Ireland | | | ------- | | | | 1,418,461 | | | | ------- | | | | 1,418,461 | |
| | | | | |
| Italy | | | ------- | | | | 1,628,761 | | | | ------- | | | | 1,628,761 | |
| | | | | |
| Japan | | | ------- | | | | 17,941,167 | | | | ------- | | | | 17,941,167 | |
| | | | | |
| Mexico | | | 2,257,424 | | | | ------- | | | | ------- | | | | 2,257,424 | |
| | | | | |
| Netherlands | | | ------- | | | | 2,563,529 | | | | ------- | | | | 2,563,529 | |
| | | | | |
| Poland | | | ------- | | | | 797,754 | | | | ------- | | | | 797,754 | |
| | | | | |
| Russia | | | ------- | | | | 3,262,957 | | | | ------- | | | | 3,262,957 | |
| | | | | |
| Singapore | | | ------- | | | | 1,689,733 | | | | ------- | | | | 1,689,733 | |
| | | | | |
| South Africa | | | ------- | | | | 3,149,150 | | | | ------- | | | | 3,149,150 | |
| | | | | |
| South Korea | | | ------- | | | | 5,868,646 | | | | ------- | | | | 5,868,646 | |
| | | | | |
| Spain | | | ------- | | | | 2,020,500 | | | | ------- | | | | 2,020,500 | |
| | | | | |
| Sweden | | | ------- | | | | 3,459,476 | | | | ------- | | | | 3,459,476 | |
| | | | | |
| Switzerland | | | ------- | | | | 3,074,446 | | | | ------- | | | | 3,074,446 | |
| | | | | |
| Taiwan | | | 2,427,628 | | | | 523,719 | | | | ------- | | | | 2,951,347 | |
| | | | | |
| Thailand | | | ------- | | | | 2,634,388 | | | | ------- | | | | 2,634,388 | |
| | | | | |
| Turkey | | | ------- | | | | 503,879 | | | | ------- | | | | 503,879 | |
| | | | | |
| United Kingdom | | | ------- | | | | 14,954,424 | | | | ------- | | | | 14,954,424 | |
| Total Common Stocks | | | $18,093,657 | | | | $107,630,255 | | | | $------- | | | | $125,723,912 | |
| Preferred Stock | | | | | | | | | | | | | | | | |
| | | | | |
| Brazil | | | $1,599,060 | | | | $------- | | | | $------- | | | | $1,599,060 | |
| Total Preferred Stock | | | $1,599,060 | | | | $------- | | | | $------- | | | | $1,599,060 | |
| Total Investments | | | $19,692,717 | | | | $107,630,255 | | | | $------- | | | | $127,322,972 | |
For more information on valuation inputs, please refer to Note 1(A) of the accompanying Notes to Financial Statements.
The accompanying notes are an integral part of these financial statements
| | |
| 16 | | www.thomaswhitefunds.com |
| | |
| Investment Portfolio (Unaudited) | | April 30, 2019 |
The Fund’s assets assigned to Level 2 include certain foreign securities for which a third party statistical pricing service may be employed for purposes of fair market valuation. There were no transfers into or out of Level 3 during the reporting period, as compared to their classification from the prior annual report.
The accompanying notes are an integral part of these financial statements
| | | | |
| www.thomaswhitefunds.com | | | 17 | |
THOMAS WHITE EMERGING MARKETS FUND
| | | | | | | | | | | | | | |
| | | | | | | | |
| | | Unaudited
Sales
Charge | | Deferred
Sales
Charge | | Administrative
Services
Fee | | 12b-1 Fees | | Operating
Expenses1,3 | | Prospectus
Gross
Annual
Operating
Expense2 | | Prospectus
Net Annual
Operating
Expense2,3 |
| Investor Class | | None | | None | | Up to 0.25% | | None | | 1.34% | | 1.55% | | 1.35% |
| Class I | | None | | None | | None | | None | | 1.09% | | 1.52% | | 1.10% |
1 In the absence of the fee deferral/expense reimbursement arrangement for the Emerging Markets Fund, the ratio of expenses to average net assets would have been 1.58% for Investor Class shares and 1.55% for Class I shares.
2 Gross Annual Operating Expense and Net Annual Operating Expense are based on the most recent prospectus and may differ from other expense ratios appearing in this report.
3 Thomas White International, Ltd. (“Advisor”) has agreed to defer its fees and/or reimburse the Fund to the extent that the operating expenses for Investor Class and Class I shares exceed (as a percentage of average daily net assets) 1.34% and 1.09%, respectively. The fee deferral/expense reimbursement agreement expires February 29, 2020. The Fund has agreed to repay the Advisor for amounts deferred or reimbursed by the Advisor pursuant to the agreement provided that such repayment does not cause the Fund to exceed the above limits and the repayment is made within three years after the year in which the Advisor incurred the expense. The fee deferral/expense reimbursement agreement may only be amended or terminated by the Fund’s Board of Trustees. The net expense ratio is applicable to investors.
| | | | | | | | |
| | | | | |
| | | NAV | | Net Assets | | Redemption Fee | | Portfolio Turnover |
| Investor Class | | $11.25 | | $1.8 million | | 2.00% on shares held less than 60 days | | 12% |
| Class I | | $11.38 | | $37.9 million |
| | |
| 18 | | www.thomaswhitefunds.com |
APRIL 30, 2019
| | | | | | | | | | | | | | | | | | | | | | | | | | |
| |
| Average Annual Returns as of April 30, 2019 (Unaudited) | |
| Class | | Sales Charge | | 6 month | | | Calendar
YTD | | | 1 Yr | | | 3 Yrs | | | 5 Yrs | | | Since
Inception
(6/28/2010)* | |
| | | | | | | | |
| Investor Class shares (TWEMX) | | None | | | 13.98% | | | | 15.15% | | | | -3.91% | | | | 7.97% | | | | 1.28% | | | | 2.48% | |
| | | | | | | | |
| Class I shares1 (TWIIX) | | None | | | 14.14% | | | | 15.18% | | | | -3.62% | | | | 8.24% | | | | 1.54% | | | | 2.66% | |
| | | | | | | | |
| MSCI Emerging Markets Index2 | | N/A | | | 13.76% | | | | 12.23% | | | | -5.04% | | | | 11.25% | | | | 4.04% | | | | 3.87% | |
* The inception date of the Investor Class shares.
1 Performance figures for Class I shares, first offered on August 31, 2012, include the historical performance of Investor Class shares through August 30, 2012.
2 The MSCI Emerging Markets Index is a free float-adjusted market capitalization index that is designed to measure equity market performance of emerging markets. The index is unmanaged and returns assume the reinvestment of dividends. It is not possible to invest directly in an index.
Returns of each share class reflect differences in expenses applicable to each class which are primarily differences in service fees.
The returns do not reflect the deduction of taxes that a shareholder would pay on Fund distributions or the redemption of Fund shares. The returns reflect the actual performance for each period and do not include the impacts of trades executed on the last business day of the period that were recorded on the first business day of the next period.
Performance data is based upon past performance, which is no guarantee of future results. The investment return and principal value of an investment will fluctuate so that an investor’s shares, when redeemed, may be worth more or less than their original cost. Current performance may be higher or lower than the performance data quoted. Please call 1-800-811-0535 to obtain performance data as of the most recent month-end. The Fund imposes a 2% redemption fee on shares held less than 60 days. Performance data does not reflect the redemption fee. If reflected, total returns would be lower. Investment performance reflects any fee waivers that were in effect. In the absence of such waivers, total return would have been reduced. The Gross Expense Ratios, based on the most recent prospectus, are 1.55% (Investor Class) and 1.52% (Class I).
| | | | |
| www.thomaswhitefunds.com | | | 19 | |
THOMAS WHITE EMERGING MARKETS FUND
GROWTH OF A $10,000 INVESTMENT WITH DIVIDENDS REINVESTED (Unaudited)
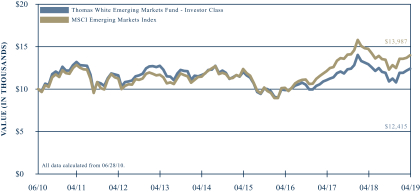
This chart illustrates the performance of a hypothetical $10,000 investment made in the Fund’s Investor Class shares and its benchmark, the MSCI Emerging Markets Index, since inception on June 28, 2010 through April 30, 2019. It assumes reinvestment of dividends and capital gains, but does not reflect the effect of any applicable redemption fees. This chart does not imply future performance. Past performance does not guarantee future results. The cumulative return since inception was 24.15% for the Fund’s Investor Class shares and 39.87% for the benchmark. The Fund’s Investor Class shares average annual total return since inception on June 28, 2010 was 2.48%. The MSCI Emerging Markets Index is a free float-adjusted market capitalization index that is designed to measure equity market performance of emerging markets. The index is unmanaged and returns assume the reinvestment of dividends. It is not possible to invest directly in an index. During the periods shown, the Fund’s manager reimbursed certain Fund expenses. Absent this reimbursement, performance would have been lower. Performance will vary from class to class based on differences in class-specific expenses.
| | |
| 20 | | www.thomaswhitefunds.com |
APRIL 30, 2019
The Thomas White Emerging Markets Fund invests primarily in securities of companies located in or whose businesses are closely associated with the world’s emerging markets countries.
Portfolio Managers
Jinwen Zhang, Ph.D., CFA
Douglas M. Jackman, CFA
Wei Li, Ph.D., CFA
John Wu, Ph.D., CFA
Rex Mathew, CFA, CMA
Ramkumar Venkatramani, CFA
Performance Review
During the trailingsix-month period ended April 30, 2019, the Thomas White Emerging Markets Fund Class I shares returned +14.14%, compared to +13.76% for its benchmark MSCI Emerging Markets Index. Since its inception on June 28, 2010, the Fund’s Class I shares have returned +2.66%* annualized, against +3.87% for the benchmark index.
Despite Trade War Noise, Emerging Markets Outperform
Emerging market equity prices outperformed the developed markets during the review period, despite recurring concerns about the U.S.-China trade war and slower global growth. Aggregate economic growth in major countries such as China, India and Indonesia remained healthy, though lower trade volumes restricted the pace of expansion in select countries. Central banks in some emerging countries also lowered
interest rates or took steps to infuse liquidity to ensure credit availability. The targeted fiscal stimulus measures in China have helped support consumer demand in that country in recent months.
There-election of market-friendly governments in India and Indonesia attracted much investor attention and drove capital inflows into those markets. The Brazilian government’s efforts to move forward with crucial structural changes such as the pension system reforms have been received well by investors, though weaker than expected economic growth did dampen some of the optimism. Global commodity prices were volatile during the review period, but average prices remained remunerative enough for the resource exporting countries. Manufacturing activity softened across most emerging markets, reflecting the weaker global trade volumes.
Portfolio Review
Consumer staples, communication services and consumer discretionary were the best performing sectors during the review period as doubts about consumer spending in major markets such as China faded. Materials and energy sectors underperformed as the price volatility dissuaded investors from increasing their allocations to these areas. Effective stock selection in the consumer staples, industrials, communication services and financials sectors contributed to the Fund’s relative returns against the benchmark during the period. Stock selection was not as effective in the technology, consumer discretionary and materials sectors.
| | | | |
| www.thomaswhitefunds.com | | | 21 | |
THOMAS WHITE EMERGING MARKETS FUND
Higher exposure to the consumer discretionary sector and lower allocation to the healthcare sector helped the Fund. Being overweight energy and materials as well as being underweight communication services hurt the Fund’s relative performance. At the country level, stock selection was most effective in China, Russia, South Africa and Korea. Stock selection effect was negative in India, Indonesia and Brazil. Higher allocation to Latin America and lower exposure to Asia detracted from relative performance during the period.
Chinese online gaming and communications groupTencent Holdings contributed the most to returns, helped by strong earnings growth as well the Chinese government’s decision to withdraw the temporary restrictions on new online game approvals. South African investment holding companyNaspers, which is the major shareholder in Tencent, also benefited from the resurgent technology valuations. Chinese ecommerce groupAlibaba advanced as its topline growth continued to exceed expectations and the company remains confident about sustaining high growth rates.Reliance Industries, an Indian conglomerate with businesses in refining, retail and telecom, advanced as it continued to gain market share in the domestic telecom market.PingAn Insurance, one of the largest insurers in Asia, outperformed as demand for its higher margin products remained robust.
Catcher Technologies, the leading Taiwanese manufacturer of camera lenses used in smartphones, detracted the most from returns during the review period on concerns that additional tariffs could negatively impact volumes. Catcher was also hurt by the U.S.
government’s actions against Chinese equipment manufacturer Huawei, though sales to Huawei only represent about 5% of Catcher’s revenues. Brazilian steelmakerGerdau was hurt by weaker than expected economic growth in the country that could dampen steel demand. Brazilian oil producerPetrobras was negatively affected by relatively lower oil prices, as well as uncertainties about fuel subsidies in the country. Chinese internet search services providerBaidu declined on concerns that growth in advertising sales is slowing, while revenue generation from the company’s investments in autonomous driving and artificial intelligence could be delayed.PT United Tractors, and Indonesian coal miner and distributor of heavy equipment, underperformed on weaker Chinese coal demand.
Depressed Valuations Make Emerging Markets Appear Attractive
Given the unexpected deterioration in the U.S.-China trade talks, as well as the hardened rhetoric from both sides, it appears less likely that a trade deal will be reached anytime soon. Disagreements have resurfaced over several important areas such as intellectual property protections and enforcement of commitments made in agreements. At the same time, given the high stakes involved and the potential damage to economic growth on both sides, the risk of the current standoff escalating to a full blown trade war is also relatively low. We believe it is more likely that the U.S. and China will agree to a truce, possibly at theG-20 meeting scheduled for end of June and then continue negotiations to settle the contentious issues. If this occurs, it should be largely positive for
| | |
| 22 | | www.thomaswhitefunds.com |
APRIL 30, 2019
investor sentiment as it will avoid the risk of further economic growth deceleration while at the same time reduce the possibility of future conflicts by addressing the deeper structural disputes.
While external trade flows have weakened for most emerging economies this year, domestic demand trends remain fairly healthy. Governments in select countries, including China and India, have offset the slower household income growth with targeted fiscal stimulus and other income support measures. This is sustainable in our view as the fiscal deficits of emerging market countries, except a few, are not excessive. In addition, central banks in several emerging markets continue to ease liquidity, as in the case of China, or lower interest rates. As inflation risks remain benign, we believe monetary policy in emerging economies can remain accommodative for an extended period. This favorable fiscal and monetary support should continue to attract investor interest to emerging market equities, where current valuations remain depressed in our opinion.
We thank you for confidence in the Thomas White Emerging Markets Fund.
| | | | |
| www.thomaswhitefunds.com | | | 23 | |
THOMAS WHITE EMERGING MARKETS FUND
Portfolio Country and Industry Allocation as of April 30, 2019 (Unaudited)
| | | | |
| | |
| Country Allocation | | % of TNA | |
| Argentina | | | 0.6% | |
| | |
| Brazil | | | 7.7% | |
| | |
| Chile | | | 1.0% | |
| | |
| China | | | 33.6% | |
| | |
| Hong Kong | | | 0.8% | |
| | |
| India | | | 8.8% | |
| | |
| Indonesia | | | 3.4% | |
| | |
| Malaysia | | | 1.0% | |
| | |
| Mexico | | | 5.1% | |
| | |
| Panama | | | 0.9% | |
| | |
| Philippines | | | 1.7% | |
| | |
| Poland | | | 1.1% | |
| | |
| Russia | | | 5.2% | |
| | |
| South Africa | | | 4.4% | |
| | |
| South Korea | | | 11.3% | |
| | |
| Taiwan | | | 6.9% | |
| | |
| Thailand | | | 2.7% | |
| | |
| Turkey | | | 0.5% | |
| | |
| United States | | | 1.0% | |
| | |
| Cash & Other | | | 2.3% | |
| | |
| | | | | |
| | |
| | | | | |
| | |
| | | | | |
| | | | |
| | |
| Industry Allocation | | % of TNA | |
| Automobiles & Components | | | 2.3% | |
| | |
| Banks | | | 18.0% | |
| | |
| Capital Goods | | | 0.9% | |
| | |
| Consumer Durables & Apparel | | | 3.0% | |
| | |
| Diversified Financials | | | 2.8% | |
| | |
| Energy | | | 10.0% | |
| | |
| Food & Staples Retailing | | | 0.7% | |
| | |
| Food, Beverage & Tobacco | | | 3.4% | |
| | |
| Health Care Equipment & Services | | | 0.8% | |
| | |
| Household & Personal Products | | | 1.5% | |
| | |
| Insurance | | | 2.4% | |
| | |
| Materials | | | 7.9% | |
| | |
| Media & Entertainment | | | 7.3% | |
| | |
| Pharmaceuticals, Biotechnology & Life Sciences | | | 1.3% | |
| | |
| Real Estate | | | 2.2% | |
| | |
| Retailing | | | 6.8% | |
| | |
| Semiconductors & Semiconductor Equipment | | | 6.1% | |
| | |
| Software & Services | | | 8.1% | |
| | |
| Technology Hardware & Equipment | | | 5.7% | |
| | |
| Telecommunication Services | | | 1.2% | |
| | |
| Transportation | | | 4.3% | |
| | |
| Utilities | | | 1.0% | |
| | |
| Cash & Other | | | 2.3% | |
TNA - Total Net Assets
Fund holdings and industry allocations are subject to change and should not be considered a recommendation to buy or sell any securities. For a complete list of Fund holdings, please refer to the Investment Portfolio section of this report.
| | |
| 24 | | www.thomaswhitefunds.com |
| | |
| Investment Portfolio (Unaudited) | | April 30, 2019 |
| | | | | | | | | | | | |
| Country | | Issue | | Industry | | Shares | | | Value (US$) | |
| | | | | | | | | | | |
COMMON
STOCKS (91.4%) | | | | | | | | | | |
|
| |
| ARGENTINA (0.6%) | | | | | | | | | | |
| | Banco Macro SA - ADR | | Banks | | | 5,900 | | | | $239,422 | |
|
| |
| BRAZIL (3.2%) | | | | | | | | |
| | Ambev SA | | Food, Beverage & Tobacco | | | 60,200 | | | | 283,567 | |
| | B3 SA - Brasil Bolsa Balcao | | Diversified Financials | | | 45,400 | | | | 400,033 | |
| | Fleury SA | | Health Care Equipment & Services | | | 60,100 | | | | 318,195 | |
| | Hypera SA | | Pharmaceuticals, Biotechnology & Life Sciences | | | 36,900 | | | | 265,756 | |
| | | | | | | | | | | | |
| | | | | | | | | | | 1,267,551 | |
|
| |
| CHILE (1.0%) | | | | | | | | |
| | Enel Americas SA | | Utilities | | | 2,347,000 | | | | 411,843 | |
|
| |
| CHINA (33.6%) | | | | | | | | |
| | Alibaba Group Holding Ltd. - ADR * | | Retailing | | | 11,125 | | | | 2,064,466 | |
| | Anhui Conch Cement Company Limited - H Shares + | | Materials | | | 138,900 | | | | 845,519 | |
| | Baidu, Inc. - ADR * | | Media & Entertainment | | | 2,475 | | | | 411,419 | |
| | Brilliance China Automotive Holdings Ltd. + | | Automobiles & Components | | | 188,000 | | | | 206,251 | |
| | China Construction Bank Corp. - H Shares + | | Banks | | | 1,053,000 | | | | 928,731 | |
| | China Overseas Land & Investment Limited + | | Real Estate | | | 146,000 | | | | 546,631 | |
| | China Petroleum and Chemical Corporation (Sinopec) - H Shares + | | Energy | | | 656,000 | | | | 502,922 | |
| | CSPC Pharmaceutical Group Limited + | | Pharmaceuticals, Biotechnology & Life Sciences | | | 128,000 | | | | 245,995 | |
| | Ctrip.com International, Ltd. - ADR * | | Retailing | | | 9,800 | | | | 431,690 | |
| | Haier Electronics Group Co., Ltd. + | | Consumer Durables & Apparel | | | 119,000 | | | | 340,719 | |
| | Kweichow Moutai Co., Ltd. - A Shares + | | Food, Beverage & Tobacco | | | 2,800 | | | | 404,799 | |
| | Midea Group Co., Ltd. - A Shares + | | Consumer Durables & Apparel | | | 33,000 | | | | 256,617 | |
| | Momo Inc. - ADR # | | Media & Entertainment | | | 12,600 | | | | 441,882 | |
| | NetEase, Inc. - ADR | | Media & Entertainment | | | 2,315 | | | | 658,687 | |
| | Ping An Insurance (Group) Company of China Limited - H Shares + | | Insurance | | | 80,200 | | | | 966,343 | |
| | Shanghai International Airport Co., Ltd. - A Shares + | | Transportation | | | 37,000 | | | | 387,903 | |
| | Shenzhou International Group Holdings Ltd. + | | Consumer Durables & Apparel | | | 44,000 | | | | 589,332 | |
| | SINA Corporation * | | Media & Entertainment | | | 4,300 | | | | 270,642 | |
| | Tencent Holdings Limited + | | Software & Services | | | 45,400 | | | | 2,249,241 | |
| | ZTO Express (Cayman) Inc. - ADR # | | Transportation | | | 30,600 | | | | 609,858 | |
| | | | | | | | | | | | |
| | | | | | | | | | | 13,359,647 | |
|
| |
The accompanying notes are an integral part of these financial statements
| | | | |
| www.thomaswhitefunds.com | | | 25 | |
| | |
| Thomas White Emerging Markets Fund | | |
| | | | | | | | | | | | |
| Country | | Issue | | Industry | | Shares | | | Value (US$) | |
| | | | | | | | | | | |
| HONG KONG (0.8%) | | | | | | | | |
| | Thai Beverage Public Company Limited + | | Food, Beverage & Tobacco | | | 511,600 | | | | $316,317 | |
|
| |
| INDIA (8.8%) | | | | | | | | |
| | Coal India Limited + | | Energy | | | 115,700 | | | | 419,894 | |
| | Exide Industries Ltd. + | | Automobiles & Components | | | 94,300 | | | | 290,319 | |
| | HDFC Bank Ltd. - ADR | | Banks | | | 4,800 | | | | 550,320 | |
| | ITC Limited + | | Food, Beverage & Tobacco | | | 84,500 | | | | 366,139 | |
| | Larsen & Toubro Ltd + | | Capital Goods | | | 18,200 | | | | 352,896 | |
| | Mahindra & Mahindra Ltd. - GDR + | | Automobiles & Components | | | 47,198 | | | | 432,392 | |
| | Vedanta Limited + | | Materials | | | 134,500 | | | | 322,606 | |
| | WNS (Holdings) Ltd. - ADR * | | Software & Services | | | 9,900 | | | | 565,785 | |
| | YES BANK Limited + | | Banks | | | 78,400 | | | | 189,986 | |
| | | | | | | | | | | | |
| | | | | | | | | | | 3,490,337 | |
|
| |
| INDONESIA (3.4%) | | | | | | | | |
| | PT Bank Negara Indonesia (Persero) Tbk * + | | Banks | | | 772,800 | | | | 520,603 | |
| | PT Matahari Department Store Tbk + | | Retailing | | | 713,600 | | | | 203,933 | |
| | PT Telekomunikasi Indonesia Persero Tbk + | | Telecommunication Services | | | 1,006,000 | | | | 268,461 | |
| | PT United Tractors Tbk + | | Energy | | | 189,400 | | | | 361,176 | |
| | | | | | | | | | | | |
| | | | | | | | | | | 1,354,173 | |
|
| |
| MALAYSIA (1.0%) | | | | | | | | |
| | CIMB Group Holdings Berhad + | | Banks | | | 312,800 | | | | 398,699 | |
|
| |
| MEXICO (4.3%) | | | | | | | | | | |
| | Cemex SAB de CV * # | | Materials | | | 534,720 | | | | 247,648 | |
| | Grupo Aeroportuario del Sureste SAB de CV - Class B | | Transportation | | | 21,300 | | | | 349,784 | |
| | Grupo Financiero Banorte, S.A.B. de C.V. - Class O | | Banks | | | 129,100 | | | | 818,003 | |
| | Wal-Mart de Mexico S.A.B. de C.V. | | Food & Staples Retailing | | | 95,100 | | | | 279,414 | |
| | | | | | | | | | | | |
| | | | | | | | | | | 1,694,849 | |
|
| |
| PANAMA (0.9%) | | | | | | | | | | |
| | Banco Latinoamericano de Comercio Exterior, S.A. - E Shares # | | Diversified Financials | | | 17,100 | | | | 369,873 | |
|
| |
| PHILIPPINES (1.7%) | | | | | | | | |
| | Metropolitan Bank & Trust Company + | | Banks | | | 253,972 | | | | 361,829 | |
| | Semirara Mining and Power Corporation + | | Energy | | | 695,700 | | | | 318,470 | |
| | | | | | | | | | | | |
| | | | | | | | | | | 680,299 | |
|
| |
| POLAND (1.1%) | | | | | | | | | | |
| | Bank Polska Kasa Opieki SA + | | Banks | | | 5,700 | | | | 169,671 | |
| | KGHM Polska Miedz S.A. * + | | Materials | | | 10,600 | | | | 285,998 | |
| | | | | | | | | | | | |
| | | | | | | | | | | 455,669 | |
|
| |
The accompanying notes are an integral part of these financial statements
| | |
| 26 | | www.thomaswhitefunds.com |
| | |
| Investment Portfolio (Unaudited) | | April 30, 2019 |
| | | | | | | | | | | | |
| Country | | Issue | | Industry | | Shares | | | Value (US$) | |
| | | | | | | | | | | |
| RUSSIA (5.2%) | | | | | | | | | | |
| | LUKOIL PJSC - ADR + | | Energy | | | 14,700 | | | | $1,250,756 | |
| | Sberbank of Russia PJSC - ADR + | | Banks | | | 56,075 | | | | 806,124 | |
| | | | | | | | | | | | |
| | | | | | | | | | | 2,056,880 | |
|
| |
| SOUTH AFRICA (4.4%) | | | | | | | | |
| | Absa Group Limited + | | Banks | | | 24,500 | | | | 281,308 | |
| | FirstRand Limited + | | Diversified Financials | | | 71,000 | | | | 337,026 | |
| | Naspers Limited - N Shares + | | Media & Entertainment | | | 4,350 | | | | 1,111,129 | |
| | | | | | | | | | | | |
| | | | | | | | | | | 1,729,463 | |
|
| |
| SOUTH KOREA (10.3%) | | | | | | | | |
| | KB Financial Group Inc. + | | Banks | | | 10,550 | | | | 417,307 | |
| | Korea Zinc Co Ltd + | | Materials | | | 1,075 | | | | 416,461 | |
| | LG Chem Ltd. + | | Materials | | | 875 | | | | 271,082 | |
| | LG Household & Health Care Ltd. + | | Household & Personal Products | | | 490 | | | | 596,656 | |
| | POSCO + | | Materials | | | 1,425 | | | | 311,199 | |
| | Samsung Electronics Co., Ltd. + | | Technology Hardware & Equipment | | | 39,950 | | | | 1,565,360 | |
| | Shinhan Financial Group Co., Ltd. + | | Banks | | | 14,025 | | | | 529,569 | |
| | | | | | | | | | | | |
| | | | | | | | | | | 4,107,634 | |
|
| |
| TAIWAN (6.9%) | | | | | | | | |
| | Catcher Technology Co., Ltd + | | Technology Hardware & Equipment | | | 33,000 | | | | 261,140 | |
| | Largan Precision Company Limited + | | Technology Hardware & Equipment | | | 3,000 | | | | 451,477 | |
| | Taiwan Semiconductor Manufacturing Company, Ltd. + | | Semiconductors & Semiconductor Equipment | | | 240,700 | | | | 2,033,211 | |
| | | | | | | | | | | | |
| | | | | | | | | | | 2,745,828 | |
|
| |
| THAILAND (2.7%) | | | | | | | | |
| | Airports of Thailand Public Company Ltd. + | | Transportation | | | 162,400 | | | | 348,717 | |
| | Kasikornbank Public Company Limited + | | Banks | | | 48,400 | | | | 288,929 | |
| | PTT Exploration and Production Public Company Limited + | | Energy | | | 108,100 | | | | 452,390 | |
| | | | | | | | | | | | |
| | | | | | | | | | | 1,090,036 | |
|
| |
| TURKEY (0.5%) | | | | | | | | |
| | Turkcell Iletisim Hizmetleri AS + | | Telecommunication Services | | | 91,600 | | | | 191,879 | |
|
| |
| UNITED STATES (1.0%) | | | | | | | | |
| | Cognizant Technology SolutionsCorporation - A Shares | | Software & Services | | | 5,400 | | | | 393,984 | |
|
| |
Total Common
Stocks | | | | (Cost $28,838,501) | | | | | | | 36,354,383 | |
| | | | | | | | | | | | |
|
| |
The accompanying notes are an integral part of these financial statements
| | | | |
| www.thomaswhitefunds.com | | | 27 | |
| | |
| Thomas White Emerging Markets Fund | | |
| | | | | | | | | | | | |
| Country | | Issue | | Industry | | Shares | | | Value (US$) | |
| | | | | | | | | | | |
PREFERRED
STOCKS (5.5%) | | | | | | | | | | |
|
| |
| BRAZIL (4.5%) | | | | | | | | | | |
| | Banco Bradesco S.A. (7/25/19, N/A) ^ | | Banks | | | 39,600 | | | | $359,531 | |
| | Gerdau S.A. (8/7/19, 1.01%) ^ | | Materials | | | 119,300 | | | | 432,037 | |
| | Itau Unibanco Holding S.A. (7/29/19, 0.51%) ^ | | Banks | | | 35,423 | | | | 306,612 | |
| | Petroleo Brasileiro SA Petrobras (7/25/19, 0.07%) ^ | | Energy | | | 100,200 | | | | 693,026 | |
| | | | | | | | | | | | |
| | | | | | | | | | | 1,791,206 | |
|
| |
| SOUTH KOREA (1.0%) | | | | | | | | |
| | Samsung Electronics Co., Ltd. (7/8/19, 3.95%) ^ + | | Semiconductors & Semiconductor Equipment | | | 12,500 | | | | 397,447 | |
|
| |
Total Preferred
Stocks | | | | (Cost $1,930,722) | | | | | | | 2,188,653 | |
| | | | | | | | | | | | |
|
| |
| REAL ESTATE INVESTMENT TRUST (REIT) (0.8%) | | | | | | | | | | |
|
| |
| MEXICO (0.8%) | | | | | | | | |
| | Fibra Uno Administracion SA de CV | | Real Estate | | | 212,600 | | | | 315,125 | |
|
| |
| Total REIT | | | | (Cost $268,290) | | | | | | | 315,125 | |
| | | | | | | | | | | | |
|
| |
SHORT TERM
INVESTMENT (2.1%) | | | | | | | | | | |
|
| |
| MONEY MARKET FUND (2.1%) | | | | | | | | |
| | Northern Institutional Treasury Portfolio, 2.34%(a) | | | | | 844,564 | | | | 844,564 | |
|
| |
Total Short Term
Investment | | (Cost $844,564) | | | | | | | 844,564 | |
| | | | | | | | | | | | |
|
| |
| | | | |
HELD AS COLLATERAL
FOR SECURITIES LENDING (0.7%) | | | | | | | | | | | | |
|
| |
SHORT TERM
INVESTMENT (0.7%) | | | | | | | | | | |
|
| |
| MONEY MARKET FUND (0.7%) | | | | | | | | |
| | Northern Institutional Liquid Assets Portfolio, 2.46%(a) | | | | | 267,360 | | | | 267,360 | |
|
| |
Total held as
collateral for
securities lending | | (Cost $267,360) | | | | | | | 267,360 | |
| | | | | | | | | | | | |
|
| |
| Total Investments | | 100.5% | | (Cost $32,149,437) | | | | | | | $39,970,085 | |
Liabilities in
excess of other
assets | | (0.5)% | | | | | | | | | (198,394 | ) |
| Total Net Assets: | | 100.0% | | | | | | | | | $39,771,691 | |
|
| |
The accompanying notes are an integral part of these financial statements
| | |
| 28 | | www.thomaswhitefunds.com |
| | |
| Investment Portfolio (Unaudited) | | April 30, 2019 |
| * | Non-Income Producing Securities |
| # | All or a portion of securities on loan at April 30, 2019. The market value of the securities loaned was $1,611,893. The loaned securities were secured with cash collateral of $267,360 andnon-cash collateral with a value of $1,392,086. Thenon-cash collateral received consists of short term investments and long term bonds, and is held for the benefit of the Fund at the Fund’s custodian. The Fund cannot repledge or resell this collateral. Collateral is calculated based on prior day’s prices. - See Note 1(I) to Financial Statements |
| ^ | Maturity Date and Preferred Dividend Rate of Preferred Stock |
| ADR | - American Depositary Receipt |
| GDR | - Global Depositary Receipt |
Industry classifications shown in the Investment Portfolio are based off of the Global Industry Classification Standard (GICS®). GICS was developed by and/or is the exclusive property of MSCI, Inc. and Standard & Poor’s Financial Services LLC (“S&P”). GICS is a service mark of MSCI and S&P and has been licensed for use by U.S. Bancorp Fund Services, LLC.
The accompanying notes are an integral part of these financial statements
| | | | |
| www.thomaswhitefunds.com | | | 29 | |
| | |
| Thomas White Emerging Markets Fund | | |
The following table summarizes the inputs used, as of April 30, 2019, in valuating the Fund’s assets:
| | | | | | | | | | | | | | | | |
| | | | | |
| | | Level 1 | | | Level 2 | | | Level 3 | | | Total | |
| Common Stocks | | | | | | | | | | | | | | | | |
| | | | | |
| Argentina | | | $239,422 | | | | $------- | | | | $------- | | | | $239,422 | |
| | | | | |
| Brazil | | | 1,267,551 | | | | ------- | | | | ------- | | | | 1,267,551 | |
| | | | | |
| Chile | | | 411,843 | | | | ------- | | | | ------- | | | | 411,843 | |
| | | | | |
| China | | | 4,888,644 | | | | 8,471,003 | | | | ------- | | | | 13,359,647 | |
| | | | | |
| Hong Kong | | | ------- | | | | 316,317 | | | | ------- | | | | 316,317 | |
| | | | | |
| India | | | 1,116,105 | | | | 2,374,232 | | | | ------- | | | | 3,490,337 | |
| | | | | |
| Indonesia | | | ------- | | | | 1,354,173 | | | | ------- | | | | 1,354,173 | |
| | | | | |
| Malaysia | | | ------- | | | | 398,699 | | | | ------- | | | | 398,699 | |
| | | | | |
| Mexico | | | 1,694,849 | | | | ------- | | | | ------- | | | | 1,694,849 | |
| | | | | |
| Panama | | | 369,873 | | | | ------- | | | | ------- | | | | 369,873 | |
| | | | | |
| Philippines | | | ------- | | | | 680,299 | | | | ------- | | | | 680,299 | |
| | | | | |
| Poland | | | ------- | | | | 455,669 | | | | ------- | | | | 455,669 | |
| | | | | |
| Russia | | | ------- | | | | 2,056,880 | | | | ------- | | | | 2,056,880 | |
| | | | | |
| South Africa | | | ------- | | | | 1,729,463 | | | | ------- | | | | 1,729,463 | |
| | | | | |
| South Korea | | | ------- | | | | 4,107,634 | | | | ------- | | | | 4,107,634 | |
| | | | | |
| Taiwan | | | ------- | | | | 2,745,828 | | | | ------- | | | | 2,745,828 | |
| | | | | |
| Thailand | | | ------- | | | | 1,090,036 | | | | ------- | | | | 1,090,036 | |
| | | | | |
| Turkey | | | ------- | | | | 191,879 | | | | ------- | | | | 191,879 | |
| | | | | |
| United States | | | 393,984 | | | | ------- | | | | ------- | | | | 393,984 | |
| Total Common Stocks | | | $10,382,271 | | | | $25,972,112 | | | | $------- | | | | $36,354,383 | |
| Preferred Stocks | | | | | | | | | | | | | | | | |
| | | | | |
| Brazil | | | $1,791,206 | | | | $ ------- | | | | $------- | | | | $ 1,791,206 | |
| | | | | |
| South Korea | | | ------- | | | | 397,447 | | | | ------- | | | | 397,447 | |
| Total Preferred Stocks | | | $1,791,206 | | | | $397,447 | | | | $------- | | | | $ 2,188,653 | |
| Real Estate Investment Trust (REIT) | | | | | | | | | | | | | | | | |
| | | | | |
| Mexico | | | $315,125 | | | | $------- | | | | $------- | | | | $315,125 | |
| Total REIT | | | $315,125 | | | | $------- | | | | $------- | | | | $315,125 | |
| | | | | |
| Short Term Investments | | | $1,111,924 | | | | $------- | | | | $------- | | | | $1,111,924 | |
| Total Investments | | | $13,600,526 | | | | $26,369,559 | | | | $------- | | | | $39,970,085 | |
For more information on valuation inputs, please refer to Note 1(A) of the accompanying Notes to Financial Statements.
The accompanying notes are an integral part of these financial statements
| | |
| 30 | | www.thomaswhitefunds.com |
| | |
| Investment Portfolio (Unaudited) | | April 30, 2019 |
The Fund’s assets assigned to Level 2 include certain foreign securities for which a third party statistical pricing service may be employed for purposes of fair market valuation. There were no transfers into or out of Level 3 during the reporting period, as compared to their classification from the prior annual report.
The accompanying notes are an integral part of these financial statements
| | | | |
| www.thomaswhitefunds.com | | | 31 | |
THOMAS WHITE AMERICAN OPPORTUNITIES FUND
| | | | | | | | | | | | | | |
| | | | | | | | |
| | | Unaudited
Sales
Charge | | Deferred
Sales
Charge | | Administrative
Services
Fee | | 12b-1 Fees | | Operating
Expenses1,3 | | Prospectus
Gross
Annual
Operating
Expense2 | | Prospectus
Net Annual
Operating
Expense2,3 |
| Investor Class | | None | | None | | Up to 0.25% | | None | | 1.34% | | 1.43% | | 1.34% |
1 In the absence of the fee deferral/expense reimbursement arrangement for the American Opportunities Fund, the ratio of expenses to average net assets would have been 1.44% for Investor Class shares.
2 Gross Annual Operating Expense and Net Annual Operating Expense are based on the most recent prospectus and may differ from other expense ratios appearing in this report.
3 Thomas White International, Ltd. (“Advisor”) has agreed to defer its fees and/or reimburse the Fund to the extent that the operating expenses for Investor Class shares exceed 1.34% of its average daily net assets. The fee deferral/expense reimbursement agreement expires February 29, 2020. The Fund has agreed to repay the Advisor for amounts deferred or reimbursed by the Advisor pursuant to the agreement provided that such repayment does not cause the Fund to exceed the above limits and the repayment is made within three years after the year in which the Advisor incurred the expense. The fee deferral/expense reimbursement agreement may only be amended or terminated by the Fund’s Board of Trustees. The net expense ratio is applicable to investors.
| | | | | | | | |
| | | | | |
| | | NAV | | Net Assets | | Redemption Fee | | Portfolio Turnover |
Investor Class | | $17.57 | | $45.5 million | | 2.00% on shares held less than 60 days | | 21% |
| | |
| 32 | | www.thomaswhitefunds.com |
APRIL 30, 2019
| | | | | | | | | | | | | | | | | | | | | | | | | | |
| |
| Average Annual Returns as of April 30, 2019 (Unaudited) | |
| Class | | 6 month | | Calendar
YTD | | | 1 Yr | | | 3 Yrs | | | 5 Yrs | | | 10 Yrs | | | Since
Inception
(3/4/1999) | |
| | | | | | | | |
| Investor Class shares (TWAOX) | | 11.20% | | | 20.18% | | | | 9.69% | | | | 10.68% | | | | 8.12% | | | | 13.17% | | | | 8.11% | |
| | | | | | | | |
| Russell Midcap Index1 | | 11.65% | | | 20.97% | | | | 10.69% | | | | 12.82% | | | | 9.75% | | | | 15.65% | | | | 9.58% | |
| | | | | | | | |
| S&P 500 Index1 | | 9.76% | | | 18.25% | | | | 13.49% | | | | 14.87% | | | | 11.63% | | | | 15.32% | | | | 6.37% | |
1 The Russell Midcap Index measures the performance of the 800 smallest companies in the Russell 1000 Index. These represent approximately 31% of the total market capitalization of the Russell 1000 Index. The S&P 500 Index measures the performance of 500 leading companies in leading industries of the U.S. economy, capturing 80% coverage of U.S. equities. Both indices are unmanaged and returns assume the reinvestment of dividends. It is not possible to invest directly in an index.
The returns do not reflect the deduction of taxes that a shareholder would pay on Fund distributions or the redemption of Fund shares. The returns reflect the actual performance for each period and do not include the impacts of trades executed on the last business day of the period that were recorded on the first business day of the next period.
Performance data is based upon past performance, which is no guarantee of future results. The investment return and principal value of an investment will fluctuate so that an investor’s shares, when redeemed, may be worth more or less than their original cost. Current performance may be higher or lower than the performance data quoted. Please call 1-800-811-0535 to obtain performance data as of the most recent month-end. The Fund imposes a 2% redemption fee on shares held less than 60 days. Performance data does not reflect the redemption fee. If reflected, total returns would be lower. Investment performance reflects any fee waivers that were in effect. In the absence of such waivers, total return would have been reduced. The Investor Class Gross Expense Ratio, based on the most recent prospectus, is 1.43%.
| | | | |
| www.thomaswhitefunds.com | | | 33 | |
THOMAS WHITE AMERICAN OPPORTUNITIES FUND
GROWTH OF A $10,000 INVESTMENT WITH DIVIDENDS REINVESTED (Unaudited)
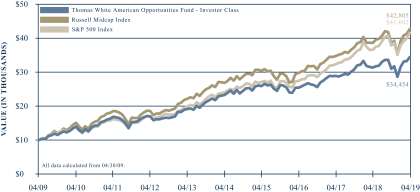
This chart illustrates the performance of a hypothetical $10,000 investment made in the Fund’s Investor Class shares, its primary benchmark, the Russell Midcap Index, and its secondary benchmark, the S&P 500 Index, for the past 10 years through April 30, 2019. It assumes reinvestment of dividends and capital gains, but does not reflect the effect of any applicable redemption fees. This chart does not imply future performance. Past performance does not guarantee future results. The cumulative ten year return was 244.54% for the Fund’s Investor Class shares, 328.05% for the primary benchmark, and 316.02% for the secondary benchmark. The Fund’s Investor Class shares average annual total return since inception on March 4, 1999 was 8.11%. The Russell Midcap Index measures the performance of the 800 smallest companies in the Russell 1000 Index. These represent approximately 31% of the total market capitalization of the Russell 1000 Index. The S&P 500 Index measures the performance of 500 leading companies in leading industries of the U.S. economy, capturing 80% coverage of U.S. equities. Both indices are unmanaged and returns assume the reinvestment of dividends. It is not possible to invest directly in an index. During the periods shown, the Fund’s manager reimbursed certain Fund expenses. Absent this reimbursement, performance would have been lower.
| | |
| 34 | | www.thomaswhitefunds.com |
APRIL 30, 2019
The Thomas White American Opportunities Fund primarily invests in equity securities of mid-size U.S. companies. The Fund may also invest in equity securities of smaller and larger size U.S. companies.
Portfolio Managers
Jinwen Zhang, Ph.D., CFA
Douglas M. Jackman, CFA
Wei Li, Ph.D., CFA
John Wu, Ph.D., CFA
Rex Mathew, CFA, CMA
Ramkumar Venkatramani, CFA
Performance Review
The Thomas White American Opportunities Fund Investor Class shares returned +11.20% during thesix-month period ended April 30, 2019 while the Fund’s primary benchmark, the Russell Midcap Index, returned +11.65% and the secondary benchmark, the S&P 500 Index, returned +9.76% during the same period. Since its inception on March 4, 1999, the Fund’s Investor Class shares annualized returns are +8.11%, compared to +9.58% for the Russell Midcap Index and +6.37% for the S&P 500 Index.
U.S. Domestic Equities Advance Despite Increased Volatility
U.S. domestic equity prices declined sharply during the final months of 2018 as fears about a global growth slowdown, worsening trade disputes, and the Federal Reserve’s rate increases unnerved investors. Demand data from overseas markets, especially China and Europe, indicated a decline in consumer spending. This was expected to weaken further as the full impact of the ongoing trade
war hit consumer and business sentiment. However, U.S. Gross Domestic Product (GDP) growth at 3.1% for the first quarter of 2019 exceeded expectations. The labor market continued to tighten with above average monthly job gains and wage growth. The healthy pace of expansion in Europe and China also helped allay pessimism about global growth.
The U.S. Federal Reserved quickly reversed its 2018year-end guidance of two or more rate increases this year as market sentiment soured and treasury yields declined. The Fed acknowledged that it will avoid rate hikes or even lower interest rates if necessary. Inflation trends have also been well contained, easing the Fed’s decision to change monetary policy direction.
Meanwhile, comments from both the U.S. and China at the beginning of 2019 indicated that negotiations to conclude a comprehensive trade deal are progressing. Though a trade deal still remains out of reach, optimism about an agreement helped revive equity prices during the first quarter of this year. At the same time, the revised trade deal between the U.S., Canada and Mexico appeared to be moving closer to legislative approval in the respective countries.
Portfolio Review
Chip design and automation software developerCadence Design Systems contributed the most to Fund returns during the review period after reporting stronger than expected earnings for the most recent quarter.Xilinx, a developer of programmable logic devices, advanced as it continued to see robust earnings expansion. Xilinx remains optimistic about the demand
| | | | |
| www.thomaswhitefunds.com | | | 35 | |
THOMAS WHITE AMERICAN OPPORTUNITIES FUND
outlook and expects revenue growth to remain high.Intuit, which develops software for small and medium businesses as well as tax return services, also benefited from the healthy demand outlook for software products that improves business productivity.Lam Research, a manufacturer of equipment used in semiconductor fabrication, gained on expectations of continued demand growth for chipsets used in handheld devices. Auto parts retailerAutoZone outperformed after reporting healthy revenue and earnings growth, helped by sustained demand for replacement parts.
Managed care services providerCentene. detracted the most from Fund returns during the review period on concerns about the high valuation of its proposed acquisition of WellCare. Investors were also disappointed that this transaction, if concluded, will make Centene less attractive as an acquisition target itself. Volatile fuel prices hurt the Fund’s energy sector holdings as future earnings and cash flows have become more uncertain. Stocks that declined included natural gas producerCNX Resources, shale energy producerEquitrans Midstream, as well as refinerMarathon Petroleum.Bio-pharmaceuticals companyJazz Pharmaceuticals underperformed despite reporting healthy revenue and earnings growth for the most recent quarter, as its revenue growth guidance for the current year fell short of market expectations.
Accommodative Fed and Sustained Earnings Growth Likely to Support Equities
Aggregate U.S. economic growth is likely to decelerate from the 3.1% achieved during the
first quarter of 2019. Yet, the U.S. should remain the fastest growing major developed economy this year. Consumer spending remains resilient and is expected to continue to support the economy. Though average monthly job additions have moderated recently, the unemployment rate remains very low and wage gains continue at a moderate pace. This should help offset the potential negative impact on household spending from higher import tariffs. The recent decline in crude oil prices should also reduce the pressure in household budgets during the summer months when fuel demand peaks.
The housing market is seeing renewed activity as the meaningful drop in mortgage rates and steady income growth are likely to help sustain demand. Though gains in existing home sales are restrained by high average home prices and lack of inventory in active markets, new home sales data and housing starts data have turned more positive. Homebuilders have become more optimistic about demand going forward, and this should give a boost to construction activity.
After its last rate increase in December of 2018, the U.S. Federal Reserve has become far more accommodative in its monetary policy stance. In recent communications and comments by Fed officials, the central bank has acknowledged the increasing downside risks to growth. At the same time, despite healthy consumer spending, inflation remains below the central bank’s target rate. This should allow the Fed to lower its target interest rate if economic growth trends weaken further, though the current market expectations of two Fed rate cuts before the
| | |
| 36 | | www.thomaswhitefunds.com |
APRIL 30, 2019
end of this year appear optimistic given the continuing economic expansion. In any case, lower fixed income yields are likely to drive higher investment allocations to equities.
Market fears of a substantial decline in U.S. corporate earnings for the first quarter of 2019 have been proven wrong. Across most sectors, aggregate corporate earnings have met or exceeded forecasts. Unless there is a major market disruption or event that could weaken consumer sentiment meaningfully, corporate earnings and cash flows are likely to remain healthy. This should allow companies to increase dividend payouts and share buybacks.
We thank you for investing in the Thomas White American Opportunities Fund.
| | | | |
| www.thomaswhitefunds.com | | | 37 | |
THOMAS WHITE AMERICAN OPPORTUNITIES FUND
Portfolio Industry Allocation and Market Capitalization as of April 30, 2019 (Unaudited)
| | | | |
| | |
Industry Allocation | | % of TNA | |
Automobiles & Components | | | 1.6% | |
| | |
Banks | | | 6.5% | |
| | |
Capital Goods | | | 13.8% | |
| | |
Consumer Durables & Apparel | | | 3.6% | |
| | |
Consumer Services | | | 2.8% | |
| | |
Diversified Financials | | | 4.2% | |
| | |
Energy | | | 4.5% | |
| | |
Food, Beverage & Tobacco | | | 1.4% | |
| | |
Health Care Equipment & Services | | | 6.9% | |
| | |
Insurance | | | 2.9% | |
| | |
Materials | | | 6.2% | |
| | |
Media & Entertainment | | | 1.0% | |
| | |
Pharmaceuticals, Biotechnology & Life Sciences | | | 4.0% | |
| | |
Real Estate | | | 6.1% | |
| | |
Retailing | | | 3.5% | |
| | |
Semiconductors & Semiconductor Equipment | | | 4.8% | |
| | |
Software & Services | | | 9.1% | |
| | |
Technology Hardware & Equipment | | | 4.2% | |
| | |
Transportation | | | 3.4% | |
| | |
Utilities | | | 7.8% | |
| | |
Cash & Other | | | 1.7% | |
| | | | |
| | |
| Portfolio Market Cap Mix | | % of TNA | |
| Large Cap (over $34.7 billion) | | | 14.8% | |
| | |
| Mid Cap ($2.5 - $34.7 billion) | | | 83.5% | |
| | |
| Cash & Other | | | 1.7% | |
| | |
| | | | | |
| | |
| | | | | |
| | |
| | | | | |
| | |
| | | | | |
| | |
| | | | | |
| | |
| | | | | |
| | |
| | | | | |
| | |
| | | | | |
| | |
| | | | | |
| | |
| | | | | |
| | |
| | | | | |
| | |
| | | | | |
| | |
| | | | | |
| | |
| | | | | |
| | |
| | | | | |
| | |
| | | | | |
| | |
| | | | | |
| | |
| | | | | |
| | |
| | | | | |
| | |
| | | | | |
TNA - Total Net Assets
Fund holdings and industry allocations are subject to change and should not be considered a recommendation to buy or sell any securities. For a complete list of Fund holdings, please refer to the Investment Portfolio section of this report.
| | |
| 38 | | www.thomaswhitefunds.com |
| | |
| Investment Portfolio (Unaudited) | | April 30, 2019 |
| | | | | | | | | | |
| Industry | | Issue | | Shares | | | Value | |
| | | | | | | | | |
| COMMON STOCKS (92.2%) | | | | | | | | |
|
| |
| AUTOMOBILES & COMPONENTS (1.6%) | | | | | | |
| | BorgWarner, Inc. | | | 12,000 | | | | $501,240 | |
| | Thor Industries, Inc. | | | 3,775 | | | | 248,659 | |
| | | | | | | | | | |
| | | | | | | | | 749,899 | |
|
| |
| BANKS (6.5%) | | | | | | |
| | Citizens Financial Group, Inc. | | | 15,100 | | | | 546,620 | |
| | Comerica Incorporated | | | 9,250 | | | | 726,958 | |
| | Fifth Third Bancorp | | | 13,600 | | | | 391,952 | |
| | Regions Financial Corporation | | | 37,100 | | | | 576,163 | |
| | Zions Bancorporation, N.A. | | | 14,900 | | | | 735,017 | |
| | | | | | | | | | |
| | | | | | | | | 2,976,710 | |
|
| |
| CAPITAL GOODS (13.8%) | | | | | | |
| | Carlisle Companies Incorporated | | | 3,530 | | | | 499,213 | |
| | Cummins Inc. | | | 2,600 | | | | 432,354 | |
| | Huntington Ingalls Industries, Inc. | | | 4,140 | | | | 921,481 | |
| | Ingersoll-Rand PLC ^ | | | 5,000 | | | | 613,050 | |
| | The Middleby Corporation * | | | 3,400 | | | | 449,242 | |
| | Parker-Hannifin Corporation | | | 2,550 | | | | 461,754 | |
| | Sensata Technologies Holding plc * ^ | | | 15,704 | | | | 784,258 | |
| | Snap-on Incorporated | | | 4,350 | | | | 732,018 | |
| | Spirit AeroSystems Holdings, Inc. - Class A | | | 8,250 | | | | 716,925 | |
| | Textron Inc. | | | 6,575 | | | | 348,475 | |
| | W.W. Grainger, Inc. | | | 1,200 | | | | 338,400 | |
| | | | | | | | | | |
| | | | | | | | | 6,297,170 | |
|
| |
| CONSUMER DURABLES & APPAREL (3.6%) | | | | | | |
| | Capri Holdings Limited * ^ | | | 4,650 | | | | 204,972 | |
| | Lennar Corporation - Class A | | | 8,250 | | | | 429,248 | |
| | NVR, Inc. * | | | 165 | | | | 520,159 | |
| | Polaris Industries Inc. | | | 4,900 | | | | 472,360 | |
| | | | | | | | | | |
| | | | | | | | | 1,626,739 | |
|
| |
| CONSUMER SERVICES (2.8%) | | | | | | |
| | Aramark | | | 11,987 | | | | 372,556 | |
| | Royal Caribbean Cruises Ltd. ^ | | | 7,400 | | | | 894,956 | |
| | | | | | | | | | |
| | | | | | | | | 1,267,512 | |
|
| |
| DIVERSIFIED FINANCIALS (4.2%) | | | | | | |
| | Ameriprise Financial, Inc. | | | 3,500 | | | | 513,695 | |
| | Intercontinental Exchange, Inc. | | | 6,500 | | | | 528,775 | |
| | Voya Financial, Inc. | | | 15,500 | | | | 850,795 | |
| | | | | | | | | | |
| | | | | | | | | 1,893,265 | |
|
| |
| ENERGY (4.5%) | | | | | | |
| | Concho Resources Inc. | | | 3,150 | | | | 363,447 | |
| | Diamondback Energy Inc | | | 3,350 | | | | 356,406 | |
| | EQT Corporation | | | 9,400 | | | | 192,230 | |
| | Marathon Petroleum Corporation | | | 12,054 | | | | 733,727 | |
| | Noble Energy, Inc. | | | 15,800 | | | | 427,548 | |
| | | | | | | | | | |
| | | | | | | | | 2,073,358 | |
|
| |
The accompanying notes are an integral part of these financial statements
| | | | |
| www.thomaswhitefunds.com | | | 39 | |
| | |
| Thomas White American Opportunities Fund | | |
| | | | | | | | | | |
| Industry | | Issue | | Shares | | | Value | |
| | | | | | | | | |
| FOOD, BEVERAGE & TOBACCO (1.4%) | | | | | | |
| | The Hershey Company | | | 5,000 | | | | $ 624,250 | |
|
| |
| HEALTH CARE EQUIPMENT & SERVICES (6.9%) | | | | | | |
| | Boston Scientific Corporation * | | | 19,230 | | | | 713,818 | |
| | Centene Corporation * | | | 9,200 | | | | 474,352 | |
| | Hill-Rom Holdings, Inc. | | | 5,290 | | | | 536,512 | |
| | Laboratory Corporation of America Holdings * | | | 3,095 | | | | 494,952 | |
| | WellCare Health Plans, Inc. * | | | 1,350 | | | | 348,772 | |
| | Zimmer Biomet Holdings, Inc. | | | 4,600 | | | | 566,536 | |
| | | | | | | | | | |
| | | | | | | | | 3,134,942 | |
|
| |
| INSURANCE (2.9%) | | | | | | |
| | Assurant, Inc. | | | 4,600 | | | | 437,000 | |
| | Everest Re Group, Ltd. ^ | | | 1,700 | | | | 400,350 | |
| | The Hartford Financial Services Group, Inc. | | | 9,300 | | | | 486,483 | |
| | | | | | | | | | |
| | | | | | | | | 1,323,833 | |
|
| |
| MATERIALS (6.2%) | | | | | | |
| | AptarGroup, Inc. | | | 4,400 | | | | 489,456 | |
| | Ball Corporation | | | 7,800 | | | | 467,532 | |
| | Martin Marietta Materials, Inc. | | | 2,900 | | | | 643,510 | |
| | PPG Industries, Inc. | | | 6,460 | | | | 759,050 | |
| | The Sherwin-Williams Company | | | 1,040 | | | | 473,023 | |
| | | | | | | | | | |
| | | | | | | | | 2,832,571 | |
|
| |
| MEDIA & ENTERTAINMENT (1.0%) | | | | | | |
| | CBS Corporation - Class BNon-Voting | | | 9,366 | | | | 480,195 | |
|
| |
| PHARMACEUTICALS, BIOTECHNOLOGY & LIFE SCIENCES (4.0%) | | | | |
| | Agilent Technologies, Inc. | | | 7,200 | | | | 565,200 | |
| | Charles River Laboratories International, Inc. * | | | 5,890 | | | | 827,368 | |
| | Jazz Pharmaceuticals Public Limited Company * ^ | | | 3,300 | | | | 428,241 | |
| | | | | | | | | | |
| | | | | | | | | 1,820,809 | |
|
| |
| RETAILING (3.5%) | | | | | | |
| | AutoZone, Inc. * | | | 694 | | | | 713,647 | |
| | Ross Stores, Inc. | | | 9,100 | | | | 888,706 | |
| | | | | | | | | | |
| | | | | | | | | 1,602,353 | |
|
| |
| SEMICONDUCTORS & SEMICONDUCTOR EQUIPMENT (4.8%) | | | | |
| | Analog Devices, Inc. | | | 4,030 | | | | 468,447 | |
| | Lam Research Corporation | | | 3,295 | | | | 683,482 | |
| | Skyworks Solutions, Inc. | | | 6,300 | | | | 555,534 | |
| | Xilinx, Inc. | | | 4,200 | | | | 504,588 | |
| | | | | | | | | | |
| | | | | | | | | 2,212,051 | |
|
| |
| SOFTWARE & SERVICES (9.1%) | | | | | | |
| | Cadence Design Systems, Inc. * | | | 9,525 | | | | 660,844 | |
| | Check Point Software Technologies Ltd. * ^ | | | 7,170 | | | | 865,849 | |
The accompanying notes are an integral part of these financial statements
| | |
| 40 | | www.thomaswhitefunds.com |
| | |
| Investment Portfolio (Unaudited) | | April 30, 2019 |
| | | | | | | | | | |
| Industry | | Issue | | Shares | | | Value | |
| | | | | | | | | |
| SOFTWARE & SERVICES (CONT.) | | | | | | |
| | DXC Technology Company | | | 4,175 | | | | $ 274,465 | |
| | Fidelity National Information Services, Inc. | | | 7,800 | | | | 904,254 | |
| | FleetCor Technologies Inc. * | | | 2,950 | | | | 769,803 | |
| | Intuit Inc. | | | 2,650 | | | | 665,309 | |
| | | | | | | | | | |
| | | | | | | | | 4,140,524 | |
|
| |
| TECHNOLOGY HARDWARE & EQUIPMENT (4.2%) | | | | | | |
| | Arista Networks Inc. * | | | 1,700 | | | | 530,893 | |
| | F5 Networks, Inc. * | | | 3,475 | | | | 545,227 | |
| | NetApp, Inc. | | | 11,250 | | | | 819,563 | |
| | | | | | | | | | |
| | | | | | | | | 1,895,683 | |
|
| |
| TRANSPORTATION (3.4%) | | | | | | |
| | Old Dominion Freight Line, Inc. | | | 4,700 | | | | 701,616 | |
| | Southwest Airlines Co. | | | 8,100 | | | | 439,263 | |
| | XPO Logistics, Inc. * | | | 5,750 | | | | 391,460 | |
| | | | | | | | | | |
| | | | | | | | | 1,532,339 | |
|
| |
| UTILITIES (7.8%) | | | | | | |
| | Alliant Energy Corporation | | | 14,000 | | | | 661,220 | |
| | Ameren Corporation | | | 11,300 | | | | 822,301 | |
| | CMS Energy Corporation | | | 13,050 | | | | 724,927 | |
| | DTE Energy Company | | | 5,200 | | | | 653,692 | |
| | Xcel Energy, Inc. | | | 12,050 | | | | 680,825 | |
| | | | | | | | | | |
| | | | | | | | | 3,542,965 | |
|
| |
| Total Common Stocks | | | (Cost $30,856,602 | ) | | | 42,027,168 | |
| | | | | | | | | | |
|
| |
| REAL ESTATE INVESTMENT TRUSTS (REITS) (6.1%) | | | | | | | | |
|
| |
| REAL ESTATE (6.1%) | | | | | | |
| | Boston Properties, Inc. | | | 4,025 | | | | 553,920 | |
| | Crown Castle International Corp. | | | 5,650 | | | | 710,657 | |
| | Digital Realty Trust, Inc. | | | 4,700 | | | | 553,237 | |
| | Prologis, Inc. | | | 8,400 | | | | 644,028 | |
| | Regency Centers Corp. | | | 4,550 | | | | 305,624 | |
| | | | | | | | | | |
| | | | | | | | | 2,767,466 | |
|
| |
| Total REITs | | | (Cost $2,342,337 | ) | | | 2,767,466 | |
| | | | | | | | | | |
|
| |
| Total Investments | | 98.3% | | | (Cost $33,198,939 | ) | | | $44,794,634 | |
| Other Assets, Less Liabilities | | 1.7% | | | | | | | 754,648 | |
| Total Net Assets: | | 100.0% | | | | | | | $45,549,282 | |
|
| |
| PLC | Public Limited Company |
| * | Non-Income Producing Securities |
| ^ | Foreign Issued Securities |
Industry classifications shown in the Investment Portfolio are based off of the Global Industry Classification Standard (GICS®). GICS was developed by and/or is the exclusive property of MSCI, Inc. and Standard & Poor’s Financial Services LLC (“S&P”). GICS is a service mark of MSCI and S&P and has been licensed for use by U.S. Bancorp Fund Services, LLC.
The accompanying notes are an integral part of these financial statements
| | | | |
| www.thomaswhitefunds.com | | | 41 | |
| | |
| Thomas White American Opportunities Fund | | |
The following table summarizes the inputs used, as of April 30, 2019, in valuating the Fund’s assets:
| | | | | | | | | | | | | | | | |
| | | | | |
| | | Level 1 | | | Level 2 | | | Level 3 | | | Total | |
| Common Stocks | | | | | | | | | | | | | | | | |
| | | | | |
| Automobiles & Components | | | $749,899 | | | | $------- | | | | $------- | | | | $749,899 | |
| | | | | |
| Banks | | | 2,976,710 | | | | ------- | | | | ------- | | | | 2,976,710 | |
| | | | | |
| Capital Goods | | | 6,297,170 | | | | ------- | | | | ------- | | | | 6,297,170 | |
| | | | | |
| Consumer Durables & Apparel | | | 1,626,739 | | | | ------- | | | | ------- | | | | 1,626,739 | |
| | | | | |
| Consumer Services | | | 1,267,512 | | | | ------- | | | | ------- | | | | 1,267,512 | |
| | | | | |
| Diversified Financials | | | 1,893,265 | | | | ------- | | | | ------- | | | | 1,893,265 | |
| | | | | |
| Energy | | | 2,073,358 | | | | ------- | | | | ------- | | | | 2,073,358 | |
| | | | | |
| Food, Beverage & Tobacco | | | 624,250 | | | | ------- | | | | ------- | | | | 624,250 | |
| | | | | |
| Health Care Equipment & Services | | | 3,134,942 | | | | ------- | | | | ------- | | | | 3,134,942 | |
| | | | | |
| Insurance | | | 1,323,833 | | | | ------- | | | | ------- | | | | 1,323,833 | |
| | | | | |
| Materials | | | 2,832,571 | | | | ------- | | | | ------- | | | | 2,832,571 | |
| | | | | |
| Media & Entertainment | | | 480,195 | | | | ------- | | | | ------- | | | | 480,195 | |
| | | | | |
| Pharmaceuticals, Biotechnology & Life Sciences | | | 1,820,809 | | | | ------- | | | | ------- | | | | 1,820,809 | |
| | | | | |
| Retailing | | | 1,602,353 | | | | ------- | | | | ------- | | | | 1,602,353 | |
| | | | | |
| Semiconductors & Semiconductor Equipment | | | 2,212,051 | | | | ------- | | | | ------- | | | | 2,212,051 | |
| | | | | |
| Software & Services | | | 4,140,524 | | | | ------- | | | | ------- | | | | 4,140,524 | |
| | | | | |
| Technology Hardware & Equipment | | | 1,895,683 | | | | ------- | | | | ------- | | | | 1,895,683 | |
| | | | | |
| Transportation | | | 1,532,339 | | | | ------- | | | | ------- | | | | 1,532,339 | |
| | | | | |
| Utilities | | | 3,542,965 | | | | ------- | | | | ------- | | | | 3,542,965 | |
| Total Common Stocks | | | $42,027,168 | | | | $------- | | | | $------- | | | | $42,027,168 | |
| Real Estate Investment Trusts (REITs) | | | | | | | | | | | | | | | | |
| | | | | |
| Real Estate | | | $2,767,466 | | | | $------- | | | | $------- | | | | $2,767,466 | |
| Total REITs | | | $2,767,466 | | | | $------- | | | | $------- | | | | $2,767,466 | |
| Total Investments | | | $44,794,634 | | | | $------- | | | | $------- | | | | $44,794,634 | |
For more information on valuation inputs, please refer to Note 1(A) of the accompanying Notes to Financial Statements.
No transfers in and/or out between Levels 1, 2 or 3 were observed during the reporting period, as compared to their classification from the prior annual report.
The accompanying notes are an integral part of these financial statements
| | |
| 42 | | www.thomaswhitefunds.com |
THOMAS WHITE FUNDS
Statements of Assets and Liabilities
April 30, 2019 (Unaudited)
| | | | | | | | | | | | | | | | | | | | | | | | |
| | | | |
| | | International
Fund | | | Emerging
Markets
Fund | | | American
Opportunities
Fund | |
| | | | | | | |
| ASSETS: | | | | | | | | | | | | | | | | | | | | | | | | |
| | | | | | | |
| Investments in securities at market value1,3 | | $ | | | | | 127,322,972 | | | $ | | | | | 39,970,085 | | | $ | | | | | 44,794,634 | |
| | | | | | | |
| Foreign currency2 | | | | | | | 36,119 | | | | | | | | 3,675 | | | | | | | | ------- | |
| | | | | | | |
| Cash | | | | | | | 806,119 | | | | | | | | 1,512 | | | | | | | | 726,402 | |
| | | | | | | |
| Receivables: | | | | | | | | | | | | | | | | | | | | | | | | |
| | | | | | | |
Securities Lending | | | | | | | 1,168 | | | | | | | | 377 | | | | | | | | ------- | |
| | | | | | | |
Dividends and interest | | | | | | | 394,024 | | | | | | | | 56,279 | | | | | | | | 11,716 | |
| | | | | | | |
Reclaims | | | | | | | 1,429,068 | | | | | | | | 19,690 | | | | | | | | 3,975 | |
| | | | | | | |
Fund shares sold | | | | | | | 60,468 | | | | | | | | 10,666 | | | | | | | | 35,168 | |
| | | | | | | |
| Prepaid expenses | | | | | | | 45,609 | | | | | | | | 27,984 | | | | | | | | 43,490 | |
| | | | | | | |
| Total assets | | | | | | | 130,095,547 | | | | | | | | 40,090,268 | | | | | | | | 45,615,385 | |
| | | | | | | | | | | | | | | | | | | | | | | | | |
| | | | | | | |
| LIABILITIES: | | | | | | | | | | | | | | | | | | | | | | | | |
| | | | | | | |
| Management and administrative fees payable | | | | | | | 33,087 | | | | | | | | 9,778 | | | | | | | | 27,730 | |
| | | | | | | |
| Business management fees payable | | | | | | | 23,045 | | | | | | | | 2,917 | | | | | | | | 1,974 | |
| | | | | | | |
| Accrued expenses | | | | | | | 160,742 | | | | | | | | 30,875 | | | | | | | | 36,399 | |
| | | | | | | |
| Payable for fund shares redeemed | | | | | | | 53,254 | | | | | | | | ------- | | | | | | | | ------- | |
| | | | | | | |
| Collateral on loaned securities (See Note 1)3,4 | | | | | | | ------- | | | | | | | | 267,360 | | | | | | | | ------- | |
| | | | | | | |
| Other liabilities | | | | | | | 33,303 | | | | | | | | 7,647 | | | | | | | | ------- | |
| | | | | | | |
| Total liabilities | | | | | | | 303,431 | | | | | | | | 318,577 | | | | | | | | 66,103 | |
| | | | | | | | | | | | | | | | | | | | | | | | | |
| | | | | | | |
| Net Assets | | $ | | | | | 129,792,116 | | | $ | | | | | 39,771,691 | | | $ | | | | | 45,549,282 | |
| | | | | | | | | | | | | | | | | | | | | | | | | |
| | | | | | | |
| NET ASSETS | | | | | | | | | | | | | | | | | | | | | | | | |
| | | | | | | |
| Source of Net Assets: | | | | | | | | | | | | | | | | | | | | | | | | |
| | | | | | | |
| Net capital paid in on shares of beneficial interest | | $ | | | | | 108,459,605 | | | $ | | | | | 39,925,454 | | | $ | | | | | 32,691,383 | |
| | | | | | | |
| Total distributable earnings | | | | | | | 21,332,511 | | | | | | | | (153,763 | ) | | | | | | | 12,857,899 | |
| | | | | | | |
| Net assets | | $ | | | | | 129,792,116 | | | $ | | | | | 39,771,691 | | | $ | | | | | 45,549,282 | |
| |
| The accompanying notes are an integral part of these financial statements. | |
| | | | |
| www.thomaswhitefunds.com | | | 43 | |
THOMAS WHITE FUNDS
Statements of Assets and Liabilities
April 30, 2019 (Unaudited)
| | | | | | | | | | | | | | | | | | | | | | | | |
| | | | |
| | | International
Fund | | | Emerging
Markets
Fund | | | American
Opportunities
Fund | |
| | | | | | | |
| INVESTOR CLASS SHARES | | | | | | | | | | | | | | | | | | | | | | | | |
| | | | | | | |
| Net assets | | | $ | | | | 29,313,509 | | | | $ | | | | 1,835,719 | | | | $ | | | | 45,549,282 | |
| | | | | | | |
| Shares outstanding5 | | | | | | | 1,910,747 | | | | | | | | 163,134 | | | | | | | | 2,591,819 | |
| | | | | | | |
| Net asset value and offering price per share | | | $ | | | | 15.34 | | | | $ | | | | 11.25 | | | | $ | | | | 17.57 | |
| | | | | | | | | | | | | | | | | | | | | | | | | |
| | | | | | | |
| CLASS I SHARES | | | | | | | | | | | | | | | | | | | | | | | | |
| | | | | | | |
| Net assets | | | $ | | | | 100,478,607 | | | | $ | | | | 37,935,972 | | | | | | | | | |
| | | | | | | |
| Shares outstanding5 | | | | | | | 6,561,392 | | | | | | | | 3,333,440 | | | | | | | | | |
| | | | | | | |
| Net asset value and offering price per share | | | $ | | | | 15.31 | | | | $ | | | | 11.38 | | | | | | | | | |
| | | | | | | |
1 Cost Basis of Investments: International Fund: $113,982,403 Emerging Markets Fund: $32,149,437 including Securities lending collateral of $267,360 American Opportunities Fund: $33,198,939 | | | | | | | | | | | | | | | | | | | | | | | | |
| | | | | | | |
2 Cost Basis of Cash denominated in foreign currencies: International Fund: $36,150 Emerging Markets Fund: $3,675 | | | | | | | | | | | | | | | | | | | | | | | | |
| | | | | | | |
3 Value of securities out on loan at 4/30/2019: Emerging Markets Fund: $1,611,893 | | | | | | | | | | | | | | | | | | | | | | | | |
| | | | | | | |
4Non-cash collateral from securities on loan: Emerging Markets Fund: $1,392,086 | | | | | | | | | | | | | | | | | | | | | | | | |
| | | | | | | |
| 5 There are an unlimited number of $.01 par value shares of beneficial interest authorized. | | | | | | | | | | | | | | | | | | | | | | | | |
| |
| The accompanying notes are an integral part of these financial statements. | |
| | |
| 44 | | www.thomaswhitefunds.com |
THOMAS WHITE FUNDS
Statements of Operations
Period Ended April 30, 2019 (Unaudited)
| | | | | | | | | | | | | | | | | | | | | | | | |
| | | | |
| | | International
Fund | | | Emerging
Markets Fund | | | American
Opportunities
Fund | |
| | | | | | | |
| INVESTMENT INCOME | | | | | | | | | | | | | | | | | | | | | | | | |
| | | | | | | |
| Income: | | | | | | | | | | | | | | | | | | | | | | | | |
| | | | | | | |
Dividends1 | | $ | | | | | 1,559,292 | | | $ | | | | | 292,403 | | | $ | | | | | 330,985 | |
| | | | | | | |
Interest | | | | | | | 5,776 | | | | | | | | 6,391 | | | | | | | | ------- | |
| | | | | | | |
Securities lending income (Note 1) | | | | | | | 2,799 | | | | | | | | 359 | | | | | | | | ------- | |
| | | | | | | |
| Total investment income | | | | | | | 1,567,867 | | | | | | | | 299,153 | | | | | | | | 330,985 | |
| | | | | | | |
| Expenses: | | | | | | | | | | | | | | | | | | | | | | | | |
| | | | | | | |
Investment management fees (Note 4) | | | | | | | 525,429 | | | | | | | | 153,979 | | | | | | | | 176,712 | |
| | | | | | | |
Business management fees (Note 4) | | | | | | | 21,635 | | | | | | | | 6,340 | | | | | | | | 7,276 | |
| | | | | | | |
Accounting fees | | | | | | | 30,051 | | | | | | | | 11,041 | | | | | | | | 8,986 | |
| | | | | | | |
Administration Fees | | | | | | | | | | | | | | | | | | | | | | | | |
| | | | | | | |
Class I shares | | | | | | | 21,066 | | | | | | | | 7,758 | | | | | | | | ------- | |
| | | | | | | |
Investor Class shares | | | | | | | 6,312 | | | | | | | | 387 | | | | | | | | 8,372 | |
| | | | | | | |
Custodian fees | | | | | | | 42,866 | | | | | | | | 21,243 | | | | | | | | 5,234 | |
| | | | | | | |
Transfer agent fees | | | | | | | | | | | | | | | | | | | | | | | | |
| | | | | | | |
Class I shares | | | | | | | 25,145 | | | | | | | | 14,737 | | | | | | | | ------- | |
| | | | | | | |
Investor Class shares | | | | | | | 7,605 | | | | | | | | 735 | | | | | | | | 8,628 | |
| | | | | | | |
Trustees’ fees and expenses | | | | | | | 49,956 | | | | | | | | 10,603 | | | | | | | | 12,331 | |
| | | | | | | |
Audit fees and expenses | | | | | | | 11,946 | | | | | | | | 10,498 | | | | | | | | 7,421 | |
| | | | | | | |
Registration fees | | | | | | | | | | | | | | | | | | | | | | | | |
| | | | | | | |
Class I shares | | | | | | | 14,754 | | | | | | | | 16,885 | | | | | | | | ------- | |
| | | | | | | |
Investor Class shares | | | | | | | 4,449 | | | | | | | | 841 | | | | | | | | 5,869 | |
| | | | | | | |
Printing expenses | | | | | | | | | | | | | | | | | | | | | | | | |
| | | | | | | |
Class I shares | | | | | | | 18,149 | | | | | | | | 3,401 | | | | | | | | ------- | |
| | | | | | | |
Investor Class shares | | | | | | | 5,515 | | | | | | | | 171 | �� | | | | | | | 3,520 | |
| | | | | | | |
Legal fees and expenses | | | | | | | 54,865 | | | | | | | | 9,917 | | | | | | | | 8,405 | |
| | | | | | | |
Administrative Service Fee: | | | | | | | | | | | | | | | | | | | | | | | | |
| | | | | | | |
Investor Class Shares | | | | | | | 24,795 | | | | | | | | 214 | | | | | | | | 37,422 | |
| | | | | | | |
Other expenses | | | | | | | 43,224 | | | | | | | | 13,172 | | | | | | | | 8,625 | |
| | | | | | | |
| Total expenses | | | | | | | 907,762 | | | | | | | | 281,922 | | | | | | | | 298,801 | |
| | | | | | | |
| Reimbursement of Class I expenses (Note 4) | | | | | | | (34,466 | ) | | | | | | | (38,646 | ) | | | | | | | ------- | |
| | | | | | | |
| Reimbursement of management fees (Note 4) | | | | | | | | | | | | | | | | | | | | | | | | |
| | | | | | | |
Class I shares | | | | | | | (171,715 | ) | | | | | | | (40,907 | ) | | | | | | | ------- | |
| | | | | | | |
Investor Class shares | | | | | | | (51,490 | ) | | | | | | | (2,038 | ) | | | | | | | (19,387 | ) |
| | | | | | | |
| Net expenses | | | | | | | 650,091 | | | | | | | | 200,331 | | | | | | | | 279,414 | |
| | | | | | | |
| Net investment income | | | | | | | 917,776 | | | | | | | | 98,822 | | | | | | | | 51,571 | |
| | | | | | | | | | | | | | | | | | | | | | | | | |
| |
| REALIZED AND UNREALIZED GAIN/(LOSS) ON INVESTMENTS | |
| | | | | | | |
| Net realized gain on investments & foreign currency transactions | | | | | | | 8,582,544 | | | | | | | | 548,842 | | | | | | | | 1,219,529 | |
| | | | | | | |
| Net change in unrealized appreciation on investments and foreign currency transactions | | | | | | | 4,726,502 | | | | | | | | 4,226,502 | | | | | | | �� | 3,286,422 | |
| | | | | | | |
| Net gain on investments | | | | | | | 13,309,046 | | | | | | | | 4,775,344 | | | | | | | | 4,505,951 | |
| | | | | | | |
| Net increase in net assets from operations | | $ | | | | | 14,226,822 | | | $ | | | | | 4,874,166 | | | $ | | | | | 4,557,522 | |
| | | | | | | |
1 Net of foreign taxes withheld of: International Fund: $148,547 Emerging Markets Fund: $41,380 | | | | | | | | | | | | | | | | | | | | | | | | |
| |
| The accompanying notes are an integral part of these financial statements. | |
| | | | |
| www.thomaswhitefunds.com | | | 45 | |
THOMAS WHITE FUNDS
Statements of Changes in Net Assets (Unaudited)
| | | | | | | | | | | | | | | | |
| | |
| | | International Fund | |
| | | | | |
| | | | | | Six Months
Ended
April 30,
2019 | | | | | | Year
Ended
October 31,
2018 | |
| | | | | |
| Change in net assets from operations: | | | | | | | | | | | | | | | | |
| | | | | |
Net investment income | | $ | | | | | 917,776 | | | $ | | | | | 4,334,767 | |
| | | | | |
Net realized gain on investments | | | | | | | 8,582,544 | | | | | | | | 21,287,918 | |
| | | | | |
Net unrealized appreciation / depreciation on investments and foreign currency transactions | | | | | | | 4,726,502 | | | | | | | | (54,785,026 | ) |
| | | | | |
Net increase (decrease) in net assets from operations | | | | | | | 14,226,822 | | | | | | | | (29,162,341 | ) |
| | | | | |
| Distributions: | | | | | | | | | | | | | | | | |
| | | | | |
Distributable earnings - Investor Class | | | | | | | ------- | | | | | | | | (3,523,265 | ) |
| | | | | |
Distributable earnings - Class I | | | | | | | ------- | | | | | | | | (21,768,071 | ) |
| | | | | |
| Total distributions | | | | | | | ------- | | | | | | | | (25,291,336 | ) |
| | | | | |
| Fund share transactions (Note 3) | | | | | | | (95,086,191 | ) | | | | | | | (55,993,715 | ) |
| | | | | |
| Total decrease | | | | | | | (80,569,369 | ) | | | | | | | (110,447,393 | ) |
| | | | | |
| Net assets: | | | | | | | | | | | | | | | | |
| | | | | |
| Beginning of period | | | | | | | 210,651,485 | | | | | | | | 321,098,877 | |
| | | | | |
| End of period | | $ | | | | | 129,792,116 | | | $ | | | | | 210,651,485 | |
| |
| The accompanying notes are an integral part of these financial statements. | |
| | |
| 46 | | www.thomaswhitefunds.com |
THOMAS WHITE FUNDS
Statements of Changes in Net Assets (Unaudited)
| | | | | | | | | | | | | | | | |
| | |
| | | Emerging Markets Fund | |
| | | | | |
| | | | | | Six Months
Ended
April 30,
2019 | | | | | | Year
Ended
October 31,
2018 | |
| | | | | |
| Change in net assets from operations: | | | | | | | | | | | | | | | | |
| | | | | |
Net investment income | | $ | | | | | 98,822 | | | $ | | | | | 413,303 | |
| | | | | |
Net realized gain on investments | | | | | | | 548,842 | | | | | | | | 3,213,563 | |
| | | | | |
Net unrealized appreciation / depreciation on investments and foreign currency transactions | | | | | | | 4,226,502 | | | | | | | | (7,169,007 | ) |
| | | | | |
Net increase (decrease) in net assets from operations | | | | | | | 4,874,166 | | | | | | | | (3,542,141 | ) |
| | | | | |
| Distributions: | | | | | | | | | | | | | | | | |
| | | | | |
Distributable earnings - Investor Class | | | | | | | ------- | | | | | | | | (19,106 | ) |
| | | | | |
Distributable earnings - Class I | | | | | | | ------- | | | | | | | | (372,630 | ) |
| | | | | |
| Total distributions | | | | | | | ------- | | | | | | | | (391,736 | ) |
| | | | | |
| Fund share transactions (Note 3) | | | | | | | 1,385,799 | | | | | | | | (9,948,857 | ) |
| | | | | |
| Total increase (decrease) | | | | | | | 6,259,965 | | | | | | | | (13,882,734 | ) |
| | | | | |
| Net assets: | | | | | | | | | | | | | | | | |
| | | | | |
| Beginning of period | | | | | | | 33,511,726 | | | | | | | | 47,394,460 | |
| | | | | |
| End of period | | $ | | | | | 39,771,691 | | | $ | | | | | 33,511,726 | |
| |
| The accompanying notes are an integral part of these financial statements. | |
| | | | |
| www.thomaswhitefunds.com | | | 47 | |
THOMAS WHITE FUNDS
Statements of Changes in Net Assets (Unaudited)
| | | | | | | | | | | | | | | | |
| | |
| | | American Opportunities Fund | |
| | | | | |
| | | | | | Six Months
Ended
April 30,
2019 | | | | | | Year
Ended
October 31,
2018 | |
| | | | | |
| Change in net assets from operations: | | | | | | | | | | | | | | | | |
| | | | | |
Net investment income | | $ | | | | | 51,571 | | | $ | | | | | 136,585 | |
| | | | | |
Net realized gain on investments | | | | | | | 1,219,529 | | | | | | | | 1,298,075 | |
| | | | | |
Net unrealized appreciation / depreciation on investments and foreign currency transactions | | | | | | | 3,286,422 | | | | | | | | (1,223,886 | ) |
| | | | | |
Net increase in net assets from operations | | | | | | | 4,557,522 | | | | | | | | 210,774 | |
| | | | | |
| Total distributions | | | | | | | ------- | | | | | | | | (1,874,691 | ) |
| | | | | |
| Fund share transactions (Note 3) | | | | | | | 22,322 | | | | | | | | 1,200,124 | |
| | | | | |
| Total increase (decrease) | | | | | | | 4,579,844 | | | | | | | | (463,793 | ) |
| | | | | |
| Net assets: | | | | | | | | | | | | | | | | |
| | | | | |
| Beginning of period | | | | | | | 40,969,438 | | | | | | | | 41,433,231 | |
| | | | | |
| End of period | | $ | | | | | 45,549,282 | | | $ | | | | | 40,969,438 | |
| |
| The accompanying notes are an integral part of these financial statements. | |
| | |
| 48 | | www.thomaswhitefunds.com |
Notes to Financial Statements Period Ended April 30, 2019 (Unaudited)
NOTE 1. SUMMARY OF ACCOUNTING POLICIES
Lord Asset Management Trust (the “Trust”) was organized as a Delaware business trust on February 9, 1994, as an open-end diversified management investment company. The Trust currently has three series of shares (collectively referred to as the “Funds”) - the Thomas White International Fund (the “International Fund”), which commenced operations with the sale of Investor Class shares on June 28, 1994 and the sale of Class I shares, Class A shares and Class C shares on August 31, 2012; the Thomas White Emerging Markets Fund (the “Emerging Markets Fund”), which commenced operations with the sale of Investor Class shares on June 28, 2010 and the sale of Class I shares, Class A shares and Class C shares on August 31, 2012; and the Thomas White American Opportunities Fund (the “American Opportunities Fund”), which commenced operations with the sale of Investor Class shares on March 4, 1999. Class A and Class C shares of the International Fund and Emerging Markets Fund closed on February 28, 2017 and effective at the close of business on that date, the outstanding Class A and Class C shares of those Funds were converted to Class I shares, as applicable. The investment objective of each Fund is to seek long-term capital growth. The International Fund invests in equity securities of companies located in the world’s developed countries outside of the U.S. The Emerging Markets Fund invests in securities of companies located in or whose businesses are closely associated with the world’s emerging markets countries. The American Opportunities Fund primarily invests in U.S. equity securities, with a focus on mid-size and small companies. The following is a summary of significant accounting policies followed in the preparation of the Trust’s financial statements.
(A) VALUATION OF SECURITIES
Securities listed or traded on a recognized national or foreign stock exchange or NASDAQ are valued at the last reported sales prices on the principal exchange on which the securities are traded. NASDAQ National Market securities are valued at the NASDAQ official closing price. Over-the-counter securities and listed securities for which no closing sale price is reported are valued at the mean between the last current bid and ask price. Securities for which market quotations are not readily available are valued at fair value under the Trust’s Valuation Procedures as determined by management and approved in good faith by the Board of Trustees. As of April 30, 2019, all securities within each Fund’s portfolio were valued at the last reported sales price on the principal exchange on which the securities are traded and, for the International and Emerging Markets Funds, adjusted by a fair value factor when necessary and as further described below. The Trust has retained an independent statistical fair value pricing service to assist in the fair valuation process for securities principally traded in a foreign market in order to adjust for changes in value that may occur between the close of the foreign exchange and the time at which Fund shares are priced. Short term investments are valued at original cost, which combined with accrued interest, approximates market value.
| | | | |
| www.thomaswhitefunds.com | | | 49 | |
Notes to Financial Statements Period Ended April 30, 2019 (Unaudited)
Fair value is defined as the price that would be received to sell an asset or paid to transfer a liability (i.e., the “exit price”) in an orderly transaction between market participants at the measurement date. In determining fair value, the Fund uses various valuation approaches. A three-tiered fair value hierarchy for inputs is used in measuring fair value that maximizes the use of observable inputs and minimizes the use of unobservable inputs by generally requiring that the most observable inputs be used when available. Observable inputs are those that market participants would use in pricing the asset or liability based on market data obtained from sources independent of a Fund. Unobservable inputs reflect the Fund’s assumptions about the inputs market participants would use in pricing the asset or liability developed based on the best information available in the circumstances. The inputs or methodologies used for valuing securities are not necessarily an indication of the risks associated with investing in those securities.
The fair value hierarchy is categorized into three levels based on the inputs as follows:
Level 1 - Valuations based on unadjusted quoted prices in active markets for identical assets.
Level 2 - Valuations based on quoted prices for similar securities or in markets that are not active or for which all significant inputs are observable, either directly or indirectly.
Level 3 - Valuations based on inputs that are unobservable and significant to the overall fair value measurement.
(B) MULTI-CLASS OPERATIONS AND ALLOCATIONS
Expenses of the Funds that are not directly attributable to a specific class of shares are prorated among the classes based on the relative net assets of each class. Expenses directly attributable to a class of shares, which presently include administration fees, administrative services fees, printing expenses, registration fees and transfer agent fees, are recorded to the specific class.
Income, realized and unrealized capital gains and losses of the Funds are prorated among the classes based on the relative net assets of each class within each specific Fund.
(C) MARKET RISK
Investing in securities of foreign companies and foreign governments involves special risks and considerations not typically associated with investing in U.S. companies and securities of the U.S. Government. These risks include revaluation of currencies and future adverse political and economic developments. Moreover, securities of many foreign companies and foreign governments and their markets may be less liquid and their prices more volatile than securities of comparable U.S. companies and securities of the U.S. Government.
| | |
| 50 | | www.thomaswhitefunds.com |
Notes to Financial Statements Period Ended April 30, 2019 (Unaudited)
(D) FOREIGN CURRENCY TRANSLATION
Portfolio securities and other assets and liabilities denominated in foreign currencies are translated into U.S. dollar amounts at date of valuation. Purchases and sales of portfolio securities and income items denominated in foreign currencies are translated into U.S. dollar amounts on the respective dates of such transactions. When a Fund purchases or sells a foreign security, it will customarily enter into a foreign exchange contract to minimize foreign exchange risk from the trade date to the settlement date of such transaction.
The Funds do not isolate the portion of the results of operations resulting from changes in foreign exchange rates on investments from the fluctuations arising from changes in market prices of securities held. Such fluctuations are included with the net realized and unrealized gain or loss from investments.
Net realized gain (loss) on investments and foreign currency transactions include those gains and losses arising from the sale of foreign currencies, currency gains or losses realized between the trade and settlement dates on securities transactions, the differences between the amounts of dividends, and foreign withholding taxes recorded on a Fund’s books, and the U.S. dollar equivalent of the amounts actually received or paid. Net unrealized appreciation (depreciation) on investments and foreign currency translation includes changes in the value of assets and liabilities resulting from exchange rates.
(E) INCOME TAXES
Each Fund is a separate taxpayer for federal income tax purposes. Each Fund intends to distribute substantially all of its net investment income and net capital gains to its shareholders and to otherwise comply with the requirements of Subchapter M of the Internal Revenue Code applicable to regulated investment companies. Therefore, no federal income tax provision is required.
All open tax years and major jurisdictions have been reviewed for the Funds and, based on this review, there are no significant uncertain tax positions that would require recognition in the financial statements. Open tax years are those that are open for exam by taxing authorities and, as of April 30, 2019, open Federal tax years include the tax years ended October 31, 2015 through 2018. The Funds have no examinations in progress and are also not aware of any tax positions for which it is reasonably possible that the total amounts of unrecognized tax benefits will significantly change in the next twelve months.
The Funds accrue for such material foreign taxes on net realized and unrealized gains at the appropriate rate for each country. Based on rates ranging from approximately 10% to 15%, there were no material accruals at period end.
| | | | |
| www.thomaswhitefunds.com | | | 51 | |
Notes to Financial Statements Period Ended April 30, 2019 (Unaudited)
(F) USE OF ESTIMATES
The preparation of financial statements in conformity with generally accepted accounting principles requires management to make estimates and assumptions that affect the reported amounts of assets and liabilities and disclosure of contingent liabilities at the date of the financial statements and the reported amounts of increases and decreases in net assets from operations during the period. Actual results could differ from these estimates.
The Funds are investment companies and follow accounting and reporting guidance under the Financial Accounting Standards Board (“FASB”) Accounting Standards Codification (“ASC”) Topic 946, “Financial Services-Investment Companies”.
(G) SECURITY TRANSACTIONS AND INVESTMENT INCOME
Security transactions are accounted for on a trade date basis. Interest is accrued on a daily basis and dividend income is recorded on the ex-dividend date, except that certain dividends from foreign securities are recorded when the information is available to the Fund. Realized gains and losses are determined using specific identification.
(H) DISTRIBUTIONS TO SHAREHOLDERS
The Funds usually declare and pay dividends from net investment income annually, but may do so more frequently to avoid excise tax. Distributions of net realized capital gains, if any, will be distributed at least annually.
(I) SECURITIES LENDING
The Funds may lend investment securities to investors who borrow securities in order to complete certain transactions. By lending investment securities, a Fund attempts to increase its net investment income through the receipt of interest earned on loan collateral. Any increase or decline in the market price of the securities loaned that might occur and any interest earned or dividends declared during the term of the loan would be for the account of the Fund. Risks of delay in recovery of the securities or even loss of rights in the collateral may occur should the borrower of the securities fail financially. Risk may also arise to the extent that the value of the securities loaned increases above the value of the collateral received. It is each Fund’s policy to obtain additional collateral from or return excess collateral to the borrower by the end of the next business day. Therefore, the value of the collateral may be temporarily less than the value of the securities on loan.
Funds that lend securities receive cash, cash equivalents, or other securities as collateral. Initial collateral levels shall not be less than 102% of the market value of the borrowed securities (105% if the collateral and the borrowed securities are denominated in different currencies). Marking to market is performed every business day (subject to de minimis rules of change in market value) for each Fund and each borrower is required to deliver additional collateral when necessary so that the total collateral held in the account for all loans of the Fund to the borrower will not be less than
| | |
| 52 | | www.thomaswhitefunds.com |
Notes to Financial Statements Period Ended April 30, 2019 (Unaudited)
100% of the market value of all the borrowed securities loaned to the borrower by the Fund. Any cash, cash equivalents, or other securities received as collateral is invested by the securities lending agent, Northern Trust, in accordance with pre-established guidelines as set forth in the securities lending agreement. The cash collateral would be invested in the Northern Institutional Liquid Asset Portfolio (an open-end regulated investment company) and would be shown on the investment portfolio for the Emerging Markets Fund. The cash collateral, if any, is reflected in the Funds’ Statements of Assets and Liabilities in the line item labeled “Investments in securities at market value.” Non-cash collateral is not shown in the Funds’ investment portfolios nor disclosed in the Statements of Assets and Liabilities as it is held by the lending agent on behalf of the Funds, and the Funds do not have the ability to re-hypthecate those securities. A portion of the interest received on the loan collateral is retained by the Fund and the remainder is rebated to the borrower of the securities. From the interest retained by the Funds, 50% is paid to the securities lending agent for the International Fund and Emerging Markets Fund for its services. The net amount of interest earned, after the interest rebate and the allocation to the securities lending agent, is included in the statement of operations as securities lending income. The value of loaned securities and related collateral outstanding at April 30, 2019 are as follows:
| | | | | | | | | | | | | | | | |
| | | | | |
| Fund | | Value of
Loaned
Securities | | | Value of
Cash
Collateral | | | Value of
Non-Cash
Collateral* | | | Total
Collateral | |
| Thomas White Emerging Markets Fund | | | $1,611,893 | | | | $267,360 | | | | $1,392,086 | | | | $1,659,446 | |
| | * | Funds cannot repledge or dispose of this collateral, nor do the Funds earn any income or receive dividends with respect to this collateral. |
The International Fund and the Emerging Markets Fund have earned income on securities lending (after rebates to borrowers and allocation to the securities lending agent) as follows:
| | | | |
| | |
| Fund | | Net Income Earned | |
| Thomas White International Fund | | | $2,799 | |
| | |
| Thomas White Emerging Markets Fund | | | $359 | |
The Funds recently adopted guidance requiring entities to present gross obligations for secured borrowings by the type of collateral pledged and remaining time to maturity. There were no such obligations at April 30, 2019.
(J) REDEMPTION FEE
The Funds assess a 2% fee on redemptions (including exchanges) of Fund shares held for less than sixty days. Redemption fees are paid to each Fund to help offset transaction costs and to protect the Fund’s long-term shareholders. Each Fund will use the “first-in, first-out” (FIFO) method to determine the sixty-day holding period. Under this method, the date of the redemption or exchange will be compared to the earliest purchase date of shares held in the
| | | | |
| www.thomaswhitefunds.com | | | 53 | |
Notes to Financial Statements Period Ended April 30, 2019 (Unaudited)
account. If this holding period is less than sixty days, the fee will be charged. The International Fund Investor Class and Class I shares charged $10 and $10, respectively, in redemption fees for the period ended April 30, 2019, which were included in net capital paid.
(K) REAL ESTATE INVESTMENT TRUSTS
The Emerging Markets Fund and American Opportunities Fund have made certain investments in real estate investment trusts (“REITs”), which pay dividends to their shareholders based upon funds available from operations. It is quite common for these dividends to exceed the REITs’ taxable earnings and profits resulting in the excess portion of such dividends being designated as a return of capital. The Emerging Markets Fund and American Opportunities Fund intend to include the gross dividends from such REITs in their annual distributions to their shareholders and, accordingly, a portion of the distributions received by the shareholders of the Emerging Markets Fund or American Opportunities Fund may also be designated as a return of capital.
(L) RECENT ACCOUNTING PRONOUNCEMENT
In August 2018, FASB issued ASU 2018-13,Fair Value Measurement (Topic 820):Disclosure Framework - Changes to the Disclosure Requirements for Fair Value Measurement (“ASU 2018-13”). The primary focus of ASU 2018-13 is to improve the effectiveness of the disclosure requirements for fair value measurements. The changes affect all companies that are required to include fair value measurement disclosures. In general, the amendments in ASU 2018-13 are effective for all entities for fiscal years and interim periods within those fiscal years, beginning after December 15, 2019. An entity is permitted to early adopt the removed or modified disclosures upon the issuance of ASU 2018-13 and may delay adoption of the additional disclosures, which are required for public companies only, until their effective date. Management is currently evaluating the impact these changes will have on the Funds’ financial statements and disclosures.
NOTE 2. SIGNIFICANT SHAREHOLDERS
The following table indicates the number of shareholders who held a significant portion of the shares of each Class’s outstanding shares as of April 30, 2019. Investment activities of these shareholders could have a material effect on each Fund.
| | | | | | | | | | |
| | | | |
| Unaudited | | | | | | | | |
| | | | |
| Fund | | Share Class | | Number of
Shareholders | | | % Held | |
| International Fund | | Investor Class | | | 1 | | | | 12.5% | |
| | | | |
| International Fund | | Class I | | | 1 | | | | 12.7% | |
| | | | |
| Emerging Markets Fund | | Investor Class | | | 2 | | | | 77.0% | |
| | | | |
| Emerging Markets Fund | | Class I | | | 1 | | | | 19.9% | |
| | | | |
| American Opportunities Fund | | Investor Class | | | 1 | | | | 20.1% | |
| | |
| 54 | | www.thomaswhitefunds.com |
Notes to Financial Statements Period Ended April 30, 2019 (Unaudited)
NOTE 3. TRANSACTIONS IN SHARES OF BENEFICIAL INTEREST
As of April 30, 2019, there were an unlimited number of $0.01 par value shares of beneficial interest authorized. Transactions are summarized as follows:
| | | | | | | | | | | | | | | | | | | | | | | | |
|
| International Fund | |
| | |
| | | Period Ended April 30, 2019 | | | Year Ended October 31, 2018 | |
| | |
| | | Investor Class | | | Investor Class | |
| | | | | | |
| | | Shares | | | | | | Amount | | | Shares | | | | | | Amount | |
| | | | | | |
| Shares sold | | | 31,625 | | | $ | | | | | 468,982 | | | | 36,613 | | | $ | | | | | 655,799 | |
| | | | | | |
| Shares issued on reinvestment of dividends & distributions | | | ------- | | | | | | | | ------- | | | | 239,520 | | | | | | | | 3,228,728 | |
| | | | | | |
| Shares redeemed | | | (247,900 | ) | | | | | | | (3,532,251 | )^ | | | (598,797 | ) | | | | | | | (10,572,135 | ) |
| | | | | | |
| Net decrease | | | (216,275 | ) | | $ | | | | | (3,063,269 | ) | | | (322,664 | ) | | $ | | | | | (6,687,608 | ) |
| | | | | | |
| Shares outstanding: | | | | | | | | | | | | | | | | | | | | | | | | |
| | | | | | |
| Beginning of period | | | 2,127,022 | | | | | | | | | | | | 2,449,686 | | | | | | | | | |
| | | | | | |
| End of period | | | 1,910,747 | | | | | | | | | | | | 2,127,022 | | | | | | | | | |
|
| ^ Includes redemption fees of $10 | |
| | | | | | | | | | | | | | | | | | | | | | | | |
| | |
| | | Period Ended April 30, 2019 | | | Year Ended October 31, 2018 | |
| | |
| | | Class I | | | Class I | |
| | | | | | |
| | | Shares | | | | | | Amount | | | Shares | | | | | | Amount | |
| | | | | | |
| Shares sold | | | 1,359,877 | | | $ | | | | | 18,868,847 | | | | 852,416 | | | $ | | | | | 15,132,987 | |
| | | | | | |
| Shares issued on reinvestment of dividends & distributions | | | ------- | | | | | | | | ------- | | | | 1,261,639 | | | | | | | | 16,956,419 | |
| | | | | | |
| Shares redeemed | | | (7,914,959 | ) | | | | | | | (110,891,769 | )^ | | | (4,582,847 | ) | | | | | | | (81,395,513 | ) |
| | | | | | |
| Net decrease | | | (6,555,082 | ) | | $ | | | | | (92,022,922 | ) | | | (2,468,792 | ) | | $ | | | | | (49,306,107 | ) |
| | | | | | |
| Shares outstanding: | | | | | | | | | | | | | | | | | | | | | | | | |
| | | | | | |
| Beginning of period | | | 13,116,474 | | | | | | | | | | | | 15,585,266 | | | | | | | | | |
| | | | | | |
| End of period | | | 6,561,392 | | | | | | | | | | | | 13,116,474 | | | | | | | | | |
|
| ^ Includes redemption fees of $10 | |
| | | | | | | | | | | | | | | | | | | | | | | | |
| | | | |
| www.thomaswhitefunds.com | | | 55 | |
Notes to Financial Statements Period Ended April 30, 2019 (Unaudited)
| | | | | | | | | | | | | | | | | | | | | | | | |
|
| Emerging Markets Fund | |
| | |
| | | Period Ended April 30, 2019 | | | Year Ended October 31, 2018 | |
| | |
| | | Investor Class | | | Investor Class | |
| | | | | | |
| | | Shares | | | | | | Amount | | | Shares | | | | | | Amount | |
| | | | | | |
| Shares sold | | | ------- | | | $ | | | | | ------- | | | | 5,032 | | | $ | | | | | 56,877 | |
| | | | | | |
| Shares issued on reinvestment of dividends & distributions | | | ------- | | | | | | | | ------- | | | | 1,122 | | | | | | | | 10,728 | |
| | | | | | |
| Shares redeemed | | | (4,079 | ) | | | | | | | (41,094 | ) | | | (16,212 | ) | | | | | | | (184,376 | ) |
| | | | | | |
| Net decrease | | | (4,079 | ) | | $ | | | | | (41,094 | ) | | | (10,058 | ) | | $ | | | | | (116,771 | ) |
| | | | | | |
| Shares outstanding: | | | | | | | | | | | | | | | | | | | | | | | | |
| | | | | | |
| Beginning of period | | | 167,213 | | | | | | | | | | | | 177,271 | | | | | | | | | |
| | | | | | |
| End of period | | | 163,134 | | | | | | | | | | | | 167,213 | | | | | | | | | |
| | | | | | | | | | | | | | | | | | | | | | | | |
| | |
| | | Period Ended April 30, 2019 | | | Year Ended October 31, 2018 | |
| | |
| | | Class I | | | Class I | |
| | | | | | |
| | | Shares | | | | | | Amount | | | Shares | | | | | | Amount | |
| | | | | | |
| Shares sold | | | 139,289 | | | $ | | | | | 1,434,114 | | | | 312,421 | | | $ | | | | | 3,543,325 | |
| | | | | | |
| Shares issued on reinvestment of dividends & distributions | | | ------- | | | | | | | | ------- | | | | 38,575 | | | | | | | | 372,630 | |
| | | | | | |
| Shares redeemed | | | (703 | ) | | | | | | | (7,221 | ) | | | (1,144,555 | ) | | | | | | | (13,748,041 | ) |
| | | | | | |
| Net increase (decrease) | | | 138,586 | | | $ | | | | | 1,426,893 | | | | (793,559 | ) | | $ | | | | | (9,832,086 | ) |
| | | | | | |
| Shares outstanding: | | | | | | | | | | | | | | | | | | | | | | | | |
| | | | | | |
| Beginning of period | | | 3,194,854 | | | | | | | | | | | | 3,988,413 | | | | | | | | | |
| | | | | | |
| End of period | | | 3,333,440 | | | | | | | | | | | | 3,194,854 | | | | | | | | | |
| | | | | | | | | | | | | | | | | | | | | | | | |
|
| American Opportunities Fund | |
| | |
| | | Period Ended April 30, 2019 | | | Year Ended October 31, 2018 | |
| | |
| | | Investor Class | | | Investor Class | |
| | | | | | |
| | | Shares | | | | | | Amount | | | Shares | | | | | | Amount | |
| | | | | | |
| Shares sold | | | 8,872 | | | $ | | | | | 137,704 | | | | 95,707 | | | $ | | | | | 1,603,940 | |
| | | | | | |
| Shares issued on reinvestment of dividends & distributions | | | ------- | | | | | | | | ------- | | | | 116,726 | | | | | | | | 1,782,396 | |
| | | | | | |
| Other transactions | | | ------- | | | | | | | | 437 | ^ | | | ------- | | | | | | | | ------- | |
| | | | | | |
| Shares redeemed | | | (7,653 | ) | | | | | | | (115,819 | ) | | | (134,381 | ) | | | | | | | (2,186,212 | ) |
| | | | | | |
| Net increase | | | 1,219 | | | $ | | | | | 22,322 | | | | 78,052 | | | $ | | | | | 1,200,124 | |
| | | | | | |
| Shares outstanding: | | | | | | | | | | | | | | | | | | | | | | | | |
| | | | | | |
| Beginning of period | | | 2,590,600 | | | | | | | | | | | | 2,512,548 | | | | | | | | | |
| | | | | | |
| End of period | | | 2,591,819 | | | | | | | | | | | | 2,590,600 | | | | | | | | | |
|
| ^ Reimbursement from U.S. Bank Global Fund Services due to NAV error. | |
| | | | | | | | | | | | | | | | | | | | | | | | |
| | |
| 56 | | www.thomaswhitefunds.com |
Notes to Financial Statements Period Ended April 30, 2019 (Unaudited)
NOTE 4. INVESTMENT MANAGEMENT FEES AND OTHER TRANSACTIONS WITH AFFILIATES
Each Fund pays a monthly investment management fee to Thomas White International, Ltd. (the “Advisor”) at the rate of 0.85% of the Fund’s average daily net assets annually. For the period ended April 30, 2019, the International Fund, Emerging Markets Fund and American Opportunities Fund paid the Advisor $525,429, $153,979 and $176,712, respectively, in investment management fees.
During the period ended April 30, 2019, the Advisor has contractually agreed to reimburse its management fee and/or reimburse the Funds’ operating expenses to the extent necessary to ensure that each Fund’s annual operating expenses do not exceed the following percentages of average daily net assets:
| | | | | | | | |
| | | |
| | | Investor Class | | | Class I | |
| International Fund | | | 1.24% | | | | 0.99% | |
| | | |
| Emerging Markets Fund | | | 1.34% | | | | 1.09% | |
| | | |
| American Opportunities Fund | | | 1.34% | | | | n/a | |
These agreements to reimburse fees renew automatically unless the Advisor gives written notice to end them.
The Advisor may recoup any previously waived amount from a Fund pursuant to the expense limitation agreements if such reimbursement does not cause the Fund to exceed either (i) the current expense limitation or (ii) the expense limitation in effect at the time the expense is waived, provided the reimbursement is made within three years after the year in which the Advisor incurred the expense. For the period ended April 30, 2019, the Advisor did not recoup any previously waived expenses.
As of April 30, 2019, the International and Emerging Markets Funds had the following amounts (and year of expiration) subject to repayment to the Advisor:
| | | | | | | | | | | | | | |
| | | | | |
| Fund | | Share Class | | Year Fees Waived | | | Repayment Expires | | | Balance | |
| | | | | |
| International Fund | | Investor Class | | | 2016 | | | | 2019 | | | | $185,995 | |
| | | | | |
| International Fund | | Investor Class | | | 2017 | | | | 2020 | | | | $115,940 | |
| | | | | |
| International Fund | | Investor Class | | | 2018 | | | | 2021 | | | | $47,574 | |
| | | | | |
| International Fund | | Investor Class | | | 2019 | | | | 2022 | | | | $51,490 | |
| | | | | |
| International Fund | | Class I | | | 2016 | | | | 2019 | | | | $376,987 | |
| | | | | |
| International Fund | | Class I | | | 2017 | | | | 2020 | | | | $535,417 | |
| | | | | |
| International Fund | | Class I | | | 2018 | | | | 2021 | | | | $465,425 | |
| | | | | |
| International Fund | | Class I | | | 2019 | | | | 2022 | | | | $206,181 | |
| | | | |
| www.thomaswhitefunds.com | | | 57 | |
Notes to Financial Statements Period Ended April 30, 2019 (Unaudited)
| | | | | | | | | | | | | | |
| | | | | |
| Fund | | Share Class | | Year Fees Waived | | | Repayment Expires | | | Balance | |
| | | | | |
| Emerging Markets Fund | | Investor Class | | | 2017 | | | | 2020 | | | | $2,618 | |
| | | | | |
| Emerging Markets Fund | | Investor Class | | | 2018 | | | | 2021 | | | | $3,875 | |
| | | | | |
| Emerging Markets Fund | | Investor Class | | | 2019 | | | | 2022 | | | | $2,038 | |
| | | | | |
| Emerging Markets Fund | | Class I | | | 2016 | | | | 2019 | | | | $150,335 | |
| | | | | |
| Emerging Markets Fund | | Class I | | | 2017 | | | | 2020 | | | | $195,908 | |
| | | | | |
| Emerging Markets Fund | | Class I | | | 2018 | | | | 2021 | | | | $159,329 | |
| | | | | |
| Emerging Markets Fund | | Class I | | | 2019 | | | | 2022 | | | | $79,553 | |
| | | | | |
| American Opportunities Fund | | Investor Class | | | 2018 | | | | 2021 | | | | $37,957 | |
| | | | | |
| American Opportunities Fund | | Investor Class | | | 2019 | | | | 2022 | | | | $19,387 | |
The Funds and U.S. Bank Global Fund Services (the “Administrator” or “Fund Services”) are parties to a Fund Administration Servicing Agreement. The Administrator provides administrative and fund accounting services pursuant to this agreement.
The Advisor and the Funds have adopted a Business Management Agreement under which the Advisor provides certain business management services to the Funds, including, without limitation, monitoring of the Funds’ relationships with third-party service providers and assisting with necessary and appropriate services to the Board of Trustees of the Trust, as well as either providing the Trust with or procuring for the Trust the services of a Chief Compliance Officer in accordance with Rule 38a-1 of the 1940 Act, in the event so requested. For these services, the Advisor is entitled to receive a fee from each Fund at a rate of 0.035% of the Fund’s average daily net assets, accrued on a daily basis and paid to the Advisor on a monthly basis. For the period ended April 30, 2019, for the services provided under the Business Management Agreement, the International Fund, Emerging Markets Fund, and American Opportunities Fund paid the Advisor $21,635, $6,340 and $7,276, respectively.
The Funds have adopted an Administrative Services Plan pursuant to which the Investor Class shares are authorized to make payments to certain entities, which may include banks, broker-dealers and other types of service providers, for providing administrative services with respect to shares of the Funds attributable to or held in the name of the service provider for its clients or customers with whom they have a servicing relationship. Under the terms of the Administrative Services Plan, Investor Class shares are authorized to make payments up to a maximum rate of 0.25% of the average daily net assets of the shares attributable to or held in the name of the service provider for providing the types of applicable administrative services covered under the terms of the Plan. For the period ended April 30, 2019, fees incurred by the International Fund pursuant to the Administrative Services Plan were $24,795 for Investor Class. For the period ended April 30, 2019, fees incurred by the Emerging Markets Fund pursuant to the Administrative Services Plan were $214 for Investor Class. For the April 30, 2019, fees incurred by the American Opportunities Fund pursuant to the Administrative Services Plan were $37,422 for Investor Class shares.
| | |
| 58 | | www.thomaswhitefunds.com |
Notes to Financial Statements Period Ended April 30, 2019 (Unaudited)
NOTE 5. CUSTODIAN AND TRANSFER AGENT FEES
Custodian Fees - Northern Trust is the custodian for the International Fund and Emerging Markets Fund. U.S. Bank is the custodian for the American Opportunities Fund. Northern Trust bills the International Fund and the Emerging Markets Fund quarterly based on the value of their holdings as of the previous quarter end plus transaction fees. U.S. Bank bills the American Opportunities Fund monthly based on the ending value of its holdings plus transaction fees.
Transfer Agent - Fund Services serves as the Funds’ transfer agent. Under the terms of the transfer agent agreement, Fund Services is entitled to account-based fees along with reimbursement of out-of-pocket expenses incurred in providing transfer agent services.
NOTE 6. INVESTMENT TRANSACTIONS
During the period ended April 30, 2019, the cost of purchases and the proceeds from sales of investment securities, other than short-term investments, were as follows:
| | | | | | | | |
| | | |
| Fund | | Purchases | | | Sales | |
| International Fund | | | $23,369,820 | | | | $114,669,451 | |
| | | |
| Emerging Markets Fund | | | 5,311,059 | | | | 4,297,109 | |
| | | |
| American Opportunities Fund | | | 4,614,464 | | | | 4,838,417 | |
The American Opportunities Fund did not purchase or sell long-term U.S. Government securities during the period ended April 30, 2019. The International Fund and Emerging Markets Fund did not directly purchase or sell long term U.S. Government securities, except for purposes of securities lending during the period ended April 30, 2019.
At October 31, 2018, the aggregate gross unrealized appreciation and depreciation of portfolio securities, based upon cost for federal income tax purposes, were as follows:
| | | | | | | | | | | | | | | | |
| | | | | |
| Fund | | Tax Cost | | | Unrealized
Appreciation | | | Unrealized
Depreciation | | | Net Unrealized
Appreciation/
(Depreciation) | |
| International Fund | | | $198,810,095 | | | | $27,568,220 | | | | $(20,387,799) | | | | $7,180,421 | |
| | | | | |
| Emerging Markets Fund | | | 29,967,815 | | | | 6,814,494 | | | | (3,268,341) | | | | 3,546,153 | |
| | | | | |
| American Opportunities Fund | | | 32,212,258 | | | | 9,599,088 | | | | (1,298,711) | | | | 8,300,377 | |
Distributions to Shareholders
The Funds will distribute net investment income and net realized gains, if any, at least once a year. The amount of distributions from net investment income and net realized gains are determined in accordance with federal income tax regulations, which may differ from generally accepted accounting principles. These “book/tax” differences are either temporary or permanent in nature and are primarily due to differing treatments for passive foreign investment companies
| | | | |
| www.thomaswhitefunds.com | | | 59 | |
Notes to Financial Statements Period Ended April 30, 2019 (Unaudited)
and losses deferred due to wash sales. Permanent differences, primarily due to reclassification of REIT income, resulted in reclassifications among the Funds’ components of net assets at October 31, 2018, the Funds’ tax year-end. For the International Fund, permanent differences resulted in reclassification of ($798,980) in distributable earnings and $798,980 in paid in capital. For the Emerging Markets Fund, permanent differences resulted in reclassification of $10,567 in distributable earnings and ($10,567) in paid in capital. For the American Opportunities Fund, permanent differences resulted in reclassification of ($11,431) in distributable earnings and $11,431 in paid in capital.
| | | | | | | | | | | | | | | | | | | | |
| | | | | | |
| Fund | | Undistributed
Ordinary
Income | | | Undistributed
Long-term
Gains | | | Net
Unrealized
Appreciation | | | Other
Accumulated
Losses | | | Total
Distributable
Earnings | |
| International Fund | | | $------- | | | | $------- | | | | $7,180,421 | | | | $(74,732) | | | | $7,105,689 | |
| | | | | | |
| Emerging Markets Fund | | | ------- | | | | ------- | | | | 3,546,153 | | | | (8,574,082) | | | | (5,027,929) | |
| | | | | | |
| American Opportunities Fund | | | ------- | | | | ------- | | | | 8,300,377 | | | | ------- | | | | 8,300,377 | |
Under the Regulated Investment Company Modernization Act of 2010, the Funds are permitted to carry forward capital losses incurred in taxable years beginning after December 22, 2010 for an unlimited period, and such capital losses will retain their character as either short-term or long-term capital losses.
As of October 31, 2018, the Emerging Markets Fund had $6,851,969 in short-term capital loss carry forwards with no expiration, and had $1,718,242 in long-term capital loss carryforwards with no expiration.
During the period ended April 30, 2019, the Funds did not pay any dividends.
The tax character of distributions paid during the periods shown below were as follows:
| | | | | | | | | | | | | | | | |
| | |
| | | Year Ended October 31, 2018 | |
| | | | | |
| | | Ordinary
Income | | | Return of
Capital | | | Long-Term
Capital Gains | | | Total
Distributions | |
| International Fund | | | $4,008,212 | | | | $------- | | | | $21,283,124 | | | | $25,291,336 | |
| | | | | |
| Emerging Markets Fund | | | 391,736 | | | | ------- | | | | ------- | | | | 391,736 | |
| | | | | |
| American Opportunities Fund | | | 122,005 | | | | ------- | | | | 1,752,686 | | | | 1,874,691 | |
NOTE 7. SUBSEQUENT EVENTS
In preparing these financial statements, the Trust has evaluated events after April 30, 2019 and determined that there were no significant subsequent events that would require adjustment to or additional disclosure in these financial statements.
| | |
| 60 | | www.thomaswhitefunds.com |
Period Ended April 30, 2019 (Unaudited)
FINANCIAL HIGHLIGHTS
| | | | | | | | | | | | | | | | | | | | | | | | | | | | | | | | | | | | | | | | | | | | | | | | |
| |
| Thomas White International Fund - Investor Class | |
| | | | | | Six Months
Ended
April 30,
2019 | | | | | | Year
Ended
October 31,
2018 | | | | | | Year
Ended
October 31,
2017 | | | | | | Year
Ended
October 31,
2016 | | | | | | Year
Ended
October 31,
2015 | | | | | | Year
Ended
October 31,
2014 | |
| |
| Per share operating performance (For a share outstanding throughout each period) | |
| | | | | | | | | | | | | |
Net asset value,
beginning of period | | | $ | | | | 13.86 | | | | $ | | | | 17.88 | | | | $ | | | | 14.97 | | | | $ | | | | 15.77 | | | | $ | | | | 16.95 | | | | $ | | | | 19.16 | |
| | | | | | | | | | | | | |
| Income from investment operations: | | | | | | | | | | | | | | | | | | | | | | | | | | | | | | | | | | | | | | | | | | | | | | | | |
| | | | | | | | | | | | | |
Net investment income 1 | | | | | | | 0.09 | | | | | | | | 0.25 | | | | | | | | 0.14 | | | | | | | | 0.17 | | | | | | | | 0.19 | | | | | | | | 0.26 | |
| | | | | | | | | | | | | |
Net realized and unrealized gains/(losses) | | | | | | | 1.39 | | | | | | | | (2.44 | ) | | | | | | | 3.30 | | | | | | | | (0.81 | ) | | | | | | | (1.17 | ) | | | | | | | (0.89 | ) |
| | | | | | | | | | | | | |
| Total from investment operations | | | | | | | 1.48 | | | | | | | | (2.19 | ) | | | | | | | 3.44 | | | | | | | | (0.64 | ) | | | | | | | (0.98 | ) | | | | | | | (0.63 | ) |
| | | | | | | | | | | | | |
| Distributions: | | | | | | | | | | | | | | | | | | | | | | | | | | | | | | | | | | | | | | | | | | | | | | | | |
| | | | | | | | | | | | | |
From net investment income | | | | | | | ------- | | | | | | | | (0.29 | ) | | | | | | | (0.28 | ) | | | | | | | (0.16 | ) | | | | | | | (0.20 | ) | | | | | | | (0.26 | ) |
| | | | | | | | | | | | | |
From net realized gains | | | | | | | ------- | | | | | | | | (1.54 | ) | | | | | | | (0.25 | ) | | | | | | | ------- | | | | | | | | ------- | | | | | | | | (1.32 | ) |
| | | | | | | | | | | | | |
| Total Distributions | | | | | | | ------- | | | | | | | | (1.83 | ) | | | | | | | (0.53 | ) | | | | | | | (0.16 | ) | | | | | | | (0.20 | ) | | | | | | | (1.58 | ) |
| | | | | | | | | | | | | |
| Change in net asset value for the period | | | | | | | 1.48 | | | | | | | | (4.02 | ) | | | | | | | 2.91 | | | | | | | | (0.80 | ) | | | | | | | (1.18 | ) | | | | | | | (2.21 | ) |
| | | | | | | | | | | | | |
| Net asset value, end of period | | | $ | | | | 15.34 | | | | $ | | | | 13.86 | | | | $ | | | | 17.88 | | | | $ | | | | 14.97 | | | | $ | | | | 15.77 | | | | $ | | | | 16.95 | |
| | | | | | | | | | | | | |
| Total Return | | | | | | | 10.68% | 2 | | | | | | | (12.01)% | | | | | | | | 23.06% | | | | | | | | (4.08)% | | | | | | | | (5.77)% | | | | | | | | (3.00)% | |
| | | | | | | | | | | | | |
| Ratios/supplemental data | | | | | | | | | | | | | | | | | | | | | | | | | | | | | | | | | | | | | | | | | | | | | | | | |
| | | | | | | | | | | | | |
| Net assets, end of period (000) | | | $ | | | | 29,314 | | | | $ | | | | 29,473 | | | | $ | | | | 43,811 | | | | $ | | | | 187,408 | | | | $ | | | | 268,518 | | | | $ | | | | 369,098 | |
| | | | | | | | | | | | | |
| Ratio to average net assets: | | | | | | | | | | | | | | | | | | | | | | | | | | | | | | | | | | | | | | | | | | | | | | | | |
| | | | | | | | | | | | | |
Expenses (net of reimbursement) | | | | | | | 1.24% | 3 | | | | | | | 1.24% | | | | | | | | 1.24% | | | | | | | | 1.24% | | | | | | | | 1.24% | | | | | | | | 1.24% | |
| | | | | | | | | | | | | |
Expenses (prior to reimbursement) | | | | | | | 1.60% | 3 | | | | | | | 1.34% | | | | | | | | 1.36% | | | | | | | | 1.33% | | | | | | | | 1.32% | | | | | | | | 1.27% | |
| | | | | | | | | | | | | |
Net investment income
(net of reimbursement) | | | | | | | 1.31% | 3 | | | | | | | 1.32% | | | | | | | | 0.90% | | | | | | | | 1.16% | | | | | | | | 1.16% | | | | | | | | 1.36% | |
| | | | | | | | | | | | | |
Net investment income
(prior to reimbursement) | | | | | | | 0.95% | 3 | | | | | | | 1.22% | | | | | | | | 0.78% | | | | | | | | 1.07% | | | | | | | | 1.08% | | | | | | | | 1.33% | |
| | | | | | | | | | | | | |
| Portfolio turnover rate4 | | | | | | | 18% | | | | | | | | 38% | | | | | | | | 48% | | | | | | | | 60% | | | | | | | | 57% | | | | | | | | 62% | |
| (1) | Net investment income per share represents net investment income divided by the average shares outstanding throughout the period. |
| (4) | Portfolio turnover is calculated on the basis of the Fund as a whole without distinguishing between the classes of shares issued. |
The accompanying notes are an integral part of these financial statements
| | | | |
| www.thomaswhitefunds.com | | | 61 | |
Period Ended April 30, 2019 (Unaudited)
FINANCIAL HIGHLIGHTS
| | | | | | | | | | | | | | | | | | | | | | | | | | | | | | | | | | | | | | | | | | | | | | | | |
| |
| Thomas White International Fund - Class I | |
| | | | | | Six Months
Ended
April 30,
2019 | | | | | | Year
Ended
October 31,
2018 | | | | | | Year
Ended
October 31,
2017 | | | | | | Year
Ended
October 31,
2016 | | | | | | Year
Ended
October 31,
2015 | | | | | | Year
Ended
October 31,
2014 | |
| |
| Per share operating performance (For a share outstanding throughout each period) | |
| | | | | | | | | | | | | |
Net asset value,
beginning of period | | | $ | | | | 13.82 | | | | $ | | | | 17.79 | | | | $ | | | | 14.98 | | | | $ | | | | 15.78 | | | | $ | | | | 16.97 | | | | $ | | | | 19.18 | |
| | | | | | | | | | | | | |
| Income from investment operations: | | | | | | | | | | | | | | | | | | | | | | | | | | | | | | | | | | | | | | | | | | | | | | | | |
| | | | | | | | | | | | | |
Net investment income 1 | | | | | | | 0.11 | | | | | | | | 0.27 | | | | | | | | 0.25 | | | | | | | | 0.23 | | | | | | | | 0.23 | | | | | | | | 0.30 | |
| | | | | | | | | | | | | |
Net realized and unrealized gains/(losses) | | | | | | | 1.38 | | | | | | | | (2.42 | ) | | | | | | | 3.22 | | | | | | | | (0.83 | ) | | | | | | | (1.17 | ) | | | | | | | (0.89 | ) |
| | | | | | | | | | | | | |
| Total from investment operations | | | | | | | 1.49 | | | | | | | | (2.15 | ) | | | | | | | 3.47 | | | | | | | | (0.60 | ) | | | | | | | (0.94 | ) | | | | | | | (0.59 | ) |
| | | | | | | | | | | | | |
| Distributions: | | | | | | | | | | | | | | | | | | | | | | | | | | | | | | | | | | | | | | | | | | | | | | | | |
| | | | | | | | | | | | | |
From net investment income | | | | | | | ------- | | | | | | | | (0.29 | ) | | | | | | | (0.41 | ) | | | | | | | (0.20 | ) | | | | | | | (0.25 | ) | | | | | | | (0.30 | ) |
| | | | | | | | | | | | | |
From net realized gains | | | | | | | ------- | | | | | | | | (1.54 | ) | | | | | | | (0.25 | ) | | | | | | | ------- | | | | | | | | ------- | | | | | | | | (1.32 | ) |
| | | | | | | | | | | | | |
| Total Distributions | | | | | | | ------- | | | | | | | | (1.83 | ) | | | | | | | (0.66 | ) | | | | | | | (0.20 | ) | | | | | | | (0.25 | ) | | | | | | | (1.62 | ) |
| | | | | | | | | | | | | |
| Change in net asset value for the period | | | | | | | 1.49 | | | | | | | | (3.98 | ) | | | | | | | 2.81 | | | | | | | | (0.80 | ) | | | | | | | (1.19 | ) | | | | | | | (2.21 | ) |
| | | | | | | | | | | | | |
| Net asset value, end of period | | | $ | | | | 15.31 | | | | $ | | | | 13.81 | | | | $ | | | | 17.79 | | | | $ | | | | 14.98 | | | | $ | | | | 15.78 | | | | $ | | | | 16.97 | |
| | | | | | | | | | | | | |
| Total Return | | | | | | | 10.86% | 2 | | | | | | | (11.80)% | | | | | | | | 23.23% | | | | | | | | (3.81)% | | | | | | | | (5.56)% | | | | | | | | (2.76)% | |
| | | | | | | | | | | | | |
| Ratios/supplemental data | | | | | | | | | | | | | | | | | | | | | | | | | | | | | | | | | | | | | | | | | | | | | | | | |
| | | | | | | | | | | | | |
| Net assets, end of period (000) | | | $ | | | | 100,479 | | | | $ | | | | 181,179 | | | | $ | | | | 277,287 | | | | $ | | | | 384,017 | | | | $ | | | | 300,331 | | | | $ | | | | 443,397 | |
| | | | | | | | | | | | | |
| Ratio to average net assets: | | | | | | | | | | | | | | | | | | | | | | | | | | | | | | | | | | | | | | | | | | | | | | | | |
| | | | | | | | | | | | | |
Expenses
(net of reimbursement) | | | | | | | 0.99% | 3 | | | | | | | 0.99% | | | | | | | | 0.99% | | | | | | | | 0.99% | | | | | | | | 0.99% | | | | | | | | 0.99% | |
| | | | | | | | | | | | | |
Expenses
(prior to reimbursement) | | | | | | | 1.43% | 3 | | | | | | | 1.18% | | | | | | | | 1.14% | | | | | | | | 1.10% | | | | | | | | 1.08% | | | | | | | | 1.05% | |
| | | | | | | | | | | | | |
Net investment income
(net of reimbursement) | | | | | | | 1.49% | 4 | | | | | | | 1.53% | | | | | | | | 1.53% | | | | | | | | 1.53% | | | | | | | | 1.40% | | | | | | | | 1.59% | |
| | | | | | | | | | | | | |
Net investment income
(prior to reimbursement) | | | | | | | 1.05% | 3 | | | | | | | 1.34% | | | | | | | | 1.38% | | | | | | | | 1.42% | | | | | | | | 1.31% | | | | | | | | 1.53% | |
| | | | | | | | | | | | | |
| Portfolio turnover rate4 | | | | | | | 18% | | | | | | | | 38% | | | | | | | | 48% | | | | | | | | 60% | | | | | | | | 57% | | | | | | | | 62% | |
| (1) | Net investment income per share represents net investment income divided by the average shares outstanding throughout the period. |
| (4) | Portfolio turnover is calculated on the basis of the Fund as a whole without distinguishing between the classes of shares issued. |
The accompanying notes are an integral part of these financial statements
| | |
| 62 | | www.thomaswhitefunds.com |
Period Ended April 30, 2019 (Unaudited)
FINANCIAL HIGHLIGHTS
| | | | | | | | | | | | | | | | | | | | | | | | | | | | | | | | | | | | | | | | | | | | | | | | |
| |
| Thomas White Emerging Markets Fund - Investor Class | |
| | | | | | Six Months
Ended
April 30,
2019 | | | | | | Year
Ended
October 31,
2018 | | | | | | Year
Ended
October 31,
2017 | | | | | | Year
Ended
October 31,
2016 | | | | | | Year
Ended
October 31,
2015 | | | | | | Year
Ended
October 31,
2014 | |
| |
| Per share operating performance (For a share outstanding throughout each period) | |
| | | | | | | | | | | | | |
Net asset value,
beginning of period | | | $ | | | | 9.87 | | | | $ | | | | 11.30 | | | | $ | | | | 9.80 | | | | $ | | | | 9.46 | | | | $ | | | | 11.55 | | | | $ | | | | 11.72 | |
| | | | | | | | | | | | | |
| Income from investment operations: | | | | | | | | | | | | | | | | | | | | | | | | | | | | | | | | | | | | | | | | | | | | | | | | |
| | | | | | | | | | | | | |
Net investment income 1 | | | | | | | 0.03 | | | | | | | | 0.10 | | | | | | | | 0.09 | | | | | | | | 0.05 | | | | | | | | 0.08 | | | | | | | | 0.13 | |
| | | | | | | | | | | | | |
Net realized and unrealized gains/(losses) | | | | | | | 1.35 | | | | | | | | (1.41 | ) | | | | | | | 1.57 | | | | | | | | 0.37 | | | | | | | | (2.08 | ) | | | | | | | (0.18 | ) |
| | | | | | | | | | | | | |
| Total from investment operations | | | | | | | 1.38 | | | | | | | | (1.31 | ) | | | | | | | 1.66 | | | | | | | | 0.42 | | | | | | | | (2.00 | ) | | | | | | | (0.05 | ) |
| | | | | | | | | | | | | |
| Distributions from net investment income | | | | | | | ------- | | | | | | | | (0.12 | ) | | | | | | | (0.16 | ) | | | | | | | (0.08 | ) | | | | | | | (0.09 | ) | | | | | | | (0.12 | ) |
| | | | | | | | | | | | | |
| Change in net asset value for the period | | | | | | | 1.38 | | | | | | | | (1.43 | ) | | | | | | | 1.50 | | | | | | | | 0.34 | | | | | | | | (2.09 | ) | | | | | | | (0.17 | ) |
| | | | | | | | | | | | | |
| Net asset value, end of period | | | $ | | | | 11.25 | | | | $ | | | | 9.87 | | | | $ | | | | 11.30 | | | | $ | | | | 9.80 | | | | $ | | | | 9.46 | | | | $ | | | | 11.55 | |
| | | | | | | | | | | | | |
| Total Return | | | | | | | 13.98% | 2 | | | | | | | (11.59)% | | | | | | | | 17.02% | | | | | | | | 4.48% | | | | | | | | (17.31)% | | | | | | | | (0.40)% | |
| | | | | | | | | | | | | |
| Ratios/supplemental data | | | | | | | | | | | | | | | | | | | | | | | | | | | | | | | | | | | | | | | | | | | | | | | | |
| | | | | | | | | | | | | |
| Net assets, end of period (000) | | | $ | | | | 1,836 | | | | $ | | | | 1,651 | | | | $ | | | | 2,002 | | | | $ | | | | 1,816 | | | | $ | | | | 4,172 | | | | $ | | | | 5,182 | |
| | | | | | | | | | | | | |
| Ratio to average net assets: | | | | | | | | | | | | | | | | | | | | | | | | | | | | | | | | | | | | | | | | | | | | | | | | |
| | | | | | | | | | | | | |
Expenses
(net of reimbursement/recoupment) | | | | | | | 1.34% | 3 | | | | | | | 1.34% | | | | | | | | 1.34% | | | | | | | | 1.34% | | | | | | | | 1.34% | | | | | | | | 1.34% | |
| | | | | | | | | | | | | |
Expenses
(prior to reimbursement/recoupment) | | | | | | | 1.58% | 3 | | | | | | | 1.54% | | | | | | | | 1.48% | | | | | | | | 1.31% | | | | | | | | 1.27% | | | | | | | | 1.29% | |
| | | | | | | | | | | | | |
Net investment income
(net of reimbursement/recoupment) | | | | | | | 0.52% | 3 | | | | | | | 0.85% | | | | | | | | 0.90% | | | | | | | | 0.59% | | | | | | | | 0.75% | | | | | | | | 1.16% | |
| | | | | | | | | | | | | |
Net investment income
(prior to reimbursement/recoupment) | | | | | | | 0.28% | 3 | | | | | | | 0.65% | | | | | | | | 0.76% | | | | | | | | 0.62% | | | | | | | | 0.82% | | | | | | | | 1.21% | |
| | | | | | | | | | | | | |
| Portfolio turnover rate4 | | | | | | | 12% | | | | | | | | 34% | | | | | | | | 67% | | | | | | | | 57% | | | | | | | | 27% | | | | | | | | 64% | |
| (1) | Net investment income per share represents net investment income divided by the average shares outstanding throughout the period. |
| (4) | Portfolio turnover is calculated on the basis of the Fund as a whole without distinguishing between the classes of shares issued. |
The accompanying notes are an integral part of these financial statements
| | | | |
| www.thomaswhitefunds.com | | | 63 | |
Period Ended April 30, 2019 (Unaudited)
FINANCIAL HIGHLIGHTS
| | | | | | | | | | | | | | | | | | | | | | | | | | | | | | | | | | | | | | | | | | | | | | | | |
| |
| Thomas White Emerging Markets Fund - Class I | |
| | | | | | Six Months
Ended
April 30,
2019 | | | | | | Year
Ended
October 31,
2018 | | | | | | Year
Ended
October 31,
2017 | | | | | | Year Ended
October 31,
2016 | | | | | | Year Ended
October 31,
2015 | | | | | | Year Ended
October 31,
2014 | |
| |
| Per share operating performance (For a share outstanding throughout each period) | |
| | | | | | | | | | | | | |
Net asset value,
beginning of period | | | $ | | | | 9.97 | | | | $ | | | | 11.38 | | | | $ | | | | 9.88 | | | | $ | | | | 9.52 | | | | $ | | | | 11.59 | | | | $ | | | | 11.73 | |
| | | | | | | | | | | | | |
| Income from investment operations: | | | | | | | | | | | | | | | | | | | | | | | | | | | | | | | | | | | | | | | | | | | | | | | | |
| | | | | | | | | | | | | |
Net investment income 1 | | | | | | | 0.03 | | | | | | | | 0.12 | | | | | | | | 0.11 | | | | | | | | 0.09 | | | | | | | | 0.11 | | | | | | | | 0.14 | |
| | | | | | | | | | | | | |
Net realized and unrealized gains/(losses) | | | | | | | 1.38 | | | | | | | | (1.41 | ) | | | | | | | 1.59 | | | | | | | | 0.36 | | | | | | | | (2.09 | ) | | | | | | | (0.16 | ) |
| | | | | | | | | | | | | |
| Total from investment operations | | | | | | | 1.41 | | | | | | | | (1.29 | ) | | | | | | | 1.70 | | | | | | | | 0.45 | | | | | | | | (1.98 | ) | | | | | | | (0.02 | ) |
| | | | | | | | | | | | | |
| Distributions from net investment income | | | | | | | ------- | | | | | | | | (0.12 | ) | | | | | | | (0.20 | ) | | | | | | | (0.09 | ) | | | | | | | (0.09 | ) | | | | | | | (0.12 | ) |
| | | | | | | | | | | | | |
| Change in net asset value for the period | | | | | | | 1.41 | | | | | | | | (1.41 | ) | | | | | | | 1.50 | | | | | | | | 0.36 | | | | | | | | (2.07 | ) | | | | | | | (0.14 | ) |
| | | | | | | | | | | | | |
| Net asset value, end of period | | | $ | | | | 11.38 | | | | $ | | | | 9.97 | | | | $ | | | | 11.38 | | | | $ | | | | 9.88 | | | | $ | | | | 9.52 | | | | $ | | | | 11.59 | |
| | | | | | | | | | | | | |
| Total Return | | | | | | | 14.14% | 2 | | | | | | | (11.33)% | | | | | | | | 17.29% | | | | | | | | 4.69% | | | | | | | | (17.06)% | | | | | | | | (0.12)% | |
| | | | | | | | | | | | | |
| Ratios/supplemental data | | | | | | | | | | | | | | | | | | | | | | | | | | | | | | | | | | | | | | | | | | | | | | | | |
| | | | | | | | | | | | | |
| Net assets, end of period (000) | | | $ | | | | 37,936 | | | | $ | | | | 31,861 | | | | $ | | | | 45,392 | | | | $ | | | | 76,240 | | | | $ | | | | 79,656 | | | | $ | | | | 76,705 | |
| | | | | | | | | | | | | |
| Ratio to average net assets: | | | | | | | | | | | | | | | | | | | | | | | | | | | | | | | | | | | | | | | | | | | | | | | | |
| | | | | | | | | | | | | |
| Expenses (net of reimbursement) | | | | | | | 1.09% | 3 | | | | | | | 1.09% | | | | | | | | 1.09% | | | | | | | | 1.09% | | | | | | | | 1.09% | | | | | | | | 1.09% | |
| | | | | | | | | | | | | |
| Expenses (prior to reimbursement) | | | | | | | 1.55% | 3 | | | | | | | 1.51% | | | | | | | | 1.41% | | | | | | | | 1.29% | | | | | | | | 1.25% | | | | | | | | 1.25% | |
| | | | | | | | | | | | | |
| Net investment income (net of reimbursement) | | | | | | | 0.55% | 3 | | | | | | | 1.04% | | | | | | | | 1.07% | | | | | | | | 0.92% | | | | | | | | 1.04% | | | | | | | | 1.18% | |
| | | | | | | | | | | | | |
| Net investment income (prior to reimbursement) | | | | | | | 0.09% | 3 | | | | | | | 0.62% | | | | | | | | 0.75% | | | | | | | | 0.72% | | | | | | | | 0.88% | | | | | | | | 1.02% | |
| | | | | | | | | | | | | |
| Portfolio turnover rate4 | | | | | | | 12% | | | | | | | | 34% | | | | | | | | 67% | | | | | | | | 57% | | | | | | | | 27% | | | | | | | | 64% | |
| (1) | Net investment income per share represents net investment income divided by the average shares outstanding throughout the period. |
| (4) | Portfolio turnover is calculated on the basis of the Fund as a whole without distinguishing between the classes of shares issued. |
The accompanying notes are an integral part of these financial statements
| | |
| 64 | | www.thomaswhitefunds.com |
Period Ended April 30, 2019 (Unaudited)
FINANCIAL HIGHLIGHTS
| | | | | | | | | | | | | | | | | | | | | | | | | | | | | | | | | | | | | | | | | | | | | | | | |
| |
| Thomas White American Opportunities Fund - Investor Class | |
| | | | | | Six Months
Ended
April 30,
2019 | | | | | | Year
Ended
October 31,
2018 | | | | | | Year
Ended
October 31,
2017 | | | | | | Year
Ended
October 31,
2016 | | | | | | Year
Ended
October 31,
2015 | | | | | | Year
Ended
October 31,
2014 | |
| |
| Per share operating performance (For a share outstanding throughout each period) | |
| | | | | | | | | | | | | |
Net asset value,
beginning of period | | | $ | | | | 15.80 | | | | $ | | | | 16.49 | | | | $ | | | | 14.91 | | | | $ | | | | 15.60 | | | | $ | | | | 15.84 | | | | $ | | | | 15.12 | |
| | | | | | | | | | | | | |
| Income from investment operations: | | | | | | | | | | | | | | | | | | | | | | | | | | | | | | | | | | | | | | | | | | | | | | | | |
| | | | | | | | | | | | | |
Net investment income | | | | | | | 0.01 | | | | | | | | 0.06 | | | | | | | | 0.04 | | | | | | | | 0.11 | 1 | | | | | | | 0.08 | 1 | | | | | | | 0.07 | 1 |
| | | | | | | | | | | | | |
Net realized and unrealized gains/(losses) | | | | | | | 1.76 | | | | | | | | ------- | | | | | | | | 3.00 | | | | | | | | (0.44 | ) | | | | | | | 0.96 | | | | | | | | 2.21 | |
| | | | | | | | | | | | | |
| Total from investment operations | | | | | | | 1.77 | | | | | | | | 0.06 | | | | | | | | 3.04 | | | | | | | | (0.33 | ) | | | | | | | 1.04 | | | | | | | | 2.28 | |
| | | | | | | | | | | | | |
| Distributions: | | | | | | | | | | | | | | | | | | | | | | | | | | | | | | | | | | | | | | | | | | | | | | | | |
| | | | | | | | | | | | | |
From net investment income | | | | | | | ------- | | | | | | | | (0.05 | ) | | | | | | | (0.14 | ) | | | | | | | (0.00 | )2 | | | | | | | (0.07 | ) | | | | | | | (0.07 | ) |
| | | | | | | | | | | | | |
From net realized gains | | | | | | | ------- | | | | | | | | (0.69 | ) | | | | | | | (1.32 | ) | | | | | | | (0.36 | ) | | | | | | | (1.21 | ) | | | | | | | (1.49 | ) |
| | | | | | | | | | | | | |
| Total Distributions | | | | | | | ------- | | | | | | | | (0.74 | ) | | | | | | | (1.46 | ) | | | | | | | (0.36 | ) | | | | | | | (1.28 | ) | | | | | | | (1.56 | ) |
| | | | | | | | | | | | | |
| Change in net asset value for the period | | | | | | | 1.77 | | | | | | | | (0.68 | ) | | | | | | | 1.58 | | | | | | | | (0.69 | ) | | | | | | | (0.24 | ) | | | | | | | 0.72 | |
| | | | | | | | | | | | | |
| Net asset value, end of period | | | $ | | | | 17.57 | | | | $ | | | | 15.81 | | | | $ | | | | 16.49 | | | | $ | | | | 14.91 | | | | $ | | | | 15.60 | | | | $ | | | | 15.84 | |
| | | | | | | | | | | | | |
| Total Return | | | | | | | 11.20% | 3 | | | | | | | 0.50% | | | | | | | | 20.45% | | | | | | | | (2.12)% | | | | | | | | 6.69% | | | | | | | | 15.38% | |
| | | | | | | | | | | | | |
| Ratios/supplemental data | | | | | | | | | | | | | | | | | | | | | | | | | | | | | | | | | | | | | | | | | | | | | | | | |
| | | | | | | | | | | | | |
| Net assets, end of period (000) | | | $ | | | | 45,549 | | | | $ | | | | 40,969 | | | | $ | | | | 41,433 | | | | $ | | | | 36,816 | | | | $ | | | | 35,875 | | | | $ | | | | 33,830 | |
| | | | | | | | | | | | | |
| Ratio to average net assets: | | | | | | | | | | | | | | | | | | | | | | | | | | | | | | | | | | | | | | | | | | | | | | | | |
| | | | | | | | | | | | | |
Expenses
(net of reimbursement/ recoupment) | | | | | | | 1.34% | 4 | | | | | | | 1.34% | | | | | | | | 1.19% | | | | | | | | 1.20% | | | | | | | | 1.18% | | | | | | | | 1.24% | |
| | | | | | | | | | | | | |
Expenses
(prior to reimbursement/recoupment) | | | | | | | 1.44% | 4 | | | | | | | 1.43% | | | | | | | | 1.19% | | | | | | | | 1.20% | | | | | | | | 1.18% | | | | | | | | 1.15% | |
| | | | | | | | | | | | | |
| Net investment income (net of reimbursement/recoupment) | | | | | | | 0.07% | 4 | | | | | | | 0.31% | | | | | | | | 0.28% | | | | | | | | 0.78% | | | | | | | | 0.52% | | | | | | | | 0.45% | |
| | | | | | | | | | | | | |
| Net investment income (prior to reimbursement/recoupment) | | | | | | | (0.03)% | 4 | | | | | | | 0.22% | | | | | | | | 0.28% | | | | | | | | 0.78% | | | | | | | | 0.52% | | | | | | | | 0.54% | |
| | | | | | | | | | | | | |
| Portfolio turnover rate | | | | | | | 21% | | | | | | | | 21% | | | | | | | | 29% | | | | | | | | 60% | | | | | | | | 38% | | | | | | | | 32% | |
| (1) | Per share net investment income was calculated prior to tax adjustments. |
| (2) | Amount is less than $0.005. |
The accompanying notes are an integral part of these financial statements
| | | | |
| www.thomaswhitefunds.com | | | 65 | |
THOMAS WHITE FUNDS
DISCLOSURE OF FUND EXPENSES (Unaudited)
As a shareholder of the Funds you incur two types of costs : (1) transaction costs, including sales charges (loads) on purchase payments or contingent deferred sales charges on redemptions, if any, or redemption fees; and (2) ongoing costs, including management fees; and other Fund expenses. This example is intended to help you understand your ongoing costs (in dollars) of investing in the Funds and to compare these costs with the ongoing costs of investing in other mutual funds.
The example is based on an investment of $1,000 invested at the beginning of the period and held for the entire period, November 1, 2018 through April 30, 2019 for the Funds’ Investor Class and Class I, as applicable.
ACTUAL EXPENSES
The third and fourth columns of the table below provide information about actual account values and actual expenses. You may use the information in this line together with the amount you invested to estimate the expenses you paid over the period. Simply divide your account value by $1,000 (for example, an $8,600 account value divided by $1,000=8.6), then multiply the result by the number in the fourth column under the heading entitled “Expenses Paid During Period” to estimate the expenses you paid on your own account during this period. IRA accounts are charged a $15.00 fee annually in September that is not reflected in the actual expense example. If you hold your Fund shares through an IRA account, you should add this cost to the expenses paid shown below.
HYPOTHETICAL EXAMPLE FOR COMPARISON PURPOSES
The fifth and sixth columns of the table below provide information about hypothetical account values and hypothetical expenses based on each Fund’s actual expense ratio and an assumed rate of return of 5% per year before expenses, which is not the Fund’s actual return. The hypothetical account values and expenses may not be used to estimate the actual ending account balance or expenses you paid for the period. You may use this information to compare the ongoing costs of investing in the Funds and other funds. To do so, compare this 5% hypothetical example with the 5% hypothetical examples that appear in the shareholder reports of the other funds. IRA accounts are charged a $15.00 fee annually in September that is not reflected in the hypothetical expense example. If you hold your Fund shares through an IRA account, you should separately compare the Funds’ IRA fees to the IRA fees of other funds.
Please note that the expenses shown in the table are meant to highlight your ongoing costs only and do not reflect any transactional costs such as sales charges (loads) or purchase payments or contingent deferred sales charges on redemptions, if any, or redemption fees. Therefore the sixth column of the table is useful in comparing ongoing costs only, and will not help you determine the relative costs of owning different funds. In addition, if these transactional costs were included, your costs may have been higher.
| | |
| 66 | | www.thomaswhitefunds.com |
THOMAS WHITE FUNDS
| | | | | | | | | | | | | | | | | | | | | | | | |
| | | | | | |
| | | | | | | | | | | | Actual | | | Hypothetical (5% return
before expenses) | |
| | | | | | | |
| | | Fund’s
Annualized
Expense
Ratio* | | | Beginning
Account
Value
November 1,
2018 | | | Ending
Account
Value
April 30,
2019 | | | Expenses
Paid
During
Period | | | Ending
Account
Value
April 30,
2019 | | | Expenses
Paid
During
Period | |
| | | | | | |
| International Fund | | | | | | | | | | | | | | | | | | | | | |
| Investor Class Shares | | | 1.24% | | | | $1,000.00 | | | | $1,106.80 | | | | $6.48 | | | | $1,018.65 | | | | $6.21 | |
| | | | | | | |
| Class I Shares | | | 0.99% | | | | $1,000.00 | | | | $1,108.60 | | | | $5.18 | | | | $1,019.89 | | | | $4.96 | |
| | | | | | |
| Emerging Markets Fund | | | | | | | | | | | | | | | | | | | | | |
| Investor Class Shares | | | 1.34% | | | | $1,000.00 | | | | $1,139.80 | | | | $7.11 | | | | $1,018.15 | | | | $6.71 | |
| | | | | | | |
| Class I Shares | | | 1.09% | | | | $1,000.00 | | | | $1,141.40 | | | | $5.79 | | | | $1,019.39 | | | | $5.46 | |
| | | | | |
| American Opportunities Fund | | | | | | | | | | | | | | | | | |
| Investor Class | | | 1.34% | | | | $1,000.00 | | | | $1,112.00 | | | | $7.02 | | | | $1,018.15 | | | | $6.71 | |
| | * | Expenses for the International, Emerging Markets and American Opportunities Funds’ annualized expense ratio (after waiver and reimbursement), multiplied by the average account value over the period, multiplied by 181/365 (to reflect the one-half year period). |
QUARTERLY FORM N-Q PORTFOLIO SCHEDULE
The Funds file their complete schedule of portfolio holdings with the Securities and Exchange Commission (“SEC”) for the first and third quarters of each fiscal year on Form N-Q. Each Fund’s Form N-Q is available on the SEC’s website at http://www.sec.gov. The Funds’ Forms N-Q may be reviewed and copied at the SEC’s Public Reference Room in Washington, D.C. Information on the operation of the SEC’s Public reference Room may be obtained by calling1-800-SEC-0330. Additionally, you may obtain copies of Forms N-Q from the Funds upon request by calling 1-800-811-0535.
PROXY VOTING POLICIES, PROCEDURES AND RECORD
You may obtain a description of the Funds’ (1) proxy voting policies, (2) proxy voting procedures and (3) information regarding how the Funds voted any proxies related to portfolio securities during the most recent 12 month period ended June 30 for which an SEC filing has been made, without charge, upon request by calling the Funds at 1-800-811-0535 or on the EDGAR database on the SEC’s website (http://www.sec.gov).
| | | | |
| www.thomaswhitefunds.com | | | 67 | |
Approval of New Investment Advisory Agreements
At anin-person meeting of the Board of Trustees (the “Board” or the “Trustees”) held on February 19, 2019, the Board considered and reviewed each of the Investment Advisory Agreements (the “Agreements”) between Lord Asset Management Trust (the “Trust”), on behalf of the Thomas White American Opportunities Fund (the “American Opportunities Fund”), the Thomas White International Fund (the “International Fund”) and the Thomas White Emerging Markets Fund (the “Emerging Markets Fund” and together with the American Opportunities Fund and the International Fund, the “Funds”), and Thomas White International, Ltd. (“TWI” or the “Advisor”), to determine whether the Agreements should be continued for aone-year period.
In accordance with the Investment Company Act of 1940, the Board of Trustees of the Funds is required, on an annual basis, to consider the continuation of each of the Agreements with the Advisor, and this must take place at anin-person meeting of the Board. The relevant provisions of the Investment Company Act of 1940 specifically provide that it is the duty of the Board to request and evaluate such information as the Board determines is necessary to allow them to properly consider the continuation of the Agreements, and it is the duty of the Advisor to furnish the Trustees with such information that is responsive to their request. Accordingly, in determining whether to renew the Agreements between the Funds and the Advisor, the Board of Trustees requested, and the Advisor provided, information and data relevant to the Board’s consideration. This included materials prepared by the Advisor for the Board that provided them with information regarding the investment performance of the Funds and information regarding the fees and expenses of the Funds, compared to other similar mutual funds.
Following their consideration and review of the Agreements, the Trustees determined that each Agreement would enable shareholders of the Fund to which it applies to obtain high quality services at a cost that is appropriate, reasonable, and in the best interests of its shareholders. Accordingly, the Board, including the Independent Trustees of the Board, unanimously approved the continuation of the Agreements. In reaching their decisions, the Trustees requested and obtained from the Advisor such information as they deemed reasonably necessary to evaluate the Agreements. The Trustees also carefully considered the information that they had received throughout the year from the Advisor as part of their regular oversight of the Funds, as well as profitability data and comparative fee, expense and performance information prepared by Trust management. In considering the continuation of the Agreements, the Trustees evaluated a number of considerations that they believed, in light of the legal advice furnished to them by Trust counsel and their own reasonable business judgment, to be relevant. They based their decisions on the following considerations, among others, although they did not identify any one specific consideration or particular information that was controlling of their decisions:
| | • | | The nature, extent and quality of the advisory services to be provided. The Trustees concluded that TWI is capable of providing high quality services to each Fund, as indicated by the nature and quality of services provided in the past, TWI’s management capabilities demonstrated with respect to the Funds, the professional qualifications and experience of the Funds’ portfolio managers, TWI’s investment and management |
| | |
| 68 | | www.thomaswhitefunds.com |
Approval of New Investment Advisory Agreements
| | oversight processes, and the overall long-term investment performance of the Funds. The Trustees also determined that TWI proposed to provide investment advisory services that were of the same quality as services it provided to the Funds in the past, and that these services are appropriate in scope and extent in light of the Funds’ operations, the competitive landscape of the investment company business and investor needs. In connection with these matters, the Trustees took into consideration the change in control transaction involving the Advisor that had occurred during the past year and they noted that the firm had continued to maintain most all of the senior management team and portfolio management team that were in place prior to the change in control transaction. |
| | • | | The investment performance of the Funds. With respect to each Fund, the Trustees concluded on the basis of information derived from the performance data that TWI had achieved investment performance that was competitive relative to comparable funds over various trailing time periods, including over longer-term trailing time periods, and the Trustees took into consideration the fact that TWI focuses on long-term performance results with respect to their management of the Funds and the Funds may have periods of underperformance. |
1.The American Opportunities Fund. With respect to the American Opportunities Fund, the Trustees noted that the Investor Class shares of the American Opportunities Fund had outperformed its peer group (based on the category average) over the trailing five- andten-year periods, but had underperformed its peer group (based on the category average) over the trailingone- and three-year periods. The Trustees also noted that the Investor Class shares of the American Opportunities Fund had underperformed its primary benchmark index, the Russell Midcap Index, and its secondary benchmark index, the S&P 500 Index, over the trailingone-, three-, five- andten-year periods. The Trustees reviewed with the representatives of the Advisor the factors that have contributed to the underperformance and they took into consideration the Advisor’s management approach that it employs with respect to the Fund.
2.The International Fund. With respect to the International Fund, the Trustees took note of the fact that the Investor Class shares of the Fund had underperformed its peer group (based on the category average) for the trailingone-, three-, five- andten-year periods. The Trustees also noted that the Investor Class shares of the International Fund had underperformed its benchmark index, the MSCI All Country World ex US Index, for the trailingone-, three-, five- andten-year periods. They also considered that the Investor Class shares of the Fund had only slightly underperformed its peer group (based on the category average) for the trailingten-year period. The Trustees reviewed with the representatives of the Advisor the factors that have contributed to the underperformance and they took into consideration the Advisor’s management approach that it employs with respect to the Fund.
| | | | |
| www.thomaswhitefunds.com | | | 69 | |
Approval of New Investment Advisory Agreements
3.The Emerging Markets Fund. With respect to the Emerging Markets Fund (which commenced investment operations in June 2010), the Trustees noted that the Investor Class shares of the Emerging Markets Fund had outperformed its peer group (based on the category average) over the trailing three-year period, but had underperformed its peer group (based on category average) over the trailingone- and five-year periods. The Trustees noted that the Investor Class shares of the Emerging Markets Fund had underperformed its benchmark index, the MSCI Emerging Markets Index, over the trailingone-, three- and five-year periods. They also considered that the Investor Class shares of the Fund had only slightly underperformed its peer group (based on the category average) for the trailingone-year period. The Trustees reviewed with the representatives of the Advisor the factors that have contributed to the underperformance and they took into consideration the Advisor’s management approach that it employs with respect to the Fund.
On the basis of the Trustees’ assessment of the nature, extent and quality of advisory services to be provided by TWI, the Trustees concluded that TWI is capable of generating a level of long-term investment performance that is appropriate in light of the Funds’ investment objectives, policies and strategies and competitive with many other investment companies, and they took into consideration TWI’s ongoing plans to address Fund performance through the implementation of certain enhancements to its research and investment analysis process.
| | • | | The cost of advisory services provided and the level of profitability. On the basis of comparative information derived from the expense data, the Trustees determined that the overall expense ratio of each Fund, on a net basis, was competitive with industry averages, particularly with respect to mutual funds of comparable asset size. The Trustees also noted that TWI had proposed to renew its contractual commitment for the benefit of Fund shareholders to limit the operating expenses of each of the classes of shares of the Funds for an additional year. The Board took into consideration information regarding the fees that TWI charges to other accounts and private funds for similar investment advisory services, and the Trustees noted that the fees were comparable based on the relevant circumstances of the types of accounts involved. The Board also considered TWI’s current level of profitability with respect to the Funds, and noted that TWI’s profitability was acceptable and not excessive and consistent with applicable industry averages and that TWI is committed to using its own resources to help grow the Funds. The Trustees also took into consideration the nature and extent of other expenses that are borne directly by TWI from its own financial resources in order to help to market and promote the Funds. Accordingly, on the basis of the Board’s review of the fees to be charged by TWI for investment advisory services, the investment advisory and other services provided to the Funds by TWI, and the estimated profitability of TWI’s relationship with each Fund, the Board concluded that the level of |
| | |
| 70 | | www.thomaswhitefunds.com |
Approval of New Investment Advisory Agreements
| | investment advisory fees and TWI’s profitability are appropriate in light of the investment advisory fees, overall expense ratios and investment performance of comparable investment companies and the historical profitability of the relationship between each Fund and TWI. The Trustees considered the profitability of TWI both before and after the impact of the marketing related expenses that TWI incurs out of its own resources in connection with its management of the Funds. |
| | • | | The extent to which economies of scale will be realized as the Funds grow and whether the advisory fees reflect economies of scale. While the Funds’ investment advisory fees do not decrease as Fund assets grow because the Funds are not currently subject to investment advisory fee breakpoints, the Trustees concluded that the Funds’ investment advisory fees are appropriate in light of the current size of the Funds, and appropriately reflect the current economic environment for TWI and the competitive nature of the mutual fund market. The Trustees noted that TWI has continued to limit the Funds’ total annual operating expenses by waiving fees and/or reimbursing certain Fund expenses. The Trustees then noted that they will have the opportunity to periodicallyre-examine whether a Fund has achieved economies of scale, and the appropriateness of investment advisory fees payable to TWI, in the future. |
| | • | | Benefits to TWI from its relationship with the Funds (and any corresponding benefits to the Funds). The Trustees concluded that other benefits derived by TWI from its relationship with the Funds, including “soft dollar” benefits in connection with Fund brokerage transactions and use of the Funds’ performance track records in advertising materials, are reasonable and fair, and consistent with industry practice and the best interests of the Funds and their shareholders. In addition, the Trustees determined that the Funds benefited from their relationship to TWI by virtue of TWI’s provision of business management services, in addition to investment advisory services, at a cost to the Funds that is generally comparable to the cost of an outside service provider, which the Trustees determined to be reasonable, fair and in the best interests of Fund shareholders in light of the nature and quality of the services provided and the necessity of the services for the Funds’ operations. In considering information regarding the business management fees payable by the Funds to TWI under the terms of the Business Management Agreement, the Board members indicated that they had considered various factors with respect to the proposed business management fees, including the level and amount of these fees and the services to be provided by the Advisor in connection with the Business Management Agreement, in determining the reasonableness of the total fees payable by the Funds to the Advisor for the overall level of services that the Advisor provides to the Funds and their shareholders. In considering the nature and extent of thesenon-advisory business management services that are provided to the Funds by the Advisor, the Board took into consideration: (i) whether the Business Management Agreement is in the best interest of the Funds and their shareholders; (ii) whether the |
| | | | |
| www.thomaswhitefunds.com | | | 71 | |
Approval of New Investment Advisory Agreements
| | services to be performed under the Business Management Agreement are required for the operation of the Funds; (iii) whether the services provided are of a nature and quality at least equal to the same or similar services provided by independent third parties; and (iv) whether the fees for the services are fair and reasonable in light of the usual and customary charges made by others for services of the same nature and quality. |
| | • | | Other Considerations. In approving the Agreements, the Trustees determined that TWI has made a substantial commitment to the recruitment and retention of high quality personnel, and maintains the financial, compliance and operational resources reasonably necessary to manage the Funds in a professional manner that is consistent with the best interests of the Funds and their shareholders. The Trustees also concluded that TWI has made a significant entrepreneurial commitment to the management and success of the Funds, which entails a substantial financial and professional commitment, including the Expense Limitation Agreements with respect to each Fund under which TWI has undertaken to waive a portion of its fees to the benefit of Fund shareholders to the extent necessary in accordance with the terms of the Expense Limitation Agreements, subject to applicable recoupment provisions. The Board also considered matters with respect to the brokerage practices of TWI, including its soft dollar arrangements and its best-execution procedures, and noted that these were reasonable and consistent with standard industry practice. In addition, the Trustees took into consideration their discussions with management of the Advisor regarding the Advisor’s ongoing plans to address Fund performance through the implementation of certain enhancements to its research and investment analysis process. |
In reaching their conclusion with respect to the continuation of each of the Agreements and the level of fees paid under the Agreements, the Trustees, as noted, did not identify any one single factor as being controlling. Rather, the Board took note of a combination of factors that had influenced their decision making process. They noted the level and quality of investment advisory services provided by the Advisor to each of the Funds, and they found that these services continued to benefit the shareholders of the Funds and also reflected management’s overall commitment to the continued growth and development of the Funds. The Trustees also considered the successful completion of the change in control transaction involving the Advisor that had occurred during the past year and the Trustees took into consideration the manner in which the Advisor had been able to retain the senior management personnel and the senior portfolio management team members who previously served the Funds, thus resulting in the successful continuity of the management of the Funds. Based upon their consideration and review of these factors and other matters deemed relevant by the Board in reaching an informed business judgment, the Trustees, including a majority of the Independent Trustees, concluded that the terms of the Agreements are fair and reasonable in light of the services provided and the Board therefore voted to renew the Agreements for an additionalone-year period.
| | |
| 72 | | www.thomaswhitefunds.com |
Privacy Policy
LORD ASSET MANAGEMENT TRUST
THOMAS WHITE INTERNATIONAL, LTD.
I. Commitment to Consumer* Privacy
The Thomas White Funds Family and Thomas White International, Ltd. (collectively, “we” or “us”) are committed to handling consumer information responsibly. We recognize and respect the privacy expectations of our consumers, and we believe that the confidentiality and security of consumers’ personal financial information is one of our fundamental responsibilities.
II. Collection of Consumer Information
We collect, retain and use consumer information only where we reasonably believe it would be useful to the consumer and allowed by law. Consumer information collected by us generally comes from the following sources:
| | • | | Information we receive on applications or other forms; |
| | • | | Information about consumers’ transactions with us, our affiliates, or others. |
III. Disclosure of Consumer Information
We may disclose all of the consumer information we collect to affiliated financial institutions and to third parties who are not our affiliates:
| | • | | to perform marketing services on our behalf or pursuant to a joint marketing agreement between us and another party; and |
| | • | | as otherwise permitted by law. |
We do not disclose any consumer information about our former customers* to anyone except as permitted by law.
IV. Security of Customer Information
We are committed to, and also require our service providers to:
| | • | | maintain policies and procedures designed to assure only appropriate access to, and use of information about our customers; and |
| | • | | maintain physical, electronic and procedural safeguards that comply with federal standards to guard non-public personal information of our customers. |
* As defined in Regulation S-P
| | | | |
| www.thomaswhitefunds.com | | | 73 | |
This page is intentionally left blank.
OFFICERS AND TRUSTEES
William H. Woolverton
Chairman of the Board
Arthur J. Fiocco, Jr.
Trustee
Geri Sands Hansen
Trustee
Elizabeth G. Montgomery
Trustee
Robert W. Thomas
Trustee
John N. Venson, D.P.M.
Trustee
Douglas M. Jackman
President and Trustee
David M. Sullivan II
Vice President, Treasurer and
Assistant Secretary
J. Ryan Conner
Secretary and Chief Compliance Officer
INVESTMENT ADVISOR AND OTHER SERVICE PROVIDERS
Thomas White International, Ltd.
425 S Financial Place, Suite 3900
Chicago, Illinois 60605-1028
CUSTODIANS
The Northern Trust Company
Chicago, Illinois
U.S. Bank, N.A.
Milwaukee, Wisconsin
LEGAL COUNSEL
Dechert LLP
Washington, DC
INDEPENDENT REGISTERED PUBLIC ACCOUNTING FIRM
Tait, Weller & Baker, LLP
Philadelphia, Pennsylvania
ADMINISTRATOR and TRANSFER AGENT
U.S. Bank Global Fund Services
Milwaukee, Wisconsin
DISTRIBUTOR
Quasar Distributors, LLC
Milwaukee, Wisconsin
FOR CURRENT PERFORMANCE, NET ASSET VALUE OR FOR ASSISTANCE WITH YOUR ACCOUNT, PLEASE CONTACT THE THOMAS WHITE FUNDS AT 800-811-0535 OR VISIT OUR WEB SITE AT WWW.THOMASWHITEFUNDS.COM

www.thomaswhitefunds.com
Item 2. Code of Ethics.
Not applicable for Semi-Annual Reports.
Item 3. Audit Committee Financial Expert.
Not applicable for Semi-Annual Reports.
Item 4. Principal Accountant Fees and Services.
Not applicable for Semi-Annual Reports.
Item 5. Audit Committee of Listed Registrants.
Not applicable to registrants who are not listed issuers (as defined in Rule10A-3 under the Securities Exchange Act of 1934).
Item 6. Investments.
| (a) | The Schedules of Investments are included as part of the report to shareholders filed under Item 1 of this FormN-CSR. |
Item 7. Disclosure of Proxy Voting Policies and Procedures forClosed-End Management Investment Companies.
Not applicable toopen-end investment companies.
Item 8. Portfolio Managers ofClosed-End Management Investment Companies.
Not applicable toopen-end investment companies.
Item 9. Purchases of Equity Securities byClosed-End Management Investment Company and Affiliated Purchasers.
Not applicable toopen-end investment companies.
Item 10. Submission of Matters to a Vote of Security Holders.
There have been no material changes to the procedures by which shareholders may recommend nominees to the Registrant’s Board of Trustees.
1
Item 11. Controls and Procedures.
| (a) | Based on an evaluation of Registrant’s Disclosure Controls and Procedures (as defined in Rule30a-3(c) under the Investment Company Act of 1940) (the “Disclosure Controls”), as of a date within 90 days prior to the filing date (the “Filing Date”) of this FormN-CSR (the “Report”), the Registrant’s principal executive officer and principal financial officer have concluded that the Disclosure Controls are effectively designed to ensure that information required to be disclosed by the Registrant in the Report is recorded, processed, summarized and reported by the Filing Date, including ensuring that information required to be disclosed in the Report is accumulated and communicated to the Registrant’s management, including the Registrant’s principal executive officer and principal financial officer, as appropriate, to allow timely decisions regarding required disclosure. |
| (b) | There were no changes in the Registrant’s internal control over financial reporting (as defined in Rule30a-3(d) under the Act) that occurred during the most recent fiscal quarter of the period covered by this report that has materially affected, or is reasonably likely to materially affect, the Registrant’s internal control over financial reporting. |
Item 12. Disclosure of Securities Lending Activities forClosed-End Management Investment Companies
Not applicable toopen-end investment companies.
Item 13. Exhibits.
| (a) | (1)Code of ethics.Not applicable. |
(2)Certifications pursuant to Section 302 of the Sarbanes-Oxley Act of 2002. Filed herewith.
(3)Any written solicitation to purchase securities under Rule 23c-1 under the Act sent orgiven during the period covered by the report by or on behalf of the Registrant to 10 or more persons. Not applicable toopen-end investment companies.
(4)Change in the registrant’s independent public accountant. There was no change in the registrant’s independent public accountant for the period covered by this report.
| (b) | Certifications pursuant to Section 906 of the Sarbanes-Oxley Act of 2002. Filed herewith. |
2
SIGNATURES
Pursuant to the requirements of the Securities Exchange Act of 1934 and the Investment Company Act of 1940, the registrant has duly caused this report to be signed on its behalf by the undersigned, thereunto duly authorized.
| | | | | | |
| | (Registrant) LORD ASSET MANAGEMENT TRUST | | |
| | | |
| | By (Signature and Title) | | /s/ Douglas M. Jackman | | |
| | | | Douglas M. Jackman | | |
| | | | President (Principal Executive Officer) | | |
| | | |
| | Date | | July 8, 2019 | | |
Pursuant to the requirements of the Securities Exchange Act of 1934 and the Investment Company Act of 1940, this report has been signed below by the following persons on behalf of the registrant and in the capacities and on the dates indicated.
| | | | | | |
| | By (Signature and Title) | | /s/ Douglas M. Jackman | | |
| | | | Douglas M. Jackman | | |
| | | | President (Principal Executive Officer) | | |
| | | |
| | Date | | July 8, 2019 | | |
| | | |
| | By (Signature and Title) | | /s/ David M. Sullivan II | | |
| | | | David M. Sullivan II | | |
| | | | Treasurer (Principal Financial Officer) | | |
| | | |
| | Date | | July 8, 2019 | | |
3