Exhibit 99.3
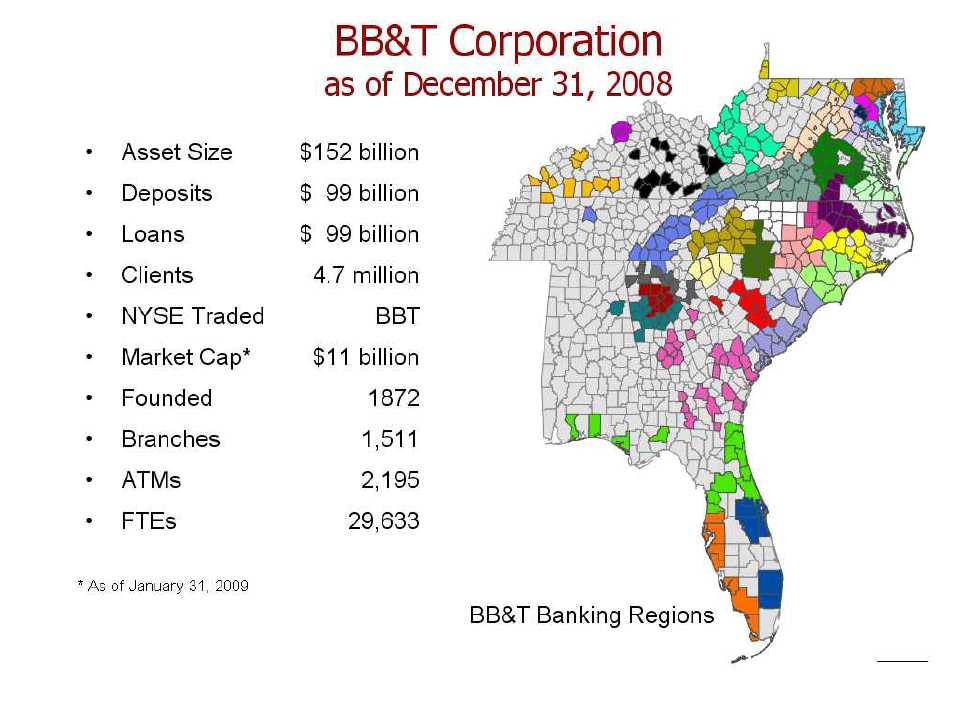
BB&TCorporation
Financial Management
Superior Relative Performance
Investor Conference
February11, 2009
| | | | | | | |
| Total Assets and Market Value |
| |
| |
| Assets | | | Market Value | | |
| |
| U.S. | | | | U.S. | | | |
| Rank | Company | $ Billions | Rank | Company | | $ Billions |
| |
| 1 | J.P. Morgan | $ | 2,175 | 1 | J.P. Morgan | $ | 95 |
| 2 | Citigroup | | 1,945 | 2 | Wells Fargo | | 80 |
| 3 | Bank of America | | 1,818 | 3 | Bank of America | | 42 |
| 4 | Wells Fargo | | 1,310 | 4 | U.S. Bancorp | | 26 |
| 5 | PNC Financial | | 291 | 5 | Citigroup | | 19 |
| 6 | U.S. Bancorp | | 266 | 6 | PNC Financial | | 14 |
| 7 | SunTrust | | 189 | 7 | BB&T | | 11 |
| 8 | Capital One | | 166 | 8 | Capital One | | 6 |
| 9 | BB&T | | 152 | 9 | SunTrust | | 4 |
| 10 | Regions | | 146 | 10 | M&T Bank | | 4 |
Assetsas ofDecember31, 2008
MarketValue as ofJanuary31, 2009
2
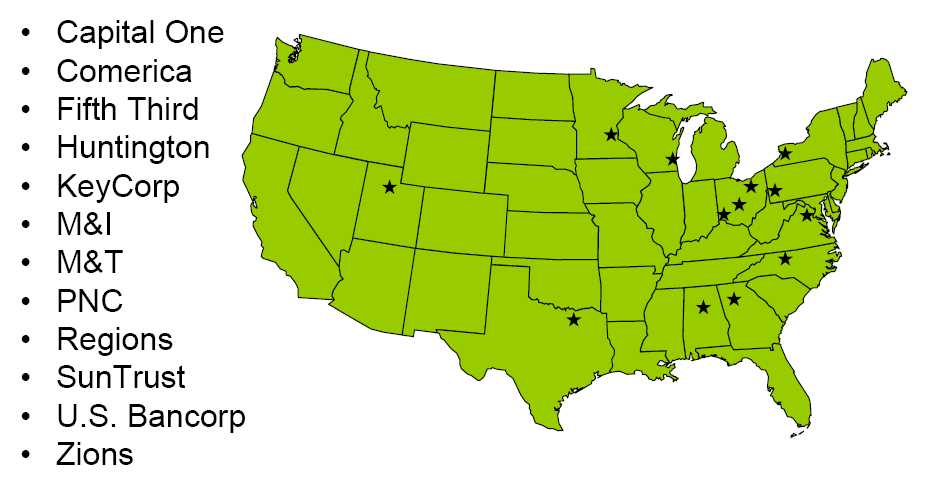
2009 Peer Banks
3
Financial Management
Agenda
| 1. | Profitability |
| 2. | Balance Sheet Strategy |
| 3. | Investment Portfolio |
| 4. | Funding and Liquidity |
| 5. | Interest Rate Sensitivity |
| 6. | Capital |
| 7. | Investing for the Future |
| 8. | Summary |
4
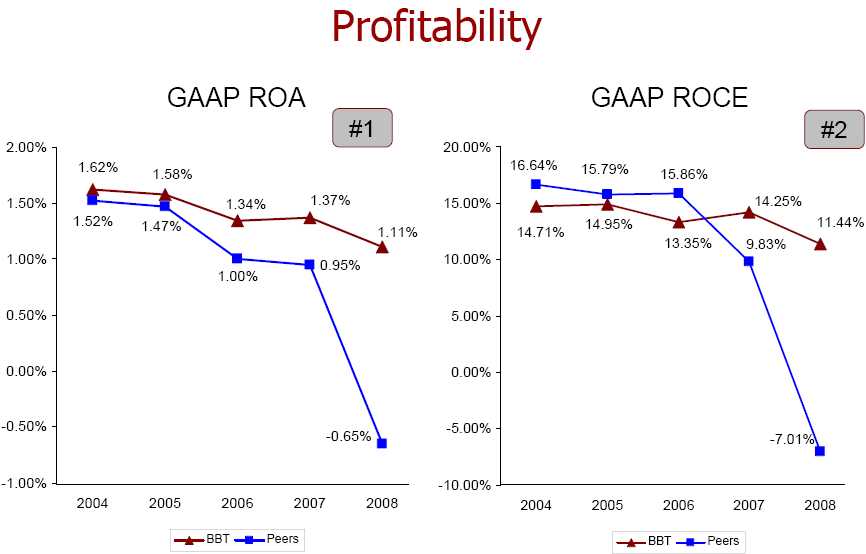
Source:SNL andCompany Reports
5
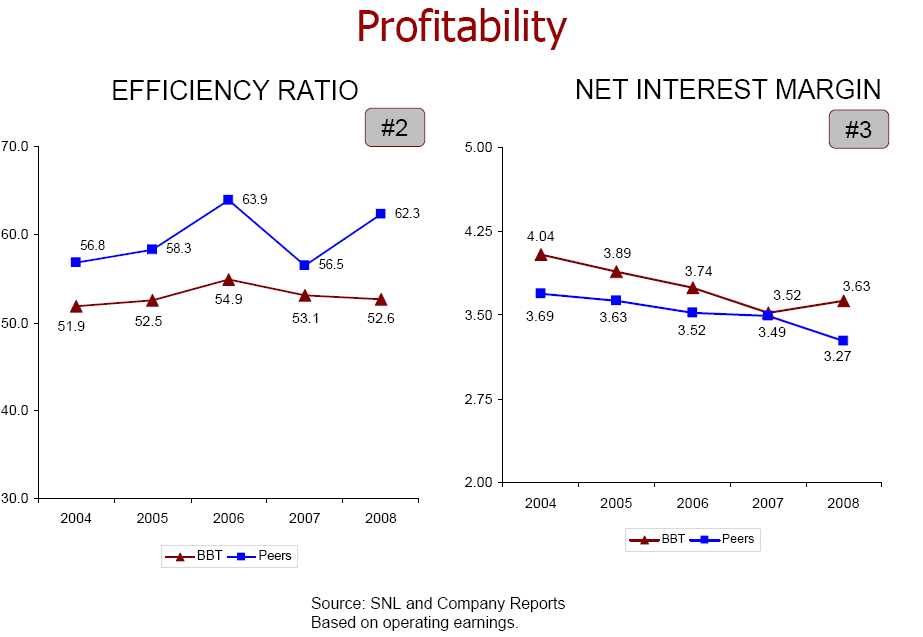
6
Profitability
EfficiencyRatio - Drivers
Integration of systems and processes
Corporate culture – everyone on same page
Disciplined integration of acquisitions
Mind set – treat company’s money as if it is yourown
Positive operating leverage
7
| | | | | | | | | | |
| Profitability |
Operating Leverage |
| | Linked Period Basis |
| | 1st Q | | 2nd Q | | 3rd Q | | 4th Q | | Year | |
| | 2008 | | 2008 | | 2008 | | 2008 | | 2008 | |
| Revenue Growth | 10.49 | % | 22.48 | % | 3.40 | % | 7.38 | % | 10.80 | % |
| Expense Growth | 8.70 | % | 22.13 | % | 1.20 | % | 3.98 | % | 9.75 | % |
| |
| Operating Leverage | 1.79 | % | 0.35 | % | 2.20 | % | 3.40 | % | 1.05 | % |
Based onoperating earnings
8
| | | | | | | | | |
| Profitability |
| Operating Income1 |
| Year-Over-Year Growth |
| (Dollars in Millions) |
| | | 2008 | | 2007 | Pct Change | | | Core2 | |
| Net interest income | $ | 4,388 | $ | 3,948 | 11.1 | | % | 10.5 | % |
| Noninterest income | | 3,060 | | 2,774 | 10.3 | | | 1.3 | |
| Total revenue | | 7,448 | | 6,722 | 10.8 | | | 6.6 | |
| Noninterest expense | | 3,952 | | 3,601 | 9.7 | | | 4.3 | |
| Pre-tax pre provision operating income | | 3,496 | | 3,121 | 12.0 | | | 9.2 | |
| Net charge-offs | | 851 | | 338 | 151.8 | | | | |
| Reserve build | | 594 | | 110 | 440.0 | | | | |
| Operating earnings before income taxes | | 2,051 | | 2,673 | (23.3 | ) | | | |
| Taxes3 | | 654 | | 924 | (29.2 | ) | | | |
| Operating earnings | | 1,397 | | 1,749 | (20.1 | ) | | | |
| |
| Operating earnings available to common shareholders | | 1,376 | | 1,749 | (21.3 | ) | | | |
1Based onoperating earnings
2Excludesthe impact ofpurchase acquisitions,theimplementationof fair valueaccountingand the net impact ofvaluation adjustmentsformortgage servicingrights and gains or losses onmortgage servicingrights-related derivatives.
3Includes$83 million and $68 million for 2008 and 2007,respectivelyfor FTEadjusted income.
9
10
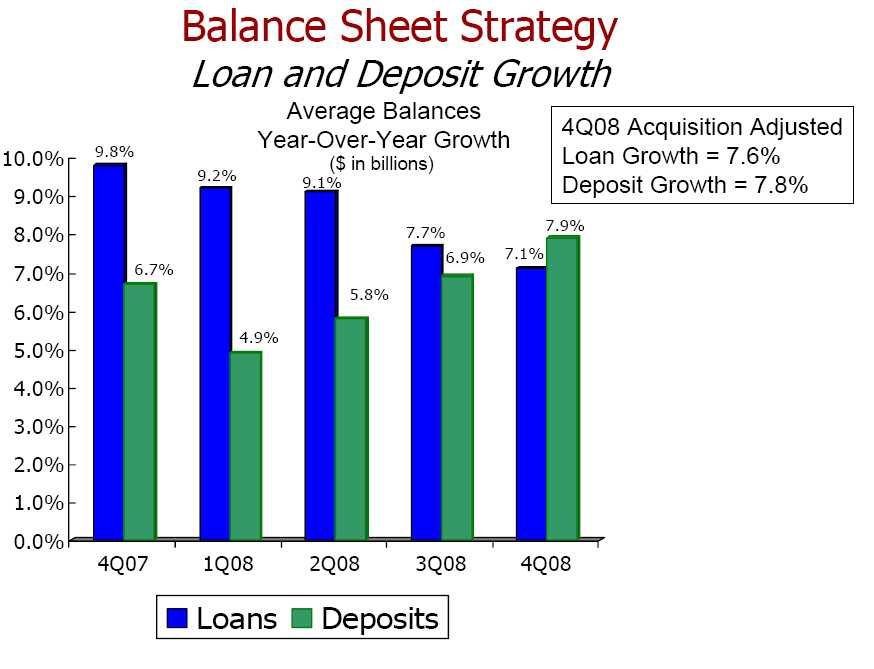
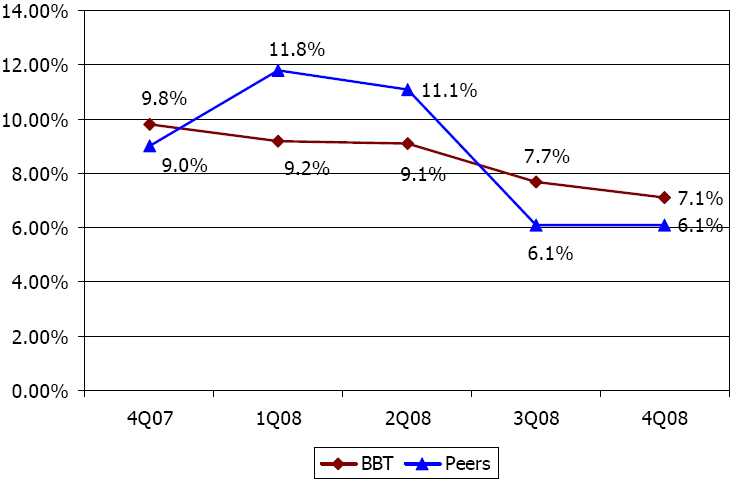
Balance Sheet Strategy
Loan Growth
Versusthe Same Period of the Prior Year
11
12
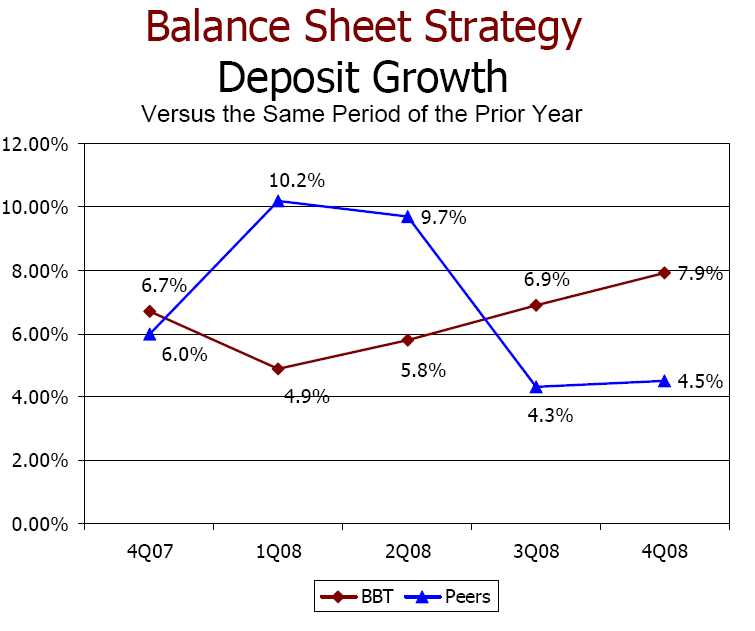
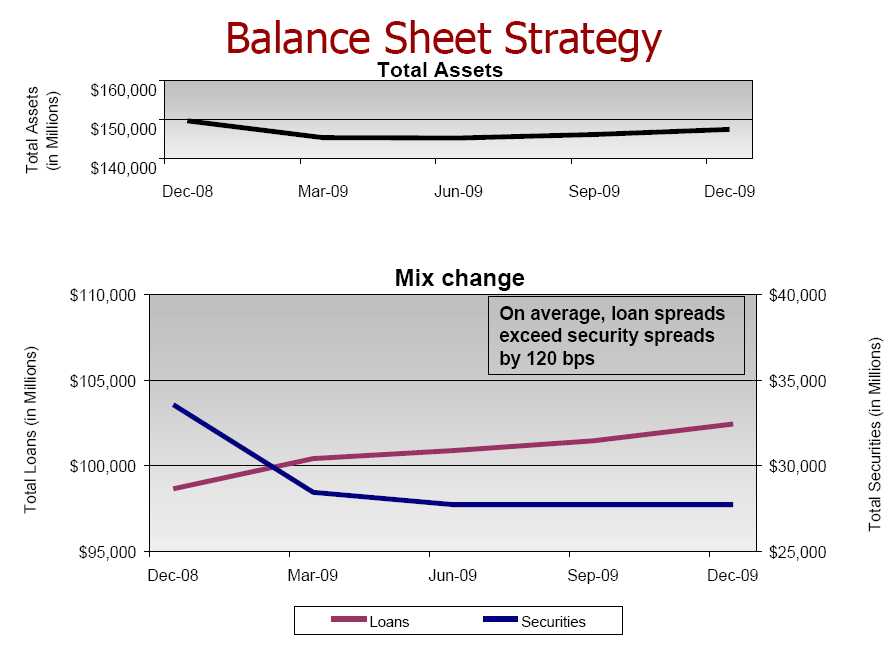
BalanceSheetStrategy
CapitalPurchase Program
U.S. Treasury invested $3.1 billion of preferredstock (including warrants) in BB&T Corporation.
Viewed favorably by regulators and ratingagencies.
Preferred stock has lower cost of capital thancurrent marketplace.
Initial goal – neutralize the cost to shareholders
–Invested in GSE mortgage-backed securities.
Increase lending activities to generate additionalearnings and tangible common equity.
13
14
Investment PortfoliobySecurityType
December31, 2008
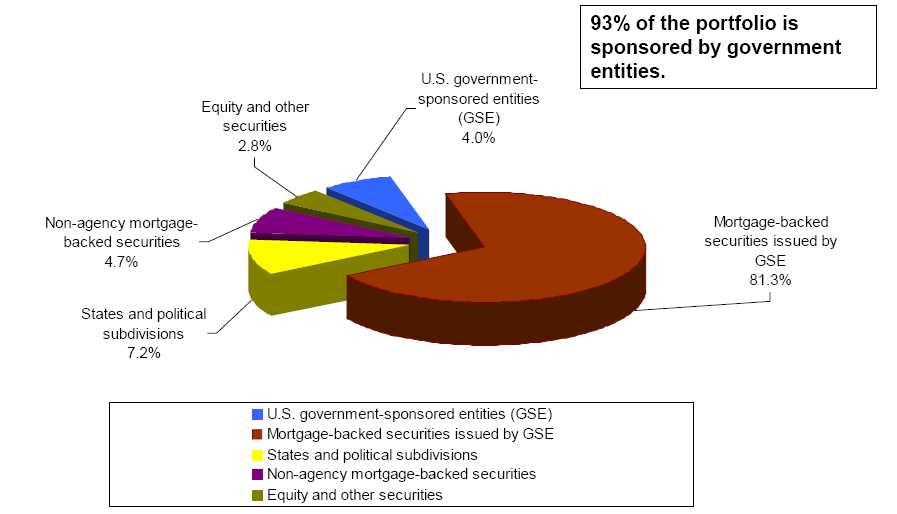
*Distributioniscalculatedbased onquarter-endamortizedcost.
15
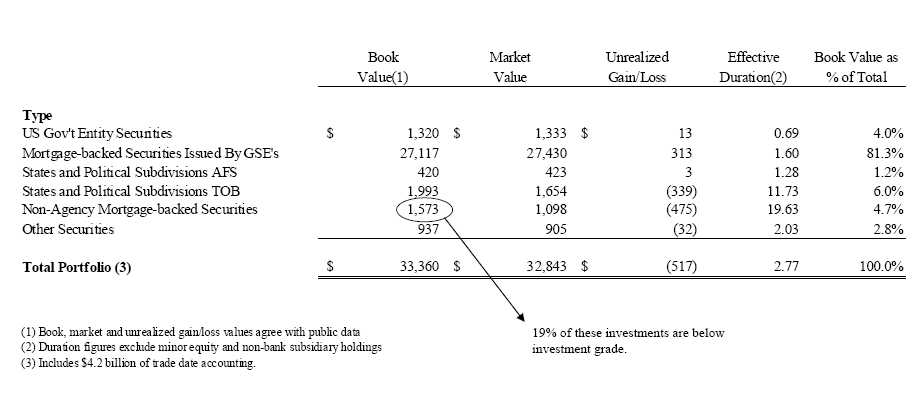
Investment Portfolio Summary
December31, 2008
(Dollars in millions)
16
Investment Portfolio
Strategy
Invest in high quality low risk securities.
Utilize cash flows to fund loan growth.
Pledge securities to bring in client public funds andrepurchase agreements.
Securities are evaluated every quarter forimpairment. In the past, we have had adequateoffsetting transactions to neutralize the impact onearnings.
Emphasize liquidity first, then earnings.
17
FundingandLiquidity
Increase Funding Flexibility
| Restructured Bank and Holding Company Debt Programs |
| | | Focus on speed and access to marketplace |
| | | Added multi-currency capability |
| | | Added medium-term note capacity |
| | | Added commercial paper facility |
| | | Added broker CD program |
| Increased borrowing capacity at both Federal Home Loan Bank and Federal Reserve Bank |
| | | Increased capacity by $20 billion |
18
| | | | |
| Funding and Liquidity |
| Secured Borrowing Sources |
| December 31, 2008 |
| | | Capacity | | Usage |
| | | (Dollars in millions) |
| Fed Discount Window | $ | 15,760.2 | $ | - |
| Treasury Tax & Loan and Treasury Auctions | | 8,630.3 | | 2,555.9 |
| Dealer Repurchase Agreements | | 3,000.0 | | 1,010.0 |
| Federal Home Loan Bank | | 19,058.7 | | 10,083.3 |
| Available Investment Securities | | 10,969.3 | | - |
| | $ | 57,418.6 | $ | 13,649.2 |
Note:Excess secured funding capacitywas 242% of one yearNational Markets funding maturities.
19
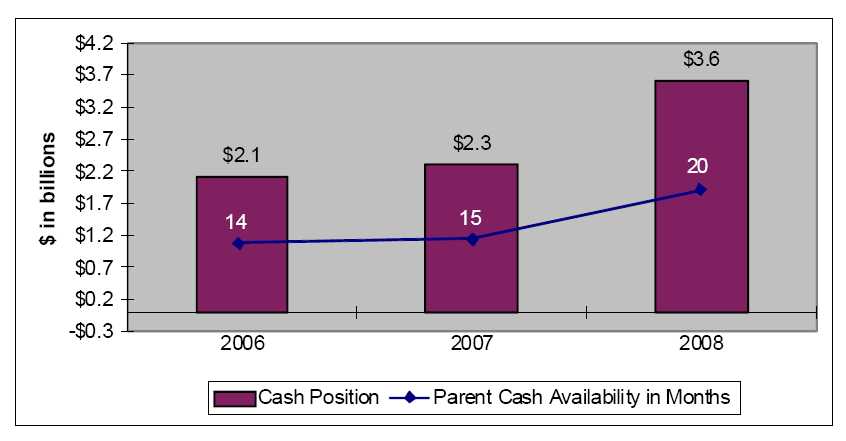
FundingandLiquidity
Liquidity Position
20
FundingandLiquidity
Funding Strategies
| Fund as much as possible from clients (deposits and borrowings) |
| Diversity of funding sources – secured and unsecured |
| | | Bank notes / medium-term notes |
| | | Broker deposits |
| | | Fed funds |
| | | Dealer repurchase agreements |
| | | Commercial paper |
| | | Eurodollars |
| Stagger maturities to avoid excessive funding pressure |
| Utilize government programs on an as needed basis |
| | | Temporary liquidity guarantee program |
| Maintain strong liquidity first, then minimize funding costs |
21
FundingandLiquidity
Structured Transactions
| IRS Issue |
| | | BB&T has received notification of proposed IRS adjustments related to foreign tax credits claimed. |
| | | Although the amount and timing of the resolution of this issue cannot currently be determined, BB&T believes its reserves are adequate to cover the expected liability. |
| | | BB&T will attempt to settle the issue during 2009 and will pursue litigation if required. |
| | | We may need to fund a payment to stop the accrual of interest on the proposed adjustment. |
22
| | | | |
| Funding and Liquidity |
| Ratings |
| | S&P | Moody’s | Fitch | DBRS |
| BB&T CORPORATION | | | | |
| - Common stock/issuer | A+ | Aa3 | AA- | AA(low) |
| SUBSIDIARY BANK-Branch Banking & Trust Company | | | |
| - Long term deposits | AA- | Aa2 | AA | AA |
| Ratings Outlook | Stable | Negative | Stable | Stable |
23
| | | | | | | | |
| Funding and Liquidity |
| |
| |
| Bank Holding Company Ratings |
| |
| as of February 2, 2009 |
| Sorted based on S&P Rating | Sorted based on Moody's Rating | Sorted based on Fitch's Rating |
| |
| Company | S&P | Outlook | Company | Moody'sOutlook | Company | Fitch | Outlook |
| |
| 1U.S. Bancorp | AA | Stable | 1U.S. Bancorp | Aa2 | Stable | 1Wells Fargo & Company | AA | Stable |
| 2Wells Fargo & Company | AA | Negative | 2Bank of NY Mellon Corporation | Aa2 | Stable | 2U.S. Bancorp | AA- | Positive |
| 3Bank of NY Mellon Corporation | AA- | Stable | 3JPMorgan Chase & Co. | Aa3 | Stable | 3BB&T Corporation | AA- | Stable |
| 4Northern Trust Corporation | AA- | Stable | 4BB&T Corporation | Aa3 | Negative | 4Bank of NY Mellon Corporation | AA- | Stable |
| 5BB&T Corporation | A+ | Stable | 5Wells Fargo & Company | Aa3 | Negative | 5JPMorgan Chase & Co. | AA- | Stable |
| 6State Street Corporation | A+ | Negative | 6Northern Trust Corporation | A1 | Stable | 6Northern Trust Corporation | AA- | Down |
| 7Bank of America Corporation | A+ | Negative | 7SunTrust Banks, Inc. | A1 | Stable | 7Bank of America Corporation | A+ | Stable |
| 8JPMorgan Chase & Co. | A+ | Negative | 8State Street Corporation | A1 | Negative | 8Citigroup Inc. * | A+ | Stable |
| 9Citigroup Inc. * | A | Stable | 9Bank of America Corporation | A1 | Negative | 9PNC Financial Services Group, Inc. | A+ | Stable |
| 10PNC Financial Services Group, Inc. | A | Stable | 10PNC Financial Services Group, Inc. | A1 | Negative | 10Comerica Incorporated | A+ | Stable |
| 11SunTrust Banks, Inc. | A | Negative | 11Marshall & Ilsley Corporation * | A1 | Down | 11Regions Financial Corporation | A+ | Negative |
| 12Regions Financial Corporation | A | Negative | 12Comerica Incorporated | A2 | Stable | 12State Street Corporation | A+ | Down |
| 13Comerica Incorporated | A | Negative | 13Keycorp | A2 | Stable | 13SunTrust Banks, Inc. | A+ | Down |
| 14M&T Bank Corporation | A- | Stable | 14M&T Bank Corporation | A2 | Negative | 14Keycorp | A | Stable |
| 15Fifth Third Bancorp | A- | Negative | 15Citigroup Inc. * | A2 | Down | 15Fifth Third Bancorp | A | |
| 16Keycorp | A- | Negative | 16Fifth Third Bancorp | A2 | Down | 16M&T Bank Corporation | A- | Stable |
| 17Synovus Financial Corp. | BBB+ | Negative | 17Regions Financial Corporation | A3 | Negative | 17Zions Bancorporation * | A- | Stable |
| 18Capital One Financial Corporation | BBB+ | Negative | 18Capital One Financial Corporation | A3 | Negative | 18Capital One Financial Corporation | A- | Stable |
| 19Marshall & Ilsley Corporation * | BBB+ | Negative | 19Zions Bancorporation * | A3 | Negative | 19Huntington Bancshares Inc. * | A- | Stable |
| 20Zions Bancorporation * | BBB+ | Negative | 20Huntington Bancshares Inc. * | A3 | Down | 20Synovus Financial Corp. | A- | Negative |
| 21First Horizon National Corporation | BBB | Stable | 21Popular, Inc. * | Baa1 | Negative | 21First Horizon National Corporation | BBB+ | Negative |
| 22Huntington Bancshares Inc. * | BBB | Negative | 22First Horizon National Corporation | Baa1 | Negative | 22Popular, Inc. * | BBB | Negative |
| 23Popular, Inc. * | BBB- | Stable | 23Colonial Bancgroup, Inc. | B2 | Down | 23Colonial Bancgroup, Inc. | BB | Down |
| 24Colonial Bancgroup, Inc. | BB- | Down | 24Synovus Financial Corp. | N/A | | 24Marshall & Ilsley Corporation * | N/A | |
| 25Associated Banc-Corp | N/A | | 25Associated Banc-Corp | N/A | | 25Associated Banc-Corp | N/A | |
| |
| |
| * Moody's issuer credit rating was not available on Reuters for these companies. Table reflects long-term debt rating. | | | |
| N/AInformation not available on Reuters. | | | | | | | |
24
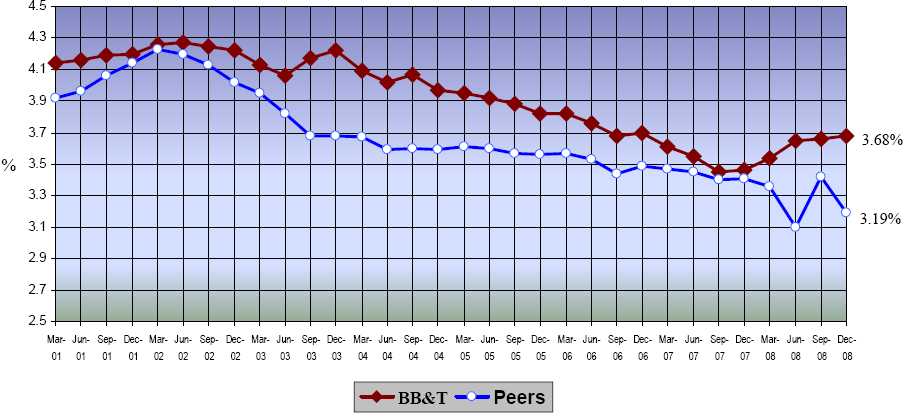
InterestRateSensitivity
InterestRate RiskManagement
Net Interest Margin
25
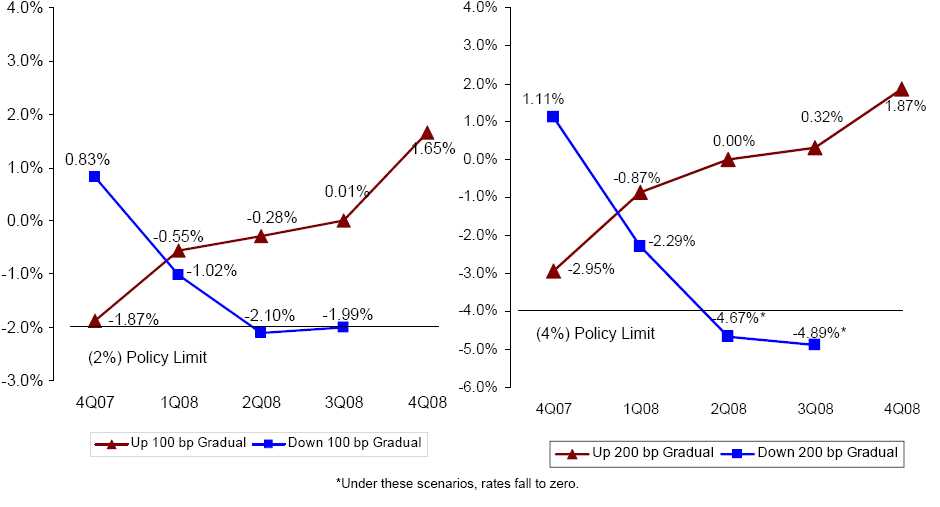
InterestRateSensitivity
26
InterestRateSensitivity
EconomicValue of EquitySensitivityReport
as ofDecember31, 2008
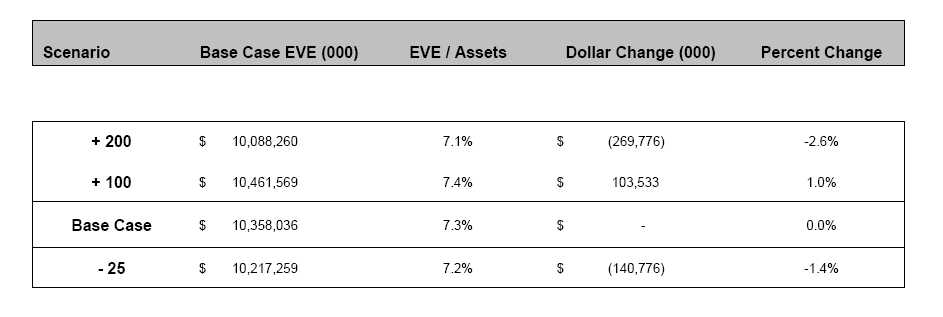
Policy Limit is + / - 30%
27
InterestRateSensitivity
InterestRate RiskStrategy
| Net Interest Income represents approximately 60% of total revenues |
| Produce a stable net interest margin (3.60% area for the full year) |
| Tools used to achieve results include derivatives, investment portfolio and pricing assets and liabilities |
| Primary drivers of net interest margin: |
| | | Loan growth (mix change) |
| | | Deposit pricing competition |
| | | Prepayment speeds on mortgages and MBS |
28
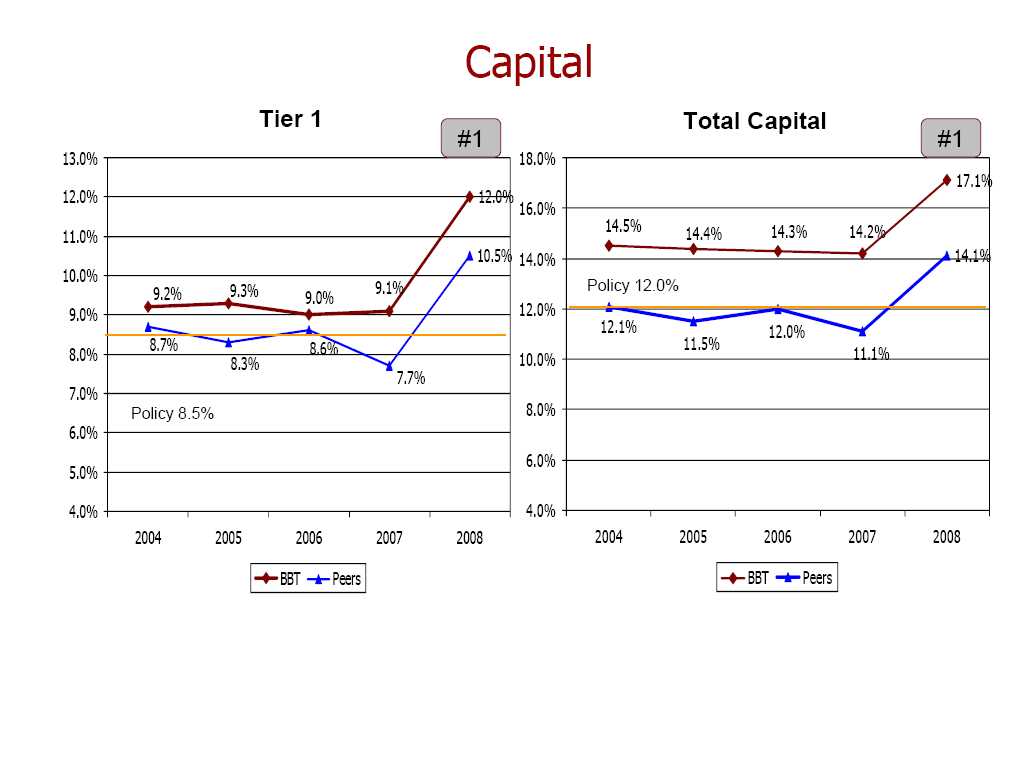
Capital
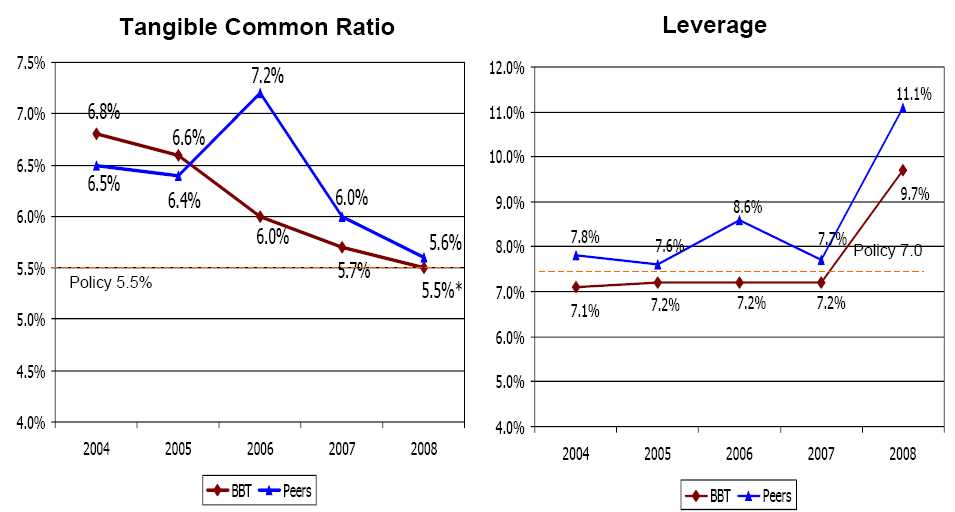
*Includingtrade dateaccounting balances,this ratio would be 5.3% .
29
30
Capital
Industry Leading Capital Generation
Cash Basis Return onTangible CommonEquity

31
Capital
CapitalManagement Strategies
Provide adequate capital in relation toBB&T’s overall risk profile
Preserve a sufficient base to support futuregrowth
Provide a competitive return toshareholders
Comply with regulatory standards
Achieve optimal credit ratings
32
Investingfor the Future
InvestingforGrowth
Disciplined decision making for bothorganic investments and acquisitions
Strong financial analysis on both aneconomic and accounting basis
Centrally managed review process
Thorough due diligence performed
Strategic and cultural fit
Executive management gives finalapproval
33
Investingfor the FutureOrganicCapitalInvestments
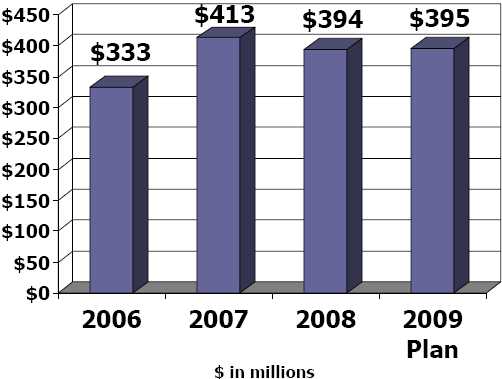
Highlights
•Openingde novobranches(106 from 2006through2009)
•Purchasingland for futurebranch consolidation
•Upgradingdata and voicenetwork– ITTransformationproject
•Expanded2missioncriticaloperations centers’ capacityandupgraded redundancy
•Movedintosignature buildinginAtlanta
34
Acquisition Investments
Invested$1.8 billion since 2006
| | | | |
| 2006 | | 2007 | | 2008 |
| • Wyman, Green & Blalock | • | Coastal Financial | • | Ott & Company |
| | | | |
| • Bergen Capital | • | AFCO/CAFO | • | Ramsey Title Group |
| | | | | |
| • FSB Financial | • | Collateral Real Estate | • | Burkey Risk Services |
| | | Capital | | |
| | | | |
| • Main Street Banks | | | • | Savannah Reinsurance |
| | • | Reese Insurance | | Underwriting Management |
| • First Citizens Bancorp | | Associates | | |
| | | • | Premier Benefits Group |
| | | | |
| | • | Carswell Insurance | • | UnionBanc Insurance Services |
| | | | |
| | • | Sidney O. Smith | • | Puckett, Sheetz & Hogan |
| | | | |
| | • | Heritage Title | • | Southern Risk Holdings, Inc. |
| | | | |
| | • | Established American | • | Commercial Title Group |
| | | Coastal | | |
| | | | • | J. Rolfe Davis Insurance |
| | | | | Agency |
| | | | |
| | | | • | TapCo Underwriters, Inc. |
| | | | |
| | | | • | Haven Trust Bank |
| | | | |
| | | | • | Live Oak Capital Ltd. |
35
Financial Management Summary
Industry leading profitability statistics
Strong core operating earnings
Excellent cost control
Strong liquidity and capital positions
Conservative risk management
Investing for the future
Low risk providing a more predictable earningsstream
High return of earnings to shareholders
36
Superior Relative Performance
BB&TVersusPeers
AnnualizedTotalReturntoShareholders
For thePeriod1-1-08through1-31-09
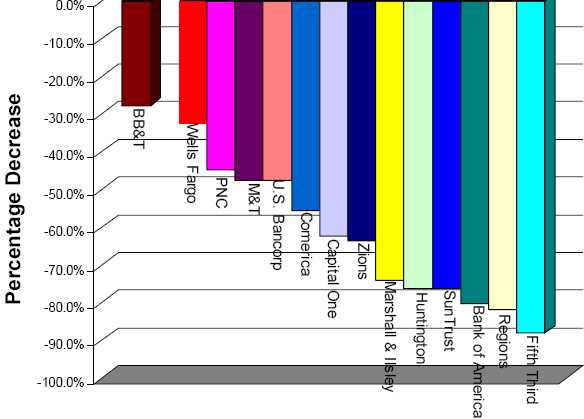
37