Exhibit 99.6
BB&TBANKING NETWORK
Executingon Time-TestedStrategies

Investor Conference February11, 2009
Duringthis time ofuncertaintyandinstability,BB&Tremains:
Our focus for 2009 isunchanged:
EXECUTION
2
OUR EXECUTION PLAN |
| Adhere to our core strategies |
| | | Foundational and enduring |
| | | Viable in any environment |
| | | Affirmed by internal and external surveys |
| Focus on performance and results, not on developing new strategies |
| Increase productivity and achieve greater efficiencies |
| Leverage our advantages |
3
LEVERAGINGOURADVANTAGES
| Capitalize on our financial strength and stability |
| | | Competitors are distracted by monumental problems |
| | | Clients and prospects are seeking a strong bank - “flight to quality” |
| | | BB&T remains committed to its clients during difficult times |
4
FLIGHTTOQUALITY DEPOSIT GROWTH TREND
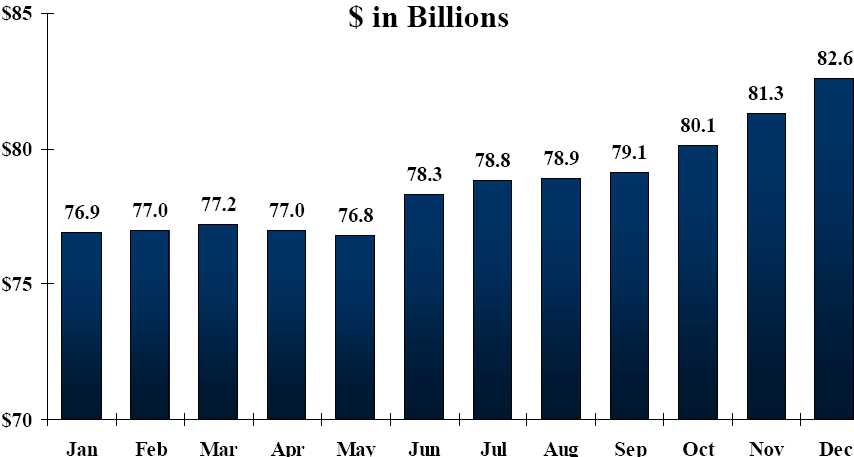
2008
5
COMMITTEDTO OURCLIENTS
LOANGROWTH TREND
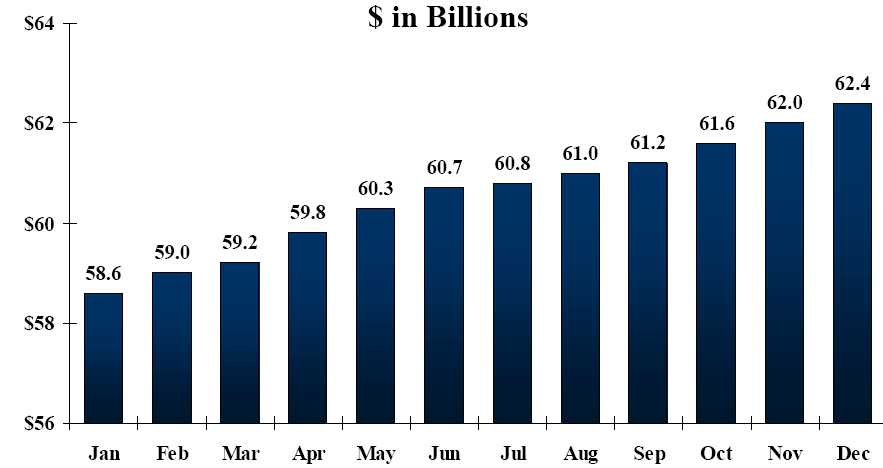
2008
6
LEVERAGINGOUR
ORGANIZATIONAL STRUCTURE
7
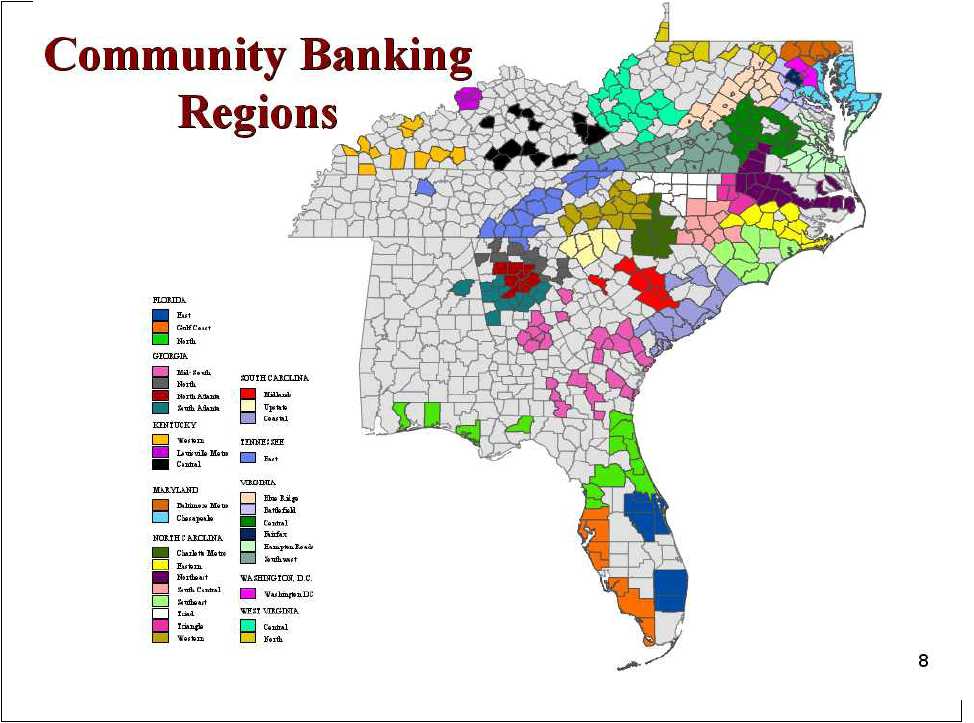
COMMUNITY BANKING LOCATIONS
| | | | |
| STATE | BRANCHES | CITIES | COUNTIES |
| ALABAMA | 3 | | 3 | 2 |
| DC MSA | 156 | | 59 | 16 |
| FLORIDA | 107 | | 63 | 26 |
| GEORGIA | 162 | | 89 | 55 |
| INDIANA | 2 | | 2 | 2 |
| KENTUCKY | 91 | | 34 | 25 |
| MARYLAND* | 94 | | 61 | 17 |
| NORTH CAROLINA | 360 | | 204 | 75 |
| SOUTH CAROLINA | 117 | | 60 | 24 |
| TENNESSEE | 58 | | 32 | 16 |
| VIRGINIA* | 283 | | 162 | 99 |
| WEST VIRGINIA | 78 | | 50 | 26 |
| TOTAL | 1,511 | | 819 | 383 |
*ExcludesDC MSA 9
LEVERAGINGOUR
ORGANIZATIONAL STRUCTURE
| Each region is led by a Regional President (RP) |
| | | Proven leaders |
| | | Long tenured and skilled |
| | | Extraordinary commitment and passion for the job |
| | | Engaged and team oriented |
| | | Long-term focused |
| | | 100% supportive of corporate strategies and Community Banking Model |
10
LEVERAGINGOUR
ORGANIZATIONAL STRUCTURE
| Community Banking Model creates competitive advantages: |
| | | Provides a structure to deploy expansive resources to compete with community banks |
| | | Empowers our regional leadership to deliver local, customized solutions versus mega banks |
| | | Keeps us close to our clients, key in times of difficulty |
| | | Provides the foundation for our Sales and ServiceCultureModel |
11
EXECUTINGOUR PLAN
6 KEYCOMPONENTS
Our People
Sales Management
Client Experience
Expense Management
Risk Management
Performance Management
12

Time-Tested
13
POSITIONINGOURPEOPLE
| Hire the right talent |
| On-board new employees (began in 2006) |
| | | 2006 = 35% on-boarded |
| | | 2008 = 85% on-boarded |
| Staff to appropriate levels |
| Set clear expectations |
| Focus on effective coaching and mentoring |
| Recognize high performers and manage non-performers |
14
POSITIONINGOURPEOPLE
| Ensure employees are well trained |
| | | No reduction in training investment |
| | | Increase in average training days |
| | | | 2007 = 6.7 days |
| | | | 2008 = 7.3 days |
| | | Emphasis on the University Certification Program |
| | | | 2007 = 29% certified |
| | | | 2008 = 52% certified |
| | | Focus on cross-training |
15
BENEFITS GENERATED
16
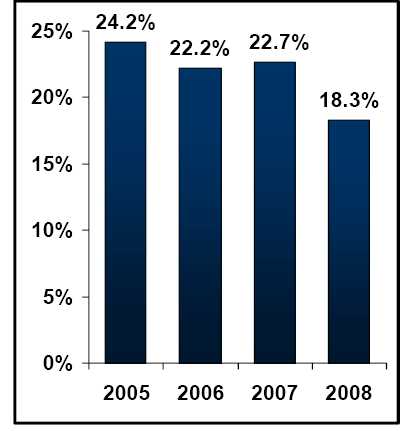
EMPLOYEE TURNOVER

17
EMPLOYEE TURNOVER
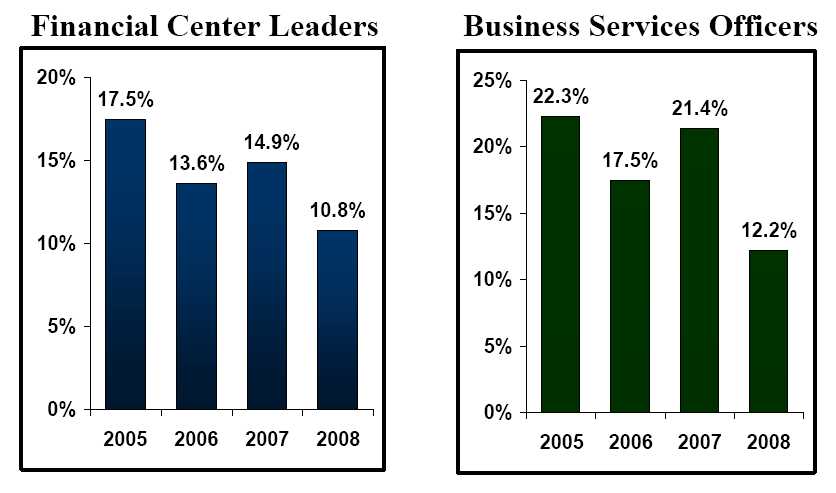
18
EMPLOYEE TURNOVER
TotalBanking Network Employees
19

Time-Tested
20
DELIVERING BB&T’S VALUE PROMISE
| Foundation to all commercial and retail sales efforts |
| Reason why a client or prospect should bank with BB&T |
| Four elements of the promise |
| | | Who am I? |
| | | Who are we? |
| | | What do we do? |
| | | How do we do it? |
21
COMMERCIAL SALES MANAGEMENT
| RPs and City Executives drive Commercial Banking through: |
| | | Adhering to the Decathlon Process |
| | | Engaging IRM (Integrated Relationship Management) partners |
| | | Leveraging our 238 Local Advisory Boards |
| | | Inspecting behaviors |
| | | Measuring results |
| | | Executing on the Consultative Sales & Retention Process |
22
CONSULTATIVE SALES&
RETENTION PROCESS

23
AFFIRMINGOURSALES APPROACH
Greenwich Associates Middle MarketStudy
BB&T received three national GreenwichExcellence Awards including “OverallSatisfaction”
Affirms that our consultative sales processgives BB&T a competitive advantage
Indicates that BB&T is well positioned tomigrate new clients towards our consistencyand soundness
24
AFFIRMINGOURSALES APPROACH
Barlow ResearchStudy
| Middle Market Banking |
| | | #1 in overall satisfaction with primary bank and account officer |
| | | #1 in likelihood for our clients to make referrals |
| | | #1 in terms of time spent discussing financials and business operations |
| | | #1 in standing by the client when times get tough |
| Small Business Banking |
| | | #1 in overall satisfaction with primary bank and branch |
| | | #1 in likelihood for our clients to make referrals |
| | | #1 in ease of doing business and getting things right the first time |
| | | #1 in standing by the client when times get tough |
25
Resultsfromsurveys conductedin the BB&Tfootprintin 2006, 2007, and 2008
NOW IS THE TIME
TO TELL OURSTORY
26
TARGETING
TOP 41LARGE MARKETS
| Focus on aggressive calling efforts |
| Ensure increased IRM partnership (Financial Services) support |
| Inspect results |
| | | Targeted reporting |
| | | Monthly sales conference calls |
| | | Separate campaign tracking |
27
| | | |
| 41 LARGE MARKETS | |
| MD | KY | GA | |
| ANNAPOLIS | LOUISVILLE | COBB COUNTY | |
| BALTIMORE | | FAYETTE COUNTY | |
| | TN | FULTON COUNTY | |
| VA | KNOXVILLE | GWINNETT COUNTY | |
| NEWPORT NEWS | NASHVILLE | | |
| NORFOLK | | AL | |
| PORTSMOUTH | NC | BIRMINGHAM | |
| RICHMOND | CARY | | |
| VIRGINIA BEACH | CHARLOTTE | FL | |
| | DURHAM | BROWARD COUNTY | |
| GREATER DC METRO | GREENSBORO | JACKSONVILLE | |
| ALEXANDRIA | RALEIGH | ORLANDO | |
| ARLINGTON | WILMINGTON | ST. PETERSBURG | |
| BETHESDA | WINSTON SALEM | TAMPA | |
| FAIRFAX CITY | | | |
| GAITHERSBURG | SC | | |
| PRINCE WILLIAM | | | |
| COUNTY | CHARLESTON | | |
| SPRINGFIELD | COLUMBIA | | |
| SUBURBAN MD | GREENVILLE | | |
| TYSONS | SPARTANBURG | | |
| WASHINGTON DC | | | 28 |
LARGE MARKET PERFORMANCE
BEFORE&AFTERNEWFOCUS
| | | | | | | | |
| | Baseline Growth* | Growth |
| | 2007 vs. 2006 | 2008 vs. 2007 |
| | Large | Banking | Large | Banking |
| | Markets | Network | Markets | Network |
| Total Business Loans | 1.6 | % | 5.6 | % | 12.5 | % | 9.8 | % |
| Retail Loans | | | | | | | | |
| (excluding Bankcard) | 2.0 | % | 3.1 | % | 1.5 | % | 0.6 | % |
| Demand Deposits | -3.0 | % | -1.9 | % | -1.4 | % | -2.0 | % |
| Total Deposits | 8.1 | % | 7.1 | % | 6.5 | % | 3.0 | % |
| Noninterest Income | 8.4 | % | 9.5 | % | 8.6 | % | 9.0 | % |
| | | | | | |
| | *September YTD | | | | | |
29
RETAIL SALES MANAGEMENT
| Driven by the Regional Retail Banking Manager and Sales & Service Leaders |
| Executed by the Financial Center Leader as the store owner/leader |
| Supports all client segments |
| Focuses on small business client strategy |
| Built on: |
| | | Store Ownership Model |
| | | Retail Consultative Concepts |
30
STORE OWNERSHIP ELEMENTS
Own the market
Own the client experience
Own the team (coaching and leadership)
Own the processes and compliance
Own the economics
31
RETAIL CONSULTATIVE CONCEPTS
| Banking |
| | | Helping to manage the client’s household finances |
| Loans |
| | | Financing the major purchases for the client |
| Insurance |
| | | Protecting the client, their family, and the things they value |
| Investments |
| | | Growing, managing or preserving the client’s money |
| Managing the client’s life events |
| | | Education, marriage, retirement, job change |
32
ACQUIRINGNEWCLIENTS
BB&T@WORK STRATEGY
| | | | | | |
| | | 2006 | | 2007 | | 2008 |
| DDA & Savings ($) | $ | 103,565,311 | $ | 150,185,651 | $ | 393,335,020 |
| DDA & Savings (#) | | 37,491 | | 70,908 | | 128,924 |
| New Company IDs (CIDs) (#) | | 3,778 | | 5,452 | | 9,288 |
| Production per BB&T@Work Sales Officer increased 31% over 2007 |
| In 2008, BB&T@Work accounted for: |
| | | 44% of net new transaction accounts |
| | | 13% of total Retail DDA production |
33
ACQUIRINGNEWCLIENTSDE NOVOSTRATEGY
| Opened 131 de novo branches since 2004 |
| Cumulative growth achieved: |
| | | $3.6 billion in deposits |
| | | $600 million in loans (retail only) |
| Average breakeven = 17.5 months |
| Cumulative breakeven in November 2008 |
| 2009 focus is to leverage the existing de novos |
34
OPENEDDENOVOSBYSTATE
| |
| STATE | # of DE NOVOS |
| NC | 32 |
| GA | 31 |
| FL | 25 |
| DC MSA | 11 |
| SC | 10 |
| MD* | 7 |
| KY/IN | 6 |
| VA* | 6 |
| TN | 3 |
| TOTAL | 131 |
| * Excludes DC MSA | |
35
ACQUIRINGNEWCLIENTS
TARGETINGTHEHISPANIC MARKET
| Represents about 50% of the population growth in our markets (for some regions, 100%) |
| Established 180 multicultural banking centers |
| Segment accounts for the following: |
| | | 110,500 households (HHs) |
| | | Growth rate 3 times faster than non-Hispanic HHs |
| | | $715 million in deposits |
| | | $2 billion in loans |
36
ACQUIRINGNEWCLIENTS
TARGETING SMALL BUSINESSES
| Renewed focus on growing this segment by leveraging our: |
| | | Branches and Financial Center Leaders to reach small businesses |
| | | Small Business Consultative Sales Process |
| | | Training resources |
| | | Bundling efforts |
| #1 goal is to grow deposits |
37
DEEPENING RELATIONSHIPS
THROUGH BUNDLING
| Initiated bundling process in October 2007 |
| HHs with new DDAs plus 3 additional products |
| | | September 2007 = 25.3% |
| | | November 2008 = 39.6% |
| Supported by Client Central (sales platform) |
| | | | |
| Products Cross Sold | 9/30/07 | | 11/30/08 | |
| Debit Card | 84.2 | % | 86.6 | % |
| Online Banking | 65.6 | % | 72.7 | % |
| Savings | 28.0 | % | 39.1 | % |
| Overdraft | 15.4 | % | 28.5 | % |
| Bankcard | 2.2 | % | 9.6 | % |
38
DELIVERING CLIENT SOLUTIONS
RELATIONSHIP BANKER PRODUCTION
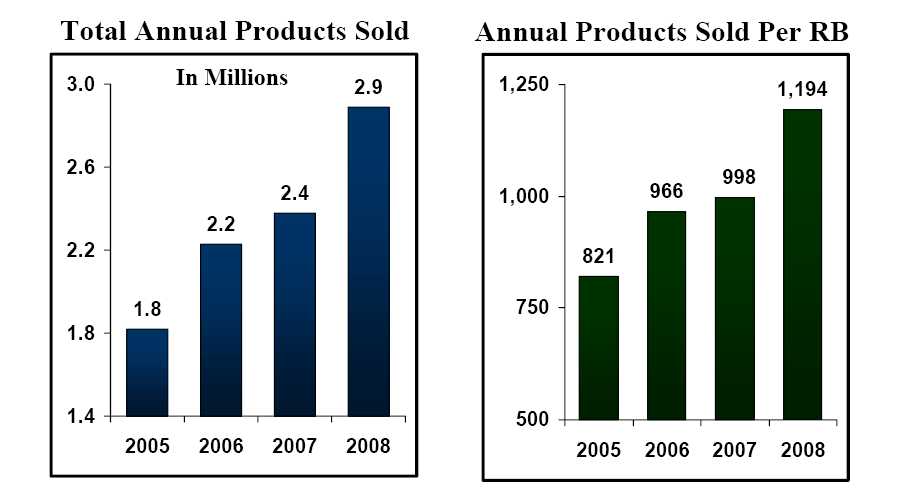
39

Time-Tested
40
PERFECT CLIENT EXPERIENCE
“PCE”
Reliable – sticking with our clients throughthick and thin
Responsive – reassuring our clients with quickfollow-up
Empathetic – willing to listen to our clientsand provide honest feedback
Competent – giving sound advice and servingas a financial partner
41
EXECUTINGPCE
Continue to focus on PCE as the foundation ofservice quality differentiation
Adhere 100% to weekly PCE meetingschedule for commercial and retail teams
Inspect using client service measurements
42
MYSTERY SHOPS
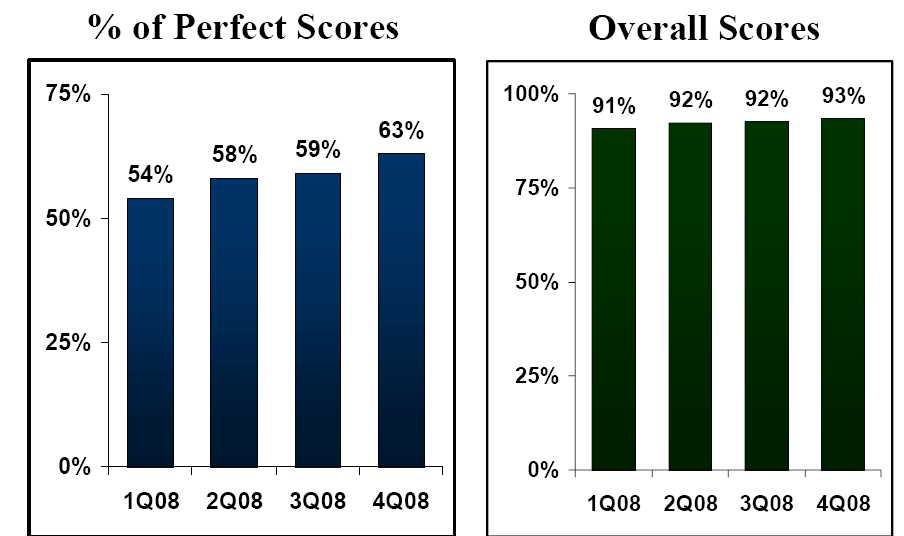
43
INTERNAL CLIENT SERVICE
MEASUREMENT
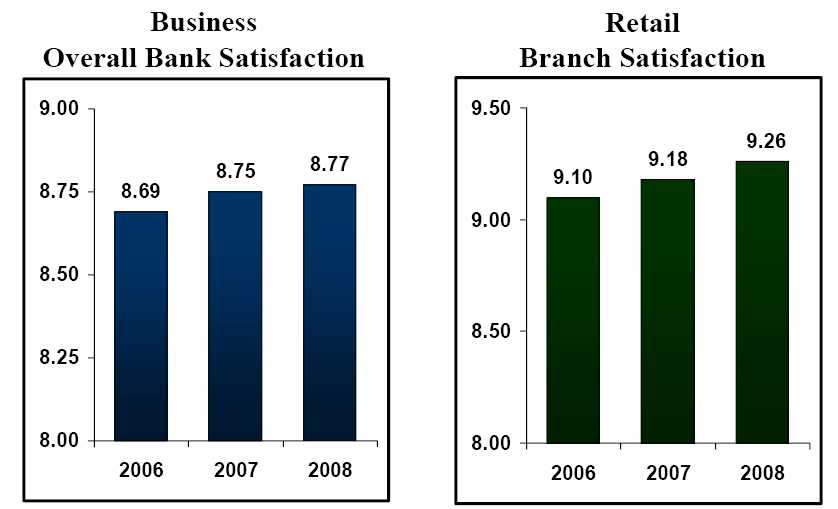
44
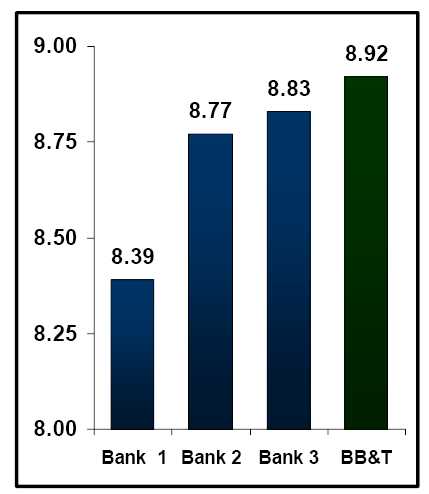
2008COMPETITIVE SCORES
RetailOverall Satisfaction
45
Research conductedby MaritzResearchInc. in 2008

Time-Tested
46
EXPENSE MANAGEMENT
| Achieving greater efficiencies is fundamental to long-term success |
| | | In economic uncertainty, expense management is an area where we can exercise considerable control |
| | | RPs are demonstrating strong leadership |
| | | Regions are being held accountable to their budgets |
47
EXPENSE MANAGEMENT
| Decreased staff in 2007 and 2008 without a significant reduction-in-force |
| | | Used attrition |
| | | Better managed non-performers |
| Introduced a teller staffing model in mid-2008 |
| | | Tellers reduced by 500 |
| | | Anticipate similar reduction in 2009 |
| In 2009, continue to right-size across all areas |
| | | Execute on additional staff reductions |
| | | Minimize impact on revenue generation and service quality |
48
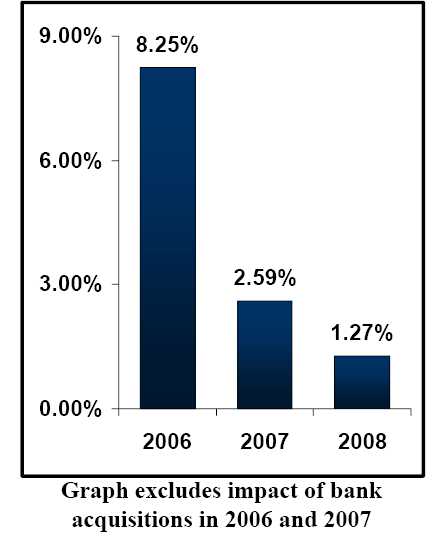
NONINTEREST EXPENSE GROWTH
ExcludesFDICInsuranceand
Foreclosed Property Expenses
49
ACHIEVING EFFICIENCIESBY
LEVERAGINGOURRESOURCES
| | | | | | | | |
| $ in Billions | | | | | | | Two Year |
| (Period-End Data) | | 2006 | | 2007 | | 2008 | Growth (%) |
| Total Loans & Leases | $ | 55.1 | $ | 58.0 | $ | 62.4 | 13.2 | % |
| Total Deposits | $ | 75.6 | $ | 77.5 | $ | 82.6 | 9.3 | % |
| Noninterest Income | $ | 1.41 | $ | 1.58 | $ | 1.72 | 22.0 | % |
| Total FTE Employees | | 14,868 | | 14,685 | | 13,961 | -6.1 | % |
| FTE: Full-Time Equivalent | | | | | | | | |
50

Time-Tested
51
| | CREDIT RISK MANAGEMENT |
| | Regional President |
| | | Drives Regional Loan Review Committee meetings |
| | | Ensures Senior and Regional Credit Officers follow a daily process of managing quality |
| | | Manages credit deterioration costs |
| | | Makes certain credit relationships are serviced at all levels |
| | Relationship Manager |
| | | Stays close to clients |
| | | Avoids adverse selection |
| | | Reassures our clients |
| | | Provides needed financial acumen |
52
OPERATIONALRISKMANAGEMENT
| Challenging economic times call for strong risk management |
| | | Ensure physical security procedures are followed |
| | | Address departmental and branch audits |
| | | | | | |
| $ in Millions | | 2006 | | 2007 | | 2008 |
| Operational Charge-Offs | | $21.5 | | $24.6 | | $21.9 |
53

Time-Tested
54
PERFORMANCE MANAGEMENT
| Centralized and regional tracking each month |
| | | Balance sheet growth and quality |
| | | Noninterest income growth |
| | | Expense control |
| | | Net income growth |
| Effort is expected, but RESULTS matter |
55
GROWTH RESULTS
| | | | |
| | 2007 | | 2008 | |
| Total Business Loans & Leases | 5.87 | % | 9.75 | % |
| Direct Retail Loans | 2.80 | % | 0.58 | % |
| Bankcard & Constant Credit | 9.44 | % | 13.95 | % |
| Demand Deposits | -1.92 | % | -2.00 | % |
| Total All Deposits | 5.98 | % | 2.84 | % |
| Noninterest Income | 11.78 | % | 8.97 | % |
| Noninterest Expense* | 2.88 | % | 4.39 | % |
| | | |
| All data excludes the impact of bank acquisitions in 2007 | | | |
| *Includes FDIC and Foreclosed Property Expenses | | | | |
56
PROFITABILITY TRENDS
$ inThousands
| | | | | | | | | |
| | | 2006 | | | 2007 | | | 2008 | |
| Net Revenue per FTE | | $329 | | | $342 | | | $361 | |
| Noninterest Income per FTE | | $97 | | | $108 | | | $120 | |
| Noninterest Expense* as a % of | | | | | | | | | |
| Total Loans and Total Deposits | | 1.14 | % | | 1.11 | % | | 1.06 | % |
All dataexcludesthe impact of bankacquisitionsin 2006 and 2007
*ExcludesFDIC andForeclosed Property Expenses
57
PRODUCTION TRENDS
PERSELLINGFTE PERMONTH
| | | | | | | | |
| | | 2005 | | 2006 | | 2007 | | 2008 |
| Business Loans ($) | | $2,017,343 | | $2,046,450 | | $1,809,977 | | $1,845,990 |
| Business Loans (#) | | 5.3 | | 5.0 | | 4.2 | | 3.2 |
| Retail Loans ($) | | $393,542 | | $361,704 | | $336,938 | | $263,295 |
| Retail Loans (#) | | 7.8 | | 7.1 | | 6.7 | | 5.4 |
| Mortgage Loans ($) | | $1,342,326 | | $1,159,930 | | $1,402,121 | | $1,217,733 |
| Mortgage Loans (#) | | 6.6 | | 5.3 | | 6.3 | | 6.3 |
| Net New Transaction Accounts (#) | | 89,598 | | 123,254 | | 91,334 | | 94,012 |
All dataexcludesthe impact of bankacquisitionsin 2006 and 2007
58

Time-Tested
59
APPENDIX
All financial data is based on internalmanagement reporting in the BankingNetwork division excluding bankacquisitions in 2006 and 2007 where noted
Loan data excludes marketable mortgageloan balances which are held outside of theBanking Network division
60