Exhibit 99.5
BB&TLendingGroup
Driving Superior Quality, ProfitabilityandGrowth
Investor Conference
February11, 2009
Objectives
| Demonstrate long term superior credit performance by BB&T based upon well defined “points of differentiation” |
| Address key concerns regarding BB&T’s current portfolio through increased disclosure |
| | | Real Estate |
| | | Other (non-real estate) segments |
| Provide outlook for performance in 2009 and beyond, including risks presented by the economy and housing markets |
KeyMessages
| Strategy, structure and process do matter |
| | | BB&T’s lending strategy enhances performance |
| | | Lending Group’s unique organizational structure and functions add value |
| | | Superior balance of credit quality, profitability and growth for many years |
| Geography, product, channel and granularity advantages mitigate but don’t eliminate challenges in Single Family Residential Real Estate segments |
| | | Non-Real Estate (RE) segments fundamentally sound despite negative cyclical trends and some exposure to markets with severe housing problems |
| | | Real estate exposure is manageable under a range of realistic scenarios |
| | | Seeing high quality production, rational spreads in non-RE segments |
| Continuing to leverage BB&T’s legacy risk management strengths to manage through the cycle and achieve superior long term performance |
Today’s Agenda
| Strategy, Organizational Structure and Lending Process |
| | | BB&T’s Long Term Lending Strategy |
| | | Lending Group Structure and Functions |
| | | Lending Process: Strategy, Transaction Management, Portfolio Management |
| Peer Comparisons |
| Portfolio Review |
| | | Current Performance – Total Portfolio |
| | | Non-Real Estate Segment Dashboards |
| | | Real Estate Segment Dashboards |
| | | 2009 Outlook |
| Summary |
| Q & A |
StrategyandStructure
BB&T’sLong TermLending Strategy
| | |
| Strategy | Execution | Portfolio Results |
| • Corporate values drive strategy | • Select clients that identify with | •Lower risk; broader, deeper and |
| | “value” promise | more profitablerelationships |
| |
| • Relationship focused | • Target market = prime credit | • Verylittle sub-prime exposure |
| | • Originate to hold | • Work through problems vs. quick |
| | | charge-off |
| |
| • Compete on value, not price | • Maintain risk-based pricing | •Better risk-adjusted returns(vs. |
| | discipline | peers) |
| |
| • Serve local communities in | • Target market = local | •In footprintportfolio |
| Southeast | • Branch based delivery | •High % direct origination loans |
| |
| • Deliver sustainable, predictable | • Intense focus on transaction risk | •Very granular exposure |
| results over the long term | mitigation | • High % of loans secured and |
| | • Avoid “trendy” lending and control | guaranteed |
| | exposure in “hot” markets | • No concentrations, except SFR RE |
| | | • Traditional,non-exotic products |
BB&T’sLong TermLending Strategy
(continued)
| | |
| Strategy | Execution | Portfolio Results |
| • Everyone in lending process is | • CCO involved in transaction | • No surprises (“we know what’s |
| accountable | approvals, problem loans and | going into the portfolio”) |
| | approves charge-offs > $100k | •Conservativetransactions |
| | • Lenders “own the loan” | |
| | • Concurring co-approval (2 | |
| | signatures) | |
| |
| |
| • One company | • Shared culture, objectives and | •Balancedquality, profitability and |
| | incentives for credit and sales | growth |
| | • Consistent training, lending tools | |
| | and systems | |
| |
| • Improve financial security of clients | • Don’t do if you don’t understand it | • Increased customer willingness and |
| | or can’t define client benefit | ability to pay |
| | | •Lower losses(frequency and |
| | | severity) |
What’sNot in thePortfolio
| | | |
| •Loans in high risk geographies outside | •Exotic products |
| our footprint | – | No Option ARMS, negative amortization, |
| – | No exposure to CA, NV, AZ (sand states), | | reverse mortgages |
| | rust belt, or Northeast | – | Limited low doc (risk layered) mortgages, |
| |
| •Loans generated through high risk | | sub-prime mortgages |
| business models | – | No CDS |
| | | – | No leveraged finance |
| – | No “stand alone” national products exposure | – | No large condo, other CRE projects |
| – | No 3rdparty/broker channel exposures in | | |
| | home equity, CRE | – | No large PUDs |
| | | – | No fully underwritten syndicated loans (best |
| •Re-intermediation risk | | efforts only) |
| – | No SIVs, other off balance sheet portfolios | – | No covenant lite or enterprise value |
| – | No “hung loans” from originate-to-distribute | | corporate loans |
| | capital markets structured product | |
| | businesses, e.g., RMBS, CMBS, CDO/CDO2 | •Large counterparty exposures |
| | | – | No large ones; limits very similar to |
| •Risky securities valuation marks | | Commercial segment |
| – | Investment portfolio used for liquidity & | | |
| | interest rate risk management, not leverage | | |
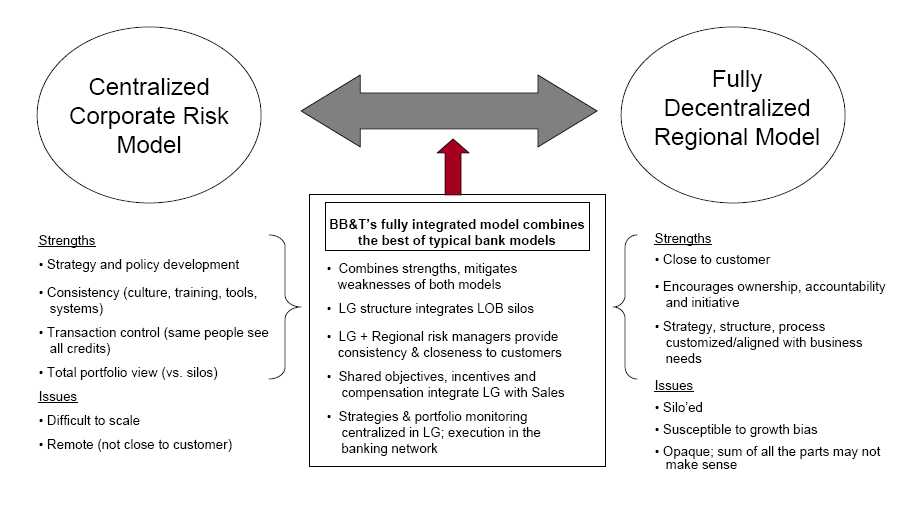
BB&TLendingGroupUnique StructureandFunctions
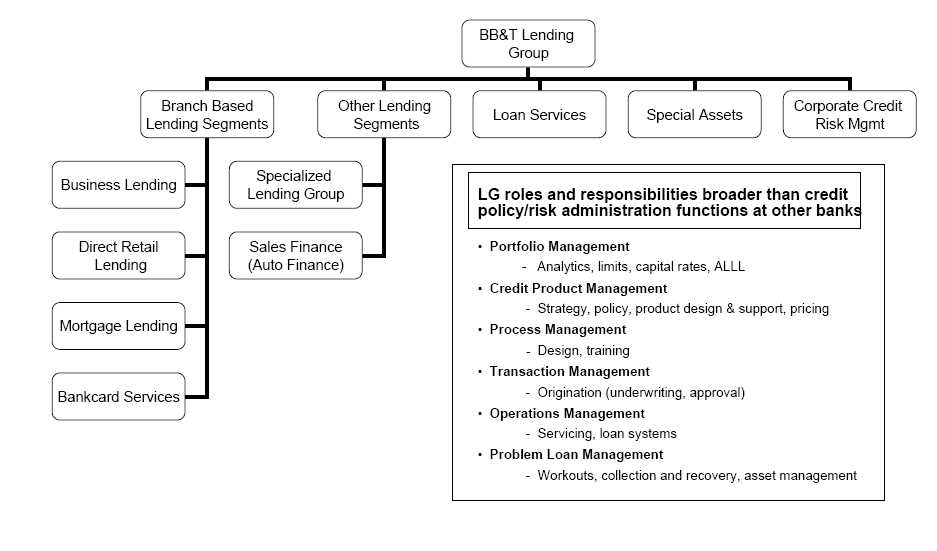
FullyIntegratedRiskManagement LendingGroup +Banking Network
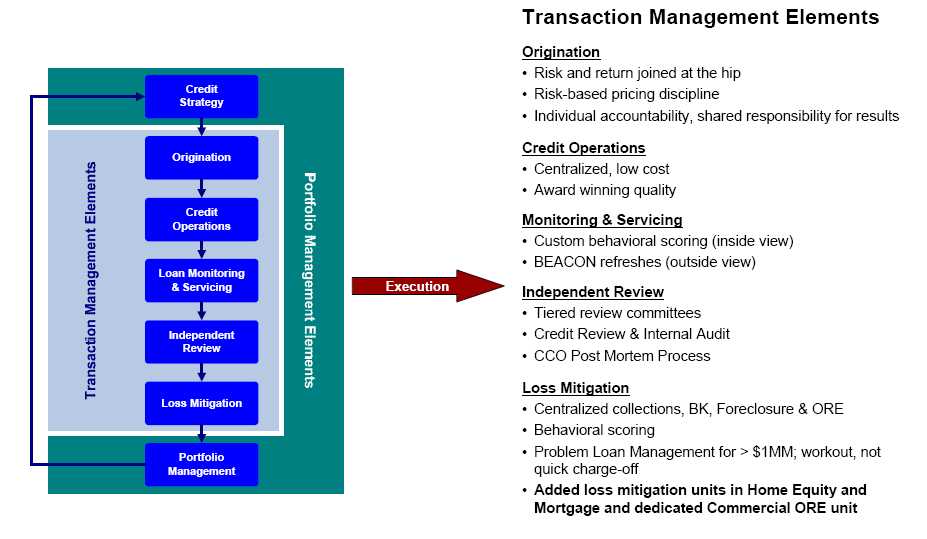
BB&TLending Process
BB&TLending Process
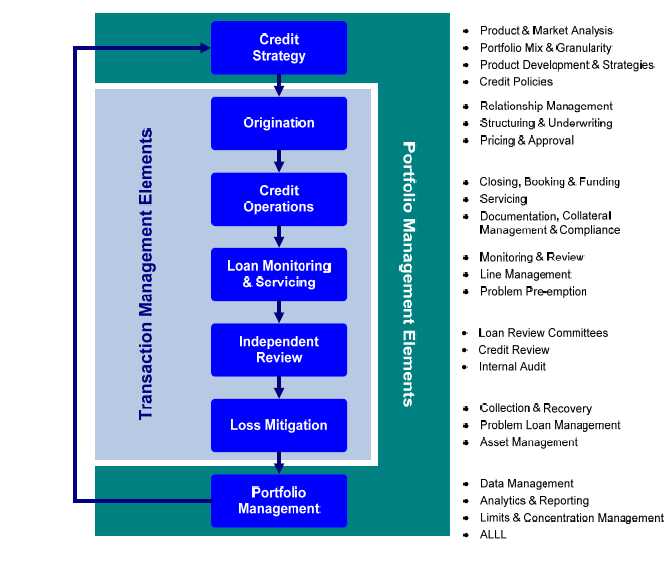
BB&TLending Process
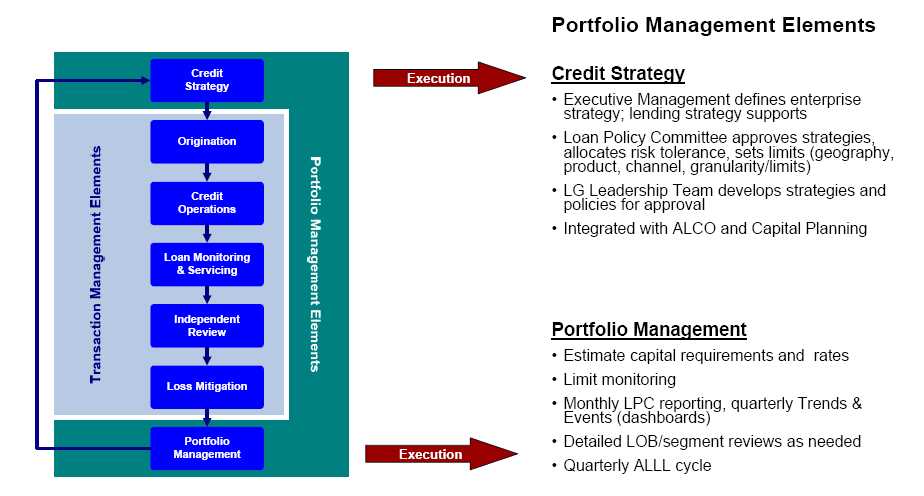
BB&TLending Process
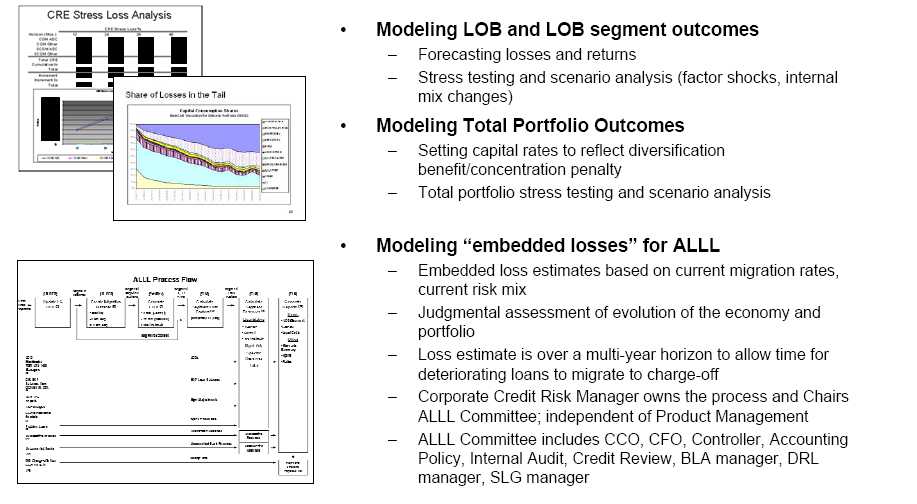
Leverage Legacy ProcesswithAnalytics
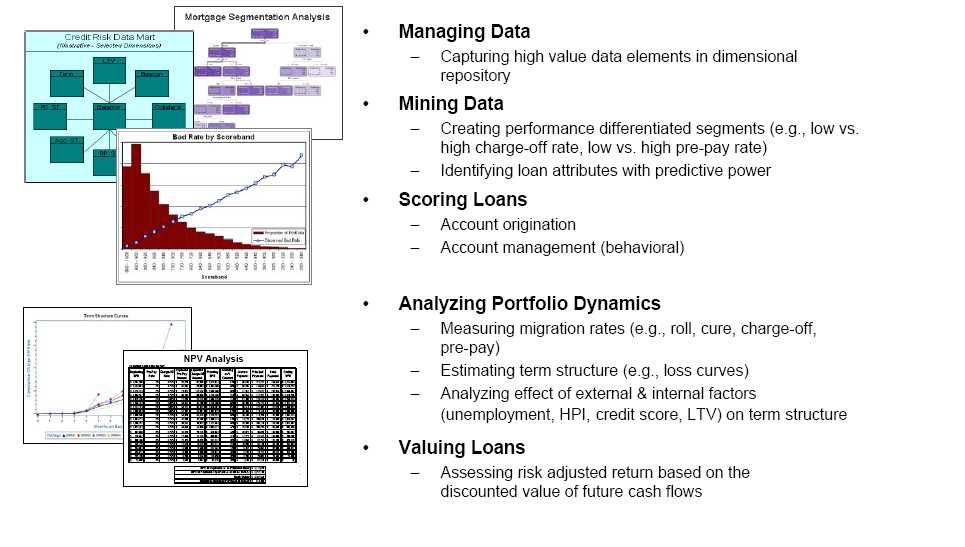
Leverage Legacy ProcesswithAnalytics
Results=Superior Performance

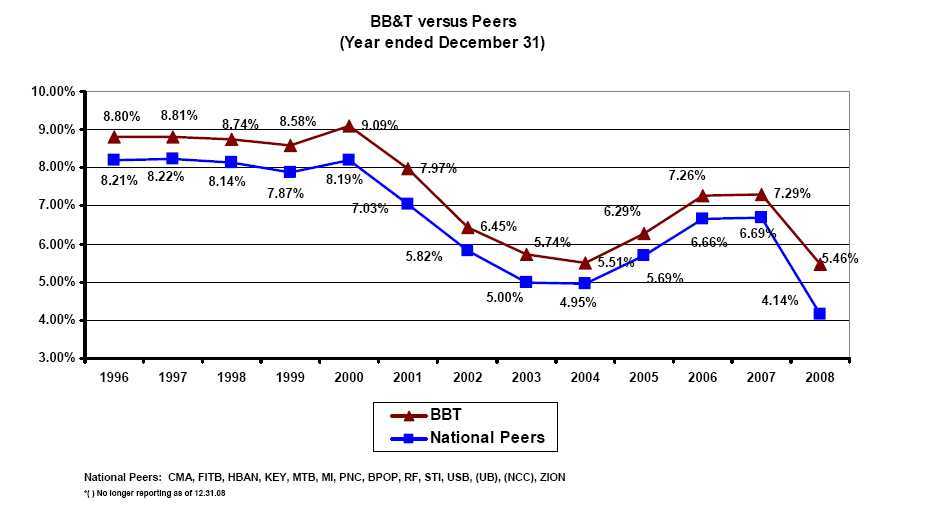
PeerComparisons
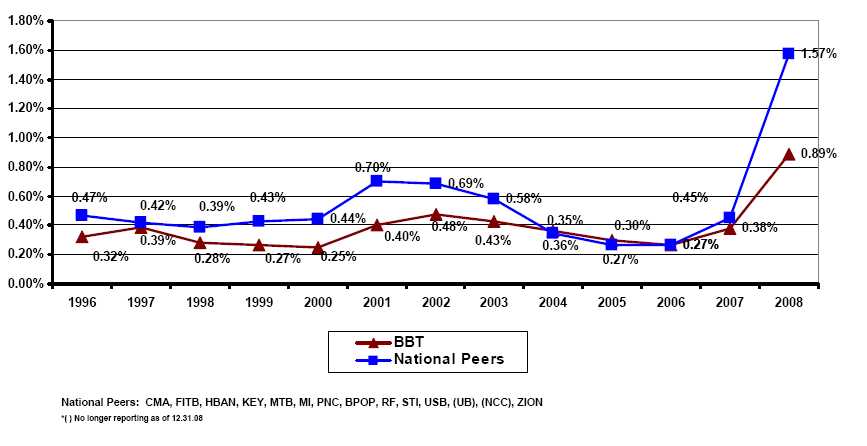
NonperformingAssets / Total Loans
BB&TversusPeers
(Yearended December31)

NetCharge-Offs /AverageLoans
BB&TversusPeers
(Yearended December31)
Total Loan Yield
BB&TversusPeers
(Yearended December31)

RiskAdjustedYield
Portfolio Review
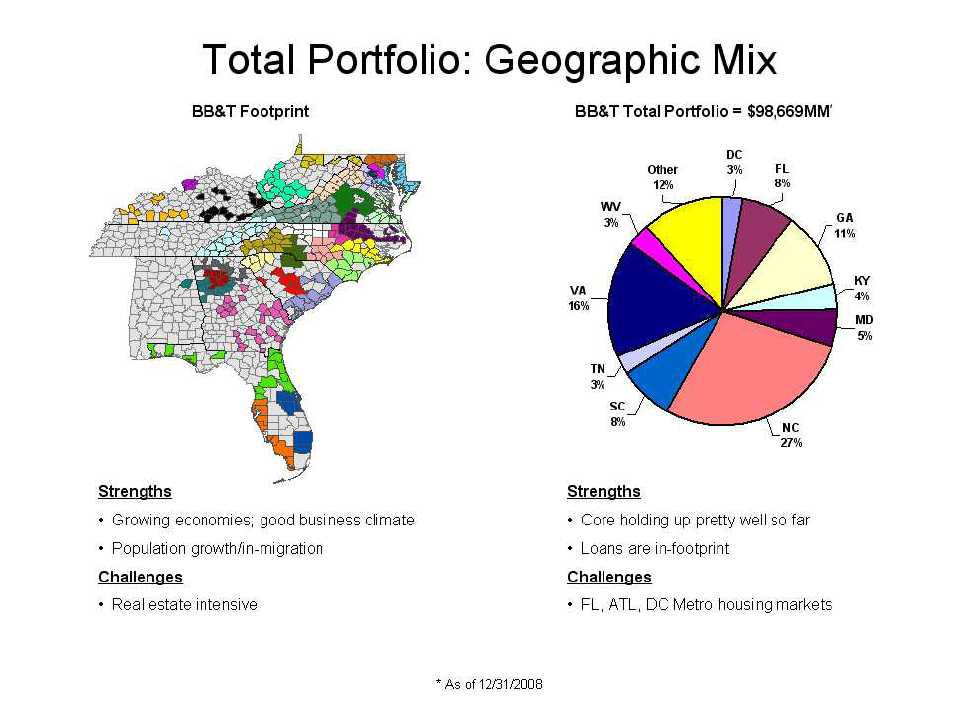
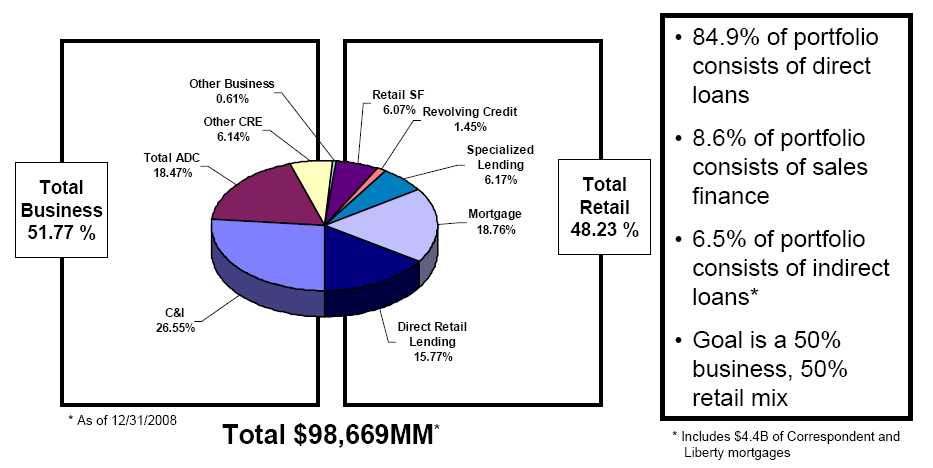
TotalPortfolio: Product&ChannelMix
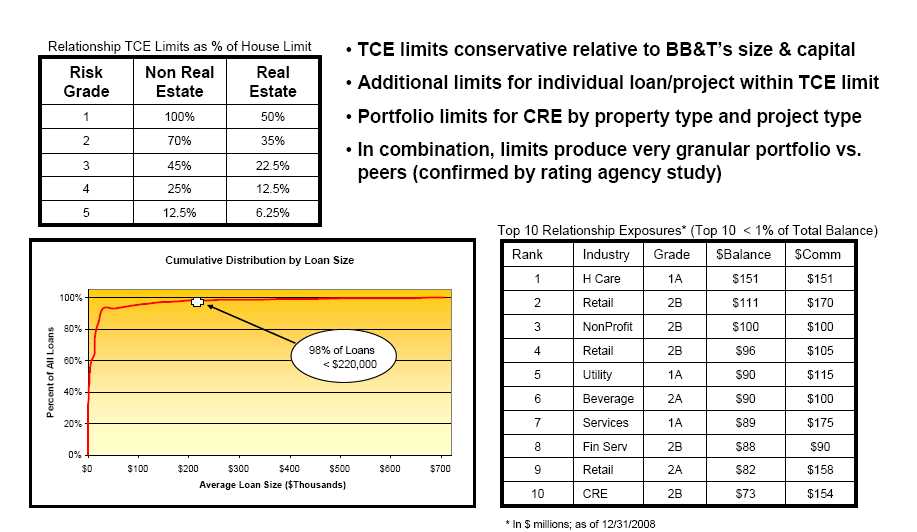
TotalPortfolio: Granularity& Limits
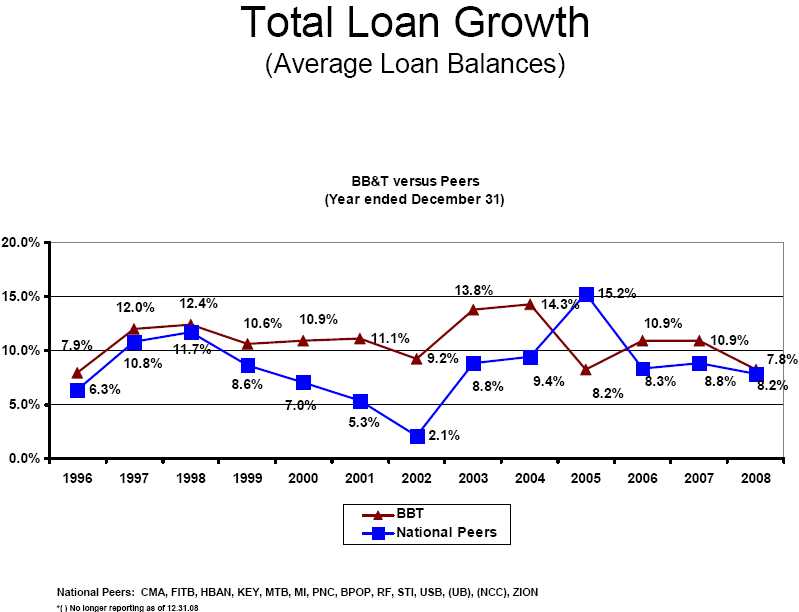
TotalPortfolio Quality, Profitabilityand
Growth
12/31/2008TotalPortfolio Scorecard
| | | | | | | | | | | | | |
| | | 4Q08 | | | 2008 | | | 2007 | |
| | | $Amt | | % | | | $Amt | % | | | $Amt | % | |
| Average Loans | $ | 97,224 | | 100 | % | $ | 95,195 | 100.00 | % | $ | 87,952 | 100 | % |
| Growth | $ | 1,281 | | 5.34 | % | $ | 7,243 | 8.24 | % | $ | 8,639 | 10.89 | % |
| Charge-offs | $ | 314 | | 1.29 | % | $ | 851 | 0.89 | % | $ | 338 | 0.38 | % |
| |
| EOP Loans | $ | 98,669 | | 100 | % | $ | 98,669 | 100 | % | $ | 91,686 | 100 | % |
| 30-89 DPD | $ | 2,047 | | 2.07 | % | $ | 2,047 | 2.07 | % | $ | 1,354 | 1.48 | % |
| 90+ Still Accruing | $ | 431 | | 0.44 | % | $ | 431 | 0.44 | % | $ | 223 | 0.24 | % |
| Non-accruing | $ | 1,413 | | 1.43 | % | $ | 1,413 | 1.43 | % | $ | 502 | 0.55 | % |
| ORE | $ | 617 | | 0.63 | % | $ | 617 | 0.63 | % | $ | 194 | 0.21 | % |
| NPA | $ | 2,030 | | 2.04 | % | $ | 2,030 | 2.04 | % | $ | 696 | 0.76 | % |
| |
| Yield | | | | 6.09 | % | | | 6.35 | % | | | 7.67 | % |
| Risk Adjusted Yield | | | | 4.80 | % | | | 5.46 | % | | | 7.29 | % |
TotalPortfolio:Flight toQuality&Production

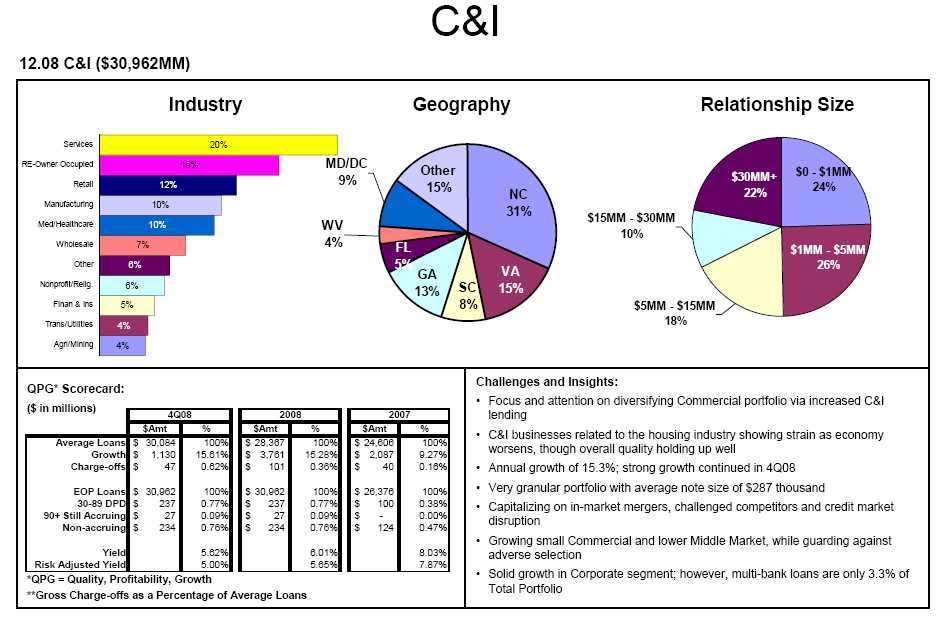
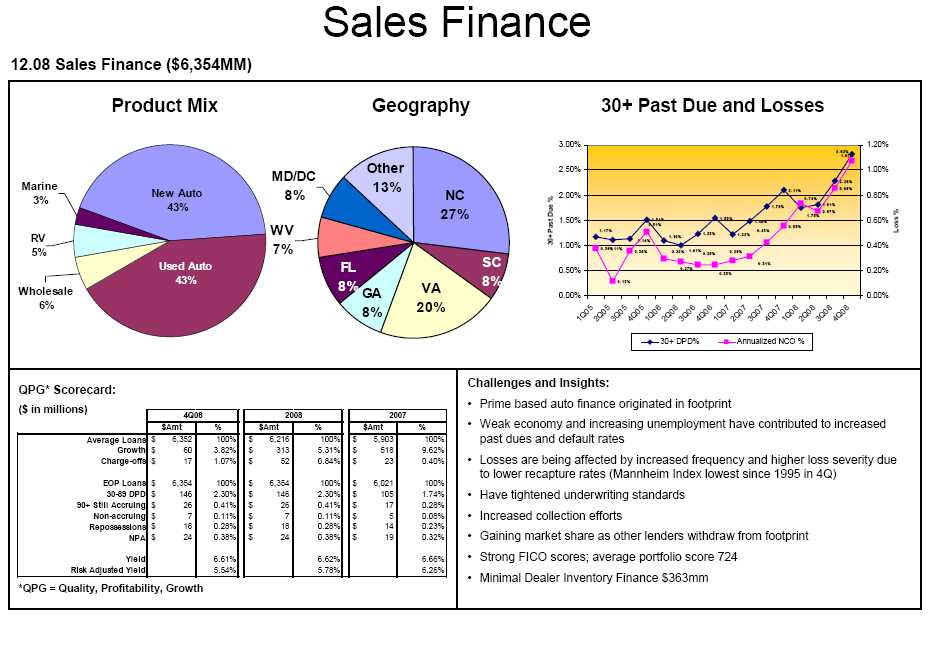
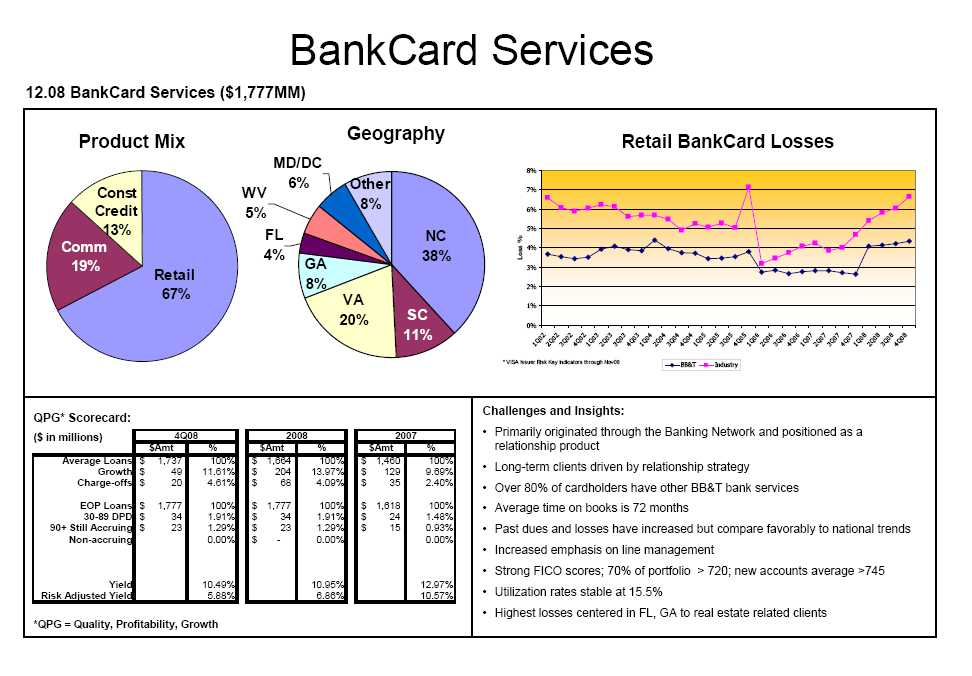
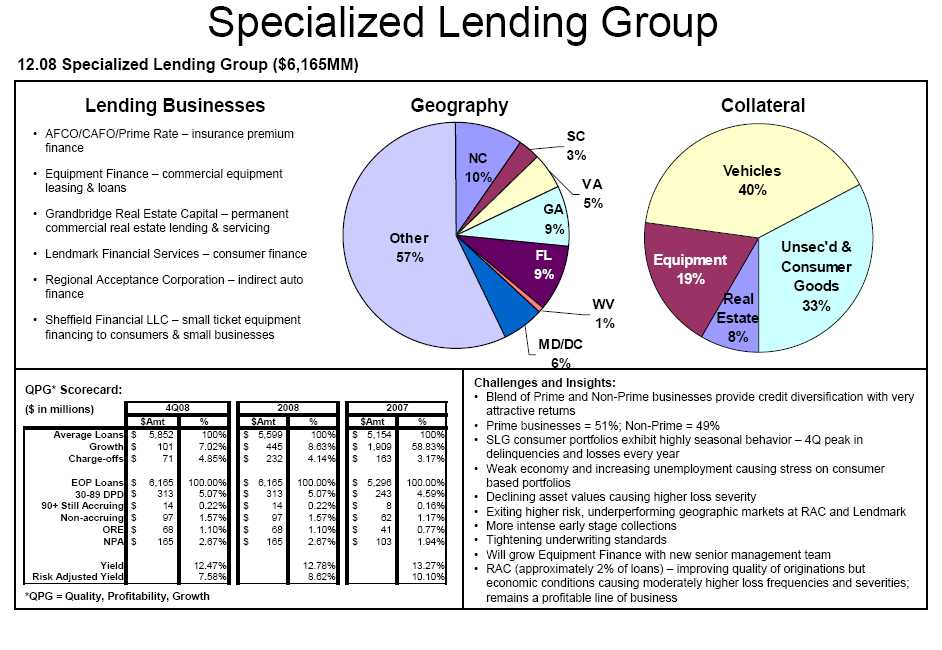
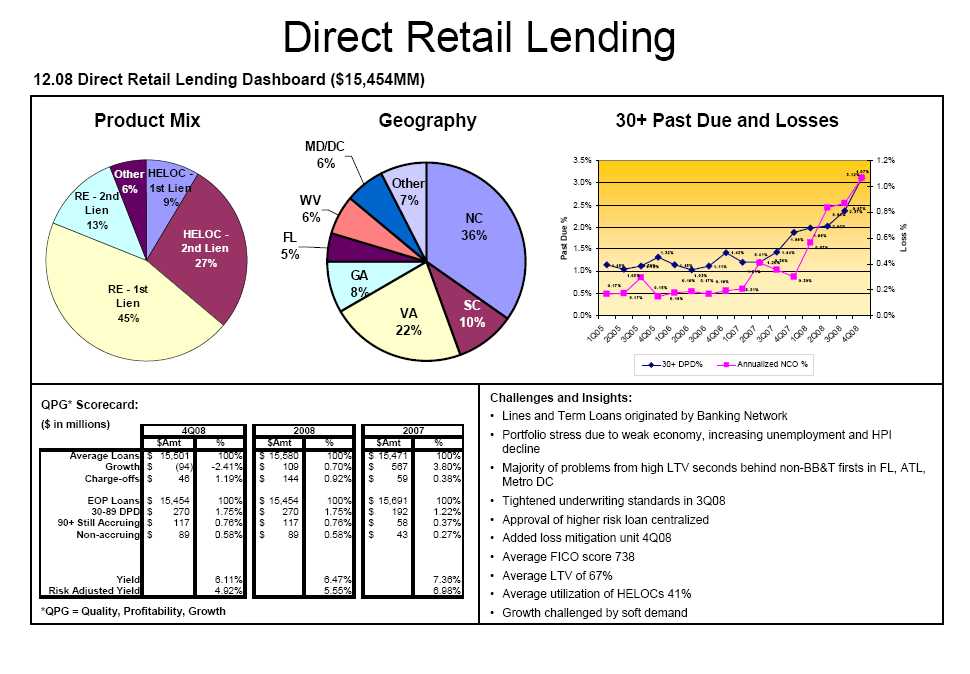
Non-Real EstateDashboards
Real EstateSegment Dashboards
Mortgage Lending

CRE Other

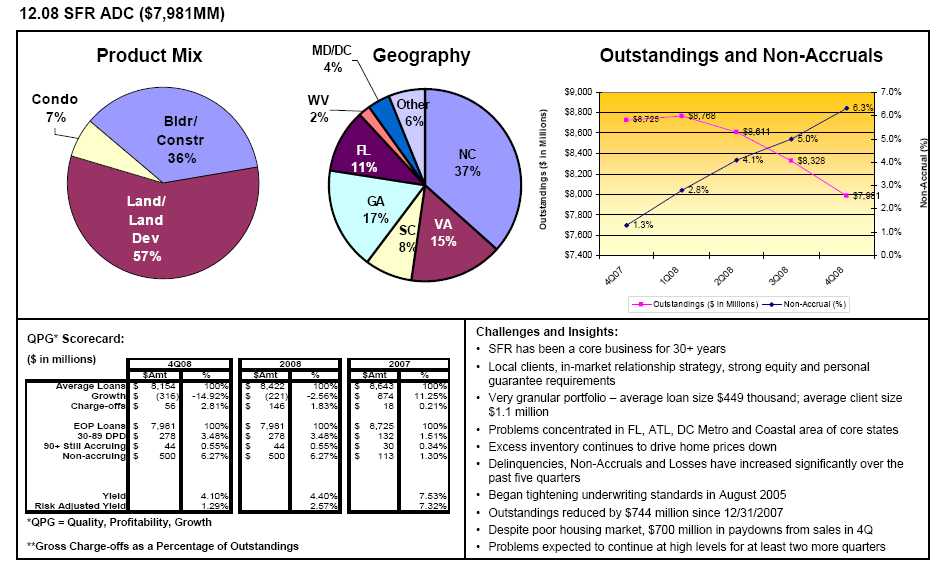
SFR ADC
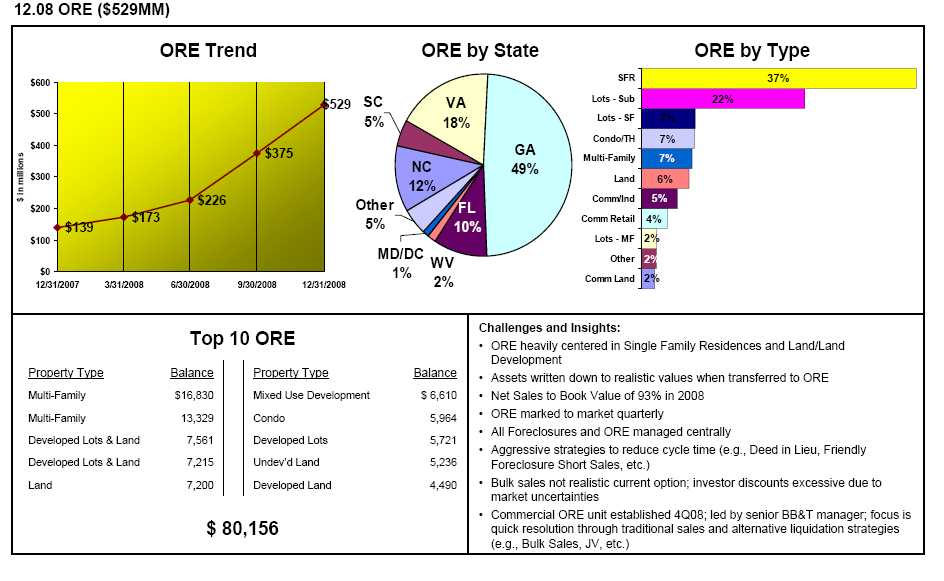
ORE
Outlook
Real Estate LossMitigation Initiatives
| | | | |
| Intense effort to identify problems and accelerate resolution cycle |
| |
| • CRE ADC | | • Mortgage Lending |
| – | Progressive tightening beginning 3Q05 | | – | Eliminated low doc products |
| – | Special portfolio reviews to ensure | | – | Tightened guidelines on standard products |
| | conservative ratings on all loans | | | |
| – | Added resources to Problem Loan Admin, | | – | Centralized risk management of |
| | | | construction to perm loans and completely |
| | placed in problem regions | | | restructured the product |
| – | Created new ORE group to manage disposal | | – | Closed small (incipient) alternative |
| | of commercial properties and allow existing | | | mortgage business |
| | ORE staff to focus on single family homes | | | |
| | | – | Added loss mitigation unit |
| – | Reduced CRE ADC outstandings $744MM | | • Home Equity |
| | for full year, including $177MM in stressed | | | |
| | markets | | – | Re-implemented and tightened existing |
| | | | | policies, especially LTV, loan size |
| • Other Commercial Real Estate | | – | Curtailed 2nds behind other bank 1sts |
| – | Tightened retail, office, hospitality guidelines | | – | Reduced authority of regions to |
| | in 2Q08 | | | approve/book exceptions |
| – | Tightened again for 2009 | | – | Added loss mitigation unit |
| – | Special portfolio review begun 1Q09 | | | |
Non-Real Estate LossMitigation Initiatives
Takeadvantageofmarket opportunitytoenhancequality andreturns
| | | |
| • All segments | • Specialized Lending Group |
| – | More assertive collection efforts | – | Reducing “book to look” ratio at Regional |
| – | Reinforcing adherence to existing policies | | Acceptance (able to be more selective as |
| | and procedures | | other lenders have pulled back from |
| – | Limiting, centralizing authority to approve | | market) |
| | policy exceptions | – | Moving upstream to higher ticket, higher |
| | | | quality leasing deals in Equipment Finance |
| • Sales Finance | – | Enhancing quality of book in premium |
| – | Lower LTV, shorter term | | finance businesses |
| • Bankcard | | |
| – | Increased focus on line management | | |
| – | Reduced level of cash advances | | |
| • C&I, Governmental Finance | | |
| – | Scrutinizing new business for signs of | | |
| | “adverse selection” | | |
| – | New business is high quality, fully priced for | | |
| | risk | | |
Allowancefor Loan and LeaseLosses
12.08Allowancefor Loan and LeaseLosses($1,574MM)
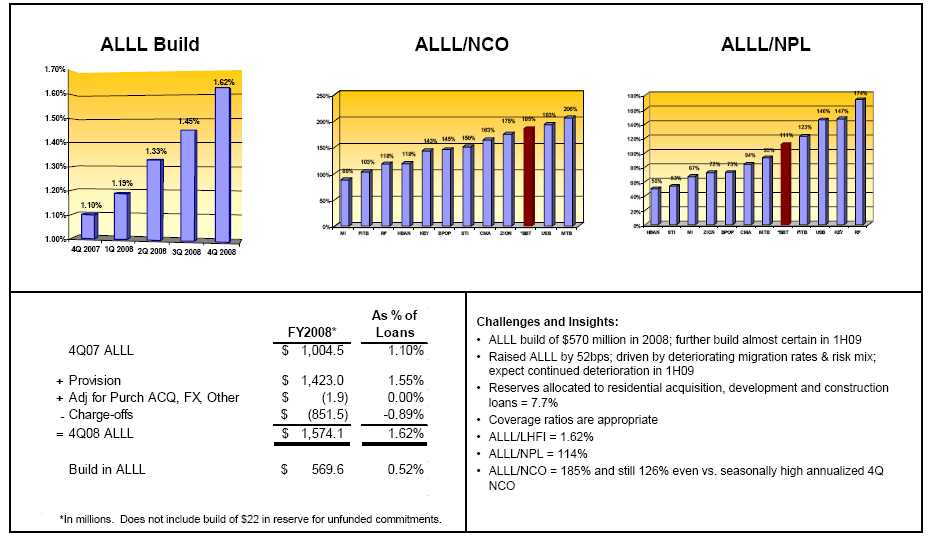
Outlookfor 2009
| 2009 forecast (financial plan baseline) |
| | | Continued deterioration in housing markets and overall economy through 1H09 |
| | | Assumed deterioration rate = same as experienced in 2H08 |
| | | NPL and NCO will increase, driven by increases from real estate segments |
| | | Continued ALLL build; provision expense > NCO; funded from earnings |
| | | ORE will go up; will resist “fire sales” to maximum extent possible |
| | | 2H09 expectations: beyond 1H09, course of economy will be primary driver |
| Stress analysis |
| | | Baseline migration analysis suggests increase will be steady, but not explosive (absent unforeseen changes in migration rates/new external “shocks”) |
| | | Stress scenarios extend period of deterioration into 3Q09 and beyond, holding deterioration rate steady at 4Q08 level (which includes 4Q seasonal effects) |
| | | More pessimistic scenario than baseline; manageable outcome |
Summary
KeyMessages:
Risks are real, but so areopportunities
Superior long term performance based on real differences
Managing through the cycle; intense focus on loss mitigation andproblem resolution
Open for business (call Kelly) and making loans in segments wheremarket conditions provide opportunities to book high quality, fullypriced new loans
Leveraging legacy lending strategy, structure and process strengthsto continue to produce superior quality, profitability and growth
Q & A