UNITED STATES
SECURITIES AND EXCHANGE COMMISSION
Washington, D.C. 20549
FORM N-CSR
CERTIFIED SHAREHOLDER REPORT OF REGISTERED
MANAGEMENT INVESTMENT COMPANIES
|
| | | | | | |
| Investment Company Act file number | 811-08532 |
| | |
| AMERICAN CENTURY STRATEGIC ASSET ALLOCATIONS, INC. |
| (Exact name of registrant as specified in charter) |
| | |
| 4500 MAIN STREET, KANSAS CITY, MISSOURI | 64111 |
| (Address of principal executive offices) | (Zip Code) |
| | |
CHARLES A. ETHERINGTON 4500 MAIN STREET, KANSAS CITY, MISSOURI 64111 |
| (Name and address of agent for service) |
| | |
| Registrant’s telephone number, including area code: | 816-531-5575 |
| | |
| Date of fiscal year end: | 07-31 |
| | |
| Date of reporting period: | 07-31-2019 |
ITEM 1. REPORTS TO STOCKHOLDERS.
|
| |
| | |
| | Annual Report |
| | |
| | July 31, 2019 |
| | |
| | Multi-Asset Income Fund |
| | Investor Class (AMJVX) |
| | I Class (AMJIX) |
| | Y Class (AMJYX) |
| | A Class (AMJAX) |
| | C Class (AMJCX) |
| | R Class (AMJWX) |
| | R5 Class (AMJGX) |
| | R6 Class (AMJRX) |
Beginning on January 1, 2021, as permitted by regulations adopted by the Securities and Exchange Commission, paper copies of the fund’s shareholder reports like this one will no longer be sent by mail, unless you specifically request paper copies of the reports from the fund or from your financial intermediary, such as a broker-dealer or bank. Instead, the reports will be made available on a website, and you will be notified by mail each time a report is posted and provided with a website link to access the report.
If you already elected to receive shareholder reports electronically, you will not be affected by this change and you need not take any action. You may elect to receive shareholder reports and other communications from the fund or your financial intermediary electronically by calling or sending an email request to your appropriate contacts as listed on the back cover of this report.
You may elect to receive all future reports in paper free of charge. You can inform the fund or your financial intermediary that you wish to continue receiving paper copies of your shareholder reports by calling or sending an email request to your appropriate contacts as listed on the back cover of this report. Your election to receive reports in paper will apply to all funds held with the fund complex/your financial intermediary.
|
| | |
| President’s Letter | 2 |
|
| Performance | 3 |
|
| Portfolio Commentary | |
|
| Fund Characteristics | |
|
| Shareholder Fee Example | |
|
| Schedule of Investments | |
|
| Statement of Assets and Liabilities | |
|
| Statement of Operations | |
|
| Statement of Changes in Net Assets | |
|
| Notes to Financial Statements | |
|
| Financial Highlights | |
|
| Report of Independent Registered Public Accounting Firm | |
|
| Management | |
|
| Approval of Management Agreement | |
|
| Additional Information | |
|
Any opinions expressed in this report reflect those of the author as of the date of the report, and do not necessarily represent the opinions of American Century Investments® or any other person in the American Century Investments organization. Any such opinions are subject to change at any time based upon market or other conditions and American Century Investments disclaims any responsibility to update such opinions. These opinions may not be relied upon as investment advice and, because investment decisions made by American Century Investments funds are based on numerous factors, may not be relied upon as an indication of trading intent on behalf of any American Century Investments fund. Security examples are used for representational purposes only and are not intended as recommendations to purchase or sell securities. Performance information for comparative indices and securities is provided to American Century Investments by third party vendors. To the best of American Century Investments’ knowledge, such information is accurate at the time of printing.
 Jonathan Thomas
Dear Investor:
Thank you for reviewing this annual report for the period ended July 31, 2019. Annual reports help convey important details about fund returns, including market factors that affected performance. For additional investment and market insights, please visit our website, americancentury.com.
Stocks Advanced Amid Volatile Climate
Most broad U.S. and global stock indices ended the year with gains. However, these positive results masked wide performance swings. For example, U.S. stocks, as measured by the S&P 500 Index, returned -3.00% in the first half of the period and 11.32% in the second half, leaving the index up 7.99% for the 12 months. Global stocks, as measured by the MSCI All Country World Index, returned -4.71% in the first half, 8.04% in the second half and 2.95% overall. For fixed-income securities, the path to positive performance was smoother, and U.S. and global bonds gained 8.08% and 5.73%, respectively, for the 12 months, according to the Bloomberg Barclays U.S. Aggregate Bond and Global Aggregate Bond indices.
Fed’s Flip Fueled Investor Optimism
Early in the period, mounting concerns about slowing global economic and earnings growth, tariffs and Federal Reserve (Fed) policy soured investor sentiment. After raising rates in September, the Fed hiked again in December and delivered a surprisingly bullish rate-hike outlook that fueled a steep sell-off among riskier assets. Meanwhile, the risk-off climate sparked a flight to quality, and government bond yields plunged.
A key policy pivot from the Fed helped improve investor sentiment beginning in early 2019. The central bank abruptly ended its rate-hike campaign and adopted a dovish tone amid moderating global growth and inflation. Additionally, investors’ worst-case fears about growth, trade and corporate earnings generally eased, which also aided stocks. At the same time, government bond yields continued to fall on moderating global growth data, muted inflation and accommodative central bank policy, including the Fed’s July rate cut. This backdrop supported continued gains for bonds and other interest rate-sensitive assets.
Looking ahead, we expect volatility to remain a formidable factor as investors react to global growth and trade trends, central bank policy and geopolitical developments. We believe this scenario underscores the importance of using professionally managed portfolios in pursuit of investment goals. We appreciate your continued trust and confidence in us.
Sincerely,
Jonathan Thomas
President and Chief Executive Officer
American Century Investments
|
| | | | |
| Total Returns as of July 31, 2019 |
| | | | Average Annual Returns | |
| | Ticker Symbol | 1 year | Since Inception | Inception Date |
| Investor Class | AMJVX | 2.89% | 4.53% | 12/1/14 |
| Bloomberg Barclays U.S. High-Yield 2% Issuer Capped Bond Index | — | 6.91% | 5.66% | — |
| Russell 3000 Value Index | — | 4.23% | 7.35% | — |
| Bloomberg Barclays U.S. Aggregate Bond Index | — | 8.08% | 2.83% | — |
| MSCI ACWI ex-U.S. Value Index | — | -5.27% | 1.60% | — |
| Blended Index | — | 5.35% | 5.35% | — |
| I Class | AMJIX | 3.10% | 4.74% | 12/1/14 |
| Y Class | AMJYX | 3.14% | 4.32% | 4/10/17 |
| A Class | AMJAX | | | 12/1/14 |
| No sales charge | | 2.53% | 4.25% | |
| With sales charge | | -3.33% | 2.94% | |
| C Class | AMJCX | 1.77% | 3.49% | 12/1/14 |
| R Class | AMJWX | 2.28% | 4.00% | 12/1/14 |
| R5 Class | AMJGX | 3.10% | 4.21% | 4/10/17 |
| R6 Class | AMJRX | 3.15% | 4.89% | 12/1/14 |
Fund returns would have been lower if a portion of the fees had not been waived. The blended index combines monthly returns of widely known indices. The Bloomberg Barclays U.S. High-Yield 2% Issuer Capped Bond Index represents 40%, the Russell 3000 Value Index represents 30%, the Bloomberg Barclays U.S. Aggregate Bond Index represents 20% and the MSCI ACWI ex-U.S. Value Index represents 10% of the blended index.
Sales charges include initial sales charges and contingent deferred sales charges (CDSCs), as applicable. A Class shares have a 5.75% maximum initial sales charge and may be subject to a maximum CDSC of 1.00%. C Class shares redeemed within 12 months of purchase are subject to a maximum CDSC of 1.00%. The SEC requires that mutual funds provide performance information net of maximum sales charges in all cases where charges could be applied.
Data presented reflect past performance. Past performance is no guarantee of future results. Current performance may be higher or lower than the performance shown. Total returns for periods less than one year are not annualized. Investment return and principal value will fluctuate, and redemption value may be more or less than original cost. Data assumes reinvestment of dividends and capital gains, and none of the charts reflect the deduction of taxes that a shareholder would pay on fund distributions or the redemption of fund shares. To obtain performance data current to the most recent month end, please call 1-800-345-2021 or visit americancentury.com. For additional information about the fund, please consult the prospectus.
|
|
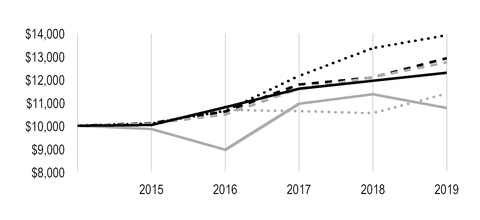
| Growth of $10,000 Over Life of Class |
| $10,000 investment made December 1, 2014 |
| Performance for other share classes will vary due to differences in fee structure. |
|
| |
| Value on July 31, 2019 |
| | Investor Class — $12,297 |
| |
| | Bloomberg Barclays U.S. High-Yield 2% Issuer Capped Bond Index — $12,927 |
| |
| | Russel 3000 Value Index — $13,919 |
| |
| | Bloomberg Barclays U.S. Aggregate Bond Index — $11,390 |
| |
| | MSCI ACWI ex-U.S. Value Index — $10,769 |
| |
| | Blended Index — $12,751 |
| |
Ending value of Investor Class would have been lower if a portion of the fees had not been waived.
|
| | | | | | | |
Total Annual Fund Operating Expenses | | |
Investor Class | I Class | Y Class | A Class | C Class | R Class | R5 Class | R6 Class |
| 1.17% | 0.97% | 0.82% | 1.42% | 2.17% | 1.67% | 0.97% | 0.82% |
The total annual fund operating expenses shown is as stated in the fund’s prospectus current as of the date of this report. The prospectus may vary from the expense ratio shown elsewhere in this report because it is based on a different time period, includes acquired fund fees and expenses, and, if applicable, does not include fee waivers or expense reimbursements.
Data presented reflect past performance. Past performance is no guarantee of future results. Current performance may be higher or lower than the performance shown. Total returns for periods less than one year are not annualized. Investment return and principal value will fluctuate, and redemption value may be more or less than original cost. Data assumes reinvestment of dividends and capital gains, and none of the charts reflect the deduction of taxes that a shareholder would pay on fund distributions or the redemption of fund shares. To obtain performance data current to the most recent month end, please call 1-800-345-2021 or visit americancentury.com. For additional information about the fund, please consult the prospectus.
Portfolio Managers: Rich Weiss, Scott Wilson, Radu Gabudean, Vidya Rajappa and John Donner
Performance Summary
For the fiscal year ended July 31, 2019, Multi-Asset Income returned 2.89%*. The strategy trailed the return of its custom-blended benchmark, which consists of 40% equity and 60% fixed-income investments. Positioning among U.S. fixed-income securities and non-U.S. equities detracted from results relative to the benchmark, while allocations to global real estate investment trusts (REITs) and U.S. equity income were beneficial. As of July 31, 2019, Multi-Asset Income Fund’s 30-day SEC yield was 3.57% after the fee waiver. Without the waiver, the 30-day SEC yield would have been 3.31%. At period-end, the fund’s annual distribution rate was 4.83%.
Fund Strategy and Positioning
The fund’s primary objective is income generation, with long-term capital appreciation as a secondary objective. Our asset allocation strategy diversifies investments directly or indirectly among a range of U.S. and foreign income-oriented equity and fixed-income securities. The fund is not required to allocate its assets in any proportion, but maintains broad allocation ranges of 20% to 80% for equities and 20% to 80% for fixed-income securities to allow the team flexibility in pursuing attractive income-generating opportunities across the globe. To gain exposure to broad investment disciplines and categories, the fund invests in varying combinations of other American Century Investments’ funds (affiliated funds), unaffiliated funds such as exchange-traded funds (ETFs), equity and debt securities and certain derivative instruments. At period-end, the fund’s allocation was 45.5% fixed-income instruments, 41.5% equity (including investments in equity and fixed-income mutual funds and ETFs) and 13% in preferred and convertible securities.
NT High Income Fund was the largest holding in the portfolio throughout the period. We increased the allocation modestly in late 2018, when yield spreads on securities rated below investment grade rose significantly, increasing their appeal in our tactical allocation framework. In 2019, we reduced our exposure to non-U.S. value, as global growth slowed and worries about a potential trade war intensified, contributing to higher volatility in the asset class.
Global Real Estate and U.S. Equity Income Add to Returns
Positioning in the global real estate allocation contributed to performance, aided by positive security selection. Sources of strength were retail REITs and those based in the U.S. Similarly, the U.S. equity income position contributed because of security selection effects, led by consumer staples holdings. The highest income generation came from the NT High Income Fund, global real estate and emerging markets debt allocations.
*All fund returns referenced in this commentary are for Investor Class shares. Fund returns would have been lower if a portion of the fees had not been waived. Performance for other share classes will vary due to differences in fee structure; when Investor Class performance exceeds that of the fund's benchmark, other share classes may not. See page 3 for returns for all share classes.
U.S. Bonds and Non-U.S. Equities Lagged Their Underlying Benchmarks
Notable detraction from performance relative to their underlying benchmarks came from positioning among both investment-grade and high-yield U.S. bonds. Both allocations underperformed their respective benchmarks because of security selection decisions. In the investment-grade slice, it also hurt relative results to have a comparatively short duration at a time when interest rates declined. Duration is a measure of a bond’s price sensitivity to interest rate changes. When interest rates fall, bond prices rise, and the longer the duration, the greater the price increase. A shorter duration provides comparatively less benefit from falling rates.
Non-U.S. equities were another source of weakness, as they generally underperformed U.S. equities and stock choices meant these positions lagged their underlying benchmarks. Security selection in the foreign exchange and equity dividend harvesting sleeves also detracted from relative results.
Outlook
We have a cautious outlook for economic growth, as U.S. industrial production, disposable income and corporate profits have all been declining. In addition, rising tariffs and ongoing trade disputes between the U.S. and many leading economies act as a further drag on growth. Despite this uncertainty, unemployment remains historically low, and sharply lower interest rates should ultimately provide a boost to the economy. What’s more, the U.S. economy remains fairly healthy relative to most other countries, whose economies are expanding more slowly. It should also be noted that we do not feel that a U.S. recession is imminent. Add it all up, and with stock market volatility increasing, trade concerns a wild card and the late stage of the economic cycle, we believe investor expectations should probably be more muted regarding financial market returns going forward.
When considering income, return and risk potential, our outlook at the end of July 2019 had better views on stocks relative to fixed-income alternatives. Within the equity allocation, we had a bias toward emerging markets value equities, global real estate and equity income. Fundamental factors and relative yields support the emerging markets position, while real estate equities are favored relative to bonds because of comparatively attractive yields. Within fixed income, slower growth in the U.S. means it pays to be conscious of credit risk in lower-rated, more economically sensitive issuers. So while the portfolio’s largest absolute allocation was to U.S. high yield, we remain vigilant against volatility in the asset class.
Multi-Asset Income was created to meet the evolving needs of clients who desire a total income solution. We believe that the pursuit of high income today shouldn’t jeopardize the potential for income tomorrow. Our broadly diversified investment approach, combining the best top-down ideas of American Century Investments’ Multi-Asset Strategies team with the bottom-up security selection of our underlying segment management teams, is designed to create an income-generating portfolio optimized for yield, total return and risk.
|
| |
| JULY 31, 2019 |
Types of Investments in Portfolio | % of net assets |
| Affiliated Funds | 50.5% |
| Domestic Common Stocks | 14.2% |
| Foreign Common Stocks* | 8.0% |
| Preferred Stocks | 10.6% |
| Convertible Preferred Stocks | 2.7% |
| Corporate Bonds | 1.6% |
| Exchange-Traded Funds | 1.6% |
| Collateralized Mortgage Obligations | 1.2% |
| Convertible Bonds | 1.1% |
| Commercial Mortgage-Backed Securities | 0.8% |
| Asset-Backed Securities | 0.5% |
| U.S. Treasury Securities | 0.4% |
| Collateralized Loan Obligations | 0.3% |
| Temporary Cash Investments | 6.5% |
| Other Assets and Liabilities | —** |
*Includes depositary shares, dual listed securities and foreign ordinary shares.
**Category is less than 0.05% of total net assets.
Fund shareholders may incur two types of costs: (1) transaction costs, including sales charges (loads) on purchase payments and redemption/exchange fees; and (2) ongoing costs, including management fees; distribution and service (12b-1) fees; and other fund expenses. This example is intended to help you understand your ongoing costs (in dollars) of investing in your fund and to compare these costs with the ongoing cost of investing in other mutual funds.
The example is based on an investment of $1,000 made at the beginning of the period and held for the entire period from February 1, 2019 to July 31, 2019.
Actual Expenses
The table provides information about actual account values and actual expenses for each class. You may use the information, together with the amount you invested, to estimate the expenses that you paid over the period. First, identify the share class you own. Then simply divide your account value by $1,000 (for example, an $8,600 account value divided by $1,000 = 8.6), then multiply the result by the number under the heading “Expenses Paid During Period” to estimate the expenses you paid on your account during this period.
If you hold Investor Class shares of any American Century Investments fund, or I Class shares of the American Century Diversified Bond Fund, in an American Century Investments account (i.e., not a financial intermediary or retirement plan account), American Century Investments may charge you a $12.50 semiannual account maintenance fee if the value of those shares is less than $10,000. We will redeem shares automatically in one of your accounts to pay the $12.50 fee. In determining your total eligible investment amount, we will include your investments in all personal accounts (including American Century Investments Brokerage accounts) registered under your Social Security number. Personal accounts include individual accounts, joint accounts, UGMA/UTMA accounts, personal trusts, Coverdell Education Savings Accounts and IRAs (including traditional, Roth, Rollover, SEP-, SARSEP- and SIMPLE-IRAs), and certain other retirement accounts. If you have only business, business retirement, employer-sponsored or American Century Investments Brokerage accounts, you are currently not subject to this fee. If you are subject to the Account Maintenance Fee, your account value could be reduced by the fee amount.
Hypothetical Example for Comparison Purposes
The table also provides information about hypothetical account values and hypothetical expenses based on the actual expense ratio of each class of your fund and an assumed rate of return of 5% per year before expenses, which is not the actual return of a fund’s share class. The hypothetical account values and expenses may not be used to estimate the actual ending account balance or expenses you paid for the period. You may use this information to compare the ongoing costs of investing in your fund and other funds. To do so, compare this 5% hypothetical example with the 5% hypothetical examples that appear in the shareholder reports of the other funds.
Please note that the expenses shown in the table are meant to highlight your ongoing costs only and do not reflect any transactional costs, such as sales charges (loads) or redemption/exchange fees. Therefore, the table is useful in comparing ongoing costs only, and will not help you determine the relative total costs of owning different funds. In addition, if these transactional costs were included, your costs would have been higher.
|
| | | | |
| | Beginning
Account Value
2/1/19 | Ending
Account Value
7/31/19 | Expenses Paid
During Period(1)
2/1/19 - 7/31/19 |
Annualized
Expense Ratio(1) |
Actual | | | | |
| Investor Class | $1,000 | $1,043.70 | $3.40 | 0.67% |
| I Class | $1,000 | $1,044.70 | $2.38 | 0.47% |
| Y Class | $1,000 | $1,045.50 | $1.62 | 0.32% |
| A Class | $1,000 | $1,041.30 | $4.66 | 0.92% |
| C Class | $1,000 | $1,038.50 | $8.44 | 1.67% |
| R Class | $1,000 | $1,040.00 | $5.92 | 1.17% |
| R5 Class | $1,000 | $1,044.70 | $2.38 | 0.47% |
| R6 Class | $1,000 | $1,045.50 | $1.62 | 0.32% |
| Hypothetical | | | | |
| Investor Class | $1,000 | $1,021.47 | $3.36 | 0.67% |
| I Class | $1,000 | $1,022.46 | $2.36 | 0.47% |
| Y Class | $1,000 | $1,023.21 | $1.61 | 0.32% |
| A Class | $1,000 | $1,020.23 | $4.61 | 0.92% |
| C Class | $1,000 | $1,016.51 | $8.35 | 1.67% |
| R Class | $1,000 | $1,018.99 | $5.86 | 1.17% |
| R5 Class | $1,000 | $1,022.46 | $2.36 | 0.47% |
| R6 Class | $1,000 | $1,023.21 | $1.61 | 0.32% |
| |
| (1) | Expenses are equal to the class's annualized expense ratio listed in the table above, multiplied by the average account value over the period, multiplied by 181, the number of days in the most recent fiscal half-year, divided by 365, to reflect the one-half year period. Annualized expense ratio reflects actual expenses, including any applicable fee waivers or expense reimbursements and excluding any acquired fund fees and expenses. |
JULY 31, 2019
|
| | | | | | | |
| | | Shares/
Principal Amount | Value |
AFFILIATED FUNDS(1) — 50.5% | | | |
| Emerging Markets Debt Fund R6 Class | | 734,425 |
| $ | 7,652,710 |
|
| Equity Income Fund R6 Class | | 459,302 |
| 4,198,024 |
|
| International Value Fund R6 Class | | 632,015 |
| 4,645,310 |
|
| NT High Income Fund G Class | | 1,311,158 |
| 12,678,901 |
|
| Utilities Fund Investor Class | | 33,004 |
| 588,459 |
|
TOTAL AFFILIATED FUNDS
(Cost $29,467,169) | | | 29,763,404 |
|
| COMMON STOCKS — 22.2% | | | |
| Airlines — 0.1% | | | |
| Eva Airways Corp. | | 64,008 |
| 30,337 |
|
Auto Components† | | | |
| Fuyao Glass Industry Group Co. Ltd., H Shares | | 5,200 |
| 15,818 |
|
| Automobiles — 0.1% | | | |
| Geely Automobile Holdings Ltd. | | 19,000 |
| 28,883 |
|
| Great Wall Motor Co. Ltd., H Shares | | 29,500 |
| 19,907 |
|
| Hyundai Motor Co. Preference Shares | | 105 |
| 6,499 |
|
| Kia Motors Corp. | | 763 |
| 27,965 |
|
| | | | 83,254 |
|
| Banks — 1.7% | | | |
| Absa Group Ltd. | | 900 |
| 9,983 |
|
| Agricultural Bank of China Ltd., H Shares | | 48,000 |
| 19,478 |
|
| AMMB Holdings Bhd | | 36,300 |
| 37,135 |
|
| Banco do Brasil SA | | 2,700 |
| 34,935 |
|
| Banco Santander Mexico SA Institucion de Banca Multiple Grupo Financiero Santand ADR | | 4,800 |
| 34,080 |
|
| Bank Mandiri Persero Tbk PT | | 40,400 |
| 22,873 |
|
| Bank Negara Indonesia Persero Tbk PT | | 18,000 |
| 10,610 |
|
| Bank of China Ltd., H Shares | | 93,000 |
| 37,746 |
|
| Bank of Communications Co. Ltd., H Shares | | 23,000 |
| 16,725 |
|
| China CITIC Bank Corp. Ltd., H Shares | | 26,000 |
| 14,450 |
|
| China Construction Bank Corp., H Shares | | 194,000 |
| 149,356 |
|
| China Merchants Bank Co. Ltd., H Shares | | 3,500 |
| 17,434 |
|
| CIMB Group Holdings Bhd | | 36,100 |
| 44,404 |
|
| Dubai Islamic Bank PJSC | | 6,402 |
| 9,266 |
|
| E.Sun Financial Holding Co. Ltd. | | 11,782 |
| 9,828 |
|
| Grupo Financiero Banorte SAB de CV | | 8,700 |
| 43,523 |
|
| Hana Financial Group, Inc. | | 1,658 |
| 48,633 |
|
| Hong Leong Financial Group Bhd | | 1,900 |
| 8,275 |
|
| Industrial & Commercial Bank of China Ltd., H Shares | | 144,000 |
| 96,928 |
|
| Itau CorpBanca | | 780,417 |
| 6,063 |
|
| Itau Unibanco Holding SA ADR | | 4,500 |
| 41,175 |
|
| Mega Financial Holding Co. Ltd. | | 15,000 |
| 15,462 |
|
|
| | | | | | | |
| | | Shares/
Principal Amount | Value |
| Nedbank Group Ltd. | | 1,859 |
| $ | 31,164 |
|
| Qatar National Bank QPSC | | 6,140 |
| 32,868 |
|
| RHB Bank Bhd | | 20,000 |
| 26,661 |
|
| Shinhan Financial Group Co. Ltd. | | 909 |
| 33,316 |
|
| SinoPac Financial Holdings Co. Ltd. | | 50,000 |
| 19,918 |
|
| Standard Bank Group Ltd. | | 4,283 |
| 53,491 |
|
| Taiwan Business Bank | | 99,000 |
| 42,550 |
|
| Woori Financial Group, Inc. | | 2,871 |
| 31,783 |
|
| | | | 1,000,113 |
|
| Beverages — 0.1% | | | |
| Cia Cervecerias Unidas SA ADR | | 1,000 |
| 27,960 |
|
| Kweichow Moutai Co. Ltd., A Shares | | 100 |
| 14,056 |
|
| Tsingtao Brewery Co. Ltd., H Shares | | 4,000 |
| 23,284 |
|
| | | | 65,300 |
|
| Capital Markets — 0.5% | | | |
| Blackstone Group, Inc. (The), Class A | | 4,722 |
| 226,561 |
|
| Haitong Securities Co. Ltd., A Shares | | 6,200 |
| 12,398 |
|
| Investec Ltd. | | 4,617 |
| 26,318 |
|
| | | | 265,277 |
|
| Chemicals — 0.1% | | | |
| Kumho Petrochemical Co. Ltd. | | 532 |
| 36,619 |
|
| Mexichem SAB de CV | | 4,900 |
| 8,954 |
|
| Petronas Chemicals Group Bhd | | 17,900 |
| 32,430 |
|
| | | | 78,003 |
|
| Construction and Engineering — 0.2% | | | |
| China Communications Services Corp. Ltd., H Shares | | 6,000 |
| 4,196 |
|
| Daelim Industrial Co. Ltd. | | 374 |
| 33,282 |
|
Samsung Engineering Co. Ltd.(2) | | 2,551 |
| 35,338 |
|
| Sinopec Engineering Group Co. Ltd., H Shares | | 23,000 |
| 18,085 |
|
| | | | 90,901 |
|
| Construction Materials — 0.3% | | | |
| Anhui Conch Cement Co. Ltd., H Shares | | 4,000 |
| 23,160 |
|
| Asia Cement Corp. | | 27,000 |
| 36,241 |
|
| China National Building Material Co. Ltd., H Shares | | 24,000 |
| 21,067 |
|
| China Resources Cement Holdings Ltd. | | 28,000 |
| 25,811 |
|
| Taiwan Cement Corp. | | 30,000 |
| 42,961 |
|
| | | | 149,240 |
|
Diversified Financial Services† | | | |
| FirstRand Ltd. | | 3,132 |
| 13,446 |
|
Diversified Telecommunication Services† | | | |
| China Unicom Hong Kong Ltd. | | 10,000 |
| 9,689 |
|
| Telkom SA SOC Ltd. | | 1,748 |
| 10,497 |
|
| | | | 20,186 |
|
| Electric Utilities — 0.6% | | | |
| Centrais Eletricas Brasileiras SA | | 900 |
| 9,244 |
|
| Edison International | | 854 |
| 63,657 |
|
| Enel Americas SA ADR | | 5,000 |
| 41,250 |
|
|
| | | | | | | |
| | | Shares/
Principal Amount | Value |
| Eversource Energy | | 922 |
| $ | 69,943 |
|
| Inter RAO UES PJSC | | 217,000 |
| 15,165 |
|
| Interconexion Electrica SA ESP | | 6,310 |
| 34,464 |
|
| Manila Electric Co. | | 550 |
| 3,943 |
|
| Pinnacle West Capital Corp. | | 766 |
| 69,875 |
|
| Xcel Energy, Inc. | | 1,180 |
| 70,340 |
|
| | | | 377,881 |
|
| Electronic Equipment, Instruments and Components — 0.1% | | |
| Hon Hai Precision Industry Co. Ltd. | | 8,400 |
| 21,123 |
|
Yageo Corp.(2) | | 1,000 |
| 8,440 |
|
| Zhen Ding Technology Holding Ltd. | | 8,000 |
| 29,246 |
|
| | | | 58,809 |
|
| Equity Real Estate Investment Trusts (REITs) — 7.9% | | | |
| Community Healthcare Trust, Inc. | | 6,675 |
| 274,276 |
|
| Essential Properties Realty Trust, Inc. | | 22,001 |
| 464,661 |
|
| Gaming and Leisure Properties, Inc. | | 8,466 |
| 319,253 |
|
| Granite Real Estate Investment Trust | | 8,250 |
| 383,433 |
|
| HCP, Inc. | | 15,534 |
| 496,001 |
|
| Jernigan Capital, Inc. | | 14,254 |
| 282,799 |
|
| Northview Apartment Real Estate Investment Trust | | 16,257 |
| 335,044 |
|
| Spirit Realty Capital, Inc. | | 11,342 |
| 500,409 |
|
| STAG Industrial, Inc. | | 12,959 |
| 385,142 |
|
| STORE Capital Corp. | | 4,810 |
| 164,550 |
|
| VEREIT, Inc. | | 27,462 |
| 250,453 |
|
| VICI Properties, Inc. | | 13,910 |
| 296,839 |
|
| Welltower, Inc. | | 6,176 |
| 513,349 |
|
| | | | 4,666,209 |
|
| Food Products — 0.2% | | | |
| JBS SA | | 6,000 |
| 39,147 |
|
| Standard Foods Corp. | | 9,000 |
| 17,397 |
|
| Uni-President Enterprises Corp. | | 22,000 |
| 57,200 |
|
| | | | 113,744 |
|
| Gas Utilities — 0.3% | | | |
| Atmos Energy Corp. | | 403 |
| 43,943 |
|
| Kunlun Energy Co. Ltd. | | 48,000 |
| 41,868 |
|
| ONE Gas, Inc. | | 427 |
| 38,934 |
|
| Spire, Inc. | | 466 |
| 38,403 |
|
| | | | 163,148 |
|
| Hotels, Restaurants and Leisure — 0.1% | | | |
| Yum China Holdings, Inc. | | 1,030 |
| 46,865 |
|
| Household Products — 0.1% | | | |
Kimberly-Clark de Mexico SAB de CV, A Shares(2) | | 23,200 |
| 48,134 |
|
| Independent Power and Renewable Electricity Producers — 0.1% | |
| Aboitiz Power Corp. | | 59,600 |
| 41,465 |
|
| CGN Power Co. Ltd., H Shares | | 36,000 |
| 10,415 |
|
| Colbun SA | | 73,527 |
| 13,775 |
|
|
| | | | | | | |
| | | Shares/
Principal Amount | Value |
| SDIC Power Holdings Co. Ltd., A Shares | | 8,200 |
| $ | 10,123 |
|
| | | | 75,778 |
|
| Industrial Conglomerates — 0.1% | | | |
| Alfa SAB de CV, Class A | | 30,600 |
| 26,506 |
|
| Shanghai Industrial Holdings Ltd. | | 8,000 |
| 16,439 |
|
| | | | 42,945 |
|
| Insurance — 0.5% | | | |
| China Life Insurance Co. Ltd., A Shares | | 2,400 |
| 10,292 |
|
| China Pacific Insurance Group Co. Ltd., H Shares | | 12,000 |
| 51,442 |
|
| DB Insurance Co. Ltd. | | 558 |
| 26,202 |
|
| Ping An Insurance Group Co. of China Ltd., H Shares | | 11,500 |
| 136,399 |
|
| Powszechny Zaklad Ubezpieczen SA | | 2,969 |
| 31,997 |
|
| Samsung Fire & Marine Insurance Co. Ltd. | | 42 |
| 9,291 |
|
| | | | 265,623 |
|
Interactive Media and Services† | | | |
| Tencent Holdings Ltd. | | 600 |
| 28,062 |
|
Internet and Direct Marketing Retail† | | | |
Alibaba Group Holding Ltd. ADR(2) | | 150 |
| 25,967 |
|
| IT Services — 0.1% | | | |
| Infosys Ltd. ADR | | 2,900 |
| 32,828 |
|
Leisure Products† | | | |
| Giant Manufacturing Co. Ltd. | | 2,000 |
| 15,298 |
|
| Machinery — 0.1% | | | |
| Sany Heavy Industry Co. Ltd., A Shares | | 8,700 |
| 17,749 |
|
| Sinotruk Hong Kong Ltd. | | 11,000 |
| 16,225 |
|
| Weichai Power Co. Ltd., H Shares | | 27,000 |
| 41,804 |
|
| | | | 75,778 |
|
Media† | | | |
| Cheil Worldwide, Inc. | | 700 |
| 15,988 |
|
| Metals and Mining — 0.4% | | | |
| Cia Siderurgica Nacional SA ADR | | 7,500 |
| 32,025 |
|
| Grupo Mexico SAB de CV, Series B | | 2,700 |
| 6,622 |
|
| Korea Zinc Co. Ltd. | | 100 |
| 37,352 |
|
| Kumba Iron Ore Ltd. | | 1,128 |
| 37,371 |
|
| POSCO | | 50 |
| 9,497 |
|
| Vale SA ADR | | 7,500 |
| 97,425 |
|
| | | | 220,292 |
|
| Mortgage Real Estate Investment Trusts (REITs) — 2.4% | | | |
| Blackstone Mortgage Trust, Inc., Class A | | 11,851 |
| 420,947 |
|
| Starwood Property Trust, Inc. | | 21,757 |
| 505,415 |
|
| TPG RE Finance Trust, Inc. | | 25,257 |
| 498,826 |
|
| | | | 1,425,188 |
|
| Multi-Utilities — 0.3% | | | |
| Ameren Corp. | | 883 |
| 66,834 |
|
| NorthWestern Corp. | | 836 |
| 58,453 |
|
|
| | | | | | | |
| | | Shares/
Principal Amount | Value |
| WEC Energy Group, Inc. | | 743 |
| $ | 63,497 |
|
| | | | 188,784 |
|
| Oil, Gas and Consumable Fuels — 4.5% | | | |
| China Petroleum & Chemical Corp., H Shares | | 18,000 |
| 11,595 |
|
| China Shenhua Energy Co. Ltd., H Shares | | 4,000 |
| 7,925 |
|
| CNOOC Ltd. | | 48,000 |
| 78,940 |
|
| Ecopetrol SA ADR | | 1,200 |
| 21,516 |
|
| Energy Transfer LP | | 15,883 |
| 228,398 |
|
| Enterprise Products Partners LP | | 17,174 |
| 517,109 |
|
| EQM Midstream Partners LP | | 4,342 |
| 167,210 |
|
| Gazprom PJSC ADR | | 5,534 |
| 40,568 |
|
| Grupa Lotos SA | | 1,801 |
| 40,596 |
|
| Hess Midstream Partners LP | | 10,215 |
| 205,934 |
|
| LUKOIL PJSC ADR | | 472 |
| 38,807 |
|
| MOL Hungarian Oil & Gas plc | | 4,284 |
| 43,594 |
|
| MPLX LP | | 7,443 |
| 218,452 |
|
| Noble Midstream Partners LP | | 5,632 |
| 174,536 |
|
| Petroleo Brasileiro SA ADR | | 3,690 |
| 50,627 |
|
| Phillips 66 Partners LP | | 4,105 |
| 214,527 |
|
| Plains All American Pipeline LP | | 11,854 |
| 281,888 |
|
| Reliance Industries Ltd. GDR | | 2,544 |
| 85,352 |
|
| Shell Midstream Partners LP | | 10,304 |
| 222,463 |
|
| Yanzhou Coal Mining Co. Ltd., H Shares | | 20,000 |
| 17,677 |
|
| | | | 2,667,714 |
|
Paper and Forest Products† | | | |
| Lee & Man Paper Manufacturing Ltd. | | 27,000 |
| 16,470 |
|
| Personal Products — 0.1% | | | |
| LG Household & Health Care Ltd. Preference Shares | | 51 |
| 34,543 |
|
| Pharmaceuticals — 0.1% | | | |
| Dr Reddy's Laboratories Ltd. ADR | | 500 |
| 18,405 |
|
| Sino Biopharmaceutical Ltd. | | 22,000 |
| 26,748 |
|
| | | | 45,153 |
|
| Real Estate Management and Development — 0.2% | | | |
| Agile Group Holdings Ltd. | | 6,000 |
| 7,759 |
|
| China Vanke Co. Ltd., H Shares | | 4,800 |
| 18,118 |
|
| CIFI Holdings Group Co. Ltd. | | 18,000 |
| 11,422 |
|
| Country Garden Holdings Co. Ltd. | | 20,000 |
| 26,987 |
|
| Longfor Group Holdings Ltd. | | 3,500 |
| 12,869 |
|
| Shui On Land Ltd. | | 126,500 |
| 26,954 |
|
| Sunac China Holdings Ltd. | | 3,000 |
| 13,624 |
|
| | | | 117,733 |
|
| Semiconductors and Semiconductor Equipment — 0.1% | | | |
| Nanya Technology Corp. | | 7,000 |
| 16,580 |
|
| SK Hynix, Inc. | | 353 |
| 22,785 |
|
| Taiwan Semiconductor Manufacturing Co. Ltd. ADR | | 600 |
| 25,578 |
|
| | | | 64,943 |
|
|
| | | | | | | |
| | | Shares/
Principal Amount | Value |
| Technology Hardware, Storage and Peripherals — 0.3% | | | |
| Lenovo Group Ltd. | | 32,000 |
| $ | 25,708 |
|
| Samsung Electronics Co. Ltd. | | 3,482 |
| 132,850 |
|
| Samsung Electronics Co. Ltd. Preference Shares | | 313 |
| 9,751 |
|
| | | | 168,309 |
|
| Transportation Infrastructure — 0.1% | | | |
| International Container Terminal Services, Inc. | | 5,940 |
| 15,784 |
|
| Taiwan High Speed Rail Corp. | | 30,000 |
| 40,060 |
|
| | | | 55,844 |
|
| Water Utilities — 0.1% | | | |
| Cia de Saneamento Basico do Estado de Sao Paulo ADR | | 3,600 |
| 50,076 |
|
| Wireless Telecommunication Services — 0.3% | | | |
| China Mobile Ltd. | | 9,000 |
| 76,609 |
|
| DiGi.Com Bhd | | 40,200 |
| 48,534 |
|
| Globe Telecom, Inc. | | 900 |
| 38,067 |
|
| SK Telecom Co. Ltd. | | 41 |
| 8,575 |
|
| | | | 171,785 |
|
TOTAL COMMON STOCKS
(Cost $12,013,891) | | | 13,091,766 |
|
| PREFERRED STOCKS — 10.6% | | | |
| Banks — 6.0% | | | |
| Bank of America Corp., 5.20% | | 33,000 |
| 33,766 |
|
| Bank of America Corp., 5.875% | | 108,000 |
| 115,058 |
|
| Bank of America Corp., 6.50% | | 418,000 |
| 465,428 |
|
| Citigroup, Inc., 5.95% | | 49,000 |
| 51,537 |
|
| JPMorgan Chase & Co., 5.15% | | 75,000 |
| 76,540 |
|
| JPMorgan Chase & Co., 6.10% | | 186,000 |
| 198,688 |
|
| PNC Capital Trust C, 3.09% | | 679,000 |
| 630,495 |
|
| SunTrust Banks, Inc., 5.125% | | 741,000 |
| 734,257 |
|
| U.S. Bancorp, 5.30% | | 162,000 |
| 170,853 |
|
| U.S. Bancorp, 6.50% | | 15,377 |
| 415,487 |
|
| Wells Fargo & Co., 6.18% | | 633,000 |
| 637,748 |
|
| | | | 3,529,857 |
|
| Capital Markets — 1.6% | | | |
| Bank of New York Mellon Corp. (The), 4.95% | | 260,000 |
| 262,335 |
|
| Charles Schwab Corp. (The), 5.00% | | 675,000 |
| 677,713 |
|
| | | | 940,048 |
|
| Diversified Financial Services — 0.2% | | | |
| JPMorgan Chase & Co., 5.00% | | 76,000 |
| 76,969 |
|
| Voya Financial, Inc., 6.125% | | 60,000 |
| 63,943 |
|
| | | | 140,912 |
|
| Equity Real Estate Investment Trusts (REITs) — 0.9% | | | |
| Kimco Realty Corp., 5.625% | | 530 |
| 13,610 |
|
| Public Storage, 5.40% | | 11,018 |
| 291,316 |
|
| Public Storage, 5.60% | | 7,069 |
| 192,630 |
|
| SITE Centers Corp., 6.25% | | 500 |
| 13,005 |
|
| | | | 510,561 |
|
|
| | | | | | | |
| | | Shares/
Principal Amount | Value |
Insurance† | | | |
| Progressive Corp. (The), 5.375% | | 17,000 |
| $ | 17,557 |
|
| Mortgage Real Estate Investment Trusts (REITs) — 0.5% | | | |
| Chimera Investment Corp., 8.00% | | 10,474 |
| 278,085 |
|
| Multi-Utilities — 1.3% | | | |
| NextEra Energy Capital Holdings, Inc., 5.25% | | 4,907 |
| 133,520 |
|
| SCE Trust II, 5.10% | | 27,718 |
| 650,264 |
|
| | | | 783,784 |
|
| Oil, Gas and Consumable Fuels — 0.1% | | | |
| Plains All American Pipeline LP, 6.125% | | 68,000 |
| 65,687 |
|
TOTAL PREFERRED STOCKS
(Cost $6,049,160) | | | 6,266,491 |
|
| CONVERTIBLE PREFERRED STOCKS — 2.7% | | | |
| Banks — 0.8% | | | |
| Bank of America Corp., 7.25% | | 143 |
| 202,694 |
|
| Wells Fargo & Co., 7.50% | | 169 |
| 235,005 |
|
| | | | 437,699 |
|
| Chemicals — 0.3% | | | |
| International Flavors & Fragrances, Inc., 6.00%, 9/15/21 | | 3,654 |
| 196,476 |
|
| Equity Real Estate Investment Trusts (REITs) — 0.8% | | | |
| QTS Realty Trust, Inc., 6.50% | | 4,366 |
| 493,838 |
|
| Health Care Equipment and Supplies — 0.6% | | | |
| Becton Dickinson and Co., 6.125%, 5/1/20 | | 4,048 |
| 249,559 |
|
| Danaher Corp., 4.75%, 4/15/22 | | 87 |
| 98,736 |
|
| | | | 348,295 |
|
| Machinery — 0.2% | | | |
| Stanley Black & Decker, Inc., 5.375%, 5/15/20 | | 943 |
| 95,705 |
|
TOTAL CONVERTIBLE PREFERRED STOCKS
(Cost $1,436,564) | | | 1,572,013 |
|
| CORPORATE BONDS — 1.6% | | | |
| Automobiles — 0.1% | | | |
| Ford Motor Co., 4.35%, 12/8/26 | | $ | 45,000 |
| 45,422 |
|
| Banks — 0.1% | | | |
| Wells Fargo & Co., MTN, 4.65%, 11/4/44 | | 50,000 |
| 56,589 |
|
| Biotechnology — 0.1% | | | |
| Amgen, Inc., 4.66%, 6/15/51 | | 40,000 |
| 43,952 |
|
| Consumer Finance — 0.1% | | | |
| Capital One Financial Corp., 3.80%, 1/31/28 | | 40,000 |
| 41,437 |
|
Containers and Packaging† | | | |
| Berry Global, Inc., 5.125%, 7/15/23 | | 20,000 |
| 20,500 |
|
Electronic Equipment, Instruments and Components† | | | |
| Vishay Intertechnology, Inc., 2.25%, 6/15/25 | | 19,000 |
| 17,787 |
|
Energy Equipment and Services† | | | |
| Valaris plc, 8.00%, 1/31/24 | | 11,000 |
| 9,350 |
|
| Entertainment — 0.1% | | | |
Walt Disney Co. (The), 6.90%, 8/15/39(4) | | 25,000 |
| 37,344 |
|
|
| | | | | | | |
| | | Shares/
Principal Amount | Value |
Equity Real Estate Investment Trusts (REITs)† | | | |
| MGM Growth Properties Operating Partnership LP / MGP Finance Co-Issuer, Inc., 4.50%, 9/1/26 | | $ | 25,000 |
| $ | 25,787 |
|
Food and Staples Retailing† | | | |
| Tesco plc, MTN, 5.50%, 12/13/19 | GBP | 10,000 |
| 12,348 |
|
| Health Care Providers and Services — 0.2% | | | |
| DaVita, Inc., 5.125%, 7/15/24 | | $ | 35,000 |
| 35,219 |
|
| Express Scripts Holding Co., 4.50%, 2/25/26 | | 50,000 |
| 54,132 |
|
| HCA, Inc., 5.00%, 3/15/24 | | 20,000 |
| 21,729 |
|
| | | | 111,080 |
|
| Hotels, Restaurants and Leisure — 0.1% | | | |
International Game Technology plc, 6.25%, 2/15/22(4) | | 35,000 |
| 37,012 |
|
| Household Durables — 0.1% | | | |
| Lennar Corp., 4.75%, 5/30/25 | | 35,000 |
| 36,750 |
|
| Insurance — 0.1% | | | |
| Prudential Financial, Inc., 3.94%, 12/7/49 | | 50,000 |
| 53,078 |
|
| Media — 0.1% | | | |
| Comcast Corp., 4.75%, 3/1/44 | | 25,000 |
| 29,151 |
|
| CSC Holdings LLC, 6.75%, 11/15/21 | | 5,000 |
| 5,362 |
|
| | | | 34,513 |
|
Mortgage Real Estate Investment Trusts (REITs)† | | | |
| Starwood Property Trust, Inc., 5.00%, 12/15/21 | | 20,000 |
| 20,700 |
|
| Multi-Utilities — 0.2% | | | |
| Dominion Energy, Inc., 4.90%, 8/1/41 | | 25,000 |
| 28,893 |
|
| Exelon Generation Co. LLC, 5.60%, 6/15/42 | | 50,000 |
| 57,250 |
|
| Sempra Energy, 3.25%, 6/15/27 | | 50,000 |
| 50,263 |
|
| | | | 136,406 |
|
| Oil, Gas and Consumable Fuels — 0.2% | | | |
| Antero Resources Corp., 5.125%, 12/1/22 | | 20,000 |
| 19,200 |
|
| Kinder Morgan Energy Partners LP, 6.50%, 9/1/39 | | 35,000 |
| 43,394 |
|
| MPLX LP, 4.875%, 12/1/24 | | 47,000 |
| 51,226 |
|
| | | | 113,820 |
|
| Pharmaceuticals — 0.1% | | | |
| Allergan Funding SCS, 4.55%, 3/15/35 | | 40,000 |
| 41,423 |
|
Specialty Retail† | | | |
| Home Depot, Inc. (The), 5.95%, 4/1/41 | | 20,000 |
| 27,372 |
|
Technology Hardware, Storage and Peripherals† | | | |
Dell International LLC / EMC Corp., 5.875%, 6/15/21(4) | | 20,000 |
| 20,353 |
|
Wireless Telecommunication Services† | | | |
| Sprint Communications, Inc., 6.00%, 11/15/22 | | 20,000 |
| 21,300 |
|
TOTAL CORPORATE BONDS
(Cost $908,488) | | | 964,323 |
|
| EXCHANGE-TRADED FUNDS — 1.6% | | | |
| Alerian MLP ETF | | 37,158 |
| 365,263 |
|
| iShares China Large-Cap ETF | | 1,480 |
| 60,828 |
|
| iShares MSCI Emerging Markets ETF | | 2,837 |
| 118,501 |
|
| iShares MSCI India ETF | | 6,090 |
| 200,970 |
|
|
| | | | | | | |
| | | Shares/
Principal Amount | Value |
| iShares MSCI Russia ETF | | 2,250 |
| $ | 87,908 |
|
| iShares MSCI Thailand ETF | | 1,150 |
| 105,800 |
|
TOTAL EXCHANGE-TRADED FUNDS
(Cost $927,205) | | | 939,270 |
|
| COLLATERALIZED MORTGAGE OBLIGATIONS — 1.2% | | | |
| Private Sponsor Collateralized Mortgage Obligations — 0.9% | | |
| Bear Stearns Adjustable Rate Mortgage Trust, Series 2004-12, Class 2A1, VRN, 4.30%, 2/25/35 | | $ | 12,281 |
| 12,524 |
|
| Bear Stearns Adjustable Rate Mortgage Trust, Series 2004-8, Class 2A1, VRN, 4.24%, 11/25/34 | | 3,157 |
| 3,132 |
|
| Chase Mortgage Finance Trust, Series 2007-A2, Class 6A2 SEQ, VRN, 4.52%, 7/25/37 | | 1,209 |
| 1,184 |
|
| Citicorp Mortgage Securities Trust, Series 2007-8, Class 1A3, 6.00%, 9/25/37 | | 3,990 |
| 4,285 |
|
| Citigroup Mortgage Loan Trust, Inc., Series 2004-UST1, Class A5, VRN, 4.40%, 8/25/34 | | 15,044 |
| 15,262 |
|
| Citigroup Mortgage Loan Trust, Inc., Series 2005-4, Class A, VRN, 4.58%, 8/25/35 | | 4,750 |
| 4,903 |
|
| Citigroup Mortgage Loan Trust, Inc., Series 2005-6, Class A2, VRN, 4.55%, (1-year H15T1Y plus 2.15%), 9/25/35 | | 17,553 |
| 18,034 |
|
| Credit Suisse First Boston Mortgage-Backed Pass-Through Certificates, Series 2005-3, Class 1A1, VRN, 5.48%, 7/25/35 | | 6,746 |
| 7,192 |
|
| GSR Mortgage Loan Trust, Series 2005-AR6, Class 2A1, VRN, 4.50%, 9/25/35 | | 15,648 |
| 16,116 |
|
| GSR Mortgage Loan Trust, Series 2005-AR6, Class 4A5, VRN, 4.56%, 9/25/35 | | 10,135 |
| 10,393 |
|
| JPMorgan Mortgage Trust, Series 2005-A4, Class 1A1, VRN, 4.42%, 7/25/35 | | 5,227 |
| 5,302 |
|
| JPMorgan Mortgage Trust, Series 2005-A4, Class 2A1, VRN, 4.38%, 7/25/35 | | 5,016 |
| 5,054 |
|
| JPMorgan Mortgage Trust, Series 2005-A6, Class 7A1, VRN, 4.32%, 8/25/35 | | 3,566 |
| 3,494 |
|
| JPMorgan Mortgage Trust, Series 2005-S2, Class 3A1, VRN, 7.16%, 2/25/32 | | 229 |
| 237 |
|
| MASTR Adjustable Rate Mortgages Trust, Series 2004-13, Class 3A7, VRN, 4.73%, 11/21/34 | | 16,155 |
| 16,865 |
|
Sequoia Mortgage Trust, Series 2017-CH2, Class A10 SEQ, VRN, 4.00%, 12/25/47(4) | | 39,263 |
| 39,697 |
|
| Thornburg Mortgage Securities Trust, Series 2006-4, Class A2B, VRN, 4.49%, 7/25/36 | | 20,385 |
| 19,920 |
|
WaMu Mortgage Pass-Through Certificates, Series 2005-AR3, Class A1, VRN, 4.45%, 3/25/35 | | 7,669 |
| 7,633 |
|
WaMu Mortgage Pass-Through Certificates, Series 2005-AR7, Class A3, VRN, 4.27%, 8/25/35 | | 3,355 |
| 3,428 |
|
Wells Fargo Mortgage-Backed Securities Trust, Series 2004-A, Class A1, VRN, 5.01%, 2/25/34 | | 7,431 |
| 7,765 |
|
Wells Fargo Mortgage-Backed Securities Trust, Series 2004-Z, Class 2A2, VRN, 4.97%, 12/25/34 | | 6,759 |
| 6,969 |
|
| Wells Fargo Mortgage-Backed Securities Trust, Series 2005-17, Class 2A1, 5.50%, 1/25/36 | | 61,038 |
| 62,638 |
|
| Wells Fargo Mortgage-Backed Securities Trust, Series 2005-18, Class 1A1, 5.50%, 1/25/36 | | 12,590 |
| 12,652 |
|
Wells Fargo Mortgage-Backed Securities Trust, Series 2005-AR4, Class 2A1, VRN, 5.10%, 4/25/35 | | 2,231 |
| 2,280 |
|
Wells Fargo Mortgage-Backed Securities Trust, Series 2005-AR7, Class 1A1, VRN, 5.10%, 5/25/35 | | 3,104 |
| 3,230 |
|
|
| | | | | | | |
| | | Shares/
Principal Amount | Value |
| Wells Fargo Mortgage-Backed Securities Trust, Series 2006-4, Class 2A1, 6.00%, 4/25/36 | | $ | 8,226 |
| $ | 8,257 |
|
| Wells Fargo Mortgage-Backed Securities Trust, Series 2006-6, Class 1A16 SEQ, 5.75%, 5/25/36 | | 14,804 |
| 14,580 |
|
| Wells Fargo Mortgage-Backed Securities Trust, Series 2006-8, Class A10 SEQ, 6.00%, 7/25/36 | | 8,590 |
| 8,707 |
|
| Wells Fargo Mortgage-Backed Securities Trust, Series 2006-8, Class A15, 6.00%, 7/25/36 | | 57,734 |
| 58,522 |
|
Wells Fargo Mortgage-Backed Securities Trust, Series 2006-AR1, Class 2A5 SEQ, VRN, 4.98%, 3/25/36 | | 4,312 |
| 4,296 |
|
Wells Fargo Mortgage-Backed Securities Trust, Series 2006-AR10, Class 1A1, VRN, 5.04%, 7/25/36 | | 2,581 |
| 2,633 |
|
Wells Fargo Mortgage-Backed Securities Trust, Series 2006-AR10, Class 4A1, VRN, 5.18%, 7/25/36 | | 15,485 |
| 15,736 |
|
Wells Fargo Mortgage-Backed Securities Trust, Series 2006-AR10, Class 5A6 SEQ, VRN, 5.02%, 7/25/36 | | 29,902 |
| 30,440 |
|
Wells Fargo Mortgage-Backed Securities Trust, Series 2006-AR12, Class 1A1, VRN, 4.76%, 9/25/36 | | 16,488 |
| 16,833 |
|
Wells Fargo Mortgage-Backed Securities Trust, Series 2006-AR14, Class 2A1, VRN, 4.76%, 10/25/36 | | 8,768 |
| 8,779 |
|
Wells Fargo Mortgage-Backed Securities Trust, Series 2006-AR16, Class A1, VRN, 4.72%, 10/25/36 | | 20,514 |
| 20,548 |
|
| Wells Fargo Mortgage-Backed Securities Trust, Series 2007-11, Class A36, 6.00%, 8/25/37 | | 13,675 |
| 13,879 |
|
| Wells Fargo Mortgage-Backed Securities Trust, Series 2007-15, Class A1, 6.00%, 11/25/37 | | 7,369 |
| 7,505 |
|
| Wells Fargo Mortgage-Backed Securities Trust, Series 2007-4, Class A15, 6.00%, 4/25/37 | | 6,158 |
| 6,248 |
|
| Wells Fargo Mortgage-Backed Securities Trust, Series 2007-7, Class A1, 6.00%, 6/25/37 | | 12,514 |
| 12,823 |
|
| | | | 519,975 |
|
| U.S. Government Agency Collateralized Mortgage Obligations — 0.3% | |
FHLMC, Series 2015-HQ2, Class M3, VRN, 5.52%, (1-month LIBOR plus 3.25%), 5/25/25 | | 50,000 |
| 53,468 |
|
FHLMC, Series 2017-DNA2, Class M1, VRN, 3.47%, (1-month LIBOR plus 1.20%), 10/25/29 | | 35,559 |
| 35,790 |
|
FHLMC, Series 2019-DNA1, Class M1, VRN, 3.30%, (1-month LIBOR plus 0.90%), 1/25/49(4) | | 47,001 |
| 47,155 |
|
FNMA, Series 2014-C02, Class 1M2, VRN, 4.87%, (1-month LIBOR plus 2.60%), 5/25/24 | | 19,742 |
| 20,596 |
|
FNMA, Series 2016-C03, Class 2M2, VRN, 8.17%, (1-month LIBOR plus 5.90%), 10/25/28 | | 4,399 |
| 4,831 |
|
| | | | 161,840 |
|
TOTAL COLLATERALIZED MORTGAGE OBLIGATIONS
(Cost $663,858) | | | 681,815 |
|
| CONVERTIBLE BONDS — 1.1% | | | |
Air Freight and Logistics† | | | |
| Air Transport Services Group, Inc., 1.125%, 10/15/24 | | 19,000 |
| 18,973 |
|
Airlines† | | | |
Citigroup Global Markets Holdings, Inc., (convertible into Southwest Airlines Co.), 6.35%, 9/17/19(3)(4) | | 461 |
| 23,773 |
|
| Biotechnology — 0.1% | | | |
Credit Suisse AG, (convertible into Celgene Corp.), 9.10%, 9/19/19(3)(4) | | 282 |
| 25,224 |
|
|
| | | | | | | |
| | | Shares/
Principal Amount | Value |
| Construction Materials — 0.2% | | | |
Royal Bank of Canada, (convertible into Martin Marietta Materials, Inc.), 6.65%, 8/2/19(3)(4) | | $ | 111 |
| $ | 20,619 |
|
Royal Bank of Canada, (convertible into Martin Marietta Materials, Inc.), 5.60%, 8/12/19(3)(4) | | 21 |
| 3,886 |
|
Wells Fargo Bank N.A., (convertible into Martin Marietta Materials, Inc.), 5.10%, 8/1/19(3)(4) | | 391 |
| 74,099 |
|
| | | | 98,604 |
|
| Diversified Financial Services — 0.1% | | | |
Citigroup Global Markets Holdings, Inc., (convertible into Berkshire Hathaway, Inc., Class B), 1.63%, 8/13/19(3)(4) | | 14 |
| 2,826 |
|
Credit Suisse AG, (convertible into Berkshire Hathaway, Inc., Class B), 1.50%, 12/5/19(3)(4) | | 138 |
| 27,892 |
|
Royal Bank of Canada, (convertible into Berkshire Hathaway, Inc., Class B), 0.90%, 1/23/20(3)(4) | | 72 |
| 15,142 |
|
| | | | 45,860 |
|
| Health Care Technology — 0.1% | | | |
Credit Suisse AG, (convertible into Cerner Corp.), 2.80%, 10/17/19(3)(4) | | 683 |
| 44,879 |
|
Morgan Stanley B.V., (convertible into Cerner Corp.), 1.48%, 10/31/19(3)(4) | | 292 |
| 19,703 |
|
| | | | 64,582 |
|
| Insurance — 0.1% | | | |
AXA SA, 7.25%, 5/15/21(4) | | 54,000 |
| 58,321 |
|
| Semiconductors and Semiconductor Equipment — 0.5% | | | |
| Microchip Technology, Inc., 1.625%, 2/15/27 | | 172,000 |
| 219,610 |
|
| Teradyne, Inc., 1.25%, 12/15/23 | | 43,000 |
| 78,891 |
|
| | | | 298,501 |
|
Software† | | | |
Palo Alto Networks, Inc., 0.75%, 7/1/23(4) | | 14,000 |
| 15,449 |
|
Technology Hardware, Storage and Peripherals† | | | |
Western Digital Corp., 1.50%, 2/1/24(4) | | 9,000 |
| 8,388 |
|
Textiles, Apparel and Luxury Goods† | | | |
UBS AG, (convertible into Ralph Lauren Corp.), 8.65%, 1/23/20(3)(4) | | 116 |
| 12,492 |
|
TOTAL CONVERTIBLE BONDS
(Cost $587,968) | | | 670,167 |
|
| COMMERCIAL MORTGAGE-BACKED SECURITIES — 0.8% | | |
Bank of America Merrill Lynch Commercial Mortgage Securities Trust, Series 2015-200P, Class B, 3.49%, 4/14/33(4) | | 25,000 |
| 26,071 |
|
| Commercial Mortgage Pass-Through Certificates, Series 2014-LC17, Class B, VRN, 4.49%, 10/10/47 | | 10,000 |
| 10,654 |
|
| Commercial Mortgage Pass-Through Certificates, Series 2016-CR28, Class B, VRN, 4.65%, 2/10/49 | | 35,000 |
| 38,436 |
|
| Commercial Mortgage Trust, Series 2015-CR22, Class B, VRN, 3.93%, 3/10/48 | | 25,000 |
| 25,964 |
|
Commercial Mortgage Trust, Series 2017-PANW, Class A SEQ, 3.24%, 10/10/29(4) | | 25,000 |
| 25,813 |
|
Core Industrial Trust, Series 2015-CALW, Class C, 3.56%, 2/10/34(4) | | 25,000 |
| 25,652 |
|
Core Industrial Trust, Series 2015-TEXW, Class B, 3.33%, 2/10/34(4) | | 25,000 |
| 25,614 |
|
|
| | | | | | | |
| | | Shares/
Principal Amount | Value |
| CSAIL Commercial Mortgage Trust, Series 2017-CX10, Class AS, VRN, 3.67%, 11/15/50 | | $ | 25,000 |
| $ | 26,296 |
|
| GS Mortgage Securities Trust, Series 2015-GC28, Class AS, 3.76%, 2/10/48 | | 15,000 |
| 15,766 |
|
| GS Mortgage Securities Trust, Series 2016-GS2, Class B, VRN, 3.76%, 5/10/49 | | 25,000 |
| 26,121 |
|
Hudson Yards Mortgage Trust, Series 2016-10HY, Class A SEQ, 2.84%, 8/10/38(4) | | 25,000 |
| 25,420 |
|
Hudson Yards Mortgage Trust, Series 2016-10HY, Class B, VRN, 2.98%, 8/10/38(4) | | 10,000 |
| 10,164 |
|
JPMBB Commercial Mortgage Securities Trust, Series 2014-C21, Class B, VRN, 4.34%, 8/15/47 | | 25,000 |
| 26,360 |
|
JPMDB Commercial Mortgage Securities Trust, Series 2017-C5, Class A4 SEQ, 3.41%, 3/15/50 | | 20,000 |
| 21,082 |
|
| JPMorgan Chase Commercial Mortgage Securities Trust, Series 2016-JP2, Class B, 3.46%, 8/15/49 | | 25,000 |
| 25,583 |
|
| JPMorgan Chase Commercial Mortgage Securities Trust, Series 2016-JP3, Class AS, 3.14%, 8/15/49 | | 25,000 |
| 25,454 |
|
| Morgan Stanley Bank of America Merrill Lynch Trust, Series 2017-C34, Class A3 SEQ, 3.28%, 11/15/52 | | 25,000 |
| 26,095 |
|
| UBS Commercial Mortgage Trust, Series 2017-C1, Class A3 SEQ, 3.20%, 6/15/50 | | 50,000 |
| 52,076 |
|
| Wells Fargo Commercial Mortgage Trust, Series 2017-C38, Class A4 SEQ, 3.19%, 7/15/50 | | 25,000 |
| 25,991 |
|
TOTAL COMMERCIAL MORTGAGE-BACKED SECURITIES
(Cost $474,955) | | 484,612 |
|
| ASSET-BACKED SECURITIES — 0.5% | | | |
Avis Budget Rental Car Funding AESOP LLC, Series 2015-2A, Class B, 3.42%, 12/20/21(4) | | 25,000 |
| 25,185 |
|
BRE Grand Islander Timeshare Issuer LLC, Series 2017-1A, Class B, 3.24%, 5/25/29(4) | | 13,006 |
| 12,976 |
|
Hilton Grand Vacations Trust, Series 2013-A, Class A SEQ, 2.28%, 1/25/26(4) | | 2,359 |
| 2,358 |
|
Hilton Grand Vacations Trust, Series 2014-AA, Class A SEQ, 1.77%, 11/25/26(4) | | 19,424 |
| 19,320 |
|
Hilton Grand Vacations Trust, Series 2017-AA, Class A SEQ, 2.66%, 12/26/28(4) | | 4,895 |
| 4,910 |
|
Invitation Homes Trust, Series 2017-SFR2, Class A, VRN, 3.16%, (1-month LIBOR plus 0.85%), 12/17/36(4) | | 23,729 |
| 23,715 |
|
Invitation Homes Trust, Series 2017-SFR2, Class B, VRN, 3.46%, (1-month LIBOR plus 1.15%), 12/17/36(4) | | 25,000 |
| 24,998 |
|
Invitation Homes Trust, Series 2018-SFR1, Class C, VRN, 3.56%, (1-month LIBOR plus 1.25%), 3/17/37(4) | | 25,000 |
| 24,948 |
|
Marriott Vacation Club Owner Trust, Series 2012-1A, Class B, VRN, 3.50%, 5/20/30(4) | | 2,582 |
| 2,583 |
|
MVW Owner Trust, Series 2013-1A, Class A SEQ, 2.15%, 4/22/30(4) | | 18,403 |
| 18,346 |
|
MVW Owner Trust, Series 2017-1A, Class B, 2.75%, 12/20/34(4) | | 26,768 |
| 26,617 |
|
Progress Residential Trust, Series 2017-SFR1, Class A SEQ, 2.77%, 8/17/34(4) | | 24,909 |
| 24,927 |
|
Progress Residential Trust, Series 2017-SFR2, Class A SEQ, 2.90%, 12/17/34(4) | | 25,000 |
| 25,024 |
|
Sierra Timeshare Conduit Receivables Funding LLC, Series 2017-1A, Class A SEQ, 2.91%, 3/20/34(4) | | 2,753 |
| 2,776 |
|
Sierra Timeshare Receivables Funding LLC, Series 2015-1A, Class A SEQ, 2.40%, 3/22/32(4) | | 2,797 |
| 2,793 |
|
|
| | | | | | | |
| | | Shares/
Principal Amount | Value |
Sierra Timeshare Receivables Funding LLC, Series 2015-2A, Class A SEQ, 2.43%, 6/20/32(4) | | $ | 6,408 |
| $ | 6,391 |
|
Sierra Timeshare Receivables Funding LLC, Series 2015-3A, Class A SEQ, 2.58%, 9/20/32(4) | | 7,767 |
| 7,754 |
|
Sierra Timeshare Receivables Funding LLC, Series 2016-2A, Class A SEQ, 2.33%, 7/20/33(4) | | 1,966 |
| 1,955 |
|
VSE VOI Mortgage LLC, Series 2016-A, Class A SEQ, 2.54%, 7/20/33(4) | | 18,144 |
| 18,105 |
|
TOTAL ASSET-BACKED SECURITIES
(Cost $275,490) | | | 275,681 |
|
| U.S. TREASURY SECURITIES — 0.4% | | | |
| U.S. Treasury Notes, 2.375%, 2/29/24 (Cost $199,004) | | 200,000 |
| 204,793 |
|
| COLLATERALIZED LOAN OBLIGATIONS — 0.3% | | | |
Carlyle Global Market Strategies CLO Ltd., Series 2014-1A, Class A1R2, VRN, 3.27%, (3-month LIBOR plus 0.97%), 4/17/31(4) | | 50,000 |
| 49,514 |
|
CBAM Ltd., Series 2018-5A, Class B1, VRN, 3.70%, (3-month LIBOR plus 1.40%), 4/17/31(4) | | 25,000 |
| 24,484 |
|
Dryden 41 Senior Loan Fund, Series 2015-41A, Class AR, VRN, 3.27%, (3-month LIBOR plus 0.97%), 4/15/31(4) | | 50,000 |
| 49,487 |
|
Dryden 64 CLO Ltd., Series 2018-64A, Class A, VRN, 3.25%, (3-month LIBOR plus 0.97%), 4/18/31(4) | | 25,000 |
| 24,758 |
|
Sounds Point CLO IV-R Ltd., Series 2013-3RA, Class B, VRN, 4.05%, (3-month LIBOR plus 1.75%), 4/18/31(4) | | 35,000 |
| 34,873 |
|
TOTAL COLLATERALIZED LOAN OBLIGATIONS
(Cost $184,642) | | | 183,116 |
|
| TEMPORARY CASH INVESTMENTS — 6.5% | | | |
| State Street Institutional U.S. Government Money Market Fund, Premier Class | | 3,498,164 |
| 3,498,164 |
|
U.S. Treasury Bills, 2.37%, 11/29/19(5)(6) | | $ | 300,000 |
| 297,972 |
|
TOTAL TEMPORARY CASH INVESTMENTS
(Cost $3,795,856) | | | 3,796,136 |
|
TOTAL INVESTMENT SECURITIES — 100.0%
(Cost $56,984,250) | | | 58,893,587 |
|
OTHER ASSETS AND LIABILITIES† | | | 3,214 |
|
| TOTAL NET ASSETS — 100.0% | | | $ | 58,896,801 |
|
FORWARD FOREIGN CURRENCY EXCHANGE CONTRACTS
|
| | | | | | | | | | |
| Currency Purchased | Currency Sold | Counterparty | Settlement Date | Unrealized Appreciation
(Depreciation) |
| AUD | 665,363 |
| USD | 461,110 |
| Bank of America N.A. | 9/18/19 | $ | (5,360 | ) |
| AUD | 478,475 |
| USD | 335,244 |
| Bank of America N.A. | 9/18/19 | (7,505 | ) |
| AUD | 469,907 |
| USD | 331,129 |
| Bank of America N.A. | 9/18/19 | (9,260 | ) |
| USD | 166,608 |
| AUD | 238,783 |
| Bank of America N.A. | 9/18/19 | 3,050 |
|
| USD | 309,950 |
| AUD | 441,430 |
| Bank of America N.A. | 9/18/19 | 7,586 |
|
| USD | 64,404 |
| AUD | 93,052 |
| Bank of America N.A. | 9/18/19 | 667 |
|
| BRL | 1,856,426 |
| USD | 461,373 |
| Goldman Sachs & Co. | 9/18/19 | 23,361 |
|
| BRL | 71,170 |
| USD | 18,360 |
| Goldman Sachs & Co. | 9/18/19 | 223 |
|
| USD | 24,262 |
| BRL | 94,750 |
| Goldman Sachs & Co. | 9/18/19 | (478 | ) |
| USD | 45,456 |
| BRL | 172,347 |
| Goldman Sachs & Co. | 9/18/19 | 454 |
|
| CAD | 828,285 |
| USD | 615,646 |
| Morgan Stanley | 9/18/19 | 12,510 |
|
|
| | | | | | | | | | |
| Currency Purchased | Currency Sold | Counterparty | Settlement Date | Unrealized Appreciation
(Depreciation) |
| USD | 308,715 |
| CAD | 406,575 |
| Morgan Stanley | 9/18/19 | $ | 376 |
|
| USD | 322,697 |
| CAD | 421,710 |
| Morgan Stanley | 9/18/19 | 2,880 |
|
| CHF | 310,080 |
| USD | 310,633 |
| UBS AG | 9/18/19 | 2,421 |
|
| CHF | 475,904 |
| USD | 482,197 |
| UBS AG | 9/18/19 | (1,729 | ) |
| CHF | 324,863 |
| USD | 332,858 |
| UBS AG | 9/18/19 | (4,880 | ) |
| USD | 317,112 |
| CHF | 310,080 |
| UBS AG | 9/18/19 | 4,058 |
|
| USD | 77,518 |
| CHF | 76,659 |
| UBS AG | 9/18/19 | 124 |
|
| CLP | 217,469,749 |
| USD | 317,892 |
| Goldman Sachs & Co. | 9/23/19 | (8,903 | ) |
| USD | 319,879 |
| CLP | 217,469,749 |
| Goldman Sachs & Co. | 9/23/19 | 10,890 |
|
| CNY | 2,242,278 |
| USD | 326,197 |
| Morgan Stanley | 9/18/19 | (1,554 | ) |
| CNY | 2,242,279 |
| USD | 326,197 |
| Morgan Stanley | 9/18/19 | (1,554 | ) |
| CNY | 1,111,546 |
| USD | 161,797 |
| Morgan Stanley | 9/18/19 | (864 | ) |
| USD | 82,321 |
| CNY | 566,669 |
| Morgan Stanley | 9/18/19 | 277 |
|
| USD | 141,419 |
| CNY | 974,097 |
| Morgan Stanley | 9/18/19 | 387 |
|
| COP | 1,034,534,031 |
| USD | 306,467 |
| Goldman Sachs & Co. | 9/18/19 | 7,934 |
|
| USD | 320,337 |
| COP | 1,034,534,031 |
| Goldman Sachs & Co. | 9/18/19 | 5,936 |
|
| USD | 289,615 |
| COP | 939,292,430 |
| Goldman Sachs & Co. | 9/18/19 | 4,158 |
|
| CZK | 7,218,427 |
| USD | 322,309 |
| UBS AG | 9/18/19 | (11,222 | ) |
| CZK | 7,450,078 |
| USD | 329,102 |
| UBS AG | 9/18/19 | (8,031 | ) |
| USD | 320,521 |
| CZK | 7,218,427 |
| UBS AG | 9/18/19 | 9,434 |
|
| USD | 32,540 |
| CZK | 747,380 |
| UBS AG | 9/18/19 | 330 |
|
| USD | 291,194 |
| CZK | 6,702,698 |
| UBS AG | 9/18/19 | 2,333 |
|
| EUR | 138,306 |
| USD | 155,676 |
| JPMorgan Chase Bank N.A. | 9/18/19 | (1,990 | ) |
| EUR | 275,017 |
| USD | 310,544 |
| JPMorgan Chase Bank N.A. | 9/18/19 | (4,945 | ) |
| EUR | 286,054 |
| USD | 322,716 |
| JPMorgan Chase Bank N.A. | 9/18/19 | (4,853 | ) |
| EUR | 290,746 |
| USD | 329,108 |
| JPMorgan Chase Bank N.A. | 9/18/19 | (6,031 | ) |
| USD | 312,732 |
| EUR | 273,249 |
| JPMorgan Chase Bank N.A. | 9/18/19 | 9,098 |
|
| USD | 159,735 |
| EUR | 140,074 |
| JPMorgan Chase Bank N.A. | 9/18/19 | 4,085 |
|
| USD | 322,482 |
| EUR | 286,054 |
| JPMorgan Chase Bank N.A. | 9/18/19 | 4,619 |
|
| USD | 327,502 |
| EUR | 290,746 |
| JPMorgan Chase Bank N.A. | 9/18/19 | 4,425 |
|
| USD | 13,112 |
| GBP | 10,261 |
| Bank of America N.A. | 9/18/19 | 606 |
|
| HUF | 5,042,094 |
| USD | 17,842 |
| UBS AG | 9/18/19 | (679 | ) |
| HUF | 93,481,190 |
| USD | 324,182 |
| UBS AG | 9/18/19 | (5,986 | ) |
| HUF | 13,957,310 |
| USD | 47,666 |
| UBS AG | 9/18/19 | (158 | ) |
| USD | 621,348 |
| HUF | 179,977,291 |
| UBS AG | 9/18/19 | 8,731 |
|
| USD | 10,606 |
| HUF | 3,050,972 |
| UBS AG | 9/18/19 | 221 |
|
| USD | 339,558 |
| HUF | 96,040,336 |
| UBS AG | 9/18/19 | 12,651 |
|
| USD | 15,308 |
| HUF | 4,414,385 |
| UBS AG | 9/18/19 | 282 |
|
| ILS | 1,170,257 |
| USD | 329,427 |
| UBS AG | 9/18/19 | 4,778 |
|
| ILS | 249,115 |
| USD | 70,967 |
| UBS AG | 9/18/19 | 176 |
|
| ILS | 1,025,702 |
| USD | 294,577 |
| UBS AG | 9/18/19 | (1,655 | ) |
| ILS | 1,036,781 |
| USD | 298,114 |
| UBS AG | 9/18/19 | (2,028 | ) |
| USD | 616,637 |
| ILS | 2,220,758 |
| UBS AG | 9/18/19 | (17,572 | ) |
| USD | 25,127 |
| ILS | 90,120 |
| UBS AG | 9/18/19 | (610 | ) |
| USD | 332,173 |
| ILS | 1,170,977 |
| UBS AG | 9/18/19 | (2,237 | ) |
| USD | 293,015 |
| ILS | 1,023,591 |
| UBS AG | 9/18/19 | 696 |
|
|
| | | | | | | | | | |
| Currency Purchased | Currency Sold | Counterparty | Settlement Date | Unrealized Appreciation
(Depreciation) |
| JPY | 33,665,311 |
| USD | 312,683 |
| Bank of America N.A. | 9/18/19 | $ | (2,141 | ) |
| JPY | 8,421,350 |
| USD | 77,785 |
| Bank of America N.A. | 9/18/19 | (103 | ) |
| USD | 309,526 |
| JPY | 33,665,311 |
| Bank of America N.A. | 9/18/19 | (1,015 | ) |
| USD | 480,761 |
| JPY | 52,057,272 |
| Bank of America N.A. | 9/18/19 | 565 |
|
| USD | 333,054 |
| JPY | 35,771,956 |
| Bank of America N.A. | 9/18/19 | 3,080 |
|
| KZT | 117,008,666 |
| USD | 301,724 |
| Goldman Sachs & Co. | 9/18/19 | (3 | ) |
| KZT | 64,178,527 |
| USD | 166,524 |
| Goldman Sachs & Co. | 9/18/19 | (1,032 | ) |
| USD | 31,681 |
| KZT | 12,323,835 |
| Goldman Sachs & Co. | 9/18/19 | (98 | ) |
| MXN | 2,947,886 |
| USD | 151,652 |
| Morgan Stanley | 9/18/19 | 984 |
|
| MXN | 6,122,331 |
| USD | 315,389 |
| Morgan Stanley | 9/18/19 | 1,613 |
|
| MXN | 6,079,416 |
| USD | 313,943 |
| Morgan Stanley | 9/18/19 | 837 |
|
| MXN | 5,105,287 |
| USD | 266,602 |
| Morgan Stanley | 9/18/19 | (2,260 | ) |
| USD | 146,774 |
| MXN | 2,947,886 |
| Morgan Stanley | 9/18/19 | (5,861 | ) |
| USD | 316,017 |
| MXN | 6,165,644 |
| Morgan Stanley | 9/18/19 | (3,228 | ) |
| USD | 141,753 |
| MXN | 2,725,904 |
| Morgan Stanley | 9/18/19 | 611 |
|
| MYR | 1,312,321 |
| USD | 318,138 |
| Goldman Sachs & Co. | 9/18/19 | (418 | ) |
| MYR | 991,142 |
| USD | 241,565 |
| Goldman Sachs & Co. | 9/18/19 | (1,604 | ) |
| USD | 47,680 |
| MYR | 196,539 |
| Goldman Sachs & Co. | 9/18/19 | 97 |
|
| NOK | 10,696,793 |
| USD | 1,225,979 |
| Goldman Sachs & Co. | 9/18/19 | (16,633 | ) |
| NOK | 167,933 |
| USD | 19,785 |
| Goldman Sachs & Co. | 9/18/19 | (799 | ) |
| NOK | 2,632,588 |
| USD | 300,882 |
| Goldman Sachs & Co. | 9/18/19 | (3,249 | ) |
| USD | 313,352 |
| NOK | 2,676,280 |
| Goldman Sachs & Co. | 9/18/19 | 10,780 |
|
| USD | 303,505 |
| NOK | 2,591,080 |
| Goldman Sachs & Co. | 9/18/19 | 10,565 |
|
| USD | 60,727 |
| NOK | 528,898 |
| Goldman Sachs & Co. | 9/18/19 | 931 |
|
| NZD | 461,190 |
| USD | 305,843 |
| Bank of America N.A. | 9/18/19 | (2,727 | ) |
| NZD | 242,885 |
| USD | 162,359 |
| Bank of America N.A. | 9/18/19 | (2,724 | ) |
| USD | 459,226 |
| NZD | 704,075 |
| Bank of America N.A. | 9/18/19 | (3,525 | ) |
| PEN | 663,891 |
| USD | 200,753 |
| Goldman Sachs & Co. | 9/18/19 | (216 | ) |
| USD | 457,448 |
| PEN | 1,546,038 |
| Goldman Sachs & Co. | 9/18/19 | (9,553 | ) |
| USD | 481,000 |
| PEN | 1,586,337 |
| Goldman Sachs & Co. | 9/18/19 | 1,825 |
|
| USD | 960,503 |
| PEN | 3,167,451 |
| Goldman Sachs & Co. | 9/18/19 | 3,732 |
|
| USD | 45,147 |
| PEN | 148,675 |
| Goldman Sachs & Co. | 9/18/19 | 238 |
|
| PHP | 1,235,536 |
| USD | 24,164 |
| Goldman Sachs & Co. | 9/18/19 | 48 |
|
| USD | 336,722 |
| PHP | 17,683,318 |
| Goldman Sachs & Co. | 9/18/19 | (9,797 | ) |
| PLN | 146,709 |
| USD | 38,835 |
| Goldman Sachs & Co. | 9/18/19 | (940 | ) |
| PLN | 1,197,896 |
| USD | 321,825 |
| Goldman Sachs & Co. | 9/18/19 | (12,405 | ) |
| PLN | 1,866,575 |
| USD | 493,614 |
| Goldman Sachs & Co. | 9/18/19 | (11,473 | ) |
| PLN | 432,405 |
| USD | 112,711 |
| Goldman Sachs & Co. | 9/18/19 | (1,020 | ) |
| USD | 1,537,978 |
| PLN | 5,909,834 |
| Goldman Sachs & Co. | 9/18/19 | 11,453 |
|
| USD | 25,467 |
| PLN | 96,757 |
| Goldman Sachs & Co. | 9/18/19 | 475 |
|
| USD | 26,036 |
| PLN | 97,500 |
| Goldman Sachs & Co. | 9/18/19 | 852 |
|
| USD | 309,497 |
| PLN | 1,161,759 |
| Goldman Sachs & Co. | 9/18/19 | 9,412 |
|
| USD | 32,927 |
| PLN | 124,573 |
| Goldman Sachs & Co. | 9/18/19 | 750 |
|
| USD | 42,355 |
| PLN | 160,739 |
| Goldman Sachs & Co. | 9/18/19 | 836 |
|
| SEK | 7,356,343 |
| USD | 777,252 |
| Goldman Sachs & Co. | 9/18/19 | (13,156 | ) |
| SEK | 1,441,051 |
| USD | 152,803 |
| Goldman Sachs & Co. | 9/18/19 | (3,122 | ) |
|
| | | | | | | | | | |
| Currency Purchased | Currency Sold | Counterparty | Settlement Date | Unrealized Appreciation
(Depreciation) |
| SEK | 259,110 |
| USD | 27,443 |
| Goldman Sachs & Co. | 9/18/19 | $ | (529 | ) |
| USD | 478,747 |
| SEK | 4,474,030 |
| Goldman Sachs & Co. | 9/18/19 | 14,033 |
|
| USD | 46,559 |
| SEK | 440,499 |
| Goldman Sachs & Co. | 9/18/19 | 805 |
|
| USD | 141,911 |
| SEK | 1,351,235 |
| Goldman Sachs & Co. | 9/18/19 | 1,560 |
|
| THB | 3,271,918 |
| USD | 105,973 |
| Goldman Sachs & Co. | 9/18/19 | (82 | ) |
| THB | 9,101,232 |
| USD | 296,699 |
| Goldman Sachs & Co. | 9/18/19 | (2,150 | ) |
| USD | 319,239 |
| THB | 9,832,252 |
| Goldman Sachs & Co. | 9/18/19 | 1,032 |
|
| USD | 236,771 |
| THB | 7,267,698 |
| Goldman Sachs & Co. | 9/18/19 | 1,562 |
|
| USD | 341,428 |
| THB | 10,534,586 |
| Goldman Sachs & Co. | 9/18/19 | 490 |
|
| USD | 163,047 |
| THB | 5,042,072 |
| Goldman Sachs & Co. | 9/18/19 | (133 | ) |
| ZAR | 2,264,974 |
| USD | 152,749 |
| UBS AG | 9/18/19 | 4,264 |
|
| ZAR | 13,434,027 |
| USD | 953,241 |
| UBS AG | 9/18/19 | (21,965 | ) |
| USD | 151,936 |
| ZAR | 2,264,974 |
| UBS AG | 9/18/19 | (5,076 | ) |
| USD | 940,682 |
| ZAR | 13,434,027 |
| UBS AG | 9/18/19 | 9,406 |
|
| | | | | | | $ | (6,528 | ) |
|
| | | | | | | | | | | |
| FUTURES CONTRACTS PURCHASED | | | | |
| Reference Entity | Contracts | Expiration
Date | Notional
Amount | Underlying
Contract
Value | Unrealized
Appreciation
(Depreciation) |
| U.S. Treasury 10-Year Ultra Notes | 1 | September 2019 | $ | 100,000 |
| $ | 137,844 |
| $ | 2,460 |
|
|
| | | | | | | | | | | |
| FUTURES CONTRACTS SOLD | | | | |
| Reference Entity | Contracts | Expiration
Date | Notional
Amount | Underlying
Contract
Value | Unrealized
Appreciation
(Depreciation) |
| U.S. Treasury 10-Year Notes | 80 | September 2019 | $ | 8,000,000 |
| $ | 10,193,750 |
| $ | (101,430 | ) |
|
| | | | | | | | | | | | | | | |
| CENTRALLY CLEARED CREDIT DEFAULT SWAP AGREEMENTS |
| Reference Entity | Type‡ | Fixed Rate
Received
(Paid) | Termination
Date | Notional
Amount | Premiums
Paid
(Received) | Unrealized
Appreciation
(Depreciation) | Value^ |
| Markit CDX North America High Yield Index Series 32 | Sell | 5.00% | 6/20/24 | $ | 297,000 |
| $ | 19,942 |
| $ | 4,176 |
| $ | 24,118 |
|
| Markit CDX North America Investment Grade Index Series 32 | Sell | 1.00% | 6/20/24 | $ | 100,000 |
| 2,221 |
| 52 |
| 2,273 |
|
| | | | | | $ | 22,163 |
| $ | 4,228 |
| $ | 26,391 |
|
‡ The maximum potential amount the fund could be required to deliver as a seller of credit protection if a credit event occurs as defined under the terms of the agreement is the notional amount. The maximum potential amount may be partially offset by any recovery values of the reference entities and upfront payments received upon entering into the agreement.
^ The value for credit default swap agreements serve as an indicator of the current status of the payment/performance risk and represent the likelihood of an expected liability or profit at the period end. Increasing values in absolute terms when compared to the notional amount of the credit default swap agreement represent a deterioration of the referenced entity's credit soundness and an increased likelihood or risk of a credit event occurring as defined in the agreement.
|
| | |
| NOTES TO SCHEDULE OF INVESTMENTS |
| ADR | - | American Depositary Receipt |
| AUD | - | Australian Dollar |
| BRL | - | Brazilian Real |
| CAD | - | Canadian Dollar |
| CDX | - | Credit Derivatives Indexes |
| CHF | - | Swiss Franc |
| CLP | - | Chilean Peso |
| CNY | - | Chinese Yuan |
| COP | - | Colombian Peso |
| CZK | - | Czech Koruna |
| EUR | - | Euro |
| FHLMC | - | Federal Home Loan Mortgage Corporation |
| FNMA | - | Federal National Mortgage Association |
| GBP | - | British Pound |
| GDR | - | Global Depositary Receipt |
| H15T1Y | - | Constant Maturity U.S. Treasury Note Yield Curve Rate Index |
| HUF | - | Hungarian Forint |
| ILS | - | Israeli Shekel |
| JPY | - | Japanese Yen |
| KZT | - | Kazakhstani Tenge |
| LIBOR | - | London Interbank Offered Rate |
| MTN | - | Medium Term Note |
| MXN | - | Mexican Peso |
| MYR | - | Malaysian Ringgit |
| NOK | - | Norwegian Krone |
| NZD | - | New Zealand Dollar |
| PEN | - | Peruvian Sol |
| PHP | - | Philippine Peso |
| PLN | - | Polish Zloty |
| SEK | - | Swedish Krona |
| SEQ | - | Sequential Payer |
| THB | - | Thai Baht |
| USD | - | United States Dollar |
| VRN | - | Variable Rate Note. The rate adjusts periodically based upon the terms set forth in the security’s offering documents. The rate shown is effective at the period end and the reference rate and spread, if any, is indicated. |
| ZAR | - | South African Rand |
| |
| † | Category is less than 0.05% of total net assets. |
| |
| (1) | Investments are funds within the American Century Investments family of funds and are considered affiliated funds. |
| |
| (3) | Equity-linked debt security. The aggregated value of these securities at the period end was $270,535, which represented 0.5% of total net assets. |
| |
| (4) | Security was purchased pursuant to Rule 144A under the Securities Act of 1933 and may be sold in transactions exempt from registration, normally to qualified institutional investors. The aggregate value of these securities at the period end was $1,131,785, which represented 1.9% of total net assets. |
| |
| (5) | Security, or a portion thereof, has been pledged at the custodian bank or with a broker for collateral requirements on forward foreign currency exchange contracts, futures contracts and/or swap agreements. At the period end, the aggregate value of securities pledged was $124,141. |
| |
| (6) | The rate indicated is the yield to maturity at purchase. |
See Notes to Financial Statements.
|
|
| Statement of Assets and Liabilities |
|
| | | |
| JULY 31, 2019 |
| Assets |
| Investment securities - affiliated, at value (cost of $29,467,169) | $ | 29,763,404 |
|
| Investment securities - unaffiliated, at value (cost of $27,517,081) | 29,130,183 |
|
| Total investment securities, at value (cost of $56,984,250) | 58,893,587 |
|
| Cash | 18,178 |
|
| Foreign currency holdings, at value (cost of $3,236) | 3,235 |
|
| Receivable for investments sold | 57,141 |
|
| Receivable for capital shares sold | 81,600 |
|
| Receivable for variation margin on swap agreements | 17,265 |
|
| Unrealized appreciation on forward foreign currency exchange contracts | 242,593 |
|
| Dividends and interest receivable | 183,253 |
|
| | 59,496,852 |
|
| | |
| Liabilities |
| Payable for investments purchased | 302,983 |
|
| Payable for capital shares redeemed | 7,744 |
|
| Payable for variation margin on futures contracts | 5,828 |
|
| Unrealized depreciation on forward foreign currency exchange contracts | 249,121 |
|
| Accrued management fees | 29,901 |
|
| Distribution and service fees payable | 4,474 |
|
| | 600,051 |
|
| | |
| Net Assets | $ | 58,896,801 |
|
| | |
| Net Assets Consist of: |
| Capital (par value and paid-in surplus) | $ | 58,662,348 |
|
| Distributable earnings | 234,453 |
|
| | $ | 58,896,801 |
|
|
| | | | | | |
| | Net Assets | Shares Outstanding | Net Asset Value Per Share |
| Investor Class, $0.01 Par Value |
| $25,047,764 |
| 2,551,753 |
| $9.82 |
| I Class, $0.01 Par Value |
| $27,799,716 |
| 2,831,554 |
| $9.82 |
| Y Class, $0.01 Par Value |
| $5,511 |
| 561 |
| $9.82 |
| A Class, $0.01 Par Value |
| $2,388,973 |
| 243,410 |
| $9.81* |
| C Class, $0.01 Par Value |
| $3,457,345 |
| 352,459 |
| $9.81 |
| R Class, $0.01 Par Value |
| $103,761 |
| 10,573 |
| $9.81 |
| R5 Class, $0.01 Par Value |
| $5,497 |
| 559 |
| $9.83 |
| R6 Class, $0.01 Par Value |
| $88,234 |
| 8,985 |
| $9.82 |
*Maximum offering price $10.41 (net asset value divided by 0.9425).
See Notes to Financial Statements.
|
| | | |
| YEAR ENDED JULY 31, 2019 |
| Investment Income (Loss) | |
| Income: | |
| Income distributions from underlying funds (including $1,431,013 from affiliated funds) | $ | 1,971,118 |
|
| Dividends (net of foreign taxes withheld of $26,739) | 821,302 |
|
| Interest | 462,336 |
|
| | 3,254,756 |
|
| | |
| Expenses: | |
| Management fees | 524,038 |
|
| Distribution and service fees: | |
| A Class | 8,473 |
|
| C Class | 38,092 |
|
| R Class | 9,631 |
|
| Directors' fees and expenses | 1,705 |
|
| Other expenses | 6,523 |
|
| | 588,462 |
|
Fees waived(1)
| (156,917 | ) |
| | 431,545 |
|
| | |
| Net investment income (loss) | 2,823,211 |
|
| | |
| Realized and Unrealized Gain (Loss) |
| Net realized gain (loss) on: | |
| Investment transactions (including $(538,923) from affiliated funds) | (361,822 | ) |
| Forward foreign currency exchange contract transactions | (31,649 | ) |
| Futures contract transactions | (562,790 | ) |
| Swap agreement transactions | 11,917 |
|
| Foreign currency translation transactions | (1,295 | ) |
| Capital gain distributions received from affiliated funds | 12,651 |
|
| | (932,988 | ) |
| | |
| Change in net unrealized appreciation (depreciation) on: | |
| Investments (including $(82,617) from affiliated funds) | 221,702 |
|
| Forward foreign currency exchange contracts | (12,962 | ) |
| Futures contracts | (98,936 | ) |
| Swap agreements | 1,059 |
|
| Translation of assets and liabilities in foreign currencies | (64 | ) |
| | 110,799 |
|
| | |
| Net realized and unrealized gain (loss) | (822,189 | ) |
| | |
| Net Increase (Decrease) in Net Assets Resulting from Operations | $ | 2,001,022 |
|
| |
| (1) | Amount consists of $99,649, $29,091, $14, $8,599, $9,718, $4,909, $14 and $4,923 for Investor Class, I Class, Y Class, A Class, C Class, R Class, R5 Class and R6 Class, respectively. |
See Notes to Financial Statements.
|
|
| Statement of Changes in Net Assets |
|
| | | | | | | | | |
YEAR ENDED JULY 31, 2019, EIGHT MONTHS ENDED JULY 31, 2018 AND YEAR ENDED NOVEMBER 30, 2017 |
| Increase (Decrease) in Net Assets | July 31, 2019 | July 31, 2018(1) | November 30, 2017 |
| Operations | |
| Net investment income (loss) | $ | 2,823,211 |
| $ | 1,862,250 |
| $ | 2,371,402 |
|
| Net realized gain (loss) | (932,988 | ) | 368,603 |
| 605,427 |
|
| Change in net unrealized appreciation (depreciation) | 110,799 |
| (1,444,564 | ) | 2,932,818 |
|
| Net increase (decrease) in net assets resulting from operations | 2,001,022 |
| 786,289 |
| 5,909,647 |
|
| | | | |
| Distributions to Shareholders | |
From earnings:(2) | | | |
| Investor Class | (1,996,030) |
| (1,558,898) |
| (2,149,271) |
|
| I Class | (643,040) |
| (136,015) |
| (95,222) |
|
| Y Class | (296) |
| (199) |
| (143) |
|
| A Class | (160,602) |
| (79,859) |
| (107,508) |
|
| C Class | (159,597) |
| (82,522) |
| (72,496) |
|
| R Class | (84,681) |
| (62,923) |
| (78,177) |
|
| R5 Class | (287) |
| (194) |
| (138) |
|
| R6 Class | (99,392) |
| (72,164) |
| (92,225) |
|
| Decrease in net assets from distributions | (3,143,925) |
| (1,992,774) |
| (2,595,180) |
|
| | | | |
| Capital Share Transactions | |
| Net increase (decrease) in net assets from capital share transactions (Note 5) | 1,216,293 |
| 2,393,760 |
| 1,667,409 |
|
| | | | |
| Net increase (decrease) in net assets | 73,390 |
| 1,187,275 |
| 4,981,876 |
|
| | | | |
| Net Assets | |
| Beginning of period | 58,823,411 |
| 57,636,136 |
| 52,654,260 |
|
| End of period | $ | 58,896,801 |
| $ | 58,823,411 |
| $ | 57,636,136 |
|
| |
| (1) | The fund's fiscal year end was changed from November 30 to July 31, resulting in an eight-month annual reporting period. |
| |
| (2) | Prior periods presentation has been updated to reflect the current period combination of distributions to shareholders from net investment income and net realized gains. For the eight months ended July 31, 2018, distributions from net investment income were $(1,499,653), $(131,628), $(192), $(76,802), $(79,327), $(60,348), $(187) and $(69,625) for Investor Class, I Class, Y Class, A Class, C Class, R Class, R5 Class and R6 Class, respectively. For the eight months ended July 31, 2018, distributions from net realized gains were $(59,245), $(4,387), $(7), $(3,057), $(3,195), $(2,575), $(7) and $(2,539) for Investor Class, I Class, Y Class, A Class, C Class, R Class, R5 Class and R6 Class, respectively. |
For the year ended November 30, 2017, distributions from net investment income were $(2,149,271), $(95,222), $(143), $(107,508), $(72,496), $(78,177), $(138) and $(92,225) for Investor Class, I Class, Y Class, A Class, C Class, R Class, R5 Class and R6 Class, respectively.
See Notes to Financial Statements.
|
|
| Notes to Financial Statements |
JULY 31, 2019
1. Organization
American Century Strategic Asset Allocations, Inc. (the corporation) is registered under the Investment Company Act of 1940, as amended (the 1940 Act), as an open-end management investment company and is organized as a Maryland corporation. Multi-Asset Income Fund (the fund) is one fund in a series issued by the corporation. The fund may invest in varying combinations of other American Century Investments funds (affiliated funds), unaffiliated funds such as exchange-traded funds, equity and debt securities, and certain derivative instruments. The fund may invest in affiliated and unaffiliated funds (collectively, the underlying funds) to an unlimited extent. The fund will assume the risks associated with the underlying funds. The fund's investment objective is to seek income. Long-term capital appreciation is a secondary objective.
The fund offers the Investor Class, I Class, Y Class, A Class, C Class, R Class, R5 Class and R6 Class. The A Class may incur an initial sales charge. The A Class and C Class may be subject to a contingent deferred sales charge. Sale of the Y Class and R5 Class commenced on April 10, 2017.
2. Significant Accounting Policies
The following is a summary of significant accounting policies consistently followed by the fund in preparation of its financial statements. The fund is an investment company and follows accounting and reporting guidance in accordance with accounting principles generally accepted in the United States of America. This may require management to make certain estimates and assumptions at the date of the financial statements. Actual results could differ from these estimates. Management evaluated the impact of events or transactions occurring through the date the financial statements were issued that would merit recognition or disclosure.
Investment Valuations — The fund determines the fair value of its investments and computes its net asset value per share at the close of regular trading (usually 4 p.m. Eastern time) on the New York Stock Exchange (NYSE) on each day the NYSE is open. The Board of Directors has adopted valuation policies and procedures to guide the investment advisor in the fund’s investment valuation process and to provide methodologies for the oversight of the fund’s pricing function.
Equity securities that are listed or traded on a domestic securities exchange are valued at the last reported sales price or at the official closing price as provided by the exchange. Equity securities traded on foreign securities exchanges are generally valued at the closing price of such securities on the exchange where primarily traded or at the close of the NYSE, if that is earlier. If no last sales price is reported, or if local convention or regulation so provides, the mean of the latest bid and asked prices may be used. Securities traded over-the-counter are valued at the mean of the latest bid and asked prices, the last sales price, or the official closing price. Equity securities initially expressed in local currencies are translated into U.S. dollars at the mean of the appropriate currency exchange rate at the close of the NYSE as provided by an independent pricing service.
Fixed income securities are valued at the evaluated mean as provided by independent pricing services or at the mean of the most recent bid and asked prices as provided by investment dealers. Corporate bonds, U.S. Treasury and Government Agency securities, convertible bonds, municipal securities, and sovereign governments and agencies are valued using market models that consider trade data, quotations from dealers and active market makers, relevant yield curve and spread data, creditworthiness, trade data or market information on comparable securities, and other relevant security specific information. Mortgage-related and asset-backed securities are valued based on models that consider trade data, prepayment and default projections, benchmark yield and spread data and estimated cash flows of each tranche of the issuer. Collateralized loan obligations are valued based on discounted cash flow models that consider trade and economic data, prepayment assumptions and default projections. Fixed income securities initially expressed in local currencies are translated into U.S. dollars at the mean of the appropriate currency exchange rate at the close of the NYSE as provided by an independent pricing service.
Open-end management investment companies are valued at the reported net asset value per share. Exchange-traded futures contracts are valued at the settlement price as provided by the appropriate exchange. Swap agreements are valued at an evaluated mean as provided by independent pricing services or independent brokers. Forward foreign currency exchange contracts are valued at the mean of the appropriate forward exchange rate at the close of the NYSE as provided by an independent pricing service.
If the fund determines that the market price for an investment is not readily available or the valuation methods mentioned above do not reflect an investment’s fair value, such investment is valued as determined in good faith by the Board of Directors or its delegate, in accordance with policies and procedures adopted by the Board of Directors. In its determination of fair value, the fund may review several factors including, but not limited to, market information regarding the specific investment or comparable investments and correlation with other investment types, futures indices or general market indicators. Circumstances that may cause the fund to use these procedures to value an investment include, but are not limited to: an investment has been declared in default or is distressed; trading in a security has been suspended during the trading day or a security is not actively trading on its principal exchange; prices received from a regular pricing source are deemed unreliable; or there is a foreign market holiday and no trading occurred.
The fund monitors for significant events occurring after the close of an investment’s primary exchange but before the fund’s net asset value per share is determined. Significant events may include, but are not limited to: corporate announcements and transactions; governmental action and political unrest that could impact a specific investment or an investment sector; or armed conflicts, natural disasters and similar events that could affect investments in a specific country or region. The fund also monitors for significant fluctuations between domestic and foreign markets, as evidenced by the U.S. market or such other indicators that the Board of Directors, or its delegate, deems appropriate. The fund may apply a model-derived factor to the closing price of equity securities traded on foreign securities exchanges. The factor is based on observable market data as provided by an independent pricing service.
Security Transactions — Security transactions are accounted for as of the trade date. Net realized gains and losses are determined on the identified cost basis, which is also used for federal income tax purposes.
Investment Income — Income and capital gain distributions, if any, from the underlying funds, are recorded as of the ex-dividend date. Long-term capital gain distributions, if any, are a component of net realized gain (loss). Dividend income less foreign taxes withheld, if any, is recorded as of the ex-dividend date. Distributions received on securities that represent a return of capital or long-term capital gain are recorded as a reduction of cost of investments and/or as a realized gain. The fund may estimate the components of distributions received that may be considered nontaxable distributions or long-term capital gain distributions for income tax purposes. Interest income is recorded on the accrual basis and includes paydown gain (loss) and accretion of discounts and amortization of premiums. Inflation adjustments related to inflation-linked debt securities are reflected as interest income.
Equity-Linked Debt and Linked-Equity Securities — The fund may invest in hybrid equity securities, which usually convert into common stock at a date predetermined by the issuer. These securities generally offer a higher dividend yield than that of the common stock to which the security is linked. These instruments are issued by a company other than the one to which the security is linked and carry the credit of the issuer, not that of the underlying common stock. The securities’ appreciation is limited based on a predetermined final cap price at the date of the conversion. Risks of investing in these securities include, but are not limited to, a set time to capture the yield advantage, limited appreciation potential, decline in value of the underlying stock, and failure of the issuer to pay dividends or to deliver common stock at maturity.
Foreign Currency Translations — All assets and liabilities initially expressed in foreign currencies are translated into U.S. dollars at prevailing exchange rates at period end. The fund may enter into spot foreign currency exchange contracts to facilitate transactions denominated in a foreign currency. Purchases and sales of investment securities, dividend and interest income, spot foreign currency exchange contracts, and expenses are translated at the rates of exchange prevailing on the respective dates of such transactions. Net realized and unrealized foreign currency exchange gains or losses related to investment securities are a component of net realized gain (loss) on investment transactions and change in net unrealized appreciation (depreciation) on investments, respectively.
Segregated Assets — In accordance with the 1940 Act, the fund segregates assets on its books and records to cover certain types of investment securities and other financial instruments. American Century Investment Management, Inc. (ACIM) (the investment advisor) monitors, on a daily basis, the securities segregated to ensure the fund designates a sufficient amount of liquid assets, marked-to-market daily. The fund may also receive assets or be required to pledge assets at the custodian bank or with a broker for collateral requirements.
Income Tax Status — It is the fund’s policy to distribute substantially all net investment income and net realized gains to shareholders and to otherwise qualify as a regulated investment company under provisions of the Internal Revenue Code. Accordingly, no provision has been made for income taxes. The fund files U.S. federal, state, local and non-U.S. tax returns as applicable. The fund's tax returns are subject to examination by the relevant taxing authority until expiration of the applicable statute of limitations, which is generally three years from the date of filing but can be longer in certain jurisdictions. At this time, management believes there are no uncertain tax positions which, based on their technical merit, would not be sustained upon examination and for which it is reasonably possible that the total amounts of unrecognized tax benefits will significantly change in the next twelve months.
Multiple Class — All shares of the fund represent an equal pro rata interest in the net assets of the class to which such shares belong, and have identical voting, dividend, liquidation and other rights and the same terms and conditions, except for class specific expenses and exclusive rights to vote on matters affecting only individual classes. Income, non-class specific expenses, and realized and unrealized capital gains and losses of the fund are allocated to each class of shares based on their relative net assets.
Distributions to Shareholders — Distributions from net investment income, if any, are generally declared and paid monthly. Distributions from net realized gains, if any, are generally declared and paid annually.
Indemnifications — Under the corporation’s organizational documents, its officers and directors are indemnified against certain liabilities arising out of the performance of their duties to the fund. In addition, in the normal course of business, the fund enters into contracts that provide general indemnifications. The maximum exposure under these arrangements is unknown as this would involve future claims that may be made against a fund. The risk of material loss from such claims is considered by management to be remote.
3. Fees and Transactions with Related Parties
Certain officers and directors of the corporation are also officers and/or directors of American Century Companies, Inc. (ACC). The corporation’s investment advisor, ACIM, the corporation's distributor, American Century Investment Services, Inc. (ACIS), and the corporation’s transfer agent, American Century Services, LLC, are wholly owned, directly or indirectly, by ACC. ACIM serves as the investment advisor for the affiliated funds.
Management Fees — The corporation has entered into a management agreement with ACIM, under which ACIM provides the fund with investment advisory and management services in exchange for a single, unified management fee (the fee) per class. The agreement provides that all expenses of managing and operating the fund, except distribution and service fees, brokerage expenses, taxes, interest, fees and expenses of the independent directors (including legal counsel fees), and extraordinary expenses, will be paid by ACIM. The fee is computed and accrued daily based on each class's daily net assets and paid monthly in arrears. The difference in the fee among the classes is a result of their separate arrangements for non-Rule 12b-1 shareholder services. It is not the result of any difference in advisory or custodial fees or other expenses related to the management of the fund’s assets, which do not vary by class. The investment advisor will waive the portion of the fund’s management fee equal to the expenses attributable to the management fees of the American Century Investments funds in which the fund invests. The amount of this waiver will fluctuate depending on the fund’s daily allocations to other American Century Investments funds. This waiver is expected to remain in effect permanently and it cannot be terminated without the approval of the Board of Directors. During the period ended July 31, 2019, the investment advisor agreed to waive an additional 0.07% of the fund's management fee. The investment advisor expects this waiver to continue until July 31, 2020 and cannot terminate it prior to such date without the approval of the Board of Directors.
The annual management fee and the effective annual management fee after waiver for each class for the period ended July 31, 2019 are as follows:
|
| | |
| | Annual Management Fee | Effective Annual Management Fee After Waiver |
| Investor Class | 0.90% | 0.65% |
| I Class | 0.70% | 0.45% |
| Y Class | 0.55% | 0.30% |
| A Class | 0.90% | 0.65% |
| C Class | 0.90% | 0.65% |
| R Class | 0.90% | 0.65% |
| R5 Class | 0.70% | 0.45% |
| R6 Class | 0.55% | 0.30% |
Distribution and Service Fees — The Board of Directors has adopted a separate Master Distribution and Individual Shareholder Services Plan for each of the A Class, C Class and R Class (collectively the plans), pursuant to Rule 12b-1 of the 1940 Act. The plans provide that the A Class will pay ACIS an annual distribution and service fee of 0.25%. The plans provide that the C Class will pay ACIS an annual distribution and service fee of 1.00%, of which 0.25% is paid for individual shareholder services and 0.75% is paid for distribution services. The plans provide that the R Class will pay ACIS an annual distribution and service fee of 0.50%. The fees are computed and accrued daily based on each class’s daily net assets and paid monthly in arrears. The fees are used to pay financial intermediaries for distribution and individual shareholder services. Fees incurred under the plans during the period ended July 31, 2019 are detailed in the Statement of Operations.
Directors' Fees and Expenses — The Board of Directors is responsible for overseeing the investment advisor’s management and operations of the fund. The directors receive detailed information about the fund and its investment advisor regularly throughout the year, and meet at least quarterly with management of the investment advisor to review reports about fund operations. The fund’s officers do not receive compensation from the fund.
Acquired Fund Fees and Expenses — The fund may invest in mutual funds, exchange-traded funds, and business development companies (the acquired funds). The fund will indirectly realize its pro rata share of the fees and expenses of the acquired funds in which it invests. These indirect fees and expenses are not paid out of the fund's assets but are reflected in the return realized by the fund on its investment in the acquired funds.
4. Investment Transactions
Purchases of investment securities, excluding short-term investments, for the period ended July 31, 2019 totaled $121,422,452, of which $752,252 represented U.S. Treasury and Government Agency obligations.
Sales of investment securities, excluding short-term investments, for the period ended July 31, 2019 totaled $121,437,129, of which $617,284 represented U.S. Treasury and Government Agency obligations.
5. Capital Share Transactions
Transactions in shares of the fund were as follows:
|
| | | | | | | | | | | | | | | |
| | Year ended July 31, 2019 | Eight months ended July 31, 2018(1) | Year ended November 30, 2017(2) |
| | Shares | Amount | Shares | Amount | Shares | Amount |
| Investor Class/Shares Authorized | 70,000,000 |
| | 70,000,000 |
| | 70,000,000 |
| |
| Sold | 1,831,570 |
| $ | 17,778,907 |
| 869,969 |
| $ | 8,801,395 |
| 1,184,007 |
| $ | 11,926,804 |
|
| Issued in reinvestment of distributions | 187,026 |
| 1,798,300 |
| 144,672 |
| 1,456,710 |
| 205,337 |
| 2,057,631 |
|
| Redeemed | (3,863,865 | ) | (37,770,909 | ) | (1,183,397 | ) | (12,025,055 | ) | (1,293,026 | ) | (13,045,080 | ) |
| | (1,845,269 | ) | (18,193,702 | ) | (168,756 | ) | (1,766,950 | ) | 96,318 |
| 939,355 |
|
| I Class/Shares Authorized | 45,000,000 |
| | 45,000,000 |
| | 45,000,000 |
| |
| Sold | 2,862,598 |
| 27,935,439 |
| 276,510 |
| 2,796,325 |
| 42,054 |
| 431,975 |
|
| Issued in reinvestment of distributions | 66,340 |
| 643,040 |
| 13,517 |
| 135,936 |
| 9,486 |
| 95,222 |
|
| Redeemed | (574,927 | ) | (5,553,374 | ) | (31,613 | ) | (316,013 | ) | (13,581 | ) | (139,012 | ) |
| | 2,354,011 |
| 23,025,105 |
| 258,414 |
| 2,616,248 |
| 37,959 |
| 388,185 |
|
| Y Class/Shares Authorized | 50,000,000 |
| | 50,000,000 |
| | 50,000,000 |
| |
| Sold | — |
| — |
| — |
| — |
| 497 |
| 5,000 |
|
| Issued in reinvestment of distributions | 30 |
| 296 |
| 20 |
| 199 |
| 14 |
| 143 |
|
| | 30 |
| 296 |
| 20 |
| 199 |
| 511 |
| 5,143 |
|
| A Class/Shares Authorized | 45,000,000 |
| | 45,000,000 |
| | 45,000,000 |
| |
| Sold | 271,584 |
| 2,637,228 |
| 29,073 |
| 295,690 |
| 75,183 |
| 764,923 |
|
| Issued in reinvestment of distributions | 16,544 |
| 159,318 |
| 7,834 |
| 78,884 |
| 10,740 |
| 107,508 |
|
| Redeemed | (286,615 | ) | (2,820,887 | ) | (8,837 | ) | (88,142 | ) | (119,789 | ) | (1,218,980 | ) |
| | 1,513 |
| (24,341 | ) | 28,070 |
| 286,432 |
| (33,866 | ) | (346,549 | ) |
| C Class/Shares Authorized | 45,000,000 |
| | 45,000,000 |
| | 45,000,000 |
| |
| Sold | 251,229 |
| 2,401,005 |
| 122,679 |
| 1,234,831 |
| 40,433 |
| 413,870 |
|
| Issued in reinvestment of distributions | 16,614 |
| 159,597 |
| 8,207 |
| 82,522 |
| 7,240 |
| 72,496 |
|
| Redeemed | (254,638 | ) | (2,474,146 | ) | (20,200 | ) | (202,134 | ) | (1,316 | ) | (13,258 | ) |
| | 13,205 |
| 86,456 |
| 110,686 |
| 1,115,219 |
| 46,357 |
| 473,108 |
|
| R Class/Shares Authorized | 50,000,000 |
| | 50,000,000 |
| | 50,000,000 |
| |
| Sold | 1,649 |
| 16,130 |
| 2,905 |
| 29,218 |
| 3,445 |
| 35,079 |
|
| Issued in reinvestment of distributions | 8,809 |
| 84,681 |
| 6,249 |
| 62,923 |
| 7,804 |
| 78,177 |
|
| Redeemed | (196,436 | ) | (1,947,440 | ) | (2,135 | ) | (21,887 | ) | (246 | ) | (2,452 | ) |
| | (185,978 | ) | (1,846,629 | ) | 7,019 |
| 70,254 |
| 11,003 |
| 110,804 |
|
| R5 Class/Shares Authorized | 50,000,000 |
| | 50,000,000 |
| | 50,000,000 |
| |
| Sold | — |
| — |
| — |
| — |
| 497 |
| 5,000 |
|
| Issued in reinvestment of distributions | 29 |
| 287 |
| 19 |
| 194 |
| 14 |
| 138 |
|
| | 29 |
| 287 |
| 19 |
| 194 |
| 511 |
| 5,138 |
|
|
| | | | | | | | | | | | | | | |
| | Year ended July 31, 2019 | Eight months ended July 31, 2018(1) | Year ended November 30, 2017(2) |
| | Shares | Amount | Shares | Amount | Shares | Amount |
| R6 Class/Shares Authorized | 50,000,000 |
| | 50,000,000 |
| | 50,000,000 |
| |
| Sold | 9,356 |
| $ | 86,730 |
| — |
| — |
| — |
| — |
|
| Issued in reinvestment of distributions | 10,322 |
| 99,392 |
| 7,167 |
| $ | 72,164 |
| 9,192 |
| $ | 92,225 |
|
| Redeemed | (203,185 | ) | (2,017,301 | ) | — |
| — |
| — |
| — |
|
| | (183,507 | ) | (1,831,179 | ) | 7,167 |
| 72,164 |
| 9,192 |
| 92,225 |
|
| Net increase (decrease) | 154,034 |
| $ | 1,216,293 |
| 242,639 |
| $ | 2,393,760 |
| 167,985 |
| $ | 1,667,409 |
|
| |
| (1) | The fund's fiscal year end was changed from November 30 to July 31, resulting in an eight-month annual reporting period. |
| |
| (2) | April 10, 2017 (commencement of sale) through November 30, 2017 for the Y Class and R5 Class. |
6. Affiliated Fund Transactions
A summary of transactions for each affiliated fund for the period ended July 31, 2019 follows (amounts in thousands):
|
| | | | | | | | | | | | | | | | | | | | | | | |
Affiliated Fund(1) | Beginning Value | Purchase
Cost | Sales
Cost | Change in Net Unrealized Appreciation (Depreciation) | Ending
Value | Ending
Shares | Net Realized
Gain (Loss) | Distributions
Received(2) |
| Emerging Markets Debt Fund R6 Class | $ | 7,895 |
| $ | 3,977 |
| $ | 4,534 |
| $ | 315 |
| $ | 7,653 |
| 734 |
| $ | 15 |
| $ | 319 |
|
| Equity Income Fund R6 Class | — |
| 4,223 |
| 1 |
| (24 | ) | 4,198 |
| 459 |
| — |
| — |
|
| International Value Fund R6 Class | 6,800 |
| 4,640 |
| 6,152 |
| (643 | ) | 4,645 |
| 632 |
| (231 | ) | 271 |
|
| NT High Income Fund G Class | 10,845 |
| 9,275 |
| 7,667 |
| 226 |
| 12,679 |
| 1,311 |
| (310 | ) | 820 |
|
| Utilities Fund Investor Class | 586 |
| 212 |
| 253 |
| 43 |
| 588 |
| 33 |
| (13 | ) | 34 |
|
| | $ | 26,126 |
| $ | 22,327 |
| $ | 18,607 |
| $ | (83 | ) | $ | 29,763 |
| 3,169 |
| $ | (539 | ) | $ | 1,444 |
|
| |
| (1) | Investments are funds within the American Century Investments family of funds and are considered affiliated funds. The fund does not invest in an affiliated fund for the purpose of exercising management or control; however, investments by the fund within its investment strategy may represent a significant portion of an affiliated fund's net assets. Additional information and attributes of each affiliated fund are available at americancentury.com. |
| |
| (2) | Distributions received includes distributions from net investment income and from capital gains, if any. |
7. Fair Value Measurements
The fund’s investments valuation process is based on several considerations and may use multiple inputs to determine the fair value of the investments held by the fund. In conformity with accounting principles generally accepted in the United States of America, the inputs used to determine a valuation are classified into three broad levels.
| |
| • | Level 1 valuation inputs consist of unadjusted quoted prices in an active market for identical investments. |
| |
| • | Level 2 valuation inputs consist of direct or indirect observable market data (including quoted prices for comparable investments, evaluations of subsequent market events, interest rates, prepayment speeds, credit risk, etc.). These inputs also consist of quoted prices for identical investments initially expressed in local currencies that are adjusted through translation into U.S. dollars. |
| |
| • | Level 3 valuation inputs consist of unobservable data (including a fund’s own assumptions). |
The level classification is based on the lowest level input that is significant to the fair valuation measurement. The valuation inputs are not necessarily an indication of the risks associated with investing in these securities or other financial instruments.
The following is a summary of the level classifications as of period end. The Schedule of Investments provides additional information on the fund’s portfolio holdings.
|
| | | | | | | | |
| | Level 1 | Level 2 | Level 3 |
| Assets | | | |
| Investment Securities | | | |
| Affiliated Funds | $ | 29,763,404 |
| — |
| — |
|
| Common Stocks | 8,959,654 |
| $ | 4,132,112 |
| — |
|
| Preferred Stocks | 1,987,917 |
| 4,278,574 |
| — |
|
| Convertible Preferred Stocks | 1,572,013 |
| — |
| — |
|
| Corporate Bonds | — |
| 964,323 |
| — |
|
| Exchange-Traded Funds | 939,270 |
| — |
| — |
|
| Collateralized Mortgage Obligations | — |
| 681,815 |
| — |
|
| Convertible Bonds | — |
| 670,167 |
| — |
|
| Commercial Mortgage-Backed Securities | — |
| 484,612 |
| — |
|
| Asset-Backed Securities | — |
| 275,681 |
| — |
|
| U.S. Treasury Securities | — |
| 204,793 |
| — |
|
| Collateralized Loan Obligations | — |
| 183,116 |
| — |
|
| Temporary Cash Investments | 3,498,164 |
| 297,972 |
| — |
|
| | $ | 46,720,422 |
| $ | 12,173,165 |
| — |
|
| Other Financial Instruments | | | |
| Futures Contracts | $ | 2,460 |
| — |
| — |
|
| Swap Agreements | — |
| $ | 26,391 |
| — |
|
| Forward Foreign Currency Exchange Contracts | — |
| 242,593 |
| — |
|
| | $ | 2,460 |
| $ | 268,984 |
| — |
|
| | | | |
| Liabilities | | | |
| Other Financial Instruments | | | |
| Futures Contracts | $ | 101,430 |
| — |
| — |
|
| Forward Foreign Currency Exchange Contracts | — |
| $ | 249,121 |
| — |
|
| | $ | 101,430 |
| $ | 249,121 |
| — |
|
8. Derivative Instruments
Credit Risk — The fund is subject to credit risk in the normal course of pursuing its investment objectives. The value of a bond generally declines as the credit quality of its issuer declines. Credit default swap agreements enable a fund to buy/sell protection against a credit event of a specific issuer or index. A fund may attempt to enhance returns by selling protection or attempt to mitigate credit risk by buying protection. The buyer/seller of credit protection against a security or basket of securities may pay/receive an up-front or periodic payment to compensate for/against potential default events. Changes in value, including the periodic amounts of interest to be paid or received on swap agreements, are recorded as unrealized appreciation (depreciation) on swap agreements. Upon entering into a centrally cleared swap, a fund is required to deposit cash or securities (initial margin) with a financial intermediary in an amount equal to a certain percentage of the notional amount. Subsequent payments (variation margin) are made or received daily, in cash, by a fund. The variation margin is equal to the daily change in the value and is a component of unrealized gains and losses. Realized gain or loss is recorded upon receipt or payment of a periodic settlement or termination of swap agreements. Net realized and unrealized gains or losses occurring during the holding period of swap agreements are a component of net realized gain (loss) on swap agreement transactions and change in net unrealized appreciation (depreciation) on swap agreements, respectively. The risks of entering into swap agreements include the possible lack of liquidity, failure of the counterparty to meet its obligations, and that
there may be unfavorable changes in the underlying investments or instruments. The fund's average notional amount held during the period was $398,250.
Equity Price Risk — The fund is subject to equity price risk in the normal course of pursuing its investment objectives. A fund may enter into futures contracts based on an equity index in order to manage its exposure to changes in market conditions. A fund may purchase futures contracts to gain exposure to increases in market value or sell futures contracts to protect against a decline in market value. Upon entering into a futures contract, a fund is required to deposit either cash or securities in an amount equal to a certain percentage of the contract value (initial margin). Subsequent payments (variation margin) are made or received daily, in cash, by a fund. The variation margin is equal to the daily change in the contract value and is recorded as unrealized gains and losses. A fund recognizes a realized gain or loss when the contract is closed or expires. Net realized and unrealized gains or losses occurring during the holding period of futures contracts are a component of net realized gain (loss) on futures contract transactions and change in net unrealized appreciation (depreciation) on futures contracts, respectively. One of the risks of entering into futures contracts is the possibility that the change in value of the contract may not correlate with the changes in value of the underlying securities. During the period, the fund participated in equity price risk derivative instruments for temporary investment purposes.
Foreign Currency Risk — The fund is subject to foreign currency exchange rate risk in the normal course of pursuing its investment objectives. The value of foreign investments held by a fund may be significantly affected by changes in foreign currency exchange rates. The dollar value of a foreign security generally decreases when the value of the dollar rises against the foreign currency in which the security is denominated and tends to increase when the value of the dollar declines against such foreign currency. A fund may enter into forward foreign currency exchange contracts to reduce a fund's exposure to foreign currency exchange rate fluctuations or to gain exposure to the fluctuations in the value of foreign currencies. The net U.S. dollar value of foreign currency underlying all contractual commitments held by a fund and the resulting unrealized appreciation or depreciation are determined daily. Realized gain or loss is recorded upon the termination of the contract. Net realized and unrealized gains or losses occurring during the holding period of forward foreign currency exchange contracts are a component of net realized gain (loss) on forward foreign currency exchange contract transactions and change in net unrealized appreciation (depreciation) on forward foreign currency exchange contracts, respectively. A fund bears the risk of an unfavorable change in the foreign currency exchange rate underlying the forward contract. Additionally, losses, up to the fair value, may arise if the counterparties do not perform under the contract terms. The fund's average U.S. dollar exposure to foreign currency risk derivative instruments held during the period was $13,995,083.
Interest Rate Risk — The fund is subject to interest rate risk in the normal course of pursuing its investment objectives. The value of bonds generally declines as interest rates rise. A fund may enter into futures contracts based on a bond index or a specific underlying security. A fund may purchase futures contracts to gain exposure to increases in market value or sell futures contracts to protect against a decline in market value. Upon entering into a futures contract, a fund will segregate cash, cash equivalents or other appropriate liquid securities on its records in amounts sufficient to meet requirements. Subsequent payments (variation margin) are made or received daily, in cash, by a fund. The variation margin is equal to the daily change in the contract value and is recorded as unrealized gains and losses. A fund recognizes a realized gain or loss when the futures contract is closed or expires. Net realized and unrealized gains or losses occurring during the holding period of futures contracts are a component of net realized gain (loss) on futures contract transactions and change in net unrealized appreciation (depreciation) on futures contracts, respectively. One of the risks of entering into futures contracts is the possibility that the change in value of the contract may not correlate with the changes in value of the underlying securities. The fund's average notional exposure to interest rate risk derivative instruments held during the period was $100,000 futures contracts purchased and $8,000,000 futures contracts sold.
|
| | | | | | | | |
| Value of Derivative Instruments as of July 31, 2019 |
| | Asset Derivatives | Liability Derivatives |
Type of Risk Exposure | Location on Statement of Assets and Liabilities | Value | Location on Statement of Assets and Liabilities | Value |
| Credit Risk | Receivable for variation margin on swap agreements* | $ | 17,265 |
| Payable for variation margin on swap agreements* | — |
|
| Foreign Currency Risk | Unrealized appreciation on forward foreign currency exchange contracts | 242,593 |
| Unrealized depreciation on forward foreign currency exchange contracts | $ | 249,121 |
|
| Interest Rate Risk | Receivable for variation margin on futures contracts* | — |
| Payable for variation margin on futures contracts* | 5,828 |
|
| | | $ | 259,858 |
| | $ | 254,949 |
|
| | | | | |
| * Included in the unrealized appreciation (depreciation) on futures contracts or centrally cleared swap agreements, as applicable, as reported in the Schedule of Investments. |
|
| | | | | | | | |
| Effect of Derivative Instruments on the Statement of Operations for the Year Ended July 31, 2019 |
| | Net Realized Gain (Loss) | Change in Net Unrealized Appreciation (Depreciation) |
Type of Risk Exposure | Location on Statement of Operations | Value | Location on Statement of Operations | Value |
| Credit Risk | Net realized gain (loss) on swap agreement transactions | $ | 11,917 |
| Change in net unrealized appreciation (depreciation) on swap agreements | $ | 1,059 |
|
| Equity Price Risk | Net realized gain (loss) on futures contract transactions | 7,028 |
| Change in net unrealized appreciation (depreciation) on futures contracts | — |
|
| Foreign Currency Risk | Net realized gain (loss) on forward foreign currency exchange contract transactions | (31,649 | ) | Change in net unrealized appreciation (depreciation) on forward foreign currency exchange contracts | (12,962 | ) |
| Interest Rate Risk | Net realized gain (loss) on futures contract transactions | (569,818 | ) | Change in net unrealized appreciation (depreciation) on futures contracts | (98,936 | ) |
| | | $ | (582,522 | ) | | $ | (110,839 | ) |
9. Risk Factors
There are certain risks involved in investing in foreign securities. These risks include those resulting from political events (such as civil unrest, national elections and imposition of exchange controls), social and economic events (such as labor strikes and rising inflation), and natural disasters. Securities of foreign issuers may be less liquid and more volatile. Investing in emerging markets or a significant portion of assets in one country or region may accentuate these risks.
The fund may invest in lower-rated debt securities, which are subject to substantial risks including liquidity risk and credit risk.
The fund’s investment process may result in high portfolio turnover, which could mean high transaction costs, affecting both performance and capital gains tax liabilities to investors.
10. Federal Tax Information
The tax character of distributions paid during the year ended July 31, 2019, eight months ended July 31, 2018 and year ended November 30, 2017 were as follows: |
| | | | | | | | | |
| | July 31, 2019 | July 31, 2018(1) | November 30, 2017 |
| Distributions Paid From | | | |
| Ordinary income | $ | 2,912,326 |
| $ | 1,906,374 |
| $ | 2,578,887 |
|
| Long-term capital gains | $ | 231,599 |
| $ | 86,400 |
| $ | 16,293 |
|
| |
| (1) | The fund's fiscal year end was changed from November 30 to July 31, resulting in an eight-month annual reporting period. |
The book-basis character of distributions made during the year from net investment income or net realized gains may differ from their ultimate characterization for federal income tax purposes. These differences reflect the differing character of certain income items and net realized gains and losses for financial statement and tax purposes, and may result in reclassification among certain capital accounts on the financial statements.
As of period end, the federal tax cost of investments and the components of distributable earnings on a tax-basis were as follows:
|
| | | |
| Federal tax cost of investments | $ | 57,824,120 |
|
| Gross tax appreciation of investments | $ | 1,564,728 |
|
| Gross tax depreciation of investments | (495,261 | ) |
| Net tax appreciation (depreciation) of investments | 1,069,467 |
|
| Net tax appreciation (depreciation) on derivatives and translation of assets and liabilities in foreign currencies | (13,756 | ) |
| Net tax appreciation (depreciation) | $ | 1,055,711 |
|
| Other book-to-tax adjustments | $ | (5,789 | ) |
| Undistributed ordinary income | — |
|
| Late-year ordinary loss deferral | $ | (21,494 | ) |
| Post-October capital loss deferral | $ | (793,975 | ) |
The difference between book-basis and tax-basis unrealized appreciation (depreciation) is attributable primarily to the tax deferral of losses on wash sales. Other book-to-tax adjustments are attributable primarily to the tax deferral of losses on straddle positions.
Loss deferrals represent certain qualified losses that the fund has elected to treat as having been incurred in the following fiscal year for federal income tax purposes.
11. Recently Issued Accounting Standards
In March 2017, the Financial Accounting Standards Board (FASB) issued Accounting Standards Update No. 2017-08, “Receivables - Nonrefundable Fees and Other Costs (Subtopic 310-20), Premium Amortization on Purchased Callable Debt Securities” (ASU 2017-08). ASU 2017-08 amends the amortization period for certain purchased callable debt securities held at a premium, shortening such period to the earliest call date. The amendments are effective for fiscal years, and interim periods within those fiscal years, beginning after December 15, 2018. Management is currently evaluating the impact that adopting ASU 2017-08 will have on the financial statements.
|
| | | | | | | | | | | | | | | | | | |
| For a Share Outstanding Throughout the Years Ended July 31 (except as noted) |
Per-Share Data | | | | | | | Ratios and Supplemental Data | | |
| | | Income From Investment Operations: | Distributions From: | | | Ratio to Average Net Assets of: | | |
| | Net Asset
Value,
Beginning
of Period | Net
Investment
Income
(Loss)(1) | Net
Realized
and
Unrealized
Gain (Loss) | Total From
Investment
Operations | Net
Investment
Income | Net Realized Gains | Tax Return of Capital | Total Distributions | Net Asset
Value,
End of Period | Total
Return(2) | Operating
Expenses(3) | Operating
Expenses
(before
expense
waiver)(3) | Net
Investment
Income
(Loss) | Net Investment
Income (Loss) (before expense waiver) | Portfolio
Turnover
Rate | Net
Assets,
End of
Period (in thousands) |
Investor Class | | | | | | | | | | | | |
| 2019 | $10.06 | 0.45 | (0.19) | 0.26 | (0.47) | (0.03) | — | (0.50) | $9.82 | 2.89% | 0.66% | 0.91% | 4.63% | 4.38% | 213% |
| $25,048 |
|
2018(4) | $10.29 | 0.33 | (0.20) | 0.13 | (0.35) | (0.01) | — | (0.36) | $10.06 | 1.32% | 0.66%(5) | 0.90%(5) | 4.99%(5) | 4.75%(5) | 152% |
| $44,245 |
|
| 2017 | $9.69 | 0.43 | 0.65 | 1.08 | (0.48) | — | — | (0.48) | $10.29 | 11.35% | 0.58% | 0.91% | 4.29% | 3.96% | 209% |
| $46,964 |
|
| 2016 | $9.40 | 0.42 | 0.31 | 0.73 | (0.44) | — | — | (0.44) | $9.69 | 7.92% | 0.61% | 0.92% | 4.50% | 4.19% | 195% |
| $43,297 |
|
| 2015 | $10.00 | 0.39 | (0.57) | (0.18) | (0.39) | — | (0.03) | (0.42) | $9.40 | (1.84)% | 0.59% | 0.91% | 4.08% | 3.76% | 127% |
| $8,559 |
|
| I Class | | | | | | | | | | | | | |
| 2019 | $10.06 | 0.47 | (0.19) | 0.28 | (0.49) | (0.03) | — | (0.52) | $9.82 | 3.10% | 0.46% | 0.71% | 4.83% | 4.58% | 213% |
| $27,800 |
|
2018(4) | $10.29 | 0.35 | (0.21) | 0.14 | (0.36) | (0.01) | — | (0.37) | $10.06 | 1.45% | 0.46%(5) | 0.70%(5) | 5.19%(5) | 4.95%(5) | 152% |
| $4,806 |
|
| 2017 | $9.69 | 0.45 | 0.65 | 1.10 | (0.50) | — | — | (0.50) | $10.29 | 11.57% | 0.38% | 0.71% | 4.49% | 4.16% | 209% |
| $2,255 |
|
| 2016 | $9.40 | 0.47 | 0.28 | 0.75 | (0.46) | — | — | (0.46) | $9.69 | 8.14% | 0.41% | 0.72% | 4.70% | 4.39% | 195% |
| $1,756 |
|
| 2015 | $10.00 | 0.42 | (0.58) | (0.16) | (0.41) | — | (0.03) | (0.44) | $9.40 | (1.65)% | 0.39% | 0.71% | 4.28% | 3.96% | 127% |
| $1,967 |
|
| Y Class | | | | | | | | | | | | | | | |
| 2019 | $10.07 | 0.49 | (0.20) | 0.29 | (0.51) | (0.03) | — | (0.54) | $9.82 | 3.14% | 0.31% | 0.56% | 4.98% | 4.73% | 213% |
| $6 |
|
2018(4) | $10.29 | 0.36 | (0.20) | 0.16 | (0.37) | (0.01) | — | (0.38) | $10.07 | 1.65% | 0.31%(5) | 0.55%(5) | 5.34%(5) | 5.10%(5) | 152% |
| $5 |
|
2017(6) | $10.06 | 0.25 | 0.26 | 0.51 | (0.28) | — | — | (0.28) | $10.29 | 5.17% | 0.23%(5) | 0.56%(5) | 3.81%(5) | 3.48%(5) | 209%(7) |
| $5 |
|
|
| | | | | | | | | | | | | | | | | | |
| For a Share Outstanding Throughout the Years Ended July 31 (except as noted) |
Per-Share Data | | | | | | | Ratios and Supplemental Data | | |
| | | Income From Investment Operations: | Distributions From: | | | Ratio to Average Net Assets of: | | |
| | Net Asset
Value,
Beginning
of Period | Net
Investment
Income
(Loss)(1) | Net
Realized
and
Unrealized
Gain (Loss) | Total From
Investment
Operations | Net
Investment
Income | Net Realized Gains | Tax Return of Capital | Total Distributions | Net Asset
Value,
End of Period | Total
Return(2) | Operating
Expenses(3) | Operating
Expenses
(before
expense
waiver)(3) | Net
Investment
Income
(Loss) | Net Investment
Income (Loss) (before expense waiver) | Portfolio
Turnover
Rate | Net
Assets,
End of
Period (in thousands) |
| A Class | | | | | | | | | | | | | | | |
| 2019 | $10.06 | 0.43 | (0.20) | 0.23 | (0.45) | (0.03) | — | (0.48) | $9.81 | 2.53% | 0.91% | 1.16% | 4.38% | 4.13% | 213% |
| $2,389 |
|
2018(4) | $10.29 | 0.32 | (0.21) | 0.11 | (0.33) | (0.01) | — | (0.34) | $10.06 | 1.16% | 0.91%(5) | 1.15%(5) | 4.74%(5) | 4.50%(5) | 152% |
| $2,434 |
|
| 2017 | $9.69 | 0.41 | 0.64 | 1.05 | (0.45) | — | — | (0.45) | $10.29 | 11.08% | 0.83% | 1.16% | 4.04% | 3.71% | 209% |
| $2,200 |
|
| 2016 | $9.40 | 0.42 | 0.28 | 0.70 | (0.41) | — | — | (0.41) | $9.69 | 7.65% | 0.86% | 1.17% | 4.25% | 3.94% | 195% |
| $2,400 |
|
| 2015 | $10.00 | 0.38 | (0.58) | (0.20) | (0.37) | — | (0.03) | (0.40) | $9.40 | (2.08)% | 0.84% | 1.16% | 3.83% | 3.51% | 127% |
| $1,647 |
|
| C Class | | | | | | | | | | | | | | | |
| 2019 | $10.06 | 0.35 | (0.19) | 0.16 | (0.38) | (0.03) | — | (0.41) | $9.81 | 1.77% | 1.66% | 1.91% | 3.63% | 3.38% | 213% |
| $3,457 |
|
2018(4) | $10.28 | 0.27 | (0.20) | 0.07 | (0.28) | (0.01) | — | (0.29) | $10.06 | 0.78% | 1.66%(5) | 1.90%(5) | 3.99%(5) | 3.75%(5) | 152% |
| $3,412 |
|
| 2017 | $9.69 | 0.33 | 0.64 | 0.97 | (0.38) | — | — | (0.38) | $10.28 | 10.16% | 1.58% | 1.91% | 3.29% | 2.96% | 209% |
| $2,350 |
|
| 2016 | $9.40 | 0.35 | 0.28 | 0.63 | (0.34) | — | — | (0.34) | $9.69 | 6.83% | 1.61% | 1.92% | 3.50% | 3.19% | 195% |
| $1,765 |
|
| 2015 | $10.00 | 0.31 | (0.58) | (0.27) | (0.31) | — | (0.02) | (0.33) | $9.40 | (2.79)% | 1.59% | 1.91% | 3.08% | 2.76% | 127% |
| $1,570 |
|
| R Class | | | | | | | | | | | | | | | |
| 2019 | $10.06 | 0.40 | (0.19) | 0.21 | (0.43) | (0.03) | — | (0.46) | $9.81 | 2.28% | 1.16% | 1.41% | 4.13% | 3.88% | 213% |
| $104 |
|
2018(4) | $10.29 | 0.30 | (0.20) | 0.10 | (0.32) | (0.01) | — | (0.33) | $10.06 | 1.00% | 1.16%(5) | 1.40%(5) | 4.49%(5) | 4.25%(5) | 152% |
| $1,978 |
|
| 2017 | $9.69 | 0.38 | 0.65 | 1.03 | (0.43) | — | — | (0.43) | $10.29 | 10.81% | 1.08% | 1.41% | 3.79% | 3.46% | 209% |
| $1,950 |
|
| 2016 | $9.40 | 0.40 | 0.28 | 0.68 | (0.39) | — | — | (0.39) | $9.69 | 7.37% | 1.11% | 1.42% | 4.00% | 3.69% | 195% |
| $1,730 |
|
| 2015 | $10.00 | 0.36 | (0.58) | (0.22) | (0.35) | — | (0.03) | (0.38) | $9.40 | (2.32)% | 1.09% | 1.41% | 3.58% | 3.26% | 127% |
| $1,580 |
|
|
| | | | | | | | | | | | | | | | | | |
| For a Share Outstanding Throughout the Years Ended July 31 (except as noted) |
Per-Share Data | | | | | | | Ratios and Supplemental Data | | |
| | | Income From Investment Operations: | Distributions From: | | | Ratio to Average Net Assets of: | | |
| | Net Asset
Value,
Beginning
of Period | Net
Investment
Income
(Loss)(1) | Net
Realized
and
Unrealized
Gain (Loss) | Total From
Investment
Operations | Net
Investment
Income | Net Realized Gains | Tax Return of Capital | Total Distributions | Net Asset
Value,
End of Period | Total
Return(2) | Operating
Expenses(3) | Operating
Expenses
(before
expense
waiver)(3) | Net
Investment
Income
(Loss) | Net Investment
Income (Loss) (before expense waiver) | Portfolio
Turnover
Rate | Net
Assets,
End of
Period (in thousands) |
| R5 Class | | | | | | | | | | | | | | | |
| 2019 | $10.07 | 0.47 | (0.19) | 0.28 | (0.49) | (0.03) | — | (0.52) | $9.83 | 3.10% | 0.46% | 0.71% | 4.83% | 4.58% | 213% |
| $5 |
|
2018(4) | $10.30 | 0.35 | (0.21) | 0.14 | (0.36) | (0.01) | — | (0.37) | $10.07 | 1.45% | 0.46%(5) | 0.70%(5) | 5.19%(5) | 4.95%(5) | 152% |
| $5 |
|
2017(6) | $10.06 | 0.24 | 0.27 | 0.51 | (0.27) | — | — | (0.27) | $10.30 | 5.17% | 0.38%(5) | 0.71%(5) | 3.66%(5) | 3.33%(5) | 209%(7) |
| $5 |
|
| R6 Class | | | | | | | | | | | | | | | |
| 2019 | $10.07 | 0.48 | (0.19) | 0.29 | (0.51) | (0.03) | — | (0.54) | $9.82 | 3.15% | 0.31% | 0.56% | 4.98% | 4.73% | 213% |
| $88 |
|
2018(4) | $10.29 | 0.36 | (0.20) | 0.16 | (0.37) | (0.01) | — | (0.38) | $10.07 | 1.65% | 0.31%(5) | 0.55%(5) | 5.34%(5) | 5.10%(5) | 152% |
| $1,938 |
|
| 2017 | $9.69 | 0.47 | 0.64 | 1.11 | (0.51) | — | — | (0.51) | $10.29 | 11.73% | 0.23% | 0.56% | 4.64% | 4.31% | 209% |
| $1,907 |
|
| 2016 | $9.40 | 0.48 | 0.28 | 0.76 | (0.47) | — | — | (0.47) | $9.69 | 8.30% | 0.26% | 0.57% | 4.85% | 4.54% | 195% |
| $1,707 |
|
| 2015 | $10.00 | 0.44 | (0.58) | (0.14) | (0.43) | — | (0.03) | (0.46) | $9.40 | (1.51)% | 0.24% | 0.56% | 4.43% | 4.11% | 127% |
| $1,576 |
|
|
| | | | |
| Notes to Financial Highlights | | |
| |
| (1) | Computed using average shares outstanding throughout the period. |
| |
| (2) | Total returns are calculated based on the net asset value of the last business day and do not reflect applicable sales charges, if any. Total returns for periods less than one year are not annualized. |
| |
| (3) | Ratio of operating expenses to average net assets does not include any fees and expenses of the acquired funds. |
| |
| (4) | December 1, 2017 through July 31, 2018. The fund's fiscal year end was changed from November 30 to July 31, resulting in an eight-month annual reporting period. For the years before July 31, 2018, the fund's fiscal year end was November 30. |
| |
| (6) | April 10, 2017 (commencement of sale) through November 30, 2017. |
| |
| (7) | Portfolio turnover is calculated at the fund level. Percentage indicated was calculated for the year ended November 30, 2017. |
See Notes to Financial Statements.
|
|
| Report of Independent Registered Public Accounting Firm |
To the Shareholders and the Board of Directors of American Century Strategic Asset Allocations, Inc.:
Opinion on the Financial Statements and Financial Highlights
We have audited the accompanying statement of assets and liabilities, including the schedule of investments, of Multi-Asset Income Fund, one of the funds constituting the American Century Strategic Asset Allocations, Inc. (the “Fund”), as of July 31, 2019; the related statement of operations for the year then ended; the statements of changes in net assets for the year then ended, the period December 1, 2017 through July 31, 2018, and for the year ended November 30, 2017; the financial highlights for the year then ended, the period December 1, 2017 through July 31, 2018 and for the years ended November 30, 2017, 2016, and 2015; and the related notes. In our opinion, the financial statements and financial highlights present fairly, in all material respects, the financial position of Multi-Asset Income Fund of the American Century Strategic Asset Allocations, Inc. as of July 31, 2019; the results of its operations for the year then ended; the changes in its net assets for the year then ended, the period December 1, 2017 through July 31, 2018, and for the year ended November 30, 2017; and the financial highlights for the year then ended, the period December 1, 2017 through July 31, 2018 and for the years ended November 30, 2017, 2016, and 2015; in conformity with accounting principles generally accepted in the United States of America.
Basis for Opinion
These financial statements and financial highlights are the responsibility of the Fund's management. Our responsibility is to express an opinion on the Fund’s financial statements and financial highlights based on our audits. We are a public accounting firm registered with the Public Company Accounting Oversight Board (United States) (PCAOB) and are required to be independent with respect to the Fund in accordance with the U.S. federal securities laws and the applicable rules and regulations of the Securities and Exchange Commission and the PCAOB.
We conducted our audits in accordance with the standards of the PCAOB. Those standards require that we plan and perform the audit to obtain reasonable assurance about whether the financial statements and financial highlights are free of material misstatement, whether due to error or fraud. The Fund is not required to have, nor were we engaged to perform, an audit of its internal control over financial reporting. As part of our audits we are required to obtain an understanding of internal control over financial reporting but not for the purpose of expressing an opinion on the effectiveness of the Fund’s internal control over financial reporting. Accordingly, we express no such opinion.
Our audits included performing procedures to assess the risks of material misstatement of the financial statements and financial highlights, whether due to error or fraud, and performing procedures that respond to those risks. Such procedures included examining, on a test basis, evidence regarding the amounts and disclosures in the financial statements and financial highlights. Our audits also included evaluating the accounting principles used and significant estimates made by management, as well as evaluating the overall presentation of the financial statements and financial highlights. Our procedures included confirmation of securities owned as of July 31, 2019, by correspondence with the custodian, transfer agent and brokers; when replies were not received from brokers, we performed other auditing procedures. We believe that our audits provide a reasonable basis for our opinion.
DELOITTE & TOUCHE LLP
Kansas City, Missouri
September 18, 2019
We have served as the auditor of one or more American Century investment companies since 1997.
The Board of Directors
The individuals listed below serve as directors of the funds. Each director will continue to serve in this capacity until death, retirement, resignation or removal from office. The board has adopted a mandatory retirement age for directors who are not “interested persons,” as that term is defined in the Investment Company Act (independent directors). Independent directors shall retire by December 31 of the year in which they reach their 75th birthday.
Mr. Thomas is an “interested person” because he currently serves as President and Chief Executive Officer of American Century Companies, Inc. (ACC), the parent company of American Century Investment Management, Inc. (ACIM or the advisor). The other directors (more than three-fourths of the total number) are independent. They are not employees, directors or officers of, and have no financial interest in, ACC or any of its wholly owned, direct or indirect, subsidiaries, including ACIM, American Century Investment Services, Inc. (ACIS) and American Century Services, LLC (ACS), and they do not have any other affiliations, positions or relationships that would cause them to be considered “interested persons” under the Investment Company Act. The directors serve in this capacity for seven (in the case of Jonathan S. Thomas, 16; and Stephen E. Yates, 8) registered investment companies in the American Century Investments family of funds.
The following table presents additional information about the directors. The mailing address for each director is 4500 Main Street, Kansas City, Missouri 64111.
|
| | | | | |
Name
(Year of Birth) | Position(s) Held with Funds | Length of Time Served | Principal Occupation(s) During Past 5 Years | Number of American Century Portfolios Overseen by Director | Other Directorships Held During Past 5 Years |
| Independent Directors |
|
|
| Thomas W. Bunn (1953) | Director | Since 2017 | Retired | 67 | SquareTwo Financial; Barings (formerly Babson Capital Funds Trust) (2013 to 2016) |
Chris H. Cheesman
(1962)
| Director | Since 2019
| Retired. Senior Vice President & Chief Audit Executive, AllianceBernstein (1999 to 2018)
| 67 | None |
Barry Fink
(1955) | Director | Since 2012 (independent since 2016) | Retired | 67 | None |
Rajesh K. Gupta
(1960)
| Director | Since 2019
| Partner Emeritus, SeaCrest Investment Management and SeaCrest Wealth Management (2019 to Present); Chief Executive Officer and Chief Investment Officer, SeaCrest Investment Management (2006 to 2019); Chief Executive Officer and Chief Investment Officer, SeaCrest Wealth Management (2008 to 2019)
| 67 | None |
|
| | | | | |
Name
(Year of Birth) | Position(s) Held with Funds | Length of Time Served | Principal Occupation(s) During Past 5 Years | Number of American Century Portfolios Overseen by Director | Other Directorships Held During Past 5 Years |
| Independent Directors |
|
|
Lynn Jenkins
(1963)
| Director | Since 2019
| United States Representative, U.S. House of Representatives (2009 to 2018) | 67 | MGP Ingredients, Inc. |
Jan M. Lewis
(1957) | Director | Since 2011 | Retired | 67 | None |
John R. Whitten
(1946) | Director | Since 2008 | Retired | 67 | Rudolph Technologies, Inc. |
Stephen E. Yates
(1948) | Director and Chairman of the Board | Since 2012 (Chairman since 2018) | Retired | 72 | None |
| Interested Director |
|
Jonathan S. Thomas
(1963) | Director and President | Since 2007 | President and Chief Executive Officer, ACC (2007 to present). Also serves as Chief Executive Officer, ACS; Executive Vice President, ACIM; Director, ACC, ACIM and other ACC subsidiaries | 117 | BioMed Valley Discoveries, Inc. |
The Statement of Additional Information has additional information about the fund's directors and is available without charge, upon request, by calling 1-800-345-2021.
Officers
The following table presents certain information about the executive officers of the funds. Each officer serves as an officer for each of the 16 (in the case of Robert J. Leach, 15) investment companies in the American Century family of funds. No officer is compensated for his or her service as an officer of the funds. The listed officers are interested persons of the funds and are appointed or re-appointed on an annual basis. The mailing address for each officer listed below is 4500 Main Street, Kansas City, Missouri 64111.
|
| | |
Name
(Year of Birth) | Offices with the Funds | Principal Occupation(s) During the Past Five Years |
Jonathan S. Thomas
(1963) | Director and President since 2007 | President and Chief Executive Officer, ACC (2007 to present). Also serves as Chief Executive Officer, ACS; Executive Vice President, ACIM; Director, ACC, ACIM and other ACC subsidiaries |
R. Wes Campbell
(1974) | Chief Financial Officer and Treasurer since 2018
| Investment Operations and Investment Accounting, ACS (2000 to present)
|
Amy D. Shelton
(1964) | Chief Compliance Officer and Vice President since 2014 | Chief Compliance Officer, American Century funds, (2014 to present); Chief Compliance Officer, ACIM (2014 to present); Chief Compliance Officer, ACIS (2009 to present). Also serves as Vice President, ACIS |
Charles A. Etherington
(1957) | General Counsel since 2007 and Senior Vice President since 2006 | Attorney, ACC (1994 to present); Vice President, ACC (2005 to present); General Counsel, ACC (2007 to present). Also serves as General Counsel, ACIM, ACS, ACIS and other ACC subsidiaries; and Senior Vice President, ACIM and ACS |
C. Jean Wade
(1964) | Vice President since 2012 | Senior Vice President, ACS (2017 to present); Vice President, ACS (2000 to 2017) |
Robert J. Leach
(1966) | Vice President since 2006 | Vice President, ACS (2000 to present) |
David H. Reinmiller
(1963) | Vice President since 2000 | Attorney, ACC (1994 to present). Also serves as Vice President, ACIM and ACS |
Ward D. Stauffer
(1960) | Secretary since 2005 | Attorney, ACC (2003 to present) |
|
|
| Approval of Management Agreement |
At a meeting held on June 26, 2019, the Fund’s Board of Directors (the "Board") unanimously approved the renewal of the management agreement pursuant to which American Century Investment Management, Inc. (the “Advisor”) acts as the investment advisor for the Fund. Under Section 15(c) of the Investment Company Act, contracts for investment advisory services are required to be reviewed, evaluated, and approved by a majority of a fund’s directors (the “Directors”), including a majority of the independent Directors, each year.
Prior to its consideration of the renewal of the management agreement, the Directors requested and reviewed extensive data and information compiled by the Advisor and certain independent providers of evaluation data concerning the Fund and the services provided to the Fund by the Advisor. This review was in addition to the oversight and evaluation undertaken by the Board and its committees on a continual basis and the information received was supplemental to the extensive information that the Board and its committees receive and consider throughout the year.
In connection with its consideration of the renewal of the management agreement, the Board’s review and evaluation of the services provided by the Advisor included, but was not limited to, the following:
| |
| • | the nature, extent, and quality of investment management, shareholder services, and other services provided and to be provided to the Fund; |
| |
| • | the wide range of other programs and services provided and to be provided to the Fund and its shareholders on a routine and non-routine basis; |
| |
| • | the investment performance of the Fund, including data comparing the Fund's performance to appropriate benchmarks and/or a peer group of other mutual funds with similar investment objectives and strategies; |
| |
| • | the cost of owning the Fund compared to the cost of owning similar funds; |
| |
| • | the compliance policies, procedures, and regulatory experience of the Advisor and the Fund's service providers; |
| |
| • | financial data showing the cost of services provided to the Fund, the profitability of the Fund to the Advisor, and the overall profitability of the Advisor; |
| |
| • | strategic plans of the Advisor; |
| |
| • | any economies of scale associated with the Advisor’s management of the Fund and other accounts; |
| |
| • | services provided and charges to the Advisor's other investment management clients; |
| |
| • | acquired fund fees and expenses; |
| |
| • | payments and practices in connection with financial intermediaries holding shares of the Fund and the services provided by intermediaries in connection therewith; and |
| |
| • | any collateral benefits derived by the Advisor from the management of the Fund. |
The Directors held three in-person meetings and one telephonic meeting to review and discuss the information provided. The independent Directors also reviewed responses to supplemental information requests provided by the Directors to the Advisor and held active discussions with the Advisor regarding the renewal of the management agreement. The independent Directors had the benefit of the advice of their independent counsel throughout the process.
Factors Considered
The Directors considered all of the information provided by the Advisor, the independent data providers, and independent counsel in connection with the approval. They determined that the information was sufficient for them to evaluate the management agreement for the Fund. In connection with their review, the Directors did not identify any single factor as being all-important or
controlling, and each Director may have attributed different levels of importance to different factors. In deciding to renew the management agreement, the Board based its decision on a number of factors, including without limitation the following:
Nature, Extent and Quality of Services — Generally. Under the management agreement, the Advisor is responsible for providing or arranging for all services necessary for the operation of the Fund. The Board noted that the Advisor provides or arranges at its own expense a wide variety of services including without limitation the following:
| |
| • | portfolio research and security selection |
| |
| • | daily valuation of the Fund’s portfolio |
| |
| • | shareholder servicing and transfer agency, including shareholder confirmations, recordkeeping, and communications |
| |
| • | legal services (except the independent Directors’ counsel) |
| |
| • | regulatory and portfolio compliance |
| |
| • | marketing and distribution (except amounts paid by the Fund under Rule 12b-1 plans) |
The Board noted that many of these services have expanded over time in terms of both quantity and complexity in response to shareholder demands, competition in the industry, changing distribution channels, and the changing regulatory environment.
Investment Management Services. The nature of the investment management services provided to the Fund is quite complex and allows Fund shareholders access to professional money management, instant diversification of their investments within an asset class, the opportunity to easily diversify among asset classes by investing in or exchanging among various American Century Investments funds, and liquidity. In evaluating investment performance, the Board expects the Advisor to manage the Fund in accordance with its investment objectives and approved strategies. Further, the Directors recognize that the Advisor has an obligation to monitor trading activities, and in particular to seek the best execution of fund trades, and to evaluate the use of and payment for research. In providing these services, the Advisor utilizes teams of investment professionals (portfolio managers, analysts, research assistants, and securities traders) who require extensive information technology, research, training, compliance, and other systems to conduct their business. The Board, directly and through its Fund Performance Review Committee, provides oversight of the investment performance process. It regularly reviews investment performance information for the Fund, together with comparative information for appropriate benchmarks and/or peer groups of similarly-managed funds, over different time horizons. The Directors also review investment performance information during the management agreement renewal process. If performance concerns are identified, the Fund receives special reviews until performance improves, during which the Board discusses with the Advisor the reasons for such results (e.g., market conditions, security selection) and any efforts being undertaken to improve performance. The Fund’s performance was above its benchmark for the three-year period and below its benchmark for the one-year period reviewed by the Board. The Board found the investment management services provided by the Advisor to the Fund to be satisfactory and consistent with the management agreement.
Shareholder and Other Services. Under the management agreement, the Advisor provides the Fund with a comprehensive package of transfer agency, shareholder, and other services. The Board, directly and through various committees of the Board, regularly reviews reports and evaluations of such services at its regular meetings. These reports include, but are not limited to, information regarding the operational efficiency and accuracy of the shareholder and transfer agency services provided, staffing levels, shareholder satisfaction, technology support (including cyber security), new products and services offered to Fund shareholders, securities trading
activities, portfolio valuation services, auditing services, and legal and operational compliance activities. The Board found the services provided by the Advisor to the Fund under the management agreement to be competitive and of high quality.
Costs of Services and Profitability. The Advisor provides detailed information concerning its cost of providing various services to the Fund, its profitability in managing the Fund (pre- and post-distribution), its overall profitability, and its financial condition. The Directors have reviewed with the Advisor the methodology used to prepare this financial information. This information is considered in evaluating the Advisor’s financial condition, its ability to continue to provide services under the management agreement, and the reasonableness of the current management fee. The Board concluded that the Advisor’s profits were reasonable in light of the services provided to the Fund.
Ethics. The Board generally considers the Advisor’s commitment to providing quality services to shareholders and to conducting its business ethically. They noted that the Advisor’s practices generally meet or exceed industry best practices.
Economies of Scale. The Board also reviewed information provided by the Advisor regarding the possible existence of economies of scale in connection with the management of the Fund. The Board concluded that economies of scale are difficult to measure and predict with precision, especially on a fund-by-fund basis. The Board concluded that the Advisor is appropriately sharing economies of scale through its competitive fee structure, offering competitive fees from fund inception, and through reinvestment in its business to provide shareholders additional content and services.
Comparison to Other Funds’ Fees. The management agreement provides that the Fund pays the Advisor a single, all-inclusive (or unified) management fee for providing all services necessary for the management and operation of the Fund, other than brokerage expenses, expenses attributable to short sales, taxes, interest, extraordinary expenses, fees and expenses of the Fund’s independent Directors (including their independent legal counsel), and expenses incurred in connection with the provision of shareholder services and distribution services under a plan adopted pursuant to Rule 12b-1 under the Investment Company Act. Under the unified fee structure, the Advisor is responsible for providing all investment advisory, custody, audit, administrative, compliance, recordkeeping, marketing and shareholder services, or arranging and supervising third parties to provide such services. By contrast, most other funds are charged a variety of fees, including an investment advisory fee, a transfer agency fee, an administrative fee, distribution charges, and other expenses. Other than their investment advisory fees and any applicable Rule 12b-1 distribution fees, all other components of the total fees charged by these other funds may be increased without shareholder approval. The Board believes the unified fee structure is a benefit to Fund shareholders because it clearly discloses to shareholders the cost of owning Fund shares, and, since the unified fee cannot be increased without a vote of Fund shareholders, it shifts to the Advisor the risk of increased costs of operating the Fund and provides a direct incentive to minimize administrative inefficiencies. Part of the Board’s analysis of fee levels involves reviewing certain evaluative data compiled by an independent provider comparing the Fund’s unified fee to the total expense ratios of its peers. The unified fee charged to shareholders of the Fund was below the median of the total expense ratios of the Fund’s peer expense universe. In spite of this, the Advisor extended a temporary reduction of the Fund's annual unified management fee of 0.07% (e.g., the Investor Class unified fee will be reduced from 0.90% to 0.83%) for at least one year, beginning August 1, 2019. The Board concluded that the management fee paid by the Fund to the Advisor under the management agreement is reasonable in light of the services provided to the Fund.
Comparison to Fees and Services Provided to Other Clients of the Advisor. The Directors also requested and received information from the Advisor concerning the nature of the services, fees, costs, and profitability of its advisory services to advisory clients other than the Fund. They observed that these varying types of client accounts require different services and involve different regulatory and entrepreneurial risks than the management of the Fund. The Board analyzed this
information and concluded that the fees charged and services provided to the Fund were reasonable by comparison.
Payments to Intermediaries. The Directors also requested and received a description of payments made to intermediaries by the Fund and the Advisor and services provided in response thereto. These payments include various payments made by the Fund or the Advisor to different types of intermediaries and recordkeepers for distribution and service activities provided for the Fund. The Board reviewed such information and received representations from the Advisor that all such payments by the Fund were made pursuant to the Fund's Rule 12b-1 Plan and that all such payments by the Advisor were made from the Advisor’s resources and reasonable profits. The Board found such payments to be reasonable in scope and purpose.
Collateral or “Fall-Out” Benefits Derived by the Advisor. The Board considered the existence of collateral benefits the Advisor may receive as a result of its relationship with the Fund. They concluded that the Advisor’s primary business is managing mutual funds and it generally does not use fund or shareholder information to generate profits in other lines of business, and therefore does not derive any significant collateral benefits from them. The Board noted that additional assets from other clients may offer the Advisor some benefit from increased leverage with service providers and counterparties. Additionally, the Advisor may receive proprietary research from broker-dealers that execute fund portfolio transactions, which the Board concluded is likely to benefit other clients of the Advisor, as well as Fund shareholders. The Board also determined that the Advisor is able to provide investment management services to certain clients other than the Fund, at least in part, due to its existing infrastructure built to serve the fund complex. The Board concluded that appropriate allocation methodologies had been employed to assign resources and the cost of those resources to these other clients and, where expressly provided, these other client assets may be included with the assets of the Fund to determine breakpoints in the management fee schedule.
Existing Relationship. The Board also considered whether there was any reason for not continuing the existing arrangement with the Advisor. In this regard, the Board was mindful of the potential disruptions of the Fund’s operations and various risks, uncertainties, and other effects that could occur as a result of a decision not to continue such relationship. In particular, the Board recognized that most shareholders have invested in the Fund on the strength of the Advisor’s industry standing and reputation and in the expectation that the Advisor will have a continuing role in providing advisory services to the Fund.
Conclusion of the Directors. As a result of this process, the Board, including all of the independent Directors, taking into account all of the factors discussed above and the information provided by the Advisor and others in connection with its review and throughout the year, determined that the management fee is fair and reasonable in light of the services provided and that the investment management agreement between the Fund and the Advisor should be renewed.
Retirement Account Information
As required by law, distributions you receive from certain retirement accounts are subject to federal income tax withholding, unless you elect not to have withholding apply*. Tax will be withheld on the total amount withdrawn even though you may be receiving amounts that are not subject to withholding, such as nondeductible contributions. In such case, excess amounts of withholding could occur. You may adjust your withholding election so that a greater or lesser amount will be withheld.
If you don’t want us to withhold on this amount, you must notify us to not withhold the federal income tax. You may notify us in writing or in certain situations by telephone or through other electronic means. For systematic withdrawals, your withholding election will remain in effect until revoked or changed by filing a new election. You have the right to revoke your election at any time and change your withholding percentage for future distributions.
Remember, even if you elect not to have income tax withheld, you are liable for paying income tax on the taxable portion of your withdrawal. If you elect not to have income tax withheld or you don’t have enough income tax withheld, you may be responsible for payment of estimated tax. You may incur penalties under the estimated tax rules if your withholding and estimated tax payments are not sufficient. You can reduce or defer the income tax on a distribution by directly or indirectly rolling such distribution over to another IRA or eligible plan. You should consult your tax advisor for additional information.
State tax will be withheld if, at the time of your distribution, your address is within one of the mandatory withholding states and you have federal income tax withheld (or as otherwise required by state law). State taxes will be withheld from your distribution in accordance with the respective state rules.
*Some 403(b), 457 and qualified retirement plan distributions may be subject to 20% mandatory withholding, as they are subject to special tax and withholding rules. Your plan administrator or plan sponsor is required to provide you with a special tax notice explaining those rules at the time you request a distribution. If applicable, federal and/or state taxes may be withheld from your distribution amount.
Proxy Voting Policies
A description of the policies that the fund's investment advisor uses in exercising the voting rights associated with the securities purchased and/or held by the fund is available without charge, upon request, by calling 1-800-345-2021. It is also available on the "About Us" page of American Century Investments’ website at americancentury.com and on the Securities and Exchange Commission’s website at sec.gov. Information regarding how the investment advisor voted proxies relating to portfolio securities during the most recent 12-month period ended June 30 is available on the "About Us" page at americancentury.com. It is also available at sec.gov.
Quarterly Portfolio Disclosure
The fund files its complete schedule of portfolio holdings with the Securities and Exchange Commission (SEC) for the first and third quarters of each fiscal year on Form N-Q or as an exhibit to its reports on Form N-PORT. The fund’s Forms N-Q and Form N-PORT reports are available on the SEC’s website at sec.gov. The fund also makes its complete schedule of portfolio holdings for the most recent quarter of its fiscal year available on its website at americancentury.com and, upon request, by calling 1-800-345-2021.
Other Tax Information
The following information is provided pursuant to provisions of the Internal Revenue Code.
The fund hereby designates up to the maximum amount allowable as qualified dividend income for the fiscal year ended July 31, 2019.
For corporate taxpayers, the fund hereby designates $302,180, or up to the maximum amount allowable, of ordinary income distributions paid during the fiscal year ended July 31, 2019 as qualified for the corporate dividends received deduction.
The fund hereby designates $231,599, or up to the maximum amount allowable, as long-term capital gain distributions (20% rate gain distributions) for the fiscal year ended July 31, 2019.
For the fiscal year ended July 31, 2019, the fund intends to pass through to shareholders foreign source income of $144,142 and foreign taxes paid of $14,860, or up to the maximum amount allowable, as a foreign tax credit. Foreign source income and foreign tax expense per outstanding share on July 31, 2019 are $0.0240 and $0.0025, respectively.
|
| | |
| |
| | | |
| Contact Us | americancentury.com | |
| Automated Information Line | 1-800-345-8765 | |
| Investor Services Representative | 1-800-345-2021 or 816-531-5575 | |
| Investors Using Advisors | 1-800-378-9878 | |
| Business, Not-For-Profit, Employer-Sponsored Retirement Plans | 1-800-345-3533 | |
| Banks and Trust Companies, Broker-Dealers, Financial Professionals, Insurance Companies | 1-800-345-6488 | |
| Telecommunications Relay Service for the Deaf | 711 | |
| | | |
| American Century Strategic Asset Allocations, Inc. | |
| | | |
Investment Advisor: American Century Investment Management, Inc. Kansas City, Missouri | |
| | | |
| This report and the statements it contains are submitted for the general information of our shareholders. The report is not authorized for distribution to prospective investors unless preceded or accompanied by an effective prospectus. | |
| | | |
©2019 American Century Proprietary Holdings, Inc. All rights reserved.
CL-ANN-91040 1909 | |

|
| |
| | |
| | Annual Report |
| | |
| | July 31, 2019 |
| | |
| | Strategic Allocation: Aggressive Fund |
| | Investor Class (TWSAX) |
| | I Class (AAAIX) |
| | A Class (ACVAX) |
| | C Class (ASTAX) |
| | R Class (AAARX) |
| | R5 Class (ASAUX) |
| | R6 Class (AAAUX) |
Beginning on January 1, 2021, as permitted by regulations adopted by the Securities and Exchange Commission, paper copies of the fund’s shareholder reports like this one will no longer be sent by mail, unless you specifically request paper copies of the reports from the fund or from your financial intermediary, such as a broker-dealer or bank. Instead, the reports will be made available on a website, and you will be notified by mail each time a report is posted and provided with a website link to access the report.
If you already elected to receive shareholder reports electronically, you will not be affected by this change and you need not take any action. You may elect to receive shareholder reports and other communications from the fund or your financial intermediary electronically by calling or sending an email request to your appropriate contacts as listed on the back cover of this report.
You may elect to receive all future reports in paper free of charge. You can inform the fund or your financial intermediary that you wish to continue receiving paper copies of your shareholder reports by calling or sending an email request to your appropriate contacts as listed on the back cover of this report. Your election to receive reports in paper will apply to all funds held with the fund complex/your financial intermediary.
|
| | |
| President’s Letter | 2 |
|
| Performance | 3 |
|
| Portfolio Commentary | |
|
| Fund Characteristics | |
|
| Shareholder Fee Example | |
|
| Schedule of Investments | |
|
| Statement of Assets and Liabilities | |
|
| Statement of Operations | |
|
| Statement of Changes in Net Assets | |
|
| Notes to Financial Statements | |
|
| Financial Highlights | |
|
| Report of Independent Registered Public Accounting Firm | |
|
| Management | |
|
| Approval of Management Agreement | |
|
| Additional Information | |
|
Any opinions expressed in this report reflect those of the author as of the date of the report, and do not necessarily represent the opinions of American Century Investments® or any other person in the American Century Investments organization. Any such opinions are subject to change at any time based upon market or other conditions and American Century Investments disclaims any responsibility to update such opinions. These opinions may not be relied upon as investment advice and, because investment decisions made by American Century Investments funds are based on numerous factors, may not be relied upon as an indication of trading intent on behalf of any American Century Investments fund. Security examples are used for representational purposes only and are not intended as recommendations to purchase or sell securities. Performance information for comparative indices and securities is provided to American Century Investments by third party vendors. To the best of American Century Investments’ knowledge, such information is accurate at the time of printing.
Jonathan Thomas
Dear Investor:
Thank you for reviewing this annual report for the period ended July 31, 2019. Annual reports help convey important details about fund returns, including market factors that affected performance. For additional investment and market insights, please visit our website, americancentury.com.
Stocks Advanced Amid Volatile Climate
Most broad U.S. and global stock indices ended the year with gains. However, these positive results masked wide performance swings. For example, U.S. stocks, as measured by the S&P 500 Index, returned -3.00% in the first half of the period and 11.32% in the second half, leaving the index up 7.99% for the 12 months. Global stocks, as measured by the MSCI All Country World Index, returned -4.71% in the first half, 8.04% in the second half and 2.95% overall. For fixed-income securities, the path to positive performance was smoother, and U.S. and global bonds gained 8.08% and 5.73%, respectively, for the 12 months, according to the Bloomberg Barclays U.S. Aggregate Bond and Global Aggregate Bond indices.
Fed’s Flip Fueled Investor Optimism
Early in the period, mounting concerns about slowing global economic and earnings growth, tariffs and Federal Reserve (Fed) policy soured investor sentiment. After raising rates in September, the Fed hiked again in December and delivered a surprisingly bullish rate-hike outlook that fueled a steep sell-off among riskier assets. Meanwhile, the risk-off climate sparked a flight to quality, and government bond yields plunged.
A key policy pivot from the Fed helped improve investor sentiment beginning in early 2019. The central bank abruptly ended its rate-hike campaign and adopted a dovish tone amid moderating global growth and inflation. Additionally, investors’ worst-case fears about growth, trade and corporate earnings generally eased, which also aided stocks. At the same time, government bond yields continued to fall on moderating global growth data, muted inflation and accommodative central bank policy, including the Fed’s July rate cut. This backdrop supported continued gains for bonds and other interest rate-sensitive assets.
Looking ahead, we expect volatility to remain a formidable factor as investors react to global growth and trade trends, central bank policy and geopolitical developments. We believe this scenario underscores the importance of using professionally managed portfolios in pursuit of investment goals. We appreciate your continued trust and confidence in us.
Sincerely,
Jonathan Thomas
President and Chief Executive Officer
American Century Investments
|
| | | | | | |
| Total Returns as of July 31, 2019 |
| | | | Average Annual Returns | |
| | Ticker Symbol | 1 year | 5 years | 10 years | Since Inception | Inception Date |
| Investor Class | TWSAX | 3.96% | 6.82% | 9.53% | — | 2/15/96 |
| S&P 500 Index | — | 7.99% | 11.33% | 14.02% | — | — |
| Bloomberg Barclays U.S. Aggregate Bond Index | — | 8.08% | 3.04% | 3.75% | — | — |
| Bloomberg Barclays U.S. 1-3 Month Treasury Bill Index | — | 2.30% | 0.86% | 0.47% | — | — |
| I Class | AAAIX | 4.22% | 7.03% | 9.76% | — | 8/1/00 |
| A Class | ACVAX | | | | | 10/2/96 |
| No sales charge | | 3.66% | 6.55% | 9.25% | — | |
| With sales charge | | -2.34% | 5.29% | 8.60% | — | |
| C Class | ASTAX | 2.91% | 5.75% | 8.43% | — | 11/27/01 |
| R Class | AAARX | 3.51% | 6.29% | 8.99% | — | 3/31/05 |
| R5 Class | ASAUX | 4.08% | — | — | 8.73% | 4/10/17 |
| R6 Class | AAAUX | 4.27% | 7.19% | — | 7.92% | 7/26/13 |
Average annual returns since inception are presented when ten years of performance history is not available.
Fund returns would have been lower if a portion of the fees had not been waived.
Sales charges include initial sales charges and contingent deferred sales charges (CDSCs), as applicable. A Class shares have a 5.75% maximum initial sales charge and may be subject to a maximum CDSC of 1.00%. C Class shares redeemed within 12 months of purchase are subject to a maximum CDSC of 1.00%. The SEC requires that mutual funds provide performance information net of maximum sales charges in all cases where charges could be applied.
Data presented reflect past performance. Past performance is no guarantee of future results. Current performance may be higher or lower than the performance shown. Total returns for periods less than one year are not annualized. Investment return and principal value will fluctuate, and redemption value may be more or less than original cost. Data assumes reinvestment of dividends and capital gains, and none of the charts reflect the deduction of taxes that a shareholder would pay on fund distributions or the redemption of fund shares. To obtain performance data current to the most recent month end, please call 1-800-345-2021 or visit americancentury.com. For additional information about the fund, please consult the prospectus.
|
|
| Growth of $10,000 Over 10 Years |
| $10,000 investment made July 31, 2009 |
| Performance for other share classes will vary due to differences in fee structure. |
|
| |
| Value on July 31, 2019 |
| | Investor Class — $24,869 |
| |
| | S&P 500 Index — $37,171 |
| |
| | Bloomberg Barclays U.S. Aggregate Bond Index — $14,456 |
| |
| | Bloomberg Barclays U.S. 1-3 Month Treasury Bill Index — $10,482 |
| |
Ending value of Investor Class would have been lower if a portion of the fees had not been waived.
|
| | | | | | |
Total Annual Fund Operating Expenses | | |
| Investor Class | I Class | A Class | C Class | R Class | R5 Class | R6 Class |
| 1.16% | 0.96% | 1.41% | 2.16% | 1.66% | 0.96% | 0.81% |
The total annual fund operating expenses shown is as stated in the fund’s prospectus current as of the date of this report. The prospectus may vary from the expense ratio shown elsewhere in this report because it is based on a different time period, includes acquired fund fees and expenses, and, if applicable, does not include fee waivers or expense reimbursements.
Data presented reflect past performance. Past performance is no guarantee of future results. Current performance may be higher or lower than the performance shown. Total returns for periods less than one year are not annualized. Investment return and principal value will fluctuate, and redemption value may be more or less than original cost. Data assumes reinvestment of dividends and capital gains, and none of the charts reflect the deduction of taxes that a shareholder would pay on fund distributions or the redemption of fund shares. To obtain performance data current to the most recent month end, please call 1-800-345-2021 or visit americancentury.com. For additional information about the fund, please consult the prospectus.
Portfolio Managers: Rich Weiss, Scott Wilson, Radu Gabudean and Vidya Rajappa
During the period, David MacEwen left the portfolio management team.
Performance Summary
Strategic Allocation: Aggressive returned 3.96%* for the fiscal period ended July 31, 2019. Because of the fund’s strategic exposure to a variety of asset classes, a review of the financial markets helps provide context around performance for the reporting period.
The period was marked by sharp volatility amid changing expectations for economic growth, interest rates and corporate profits. In the U.S., growth in the economy and in corporate profits initially led to stock market gains, but worry that U.S. trade policy and rising interest rates might choke off growth meant stocks declined sharply from October through December. But beginning in January, the U.S. Federal Reserve (the Fed) and central banks around the world reassured investors, promising to work to support economic growth. Nevertheless, the companies in the S&P 500 Index reported negative earnings growth for the first two quarters of 2019.
Against a backdrop of slowing global growth, stagnant corporate profits, trade difficulties and shifting central bank policies, global equity markets produced mixed results. Most major indices within the U.S. gained, ending the period at or near record highs. Meanwhile, many non-U.S. markets lost ground. In the U.S., large-cap companies outperformed their mid- and small-cap counterparts, and growth beat value across stocks of all sizes, according to the Russell family of indices. Small-cap stocks were the only major segment of the U.S. equity market to experience a negative return during the 12 months. Non-U.S. developed markets stocks mildly underperformed emerging markets, but both delivered a negative return and trailed U.S. equities. For the year, the S&P 500 Index’s gain of 7.99% dwarfed the -2.18% loss of the MSCI Emerging Markets Index and the -2.60% return of the MSCI EAFE Index.
Within fixed-income investments, after raising interest rates twice in late 2018, the Fed reversed course and cut rates on the last day of the reporting period to a range from 2.00% to 2.25%. Worries about slower economic growth and volatility in equity markets supported demand for longer-term U.S. Treasury bonds. The yield on the benchmark 10-year Treasury note fell and finished the fiscal year just above 2.00%. (When bond yields fall, prices rise, and vice versa.) Investment-grade U.S. corporate debt generally outperformed other spread sectors of the market, although U.S. high-yield and non-U.S. debt also produced strong returns. The Bloomberg Barclays U.S. High-Yield 2.00% Issuer Capped Bond Index gained 6.91%, while the Bloomberg Barclays U.S. Aggregate Bond Index returned 8.08%, the Bloomberg Barclays Global Aggregate Bond Index ex-USD (Unhedged) returned 3.74% and the Bloomberg Barclays Global Aggregate Bond Index (USD, Hedged) returned 8.61%.
Strategic Allocation: Aggressive’s neutral asset mix throughout the period was 79% stocks, 20% bonds and 1% cash-equivalent investments. However, the portfolio’s actual asset weightings varied based on short-term tactical adjustments and fluctuating securities prices.
*All fund returns referenced in this commentary are for Investor Class shares. Fund returns would have been lower if a portion of the fees had not been waived. Performance for other share classes will vary due to differences in fee structure; when Investor Class performance exceeds that of the fund's benchmark, other share classes may not. See page 3 for returns for all share classes.
Tactical Positioning
In managing the fund, we make modest tactical adjustments to the asset mix in an effort to add value and improve the fund’s ability to meet its investment objective. We began the reporting period with a neutral allocation across stocks, bonds and cash, and we maintained that throughout the period. Within the equity segment, we generally favored U.S. equities over non-U.S. stocks. The portfolio also tended to be overweight large-cap stocks relative to small caps for much of the period. In addition, we generally maintained an overweight to the large-cap growth segment and an underweight to large-cap value stocks. In the bond segment, we generally favored higher-yielding corporate and securitized bonds and select emerging markets securities, adjusting exposure as valuations, fundamentals and market conditions dictated.
From a return perspective, the overweight position in growth stocks and corresponding underweight to value was the most successful area of tactical allocation. However, our allocation to large-cap core U.S. stocks underperformed, and the effect of our tactical changes overall detracted slightly from performance.
Equity Contribution Mixed
The equity portion of Strategic Allocation: Aggressive produced gains, with U.S. growth-oriented shares contributing the most to performance. In absolute terms, U.S. large-cap growth, mid-cap growth and small-cap growth performed well and benefited from strong stock selection, as did U.S. large-cap value to a lesser extent. U.S. large-cap core and disciplined large-cap growth produced positive returns but underperformed their respective underlying benchmarks because of stock choices. An overweight to U.S. stocks relative to non-U.S. developed markets stocks contributed to returns, as U.S. equities significantly outperformed their non-U.S. counterparts.
Indeed, non-U.S. equities detracted amid a challenging environment for global economic growth. Security selection further diminished results in non-U.S. small-cap growth, fundamental value and large-cap growth. However, positioning in a small global real estate allocation contributed to performance, aided by positive security selection.
Global Fixed-Income Allocation Performed Well
Global bonds produced strong gains as the economy weakened, inflation remained tame, global central banks eased monetary policy and investors sought bonds for their relative safety amid uncertainty around trade, Brexit and volatility in stocks. Indeed, bond yields in many developed economies ended the period below zero, meaning investors placed a premium on safety of principal. As a result, the global bond allocation contributed to gains and benefited from strong security selection, particularly among securitized bonds and investment-grade corporate bonds.
Outlook
At period-end, the Strategic Allocation: Aggressive portfolio was neutral in terms of stocks, bonds and cash, with an overweight position in U.S. large-cap growth stocks. The portfolio had underweights in U.S. value stocks and non-U.S. equities. However, we are in the process of removing our long-standing overweight allocation to the U.S. This reflects the input of our quantitative process, which shows a split between fundamental factors, which tend to lean toward stocks outside the U.S., while momentum and technical factors favor the U.S.
|
| |
| JULY 31, 2019 |
Top Ten Common Stocks | % of net assets |
| Microsoft Corp. | 1.8% |
| Alphabet, Inc., Class A | 1.5% |
| Amazon.com, Inc. | 1.4% |
| Apple, Inc. | 1.3% |
| Visa, Inc., Class A | 0.9% |
| Facebook, Inc., Class A | 0.9% |
| JPMorgan Chase & Co. | 0.7% |
| Verizon Communications, Inc. | 0.6% |
| Zimmer Biomet Holdings, Inc. | 0.6% |
| Medtronic plc | 0.6% |
| | |
Geographic Composition of Common Stocks | % of net assets |
| United States | 53.1% |
| Japan | 3.1% |
| United Kingdom | 2.9% |
| China | 2.6% |
| Other Countries | 14.9% |
| | |
Key Fixed-Income Portfolio Statistics |
| Weighted Average Life to Maturity | 6.6 years |
| Average Duration (effective) | 5.3 years |
| | |
Types of Investments in Portfolio | % of net assets |
| Domestic Common Stocks | 53.1% |
| Foreign Common Stocks* | 23.5% |
| Corporate Bonds | 6.4% |
| U.S. Treasury Securities | 5.0% |
| U.S. Government Agency Mortgage-Backed Securities | 2.1% |
| Sovereign Governments and Agencies | 1.4% |
| Affiliated Funds | 1.3% |
| Asset-Backed Securities | 1.2% |
| Collateralized Mortgage Obligations | 1.0% |
| Collateralized Loan Obligations | 0.9% |
| Commercial Mortgage-Backed Securities | 0.5% |
| Exchange-Traded Funds | 0.5% |
| Municipal Securities | 0.4% |
| Commercial Paper | 0.1% |
| Warrants | —** |
| Temporary Cash Investments | 2.9% |
| Other Assets and Liabilities | (0.3)% |
| *Includes depositary shares, dual listed securities and foreign ordinary shares. | |
| **Category is less than 0.05% of total net assets. | |
Fund shareholders may incur two types of costs: (1) transaction costs, including sales charges (loads) on purchase payments and redemption/exchange fees; and (2) ongoing costs, including management fees; distribution and service (12b-1) fees; and other fund expenses. This example is intended to help you understand your ongoing costs (in dollars) of investing in your fund and to compare these costs with the ongoing cost of investing in other mutual funds.
The example is based on an investment of $1,000 made at the beginning of the period and held for the entire period from February 1, 2019 to July 31, 2019.
Actual Expenses
The table provides information about actual account values and actual expenses for each class. You may use the information, together with the amount you invested, to estimate the expenses that you paid over the period. First, identify the share class you own. Then simply divide your account value by $1,000 (for example, an $8,600 account value divided by $1,000 = 8.6), then multiply the result by the number under the heading “Expenses Paid During Period” to estimate the expenses you paid on your account during this period.
If you hold Investor Class shares of any American Century Investments fund, or I Class shares of the American Century Diversified Bond Fund, in an American Century Investments account (i.e., not a financial intermediary or retirement plan account), American Century Investments may charge you a $12.50 semiannual account maintenance fee if the value of those shares is less than $10,000. We will redeem shares automatically in one of your accounts to pay the $12.50 fee. In determining your total eligible investment amount, we will include your investments in all personal accounts (including American Century Investments Brokerage accounts) registered under your Social Security number. Personal accounts include individual accounts, joint accounts, UGMA/UTMA accounts, personal trusts, Coverdell Education Savings Accounts and IRAs (including traditional, Roth, Rollover, SEP-, SARSEP- and SIMPLE-IRAs), and certain other retirement accounts. If you have only business, business retirement, employer-sponsored or American Century Investments Brokerage accounts, you are currently not subject to this fee. If you are subject to the Account Maintenance Fee, your account value could be reduced by the fee amount.
Hypothetical Example for Comparison Purposes
The table also provides information about hypothetical account values and hypothetical expenses based on the actual expense ratio of each class of your fund and an assumed rate of return of 5% per year before expenses, which is not the actual return of a fund’s share class. The hypothetical account values and expenses may not be used to estimate the actual ending account balance or expenses you paid for the period. You may use this information to compare the ongoing costs of investing in your fund and other funds. To do so, compare this 5% hypothetical example with the 5% hypothetical examples that appear in the shareholder reports of the other funds.
Please note that the expenses shown in the table are meant to highlight your ongoing costs only and do not reflect any transactional costs, such as sales charges (loads) or redemption/exchange fees. Therefore, the table is useful in comparing ongoing costs only, and will not help you determine the relative total costs of owning different funds. In addition, if these transactional costs were included, your costs would have been higher.
|
| | | | |
| | Beginning
Account Value
2/1/19 | Ending
Account Value
7/31/19 | Expenses Paid
During Period(1)
2/1/19 - 7/31/19 |
Annualized
Expense Ratio(1) |
Actual |
| Investor Class | $1,000 | $1,083.60 | $5.73 | 1.11% |
| I Class | $1,000 | $1,084.10 | $4.70 | 0.91% |
| A Class | $1,000 | $1,081.40 | $7.02 | 1.36% |
| C Class | $1,000 | $1,077.90 | $10.87 | 2.11% |
| R Class | $1,000 | $1,081.50 | $8.31 | 1.61% |
| R5 Class | $1,000 | $1,084.10 | $4.70 | 0.91% |
| R6 Class | $1,000 | $1,084.40 | $3.93 | 0.76% |
| Hypothetical |
| Investor Class | $1,000 | $1,019.29 | $5.56 | 1.11% |
| I Class | $1,000 | $1,020.28 | $4.56 | 0.91% |
| A Class | $1,000 | $1,018.05 | $6.81 | 1.36% |
| C Class | $1,000 | $1,014.33 | $10.54 | 2.11% |
| R Class | $1,000 | $1,016.81 | $8.05 | 1.61% |
| R5 Class | $1,000 | $1,020.28 | $4.56 | 0.91% |
| R6 Class | $1,000 | $1,021.03 | $3.81 | 0.76% |
| |
| (1) | Expenses are equal to the class's annualized expense ratio listed in the table above, multiplied by the average account value over the period, multiplied by 181, the number of days in the most recent fiscal half-year, divided by 365, to reflect the one-half year period. Annualized expense ratio reflects actual expenses, including any applicable fee waivers or expense reimbursements and excluding any acquired fund fees and expenses. |
JULY 31, 2019
|
| | | | | | |
| | | Shares/
Principal Amount | Value |
| COMMON STOCKS — 76.6% | | | |
| Aerospace and Defense — 1.1% | | | |
Aerojet Rocketdyne Holdings, Inc.(1) | | 2,600 |
| $ | 111,072 |
|
| Airbus SE | | 4,910 |
| 694,153 |
|
| BAE Systems plc | | 82,403 |
| 547,833 |
|
| Boeing Co. (The) | | 1,836 |
| 626,406 |
|
| Embraer SA ADR | | 60,998 |
| 1,232,160 |
|
| Hexcel Corp. | | 2,160 |
| 176,602 |
|
| L3Harris Technologies, Inc. | | 9,353 |
| 1,941,683 |
|
| Lockheed Martin Corp. | | 5,490 |
| 1,988,313 |
|
Mercury Systems, Inc.(1) | | 2,614 |
| 213,093 |
|
| Raytheon Co. | | 3,424 |
| 624,161 |
|
| Textron, Inc. | | 4,145 |
| 204,348 |
|
| | | | 8,359,824 |
|
| Air Freight and Logistics — 0.3% | | | |
| CH Robinson Worldwide, Inc. | | 11,235 |
| 940,706 |
|
| United Parcel Service, Inc., Class B | | 8,640 |
| 1,032,221 |
|
| | | | 1,972,927 |
|
| Airlines — 0.4% | | | |
| Delta Air Lines, Inc. | | 16,819 |
| 1,026,632 |
|
| Southwest Airlines Co. | | 38,904 |
| 2,004,723 |
|
| | | | 3,031,355 |
|
| Auto Components — 0.5% | | | |
| Aptiv plc | | 10,003 |
| 876,763 |
|
| BorgWarner, Inc. | | 27,289 |
| 1,031,524 |
|
| Hyundai Mobis Co. Ltd. | | 6,928 |
| 1,402,479 |
|
| Hyundai Wia Corp. | | 5,218 |
| 189,932 |
|
Leoni AG(1) | | 21,841 |
| 293,655 |
|
| NOK Corp. | | 13,400 |
| 196,717 |
|
| | | | 3,991,070 |
|
| Automobiles — 1.1% | | | |
| Astra International Tbk PT | | 440,100 |
| 218,640 |
|
| Brilliance China Automotive Holdings Ltd. | | 456,000 |
| 499,719 |
|
| Honda Motor Co. Ltd. ADR | | 51,266 |
| 1,275,498 |
|
| Hyundai Motor Co. | | 16,250 |
| 1,725,542 |
|
| Kia Motors Corp. | | 28,869 |
| 1,058,072 |
|
| Mazda Motor Corp. | | 96,200 |
| 947,446 |
|
| Nissan Motor Co. Ltd. | | 247,800 |
| 1,618,462 |
|
| Peugeot SA | | 8,680 |
| 203,834 |
|
| Renault SA | | 11,473 |
| 637,490 |
|
| Thor Industries, Inc. | | 6,519 |
| 388,532 |
|
| | | | 8,573,235 |
|
|
| | | | | | |
| | | Shares/
Principal Amount | Value |
| Banks — 6.4% | | | |
| Ameris Bancorp | | 1,112 |
| $ | 44,224 |
|
| Banco Bradesco SA ADR | | 82,091 |
| 742,103 |
|
| Bancolombia SA ADR | | 3,535 |
| 176,326 |
|
| Bank Central Asia Tbk PT | | 167,000 |
| 367,295 |
|
| Bank of America Corp. | | 89,792 |
| 2,754,819 |
|
| Bank OZK | | 2,007 |
| 61,374 |
|
| Bank Rakyat Indonesia Persero Tbk PT | | 2,363,600 |
| 753,222 |
|
| BankUnited, Inc. | | 8,152 |
| 280,510 |
|
| Barclays plc | | 1,039,410 |
| 1,950,346 |
|
| BB&T Corp. | | 67,888 |
| 3,498,269 |
|
| BNP Paribas SA | | 39,458 |
| 1,833,504 |
|
| Capitec Bank Holdings Ltd. | | 5,940 |
| 488,847 |
|
| Central Pacific Financial Corp. | | 194 |
| 5,717 |
|
| China Construction Bank Corp., H Shares | | 939,000 |
| 722,915 |
|
| Citigroup, Inc. | | 1,634 |
| 116,275 |
|
| Comerica, Inc. | | 22,485 |
| 1,645,902 |
|
| Commerce Bancshares, Inc. | | 9,745 |
| 592,788 |
|
| Commercial International Bank Egypt S.A.E. | | 50,663 |
| 221,441 |
|
| Commercial International Bank Egypt S.A.E. GDR | | 11,011 |
| 47,320 |
|
| Commerzbank AG | | 212,981 |
| 1,454,810 |
|
| Credicorp Ltd. | | 2,376 |
| 517,944 |
|
Erste Group Bank AG(1) | | 13,952 |
| 498,977 |
|
| Fifth Third Bancorp | | 8,553 |
| 253,939 |
|
| FinecoBank Banca Fineco SpA | | 17,593 |
| 174,300 |
|
| First Abu Dhabi Bank PJSC | | 78,993 |
| 341,825 |
|
| First BanCorp | | 4,863 |
| 52,326 |
|
| First Hawaiian, Inc. | | 31,611 |
| 845,910 |
|
| Glacier Bancorp, Inc. | | 1,194 |
| 50,041 |
|
| Hana Financial Group, Inc. | | 22,166 |
| 650,181 |
|
| HDFC Bank Ltd. | | 41,098 |
| 1,340,363 |
|
| Hilltop Holdings, Inc. | | 3,890 |
| 88,225 |
|
| Home BancShares, Inc. | | 14,398 |
| 283,209 |
|
| Independent Bank Group, Inc. | | 1,908 |
| 108,393 |
|
| IndusInd Bank Ltd. | | 22,125 |
| 451,940 |
|
| Industrial & Commercial Bank of China Ltd., H Shares | | 1,051,770 |
| 707,961 |
|
| JPMorgan Chase & Co. | | 49,372 |
| 5,727,152 |
|
| Kasikornbank PCL NVDR | | 40,900 |
| 229,026 |
|
| KBC Group NV | | 7,820 |
| 502,235 |
|
| LegacyTexas Financial Group, Inc. | | 3,231 |
| 138,093 |
|
| M&T Bank Corp. | | 3,944 |
| 647,802 |
|
| Mitsubishi UFJ Financial Group, Inc. | | 477,400 |
| 2,359,919 |
|
| Mizuho Financial Group, Inc. | | 850,600 |
| 1,202,696 |
|
| Moneta Money Bank AS | | 54,346 |
| 186,410 |
|
| Origin Bancorp, Inc. | | 4,111 |
| 143,104 |
|
| OTP Bank Nyrt. | | 12,122 |
| 505,312 |
|
| Pacific Premier Bancorp, Inc. | | 2,852 |
| 90,209 |
|
|
| | | | | | |
| | | Shares/
Principal Amount | Value |
| PNC Financial Services Group, Inc. (The) | | 18,270 |
| $ | 2,610,783 |
|
| Prosperity Bancshares, Inc. | | 4,323 |
| 299,973 |
|
| Sberbank of Russia PJSC ADR (London) | | 28,551 |
| 425,338 |
|
| Signature Bank | | 1,560 |
| 198,838 |
|
| Societe Generale SA | | 26,771 |
| 655,774 |
|
| South State Corp. | | 1,714 |
| 137,240 |
|
| Standard Chartered plc (London) | | 105,339 |
| 863,959 |
|
| Sumitomo Mitsui Financial Group, Inc. | | 21,200 |
| 742,332 |
|
| SunTrust Banks, Inc. | | 8,049 |
| 536,063 |
|
Texas Capital Bancshares, Inc.(1) | | 3,508 |
| 220,758 |
|
| Towne Bank | | 2,314 |
| 65,116 |
|
| U.S. Bancorp | | 38,890 |
| 2,222,564 |
|
| UMB Financial Corp. | | 12,315 |
| 840,622 |
|
| UniCredit SpA | | 59,753 |
| 701,108 |
|
| Valley National Bancorp | | 27,679 |
| 308,898 |
|
| Veritex Holdings, Inc. | | 2,427 |
| 62,107 |
|
| Wells Fargo & Co. | | 54,362 |
| 2,631,664 |
|
| Westamerica Bancorporation | | 6,211 |
| 398,125 |
|
| | | | 49,776,761 |
|
| Beverages — 0.8% | | | |
| Brown-Forman Corp., Class B | | 4,927 |
| 270,049 |
|
| Coca-Cola Co. (The) | | 5,829 |
| 306,780 |
|
| Coca-Cola Consolidated, Inc. | | 82 |
| 24,070 |
|
| Constellation Brands, Inc., Class A | | 3,598 |
| 708,158 |
|
| Diageo plc | | 20,580 |
| 858,694 |
|
| Fevertree Drinks plc | | 8,338 |
| 236,265 |
|
| Kweichow Moutai Co. Ltd., A Shares | | 1,500 |
| 210,842 |
|
| MGP Ingredients, Inc. | | 1,276 |
| 63,787 |
|
| Molson Coors Brewing Co., Class B | | 4,320 |
| 233,237 |
|
Monster Beverage Corp.(1) | | 835 |
| 53,832 |
|
| PepsiCo, Inc. | | 20,972 |
| 2,680,431 |
|
| Treasury Wine Estates Ltd. | | 33,010 |
| 397,901 |
|
| | | | 6,044,046 |
|
| Biotechnology — 1.4% | | | |
| AbbVie, Inc. | | 13,994 |
| 932,280 |
|
| Abcam plc | | 6,812 |
| 107,729 |
|
Acceleron Pharma, Inc.(1) | | 1,460 |
| 63,744 |
|
Aimmune Therapeutics, Inc.(1) | | 1,968 |
| 37,884 |
|
Alder Biopharmaceuticals, Inc.(1) | | 2,552 |
| 25,826 |
|
Amarin Corp. plc ADR(1) | | 1,535 |
| 28,536 |
|
| Amgen, Inc. | | 4,882 |
| 910,884 |
|
Amicus Therapeutics, Inc.(1) | | 5,249 |
| 65,088 |
|
AnaptysBio, Inc.(1) | | 362 |
| 19,443 |
|
Arena Pharmaceuticals, Inc.(1) | | 1,743 |
| 109,251 |
|
Argenx SE(1) | | 1,099 |
| 154,523 |
|
ArQule, Inc.(1) | | 3,115 |
| 31,430 |
|
Biogen, Inc.(1) | | 6,991 |
| 1,662,600 |
|
|
| | | | | | |
| | | Shares/
Principal Amount | Value |
Blueprint Medicines Corp.(1) | | 791 |
| $ | 79,219 |
|
Celgene Corp.(1) | | 6,918 |
| 635,488 |
|
| CSL Ltd. | | 8,010 |
| 1,250,743 |
|
Exact Sciences Corp.(1) | | 4,721 |
| 543,434 |
|
Exelixis, Inc.(1) | | 8,349 |
| 177,583 |
|
FibroGen, Inc.(1) | | 1,016 |
| 48,016 |
|
Flexion Therapeutics, Inc.(1) | | 2,082 |
| 20,903 |
|
Galapagos NV(1) | | 1,390 |
| 241,184 |
|
| Gilead Sciences, Inc. | | 16,383 |
| 1,073,414 |
|
Global Blood Therapeutics, Inc.(1) | | 770 |
| 42,196 |
|
Halozyme Therapeutics, Inc.(1) | | 2,902 |
| 49,305 |
|
Heron Therapeutics, Inc.(1) | | 1,930 |
| 33,659 |
|
Immunomedics, Inc.(1) | | 29,899 |
| 441,010 |
|
Incyte Corp.(1) | | 4,607 |
| 391,227 |
|
Insmed, Inc.(1) | | 1,828 |
| 40,125 |
|
Medicines Co. (The)(1) | | 1,148 |
| 41,144 |
|
Mirati Therapeutics, Inc.(1) | | 284 |
| 30,047 |
|
MorphoSys AG(1) | | 1,437 |
| 173,811 |
|
Natera, Inc.(1) | | 3,047 |
| 84,036 |
|
PeptiDream, Inc.(1) | | 3,900 |
| 217,862 |
|
Portola Pharmaceuticals, Inc.(1) | | 1,613 |
| 43,035 |
|
Principia Biopharma, Inc.(1) | | 985 |
| 36,583 |
|
PTC Therapeutics, Inc.(1) | | 1,282 |
| 61,754 |
|
REGENXBIO, Inc.(1) | | 732 |
| 32,508 |
|
Sarepta Therapeutics, Inc.(1) | | 3,758 |
| 559,378 |
|
Stoke Therapeutics, Inc.(1) | | 1,297 |
| 31,958 |
|
Ultragenyx Pharmaceutical, Inc.(1) | | 740 |
| 44,592 |
|
Vertex Pharmaceuticals, Inc.(1) | | 3,358 |
| 559,510 |
|
Viking Therapeutics, Inc.(1) | | 3,537 |
| 27,200 |
|
| | | | 11,160,142 |
|
| Building Products — 0.6% | | | |
| CSW Industrials, Inc. | | 149 |
| 10,521 |
|
| Daikin Industries Ltd. | | 2,500 |
| 310,352 |
|
| Fortune Brands Home & Security, Inc. | | 842 |
| 46,259 |
|
Gibraltar Industries, Inc.(1) | | 1,638 |
| 67,879 |
|
| Johnson Controls International plc | | 70,023 |
| 2,971,776 |
|
| Lindab International AB | | 11,370 |
| 129,689 |
|
| Masco Corp. | | 9,347 |
| 381,077 |
|
PGT Innovations, Inc.(1) | | 4,129 |
| 66,559 |
|
Trex Co., Inc.(1) | | 5,253 |
| 429,433 |
|
| | | | 4,413,545 |
|
| Capital Markets — 2.3% | | | |
| Ameriprise Financial, Inc. | | 14,200 |
| 2,066,242 |
|
| Ares Management Corp., Class A | | 7,652 |
| 223,821 |
|
| Artisan Partners Asset Management, Inc., Class A | | 7,305 |
| 216,155 |
|
| Ashmore Group plc | | 35,978 |
| 233,816 |
|
Assetmark Financial Holdings, Inc.(1) | | 2,177 |
| 61,587 |
|
|
| | | | | | |
| | | Shares/
Principal Amount | Value |
| B3 SA - Brasil Bolsa Balcao | | 68,400 |
| $ | 758,138 |
|
| Bank of New York Mellon Corp. (The) | | 46,070 |
| 2,161,604 |
|
| Burford Capital Ltd. | | 5,697 |
| 103,711 |
|
| Charles Schwab Corp. (The) | | 21,738 |
| 939,516 |
|
Credit Suisse Group AG(1) | | 110,121 |
| 1,333,635 |
|
Donnelley Financial Solutions, Inc.(1) | | 13,680 |
| 186,458 |
|
| Euronext NV | | 3,202 |
| 247,803 |
|
| Evercore, Inc., Class A | | 1,005 |
| 86,802 |
|
| Hamilton Lane, Inc., Class A | | 1,676 |
| 98,381 |
|
| Hong Kong Exchanges & Clearing Ltd. | | 14,200 |
| 479,565 |
|
| Intermediate Capital Group plc | | 20,646 |
| 349,421 |
|
| Invesco Ltd. | | 41,198 |
| 790,590 |
|
| London Stock Exchange Group plc | | 12,360 |
| 997,172 |
|
| LPL Financial Holdings, Inc. | | 21,723 |
| 1,821,908 |
|
| MSCI, Inc. | | 3,806 |
| 864,875 |
|
| Northern Trust Corp. | | 17,044 |
| 1,670,312 |
|
| Partners Group Holding AG | | 710 |
| 565,919 |
|
| Piper Jaffray Cos. | | 539 |
| 41,665 |
|
| S&P Global, Inc. | | 3,415 |
| 836,504 |
|
| State Street Corp. | | 8,407 |
| 488,363 |
|
| TD Ameritrade Holding Corp. | | 1,400 |
| 71,540 |
|
| | | | 17,695,503 |
|
| Chemicals — 0.7% | | | |
| CF Industries Holdings, Inc. | | 1,778 |
| 88,118 |
|
| Chr Hansen Holding A/S | | 3,140 |
| 273,552 |
|
| Dow, Inc. | | 20,725 |
| 1,003,919 |
|
| DuPont de Nemours, Inc. | | 12,730 |
| 918,597 |
|
| Eastman Chemical Co. | | 7,185 |
| 541,390 |
|
Ferro Corp.(1) | | 5,555 |
| 81,825 |
|
| Innophos Holdings, Inc. | | 5,220 |
| 141,828 |
|
| KH Neochem Co. Ltd. | | 5,300 |
| 131,812 |
|
| Koninklijke DSM NV | | 7,080 |
| 876,141 |
|
| Minerals Technologies, Inc. | | 3,645 |
| 194,096 |
|
| Nutrien Ltd. | | 4,420 |
| 242,333 |
|
| PolyOne Corp. | | 700 |
| 22,939 |
|
| Scotts Miracle-Gro Co. (The) | | 6 |
| 673 |
|
| Sika AG | | 3,565 |
| 515,129 |
|
| Symrise AG | | 6,780 |
| 628,083 |
|
| | | | 5,660,435 |
|
| Commercial Services and Supplies — 1.0% | | | |
| ABM Industries, Inc. | | 2,772 |
| 116,674 |
|
Advanced Disposal Services, Inc.(1) | | 3,224 |
| 104,361 |
|
| Babcock International Group plc | | 316,353 |
| 1,825,724 |
|
| Brink's Co. (The) | | 3,535 |
| 318,716 |
|
Casella Waste Systems, Inc., Class A(1) | | 2,047 |
| 89,249 |
|
CECO Environmental Corp.(1) | | 6,280 |
| 57,964 |
|
Charah Solutions, Inc.(1) | | 15,062 |
| 78,322 |
|
|
| | | | | | |
| | | Shares/
Principal Amount | Value |
Clean Harbors, Inc.(1) | | 1,718 |
| $ | 133,678 |
|
| Cleanaway Waste Management Ltd. | | 139,153 |
| 228,777 |
|
| Country Garden Services Holdings Co. Ltd. | | 89,000 |
| 215,770 |
|
| Deluxe Corp. | | 3,179 |
| 141,847 |
|
| Edenred | | 10,360 |
| 519,504 |
|
| HomeServe plc | | 17,280 |
| 239,575 |
|
| Loomis AB, B Shares | | 5,044 |
| 173,688 |
|
Raksul, Inc.(1) | | 2,300 |
| 79,253 |
|
| Rentokil Initial plc | | 20,169 |
| 106,394 |
|
| Republic Services, Inc. | | 16,073 |
| 1,424,871 |
|
| UniFirst Corp. | | 713 |
| 140,368 |
|
| US Ecology, Inc. | | 1,787 |
| 113,707 |
|
| Waste Management, Inc. | | 15,634 |
| 1,829,178 |
|
| | | | 7,937,620 |
|
| Communications Equipment — 0.7% | | | |
Acacia Communications, Inc.(1) | | 788 |
| 52,930 |
|
Arista Networks, Inc.(1) | | 2,934 |
| 802,302 |
|
| AudioCodes Ltd. | | 2,941 |
| 54,879 |
|
Casa Systems, Inc.(1) | | 11,895 |
| 78,388 |
|
| Cisco Systems, Inc. | | 40,416 |
| 2,239,046 |
|
| Juniper Networks, Inc. | | 9,793 |
| 264,607 |
|
Lumentum Holdings, Inc.(1) | | 1,154 |
| 65,351 |
|
| Motorola Solutions, Inc. | | 5,907 |
| 980,326 |
|
| Telefonaktiebolaget LM Ericsson, B Shares | | 72,820 |
| 638,908 |
|
Viavi Solutions, Inc.(1) | | 4,134 |
| 60,646 |
|
| | | | 5,237,383 |
|
| Construction and Engineering — 0.3% | | | |
| Badger Daylighting Ltd. | | 9,746 |
| 351,943 |
|
| Comfort Systems USA, Inc. | | 381 |
| 16,002 |
|
Dycom Industries, Inc.(1) | | 3,375 |
| 186,165 |
|
| EMCOR Group, Inc. | | 217 |
| 18,313 |
|
| Hazama Ando Corp. | | 36,200 |
| 248,773 |
|
| Jacobs Engineering Group, Inc. | | 9,469 |
| 781,287 |
|
| Larsen & Toubro Ltd. | | 10,249 |
| 206,077 |
|
| SHO-BOND Holdings Co. Ltd. | | 5,400 |
| 185,136 |
|
| Valmont Industries, Inc. | | 313 |
| 43,069 |
|
| | | | 2,036,765 |
|
| Construction Materials — 0.4% | | | |
| Anhui Conch Cement Co. Ltd., H Shares | | 85,000 |
| 492,153 |
|
| Cemex SAB de CV ADR | | 96,578 |
| 343,818 |
|
| CRH plc | | 19,387 |
| 645,197 |
|
| POSCO Chemical Co. Ltd. | | 4,492 |
| 184,394 |
|
| Taiwan Cement Corp. | | 238,300 |
| 341,250 |
|
Taiwan Cement Corp. Preference Shares(1) | | 18,866 |
| 31,663 |
|
| Tecnoglass, Inc. | | 8,380 |
| 59,666 |
|
| Vulcan Materials Co. | | 5,927 |
| 820,000 |
|
| | | | 2,918,141 |
|
|
| | | | | | |
| | | Shares/
Principal Amount | Value |
| Consumer Finance — 0.5% | | | |
| American Express Co. | | 11,737 |
| $ | 1,459,731 |
|
| Bajaj Finance Ltd. | | 4,221 |
| 199,057 |
|
| Discover Financial Services | | 10,858 |
| 974,397 |
|
Green Dot Corp., Class A(1) | | 1,908 |
| 96,717 |
|
| Muangthai Capital PCL | | 185,900 |
| 361,892 |
|
| Synchrony Financial | | 25,404 |
| 911,495 |
|
| | | | 4,003,289 |
|
| Containers and Packaging — 0.5% | | | |
| Ball Corp. | | 10,047 |
| 718,159 |
|
Berry Global Group, Inc.(1) | | 1,891 |
| 85,189 |
|
| Graphic Packaging Holding Co. | | 56,974 |
| 846,634 |
|
| Packaging Corp. of America | | 14,244 |
| 1,438,217 |
|
| Rengo Co. Ltd. | | 15,800 |
| 120,160 |
|
| Silgan Holdings, Inc. | | 6,560 |
| 197,194 |
|
| Sonoco Products Co. | | 5,291 |
| 317,619 |
|
| | | | 3,723,172 |
|
| Distributors — 0.2% | | | |
| Core-Mark Holding Co., Inc. | | 2,538 |
| 94,997 |
|
| Genuine Parts Co. | | 4,712 |
| 457,630 |
|
IAA, Inc.(1) | | 2,386 |
| 111,546 |
|
LKQ Corp.(1) | | 19,783 |
| 532,756 |
|
| Pool Corp. | | 293 |
| 55,485 |
|
| | | | 1,252,414 |
|
| Diversified Consumer Services — 0.3% | | | |
Chegg, Inc.(1) | | 3,210 |
| 144,193 |
|
| China Education Group Holdings Ltd. | | 243,000 |
| 380,772 |
|
frontdoor, Inc.(1) | | 1,524 |
| 69,555 |
|
Grand Canyon Education, Inc.(1) | | 958 |
| 104,202 |
|
New Oriental Education & Technology Group, Inc. ADR(1) | | 6,882 |
| 717,861 |
|
ServiceMaster Global Holdings, Inc.(1) | | 250 |
| 13,307 |
|
TAL Education Group ADR(1) | | 21,178 |
| 681,932 |
|
| | | | 2,111,822 |
|
| Diversified Financial Services — 0.5% | | | |
Berkshire Hathaway, Inc., Class B(1) | | 14,217 |
| 2,920,598 |
|
| Chailease Holding Co. Ltd. | | 183,154 |
| 772,338 |
|
| Compass Diversified Holdings | | 13,454 |
| 258,317 |
|
| ECN Capital Corp. | | 22,962 |
| 82,293 |
|
| Zenkoku Hosho Co. Ltd. | | 4,900 |
| 191,154 |
|
| | | | 4,224,700 |
|
| Diversified Telecommunication Services — 0.8% | | | |
| AT&T, Inc. | | 5,399 |
| 183,836 |
|
Cellnex Telecom SA(1) | | 21,199 |
| 790,641 |
|
| Telekomunikasi Indonesia Persero Tbk PT | | 2,071,700 |
| 633,457 |
|
| Verizon Communications, Inc. | | 82,506 |
| 4,560,106 |
|
| | | | 6,168,040 |
|
|
| | | | | | |
| | | Shares/
Principal Amount | Value |
| Electric Utilities — 0.9% | | | |
| Edison International | | 6,589 |
| $ | 491,144 |
|
| Eversource Energy | | 23,021 |
| 1,746,373 |
|
| Exelon Corp. | | 2,792 |
| 125,808 |
|
| Iberdrola SA | | 31,850 |
| 301,772 |
|
| IDACORP, Inc. | | 1,881 |
| 191,975 |
|
| Pinnacle West Capital Corp. | | 19,432 |
| 1,772,587 |
|
| Xcel Energy, Inc. | | 44,458 |
| 2,650,141 |
|
| | | | 7,279,800 |
|
| Electrical Equipment — 1.4% | | | |
| AMETEK, Inc. | | 14,518 |
| 1,300,958 |
|
| Eaton Corp. plc | | 20,402 |
| 1,676,840 |
|
| Emerson Electric Co. | | 35,035 |
| 2,273,071 |
|
| Hubbell, Inc. | | 9,468 |
| 1,229,704 |
|
| Melrose Industries plc | | 255,420 |
| 573,074 |
|
| nVent Electric plc | | 23,781 |
| 589,531 |
|
| Prysmian SpA | | 10,890 |
| 224,225 |
|
| Rockwell Automation, Inc. | | 2,838 |
| 456,294 |
|
| Schneider Electric SE | | 11,557 |
| 995,025 |
|
| Signify NV | | 35,081 |
| 951,611 |
|
| TKH Group NV | | 1,723 |
| 102,394 |
|
Varta AG(1) | | 1,565 |
| 118,454 |
|
| | | | 10,491,181 |
|
| Electronic Equipment, Instruments and Components — 1.2% | | |
| Anritsu Corp. | | 9,300 |
| 171,180 |
|
| Avnet, Inc. | | 1,571 |
| 71,355 |
|
| Barco NV | | 1,494 |
| 309,729 |
|
| Belden, Inc. | | 2,827 |
| 128,515 |
|
| CDW Corp. | | 20,931 |
| 2,473,207 |
|
| Chroma ATE, Inc. | | 82,000 |
| 384,067 |
|
Coherent, Inc.(1) | | 984 |
| 136,628 |
|
| Dolby Laboratories, Inc., Class A | | 1,439 |
| 97,996 |
|
| Electrocomponents plc | | 33,407 |
| 246,278 |
|
| FLIR Systems, Inc. | | 518 |
| 25,724 |
|
| Hexagon AB, B Shares | | 9,200 |
| 446,310 |
|
II-VI, Inc.(1) | | 327 |
| 12,982 |
|
| Isra Vision AG | | 2,293 |
| 100,173 |
|
| Keyence Corp. | | 1,400 |
| 798,961 |
|
Keysight Technologies, Inc.(1) | | 20,720 |
| 1,854,854 |
|
Landis+Gyr Group AG(1) | | 600 |
| 48,616 |
|
| National Instruments Corp. | | 1,480 |
| 61,805 |
|
| Samsung Electro-Mechanics Co. Ltd. | | 2,174 |
| 168,243 |
|
| SYNNEX Corp. | | 447 |
| 44,047 |
|
| TE Connectivity Ltd. | | 17,393 |
| 1,607,113 |
|
Tech Data Corp.(1) | | 727 |
| 73,674 |
|
|
| | | | | | |
| | | Shares/
Principal Amount | Value |
Zebra Technologies Corp., Class A(1) | | 218 |
| $ | 45,974 |
|
| | | | 9,307,431 |
|
| Energy Equipment and Services — 0.5% | | | |
| Baker Hughes a GE Co. | | 49,942 |
| 1,268,027 |
|
C&J Energy Services, Inc.(1) | | 2,256 |
| 24,681 |
|
Dril-Quip, Inc.(1) | | 941 |
| 49,515 |
|
| Liberty Oilfield Services, Inc., Class A | | 1,304 |
| 18,452 |
|
| Modec, Inc. | | 3,600 |
| 95,848 |
|
NCS Multistage Holdings, Inc.(1) | | 11,582 |
| 37,178 |
|
| Schlumberger Ltd. | | 35,790 |
| 1,430,526 |
|
| Subsea 7 SA | | 31,894 |
| 342,883 |
|
Tecnicas Reunidas SA(1) | | 29,314 |
| 706,251 |
|
| TGS NOPEC Geophysical Co. ASA | | 5,571 |
| 134,795 |
|
| | | | 4,108,156 |
|
| Entertainment — 1.2% | | | |
| Activision Blizzard, Inc. | | 22,194 |
| 1,081,736 |
|
Electronic Arts, Inc.(1) | | 11,833 |
| 1,094,553 |
|
| Entertainment One Ltd. | | 59,081 |
| 315,800 |
|
Liberty Media Corp-Liberty Formula One, Class C(1) | | 5,668 |
| 223,206 |
|
Live Nation Entertainment, Inc.(1) | | 683 |
| 49,217 |
|
Netflix, Inc.(1) | | 3,613 |
| 1,166,963 |
|
Take-Two Interactive Software, Inc.(1) | | 21,381 |
| 2,619,600 |
|
| Walt Disney Co. (The) | | 16,301 |
| 2,331,206 |
|
| World Wrestling Entertainment, Inc., Class A | | 1,076 |
| 78,311 |
|
Zynga, Inc., Class A(1) | | 12,530 |
| 79,941 |
|
| | | | 9,040,533 |
|
| Equity Real Estate Investment Trusts (REITs) — 3.8% | | | |
| Acadia Realty Trust | | 4,786 |
| 134,343 |
|
| Advance Residence Investment Corp. | | 62 |
| 192,154 |
|
| Agree Realty Corp. | | 4,036 |
| 269,807 |
|
| Alexandria Real Estate Equities, Inc. | | 4,187 |
| 612,809 |
|
| Allied Properties Real Estate Investment Trust | | 4,380 |
| 162,383 |
|
| American Homes 4 Rent, Class A | | 6,734 |
| 163,030 |
|
| American Tower Corp. | | 647 |
| 136,918 |
|
| Americold Realty Trust | | 23,266 |
| 780,109 |
|
| Boston Properties, Inc. | | 1,238 |
| 164,592 |
|
| Brandywine Realty Trust | | 10,203 |
| 150,494 |
|
| Camden Property Trust | | 5,937 |
| 615,726 |
|
| Canadian Apartment Properties REIT | | 4,755 |
| 175,493 |
|
| CapitaLand Commercial Trust | | 91,900 |
| 137,629 |
|
| CareTrust REIT, Inc. | | 12,241 |
| 284,358 |
|
| Charter Hall Group | | 38,954 |
| 300,696 |
|
| Community Healthcare Trust, Inc. | | 823 |
| 33,817 |
|
| CoreSite Realty Corp. | | 899 |
| 94,224 |
|
| Corporate Office Properties Trust | | 2,354 |
| 65,724 |
|
| Cousins Properties, Inc. | | 4,045 |
| 142,303 |
|
| CyrusOne, Inc. | | 1,937 |
| 111,184 |
|
|
| | | | | | |
| | | Shares/
Principal Amount | Value |
Embassy Office Parks REIT(1) | | 8,800 |
| $ | 47,847 |
|
| Empire State Realty Trust, Inc., Class A | | 27,816 |
| 389,702 |
|
| Equinix, Inc. | | 1,034 |
| 519,171 |
|
| Equity Residential | | 16,152 |
| 1,274,231 |
|
| Essential Properties Realty Trust, Inc. | | 6,183 |
| 130,585 |
|
| Extra Space Storage, Inc. | | 1,130 |
| 127,001 |
|
| Fibra Uno Administracion SA de CV | | 1,334,332 |
| 1,717,721 |
|
| Gaming and Leisure Properties, Inc. | | 10,050 |
| 378,986 |
|
| Gecina SA | | 1,243 |
| 188,997 |
|
| GEO Group, Inc. (The) | | 26,358 |
| 469,436 |
|
| GLP J-Reit | | 127 |
| 141,727 |
|
| Goodman Group | | 46,808 |
| 472,897 |
|
| HCP, Inc. | | 15,513 |
| 495,330 |
|
| Healthcare Trust of America, Inc., Class A | | 29,042 |
| 782,101 |
|
| Highwoods Properties, Inc. | | 1,035 |
| 46,917 |
|
| Hudson Pacific Properties, Inc. | | 7,353 |
| 259,561 |
|
| Inmobiliaria Colonial Socimi SA | | 20,595 |
| 230,491 |
|
| Invesco Office J-Reit, Inc. | | 1,732 |
| 307,588 |
|
| Invincible Investment Corp. | | 116 |
| 66,563 |
|
| Invitation Homes, Inc. | | 18,072 |
| 496,438 |
|
| Japan Hotel REIT Investment Corp. | | 124 |
| 103,258 |
|
| Kilroy Realty Corp. | | 3,633 |
| 288,678 |
|
| Kite Realty Group Trust | | 10,275 |
| 163,475 |
|
| Lexington Realty Trust | | 5,533 |
| 54,611 |
|
| Life Storage, Inc. | | 6,653 |
| 648,601 |
|
| Link REIT | | 44,500 |
| 518,923 |
|
| Mapletree Commercial Trust | | 102,400 |
| 154,234 |
|
| Mapletree Industrial Trust | | 65,900 |
| 107,660 |
|
| MGM Growth Properties LLC, Class A | | 18,172 |
| 542,616 |
|
| National Health Investors, Inc. | | 960 |
| 76,205 |
|
| Northview Apartment Real Estate Investment Trust | | 5,797 |
| 119,472 |
|
| Orix JREIT, Inc. | | 435 |
| 844,839 |
|
| Piedmont Office Realty Trust, Inc., Class A | | 23,421 |
| 487,391 |
|
| Prologis, Inc. | | 11,316 |
| 912,183 |
|
| Regency Centers Corp. | | 921 |
| 61,431 |
|
| Rexford Industrial Realty, Inc. | | 10,874 |
| 450,184 |
|
| RLJ Lodging Trust | | 2,976 |
| 51,425 |
|
| Ryman Hospitality Properties, Inc. | | 2,362 |
| 177,150 |
|
| Sabra Health Care REIT, Inc. | | 4,616 |
| 95,274 |
|
| Safestore Holdings plc | | 25,514 |
| 193,492 |
|
SBA Communications Corp.(1) | | 14,318 |
| 3,513,780 |
|
| Segro plc | | 59,051 |
| 547,734 |
|
| Spirit Realty Capital, Inc. | | 3,748 |
| 165,362 |
|
| STORE Capital Corp. | | 9,563 |
| 327,150 |
|
| Summit Hotel Properties, Inc. | | 5,534 |
| 61,483 |
|
| Sun Communities, Inc. | | 4,826 |
| 640,941 |
|
| UDR, Inc. | | 8,898 |
| 409,842 |
|
|
| | | | | | |
| | | Shares/
Principal Amount | Value |
| UNITE Group plc (The) | | 31,354 |
| $ | 392,755 |
|
| Urstadt Biddle Properties, Inc., Class A | | 1,457 |
| 31,457 |
|
| VICI Properties, Inc. | | 9,103 |
| 194,258 |
|
| Weingarten Realty Investors | | 3,533 |
| 98,606 |
|
| Welltower, Inc. | | 22,735 |
| 1,889,733 |
|
| Weyerhaeuser Co. | | 87,135 |
| 2,214,100 |
|
| | | | 29,809,386 |
|
| Food and Staples Retailing — 0.7% | | | |
| Alimentation Couche-Tard, Inc., B Shares | | 9,050 |
| 554,739 |
|
| BIM Birlesik Magazalar AS | | 25,846 |
| 216,621 |
|
| Cosmos Pharmaceutical Corp. | | 300 |
| 55,118 |
|
| Costco Wholesale Corp. | | 225 |
| 62,017 |
|
| CP ALL PCL | | 170,500 |
| 478,154 |
|
Grocery Outlet Holding Corp.(1) | | 648 |
| 25,233 |
|
| Kobe Bussan Co. Ltd. | | 4,500 |
| 250,938 |
|
| Koninklijke Ahold Delhaize NV | | 24,675 |
| 557,898 |
|
| President Chain Store Corp. | | 21,000 |
| 202,457 |
|
| Sysco Corp. | | 16,957 |
| 1,162,742 |
|
| Wal-Mart de Mexico SAB de CV | | 121,018 |
| 357,110 |
|
| Walmart, Inc. | | 13,588 |
| 1,499,844 |
|
| Weis Markets, Inc. | | 1,589 |
| 57,919 |
|
| | | | 5,480,790 |
|
| Food Products — 1.7% | | | |
a2 Milk Co. Ltd.(1) | | 27,740 |
| 321,619 |
|
| AAK AB | | 10,043 |
| 205,444 |
|
| Associated British Foods plc | | 16,630 |
| 488,011 |
|
Ausnutria Dairy Corp. Ltd.(1) | | 52,000 |
| 93,261 |
|
| Bakkafrost P/F | | 2,159 |
| 124,005 |
|
Beyond Meat, Inc.(1) | | 213 |
| 41,857 |
|
| Campbell Soup Co. | | 19,663 |
| 812,868 |
|
| Conagra Brands, Inc. | | 45,146 |
| 1,303,365 |
|
| Danone SA | | 12,270 |
| 1,063,804 |
|
| General Mills, Inc. | | 21,107 |
| 1,120,993 |
|
Hain Celestial Group, Inc. (The)(1) | | 8,106 |
| 176,467 |
|
| Hershey Co. (The) | | 9,141 |
| 1,387,055 |
|
| J.M. Smucker Co. (The) | | 2,563 |
| 284,980 |
|
| Kellogg Co. | | 4,999 |
| 291,042 |
|
| Kerry Group plc, A Shares | | 3,910 |
| 452,861 |
|
| Mondelez International, Inc., Class A | | 40,745 |
| 2,179,450 |
|
| Nestle India Ltd. | | 1,498 |
| 254,037 |
|
| Nestle SA | | 11,620 |
| 1,233,085 |
|
Nomad Foods Ltd.(1) | | 11,184 |
| 249,068 |
|
| Orion Corp/Republic of Korea | | 2,744 |
| 186,464 |
|
| Orkla ASA | | 89,079 |
| 756,028 |
|
| | | | 13,025,764 |
|
| Gas Utilities — 0.2% | | | |
| Atmos Energy Corp. | | 3,987 |
| 434,743 |
|
|
| | | | | | |
| | | Shares/
Principal Amount | Value |
| Chesapeake Utilities Corp. | | 582 |
| $ | 54,394 |
|
| China Gas Holdings Ltd. | | 104,800 |
| 434,556 |
|
| Indraprastha Gas Ltd. | | 43,973 |
| 193,164 |
|
| Spire, Inc. | | 5,284 |
| 435,454 |
|
| | | | 1,552,311 |
|
| Health Care Equipment and Supplies — 3.3% | | | |
ABIOMED, Inc.(1) | | 604 |
| 168,250 |
|
Alcon, Inc.(1) | | 5,214 |
| 301,572 |
|
| Baxter International, Inc. | | 16,524 |
| 1,387,520 |
|
Boston Scientific Corp.(1) | | 22,035 |
| 935,606 |
|
| Danaher Corp. | | 10,039 |
| 1,410,480 |
|
DexCom, Inc.(1) | | 2,272 |
| 356,409 |
|
Edwards Lifesciences Corp.(1) | | 2,254 |
| 479,764 |
|
| Elekta AB, B Shares | | 7,367 |
| 104,847 |
|
Haemonetics Corp.(1) | | 7,049 |
| 860,542 |
|
| Hill-Rom Holdings, Inc. | | 5,206 |
| 555,168 |
|
Hologic, Inc.(1) | | 41,674 |
| 2,135,793 |
|
| Hoya Corp. | | 9,400 |
| 722,212 |
|
ICU Medical, Inc.(1) | | 271 |
| 68,953 |
|
IDEXX Laboratories, Inc.(1) | | 552 |
| 155,692 |
|
Insulet Corp.(1) | | 4,001 |
| 491,883 |
|
Integer Holdings Corp.(1) | | 6,113 |
| 535,071 |
|
Intuitive Surgical, Inc.(1) | | 928 |
| 482,105 |
|
Masimo Corp.(1) | | 4,305 |
| 679,544 |
|
| Medtronic plc | | 42,289 |
| 4,310,941 |
|
Merit Medical Systems, Inc.(1) | | 1,877 |
| 74,066 |
|
| Nihon Kohden Corp. | | 3,500 |
| 95,806 |
|
NuVasive, Inc.(1) | | 2,217 |
| 147,652 |
|
OrthoPediatrics Corp.(1) | | 1,285 |
| 45,373 |
|
Penumbra, Inc.(1) | | 1,701 |
| 285,088 |
|
| ResMed, Inc. | | 4,916 |
| 632,689 |
|
| Siemens Healthineers AG | | 11,641 |
| 486,323 |
|
Silk Road Medical, Inc.(1) | | 1,432 |
| 61,991 |
|
| STERIS plc | | 1,757 |
| 261,547 |
|
| Straumann Holding AG | | 600 |
| 489,192 |
|
| Stryker Corp. | | 5,832 |
| 1,223,437 |
|
| Sysmex Corp. | | 9,400 |
| 679,770 |
|
| Terumo Corp. | | 19,600 |
| 570,191 |
|
| Zimmer Biomet Holdings, Inc. | | 33,283 |
| 4,497,532 |
|
| | | | 25,693,009 |
|
| Health Care Providers and Services — 1.6% | | | |
Acadia Healthcare Co., Inc.(1) | | 1,989 |
| 63,529 |
|
Amedisys, Inc.(1) | | 4,503 |
| 620,919 |
|
| Amplifon SpA | | 8,958 |
| 220,773 |
|
| Cardinal Health, Inc. | | 15,527 |
| 710,050 |
|
Centene Corp.(1) | | 10,854 |
| 565,385 |
|
| Chemed Corp. | | 158 |
| 64,052 |
|
|
| | | | | | |
| | | Shares/
Principal Amount | Value |
CorVel Corp.(1) | | 804 |
| $ | 68,501 |
|
Covetrus, Inc.(1) | | 18,369 |
| 434,794 |
|
| Encompass Health Corp. | | 20,993 |
| 1,340,193 |
|
| Ensign Group, Inc. (The) | | 2,212 |
| 133,295 |
|
HealthEquity, Inc.(1) | | 3,455 |
| 283,241 |
|
Henry Schein, Inc.(1) | | 5,305 |
| 352,995 |
|
| Korian SA | | 7,529 |
| 297,229 |
|
| McKesson Corp. | | 8,915 |
| 1,238,739 |
|
| NMC Health plc | | 8,716 |
| 261,706 |
|
Premier, Inc., Class A(1) | | 4,189 |
| 162,324 |
|
Providence Service Corp. (The)(1) | | 3,100 |
| 172,794 |
|
| Quest Diagnostics, Inc. | | 21,874 |
| 2,232,898 |
|
R1 RCM, Inc.(1) | | 11,214 |
| 141,072 |
|
| UnitedHealth Group, Inc. | | 9,931 |
| 2,472,918 |
|
| Universal Health Services, Inc., Class B | | 3,541 |
| 534,195 |
|
| | | | 12,371,602 |
|
| Health Care Technology — 0.3% | | | |
| Cerner Corp. | | 17,703 |
| 1,268,420 |
|
Health Catalyst, Inc.(1) | | 969 |
| 42,878 |
|
Inspire Medical Systems, Inc.(1) | | 821 |
| 55,524 |
|
Phreesia, Inc.(1) | | 2,438 |
| 66,631 |
|
Teladoc Health, Inc.(1) | | 2,523 |
| 172,170 |
|
Veeva Systems, Inc., Class A(1) | | 4,289 |
| 711,545 |
|
| | | | 2,317,168 |
|
| Hotels, Restaurants and Leisure — 1.6% | | | |
| Aristocrat Leisure Ltd. | | 13,350 |
| 278,725 |
|
| Autogrill SpA | | 12,306 |
| 129,641 |
|
| Carnival Corp. | | 26,638 |
| 1,258,113 |
|
| China International Travel Service Corp. Ltd., A Shares | | 16,798 |
| 219,052 |
|
Chipotle Mexican Grill, Inc.(1) | | 1,033 |
| 821,782 |
|
| Churchill Downs, Inc. | | 1,263 |
| 151,118 |
|
| Darden Restaurants, Inc. | | 13,646 |
| 1,658,808 |
|
| Domino's Pizza, Inc. | | 3,677 |
| 899,137 |
|
| Jubilant Foodworks Ltd. | | 11,904 |
| 207,120 |
|
| Jumbo Interactive Ltd. | | 11,352 |
| 149,135 |
|
| Kyoritsu Maintenance Co. Ltd. | | 2,300 |
| 99,159 |
|
| Las Vegas Sands Corp. | | 7,663 |
| 463,152 |
|
| Melco International Development Ltd. | | 78,000 |
| 188,674 |
|
| Minor International PCL | | 167,900 |
| 219,302 |
|
Planet Fitness, Inc., Class A(1) | | 8,649 |
| 680,330 |
|
Red Robin Gourmet Burgers, Inc.(1) | | 3,613 |
| 119,301 |
|
| Red Rock Resorts, Inc., Class A | | 7,988 |
| 166,470 |
|
| Royal Caribbean Cruises Ltd. | | 12,589 |
| 1,464,604 |
|
| Sodexo SA | | 4,860 |
| 556,523 |
|
| SSP Group plc | | 10,735 |
| 91,627 |
|
| Starbucks Corp. | | 18,829 |
| 1,782,918 |
|
| Texas Roadhouse, Inc. | | 1,492 |
| 82,403 |
|
|
| | | | | | |
| | | Shares/
Principal Amount | Value |
| Wynn Resorts Ltd. | | 3,593 |
| $ | 467,342 |
|
| | | | 12,154,436 |
|
| Household Durables — 0.6% | | | |
| Breville Group Ltd. | | 3,241 |
| 42,493 |
|
| Cyrela Brazil Realty SA Empreendimentos e Participacoes | | 21,500 |
| 137,461 |
|
| Haier Electronics Group Co. Ltd. | | 87,000 |
| 205,105 |
|
| Haseko Corp. | | 127,900 |
| 1,387,401 |
|
| Iida Group Holdings Co. Ltd. | | 52,600 |
| 863,402 |
|
| Newell Brands, Inc. | | 3,919 |
| 55,611 |
|
PlayAGS, Inc.(1) | | 5,416 |
| 101,604 |
|
| Pressance Corp. | | 11,600 |
| 161,813 |
|
| PulteGroup, Inc. | | 42,431 |
| 1,337,001 |
|
Skyline Champion Corp.(1) | | 3,108 |
| 88,578 |
|
| Token Corp. | | 6,300 |
| 361,112 |
|
TopBuild Corp.(1) | | 1,321 |
| 107,173 |
|
| | | | 4,848,754 |
|
| Household Products — 0.8% | | | |
Central Garden & Pet Co., Class A(1) | | 1,551 |
| 42,730 |
|
| Church & Dwight Co., Inc. | | 3,689 |
| 278,298 |
|
| Colgate-Palmolive Co. | | 22,018 |
| 1,579,571 |
|
| Kimberly-Clark Corp. | | 3,663 |
| 496,886 |
|
| Pigeon Corp. | | 2,600 |
| 95,577 |
|
| Procter & Gamble Co. (The) | | 30,867 |
| 3,643,541 |
|
| Spectrum Brands Holdings, Inc. | | 4,060 |
| 203,447 |
|
| | | | 6,340,050 |
|
| Industrial Conglomerates — 0.2% | | | |
| Rheinmetall AG | | 2,221 |
| 253,919 |
|
| Roper Technologies, Inc. | | 1,603 |
| 582,931 |
|
| Siemens AG | | 9,570 |
| 1,050,533 |
|
| | | | 1,887,383 |
|
| Insurance — 2.0% | | | |
| Aegon NV | | 374,654 |
| 1,848,603 |
|
| Aflac, Inc. | | 30,007 |
| 1,579,568 |
|
| AIA Group Ltd. | | 151,000 |
| 1,539,190 |
|
| AMERISAFE, Inc. | | 1,896 |
| 123,354 |
|
| Arthur J. Gallagher & Co. | | 1,701 |
| 153,821 |
|
| Axis Capital Holdings Ltd. | | 3,704 |
| 235,834 |
|
| Brown & Brown, Inc. | | 8,494 |
| 305,189 |
|
| Chubb Ltd. | | 18,759 |
| 2,867,126 |
|
| Discovery Ltd. | | 22,510 |
| 207,306 |
|
| Goosehead Insurance, Inc., Class A | | 824 |
| 37,088 |
|
| Hanover Insurance Group, Inc. (The) | | 631 |
| 81,847 |
|
| Intact Financial Corp. | | 2,990 |
| 278,701 |
|
| James River Group Holdings Ltd. | | 1,985 |
| 94,943 |
|
| Kemper Corp. | | 1,483 |
| 130,534 |
|
| Kinsale Capital Group, Inc. | | 1,523 |
| 136,857 |
|
| Mercury General Corp. | | 5,573 |
| 316,045 |
|
|
| | | | | | |
| | | Shares/
Principal Amount | Value |
| NN Group NV | | 12,666 |
| $ | 475,720 |
|
Palomar Holdings, Inc.(1) | | 1,857 |
| 53,203 |
|
| Ping An Insurance Group Co. of China Ltd., H Shares | | 62,500 |
| 741,299 |
|
| ProAssurance Corp. | | 18,878 |
| 737,941 |
|
| Progressive Corp. (The) | | 26,303 |
| 2,130,017 |
|
ProSight Global, Inc.(1) | | 1,870 |
| 31,883 |
|
| Prudential plc | | 15,370 |
| 316,989 |
|
| Reinsurance Group of America, Inc. | | 4,005 |
| 624,460 |
|
| RenaissanceRe Holdings Ltd. | | 713 |
| 129,160 |
|
| Torchmark Corp. | | 2,213 |
| 202,091 |
|
| Travelers Cos., Inc. (The) | | 1,414 |
| 207,321 |
|
| White Mountains Insurance Group Ltd. | | 77 |
| 82,852 |
|
| | | | 15,668,942 |
|
| Interactive Media and Services — 3.2% | | | |
Alphabet, Inc., Class A(1) | | 9,679 |
| 11,790,958 |
|
Facebook, Inc., Class A(1) | | 36,120 |
| 7,015,587 |
|
Pinterest, Inc., Class A(1) | | 16,824 |
| 487,728 |
|
| Tencent Holdings Ltd. | | 64,700 |
| 3,026,044 |
|
Twitter, Inc.(1) | | 44,671 |
| 1,890,030 |
|
Yandex NV, A Shares(1) | | 26,335 |
| 1,032,859 |
|
| | | | 25,243,206 |
|
| Internet and Direct Marketing Retail — 2.3% | | | |
Alibaba Group Holding Ltd. ADR(1) | | 15,910 |
| 2,754,180 |
|
Amazon.com, Inc.(1) | | 5,719 |
| 10,676,115 |
|
Baozun, Inc. ADR(1) | | 11,125 |
| 551,911 |
|
| eBay, Inc. | | 28,889 |
| 1,189,938 |
|
Etsy, Inc.(1) | | 951 |
| 63,736 |
|
| Expedia Group, Inc. | | 4,899 |
| 650,293 |
|
| Moneysupermarket.com Group plc | | 38,862 |
| 173,643 |
|
| Naspers Ltd., N Shares | | 4,703 |
| 1,144,204 |
|
Revolve Group, Inc.(1) | | 1,498 |
| 51,636 |
|
Takeaway.com NV(1) | | 2,055 |
| 183,583 |
|
Trainline plc(1) | | 9,578 |
| 49,853 |
|
| Yume No Machi Souzou Iinkai Co. Ltd. | | 4,400 |
| 66,400 |
|
| | | | 17,555,492 |
|
| IT Services — 3.5% | | | |
| Accenture plc, Class A | | 416 |
| 80,113 |
|
Afterpay Touch Group Ltd.(1) | | 9,751 |
| 177,727 |
|
Akamai Technologies, Inc.(1) | | 14,154 |
| 1,247,392 |
|
| Alten SA | | 1,897 |
| 234,911 |
|
| Booz Allen Hamilton Holding Corp. | | 18,296 |
| 1,257,850 |
|
| EVERTEC, Inc. | | 11,252 |
| 360,289 |
|
Evo Payments, Inc., Class A(1) | | 2,031 |
| 63,205 |
|
Fastly, Inc., Class A(1) | | 5,381 |
| 116,768 |
|
Fiserv, Inc.(1) | | 23,751 |
| 2,504,068 |
|
FleetCor Technologies, Inc.(1) | | 5,334 |
| 1,515,763 |
|
GDS Holdings Ltd. ADR(1) | | 30,955 |
| 1,274,727 |
|
|
| | | | | | |
| | | Shares/
Principal Amount | Value |
| Genpact Ltd. | | 3,652 |
| $ | 144,911 |
|
| GMO Payment Gateway, Inc. | | 6,700 |
| 488,510 |
|
InterXion Holding NV(1) | | 19,129 |
| 1,440,414 |
|
| Keywords Studios plc | | 3,675 |
| 73,954 |
|
| MasterCard, Inc., Class A | | 5,814 |
| 1,582,978 |
|
Nexi SpA(1) | | 28,197 |
| 300,818 |
|
NEXTDC Ltd.(1) | | 23,235 |
| 109,111 |
|
| Obic Co. Ltd. | | 3,500 |
| 370,477 |
|
Pagseguro Digital Ltd., Class A(1) | | 11,940 |
| 519,151 |
|
PayPal Holdings, Inc.(1) | | 30,306 |
| 3,345,782 |
|
| Presidio, Inc. | | 8,676 |
| 121,464 |
|
| SCSK Corp. | | 3,300 |
| 157,675 |
|
SHIFT, Inc.(1) | | 2,100 |
| 97,137 |
|
Solutions 30 SE(1) | | 15,470 |
| 158,073 |
|
Square, Inc., Class A(1) | | 14,602 |
| 1,174,147 |
|
| Tata Consultancy Services Ltd. | | 11,836 |
| 378,536 |
|
VeriSign, Inc.(1) | | 1,893 |
| 399,593 |
|
| Visa, Inc., Class A | | 39,946 |
| 7,110,388 |
|
| | | | 26,805,932 |
|
Leisure Products† | | | |
Malibu Boats, Inc., Class A(1) | | 1,649 |
| 49,685 |
|
| Merida Industry Co. Ltd. | | 24,000 |
| 150,199 |
|
| Thule Group AB | | 7,408 |
| 162,241 |
|
| | | | 362,125 |
|
| Life Sciences Tools and Services — 0.9% | | | |
Adaptive Biotechnologies Corp.(1) | | 1,951 |
| 75,211 |
|
| Agilent Technologies, Inc. | | 13,651 |
| 947,516 |
|
Bio-Rad Laboratories, Inc., Class A(1) | | 962 |
| 302,934 |
|
| Bruker Corp. | | 13,258 |
| 634,395 |
|
ICON plc(1) | | 2,120 |
| 331,080 |
|
Illumina, Inc.(1) | | 4,794 |
| 1,435,228 |
|
Lonza Group AG(1) | | 3,300 |
| 1,128,900 |
|
NeoGenomics, Inc.(1) | | 3,999 |
| 97,456 |
|
Personalis, Inc.(1) | | 2,250 |
| 40,298 |
|
PRA Health Sciences, Inc.(1) | | 823 |
| 82,226 |
|
QIAGEN NV(1) | | 8,072 |
| 304,476 |
|
| Tecan Group AG | | 907 |
| 230,486 |
|
| Thermo Fisher Scientific, Inc. | | 6,116 |
| 1,698,291 |
|
| | | | 7,308,497 |
|
| Machinery — 1.5% | | | |
| Albany International Corp., Class A | | 224 |
| 19,262 |
|
| Allison Transmission Holdings, Inc. | | 15,886 |
| 729,962 |
|
| Atlas Copco AB, A Shares | | 9,670 |
| 296,201 |
|
| Atlas Copco AB, B Shares | | 46,324 |
| 1,265,177 |
|
ATS Automation Tooling Systems, Inc.(1) | | 6,096 |
| 97,689 |
|
Chart Industries, Inc.(1) | | 1,976 |
| 149,247 |
|
Colfax Corp.(1) | | 2,545 |
| 70,446 |
|
|
| | | | | | |
| | | Shares/
Principal Amount | Value |
| CRRC Corp. Ltd., H Shares | | 290,000 |
| $ | 228,829 |
|
| Cummins, Inc. | | 22,140 |
| 3,630,960 |
|
| Doosan Bobcat, Inc. | | 3,896 |
| 118,062 |
|
| EnPro Industries, Inc. | | 1,438 |
| 102,156 |
|
| Georg Fischer AG | | 109 |
| 93,814 |
|
| Graham Corp. | | 1,037 |
| 22,451 |
|
| Hurco Cos., Inc. | | 1,393 |
| 47,627 |
|
| IMI plc | | 42,683 |
| 535,872 |
|
| Ingersoll-Rand plc | | 9,222 |
| 1,140,393 |
|
| Interroll Holding AG | | 30 |
| 60,846 |
|
| Kennametal, Inc. | | 2,375 |
| 82,128 |
|
| Konecranes Oyj | | 3,773 |
| 110,775 |
|
Korea Shipbuilding & Offshore Engineering Co. Ltd.(1) | | 3,263 |
| 297,906 |
|
Kornit Digital Ltd.(1) | | 6,561 |
| 204,703 |
|
Milacron Holdings Corp.(1) | | 1,335 |
| 22,481 |
|
| Mueller Water Products, Inc., Class A | | 10,036 |
| 102,066 |
|
| Nabtesco Corp. | | 5,100 |
| 137,351 |
|
| PACCAR, Inc. | | 5,628 |
| 394,748 |
|
| Parker-Hannifin Corp. | | 3,392 |
| 593,871 |
|
| Rotork plc | | 34,414 |
| 128,094 |
|
| Snap-on, Inc. | | 4,382 |
| 668,737 |
|
| Tadano Ltd. | | 2,300 |
| 20,670 |
|
| Timken Co. (The) | | 4,374 |
| 199,936 |
|
| Valmet Oyj | | 6,539 |
| 127,088 |
|
| Woodward, Inc. | | 1,311 |
| 146,884 |
|
| | | | 11,846,432 |
|
| Media — 0.2% | | | |
| Atresmedia Corp. de Medios de Comunicacion SA | | 50,602 |
| 196,867 |
|
| Entravision Communications Corp., Class A | | 34,274 |
| 111,733 |
|
| Nippon Television Holdings, Inc. | | 60,800 |
| 836,036 |
|
| NOS SGPS SA | | 30,246 |
| 187,977 |
|
| Stroeer SE & Co. KGaA | | 2,487 |
| 196,626 |
|
| Townsquare Media, Inc., Class A | | 3,250 |
| 17,517 |
|
| TV Asahi Holdings Corp. | | 18,100 |
| 296,589 |
|
| | | | 1,843,345 |
|
| Metals and Mining — 0.3% | | | |
| BHP Group Ltd. | | 20,320 |
| 561,294 |
|
| Hudbay Minerals, Inc. | | 9,731 |
| 47,262 |
|
| Kirkland Lake Gold Ltd. | | 6,094 |
| 252,016 |
|
| Kumba Iron Ore Ltd. | | 10,685 |
| 353,995 |
|
| Northern Star Resources Ltd. | | 13,704 |
| 118,979 |
|
Saracen Mineral Holdings Ltd.(1) | | 87,301 |
| 244,159 |
|
| Steel Dynamics, Inc. | | 28,608 |
| 901,438 |
|
| | | | 2,479,143 |
|
| Multi-Utilities — 0.2% | | | |
| Ameren Corp. | | 7,344 |
| 555,867 |
|
| NorthWestern Corp. | | 9,674 |
| 676,406 |
|
|
| | | | | | |
| | | Shares/
Principal Amount | Value |
| WEC Energy Group, Inc. | | 5,510 |
| $ | 470,885 |
|
| | | | 1,703,158 |
|
| Multiline Retail — 0.5% | | | |
| B&M European Value Retail SA | | 125,503 |
| 565,149 |
|
| Lojas Renner SA | | 42,240 |
| 522,971 |
|
| Magazine Luiza SA | | 16,200 |
| 1,116,407 |
|
| Pan Pacific International Holdings Corp. | | 10,700 |
| 682,747 |
|
| Target Corp. | | 12,419 |
| 1,073,002 |
|
| | | | 3,960,276 |
|
| Oil, Gas and Consumable Fuels — 3.0% | | | |
Callon Petroleum Co.(1) | | 10,071 |
| 49,549 |
|
Centennial Resource Development, Inc., Class A(1) | | 5,789 |
| 34,445 |
|
| Chevron Corp. | | 32,702 |
| 4,025,943 |
|
| Cimarex Energy Co. | | 3,442 |
| 174,406 |
|
| CNOOC Ltd. | | 472,000 |
| 776,245 |
|
| Concho Resources, Inc. | | 5,400 |
| 527,472 |
|
| ConocoPhillips | | 1,067 |
| 63,038 |
|
| CVR Energy, Inc. | | 18,338 |
| 973,198 |
|
| Delek US Holdings, Inc. | | 4,603 |
| 198,297 |
|
| Devon Energy Corp. | | 12,979 |
| 350,433 |
|
Earthstone Energy, Inc., Class A(1) | | 6,272 |
| 27,471 |
|
| Eni SpA | | 106,747 |
| 1,671,117 |
|
| EQT Corp. | | 19,142 |
| 289,236 |
|
| Equitrans Midstream Corp. | | 14,816 |
| 245,798 |
|
Extraction Oil & Gas, Inc.(1) | | 3,944 |
| 14,632 |
|
| Exxon Mobil Corp. | | 7,326 |
| 544,761 |
|
| Gazprom PJSC ADR | | 214,585 |
| 1,573,036 |
|
| Gazprom PJSC | | 107,331 |
| 398,796 |
|
| Gaztransport Et Technigaz SA | | 2,362 |
| 214,229 |
|
| Gibson Energy, Inc. | | 10,905 |
| 188,966 |
|
| HollyFrontier Corp. | | 9,846 |
| 490,035 |
|
| Imperial Oil Ltd. | | 9,965 |
| 272,871 |
|
| Lundin Petroleum AB | | 17,610 |
| 552,881 |
|
Magnolia Oil & Gas Corp., Class A(1) | | 2,425 |
| 27,112 |
|
| Neste Oyj | | 21,780 |
| 719,974 |
|
| Noble Energy, Inc. | | 20,989 |
| 463,437 |
|
| Novatek PJSC GDR | | 4,892 |
| 1,021,820 |
|
| Occidental Petroleum Corp. | | 2,870 |
| 147,403 |
|
| PetroChina Co. Ltd., H Shares | | 1,298,000 |
| 687,939 |
|
| Phillips 66 | | 11,254 |
| 1,154,210 |
|
| Royal Dutch Shell plc, Class B ADR | | 10,070 |
| 639,143 |
|
| Saras SpA | | 480,664 |
| 791,118 |
|
| Surgutneftegas PJSC Preference Shares | | 2,664,554 |
| 1,303,418 |
|
| TOTAL SA | | 10,270 |
| 532,159 |
|
| TOTAL SA ADR | | 47,630 |
| 2,464,376 |
|
| | | | 23,608,964 |
|
|
| | | | | | |
| | | Shares/
Principal Amount | Value |
| Paper and Forest Products — 0.1% | | | |
| Boise Cascade Co. | | 2,377 |
| $ | 64,179 |
|
| Domtar Corp. | | 16,189 |
| 687,223 |
|
| Neenah, Inc. | | 875 |
| 57,496 |
|
| | | | 808,898 |
|
| Personal Products — 0.3% | | | |
| Cosmax, Inc. | | 3,909 |
| 337,004 |
|
| Estee Lauder Cos., Inc. (The), Class A | | 2,623 |
| 483,130 |
|
| Fancl Corp. | | 5,500 |
| 138,386 |
|
| Medifast, Inc. | | 1,151 |
| 128,509 |
|
| Ontex Group NV | | 25,748 |
| 424,538 |
|
| Shiseido Co. Ltd. | | 10,000 |
| 736,081 |
|
| | | | 2,247,648 |
|
| Pharmaceuticals — 2.6% | | | |
Aerie Pharmaceuticals, Inc.(1) | | 1,337 |
| 28,973 |
|
| AstraZeneca plc | | 15,640 |
| 1,342,419 |
|
Catalent, Inc.(1) | | 11,531 |
| 651,386 |
|
| Dechra Pharmaceuticals plc | | 4,036 |
| 143,762 |
|
| Eli Lilly & Co. | | 7,023 |
| 765,156 |
|
Horizon Therapeutics plc(1) | | 3,949 |
| 98,291 |
|
Jazz Pharmaceuticals plc(1) | | 2,895 |
| 403,505 |
|
| Johnson & Johnson | | 32,536 |
| 4,236,838 |
|
| Merck & Co., Inc. | | 35,821 |
| 2,972,785 |
|
| Novartis AG | | 9,940 |
| 911,489 |
|
| Novo Nordisk A/S, B Shares | | 17,954 |
| 861,732 |
|
Optinose, Inc.(1) | | 3,660 |
| 19,654 |
|
| Pfizer, Inc. | | 77,070 |
| 2,993,399 |
|
Reata Pharmaceuticals, Inc., Class A(1) | | 399 |
| 36,169 |
|
| Roche Holding AG | | 3,260 |
| 872,880 |
|
| Sanofi | | 10,178 |
| 849,239 |
|
| Sanofi ADR | | 38,602 |
| 1,609,703 |
|
| Zoetis, Inc. | | 9,045 |
| 1,039,180 |
|
| | | | 19,836,560 |
|
| Professional Services — 0.7% | | | |
| Applus Services SA | | 7,159 |
| 100,854 |
|
ASGN, Inc.(1) | | 1,246 |
| 78,560 |
|
Capita plc(1) | | 752,233 |
| 1,063,639 |
|
CoStar Group, Inc.(1) | | 1,879 |
| 1,156,337 |
|
IHS Markit Ltd.(1) | | 11,875 |
| 764,987 |
|
InnerWorkings, Inc.(1) | | 18,596 |
| 68,061 |
|
| Korn Ferry | | 3,329 |
| 130,763 |
|
| Nihon M&A Center, Inc. | | 5,600 |
| 150,755 |
|
| Recruit Holdings Co. Ltd. | | 25,100 |
| 854,177 |
|
| Teleperformance | | 987 |
| 206,557 |
|
| Trust Tech, Inc. | | 12,600 |
| 179,699 |
|
| UT Group Co. Ltd. | | 3,200 |
| 70,574 |
|
|
| | | | | | |
| | | Shares/
Principal Amount | Value |
| Verisk Analytics, Inc. | | 6,210 |
| $ | 942,181 |
|
| | | | 5,767,144 |
|
| Real Estate Management and Development — 0.9% | | | |
| Altus Group Ltd. | | 1,728 |
| 43,874 |
|
| Aroundtown SA | | 66,399 |
| 531,165 |
|
| Ayala Land, Inc. | | 822,110 |
| 804,617 |
|
| CapitaLand Ltd. | | 88,200 |
| 231,493 |
|
| China Overseas Land & Investment Ltd. | | 80,000 |
| 273,825 |
|
| CIFI Holdings Group Co. Ltd. | | 899,610 |
| 570,871 |
|
| Colliers International Group, Inc. | | 2,404 |
| 174,644 |
|
| Corp. Inmobiliaria Vesta SAB de CV | | 93,649 |
| 141,081 |
|
| Fabege AB | | 28,119 |
| 433,600 |
|
Fastighets AB Balder, B Shares(1) | | 6,879 |
| 235,437 |
|
| FirstService Corp. | | 2,711 |
| 284,493 |
|
| Hang Lung Properties Ltd. | | 57,000 |
| 134,251 |
|
KWG Group Holdings Ltd.(1) | | 99,500 |
| 93,095 |
|
| LEG Immobilien AG | | 5,138 |
| 595,528 |
|
| Longfor Group Holdings Ltd. | | 72,500 |
| 266,568 |
|
| Mitsubishi Estate Co. Ltd. | | 23,500 |
| 429,887 |
|
| Mitsui Fudosan Co. Ltd. | | 10,400 |
| 235,346 |
|
| New World Development Co. Ltd. | | 136,000 |
| 190,368 |
|
| Nexity SA | | 672 |
| 32,330 |
|
| Pakuwon Jati Tbk PT | | 886,000 |
| 46,305 |
|
| Shimao Property Holdings Ltd. | | 53,000 |
| 146,332 |
|
| Shurgard Self Storage SA | | 2,761 |
| 95,716 |
|
| Sun Hung Kai Properties Ltd. | | 16,000 |
| 257,139 |
|
| Times China Holdings Ltd. | | 72,000 |
| 125,360 |
|
| VGP NV | | 1,208 |
| 101,488 |
|
| Vonovia SE | | 9,764 |
| 477,893 |
|
| | | | 6,952,706 |
|
| Road and Rail — 0.8% | | | |
| Canadian Pacific Railway Ltd. | | 1,750 |
| 417,823 |
|
CJ Logistics Corp.(1) | | 3,660 |
| 422,595 |
|
| CSX Corp. | | 829 |
| 58,362 |
|
| DSV A/S | | 5,306 |
| 505,674 |
|
| Heartland Express, Inc. | | 29,310 |
| 581,510 |
|
| J.B. Hunt Transport Services, Inc. | | 4,806 |
| 491,990 |
|
| Localiza Rent a Car SA | | 100,781 |
| 1,156,657 |
|
Lyft, Inc., Class A(1) | | 3,767 |
| 229,297 |
|
| Sixt SE | | 1,490 |
| 152,584 |
|
| TFI International, Inc. | | 3,478 |
| 110,022 |
|
| Union Pacific Corp. | | 11,242 |
| 2,022,998 |
|
| | | | 6,149,512 |
|
| Semiconductors and Semiconductor Equipment — 2.8% | | | |
Advanced Energy Industries, Inc.(1) | | 773 |
| 45,143 |
|
Advanced Micro Devices, Inc.(1) | | 35,468 |
| 1,080,001 |
|
| Analog Devices, Inc. | | 3,770 |
| 442,824 |
|
|
| | | | | | |
| | | Shares/
Principal Amount | Value |
| Applied Materials, Inc. | | 75,263 |
| $ | 3,715,734 |
|
| ASML Holding NV | | 8,131 |
| 1,803,502 |
|
| BE Semiconductor Industries NV | | 1,076 |
| 31,916 |
|
| Broadcom, Inc. | | 11,935 |
| 3,461,031 |
|
| Cypress Semiconductor Corp. | | 4,029 |
| 92,546 |
|
| Entegris, Inc. | | 1,412 |
| 61,436 |
|
| Globalwafers Co. Ltd. | | 11,000 |
| 116,990 |
|
| Infineon Technologies AG | | 23,257 |
| 440,726 |
|
Inphi Corp.(1) | | 3,207 |
| 193,093 |
|
| Intel Corp. | | 48,156 |
| 2,434,286 |
|
| Kulicke & Soffa Industries, Inc. | | 5,341 |
| 120,867 |
|
| Lasertec Corp. | | 4,600 |
| 220,301 |
|
Lattice Semiconductor Corp.(1) | | 10,724 |
| 207,402 |
|
| Marvell Technology Group Ltd. | | 32,927 |
| 864,663 |
|
| Maxim Integrated Products, Inc. | | 23,534 |
| 1,392,977 |
|
| Microchip Technology, Inc. | | 4,828 |
| 455,860 |
|
| Monolithic Power Systems, Inc. | | 448 |
| 66,376 |
|
| NVIDIA Corp. | | 24 |
| 4,049 |
|
Qorvo, Inc.(1) | | 1,923 |
| 140,937 |
|
| QUALCOMM, Inc. | | 5,266 |
| 385,261 |
|
Silicon Laboratories, Inc.(1) | | 721 |
| 80,903 |
|
SOITEC(1) | | 2,325 |
| 240,318 |
|
| Taiwan Semiconductor Manufacturing Co. Ltd. | | 317,425 |
| 2,624,303 |
|
| Teradyne, Inc. | | 28 |
| 1,560 |
|
| Xilinx, Inc. | | 6,314 |
| 721,122 |
|
| | | | 21,446,127 |
|
| Software — 4.4% | | | |
Adobe, Inc.(1) | | 5,563 |
| 1,662,558 |
|
Adyen NV(1) | | 636 |
| 480,077 |
|
ANSYS, Inc.(1) | | 239 |
| 48,546 |
|
Aspen Technology, Inc.(1) | | 770 |
| 101,540 |
|
Atlassian Corp. plc, Class A(1) | | 8,208 |
| 1,150,105 |
|
Autodesk, Inc.(1) | | 5,793 |
| 904,693 |
|
Avalara, Inc.(1) | | 1,433 |
| 116,761 |
|
| Avast plc | | 48,812 |
| 199,578 |
|
| Aveva Group plc | | 4,015 |
| 195,286 |
|
Bottomline Technologies de, Inc.(1) | | 1,473 |
| 61,999 |
|
Cadence Design Systems, Inc.(1) | | 16,905 |
| 1,249,448 |
|
Coupa Software, Inc.(1) | | 3,899 |
| 529,133 |
|
| Dassault Systemes SE | | 3,670 |
| 555,575 |
|
Descartes Systems Group, Inc. (The)(1) | | 4,488 |
| 163,055 |
|
Elastic NV(1) | | 462 |
| 45,659 |
|
Fair Isaac Corp.(1) | | 315 |
| 109,437 |
|
Five9, Inc.(1) | | 2,264 |
| 111,774 |
|
| Fuji Soft, Inc. | | 2,300 |
| 102,831 |
|
Globant SA(1) | | 1,044 |
| 110,664 |
|
| Intuit, Inc. | | 5,755 |
| 1,595,919 |
|
|
| | | | | | |
| | | Shares/
Principal Amount | Value |
| LogMeIn, Inc. | | 2,449 |
| $ | 186,050 |
|
Manhattan Associates, Inc.(1) | | 525 |
| 44,620 |
|
Medallia, Inc.(1) | | 1,023 |
| 40,766 |
|
| Microsoft Corp. | | 100,732 |
| 13,726,750 |
|
| Oracle Corp. (New York) | | 34,127 |
| 1,921,350 |
|
Pagerduty, Inc.(1) | | 2,653 |
| 117,263 |
|
Palo Alto Networks, Inc.(1) | | 6,869 |
| 1,556,103 |
|
Paycom Software, Inc.(1) | | 619 |
| 149,024 |
|
Paylocity Holding Corp.(1) | | 1,782 |
| 181,924 |
|
Proofpoint, Inc.(1) | | 68 |
| 8,582 |
|
PTC, Inc.(1) | | 8,008 |
| 542,782 |
|
Rapid7, Inc.(1) | | 2,552 |
| 154,779 |
|
RingCentral, Inc., Class A(1) | | 4,338 |
| 615,909 |
|
salesforce.com, Inc.(1) | | 8,092 |
| 1,250,214 |
|
| SAP SE | | 6,040 |
| 749,249 |
|
| Sapiens International Corp. NV | | 1,379 |
| 22,188 |
|
ServiceNow, Inc.(1) | | 2,373 |
| 658,246 |
|
| Sophos Group plc | | 26,433 |
| 140,152 |
|
Splunk, Inc.(1) | | 4,051 |
| 548,141 |
|
Temenos AG(1) | | 2,960 |
| 519,910 |
|
Teradata Corp.(1) | | 6,134 |
| 224,627 |
|
| VMware, Inc., Class A | | 2,524 |
| 440,413 |
|
| WiseTech Global Ltd. | | 9,388 |
| 203,775 |
|
Workday, Inc., Class A(1) | | 2,561 |
| 512,149 |
|
Zendesk, Inc.(1) | | 1,100 |
| 91,916 |
|
Zoom Video Communications, Inc., Class A(1) | | 808 |
| 77,172 |
|
| | | | 34,178,692 |
|
| Specialty Retail — 1.9% | | | |
| Adastria Co. Ltd. | | 5,000 |
| 97,882 |
|
| Advance Auto Parts, Inc. | | 15,323 |
| 2,308,257 |
|
AutoZone, Inc.(1) | | 1,064 |
| 1,194,915 |
|
Boot Barn Holdings, Inc.(1) | | 2,748 |
| 85,985 |
|
Burlington Stores, Inc.(1) | | 6,146 |
| 1,110,889 |
|
| Camping World Holdings, Inc., Class A | | 13,659 |
| 160,220 |
|
| Fast Retailing Co. Ltd. | | 700 |
| 419,235 |
|
Five Below, Inc.(1) | | 4,174 |
| 490,278 |
|
Floor & Decor Holdings, Inc., Class A(1) | | 10,859 |
| 425,130 |
|
| Foschini Group Ltd. (The) | | 19,040 |
| 219,686 |
|
| Home Depot, Inc. (The) | | 923 |
| 197,236 |
|
| Hotel Shilla Co. Ltd. | | 2,828 |
| 187,119 |
|
| JD Sports Fashion plc | | 15,831 |
| 125,288 |
|
| Kingfisher plc | | 857,113 |
| 2,305,938 |
|
MarineMax, Inc.(1) | | 3,466 |
| 53,515 |
|
Murphy USA, Inc.(1) | | 4,502 |
| 397,797 |
|
National Vision Holdings, Inc.(1) | | 2,244 |
| 70,888 |
|
O'Reilly Automotive, Inc.(1) | | 4,824 |
| 1,836,786 |
|
| Penske Automotive Group, Inc. | | 3,190 |
| 146,644 |
|
|
| | | | | | |
| | | Shares/
Principal Amount | Value |
| TJX Cos., Inc. (The) | | 26,127 |
| $ | 1,425,489 |
|
Tokyo Base Co. Ltd.(1) | | 12,300 |
| 83,808 |
|
| Tractor Supply Co. | | 7,432 |
| 808,676 |
|
Ulta Beauty, Inc.(1) | | 1,443 |
| 503,968 |
|
| | | | 14,655,629 |
|
| Technology Hardware, Storage and Peripherals — 1.6% | | | |
| Apple, Inc. | | 47,918 |
| 10,208,451 |
|
Cray, Inc.(1) | | 3,910 |
| 135,442 |
|
| HP, Inc. | | 21,299 |
| 448,131 |
|
| Samsung Electronics Co. Ltd. | | 37,480 |
| 1,429,986 |
|
| | | | 12,222,010 |
|
| Textiles, Apparel and Luxury Goods — 1.2% | | | |
| adidas AG | | 2,650 |
| 849,807 |
|
| ANTA Sports Products Ltd. | | 41,000 |
| 304,738 |
|
| Bata India Ltd. | | 10,859 |
| 206,285 |
|
| Burberry Group plc | | 19,340 |
| 527,603 |
|
Canada Goose Holdings, Inc.(1) | | 13,949 |
| 652,674 |
|
Deckers Outdoor Corp.(1) | | 6,156 |
| 962,060 |
|
| Fila Korea Ltd. | | 15,768 |
| 893,304 |
|
| HUGO BOSS AG | | 4,120 |
| 260,059 |
|
| Li Ning Co. Ltd. | | 191,000 |
| 468,054 |
|
Lululemon Athletica, Inc.(1) | | 2,460 |
| 470,081 |
|
| LVMH Moet Hennessy Louis Vuitton SE | | 1,260 |
| 521,002 |
|
| NIKE, Inc., Class B | | 22,898 |
| 1,969,915 |
|
| Salvatore Ferragamo SpA | | 4,467 |
| 93,522 |
|
| Shenzhou International Group Holdings Ltd. | | 30,500 |
| 419,009 |
|
| Tapestry, Inc. | | 11,995 |
| 371,005 |
|
| Titan Co. Ltd. | | 6,442 |
| 98,455 |
|
| | | | 9,067,573 |
|
| Thrifts and Mortgage Finance — 0.2% | | | |
| Aruhi Corp. | | 6,300 |
| 118,025 |
|
| Capitol Federal Financial, Inc. | | 40,037 |
| 546,905 |
|
Essent Group Ltd.(1) | | 10,780 |
| 497,605 |
|
LendingTree, Inc.(1) | | 143 |
| 46,123 |
|
| | | | 1,208,658 |
|
Tobacco† | | | |
| Swedish Match AB | | 6,530 |
| 249,577 |
|
| Trading Companies and Distributors — 0.6% | | | |
AerCap Holdings NV(1) | | 32,883 |
| 1,793,110 |
|
DXP Enterprises, Inc.(1) | | 288 |
| 9,778 |
|
Ferguson plc(1) | | 5,000 |
| 372,387 |
|
Foundation Building Materials, Inc.(1) | | 3,362 |
| 57,860 |
|
GMS, Inc.(1) | | 2,896 |
| 65,189 |
|
| Grafton Group plc | | 11,714 |
| 102,944 |
|
| H&E Equipment Services, Inc. | | 3,305 |
| 101,166 |
|
HD Supply Holdings, Inc.(1) | | 2,188 |
| 88,636 |
|
| IMCD NV | | 1,856 |
| 162,965 |
|
|
| | | | | | |
| | | Shares/
Principal Amount | Value |
| Indutrade AB | | 7,373 |
| $ | 207,938 |
|
| MonotaRO Co. Ltd. | | 19,900 |
| 434,874 |
|
| MSC Industrial Direct Co., Inc., Class A | | 12,864 |
| 913,987 |
|
NOW, Inc.(1) | | 5,053 |
| 61,899 |
|
| Seven Group Holdings Ltd. | | 21,167 |
| 258,578 |
|
SiteOne Landscape Supply, Inc.(1) | | 1,632 |
| 120,556 |
|
| Yamazen Corp. | | 18,300 |
| 174,106 |
|
| | | | 4,925,973 |
|
| Transportation Infrastructure — 0.1% | | | |
| Airports of Thailand PCL | | 92,900 |
| 216,731 |
|
| Grupo Aeroportuario del Centro Norte SAB de CV | | 69,500 |
| 427,073 |
|
| Macquarie Infrastructure Corp. | | 2,004 |
| 83,046 |
|
| | | | 726,850 |
|
Water Utilities† | | | |
| SJW Group | | 783 |
| 50,809 |
|
Wireless Telecommunication Services† | | | |
| America Movil SAB de CV, Class L ADR | | 14,527 |
| 203,233 |
|
T-Mobile US, Inc.(1) | | 95 |
| 7,574 |
|
| | | | 210,807 |
|
TOTAL COMMON STOCKS
(Cost $461,588,294) | | | 595,090,628 |
|
| CORPORATE BONDS — 6.4% | | | |
| Aerospace and Defense — 0.1% | | | |
| Arconic, Inc., 5.40%, 4/15/21 | $ | 45,000 |
| 46,649 |
|
| Arconic, Inc., 5.125%, 10/1/24 | | 160,000 |
| 170,721 |
|
Bombardier, Inc., 8.75%, 12/1/21(2) | | 25,000 |
| 27,344 |
|
Bombardier, Inc., 5.75%, 3/15/22(2) | | 125,000 |
| 128,281 |
|
Bombardier, Inc., 6.00%, 10/15/22(2) | | 30,000 |
| 30,150 |
|
Bombardier, Inc., 7.50%, 3/15/25(2) | | 55,000 |
| 56,134 |
|
| TransDigm, Inc., 6.00%, 7/15/22 | | 135,000 |
| 136,728 |
|
| TransDigm, Inc., 6.375%, 6/15/26 | | 50,000 |
| 51,110 |
|
| United Technologies Corp., 6.05%, 6/1/36 | | 66,000 |
| 85,933 |
|
| | | | 733,050 |
|
Air Freight and Logistics† | | | |
| United Parcel Service, Inc., 2.80%, 11/15/24 | | 80,000 |
| 81,864 |
|
XPO Logistics, Inc., 6.50%, 6/15/22(2) | | 30,000 |
| 30,551 |
|
| | | | 112,415 |
|
Airlines† | | | |
American Airlines Group, Inc., 4.625%, 3/1/20(2) | | 125,000 |
| 126,250 |
|
| United Airlines Holdings, Inc., 5.00%, 2/1/24 | | 140,000 |
| 147,350 |
|
| | | | 273,600 |
|
Auto Components† | | | |
| American Axle & Manufacturing, Inc., 6.625%, 10/15/22 | | 20,000 |
| 20,301 |
|
ZF North America Capital, Inc., 4.75%, 4/29/25(2) | | 110,000 |
| 113,820 |
|
| | | | 134,121 |
|
| | | | |
|
| | | | | | | |
| | | Shares/
Principal Amount | Value |
| Automobiles — 0.1% | | | |
| Ford Motor Credit Co. LLC, 5.875%, 8/2/21 | | $ | 330,000 |
| $ | 347,171 |
|
| General Motors Co., 5.15%, 4/1/38 | | 60,000 |
| 60,396 |
|
| General Motors Financial Co., Inc., 3.20%, 7/6/21 | | 130,000 |
| 131,110 |
|
| | | | 538,677 |
|
| Banks — 0.8% | | | |
| Akbank T.A.S., 5.00%, 10/24/22 | | 70,000 |
| 68,330 |
|
Avi Funding Co. Ltd., 3.80%, 9/16/25(2) | | 143,000 |
| 149,171 |
|
| Banco Mercantil del Norte SA, VRN, 5.75%, 10/4/31 | | 114,000 |
| 112,291 |
|
| Banco Santander SA, MTN, 2.50%, 3/18/25 | EUR | 100,000 |
| 121,372 |
|
| Banistmo SA, 3.65%, 9/19/22 | | $ | 150,000 |
| 151,328 |
|
| Bank of America Corp., MTN, 4.20%, 8/26/24 | | 200,000 |
| 212,568 |
|
| Bank of America Corp., MTN, 2.30%, 7/25/25 | GBP | 100,000 |
| 127,626 |
|
| Bank of America Corp., MTN, 5.00%, 1/21/44 | | $ | 55,000 |
| 67,764 |
|
| Bank of America Corp., MTN, VRN, 4.44%, 1/20/48 | | 20,000 |
| 22,996 |
|
| Bank of America Corp., VRN, 3.42%, 12/20/28 | | 13,000 |
| 13,387 |
|
| Barclays Bank plc, MTN, 6.625%, 3/30/22 | EUR | 50,000 |
| 63,868 |
|
| BPCE SA, VRN, 2.75%, 7/8/26 | EUR | 100,000 |
| 116,634 |
|
| CaixaBank SA, MTN, VRN, 2.75%, 7/14/28 | EUR | 100,000 |
| 117,352 |
|
| CIT Group, Inc., 5.00%, 8/15/22 | | $ | 160,000 |
| 169,600 |
|
| CIT Group, Inc., 5.00%, 8/1/23 | | 50,000 |
| 53,563 |
|
| Citigroup, Inc., 2.75%, 4/25/22 | | 110,000 |
| 110,910 |
|
| Citigroup, Inc., 4.45%, 9/29/27 | | 230,000 |
| 248,385 |
|
| Citigroup, Inc., VRN, 3.52%, 10/27/28 | | 140,000 |
| 144,599 |
|
| Co-Operative Bank plc (The), 4.75%, 11/11/21 (Secured) | GBP | 100,000 |
| 129,418 |
|
| Cooperatieve Rabobank UA, VRN, 2.50%, 5/26/26 | EUR | 100,000 |
| 115,650 |
|
| Credit Agricole SA, MTN, 7.375%, 12/18/23 | GBP | 50,000 |
| 75,738 |
|
| European Financial Stability Facility, MTN, 2.125%, 2/19/24 | EUR | 93,000 |
| 115,403 |
|
| European Investment Bank, MTN, 2.25%, 10/14/22 | EUR | 130,000 |
| 157,365 |
|
| Fifth Third BanCorp., 4.30%, 1/16/24 | | $ | 40,000 |
| 42,609 |
|
| HSBC Holdings plc, 2.95%, 5/25/21 | | 200,000 |
| 201,632 |
|
| HSBC Holdings plc, 4.375%, 11/23/26 | | 200,000 |
| 212,965 |
|
Intercorp Financial Services, Inc., 4.125%, 10/19/27(2) | | 170,000 |
| 173,740 |
|
| JPMorgan Chase & Co., 3.875%, 9/10/24 | | 405,000 |
| 425,120 |
|
| JPMorgan Chase & Co., 3.125%, 1/23/25 | | 110,000 |
| 112,656 |
|
| JPMorgan Chase & Co., VRN, 3.96%, 11/15/48 | | 50,000 |
| 53,700 |
|
| JPMorgan Chase & Co., VRN, 3.90%, 1/23/49 | | 20,000 |
| 21,268 |
|
| KEB Hana Bank, MTN, 4.375%, 9/30/24 | | 114,000 |
| 120,852 |
|
| Kreditanstalt fuer Wiederaufbau, 4.625%, 1/4/23 | EUR | 75,000 |
| 98,133 |
|
| Lloyds Bank plc, MTN, 7.625%, 4/22/25 | GBP | 20,000 |
| 31,372 |
|
| PNC Financial Services Group, Inc. (The), 4.375%, 8/11/20 | | $ | 225,000 |
| 229,722 |
|
| Royal Bank of Scotland Group plc, 6.125%, 12/15/22 | | 55,000 |
| 59,159 |
|
Turkiye Garanti Bankasi AS, VRN, 6.125%, 5/24/27(2) | | 90,000 |
| 78,003 |
|
| U.S. Bancorp, MTN, 3.60%, 9/11/24 | | 110,000 |
| 115,589 |
|
| Wells Fargo & Co., 4.125%, 8/15/23 | | 100,000 |
| 105,517 |
|
| Wells Fargo & Co., 3.00%, 4/22/26 | | 140,000 |
| 141,426 |
|
| Wells Fargo & Co., MTN, 2.60%, 7/22/20 | | 225,000 |
| 225,648 |
|
|
| | | | | | | |
| | | Shares/
Principal Amount | Value |
| Wells Fargo & Co., MTN, 4.10%, 6/3/26 | | $ | 70,000 |
| $ | 74,102 |
|
| Wells Fargo & Co., MTN, 4.65%, 11/4/44 | | 36,000 |
| 40,744 |
|
| Westpac Banking Corp., 4.875%, 11/19/19 | | 500,000 |
| 503,898 |
|
| Woori Bank, MTN, 4.75%, 4/30/24 | | 86,000 |
| 91,731 |
|
| | | | 5,824,904 |
|
Beverages† | | | |
| Anheuser-Busch Cos. LLC / Anheuser-Busch InBev Worldwide, Inc., 4.90%, 2/1/46 | | 130,000 |
| 148,068 |
|
| Biotechnology — 0.1% | | | |
| AbbVie, Inc., 3.60%, 5/14/25 | | 20,000 |
| 20,623 |
|
| AbbVie, Inc., 4.40%, 11/6/42 | | 80,000 |
| 79,361 |
|
| AbbVie, Inc., 4.70%, 5/14/45 | | 10,000 |
| 10,199 |
|
| Amgen, Inc., 4.66%, 6/15/51 | | 80,000 |
| 87,903 |
|
| Celgene Corp., 3.25%, 8/15/22 | | 50,000 |
| 51,294 |
|
| Celgene Corp., 3.625%, 5/15/24 | | 150,000 |
| 156,465 |
|
| Celgene Corp., 3.875%, 8/15/25 | | 40,000 |
| 42,599 |
|
| Gilead Sciences, Inc., 4.40%, 12/1/21 | | 40,000 |
| 41,746 |
|
| Gilead Sciences, Inc., 3.65%, 3/1/26 | | 230,000 |
| 242,995 |
|
| | | | 733,185 |
|
Building Products† | | | |
Builders FirstSource, Inc., 5.625%, 9/1/24(2) | | 87,000 |
| 90,371 |
|
| Capital Markets — 0.2% | | | |
| Credit Suisse Group AG, VRN, 2.125%, 9/12/25 | GBP | 100,000 |
| 123,186 |
|
| Goldman Sachs Group, Inc. (The), 5.50%, 10/12/21 | GBP | 50,000 |
| 66,311 |
|
| Goldman Sachs Group, Inc. (The), 3.50%, 11/16/26 | | $ | 195,000 |
| 200,244 |
|
| Morgan Stanley, 4.375%, 1/22/47 | | 30,000 |
| 33,797 |
|
| Morgan Stanley, MTN, 5.625%, 9/23/19 | | 150,000 |
| 150,657 |
|
| Morgan Stanley, MTN, 3.70%, 10/23/24 | | 270,000 |
| 283,479 |
|
| Morgan Stanley, MTN, 4.00%, 7/23/25 | | 130,000 |
| 138,911 |
|
| Morgan Stanley, MTN, VRN, 2.72%, 7/22/25 | | 70,000 |
| 70,155 |
|
| SURA Asset Management SA, 4.375%, 4/11/27 | | 55,000 |
| 57,201 |
|
| | | | 1,123,941 |
|
| Chemicals — 0.1% | | | |
| CF Industries, Inc., 3.45%, 6/1/23 | | 95,000 |
| 96,306 |
|
Element Solutions, Inc., 5.875%, 12/1/25(2) | | 80,000 |
| 81,800 |
|
Equate Petrochemical BV, 4.25%, 11/3/26(2) | | 46,000 |
| 49,007 |
|
| Huntsman International LLC, 5.125%, 11/15/22 | | 85,000 |
| 90,203 |
|
| Olin Corp., 5.125%, 9/15/27 | | 70,000 |
| 70,731 |
|
Tronox Finance plc, 5.75%, 10/1/25(2) | | 30,000 |
| 28,350 |
|
| | | | 416,397 |
|
| Commercial Services and Supplies — 0.1% | | | |
| ADT Security Corp. (The), 6.25%, 10/15/21 | | 100,000 |
| 106,753 |
|
Harland Clarke Holdings Corp., 9.25%, 3/1/21(2) | | 35,000 |
| 33,775 |
|
HPHT Finance 15 Ltd., 2.875%, 3/17/20(2) | | 286,000 |
| 286,389 |
|
Nielsen Finance LLC / Nielsen Finance Co., 5.00%, 4/15/22(2) | | 60,000 |
| 60,207 |
|
Prime Security Services Borrower LLC / Prime Finance, Inc., 9.25%, 5/15/23(2) | | 64,000 |
| 67,360 |
|
|
| | | | | | | |
| | | Shares/
Principal Amount | Value |
| Republic Services, Inc., 3.55%, 6/1/22 | | $ | 100,000 |
| $ | 102,785 |
|
| RR Donnelley & Sons Co., 6.00%, 4/1/24 | | 90,000 |
| 88,763 |
|
| | | | 746,032 |
|
Communications Equipment† | | | |
CommScope Technologies LLC, 6.00%, 6/15/25(2) | | 170,000 |
| 155,550 |
|
HTA Group Ltd., 9.125%, 3/8/22(2) | | 86,000 |
| 90,287 |
|
IHS Netherlands Holdco BV, 9.50%, 10/27/21(2) | | 50,000 |
| 51,868 |
|
| | | | 297,705 |
|
Construction Materials† | | | |
| Cemex SAB de CV, 6.125%, 5/5/25 | | 115,000 |
| 119,370 |
|
Standard Industries, Inc., 6.00%, 10/15/25(2) | | 100,000 |
| 105,125 |
|
| | | | 224,495 |
|
| Consumer Finance — 0.1% | | | |
| Ally Financial, Inc., 8.00%, 11/1/31 | | 70,000 |
| 93,905 |
|
| Capital One Financial Corp., 3.80%, 1/31/28 | | 180,000 |
| 186,465 |
|
| Navient Corp., 5.00%, 10/26/20 | | 65,000 |
| 66,503 |
|
| Navient Corp., 5.50%, 1/25/23 | | 220,000 |
| 228,459 |
|
| | | | 575,332 |
|
| Containers and Packaging — 0.2% | | | |
ARD Finance SA, 7.125% Cash or 7.875% PIK, 9/15/23(3) | | 200,000 |
| 207,000 |
|
| Ball Corp., 5.00%, 3/15/22 | | 40,000 |
| 41,992 |
|
| Ball Corp., 4.00%, 11/15/23 | | 100,000 |
| 103,500 |
|
| Ball Corp., 5.25%, 7/1/25 | | 35,000 |
| 38,194 |
|
| Berry Global, Inc., 5.50%, 5/15/22 | | 85,000 |
| 86,275 |
|
| Berry Global, Inc., 5.125%, 7/15/23 | | 60,000 |
| 61,500 |
|
| Crown Americas LLC / Crown Americas Capital Corp. IV, 4.50%, 1/15/23 | | 190,000 |
| 196,650 |
|
Mauser Packaging Solutions Holding Co., 5.50%, 4/15/24(2) | | 40,000 |
| 40,088 |
|
Owens-Brockway Glass Container, Inc., 5.875%, 8/15/23(2) | | 40,000 |
| 43,200 |
|
Reynolds Group Issuer, Inc. / Reynolds Group Issuer LLC / Reynolds Group Issuer Lu, 5.125%, 7/15/23(2) | | 100,000 |
| 102,000 |
|
Reynolds Group Issuer, Inc. / Reynolds Group Issuer LLC / Reynolds Group Issuer Lu, 7.00%, 7/15/24(2) | | 200,000 |
| 206,875 |
|
Sealed Air Corp., 5.125%, 12/1/24(2) | | 105,000 |
| 112,350 |
|
| | | | 1,239,624 |
|
Diversified Consumer Services† | | | |
| CommonSpirit Health, 2.95%, 11/1/22 | | 40,000 |
| 40,309 |
|
| Diversified Financial Services — 0.1% | | | |
| Berkshire Hathaway, Inc., 2.75%, 3/15/23 | | 30,000 |
| 30,605 |
|
| Icahn Enterprises LP / Icahn Enterprises Finance Corp., 6.00%, 8/1/20 | | 90,000 |
| 90,000 |
|
| Icahn Enterprises LP / Icahn Enterprises Finance Corp., 5.875%, 2/1/22 | | 80,000 |
| 81,100 |
|
MDC GMTN B.V., 3.25%, 4/28/22(2) | | 57,000 |
| 58,154 |
|
| Voya Financial, Inc., 5.70%, 7/15/43 | | 50,000 |
| 61,940 |
|
| Voya Financial, Inc., VRN, 5.65%, 5/15/53 | | 75,000 |
| 79,228 |
|
| | | | 401,027 |
|
|
| | | | | | | |
| | | Shares/
Principal Amount | Value |
| Diversified Telecommunication Services — 0.3% | | | |
Altice France SA, 7.375%, 5/1/26(2) | | $ | 140,000 |
| $ | 148,428 |
|
| AT&T, Inc., 3.40%, 5/15/25 | | 70,000 |
| 72,059 |
|
| AT&T, Inc., 2.95%, 7/15/26 | | 80,000 |
| 80,394 |
|
| AT&T, Inc., 3.80%, 2/15/27 | | 60,000 |
| 62,649 |
|
| AT&T, Inc., 4.10%, 2/15/28 | | 30,000 |
| 31,907 |
|
| AT&T, Inc., 5.15%, 11/15/46 | | 91,000 |
| 100,891 |
|
| CenturyLink, Inc., 5.625%, 4/1/20 | | 170,000 |
| 172,868 |
|
| CenturyLink, Inc., 5.80%, 3/15/22 | | 90,000 |
| 94,050 |
|
Cincinnati Bell, Inc., 7.00%, 7/15/24(2) | | 30,000 |
| 25,800 |
|
| Frontier Communications Corp., 7.125%, 1/15/23 | | 145,000 |
| 86,275 |
|
| Frontier Communications Corp., 6.875%, 1/15/25 | | 140,000 |
| 77,700 |
|
| Frontier Communications Corp., 11.00%, 9/15/25 | | 10,000 |
| 5,850 |
|
| Hughes Satellite Systems Corp., 5.25%, 8/1/26 | | 100,000 |
| 106,325 |
|
Inmarsat Finance plc, 4.875%, 5/15/22(2) | | 50,000 |
| 50,651 |
|
Intelsat Jackson Holdings SA, 9.75%, 7/15/25(2) | | 180,000 |
| 187,200 |
|
| Level 3 Financing, Inc., 5.375%, 8/15/22 | | 160,000 |
| 161,200 |
|
| Level 3 Financing, Inc., 5.375%, 5/1/25 | | 55,000 |
| 56,788 |
|
Ooredoo International Finance Ltd., 3.75%, 6/22/26(2) | | 86,000 |
| 89,812 |
|
| Orange SA, 4.125%, 9/14/21 | | 70,000 |
| 72,528 |
|
| Sprint Capital Corp., 8.75%, 3/15/32 | | 100,000 |
| 124,625 |
|
| Telecom Italia Capital SA, 6.375%, 11/15/33 | | 200,000 |
| 211,040 |
|
| Telefonica Emisiones SA, 5.46%, 2/16/21 | | 10,000 |
| 10,440 |
|
Turk Telekomunikasyon AS, 4.875%, 6/19/24(2) | | 115,000 |
| 110,275 |
|
| Verizon Communications, Inc., 2.625%, 8/15/26 | | 50,000 |
| 49,902 |
|
| Verizon Communications, Inc., 4.75%, 11/1/41 | | 40,000 |
| 45,974 |
|
| Verizon Communications, Inc., 5.01%, 8/21/54 | | 30,000 |
| 35,573 |
|
| Zayo Group LLC / Zayo Capital, Inc., 6.00%, 4/1/23 | | 140,000 |
| 144,900 |
|
| | | | 2,416,104 |
|
| Electric Utilities — 0.1% | | | |
| Duke Energy Florida LLC, 6.35%, 9/15/37 | | 51,000 |
| 71,370 |
|
| Duke Energy Florida LLC, 3.85%, 11/15/42 | | 40,000 |
| 42,216 |
|
| Duke Energy Progress LLC, 4.15%, 12/1/44 | | 40,000 |
| 44,144 |
|
| Exelon Corp., 4.45%, 4/15/46 | | 20,000 |
| 21,962 |
|
| FirstEnergy Corp., 4.25%, 3/15/23 | | 70,000 |
| 73,870 |
|
| FirstEnergy Corp., 4.85%, 7/15/47 | | 20,000 |
| 23,024 |
|
| Georgia Power Co., 4.30%, 3/15/42 | | 30,000 |
| 32,174 |
|
Greenko Investment Co., 4.875%, 8/16/23(2) | | 57,000 |
| 56,359 |
|
| Pampa Energia SA, 7.50%, 1/24/27 | | 114,000 |
| 105,592 |
|
| Progress Energy, Inc., 3.15%, 4/1/22 | | 40,000 |
| 40,663 |
|
| Southern Co. Gas Capital Corp., 3.95%, 10/1/46 | | 20,000 |
| 19,917 |
|
| Xcel Energy, Inc., 3.35%, 12/1/26 | | 30,000 |
| 31,125 |
|
| | | | 562,416 |
|
| Energy Equipment and Services — 0.1% | | | |
| Halliburton Co., 4.85%, 11/15/35 | | 40,000 |
| 44,029 |
|
| Nabors Industries, Inc., 4.625%, 9/15/21 | | 70,000 |
| 68,950 |
|
| Precision Drilling Corp., 5.25%, 11/15/24 | | 105,000 |
| 96,075 |
|
|
| | | | | | | |
| | | Shares/
Principal Amount | Value |
Transocean, Inc., 9.00%, 7/15/23(2) | | $ | 200,000 |
| $ | 211,192 |
|
| Valaris plc, 8.00%, 1/31/24 | | 96,000 |
| 81,600 |
|
| Valaris plc, 5.20%, 3/15/25 | | 80,000 |
| 57,600 |
|
| | | | 559,446 |
|
| Entertainment — 0.1% | | | |
| AMC Entertainment Holdings, Inc., 5.75%, 6/15/25 | | 100,000 |
| 94,843 |
|
| Cinemark USA, Inc., 5.125%, 12/15/22 | | 55,000 |
| 56,021 |
|
| Viacom, Inc., 4.375%, 3/15/43 | | 20,000 |
| 19,802 |
|
| VTR Finance BV, 6.875%, 1/15/24 | | 129,000 |
| 133,676 |
|
Walt Disney Co. (The), 4.75%, 9/15/44(2) | | 30,000 |
| 37,029 |
|
Ziggo Bond Co. BV, 5.875%, 1/15/25(2) | | 85,000 |
| 87,444 |
|
Ziggo BV, 5.50%, 1/15/27(2) | | 150,000 |
| 153,937 |
|
| | | | 582,752 |
|
| Equity Real Estate Investment Trusts (REITs) — 0.2% | | | |
| Boston Properties LP, 3.65%, 2/1/26 | | 70,000 |
| 73,373 |
|
| Equinix, Inc., 5.375%, 5/15/27 | | 90,000 |
| 96,835 |
|
| Essex Portfolio LP, 3.625%, 8/15/22 | | 70,000 |
| 72,056 |
|
| Essex Portfolio LP, 3.25%, 5/1/23 | | 20,000 |
| 20,387 |
|
| GLP Capital LP / GLP Financing II, Inc., 5.375%, 11/1/23 | | 70,000 |
| 75,729 |
|
| GLP Capital LP / GLP Financing II, Inc., 5.375%, 4/15/26 | | 100,000 |
| 109,062 |
|
| Hospitality Properties Trust, 4.65%, 3/15/24 | | 80,000 |
| 82,439 |
|
| Iron Mountain, Inc., 5.75%, 8/15/24 | | 125,000 |
| 126,212 |
|
Iron Mountain, Inc., 4.875%, 9/15/27(2) | | 100,000 |
| 99,750 |
|
| Kilroy Realty LP, 3.80%, 1/15/23 | | 60,000 |
| 62,309 |
|
| MGM Growth Properties Operating Partnership LP / MGP Finance Co-Issuer, Inc., 5.625%, 5/1/24 | | 90,000 |
| 96,413 |
|
| RHP Hotel Properties LP / RHP Finance Corp., 5.00%, 4/15/21 | | 75,000 |
| 75,263 |
|
| SBA Communications Corp., 4.875%, 7/15/22 | | 125,000 |
| 126,565 |
|
Uniti Group LP / Uniti Group Finance, Inc. / CSL Capital LLC, 6.00%, 4/15/23(2) | | 60,000 |
| 57,150 |
|
| | | | 1,173,543 |
|
| Food and Staples Retailing — 0.1% | | | |
| Albertsons Cos. LLC / Safeway, Inc. / New Albertson's, LP / Albertson's LLC, 6.625%, 6/15/24 | | 150,000 |
| 157,125 |
|
CK Hutchison International 17 II Ltd., 2.25%, 9/29/20(2) | | 229,000 |
| 228,206 |
|
| Kroger Co. (The), 3.30%, 1/15/21 | | 110,000 |
| 111,368 |
|
| Kroger Co. (The), 3.875%, 10/15/46 | | 30,000 |
| 26,978 |
|
| Tesco plc, MTN, 5.50%, 12/13/19 | GBP | 60,000 |
| 74,086 |
|
| Walmart, Inc., 2.55%, 4/11/23 | | $ | 4,000 |
| 4,052 |
|
| Walmart, Inc., 4.05%, 6/29/48 | | 110,000 |
| 126,701 |
|
| | | | 728,516 |
|
| Food Products — 0.1% | | | |
| B&G Foods, Inc., 5.25%, 4/1/25 | | 80,000 |
| 79,900 |
|
JBS USA LUX SA / JBS USA Finance, Inc., 5.875%, 7/15/24(2) | | 60,000 |
| 61,800 |
|
JBS USA LUX SA / JBS USA Finance, Inc., 5.75%, 6/15/25(2) | | 80,000 |
| 82,900 |
|
Lamb Weston Holdings, Inc., 4.625%, 11/1/24(2) | | 90,000 |
| 94,500 |
|
| | | | |
|
| | | | | | | |
| | | Shares/
Principal Amount | Value |
MHP SE, 7.75%, 5/10/24(2) | | $ | 71,000 |
| $ | 76,002 |
|
| Minerva Luxembourg SA, 6.50%, 9/20/26 | | 183,000 |
| 187,118 |
|
Minerva Luxembourg SA, 5.875%, 1/19/28(2) | | 40,000 |
| 39,500 |
|
Pilgrim's Pride Corp., 5.75%, 3/15/25(2) | | 280,000 |
| 289,800 |
|
Post Holdings, Inc., 5.00%, 8/15/26(2) | | 200,000 |
| 205,000 |
|
| | | | 1,116,520 |
|
| Gas Utilities — 0.2% | | | |
| Andeavor Logistics LP / Tesoro Logistics Finance Corp., 5.50%, 10/15/19 | | 50,000 |
| 50,154 |
|
| Andeavor Logistics LP / Tesoro Logistics Finance Corp., 6.25%, 10/15/22 | | 22,000 |
| 22,592 |
|
| Cheniere Corpus Christi Holdings LLC, 5.875%, 3/31/25 | | 90,000 |
| 99,234 |
|
| Cheniere Corpus Christi Holdings LLC, 5.125%, 6/30/27 | | 190,000 |
| 207,556 |
|
| China Resources Gas Group Ltd., MTN, 4.50%, 4/5/22 | | 143,000 |
| 149,230 |
|
| Crestwood Midstream Partners LP / Crestwood Midstream Finance Corp., 6.25%, 4/1/23 | | 40,000 |
| 40,902 |
|
| Crestwood Midstream Partners LP / Crestwood Midstream Finance Corp., 5.75%, 4/1/25 | | 90,000 |
| 91,942 |
|
| Enterprise Products Operating LLC, 5.20%, 9/1/20 | | 35,000 |
| 36,022 |
|
| Enterprise Products Operating LLC, 4.85%, 3/15/44 | | 130,000 |
| 143,543 |
|
| Genesis Energy LP / Genesis Energy Finance Corp., 6.75%, 8/1/22 | | 45,000 |
| 45,951 |
|
| Genesis Energy LP / Genesis Energy Finance Corp., 5.625%, 6/15/24 | | 200,000 |
| 197,500 |
|
| NuStar Logistics LP, 4.75%, 2/1/22 | | 40,000 |
| 40,900 |
|
| Perusahaan Gas Negara Tbk PT, 5.125%, 5/16/24 | | 114,000 |
| 123,603 |
|
| Plains All American Pipeline LP / PAA Finance Corp., 3.65%, 6/1/22 | | 90,000 |
| 92,022 |
|
| Sabine Pass Liquefaction LLC, 5.625%, 3/1/25 | | 120,000 |
| 133,531 |
|
| Sunoco Logistics Partners Operations LP, 3.45%, 1/15/23 | | 110,000 |
| 112,052 |
|
| Targa Resources Partners LP / Targa Resources Partners Finance Corp., 4.25%, 11/15/23 | | 150,000 |
| 150,705 |
|
| Targa Resources Partners LP / Targa Resources Partners Finance Corp., 5.125%, 2/1/25 | | 94,000 |
| 97,309 |
|
| | | | 1,834,748 |
|
Health Care Equipment and Supplies† | | | |
| Medtronic, Inc., 3.50%, 3/15/25 | | 58,000 |
| 61,581 |
|
| Medtronic, Inc., 4.375%, 3/15/35 | | 36,000 |
| 42,085 |
|
Ortho-Clinical Diagnostics, Inc. / Ortho-Clinical Diagnostics SA, 6.625%, 5/15/22(2) | | 50,000 |
| 49,000 |
|
| | | | 152,666 |
|
| Health Care Providers and Services — 0.4% | | | |
| Acadia Healthcare Co., Inc., 5.125%, 7/1/22 | | 25,000 |
| 25,094 |
|
| Acadia Healthcare Co., Inc., 5.625%, 2/15/23 | | 70,000 |
| 70,900 |
|
| Aetna, Inc., 2.75%, 11/15/22 | | 60,000 |
| 60,162 |
|
| Anthem, Inc., 4.65%, 1/15/43 | | 40,000 |
| 43,306 |
|
| CHS / Community Health Systems, Inc., 6.875%, 2/1/22 | | 60,000 |
| 41,400 |
|
| CHS / Community Health Systems, Inc., 6.25%, 3/31/23 | | 100,000 |
| 96,125 |
|
CHS / Community Health Systems, Inc., 8.125%, 6/30/24(2) | | 55,000 |
| 42,075 |
|
|
| | | | | | | |
| | | Shares/
Principal Amount | Value |
CHS / Community Health Systems, Inc., VRN, 9.875%, 6/30/23(2) | | $ | 150,000 |
| $ | 126,000 |
|
| CVS Health Corp., 3.50%, 7/20/22 | | 50,000 |
| 51,333 |
|
| CVS Health Corp., 4.30%, 3/25/28 | | 120,000 |
| 127,479 |
|
| CVS Health Corp., 4.78%, 3/25/38 | | 40,000 |
| 42,435 |
|
| CVS Health Corp., 5.05%, 3/25/48 | | 60,000 |
| 65,313 |
|
| DaVita, Inc., 5.125%, 7/15/24 | | 107,000 |
| 107,669 |
|
| DaVita, Inc., 5.00%, 5/1/25 | | 155,000 |
| 152,484 |
|
| Encompass Health Corp., 5.75%, 11/1/24 | | 50,000 |
| 50,751 |
|
Envision Healthcare Corp., 8.75%, 10/15/26(2) | | 200,000 |
| 139,500 |
|
| HCA, Inc., 7.50%, 2/15/22 | | 215,000 |
| 238,586 |
|
| HCA, Inc., 5.00%, 3/15/24 | | 110,000 |
| 119,510 |
|
| HCA, Inc., 5.375%, 2/1/25 | | 220,000 |
| 238,471 |
|
| HCA, Inc., 4.50%, 2/15/27 | | 70,000 |
| 74,492 |
|
Jaguar Holding Co. II / Pharmaceutical Product Development LLC, 6.375%, 8/1/23(2) | | 95,000 |
| 98,681 |
|
| Northwell Healthcare, Inc., 4.26%, 11/1/47 | | 30,000 |
| 32,276 |
|
Team Health Holdings, Inc., 6.375%, 2/1/25(2) | | 45,000 |
| 36,900 |
|
| Tenet Healthcare Corp., 4.50%, 4/1/21 | | 50,000 |
| 51,063 |
|
| Tenet Healthcare Corp., 8.125%, 4/1/22 | | 230,000 |
| 246,387 |
|
| Tenet Healthcare Corp., 6.75%, 6/15/23 | | 50,000 |
| 51,625 |
|
| Tenet Healthcare Corp., 5.125%, 5/1/25 | | 150,000 |
| 149,844 |
|
| UnitedHealth Group, Inc., 2.875%, 3/15/22 | | 80,000 |
| 81,094 |
|
| UnitedHealth Group, Inc., 3.75%, 7/15/25 | | 80,000 |
| 85,491 |
|
| UnitedHealth Group, Inc., 4.75%, 7/15/45 | | 50,000 |
| 58,770 |
|
| | | | 2,805,216 |
|
| Hotels, Restaurants and Leisure — 0.3% | | | |
1011778 BC ULC / New Red Finance, Inc., 5.00%, 10/15/25(2) | | 130,000 |
| 132,925 |
|
| Boyd Gaming Corp., 6.875%, 5/15/23 | | 91,000 |
| 94,413 |
|
| Boyd Gaming Corp., 6.375%, 4/1/26 | | 75,000 |
| 79,406 |
|
| Eldorado Resorts, Inc., 7.00%, 8/1/23 | | 160,000 |
| 167,600 |
|
Golden Nugget, Inc., 6.75%, 10/15/24(2) | | 140,000 |
| 144,463 |
|
| Hilton Domestic Operating Co., Inc., 4.25%, 9/1/24 | | 150,000 |
| 152,280 |
|
| Hilton Worldwide Finance LLC / Hilton Worldwide Finance Corp., 4.625%, 4/1/25 | | 90,000 |
| 92,475 |
|
International Game Technology plc, 6.25%, 2/15/22(2) | | 170,000 |
| 179,775 |
|
Jack Ohio Finance LLC / Jack Ohio Finance 1 Corp., 6.75%, 11/15/21(2) | | 85,000 |
| 87,084 |
|
KFC Holding Co. / Pizza Hut Holdings LLC / Taco Bell of America LLC, 5.25%, 6/1/26(2) | | 45,000 |
| 46,832 |
|
| McDonald's Corp., MTN, 3.375%, 5/26/25 | | 30,000 |
| 31,352 |
|
| McDonald's Corp., MTN, 4.70%, 12/9/35 | | 20,000 |
| 23,160 |
|
| McDonald's Corp., MTN, 4.45%, 3/1/47 | | 70,000 |
| 77,154 |
|
| MGM Resorts International, 6.00%, 3/15/23 | | 135,000 |
| 146,812 |
|
| MGM Resorts International, 4.625%, 9/1/26 | | 50,000 |
| 51,500 |
|
Penn National Gaming, Inc., 5.625%, 1/15/27(2) | | 175,000 |
| 178,150 |
|
Rivers Pittsburgh Borrower LP / Rivers Pittsburgh Finance Corp., 6.125%, 8/15/21(2) | | 50,000 |
| 50,875 |
|
|
| | | | | | | |
| | | Shares/
Principal Amount | Value |
| Royal Caribbean Cruises Ltd., 5.25%, 11/15/22 | | $ | 30,000 |
| $ | 32,521 |
|
| Scientific Games International, Inc., 6.25%, 9/1/20 | | 70,000 |
| 70,438 |
|
| Scientific Games International, Inc., 10.00%, 12/1/22 | | 57,000 |
| 59,637 |
|
Wynn Las Vegas LLC / Wynn Las Vegas Capital Corp., 5.50%, 3/1/25(2) | | 235,000 |
| 247,044 |
|
| Yum! Brands, Inc., 3.75%, 11/1/21 | | 50,000 |
| 50,625 |
|
| | | | 2,196,521 |
|
| Household Durables — 0.1% | | | |
| Beazer Homes USA, Inc., 7.25%, 2/1/23 | | 5,000 |
| 4,950 |
|
| Beazer Homes USA, Inc., 5.875%, 10/15/27 | | 90,000 |
| 82,800 |
|
Brookfield Residential Properties, Inc. / Brookfield Residential US Corp., 6.125%, 7/1/22(2) | | 50,000 |
| 50,631 |
|
| Meritage Homes Corp., 5.125%, 6/6/27 | | 190,000 |
| 197,600 |
|
| PulteGroup, Inc., 5.50%, 3/1/26 | | 100,000 |
| 108,125 |
|
Shea Homes LP / Shea Homes Funding Corp., 5.875%, 4/1/23(2) | | 60,000 |
| 62,028 |
|
Taylor Morrison Communities, Inc. / Taylor Morrison Holdings II, Inc., 5.625%, 3/1/24(2) | | 225,000 |
| 235,687 |
|
| Toll Brothers Finance Corp., 4.35%, 2/15/28 | | 50,000 |
| 50,725 |
|
| William Lyon Homes, Inc., 5.875%, 1/31/25 | | 115,000 |
| 115,575 |
|
| | | | 908,121 |
|
Household Products† | | | |
Energizer Holdings, Inc., 5.50%, 6/15/25(2) | | 65,000 |
| 66,158 |
|
| Spectrum Brands, Inc., 5.75%, 7/15/25 | | 40,000 |
| 41,638 |
|
| | | | 107,796 |
|
Independent Power and Renewable Electricity Producers† | | | |
| Calpine Corp., 5.375%, 1/15/23 | | 160,000 |
| 161,600 |
|
| NRG Energy, Inc., 7.25%, 5/15/26 | | 75,000 |
| 81,253 |
|
| | | | 242,853 |
|
| Insurance — 0.2% | | | |
| Allianz SE, MTN, VRN, 4.75%, 10/24/23 | EUR | 100,000 |
| 128,288 |
|
| American International Group, Inc., 4.125%, 2/15/24 | | $ | 110,000 |
| 117,052 |
|
| American International Group, Inc., 4.50%, 7/16/44 | | 40,000 |
| 42,886 |
|
| Assicurazioni Generali SpA, MTN, VRN, 4.60%, 11/21/25 | EUR | 100,000 |
| 118,025 |
|
| AXA SA, 7.125%, 12/15/20 | GBP | 20,000 |
| 26,272 |
|
| Berkshire Hathaway Finance Corp., 3.00%, 5/15/22 | | $ | 78,000 |
| 79,886 |
|
| Chubb INA Holdings, Inc., 3.15%, 3/15/25 | | 70,000 |
| 72,802 |
|
| Chubb INA Holdings, Inc., 3.35%, 5/3/26 | | 30,000 |
| 31,593 |
|
| CNP Assurances, VRN, 4.00%, 11/18/24 | EUR | 100,000 |
| 124,119 |
|
| Fiore Capital LLC, VRDN, 2.35%, 8/7/19 (LOC: Wells Fargo Bank N.A.) | | $ | 450,000 |
| 450,000 |
|
| Genworth Holdings, Inc., 7.625%, 9/24/21 | | 35,000 |
| 36,400 |
|
| Hartford Financial Services Group, Inc. (The), 5.95%, 10/15/36 | | 20,000 |
| 25,358 |
|
| Intesa Sanpaolo Vita SpA, VRN, 4.75%, 12/17/24 | EUR | 100,000 |
| 117,113 |
|
| Markel Corp., 4.90%, 7/1/22 | | $ | 70,000 |
| 74,306 |
|
| MetLife, Inc., 4.125%, 8/13/42 | | 30,000 |
| 32,603 |
|
| MetLife, Inc., 4.875%, 11/13/43 | | 30,000 |
| 36,089 |
|
| Principal Financial Group, Inc., 3.30%, 9/15/22 | | 30,000 |
| 30,516 |
|
|
| | | | | | | |
| | | Shares/
Principal Amount | Value |
| Prudential Financial, Inc., 3.94%, 12/7/49 | | $ | 90,000 |
| $ | 95,540 |
|
| WR Berkley Corp., 4.625%, 3/15/22 | | 40,000 |
| 42,173 |
|
| | | | 1,681,021 |
|
Interactive Media and Services† | | | |
Rackspace Hosting, Inc., 8.625%, 11/15/24(2) | | 175,000 |
| 161,000 |
|
Tencent Holdings Ltd., 3.80%, 2/11/25(2) | | 86,000 |
| 90,005 |
|
| | | | 251,005 |
|
Internet and Direct Marketing Retail† | | | |
| Alibaba Group Holding Ltd., 2.80%, 6/6/23 | | 200,000 |
| 201,419 |
|
| JD.com, Inc., 3.875%, 4/29/26 | | 143,000 |
| 142,716 |
|
| | | | 344,135 |
|
IT Services† | | | |
| CDW LLC / CDW Finance Corp., 5.50%, 12/1/24 | | 90,000 |
| 97,569 |
|
| Fidelity National Information Services, Inc., 3.00%, 8/15/26 | | 100,000 |
| 101,532 |
|
First Data Corp., 5.75%, 1/15/24(2) | | 120,000 |
| 123,645 |
|
| | | | 322,746 |
|
Life Sciences Tools and Services† | | | |
IQVIA, Inc., 4.875%, 5/15/23(2) | | 150,000 |
| 153,600 |
|
| Thermo Fisher Scientific, Inc., 3.60%, 8/15/21 | | 65,000 |
| 66,358 |
|
| Thermo Fisher Scientific, Inc., 3.30%, 2/15/22 | | 27,000 |
| 27,647 |
|
| | | | 247,605 |
|
Marine† | | | |
| Martin Midstream Partners LP / Martin Midstream Finance Corp., 7.25%, 2/15/21 | | 150,000 |
| 148,140 |
|
| Media — 0.5% | | | |
Altice Financing SA, 6.625%, 2/15/23(2) | | 260,000 |
| 268,775 |
|
| AMC Networks, Inc., 4.75%, 8/1/25 | | 190,000 |
| 194,037 |
|
| Cablevision Systems Corp., 5.875%, 9/15/22 | | 125,000 |
| 133,125 |
|
| CBS Corp., 4.85%, 7/1/42 | | 30,000 |
| 32,400 |
|
| CCO Holdings LLC / CCO Holdings Capital Corp., 5.25%, 9/30/22 | | 170,000 |
| 172,231 |
|
CCO Holdings LLC / CCO Holdings Capital Corp., 5.75%, 2/15/26(2) | | 150,000 |
| 158,394 |
|
CCO Holdings LLC / CCO Holdings Capital Corp., 5.125%, 5/1/27(2) | | 60,000 |
| 62,025 |
|
| Charter Communications Operating LLC / Charter Communications Operating Capital, 4.91%, 7/23/25 | | 170,000 |
| 183,500 |
|
| Charter Communications Operating LLC / Charter Communications Operating Capital, 6.48%, 10/23/45 | | 50,000 |
| 58,885 |
|
| Comcast Corp., 6.40%, 5/15/38 | | 100,000 |
| 136,842 |
|
| Comcast Corp., 4.75%, 3/1/44 | | 30,000 |
| 34,981 |
|
CSC Holdings LLC, 5.375%, 7/15/23(2) | | 100,000 |
| 102,810 |
|
CSC Holdings LLC, 6.625%, 10/15/25(2) | | 100,000 |
| 106,500 |
|
CSC Holdings LLC, 5.50%, 5/15/26(2) | | 50,000 |
| 52,375 |
|
| Digicel Ltd., 6.00%, 4/15/21 | | 86,000 |
| 59,555 |
|
| DISH DBS Corp., 6.75%, 6/1/21 | | 100,000 |
| 104,345 |
|
| DISH DBS Corp., 5.00%, 3/15/23 | | 130,000 |
| 125,937 |
|
| DISH DBS Corp., 5.875%, 11/15/24 | | 175,000 |
| 162,859 |
|
Gray Television, Inc., 5.125%, 10/15/24(2) | | 100,000 |
| 102,875 |
|
|
| | | | | | | |
| | | Shares/
Principal Amount | Value |
Gray Television, Inc., 5.875%, 7/15/26(2) | | $ | 175,000 |
| $ | 182,000 |
|
| Interpublic Group of Cos., Inc. (The), 4.00%, 3/15/22 | | 6,000 |
| 6,178 |
|
| Lamar Media Corp., 5.00%, 5/1/23 | | 90,000 |
| 91,885 |
|
| Lamar Media Corp., 5.375%, 1/15/24 | | 30,000 |
| 31,013 |
|
| Myriad International Holdings BV, 6.00%, 7/18/20 | | 86,000 |
| 88,498 |
|
Nexstar Broadcasting, Inc., 5.625%, 8/1/24(2) | | 140,000 |
| 145,775 |
|
Sinclair Television Group, Inc., 5.625%, 8/1/24(2) | | 120,000 |
| 123,714 |
|
Sirius XM Radio, Inc., 4.625%, 5/15/23(2) | | 95,000 |
| 96,900 |
|
Sirius XM Radio, Inc., 5.375%, 4/15/25(2) | | 55,000 |
| 57,269 |
|
TEGNA, Inc., 5.50%, 9/15/24(2) | | 130,000 |
| 134,712 |
|
Univision Communications, Inc., 5.125%, 2/15/25(2) | | 170,000 |
| 165,750 |
|
| Videotron Ltd., 5.00%, 7/15/22 | | 75,000 |
| 78,634 |
|
| | | | 3,454,779 |
|
| Metals and Mining — 0.2% | | | |
Alcoa Nederland Holding BV, 6.75%, 9/30/24(2) | | 75,000 |
| 78,938 |
|
| Allegheny Technologies, Inc., 5.95%, 1/15/21 | | 205,000 |
| 210,894 |
|
| ArcelorMittal, 5.50%, 3/1/21 | | 70,000 |
| 72,767 |
|
| Cleveland-Cliffs, Inc., 5.75%, 3/1/25 | | 220,000 |
| 223,960 |
|
First Quantum Minerals Ltd., 7.25%, 5/15/22(2) | | 90,000 |
| 90,787 |
|
| First Quantum Minerals Ltd., 7.25%, 4/1/23 | | 50,000 |
| 49,688 |
|
First Quantum Minerals Ltd., 6.50%, 3/1/24(2) | | 140,000 |
| 135,208 |
|
| Freeport-McMoRan, Inc., 3.55%, 3/1/22 | | 130,000 |
| 130,659 |
|
| Freeport-McMoRan, Inc., 5.40%, 11/14/34 | | 215,000 |
| 208,550 |
|
| Nexa Resources SA, 5.375%, 5/4/27 | | 128,000 |
| 135,201 |
|
Novelis Corp., 5.875%, 9/30/26(2) | | 190,000 |
| 197,362 |
|
| Steel Dynamics, Inc., 5.25%, 4/15/23 | | 115,000 |
| 116,903 |
|
| Teck Resources Ltd., 6.25%, 7/15/41 | | 40,000 |
| 45,264 |
|
Vedanta Resources Ltd., 6.125%, 8/9/24(2) | | 121,000 |
| 114,035 |
|
| | | | 1,810,216 |
|
| Multi-Utilities — 0.1% | | | |
Abu Dhabi National Energy Co. PJSC, 5.875%, 12/13/21(2) | | 114,000 |
| 122,677 |
|
Abu Dhabi National Energy Co. PJSC, 3.625%, 1/12/23(2) | | 86,000 |
| 88,577 |
|
| AmeriGas Partners LP / AmeriGas Finance Corp., 5.875%, 8/20/26 | | 75,000 |
| 79,875 |
|
| Berkshire Hathaway Energy Co., 3.50%, 2/1/25 | | 50,000 |
| 52,462 |
|
| Berkshire Hathaway Energy Co., 3.80%, 7/15/48 | | 40,000 |
| 41,448 |
|
| Consolidated Edison Co. of New York, Inc., 3.95%, 3/1/43 | | 40,000 |
| 42,293 |
|
| Dominion Energy, Inc., 4.90%, 8/1/41 | | 30,000 |
| 34,672 |
|
| Exelon Generation Co. LLC, 4.25%, 6/15/22 | | 40,000 |
| 41,759 |
|
| Exelon Generation Co. LLC, 5.60%, 6/15/42 | | 30,000 |
| 34,350 |
|
| Florida Power & Light Co., 3.95%, 3/1/48 | | 30,000 |
| 33,200 |
|
Israel Electric Corp. Ltd., 6.875%, 6/21/23(2) | | 57,000 |
| 64,736 |
|
| Listrindo Capital BV, 4.95%, 9/14/26 | | 57,000 |
| 57,242 |
|
| MidAmerican Energy Co., 4.40%, 10/15/44 | | 60,000 |
| 69,251 |
|
| NiSource, Inc., 5.65%, 2/1/45 | | 40,000 |
| 49,683 |
|
| Sempra Energy, 2.875%, 10/1/22 | | 70,000 |
| 70,659 |
|
| Sempra Energy, 3.25%, 6/15/27 | | 50,000 |
| 50,263 |
|
|
| | | | | | | |
| | | Shares/
Principal Amount | Value |
| Sempra Energy, 4.00%, 2/1/48 | | $ | 30,000 |
| $ | 30,294 |
|
| Southwestern Public Service Co., 3.70%, 8/15/47 | | 20,000 |
| 20,623 |
|
| Talen Energy Supply LLC, 6.50%, 6/1/25 | | 95,000 |
| 76,950 |
|
| | | | 1,061,014 |
|
| Oil, Gas and Consumable Fuels — 0.7% | | | |
| Antero Resources Corp., 5.125%, 12/1/22 | | 145,000 |
| 139,200 |
|
| Antero Resources Corp., 5.625%, 6/1/23 | | 35,000 |
| 33,338 |
|
| Antero Resources Corp., 5.00%, 3/1/25 | | 20,000 |
| 17,996 |
|
| Calumet Specialty Products Partners LP / Calumet Finance Corp., 6.50%, 4/15/21 | | 70,000 |
| 69,825 |
|
| Carrizo Oil & Gas, Inc., 6.25%, 4/15/23 | | 70,000 |
| 69,090 |
|
| Chesapeake Energy Corp., 8.00%, 1/15/25 | | 150,000 |
| 129,000 |
|
| CNOOC Finance 2013 Ltd., 3.00%, 5/9/23 | | 143,000 |
| 144,296 |
|
| CNOOC Nexen Finance 2014 ULC, 4.25%, 4/30/24 | | 50,000 |
| 53,346 |
|
| CNX Resources Corp., 5.875%, 4/15/22 | | 147,000 |
| 141,855 |
|
Denbury Resources, Inc., 9.00%, 5/15/21(2) | | 50,000 |
| 47,375 |
|
| Denbury Resources, Inc., 4.625%, 7/15/23 | | 75,000 |
| 29,250 |
|
| Diamondback Energy, Inc., 4.75%, 11/1/24 | | 105,000 |
| 108,250 |
|
| Ecopetrol SA, 5.875%, 5/28/45 | | 185,000 |
| 208,477 |
|
| Enbridge, Inc., 4.00%, 10/1/23 | | 40,000 |
| 42,040 |
|
| Encana Corp., 6.50%, 2/1/38 | | 30,000 |
| 36,185 |
|
| Energy Transfer Operating LP, 4.15%, 10/1/20 | | 70,000 |
| 71,056 |
|
| Energy Transfer Operating LP, 3.60%, 2/1/23 | | 12,000 |
| 12,302 |
|
| Energy Transfer Operating LP, 6.50%, 2/1/42 | | 40,000 |
| 47,425 |
|
Gazprom OAO Via Gaz Capital SA, 6.51%, 3/7/22(2) | | 79,000 |
| 85,778 |
|
Gazprom OAO Via Gaz Capital SA, 7.29%, 8/16/37(2) | | 79,000 |
| 101,556 |
|
Gran Tierra Energy International Holdings Ltd., 6.25%, 2/15/25(2) | | 120,000 |
| 114,450 |
|
| Gulfport Energy Corp., 6.00%, 10/15/24 | | 75,000 |
| 58,118 |
|
| Gulfport Energy Corp., 6.375%, 5/15/25 | | 95,000 |
| 73,150 |
|
| Hess Corp., 6.00%, 1/15/40 | | 40,000 |
| 43,527 |
|
Hilcorp Energy I LP / Hilcorp Finance Co., 5.75%, 10/1/25(2) | | 40,000 |
| 39,100 |
|
| Kinder Morgan Energy Partners LP, 6.50%, 9/1/39 | | 90,000 |
| 111,586 |
|
| Laredo Petroleum, Inc., 6.25%, 3/15/23 | | 70,000 |
| 63,175 |
|
MEG Energy Corp., 7.00%, 3/31/24(2) | | 100,000 |
| 95,978 |
|
MEG Energy Corp., 6.50%, 1/15/25(2) | | 75,000 |
| 75,094 |
|
| MPLX LP, 4.875%, 6/1/25 | | 140,000 |
| 152,415 |
|
| MPLX LP, 4.50%, 4/15/38 | | 20,000 |
| 20,272 |
|
| MPLX LP, 5.20%, 3/1/47 | | 10,000 |
| 10,730 |
|
| Murphy Oil Corp., 4.20%, 12/1/22 | | 90,000 |
| 91,775 |
|
| Newfield Exploration Co., 5.75%, 1/30/22 | | 85,000 |
| 90,801 |
|
| Newfield Exploration Co., 5.375%, 1/1/26 | | 50,000 |
| 54,758 |
|
| Noble Energy, Inc., 4.15%, 12/15/21 | | 60,000 |
| 61,878 |
|
| Oasis Petroleum, Inc., 6.875%, 3/15/22 | | 175,000 |
| 175,061 |
|
Parsley Energy LLC / Parsley Finance Corp., 5.375%, 1/15/25(2) | | 160,000 |
| 162,810 |
|
| Petrobras Global Finance BV, 5.75%, 2/1/29 | | 220,000 |
| 237,160 |
|
| Petrobras Global Finance BV, 7.25%, 3/17/44 | | 100,000 |
| 117,400 |
|
|
| | | | | | | |
| | | Shares/
Principal Amount | Value |
| Petroleos Mexicanos, 6.00%, 3/5/20 | | $ | 52,000 |
| $ | 52,771 |
|
| Petroleos Mexicanos, 4.875%, 1/24/22 | | 20,000 |
| 20,250 |
|
| Petroleos Mexicanos, 3.50%, 1/30/23 | | 30,000 |
| 28,770 |
|
| Petroleos Mexicanos, 6.50%, 3/13/27 | | 80,000 |
| 79,536 |
|
| Petroleos Mexicanos, 5.50%, 6/27/44 | | 60,000 |
| 49,050 |
|
| QEP Resources, Inc., 5.375%, 10/1/22 | | 150,000 |
| 139,687 |
|
| Range Resources Corp., 5.00%, 8/15/22 | | 155,000 |
| 143,328 |
|
| Ras Laffan Liquefied Natural Gas Co. Ltd. II, 5.30%, 9/30/20 | | 19,015 |
| 19,364 |
|
Ras Laffan Liquefied Natural Gas Co. Ltd. III, 6.75%, 9/30/19(2) | | 257,000 |
| 258,786 |
|
| Reliance Industries Ltd., 4.125%, 1/28/25 | | 185,000 |
| 193,805 |
|
| Shell International Finance BV, 3.625%, 8/21/42 | | 55,000 |
| 56,774 |
|
| SM Energy Co., 5.00%, 1/15/24 | | 70,000 |
| 64,575 |
|
| Southwestern Energy Co., 6.20%, 1/23/25 | | 150,000 |
| 130,125 |
|
| Suburban Propane Partners LP / Suburban Energy Finance Corp., 5.50%, 6/1/24 | | 110,000 |
| 112,750 |
|
| Suburban Propane Partners LP / Suburban Energy Finance Corp., 5.75%, 3/1/25 | | 135,000 |
| 137,363 |
|
Tullow Oil plc, 7.00%, 3/1/25(2) | | 150,000 |
| 151,312 |
|
| Whiting Petroleum Corp., 5.75%, 3/15/21 | | 140,000 |
| 140,700 |
|
| Williams Cos., Inc. (The), 4.55%, 6/24/24 | | 130,000 |
| 139,529 |
|
| Williams Cos., Inc. (The), 5.10%, 9/15/45 | | 50,000 |
| 54,524 |
|
| WPX Energy, Inc., 6.00%, 1/15/22 | | 100,000 |
| 104,125 |
|
| WPX Energy, Inc., 8.25%, 8/1/23 | | 65,000 |
| 73,450 |
|
| | | | 5,587,452 |
|
Personal Products† | | | |
| Avon Products, Inc., 7.00%, 3/15/23 | | 45,000 |
| 45,518 |
|
| Pharmaceuticals — 0.1% | | | |
| Allergan Finance LLC, 3.25%, 10/1/22 | | 88,000 |
| 89,259 |
|
| Allergan Funding SCS, 3.85%, 6/15/24 | | 100,000 |
| 104,162 |
|
| Allergan Funding SCS, 4.55%, 3/15/35 | | 40,000 |
| 41,423 |
|
Bausch Health Cos., Inc., 5.50%, 3/1/23(2) | | 62,000 |
| 62,582 |
|
Bausch Health Cos., Inc., 7.00%, 3/15/24(2) | | 50,000 |
| 52,875 |
|
Bausch Health Cos., Inc., 6.125%, 4/15/25(2) | | 120,000 |
| 123,114 |
|
| Horizon Pharma USA, Inc., 6.625%, 5/1/23 | | 35,000 |
| 36,179 |
|
| Shire Acquisitions Investments Ireland DAC, 2.40%, 9/23/21 | | 150,000 |
| 149,752 |
|
| Teva Pharmaceutical Finance Netherlands III BV, 3.15%, 10/1/26 | | 150,000 |
| 117,358 |
|
| Teva Pharmaceutical Finance Netherlands III BV, 6.75%, 3/1/28 | | 150,000 |
| 134,812 |
|
| | | | 911,516 |
|
| Road and Rail — 0.1% | | | |
| Burlington Northern Santa Fe LLC, 3.60%, 9/1/20 | | 103,000 |
| 103,979 |
|
| Burlington Northern Santa Fe LLC, 4.95%, 9/15/41 | | 30,000 |
| 36,042 |
|
| Burlington Northern Santa Fe LLC, 4.45%, 3/15/43 | | 12,000 |
| 13,689 |
|
| Burlington Northern Santa Fe LLC, 4.15%, 4/1/45 | | 80,000 |
| 88,775 |
|
Park Aerospace Holdings Ltd., 5.25%, 8/15/22(2) | | 90,000 |
| 95,228 |
|
| Rumo Luxembourg Sarl, 7.375%, 2/9/24 | | 100,000 |
| 108,490 |
|
| | | | |
|
| | | | | | | |
| | | Shares/
Principal Amount | Value |
| Union Pacific Corp., 4.75%, 9/15/41 | | $ | 80,000 |
| $ | 90,945 |
|
| | | | 537,148 |
|
Semiconductors and Semiconductor Equipment† | | | |
| Advanced Micro Devices, Inc., 7.00%, 7/1/24 | | 45,000 |
| 46,969 |
|
NXP BV / NXP Funding LLC, 3.875%, 9/1/22(2) | | 75,000 |
| 77,278 |
|
| | | | 124,247 |
|
| Software — 0.1% | | | |
| Infor US, Inc., 6.50%, 5/15/22 | | 263,000 |
| 268,589 |
|
| Microsoft Corp., 2.70%, 2/12/25 | | 100,000 |
| 102,434 |
|
| Microsoft Corp., 3.45%, 8/8/36 | | 20,000 |
| 21,283 |
|
| Microsoft Corp., 4.25%, 2/6/47 | | 130,000 |
| 153,447 |
|
| Oracle Corp., 3.625%, 7/15/23 | | 90,000 |
| 94,780 |
|
| Oracle Corp., 2.65%, 7/15/26 | | 50,000 |
| 50,249 |
|
| | | | 690,782 |
|
| Specialty Retail — 0.2% | | | |
| Hertz Corp. (The), 7.375%, 1/15/21 | | 90,000 |
| 90,099 |
|
| Hertz Corp. (The), 6.25%, 10/15/22 | | 65,000 |
| 65,981 |
|
| Home Depot, Inc. (The), 3.75%, 2/15/24 | | 130,000 |
| 138,456 |
|
| Home Depot, Inc. (The), 5.95%, 4/1/41 | | 70,000 |
| 95,801 |
|
| L Brands, Inc., 5.625%, 2/15/22 | | 140,000 |
| 147,595 |
|
Party City Holdings, Inc., 6.125%, 8/15/23(2) | | 75,000 |
| 75,375 |
|
PetSmart, Inc., 5.875%, 6/1/25(2) | | 60,000 |
| 59,616 |
|
| Sally Holdings LLC / Sally Capital, Inc., 5.50%, 11/1/23 | | 75,000 |
| 76,547 |
|
| Sonic Automotive, Inc., 5.00%, 5/15/23 | | 50,000 |
| 50,615 |
|
| United Rentals North America, Inc., 4.625%, 7/15/23 | | 110,000 |
| 112,857 |
|
| United Rentals North America, Inc., 5.50%, 7/15/25 | | 200,000 |
| 208,500 |
|
| United Rentals North America, Inc., 5.50%, 5/15/27 | | 50,000 |
| 52,360 |
|
| | | | 1,173,802 |
|
| Technology Hardware, Storage and Peripherals — 0.1% | | | |
| Apple, Inc., 2.45%, 8/4/26 | | 50,000 |
| 49,969 |
|
| Apple, Inc., 3.20%, 5/11/27 | | 70,000 |
| 72,984 |
|
| Apple, Inc., 2.90%, 9/12/27 | | 20,000 |
| 20,483 |
|
Dell International LLC / EMC Corp., 7.125%, 6/15/24(2) | | 195,000 |
| 206,215 |
|
| EMC Corp., 2.65%, 6/1/20 | | 50,000 |
| 49,747 |
|
| Hewlett Packard Enterprise Co., 3.60%, 10/15/20 | | 80,000 |
| 80,960 |
|
| NCR Corp., 5.00%, 7/15/22 | | 100,000 |
| 100,845 |
|
| Western Digital Corp., 4.75%, 2/15/26 | | 80,000 |
| 79,300 |
|
| | | | 660,503 |
|
Textiles, Apparel and Luxury Goods† | | | |
Hanesbrands, Inc., 4.625%, 5/15/24(2) | | 90,000 |
| 93,844 |
|
Trading Companies and Distributors† | | | |
Beacon Roofing Supply, Inc., 4.875%, 11/1/25(2) | | 100,000 |
| 99,375 |
|
| International Lease Finance Corp., 5.875%, 8/15/22 | | 100,000 |
| 108,972 |
|
| | | | 208,347 |
|
| Wireless Telecommunication Services — 0.2% | | | |
C&W Senior Financing DAC, 6.875%, 9/15/27(2) | | 130,000 |
| 136,506 |
|
GTH Finance BV, 7.25%, 4/26/23(2) | | 87,000 |
| 96,645 |
|
|
| | | | | | | |
| | | Shares/
Principal Amount | Value |
Millicom International Cellular SA, 5.125%, 1/15/28(2) | | $ | 143,000 |
| $ | 147,111 |
|
| Sprint Corp., 7.25%, 9/15/21 | | 80,000 |
| 86,100 |
|
| Sprint Corp., 7.875%, 9/15/23 | | 70,000 |
| 77,963 |
|
| Sprint Corp., 7.125%, 6/15/24 | | 315,000 |
| 344,531 |
|
| T-Mobile USA, Inc., 6.375%, 3/1/25 | | 130,000 |
| 135,038 |
|
| T-Mobile USA, Inc., 6.50%, 1/15/26 | | 100,000 |
| 106,720 |
|
| | | | 1,130,614 |
|
TOTAL CORPORATE BONDS
(Cost $48,747,494) | | | 49,524,905 |
|
| U.S. TREASURY SECURITIES — 5.0% | | | |
| U.S. Treasury Bonds, 4.50%, 2/15/36 | | 900,000 |
| 1,186,805 |
|
| U.S. Treasury Bonds, 3.50%, 2/15/39 | | 150,000 |
| 178,084 |
|
| U.S. Treasury Bonds, 3.00%, 5/15/42 | | 250,000 |
| 273,745 |
|
| U.S. Treasury Bonds, 3.75%, 11/15/43 | | 40,000 |
| 49,229 |
|
U.S. Treasury Bonds, 3.125%, 8/15/44(4) | | 1,460,000 |
| 1,627,957 |
|
| U.S. Treasury Bonds, 3.00%, 11/15/44 | | 100,000 |
| 109,158 |
|
| U.S. Treasury Bonds, 3.00%, 5/15/45 | | 100,000 |
| 109,271 |
|
| U.S. Treasury Bonds, 3.00%, 11/15/45 | | 50,000 |
| 54,684 |
|
| U.S. Treasury Bonds, 2.50%, 5/15/46 | | 750,000 |
| 745,620 |
|
U.S. Treasury Inflation Indexed Bonds, 2.375%, 1/15/25(4) | | 2,513,410 |
| 2,798,908 |
|
| U.S. Treasury Inflation Indexed Bonds, 2.00%, 1/15/26 | | 1,483,822 |
| 1,649,835 |
|
| U.S. Treasury Inflation Indexed Bonds, 2.375%, 1/15/27 | | 253,978 |
| 293,378 |
|
| U.S. Treasury Inflation Indexed Bonds, 2.50%, 1/15/29 | | 2,564,499 |
| 3,086,697 |
|
| U.S. Treasury Inflation Indexed Bonds, 2.125%, 2/15/40 | | 426,546 |
| 550,500 |
|
| U.S. Treasury Inflation Indexed Bonds, 0.75%, 2/15/42 | | 748,011 |
| 759,162 |
|
| U.S. Treasury Inflation Indexed Bonds, 0.625%, 2/15/43 | | 345,300 |
| 338,728 |
|
| U.S. Treasury Inflation Indexed Bonds, 1.375%, 2/15/44 | | 1,263,655 |
| 1,449,938 |
|
| U.S. Treasury Inflation Indexed Bonds, 0.75%, 2/15/45 | | 1,326,774 |
| 1,328,128 |
|
| U.S. Treasury Inflation Indexed Bonds, 0.875%, 2/15/47 | | 424,356 |
| 437,467 |
|
| U.S. Treasury Inflation Indexed Notes, 0.625%, 1/15/24 | | 823,163 |
| 836,155 |
|
| U.S. Treasury Inflation Indexed Notes, 0.625%, 1/15/26 | | 1,293,336 |
| 1,324,753 |
|
| U.S. Treasury Inflation Indexed Notes, 0.125%, 7/15/26 | | 3,685,911 |
| 3,666,832 |
|
| U.S. Treasury Inflation Indexed Notes, 0.875%, 1/15/29 | | 354,977 |
| 374,283 |
|
| U.S. Treasury Notes, 1.75%, 9/30/19 | | 850,000 |
| 849,441 |
|
| U.S. Treasury Notes, 1.50%, 11/30/19 | | 1,350,000 |
| 1,347,100 |
|
U.S. Treasury Notes, 1.375%, 1/15/20(4) | | 300,000 |
| 299,004 |
|
| U.S. Treasury Notes, 1.375%, 2/29/20 | | 850,000 |
| 846,265 |
|
| U.S. Treasury Notes, 1.50%, 5/31/20 | | 200,000 |
| 199,039 |
|
| U.S. Treasury Notes, 2.50%, 2/28/21 | | 5,250,000 |
| 5,295,937 |
|
| U.S. Treasury Notes, 2.375%, 3/15/21 | | 5,200,000 |
| 5,236,664 |
|
| U.S. Treasury Notes, 1.125%, 8/31/21 | | 80,000 |
| 78,775 |
|
U.S. Treasury Notes, 2.00%, 12/31/21(4) | | 200,000 |
| 200,723 |
|
| U.S. Treasury Notes, 1.875%, 4/30/22 | | 1,000,000 |
| 1,000,918 |
|
U.S. Treasury Notes, 2.25%, 8/15/27(4) | | 200,000 |
| 204,395 |
|
|
| | | | | | | |
| | | Shares/
Principal Amount | Value |
| U.S. Treasury Notes, 2.75%, 2/15/28 | | $ | 200,000 |
| $ | 212,168 |
|
TOTAL U.S. TREASURY SECURITIES
(Cost $37,556,258) | | | 38,999,746 |
|
| U.S. GOVERNMENT AGENCY MORTGAGE-BACKED SECURITIES — 2.1% | |
| Adjustable-Rate U.S. Government Agency Mortgage-Backed Securities — 0.2% | |
| FHLMC, VRN, 4.75%, (1-year H15T1Y plus 2.25%), 9/1/35 | | 74,803 |
| 78,934 |
|
| FHLMC, VRN, 4.74%, (12-month LIBOR plus 1.87%), 7/1/36 | | 21,475 |
| 22,605 |
|
| FHLMC, VRN, 4.46%, (1-year H15T1Y plus 2.14%), 10/1/36 | | 32,554 |
| 34,237 |
|
| FHLMC, VRN, 4.80%, (1-year H15T1Y plus 2.25%), 4/1/37 | | 38,017 |
| 40,074 |
|
| FHLMC, VRN, 4.11%, (12-month LIBOR plus 1.78%), 9/1/40 | | 21,048 |
| 21,958 |
|
| FHLMC, VRN, 4.77%, (12-month LIBOR plus 1.88%), 5/1/41 | | 8,659 |
| 9,076 |
|
| FHLMC, VRN, 3.69%, (12-month LIBOR plus 1.89%), 7/1/41 | | 29,463 |
| 30,325 |
|
| FHLMC, VRN, 4.09%, (12-month LIBOR plus 1.87%), 7/1/41 | | 28,469 |
| 29,756 |
|
| FHLMC, VRN, 4.72%, (12-month LIBOR plus 1.64%), 2/1/43 | | 12,953 |
| 13,393 |
|
| FHLMC, VRN, 4.44%, (12-month LIBOR plus 1.65%), 6/1/43 | | 9,538 |
| 9,908 |
|
| FHLMC, VRN, 4.50%, (12-month LIBOR plus 1.62%), 6/1/43 | | 191 |
| 197 |
|
| FHLMC, VRN, 2.37%, (12-month LIBOR plus 1.63%), 8/1/46 | | 295,457 |
| 296,153 |
|
| FHLMC, VRN, 3.07%, (12-month LIBOR plus 1.64%), 9/1/47 | | 238,100 |
| 242,036 |
|
| FNMA, VRN, 4.19%, (6-month LIBOR plus 1.57%), 6/1/35 | | 27,252 |
| 28,266 |
|
| FNMA, VRN, 4.19%, (6-month LIBOR plus 1.57%), 6/1/35 | | 90,463 |
| 93,825 |
|
| FNMA, VRN, 4.19%, (6-month LIBOR plus 1.57%), 6/1/35 | | 42,567 |
| 44,096 |
|
| FNMA, VRN, 4.20%, (6-month LIBOR plus 1.57%), 6/1/35 | | 50,052 |
| 51,889 |
|
| FNMA, VRN, 4.34%, (6-month LIBOR plus 1.54%), 9/1/35 | | 10,498 |
| 10,869 |
|
| FNMA, VRN, 4.56%, (1-year H15T1Y plus 2.16%), 3/1/38 | | 37,838 |
| 39,802 |
|
| FNMA, VRN, 4.82%, (12-month LIBOR plus 1.69%), 1/1/40 | | 7,177 |
| 7,599 |
|
| FNMA, VRN, 4.71%, (12-month LIBOR plus 1.80%), 3/1/40 | | 16,130 |
| 17,017 |
|
| FNMA, VRN, 3.62%, (12-month LIBOR plus 1.79%), 8/1/40 | | 28,052 |
| 29,240 |
|
| FNMA, VRN, 3.92%, (12-month LIBOR plus 1.76%), 10/1/40 | | 33,761 |
| 35,124 |
|
| FNMA, VRN, 3.33%, (12-month LIBOR plus 1.82%), 9/1/41 | | 39,985 |
| 41,053 |
|
| FNMA, VRN, 3.18%, (12-month LIBOR plus 1.61%), 3/1/47 | | 180,704 |
| 184,227 |
|
| FNMA, VRN, 3.19%, (12-month LIBOR plus 1.61%), 3/1/47 | | 102,877 |
| 104,885 |
|
| FNMA, VRN, 3.17%, (12-month LIBOR plus 1.61%), 4/1/47 | | 93,383 |
| 95,250 |
|
| FNMA, VRN, 2.95%, (12-month LIBOR plus 1.62%), 5/1/47 | | 118,759 |
| 120,888 |
|
| FNMA, VRN, 3.25%, (12-month LIBOR plus 1.62%), 5/1/47 | | 122,303 |
| 124,813 |
|
| | | | 1,857,495 |
|
| Fixed-Rate U.S. Government Agency Mortgage-Backed Securities — 1.9% | |
| FHLMC, 7.00%, 8/1/29 | | 528 |
| 572 |
|
| FHLMC, 8.00%, 7/1/30 | | 4,133 |
| 4,902 |
|
| FHLMC, 5.50%, 12/1/33 | | 29,519 |
| 32,763 |
|
| FHLMC, 6.00%, 11/1/38 | | 120,548 |
| 137,063 |
|
| FHLMC, 3.50%, 4/1/49 | | 1,834,362 |
| 1,891,057 |
|
| FNMA, 4.50%, TBA | | 2,223,000 |
| 2,330,125 |
|
| FNMA, 5.00%, 9/1/20 | | 3,360 |
| 3,451 |
|
| FNMA, 7.00%, 6/1/26 | | 211 |
| 231 |
|
| FNMA, 7.00%, 1/1/29 | | 3,357 |
| 3,563 |
|
| FNMA, 6.50%, 4/1/29 | | 4,964 |
| 5,509 |
|
| FNMA, 6.50%, 8/1/29 | | 2,868 |
| 3,205 |
|
|
| | | | | | | |
| | | Shares/
Principal Amount | Value |
| FNMA, 6.50%, 12/1/29 | | $ | 7,988 |
| $ | 8,864 |
|
| FNMA, 7.00%, 3/1/30 | | 1,753 |
| 1,903 |
|
| FNMA, 7.50%, 9/1/30 | | 1,093 |
| 1,298 |
|
| FNMA, 5.00%, 7/1/31 | | 3,621 |
| 3,845 |
|
| FNMA, 7.00%, 9/1/31 | | 4,271 |
| 4,472 |
|
| FNMA, 6.50%, 1/1/32 | | 1,746 |
| 1,938 |
|
| FNMA, 6.50%, 8/1/32 | | 3,130 |
| 3,587 |
|
| FNMA, 6.50%, 11/1/32 | | 32,608 |
| 37,152 |
|
| FNMA, 5.50%, 6/1/33 | | 10,973 |
| 12,176 |
|
| FNMA, 5.50%, 8/1/33 | | 17,158 |
| 19,141 |
|
| FNMA, 5.00%, 11/1/33 | | 127,638 |
| 139,220 |
|
| FNMA, 3.50%, 3/1/34 | | 98,040 |
| 101,843 |
|
| FNMA, 4.50%, 9/1/35 | | 68,037 |
| 73,265 |
|
| FNMA, 5.00%, 2/1/36 | | 94,513 |
| 103,775 |
|
| FNMA, 5.50%, 1/1/37 | | 63,963 |
| 71,640 |
|
| FNMA, 6.50%, 8/1/37 | | 16,180 |
| 17,820 |
|
| FNMA, 5.00%, 4/1/40 | | 244,179 |
| 266,614 |
|
| FNMA, 4.00%, 1/1/41 | | 818,718 |
| 872,346 |
|
| FNMA, 4.50%, 7/1/41 | | 366,908 |
| 395,794 |
|
| FNMA, 4.50%, 9/1/41 | | 31,889 |
| 34,413 |
|
| FNMA, 4.00%, 12/1/41 | | 247,579 |
| 263,975 |
|
| FNMA, 3.50%, 5/1/42 | | 197,307 |
| 205,614 |
|
| FNMA, 3.50%, 6/1/42 | | 116,115 |
| 121,011 |
|
| FNMA, 3.00%, 11/1/42 | | 399,978 |
| 407,792 |
|
| FNMA, 3.50%, 5/1/45 | | 538,784 |
| 558,162 |
|
| FNMA, 3.50%, 2/1/46 | | 1,036,924 |
| 1,073,119 |
|
| FNMA, 3.00%, 11/1/46 | | 478,378 |
| 485,724 |
|
| FNMA, 6.50%, 8/1/47 | | 5,738 |
| 6,143 |
|
| FNMA, 6.50%, 9/1/47 | | 11,617 |
| 12,394 |
|
| FNMA, 6.50%, 9/1/47 | | 558 |
| 597 |
|
| FNMA, 6.50%, 9/1/47 | | 6,107 |
| 6,519 |
|
| FNMA, 3.00%, 4/1/48 | | 466,708 |
| 474,095 |
|
| FNMA, 4.00%, 6/1/48 | | 2,215,006 |
| 2,301,238 |
|
| GNMA, 3.00%, TBA | | 700,000 |
| 715,053 |
|
| GNMA, 7.50%, 10/15/25 | | 906 |
| 918 |
|
| GNMA, 6.00%, 3/15/26 | | 2,791 |
| 3,063 |
|
| GNMA, 7.00%, 12/15/27 | | 2,628 |
| 2,638 |
|
| GNMA, 6.50%, 2/15/28 | | 142 |
| 156 |
|
| GNMA, 7.00%, 5/15/31 | | 9,062 |
| 10,431 |
|
| GNMA, 5.50%, 11/15/32 | | 17,645 |
| 19,571 |
|
| GNMA, 6.50%, 10/15/38 | | 243,801 |
| 283,078 |
|
| GNMA, 4.50%, 5/20/41 | | 215,563 |
| 230,974 |
|
| GNMA, 4.50%, 6/15/41 | | 272,640 |
| 294,459 |
|
| GNMA, 3.50%, 4/20/45 | | 67,646 |
| 70,395 |
|
| GNMA, 2.50%, 7/20/46 | | 111,854 |
| 111,989 |
|
| GNMA, 2.50%, 8/20/46 | | 241,278 |
| 241,569 |
|
| | | | |
|
| | | | | | | |
| | | Shares/
Principal Amount | Value |
| GNMA, 2.50%, 2/20/47 | | $ | 33,577 |
| $ | 33,617 |
|
| | | | 14,517,841 |
|
TOTAL U.S. GOVERNMENT AGENCY MORTGAGE-BACKED SECURITIES
(Cost $16,076,260) | 16,375,336 |
|
| SOVEREIGN GOVERNMENTS AND AGENCIES — 1.4% | | | |
| Australia — 0.1% | | | |
| Australia Government Bond, 2.75%, 4/21/24 | AUD | 305,000 |
| 227,159 |
|
| New South Wales Treasury Corp., 3.00%, 3/20/28 | AUD | 110,000 |
| 84,230 |
|
| | | | 311,389 |
|
Austria† | | | |
Republic of Austria Government Bond, 3.40%, 11/22/22(2) | EUR | 69,000 |
| 86,869 |
|
Republic of Austria Government Bond, 0.75%, 10/20/26(2) | EUR | 41,000 |
| 49,310 |
|
Republic of Austria Government Bond, 4.15%, 3/15/37(2) | EUR | 29,000 |
| 54,056 |
|
| | | | 190,235 |
|
Belgium† | | | |
Kingdom of Belgium Government Bond, 4.25%, 3/28/41(2) | EUR | 27,000 |
| 52,739 |
|
| Canada — 0.1% | | | |
| Province of British Columbia Canada, 3.25%, 12/18/21 | CAD | 179,000 |
| 140,318 |
|
| Province of British Columbia Canada, 2.85%, 6/18/25 | CAD | 201,000 |
| 160,115 |
|
| Province of Quebec Canada, 3.00%, 9/1/23 | CAD | 215,000 |
| 170,153 |
|
| Province of Quebec Canada, 5.75%, 12/1/36 | CAD | 108,000 |
| 120,628 |
|
| Province of Quebec Canada, 3.50%, 12/1/48 | CAD | 20,000 |
| 18,445 |
|
| | | | 609,659 |
|
Colombia† | | | |
| Colombia Government International Bond, 4.375%, 7/12/21 | | $ | 100,000 |
| 103,551 |
|
Czech Republic† | | | |
| Czech Republic Government Bond, 4.70%, 9/12/22 | CZK | 610,000 |
| 29,174 |
|
Denmark† | | | |
| Denmark Government Bond, 0.50%, 11/15/27 | DKK | 245,000 |
| 39,532 |
|
| Denmark Government Bond, 4.50%, 11/15/39 | DKK | 62,000 |
| 17,888 |
|
| | | | 57,420 |
|
Finland† | | | |
Finland Government Bond, 4.00%, 7/4/25(2) | EUR | 58,000 |
| 81,952 |
|
| France — 0.1% | | | |
| French Republic Government Bond OAT, 1.75%, 11/25/24 | EUR | 153,000 |
| 190,795 |
|
| French Republic Government Bond OAT, 5.50%, 4/25/29 | EUR | 100,000 |
| 173,308 |
|
| French Republic Government Bond OAT, 3.25%, 5/25/45 | EUR | 132,000 |
| 239,541 |
|
| | | | 603,644 |
|
| Germany — 0.2% | | | |
| Bundesrepublik Deutschland Bundesanleihe, 0.50%, 2/15/25 | EUR | 185,000 |
| 219,037 |
|
Bundesrepublik Deutschland Bundesanleihe, 0.00%, 8/15/26(5) | EUR | 365,000 |
| 423,341 |
|
| Bundesrepublik Deutschland Bundesanleihe, 0.25%, 2/15/27 | EUR | 248,000 |
| 293,206 |
|
| Bundesrepublik Deutschland Bundesanleihe, 4.75%, 7/4/28 | EUR | 34,000 |
| 56,000 |
|
| Bundesrepublik Deutschland Bundesanleihe, 4.75%, 7/4/40 | EUR | 24,000 |
| 53,734 |
|
| Bundesrepublik Deutschland Bundesanleihe, 2.50%, 7/4/44 | EUR | 56,000 |
| 99,649 |
|
| | | | 1,144,967 |
|
| | | | |
|
| | | | | | | |
| | | Shares/
Principal Amount | Value |
Indonesia† | | | |
| Indonesia Treasury Bond, 8.375%, 9/15/26 | IDR | 2,000,000,000 |
| $ | 152,615 |
|
Ireland† | | | |
| Ireland Government Bond, 3.40%, 3/18/24 | EUR | 74,000 |
| 96,543 |
|
| Italy — 0.1% | | | |
| Italy Buoni Poliennali Del Tesoro, 1.50%, 6/1/25 | EUR | 35,000 |
| 39,947 |
|
| Italy Buoni Poliennali Del Tesoro, 2.00%, 12/1/25 | EUR | 223,000 |
| 261,451 |
|
Italy Buoni Poliennali Del Tesoro, 4.75%, 9/1/44(2) | EUR | 199,000 |
| 310,381 |
|
Italy Buoni Poliennali Del Tesoro, 3.45%, 3/1/48(2) | EUR | 130,000 |
| 170,743 |
|
| | | | 782,522 |
|
| Japan — 0.4% | | | |
| Japan Government Thirty Year Bond, 2.40%, 3/20/37 | JPY | 60,800,000 |
| 781,384 |
|
| Japan Government Thirty Year Bond, 2.00%, 9/20/41 | JPY | 29,700,000 |
| 377,335 |
|
| Japan Government Thirty Year Bond, 1.40%, 12/20/45 | JPY | 21,750,000 |
| 255,831 |
|
| Japan Government Twenty Year Bond, 2.10%, 12/20/26 | JPY | 131,900,000 |
| 1,426,041 |
|
| | | | 2,840,591 |
|
Malaysia† | | | |
| Malaysia Government Bond, 3.96%, 9/15/25 | MYR | 250,000 |
| 61,927 |
|
| Mexico — 0.1% | | | |
| Mexican Bonos, 6.50%, 6/9/22 | MXN | 2,290,000 |
| 117,155 |
|
| Mexico Government International Bond, 4.15%, 3/28/27 | | $ | 200,000 |
| 208,350 |
|
| | | | 325,505 |
|
Netherlands† | | | |
Netherlands Government Bond, 0.00%, 1/15/22(2)(5) | EUR | 65,000 |
| 73,332 |
|
Netherlands Government Bond, 0.50%, 7/15/26(2) | EUR | 100,000 |
| 118,921 |
|
Netherlands Government Bond, 2.75%, 1/15/47(2) | EUR | 27,000 |
| 51,016 |
|
| | | | 243,269 |
|
| Norway — 0.2% | | | |
Norway Government Bond, 2.00%, 5/24/23(2) | NOK | 85,000 |
| 9,867 |
|
Norway Government Bond, 1.75%, 2/17/27(2) | NOK | 510,000 |
| 59,464 |
|
Norway Government Bond, 1.75%, 9/6/29(2) | NOK | 14,000,000 |
| 1,638,965 |
|
| | | | 1,708,296 |
|
Peru† | | | |
| Peruvian Government International Bond, 5.625%, 11/18/50 | | $ | 60,000 |
| 83,551 |
|
Poland† | | | |
| Republic of Poland Government Bond, 4.00%, 10/25/23 | PLN | 215,000 |
| 60,447 |
|
| Republic of Poland Government International Bond, 5.125%, 4/21/21 | | $ | 70,000 |
| 73,487 |
|
| | | | 133,934 |
|
Russia† | | | |
| Russian Federal Bond - OFZ, 7.05%, 1/19/28 | RUB | 1,400,000 |
| 21,957 |
|
Singapore† | | | |
| Singapore Government Bond, 3.125%, 9/1/22 | SGD | 90,000 |
| 68,333 |
|
South Africa† | | | |
| Republic of South Africa Government International Bond, 5.50%, 3/9/20 | | $ | 110,000 |
| 111,513 |
|
|
| | | | | | | |
| | | Shares/
Principal Amount | Value |
Switzerland† | | | |
| Swiss Confederation Government Bond, 1.25%, 5/28/26 | CHF | 147,000 |
| $ | 169,845 |
|
| Swiss Confederation Government Bond, 2.50%, 3/8/36 | CHF | 3,000 |
| 4,509 |
|
| | | | 174,354 |
|
Thailand† | | | |
| Thailand Government Bond, 3.625%, 6/16/23 | THB | 1,150,000 |
| 40,055 |
|
| Thailand Government Bond, 3.85%, 12/12/25 | THB | 3,200,000 |
| 117,144 |
|
| | | | 157,199 |
|
| United Kingdom — 0.1% | | | |
| United Kingdom Gilt, 1.50%, 7/22/26 | GBP | 249,000 |
| 325,104 |
|
| United Kingdom Gilt, 4.50%, 12/7/42 | GBP | 192,000 |
| 387,710 |
|
| United Kingdom Gilt, 4.25%, 12/7/49 | GBP | 65,000 |
| 137,794 |
|
| United Kingdom Gilt, 4.25%, 12/7/55 | GBP | 2,000 |
| 4,545 |
|
| | | | 855,153 |
|
Uruguay† | | | |
| Uruguay Government International Bond, 4.125%, 11/20/45 | | $ | 30,000 |
| 31,133 |
|
TOTAL SOVEREIGN GOVERNMENTS AND AGENCIES
(Cost $10,378,857) | | | 11,033,125 |
|
AFFILIATED FUNDS(6) — 1.3% | | | |
| American Century Diversified Corporate Bond ETF | | 145,739 |
| 7,408,642 |
|
| American Century STOXX U.S. Quality Value ETF | | 73,730 |
| 2,958,896 |
|
TOTAL AFFILIATED FUNDS
(Cost $10,181,388) | | | 10,367,538 |
|
| ASSET-BACKED SECURITIES — 1.2% | | | |
BRE Grand Islander Timeshare Issuer LLC, Series 2017-1A, Class A SEQ, 2.94%, 5/25/29(2) | | $ | 104,044 |
| 104,277 |
|
Hilton Grand Vacations Trust, Series 2013-A, Class A SEQ, 2.28%, 1/25/26(2) | | 11,796 |
| 11,792 |
|
Hilton Grand Vacations Trust, Series 2014-AA, Class A SEQ, 1.77%, 11/25/26(2) | | 72,840 |
| 72,451 |
|
Invitation Homes Trust, Series 2018-SFR1, Class A, VRN, 3.01%, (1-month LIBOR plus 0.70%), 3/17/37(2) | | 334,925 |
| 331,205 |
|
Invitation Homes Trust, Series 2018-SFR1, Class B, VRN, 3.26%, (1-month LIBOR plus 0.95%), 3/17/37(2) | | 1,325,000 |
| 1,313,168 |
|
Invitation Homes Trust, Series 2018-SFR2, Class C, VRN, 3.61%, (1-month LIBOR plus 1.28%), 6/17/37(2) | | 350,000 |
| 349,634 |
|
Invitation Homes Trust, Series 2018-SFR3, Class B, VRN, 3.46%, (1-month LIBOR plus 1.15%), 7/17/37(2) | | 700,000 |
| 700,023 |
|
Invitation Homes Trust, Series 2018-SFR4, Class B, VRN, 3.56%, (1-month LIBOR plus 1.25%), 1/17/38(2) | | 1,100,000 |
| 1,100,144 |
|
MVW Owner Trust, Series 2014-1A, Class A SEQ, 2.25%, 9/22/31(2) | | 49,799 |
| 49,605 |
|
MVW Owner Trust, Series 2015-1A, Class A SEQ, 2.52%, 12/20/32(2) | | 39,627 |
| 39,502 |
|
MVW Owner Trust, Series 2016-1A, Class A SEQ, 2.25%, 12/20/33(2) | | 43,105 |
| 42,658 |
|
MVW Owner Trust, Series 2017-1A, Class A SEQ, 2.42%, 12/20/34(2) | | 133,838 |
| 133,481 |
|
MVW Owner Trust, Series 2018-1A, Class B, 3.60%, 1/21/36(2) | | 802,362 |
| 820,825 |
|
Progress Residential Trust, Series 2018-SFR1, Class B, 3.48%, 3/17/35(2) | | 100,000 |
| 101,180 |
|
|
| | | | | | | |
| | | Shares/
Principal Amount | Value |
Progress Residential Trust, Series 2018-SFR3, Class C, 4.18%, 10/17/35(2) | | $ | 850,000 |
| $ | 876,807 |
|
Sierra Timeshare Conduit Receivables Funding LLC, Series 2017-1A, Class A SEQ, 2.91%, 3/20/34(2) | | 55,057 |
| 55,514 |
|
Sierra Timeshare Receivables Funding LLC, Series 2015-1A, Class A SEQ, 2.40%, 3/22/32(2) | | 47,547 |
| 47,477 |
|
Sierra Timeshare Receivables Funding LLC, Series 2016-2A, Class A SEQ, 2.33%, 7/20/33(2) | | 19,657 |
| 19,553 |
|
Sierra Timeshare Receivables Funding LLC, Series 2018-2A, Class B, 3.65%, 6/20/35(2) | | 361,971 |
| 366,248 |
|
Sierra Timeshare Receivables Funding LLC, Series 2018-3A, Class B, 3.87%, 9/20/35(2) | | 259,733 |
| 264,001 |
|
Towd Point Mortgage Trust, Series 2017-2, Class A1, VRN, 2.75%, 4/25/57(2) | | 118,317 |
| 118,746 |
|
Towd Point Mortgage Trust, Series 2017-4, Class A1, VRN, 2.75%, 6/25/57(2) | | 350,657 |
| 351,617 |
|
Towd Point Mortgage Trust, Series 2017-6, Class A1, VRN, 2.75%, 10/25/57(2) | | 171,192 |
| 171,727 |
|
Towd Point Mortgage Trust, Series 2018-1, Class A1 SEQ, VRN, 3.00%, 1/25/58(2) | | 133,111 |
| 134,068 |
|
Towd Point Mortgage Trust, Series 2018-4, Class A1, VRN, 3.00%, 6/25/58(2) | | 363,821 |
| 367,180 |
|
| UAL Pass-Through Trust, Series 2007-1, Class A, 6.64%, 1/2/24 | | 54,719 |
| 57,983 |
|
| US Airways Pass-Through Trust, Series 2013-1, Class A, 3.95%, 5/15/27 | | 41,238 |
| 43,143 |
|
VSE VOI Mortgage LLC, Series 2016-A, Class A SEQ, 2.54%, 7/20/33(2) | | 471,737 |
| 470,723 |
|
VSE VOI Mortgage LLC, Series 2017-A, Class A SEQ, 2.33%, 3/20/35(2) | | 151,971 |
| 151,328 |
|
VSE VOI Mortgage LLC, Series 2018-A, Class B, 3.72%, 2/20/36(2) | | 356,461 |
| 364,612 |
|
TOTAL ASSET-BACKED SECURITIES
(Cost $8,943,281) | | | 9,030,672 |
|
| COLLATERALIZED MORTGAGE OBLIGATIONS — 1.0% | | | |
| Private Sponsor Collateralized Mortgage Obligations — 0.5% | | |
| ABN Amro Mortgage Corp., Series 2003-4, Class A4, 5.50%, 3/25/33 | | 10,037 |
| 10,223 |
|
| Adjustable Rate Mortgage Trust, Series 2004-4, Class 4A1, VRN, 4.45%, 3/25/35 | | 17,346 |
| 17,861 |
|
| Banc of America Mortgage Trust, Series 2004-E, Class 2A6 SEQ, VRN, 4.80%, 6/25/34 | | 64,822 |
| 65,519 |
|
| Bear Stearns Adjustable Rate Mortgage Trust, Series 2004-8, Class 2A1, VRN, 4.24%, 11/25/34 | | 18,944 |
| 18,790 |
|
| Citigroup Mortgage Loan Trust, Inc., Series 2004-UST1, Class A4, VRN, 4.41%, 8/25/34 | | 22,245 |
| 21,858 |
|
| Citigroup Mortgage Loan Trust, Inc., Series 2004-UST1, Class A5, VRN, 4.40%, 8/25/34 | | 58,612 |
| 59,463 |
|
| Citigroup Mortgage Loan Trust, Inc., Series 2005-4, Class A, VRN, 4.58%, 8/25/35 | | 20,901 |
| 21,573 |
|
| Credit Suisse First Boston Mortgage-Backed Pass-Through Certificates, Series 2005-3, Class 1A1, VRN, 5.48%, 7/25/35 | | 67,464 |
| 71,924 |
|
Credit Suisse Mortgage Trust, Series 2017-HL2, Class A3 SEQ, VRN, 3.50%, 10/25/47(2) | | 162,900 |
| 166,137 |
|
| First Horizon Alternative Mortgage Securities Trust, Series 2004-AA4, Class A1, VRN, 4.49%, 10/25/34 | | 43,440 |
| 43,612 |
|
|
| | | | | | | |
| | | Shares/
Principal Amount | Value |
| First Horizon Mortgage Pass-Through Trust, Series 2005-AR3, Class 4A1, VRN, 4.80%, 8/25/35 | | $ | 19,775 |
| $ | 20,490 |
|
| GSR Mortgage Loan Trust, Series 2004-7, Class 3A1, VRN, 4.09%, 6/25/34 | | 23,618 |
| 23,617 |
|
| GSR Mortgage Loan Trust, Series 2004-AR5, Class 3A3, VRN, 4.61%, 5/25/34 | | 45,851 |
| 47,318 |
|
| GSR Mortgage Loan Trust, Series 2005-AR1, Class 3A1, VRN, 3.97%, 1/25/35 | | 42,866 |
| 42,823 |
|
| GSR Mortgage Loan Trust, Series 2005-AR6, Class 2A1, VRN, 4.50%, 9/25/35 | | 59,612 |
| 61,394 |
|
| GSR Mortgage Loan Trust, Series 2005-AR6, Class 4A5, VRN, 4.56%, 9/25/35 | | 20,270 |
| 20,787 |
|
| JPMorgan Mortgage Trust, Series 2005-A4, Class 1A1, VRN, 4.42%, 7/25/35 | | 17,640 |
| 17,894 |
|
| JPMorgan Mortgage Trust, Series 2005-A4, Class 2A1, VRN, 4.38%, 7/25/35 | | 13,793 |
| 13,900 |
|
| JPMorgan Mortgage Trust, Series 2006-A3, Class 7A1, VRN, 4.67%, 4/25/35 | | 35,216 |
| 36,119 |
|
JPMorgan Mortgage Trust, Series 2013-1, Class 2A2 SEQ, VRN, 2.50%, 3/25/43(2) | | 51,891 |
| 51,817 |
|
| MASTR Adjustable Rate Mortgages Trust, Series 2004-13, Class 3A7, VRN, 4.73%, 11/21/34 | | 92,893 |
| 96,973 |
|
| Merrill Lynch Mortgage Investors Trust, Series 2005-3, Class 2A, VRN, 4.40%, 11/25/35 | | 43,935 |
| 44,463 |
|
| Merrill Lynch Mortgage Investors Trust, Series 2005-A2, Class A1, VRN, 4.46%, 2/25/35 | | 29,001 |
| 29,511 |
|
| Merrill Lynch Mortgage Investors Trust, Series 2005-A2, Class A2, VRN, 4.46%, 2/25/35 | | 11,600 |
| 11,776 |
|
New Residential Mortgage Loan Trust, Series 2017-2A, Class A3, VRN, 4.00%, 3/25/57(2) | | 444,355 |
| 463,648 |
|
New Residential Mortgage Loan Trust, Series 2017-5A, Class A1, VRN, 3.77%, (1-month LIBOR plus 1.50%), 6/25/57(2) | | 285,329 |
| 291,350 |
|
Sequoia Mortgage Trust, Series 2017-7, Class A4 SEQ, VRN, 3.50%, 10/25/47(2) | | 164,570 |
| 167,710 |
|
Sequoia Mortgage Trust, Series 2017-CH2, Class A10 SEQ, VRN, 4.00%, 12/25/47(2) | | 261,756 |
| 264,644 |
|
Sequoia Mortgage Trust, Series 2018-2, Class A4 SEQ, VRN, 3.50%, 2/25/48(2) | | 169,741 |
| 172,279 |
|
Sequoia Mortgage Trust, Series 2018-CH2, Class A12 SEQ, VRN, 4.00%, 6/25/48(2) | | 280,639 |
| 284,355 |
|
Sofi Mortgage Trust, Series 2016-1A, Class 1A4 SEQ, VRN, 3.00%, 11/25/46(2) | | 60,316 |
| 59,819 |
|
| Structured Adjustable Rate Mortgage Loan Trust, Series 2004-8, Class 2A1, VRN, 4.39%, 7/25/34 | | 24,605 |
| 25,024 |
|
| Thornburg Mortgage Securities Trust, Series 2004-3, Class A, VRN, 3.01%, (1-month LIBOR plus 0.74%), 9/25/44 | | 48,640 |
| 48,727 |
|
| WaMu Mortgage Pass-Through Certificates, Series 2003-S11, Class 3A5, 5.95%, 11/25/33 | | 26,718 |
| 27,367 |
|
| WaMu Mortgage Pass-Through Certificates, Series 2005-AR3, Class A1, VRN, 4.45%, 3/25/35 | | 96,054 |
| 95,596 |
|
| WaMu Mortgage Pass-Through Certificates, Series 2005-AR7, Class A3, VRN, 4.27%, 8/25/35 | | 50,329 |
| 51,417 |
|
| Wells Fargo Mortgage-Backed Securities Trust, Series 2004-S, Class A1, VRN, 4.91%, 9/25/34 | | 33,524 |
| 34,902 |
|
| Wells Fargo Mortgage-Backed Securities Trust, Series 2004-Z, Class 2A2, VRN, 4.97%, 12/25/34 | | 33,793 |
| 34,845 |
|
|
| | | | | | | |
| | | Shares/
Principal Amount | Value |
| Wells Fargo Mortgage-Backed Securities Trust, Series 2005-17, Class 1A1, 5.50%, 1/25/36 | | $ | 27,092 |
| $ | 27,008 |
|
| Wells Fargo Mortgage-Backed Securities Trust, Series 2005-9, Class 2A6, 5.25%, 10/25/35 | | 45,704 |
| 47,151 |
|
| Wells Fargo Mortgage-Backed Securities Trust, Series 2005-AR10, Class 1A1, VRN, 4.96%, 6/25/35 | | 98,421 |
| 99,766 |
|
| Wells Fargo Mortgage-Backed Securities Trust, Series 2005-AR12, Class 2A6, VRN, 5.00%, 6/25/35 | | 12,570 |
| 13,091 |
|
| Wells Fargo Mortgage-Backed Securities Trust, Series 2005-AR16, Class 3A2, VRN, 5.00%, 3/25/35 | | 26,989 |
| 27,870 |
|
| Wells Fargo Mortgage-Backed Securities Trust, Series 2005-AR4, Class 2A1, VRN, 5.10%, 4/25/35 | | 19,335 |
| 19,757 |
|
| Wells Fargo Mortgage-Backed Securities Trust, Series 2005-AR7, Class 1A1, VRN, 5.10%, 5/25/35 | | 54,326 |
| 56,521 |
|
| Wells Fargo Mortgage-Backed Securities Trust, Series 2006-10, Class A4 SEQ, 6.00%, 8/25/36 | | 40,127 |
| 40,326 |
|
| Wells Fargo Mortgage-Backed Securities Trust, Series 2006-4, Class 2A1, 6.00%, 4/25/36 | | 274,205 |
| 275,219 |
|
| Wells Fargo Mortgage-Backed Securities Trust, Series 2006-AR10, Class 1A1, VRN, 5.04%, 7/25/36 | | 41,295 |
| 42,128 |
|
| Wells Fargo Mortgage-Backed Securities Trust, Series 2006-AR12, Class 1A1, VRN, 4.76%, 9/25/36 | | 39,845 |
| 40,680 |
|
| Wells Fargo Mortgage-Backed Securities Trust, Series 2007-13, Class A1, 6.00%, 9/25/37 | | 17,191 |
| 17,385 |
|
| Wells Fargo Mortgage-Backed Securities Trust, Series 2007-14, Class 2A2, 5.50%, 10/25/22 | | 6,283 |
| 6,409 |
|
| Wells Fargo Mortgage-Backed Securities Trust, Series 2007-15, Class A1, 6.00%, 11/25/37 | | 25,706 |
| 26,180 |
|
| Wells Fargo Mortgage-Backed Securities Trust, Series 2007-16, Class 1A1, 6.00%, 12/28/37 | | 7,309 |
| 7,325 |
|
| Wells Fargo Mortgage-Backed Securities Trust, Series 2007-AR10, Class 1A1, VRN, 4.91%, 1/25/38 | | 41,536 |
| 40,334 |
|
| Wells Fargo Mortgage-Backed Securities Trust, Series 2007-AR7, Class A1, VRN, 4.79%, 12/28/37 | | 23,140 |
| 22,994 |
|
| Wells Fargo Mortgage-Backed Securities Trust, Series 2008-1, Class 4A1, 5.75%, 2/25/38 | | 21,443 |
| 22,808 |
|
| | | | 3,870,477 |
|
| U.S. Government Agency Collateralized Mortgage Obligations — 0.5% | |
| FHLMC, Series 2016-HQA3, Class M2, VRN, 3.62%, (1-month LIBOR plus 1.35%), 3/25/29 | | 65,667 |
| 66,000 |
|
| FHLMC, Series 2017-DNA2, Class M1, VRN, 3.47%, (1-month LIBOR plus 1.20%), 10/25/29 | | 1,422,367 |
| 1,431,593 |
|
| FHLMC, Series 2018-DNA1, Class M1, VRN, 2.72%, (1-month LIBOR plus 0.45%), 7/25/30 | | 82,879 |
| 82,806 |
|
| FNMA, Series 2014-C02, Class 1M2, VRN, 4.87%, (1-month LIBOR plus 2.60%), 5/25/24 | | 54,289 |
| 56,640 |
|
| FNMA, Series 2014-C02, Class 2M2, VRN, 4.87%, (1-month LIBOR plus 2.60%), 5/25/24 | | 225,697 |
| 234,733 |
|
| FNMA, Series 2017-C01, Class 1M1, VRN, 3.57%, (1-month LIBOR plus 1.30%), 7/25/29 | | 47,643 |
| 47,788 |
|
| FNMA, Series 2017-C03, Class 1M2, VRN, 5.27%, (1-month LIBOR plus 3.00%), 10/25/29 | | 75,000 |
| 78,477 |
|
| FNMA, Series 2017-C06, Class 2M2, VRN, 5.07%, (1-month LIBOR plus 2.80%), 2/25/30 | | 100,000 |
| 103,200 |
|
|
| | | | | | | |
| | | Shares/
Principal Amount | Value |
| FNMA, Series 2017-C07, Class 1M2, VRN, 4.67%, (1-month LIBOR plus 2.40%), 5/28/30 | | $ | 1,600,000 |
| $ | 1,624,634 |
|
| | | | 3,725,871 |
|
TOTAL COLLATERALIZED MORTGAGE OBLIGATIONS
(Cost $7,559,887) | | | 7,596,348 |
|
| COLLATERALIZED LOAN OBLIGATIONS — 0.9% | | | |
Ares XLI CLO Ltd., Series 2016-41A, Class AR, VRN, 3.50%, (3-month LIBOR plus 1.20%), 1/15/29(2)(7) | | 1,000,000 |
| 1,000,000 |
|
Ares XXXIIR CLO Ltd., Series 2014-32RA, Class A2A, VRN, 4.07%, (3-month LIBOR plus 1.55%), 5/15/30(2) | | 300,000 |
| 295,475 |
|
Bean Creek CLO Ltd., Series 2015-1A, Class AR, VRN, 3.30%, (3-month LIBOR plus 1.02%), 4/20/31(2) | | 150,000 |
| 148,435 |
|
Bean Creek CLO Ltd., Series 2015-1A, Class BR, VRN, 3.73%, (3-month LIBOR plus 1.45%), 4/20/31(2) | | 100,000 |
| 98,064 |
|
Carlyle Global Market Strategies CLO Ltd., Series 2014-2RA, Class A3, VRN, 4.02%, (3-month LIBOR plus 1.50%), 5/15/31(2) | 1,250,000 |
| 1,233,391 |
|
CBAM Ltd., Series 2018-5A, Class A, VRN, 3.32%, (3-month LIBOR plus 1.02%), 4/17/31(2) | | 125,000 |
| 123,752 |
|
CBAM Ltd., Series 2018-5A, Class B1, VRN, 3.70%, (3-month LIBOR plus 1.40%), 4/17/31(2) | | 325,000 |
| 318,297 |
|
CIFC Funding Ltd., Series 2013-3RA, Class A1, VRN, 3.56%, (3-month LIBOR plus 0.98%), 4/24/31(2) | | 300,000 |
| 296,174 |
|
Dryden 64 CLO Ltd., Series 2018-64A, Class A, VRN, 3.57%, (3-month LIBOR plus 0.97%), 4/18/31(2) | | 350,000 |
| 346,606 |
|
Goldentree Loan Management US CLO 3 Ltd., Series 2018-3A, Class B1, VRN, 3.83%, (3-month LIBOR plus 1.55%), 4/20/30(2) | | 300,000 |
| 297,291 |
|
Goldentree Loan Management US CLO 5 Ltd., Series 2019-5A, Class A, VRN, 3.49%, (3-month LIBOR plus 1.30%), 10/20/32(2)(7) | | 750,000 |
| 750,000 |
|
Goldentree Loan Opportunities X Ltd., Series 2015-10A, Class AR, VRN, 3.40%, (3-month LIBOR plus 1.12%), 7/20/31(2) | | 150,000 |
| 149,688 |
|
Goldentree Loan Opportunities XI Ltd., Series 2015-11A, Class AR2, VRN, 3.37%, (3-month LIBOR plus 1.07%), 1/18/31(2) | | 100,000 |
| 99,359 |
|
KKR CLO Ltd., Series 2022A, Class A, VRN, 3.43%, (3-month LIBOR plus 1.15%), 7/20/31(2) | | 200,000 |
| 198,945 |
|
KKR CLO Ltd., Series 2022A, Class B, VRN, 3.88%, (3-month LIBOR plus 1.60%), 7/20/31(2) | | 200,000 |
| 197,770 |
|
Madison Park Funding XIII Ltd., Series 2014-13A, Class AR2, VRN, 3.25%, (3-month LIBOR plus 0.95%), 4/19/30(2) | | 150,000 |
| 149,340 |
|
Madison Park Funding XIII Ltd., Series 2014-13A, Class BR2, VRN, 3.80%, (3-month LIBOR plus 1.50%), 4/19/30(2) | | 100,000 |
| 99,321 |
|
Magnetite VIII Ltd., Series 2014-8A, Class AR2, VRN, 3.28%, (3-month LIBOR plus 0.98%), 4/15/31(2) | | 275,000 |
| 273,017 |
|
Magnetite VIII Ltd., Series 2014-8A, Class BR2, VRN, 3.80%, (3-month LIBOR plus 1.50%), 4/15/31(2) | | 300,000 |
| 295,681 |
|
Sounds Point CLO IV-R Ltd., Series 2013-3RA, Class B, VRN, 4.05%, (3-month LIBOR plus 1.75%), 4/18/31(2) | | 25,000 |
| 24,909 |
|
Symphony CLO XIX Ltd., Series 2018-19A, Class A, VRN, 3.28%, (3-month LIBOR plus 0.96%), 4/16/31(2) | | 225,000 |
| 222,033 |
|
Voya CLO Ltd., Series 2013-3A, Class A2RR, VRN, 4.00%, (3-month LIBOR plus 1.70%), 10/18/31(2) | | 400,000 |
| 397,426 |
|
TOTAL COLLATERALIZED LOAN OBLIGATIONS
(Cost $7,060,312) | | 7,014,974 |
|
| | | | |
| | | | |
|
| | | | | | | |
| | | Shares/
Principal Amount | Value |
| COMMERCIAL MORTGAGE-BACKED SECURITIES — 0.5% | | |
BB-UBS Trust, Series 2012-SHOW, Class A SEQ, 3.43%, 11/5/36(2) | | $ | 300,000 |
| $ | 314,081 |
|
| Benchmark Mortgage Trust, Series 2018-B6, Class AS, 4.44%, 10/10/51 | | 825,000 |
| 919,972 |
|
| Commercial Mortgage Pass-Through Certificates, Series 2014-CR15, Class AM, VRN, 4.43%, 2/10/47 | | 250,000 |
| 269,525 |
|
| Commercial Mortgage Pass-Through Certificates, Series 2014-LC17, Class AM, VRN, 4.19%, 10/10/47 | | 225,000 |
| 240,664 |
|
| Commercial Mortgage Pass-Through Certificates, Series 2014-UBS5, Class AM, VRN, 4.19%, 9/10/47 | | 200,000 |
| 212,512 |
|
| Commercial Mortgage Pass-Through Certificates, Series 2015-CR22, Class AM, VRN, 3.60%, 3/10/48 | | 275,000 |
| 286,492 |
|
| Commercial Mortgage Trust, Series 2016-CD2, Class A4 SEQ, VRN, 3.53%, 11/10/49 | | 200,000 |
| 212,584 |
|
DBCG Mortgage Trust, Series 2017-BBG, Class A, VRN, 3.03%, (1-month LIBOR plus 0.70%), 6/15/34(2) | | 400,000 |
| 400,368 |
|
| GS Mortgage Securities Trust, Series 2016-GS2, Class B, VRN, 3.76%, 5/10/49 | | 200,000 |
| 208,964 |
|
Hudson Yards Mortgage Trust, Series 2016-10HY, Class A SEQ, 2.84%, 8/10/38(2) | | 400,000 |
| 406,716 |
|
| JPMorgan Chase Commercial Mortgage Securities Trust, Series 2016-JP2, Class A4 SEQ, 2.82%, 8/15/49 | | 100,000 |
| 101,976 |
|
| JPMorgan Chase Commercial Mortgage Securities Trust, Series 2016-JP2, Class B, 3.46%, 8/15/49 | | 100,000 |
| 102,334 |
|
Morgan Stanley Capital I Trust, Series 2014-CPT, Class C, VRN, 3.45%, 7/13/29(2) | | 225,000 |
| 227,535 |
|
| UBS Commercial Mortgage Trust, Series 2017-C1, Class A3 SEQ, 3.20%, 6/15/50 | | 250,000 |
| 260,382 |
|
TOTAL COMMERCIAL MORTGAGE-BACKED SECURITIES
(Cost $4,003,409) | | 4,164,105 |
|
| EXCHANGE-TRADED FUNDS — 0.5% | | | |
| iShares MSCI EAFE Value ETF | | 32,589 |
| 1,523,210 |
|
| iShares Russell 2000 Value ETF | | 460 |
| 55,641 |
|
| iShares Russell Mid-Cap Value ETF | | 20,051 |
| 1,801,983 |
|
| SPDR S&P Oil & Gas Exploration & Production ETF | | 13,592 |
| 340,208 |
|
| SPDR S&P Regional Banking ETF | | 5,105 |
| 281,490 |
|
TOTAL EXCHANGE-TRADED FUNDS
(Cost $4,049,394) | | | 4,002,532 |
|
| MUNICIPAL SECURITIES — 0.4% | | | |
| Bay Area Toll Authority Rev., 6.92%, 4/1/40 | | $ | 100,000 |
| 144,379 |
|
| Chicago Midway International Airport Rev., VRDN, 1.38%, 8/7/19 (LOC: Bank of Montreal) | | 410,000 |
| 410,000 |
|
| Los Angeles Community College District GO, 6.68%, 8/1/36 | | 50,000 |
| 73,110 |
|
| Metropolitan Transportation Authority Rev., 6.69%, 11/15/40 | | 15,000 |
| 21,099 |
|
| Metropolitan Transportation Authority Rev., 6.81%, 11/15/40 | | 10,000 |
| 14,215 |
|
| New Jersey Turnpike Authority Rev., 7.41%, 1/1/40 | | 40,000 |
| 63,046 |
|
| New Jersey Turnpike Authority Rev., 7.10%, 1/1/41 | | 30,000 |
| 46,012 |
|
| New York City GO, 6.27%, 12/1/37 | | 5,000 |
| 6,882 |
|
| Ohio Water Development Authority Water Pollution Control Loan Fund Rev., 4.88%, 12/1/34 | | 80,000 |
| 93,522 |
|
| Pasadena Public Financing Authority Rev., VRDN, 2.36%, 8/7/19 (SBBPA: Bank of the West) | | 530,000 |
| 530,000 |
|
|
| | | | | | | |
| | | Shares/
Principal Amount | Value |
| Port Authority of New York & New Jersey Rev., 4.93%, 10/1/51 | | $ | 35,000 |
| $ | 45,235 |
|
| Port Authority of New York & New Jersey Rev., 4.46%, 10/1/62 | | 10,000 |
| 12,110 |
|
| Red River Education Finance Corp. Rev., (Texas Christian University), VRDN, 1.38%, 8/7/19 (SBBPA: Northern Trust Company) | | 500,000 |
| 500,000 |
|
| Rutgers The State University of New Jersey Rev., 5.67%, 5/1/40 | | 90,000 |
| 116,966 |
|
| Sacramento Municipal Utility District Rev., 6.16%, 5/15/36 | | 140,000 |
| 187,263 |
|
| Salt River Project Agricultural Improvement & Power District Rev., 4.84%, 1/1/41 | | 45,000 |
| 55,823 |
|
| San Francisco Public Utilities Commission Water Rev., 6.00%, 11/1/40 | | 10,000 |
| 13,090 |
|
| San Francisco Public Utilities Commission Water Rev., 6.95%, 11/1/50 | | 5,000 |
| 7,702 |
|
| State of California GO, 6.65%, 3/1/22 | | 20,000 |
| 21,890 |
|
| State of California GO, 4.60%, 4/1/38 | | 30,000 |
| 33,608 |
|
| State of California GO, 7.55%, 4/1/39 | | 20,000 |
| 32,114 |
|
| State of California GO, 7.30%, 10/1/39 | | 25,000 |
| 38,071 |
|
| State of California GO, 7.60%, 11/1/40 | | 40,000 |
| 65,629 |
|
| State of Illinois GO, 5.10%, 6/1/33 | | 45,000 |
| 46,506 |
|
| State of Oregon Department of Transportation Rev., 5.83%, 11/15/34 | | 50,000 |
| 65,963 |
|
| State of Washington GO, 5.14%, 8/1/40 | | 20,000 |
| 25,214 |
|
TOTAL MUNICIPAL SECURITIES
(Cost $2,386,425) | | | 2,669,449 |
|
COMMERCIAL PAPER(8) — 0.1% | | | |
Old Line Funding LLC, 2.42%, 1/16/20(2)
(Cost $400,000) | | 400,000 |
| 399,993 |
|
WARRANTS† | | | |
Hotels, Restaurants and Leisure† | | | |
Minor International PCL(1)
(Cost $—) | | 8,395 |
| 1,501 |
|
| TEMPORARY CASH INVESTMENTS — 2.9% | | | |
State Street Institutional U.S. Government Money Market Fund, Premier Class
(Cost $22,401,853) | | 22,401,853 |
| 22,401,853 |
|
TOTAL INVESTMENT SECURITIES — 100.3%
(Cost $641,333,112) | | | 778,672,705 |
|
| OTHER ASSETS AND LIABILITIES — (0.3)% | | | (2,012,907 | ) |
| TOTAL NET ASSETS — 100.0% | | | $ | 776,659,798 |
|
FORWARD FOREIGN CURRENCY EXCHANGE CONTRACTS
|
| | | | | | | | | | |
| Currency Purchased | Currency Sold | Counterparty | Settlement Date | Unrealized Appreciation
(Depreciation) |
| AUD | 1,110,067 |
| USD | 782,231 |
| Bank of America N.A. | 9/18/19 | $ | (21,874 | ) |
| AUD | 1,231,011 |
| USD | 853,115 |
| Bank of America N.A. | 9/18/19 | (9,916 | ) |
| AUD | 1,106,640 |
| USD | 775,367 |
| Bank of America N.A. | 9/18/19 | (17,358 | ) |
| USD | 402,146 |
| AUD | 576,355 |
| Bank of America N.A. | 9/18/19 | 7,363 |
|
| USD | 774,373 |
| AUD | 1,102,860 |
| Bank of America N.A. | 9/18/19 | 18,953 |
|
| BRL | 4,567,166 |
| USD | 1,135,066 |
| Goldman Sachs & Co. | 9/18/19 | 57,473 |
|
| CAD | 1,242,876 |
| USD | 923,803 |
| Morgan Stanley | 9/18/19 | 18,772 |
|
|
| | | | | | | | | | |
| Currency Purchased | Currency Sold | Counterparty | Settlement Date | Unrealized Appreciation
(Depreciation) |
| CAD | 9,910 |
| USD | 7,596 |
| Morgan Stanley | 9/30/19 | $ | (79 | ) |
| CAD | 8,724 |
| USD | 6,624 |
| Morgan Stanley | 9/30/19 | (6 | ) |
| CAD | 33,848 |
| USD | 25,750 |
| Morgan Stanley | 9/30/19 | (75 | ) |
| CAD | 42,983 |
| USD | 32,727 |
| Morgan Stanley | 9/30/19 | (122 | ) |
| CAD | 9,148 |
| USD | 6,980 |
| Morgan Stanley | 9/30/19 | (41 | ) |
| CAD | 8,863 |
| USD | 6,763 |
| Morgan Stanley | 9/30/19 | (40 | ) |
| USD | 778,817 |
| CAD | 1,025,694 |
| Morgan Stanley | 9/18/19 | 949 |
|
| USD | 786,573 |
| CAD | 1,027,917 |
| Morgan Stanley | 9/18/19 | 7,019 |
|
| USD | 307,947 |
| CAD | 406,216 |
| Morgan Stanley | 9/30/19 | (186 | ) |
| USD | 240,538 |
| CAD | 317,296 |
| Morgan Stanley | 9/30/19 | (145 | ) |
| USD | 7,899 |
| CAD | 10,308 |
| Morgan Stanley | 9/30/19 | 80 |
|
| USD | 8,859 |
| CAD | 11,575 |
| Morgan Stanley | 9/30/19 | 78 |
|
| USD | 5,899 |
| CAD | 7,708 |
| Morgan Stanley | 9/30/19 | 52 |
|
| USD | 6,580 |
| CAD | 8,640 |
| Morgan Stanley | 9/30/19 | 27 |
|
| USD | 10,482 |
| CAD | 13,781 |
| Morgan Stanley | 9/30/19 | 28 |
|
| USD | 19,246 |
| CAD | 25,349 |
| Morgan Stanley | 9/30/19 | 17 |
|
| USD | 8,109 |
| CAD | 10,654 |
| Morgan Stanley | 9/30/19 | 27 |
|
| CHF | 1,158,441 |
| USD | 1,173,759 |
| UBS AG | 9/18/19 | (4,208 | ) |
| CHF | 758,097 |
| USD | 776,755 |
| UBS AG | 9/18/19 | (11,387 | ) |
| CHF | 615,185 |
| USD | 616,282 |
| UBS AG | 9/18/19 | 4,803 |
|
| CHF | 22,307 |
| USD | 22,801 |
| UBS AG | 9/30/19 | (254 | ) |
| CHF | 18,150 |
| USD | 18,616 |
| UBS AG | 9/30/19 | (271 | ) |
| USD | 805,408 |
| CHF | 787,548 |
| UBS AG | 9/18/19 | 10,307 |
|
| USD | 658,755 |
| CHF | 641,706 |
| UBS AG | 9/30/19 | 10,146 |
|
| USD | 33,235 |
| CHF | 32,045 |
| UBS AG | 9/30/19 | 845 |
|
| USD | 46,293 |
| CHF | 44,775 |
| UBS AG | 9/30/19 | 1,036 |
|
| USD | 23,607 |
| CHF | 23,095 |
| UBS AG | 9/30/19 | 264 |
|
| USD | 8,827 |
| CHF | 8,628 |
| UBS AG | 9/30/19 | 107 |
|
| USD | 24,130 |
| CHF | 23,554 |
| UBS AG | 9/30/19 | 324 |
|
| CLP | 527,746,906 |
| USD | 771,447 |
| Goldman Sachs & Co. | 9/23/19 | (21,606 | ) |
| USD | 776,342 |
| CLP | 527,795,868 |
| Goldman Sachs & Co. | 9/23/19 | 26,431 |
|
| CNY | 5,539,736 |
| USD | 805,897 |
| Morgan Stanley | 9/18/19 | (3,839 | ) |
| CNY | 5,366,607 |
| USD | 780,711 |
| Morgan Stanley | 9/18/19 | (3,719 | ) |
| CNY | 2,695,830 |
| USD | 392,406 |
| Morgan Stanley | 9/18/19 | (2,097 | ) |
| USD | 386,310 |
| CNY | 2,660,906 |
| Morgan Stanley | 9/18/19 | 1,057 |
|
| COP | 2,557,437,588 |
| USD | 757,607 |
| Goldman Sachs & Co. | 9/18/19 | 19,614 |
|
| USD | 791,894 |
| COP | 2,557,437,588 |
| Goldman Sachs & Co. | 9/18/19 | 14,673 |
|
| USD | 772,918 |
| COP | 2,506,765,767 |
| Goldman Sachs & Co. | 9/18/19 | 11,096 |
|
| CZK | 17,810,788 |
| USD | 786,779 |
| UBS AG | 9/18/19 | (19,201 | ) |
| CZK | 17,557,074 |
| USD | 783,938 |
| UBS AG | 9/18/19 | (27,294 | ) |
| USD | 29,792 |
| CZK | 689,787 |
| UBS AG | 9/18/19 | 65 |
|
| USD | 779,763 |
| CZK | 17,560,967 |
| UBS AG | 9/18/19 | 22,951 |
|
| USD | 773,884 |
| CZK | 17,813,255 |
| UBS AG | 9/18/19 | 6,199 |
|
| USD | 68,174 |
| DKK | 452,912 |
| Goldman Sachs & Co. | 9/18/19 | 763 |
|
| EUR | 694,971 |
| USD | 782,345 |
| JPMorgan Chase Bank N.A. | 8/21/19 | (11,848 | ) |
| EUR | 697,986 |
| USD | 788,366 |
| JPMorgan Chase Bank N.A. | 8/21/19 | (14,526 | ) |
| EUR | 151,237 |
| USD | 170,793 |
| Credit Suisse AG | 9/30/19 | (2,570 | ) |
| EUR | 155,502 |
| USD | 175,590 |
| Credit Suisse AG | 9/30/19 | (2,625 | ) |
| EUR | 24,512 |
| USD | 27,761 |
| Credit Suisse AG | 9/30/19 | (496 | ) |
| EUR | 39,182 |
| USD | 44,423 |
| Credit Suisse AG | 9/30/19 | (840 | ) |
|
| | | | | | | | | | |
| Currency Purchased | Currency Sold | Counterparty | Settlement Date | Unrealized Appreciation
(Depreciation) |
| EUR | 76,678 |
| USD | 86,554 |
| Credit Suisse AG | 9/30/19 | $ | (1,265 | ) |
| EUR | 106,693 |
| USD | 120,435 |
| Credit Suisse AG | 9/30/19 | (1,760 | ) |
| EUR | 67,832 |
| USD | 75,873 |
| Credit Suisse AG | 9/30/19 | (423 | ) |
| USD | 5,422,627 |
| EUR | 4,822,042 |
| JPMorgan Chase Bank N.A. | 8/21/19 | 76,548 |
|
| USD | 774,204 |
| EUR | 688,732 |
| JPMorgan Chase Bank N.A. | 8/21/19 | 10,623 |
|
| USD | 916,721 |
| EUR | 803,754 |
| Credit Suisse AG | 9/30/19 | 22,701 |
|
| USD | 1,633,890 |
| EUR | 1,432,546 |
| Credit Suisse AG | 9/30/19 | 40,461 |
|
| USD | 3,760,347 |
| EUR | 3,296,959 |
| Credit Suisse AG | 9/30/19 | 93,120 |
|
| USD | 40,001 |
| EUR | 34,951 |
| Credit Suisse AG | 9/30/19 | 1,125 |
|
| USD | 27,439 |
| EUR | 24,151 |
| Credit Suisse AG | 9/30/19 | 575 |
|
| USD | 28,797 |
| EUR | 25,323 |
| Credit Suisse AG | 9/30/19 | 631 |
|
| USD | 45,476 |
| EUR | 40,269 |
| Credit Suisse AG | 9/30/19 | 684 |
|
| USD | 40,667 |
| EUR | 36,027 |
| Credit Suisse AG | 9/30/19 | 594 |
|
| USD | 51,269 |
| EUR | 45,419 |
| Credit Suisse AG | 9/30/19 | 749 |
|
| USD | 27,955 |
| EUR | 24,782 |
| Credit Suisse AG | 9/30/19 | 390 |
|
| USD | 53,339 |
| EUR | 47,584 |
| Credit Suisse AG | 9/30/19 | 411 |
|
| USD | 32,275 |
| EUR | 28,837 |
| Credit Suisse AG | 9/30/19 | 199 |
|
| USD | 56,469 |
| EUR | 50,406 |
| Credit Suisse AG | 9/30/19 | 403 |
|
| GBP | 13,853 |
| USD | 17,375 |
| JPMorgan Chase Bank N.A. | 9/30/19 | (479 | ) |
| USD | 1,532,084 |
| GBP | 1,209,033 |
| Bank of America N.A. | 9/18/19 | 58,376 |
|
| USD | 875,246 |
| GBP | 687,887 |
| JPMorgan Chase Bank N.A. | 9/30/19 | 36,267 |
|
| USD | 568,718 |
| GBP | 446,975 |
| JPMorgan Chase Bank N.A. | 9/30/19 | 23,566 |
|
| USD | 36,110 |
| GBP | 28,325 |
| JPMorgan Chase Bank N.A. | 9/30/19 | 1,563 |
|
| USD | 31,919 |
| GBP | 25,495 |
| JPMorgan Chase Bank N.A. | 9/30/19 | 824 |
|
| USD | 29,781 |
| GBP | 24,403 |
| JPMorgan Chase Bank N.A. | 9/30/19 | 18 |
|
| USD | 16,535 |
| GBP | 13,549 |
| JPMorgan Chase Bank N.A. | 9/30/19 | 10 |
|
| HUF | 216,061,854 |
| USD | 749,278 |
| UBS AG | 9/18/19 | (13,834 | ) |
| USD | 1,544,329 |
| HUF | 447,324,128 |
| UBS AG | 9/18/19 | 21,701 |
|
| USD | 774,608 |
| HUF | 219,089,347 |
| UBS AG | 9/18/19 | 28,859 |
|
| USD | 144,101 |
| IDR | 2,126,935,568 |
| Goldman Sachs & Co. | 9/18/19 | (5,772 | ) |
| ILS | 2,783,258 |
| USD | 783,487 |
| UBS AG | 9/18/19 | 11,363 |
|
| ILS | 2,774,587 |
| USD | 796,849 |
| UBS AG | 9/18/19 | (4,476 | ) |
| ILS | 2,752,657 |
| USD | 791,494 |
| UBS AG | 9/18/19 | (5,384 | ) |
| USD | 1,544,188 |
| ILS | 5,561,237 |
| UBS AG | 9/18/19 | (44,003 | ) |
| USD | 779,433 |
| ILS | 2,747,658 |
| UBS AG | 9/18/19 | (5,249 | ) |
| USD | 781,065 |
| ILS | 2,728,493 |
| UBS AG | 9/18/19 | 1,855 |
|
| JPY | 2,472,273 |
| USD | 23,064 |
| Bank of America N.A. | 9/30/19 | (237 | ) |
| JPY | 2,172,056 |
| USD | 20,085 |
| Bank of America N.A. | 9/30/19 | (30 | ) |
| USD | 4,040,294 |
| JPY | 435,616,412 |
| Bank of America N.A. | 8/21/19 | 30,620 |
|
| USD | 776,322 |
| JPY | 83,549,284 |
| Bank of America N.A. | 8/21/19 | 7,284 |
|
| USD | 338,536 |
| JPY | 36,192,236 |
| Bank of America N.A. | 9/30/19 | 4,364 |
|
| USD | 656,267 |
| JPY | 70,160,147 |
| Bank of America N.A. | 9/30/19 | 8,461 |
|
| USD | 17,519 |
| JPY | 1,886,348 |
| Bank of America N.A. | 9/30/19 | 101 |
|
| USD | 17,042 |
| JPY | 1,831,527 |
| Bank of America N.A. | 9/30/19 | 131 |
|
| USD | 12,490 |
| KRW | 14,807,935 |
| Goldman Sachs & Co. | 9/18/19 | 9 |
|
| KZT | 278,913,016 |
| USD | 719,219 |
| Goldman Sachs & Co. | 9/18/19 | (6 | ) |
| KZT | 162,591,888 |
| USD | 421,878 |
| Goldman Sachs & Co. | 9/18/19 | (2,615 | ) |
| MXN | 15,047,647 |
| USD | 785,798 |
| Morgan Stanley | 9/18/19 | (6,661 | ) |
| MXN | 5,137,983 |
| USD | 264,320 |
| Morgan Stanley | 9/18/19 | 1,715 |
|
| MXN | 14,930,014 |
| USD | 769,113 |
| Morgan Stanley | 9/18/19 | 3,934 |
|
|
| | | | | | | | | | |
| Currency Purchased | Currency Sold | Counterparty | Settlement Date | Unrealized Appreciation
(Depreciation) |
| MXN | 14,964,904 |
| USD | 773,800 |
| Morgan Stanley | 9/18/19 | $ | 1,053 |
|
| USD | 369,094 |
| MXN | 7,413,067 |
| Morgan Stanley | 9/18/19 | (14,740 | ) |
| USD | 778,734 |
| MXN | 15,193,481 |
| Morgan Stanley | 9/18/19 | (7,955 | ) |
| USD | 384,445 |
| MXN | 7,392,883 |
| Morgan Stanley | 9/18/19 | 1,657 |
|
| MYR | 2,430,678 |
| USD | 592,415 |
| Goldman Sachs & Co. | 9/18/19 | (3,934 | ) |
| MYR | 3,205,031 |
| USD | 777,166 |
| Goldman Sachs & Co. | 9/18/19 | (1,210 | ) |
| USD | 59,835 |
| MYR | 252,444 |
| Goldman Sachs & Co. | 9/18/19 | (1,283 | ) |
| NOK | 7,021,075 |
| USD | 802,447 |
| Goldman Sachs & Co. | 9/18/19 | (8,666 | ) |
| NOK | 12,483,221 |
| USD | 1,430,725 |
| Goldman Sachs & Co. | 9/18/19 | (19,411 | ) |
| NOK | 178,692 |
| USD | 20,972 |
| Goldman Sachs & Co. | 9/30/19 | (764 | ) |
| USD | 99,666 |
| NOK | 861,059 |
| Goldman Sachs & Co. | 9/18/19 | 2,317 |
|
| USD | 783,637 |
| NOK | 6,692,883 |
| Goldman Sachs & Co. | 9/18/19 | 26,960 |
|
| USD | 776,756 |
| NOK | 6,631,324 |
| Goldman Sachs & Co. | 9/18/19 | 27,039 |
|
| USD | 678,172 |
| NOK | 5,783,276 |
| Goldman Sachs & Co. | 9/30/19 | 24,134 |
|
| USD | 22,717 |
| NOK | 195,350 |
| Goldman Sachs & Co. | 9/30/19 | 625 |
|
| NZD | 1,175,302 |
| USD | 779,413 |
| Bank of America N.A. | 9/18/19 | (6,950 | ) |
| NZD | 590,263 |
| USD | 394,567 |
| Bank of America N.A. | 9/18/19 | (6,619 | ) |
| USD | 1,151,566 |
| NZD | 1,765,556 |
| Bank of America N.A. | 9/18/19 | (8,839 | ) |
| PEN | 236,692 |
| USD | 71,734 |
| Goldman Sachs & Co. | 9/18/19 | (238 | ) |
| PEN | 281,297 |
| USD | 85,092 |
| Goldman Sachs & Co. | 9/18/19 | (122 | ) |
| USD | 1,305,653 |
| PEN | 4,412,717 |
| Goldman Sachs & Co. | 9/18/19 | (27,267 | ) |
| USD | 769,892 |
| PEN | 2,538,872 |
| Goldman Sachs & Co. | 9/18/19 | 2,991 |
|
| USD | 840,306 |
| PHP | 44,351,352 |
| Goldman Sachs & Co. | 9/18/19 | (28,797 | ) |
| PLN | 4,351,066 |
| USD | 1,150,634 |
| Goldman Sachs & Co. | 9/18/19 | (26,743 | ) |
| PLN | 366,713 |
| USD | 97,512 |
| Goldman Sachs & Co. | 9/18/19 | (2,789 | ) |
| PLN | 2,931,837 |
| USD | 787,662 |
| Goldman Sachs & Co. | 9/18/19 | (30,362 | ) |
| USD | 3,945,103 |
| PLN | 15,159,452 |
| Goldman Sachs & Co. | 9/18/19 | 29,379 |
|
| USD | 764,012 |
| PLN | 2,868,789 |
| Goldman Sachs & Co. | 9/18/19 | 22,997 |
|
| USD | 62,871 |
| PLN | 237,859 |
| Goldman Sachs & Co. | 9/18/19 | 1,431 |
|
| USD | 21,337 |
| RUB | 1,408,247 |
| Goldman Sachs & Co. | 9/18/19 | (640 | ) |
| SEK | 18,656,754 |
| USD | 1,971,225 |
| Goldman Sachs & Co. | 9/18/19 | (33,366 | ) |
| SEK | 3,425,094 |
| USD | 363,182 |
| Goldman Sachs & Co. | 9/18/19 | (7,421 | ) |
| SEK | 92,559 |
| USD | 9,841 |
| Goldman Sachs & Co. | 9/30/19 | (219 | ) |
| SEK | 215,560 |
| USD | 22,920 |
| Goldman Sachs & Co. | 9/30/19 | (510 | ) |
| SEK | 119,709 |
| USD | 12,846 |
| Goldman Sachs & Co. | 9/30/19 | (401 | ) |
| SEK | 184,093 |
| USD | 19,799 |
| Goldman Sachs & Co. | 9/30/19 | (661 | ) |
| USD | 1,190,565 |
| SEK | 11,126,187 |
| Goldman Sachs & Co. | 9/18/19 | 34,899 |
|
| USD | 372,152 |
| SEK | 3,543,515 |
| Goldman Sachs & Co. | 9/18/19 | 4,091 |
|
| USD | 640,358 |
| SEK | 5,973,642 |
| Goldman Sachs & Co. | 9/30/19 | 19,334 |
|
| USD | 352,298 |
| SEK | 3,286,448 |
| Goldman Sachs & Co. | 9/30/19 | 10,637 |
|
| USD | 29,759 |
| SEK | 274,415 |
| Goldman Sachs & Co. | 9/30/19 | 1,231 |
|
| USD | 21,553 |
| SEK | 199,786 |
| Goldman Sachs & Co. | 9/30/19 | 783 |
|
| USD | 35,274 |
| SEK | 330,886 |
| Goldman Sachs & Co. | 9/30/19 | 875 |
|
| USD | 9,242 |
| SEK | 86,388 |
| Goldman Sachs & Co. | 9/30/19 | 261 |
|
| USD | 23,581 |
| SEK | 220,730 |
| Goldman Sachs & Co. | 9/30/19 | 634 |
|
| USD | 12,891 |
| SEK | 120,967 |
| Goldman Sachs & Co. | 9/30/19 | 316 |
|
| USD | 68,356 |
| SGD | 94,171 |
| Bank of America N.A. | 9/18/19 | (222 | ) |
| THB | 24,277,465 |
| USD | 791,441 |
| Goldman Sachs & Co. | 9/18/19 | (5,734 | ) |
| USD | 150,696 |
| THB | 4,781,972 |
| Goldman Sachs & Co. | 9/18/19 | (4,066 | ) |
| USD | 778,479 |
| THB | 23,976,379 |
| Goldman Sachs & Co. | 9/18/19 | 2,516 |
|
|
| | | | | | | | | | |
| Currency Purchased | Currency Sold | Counterparty | Settlement Date | Unrealized Appreciation
(Depreciation) |
| USD | 584,383 |
| THB | 17,937,627 |
| Goldman Sachs & Co. | 9/18/19 | $ | 3,856 |
|
| USD | 793,254 |
| THB | 24,475,444 |
| Goldman Sachs & Co. | 9/18/19 | 1,139 |
|
| USD | 396,613 |
| THB | 12,264,872 |
| Goldman Sachs & Co. | 9/18/19 | (323 | ) |
| ZAR | 10,958,412 |
| USD | 777,578 |
| UBS AG | 9/18/19 | (17,917 | ) |
| ZAR | 5,688,508 |
| USD | 383,630 |
| UBS AG | 9/18/19 | 10,710 |
|
| USD | 381,590 |
| ZAR | 5,688,508 |
| UBS AG | 9/18/19 | (12,750 | ) |
| USD | 766,714 |
| ZAR | 10,958,412 |
| UBS AG | 9/18/19 | 7,053 |
|
| | | | | | | $ | 420,936 |
|
|
| | | | | | | | | | | |
| FUTURES CONTRACTS PURCHASED |
| Reference Entity | Contracts | Expiration
Date | Notional Amount | Underlying Contract Value | Unrealized Appreciation
(Depreciation) |
| Japanese 10-Year Mini Government Bonds | 6 | September 2019 | JPY | 60,000,000 |
| $ | 848,350 |
| $ | 2,053 |
|
| Korean Treasury 10-Year Bonds | 3 | September 2019 | KRW | 300,000,000 |
| 338,594 |
| 5,827 |
|
| S&P 500 E-Mini | 15 | September 2019 | USD | 750 |
| 2,236,725 |
| (9,422 | ) |
| U.S. Treasury 10-Year Ultra Notes | 18 | September 2019 | USD | 1,800,000 |
| 2,481,187 |
| 30,857 |
|
| U.S. Treasury 2-Year Notes | 99 | September 2019 | USD | 19,800,000 |
| 21,226,219 |
| 42,945 |
|
| U.S. Treasury 5-Year Notes | 66 | September 2019 | USD | 6,600,000 |
| 7,758,609 |
| 59,144 |
|
| | | | | | $ | 34,889,684 |
| $ | 131,404 |
|
| | | | | | | |
| FUTURES CONTRACTS SOLD |
| Reference Entity | Contracts | Expiration
Date | Notional Amount | Underlying Contract Value | Unrealized Appreciation
(Depreciation) |
| Euro-Bund 10-Year Bonds | 1 | September 2019 | EUR | 100,000 |
| $ | 193,803 |
| $ | (5,193 | ) |
| Euro-OAT 10-Year Bonds | 2 | September 2019 | EUR | 200,000 |
| 370,247 |
| (12,712 | ) |
| | | | | | $ | 564,050 |
| $ | (17,905 | ) |
|
| | | | | | | | | | | | | | | |
| CENTRALLY CLEARED CREDIT DEFAULT SWAP AGREEMENTS |
| Reference Entity | Type‡ | Fixed Rate
Received
(Paid) | Termination
Date | Notional
Amount | Premiums
Paid
(Received) | Unrealized
Appreciation
(Depreciation) | Value^ |
| Markit CDX North America High Yield Index Series 32 | Sell | 5.00% | 6/20/24 | $ | 4,360,950 |
| $ | 286,471 |
| $ | 67,665 |
| $ | 354,136 |
|
‡The maximum potential amount the fund could be required to deliver as a seller of credit protection if a credit event occurs as defined under the terms of the agreement is the notional amount. The maximum potential amount may be partially offset by any recovery values of the reference entities and upfront payments received upon entering into the agreement.
^ The value for credit default swap agreements serve as an indicator of the current status of the payment/performance risk and represent the likelihood of an expected liability or profit at the period end. Increasing values in absolute terms when compared to the notional amount of the credit default swap agreement represent a deterioration of the referenced entity's credit soundness and an increased likelihood or risk of a credit event occurring as defined in the agreement.
|
| | | | | |
| NOTES TO SCHEDULE OF INVESTMENTS |
| ADR | - | American Depositary Receipt | NOK | - | Norwegian Krone |
| AUD | - | Australian Dollar | NVDR | - | Non-Voting Depositary Receipt |
| BRL | - | Brazilian Real | NZD | - | New Zealand Dollar |
| CAD | - | Canadian Dollar | PEN | - | Peruvian Sol |
| CDX | - | Credit Derivatives Indexes | PHP | - | Philippine Peso |
| CHF | - | Swiss Franc | PIK | - | Payment in Kind. Security may pay a cash rate and/or an in kind rate. |
| CLP | - | Chilean Peso | PLN | - | Polish Zloty |
| CNY | - | Chinese Yuan | RUB | - | Russian Ruble |
| COP | - | Colombian Peso | SBBPA | - | Standby Bond Purchase Agreement |
| CZK | - | Czech Koruna | SEK | - | Swedish Krona |
| DKK | - | Danish Krone | SEQ | - | Sequential Payer |
| EUR | - | Euro | SGD | - | Singapore Dollar |
| FHLMC | - | Federal Home Loan Mortgage Corporation | TBA | - | To-Be-Announced. Security was purchased on a forward commitment basis with an approximate principal amount and maturity date. Actual principal amount and maturity date will be determined upon settlement. |
| FNMA | - | Federal National Mortgage Association | | |
| GBP | - | British Pound | | |
| GDR | - | Global Depositary Receipt | | |
| GNMA | - | Government National Mortgage Association | THB | - | Thai Baht |
| GO | - | General Obligation | USD | - | United States Dollar |
| H15T1Y | - | Constant Maturity U.S. Treasury Note Yield Curve Rate Index | VRDN | - | Variable Rate Demand Note. The instrument may be payable upon demand and adjusts periodically based upon the terms set forth in the security's offering documents. The rate shown is effective at the period end and the reference rate and spread, if any, is indicated. The date of the demand feature is disclosed. |
| HUF | - | Hungarian Forint | | |
| IDR | - | Indonesian Rupiah | | |
| ILS | - | Israeli Shekel | | |
| JPY | - | Japanese Yen | | |
| KRW | - | South Korean Won | VRN | - | Variable Rate Note. The rate adjusts periodically based upon the terms set forth in the security’s offering documents. The rate shown is effective at the period end and the reference rate and spread, if any, is indicated. |
| KZT | - | Kazakhstani Tenge | | |
| LIBOR | - | London Interbank Offered Rate | | |
| LOC | - | Letter of Credit | | |
| MTN | - | Medium Term Note | ZAR | - | South African Rand |
| MXN | - | Mexican Peso | | | |
| MYR | - | Malaysian Ringgit | | | |
| |
| † | Category is less than 0.05% of total net assets. |
| |
| (2) | Security was purchased pursuant to Rule 144A or Section 4(2) under the Securities Act of 1933 and may be sold in transactions exempt from registration, normally to qualified institutional investors. The aggregate value of these securities at the period end was $34,953,777, which represented 4.5% of total net assets. |
| |
| (3) | The security's rate was paid in cash at the last payment date. |
| |
| (4) | Security, or a portion thereof, has been pledged at the custodian bank or with a broker for collateral requirements on forward commitments, forward foreign currency exchange contracts, futures contracts and/or swap agreements. At the period end, the aggregate value of securities pledged was $411,299. |
| |
| (5) | Security is a zero-coupon bond. |
| |
| (6) | Investments are funds within the American Century Investments family of funds and are considered affiliated funds. |
| |
| (7) | When-issued security. The issue price and yield are fixed on the date of the commitment, but payment and delivery are scheduled for a future date. |
| |
| (8) | The rate indicated is the yield to maturity at purchase for non-interest bearing securities. For interest bearing securities, the stated coupon rate is shown. |
See Notes to Financial Statements.
|
|
| Statement of Assets and Liabilities |
|
| | | |
| JULY 31, 2019 |
| Assets |
| Investment securities - unaffiliated, at value (cost of $631,151,724) | $ | 768,305,167 |
|
| Investment securities - affiliated, at value (cost of $10,181,388) | 10,367,538 |
|
| Total investment securities, at value (cost of $641,333,112) | 778,672,705 |
|
| Foreign currency holdings, at value (cost of $3,217) | 2,980 |
|
| Foreign deposits with broker for futures contracts, at value (cost of $45,874) | 44,155 |
|
| Deposits with broker for futures contracts | 94,500 |
|
| Receivable for investments sold | 2,443,314 |
|
| Receivable for capital shares sold | 741,463 |
|
| Receivable for variation margin on futures contracts | 1,313 |
|
| Unrealized appreciation on forward foreign currency exchange contracts | 970,672 |
|
| Dividends and interest receivable | 2,210,893 |
|
| Other assets | 22,728 |
|
| | 785,204,723 |
|
| | |
| Liabilities |
| Disbursements in excess of demand deposit cash | 44,719 |
|
| Payable for investments purchased | 6,622,231 |
|
| Payable for capital shares redeemed | 537,850 |
|
| Payable for variation margin on futures contracts | 38,631 |
|
| Payable for variation margin on swap agreements | 15,890 |
|
| Unrealized depreciation on forward foreign currency exchange contracts | 549,736 |
|
| Accrued management fees | 660,250 |
|
| Distribution and service fees payable | 75,288 |
|
| Accrued foreign taxes | 330 |
|
| | 8,544,925 |
|
| | |
| Net Assets | $ | 776,659,798 |
|
| | |
| Net Assets Consist of: |
| Capital (par value and paid-in surplus) | $ | 620,693,809 |
|
| Distributable earnings | 155,965,989 |
|
| | $ | 776,659,798 |
|
|
| | | | |
| | Net Assets | Shares Outstanding | Net Asset Value Per Share |
| Investor Class, $0.01 Par Value | $300,544,206 | 38,002,326 |
| $7.91 |
| I Class, $0.01 Par Value | $52,388,894 | 6,667,666 |
| $7.86 |
| A Class, $0.01 Par Value | $168,773,928 | 21,177,212 |
| $7.97* |
| C Class, $0.01 Par Value | $36,619,660 | 4,722,994 |
| $7.75 |
| R Class, $0.01 Par Value | $17,857,715 | 2,244,838 |
| $7.96 |
| R5 Class, $0.01 Par Value | $7,558 | 961 |
| $7.86 |
| R6 Class, $0.01 Par Value | $200,467,837 | 25,568,378 |
| $7.84 |
| *Maximum offering price $8.46 (net asset value divided by 0.9425). |
See Notes to Financial Statements.
|
| | | |
| YEAR ENDED JULY 31, 2019 |
| Investment Income (Loss) | |
| Income: | |
| Dividends (including $100,785 from affiliated funds and net of foreign taxes withheld of $563,427) | $ | 12,979,546 |
|
| Interest (net of foreign taxes withheld of $460) | 6,172,511 |
|
| | 19,152,057 |
|
| | |
| Expenses: | |
| Management fees | 8,479,689 |
|
| Distribution and service fees: | |
| A Class | 430,563 |
|
| C Class | 417,846 |
|
| R Class | 89,322 |
|
| Directors' fees and expenses | 22,502 |
|
| Other expenses | 64,431 |
|
| | 9,504,353 |
|
Fees waived(1) | (417,547) |
|
| | 9,086,806 |
|
| | |
| Net investment income (loss) | 10,065,251 |
|
| | |
| Realized and Unrealized Gain (Loss) |
| Net realized gain (loss) on: | |
| Investment transactions (including $121 from affiliated funds) | 34,573,026 |
|
| Forward foreign currency exchange contract transactions | 880,002 |
|
| Futures contract transactions | 490,855 |
|
| Swap agreement transactions | 177,904 |
|
| Foreign currency translation transactions | (106,761 | ) |
| | 36,015,026 |
|
| | |
| Change in net unrealized appreciation (depreciation) on: | |
| Investments (including $186,150 from affiliated funds and (increase) decrease in accrued foreign taxes of $5,623) | (23,050,363 | ) |
| Forward foreign currency exchange contracts | 326,175 |
|
| Futures contracts | 124,827 |
|
| Swap agreements | 13,927 |
|
| Translation of assets and liabilities in foreign currencies | (17,326 | ) |
| | (22,602,760 | ) |
| | |
| Net realized and unrealized gain (loss) | 13,412,266 |
|
| | |
| Net Increase (Decrease) in Net Assets Resulting from Operations | $ | 23,477,517 |
|
| |
| (1) | Amount consists of $169,993, $28,141, $89,357, $21,662, $9,270, $4, $99,120 for Investor Class, I Class, A Class, C Class, R Class, R5 Class and R6 Class, respectively. |
See Notes to Financial Statements.
|
|
| Statement of Changes in Net Assets |
|
| | | | | | | | | |
| YEAR ENDED JULY 31, 2019, EIGHT MONTHS ENDED JULY 31, 2018 AND YEAR ENDED NOVEMBER 30, 2017 |
| Increase (Decrease) in Net Assets | July 31, 2019 | July 31, 2018(1) | November 30, 2017 |
| Operations | |
| Net investment income (loss) | $ | 10,065,251 |
| $ | 6,590,752 |
| $ | 10,665,888 |
|
| Net realized gain (loss) | 36,015,026 |
| 72,970,860 |
| 82,106,446 |
|
| Change in net unrealized appreciation (depreciation) | (22,602,760 | ) | (42,242,816 | ) | 77,392,849 |
|
| Net increase (decrease) in net assets resulting from operations | 23,477,517 |
| 37,318,796 |
| 170,165,183 |
|
| | | | |
| Distributions to Shareholders | |
From earnings:(2) | | | |
| Investor Class | (35,896,956 | ) | (39,202,396 | ) | (12,657,263 | ) |
| I Class | (5,086,183 | ) | (12,873,324 | ) | (3,688,164 | ) |
| A Class | (17,614,660 | ) | (17,679,660 | ) | (6,408,918 | ) |
| C Class | (4,161,706 | ) | (5,209,229 | ) | (1,306,027 | ) |
| R Class | (1,787,515 | ) | (1,901,334 | ) | (582,606 | ) |
| R5 Class | (665 | ) | (511 | ) | — |
|
| R6 Class | (20,521,305 | ) | (8,471,403 | ) | (1,685,444 | ) |
| Decrease in net assets from distributions | (85,068,990 | ) | (85,337,857 | ) | (26,328,422 | ) |
| | | | |
| Capital Share Transactions | |
| Net increase (decrease) in net assets from capital share transactions (Note 5) | (65,940,445 | ) | (23,051,677 | ) | (120,257,643 | ) |
| | | | |
| Net increase (decrease) in net assets | (127,531,918 | ) | (71,070,738 | ) | 23,579,118 |
|
| | | | |
| Net Assets | |
| Beginning of period | 904,191,716 |
| 975,262,454 |
| 951,683,336 |
|
| End of period | $ | 776,659,798 |
| $ | 904,191,716 |
| $ | 975,262,454 |
|
| |
| (1) | The fund's fiscal year end was changed from November 30 to July 31, resulting in an eight-month annual reporting period. |
| |
| (2) | Prior periods presentation has been updated to reflect the current period combination of distributions to shareholders from net investment income and net realized gains. For the eight months ended July 31, 2018, distributions from net investment income were $(5,673,712), $(2,105,356), $(2,120,300), $(188,728), $(176,931), $(81) and $(1,500,879) for Investor Class, I Class, A Class, C Class, R Class, R5 Class and R6 Class, respectively. For the eight months ended July 31, 2018, distributions from net realized gains were $(33,528,684), $(10,767,968), $(15,559,360), $(5,020,501), $(1,724,403), $(430) and $(6,970,524) for Investor Class, I Class, A Class, C Class, R Class, R5 Class and R6 Class, respectively. |
For the year ended November 30, 2017, distributions from net investment income were $(6,025,744), $(1,882,284), $(2,729,951), $(253,034), $(212,585) and $(898,697) for Investor Class, I Class, A Class, C Class, R Class and R6 Class, respectively. For the year ended November 30, 2017, distributions from net realized gains were $(6,631,519), $(1,805,880), $(3,678,967), $(1,052,993), $(370,021) and $(786,747) for Investor Class, I Class, A Class, C Class, R Class and R6 Class, respectively.
See Notes to Financial Statements.
|
|
| Notes to Financial Statements |
JULY 31, 2019
1. Organization
American Century Strategic Asset Allocations, Inc. (the corporation) is registered under the Investment Company Act of 1940, as amended (the 1940 Act), as an open-end management investment company and is organized as a Maryland corporation. Strategic Allocation: Aggressive Fund (the fund) is one fund in a series issued by the corporation. The fund is an asset allocation fund and its investment objective is to seek the highest level of total return consistent with its asset mix.
The fund offers the Investor Class, I Class, A Class, C Class, R Class, R5 Class and R6 Class. The A Class may incur an initial sales charge. The A Class and C Class may be subject to a contingent deferred sales charge. Sale of the R5 Class commenced on April 10, 2017.
2. Significant Accounting Policies
The following is a summary of significant accounting policies consistently followed by the fund in preparation of its financial statements. The fund is an investment company and follows accounting and reporting guidance in accordance with accounting principles generally accepted in the United States of America. This may require management to make certain estimates and assumptions at the date of the financial statements. Actual results could differ from these estimates. Management evaluated the impact of events or transactions occurring through the date the financial statements were issued that would merit recognition or disclosure.
Investment Valuations — The fund determines the fair value of its investments and computes its net asset value per share at the close of regular trading (usually 4 p.m. Eastern time) on the New York Stock Exchange (NYSE) on each day the NYSE is open. The Board of Directors has adopted valuation policies and procedures to guide the investment advisor in the fund’s investment valuation process and to provide methodologies for the oversight of the fund’s pricing function.
Equity securities that are listed or traded on a domestic securities exchange are valued at the last reported sales price or at the official closing price as provided by the exchange. Equity securities traded on foreign securities exchanges are generally valued at the closing price of such securities on the exchange where primarily traded or at the close of the NYSE, if that is earlier. If no last sales price is reported, or if local convention or regulation so provides, the mean of the latest bid and asked prices may be used. Securities traded over-the-counter are valued at the mean of the latest bid and asked prices, the last sales price, or the official closing price. Equity securities initially expressed in local currencies are translated into U.S. dollars at the mean of the appropriate currency exchange rate at the close of the NYSE as provided by an independent pricing service.
Fixed income securities are valued at the evaluated mean as provided by independent pricing services or at the mean of the most recent bid and asked prices as provided by investment dealers. Corporate bonds, U.S. Treasury and Government Agency securities, convertible bonds, municipal securities, and sovereign governments and agencies are valued using market models that consider trade data, quotations from dealers and active market makers, relevant yield curve and spread data, creditworthiness, trade data or market information on comparable securities, and other relevant security specific information. Mortgage-related and asset-backed securities are valued based on models that consider trade data, prepayment and default projections, benchmark yield and spread data and estimated cash flows of each tranche of the issuer. Collateralized loan obligations are valued based on discounted cash flow models that consider trade and economic data, prepayment assumptions and default projections. Commercial paper is valued using a curve-based approach that considers money market rates for specific instruments, programs, currencies and maturity points from a variety of active market makers. Fixed income securities initially expressed in local currencies are translated into U.S. dollars at the mean of the appropriate currency exchange rate at the close of the NYSE as provided by an independent pricing service.
Open-end management investment companies are valued at the reported net asset value per share. Exchange-traded futures contracts are valued at the settlement price as provided by the appropriate exchange. Swap agreements are valued at an evaluated mean as provided by independent pricing services or independent brokers. Forward foreign currency exchange contracts are valued at the mean of the appropriate forward exchange rate at the close of the NYSE as provided by an independent pricing service. Investments initially expressed in local currencies are translated into U.S. dollars at the mean of the appropriate currency exchange rate at the close of the NYSE as provided by an independent pricing service.
If the fund determines that the market price for an investment is not readily available or the valuation methods mentioned above do not reflect an investment’s fair value, such investment is valued as determined in good faith by the Board of Directors or its delegate, in accordance with policies and procedures adopted by the Board of Directors. In its determination of fair value, the fund may review several factors including, but not limited to, market information regarding the specific investment or comparable investments and correlation with other investment types, futures indices or general market indicators. Circumstances that may cause the fund to use these procedures to value an investment include, but are not limited to: an investment has been declared in default or is distressed; trading in a security has been suspended during the trading day or a security is not actively trading on its principal exchange; prices received from a regular pricing source are deemed unreliable; or there is a foreign market holiday and no trading occurred.
The fund monitors for significant events occurring after the close of an investment’s primary exchange but before the fund’s net asset value per share is determined. Significant events may include, but are not limited to: corporate announcements and transactions; governmental action and political unrest that could impact a specific investment or an investment sector; or armed conflicts, natural disasters and similar events that could affect investments in a specific country or region. The fund also monitors for significant fluctuations between domestic and foreign markets, as evidenced by the U.S. market or such other indicators that the Board of Directors, or its delegate, deems appropriate. The fund may apply a model-derived factor to the closing price of equity securities traded on foreign securities exchanges. The factor is based on observable market data as provided by an independent pricing service.
Security Transactions — Security transactions are accounted for as of the trade date. Net realized gains and losses are determined on the identified cost basis, which is also used for federal income tax purposes. Certain countries impose taxes on realized gains on the sale of securities registered in their country. The fund records the foreign tax expense, if any, on an accrual basis. The foreign tax expense on realized gains and unrealized appreciation reduces the net realized gain (loss) on investment transactions and net unrealized appreciation (depreciation) on investments, respectively.
Investment Income — Dividend income less foreign taxes withheld, if any, is recorded as of the ex-dividend date. Distributions received on securities that represent a return of capital or long-term capital gain are recorded as a reduction of cost of investments and/or as a realized gain. The fund may estimate the components of distributions received that may be considered nontaxable distributions or long-term capital gain distributions for income tax purposes. Interest income less foreign taxes withheld, if any, is recorded on the accrual basis and includes paydown gain (loss) and accretion of discounts and amortization of premiums. Inflation adjustments related to inflation-linked debt securities are reflected as interest income.
Segregated Assets — In accordance with the 1940 Act, the fund segregates assets on its books and records to cover certain types of investment securities and other financial instruments. American Century Investment Management, Inc. (ACIM) (the investment advisor) monitors, on a daily basis, the securities segregated to ensure the fund designates a sufficient amount of liquid assets, marked-to-market daily. The fund may also receive assets or be required to pledge assets at the custodian bank or with a broker for collateral requirements.
Foreign Currency Translations — All assets and liabilities initially expressed in foreign currencies are translated into U.S. dollars at prevailing exchange rates at period end. The fund may enter into spot foreign currency exchange contracts to facilitate transactions denominated in a foreign currency. Purchases and sales of investment securities, dividend and interest income, spot foreign currency exchange contracts, and expenses are translated at the rates of exchange prevailing on the respective dates of such transactions. Net realized and unrealized foreign currency exchange gains or losses related to investment securities are a component of net realized gain (loss) on investment transactions and change in net unrealized appreciation (depreciation) on investments, respectively.
Forward Commitments — The fund may engage in securities transactions on a forward commitment basis. In these transactions, the securities’ prices and yields are fixed on the date of the commitment. The fund may sell a to-be-announced (TBA) security and at the same time make a commitment to purchase the same security at a future date at a specified price. Conversely, the fund may purchase a TBA security and at the same time make a commitment to sell the same security at a future date at a specified price. These types of transactions are known as “TBA roll” transactions and are accounted for as purchases and sales. The fund will segregate cash, cash equivalents or other appropriate liquid securities on its records in amounts sufficient to meet the purchase price.
Income Tax Status — It is the fund’s policy to distribute substantially all net investment income and net realized gains to shareholders and to otherwise qualify as a regulated investment company under provisions of the Internal Revenue Code. Accordingly, no provision has been made for income taxes. The fund files U.S. federal, state, local and non-U.S. tax returns as applicable. The fund's tax returns are subject to examination by the relevant taxing authority until expiration of the applicable statute of limitations, which is generally three years from the date of filing but can be longer in certain jurisdictions. At this time, management believes there are no uncertain tax positions which, based on their technical merit, would not be sustained upon examination and for which it is reasonably possible that the total amounts of unrecognized tax benefits will significantly change in the next twelve months.
Multiple Class — All shares of the fund represent an equal pro rata interest in the net assets of the class to which such shares belong, and have identical voting, dividend, liquidation and other rights and the same terms and conditions, except for class specific expenses and exclusive rights to vote on matters affecting only individual classes. Income, non-class specific expenses, and realized and unrealized capital gains and losses of the fund are allocated to each class of shares based on their relative net assets.
Distributions to Shareholders — Distributions from net investment income and net realized gains, if any, are generally declared and paid annually. The fund may elect to treat a portion of its payment to a redeeming shareholder, which represents the pro rata share of undistributed net investment income and net realized gains, as a distribution for federal income tax purposes (tax equalization).
Indemnifications — Under the corporation’s organizational documents, its officers and directors are indemnified against certain liabilities arising out of the performance of their duties to the fund. In addition, in the normal course of business, the fund enters into contracts that provide general indemnifications. The maximum exposure under these arrangements is unknown as this would involve future claims that may be made against a fund. The risk of material loss from such claims is considered by management to be remote.
3. Fees and Transactions with Related Parties
Certain officers and directors of the corporation are also officers and/or directors of American Century Companies, Inc. (ACC). The corporation’s investment advisor, ACIM, the corporation's distributor, American Century Investment Services, Inc. (ACIS), and the corporation’s transfer agent, American Century Services, LLC, are wholly owned, directly or indirectly, by ACC.
Management Fees — The corporation has entered into a management agreement with ACIM, under which ACIM provides the fund with investment advisory and management services in exchange for a single, unified management fee (the fee) per class. The agreement provides that all expenses of managing and operating the fund, except distribution and service fees, brokerage expenses, taxes, interest, fees and expenses of the independent directors (including legal counsel fees), and extraordinary expenses, will be paid by ACIM. The fee is computed and accrued daily based on each class’s daily net assets and paid monthly in arrears. The difference in the fee among the classes is a result of their separate arrangements for non-Rule 12b-1 shareholder services. It is not the result of any difference in advisory or custodial fees or other expenses related to the management of the fund’s assets, which do not vary by class. The rate of the fee is determined by applying a fee rate calculation formula. This formula takes into account the fund’s assets as well as certain assets, if any, of other clients of the investment advisor outside the American Century Investments family of funds (such as subadvised funds and separate accounts) that use very similar investment teams and strategies (strategy assets). The investment advisor will waive the portion of the fund’s management fee equal to the expenses attributable to the management fees of the American Century Investments funds in which the fund invests. The amount of this waiver will fluctuate depending on the fund’s daily allocation to other American Century Investments funds. This waiver is expected to remain in effect permanently and it cannot be terminated without the approval of the Board of Directors. During the period ended July 31, 2019, the investment advisor agreed to waive an additional 0.05% of the fund's management fee. The investment advisor expects this waiver to continue until July 31, 2020 and cannot terminate it prior to such date without the approval of the Board of Directors.
The management fee schedule range and the effective annual management fee before and after waiver for each class for the period ended July 31, 2019 are as follows:
|
| | | |
| | Management Fee Schedule Range | Effective Annual Management Fee |
| | Before Waiver | After Waiver |
| Investor Class | 0.90% to 1.15% | 1.15% | 1.10% |
| I Class | 0.70% to 0.95% | 0.95% | 0.90% |
| A Class | 0.90% to 1.15% | 1.15% | 1.10% |
| C Class | 0.90% to 1.15% | 1.15% | 1.10% |
| R Class | 0.90% to 1.15% | 1.15% | 1.10% |
| R5 Class | 0.70% to 0.95% | 0.95% | 0.90% |
| R6 Class | 0.55% to 0.80% | 0.80% | 0.75% |
Distribution and Service Fees — The Board of Directors has adopted a separate Master Distribution and Individual Shareholder Services Plan for each of the A Class, C Class and R Class (collectively the plans), pursuant to Rule 12b-1 of the 1940 Act. The plans provide that the A Class will pay ACIS an annual distribution and service fee of 0.25%. The plans provide that the C Class will pay ACIS an annual distribution and service fee of 1.00%, of which 0.25% is paid for individual shareholder services and 0.75% is paid for distribution services. The plans provide that the R Class will pay ACIS an annual distribution and service fee of 0.50%. The fees are computed and accrued daily based on each class’s daily net assets and paid monthly in arrears. The fees are used to pay financial intermediaries for distribution and individual shareholder services. Fees incurred under the plans during the period ended July 31, 2019 are detailed in the Statement of Operations.
Directors' Fees and Expenses — The Board of Directors is responsible for overseeing the investment advisor’s management and operations of the fund. The directors receive detailed information about the fund and its investment advisor regularly throughout the year, and meet at least quarterly with management of the investment advisor to review reports about fund operations. The fund’s officers do not receive compensation from the fund.
Interfund Transactions — The fund may enter into security transactions with other American Century Investments funds and other client accounts of the investment advisor, in accordance with the 1940 Act rules and procedures adopted by the Board of Directors. The rules and procedures require, among other things, that these transactions be effected at the independent current market price of the security. During the period, the interfund purchases and sales were $7,678,616 and $7,335,510, respectively. The effect of interfund transactions on the Statement of Operations was $510,900 in net realized gain (loss) on investment transactions.
4. Investment Transactions
Purchases of investment securities, excluding short-term investments, for the period ended July 31, 2019 totaled $620,631,201, of which $83,691,889 represented U.S. Treasury and Government Agency obligations.
Sales of investment securities, excluding short-term investments, for the period ended July 31, 2019 totaled $766,202,803, of which $103,314,391 represented U.S. Treasury and Government Agency obligations.
5. Capital Share Transactions
Transactions in shares of the fund were as follows:
|
| | | | | | | | | | | | | | | |
| | Year ended July 31, 2019 | Eight months ended July 31, 2018(1) | Year ended November 30, 2017(2) |
| | Shares | Amount | Shares | Amount | Shares | Amount |
| Investor Class/Shares Authorized | 600,000,000 |
| | 600,000,000 |
| | 600,000,000 |
| |
| Sold | 3,876,856 |
| $ | 30,717,281 |
| 2,638,250 |
| $ | 22,420,025 |
| 8,094,319 |
| $ | 66,669,699 |
|
| Issued in reinvestment of distributions | 5,134,280 |
| 35,221,158 |
| 4,653,321 |
| 38,576,035 |
| 1,620,801 |
| 12,464,888 |
|
| Redeemed | (14,490,248 | ) | (110,897,287 | ) | (13,388,478 | ) | (113,402,517 | ) | (16,319,184 | ) | (135,602,640 | ) |
| | (5,479,112 | ) | (44,958,848 | ) | (6,096,907 | ) | (52,406,457 | ) | (6,604,064 | ) | (56,468,053 | ) |
| I Class/Shares Authorized | 150,000,000 |
| | 150,000,000 |
| | 150,000,000 |
| |
| Sold | 2,975,109 |
| 23,218,777 |
| 1,989,118 |
| 16,821,683 |
| 6,669,932 |
| 55,301,893 |
|
| Issued in reinvestment of distributions | 739,624 |
| 5,029,442 |
| 1,528,134 |
| 12,576,546 |
| 475,813 |
| 3,635,473 |
|
| Redeemed | (5,140,702 | ) | (40,362,621 | ) | (10,880,525 | ) | (89,246,816 | ) | (7,620,259 | ) | (62,541,524 | ) |
| | (1,425,969 | ) | (12,114,402 | ) | (7,363,273 | ) | (59,848,587 | ) | (474,514 | ) | (3,604,158 | ) |
| A Class/Shares Authorized | 375,000,000 |
| | 375,000,000 |
| | 375,000,000 |
| |
| Sold | 2,998,946 |
| 23,794,704 |
| 1,651,776 |
| 14,147,752 |
| 2,933,525 |
| 24,268,900 |
|
| Issued in reinvestment of distributions | 2,457,011 |
| 17,002,518 |
| 2,047,458 |
| 17,116,748 |
| 808,422 |
| 6,265,765 |
|
| Redeemed | (6,171,960 | ) | (48,346,675 | ) | (4,831,016 | ) | (41,516,656 | ) | (12,107,621 | ) | (101,126,870 | ) |
| | (716,003 | ) | (7,549,453 | ) | (1,131,782 | ) | (10,252,156 | ) | (8,365,674 | ) | (70,592,205 | ) |
| C Class/Shares Authorized | 90,000,000 |
| | 90,000,000 |
| | 90,000,000 |
| |
| Sold | 419,947 |
| 3,195,688 |
| 406,129 |
| 3,402,001 |
| 737,458 |
| 5,975,656 |
|
| Issued in reinvestment of distributions | 605,802 |
| 4,095,222 |
| 627,821 |
| 5,141,855 |
| 165,938 |
| 1,261,263 |
|
| Redeemed | (2,661,920 | ) | (20,818,745 | ) | (2,134,698 | ) | (17,934,739 | ) | (2,337,156 | ) | (19,044,858 | ) |
| | (1,636,171 | ) | (13,527,835 | ) | (1,100,748 | ) | (9,390,883 | ) | (1,433,760 | ) | (11,807,939 | ) |
| R Class/Shares Authorized | 50,000,000 |
| | 50,000,000 |
| | 50,000,000 |
| |
| Sold | 312,151 |
| 2,485,602 |
| 284,612 |
| 2,425,801 |
| 432,594 |
| 3,575,675 |
|
| Issued in reinvestment of distributions | 255,517 |
| 1,768,182 |
| 224,019 |
| 1,870,557 |
| 74,055 |
| 573,976 |
|
| Redeemed | (602,858 | ) | (4,734,465 | ) | (713,108 | ) | (6,078,840 | ) | (1,179,914 | ) | (9,716,703 | ) |
| | (35,190 | ) | (480,681 | ) | (204,477 | ) | (1,782,482 | ) | (673,265 | ) | (5,567,052 | ) |
| R5 Class/Shares Authorized | 50,000,000 |
| | 50,000,000 |
| | 50,000,000 |
| |
| Sold | 145 |
| 1,119 |
| 38 |
| 311 |
| 621 |
| 5,000 |
|
| Issued in reinvestment of distributions | 97 |
| 665 |
| 62 |
| 511 |
| — |
| — |
|
| Redeemed | (2 | ) | (15 | ) | — |
| — |
| — |
| — |
|
| | 240 |
| 1,769 |
| 100 |
| 822 |
| 621 |
| 5,000 |
|
| R6 Class/Shares Authorized | 90,000,000 |
| | 90,000,000 |
| | 90,000,000 |
| |
| Sold | 3,212,752 |
| 24,766,797 |
| 15,655,159 |
| 128,479,571 |
| 4,775,522 |
| 39,408,843 |
|
| Issued in reinvestment of distributions | 3,026,739 |
| 20,521,293 |
| 1,031,840 |
| 8,471,403 |
| 221,169 |
| 1,685,443 |
|
| Redeemed | (4,249,987 | ) | (32,599,085 | ) | (3,155,401 | ) | (26,322,908 | ) | (1,578,798 | ) | (13,317,522 | ) |
| | 1,989,504 |
| 12,689,005 |
| 13,531,598 |
| 110,628,066 |
| 3,417,893 |
| 27,776,764 |
|
| Net increase (decrease) | (7,302,701 | ) | $ | (65,940,445 | ) | (2,365,489 | ) | $ | (23,051,677 | ) | (14,132,763 | ) | $ | (120,257,643 | ) |
| |
| (1) | The fund's fiscal year end was changed from November 30 to July 31, resulting in an eight-month annual reporting period. |
| |
| (2) | April 10, 2017 (commencement of sale) through November 30, 2017 for the R5 Class. |
6. Affiliated Fund Transactions
A summary of transactions for each affiliated fund for the period ended July 31, 2019 follows (amounts in thousands):
|
| | | | | | | | | | | | | | | | | | | | | |
Affiliated Fund(1) | Beginning Value | Purchase
Cost | Sales
Cost | Change in Net Unrealized Appreciation (Depreciation) | Ending
Value | Ending
Shares | Net Realized
Gain (Loss) | Distributions
Received(2) |
| American Century Diversified Corporate Bond ETF | — |
| $ | 7,209 |
| — |
| $ | 200 |
| $ | 7,409 |
| 146 |
| — |
| $ | 101 |
|
| American Century STOXX U.S. Quality Value ETF | — |
| 3,017 |
| $ | 44 |
| (14 | ) | 2,959 |
| 74 |
| — |
| — |
|
| | — |
| $ | 10,226 |
| $ | 44 |
| $ | 186 |
| $ | 10,368 |
| 220 |
| — |
| $ | 101 |
|
| |
| (1) | Investments are funds within the American Century Investments family of funds and are considered affiliated funds. The fund does not invest in an affiliated fund for the purpose of exercising management or control; however, investments by the fund within its investment strategy may represent a significant portion of an affiliated fund's net assets. Additional information and attributes of each affiliated fund are available at americancentury.com. |
| |
| (2) | Distributions received includes distributions from net investment income and from capital gains, if any. |
7. Fair Value Measurements
The fund’s investments valuation process is based on several considerations and may use multiple inputs to determine the fair value of the investments held by the fund. In conformity with accounting principles generally accepted in the United States of America, the inputs used to determine a valuation are classified into three broad levels.
| |
| • | Level 1 valuation inputs consist of unadjusted quoted prices in an active market for identical investments. |
| |
| • | Level 2 valuation inputs consist of direct or indirect observable market data (including quoted prices for comparable investments, evaluations of subsequent market events, interest rates, prepayment speeds, credit risk, etc.). These inputs also consist of quoted prices for identical investments initially expressed in local currencies that are adjusted through translation into U.S. dollars. |
| |
| • | Level 3 valuation inputs consist of unobservable data (including a fund’s own assumptions). |
The level classification is based on the lowest level input that is significant to the fair valuation measurement. The valuation inputs are not necessarily an indication of the risks associated with investing in these securities or other financial instruments.
The following is a summary of the level classifications as of period end. The Schedule of Investments provides additional information on the fund’s portfolio holdings.
|
| | | | | | | | |
| | Level 1 | Level 2 | Level 3 |
| Assets | | | |
| Investment Securities | | | |
| Common Stocks | $ | 433,480,844 |
| $ | 161,609,784 |
| — |
|
| Corporate Bonds | — |
| 49,524,905 |
| — |
|
| U.S. Treasury Securities | — |
| 38,999,746 |
| — |
|
| U.S. Government Agency Mortgage-Backed Securities | — |
| 16,375,336 |
| — |
|
| Sovereign Governments and Agencies | — |
| 11,033,125 |
| — |
|
| Affiliated Funds | 10,367,538 |
| — |
| — |
|
| Asset-Backed Securities | — |
| 9,030,672 |
| — |
|
| Collateralized Mortgage Obligations | — |
| 7,596,348 |
| — |
|
| Collateralized Loan Obligations | — |
| 7,014,974 |
| — |
|
| Commercial Mortgage-Backed Securities | — |
| 4,164,105 |
| — |
|
| Exchange-Traded Funds | 4,002,532 |
| — |
| — |
|
| Municipal Securities | — |
| 2,669,449 |
| — |
|
| Commercial Paper | — |
| 399,993 |
| — |
|
| Warrants | — |
| 1,501 |
| — |
|
| Temporary Cash Investments | 22,401,853 |
| — |
| — |
|
| | $ | 470,252,767 |
| $ | 308,419,938 |
| — |
|
| Other Financial Instruments | | | |
| Futures Contracts | $ | 132,946 |
| $ | 7,880 |
| — |
|
| Swap Agreements | — |
| 354,136 |
| — |
|
| Forward Foreign Currency Exchange Contracts | — |
| 970,672 |
| — |
|
| | $ | 132,946 |
| $ | 1,332,688 |
| — |
|
| | | | |
| Liabilities | | | |
| Other Financial Instruments | | | |
| Futures Contracts | $ | 9,422 |
| $ | 17,905 |
| — |
|
| Forward Foreign Currency Exchange Contracts | — |
| 549,736 |
| — |
|
| | $ | 9,422 |
| $ | 567,641 |
| — |
|
8. Derivative Instruments
Credit Risk — The fund is subject to credit risk in the normal course of pursuing its investment objectives. The value of a bond generally declines as the credit quality of its issuer declines. Credit default swap agreements enable a fund to buy/sell protection against a credit event of a specific issuer or index. A fund may attempt to enhance returns by selling protection or attempt to mitigate credit risk by buying protection. The buyer/seller of credit protection against a security or basket of securities may pay/receive an up-front or periodic payment to compensate for/against potential default events. Changes in value, including the periodic amounts of interest to be paid or received on swap agreements, are recorded as unrealized appreciation (depreciation) on swap agreements. Upon entering into a centrally cleared swap, a fund is required to deposit cash or securities (initial margin) with a financial intermediary in an amount equal to a certain percentage of the notional amount. Subsequent payments (variation margin) are made or received daily, in cash, by a fund. The variation margin is equal to the daily change in the value and is a component of unrealized gains and losses. Realized gain or loss is recorded upon receipt or payment of a periodic settlement or termination of swap agreements. Net realized and unrealized gains or losses occurring during the holding period of swap agreements are a component of net realized gain (loss) on swap agreement transactions and change in net unrealized appreciation (depreciation) on swap agreements, respectively. The risks of entering into swap agreements include the possible lack of liquidity, failure of the counterparty to meet its obligations, and that there may be unfavorable changes in the underlying investments or instruments. The fund's average notional amount held during the period was $4,579,304.
Equity Price Risk — The fund is subject to equity price risk in the normal course of pursuing its investment objectives. A fund may enter into futures contracts based on an equity index in order to manage its exposure to changes in market conditions. A fund may purchase futures contracts to gain exposure to increases in market value or sell futures contracts to protect against a decline in market value. Upon entering into a futures contract, a fund is required to deposit either cash or securities in an amount equal to a certain percentage of the contract value (initial margin). Subsequent payments (variation margin) are made or received daily, in cash, by a fund. The variation margin is equal to the daily change in the contract value and is recorded as unrealized gains and losses. A fund recognizes a realized gain or loss when the contract is closed or expires. Net realized and unrealized gains or losses occurring during the holding period of futures contracts are a component of net realized gain (loss) on futures contract transactions and change in net unrealized appreciation (depreciation) on futures contracts, respectively. One of the risks of entering into futures contracts is the possibility that the change in value of the contract may not correlate with the changes in value of the underlying securities. The fund's average notional exposure to equity price risk derivative instruments held during the period was $425 futures contracts purchased.
Foreign Currency Risk — The fund is subject to foreign currency exchange rate risk in the normal course of pursuing its investment objectives. The value of foreign investments held by a fund may be significantly affected by changes in foreign currency exchange rates. The dollar value of a foreign security generally decreases when the value of the dollar rises against the foreign currency in which the security is denominated and tends to increase when the value of the dollar declines against such foreign currency. A fund may enter into forward foreign currency exchange contracts to reduce a fund's exposure to foreign currency exchange rate fluctuations or to gain exposure to the fluctuations in the value of foreign currencies. The net U.S. dollar value of foreign currency underlying all contractual commitments held by a fund and the resulting unrealized appreciation or depreciation are determined daily. Realized gain or loss is recorded upon the termination of the contract. Net realized and unrealized gains or losses occurring during the holding period of forward foreign currency exchange contracts are a component of net realized gain (loss) on forward foreign currency exchange contract transactions and change in net unrealized appreciation (depreciation) on forward foreign currency exchange contracts, respectively. A fund bears the risk of an unfavorable change in the foreign currency exchange rate underlying the forward contract. Additionally, losses, up to the fair value, may arise if the counterparties do not perform under the contract terms. The fund's average U.S. dollar exposure to foreign currency risk derivative instruments held during the period was $59,122,500.
Interest Rate Risk — The fund is subject to interest rate risk in the normal course of pursuing its investment objectives. A fund may enter into futures contracts or interest rate swap agreements in order to manage its exposure to changes in market conditions. The value of bonds generally declines as interest rates rise. The risks of entering into interest rate risk derivative instruments include the possible lack of liquidity, failure of the counterparty to meet its obligations, and that there may be unfavorable changes in the underlying investments or instruments.
A fund may enter into futures contracts based on a bond index or a specific underlying security. A fund may purchase futures contracts to gain exposure to increases in market value or sell futures contracts to protect against a decline in market value. Upon entering into a futures contract, a fund will segregate cash, cash equivalents or other appropriate liquid securities on its records in amounts sufficient to meet requirements. Subsequent payments (variation margin) are made or received daily, in cash, by a fund. The variation margin is equal to the daily change in the contract value and is recorded as unrealized gains and losses. A fund recognizes a realized gain or loss when the futures contract is closed or expires. Net realized and unrealized gains or losses occurring during the holding period of futures contracts are a component of net realized gain (loss) on futures contract transactions and change in net unrealized appreciation (depreciation) on futures contracts, respectively. The fund's average notional exposure to these interest rate risk derivative instruments held during the period was $16,855,762 futures contracts purchased and $1,415,089 futures contracts sold.
A fund may enter into interest rate swap agreements to gain exposure to declines in interest rates, to protect against increases in interest rates, or to maintain its ability to generate income at prevailing interest rates. A fund will segregate cash, cash equivalents or other appropriate liquid securities on its records in amounts sufficient to meet requirements. Changes in value, including the periodic amounts of interest to be paid or received on swap agreements, are recorded as unrealized appreciation (depreciation) on swap agreements. Upon entering into a centrally cleared swap, a fund is required to deposit cash or securities (initial margin) with a financial intermediary in an amount equal to a certain percentage of the notional amount. Subsequent payments (variation margin) are made or received daily, in cash, by a fund. The variation margin is equal to the daily change in the value and is a component of unrealized gains and losses. Realized gain or loss is recorded upon receipt or payment of a periodic settlement or termination of swap agreements. Net realized and unrealized gains or losses occurring during the holding period of swap agreements are a component of net realized gain (loss) on swap agreement transactions and change in net unrealized appreciation
(depreciation) on swap agreements, respectively. The fund's average notional amount on interest rate swap agreements held during the period was $215,569.
Value of Derivative Instruments as of July 31, 2019
|
| | | | | | | | |
| | Asset Derivatives | Liability Derivatives |
| Type of Risk Exposure | Location on Statement of Assets and Liabilities | Value | Location on Statement of Assets and Liabilities | Value |
| Credit Risk | Receivable for variation margin on swap agreements* | — |
| Payable for variation margin on swap agreements* | $ | 15,890 |
|
| Equity Price Risk | Receivable for variation margin on futures contracts* | — |
| Payable for variation margin on futures contracts* | 22,500 |
|
| Foreign Currency Risk | Unrealized appreciation on forward foreign currency exchange contracts | $ | 970,672 |
| Unrealized depreciation on forward foreign currency exchange contracts | 549,736 |
|
| Interest Rate Risk | Receivable for variation margin on futures contracts* | 1,313 |
| Payable for variation margin on futures contracts* | 16,131 |
|
| | | $ | 971,985 |
| | $ | 604,257 |
|
| | | | | |
| * Included in the unrealized appreciation (depreciation) on centrally cleared swap agreements or futures contracts, as applicable, as reported in the Schedule of Investments. |
| Effect of Derivative Instruments on the Statement of Operations for the Year Ended July 31, 2019 |
| | Net Realized Gain (Loss) | Change in Net Unrealized Appreciation (Depreciation) |
| Type of Risk Exposure | Location on Statement of Operations | Value | Location on Statement of Operations | Value |
| Credit Risk | Net realized gain (loss) on swap agreement transactions | $ | 177,514 |
| Change in net unrealized appreciation (depreciation) on swap agreements | $ | 13,527 |
|
| Equity Price Risk | Net realized gain (loss) on futures contract transactions | 59,520 |
| Change in net unrealized appreciation (depreciation) on futures contracts | (9,422 | ) |
| Foreign Currency Risk | Net realized gain (loss) on forward foreign currency exchange contract transactions | 880,002 |
| Change in net unrealized appreciation (depreciation) on forward foreign currency exchange contracts | 326,175 |
|
| Interest Rate Risk | Net realized gain (loss) on futures contract transactions | 431,335 |
| Change in net unrealized appreciation (depreciation) on futures contracts | 134,249 |
|
| Interest Rate Risk | Net realized gain (loss) on swap agreement transactions | 390 |
| Change in net unrealized appreciation (depreciation) on swap agreements | 400 |
|
| | | $ | 1,548,761 |
| | $ | 464,929 |
|
9. Risk Factors
There are certain risks involved in investing in foreign securities. These risks include those resulting from political events (such as civil unrest, national elections and imposition of exchange controls), social and economic events (such as labor strikes and rising inflation), and natural disasters. Securities of foreign issuers may be less liquid and more volatile. Investing in emerging markets or a significant portion of assets in one country or region may accentuate these risks.
10. Federal Tax Information
The tax character of distributions paid during the year ended July 31, 2019, eight months ended July 31, 2018 and year ended November 30, 2017 were as follows:
|
| | | | | | | | | |
| | July 31, 2019 | July 31, 2018(1) | November 30, 2017 |
| Distributions Paid From | | | |
| Ordinary income | $ | 15,578,776 |
| $ | 26,735,774 |
| $ | 12,002,295 |
|
| Long-term capital gains | $ | 69,490,214 |
| $ | 58,602,083 |
| $ | 14,326,127 |
|
(1) The fund's fiscal year end was changed from November 30 to July 31, resulting in an eight month annual reporting period.
The book-basis character of distributions made during the year from net investment income or net realized gains may differ from their ultimate characterization for federal income tax purposes. These differences reflect the differing character of certain income items and net realized gains and losses for financial statement and tax purposes, and may result in reclassification among certain capital accounts on the financial statements.
As of period end, the federal tax cost of investments and the components of distributable earnings on a tax-basis were as follows:
|
| | | |
| Federal tax cost of investments | $ | 653,468,961 |
|
| Gross tax appreciation of investments | $ | 144,739,525 |
|
| Gross tax depreciation of investments | (19,535,781 | ) |
| Net tax appreciation (depreciation) of investments | 125,203,744 |
|
| Net tax appreciation (depreciation) on derivatives and translation of assets and liabilities in foreign currencies | (47,491 | ) |
| Net tax appreciation (depreciation) | $ | 125,156,253 |
|
| Other book-to-tax adjustments | $ | (26,892 | ) |
| Undistributed ordinary income | $ | 7,489,458 |
|
| Accumulated long-term gains | $ | 23,347,170 |
|
The difference between book-basis and tax-basis unrealized appreciation (depreciation) is attributable primarily to the tax deferral of losses on wash sales. Other book-to-tax adjustments are attributable primarily to the tax deferral of losses on straddle positions.
11. Recently Issued Accounting Standards
In March 2017, the Financial Accounting Standards Board (FASB) issued Accounting Standards Update No. 2017-08, “Receivables - Nonrefundable Fees and Other Costs (Subtopic 310-20), Premium Amortization on Purchased Callable Debt Securities” (ASU 2017-08). ASU 2017-08 amends the amortization period for certain purchased callable debt securities held at a premium, shortening such period to the earliest call date. The amendments are effective for fiscal years, and interim periods within those fiscal years, beginning after December 15, 2018. Management is currently evaluating the impact that adopting ASU 2017-08 will have on the financial statements.
|
| | | | | | | | | | | | | | | | | |
| For a Share Outstanding Throughout the Years Ended July 31 (except as noted) |
| Per-Share Data | | | | | | | | | Ratios and Supplemental Data | |
| | | Income From Investment Operations: | Distributions From: | | | Ratio to Average Net Assets of: | | |
| | Net Asset Value, Beginning of Period | Net Investment Income (Loss)(1) | Net Realized and Unrealized Gain (Loss) | Total From Investment Operations | Net Investment Income | Net Realized Gains | Total Distributions | Net Asset Value, End of Period | Total Return(2) | Operating Expenses | Operating Expenses (before expense waiver) | Net Investment Income (Loss) | Net Investment Income (Loss) (before expense waiver) | Portfolio Turnover Rate | Net Assets, End of Period (in thousands) |
| Investor Class |
| 2019 | $8.57 | 0.10 | 0.11 | 0.21 | (0.10) | (0.77) | (0.87) | $7.91 | 3.96% | 1.11% | 1.16% | 1.27% | 1.22% | 78% |
| $300,544 |
|
2018(3) | $9.04 | 0.06 | 0.28 | 0.34 | (0.12) | (0.69) | (0.81) | $8.57 | 4.05% | 1.11%(4) | 1.16%(4) | 1.10%(4) | 1.05%(4) | 58% |
| $372,601 |
|
| 2017 | $7.80 | 0.10 | 1.37 | 1.47 | (0.11) | (0.12) | (0.23) | $9.04 | 19.30% | 1.11% | 1.16% | 1.19% | 1.14% | 80% |
| $448,081 |
|
| 2016 | $8.19 | 0.09 | 0.17 | 0.26 | (0.09) | (0.56) | (0.65) | $7.80 | 3.61% | 1.11% | 1.16% | 1.23% | 1.18% | 82% |
| $438,001 |
|
| 2015 | $9.19 | 0.08 | (0.14) | (0.06) | (0.03) | (0.91) | (0.94) | $8.19 | (0.27)% | 1.13% | 1.15% | 0.98% | 0.96% | 94% |
| $492,452 |
|
| 2014 | $9.46 | 0.07 | 0.71 | 0.78 | (0.12) | (0.93) | (1.05) | $9.19 | 9.47% | 1.17% | 1.17% | 0.76% | 0.76% | 77% |
| $527,740 |
|
| I Class | | | | | | | | | | | | | |
| 2019 | $8.52 | 0.11 | 0.11 | 0.22 | (0.11) | (0.77) | (0.88) | $7.86 | 4.22% | 0.91% | 0.96% | 1.47% | 1.42% | 78% |
| $52,389 |
|
2018(3) | $9.00 | 0.07 | 0.28 | 0.35 | (0.14) | (0.69) | (0.83) | $8.52 | 4.18% | 0.91%(4) | 0.96%(4) | 1.30%(4) | 1.25%(4) | 58% |
| $68,975 |
|
| 2017 | $7.76 | 0.12 | 1.36 | 1.48 | (0.12) | (0.12) | (0.24) | $9.00 | 19.64% | 0.91% | 0.96% | 1.39% | 1.34% | 80% |
| $139,110 |
|
| 2016 | $8.16 | 0.11 | 0.15 | 0.26 | (0.10) | (0.56) | (0.66) | $7.76 | 3.71% | 0.91% | 0.96% | 1.43% | 1.38% | 82% |
| $123,699 |
|
| 2015 | $9.16 | 0.10 | (0.14) | (0.04) | (0.05) | (0.91) | (0.96) | $8.16 | (0.06)% | 0.93% | 0.95% | 1.18% | 1.16% | 94% |
| $144,546 |
|
| 2014 | $9.44 | 0.08 | 0.71 | 0.79 | (0.14) | (0.93) | (1.07) | $9.16 | 9.62% | 0.97% | 0.97% | 0.96% | 0.96% | 77% |
| $134,763 |
|
|
| | | | | | | | | | | | | | | | | |
| For a Share Outstanding Throughout the Years Ended July 31 (except as noted) |
| Per-Share Data | | | | | | | | | Ratios and Supplemental Data | |
| | | Income From Investment Operations: | Distributions From: | | | Ratio to Average Net Assets of: | | |
| | Net Asset Value, Beginning of Period | Net Investment Income (Loss)(1) | Net Realized and Unrealized Gain (Loss) | Total From Investment Operations | Net Investment Income | Net Realized Gains | Total Distributions | Net Asset Value, End of Period | Total Return(2) | Operating Expenses | Operating Expenses (before expense waiver) | Net Investment Income (Loss) | Net Investment Income (Loss) (before expense waiver) | Portfolio Turnover Rate | Net Assets, End of Period (in thousands) |
| A Class | | | | | | | | | | | | | | |
| 2019 | $8.63 | 0.08 | 0.11 | 0.19 | (0.08) | (0.77) | (0.85) | $7.97 | 3.66% | 1.36% | 1.41% | 1.02% | 0.97% | 78% |
| $168,774 |
|
2018(3) | $9.08 | 0.05 | 0.28 | 0.33 | (0.09) | (0.69) | (0.78) | $8.63 | 3.87% | 1.36%(4) | 1.41%(4) | 0.85%(4) | 0.80%(4) | 58% |
| $188,883 |
|
| 2017 | $7.84 | 0.08 | 1.37 | 1.45 | (0.09) | (0.12) | (0.21) | $9.08 | 19.02% | 1.36% | 1.41% | 0.94% | 0.89% | 80% |
| $209,181 |
|
| 2016 | $8.22 | 0.07 | 0.18 | 0.25 | (0.07) | (0.56) | (0.63) | $7.84 | 3.44% | 1.36% | 1.41% | 0.98% | 0.93% | 82% |
| $245,955 |
|
| 2015 | $9.22 | 0.06 | (0.14) | (0.08) | (0.01) | (0.91) | (0.92) | $8.22 | (0.56)% | 1.38% | 1.40% | 0.73% | 0.71% | 94% |
| $298,762 |
|
| 2014 | $9.49 | 0.05 | 0.70 | 0.75 | (0.09) | (0.93) | (1.02) | $9.22 | 9.13% | 1.42% | 1.42% | 0.51% | 0.51% | 77% |
| $346,972 |
|
| C Class | | | | | | | | | | | | | | |
| 2019 | $8.41 | 0.02 | 0.11 | 0.13 | (0.02) | (0.77) | (0.79) | $7.75 | 2.91% | 2.11% | 2.16% | 0.27% | 0.22% | 78% |
| $36,620 |
|
2018(3) | $8.85 | 0.01 | 0.27 | 0.28 | (0.03) | (0.69) | (0.72) | $8.41 | 3.36% | 2.11%(4) | 2.16%(4) | 0.10%(4) | 0.05%(4) | 58% |
| $53,503 |
|
| 2017 | $7.64 | 0.02 | 1.34 | 1.36 | (0.03) | (0.12) | (0.15) | $8.85 | 18.07% | 2.11% | 2.16% | 0.19% | 0.14% | 80% |
| $66,032 |
|
| 2016 | $8.03 | 0.02 | 0.16 | 0.18 | (0.01) | (0.56) | (0.57) | $7.64 | 2.56% | 2.11% | 2.16% | 0.23% | 0.18% | 82% |
| $67,920 |
|
| 2015 | $9.08 | —(5) | (0.14) | (0.14) | — | (0.91) | (0.91) | $8.03 | (1.27)% | 2.13% | 2.15% | (0.02)% | (0.04)% | 94% |
| $75,881 |
|
| 2014 | $9.35 | (0.02) | 0.70 | 0.68 | (0.02) | (0.93) | (0.95) | $9.08 | 8.36% | 2.17% | 2.17% | (0.24)% | (0.24)% | 77% |
| $77,937 |
|
|
| | | | | | | | | | | | | | | | | |
| For a Share Outstanding Throughout the Years Ended July 31 (except as noted) |
| Per-Share Data | | | | | | | | | Ratios and Supplemental Data | |
| | | Income From Investment Operations: | Distributions From: | | | Ratio to Average Net Assets of: | | |
| | Net Asset Value, Beginning of Period | Net Investment Income (Loss)(1) | Net Realized and Unrealized Gain (Loss) | Total From Investment Operations | Net Investment Income | Net Realized Gains | Total Distributions | Net Asset Value, End of Period | Total Return(2) | Operating Expenses | Operating Expenses (before expense waiver) | Net Investment Income (Loss) | Net Investment Income (Loss) (before expense waiver) | Portfolio Turnover Rate | Net Assets, End of Period (in thousands) |
| R Class | | | | | | | | | | | | | | |
| 2019 | $8.61 | 0.06 | 0.12 | 0.18 | (0.06) | (0.77) | (0.83) | $7.96 | 3.51% | 1.61% | 1.66% | 0.77% | 0.72% | 78% |
| $17,858 |
|
2018(3) | $9.06 | 0.03 | 0.28 | 0.31 | (0.07) | (0.69) | (0.76) | $8.61 | 3.72% | 1.61%(4) | 1.66%(4) | 0.60%(4) | 0.55%(4) | 58% |
| $19,634 |
|
| 2017 | $7.82 | 0.06 | 1.37 | 1.43 | (0.07) | (0.12) | (0.19) | $9.06 | 18.64% | 1.61% | 1.66% | 0.69% | 0.64% | 80% |
| $22,514 |
|
| 2016 | $8.20 | 0.06 | 0.17 | 0.23 | (0.05) | (0.56) | (0.61) | $7.82 | 3.18% | 1.61% | 1.66% | 0.73% | 0.68% | 82% |
| $24,678 |
|
| 2015 | $9.22 | 0.04 | (0.15) | (0.11) | — | (0.91) | (0.91) | $8.20 | (0.89)% | 1.63% | 1.65% | 0.48% | 0.46% | 94% |
| $24,106 |
|
| 2014 | $9.48 | 0.02 | 0.72 | 0.74 | (0.07) | (0.93) | (1.00) | $9.22 | 8.96% | 1.67% | 1.67% | 0.26% | 0.26% | 77% |
| $24,106 |
|
| R5 Class | | | | | | | | | | | | | | |
| 2019 | $8.53 | 0.11 | 0.10 | 0.21 | (0.11) | (0.77) | (0.88) | $7.86 | 4.08% | 0.91% | 0.96% | 1.47% | 1.42% | 78% |
| $8 |
|
2018(3) | $9.00 | 0.07 | 0.28 | 0.35 | (0.13) | (0.69) | (0.82) | $8.53 | 4.24% | 0.91%(4) | 0.96%(4) | 1.30%(4) | 1.25%(4) | 58% |
| $6 |
|
2017(6) | $8.05 | 0.08 | 0.87 | 0.95 | — | — | — | $9.00 | 11.80% | 0.91%(4) | 0.96%(4) | 1.46%(4) | 1.41%(4) | 80%(7) |
| $6 |
|
| R6 Class | | | | | | | | | | | | | | |
| 2019 | $8.51 | 0.13 | 0.10 | 0.23 | (0.13) | (0.77) | (0.90) | $7.84 | 4.27% | 0.76% | 0.81% | 1.62% | 1.57% | 78% |
| $200,468 |
|
2018(3) | $8.99 | 0.09 | 0.27 | 0.36 | (0.15) | (0.69) | (0.84) | $8.51 | 4.36% | 0.76%(4) | 0.81%(4) | 1.45%(4) | 1.40%(4) | 58% |
| $200,589 |
|
| 2017 | $7.76 | 0.13 | 1.36 | 1.49 | (0.14) | (0.12) | (0.26) | $8.99 | 19.70% | 0.76% | 0.81% | 1.54% | 1.49% | 80% |
| $90,339 |
|
| 2016 | $8.15 | 0.12 | 0.16 | 0.28 | (0.11) | (0.56) | (0.67) | $7.76 | 4.02% | 0.76% | 0.81% | 1.58% | 1.53% | 82% |
| $51,430 |
|
| 2015 | $9.16 | 0.11 | (0.15) | (0.04) | (0.06) | (0.91) | (0.97) | $8.15 | 0.00% | 0.78% | 0.80% | 1.33% | 1.31% | 94% |
| $18,544 |
|
| 2014 | $9.44 | 0.08 | 0.72 | 0.80 | (0.15) | (0.93) | (1.08) | $9.16 | 9.82% | 0.80% | 0.80% | 1.13% | 1.13% | 77% |
| $5,136 |
|
|
| | | | |
| Notes to Financial Highlights | | |
| |
| (1) | Computed using average shares outstanding throughout the period. |
| |
| (2) | Total returns are calculated based on the net asset value of the last business day and do not reflect applicable sales charges, if any. Total returns for periods less than one year are not annualized. |
| |
| (3) | December 1, 2017 through July 31, 2018. The fund's fiscal year end was changed from November 30 to July 31, resulting in an eight-month annual reporting period. For the years before July 31, 2018, the fund's fiscal year end was November 30. |
| |
| (5) | Per-share amount was less than $0.005. |
| |
| (6) | April 10, 2017 (commencement of sale) through November 30, 2017. |
| |
| (7) | Portfolio turnover is calculated at the fund level. Percentage indicated was calculated for the year ended November 30, 2017. |
See Notes to Financial Statements.
|
|
| Report of Independent Registered Public Accounting Firm |
To the Shareholders and the Board of Directors of American Century Strategic Asset Allocations, Inc.:
Opinion on the Financial Statements and Financial Highlights
We have audited the accompanying statement of assets and liabilities, including the schedule of investments, of Strategic Allocation: Aggressive Fund, one of the funds constituting the American Century Strategic Asset Allocations, Inc. (the “Fund”), as of July 31, 2019; the related statement of operations for the year then ended; the statements of changes in net assets for the year then ended, the period December 1, 2017 through July 31, 2018, and for the year ended November 30, 2017; the financial highlights for the year then ended, the period December 1, 2017 through July 31, 2018 and for the years ended November 30, 2017, 2016, 2015, and 2014; and the related notes. In our opinion, the financial statements and financial highlights present fairly, in all material respects, the financial position of Strategic Allocation: Aggressive Fund of the American Century Strategic Asset Allocations, Inc. as of July 31, 2019; the results of its operations for the year then ended; the changes in its net assets for the year then ended, the period December 1, 2017 through July 31, 2018, and for the year ended November 30, 2017; and the financial highlights for the year then ended, the period December 1, 2017 through July 31, 2018 and for the years ended November 30, 2017, 2016, 2015, and 2014; in conformity with accounting principles generally accepted in the United States of America.
Basis for Opinion
These financial statements and financial highlights are the responsibility of the Fund's management. Our responsibility is to express an opinion on the Fund’s financial statements and financial highlights based on our audits. We are a public accounting firm registered with the Public Company Accounting Oversight Board (United States) (PCAOB) and are required to be independent with respect to the Fund in accordance with the U.S. federal securities laws and the applicable rules and regulations of the Securities and Exchange Commission and the PCAOB.
We conducted our audits in accordance with the standards of the PCAOB. Those standards require that we plan and perform the audit to obtain reasonable assurance about whether the financial statements and financial highlights are free of material misstatement, whether due to error or fraud. The Fund is not required to have, nor were we engaged to perform, an audit of its internal control over financial reporting. As part of our audits we are required to obtain an understanding of internal control over financial reporting but not for the purpose of expressing an opinion on the effectiveness of the Fund’s internal control over financial reporting. Accordingly, we express no such opinion.
Our audits included performing procedures to assess the risks of material misstatement of the financial statements and financial highlights, whether due to error or fraud, and performing procedures that respond to those risks. Such procedures included examining, on a test basis, evidence regarding the amounts and disclosures in the financial statements and financial highlights. Our audits also included evaluating the accounting principles used and significant estimates made by management, as well as evaluating the overall presentation of the financial statements and financial highlights. Our procedures included confirmation of securities owned as of July 31, 2019, by correspondence with the custodian and brokers; when replies were not received from brokers, we performed other auditing procedures. We believe that our audits provide a reasonable basis for our opinion.
DELOITTE & TOUCHE LLP
Kansas City, Missouri
September 18, 2019
We have served as the auditor of one or more American Century investment companies since 1997.
The Board of Directors
The individuals listed below serve as directors of the funds. Each director will continue to serve in this capacity until death, retirement, resignation or removal from office. The board has adopted a mandatory retirement age for directors who are not “interested persons,” as that term is defined in the Investment Company Act (independent directors). Independent directors shall retire by December 31 of the year in which they reach their 75th birthday.
Mr. Thomas is an “interested person” because he currently serves as President and Chief Executive Officer of American Century Companies, Inc. (ACC), the parent company of American Century Investment Management, Inc. (ACIM or the advisor). The other directors (more than three-fourths of the total number) are independent. They are not employees, directors or officers of, and have no financial interest in, ACC or any of its wholly owned, direct or indirect, subsidiaries, including ACIM, American Century Investment Services, Inc. (ACIS) and American Century Services, LLC (ACS), and they do not have any other affiliations, positions or relationships that would cause them to be considered “interested persons” under the Investment Company Act. The directors serve in this capacity for seven (in the case of Jonathan S. Thomas, 16; and Stephen E. Yates, 8) registered investment companies in the American Century Investments family of funds.
The following table presents additional information about the directors. The mailing address for each director is 4500 Main Street, Kansas City, Missouri 64111.
|
| | | | | |
Name
(Year of Birth) | Position(s) Held with Funds | Length of Time Served | Principal Occupation(s) During Past 5 Years | Number of American Century Portfolios Overseen by Director | Other Directorships Held During Past 5 Years |
| Independent Directors |
|
|
| Thomas W. Bunn (1953) | Director | Since 2017 | Retired | 67 | SquareTwo Financial; Barings (formerly Babson Capital Funds Trust) (2013 to 2016) |
Chris H. Cheesman
(1962)
| Director | Since 2019
| Retired. Senior Vice President & Chief Audit Executive, AllianceBernstein (1999 to 2018)
| 67 | None |
Barry Fink
(1955) | Director | Since 2012 (independent since 2016) | Retired | 67 | None |
Rajesh K. Gupta
(1960)
| Director | Since 2019
| Partner Emeritus, SeaCrest Investment Management and SeaCrest Wealth Management (2019 to Present); Chief Executive Officer and Chief Investment Officer, SeaCrest Investment Management (2006 to 2019); Chief Executive Officer and Chief Investment Officer, SeaCrest Wealth Management (2008 to 2019)
| 67 | None |
|
| | | | | |
Name
(Year of Birth) | Position(s) Held with Funds | Length of Time Served | Principal Occupation(s) During Past 5 Years | Number of American Century Portfolios Overseen by Director | Other Directorships Held During Past 5 Years |
| Independent Directors |
|
|
Lynn Jenkins
(1963)
| Director | Since 2019
| United States Representative, U.S. House of Representatives (2009 to 2018) | 67 | MGP Ingredients, Inc. |
Jan M. Lewis
(1957) | Director | Since 2011 | Retired | 67 | None |
John R. Whitten
(1946) | Director | Since 2008 | Retired | 67 | Rudolph Technologies, Inc. |
Stephen E. Yates
(1948) | Director and Chairman of the Board | Since 2012 (Chairman since 2018) | Retired | 72 | None |
| Interested Director |
|
Jonathan S. Thomas
(1963) | Director and President | Since 2007 | President and Chief Executive Officer, ACC (2007 to present). Also serves as Chief Executive Officer, ACS; Executive Vice President, ACIM; Director, ACC, ACIM and other ACC subsidiaries | 117 | BioMed Valley Discoveries, Inc. |
The Statement of Additional Information has additional information about the fund's directors and is available without charge, upon request, by calling 1-800-345-2021.
Officers
The following table presents certain information about the executive officers of the funds. Each officer serves as an officer for each of the 16 (in the case of Robert J. Leach, 15) investment companies in the American Century family of funds. No officer is compensated for his or her service as an officer of the funds. The listed officers are interested persons of the funds and are appointed or re-appointed on an annual basis. The mailing address for each officer listed below is 4500 Main Street, Kansas City, Missouri 64111.
|
| | |
Name
(Year of Birth) | Offices with the Funds | Principal Occupation(s) During the Past Five Years |
Jonathan S. Thomas
(1963) | Director and President since 2007 | President and Chief Executive Officer, ACC (2007 to present). Also serves as Chief Executive Officer, ACS; Executive Vice President, ACIM; Director, ACC, ACIM and other ACC subsidiaries |
R. Wes Campbell
(1974) | Chief Financial Officer and Treasurer since 2018
| Investment Operations and Investment Accounting, ACS (2000 to present)
|
Amy D. Shelton
(1964) | Chief Compliance Officer and Vice President since 2014 | Chief Compliance Officer, American Century funds, (2014 to present); Chief Compliance Officer, ACIM (2014 to present); Chief Compliance Officer, ACIS (2009 to present). Also serves as Vice President, ACIS |
Charles A. Etherington
(1957) | General Counsel since 2007 and Senior Vice President since 2006 | Attorney, ACC (1994 to present); Vice President, ACC (2005 to present); General Counsel, ACC (2007 to present). Also serves as General Counsel, ACIM, ACS, ACIS and other ACC subsidiaries; and Senior Vice President, ACIM and ACS |
C. Jean Wade
(1964) | Vice President since 2012 | Senior Vice President, ACS (2017 to present); Vice President, ACS (2000 to 2017) |
Robert J. Leach
(1966) | Vice President since 2006 | Vice President, ACS (2000 to present) |
David H. Reinmiller
(1963) | Vice President since 2000 | Attorney, ACC (1994 to present). Also serves as Vice President, ACIM and ACS |
Ward D. Stauffer
(1960) | Secretary since 2005 | Attorney, ACC (2003 to present) |
|
|
| Approval of Management Agreement |
At a meeting held on June 26, 2019, the Fund’s Board of Directors (the "Board") unanimously approved the renewal of the management agreement pursuant to which American Century Investment Management, Inc. (the “Advisor”) acts as the investment advisor for the Fund. Under Section 15(c) of the Investment Company Act, contracts for investment advisory services are required to be reviewed, evaluated, and approved by a majority of a fund’s directors (the “Directors”), including a majority of the independent Directors, each year.
Prior to its consideration of the renewal of the management agreement, the Directors requested and reviewed extensive data and information compiled by the Advisor and certain independent providers of evaluation data concerning the Fund and the services provided to the Fund by the Advisor. This review was in addition to the oversight and evaluation undertaken by the Board and its committees on a continual basis and the information received was supplemental to the extensive information that the Board and its committees receive and consider throughout the year.
In connection with its consideration of the renewal of the management agreement, the Board’s review and evaluation of the services provided by the Advisor included, but was not limited to, the following:
| |
| • | the nature, extent, and quality of investment management, shareholder services, and other services provided and to be provided to the Fund; |
| |
| • | the wide range of other programs and services provided and to be provided to the Fund and its shareholders on a routine and non-routine basis; |
| |
| • | the investment performance of the Fund, including data comparing the Fund's performance to appropriate benchmarks and/or a peer group of other mutual funds with similar investment objectives and strategies; |
| |
| • | the cost of owning the Fund compared to the cost of owning similar funds; |
| |
| • | the compliance policies, procedures, and regulatory experience of the Advisor and the Fund's service providers; |
| |
| • | financial data showing the cost of services provided to the Fund, the profitability of the Fund to the Advisor, and the overall profitability of the Advisor; |
| |
| • | strategic plans of the Advisor; |
| |
| • | any economies of scale associated with the Advisor’s management of the Fund and other accounts; |
| |
| • | services provided and charges to the Advisor's other investment management clients; |
| |
| • | acquired fund fees and expenses; |
| |
| • | payments and practices in connection with financial intermediaries holding shares of the Fund and the services provided by intermediaries in connection therewith; and |
| |
| • | any collateral benefits derived by the Advisor from the management of the Fund. |
The Directors held three in-person meetings and one telephonic meeting to review and discuss the information provided. The independent Directors also reviewed responses to supplemental information requests provided by the Directors to the Advisor and held active discussions with the Advisor regarding the renewal of the management agreement. The independent Directors had the benefit of the advice of their independent counsel throughout the process.
Factors Considered
The Directors considered all of the information provided by the Advisor, the independent data providers, and independent counsel in connection with the approval. They determined that the information was sufficient for them to evaluate the management agreement for the Fund. In connection with their review, the Directors did not identify any single factor as being all-important or
controlling, and each Director may have attributed different levels of importance to different factors. In deciding to renew the management agreement, the Board based its decision on a number of factors, including without limitation the following:
Nature, Extent and Quality of Services — Generally. Under the management agreement, the Advisor is responsible for providing or arranging for all services necessary for the operation of the Fund. The Board noted that the Advisor provides or arranges at its own expense a wide variety of services including without limitation the following:
| |
| • | portfolio research and security selection |
| |
| • | daily valuation of the Fund’s portfolio |
| |
| • | shareholder servicing and transfer agency, including shareholder confirmations, recordkeeping, and communications |
| |
| • | legal services (except the independent Directors’ counsel) |
| |
| • | regulatory and portfolio compliance |
| |
| • | marketing and distribution (except amounts paid by the Fund under Rule 12b-1 plans) |
The Board noted that many of these services have expanded over time in terms of both quantity and complexity in response to shareholder demands, competition in the industry, changing distribution channels, and the changing regulatory environment.
Investment Management Services. The nature of the investment management services provided to the Fund is quite complex and allows Fund shareholders access to professional money management, instant diversification of their investments within an asset class, the opportunity to easily diversify among asset classes by investing in or exchanging among various American Century Investments funds, and liquidity. In evaluating investment performance, the Board expects the Advisor to manage the Fund in accordance with its investment objectives and approved strategies. Further, the Directors recognize that the Advisor has an obligation to monitor trading activities, and in particular to seek the best execution of fund trades, and to evaluate the use of and payment for research. In providing these services, the Advisor utilizes teams of investment professionals (portfolio managers, analysts, research assistants, and securities traders) who require extensive information technology, research, training, compliance, and other systems to conduct their business. The Board, directly and through its Fund Performance Review Committee, provides oversight of the investment performance process. It regularly reviews investment performance information for the Fund, together with comparative information for appropriate benchmarks and/or peer groups of similarly-managed funds, over different time horizons. The Directors also review investment performance information during the management agreement renewal process. If performance concerns are identified, the Fund receives special reviews until performance improves, during which the Board discusses with the Advisor the reasons for such results (e.g., market conditions, security selection) and any efforts being undertaken to improve performance. The Fund’s performance was above its benchmark for the five-year period and below its benchmark for the one-, three-, and ten-year periods reviewed by the Board. The Board found the investment management services provided by the Advisor to the Fund to be satisfactory and consistent with the management agreement.
Shareholder and Other Services. Under the management agreement, the Advisor provides the Fund with a comprehensive package of transfer agency, shareholder, and other services. The Board, directly and through various committees of the Board, regularly reviews reports and evaluations of such services at its regular meetings. These reports include, but are not limited to, information regarding the operational efficiency and accuracy of the shareholder and transfer agency services provided, staffing levels, shareholder satisfaction, technology support (including cyber security), new products and services offered to Fund shareholders, securities trading
activities, portfolio valuation services, auditing services, and legal and operational compliance activities. The Board found the services provided by the Advisor to the Fund under the management agreement to be competitive and of high quality.
Costs of Services and Profitability. The Advisor provides detailed information concerning its cost of providing various services to the Fund, its profitability in managing the Fund (pre- and post-distribution), its overall profitability, and its financial condition. The Directors have reviewed with the Advisor the methodology used to prepare this financial information. This information is considered in evaluating the Advisor’s financial condition, its ability to continue to provide services under the management agreement, and the reasonableness of the current management fee. The Board concluded that the Advisor’s profits were reasonable in light of the services provided to the Fund.
Ethics. The Board generally considers the Advisor’s commitment to providing quality services to shareholders and to conducting its business ethically. They noted that the Advisor’s practices generally meet or exceed industry best practices.
Economies of Scale. The Board also reviewed information provided by the Advisor regarding the possible existence of economies of scale in connection with the management of the Fund. The Board concluded that economies of scale are difficult to measure and predict with precision, especially on a fund-by-fund basis. The Board concluded that the Advisor is appropriately sharing economies of scale through its competitive fee structure, offering competitive fees from fund inception, and through reinvestment in its business to provide shareholders additional content and services. The Board also noted that economies of scale are shared with the Fund and its shareholders through management fee breakpoints that serve to reduce the effective management fee as the assets of the Fund grow.
Comparison to Other Funds’ Fees. The management agreement provides that the Fund pays the Advisor a single, all-inclusive (or unified) management fee for providing all services necessary for the management and operation of the Fund, other than brokerage expenses, expenses attributable to short sales, taxes, interest, extraordinary expenses, fees and expenses of the Fund’s independent Directors (including their independent legal counsel), and expenses incurred in connection with the provision of shareholder services and distribution services under a plan adopted pursuant to Rule 12b-1 under the Investment Company Act. Under the unified fee structure, the Advisor is responsible for providing all investment advisory, custody, audit, administrative, compliance, recordkeeping, marketing and shareholder services, or arranging and supervising third parties to provide such services. By contrast, most other funds are charged a variety of fees, including an investment advisory fee, a transfer agency fee, an administrative fee, distribution charges, and other expenses. Other than their investment advisory fees and any applicable Rule 12b-1 distribution fees, all other components of the total fees charged by these other funds may be increased without shareholder approval. The Board believes the unified fee structure is a benefit to Fund shareholders because it clearly discloses to shareholders the cost of owning Fund shares, and, since the unified fee cannot be increased without a vote of Fund shareholders, it shifts to the Advisor the risk of increased costs of operating the Fund and provides a direct incentive to minimize administrative inefficiencies. Part of the Board’s analysis of fee levels involves reviewing certain evaluative data compiled by an independent provider comparing the Fund’s unified fee to the total expense ratios of its peers. The unified fee charged to shareholders of the Fund was above the median of the total expense ratios of the Fund’s peer expense universe and was within the range of its peer expense group. The Board and the Advisor agreed to a temporary reduction of the Fund's annual unified management fee of 0.05% (e.g., the Investor Class unified fee will be reduced from 1.15% to 1.10%) for at least one year, beginning August 1, 2019. The Board concluded that the management fee paid by the Fund to the Advisor under the management agreement is reasonable in light of the services provided to the Fund.
Comparison to Fees and Services Provided to Other Clients of the Advisor. The Directors also requested and received information from the Advisor concerning the nature of the services, fees, costs, and profitability of its advisory services to advisory clients other than the Fund. They
observed that these varying types of client accounts require different services and involve different regulatory and entrepreneurial risks than the management of the Fund. The Board analyzed this information and concluded that the fees charged and services provided to the Fund were reasonable by comparison.
Payments to Intermediaries. The Directors also requested and received a description of payments made to intermediaries by the Fund and the Advisor and services provided in response thereto. These payments include various payments made by the Fund or the Advisor to different types of intermediaries and recordkeepers for distribution and service activities provided for the Fund. The Board reviewed such information and received representations from the Advisor that all such payments by the Fund were made pursuant to the Fund's Rule 12b-1 Plan and that all such payments by the Advisor were made from the Advisor’s resources and reasonable profits. The Board found such payments to be reasonable in scope and purpose.
Collateral or “Fall-Out” Benefits Derived by the Advisor. The Board considered the existence of collateral benefits the Advisor may receive as a result of its relationship with the Fund. They concluded that the Advisor’s primary business is managing mutual funds and it generally does not use fund or shareholder information to generate profits in other lines of business, and therefore does not derive any significant collateral benefits from them. The Board noted that additional assets from other clients may offer the Advisor some benefit from increased leverage with service providers and counterparties. Additionally, the Advisor may receive proprietary research from broker-dealers that execute fund portfolio transactions, which the Board concluded is likely to benefit other clients of the Advisor, as well as Fund shareholders. The Board also determined that the Advisor is able to provide investment management services to certain clients other than the Fund, at least in part, due to its existing infrastructure built to serve the fund complex. The Board concluded that appropriate allocation methodologies had been employed to assign resources and the cost of those resources to these other clients and, where expressly provided, these other client assets may be included with the assets of the Fund to determine breakpoints in the management fee schedule.
Existing Relationship. The Board also considered whether there was any reason for not continuing the existing arrangement with the Advisor. In this regard, the Board was mindful of the potential disruptions of the Fund’s operations and various risks, uncertainties, and other effects that could occur as a result of a decision not to continue such relationship. In particular, the Board recognized that most shareholders have invested in the Fund on the strength of the Advisor’s industry standing and reputation and in the expectation that the Advisor will have a continuing role in providing advisory services to the Fund.
Conclusion of the Directors. As a result of this process, the Board, including all of the independent Directors, taking into account all of the factors discussed above and the information provided by the Advisor and others in connection with its review and throughout the year, determined that the management fee is fair and reasonable in light of the services provided and that the investment management agreement between the Fund and the Advisor should be renewed.
Retirement Account Information
As required by law, distributions you receive from certain retirement accounts are subject to federal income tax withholding, unless you elect not to have withholding apply*. Tax will be withheld on the total amount withdrawn even though you may be receiving amounts that are not subject to withholding, such as nondeductible contributions. In such case, excess amounts of withholding could occur. You may adjust your withholding election so that a greater or lesser amount will be withheld.
If you don’t want us to withhold on this amount, you must notify us to not withhold the federal income tax. You may notify us in writing or in certain situations by telephone or through other electronic means. For systematic withdrawals, your withholding election will remain in effect until revoked or changed by filing a new election. You have the right to revoke your election at any time and change your withholding percentage for future distributions.
Remember, even if you elect not to have income tax withheld, you are liable for paying income tax on the taxable portion of your withdrawal. If you elect not to have income tax withheld or you don’t have enough income tax withheld, you may be responsible for payment of estimated tax. You may incur penalties under the estimated tax rules if your withholding and estimated tax payments are not sufficient. You can reduce or defer the income tax on a distribution by directly or indirectly rolling such distribution over to another IRA or eligible plan. You should consult your tax advisor for additional information.
State tax will be withheld if, at the time of your distribution, your address is within one of the mandatory withholding states and you have federal income tax withheld (or as otherwise required by state law). State taxes will be withheld from your distribution in accordance with the respective state rules.
*Some 403(b), 457 and qualified retirement plan distributions may be subject to 20% mandatory withholding, as they are subject to special tax and withholding rules. Your plan administrator or plan sponsor is required to provide you with a special tax notice explaining those rules at the time you request a distribution. If applicable, federal and/or state taxes may be withheld from your distribution amount.
Proxy Voting Policies
A description of the policies that the fund's investment advisor uses in exercising the voting rights associated with the securities purchased and/or held by the fund is available without charge, upon request, by calling 1-800-345-2021. It is also available on the "About Us" page of American Century Investments’ website at americancentury.com and on the Securities and Exchange Commission’s website at sec.gov. Information regarding how the investment advisor voted proxies relating to portfolio securities during the most recent 12-month period ended June 30 is available on the "About Us" page at americancentury.com. It is also available at sec.gov.
Quarterly Portfolio Disclosure
The fund files its complete schedule of portfolio holdings with the Securities and Exchange Commission (SEC) for the first and third quarters of each fiscal year on Form N-Q or as an exhibit to its reports on Form N-PORT. The fund’s Forms N-Q and Form N-PORT reports are available on the SEC’s website at sec.gov. The fund also makes its complete schedule of portfolio holdings for the most recent quarter of its fiscal year available on its website at americancentury.com and, upon request, by calling 1-800-345-2021.
Other Tax Information
The following information is provided pursuant to provisions of the Internal Revenue Code.
The fund hereby designates up to the maximum amount allowable as qualified dividend income for the fiscal year ended July 31, 2019.
For corporate taxpayers, the fund hereby designates $4,471,277, or up to the maximum amount allowable, of ordinary income distributions paid during the fiscal year ended July 31, 2019 as qualified for the corporate dividends received deduction.
The fund hereby designates $70,063,994, or up to the maximum amount allowable, as long-term capital gain distributions (20% rate gain distributions) for the fiscal year ended July 31, 2019.
The fund hereby designates $6,036,517 as qualified short-term capital gain distributions for purposes of Internal Revenue Code Section 871 for the fiscal year ended July 31, 2019.
The fund utilized earnings and profits of $767,457 distributed to shareholders on redemption of shares as part of the dividends paid deduction (tax equalization).
|
| | |
| |
| | | |
| Contact Us | americancentury.com | |
| Automated Information Line | 1-800-345-8765 | |
| Investor Services Representative | 1-800-345-2021 or 816-531-5575 | |
| Investors Using Advisors | 1-800-378-9878 | |
| Business, Not-For-Profit, Employer-Sponsored Retirement Plans | 1-800-345-3533 | |
| Banks and Trust Companies, Broker-Dealers, Financial Professionals, Insurance Companies | 1-800-345-6488 | |
| Telecommunications Relay Service for the Deaf | 711 | |
| | | |
| American Century Strategic Asset Allocations, Inc. | |
| | | |
Investment Advisor: American Century Investment Management, Inc. Kansas City, Missouri | |
| | | |
| This report and the statements it contains are submitted for the general information of our shareholders. The report is not authorized for distribution to prospective investors unless preceded or accompanied by an effective prospectus. | |
| | | |
©2019 American Century Proprietary Holdings, Inc. All rights reserved.
CL-ANN-91037 1909 | |
|
| |
| | |
| | Annual Report |
| | |
| | July 31, 2019 |
| | |
| | Strategic Allocation: Conservative Fund |
| | Investor Class (TWSCX) |
| | I Class (ACCIX) |
| | A Class (ACCAX) |
| | C Class (AACCX) |
| | R Class (AACRX) |
| | R5 Class (AACGX) |
| | R6 Class (AACDX) |
Beginning on January 1, 2021, as permitted by regulations adopted by the Securities and Exchange Commission, paper copies of the fund’s shareholder reports like this one will no longer be sent by mail, unless you specifically request paper copies of the reports from the fund or from your financial intermediary, such as a broker-dealer or bank. Instead, the reports will be made available on a website, and you will be notified by mail each time a report is posted and provided with a website link to access the report.
If you already elected to receive shareholder reports electronically, you will not be affected by this change and you need not take any action. You may elect to receive shareholder reports and other communications from the fund or your financial intermediary electronically by calling or sending an email request to your appropriate contacts as listed on the back cover of this report.
You may elect to receive all future reports in paper free of charge. You can inform the fund or your financial intermediary that you wish to continue receiving paper copies of your shareholder reports by calling or sending an email request to your appropriate contacts as listed on the back cover of this report. Your election to receive reports in paper will apply to all funds held with the fund complex/your financial intermediary.
|
| | |
| President’s Letter | 2 |
|
| Performance | 3 |
|
| Portfolio Commentary | |
|
| Fund Characteristics | |
|
| Shareholder Fee Example | |
|
| Schedule of Investments | |
|
| Statement of Assets and Liabilities | |
|
| Statement of Operations | |
|
| Statement of Changes in Net Assets | |
|
| Notes to Financial Statements | |
|
| Financial Highlights | |
|
| Report of Independent Registered Public Accounting Firm | |
|
| Management | |
|
| Approval of Management Agreement | |
|
| Additional Information | |
|
Any opinions expressed in this report reflect those of the author as of the date of the report, and do not necessarily represent the opinions of American Century Investments® or any other person in the American Century Investments organization. Any such opinions are subject to change at any time based upon market or other conditions and American Century Investments disclaims any responsibility to update such opinions. These opinions may not be relied upon as investment advice and, because investment decisions made by American Century Investments funds are based on numerous factors, may not be relied upon as an indication of trading intent on behalf of any American Century Investments fund. Security examples are used for representational purposes only and are not intended as recommendations to purchase or sell securities. Performance information for comparative indices and securities is provided to American Century Investments by third party vendors. To the best of American Century Investments’ knowledge, such information is accurate at the time of printing.
Jonathan Thomas
Dear Investor:
Thank you for reviewing this annual report for the period ended July 31, 2019. Annual reports help convey important details about fund returns, including market factors that affected performance. For additional investment and market insights, please visit our website, americancentury.com.
Stocks Advanced Amid Volatile Climate
Most broad U.S. and global stock indices ended the year with gains. However, these positive results masked wide performance swings. For example, U.S. stocks, as measured by the S&P 500 Index, returned -3.00% in the first half of the period and 11.32% in the second half, leaving the index up 7.99% for the 12 months. Global stocks, as measured by the MSCI All Country World Index, returned -4.71% in the first half, 8.04% in the second half and 2.95% overall. For fixed-income securities, the path to positive performance was smoother, and U.S. and global bonds gained 8.08% and 5.73%, respectively, for the 12 months, according to the Bloomberg Barclays U.S. Aggregate Bond and Global Aggregate Bond indices.
Fed’s Flip Fueled Investor Optimism
Early in the period, mounting concerns about slowing global economic and earnings growth, tariffs and Federal Reserve (Fed) policy soured investor sentiment. After raising rates in September, the Fed hiked again in December and delivered a surprisingly bullish rate-hike outlook that fueled a steep sell-off among riskier assets. Meanwhile, the risk-off climate sparked a flight to quality, and government bond yields plunged.
A key policy pivot from the Fed helped improve investor sentiment beginning in early 2019. The central bank abruptly ended its rate-hike campaign and adopted a dovish tone amid moderating global growth and inflation. Additionally, investors’ worst-case fears about growth, trade and corporate earnings generally eased, which also aided stocks. At the same time, government bond yields continued to fall on moderating global growth data, muted inflation and accommodative central bank policy, including the Fed’s July rate cut. This backdrop supported continued gains for bonds and other interest rate-sensitive assets.
Looking ahead, we expect volatility to remain a formidable factor as investors react to global growth and trade trends, central bank policy and geopolitical developments. We believe this scenario underscores the importance of using professionally managed portfolios in pursuit of investment goals. We appreciate your continued trust and confidence in us.
Sincerely,
Jonathan Thomas
President and Chief Executive Officer
American Century Investments
|
| | | | | | |
| Total Returns as of July 31, 2019 |
| | | | Average Annual Returns | |
| | Ticker Symbol | 1 year | 5 years | 10 years | Since Inception | Inception Date |
| Investor Class | TWSCX | 4.55% | 4.51% | 6.55% | — | 2/15/96 |
| S&P 500 Index | — | 7.99% | 11.33% | 14.02% | — | — |
| Bloomberg Barclays U.S. Aggregate Bond Index | — | 8.08% | 3.04% | 3.75% | — | — |
| Bloomberg Barclays U.S. 1-3 Month Treasury Bill Index | — | 2.30% | 0.86% | 0.47% | — | — |
| I Class | ACCIX | 4.57% | 4.72% | 6.76% | — | 8/1/00 |
| A Class | ACCAX | | | | | 10/2/96 |
| No sales charge | | 4.29% | 4.30% | 6.29% | — | |
| With sales charge | | -1.78% | 3.07% | 5.65% | — | |
| C Class | AACCX | 3.43% | 3.50% | 5.49% |
| 9/30/04 |
| R Class | AACRX | 3.86% | 4.00% | 6.01% | — | 3/31/05 |
| R5 Class | AACGX | 4.75% | — | — | 5.96% | 4/10/17 |
| R6 Class | AACDX | 4.91% | 4.91% | — | 5.42% | 7/26/13 |
Average annual returns since inception are presented when ten years of performance history is not available.
Fund returns would have been lower if a portion of the fees had not been waived.
Sales charges include initial sales charges and contingent deferred sales charges (CDSCs), as applicable. A Class shares have a 5.75% maximum initial sales charge and may be subject to a maximum CDSC of 1.00%. C Class shares redeemed within 12 months of purchase are subject to a maximum CDSC of 1.00%. The SEC requires that mutual funds provide performance information net of maximum sales charges in all cases where charges could be applied.
Data presented reflect past performance. Past performance is no guarantee of future results. Current performance may be higher or lower than the performance shown. Total returns for periods less than one year are not annualized. Investment return and principal value will fluctuate, and redemption value may be more or less than original cost. Data assumes reinvestment of dividends and capital gains, and none of the charts reflect the deduction of taxes that a shareholder would pay on fund distributions or the redemption of fund shares. To obtain performance data current to the most recent month end, please call 1-800-345-2021 or visit americancentury.com. For additional information about the fund, please consult the prospectus.
|
|
| Growth of $10,000 Over 10 Years |
| $10,000 investment made July 31, 2009 |
| Performance for other share classes will vary due to differences in fee structure. |
|
| |
| Value on July 31, 2019 |
| | Investor Class — $18,865 |
| |
| | S&P 500 Index — $37,171 |
| |
| | Bloomberg Barclays U.S. Aggregate Bond Index — $14,456 |
| |
| | Bloomberg Barclays U.S. 1-3 Month Treasury Bill Index — $10,482 |
| |
Ending value of Investor Class would have been lower if a portion of the fees had not been waived.
|
| | | | | | |
Total Annual Fund Operating Expenses | | |
| Investor Class | I Class | A Class | C Class | R Class | R5 Class | R6 Class |
| 1.01% | 0.81% | 1.26% | 2.01% | 1.51% | 0.81% | 0.66% |
The total annual fund operating expenses shown is as stated in the fund’s prospectus current as of the date of this report. The prospectus may vary from the expense ratio shown elsewhere in this report because it is based on a different time period, includes acquired fund fees and expenses, and, if applicable, does not include fee waivers or expense reimbursements.
Data presented reflect past performance. Past performance is no guarantee of future results. Current performance may be higher or lower than the performance shown. Total returns for periods less than one year are not annualized. Investment return and principal value will fluctuate, and redemption value may be more or less than original cost. Data assumes reinvestment of dividends and capital gains, and none of the charts reflect the deduction of taxes that a shareholder would pay on fund distributions or the redemption of fund shares. To obtain performance data current to the most recent month end, please call 1-800-345-2021 or visit americancentury.com. For additional information about the fund, please consult the prospectus.
Portfolio Managers: Rich Weiss, Scott Wilson, Radu Gabudean and Vidya Rajappa
During the period, David MacEwen left the portfolio management team.
Performance Summary
Strategic Allocation: Conservative returned 4.55%* for the fiscal period ended July 31, 2019. Because of the fund’s strategic exposure to a variety of asset classes, a review of the financial markets helps provide context around performance for the reporting period.
The period was marked by sharp volatility amid changing expectations for economic growth, interest rates and corporate profits. In the U.S., growth in the economy and in corporate profits initially led to stock market gains, but worry that U.S. trade policy and rising interest rates might choke off growth meant stocks declined sharply from October through December. But beginning in January, the U.S. Federal Reserve (the Fed) and central banks around the world reassured investors, promising to work to support economic growth. Nevertheless, the companies in the S&P 500 Index reported negative earnings growth for the first two quarters of 2019.
Against a backdrop of slowing global growth, stagnant corporate profits, trade difficulties and shifting central bank policies, global equity markets produced mixed results. Most major indices within the U.S. gained, ending the period at or near record highs. Meanwhile, many non-U.S. markets lost ground. In the U.S., large-cap companies outperformed their mid- and small-cap counterparts, and growth beat value across stocks of all sizes, according to the Russell family of indices. Small-cap stocks were the only major segment of the U.S. equity market to experience a negative return during the 12 months. Non-U.S. developed markets stocks mildly underperformed emerging markets, but both delivered a negative return and trailed U.S. equities. For the year, the S&P 500 Index’s gain of 7.99% dwarfed the -2.18% loss of the MSCI Emerging Markets Index and the -2.60% return of the MSCI EAFE Index.
Within fixed-income investments, after raising interest rates twice in late 2018, the Fed reversed course and cut rates on the last day of the reporting period to a range from 2.00% to 2.25%. Worries about slower economic growth and volatility in equity markets supported demand for longer-term U.S. Treasury bonds. The yield on the benchmark 10-year Treasury note fell and finished the fiscal year just above 2.00%. (When bond yields fall, prices rise, and vice versa.) Investment-grade U.S. corporate debt generally outperformed other spread sectors of the market, although U.S. high-yield and non-U.S. debt also produced strong returns. The Bloomberg Barclays U.S. High-Yield 2.00% Issuer Capped Bond Index gained 6.91%, while the Bloomberg Barclays U.S. Aggregate Bond Index returned 8.08%, the Bloomberg Barclays Global Aggregate Bond Index ex-USD (Unhedged) returned 3.74% and the Bloomberg Barclays Global Aggregate Bond Index (USD, Hedged) returned 8.61%.
Strategic Allocation: Conservative’s neutral asset mix throughout the period was 45% stocks, 49% bonds and 6% cash-equivalent investments. However, the portfolio’s actual asset weightings varied based on short-term tactical adjustments and fluctuating securities prices.
*All fund returns referenced in this commentary are for Investor Class shares. Fund returns would have been lower if a portion of the fees had not been waived. Performance for other share classes will vary due to differences in fee structure; when Investor Class performance exceeds that of the fund's benchmark, other share classes may not. See page 3 for returns for all share classes.
Tactical Positioning
In managing the fund, we make modest tactical adjustments to the asset mix in an effort to add value and improve the fund’s ability to meet its investment objective. We began the reporting period with a neutral allocation across stocks, bonds and cash, and we maintained that throughout the period. Within the equity segment, we generally favored U.S. equities over non-U.S. stocks. The portfolio also tended to be overweight large-cap stocks relative to small caps for much of the period. In addition, we generally maintained an overweight to the large-cap growth segment and an underweight to large-cap value stocks. In the bond segment, we generally favored higher-yielding corporate and securitized bonds and select emerging markets securities, adjusting exposure as valuations, fundamentals and market conditions dictated.
From a return perspective, the overweight position in growth stocks and corresponding underweight to value was the most successful area of tactical allocation. However, our allocation to large-cap core U.S. stocks underperformed, and the effect of our tactical changes overall detracted slightly from performance.
Fixed-Income Allocation Performed Well
Global bonds produced strong gains as the economy weakened, inflation remained tame, global central banks eased monetary policy and investors sought bonds for their relative safety amid uncertainty around trade, Brexit and volatility in stocks. Indeed, bond yields in many developed economies ended the period below zero, meaning investors placed a premium on safety of principal. However, the U.S. dollar strengthened during the period, limiting the performance of unhedged non-U.S. bonds, when returns were translated back into dollars. Both the global and non-U.S. fixed-income allocations contributed to gains and benefited from strong security selection, particularly among securitized bonds and investment-grade corporate bonds.
Within the U.S. fixed-income allocation, however, security selection decisions detracted from performance in both the investment-grade and high-yield allocations, while it also hurt results to have a comparatively short duration at a time when interest rates declined.
Equity Contribution Mixed
The equity portion of Strategic Allocation: Conservative produced gains, with U.S. growth-oriented shares contributing the most to performance. In absolute terms, U.S. large-cap growth, mid-cap growth and small-cap growth performed well and benefited from strong stock selection, as did U.S. large-cap value to a lesser extent. U.S. large-cap core and disciplined large-cap growth produced positive returns but underperformed their respective underlying benchmarks because of stock choices.
Non-U.S. equities detracted amid a challenging environment for global economic growth. Security selection further diminished results in non-U.S. small-cap growth, fundamental value and large-cap growth. However, positioning in a small global real estate allocation contributed to performance, aided by positive security selection.
Outlook
At period-end, the Strategic Allocation: Conservative portfolio was neutral in terms of stocks, bonds and cash, with an overweight position in U.S. large-cap growth stocks. The portfolio had underweights in U.S. value stocks and non-U.S. equities. However, we are in the process of removing our long-standing overweight allocation to the U.S. This reflects the input of our quantitative process, which shows a split between fundamental factors, which tend to lean toward stocks outside the U.S., while momentum and technical factors favor the U.S.
|
| |
| JULY 31, 2019 |
Top Ten Common Stocks | % of net assets |
| Microsoft Corp. | 1.1% |
| Alphabet, Inc., Class A | 1.0% |
| Amazon.com, Inc. | 0.9% |
| Apple, Inc. | 0.8% |
| Visa, Inc., Class A | 0.6% |
| Facebook, Inc., Class A | 0.6% |
| JPMorgan Chase & Co. | 0.5% |
| Zimmer Biomet Holdings, Inc. | 0.4% |
| Verizon Communications, Inc. | 0.4% |
| Medtronic plc | 0.4% |
| | |
Geographic Composition of Common Stocks | % of net assets |
| United States | 31.5% |
| Japan | 2.3% |
| United Kingdom | 1.9% |
| France | 1.6% |
| Other Countries | 6.2% |
| | |
Key Fixed-Income Portfolio Statistics |
| Weighted Average Life to Maturity | 7.3 years |
| Average Duration (effective) | 5.9 years |
| | |
Types of Investments in Portfolio | % of net assets |
| Domestic Common Stocks | 31.5% |
| Foreign Common Stocks* | 12.0% |
| U.S. Treasury Securities | 14.1% |
| Corporate Bonds | 10.6% |
| Sovereign Governments and Agencies | 6.9% |
| U.S. Government Agency Mortgage-Backed Securities | 5.6% |
| Municipal Securities | 3.4% |
| Asset-Backed Securities | 2.8% |
| Affiliated Funds | 2.7% |
| Collateralized Mortgage Obligations | 2.3% |
| Collateralized Loan Obligations | 2.2% |
| Commercial Mortgage-Backed Securities | 1.5% |
| Exchange-Traded Funds | 0.3% |
| Commercial Paper | 0.3% |
| Temporary Cash Investments | 4.7% |
| Other Assets and Liabilities | (0.9)% |
| *Includes depositary shares, dual listed securities and foreign ordinary shares. | |
Fund shareholders may incur two types of costs: (1) transaction costs, including sales charges (loads) on purchase payments and redemption/exchange fees; and (2) ongoing costs, including management fees; distribution and service (12b-1) fees; and other fund expenses. This example is intended to help you understand your ongoing costs (in dollars) of investing in your fund and to compare these costs with the ongoing cost of investing in other mutual funds.
The example is based on an investment of $1,000 made at the beginning of the period and held for the entire period from February 1, 2019 to July 31, 2019.
Actual Expenses
The table provides information about actual account values and actual expenses for each class. You may use the information, together with the amount you invested, to estimate the expenses that you paid over the period. First, identify the share class you own. Then simply divide your account value by $1,000 (for example, an $8,600 account value divided by $1,000 = 8.6), then multiply the result by the number under the heading “Expenses Paid During Period” to estimate the expenses you paid on your account during this period.
If you hold Investor Class shares of any American Century Investments fund, or I Class shares of the American Century Diversified Bond Fund, in an American Century Investments account (i.e., not a financial intermediary or retirement plan account), American Century Investments may charge you a $12.50 semiannual account maintenance fee if the value of those shares is less than $10,000. We will redeem shares automatically in one of your accounts to pay the $12.50 fee. In determining your total eligible investment amount, we will include your investments in all personal accounts (including American Century Investments Brokerage accounts) registered under your Social Security number. Personal accounts include individual accounts, joint accounts, UGMA/UTMA accounts, personal trusts, Coverdell Education Savings Accounts and IRAs (including traditional, Roth, Rollover, SEP-, SARSEP- and SIMPLE-IRAs), and certain other retirement accounts. If you have only business, business retirement, employer-sponsored or American Century Investments Brokerage accounts, you are currently not subject to this fee. If you are subject to the Account Maintenance Fee, your account value could be reduced by the fee amount.
Hypothetical Example for Comparison Purposes
The table also provides information about hypothetical account values and hypothetical expenses based on the actual expense ratio of each class of your fund and an assumed rate of return of 5% per year before expenses, which is not the actual return of a fund’s share class. The hypothetical account values and expenses may not be used to estimate the actual ending account balance or expenses you paid for the period. You may use this information to compare the ongoing costs of investing in your fund and other funds. To do so, compare this 5% hypothetical example with the 5% hypothetical examples that appear in the shareholder reports of the other funds.
Please note that the expenses shown in the table are meant to highlight your ongoing costs only and do not reflect any transactional costs, such as sales charges (loads) or redemption/exchange fees. Therefore, the table is useful in comparing ongoing costs only, and will not help you determine the relative total costs of owning different funds. In addition, if these transactional costs were included, your costs would have been higher.
|
| | | | |
| | Beginning
Account Value
2/1/19 | Ending
Account Value
7/31/19 | Expenses Paid
During Period(1)
2/1/19 - 7/31/19 |
Annualized
Expense Ratio(1) |
Actual |
| Investor Class | $1,000 | $1,063.00 | $5.17 | 1.01% |
| I Class | $1,000 | $1,064.00 | $4.15 | 0.81% |
| A Class | $1,000 | $1,063.80 | $6.45 | 1.26% |
| C Class | $1,000 | $1,057.60 | $10.25 | 2.01% |
| R Class | $1,000 | $1,060.80 | $7.72 | 1.51% |
| R5 Class | $1,000 | $1,063.90 | $4.15 | 0.81% |
| R6 Class | $1,000 | $1,066.60 | $3.38 | 0.66% |
| Hypothetical |
| Investor Class | $1,000 | $1,019.79 | $5.06 | 1.01% |
| I Class | $1,000 | $1,020.78 | $4.06 | 0.81% |
| A Class | $1,000 | $1,018.55 | $6.31 | 1.26% |
| C Class | $1,000 | $1,014.83 | $10.04 | 2.01% |
| R Class | $1,000 | $1,017.31 | $7.55 | 1.51% |
| R5 Class | $1,000 | $1,020.78 | $4.06 | 0.81% |
| R6 Class | $1,000 | $1,021.52 | $3.31 | 0.66% |
| |
| (1) | Expenses are equal to the class's annualized expense ratio listed in the table above, multiplied by the average account value over the period, multiplied by 181, the number of days in the most recent fiscal half-year, divided by 365, to reflect the one-half year period. Annualized expense ratio reflects actual expenses, including any applicable fee waivers or expense reimbursements and excluding any acquired fund fees and expenses. |
JULY 31, 2019
|
| | | | | | | |
| | | Shares/
Principal Amount | Value |
| COMMON STOCKS — 43.5% | | | |
| Aerospace and Defense — 0.7% | | | |
Aerojet Rocketdyne Holdings, Inc.(1) | | 722 |
| $ | 30,844 |
|
| Airbus SE | | 1,560 |
| 220,545 |
|
| BAE Systems plc | | 34,172 |
| 227,183 |
|
| Boeing Co. (The) | | 607 |
| 207,096 |
|
| Embraer SA ADR | | 22,399 |
| 452,460 |
|
| Hexcel Corp. | | 755 |
| 61,729 |
|
| L3Harris Technologies, Inc. | | 2,642 |
| 548,479 |
|
| Lockheed Martin Corp. | | 1,824 |
| 660,598 |
|
Mercury Systems, Inc.(1) | | 786 |
| 64,075 |
|
| Raytheon Co. | | 1,228 |
| 223,852 |
|
| Textron, Inc. | | 1,720 |
| 84,796 |
|
| | | | 2,781,657 |
|
| Air Freight and Logistics — 0.2% | | | |
| CH Robinson Worldwide, Inc. | | 4,103 |
| 343,544 |
|
| United Parcel Service, Inc., Class B | | 2,790 |
| 333,321 |
|
| | | | 676,865 |
|
| Airlines — 0.3% | | | |
| Delta Air Lines, Inc. | | 5,663 |
| 345,669 |
|
| Southwest Airlines Co. | | 13,896 |
| 716,061 |
|
| | | | 1,061,730 |
|
| Auto Components — 0.3% | | | |
| Aptiv plc | | 2,764 |
| 242,265 |
|
| BorgWarner, Inc. | | 9,977 |
| 377,131 |
|
| Hyundai Mobis Co. Ltd. | | 2,627 |
| 531,800 |
|
| Hyundai Wia Corp. | | 1,874 |
| 68,212 |
|
Leoni AG(1) | | 7,874 |
| 105,867 |
|
| NOK Corp. | | 5,000 |
| 73,402 |
|
| | | | 1,398,677 |
|
| Automobiles — 0.7% | | | |
| Honda Motor Co. Ltd. ADR | | 18,390 |
| 457,543 |
|
| Hyundai Motor Co. | | 5,569 |
| 591,356 |
|
| Kia Motors Corp. | | 10,466 |
| 383,588 |
|
| Mazda Motor Corp. | | 34,500 |
| 339,781 |
|
| Nissan Motor Co. Ltd. | | 85,000 |
| 555,162 |
|
| Peugeot SA | | 2,820 |
| 66,223 |
|
| Renault SA | | 4,118 |
| 228,814 |
|
| Thor Industries, Inc. | | 2,714 |
| 161,754 |
|
| | | | 2,784,221 |
|
| Banks — 3.5% | | | |
| Ameris Bancorp | | 334 |
| 13,283 |
|
| Bank of America Corp. | | 31,565 |
| 968,414 |
|
|
| | | | | | | |
| | | Shares/
Principal Amount | Value |
| Bank OZK | | 668 |
| $ | 20,428 |
|
| BankUnited, Inc. | | 2,310 |
| 79,487 |
|
| Barclays plc | | 372,970 |
| 699,840 |
|
| BB&T Corp. | | 24,314 |
| 1,252,900 |
|
| BNP Paribas SA | | 13,629 |
| 633,302 |
|
| Central Pacific Financial Corp. | | 56 |
| 1,650 |
|
| Citigroup, Inc. | | 588 |
| 41,842 |
|
| Comerica, Inc. | | 8,562 |
| 626,738 |
|
| Commerce Bancshares, Inc. | | 4,026 |
| 244,902 |
|
| Commerzbank AG | | 70,272 |
| 480,007 |
|
Erste Group Bank AG(1) | | 5,333 |
| 190,729 |
|
| Fifth Third Bancorp | | 3,415 |
| 101,391 |
|
| FinecoBank Banca Fineco SpA | | 3,778 |
| 37,430 |
|
| First BanCorp | | 1,341 |
| 14,429 |
|
| First Hawaiian, Inc. | | 12,067 |
| 322,913 |
|
| Glacier Bancorp, Inc. | | 343 |
| 14,375 |
|
| Hana Financial Group, Inc. | | 7,544 |
| 221,283 |
|
| Hilltop Holdings, Inc. | | 1,105 |
| 25,061 |
|
| Home BancShares, Inc. | | 4,105 |
| 80,745 |
|
| HSBC Holdings plc | | 14,000 |
| 112,994 |
|
| Independent Bank Group, Inc. | | 533 |
| 30,280 |
|
| JPMorgan Chase & Co. | | 16,729 |
| 1,940,564 |
|
| KBC Group NV | | 2,310 |
| 148,358 |
|
| LegacyTexas Financial Group, Inc. | | 914 |
| 39,064 |
|
| M&T Bank Corp. | | 1,642 |
| 269,699 |
|
| Mitsubishi UFJ Financial Group, Inc. | | 162,500 |
| 803,282 |
|
| Mizuho Financial Group, Inc. | | 296,000 |
| 418,526 |
|
| Origin Bancorp, Inc. | | 1,196 |
| 41,633 |
|
| Pacific Premier Bancorp, Inc. | | 792 |
| 25,051 |
|
| PNC Financial Services Group, Inc. (The) | | 5,890 |
| 841,681 |
|
| Prosperity Bancshares, Inc. | | 1,800 |
| 124,902 |
|
| Signature Bank | | 441 |
| 56,210 |
|
| Societe Generale SA | | 9,807 |
| 240,229 |
|
| South State Corp. | | 485 |
| 38,834 |
|
| Standard Chartered plc (London) | | 32,954 |
| 270,279 |
|
| Sumitomo Mitsui Financial Group, Inc. | | 8,300 |
| 290,630 |
|
| SunTrust Banks, Inc. | | 3,175 |
| 211,455 |
|
Texas Capital Bancshares, Inc.(1) | | 990 |
| 62,301 |
|
| Towne Bank | | 662 |
| 18,629 |
|
| U.S. Bancorp | | 12,640 |
| 722,376 |
|
| UMB Financial Corp. | | 4,814 |
| 328,604 |
|
| UniCredit SpA | | 20,710 |
| 243,000 |
|
| Valley National Bancorp | | 7,921 |
| 88,398 |
|
| Veritex Holdings, Inc. | | 681 |
| 17,427 |
|
| Wells Fargo & Co. | | 17,904 |
| 866,733 |
|
| Westamerica Bancorporation | | 2,562 |
| 164,224 |
|
| | | | 14,486,512 |
|
|
| | | | | | | |
| | | Shares/
Principal Amount | Value |
| Beverages — 0.6% | | | |
| Brown-Forman Corp., Class B | | 995 |
| $ | 54,536 |
|
| Coca-Cola Co. (The) | | 1,840 |
| 96,839 |
|
| Coca-Cola Consolidated, Inc. | | 23 |
| 6,751 |
|
| Constellation Brands, Inc., Class A | | 758 |
| 149,190 |
|
| Davide Campari-Milano SpA | | 20,660 |
| 191,629 |
|
| Diageo plc | | 4,860 |
| 202,782 |
|
| Fevertree Drinks plc | | 7,129 |
| 202,007 |
|
| MGP Ingredients, Inc. | | 351 |
| 17,546 |
|
| Molson Coors Brewing Co., Class B | | 1,799 |
| 97,128 |
|
Monster Beverage Corp.(1) | | 215 |
| 13,861 |
|
| PepsiCo, Inc. | | 7,100 |
| 907,451 |
|
| Remy Cointreau SA | | 1,550 |
| 227,970 |
|
| Treasury Wine Estates Ltd. | | 10,640 |
| 128,254 |
|
| | | | 2,295,944 |
|
| Biotechnology — 0.8% | | | |
| AbbVie, Inc. | | 4,655 |
| 310,116 |
|
| Abcam plc | | 1,416 |
| 22,393 |
|
Acceleron Pharma, Inc.(1) | | 406 |
| 17,726 |
|
Aimmune Therapeutics, Inc.(1) | | 555 |
| 10,684 |
|
Alder Biopharmaceuticals, Inc.(1) | | 727 |
| 7,357 |
|
Amarin Corp. plc ADR(1) | | 432 |
| 8,031 |
|
| Amgen, Inc. | | 1,698 |
| 316,813 |
|
Amicus Therapeutics, Inc.(1) | | 1,488 |
| 18,451 |
|
AnaptysBio, Inc.(1) | | 101 |
| 5,425 |
|
Arena Pharmaceuticals, Inc.(1) | | 486 |
| 30,462 |
|
Argenx SE(1) | | 229 |
| 32,198 |
|
ArQule, Inc.(1) | | 905 |
| 9,131 |
|
Biogen, Inc.(1) | | 2,360 |
| 561,255 |
|
Blueprint Medicines Corp.(1) | | 220 |
| 22,033 |
|
Celgene Corp.(1) | | 2,458 |
| 225,792 |
|
| CSL Ltd. | | 2,510 |
| 391,931 |
|
Exact Sciences Corp.(1) | | 1,022 |
| 117,642 |
|
Exelixis, Inc.(1) | | 2,781 |
| 59,152 |
|
FibroGen, Inc.(1) | | 281 |
| 13,280 |
|
Flexion Therapeutics, Inc.(1) | | 619 |
| 6,215 |
|
Galapagos NV(1) | | 291 |
| 50,492 |
|
| Gilead Sciences, Inc. | | 5,369 |
| 351,777 |
|
Global Blood Therapeutics, Inc.(1) | | 213 |
| 11,672 |
|
Halozyme Therapeutics, Inc.(1) | | 835 |
| 14,187 |
|
Heron Therapeutics, Inc.(1) | | 545 |
| 9,505 |
|
Immunomedics, Inc.(1) | | 6,457 |
| 95,241 |
|
Incyte Corp.(1) | | 1,469 |
| 124,747 |
|
Insmed, Inc.(1) | | 512 |
| 11,238 |
|
Medicines Co. (The)(1) | | 327 |
| 11,720 |
|
Mirati Therapeutics, Inc.(1) | | 81 |
| 8,570 |
|
MorphoSys AG(1) | | 284 |
| 34,351 |
|
|
| | | | | | | |
| | | Shares/
Principal Amount | Value |
Natera, Inc.(1) | | 877 |
| $ | 24,188 |
|
PeptiDream, Inc.(1) | | 800 |
| 44,690 |
|
Portola Pharmaceuticals, Inc.(1) | | 456 |
| 12,166 |
|
Principia Biopharma, Inc.(1) | | 269 |
| 9,991 |
|
PTC Therapeutics, Inc.(1) | | 351 |
| 16,908 |
|
REGENXBIO, Inc.(1) | | 210 |
| 9,326 |
|
Sarepta Therapeutics, Inc.(1) | | 799 |
| 118,931 |
|
Stoke Therapeutics, Inc.(1) | | 379 |
| 9,339 |
|
Ultragenyx Pharmaceutical, Inc.(1) | | 211 |
| 12,715 |
|
Vertex Pharmaceuticals, Inc.(1) | | 1,144 |
| 190,613 |
|
Viking Therapeutics, Inc.(1) | | 1,035 |
| 7,959 |
|
| | | | 3,366,413 |
|
| Building Products — 0.4% | | | |
| CSW Industrials, Inc. | | 46 |
| 3,248 |
|
| Daikin Industries Ltd. | | 1,000 |
| 124,141 |
|
| Fortune Brands Home & Security, Inc. | | 237 |
| 13,021 |
|
Gibraltar Industries, Inc.(1) | | 455 |
| 18,855 |
|
| Johnson Controls International plc | | 25,094 |
| 1,064,989 |
|
| Lindab International AB | | 2,342 |
| 26,713 |
|
| Masco Corp. | | 3,041 |
| 123,982 |
|
PGT Innovations, Inc.(1) | | 1,144 |
| 18,441 |
|
Trex Co., Inc.(1) | | 1,082 |
| 88,454 |
|
| | | | 1,481,844 |
|
| Capital Markets — 1.3% | | | |
| Ameriprise Financial, Inc. | | 5,132 |
| 746,757 |
|
| Ares Management Corp., Class A | | 2,144 |
| 62,712 |
|
| Artisan Partners Asset Management, Inc., Class A | | 2,639 |
| 78,088 |
|
| Ashmore Group plc | | 7,710 |
| 50,106 |
|
Assetmark Financial Holdings, Inc.(1) | | 607 |
| 17,172 |
|
| Bank of New York Mellon Corp. (The) | | 14,950 |
| 701,454 |
|
| Burford Capital Ltd. | | 1,418 |
| 25,814 |
|
| Charles Schwab Corp. (The) | | 7,265 |
| 313,993 |
|
Credit Suisse Group AG(1) | | 37,915 |
| 459,175 |
|
Donnelley Financial Solutions, Inc.(1) | | 3,840 |
| 52,339 |
|
| Euronext NV | | 685 |
| 53,012 |
|
| Evercore, Inc., Class A | | 285 |
| 24,615 |
|
| Hamilton Lane, Inc., Class A | | 470 |
| 27,589 |
|
| Hong Kong Exchanges & Clearing Ltd. | | 6,700 |
| 226,273 |
|
| Intermediate Capital Group plc | | 4,385 |
| 74,214 |
|
| Invesco Ltd. | | 14,627 |
| 280,692 |
|
| London Stock Exchange Group plc | | 3,910 |
| 315,448 |
|
| LPL Financial Holdings, Inc. | | 5,834 |
| 489,298 |
|
| MSCI, Inc. | | 828 |
| 188,155 |
|
| Northern Trust Corp. | | 7,080 |
| 693,840 |
|
| Partners Group Holding AG | | 310 |
| 247,092 |
|
| Piper Jaffray Cos. | | 160 |
| 12,368 |
|
| S&P Global, Inc. | | 692 |
| 169,505 |
|
|
| | | | | | | |
| | | Shares/
Principal Amount | Value |
| State Street Corp. | | 3,484 |
| $ | 202,386 |
|
| TD Ameritrade Holding Corp. | | 581 |
| 29,689 |
|
| | | | 5,541,786 |
|
| Chemicals — 0.4% | | | |
| CF Industries Holdings, Inc. | | 552 |
| 27,357 |
|
| Chr Hansen Holding A/S | | 1,010 |
| 87,990 |
|
| Dow, Inc. | | 6,939 |
| 336,125 |
|
| DuPont de Nemours, Inc. | | 4,100 |
| 295,856 |
|
| Eastman Chemical Co. | | 1,486 |
| 111,970 |
|
Ferro Corp.(1) | | 1,537 |
| 22,640 |
|
| Innophos Holdings, Inc. | | 1,477 |
| 40,130 |
|
| KH Neochem Co. Ltd. | | 1,100 |
| 27,357 |
|
| Koninklijke DSM NV | | 2,540 |
| 314,322 |
|
| Minerals Technologies, Inc. | | 1,038 |
| 55,273 |
|
| Nutrien Ltd. | | 1,430 |
| 78,402 |
|
| PolyOne Corp. | | 194 |
| 6,357 |
|
| Scotts Miracle-Gro Co. (The) | | 1 |
| 112 |
|
| Sika AG | | 1,285 |
| 185,678 |
|
| Symrise AG | | 2,120 |
| 196,392 |
|
| | | | 1,785,961 |
|
| Commercial Services and Supplies — 0.6% | | | |
| ABM Industries, Inc. | | 775 |
| 32,620 |
|
Advanced Disposal Services, Inc.(1) | | 885 |
| 28,647 |
|
| Babcock International Group plc | | 111,659 |
| 644,402 |
|
| Brink's Co. (The) | | 991 |
| 89,349 |
|
Casella Waste Systems, Inc., Class A(1) | | 569 |
| 24,808 |
|
CECO Environmental Corp.(1) | | 1,789 |
| 16,513 |
|
Charah Solutions, Inc.(1) | | 4,255 |
| 22,126 |
|
Clean Harbors, Inc.(1) | | 473 |
| 36,804 |
|
| Cleanaway Waste Management Ltd. | | 28,743 |
| 47,255 |
|
| Deluxe Corp. | | 940 |
| 41,943 |
|
| Edenred | | 4,540 |
| 227,659 |
|
| HomeServe plc | | 3,599 |
| 49,898 |
|
| Loomis AB, B Shares | | 1,057 |
| 36,397 |
|
Raksul, Inc.(1) | | 500 |
| 17,229 |
|
| Rentokil Initial plc | | 4,169 |
| 21,992 |
|
| Republic Services, Inc. | | 5,828 |
| 516,652 |
|
| UniFirst Corp. | | 199 |
| 39,177 |
|
| US Ecology, Inc. | | 495 |
| 31,497 |
|
| Waste Management, Inc. | | 4,722 |
| 552,474 |
|
| | | | 2,477,442 |
|
| Communications Equipment — 0.4% | | | |
Acacia Communications, Inc.(1) | | 225 |
| 15,113 |
|
Arista Networks, Inc.(1) | | 905 |
| 247,472 |
|
| AudioCodes Ltd. | | 820 |
| 15,301 |
|
Casa Systems, Inc.(1) | | 3,334 |
| 21,971 |
|
| Cisco Systems, Inc. | | 14,046 |
| 778,149 |
|
|
| | | | | | | |
| | | Shares/
Principal Amount | Value |
| Juniper Networks, Inc. | | 3,558 |
| $ | 96,137 |
|
Lumentum Holdings, Inc.(1) | | 325 |
| 18,405 |
|
| Motorola Solutions, Inc. | | 2,030 |
| 336,899 |
|
| Telefonaktiebolaget LM Ericsson, B Shares | | 25,230 |
| 221,363 |
|
Viavi Solutions, Inc.(1) | | 1,185 |
| 17,384 |
|
| | | | 1,768,194 |
|
| Construction and Engineering — 0.1% | | | |
| Badger Daylighting Ltd. | | 2,258 |
| 81,540 |
|
| Comfort Systems USA, Inc. | | 100 |
| 4,200 |
|
Dycom Industries, Inc.(1) | | 945 |
| 52,126 |
|
| EMCOR Group, Inc. | | 55 |
| 4,642 |
|
| Hazama Ando Corp. | | 13,000 |
| 89,338 |
|
| Jacobs Engineering Group, Inc. | | 1,975 |
| 162,957 |
|
| SHO-BOND Holdings Co. Ltd. | | 1,100 |
| 37,713 |
|
| Valmont Industries, Inc. | | 93 |
| 12,797 |
|
| | | | 445,313 |
|
| Construction Materials — 0.1% | | | |
| Cemex SAB de CV ADR | | 31,590 |
| 112,460 |
|
| CRH plc | | 6,237 |
| 207,567 |
|
| Tecnoglass, Inc. | | 2,413 |
| 17,181 |
|
| Vulcan Materials Co. | | 1,253 |
| 173,352 |
|
| | | | 510,560 |
|
| Consumer Finance — 0.3% | | | |
| American Express Co. | | 4,171 |
| 518,747 |
|
| Discover Financial Services | | 3,913 |
| 351,152 |
|
Green Dot Corp., Class A(1) | | 514 |
| 26,055 |
|
| Synchrony Financial | | 9,193 |
| 329,845 |
|
| | | | 1,225,799 |
|
| Containers and Packaging — 0.3% | | | |
| Ball Corp. | | 2,118 |
| 151,395 |
|
Berry Global Group, Inc.(1) | | 526 |
| 23,696 |
|
| Graphic Packaging Holding Co. | | 21,115 |
| 313,769 |
|
| Packaging Corp. of America | | 5,448 |
| 550,084 |
|
| Rengo Co. Ltd. | | 3,300 |
| 25,097 |
|
| Silgan Holdings, Inc. | | 1,832 |
| 55,070 |
|
| Sonoco Products Co. | | 2,195 |
| 131,766 |
|
| | | | 1,250,877 |
|
| Distributors — 0.1% | | | |
| Core-Mark Holding Co., Inc. | | 715 |
| 26,762 |
|
| Genuine Parts Co. | | 1,955 |
| 189,870 |
|
IAA, Inc.(1) | | 667 |
| 31,182 |
|
LKQ Corp.(1) | | 4,264 |
| 114,830 |
|
| Pool Corp. | | 84 |
| 15,907 |
|
| | | | 378,551 |
|
Diversified Consumer Services† | | | |
Chegg, Inc.(1) | | 895 |
| 40,203 |
|
frontdoor, Inc.(1) | | 437 |
| 19,945 |
|
|
| | | | | | | |
| | | Shares/
Principal Amount | Value |
Grand Canyon Education, Inc.(1) | | 262 |
| $ | 28,498 |
|
ServiceMaster Global Holdings, Inc.(1) | | 67 |
| 3,566 |
|
| | | | 92,212 |
|
| Diversified Financial Services — 0.3% | | | |
Berkshire Hathaway, Inc., Class B(1) | | 4,780 |
| 981,955 |
|
| Compass Diversified Holdings | | 3,795 |
| 72,864 |
|
| ECN Capital Corp. | | 4,780 |
| 17,131 |
|
| Zenkoku Hosho Co. Ltd. | | 1,000 |
| 39,011 |
|
| | | | 1,110,961 |
|
| Diversified Telecommunication Services — 0.5% | | | |
| AT&T, Inc. | | 1,913 |
| 65,137 |
|
Cellnex Telecom SA(1) | | 8,543 |
| 318,621 |
|
| Verizon Communications, Inc. | | 27,810 |
| 1,537,059 |
|
| | | | 1,920,817 |
|
| Electric Utilities — 0.6% | | | |
| Edison International | | 2,713 |
| 202,227 |
|
| Eversource Energy | | 7,968 |
| 604,453 |
|
| Exelon Corp. | | 1,016 |
| 45,781 |
|
| Iberdrola SA | | 12,030 |
| 113,982 |
|
| IDACORP, Inc. | | 667 |
| 68,074 |
|
Korea Electric Power Corp.(1) | | 1,281 |
| 30,163 |
|
| Pinnacle West Capital Corp. | | 6,988 |
| 637,445 |
|
| Xcel Energy, Inc. | | 16,160 |
| 963,298 |
|
| | | | 2,665,423 |
|
| Electrical Equipment — 0.9% | | | |
| AMETEK, Inc. | | 2,958 |
| 265,066 |
|
| Eaton Corp. plc | | 7,187 |
| 590,700 |
|
| Emerson Electric Co. | | 12,702 |
| 824,106 |
|
| Hubbell, Inc. | | 3,909 |
| 507,701 |
|
| Melrose Industries plc | | 89,810 |
| 201,503 |
|
| nVent Electric plc | | 9,819 |
| 243,413 |
|
| Prysmian SpA | | 3,540 |
| 72,888 |
|
| Rockwell Automation, Inc. | | 1,034 |
| 166,247 |
|
| Schneider Electric SE | | 4,263 |
| 367,032 |
|
| Signify NV | | 12,205 |
| 331,074 |
|
| TKH Group NV | | 354 |
| 21,038 |
|
Varta AG(1) | | 324 |
| 24,523 |
|
| | | | 3,615,291 |
|
| Electronic Equipment, Instruments and Components — 0.6% | | |
| Anritsu Corp. | | 1,900 |
| 34,972 |
|
| Avnet, Inc. | | 443 |
| 20,121 |
|
| Barco NV | | 305 |
| 63,231 |
|
| Belden, Inc. | | 824 |
| 37,459 |
|
| CDW Corp. | | 5,935 |
| 701,280 |
|
Coherent, Inc.(1) | | 277 |
| 38,462 |
|
| Dolby Laboratories, Inc., Class A | | 403 |
| 27,444 |
|
| | | | |
|
| | | | | | | |
| | | Shares/
Principal Amount | Value |
| Electrocomponents plc | | 7,207 |
| $ | 53,130 |
|
| FLIR Systems, Inc. | | 165 |
| 8,194 |
|
| Hexagon AB, B Shares | | 3,470 |
| 168,337 |
|
II-VI, Inc.(1) | | 91 |
| 3,613 |
|
| Isra Vision AG | | 474 |
| 20,707 |
|
| Keyence Corp. | | 400 |
| 228,275 |
|
Keysight Technologies, Inc.(1) | | 5,885 |
| 526,825 |
|
Landis+Gyr Group AG(1) | | 124 |
| 10,047 |
|
| National Instruments Corp. | | 441 |
| 18,416 |
|
| SYNNEX Corp. | | 128 |
| 12,613 |
|
| TE Connectivity Ltd. | | 6,210 |
| 573,804 |
|
Tech Data Corp.(1) | | 215 |
| 21,788 |
|
Zebra Technologies Corp., Class A(1) | | 62 |
| 13,075 |
|
| | | | 2,581,793 |
|
| Energy Equipment and Services — 0.3% | | | |
| Baker Hughes a GE Co. | | 18,154 |
| 460,930 |
|
C&J Energy Services, Inc.(1) | | 649 |
| 7,100 |
|
Dril-Quip, Inc.(1) | | 266 |
| 13,997 |
|
| Liberty Oilfield Services, Inc., Class A | | 413 |
| 5,844 |
|
| Modec, Inc. | | 800 |
| 21,300 |
|
NCS Multistage Holdings, Inc.(1) | | 3,341 |
| 10,724 |
|
| Schlumberger Ltd. | | 11,570 |
| 462,453 |
|
| Subsea 7 SA | | 9,179 |
| 98,681 |
|
Tecnicas Reunidas SA(1) | | 9,079 |
| 218,737 |
|
| TGS NOPEC Geophysical Co. ASA | | 1,156 |
| 27,970 |
|
| | | | 1,327,736 |
|
| Entertainment — 0.7% | | | |
| Activision Blizzard, Inc. | | 7,722 |
| 376,370 |
|
Electronic Arts, Inc.(1) | | 4,115 |
| 380,637 |
|
| Entertainment One Ltd. | | 12,174 |
| 65,073 |
|
Liberty Media Corp-Liberty Formula One, Class C(1) | | 1,892 |
| 74,507 |
|
Live Nation Entertainment, Inc.(1) | | 201 |
| 14,484 |
|
Netflix, Inc.(1) | | 1,202 |
| 388,234 |
|
Take-Two Interactive Software, Inc.(1) | | 6,253 |
| 766,118 |
|
| Walt Disney Co. (The) | | 5,485 |
| 784,410 |
|
| World Wrestling Entertainment, Inc., Class A | | 296 |
| 21,543 |
|
Zynga, Inc., Class A(1) | | 3,456 |
| 22,049 |
|
| | | | 2,893,425 |
|
| Equity Real Estate Investment Trusts (REITs) — 2.3% | | | |
| Acadia Realty Trust | | 1,502 |
| 42,161 |
|
| Advance Residence Investment Corp. | | 19 |
| 58,886 |
|
| Agree Realty Corp. | | 1,266 |
| 84,632 |
|
| Alexandria Real Estate Equities, Inc. | | 1,313 |
| 192,171 |
|
| Allied Properties Real Estate Investment Trust | | 1,403 |
| 52,015 |
|
| American Homes 4 Rent, Class A | | 2,372 |
| 57,426 |
|
| American Tower Corp. | | 188 |
| 39,785 |
|
| Americold Realty Trust | | 7,099 |
| 238,030 |
|
|
| | | | | | | |
| | | Shares/
Principal Amount | Value |
| Boston Properties, Inc. | | 389 |
| $ | 51,718 |
|
| Brandywine Realty Trust | | 2,878 |
| 42,451 |
|
| Camden Property Trust | | 1,862 |
| 193,108 |
|
| Canadian Apartment Properties REIT | | 1,488 |
| 54,918 |
|
| CapitaLand Commercial Trust | | 29,000 |
| 43,430 |
|
| CareTrust REIT, Inc. | | 3,589 |
| 83,373 |
|
| Charter Hall Group | | 12,216 |
| 94,299 |
|
| Community Healthcare Trust, Inc. | | 228 |
| 9,369 |
|
| CoreSite Realty Corp. | | 254 |
| 26,622 |
|
| Corporate Office Properties Trust | | 847 |
| 23,648 |
|
| Cousins Properties, Inc. | | 1,190 |
| 41,864 |
|
| CyrusOne, Inc. | | 601 |
| 34,497 |
|
Embassy Office Parks REIT(1) | | 2,800 |
| 15,224 |
|
| Empire State Realty Trust, Inc., Class A | | 11,527 |
| 161,493 |
|
| Equinix, Inc. | | 326 |
| 163,685 |
|
| Equity Residential | | 5,309 |
| 418,827 |
|
| Essential Properties Realty Trust, Inc. | | 1,919 |
| 40,529 |
|
| Extra Space Storage, Inc. | | 359 |
| 40,348 |
|
| Fibra Uno Administracion SA de CV | | 453,492 |
| 583,792 |
|
| Gaming and Leisure Properties, Inc. | | 3,152 |
| 118,862 |
|
| Gecina SA | | 389 |
| 59,147 |
|
| GEO Group, Inc. (The) | | 9,456 |
| 168,411 |
|
| GLP J-Reit | | 40 |
| 44,638 |
|
| Goodman Group | | 14,679 |
| 148,301 |
|
| HCP, Inc. | | 4,865 |
| 155,339 |
|
| Healthcare Trust of America, Inc., Class A | | 10,383 |
| 279,614 |
|
| Highwoods Properties, Inc. | | 319 |
| 14,460 |
|
| Hudson Pacific Properties, Inc. | | 2,307 |
| 81,437 |
|
| Inmobiliaria Colonial Socimi SA | | 5,439 |
| 60,871 |
|
| Invesco Office J-Reit, Inc. | | 545 |
| 96,787 |
|
| Invincible Investment Corp. | | 35 |
| 20,084 |
|
| Invitation Homes, Inc. | | 5,667 |
| 155,673 |
|
| Japan Hotel REIT Investment Corp. | | 39 |
| 32,476 |
|
| Kilroy Realty Corp. | | 1,140 |
| 90,584 |
|
| Kite Realty Group Trust | | 2,936 |
| 46,712 |
|
| Lexington Realty Trust | | 1,630 |
| 16,088 |
|
| Life Storage, Inc. | | 2,389 |
| 232,904 |
|
| Link REIT | | 14,000 |
| 163,257 |
|
| Mapletree Commercial Trust | | 32,600 |
| 49,102 |
|
| Mapletree Industrial Trust | | 13,900 |
| 22,708 |
|
| MGM Growth Properties LLC, Class A | | 7,566 |
| 225,921 |
|
| National Health Investors, Inc. | | 288 |
| 22,861 |
|
| Northview Apartment Real Estate Investment Trust | | 1,798 |
| 37,055 |
|
| Orix JREIT, Inc. | | 119 |
| 231,117 |
|
| Piedmont Office Realty Trust, Inc., Class A | | 9,751 |
| 202,918 |
|
| Prologis, Inc. | | 3,549 |
| 286,085 |
|
| Regency Centers Corp. | | 289 |
| 19,276 |
|
|
| | | | | | | |
| | | Shares/
Principal Amount | Value |
| Rexford Industrial Realty, Inc. | | 3,410 |
| $ | 141,174 |
|
| RLJ Lodging Trust | | 894 |
| 15,448 |
|
| Ryman Hospitality Properties, Inc. | | 741 |
| 55,575 |
|
| Sabra Health Care REIT, Inc. | | 1,291 |
| 26,646 |
|
| Safestore Holdings plc | | 8,001 |
| 60,678 |
|
SBA Communications Corp.(1) | | 3,876 |
| 951,209 |
|
| Segro plc | | 18,526 |
| 171,840 |
|
| Spirit Realty Capital, Inc. | | 1,174 |
| 51,797 |
|
| STORE Capital Corp. | | 2,990 |
| 102,288 |
|
| Summit Hotel Properties, Inc. | | 1,563 |
| 17,365 |
|
| Sun Communities, Inc. | | 1,514 |
| 201,074 |
|
| UDR, Inc. | | 2,790 |
| 128,507 |
|
| UNITE Group plc (The) | | 8,014 |
| 100,387 |
|
| Urstadt Biddle Properties, Inc., Class A | | 438 |
| 9,456 |
|
| VICI Properties, Inc. | | 2,855 |
| 60,926 |
|
| Weingarten Realty Investors | | 1,001 |
| 27,938 |
|
| Welltower, Inc. | | 7,773 |
| 646,092 |
|
| Weyerhaeuser Co. | | 32,037 |
| 814,060 |
|
| | | | 9,553,449 |
|
| Food and Staples Retailing — 0.3% | | | |
| Alimentation Couche-Tard, Inc., B Shares | | 2,980 |
| 182,665 |
|
| Cosmos Pharmaceutical Corp. | | 100 |
| 18,373 |
|
| Costco Wholesale Corp. | | 57 |
| 15,711 |
|
Grocery Outlet Holding Corp.(1) | | 179 |
| 6,970 |
|
| Kobe Bussan Co. Ltd. | | 900 |
| 50,188 |
|
| Koninklijke Ahold Delhaize NV | | 10,233 |
| 231,367 |
|
| Sysco Corp. | | 6,181 |
| 423,831 |
|
| Walmart, Inc. | | 4,452 |
| 491,412 |
|
| Weis Markets, Inc. | | 468 |
| 17,058 |
|
| | | | 1,437,575 |
|
| Food Products — 1.1% | | | |
a2 Milk Co. Ltd.(1) | | 10,880 |
| 126,143 |
|
| AAK AB | | 2,081 |
| 42,570 |
|
| Associated British Foods plc | | 5,820 |
| 170,789 |
|
Ausnutria Dairy Corp. Ltd.(1) | | 11,000 |
| 19,728 |
|
| Bakkafrost P/F | | 452 |
| 25,961 |
|
Beyond Meat, Inc.(1) | | 73 |
| 14,345 |
|
| Campbell Soup Co. | | 7,024 |
| 290,372 |
|
| Conagra Brands, Inc. | | 16,384 |
| 473,006 |
|
| Danone SA | | 3,780 |
| 327,725 |
|
| General Mills, Inc. | | 7,425 |
| 394,342 |
|
Hain Celestial Group, Inc. (The)(1) | | 2,271 |
| 49,440 |
|
| Hershey Co. (The) | | 3,168 |
| 480,712 |
|
| J.M. Smucker Co. (The) | | 1,067 |
| 118,640 |
|
| Kellogg Co. | | 2,081 |
| 121,156 |
|
| Kerry Group plc, A Shares | | 1,710 |
| 198,054 |
|
| Mondelez International, Inc., Class A | | 13,836 |
| 740,088 |
|
|
| | | | | | | |
| | | Shares/
Principal Amount | Value |
| Nestle SA | | 3,950 |
| $ | 419,164 |
|
Nomad Foods Ltd.(1) | | 2,341 |
| 52,134 |
|
| Orkla ASA | | 36,872 |
| 312,939 |
|
| | | | 4,377,308 |
|
| Gas Utilities — 0.1% | | | |
| Atmos Energy Corp. | | 1,660 |
| 181,006 |
|
| Chesapeake Utilities Corp. | | 162 |
| 15,141 |
|
| Spire, Inc. | | 2,200 |
| 181,302 |
|
| | | | 377,449 |
|
| Health Care Equipment and Supplies — 2.0% | | | |
ABIOMED, Inc.(1) | | 154 |
| 42,898 |
|
Alcon, Inc.(1) | | 1,868 |
| 108,043 |
|
| Baxter International, Inc. | | 5,418 |
| 454,950 |
|
Boston Scientific Corp.(1) | | 7,383 |
| 313,482 |
|
| Danaher Corp. | | 3,588 |
| 504,114 |
|
DexCom, Inc.(1) | | 495 |
| 77,651 |
|
Edwards Lifesciences Corp.(1) | | 762 |
| 162,192 |
|
| Elekta AB, B Shares | | 1,542 |
| 21,946 |
|
Haemonetics Corp.(1) | | 1,431 |
| 174,697 |
|
| Hill-Rom Holdings, Inc. | | 1,914 |
| 204,109 |
|
Hologic, Inc.(1) | | 14,613 |
| 748,916 |
|
| Hoya Corp. | | 3,100 |
| 238,176 |
|
ICU Medical, Inc.(1) | | 76 |
| 19,337 |
|
IDEXX Laboratories, Inc.(1) | | 185 |
| 52,179 |
|
Insulet Corp.(1) | | 838 |
| 103,024 |
|
Integer Holdings Corp.(1) | | 2,091 |
| 183,025 |
|
Intuitive Surgical, Inc.(1) | | 300 |
| 155,853 |
|
Masimo Corp.(1) | | 910 |
| 143,644 |
|
| Medtronic plc | | 14,062 |
| 1,433,480 |
|
Merit Medical Systems, Inc.(1) | | 524 |
| 20,677 |
|
| Nihon Kohden Corp. | | 700 |
| 19,161 |
|
NuVasive, Inc.(1) | | 835 |
| 55,611 |
|
OrthoPediatrics Corp.(1) | | 359 |
| 12,676 |
|
Penumbra, Inc.(1) | | 529 |
| 88,660 |
|
| ResMed, Inc. | | 1,023 |
| 131,660 |
|
| Siemens Healthineers AG | | 4,831 |
| 201,823 |
|
Silk Road Medical, Inc.(1) | | 393 |
| 17,013 |
|
| STERIS plc | | 632 |
| 94,080 |
|
| Straumann Holding AG | | 190 |
| 154,911 |
|
| Stryker Corp. | | 2,028 |
| 425,434 |
|
| Sysmex Corp. | | 2,800 |
| 202,485 |
|
| Terumo Corp. | | 6,400 |
| 186,185 |
|
| Zimmer Biomet Holdings, Inc. | | 11,934 |
| 1,612,641 |
|
| | | | 8,364,733 |
|
| Health Care Providers and Services — 0.9% | | | |
Acadia Healthcare Co., Inc.(1) | | 550 |
| 17,567 |
|
Amedisys, Inc.(1) | | 1,493 |
| 205,870 |
|
|
| | | | | | | |
| | | Shares/
Principal Amount | Value |
| Amplifon SpA | | 1,917 |
| $ | 47,245 |
|
| Cardinal Health, Inc. | | 6,438 |
| 294,410 |
|
Centene Corp.(1) | | 2,309 |
| 120,276 |
|
| Chemed Corp. | | 45 |
| 18,243 |
|
CorVel Corp.(1) | | 210 |
| 17,892 |
|
Covetrus, Inc.(1) | | 4,203 |
| 99,485 |
|
| Encompass Health Corp. | | 4,802 |
| 306,560 |
|
| Ensign Group, Inc. (The) | | 611 |
| 36,819 |
|
HealthEquity, Inc.(1) | | 1,057 |
| 86,653 |
|
Henry Schein, Inc.(1) | | 2,196 |
| 146,122 |
|
| Korian SA | | 1,567 |
| 61,862 |
|
| McKesson Corp. | | 3,295 |
| 457,840 |
|
Premier, Inc., Class A(1) | | 1,172 |
| 45,415 |
|
Providence Service Corp. (The)(1) | | 876 |
| 48,828 |
|
| Quest Diagnostics, Inc. | | 7,813 |
| 797,551 |
|
R1 RCM, Inc.(1) | | 3,125 |
| 39,312 |
|
| UnitedHealth Group, Inc. | | 3,302 |
| 822,231 |
|
| Universal Health Services, Inc., Class B | | 1,462 |
| 220,557 |
|
| | | | 3,890,738 |
|
| Health Care Technology — 0.2% | | | |
| Cerner Corp. | | 6,283 |
| 450,177 |
|
Health Catalyst, Inc.(1) | | 269 |
| 11,903 |
|
Inspire Medical Systems, Inc.(1) | | 230 |
| 15,555 |
|
Phreesia, Inc.(1) | | 680 |
| 18,584 |
|
Teladoc Health, Inc.(1) | | 695 |
| 47,427 |
|
Veeva Systems, Inc., Class A(1) | | 1,433 |
| 237,735 |
|
| | | | 781,381 |
|
| Hotels, Restaurants and Leisure — 0.9% | | | |
| Aristocrat Leisure Ltd. | | 5,880 |
| 122,764 |
|
| Autogrill SpA | | 2,566 |
| 27,032 |
|
| Carnival Corp. | | 9,718 |
| 458,981 |
|
Chipotle Mexican Grill, Inc.(1) | | 291 |
| 231,499 |
|
| Churchill Downs, Inc. | | 353 |
| 42,236 |
|
| Darden Restaurants, Inc. | | 4,564 |
| 554,800 |
|
| Domino's Pizza, Inc. | | 1,090 |
| 266,538 |
|
| Jumbo Interactive Ltd. | | 2,335 |
| 30,676 |
|
| Kyoritsu Maintenance Co. Ltd. | | 500 |
| 21,556 |
|
| Las Vegas Sands Corp. | | 2,457 |
| 148,501 |
|
| Melco International Development Ltd. | | 16,000 |
| 38,702 |
|
Planet Fitness, Inc., Class A(1) | | 1,883 |
| 148,117 |
|
Red Robin Gourmet Burgers, Inc.(1) | | 1,039 |
| 34,308 |
|
| Red Rock Resorts, Inc., Class A | | 1,484 |
| 30,927 |
|
| Royal Caribbean Cruises Ltd. | | 4,103 |
| 477,343 |
|
| Sodexo SA | | 1,994 |
| 228,335 |
|
| SSP Group plc | | 2,280 |
| 19,461 |
|
| Starbucks Corp. | | 6,466 |
| 612,266 |
|
| Texas Roadhouse, Inc. | | 422 |
| 23,307 |
|
|
| | | | | | | |
| | | Shares/
Principal Amount | Value |
| Wynn Resorts Ltd. | | 717 |
| $ | 93,260 |
|
| | | | 3,610,609 |
|
| Household Durables — 0.4% | | | |
| Breville Group Ltd. | | 691 |
| 9,060 |
|
| Haseko Corp. | | 45,000 |
| 488,139 |
|
| Iida Group Holdings Co. Ltd. | | 19,100 |
| 313,517 |
|
| Newell Brands, Inc. | | 1,413 |
| 20,050 |
|
PlayAGS, Inc.(1) | | 1,505 |
| 28,234 |
|
| Pressance Corp. | | 2,400 |
| 33,479 |
|
| PulteGroup, Inc. | | 15,632 |
| 492,564 |
|
Skyline Champion Corp.(1) | | 863 |
| 24,595 |
|
| Token Corp. | | 2,000 |
| 114,639 |
|
TopBuild Corp.(1) | | 371 |
| 30,099 |
|
| | | | 1,554,376 |
|
| Household Products — 0.5% | | | |
Central Garden & Pet Co., Class A(1) | | 432 |
| 11,901 |
|
| Church & Dwight Co., Inc. | | 1,284 |
| 96,865 |
|
| Colgate-Palmolive Co. | | 7,463 |
| 535,396 |
|
| Kimberly-Clark Corp. | | 1,512 |
| 205,103 |
|
| Pigeon Corp. | | 600 |
| 22,056 |
|
| Procter & Gamble Co. (The) | | 10,036 |
| 1,184,649 |
|
| Spectrum Brands Holdings, Inc. | | 1,133 |
| 56,775 |
|
| | | | 2,112,745 |
|
| Industrial Conglomerates — 0.1% | | | |
| Rheinmetall AG | | 462 |
| 52,819 |
|
| Roper Technologies, Inc. | | 335 |
| 121,823 |
|
| Siemens AG | | 3,140 |
| 344,689 |
|
| | | | 519,331 |
|
| Insurance — 1.3% | | | |
| Aegon NV | | 129,842 |
| 640,661 |
|
| Aflac, Inc. | | 10,331 |
| 543,824 |
|
| AIA Group Ltd. | | 47,000 |
| 479,086 |
|
| AMERISAFE, Inc. | | 535 |
| 34,807 |
|
| Arthur J. Gallagher & Co. | | 705 |
| 63,753 |
|
| Axis Capital Holdings Ltd. | | 1,006 |
| 64,052 |
|
| Brown & Brown, Inc. | | 3,520 |
| 126,474 |
|
| Chubb Ltd. | | 6,599 |
| 1,008,591 |
|
| Goosehead Insurance, Inc., Class A | | 227 |
| 10,217 |
|
| Hanover Insurance Group, Inc. (The) | | 176 |
| 22,829 |
|
| Hiscox Ltd. | | 8,314 |
| 172,174 |
|
| Intact Financial Corp. | | 990 |
| 92,279 |
|
| James River Group Holdings Ltd. | | 558 |
| 26,689 |
|
| Kemper Corp. | | 416 |
| 36,616 |
|
| Kinsale Capital Group, Inc. | | 426 |
| 38,280 |
|
| Mercury General Corp. | | 1,986 |
| 112,626 |
|
| NN Group NV | | 4,392 |
| 164,959 |
|
Palomar Holdings, Inc.(1) | | 516 |
| 14,784 |
|
|
| | | | | | | |
| | | Shares/
Principal Amount | Value |
| ProAssurance Corp. | | 6,978 |
| $ | 272,770 |
|
| Progressive Corp. (The) | | 8,991 |
| 728,091 |
|
ProSight Global, Inc.(1) | | 528 |
| 9,003 |
|
| Prudential plc | | 5,580 |
| 115,081 |
|
| Reinsurance Group of America, Inc. | | 1,658 |
| 258,515 |
|
| RenaissanceRe Holdings Ltd. | | 202 |
| 36,592 |
|
| Torchmark Corp. | | 921 |
| 84,106 |
|
| Travelers Cos., Inc. (The) | | 589 |
| 86,359 |
|
| White Mountains Insurance Group Ltd. | | 24 |
| 25,824 |
|
| | | | 5,269,042 |
|
| Interactive Media and Services — 1.7% | | | |
Alphabet, Inc., Class A(1) | | 3,267 |
| 3,979,859 |
|
Facebook, Inc., Class A(1) | | 12,224 |
| 2,374,268 |
|
Pinterest, Inc., Class A(1) | | 3,179 |
| 92,159 |
|
Twitter, Inc.(1) | | 10,550 |
| 446,371 |
|
| | | | 6,892,657 |
|
| Internet and Direct Marketing Retail — 1.0% | | | |
Amazon.com, Inc.(1) | | 1,928 |
| 3,599,152 |
|
| eBay, Inc. | | 10,102 |
| 416,101 |
|
Etsy, Inc.(1) | | 267 |
| 17,894 |
|
| Expedia Group, Inc. | | 994 |
| 131,944 |
|
| Moneysupermarket.com Group plc | | 8,041 |
| 35,929 |
|
Revolve Group, Inc.(1) | | 422 |
| 14,546 |
|
Takeaway.com NV(1) | | 443 |
| 39,575 |
|
Trainline plc(1) | | 1,975 |
| 10,280 |
|
| Yume No Machi Souzou Iinkai Co. Ltd. | | 1,000 |
| 15,091 |
|
| | | | 4,280,512 |
|
| IT Services — 1.8% | | | |
| Accenture plc, Class A | | 107 |
| 20,606 |
|
Afterpay Touch Group Ltd.(1) | | 2,013 |
| 36,690 |
|
Akamai Technologies, Inc.(1) | | 4,972 |
| 438,183 |
|
| Alten SA | | 393 |
| 48,666 |
|
| Booz Allen Hamilton Holding Corp. | | 3,791 |
| 260,631 |
|
| EVERTEC, Inc. | | 3,430 |
| 109,829 |
|
Evo Payments, Inc., Class A(1) | | 561 |
| 17,458 |
|
Fastly, Inc., Class A(1) | | 1,797 |
| 38,995 |
|
Fiserv, Inc.(1) | | 4,933 |
| 520,086 |
|
FleetCor Technologies, Inc.(1) | | 1,088 |
| 309,177 |
|
GDS Holdings Ltd. ADR(1) | | 2,165 |
| 89,155 |
|
| Genpact Ltd. | | 1,018 |
| 40,394 |
|
| GMO Payment Gateway, Inc. | | 2,200 |
| 160,406 |
|
InterXion Holding NV(1) | | 5,960 |
| 448,788 |
|
| Keywords Studios plc | | 758 |
| 15,254 |
|
| MasterCard, Inc., Class A | | 1,925 |
| 524,120 |
|
Nexi SpA(1) | | 6,327 |
| 67,499 |
|
NEXTDC Ltd.(1) | | 7,384 |
| 34,675 |
|
| Obic Co. Ltd. | | 1,000 |
| 105,851 |
|
|
| | | | | | | |
| | | Shares/
Principal Amount | Value |
PayPal Holdings, Inc.(1) | | 10,308 |
| $ | 1,138,003 |
|
| Presidio, Inc. | | 2,456 |
| 34,384 |
|
| SCSK Corp. | | 700 |
| 33,446 |
|
SHIFT, Inc.(1) | | 400 |
| 18,502 |
|
Solutions 30 SE(1) | | 3,195 |
| 32,647 |
|
Square, Inc., Class A(1) | | 3,037 |
| 244,205 |
|
VeriSign, Inc.(1) | | 640 |
| 135,098 |
|
| Visa, Inc., Class A | | 13,386 |
| 2,382,708 |
|
| | | | 7,305,456 |
|
Leisure Products† | | | |
Malibu Boats, Inc., Class A(1) | | 439 |
| 13,227 |
|
| Thule Group AB | | 1,559 |
| 34,143 |
|
| | | | 47,370 |
|
| Life Sciences Tools and Services — 0.6% | | | |
Adaptive Biotechnologies Corp.(1) | | 539 |
| 20,779 |
|
| Agilent Technologies, Inc. | | 4,257 |
| 295,478 |
|
Bio-Rad Laboratories, Inc., Class A(1) | | 348 |
| 109,585 |
|
| Bruker Corp. | | 2,697 |
| 129,052 |
|
ICON plc(1) | | 720 |
| 112,442 |
|
Illumina, Inc.(1) | | 1,634 |
| 489,187 |
|
Lonza Group AG(1) | | 1,070 |
| 366,037 |
|
NeoGenomics, Inc.(1) | | 1,106 |
| 26,953 |
|
Personalis, Inc.(1) | | 631 |
| 11,301 |
|
PRA Health Sciences, Inc.(1) | | 223 |
| 22,280 |
|
QIAGEN NV(1) | | 2,709 |
| 102,184 |
|
| Tecan Group AG | | 195 |
| 49,553 |
|
| Thermo Fisher Scientific, Inc. | | 2,133 |
| 592,292 |
|
| | | | 2,327,123 |
|
| Machinery — 0.9% | | | |
| Albany International Corp., Class A | | 66 |
| 5,675 |
|
| Allison Transmission Holdings, Inc. | | 5,433 |
| 249,646 |
|
| Atlas Copco AB, A Shares | | 4,040 |
| 123,749 |
|
| Atlas Copco AB, B Shares | | 16,287 |
| 444,822 |
|
ATS Automation Tooling Systems, Inc.(1) | | 1,277 |
| 20,464 |
|
Chart Industries, Inc.(1) | | 549 |
| 41,466 |
|
Colfax Corp.(1) | | 715 |
| 19,791 |
|
| Cummins, Inc. | | 7,801 |
| 1,279,364 |
|
| EnPro Industries, Inc. | | 402 |
| 28,558 |
|
| Georg Fischer AG | | 22 |
| 18,935 |
|
| Graham Corp. | | 295 |
| 6,387 |
|
| Hurco Cos., Inc. | | 383 |
| 13,095 |
|
| IMI plc | | 17,770 |
| 223,097 |
|
| Ingersoll-Rand plc | | 1,935 |
| 239,282 |
|
| Interroll Holding AG | | 6 |
| 12,169 |
|
| Kennametal, Inc. | | 650 |
| 22,477 |
|
| Konecranes Oyj | | 803 |
| 23,576 |
|
Kornit Digital Ltd.(1) | | 1,365 |
| 42,588 |
|
|
| | | | | | | |
| | | Shares/
Principal Amount | Value |
Milacron Holdings Corp.(1) | | 373 |
| $ | 6,281 |
|
| Mueller Water Products, Inc., Class A | | 2,961 |
| 30,113 |
|
| Nabtesco Corp. | | 1,100 |
| 29,625 |
|
| PACCAR, Inc. | | 2,335 |
| 163,777 |
|
| Parker-Hannifin Corp. | | 705 |
| 123,432 |
|
| Rotork plc | | 7,433 |
| 27,667 |
|
| Snap-on, Inc. | | 1,517 |
| 231,510 |
|
| Tadano Ltd. | | 600 |
| 5,392 |
|
| Timken Co. (The) | | 1,230 |
| 56,223 |
|
| Valmet Oyj | | 1,342 |
| 26,083 |
|
| Woodward, Inc. | | 372 |
| 41,679 |
|
| | | | 3,556,923 |
|
| Media — 0.1% | | | |
| Atresmedia Corp. de Medios de Comunicacion SA | | 18,280 |
| 71,118 |
|
| Entravision Communications Corp., Class A | | 9,947 |
| 32,427 |
|
| Nippon Television Holdings, Inc. | | 19,800 |
| 272,262 |
|
| NOS SGPS SA | | 6,290 |
| 39,092 |
|
| Stroeer SE & Co. KGaA | | 515 |
| 40,717 |
|
| Townsquare Media, Inc., Class A | | 941 |
| 5,072 |
|
| TV Asahi Holdings Corp. | | 6,500 |
| 106,510 |
|
| | | | 567,198 |
|
| Metals and Mining — 0.2% | | | |
| BHP Group Ltd. | | 6,280 |
| 173,471 |
|
| Hudbay Minerals, Inc. | | 2,010 |
| 9,762 |
|
| Kirkland Lake Gold Ltd. | | 1,295 |
| 53,554 |
|
| Northern Star Resources Ltd. | | 2,834 |
| 24,605 |
|
Saracen Mineral Holdings Ltd.(1) | | 18,172 |
| 50,823 |
|
| Steel Dynamics, Inc. | | 10,221 |
| 322,064 |
|
| | | | 634,279 |
|
| Multi-Utilities — 0.2% | | | |
| Ameren Corp. | | 3,047 |
| 230,628 |
|
| NorthWestern Corp. | | 4,011 |
| 280,449 |
|
| WEC Energy Group, Inc. | | 2,294 |
| 196,045 |
|
| | | | 707,122 |
|
| Multiline Retail — 0.2% | | | |
| B&M European Value Retail SA | | 42,762 |
| 192,560 |
|
| Pan Pacific International Holdings Corp. | | 3,400 |
| 216,948 |
|
| Target Corp. | | 4,438 |
| 383,443 |
|
| | | | 792,951 |
|
| Oil, Gas and Consumable Fuels — 1.8% | | | |
Callon Petroleum Co.(1) | | 2,817 |
| 13,860 |
|
Centennial Resource Development, Inc., Class A(1) | | 1,626 |
| 9,675 |
|
| Chevron Corp. | | 11,125 |
| 1,369,599 |
|
| Cimarex Energy Co. | | 1,388 |
| 70,330 |
|
| Concho Resources, Inc. | | 1,504 |
| 146,911 |
|
| ConocoPhillips | | 422 |
| 24,932 |
|
| CVR Energy, Inc. | | 6,227 |
| 330,467 |
|
|
| | | | | | | |
| | | Shares/
Principal Amount | Value |
| Delek US Holdings, Inc. | | 1,637 |
| $ | 70,522 |
|
| Devon Energy Corp. | | 5,404 |
| 145,908 |
|
Earthstone Energy, Inc., Class A(1) | | 1,796 |
| 7,866 |
|
| Eni SpA | | 38,509 |
| 602,856 |
|
| EQT Corp. | | 7,969 |
| 120,412 |
|
| Equitrans Midstream Corp. | | 6,168 |
| 102,327 |
|
Extraction Oil & Gas, Inc.(1) | | 1,104 |
| 4,096 |
|
| Exxon Mobil Corp. | | 2,535 |
| 188,503 |
|
| Gazprom PJSC ADR | | 57,897 |
| 424,420 |
|
| Gazprom PJSC | | 61,499 |
| 228,504 |
|
| Gaztransport Et Technigaz SA | | 502 |
| 45,530 |
|
| Gibson Energy, Inc. | | 2,267 |
| 39,283 |
|
| HollyFrontier Corp. | | 3,513 |
| 174,842 |
|
| Imperial Oil Ltd. | | 4,130 |
| 113,092 |
|
| Lundin Petroleum AB | | 5,520 |
| 173,305 |
|
Magnolia Oil & Gas Corp., Class A(1) | | 684 |
| 7,647 |
|
| Neste Oyj | | 6,690 |
| 221,149 |
|
| Noble Energy, Inc. | | 8,739 |
| 192,957 |
|
| Occidental Petroleum Corp. | | 1,029 |
| 52,849 |
|
| PetroChina Co. Ltd., H Shares | | 624,000 |
| 330,719 |
|
| Phillips 66 | | 4,057 |
| 416,086 |
|
| Royal Dutch Shell plc, Class B ADR | | 3,210 |
| 203,739 |
|
| Saras SpA | | 172,040 |
| 283,158 |
|
| Surgutneftegas PJSC Preference Shares | | 960,080 |
| 469,641 |
|
| TOTAL SA | | 4,525 |
| 234,471 |
|
| TOTAL SA ADR | | 15,480 |
| 800,935 |
|
| | | | 7,620,591 |
|
| Paper and Forest Products — 0.1% | | | |
| Boise Cascade Co. | | 669 |
| 18,063 |
|
| Domtar Corp. | | 5,815 |
| 246,847 |
|
| Neenah, Inc. | | 260 |
| 17,084 |
|
| | | | 281,994 |
|
| Personal Products — 0.2% | | | |
| Estee Lauder Cos., Inc. (The), Class A | | 878 |
| 161,719 |
|
| Fancl Corp. | | 1,100 |
| 27,677 |
|
| Kose Corp. | | 700 |
| 119,074 |
|
| Medifast, Inc. | | 320 |
| 35,728 |
|
| Ontex Group NV | | 9,245 |
| 152,433 |
|
| Shiseido Co. Ltd. | | 3,200 |
| 235,546 |
|
| | | | 732,177 |
|
| Pharmaceuticals — 1.6% | | | |
Aerie Pharmaceuticals, Inc.(1) | | 379 |
| 8,213 |
|
| AstraZeneca plc | | 4,850 |
| 416,287 |
|
Catalent, Inc.(1) | | 2,607 |
| 147,269 |
|
| Dechra Pharmaceuticals plc | | 849 |
| 30,241 |
|
| Eli Lilly & Co. | | 2,435 |
| 265,293 |
|
Horizon Therapeutics plc(1) | | 1,069 |
| 26,607 |
|
|
| | | | | | | |
| | | Shares/
Principal Amount | Value |
Jazz Pharmaceuticals plc(1) | | 983 |
| $ | 137,011 |
|
| Johnson & Johnson | | 10,989 |
| 1,430,988 |
|
| Merck & Co., Inc. | | 12,235 |
| 1,015,383 |
|
| Novartis AG | | 3,210 |
| 294,354 |
|
| Novo Nordisk A/S, B Shares | | 6,032 |
| 289,516 |
|
Optinose, Inc.(1) | | 1,130 |
| 6,068 |
|
| Pfizer, Inc. | | 25,344 |
| 984,361 |
|
Reata Pharmaceuticals, Inc., Class A(1) | | 117 |
| 10,606 |
|
| Roche Holding AG | | 1,060 |
| 283,820 |
|
| Sanofi | | 4,512 |
| 376,475 |
|
| Sanofi ADR | | 11,393 |
| 475,088 |
|
| Zoetis, Inc. | | 3,056 |
| 351,104 |
|
| | | | 6,548,684 |
|
| Professional Services — 0.4% | | | |
| Applus Services SA | | 1,490 |
| 20,991 |
|
ASGN, Inc.(1) | | 347 |
| 21,878 |
|
Capita plc(1) | | 245,958 |
| 347,778 |
|
CoStar Group, Inc.(1) | | 654 |
| 402,472 |
|
IHS Markit Ltd.(1) | | 2,749 |
| 177,090 |
|
InnerWorkings, Inc.(1) | | 5,285 |
| 19,343 |
|
| Korn Ferry | | 1,054 |
| 41,401 |
|
| Nihon M&A Center, Inc. | | 1,200 |
| 32,305 |
|
| Recruit Holdings Co. Ltd. | | 8,900 |
| 302,875 |
|
| Teleperformance | | 208 |
| 43,530 |
|
| Trust Tech, Inc. | | 2,600 |
| 37,081 |
|
| UT Group Co. Ltd. | | 600 |
| 13,233 |
|
| Verisk Analytics, Inc. | | 1,321 |
| 200,422 |
|
| | | | 1,660,399 |
|
| Real Estate Management and Development — 0.4% | | | |
| Altus Group Ltd. | | 482 |
| 12,238 |
|
| Aroundtown SA | | 24,376 |
| 194,998 |
|
| Ayala Land, Inc. | | 74,700 |
| 73,110 |
|
| CapitaLand Ltd. | | 27,600 |
| 72,440 |
|
| China Overseas Land & Investment Ltd. | | 8,000 |
| 27,382 |
|
| CIFI Holdings Group Co. Ltd. | | 58,000 |
| 36,805 |
|
| Colliers International Group, Inc. | | 491 |
| 35,670 |
|
| Corp. Inmobiliaria Vesta SAB de CV | | 29,108 |
| 43,851 |
|
| Fabege AB | | 7,420 |
| 114,418 |
|
Fastighets AB Balder, B Shares(1) | | 1,480 |
| 50,654 |
|
| FirstService Corp. | | 642 |
| 67,371 |
|
| Hang Lung Properties Ltd. | | 18,000 |
| 42,395 |
|
| LEG Immobilien AG | | 1,336 |
| 154,851 |
|
| Longfor Group Holdings Ltd. | | 22,500 |
| 82,728 |
|
| Mitsubishi Estate Co. Ltd. | | 7,400 |
| 135,369 |
|
| Mitsui Fudosan Co. Ltd. | | 3,200 |
| 72,414 |
|
| New World Development Co. Ltd. | | 43,000 |
| 60,190 |
|
| Nexity SA | | 140 |
| 6,735 |
|
|
| | | | | | | |
| | | Shares/
Principal Amount | Value |
| Pakuwon Jati Tbk PT | | 282,700 |
| $ | 14,775 |
|
| Shimao Property Holdings Ltd. | | 16,500 |
| 45,556 |
|
| Shurgard Self Storage SA | | 854 |
| 29,606 |
|
| Sun Hung Kai Properties Ltd. | | 5,000 |
| 80,356 |
|
| Times China Holdings Ltd. | | 23,000 |
| 40,046 |
|
| VGP NV | | 378 |
| 31,757 |
|
| Vonovia SE | | 3,062 |
| 149,868 |
|
| | | | 1,675,583 |
|
| Road and Rail — 0.4% | | | |
| Canadian Pacific Railway Ltd. | | 560 |
| 133,703 |
|
| CSX Corp. | | 232 |
| 16,333 |
|
| DSV A/S | | 2,256 |
| 215,002 |
|
| Heartland Express, Inc. | | 12,147 |
| 240,996 |
|
| J.B. Hunt Transport Services, Inc. | | 994 |
| 101,756 |
|
Lyft, Inc., Class A(1) | | 1,279 |
| 77,853 |
|
| Sixt SE | | 313 |
| 32,053 |
|
| TFI International, Inc. | | 850 |
| 26,888 |
|
| Union Pacific Corp. | | 3,761 |
| 676,792 |
|
| | | | 1,521,376 |
|
| Semiconductors and Semiconductor Equipment — 1.4% | | | |
Advanced Energy Industries, Inc.(1) | | 214 |
| 12,498 |
|
Advanced Micro Devices, Inc.(1) | | 7,179 |
| 218,601 |
|
| Analog Devices, Inc. | | 1,264 |
| 148,469 |
|
| Applied Materials, Inc. | | 23,963 |
| 1,183,053 |
|
| ASML Holding NV | | 2,643 |
| 586,233 |
|
| BE Semiconductor Industries NV | | 223 |
| 6,615 |
|
| Broadcom, Inc. | | 4,061 |
| 1,177,649 |
|
| Cypress Semiconductor Corp. | | 1,110 |
| 25,497 |
|
| Entegris, Inc. | | 393 |
| 17,099 |
|
| Infineon Technologies AG | | 8,836 |
| 167,444 |
|
Inphi Corp.(1) | | 906 |
| 54,550 |
|
| Intel Corp. | | 16,189 |
| 818,354 |
|
| Kulicke & Soffa Industries, Inc. | | 1,505 |
| 34,058 |
|
| Lasertec Corp. | | 1,000 |
| 47,892 |
|
Lattice Semiconductor Corp.(1) | | 2,960 |
| 57,246 |
|
| Marvell Technology Group Ltd. | | 6,716 |
| 176,362 |
|
| Maxim Integrated Products, Inc. | | 8,682 |
| 513,888 |
|
| Microchip Technology, Inc. | | 2,010 |
| 189,784 |
|
| Monolithic Power Systems, Inc. | | 127 |
| 18,816 |
|
| NVIDIA Corp. | | 7 |
| 1,181 |
|
Qorvo, Inc.(1) | | 562 |
| 41,189 |
|
| QUALCOMM, Inc. | | 1,882 |
| 137,687 |
|
Silicon Laboratories, Inc.(1) | | 199 |
| 22,330 |
|
SOITEC(1) | | 491 |
| 50,751 |
|
| Teradyne, Inc. | | 12 |
| 669 |
|
| Xilinx, Inc. | | 1,767 |
| 201,809 |
|
| | | | 5,909,724 |
|
|
| | | | | | | |
| | | Shares/
Principal Amount | Value |
| Software — 2.5% | | | |
Adobe, Inc.(1) | | 1,965 |
| $ | 587,260 |
|
Adyen NV(1) | | 232 |
| 175,122 |
|
ANSYS, Inc.(1) | | 71 |
| 14,422 |
|
Aspen Technology, Inc.(1) | | 227 |
| 29,935 |
|
Atlassian Corp. plc, Class A(1) | | 2,168 |
| 303,780 |
|
Autodesk, Inc.(1) | | 1,221 |
| 190,684 |
|
Avalara, Inc.(1) | | 401 |
| 32,673 |
|
| Avast plc | | 9,978 |
| 40,797 |
|
| Aveva Group plc | | 832 |
| 40,468 |
|
Bottomline Technologies de, Inc.(1) | | 407 |
| 17,131 |
|
Cadence Design Systems, Inc.(1) | | 3,701 |
| 273,541 |
|
Coupa Software, Inc.(1) | | 914 |
| 124,039 |
|
| Dassault Systemes SE | | 1,290 |
| 195,284 |
|
Descartes Systems Group, Inc. (The)(1) | | 926 |
| 33,643 |
|
Elastic NV(1) | | 130 |
| 12,848 |
|
Fair Isaac Corp.(1) | | 84 |
| 29,183 |
|
Five9, Inc.(1) | | 628 |
| 31,004 |
|
| Fuji Soft, Inc. | | 500 |
| 22,355 |
|
Globant SA(1) | | 291 |
| 30,846 |
|
| Intuit, Inc. | | 1,993 |
| 552,679 |
|
| LogMeIn, Inc. | | 751 |
| 57,053 |
|
Manhattan Associates, Inc.(1) | | 148 |
| 12,579 |
|
Medallia, Inc.(1) | | 284 |
| 11,317 |
|
| Microsoft Corp. | | 33,883 |
| 4,617,236 |
|
| Oracle Corp. (New York) | | 11,556 |
| 650,603 |
|
Pagerduty, Inc.(1) | | 889 |
| 39,294 |
|
Palo Alto Networks, Inc.(1) | | 1,733 |
| 392,594 |
|
Paycom Software, Inc.(1) | | 181 |
| 43,576 |
|
Paylocity Holding Corp.(1) | | 498 |
| 50,841 |
|
Proofpoint, Inc.(1) | | 46 |
| 5,805 |
|
PTC, Inc.(1) | | 1,560 |
| 105,737 |
|
Rapid7, Inc.(1) | | 706 |
| 42,819 |
|
RingCentral, Inc., Class A(1) | | 839 |
| 119,121 |
|
salesforce.com, Inc.(1) | | 2,697 |
| 416,687 |
|
| SAP SE | | 1,460 |
| 181,110 |
|
| Sapiens International Corp. NV | | 390 |
| 6,275 |
|
ServiceNow, Inc.(1) | | 534 |
| 148,126 |
|
| Sophos Group plc | | 5,472 |
| 29,013 |
|
Splunk, Inc.(1) | | 838 |
| 113,390 |
|
Temenos AG(1) | | 1,040 |
| 182,671 |
|
Teradata Corp.(1) | | 1,736 |
| 63,572 |
|
| VMware, Inc., Class A | | 902 |
| 157,390 |
|
| WiseTech Global Ltd. | | 2,066 |
| 44,844 |
|
Workday, Inc., Class A(1) | | 532 |
| 106,389 |
|
Zendesk, Inc.(1) | | 304 |
| 25,402 |
|
|
| | | | | | | |
| | | Shares/
Principal Amount | Value |
Zoom Video Communications, Inc., Class A(1) | | 267 |
| $ | 25,501 |
|
| | | | 10,386,639 |
|
| Specialty Retail — 1.0% | | | |
| Adastria Co. Ltd. | | 1,100 |
| 21,534 |
|
| Advance Auto Parts, Inc. | | 4,971 |
| 748,831 |
|
AutoZone, Inc.(1) | | 367 |
| 412,156 |
|
Boot Barn Holdings, Inc.(1) | | 770 |
| 24,093 |
|
Burlington Stores, Inc.(1) | | 1,291 |
| 233,348 |
|
| Camping World Holdings, Inc., Class A | | 3,856 |
| 45,231 |
|
| Fast Retailing Co. Ltd. | | 200 |
| 119,781 |
|
Five Below, Inc.(1) | | 880 |
| 103,365 |
|
Floor & Decor Holdings, Inc., Class A(1) | | 2,335 |
| 91,415 |
|
| Home Depot, Inc. (The) | | 263 |
| 56,201 |
|
| JD Sports Fashion plc | | 3,380 |
| 26,750 |
|
| Kingfisher plc | | 293,725 |
| 790,224 |
|
MarineMax, Inc.(1) | | 970 |
| 14,977 |
|
Murphy USA, Inc.(1) | | 1,543 |
| 136,340 |
|
National Vision Holdings, Inc.(1) | | 621 |
| 19,617 |
|
O'Reilly Automotive, Inc.(1) | | 1,431 |
| 544,868 |
|
| Penske Automotive Group, Inc. | | 894 |
| 41,097 |
|
| TJX Cos., Inc. (The) | | 8,601 |
| 469,271 |
|
Tokyo Base Co. Ltd.(1) | | 2,700 |
| 18,397 |
|
| Tractor Supply Co. | | 1,552 |
| 168,873 |
|
Ulta Beauty, Inc.(1) | | 293 |
| 102,330 |
|
| | | | 4,188,699 |
|
| Technology Hardware, Storage and Peripherals — 0.9% | | | |
| Apple, Inc. | | 16,134 |
| 3,437,187 |
|
Cray, Inc.(1) | | 1,125 |
| 38,970 |
|
| HP, Inc. | | 8,820 |
| 185,573 |
|
| | | | 3,661,730 |
|
| Textiles, Apparel and Luxury Goods — 0.5% | | | |
| adidas AG | | 880 |
| 282,200 |
|
| Burberry Group plc | | 6,500 |
| 177,323 |
|
Canada Goose Holdings, Inc.(1) | | 4,056 |
| 189,780 |
|
Deckers Outdoor Corp.(1) | | 2,124 |
| 331,939 |
|
| HUGO BOSS AG | | 1,650 |
| 104,150 |
|
Lululemon Athletica, Inc.(1) | | 509 |
| 97,265 |
|
| LVMH Moet Hennessy Louis Vuitton SE | | 340 |
| 140,588 |
|
| NIKE, Inc., Class B | | 7,530 |
| 647,806 |
|
| Salvatore Ferragamo SpA | | 933 |
| 19,533 |
|
| Tapestry, Inc. | | 4,068 |
| 125,823 |
|
| | | | 2,116,407 |
|
| Thrifts and Mortgage Finance — 0.1% | | | |
| Aruhi Corp. | | 1,200 |
| 22,481 |
|
| Capitol Federal Financial, Inc. | | 16,644 |
| 227,357 |
|
Essent Group Ltd.(1) | | 3,697 |
| 170,653 |
|
|
| | | | | | | |
| | | Shares/
Principal Amount | Value |
LendingTree, Inc.(1) | | 40 |
| $ | 12,902 |
|
| | | | 433,393 |
|
Tobacco† | | | |
| Swedish Match AB | | 2,120 |
| 81,027 |
|
| Trading Companies and Distributors — 0.4% | | | |
AerCap Holdings NV(1) | | 11,522 |
| 628,295 |
|
DXP Enterprises, Inc.(1) | | 80 |
| 2,716 |
|
Ferguson plc(1) | | 1,870 |
| 139,273 |
|
Foundation Building Materials, Inc.(1) | | 961 |
| 16,539 |
|
GMS, Inc.(1) | | 833 |
| 18,751 |
|
| Grafton Group plc | | 2,427 |
| 21,329 |
|
| H&E Equipment Services, Inc. | | 913 |
| 27,947 |
|
HD Supply Holdings, Inc.(1) | | 612 |
| 24,792 |
|
| IMCD NV | | 382 |
| 33,541 |
|
| Indutrade AB | | 1,514 |
| 42,699 |
|
| MonotaRO Co. Ltd. | | 7,400 |
| 161,712 |
|
| MSC Industrial Direct Co., Inc., Class A | | 5,207 |
| 369,957 |
|
NOW, Inc.(1) | | 1,359 |
| 16,648 |
|
| Seven Group Holdings Ltd. | | 4,501 |
| 54,984 |
|
SiteOne Landscape Supply, Inc.(1) | | 461 |
| 34,054 |
|
| Yamazen Corp. | | 6,500 |
| 61,841 |
|
| | | | 1,655,078 |
|
Transportation Infrastructure† | | | |
| Macquarie Infrastructure Corp. | | 753 |
| 31,204 |
|
Water Utilities† | | | |
| SJW Group | | 218 |
| 14,146 |
|
Wireless Telecommunication Services† | | | |
T-Mobile US, Inc.(1) | | 36 |
| 2,870 |
|
TOTAL COMMON STOCKS
(Cost $140,043,045) | | | 179,408,052 |
|
| U.S. TREASURY SECURITIES — 14.1% | | | |
| U.S. Treasury Bonds, 3.125%, 11/15/41 | | $ | 150,000 |
| 167,815 |
|
| U.S. Treasury Bonds, 3.00%, 5/15/42 | | 430,000 |
| 470,842 |
|
| U.S. Treasury Bonds, 2.875%, 5/15/43 | | 920,000 |
| 983,951 |
|
| U.S. Treasury Bonds, 3.125%, 8/15/44 | | 100,000 |
| 111,504 |
|
| U.S. Treasury Bonds, 3.00%, 11/15/44 | | 150,000 |
| 163,737 |
|
U.S. Treasury Bonds, 2.50%, 2/15/45(2) | | 2,700,000 |
| 2,689,189 |
|
| U.S. Treasury Bonds, 3.00%, 5/15/45 | | 600,000 |
| 655,629 |
|
| U.S. Treasury Bonds, 3.00%, 11/15/45 | | 850,000 |
| 929,621 |
|
| U.S. Treasury Bonds, 2.50%, 5/15/46 | | 450,000 |
| 447,372 |
|
| U.S. Treasury Inflation Indexed Bonds, 2.375%, 1/15/25 | | 2,105,830 |
| 2,345,031 |
|
| U.S. Treasury Inflation Indexed Bonds, 2.375%, 1/15/27 | | 380,967 |
| 440,067 |
|
| U.S. Treasury Inflation Indexed Bonds, 0.75%, 2/15/42 | | 566,675 |
| 575,123 |
|
| U.S. Treasury Inflation Indexed Bonds, 0.625%, 2/15/43 | | 556,935 |
| 546,336 |
|
| U.S. Treasury Inflation Indexed Bonds, 0.75%, 2/15/45 | | 543,760 |
| 544,315 |
|
| U.S. Treasury Inflation Indexed Bonds, 0.875%, 2/15/47 | | 530,445 |
| 546,834 |
|
| U.S. Treasury Inflation Indexed Notes, 0.125%, 7/15/22 | | 2,728,369 |
| 2,714,933 |
|
|
| | | | | | | |
| | | Shares/
Principal Amount | Value |
| U.S. Treasury Inflation Indexed Notes, 0.125%, 1/15/23 | | $ | 3,106,544 |
| $ | 3,084,115 |
|
| U.S. Treasury Inflation Indexed Notes, 0.375%, 7/15/23 | | 3,411,364 |
| 3,432,744 |
|
| U.S. Treasury Inflation Indexed Notes, 0.625%, 1/15/24 | | 1,426,815 |
| 1,449,336 |
|
| U.S. Treasury Inflation Indexed Notes, 0.125%, 7/15/24 | | 9,437,138 |
| 9,414,186 |
|
| U.S. Treasury Inflation Indexed Notes, 0.25%, 1/15/25 | | 4,324,880 |
| 4,324,280 |
|
| U.S. Treasury Inflation Indexed Notes, 0.625%, 1/15/26 | | 6,035,568 |
| 6,182,180 |
|
| U.S. Treasury Inflation Indexed Notes, 0.125%, 7/15/26 | | 1,175,218 |
| 1,169,135 |
|
| U.S. Treasury Inflation Indexed Notes, 0.375%, 1/15/27 | | 212,032 |
| 213,860 |
|
| U.S. Treasury Inflation Indexed Notes, 0.50%, 1/15/28 | | 1,557,315 |
| 1,585,440 |
|
| U.S. Treasury Inflation Indexed Notes, 0.875%, 1/15/29 | | 2,535,550 |
| 2,673,450 |
|
| U.S. Treasury Notes, 1.75%, 9/30/19 | | 2,000,000 |
| 1,998,685 |
|
| U.S. Treasury Notes, 1.50%, 11/30/19 | | 1,090,000 |
| 1,087,658 |
|
| U.S. Treasury Notes, 1.375%, 1/15/20 | | 350,000 |
| 348,838 |
|
| U.S. Treasury Notes, 1.50%, 5/31/20 | | 300,000 |
| 298,559 |
|
| U.S. Treasury Notes, 1.375%, 9/15/20 | | 900,000 |
| 893,812 |
|
| U.S. Treasury Notes, 1.375%, 10/31/20 | | 1,600,000 |
| 1,588,062 |
|
| U.S. Treasury Notes, 2.00%, 11/30/20 | | 250,000 |
| 250,117 |
|
| U.S. Treasury Notes, 2.50%, 2/28/21 | | 2,750,000 |
| 2,774,062 |
|
| U.S. Treasury Notes, 1.875%, 4/30/22 | | 900,000 |
| 900,826 |
|
U.S. Treasury Notes, 2.25%, 8/15/27(2) | | 300,000 |
| 306,592 |
|
TOTAL U.S. TREASURY SECURITIES
(Cost $57,103,591) | | | 58,308,236 |
|
| CORPORATE BONDS — 10.6% | | | |
| Aerospace and Defense — 0.1% | | | |
| Arconic, Inc., 5.125%, 10/1/24 | | 50,000 |
| 53,350 |
|
Bombardier, Inc., 8.75%, 12/1/21(3) | | 25,000 |
| 27,344 |
|
Bombardier, Inc., 7.50%, 3/15/25(3) | | 35,000 |
| 35,722 |
|
| TransDigm, Inc., 6.00%, 7/15/22 | | 40,000 |
| 40,512 |
|
| United Technologies Corp., 6.05%, 6/1/36 | | 51,000 |
| 66,403 |
|
| United Technologies Corp., 5.70%, 4/15/40 | | 75,000 |
| 97,583 |
|
| | | | 320,914 |
|
Air Freight and Logistics† | | | |
| United Parcel Service, Inc., 2.80%, 11/15/24 | | 120,000 |
| 122,796 |
|
XPO Logistics, Inc., 6.50%, 6/15/22(3) | | 19,000 |
| 19,349 |
|
| | | | 142,145 |
|
Airlines† | | | |
American Airlines Group, Inc., 4.625%, 3/1/20(3) | | 40,000 |
| 40,400 |
|
| United Airlines Holdings, Inc., 5.00%, 2/1/24 | | 45,000 |
| 47,362 |
|
| | | | 87,762 |
|
Auto Components† | | | |
| American Axle & Manufacturing, Inc., 6.625%, 10/15/22 | | 12,000 |
| 12,181 |
|
| Automobiles — 0.2% | | | |
| BMW Finance NV, MTN, 1.00%, 2/15/22 | EUR | 40,000 |
| 45,623 |
|
| BMW Finance NV, MTN, 0.875%, 4/3/25 | EUR | 50,000 |
| 58,061 |
|
| Ford Motor Credit Co. LLC, 5.875%, 8/2/21 | | $ | 240,000 |
| 252,488 |
|
| General Motors Co., 4.20%, 10/1/27 | | 30,000 |
| 30,496 |
|
| General Motors Co., 5.15%, 4/1/38 | | 100,000 |
| 100,661 |
|
|
| | | | | | | |
| | | Shares/
Principal Amount | Value |
| General Motors Financial Co., Inc., 3.20%, 7/6/21 | | $ | 190,000 |
| $ | 191,622 |
|
| | | | 678,951 |
|
| Banks — 2.2% | | | |
| ABN AMRO Bank NV, MTN, VRN, 2.875%, 6/30/25 | EUR | 100,000 |
| 113,458 |
|
| Akbank T.A.S., 5.00%, 10/24/22 | | $ | 50,000 |
| 48,807 |
|
Avi Funding Co. Ltd., 3.80%, 9/16/25(3) | | 102,000 |
| 106,402 |
|
| Banco Mercantil del Norte SA, VRN, 5.75%, 10/4/31 | | 82,000 |
| 80,771 |
|
| Banco Santander SA, MTN, 2.50%, 3/18/25 | EUR | 200,000 |
| 242,745 |
|
| Banistmo SA, 3.65%, 9/19/22 | | $ | 120,000 |
| 121,062 |
|
| Bank of America Corp., 4.10%, 7/24/23 | | 70,000 |
| 74,370 |
|
| Bank of America Corp., MTN, 4.20%, 8/26/24 | | 260,000 |
| 276,339 |
|
| Bank of America Corp., MTN, 2.30%, 7/25/25 | GBP | 100,000 |
| 127,626 |
|
| Bank of America Corp., MTN, 5.00%, 1/21/44 | | $ | 60,000 |
| 73,924 |
|
| Bank of America Corp., MTN, VRN, 4.44%, 1/20/48 | | 40,000 |
| 45,991 |
|
| Bank of America Corp., VRN, 3.42%, 12/20/28 | | 56,000 |
| 57,667 |
|
| Barclays Bank plc, 5.14%, 10/14/20 | | 100,000 |
| 102,566 |
|
| Barclays plc, MTN, VRN, 2.00%, 2/7/28 | EUR | 200,000 |
| 216,479 |
|
| BPCE SA, VRN, 2.75%, 7/8/26 | EUR | 100,000 |
| 116,634 |
|
| CaixaBank SA, MTN, VRN, 2.75%, 7/14/28 | EUR | 100,000 |
| 117,352 |
|
| CIT Group, Inc., 5.00%, 8/15/22 | | $ | 90,000 |
| 95,400 |
|
| Citigroup, Inc., 2.75%, 4/25/22 | | 60,000 |
| 60,496 |
|
| Citigroup, Inc., 4.45%, 9/29/27 | | 350,000 |
| 377,977 |
|
| Citigroup, Inc., VRN, 3.52%, 10/27/28 | | 210,000 |
| 216,899 |
|
| Co-Operative Bank plc (The), 4.75%, 11/11/21 (Secured) | GBP | 200,000 |
| 258,837 |
|
| Commerzbank AG, MTN, 4.00%, 3/23/26 | EUR | 120,000 |
| 154,027 |
|
| Cooperatieve Rabobank UA, VRN, 2.50%, 5/26/26 | EUR | 100,000 |
| 115,650 |
|
| Credit Agricole SA, MTN, 7.375%, 12/18/23 | GBP | 100,000 |
| 151,476 |
|
| European Financial Stability Facility, MTN, 2.125%, 2/19/24 | EUR | 351,000 |
| 435,554 |
|
| European Financial Stability Facility, MTN, 2.35%, 7/29/44 | EUR | 62,000 |
| 97,417 |
|
| European Investment Bank, MTN, 2.25%, 10/14/22 | EUR | 165,000 |
| 199,732 |
|
| Fifth Third BanCorp., 4.30%, 1/16/24 | | $ | 60,000 |
| 63,914 |
|
| Fifth Third Bank, 2.875%, 10/1/21 | | 31,000 |
| 31,302 |
|
| HSBC Bank plc, MTN, VRN, 5.375%, 11/4/30 | GBP | 90,000 |
| 128,733 |
|
| HSBC Holdings plc, 4.30%, 3/8/26 | | $ | 200,000 |
| 214,028 |
|
| HSBC Holdings plc, VRN, 3.26%, 3/13/23 | | 200,000 |
| 203,005 |
|
Intercorp Financial Services, Inc., 4.125%, 10/19/27(3) | | 125,000 |
| 127,750 |
|
| JPMorgan Chase & Co., 3.875%, 9/10/24 | | 550,000 |
| 577,324 |
|
| JPMorgan Chase & Co., 3.125%, 1/23/25 | | 240,000 |
| 245,796 |
|
| JPMorgan Chase & Co., VRN, 3.90%, 1/23/49 | | 90,000 |
| 95,707 |
|
| KEB Hana Bank, MTN, 4.375%, 9/30/24 | | 82,000 |
| 86,929 |
|
| Kreditanstalt fuer Wiederaufbau, 4.625%, 1/4/23 | EUR | 250,000 |
| 327,111 |
|
| Lloyds Bank plc, MTN, 7.625%, 4/22/25 | GBP | 80,000 |
| 125,490 |
|
| PNC Financial Services Group, Inc. (The), 4.375%, 8/11/20 | | $ | 80,000 |
| 81,679 |
|
| Royal Bank of Scotland Group plc, 6.125%, 12/15/22 | | 25,000 |
| 26,890 |
|
| Santander UK plc, MTN, 5.125%, 4/14/21 | GBP | 100,000 |
| 130,272 |
|
Turkiye Garanti Bankasi AS, VRN, 6.125%, 5/24/27(3) | | $ | 60,000 |
| 52,002 |
|
| U.S. Bancorp, MTN, 3.60%, 9/11/24 | | 24,000 |
| 25,219 |
|
|
| | | | | | | |
| | | Shares/
Principal Amount | Value |
| U.S. Bank N.A., 2.80%, 1/27/25 | | $ | 250,000 |
| $ | 255,202 |
|
| UniCredit SpA, MTN, VRN, 5.75%, 10/28/25 | EUR | 100,000 |
| 117,552 |
|
| Wells Fargo & Co., 4.125%, 8/15/23 | | $ | 100,000 |
| 105,517 |
|
| Wells Fargo & Co., 3.00%, 4/22/26 | | 180,000 |
| 181,834 |
|
| Wells Fargo & Co., MTN, 2.60%, 7/22/20 | | 130,000 |
| 130,374 |
|
| Wells Fargo & Co., MTN, 4.10%, 6/3/26 | | 120,000 |
| 127,031 |
|
| Wells Fargo & Co., MTN, 4.65%, 11/4/44 | | 115,000 |
| 130,155 |
|
| Westpac Banking Corp., 4.875%, 11/19/19 | | 1,200,000 |
| 1,209,354 |
|
| Woori Bank, MTN, 4.75%, 4/30/24 | | 61,000 |
| 65,065 |
|
| | | | 8,950,893 |
|
| Beverages — 0.1% | | | |
| Anheuser-Busch Cos. LLC / Anheuser-Busch InBev Worldwide, Inc., 4.90%, 2/1/46 | | 180,000 |
| 205,017 |
|
| Anheuser-Busch InBev SA, MTN, 1.50%, 3/17/25 | EUR | 50,000 |
| 60,415 |
|
| | | | 265,432 |
|
| Biotechnology — 0.2% | | | |
| AbbVie, Inc., 2.90%, 11/6/22 | | $ | 5,000 |
| 5,050 |
|
| AbbVie, Inc., 3.60%, 5/14/25 | | 40,000 |
| 41,246 |
|
| AbbVie, Inc., 4.40%, 11/6/42 | | 130,000 |
| 128,962 |
|
| AbbVie, Inc., 4.70%, 5/14/45 | | 10,000 |
| 10,199 |
|
| Amgen, Inc., 4.66%, 6/15/51 | | 138,000 |
| 151,633 |
|
| Celgene Corp., 3.25%, 8/15/22 | | 90,000 |
| 92,329 |
|
| Celgene Corp., 3.625%, 5/15/24 | | 15,000 |
| 15,646 |
|
| Celgene Corp., 3.875%, 8/15/25 | | 130,000 |
| 138,447 |
|
| Gilead Sciences, Inc., 4.40%, 12/1/21 | | 110,000 |
| 114,801 |
|
| Gilead Sciences, Inc., 3.65%, 3/1/26 | | 230,000 |
| 242,995 |
|
| | | | 941,308 |
|
Building Products† | | | |
Builders FirstSource, Inc., 5.625%, 9/1/24(3) | | 9,000 |
| 9,349 |
|
| Capital Markets — 0.3% | | | |
| Credit Suisse Group AG, VRN, 2.125%, 9/12/25 | GBP | 100,000 |
| 123,186 |
|
| Criteria Caixa SAU, MTN, 1.50%, 5/10/23 | EUR | 100,000 |
| 115,624 |
|
| Goldman Sachs Group, Inc. (The), 5.50%, 10/12/21 | GBP | 50,000 |
| 66,311 |
|
| Goldman Sachs Group, Inc. (The), 3.50%, 11/16/26 | | $ | 305,000 |
| 313,203 |
|
| Morgan Stanley, 4.375%, 1/22/47 | | 40,000 |
| 45,062 |
|
| Morgan Stanley, MTN, 5.625%, 9/23/19 | | 150,000 |
| 150,658 |
|
| Morgan Stanley, MTN, 3.70%, 10/23/24 | | 250,000 |
| 262,480 |
|
| Morgan Stanley, MTN, 4.00%, 7/23/25 | | 70,000 |
| 74,799 |
|
| Morgan Stanley, MTN, VRN, 2.72%, 7/22/25 | | 92,000 |
| 92,204 |
|
| SURA Asset Management SA, 4.375%, 4/11/27 | | 40,000 |
| 41,600 |
|
| | | | 1,285,127 |
|
Chemicals† | | | |
| CF Industries, Inc., 3.45%, 6/1/23 | | 20,000 |
| 20,275 |
|
Element Solutions, Inc., 5.875%, 12/1/25(3) | | 10,000 |
| 10,225 |
|
Equate Petrochemical BV, 4.25%, 11/3/26(3) | | 34,000 |
| 36,222 |
|
| Huntsman International LLC, 5.125%, 11/15/22 | | 25,000 |
| 26,530 |
|
| Olin Corp., 5.125%, 9/15/27 | | 10,000 |
| 10,105 |
|
|
| | | | | | | |
| | | Shares/
Principal Amount | Value |
Tronox Finance plc, 5.75%, 10/1/25(3) | | $ | 10,000 |
| $ | 9,450 |
|
| | | | 112,807 |
|
| Commercial Services and Supplies — 0.1% | | | |
| ADT Security Corp. (The), 6.25%, 10/15/21 | | 20,000 |
| 21,351 |
|
HPHT Finance 15 Ltd., 2.875%, 3/17/20(3) | | 204,000 |
| 204,278 |
|
Nielsen Finance LLC / Nielsen Finance Co., 5.00%, 4/15/22(3) | | 60,000 |
| 60,207 |
|
Prime Security Services Borrower LLC / Prime Finance, Inc., 9.25%, 5/15/23(3) | | 25,000 |
| 26,312 |
|
| Republic Services, Inc., 3.55%, 6/1/22 | | 220,000 |
| 226,127 |
|
| RR Donnelley & Sons Co., 6.00%, 4/1/24 | | 25,000 |
| 24,656 |
|
| | | | 562,931 |
|
Communications Equipment† | | | |
CommScope Technologies LLC, 6.00%, 6/15/25(3) | | 50,000 |
| 45,750 |
|
HTA Group Ltd., 9.125%, 3/8/22(3) | | 61,000 |
| 64,041 |
|
IHS Netherlands Holdco BV, 9.50%, 10/27/21(3) | | 37,000 |
| 38,382 |
|
| | | | 148,173 |
|
Construction Materials† | | | |
| Cemex SAB de CV, 6.125%, 5/5/25 | | 80,000 |
| 83,040 |
|
Standard Industries, Inc., 6.00%, 10/15/25(3) | | 20,000 |
| 21,025 |
|
| | | | 104,065 |
|
| Consumer Finance — 0.1% | | | |
| Capital One Financial Corp., 3.80%, 1/31/28 | | 190,000 |
| 196,824 |
|
| Navient Corp., 5.00%, 10/26/20 | | 45,000 |
| 46,040 |
|
| Navient Corp., 5.50%, 1/25/23 | | 20,000 |
| 20,769 |
|
| | | | 263,633 |
|
| Containers and Packaging — 0.1% | | | |
| Ball Corp., 4.00%, 11/15/23 | | 60,000 |
| 62,100 |
|
| Berry Global, Inc., 5.125%, 7/15/23 | | 25,000 |
| 25,625 |
|
| Crown Americas LLC / Crown Americas Capital Corp. IV, 4.50%, 1/15/23 | | 175,000 |
| 181,125 |
|
Mauser Packaging Solutions Holding Co., 5.50%, 4/15/24(3) | | 10,000 |
| 10,022 |
|
| Reynolds Group Issuer, Inc. / Reynolds Group Issuer LLC / Reynolds Group Issuer Lu, 5.75%, 10/15/20 | | 33,919 |
| 34,084 |
|
Reynolds Group Issuer, Inc. / Reynolds Group Issuer LLC / Reynolds Group Issuer Lu, 5.125%, 7/15/23(3) | | 30,000 |
| 30,600 |
|
Reynolds Group Issuer, Inc. / Reynolds Group Issuer LLC / Reynolds Group Issuer Lu, 7.00%, 7/15/24(3) | | 40,000 |
| 41,375 |
|
Sealed Air Corp., 5.125%, 12/1/24(3) | | 25,000 |
| 26,750 |
|
| | | | 411,681 |
|
Diversified Consumer Services† | | | |
| CommonSpirit Health, 2.95%, 11/1/22 | | 70,000 |
| 70,541 |
|
| Diversified Financial Services — 0.9% | | | |
| Berkshire Hathaway, Inc., 2.75%, 3/15/23 | | 50,000 |
| 51,008 |
|
| GE Capital European Funding Unlimited. Co., MTN, 5.375%, 1/23/20 | EUR | 200,000 |
| 227,238 |
|
Gulf Gate Apartments LLC, VRN, 2.34%, 9/1/28, (Acquired 9/29/03 - 11/10/03, Cost $3,000,000)(4) | | $ | 3,000,000 |
| 3,000,000 |
|
| Icahn Enterprises LP / Icahn Enterprises Finance Corp., 5.875%, 2/1/22 | | 50,000 |
| 50,687 |
|
|
| | | | | | | |
| | | Shares/
Principal Amount | Value |
MDC GMTN B.V., 3.25%, 4/28/22(3) | | $ | 41,000 |
| $ | 41,830 |
|
| Voya Financial, Inc., 5.70%, 7/15/43 | | 110,000 |
| 136,267 |
|
| | | | 3,507,030 |
|
| Diversified Telecommunication Services — 0.4% | | | |
Altice France SA, 7.375%, 5/1/26(3) | | 35,000 |
| 37,107 |
|
| AT&T, Inc., 4.45%, 4/1/24 | | 6,000 |
| 6,458 |
|
| AT&T, Inc., 3.40%, 5/15/25 | | 90,000 |
| 92,648 |
|
| AT&T, Inc., 2.95%, 7/15/26 | | 80,000 |
| 80,394 |
|
| AT&T, Inc., 3.80%, 2/15/27 | | 100,000 |
| 104,415 |
|
| AT&T, Inc., 2.60%, 12/17/29 | EUR | 100,000 |
| 130,704 |
|
| AT&T, Inc., 5.15%, 11/15/46 | | $ | 171,000 |
| 189,587 |
|
| CenturyLink, Inc., 5.625%, 4/1/20 | | 50,000 |
| 50,843 |
|
| CenturyLink, Inc., 5.80%, 3/15/22 | | 10,000 |
| 10,450 |
|
Cincinnati Bell, Inc., 7.00%, 7/15/24(3) | | 5,000 |
| 4,300 |
|
| Deutsche Telekom International Finance BV, MTN, 1.25%, 10/6/23 | GBP | 50,000 |
| 61,490 |
|
| Deutsche Telekom International Finance BV, MTN, 0.875%, 1/30/24 | EUR | 40,000 |
| 46,258 |
|
| Frontier Communications Corp., 10.50%, 9/15/22 | | $ | 85,000 |
| 53,550 |
|
| Frontier Communications Corp., 11.00%, 9/15/25 | | 35,000 |
| 20,475 |
|
| Hughes Satellite Systems Corp., 5.25%, 8/1/26 | | 25,000 |
| 26,581 |
|
Intelsat Jackson Holdings SA, 9.75%, 7/15/25(3) | | 80,000 |
| 83,200 |
|
| Level 3 Financing, Inc., 5.375%, 8/15/22 | | 55,000 |
| 55,412 |
|
Ooredoo International Finance Ltd., 3.75%, 6/22/26(3) | | 61,000 |
| 63,704 |
|
| Orange SA, 4.125%, 9/14/21 | | 120,000 |
| 124,334 |
|
| Telecom Italia Capital SA, 6.375%, 11/15/33 | | 45,000 |
| 47,484 |
|
| Telefonica Europe BV, VRN, 5.875%, 3/31/24 | EUR | 100,000 |
| 128,241 |
|
Turk Telekomunikasyon AS, 4.875%, 6/19/24(3) | | $ | 80,000 |
| 76,713 |
|
| Verizon Communications, Inc., 2.625%, 8/15/26 | | 120,000 |
| 119,766 |
|
| Verizon Communications, Inc., 4.40%, 11/1/34 | | 40,000 |
| 44,510 |
|
| Verizon Communications, Inc., 4.75%, 11/1/41 | | 15,000 |
| 17,240 |
|
| Verizon Communications, Inc., 5.01%, 8/21/54 | | 55,000 |
| 65,218 |
|
| Zayo Group LLC / Zayo Capital, Inc., 6.00%, 4/1/23 | | 25,000 |
| 25,875 |
|
| | | | 1,766,957 |
|
| Electric Utilities — 0.2% | | | |
| Duke Energy Florida LLC, 6.35%, 9/15/37 | | 70,000 |
| 97,959 |
|
| Duke Energy Florida LLC, 3.85%, 11/15/42 | | 80,000 |
| 84,431 |
|
| Duke Energy Progress LLC, 4.15%, 12/1/44 | | 9,000 |
| 9,932 |
|
| Exelon Corp., 4.45%, 4/15/46 | | 30,000 |
| 32,943 |
|
| FirstEnergy Corp., 4.25%, 3/15/23 | | 120,000 |
| 126,635 |
|
| FirstEnergy Corp., 4.85%, 7/15/47 | | 30,000 |
| 34,536 |
|
| Georgia Power Co., 4.30%, 3/15/42 | | 50,000 |
| 53,624 |
|
Greenko Investment Co., 4.875%, 8/16/23(3) | | 41,000 |
| 40,539 |
|
NextEra Energy Operating Partners LP, 4.50%, 9/15/27(3) | | 50,000 |
| 50,423 |
|
| Pampa Energia SA, 7.50%, 1/24/27 | | 82,000 |
| 75,952 |
|
| Progress Energy, Inc., 3.15%, 4/1/22 | | 60,000 |
| 60,995 |
|
| Southern Co. Gas Capital Corp., 3.95%, 10/1/46 | | 30,000 |
| 29,875 |
|
|
| | | | | | | |
| | | Shares/
Principal Amount | Value |
| SSE plc, VRN, 2.375%, 4/1/21 | EUR | 100,000 |
| $ | 113,254 |
|
| Xcel Energy, Inc., 3.35%, 12/1/26 | | $ | 40,000 |
| 41,500 |
|
| | | | 852,598 |
|
| Energy Equipment and Services — 0.1% | | | |
| Halliburton Co., 4.85%, 11/15/35 | | 60,000 |
| 66,043 |
|
| Nabors Industries, Inc., 4.625%, 9/15/21 | | 10,000 |
| 9,850 |
|
Transocean, Inc., 9.00%, 7/15/23(3) | | 55,000 |
| 58,078 |
|
| Valaris plc, 8.00%, 1/31/24 | | 17,000 |
| 14,450 |
|
| Valaris plc, 5.20%, 3/15/25 | | 30,000 |
| 21,600 |
|
| | | | 170,021 |
|
| Entertainment — 0.1% | | | |
| AMC Entertainment Holdings, Inc., 5.75%, 6/15/25 | | 25,000 |
| 23,711 |
|
| Viacom, Inc., 4.375%, 3/15/43 | | 30,000 |
| 29,702 |
|
| VTR Finance BV, 6.875%, 1/15/24 | | 92,000 |
| 95,335 |
|
Walt Disney Co. (The), 6.90%, 8/15/39(3) | | 30,000 |
| 44,813 |
|
Walt Disney Co. (The), 4.75%, 9/15/44(3) | | 32,000 |
| 39,497 |
|
| | | | 233,058 |
|
| Equity Real Estate Investment Trusts (REITs) — 0.1% | | | |
| Boston Properties LP, 3.65%, 2/1/26 | | 100,000 |
| 104,819 |
|
| Equinix, Inc., 5.375%, 5/15/27 | | 20,000 |
| 21,519 |
|
| Essex Portfolio LP, 3.625%, 8/15/22 | | 90,000 |
| 92,643 |
|
| Essex Portfolio LP, 3.25%, 5/1/23 | | 30,000 |
| 30,580 |
|
| GLP Capital LP / GLP Financing II, Inc., 5.375%, 11/1/23 | | 20,000 |
| 21,637 |
|
| GLP Capital LP / GLP Financing II, Inc., 5.375%, 4/15/26 | | 20,000 |
| 21,812 |
|
| Hospitality Properties Trust, 4.65%, 3/15/24 | | 60,000 |
| 61,830 |
|
| Iron Mountain, Inc., 5.75%, 8/15/24 | | 35,000 |
| 35,339 |
|
Iron Mountain, Inc., 4.875%, 9/15/27(3) | | 20,000 |
| 19,950 |
|
| Kilroy Realty LP, 3.80%, 1/15/23 | | 100,000 |
| 103,849 |
|
| MGM Growth Properties Operating Partnership LP / MGP Finance Co-Issuer, Inc., 5.625%, 5/1/24 | | 20,000 |
| 21,425 |
|
| SBA Communications Corp., 4.875%, 7/15/22 | | 35,000 |
| 35,438 |
|
| | | | 570,841 |
|
| Food and Staples Retailing — 0.2% | | | |
| Albertsons Cos. LLC / Safeway, Inc. / New Albertson's, LP / Albertson's LLC, 6.625%, 6/15/24 | | 35,000 |
| 36,662 |
|
CK Hutchison International 17 II Ltd., 2.25%, 9/29/20(3) | | 163,000 |
| 162,434 |
|
| Kroger Co. (The), 3.30%, 1/15/21 | | 170,000 |
| 172,115 |
|
| Kroger Co. (The), 3.875%, 10/15/46 | | 50,000 |
| 44,964 |
|
| Tesco plc, MTN, 5.00%, 3/24/23 | GBP | 50,000 |
| 68,251 |
|
| Walmart, Inc., 2.55%, 4/11/23 | | $ | 19,000 |
| 19,249 |
|
| Walmart, Inc., 4.05%, 6/29/48 | | 140,000 |
| 161,256 |
|
| | | | 664,931 |
|
| Food Products — 0.1% | | | |
| B&G Foods, Inc., 5.25%, 4/1/25 | | 20,000 |
| 19,975 |
|
JBS USA LUX SA / JBS USA Finance, Inc., 5.875%, 7/15/24(3) | | 20,000 |
| 20,600 |
|
JBS USA LUX SA / JBS USA Finance, Inc., 5.75%, 6/15/25(3) | | 30,000 |
| 31,088 |
|
Lamb Weston Holdings, Inc., 4.625%, 11/1/24(3) | | 70,000 |
| 73,500 |
|
|
| | | | | | | |
| | | Shares/
Principal Amount | Value |
MHP SE, 7.75%, 5/10/24(3) | | $ | 51,000 |
| $ | 54,593 |
|
| Minerva Luxembourg SA, 6.50%, 9/20/26 | | 126,000 |
| 128,835 |
|
Minerva Luxembourg SA, 5.875%, 1/19/28(3) | | 30,000 |
| 29,625 |
|
Pilgrim's Pride Corp., 5.75%, 3/15/25(3) | | 70,000 |
| 72,450 |
|
Post Holdings, Inc., 5.00%, 8/15/26(3) | | 40,000 |
| 41,000 |
|
| | | | 471,666 |
|
| Gas Utilities — 0.3% | | | |
| Andeavor Logistics LP / Tesoro Logistics Finance Corp., 6.25%, 10/15/22 | | 9,000 |
| 9,242 |
|
| Cheniere Corpus Christi Holdings LLC, 5.875%, 3/31/25 | | 40,000 |
| 44,104 |
|
| Cheniere Corpus Christi Holdings LLC, 5.125%, 6/30/27 | | 20,000 |
| 21,848 |
|
| China Resources Gas Group Ltd., MTN, 4.50%, 4/5/22 | | 102,000 |
| 106,444 |
|
| Crestwood Midstream Partners LP / Crestwood Midstream Finance Corp., 5.75%, 4/1/25 | | 25,000 |
| 25,540 |
|
| Enterprise Products Operating LLC, 4.85%, 3/15/44 | | 220,000 |
| 242,919 |
|
| Genesis Energy LP / Genesis Energy Finance Corp., 6.75%, 8/1/22 | | 35,000 |
| 35,740 |
|
| Genesis Energy LP / Genesis Energy Finance Corp., 5.625%, 6/15/24 | | 20,000 |
| 19,750 |
|
| Perusahaan Gas Negara Tbk PT, 5.125%, 5/16/24 | | 82,000 |
| 88,907 |
|
| Plains All American Pipeline LP / PAA Finance Corp., 3.65%, 6/1/22 | | 160,000 |
| 163,595 |
|
| Sabine Pass Liquefaction LLC, 5.625%, 3/1/25 | | 180,000 |
| 200,297 |
|
| Sunoco Logistics Partners Operations LP, 3.45%, 1/15/23 | | 170,000 |
| 173,171 |
|
| Targa Resources Partners LP / Targa Resources Partners Finance Corp., 4.25%, 11/15/23 | | 45,000 |
| 45,211 |
|
| Targa Resources Partners LP / Targa Resources Partners Finance Corp., 5.125%, 2/1/25 | | 20,000 |
| 20,704 |
|
| Targa Resources Partners LP / Targa Resources Partners Finance Corp., 5.00%, 1/15/28 | | 30,000 |
| 30,487 |
|
| | | | 1,227,959 |
|
Health Care Equipment and Supplies† | | | |
| Medtronic, Inc., 3.50%, 3/15/25 | | 6,000 |
| 6,371 |
|
| Medtronic, Inc., 4.375%, 3/15/35 | | 136,000 |
| 158,989 |
|
| | | | 165,360 |
|
| Health Care Providers and Services — 0.3% | | | |
| Acadia Healthcare Co., Inc., 5.125%, 7/1/22 | | 10,000 |
| 10,038 |
|
| Aetna, Inc., 2.75%, 11/15/22 | | 90,000 |
| 90,243 |
|
| Anthem, Inc., 4.65%, 1/15/43 | | 50,000 |
| 54,133 |
|
| CHS / Community Health Systems, Inc., 6.875%, 2/1/22 | | 50,000 |
| 34,500 |
|
| CHS / Community Health Systems, Inc., 6.25%, 3/31/23 | | 20,000 |
| 19,225 |
|
CHS / Community Health Systems, Inc., VRN, 9.875%, 6/30/23(3) | | 10,000 |
| 8,400 |
|
| CVS Health Corp., 3.50%, 7/20/22 | | 110,000 |
| 112,933 |
|
| CVS Health Corp., 4.30%, 3/25/28 | | 130,000 |
| 138,102 |
|
| CVS Health Corp., 4.78%, 3/25/38 | | 60,000 |
| 63,653 |
|
| CVS Health Corp., 5.05%, 3/25/48 | | 70,000 |
| 76,198 |
|
| DaVita, Inc., 5.125%, 7/15/24 | | 35,000 |
| 35,219 |
|
| DaVita, Inc., 5.00%, 5/1/25 | | 30,000 |
| 29,513 |
|
| Encompass Health Corp., 5.75%, 11/1/24 | | 14,000 |
| 14,210 |
|
|
| | | | | | | |
| | | Shares/
Principal Amount | Value |
| HCA, Inc., 5.00%, 3/15/24 | | $ | 70,000 |
| $ | 76,052 |
|
| HCA, Inc., 5.375%, 2/1/25 | | 70,000 |
| 75,877 |
|
| HCA, Inc., 4.50%, 2/15/27 | | 45,000 |
| 47,887 |
|
Jaguar Holding Co. II / Pharmaceutical Product Development LLC, 6.375%, 8/1/23(3) | | 30,000 |
| 31,162 |
|
| Northwell Healthcare, Inc., 4.26%, 11/1/47 | | 40,000 |
| 43,035 |
|
Team Health Holdings, Inc., 6.375%, 2/1/25(3) | | 10,000 |
| 8,200 |
|
| Tenet Healthcare Corp., 4.50%, 4/1/21 | | 10,000 |
| 10,213 |
|
| Tenet Healthcare Corp., 8.125%, 4/1/22 | | 35,000 |
| 37,494 |
|
| Tenet Healthcare Corp., 6.75%, 6/15/23 | | 40,000 |
| 41,300 |
|
| Tenet Healthcare Corp., 5.125%, 5/1/25 | | 50,000 |
| 49,948 |
|
| UnitedHealth Group, Inc., 2.875%, 3/15/22 | | 120,000 |
| 121,641 |
|
| UnitedHealth Group, Inc., 3.75%, 7/15/25 | | 50,000 |
| 53,432 |
|
| UnitedHealth Group, Inc., 4.25%, 3/15/43 | | 80,000 |
| 88,225 |
|
| | | | 1,370,833 |
|
| Hotels, Restaurants and Leisure — 0.2% | | | |
1011778 BC ULC / New Red Finance, Inc., 4.625%, 1/15/22(3) | | 50,000 |
| 50,175 |
|
1011778 BC ULC / New Red Finance, Inc., 5.00%, 10/15/25(3) | | 30,000 |
| 30,675 |
|
| Boyd Gaming Corp., 6.875%, 5/15/23 | | 10,000 |
| 10,375 |
|
| Boyd Gaming Corp., 6.375%, 4/1/26 | | 25,000 |
| 26,469 |
|
| Eldorado Resorts, Inc., 7.00%, 8/1/23 | | 35,000 |
| 36,662 |
|
Golden Nugget, Inc., 6.75%, 10/15/24(3) | | 30,000 |
| 30,956 |
|
| Hilton Domestic Operating Co., Inc., 4.25%, 9/1/24 | | 110,000 |
| 111,672 |
|
| Hilton Worldwide Finance LLC / Hilton Worldwide Finance Corp., 4.625%, 4/1/25 | | 20,000 |
| 20,550 |
|
International Game Technology plc, 6.25%, 2/15/22(3) | | 25,000 |
| 26,438 |
|
Jack Ohio Finance LLC / Jack Ohio Finance 1 Corp., 6.75%, 11/15/21(3) | | 20,000 |
| 20,490 |
|
| McDonald's Corp., MTN, 3.375%, 5/26/25 | | 60,000 |
| 62,704 |
|
| McDonald's Corp., MTN, 4.70%, 12/9/35 | | 40,000 |
| 46,321 |
|
| MGM Resorts International, 6.00%, 3/15/23 | | 30,000 |
| 32,625 |
|
| MGM Resorts International, 4.625%, 9/1/26 | | 10,000 |
| 10,300 |
|
Penn National Gaming, Inc., 5.625%, 1/15/27(3) | | 35,000 |
| 35,630 |
|
Rivers Pittsburgh Borrower LP / Rivers Pittsburgh Finance Corp., 6.125%, 8/15/21(3) | | 10,000 |
| 10,175 |
|
| Royal Caribbean Cruises Ltd., 5.25%, 11/15/22 | | 60,000 |
| 65,041 |
|
| Scientific Games International, Inc., 6.25%, 9/1/20 | | 15,000 |
| 15,094 |
|
| Scientific Games International, Inc., 10.00%, 12/1/22 | | 11,000 |
| 11,509 |
|
Wynn Las Vegas LLC / Wynn Las Vegas Capital Corp., 5.50%, 3/1/25(3) | | 55,000 |
| 57,819 |
|
| Yum! Brands, Inc., 3.75%, 11/1/21 | | 25,000 |
| 25,313 |
|
| | | | 736,993 |
|
| Household Durables — 0.1% | | | |
| Beazer Homes USA, Inc., 7.25%, 2/1/23 | | 2,000 |
| 1,980 |
|
| Beazer Homes USA, Inc., 5.875%, 10/15/27 | | 20,000 |
| 18,400 |
|
| Lennar Corp., 4.75%, 4/1/21 | | 70,000 |
| 71,750 |
|
| Meritage Homes Corp., 5.125%, 6/6/27 | | 40,000 |
| 41,600 |
|
|
| | | | | | | |
| | | Shares/
Principal Amount | Value |
| PulteGroup, Inc., 5.50%, 3/1/26 | | $ | 20,000 |
| $ | 21,625 |
|
Shea Homes LP / Shea Homes Funding Corp., 5.875%, 4/1/23(3) | | 20,000 |
| 20,676 |
|
Taylor Morrison Communities, Inc. / Taylor Morrison Holdings II, Inc., 5.625%, 3/1/24(3) | | 55,000 |
| 57,612 |
|
| Toll Brothers Finance Corp., 4.35%, 2/15/28 | | 80,000 |
| 81,160 |
|
| William Lyon Homes, Inc., 5.875%, 1/31/25 | | 25,000 |
| 25,125 |
|
| | | | 339,928 |
|
Household Products† | | | |
Energizer Holdings, Inc., 5.50%, 6/15/25(3) | | 25,000 |
| 25,445 |
|
| Spectrum Brands, Inc., 5.75%, 7/15/25 | | 40,000 |
| 41,638 |
|
| | | | 67,083 |
|
Independent Power and Renewable Electricity Producers† | | | |
| Calpine Corp., 5.375%, 1/15/23 | | 35,000 |
| 35,350 |
|
| Insurance — 1.0% | | | |
| AerCap Ireland Capital DAC / AerCap Global Aviation Trust, 5.00%, 10/1/21 | | 150,000 |
| 157,030 |
|
| Allianz SE, VRN, 3.375%, 9/18/24 | EUR | 200,000 |
| 245,328 |
|
| American International Group, Inc., 4.125%, 2/15/24 | | $ | 240,000 |
| 255,387 |
|
| American International Group, Inc., 4.50%, 7/16/44 | | 70,000 |
| 75,051 |
|
| Assicurazioni Generali SpA, VRN, 6.42%, 2/8/22 | GBP | 50,000 |
| 64,300 |
|
| AXA SA, 7.125%, 12/15/20 | GBP | 110,000 |
| 144,493 |
|
| AXA SA, MTN, VRN, 3.375%, 7/6/47 | EUR | 200,000 |
| 253,918 |
|
| Berkshire Hathaway Finance Corp., 3.00%, 5/15/22 | | $ | 90,000 |
| 92,177 |
|
| Berkshire Hathaway Finance Corp., 4.20%, 8/15/48 | | 110,000 |
| 123,937 |
|
| Chubb INA Holdings, Inc., 3.15%, 3/15/25 | | 120,000 |
| 124,803 |
|
| Chubb INA Holdings, Inc., 3.35%, 5/3/26 | | 60,000 |
| 63,187 |
|
| CNP Assurances, VRN, 4.00%, 11/18/24 | EUR | 100,000 |
| 124,119 |
|
| Credit Agricole Assurances SA, VRN, 4.25%, 1/13/25 | EUR | 100,000 |
| 122,875 |
|
| Fiore Capital LLC, VRDN, 2.35%, 8/7/19 (LOC: Wells Fargo Bank N.A.) | | $ | 1,500,000 |
| 1,500,000 |
|
| Genworth Holdings, Inc., 7.625%, 9/24/21 | | 20,000 |
| 20,800 |
|
| Hartford Financial Services Group, Inc. (The), 5.95%, 10/15/36 | | 30,000 |
| 38,037 |
|
| Intesa Sanpaolo Vita SpA, VRN, 4.75%, 12/17/24 | EUR | 200,000 |
| 234,225 |
|
| Markel Corp., 4.90%, 7/1/22 | | $ | 120,000 |
| 127,382 |
|
| MetLife, Inc., 4.125%, 8/13/42 | | 9,000 |
| 9,781 |
|
| MetLife, Inc., 4.875%, 11/13/43 | | 70,000 |
| 84,207 |
|
Metropolitan Life Global Funding I, 3.00%, 1/10/23(3) | | 100,000 |
| 101,943 |
|
| Principal Financial Group, Inc., 3.30%, 9/15/22 | | 50,000 |
| 50,860 |
|
| Prudential Financial, Inc., 3.94%, 12/7/49 | | 166,000 |
| 176,219 |
|
| WR Berkley Corp., 4.625%, 3/15/22 | | 80,000 |
| 84,346 |
|
| | | | 4,274,405 |
|
Interactive Media and Services† | | | |
Rackspace Hosting, Inc., 8.625%, 11/15/24(3) | | 45,000 |
| 41,400 |
|
Tencent Holdings Ltd., 3.80%, 2/11/25(3) | | 61,000 |
| 63,841 |
|
| | | | 105,241 |
|
|
| | | | | | | |
| | | Shares/
Principal Amount | Value |
| Internet and Direct Marketing Retail — 0.1% | | | |
| Alibaba Group Holding Ltd., 2.80%, 6/6/23 | | $ | 140,000 |
| $ | 140,993 |
|
| JD.com, Inc., 3.875%, 4/29/26 | | 102,000 |
| 101,798 |
|
| | | | 242,791 |
|
| IT Services — 0.1% | | | |
| Fidelity National Information Services, Inc., 3.00%, 8/15/26 | | 90,000 |
| 91,379 |
|
First Data Corp., 5.75%, 1/15/24(3) | | 5,000 |
| 5,152 |
|
| International Business Machines Corp., 1.75%, 3/7/28 | EUR | 100,000 |
| 125,372 |
|
| | | | 221,903 |
|
Life Sciences Tools and Services† | | | |
IQVIA, Inc., 4.875%, 5/15/23(3) | | $ | 30,000 |
| 30,720 |
|
| Thermo Fisher Scientific, Inc., 3.60%, 8/15/21 | | 93,000 |
| 94,943 |
|
| Thermo Fisher Scientific, Inc., 3.30%, 2/15/22 | | 35,000 |
| 35,839 |
|
| | | | 161,502 |
|
Marine† | | | |
| Martin Midstream Partners LP / Martin Midstream Finance Corp., 7.25%, 2/15/21 | | 30,000 |
| 29,628 |
|
| Media — 0.5% | | | |
Altice Financing SA, 6.625%, 2/15/23(3) | | 70,000 |
| 72,362 |
|
| AMC Networks, Inc., 4.75%, 8/1/25 | | 100,000 |
| 102,125 |
|
| CBS Corp., 4.85%, 7/1/42 | | 50,000 |
| 54,000 |
|
| CCO Holdings LLC / CCO Holdings Capital Corp., 5.25%, 9/30/22 | | 170,000 |
| 172,231 |
|
CCO Holdings LLC / CCO Holdings Capital Corp., 5.75%, 2/15/26(3) | | 85,000 |
| 89,757 |
|
CCO Holdings LLC / CCO Holdings Capital Corp., 5.125%, 5/1/27(3) | | 30,000 |
| 31,013 |
|
| Charter Communications Operating LLC / Charter Communications Operating Capital, 4.91%, 7/23/25 | | 290,000 |
| 313,029 |
|
| Charter Communications Operating LLC / Charter Communications Operating Capital, 6.48%, 10/23/45 | | 20,000 |
| 23,554 |
|
| Comcast Corp., 6.40%, 5/15/38 | | 110,000 |
| 150,526 |
|
| Comcast Corp., 4.75%, 3/1/44 | | 120,000 |
| 139,923 |
|
| CSC Holdings LLC, 6.75%, 11/15/21 | | 45,000 |
| 48,262 |
|
CSC Holdings LLC, 6.625%, 10/15/25(3) | | 50,000 |
| 53,250 |
|
CSC Holdings LLC, 5.50%, 5/15/26(3) | | 25,000 |
| 26,188 |
|
| Digicel Ltd., 6.00%, 4/15/21 | | 61,000 |
| 42,242 |
|
| DISH DBS Corp., 6.75%, 6/1/21 | | 25,000 |
| 26,086 |
|
| DISH DBS Corp., 5.00%, 3/15/23 | | 15,000 |
| 14,531 |
|
| DISH DBS Corp., 5.875%, 11/15/24 | | 55,000 |
| 51,184 |
|
Gray Television, Inc., 5.125%, 10/15/24(3) | | 25,000 |
| 25,719 |
|
Gray Television, Inc., 5.875%, 7/15/26(3) | | 40,000 |
| 41,600 |
|
| Lamar Media Corp., 5.00%, 5/1/23 | | 30,000 |
| 30,629 |
|
| Lamar Media Corp., 5.375%, 1/15/24 | | 100,000 |
| 103,375 |
|
| Myriad International Holdings BV, 6.00%, 7/18/20 | | 61,000 |
| 62,772 |
|
Nexstar Broadcasting, Inc., 5.625%, 8/1/24(3) | | 25,000 |
| 26,031 |
|
Sinclair Television Group, Inc., 5.625%, 8/1/24(3) | | 30,000 |
| 30,929 |
|
Sirius XM Radio, Inc., 4.625%, 5/15/23(3) | | 15,000 |
| 15,300 |
|
Sirius XM Radio, Inc., 5.375%, 4/15/25(3) | | 50,000 |
| 52,062 |
|
|
| | | | | | | |
| | | Shares/
Principal Amount | Value |
TEGNA, Inc., 5.50%, 9/15/24(3) | | $ | 30,000 |
| $ | 31,088 |
|
Univision Communications, Inc., 5.125%, 2/15/25(3) | | 45,000 |
| 43,875 |
|
| WPP Finance 2013, MTN, 3.00%, 11/20/23 | EUR | 100,000 |
| 125,193 |
|
| | | | 1,998,836 |
|
| Metals and Mining — 0.2% | | | |
Alcoa Nederland Holding BV, 6.75%, 9/30/24(3) | | $ | 20,000 |
| 21,050 |
|
| Allegheny Technologies, Inc., 5.95%, 1/15/21 | | 45,000 |
| 46,294 |
|
| ArcelorMittal, 5.50%, 3/1/21 | | 60,000 |
| 62,372 |
|
| Cleveland-Cliffs, Inc., 5.75%, 3/1/25 | | 50,000 |
| 50,900 |
|
| First Quantum Minerals Ltd., 7.25%, 4/1/23 | | 50,000 |
| 49,687 |
|
First Quantum Minerals Ltd., 6.50%, 3/1/24(3) | | 110,000 |
| 106,235 |
|
| Freeport-McMoRan, Inc., 3.55%, 3/1/22 | | 55,000 |
| 55,279 |
|
| Freeport-McMoRan, Inc., 5.40%, 11/14/34 | | 40,000 |
| 38,800 |
|
| Nexa Resources SA, 5.375%, 5/4/27 | | 92,000 |
| 97,176 |
|
Novelis Corp., 5.875%, 9/30/26(3) | | 55,000 |
| 57,131 |
|
| Steel Dynamics, Inc., 5.25%, 4/15/23 | | 30,000 |
| 30,496 |
|
Vedanta Resources Ltd., 6.125%, 8/9/24(3) | | 87,000 |
| 81,992 |
|
| | | | 697,412 |
|
| Multi-Utilities — 0.3% | | | |
Abu Dhabi National Energy Co. PJSC, 5.875%, 12/13/21(3) | | 82,000 |
| 88,241 |
|
Abu Dhabi National Energy Co. PJSC, 3.625%, 1/12/23(3) | | 61,000 |
| 62,828 |
|
| AmeriGas Partners LP / AmeriGas Finance Corp., 5.875%, 8/20/26 | | 25,000 |
| 26,625 |
|
| Berkshire Hathaway Energy Co., 3.50%, 2/1/25 | | 80,000 |
| 83,939 |
|
| Berkshire Hathaway Energy Co., 3.80%, 7/15/48 | | 70,000 |
| 72,535 |
|
| Centrica plc, VRN, 5.25%, 4/10/75 | GBP | 100,000 |
| 127,685 |
|
| Consolidated Edison Co. of New York, Inc., 3.95%, 3/1/43 | | $ | 60,000 |
| 63,439 |
|
| Dominion Energy, Inc., 4.90%, 8/1/41 | | 70,000 |
| 80,900 |
|
| Exelon Generation Co. LLC, 4.25%, 6/15/22 | | 60,000 |
| 62,639 |
|
| Exelon Generation Co. LLC, 5.60%, 6/15/42 | | 40,000 |
| 45,800 |
|
| Florida Power & Light Co., 3.95%, 3/1/48 | | 50,000 |
| 55,333 |
|
Israel Electric Corp. Ltd., 6.875%, 6/21/23(3) | | 41,000 |
| 46,565 |
|
KazTransGas JSC, 4.375%, 9/26/27(3) | | 82,000 |
| 85,331 |
|
| Listrindo Capital BV, 4.95%, 9/14/26 | | 41,000 |
| 41,174 |
|
| MidAmerican Energy Co., 4.40%, 10/15/44 | | 40,000 |
| 46,167 |
|
| NiSource, Inc., 5.65%, 2/1/45 | | 70,000 |
| 86,946 |
|
| Sempra Energy, 2.875%, 10/1/22 | | 130,000 |
| 131,224 |
|
| Sempra Energy, 3.25%, 6/15/27 | | 80,000 |
| 80,420 |
|
| Sempra Energy, 4.00%, 2/1/48 | | 40,000 |
| 40,392 |
|
| Southwestern Public Service Co., 3.70%, 8/15/47 | | 30,000 |
| 30,935 |
|
| | | | 1,359,118 |
|
| Oil, Gas and Consumable Fuels — 0.9% | | | |
| Antero Resources Corp., 5.125%, 12/1/22 | | 95,000 |
| 91,200 |
|
| Antero Resources Corp., 5.00%, 3/1/25 | | 40,000 |
| 35,993 |
|
| Calumet Specialty Products Partners LP / Calumet Finance Corp., 6.50%, 4/15/21 | | 25,000 |
| 24,938 |
|
| Chesapeake Energy Corp., 8.00%, 1/15/25 | | 30,000 |
| 25,800 |
|
|
| | | | | | | |
| | | Shares/
Principal Amount | Value |
| CNOOC Finance 2013 Ltd., 3.00%, 5/9/23 | | $ | 102,000 |
| $ | 102,924 |
|
| CNX Resources Corp., 5.875%, 4/15/22 | | 33,000 |
| 31,845 |
|
Denbury Resources, Inc., 9.00%, 5/15/21(3) | | 10,000 |
| 9,475 |
|
| Denbury Resources, Inc., 4.625%, 7/15/23 | | 15,000 |
| 5,850 |
|
| Diamondback Energy, Inc., 4.75%, 11/1/24 | | 25,000 |
| 25,774 |
|
| Ecopetrol SA, 5.875%, 5/28/45 | | 130,000 |
| 146,497 |
|
| Enbridge, Inc., 4.00%, 10/1/23 | | 70,000 |
| 73,570 |
|
| Encana Corp., 6.50%, 2/1/38 | | 60,000 |
| 72,371 |
|
| Energy Transfer Operating LP, 4.15%, 10/1/20 | | 110,000 |
| 111,660 |
|
| Energy Transfer Operating LP, 3.60%, 2/1/23 | | 14,000 |
| 14,353 |
|
| Energy Transfer Operating LP, 6.50%, 2/1/42 | | 80,000 |
| 94,850 |
|
Gazprom OAO Via Gaz Capital SA, 6.51%, 3/7/22(3) | | 56,000 |
| 60,805 |
|
Gazprom OAO Via Gaz Capital SA, 7.29%, 8/16/37(3) | | 56,000 |
| 71,989 |
|
Gran Tierra Energy International Holdings Ltd., 6.25%, 2/15/25(3) | | 80,000 |
| 76,300 |
|
| Gulfport Energy Corp., 6.00%, 10/15/24 | | 15,000 |
| 11,624 |
|
| Gulfport Energy Corp., 6.375%, 5/15/25 | | 25,000 |
| 19,250 |
|
| Hess Corp., 6.00%, 1/15/40 | | 80,000 |
| 87,054 |
|
| Kinder Morgan Energy Partners LP, 6.50%, 9/1/39 | | 200,000 |
| 247,968 |
|
| Laredo Petroleum, Inc., 6.25%, 3/15/23 | | 10,000 |
| 9,025 |
|
MEG Energy Corp., 6.50%, 1/15/25(3) | | 25,000 |
| 25,031 |
|
| MPLX LP, 4.875%, 12/1/24 | | 25,000 |
| 27,248 |
|
| MPLX LP, 4.875%, 6/1/25 | | 30,000 |
| 32,660 |
|
| MPLX LP, 4.50%, 4/15/38 | | 40,000 |
| 40,545 |
|
| MPLX LP, 5.20%, 3/1/47 | | 20,000 |
| 21,460 |
|
| Murphy Oil Corp., 4.20%, 12/1/22 | | 30,000 |
| 30,592 |
|
| Newfield Exploration Co., 5.75%, 1/30/22 | | 150,000 |
| 160,237 |
|
| Newfield Exploration Co., 5.375%, 1/1/26 | | 10,000 |
| 10,952 |
|
| Noble Energy, Inc., 4.15%, 12/15/21 | | 120,000 |
| 123,756 |
|
| Oasis Petroleum, Inc., 6.875%, 3/15/22 | | 40,000 |
| 40,014 |
|
Parsley Energy LLC / Parsley Finance Corp., 5.375%, 1/15/25(3) | | 40,000 |
| 40,702 |
|
| Petrobras Global Finance BV, 5.75%, 2/1/29 | | 150,000 |
| 161,700 |
|
| Petrobras Global Finance BV, 7.25%, 3/17/44 | | 70,000 |
| 82,180 |
|
| Petroleos Mexicanos, 6.50%, 3/13/27 | | 55,000 |
| 54,681 |
|
| QEP Resources, Inc., 5.375%, 10/1/22 | | 50,000 |
| 46,562 |
|
| Range Resources Corp., 5.00%, 8/15/22 | | 45,000 |
| 41,611 |
|
| Ras Laffan Liquefied Natural Gas Co. Ltd. II, 5.30%, 9/30/20 | | 13,678 |
| 13,928 |
|
Ras Laffan Liquefied Natural Gas Co. Ltd. III, 6.75%, 9/30/19(3) | | 184,000 |
| 185,279 |
|
| Reliance Industries Ltd., 4.125%, 1/28/25 | | 133,000 |
| 139,330 |
|
| Shell International Finance BV, 3.625%, 8/21/42 | | 120,000 |
| 123,871 |
|
| SM Energy Co., 5.00%, 1/15/24 | | 25,000 |
| 23,063 |
|
| Southwestern Energy Co., 6.20%, 1/23/25 | | 35,000 |
| 30,362 |
|
| Suburban Propane Partners LP / Suburban Energy Finance Corp., 5.50%, 6/1/24 | | 60,000 |
| 61,500 |
|
| TOTAL SA, MTN, VRN, 2.25%, 2/26/21 | EUR | 100,000 |
| 114,090 |
|
Tullow Oil plc, 7.00%, 3/1/25(3) | | $ | 100,000 |
| 100,875 |
|
|
| | | | | | | |
| | | Shares/
Principal Amount | Value |
| Whiting Petroleum Corp., 5.75%, 3/15/21 | | $ | 30,000 |
| $ | 30,150 |
|
| Williams Cos., Inc. (The), 4.125%, 11/15/20 | | 20,000 |
| 20,325 |
|
| Williams Cos., Inc. (The), 4.55%, 6/24/24 | | 170,000 |
| 182,461 |
|
| Williams Cos., Inc. (The), 5.10%, 9/15/45 | | 90,000 |
| 98,142 |
|
| WPX Energy, Inc., 6.00%, 1/15/22 | | 45,000 |
| 46,856 |
|
| | | | 3,561,278 |
|
| Pharmaceuticals — 0.2% | | | |
| Allergan Finance LLC, 3.25%, 10/1/22 | | 190,000 |
| 192,718 |
|
| Allergan Funding SCS, 3.85%, 6/15/24 | | 80,000 |
| 83,329 |
|
| Allergan Funding SCS, 4.55%, 3/15/35 | | 80,000 |
| 82,846 |
|
Bausch Health Cos., Inc., 5.50%, 3/1/23(3) | | 27,000 |
| 27,253 |
|
Bausch Health Cos., Inc., 7.00%, 3/15/24(3) | | 15,000 |
| 15,862 |
|
Bausch Health Cos., Inc., 6.125%, 4/15/25(3) | | 85,000 |
| 87,206 |
|
| Horizon Pharma USA, Inc., 6.625%, 5/1/23 | | 9,000 |
| 9,303 |
|
| Shire Acquisitions Investments Ireland DAC, 2.40%, 9/23/21 | | 60,000 |
| 59,901 |
|
| Teva Pharmaceutical Finance Netherlands III BV, 3.15%, 10/1/26 | | 40,000 |
| 31,296 |
|
| Teva Pharmaceutical Finance Netherlands III BV, 6.75%, 3/1/28 | | 100,000 |
| 89,875 |
|
| | | | 679,589 |
|
| Road and Rail — 0.1% | | | |
| Burlington Northern Santa Fe LLC, 3.60%, 9/1/20 | | 142,000 |
| 143,349 |
|
| Burlington Northern Santa Fe LLC, 4.95%, 9/15/41 | | 90,000 |
| 108,127 |
|
| Burlington Northern Santa Fe LLC, 4.45%, 3/15/43 | | 16,000 |
| 18,252 |
|
| Burlington Northern Santa Fe LLC, 4.15%, 4/1/45 | | 40,000 |
| 44,387 |
|
Park Aerospace Holdings Ltd., 5.25%, 8/15/22(3) | | 20,000 |
| 21,162 |
|
| Rumo Luxembourg Sarl, 7.375%, 2/9/24 | | 70,000 |
| 75,943 |
|
| Union Pacific Corp., 4.75%, 9/15/41 | | 120,000 |
| 136,418 |
|
| | | | 547,638 |
|
Semiconductors and Semiconductor Equipment† | | | |
Sensata Technologies BV, 5.00%, 10/1/25(3) | | 20,000 |
| 21,150 |
|
| Software — 0.2% | | | |
| Infor US, Inc., 6.50%, 5/15/22 | | 60,000 |
| 61,275 |
|
| Microsoft Corp., 2.70%, 2/12/25 | | 210,000 |
| 215,111 |
|
| Microsoft Corp., 3.45%, 8/8/36 | | 50,000 |
| 53,208 |
|
| Microsoft Corp., 4.25%, 2/6/47 | | 160,000 |
| 188,858 |
|
| Oracle Corp., 2.50%, 10/15/22 | | 200,000 |
| 201,576 |
|
| Oracle Corp., 3.625%, 7/15/23 | | 60,000 |
| 63,187 |
|
| Oracle Corp., 2.65%, 7/15/26 | | 180,000 |
| 180,896 |
|
| | | | 964,111 |
|
| Specialty Retail — 0.2% | | | |
| Hertz Corp. (The), 6.25%, 10/15/22 | | 40,000 |
| 40,604 |
|
| Home Depot, Inc. (The), 3.75%, 2/15/24 | | 70,000 |
| 74,553 |
|
| Home Depot, Inc. (The), 5.95%, 4/1/41 | | 180,000 |
| 246,344 |
|
| L Brands, Inc., 5.625%, 2/15/22 | | 40,000 |
| 42,170 |
|
Party City Holdings, Inc., 6.125%, 8/15/23(3) | | 25,000 |
| 25,125 |
|
PetSmart, Inc., 5.875%, 6/1/25(3) | | 10,000 |
| 9,936 |
|
|
| | | | | | | |
| | | Shares/
Principal Amount | Value |
| Sally Holdings LLC / Sally Capital, Inc., 5.50%, 11/1/23 | | $ | 10,000 |
| $ | 10,206 |
|
| Sonic Automotive, Inc., 5.00%, 5/15/23 | | 25,000 |
| 25,308 |
|
| United Rentals North America, Inc., 4.625%, 7/15/23 | | 105,000 |
| 107,727 |
|
| United Rentals North America, Inc., 5.50%, 7/15/25 | | 45,000 |
| 46,913 |
|
| United Rentals North America, Inc., 5.50%, 5/15/27 | | 15,000 |
| 15,708 |
|
| | | | 644,594 |
|
| Technology Hardware, Storage and Peripherals — 0.2% | | | |
| Apple, Inc., 2.50%, 2/9/25 | | 220,000 |
| 221,741 |
|
| Apple, Inc., 2.45%, 8/4/26 | | 80,000 |
| 79,950 |
|
| Apple, Inc., 3.20%, 5/11/27 | | 100,000 |
| 104,263 |
|
| Apple, Inc., 2.90%, 9/12/27 | | 50,000 |
| 51,208 |
|
Dell International LLC / EMC Corp., 7.125%, 6/15/24(3) | | 70,000 |
| 74,026 |
|
| Hewlett Packard Enterprise Co., 3.60%, 10/15/20 | | 170,000 |
| 172,039 |
|
| NCR Corp., 5.00%, 7/15/22 | | 20,000 |
| 20,169 |
|
| Western Digital Corp., 4.75%, 2/15/26 | | 20,000 |
| 19,825 |
|
| | | | 743,221 |
|
Textiles, Apparel and Luxury Goods† | | | |
Hanesbrands, Inc., 4.625%, 5/15/24(3) | | 65,000 |
| 67,776 |
|
Trading Companies and Distributors† | | | |
Beacon Roofing Supply, Inc., 4.875%, 11/1/25(3) | | 30,000 |
| 29,813 |
|
| Wireless Telecommunication Services — 0.2% | | | |
C&W Senior Financing DAC, 6.875%, 9/15/27(3) | | 97,000 |
| 101,855 |
|
GTH Finance BV, 7.25%, 4/26/23(3) | | 121,000 |
| 134,414 |
|
Millicom International Cellular SA, 5.125%, 1/15/28(3) | | 102,000 |
| 104,932 |
|
| Sprint Corp., 7.25%, 9/15/21 | | 85,000 |
| 91,481 |
|
| Sprint Corp., 7.875%, 9/15/23 | | 35,000 |
| 38,981 |
|
| Sprint Corp., 7.125%, 6/15/24 | | 70,000 |
| 76,563 |
|
| T-Mobile USA, Inc., 6.375%, 3/1/25 | | 30,000 |
| 31,163 |
|
| T-Mobile USA, Inc., 6.50%, 1/15/26 | | 10,000 |
| 10,672 |
|
| | | | 590,061 |
|
TOTAL CORPORATE BONDS
(Cost $42,344,547) | | | 43,488,568 |
|
| SOVEREIGN GOVERNMENTS AND AGENCIES — 6.9% | | | |
| Australia — 0.2% | | | |
| Australia Government Bond, 2.75%, 4/21/24 | AUD | 1,012,000 |
| 753,720 |
|
| New South Wales Treasury Corp., 3.00%, 3/20/28 | AUD | 285,000 |
| 218,232 |
|
| | | | 971,952 |
|
| Austria — 0.1% | | | |
Republic of Austria Government Bond, 3.40%, 11/22/22(3) | EUR | 126,000 |
| 158,630 |
|
Republic of Austria Government Bond, 0.75%, 10/20/26(3) | EUR | 140,000 |
| 168,377 |
|
Republic of Austria Government Bond, 4.15%, 3/15/37(3) | EUR | 101,000 |
| 188,265 |
|
| | | | 515,272 |
|
Belgium† | | | |
Kingdom of Belgium Government Bond, 4.25%, 3/28/41(3) | EUR | 47,000 |
| 91,805 |
|
| Canada — 0.4% | | | |
| Province of British Columbia Canada, 3.25%, 12/18/21 | CAD | 302,000 |
| 236,737 |
|
| Province of British Columbia Canada, 2.85%, 6/18/25 | CAD | 684,000 |
| 544,868 |
|
|
| | | | | | | |
| | | Shares/
Principal Amount | Value |
| Province of Quebec Canada, 3.00%, 9/1/23 | CAD | 460,000 |
| $ | 364,048 |
|
| Province of Quebec Canada, 5.75%, 12/1/36 | CAD | 325,000 |
| 363,001 |
|
| Province of Quebec Canada, 5.00%, 12/1/41 | CAD | 33,000 |
| 35,833 |
|
| Province of Quebec Canada, 3.50%, 12/1/48 | CAD | 102,000 |
| 94,071 |
|
| | | | 1,638,558 |
|
Colombia† | | | |
| Colombia Government International Bond, 7.375%, 9/18/37 | | $ | 100,000 |
| 138,376 |
|
Czech Republic† | | | |
| Czech Republic Government Bond, 4.70%, 9/12/22 | CZK | 2,100,000 |
| 100,434 |
|
Denmark† | | | |
| Denmark Government Bond, 0.50%, 11/15/27 | DKK | 517,000 |
| 83,420 |
|
| Denmark Government Bond, 4.50%, 11/15/39 | DKK | 260,000 |
| 75,016 |
|
| | | | 158,436 |
|
| Finland — 0.1% | | | |
Finland Government Bond, 4.00%, 7/4/25(3) | EUR | 173,000 |
| 244,443 |
|
| France — 0.6% | | | |
| French Republic Government Bond OAT, 1.75%, 11/25/24 | EUR | 1,030,570 |
| 1,285,143 |
|
| French Republic Government Bond OAT, 5.50%, 4/25/29 | EUR | 217,176 |
| 376,384 |
|
| French Republic Government Bond OAT, 3.25%, 5/25/45 | EUR | 358,000 |
| 649,664 |
|
| | | | 2,311,191 |
|
| Germany — 0.7% | | | |
| Bundesrepublik Deutschland Bundesanleihe, 0.50%, 2/15/25 | EUR | 155,000 |
| 183,518 |
|
Bundesrepublik Deutschland Bundesanleihe, 0.00%, 8/15/26(5) | EUR | 428,000 |
| 496,411 |
|
| Bundesrepublik Deutschland Bundesanleihe, 0.25%, 2/15/27 | EUR | 923,000 |
| 1,091,246 |
|
| Bundesrepublik Deutschland Bundesanleihe, 4.75%, 7/4/28 | EUR | 181,000 |
| 298,116 |
|
| Bundesrepublik Deutschland Bundesanleihe, 4.75%, 7/4/40 | EUR | 176,000 |
| 394,050 |
|
| Bundesrepublik Deutschland Bundesanleihe, 2.50%, 7/4/44 | EUR | 136,000 |
| 242,005 |
|
| | | | 2,705,346 |
|
| Indonesia — 0.1% | | | |
| Indonesia Treasury Bond, 8.375%, 9/15/26 | IDR | 3,000,000,000 |
| 228,922 |
|
| Ireland — 0.1% | | | |
| Ireland Government Bond, 3.40%, 3/18/24 | EUR | 196,000 |
| 255,707 |
|
| Italy — 0.6% | | | |
| Italy Buoni Poliennali Del Tesoro, 1.50%, 6/1/25 | EUR | 263,000 |
| 300,173 |
|
| Italy Buoni Poliennali Del Tesoro, 2.00%, 12/1/25 | EUR | 971,000 |
| 1,138,427 |
|
Italy Buoni Poliennali Del Tesoro, 4.75%, 9/1/44(3) | EUR | 499,000 |
| 778,291 |
|
Italy Buoni Poliennali Del Tesoro, 3.45%, 3/1/48(3) | EUR | 295,000 |
| 387,456 |
|
| | | | 2,604,347 |
|
| Japan — 2.0% | | | |
| Japan Government Ten Year Bond, 0.80%, 6/20/23 | JPY | 31,500,000 |
| 301,346 |
|
| Japan Government Thirty Year Bond, 2.40%, 3/20/37 | JPY | 161,750,000 |
| 2,078,765 |
|
| Japan Government Thirty Year Bond, 2.00%, 9/20/41 | JPY | 154,250,000 |
| 1,959,728 |
|
| Japan Government Thirty Year Bond, 1.40%, 12/20/45 | JPY | 39,200,000 |
| 461,083 |
|
| Japan Government Twenty Year Bond, 2.10%, 12/20/26 | JPY | 313,550,000 |
| 3,389,957 |
|
| | | | 8,190,879 |
|
|
| | | | | | | |
| | | Shares/
Principal Amount | Value |
Malaysia† | | | |
| Malaysia Government Bond, 3.96%, 9/15/25 | MYR | 785,000 |
| $ | 194,452 |
|
| Mexico — 0.2% | | | |
| Mexican Bonos, 6.50%, 6/9/22 | MXN | 7,800,000 |
| 399,045 |
|
| Mexico Government International Bond, 4.15%, 3/28/27 | | $ | 400,000 |
| 416,700 |
|
| | | | 815,745 |
|
| Netherlands — 0.2% | | | |
Netherlands Government Bond, 0.00%, 1/15/22(3)(5) | EUR | 95,000 |
| 107,177 |
|
Netherlands Government Bond, 0.50%, 7/15/26(3) | EUR | 401,000 |
| 476,872 |
|
Netherlands Government Bond, 2.75%, 1/15/47(3) | EUR | 63,000 |
| 119,038 |
|
| | | | 703,087 |
|
| Norway — 0.6% | | | |
Norway Government Bond, 2.00%, 5/24/23(3) | NOK | 360,000 |
| 41,791 |
|
Norway Government Bond, 1.75%, 2/17/27(3) | NOK | 1,510,000 |
| 176,058 |
|
Norway Government Bond, 1.75%, 9/6/29(3) | NOK | 18,900,000 |
| 2,212,603 |
|
| | | | 2,430,452 |
|
Poland† | | | |
| Republic of Poland Government Bond, 4.00%, 10/25/23 | PLN | 650,000 |
| 182,746 |
|
Russia† | | | |
| Russian Federal Bond - OFZ, 7.05%, 1/19/28 | RUB | 4,500,000 |
| 70,577 |
|
| Singapore — 0.1% | | | |
| Singapore Government Bond, 3.125%, 9/1/22 | SGD | 288,000 |
| 218,667 |
|
South Africa† | | | |
| Republic of South Africa Government International Bond, 5.50%, 3/9/20 | | $ | 75,000 |
| 76,032 |
|
| Spain — 0.1% | | | |
Spain Government Bond, 4.40%, 10/31/23(3) | EUR | 5,000 |
| 6,661 |
|
Spain Government Bond, 1.60%, 4/30/25(3) | EUR | 164,000 |
| 200,497 |
|
Spain Government Bond, 5.15%, 10/31/28(3) | EUR | 16,000 |
| 25,818 |
|
Spain Government Bond, 5.15%, 10/31/44(3) | EUR | 30,000 |
| 62,604 |
|
| | | | 295,580 |
|
| Switzerland — 0.1% | | | |
| Swiss Confederation Government Bond, 1.25%, 5/28/26 | CHF | 253,000 |
| 292,318 |
|
| Swiss Confederation Government Bond, 2.50%, 3/8/36 | CHF | 89,000 |
| 133,767 |
|
| | | | 426,085 |
|
| Thailand — 0.1% | | | |
| Thailand Government Bond, 3.625%, 6/16/23 | THB | 3,450,000 |
| 120,166 |
|
| Thailand Government Bond, 3.85%, 12/12/25 | THB | 9,350,000 |
| 342,280 |
|
| | | | 462,446 |
|
| United Kingdom — 0.6% | | | |
| United Kingdom Gilt, 1.75%, 9/7/22 | GBP | 123,000 |
| 156,110 |
|
| United Kingdom Gilt, 1.50%, 7/22/26 | GBP | 521,000 |
| 680,237 |
|
| United Kingdom Gilt, 4.50%, 12/7/42 | GBP | 403,000 |
| 813,788 |
|
| United Kingdom Gilt, 4.25%, 12/7/49 | GBP | 137,000 |
| 290,428 |
|
|
| | | | | | | |
| | | Shares/
Principal Amount | Value |
| United Kingdom Gilt, 4.25%, 12/7/55 | GBP | 192,000 |
| $ | 436,285 |
|
| | | | 2,376,848 |
|
TOTAL SOVEREIGN GOVERNMENTS AND AGENCIES
(Cost $26,621,756) | | | 28,408,385 |
|
| U.S. GOVERNMENT AGENCY MORTGAGE-BACKED SECURITIES — 5.6% | |
| Adjustable-Rate U.S. Government Agency Mortgage-Backed Securities — 0.6% | | | |
| FHLMC, VRN, 4.75%, (1-year H15T1Y plus 2.25%), 9/1/35 | | $ | 112,204 |
| 118,401 |
|
| FHLMC, VRN, 4.74%, (12-month LIBOR plus 1.87%), 7/1/36 | | 8,053 |
| 8,477 |
|
| FHLMC, VRN, 4.46%, (1-year H15T1Y plus 2.14%), 10/1/36 | | 28,485 |
| 29,957 |
|
| FHLMC, VRN, 4.80%, (1-year H15T1Y plus 2.25%), 4/1/37 | | 75,084 |
| 79,147 |
|
| FHLMC, VRN, 4.11%, (12-month LIBOR plus 1.78%), 9/1/40 | | 33,430 |
| 34,875 |
|
| FHLMC, VRN, 4.77%, (12-month LIBOR plus 1.88%), 5/1/41 | | 12,627 |
| 13,236 |
|
| FHLMC, VRN, 3.69%, (12-month LIBOR plus 1.89%), 7/1/41 | | 32,409 |
| 33,357 |
|
| FHLMC, VRN, 4.09%, (12-month LIBOR plus 1.87%), 7/1/41 | | 56,226 |
| 58,769 |
|
| FHLMC, VRN, 4.72%, (12-month LIBOR plus 1.64%), 2/1/43 | | 25,500 |
| 26,368 |
|
| FHLMC, VRN, 4.44%, (12-month LIBOR plus 1.65%), 6/1/43 | | 15,499 |
| 16,101 |
|
| FHLMC, VRN, 4.50%, (12-month LIBOR plus 1.62%), 6/1/43 | | 310 |
| 321 |
|
| FHLMC, VRN, 2.37%, (12-month LIBOR plus 1.63%), 8/1/46 | | 362,606 |
| 363,461 |
|
| FHLMC, VRN, 3.07%, (12-month LIBOR plus 1.64%), 9/1/47 | | 277,784 |
| 282,375 |
|
| FNMA, VRN, 4.19%, (6-month LIBOR plus 1.57%), 6/1/35 | | 37,472 |
| 38,866 |
|
| FNMA, VRN, 4.19%, (6-month LIBOR plus 1.57%), 6/1/35 | | 90,463 |
| 93,825 |
|
| FNMA, VRN, 4.19%, (6-month LIBOR plus 1.57%), 6/1/35 | | 58,263 |
| 60,356 |
|
| FNMA, VRN, 4.20%, (6-month LIBOR plus 1.57%), 6/1/35 | | 100,941 |
| 104,646 |
|
| FNMA, VRN, 4.34%, (6-month LIBOR plus 1.54%), 9/1/35 | | 8,748 |
| 9,057 |
|
| FNMA, VRN, 4.56%, (1-year H15T1Y plus 2.16%), 3/1/38 | | 59,459 |
| 62,546 |
|
| FNMA, VRN, 4.82%, (12-month LIBOR plus 1.69%), 1/1/40 | | 11,821 |
| 12,516 |
|
| FNMA, VRN, 4.71%, (12-month LIBOR plus 1.80%), 3/1/40 | | 25,092 |
| 26,470 |
|
| FNMA, VRN, 3.62%, (12-month LIBOR plus 1.79%), 8/1/40 | | 74,806 |
| 77,973 |
|
| FNMA, VRN, 3.92%, (12-month LIBOR plus 1.76%), 10/1/40 | | 61,383 |
| 63,861 |
|
| FNMA, VRN, 3.33%, (12-month LIBOR plus 1.82%), 9/1/41 | | 59,977 |
| 61,579 |
|
| FNMA, VRN, 2.71%, (12-month LIBOR plus 1.72%), 4/1/42 | | 12,477 |
| 12,646 |
|
| FNMA, VRN, 2.60%, (12-month LIBOR plus 1.60%), 4/1/46 | | 92,137 |
| 92,934 |
|
| FNMA, VRN, 3.18%, (12-month LIBOR plus 1.61%), 3/1/47 | | 234,915 |
| 239,495 |
|
| FNMA, VRN, 3.19%, (12-month LIBOR plus 1.61%), 3/1/47 | | 68,585 |
| 69,923 |
|
| FNMA, VRN, 3.17%, (12-month LIBOR plus 1.61%), 4/1/47 | | 149,413 |
| 152,401 |
|
| FNMA, VRN, 3.25%, (12-month LIBOR plus 1.62%), 5/1/47 | | 279,549 |
| 285,288 |
|
| | | | 2,529,227 |
|
| Fixed-Rate U.S. Government Agency Mortgage-Backed Securities — 5.0% | | | |
| FHLMC, 8.00%, 7/1/30 | | 1,889 |
| 2,241 |
|
| FHLMC, 6.50%, 5/1/31 | | 7,161 |
| 7,951 |
|
| FHLMC, 5.50%, 12/1/33 | | 64,942 |
| 72,080 |
|
| FHLMC, 5.50%, 1/1/38 | | 84,553 |
| 92,763 |
|
| FHLMC, 6.00%, 2/1/38 | | 115,146 |
| 131,193 |
|
| FHLMC, 6.00%, 11/1/38 | | 84,470 |
| 96,042 |
|
| FNMA, 4.50%, TBA | | 1,956,000 |
| 2,050,259 |
|
| FNMA, 5.00%, 9/1/20 | | 18,667 |
| 19,173 |
|
|
| | | | | | | |
| | | Shares/
Principal Amount | Value |
| FNMA, 7.00%, 6/1/26 | | $ | 211 |
| $ | 231 |
|
| FNMA, 6.50%, 6/1/29 | | 8,967 |
| 9,948 |
|
| FNMA, 7.00%, 7/1/29 | | 522 |
| 523 |
|
| FNMA, 7.00%, 3/1/30 | | 3,507 |
| 3,805 |
|
| FNMA, 7.50%, 9/1/30 | | 2,185 |
| 2,596 |
|
| FNMA, 6.50%, 9/1/31 | | 16,331 |
| 18,125 |
|
| FNMA, 7.00%, 9/1/31 | | 4,271 |
| 4,472 |
|
| FNMA, 6.50%, 1/1/32 | | 3,493 |
| 3,877 |
|
| FNMA, 5.50%, 6/1/33 | | 54,019 |
| 59,943 |
|
| FNMA, 5.50%, 8/1/33 | | 240,212 |
| 267,971 |
|
| FNMA, 5.50%, 9/1/33 | | 71,313 |
| 79,780 |
|
| FNMA, 5.00%, 11/1/33 | | 236,887 |
| 258,383 |
|
| FNMA, 5.50%, 1/1/34 | | 197,500 |
| 220,129 |
|
| FNMA, 3.50%, 3/1/34 | | 176,472 |
| 183,318 |
|
| FNMA, 4.50%, 9/1/35 | | 122,466 |
| 131,877 |
|
| FNMA, 5.00%, 2/1/36 | | 206,353 |
| 226,575 |
|
| FNMA, 5.50%, 4/1/36 | | 35,359 |
| 39,570 |
|
| FNMA, 5.00%, 10/1/36 | | 18,203 |
| 19,328 |
|
| FNMA, 5.50%, 12/1/36 | | 72,533 |
| 81,068 |
|
| FNMA, 5.50%, 1/1/37 | | 230,265 |
| 257,902 |
|
| FNMA, 6.50%, 8/1/37 | | 25,981 |
| 28,615 |
|
| FNMA, 5.00%, 4/1/40 | | 427,313 |
| 466,574 |
|
| FNMA, 4.00%, 1/1/41 | | 615,866 |
| 656,207 |
|
| FNMA, 5.00%, 6/1/41 | | 341,512 |
| 372,759 |
|
| FNMA, 4.50%, 7/1/41 | | 316,300 |
| 341,202 |
|
| FNMA, 4.50%, 9/1/41 | | 243,130 |
| 262,378 |
|
| FNMA, 4.50%, 9/1/41 | | 744,076 |
| 802,976 |
|
| FNMA, 4.00%, 12/1/41 | | 577,684 |
| 615,942 |
|
| FNMA, 4.00%, 1/1/42 | | 365,802 |
| 388,001 |
|
| FNMA, 3.50%, 5/1/42 | | 749,766 |
| 781,334 |
|
| FNMA, 3.50%, 6/1/42 | | 464,460 |
| 484,044 |
|
| FNMA, 3.00%, 11/1/42 | | 874,951 |
| 892,044 |
|
| FNMA, 3.50%, 5/1/45 | | 538,784 |
| 558,162 |
|
| FNMA, 3.50%, 2/1/46 | | 1,382,566 |
| 1,430,825 |
|
| FNMA, 3.00%, 11/1/46 | | 478,378 |
| 485,724 |
|
| FNMA, 6.50%, 8/1/47 | | 9,214 |
| 9,865 |
|
| FNMA, 6.50%, 9/1/47 | | 18,654 |
| 19,902 |
|
| FNMA, 6.50%, 9/1/47 | | 896 |
| 958 |
|
| FNMA, 6.50%, 9/1/47 | | 9,807 |
| 10,468 |
|
| FNMA, 3.00%, 4/1/48 | | 466,708 |
| 474,095 |
|
| FNMA, 4.00%, 6/1/48 | | 2,746,608 |
| 2,853,536 |
|
| GNMA, 3.00%, TBA | | 1,100,000 |
| 1,123,654 |
|
| GNMA, 7.00%, 1/15/24 | | 626 |
| 652 |
|
| GNMA, 8.00%, 7/15/24 | | 3,194 |
| 3,284 |
|
| GNMA, 8.00%, 9/15/24 | | 1,007 |
| 1,006 |
|
| GNMA, 9.00%, 4/20/25 | | 463 |
| 505 |
|
| GNMA, 7.00%, 9/15/25 | | 4,880 |
| 4,955 |
|
|
| | | | | | | |
| | | Shares/
Principal Amount | Value |
| GNMA, 7.50%, 10/15/25 | | $ | 3,323 |
| $ | 3,366 |
|
| GNMA, 7.50%, 2/15/26 | | 8,022 |
| 8,625 |
|
| GNMA, 8.25%, 7/15/26 | | 20,722 |
| 20,995 |
|
| GNMA, 7.00%, 12/15/27 | | 12,265 |
| 12,311 |
|
| GNMA, 6.50%, 2/15/28 | | 1,948 |
| 2,145 |
|
| GNMA, 6.50%, 3/15/28 | | 7,847 |
| 8,638 |
|
| GNMA, 6.50%, 4/15/28 | | 547 |
| 602 |
|
| GNMA, 6.00%, 10/15/28 | | 15,152 |
| 16,746 |
|
| GNMA, 7.00%, 5/15/31 | | 5,179 |
| 5,960 |
|
| GNMA, 5.50%, 11/15/32 | | 35,290 |
| 39,141 |
|
| GNMA, 6.50%, 10/15/38 | | 404,276 |
| 469,405 |
|
| GNMA, 4.50%, 5/20/41 | | 330,529 |
| 354,160 |
|
| GNMA, 4.50%, 6/15/41 | | 187,818 |
| 202,849 |
|
| GNMA, 4.00%, 12/15/41 | | 701,240 |
| 744,787 |
|
| GNMA, 3.50%, 6/20/42 | | 285,906 |
| 299,788 |
|
| GNMA, 3.50%, 7/20/42 | | 218,551 |
| 229,107 |
|
| GNMA, 3.50%, 4/20/45 | | 87,542 |
| 91,100 |
|
| GNMA, 2.50%, 7/20/46 | | 141,681 |
| 141,852 |
|
| GNMA, 2.50%, 8/20/46 | | 445,436 |
| 445,974 |
|
| GNMA, 2.50%, 2/20/47 | | 47,967 |
| 48,025 |
|
| | | | 20,556,366 |
|
TOTAL U.S. GOVERNMENT AGENCY MORTGAGE-BACKED SECURITIES
(Cost $22,673,713) | 23,085,593 |
|
| MUNICIPAL SECURITIES — 3.4% | | | |
| Bay Area Toll Authority Rev., 6.92%, 4/1/40 | | 105,000 |
| 151,598 |
|
| Calcasieu Parish Public Trust Authority Rev., (WPT Corp.), VRDN, 1.47%, 8/7/19 (LOC: Bank of America N.A.) | | 1,600,000 |
| 1,600,000 |
|
| Chicago Midway International Airport Rev., VRDN, 1.38%, 8/7/19 (LOC: Bank of Montreal) | | 1,465,000 |
| 1,465,000 |
|
| Illinois Housing Development Authority Rev., VRDN, 2.44%, 8/7/19 (LIQ FAC: FHLB) | | 2,150,000 |
| 2,150,000 |
|
| Kansas City Rev., VRDN, 2.20%, 8/7/19 (LOC: JPMorgan Chase Bank N.A.) | | 920,000 |
| 920,000 |
|
| Los Angeles Community College District GO, 6.68%, 8/1/36 | | 10,000 |
| 14,622 |
|
| Metropolitan Transportation Authority Rev., 6.81%, 11/15/40 | | 30,000 |
| 42,644 |
|
| New Jersey Turnpike Authority Rev., 7.41%, 1/1/40 | | 100,000 |
| 157,615 |
|
| New Jersey Turnpike Authority Rev., 7.10%, 1/1/41 | | 9,000 |
| 13,804 |
|
| New York City GO, 6.27%, 12/1/37 | | 40,000 |
| 55,058 |
|
| Ohio Water Development Authority Water Pollution Control Loan Fund Rev., 4.88%, 12/1/34 | | 110,000 |
| 128,592 |
|
| Orange County Housing Finance Authority Rev., (Landings on Millenia Boulevard Partners Ltd.), VRDN, 2.44%, 8/7/19 (LOC: FNMA) | | 115,000 |
| 115,000 |
|
| Pasadena Public Financing Authority Rev., VRDN, 2.36%, 8/7/19 (SBBPA: Bank of the West) | | 2,320,000 |
| 2,320,000 |
|
| Port Authority of New York & New Jersey Rev., 4.93%, 10/1/51 | | 50,000 |
| 64,622 |
|
| Port Authority of New York & New Jersey Rev., 4.46%, 10/1/62 | | 15,000 |
| 18,165 |
|
|
| | | | | | | |
| | | Shares/
Principal Amount | Value |
| Red River Education Finance Corp. Rev., (Texas Christian University), VRDN, 1.38%, 8/7/19 (SBBPA: Northern Trust Company) | | $ | 1,500,000 |
| $ | 1,500,000 |
|
| Rutgers The State University of New Jersey Rev., 5.67%, 5/1/40 | | 150,000 |
| 194,943 |
|
| Sacramento Municipal Utility District Rev., 6.16%, 5/15/36 | | 180,000 |
| 240,766 |
|
| Salt River Project Agricultural Improvement & Power District Rev., 4.84%, 1/1/41 | | 10,000 |
| 12,405 |
|
| San Francisco Public Utilities Commission Water Rev., 6.00%, 11/1/40 | | 75,000 |
| 98,173 |
|
| San Francisco Public Utilities Commission Water Rev., 6.95%, 11/1/50 | | 5,000 |
| 7,702 |
|
| Santa Clara Valley Transportation Authority Rev., 5.88%, 4/1/32 | | 105,000 |
| 129,712 |
|
| State of California GO, 4.60%, 4/1/38 | | 40,000 |
| 44,810 |
|
| State of California GO, 7.55%, 4/1/39 | | 30,000 |
| 48,171 |
|
| State of California GO, 7.30%, 10/1/39 | | 30,000 |
| 45,685 |
|
| State of California GO, 7.60%, 11/1/40 | | 65,000 |
| 106,647 |
|
| State of Illinois GO, 5.10%, 6/1/33 | | 65,000 |
| 67,176 |
|
| State of Oregon Department of Transportation Rev., 5.83%, 11/15/34 | | 70,000 |
| 92,348 |
|
| State of Texas GO, 5.52%, 4/1/39 | | 15,000 |
| 19,962 |
|
| State of Washington GO, 5.14%, 8/1/40 | | 5,000 |
| 6,304 |
|
| Tempe Industrial Development Authority Rev., (ASUF Brickyard LLC), VRDN, 2.35%, 8/7/19 (LOC: Bank of America N.A.) | | 1,002,000 |
| 1,002,000 |
|
| Tennis for Charity, Inc. Rev., VRDN, 2.33%, 8/7/19 (LOC: JPMorgan Chase Bank N.A.) | | 1,355,000 |
| 1,355,000 |
|
TOTAL MUNICIPAL SECURITIES
(Cost $13,780,824) | | | 14,188,524 |
|
| ASSET-BACKED SECURITIES — 2.8% | | | |
BRE Grand Islander Timeshare Issuer LLC, Series 2017-1A, Class A SEQ, 2.94%, 5/25/29(3) | | 156,067 |
| 156,415 |
|
Hilton Grand Vacations Trust, Series 2013-A, Class A SEQ, 2.28%, 1/25/26(3) | | 18,873 |
| 18,867 |
|
Hilton Grand Vacations Trust, Series 2014-AA, Class A SEQ, 1.77%, 11/25/26(3) | | 109,261 |
| 108,677 |
|
Invitation Homes Trust, Series 2018-SFR1, Class A, VRN, 3.01%, (1-month LIBOR plus 0.70%), 3/17/37(3) | | 693,774 |
| 686,067 |
|
Invitation Homes Trust, Series 2018-SFR1, Class B, VRN, 3.26%, (1-month LIBOR plus 0.95%), 3/17/37(3) | | 1,750,000 |
| 1,734,372 |
|
Invitation Homes Trust, Series 2018-SFR2, Class C, VRN, 3.61%, (1-month LIBOR plus 1.28%), 6/17/37(3) | | 600,000 |
| 599,372 |
|
Invitation Homes Trust, Series 2018-SFR3, Class B, VRN, 3.46%, (1-month LIBOR plus 1.15%), 7/17/37(3) | | 925,000 |
| 925,030 |
|
Invitation Homes Trust, Series 2018-SFR4, Class B, VRN, 3.56%, (1-month LIBOR plus 1.25%), 1/17/38(3) | | 1,450,000 |
| 1,450,190 |
|
MVW Owner Trust, Series 2015-1A, Class A SEQ, 2.52%, 12/20/32(3) | | 79,254 |
| 79,003 |
|
MVW Owner Trust, Series 2016-1A, Class A SEQ, 2.25%, 12/20/33(3) | | 77,590 |
| 76,785 |
|
MVW Owner Trust, Series 2017-1A, Class A SEQ, 2.42%, 12/20/34(3) | | 240,908 |
| 240,267 |
|
MVW Owner Trust, Series 2018-1A, Class B, 3.60%, 1/21/36(3) | | 601,771 |
| 615,618 |
|
|
| | | | | | | |
| | | Shares/
Principal Amount | Value |
Progress Residential Trust, Series 2017-SFR1, Class A SEQ, 2.77%, 8/17/34(3) | | $ | 99,635 |
| $ | 99,708 |
|
Progress Residential Trust, Series 2018-SFR1, Class B, 3.48%, 3/17/35(3) | | 100,000 |
| 101,180 |
|
Progress Residential Trust, Series 2018-SFR3, Class C, 4.18%, 10/17/35(3) | | 1,125,000 |
| 1,160,480 |
|
Sierra Timeshare Conduit Receivables Funding LLC, Series 2017-1A, Class A SEQ, 2.91%, 3/20/34(3) | | 77,079 |
| 77,719 |
|
Sierra Timeshare Receivables Funding LLC, Series 2015-1A, Class A SEQ, 2.40%, 3/22/32(3) | | 69,922 |
| 69,819 |
|
Sierra Timeshare Receivables Funding LLC, Series 2015-2A, Class A SEQ, 2.43%, 6/20/32(3) | | 96,116 |
| 95,861 |
|
Sierra Timeshare Receivables Funding LLC, Series 2016-2A, Class A SEQ, 2.33%, 7/20/33(3) | | 24,571 |
| 24,441 |
|
Sierra Timeshare Receivables Funding LLC, Series 2018-2A, Class B, 3.65%, 6/20/35(3) | | 492,280 |
| 498,098 |
|
Towd Point Mortgage Trust, Series 2016-1, Class A1, VRN, 3.50%, 2/25/55(3) | | 72,003 |
| 72,801 |
|
Towd Point Mortgage Trust, Series 2017-2, Class A1, VRN, 2.75%, 4/25/57(3) | | 88,737 |
| 89,060 |
|
Towd Point Mortgage Trust, Series 2017-4, Class A1, VRN, 2.75%, 6/25/57(3) | | 259,486 |
| 260,197 |
|
Towd Point Mortgage Trust, Series 2017-6, Class A1, VRN, 2.75%, 10/25/57(3) | | 342,384 |
| 343,454 |
|
Towd Point Mortgage Trust, Series 2018-1, Class A1 SEQ, VRN, 3.00%, 1/25/58(3) | | 323,271 |
| 325,593 |
|
Towd Point Mortgage Trust, Series 2018-4, Class A1, VRN, 3.00%, 6/25/58(3) | | 545,732 |
| 550,771 |
|
| US Airways Pass-Through Trust, Series 2013-1, Class A, 3.95%, 5/15/27 | | 54,984 |
| 57,524 |
|
VSE VOI Mortgage LLC, Series 2016-A, Class A SEQ, 2.54%, 7/20/33(3) | | 370,132 |
| 369,337 |
|
VSE VOI Mortgage LLC, Series 2017-A, Class A SEQ, 2.33%, 3/20/35(3) | | 288,745 |
| 287,523 |
|
VSE VOI Mortgage LLC, Series 2018-A, Class B, 3.72%, 2/20/36(3) | | 463,400 |
| 473,996 |
|
TOTAL ASSET-BACKED SECURITIES
(Cost $11,572,747) | | | 11,648,225 |
|
AFFILIATED FUNDS(6) — 2.7% | | | |
| American Century Diversified Corporate Bond ETF | | 202,120 |
| 10,274,770 |
|
| American Century STOXX U.S. Quality Value ETF | | 23,980 |
| 962,354 |
|
TOTAL AFFILIATED FUNDS
(Cost $10,971,982) | | | 11,237,124 |
|
| COLLATERALIZED MORTGAGE OBLIGATIONS — 2.3% | | | |
| Private Sponsor Collateralized Mortgage Obligations — 1.3% | | |
Agate Bay Mortgage Trust, Series 2016-1, Class A5 SEQ, VRN, 3.50%, 12/25/45(3) | | $ | 87,449 |
| 89,128 |
|
| Bear Stearns Adjustable Rate Mortgage Trust, Series 2004-8, Class 2A1, VRN, 4.24%, 11/25/34 | | 336,787 |
| 334,052 |
|
| Citigroup Mortgage Loan Trust, Inc., Series 2004-UST1, Class A5, VRN, 4.40%, 8/25/34 | | 142,818 |
| 144,892 |
|
| Credit Suisse First Boston Mortgage-Backed Pass-Through Certificates, Series 2005-3, Class 1A1, VRN, 5.48%, 7/25/35 | | 114,690 |
| 122,272 |
|
Credit Suisse Mortgage Trust, Series 2017-HL2, Class A3 SEQ, VRN, 3.50%, 10/25/47(3) | | 244,350 |
| 249,205 |
|
|
| | | | | | | |
| | | Shares/
Principal Amount | Value |
| GSR Mortgage Loan Trust, Series 2005-AR6, Class 2A1, VRN, 4.50%, 9/25/35 | | $ | 447,089 |
| $ | 460,455 |
|
| GSR Mortgage Loan Trust, Series 2005-AR6, Class 4A5, VRN, 4.56%, 9/25/35 | | 330,393 |
| 338,820 |
|
JPMorgan Mortgage Trust, Series 2013-1, Class 2A2 SEQ, VRN, 2.50%, 3/25/43(3) | | 51,891 |
| 51,816 |
|
JPMorgan Mortgage Trust, Series 2014-5, Class A1, VRN, 2.98%, 10/25/29(3) | | 177,022 |
| 179,007 |
|
New Residential Mortgage Loan Trust, Series 2017-2A, Class A3, VRN, 4.00%, 3/25/57(3) | | 348,059 |
| 363,171 |
|
New Residential Mortgage Loan Trust, Series 2017-5A, Class A1, VRN, 3.77%, (1-month LIBOR plus 1.50%), 6/25/57(3) | | 207,314 |
| 211,688 |
|
Sequoia Mortgage Trust, Series 2014-4, Class A2 SEQ, VRN, 3.50%, 11/25/44(3) | | 72,480 |
| 73,090 |
|
Sequoia Mortgage Trust, Series 2017-7, Class A4 SEQ, VRN, 3.50%, 10/25/47(3) | | 205,712 |
| 209,638 |
|
Sequoia Mortgage Trust, Series 2017-CH2, Class A10 SEQ, VRN, 4.00%, 12/25/47(3) | | 418,810 |
| 423,430 |
|
Sequoia Mortgage Trust, Series 2018-2, Class A4 SEQ, VRN, 3.50%, 2/25/48(3) | | 381,918 |
| 387,627 |
|
Sequoia Mortgage Trust, Series 2018-CH2, Class A12 SEQ, VRN, 4.00%, 6/25/48(3) | | 350,799 |
| 355,443 |
|
Sofi Mortgage Trust, Series 2016-1A, Class 1A4 SEQ, VRN, 3.00%, 11/25/46(3) | | 80,422 |
| 79,758 |
|
| Thornburg Mortgage Securities Trust, Series 2004-3, Class A, VRN, 3.01%, (1-month LIBOR plus 0.74%), 9/25/44 | | 275,625 |
| 276,122 |
|
| WaMu Mortgage Pass-Through Certificates, Series 2005-AR3, Class A1, VRN, 4.45%, 3/25/35 | | 126,792 |
| 126,187 |
|
WaMu Mortgage Pass-Through Certificates, Series 2005-AR7, Class A3, VRN, 4.27%, 8/25/35 | | 67,105 |
| 68,556 |
|
Wells Fargo Mortgage-Backed Securities Trust, Series 2004-A, Class A1, VRN, 5.01%, 2/25/34 | | 26,540 |
| 27,731 |
|
Wells Fargo Mortgage-Backed Securities Trust, Series 2005-AR10, Class 2A15, VRN, 4.97%, 6/25/35 | | 43,683 |
| 45,819 |
|
Wells Fargo Mortgage-Backed Securities Trust, Series 2005-AR4, Class 2A1, VRN, 5.10%, 4/25/35 | | 240,949 |
| 246,199 |
|
| Wells Fargo Mortgage-Backed Securities Trust, Series 2006-4, Class 2A1, 6.00%, 4/25/36 | | 329,046 |
| 330,263 |
|
Wells Fargo Mortgage-Backed Securities Trust, Series 2006-AR10, Class 1A1, VRN, 5.04%, 7/25/36 | | 51,618 |
| 52,660 |
|
Wells Fargo Mortgage-Backed Securities Trust, Series 2006-AR12, Class 1A1, VRN, 4.76%, 9/25/36 | | 49,463 |
| 50,499 |
|
| Wells Fargo Mortgage-Backed Securities Trust, Series 2007-15, Class A1, 6.00%, 11/25/37 | | 114,250 |
| 116,355 |
|
| | | | 5,413,883 |
|
| U.S. Government Agency Collateralized Mortgage Obligations — 1.0% | | | |
FHLMC, Series 2016-HQA3, Class M2, VRN, 3.62%, (1-month LIBOR plus 1.35%), 3/25/29 | | 43,778 |
| 44,000 |
|
FHLMC, Series 2017-DNA2, Class M1, VRN, 3.47%, (1-month LIBOR plus 1.20%), 10/25/29 | | 1,429,479 |
| 1,438,751 |
|
FHLMC, Series 2017-HQA2, Class M1, VRN, 3.07%, (1-month LIBOR plus 0.80%), 12/25/29 | | 73,834 |
| 73,939 |
|
FHLMC, Series 2018-DNA1, Class M1, VRN, 2.72%, (1-month LIBOR plus 0.45%), 7/25/30 | | 165,759 |
| 165,611 |
|
|
| | | | | | | |
| | | Shares/
Principal Amount | Value |
| FNMA, Series 2014-C02, Class 1M2, VRN, 4.87%, (1-month LIBOR plus 2.60%), 5/25/24 | | $ | 118,450 |
| $ | 123,579 |
|
| FNMA, Series 2014-C02, Class 2M2, VRN, 4.87%, (1-month LIBOR plus 2.60%), 5/25/24 | | 206,889 |
| 215,172 |
|
| FNMA, Series 2017-C01, Class 1M1, VRN, 3.57%, (1-month LIBOR plus 1.30%), 7/25/29 | | 79,406 |
| 79,647 |
|
| FNMA, Series 2017-C03, Class 1M2, VRN, 5.27%, (1-month LIBOR plus 3.00%), 10/25/29 | | 135,000 |
| 141,258 |
|
| FNMA, Series 2017-C06, Class 2M2, VRN, 5.07%, (1-month LIBOR plus 2.80%), 2/25/30 | | 75,000 |
| 77,400 |
|
| FNMA, Series 2017-C07, Class 1M2, VRN, 4.67%, (1-month LIBOR plus 2.40%), 5/28/30 | | 1,600,000 |
| 1,624,634 |
|
| | | | 3,983,991 |
|
TOTAL COLLATERALIZED MORTGAGE OBLIGATIONS
(Cost $9,321,341) | | | 9,397,874 |
|
| COLLATERALIZED LOAN OBLIGATIONS — 2.2% | | | |
Ares XLI CLO Ltd., Series 2016-41A, Class AR, VRN, 3.50%, (3-month LIBOR plus 1.20%), 1/15/29(3)(7) | | 1,100,000 |
| 1,100,000 |
|
Ares XXXIIR CLO Ltd., Series 2014-32RA, Class A2A, VRN, 4.07%, (3-month LIBOR plus 1.55%), 5/15/30(3) | | 400,000 |
| 393,966 |
|
Bean Creek CLO Ltd., Series 2015-1A, Class AR, VRN, 3.30%, (3-month LIBOR plus 1.02%), 4/20/31(3) | | 225,000 |
| 222,653 |
|
Bean Creek CLO Ltd., Series 2015-1A, Class BR, VRN, 3.73%, (3-month LIBOR plus 1.45%), 4/20/31(3) | | 125,000 |
| 122,580 |
|
Carlyle Global Market Strategies CLO Ltd., Series 2014-2RA, Class A3, VRN, 4.02%, (3-month LIBOR plus 1.50%), 5/15/31(3) | | 1,500,000 |
| 1,480,069 |
|
CBAM Ltd., Series 2018-5A, Class A, VRN, 3.32%, (3-month LIBOR plus 1.02%), 4/17/31(3) | | 175,000 |
| 173,253 |
|
CBAM Ltd., Series 2018-5A, Class B1, VRN, 3.70%, (3-month LIBOR plus 1.40%), 4/17/31(3) | | 450,000 |
| 440,719 |
|
CIFC Funding Ltd., Series 2013-3RA, Class A1, VRN, 3.33%, (3-month LIBOR plus 0.98%), 4/24/31(3) | | 425,000 |
| 419,579 |
|
Dryden 64 CLO Ltd., Series 2018-64A, Class A, VRN, 3.25%, (3-month LIBOR plus 0.97%), 4/18/31(3) | | 575,000 |
| 569,425 |
|
Goldentree Loan Management US CLO 3 Ltd., Series 2018-3A, Class B1, VRN, 3.83%, (3-month LIBOR plus 1.55%), 4/20/30(3) | | 400,000 |
| 396,389 |
|
Goldentree Loan Management US CLO 5 Ltd., Series 2019-5A, Class A, VRN, 3.49%, (3-month LIBOR plus 1.30%), 10/20/32(3)(7) | | 600,000 |
| 600,000 |
|
Goldentree Loan Opportunities X Ltd., Series 2015-10A, Class AR, VRN, 3.40%, (3-month LIBOR plus 1.12%), 7/20/31(3) | | 200,000 |
| 199,585 |
|
Goldentree Loan Opportunities XI Ltd., Series 2015-11A, Class AR2, VRN, 3.37%, (3-month LIBOR plus 1.07%), 1/18/31(3) | | 200,000 |
| 198,718 |
|
KKR CLO Ltd., Series 2022A, Class A, VRN, 3.43%, (3-month LIBOR plus 1.15%), 7/20/31(3) | | 300,000 |
| 298,417 |
|
KKR CLO Ltd., Series 2022A, Class B, VRN, 3.88%, (3-month LIBOR plus 1.60%), 7/20/31(3) | | 300,000 |
| 296,655 |
|
Madison Park Funding XIII Ltd., Series 2014-13A, Class AR2, VRN, 3.25%, (3-month LIBOR plus 0.95%), 4/19/30(3) | | 250,000 |
| 248,899 |
|
Madison Park Funding XIII Ltd., Series 2014-13A, Class BR2, VRN, 3.80%, (3-month LIBOR plus 1.50%), 4/19/30(3) | | 100,000 |
| 99,321 |
|
Magnetite VIII Ltd., Series 2014-8A, Class AR2, VRN, 3.28%, (3-month LIBOR plus 0.98%), 4/15/31(3) | | 450,000 |
| 446,755 |
|
|
| | | | | | | |
| | | Shares/
Principal Amount | Value |
Magnetite VIII Ltd., Series 2014-8A, Class BR2, VRN, 3.80%, (3-month LIBOR plus 1.50%), 4/15/31(3) | | $ | 400,000 |
| $ | 394,241 |
|
Sounds Point CLO IV-R Ltd., Series 2013-3RA, Class B, VRN, 4.05%, (3-month LIBOR plus 1.75%), 4/18/31(3) | | 100,000 |
| 99,637 |
|
Symphony CLO XIX Ltd., Series 2018-19A, Class A, VRN, 3.28%, (3-month LIBOR plus 0.96%), 4/16/31(3) | | 350,000 |
| 345,384 |
|
Voya CLO Ltd., Series 2013-3A, Class A2RR, VRN, 4.00%, (3-month LIBOR plus 1.70%), 10/18/31(3) | | 600,000 |
| 596,139 |
|
TOTAL COLLATERALIZED LOAN OBLIGATIONS
(Cost $9,205,316) | | | 9,142,384 |
|
| COMMERCIAL MORTGAGE-BACKED SECURITIES — 1.5% | | |
Bank of America Merrill Lynch Commercial Mortgage Securities Trust, Series 2015-200P, Class B, 3.49%, 4/14/33(3) | | 500,000 |
| 521,422 |
|
BB-UBS Trust, Series 2012-SHOW, Class A SEQ, 3.43%, 11/5/36(3) | | 425,000 |
| 444,948 |
|
| Benchmark Mortgage Trust, Series 2018-B6, Class AS, 4.44%, 10/10/51 | | 1,075,000 |
| 1,198,752 |
|
| Commercial Mortgage Pass-Through Certificates, Series 2014-CR15, Class AM, VRN, 4.43%, 2/10/47 | | 375,000 |
| 404,287 |
|
| Commercial Mortgage Pass-Through Certificates, Series 2014-LC17, Class AM, VRN, 4.19%, 10/10/47 | | 425,000 |
| 454,587 |
|
| Commercial Mortgage Pass-Through Certificates, Series 2014-LC17, Class B, VRN, 4.49%, 10/10/47 | | 108,000 |
| 115,069 |
|
| Commercial Mortgage Pass-Through Certificates, Series 2014-UBS5, Class AM, VRN, 4.19%, 9/10/47 | | 375,000 |
| 398,461 |
|
| Commercial Mortgage Pass-Through Certificates, Series 2015-CR22, Class AM, VRN, 3.60%, 3/10/48 | | 125,000 |
| 130,223 |
|
| Commercial Mortgage Trust, Series 2016-CD2, Class A4 SEQ, VRN, 3.53%, 11/10/49 | | 350,000 |
| 372,022 |
|
| CSAIL Commercial Mortgage Trust, Series 2017-CX10, Class AS, VRN, 3.67%, 11/15/50 | | 50,000 |
| 52,591 |
|
DBCG Mortgage Trust, Series 2017-BBG, Class A, VRN, 3.03%, (1-month LIBOR plus 0.70%), 6/15/34(3) | | 550,000 |
| 550,506 |
|
| GS Mortgage Securities Trust, Series 2016-GS2, Class B, VRN, 3.76%, 5/10/49 | | 325,000 |
| 339,567 |
|
Hudson Yards Mortgage Trust, Series 2016-10HY, Class A SEQ, 2.84%, 8/10/38(3) | | 400,000 |
| 406,716 |
|
| JPMorgan Chase Commercial Mortgage Securities Trust, Series 2016-JP2, Class A4 SEQ, 2.82%, 8/15/49 | | 200,000 |
| 203,953 |
|
| JPMorgan Chase Commercial Mortgage Securities Trust, Series 2016-JP2, Class B, 3.46%, 8/15/49 | | 100,000 |
| 102,334 |
|
| Morgan Stanley Bank of America Merrill Lynch Trust, Series 2017-C34, Class A3 SEQ, 3.28%, 11/15/52 | | 100,000 |
| 104,379 |
|
| UBS Commercial Mortgage Trust, Series 2017-C1, Class A3 SEQ, 3.20%, 6/15/50 | | 445,000 |
| 463,480 |
|
TOTAL COMMERCIAL MORTGAGE-BACKED SECURITIES
(Cost $6,023,870) | | 6,263,297 |
|
| EXCHANGE-TRADED FUNDS — 0.3% | | | |
| iShares MSCI EAFE Value ETF | | 7,603 |
| 355,364 |
|
| iShares Russell Mid-Cap Value ETF | | 8,278 |
| 743,944 |
|
| SPDR S&P Oil & Gas Exploration & Production ETF | | 2,891 |
| 72,362 |
|
|
| | | | | | | |
| | | Shares/
Principal Amount | Value |
| SPDR S&P Regional Banking ETF | | 1,055 |
| $ | 58,172 |
|
TOTAL EXCHANGE-TRADED FUNDS
(Cost $1,217,429) | | | 1,229,842 |
|
COMMERCIAL PAPER(8) — 0.3% | | | |
Old Line Funding LLC, 2.42%, 1/16/20(3)
(Cost $1,000,000) | | $ | 1,000,000 |
| 999,983 |
|
| TEMPORARY CASH INVESTMENTS — 4.7% | | | |
State Street Institutional U.S. Government Money Market Fund, Premier Class
(Cost $19,168,298) | | 19,168,298 |
| 19,168,298 |
|
TOTAL INVESTMENT SECURITIES — 100.9%
(Cost $371,048,459) | | | 415,974,385 |
|
| OTHER ASSETS AND LIABILITIES — (0.9)% | | | (3,518,670 | ) |
| TOTAL NET ASSETS — 100.0% | | | $ | 412,455,715 |
|
FORWARD FOREIGN CURRENCY EXCHANGE CONTRACTS
|
| | | | | | | | | | |
| Currency Purchased | Currency Sold | Counterparty | Settlement Date | Unrealized Appreciation
(Depreciation) |
| AUD | 1,568,875 |
| USD | 1,087,262 |
| Bank of America, N.A. | 9/18/19 | $ | (12,637 | ) |
| AUD | 1,455,091 |
| USD | 1,019,510 |
| Bank of America, N.A. | 9/18/19 | (22,823 | ) |
| AUD | 1,453,286 |
| USD | 1,024,087 |
| Bank of America, N.A. | 9/18/19 | (28,637 | ) |
| USD | 558,108 |
| AUD | 799,879 |
| Bank of America, N.A. | 9/18/19 | 10,218 |
|
| USD | 1,009,548 |
| AUD | 1,437,796 |
| Bank of America, N.A. | 9/18/19 | 24,708 |
|
| BRL | 6,268,691 |
| USD | 1,557,942 |
| Goldman Sachs & Co. | 9/18/19 | 78,886 |
|
| USD | 106,250 |
| BRL | 415,959 |
| Goldman Sachs & Co. | 9/18/19 | (2,361 | ) |
| CAD | 1,726,967 |
| USD | 1,283,617 |
| Morgan Stanley | 9/18/19 | 26,084 |
|
| CAD | 348,000 |
| USD | 258,581 |
| Morgan Stanley | 9/18/19 | 5,336 |
|
| CAD | 3,791 |
| USD | 2,893 |
| Morgan Stanley | 9/30/19 | (17 | ) |
| CAD | 2,604 |
| USD | 1,987 |
| Morgan Stanley | 9/30/19 | (12 | ) |
| CAD | 3,465 |
| USD | 2,661 |
| Morgan Stanley | 9/30/19 | (33 | ) |
| CAD | 4,107 |
| USD | 3,148 |
| Morgan Stanley | 9/30/19 | (33 | ) |
| CAD | 3,616 |
| USD | 2,745 |
| Morgan Stanley | 9/30/19 | (2 | ) |
| CAD | 9,794 |
| USD | 7,451 |
| Morgan Stanley | 9/30/19 | (22 | ) |
| CAD | 11,930 |
| USD | 9,083 |
| Morgan Stanley | 9/30/19 | (34 | ) |
| USD | 1,049,969 |
| CAD | 1,382,799 |
| Morgan Stanley | 9/18/19 | 1,279 |
|
| USD | 1,083,746 |
| CAD | 1,416,272 |
| Morgan Stanley | 9/18/19 | 9,671 |
|
| USD | 99,691 |
| CAD | 131,503 |
| Morgan Stanley | 9/30/19 | (60 | ) |
| USD | 90,591 |
| CAD | 119,499 |
| Morgan Stanley | 9/30/19 | (55 | ) |
| USD | 2,287 |
| CAD | 2,988 |
| Morgan Stanley | 9/30/19 | 20 |
|
| USD | 2,445 |
| CAD | 3,195 |
| Morgan Stanley | 9/30/19 | 22 |
|
| USD | 2,727 |
| CAD | 3,581 |
| Morgan Stanley | 9/30/19 | 11 |
|
| USD | 3,256 |
| CAD | 4,280 |
| Morgan Stanley | 9/30/19 | 9 |
|
| USD | 5,390 |
| CAD | 7,099 |
| Morgan Stanley | 9/30/19 | 5 |
|
| USD | 2,236 |
| CAD | 2,938 |
| Morgan Stanley | 9/30/19 | 7 |
|
| CHF | 910,625 |
| USD | 912,249 |
| UBS AG | 9/18/19 | 7,109 |
|
| CHF | 1,512,564 |
| USD | 1,532,564 |
| UBS AG | 9/18/19 | (5,494 | ) |
| CHF | 990,596 |
| USD | 1,014,976 |
| UBS AG | 9/18/19 | (14,880 | ) |
| USD | 1,011,673 |
| CHF | 989,239 |
| UBS AG | 9/18/19 | 12,947 |
|
| USD | 109,162 |
| CHF | 106,737 |
| UBS AG | 9/18/19 | 1,401 |
|
| USD | 210,606 |
| CHF | 205,155 |
| UBS AG | 9/30/19 | 3,244 |
|
|
| | | | | | | | | | |
| Currency Purchased | Currency Sold | Counterparty | Settlement Date | Unrealized Appreciation
(Depreciation) |
| USD | 14,449 |
| CHF | 13,932 |
| UBS AG | 9/30/19 | $ | 367 |
|
| USD | 13,831 |
| CHF | 13,377 |
| UBS AG | 9/30/19 | 310 |
|
| USD | 7,317 |
| CHF | 7,143 |
| UBS AG | 9/30/19 | 97 |
|
| CLP | 709,032,893 |
| USD | 1,036,446 |
| Goldman Sachs & Co. | 9/23/19 | (29,028 | ) |
| USD | 1,014,887 |
| CLP | 689,971,203 |
| Goldman Sachs & Co. | 9/23/19 | 34,552 |
|
| CNY | 1,897,620 |
| USD | 273,732 |
| Morgan Stanley | 9/18/19 | 1,010 |
|
| CNY | 821,604 |
| USD | 118,849 |
| Morgan Stanley | 9/18/19 | 105 |
|
| CNY | 1,061,408 |
| USD | 154,965 |
| Morgan Stanley | 9/18/19 | (1,292 | ) |
| CNY | 7,044,669 |
| USD | 1,024,828 |
| Morgan Stanley | 9/18/19 | (4,882 | ) |
| CNY | 7,007,105 |
| USD | 1,019,364 |
| Morgan Stanley | 9/18/19 | (4,856 | ) |
| CNY | 3,499,586 |
| USD | 509,401 |
| Morgan Stanley | 9/18/19 | (2,722 | ) |
| USD | 509,548 |
| CNY | 3,509,766 |
| Morgan Stanley | 9/18/19 | 1,395 |
|
| COP | 3,483,703,198 |
| USD | 1,032,000 |
| Goldman Sachs & Co. | 9/18/19 | 26,718 |
|
| USD | 1,078,706 |
| COP | 3,483,703,198 |
| Goldman Sachs & Co. | 9/18/19 | 19,988 |
|
| USD | 1,007,128 |
| COP | 3,266,369,112 |
| Goldman Sachs & Co. | 9/18/19 | 14,459 |
|
| CZK | 23,020,923 |
| USD | 1,027,903 |
| UBS AG | 9/18/19 | (35,788 | ) |
| CZK | 23,265,252 |
| USD | 1,027,726 |
| UBS AG | 9/18/19 | (25,081 | ) |
| USD | 61,677 |
| CZK | 1,428,017 |
| UBS AG | 9/18/19 | 135 |
|
| USD | 1,024,627 |
| CZK | 23,075,515 |
| UBS AG | 9/18/19 | 30,158 |
|
| USD | 1,011,130 |
| CZK | 23,274,192 |
| UBS AG | 9/18/19 | 8,100 |
|
| USD | 13,688 |
| DKK | 90,938 |
| Goldman Sachs & Co. | 9/18/19 | 153 |
|
| EUR | 901,735 |
| USD | 1,015,104 |
| JPMorgan Chase Bank N.A. | 8/21/19 | (15,372 | ) |
| EUR | 907,650 |
| USD | 1,025,179 |
| JPMorgan Chase Bank N.A. | 8/21/19 | (18,890 | ) |
| EUR | 43,522 |
| USD | 49,149 |
| Credit Suisse AG | 9/30/19 | (740 | ) |
| EUR | 50,803 |
| USD | 57,366 |
| Credit Suisse AG | 9/30/19 | (858 | ) |
| EUR | 8,545 |
| USD | 9,678 |
| Credit Suisse AG | 9/30/19 | (173 | ) |
| EUR | 8,434 |
| USD | 9,562 |
| Credit Suisse AG | 9/30/19 | (181 | ) |
| EUR | 49,674 |
| USD | 56,072 |
| Credit Suisse AG | 9/30/19 | (819 | ) |
| EUR | 21,985 |
| USD | 24,591 |
| Credit Suisse AG | 9/30/19 | (137 | ) |
| USD | 5,143,571 |
| EUR | 4,573,893 |
| JPMorgan Chase Bank N.A. | 8/21/19 | 72,609 |
|
| USD | 1,019,509 |
| EUR | 906,956 |
| JPMorgan Chase Bank N.A. | 8/21/19 | 13,989 |
|
| USD | 680,698 |
| EUR | 596,816 |
| Credit Suisse AG | 9/30/19 | 16,857 |
|
| USD | 319,581 |
| EUR | 280,199 |
| Credit Suisse AG | 9/30/19 | 7,914 |
|
| USD | 1,207,493 |
| EUR | 1,058,694 |
| Credit Suisse AG | 9/30/19 | 29,902 |
|
| USD | 9,566 |
| EUR | 8,419 |
| Credit Suisse AG | 9/30/19 | 201 |
|
| USD | 20,305 |
| EUR | 17,872 |
| Credit Suisse AG | 9/30/19 | 426 |
|
| USD | 10,039 |
| EUR | 8,828 |
| Credit Suisse AG | 9/30/19 | 220 |
|
| USD | 15,294 |
| EUR | 13,549 |
| Credit Suisse AG | 9/30/19 | 223 |
|
| USD | 18,926 |
| EUR | 16,766 |
| Credit Suisse AG | 9/30/19 | 277 |
|
| USD | 9,403 |
| EUR | 8,336 |
| Credit Suisse AG | 9/30/19 | 131 |
|
| USD | 10,856 |
| EUR | 9,700 |
| Credit Suisse AG | 9/30/19 | 67 |
|
| USD | 19,530 |
| EUR | 17,450 |
| Credit Suisse AG | 9/30/19 | 120 |
|
| USD | 19,556 |
| EUR | 17,456 |
| Credit Suisse AG | 9/30/19 | 140 |
|
| GBP | 4,416 |
| USD | 5,539 |
| JPMorgan Chase Bank N.A. | 9/30/19 | (153 | ) |
| USD | 2,018,782 |
| GBP | 1,593,107 |
| Bank of America, N.A. | 9/18/19 | 76,921 |
|
| USD | 113,643 |
| GBP | 89,515 |
| Bank of America, N.A. | 9/18/19 | 4,532 |
|
| USD | 181,289 |
| GBP | 142,482 |
| JPMorgan Chase Bank N.A. | 9/30/19 | 7,512 |
|
| USD | 361,779 |
| GBP | 284,335 |
| JPMorgan Chase Bank N.A. | 9/30/19 | 14,991 |
|
| USD | 16,926 |
| GBP | 13,277 |
| JPMorgan Chase Bank N.A. | 9/30/19 | 733 |
|
|
| | | | | | | | | | |
| Currency Purchased | Currency Sold | Counterparty | Settlement Date | Unrealized Appreciation
(Depreciation) |
| USD | 13,237 |
| GBP | 10,573 |
| JPMorgan Chase Bank N.A. | 9/30/19 | $ | 342 |
|
| USD | 5,271 |
| GBP | 4,319 |
| JPMorgan Chase Bank N.A. | 9/30/19 | 3 |
|
| USD | 12,386 |
| GBP | 10,149 |
| JPMorgan Chase Bank N.A. | 9/30/19 | 7 |
|
| HUF | 286,049,277 |
| USD | 991,987 |
| UBS AG | 9/18/19 | (18,315 | ) |
| USD | 2,017,931 |
| HUF | 584,505,932 |
| UBS AG | 9/18/19 | 28,356 |
|
| USD | 994,553 |
| HUF | 281,298,421 |
| UBS AG | 9/18/19 | 37,053 |
|
| USD | 87,631 |
| IDR | 1,293,431,386 |
| Goldman Sachs & Co. | 9/18/19 | (3,510 | ) |
| ILS | 3,657,402 |
| USD | 1,029,558 |
| UBS AG | 9/18/19 | 14,931 |
|
| ILS | 3,637,687 |
| USD | 1,044,727 |
| UBS AG | 9/18/19 | (5,868 | ) |
| ILS | 3,581,890 |
| USD | 1,029,930 |
| UBS AG | 9/18/19 | (7,005 | ) |
| USD | 1,972,893 |
| ILS | 7,105,178 |
| UBS AG | 9/18/19 | (56,220 | ) |
| USD | 1,018,938 |
| ILS | 3,591,960 |
| UBS AG | 9/18/19 | (6,862 | ) |
| USD | 1,016,162 |
| ILS | 3,549,759 |
| UBS AG | 9/18/19 | 2,414 |
|
| JPY | 786,253 |
| USD | 7,335 |
| Bank of America, N.A. | 9/30/19 | (75 | ) |
| JPY | 690,775 |
| USD | 6,388 |
| Bank of America, N.A. | 9/30/19 | (10 | ) |
| USD | 2,945,296 |
| JPY | 317,555,952 |
| Bank of America, N.A. | 8/21/19 | 22,321 |
|
| USD | 1,001,332 |
| JPY | 107,765,317 |
| Bank of America, N.A. | 8/21/19 | 9,395 |
|
| USD | 208,711 |
| JPY | 22,312,917 |
| Bank of America, N.A. | 9/30/19 | 2,691 |
|
| USD | 140,288 |
| JPY | 14,997,892 |
| Bank of America, N.A. | 9/30/19 | 1,809 |
|
| USD | 5,571 |
| JPY | 599,912 |
| Bank of America, N.A. | 9/30/19 | 32 |
|
| USD | 5,420 |
| JPY | 582,477 |
| Bank of America, N.A. | 9/30/19 | 42 |
|
| KRW | 508,781,316 |
| USD | 429,134 |
| Goldman Sachs & Co. | 9/18/19 | (309 | ) |
| KZT | 394,229,548 |
| USD | 1,016,580 |
| Goldman Sachs & Co. | 9/18/19 | (9 | ) |
| KZT | 186,623,048 |
| USD | 484,232 |
| Goldman Sachs & Co. | 9/18/19 | (3,001 | ) |
| MXN | 4,350,853 |
| USD | 223,827 |
| Morgan Stanley | 9/18/19 | 1,452 |
|
| MXN | 19,711,263 |
| USD | 1,015,416 |
| Morgan Stanley | 9/18/19 | 5,193 |
|
| MXN | 19,140,917 |
| USD | 989,732 |
| Morgan Stanley | 9/18/19 | 1,347 |
|
| MXN | 19,555,857 |
| USD | 1,021,220 |
| Morgan Stanley | 9/18/19 | (8,657 | ) |
| USD | 483,326 |
| MXN | 9,707,353 |
| Morgan Stanley | 9/18/19 | (19,302 | ) |
| USD | 1,017,317 |
| MXN | 19,848,356 |
| Morgan Stanley | 9/18/19 | (10,392 | ) |
| USD | 503,238 |
| MXN | 9,677,262 |
| Morgan Stanley | 9/18/19 | 2,168 |
|
| MYR | 4,138,710 |
| USD | 1,003,567 |
| Goldman Sachs & Co. | 9/18/19 | (1,563 | ) |
| MYR | 3,181,292 |
| USD | 775,358 |
| Goldman Sachs & Co. | 9/18/19 | (5,149 | ) |
| USD | 58,867 |
| MYR | 248,360 |
| Goldman Sachs & Co. | 9/18/19 | (1,262 | ) |
| NOK | 14,748,838 |
| USD | 1,690,392 |
| Goldman Sachs & Co. | 9/18/19 | (22,934 | ) |
| NOK | 9,044,351 |
| USD | 1,033,690 |
| Goldman Sachs & Co. | 9/18/19 | (11,164 | ) |
| NOK | 73,965 |
| USD | 8,681 |
| Goldman Sachs & Co. | 9/30/19 | (316 | ) |
| USD | 105,053 |
| NOK | 905,288 |
| Goldman Sachs & Co. | 9/18/19 | 2,704 |
|
| USD | 1,027,930 |
| NOK | 8,779,343 |
| Goldman Sachs & Co. | 9/18/19 | 35,364 |
|
| USD | 1,016,007 |
| NOK | 8,673,851 |
| Goldman Sachs & Co. | 9/18/19 | 35,368 |
|
| USD | 280,712 |
| NOK | 2,393,841 |
| Goldman Sachs & Co. | 9/30/19 | 9,990 |
|
| USD | 9,403 |
| NOK | 80,860 |
| Goldman Sachs & Co. | 9/30/19 | 258 |
|
| NZD | 1,534,373 |
| USD | 1,017,535 |
| Bank of America, N.A. | 9/18/19 | (9,073 | ) |
| NZD | 773,365 |
| USD | 516,964 |
| Bank of America, N.A. | 9/18/19 | (8,672 | ) |
| USD | 1,462,976 |
| NZD | 2,243,002 |
| Bank of America, N.A. | 9/18/19 | (11,230 | ) |
| PEN | 530,150 |
| USD | 160,671 |
| Goldman Sachs & Co. | 9/18/19 | (532 | ) |
| PEN | 617,362 |
| USD | 186,751 |
| Goldman Sachs & Co. | 9/18/19 | (269 | ) |
| USD | 1,897,554 |
| PEN | 6,413,162 |
| Goldman Sachs & Co. | 9/18/19 | (39,629 | ) |
| USD | 947,153 |
| PEN | 3,123,425 |
| Goldman Sachs & Co. | 9/18/19 | 3,680 |
|
|
| | | | | | | | | | |
| Currency Purchased | Currency Sold | Counterparty | Settlement Date | Unrealized Appreciation
(Depreciation) |
| USD | 1,144,659 |
| PHP | 60,415,124 |
| Goldman Sachs & Co. | 9/18/19 | $ | (39,226 | ) |
| PLN | 390,811 |
| USD | 103,920 |
| Goldman Sachs & Co. | 9/18/19 | (2,972 | ) |
| PLN | 3,533,816 |
| USD | 949,389 |
| Goldman Sachs & Co. | 9/18/19 | (36,596 | ) |
| PLN | 441,452 |
| USD | 118,174 |
| Goldman Sachs & Co. | 9/18/19 | (4,146 | ) |
| PLN | 5,653,791 |
| USD | 1,495,138 |
| Goldman Sachs & Co. | 9/18/19 | (34,750 | ) |
| USD | 5,174,631 |
| PLN | 19,884,037 |
| Goldman Sachs & Co. | 9/18/19 | 38,535 |
|
| USD | 1,007,661 |
| PLN | 3,783,665 |
| Goldman Sachs & Co. | 9/18/19 | 30,331 |
|
| USD | 77,878 |
| PLN | 294,636 |
| Goldman Sachs & Co. | 9/18/19 | 1,773 |
|
| RUB | 62,863 |
| USD | 952 |
| Goldman Sachs & Co. | 9/18/19 | 29 |
|
| SEK | 26,261,696 |
| USD | 2,774,743 |
| Goldman Sachs & Co. | 9/18/19 | (46,967 | ) |
| SEK | 4,537,127 |
| USD | 481,097 |
| Goldman Sachs & Co. | 9/18/19 | (9,830 | ) |
| SEK | 69,972 |
| USD | 7,440 |
| Goldman Sachs & Co. | 9/30/19 | (166 | ) |
| SEK | 38,537 |
| USD | 4,097 |
| Goldman Sachs & Co. | 9/30/19 | (91 | ) |
| SEK | 49,841 |
| USD | 5,348 |
| Goldman Sachs & Co. | 9/30/19 | (167 | ) |
| SEK | 83,248 |
| USD | 8,953 |
| Goldman Sachs & Co. | 9/30/19 | (299 | ) |
| USD | 95,991 |
| SEK | 890,388 |
| Goldman Sachs & Co. | 9/18/19 | 3,508 |
|
| USD | 1,489,310 |
| SEK | 13,918,053 |
| Goldman Sachs & Co. | 9/18/19 | 43,656 |
|
| USD | 490,706 |
| SEK | 4,672,345 |
| Goldman Sachs & Co. | 9/18/19 | 5,394 |
|
| USD | 146,680 |
| SEK | 1,368,316 |
| Goldman Sachs & Co. | 9/30/19 | 4,429 |
|
| USD | 206,449 |
| SEK | 1,925,882 |
| Goldman Sachs & Co. | 9/30/19 | 6,233 |
|
| USD | 10,851 |
| SEK | 100,061 |
| Goldman Sachs & Co. | 9/30/19 | 449 |
|
| USD | 6,988 |
| SEK | 64,781 |
| Goldman Sachs & Co. | 9/30/19 | 254 |
|
| USD | 11,694 |
| SEK | 109,690 |
| Goldman Sachs & Co. | 9/30/19 | 290 |
|
| USD | 3,848 |
| SEK | 35,968 |
| Goldman Sachs & Co. | 9/30/19 | 109 |
|
| USD | 8,207 |
| SEK | 76,819 |
| Goldman Sachs & Co. | 9/30/19 | 221 |
|
| USD | 5,339 |
| SEK | 50,096 |
| Goldman Sachs & Co. | 9/30/19 | 131 |
|
| USD | 127,761 |
| SGD | 176,011 |
| Bank of America, N.A. | 9/18/19 | (415 | ) |
| THB | 31,843,230 |
| USD | 1,038,084 |
| Goldman Sachs & Co. | 9/18/19 | (7,521 | ) |
| USD | 299,067 |
| THB | 9,490,141 |
| Goldman Sachs & Co. | 9/18/19 | (8,069 | ) |
| USD | 1,026,174 |
| THB | 31,605,122 |
| Goldman Sachs & Co. | 9/18/19 | 3,316 |
|
| USD | 765,021 |
| THB | 23,482,324 |
| Goldman Sachs & Co. | 9/18/19 | 5,047 |
|
| USD | 1,034,131 |
| THB | 31,907,594 |
| Goldman Sachs & Co. | 9/18/19 | 1,485 |
|
| USD | 513,502 |
| THB | 15,879,521 |
| Goldman Sachs & Co. | 9/18/19 | (418 | ) |
| ZAR | 7,449,307 |
| USD | 502,378 |
| UBS AG | 9/18/19 | 14,025 |
|
| ZAR | 14,307,196 |
| USD | 1,015,199 |
| UBS AG | 9/18/19 | (23,393 | ) |
| USD | 499,705 |
| ZAR | 7,449,307 |
| UBS AG | 9/18/19 | (16,697 | ) |
| USD | 1,001,014 |
| ZAR | 14,307,196 |
| UBS AG | 9/18/19 | 9,208 |
|
| | | | | | | $ | 240,489 |
|
|
| | | | | | | | | | | |
| FUTURES CONTRACTS PURCHASED |
| Reference Entity | Contracts | Expiration
Date | Notional
Amount | Underlying
Contract
Value | Unrealized
Appreciation
(Depreciation) |
| Japanese 10-Year Mini Government Bonds | 16 | September 2019 | JPY | 160,000,000 |
| $ | 2,262,267 |
| $ | 5,476 |
|
Korean Treasury 10-Year Bonds | 7 | September 2019 | KRW | 700,000,000 |
| 790,052 |
| 13,596 |
|
| S&P 500 E-Mini | 6 | September 2019 | USD | 300 |
| 894,690 |
| 1,686 |
|
U.S. Treasury 2-Year Notes | 195 | September 2019 | USD | 39,000,000 |
| 41,809,219 |
| 63,312 |
|
U.S. Treasury Ultra Bonds | 11 | September 2019 | USD | 1,100,000 |
| 1,953,187 |
| 49,583 |
|
| | | | | | $ | 47,709,415 |
| $ | 133,653 |
|
|
| | | | | | | | | | | |
| FUTURES CONTRACTS SOLD |
| Reference Entity | Contracts | Expiration
Date | Notional
Amount | Underlying
Contract
Value | Unrealized
Appreciation
(Depreciation) |
| Euro-Bund 10-Year Bonds | 2 | September 2019 | EUR | 200,000 |
| $ | 387,605 |
| $ | (10,387 | ) |
| Euro-OAT 10-Year Bonds | 5 | September 2019 | EUR | 500,000 |
| 925,619 |
| (31,779 | ) |
| | | | | | $ | 1,313,224 |
| $ | (42,166 | ) |
|
| | | | | | | | | | | | | | | |
| CENTRALLY CLEARED CREDIT DEFAULT SWAP AGREEMENTS |
| Reference Entity | Type‡ | Fixed Rate
Received
(Paid) | Termination
Date | Notional
Amount | Premiums
Paid
(Received) | Unrealized
Appreciation
(Depreciation) | Value^ |
| Markit CDX North America High Yield Index Series 32 | Sell | 5.00% | 6/20/24 | $ | 1,178,100 |
| $ | 77,343 |
| $ | 18,326 |
| $ | 95,669 |
|
| |
| ‡ | The maximum potential amount the fund could be required to deliver as a seller of credit protection if a credit event occurs as defined under the terms of the agreement is the notional amount. The maximum potential amount may be partially offset by any recovery values of the reference entities and upfront payments received upon entering into the agreement. |
| |
| ^ | The value for credit default swap agreements serve as an indicator of the current status of the payment/performance risk and represent the likelihood of an expected liability or profit at the period end. Increasing values in absolute terms when compared to the notional amount of the credit default swap agreement represent a deterioration of the referenced entity's credit soundness and an increased likelihood or risk of a credit event occurring as defined in the agreement. |
|
| | | | | |
| NOTES TO SCHEDULE OF INVESTMENTS | |
| ADR | - | American Depositary Receipt | MYR | - | Malaysian Ringgit |
| AUD | - | Australian Dollar | NOK | - | Norwegian Krone |
| BRL | - | Brazilian Real | NZD | - | New Zealand Dollar |
| CAD | - | Canadian Dollar | PEN | - | Peruvian Sol |
| CDX | - | Credit Derivatives Indexes | PHP | - | Philippine Peso |
| CHF | - | Swiss Franc | PLN | - | Polish Zloty |
| CLP | - | Chilean Peso | RUB | - | Russian Ruble |
| CNY | - | Chinese Yuan | SBBPA | - | Standby Bond Purchase Agreement |
| COP | - | Colombian Peso | SEK | - | Swedish Krona |
| CZK | - | Czech Koruna | SEQ | - | Sequential Payer |
| DKK | - | Danish Krone | SGD | - | Singapore Dollar |
| EUR | - | Euro | TBA | - | To-Be-Announced. Security was purchased on a forward commitment basis with an approximate principal amount and maturity date. Actual principal amount and maturity date will be determined upon settlement. |
| FHLB | - | Federal Home Loan Bank | | |
| FHLMC | - | Federal Home Loan Mortgage Corporation | | |
| FNMA | - | Federal National Mortgage Association | | |
| GBP | - | British Pound | THB | - | Thai Baht |
| GNMA | - | Government National Mortgage Association | USD | - | United States Dollar |
| GO | - | General Obligation | VRDN | - | Variable Rate Demand Note. The instrument may be payable upon demand and adjusts periodically based upon the terms set forth in the security's offering documents. The rate shown is effective at the period end and the reference rate and spread, if any, is indicated. The date of the demand feature is disclosed. |
| H15T1Y | - | Constant Maturity U.S. Treasury Note Yield Curve Rate Index | | |
| HUF | - | Hungarian Forint | | |
| IDR | - | Indonesian Rupiah | | |
| ILS | - | Israeli Shekel | | |
| JPY | - | Japanese Yen | | |
| KRW | - | South Korean Won | VRN | - | Variable Rate Note. The rate adjusts periodically based upon the terms set forth in the security’s offering documents. The rate shown is effective at the period end and the reference rate and spread, if any, is indicated. |
| KZT | - | Kazakhstani Tenge | | |
| LIBOR | - | London Interbank Offered Rate | | |
| LIQ FAC | - | Liquidity Facilities | | |
| LOC | - | Letter of Credit | ZAR | - | South African Rand |
| MTN | - | Medium Term Note | | | |
| MXN | - | Mexican Peso | | | |
† Category is less than 0.05% of total net assets
| |
| (2) | Security, or a portion thereof, has been pledged at the custodian bank or with a broker for collateral requirements on forward commitments, forward foreign currency exchange contracts, futures contracts, and/or swap agreements. At the period end, the aggregate value of securities pledged was $274,782. |
| |
| (3) | Security was purchased pursuant to Rule 144A or Section 4(2) under the Securities Act of 1933 and may be sold in transactions exempt from registration, normally to qualified institutional investors. The aggregate value of these securities at the period end was $36,900,870, which represented 8.9% of total net assets. |
| |
| (4) | Restricted security that may not be offered for public sale without being registered with the Securities and Exchange Commission and/or may be subject to resale, redemption or transferability restrictions. The aggregate value of these securities at the period end was $3,000,000, which represented 0.7% of total net assets. |
| |
| (5) | Security is a zero-coupon bond. |
| |
| (6) | Investments are funds within the American Century Investments family of funds and are considered affiliated funds. |
| |
| (7) | When-issued security. The issue price and yield are fixed on the date of the commitment, but payment and delivery are scheduled for a future date. |
| |
| (8) | The rate indicated is the yield to maturity at purchase for non-interest bearing securities. For interest bearing securities, the stated coupon rate is shown. |
See Notes to Financial Statements.
|
|
| Statement of Assets and Liabilities |
|
| | | |
| JULY 31, 2019 |
| Assets |
| Investment securities - unaffiliated, at value (cost of $360,076,477) | $ | 404,737,261 |
|
| Investment securities - affiliated, at value (cost of $10,971,982) | 11,237,124 |
|
| Total investment securities, at value (cost of $371,048,459) | 415,974,385 |
|
| Foreign currency holdings, at value (cost of $4,528) | 4,010 |
|
| Foreign deposits with broker for futures contracts, at value (cost of $125,097) | 119,641 |
|
| Deposits with broker for futures contracts | 37,800 |
|
| Receivable for investments sold | 755,130 |
|
| Receivable for capital shares sold | 68,396 |
|
| Receivable for variation margin on futures contracts | 3,248 |
|
| Unrealized appreciation on forward foreign currency exchange contracts | 951,612 |
|
| Interest and dividends receivable | 1,452,542 |
|
| | 419,366,764 |
|
| | |
| Liabilities |
| Disbursements in excess of demand deposit cash | 42,156 |
|
| Payable for investments purchased | 5,342,824 |
|
| Payable for capital shares redeemed | 424,656 |
|
| Payable for variation margin on futures contracts | 28,410 |
|
| Payable for variation margin on swap agreements | 4,293 |
|
| Unrealized depreciation on forward foreign currency exchange contracts | 711,123 |
|
| Accrued management fees | 318,442 |
|
| Distribution and service fees payable | 38,386 |
|
| Accrued foreign taxes | 759 |
|
| | 6,911,049 |
|
| | |
| Net Assets | $ | 412,455,715 |
|
| | |
| Net Assets Consist of: |
| Capital (par value and paid-in surplus) | $ | 365,324,889 |
|
| Distributable earnings | 47,130,826 |
|
| | $ | 412,455,715 |
|
|
| | | | |
| | Net Assets | Shares Outstanding | Net Asset Value Per Share |
| Investor Class, $0.01 Par Value | $161,655,040 | 28,503,142 |
| $5.67 |
| I Class, $0.01 Par Value | $29,248,119 | 5,154,298 |
| $5.67 |
| A Class, $0.01 Par Value | $86,821,657 | 15,324,363 |
| $5.67* |
| C Class, $0.01 Par Value | $17,705,218 | 3,178,504 |
| $5.57 |
| R Class, $0.01 Par Value | $10,313,697 | 1,824,728 |
| $5.65 |
| R5 Class, $0.01 Par Value | $36,865,733 | 6,488,003 |
| $5.68 |
| R6 Class, $0.01 Par Value | $69,846,251 | 12,306,791 |
| $5.68 |
| *Maximum offering price $6.02 (net asset value divided by 0.9425). |
See Notes to Financial Statements.
|
| | | |
| YEAR ENDED JULY 31, 2019 |
| Investment Income (Loss) |
| Income: | |
| Interest (net of foreign taxes withheld of $1,398) | $ | 7,115,951 |
|
Dividends (including $134,441 from affiliated funds and net of foreign taxes withheld of $162,171) | 4,286,135 |
|
| | 11,402,086 |
|
| | |
| Expenses: | |
| Management fees | 4,024,649 |
|
| Distribution and service fees: | |
| A Class | 237,480 |
|
| C Class | 204,266 |
|
| R Class | 52,489 |
|
| Directors' fees and expenses | 12,357 |
|
| Other expenses | 26,719 |
|
| | 4,557,960 |
|
Fees waived(1) | (19,802 | ) |
| | 4,538,158 |
|
| | |
| Net investment income (loss) | 6,863,928 |
|
| | |
| Realized and Unrealized Gain (Loss) |
| Net realized gain (loss) on: | |
| Investment transactions (including $38 from affiliated funds) | 9,280,383 |
|
| Forward foreign currency exchange contract transactions | 188,873 |
|
| Futures contract transactions | 271,708 |
|
| Swap agreement transactions | 227,138 |
|
| Foreign currency translation transactions | (44,386 | ) |
| | 9,923,716 |
|
| | |
| Change in net unrealized appreciation (depreciation) on: | |
| Investments (including $265,142 from affiliated funds and (increase) decrease in accrued foreign taxes of $(759)) | (487,780 | ) |
| Forward foreign currency exchange contracts | 285,372 |
|
| Futures contracts | 116,802 |
|
| Swap agreements | (66,917 | ) |
| Translation of assets and liabilities in foreign currencies | (9,978 | ) |
| | (162,501 | ) |
| | |
| Net realized and unrealized gain (loss) | 9,761,215 |
|
| | |
| Net Increase (Decrease) in Net Assets Resulting from Operations | $ | 16,625,143 |
|
| |
| (1) | Amount consists of $7,884, $1,549, $4,170, $897, $478, $1,612 and $3,212 for Investor Class, I Class, A Class, C Class, R Class, R5 Class and R6 Class, respectively. |
See Notes to Financial Statements.
|
|
| Statement of Changes in Net Assets |
|
| | | | | | | | | |
| YEAR ENDED JULY 31, 2019, EIGHT MONTHS ENDED JULY 31, 2018 AND YEAR ENDED NOVEMBER 30, 2017 |
| Increase (Decrease) in Net Assets | July 31, 2019 | July 31, 2018(1) | November 30, 2017 |
| Operations | |
| Net investment income (loss) | $ | 6,863,928 |
| $ | 4,843,467 |
| $ | 6,281,898 |
|
| Net realized gain (loss) | 9,923,716 |
| 22,032,427 |
| 27,132,074 |
|
| Change in net unrealized appreciation (depreciation) | (162,501 | ) | (16,275,301 | ) | 20,302,914 |
|
| Net increase (decrease) in net assets resulting from operations | 16,625,143 |
| 10,600,593 |
| 53,716,886 |
|
| | | | |
| Distributions to Shareholders | |
From earnings:(2) | | | |
| Investor Class | (12,413,056 | ) | (13,705,106 | ) | (7,163,045 | ) |
| I Class | (2,432,004 | ) | (2,757,442 | ) | (2,134,489 | ) |
| A Class | (6,133,158 | ) | (6,466,912 | ) | (3,563,637 | ) |
| C Class | (1,253,150 | ) | (1,628,113 | ) | (741,646 | ) |
| R Class | (668,011 | ) | (794,498 | ) | (373,837 | ) |
| R5 Class | (2,396,013 | ) | (222,689 | ) | (42 | ) |
| R6 Class | (5,258,260 | ) | (3,882,759 | ) | (1,021,618 | ) |
| Decrease in net assets from distributions | (30,553,652 | ) | (29,457,519 | ) | (14,998,314 | ) |
| | | | |
| Capital Share Transactions | |
| Net increase (decrease) in net assets from capital share transactions (Note 5) | (60,243,829 | ) | (15,525,800 | ) | (50,118,767 | ) |
| | | | |
| Net increase (decrease) in net assets | (74,172,338 | ) | (34,382,726 | ) | (11,400,195 | ) |
| | | | |
| Net Assets | |
| Beginning of period | 486,628,053 |
| 521,010,779 |
| 532,410,974 |
|
| End of period | $ | 412,455,715 |
| $ | 486,628,053 |
| $ | 521,010,779 |
|
| |
| (1) | The fund's fiscal year end was changed from November 30 to July 31, resulting in an eight-month annual reporting period. |
| |
| (2) | Prior periods presentation has been updated to reflect the current period combination of distributions to shareholders from net investment income and net realized gains. For the eight months ended July 31, 2018, distributions from net investment income were $(2,281,277), $(554,456), $(1,024,428), $(138,147), $(99,850), $(222,440) and $(926,814) for Investor Class, I Class, A Class, C Class, R Class, R5 Class and R6 Class, respectively. For the eight months ended July 31, 2018, distributions from net realized gains were $(11,423,829), $(2,202,986), $(5,442,484), $(1,489,966), $(694,648), $(249) and $(2,955,945) for Investor Class, I Class, A Class, C Class, R Class, R5 Class and R6 Class, respectively. |
For the year ended November 30, 2017, distributions from net investment income were $(3,272,426), $(938,104), $(1,384,197), $(145,376), $(127,656), $(42) and $(695,182) for Investor Class, I Class, A Class, C Class, R Class, R5 Class and R6 Class, respectively. For the year ended November 30, 2017, distributions from net realized gains were $(3,890,619), $(1,196,385), $(2,179,440), $(596,270), $(246,181) and $(326,436) for Investor Class, I Class, A Class, C Class, R Class and R6 Class, respectively.
See Notes to Financial Statements.
|
|
| Notes to Financial Statements |
JULY 31, 2019
1. Organization
American Century Strategic Asset Allocations, Inc. (the corporation) is registered under the Investment Company Act of 1940, as amended (the 1940 Act), as an open-end management investment company and is organized as a Maryland corporation. Strategic Allocation: Conservative Fund (the fund) is one fund in a series issued by the corporation. The fund is an asset allocation fund and its investment objective is to seek the highest level of total return consistent with its asset mix.
The fund offers the Investor Class, I Class, A Class, C Class, R Class, R5 Class and R6 Class. The A Class may incur an initial sales charge. The A Class and C Class may be subject to a contingent deferred sales charge. Sale of the R5 Class commenced on April 10, 2017.
2. Significant Accounting Policies
The following is a summary of significant accounting policies consistently followed by the fund in preparation of its financial statements. The fund is an investment company and follows accounting and reporting guidance in accordance with accounting principles generally accepted in the United States of America. This may require management to make certain estimates and assumptions at the date of the financial statements. Actual results could differ from these estimates. Management evaluated the impact of events or transactions occurring through the date the financial statements were issued that would merit recognition or disclosure.
Investment Valuations — The fund determines the fair value of its investments and computes its net asset value per share at the close of regular trading (usually 4 p.m. Eastern time) on the New York Stock Exchange (NYSE) on each day the NYSE is open. The Board of Directors has adopted valuation policies and procedures to guide the investment advisor in the fund’s investment valuation process and to provide methodologies for the oversight of the fund’s pricing function.
Equity securities that are listed or traded on a domestic securities exchange are valued at the last reported sales price or at the official closing price as provided by the exchange. Equity securities traded on foreign securities exchanges are generally valued at the closing price of such securities on the exchange where primarily traded or at the close of the NYSE, if that is earlier. If no last sales price is reported, or if local convention or regulation so provides, the mean of the latest bid and asked prices may be used. Securities traded over-the-counter are valued at the mean of the latest bid and asked prices, the last sales price, or the official closing price. Equity securities initially expressed in local currencies are translated into U.S. dollars at the mean of the appropriate currency exchange rate at the close of the NYSE as provided by an independent pricing service.
Fixed income securities are valued at the evaluated mean as provided by independent pricing services or at the mean of the most recent bid and asked prices as provided by investment dealers. Corporate bonds, U.S. Treasury and Government Agency securities, convertible bonds, municipal securities, and sovereign governments and agencies are valued using market models that consider trade data, quotations from dealers and active market makers, relevant yield curve and spread data, creditworthiness, trade data or market information on comparable securities, and other relevant security specific information. Mortgage-related and asset-backed securities are valued based on models that consider trade data, prepayment and default projections, benchmark yield and spread data and estimated cash flows of each tranche of the issuer. Collateralized loan obligations are valued based on discounted cash flow models that consider trade and economic data, prepayment assumptions and default projections. Commercial paper is valued using a curve-based approach that considers money market rates for specific instruments, programs, currencies and maturity points from a variety of active market makers. Fixed income securities initially expressed in local currencies are translated into U.S. dollars at the mean of the appropriate currency exchange rate at the close of the NYSE as provided by an independent pricing service.
Open-end management investment companies are valued at the reported net asset value per share. Exchange-traded futures contracts are valued at the settlement price as provided by the appropriate exchange. Swap agreements are valued at an evaluated mean as provided by independent pricing services or independent brokers. Forward foreign currency exchange contracts are valued at the mean of the appropriate forward exchange rate at the close of the NYSE as provided by an independent pricing service. Investments
initially expressed in local currencies are translated into U.S. dollars at the mean of the appropriate currency exchange rate at the close of the NYSE as provided by an independent pricing service.
If the fund determines that the market price for an investment is not readily available or the valuation methods mentioned above do not reflect an investment’s fair value, such investment is valued as determined in good faith by the Board of Directors or its delegate, in accordance with policies and procedures adopted by the Board of Directors. In its determination of fair value, the fund may review several factors including, but not limited to, market information regarding the specific investment or comparable investments and correlation with other investment types, futures indices or general market indicators. Circumstances that may cause the fund to use these procedures to value an investment include, but are not limited to: an investment has been declared in default or is distressed; trading in a security has been suspended during the trading day or a security is not actively trading on its principal exchange; prices received from a regular pricing source are deemed unreliable; or there is a foreign market holiday and no trading occurred.
The fund monitors for significant events occurring after the close of an investment’s primary exchange but before the fund’s net asset value per share is determined. Significant events may include, but are not limited to: corporate announcements and transactions; governmental action and political unrest that could impact a specific investment or an investment sector; or armed conflicts, natural disasters and similar events that could affect investments in a specific country or region. The fund also monitors for significant fluctuations between domestic and foreign markets, as evidenced by the U.S. market or such other indicators that the Board of Directors, or its delegate, deems appropriate. The fund may apply a model-derived factor to the closing price of equity securities traded on foreign securities exchanges. The factor is based on observable market data as provided by an independent pricing service.
Security Transactions — Security transactions are accounted for as of the trade date. Net realized gains and losses are determined on the identified cost basis, which is also used for federal income tax purposes. Certain countries impose taxes on realized gains on the sale of securities registered in their country. The fund records the foreign tax expense, if any, on an accrual basis. The foreign tax expense on realized gains and unrealized appreciation reduces the net realized gain (loss) on investment transactions and net unrealized appreciation (depreciation) on investments, respectively.
Investment Income — Dividend income less foreign taxes withheld, if any, is recorded as of the ex-dividend date. Distributions received on securities that represent a return of capital or long-term capital gain are recorded as a reduction of cost of investments and/or as a realized gain. The fund may estimate the components of distributions received that may be considered nontaxable distributions or long-term capital gain distributions for income tax purposes. Interest income less foreign taxes withheld, if any, is recorded on the accrual basis and includes paydown gain (loss) and accretion of discounts and amortization of premiums. Inflation adjustments related to inflation-linked debt securities are reflected as interest income.
Segregated Assets — In accordance with the 1940 Act, the fund segregates assets on its books and records to cover certain types of investment securities and other financial instruments. American Century Investment Management, Inc. (ACIM) (the investment advisor) monitors, on a daily basis, the securities segregated to ensure the fund designates a sufficient amount of liquid assets, marked-to-market daily. The fund may also receive assets or be required to pledge assets at the custodian bank or with a broker for collateral requirements.
Foreign Currency Translations — All assets and liabilities initially expressed in foreign currencies are translated into U.S. dollars at prevailing exchange rates at period end. The fund may enter into spot foreign currency exchange contracts to facilitate transactions denominated in a foreign currency. Purchases and sales of investment securities, dividend and interest income, spot foreign currency exchange contracts, and expenses are translated at the rates of exchange prevailing on the respective dates of such transactions. Net realized and unrealized foreign currency exchange gains or losses related to investment securities are a component of net realized gain (loss) on investment transactions and change in net unrealized appreciation (depreciation) on investments, respectively.
Forward Commitments — The fund may engage in securities transactions on a forward commitment basis. In these transactions, the securities’ prices and yields are fixed on the date of the commitment. The fund may sell a to-be-announced (TBA) security and at the same time make a commitment to purchase the same security at a future date at a specified price. Conversely, the fund may purchase a TBA security and at the same time make a commitment to sell the same security at a future date at a specified price. These types of transactions are known as “TBA roll” transactions and are accounted for as purchases and sales. The fund will segregate cash, cash equivalents or other appropriate liquid securities on its records in amounts sufficient to meet the purchase price.
Income Tax Status — It is the fund’s policy to distribute substantially all net investment income and net realized gains to shareholders and to otherwise qualify as a regulated investment company under provisions of the Internal Revenue Code. Accordingly, no provision has been made for income taxes. The fund files U.S. federal, state, local and non-U.S. tax returns as applicable. The fund's tax returns are subject to examination by the relevant taxing authority until expiration of the applicable statute of limitations, which is generally three years from the date of filing but can be longer in certain jurisdictions. At this time, management believes there are no uncertain tax positions which, based on their technical merit, would not be sustained upon examination and for which it is reasonably possible that the total amounts of unrecognized tax benefits will significantly change in the next twelve months.
Multiple Class — All shares of the fund represent an equal pro rata interest in the net assets of the class to which such shares belong, and have identical voting, dividend, liquidation and other rights and the same terms and conditions, except for class specific expenses and exclusive rights to vote on matters affecting only individual classes. Income, non-class specific expenses, and realized and unrealized capital gains and losses of the fund are allocated to each class of shares based on their relative net assets.
Distributions to Shareholders — Distributions from net investment income, if any, are generally declared and paid quarterly. Distributions from net realized gains, if any, are generally declared and paid annually. The fund may elect to treat a portion of its payment to a redeeming shareholder, which represents the pro rata share of undistributed net investment income and net realized gains, as a distribution for federal income tax purposes (tax equalization).
Indemnifications — Under the corporation’s organizational documents, its officers and directors are indemnified against certain liabilities arising out of the performance of their duties to the fund. In addition, in the normal course of business, the fund enters into contracts that provide general indemnifications. The maximum exposure under these arrangements is unknown as this would involve future claims that may be made against a fund. The risk of material loss from such claims is considered by management to be remote.
3. Fees and Transactions with Related Parties
Certain officers and directors of the corporation are also officers and/or directors of American Century Companies, Inc. (ACC). The corporation’s investment advisor, ACIM, the corporation's distributor, American Century Investment Services, Inc. (ACIS), and the corporation’s transfer agent, American Century Services, LLC, are wholly owned, directly or indirectly, by ACC.
Management Fees — The corporation has entered into a management agreement with ACIM, under which ACIM provides the fund with investment advisory and management services in exchange for a single, unified management fee (the fee) per class. The agreement provides that all expenses of managing and operating the fund, except distribution and service fees, brokerage expenses, taxes, interest, fees and expenses of the independent directors (including legal counsel fees), and extraordinary expenses, will be paid by ACIM. The fee is computed and accrued daily based on each class's daily net assets and paid monthly in arrears. The difference in the fee among the classes is a result of their separate arrangements for non-Rule 12b-1 shareholder services. It is not the result of any difference in advisory or custodial fees or other expenses related to the management of the fund’s assets, which do not vary by class. The rate of the fee is determined by applying a fee rate calculation formula. This formula takes into account the fund’s assets as well as certain assets, if any, of other clients of the investment advisor outside the American Century Investments family of funds (such as subadvised funds and separate accounts) that use very similar investment teams and strategies (strategy assets). The investment advisor will waive the portion of the fund’s management fee equal to the expenses attributable to the management fees of the American Century Investments funds in which the fund invests. The amount of this waiver will fluctuate depending on the fund’s daily allocation to other American Century Investments funds. This waiver is expected to remain in effect permanently and it cannot be terminated without the approval of the Board of Directors.
The management fee schedule range and the effective annual management fee before and after waiver for each class for the period ended July 31, 2019 are as follows:
|
| | | |
| | | Effective Annual Management Fee |
| | Management Fee Schedule Range | Before Waiver | After Waiver |
| Investor Class | 0.80% to 1.00% | 1.00% | 0.99% |
| I Class | 0.60% to 0.80% | 0.80% | 0.79% |
| A Class | 0.80% to 1.00% | 1.00% | 0.99% |
| C Class | 0.80% to 1.00% | 1.00% | 0.99% |
| R Class | 0.80% to 1.00% | 1.00% | 0.99% |
| R5 Class | 0.60% to 0.80% | 0.80% | 0.79% |
| R6 Class | 0.45% to 0.65% | 0.65% | 0.64% |
Distribution and Service Fees — The Board of Directors has adopted a separate Master Distribution and Individual Shareholder Services Plan for each of the A Class, C Class and R Class (collectively the plans), pursuant to Rule 12b-1 of the 1940 Act. The plans provide that the A Class will pay ACIS an annual distribution and service fee of 0.25%. The plans provide that the C Class will pay ACIS an annual distribution and service fee of 1.00%, of which 0.25% is paid for individual shareholder services and 0.75% is paid for distribution services. The plans provide that the R Class will pay ACIS an annual distribution and service fee of 0.50%. The fees are computed and accrued daily based on each class’s daily net assets and paid monthly in arrears. The fees are used to pay financial intermediaries for distribution and individual shareholder services. Fees incurred under the plans during the period ended July 31, 2019 are detailed in the Statement of Operations.
Directors' Fees and Expenses — The Board of Directors is responsible for overseeing the investment advisor’s management and operations of the fund. The directors receive detailed information about the fund and its investment advisor regularly throughout the year, and meet at least quarterly with management of the investment advisor to review reports about fund operations. The fund’s officers do not receive compensation from the fund.
Interfund Transactions — The fund may enter into security transactions with other American Century Investments funds and other client accounts of the investment advisor, in accordance with the 1940 Act rules and procedures adopted by the Board of Directors. The rules and procedures require, among other things, that these transactions be effected at the independent current market price of the security. During the period, the interfund purchases and sales were $4,886,746 and $2,859,946, respectively. The effect of interfund transactions on the Statement of Operations was $154,088 in net realized gain (loss) on investment transactions.
4. Investment Transactions
Purchases of investment securities, excluding short-term investments, for the period ended July 31, 2019 totaled $278,878,247, of which $89,668,012 represented U.S. Treasury and Government Agency obligations.
Sales of investment securities, excluding short-term investments, for the period ended July 31, 2019 totaled $366,059,126, of which $125,035,459 represented U.S. Treasury and Government Agency obligations.
5. Capital Share Transactions
Transactions in shares of the fund were as follows: |
| | | | | | | | | | | | | | | |
| | Year ended July 31, 2019 | Eight months ended July 31, 2018(1) | Year ended November 30, 2017(2) |
| | Shares | Amount | Shares | Amount | Shares | Amount |
| Investor Class/Shares Authorized | 500,000,000 |
| | 500,000,000 |
| | 500,000,000 |
| |
| Sold | 5,781,182 |
| $ | 32,299,686 |
| 2,148,181 |
| $ | 12,499,844 |
| 8,025,892 |
| $ | 46,523,034 |
|
| Issued in reinvestment of distributions | 2,322,117 |
| 12,175,725 |
| 2,324,465 |
| 13,453,886 |
| 1,242,038 |
| 7,012,167 |
|
| Redeemed | (10,449,583 | ) | (57,799,131 | ) | (14,410,894 | ) | (83,862,307 | ) | (12,175,793 | ) | (70,518,807 | ) |
| | (2,346,284 | ) | (13,323,720 | ) | (9,938,248 | ) | (57,908,577 | ) | (2,907,863 | ) | (16,983,606 | ) |
| I Class/Shares Authorized | 120,000,000 |
| | 120,000,000 |
| | 120,000,000 |
| |
| Sold | 3,724,472 |
| 20,776,497 |
| 1,386,828 |
| 8,069,783 |
| 3,353,788 |
| 19,340,746 |
|
| Issued in reinvestment of distributions | 461,063 |
| 2,429,216 |
| 470,039 |
| 2,724,822 |
| 378,496 |
| 2,131,937 |
|
| Redeemed | (6,585,386 | ) | (36,475,755 | ) | (1,982,877 | ) | (11,496,275 | ) | (9,654,205 | ) | (54,736,902 | ) |
| | (2,399,851 | ) | (13,270,042 | ) | (126,010 | ) | (701,670 | ) | (5,921,921 | ) | (33,264,219 | ) |
| A Class/Shares Authorized | 270,000,000 |
| | 270,000,000 |
| | 270,000,000 |
| |
| Sold | 2,780,005 |
| 15,533,062 |
| 2,655,940 |
| 15,421,280 |
| 3,923,471 |
| 22,565,139 |
|
| Issued in reinvestment of distributions | 1,122,198 |
| 5,886,927 |
| 1,081,238 |
| 6,257,735 |
| 611,963 |
| 3,438,196 |
|
| Redeemed | (8,112,627 | ) | (45,068,208 | ) | (3,585,063 | ) | (20,842,631 | ) | (9,572,272 | ) | (55,219,343 | ) |
| | (4,210,424 | ) | (23,648,219 | ) | 152,115 |
| 836,384 |
| (5,036,838 | ) | (29,216,008 | ) |
| C Class/Shares Authorized | 70,000,000 |
| | 70,000,000 |
| | 70,000,000 |
| |
| Sold | 250,237 |
| 1,359,309 |
| 336,450 |
| 1,921,669 |
| 553,494 |
| 3,168,468 |
|
| Issued in reinvestment of distributions | 238,141 |
| 1,220,077 |
| 277,712 |
| 1,582,801 |
| 130,086 |
| 715,562 |
|
| Redeemed | (1,990,898 | ) | (11,032,622 | ) | (1,316,852 | ) | (7,559,484 | ) | (2,007,131 | ) | (11,420,632 | ) |
| | (1,502,520 | ) | (8,453,236 | ) | (702,690 | ) | (4,055,014 | ) | (1,323,551 | ) | (7,536,602 | ) |
| R Class/Shares Authorized | 50,000,000 |
| | 50,000,000 |
| | 50,000,000 |
| |
| Sold | 355,015 |
| 1,938,614 |
| 273,404 |
| 1,585,533 |
| 478,372 |
| 2,746,651 |
|
| Issued in reinvestment of distributions | 126,561 |
| 659,723 |
| 136,036 |
| 784,811 |
| 65,802 |
| 368,553 |
|
| Redeemed | (541,152 | ) | (2,984,663 | ) | (1,010,609 | ) | (5,851,318 | ) | (804,968 | ) | (4,655,809 | ) |
| | (59,576 | ) | (386,326 | ) | (601,169 | ) | (3,480,974 | ) | (260,794 | ) | (1,540,605 | ) |
| R5 Class/Shares Authorized | 50,000,000 |
| | 50,000,000 |
| | 50,000,000 |
| |
| Sold | 518,663 |
| 2,832,770 |
| 6,073,513 |
| 35,400,223 |
| 873 |
| 5,000 |
|
| Issued in reinvestment of distributions | 455,021 |
| 2,396,013 |
| 38,341 |
| 222,689 |
| 7 |
| 42 |
|
| Redeemed | (433,633 | ) | (2,424,754 | ) | (164,782 | ) | (958,984 | ) | — |
| — |
|
| | 540,051 |
| 2,804,029 |
| 5,947,072 |
| 34,663,928 |
| 880 |
| 5,042 |
|
| R6 Class/Shares Authorized | 90,000,000 |
| | 90,000,000 |
| | 90,000,000 |
| |
| Sold | 1,764,686 |
| 9,854,115 |
| 4,611,248 |
| 26,729,920 |
| 8,093,394 |
| 45,974,065 |
|
| Issued in reinvestment of distributions | 998,795 |
| 5,258,260 |
| 669,911 |
| 3,882,759 |
| 178,189 |
| 1,021,618 |
|
| Redeemed | (3,487,147 | ) | (19,078,690 | ) | (2,673,071 | ) | (15,492,556 | ) | (1,473,964 | ) | (8,578,452 | ) |
| | (723,666 | ) | (3,966,315 | ) | 2,608,088 |
| 15,120,123 |
| 6,797,619 |
| 38,417,231 |
|
| Net increase (decrease) | (10,702,270 | ) | $ | (60,243,829 | ) | (2,660,842 | ) | $ | (15,525,800 | ) | (8,652,468 | ) | $ | (50,118,767 | ) |
| |
| (1) | The fund's fiscal year end was changed from November 30 to July 31, resulting in an eight-month annual reporting period. |
| |
| (2) | April 10, 2017 (commencement of sale) through November 30, 2017 for the R5 Class. |
6. Affiliated Fund Transactions
A summary of transactions for each affiliated fund for the period ended July 31, 2019 follows (amounts in thousands):
|
| | | | | | | | | | | | | | | | | | | | | |
Affiliated Fund(1) | Beginning Value | Purchase
Cost | Sales
Cost | Change in Net Unrealized Appreciation (Depreciation) | Ending
Value | Ending
Shares | Net Realized
Gain (Loss) | Distributions
Received(2) |
| American Century Diversified Corporate Bond ETF | — |
| $ | 10,005 |
| — |
| $ | 270 |
| $ | 10,275 |
| 202 |
| — |
| $ | 134 |
|
| American Century STOXX U.S. Quality Value ETF | — |
| 981 |
| $ | 14 |
| (5 | ) | 962 |
| 24 |
| — |
| — |
|
| | — |
| $ | 10,986 |
| $ | 14 |
| $ | 265 |
| $ | 11,237 |
| 226 |
| — |
| $ | 134 |
|
| |
| (1) | Investments are funds within the American Century Investments family of funds and are considered affiliated funds. The fund does not invest in an affiliated fund for the purpose of exercising management or control; however, investments by the fund within its investment strategy may represent a significant portion of an affiliated fund's net assets. Additional information and attributes of each affiliated fund are available at americancentury.com. |
| |
| (2) | Distributions received includes distributions from net investment income and from capital gains, if any. |
7. Fair Value Measurements
The fund’s investments valuation process is based on several considerations and may use multiple inputs to determine the fair value of the investments held by the fund. In conformity with accounting principles generally accepted in the United States of America, the inputs used to determine a valuation are classified into three broad levels.
| |
| • | Level 1 valuation inputs consist of unadjusted quoted prices in an active market for identical investments. |
| |
| • | Level 2 valuation inputs consist of direct or indirect observable market data (including quoted prices for comparable investments, evaluations of subsequent market events, interest rates, prepayment speeds, credit risk, etc.). These inputs also consist of quoted prices for identical investments initially expressed in local currencies that are adjusted through translation into U.S. dollars. |
| |
| • | Level 3 valuation inputs consist of unobservable data (including a fund’s own assumptions). |
The level classification is based on the lowest level input that is significant to the fair valuation measurement. The valuation inputs are not necessarily an indication of the risks associated with investing in these securities or other financial instruments.
The following is a summary of the level classifications as of period end. The Schedule of Investments provides additional information on the fund’s portfolio holdings.
|
| | | | | | | | |
| | Level 1 | Level 2 | Level 3 |
| Assets | | | |
| Investment Securities |
| Common Stocks | $ | 138,143,422 |
| $ | 41,264,630 |
| — |
|
| U.S. Treasury Securities | — |
| 58,308,236 |
| — |
|
| Corporate Bonds | — |
| 43,488,568 |
| — |
|
| Sovereign Governments and Agencies | — |
| 28,408,385 |
| — |
|
| U.S. Government Agency Mortgage-Backed Securities | — |
| 23,085,593 |
| — |
|
| Municipal Securities | — |
| 14,188,524 |
| — |
|
| Asset-Backed Securities | — |
| 11,648,225 |
| — |
|
| Affiliated Funds | 11,237,124 |
| — |
| — |
|
| Collateralized Mortgage Obligations | — |
| 9,397,874 |
| — |
|
| Collateralized Loan Obligations | — |
| 9,142,384 |
| — |
|
| Commercial Mortgage-Backed Securities | — |
| 6,263,297 |
| — |
|
| Exchange-Traded Funds | 1,229,842 |
| — |
| — |
|
| Commercial Paper | — |
| 999,983 |
| — |
|
| Temporary Cash Investments | 19,168,298 |
| — |
| — |
|
| | $ | 169,778,686 |
| $ | 246,195,699 |
| — |
|
| Other Financial Instruments | | | |
| Futures Contracts | $ | 114,581 |
| $ | 19,072 |
| — |
|
| Swap Agreements | — |
| 95,669 |
| — |
|
| Forward Foreign Currency Exchange Contracts | — |
| 951,612 |
| — |
|
| | $ | 114,581 |
| $ | 1,066,353 |
| — |
|
| | | | |
| Liabilities | | | |
| Other Financial Instruments | | | |
| Futures Contracts | — |
| $ | 42,166 |
| — |
|
| Forward Foreign Currency Exchange Contracts | — |
| 711,123 |
| — |
|
| | — |
| $ | 753,289 |
| — |
|
8. Derivative Instruments
Credit Risk — The fund is subject to credit risk in the normal course of pursuing its investment objectives. The value of a bond generally declines as the credit quality of its issuer declines. Credit default swap agreements enable a fund to buy/sell protection against a credit event of a specific issuer or index. A fund may attempt to enhance returns by selling protection or attempt to mitigate credit risk by buying protection. The buyer/seller of credit protection against a security or basket of securities may pay/receive an up-front or periodic payment to compensate for/against potential default events. Changes in value, including the periodic amounts of interest to be paid or received on swap agreements, are recorded as unrealized appreciation (depreciation) on swap agreements. Upon entering into a centrally cleared swap, a fund is required to deposit cash or securities (initial margin) with a financial intermediary in an amount equal to a certain percentage of the notional amount. Subsequent payments (variation margin) are made or received daily, in cash, by a fund. The variation margin is equal to the daily change in the value and is a component of unrealized gains and losses. Realized gain or loss is recorded upon receipt or payment of a periodic settlement or termination of swap agreements. Net realized and unrealized gains or losses occurring during the holding period of swap agreements are a component of net realized gain (loss) on swap agreement transactions and change in net unrealized appreciation (depreciation) on swap agreements, respectively. The risks of entering into swap agreements include the possible lack of liquidity, failure of the counterparty to meet its obligations, and that there may be unfavorable changes in the underlying investments or instruments. The fund's average notional amount held during the period was $6,274,892.
Equity Price Risk — The fund is subject to equity price risk in the normal course of pursuing its investment objectives. A fund may enter into futures contracts based on an equity index in order to manage its exposure to changes in market conditions. A fund may purchase futures contracts to gain exposure to increases in
market value or sell futures contracts to protect against a decline in market value. Upon entering into a futures contract, a fund is required to deposit either cash or securities in an amount equal to a certain percentage of the contract value (initial margin). Subsequent payments (variation margin) are made or received daily, in cash, by a fund. The variation margin is equal to the daily change in the contract value and is recorded as unrealized gains and losses. A fund recognizes a realized gain or loss when the contract is closed or expires. Net realized and unrealized gains or losses occurring during the holding period of futures contracts are a component of net realized gain (loss) on futures contract transactions and change in net unrealized appreciation (depreciation) on futures contracts, respectively. One of the risks of entering into futures contracts is the possibility that the change in value of the contract may not correlate with the changes in value of the underlying securities. The fund's average notional exposure to equity price risk derivative instruments held during the period was $264 futures contracts purchased.
Foreign Currency Risk — The fund is subject to foreign currency exchange rate risk in the normal course of pursuing its investment objectives. The value of foreign investments held by a fund may be significantly affected by changes in foreign currency exchange rates. The dollar value of a foreign security generally decreases when the value of the dollar rises against the foreign currency in which the security is denominated and tends to increase when the value of the dollar declines against such foreign currency. A fund may enter into forward foreign currency exchange contracts to reduce a fund's exposure to foreign currency exchange rate fluctuations or to gain exposure to the fluctuations in the value of foreign currencies. The net U.S. dollar value of foreign currency underlying all contractual commitments held by a fund and the resulting unrealized appreciation or depreciation are determined daily. Realized gain or loss is recorded upon the termination of the contract. Net realized and unrealized gains or losses occurring during the holding period of forward foreign currency exchange contracts are a component of net realized gain (loss) on forward foreign currency exchange contract transactions and change in net unrealized appreciation (depreciation) on forward foreign currency exchange contracts, respectively. A fund bears the risk of an unfavorable change in the foreign currency exchange rate underlying the forward contract. Additionally, losses, up to the fair value, may arise if the counterparties do not perform under the contract terms. The fund's average U.S. dollar exposure to foreign currency risk derivative instruments held during the period was $63,464,141.
Interest Rate Risk — The fund is subject to interest rate risk in the normal course of pursuing its investment objectives. A fund may enter into futures contracts or interest rate swap agreements in order to manage its exposure to changes in market conditions. The value of bonds generally declines as interest rates rise. The risks of entering into interest rate risk derivative instruments include the possible lack of liquidity, failure of the counterparty to meet its obligations, and that there may be unfavorable changes in the underlying investments or instruments.
A fund may enter into futures contracts based on a bond index or a specific underlying security. A fund may purchase futures contracts to gain exposure to increases in market value or sell futures contracts to protect against a decline in market value. Upon entering into a futures contract, a fund will segregate cash, cash equivalents or other appropriate liquid securities on its records in amounts sufficient to meet requirements. Subsequent payments (variation margin) are made or received daily, in cash, by a fund. The variation margin is equal to the daily change in the contract value and is recorded as unrealized gains and losses. A fund recognizes a realized gain or loss when the futures contract is closed or expires. Net realized and unrealized gains or losses occurring during the holding period of futures contracts are a component of net realized gain (loss) on futures contract transactions and change in net unrealized appreciation (depreciation) on futures contracts, respectively. The fund's average notional exposure to these interest rate risk derivative instruments held during the period was $21,744,184 futures contracts purchased and $3,172,899 futures contracts sold.
A fund may enter into interest rate swap agreements to gain exposure to declines in interest rates, to protect against increases in interest rates, or to maintain its ability to generate income at prevailing interest rates. A fund will segregate cash, cash equivalents or other appropriate liquid securities on its records in amounts sufficient to meet requirements. Changes in value, including the periodic amounts of interest to be paid or received on swap agreements, are recorded as unrealized appreciation (depreciation) on swap agreements. Upon entering into a centrally cleared swap, a fund is required to deposit cash or securities (initial margin) with a financial intermediary in an amount equal to a certain percentage of the notional amount. Subsequent payments (variation margin) are made or received daily, in cash, by a fund. The variation margin is equal to the daily change in the value and is a component of unrealized gains and losses. Realized gain or loss is recorded upon receipt or payment of a periodic settlement or termination of swap agreements. Net realized and unrealized gains or losses occurring during the holding period of swap agreements are a component of net realized gain (loss) on swap agreement transactions and change in net unrealized appreciation (depreciation) on swap agreements, respectively. The fund's average notional amount on interest rate swap agreements held during the period was $523,589.
|
| | | | | | | | |
| Value of Derivative Instruments as of July 31, 2019 |
| | Asset Derivatives | Liability Derivatives |
Type of Risk Exposure | Location on Statement of Assets and Liabilities | Value | Location on Statement of Assets and Liabilities | Value |
| Credit Risk | Receivable for variation margin on swap agreements* | — |
| Payable for variation margin on swap agreements* | $ | 4,293 |
|
| Equity Price Risk | Receivable for variation margin on futures contracts* | — |
| Payable for variation margin on futures contracts* | 9,000 |
|
| Foreign Currency Risk | Unrealized appreciation on forward foreign currency exchange contracts | $ | 951,612 |
| Unrealized depreciation on forward foreign currency exchange contracts | 711,123 |
|
| Interest Rate Risk | Receivable for variation margin on futures contracts* | 3,248 |
| Payable for variation margin on futures contracts* | 19,410 |
|
| | | $ | 954,860 |
| | $ | 743,826 |
|
* Included in the unrealized appreciation (depreciation) on futures contracts or centrally cleared swap
agreements, as applicable, as reported in the Schedule of Investments.
|
| | | | | | | | |
| Effect of Derivative Instruments on the Statement of Operations for the Year Ended July 31, 2019 |
| | Net Realized Gain (Loss) | Change in Net Unrealized Appreciation (Depreciation) |
Type of Risk Exposure | Location on Statement of Operations | Value | Location on Statement of Operations | Value |
| Credit Risk | Net realized gain (loss) on swap agreement transactions | $ | 226,084 |
| Change in net unrealized appreciation (depreciation) on swap agreements | $ | (67,867 | ) |
| Equity Price Risk | Net realized gain (loss) on futures contract transactions | (137,659 | ) | Change in net unrealized appreciation (depreciation) on futures contracts | 1,686 |
|
| Foreign Currency Risk | Net realized gain (loss) on forward foreign currency exchange contract transactions | 188,873 |
| Change in net unrealized appreciation (depreciation) on forward foreign currency exchange contracts | 285,372 |
|
| Interest Rate Risk | Net realized gain (loss) on futures contract transactions | 409,367 |
| Change in net unrealized appreciation (depreciation) on futures contracts | 115,116 |
|
| Interest Rate Risk | Net realized gain (loss) on swap agreement transactions | 1,054 |
| Change in net unrealized appreciation (depreciation) on swap agreements | 950 |
|
| | | $ | 687,719 |
| | $ | 335,257 |
|
9. Risk Factors
There are certain risks involved in investing in foreign securities. These risks include those resulting from political events (such as civil unrest, national elections and imposition of exchange controls), social and economic events (such as labor strikes and rising inflation), and natural disasters. Securities of foreign issuers may be less liquid and more volatile. Investing in emerging markets or a significant portion of assets in one country or region may accentuate these risks.
10. Federal Tax Information
The tax character of distributions paid during the year ended July 31, 2019, eight months ended July 31, 2018 and year ended November 30, 2017 were as follows:
|
| | | | | | | | | |
| | July 31, 2019 | July 31, 2018(1) | November 30, 2017 |
| Distributions Paid From | | | |
| Ordinary income | $ | 9,717,920 |
| $ | 10,021,116 |
| $ | 6,532,829 |
|
| Long-term capital gains | $ | 20,835,732 |
| $ | 19,436,403 |
| $ | 8,465,485 |
|
| |
| (1) | The fund's fiscal year end was changed from November 30 to July 31, resulting in an eight-month annual reporting period. |
The book-basis character of distributions made during the year from net investment income or net realized gains may differ from their ultimate characterization for federal income tax purposes. These differences reflect the differing character of certain income items and net realized gains and losses for financial statement and tax purposes, and may result in reclassification among certain capital accounts on the financial statements.
As of period end, the federal tax cost of investments and the components of distributable earnings on a tax-basis were as follows:
|
| | | |
| Federal tax cost of investments | $ | 375,726,098 |
|
| Gross tax appreciation of investments | $ | 46,993,726 |
|
| Gross tax depreciation of investments | (6,745,439 | ) |
| Net tax appreciation (depreciation) of investments | 40,248,287 |
|
| Net tax appreciation (depreciation) on derivatives and translation of assets and liabilities in foreign currencies | (81,503 | ) |
| Net tax appreciation (depreciation) | $ | 40,166,784 |
|
| Other book-to-tax adjustments | $ | (84,444 | ) |
| Undistributed ordinary income | $ | 1,387,663 |
|
| Accumulated long-term gains | $ | 5,660,823 |
|
The difference between book-basis and tax-basis unrealized appreciation (depreciation) is attributable primarily to the tax deferral of losses on wash sales. Other book-to-tax adjustments are attributable primarily to the tax deferral of losses on straddle positions.
11. Recently Issued Accounting Standards
In March 2017, the Financial Accounting Standards Board (FASB) issued Accounting Standards Update No. 2017-08, “Receivables - Nonrefundable Fees and Other Costs (Subtopic 310-20), Premium Amortization on Purchased Callable Debt Securities” (ASU 2017-08). ASU 2017-08 amends the amortization period for certain purchased callable debt securities held at a premium, shortening such period to the earliest call date. The amendments are effective for fiscal years, and interim periods within those fiscal years, beginning after December 15, 2018. Management is currently evaluating the impact that adopting ASU 2017-08 will have on the financial statements.
|
| | | | | | | | | | | | | | | | | |
| For a Share Outstanding Throughout the Years Ended July 31 (except as noted) | | | | | |
| Per-Share Data | | Ratios and Supplemental Data |
| | | Income From Investment Operations: | Distributions From: | | | Ratio to Average Net Assets of: | | | |
| | Net Asset Value, Beginning
of Period | Net
Investment Income
(Loss)(1) | Net
Realized and Unrealized Gain (Loss) | Total From Investment Operations | Net Investment Income | Net Realized Gains | Total Distributions | Net Asset Value,
End of
Period | Total
Return(2) | Operating Expenses | Operating Expenses (before expense waiver) | Net Investment Income (Loss) | Net Investment Income (Loss) (before expense waiver) | Portfolio Turnover
Rate | Net Assets, End of Period (in thousands) |
| Investor Class | | | | | | | | | | | | | |
| 2019 | $5.83 | 0.09 | 0.14 | 0.23 | (0.10) | (0.29) | (0.39) | $5.67 | 4.55% | 1.00% | 1.01% | 1.58% | 1.57% | 65% |
| $161,655 |
|
2018(3) | $6.06 | 0.06 | 0.05 | 0.11 | (0.06) | (0.28) | (0.34) | $5.83 | 2.01% | 1.00%(4) | 1.00%(4) | 1.51%(4) | 1.51%(4) | 53% |
| $179,992 |
|
| 2017 | $5.62 | 0.07 | 0.54 | 0.61 | (0.08) | (0.09) | (0.17) | $6.06 | 11.02% | 1.01% | 1.01% | 1.28% | 1.28% | 78% |
| $246,975 |
|
| 2016 | $5.83 | 0.07 | 0.09 | 0.16 | (0.05) | (0.32) | (0.37) | $5.62 | 2.96% | 1.00% | 1.00% | 1.21% | 1.21% | 87% |
| $245,726 |
|
| 2015 | $6.21 | 0.05 | (0.07) | (0.02) | (0.02) | (0.34) | (0.36) | $5.83 | (0.25)% | 1.00% | 1.00% | 0.81% | 0.81% | 90% |
| $275,947 |
|
| 2014 | $6.23 | 0.05 | 0.36 | 0.41 | (0.06) | (0.37) | (0.43) | $6.21 | 7.00% | 0.99% | 0.99% | 0.91% | 0.91% | 59% |
| $304,125 |
|
| I Class | | | | | | | | | | | | | |
| 2019 | $5.84 | 0.10 | 0.13 | 0.23 | (0.11) | (0.29) | (0.40) | $5.67 | 4.57% | 0.80% | 0.81% | 1.78% | 1.77% | 65% |
| $29,248 |
|
2018(3) | $6.06 | 0.07 | 0.06 | 0.13 | (0.07) | (0.28) | (0.35) | $5.84 | 2.33% | 0.80%(4) | 0.80%(4) | 1.71%(4) | 1.71%(4) | 53% |
| $44,101 |
|
| 2017 | $5.63 | 0.09 | 0.52 | 0.61 | (0.09) | (0.09) | (0.18) | $6.06 | 11.05% | 0.81% | 0.81% | 1.48% | 1.48% | 78% |
| $46,536 |
|
| 2016 | $5.84 | 0.08 | 0.10 | 0.18 | (0.07) | (0.32) | (0.39) | $5.63 | 3.27% | 0.80% | 0.80% | 1.41% | 1.41% | 87% |
| $76,532 |
|
| 2015 | $6.21 | 0.06 | (0.07) | (0.01) | (0.02) | (0.34) | (0.36) | $5.84 | 0.02% | 0.80% | 0.80% | 1.01% | 1.01% | 90% |
| $72,235 |
|
| 2014 | $6.23 | 0.06 | 0.36 | 0.42 | (0.07) | (0.37) | (0.44) | $6.21 | 7.21% | 0.79% | 0.79% | 1.11% | 1.11% | 59% |
| $66,425 |
|
|
| | | | | | | | | | | | | | | | | |
| For a Share Outstanding Throughout the Years Ended July 31 (except as noted) | | | | | |
| Per-Share Data | | Ratios and Supplemental Data |
| | | Income From Investment Operations: | Distributions From: | | | Ratio to Average Net Assets of: | | | |
| | Net Asset Value, Beginning
of Period | Net
Investment Income
(Loss)(1) | Net
Realized and Unrealized Gain (Loss) | Total From Investment Operations | Net Investment Income | Net Realized Gains | Total Distributions | Net Asset Value,
End of
Period | Total
Return(2) | Operating Expenses | Operating Expenses (before expense waiver) | Net Investment Income (Loss) | Net Investment Income (Loss) (before expense waiver) | Portfolio Turnover
Rate | Net Assets, End of Period (in thousands) |
| A Class | | | | | | | | | | | | | |
| 2019 | $5.83 | 0.07 | 0.14 | 0.21 | (0.08) | (0.29) | (0.37) | $5.67 | 4.29% | 1.25% | 1.26% | 1.33% | 1.32% | 65% |
| $86,822 |
|
2018(3) | $6.05 | 0.05 | 0.06 | 0.11 | (0.05) | (0.28) | (0.33) | $5.83 | 1.99% | 1.25%(4) | 1.25%(4) | 1.26%(4) | 1.26%(4) | 53% |
| $113,865 |
|
| 2017 | $5.62 | 0.06 | 0.52 | 0.58 | (0.06) | (0.09) | (0.15) | $6.05 | 10.56% | 1.26% | 1.26% | 1.03% | 1.03% | 78% |
| $117,230 |
|
| 2016 | $5.81 | 0.05 | 0.11 | 0.16 | (0.03) | (0.32) | (0.35) | $5.62 | 2.94% | 1.25% | 1.25% | 0.96% | 0.96% | 87% |
| $137,168 |
|
| 2015 | $6.20 | 0.03 | (0.07) | (0.04) | (0.01) | (0.34) | (0.35) | $5.81 | (0.52)% | 1.25% | 1.25% | 0.56% | 0.56% | 90% |
| $162,077 |
|
| 2014 | $6.22 | 0.04 | 0.35 | 0.39 | (0.04) | (0.37) | (0.41) | $6.20 | 6.74% | 1.24% | 1.24% | 0.66% | 0.66% | 59% |
| $187,559 |
|
| C Class | | | | | | | | | | | | |
| 2019 | $5.74 | 0.03 | 0.14 | 0.17 | (0.05) | (0.29) | (0.34) | $5.57 | 3.43% | 2.00% | 2.01% | 0.58% | 0.57% | 65% |
| $17,705 |
|
2018(3) | $5.96 | 0.02 | 0.07 | 0.09 | (0.03) | (0.28) | (0.31) | $5.74 | 1.58% | 2.00%(4) | 2.00%(4) | 0.51%(4) | 0.51%(4) | 53% |
| $26,867 |
|
| 2017 | $5.54 | 0.02 | 0.51 | 0.53 | (0.02) | (0.09) | (0.11) | $5.96 | 9.77% | 2.01% | 2.01% | 0.28% | 0.28% | 78% |
| $32,110 |
|
| 2016 | $5.75 | 0.01 | 0.10 | 0.11 | — | (0.32) | (0.32) | $5.54 | 2.06% | 2.00% | 2.00% | 0.21% | 0.21% | 87% |
| $37,188 |
|
| 2015 | $6.18 | (0.01) | (0.08) | (0.09) | — | (0.34) | (0.34) | $5.75 | (1.38)% | 2.00% | 2.00% | (0.19)% | (0.19)% | 90% |
| $42,585 |
|
| 2014 | $6.21 | (0.01) | 0.35 | 0.34 | —(5) | (0.37) | (0.37) | $6.18 | 5.93% | 1.99% | 1.99% | (0.09)% | (0.09)% | 59% |
| $43,361 |
|
| R Class | | | | | | | | | | | | | |
| 2019 | $5.82 | 0.06 | 0.13 | 0.19 | (0.07) | (0.29) | (0.36) | $5.65 | 3.86% | 1.50% | 1.51% | 1.08% | 1.07% | 65% |
| $10,314 |
|
2018(3) | $6.04 | 0.04 | 0.06 | 0.10 | (0.04) | (0.28) | (0.32) | $5.82 | 1.83% | 1.50%(4) | 1.50%(4) | 1.01%(4) | 1.01%(4) | 53% |
| $10,960 |
|
| 2017 | $5.61 | 0.05 | 0.52 | 0.57 | (0.05) | (0.09) | (0.14) | $6.04 | 10.31% | 1.51% | 1.51% | 0.78% | 0.78% | 78% |
| $15,004 |
|
| 2016 | $5.80 | 0.04 | 0.10 | 0.14 | (0.01) | (0.32) | (0.33) | $5.61 | 2.59% | 1.50% | 1.50% | 0.71% | 0.71% | 87% |
| $15,398 |
|
| 2015 | $6.20 | 0.02 | (0.07) | (0.05) | (0.01) | (0.34) | (0.35) | $5.80 | (0.77)% | 1.50% | 1.50% | 0.31% | 0.31% | 90% |
| $14,766 |
|
| 2014 | $6.22 | 0.02 | 0.36 | 0.38 | (0.03) | (0.37) | (0.40) | $6.20 | 6.48% | 1.49% | 1.49% | 0.41% | 0.41% | 59% |
| $16,239 |
|
|
| | | | | | | | | | | | | | | | | |
| For a Share Outstanding Throughout the Years Ended July 31 (except as noted) | | | | | |
| Per-Share Data | | Ratios and Supplemental Data |
| | | Income From Investment Operations: | Distributions From: | | | Ratio to Average Net Assets of: | | | |
| | Net Asset Value, Beginning
of Period | Net
Investment Income
(Loss)(1) | Net
Realized and Unrealized Gain (Loss) | Total From Investment Operations | Net Investment Income | Net Realized Gains | Total Distributions | Net Asset Value,
End of
Period | Total
Return(2) | Operating Expenses | Operating Expenses (before expense waiver) | Net Investment Income (Loss) | Net Investment Income (Loss) (before expense waiver) | Portfolio Turnover
Rate | Net Assets, End of Period (in thousands) |
| R5 Class | | | | | | | | | | | | | |
| 2019 | $5.85 | 0.10 | 0.13 | 0.23 | (0.11) | (0.29) | (0.40) | $5.68 | 4.75% | 0.80% | 0.81% | 1.78% | 1.77% | 65% |
| $36,866 |
|
2018(3) | $6.07 | 0.08 | 0.05 | 0.13 | (0.07) | (0.28) | (0.35) | $5.85 | 2.15% | 0.80%(4) | 0.80%(4) | 1.71%(4) | 1.71%(4) | 53% |
| $34,766 |
|
2017(6) | $5.73 | 0.06 | 0.33 | 0.39 | (0.05) | — | (0.05) | $6.07 | 6.80% | 0.81%(4) | 0.81%(4) | 1.60%(4) | 1.60%(4) | 78%(7) |
| $5 |
|
| R6 Class | | | | | | | | | | | | | |
| 2019 | $5.84 | 0.11 | 0.14 | 0.25 | (0.12) | (0.29) | (0.41) | $5.68 | 4.91% | 0.65% | 0.66% | 1.93% | 1.92% | 65% |
| $69,846 |
|
2018(3) | $6.06 | 0.07 | 0.07 | 0.14 | (0.08) | (0.28) | (0.36) | $5.84 | 2.44% | 0.65%(4) | 0.65%(4) | 1.86%(4) | 1.86%(4) | 53% |
| $76,077 |
|
| 2017 | $5.63 | 0.10 | 0.52 | 0.62 | (0.10) | (0.09) | (0.19) | $6.06 | 11.21% | 0.66% | 0.66% | 1.63% | 1.63% | 78% |
| $63,151 |
|
| 2016 | $5.84 | 0.09 | 0.10 | 0.19 | (0.08) | (0.32) | (0.40) | $5.63 | 3.50% | 0.65% | 0.65% | 1.56% | 1.56% | 87% |
| $20,398 |
|
| 2015 | $6.21 | 0.07 | (0.07) | — | (0.03) | (0.34) | (0.37) | $5.84 | 0.09% | 0.65% | 0.65% | 1.16% | 1.16% | 90% |
| $7,150 |
|
| 2014 | $6.23 | 0.07 | 0.36 | 0.43 | (0.08) | (0.37) | (0.45) | $6.21 | 7.37% | 0.64% | 0.64% | 1.26% | 1.26% | 59% |
| $1,815 |
|
|
| |
| Notes to Financial Highlights |
| |
| (1) | Computed using average shares outstanding throughout the period. |
| |
| (2) | Total returns are calculated based on the net asset value of the last business day and do not reflect applicable sales charges, if any. Total returns for periods less than one year are not annualized. |
| |
| (3) | December 1, 2017 through July 31, 2018. The fund's fiscal year end was changed from November 30 to July 31, resulting in an eight-month annual reporting period. For the years before July 31, 2018, the fund's fiscal year end was November 30. |
| |
| (5) | Per-share amount was less than $0.005. |
| |
| (6) | April 10, 2017 (commencement of sale) through November 30, 2017. |
| |
| (7) | Portfolio turnover is calculated at the fund level. Percentage indicated was calculated for the year ended November 30, 2017. |
See Notes to Financial Statements.
|
|
| Report of Independent Registered Public Accounting Firm |
To the shareholders and the Board of Directors of American Century Strategic Asset Allocations, Inc.:
Opinion on the Financial Statements and Financial Highlights
We have audited the accompanying statement of assets and liabilities, including the schedule of investments, of Strategic Allocation: Conservative Fund, one of the funds constituting the American Century Strategic Asset Allocations, Inc. (the “Fund”), as of July 31, 2019; the related statement of operations for the year then ended; the statements of changes in net assets for the year then ended, the period December 1, 2017 through July 31, 2018, and for the year ended November 30, 2017; the financial highlights for the year then ended, the period December 1, 2017 through July 31, 2018 and for the years ended November 30, 2017, 2016, 2015, and 2014; and the related notes. In our opinion, the financial statements and financial highlights present fairly, in all material respects, the financial position of Strategic Allocation: Conservative Fund of the American Century Strategic Asset Allocations, Inc. as of July 31, 2019; the results of its operations for the year then ended; the changes in its net assets for the year then ended, the period December 1, 2017 through July 31, 2018, and for the year ended November 30, 2017; and the financial highlights for the year then ended, the period December 1, 2017 through July 31, 2018 and for the years ended November 30, 2017, 2016, 2015, and 2014; in conformity with accounting principles generally accepted in the United States of America.
Basis for Opinion
These financial statements and financial highlights are the responsibility of the Fund's management. Our responsibility is to express an opinion on the Fund’s financial statements and financial highlights based on our audits. We are a public accounting firm registered with the Public Company Accounting Oversight Board (United States) (PCAOB) and are required to be independent with respect to the Fund in accordance with the U.S. federal securities laws and the applicable rules and regulations of the Securities and Exchange Commission and the PCAOB.
We conducted our audits in accordance with the standards of the PCAOB. Those standards require that we plan and perform the audit to obtain reasonable assurance about whether the financial statements and financial highlights are free of material misstatement, whether due to error or fraud. The Fund is not required to have, nor were we engaged to perform, an audit of its internal control over financial reporting. As part of our audits we are required to obtain an understanding of internal control over financial reporting but not for the purpose of expressing an opinion on the effectiveness of the Fund’s internal control over financial reporting. Accordingly, we express no such opinion.
Our audits included performing procedures to assess the risks of material misstatement of the financial statements and financial highlights, whether due to error or fraud, and performing procedures that respond to those risks. Such procedures included examining, on a test basis, evidence regarding the amounts and disclosures in the financial statements and financial highlights. Our audits also included evaluating the accounting principles used and significant estimates made by management, as well as evaluating the overall presentation of the financial statements and financial highlights. Our procedures included confirmation of securities owned as of July 31, 2019, by correspondence with the custodian and brokers; when replies were not received from brokers, we performed other auditing procedures. We believe that our audits provide a reasonable basis for our opinion.
DELOITTE & TOUCHE LLP
Kansas City, Missouri
September 18, 2019
We have served as the auditor of one or more American Century investment companies since 1997.
The Board of Directors
The individuals listed below serve as directors of the funds. Each director will continue to serve in this capacity until death, retirement, resignation or removal from office. The board has adopted a mandatory retirement age for directors who are not “interested persons,” as that term is defined in the Investment Company Act (independent directors). Independent directors shall retire by December 31 of the year in which they reach their 75th birthday.
Mr. Thomas is an “interested person” because he currently serves as President and Chief Executive Officer of American Century Companies, Inc. (ACC), the parent company of American Century Investment Management, Inc. (ACIM or the advisor). The other directors (more than three-fourths of the total number) are independent. They are not employees, directors or officers of, and have no financial interest in, ACC or any of its wholly owned, direct or indirect, subsidiaries, including ACIM, American Century Investment Services, Inc. (ACIS) and American Century Services, LLC (ACS), and they do not have any other affiliations, positions or relationships that would cause them to be considered “interested persons” under the Investment Company Act. The directors serve in this capacity for seven (in the case of Jonathan S. Thomas, 16; and Stephen E. Yates, 8) registered investment companies in the American Century Investments family of funds.
The following table presents additional information about the directors. The mailing address for each director is 4500 Main Street, Kansas City, Missouri 64111.
|
| | | | | |
Name
(Year of Birth) | Position(s) Held with Funds | Length of Time Served | Principal Occupation(s) During Past 5 Years | Number of American Century Portfolios Overseen by Director | Other Directorships Held During Past 5 Years |
| Independent Directors |
|
|
| Thomas W. Bunn (1953) | Director | Since 2017 | Retired | 67 | SquareTwo Financial; Barings (formerly Babson Capital Funds Trust) (2013 to 2016) |
Chris H. Cheesman
(1962)
| Director | Since 2019
| Retired. Senior Vice President & Chief Audit Executive, AllianceBernstein (1999 to 2018)
| 67 | None |
Barry Fink
(1955) | Director | Since 2012 (independent since 2016) | Retired | 67 | None |
Rajesh K. Gupta
(1960)
| Director | Since 2019
| Partner Emeritus, SeaCrest Investment Management and SeaCrest Wealth Management (2019 to Present); Chief Executive Officer and Chief Investment Officer, SeaCrest Investment Management (2006 to 2019); Chief Executive Officer and Chief Investment Officer, SeaCrest Wealth Management (2008 to 2019)
| 67 | None |
|
| | | | | |
Name
(Year of Birth) | Position(s) Held with Funds | Length of Time Served | Principal Occupation(s) During Past 5 Years | Number of American Century Portfolios Overseen by Director | Other Directorships Held During Past 5 Years |
| Independent Directors |
|
|
Lynn Jenkins
(1963)
| Director | Since 2019
| United States Representative, U.S. House of Representatives (2009 to 2018) | 67 | MGP Ingredients, Inc. |
Jan M. Lewis
(1957) | Director | Since 2011 | Retired | 67 | None |
John R. Whitten
(1946) | Director | Since 2008 | Retired | 67 | Rudolph Technologies, Inc. |
Stephen E. Yates
(1948) | Director and Chairman of the Board | Since 2012 (Chairman since 2018) | Retired | 72 | None |
| Interested Director |
|
Jonathan S. Thomas
(1963) | Director and President | Since 2007 | President and Chief Executive Officer, ACC (2007 to present). Also serves as Chief Executive Officer, ACS; Executive Vice President, ACIM; Director, ACC, ACIM and other ACC subsidiaries | 117 | BioMed Valley Discoveries, Inc. |
The Statement of Additional Information has additional information about the fund's directors and is available without charge, upon request, by calling 1-800-345-2021.
Officers
The following table presents certain information about the executive officers of the funds. Each officer serves as an officer for each of the 16 (in the case of Robert J. Leach, 15) investment companies in the American Century family of funds. No officer is compensated for his or her service as an officer of the funds. The listed officers are interested persons of the funds and are appointed or re-appointed on an annual basis. The mailing address for each officer listed below is 4500 Main Street, Kansas City, Missouri 64111.
|
| | |
Name
(Year of Birth) | Offices with the Funds | Principal Occupation(s) During the Past Five Years |
Jonathan S. Thomas
(1963) | Director and President since 2007 | President and Chief Executive Officer, ACC (2007 to present). Also serves as Chief Executive Officer, ACS; Executive Vice President, ACIM; Director, ACC, ACIM and other ACC subsidiaries |
R. Wes Campbell
(1974) | Chief Financial Officer and Treasurer since 2018
| Investment Operations and Investment Accounting, ACS (2000 to present)
|
Amy D. Shelton
(1964) | Chief Compliance Officer and Vice President since 2014 | Chief Compliance Officer, American Century funds, (2014 to present); Chief Compliance Officer, ACIM (2014 to present); Chief Compliance Officer, ACIS (2009 to present). Also serves as Vice President, ACIS |
Charles A. Etherington
(1957) | General Counsel since 2007 and Senior Vice President since 2006 | Attorney, ACC (1994 to present); Vice President, ACC (2005 to present); General Counsel, ACC (2007 to present). Also serves as General Counsel, ACIM, ACS, ACIS and other ACC subsidiaries; and Senior Vice President, ACIM and ACS |
C. Jean Wade
(1964) | Vice President since 2012 | Senior Vice President, ACS (2017 to present); Vice President, ACS (2000 to 2017) |
Robert J. Leach
(1966) | Vice President since 2006 | Vice President, ACS (2000 to present) |
David H. Reinmiller
(1963) | Vice President since 2000 | Attorney, ACC (1994 to present). Also serves as Vice President, ACIM and ACS |
Ward D. Stauffer
(1960) | Secretary since 2005 | Attorney, ACC (2003 to present) |
|
|
| Approval of Management Agreement |
At a meeting held on June 26, 2019, the Fund’s Board of Directors (the "Board") unanimously approved the renewal of the management agreement pursuant to which American Century Investment Management, Inc. (the “Advisor”) acts as the investment advisor for the Fund. Under Section 15(c) of the Investment Company Act, contracts for investment advisory services are required to be reviewed, evaluated, and approved by a majority of a fund’s directors (the “Directors”), including a majority of the independent Directors, each year.
Prior to its consideration of the renewal of the management agreement, the Directors requested and reviewed extensive data and information compiled by the Advisor and certain independent providers of evaluation data concerning the Fund and the services provided to the Fund by the Advisor. This review was in addition to the oversight and evaluation undertaken by the Board and its committees on a continual basis and the information received was supplemental to the extensive information that the Board and its committees receive and consider throughout the year.
In connection with its consideration of the renewal of the management agreement, the Board’s review and evaluation of the services provided by the Advisor included, but was not limited to, the following:
| |
| • | the nature, extent, and quality of investment management, shareholder services, and other services provided and to be provided to the Fund; |
| |
| • | the wide range of other programs and services provided and to be provided to the Fund and its shareholders on a routine and non-routine basis; |
| |
| • | the investment performance of the Fund, including data comparing the Fund's performance to appropriate benchmarks and/or a peer group of other mutual funds with similar investment objectives and strategies; |
| |
| • | the cost of owning the Fund compared to the cost of owning similar funds; |
| |
| • | the compliance policies, procedures, and regulatory experience of the Advisor and the Fund's service providers; |
| |
| • | financial data showing the cost of services provided to the Fund, the profitability of the Fund to the Advisor, and the overall profitability of the Advisor; |
| |
| • | strategic plans of the Advisor; |
| |
| • | any economies of scale associated with the Advisor’s management of the Fund and other accounts; |
| |
| • | services provided and charges to the Advisor's other investment management clients; |
| |
| • | acquired fund fees and expenses; |
| |
| • | payments and practices in connection with financial intermediaries holding shares of the Fund and the services provided by intermediaries in connection therewith; and |
| |
| • | any collateral benefits derived by the Advisor from the management of the Fund. |
The Directors held three in-person meetings and one telephonic meeting to review and discuss the information provided. The independent Directors also reviewed responses to supplemental information requests provided by the Directors to the Advisor and held active discussions with the Advisor regarding the renewal of the management agreement. The independent Directors had the benefit of the advice of their independent counsel throughout the process.
Factors Considered
The Directors considered all of the information provided by the Advisor, the independent data providers, and independent counsel in connection with the approval. They determined that the information was sufficient for them to evaluate the management agreement for the Fund. In connection with their review, the Directors did not identify any single factor as being all-important or
controlling, and each Director may have attributed different levels of importance to different factors. In deciding to renew the management agreement, the Board based its decision on a number of factors, including without limitation the following:
Nature, Extent and Quality of Services — Generally. Under the management agreement, the Advisor is responsible for providing or arranging for all services necessary for the operation of the Fund. The Board noted that the Advisor provides or arranges at its own expense a wide variety of services including without limitation the following:
| |
| • | portfolio research and security selection |
| |
| • | daily valuation of the Fund’s portfolio |
| |
| • | shareholder servicing and transfer agency, including shareholder confirmations, recordkeeping, and communications |
| |
| • | legal services (except the independent Directors’ counsel) |
| |
| • | regulatory and portfolio compliance |
| |
| • | marketing and distribution (except amounts paid by the Fund under Rule 12b-1 plans) |
The Board noted that many of these services have expanded over time in terms of both quantity and complexity in response to shareholder demands, competition in the industry, changing distribution channels, and the changing regulatory environment.
Investment Management Services. The nature of the investment management services provided to the Fund is quite complex and allows Fund shareholders access to professional money management, instant diversification of their investments within an asset class, the opportunity to easily diversify among asset classes by investing in or exchanging among various American Century Investments funds, and liquidity. In evaluating investment performance, the Board expects the Advisor to manage the Fund in accordance with its investment objectives and approved strategies. Further, the Directors recognize that the Advisor has an obligation to monitor trading activities, and in particular to seek the best execution of fund trades, and to evaluate the use of and payment for research. In providing these services, the Advisor utilizes teams of investment professionals (portfolio managers, analysts, research assistants, and securities traders) who require extensive information technology, research, training, compliance, and other systems to conduct their business. The Board, directly and through its Fund Performance Review Committee, provides oversight of the investment performance process. It regularly reviews investment performance information for the Fund, together with comparative information for appropriate benchmarks and/or peer groups of similarly-managed funds, over different time horizons. The Directors also review investment performance information during the management agreement renewal process. If performance concerns are identified, the Fund receives special reviews until performance improves, during which the Board discusses with the Advisor the reasons for such results (e.g., market conditions, security selection) and any efforts being undertaken to improve performance. The Fund’s performance was above its benchmark for the five- and ten-year periods, at its benchmark for the three-year period and below its benchmark for the one-year period reviewed by the Board. The Board found the investment management services provided by the Advisor to the Fund to be satisfactory and consistent with the management agreement.
Shareholder and Other Services. Under the management agreement, the Advisor provides the Fund with a comprehensive package of transfer agency, shareholder, and other services. The Board, directly and through various committees of the Board, regularly reviews reports and evaluations of such services at its regular meetings. These reports include, but are not limited to, information regarding the operational efficiency and accuracy of the shareholder and transfer agency services provided, staffing levels, shareholder satisfaction, technology support (including cyber security), new products and services offered to Fund shareholders, securities trading
activities, portfolio valuation services, auditing services, and legal and operational compliance activities. The Board found the services provided by the Advisor to the Fund under the management agreement to be competitive and of high quality.
Costs of Services and Profitability. The Advisor provides detailed information concerning its cost of providing various services to the Fund, its profitability in managing the Fund (pre- and post-distribution), its overall profitability, and its financial condition. The Directors have reviewed with the Advisor the methodology used to prepare this financial information. This information is considered in evaluating the Advisor’s financial condition, its ability to continue to provide services under the management agreement, and the reasonableness of the current management fee. The Board concluded that the Advisor’s profits were reasonable in light of the services provided to the Fund.
Ethics. The Board generally considers the Advisor’s commitment to providing quality services to shareholders and to conducting its business ethically. They noted that the Advisor’s practices generally meet or exceed industry best practices.
Economies of Scale. The Board also reviewed information provided by the Advisor regarding the possible existence of economies of scale in connection with the management of the Fund. The Board concluded that economies of scale are difficult to measure and predict with precision, especially on a fund-by-fund basis. The Board concluded that the Advisor is appropriately sharing economies of scale through its competitive fee structure, offering competitive fees from fund inception, and through reinvestment in its business to provide shareholders additional content and services. The Board also noted that economies of scale are shared with the Fund and its shareholders through management fee breakpoints that serve to reduce the effective management fee as the assets of the Fund grow.
Comparison to Other Funds’ Fees. The management agreement provides that the Fund pays the Advisor a single, all-inclusive (or unified) management fee for providing all services necessary for the management and operation of the Fund, other than brokerage expenses, expenses attributable to short sales, taxes, interest, extraordinary expenses, fees and expenses of the Fund’s independent Directors (including their independent legal counsel), and expenses incurred in connection with the provision of shareholder services and distribution services under a plan adopted pursuant to Rule 12b-1 under the Investment Company Act. Under the unified fee structure, the Advisor is responsible for providing all investment advisory, custody, audit, administrative, compliance, recordkeeping, marketing and shareholder services, or arranging and supervising third parties to provide such services. By contrast, most other funds are charged a variety of fees, including an investment advisory fee, a transfer agency fee, an administrative fee, distribution charges, and other expenses. Other than their investment advisory fees and any applicable Rule 12b-1 distribution fees, all other components of the total fees charged by these other funds may be increased without shareholder approval. The Board believes the unified fee structure is a benefit to Fund shareholders because it clearly discloses to shareholders the cost of owning Fund shares, and, since the unified fee cannot be increased without a vote of Fund shareholders, it shifts to the Advisor the risk of increased costs of operating the Fund and provides a direct incentive to minimize administrative inefficiencies. Part of the Board’s analysis of fee levels involves reviewing certain evaluative data compiled by an independent provider comparing the Fund’s unified fee to the total expense ratios of its peers. The unified fee charged to shareholders of the Fund was at the median of the total expense ratios of the Fund’s peer expense universe. The Board concluded that the management fee paid by the Fund to the Advisor under the management agreement is reasonable in light of the services provided to the Fund.
Comparison to Fees and Services Provided to Other Clients of the Advisor. The Directors also requested and received information from the Advisor concerning the nature of the services, fees, costs, and profitability of its advisory services to advisory clients other than the Fund. They observed that these varying types of client accounts require different services and involve different regulatory and entrepreneurial risks than the management of the Fund. The Board analyzed this
information and concluded that the fees charged and services provided to the Fund were reasonable by comparison.
Payments to Intermediaries. The Directors also requested and received a description of payments made to intermediaries by the Fund and the Advisor and services provided in response thereto. These payments include various payments made by the Fund or the Advisor to different types of intermediaries and recordkeepers for distribution and service activities provided for the Fund. The Board reviewed such information and received representations from the Advisor that all such payments by the Fund were made pursuant to the Fund's Rule 12b-1 Plan and that all such payments by the Advisor were made from the Advisor’s resources and reasonable profits. The Board found such payments to be reasonable in scope and purpose.
Collateral or “Fall-Out” Benefits Derived by the Advisor. The Board considered the existence of collateral benefits the Advisor may receive as a result of its relationship with the Fund. They concluded that the Advisor’s primary business is managing mutual funds and it generally does not use fund or shareholder information to generate profits in other lines of business, and therefore does not derive any significant collateral benefits from them. The Board noted that additional assets from other clients may offer the Advisor some benefit from increased leverage with service providers and counterparties. Additionally, the Advisor may receive proprietary research from broker-dealers that execute fund portfolio transactions, which the Board concluded is likely to benefit other clients of the Advisor, as well as Fund shareholders. The Board also determined that the Advisor is able to provide investment management services to certain clients other than the Fund, at least in part, due to its existing infrastructure built to serve the fund complex. The Board concluded that appropriate allocation methodologies had been employed to assign resources and the cost of those resources to these other clients and, where expressly provided, these other client assets may be included with the assets of the Fund to determine breakpoints in the management fee schedule.
Existing Relationship. The Board also considered whether there was any reason for not continuing the existing arrangement with the Advisor. In this regard, the Board was mindful of the potential disruptions of the Fund’s operations and various risks, uncertainties, and other effects that could occur as a result of a decision not to continue such relationship. In particular, the Board recognized that most shareholders have invested in the Fund on the strength of the Advisor’s industry standing and reputation and in the expectation that the Advisor will have a continuing role in providing advisory services to the Fund.
Conclusion of the Directors. As a result of this process, the Board, including all of the independent Directors, taking into account all of the factors discussed above and the information provided by the Advisor and others in connection with its review and throughout the year, determined that the management fee is fair and reasonable in light of the services provided and that the investment management agreement between the Fund and the Advisor should be renewed.
Retirement Account Information
As required by law, distributions you receive from certain retirement accounts are subject to federal income tax withholding, unless you elect not to have withholding apply*. Tax will be withheld on the total amount withdrawn even though you may be receiving amounts that are not subject to withholding, such as nondeductible contributions. In such case, excess amounts of withholding could occur. You may adjust your withholding election so that a greater or lesser amount will be withheld.
If you don’t want us to withhold on this amount, you must notify us to not withhold the federal income tax. You may notify us in writing or in certain situations by telephone or through other electronic means. For systematic withdrawals, your withholding election will remain in effect until revoked or changed by filing a new election. You have the right to revoke your election at any time and change your withholding percentage for future distributions.
Remember, even if you elect not to have income tax withheld, you are liable for paying income tax on the taxable portion of your withdrawal. If you elect not to have income tax withheld or you don’t have enough income tax withheld, you may be responsible for payment of estimated tax. You may incur penalties under the estimated tax rules if your withholding and estimated tax payments are not sufficient. You can reduce or defer the income tax on a distribution by directly or indirectly rolling such distribution over to another IRA or eligible plan. You should consult your tax advisor for additional information.
State tax will be withheld if, at the time of your distribution, your address is within one of the mandatory withholding states and you have federal income tax withheld (or as otherwise required by state law). State taxes will be withheld from your distribution in accordance with the respective state rules.
*Some 403(b), 457 and qualified retirement plan distributions may be subject to 20% mandatory withholding, as they are subject to special tax and withholding rules. Your plan administrator or plan sponsor is required to provide you with a special tax notice explaining those rules at the time you request a distribution. If applicable, federal and/or state taxes may be withheld from your distribution amount.
Proxy Voting Policies
A description of the policies that the fund's investment advisor uses in exercising the voting rights associated with the securities purchased and/or held by the fund is available without charge, upon request, by calling 1-800-345-2021. It is also available on the "About Us" page of American Century Investments’ website at americancentury.com and on the Securities and Exchange Commission’s website at sec.gov. Information regarding how the investment advisor voted proxies relating to portfolio securities during the most recent 12-month period ended June 30 is available on the "About Us" page at americancentury.com. It is also available at sec.gov.
Quarterly Portfolio Disclosure
The fund files its complete schedule of portfolio holdings with the Securities and Exchange Commission (SEC) for the first and third quarters of each fiscal year on Form N-Q or as an exhibit to its reports on Form N-PORT. The fund’s Forms N-Q and Form N-PORT reports are available on the SEC’s website at sec.gov. The fund also makes its complete schedule of portfolio holdings for the most recent quarter of its fiscal year available on its website at americancentury.com and, upon request, by calling 1-800-345-2021.
Other Tax Information
The following information is provided pursuant to provisions of the Internal Revenue Code.
The fund hereby designates up to the maximum amount allowable as qualified dividend income for the fiscal year ended July 31, 2019.
For corporate taxpayers, the fund hereby designates $2,161,372, or up to the maximum amount
allowable, of ordinary income distributions paid during the fiscal year ended July 31, 2019 as
qualified for the corporate dividends received deduction.
The fund hereby designates $1,980,797 as qualified short-term capital gain distributions for purposes of Internal Revenue Code Section 871 for the fiscal year ended July 31, 2019.
The fund hereby designates $20,932,299, or up to the maximum amount allowable, as long-term capital gain distributions (20% rate gain distributions) for the fiscal year ended July 31, 2019.
The fund utilized earnings and profits of $175,539 distributed to shareholders on redemption of shares as part of the dividends paid deduction (tax equalization).
|
| | |
| |
| | | |
| Contact Us | americancentury.com | |
| Automated Information Line | 1-800-345-8765 | |
| Investor Services Representative | 1-800-345-2021 or 816-531-5575 | |
| Investors Using Advisors | 1-800-378-9878 | |
| Business, Not-For-Profit, Employer-Sponsored Retirement Plans | 1-800-345-3533 | |
| Banks and Trust Companies, Broker-Dealers, Financial Professionals, Insurance Companies | 1-800-345-6488 | |
| Telecommunications Relay Service for the Deaf | 711 | |
| | | |
| American Century Strategic Asset Allocations, Inc. | |
| | | |
Investment Advisor: American Century Investment Management, Inc. Kansas City, Missouri | |
| | | |
| This report and the statements it contains are submitted for the general information of our shareholders. The report is not authorized for distribution to prospective investors unless preceded or accompanied by an effective prospectus. | |
| | | |
©2019 American Century Proprietary Holdings, Inc. All rights reserved.
CL-ANN-91039 1909 | |
|
| |
| | |
| | Annual Report |
| | |
| | July 31, 2019 |
| | |
| | Strategic Allocation: Moderate Fund |
| | Investor Class (TWSMX) |
| | I Class (ASAMX) |
| | A Class (ACOAX) |
| | C Class (ASTCX) |
| | R Class (ASMRX) |
| | R5 Class (ASMUX) |
| | R6 Class (ASMDX) |
Beginning on January 1, 2021, as permitted by regulations adopted by the Securities and Exchange Commission, paper copies of the fund’s shareholder reports like this one will no longer be sent by mail, unless you specifically request paper copies of the reports from the fund or from your financial intermediary, such as a broker-dealer or bank. Instead, the reports will be made available on a website, and you will be notified by mail each time a report is posted and provided with a website link to access the report.
If you already elected to receive shareholder reports electronically, you will not be affected by this change and you need not take any action. You may elect to receive shareholder reports and other communications from the fund or your financial intermediary electronically by calling or sending an email request to your appropriate contacts as listed on the back cover of this report.
You may elect to receive all future reports in paper free of charge. You can inform the fund or your financial intermediary that you wish to continue receiving paper copies of your shareholder reports by calling or sending an email request to your appropriate contacts as listed on the back cover of this report. Your election to receive reports in paper will apply to all funds held with the fund complex/your financial intermediary.
|
| | |
| President’s Letter | 2 |
|
| Performance | 3 |
|
| Portfolio Commentary | |
|
| Fund Characteristics | |
|
| Shareholder Fee Example | |
|
| Schedule of Investments | |
|
| Statement of Assets and Liabilities | |
|
| Statement of Operations | |
|
| Statement of Changes in Net Assets | |
|
| Notes to Financial Statements | |
|
| Financial Highlights | |
|
| Report of Independent Registered Public Accounting Firm | |
|
| Management | |
|
| Approval of Management Agreement | |
|
| Additional Information | |
|
Any opinions expressed in this report reflect those of the author as of the date of the report, and do not necessarily represent the opinions of American Century Investments® or any other person in the American Century Investments organization. Any such opinions are subject to change at any time based upon market or other conditions and American Century Investments disclaims any responsibility to update such opinions. These opinions may not be relied upon as investment advice and, because investment decisions made by American Century Investments funds are based on numerous factors, may not be relied upon as an indication of trading intent on behalf of any American Century Investments fund. Security examples are used for representational purposes only and are not intended as recommendations to purchase or sell securities. Performance information for comparative indices and securities is provided to American Century Investments by third party vendors. To the best of American Century Investments’ knowledge, such information is accurate at the time of printing.
Jonathan Thomas
Dear Investor:
Thank you for reviewing this annual report for the period ended July 31, 2019. Annual reports help convey important details about fund returns, including market factors that affected performance. For additional investment and market insights, please visit our website, americancentury.com.
Stocks Advanced Amid Volatile Climate
Most broad U.S. and global stock indices ended the year with gains. However, these positive results masked wide performance swings. For example, U.S. stocks, as measured by the S&P 500 Index, returned -3.00% in the first half of the period and 11.32% in the second half, leaving the index up 7.99% for the 12 months. Global stocks, as measured by the MSCI All Country World Index, returned -4.71% in the first half, 8.04% in the second half and 2.95% overall. For fixed-income securities, the path to positive performance was smoother, and U.S. and global bonds gained 8.08% and 5.73%, respectively, for the 12 months, according to the Bloomberg Barclays U.S. Aggregate Bond and Global Aggregate Bond indices.
Fed’s Flip Fueled Investor Optimism
Early in the period, mounting concerns about slowing global economic and earnings growth, tariffs and Federal Reserve (Fed) policy soured investor sentiment. After raising rates in September, the Fed hiked again in December and delivered a surprisingly bullish rate-hike outlook that fueled a steep sell-off among riskier assets. Meanwhile, the risk-off climate sparked a flight to quality, and government bond yields plunged.
A key policy pivot from the Fed helped improve investor sentiment beginning in early 2019. The central bank abruptly ended its rate-hike campaign and adopted a dovish tone amid moderating global growth and inflation. Additionally, investors’ worst-case fears about growth, trade and corporate earnings generally eased, which also aided stocks. At the same time, government bond yields continued to fall on moderating global growth data, muted inflation and accommodative central bank policy, including the Fed’s July rate cut. This backdrop supported continued gains for bonds and other interest rate-sensitive assets.
Looking ahead, we expect volatility to remain a formidable factor as investors react to global growth and trade trends, central bank policy and geopolitical developments. We believe this scenario underscores the importance of using professionally managed portfolios in pursuit of investment goals. We appreciate your continued trust and confidence in us.
Sincerely,
Jonathan Thomas
President and Chief Executive Officer
American Century Investments
|
| | | | | | |
| Total Returns as of July 31, 2019 |
| | | | Average Annual Returns | |
| | Ticker Symbol | 1 year | 5 years | 10 years | Since Inception | Inception Date |
| Investor Class | TWSMX | 4.36% | 5.77% | 8.25% | — | 2/15/96 |
| S&P 500 Index | — | 7.99% | 11.33% | 14.02% | — | — |
| Bloomberg Barclays U.S. Aggregate Bond Index | — | 8.08% | 3.04% | 3.75% | — | — |
| Bloomberg Barclays U.S. 1-3 Month Treasury Bill Index | — | 2.30% | 0.86% | 0.47% | — | — |
| I Class | ASAMX | 4.55% | 5.98% | 8.47% | — | 8/1/00 |
| A Class | ACOAX | | | | | 10/2/96 |
| No sales charge | | 4.11% | 5.50% | 7.99% | — | |
| With sales charge | | -1.91% | 4.27% | 7.36% | — | |
| C Class | ASTCX | 3.30% | 4.71% | 7.17% | — | 10/2/01 |
| R Class | ASMRX | 3.88% | 5.24% | 7.71% | — | 8/29/03 |
| R5 Class | ASMUX | 4.56% | — | — | 7.55% | 4/10/17 |
| R6 Class | ASMDX | 4.72% | 6.12% | — | 6.79% | 7/26/13 |
Average annual returns since inception are presented when ten years of performance history is not available.
Fund returns would have been lower if a portion of the fees had not been waived.
Sales charges include initial sales charges and contingent deferred sales charges (CDSCs), as applicable. A Class shares have a 5.75% maximum initial sales charge and may be subject to a maximum CDSC of 1.00%. C Class shares redeemed within 12 months of purchase are subject to a maximum CDSC of 1.00%. The SEC requires that mutual funds provide performance information net of maximum sales charges in all cases where charges could be applied.
Data presented reflect past performance. Past performance is no guarantee of future results. Current performance may be higher or lower than the performance shown. Total returns for periods less than one year are not annualized. Investment return and principal value will fluctuate, and redemption value may be more or less than original cost. Data assumes reinvestment of dividends and capital gains, and none of the charts reflect the deduction of taxes that a shareholder would pay on fund distributions or the redemption of fund shares. To obtain performance data current to the most recent month end, please call 1-800-345-2021 or visit americancentury.com. For additional information about the fund, please consult the prospectus.
|
|
| Growth of $10,000 Over 10 Years |
| $10,000 investment made July 31, 2009 |
| Performance for other share classes will vary due to differences in fee structure. |
|
| |
| Value on July 31, 2019 |
| | Investor Class — $22,113 |
| |
| | S&P 500 Index — $37,171 |
| |
| | Bloomberg Barclays U.S. Aggregate Bond Index — $14,456 |
| |
| | Bloomberg Barclays U.S. 1-3 Month Treasury Bill Index — $10,482 |
| |
Ending value of Investor Class would have been lower if a portion of the fees had not been waived.
|
| | | | | | |
Total Annual Fund Operating Expenses | | |
| Investor Class | I Class | A Class | C Class | R Class | R5 Class | R6 Class |
| 1.09% | 0.89% | 1.34% | 2.09% | 1.59% | 0.89% | 0.74% |
The total annual fund operating expenses shown is as stated in the fund’s prospectus current as of the date of this report. The prospectus may vary from the expense ratio shown elsewhere in this report because it is based on a different time period, includes acquired fund fees and expenses, and, if applicable, does not include fee waivers or expense reimbursements.
Data presented reflect past performance. Past performance is no guarantee of future results. Current performance may be higher or lower than the performance shown. Total returns for periods less than one year are not annualized. Investment return and principal value will fluctuate, and redemption value may be more or less than original cost. Data assumes reinvestment of dividends and capital gains, and none of the charts reflect the deduction of taxes that a shareholder would pay on fund distributions or the redemption of fund shares. To obtain performance data current to the most recent month end, please call 1-800-345-2021 or visit americancentury.com. For additional information about the fund, please consult the prospectus.
Portfolio Managers: Rich Weiss, Scott Wilson, Radu Gabudean and Vidya Rajappa
During the period, David MacEwen left the portfolio management team.
Performance Summary
Strategic Allocation: Moderate returned 4.36%* for the fiscal period ended July 31, 2019. Because of the fund’s strategic exposure to a variety of asset classes, a review of the financial markets helps provide context around performance for the reporting period.
The period was marked by sharp volatility amid changing expectations for economic growth, interest rates and corporate profits. In the U.S., growth in the economy and in corporate profits initially led to stock market gains, but worry that U.S. trade policy and rising interest rates might choke off growth meant stocks declined sharply from October through December. But beginning in January, the U.S. Federal Reserve (the Fed) and central banks around the world reassured investors, promising to work to support economic growth. Nevertheless, the companies in the S&P 500 Index reported negative earnings growth for the first two quarters of 2019.
Against a backdrop of slowing global growth, stagnant corporate profits, trade difficulties and shifting central bank policies, global equity markets produced mixed results. Most major indices within the U.S. gained, ending the period at or near record highs. Meanwhile, many non-U.S. markets lost ground. In the U.S., large-cap companies outperformed their mid- and small-cap counterparts, and growth beat value across stocks of all sizes, according to the Russell family of indices. Small-cap stocks were the only major segment of the U.S. equity market to experience a negative return during the 12 months. Non-U.S. developed markets stocks mildly underperformed emerging markets, but both delivered a negative return and trailed U.S. equities. For the year, the S&P 500 Index’s gain of 7.99% dwarfed the -2.18% loss of the MSCI Emerging Markets Index and the -2.60% return of the MSCI EAFE Index.
Within fixed-income investments, after raising interest rates twice in late 2018, the Fed reversed course and cut rates on the last day of the reporting period to a range from 2.00% to 2.25%. Worries about slower economic growth and volatility in equity markets supported demand for longer-term U.S. Treasury bonds. The yield on the benchmark 10-year Treasury note fell and finished the fiscal year just above 2.00%. (When bond yields fall, prices rise, and vice versa.) Investment-grade U.S. corporate debt generally outperformed other spread sectors of the market, although U.S. high-yield and non-U.S. debt also produced strong returns. The Bloomberg Barclays U.S. High-Yield 2.00% Issuer Capped Bond Index gained 6.91%, while the Bloomberg Barclays U.S. Aggregate Bond Index returned 8.08%, the Bloomberg Barclays Global Aggregate Bond Index ex-USD (Unhedged) returned 3.74% and the Bloomberg Barclays Global Aggregate Bond Index (USD, Hedged) returned 8.61%.
Strategic Allocation: Moderate’s neutral asset mix throughout the period was 64% stocks, 32% bonds and 4% cash-equivalent investments. However, the portfolio’s actual asset weightings varied based on short-term tactical adjustments and fluctuating securities prices.
*All fund returns referenced in this commentary are for Investor Class shares. Fund returns would have been lower if a portion of the fees had not been waived. Performance for other share classes will vary due to differences in fee structure; when Investor Class performance exceeds that of the fund's benchmark, other share classes may not. See page 3 for returns for all share classes.
Tactical Positioning
In managing the fund, we make modest tactical adjustments to the asset mix in an effort to add value and improve the fund’s ability to meet its investment objective. We began the reporting period with a neutral allocation across stocks, bonds and cash, and we maintained that throughout the period. Within the equity segment, we generally favored U.S. equities over non-U.S. stocks. The portfolio also tended to be overweight large-cap stocks relative to small caps for much of the period. In addition, we generally maintained an overweight to the large-cap growth segment and an underweight to large-cap value stocks. In the bond segment, we generally favored higher-yielding corporate and securitized bonds and select emerging markets securities, adjusting exposure as valuations, fundamentals and market conditions dictated.
From a return perspective, the overweight position in growth stocks and corresponding underweight to value was the most successful area of tactical allocation. However, our allocation to large-cap core U.S. stocks underperformed, and the effect of our tactical changes overall detracted slightly from performance.
Equity Contribution Mixed
The equity portion of Strategic Allocation: Moderate produced gains, with U.S. growth-oriented shares contributing the most to performance. In absolute terms, U.S. large-cap growth, mid-cap growth and small-cap growth performed well and benefited from strong stock selection, as did U.S. large-cap value to a lesser extent. U.S. large-cap core and disciplined large-cap growth produced positive returns but underperformed their respective underlying benchmarks because of stock choices. An overweight to U.S. stocks relative to non-U.S. developed markets stocks contributed to returns, as U.S. equities significantly outperformed their non-U.S. counterparts.
Indeed, non-U.S. equities detracted amid a challenging environment for global economic growth. Security selection further diminished results in non-U.S. small-cap growth, fundamental value and large-cap growth. However, positioning in a small global real estate allocation contributed to performance, aided by positive security selection.
Global Fixed-Income Allocation Contributed Meaningfully
Global bonds produced strong gains as the economy weakened, inflation remained tame, global central banks eased monetary policy and investors sought bonds for their relative safety amid uncertainty around trade, Brexit and volatility in stocks. Indeed, bond yields in many developed economies ended the period below zero, meaning investors placed a premium on safety of principal. As a result, the global bond allocation contributed to gains and benefited from strong security selection, particularly among securitized bonds and investment-grade corporate bonds.
Outlook
At period-end, the Strategic Allocation: Moderate portfolio was neutral in terms of stocks, bonds and cash, with an overweight position in U.S. large-cap growth stocks. The portfolio had underweights in U.S. value stocks and non-U.S. equities. However, we are in the process of removing our long-standing overweight allocation to the U.S. This reflects the input of our quantitative process, which shows a split between fundamental factors, which tend to lean toward stocks outside the U.S., while momentum and technical factors favor the U.S.
|
| |
| JULY 31, 2019 |
Top Ten Common Stocks | % of net assets |
| Microsoft Corp. | 1.5% |
| Alphabet, Inc., Class A | 1.3% |
| Amazon.com, Inc. | 1.1% |
| Apple, Inc. | 1.1% |
| Facebook, Inc., Class A | 0.8% |
| Visa, Inc., Class A | 0.7% |
| JPMorgan Chase & Co. | 0.6% |
| Verizon Communications, Inc. | 0.5% |
| Zimmer Biomet Holdings, Inc. | 0.4% |
| Johnson & Johnson | 0.4% |
| | |
Geographic Composition of Common Stocks | % of net assets |
| United States | 42.4% |
| Japan | 2.6% |
| United Kingdom | 2.6% |
| China | 1.9% |
| Other Countries | 12.5% |
| | |
Key Fixed-Income Portfolio Statistics |
| Weighted Average Life to Maturity | 7.5 years |
| Average Duration (effective) | 5.8 years |
| | |
Types of Investments in Portfolio | % of net assets |
| Domestic Common Stocks | 42.4% |
| Foreign Common Stocks* | 19.6% |
| Corporate Bonds | 8.9% |
| U.S. Treasury Securities | 6.4% |
| Sovereign Governments and Agencies | 4.2% |
| U.S. Government Agency Mortgage-Backed Securities | 3.6% |
| Affiliated Funds | 2.4% |
| Municipal Securities | 2.4% |
| Asset-Backed Securities | 1.9% |
| Collateralized Mortgage Obligations | 1.7% |
| Collateralized Loan Obligations | 1.5% |
| Commercial Mortgage-Backed Securities | 1.2% |
| Exchange-Traded Funds | 0.4% |
| Commercial Paper | 0.3% |
| Warrants | —** |
| Temporary Cash Investments | 3.6% |
| Other Assets and Liabilities | (0.5)% |
*Includes depositary shares, dual listed securities and foreign ordinary shares.
**Category is less than 0.05% of total net assets.
Fund shareholders may incur two types of costs: (1) transaction costs, including sales charges (loads) on purchase payments and redemption/exchange fees; and (2) ongoing costs, including management fees; distribution and service (12b-1) fees; and other fund expenses. This example is intended to help you understand your ongoing costs (in dollars) of investing in your fund and to compare these costs with the ongoing cost of investing in other mutual funds.
The example is based on an investment of $1,000 made at the beginning of the period and held for the entire period from February 1, 2019 to July 31, 2019.
Actual Expenses
The table provides information about actual account values and actual expenses for each class. You may use the information, together with the amount you invested, to estimate the expenses that you paid over the period. First, identify the share class you own. Then simply divide your account value by $1,000 (for example, an $8,600 account value divided by $1,000 = 8.6), then multiply the result by the number under the heading “Expenses Paid During Period” to estimate the expenses you paid on your account during this period.
If you hold Investor Class shares of any American Century Investments fund, or I Class shares of the American Century Diversified Bond Fund, in an American Century Investments account (i.e., not a financial intermediary or retirement plan account), American Century Investments may charge you a $12.50 semiannual account maintenance fee if the value of those shares is less than $10,000. We will redeem shares automatically in one of your accounts to pay the $12.50 fee. In determining your total eligible investment amount, we will include your investments in all personal accounts (including American Century Investments Brokerage accounts) registered under your Social Security number. Personal accounts include individual accounts, joint accounts, UGMA/UTMA accounts, personal trusts, Coverdell Education Savings Accounts and IRAs (including traditional, Roth, Rollover, SEP-, SARSEP- and SIMPLE-IRAs), and certain other retirement accounts. If you have only business, business retirement, employer-sponsored or American Century Investments Brokerage accounts, you are currently not subject to this fee. If you are subject to the Account Maintenance Fee, your account value could be reduced by the fee amount.
Hypothetical Example for Comparison Purposes
The table also provides information about hypothetical account values and hypothetical expenses based on the actual expense ratio of each class of your fund and an assumed rate of return of 5% per year before expenses, which is not the actual return of a fund’s share class. The hypothetical account values and expenses may not be used to estimate the actual ending account balance or expenses you paid for the period. You may use this information to compare the ongoing costs of investing in your fund and other funds. To do so, compare this 5% hypothetical example with the 5% hypothetical examples that appear in the shareholder reports of the other funds.
Please note that the expenses shown in the table are meant to highlight your ongoing costs only and do not reflect any transactional costs, such as sales charges (loads) or redemption/exchange fees. Therefore, the table is useful in comparing ongoing costs only, and will not help you determine the relative total costs of owning different funds. In addition, if these transactional costs were included, your costs would have been higher.
|
| | | | |
| | Beginning
Account Value
2/1/19 | Ending
Account Value
7/31/19 | Expenses Paid
During Period(1)
2/1/19 - 7/31/19 |
Annualized
Expense Ratio(1) |
Actual |
| Investor Class | $1,000 | $1,074.30 | $5.45 | 1.06% |
| I Class | $1,000 | $1,075.30 | $4.43 | 0.86% |
| A Class | $1,000 | $1,073.30 | $6.73 | 1.31% |
| C Class | $1,000 | $1,069.70 | $10.57 | 2.06% |
| R Class | $1,000 | $1,072.50 | $8.02 | 1.56% |
| R5 Class | $1,000 | $1,076.90 | $4.43 | 0.86% |
| R6 Class | $1,000 | $1,076.10 | $3.65 | 0.71% |
| Hypothetical |
| Investor Class | $1,000 | $1,019.54 | $5.31 | 1.06% |
| I Class | $1,000 | $1,020.53 | $4.31 | 0.86% |
| A Class | $1,000 | $1,018.30 | $6.56 | 1.31% |
| C Class | $1,000 | $1,014.58 | $10.29 | 2.06% |
| R Class | $1,000 | $1,017.06 | $7.80 | 1.56% |
| R5 Class | $1,000 | $1,020.53 | $4.31 | 0.86% |
| R6 Class | $1,000 | $1,021.27 | $3.56 | 0.71% |
| |
| (1) | Expenses are equal to the class's annualized expense ratio listed in the table above, multiplied by the average account value over the period, multiplied by 181, the number of days in the most recent fiscal half-year, divided by 365, to reflect the one-half year period. Annualized expense ratio reflects actual expenses, including any applicable fee waivers or expense reimbursements and excluding any underlying fund fees and expenses. |
JULY 31, 2019
|
| | | | | | | |
| | | Shares/
Principal Amount | Value |
| COMMON STOCKS — 62.0% | | | |
| Aerospace and Defense — 0.9% | | | |
Aerojet Rocketdyne Holdings, Inc.(1) | | 2,447 |
| $ | 104,536 |
|
| Airbus SE | | 4,750 |
| 671,533 |
|
| BAE Systems plc | | 81,330 |
| 540,699 |
|
| Boeing Co. (The) | | 1,605 |
| 547,594 |
|
| Embraer SA ADR | | 60,590 |
| 1,223,918 |
|
| Hexcel Corp. | | 2,170 |
| 177,419 |
|
| L3Harris Technologies, Inc. | | 8,596 |
| 1,784,530 |
|
| Lockheed Martin Corp. | | 4,873 |
| 1,764,854 |
|
Mercury Systems, Inc.(1) | | 2,330 |
| 189,942 |
|
| Raytheon Co. | | 3,604 |
| 656,973 |
|
| Textron, Inc. | | 4,044 |
| 199,369 |
|
| | | | 7,861,367 |
|
| Air Freight and Logistics — 0.2% | | | |
| CH Robinson Worldwide, Inc. | | 11,896 |
| 996,052 |
|
| United Parcel Service, Inc., Class B | | 7,130 |
| 851,821 |
|
| | | | 1,847,873 |
|
| Airlines — 0.3% | | | |
| Delta Air Lines, Inc. | | 15,217 |
| 928,846 |
|
| Southwest Airlines Co. | | 34,154 |
| 1,759,955 |
|
| | | | 2,688,801 |
|
| Auto Components — 0.4% | | | |
| Aptiv plc | | 8,616 |
| 755,193 |
|
| BorgWarner, Inc. | | 24,165 |
| 913,437 |
|
| Hyundai Mobis Co. Ltd. | | 7,275 |
| 1,472,724 |
|
| Hyundai Wia Corp. | | 5,696 |
| 207,331 |
|
Leoni AG(1) | | 23,801 |
| 320,008 |
|
| NOK Corp. | | 14,500 |
| 212,865 |
|
| | | | 3,881,558 |
|
| Automobiles — 0.9% | | | |
| Astra International Tbk PT | | 378,700 |
| 188,136 |
|
| Brilliance China Automotive Holdings Ltd. | | 366,000 |
| 401,090 |
|
| Honda Motor Co. Ltd. ADR | | 44,729 |
| 1,112,858 |
|
| Hyundai Motor Co. | | 16,106 |
| 1,710,251 |
|
| Kia Motors Corp. | | 30,477 |
| 1,117,007 |
|
| Mazda Motor Corp. | | 97,100 |
| 956,310 |
|
| Nissan Motor Co. Ltd. | | 251,400 |
| 1,641,975 |
|
| Peugeot SA | | 8,140 |
| 191,153 |
|
| Renault SA | | 12,486 |
| 693,776 |
|
| Thor Industries, Inc. | | 6,266 |
| 373,454 |
|
| | | | 8,386,010 |
|
|
| | | | | | | |
| | | Shares/
Principal Amount | Value |
| Banks — 5.2% | | | |
| Ameris Bancorp | | 996 |
| $ | 39,611 |
|
| Banco Bradesco SA ADR | | 68,994 |
| 623,706 |
|
| Bancolombia SA ADR | | 3,243 |
| 161,761 |
|
| Bank Central Asia Tbk PT | | 159,600 |
| 351,020 |
|
| Bank of America Corp. | | 89,370 |
| 2,741,872 |
|
| Bank OZK | | 1,993 |
| 60,946 |
|
| Bank Rakyat Indonesia Persero Tbk PT | | 1,970,000 |
| 627,791 |
|
| BankUnited, Inc. | | 8,036 |
| 276,519 |
|
| Barclays plc | | 1,081,734 |
| 2,029,762 |
|
| BB&T Corp. | | 59,590 |
| 3,070,673 |
|
| BNP Paribas SA | | 38,758 |
| 1,800,977 |
|
| Capitec Bank Holdings Ltd. | | 5,441 |
| 447,780 |
|
| Central Pacific Financial Corp. | | 158 |
| 4,656 |
|
| China Construction Bank Corp., H Shares | | 764,000 |
| 588,186 |
|
| Citigroup, Inc. | | 1,815 |
| 129,155 |
|
| Comerica, Inc. | | 23,078 |
| 1,689,310 |
|
| Commerce Bancshares, Inc. | | 9,450 |
| 574,843 |
|
| Commercial International Bank Egypt S.A.E. | | 31,301 |
| 136,812 |
|
| Commercial International Bank Egypt S.A.E. GDR | | 23,106 |
| 99,299 |
|
| Commerzbank AG | | 209,758 |
| 1,432,795 |
|
| Credicorp Ltd. | | 1,914 |
| 417,233 |
|
Erste Group Bank AG(1) | | 13,300 |
| 475,659 |
|
| Fifth Third Bancorp | | 9,911 |
| 294,258 |
|
| FinecoBank Banca Fineco SpA | | 16,415 |
| 162,629 |
|
| First Abu Dhabi Bank PJSC | | 70,028 |
| 303,031 |
|
| First BanCorp | | 4,469 |
| 48,086 |
|
| First Hawaiian, Inc. | | 30,639 |
| 819,900 |
|
| Glacier Bancorp, Inc. | | 1,105 |
| 46,311 |
|
| Hana Financial Group, Inc. | | 20,705 |
| 607,327 |
|
| HDFC Bank Ltd. | | 35,576 |
| 1,160,269 |
|
| Hilltop Holdings, Inc. | | 3,838 |
| 87,046 |
|
| Home BancShares, Inc. | | 13,246 |
| 260,549 |
|
| Independent Bank Group, Inc. | | 1,880 |
| 106,803 |
|
| IndusInd Bank Ltd. | | 19,315 |
| 394,541 |
|
| Industrial & Commercial Bank of China Ltd., H Shares | | 854,105 |
| 574,910 |
|
| JPMorgan Chase & Co. | | 45,725 |
| 5,304,100 |
|
| Kasikornbank PCL NVDR | | 35,600 |
| 199,348 |
|
| KBC Group NV | | 7,510 |
| 482,325 |
|
| LegacyTexas Financial Group, Inc. | | 3,188 |
| 136,255 |
|
| M&T Bank Corp. | | 3,791 |
| 622,672 |
|
| Mitsubishi UFJ Financial Group, Inc. | | 462,000 |
| 2,283,793 |
|
| Mizuho Financial Group, Inc. | | 872,900 |
| 1,234,227 |
|
| Moneta Money Bank AS | | 46,751 |
| 160,358 |
|
| Origin Bancorp, Inc. | | 3,799 |
| 132,243 |
|
| OTP Bank Nyrt. | | 10,916 |
| 455,040 |
|
| Pacific Premier Bancorp, Inc. | | 2,786 |
| 88,121 |
|
|
| | | | | | | |
| | | Shares/
Principal Amount | Value |
| PNC Financial Services Group, Inc. (The) | | 16,020 |
| $ | 2,289,258 |
|
| Prosperity Bancshares, Inc. | | 4,292 |
| 297,822 |
|
| Sberbank of Russia PJSC ADR (London) | | 24,577 |
| 366,136 |
|
| Signature Bank | | 1,516 |
| 193,229 |
|
| Societe Generale SA | | 27,773 |
| 680,319 |
|
| South State Corp. | | 1,692 |
| 135,478 |
|
| Standard Chartered plc (London) | | 91,908 |
| 753,802 |
|
| Sumitomo Mitsui Financial Group, Inc. | | 21,100 |
| 738,830 |
|
| SunTrust Banks, Inc. | | 8,031 |
| 534,865 |
|
Texas Capital Bancshares, Inc.(1) | | 3,524 |
| 221,765 |
|
| Towne Bank | | 2,135 |
| 60,079 |
|
| U.S. Bancorp | | 32,280 |
| 1,844,802 |
|
| UMB Financial Corp. | | 11,821 |
| 806,901 |
|
| UniCredit SpA | | 61,943 |
| 726,804 |
|
| Valley National Bancorp | | 25,606 |
| 285,763 |
|
| Veritex Holdings, Inc. | | 2,307 |
| 59,036 |
|
| Wells Fargo & Co. | | 48,891 |
| 2,366,813 |
|
| Westamerica Bancorporation | | 6,028 |
| 386,395 |
|
| | | | 46,492,605 |
|
| Beverages — 0.6% | | | |
| Brown-Forman Corp., Class B | | 3,995 |
| 218,966 |
|
| Coca-Cola Co. (The) | | 5,182 |
| 272,729 |
|
| Coca-Cola Consolidated, Inc. | | 67 |
| 19,666 |
|
| Constellation Brands, Inc., Class A | | 2,936 |
| 577,864 |
|
| Diageo plc | | 19,840 |
| 827,818 |
|
| Fevertree Drinks plc | | 7,793 |
| 220,822 |
|
| Kweichow Moutai Co. Ltd., A Shares | | 1,300 |
| 182,729 |
|
| MGP Ingredients, Inc. | | 1,215 |
| 60,738 |
|
| Molson Coors Brewing Co., Class B | | 4,152 |
| 224,166 |
|
Monster Beverage Corp.(1) | | 683 |
| 44,033 |
|
| PepsiCo, Inc. | | 19,774 |
| 2,527,315 |
|
| Treasury Wine Estates Ltd. | | 31,750 |
| 382,713 |
|
| | | | 5,559,559 |
|
| Biotechnology — 1.2% | | | |
| AbbVie, Inc. | | 13,710 |
| 913,360 |
|
| Abcam plc | | 5,634 |
| 89,100 |
|
Acceleron Pharma, Inc.(1) | | 1,378 |
| 60,163 |
|
Aimmune Therapeutics, Inc.(1) | | 1,944 |
| 37,422 |
|
Alder Biopharmaceuticals, Inc.(1) | | 2,349 |
| 23,772 |
|
Amarin Corp. plc ADR(1) | | 1,349 |
| 25,078 |
|
| Amgen, Inc. | | 4,998 |
| 932,527 |
|
Amicus Therapeutics, Inc.(1) | | 5,065 |
| 62,806 |
|
AnaptysBio, Inc.(1) | | 324 |
| 17,402 |
|
Arena Pharmaceuticals, Inc.(1) | | 1,670 |
| 104,676 |
|
Argenx SE(1) | | 990 |
| 139,197 |
|
ArQule, Inc.(1) | | 3,058 |
| 30,855 |
|
Biogen, Inc.(1) | | 6,711 |
| 1,596,010 |
|
|
| | | | | | | |
| | | Shares/
Principal Amount | Value |
Blueprint Medicines Corp.(1) | | 743 |
| $ | 74,411 |
|
Celgene Corp.(1) | | 7,103 |
| 652,482 |
|
| CSL Ltd. | | 7,980 |
| 1,246,059 |
|
Exact Sciences Corp.(1) | | 3,874 |
| 445,936 |
|
Exelixis, Inc.(1) | | 8,290 |
| 176,328 |
|
FibroGen, Inc.(1) | | 985 |
| 46,551 |
|
Flexion Therapeutics, Inc.(1) | | 1,827 |
| 18,343 |
|
Galapagos NV(1) | | 1,262 |
| 218,974 |
|
| Gilead Sciences, Inc. | | 13,843 |
| 906,993 |
|
Global Blood Therapeutics, Inc.(1) | | 731 |
| 40,059 |
|
Halozyme Therapeutics, Inc.(1) | | 2,693 |
| 45,754 |
|
Heron Therapeutics, Inc.(1) | | 1,838 |
| 32,055 |
|
Immunomedics, Inc.(1) | | 24,749 |
| 365,048 |
|
Incyte Corp.(1) | | 4,231 |
| 359,296 |
|
Insmed, Inc.(1) | | 1,792 |
| 39,334 |
|
Medicines Co. (The)(1) | | 1,120 |
| 40,141 |
|
Mirati Therapeutics, Inc.(1) | | 252 |
| 26,662 |
|
MorphoSys AG(1) | | 1,287 |
| 155,668 |
|
Natera, Inc.(1) | | 2,938 |
| 81,030 |
|
PeptiDream, Inc.(1) | | 3,500 |
| 195,518 |
|
Portola Pharmaceuticals, Inc.(1) | | 1,532 |
| 40,874 |
|
Principia Biopharma, Inc.(1) | | 923 |
| 34,280 |
|
PTC Therapeutics, Inc.(1) | | 1,202 |
| 57,900 |
|
REGENXBIO, Inc.(1) | | 673 |
| 29,888 |
|
Sarepta Therapeutics, Inc.(1) | | 2,980 |
| 443,573 |
|
Stoke Therapeutics, Inc.(1) | | 1,256 |
| 30,948 |
|
Ultragenyx Pharmaceutical, Inc.(1) | | 685 |
| 41,278 |
|
Vertex Pharmaceuticals, Inc.(1) | | 2,982 |
| 496,861 |
|
Viking Therapeutics, Inc.(1) | | 3,499 |
| 26,907 |
|
| | | | 10,401,519 |
|
| Building Products — 0.5% | | | |
| CSW Industrials, Inc. | | 144 |
| 10,168 |
|
| Daikin Industries Ltd. | | 2,400 |
| 297,937 |
|
| Fortune Brands Home & Security, Inc. | | 805 |
| 44,227 |
|
Gibraltar Industries, Inc.(1) | | 1,609 |
| 66,677 |
|
| Johnson Controls International plc | | 64,920 |
| 2,755,205 |
|
| Lindab International AB | | 10,113 |
| 115,351 |
|
| Masco Corp. | | 9,073 |
| 369,906 |
|
PGT Innovations, Inc.(1) | | 3,943 |
| 63,561 |
|
Trex Co., Inc.(1) | | 4,391 |
| 358,964 |
|
| | | | 4,081,996 |
|
| Capital Markets — 1.8% | | | |
| Ameriprise Financial, Inc. | | 12,513 |
| 1,820,767 |
|
| Ares Management Corp., Class A | | 7,379 |
| 215,836 |
|
| Artisan Partners Asset Management, Inc., Class A | | 8,067 |
| 238,703 |
|
| Ashmore Group plc | | 32,564 |
| 211,629 |
|
Assetmark Financial Holdings, Inc.(1) | | 2,063 |
| 58,362 |
|
|
| | | | | | | |
| | | Shares/
Principal Amount | Value |
| B3 SA - Brasil Bolsa Balcao | | 57,100 |
| $ | 632,890 |
|
| Bank of New York Mellon Corp. (The) | | 38,570 |
| 1,809,704 |
|
| Burford Capital Ltd. | | 5,149 |
| 93,735 |
|
| Charles Schwab Corp. (The) | | 19,215 |
| 830,472 |
|
Credit Suisse Group AG(1) | | 109,780 |
| 1,329,505 |
|
Donnelley Financial Solutions, Inc.(1) | | 13,438 |
| 183,160 |
|
| Euronext NV | | 2,970 |
| 229,848 |
|
| Evercore, Inc., Class A | | 827 |
| 71,428 |
|
| Hamilton Lane, Inc., Class A | | 1,583 |
| 92,922 |
|
| Hong Kong Exchanges & Clearing Ltd. | | 13,600 |
| 459,301 |
|
| Intermediate Capital Group plc | | 18,748 |
| 317,299 |
|
| Invesco Ltd. | | 36,184 |
| 694,371 |
|
| London Stock Exchange Group plc | | 11,910 |
| 960,867 |
|
| LPL Financial Holdings, Inc. | | 19,503 |
| 1,635,717 |
|
| MSCI, Inc. | | 3,043 |
| 691,491 |
|
| Northern Trust Corp. | | 16,609 |
| 1,627,682 |
|
| Partners Group Holding AG | | 680 |
| 542,007 |
|
| Piper Jaffray Cos. | | 496 |
| 38,341 |
|
| S&P Global, Inc. | | 2,778 |
| 680,471 |
|
| State Street Corp. | | 8,072 |
| 468,902 |
|
| TD Ameritrade Holding Corp. | | 1,533 |
| 78,336 |
|
| | | | 16,013,746 |
|
| Chemicals — 0.6% | | | |
| CF Industries Holdings, Inc. | | 1,742 |
| 86,334 |
|
| Chr Hansen Holding A/S | | 3,010 |
| 262,226 |
|
| Dow, Inc. | | 18,195 |
| 881,366 |
|
| DuPont de Nemours, Inc. | | 10,470 |
| 755,515 |
|
| Eastman Chemical Co. | | 5,798 |
| 436,879 |
|
Ferro Corp.(1) | | 5,330 |
| 78,511 |
|
| Innophos Holdings, Inc. | | 5,171 |
| 140,496 |
|
| KH Neochem Co. Ltd. | | 4,700 |
| 116,890 |
|
| Koninklijke DSM NV | | 6,840 |
| 846,441 |
|
| Minerals Technologies, Inc. | | 3,533 |
| 188,132 |
|
| Nutrien Ltd. | | 4,260 |
| 233,561 |
|
| PolyOne Corp. | | 689 |
| 22,579 |
|
| Scotts Miracle-Gro Co. (The) | | 29 |
| 3,253 |
|
| Sika AG | | 3,494 |
| 504,870 |
|
| Symrise AG | | 6,520 |
| 603,998 |
|
| | | | 5,161,051 |
|
| Commercial Services and Supplies — 0.9% | | | |
| ABM Industries, Inc. | | 2,627 |
| 110,570 |
|
Advanced Disposal Services, Inc.(1) | | 3,055 |
| 98,890 |
|
| Babcock International Group plc | | 320,911 |
| 1,852,028 |
|
| Brink's Co. (The) | | 3,419 |
| 308,257 |
|
Casella Waste Systems, Inc., Class A(1) | | 1,943 |
| 84,715 |
|
CECO Environmental Corp.(1) | | 5,751 |
| 53,082 |
|
Charah Solutions, Inc.(1) | | 14,883 |
| 77,392 |
|
|
| | | | | | | |
| | | Shares/
Principal Amount | Value |
Clean Harbors, Inc.(1) | | 1,645 |
| $ | 127,997 |
|
| Cleanaway Waste Management Ltd. | | 124,586 |
| 204,828 |
|
| Country Garden Services Holdings Co. Ltd. | | 75,000 |
| 181,829 |
|
| Deluxe Corp. | | 2,802 |
| 125,025 |
|
| Edenred | | 9,880 |
| 495,434 |
|
| HomeServe plc | | 15,603 |
| 216,325 |
|
| Loomis AB, B Shares | | 4,559 |
| 156,987 |
|
Raksul, Inc.(1) | | 2,200 |
| 75,808 |
|
| Rentokil Initial plc | | 17,883 |
| 94,335 |
|
| Republic Services, Inc. | | 16,300 |
| 1,444,995 |
|
| UniFirst Corp. | | 684 |
| 134,659 |
|
| US Ecology, Inc. | | 1,707 |
| 108,616 |
|
| Waste Management, Inc. | | 14,711 |
| 1,721,187 |
|
| | | | 7,672,959 |
|
| Communications Equipment — 0.6% | | | |
Acacia Communications, Inc.(1) | | 624 |
| 41,914 |
|
Arista Networks, Inc.(1) | | 2,657 |
| 726,557 |
|
| AudioCodes Ltd. | | 2,803 |
| 52,304 |
|
Casa Systems, Inc.(1) | | 11,782 |
| 77,643 |
|
| Cisco Systems, Inc. | | 41,089 |
| 2,276,331 |
|
| Juniper Networks, Inc. | | 10,438 |
| 282,035 |
|
Lumentum Holdings, Inc.(1) | | 1,106 |
| 62,633 |
|
| Motorola Solutions, Inc. | | 6,146 |
| 1,019,990 |
|
| Telefonaktiebolaget LM Ericsson, B Shares | | 70,160 |
| 615,569 |
|
Viavi Solutions, Inc.(1) | | 3,743 |
| 54,910 |
|
| | | | 5,209,886 |
|
| Construction and Engineering — 0.2% | | | |
| Badger Daylighting Ltd. | | 9,054 |
| 326,954 |
|
| Comfort Systems USA, Inc. | | 234 |
| 9,828 |
|
Dycom Industries, Inc.(1) | | 3,205 |
| 176,788 |
|
| EMCOR Group, Inc. | | 200 |
| 16,878 |
|
| Hazama Ando Corp. | | 39,200 |
| 269,389 |
|
| Jacobs Engineering Group, Inc. | | 7,572 |
| 624,766 |
|
| Larsen & Toubro Ltd. | | 8,816 |
| 177,263 |
|
| SHO-BOND Holdings Co. Ltd. | | 4,800 |
| 164,566 |
|
| Valmont Industries, Inc. | | 275 |
| 37,840 |
|
| | | | 1,804,272 |
|
| Construction Materials — 0.3% | | | |
| Anhui Conch Cement Co. Ltd., H Shares | | 69,000 |
| 399,513 |
|
| Cemex SAB de CV ADR | | 95,931 |
| 341,514 |
|
| CRH plc | | 19,072 |
| 634,714 |
|
| POSCO Chemical Co. Ltd. | | 3,804 |
| 156,152 |
|
| Taiwan Cement Corp. | | 205,600 |
| 294,423 |
|
Taiwan Cement Corp. Preference Shares(1) | | 15,085 |
| 25,317 |
|
| Tecnoglass, Inc. | | 7,763 |
| 55,273 |
|
| Vulcan Materials Co. | | 4,810 |
| 665,463 |
|
| | | | 2,572,369 |
|
|
| | | | | | | |
| | | Shares/
Principal Amount | Value |
| Consumer Finance — 0.5% | | | |
| American Express Co. | | 11,356 |
| $ | 1,412,346 |
|
| Bajaj Finance Ltd. | | 3,919 |
| 184,815 |
|
| Discover Financial Services | | 11,569 |
| 1,038,202 |
|
Green Dot Corp., Class A(1) | | 1,798 |
| 91,140 |
|
| Muangthai Capital PCL | | 164,700 |
| 320,622 |
|
| Synchrony Financial | | 27,303 |
| 979,632 |
|
| | | | 4,026,757 |
|
| Containers and Packaging — 0.4% | | | |
| Ball Corp. | | 7,982 |
| 570,553 |
|
Berry Global Group, Inc.(1) | | 1,782 |
| 80,279 |
|
| Graphic Packaging Holding Co. | | 55,686 |
| 827,494 |
|
| Packaging Corp. of America | | 14,731 |
| 1,487,389 |
|
| Rengo Co. Ltd. | | 14,200 |
| 107,992 |
|
| Silgan Holdings, Inc. | | 6,459 |
| 194,158 |
|
| Sonoco Products Co. | | 5,162 |
| 309,875 |
|
| | | | 3,577,740 |
|
| Distributors — 0.1% | | | |
| Core-Mark Holding Co., Inc. | | 2,101 |
| 78,641 |
|
| Genuine Parts Co. | | 4,597 |
| 446,461 |
|
IAA, Inc.(1) | | 2,268 |
| 106,029 |
|
LKQ Corp.(1) | | 15,870 |
| 427,379 |
|
| Pool Corp. | | 266 |
| 50,372 |
|
| | | | 1,108,882 |
|
| Diversified Consumer Services — 0.2% | | | |
Chegg, Inc.(1) | | 3,025 |
| 135,883 |
|
| China Education Group Holdings Ltd. | | 205,000 |
| 321,227 |
|
frontdoor, Inc.(1) | | 1,458 |
| 66,543 |
|
Grand Canyon Education, Inc.(1) | | 913 |
| 99,307 |
|
New Oriental Education & Technology Group, Inc. ADR(1) | | 5,804 |
| 605,415 |
|
ServiceMaster Global Holdings, Inc.(1) | | 226 |
| 12,030 |
|
TAL Education Group ADR(1) | | 19,754 |
| 636,079 |
|
| | | | 1,876,484 |
|
| Diversified Financial Services — 0.4% | | | |
Berkshire Hathaway, Inc., Class B(1) | | 12,834 |
| 2,636,489 |
|
| Chailease Holding Co. Ltd. | | 150,380 |
| 634,134 |
|
| Compass Diversified Holdings | | 12,739 |
| 244,589 |
|
| ECN Capital Corp. | | 20,721 |
| 74,261 |
|
| Zenkoku Hosho Co. Ltd. | | 4,400 |
| 171,649 |
|
| | | | 3,761,122 |
|
| Diversified Telecommunication Services — 0.6% | | | |
| AT&T, Inc. | | 5,685 |
| 193,574 |
|
Cellnex Telecom SA(1) | | 20,863 |
| 778,109 |
|
| Telekomunikasi Indonesia Persero Tbk PT | | 1,676,100 |
| 512,496 |
|
| Verizon Communications, Inc. | | 75,762 |
| 4,187,366 |
|
| | | | 5,671,545 |
|
|
| | | | | | | |
| | | Shares/
Principal Amount | Value |
| Electric Utilities — 0.7% | | | |
| Edison International | | 6,374 |
| $ | 475,118 |
|
| Eversource Energy | | 19,807 |
| 1,502,559 |
|
| Exelon Corp. | | 2,823 |
| 127,204 |
|
| Iberdrola SA | | 30,720 |
| 291,066 |
|
| IDACORP, Inc. | | 1,572 |
| 160,438 |
|
| Pinnacle West Capital Corp. | | 17,067 |
| 1,556,852 |
|
| Xcel Energy, Inc. | | 39,327 |
| 2,344,283 |
|
| | | | 6,457,520 |
|
| Electrical Equipment — 1.1% | | | |
| AMETEK, Inc. | | 11,504 |
| 1,030,873 |
|
| Eaton Corp. plc | | 17,780 |
| 1,461,338 |
|
| Emerson Electric Co. | | 31,176 |
| 2,022,699 |
|
| Hubbell, Inc. | | 9,180 |
| 1,192,298 |
|
| Melrose Industries plc | | 246,330 |
| 552,679 |
|
| nVent Electric plc | | 23,021 |
| 570,691 |
|
| Prysmian SpA | | 10,500 |
| 216,195 |
|
| Rockwell Automation, Inc. | | 2,986 |
| 480,089 |
|
| Schneider Electric SE | | 11,054 |
| 951,718 |
|
| Signify NV | | 34,672 |
| 940,517 |
|
| TKH Group NV | | 1,560 |
| 92,708 |
|
Varta AG(1) | | 1,414 |
| 107,025 |
|
| | | | 9,618,830 |
|
| Electronic Equipment, Instruments and Components — 1.0% | | |
| Anritsu Corp. | | 8,900 |
| 163,818 |
|
| Avnet, Inc. | | 1,555 |
| 70,628 |
|
| Barco NV | | 1,330 |
| 275,729 |
|
| Belden, Inc. | | 2,612 |
| 118,742 |
|
| CDW Corp. | | 18,087 |
| 2,137,160 |
|
| Chroma ATE, Inc. | | 65,000 |
| 304,443 |
|
Coherent, Inc.(1) | | 968 |
| 134,407 |
|
| Dolby Laboratories, Inc., Class A | | 1,361 |
| 92,684 |
|
| Electrocomponents plc | | 30,837 |
| 227,332 |
|
| FLIR Systems, Inc. | | 264 |
| 13,110 |
|
| Hexagon AB, B Shares | | 8,830 |
| 428,361 |
|
II-VI, Inc.(1) | | 322 |
| 12,783 |
|
| Isra Vision AG | | 2,053 |
| 89,688 |
|
| Keyence Corp. | | 1,500 |
| 856,029 |
|
Keysight Technologies, Inc.(1) | | 19,318 |
| 1,729,347 |
|
Landis+Gyr Group AG(1) | | 537 |
| 43,511 |
|
| National Instruments Corp. | | 1,209 |
| 50,488 |
|
| Samsung Electro-Mechanics Co. Ltd. | | 1,870 |
| 144,717 |
|
| SYNNEX Corp. | | 410 |
| 40,401 |
|
| TE Connectivity Ltd. | | 15,351 |
| 1,418,432 |
|
Tech Data Corp.(1) | | 643 |
| 65,162 |
|
|
| | | | | | | |
| | | Shares/
Principal Amount | Value |
Zebra Technologies Corp., Class A(1) | | 176 |
| $ | 37,117 |
|
| | | | 8,454,089 |
|
| Energy Equipment and Services — 0.4% | | | |
| Baker Hughes a GE Co. | | 44,143 |
| 1,120,791 |
|
C&J Energy Services, Inc.(1) | | 2,274 |
| 24,878 |
|
Dril-Quip, Inc.(1) | | 915 |
| 48,147 |
|
| Liberty Oilfield Services, Inc., Class A | | 1,168 |
| 16,527 |
|
| Modec, Inc. | | 3,300 |
| 87,861 |
|
NCS Multistage Holdings, Inc.(1) | | 11,729 |
| 37,650 |
|
| Schlumberger Ltd. | | 29,520 |
| 1,179,914 |
|
| Subsea 7 SA | | 29,000 |
| 311,770 |
|
Tecnicas Reunidas SA(1) | | 29,054 |
| 699,987 |
|
| TGS NOPEC Geophysical Co. ASA | | 5,002 |
| 121,027 |
|
| | | | 3,648,552 |
|
| Entertainment — 1.0% | | | |
| Activision Blizzard, Inc. | | 23,008 |
| 1,121,410 |
|
Electronic Arts, Inc.(1) | | 12,160 |
| 1,124,800 |
|
| Entertainment One Ltd. | | 52,288 |
| 279,490 |
|
Liberty Media Corp-Liberty Formula One, Class C(1) | | 5,212 |
| 205,249 |
|
Live Nation Entertainment, Inc.(1) | | 556 |
| 40,065 |
|
Netflix, Inc.(1) | | 3,175 |
| 1,025,493 |
|
Take-Two Interactive Software, Inc.(1) | | 19,723 |
| 2,416,462 |
|
| Walt Disney Co. (The) | | 14,775 |
| 2,112,973 |
|
| World Wrestling Entertainment, Inc., Class A | | 1,013 |
| 73,726 |
|
Zynga, Inc., Class A(1) | | 11,742 |
| 74,914 |
|
| | | | 8,474,582 |
|
| Equity Real Estate Investment Trusts (REITs) — 3.1% | | | |
| Acadia Realty Trust | | 4,355 |
| 122,245 |
|
| Advance Residence Investment Corp. | | 57 |
| 176,658 |
|
| Agree Realty Corp. | | 3,651 |
| 244,069 |
|
| Alexandria Real Estate Equities, Inc. | | 3,787 |
| 554,265 |
|
| Allied Properties Real Estate Investment Trust | | 4,030 |
| 149,407 |
|
| American Homes 4 Rent, Class A | | 7,466 |
| 180,752 |
|
| American Tower Corp. | | 532 |
| 112,582 |
|
| Americold Realty Trust | | 21,200 |
| 710,836 |
|
| Boston Properties, Inc. | | 1,127 |
| 149,835 |
|
| Brandywine Realty Trust | | 10,045 |
| 148,164 |
|
| Camden Property Trust | | 5,370 |
| 556,923 |
|
| Canadian Apartment Properties REIT | | 4,374 |
| 161,432 |
|
| CapitaLand Commercial Trust | | 83,600 |
| 125,199 |
|
| CareTrust REIT, Inc. | | 11,773 |
| 273,487 |
|
| Charter Hall Group | | 35,231 |
| 271,957 |
|
| Community Healthcare Trust, Inc. | | 827 |
| 33,981 |
|
| CoreSite Realty Corp. | | 857 |
| 89,822 |
|
| Corporate Office Properties Trust | | 1,922 |
| 53,662 |
|
| Cousins Properties, Inc. | | 3,814 |
| 134,177 |
|
| CyrusOne, Inc. | | 1,740 |
| 99,876 |
|
|
| | | | | | | |
| | | Shares/
Principal Amount | Value |
Embassy Office Parks REIT(1) | | 8,000 |
| $ | 43,497 |
|
| Empire State Realty Trust, Inc., Class A | | 26,702 |
| 374,095 |
|
| Equinix, Inc. | | 939 |
| 471,472 |
|
| Equity Residential | | 14,438 |
| 1,139,014 |
|
| Essential Properties Realty Trust, Inc. | | 5,557 |
| 117,364 |
|
| Extra Space Storage, Inc. | | 1,040 |
| 116,886 |
|
| Fibra Uno Administracion SA de CV | | 1,318,332 |
| 1,697,123 |
|
| Gaming and Leisure Properties, Inc. | | 9,089 |
| 342,746 |
|
| Gecina SA | | 1,144 |
| 173,944 |
|
| GEO Group, Inc. (The) | | 27,433 |
| 488,582 |
|
GLP J-Reit(1) | | 115 |
| 128,335 |
|
| Goodman Group | | 42,502 |
| 429,394 |
|
| HCP, Inc. | | 14,030 |
| 447,978 |
|
| Healthcare Trust of America, Inc., Class A | | 31,440 |
| 846,679 |
|
| Highwoods Properties, Inc. | | 927 |
| 42,021 |
|
| Hudson Pacific Properties, Inc. | | 6,691 |
| 236,192 |
|
| Inmobiliaria Colonial Socimi SA | | 18,175 |
| 203,407 |
|
| Invesco Office J-Reit, Inc. | | 1,568 |
| 278,463 |
|
| Invincible Investment Corp. | | 103 |
| 59,104 |
|
| Invitation Homes, Inc. | | 16,345 |
| 448,997 |
|
| Japan Hotel REIT Investment Corp. | | 112 |
| 93,265 |
|
| Kilroy Realty Corp. | | 3,306 |
| 262,695 |
|
| Kite Realty Group Trust | | 9,901 |
| 157,525 |
|
| Lexington Realty Trust | | 4,866 |
| 48,027 |
|
| Life Storage, Inc. | | 6,977 |
| 680,188 |
|
| Link REIT | | 40,500 |
| 472,278 |
|
| Mapletree Commercial Trust | | 94,400 |
| 142,184 |
|
| Mapletree Industrial Trust | | 54,700 |
| 89,363 |
|
| MGM Growth Properties LLC, Class A | | 17,466 |
| 521,535 |
|
| National Health Investors, Inc. | | 860 |
| 68,267 |
|
| Northview Apartment Real Estate Investment Trust | | 5,209 |
| 107,353 |
|
| Orix JREIT, Inc. | | 391 |
| 759,384 |
|
| Piedmont Office Realty Trust, Inc., Class A | | 22,511 |
| 468,454 |
|
| Prologis, Inc. | | 10,279 |
| 828,590 |
|
| Regency Centers Corp. | | 838 |
| 55,895 |
|
| Rexford Industrial Realty, Inc. | | 9,835 |
| 407,169 |
|
| RLJ Lodging Trust | | 2,882 |
| 49,801 |
|
| Ryman Hospitality Properties, Inc. | | 2,153 |
| 161,475 |
|
| Sabra Health Care REIT, Inc. | | 4,500 |
| 92,880 |
|
| Safestore Holdings plc | | 23,467 |
| 177,968 |
|
SBA Communications Corp.(1) | | 11,928 |
| 2,927,250 |
|
| Segro plc | | 53,686 |
| 497,970 |
|
| Spirit Realty Capital, Inc. | | 3,456 |
| 152,479 |
|
| STORE Capital Corp. | | 8,649 |
| 295,882 |
|
| Summit Hotel Properties, Inc. | | 5,283 |
| 58,694 |
|
| Sun Communities, Inc. | | 4,400 |
| 584,364 |
|
| UDR, Inc. | | 8,047 |
| 370,645 |
|
|
| | | | | | | |
| | | Shares/
Principal Amount | Value |
| UNITE Group plc (The) | | 28,210 |
| $ | 353,372 |
|
| Urstadt Biddle Properties, Inc., Class A | | 1,305 |
| 28,175 |
|
| VICI Properties, Inc. | | 8,233 |
| 175,692 |
|
| Weingarten Realty Investors | | 3,492 |
| 97,462 |
|
| Welltower, Inc. | | 20,102 |
| 1,670,878 |
|
| Weyerhaeuser Co. | | 77,663 |
| 1,973,417 |
|
| | | | 27,265,198 |
|
| Food and Staples Retailing — 0.6% | | | |
| Alimentation Couche-Tard, Inc., B Shares | | 8,700 |
| 533,285 |
|
| BIM Birlesik Magazalar AS | | 21,450 |
| 179,777 |
|
| Cosmos Pharmaceutical Corp. | | 300 |
| 55,118 |
|
| Costco Wholesale Corp. | | 187 |
| 51,543 |
|
| CP ALL PCL | | 137,500 |
| 385,608 |
|
Grocery Outlet Holding Corp.(1) | | 570 |
| 22,196 |
|
| Kobe Bussan Co. Ltd. | | 4,100 |
| 228,633 |
|
| Koninklijke Ahold Delhaize NV | | 24,354 |
| 550,641 |
|
| President Chain Store Corp. | | 18,000 |
| 173,534 |
|
| Sysco Corp. | | 15,143 |
| 1,038,355 |
|
| Wal-Mart de Mexico SAB de CV | | 101,640 |
| 299,928 |
|
| Walmart, Inc. | | 11,710 |
| 1,292,550 |
|
| Weis Markets, Inc. | | 1,413 |
| 51,504 |
|
| | | | 4,862,672 |
|
| Food Products — 1.4% | | | |
a2 Milk Co. Ltd.(1) | | 26,570 |
| 308,054 |
|
| AAK AB | | 9,022 |
| 184,558 |
|
| Associated British Foods plc | | 16,150 |
| 473,926 |
|
Ausnutria Dairy Corp. Ltd.(1) | | 49,000 |
| 87,881 |
|
| Bakkafrost P/F | | 1,961 |
| 112,633 |
|
Beyond Meat, Inc.(1) | | 199 |
| 39,106 |
|
| Campbell Soup Co. | | 20,872 |
| 862,848 |
|
| Conagra Brands, Inc. | | 39,914 |
| 1,152,317 |
|
| Danone SA | | 12,220 |
| 1,059,469 |
|
| General Mills, Inc. | | 21,749 |
| 1,155,089 |
|
Hain Celestial Group, Inc. (The)(1) | | 7,955 |
| 173,180 |
|
| Hershey Co. (The) | | 9,418 |
| 1,429,087 |
|
| J.M. Smucker Co. (The) | | 2,463 |
| 273,861 |
|
| Kellogg Co. | | 4,804 |
| 279,689 |
|
| Kerry Group plc, A Shares | | 3,770 |
| 436,646 |
|
| Mondelez International, Inc., Class A | | 35,098 |
| 1,877,392 |
|
| Nestle India Ltd. | | 1,337 |
| 226,734 |
|
| Nestle SA | | 11,210 |
| 1,189,577 |
|
Nomad Foods Ltd.(1) | | 10,142 |
| 225,862 |
|
| Orion Corp/Republic of Korea | | 2,396 |
| 162,816 |
|
| Orkla ASA | | 85,770 |
| 727,944 |
|
| | | | 12,438,669 |
|
| Gas Utilities — 0.2% | | | |
| Atmos Energy Corp. | | 3,832 |
| 417,841 |
|
|
| | | | | | | |
| | | Shares/
Principal Amount | Value |
| Chesapeake Utilities Corp. | | 558 |
| $ | 52,151 |
|
| China Gas Holdings Ltd. | | 82,200 |
| 340,845 |
|
| Indraprastha Gas Ltd. | | 39,231 |
| 172,334 |
|
| Spire, Inc. | | 5,079 |
| 418,560 |
|
| | | | 1,401,731 |
|
| Health Care Equipment and Supplies — 2.7% | | | |
ABIOMED, Inc.(1) | | 534 |
| 148,751 |
|
Alcon, Inc.(1) | | 4,870 |
| 281,676 |
|
| Baxter International, Inc. | | 14,348 |
| 1,204,802 |
|
Boston Scientific Corp.(1) | | 19,766 |
| 839,264 |
|
| Danaher Corp. | | 10,599 |
| 1,489,159 |
|
DexCom, Inc.(1) | | 1,884 |
| 295,543 |
|
Edwards Lifesciences Corp.(1) | | 2,062 |
| 438,897 |
|
| Elekta AB, B Shares | | 6,595 |
| 93,860 |
|
Haemonetics Corp.(1) | | 5,706 |
| 696,588 |
|
| Hill-Rom Holdings, Inc. | | 5,533 |
| 590,039 |
|
Hologic, Inc.(1) | | 38,225 |
| 1,959,031 |
|
| Hoya Corp. | | 9,200 |
| 706,845 |
|
ICU Medical, Inc.(1) | | 257 |
| 65,391 |
|
IDEXX Laboratories, Inc.(1) | | 491 |
| 138,487 |
|
Insulet Corp.(1) | | 3,368 |
| 414,062 |
|
Integer Holdings Corp.(1) | | 6,199 |
| 542,598 |
|
Intuitive Surgical, Inc.(1) | | 813 |
| 422,362 |
|
Masimo Corp.(1) | | 3,439 |
| 542,846 |
|
| Medtronic plc | | 37,186 |
| 3,790,741 |
|
Merit Medical Systems, Inc.(1) | | 1,777 |
| 70,120 |
|
| Nihon Kohden Corp. | | 3,100 |
| 84,857 |
|
NuVasive, Inc.(1) | | 2,616 |
| 174,226 |
|
OrthoPediatrics Corp.(1) | | 1,213 |
| 42,831 |
|
Penumbra, Inc.(1) | | 1,407 |
| 235,813 |
|
| ResMed, Inc. | | 4,005 |
| 515,444 |
|
| Siemens Healthineers AG | | 11,358 |
| 474,500 |
|
Silk Road Medical, Inc.(1) | | 1,355 |
| 58,658 |
|
| STERIS plc | | 1,848 |
| 275,093 |
|
| Straumann Holding AG | | 580 |
| 472,886 |
|
| Stryker Corp. | | 6,196 |
| 1,299,797 |
|
| Sysmex Corp. | | 9,300 |
| 672,538 |
|
| Terumo Corp. | | 18,900 |
| 549,827 |
|
| Zimmer Biomet Holdings, Inc. | | 29,389 |
| 3,971,336 |
|
| | | | 23,558,868 |
|
| Health Care Providers and Services — 1.3% | | | |
Acadia Healthcare Co., Inc.(1) | | 1,867 |
| 59,632 |
|
Amedisys, Inc.(1) | | 4,408 |
| 607,819 |
|
| Amplifon SpA | | 8,141 |
| 200,638 |
|
| Cardinal Health, Inc. | | 15,148 |
| 692,718 |
|
Centene Corp.(1) | | 8,849 |
| 460,944 |
|
| Chemed Corp. | | 138 |
| 55,944 |
|
|
| | | | | | | |
| | | Shares/
Principal Amount | Value |
CorVel Corp.(1) | | 643 |
| $ | 54,784 |
|
Covetrus, Inc.(1) | | 15,820 |
| 374,459 |
|
| Encompass Health Corp. | | 17,803 |
| 1,136,544 |
|
| Ensign Group, Inc. (The) | | 2,122 |
| 127,872 |
|
HealthEquity, Inc.(1) | | 3,237 |
| 265,369 |
|
Henry Schein, Inc.(1) | | 5,082 |
| 338,156 |
|
| Korian SA | | 6,760 |
| 266,871 |
|
| McKesson Corp. | | 8,027 |
| 1,115,352 |
|
| NMC Health plc | | 7,498 |
| 225,135 |
|
Premier, Inc., Class A(1) | | 3,924 |
| 152,055 |
|
Providence Service Corp. (The)(1) | | 3,043 |
| 169,617 |
|
| Quest Diagnostics, Inc. | | 19,237 |
| 1,963,713 |
|
R1 RCM, Inc.(1) | | 10,597 |
| 133,310 |
|
| UnitedHealth Group, Inc. | | 8,894 |
| 2,214,695 |
|
| Universal Health Services, Inc., Class B | | 3,427 |
| 516,997 |
|
| | | | 11,132,624 |
|
| Health Care Technology — 0.2% | | | |
| Cerner Corp. | | 15,559 |
| 1,114,802 |
|
Health Catalyst, Inc.(1) | | 927 |
| 41,020 |
|
Inspire Medical Systems, Inc.(1) | | 769 |
| 52,007 |
|
Phreesia, Inc.(1) | | 2,301 |
| 62,886 |
|
Teladoc Health, Inc.(1) | | 2,398 |
| 163,640 |
|
Veeva Systems, Inc., Class A(1) | | 4,251 |
| 705,241 |
|
| | | | 2,139,596 |
|
| Hotels, Restaurants and Leisure — 1.3% | | | |
| Aristocrat Leisure Ltd. | | 12,840 |
| 268,077 |
|
| Autogrill SpA | | 11,122 |
| 117,168 |
|
| Carnival Corp. | | 24,088 |
| 1,137,676 |
|
| China International Travel Service Corp. Ltd., A Shares | | 14,098 |
| 183,843 |
|
Chipotle Mexican Grill, Inc.(1) | | 888 |
| 706,431 |
|
| Churchill Downs, Inc. | | 1,197 |
| 143,221 |
|
| Darden Restaurants, Inc. | | 13,367 |
| 1,624,892 |
|
| Domino's Pizza, Inc. | | 3,174 |
| 776,138 |
|
| Jubilant Foodworks Ltd. | | 10,042 |
| 174,723 |
|
| Jumbo Interactive Ltd. | | 9,777 |
| 128,443 |
|
| Kyoritsu Maintenance Co. Ltd. | | 2,200 |
| 94,848 |
|
| Las Vegas Sands Corp. | | 6,682 |
| 403,860 |
|
| Melco International Development Ltd. | | 69,000 |
| 166,904 |
|
| Minor International PCL | | 153,400 |
| 200,363 |
|
Planet Fitness, Inc., Class A(1) | | 7,060 |
| 555,340 |
|
Red Robin Gourmet Burgers, Inc.(1) | | 3,356 |
| 110,815 |
|
| Red Rock Resorts, Inc., Class A | | 6,633 |
| 138,232 |
|
| Royal Caribbean Cruises Ltd. | | 10,893 |
| 1,267,292 |
|
| Sodexo SA | | 4,689 |
| 536,942 |
|
| SSP Group plc | | 9,904 |
| 84,534 |
|
| Starbucks Corp. | | 19,360 |
| 1,833,198 |
|
| Texas Roadhouse, Inc. | | 1,448 |
| 79,973 |
|
|
| | | | | | | |
| | | Shares/
Principal Amount | Value |
| Wynn Resorts Ltd. | | 2,894 |
| $ | 376,423 |
|
| | | | 11,109,336 |
|
| Household Durables — 0.5% | | | |
| Breville Group Ltd. | | 3,081 |
| 40,395 |
|
| Cyrela Brazil Realty SA Empreendimentos e Participacoes | | 18,100 |
| 115,723 |
|
| Haier Electronics Group Co. Ltd. | | 74,000 |
| 174,458 |
|
| Haseko Corp. | | 132,600 |
| 1,438,384 |
|
| Iida Group Holdings Co. Ltd. | | 58,600 |
| 961,888 |
|
| Newell Brands, Inc. | | 4,005 |
| 56,831 |
|
PlayAGS, Inc.(1) | | 5,068 |
| 95,076 |
|
| Pressance Corp. | | 10,900 |
| 152,049 |
|
| PulteGroup, Inc. | | 38,166 |
| 1,202,611 |
|
Skyline Champion Corp.(1) | | 2,989 |
| 85,186 |
|
| Token Corp. | | 3,400 |
| 194,886 |
|
TopBuild Corp.(1) | | 1,272 |
| 103,197 |
|
| | | | 4,620,684 |
|
| Household Products — 0.6% | | | |
Central Garden & Pet Co., Class A(1) | | 1,464 |
| 40,333 |
|
| Church & Dwight Co., Inc. | | 3,030 |
| 228,583 |
|
| Colgate-Palmolive Co. | | 20,533 |
| 1,473,037 |
|
| Kimberly-Clark Corp. | | 3,546 |
| 481,015 |
|
| Pigeon Corp. | | 2,400 |
| 88,225 |
|
| Procter & Gamble Co. (The) | | 26,561 |
| 3,135,261 |
|
| Spectrum Brands Holdings, Inc. | | 3,978 |
| 199,338 |
|
| | | | 5,645,792 |
|
| Industrial Conglomerates — 0.2% | | | |
| Rheinmetall AG | | 2,004 |
| 229,110 |
|
| Roper Technologies, Inc. | | 1,255 |
| 456,381 |
|
| Siemens AG | | 8,000 |
| 878,189 |
|
| | | | 1,563,680 |
|
| Insurance — 1.7% | | | |
| Aegon NV | | 374,903 |
| 1,849,831 |
|
| Aflac, Inc. | | 25,171 |
| 1,325,001 |
|
| AIA Group Ltd. | | 147,200 |
| 1,500,455 |
|
| AMERISAFE, Inc. | | 1,871 |
| 121,727 |
|
| Arthur J. Gallagher & Co. | | 1,683 |
| 152,194 |
|
| Axis Capital Holdings Ltd. | | 3,547 |
| 225,838 |
|
| Brown & Brown, Inc. | | 8,156 |
| 293,045 |
|
| Chubb Ltd. | | 16,369 |
| 2,501,838 |
|
| Discovery Ltd. | | 19,338 |
| 178,094 |
|
| Goosehead Insurance, Inc., Class A | | 787 |
| 35,423 |
|
| Hanover Insurance Group, Inc. (The) | | 607 |
| 78,734 |
|
| Intact Financial Corp. | | 2,860 |
| 266,584 |
|
| James River Group Holdings Ltd. | | 1,801 |
| 86,142 |
|
| Kemper Corp. | | 1,414 |
| 124,460 |
|
| Kinsale Capital Group, Inc. | | 1,434 |
| 128,859 |
|
| Mercury General Corp. | | 6,037 |
| 342,358 |
|
|
| | | | | | | |
| | | Shares/
Principal Amount | Value |
| NN Group NV | | 11,456 |
| $ | 430,274 |
|
Palomar Holdings, Inc.(1) | | 1,755 |
| 50,281 |
|
| Ping An Insurance Group Co. of China Ltd., H Shares | | 51,500 |
| 610,830 |
|
| ProAssurance Corp. | | 18,427 |
| 720,311 |
|
| Progressive Corp. (The) | | 25,440 |
| 2,060,131 |
|
ProSight Global, Inc.(1) | | 1,839 |
| 31,355 |
|
| Prudential plc | | 14,360 |
| 296,159 |
|
| Reinsurance Group of America, Inc. | | 3,893 |
| 606,997 |
|
| RenaissanceRe Holdings Ltd. | | 677 |
| 122,639 |
|
| Torchmark Corp. | | 2,127 |
| 194,238 |
|
| Travelers Cos., Inc. (The) | | 1,359 |
| 199,257 |
|
| White Mountains Insurance Group Ltd. | | 69 |
| 74,244 |
|
| | | | 14,607,299 |
|
| Interactive Media and Services — 2.6% | | | |
Alphabet, Inc., Class A(1) | | 9,096 |
| 11,080,747 |
|
Facebook, Inc., Class A(1) | | 34,295 |
| 6,661,118 |
|
Pinterest, Inc., Class A(1) | | 12,784 |
| 370,608 |
|
| Tencent Holdings Ltd. | | 56,200 |
| 2,628,496 |
|
Twitter, Inc.(1) | | 36,304 |
| 1,536,022 |
|
Yandex NV, A Shares(1) | | 23,373 |
| 916,689 |
|
| | | | 23,193,680 |
|
| Internet and Direct Marketing Retail — 1.8% | | | |
Alibaba Group Holding Ltd. ADR(1) | | 14,102 |
| 2,441,197 |
|
Amazon.com, Inc.(1) | | 5,393 |
| 10,067,545 |
|
Baozun, Inc. ADR(1) | | 9,181 |
| 455,469 |
|
| eBay, Inc. | | 29,689 |
| 1,222,890 |
|
Etsy, Inc.(1) | | 916 |
| 61,390 |
|
| Expedia Group, Inc. | | 3,933 |
| 522,066 |
|
| Moneysupermarket.com Group plc | | 34,673 |
| 154,926 |
|
| Naspers Ltd., N Shares | | 3,938 |
| 958,085 |
|
Revolve Group, Inc.(1) | | 1,442 |
| 49,706 |
|
Takeaway.com NV(1) | | 1,928 |
| 172,238 |
|
Trainline plc(1) | | 8,617 |
| 44,851 |
|
| Yume No Machi Souzou Iinkai Co. Ltd. | | 4,200 |
| 63,382 |
|
| | | | 16,213,745 |
|
| IT Services — 2.7% | | | |
| Accenture plc, Class A | | 340 |
| 65,477 |
|
Afterpay Touch Group Ltd.(1) | | 8,859 |
| 161,469 |
|
Akamai Technologies, Inc.(1) | | 14,680 |
| 1,293,748 |
|
| Alten SA | | 1,737 |
| 215,098 |
|
| Booz Allen Hamilton Holding Corp. | | 14,591 |
| 1,003,131 |
|
| EVERTEC, Inc. | | 10,764 |
| 344,663 |
|
Evo Payments, Inc., Class A(1) | | 1,947 |
| 60,591 |
|
Fastly, Inc., Class A(1) | | 4,756 |
| 103,205 |
|
Fiserv, Inc.(1) | | 19,406 |
| 2,045,975 |
|
FleetCor Technologies, Inc.(1) | | 4,239 |
| 1,204,597 |
|
GDS Holdings Ltd. ADR(1) | | 27,339 |
| 1,125,820 |
|
|
| | | | | | | |
| | | Shares/
Principal Amount | Value |
| Genpact Ltd. | | 3,437 |
| $ | 136,380 |
|
| GMO Payment Gateway, Inc. | | 6,300 |
| 459,345 |
|
InterXion Holding NV(1) | | 17,815 |
| 1,341,469 |
|
| Keywords Studios plc | | 3,291 |
| 66,227 |
|
| MasterCard, Inc., Class A | | 5,665 |
| 1,542,409 |
|
Nexi SpA(1) | | 26,357 |
| 281,188 |
|
NEXTDC Ltd.(1) | | 21,371 |
| 100,357 |
|
| Obic Co. Ltd. | | 3,600 |
| 381,063 |
|
Pagseguro Digital Ltd., Class A(1) | | 9,491 |
| 412,669 |
|
PayPal Holdings, Inc.(1) | | 28,233 |
| 3,116,923 |
|
| Presidio, Inc. | | 8,314 |
| 116,396 |
|
| SCSK Corp. | | 3,000 |
| 143,341 |
|
SHIFT, Inc.(1) | | 1,900 |
| 87,886 |
|
Solutions 30 SE(1) | | 13,988 |
| 142,930 |
|
Square, Inc., Class A(1) | | 11,617 |
| 934,123 |
|
| Tata Consultancy Services Ltd. | | 10,201 |
| 326,246 |
|
VeriSign, Inc.(1) | | 1,629 |
| 343,866 |
|
| Visa, Inc., Class A | | 36,928 |
| 6,573,184 |
|
| | | | 24,129,776 |
|
Leisure Products† | | | |
Malibu Boats, Inc., Class A(1) | | 1,566 |
| 47,183 |
|
| Merida Industry Co. Ltd. | | 21,000 |
| 131,424 |
|
| Thule Group AB | | 6,737 |
| 147,546 |
|
| | | | 326,153 |
|
| Life Sciences Tools and Services — 0.8% | | | |
Adaptive Biotechnologies Corp.(1) | | 1,833 |
| 70,662 |
|
| Agilent Technologies, Inc. | | 12,618 |
| 875,815 |
|
Bio-Rad Laboratories, Inc., Class A(1) | | 996 |
| 313,640 |
|
| Bruker Corp. | | 10,549 |
| 504,770 |
|
ICON plc(1) | | 1,540 |
| 240,502 |
|
Illumina, Inc.(1) | | 4,667 |
| 1,397,207 |
|
Lonza Group AG(1) | | 3,180 |
| 1,087,849 |
|
NeoGenomics, Inc.(1) | | 3,739 |
| 91,120 |
|
Personalis, Inc.(1) | | 2,130 |
| 38,148 |
|
PRA Health Sciences, Inc.(1) | | 788 |
| 78,729 |
|
QIAGEN NV(1) | | 7,784 |
| 293,613 |
|
| Tecan Group AG | | 846 |
| 214,985 |
|
| Thermo Fisher Scientific, Inc. | | 6,284 |
| 1,744,941 |
|
| | | | 6,951,981 |
|
| Machinery — 1.2% | | | |
| Albany International Corp., Class A | | 229 |
| 19,692 |
|
| Allison Transmission Holdings, Inc. | | 16,128 |
| 741,082 |
|
| Atlas Copco AB, A Shares | | 9,430 |
| 288,850 |
|
| Atlas Copco AB, B Shares | | 40,440 |
| 1,104,477 |
|
ATS Automation Tooling Systems, Inc.(1) | | 5,508 |
| 88,267 |
|
Chart Industries, Inc.(1) | | 1,895 |
| 143,129 |
|
Colfax Corp.(1) | | 2,452 |
| 67,871 |
|
|
| | | | | | | |
| | | Shares/
Principal Amount | Value |
| CRRC Corp. Ltd., H Shares | | 253,000 |
| $ | 199,634 |
|
| Cummins, Inc. | | 20,178 |
| 3,309,192 |
|
| Doosan Bobcat, Inc. | | 3,420 |
| 103,638 |
|
| EnPro Industries, Inc. | | 1,418 |
| 100,735 |
|
| Georg Fischer AG | | 98 |
| 84,346 |
|
| Graham Corp. | | 955 |
| 20,676 |
|
| Hurco Cos., Inc. | | 1,348 |
| 46,088 |
|
| IMI plc | | 41,024 |
| 515,044 |
|
| Ingersoll-Rand plc | | 7,431 |
| 918,917 |
|
| Interroll Holding AG | | 27 |
| 54,761 |
|
| Kennametal, Inc. | | 2,246 |
| 77,667 |
|
| Konecranes Oyj | | 3,439 |
| 100,968 |
|
Korea Shipbuilding & Offshore Engineering Co. Ltd.(1) | | 2,849 |
| 260,108 |
|
Kornit Digital Ltd.(1) | | 5,917 |
| 184,610 |
|
Milacron Holdings Corp.(1) | | 1,305 |
| 21,976 |
|
| Mueller Water Products, Inc., Class A | | 9,606 |
| 97,693 |
|
| Nabtesco Corp. | | 4,800 |
| 129,272 |
|
| PACCAR, Inc. | | 5,491 |
| 385,139 |
|
| Parker-Hannifin Corp. | | 2,631 |
| 460,635 |
|
| Rotork plc | | 31,649 |
| 117,802 |
|
| Snap-on, Inc. | | 4,560 |
| 695,902 |
|
| Tadano Ltd. | | 2,100 |
| 18,873 |
|
| Timken Co. (The) | | 4,322 |
| 197,559 |
|
| Valmet Oyj | | 5,841 |
| 113,522 |
|
| Woodward, Inc. | | 1,090 |
| 122,124 |
|
| | | | 10,790,249 |
|
| Media — 0.2% | | | |
| Atresmedia Corp. de Medios de Comunicacion SA | | 55,624 |
| 216,405 |
|
| Entravision Communications Corp., Class A | | 31,702 |
| 103,349 |
|
| Nippon Television Holdings, Inc. | | 60,300 |
| 829,161 |
|
| NOS SGPS SA | | 26,761 |
| 166,318 |
|
| Stroeer SE & Co. KGaA | | 2,231 |
| 176,386 |
|
| Townsquare Media, Inc., Class A | | 3,072 |
| 16,558 |
|
| TV Asahi Holdings Corp. | | 19,800 |
| 324,445 |
|
| | | | 1,832,622 |
|
| Metals and Mining — 0.3% | | | |
| BHP Group Ltd. | | 19,870 |
| 548,863 |
|
| Hudbay Minerals, Inc. | | 8,712 |
| 42,312 |
|
| Kirkland Lake Gold Ltd. | | 5,621 |
| 232,455 |
|
| Kumba Iron Ore Ltd. | | 9,328 |
| 309,037 |
|
| Northern Star Resources Ltd. | | 12,404 |
| 107,693 |
|
Saracen Mineral Holdings Ltd.(1) | | 78,782 |
| 220,334 |
|
| Steel Dynamics, Inc. | | 30,217 |
| 952,138 |
|
| | | | 2,412,832 |
|
| Multi-Utilities — 0.2% | | | |
| Ameren Corp. | | 7,165 |
| 542,319 |
|
| NorthWestern Corp. | | 9,328 |
| 652,214 |
|
|
| | | | | | | |
| | | Shares/
Principal Amount | Value |
| WEC Energy Group, Inc. | | 5,295 |
| $ | 452,510 |
|
| | | | 1,647,043 |
|
| Multiline Retail — 0.4% | | | |
| B&M European Value Retail SA | | 119,969 |
| 540,229 |
|
| Lojas Renner SA | | 36,640 |
| 453,638 |
|
| Magazine Luiza SA | | 14,000 |
| 964,796 |
|
| Pan Pacific International Holdings Corp. | | 10,600 |
| 676,366 |
|
| Target Corp. | | 11,416 |
| 986,343 |
|
| | | | 3,621,372 |
|
| Oil, Gas and Consumable Fuels — 2.6% | | | |
Callon Petroleum Co.(1) | | 9,565 |
| 47,060 |
|
Centennial Resource Development, Inc., Class A(1) | | 5,711 |
| 33,980 |
|
| Chevron Corp. | | 30,741 |
| 3,784,524 |
|
| Cimarex Energy Co. | | 3,222 |
| 163,259 |
|
| CNOOC Ltd. | | 391,000 |
| 643,033 |
|
| Concho Resources, Inc. | | 4,622 |
| 451,477 |
|
| ConocoPhillips | | 1,131 |
| 66,819 |
|
| CVR Energy, Inc. | | 18,369 |
| 974,843 |
|
| Delek US Holdings, Inc. | | 5,016 |
| 216,089 |
|
| Devon Energy Corp. | | 12,437 |
| 335,799 |
|
Earthstone Energy, Inc., Class A(1) | | 6,120 |
| 26,806 |
|
| Eni SpA | | 110,616 |
| 1,731,686 |
|
| EQT Corp. | | 18,398 |
| 277,994 |
|
| Equitrans Midstream Corp. | | 14,240 |
| 236,242 |
|
Extraction Oil & Gas, Inc.(1) | | 3,808 |
| 14,128 |
|
| Exxon Mobil Corp. | | 7,689 |
| 571,754 |
|
| Gazprom PJSC ADR | | 180,960 |
| 1,326,545 |
|
| Gazprom PJSC | | 162,019 |
| 601,994 |
|
| Gaztransport Et Technigaz SA | | 2,128 |
| 193,005 |
|
| Gibson Energy, Inc. | | 9,914 |
| 171,793 |
|
| HollyFrontier Corp. | | 10,452 |
| 520,196 |
|
| Imperial Oil Ltd. | | 9,568 |
| 262,000 |
|
| Lundin Petroleum AB | | 16,410 |
| 515,206 |
|
Magnolia Oil & Gas Corp., Class A(1) | | 2,383 |
| 26,642 |
|
| Neste Oyj | | 20,990 |
| 693,859 |
|
| Noble Energy, Inc. | | 20,174 |
| 445,442 |
|
| Novatek PJSC GDR | | 4,097 |
| 855,763 |
|
| Occidental Petroleum Corp. | | 3,038 |
| 156,032 |
|
| PetroChina Co. Ltd., H Shares | | 1,426,000 |
| 755,779 |
|
| Phillips 66 | | 11,835 |
| 1,213,798 |
|
| Royal Dutch Shell plc, Class B ADR | | 8,270 |
| 524,897 |
|
| Saras SpA | | 524,878 |
| 863,889 |
|
| Surgutneftegas PJSC Preference Shares | | 2,757,767 |
| 1,349,014 |
|
| TOTAL SA | | 10,054 |
| 520,967 |
|
| TOTAL SA ADR | | 39,530 |
| 2,045,282 |
|
| | | | 22,617,596 |
|
|
| | | | | | | |
| | | Shares/
Principal Amount | Value |
| Paper and Forest Products — 0.1% | | | |
| Boise Cascade Co. | | 2,267 |
| $ | 61,209 |
|
| Domtar Corp. | | 17,282 |
| 733,621 |
|
| Neenah, Inc. | | 774 |
| 50,859 |
|
| | | | 845,689 |
|
| Personal Products — 0.2% | | | |
| Cosmax, Inc. | | 3,412 |
| 294,157 |
|
| Estee Lauder Cos., Inc. (The), Class A | | 2,334 |
| 429,900 |
|
| Fancl Corp. | | 4,800 |
| 120,773 |
|
| Medifast, Inc. | | 1,102 |
| 123,038 |
|
| Ontex Group NV | | 27,901 |
| 460,037 |
|
| Shiseido Co. Ltd. | | 8,200 |
| 603,586 |
|
| | | | 2,031,491 |
|
| Pharmaceuticals — 2.1% | | | |
Aerie Pharmaceuticals, Inc.(1) | | 1,286 |
| 27,868 |
|
| AstraZeneca plc | | 15,250 |
| 1,308,944 |
|
Catalent, Inc.(1) | | 9,824 |
| 554,958 |
|
| Dechra Pharmaceuticals plc | | 3,665 |
| 130,547 |
|
| Eli Lilly & Co. | | 7,075 |
| 770,821 |
|
Horizon Therapeutics plc(1) | | 3,735 |
| 92,964 |
|
Jazz Pharmaceuticals plc(1) | | 2,735 |
| 381,204 |
|
| Johnson & Johnson | | 29,991 |
| 3,905,428 |
|
| Merck & Co., Inc. | | 33,968 |
| 2,819,004 |
|
| Novartis AG | | 9,550 |
| 875,727 |
|
| Novo Nordisk A/S, B Shares | | 15,586 |
| 748,076 |
|
Optinose, Inc.(1) | | 3,772 |
| 20,256 |
|
| Pfizer, Inc. | | 66,843 |
| 2,596,182 |
|
Reata Pharmaceuticals, Inc., Class A(1) | | 371 |
| 33,631 |
|
| Roche Holding AG | | 2,710 |
| 725,615 |
|
| Sanofi | | 11,407 |
| 951,785 |
|
| Sanofi ADR | | 35,869 |
| 1,495,737 |
|
| Zoetis, Inc. | | 8,753 |
| 1,005,632 |
|
| | | | 18,444,379 |
|
| Professional Services — 0.6% | | | |
| Applus Services SA | | 6,461 |
| 91,021 |
|
ASGN, Inc.(1) | | 1,192 |
| 75,156 |
|
Capita plc(1) | | 745,561 |
| 1,054,204 |
|
CoStar Group, Inc.(1) | | 1,912 |
| 1,176,645 |
|
IHS Markit Ltd.(1) | | 9,673 |
| 623,135 |
|
InnerWorkings, Inc.(1) | | 17,921 |
| 65,591 |
|
| Korn Ferry | | 3,520 |
| 138,266 |
|
| Nihon M&A Center, Inc. | | 5,100 |
| 137,295 |
|
| Recruit Holdings Co. Ltd. | | 24,500 |
| 833,758 |
|
| Teleperformance | | 940 |
| 196,721 |
|
| Trust Tech, Inc. | | 11,400 |
| 162,584 |
|
| UT Group Co. Ltd. | | 2,800 |
| 61,752 |
|
|
| | | | | | | |
| | | Shares/
Principal Amount | Value |
| Verisk Analytics, Inc. | | 5,049 |
| $ | 766,034 |
|
| | | | 5,382,162 |
|
| Real Estate Management and Development — 0.7% | | | |
| Altus Group Ltd. | | 1,653 |
| 41,970 |
|
| Aroundtown SA | | 62,676 |
| 501,383 |
|
| Ayala Land, Inc. | | 693,430 |
| 678,675 |
|
| CapitaLand Ltd. | | 79,800 |
| 209,446 |
|
| China Overseas Land & Investment Ltd. | | 74,000 |
| 253,288 |
|
| CIFI Holdings Group Co. Ltd. | | 769,624 |
| 488,385 |
|
| Colliers International Group, Inc. | | 2,134 |
| 155,029 |
|
| Corp. Inmobiliaria Vesta SAB de CV | | 84,161 |
| 126,788 |
|
| Fabege AB | | 25,917 |
| 399,645 |
|
Fastighets AB Balder, B Shares(1) | | 6,237 |
| 213,464 |
|
| FirstService Corp. | | 2,461 |
| 258,258 |
|
| Hang Lung Properties Ltd. | | 52,000 |
| 122,475 |
|
KWG Group Holdings Ltd.(1) | | 89,000 |
| 83,271 |
|
| LEG Immobilien AG | | 4,623 |
| 535,836 |
|
| Longfor Group Holdings Ltd. | | 66,000 |
| 242,669 |
|
| Mitsubishi Estate Co. Ltd. | | 21,300 |
| 389,642 |
|
| Mitsui Fudosan Co. Ltd. | | 9,400 |
| 212,716 |
|
| New World Development Co. Ltd. | | 123,000 |
| 172,171 |
|
| Nexity SA | | 606 |
| 29,155 |
|
| Pakuwon Jati Tbk PT | | 838,400 |
| 43,817 |
|
| Shimao Property Holdings Ltd. | | 48,000 |
| 132,527 |
|
| Shurgard Self Storage SA | | 2,453 |
| 85,039 |
|
| Sun Hung Kai Properties Ltd. | | 14,500 |
| 233,032 |
|
| Times China Holdings Ltd. | | 66,000 |
| 114,913 |
|
| VGP NV | | 1,085 |
| 91,154 |
|
| Vonovia SE | | 8,831 |
| 432,228 |
|
| | | | 6,246,976 |
|
| Road and Rail — 0.6% | | | |
| Canadian Pacific Railway Ltd. | | 1,640 |
| 391,560 |
|
CJ Logistics Corp.(1) | | 3,191 |
| 368,443 |
|
| CSX Corp. | | 740 |
| 52,096 |
|
| DSV A/S | | 5,093 |
| 485,374 |
|
| Heartland Express, Inc. | | 28,750 |
| 570,400 |
|
| J.B. Hunt Transport Services, Inc. | | 3,878 |
| 396,991 |
|
| Localiza Rent a Car SA | | 88,956 |
| 1,020,942 |
|
Lyft, Inc., Class A(1) | | 3,571 |
| 217,367 |
|
| Sixt SE | | 1,359 |
| 139,169 |
|
| TFI International, Inc. | | 3,239 |
| 102,461 |
|
| Union Pacific Corp. | | 9,999 |
| 1,799,320 |
|
| | | | 5,544,123 |
|
| Semiconductors and Semiconductor Equipment — 2.2% | | |
Advanced Energy Industries, Inc.(1) | | 746 |
| 43,566 |
|
Advanced Micro Devices, Inc.(1) | | 28,690 |
| 873,611 |
|
| | | | |
|
| | | | | | | |
| | | Shares/
Principal Amount | Value |
| Analog Devices, Inc. | | 3,355 |
| $ | 394,078 |
|
| Applied Materials, Inc. | | 65,990 |
| 3,257,926 |
|
| ASML Holding NV | | 7,353 |
| 1,630,937 |
|
| BE Semiconductor Industries NV | | 982 |
| 29,128 |
|
| Broadcom, Inc. | | 11,366 |
| 3,296,026 |
|
| Cypress Semiconductor Corp. | | 3,880 |
| 89,124 |
|
| Entegris, Inc. | | 1,351 |
| 58,782 |
|
| Globalwafers Co. Ltd. | | 10,000 |
| 106,355 |
|
| Infineon Technologies AG | | 22,426 |
| 424,978 |
|
Inphi Corp.(1) | | 2,826 |
| 170,154 |
|
| Intel Corp. | | 44,186 |
| 2,233,602 |
|
| Kulicke & Soffa Industries, Inc. | | 5,229 |
| 118,332 |
|
| Lasertec Corp. | | 4,200 |
| 201,144 |
|
Lattice Semiconductor Corp.(1) | | 9,504 |
| 183,807 |
|
| Marvell Technology Group Ltd. | | 27,190 |
| 714,009 |
|
| Maxim Integrated Products, Inc. | | 21,168 |
| 1,252,934 |
|
| Microchip Technology, Inc. | | 4,640 |
| 438,109 |
|
| Monolithic Power Systems, Inc. | | 434 |
| 64,302 |
|
| NVIDIA Corp. | | 16 |
| 2,700 |
|
Qorvo, Inc.(1) | | 1,656 |
| 121,368 |
|
| QUALCOMM, Inc. | | 5,646 |
| 413,061 |
|
Silicon Laboratories, Inc.(1) | | 663 |
| 74,395 |
|
SOITEC(1) | | 2,145 |
| 221,713 |
|
| Taiwan Semiconductor Manufacturing Co. Ltd. | | 277,500 |
| 2,294,224 |
|
| Teradyne, Inc. | | 27 |
| 1,505 |
|
| Xilinx, Inc. | | 5,528 |
| 631,353 |
|
| | | | 19,341,223 |
|
| Software — 3.5% | | | |
Adobe, Inc.(1) | | 5,788 |
| 1,729,802 |
|
Adyen NV(1) | | 560 |
| 422,709 |
|
ANSYS, Inc.(1) | | 204 |
| 41,436 |
|
Aspen Technology, Inc.(1) | | 572 |
| 75,430 |
|
Atlassian Corp. plc, Class A(1) | | 6,189 |
| 867,203 |
|
Autodesk, Inc.(1) | | 4,664 |
| 728,377 |
|
Avalara, Inc.(1) | | 1,369 |
| 111,546 |
|
| Avast plc | | 42,886 |
| 175,348 |
|
| Aveva Group plc | | 3,612 |
| 175,684 |
|
Bottomline Technologies de, Inc.(1) | | 1,394 |
| 58,673 |
|
Cadence Design Systems, Inc.(1) | | 13,566 |
| 1,002,663 |
|
Coupa Software, Inc.(1) | | 3,453 |
| 468,607 |
|
| Dassault Systemes SE | | 3,540 |
| 535,895 |
|
Descartes Systems Group, Inc. (The)(1) | | 4,027 |
| 146,306 |
|
Elastic NV(1) | | 449 |
| 44,375 |
|
Fair Isaac Corp.(1) | | 275 |
| 95,541 |
|
Five9, Inc.(1) | | 2,159 |
| 106,590 |
|
| Fuji Soft, Inc. | | 2,100 |
| 93,890 |
|
Globant SA(1) | | 985 |
| 104,410 |
|
|
| | | | | | | |
| | | Shares/
Principal Amount | Value |
| Intuit, Inc. | | 5,843 |
| $ | 1,620,322 |
|
| LogMeIn, Inc. | | 2,231 |
| 169,489 |
|
Manhattan Associates, Inc.(1) | | 411 |
| 34,931 |
|
Medallia, Inc.(1) | | 964 |
| 38,415 |
|
| Microsoft Corp. | | 94,533 |
| 12,882,012 |
|
| Oracle Corp. (New York) | | 32,353 |
| 1,821,474 |
|
Pagerduty, Inc.(1) | | 2,361 |
| 104,356 |
|
Palo Alto Networks, Inc.(1) | | 5,792 |
| 1,312,120 |
|
Paycom Software, Inc.(1) | | 519 |
| 124,949 |
|
Paylocity Holding Corp.(1) | | 1,691 |
| 172,634 |
|
Proofpoint, Inc.(1) | | 148 |
| 18,678 |
|
PTC, Inc.(1) | | 6,521 |
| 441,993 |
|
Rapid7, Inc.(1) | | 2,434 |
| 147,622 |
|
RingCentral, Inc., Class A(1) | | 3,532 |
| 501,473 |
|
salesforce.com, Inc.(1) | | 7,123 |
| 1,100,504 |
|
| SAP SE | | 5,820 |
| 721,958 |
|
| Sapiens International Corp. NV | | 1,245 |
| 20,032 |
|
ServiceNow, Inc.(1) | | 1,949 |
| 540,633 |
|
| Sophos Group plc | | 23,726 |
| 125,799 |
|
Splunk, Inc.(1) | | 3,298 |
| 446,252 |
|
Temenos AG(1) | | 2,850 |
| 500,589 |
|
Teradata Corp.(1) | | 6,048 |
| 221,478 |
|
| VMware, Inc., Class A | | 2,661 |
| 464,318 |
|
| WiseTech Global Ltd. | | 8,296 |
| 180,072 |
|
Workday, Inc., Class A(1) | | 2,092 |
| 418,358 |
|
Zendesk, Inc.(1) | | 1,054 |
| 88,072 |
|
Zoom Video Communications, Inc., Class A(1) | | 754 |
| 72,015 |
|
| | | | 31,275,033 |
|
| Specialty Retail — 1.5% | | | |
| Adastria Co. Ltd. | | 4,500 |
| 88,094 |
|
| Advance Auto Parts, Inc. | | 13,302 |
| 2,003,813 |
|
AutoZone, Inc.(1) | | 1,077 |
| 1,209,514 |
|
Boot Barn Holdings, Inc.(1) | | 2,668 |
| 83,482 |
|
Burlington Stores, Inc.(1) | | 5,024 |
| 908,088 |
|
| Camping World Holdings, Inc., Class A | | 13,385 |
| 157,006 |
|
| Fast Retailing Co. Ltd. | | 500 |
| 299,454 |
|
Five Below, Inc.(1) | | 3,471 |
| 407,703 |
|
Floor & Decor Holdings, Inc., Class A(1) | | 8,959 |
| 350,745 |
|
| Foschini Group Ltd. (The) | | 16,356 |
| 188,718 |
|
| Home Depot, Inc. (The) | | 730 |
| 155,994 |
|
| Hotel Shilla Co. Ltd. | | 2,517 |
| 166,542 |
|
| JD Sports Fashion plc | | 14,573 |
| 115,332 |
|
| Kingfisher plc | | 853,085 |
| 2,295,101 |
|
MarineMax, Inc.(1) | | 3,352 |
| 51,755 |
|
Murphy USA, Inc.(1) | | 4,558 |
| 402,745 |
|
National Vision Holdings, Inc.(1) | | 2,123 |
| 67,065 |
|
O'Reilly Automotive, Inc.(1) | | 4,548 |
| 1,731,696 |
|
|
| | | | | | | |
| | | Shares/
Principal Amount | Value |
| Penske Automotive Group, Inc. | | 3,119 |
| $ | 143,380 |
|
| TJX Cos., Inc. (The) | | 23,250 |
| 1,268,520 |
|
Tokyo Base Co. Ltd.(1) | | 11,100 |
| 75,632 |
|
| Tractor Supply Co. | | 6,056 |
| 658,953 |
|
Ulta Beauty, Inc.(1) | | 1,111 |
| 388,017 |
|
| | | | 13,217,349 |
|
| Technology Hardware, Storage and Peripherals — 1.3% | | | |
| Apple, Inc. | | 45,634 |
| 9,721,868 |
|
Cray, Inc.(1) | | 3,769 |
| 130,558 |
|
| HP, Inc. | | 20,779 |
| 437,190 |
|
| Samsung Electronics Co. Ltd. | | 31,383 |
| 1,197,365 |
|
| | | | 11,486,981 |
|
| Textiles, Apparel and Luxury Goods — 0.9% | | | |
| adidas AG | | 2,540 |
| 814,532 |
|
| ANTA Sports Products Ltd. | | 39,000 |
| 289,873 |
|
| Bata India Ltd. | | 9,160 |
| 174,010 |
|
| Burberry Group plc | | 18,580 |
| 506,870 |
|
Canada Goose Holdings, Inc.(1) | | 13,101 |
| 612,996 |
|
Deckers Outdoor Corp.(1) | | 6,261 |
| 978,469 |
|
| Fila Korea Ltd. | | 13,623 |
| 771,784 |
|
| HUGO BOSS AG | | 3,930 |
| 248,066 |
|
| Li Ning Co. Ltd. | | 155,500 |
| 381,060 |
|
Lululemon Athletica, Inc.(1) | | 1,985 |
| 379,314 |
|
| LVMH Moet Hennessy Louis Vuitton SE | | 1,220 |
| 504,462 |
|
| NIKE, Inc., Class B | | 20,386 |
| 1,753,807 |
|
| Salvatore Ferragamo SpA | | 3,889 |
| 81,421 |
|
| Shenzhou International Group Holdings Ltd. | | 24,200 |
| 332,459 |
|
| Tapestry, Inc. | | 11,239 |
| 347,622 |
|
| Titan Co. Ltd. | | 5,656 |
| 86,442 |
|
| | | | 8,263,187 |
|
| Thrifts and Mortgage Finance — 0.1% | | | |
Aruhi Corp.(1) | | 5,600 |
| 104,911 |
|
| Capitol Federal Financial, Inc. | | 38,424 |
| 524,872 |
|
Essent Group Ltd.(1) | | 10,724 |
| 495,020 |
|
LendingTree, Inc.(1) | | 132 |
| 42,575 |
|
| | | | 1,167,378 |
|
Tobacco† | | | |
| Swedish Match AB | | 6,290 |
| 240,404 |
|
| Trading Companies and Distributors — 0.5% | | | |
AerCap Holdings NV(1) | | 32,663 |
| 1,781,113 |
|
DXP Enterprises, Inc.(1) | | 284 |
| 9,642 |
|
Ferguson plc(1) | | 4,780 |
| 356,002 |
|
Foundation Building Materials, Inc.(1) | | 3,281 |
| 56,466 |
|
GMS, Inc.(1) | | 2,700 |
| 60,777 |
|
| Grafton Group plc | | 10,523 |
| 92,477 |
|
| H&E Equipment Services, Inc. | | 3,174 |
| 97,156 |
|
HD Supply Holdings, Inc.(1) | | 1,757 |
| 71,176 |
|
|
| | | | | | | |
| | | Shares/
Principal Amount | Value |
| IMCD NV | | 1,662 |
| $ | 145,931 |
|
| Indutrade AB | | 6,582 |
| 185,630 |
|
| MonotaRO Co. Ltd. | | 19,400 |
| 423,947 |
|
| MSC Industrial Direct Co., Inc., Class A | | 12,457 |
| 885,070 |
|
NOW, Inc.(1) | | 4,795 |
| 58,739 |
|
| Seven Group Holdings Ltd. | | 19,613 |
| 239,594 |
|
SiteOne Landscape Supply, Inc.(1) | | 1,566 |
| 115,681 |
|
| Yamazen Corp. | | 19,700 |
| 187,426 |
|
| | | | 4,766,827 |
|
| Transportation Infrastructure — 0.1% | | | |
| Airports of Thailand PCL | | 83,400 |
| 194,568 |
|
| Grupo Aeroportuario del Centro Norte SAB de CV | | 55,704 |
| 342,297 |
|
| Macquarie Infrastructure Corp. | | 2,142 |
| 88,765 |
|
| | | | 625,630 |
|
Water Utilities† | | | |
| SJW Group | | 723 |
| 46,915 |
|
Wireless Telecommunication Services† | | | |
| America Movil SAB de CV, Class L ADR | | 12,252 |
| 171,405 |
|
T-Mobile US, Inc.(1) | | 82 |
| 6,538 |
|
| | | | 177,943 |
|
TOTAL COMMON STOCKS
(Cost $419,370,905) | | | 549,498,562 |
|
| CORPORATE BONDS — 8.9% | | | |
| Aerospace and Defense — 0.1% | | | |
| Arconic, Inc., 5.40%, 4/15/21 | | $ | 25,000 |
| 25,916 |
|
| Arconic, Inc., 5.125%, 10/1/24 | | 115,000 |
| 122,706 |
|
Bombardier, Inc., 8.75%, 12/1/21(2) | | 50,000 |
| 54,687 |
|
Bombardier, Inc., 5.75%, 3/15/22(2) | | 30,000 |
| 30,788 |
|
Bombardier, Inc., 6.00%, 10/15/22(2) | | 35,000 |
| 35,175 |
|
Bombardier, Inc., 7.50%, 3/15/25(2) | | 80,000 |
| 81,650 |
|
| TransDigm, Inc., 6.00%, 7/15/22 | | 115,000 |
| 116,472 |
|
| TransDigm, Inc., 6.375%, 6/15/26 | | 50,000 |
| 51,110 |
|
| United Technologies Corp., 6.05%, 6/1/36 | | 140,000 |
| 182,282 |
|
| | | | 700,786 |
|
Air Freight and Logistics† | | | |
| United Parcel Service, Inc., 2.80%, 11/15/24 | | 210,000 |
| 214,893 |
|
XPO Logistics, Inc., 6.50%, 6/15/22(2) | | 15,000 |
| 15,276 |
|
| | | | 230,169 |
|
Airlines† | | | |
American Airlines Group, Inc., 4.625%, 3/1/20(2) | | 85,000 |
| 85,850 |
|
| United Airlines Holdings, Inc., 5.00%, 2/1/24 | | 85,000 |
| 89,462 |
|
| | | | 175,312 |
|
Auto Components† | | | |
| American Axle & Manufacturing, Inc., 6.625%, 10/15/22 | | 12,000 |
| 12,181 |
|
ZF North America Capital, Inc., 4.75%, 4/29/25(2) | | 105,000 |
| 108,646 |
|
| | | | 120,827 |
|
|
| | | | | | | |
| | | Shares/
Principal Amount | Value |
| Automobiles — 0.2% | | | |
| BMW Finance NV, MTN, 1.00%, 2/15/22 | EUR | 10,000 |
| $ | 11,406 |
|
| BMW Finance NV, MTN, 0.875%, 4/3/25 | EUR | 50,000 |
| 58,061 |
|
| Ford Motor Credit Co. LLC, 5.875%, 8/2/21 | | $ | 850,000 |
| 894,228 |
|
| General Motors Co., 4.20%, 10/1/27 | | 80,000 |
| 81,323 |
|
| General Motors Co., 5.00%, 4/1/35 | | 70,000 |
| 70,078 |
|
| General Motors Co., 5.15%, 4/1/38 | | 160,000 |
| 161,057 |
|
| General Motors Financial Co., Inc., 3.20%, 7/6/21 | | 430,000 |
| 433,670 |
|
| | | | 1,709,823 |
|
| Banks — 1.6% | | | |
| Akbank T.A.S., 5.00%, 10/24/22 | | 130,000 |
| 126,899 |
|
Avi Funding Co. Ltd., 3.80%, 9/16/25(2) | | 255,000 |
| 266,004 |
|
| Banco Mercantil del Norte SA, VRN, 5.75%, 10/4/31 | | 204,000 |
| 200,942 |
|
| Banco Santander SA, MTN, 2.50%, 3/18/25 | EUR | 200,000 |
| 242,745 |
|
| Banistmo SA, 3.65%, 9/19/22 | | $ | 280,000 |
| 282,478 |
|
| Bank of America Corp., 4.10%, 7/24/23 | | 110,000 |
| 116,866 |
|
| Bank of America Corp., MTN, 4.20%, 8/26/24 | | 360,000 |
| 382,623 |
|
| Bank of America Corp., MTN, 5.00%, 1/21/44 | | 90,000 |
| 110,887 |
|
| Bank of America Corp., MTN, VRN, 4.44%, 1/20/48 | | 80,000 |
| 91,982 |
|
| Bank of America Corp., VRN, 3.42%, 12/20/28 | | 42,000 |
| 43,250 |
|
| Barclays Bank plc, 5.14%, 10/14/20 | | 100,000 |
| 102,566 |
|
| Barclays Bank plc, MTN, 6.625%, 3/30/22 | EUR | 50,000 |
| 63,868 |
|
| Barclays plc, MTN, VRN, 1.375%, 1/24/26 | EUR | 100,000 |
| 111,143 |
|
| Barclays plc, MTN, VRN, 2.00%, 2/7/28 | EUR | 100,000 |
| 108,240 |
|
| BPCE SA, VRN, 2.75%, 7/8/26 | EUR | 100,000 |
| 116,634 |
|
| CaixaBank SA, MTN, VRN, 2.75%, 7/14/28 | EUR | 200,000 |
| 234,704 |
|
| CIT Group, Inc., 5.00%, 8/15/22 | | $ | 150,000 |
| 159,000 |
|
| CIT Group, Inc., 5.00%, 8/1/23 | | 50,000 |
| 53,562 |
|
| Citigroup, Inc., 2.75%, 4/25/22 | | 230,000 |
| 231,902 |
|
| Citigroup, Inc., 4.45%, 9/29/27 | | 425,000 |
| 458,972 |
|
| Citigroup, Inc., VRN, 3.52%, 10/27/28 | | 340,000 |
| 351,170 |
|
| Co-Operative Bank plc (The), 4.75%, 11/11/21 (Secured) | GBP | 200,000 |
| 258,837 |
|
| Commerzbank AG, MTN, 4.00%, 3/23/26 | EUR | 150,000 |
| 192,534 |
|
| Cooperatieve Rabobank UA, VRN, 2.50%, 5/26/26 | EUR | 150,000 |
| 173,476 |
|
| Credit Agricole SA, MTN, 7.375%, 12/18/23 | GBP | 100,000 |
| 151,476 |
|
| European Financial Stability Facility, MTN, 2.125%, 2/19/24 | EUR | 399,000 |
| 495,117 |
|
| European Financial Stability Facility, MTN, 2.35%, 7/29/44 | EUR | 60,000 |
| 94,275 |
|
| European Investment Bank, MTN, 2.25%, 10/14/22 | EUR | 285,000 |
| 344,992 |
|
| Fifth Third BanCorp., 4.30%, 1/16/24 | | $ | 120,000 |
| 127,828 |
|
| HSBC Bank plc, MTN, VRN, 5.375%, 11/4/30 | GBP | 50,000 |
| 71,518 |
|
| HSBC Holdings plc, 2.95%, 5/25/21 | | $ | 200,000 |
| 201,632 |
|
| HSBC Holdings plc, 4.30%, 3/8/26 | | 400,000 |
| 428,055 |
|
| HSBC Holdings plc, 2.625%, 8/16/28 | GBP | 120,000 |
| 152,462 |
|
| HSBC Holdings plc, VRN, 3.26%, 3/13/23 | | $ | 210,000 |
| 213,155 |
|
Intercorp Financial Services, Inc., 4.125%, 10/19/27(2) | | 305,000 |
| 311,710 |
|
| Intesa Sanpaolo SpA, MTN, 6.625%, 9/13/23 | EUR | 220,000 |
| 295,143 |
|
| JPMorgan Chase & Co., 3.875%, 9/10/24 | | $ | 780,000 |
| 818,750 |
|
|
| | | | | | | |
| | | Shares/
Principal Amount | Value |
| JPMorgan Chase & Co., 3.125%, 1/23/25 | | $ | 320,000 |
| $ | 327,728 |
|
| JPMorgan Chase & Co., VRN, 3.90%, 1/23/49 | | 160,000 |
| 170,145 |
|
| KEB Hana Bank, MTN, 4.375%, 9/30/24 | | 204,000 |
| 216,262 |
|
| Kreditanstalt fuer Wiederaufbau, 4.625%, 1/4/23 | EUR | 300,000 |
| 392,533 |
|
| Lloyds Bank plc, MTN, 7.625%, 4/22/25 | GBP | 120,000 |
| 188,235 |
|
| PNC Financial Services Group, Inc. (The), 4.375%, 8/11/20 | | $ | 160,000 |
| 163,358 |
|
| Royal Bank of Scotland Group plc, 6.125%, 12/15/22 | | 40,000 |
| 43,025 |
|
| Santander UK plc, MTN, 5.125%, 4/14/21 | GBP | 100,000 |
| 130,272 |
|
Turkiye Garanti Bankasi AS, VRN, 6.125%, 5/24/27(2) | | $ | 150,000 |
| 130,005 |
|
| U.S. Bancorp, MTN, 3.60%, 9/11/24 | | 310,000 |
| 325,750 |
|
| UniCredit SpA, MTN, VRN, 5.75%, 10/28/25 | EUR | 100,000 |
| 117,552 |
|
| Wells Fargo & Co., 4.125%, 8/15/23 | | $ | 300,000 |
| 316,552 |
|
| Wells Fargo & Co., 3.00%, 4/22/26 | | 220,000 |
| 222,242 |
|
| Wells Fargo & Co., MTN, 2.60%, 7/22/20 | | 280,000 |
| 280,806 |
|
| Wells Fargo & Co., MTN, 4.10%, 6/3/26 | | 200,000 |
| 211,718 |
|
| Wells Fargo & Co., MTN, 4.65%, 11/4/44 | | 175,000 |
| 198,062 |
|
| Westpac Banking Corp., 4.875%, 11/19/19 | | 2,300,000 |
| 2,317,928 |
|
| Woori Bank, MTN, 4.75%, 4/30/24 | | 153,000 |
| 163,196 |
|
| | | | 14,102,766 |
|
| Beverages — 0.1% | | | |
| Anheuser-Busch Cos. LLC / Anheuser-Busch InBev Worldwide, Inc., 4.90%, 2/1/46 | | 370,000 |
| 421,424 |
|
| Anheuser-Busch InBev SA, MTN, 1.50%, 3/17/25 | EUR | 50,000 |
| 60,415 |
|
| | | | 481,839 |
|
| Biotechnology — 0.2% | | | |
| AbbVie, Inc., 3.60%, 5/14/25 | | $ | 70,000 |
| 72,181 |
|
| AbbVie, Inc., 4.40%, 11/6/42 | | 240,000 |
| 238,085 |
|
| AbbVie, Inc., 4.70%, 5/14/45 | | 20,000 |
| 20,398 |
|
| Amgen, Inc., 4.66%, 6/15/51 | | 219,000 |
| 240,635 |
|
| Celgene Corp., 3.25%, 8/15/22 | | 160,000 |
| 164,140 |
|
| Celgene Corp., 3.625%, 5/15/24 | | 410,000 |
| 427,672 |
|
| Celgene Corp., 3.875%, 8/15/25 | | 140,000 |
| 149,097 |
|
| Gilead Sciences, Inc., 4.40%, 12/1/21 | | 100,000 |
| 104,364 |
|
| Gilead Sciences, Inc., 3.65%, 3/1/26 | | 390,000 |
| 412,034 |
|
| | | | 1,828,606 |
|
Building Products† | | | |
Builders FirstSource, Inc., 5.625%, 9/1/24(2) | | 78,000 |
| 81,023 |
|
| Capital Markets — 0.2% | | | |
| Criteria Caixa SAU, MTN, 1.50%, 5/10/23 | EUR | 100,000 |
| 115,624 |
|
| Goldman Sachs Group, Inc. (The), 5.50%, 10/12/21 | GBP | 150,000 |
| 198,933 |
|
| Goldman Sachs Group, Inc. (The), 3.50%, 11/16/26 | | $ | 280,000 |
| 287,530 |
|
| Morgan Stanley, 4.375%, 1/22/47 | | 80,000 |
| 90,124 |
|
| Morgan Stanley, MTN, 5.625%, 9/23/19 | | 670,000 |
| 672,937 |
|
| Morgan Stanley, MTN, 3.70%, 10/23/24 | | 250,000 |
| 262,480 |
|
| Morgan Stanley, MTN, 4.00%, 7/23/25 | | 100,000 |
| 106,855 |
|
| Morgan Stanley, MTN, VRN, 2.72%, 7/22/25 | | 128,000 |
| 128,285 |
|
|
| | | | | | | |
| | | Shares/
Principal Amount | Value |
| SURA Asset Management SA, 4.375%, 4/11/27 | | $ | 105,000 |
| $ | 109,201 |
|
| | | | 1,971,969 |
|
| Chemicals — 0.1% | | | |
| CF Industries, Inc., 3.45%, 6/1/23 | | 80,000 |
| 81,100 |
|
Element Solutions, Inc., 5.875%, 12/1/25(2) | | 40,000 |
| 40,900 |
|
Equate Petrochemical BV, 4.25%, 11/3/26(2) | | 82,000 |
| 87,359 |
|
| Huntsman International LLC, 5.125%, 11/15/22 | | 85,000 |
| 90,203 |
|
| Olin Corp., 5.125%, 9/15/27 | | 60,000 |
| 60,627 |
|
Tronox Finance plc, 5.75%, 10/1/25(2) | | 30,000 |
| 28,350 |
|
| | | | 388,539 |
|
| Commercial Services and Supplies — 0.1% | | | |
| ADT Security Corp. (The), 6.25%, 10/15/21 | | 100,000 |
| 106,753 |
|
Harland Clarke Holdings Corp., 9.25%, 3/1/21(2) | | 35,000 |
| 33,775 |
|
HPHT Finance 15 Ltd., 2.875%, 3/17/20(2) | | 510,000 |
| 510,694 |
|
Nielsen Finance LLC / Nielsen Finance Co., 5.00%, 4/15/22(2) | | 80,000 |
| 80,276 |
|
Prime Security Services Borrower LLC / Prime Finance, Inc., 9.25%, 5/15/23(2) | | 71,000 |
| 74,728 |
|
| Republic Services, Inc., 3.55%, 6/1/22 | | 175,000 |
| 179,874 |
|
| RR Donnelley & Sons Co., 6.00%, 4/1/24 | | 65,000 |
| 64,106 |
|
| | | | 1,050,206 |
|
Communications Equipment† | | | |
CommScope Technologies LLC, 6.00%, 6/15/25(2) | | 135,000 |
| 123,525 |
|
HTA Group Ltd., 9.125%, 3/8/22(2) | | 153,000 |
| 160,627 |
|
IHS Netherlands Holdco BV, 9.50%, 10/27/21(2) | | 88,000 |
| 91,287 |
|
| | | | 375,439 |
|
Construction Materials† | | | |
| Cemex SAB de CV, 6.125%, 5/5/25 | | 205,000 |
| 212,790 |
|
Standard Industries, Inc., 6.00%, 10/15/25(2) | | 80,000 |
| 84,100 |
|
| | | | 296,890 |
|
Consumer Finance† | | | |
| Ally Financial, Inc., 8.00%, 11/1/31 | | 45,000 |
| 60,368 |
|
| Capital One Financial Corp., 3.80%, 1/31/28 | | 70,000 |
| 72,514 |
|
| Navient Corp., 5.00%, 10/26/20 | | 100,000 |
| 102,312 |
|
| Navient Corp., 5.50%, 1/25/23 | | 105,000 |
| 109,037 |
|
| | | | 344,231 |
|
| Containers and Packaging — 0.1% | | | |
ARD Finance SA, 7.125% Cash or 7.875% PIK, 9/15/23(3) | | 200,000 |
| 207,000 |
|
| Ball Corp., 4.00%, 11/15/23 | | 120,000 |
| 124,200 |
|
| Ball Corp., 5.25%, 7/1/25 | | 35,000 |
| 38,194 |
|
| Berry Global, Inc., 5.50%, 5/15/22 | | 60,000 |
| 60,900 |
|
| Berry Global, Inc., 5.125%, 7/15/23 | | 50,000 |
| 51,250 |
|
| Crown Americas LLC / Crown Americas Capital Corp. IV, 4.50%, 1/15/23 | | 305,000 |
| 315,675 |
|
Mauser Packaging Solutions Holding Co., 5.50%, 4/15/24(2) | | 30,000 |
| 30,066 |
|
Owens-Brockway Glass Container, Inc., 5.875%, 8/15/23(2) | | 20,000 |
| 21,600 |
|
| Reynolds Group Issuer, Inc. / Reynolds Group Issuer LLC / Reynolds Group Issuer Lu, 6.875%, 2/15/21 | | 34,654 |
| 34,783 |
|
|
| | | | | | | |
| | | Shares/
Principal Amount | Value |
Reynolds Group Issuer, Inc. / Reynolds Group Issuer LLC / Reynolds Group Issuer Lu, 5.125%, 7/15/23(2) | | $ | 30,000 |
| $ | 30,600 |
|
Reynolds Group Issuer, Inc. / Reynolds Group Issuer LLC / Reynolds Group Issuer Lu, 7.00%, 7/15/24(2) | | 160,000 |
| 165,500 |
|
Sealed Air Corp., 5.125%, 12/1/24(2) | | 80,000 |
| 85,600 |
|
| | | | 1,165,368 |
|
Diversified Consumer Services† | | | |
| CommonSpirit Health, 2.95%, 11/1/22 | | 130,000 |
| 131,004 |
|
| Diversified Financial Services — 0.1% | | | |
| Berkshire Hathaway, Inc., 2.75%, 3/15/23 | | 90,000 |
| 91,815 |
|
| GE Capital European Funding Unlimited. Co., MTN, 5.375%, 1/23/20 | EUR | 220,000 |
| 249,961 |
|
| Icahn Enterprises LP / Icahn Enterprises Finance Corp., 6.00%, 8/1/20 | | $ | 50,000 |
| 50,000 |
|
| Icahn Enterprises LP / Icahn Enterprises Finance Corp., 5.875%, 2/1/22 | | 80,000 |
| 81,100 |
|
MDC GMTN B.V., 3.25%, 4/28/22(2) | | 102,000 |
| 104,065 |
|
| Voya Financial, Inc., 5.70%, 7/15/43 | | 150,000 |
| 185,819 |
|
| Voya Financial, Inc., VRN, 5.65%, 5/15/53 | | 75,000 |
| 79,228 |
|
| | | | 841,988 |
|
| Diversified Telecommunication Services — 0.5% | | | |
Altice France SA, 7.375%, 5/1/26(2) | | 175,000 |
| 185,535 |
|
| AT&T, Inc., 3.875%, 8/15/21 | | 100,000 |
| 102,951 |
|
| AT&T, Inc., 2.95%, 7/15/26 | | 240,000 |
| 241,183 |
|
| AT&T, Inc., 3.80%, 2/15/27 | | 180,000 |
| 187,948 |
|
| AT&T, Inc., 2.60%, 12/17/29 | EUR | 120,000 |
| 156,845 |
|
| AT&T, Inc., 5.15%, 11/15/46 | | $ | 291,000 |
| 322,630 |
|
| CenturyLink, Inc., 5.625%, 4/1/20 | | 130,000 |
| 132,193 |
|
| CenturyLink, Inc., 5.80%, 3/15/22 | | 40,000 |
| 41,800 |
|
Cincinnati Bell, Inc., 7.00%, 7/15/24(2) | | 30,000 |
| 25,800 |
|
| Deutsche Telekom International Finance BV, MTN, 1.25%, 10/6/23 | GBP | 150,000 |
| 184,470 |
|
| Deutsche Telekom International Finance BV, MTN, 0.875%, 1/30/24 | EUR | 40,000 |
| 46,258 |
|
| Frontier Communications Corp., 7.125%, 1/15/23 | | $ | 145,000 |
| 86,275 |
|
| Frontier Communications Corp., 6.875%, 1/15/25 | | 90,000 |
| 49,950 |
|
| Hughes Satellite Systems Corp., 5.25%, 8/1/26 | | 100,000 |
| 106,325 |
|
Inmarsat Finance plc, 4.875%, 5/15/22(2) | | 50,000 |
| 50,651 |
|
Intelsat Jackson Holdings SA, 9.75%, 7/15/25(2) | | 100,000 |
| 104,000 |
|
| Level 3 Financing, Inc., 5.375%, 8/15/22 | | 110,000 |
| 110,825 |
|
| Level 3 Financing, Inc., 5.375%, 5/1/25 | | 50,000 |
| 51,625 |
|
Ooredoo International Finance Ltd., 3.75%, 6/22/26(2) | | 153,000 |
| 159,781 |
|
| Orange SA, 4.125%, 9/14/21 | | 180,000 |
| 186,501 |
|
| Orange SA, MTN, VRN, 4.00%, 10/1/21 | EUR | 150,000 |
| 180,008 |
|
| Sprint Capital Corp., 8.75%, 3/15/32 | | $ | 105,000 |
| 130,856 |
|
| Telecom Italia Capital SA, 6.375%, 11/15/33 | | 175,000 |
| 184,660 |
|
| Telefonica Europe BV, VRN, 5.875%, 3/31/24 | EUR | 100,000 |
| 128,241 |
|
Turk Telekomunikasyon AS, 4.875%, 6/19/24(2) | | $ | 205,000 |
| 196,576 |
|
| Verizon Communications, Inc., 2.625%, 8/15/26 | | 280,000 |
| 279,453 |
|
|
| | | | | | | |
| | | Shares/
Principal Amount | Value |
| Verizon Communications, Inc., 4.75%, 11/1/41 | | $ | 100,000 |
| $ | 114,935 |
|
| Verizon Communications, Inc., 5.01%, 8/21/54 | | 90,000 |
| 106,720 |
|
| Zayo Group LLC / Zayo Capital, Inc., 6.00%, 4/1/23 | | 80,000 |
| 82,800 |
|
| | | | 3,937,795 |
|
| Electric Utilities — 0.2% | | | |
| Duke Energy Florida LLC, 6.35%, 9/15/37 | | 70,000 |
| 97,960 |
|
| Duke Energy Florida LLC, 3.85%, 11/15/42 | | 130,000 |
| 137,200 |
|
| Duke Energy Progress LLC, 4.15%, 12/1/44 | | 59,000 |
| 65,112 |
|
| Exelon Corp., 4.45%, 4/15/46 | | 100,000 |
| 109,810 |
|
| FirstEnergy Corp., 4.25%, 3/15/23 | | 90,000 |
| 94,976 |
|
| FirstEnergy Corp., 4.85%, 7/15/47 | | 50,000 |
| 57,560 |
|
| Georgia Power Co., 4.30%, 3/15/42 | | 60,000 |
| 64,349 |
|
Greenko Investment Co., 4.875%, 8/16/23(2) | | 102,000 |
| 100,853 |
|
NextEra Energy Operating Partners LP, 4.50%, 9/15/27(2) | | 40,000 |
| 40,338 |
|
| Pampa Energia SA, 7.50%, 1/24/27 | | 204,000 |
| 188,955 |
|
| Progress Energy, Inc., 3.15%, 4/1/22 | | 110,000 |
| 111,824 |
|
| Southern Co. Gas Capital Corp., 3.95%, 10/1/46 | | 50,000 |
| 49,791 |
|
| SSE plc, VRN, 2.375%, 4/1/21 | EUR | 200,000 |
| 226,509 |
|
| Xcel Energy, Inc., 3.35%, 12/1/26 | | $ | 70,000 |
| 72,624 |
|
| | | | 1,417,861 |
|
| Energy Equipment and Services — 0.1% | | | |
| Halliburton Co., 4.85%, 11/15/35 | | 110,000 |
| 121,079 |
|
| Nabors Industries, Inc., 4.625%, 9/15/21 | | 60,000 |
| 59,100 |
|
| Precision Drilling Corp., 5.25%, 11/15/24 | | 65,000 |
| 59,475 |
|
Transocean, Inc., 9.00%, 7/15/23(2) | | 190,000 |
| 200,632 |
|
| Valaris plc, 8.00%, 1/31/24 | | 90,000 |
| 76,500 |
|
| Valaris plc, 5.20%, 3/15/25 | | 60,000 |
| 43,200 |
|
| | | | 559,986 |
|
| Entertainment — 0.1% | | | |
| AMC Entertainment Holdings, Inc., 5.75%, 6/15/25 | | 50,000 |
| 47,421 |
|
| Cinemark USA, Inc., 5.125%, 12/15/22 | | 60,000 |
| 61,114 |
|
| Viacom, Inc., 4.375%, 3/15/43 | | 40,000 |
| 39,603 |
|
| VTR Finance BV, 6.875%, 1/15/24 | | 205,000 |
| 212,431 |
|
Walt Disney Co. (The), 4.75%, 9/15/44(2) | | 57,000 |
| 70,355 |
|
Ziggo Bond Co. BV, 5.875%, 1/15/25(2) | | 90,000 |
| 92,588 |
|
| | | | 523,512 |
|
| Equity Real Estate Investment Trusts (REITs) — 0.2% | | | |
| Boston Properties LP, 3.65%, 2/1/26 | | 180,000 |
| 188,674 |
|
| Equinix, Inc., 5.375%, 5/15/27 | | 70,000 |
| 75,317 |
|
| Essex Portfolio LP, 3.625%, 8/15/22 | | 100,000 |
| 102,937 |
|
| Essex Portfolio LP, 3.25%, 5/1/23 | | 50,000 |
| 50,967 |
|
| GLP Capital LP / GLP Financing II, Inc., 5.375%, 11/1/23 | | 30,000 |
| 32,455 |
|
| GLP Capital LP / GLP Financing II, Inc., 5.375%, 4/15/26 | | 100,000 |
| 109,062 |
|
| Hospitality Properties Trust, 4.65%, 3/15/24 | | 210,000 |
| 216,403 |
|
| Iron Mountain, Inc., 5.75%, 8/15/24 | | 95,000 |
| 95,921 |
|
Iron Mountain, Inc., 4.875%, 9/15/27(2) | | 80,000 |
| 79,800 |
|
| Kilroy Realty LP, 3.80%, 1/15/23 | | 140,000 |
| 145,389 |
|
|
| | | | | | | |
| | | Shares/
Principal Amount | Value |
| MGM Growth Properties Operating Partnership LP / MGP Finance Co-Issuer, Inc., 5.625%, 5/1/24 | | $ | 90,000 |
| $ | 96,412 |
|
| RHP Hotel Properties LP / RHP Finance Corp., 5.00%, 4/15/21 | | 50,000 |
| 50,175 |
|
| SBA Communications Corp., 4.875%, 7/15/22 | | 75,000 |
| 75,939 |
|
Uniti Group LP / Uniti Group Finance, Inc. / CSL Capital LLC, 6.00%, 4/15/23(2) | | 50,000 |
| 47,625 |
|
| | | | 1,367,076 |
|
| Food and Staples Retailing — 0.1% | | | |
| Albertsons Cos. LLC / Safeway, Inc. / New Albertson's, LP / Albertson's LLC, 6.625%, 6/15/24 | | 110,000 |
| 115,225 |
|
CK Hutchison International 17 II Ltd., 2.25%, 9/29/20(2) | | 408,000 |
| 406,584 |
|
| Kroger Co. (The), 3.30%, 1/15/21 | | 190,000 |
| 192,364 |
|
| Kroger Co. (The), 3.875%, 10/15/46 | | 90,000 |
| 80,934 |
|
| Tesco plc, MTN, 5.00%, 3/24/23 | GBP | 50,000 |
| 68,251 |
|
| Walmart, Inc., 2.55%, 4/11/23 | | $ | 44,000 |
| 44,576 |
|
| Walmart, Inc., 4.05%, 6/29/48 | | 220,000 |
| 253,403 |
|
| | | | 1,161,337 |
|
| Food Products — 0.1% | | | |
| B&G Foods, Inc., 5.25%, 4/1/25 | | 70,000 |
| 69,912 |
|
JBS USA LUX SA / JBS USA Finance, Inc., 5.875%, 7/15/24(2) | | 50,000 |
| 51,500 |
|
JBS USA LUX SA / JBS USA Finance, Inc., 5.75%, 6/15/25(2) | | 35,000 |
| 36,269 |
|
Lamb Weston Holdings, Inc., 4.625%, 11/1/24(2) | | 130,000 |
| 136,500 |
|
MHP SE, 7.75%, 5/10/24(2) | | 128,000 |
| 137,018 |
|
| Minerva Luxembourg SA, 6.50%, 9/20/26 | | 316,000 |
| 323,110 |
|
Minerva Luxembourg SA, 5.875%, 1/19/28(2) | | 80,000 |
| 79,000 |
|
Pilgrim's Pride Corp., 5.75%, 3/15/25(2) | | 200,000 |
| 207,000 |
|
Post Holdings, Inc., 5.00%, 8/15/26(2) | | 115,000 |
| 117,875 |
|
| | | | 1,158,184 |
|
| Gas Utilities — 0.3% | | | |
| Andeavor Logistics LP / Tesoro Logistics Finance Corp., 5.50%, 10/15/19 | | 120,000 |
| 120,371 |
|
| Andeavor Logistics LP / Tesoro Logistics Finance Corp., 6.25%, 10/15/22 | | 19,000 |
| 19,511 |
|
| Cheniere Corpus Christi Holdings LLC, 5.875%, 3/31/25 | | 75,000 |
| 82,695 |
|
| Cheniere Corpus Christi Holdings LLC, 5.125%, 6/30/27 | | 130,000 |
| 142,012 |
|
| China Resources Gas Group Ltd., MTN, 4.50%, 4/5/22 | | 255,000 |
| 266,109 |
|
| Crestwood Midstream Partners LP / Crestwood Midstream Finance Corp., 6.25%, 4/1/23 | | 40,000 |
| 40,902 |
|
| Crestwood Midstream Partners LP / Crestwood Midstream Finance Corp., 5.75%, 4/1/25 | | 70,000 |
| 71,511 |
|
| Enterprise Products Operating LLC, 4.85%, 3/15/44 | | 360,000 |
| 397,503 |
|
| Genesis Energy LP / Genesis Energy Finance Corp., 6.75%, 8/1/22 | | 15,000 |
| 15,317 |
|
| Genesis Energy LP / Genesis Energy Finance Corp., 5.625%, 6/15/24 | | 160,000 |
| 158,000 |
|
| NuStar Logistics LP, 4.75%, 2/1/22 | | 40,000 |
| 40,900 |
|
| Perusahaan Gas Negara Tbk PT, 5.125%, 5/16/24 | | 204,000 |
| 221,183 |
|
|
| | | | | | | |
| | | Shares/
Principal Amount | Value |
| Plains All American Pipeline LP / PAA Finance Corp., 3.65%, 6/1/22 | | $ | 130,000 |
| $ | 132,921 |
|
| Sabine Pass Liquefaction LLC, 5.625%, 3/1/25 | | 350,000 |
| 389,467 |
|
| Sunoco Logistics Partners Operations LP, 3.45%, 1/15/23 | | 300,000 |
| 305,596 |
|
| Targa Resources Partners LP / Targa Resources Partners Finance Corp., 4.25%, 11/15/23 | | 84,000 |
| 84,395 |
|
| Targa Resources Partners LP / Targa Resources Partners Finance Corp., 5.125%, 2/1/25 | | 86,000 |
| 89,027 |
|
| Targa Resources Partners LP / Targa Resources Partners Finance Corp., 5.00%, 1/15/28 | | 20,000 |
| 20,325 |
|
| | | | 2,597,745 |
|
Health Care Equipment and Supplies† | | | |
| Medtronic, Inc., 3.50%, 3/15/25 | | 107,000 |
| 113,605 |
|
| Medtronic, Inc., 4.375%, 3/15/35 | | 172,000 |
| 201,075 |
|
Ortho-Clinical Diagnostics, Inc. / Ortho-Clinical Diagnostics SA, 6.625%, 5/15/22(2) | | 40,000 |
| 39,200 |
|
| | | | 353,880 |
|
| Health Care Providers and Services — 0.4% | | | |
| Acadia Healthcare Co., Inc., 5.625%, 2/15/23 | | 60,000 |
| 60,772 |
|
| Aetna, Inc., 2.75%, 11/15/22 | | 160,000 |
| 160,432 |
|
| Anthem, Inc., 4.65%, 1/15/43 | | 100,000 |
| 108,265 |
|
| CHS / Community Health Systems, Inc., 6.875%, 2/1/22 | | 60,000 |
| 41,400 |
|
| CHS / Community Health Systems, Inc., 6.25%, 3/31/23 | | 80,000 |
| 76,900 |
|
CHS / Community Health Systems, Inc., 8.125%, 6/30/24(2) | | 60,000 |
| 45,900 |
|
CHS / Community Health Systems, Inc., VRN, 9.875%, 6/30/23(2) | | 95,000 |
| 79,800 |
|
| CVS Health Corp., 3.50%, 7/20/22 | | 160,000 |
| 164,267 |
|
| CVS Health Corp., 4.30%, 3/25/28 | | 250,000 |
| 265,581 |
|
| CVS Health Corp., 4.78%, 3/25/38 | | 100,000 |
| 106,088 |
|
| CVS Health Corp., 5.05%, 3/25/48 | | 100,000 |
| 108,855 |
|
| DaVita, Inc., 5.125%, 7/15/24 | | 130,000 |
| 130,812 |
|
| DaVita, Inc., 5.00%, 5/1/25 | | 130,000 |
| 127,890 |
|
| Encompass Health Corp., 5.75%, 11/1/24 | | 41,000 |
| 41,616 |
|
Envision Healthcare Corp., 8.75%, 10/15/26(2) | | 200,000 |
| 139,500 |
|
| HCA, Inc., 7.50%, 2/15/22 | | 145,000 |
| 160,906 |
|
| HCA, Inc., 5.00%, 3/15/24 | | 120,000 |
| 130,375 |
|
| HCA, Inc., 5.375%, 2/1/25 | | 160,000 |
| 173,434 |
|
Jaguar Holding Co. II / Pharmaceutical Product Development LLC, 6.375%, 8/1/23(2) | | 50,000 |
| 51,937 |
|
| Northwell Healthcare, Inc., 4.26%, 11/1/47 | | 70,000 |
| 75,312 |
|
Team Health Holdings, Inc., 6.375%, 2/1/25(2) | | 40,000 |
| 32,800 |
|
| Tenet Healthcare Corp., 4.50%, 4/1/21 | | 50,000 |
| 51,062 |
|
| Tenet Healthcare Corp., 8.125%, 4/1/22 | | 195,000 |
| 208,894 |
|
| Tenet Healthcare Corp., 6.75%, 6/15/23 | | 40,000 |
| 41,300 |
|
| Tenet Healthcare Corp., 5.125%, 5/1/25 | | 100,000 |
| 99,896 |
|
| UnitedHealth Group, Inc., 2.875%, 3/15/22 | | 290,000 |
| 293,966 |
|
| UnitedHealth Group, Inc., 3.75%, 7/15/25 | | 100,000 |
| 106,863 |
|
Universal Health Services, Inc., 4.75%, 8/1/22(2) | | 50,000 |
| 50,750 |
|
| | | | 3,135,573 |
|
|
| | | | | | | |
| | | Shares/
Principal Amount | Value |
| Hotels, Restaurants and Leisure — 0.2% | | | |
1011778 BC ULC / New Red Finance, Inc., 4.625%, 1/15/22(2) | | $ | 40,000 |
| $ | 40,140 |
|
1011778 BC ULC / New Red Finance, Inc., 5.00%, 10/15/25(2) | | 100,000 |
| 102,250 |
|
| Boyd Gaming Corp., 6.875%, 5/15/23 | | 81,000 |
| 84,038 |
|
| Boyd Gaming Corp., 6.375%, 4/1/26 | | 35,000 |
| 37,056 |
|
| Eldorado Resorts, Inc., 7.00%, 8/1/23 | | 110,000 |
| 115,225 |
|
Golden Nugget, Inc., 6.75%, 10/15/24(2) | | 120,000 |
| 123,826 |
|
| Hilton Domestic Operating Co., Inc., 4.25%, 9/1/24 | | 235,000 |
| 238,572 |
|
| Hilton Worldwide Finance LLC / Hilton Worldwide Finance Corp., 4.625%, 4/1/25 | | 80,000 |
| 82,200 |
|
International Game Technology plc, 6.25%, 2/15/22(2) | | 95,000 |
| 100,462 |
|
Jack Ohio Finance LLC / Jack Ohio Finance 1 Corp., 6.75%, 11/15/21(2) | | 75,000 |
| 76,839 |
|
KFC Holding Co. / Pizza Hut Holdings LLC / Taco Bell of America LLC, 5.25%, 6/1/26(2) | | 75,000 |
| 78,053 |
|
| McDonald's Corp., MTN, 3.375%, 5/26/25 | | 100,000 |
| 104,507 |
|
| McDonald's Corp., MTN, 4.70%, 12/9/35 | | 80,000 |
| 92,641 |
|
| MGM Resorts International, 6.00%, 3/15/23 | | 130,000 |
| 141,375 |
|
Penn National Gaming, Inc., 5.625%, 1/15/27(2) | | 150,000 |
| 152,700 |
|
Rivers Pittsburgh Borrower LP / Rivers Pittsburgh Finance Corp., 6.125%, 8/15/21(2) | | 50,000 |
| 50,875 |
|
| Royal Caribbean Cruises Ltd., 5.25%, 11/15/22 | | 120,000 |
| 130,083 |
|
| Scientific Games International, Inc., 6.25%, 9/1/20 | | 100,000 |
| 100,625 |
|
| Scientific Games International, Inc., 10.00%, 12/1/22 | | 63,000 |
| 65,915 |
|
Wynn Las Vegas LLC / Wynn Las Vegas Capital Corp., 5.50%, 3/1/25(2) | | 150,000 |
| 157,687 |
|
| | | | 2,075,069 |
|
| Household Durables — 0.1% | | | |
| Beazer Homes USA, Inc., 7.25%, 2/1/23 | | 5,000 |
| 4,950 |
|
| Beazer Homes USA, Inc., 5.875%, 10/15/27 | | 20,000 |
| 18,400 |
|
Brookfield Residential Properties, Inc. / Brookfield Residential US Corp., 6.125%, 7/1/22(2) | | 50,000 |
| 50,631 |
|
| Lennar Corp., 4.75%, 4/1/21 | | 60,000 |
| 61,500 |
|
| Meritage Homes Corp., 5.125%, 6/6/27 | | 160,000 |
| 166,400 |
|
| PulteGroup, Inc., 5.50%, 3/1/26 | | 60,000 |
| 64,875 |
|
Shea Homes LP / Shea Homes Funding Corp., 5.875%, 4/1/23(2) | | 60,000 |
| 62,028 |
|
Taylor Morrison Communities, Inc. / Taylor Morrison Holdings II, Inc., 5.625%, 3/1/24(2) | | 200,000 |
| 209,500 |
|
| Toll Brothers Finance Corp., 4.35%, 2/15/28 | | 130,000 |
| 131,885 |
|
| William Lyon Homes, Inc., 5.875%, 1/31/25 | | 100,000 |
| 100,500 |
|
| | | | 870,669 |
|
Household Products† | | | |
Energizer Holdings, Inc., 5.50%, 6/15/25(2) | | 70,000 |
| 71,247 |
|
| Spectrum Brands, Inc., 5.75%, 7/15/25 | | 144,000 |
| 149,897 |
|
| | | | 221,144 |
|
|
| | | | | | | |
| | | Shares/
Principal Amount | Value |
Independent Power and Renewable Electricity Producers† | | |
| Calpine Corp., 5.375%, 1/15/23 | | $ | 120,000 |
| $ | 121,200 |
|
| NRG Energy, Inc., 7.25%, 5/15/26 | | 50,000 |
| 54,168 |
|
| | | | 175,368 |
|
| Insurance — 0.7% | | | |
| AerCap Ireland Capital DAC / AerCap Global Aviation Trust, 5.00%, 10/1/21 | | 180,000 |
| 188,436 |
|
| Allianz SE, MTN, VRN, 4.75%, 10/24/23 | EUR | 200,000 |
| 256,576 |
|
| Allianz SE, VRN, 3.375%, 9/18/24 | EUR | 100,000 |
| 122,664 |
|
| American International Group, Inc., 4.125%, 2/15/24 | | $ | 340,000 |
| 361,798 |
|
| American International Group, Inc., 4.50%, 7/16/44 | | 110,000 |
| 117,937 |
|
| AXA SA, 7.125%, 12/15/20 | GBP | 55,000 |
| 72,247 |
|
| AXA SA, MTN, VRN, 6.69%, 7/6/26 | GBP | 50,000 |
| 72,171 |
|
| AXA SA, MTN, VRN, 3.375%, 7/6/47 | EUR | 200,000 |
| 253,919 |
|
| Berkshire Hathaway Finance Corp., 3.00%, 5/15/22 | | $ | 290,000 |
| 297,013 |
|
| Chubb INA Holdings, Inc., 3.15%, 3/15/25 | | 210,000 |
| 218,405 |
|
| Chubb INA Holdings, Inc., 3.35%, 5/3/26 | | 100,000 |
| 105,311 |
|
| CNP Assurances, VRN, 4.00%, 11/18/24 | EUR | 400,000 |
| 496,476 |
|
| Credit Agricole Assurances SA, VRN, 4.25%, 1/13/25 | EUR | 200,000 |
| 245,749 |
|
| Fiore Capital LLC, VRDN, 2.35%, 8/7/19 (LOC: Wells Fargo Bank N.A.) | | $ | 2,500,000 |
| 2,500,000 |
|
| Genworth Holdings, Inc., 7.625%, 9/24/21 | | 35,000 |
| 36,400 |
|
| Hartford Financial Services Group, Inc. (The), 5.95%, 10/15/36 | | 60,000 |
| 76,074 |
|
| Intesa Sanpaolo Vita SpA, VRN, 4.75%, 12/17/24 | EUR | 100,000 |
| 117,113 |
|
| Markel Corp., 4.90%, 7/1/22 | | $ | 200,000 |
| 212,303 |
|
| MetLife, Inc., 4.125%, 8/13/42 | | 90,000 |
| 97,810 |
|
| MetLife, Inc., 4.875%, 11/13/43 | | 50,000 |
| 60,148 |
|
Metropolitan Life Global Funding I, 3.00%, 1/10/23(2) | | 119,000 |
| 121,312 |
|
| Principal Financial Group, Inc., 3.30%, 9/15/22 | | 80,000 |
| 81,376 |
|
| Prudential Financial, Inc., 3.94%, 12/7/49 | | 244,000 |
| 259,020 |
|
| WR Berkley Corp., 4.625%, 3/15/22 | | 130,000 |
| 137,063 |
|
| | | | 6,507,321 |
|
Interactive Media and Services† | | | |
Rackspace Hosting, Inc., 8.625%, 11/15/24(2) | | 130,000 |
| 119,600 |
|
Tencent Holdings Ltd., 3.80%, 2/11/25(2) | | 153,000 |
| 160,125 |
|
| | | | 279,725 |
|
| Internet and Direct Marketing Retail — 0.1% | | | |
| Alibaba Group Holding Ltd., 2.80%, 6/6/23 | | 330,000 |
| 332,342 |
|
| JD.com, Inc., 3.875%, 4/29/26 | | 255,000 |
| 254,494 |
|
| | | | 586,836 |
|
| IT Services — 0.1% | | | |
| CDW LLC / CDW Finance Corp., 5.50%, 12/1/24 | | 90,000 |
| 97,569 |
|
| Fidelity National Information Services, Inc., 3.00%, 8/15/26 | | 260,000 |
| 263,984 |
|
First Data Corp., 5.75%, 1/15/24(2) | | 120,000 |
| 123,645 |
|
| | | | 485,198 |
|
| | | | |
|
| | | | | | | |
| | | Shares/
Principal Amount | Value |
| Life Sciences Tools and Services — 0.1% | | | |
IQVIA, Inc., 4.875%, 5/15/23(2) | | $ | 120,000 |
| $ | 122,880 |
|
| Thermo Fisher Scientific, Inc., 3.60%, 8/15/21 | | 210,000 |
| 214,388 |
|
| Thermo Fisher Scientific, Inc., 3.30%, 2/15/22 | | 61,000 |
| 62,462 |
|
| | | | 399,730 |
|
Marine† | | | |
| Martin Midstream Partners LP / Martin Midstream Finance Corp., 7.25%, 2/15/21 | | 90,000 |
| 88,884 |
|
| Media — 0.5% | | | |
Altice Financing SA, 6.625%, 2/15/23(2) | | 200,000 |
| 206,750 |
|
| AMC Networks, Inc., 4.75%, 8/1/25 | | 170,000 |
| 173,612 |
|
| Cablevision Systems Corp., 5.875%, 9/15/22 | | 100,000 |
| 106,500 |
|
| CBS Corp., 4.85%, 7/1/42 | | 70,000 |
| 75,599 |
|
| CCO Holdings LLC / CCO Holdings Capital Corp., 5.25%, 9/30/22 | | 170,000 |
| 172,231 |
|
CCO Holdings LLC / CCO Holdings Capital Corp., 5.75%, 2/15/26(2) | | 140,000 |
| 147,834 |
|
CCO Holdings LLC / CCO Holdings Capital Corp., 5.125%, 5/1/27(2) | | 65,000 |
| 67,194 |
|
| Charter Communications Operating LLC / Charter Communications Operating Capital, 4.91%, 7/23/25 | | 580,000 |
| 626,059 |
|
| Charter Communications Operating LLC / Charter Communications Operating Capital, 6.48%, 10/23/45 | | 40,000 |
| 47,108 |
|
| Comcast Corp., 6.40%, 5/15/38 | | 230,000 |
| 314,736 |
|
| Comcast Corp., 4.75%, 3/1/44 | | 150,000 |
| 174,904 |
|
CSC Holdings LLC, 5.375%, 7/15/23(2) | | 105,000 |
| 107,950 |
|
CSC Holdings LLC, 6.625%, 10/15/25(2) | | 100,000 |
| 106,500 |
|
CSC Holdings LLC, 5.50%, 5/15/26(2) | | 25,000 |
| 26,188 |
|
| Digicel Ltd., 6.00%, 4/15/21 | | 153,000 |
| 105,952 |
|
| DISH DBS Corp., 6.75%, 6/1/21 | | 95,000 |
| 99,128 |
|
| DISH DBS Corp., 5.00%, 3/15/23 | | 135,000 |
| 130,781 |
|
| DISH DBS Corp., 5.875%, 11/15/24 | | 100,000 |
| 93,063 |
|
Gray Television, Inc., 5.125%, 10/15/24(2) | | 100,000 |
| 102,875 |
|
Gray Television, Inc., 5.875%, 7/15/26(2) | | 75,000 |
| 78,000 |
|
| Lamar Media Corp., 5.00%, 5/1/23 | | 100,000 |
| 102,095 |
|
| Lamar Media Corp., 5.375%, 1/15/24 | | 140,000 |
| 144,725 |
|
| Myriad International Holdings BV, 6.00%, 7/18/20 | | 153,000 |
| 157,444 |
|
Nexstar Broadcasting, Inc., 5.625%, 8/1/24(2) | | 105,000 |
| 109,331 |
|
Sinclair Television Group, Inc., 5.625%, 8/1/24(2) | | 90,000 |
| 92,786 |
|
Sirius XM Radio, Inc., 4.625%, 5/15/23(2) | | 70,000 |
| 71,400 |
|
Sirius XM Radio, Inc., 5.375%, 4/15/25(2) | | 60,000 |
| 62,475 |
|
TEGNA, Inc., 5.50%, 9/15/24(2) | | 100,000 |
| 103,625 |
|
Univision Communications, Inc., 5.125%, 2/15/25(2) | | 100,000 |
| 97,500 |
|
| Videotron Ltd., 5.00%, 7/15/22 | | 75,000 |
| 78,634 |
|
| WPP Finance 2013, MTN, 3.00%, 11/20/23 | EUR | 100,000 |
| 125,193 |
|
| | | | 4,108,172 |
|
| Metals and Mining — 0.2% | | | |
Alcoa Nederland Holding BV, 6.75%, 9/30/24(2) | | $ | 70,000 |
| 73,675 |
|
| Allegheny Technologies, Inc., 5.95%, 1/15/21 | | 110,000 |
| 113,163 |
|
|
| | | | | | | |
| | | Shares/
Principal Amount | Value |
| Cleveland-Cliffs, Inc., 5.75%, 3/1/25 | | $ | 160,000 |
| $ | 162,880 |
|
First Quantum Minerals Ltd., 7.25%, 5/15/22(2) | | 80,000 |
| 80,700 |
|
| First Quantum Minerals Ltd., 7.25%, 4/1/23 | | 150,000 |
| 149,063 |
|
First Quantum Minerals Ltd., 6.50%, 3/1/24(2) | | 250,000 |
| 241,442 |
|
| Freeport-McMoRan, Inc., 3.55%, 3/1/22 | | 100,000 |
| 100,507 |
|
| Freeport-McMoRan, Inc., 5.40%, 11/14/34 | | 180,000 |
| 174,600 |
|
| Nexa Resources SA, 5.375%, 5/4/27 | | 230,000 |
| 242,940 |
|
Novelis Corp., 5.875%, 9/30/26(2) | | 125,000 |
| 129,844 |
|
| Steel Dynamics, Inc., 5.25%, 4/15/23 | | 100,000 |
| 101,655 |
|
| Teck Resources Ltd., 6.25%, 7/15/41 | | 40,000 |
| 45,264 |
|
Vedanta Resources Ltd., 6.125%, 8/9/24(2) | | 217,000 |
| 204,509 |
|
| | | | 1,820,242 |
|
| Multi-Utilities — 0.2% | | | |
Abu Dhabi National Energy Co. PJSC, 5.875%, 12/13/21(2) | | 204,000 |
| 219,527 |
|
Abu Dhabi National Energy Co. PJSC, 3.625%, 1/12/23(2) | | 153,000 |
| 157,584 |
|
| AmeriGas Partners LP / AmeriGas Finance Corp., 5.875%, 8/20/26 | | 75,000 |
| 79,875 |
|
| Berkshire Hathaway Energy Co., 3.50%, 2/1/25 | | 90,000 |
| 94,431 |
|
| Berkshire Hathaway Energy Co., 3.80%, 7/15/48 | | 110,000 |
| 113,983 |
|
| Centrica plc, VRN, 5.25%, 4/10/75 | GBP | 100,000 |
| 127,685 |
|
| Consolidated Edison Co. of New York, Inc., 3.95%, 3/1/43 | | $ | 100,000 |
| 105,732 |
|
| Dominion Energy, Inc., 4.90%, 8/1/41 | | 70,000 |
| 80,900 |
|
| Exelon Generation Co. LLC, 4.25%, 6/15/22 | | 19,000 |
| 19,836 |
|
| Exelon Generation Co. LLC, 5.60%, 6/15/42 | | 80,000 |
| 91,600 |
|
| Florida Power & Light Co., 3.95%, 3/1/48 | | 90,000 |
| 99,600 |
|
Israel Electric Corp. Ltd., 6.875%, 6/21/23(2) | | 102,000 |
| 115,844 |
|
| Listrindo Capital BV, 4.95%, 9/14/26 | | 102,000 |
| 102,434 |
|
| MidAmerican Energy Co., 4.40%, 10/15/44 | | 80,000 |
| 92,334 |
|
| NiSource, Inc., 5.65%, 2/1/45 | | 110,000 |
| 136,629 |
|
| Sempra Energy, 2.875%, 10/1/22 | | 110,000 |
| 111,035 |
|
| Sempra Energy, 3.25%, 6/15/27 | | 140,000 |
| 140,736 |
|
| Sempra Energy, 4.00%, 2/1/48 | | 70,000 |
| 70,686 |
|
| Southwestern Public Service Co., 3.70%, 8/15/47 | | 60,000 |
| 61,869 |
|
| | | | 2,022,320 |
|
| Oil, Gas and Consumable Fuels — 0.9% | | | |
| Antero Resources Corp., 5.125%, 12/1/22 | | 160,000 |
| 153,600 |
|
| Antero Resources Corp., 5.00%, 3/1/25 | | 70,000 |
| 62,987 |
|
| Calumet Specialty Products Partners LP / Calumet Finance Corp., 6.50%, 4/15/21 | | 20,000 |
| 19,950 |
|
| Carrizo Oil & Gas, Inc., 6.25%, 4/15/23 | | 70,000 |
| 69,090 |
|
| Chesapeake Energy Corp., 8.00%, 1/15/25 | | 95,000 |
| 81,700 |
|
| CNOOC Finance 2013 Ltd., 3.00%, 5/9/23 | | 255,000 |
| 257,310 |
|
| CNOOC Nexen Finance 2014 ULC, 4.25%, 4/30/24 | | 150,000 |
| 160,038 |
|
| CNX Resources Corp., 5.875%, 4/15/22 | | 111,000 |
| 107,115 |
|
Denbury Resources, Inc., 9.00%, 5/15/21(2) | | 40,000 |
| 37,900 |
|
|
| | | | | | | |
| | | Shares/
Principal Amount | Value |
| Denbury Resources, Inc., 4.625%, 7/15/23 | | $ | 75,000 |
| $ | 29,250 |
|
| Diamondback Energy, Inc., 4.75%, 11/1/24 | | 100,000 |
| 103,095 |
|
| Ecopetrol SA, 5.875%, 5/28/45 | | 395,000 |
| 445,126 |
|
| Enbridge, Inc., 4.00%, 10/1/23 | | 120,000 |
| 126,120 |
|
| Encana Corp., 6.50%, 2/1/38 | | 130,000 |
| 156,804 |
|
| Energy Transfer Operating LP, 4.15%, 10/1/20 | | 200,000 |
| 203,018 |
|
| Energy Transfer Operating LP, 3.60%, 2/1/23 | | 27,000 |
| 27,680 |
|
| Energy Transfer Operating LP, 6.50%, 2/1/42 | | 100,000 |
| 118,562 |
|
Gazprom OAO Via Gaz Capital SA, 6.51%, 3/7/22(2) | | 140,000 |
| 152,012 |
|
Gazprom OAO Via Gaz Capital SA, 7.29%, 8/16/37(2) | | 140,000 |
| 179,973 |
|
Gran Tierra Energy International Holdings Ltd., 6.25%, 2/15/25(2) | | 200,000 |
| 190,750 |
|
| Gulfport Energy Corp., 6.00%, 10/15/24 | | 40,000 |
| 30,996 |
|
| Gulfport Energy Corp., 6.375%, 5/15/25 | | 70,000 |
| 53,900 |
|
| Hess Corp., 6.00%, 1/15/40 | | 110,000 |
| 119,699 |
|
Hilcorp Energy I LP / Hilcorp Finance Co., 5.75%, 10/1/25(2) | | 20,000 |
| 19,550 |
|
| Kinder Morgan Energy Partners LP, 6.50%, 9/1/39 | | 300,000 |
| 371,952 |
|
| Laredo Petroleum, Inc., 6.25%, 3/15/23 | | 50,000 |
| 45,125 |
|
MEG Energy Corp., 7.00%, 3/31/24(2) | | 50,000 |
| 47,989 |
|
MEG Energy Corp., 6.50%, 1/15/25(2) | | 70,000 |
| 70,088 |
|
| MPLX LP, 4.50%, 4/15/38 | | 60,000 |
| 60,817 |
|
| MPLX LP, 5.20%, 3/1/47 | | 40,000 |
| 42,920 |
|
| Murphy Oil Corp., 4.20%, 12/1/22 | | 80,000 |
| 81,578 |
|
| Newfield Exploration Co., 5.75%, 1/30/22 | | 230,000 |
| 245,696 |
|
| Newfield Exploration Co., 5.375%, 1/1/26 | | 60,000 |
| 65,710 |
|
| Noble Energy, Inc., 4.15%, 12/15/21 | | 175,000 |
| 180,478 |
|
| Oasis Petroleum, Inc., 6.875%, 3/15/22 | | 120,000 |
| 120,042 |
|
Parsley Energy LLC / Parsley Finance Corp., 5.375%, 1/15/25(2) | | 120,000 |
| 122,107 |
|
| Petrobras Global Finance BV, 5.75%, 2/1/29 | | 380,000 |
| 409,640 |
|
| Petrobras Global Finance BV, 7.25%, 3/17/44 | | 180,000 |
| 211,320 |
|
| Petroleos Mexicanos, 6.00%, 3/5/20 | | 122,000 |
| 123,809 |
|
| Petroleos Mexicanos, 4.875%, 1/24/22 | | 40,000 |
| 40,500 |
|
| Petroleos Mexicanos, 3.50%, 1/30/23 | | 70,000 |
| 67,130 |
|
| Petroleos Mexicanos, 6.50%, 3/13/27 | | 140,000 |
| 139,188 |
|
| Petroleos Mexicanos, 5.50%, 6/27/44 | | 230,000 |
| 188,025 |
|
| QEP Resources, Inc., 5.375%, 10/1/22 | | 110,000 |
| 102,437 |
|
| Range Resources Corp., 5.00%, 8/15/22 | | 100,000 |
| 92,470 |
|
| Ras Laffan Liquefied Natural Gas Co. Ltd. II, 5.30%, 9/30/20 | | 34,027 |
| 34,651 |
|
Ras Laffan Liquefied Natural Gas Co. Ltd. IIII, 6.75%, 9/30/19(2) | | 459,000 |
| 462,190 |
|
| Reliance Industries Ltd., 4.125%, 1/28/25 | | 332,000 |
| 347,802 |
|
| Shell International Finance BV, 3.625%, 8/21/42 | | 165,000 |
| 170,323 |
|
| SM Energy Co., 5.00%, 1/15/24 | | 80,000 |
| 73,800 |
|
| Southwestern Energy Co., 6.20%, 1/23/25 | | 100,000 |
| 86,750 |
|
| Suburban Propane Partners LP / Suburban Energy Finance Corp., 5.50%, 6/1/24 | | 70,000 |
| 71,750 |
|
|
| | | | | | | |
| | | Shares/
Principal Amount | Value |
| Suburban Propane Partners LP / Suburban Energy Finance Corp., 5.75%, 3/1/25 | | $ | 100,000 |
| $ | 101,750 |
|
| TOTAL SA, MTN, VRN, 2.25%, 2/26/21 | EUR | 150,000 |
| 171,135 |
|
Tullow Oil plc, 7.00%, 3/1/25(2) | | $ | 250,000 |
| 252,187 |
|
| Whiting Petroleum Corp., 5.75%, 3/15/21 | | 100,000 |
| 100,500 |
|
| Williams Cos., Inc. (The), 4.55%, 6/24/24 | | 270,000 |
| 289,791 |
|
| Williams Cos., Inc. (The), 5.10%, 9/15/45 | | 150,000 |
| 163,571 |
|
| WPX Energy, Inc., 6.00%, 1/15/22 | | 70,000 |
| 72,888 |
|
| WPX Energy, Inc., 8.25%, 8/1/23 | | 50,000 |
| 56,500 |
|
| | | | 8,190,834 |
|
Personal Products† | | | |
| Avon Products, Inc., 7.00%, 3/15/23 | | 45,000 |
| 45,518 |
|
| Pharmaceuticals — 0.2% | | | |
| Allergan Finance LLC, 3.25%, 10/1/22 | | 270,000 |
| 273,862 |
|
| Allergan Funding SCS, 3.85%, 6/15/24 | | 230,000 |
| 239,572 |
|
| Allergan Funding SCS, 4.55%, 3/15/35 | | 110,000 |
| 113,913 |
|
Bausch Health Cos., Inc., 7.00%, 3/15/24(2) | | 60,000 |
| 63,450 |
|
Bausch Health Cos., Inc., 6.125%, 4/15/25(2) | | 195,000 |
| 200,060 |
|
| Horizon Pharma USA, Inc., 6.625%, 5/1/23 | | 35,000 |
| 36,180 |
|
| Shire Acquisitions Investments Ireland DAC, 2.40%, 9/23/21 | | 450,000 |
| 449,256 |
|
| Teva Pharmaceutical Finance Netherlands III BV, 3.15%, 10/1/26 | | 110,000 |
| 86,063 |
|
| Teva Pharmaceutical Finance Netherlands III BV, 6.75%, 3/1/28 | | 250,000 |
| 224,687 |
|
| | | | 1,687,043 |
|
| Road and Rail — 0.1% | | | |
| Burlington Northern Santa Fe LLC, 3.60%, 9/1/20 | | 265,000 |
| 267,517 |
|
| Burlington Northern Santa Fe LLC, 4.95%, 9/15/41 | | 18,000 |
| 21,625 |
|
| Burlington Northern Santa Fe LLC, 4.45%, 3/15/43 | | 160,000 |
| 182,526 |
|
| Burlington Northern Santa Fe LLC, 4.15%, 4/1/45 | | 70,000 |
| 77,678 |
|
Park Aerospace Holdings Ltd., 5.25%, 8/15/22(2) | | 80,000 |
| 84,647 |
|
| Rumo Luxembourg Sarl, 7.375%, 2/9/24 | | 180,000 |
| 195,282 |
|
| Union Pacific Corp., 4.75%, 9/15/41 | | 220,000 |
| 250,099 |
|
| | | | 1,079,374 |
|
Semiconductors and Semiconductor Equipment† | | | |
| Advanced Micro Devices, Inc., 7.00%, 7/1/24 | | 45,000 |
| 46,969 |
|
NXP BV / NXP Funding LLC, 3.875%, 9/1/22(2) | | 70,000 |
| 72,126 |
|
Sensata Technologies BV, 5.00%, 10/1/25(2) | | 20,000 |
| 21,149 |
|
| | | | 140,244 |
|
| Software — 0.2% | | | |
| Infor US, Inc., 6.50%, 5/15/22 | | 198,000 |
| 202,207 |
|
| Microsoft Corp., 2.70%, 2/12/25 | | 340,000 |
| 348,275 |
|
| Microsoft Corp., 4.25%, 2/6/47 | | 340,000 |
| 401,323 |
|
| Oracle Corp., 3.625%, 7/15/23 | | 280,000 |
| 294,873 |
|
| Oracle Corp., 2.65%, 7/15/26 | | 280,000 |
| 281,394 |
|
| | | | 1,528,072 |
|
|
| | | | | | | |
| | | Shares/
Principal Amount | Value |
| Specialty Retail — 0.2% | | | |
| Hertz Corp. (The), 7.375%, 1/15/21 | | $ | 40,000 |
| $ | 40,044 |
|
| Hertz Corp. (The), 6.25%, 10/15/22 | | 75,000 |
| 76,133 |
|
| Home Depot, Inc. (The), 3.75%, 2/15/24 | | 230,000 |
| 244,961 |
|
| Home Depot, Inc. (The), 5.95%, 4/1/41 | | 260,000 |
| 355,831 |
|
| L Brands, Inc., 5.625%, 2/15/22 | | 105,000 |
| 110,696 |
|
Party City Holdings, Inc., 6.125%, 8/15/23(2) | | 50,000 |
| 50,250 |
|
PetSmart, Inc., 5.875%, 6/1/25(2) | | 50,000 |
| 49,680 |
|
| Sally Holdings LLC / Sally Capital, Inc., 5.50%, 11/1/23 | | 55,000 |
| 56,134 |
|
| Sonic Automotive, Inc., 5.00%, 5/15/23 | | 50,000 |
| 50,615 |
|
| United Rentals North America, Inc., 4.625%, 7/15/23 | | 260,000 |
| 266,752 |
|
| United Rentals North America, Inc., 5.50%, 7/15/25 | | 70,000 |
| 72,975 |
|
| United Rentals North America, Inc., 5.50%, 5/15/27 | | 85,000 |
| 89,012 |
|
| | | | 1,463,083 |
|
| Technology Hardware, Storage and Peripherals — 0.1% | | | |
| Apple, Inc., 2.45%, 8/4/26 | | 140,000 |
| 139,913 |
|
| Apple, Inc., 3.20%, 5/11/27 | | 190,000 |
| 198,099 |
|
| Apple, Inc., 2.90%, 9/12/27 | | 90,000 |
| 92,175 |
|
Dell International LLC / EMC Corp., 7.125%, 6/15/24(2) | | 160,000 |
| 169,202 |
|
| EMC Corp., 2.65%, 6/1/20 | | 25,000 |
| 24,873 |
|
| Hewlett Packard Enterprise Co., 3.60%, 10/15/20 | | 270,000 |
| 273,239 |
|
| NCR Corp., 5.00%, 7/15/22 | | 90,000 |
| 90,761 |
|
| Western Digital Corp., 4.75%, 2/15/26 | | 60,000 |
| 59,475 |
|
| | | | 1,047,737 |
|
Textiles, Apparel and Luxury Goods† | | | |
Hanesbrands, Inc., 4.625%, 5/15/24(2) | | 115,000 |
| 119,912 |
|
Trading Companies and Distributors† | | | |
Beacon Roofing Supply, Inc., 4.875%, 11/1/25(2) | | 70,000 |
| 69,563 |
|
| Wireless Telecommunication Services — 0.2% | | | |
C&W Senior Financing DAC, 6.875%, 9/15/27(2) | | 228,000 |
| 239,411 |
|
GTH Finance BV, 7.25%, 4/26/23(2) | | 217,000 |
| 241,057 |
|
Millicom International Cellular SA, 5.125%, 1/15/28(2) | | 255,000 |
| 262,331 |
|
| Oztel Holdings SPC Ltd., 6.625%, 4/24/28 | | 204,000 |
| 209,962 |
|
| Sprint Corp., 7.25%, 9/15/21 | | 120,000 |
| 129,150 |
|
| Sprint Corp., 7.875%, 9/15/23 | | 75,000 |
| 83,531 |
|
| Sprint Corp., 7.125%, 6/15/24 | | 205,000 |
| 224,219 |
|
| T-Mobile USA, Inc., 6.375%, 3/1/25 | | 100,000 |
| 103,875 |
|
| T-Mobile USA, Inc., 6.50%, 1/15/26 | | 80,000 |
| 85,376 |
|
| | | | 1,578,912 |
|
TOTAL CORPORATE BONDS
(Cost $76,780,758) | | | 78,800,704 |
|
| U.S. TREASURY SECURITIES — 6.4% | | | |
| U.S. Treasury Bonds, 4.50%, 2/15/36 | | 2,150,000 |
| 2,835,145 |
|
U.S. Treasury Bonds, 3.125%, 8/15/44(4) | | 390,000 |
| 434,865 |
|
| U.S. Treasury Bonds, 3.00%, 11/15/44 | | 300,000 |
| 327,475 |
|
| U.S. Treasury Bonds, 2.50%, 2/15/45 | | 1,560,000 |
| 1,553,754 |
|
| U.S. Treasury Bonds, 3.00%, 5/15/45 | | 560,000 |
| 611,920 |
|
|
| | | | | | | |
| | | Shares/
Principal Amount | Value |
| U.S. Treasury Bonds, 3.00%, 11/15/45 | | $ | 100,000 |
| $ | 109,367 |
|
| U.S. Treasury Bonds, 2.50%, 5/15/46 | | 300,000 |
| 298,248 |
|
| U.S. Treasury Inflation Indexed Bonds, 2.375%, 1/15/25 | | 1,018,950 |
| 1,134,693 |
|
| U.S. Treasury Inflation Indexed Bonds, 2.375%, 1/15/27 | | 317,473 |
| 366,722 |
|
| U.S. Treasury Inflation Indexed Bonds, 2.50%, 1/15/29 | | 1,353,817 |
| 1,629,489 |
|
| U.S. Treasury Inflation Indexed Bonds, 3.375%, 4/15/32 | | 144,277 |
| 197,757 |
|
| U.S. Treasury Inflation Indexed Bonds, 2.125%, 2/15/40 | | 710,910 |
| 917,500 |
|
| U.S. Treasury Inflation Indexed Bonds, 2.125%, 2/15/41 | | 958,924 |
| 1,246,353 |
|
| U.S. Treasury Inflation Indexed Bonds, 0.625%, 2/15/43 | | 1,080,454 |
| 1,059,891 |
|
| U.S. Treasury Inflation Indexed Bonds, 1.375%, 2/15/44 | | 2,911,900 |
| 3,341,161 |
|
| U.S. Treasury Inflation Indexed Bonds, 0.75%, 2/15/45 | | 3,382,187 |
| 3,385,637 |
|
| U.S. Treasury Inflation Indexed Bonds, 0.875%, 2/15/47 | | 583,490 |
| 601,518 |
|
| U.S. Treasury Inflation Indexed Notes, 0.125%, 7/15/22 | | 1,837,473 |
| 1,828,424 |
|
| U.S. Treasury Inflation Indexed Notes, 0.625%, 1/15/24 | | 5,487,750 |
| 5,574,369 |
|
| U.S. Treasury Inflation Indexed Notes, 0.25%, 1/15/25 | | 4,324,880 |
| 4,324,280 |
|
| U.S. Treasury Inflation Indexed Notes, 0.625%, 1/15/26 | | 3,772,230 |
| 3,863,862 |
|
| U.S. Treasury Inflation Indexed Notes, 0.125%, 7/15/26 | | 6,143,185 |
| 6,111,387 |
|
| U.S. Treasury Inflation Indexed Notes, 0.50%, 1/15/28 | | 363,374 |
| 369,936 |
|
| U.S. Treasury Inflation Indexed Notes, 0.875%, 1/15/29 | | 1,927,018 |
| 2,031,822 |
|
| U.S. Treasury Notes, 1.75%, 9/30/19 | | 1,100,000 |
| 1,099,277 |
|
U.S. Treasury Notes, 1.375%, 1/15/20(4) | | 850,000 |
| 847,178 |
|
U.S. Treasury Notes, 1.375%, 2/29/20(4) | | 1,000,000 |
| 995,605 |
|
| U.S. Treasury Notes, 1.875%, 12/15/20 | | 800,000 |
| 799,016 |
|
| U.S. Treasury Notes, 2.375%, 3/15/21 | | 5,700,000 |
| 5,740,189 |
|
| U.S. Treasury Notes, 2.00%, 12/31/21 | | 2,000,000 |
| 2,007,227 |
|
U.S. Treasury Notes, 2.25%, 8/15/27(4) | | 400,000 |
| 408,789 |
|
| U.S. Treasury Notes, 2.75%, 2/15/28 | | 300,000 |
| 318,252 |
|
TOTAL U.S. TREASURY SECURITIES
(Cost $54,277,821) | | | 56,371,108 |
|
| SOVEREIGN GOVERNMENTS AND AGENCIES — 4.2% | | | |
| Australia — 0.1% | | | |
| Australia Government Bond, 2.75%, 4/21/24 | AUD | 1,219,000 |
| 907,890 |
|
| New South Wales Treasury Corp., 3.00%, 3/20/28 | AUD | 395,000 |
| 302,462 |
|
| | | | 1,210,352 |
|
| Austria — 0.1% | | | |
Republic of Austria Government Bond, 3.40%, 11/22/22(2) | EUR | 172,000 |
| 216,543 |
|
Republic of Austria Government Bond, 0.75%, 10/20/26(2) | EUR | 185,000 |
| 222,498 |
|
Republic of Austria Government Bond, 4.15%, 3/15/37(2) | EUR | 121,000 |
| 225,544 |
|
| | | | 664,585 |
|
Belgium† | | | |
Kingdom of Belgium Government Bond, 4.25%, 3/28/41(2) | EUR | 74,000 |
| 144,544 |
|
| Canada — 0.2% | | | |
| Province of British Columbia Canada, 3.25%, 12/18/21 | CAD | 594,000 |
| 465,636 |
|
| Province of British Columbia Canada, 2.85%, 6/18/25 | CAD | 809,000 |
| 644,442 |
|
| Province of Quebec Canada, 3.00%, 9/1/23 | CAD | 465,000 |
| 368,005 |
|
| Province of Quebec Canada, 5.75%, 12/1/36 | CAD | 445,000 |
| 497,032 |
|
| Province of Quebec Canada, 5.00%, 12/1/41 | CAD | 30,000 |
| 32,575 |
|
|
| | | | | | | |
| | | Shares/
Principal Amount | Value |
| Province of Quebec Canada, 3.50%, 12/1/48 | CAD | 110,000 |
| $ | 101,450 |
|
| | | | 2,109,140 |
|
Chile† | | | |
| Chile Government International Bond, 3.25%, 9/14/21 | | $ | 230,000 |
| 235,235 |
|
Colombia† | | | |
| Colombia Government International Bond, 4.375%, 7/12/21 | | $ | 290,000 |
| 300,298 |
|
Czech Republic† | | | |
| Czech Republic Government Bond, 4.70%, 9/12/22 | CZK | 2,470,000 |
| 118,129 |
|
Denmark† | | | |
| Denmark Government Bond, 0.50%, 11/15/27 | DKK | 600,000 |
| 96,812 |
|
| Denmark Government Bond, 4.50%, 11/15/39 | DKK | 340,000 |
| 98,098 |
|
| | | | 194,910 |
|
Finland† | | | |
Finland Government Bond, 4.00%, 7/4/25(2) | EUR | 219,000 |
| 309,439 |
|
| France — 0.3% | | | |
| French Republic Government Bond OAT, 1.75%, 11/25/24 | EUR | 893,750 |
| 1,114,526 |
|
| French Republic Government Bond OAT, 5.50%, 4/25/29 | EUR | 155,844 |
| 270,090 |
|
| French Republic Government Bond OAT, 3.25%, 5/25/45 | EUR | 533,000 |
| 967,238 |
|
| | | | 2,351,854 |
|
| Germany — 0.4% | | | |
| Bundesrepublik Deutschland Bundesanleihe, 0.50%, 2/15/25 | EUR | 178,000 |
| 210,749 |
|
Bundesrepublik Deutschland Bundesanleihe, 0.00%, 8/15/26(5) | EUR | 775,000 |
| 898,874 |
|
| Bundesrepublik Deutschland Bundesanleihe, 0.25%, 2/15/27 | EUR | 1,253,000 |
| 1,481,399 |
|
| Bundesrepublik Deutschland Bundesanleihe, 4.75%, 7/4/28 | EUR | 98,000 |
| 161,411 |
|
| Bundesrepublik Deutschland Bundesanleihe, 4.75%, 7/4/40 | EUR | 111,000 |
| 248,521 |
|
| Bundesrepublik Deutschland Bundesanleihe, 2.50%, 7/4/44 | EUR | 358,000 |
| 637,043 |
|
| | | | 3,637,997 |
|
| Indonesia — 0.1% | | | |
| Indonesia Treasury Bond, 8.375%, 9/15/26 | IDR | 6,000,000,000 |
| 457,844 |
|
Ireland† | | | |
| Ireland Government Bond, 3.40%, 3/18/24 | EUR | 283,000 |
| 369,210 |
|
| Italy — 0.4% | | | |
| Italy Buoni Poliennali Del Tesoro, 1.50%, 6/1/25 | EUR | 180,000 |
| 205,442 |
|
| Italy Buoni Poliennali Del Tesoro, 2.00%, 12/1/25 | EUR | 1,338,000 |
| 1,568,708 |
|
Italy Buoni Poliennali Del Tesoro, 4.75%, 9/1/44(2) | EUR | 623,000 |
| 971,694 |
|
Italy Buoni Poliennali Del Tesoro, 3.45%, 3/1/48(2) | EUR | 405,000 |
| 531,931 |
|
| | | | 3,277,775 |
|
| Japan — 1.1% | | | |
| Japan Government Ten Year Bond, 0.80%, 6/20/23 | JPY | 26,250,000 |
| 251,121 |
|
| Japan Government Thirty Year Bond, 2.40%, 3/20/37 | JPY | 226,800,000 |
| 2,914,769 |
|
| Japan Government Thirty Year Bond, 2.00%, 9/20/41 | JPY | 154,250,000 |
| 1,959,728 |
|
| Japan Government Thirty Year Bond, 1.40%, 12/20/45 | JPY | 28,550,000 |
| 335,814 |
|
| Japan Government Twenty Year Bond, 2.10%, 12/20/26 | JPY | 402,800,000 |
| 4,354,887 |
|
| | | | 9,816,319 |
|
|
| | | | | | | |
| | | Shares/
Principal Amount | Value |
Malaysia† | | | |
| Malaysia Government Bond, 3.96%, 9/15/25 | MYR | 990,000 |
| $ | 245,232 |
|
| Mexico — 0.1% | | | |
| Mexican Bonos, 6.50%, 6/9/22 | MXN | 9,190,000 |
| 470,157 |
|
| Mexico Government International Bond, 4.15%, 3/28/27 | | $ | 700,000 |
| 729,225 |
|
| | | | 1,199,382 |
|
| Netherlands — 0.1% | | | |
Netherlands Government Bond, 0.00%, 1/15/22(2)(5) | EUR | 152,000 |
| 171,484 |
|
Netherlands Government Bond, 0.50%, 7/15/26(2) | EUR | 506,000 |
| 601,738 |
|
Netherlands Government Bond, 2.75%, 1/15/47(2) | EUR | 82,000 |
| 154,938 |
|
| | | | 928,160 |
|
| Norway — 0.4% | | | |
Norway Government Bond, 2.00%, 5/24/23(2) | NOK | 405,000 |
| 47,015 |
|
Norway Government Bond, 1.75%, 2/17/27(2) | NOK | 1,880,000 |
| 219,198 |
|
Norway Government Bond, 1.75%, 9/6/29(2) | NOK | 26,750,000 |
| 3,131,594 |
|
| | | | 3,397,807 |
|
Peru† | | | |
| Peruvian Government International Bond, 5.625%, 11/18/50 | | $ | 160,000 |
| 222,802 |
|
| Philippines — 0.1% | | | |
| Philippine Government International Bond, 4.00%, 1/15/21 | | $ | 300,000 |
| 307,395 |
|
| Philippine Government International Bond, 6.375%, 10/23/34 | | $ | 100,000 |
| 140,326 |
|
| | | | 447,721 |
|
| Poland — 0.1% | | | |
| Republic of Poland Government Bond, 4.00%, 10/25/23 | PLN | 775,000 |
| 217,890 |
|
| Republic of Poland Government International Bond, 5.125%, 4/21/21 | | $ | 250,000 |
| 262,456 |
|
| | | | 480,346 |
|
Russia† | | | |
| Russian Federal Bond - OFZ, 7.05%, 1/19/28 | RUB | 5,500,000 |
| 86,260 |
|
Singapore† | | | |
| Singapore Government Bond, 3.125%, 9/1/22 | SGD | 377,000 |
| 286,241 |
|
South Africa† | | | |
| Republic of South Africa Government International Bond, 5.50%, 3/9/20 | | $ | 185,000 |
| 187,545 |
|
| Spain — 0.1% | | | |
Spain Government Bond, 4.40%, 10/31/23(2) | EUR | 100,000 |
| 133,224 |
|
Spain Government Bond, 1.60%, 4/30/25(2) | EUR | 132,000 |
| 161,375 |
|
Spain Government Bond, 5.15%, 10/31/28(2) | EUR | 47,000 |
| 75,841 |
|
Spain Government Bond, 5.15%, 10/31/44(2) | EUR | 9,000 |
| 18,781 |
|
| | | | 389,221 |
|
| Switzerland — 0.1% | | | |
| Swiss Confederation Government Bond, 1.25%, 5/28/26 | CHF | 410,000 |
| 473,717 |
|
| Swiss Confederation Government Bond, 2.50%, 3/8/36 | CHF | 71,000 |
| 106,713 |
|
| | | | 580,430 |
|
| Thailand — 0.1% | | | |
| Thailand Government Bond, 3.625%, 6/16/23 | THB | 4,150,000 |
| 144,548 |
|
|
| | | | | | | |
| | | Shares/
Principal Amount | Value |
| Thailand Government Bond, 3.85%, 12/12/25 | THB | 11,550,000 |
| $ | 422,816 |
|
| | | | 567,364 |
|
| United Kingdom — 0.4% | | | |
| United Kingdom Gilt, 1.75%, 9/7/22 | GBP | 467,000 |
| 592,710 |
|
| United Kingdom Gilt, 1.50%, 7/22/26 | GBP | 761,000 |
| 993,590 |
|
| United Kingdom Gilt, 4.50%, 12/7/42 | GBP | 396,000 |
| 799,653 |
|
| United Kingdom Gilt, 4.25%, 12/7/49 | GBP | 190,000 |
| 402,783 |
|
| United Kingdom Gilt, 4.25%, 12/7/55 | GBP | 106,000 |
| 240,866 |
|
| | | | 3,029,602 |
|
Uruguay† | | | |
| Uruguay Government International Bond, 4.125%, 11/20/45 | | $ | 80,000 |
| 83,021 |
|
TOTAL SOVEREIGN GOVERNMENTS AND AGENCIES
(Cost $35,155,457) | | | 37,328,765 |
|
| U.S. GOVERNMENT AGENCY MORTGAGE-BACKED SECURITIES — 3.6% | |
| Adjustable-Rate U.S. Government Agency Mortgage-Backed Securities — 0.5% | |
| FHLMC, VRN, 4.75%, (1-year H15T1Y plus 2.25%), 9/1/35 | | 199,474 |
| 210,491 |
|
| FHLMC, VRN, 4.74%, (12-month LIBOR plus 1.87%), 7/1/36 | | 37,582 |
| 39,559 |
|
| FHLMC, VRN, 4.46%, (1-year H15T1Y plus 2.14%), 10/1/36 | | 120,044 |
| 126,249 |
|
| FHLMC, VRN, 4.80%, (1-year H15T1Y plus 2.25%), 4/1/37 | | 119,754 |
| 126,234 |
|
| FHLMC, VRN, 4.11%, (12-month LIBOR plus 1.78%), 9/1/40 | | 56,954 |
| 59,416 |
|
| FHLMC, VRN, 4.77%, (12-month LIBOR plus 1.88%), 5/1/41 | | 24,353 |
| 25,527 |
|
| FHLMC, VRN, 3.69%, (12-month LIBOR plus 1.89%), 7/1/41 | | 92,808 |
| 95,522 |
|
| FHLMC, VRN, 4.09%, (12-month LIBOR plus 1.87%), 7/1/41 | | 96,083 |
| 100,428 |
|
| FHLMC, VRN, 4.72%, (12-month LIBOR plus 1.64%), 2/1/43 | | 44,525 |
| 46,039 |
|
| FHLMC, VRN, 4.44%, (12-month LIBOR plus 1.65%), 6/1/43 | | 30,402 |
| 31,583 |
|
| FHLMC, VRN, 4.50%, (12-month LIBOR plus 1.62%), 6/1/43 | | 533 |
| 551 |
|
| FHLMC, VRN, 2.37%, (12-month LIBOR plus 1.63%), 8/1/46 | | 376,036 |
| 376,923 |
|
| FHLMC, VRN, 3.07%, (12-month LIBOR plus 1.64%), 9/1/47 | | 396,834 |
| 403,393 |
|
| FNMA, VRN, 4.19%, (6-month LIBOR plus 1.57%), 6/1/35 | | 68,131 |
| 70,665 |
|
| FNMA, VRN, 4.19%, (6-month LIBOR plus 1.57%), 6/1/35 | | 158,311 |
| 164,194 |
|
| FNMA, VRN, 4.19%, (6-month LIBOR plus 1.57%), 6/1/35 | | 112,004 |
| 116,027 |
|
| FNMA, VRN, 4.20%, (6-month LIBOR plus 1.57%), 6/1/35 | | 176,542 |
| 183,021 |
|
| FNMA, VRN, 4.34%, (6-month LIBOR plus 1.54%), 9/1/35 | | 22,046 |
| 22,824 |
|
| FNMA, VRN, 4.56%, (1-year H15T1Y plus 2.16%), 3/1/38 | | 113,513 |
| 119,406 |
|
| FNMA, VRN, 4.82%, (12-month LIBOR plus 1.69%), 1/1/40 | | 20,265 |
| 21,457 |
|
| FNMA, VRN, 4.71%, (12-month LIBOR plus 1.80%), 3/1/40 | | 43,015 |
| 45,378 |
|
| FNMA, VRN, 3.62%, (12-month LIBOR plus 1.79%), 8/1/40 | | 112,210 |
| 116,959 |
|
| FNMA, VRN, 3.92%, (12-month LIBOR plus 1.76%), 10/1/40 | | 98,213 |
| 102,178 |
|
| FNMA, VRN, 3.33%, (12-month LIBOR plus 1.82%), 9/1/41 | | 104,722 |
| 107,519 |
|
|
| | | | | | | |
| | | Shares/
Principal Amount | Value |
| FNMA, VRN, 2.71%, (12-month LIBOR plus 1.72%), 4/1/42 | | $ | 22,686 |
| $ | 22,993 |
|
| FNMA, VRN, 2.60%, (12-month LIBOR plus 1.60%), 4/1/46 | | 214,986 |
| 216,846 |
|
| FNMA, VRN, 3.18%, (12-month LIBOR plus 1.61%), 3/1/47 | | 415,619 |
| 423,721 |
|
| FNMA, VRN, 3.19%, (12-month LIBOR plus 1.61%), 3/1/47 | | 274,340 |
| 279,693 |
|
| FNMA, VRN, 3.17%, (12-month LIBOR plus 1.61%), 4/1/47 | | 261,473 |
| 266,701 |
|
| FNMA, VRN, 3.25%, (12-month LIBOR plus 1.62%), 5/1/47 | | 384,380 |
| 392,271 |
|
| | | | 4,313,768 |
|
| Fixed-Rate U.S. Government Agency Mortgage-Backed Securities — 3.1% | |
| FHLMC, 5.00%, 10/1/19 | | 16 |
| 16 |
|
| FHLMC, 5.00%, 11/1/19 | | 522 |
| 536 |
|
| FHLMC, 5.50%, 11/1/19 | | 103 |
| 103 |
|
| FHLMC, 5.50%, 11/1/19 | | 15 |
| 15 |
|
| FHLMC, 5.50%, 12/1/19 | | 123 |
| 123 |
|
| FHLMC, 5.00%, 2/1/20 | | 99 |
| 101 |
|
| FHLMC, 5.00%, 2/1/20 | | 40 |
| 41 |
|
| FHLMC, 5.50%, 3/1/20 | | 149 |
| 149 |
|
| FHLMC, 5.50%, 3/1/20 | | 200 |
| 200 |
|
| FHLMC, 5.50%, 3/1/20 | | 142 |
| 142 |
|
| FHLMC, 5.00%, 5/1/20 | | 95 |
| 98 |
|
| FHLMC, 5.00%, 5/1/20 | | 252 |
| 259 |
|
| FHLMC, 5.00%, 5/1/20 | | 492 |
| 505 |
|
| FHLMC, 4.50%, 7/1/20 | | 1,750 |
| 1,795 |
|
| FHLMC, 4.00%, 10/1/20 | | 956 |
| 994 |
|
| FHLMC, 8.00%, 6/1/26 | | 3,436 |
| 3,506 |
|
| FHLMC, 8.00%, 6/1/26 | | 217 |
| 237 |
|
| FHLMC, 7.00%, 8/1/29 | | 880 |
| 953 |
|
| FHLMC, 8.00%, 7/1/30 | | 6,258 |
| 7,422 |
|
| FHLMC, 5.50%, 12/1/33 | | 118,077 |
| 131,054 |
|
| FHLMC, 6.50%, 5/1/34 | | 5,833 |
| 6,767 |
|
| FHLMC, 5.50%, 6/1/35 | | 3,163 |
| 3,390 |
|
| FHLMC, 5.00%, 9/1/35 | | 2,067 |
| 2,248 |
|
| FHLMC, 5.00%, 9/1/35 | | 2,265 |
| 2,487 |
|
| FHLMC, 5.50%, 10/1/35 | | 18,237 |
| 20,350 |
|
| FHLMC, 5.50%, 10/1/35 | | 12,714 |
| 13,986 |
|
| FHLMC, 5.00%, 11/1/35 | | 43,398 |
| 47,662 |
|
| FHLMC, 5.00%, 11/1/35 | | 69,197 |
| 76,590 |
|
| FHLMC, 6.50%, 3/1/36 | | 450 |
| 499 |
|
| FHLMC, 6.50%, 3/1/36 | | 1,364 |
| 1,515 |
|
| FHLMC, 5.50%, 1/1/38 | | 67,258 |
| 73,789 |
|
| FHLMC, 6.00%, 2/1/38 | | 44,247 |
| 50,413 |
|
| FHLMC, 6.00%, 11/1/38 | | 193,774 |
| 220,321 |
|
| FNMA, 4.50%, TBA | | 2,621,000 |
| 2,747,305 |
|
| FNMA, 4.50%, 12/1/19 | | 153 |
| 157 |
|
| FNMA, 5.00%, 3/1/20 | | 570 |
| 585 |
|
| FNMA, 5.00%, 3/1/20 | | 443 |
| 455 |
|
| FNMA, 5.00%, 4/1/20 | | 582 |
| 597 |
|
|
| | | | | | | |
| | | Shares/
Principal Amount | Value |
| FNMA, 5.00%, 5/1/20 | | $ | 86 |
| $ | 88 |
|
| FNMA, 5.00%, 5/1/20 | | 496 |
| 509 |
|
| FNMA, 5.00%, 7/1/20 | | 854 |
| 877 |
|
| FNMA, 7.00%, 5/1/26 | | 1,730 |
| 1,806 |
|
| FNMA, 7.00%, 6/1/26 | | 843 |
| 923 |
|
| FNMA, 6.50%, 4/1/29 | | 4,964 |
| 5,509 |
|
| FNMA, 6.50%, 6/1/29 | | 8,967 |
| 9,948 |
|
| FNMA, 6.50%, 6/1/29 | | 5,985 |
| 6,642 |
|
| FNMA, 7.00%, 7/1/29 | | 1,045 |
| 1,045 |
|
| FNMA, 6.50%, 8/1/29 | | 8,044 |
| 8,988 |
|
| FNMA, 7.00%, 3/1/30 | | 5,260 |
| 5,708 |
|
| FNMA, 7.50%, 9/1/30 | | 3,642 |
| 4,327 |
|
| FNMA, 6.50%, 9/1/31 | | 27,112 |
| 30,089 |
|
| FNMA, 7.00%, 9/1/31 | | 12,813 |
| 13,416 |
|
| FNMA, 6.50%, 1/1/32 | | 5,821 |
| 6,461 |
|
| FNMA, 5.50%, 6/1/33 | | 40,514 |
| 44,958 |
|
| FNMA, 5.50%, 8/1/33 | | 257,371 |
| 287,112 |
|
| FNMA, 5.00%, 11/1/33 | | 234,969 |
| 256,291 |
|
| FNMA, 5.50%, 1/1/34 | | 224,343 |
| 250,048 |
|
| FNMA, 3.50%, 3/1/34 | | 299,023 |
| 310,622 |
|
| FNMA, 5.50%, 9/1/34 | | 12,790 |
| 14,296 |
|
| FNMA, 5.50%, 10/1/34 | | 11,877 |
| 13,284 |
|
| FNMA, 6.00%, 10/1/34 | | 19,656 |
| 21,703 |
|
| FNMA, 5.00%, 11/1/34 | | 59,158 |
| 62,969 |
|
| FNMA, 5.50%, 3/1/35 | | 10,928 |
| 12,211 |
|
| FNMA, 5.50%, 3/1/35 | | 8,844 |
| 9,724 |
|
| FNMA, 5.50%, 3/1/35 | | 656 |
| 706 |
|
| FNMA, 5.50%, 3/1/35 | | 4,476 |
| 4,835 |
|
| FNMA, 5.50%, 3/1/35 | | 5,647 |
| 6,121 |
|
| FNMA, 5.00%, 4/1/35 | | 9,817 |
| 10,623 |
|
| FNMA, 6.00%, 5/1/35 | | 4,165 |
| 4,657 |
|
| FNMA, 6.00%, 6/1/35 | | 1,233 |
| 1,358 |
|
| FNMA, 6.00%, 6/1/35 | | 359 |
| 398 |
|
| FNMA, 6.00%, 6/1/35 | | 4,473 |
| 4,920 |
|
| FNMA, 5.00%, 7/1/35 | | 56,252 |
| 62,088 |
|
| FNMA, 5.50%, 7/1/35 | | 6,748 |
| 7,370 |
|
| FNMA, 6.00%, 7/1/35 | | 8,669 |
| 9,568 |
|
| FNMA, 6.00%, 7/1/35 | | 24,811 |
| 28,215 |
|
| FNMA, 6.00%, 7/1/35 | | 2,955 |
| 3,264 |
|
| FNMA, 5.50%, 8/1/35 | | 5,251 |
| 5,840 |
|
| FNMA, 4.50%, 9/1/35 | | 239,490 |
| 257,892 |
|
| FNMA, 5.50%, 9/1/35 | | 506 |
| 559 |
|
| FNMA, 5.50%, 9/1/35 | | 322 |
| 360 |
|
| FNMA, 5.50%, 9/1/35 | | 8,222 |
| 9,199 |
|
| FNMA, 5.50%, 9/1/35 | | 43,181 |
| 48,321 |
|
| FNMA, 5.50%, 9/1/35 | | 6,291 |
| 6,739 |
|
| FNMA, 5.00%, 10/1/35 | | 8,724 |
| 9,581 |
|
|
| | | | | | | |
| | | Shares/
Principal Amount | Value |
| FNMA, 5.50%, 10/1/35 | | $ | 100,255 |
| $ | 112,154 |
|
| FNMA, 6.00%, 10/1/35 | | 17,157 |
| 19,238 |
|
| FNMA, 5.50%, 11/1/35 | | 57,575 |
| 64,403 |
|
| FNMA, 6.00%, 11/1/35 | | 5,294 |
| 5,822 |
|
| FNMA, 6.50%, 11/1/35 | | 2,653 |
| 2,947 |
|
| FNMA, 6.50%, 12/1/35 | | 5,433 |
| 6,030 |
|
| FNMA, 6.50%, 4/1/36 | | 6,003 |
| 6,693 |
|
| FNMA, 6.00%, 8/1/36 | | 6,923 |
| 7,845 |
|
| FNMA, 5.00%, 10/1/36 | | 67,417 |
| 71,585 |
|
| FNMA, 5.00%, 11/1/36 | | 58,468 |
| 62,082 |
|
| FNMA, 5.50%, 1/1/37 | | 307,021 |
| 343,870 |
|
| FNMA, 6.00%, 5/1/37 | | 5,622 |
| 6,321 |
|
| FNMA, 6.00%, 7/1/37 | | 1,681 |
| 1,906 |
|
| FNMA, 6.50%, 8/1/37 | | 1,695 |
| 1,866 |
|
| FNMA, 6.50%, 8/1/37 | | 150,343 |
| 156,853 |
|
| FNMA, 6.50%, 8/1/37 | | 398,291 |
| 417,670 |
|
| FNMA, 5.00%, 4/1/40 | | 793,581 |
| 866,494 |
|
| FNMA, 4.00%, 1/1/41 | | 3,070,193 |
| 3,271,296 |
|
| FNMA, 5.00%, 6/1/41 | | 612,844 |
| 668,917 |
|
| FNMA, 4.50%, 7/1/41 | | 632,600 |
| 682,403 |
|
| FNMA, 4.50%, 9/1/41 | | 17,505 |
| 18,891 |
|
| FNMA, 4.50%, 9/1/41 | | 1,594,449 |
| 1,720,663 |
|
| FNMA, 4.00%, 12/1/41 | | 1,320,420 |
| 1,407,867 |
|
| FNMA, 4.00%, 1/1/42 | | 26,338 |
| 27,936 |
|
| FNMA, 3.50%, 5/1/42 | | 1,176,822 |
| 1,226,372 |
|
| FNMA, 3.50%, 6/1/42 | | 580,575 |
| 605,055 |
|
| FNMA, 3.00%, 11/1/42 | | 874,951 |
| 892,044 |
|
| FNMA, 3.50%, 5/1/45 | | 1,077,568 |
| 1,116,324 |
|
| FNMA, 4.00%, 4/1/46 | | 1,217,913 |
| 1,285,122 |
|
| FNMA, 6.50%, 8/1/47 | | 17,267 |
| 18,487 |
|
| FNMA, 6.50%, 9/1/47 | | 34,958 |
| 37,298 |
|
| FNMA, 6.50%, 9/1/47 | | 1,680 |
| 1,796 |
|
| FNMA, 6.50%, 9/1/47 | | 18,378 |
| 19,618 |
|
| FNMA, 4.00%, 6/1/48 | | 699,942 |
| 727,191 |
|
| GNMA, 3.00%, TBA | | 2,100,000 |
| 2,145,158 |
|
| GNMA, 9.00%, 4/20/25 | | 463 |
| 505 |
|
| GNMA, 7.50%, 10/15/25 | | 1,813 |
| 1,836 |
|
| GNMA, 6.00%, 4/15/26 | | 494 |
| 542 |
|
| GNMA, 7.50%, 6/15/26 | | 1,740 |
| 1,782 |
|
| GNMA, 7.00%, 12/15/27 | | 8,761 |
| 8,793 |
|
| GNMA, 7.50%, 12/15/27 | | 5,150 |
| 5,609 |
|
| GNMA, 6.00%, 5/15/28 | | 5,463 |
| 5,995 |
|
| GNMA, 6.50%, 5/15/28 | | 4,872 |
| 5,363 |
|
| GNMA, 7.00%, 5/15/31 | | 17,089 |
| 19,670 |
|
| GNMA, 5.50%, 11/15/32 | | 52,935 |
| 58,712 |
|
| GNMA, 6.50%, 10/15/38 | | 749,632 |
| 870,398 |
|
| GNMA, 4.50%, 5/20/41 | | 862,250 |
| 923,896 |
|
|
| | | | | | | |
| | | Shares/
Principal Amount | Value |
| GNMA, 4.50%, 6/15/41 | | $ | 348,373 |
| $ | 376,253 |
|
| GNMA, 4.00%, 12/15/41 | | 438,275 |
| 465,492 |
|
| GNMA, 3.50%, 7/20/42 | | 364,251 |
| 381,844 |
|
| GNMA, 3.50%, 4/20/45 | | 179,063 |
| 186,340 |
|
| GNMA, 2.50%, 7/20/46 | | 279,635 |
| 279,972 |
|
| GNMA, 2.50%, 8/20/46 | | 816,632 |
| 817,618 |
|
| GNMA, 2.50%, 2/20/47 | | 95,934 |
| 96,050 |
|
| | | | 27,812,420 |
|
TOTAL U.S. GOVERNMENT AGENCY MORTGAGE-BACKED SECURITIES
(Cost $31,409,558) | 32,126,188 |
|
AFFILIATED FUNDS(6) — 2.4% | | | |
| American Century Diversified Corporate Bond ETF | | 370,657 |
| 18,842,348 |
|
| American Century STOXX U.S. Quality Value ETF | | 61,100 |
| 2,452,035 |
|
TOTAL AFFILIATED FUNDS
(Cost $20,856,610) | | | 21,294,383 |
|
| MUNICIPAL SECURITIES — 2.4% | | | |
| Bay Area Toll Authority Rev., 6.92%, 4/1/40 | | $ | 130,000 |
| 187,693 |
|
| Calcasieu Parish Public Trust Authority Rev., (WPT Corp.), VRDN, 1.47%, 8/7/19 (LOC: Bank of America N.A.) | | 1,285,000 |
| 1,285,000 |
|
| Chicago Midway International Airport Rev., VRDN, 1.38%, 8/7/19 (LOC: Bank of Montreal) | | 1,800,000 |
| 1,800,000 |
|
| Erie County Industrial Development Agency Rev., (Our Lady of Victory Renaissance Corp.), VRDN, 1.45%, 8/7/19 (LOC: HSBC Bank USA N.A.) | | 1,165,000 |
| 1,165,000 |
|
| Illinois Housing Development Authority Rev., VRDN, 2.44%, 8/7/19 (LIQ FAC: FHLB) | | 3,850,000 |
| 3,850,000 |
|
| Kansas City Rev., VRDN, 2.20%, 8/7/19 (LOC: JPMorgan Chase Bank N.A.) | | 1,760,000 |
| 1,760,000 |
|
| Kansas City Rev., VRDN, 2.22%, 8/7/19 (LOC: JPMorgan Chase Bank N.A.) | | 525,000 |
| 525,000 |
|
| Los Angeles Community College District GO, 6.68%, 8/1/36 | | 120,000 |
| 175,465 |
|
| Metropolitan Transportation Authority Rev., 6.69%, 11/15/40 | | 30,000 |
| 42,199 |
|
| Metropolitan Transportation Authority Rev., 6.81%, 11/15/40 | | 15,000 |
| 21,322 |
|
| New Jersey Turnpike Authority Rev., 7.10%, 1/1/41 | | 140,000 |
| 214,722 |
|
| New York City GO, 6.27%, 12/1/37 | | 40,000 |
| 55,058 |
|
| Ohio Water Development Authority Water Pollution Control Loan Fund Rev., 4.88%, 12/1/34 | | 200,000 |
| 233,804 |
|
| Orange County Housing Finance Authority Rev., (Landings on Millenia Boulevard Partners Ltd.), VRDN, 2.44%, 8/7/19 (LOC: FNMA) | | 275,000 |
| 275,000 |
|
| Pasadena Public Financing Authority Rev., VRDN, 2.36%, 8/7/19 (SBBPA: Bank of the West) | | 4,160,000 |
| 4,160,000 |
|
| Port Authority of New York & New Jersey Rev., 4.46%, 10/1/62 | | 130,000 |
| 157,434 |
|
| Rutgers The State University of New Jersey Rev., 5.67%, 5/1/40 | | 130,000 |
| 168,951 |
|
| Sacramento Municipal Utility District Rev., 6.16%, 5/15/36 | | 170,000 |
| 227,390 |
|
| Salt River Project Agricultural Improvement & Power District Rev., 4.84%, 1/1/41 | | 165,000 |
| 204,684 |
|
| San Francisco Public Utilities Commission Water Rev., 6.00%, 11/1/40 | | 135,000 |
| 176,712 |
|
| San Francisco Public Utilities Commission Water Rev., 6.95%, 11/1/50 | | 15,000 |
| 23,106 |
|
|
| | | | | | | |
| | | Shares/
Principal Amount | Value |
| State of California GO, 4.60%, 4/1/38 | | $ | 100,000 |
| $ | 112,026 |
|
| State of California GO, 7.55%, 4/1/39 | | 60,000 |
| 96,342 |
|
| State of California GO, 7.30%, 10/1/39 | | 90,000 |
| 137,054 |
|
| State of Illinois GO, 5.10%, 6/1/33 | | 170,000 |
| 175,690 |
|
| State of Oregon Department of Transportation Rev., 5.83%, 11/15/34 | | 30,000 |
| 39,578 |
|
| Tempe Industrial Development Authority Rev., (ASUF Brickyard LLC), VRDN, 2.35%, 8/7/19 (LOC: Bank of America N.A.) | | 1,453,000 |
| 1,453,000 |
|
| Tennis for Charity, Inc. Rev., VRDN, 2.33%, 8/7/19 (LOC: JPMorgan Chase Bank N.A.) | | 2,545,000 |
| 2,545,000 |
|
TOTAL MUNICIPAL SECURITIES
(Cost $20,729,050) | | | 21,267,230 |
|
| ASSET-BACKED SECURITIES — 1.9% | | | |
BRE Grand Islander Timeshare Issuer LLC, Series 2017-1A, Class A SEQ, 2.94%, 5/25/29(2) | | 273,117 |
| 273,727 |
|
Hilton Grand Vacations Trust, Series 2013-A, Class A SEQ, 2.28%, 1/25/26(2) | | 33,028 |
| 33,018 |
|
Hilton Grand Vacations Trust, Series 2014-AA, Class A SEQ, 1.77%, 11/25/26(2) | | 202,335 |
| 201,253 |
|
Invitation Homes Trust, Series 2018-SFR1, Class A, VRN, 3.01%, (1-month LIBOR plus 0.70%), 3/17/37(2) | | 1,052,622 |
| 1,040,929 |
|
Invitation Homes Trust, Series 2018-SFR1, Class B, VRN, 3.26%, (1-month LIBOR plus 0.95%), 3/17/37(2) | | 2,725,000 |
| 2,700,665 |
|
Invitation Homes Trust, Series 2018-SFR2, Class C, VRN, 3.61%, (1-month LIBOR plus 1.28%), 6/17/37(2) | | 975,000 |
| 973,979 |
|
Invitation Homes Trust, Series 2018-SFR3, Class B, VRN, 3.46%, (1-month LIBOR plus 1.15%), 7/17/37(2) | | 1,450,000 |
| 1,450,047 |
|
Invitation Homes Trust, Series 2018-SFR4, Class B, VRN, 3.56%, (1-month LIBOR plus 1.25%), 1/17/38(2) | | 2,250,000 |
| 2,250,295 |
|
MVW Owner Trust, Series 2014-1A, Class A SEQ, 2.25%, 9/22/31(2) | | 143,865 |
| 143,303 |
|
MVW Owner Trust, Series 2015-1A, Class A SEQ, 2.52%, 12/20/32(2) | | 135,863 |
| 135,434 |
|
MVW Owner Trust, Series 2016-1A, Class A SEQ, 2.25%, 12/20/33(2) | | 146,558 |
| 145,039 |
|
MVW Owner Trust, Series 2017-1A, Class A SEQ, 2.42%, 12/20/34(2) | | 53,535 |
| 53,393 |
|
MVW Owner Trust, Series 2018-1A, Class B, 3.60%, 1/21/36(2) | | 942,775 |
| 964,469 |
|
Progress Residential Trust, Series 2017-SFR1, Class A SEQ, 2.77%, 8/17/34(2) | | 74,726 |
| 74,781 |
|
Progress Residential Trust, Series 2018-SFR1, Class B, 3.48%, 3/17/35(2) | | 150,000 |
| 151,771 |
|
Progress Residential Trust, Series 2018-SFR3, Class C, 4.18%, 10/17/35(2) | | 1,725,000 |
| 1,779,403 |
|
Sierra Timeshare Conduit Receivables Funding LLC, Series 2017-1A, Class A SEQ, 2.91%, 3/20/34(2) | | 151,406 |
| 152,663 |
|
Sierra Timeshare Receivables Funding LLC, Series 2015-1A, Class A SEQ, 2.40%, 3/22/32(2) | | 128,657 |
| 128,467 |
|
Sierra Timeshare Receivables Funding LLC, Series 2016-2A, Class A SEQ, 2.33%, 7/20/33(2) | | 49,141 |
| 48,883 |
|
Sierra Timeshare Receivables Funding LLC, Series 2018-2A, Class B, 3.65%, 6/20/35(2) | | 738,420 |
| 747,146 |
|
Towd Point Mortgage Trust, Series 2017-4, Class A1, VRN, 2.75%, 6/25/57(2) | | 525,986 |
| 527,426 |
|
|
| | | | | | | |
| | | Shares/
Principal Amount | Value |
Towd Point Mortgage Trust, Series 2017-6, Class A1, VRN, 2.75%, 10/25/57(2) | | $ | 494,554 |
| $ | 496,100 |
|
Towd Point Mortgage Trust, Series 2018-1, Class A1 SEQ, VRN, 3.00%, 1/25/58(2) | | 380,318 |
| 383,050 |
|
Towd Point Mortgage Trust, Series 2018-4, Class A1, VRN, 3.00%, 6/25/58(2) | | 909,553 |
| 917,951 |
|
| UAL Pass-Through Trust, Series 2007-1, Class A, 6.64%, 1/2/24 | | 56,824 |
| 60,213 |
|
| US Airways Pass-Through Trust, Series 2013-1, Class A, 3.95%, 5/15/27 | | 103,094 |
| 107,857 |
|
VSE VOI Mortgage LLC, Series 2016-A, Class A SEQ, 2.54%, 7/20/33(2) | | 460,851 |
| 459,860 |
|
VSE VOI Mortgage LLC, Series 2018-A, Class B, 3.72%, 2/20/36(2) | | 730,745 |
| 747,455 |
|
TOTAL ASSET-BACKED SECURITIES
(Cost $17,022,916) | | | 17,148,577 |
|
| COLLATERALIZED MORTGAGE OBLIGATIONS — 1.7% | | | |
| Private Sponsor Collateralized Mortgage Obligations — 1.0% | | |
| ABN Amro Mortgage Corp., Series 2003-4, Class A4, 5.50%, 3/25/33 | | 25,093 |
| 25,557 |
|
| Adjustable Rate Mortgage Trust, Series 2004-4, Class 4A1, VRN, 4.45%, 3/25/35 | | 55,508 |
| 57,156 |
|
Agate Bay Mortgage Trust, Series 2016-1, Class A5 SEQ, VRN, 3.50%, 12/25/45(2) | | 71,549 |
| 72,923 |
|
| Banc of America Mortgage Trust, Series 2004-E, Class 2A6 SEQ, VRN, 4.80%, 6/25/34 | | 129,644 |
| 131,039 |
|
| Bear Stearns Adjustable Rate Mortgage Trust, Series 2004-8, Class 2A1, VRN, 4.24%, 11/25/34 | | 31,574 |
| 31,317 |
|
| Citigroup Mortgage Loan Trust, Inc., Series 2004-UST1, Class A4, VRN, 4.41%, 8/25/34 | | 66,735 |
| 65,575 |
|
| Citigroup Mortgage Loan Trust, Inc., Series 2004-UST1, Class A5, VRN, 4.40%, 8/25/34 | | 117,224 |
| 118,926 |
|
| Citigroup Mortgage Loan Trust, Inc., Series 2005-4, Class A, VRN, 4.58%, 8/25/35 | | 72,204 |
| 74,524 |
|
| Credit Suisse First Boston Mortgage-Backed Pass-Through Certificates, Series 2005-3, Class 1A1, VRN, 5.48%, 7/25/35 | | 134,929 |
| 143,849 |
|
Credit Suisse Mortgage Trust, Series 2017-HL2, Class A3 SEQ, VRN, 3.50%, 10/25/47(2) | | 203,625 |
| 207,671 |
|
| First Horizon Alternative Mortgage Securities Trust, Series 2004-AA4, Class A1, VRN, 4.49%, 10/25/34 | | 108,601 |
| 109,030 |
|
| First Horizon Mortgage Pass-Through Trust, Series 2005-AR3, Class 4A1, VRN, 4.80%, 8/25/35 | | 54,382 |
| 56,348 |
|
| GSR Mortgage Loan Trust, Series 2004-7, Class 3A1, VRN, 4.09%, 6/25/34 | | 47,236 |
| 47,234 |
|
| GSR Mortgage Loan Trust, Series 2004-AR5, Class 3A3, VRN, 4.61%, 5/25/34 | | 91,702 |
| 94,636 |
|
| GSR Mortgage Loan Trust, Series 2005-AR1, Class 3A1, VRN, 3.97%, 1/25/35 | | 130,462 |
| 130,331 |
|
| GSR Mortgage Loan Trust, Series 2005-AR6, Class 2A1, VRN, 4.50%, 9/25/35 | | 190,013 |
| 195,694 |
|
| GSR Mortgage Loan Trust, Series 2005-AR6, Class 4A5, VRN, 4.56%, 9/25/35 | | 43,579 |
| 44,691 |
|
| JPMorgan Mortgage Trust, Series 2005-A4, Class 1A1, VRN, 4.42%, 7/25/35 | | 65,332 |
| 66,275 |
|
| JPMorgan Mortgage Trust, Series 2005-A4, Class 2A1, VRN, 4.38%, 7/25/35 | | 50,155 |
| 50,544 |
|
|
| | | | | | | |
| | | Shares/
Principal Amount | Value |
| JPMorgan Mortgage Trust, Series 2006-A3, Class 7A1, VRN, 4.67%, 4/25/35 | | $ | 106,862 |
| $ | 109,602 |
|
JPMorgan Mortgage Trust, Series 2013-1, Class 2A2 SEQ, VRN, 2.50%, 3/25/43(2) | | 10,378 |
| 10,363 |
|
JPMorgan Mortgage Trust, Series 2017-1, Class A2, VRN, 3.50%, 1/25/47(2) | | 489,282 |
| 498,166 |
|
| MASTR Adjustable Rate Mortgages Trust, Series 2004-13, Class 3A7, VRN, 4.73%, 11/21/34 | | 367,534 |
| 383,676 |
|
| Merrill Lynch Mortgage Investors Trust, Series 2005-3, Class 2A, VRN, 4.40%, 11/25/35 | | 87,870 |
| 88,926 |
|
| Merrill Lynch Mortgage Investors Trust, Series 2005-A2, Class A1, VRN, 4.46%, 2/25/35 | | 92,803 |
| 94,435 |
|
| Merrill Lynch Mortgage Investors Trust, Series 2005-A2, Class A2, VRN, 4.46%, 2/25/35 | | 29,001 |
| 29,441 |
|
New Residential Mortgage Loan Trust, Series 2017-2A, Class A3, VRN, 4.00%, 3/25/57(2) | | 536,591 |
| 559,888 |
|
New Residential Mortgage Loan Trust, Series 2017-5A, Class A1, VRN, 3.77%, (1-month LIBOR plus 1.50%), 6/25/57(2) | | 340,977 |
| 348,171 |
|
Sequoia Mortgage Trust, Series 2017-7, Class A4 SEQ, VRN, 3.50%, 10/25/47(2) | | 617,136 |
| 628,913 |
|
Sequoia Mortgage Trust, Series 2017-CH2, Class A10 SEQ, VRN, 4.00%, 12/25/47(2) | | 628,215 |
| 635,145 |
|
Sequoia Mortgage Trust, Series 2018-2, Class A4 SEQ, VRN, 3.50%, 2/25/48(2) | | 424,354 |
| 430,697 |
|
Sequoia Mortgage Trust, Series 2018-CH2, Class A12 SEQ, VRN, 4.00%, 6/25/48(2) | | 561,278 |
| 568,709 |
|
Sofi Mortgage Trust, Series 2016-1A, Class 1A4 SEQ, VRN, 3.00%, 11/25/46(2) | | 180,949 |
| 179,456 |
|
| Structured Adjustable Rate Mortgage Loan Trust, Series 2004-8, Class 2A1, VRN, 4.39%, 7/25/34 | | 73,816 |
| 75,073 |
|
| Thornburg Mortgage Securities Trust, Series 2004-3, Class A, VRN, 3.01%, (1-month LIBOR plus 0.74%), 9/25/44 | | 301,566 |
| 302,110 |
|
| WaMu Mortgage Pass-Through Certificates, Series 2003-S11, Class 3A5, 5.95%, 11/25/33 | | 68,010 |
| 69,662 |
|
| WaMu Mortgage Pass-Through Certificates, Series 2005-AR3, Class A1, VRN, 4.45%, 3/25/35 | | 276,636 |
| 275,317 |
|
| WaMu Mortgage Pass-Through Certificates, Series 2005-AR7, Class A3, VRN, 4.27%, 8/25/35 | | 125,822 |
| 128,543 |
|
| Wells Fargo Mortgage-Backed Securities Trust, Series 2004-S, Class A1, VRN, 4.91%, 9/25/34 | | 9,219 |
| 9,598 |
|
| Wells Fargo Mortgage-Backed Securities Trust, Series 2004-Z, Class 2A2, VRN, 4.97%, 12/25/34 | | 94,622 |
| 97,566 |
|
| Wells Fargo Mortgage-Backed Securities Trust, Series 2005-17, Class 1A1, 5.50%, 1/25/36 | | 65,022 |
| 64,819 |
|
| Wells Fargo Mortgage-Backed Securities Trust, Series 2005-9, Class 2A6, 5.25%, 10/25/35 | | 154,252 |
| 159,136 |
|
| Wells Fargo Mortgage-Backed Securities Trust, Series 2005-AR10, Class 1A1, VRN, 4.96%, 6/25/35 | | 262,457 |
| 266,043 |
|
| Wells Fargo Mortgage-Backed Securities Trust, Series 2005-AR12, Class 2A6, VRN, 5.00%, 6/25/35 | | 31,424 |
| 32,727 |
|
| Wells Fargo Mortgage-Backed Securities Trust, Series 2005-AR16, Class 3A2, VRN, 5.00%, 3/25/35 | | 124,149 |
| 128,203 |
|
| Wells Fargo Mortgage-Backed Securities Trust, Series 2005-AR4, Class 2A1, VRN, 5.10%, 4/25/35 | | 49,082 |
| 50,152 |
|
| Wells Fargo Mortgage-Backed Securities Trust, Series 2005-AR7, Class 1A1, VRN, 5.10%, 5/25/35 | | 108,652 |
| 113,041 |
|
|
| | | | | | | |
| | | Shares/
Principal Amount | Value |
| Wells Fargo Mortgage-Backed Securities Trust, Series 2006-10, Class A4 SEQ, 6.00%, 8/25/36 | | $ | 93,630 |
| $ | 94,094 |
|
| Wells Fargo Mortgage-Backed Securities Trust, Series 2006-4, Class 2A1, 6.00%, 4/25/36 | | 274,205 |
| 275,219 |
|
| Wells Fargo Mortgage-Backed Securities Trust, Series 2006-AR10, Class 1A1, VRN, 5.04%, 7/25/36 | | 103,236 |
| 105,320 |
|
| Wells Fargo Mortgage-Backed Securities Trust, Series 2006-AR12, Class 1A1, VRN, 4.76%, 9/25/36 | | 82,438 |
| 84,166 |
|
| Wells Fargo Mortgage-Backed Securities Trust, Series 2007-13, Class A1, 6.00%, 9/25/37 | | 42,977 |
| 43,461 |
|
| Wells Fargo Mortgage-Backed Securities Trust, Series 2007-14, Class 2A2, 5.50%, 10/25/22 | | 17,278 |
| 17,625 |
|
| Wells Fargo Mortgage-Backed Securities Trust, Series 2007-15, Class A1, 6.00%, 11/25/37 | | 57,125 |
| 58,177 |
|
| Wells Fargo Mortgage-Backed Securities Trust, Series 2007-16, Class 1A1, 6.00%, 12/28/37 | | 21,928 |
| 21,974 |
|
| Wells Fargo Mortgage-Backed Securities Trust, Series 2007-AR10, Class 1A1, VRN, 4.91%, 1/25/38 | | 60,227 |
| 58,484 |
|
| Wells Fargo Mortgage-Backed Securities Trust, Series 2007-AR7, Class A1, VRN, 4.79%, 12/28/37 | | 57,850 |
| 57,485 |
|
| Wells Fargo Mortgage-Backed Securities Trust, Series 2008-1, Class 4A1, 5.75%, 2/25/38 | | 68,229 |
| 72,571 |
|
| | | | 8,949,474 |
|
| U.S. Government Agency Collateralized Mortgage Obligations — 0.7% | |
FHLMC, Series 2016-HQA3, Class M2, VRN, 3.62%, (1-month LIBOR plus 1.35%), 3/25/29 | | 87,555 |
| 87,999 |
|
FHLMC, Series 2017-DNA2, Class M1, VRN, 3.47%, (1-month LIBOR plus 1.20%), 10/25/29 | | 1,945,087 |
| 1,957,703 |
|
FHLMC, Series 2017-HQA2, Class M1, VRN, 3.07%, (1-month LIBOR plus 0.80%), 12/25/29 | | 61,529 |
| 61,616 |
|
FHLMC, Series 2018-DNA1, Class M1, VRN, 2.72%, (1-month LIBOR plus 0.45%), 7/25/30 | | 124,319 |
| 124,208 |
|
FNMA, Series 2014-C02, Class 1M2, VRN, 4.87%, (1-month LIBOR plus 2.60%), 5/25/24 | | 222,093 |
| 231,711 |
|
FNMA, Series 2014-C02, Class 2M2, VRN, 4.87%, (1-month LIBOR plus 2.60%), 5/25/24 | | 451,395 |
| 469,467 |
|
FNMA, Series 2017-C01, Class 1M1, VRN, 3.57%, (1-month LIBOR plus 1.30%), 7/25/29 | | 158,811 |
| 159,294 |
|
FNMA, Series 2017-C03, Class 1M2, VRN, 5.27%, (1-month LIBOR plus 3.00%), 10/25/29 | | 130,000 |
| 136,027 |
|
FNMA, Series 2017-C07, Class 1M2, VRN, 4.67%, (1-month LIBOR plus 2.40%), 5/28/30 | | 2,500,000 |
| 2,538,490 |
|
| | | | 5,766,515 |
|
TOTAL COLLATERALIZED MORTGAGE OBLIGATIONS
(Cost $14,603,845) | | | 14,715,989 |
|
| COLLATERALIZED LOAN OBLIGATIONS — 1.5% | | | |
Ares XLI CLO Ltd., Series 2016-41A, Class AR, VRN, 3.50%, (3-month LIBOR plus 1.20%), 1/15/29(2)(7) | | 1,750,000 |
| 1,750,000 |
|
Ares XXXIIR CLO Ltd., Series 2014-32RA, Class A2A, VRN, 4.07%, (3-month LIBOR plus 1.55%), 5/15/30(2) | | 300,000 |
| 295,475 |
|
Bean Creek CLO Ltd., Series 2015-1A, Class AR, VRN, 3.30%, (3-month LIBOR plus 1.02%), 4/20/31(2) | | 375,000 |
| 371,089 |
|
Bean Creek CLO Ltd., Series 2015-1A, Class BR, VRN, 3.73%, (3-month LIBOR plus 1.45%), 4/20/31(2) | | 225,000 |
| 220,644 |
|
|
| | | | | | | |
| | | Shares/
Principal Amount | Value |
Carlyle Global Market Strategies CLO Ltd., Series 2014-2RA, Class A3, VRN, 4.02%, (3-month LIBOR plus 1.50%), 5/15/31(2) | | $ | 2,000,000 |
| $ | 1,973,425 |
|
CBAM Ltd., Series 2018-5A, Class A, VRN, 3.32%, (3-month LIBOR plus 1.02%), 4/17/31(2) | | 250,000 |
| 247,505 |
|
CBAM Ltd., Series 2018-5A, Class B1, VRN, 3.70%, (3-month LIBOR plus 1.40%), 4/17/31(2) | | 350,000 |
| 342,781 |
|
CIFC Funding Ltd., Series 2013-3RA, Class A1, VRN, 3.33%, (3-month LIBOR plus 0.98%), 4/24/31(2) | | 750,000 |
| 740,434 |
|
Dryden 64 CLO Ltd., Series 2018-64A, Class A, VRN, 3.25%, (3-month LIBOR plus 0.97%), 4/18/31(2) | | 1,000,000 |
| 990,304 |
|
Goldentree Loan Management US CLO 3 Ltd., Series 2018-3A, Class B1, VRN, 3.83%, (3-month LIBOR plus 1.55%), 4/20/30(2) | | 600,000 |
| 594,583 |
|
Goldentree Loan Management US CLO 5 Ltd., Series 2019-5A, Class A, VRN, 3.49%, (3-month LIBOR plus 1.30%), 10/20/32(2)(7) | | 1,125,000 |
| 1,125,000 |
|
Goldentree Loan Opportunities X Ltd., Series 2015-10A, Class AR, VRN, 3.40%, (3-month LIBOR plus 1.12%), 7/20/31(2) | | 300,000 |
| 299,377 |
|
Goldentree Loan Opportunities XI Ltd., Series 2015-11A, Class AR2, VRN, 3.37%, (3-month LIBOR plus 1.07%), 1/18/31(2) | | 275,000 |
| 273,237 |
|
KKR CLO Ltd., Series 2022A, Class A, VRN, 3.43%, (3-month LIBOR plus 1.15%), 7/20/31(2) | | 450,000 |
| 447,625 |
|
KKR CLO Ltd., Series 2022A, Class B, VRN, 3.88%, (3-month LIBOR plus 1.60%), 7/20/31(2) | | 350,000 |
| 346,098 |
|
Madison Park Funding XIII Ltd., Series 2014-13A, Class AR2, VRN, 3.25%, (3-month LIBOR plus 0.95%), 4/19/30(2) | | 225,000 |
| 224,009 |
|
Madison Park Funding XIII Ltd., Series 2014-13A, Class BR2, VRN, 3.80%, (3-month LIBOR plus 1.50%), 4/19/30(2) | | 200,000 |
| 198,643 |
|
Magnetite VIII Ltd., Series 2014-8A, Class AR2, VRN, 3.28%, (3-month LIBOR plus 0.98%), 4/15/31(2) | | 650,000 |
| 645,313 |
|
Magnetite VIII Ltd., Series 2014-8A, Class BR2, VRN, 3.80%, (3-month LIBOR plus 1.50%), 4/15/31(2) | | 600,000 |
| 591,361 |
|
Sounds Point CLO IV-R Ltd., Series 2013-3RA, Class B, VRN, 4.05%, (3-month LIBOR plus 1.75%), 4/18/31(2) | | 125,000 |
| 124,547 |
|
Symphony CLO XIX Ltd., Series 2018-19A, Class A, VRN, 3.28%, (3-month LIBOR plus 0.96%), 4/16/31(2) | | 250,000 |
| 246,703 |
|
Voya CLO Ltd., Series 2013-3A, Class A2RR, VRN, 4.00%, (3-month LIBOR plus 1.70%), 10/18/31(2) | | 900,000 |
| 894,208 |
|
TOTAL COLLATERALIZED LOAN OBLIGATIONS
(Cost $13,033,073) | | | 12,942,361 |
|
| COMMERCIAL MORTGAGE-BACKED SECURITIES — 1.2% | | |
BB-UBS Trust, Series 2012-SHOW, Class A SEQ, 3.43%, 11/5/36(2) | | 850,000 |
| 889,896 |
|
| Benchmark Mortgage Trust, Series 2018-B6, Class AS, 4.44%, 10/10/51 | | 1,650,000 |
| 1,839,944 |
|
| Commercial Mortgage Pass-Through Certificates, Series 2014-CR15, Class AM, VRN, 4.43%, 2/10/47 | | 700,000 |
| 754,669 |
|
| Commercial Mortgage Pass-Through Certificates, Series 2014-LC17, Class AM, VRN, 4.19%, 10/10/47 | | 700,000 |
| 748,732 |
|
| Commercial Mortgage Pass-Through Certificates, Series 2014-UBS5, Class AM, VRN, 4.19%, 9/10/47 | | 750,000 |
| 796,921 |
|
| Commercial Mortgage Pass-Through Certificates, Series 2015-CR22, Class AM, VRN, 3.60%, 3/10/48 | | 775,000 |
| 807,385 |
|
| Commercial Mortgage Trust, Series 2016-CD2, Class A4 SEQ, VRN, 3.53%, 11/10/49 | | 700,000 |
| 744,044 |
|
|
| | | | | | | |
| | | Shares/
Principal Amount | Value |
| CSAIL Commercial Mortgage Trust, Series 2017-CX10, Class AS, VRN, 3.67%, 11/15/50 | | $ | 50,000 |
| $ | 52,591 |
|
DBCG Mortgage Trust, Series 2017-BBG, Class A, VRN, 3.03%, (1-month LIBOR plus 0.70%), 6/15/34(2) | | 1,050,000 |
| 1,050,965 |
|
| GS Mortgage Securities Trust, Series 2016-GS2, Class B, VRN, 3.76%, 5/10/49 | | 700,000 |
| 731,376 |
|
| JPMorgan Chase Commercial Mortgage Securities Trust, Series 2016-JP2, Class A4 SEQ, 2.82%, 8/15/49 | | 400,000 |
| 407,906 |
|
| JPMorgan Chase Commercial Mortgage Securities Trust, Series 2016-JP2, Class B, 3.46%, 8/15/49 | | 200,000 |
| 204,667 |
|
| Morgan Stanley Bank of America Merrill Lynch Trust, Series 2017-C34, Class A3 SEQ, 3.28%, 11/15/52 | | 100,000 |
| 104,379 |
|
Morgan Stanley Capital I Trust, Series 2014-CPT, Class C, VRN, 3.45%, 7/13/29(2) | | 700,000 |
| 707,887 |
|
| UBS Commercial Mortgage Trust, Series 2017-C1, Class A3 SEQ, 3.20%, 6/15/50 | | 705,000 |
| 734,278 |
|
TOTAL COMMERCIAL MORTGAGE-BACKED SECURITIES
(Cost $10,199,487) | | 10,575,640 |
|
| EXCHANGE-TRADED FUNDS — 0.4% | | | |
| iShares MSCI EAFE Value ETF | | 21,737 |
| 1,015,987 |
|
| iShares Russell 2000 Value ETF | | 3,098 |
| 374,734 |
|
| iShares Russell Mid-Cap Value ETF | | 19,509 |
| 1,753,274 |
|
| SPDR S&P Oil & Gas Exploration & Production ETF | | 11,512 |
| 288,145 |
|
| SPDR S&P Regional Banking ETF | | 4,134 |
| 227,949 |
|
TOTAL EXCHANGE-TRADED FUNDS
(Cost $3,671,231) | | | 3,660,089 |
|
COMMERCIAL PAPER(8) — 0.3% | | | |
Old Line Funding LLC, 2.42%, 1/16/20(2)
(Cost $3,000,000) | | $ | 3,000,000 |
| 2,999,948 |
|
WARRANTS† | | | |
Hotels, Restaurants and Leisure† | | | |
Minor International PCL(1)
(Cost $—) | | 6,775 |
| 1,212 |
|
| TEMPORARY CASH INVESTMENTS — 3.6% | | | |
State Street Institutional U.S. Government Money Market Fund, Premier Class
(Cost $31,817,864) | | 31,817,864 |
| 31,817,864 |
|
TOTAL INVESTMENT SECURITIES — 100.5%
(Cost $751,928,575) | | | 890,548,620 |
|
| OTHER ASSETS AND LIABILITIES — (0.5)% | | | (4,609,456 | ) |
| TOTAL NET ASSETS — 100.0% | | | $ | 885,939,164 |
|
FORWARD FOREIGN CURRENCY EXCHANGE CONTRACTS
|
| | | | | | | | | | |
| Currency Purchased | Currency Sold | Counterparty | Settlement Date | Unrealized Appreciation
(Depreciation) |
| AUD | 1,981,010 |
| USD | 1,372,880 |
| Bank of America, N.A. | 9/18/19 | $ | (15,958 | ) |
| AUD | 2,040,910 |
| USD | 1,429,964 |
| Bank of America, N.A. | 9/18/19 | (32,012 | ) |
| AUD | 2,032,208 |
| USD | 1,432,036 |
| Bank of America, N.A. | 9/18/19 | (40,045 | ) |
| USD | 807,151 |
| AUD | 1,156,807 |
| Bank of America, N.A. | 9/18/19 | 14,778 |
|
| USD | 1,410,440 |
| AUD | 2,008,745 |
| Bank of America, N.A. | 9/18/19 | 34,520 |
|
| BRL | 8,970,618 |
| USD | 2,229,445 |
| Goldman Sachs & Co. | 9/18/19 | 112,887 |
|
| USD | 177,079 |
| BRL | 693,247 |
| Goldman Sachs & Co. | 9/18/19 | (3,936 | ) |
|
| | | | | | | | | | |
| Currency Purchased | Currency Sold | Counterparty | Settlement Date | Unrealized Appreciation
(Depreciation) |
| CAD | 2,254,292 |
| USD | 1,675,566 |
| Morgan Stanley | 9/18/19 | $ | 34,048 |
|
| CAD | 7,817 |
| USD | 5,964 |
| Morgan Stanley | 9/30/19 | (35 | ) |
| CAD | 9,052 |
| USD | 6,907 |
| Morgan Stanley | 9/30/19 | (41 | ) |
| CAD | 10,036 |
| USD | 7,666 |
| Morgan Stanley | 9/30/19 | (53 | ) |
| CAD | 9,190 |
| USD | 7,044 |
| Morgan Stanley | 9/30/19 | (73 | ) |
| CAD | 8,377 |
| USD | 6,360 |
| Morgan Stanley | 9/30/19 | (6 | ) |
| CAD | 32,363 |
| USD | 24,620 |
| Morgan Stanley | 9/30/19 | (71 | ) |
| CAD | 40,681 |
| USD | 30,974 |
| Morgan Stanley | 9/30/19 | (116 | ) |
| USD | 1,498,705 |
| CAD | 1,973,780 |
| Morgan Stanley | 9/18/19 | 1,826 |
|
| USD | 1,508,713 |
| CAD | 1,971,631 |
| Morgan Stanley | 9/18/19 | 13,463 |
|
| USD | 271,427 |
| CAD | 358,042 |
| Morgan Stanley | 9/30/19 | (164 | ) |
| USD | 238,027 |
| CAD | 313,984 |
| Morgan Stanley | 9/30/19 | (144 | ) |
| USD | 6,953 |
| CAD | 9,073 |
| Morgan Stanley | 9/30/19 | 70 |
|
| USD | 8,084 |
| CAD | 10,522 |
| Morgan Stanley | 9/30/19 | 103 |
|
| USD | 6,178 |
| CAD | 8,051 |
| Morgan Stanley | 9/30/19 | 70 |
|
| USD | 16,294 |
| CAD | 21,237 |
| Morgan Stanley | 9/30/19 | 185 |
|
| USD | 9,248 |
| CAD | 12,142 |
| Morgan Stanley | 9/30/19 | 38 |
|
| USD | 6,318 |
| CAD | 8,295 |
| Morgan Stanley | 9/30/19 | 26 |
|
| USD | 25,213 |
| CAD | 33,209 |
| Morgan Stanley | 9/30/19 | 23 |
|
| USD | 7,801 |
| CAD | 10,250 |
| Morgan Stanley | 9/30/19 | 26 |
|
| CHF | 1,160,662 |
| USD | 1,162,732 |
| UBS AG | 9/18/19 | 9,061 |
|
| CHF | 2,121,561 |
| USD | 2,149,613 |
| UBS AG | 9/18/19 | (7,706 | ) |
| CHF | 1,392,259 |
| USD | 1,426,524 |
| UBS AG | 9/18/19 | (20,913 | ) |
| CHF | 3,117 |
| USD | 3,189 |
| UBS AG | 9/30/19 | (39 | ) |
| CHF | 18,543 |
| USD | 18,954 |
| UBS AG | 9/30/19 | (211 | ) |
| CHF | 15,088 |
| USD | 15,475 |
| UBS AG | 9/30/19 | (225 | ) |
| USD | 146,184 |
| CHF | 141,306 |
| UBS AG | 9/18/19 | 3,523 |
|
| USD | 1,445,353 |
| CHF | 1,413,302 |
| UBS AG | 9/18/19 | 18,497 |
|
| USD | 558,350 |
| CHF | 543,900 |
| UBS AG | 9/30/19 | 8,599 |
|
| USD | 27,170 |
| CHF | 26,198 |
| UBS AG | 9/30/19 | 691 |
|
| USD | 39,358 |
| CHF | 38,067 |
| UBS AG | 9/30/19 | 881 |
|
| USD | 19,038 |
| CHF | 18,625 |
| UBS AG | 9/30/19 | 213 |
|
| USD | 20,059 |
| CHF | 19,580 |
| UBS AG | 9/30/19 | 269 |
|
| CLP | 995,040,135 |
| USD | 1,454,524 |
| Goldman Sachs & Co. | 9/23/19 | (40,737 | ) |
| USD | 1,442,321 |
| CLP | 980,561,806 |
| Goldman Sachs & Co. | 9/23/19 | 49,104 |
|
| CNY | 1,477,909 |
| USD | 213,189 |
| Morgan Stanley | 9/18/19 | 787 |
|
| CNY | 1,563,774 |
| USD | 228,310 |
| Morgan Stanley | 9/18/19 | (1,903 | ) |
| CNY | 9,872,348 |
| USD | 1,436,187 |
| Morgan Stanley | 9/18/19 | (6,842 | ) |
| CNY | 9,838,167 |
| USD | 1,431,214 |
| Morgan Stanley | 9/18/19 | (6,818 | ) |
| CNY | 4,928,987 |
| USD | 717,465 |
| Morgan Stanley | 9/18/19 | (3,833 | ) |
| USD | 714,453 |
| CNY | 4,921,153 |
| Morgan Stanley | 9/18/19 | 1,955 |
|
| COP | 4,979,021,316 |
| USD | 1,474,968 |
| Goldman Sachs & Co. | 9/18/19 | 38,186 |
|
| USD | 1,541,722 |
| COP | 4,979,021,316 |
| Goldman Sachs & Co. | 9/18/19 | 28,567 |
|
| USD | 1,415,923 |
| COP | 4,592,191,435 |
| Goldman Sachs & Co. | 9/18/19 | 20,328 |
|
| CZK | 32,616,138 |
| USD | 1,456,338 |
| UBS AG | 9/18/19 | (50,704 | ) |
| CZK | 32,666,362 |
| USD | 1,443,013 |
| UBS AG | 9/18/19 | (35,216 | ) |
| USD | 88,794 |
| CZK | 2,055,862 |
| UBS AG | 9/18/19 | 194 |
|
| USD | 1,451,039 |
| CZK | 32,678,705 |
| UBS AG | 9/18/19 | 42,709 |
|
| USD | 1,419,711 |
| CZK | 32,678,905 |
| UBS AG | 9/18/19 | 11,372 |
|
|
| | | | | | | | | | |
| Currency Purchased | Currency Sold | Counterparty | Settlement Date | Unrealized Appreciation
(Depreciation) |
| USD | 62,827 |
| DKK | 417,393 |
| Goldman Sachs & Co. | 9/18/19 | $ | 703 |
|
| EUR | 1,278,220 |
| USD | 1,438,922 |
| JPMorgan Chase Bank N.A. | 8/21/19 | (21,791 | ) |
| EUR | 1,268,721 |
| USD | 1,433,004 |
| JPMorgan Chase Bank N.A. | 8/21/19 | (26,404 | ) |
| EUR | 109,717 |
| USD | 124,653 |
| Credit Suisse AG | 9/30/19 | (2,614 | ) |
| EUR | 122,864 |
| USD | 138,750 |
| Credit Suisse AG | 9/30/19 | (2,088 | ) |
| EUR | 17,866 |
| USD | 20,174 |
| Credit Suisse AG | 9/30/19 | (302 | ) |
| EUR | 120,222 |
| USD | 135,752 |
| Credit Suisse AG | 9/30/19 | (2,029 | ) |
| EUR | 117,740 |
| USD | 132,905 |
| Credit Suisse AG | 9/30/19 | (1,942 | ) |
| EUR | 30,847 |
| USD | 34,503 |
| Credit Suisse AG | 9/30/19 | (192 | ) |
| EUR | 56,524 |
| USD | 63,225 |
| Credit Suisse AG | 9/30/19 | (352 | ) |
| USD | 11,892,571 |
| EUR | 10,575,404 |
| JPMorgan Chase Bank N.A. | 8/21/19 | 167,881 |
|
| USD | 1,427,427 |
| EUR | 1,269,840 |
| JPMorgan Chase Bank N.A. | 8/21/19 | 19,587 |
|
| USD | 3,199,415 |
| EUR | 2,805,151 |
| Credit Suisse AG | 9/30/19 | 79,229 |
|
| USD | 1,615,496 |
| EUR | 1,416,419 |
| Credit Suisse AG | 9/30/19 | 40,005 |
|
| USD | 856,886 |
| EUR | 751,292 |
| Credit Suisse AG | 9/30/19 | 21,220 |
|
| USD | 25,648 |
| EUR | 22,575 |
| Credit Suisse AG | 9/30/19 | 538 |
|
| USD | 47,566 |
| EUR | 41,866 |
| Credit Suisse AG | 9/30/19 | 997 |
|
| USD | 38,046 |
| EUR | 33,705 |
| Credit Suisse AG | 9/30/19 | 556 |
|
| USD | 25,255 |
| EUR | 22,389 |
| Credit Suisse AG | 9/30/19 | 352 |
|
| USD | 58,773 |
| EUR | 52,432 |
| Credit Suisse AG | 9/30/19 | 453 |
|
| USD | 29,158 |
| EUR | 26,052 |
| Credit Suisse AG | 9/30/19 | 180 |
|
| USD | 54,799 |
| EUR | 48,914 |
| Credit Suisse AG | 9/30/19 | 391 |
|
| GBP | 16,507 |
| USD | 20,948 |
| JPMorgan Chase Bank N.A. | 9/30/19 | (815 | ) |
| GBP | 21,168 |
| USD | 26,581 |
| JPMorgan Chase Bank N.A. | 9/30/19 | (763 | ) |
| USD | 3,129,990 |
| GBP | 2,470,009 |
| Bank of America, N.A. | 9/18/19 | 119,260 |
|
| USD | 212,972 |
| GBP | 167,120 |
| Bank of America, N.A. | 9/18/19 | 9,267 |
|
| USD | 484,003 |
| GBP | 380,395 |
| JPMorgan Chase Bank N.A. | 9/30/19 | 20,055 |
|
| USD | 866,632 |
| GBP | 681,116 |
| JPMorgan Chase Bank N.A. | 9/30/19 | 35,910 |
|
| USD | 35,646 |
| GBP | 27,962 |
| JPMorgan Chase Bank N.A. | 9/30/19 | 1,543 |
|
| USD | 31,041 |
| GBP | 24,861 |
| JPMorgan Chase Bank N.A. | 9/30/19 | 720 |
|
| USD | 27,451 |
| GBP | 22,388 |
| JPMorgan Chase Bank N.A. | 9/30/19 | 146 |
|
| HUF | 413,159,267 |
| USD | 1,432,790 |
| UBS AG | 9/18/19 | (26,454 | ) |
| USD | 2,884,626 |
| HUF | 835,549,193 |
| UBS AG | 9/18/19 | 40,535 |
|
| USD | 1,402,465 |
| HUF | 396,671,844 |
| UBS AG | 9/18/19 | 52,250 |
|
| USD | 331,676 |
| IDR | 4,895,539,136 |
| Goldman Sachs & Co. | 9/18/19 | (13,285 | ) |
| ILS | 5,267,348 |
| USD | 1,482,758 |
| UBS AG | 9/18/19 | 21,504 |
|
| ILS | 5,104,176 |
| USD | 1,465,896 |
| UBS AG | 9/18/19 | (8,233 | ) |
| ILS | 5,033,253 |
| USD | 1,447,252 |
| UBS AG | 9/18/19 | (9,844 | ) |
| USD | 2,838,207 |
| ILS | 10,221,520 |
| UBS AG | 9/18/19 | (80,878 | ) |
| USD | 1,430,989 |
| ILS | 5,044,524 |
| UBS AG | 9/18/19 | (9,637 | ) |
| USD | 1,427,455 |
| ILS | 4,986,527 |
| UBS AG | 9/18/19 | 3,391 |
|
| JPY | 2,075,743 |
| USD | 19,260 |
| Bank of America, N.A. | 9/30/19 | (94 | ) |
| JPY | 1,756,270 |
| USD | 16,240 |
| Bank of America, N.A. | 9/30/19 | (24 | ) |
| JPY | 1,360,228 |
| USD | 12,690 |
| Bank of America, N.A. | 9/30/19 | (130 | ) |
| JPY | 1,999,018 |
| USD | 18,649 |
| Bank of America, N.A. | 9/30/19 | (191 | ) |
| USD | 6,834,706 |
| JPY | 736,904,305 |
| Bank of America, N.A. | 8/21/19 | 51,798 |
|
| USD | 1,409,594 |
| JPY | 151,703,349 |
| Bank of America, N.A. | 8/21/19 | 13,226 |
|
| USD | 334,986 |
| JPY | 35,812,691 |
| Bank of America, N.A. | 9/30/19 | 4,319 |
|
| USD | 549,917 |
| JPY | 58,790,508 |
| Bank of America, N.A. | 9/30/19 | 7,090 |
|
|
| | | | | | | | | | |
| Currency Purchased | Currency Sold | Counterparty | Settlement Date | Unrealized Appreciation
(Depreciation) |
| USD | 14,304 |
| JPY | 1,540,250 |
| Bank of America, N.A. | 9/30/19 | $ | 83 |
|
| USD | 13,780 |
| JPY | 1,480,927 |
| Bank of America, N.A. | 9/30/19 | 106 |
|
| KRW | 335,226,476 |
| USD | 282,748 |
| Goldman Sachs & Co. | 9/18/19 | (204 | ) |
| KZT | 558,589,756 |
| USD | 1,440,407 |
| Goldman Sachs & Co. | 9/18/19 | (13 | ) |
| KZT | 263,122,894 |
| USD | 682,727 |
| Goldman Sachs & Co. | 9/18/19 | (4,231 | ) |
| MXN | 6,531,246 |
| USD | 335,995 |
| Morgan Stanley | 9/18/19 | 2,179 |
|
| MXN | 27,923,510 |
| USD | 1,438,466 |
| Morgan Stanley | 9/18/19 | 7,357 |
|
| MXN | 26,715,645 |
| USD | 1,381,403 |
| Morgan Stanley | 9/18/19 | 1,880 |
|
| MXN | 27,553,089 |
| USD | 1,438,841 |
| Morgan Stanley | 9/18/19 | (12,197 | ) |
| USD | 688,359 |
| MXN | 13,825,355 |
| Morgan Stanley | 9/18/19 | (27,490 | ) |
| USD | 1,427,530 |
| MXN | 27,851,821 |
| Morgan Stanley | 9/18/19 | (14,582 | ) |
| USD | 708,474 |
| MXN | 13,623,948 |
| Morgan Stanley | 9/18/19 | 3,053 |
|
| MYR | 5,824,409 |
| USD | 1,412,320 |
| Goldman Sachs & Co. | 9/18/19 | (2,199 | ) |
| MYR | 4,462,595 |
| USD | 1,087,642 |
| Goldman Sachs & Co. | 9/18/19 | (7,223 | ) |
| USD | 136,763 |
| MYR | 577,002 |
| Goldman Sachs & Co. | 9/18/19 | (2,933 | ) |
| NOK | 21,314,904 |
| USD | 2,442,941 |
| Goldman Sachs & Co. | 9/18/19 | (33,144 | ) |
| NOK | 12,721,429 |
| USD | 1,453,948 |
| Goldman Sachs & Co. | 9/18/19 | (15,702 | ) |
| NOK | 178,352 |
| USD | 20,892 |
| Goldman Sachs & Co. | 9/30/19 | (722 | ) |
| NOK | 170,753 |
| USD | 20,041 |
| Goldman Sachs & Co. | 9/30/19 | (730 | ) |
| USD | 141,856 |
| NOK | 1,225,558 |
| Goldman Sachs & Co. | 9/18/19 | 3,298 |
|
| USD | 144,475 |
| NOK | 1,233,150 |
| Goldman Sachs & Co. | 9/18/19 | 5,059 |
|
| USD | 1,390,571 |
| NOK | 11,876,588 |
| Goldman Sachs & Co. | 9/18/19 | 47,841 |
|
| USD | 1,423,913 |
| NOK | 12,156,227 |
| Goldman Sachs & Co. | 9/18/19 | 49,567 |
|
| USD | 669,462 |
| NOK | 5,709,004 |
| Goldman Sachs & Co. | 9/30/19 | 23,824 |
|
| USD | 21,203 |
| NOK | 182,329 |
| Goldman Sachs & Co. | 9/30/19 | 583 |
|
| NZD | 2,188,695 |
| USD | 1,451,455 |
| Bank of America, N.A. | 9/18/19 | (12,943 | ) |
| NZD | 1,095,909 |
| USD | 732,571 |
| Bank of America, N.A. | 9/18/19 | (12,289 | ) |
| USD | 2,110,146 |
| NZD | 3,235,229 |
| Bank of America, N.A. | 9/18/19 | (16,198 | ) |
| PEN | 728,427 |
| USD | 220,762 |
| Goldman Sachs & Co. | 9/18/19 | (731 | ) |
| PEN | 857,432 |
| USD | 259,372 |
| Goldman Sachs & Co. | 9/18/19 | (373 | ) |
| USD | 2,701,439 |
| PEN | 9,130,053 |
| Goldman Sachs & Co. | 9/18/19 | (56,417 | ) |
| USD | 1,286,571 |
| PEN | 4,242,725 |
| Goldman Sachs & Co. | 9/18/19 | 4,999 |
|
| USD | 1,638,876 |
| PHP | 86,499,889 |
| Goldman Sachs & Co. | 9/18/19 | (56,163 | ) |
| PLN | 607,924 |
| USD | 161,652 |
| Goldman Sachs & Co. | 9/18/19 | (4,624 | ) |
| PLN | 5,149,410 |
| USD | 1,383,432 |
| Goldman Sachs & Co. | 9/18/19 | (53,326 | ) |
| PLN | 649,289 |
| USD | 173,811 |
| Goldman Sachs & Co. | 9/18/19 | (6,098 | ) |
| PLN | 7,955,601 |
| USD | 2,103,849 |
| Goldman Sachs & Co. | 9/18/19 | (48,898 | ) |
| USD | 7,350,840 |
| PLN | 28,246,338 |
| Goldman Sachs & Co. | 9/18/19 | 54,741 |
|
| USD | 1,413,909 |
| PLN | 5,309,087 |
| Goldman Sachs & Co. | 9/18/19 | 42,559 |
|
| USD | 114,475 |
| PLN | 433,092 |
| Goldman Sachs & Co. | 9/18/19 | 2,606 |
|
| USD | 11,060 |
| RUB | 729,959 |
| Goldman Sachs & Co. | 9/18/19 | (332 | ) |
| SEK | 36,133,125 |
| USD | 3,817,733 |
| Goldman Sachs & Co. | 9/18/19 | (64,621 | ) |
| SEK | 6,291,714 |
| USD | 667,145 |
| Goldman Sachs & Co. | 9/18/19 | (13,631 | ) |
| SEK | 80,626 |
| USD | 8,595 |
| Goldman Sachs & Co. | 9/30/19 | (213 | ) |
| SEK | 178,568 |
| USD | 18,987 |
| Goldman Sachs & Co. | 9/30/19 | (422 | ) |
| SEK | 112,687 |
| USD | 11,982 |
| Goldman Sachs & Co. | 9/30/19 | (267 | ) |
| SEK | 115,059 |
| USD | 12,347 |
| Goldman Sachs & Co. | 9/30/19 | (385 | ) |
| SEK | 133,969 |
| USD | 14,408 |
| Goldman Sachs & Co. | 9/30/19 | (481 | ) |
| USD | 164,576 |
| SEK | 1,526,556 |
| Goldman Sachs & Co. | 9/18/19 | 6,014 |
|
|
| | | | | | | | | | |
| Currency Purchased | Currency Sold | Counterparty | Settlement Date | Unrealized Appreciation
(Depreciation) |
| USD | 2,090,728 |
| SEK | 19,538,484 |
| Goldman Sachs & Co. | 9/18/19 | $ | 61,286 |
|
| USD | 685,787 |
| SEK | 6,529,848 |
| Goldman Sachs & Co. | 9/18/19 | 7,538 |
|
| USD | 349,799 |
| SEK | 3,263,134 |
| Goldman Sachs & Co. | 9/30/19 | 10,561 |
|
| USD | 541,929 |
| SEK | 5,055,439 |
| Goldman Sachs & Co. | 9/30/19 | 16,362 |
|
| USD | 24,040 |
| SEK | 221,678 |
| Goldman Sachs & Co. | 9/30/19 | 994 |
|
| USD | 18,203 |
| SEK | 168,739 |
| Goldman Sachs & Co. | 9/30/19 | 661 |
|
| USD | 18,078 |
| SEK | 169,582 |
| Goldman Sachs & Co. | 9/30/19 | 448 |
|
| USD | 8,883 |
| SEK | 83,032 |
| Goldman Sachs & Co. | 9/30/19 | 251 |
|
| USD | 20,674 |
| SEK | 193,515 |
| Goldman Sachs & Co. | 9/30/19 | 556 |
|
| USD | 12,577 |
| SEK | 118,014 |
| Goldman Sachs & Co. | 9/30/19 | 308 |
|
| USD | 207,271 |
| SGD | 285,549 |
| Bank of America, N.A. | 9/18/19 | (674 | ) |
| THB | 44,726,720 |
| USD | 1,458,084 |
| Goldman Sachs & Co. | 9/18/19 | (10,564 | ) |
| USD | 432,618 |
| THB | 13,728,041 |
| Goldman Sachs & Co. | 9/18/19 | (11,672 | ) |
| USD | 1,436,135 |
| THB | 44,231,534 |
| Goldman Sachs & Co. | 9/18/19 | 4,641 |
|
| USD | 1,072,923 |
| THB | 32,933,356 |
| Goldman Sachs & Co. | 9/18/19 | 7,079 |
|
| USD | 1,453,384 |
| THB | 44,843,443 |
| Goldman Sachs & Co. | 9/18/19 | 2,087 |
|
| USD | 723,923 |
| THB | 22,386,580 |
| Goldman Sachs & Co. | 9/18/19 | (589 | ) |
| ZAR | 10,597,528 |
| USD | 714,692 |
| UBS AG | 9/18/19 | 19,952 |
|
| ZAR | 20,075,289 |
| USD | 1,424,487 |
| UBS AG | 9/18/19 | (32,823 | ) |
| USD | 710,890 |
| ZAR | 10,597,528 |
| UBS AG | 9/18/19 | (23,753 | ) |
| USD | 1,404,583 |
| ZAR | 20,075,289 |
| UBS AG | 9/18/19 | 12,920 |
|
| | | | | | | $ | 535,778 |
|
|
| | | | | | | | | | | |
| FUTURES CONTRACTS PURCHASED |
| Reference Entity | Contracts | Expiration Date | Notional
Amount | Underlying
Contract
Value | Unrealized Appreciation
(Depreciation) |
| Japanese 10-Year Mini Government Bonds | 12 | September 2019 | JPY | 120,000,000 |
| $ | 1,696,700 |
| $ | 4,107 |
|
| Korean Treasury 10-Year Bonds | 10 | September 2019 | KRW | 1,000,000,000 |
| 1,128,645 |
| 19,424 |
|
| S&P 500 E-Mini | 15 | September 2019 | USD | 750 |
| 2,236,725 |
| (2,249 | ) |
| U.S. Treasury 10-Year Ultra Notes | 19 | September 2019 | USD | 1,900,000 |
| 2,619,031 |
| 46,736 |
|
| U.S. Treasury 2-Year Notes | 187 | September 2019 | USD | 37,400,000 |
| 40,093,969 |
| 81,119 |
|
| U.S. Treasury 5-Year Notes | 91 | September 2019 | USD | 9,100,000 |
| 10,697,477 |
| 81,547 |
|
| | | | | | $ | 58,472,547 |
| $ | 230,684 |
|
|
| | | | | | | | | | | |
| FUTURES CONTRACTS SOLD |
| Reference Entity | Contracts | Expiration Date | Notional
Amount | Underlying
Contract
Value | Unrealized Appreciation
(Depreciation) |
| Euro-Bund 10-Year Bonds | 3 | September 2019 | EUR | 300,000 |
| $ | 581,408 |
| $ | (15,580 | ) |
| Euro-OAT 10-Year Bonds | 7 | September 2019 | EUR | 700,000 |
| 1,295,866 |
| (44,491 | ) |
| | | | | | $ | 1,877,274 |
| $ | (60,071 | ) |
|
| | | | | | | | | | | | | | | |
| CENTRALLY CLEARED CREDIT DEFAULT SWAP AGREEMENTS | |
| Reference Entity | Type‡ | Fixed Rate
Received
(Paid) | Termination
Date | Notional
Amount | Premiums
Paid
(Received) | Unrealized
Appreciation
(Depreciation) | Value^ |
| Markit CDX North America High Yield Index Series 32 | Sell | 5.00% | 6/20/24 | $ | 2,034,450 |
| $ | 133,532 |
| $ | 31,678 |
| $ | 165,210 |
|
‡ The maximum potential amount the fund could be required to deliver as a seller of credit protection if a credit event occurs as defined under the terms of the agreement is the notional amount. The maximum potential amount may be partially offset by any recovery values of the reference entities and upfront payments received upon entering into the agreement.
^The value for credit default swap agreements serve as an indicator of the current status of the payment/performance risk and represent the likelihood of an expected liability or profit at the period end. Increasing values in absolute terms when compared to the notional amount of the credit default swap agreement represent a deterioration of the referenced entity's credit soundness and an increased likelihood or risk of a credit event occurring as defined in the agreement.
|
| | | | | |
| NOTES TO SCHEDULE OF INVESTMENTS |
| ADR | - | American Depositary Receipt | MYR | - | Malaysian Ringgit |
| AUD | - | Australian Dollar | NOK | - | Norwegian Krone |
| BRL | - | Brazilian Real | NVDR | - | Non-Voting Depositary Receipt |
| CAD | - | Canadian Dollar | NZD | - | New Zealand Dollar |
| CDX | - | Credit Derivatives Indexes | PEN | - | Peruvian Sol |
| CHF | - | Swiss Franc | PHP | - | Philippine Peso |
| CLP | - | Chilean Peso | PIK | - | Payment in Kind. Security may pay a cash rate and/or an in kind rate. |
| | | | | |
| CNY | - | Chinese Yuan | PLN | - | Polish Zloty |
| COP | - | Colombian Peso | RUB | - | Russian Ruble |
| CZK | - | Czech Koruna | SBBPA | - | Standby Bond Purchase Agreement |
| DKK | - | Danish Krone | SEK | - | Swedish Krona |
| EUR | - | Euro | SEQ | - | Sequential Payer |
| FHLB | - | Federal Home Loan Bank | SGD | - | Singapore Dollar |
| FHLMC | - | Federal Home Loan Mortgage Corporation | TBA | - | To-Be-Announced. Security was purchased on a forward commitment basis with an approximate principal amount and maturity date. Actual principal amount and maturity date will be determined upon settlement. |
| FNMA | - | Federal National Mortgage Association | | |
| GBP | - | British Pound | | |
| GDR | - | Global Depositary Receipt | | |
| GNMA | - | Government National Mortgage Association | THB | - | Thai Baht |
| GO | - | General Obligation | USD | - | United States Dollar |
| H15T1Y | - | Constant Maturity U.S. Treasury Note Yield Curve Rate Index | VRDN | - | Variable Rate Demand Note. The instrument may be payable upon demand and adjusts periodically based upon the terms set forth in the security's offering documents. The rate shown is effective at the period end and the reference rate and spread, if any, is indicated. The date of the demand feature is disclosed. |
| HUF | - | Hungarian Forint | | |
| IDR | - | Indonesian Rupiah | | |
| ILS | - | Israeli Shekel | | |
| JPY | - | Japanese Yen | | |
| KRW | - | South Korean Won | VRN | - | Variable Rate Note. The rate adjusts periodically based upon the terms set forth in the security’s offering documents. The rate shown is effective at the period end and the reference rate and spread, if any, is indicated. |
| KZT | - | Kazakhstani Tenge | | |
| LIBOR | - | London Interbank Offered Rate | | |
| LIQ FAC | - | Liquidity Facilities | | |
| LOC | - | Letter of Credit | ZAR | - | South African Rand |
| MTN | - | Medium Term Note | | | |
| MXN | - | Mexican Peso | | | |
† Category is less than 0.05% of total net assets.
| |
| (2) | Security was purchased pursuant to Rule 144A or Section 4(2) under the Securities Act of 1933 and may be sold in transactions exempt from registration, normally to qualified institutional investors. The aggregate value of these securities at the period end was $60,673,997, which represented 6.8% of total net assets. |
| |
| (3) | The security's rate was paid in cash at the last payment date. |
| |
| (4) | Security, or a portion thereof, has been pledged at the custodian bank or with a broker for collateral requirements on forward commitments, forward foreign currency exchange contracts, futures contracts, and/or swap agreements. At the period end, the aggregate value of securities pledged was $388,145. |
| |
| (5) | Security is a zero-coupon bond. |
| |
| (6) | Investments are funds within the American Century Investments family of funds and are considered affiliated funds. |
| |
| (7) | When-issued security. The issue price and yield are fixed on the date of the commitment, but payment and delivery are scheduled for a future date. |
| |
| (8) | The rate indicated is the yield to maturity at purchase for non-interest bearing securities. For interest bearing securities, the stated coupon rate is shown. |
See Notes to Financial Statements.
|
|
| Statement of Assets and Liabilities |
|
| | | |
| JULY 31, 2019 | |
| Assets | |
| Investment securities - unaffiliated, at value (cost of $731,071,965) | $ | 869,254,237 |
|
| Investment securities - affiliated, at value (cost of $20,856,610) | 21,294,383 |
|
| Total investment securities, at value (cost of $751,928,575) | 890,548,620 |
|
| Foreign currency holdings, at value (cost of $5,115) | 4,338 |
|
| Foreign deposits with broker for futures contracts, at value (cost of $170,262) | 163,139 |
|
| Deposits with broker for futures contracts | 94,500 |
|
| Receivable for investments sold | 2,052,268 |
|
| Receivable for capital shares sold | 792,170 |
|
| Receivable for variation margin on futures contracts | 3,641 |
|
| Unrealized appreciation on forward foreign currency exchange contracts | 1,561,498 |
|
| Dividends and interest receivable | 2,996,169 |
|
| Other assets | 14,365 |
|
| | 898,230,708 |
|
| | |
| Liabilities | |
| Disbursements in excess of demand deposit cash | 74 |
|
| Payable for investments purchased | 9,264,139 |
|
| Payable for capital shares redeemed | 1,060,091 |
|
| Payable for variation margin on futures contracts | 59,941 |
|
| Payable for variation margin on swap agreements | 7,413 |
|
| Unrealized depreciation on forward foreign currency exchange contracts | 1,025,720 |
|
| Accrued management fees | 749,714 |
|
| Distribution and service fees payable | 123,461 |
|
| Accrued foreign taxes | 991 |
|
| | 12,291,544 |
|
| | |
| Net Assets | $ | 885,939,164 |
|
| | |
| Net Assets Consist of: | |
| Capital (par value and paid-in surplus) | $ | 729,013,391 |
|
| Distributable earnings | 156,925,773 |
|
| | $ | 885,939,164 |
|
|
| | | | |
| | Net Assets | Shares Outstanding | Net Asset Value Per Share |
| Investor Class, $0.01 Par Value | $314,567,256 | 47,873,225 |
| $6.57 |
| I Class, $0.01 Par Value | $76,201,609 | 11,591,096 |
| $6.57 |
| A Class, $0.01 Par Value | $304,644,179 | 46,514,821 |
| $6.55* |
| C Class, $0.01 Par Value | $48,514,526 | 7,522,057 |
| $6.45 |
| R Class, $0.01 Par Value | $39,114,181 | 6,007,725 |
| $6.51 |
| R5 Class, $0.01 Par Value | $7,199,931 | 1,094,706 |
| $6.58 |
| R6 Class, $0.01 Par Value | $95,697,482 | 14,577,811 |
| $6.56 |
*Maximum offering price $6.95 (net asset value divided by 0.9425).
See Notes to Financial Statements.
|
| | | |
| YEAR ENDED JULY 31, 2019 |
| Investment Income (Loss) | |
| Income: | |
| Dividends (including $213,850 from affiliated funds and net of foreign taxes withheld of $558,667) | $ | 13,052,122 |
|
| Interest (net of foreign taxes withheld of $1,947) | 11,543,793 |
|
| | 24,595,915 |
|
| | |
| Expenses: | |
| Management fees | 10,343,582 |
|
| Distribution and service fees: | |
| A Class | 814,897 |
|
| C Class | 585,800 |
|
| R Class | 200,211 |
|
| Directors' fees and expenses | 27,854 |
|
| Other expenses | 85,977 |
|
| | 12,058,321 |
|
Fees waived(1) | (528,474 | ) |
| | 11,529,847 |
|
| | |
| Net investment income (loss) | 13,066,068 |
|
| | |
| Realized and Unrealized Gain (Loss) | |
| Net realized gain (loss) on: | |
| Investment transactions (including $115 from affiliated funds) | 44,060,483 |
|
| Forward foreign currency exchange contract transactions | 1,070,902 |
|
| Futures contract transactions | 512,374 |
|
| Swap agreement transactions | 296,850 |
|
| Foreign currency translation transactions | (122,612 | ) |
| | 45,817,997 |
|
| | |
| Change in net unrealized appreciation (depreciation) on: | |
| Investments (including $437,773 from affiliated funds and (increase) decrease in accrued foreign taxes of $5,159) | (31,695,689 | ) |
| Forward foreign currency exchange contracts | 469,598 |
|
| Futures contracts | 200,452 |
|
| Swap agreements | (78,871 | ) |
| Translation of assets and liabilities in foreign currencies | (22,249 | ) |
| | (31,126,759 | ) |
| | |
| Net realized and unrealized gain (loss) | 14,691,238 |
|
| | |
| Net Increase (Decrease) in Net Assets Resulting from Operations | $ | 27,757,306 |
|
| |
| (1) | Amount consists of $198,576, $46,885, $173,798, $31,144, $21,351, $3,552 and $53,168 for Investor Class, I Class, A Class, C Class, R Class, R5 Class and R6 Class, respectively. |
See Notes to Financial Statements.
|
|
| Statement of Changes in Net Assets |
|
| | | | | | | | | |
| YEAR ENDED JULY 31, 2019, EIGHT MONTHS ENDED JULY 31, 2018 AND YEAR ENDED NOVEMBER 30, 2017 |
| Increase (Decrease) in Net Assets | July 31, 2019 | July 31, 2018(1) | November 30, 2017 |
| Operations | | | |
| Net investment income (loss) | $ | 13,066,068 |
| $ | 9,146,237 |
| $ | 15,188,631 |
|
| Net realized gain (loss) | 45,817,997 |
| 88,049,994 |
| 123,145,311 |
|
| Change in net unrealized appreciation (depreciation) | (31,126,759 | ) | (58,961,112 | ) | 61,925,164 |
|
| Net increase (decrease) in net assets resulting from operations | 27,757,306 |
| 38,235,119 |
| 200,259,106 |
|
| | | | |
| Distributions to Shareholders | | | |
From earnings:(2) | | | |
| Investor Class | (39,277,283 | ) | (48,466,399 | ) | (14,049,234 | ) |
| I Class | (8,449,534 | ) | (12,495,566 | ) | (5,048,036 | ) |
| A Class | (32,296,649 | ) | (37,105,007 | ) | (9,913,896 | ) |
| C Class | (5,622,272 | ) | (8,815,375 | ) | (1,738,048 | ) |
| R Class | (3,699,119 | ) | (4,635,090 | ) | (1,089,567 | ) |
| R5 Class | (654,958 | ) | (22,790 | ) | (44 | ) |
| R6 Class | (11,327,933 | ) | (9,179,380 | ) | (2,339,956 | ) |
| Decrease in net assets from distributions | (101,327,748 | ) | (120,719,607 | ) | (34,178,781 | ) |
| | | | |
| Capital Share Transactions | | | |
| Net increase (decrease) in net assets from capital share transactions (Note 5) | (200,002,583 | ) | (48,674,810 | ) | (352,116,430 | ) |
| | | | |
| Net increase (decrease) in net assets | (273,573,025 | ) | (131,159,298 | ) | (186,036,105 | ) |
| | | | |
| Net Assets | | | |
| Beginning of period | 1,159,512,189 |
| 1,290,671,487 |
| 1,476,707,592 |
|
| End of period | $ | 885,939,164 |
| $ | 1,159,512,189 |
| $ | 1,290,671,487 |
|
| |
| (1) | The fund's fiscal year end was changed from November 30 to July 31, resulting in an eight-month annual reporting period. |
| |
| (2) | Prior periods presentation has been updated to reflect the current period combination of distributions to shareholders from net investment income and net realized gains. For the eight months ended July 31 2018, distributions from net investment income were $(4,435,536), $(1,358,612), $(2,826,853), $(399,830), $(280,348), $(22,317) and $(1,136,649) for Investor Class, I Class, A Class, C Class, R Class, R5 Class and R6 Class, respectively. For the eight months ended July 31, 2018, distributions from net realized gains were $(44,030,863), $(11,136,954), $(34,278,154), $(8,415,545), $(4,354,742), $(473) and $(8,042,731) for Investor Class, I Class, A Class, C Class, R Class, R5 Class and R6 Class, respectively. |
For the year ended November 30, 2017, distributions from net investment income were $(7,234,108), $(2,828,701), $(4,513,083), $(466,188), $(439,882), $(44) and $(1,483,111) for Investor Class, I Class, A Class, C Class, R Class, R5 Class and R6 Class, respectively. For the year ended November 30, 2017, distributions from net realized gains were $(6,815,126), $(2,219,335), $(5,400,813), $(1,271,860), $(649,685) and $(856,845) for Investor Class, I Class, A Class, C Class, R Class and R6 Class, respectively.
See Notes to Financial Statements.
|
|
| Notes to Financial Statements |
JULY 31, 2019
1. Organization
American Century Strategic Asset Allocations, Inc. (the corporation) is registered under the Investment Company Act of 1940, as amended (the 1940 Act), as an open-end management investment company and is organized as a Maryland corporation. Strategic Allocation: Moderate Fund (the fund) is one fund in a series issued by the corporation. The fund is an asset allocation fund and its investment objective is to seek the highest level of total return consistent with its asset mix.
The fund offers the Investor Class, I Class, A Class, C Class, R Class, R5 Class and R6 Class. The A Class may incur an initial sales charge. The A Class and C Class may be subject to a contingent deferred sales charge. Sale of the R5 Class commenced on April 10, 2017.
2. Significant Accounting Policies
The following is a summary of significant accounting policies consistently followed by the fund in preparation of its financial statements. The fund is an investment company and follows accounting and reporting guidance in accordance with accounting principles generally accepted in the United States of America. This may require management to make certain estimates and assumptions at the date of the financial statements. Actual results could differ from these estimates. Management evaluated the impact of events or transactions occurring through the date the financial statements were issued that would merit recognition or disclosure.
Investment Valuations — The fund determines the fair value of its investments and computes its net asset value per share at the close of regular trading (usually 4 p.m. Eastern time) on the New York Stock Exchange (NYSE) on each day the NYSE is open. The Board of Directors has adopted valuation policies and procedures to guide the investment advisor in the fund’s investment valuation process and to provide methodologies for the oversight of the fund’s pricing function.
Equity securities that are listed or traded on a domestic securities exchange are valued at the last reported sales price or at the official closing price as provided by the exchange. Equity securities traded on foreign securities exchanges are generally valued at the closing price of such securities on the exchange where primarily traded or at the close of the NYSE, if that is earlier. If no last sales price is reported, or if local convention or regulation so provides, the mean of the latest bid and asked prices may be used. Securities traded over-the-counter are valued at the mean of the latest bid and asked prices, the last sales price, or the official closing price. Equity securities initially expressed in local currencies are translated into U.S. dollars at the mean of the appropriate currency exchange rate at the close of the NYSE as provided by an independent pricing service.
Fixed income securities are valued at the evaluated mean as provided by independent pricing services or at the mean of the most recent bid and asked prices as provided by investment dealers. Corporate bonds, U.S. Treasury and Government Agency securities, convertible bonds, municipal securities, and sovereign governments and agencies are valued using market models that consider trade data, quotations from dealers and active market makers, relevant yield curve and spread data, creditworthiness, trade data or market information on comparable securities, and other relevant security specific information. Mortgage-related and asset-backed securities are valued based on models that consider trade data, prepayment and default projections, benchmark yield and spread data and estimated cash flows of each tranche of the issuer. Collateralized loan obligations are valued based on discounted cash flow models that consider trade and economic data, prepayment assumptions and default projections. Commercial paper is valued using a curve-based approach that considers money market rates for specific instruments, programs, currencies and maturity points from a variety of active market makers. Fixed income securities initially expressed in local currencies are translated into U.S. dollars at the mean of the appropriate currency exchange rate at the close of the NYSE as provided by an independent pricing service.
Open-end management investment companies are valued at the reported net asset value per share. Exchange-traded futures contracts are valued at the settlement price as provided by the appropriate exchange. Swap agreements are valued at an evaluated mean as provided by independent pricing services or independent brokers. Forward foreign currency exchange contracts are valued at the mean of the appropriate forward exchange rate at the close of the NYSE as provided by an independent pricing service. Investments initially expressed in local currencies are translated into U.S. dollars at the mean of the appropriate currency exchange rate at the close of the NYSE as provided by an independent pricing service.
If the fund determines that the market price for an investment is not readily available or the valuation methods mentioned above do not reflect an investment’s fair value, such investment is valued as determined in good faith by the Board of Directors or its delegate, in accordance with policies and procedures adopted by the Board of Directors. In its determination of fair value, the fund may review several factors including, but not limited to, market information regarding the specific investment or comparable investments and correlation with other investment types, futures indices or general market indicators. Circumstances that may cause the fund to use these procedures to value an investment include, but are not limited to: an investment has been declared in default or is distressed; trading in a security has been suspended during the trading day or a security is not actively trading on its principal exchange; prices received from a regular pricing source are deemed unreliable; or there is a foreign market holiday and no trading occurred.
The fund monitors for significant events occurring after the close of an investment’s primary exchange but before the fund’s net asset value per share is determined. Significant events may include, but are not limited to: corporate announcements and transactions; governmental action and political unrest that could impact a specific investment or an investment sector; or armed conflicts, natural disasters and similar events that could affect investments in a specific country or region. The fund also monitors for significant fluctuations between domestic and foreign markets, as evidenced by the U.S. market or such other indicators that the Board of Directors, or its delegate, deems appropriate. The fund may apply a model-derived factor to the closing price of equity securities traded on foreign securities exchanges. The factor is based on observable market data as provided by an independent pricing service.
Security Transactions — Security transactions are accounted for as of the trade date. Net realized gains and losses are determined on the identified cost basis, which is also used for federal income tax purposes. Certain countries impose taxes on realized gains on the sale of securities registered in their country. The fund records the foreign tax expense, if any, on an accrual basis. The foreign tax expense on realized gains and unrealized appreciation reduces the net realized gain (loss) on investment transactions and net unrealized appreciation (depreciation) on investments, respectively.
Investment Income — Dividend income less foreign taxes withheld, if any, is recorded as of the ex-dividend date. Distributions received on securities that represent a return of capital or long-term capital gain are recorded as a reduction of cost of investments and/or as a realized gain. The fund may estimate the components of distributions received that may be considered nontaxable distributions or long-term capital gain distributions for income tax purposes. Interest income less foreign taxes withheld, if any, is recorded on the accrual basis and includes paydown gain (loss) and accretion of discounts and amortization of premiums. Inflation adjustments related to inflation-linked debt securities are reflected as interest income.
Segregated Assets — In accordance with the 1940 Act, the fund segregates assets on its books and records to cover certain types of investment securities and other financial instruments. American Century Investment Management, Inc. (ACIM) (the investment advisor) monitors, on a daily basis, the securities segregated to ensure the fund designates a sufficient amount of liquid assets, marked-to-market daily. The fund may also receive assets or be required to pledge assets at the custodian bank or with a broker for collateral requirements.
Foreign Currency Translations — All assets and liabilities initially expressed in foreign currencies are translated into U.S. dollars at prevailing exchange rates at period end. The fund may enter into spot foreign currency exchange contracts to facilitate transactions denominated in a foreign currency. Purchases and sales of investment securities, dividend and interest income, spot foreign currency exchange contracts, and expenses are translated at the rates of exchange prevailing on the respective dates of such transactions. Net realized and unrealized foreign currency exchange gains or losses related to investment securities are a component of net realized gain (loss) on investment transactions and change in net unrealized appreciation (depreciation) on investments, respectively.
Forward Commitments — The fund may engage in securities transactions on a forward commitment basis. In these transactions, the securities’ prices and yields are fixed on the date of the commitment. The fund may sell a to-be-announced (TBA) security and at the same time make a commitment to purchase the same security at a future date at a specified price. Conversely, the fund may purchase a TBA security and at the same time make a commitment to sell the same security at a future date at a specified price. These types of transactions are known as “TBA roll” transactions and are accounted for as purchases and sales. The fund will segregate cash, cash equivalents or other appropriate liquid securities on its records in amounts sufficient to meet the purchase price.
Income Tax Status — It is the fund’s policy to distribute substantially all net investment income and net realized gains to shareholders and to otherwise qualify as a regulated investment company under provisions of the Internal Revenue Code. Accordingly, no provision has been made for income taxes. The fund files U.S. federal, state, local and non-U.S. tax returns as applicable. The fund's tax returns are subject to examination by the relevant taxing authority until expiration of the applicable statute of limitations, which is generally three years from the date of filing but can be longer in certain jurisdictions. At this time, management believes there are no uncertain tax positions which, based on their technical merit, would not be sustained upon examination and for which it is reasonably possible that the total amounts of unrecognized tax benefits will significantly change in the next twelve months.
Multiple Class — All shares of the fund represent an equal pro rata interest in the net assets of the class to which such shares belong, and have identical voting, dividend, liquidation and other rights and the same terms and conditions, except for class specific expenses and exclusive rights to vote on matters affecting only individual classes. Income, non-class specific expenses, and realized and unrealized capital gains and losses of the fund are allocated to each class of shares based on their relative net assets.
Distributions to Shareholders — Distributions from net investment income, if any, are generally declared and paid quarterly. Distributions from net realized gains, if any, are generally declared and paid annually. The fund may elect to treat a portion of its payment to a redeeming shareholder, which represents the pro rata share of undistributed net investment income and net realized gains, as a distribution for federal income tax purposes (tax equalization).
Indemnifications — Under the corporation’s organizational documents, its officers and directors are indemnified against certain liabilities arising out of the performance of their duties to the fund. In addition, in the normal course of business, the fund enters into contracts that provide general indemnifications. The maximum exposure under these arrangements is unknown as this would involve future claims that may be made against a fund. The risk of material loss from such claims is considered by management to be remote.
3. Fees and Transactions with Related Parties
Certain officers and directors of the corporation are also officers and/or directors of American Century Companies, Inc. (ACC). The corporation’s investment advisor, ACIM, the corporation's distributor, American Century Investment Services, Inc. (ACIS), and the corporation’s transfer agent, American Century Services, LLC, are wholly owned, directly or indirectly, by ACC.
Management Fees —The corporation has entered into a management agreement with ACIM, under which ACIM provides the fund with investment advisory and management services in exchange for a single, unified management fee (the fee) per class. The agreement provides that all expenses of managing and operating the fund, except distribution and service fees, brokerage expenses, taxes, interest, fees and expenses of the independent directors (including legal counsel fees), and extraordinary expenses, will be paid by ACIM. The fee is computed and accrued daily based on each class’s daily net assets and paid monthly in arrears. The difference in the fee among the classes is a result of their separate arrangements for non-Rule 12b-1 shareholder services. It is not the result of any difference in advisory or custodial fees or other expenses related to the management of the fund’s assets, which do not vary by class. The rate of the fee is determined by applying a fee rate calculation formula. This formula takes into account the fund’s assets as well as certain assets, if any, of other clients of the investment advisor outside the American Century Investments family of funds (such as subadvised funds and separate accounts) that use very similar investment teams and strategies (strategy assets). The investment advisor will waive the portion of the fund’s management fee equal to the expenses attributable to the management fees of the American Century Investments funds in which the fund invests. The amount of this waiver will fluctuate depending on the fund’s daily allocation to other American Century Investments funds. This waiver is expected to remain in effect permanently and it cannot be terminated without the approval of the Board of Directors. During the period ended July 31, 2019, the investment advisor agreed to waive an additional 0.05% of the fund's management fee. The investment
advisor expects this waiver to continue until July 31, 2020 and cannot terminate it prior to such date without the approval of the Board of Directors.
The management fee schedule range and the effective annual management fee before and after waiver for each class for the period ended July 31, 2019 are as follows:
|
| | | |
| | | Effective Annual Management Fee |
| | Management Fee Schedule Range | Before Waiver | After Waiver |
| Investor Class | 0.90% to 1.10% | 1.10% | 1.05% |
| I Class | 0.70% to 0.90% | 0.90% | 0.85% |
| A Class | 0.90% to 1.10% | 1.10% | 1.05% |
| C Class | 0.90% to 1.10% | 1.10% | 1.05% |
| R Class | 0.90% to 1.10% | 1.10% | 1.05% |
| R5 Class | 0.70% to 0.90% | 0.90% | 0.85% |
| R6 Class | 0.55% to 0.75% | 0.75% | 0.70% |
Distribution and Service Fees — The Board of Directors has adopted a separate Master Distribution and Individual Shareholder Services Plan for each of the A Class, C Class and R Class (collectively the plans), pursuant to Rule 12b-1 of the 1940 Act. The plans provide that the A Class will pay ACIS an annual distribution and service fee of 0.25%. The plans provide that the C Class will pay ACIS an annual distribution and service fee of 1.00%, of which 0.25% is paid for individual shareholder services and 0.75% is paid for distribution services. The plans provide that the R Class will pay ACIS an annual distribution and service fee of 0.50%. The fees are computed and accrued daily based on each class’s daily net assets and paid monthly in arrears. The fees are used to pay financial intermediaries for distribution and individual shareholder services. Fees incurred under the plans during the period ended July 31, 2019 are detailed in the Statement of Operations.
Directors' Fees and Expenses — The Board of Directors is responsible for overseeing the investment advisor’s management and operations of the fund. The directors receive detailed information about the fund and its investment advisor regularly throughout the year, and meet at least quarterly with management of the investment advisor to review reports about fund operations. The fund’s officers do not receive compensation from the fund.
Interfund Transactions — The fund may enter into security transactions with other American Century Investments funds and other client accounts of the investment advisor, in accordance with the 1940 Act rules and procedures adopted by the Board of Directors. The rules and procedures require, among other things, that these transactions be effected at the independent current market price of the security. During the period, the interfund purchases and sales were $8,039,673 and $12,896,189, respectively. The effect of interfund transactions on the Statement of Operations was $844,622 in net realized gain (loss) on investment transactions.
4. Investment Transactions
Purchases of investment securities, excluding short-term investments, for the period ended July 31, 2019 totaled $651,003,891, of which $100,832,691 represented U.S. Treasury and Government Agency obligations.
Sales of investment securities, excluding short-term investments, for the period ended July 31, 2019 totaled $934,520,904, of which $167,794,817 represented U.S. Treasury and Government Agency obligations.
5. Capital Share Transactions
Transactions in shares of the fund were as follows:
|
| | | | | | | | | | | | | | | |
| | Year ended July 31, 2019 | Eight months ended July 31, 2018(1) | Year ended November 30, 2017(2) |
| | Shares | Amount | Shares | Amount | Shares | Amount |
| Investor Class/Shares Authorized | 790,000,000 |
| | 790,000,000 |
| | 790,000,000 |
| |
| Sold | 5,106,477 |
| $ | 33,225,147 |
| 4,611,023 |
| $ | 32,250,334 |
| 12,920,825 |
| $ | 90,675,133 |
|
| Issued in reinvestment of distributions | 6,570,306 |
| 38,839,511 |
| 6,954,777 |
| 47,978,690 |
| 2,038,633 |
| 13,903,568 |
|
| Redeemed | (27,077,167 | ) | (172,824,566 | ) | (17,928,486 | ) | (125,884,910 | ) | (31,462,012 | ) | (221,849,064 | ) |
| | (15,400,384 | ) | (100,759,908 | ) | (6,362,686 | ) | (45,655,886 | ) | (16,502,554 | ) | (117,270,363 | ) |
| I Class/Shares Authorized | 380,000,000 |
| | 380,000,000 |
| | 380,000,000 |
| |
| Sold | 6,114,875 |
| 40,867,347 |
| 2,225,351 |
| 15,588,958 |
| 6,154,728 |
| 43,137,167 |
|
| Issued in reinvestment of distributions | 1,419,398 |
| 8,448,896 |
| 1,793,497 |
| 12,389,825 |
| 736,588 |
| 5,035,400 |
|
| Redeemed | (13,789,127 | ) | (90,242,548 | ) | (4,214,590 | ) | (29,834,539 | ) | (20,831,687 | ) | (147,212,919 | ) |
| | (6,254,854 | ) | (40,926,305 | ) | (195,742 | ) | (1,855,756 | ) | (13,940,371 | ) | (99,040,352 | ) |
| A Class/Shares Authorized | 670,000,000 |
| | 670,000,000 |
| | 670,000,000 |
| |
| Sold | 8,836,897 |
| 57,236,516 |
| 4,534,090 |
| 31,571,822 |
| 6,565,906 |
| 45,900,836 |
|
| Issued in reinvestment of distributions | 5,304,364 |
| 31,208,520 |
| 5,235,390 |
| 36,009,274 |
| 1,426,375 |
| 9,671,984 |
|
| Redeemed | (17,236,316 | ) | (110,250,267 | ) | (13,349,495 | ) | (93,514,032 | ) | (23,367,563 | ) | (163,749,544 | ) |
| | (3,095,055 | ) | (21,805,231 | ) | (3,580,015 | ) | (25,932,936 | ) | (15,375,282 | ) | (108,176,724 | ) |
| C Class/Shares Authorized | 160,000,000 |
| | 160,000,000 |
| | 160,000,000 |
| |
| Sold | 522,498 |
| 3,313,429 |
| 654,196 |
| 4,503,746 |
| 1,030,907 |
| 7,150,520 |
|
| Issued in reinvestment of distributions | 959,909 |
| 5,533,027 |
| 1,270,366 |
| 8,636,760 |
| 251,497 |
| 1,676,528 |
|
| Redeemed | (5,570,385 | ) | (36,035,344 | ) | (3,431,673 | ) | (23,697,580 | ) | (4,321,833 | ) | (30,090,888 | ) |
| | (4,087,978 | ) | (27,188,888 | ) | (1,507,111 | ) | (10,557,074 | ) | (3,039,429 | ) | (21,263,840 | ) |
| R Class/Shares Authorized | 90,000,000 |
| | 90,000,000 |
| | 90,000,000 |
| |
| Sold | 763,380 |
| 4,846,322 |
| 555,234 |
| 3,854,070 |
| 972,450 |
| 6,761,626 |
|
| Issued in reinvestment of distributions | 626,087 |
| 3,653,574 |
| 667,048 |
| 4,561,392 |
| 159,071 |
| 1,071,635 |
|
| Redeemed | (1,641,699 | ) | (10,587,946 | ) | (1,720,689 | ) | (11,897,375 | ) | (2,506,262 | ) | (17,499,349 | ) |
| | (252,232 | ) | (2,088,050 | ) | (498,407 | ) | (3,481,913 | ) | (1,374,741 | ) | (9,666,088 | ) |
| | | | | | | |
|
| | | | | | | | | | | | | | | |
| | Year ended July 31, 2019 | Eight months ended July 31, 2018(1) | Year ended November 30, 2017(2) |
| | Shares | Amount | Shares | Amount | Shares | Amount |
| R5 Class/Shares Authorized | 50,000,000 |
| | 50,000,000 |
| | 50,000,000 |
| |
| Sold | 102,275 |
| $ | 657,873 |
| 1,048,946 |
| $ | 7,341,301 |
| 722 |
| $ | 5,000 |
|
| Issued in reinvestment of distributions | 110,387 |
| 654,958 |
| 3,266 |
| 22,790 |
| 6 |
| 44 |
|
| Redeemed | (97,788 | ) | (651,877 | ) | (73,108 | ) | (514,776 | ) | – |
| – |
|
| | 114,874 |
| 660,954 |
| 979,104 |
| 6,849,315 |
| 728 |
| 5,044 |
|
| R6 Class/Shares Authorized | 150,000,000 |
| | 150,000,000 |
| | 150,000,000 |
| |
| Sold | 3,011,246 |
| 19,700,526 |
| 7,720,823 |
| 53,908,442 |
| 10,337,985 |
| 71,479,267 |
|
| Issued in reinvestment of distributions | 1,913,370 |
| 11,327,933 |
| 1,330,511 |
| 9,179,380 |
| 340,880 |
| 2,339,956 |
|
| Redeemed | (6,304,564 | ) | (38,923,614 | ) | (4,493,981 | ) | (31,128,382 | ) | (9,971,031 | ) | (70,523,330 | ) |
| | (1,379,948 | ) | (7,895,155 | ) | 4,557,353 |
| 31,959,440 |
| 707,834 |
| 3,295,893 |
|
| Net increase (decrease) | (30,355,577 | ) | $ | (200,002,583 | ) | (6,607,504 | ) | $ | (48,674,810 | ) | (49,523,815 | ) | $ | (352,116,430 | ) |
| |
| (1) | The fund's fiscal year end was changed from November 30 to July 31, resulting in an eight-month annual reporting period. |
| |
| (2) | April 10, 2017 (commencement of sale) through November 30, 2017 for the R5 Class. |
6. Affiliated Fund Transactions
A summary of transactions for each affiliated fund for the period ended July 31, 2019 follows (amounts in thousands):
|
| | | | | | | | | | | | | | | | | | | | | |
Affiliated Fund(1) | Beginning Value | Purchase
Cost | Sales
Cost | Change in Net Unrealized Appreciation (Depreciation) | Ending
Value | Ending
Shares | Net Realized
Gain (Loss) | Distributions
Received(2) |
| American Century Diversified Corporate Bond ETF | — |
| $ | 18,393 |
| — |
| $ | 449 |
| $ | 18,842 |
| 371 |
| — |
| $ | 214 |
|
| American Century STOXX U.S. Quality Value ETF | — |
| 2,505 |
| $ | 42 |
| (11 | ) | 2,452 |
| 61 |
| — |
| — |
|
| | — |
| $ | 20,898 |
| $ | 42 |
| $ | 438 |
| $ | 21,294 |
| 432 |
| — |
| $ | 214 |
|
| |
| (1) | Investments are funds within the American Century Investments family of funds and are considered affiliated funds. The fund does not invest in an affiliated fund for the purpose of exercising management or control; however, investments by the fund within its investment strategy may represent a significant portion of an affiliated fund's net assets. Additional information and attributes of each affiliated fund are available at americancentury.com. |
| |
| (2) | Distributions received includes distributions from net investment income and from capital gains, if any. |
7. Fair Value Measurements
The fund’s investments valuation process is based on several considerations and may use multiple inputs to determine the fair value of the investments held by the fund. In conformity with accounting principles generally accepted in the United States of America, the inputs used to determine a valuation are classified into three broad levels.
| |
| • | Level 1 valuation inputs consist of unadjusted quoted prices in an active market for identical investments. |
| |
| • | Level 2 valuation inputs consist of direct or indirect observable market data (including quoted prices for comparable investments, evaluations of subsequent market events, interest rates, prepayment speeds, credit risk, etc.). These inputs also consist of quoted prices for identical investments initially expressed in local currencies that are adjusted through translation into U.S. dollars. |
| |
| • | Level 3 valuation inputs consist of unobservable data (including a fund’s own assumptions). |
The level classification is based on the lowest level input that is significant to the fair valuation measurement. The valuation inputs are not necessarily an indication of the risks associated with investing in these securities or other financial instruments.
The following is a summary of the level classifications as of period end. The Schedule of Investments provides additional information on the fund’s portfolio holdings.
|
| | | | | | | | |
| | Level 1 | Level 2 | Level 3 |
| Assets | | | |
| Investment Securities | | | |
| Common Stocks | $ | 397,908,456 |
| $ | 151,590,106 |
| — |
|
| Corporate Bonds | — |
| 78,800,704 |
| — |
|
| U.S. Treasury Securities | — |
| 56,371,108 |
| — |
|
| Sovereign Governments and Agencies | — |
| 37,328,765 |
| — |
|
| U.S. Government Agency Mortgage-Backed Securities | — |
| 32,126,188 |
| — |
|
| Affiliated Funds | 21,294,383 |
| — |
| — |
|
| Municipal Securities | — |
| 21,267,230 |
| — |
|
| Asset-Backed Securities | — |
| 17,148,577 |
| — |
|
| Collateralized Mortgage Obligations | — |
| 14,715,989 |
| — |
|
| Collateralized Loan Obligations | — |
| 12,942,361 |
| — |
|
| Commercial Mortgage-Backed Securities | — |
| 10,575,640 |
| — |
|
| Exchange-Traded Funds | 3,660,089 |
| — |
| — |
|
| Commercial Paper | — |
| 2,999,948 |
| — |
|
| Warrants | — |
| 1,212 |
| — |
|
| Temporary Cash Investments | 31,817,864 |
| — |
| — |
|
| | $ | 454,680,792 |
| $ | 435,867,828 |
| — |
|
| Other Financial Instruments | | | |
| Futures Contracts | $ | 209,402 |
| $ | 23,531 |
| — |
|
| Swap Agreements | — |
| 165,210 |
| — |
|
| Forward Foreign Currency Exchange Contracts | — |
| 1,561,498 |
| — |
|
| | $ | 209,402 |
| $ | 1,750,239 |
| — |
|
| | | | |
| Liabilities | | | |
| Other Financial Instruments | | | |
| Futures Contracts | $ | 2,249 |
| $ | 60,071 |
| — |
|
| Forward Foreign Currency Exchange Contracts | — |
| 1,025,720 |
| — |
|
| | $ | 2,249 |
| $ | 1,085,791 |
| — |
|
8. Derivative Instruments
Credit Risk — The fund is subject to credit risk in the normal course of pursuing its investment objectives. The value of a bond generally declines as the credit quality of its issuer declines. Credit default swap agreements enable a fund to buy/sell protection against a credit event of a specific issuer or index. A fund may attempt to enhance returns by selling protection or attempt to mitigate credit risk by buying protection. The buyer/seller of credit protection against a security or basket of securities may pay/receive an up-front or periodic payment to compensate for/against potential default events. Changes in value, including the periodic amounts of interest to be paid or received on swap agreements, are recorded as unrealized appreciation (depreciation) on swap agreements. Upon entering into a centrally cleared swap, a fund is required to deposit cash or securities (initial margin) with a financial intermediary in an amount equal to a certain percentage of the notional amount. Subsequent payments (variation margin) are made or received daily, in cash, by a fund. The variation margin is equal to the daily change in the value and is a component of unrealized gains and losses. Realized gain or loss is recorded upon receipt or payment of a periodic settlement or termination of swap agreements. Net realized and unrealized gains or losses occurring during the holding period of swap agreements are a component of net realized gain (loss) on swap agreement transactions and change in net unrealized appreciation (depreciation) on swap agreements, respectively. The risks of entering into swap agreements include the possible lack of liquidity, failure of the counterparty to meet its obligations, and that there may be unfavorable changes in the underlying investments or instruments. The fund's average notional amount held during the period was $8,466,346.
Equity Price Risk — The fund is subject to equity price risk in the normal course of pursuing its investment objectives. A fund may enter into futures contracts based on an equity index in order to manage its exposure to changes in market conditions. A fund may purchase futures contracts to gain exposure to increases in market value or sell futures contracts to protect against a decline in market value. Upon entering into a futures contract, a fund is required to deposit either cash or securities in an amount equal to a certain percentage of the contract value (initial margin). Subsequent payments (variation margin) are made or received daily, in cash, by a fund. The variation margin is equal to the daily change in the contract value and is recorded as unrealized gains and losses. A fund recognizes a realized gain or loss when the contract is closed or expires. Net realized and unrealized gains or losses occurring during the holding period of futures contracts are a component of net realized gain (loss) on futures contract transactions and change in net unrealized appreciation (depreciation) on futures contracts, respectively. One of the risks of entering into futures contracts is the possibility that the change in value of the contract may not correlate with the changes in value of the underlying securities. The fund's average notional exposure to equity price risk derivative instruments held during the period was $1,343 futures contracts purchased.
Foreign Currency Risk — The fund is subject to foreign currency exchange rate risk in the normal course of pursuing its investment objectives. The value of foreign investments held by a fund may be significantly affected by changes in foreign currency exchange rates. The dollar value of a foreign security generally decreases when the value of the dollar rises against the foreign currency in which the security is denominated and tends to increase when the value of the dollar declines against such foreign currency. A fund may enter into forward foreign currency exchange contracts to reduce a fund's exposure to foreign currency exchange rate fluctuations or to gain exposure to the fluctuations in the value of foreign currencies. The net U.S. dollar value of foreign currency underlying all contractual commitments held by a fund and the resulting unrealized appreciation or depreciation are determined daily. Realized gain or loss is recorded upon the termination of the contract. Net realized and unrealized gains or losses occurring during the holding period of forward foreign currency exchange contracts are a component of net realized gain (loss) on forward foreign currency exchange contract transactions and change in net unrealized appreciation (depreciation) on forward foreign currency exchange contracts, respectively. A fund bears the risk of an unfavorable change in the foreign currency exchange rate underlying the forward contract. Additionally, losses, up to the fair value, may arise if the counterparties do not perform under the contract terms. The fund's average U.S. dollar exposure to foreign currency risk derivative instruments held during the period was $106,225,883.
Interest Rate Risk — The fund is subject to interest rate risk in the normal course of pursuing its investment objectives. A fund may enter into futures contracts or interest rate swap agreements in order to manage its exposure to changes in market conditions. The value of bonds generally declines as interest rates rise. The risks of entering into interest rate risk derivative instruments include the possible lack of liquidity, failure of the counterparty to meet its obligations, and that there may be unfavorable changes in the underlying investments or instruments.
A fund may enter into futures contracts based on a bond index or a specific underlying security. A fund may purchase futures contracts to gain exposure to increases in market value or sell futures contracts to protect against a decline in market value. Upon entering into a futures contract, a fund will segregate cash, cash equivalents or other appropriate liquid securities on its records in amounts sufficient to meet requirements. Subsequent payments (variation margin) are made or received daily, in cash, by a fund. The variation margin is equal to the daily change in the contract value and is recorded as unrealized gains and losses. A fund recognizes a realized gain or loss when the futures contract is closed or expires. Net realized and unrealized gains or losses occurring during the holding period of futures contracts are a component of net realized gain (loss) on futures contract transactions and change in net unrealized appreciation (depreciation) on futures contracts, respectively. The fund's average notional exposure to these interest rate risk derivative instruments held during the period was $34,193,527 futures contracts purchased and $4,530,680 futures contracts sold.
A fund may enter into interest rate swap agreements to gain exposure to declines in interest rates, to protect against increases in interest rates, or to maintain its ability to generate income at prevailing interest rates. A fund will segregate cash, cash equivalents or other appropriate liquid securities on its records in amounts sufficient to meet requirements. Changes in value, including the periodic amounts of interest to be paid or received on swap agreements, are recorded as unrealized appreciation (depreciation) on swap agreements. Upon entering into a centrally cleared swap, a fund is required to deposit cash or securities (initial margin) with a financial intermediary in an amount equal to a certain percentage of the notional amount. Subsequent payments (variation margin) are made or received daily, in cash, by a fund. The variation margin is equal to the daily change in the value and is a component of unrealized gains and losses. Realized gain or loss is recorded upon receipt or payment of a periodic settlement or termination of swap agreements. Net realized and unrealized gains or losses occurring during the holding period of swap agreements are a component of net realized gain (loss) on swap agreement transactions and change in net unrealized appreciation (depreciation) on swap agreements, respectively. The fund's average notional amount on interest rate swap agreements held during the period was $710,947.
Value of Derivative Instruments as of July 31, 2019
|
| | | | | | | | |
| | Asset Derivatives | Liability Derivatives |
| Type of Risk Exposure | Location on Statement of Assets and Liabilities | Value | Location on Statement of Assets and Liabilities | Value |
| Credit Risk | Receivable for variation margin on swap agreements* | — |
| Payable for variation margin on swap agreements* | $ | 7,413 |
|
| Equity Price Risk | Receivable for variation margin on futures contracts* | — |
| Payable for variation margin on futures contracts* | 22,500 |
|
| Foreign Currency Risk | Unrealized appreciation on forward foreign currency exchange contracts | $ | 1,561,498 |
| Unrealized depreciation on forward foreign currency exchange contracts | 1,025,720 |
|
| Interest Rate Risk | Receivable for variation margin on futures contracts* | 3,641 |
| Payable for variation margin on futures contracts* | 37,441 |
|
| | | $ | 1,565,139 |
| | $ | 1,093,074 |
|
* Included in the unrealized appreciation (depreciation) on futures contracts or centrally cleared swap agreements, as applicable, as reported in the Schedule of Investments.
|
| | | | | | | | |
| Effect of Derivative Instruments on the Statement of Operations for the Year Ended July 31, 2019 |
| | Net Realized Gain (Loss) | Change in Net Unrealized Appreciation (Depreciation) |
| Type of Risk Exposure | Location on Statement of Operations | Value | Location on Statement of Operations | Value |
| Credit Risk | Net realized gain (loss) on swap agreement transactions | $ | 295,360 |
| Change in net unrealized appreciation (depreciation) on swap agreements | $ | (80,121 | ) |
| Equity Price Risk | Net realized gain (loss) on futures contract transactions | (240,567 | ) | Change in net unrealized appreciation (depreciation) on futures contracts | (2,249 | ) |
| Foreign Currency Risk | Net realized gain (loss) on forward foreign currency exchange contract transactions | 1,070,902 |
| Change in net unrealized appreciation (depreciation) on forward foreign currency exchange contracts | 469,598 |
|
| Interest Rate Risk | Net realized gain (loss) on futures contract transactions | 752,941 |
| Change in net unrealized appreciation (depreciation) on futures contracts | 202,701 |
|
| Interest Rate Risk | Net realized gain (loss) on swap agreement transactions | 1,490 |
| Change in net unrealized appreciation (depreciation) on swap agreements | 1,250 |
|
| | | $ | 1,880,126 |
| | $ | 591,179 |
|
9. Risk Factors
There are certain risks involved in investing in foreign securities. These risks include those resulting from political events (such as civil unrest, national elections and imposition of exchange controls), social and economic events (such as labor strikes and rising inflation), and natural disasters. Securities of foreign issuers may be less liquid and more volatile. Investing in emerging markets or a significant portion of assets in one country or region may accentuate these risks.
10. Federal Tax Information
The tax character of distributions paid during the year ended July 31, 2019, eight months ended July 31, 2018 and year ended November 30, 2017 were as follows:
|
| | | | | | | | | |
| | July 31, 2019 | July 31, 2018(1) | November 30, 2017 |
| Distributions Paid From | | | |
| Ordinary income | $ | 22,148,776 |
| $ | 31,593,492 |
| $ | 16,965,117 |
|
| Long-term capital gains | $ | 79,178,972 |
| $ | 89,126,115 |
| $ | 17,213,664 |
|
(1) The fund's fiscal year end was changed from November 30 to July 31, resulting in an eight month annual reporting period.
The book-basis character of distributions made during the year from net investment income or net realized gains may differ from their ultimate characterization for federal income tax purposes. These differences reflect the differing character of certain income items and net realized gains and losses for financial statement and tax purposes, and may result in reclassification among certain capital accounts on the financial statements.
As of period end, the federal tax cost of investments and the components of distributable earnings on a tax-basis were as follows:
|
| | | |
| Federal tax cost of investments | $ | 766,340,384 |
|
| Gross tax appreciation of investments | $ | 143,291,603 |
|
| Gross tax depreciation of investments | (19,083,367 | ) |
| Net tax appreciation (depreciation) of investments | 124,208,236 |
|
| Net tax appreciation (depreciation) on derivatives and translation of assets and liabilities in foreign currencies | (141,865 | ) |
| Net tax appreciation (depreciation) | $ | 124,066,371 |
|
| Other book-to-tax adjustments | $ | (200,566 | ) |
| Undistributed ordinary income | $ | 3,674,019 |
|
| Accumulated long-term gains | $ | 29,385,949 |
|
The difference between book-basis and tax-basis unrealized appreciation (depreciation) is attributable primarily to the tax deferral of losses on wash sales. Other book-to-tax adjustments are attributable primarily to the tax deferral of losses on straddle positions.
11. Recently Issued Accounting Standards
In March 2017, the Financial Accounting Standards Board (FASB) issued Accounting Standards Update No. 2017-08, “Receivables - Nonrefundable Fees and Other Costs (Subtopic 310-20), Premium Amortization on Purchased Callable Debt Securities” (ASU 2017-08). ASU 2017-08 amends the amortization period for certain purchased callable debt securities held at a premium, shortening such period to the earliest call date. The amendments are effective for fiscal years, and interim periods within those fiscal years, beginning after December 15, 2018. Management is currently evaluating the impact that adopting ASU 2017-08 will have on the financial statements.
|
| | | | | | | | | | | | | | | | | |
| For a Share Outstanding Throughout the Years Ended July 31 (except as noted) | | | | | | | |
| Per-Share Data | | | | Ratios and Supplemental Data | | |
| | | Income From Investment Operations: | Distributions From: | | | Ratio to Average Net Assets of: | | |
| | Net Asset Value, Beginning of Period | Net Investment Income (Loss)(1) | Net Realized and Unrealized Gain (Loss) | Total From Investment Operations | Net Investment Income | Net Realized Gains | Total Distributions | Net Asset Value, End of Period | Total Return(2) | Operating Expenses | Operating Expenses (before expense waiver) | Net Investment Income (Loss) | Net
Investment Income
(Loss) (before expense waiver) | Portfolio Turnover Rate | Net Assets, End of Period (in thousands) |
| Investor Class | | | | | | | | | | | | | |
| 2019 | $7.02 | 0.09 | 0.13 | 0.22 | (0.10) | (0.57) | (0.67) | $6.57 | 4.36% | 1.06% | 1.11% | 1.42% | 1.37% | 68% |
| $314,567 |
|
2018(3) | $7.51 | 0.06 | 0.16 | 0.22 | (0.06) | (0.65) | (0.71) | $7.02 | 3.22% | 1.09%(4) | 1.09%(4) | 1.25%(4) | 1.25%(4) | 55% |
| $444,259 |
|
| 2017 | $6.67 | 0.08 | 0.93 | 1.01 | (0.09) | (0.08) | (0.17) | $7.51 | 15.42% | 1.08% | 1.08% | 1.20% | 1.20% | 81% |
| $523,241 |
|
| 2016 | $6.97 | 0.08 | 0.14 | 0.22 | (0.07) | (0.45) | (0.52) | $6.67 | 3.49% | 1.07% | 1.07% | 1.22% | 1.22% | 82% |
| $574,968 |
|
| 2015 | $7.67 | 0.07 | (0.13) | (0.06) | (0.04) | (0.60) | (0.64) | $6.97 | (0.56)% | 1.06% | 1.06% | 0.97% | 0.97% | 88% |
| $645,785 |
|
| 2014 | $7.75 | 0.07 | 0.53 | 0.60 | (0.07) | (0.61) | (0.68) | $7.67 | 8.46% | 1.06% | 1.06% | 0.92% | 0.92% | 69% |
| $714,110 |
|
| I Class | | | | | | | | | | | | | |
| 2019 | $7.02 | 0.11 | 0.13 | 0.24 | (0.12) | (0.57) | (0.69) | $6.57 | 4.55% | 0.86% | 0.91% | 1.62% | 1.57% | 68% |
| $76,202 |
|
2018(3) | $7.52 | 0.07 | 0.15 | 0.22 | (0.07) | (0.65) | (0.72) | $7.02 | 3.23% | 0.89%(4) | 0.89%(4) | 1.45%(4) | 1.45%(4) | 55% |
| $125,345 |
|
| 2017 | $6.68 | 0.10 | 0.92 | 1.02 | (0.10) | (0.08) | (0.18) | $7.52 | 15.64% | 0.88% | 0.88% | 1.40% | 1.40% | 81% |
| $135,618 |
|
| 2016 | $6.97 | 0.09 | 0.15 | 0.24 | (0.08) | (0.45) | (0.53) | $6.68 | 3.86% | 0.87% | 0.87% | 1.42% | 1.42% | 82% |
| $213,502 |
|
| 2015 | $7.68 | 0.08 | (0.13) | (0.05) | (0.06) | (0.60) | (0.66) | $6.97 | (0.50)% | 0.86% | 0.86% | 1.17% | 1.17% | 88% |
| $263,207 |
|
| 2014 | $7.75 | 0.08 | 0.54 | 0.62 | (0.08) | (0.61) | (0.69) | $7.68 | 8.82% | 0.86% | 0.86% | 1.12% | 1.12% | 69% |
| $289,676 |
|
|
| | | | | | | | | | | | | | | | | |
| For a Share Outstanding Throughout the Years Ended July 31 (except as noted) | | | | | | | |
| Per-Share Data | | | | Ratios and Supplemental Data | | |
| | | Income From Investment Operations: | Distributions From: | | | Ratio to Average Net Assets of: | | |
| | Net Asset Value, Beginning of Period | Net Investment Income (Loss)(1) | Net Realized and Unrealized Gain (Loss) | Total From Investment Operations | Net Investment Income | Net Realized Gains | Total Distributions | Net Asset Value, End of Period | Total Return(2) | Operating Expenses | Operating Expenses (before expense waiver) | Net Investment Income (Loss) | Net
Investment Income
(Loss) (before expense waiver) | Portfolio Turnover Rate | Net Assets, End of Period (in thousands) |
| A Class |
| 2019 | $7.00 | 0.08 | 0.13 | 0.21 | (0.09) | (0.57) | (0.66) | $6.55 | 4.11% | 1.31% | 1.36% | 1.17% | 1.12% | 68% |
| $304,644 |
|
2018(3) | $7.49 | 0.05 | 0.16 | 0.21 | (0.05) | (0.65) | (0.70) | $7.00 | 3.04% | 1.34%(4) | 1.34%(4) | 1.00%(4) | 1.00%(4) | 55% |
| $347,290 |
|
| 2017 | $6.66 | 0.07 | 0.91 | 0.98 | (0.07) | (0.08) | (0.15) | $7.49 | 15.01% | 1.33% | 1.33% | 0.95% | 0.95% | 81% |
| $398,519 |
|
| 2016 | $6.95 | 0.06 | 0.15 | 0.21 | (0.05) | (0.45) | (0.50) | $6.66 | 3.38% | 1.32% | 1.32% | 0.97% | 0.97% | 82% |
| $456,392 |
|
| 2015 | $7.66 | 0.05 | (0.13) | (0.08) | (0.03) | (0.60) | (0.63) | $6.95 | (0.90)% | 1.31% | 1.31% | 0.72% | 0.72% | 88% |
| $504,771 |
|
| 2014 | $7.74 | 0.05 | 0.53 | 0.58 | (0.05) | (0.61) | (0.66) | $7.66 | 8.22% | 1.31% | 1.31% | 0.67% | 0.67% | 69% |
| $606,035 |
|
| C Class | | | | | | | | | | | | | |
| 2019 | $6.91 | 0.03 | 0.12 | 0.15 | (0.04) | (0.57) | (0.61) | $6.45 | 3.30% | 2.06% | 2.11% | 0.42% | 0.37% | 68% |
| $48,515 |
|
2018(3) | $7.42 | 0.01 | 0.16 | 0.17 | (0.03) | (0.65) | (0.68) | $6.91 | 2.46% | 2.09%(4) | 2.09%(4) | 0.25%(4) | 0.25%(4) | 55% |
| $80,205 |
|
| 2017 | $6.60 | 0.01 | 0.92 | 0.93 | (0.03) | (0.08) | (0.11) | $7.42 | 14.29% | 2.08% | 2.08% | 0.20% | 0.20% | 81% |
| $97,269 |
|
| 2016 | $6.91 | 0.01 | 0.15 | 0.16 | (0.02) | (0.45) | (0.47) | $6.60 | 2.55% | 2.07% | 2.07% | 0.22% | 0.22% | 82% |
| $106,604 |
|
| 2015 | $7.64 | —(5) | (0.13) | (0.13) | —(5) | (0.60) | (0.60) | $6.91 | (1.57)% | 2.06% | 2.06% | (0.03)% | (0.03)% | 88% |
| $121,748 |
|
| 2014 | $7.74 | (0.01) | 0.53 | 0.52 | (0.01) | (0.61) | (0.62) | $7.64 | 7.33% | 2.06% | 2.06% | (0.08)% | (0.08)% | 69% |
| $128,076 |
|
|
| | | | | | | | | | | | | | | | | |
| For a Share Outstanding Throughout the Years Ended July 31 (except as noted) | | | | | | | |
| Per-Share Data | | | | Ratios and Supplemental Data | | |
| | | Income From Investment Operations: | Distributions From: | | | Ratio to Average Net Assets of: | | |
| | Net Asset Value, Beginning of Period | Net Investment Income (Loss)(1) | Net Realized and Unrealized Gain (Loss) | Total From Investment Operations | Net Investment Income | Net Realized Gains | Total Distributions | Net Asset Value, End of Period | Total Return(2) | Operating Expenses | Operating Expenses (before expense waiver) | Net Investment Income (Loss) | Net
Investment Income
(Loss) (before expense waiver) | Portfolio Turnover Rate | Net Assets, End of Period (in thousands) |
| R Class | | | | | | | | | | | | | |
| 2019 | $6.96 | 0.06 | 0.13 | 0.19 | (0.07) | (0.57) | (0.64) | $6.51 | 3.88% | 1.56% | 1.61% | 0.92% | 0.87% | 68% |
| $39,114 |
|
2018(3) | $7.46 | 0.03 | 0.16 | 0.19 | (0.04) | (0.65) | (0.69) | $6.96 | 2.74% | 1.59%(4) | 1.59%(4) | 0.75%(4) | 0.75%(4) | 55% |
| $43,590 |
|
| 2017 | $6.63 | 0.05 | 0.92 | 0.97 | (0.06) | (0.08) | (0.14) | $7.46 | 14.83% | 1.58% | 1.58% | 0.70% | 0.70% | 81% |
| $50,395 |
|
| 2016 | $6.93 | 0.05 | 0.13 | 0.18 | (0.03) | (0.45) | (0.48) | $6.63 | 2.98% | 1.57% | 1.57% | 0.72% | 0.72% | 82% |
| $53,902 |
|
| 2015 | $7.64 | 0.03 | (0.12) | (0.09) | (0.02) | (0.60) | (0.62) | $6.93 | (1.04)% | 1.56% | 1.56% | 0.47% | 0.47% | 88% |
| $52,262 |
|
| 2014 | $7.72 | 0.03 | 0.54 | 0.57 | (0.04) | (0.61) | (0.65) | $7.64 | 8.02% | 1.56% | 1.56% | 0.42% | 0.42% | 69% |
| $49,716 |
|
| R5 Class | | | | | | | | | | | | | |
| 2019 | $7.03 | 0.11 | 0.13 | 0.24 | (0.12) | (0.57) | (0.69) | $6.58 | 4.56% | 0.86% | 0.91% | 1.62% | 1.57% | 68% |
| $7,200 |
|
2018(3) | $7.52 | 0.08 | 0.15 | 0.23 | (0.07) | (0.65) | (0.72) | $7.03 | 3.38% | 0.89%(4) | 0.89%(4) | 1.45%(4) | 1.45%(4) | 55% |
| $6,885 |
|
2017(6) | $6.93 | 0.07 | 0.58 | 0.65 | (0.06) | — | (0.06) | $7.52 | 9.43% | 0.88%(4) | 0.88%(4) | 1.46%(4) | 1.46%(4) | 81%(7) |
| $5 |
|
|
| | | | | | | | | | | | | | | | | |
| For a Share Outstanding Throughout the Years Ended July 31 (except as noted) | | | | | | | |
| Per-Share Data | | | | Ratios and Supplemental Data | | |
| | | Income From Investment Operations: | Distributions From: | | | Ratio to Average Net Assets of: | | |
| | Net Asset Value, Beginning of Period | Net Investment Income (Loss)(1) | Net Realized and Unrealized Gain (Loss) | Total From Investment Operations | Net Investment Income | Net Realized Gains | Total Distributions | Net Asset Value, End of Period | Total Return(2) | Operating Expenses | Operating Expenses (before expense waiver) | Net Investment Income (Loss) | Net
Investment Income
(Loss) (before expense waiver) | Portfolio Turnover Rate | Net Assets, End of Period (in thousands) |
| R6 Class | | | | | | | | | | | | |
| 2019 | $7.01 | 0.12 | 0.13 | 0.25 | (0.13) | (0.57) | (0.70) | $6.56 | 4.72% | 0.71% | 0.76% | 1.77% | 1.72% | 68% |
| $95,697 |
|
2018(3) | $7.51 | 0.08 | 0.15 | 0.23 | (0.08) | (0.65) | (0.73) | $7.01 | 3.35% | 0.74%(4) | 0.74%(4) | 1.60%(4) | 1.60%(4) | 55% |
| $111,937 |
|
| 2017 | $6.67 | 0.11 | 0.93 | 1.04 | (0.12) | (0.08) | (0.20) | $7.51 | 15.83% | 0.73% | 0.73% | 1.55% | 1.55% | 81% |
| $85,623 |
|
| 2016 | $6.97 | 0.10 | 0.14 | 0.24 | (0.09) | (0.45) | (0.54) | $6.67 | 3.86% | 0.72% | 0.72% | 1.57% | 1.57% | 82% |
| $71,340 |
|
| 2015 | $7.67 | 0.09 | (0.12) | (0.03) | (0.07) | (0.60) | (0.67) | $6.97 | (0.20)% | 0.71% | 0.71% | 1.32% | 1.32% | 88% |
| $35,867 |
|
| 2014 | $7.75 | 0.08 | 0.55 | 0.63 | (0.10) | (0.61) | (0.71) | $7.67 | 8.84% | 0.71% | 0.71% | 1.27% | 1.27% | 69% |
| $8,420 |
|
|
|
| Notes to Financial Highlights |
| |
| (1) | Computed using average shares outstanding throughout the period. |
| |
| (2) | Total returns are calculated based on the net asset value of the last business day and do not reflect applicable sales charges, if any. Total returns for periods less than one year are not annualized. |
| |
| (3) | December 1, 2017 through July 31, 2018. The fund's fiscal year end was changed from November 30 to July 31, resulting in an eight-month annual reporting period. For the years before July 31, 2018, the fund's fiscal year end was November 30. |
| |
| (5) | Per-share amount was less than $0.005. |
| |
| (6) | April 10, 2017 (commencement of sale) through November 30, 2017. |
| |
| (7) | Portfolio turnover is calculated at the fund level. Percentage indicated was calculated for the year ended November 30, 2017. |
See Notes to Financial Statements.
|
|
| Report of Independent Registered Public Accounting Firm |
To the Shareholders and the Board of Directors of American Century Strategic Asset Allocations, Inc.:
Opinion on the Financial Statements and Financial Highlights
We have audited the accompanying statement of assets and liabilities, including the schedule of investments, of Strategic Allocation: Moderate Fund, one of the funds constituting the American Century Strategic Asset Allocations, Inc. (the “Fund”), as of July 31, 2019; the related statement of operations for the year then ended; the statements of changes in net assets for the year then ended, the period December 1, 2017 through July 31, 2018, and for the year ended November 30, 2017; the financial highlights for the year then ended, the period December 1, 2017 through July 31, 2018 and for the years ended November 30, 2017, 2016, 2015, and 2014; and the related notes. In our opinion, the financial statements and financial highlights present fairly, in all material respects, the financial position of Strategic Allocation: Moderate Fund of the American Century Strategic Asset Allocations, Inc. as of July 31, 2019; the results of its operations for the year then ended; the changes in its net assets for the year then ended, the period December 1, 2017 through July 31, 2018, and for the year ended November 30, 2017; and the financial highlights for the year then ended, the period December 1, 2017 through July 31, 2018 and for the years ended November 30, 2017, 2016, 2015, and 2014; in conformity with accounting principles generally accepted in the United States of America.
Basis for Opinion
These financial statements and financial highlights are the responsibility of the Fund's management. Our responsibility is to express an opinion on the Fund’s financial statements and financial highlights based on our audits. We are a public accounting firm registered with the Public Company Accounting Oversight Board (United States) (PCAOB) and are required to be independent with respect to the Fund in accordance with the U.S. federal securities laws and the applicable rules and regulations of the Securities and Exchange Commission and the PCAOB.
We conducted our audits in accordance with the standards of the PCAOB. Those standards require that we plan and perform the audit to obtain reasonable assurance about whether the financial statements and financial highlights are free of material misstatement, whether due to error or fraud. The Fund is not required to have, nor were we engaged to perform, an audit of its internal control over financial reporting. As part of our audits we are required to obtain an understanding of internal control over financial reporting but not for the purpose of expressing an opinion on the effectiveness of the Fund’s internal control over financial reporting. Accordingly, we express no such opinion.
Our audits included performing procedures to assess the risks of material misstatement of the financial statements and financial highlights, whether due to error or fraud, and performing procedures that respond to those risks. Such procedures included examining, on a test basis, evidence regarding the amounts and disclosures in the financial statements and financial highlights. Our audits also included evaluating the accounting principles used and significant estimates made by management, as well as evaluating the overall presentation of the financial statements and financial highlights. Our procedures included confirmation of securities owned as of July 31, 2019, by correspondence with the custodian and brokers; when replies were not received from brokers, we performed other auditing procedures. We believe that our audits provide a reasonable basis for our opinion.
DELOITTE & TOUCHE LLP
Kansas City, Missouri
September 18, 2019
We have served as the auditor of one or more American Century investment companies since 1997.
The Board of Directors
The individuals listed below serve as directors of the funds. Each director will continue to serve in this capacity until death, retirement, resignation or removal from office. The board has adopted a mandatory retirement age for directors who are not “interested persons,” as that term is defined in the Investment Company Act (independent directors). Independent directors shall retire by December 31 of the year in which they reach their 75th birthday.
Mr. Thomas is an “interested person” because he currently serves as President and Chief Executive Officer of American Century Companies, Inc. (ACC), the parent company of American Century Investment Management, Inc. (ACIM or the advisor). The other directors (more than three-fourths of the total number) are independent. They are not employees, directors or officers of, and have no financial interest in, ACC or any of its wholly owned, direct or indirect, subsidiaries, including ACIM, American Century Investment Services, Inc. (ACIS) and American Century Services, LLC (ACS), and they do not have any other affiliations, positions or relationships that would cause them to be considered “interested persons” under the Investment Company Act. The directors serve in this capacity for seven (in the case of Jonathan S. Thomas, 16; and Stephen E. Yates, 8) registered investment companies in the American Century Investments family of funds.
The following table presents additional information about the directors. The mailing address for each director is 4500 Main Street, Kansas City, Missouri 64111.
|
| | | | | |
Name
(Year of Birth) | Position(s) Held with Funds | Length of Time Served | Principal Occupation(s) During Past 5 Years | Number of American Century Portfolios Overseen by Director | Other Directorships Held During Past 5 Years |
| Independent Directors |
|
|
| Thomas W. Bunn (1953) | Director | Since 2017 | Retired | 67 | SquareTwo Financial; Barings (formerly Babson Capital Funds Trust) (2013 to 2016) |
Chris H. Cheesman
(1962)
| Director | Since 2019
| Retired. Senior Vice President & Chief Audit Executive, AllianceBernstein (1999 to 2018)
| 67 | None |
Barry Fink
(1955) | Director | Since 2012 (independent since 2016) | Retired | 67 | None |
Rajesh K. Gupta
(1960)
| Director | Since 2019
| Partner Emeritus, SeaCrest Investment Management and SeaCrest Wealth Management (2019 to Present); Chief Executive Officer and Chief Investment Officer, SeaCrest Investment Management (2006 to 2019); Chief Executive Officer and Chief Investment Officer, SeaCrest Wealth Management (2008 to 2019)
| 67 | None |
|
| | | | | |
Name
(Year of Birth) | Position(s) Held with Funds | Length of Time Served | Principal Occupation(s) During Past 5 Years | Number of American Century Portfolios Overseen by Director | Other Directorships Held During Past 5 Years |
| Independent Directors |
|
|
Lynn Jenkins
(1963)
| Director | Since 2019
| United States Representative, U.S. House of Representatives (2009 to 2018) | 67 | MGP Ingredients, Inc. |
Jan M. Lewis
(1957) | Director | Since 2011 | Retired | 67 | None |
John R. Whitten
(1946) | Director | Since 2008 | Retired | 67 | Rudolph Technologies, Inc. |
Stephen E. Yates
(1948) | Director and Chairman of the Board | Since 2012 (Chairman since 2018) | Retired | 72 | None |
| Interested Director |
|
Jonathan S. Thomas
(1963) | Director and President | Since 2007 | President and Chief Executive Officer, ACC (2007 to present). Also serves as Chief Executive Officer, ACS; Executive Vice President, ACIM; Director, ACC, ACIM and other ACC subsidiaries | 117 | BioMed Valley Discoveries, Inc. |
The Statement of Additional Information has additional information about the fund's directors and is available without charge, upon request, by calling 1-800-345-2021.
Officers
The following table presents certain information about the executive officers of the funds. Each officer serves as an officer for each of the 16 (in the case of Robert J. Leach, 15) investment companies in the American Century family of funds. No officer is compensated for his or her service as an officer of the funds. The listed officers are interested persons of the funds and are appointed or re-appointed on an annual basis. The mailing address for each officer listed below is 4500 Main Street, Kansas City, Missouri 64111.
|
| | |
Name
(Year of Birth) | Offices with the Funds | Principal Occupation(s) During the Past Five Years |
Jonathan S. Thomas
(1963) | Director and President since 2007 | President and Chief Executive Officer, ACC (2007 to present). Also serves as Chief Executive Officer, ACS; Executive Vice President, ACIM; Director, ACC, ACIM and other ACC subsidiaries |
R. Wes Campbell
(1974) | Chief Financial Officer and Treasurer since 2018
| Investment Operations and Investment Accounting, ACS (2000 to present)
|
Amy D. Shelton
(1964) | Chief Compliance Officer and Vice President since 2014 | Chief Compliance Officer, American Century funds, (2014 to present); Chief Compliance Officer, ACIM (2014 to present); Chief Compliance Officer, ACIS (2009 to present). Also serves as Vice President, ACIS |
Charles A. Etherington
(1957) | General Counsel since 2007 and Senior Vice President since 2006 | Attorney, ACC (1994 to present); Vice President, ACC (2005 to present); General Counsel, ACC (2007 to present). Also serves as General Counsel, ACIM, ACS, ACIS and other ACC subsidiaries; and Senior Vice President, ACIM and ACS |
C. Jean Wade
(1964) | Vice President since 2012 | Senior Vice President, ACS (2017 to present); Vice President, ACS (2000 to 2017) |
Robert J. Leach
(1966) | Vice President since 2006 | Vice President, ACS (2000 to present) |
David H. Reinmiller
(1963) | Vice President since 2000 | Attorney, ACC (1994 to present). Also serves as Vice President, ACIM and ACS |
Ward D. Stauffer
(1960) | Secretary since 2005 | Attorney, ACC (2003 to present) |
|
|
| Approval of Management Agreement |
At a meeting held on June 26, 2019, the Fund’s Board of Directors (the "Board") unanimously approved the renewal of the management agreement pursuant to which American Century Investment Management, Inc. (the “Advisor”) acts as the investment advisor for the Fund. Under Section 15(c) of the Investment Company Act, contracts for investment advisory services are required to be reviewed, evaluated, and approved by a majority of a fund’s directors (the “Directors”), including a majority of the independent Directors, each year.
Prior to its consideration of the renewal of the management agreement, the Directors requested and reviewed extensive data and information compiled by the Advisor and certain independent providers of evaluation data concerning the Fund and the services provided to the Fund by the Advisor. This review was in addition to the oversight and evaluation undertaken by the Board and its committees on a continual basis and the information received was supplemental to the extensive information that the Board and its committees receive and consider throughout the year.
In connection with its consideration of the renewal of the management agreement, the Board’s review and evaluation of the services provided by the Advisor included, but was not limited to, the following:
| |
| • | the nature, extent, and quality of investment management, shareholder services, and other services provided and to be provided to the Fund; |
| |
| • | the wide range of other programs and services provided and to be provided to the Fund and its shareholders on a routine and non-routine basis; |
| |
| • | the investment performance of the Fund, including data comparing the Fund's performance to appropriate benchmarks and/or a peer group of other mutual funds with similar investment objectives and strategies; |
| |
| • | the cost of owning the Fund compared to the cost of owning similar funds; |
| |
| • | the compliance policies, procedures, and regulatory experience of the Advisor and the Fund's service providers; |
| |
| • | financial data showing the cost of services provided to the Fund, the profitability of the Fund to the Advisor, and the overall profitability of the Advisor; |
| |
| • | strategic plans of the Advisor; |
| |
| • | any economies of scale associated with the Advisor’s management of the Fund and other accounts; |
| |
| • | services provided and charges to the Advisor's other investment management clients; |
| |
| • | acquired fund fees and expenses; |
| |
| • | payments and practices in connection with financial intermediaries holding shares of the Fund and the services provided by intermediaries in connection therewith; and |
| |
| • | any collateral benefits derived by the Advisor from the management of the Fund. |
The Directors held three in-person meetings and one telephonic meeting to review and discuss the information provided. The independent Directors also reviewed responses to supplemental information requests provided by the Directors to the Advisor and held active discussions with the Advisor regarding the renewal of the management agreement. The independent Directors had the benefit of the advice of their independent counsel throughout the process.
Factors Considered
The Directors considered all of the information provided by the Advisor, the independent data providers, and independent counsel in connection with the approval. They determined that the information was sufficient for them to evaluate the management agreement for the Fund. In connection with their review, the Directors did not identify any single factor as being all-important or
controlling, and each Director may have attributed different levels of importance to different factors. In deciding to renew the management agreement, the Board based its decision on a number of factors, including without limitation the following:
Nature, Extent and Quality of Services — Generally. Under the management agreement, the Advisor is responsible for providing or arranging for all services necessary for the operation of the Fund. The Board noted that the Advisor provides or arranges at its own expense a wide variety of services including without limitation the following:
| |
| • | portfolio research and security selection |
| |
| • | daily valuation of the Fund’s portfolio |
| |
| • | shareholder servicing and transfer agency, including shareholder confirmations, recordkeeping, and communications |
| |
| • | legal services (except the independent Directors’ counsel) |
| |
| • | regulatory and portfolio compliance |
| |
| • | marketing and distribution (except amounts paid by the Fund under Rule 12b-1 plans) |
The Board noted that many of these services have expanded over time in terms of both quantity and complexity in response to shareholder demands, competition in the industry, changing distribution channels, and the changing regulatory environment.
Investment Management Services. The nature of the investment management services provided to the Fund is quite complex and allows Fund shareholders access to professional money management, instant diversification of their investments within an asset class, the opportunity to easily diversify among asset classes by investing in or exchanging among various American Century Investments funds, and liquidity. In evaluating investment performance, the Board expects the Advisor to manage the Fund in accordance with its investment objectives and approved strategies. Further, the Directors recognize that the Advisor has an obligation to monitor trading activities, and in particular to seek the best execution of fund trades, and to evaluate the use of and payment for research. In providing these services, the Advisor utilizes teams of investment professionals (portfolio managers, analysts, research assistants, and securities traders) who require extensive information technology, research, training, compliance, and other systems to conduct their business. The Board, directly and through its Fund Performance Review Committee, provides oversight of the investment performance process. It regularly reviews investment performance information for the Fund, together with comparative information for appropriate benchmarks and/or peer groups of similarly-managed funds, over different time horizons. The Directors also review investment performance information during the management agreement renewal process. If performance concerns are identified, the Fund receives special reviews until performance improves, during which the Board discusses with the Advisor the reasons for such results (e.g., market conditions, security selection) and any efforts being undertaken to improve performance. The Fund’s performance was above its benchmark for the five- and ten-year periods and below its benchmark for the one- and three-year periods reviewed by the Board. The Board found the investment management services provided by the Advisor to the Fund to be satisfactory and consistent with the management agreement.
Shareholder and Other Services. Under the management agreement, the Advisor provides the Fund with a comprehensive package of transfer agency, shareholder, and other services. The Board, directly and through various committees of the Board, regularly reviews reports and evaluations of such services at its regular meetings. These reports include, but are not limited to, information regarding the operational efficiency and accuracy of the shareholder and transfer agency services provided, staffing levels, shareholder satisfaction, technology support (including cyber security), new products and services offered to Fund shareholders, securities trading
activities, portfolio valuation services, auditing services, and legal and operational compliance activities. The Board found the services provided by the Advisor to the Fund under the management agreement to be competitive and of high quality.
Costs of Services and Profitability. The Advisor provides detailed information concerning its cost of providing various services to the Fund, its profitability in managing the Fund (pre- and post-distribution), its overall profitability, and its financial condition. The Directors have reviewed with the Advisor the methodology used to prepare this financial information. This information is considered in evaluating the Advisor’s financial condition, its ability to continue to provide services under the management agreement, and the reasonableness of the current management fee. The Board concluded that the Advisor’s profits were reasonable in light of the services provided to the Fund.
Ethics. The Board generally considers the Advisor’s commitment to providing quality services to shareholders and to conducting its business ethically. They noted that the Advisor’s practices generally meet or exceed industry best practices.
Economies of Scale. The Board also reviewed information provided by the Advisor regarding the possible existence of economies of scale in connection with the management of the Fund. The Board concluded that economies of scale are difficult to measure and predict with precision, especially on a fund-by-fund basis. The Board concluded that the Advisor is appropriately sharing economies of scale through its competitive fee structure, offering competitive fees from fund inception, and through reinvestment in its business to provide shareholders additional content and services. The Board also noted that economies of scale are shared with the Fund and its shareholders through management fee breakpoints that serve to reduce the effective management fee as the assets of the Fund grow.
Comparison to Other Funds’ Fees. The management agreement provides that the Fund pays the Advisor a single, all-inclusive (or unified) management fee for providing all services necessary for the management and operation of the Fund, other than brokerage expenses, expenses attributable to short sales, taxes, interest, extraordinary expenses, fees and expenses of the Fund’s independent Directors (including their independent legal counsel), and expenses incurred in connection with the provision of shareholder services and distribution services under a plan adopted pursuant to Rule 12b-1 under the Investment Company Act. Under the unified fee structure, the Advisor is responsible for providing all investment advisory, custody, audit, administrative, compliance, recordkeeping, marketing and shareholder services, or arranging and supervising third parties to provide such services. By contrast, most other funds are charged a variety of fees, including an investment advisory fee, a transfer agency fee, an administrative fee, distribution charges, and other expenses. Other than their investment advisory fees and any applicable Rule 12b-1 distribution fees, all other components of the total fees charged by these other funds may be increased without shareholder approval. The Board believes the unified fee structure is a benefit to Fund shareholders because it clearly discloses to shareholders the cost of owning Fund shares, and, since the unified fee cannot be increased without a vote of Fund shareholders, it shifts to the Advisor the risk of increased costs of operating the Fund and provides a direct incentive to minimize administrative inefficiencies. Part of the Board’s analysis of fee levels involves reviewing certain evaluative data compiled by an independent provider comparing the Fund’s unified fee to the total expense ratios of its peers. The unified fee charged to shareholders of the Fund was above the median of the total expense ratios of the Fund’s peer expense universe and was within the range of its peer expense group. The Board and the Advisor agreed to a temporary reduction of the Fund's annual unified management fee of 0.05% (e.g., the Investor Class unified fee will be reduced from 1.08% to 1.03%) for at least one year, beginning August 1, 2019. The Board concluded that the management fee paid by the Fund to the Advisor under the management agreement is reasonable in light of the services provided to the Fund.
Comparison to Fees and Services Provided to Other Clients of the Advisor. The Directors also requested and received information from the Advisor concerning the nature of the services, fees, costs, and profitability of its advisory services to advisory clients other than the Fund. They
observed that these varying types of client accounts require different services and involve different regulatory and entrepreneurial risks than the management of the Fund. The Board analyzed this information and concluded that the fees charged and services provided to the Fund were reasonable by comparison.
Payments to Intermediaries. The Directors also requested and received a description of payments made to intermediaries by the Fund and the Advisor and services provided in response thereto. These payments include various payments made by the Fund or the Advisor to different types of intermediaries and recordkeepers for distribution and service activities provided for the Fund. The Board reviewed such information and received representations from the Advisor that all such payments by the Fund were made pursuant to the Fund's Rule 12b-1 Plan and that all such payments by the Advisor were made from the Advisor’s resources and reasonable profits. The Board found such payments to be reasonable in scope and purpose.
Collateral or “Fall-Out” Benefits Derived by the Advisor. The Board considered the existence of collateral benefits the Advisor may receive as a result of its relationship with the Fund. They concluded that the Advisor’s primary business is managing mutual funds and it generally does not use fund or shareholder information to generate profits in other lines of business, and therefore does not derive any significant collateral benefits from them. The Board noted that additional assets from other clients may offer the Advisor some benefit from increased leverage with service providers and counterparties. Additionally, the Advisor may receive proprietary research from broker-dealers that execute fund portfolio transactions, which the Board concluded is likely to benefit other clients of the Advisor, as well as Fund shareholders. The Board also determined that the Advisor is able to provide investment management services to certain clients other than the Fund, at least in part, due to its existing infrastructure built to serve the fund complex. The Board concluded that appropriate allocation methodologies had been employed to assign resources and the cost of those resources to these other clients and, where expressly provided, these other client assets may be included with the assets of the Fund to determine breakpoints in the management fee schedule.
Existing Relationship. The Board also considered whether there was any reason for not continuing the existing arrangement with the Advisor. In this regard, the Board was mindful of the potential disruptions of the Fund’s operations and various risks, uncertainties, and other effects that could occur as a result of a decision not to continue such relationship. In particular, the Board recognized that most shareholders have invested in the Fund on the strength of the Advisor’s industry standing and reputation and in the expectation that the Advisor will have a continuing role in providing advisory services to the Fund.
Conclusion of the Directors. As a result of this process, the Board, including all of the independent Directors, taking into account all of the factors discussed above and the information provided by the Advisor and others in connection with its review and throughout the year, determined that the management fee is fair and reasonable in light of the services provided and that the investment management agreement between the Fund and the Advisor should be renewed.
Retirement Account Information
As required by law, distributions you receive from certain retirement accounts are subject to federal income tax withholding, unless you elect not to have withholding apply*. Tax will be withheld on the total amount withdrawn even though you may be receiving amounts that are not subject to withholding, such as nondeductible contributions. In such case, excess amounts of withholding could occur. You may adjust your withholding election so that a greater or lesser amount will be withheld.
If you don’t want us to withhold on this amount, you must notify us to not withhold the federal income tax. You may notify us in writing or in certain situations by telephone or through other electronic means. For systematic withdrawals, your withholding election will remain in effect until revoked or changed by filing a new election. You have the right to revoke your election at any time and change your withholding percentage for future distributions.
Remember, even if you elect not to have income tax withheld, you are liable for paying income tax on the taxable portion of your withdrawal. If you elect not to have income tax withheld or you don’t have enough income tax withheld, you may be responsible for payment of estimated tax. You may incur penalties under the estimated tax rules if your withholding and estimated tax payments are not sufficient. You can reduce or defer the income tax on a distribution by directly or indirectly rolling such distribution over to another IRA or eligible plan. You should consult your tax advisor for additional information.
State tax will be withheld if, at the time of your distribution, your address is within one of the mandatory withholding states and you have federal income tax withheld (or as otherwise required by state law). State taxes will be withheld from your distribution in accordance with the respective state rules.
*Some 403(b), 457 and qualified retirement plan distributions may be subject to 20% mandatory withholding, as they are subject to special tax and withholding rules. Your plan administrator or plan sponsor is required to provide you with a special tax notice explaining those rules at the time you request a distribution. If applicable, federal and/or state taxes may be withheld from your distribution amount.
Proxy Voting Policies
A description of the policies that the fund's investment advisor uses in exercising the voting rights associated with the securities purchased and/or held by the fund is available without charge, upon request, by calling 1-800-345-2021. It is also available on the "About Us" page of American Century Investments’ website at americancentury.com and on the Securities and Exchange Commission’s website at sec.gov. Information regarding how the investment advisor voted proxies relating to portfolio securities during the most recent 12-month period ended June 30 is available on the "About Us" page at americancentury.com. It is also available at sec.gov.
Quarterly Portfolio Disclosure
The fund files its complete schedule of portfolio holdings with the Securities and Exchange Commission (SEC) for the first and third quarters of each fiscal year on Form N-Q or as an exhibit to its reports on Form N-PORT. The fund’s Forms N-Q and Form N-PORT reports are available on the SEC’s website at sec.gov. The fund also makes its complete schedule of portfolio holdings for the most recent quarter of its fiscal year available on its website at americancentury.com and, upon request, by calling 1-800-345-2021.
Other Tax Information
The following information is provided pursuant to provisions of the Internal Revenue Code.
The fund hereby designates up to the maximum amount allowable as qualified dividend income for the fiscal year ended July 31, 2019.
For corporate taxpayers, the fund hereby designates $6,460,261, or up to the maximum amount allowable, of ordinary income distributions paid during the fiscal year ended July 31, 2019 as qualified for the corporate dividends received deduction.
The fund hereby designates $79,913,866, or up to the maximum amount allowable, as long-term capital gain distributions (20% rate gain distributions) for the fiscal year ended July 31, 2019.
The fund hereby designates $6,878,681 as qualified short-term capital gain distributions for purposes of Internal Revenue Code Section 871 for the fiscal year ended July 31, 2019.
The fund utilized earnings and profits of $941,927 distributed to shareholders on redemption of shares as part of the dividends paid deduction (tax equalization).
|
| | |
| |
| | | |
| Contact Us | americancentury.com | |
| Automated Information Line | 1-800-345-8765 | |
| Investor Services Representative | 1-800-345-2021 or 816-531-5575 | |
| Investors Using Advisors | 1-800-378-9878 | |
| Business, Not-For-Profit, Employer-Sponsored Retirement Plans | 1-800-345-3533 | |
| Banks and Trust Companies, Broker-Dealers, Financial Professionals, Insurance Companies | 1-800-345-6488 | |
| Telecommunications Relay Service for the Deaf | 711 | |
| | | |
| American Century Strategic Asset Allocations, Inc. | |
| | | |
Investment Advisor: American Century Investment Management, Inc. Kansas City, Missouri | |
| | | |
| This report and the statements it contains are submitted for the general information of our shareholders. The report is not authorized for distribution to prospective investors unless preceded or accompanied by an effective prospectus. | |
| | | |
©2019 American Century Proprietary Holdings, Inc. All rights reserved.
CL-ANN-91038 1909 | |
ITEM 2. CODE OF ETHICS.
| |
| (a) | The registrant has adopted a Code of Ethics for Senior Financial Officers that applies to the registrant’s principal executive officer, principal financial officer, principal accounting officer, and persons performing similar functions. |
| |
| (f) | The registrant’s Code of Ethics for Senior Financial Officers was filed as Exhibit 12 (a)(1) to American Century Asset Allocation Portfolios, Inc.’s Annual Certified Shareholder Report on Form N-CSR, File No. 811-21591, on September 29, 2005, and is incorporated herein by reference. |
ITEM 3. AUDIT COMMITTEE FINANCIAL EXPERT.
| |
| (a)(1) | The registrant’s board has determined that the registrant has at least one audit committee financial expert serving on its audit committee. |
| |
| (a)(2) | John R. Whitten, Jan M. Lewis, Chris H. Cheesman and Lynn M. Jenkins are the registrant’s designated audit committee financial experts. They are “independent” as defined in Item 3 of Form N-CSR. |
ITEM 4. PRINCIPAL ACCOUNTANT FEES AND SERVICES.
The aggregate fees billed for each of the last two fiscal years for professional services rendered by the principal accountant for the audit of the registrant’s annual financial statements or services that are normally provided by the accountant in connection with statutory and regulatory filings or engagements for those fiscal years were as follows:
FY 2018: $126,890
FY 2019: $125,320
The aggregate fees billed in each of the last two fiscal years for assurance and related services by the principal accountant that are reasonably related to the performance of the audit of the registrant’s financial statements and are not reported under paragraph (a) of this Item were as follows:
For services rendered to the registrant:
FY 2018:$0
FY 2019:$0
Fees required to be approved pursuant to paragraph (c)(7)(ii) of Rule 2-01 of Regulation S-X (relating to certain engagements for non-audit services with the registrant’s investment adviser and its affiliates):
FY 2018:$0
FY 2019:$0
The aggregate fees billed in each of the last two fiscal years for professional services rendered by the principal accountant for tax compliance, tax advice, and tax planning were as follows:
For services rendered to the registrant:
FY 2018: $0
FY 2019: $0
Fees required to be approved pursuant to paragraph (c)(7)(ii) of Rule 2-01 of Regulation S-X (relating to certain engagements for non-audit services with the registrant’s investment adviser and its affiliates):
FY 2018: $0
FY 2019: $0
The aggregate fees billed in each of the last two fiscal years for products and services provided by the principal accountant, other than the services reported in paragraphs (a) through (c) of this Item were as follows:
For services rendered to the registrant:
FY 2018:$0
FY 2019:$0
Fees required to be approved pursuant to paragraph (c)(7)(ii) of Rule 2-01 of Regulation S-X (relating to certain engagements for non-audit services with the registrant’s investment adviser and its affiliates):
FY 2018:$0
FY 2019:$0
| |
| (e)(1) | In accordance with paragraph (c)(7)(i)(A) of Rule 2-01 of Regulation S-X, before the accountant is engaged by the registrant to render audit or non-audit services, the engagement is approved by the registrant’s audit committee. Pursuant to paragraph (c)(7)(ii) of Rule 2-01 of Regulation S-X, the registrant’s audit committee also pre-approves its accountant’s engagements for non-audit services with the registrant’s investment adviser, its parent company, and any entity controlled by, or under common control with the investment adviser that provides ongoing services to the registrant, if the engagement relates directly to the operations and financial reporting of the registrant. |
| |
| (e)(2) | All services described in each of paragraphs (b) through (d) of this Item were pre-approved before the engagement by the registrant’s audit committee pursuant to paragraph (c)(7)(i)(A) of Rule 2-01 of Regulation S-X. Consequently, none of such services were required to be approved by the audit committee pursuant to paragraph (c)(7)(i)(C). |
| |
| (f) | The percentage of hours expended on the principal accountant’s engagement to audit the registrant’s financial statements for the most recent fiscal year that were attributed to work performed by persons other than the principal accountant’s full-time, permanent employees was less than 50%. |
| |
| (g) | The aggregate non-audit fees billed by the registrant’s accountant for services rendered to the registrant, and rendered to the registrant’s investment adviser (not including any sub-adviser whose role is primarily portfolio management and is subcontracted with or overseen by another investment adviser), and any entity controlling, controlled by, or under common control with the adviser that provides ongoing services to the registrant for each of the last two fiscal years of the registrant were as follows: |
FY 2018: $115,750*
FY 2019: $119,500
*The funds in the registrant changed their fiscal year end from November 30 to July 31. Therefore, the amounts reported in this Item 4(g) represent an eight-month reporting period from December 1, 2017 to July 31, 2018.
| |
| (h) | The registrant’s investment adviser and accountant have notified the registrant’s audit committee of all non-audit services that were rendered by the registrant’s accountant to the registrant’s investment adviser, its parent company, and any entity controlled by, or under common control with the investment adviser that provides services to the registrant, which services were not required to be pre-approved pursuant to paragraph (c)(7)(ii) of Rule 2-01 of Regulation S-X. The notification provided to the registrant’s audit committee included sufficient details regarding such services to allow the registrant’s audit committee to consider the continuing independence of its principal accountant. |
ITEM 5. AUDIT COMMITTEE OF LISTED REGISTRANTS.
Not applicable.
ITEM 6. INVESTMENTS.
| |
| (a) | The schedule of investments is included as part of the report to stockholders filed under Item 1 of this Form. |
ITEM 7. DISCLOSURE OF PROXY VOTING POLICIES AND PROCEDURES FOR CLOSED-END MANAGEMENT INVESTMENT COMPANIES.
Not applicable.
ITEM 8. PORTFOLIO MANAGERS OF CLOSED-END MANAGEMENT INVESTMENT COMPANIES.
Not applicable.
ITEM 9. PURCHASES OF EQUITY SECURITIES BY CLOSED-END MANAGEMENT INVESTMENT COMPANY AND AFFILIATED PURCHASERS.
Not applicable.
ITEM 10. SUBMISSION OF MATTERS TO A VOTE OF SECURITY HOLDERS.
During the reporting period, there were no material changes to the procedures by which shareholders may recommend nominees to the registrant’s board.
ITEM 11. CONTROLS AND PROCEDURES.
| |
| (a) | The registrant's principal executive officer and principal financial officer have concluded that the registrant's disclosure controls and procedures (as defined in Rule 30a-3(c) under the Investment Company Act of 1940) are effective based on their evaluation of these controls and procedures as of a date within 90 days of the filing date of this report. |
| |
| (b) | There were no changes in the registrant's internal control over financial reporting (as defined in Rule 30a-3(d) under the Investment Company Act of 1940) that occurred during the period covered by this report that have materially affected, or are reasonably likely to materially affect, the registrant's internal control over financial reporting. |
ITEM 12. DISCLOSURE OF SECURITIES LENDING ACTIVITIES FOR CLOSED-END MANAGEMENT INVESTMENT COMPANIES.
Not applicable.
ITEM 13. EXHIBITS.
| |
| (a)(1) | Registrant’s Code of Ethics for Senior Financial Officers, which is the subject of the disclosure required by Item 2 of Form N-CSR, was filed as Exhibit 12(a)(1) to American Century Asset Allocation Portfolios, Inc.’s Certified Shareholder Report on Form N-CSR, File No. 811-21591, on September 29, 2005. |
| |
| (a)(2) | Separate certifications by the registrant’s principal executive officer and principal financial officer, pursuant to Section 302 of the Sarbanes-Oxley Act of 2002 and Rule 30a-2(a) under the Investment Company Act of 1940, are filed and attached hereto as EX-99.CERT. |
| |
| (b) | A certification by the registrant’s chief executive officer and chief financial officer, pursuant to Section 906 of the Sarbanes-Oxley Act of 2002, is furnished and attached hereto as EX-99.906CERT. |
SIGNATURES
Pursuant to the requirements of the Securities Exchange Act of 1934 and the Investment Company Act of 1940, the registrant has duly caused this report to be signed on its behalf by the undersigned, thereunto duly authorized.
|
| | | | |
| Registrant: | American Century Strategic Asset Allocations, Inc. | |
| | | | |
| By: | /s/ Patrick Bannigan | |
| | Name: | Patrick Bannigan | |
| | Title: | President | |
| | | | |
| Date: | September 26, 2019 | |
Pursuant to the requirements of the Securities Exchange Act of 1934 and the Investment Company Act of 1940, this report has been signed below by the following persons on behalf of the registrant and in the capacities and on the dates indicated.
|
| | | |
| By: | /s/ Patrick Bannigan |
| | Name: Patrick Bannigan | |
| | Title: President | |
| | (principal executive officer) |
| | | |
| Date: | September 26, 2019 | |
|
| | | |
| By: | /s/ R. Wes Campbell |
| | Name: R. Wes Campbell | |
| | Title: Treasurer and | |
| | Chief Financial Officer |
| | (principal financial officer) | |
| | | |
| Date: | September 26, 2019 | |