UNITED STATES
SECURITIES AND EXCHANGE COMMISSION
Washington, D.C. 20549
FORM N-CSR
CERTIFIED SHAREHOLDER REPORT OF REGISTERED
MANAGEMENT INVESTMENT COMPANIES
| | | | | | | | | | | | | | | | | | | | |
| Investment Company Act file number | 811-08532 |
| |
| AMERICAN CENTURY STRATEGIC ASSET ALLOCATIONS, INC. |
| (Exact name of registrant as specified in charter) |
| |
| 4500 MAIN STREET, KANSAS CITY, MISSOURI | 64111 |
| (Address of principal executive offices) | (Zip Code) |
| |
JOHN PAK
4500 MAIN STREET, KANSAS CITY, MISSOURI 64111 |
| (Name and address of agent for service) |
| |
| Registrant’s telephone number, including area code: | 816-531-5575 |
| |
| Date of fiscal year end: | 07-31 |
| |
| Date of reporting period: | 07-31-2021 |
ITEM 1. REPORTS TO STOCKHOLDERS.
(a) Provided under separate cover.
| | | | | |
| |
| Annual Report |
| |
| July 31, 2021 |
| |
| Strategic Allocation: Aggressive Fund |
| Investor Class (TWSAX) |
| I Class (AAAIX) |
| A Class (ACVAX) |
| C Class (ASTAX) |
| R Class (AAARX) |
| R5 Class (ASAUX) |
| R6 Class (AAAUX) |
| | | | | |
| President’s Letter | |
| Performance | |
| Portfolio Commentary | |
| Fund Characteristics | |
| Shareholder Fee Example | |
| Schedule of Investments | |
| Statement of Assets and Liabilities | |
| Statement of Operations | |
| Statement of Changes in Net Assets | |
| Notes to Financial Statements | |
| Financial Highlights | |
| Report of Independent Registered Public Accounting Firm | |
| Management | |
| Approval of Management Agreement | |
| Liquidity Risk Management Program | |
| |
| Additional Information | |
| |
Any opinions expressed in this report reflect those of the author as of the date of the report, and do not necessarily represent the opinions of American Century Investments® or any other person in the American Century Investments organization. Any such opinions are subject to change at any time based upon market or other conditions and American Century Investments disclaims any responsibility to update such opinions. These opinions may not be relied upon as investment advice and, because investment decisions made by American Century Investments funds are based on numerous factors, may not be relied upon as an indication of trading intent on behalf of any American Century Investments fund. Security examples are used for representational purposes only and are not intended as recommendations to purchase or sell securities. Performance information for comparative indices and securities is provided to American Century Investments by third party vendors. To the best of American Century Investments’ knowledge, such information is accurate at the time of printing.
 Jonathan Thomas
Dear Investor:
Thank you for reviewing this annual report for the period ended July 31, 2021. Annual reports help convey important information about fund returns, including market factors that affected performance. For additional investment insights, please visit americancentury.com.
Stocks Delivered Strong Gains
Global equities and other risk-on assets rallied for the 12-month period, benefiting from ongoing central bank and federal government support. These programs helped sustain investor confidence and bolster the economic landscape, despite ongoing challenges from COVID-19 and the inconsistent lifting of virus-related restrictions.
In general, data on U.S. manufacturing, employment, housing and corporate earnings remained upbeat during the period. Additionally, expanding COVID-19 vaccine availability and two federal coronavirus aid packages also helped promote investor optimism. Outside the U.S., economies recovered but at a slower pace. Virus outbreaks and slower vaccine rollouts led to lingering lockdowns in some regions.
Against this backdrop, inflation rose, but central banks remained supportive. In the U.S., where annual inflation soared to a 13-year high, the Federal Reserve (Fed) insisted temporary supply chain disruptions and other transient factors were at play. The Fed left interest rates unchanged but hinted it may start hiking rates in 2023, sooner than its previous timetable of 2024.
Despite ongoing pandemic-related challenges, including the emergence of the delta variant of COVID-19, risk assets remained in favor, and global stocks delivered stellar 12-month returns. The U.S. generally outperformed other developed markets, as the S&P 500 Index returned more than 36%. Value stocks generally outperformed growth stocks, while small caps sharply outpaced large caps. The broad U.S. bond market declined modestly, but global bonds delivered a slight gain.
Several Influences Shaping Market Dynamics
The return to pre-pandemic life is progressing, albeit somewhat cautiously due to the spread of the delta variant. As the economy and markets respond to this fluid backdrop, investors will face opportunities and ongoing challenges. Economic growth, inflation, the virus’s trajectory, supply chain normalization and fiscal and monetary policy likely will sway market dynamics.
We appreciate your confidence in us during these extraordinary times. Our firm has a long history of helping clients weather unpredictable markets, and we’re confident we will continue to meet today’s challenges.
Sincerely,
Jonathan Thomas
President and Chief Executive Officer
American Century Investments
| | | | | | | | | | | | | | | | | | | | | |
| Total Returns as of July 31, 2021 |
| | | | Average Annual Returns | |
| Ticker Symbol | | 1 year | 5 years | 10 years | Since
Inception | Inception Date |
| Investor Class | TWSAX | | 30.04% | 12.76% | 10.18% | — | 2/15/96 |
| S&P 500 Index | — | | 36.45% | 17.34% | 15.33% | — | — |
| Bloomberg Barclays U.S. Aggregate Bond Index | — | | -0.70% | 3.12% | 3.34% | — | — |
| Bloomberg Barclays U.S. 1-3 Month Treasury Bill Index | — | | 0.06% | 1.10% | 0.58% | — | — |
| I Class | AAAIX | | 30.42% | 13.01% | 10.41% | — | 8/1/00 |
| A Class | ACVAX | | | | | | 10/2/96 |
| No sales charge | | | 29.69% | 12.47% | 9.91% | — | |
| With sales charge | | | 22.21% | 11.14% | 9.27% | — | |
| C Class | ASTAX | | 28.76% | 11.63% | 9.09% | — | 11/27/01 |
| R Class | AAARX | | 29.58% | 12.22% | 9.65% | — | 3/31/05 |
| R5 Class | ASAUX | | 30.24% | — | — | 13.47% | 4/10/17 |
| R6 Class | AAAUX | | 30.57% | 13.17% | — | 10.67% | 7/26/13 |
Average annual returns since inception are presented when ten years of performance history is not available.
Fund returns would have been lower if a portion of the fees had not been waived. Extraordinary performance is attributable in part to unusually favorable market conditions and may not be repeated or consistently achieved in the future.
C Class shares will automatically convert to A Class shares after being held for approximately eight years. C Class average annual returns do not reflect this conversion.
Sales charges include initial sales charges and contingent deferred sales charges (CDSCs), as applicable. A Class shares have a 5.75% maximum initial sales charge and may be subject to a maximum CDSC of 1.00%. C Class shares redeemed within 12 months of purchase are subject to a maximum CDSC of 1.00%. The SEC requires that mutual funds provide performance information net of maximum sales charges in all cases where charges could be applied.
Data presented reflect past performance. Past performance is no guarantee of future results. Current performance may be higher or lower than the performance shown. Total returns for periods less than one year are not annualized. Investment return and principal value will fluctuate, and redemption value may be more or less than original cost. Data assumes reinvestment of dividends and capital gains, and none of the charts reflect the deduction of taxes that a shareholder would pay on fund distributions or the redemption of fund shares. To obtain performance data current to the most recent month end, please call 1-800-345-2021 or visit americancentury.com. For additional information about the fund, please consult the prospectus.
| | |
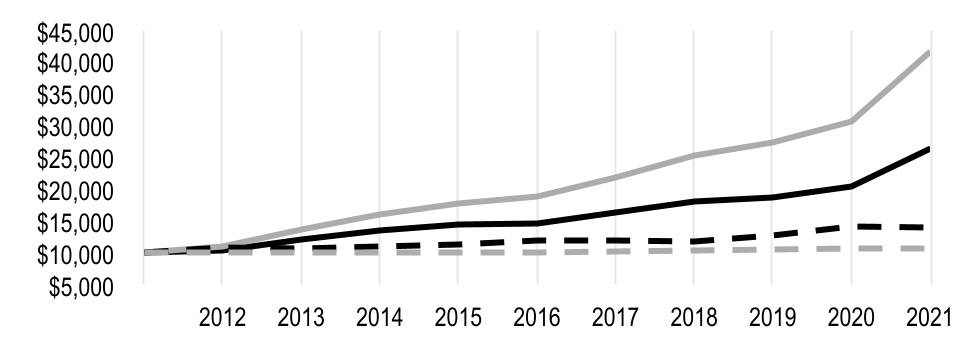
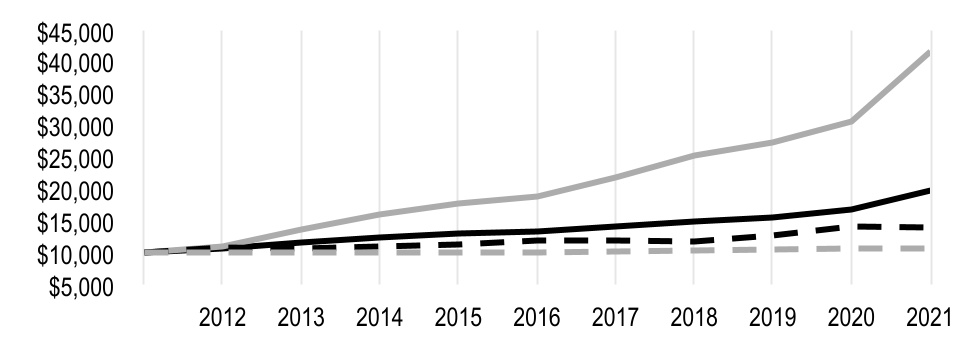
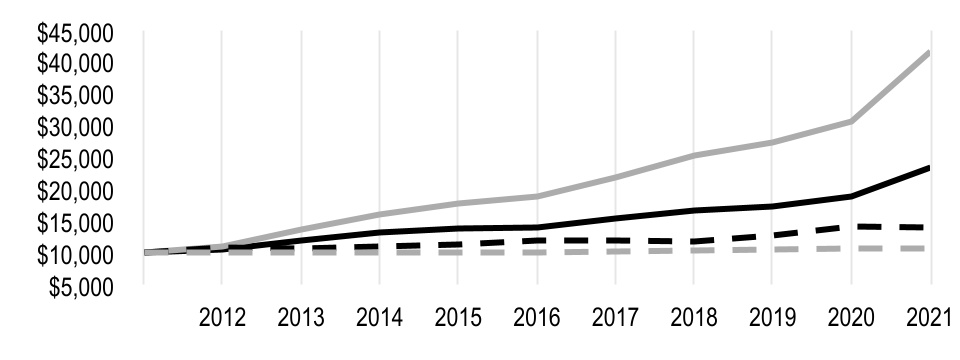
| Growth of $10,000 Over 10 Years |
| $10,000 investment made July 31, 2011 |
| Performance for other share classes will vary due to differences in fee structure. |
| | | | | |
| Value on July 31, 2021 |
| Investor Class — $26,397 |
|
| S&P 500 Index — $41,689 |
|
| Bloomberg Barclays U.S. Aggregate Bond Index — $13,897 |
|
| Bloomberg Barclays U.S. 1-3 Month Treasury Bill Index — $10,600 |
|
Ending value of Investor Class would have been lower if a portion of the fees had not been waived.
| | | | | | | | | | | | | | | | | | | | |
Total Annual Fund Operating Expenses | | |
| Investor Class | I Class | A Class | C Class | R Class | R5 Class | R6 Class |
| 1.32% | 1.12% | 1.57% | 2.32% | 1.82% | 1.12% | 0.97% |
The total annual fund operating expenses shown is as stated in the fund’s prospectus current as of the date of this report. The prospectus may vary from the expense ratio shown elsewhere in this report because it is based on a different time period, includes acquired fund fees and expenses, and, if applicable, does not include fee waivers or expense reimbursements.
Data presented reflect past performance. Past performance is no guarantee of future results. Current performance may be higher or lower than the performance shown. Total returns for periods less than one year are not annualized. Investment return and principal value will fluctuate, and redemption value may be more or less than original cost. Data assumes reinvestment of dividends and capital gains, and none of the charts reflect the deduction of taxes that a shareholder would pay on fund distributions or the redemption of fund shares. To obtain performance data current to the most recent month end, please call 1-800-345-2021 or visit americancentury.com. For additional information about the fund, please consult the prospectus.
Portfolio Managers: Rich Weiss, Scott Wilson, Radu Gabudean, Vidya Rajappa and Brian Garbe
Performance Summary
Strategic Allocation: Aggressive returned 30.04%* for the fiscal period ended July 31, 2021. Because of the fund’s strategic exposure to a variety of asset classes, a review of the financial markets helps provide context around performance for the reporting period.
Global financial markets performance was colored by a shift in investor sentiment in late 2020, when investors began to anticipate the rollout of COVID-19 vaccines. Prior to the approval, stock and bond markets had been volatile as the outlook for growth varied with pandemic news. Nevertheless, stimulative fiscal and monetary policies supported the economy and financial markets throughout. The change in sentiment was reflected in equity market performance—gains were initially led by growth-oriented stocks, but then shifted to more economically sensitive value stocks. It was a similar story in fixed-income markets, where risk aversion initially kept yields on government bonds near historic lows. But with the prospect of vaccine distribution and the end of the pandemic, investors generally shifted out of government bonds and into higher-yielding, more procyclical sectors to take advantage of an anticipated economic recovery. Later, however, inflation concerns began to play into investor decisions and contributed to market volatility.
In that environment, broad global equity indices finished the period at or near record highs. In the U.S., stocks generally posted very strong returns. Mid-cap companies led the way, followed by small caps and large caps, while value outperformed growth across all market capitalizations, according to the Russell family of indices. Emerging markets stocks also performed well but lagged the U.S. and developed non-U.S. markets. For the period, the S&P 500 Index gained 36.45%, while the MSCI EAFE Index rose 30.31% and the MSCI Emerging Markets (Net) Index increased 20.64%.
In fixed-income markets, government bonds benefited from concerns about the pandemic early in the period, as investors sought out high-quality, perceived safe-haven investments. In the U.S., unprecedented fiscal and monetary stimulus, and a new tolerance for higher inflation by the Federal Reserve, led to a rise in inflation expectations. As a result, yields on government bonds rose, while inflation-protected and corporate bonds performed well. Later in the period, concerns about a resurgence of COVID-19 and questions about the economic recovery caused government bond yields to decline somewhat. It was a similar story outside the U.S., where yields generally followed the same falling-rising-falling pattern, and ultimately ended the period higher than where they began. Add it all up, and the Bloomberg Barclays Global Aggregate Bond Index ex-USD (Unhedged) returned 1.66% and the Bloomberg Barclays Global Aggregate Bond Index (USD, Hedged) returned 0.23%. By comparison, the Bloomberg Barclays U.S. Aggregate Bond, U.S. High-Yield 2% Issuer Capped Bond and U.S. Treasury Inflation-Protected Securities (TIPS) Indices returned -0.70%, 10.62% and 6.90%, respectively.
Strategic Allocation: Aggressive’s neutral asset mix throughout the period was 79% stocks, 20% bonds and 1% cash-equivalent investments. However, the portfolio’s actual asset weightings varied based on short-term tactical adjustments and fluctuating securities prices.
Tactical Positioning
In an effort to add value and improve the fund’s ability to achieve its objective, we make modest adjustments to the asset allocation. As for regional allocations, because of the speed and success of vaccine rollouts, the U.S. led the economic and earnings recovery. As a result, we maintained our overweight to U.S. stocks relative to non-U.S. markets throughout the period.
*All fund returns referenced in this commentary are for Investor Class shares. Fund returns would have been lower if a portion of the fees had not been waived. Performance for other share classes will vary due to differences in fee structure; when Investor Class performance exceeds that of the fund’s benchmark, other share classes may not. See page 3 for returns for all classes.
Similarly, the continued economic recovery, rising consumer sentiment and indications of higher interest rates all favored value-oriented sectors like financials, materials and industrials over technology and health care. In that environment, we eliminated our long-standing growth overweight and moved to a value overweight during the period. The strong U.S. economic recovery and positive sentiment also pointed us toward a bias in favor of small-cap stocks relative to large.
In fixed income, the rapid economic rebound, higher interest rates and concerns about inflation weighed on government bond markets but favored TIPS and corporate bonds. These conditions benefited our fixed-income allocation, which generally underweighted government bonds in favor of TIPS and higher-yielding sectors such as corporates and select asset-backed securities. Our other tactical allocation decisions also produced positive effects, as U.S. equities outperformed non-U.S. equities, value beat growth and small beat large.
Equity Allocation Performed Well
The equity allocation of Strategic Allocation: Aggressive performed well as all strategies produced positive returns. Key contributions to absolute returns came from U.S. large-cap and value-oriented holdings. While overweight allocations to large-cap value were beneficial, security selection in this category limited gains. Returns were also strongly positive among small-cap value and small-cap growth positions, aided by strong stock selection. Mid-cap equity returns were also positive, though stock selection effects were mixed.
Outside the U.S., large-cap shares and global real estate were significant contributors, while growth-oriented and small-cap holdings made more modest contributions. In global real estate, our decision to overweight this segment during the period added to performance. Security selection was generally positive across the international equity segment and was particularly strong in the international small-cap value allocation.
Fixed-Income Contributed to Performance
In a period when stocks surged to record highs and interest rates rose, the global bond allocation made only a modest, positive contribution to performance. Certain decisions particularly benefited fixed-income returns. For example, worries about resurgent inflation meant that it was beneficial to overweight TIPS. At the same time, expectations of an improving economy also contributed to strong returns in the high-yield market, where we were overweight.
Outlook
The global economic recovery is underway and corporate profits have rebounded sharply, but risks remain. Volatility could spike if investors’ assumptions about inflation, interest rates and corporate earnings disappoint. In addition, the resurgent virus and challenges in terms of vaccine distribution and virus mutation mean we are not out of the woods yet with respect to a sustained global economic recovery. And while the U.S. is leading the recovery in developed markets as easing coronavirus restrictions unleash pent-up consumer demand, emerging markets are improving more gradually as vaccination rates climb. Therefore, we remain neutral in our stock allocations relative to bonds and cash, preferring to stick to our long-term strategic diversification targets.
Within equities, economically sensitive value stocks look appealing relative to growth stocks. We believe the economic recovery that’s driving the rotation from growth to value still has plenty of room to run in the U.S. We also favor small-cap stocks based on several favorable conditions, including stronger U.S. growth relative to non-U.S. economies, low interest rates, tight corporate bond spreads, rising commodity prices and relatively attractive valuations.
In fixed-income markets, our outlook for emerging markets sovereign debt and U.S. securitized bonds is positive. We’re more selective around U.S. credit, U.S. government debt and European debt.
| | | | | |
| JULY 31, 2021 |
Types of Investments in Portfolio | % of net assets |
| Affiliated Funds | 48.8% |
| Common Stocks | 31.8% |
| U.S. Treasury Securities | 5.2% |
| Corporate Bonds | 3.4% |
| Sovereign Governments and Agencies | 2.9% |
| Collateralized Loan Obligations | 0.8% |
| Commercial Paper | 0.5% |
| Municipal Securities | 0.4% |
| Collateralized Mortgage Obligations | 0.4% |
| Asset-Backed Securities | 0.3% |
| Preferred Stocks | 0.3% |
| U.S. Government Agency Mortgage-Backed Securities | 0.1% |
| Exchange-Traded Funds | 0.1% |
| Temporary Cash Investments | 4.3% |
| Temporary Cash Investments - Securities Lending Collateral | 0.1% |
| Other Assets and Liabilities | 0.6% |
Fund shareholders may incur two types of costs: (1) transaction costs, including sales charges (loads) on purchase payments and redemption/exchange fees; and (2) ongoing costs, including management fees; distribution and service (12b-1) fees; and other fund expenses. This example is intended to help you understand your ongoing costs (in dollars) of investing in your fund and to compare these costs with the ongoing cost of investing in other mutual funds.
The example is based on an investment of $1,000 made at the beginning of the period and held for the entire period from February 1, 2021 to July 31, 2021.
Actual Expenses
The table provides information about actual account values and actual expenses for each class. You may use the information, together with the amount you invested, to estimate the expenses that you paid over the period. First, identify the share class you own. Then simply divide your account value by $1,000 (for example, an $8,600 account value divided by $1,000 = 8.6), then multiply the result by the number under the heading “Expenses Paid During Period” to estimate the expenses you paid on your account during this period.
If you hold Investor Class shares of any American Century Investments fund, or I Class shares of the American Century Diversified Bond Fund, in an American Century Investments account (i.e., not through a financial intermediary or employer-sponsored retirement plan account), American Century Investments may charge you a $25.00 annual account maintenance fee if the value of those shares is less than $10,000. We will redeem shares automatically in one of your accounts to pay the $25.00 fee. In determining your total eligible investment amount, we will include your investments in all personal accounts (including American Century Investments brokerage accounts) registered under your Social Security number. Personal accounts include individual accounts, joint accounts, UGMA/UTMA accounts, personal trusts, Coverdell Education Savings Accounts and IRAs (including traditional, Roth, Rollover, SEP-, SARSEP- and SIMPLE-IRAs), and certain other retirement accounts. If you have only business, business retirement, employer-sponsored or American Century Investments brokerage accounts, you are currently not subject to this fee. If you are subject to the account maintenance fee, your account value could be reduced by the fee amount.
Hypothetical Example for Comparison Purposes
The table also provides information about hypothetical account values and hypothetical expenses based on the actual expense ratio of each class of your fund and an assumed rate of return of 5% per year before expenses, which is not the actual return of a fund’s share class. The hypothetical account values and expenses may not be used to estimate the actual ending account balance or expenses you paid for the period. You may use this information to compare the ongoing costs of investing in your fund and other funds. To do so, compare this 5% hypothetical example with the 5% hypothetical examples that appear in the shareholder reports of the other funds.
Please note that the expenses shown in the table are meant to highlight your ongoing costs only and do not reflect any transactional costs, such as sales charges (loads) or redemption/exchange fees. Therefore, the table is useful in comparing ongoing costs only, and will not help you determine the relative total costs of owning different funds. In addition, if these transactional costs were included, your costs would have been higher.
| | | | | | | | | | | | | | |
| Beginning
Account Value
2/1/21 | Ending
Account Value
7/31/21 | Expenses Paid During Period(1) 2/1/21 - 7/31/21 | Annualized Expense Ratio(1) |
Actual |
| Investor Class | $1,000 | $1,122.20 | $3.53 | 0.67% |
| I Class | $1,000 | $1,123.30 | $2.47 | 0.47% |
| A Class | $1,000 | $1,120.90 | $4.84 | 0.92% |
| C Class | $1,000 | $1,117.30 | $8.77 | 1.67% |
| R Class | $1,000 | $1,121.00 | $6.15 | 1.17% |
| R5 Class | $1,000 | $1,123.30 | $2.47 | 0.47% |
| R6 Class | $1,000 | $1,123.80 | $1.69 | 0.32% |
| Hypothetical |
| Investor Class | $1,000 | $1,021.47 | $3.36 | 0.67% |
| I Class | $1,000 | $1,022.46 | $2.36 | 0.47% |
| A Class | $1,000 | $1,020.23 | $4.61 | 0.92% |
| C Class | $1,000 | $1,016.51 | $8.35 | 1.67% |
| R Class | $1,000 | $1,018.99 | $5.86 | 1.17% |
| R5 Class | $1,000 | $1,022.46 | $2.36 | 0.47% |
| R6 Class | $1,000 | $1,023.21 | $1.61 | 0.32% |
(1)Expenses are equal to the class's annualized expense ratio listed in the table above, multiplied by the average account value over the period, multiplied by 181, the number of days in the most recent fiscal half-year, divided by 365, to reflect the one-half year period. Annualized expense ratio reflects actual expenses, including any applicable fee waivers or expense reimbursements and excluding any acquired fund fees and expenses.
JULY 31, 2021
| | | | | | | | | | | |
| | Shares/Principal Amount | Value |
AFFILIATED FUNDS(1) — 48.8% |
|
|
|
| American Century Diversified Corporate Bond ETF | | 288,278 | | $ | 15,244,717 | |
| American Century Focused Dynamic Growth ETF | | 560,733 | | 46,367,012 | |
| American Century Focused Large Cap Value ETF | | 1,010,108 | | 61,895,681 | |
| American Century Quality Diversified International ETF | | 641,891 | | 33,428,207 | |
| American Century STOXX U.S. Quality Growth ETF | | 649,356 | | 47,413,702 | |
| American Century STOXX U.S. Quality Value ETF | | 1,222,230 | | 62,021,083 | |
| Avantis Emerging Markets Equity ETF | | 442,672 | | 29,196,432 | |
| Avantis International Equity ETF | | 499,019 | | 31,772,540 | |
| Avantis International Small Cap Value ETF | | 170,103 | | 11,111,128 | |
| Avantis U.S. Equity ETF | | 814,674 | | 60,978,349 | |
| Avantis U.S. Small Cap Value ETF | | 273,475 | | 20,070,330 | |
TOTAL AFFILIATED FUNDS (Cost $309,495,780) |
| | 419,499,181 | |
| COMMON STOCKS — 31.8% |
|
|
|
| Aerospace and Defense — 0.4% | | | |
Babcock International Group plc(2) | | 65,791 | | 233,830 | |
| BAE Systems plc | | 136,427 | | 1,093,809 | |
CAE, Inc.(2) | | 3,582 | | 109,303 | |
| General Dynamics Corp. | | 4,310 | | 844,889 | |
| Lockheed Martin Corp. | | 1,556 | | 578,319 | |
Mercury Systems, Inc.(2) | | 2,987 | | 197,142 | |
| Safran SA | | 3,561 | | 466,044 | |
| Spirit AeroSystems Holdings, Inc., Class A | | 3,025 | | 130,710 | |
| | | 3,654,046 | |
| Air Freight and Logistics — 0.1% | | | |
| Expeditors International of Washington, Inc. | | 2,182 | | 279,842 | |
| United Parcel Service, Inc., Class B | | 3,140 | | 600,870 | |
| | | 880,712 | |
| Airlines — 0.1% | | | |
Ryanair Holdings plc, ADR(2) | | 2,689 | | 293,208 | |
Southwest Airlines Co.(2) | | 17,871 | | 902,843 | |
| | | 1,196,051 | |
| Auto Components — 0.4% | | | |
Aptiv plc(2) | | 10,664 | | 1,779,288 | |
| BorgWarner, Inc. | | 13,677 | | 669,900 | |
| Bridgestone Corp. | | 6,600 | | 290,762 | |
| Hyundai Mobis Co. Ltd. | | 1,567 | | 364,069 | |
| Linamar Corp. | | 2,335 | | 138,161 | |
| Minth Group Ltd. | | 10,000 | | 42,290 | |
| Sumitomo Rubber Industries Ltd. | | 14,100 | | 189,774 | |
| Valeo SA | | 10,728 | | 310,209 | |
| | | 3,784,453 | |
| Automobiles — 0.3% | | | |
| Bayerische Motoren Werke AG | | 4,404 | | 437,895 | |
| Daimler AG | | 11,496 | | 1,025,897 | |
| Honda Motor Co. Ltd., ADR | | 18,341 | | 588,746 | |
| | | | | | | | | | | |
| | Shares/Principal Amount | Value |
Nissan Motor Co. Ltd.(2) | | 84,000 | | $ | 487,522 | |
Tesla, Inc.(2) | | 478 | | 328,482 | |
| | | 2,868,542 | |
| Banks — 1.4% | | | |
AIB Group plc(2) | | 48,655 | | 119,499 | |
Banco Bilbao Vizcaya Argentaria SA(2) | | 64,732 | | 414,380 | |
| Banco Bradesco SA | | 26,763 | | 106,882 | |
| Banco do Brasil SA | | 30,900 | | 187,302 | |
| Bank Central Asia Tbk PT | | 81,400 | | 168,039 | |
| Bank of America Corp. | | 21,972 | | 842,846 | |
| Barclays plc | | 337,468 | | 816,362 | |
| BNP Paribas SA | | 9,602 | | 585,522 | |
| BPER Banca | | 49,178 | | 95,873 | |
| CaixaBank SA | | 143,087 | | 424,955 | |
| Canadian Western Bank | | 4,218 | | 114,984 | |
| Commerce Bancshares, Inc. | | 1,526 | | 107,934 | |
Commerzbank AG(2) | | 21,761 | | 140,140 | |
| Eastern Bankshares, Inc. | | 3,359 | | 61,302 | |
| First Hawaiian, Inc. | | 11,936 | | 328,598 | |
| HDFC Bank Ltd., ADR | | 5,832 | | 411,564 | |
| HSBC Holdings plc | | 84,400 | | 465,853 | |
| JPMorgan Chase & Co. | | 7,056 | | 1,070,960 | |
Jyske Bank A/S(2) | | 1,933 | | 93,796 | |
| M&T Bank Corp. | | 4,312 | | 577,161 | |
| Mitsubishi UFJ Financial Group, Inc. | | 113,800 | | 601,169 | |
| Mizuho Financial Group, Inc. | | 30,650 | | 437,977 | |
| Prosperity Bancshares, Inc. | | 5,446 | | 371,363 | |
| Regions Financial Corp. | | 33,543 | | 645,703 | |
Silvergate Capital Corp., Class A(2) | | 1,306 | | 134,257 | |
| Societe Generale SA | | 9,086 | | 266,090 | |
| Standard Chartered plc (London) | | 21,741 | | 130,333 | |
| Sumitomo Mitsui Financial Group, Inc. | | 11,300 | | 380,912 | |
Triumph Bancorp, Inc.(2) | | 2,508 | | 192,263 | |
| Truist Financial Corp. | | 15,507 | | 844,046 | |
| UniCredit SpA | | 13,585 | | 162,495 | |
Virgin Money UK plc(2) | | 22,970 | | 63,487 | |
| Westamerica Bancorporation | | 5,917 | | 328,689 | |
| | | 11,692,736 | |
| Beverages — 0.2% | | | |
Boston Beer Co., Inc. (The), Class A(2) | | 613 | | 435,230 | |
| MGP Ingredients, Inc. | | 1,553 | | 92,636 | |
| PepsiCo, Inc. | | 5,767 | | 905,131 | |
| Royal Unibrew A/S | | 876 | | 118,710 | |
| | | 1,551,707 | |
| Biotechnology — 0.7% | | | |
| AbbVie, Inc. | | 1,914 | | 222,598 | |
Acceleron Pharma, Inc.(2) | | 945 | | 118,182 | |
ADC Therapeutics SA(2) | | 3,363 | | 70,758 | |
Alnylam Pharmaceuticals, Inc.(2) | | 3,452 | | 617,701 | |
| Amgen, Inc. | | 1,917 | | 463,032 | |
Arcutis Biotherapeutics, Inc.(2) | | 3,325 | | 77,572 | |
| | | | | | | | | | | |
| | Shares/Principal Amount | Value |
Arena Pharmaceuticals, Inc.(2) | | 1,112 | | $ | 68,788 | |
Argenx SE, ADR(2) | | 1,358 | | 413,416 | |
Biohaven Pharmaceutical Holding Co. Ltd.(2) | | 1,634 | | 205,900 | |
Blueprint Medicines Corp.(2) | | 1,349 | | 118,537 | |
Bridgebio Pharma, Inc.(2) | | 2,271 | | 121,385 | |
Centessa Pharmaceuticals plc, ADR(2) | | 3,298 | | 68,071 | |
Cytokinetics, Inc.(2) | | 3,030 | | 89,930 | |
Deciphera Pharmaceuticals, Inc.(2) | | 2,590 | | 78,969 | |
Erasca, Inc.(2) | | 2,663 | | 55,923 | |
Fate Therapeutics, Inc.(2) | | 1,138 | | 94,226 | |
FibroGen, Inc.(2) | | 2,455 | | 31,915 | |
Flexion Therapeutics, Inc.(2) | | 6,144 | | 36,434 | |
Global Blood Therapeutics, Inc.(2) | | 2,999 | | 81,963 | |
Halozyme Therapeutics, Inc.(2) | | 3,740 | | 154,574 | |
Heron Therapeutics, Inc.(2) | | 2,868 | | 35,449 | |
Horizon Therapeutics plc(2) | | 7,035 | | 703,641 | |
Immunovant, Inc.(2) | | 2,342 | | 24,497 | |
Insmed, Inc.(2) | | 4,739 | | 116,579 | |
Intellia Therapeutics, Inc.(2) | | 613 | | 86,954 | |
Invitae Corp.(2)(3) | | 2,044 | | 57,212 | |
Iovance Biotherapeutics, Inc.(2) | | 1,105 | | 24,608 | |
KalVista Pharmaceuticals, Inc.(2) | | 2,386 | | 48,054 | |
Karuna Therapeutics, Inc.(2) | | 1,126 | | 128,612 | |
Kinnate Biopharma, Inc.(2)(3) | | 1,504 | | 32,456 | |
Kymera Therapeutics, Inc.(2) | | 1,320 | | 79,438 | |
Natera, Inc.(2) | | 5,847 | | 669,598 | |
Relay Therapeutics, Inc.(2) | | 1,752 | | 56,835 | |
Sigilon Therapeutics, Inc.(2) | | 3,137 | | 15,810 | |
Turning Point Therapeutics, Inc.(2) | | 3,397 | | 216,797 | |
Vertex Pharmaceuticals, Inc.(2) | | 933 | | 188,074 | |
| | | 5,674,488 | |
| Building Products — 0.3% | | | |
| Johnson Controls International plc | | 13,677 | | 976,811 | |
| Masco Corp. | | 6,825 | | 407,521 | |
Masonite International Corp.(2) | | 1,722 | | 194,862 | |
| Sanwa Holdings Corp. | | 5,600 | | 68,148 | |
| Trane Technologies plc | | 5,515 | | 1,122,909 | |
Trex Co., Inc.(2) | | 1,540 | | 149,534 | |
| | | 2,919,785 | |
| Capital Markets — 1.4% | | | |
| Ameriprise Financial, Inc. | | 4,390 | | 1,130,688 | |
| Bank of New York Mellon Corp. (The) | | 28,731 | | 1,474,762 | |
| BlackRock, Inc. | | 661 | | 573,199 | |
| Credit Suisse Group AG | | 50,728 | | 509,274 | |
flatexDEGIRO AG(2) | | 678 | | 81,930 | |
| GCM Grosvenor, Inc., Class A | | 7,764 | | 77,329 | |
| Intercontinental Exchange, Inc. | | 2,576 | | 308,682 | |
| Intermediate Capital Group plc | | 6,499 | | 195,851 | |
| LPL Financial Holdings, Inc. | | 7,647 | | 1,078,533 | |
| MarketAxess Holdings, Inc. | | 1,029 | | 488,950 | |
| Morgan Stanley | | 11,193 | | 1,074,304 | |
| | | | | | | | | | | |
| | Shares/Principal Amount | Value |
| MSCI, Inc. | | 1,782 | | $ | 1,062,001 | |
| Northern Trust Corp. | | 11,433 | | 1,290,214 | |
Open Lending Corp., Class A(2) | | 6,917 | | 262,846 | |
| Partners Group Holding AG | | 366 | | 625,261 | |
| S&P Global, Inc. | | 1,627 | | 697,528 | |
| State Street Corp. | | 4,154 | | 361,980 | |
| T. Rowe Price Group, Inc. | | 2,945 | | 601,251 | |
| | | 11,894,583 | |
| Chemicals — 0.5% | | | |
| Air Liquide SA | | 2,019 | | 351,121 | |
| Air Products and Chemicals, Inc. | | 1,006 | | 292,776 | |
| Albemarle Corp. | | 1,846 | | 380,350 | |
Axalta Coating Systems Ltd.(2) | | 16,222 | | 488,282 | |
| Corbion NV | | 509 | | 27,865 | |
Diversey Holdings Ltd.(2) | | 9,154 | | 152,689 | |
| Ecolab, Inc. | | 1,333 | | 294,366 | |
| Element Solutions, Inc. | | 28,997 | | 678,240 | |
| Koninklijke DSM NV | | 1,912 | | 385,424 | |
| Linde plc | | 2,495 | | 766,938 | |
OCI NV(2) | | 2,534 | | 61,472 | |
| Sherwin-Williams Co. (The) | | 1,372 | | 399,293 | |
| Zeon Corp. | | 4,600 | | 62,851 | |
| | | 4,341,667 | |
| Commercial Services and Supplies — 0.2% | | | |
| Brink's Co. (The) | | 3,301 | | 254,045 | |
Clean Harbors, Inc.(2) | | 2,534 | | 240,730 | |
Driven Brands Holdings, Inc.(2) | | 8,798 | | 279,952 | |
Elis SA(2) | | 6,484 | | 116,276 | |
| Loomis AB | | 3,849 | | 129,057 | |
| Republic Services, Inc. | | 6,291 | | 744,603 | |
| | | 1,764,663 | |
| Communications Equipment — 0.6% | | | |
Arista Networks, Inc.(2) | | 3,644 | | 1,386,141 | |
| Cisco Systems, Inc. | | 12,769 | | 707,020 | |
F5 Networks, Inc.(2) | | 9,126 | | 1,884,610 | |
| Juniper Networks, Inc. | | 14,237 | | 400,629 | |
| Telefonaktiebolaget LM Ericsson, B Shares | | 33,852 | | 390,455 | |
| | | 4,768,855 | |
Construction and Engineering† | | | |
| Arcadis NV | | 2,651 | | 117,401 | |
| Hazama Ando Corp. | | 10,800 | | 82,162 | |
| | | 199,563 | |
| Construction Materials — 0.1% | | | |
| Buzzi Unicem SpA | | 2,321 | | 61,351 | |
Cemex SAB de CV, ADR(2) | | 74,786 | | 608,010 | |
| Eagle Materials, Inc. | | 1,140 | | 161,105 | |
Summit Materials, Inc., Class A(2) | | 2,631 | | 88,402 | |
| | | 918,868 | |
| Consumer Finance — 0.1% | | | |
| American Express Co. | | 2,922 | | 498,289 | |
goeasy Ltd.(3) | | 971 | | 133,088 | |
| | | 631,377 | |
| | | | | | | | | | | |
| | Shares/Principal Amount | Value |
| Containers and Packaging — 0.5% | | | |
| Amcor plc | | 26,130 | | $ | 302,063 | |
| Avery Dennison Corp. | | 5,198 | | 1,095,115 | |
| Ball Corp. | | 9,994 | | 808,315 | |
| Intertape Polymer Group, Inc. | | 4,918 | | 109,468 | |
| Packaging Corp. of America | | 2,869 | | 405,964 | |
SIG Combibloc Group AG(2) | | 4,408 | | 130,061 | |
| Sonoco Products Co. | | 16,731 | | 1,067,270 | |
| | | 3,918,256 | |
Distributors† | | | |
| D'ieteren Group | | 1,198 | | 192,013 | |
Diversified Consumer Services† | | | |
Chegg, Inc.(2) | | 2,357 | | 208,901 | |
| IDP Education Ltd. | | 4,667 | | 96,706 | |
| | | 305,607 | |
Diversified Financial Services† | | | |
| Zenkoku Hosho Co. Ltd. | | 2,300 | | 104,353 | |
| Diversified Telecommunication Services — 0.1% | | | |
BT Group plc(2) | | 56,365 | | 135,768 | |
| Cellnex Telecom SA | | 11,836 | | 771,904 | |
| Verizon Communications, Inc. | | 4,307 | | 240,245 | |
| | | 1,147,917 | |
| Electric Utilities — 0.5% | | | |
| Edison International | | 17,158 | | 935,111 | |
| Evergy, Inc. | | 5,277 | | 344,166 | |
| Eversource Energy | | 4,255 | | 367,079 | |
| Iberdrola SA | | 30,707 | | 369,561 | |
| NextEra Energy, Inc. | | 13,982 | | 1,089,198 | |
| Pinnacle West Capital Corp. | | 11,301 | | 944,199 | |
| Xcel Energy, Inc. | | 2,281 | | 155,678 | |
| | | 4,204,992 | |
| Electrical Equipment — 0.9% | | | |
| AMETEK, Inc. | | 6,747 | | 938,170 | |
| Eaton Corp. plc | | 2,867 | | 453,129 | |
| Emerson Electric Co. | | 11,762 | | 1,186,668 | |
Generac Holdings, Inc.(2) | | 1,223 | | 512,877 | |
| Hubbell, Inc. | | 3,471 | | 695,797 | |
| Nexans SA | | 1,425 | | 136,392 | |
| nVent Electric plc | | 51,311 | | 1,621,941 | |
Plug Power, Inc.(2) | | 5,358 | | 146,166 | |
| Rockwell Automation, Inc. | | 2,434 | | 748,260 | |
| Schneider Electric SE | | 4,266 | | 714,505 | |
Sensata Technologies Holding plc(2) | | 3,193 | | 187,174 | |
| Ushio, Inc. | | 4,400 | | 78,844 | |
| | | 7,419,923 | |
| Electronic Equipment, Instruments and Components — 0.7% |
| CDW Corp. | | 2,549 | | 467,359 | |
| Cognex Corp. | | 15,422 | | 1,394,303 | |
| Comet Holding AG | | 309 | | 101,180 | |
Fabrinet(2) | | 1,108 | | 104,728 | |
| Hexagon AB, B Shares | | 33,719 | | 558,171 | |
| | | | | | | | | | | |
| | Shares/Principal Amount | Value |
| Jabil, Inc. | | 2,741 | | $ | 163,199 | |
| Keyence Corp. | | 1,000 | | 557,003 | |
Keysight Technologies, Inc.(2) | | 10,408 | | 1,712,636 | |
| National Instruments Corp. | | 2,782 | | 122,714 | |
nLight, Inc.(2) | | 6,145 | | 213,170 | |
Sesa SpA(2) | | 690 | | 122,850 | |
| TE Connectivity Ltd. | | 2,203 | | 324,876 | |
| | | 5,842,189 | |
| Energy Equipment and Services — 0.1% | | | |
| Baker Hughes Co. | | 22,408 | | 475,946 | |
| Schlumberger NV | | 10,963 | | 316,063 | |
| | | 792,009 | |
| Entertainment — 0.4% | | | |
| Activision Blizzard, Inc. | | 2,994 | | 250,358 | |
Live Nation Entertainment, Inc.(2) | | 4,713 | | 371,809 | |
ROBLOX Corp., Class A(2) | | 1,895 | | 145,877 | |
Roku, Inc.(2) | | 2,479 | | 1,061,780 | |
Sea Ltd., ADR(2) | | 1,391 | | 384,138 | |
Walt Disney Co. (The)(2) | | 6,029 | | 1,061,225 | |
Zynga, Inc., Class A(2) | | 58,437 | | 590,214 | |
| | | 3,865,401 | |
| Equity Real Estate Investment Trusts (REITs) — 3.0% | | | |
| American Campus Communities, Inc. | | 5,015 | | 252,305 | |
| Brixmor Property Group, Inc. | | 13,737 | | 316,226 | |
Capital & Counties Properties plc(2) | | 87,955 | | 208,596 | |
| Charter Hall Group | | 28,634 | | 342,172 | |
| Comforia Residential REIT, Inc. | | 58 | | 185,340 | |
| Community Healthcare Trust, Inc. | | 2,326 | | 115,905 | |
| CoreSite Realty Corp. | | 1,680 | | 232,193 | |
| Crown Castle International Corp. | | 924 | | 178,415 | |
| Empire State Realty Trust, Inc., Class A | | 11,433 | | 130,679 | |
| Equinix, Inc. | | 2,013 | | 1,651,485 | |
| Equity Residential | | 8,008 | | 673,713 | |
| Essential Properties Realty Trust, Inc. | | 5,402 | | 160,980 | |
| Essex Property Trust, Inc. | | 3,031 | | 994,471 | |
| Extra Space Storage, Inc. | | 3,791 | | 660,165 | |
| Fibra Uno Administracion SA de CV | | 210,318 | | 228,847 | |
| Global Medical REIT, Inc. | | 7,461 | | 116,093 | |
| Goodman Group | | 45,995 | | 764,996 | |
| Healthcare Trust of America, Inc., Class A | | 21,076 | | 602,563 | |
| Healthpeak Properties, Inc. | | 21,965 | | 812,046 | |
| Ingenia Communities Group | | 46,039 | | 196,511 | |
| Innovative Industrial Properties, Inc. | | 2,857 | | 614,226 | |
| Invincible Investment Corp. | | 437 | | 171,683 | |
| Invitation Homes, Inc. | | 25,511 | | 1,037,788 | |
| Iron Mountain, Inc. | | 7,054 | | 308,683 | |
| Japan Hotel REIT Investment Corp. | | 131 | | 79,885 | |
| Kilroy Realty Corp. | | 4,079 | | 282,552 | |
| Kimco Realty Corp. | | 20,503 | | 437,329 | |
Klepierre SA(2) | | 10,337 | | 250,279 | |
| LaSalle Logiport REIT | | 135 | | 247,266 | |
| | | | | | | | | | | |
| | Shares/Principal Amount | Value |
| Life Storage, Inc. | | 4,783 | | $ | 561,333 | |
| Link REIT | | 37,700 | | 360,274 | |
| Mapletree Commercial Trust | | 133,200 | | 212,063 | |
| Mapletree Logistics Trust | | 111,700 | | 173,913 | |
| MGM Growth Properties LLC, Class A | | 20,107 | | 760,045 | |
| Mitsubishi Estate Logistics REIT Investment Corp. | | 38 | | 175,192 | |
| NETSTREIT Corp. | | 6,500 | | 168,675 | |
| Orix JREIT, Inc. | | 99 | | 188,900 | |
| Prologis, Inc. | | 24,753 | | 3,169,374 | |
| Realty Income Corp. | | 7,632 | | 536,453 | |
| Rexford Industrial Realty, Inc. | | 6,999 | | 430,579 | |
Ryman Hospitality Properties, Inc.(2) | | 2,367 | | 181,549 | |
| SBA Communications Corp. | | 848 | | 289,160 | |
| Segro plc | | 25,305 | | 427,762 | |
Shaftesbury plc(3) | | 25,523 | | 209,215 | |
| Simon Property Group, Inc. | | 5,318 | | 672,833 | |
| SL Green Realty Corp. | | 2,757 | | 205,286 | |
| SOSiLA Logistics REIT, Inc. | | 178 | | 279,341 | |
| Sun Communities, Inc. | | 3,807 | | 746,591 | |
| Tritax Big Box REIT plc | | 45,868 | | 134,190 | |
| UDR, Inc. | | 17,479 | | 961,170 | |
| Urban Edge Properties | | 13,885 | | 263,815 | |
| Ventas, Inc. | | 5,890 | | 352,104 | |
| VICI Properties, Inc. | | 11,122 | | 346,895 | |
| Welltower, Inc. | | 9,347 | | 811,880 | |
| Weyerhaeuser Co. | | 5,108 | | 172,293 | |
| Workspace Group plc | | 21,651 | | 259,333 | |
Xenia Hotels & Resorts, Inc.(2) | | 15,352 | | 271,423 | |
| | | 25,575,033 | |
| Food and Staples Retailing — 0.3% | | | |
| Costco Wholesale Corp. | | 772 | | 331,744 | |
| Koninklijke Ahold Delhaize NV | | 35,076 | | 1,090,332 | |
MARR SpA(2) | | 4,081 | | 94,713 | |
| Matsumotokiyoshi Holdings Co. Ltd. | | 2,600 | | 115,523 | |
| Sysco Corp. | | 11,726 | | 870,069 | |
Zur Rose Group AG(2) | | 1,028 | | 382,249 | |
| | | 2,884,630 | |
| Food Products — 0.4% | | | |
| Bakkafrost P/F | | 1,975 | | 167,840 | |
Beyond Meat, Inc.(2) | | 149 | | 18,282 | |
| Conagra Brands, Inc. | | 31,271 | | 1,047,266 | |
| General Mills, Inc. | | 6,077 | | 357,692 | |
| Glanbia plc | | 7,010 | | 120,342 | |
| J.M. Smucker Co. (The) | | 3,735 | | 489,696 | |
| Kellogg Co. | | 5,982 | | 379,019 | |
| Mondelez International, Inc., Class A | | 7,167 | | 453,384 | |
| Orkla ASA | | 45,122 | | 409,816 | |
Vital Farms, Inc.(2) | | 1,987 | | 34,594 | |
Whole Earth Brands, Inc.(2) | | 9,817 | | 126,247 | |
| | | 3,604,178 | |
| | | | | | | | | | | |
| | Shares/Principal Amount | Value |
| Gas Utilities — 0.1% | | | |
| Atmos Energy Corp. | | 4,770 | | $ | 470,274 | |
| Nippon Gas Co. Ltd. | | 8,800 | | 138,996 | |
| Spire, Inc. | | 6,191 | | 439,252 | |
| | | 1,048,522 | |
| Health Care Equipment and Supplies — 1.2% | | | |
Align Technology, Inc.(2) | | 995 | | 692,321 | |
| Arjo AB, B Shares | | 4,395 | | 55,517 | |
| Baxter International, Inc. | | 4,159 | | 321,699 | |
| Becton Dickinson and Co. | | 2,552 | | 652,674 | |
DexCom, Inc.(2) | | 1,882 | | 970,190 | |
Eargo, Inc.(2)(3) | | 3,304 | | 118,944 | |
Edwards Lifesciences Corp.(2) | | 5,427 | | 609,289 | |
| Elekta AB, B Shares | | 3,911 | | 57,083 | |
Envista Holdings Corp.(2) | | 6,733 | | 290,058 | |
IDEXX Laboratories, Inc.(2) | | 1,879 | | 1,274,958 | |
Inmode Ltd.(2) | | 1,328 | | 150,954 | |
| Koninklijke Philips NV | | 8,711 | | 401,054 | |
| Medtronic plc | | 4,104 | | 538,896 | |
NeuroPace, Inc.(2) | | 4,658 | | 99,215 | |
| Olympus Corp. | | 15,200 | | 312,806 | |
Ortho Clinical Diagnostics Holdings plc(2) | | 9,001 | | 202,252 | |
OrthoPediatrics Corp.(2) | | 1,532 | | 96,271 | |
| ResMed, Inc. | | 485 | | 131,823 | |
Silk Road Medical, Inc.(2) | | 2,974 | | 149,235 | |
Tandem Diabetes Care, Inc.(2) | | 2,525 | | 274,392 | |
| Teleflex, Inc. | | 1,622 | | 644,631 | |
| Zimmer Biomet Holdings, Inc. | | 11,366 | | 1,857,432 | |
| | | 9,901,694 | |
| Health Care Providers and Services — 1.3% | | | |
| Alfresa Holdings Corp. | | 18,000 | | 274,138 | |
Amedisys, Inc.(2) | | 2,417 | | 629,919 | |
| Amvis Holdings, Inc. | | 800 | | 44,151 | |
ATI Physical Therapy, Inc.(2)(3) | | 13,508 | | 46,062 | |
Cano Health, Inc.(2) | | 6,561 | | 70,531 | |
| Cardinal Health, Inc. | | 16,178 | | 960,650 | |
Centene Corp.(2) | | 6,364 | | 436,634 | |
| Chartwell Retirement Residences | | 20,012 | | 210,290 | |
| Cigna Corp. | | 3,123 | | 716,697 | |
Covetrus, Inc.(2) | | 930 | | 23,678 | |
| CVS Health Corp. | | 6,385 | | 525,869 | |
| Encompass Health Corp. | | 11,858 | | 987,178 | |
| Ensign Group, Inc. (The) | | 1,487 | | 126,499 | |
HealthEquity, Inc.(2) | | 3,404 | | 251,828 | |
Henry Schein, Inc.(2) | | 11,680 | | 936,152 | |
| Humana, Inc. | | 626 | | 266,588 | |
| McKesson Corp. | | 3,552 | | 724,004 | |
Option Care Health, Inc.(2) | | 8,066 | | 167,128 | |
| Quest Diagnostics, Inc. | | 8,187 | | 1,160,917 | |
R1 RCM, Inc.(2) | | 22,806 | | 488,276 | |
RadNet, Inc.(2) | | 5,087 | | 186,896 | |
| | | | | | | | | | | |
| | Shares/Principal Amount | Value |
| UnitedHealth Group, Inc. | | 2,018 | | $ | 831,860 | |
| Universal Health Services, Inc., Class B | | 6,927 | | 1,111,160 | |
| | | 11,177,105 | |
| Health Care Technology — 0.3% | | | |
| Cerner Corp. | | 14,173 | | 1,139,368 | |
Health Catalyst, Inc.(2) | | 4,176 | | 242,459 | |
OptimizeRx Corp.(2) | | 1,868 | | 103,244 | |
Veeva Systems, Inc., Class A(2) | | 3,551 | | 1,181,453 | |
| | | 2,666,524 | |
| Hotels, Restaurants and Leisure — 0.7% | | | |
Autogrill SpA(2)(3) | | 14,626 | | 102,617 | |
Basic-Fit NV(2)(3) | | 2,077 | | 96,002 | |
Booking Holdings, Inc.(2) | | 174 | | 379,017 | |
Brinker International, Inc.(2) | | 2,144 | | 116,505 | |
Chipotle Mexican Grill, Inc.(2) | | 673 | | 1,254,095 | |
| Churchill Downs, Inc. | | 985 | | 183,013 | |
Corporate Travel Management Ltd.(2) | | 4,670 | | 74,552 | |
| Cracker Barrel Old Country Store, Inc. | | 1,335 | | 181,800 | |
Expedia Group, Inc.(2) | | 2,879 | | 463,145 | |
| Food & Life Cos. Ltd. | | 3,600 | | 146,681 | |
Greggs plc(2) | | 3,929 | | 150,551 | |
Hilton Worldwide Holdings, Inc.(2) | | 5,077 | | 667,372 | |
Las Vegas Sands Corp.(2) | | 12,812 | | 542,588 | |
Planet Fitness, Inc., Class A(2) | | 1,930 | | 145,194 | |
SeaWorld Entertainment, Inc.(2) | | 1,683 | | 79,791 | |
Sodexo SA(2) | | 6,576 | | 560,311 | |
| Travel + Leisure Co. | | 604 | | 31,287 | |
Whitbread plc(2) | | 9,629 | | 406,977 | |
| Wingstop, Inc. | | 1,048 | | 179,533 | |
| Wyndham Hotels & Resorts, Inc. | | 2,932 | | 211,280 | |
| | | 5,972,311 | |
| Household Durables — 0.2% | | | |
| Haseko Corp. | | 12,700 | | 171,860 | |
| Man Wah Holdings Ltd. | | 29,200 | | 58,590 | |
| Open House Co. Ltd. | | 11,000 | | 556,157 | |
Sonos, Inc.(2) | | 5,515 | | 184,091 | |
| Taylor Wimpey plc | | 178,294 | | 407,628 | |
| Token Corp. | | 1,000 | | 90,275 | |
| | | 1,468,601 | |
| Household Products — 0.2% | | | |
| Colgate-Palmolive Co. | | 3,468 | | 275,706 | |
| Kimberly-Clark Corp. | | 3,914 | | 531,208 | |
| Procter & Gamble Co. (The) | | 4,698 | | 668,196 | |
| Reynolds Consumer Products, Inc. | | 2,233 | | 63,529 | |
| | | 1,538,639 | |
| Industrial Conglomerates — 0.1% | | | |
| Honeywell International, Inc. | | 3,561 | | 832,526 | |
| Lifco AB, B Shares | | 4,445 | | 130,372 | |
| | | 962,898 | |
| Insurance — 0.8% | | | |
| Aegon NV | | 50,910 | | 216,754 | |
| | | | | | | | | | | |
| | Shares/Principal Amount | Value |
| Aflac, Inc. | | 20,779 | | $ | 1,142,845 | |
| AIA Group Ltd. | | 28,200 | | 337,435 | |
| Allstate Corp. (The) | | 3,948 | | 513,438 | |
| Arthur J. Gallagher & Co. | | 1,651 | | 230,001 | |
| Chubb Ltd. | | 7,487 | | 1,263,356 | |
| Goosehead Insurance, Inc., Class A | | 1,037 | | 124,637 | |
| Hartford Financial Services Group, Inc. (The) | | 4,538 | | 288,708 | |
| Kinsale Capital Group, Inc. | | 1,012 | | 180,789 | |
| Marsh & McLennan Cos., Inc. | | 2,006 | | 295,323 | |
Palomar Holdings, Inc.(2) | | 1,572 | | 128,008 | |
| Prudential Financial, Inc. | | 2,705 | | 271,257 | |
| Reinsurance Group of America, Inc. | | 8,167 | | 899,840 | |
Ryan Specialty Group Holdings, Inc., Class A(2) | | 3,568 | | 105,256 | |
SelectQuote, Inc.(2) | | 19,235 | | 342,383 | |
| Storebrand ASA | | 10,861 | | 93,253 | |
| Travelers Cos., Inc. (The) | | 2,371 | | 353,089 | |
| | | 6,786,372 | |
| Interactive Media and Services — 0.8% | | | |
Alphabet, Inc., Class A(2) | | 1,109 | | 2,988,234 | |
Baidu, Inc., Class A(2) | | 20,600 | | 422,094 | |
| carsales.com Ltd. | | 5,308 | | 85,592 | |
Eventbrite, Inc., Class A(2) | | 6,512 | | 115,718 | |
Facebook, Inc., Class A(2) | | 2,574 | | 917,116 | |
fuboTV, Inc.(2)(3) | | 3,341 | | 87,000 | |
Match Group, Inc.(2) | | 5,968 | | 950,523 | |
Pinterest, Inc., Class A(2) | | 11,262 | | 663,332 | |
QuinStreet, Inc.(2) | | 12,542 | | 230,020 | |
| Tencent Holdings Ltd. | | 8,800 | | 530,712 | |
| | | 6,990,341 | |
| Internet and Direct Marketing Retail — 0.5% | | | |
Alibaba Group Holding Ltd.(2) | | 16,700 | | 407,860 | |
Amazon.com, Inc.(2) | | 716 | | 2,382,554 | |
| ASKUL Corp. | | 3,700 | | 55,852 | |
ASOS plc(2) | | 5,689 | | 300,817 | |
BHG Group AB(2) | | 1,808 | | 27,887 | |
Chewy, Inc., Class A(2)(3) | | 5,913 | | 494,918 | |
Etsy, Inc.(2) | | 3,296 | | 604,849 | |
Revolve Group, Inc.(2) | | 1,807 | | 125,785 | |
| | | 4,400,522 | |
| IT Services — 1.2% | | | |
| Accenture plc, Class A | | 2,264 | | 719,228 | |
Adyen NV(2) | | 250 | | 677,512 | |
| Alten SA | | 815 | | 129,557 | |
| Amdocs Ltd. | | 4,303 | | 331,804 | |
| Atos SE | | 3,526 | | 168,623 | |
| Capgemini SE | | 3,450 | | 745,727 | |
Capita plc(2) | | 138,282 | | 67,745 | |
DigitalOcean Holdings, Inc.(2) | | 2,569 | | 132,304 | |
| Edenred | | 6,614 | | 384,247 | |
Endava plc, ADR(2) | | 1,165 | | 149,842 | |
EPAM Systems, Inc.(2) | | 1,457 | | 815,629 | |
| | | | | | | | | | | |
| | Shares/Principal Amount | Value |
Euronet Worldwide, Inc.(2) | | 2,031 | | $ | 290,067 | |
GDS Holdings Ltd., Class A(2) | | 10,900 | | 80,819 | |
I3 Verticals, Inc., Class A(2) | | 6,320 | | 201,734 | |
Indra Sistemas SA(2) | | 17,105 | | 179,063 | |
| Mastercard, Inc., Class A | | 2,252 | | 869,137 | |
| MAXIMUS, Inc. | | 2,932 | | 260,948 | |
Nuvei Corp.(2) | | 1,381 | | 113,242 | |
Okta, Inc.(2) | | 3,608 | | 894,026 | |
PayPal Holdings, Inc.(2) | | 3,531 | | 972,896 | |
Perficient, Inc.(2) | | 1,991 | | 187,731 | |
Repay Holdings Corp.(2) | | 4,118 | | 102,579 | |
Square, Inc., Class A(2) | | 2,527 | | 624,826 | |
Twilio, Inc., Class A(2) | | 1,900 | | 709,821 | |
| Visa, Inc., Class A | | 3,717 | | 915,832 | |
| | | 10,724,939 | |
| Leisure Products — 0.2% | | | |
Accell Group NV(2) | | 1,745 | | 86,417 | |
| BRP, Inc. | | 1,439 | | 120,566 | |
| Brunswick Corp. | | 2,021 | | 210,992 | |
Callaway Golf Co.(2) | | 5,794 | | 183,554 | |
Hayward Holdings, Inc.(2) | | 9,228 | | 222,303 | |
Peloton Interactive, Inc., Class A(2) | | 2,433 | | 287,216 | |
| Polaris, Inc. | | 2,673 | | 350,350 | |
| | | 1,461,398 | |
| Life Sciences Tools and Services — 0.7% | | | |
10X Genomics, Inc., Class A(2) | | 2,678 | | 490,690 | |
| Agilent Technologies, Inc. | | 4,383 | | 671,607 | |
Akoya Biosciences, Inc.(2)(3) | | 2,738 | | 47,477 | |
| Bio-Techne Corp. | | 1,534 | | 739,756 | |
ICON plc(2) | | 1,171 | | 284,869 | |
| Lonza Group AG | | 749 | | 583,190 | |
Mettler-Toledo International, Inc.(2) | | 743 | | 1,094,967 | |
NeoGenomics, Inc.(2) | | 3,895 | | 179,560 | |
Repligen Corp.(2) | | 2,047 | | 502,948 | |
| Thermo Fisher Scientific, Inc. | | 1,137 | | 613,991 | |
Wuxi Biologics Cayman, Inc.(2) | | 30,000 | | 458,227 | |
| | | 5,667,282 | |
| Machinery — 0.8% | | | |
| ANDRITZ AG | | 2,308 | | 127,067 | |
| Astec Industries, Inc. | | 1,873 | | 114,834 | |
| Crane Co. | | 3,923 | | 381,433 | |
| Cummins, Inc. | | 3,356 | | 778,928 | |
Evoqua Water Technologies Corp.(2) | | 5,400 | | 178,254 | |
| FANUC Corp. | | 1,300 | | 291,158 | |
| Graco, Inc. | | 6,496 | | 507,208 | |
IHI Corp.(2) | | 5,700 | | 131,841 | |
| IMI plc | | 8,021 | | 196,233 | |
| Japan Steel Works Ltd. (The) | | 3,000 | | 73,799 | |
Kornit Digital Ltd.(2) | | 1,027 | | 135,728 | |
| Metso Outotec Oyj | | 14,932 | | 169,540 | |
| Oshkosh Corp. | | 4,315 | | 515,858 | |
| | | | | | | | | | | |
| | Shares/Principal Amount | Value |
| PACCAR, Inc. | | 4,914 | | $ | 407,813 | |
| Parker-Hannifin Corp. | | 5,465 | | 1,705,244 | |
| Rexnord Corp. | | 10,325 | | 581,607 | |
| Techtronic Industries Co. Ltd. | | 31,000 | | 552,801 | |
| Timken Co. (The) | | 2,079 | | 165,280 | |
| Trelleborg AB, B Shares | | 2,718 | | 67,188 | |
| Tsubaki Nakashima Co. Ltd. | | 7,100 | | 107,029 | |
| | | 7,188,843 | |
| Media — 0.3% | | | |
Atresmedia Corp. de Medios de Comunicacion SA(2) | | 16,736 | | 69,190 | |
| Comcast Corp., Class A | | 6,626 | | 389,808 | |
Criteo SA, ADR(2) | | 1,551 | | 60,163 | |
| Fox Corp., Class B | | 23,631 | | 785,494 | |
| Future plc | | 3,638 | | 174,282 | |
Nordic Entertainment Group AB, B Shares(2) | | 1,865 | | 99,593 | |
| ProSiebenSat.1 Media SE | | 2,933 | | 55,724 | |
| Publicis Groupe SA | | 8,165 | | 515,462 | |
Storytel AB(2) | | 1,043 | | 27,007 | |
| WPP plc | | 49,186 | | 636,124 | |
| | | 2,812,847 | |
| Metals and Mining — 0.1% | | | |
| Alamos Gold, Inc. (New York), Class A | | 7,450 | | 60,494 | |
| APERAM SA | | 2,161 | | 135,432 | |
| Mineral Resources Ltd. | | 2,112 | | 97,721 | |
| MMC Norilsk Nickel PJSC | | 1,515 | | 523,638 | |
| Nickel Mines Ltd. | | 31,311 | | 25,264 | |
| OZ Minerals Ltd. | | 4,454 | | 75,512 | |
| Teck Resources Ltd., Class B | | 13,017 | | 297,308 | |
| | | 1,215,369 | |
| Multi-Utilities — 0.1% | | | |
| NorthWestern Corp. | | 13,685 | | 848,333 | |
| Multiline Retail — 0.2% | | | |
Dollar Tree, Inc.(2) | | 7,882 | | 786,545 | |
| Isetan Mitsukoshi Holdings Ltd. | | 16,000 | | 108,344 | |
| Magazine Luiza SA | | 75,876 | | 300,110 | |
Marks & Spencer Group plc(2) | | 38,322 | | 72,142 | |
| Target Corp. | | 1,384 | | 361,293 | |
| | | 1,628,434 | |
| Oil, Gas and Consumable Fuels — 0.6% | | | |
| Cimarex Energy Co. | | 3,749 | | 244,435 | |
| ConocoPhillips | | 27,895 | | 1,563,794 | |
| Devon Energy Corp. | | 17,152 | | 443,208 | |
| Eni SpA | | 17,985 | | 212,684 | |
| Matador Resources Co. | | 4,956 | | 153,140 | |
| Neste Oyj | | 7,363 | | 452,609 | |
| Pioneer Natural Resources Co. | | 2,550 | | 370,693 | |
| Surgutneftegas PJSC, Preference Shares | | 912,892 | | 476,530 | |
| TotalEnergies SE | | 12,519 | | 545,912 | |
Whitecap Resources, Inc.(3) | | 58,475 | | 267,628 | |
| | | 4,730,633 | |
| | | | | | | | | | | |
| | Shares/Principal Amount | Value |
| Paper and Forest Products — 0.1% | | | |
| Mondi plc | | 32,128 | | $ | 890,709 | |
| Personal Products — 0.1% | | | |
| Estee Lauder Cos., Inc. (The), Class A | | 921 | | 307,457 | |
| Shiseido Co. Ltd. | | 7,900 | | 528,002 | |
| | | 835,459 | |
| Pharmaceuticals — 0.8% | | | |
ALK-Abello A/S(2) | | 291 | | 143,465 | |
Arvinas, Inc.(2) | | 1,038 | | 104,942 | |
| AstraZeneca plc | | 2,325 | | 267,165 | |
| AstraZeneca plc, ADR | | 12,963 | | 742,002 | |
Axsome Therapeutics, Inc.(2) | | 1,155 | | 56,121 | |
| Bristol-Myers Squibb Co. | | 9,291 | | 630,580 | |
| Dermapharm Holding SE | | 1,215 | | 97,192 | |
Edgewise Therapeutics, Inc.(2)(3) | | 2,587 | | 45,298 | |
| GlaxoSmithKline plc | | 52,740 | | 1,041,290 | |
Harmony Biosciences Holdings, Inc.(2) | | 1,654 | | 43,269 | |
| Laboratorios Farmaceuticos Rovi SA | | 1,039 | | 73,342 | |
| Merck & Co., Inc. | | 7,172 | | 551,312 | |
| Novartis AG | | 4,083 | | 377,589 | |
| Novo Nordisk A/S, B Shares | | 9,169 | | 848,786 | |
Reata Pharmaceuticals, Inc., Class A(2) | | 583 | | 73,056 | |
| Sanofi | | 2,088 | | 215,217 | |
| Sanofi, ADR | | 12,651 | | 652,286 | |
| Takeda Pharmaceutical Co. Ltd. | | 15,600 | | 519,270 | |
| Zoetis, Inc. | | 2,786 | | 564,722 | |
| | | 7,046,904 | |
| Professional Services — 0.5% | | | |
ASGN, Inc.(2) | | 1,292 | | 130,660 | |
| Bureau Veritas SA | | 11,044 | | 364,714 | |
CoStar Group, Inc.(2) | | 6,000 | | 533,100 | |
| DKSH Holding AG | | 1,277 | | 107,953 | |
| en Japan, Inc. | | 2,500 | | 87,302 | |
First Advantage Corp.(2) | | 8,415 | | 165,018 | |
| IHS Markit Ltd. | | 1,546 | | 180,635 | |
| IR Japan Holdings Ltd. | | 500 | | 61,873 | |
| Jacobs Engineering Group, Inc. | | 5,985 | | 809,471 | |
| Outsourcing, Inc. | | 3,600 | | 68,907 | |
| Recruit Holdings Co. Ltd. | | 12,300 | | 637,517 | |
| Teleperformance | | 1,173 | | 494,767 | |
| TransUnion | | 3,260 | | 391,395 | |
| Verisk Analytics, Inc. | | 2,620 | | 497,643 | |
| | | 4,530,955 | |
| Real Estate Management and Development — 0.3% | | | |
Altus Group Ltd.(3) | | 1,978 | | 93,097 | |
| CapitaLand Ltd. | | 56,200 | | 166,968 | |
| Colliers International Group, Inc. | | 738 | | 94,899 | |
| Colliers International Group, Inc. (Toronto) | | 1,158 | | 148,583 | |
CTP NV(2) | | 9,863 | | 198,812 | |
ESR Cayman Ltd.(2) | | 41,000 | | 144,108 | |
Fastighets AB Balder, B Shares(2) | | 1,400 | | 96,612 | |
| | | | | | | | | | | |
| | Shares/Principal Amount | Value |
| FirstService Corp. | | 485 | | $ | 90,337 | |
| Newmark Group, Inc., Class A | | 6,083 | | 78,349 | |
| Relo Group, Inc. | | 2,500 | | 55,172 | |
Samhallsbyggnadsbolaget i Norden AB(3) | | 22,962 | | 115,038 | |
| Savills plc | | 5,153 | | 82,300 | |
| Tokyu Fudosan Holdings Corp. | | 43,800 | | 247,266 | |
| Tricon Residential, Inc. | | 38,850 | | 465,540 | |
| VGP NV | | 561 | | 115,495 | |
| | | 2,192,576 | |
| Road and Rail — 0.2% | | | |
| Heartland Express, Inc. | | 22,861 | | 389,323 | |
Nagoya Railroad Co. Ltd.(2) | | 2,600 | | 43,783 | |
| Norfolk Southern Corp. | | 1,663 | | 428,771 | |
| TFI International, Inc. | | 1,191 | | 133,324 | |
| Union Pacific Corp. | | 1,561 | | 341,485 | |
| | | 1,336,686 | |
| Semiconductors and Semiconductor Equipment — 1.1% | | | |
Advanced Micro Devices, Inc.(2) | | 3,312 | | 351,701 | |
Allegro MicroSystems, Inc.(2) | | 2,455 | | 67,292 | |
| Applied Materials, Inc. | | 3,937 | | 550,904 | |
| ASM International NV | | 163 | | 57,850 | |
| ASML Holding NV | | 1,000 | | 764,384 | |
| BE Semiconductor Industries NV | | 1,551 | | 136,114 | |
Enphase Energy, Inc.(2) | | 5,298 | | 1,004,501 | |
Ichor Holdings Ltd.(2) | | 1,967 | | 101,438 | |
| Infineon Technologies AG | | 11,861 | | 453,258 | |
MACOM Technology Solutions Holdings, Inc.(2) | | 3,659 | | 225,833 | |
| Marvell Technology, Inc. | | 14,848 | | 898,453 | |
Nova Ltd.(2) | | 1,589 | | 155,404 | |
| NVIDIA Corp. | | 6,112 | | 1,191,779 | |
Onto Innovation, Inc.(2) | | 2,900 | | 203,232 | |
| Optorun Co. Ltd. | | 800 | | 16,121 | |
| Power Integrations, Inc. | | 910 | | 88,261 | |
Semtech Corp.(2) | | 3,525 | | 218,233 | |
| Skyworks Solutions, Inc. | | 5,591 | | 1,031,595 | |
SOITEC(2) | | 506 | | 121,312 | |
| Taiwan Semiconductor Manufacturing Co. Ltd. | | 38,000 | | 794,181 | |
| Teradyne, Inc. | | 4,261 | | 541,147 | |
| Texas Instruments, Inc. | | 3,406 | | 649,252 | |
| | | 9,622,245 | |
| Software — 2.4% | | | |
Adobe, Inc.(2) | | 1,005 | | 624,738 | |
Atlassian Corp. plc, Class A(2) | | 3,209 | | 1,043,310 | |
Autodesk, Inc.(2) | | 3,157 | | 1,013,808 | |
Cadence Design Systems, Inc.(2) | | 11,475 | | 1,694,284 | |
| CDK Global, Inc. | | 8,061 | | 386,847 | |
Cloudflare, Inc., Class A(2) | | 3,248 | | 385,310 | |
Coupa Software, Inc.(2) | | 1,546 | | 335,482 | |
| Dassault Systemes SE | | 8,440 | | 465,569 | |
Descartes Systems Group, Inc. (The)(2) | | 1,626 | | 117,936 | |
DocuSign, Inc.(2) | | 5,453 | | 1,625,212 | |
| | | | | | | | | | | |
| | Shares/Principal Amount | Value |
Everbridge, Inc.(2) | | 691 | | $ | 97,583 | |
Five9, Inc.(2) | | 1,036 | | 208,537 | |
HubSpot, Inc.(2) | | 2,398 | | 1,429,256 | |
Lightspeed POS, Inc.(2) | | 1,106 | | 94,705 | |
| m-up Holdings, Inc. | | 1,800 | | 54,187 | |
Manhattan Associates, Inc.(2) | | 9,956 | | 1,589,276 | |
| Microsoft Corp. | | 17,197 | | 4,899,597 | |
Model N, Inc.(2) | | 4,265 | | 138,058 | |
nCino, Inc.(2) | | 2,346 | | 149,135 | |
| Open Text Corp. | | 9,847 | | 511,158 | |
Palo Alto Networks, Inc.(2) | | 3,808 | | 1,519,582 | |
Paycor HCM, Inc.(2) | | 3,464 | | 95,260 | |
Paylocity Holding Corp.(2) | | 1,039 | | 215,551 | |
RingCentral, Inc., Class A(2) | | 2,240 | | 598,685 | |
SailPoint Technologies Holdings, Inc.(2) | | 4,347 | | 217,307 | |
salesforce.com, Inc.(2) | | 1,629 | | 394,104 | |
Sprinklr, Inc., Class A(2) | | 5,262 | | 101,767 | |
Sprout Social, Inc., Class A(2) | | 3,862 | | 343,100 | |
Workday, Inc., Class A(2) | | 615 | | 144,156 | |
| | | 20,493,500 | |
| Specialty Retail — 0.9% | | | |
| Advance Auto Parts, Inc. | | 5,377 | | 1,140,247 | |
American Eagle Outfitters, Inc.(3) | | 6,747 | | 232,569 | |
Arko Corp.(2) | | 11,987 | | 99,492 | |
Burlington Stores, Inc.(2) | | 3,486 | | 1,167,113 | |
Carvana Co.(2) | | 1,799 | | 607,270 | |
Five Below, Inc.(2) | | 2,536 | | 493,049 | |
Floor & Decor Holdings, Inc., Class A(2) | | 5,633 | | 687,282 | |
| Home Depot, Inc. (The) | | 4,332 | | 1,421,719 | |
Leslie's, Inc.(2) | | 9,637 | | 234,661 | |
| Lithia Motors, Inc. | | 294 | | 110,903 | |
Musti Group Oyj(2) | | 3,117 | | 128,659 | |
National Vision Holdings, Inc.(2) | | 3,511 | | 189,524 | |
| Nextage Co. Ltd. | | 6,400 | | 131,632 | |
| Pets at Home Group plc | | 20,309 | | 131,944 | |
| TJX Cos., Inc. (The) | | 6,250 | | 430,062 | |
| Tractor Supply Co. | | 997 | | 180,387 | |
Watches of Switzerland Group plc(2) | | 10,904 | | 152,505 | |
WH Smith plc(2) | | 2,419 | | 54,558 | |
| | | 7,593,576 | |
| Technology Hardware, Storage and Peripherals — 0.4% | | | |
| Apple, Inc. | | 16,837 | | 2,455,845 | |
| HP, Inc. | | 23,246 | | 671,112 | |
| | | 3,126,957 | |
| Textiles, Apparel and Luxury Goods — 0.5% | | | |
| ANTA Sports Products Ltd. | | 23,000 | | 500,741 | |
| Asics Corp. | | 4,700 | | 103,798 | |
Capri Holdings Ltd.(2) | | 2,633 | | 148,264 | |
Crocs, Inc.(2) | | 2,171 | | 294,844 | |
Dr. Martens plc(2) | | 14,150 | | 85,270 | |
lululemon athletica, Inc.(2) | | 2,606 | | 1,042,843 | |
| | | | | | | | | | | |
| | Shares/Principal Amount | Value |
| LVMH Moet Hennessy Louis Vuitton SE | | 801 | | $ | 641,334 | |
| NIKE, Inc., Class B | | 5,334 | | 893,498 | |
| Pandora A/S | | 1,302 | | 168,423 | |
| Puma SE | | 4,090 | | 501,718 | |
| VF Corp. | | 3,577 | | 286,875 | |
| | | 4,667,608 | |
Thrifts and Mortgage Finance† | | | |
| Capitol Federal Financial, Inc. | | 15,982 | | 177,240 | |
NMI Holdings, Inc., Class A(2) | | 3,556 | | 78,303 | |
| | | 255,543 | |
| Trading Companies and Distributors — 0.4% | | | |
| AddTech AB, B Shares | | 3,676 | | 76,489 | |
| Ashtead Group plc | | 6,291 | | 470,752 | |
Beacon Roofing Supply, Inc.(2) | | 3,446 | | 184,292 | |
| Diploma plc | | 3,516 | | 144,435 | |
| Electrocomponents plc | | 10,769 | | 152,142 | |
| Finning International, Inc. | | 7,839 | | 202,698 | |
| Grafton Group plc | | 10,988 | | 196,032 | |
| Howden Joinery Group plc | | 13,645 | | 170,038 | |
| MSC Industrial Direct Co., Inc., Class A | | 9,736 | | 868,159 | |
NOW, Inc.(2) | | 5,943 | | 58,657 | |
Seven Group Holdings Ltd.(3) | | 3,801 | | 65,190 | |
| W.W. Grainger, Inc. | | 1,583 | | 703,770 | |
| Yamazen Corp. | | 6,100 | | 57,566 | |
| | | 3,350,220 | |
TOTAL COMMON STOCKS (Cost $182,720,732) |
| | 273,733,142 | |
| U.S. TREASURY SECURITIES — 5.2% |
|
|
|
U.S. Treasury Bills, 0.05%, 9/30/21(4) | | $ | 450,000 | | 449,969 | |
| U.S. Treasury Bonds, 3.00%, 5/15/42 | | 250,000 | | 301,709 | |
| U.S. Treasury Bonds, 3.75%, 11/15/43 | | 40,000 | | 54,102 | |
U.S. Treasury Bonds, 3.125%, 8/15/44(5) | | 1,350,000 | | 1,671,996 | |
| U.S. Treasury Bonds, 3.00%, 5/15/45 | | 100,000 | | 121,840 | |
| U.S. Treasury Bonds, 3.00%, 11/15/45 | | 50,000 | | 61,101 | |
U.S. Treasury Cash Management Bills, 0.04%, 9/16/21(4) | | 440,000 | | 439,979 | |
U.S. Treasury Inflation Indexed Bonds, 2.375%, 1/15/25(5) | | 2,642,799 | | 3,091,572 | |
| U.S. Treasury Inflation Indexed Bonds, 2.00%, 1/15/26 | | 1,560,217 | | 1,859,416 | |
| U.S. Treasury Inflation Indexed Bonds, 2.375%, 1/15/27 | | 267,054 | | 332,990 | |
| U.S. Treasury Inflation Indexed Bonds, 2.50%, 1/15/29 | | 2,696,530 | | 3,558,784 | |
| U.S. Treasury Inflation Indexed Bonds, 2.125%, 2/15/40 | | 448,502 | | 688,420 | |
| U.S. Treasury Inflation Indexed Bonds, 0.75%, 2/15/42 | | 786,515 | | 990,054 | |
| U.S. Treasury Inflation Indexed Bonds, 0.625%, 2/15/43 | | 363,078 | | 448,750 | |
| U.S. Treasury Inflation Indexed Bonds, 1.375%, 2/15/44 | | 1,328,710 | | 1,893,637 | |
| U.S. Treasury Inflation Indexed Bonds, 0.75%, 2/15/45 | | 1,395,082 | | 1,782,968 | |
| U.S. Treasury Inflation Indexed Bonds, 0.875%, 2/15/47 | | 446,204 | | 596,562 | |
| U.S. Treasury Inflation Indexed Bonds, 0.125%, 2/15/51 | | 568,854 | | 654,688 | |
| U.S. Treasury Inflation Indexed Notes, 0.625%, 1/15/24 | | 4,327,688 | | 4,678,185 | |
| U.S. Treasury Inflation Indexed Notes, 0.50%, 4/15/24 | | 3,203,010 | | 3,469,266 | |
| U.S. Treasury Inflation Indexed Notes, 0.125%, 4/15/25 | | 1,928,607 | | 2,103,494 | |
| U.S. Treasury Inflation Indexed Notes, 0.625%, 1/15/26 | | 1,359,912 | | 1,531,839 | |
| U.S. Treasury Inflation Indexed Notes, 0.125%, 4/15/26 | | 3,080,370 | | 3,400,306 | |
| | | | | | | | | | | |
| | Shares/Principal Amount | Value |
| U.S. Treasury Inflation Indexed Notes, 0.125%, 7/15/26 | | $ | 3,875,661 | | $ | 4,317,915 | |
| U.S. Treasury Inflation Indexed Notes, 0.875%, 1/15/29 | | 373,251 | | 443,739 | |
| U.S. Treasury Inflation Indexed Notes, 0.125%, 1/15/31 | | 3,103,260 | | 3,515,788 | |
U.S. Treasury Notes, 2.00%, 12/31/21(5) | | 200,000 | | 201,598 | |
U.S. Treasury Notes, 2.25%, 8/15/27(5) | | 200,000 | | 216,469 | |
| U.S. Treasury Notes, 0.625%, 5/15/30 | | 1,700,000 | | 1,622,836 | |
TOTAL U.S. TREASURY SECURITIES (Cost $39,660,436) |
| | 44,499,972 | |
| CORPORATE BONDS — 3.4% |
|
|
|
| Aerospace and Defense — 0.1% | | | |
| Boeing Co. (The), 5.81%, 5/1/50 | | 70,000 | | 95,642 | |
Bombardier, Inc., 6.00%, 10/15/22(6) | | 16,000 | | 16,082 | |
| Howmet Aerospace, Inc., 5.125%, 10/1/24 | | 160,000 | | 176,350 | |
| TransDigm, Inc., 6.375%, 6/15/26 | | 50,000 | | 51,750 | |
TransDigm, Inc., 4.625%, 1/15/29(6) | | 290,000 | | 289,649 | |
| | | 629,473 | |
| Airlines — 0.1% | | | |
American Airlines, Inc. / AAdvantage Loyalty IP Ltd., 5.50%, 4/20/26(6) | | 315,000 | | 329,962 | |
| United Airlines Holdings, Inc., 5.00%, 2/1/24 | | 140,000 | | 145,381 | |
| | | 475,343 | |
Auto Components† | | | |
ZF North America Capital, Inc., 4.75%, 4/29/25(6) | | 110,000 | | 119,567 | |
| Automobiles — 0.1% | | | |
| Ford Motor Credit Co. LLC, 3.625%, 6/17/31 | | 370,000 | | 383,918 | |
| General Motors Co., 5.15%, 4/1/38 | | 240,000 | | 295,138 | |
| | | 679,056 | |
| Banks — 0.4% | | | |
| Akbank T.A.S., 5.00%, 10/24/22 | | 70,000 | | 72,012 | |
Avi Funding Co. Ltd., 3.80%, 9/16/25(6) | | 143,000 | | 157,988 | |
| Banco Santander SA, MTN, 2.50%, 3/18/25 | EUR | 100,000 | | 128,829 | |
Banistmo SA, 4.25%, 7/31/27(6) | | $ | 235,000 | | 241,956 | |
| Bank of America Corp., MTN, 2.30%, 7/25/25 | GBP | 100,000 | | 146,874 | |
| Bank of America Corp., MTN, VRN, 2.68%, 6/19/41 | | $ | 370,000 | | 365,821 | |
| Barclays Bank plc, MTN, 6.625%, 3/30/22 | EUR | 50,000 | | 61,912 | |
| CaixaBank SA, MTN, VRN, 2.75%, 7/14/28 | EUR | 100,000 | | 123,959 | |
| CaixaBank SA, MTN, VRN, 2.25%, 4/17/30 | EUR | 100,000 | | 125,002 | |
| Citigroup, Inc., VRN, 3.52%, 10/27/28 | | $ | 220,000 | | 242,622 | |
| Co-Operative Bank plc (The), 4.75%, 11/11/21 (Secured) | GBP | 100,000 | | 140,476 | |
| Commerzbank AG, MTN, 4.00%, 3/23/26 | EUR | 150,000 | | 202,011 | |
| Credit Agricole SA, MTN, 7.375%, 12/18/23 | GBP | 50,000 | | 79,925 | |
| European Financial Stability Facility, MTN, 2.125%, 2/19/24 | EUR | 93,000 | | 117,958 | |
| European Financial Stability Facility, MTN, 0.40%, 5/31/26 | EUR | 200,000 | | 247,498 | |
| ING Groep NV, MTN, 2.125%, 1/10/26 | EUR | 200,000 | | 260,580 | |
Intercorp Financial Services, Inc., 4.125%, 10/19/27(6) | | $ | 170,000 | | 171,800 | |
| Kreditanstalt fuer Wiederaufbau, 4.625%, 1/4/23 | EUR | 75,000 | | 95,685 | |
| Lloyds Bank plc, MTN, 7.625%, 4/22/25 | GBP | 20,000 | | 34,389 | |
| Wells Fargo & Co., VRN, 3.07%, 4/30/41 | | $ | 365,000 | | 383,311 | |
| | | 3,400,608 | |
Beverages† | | | |
| Anheuser-Busch Cos. LLC / Anheuser-Busch InBev Worldwide, Inc., 4.90%, 2/1/46 | | 130,000 | | 166,976 | |
| | | | | | | | | | | |
| | Shares/Principal Amount | Value |
| Biotechnology — 0.1% | | | |
| AbbVie, Inc., 4.55%, 3/15/35 | | $ | 40,000 | | $ | 49,158 | |
| AbbVie, Inc., 4.40%, 11/6/42 | | 280,000 | | 345,619 | |
| Gilead Sciences, Inc., 3.65%, 3/1/26 | | 230,000 | | 255,128 | |
| | | 649,905 | |
| Capital Markets — 0.1% | | | |
| Goldman Sachs Group, Inc. (The), 5.50%, 10/12/21 | GBP | 50,000 | | 70,137 | |
| Goldman Sachs Group, Inc. (The), VRN, 1.43%, 3/9/27 | | $ | 125,000 | | 125,674 | |
LPL Holdings, Inc., 4.375%, 5/15/31(6) | | 424,000 | | 435,141 | |
MDGH - GMTN B.V., 3.25%, 4/28/22(6) | | 57,000 | | 58,249 | |
| | | 689,201 | |
Chemicals† | | | |
| Dow Chemical Co. (The), 3.60%, 11/15/50 | | 170,000 | | 189,693 | |
Equate Petrochemical BV, 4.25%, 11/3/26(6) | | 46,000 | | 51,199 | |
| Olin Corp., 5.125%, 9/15/27 | | 70,000 | | 72,977 | |
| | | 313,869 | |
| Commercial Services and Supplies — 0.1% | | | |
Sodexo, Inc., 2.72%, 4/16/31(6) | | 300,000 | | 311,241 | |
| Waste Management, Inc., 2.50%, 11/15/50 | | 120,000 | | 115,888 | |
| | | 427,129 | |
| Consumer Finance — 0.1% | | | |
| Navient Corp., 4.875%, 3/15/28 | | 420,000 | | 424,211 | |
| Containers and Packaging — 0.1% | | | |
Ardagh Metal Packaging Finance USA LLC / Ardagh Metal Packaging Finance plc, 4.00%, 9/1/29(6) | | 145,000 | | 145,544 | |
| Ball Corp., 5.25%, 7/1/25 | | 35,000 | | 39,518 | |
Mauser Packaging Solutions Holding Co., 5.50%, 4/15/24(6) | | 40,000 | | 40,300 | |
Owens-Brockway Glass Container, Inc., 5.875%, 8/15/23(6) | | 40,000 | | 42,982 | |
Sealed Air Corp., 5.125%, 12/1/24(6) | | 105,000 | | 114,251 | |
| | | 382,595 | |
| Diversified Financial Services — 0.1% | | | |
| Allen C Stonecipher Life Insurance Trust, VRDN, 0.12%, 8/6/21 (LOC: Texas Capital Bank and FHLB) | | 155,000 | | 155,000 | |
| Fiore Capital LLC, VRDN, 0.12%, 8/6/21 (LOC: Wells Fargo Bank N.A.) | | 450,000 | | 450,000 | |
| | | 605,000 | |
| Diversified Telecommunication Services — 0.1% | | | |
Altice France SA, 7.375%, 5/1/26(6) | | 140,000 | | 145,775 | |
AT&T, Inc., 3.55%, 9/15/55(6) | | 68,000 | | 70,404 | |
| Hughes Satellite Systems Corp., 5.25%, 8/1/26 | | 100,000 | | 111,950 | |
Level 3 Financing, Inc., 4.625%, 9/15/27(6) | | 185,000 | | 192,426 | |
| Lumen Technologies, Inc., 5.80%, 3/15/22 | | 45,000 | | 46,233 | |
Ooredoo International Finance Ltd., 3.75%, 6/22/26(6) | | 86,000 | | 95,255 | |
Turk Telekomunikasyon AS, 4.875%, 6/19/24(6) | | 115,000 | | 120,565 | |
| Verizon Communications, Inc., 1.75%, 1/20/31 | | 140,000 | | 136,100 | |
| Verizon Communications, Inc., 2.99%, 10/30/56 | | 200,000 | | 194,891 | |
| | | 1,113,599 | |
| Electric Utilities — 0.1% | | | |
| Duke Energy Carolinas LLC, 3.20%, 8/15/49 | | 140,000 | | 152,284 | |
| Duke Energy Florida LLC, 3.85%, 11/15/42 | | 40,000 | | 47,734 | |
| Duke Energy Progress LLC, 4.15%, 12/1/44 | | 40,000 | | 49,453 | |
| Exelon Corp., 4.45%, 4/15/46 | | 20,000 | | 24,931 | |
| | | | | | | | | | | |
| | Shares/Principal Amount | Value |
Greenko Investment Co., 4.875%, 8/16/23(6) | | $ | 57,000 | | $ | 57,674 | |
Israel Electric Corp. Ltd., 6.875%, 6/21/23(6) | | 57,000 | | 63,493 | |
| MidAmerican Energy Co., 4.40%, 10/15/44 | | 60,000 | | 76,055 | |
| NRG Energy, Inc., 7.25%, 5/15/26 | | 75,000 | | 78,111 | |
| PacifiCorp, 2.90%, 6/15/52 | | 60,000 | | 61,352 | |
| Perusahaan Perseroan (Persero) PT Perusahaan Listrik Negara, MTN, 3.00%, 6/30/30 | | 300,000 | | 301,056 | |
| Southern Co. Gas Capital Corp., 3.95%, 10/1/46 | | 20,000 | | 22,967 | |
| Virginia Electric and Power Co., 2.45%, 12/15/50 | | 70,000 | | 66,248 | |
| | | 1,001,358 | |
| Equity Real Estate Investment Trusts (REITs) — 0.1% | | | |
| EPR Properties, 4.95%, 4/15/28 | | 398,000 | | 430,980 | |
IIP Operating Partnership LP, 5.50%, 5/25/26(6) | | 180,000 | | 188,361 | |
Iron Mountain, Inc., 4.875%, 9/15/29(6) | | 355,000 | | 372,384 | |
| MGM Growth Properties Operating Partnership LP / MGP Finance Co-Issuer, Inc., 5.625%, 5/1/24 | | 90,000 | | 97,530 | |
| | | 1,089,255 | |
Food and Staples Retailing† | | | |
| Kroger Co. (The), 3.875%, 10/15/46 | | 80,000 | | 90,198 | |
Food Products† | | | |
Lamb Weston Holdings, Inc., 4.625%, 11/1/24(6) | | 90,000 | | 92,471 | |
MHP SE, 7.75%, 5/10/24(6) | | 71,000 | | 76,819 | |
Post Holdings, Inc., 4.625%, 4/15/30(6) | | 190,000 | | 193,818 | |
| | | 363,108 | |
Gas Utilities† | | | |
| Perusahaan Gas Negara Tbk PT, 5.125%, 5/16/24 | | 114,000 | | 125,987 | |
| Health Care Providers and Services — 0.2% | | | |
CHS / Community Health Systems, Inc., 8.00%, 12/15/27(6) | | 17,000 | | 18,842 | |
CHS / Community Health Systems, Inc., 6.875%, 4/1/28(6) | | 42,000 | | 41,578 | |
| CVS Health Corp., 4.30%, 3/25/28 | | 68,000 | | 78,799 | |
| CVS Health Corp., 4.78%, 3/25/38 | | 40,000 | | 50,291 | |
DaVita, Inc., 4.625%, 6/1/30(6) | | 270,000 | | 279,450 | |
| Kaiser Foundation Hospitals, 3.00%, 6/1/51 | | 70,000 | | 74,310 | |
Team Health Holdings, Inc., 6.375%, 2/1/25(6) | | 45,000 | | 41,794 | |
| Tenet Healthcare Corp., 6.75%, 6/15/23 | | 50,000 | | 54,313 | |
Tenet Healthcare Corp., 6.125%, 10/1/28(6) | | 245,000 | | 261,242 | |
Universal Health Services, Inc., 2.65%, 10/15/30(6) | | 335,000 | | 341,380 | |
| | | 1,241,999 | |
| Hotels, Restaurants and Leisure — 0.1% | | | |
1011778 BC ULC / New Red Finance, Inc., 4.375%, 1/15/28(6) | | 120,000 | | 121,956 | |
Caesars Resort Collection LLC / CRC Finco, Inc., 5.25%, 10/15/25(6) | | 290,000 | | 292,729 | |
Golden Nugget, Inc., 6.75%, 10/15/24(6) | | 140,000 | | 140,525 | |
| MGM Resorts International, 6.00%, 3/15/23 | | 135,000 | | 142,819 | |
| MGM Resorts International, 4.625%, 9/1/26 | | 39,000 | | 40,706 | |
Penn National Gaming, Inc., 5.625%, 1/15/27(6) | | 175,000 | | 181,563 | |
Penn National Gaming, Inc., 4.125%, 7/1/29(6) | | 43,000 | | 42,450 | |
Wynn Las Vegas LLC / Wynn Las Vegas Capital Corp., 5.50%, 3/1/25(6) | | 235,000 | | 248,806 | |
| | | 1,211,554 | |
| Household Durables — 0.1% | | | |
| KB Home, 4.80%, 11/15/29 | | 253,000 | | 276,402 | |
| | | | | | | | | | | |
| | Shares/Principal Amount | Value |
| Meritage Homes Corp., 5.125%, 6/6/27 | | $ | 190,000 | | $ | 214,227 | |
| | | 490,629 | |
Industrial Conglomerates† | | | |
| General Electric Co., 4.35%, 5/1/50 | | 170,000 | | 209,872 | |
Insurance† | | | |
| American International Group, Inc., 6.25%, 5/1/36 | | 200,000 | | 283,780 | |
Interactive Media and Services† | | | |
Tencent Holdings Ltd., 3.80%, 2/11/25(6) | | 86,000 | | 93,576 | |
| Internet and Direct Marketing Retail — 0.1% | | | |
| Alibaba Group Holding Ltd., 2.80%, 6/6/23 | | 200,000 | | 207,544 | |
Meituan, 3.05%, 10/28/30(6) | | 300,000 | | 281,071 | |
Prosus NV, 3.68%, 1/21/30(6) | | 300,000 | | 316,428 | |
| | | 805,043 | |
IT Services† | | | |
| CDW LLC / CDW Finance Corp., 5.50%, 12/1/24 | | 90,000 | | 99,370 | |
Life Sciences Tools and Services† | | | |
| Agilent Technologies, Inc., 2.30%, 3/12/31 | | 310,000 | | 316,875 | |
| Media — 0.3% | | | |
CCO Holdings LLC / CCO Holdings Capital Corp., 5.00%, 2/1/28(6) | | 80,000 | | 83,980 | |
CCO Holdings LLC / CCO Holdings Capital Corp., 4.25%, 2/1/31(6) | | 274,000 | | 283,047 | |
| Charter Communications Operating LLC / Charter Communications Operating Capital, 6.48%, 10/23/45 | | 50,000 | | 70,509 | |
| Charter Communications Operating LLC / Charter Communications Operating Capital, 5.125%, 7/1/49 | | 160,000 | | 194,600 | |
| CSC Holdings LLC, 5.875%, 9/15/22 | | 125,000 | | 130,916 | |
| CSC Holdings LLC, 5.25%, 6/1/24 | | 180,000 | | 194,715 | |
| DISH DBS Corp., 7.75%, 7/1/26 | | 165,000 | | 188,513 | |
Gray Television, Inc., 5.875%, 7/15/26(6) | | 175,000 | | 180,906 | |
| Lamar Media Corp., 3.75%, 2/15/28 | | 185,000 | | 188,386 | |
| TEGNA, Inc., 4.625%, 3/15/28 | | 376,000 | | 387,895 | |
| ViacomCBS, Inc., 4.375%, 3/15/43 | | 100,000 | | 118,516 | |
Ziggo BV, 5.50%, 1/15/27(6) | | 150,000 | | 155,714 | |
| | | 2,177,697 | |
| Metals and Mining — 0.3% | | | |
Alcoa Nederland Holding BV, 4.125%, 3/31/29(6) | | 200,000 | | 210,906 | |
Cleveland-Cliffs, Inc., 4.625%, 3/1/29(6) | | 235,000 | | 249,712 | |
| First Quantum Minerals Ltd., 7.25%, 4/1/23 | | 50,000 | | 51,000 | |
First Quantum Minerals Ltd., 6.50%, 3/1/24(6) | | 140,000 | | 142,937 | |
| Freeport-McMoRan, Inc., 5.40%, 11/14/34 | | 215,000 | | 273,630 | |
GUSAP III LP, 4.25%, 1/21/30(6) | | 300,000 | | 326,901 | |
Indonesia Asahan Aluminium Persero PT, 5.45%, 5/15/30(6) | | 300,000 | | 350,289 | |
Minera Mexico SA de CV, 4.50%, 1/26/50(6) | | 300,000 | | 337,221 | |
| Teck Resources Ltd., 6.25%, 7/15/41 | | 130,000 | | 175,517 | |
| | | 2,118,113 | |
Mortgage Real Estate Investment Trusts (REITs)† | | | |
Ladder Capital Finance Holdings LLLP / Ladder Capital Finance Corp., 4.75%, 6/15/29(6) | | 355,000 | | 354,113 | |
Multi-Utilities† | | | |
| Dominion Energy, Inc., 4.90%, 8/1/41 | | 30,000 | | 39,349 | |
| NiSource, Inc., 5.65%, 2/1/45 | | 70,000 | | 98,516 | |
| | | | | | | | | | | |
| | Shares/Principal Amount | Value |
| Sempra Energy, 3.25%, 6/15/27 | | $ | 50,000 | | $ | 54,502 | |
| | | 192,367 | |
| Oil, Gas and Consumable Fuels — 0.3% | | | |
Antero Resources Corp., 7.625%, 2/1/29(6) | | 133,000 | | 145,967 | |
| BP Capital Markets America, Inc., 3.06%, 6/17/41 | | 100,000 | | 103,249 | |
| Crestwood Midstream Partners LP / Crestwood Midstream Finance Corp., 5.75%, 4/1/25 | | 90,000 | | 92,246 | |
| Enterprise Products Operating LLC, 4.85%, 3/15/44 | | 130,000 | | 163,138 | |
Galaxy Pipeline Assets Bidco Ltd., 2.94%, 9/30/40(6) | | 300,000 | | 302,795 | |
Gazprom PJSC Via Gaz Capital SA, 6.51%, 3/7/22(6) | | 79,000 | | 81,712 | |
Gazprom PJSC Via Gaz Capital SA, 7.29%, 8/16/37(6) | | 79,000 | | 110,491 | |
| KazMunayGas National Co. JSC, 4.75%, 4/19/27 | | 300,000 | | 340,872 | |
| Kinder Morgan Energy Partners LP, 6.50%, 9/1/39 | | 60,000 | | 85,489 | |
MEG Energy Corp., 6.50%, 1/15/25(6) | | 49,000 | | 50,696 | |
MEG Energy Corp., 5.875%, 2/1/29(6) | | 120,000 | | 124,213 | |
| NuStar Logistics LP, 4.75%, 2/1/22 | | 40,000 | | 40,269 | |
| Petroleos Mexicanos, 3.50%, 1/30/23 | | 50,000 | | 50,967 | |
| Petroleos Mexicanos, 6.50%, 3/13/27 | | 80,000 | | 84,820 | |
| Petroleos Mexicanos, 5.50%, 6/27/44 | | 60,000 | | 49,367 | |
| Saudi Arabian Oil Co., MTN, 4.25%, 4/16/39 | | 300,000 | | 340,467 | |
| SM Energy Co., 5.00%, 1/15/24 | | 70,000 | | 69,777 | |
| Southwestern Energy Co., 6.45%, 1/23/25 | | 150,000 | | 164,431 | |
| Suncor Energy, Inc., 3.75%, 3/4/51 | | 60,000 | | 66,694 | |
| | | 2,467,660 | |
Personal Products† | | | |
| Avon Products, Inc., 6.50%, 3/15/23 | | 45,000 | | 47,981 | |
| Pharmaceuticals — 0.1% | | | |
| Astrazeneca Finance LLC, 1.75%, 5/28/28 | | 310,000 | | 315,714 | |
Bausch Health Cos., Inc., 6.125%, 4/15/25(6) | | 110,000 | | 112,406 | |
| | | 428,120 | |
Real Estate Management and Development† | | | |
Howard Hughes Corp. (The), 4.375%, 2/1/31(6) | | 212,000 | | 211,727 | |
Road and Rail† | | | |
| Burlington Northern Santa Fe LLC, 4.45%, 3/15/43 | | 12,000 | | 15,468 | |
| Burlington Northern Santa Fe LLC, 4.15%, 4/1/45 | | 80,000 | | 98,866 | |
| | | 114,334 | |
Software† | | | |
| Oracle Corp., 3.60%, 4/1/40 | | 280,000 | | 300,294 | |
Specialty Retail† | | | |
| Home Depot, Inc. (The), 2.375%, 3/15/51 | | 270,000 | | 256,254 | |
Rent-A-Center, Inc., 6.375%, 2/15/29(6) | | 80,000 | | 86,173 | |
| | | 342,427 | |
| Technology Hardware, Storage and Peripherals — 0.1% | | | |
NCR Corp., 5.125%, 4/15/29(6) | | 180,000 | | 187,609 | |
| Seagate HDD Cayman, 4.875%, 6/1/27 | | 175,000 | | 195,562 | |
| Western Digital Corp., 4.75%, 2/15/26 | | 308,000 | | 342,265 | |
| | | 725,436 | |
Textiles, Apparel and Luxury Goods† | | | |
Hanesbrands, Inc., 4.625%, 5/15/24(6) | | 90,000 | | 95,446 | |
Thrifts and Mortgage Finance† | | | |
United Wholesale Mortgage LLC, 5.50%, 4/15/29(6) | | 195,000 | | 193,820 | |
| | | | | | | | | | | |
| | Shares/Principal Amount | Value |
| Transportation Infrastructure — 0.1% | | | |
| Adani Ports & Special Economic Zone Ltd., 4.00%, 7/30/27 | | $ | 300,000 | | $ | 313,222 | |
| DP World Crescent Ltd., MTN, 4.85%, 9/26/28 | | 300,000 | | 344,167 | |
| | | 657,389 | |
| Wireless Telecommunication Services — 0.1% | | | |
C&W Senior Financing DAC, 6.875%, 9/15/27(6) | | 130,000 | | 138,093 | |
Millicom International Cellular SA, 5.125%, 1/15/28(6) | | 128,700 | | 134,295 | |
| Sprint Corp., 7.875%, 9/15/23 | | 70,000 | | 79,286 | |
| Sprint Corp., 7.125%, 6/15/24 | | 315,000 | | 362,565 | |
| T-Mobile USA, Inc., 4.75%, 2/1/28 | | 205,000 | | 218,181 | |
T-Mobile USA, Inc., 3.50%, 4/15/31(6) | | 85,000 | | 89,269 | |
| T-Mobile USA, Inc., 3.50%, 4/15/31 | | 15,000 | | 15,753 | |
| | | 1,037,442 | |
TOTAL CORPORATE BONDS (Cost $27,861,763) |
| | 28,963,502 | |
| SOVEREIGN GOVERNMENTS AND AGENCIES — 2.9% |
|
|
|
| Australia — 0.1% | | | |
| Australia Government Bond, 2.75%, 4/21/24 | AUD | 305,000 | | 240,343 | |
| Australia Government Bond, 3.00%, 3/21/47 | AUD | 120,000 | | 105,551 | |
| New South Wales Treasury Corp., 3.00%, 3/20/28 | AUD | 110,000 | | 90,842 | |
| | | 436,736 | |
Austria† | | | |
Republic of Austria Government Bond, 3.40%, 11/22/22(6) | EUR | 69,000 | | 86,274 | |
Republic of Austria Government Bond, 0.75%, 10/20/26(6) | EUR | 41,000 | | 52,202 | |
Republic of Austria Government Bond, 4.15%, 3/15/37(6) | EUR | 29,000 | | 56,361 | |
| | | 194,837 | |
Belgium† | | | |
Kingdom of Belgium Government Bond, 4.25%, 3/28/41(6) | EUR | 27,000 | | 55,449 | |
| Canada — 0.2% | | | |
| Canadian Government Bond, 0.25%, 3/1/26 | CAD | 850,000 | | 664,173 | |
| Province of British Columbia Canada, 3.25%, 12/18/21 | CAD | 179,000 | | 145,132 | |
| Province of British Columbia Canada, 2.85%, 6/18/25 | CAD | 201,000 | | 172,980 | |
| Province of Quebec Canada, 3.00%, 9/1/23 | CAD | 215,000 | | 181,189 | |
| Province of Quebec Canada, 5.75%, 12/1/36 | CAD | 108,000 | | 126,504 | |
| Province of Quebec Canada, 3.50%, 12/1/48 | CAD | 20,000 | | 19,183 | |
| | | 1,309,161 | |
| China — 1.5% | | | |
| China Government Bond, 2.64%, 8/13/22 | CNY | 63,500,000 | | 9,850,443 | |
| China Government Bond, 2.88%, 11/5/23 | CNY | 19,000,000 | | 2,969,359 | |
| China Government Bond, 3.25%, 6/6/26 | CNY | 400,000 | | 63,515 | |
| China Government Bond, 3.29%, 5/23/29 | CNY | 300,000 | | 47,615 | |
| | | 12,930,932 | |
Czech Republic† | | | |
| Czech Republic Government Bond, 4.70%, 9/12/22 | CZK | 610,000 | | 29,693 | |
Denmark† | | | |
| Denmark Government Bond, 0.50%, 11/15/27 | DKK | 245,000 | | 41,393 | |
| Denmark Government Bond, 4.50%, 11/15/39 | DKK | 62,000 | | 17,923 | |
| | | 59,316 | |
| | | | | | | | | | | |
| | Shares/Principal Amount | Value |
| Finland — 0.1% | | | |
Finland Government Bond, 4.00%, 7/4/25(6) | EUR | 58,000 | | $ | 81,824 | |
Finland Government Bond, 0.125%, 4/15/36(6) | EUR | 350,000 | | 419,921 | |
| | | 501,745 | |
| France — 0.2% | | | |
French Republic Government Bond OAT, 0.00%, 11/25/31(7) | EUR | 1,050,000 | | 1,258,607 | |
Indonesia† | | | |
| Indonesia Treasury Bond, 8.375%, 9/15/26 | IDR | 2,000,000,000 | | 157,028 | |
Ireland† | | | |
| Ireland Government Bond, 3.40%, 3/18/24 | EUR | 74,000 | | 97,203 | |
Italy† | | | |
| Italy Buoni Poliennali Del Tesoro, 1.50%, 6/1/25 | EUR | 35,000 | | 44,191 | |
| Italy Buoni Poliennali Del Tesoro, 2.00%, 12/1/25 | EUR | 223,000 | | 288,853 | |
| | | 333,044 | |
| Japan — 0.5% | | | |
| Japan Government Thirty Year Bond, 2.40%, 3/20/37 | JPY | 60,800,000 | | 737,281 | |
| Japan Government Thirty Year Bond, 2.00%, 9/20/41 | JPY | 29,700,000 | | 353,992 | |
| Japan Government Twenty Year Bond, 2.10%, 12/20/26 | JPY | 131,900,000 | | 1,347,289 | |
| Japanese Government CPI Linked Bond, 0.10%, 3/10/29 | JPY | 175,249,236 | | 1,642,986 | |
| | | 4,081,548 | |
Malaysia† | | | |
| Malaysia Government Bond, 3.96%, 9/15/25 | MYR | 250,000 | | 62,498 | |
| Mexico — 0.1% | | | |
| Mexican Bonos, 6.50%, 6/9/22 | MXN | 2,290,000 | | 116,047 | |
| Mexico Government International Bond, 4.15%, 3/28/27 | | $ | 200,000 | | 227,873 | |
| | | 343,920 | |
Namibia† | | | |
| Namibia International Bond, 5.25%, 10/29/25 | | $ | 200,000 | | 214,460 | |
Netherlands† | | | |
Netherlands Government Bond, 0.00%, 1/15/22(6)(7) | EUR | 65,000 | | 77,336 | |
Netherlands Government Bond, 0.50%, 7/15/26(6) | EUR | 100,000 | | 125,888 | |
Netherlands Government Bond, 2.75%, 1/15/47(6) | EUR | 27,000 | | 54,383 | |
| | | 257,607 | |
Norway† | | | |
Norway Government Bond, 2.00%, 5/24/23(6) | NOK | 85,000 | | 9,872 | |
Norway Government Bond, 1.75%, 2/17/27(6) | NOK | 510,000 | | 60,031 | |
| | | 69,903 | |
Peru† | | | |
| Peruvian Government International Bond, 5.625%, 11/18/50 | | $ | 60,000 | | 81,454 | |
Poland† | | | |
| Republic of Poland Government Bond, 4.00%, 10/25/23 | PLN | 215,000 | | 60,310 | |
Russia† | | | |
| Russian Federal Bond - OFZ, 7.05%, 1/19/28 | RUB | 1,400,000 | | 19,495 | |
Singapore† | | | |
| Singapore Government Bond, 3.125%, 9/1/22 | SGD | 90,000 | | 68,402 | |
Switzerland† | | | |
| Swiss Confederation Government Bond, 1.25%, 5/28/26 | CHF | 147,000 | | 177,733 | |
| Swiss Confederation Government Bond, 2.50%, 3/8/36 | CHF | 3,000 | | 4,639 | |
| | | 182,372 | |
Thailand† | | | |
| Thailand Government Bond, 3.625%, 6/16/23 | THB | 1,150,000 | | 37,012 | |
| | | | | | | | | | | |
| | Shares/Principal Amount | Value |
| Thailand Government Bond, 3.85%, 12/12/25 | THB | 3,200,000 | | $ | 110,245 | |
| | | 147,257 | |
Turkey† | | | |
| Turkey Government International Bond, 6.875%, 3/17/36 | | $ | 200,000 | | 204,551 | |
| United Kingdom — 0.2% | | | |
| United Kingdom Gilt, 0.125%, 1/30/26 | GBP | 1,100,000 | | 1,519,166 | |
Uruguay† | | | |
| Uruguay Government International Bond, 4.125%, 11/20/45 | | $ | 30,000 | | 35,455 | |
TOTAL SOVEREIGN GOVERNMENTS AND AGENCIES (Cost $23,721,973) |
| | 24,712,149 | |
| COLLATERALIZED LOAN OBLIGATIONS — 0.8% |
|
|
|
Ares LVI CLO Ltd., Series 2020-56A, Class C, VRN, 2.53%, (3-month LIBOR plus 2.40%), 10/25/31(6) | | 325,000 | | 326,052 | |
Ares XXXIV CLO Ltd., Series 2015-2A, Class BR2, VRN, 1.73%, (3-month LIBOR plus 1.60%), 4/17/33(6) | | 375,000 | | 374,519 | |
Bean Creek CLO Ltd., Series 2015-1A, Class BR, VRN, 1.58%, (3-month LIBOR plus 1.45%), 4/20/31(6) | | 300,000 | | 299,217 | |
CBAM Ltd., Series 2018-5A, Class B1, VRN, 1.53%, (3-month LIBOR plus 1.40%), 4/17/31(6) | | 325,000 | | 323,021 | |
Dryden Senior Loan Fund, Series 2017-50A, Class A1R, VRN, 1.13%, (3-month LIBOR plus 1.00%), 7/15/30(6) | | 250,000 | | 250,329 | |
Dryden Senior Loan Fund, Series 2021-87A, Class D, VRN, 3.07%, (3-month LIBOR plus 2.95%), 5/20/34(6) | | 250,000 | | 251,257 | |
Elmwood CLO IV Ltd., Series 2020-1A, Class C, VRN, 2.18%, (3-month LIBOR plus 2.05%), 4/15/33(6) | | 200,000 | | 200,805 | |
Elmwood CLO IV Ltd., Series 2020-1A, Class D, VRN, 3.28%, (3-month LIBOR plus 3.15%), 4/15/33(6) | | 100,000 | | 100,628 | |
Elmwood CLO V Ltd., Series 2020-2A, Class C, VRN, 2.875%, (3-month LIBOR plus 2.75%), 7/24/31(6) | | 375,000 | | 376,364 | |
Elmwood CLO V Ltd., Series 2020-2A, Class CR, VRN, 2.12%, (3-month LIBOR plus 2.00%), 10/20/34(6)(8) | | 275,000 | | 275,003 | |
Elmwood CLO VII Ltd., Series 2020-4A, Class C, VRN, 2.38%, (3-month LIBOR plus 2.25%), 1/17/34(6) | | 200,000 | | 201,609 | |
Flatiron CLO Ltd., Series 2020-1A, Class C, VRN, 2.61%, (3-month LIBOR plus 2.45%), 11/20/33(6) | | 250,000 | | 253,356 | |
Goldentree Loan Opportunities X Ltd., Series 2015-10A, Class AR, VRN, 1.25%, (3-month LIBOR plus 1.12%), 7/20/31(6) | | 175,000 | | 175,286 | |
Kayne CLO Ltd., Series 2020-9A, Class C, VRN, 2.73%, (3-month LIBOR plus 2.60%), 1/15/34(6) | | 250,000 | | 254,241 | |
KKR CLO Ltd., Series 2022A, Class B, VRN, 1.73%, (3-month LIBOR plus 1.60%), 7/20/31(6) | | 300,000 | | 300,007 | |
Logan CLO I Ltd., Series 2021-1A, Class C, VRN, 2.05%, (3-month LIBOR plus 1.90%), 7/20/34(6) | | 250,000 | | 249,605 | |
Magnetite VIII Ltd., Series 2014-8A, Class BR2, VRN, 1.63%, (3-month LIBOR plus 1.50%), 4/15/31(6) | | 300,000 | | 299,081 | |
Magnetite XIV-R Ltd., Series 2015-14RA, Class B, VRN, 1.73%, (3-month LIBOR plus 1.60%), 10/18/31(6) | | 250,000 | | 249,734 | |
Magnetite XXV Ltd., Series 2020-25A, Class C, VRN, 2.23%, (3-month LIBOR plus 2.10%), 1/25/32(6) | | 300,000 | | 301,176 | |
Neuberger Berman Loan Advisers CLO Ltd., Series 2018-30A, Class DR, VRN, 2.98%, (3-month LIBOR plus 2.85%), 1/20/31(6) | | 125,000 | | 125,439 | |
| | | | | | | | | | | |
| | Shares/Principal Amount | Value |
Neuberger Berman Loan Advisers CLO Ltd., Series 2019-34A, Class C1, VRN, 2.73%, (3-month LIBOR plus 2.60%), 1/20/33(6) | | $ | 200,000 | | $ | 201,353 | |
Octagon Ltd., Series 2021-1A, Class D, VRN, 3.18%, (3-month LIBOR plus 3.05%), 7/15/34(6) | | 250,000 | | 251,933 | |
OHA Credit Funding Ltd., Series 2020-7A, Class B, VRN, 1.83%, (3-month LIBOR plus 1.70%), 10/19/32(6) | | 250,000 | | 250,460 | |
OHA Credit Partners VII Ltd., Series 2012-7A, Class D1R3, VRN, 3.06%, (3-month LIBOR plus 2.90%), 2/20/34(6) | | 200,000 | | 200,917 | |
Point Au Roche Park CLO Ltd., Series 2021-1A, Class D, VRN, 2.98%, (3-month LIBOR plus 2.80%), 7/20/34(6) | | 175,000 | | 175,903 | |
Reese Park CLO Ltd., Series 2020-1A, Class C1, VRN, 2.58%, (3-month LIBOR plus 2.45%), 10/15/32(6) | | 250,000 | | 250,883 | |
Rockford Tower CLO Ltd., Series 2020-1A, Class C, VRN, 2.48%, (3-month LIBOR plus 2.35%), 1/20/32(6) | | 250,000 | | 251,121 | |
Symphony CLO XXII Ltd., Series 2020-22A, Class B, VRN, 1.83%, (3-month LIBOR plus 1.70%), 4/18/33(6) | | 500,000 | | 502,132 | |
TOTAL COLLATERALIZED LOAN OBLIGATIONS (Cost $7,233,162) |
| | 7,271,431 | |
COMMERCIAL PAPER(4) — 0.5% |
|
|
|
Ridgefield Funding Co. LLC, 0.19%, 11/2/21(6) | | 1,070,000 | | 1,069,726 | |
| Royal Bank of Canada (New York), VRN, 0.14%, (3-month LIBOR plus 0.01%), 1/27/22 | | 1,270,000 | | 1,270,088 | |
Societe Generale SA, 0.19%, 10/21/21(6) | | 520,000 | | 519,892 | |
Toronto-Dominion Bank (The), 0.23%, 4/11/22(6) | | 1,520,000 | | 1,518,406 | |
TOTAL COMMERCIAL PAPER (Cost $4,376,809) |
| | 4,378,112 | |
| MUNICIPAL SECURITIES — 0.4% |
|
|
|
| Bay Area Toll Authority Rev., 6.92%, 4/1/40 | | 100,000 | | 153,423 | |
| Metropolitan Transportation Authority Rev., 6.69%, 11/15/40 | | 15,000 | | 21,877 | |
| Metropolitan Transportation Authority Rev., 6.81%, 11/15/40 | | 10,000 | | 14,713 | |
| Michigan Finance Authority Rev., 4.00%, 8/20/21 (LOC: JPMorgan Chase Bank N.A.) | | 800,000 | | 801,573 | |
| New Jersey Turnpike Authority Rev., 7.41%, 1/1/40 | | 40,000 | | 67,102 | |
| New Jersey Turnpike Authority Rev., 7.10%, 1/1/41 | | 30,000 | | 49,099 | |
| New York City GO, 6.27%, 12/1/37 | | 5,000 | | 7,474 | |
| Ohio Water Development Authority Water Pollution Control Loan Fund Rev., 4.88%, 12/1/34 | | 80,000 | | 96,801 | |
| Port Authority of New York & New Jersey Rev., 4.93%, 10/1/51 | | 35,000 | | 50,072 | |
| Regents of the University of California Medical Center Pooled Rev., 3.26%, 5/15/60 | | 100,000 | | 110,778 | |
| Rutgers The State University of New Jersey Rev., 5.67%, 5/1/40 | | 90,000 | | 125,464 | |
| Sacramento Municipal Utility District Rev., 6.16%, 5/15/36 | | 140,000 | | 199,010 | |
| San Francisco Public Utilities Commission Water Rev., 6.00%, 11/1/40 | | 10,000 | | 14,151 | |
| State of California GO, 4.60%, 4/1/38 | | 30,000 | | 35,273 | |
| State of California GO, 7.55%, 4/1/39 | | 20,000 | | 34,748 | |
| State of California GO, 7.30%, 10/1/39 | | 25,000 | | 40,641 | |
| State of California GO, 7.60%, 11/1/40 | | 40,000 | | 71,243 | |
| State of New York Mortgage Agency Rev., VRDN, 0.04%, 8/1/21 (SBBPA: Barclays Bank plc) | | 395,000 | | 395,000 | |
| State of Texas Rev., 4.00%, 8/26/21 | | 1,180,000 | | 1,183,129 | |
| | | | | | | | | | | |
| | Shares/Principal Amount | Value |
| State of Washington GO, 5.14%, 8/1/40 | | $ | 20,000 | | $ | 28,420 | |
TOTAL MUNICIPAL SECURITIES (Cost $3,202,073) |
| | 3,499,991 | |
| COLLATERALIZED MORTGAGE OBLIGATIONS — 0.4% |
|
|
|
| Private Sponsor Collateralized Mortgage Obligations — 0.1% |
| ABN Amro Mortgage Corp., Series 2003-4, Class A4, 5.50%, 3/25/33 | | 3,482 | | 3,569 | |
| Adjustable Rate Mortgage Trust, Series 2004-4, Class 4A1, VRN, 2.63%, 3/25/35 | | 10,974 | | 11,161 | |
| Banc of America Mortgage Trust, Series 2004-E, Class 2A6 SEQ, VRN, 2.83%, 6/25/34 | | 36,527 | | 37,348 | |
| Citigroup Mortgage Loan Trust, Inc., Series 2004-UST1, Class A5, VRN, 2.01%, 8/25/34 | | 35,358 | | 36,210 | |
| First Horizon Alternative Mortgage Securities Trust, Series 2004-AA4, Class A1, VRN, 2.37%, 10/25/34 | | 25,778 | | 26,683 | |
| GSR Mortgage Loan Trust, Series 2004-7, Class 3A1, VRN, 2.34%, 6/25/34 | | 13,319 | | 13,343 | |
| GSR Mortgage Loan Trust, Series 2004-AR5, Class 3A3, VRN, 2.60%, 5/25/34 | | 25,177 | | 24,741 | |
| GSR Mortgage Loan Trust, Series 2005-AR1, Class 3A1, VRN, 2.89%, 1/25/35 | | 23,550 | | 24,030 | |
JP Morgan Mortgage Trust, Series 2013-1, Class 2A2 SEQ, VRN, 2.50%, 3/25/43(6) | | 22,713 | | 22,995 | |
| MASTR Adjustable Rate Mortgages Trust, Series 2004-13, Class 3A7, VRN, 2.79%, 11/21/34 | | 52,708 | | 53,274 | |
| Merrill Lynch Mortgage Investors Trust, Series 2005-3, Class 2A, VRN, 2.19%, 11/25/35 | | 20,775 | | 20,760 | |
| Merrill Lynch Mortgage Investors Trust, Series 2005-A2, Class A1, VRN, 2.82%, 2/25/35 | | 18,329 | | 18,513 | |
| Merrill Lynch Mortgage Investors Trust, Series 2005-A2, Class A2, VRN, 2.82%, 2/25/35 | | 7,332 | | 7,426 | |
Radnor RE Ltd., Series 2021-1, Class M1B, VRN, 1.75%, (SOFR plus 1.70%), 12/27/33(6) | | 550,000 | | 551,157 | |
Sofi Mortgage Trust, Series 2016-1A, Class 1A4 SEQ, VRN, 3.00%, 11/25/46(6) | | 15,484 | | 15,813 | |
| Structured Adjustable Rate Mortgage Loan Trust, Series 2004-8, Class 2A1, VRN, 2.45%, 7/25/34 | | 13,807 | | 14,187 | |
| WaMu Mortgage Pass-Through Certificates, Series 2003-S11, Class 3A5, 5.95%, 11/25/33 | | 15,565 | | 16,249 | |
| Wells Fargo Mortgage-Backed Securities Trust, Series 2007-13, Class A1, 6.00%, 9/25/37 | | 334 | | 341 | |
| | | 897,800 | |
| U.S. Government Agency Collateralized Mortgage Obligations — 0.3% |
| FHLMC, Series 2014-HQ2, Class M3, VRN, 3.84%, (1-month LIBOR plus 3.75%), 9/25/24 | | 388,132 | | 395,318 | |
FHLMC, Series 2016-DNA3, Class M3, VRN, 5.09%,
(1-month LIBOR plus 5.00%), 12/25/28 | | 311,902 | | 325,196 | |
FHLMC, Series 2016-HQA3, Class M2, VRN, 1.44%,
(1-month LIBOR plus 1.35%), 3/25/29 | | 2,837 | | 2,836 | |
FHLMC, Series 2016-HQA4, Class M3, VRN, 3.99%,
(1-month LIBOR plus 3.90%), 4/25/29 | | 713,854 | | 737,433 | |
| FHLMC, Series 5123, Class HI, IO, 5.00%, 1/25/42 | | 198,465 | | 35,039 | |
| FNMA, Series 2014-C02, Class 2M2, VRN, 2.69%, (1-month LIBOR plus 2.60%), 5/25/24 | | 205,481 | | 207,637 | |
| FNMA, Series 2015-C04, Class 1M2, VRN, 5.79%, (1-month LIBOR plus 5.70%), 4/25/28 | | 122,129 | | 129,394 | |
| FNMA, Series 2016-C03, Class 2M2, VRN, 5.99%, (1-month LIBOR plus 5.90%), 10/25/28 | | 66,937 | | 70,673 | |
| | | | | | | | | | | |
| | Shares/Principal Amount | Value |
| FNMA, Series 2017-C03, Class 1M2, VRN, 3.09%, (1-month LIBOR plus 3.00%), 10/25/29 | | $ | 66,638 | | $ | 68,519 | |
| FNMA, Series 2018-C04, Class 2M2, VRN, 2.64%, (1-month LIBOR plus 2.55%), 12/25/30 | | 468,442 | | 474,861 | |
| | | 2,446,906 | |
TOTAL COLLATERALIZED MORTGAGE OBLIGATIONS (Cost $3,194,683) |
| | 3,344,706 | |
| ASSET-BACKED SECURITIES — 0.3% |
|
|
|
Arbys Funding LLC, Series 2020-1A, Class A2 SEQ, 3.24%, 7/30/50(6) | | 495,000 | | 523,338 | |
BRE Grand Islander Timeshare Issuer LLC, Series 2017-1A, Class A SEQ, 2.94%, 5/25/29(6) | | 55,410 | | 56,817 | |
FirstKey Homes Trust, Series 2020-SFR1, Class C, 1.94%, 9/17/25(6) | | 300,000 | | 302,954 | |
FirstKey Homes Trust, Series 2020-SFR2, Class E, 2.67%, 10/19/37(6) | | 900,000 | | 922,225 | |
Sierra Timeshare Receivables Funding LLC, Series 2018-2A, Class B, 3.65%, 6/20/35(6) | | 153,756 | | 158,291 | |
Sierra Timeshare Receivables Funding LLC, Series 2018-3A, Class B, 3.87%, 9/20/35(6) | | 105,902 | | 110,410 | |
| UAL Pass-Through Trust, Series 2007-1, Class A, 6.64%, 1/2/24 | | 36,176 | | 37,427 | |
VSE VOI Mortgage LLC, Series 2016-A, Class A SEQ, 2.54%, 7/20/33(6) | | 207,130 | | 207,297 | |
VSE VOI Mortgage LLC, Series 2018-A, Class B, 3.72%, 2/20/36(6) | | 173,236 | | 181,538 | |
TOTAL ASSET-BACKED SECURITIES (Cost $2,442,971) |
| | 2,500,297 | |
| PREFERRED STOCKS — 0.3% |
|
|
|
| Automobiles — 0.1% | | | |
| Volkswagen International Finance NV, 3.875% | | 300,000 | | 401,682 | |
Diversified Telecommunication Services† | | | |
| Telefonica Europe BV, 3.00% | | 300,000 | | 368,330 | |
| Electric Utilities — 0.1% | | | |
| Electricite de France SA, 3.375% | | 200,000 | | 252,374 | |
| Enel SpA, 2.25% | | 100,000 | | 125,395 | |
| | | 377,769 | |
| Insurance — 0.1% | | | |
| Allianz SE, 2.625% | | 200,000 | | 243,774 | |
| Allianz SE, MTN, 4.75% | | 100,000 | | 130,923 | |
| Assicurazioni Generali SpA, MTN, 4.60% | | 100,000 | | 134,194 | |
| Intesa Sanpaolo Vita SpA, 4.75% | | 100,000 | | 130,985 | |
| | | 639,876 | |
Oil, Gas and Consumable Fuels† | | | |
| Eni SpA, 3.375% | | 200,000 | | 256,586 | |
Trading Companies and Distributors† | | | |
Aircastle Ltd., 5.25%(6) | | 285,000 | | 288,563 | |
TOTAL PREFERRED STOCKS (Cost $2,290,396) | | | 2,332,806 | |
| U.S. GOVERNMENT AGENCY MORTGAGE-BACKED SECURITIES — 0.1% |
Adjustable-Rate U.S. Government Agency Mortgage-Backed Securities† |
| FHLMC, VRN, 2.25%, (12-month LIBOR plus 1.87%), 7/1/36 | | $ | 13,553 | | 14,365 | |
| FHLMC, VRN, 2.34%, (1-year H15T1Y plus 2.14%), 10/1/36 | | 19,560 | | 20,936 | |
| | | | | | | | | | | |
| | Shares/Principal Amount | Value |
| FHLMC, VRN, 2.42%, (1-year H15T1Y plus 2.26%), 4/1/37 | | $ | 24,246 | | $ | 25,842 | |
| FHLMC, VRN, 2.30%, (12-month LIBOR plus 1.77%), 9/1/40 | | 6,809 | | 7,089 | |
| FHLMC, VRN, 2.15%, (12-month LIBOR plus 1.88%), 5/1/41 | | 5,447 | | 5,683 | |
| FHLMC, VRN, 2.45%, (12-month LIBOR plus 1.86%), 7/1/41 | | 14,070 | | 14,961 | |
| FHLMC, VRN, 2.02%, (12-month LIBOR plus 1.64%), 2/1/43 | | 4,231 | | 4,342 | |
| FHLMC, VRN, 1.87%, (12-month LIBOR plus 1.62%), 6/1/43 | | 76 | | 77 | |
| FHLMC, VRN, 1.90%, (12-month LIBOR plus 1.65%), 6/1/43 | | 2,589 | | 2,598 | |
| FNMA, VRN, 1.82%, (6-month LIBOR plus 1.57%), 6/1/35 | | 17,179 | | 17,920 | |
| FNMA, VRN, 1.82%, (6-month LIBOR plus 1.57%), 6/1/35 | | 22,045 | | 22,991 | |
| FNMA, VRN, 1.79%, (6-month LIBOR plus 1.54%), 9/1/35 | | 5,779 | | 6,023 | |
| FNMA, VRN, 2.36%, (1-year H15T1Y plus 2.16%), 3/1/38 | | 21,904 | | 23,355 | |
| FNMA, VRN, 2.07%, (12-month LIBOR plus 1.69%), 1/1/40 | | 3,589 | | 3,737 | |
| FNMA, VRN, 2.29%, (12-month LIBOR plus 1.86%), 3/1/40 | | 5,090 | | 5,409 | |
| FNMA, VRN, 2.32%, (12-month LIBOR plus 1.77%), 10/1/40 | | 8,642 | | 9,136 | |
| | | 184,464 | |
| Fixed-Rate U.S. Government Agency Mortgage-Backed Securities — 0.1% |
| FHLMC, 7.00%, 8/1/29 | | 339 | | 374 | |
| FHLMC, 8.00%, 7/1/30 | | 2,155 | | 2,593 | |
| FHLMC, 5.50%, 12/1/33 | | 18,259 | | 20,817 | |
| FHLMC, 6.00%, 11/1/38 | | 73,229 | | 85,288 | |
| FNMA, 7.00%, 6/1/26 | | 121 | | 133 | |
| FNMA, 7.00%, 1/1/29 | | 2,020 | | 2,048 | |
| FNMA, 6.50%, 4/1/29 | | 4,178 | | 4,703 | |
| FNMA, 6.50%, 8/1/29 | | 1,740 | | 1,986 | |
| FNMA, 6.50%, 12/1/29 | | 5,377 | | 6,051 | |
| FNMA, 7.00%, 3/1/30 | | 1,109 | | 1,218 | |
| FNMA, 7.50%, 9/1/30 | | 794 | | 921 | |
| FNMA, 7.00%, 9/1/31 | | 3,467 | | 3,658 | |
| FNMA, 6.50%, 1/1/32 | | 1,105 | | 1,243 | |
| FNMA, 6.50%, 8/1/32 | | 2,120 | | 2,413 | |
| FNMA, 6.50%, 11/1/32 | | 20,988 | | 24,341 | |
| FNMA, 5.50%, 6/1/33 | | 7,010 | | 8,099 | |
| FNMA, 5.50%, 8/1/33 | | 14,028 | | 16,227 | |
| FNMA, 3.50%, 3/1/34 | | 40,425 | | 43,539 | |
| FNMA, 5.50%, 1/1/37 | | 42,604 | | 49,473 | |
| FNMA, 6.50%, 8/1/37 | | 15,226 | | 17,514 | |
| FNMA, 6.50%, 8/1/47 | | 4,710 | | 5,117 | |
| FNMA, 6.50%, 9/1/47 | | 11,273 | | 12,211 | |
| FNMA, 6.50%, 9/1/47 | | 542 | | 588 | |
| FNMA, 6.50%, 9/1/47 | | 5,961 | | 6,455 | |
| GNMA, 7.50%, 10/15/25 | | 631 | | 640 | |
| GNMA, 6.00%, 3/15/26 | | 2,040 | | 2,284 | |
| GNMA, 7.00%, 12/15/27 | | 2,127 | | 2,135 | |
| GNMA, 7.00%, 5/15/31 | | 5,866 | | 6,895 | |
| GNMA, 5.50%, 11/15/32 | | 9,596 | | 11,062 | |
| GNMA, 6.50%, 10/15/38 | | 174,311 | | 209,492 | |
| GNMA, 4.50%, 5/20/41 | | 112,097 | | 124,751 | |
| GNMA, 4.50%, 6/15/41 | | 152,266 | | 174,622 | |
| GNMA, 3.50%, 4/20/45 | | 28,174 | | 30,056 | |
| GNMA, 2.50%, 2/20/47 | | 18,802 | | 19,627 | |
| | | 898,574 | |
TOTAL U.S. GOVERNMENT AGENCY MORTGAGE-BACKED SECURITIES (Cost $986,276) | 1,083,038 | |
| | | | | | | | | | | |
| | Shares | Value |
| EXCHANGE-TRADED FUNDS — 0.1% |
|
|
|
| iShares MSCI EAFE Value ETF | | 4,798 | | $ | 247,673 | |
| iShares Russell 2000 Growth ETF | | 1,396 | | 418,870 | |
TOTAL EXCHANGE-TRADED FUNDS (Cost $685,769) |
| | 666,543 | |
| TEMPORARY CASH INVESTMENTS — 4.3% |
|
|
|
State Street Institutional U.S. Government Money Market Fund, Premier Class (Cost $36,874,568) |
| 36,874,568 | | 36,874,568 | |
TEMPORARY CASH INVESTMENTS - SECURITIES LENDING COLLATERAL(9) — 0.1% |
State Street Navigator Securities Lending Government Money Market Portfolio
(Cost $843,131) |
| 843,131 | | 843,131 | |
TOTAL INVESTMENT SECURITIES — 99.4% (Cost $645,590,522) |
|
| 854,202,569 | |
| OTHER ASSETS AND LIABILITIES — 0.6% |
|
| 5,110,318 | |
| TOTAL NET ASSETS — 100.0% |
|
| $ | 859,312,887 | |
FORWARD FOREIGN CURRENCY EXCHANGE CONTRACTS
| | | | | | | | | | | | | | | | | | | | |
| Currency Purchased | Currency Sold | Counterparty | Settlement Date | Unrealized Appreciation
(Depreciation) |
| AUD | 560,048 | | USD | 419,146 | | Bank of America N.A. | 9/15/21 | $ | (8,071) | |
| USD | 444,624 | | AUD | 574,992 | | Bank of America N.A. | 9/15/21 | 22,581 | |
| USD | 432,131 | | AUD | 576,006 | | Bank of America N.A. | 9/15/21 | 9,344 | |
| BRL | 2,899,741 | | USD | 566,522 | | Goldman Sachs & Co. | 9/15/21 | (12,949) | |
| USD | 280,699 | | BRL | 1,428,336 | | Goldman Sachs & Co. | 9/15/21 | 8,024 | |
| CAD | 36,571 | | USD | 28,624 | | Morgan Stanley | 9/29/21 | 689 | |
| CAD | 18,167 | | USD | 14,422 | | Morgan Stanley | 9/29/21 | 140 | |
| USD | 1,104,985 | | CAD | 1,336,148 | | Bank of America N.A. | 9/15/21 | 34,031 | |
| USD | 247,342 | | CAD | 300,902 | | Bank of America N.A. | 9/15/21 | 6,163 | |
| USD | 2,116 | | CAD | 2,608 | | Morgan Stanley | 9/29/21 | 25 | |
| USD | 667,123 | | CAD | 826,608 | | Morgan Stanley | 9/29/21 | 4,567 | |
| USD | 15,743 | | CAD | 19,782 | | Morgan Stanley | 9/29/21 | (113) | |
| USD | 18,630 | | CAD | 23,402 | | Morgan Stanley | 9/29/21 | (128) | |
| USD | 541,131 | | CHF | 483,993 | | Morgan Stanley | 9/15/21 | 6,248 | |
| CLP | 10,793 | | USD | 15 | | Goldman Sachs & Co. | 9/15/21 | (1) | |
| USD | 13,201,200 | | CNY | 84,943,120 | | Goldman Sachs & Co. | 9/15/21 | 107,444 | |
| COP | 759,427,986 | | USD | 210,715 | | Goldman Sachs & Co. | 9/15/21 | (15,335) | |
| USD | 202,150 | | COP | 759,041,098 | | Goldman Sachs & Co. | 9/15/21 | 6,869 | |
| USD | 31,779 | | CZK | 662,404 | | UBS AG | 9/15/21 | 985 | |
| USD | 74,337 | | DKK | 452,912 | | UBS AG | 9/15/21 | 2,058 | |
| EUR | 87,489 | | USD | 104,021 | | JPMorgan Chase Bank N.A. | 8/18/21 | (207) | |
| EUR | 13,430 | | USD | 15,890 | | Credit Suisse AG | 9/30/21 | 60 | |
| EUR | 18,955 | | USD | 22,353 | | Credit Suisse AG | 9/30/21 | 158 | |
| EUR | 12,580 | | USD | 14,958 | | Credit Suisse AG | 9/30/21 | (18) | |
| USD | 6,992,777 | | EUR | 5,911,254 | | JPMorgan Chase Bank N.A. | 8/18/21 | (21,474) | |
| USD | 1,567,464 | | EUR | 1,314,159 | | Credit Suisse AG | 9/30/21 | 6,751 | |
| USD | 571,602 | | EUR | 479,230 | | Credit Suisse AG | 9/30/21 | 2,462 | |
| USD | 18,598 | | EUR | 15,555 | | Credit Suisse AG | 9/30/21 | 125 | |
| USD | 38,023 | | EUR | 31,828 | | Credit Suisse AG | 9/30/21 | 223 | |
| USD | 45,048 | | EUR | 37,998 | | Credit Suisse AG | 9/30/21 | (78) | |
| USD | 15,942 | | EUR | 13,430 | | Credit Suisse AG | 9/30/21 | (8) | |
| USD | 16,620 | | EUR | 14,025 | | Credit Suisse AG | 9/30/21 | (36) | |
| USD | 21,821 | | EUR | 18,530 | | Credit Suisse AG | 9/30/21 | (186) | |
| USD | 64,689 | | EUR | 54,933 | | Credit Suisse AG | 9/30/21 | (550) | |
| USD | 21,739 | | EUR | 18,445 | | Credit Suisse AG | 9/30/21 | (166) | |
| USD | 18,086 | | EUR | 15,300 | | Credit Suisse AG | 9/30/21 | (84) | |
| USD | 19,722 | | EUR | 16,575 | | Credit Suisse AG | 9/30/21 | 38 | |
| USD | 42,698 | | EUR | 36,109 | | Goldman Sachs & Co. | 9/30/21 | (186) | |
| GBP | 33,164 | | USD | 45,166 | | JPMorgan Chase Bank N.A. | 9/30/21 | 939 | |
| GBP | 33,631 | | USD | 46,685 | | JPMorgan Chase Bank N.A. | 9/30/21 | 69 | |
| GBP | 27,716 | | USD | 38,531 | | JPMorgan Chase Bank N.A. | 9/30/21 | — | |
| USD | 1,207,185 | | GBP | 854,705 | | Bank of America N.A. | 9/15/21 | 19,019 | |
| USD | 45,072 | | GBP | 32,422 | | Goldman Sachs & Co. | 9/30/21 | (2) | |
| USD | 1,556,479 | | GBP | 1,118,208 | | JPMorgan Chase Bank N.A. | 9/30/21 | 1,940 | |
| USD | 34,626 | | GBP | 25,139 | | JPMorgan Chase Bank N.A. | 9/30/21 | (322) | |
| HKD | 116,739 | | USD | 15,003 | | Bank of America N.A. | 9/30/21 | 21 | |
| HKD | 83,876 | | USD | 10,779 | | Bank of America N.A. | 9/30/21 | 15 | |
| HKD | 31,392 | | USD | 4,037 | | Bank of America N.A. | 9/30/21 | 3 | |
| USD | 5,762 | | HKD | 44,762 | | Bank of America N.A. | 9/30/21 | 1 | |
| | | | | | | | | | | | | | | | | | | | |
| Currency Purchased | Currency Sold | Counterparty | Settlement Date | Unrealized Appreciation
(Depreciation) |
| USD | 5,565 | | HKD | 43,250 | | Bank of America N.A. | 9/30/21 | $ | (1) | |
| USD | 14,910 | | HKD | 115,893 | | Bank of America N.A. | 9/30/21 | (5) | |
| USD | 13,334 | | HKD | 103,617 | | Bank of America N.A. | 9/30/21 | (1) | |
| USD | 51,660 | | HKD | 401,252 | | Bank of America N.A. | 9/30/21 | 20 | |
| USD | 2,146 | | HKD | 16,677 | | Bank of America N.A. | 9/30/21 | — | |
| USD | 15,393 | | HKD | 119,682 | | Bank of America N.A. | 9/30/21 | (10) | |
| USD | 19 | | HUF | 5,289 | | UBS AG | 9/15/21 | 1 | |
| IDR | 4,210,629,690 | | USD | 291,918 | | Goldman Sachs & Co. | 9/15/21 | (1,641) | |
| USD | 24 | | ILS | 77 | | UBS AG | 9/17/21 | — | |
| USD | 373,594 | | INR | 27,577,603 | | Goldman Sachs & Co. | 9/15/21 | 4,579 | |
| JPY | 1,215,810 | | USD | 11,040 | | Bank of America N.A. | 9/30/21 | 48 | |
| JPY | 2,064,571 | | USD | 18,878 | | Bank of America N.A. | 9/30/21 | (50) | |
| JPY | 2,505,940 | | USD | 22,758 | | Bank of America N.A. | 9/30/21 | 95 | |
| JPY | 1,485,990 | | USD | 13,495 | | Bank of America N.A. | 9/30/21 | 56 | |
| JPY | 1,805,940 | | USD | 16,475 | | Bank of America N.A. | 9/30/21 | (5) | |
| USD | 3,652,980 | | JPY | 402,285,911 | | Bank of America N.A. | 8/18/21 | (14,391) | |
| USD | 493,916 | | JPY | 54,626,130 | | Bank of America N.A. | 9/30/21 | (4,248) | |
| USD | 544,636 | | JPY | 60,235,637 | | Bank of America N.A. | 9/30/21 | (4,684) | |
| USD | 17,198 | | JPY | 1,905,480 | | Bank of America N.A. | 9/30/21 | (179) | |
| USD | 17,957 | | JPY | 1,983,690 | | Bank of America N.A. | 9/30/21 | (133) | |
| USD | 214,912 | | JPY | 23,632,104 | | Bank of America N.A. | 9/30/21 | (602) | |
| USD | 19,106 | | JPY | 2,097,384 | | Bank of America N.A. | 9/30/21 | (21) | |
| USD | 2,122 | | KRW | 2,368,712 | | Goldman Sachs & Co. | 9/15/21 | 69 | |
| KZT | 60,927,902 | | USD | 140,500 | | Goldman Sachs & Co. | 9/15/21 | 1,401 | |
| USD | 119,505 | | MXN | 2,385,218 | | Morgan Stanley | 9/15/21 | 371 | |
| MYR | 1,954,495 | | USD | 474,104 | | Goldman Sachs & Co. | 9/15/21 | (13,578) | |
| NOK | 257,486 | | USD | 29,157 | | UBS AG | 9/30/21 | (9) | |
| NOK | 86,500 | | USD | 10,155 | | UBS AG | 9/30/21 | (363) | |
| USD | 77,440 | | NOK | 640,807 | | UBS AG | 9/15/21 | 4,899 | |
| USD | 390,399 | | NOK | 3,351,044 | | UBS AG | 9/30/21 | 11,053 | |
| USD | 11,809 | | NOK | 103,376 | | UBS AG | 9/30/21 | 107 | |
| USD | 3,520 | | NOK | 31,501 | | UBS AG | 9/30/21 | (46) | |
| NZD | 286,983 | | USD | 200,664 | | Bank of America N.A. | 9/15/21 | (757) | |
| USD | 205,854 | | NZD | 286,944 | | Bank of America N.A. | 9/15/21 | 5,974 | |
| USD | 508 | | PEN | 1,964 | | Goldman Sachs & Co. | 9/15/21 | 24 | |
| USD | 576,369 | | PHP | 27,704,345 | | Goldman Sachs & Co. | 9/15/21 | 23,183 | |
| USD | 67,293 | | PLN | 247,112 | | UBS AG | 9/15/21 | 3,141 | |
| USD | 20,778 | | RUB | 1,522,957 | | Goldman Sachs & Co. | 9/15/21 | 80 | |
| SEK | 3,676,280 | | USD | 423,517 | | UBS AG | 9/15/21 | 3,686 | |
| SEK | 827 | | USD | 100 | | UBS AG | 9/15/21 | (4) | |
| USD | 71,054 | | SGD | 94,171 | | Bank of America N.A. | 9/15/21 | 1,557 | |
| USD | 656,551 | | THB | 20,514,594 | | Goldman Sachs & Co. | 9/15/21 | 32,534 | |
| | | | | | $ | 233,228 | |
| | | | | | | | | | | | | | |
| FUTURES CONTRACTS PURCHASED |
| Reference Entity | Contracts | Expiration Date | Notional
Amount | Unrealized Appreciation
(Depreciation)^ |
| Euro-Bobl 5-Year Bonds | 2 | September 2021 | $ | 321,141 | | $ | 3,057 | |
| Korean Treasury 10-Year Bonds | 3 | September 2021 | 334,493 | | 5,941 | |
| U.S. Treasury 2-Year Notes | 70 | September 2021 | 15,445,937 | | (5,605) | |
| U.S. Treasury 5-Year Notes | 161 | September 2021 | 20,035,695 | | 63,582 | |
| U.S. Treasury Ultra Bonds | 10 | September 2021 | 1,995,313 | | 17,168 | |
| | | $ | 38,132,579 | | $ | 84,143 | |
^Amount represents value and unrealized appreciation (depreciation).
| | | | | | | | | | | | | | |
| FUTURES CONTRACTS SOLD |
| Reference Entity | Contracts | Expiration Date | Notional
Amount | Unrealized
Appreciation
(Depreciation)^ |
| U.S. Treasury 10-Year Notes | 10 | September 2021 | $ | 1,344,531 | | $ | (2,391) | |
| U.S. Treasury Long Bonds | 7 | September 2021 | 1,153,031 | | (56,232) | |
| | | $ | 2,497,562 | | $ | (58,623) | |
^Amount represents value and unrealized appreciation (depreciation).
| | | | | | | | | | | | | | | | | | | | | | | |
| CENTRALLY CLEARED CREDIT DEFAULT SWAP AGREEMENTS |
| Reference Entity | Type‡ | Fixed Rate
Received
(Paid)
Quarterly | Termination
Date | Notional
Amount | Premiums
Paid
(Received) | Unrealized
Appreciation
(Depreciation) | Value^ |
| Markit CDX North America High Yield Index Series 32 | Sell | 5.00% | 6/20/24 | $ | 3,920,450 | | $ | 152,068 | | $ | 203,839 | | $ | 355,907 | |
| Markit CDX North America High Yield Index Series 35 | Sell | 5.00% | 12/20/25 | $ | 13,367,000 | | 1,065,692 | | 244,761 | | 1,310,453 | |
| | | | | $ | 1,217,760 | | $ | 448,600 | | $ | 1,666,360 | |
‡The maximum potential amount the fund could be required to deliver as a seller of credit protection if a credit event occurs as defined under the terms of the agreement is the notional amount. The maximum potential amount may be partially offset by any recovery values of the reference entities and upfront payments received upon entering into the agreement.
^The value for credit default swap agreements serves as an indicator of the current status of the payment/performance risk and represent the likelihood of an expected liability or profit at the period end. Increasing values in absolute terms when compared to the notional amount of the credit default swap agreement represent a deterioration of the referenced entity's credit soundness and an increased likelihood or risk of a credit event occurring as defined in the agreement.
| | | | | | | | | | | | | | | | | |
| NOTES TO SCHEDULE OF INVESTMENTS |
| ADR | - | American Depositary Receipt | LIBOR | - | London Interbank Offered Rate |
| AUD | - | Australian Dollar | LOC | - | Letter of Credit |
| BRL | - | Brazilian Real | MTN | - | Medium Term Note |
| CAD | - | Canadian Dollar | MXN | - | Mexican Peso |
| CDX | - | Credit Derivatives Indexes | MYR | - | Malaysian Ringgit |
| CHF | - | Swiss Franc | NOK | - | Norwegian Krone |
| CLP | - | Chilean Peso | NZD | - | New Zealand Dollar |
| CNY | - | Chinese Yuan | PEN | - | Peruvian Sol |
| COP | - | Colombian Peso | PHP | - | Philippine Peso |
| CPI | - | Consumer Price Index | PLN | - | Polish Zloty |
| CZK | - | Czech Koruna | RUB | - | Russian Ruble |
| DKK | - | Danish Krone | SBBPA | - | Standby Bond Purchase Agreement |
| EUR | - | Euro | SEK | - | Swedish Krona |
| FHLB | - | Federal Home Loan Bank | SEQ | - | Sequential Payer |
| FHLMC | - | Federal Home Loan Mortgage Corporation | SGD | - | Singapore Dollar |
| FNMA | - | Federal National Mortgage Association | SOFR | - | Secured Overnight Financing Rate |
| GBP | - | British Pound | THB | - | Thai Baht |
| GNMA | - | Government National Mortgage Association | USD | - | United States Dollar |
| GO | - | General Obligation | VRDN | - | Variable Rate Demand Note. The instrument may be payable upon demand and adjusts periodically based upon the terms set forth in the security's offering documents. The rate shown is effective at the period end and the reference rate and spread, if any, is indicated. The date of the demand feature is disclosed. |
| H15T1Y | - | Constant Maturity U.S. Treasury Note Yield Curve Rate Index | | |
| HKD | - | Hong Kong Dollar | | |
| HUF | - | Hungarian Forint | | |
| IDR | - | Indonesian Rupiah | | |
| ILS | - | Israeli Shekel | | |
| INR | - | Indian Rupee | VRN | - | Variable Rate Note. The rate adjusts periodically based upon the terms set forth in the security’s offering documents. The rate shown is effective at the period end and the reference rate and spread, if any, is indicated. The security's effective maturity date may be shorter than the final maturity date shown. |
| IO | - | Interest Only | | |
| JPY | - | Japanese Yen | | |
| KRW | - | South Korean Won | | |
| KZT | - | Kazakhstani Tenge | | |
†Category is less than 0.05% of total net assets.
(1)Investments are funds within the American Century Investments family of funds and are considered affiliated funds.
(2)Non-income producing.
(3)Security, or a portion thereof, is on loan. At the period end, the aggregate value of securities on loan was $1,960,738. The amount of securities on loan indicated may not correspond with the securities on loan identified because securities with pending sales are in the process of recall from the brokers.
(4)The rate indicated is the yield to maturity at purchase for non-interest bearing securities. For interest bearing securities, the stated coupon rate is shown.
(5)Security, or a portion thereof, has been pledged at the custodian bank or with a broker for collateral requirements on forward foreign currency exchange contracts, futures contracts and/or swap agreements. At the period end, the aggregate value of securities pledged was $1,413,656.
(6)Security was purchased pursuant to Rule 144A or Section 4(2) under the Securities Act of 1933 and may be sold in transactions exempt from registration, normally to qualified institutional investors. The aggregate value of these securities at the period end was $26,439,578, which represented 3.1% of total net assets.
(7)Security is a zero-coupon bond.
(8)When-issued security. The issue price and yield are fixed on the date of the commitment, but payment and delivery are scheduled for a future date.
(9)Investment of cash collateral from securities on loan. At the period end, the aggregate value of the collateral held by the fund was $2,057,994, which includes securities collateral of $1,214,863.
See Notes to Financial Statements.
| | |
| Statement of Assets and Liabilities |
| | | | | |
| JULY 31, 2021 |
| Assets |
| Investment securities - unaffiliated, at value (cost of $335,251,611) — including $1,960,738 of securities on loan | $ | 433,860,257 | |
| Investment securities - affiliated, at value (cost of $309,495,780) | 419,499,181 | |
Investment made with cash collateral received for securities on loan, at value
(cost of $843,131) | 843,131 | |
| Total investment securities, at value (cost of $645,590,522) | 854,202,569 | |
| Cash | 94,136 | |
| Foreign currency holdings, at value (cost of $4,202) | 4,199 | |
| Foreign deposits with broker for futures contracts, at value (cost of $35,990) | 36,647 | |
| Receivable for investments sold | 5,936,465 | |
| Receivable for capital shares sold | 254,377 | |
| Receivable for variation margin on futures contracts | 13,028 | |
| Unrealized appreciation on forward foreign currency exchange contracts | 333,870 | |
| Dividends and interest receivable | 1,353,293 | |
| Securities lending receivable | 1,622 | |
| Other assets | 27,986 | |
| 862,258,192 | |
| |
| Liabilities |
| Payable for collateral received for securities on loan | 843,131 | |
| Payable for investments purchased | 1,112,799 | |
| Payable for capital shares redeemed | 377,563 | |
| Payable for variation margin on swap agreements | 48,288 | |
| Unrealized depreciation on forward foreign currency exchange contracts | 100,642 | |
| Accrued management fees | 396,563 | |
| Distribution and service fees payable | 65,197 | |
| Accrued foreign taxes | 1,122 | |
| 2,945,305 | |
| |
| Net Assets | $ | 859,312,887 | |
| |
| Net Assets Consist of: |
| Capital (par value and paid-in surplus) | $ | 594,141,672 | |
| Distributable earnings | 265,171,215 | |
| $ | 859,312,887 | |
| | | | | | | | | | | |
| Net Assets | Shares Outstanding | Net Asset Value Per Share |
| Investor Class, $0.01 Par Value | $316,039,237 | 34,754,224 | $9.09 |
| I Class, $0.01 Par Value | $55,466,349 | 6,149,800 | $9.02 |
| A Class, $0.01 Par Value | $177,146,690 | 19,289,224 | $9.18* |
| C Class, $0.01 Par Value | $23,337,635 | 2,633,190 | $8.86 |
| R Class, $0.01 Par Value | $18,728,759 | 2,043,292 | $9.17 |
| R5 Class, $0.01 Par Value | $15,410 | 1,708 | $9.02 |
| R6 Class, $0.01 Par Value | $268,578,807 | 29,867,179 | $8.99 |
*Maximum offering price $9.74 (net asset value divided by 0.9425).
See Notes to Financial Statements.
| | | | | |
| YEAR ENDED JULY 31, 2021 |
| Investment Income (Loss) | |
| Income: | |
| Income distributions from affiliated funds | $ | 5,270,861 | |
| Dividends (net of foreign taxes withheld of $129,227) | 3,883,982 | |
| Interest (net of foreign taxes withheld of $1,535) | 3,686,872 | |
| Securities lending, net | 22,874 | |
| 12,864,589 | |
| |
| Expenses: | |
| Management fees | 8,162,390 | |
| Distribution and service fees: | |
| A Class | 408,356 | |
| C Class | 272,077 | |
| R Class | 88,245 | |
| Directors' fees and expenses | 21,816 | |
| Other expenses | 26,759 | |
| 8,979,643 | |
Fees waived(1) | (3,840,070) | |
| 5,139,573 | |
| |
| Net investment income (loss) | 7,725,016 | |
| |
| Realized and Unrealized Gain (Loss) |
| Net realized gain (loss) on: | |
| Investment transactions (including $22,973,719 from affiliated funds) | 68,264,576 | |
| Forward foreign currency exchange contract transactions | (1,000,998) | |
| Futures contract transactions | 40,404 | |
| Swap agreement transactions | 322,952 | |
| Foreign currency translation transactions | (33,233) | |
| Capital gain distributions received from affiliated funds | 64,661 | |
| 67,658,362 | |
| |
| Change in net unrealized appreciation (depreciation) on: | |
| Investments (including $94,080,754 from affiliated funds and (increase) decrease in accrued foreign taxes of $(523)) | 129,149,571 | |
| Forward foreign currency exchange contracts | 525,125 | |
| Futures contracts | 22,825 | |
| Swap agreements | 499,552 | |
| Translation of assets and liabilities in foreign currencies | 1,543 | |
| 130,198,616 | |
| |
| Net realized and unrealized gain (loss) | 197,856,978 | |
| |
| Net Increase (Decrease) in Net Assets Resulting from Operations | $ | 205,581,994 | |
(1)Amount consists of $1,417,103, $249,260, $792,218, $132,061, $85,608, $62, $1,163,758 for Investor Class, I Class, A Class, C Class, R Class, R5 Class and R6 Class, respectively.
See Notes to Financial Statements.
| | |
| Statement of Changes in Net Assets |
| | | | | | | | |
| YEARS ENDED JULY 31, 2021 AND JULY 31, 2020 |
| Increase (Decrease) in Net Assets | July 31, 2021 | July 31, 2020 |
| Operations |
| Net investment income (loss) | $ | 7,725,016 | | $ | 7,535,867 | |
| Net realized gain (loss) | 67,658,362 | | 109,420,406 | |
| Change in net unrealized appreciation (depreciation) | 130,198,616 | | (58,794,425) | |
| Net increase (decrease) in net assets resulting from operations | 205,581,994 | | 58,161,848 | |
| | |
| Distributions to Shareholders |
| From earnings: | | |
| Investor Class | (17,917,667) | | (39,330,667) | |
| I Class | (3,556,580) | | (7,242,449) | |
| A Class | (9,386,645) | | (20,887,372) | |
| C Class | (1,759,444) | | (4,378,225) | |
| R Class | (967,727) | | (2,438,972) | |
| R5 Class | (777) | | (1,169) | |
| R6 Class | (15,520,125) | | (29,024,821) | |
| Decrease in net assets from distributions | (49,108,965) | | (103,303,675) | |
| | |
| Capital Share Transactions |
| Net increase (decrease) in net assets from capital share transactions (Note 5) | (12,970,944) | | (15,707,169) | |
| | |
| Net increase (decrease) in net assets | 143,502,085 | | (60,848,996) | |
| | |
| Net Assets |
| Beginning of period | 715,810,802 | | 776,659,798 | |
| End of period | $ | 859,312,887 | | $ | 715,810,802 | |
See Notes to Financial Statements.
| | |
| Notes to Financial Statements |
JULY 31, 2021
1. Organization
American Century Strategic Asset Allocations, Inc. (the corporation) is registered under the Investment Company Act of 1940, as amended (the 1940 Act), as an open-end management investment company and is organized as a Maryland corporation. Strategic Allocation: Aggressive Fund (the fund) is one fund in a series issued by the corporation. The fund may invest in varying combinations of other affiliated investment companies such as mutual funds and exchange-traded funds advised by American Century Investments (affiliated funds). The fund will assume the risks associated with the affiliated funds. The fund is an asset allocation fund and its investment objective is to seek the highest level of total return consistent with its asset mix.
The fund offers the Investor Class, I Class, A Class, C Class, R Class, R5 Class and R6 Class. The A Class may incur an initial sales charge. The A Class and C Class may be subject to a contingent deferred sales charge.
2. Significant Accounting Policies
The following is a summary of significant accounting policies consistently followed by the fund in preparation of its financial statements. The fund is an investment company and follows accounting and reporting guidance in accordance with accounting principles generally accepted in the United States of America. This may require management to make certain estimates and assumptions at the date of the financial statements. Actual results could differ from these estimates. Management evaluated the impact of events or transactions occurring through the date the financial statements were issued that would merit recognition or disclosure.
Investment Valuations — The fund determines the fair value of its investments and computes its net asset value (NAV) per share at the close of regular trading (usually 4 p.m. Eastern time) on the New York Stock Exchange (NYSE) on each day the NYSE is open. The Board of Directors has adopted valuation policies and procedures to guide the investment advisor in the fund’s investment valuation process and to provide methodologies for the oversight of the fund’s pricing function.
Equity securities that are listed or traded on a domestic securities exchange are valued at the last reported sales price or at the official closing price as provided by the exchange. Equity securities traded on foreign securities exchanges are generally valued at the closing price of such securities on the exchange where primarily traded or at the close of the NYSE, if that is earlier. If no last sales price is reported, or if local convention or regulation so provides, the mean of the latest bid and asked prices may be used. Securities traded over-the-counter are valued at the mean of the latest bid and asked prices, the last sales price, or the official closing price. Equity securities initially expressed in local currencies are translated into U.S. dollars at the mean of the appropriate currency exchange rate at the close of the NYSE as provided by an independent pricing service.
Fixed income securities are valued at the evaluated mean as provided by independent pricing services or at the mean of the most recent bid and asked prices as provided by investment dealers. Corporate bonds, U.S. Treasury and Government Agency securities, convertible bonds, municipal securities, and sovereign governments and agencies are valued using market models that consider trade data, quotations from dealers and active market makers, relevant yield curve and spread data, creditworthiness, trade data or market information on comparable securities, and other relevant security specific information. Mortgage-related and asset-backed securities are valued based on models that consider trade data, prepayment and default projections, benchmark yield and spread data and estimated cash flows of each tranche of the issuer. Collateralized loan obligations are valued based on discounted cash flow models that consider trade and economic data, prepayment assumptions and default projections. Commercial paper is valued using a curve-based approach that considers money market rates for specific instruments, programs, currencies and maturity points from a variety of active market makers. Fixed income securities initially expressed in local currencies are translated into U.S. dollars at the mean of the appropriate currency exchange rate at the close of the NYSE as provided by an independent pricing service.
Hybrid securities are valued at the evaluated mean as provided by independent pricing services or at the mean of the most recent bid and asked prices as provided by investment dealers. Preferred stocks and convertible preferred stocks with perpetual maturities are valued using market models that consider trade data, quotations from dealers and active market makers, relevant yield curve and spread data, creditworthiness, trade data or market information on comparable securities, and other relevant security specific information.
Open-end management investment companies are valued at the reported NAV per share. Exchange-traded futures contracts are valued at the settlement price as provided by the appropriate exchange. Swap agreements are valued at an evaluated mean as provided by independent pricing services or independent brokers. Forward foreign currency exchange contracts are valued at the mean of the appropriate forward exchange rate at the close of the NYSE as provided by an independent pricing service. Investments initially expressed in local currencies are translated into U.S. dollars at the mean of the appropriate currency exchange rate at the close of the NYSE as provided by an independent pricing service.
If the fund determines that the market price for an investment is not readily available or the valuation methods mentioned above do not reflect an investment’s fair value, such investment is valued as determined in good faith by the Board of Directors or its delegate, in accordance with policies and procedures adopted by the Board of Directors. In its determination of fair value, the fund may review several factors including, but not limited to, market information regarding the specific investment or comparable investments and correlation with other investment types, futures indices or general market indicators. Circumstances that may cause the fund to use these procedures to value an investment include, but are not limited to: an investment has been declared in default or is distressed; trading in a security has been suspended during the trading day or a security is not actively trading on its principal exchange; prices received from a regular pricing source are deemed unreliable; or there is a foreign market holiday and no trading occurred.
The fund monitors for significant events occurring after the close of an investment’s primary exchange but before the fund’s NAV per share is determined. Significant events may include, but are not limited to: corporate announcements and transactions; governmental action and political unrest that could impact a specific investment or an investment sector; or armed conflicts, natural disasters and similar events that could affect investments in a specific country or region. The fund also monitors for significant fluctuations between domestic and foreign markets, as evidenced by the U.S. market or such other indicators that the Board of Directors, or its delegate, deems appropriate. The fund may apply a model-derived factor to the closing price of equity securities traded on foreign securities exchanges. The factor is based on observable market data as provided by an independent pricing service.
Security Transactions — Security transactions are accounted for as of the trade date. Net realized gains and losses are determined on the identified cost basis, which is also used for federal income tax purposes. Certain countries impose taxes on realized gains on the sale of securities registered in their country. The fund records the foreign tax expense, if any, on an accrual basis. The foreign tax expense on realized gains and unrealized appreciation reduces the net realized gain (loss) on investment transactions and net unrealized appreciation (depreciation) on investments, respectively.
Investment Income — Dividend income less foreign taxes withheld, if any, is recorded as of the ex-dividend date. Distributions received on securities that represent a return of capital or long-term capital gain are recorded as a reduction of cost of investments and/or as a realized gain. The fund may estimate the components of distributions received that may be considered nontaxable distributions or long-term capital gain distributions for income tax purposes. Income and capital gain distributions, if any, from the affiliated funds are recorded as of the ex-dividend date. Interest income less foreign taxes withheld, if any, is recorded on the accrual basis and includes paydown gain (loss) and accretion of discounts and amortization of premiums. Inflation adjustments related to inflation-linked debt securities are reflected as interest income. Securities lending income is net of fees and rebates earned by the lending agent for its services.
Segregated Assets — In accordance with the 1940 Act, the fund segregates assets on its books and records to cover certain types of investment securities and other financial instruments. American Century Investment Management, Inc. (ACIM) (the investment advisor) monitors, on a daily basis, the securities segregated to ensure the fund designates a sufficient amount of liquid assets, marked-to-market daily. The fund may also receive assets or be required to pledge assets at the custodian bank or with a broker for collateral requirements.
Foreign Currency Translations — All assets and liabilities initially expressed in foreign currencies are translated into U.S. dollars at prevailing exchange rates at period end. The fund may enter into spot foreign currency exchange contracts to facilitate transactions denominated in a foreign currency. Purchases and sales of investment securities, dividend and interest income, spot foreign currency exchange contracts, and expenses are translated at the rates of exchange prevailing on the respective dates of such transactions. Net realized and unrealized foreign currency exchange gains or losses related to investment securities are a component of net realized gain (loss) on investment transactions and change in net unrealized appreciation (depreciation) on investments, respectively.
Income Tax Status — It is the fund’s policy to distribute substantially all net investment income and net realized gains to shareholders and to otherwise qualify as a regulated investment company under provisions of the Internal Revenue Code. Accordingly, no provision has been made for income taxes. The fund files U.S. federal, state, local and non-U.S. tax returns as applicable. The fund's tax returns are subject to examination by the relevant taxing authority until expiration of the applicable statute of limitations, which is generally three years from the date of filing but can be longer in certain jurisdictions. At this time, management believes there are no uncertain tax positions which, based on their technical merit, would not be sustained upon examination and for which it is reasonably possible that the total amounts of unrecognized tax benefits will significantly change in the next twelve months.
Multiple Class — All shares of the fund represent an equal pro rata interest in the net assets of the class to which such shares belong, and have identical voting, dividend, liquidation and other rights and the same terms and conditions, except for class specific expenses and exclusive rights to vote on matters affecting only individual classes. Income, non-class specific expenses, and realized and unrealized capital gains and losses of the fund are allocated to each class of shares based on their relative net assets.
Distributions to Shareholders — Distributions from net investment income and net realized gains, if any, are generally declared and paid annually.
Indemnifications — Under the corporation’s organizational documents, its officers and directors are indemnified against certain liabilities arising out of the performance of their duties to the fund. In addition, in the normal course of business, the fund enters into contracts that provide general indemnifications. The maximum exposure under these arrangements is unknown as this would involve future claims that may be made against a fund. The risk of material loss from such claims is considered by management to be remote.
Securities Lending — Securities are lent to qualified financial institutions and brokers. State Street Bank & Trust Co. serves as securities lending agent to the fund pursuant to a Securities Lending Agreement. The lending of securities exposes the fund to risks such as: the borrowers may fail to return the loaned securities, the borrowers may not be able to provide additional collateral, the fund may experience delays in recovery of the loaned securities or delays in access to collateral, or the fund may experience losses related to the investment collateral. To minimize certain risks, loan counterparties pledge collateral in the form of cash and/or securities. The lending agent has agreed to indemnify the fund in the case of default of any securities borrowed. Cash collateral received is invested in the State Street Navigator Securities Lending Government Money Market Portfolio, a money market mutual fund registered under the 1940 Act. The loans may also be secured by U.S. government securities in an amount at least equal to the market value of the securities loaned, plus accrued interest and dividends, determined on a daily basis and adjusted accordingly. By lending securities, the fund seeks to increase its net investment income through the receipt of interest and fees. Such income is reflected separately within the Statement of Operations. The value of loaned securities and related collateral outstanding at period end, if any, are shown on a gross basis within the Schedule of Investments and Statement of Assets and Liabilities.
The following table reflects a breakdown of transactions accounted for as secured borrowings, the gross obligation by the type of collateral pledged, and the remaining contractual maturity of those transactions as of July 31, 2021.
| | | | | | | | | | | | | | | | | |
| Remaining Contractual Maturity of Agreements |
| Overnight and
Continuous | <30 days | Between
30 & 90 days | >90 days | Total |
Securities Lending Transactions(1) | | | | |
| Common Stocks | $ | 843,131 | | — | | — | | — | | $ | 843,131 | |
| Gross amount of recognized liabilities for securities lending transactions | $ | 843,131 | |
(1)Amount represents the payable for cash collateral received for securities on loan. This will generally be in the Overnight and Continuous column as the securities are typically callable on demand.
3. Fees and Transactions with Related Parties
Certain officers and directors of the corporation are also officers and/or directors of American Century Companies, Inc. (ACC). The corporation’s investment advisor, ACIM, the corporation's distributor, American Century Investment Services, Inc. (ACIS), and the corporation’s transfer agent, American Century Services, LLC, are wholly owned, directly or indirectly, by ACC. ACIM serves as the investment advisor for the affiliated funds.
Management Fees — The corporation has entered into a management agreement with ACIM, under which ACIM provides the fund with investment advisory and management services in exchange for a single, unified management fee (the fee) per class. The agreement provides that ACIM will pay all expenses of managing and operating the fund, except brokerage expenses, taxes, interest, fees and expenses of the independent directors (including legal counsel fees), extraordinary expenses, and expenses incurred in connection with the provision of shareholder services and distribution services under a plan adopted pursuant to Rule 12b-1 under the 1940 Act. The fee is computed and accrued daily based on each class’s daily net assets and paid monthly in arrears. The difference in the fee among the classes is a result of their separate arrangements for non-Rule 12b-1 shareholder services. It is not the result of any difference in advisory or custodial fees or other expenses related to the management of the fund’s assets, which do not vary by class. The rate of the fee is determined by applying a fee rate calculation formula. This formula takes into account the fund’s assets as well as certain assets, if any, of other clients of the investment advisor outside the American Century Investments family of funds (such as subadvised funds and separate accounts) that use very similar investment teams and strategies (strategy assets). The investment advisor will waive the portion of the fund’s management fee equal to the expenses attributable to the management fees of the American Century Investments funds in which the fund invests. The amount of this waiver will fluctuate depending on the fund’s daily allocation to other American Century Investments funds. This waiver is expected to remain in effect permanently and it cannot be terminated without the approval of the Board of Directors. During the period ended July 31, 2021, the investment advisor agreed to waive an additional 0.33% of the fund's management fee. Effective August 1, 2021, the investment advisor agreed to increase the amount of the additional waiver from 0.33% to 0.37% of the fund's management fee. The investment advisor expects this waiver to continue until July 31, 2022 and cannot terminate it prior to such date without the approval of the Board of Directors.
The management fee schedule range and the effective annual management fee before and after waiver for each class for the period ended July 31, 2021 are as follows:
| | | | | | | | | | | |
| Management Fee Schedule Range | Effective Annual Management Fee |
| Before Waiver | After Waiver |
| Investor Class | 0.90% to 1.15% | 1.15% | 0.66% |
| I Class | 0.70% to 0.95% | 0.95% | 0.46% |
| A Class | 0.90% to 1.15% | 1.15% | 0.66% |
| C Class | 0.90% to 1.15% | 1.15% | 0.66% |
| R Class | 0.90% to 1.15% | 1.15% | 0.66% |
| R5 Class | 0.70% to 0.95% | 0.95% | 0.46% |
| R6 Class | 0.55% to 0.80% | 0.80% | 0.31% |
Distribution and Service Fees — The Board of Directors has adopted a separate Master Distribution and Individual Shareholder Services Plan for each of the A Class, C Class and R Class (collectively the plans), pursuant to Rule 12b-1 of the 1940 Act. The plans provide that the A Class will pay ACIS an annual distribution and service fee of 0.25%. The plans provide that the C Class will pay ACIS an annual distribution and service fee of 1.00%, of which 0.25% is paid for individual shareholder services and 0.75% is paid for distribution services. The plans provide that the R Class will pay ACIS an annual distribution and service fee of 0.50%. The fees are computed and accrued daily based on each class’s daily net assets and paid monthly in arrears. The fees are used to pay financial intermediaries for distribution and individual shareholder services. Fees incurred under the plans during the period ended July 31, 2021 are detailed in the Statement of Operations.
Directors' Fees and Expenses — The Board of Directors is responsible for overseeing the investment advisor’s management and operations of the fund. The directors receive detailed information about the fund and its investment advisor regularly throughout the year, and meet at least quarterly with management of the investment advisor to review reports about fund operations. The fund’s officers do not receive compensation from the fund.
Interfund Transactions — The fund may enter into security transactions with other American Century Investments funds and other client accounts of the investment advisor, in accordance with the 1940 Act rules and procedures adopted by the Board of Directors. The rules and procedures require, among other things, that these transactions be effected at the independent current market price of the security. During the period, the interfund purchases and sales were $1,033,560 and $487,114, respectively. The effect of interfund transactions on the Statement of Operations was $111,714 in net realized gain (loss) on investment transactions.
4. Investment Transactions
Purchases of investment securities, excluding short-term investments, for the period ended July 31, 2021 totaled $338,876,127, of which $82,934,066 represented U.S. Treasury and Government Agency obligations.
Sales of investment securities, excluding short-term investments, for the period ended July 31, 2021 totaled $421,876,101, of which $95,428,243 represented U.S. Treasury and Government Agency obligations.
5. Capital Share Transactions
Transactions in shares of the fund were as follows:
| | | | | | | | | | | | | | |
| Year ended
July 31, 2021 | Year ended
July 31, 2020 |
| Shares | Amount | Shares | Amount |
| Investor Class/Shares Authorized | 550,000,000 | | | 600,000,000 | | |
| Sold | 3,263,504 | | $ | 27,478,027 | | 2,677,423 | | $ | 19,251,738 | |
| Issued in reinvestment of distributions | 2,162,944 | | 17,450,952 | | 5,236,240 | | 38,015,100 | |
| Redeemed | (5,962,227) | | (49,655,857) | | (10,625,986) | | (76,896,330) | |
| (535,779) | | (4,726,878) | | (2,712,323) | | (19,629,492) | |
| I Class/Shares Authorized | 150,000,000 | | | 150,000,000 | | |
| Sold | 1,728,521 | | 14,299,849 | | 980,380 | | 7,018,382 | |
| Issued in reinvestment of distributions | 440,091 | | 3,520,729 | | 995,634 | | 7,168,568 | |
| Redeemed | (2,253,030) | | (18,424,221) | | (2,409,462) | | (17,295,574) | |
| (84,418) | | (603,643) | | (433,448) | | (3,108,624) | |
| A Class/Shares Authorized | 325,000,000 | | | 375,000,000 | | |
| Sold | 2,538,820 | | 21,425,145 | | 2,238,185 | | 16,347,885 | |
| Issued in reinvestment of distributions | 1,114,860 | | 9,108,015 | | 2,745,550 | | 20,152,338 | |
| Redeemed | (4,024,599) | | (33,740,882) | | (6,500,804) | | (48,442,961) | |
| (370,919) | | (3,207,722) | | (1,517,069) | | (11,942,738) | |
| C Class/Shares Authorized | 90,000,000 | | | 90,000,000 | | |
| Sold | 327,892 | | 2,685,619 | | 366,218 | | 2,540,491 | |
| Issued in reinvestment of distributions | 221,888 | | 1,757,356 | | 601,653 | | 4,301,818 | |
| Redeemed | (1,951,339) | | (15,933,146) | | (1,656,116) | | (11,800,971) | |
| (1,401,559) | | (11,490,171) | | (688,245) | | (4,958,662) | |
| R Class/Shares Authorized | 50,000,000 | | | 50,000,000 | | |
| Sold | 284,266 | | 2,416,172 | | 326,132 | | 2,369,914 | |
| Issued in reinvestment of distributions | 117,211 | | 956,064 | | 327,567 | | 2,404,343 | |
| Redeemed | (536,673) | | (4,556,180) | | (720,049) | | (5,070,340) | |
| (135,196) | | (1,183,944) | | (66,350) | | (296,083) | |
| R5 Class/Shares Authorized | 50,000,000 | | | 50,000,000 | | |
| Sold | 282 | | 2,345 | | 273 | | 1,931 | |
| Issued in reinvestment of distributions | 97 | | 777 | | 162 | | 1,169 | |
| Redeemed | (49) | | (391) | | (18) | | (144) | |
| 330 | | 2,731 | | 417 | | 2,956 | |
| R6 Class/Shares Authorized | 455,000,000 | | | 90,000,000 | | |
| Sold | 3,954,740 | | 33,471,186 | | 4,002,821 | | 28,609,326 | |
| Issued in reinvestment of distributions | 1,947,318 | | 15,520,125 | | 4,048,092 | | 29,024,821 | |
| Redeemed | (4,924,949) | | (40,752,628) | | (4,729,221) | | (33,408,673) | |
| 977,109 | | 8,238,683 | | 3,321,692 | | 24,225,474 | |
| Net increase (decrease) | (1,550,432) | | $ | (12,970,944) | | (2,095,326) | | $ | (15,707,169) | |
6. Fair Value Measurements
The fund’s investments valuation process is based on several considerations and may use multiple inputs to determine the fair value of the investments held by the fund. In conformity with accounting principles generally accepted in the United States of America, the inputs used to determine a valuation are classified into three broad levels.
•Level 1 valuation inputs consist of unadjusted quoted prices in an active market for identical investments.
•Level 2 valuation inputs consist of direct or indirect observable market data (including quoted prices for comparable investments, evaluations of subsequent market events, interest rates, prepayment speeds, credit risk, etc.). These inputs also consist of quoted prices for identical investments initially expressed in local currencies that are adjusted through translation into U.S. dollars.
•Level 3 valuation inputs consist of unobservable data (including a fund’s own assumptions).
The level classification is based on the lowest level input that is significant to the fair valuation measurement. The valuation inputs are not necessarily an indication of the risks associated with investing in these securities or other financial instruments.
The following is a summary of the level classifications as of period end. The Schedule of Investments provides additional information on the fund’s portfolio holdings.
| | | | | | | | | | | |
| Level 1 | Level 2 | Level 3 |
| Assets | | | |
| Investment Securities | | | |
| Affiliated Funds | $ | 419,499,181 | | — | | — | |
| Common Stocks | 214,455,133 | | $ | 59,278,009 | | — | |
| U.S. Treasury Securities | — | | 44,499,972 | | — | |
| Corporate Bonds | — | | 28,963,502 | | — | |
| Sovereign Governments and Agencies | — | | 24,712,149 | | — | |
| Collateralized Loan Obligations | — | | 7,271,431 | | — | |
| Commercial Paper | — | | 4,378,112 | | — | |
| Municipal Securities | — | | 3,499,991 | | — | |
| Collateralized Mortgage Obligations | — | | 3,344,706 | | — | |
| Asset-Backed Securities | — | | 2,500,297 | | — | |
| Preferred Stocks | — | | 2,332,806 | | — | |
| U.S. Government Agency Mortgage-Backed Securities | — | | 1,083,038 | | — | |
| Exchange-Traded Funds | 666,543 | | — | | — | |
| Temporary Cash Investments | 36,874,568 | | — | | — | |
| Temporary Cash Investments - Securities Lending Collateral | 843,131 | | — | | — | |
| $ | 672,338,556 | | $ | 181,864,013 | | — | |
| Other Financial Instruments | | | |
| Futures Contracts | $ | 80,750 | | $ | 8,998 | | — | |
| Swap Agreements | — | | 1,666,360 | | — | |
| Forward Foreign Currency Exchange Contracts | — | | 333,870 | | — | |
| $ | 80,750 | | $ | 2,009,228 | | — | |
| | | |
| Liabilities | | | |
| Other Financial Instruments | | | |
| Futures Contracts | $ | 64,228 | | — | | — | |
| Forward Foreign Currency Exchange Contracts | — | | $ | 100,642 | | — | |
| $ | 64,228 | | $ | 100,642 | | — | |
7. Derivative Instruments
Credit Risk — The fund is subject to credit risk in the normal course of pursuing its investment objectives. The value of a bond generally declines as the credit quality of its issuer declines. Credit default swap agreements enable a fund to buy/sell protection against a credit event of a specific issuer or index. A fund may attempt to enhance returns by selling protection or attempt to mitigate credit risk by buying protection. The buyer/seller of credit protection against a security or basket of securities may pay/receive an up-front or periodic payment to compensate for/against potential default events. Changes in value, including the periodic amounts of interest to be paid or received on swap agreements, are recorded as unrealized appreciation (depreciation) on swap agreements. Upon entering into a centrally cleared swap, a fund is required to deposit cash or securities (initial margin) with a financial intermediary in an amount equal to a certain percentage of the notional amount. Subsequent payments (variation margin) are made or received daily, in cash, by a fund. The variation margin is equal to the daily change in the value and is a component of unrealized gains and losses. Realized gain or loss is recorded upon receipt or payment of a periodic settlement or termination of swap agreements. Net realized and unrealized gains or losses occurring during the holding period of swap agreements are a component of net realized gain (loss) on swap agreement transactions and change in net unrealized appreciation (depreciation) on swap agreements, respectively. The risks of entering into swap agreements include the possible lack of liquidity, failure of the counterparty to meet its obligations, and that there may be unfavorable changes in the underlying investments or instruments. The fund's average notional amount held during the period was $14,581,783.
Foreign Currency Risk — The fund is subject to foreign currency exchange rate risk in the normal course of pursuing its investment objectives. The value of foreign investments held by a fund may be significantly affected by changes in foreign currency exchange rates. The dollar value of a foreign security generally decreases when the value of the dollar rises against the foreign currency in which the security is denominated and tends to increase when the value of the dollar declines against such foreign currency. A fund may enter into forward foreign currency exchange contracts to reduce a fund's exposure to foreign currency exchange rate fluctuations or to gain exposure to the fluctuations in the value of foreign currencies. The net U.S. dollar value of foreign currency underlying all contractual commitments held by a fund and the resulting unrealized appreciation or depreciation are determined daily. Realized gain or loss is recorded upon settlement of the contract. Net realized and unrealized gains or losses occurring during the holding period of forward foreign currency exchange contracts are a component of net realized gain (loss) on forward foreign currency exchange contract transactions and change in net unrealized appreciation (depreciation) on forward foreign currency exchange contracts, respectively. A fund bears the risk of an unfavorable change in the foreign currency exchange rate underlying the forward contract. Additionally, losses, up to the fair value, may arise if the counterparties do not perform under the contract terms. The fund's average U.S. dollar exposure to foreign currency risk derivative instruments held during the period was $35,397,546.
Interest Rate Risk — The fund is subject to interest rate risk in the normal course of pursuing its investment objectives. The value of bonds generally declines as interest rates rise. A fund may enter into futures contracts based on a bond index or a specific underlying security. A fund may purchase futures contracts to gain exposure to increases in market value or sell futures contracts to protect against a decline in market value. Upon entering into a futures contract, a fund will segregate cash, cash equivalents or other appropriate liquid securities on its records in amounts sufficient to meet requirements. Subsequent payments (variation margin) are made or received daily, in cash, by a fund. The variation margin is equal to the daily change in the contract value and is recorded as unrealized gains and losses. A fund recognizes a realized gain or loss when the futures contract is closed or expires. Net realized and unrealized gains or losses occurring during the holding period of futures contracts are a component of net realized gain (loss) on futures contract transactions and change in net unrealized appreciation (depreciation) on futures contracts, respectively. One of the risks of entering into futures contracts is the possibility that the change in value of the contract may not correlate with the changes in value of the underlying securities. The fund's average notional exposure to interest rate risk derivative instruments held during the period was $12,431,727 futures contracts purchased and $6,037,833 futures contracts sold.
Value of Derivative Instruments as of July 31, 2021
| | | | | | | | | | | | | | |
| Asset Derivatives | Liability Derivatives |
| Type of Risk Exposure | Location on Statement of Assets and Liabilities | Value | Location on Statement of Assets and Liabilities | Value |
| Credit Risk | Receivable for variation margin on swap agreements* | — | | Payable for variation margin on swap agreements* | $ | 48,288 | |
| Foreign Currency Risk | Unrealized appreciation on forward foreign currency exchange contracts | $ | 333,870 | | Unrealized depreciation on forward foreign currency exchange contracts | 100,642 | |
| Interest Rate Risk | Receivable for variation margin on futures contracts* | 13,028 | | Payable for variation margin on futures contracts* | — | |
| | $ | 346,898 | | | $ | 148,930 | |
*Included in the unrealized appreciation (depreciation) on futures contracts or centrally cleared swap agreements, as applicable, as reported in the Schedule of Investments.
Effect of Derivative Instruments on the Statement of Operations for the Year Ended July 31, 2021
| | | | | | | | | | | | | | |
| Net Realized Gain (Loss) | Change in Net Unrealized
Appreciation (Depreciation) |
| Type of Risk Exposure | Location on Statement of Operations | Value | Location on Statement of Operations | Value |
| Credit Risk | Net realized gain (loss) on swap agreement transactions | $ | 322,952 | | Change in net unrealized appreciation (depreciation) on swap agreements | $ | 499,552 | |
| Foreign Currency Risk | Net realized gain (loss) on forward foreign currency exchange contract transactions | (1,000,998) | | Change in net unrealized appreciation (depreciation) on forward foreign currency exchange contracts | 525,125 | |
| Interest Rate Risk | Net realized gain (loss) on futures contract transactions | 40,404 | | Change in net unrealized appreciation (depreciation) on futures contracts | 22,825 | |
| | $ | (637,642) | | | $ | 1,047,502 | |
8. Risk Factors
The value of the fund’s shares will go up and down, sometimes rapidly or unpredictably, based on the performance of the securities owned by the fund and other factors generally affecting the securities market. Market risks, including political, regulatory, economic and social developments, can affect the value of the fund’s investments. Natural disasters, public health emergencies, terrorism and other unforeseeable events may lead to increased market volatility and may have adverse long-term effects on world economies and markets generally.
There are certain risks involved in investing in foreign securities. These risks include those resulting from political events (such as civil unrest, national elections and imposition of exchange controls), social and economic events (such as labor strikes and rising inflation), and natural disasters. Securities of foreign issuers may be less liquid and more volatile. Investing in emerging markets or a significant portion of assets in one country or region may accentuate these risks.
The fund may invest in instruments that have variable or floating coupon rates based on the London Interbank Offered Rate (LIBOR). LIBOR is a benchmark interest rate intended to be representative of the rate at which certain major international banks lend to one another over short-terms. However, LIBOR is expected to be phased out and the transition process may lead to increased volatility or illiquidity in markets for instruments that rely on LIBOR. This could result in a change to the value of such instruments.
9. Federal Tax Information
The tax character of distributions paid during the years ended July 31, 2021 and July 31, 2020 were as follows:
| | | | | | | | |
| 2021 | 2020 |
| Distributions Paid From | | |
| Ordinary income | $ | 16,745,049 | | $ | 20,490,813 | |
| Long-term capital gains | $ | 32,363,916 | | $ | 82,812,862 | |
The book-basis character of distributions made during the year from net investment income or net realized gains may differ from their ultimate characterization for federal income tax purposes. These differences reflect the differing character of certain income items and net realized gains and losses for financial statement and tax purposes, and may result in reclassification among certain capital accounts on the financial statements.
As of period end, the federal tax cost of investments and the components of distributable earnings on a tax-basis were as follows:
| | | | | |
| Federal tax cost of investments | $ | 649,887,273 | |
| Gross tax appreciation of investments | $ | 208,180,877 | |
| Gross tax depreciation of investments | (3,865,581) | |
| Net tax appreciation (depreciation) of investments | 204,315,296 | |
| Net tax appreciation (depreciation) on derivatives and translation of assets and liabilities in foreign currencies | 402,153 | |
| Net tax appreciation (depreciation) | $ | 204,717,449 | |
| Other book-to-tax adjustments | $ | (237,977) | |
| Undistributed ordinary income | $ | 20,992,980 | |
| Accumulated long-term gains | $ | 39,698,763 | |
The difference between book-basis and tax-basis unrealized appreciation (depreciation) is attributable primarily to the tax deferral of losses on wash sales. Other book-to-tax adjustments are attributable primarily to the tax deferral of losses on straddle positions.
10. Investments in Affiliated Funds
The fund does not invest in an affiliated fund for the purpose of exercising management or control; however, investments by the fund within its investment strategy may represent a significant portion of an affiliated fund's net assets.
11. Affiliated Fund Transactions
A summary of transactions for each affiliated fund for the period ended July 31, 2021 follows (amounts in thousands):
| | | | | | | | | | | | | | | | | | | | | | | | | | |
Affiliated Fund(1) | Beginning Value | Purchase
Cost | Sales
Cost | Change in Net Unrealized Appreciation (Depreciation) | Ending
Value | Ending
Shares | Net Realized
Gain (Loss) | Distributions
Received(2) |
| American Century Diversified Corporate Bond ETF | $ | 15,277 | | — | | — | | $ | (32) | | $ | 15,245 | | 288 | | — | | $ | 473 | |
| American Century Focused Dynamic Growth ETF | 53,354 | | — | | $ | 16,647 | | 9,660 | | 46,367 | | 561 | | $ | 6,177 | | 6 | |
| American Century Focused Large Cap Value ETF | 37,235 | | $ | 13,441 | | — | | 11,220 | | 61,896 | | 1,010 | | — | | 795 | |
| American Century Quality Diversified International ETF | 28,549 | | 2,200 | | 3,860 | | 6,539 | | 33,428 | | 642 | | 590 | | 674 | |
| American Century STOXX U.S. Quality Growth ETF | 52,558 | | — | | 14,850 | | 9,706 | | 47,414 | | 649 | | 6,901 | | 115 | |
| American Century STOXX U.S. Quality Value ETF | 35,445 | | 12,781 | | — | | 13,795 | | 62,021 | | 1,222 | | — | | 816 | |
| Avantis Emerging Markets Equity ETF | 40,081 | | 762 | | 18,089 | | 6,442 | | 29,196 | | 443 | | 4,925 | | 678 | |
| Avantis International Equity ETF | 25,977 | | 1,527 | | 3,676 | | 7,945 | | 31,773 | | 499 | | 232 | | 615 | |
| Avantis International Small Cap Value ETF | 8,563 | | 209 | | 1,199 | | 3,538 | | 11,111 | | 170 | | 276 | | 229 | |
| Avantis U.S. Equity ETF | 50,644 | | 1,210 | | 8,842 | | 17,966 | | 60,978 | | 815 | | 3,221 | | 718 | |
| Avantis U.S. Small Cap Value ETF | 11,434 | | 4,684 | | 3,350 | | 7,302 | | 20,070 | | 273 | | 652 | | 217 | |
| $ | 359,117 | | $ | 36,814 | | $ | 70,513 | | $ | 94,081 | | $ | 419,499 | | 6,572 | | $ | 22,974 | | $ | 5,336 | |
(1)Investments are funds within the American Century Investments family of funds and are considered affiliated funds. Additional information and attributes of each affiliated fund are available at americancentury.com or avantisinvestors.com.
(2)Distributions received includes distributions from net investment income and from capital gains, if any.
| | | | | | | | | | | | | | | | | | | | | | | | | | | | | | | | | | | | | | | | | | | | | | | |
| For a Share Outstanding Throughout the Years Ended July 31 (except as noted) |
| Per-Share Data | | | | | | | | | Ratios and Supplemental Data | |
| | Income From Investment Operations: | Distributions From: | | | Ratio to Average Net Assets of: | | |
| Net Asset
Value,
Beginning
of Period | Net Investment Income (Loss)(1) | Net Realized and Unrealized Gain (Loss) | Total From
Investment
Operations | Net
Investment
Income | Net
Realized
Gains | Total
Distributions | Net Asset
Value,
End
of Period | Total Return(2) | Operating
Expenses | Operating
Expenses
(before
expense
waiver) | Net
Investment
Income
(Loss) | Net
Investment
Income
(Loss)
(before
expense
waiver) | Portfolio
Turnover
Rate | Net
Assets,
End of
Period
(in thousands) |
| Investor Class |
| 2021 | $7.45 | 0.08 | 2.09 | 2.17 | (0.06) | (0.47) | (0.53) | $9.09 | 30.04% | 0.67% | 1.16% | 0.95% | 0.46% | 44% | $316,039 | |
| 2020 | $7.91 | 0.08 | 0.58 | 0.66 | (0.13) | (0.99) | (1.12) | $7.45 | 8.82% | 0.84% | 1.16% | 1.06% | 0.74% | 109% | $262,987 | |
| 2019 | $8.57 | 0.10 | 0.11 | 0.21 | (0.10) | (0.77) | (0.87) | $7.91 | 3.96% | 1.11% | 1.16% | 1.27% | 1.22% | 78% | $300,544 | |
2018(3) | $9.04 | 0.06 | 0.28 | 0.34 | (0.12) | (0.69) | (0.81) | $8.57 | 4.05% | 1.11%(4) | 1.16%(4) | 1.10%(4) | 1.05%(4) | 58% | $372,601 | |
| 2017 | $7.80 | 0.10 | 1.37 | 1.47 | (0.11) | (0.12) | (0.23) | $9.04 | 19.30% | 1.11% | 1.16% | 1.19% | 1.14% | 80% | $448,081 | |
| 2016 | $8.19 | 0.09 | 0.17 | 0.26 | (0.09) | (0.56) | (0.65) | $7.80 | 3.61% | 1.11% | 1.16% | 1.23% | 1.18% | 82% | $438,001 | |
| I Class | | | | | | | | | | | | | |
| 2021 | $7.40 | 0.10 | 2.07 | 2.17 | (0.08) | (0.47) | (0.55) | $9.02 | 30.42% | 0.47% | 0.96% | 1.15% | 0.66% | 44% | $55,466 | |
| 2020 | $7.86 | 0.09 | 0.59 | 0.68 | (0.15) | (0.99) | (1.14) | $7.40 | 8.97% | 0.64% | 0.96% | 1.26% | 0.94% | 109% | $46,105 | |
| 2019 | $8.52 | 0.11 | 0.11 | 0.22 | (0.11) | (0.77) | (0.88) | $7.86 | 4.22% | 0.91% | 0.96% | 1.47% | 1.42% | 78% | $52,389 | |
2018(3) | $9.00 | 0.07 | 0.28 | 0.35 | (0.14) | (0.69) | (0.83) | $8.52 | 4.18% | 0.91%(4) | 0.96%(4) | 1.30%(4) | 1.25%(4) | 58% | $68,975 | |
| 2017 | $7.76 | 0.12 | 1.36 | 1.48 | (0.12) | (0.12) | (0.24) | $9.00 | 19.64% | 0.91% | 0.96% | 1.39% | 1.34% | 80% | $139,110 | |
| 2016 | $8.16 | 0.11 | 0.15 | 0.26 | (0.10) | (0.56) | (0.66) | $7.76 | 3.71% | 0.91% | 0.96% | 1.43% | 1.38% | 82% | $123,699 | |
| | | | | | | | | | | | | | | | | | | | | | | | | | | | | | | | | | | | | | | | | | | | | | | |
| For a Share Outstanding Throughout the Years Ended July 31 (except as noted) |
| Per-Share Data | | | | | | | | | Ratios and Supplemental Data | |
| | Income From Investment Operations: | Distributions From: | | | Ratio to Average Net Assets of: | | |
| Net Asset
Value,
Beginning
of Period | Net Investment Income (Loss)(1) | Net Realized and Unrealized Gain (Loss) | Total From
Investment
Operations | Net
Investment
Income | Net
Realized
Gains | Total
Distributions | Net Asset
Value,
End
of Period | Total Return(2) | Operating
Expenses | Operating
Expenses
(before
expense
waiver) | Net
Investment
Income
(Loss) | Net
Investment
Income
(Loss)
(before
expense
waiver) | Portfolio
Turnover
Rate | Net
Assets,
End of
Period
(in thousands) |
| A Class |
| 2021 | $7.52 | 0.06 | 2.11 | 2.17 | (0.04) | (0.47) | (0.51) | $9.18 | 29.69% | 0.92% | 1.41% | 0.70% | 0.21% | 44% | $177,147 | |
| 2020 | $7.97 | 0.06 | 0.59 | 0.65 | (0.11) | (0.99) | (1.10) | $7.52 | 8.58% | 1.09% | 1.41% | 0.81% | 0.49% | 109% | $147,856 | |
| 2019 | $8.63 | 0.08 | 0.11 | 0.19 | (0.08) | (0.77) | (0.85) | $7.97 | 3.66% | 1.36% | 1.41% | 1.02% | 0.97% | 78% | $168,774 | |
2018(3) | $9.08 | 0.05 | 0.28 | 0.33 | (0.09) | (0.69) | (0.78) | $8.63 | 3.87% | 1.36%(4) | 1.41%(4) | 0.85%(4) | 0.80%(4) | 58% | $188,883 | |
| 2017 | $7.84 | 0.08 | 1.37 | 1.45 | (0.09) | (0.12) | (0.21) | $9.08 | 19.02% | 1.36% | 1.41% | 0.94% | 0.89% | 80% | $209,181 | |
| 2016 | $8.22 | 0.07 | 0.18 | 0.25 | (0.07) | (0.56) | (0.63) | $7.84 | 3.44% | 1.36% | 1.41% | 0.98% | 0.93% | 82% | $245,955 | |
| C Class | | | | | | | | | | | | | | |
| 2021 | $7.29 | (0.01) | 2.05 | 2.04 | — | (0.47) | (0.47) | $8.86 | 28.76% | 1.67% | 2.16% | (0.05)% | (0.54)% | 44% | $23,338 | |
| 2020 | $7.75 | —(5) | 0.58 | 0.58 | (0.05) | (0.99) | (1.04) | $7.29 | 7.80% | 1.84% | 2.16% | 0.06% | (0.26)% | 109% | $29,423 | |
| 2019 | $8.41 | 0.02 | 0.11 | 0.13 | (0.02) | (0.77) | (0.79) | $7.75 | 2.91% | 2.11% | 2.16% | 0.27% | 0.22% | 78% | $36,620 | |
2018(3) | $8.85 | 0.01 | 0.27 | 0.28 | (0.03) | (0.69) | (0.72) | $8.41 | 3.36% | 2.11%(4) | 2.16%(4) | 0.10%(4) | 0.05%(4) | 58% | $53,503 | |
| 2017 | $7.64 | 0.02 | 1.34 | 1.36 | (0.03) | (0.12) | (0.15) | $8.85 | 18.07% | 2.11% | 2.16% | 0.19% | 0.14% | 80% | $66,032 | |
| 2016 | $8.03 | 0.02 | 0.16 | 0.18 | (0.01) | (0.56) | (0.57) | $7.64 | 2.56% | 2.11% | 2.16% | 0.23% | 0.18% | 82% | $67,920 | |
| | | | | | | | | | | | | | | | | | | | | | | | | | | | | | | | | | | | | | | | | | | | | | | |
| For a Share Outstanding Throughout the Years Ended July 31 (except as noted) |
| Per-Share Data | | | | | | | | | Ratios and Supplemental Data | |
| | Income From Investment Operations: | Distributions From: | | | Ratio to Average Net Assets of: | | |
| Net Asset
Value,
Beginning
of Period | Net Investment Income (Loss)(1) | Net Realized and Unrealized Gain (Loss) | Total From
Investment
Operations | Net
Investment
Income | Net
Realized
Gains | Total
Distributions | Net Asset
Value,
End
of Period | Total Return(2) | Operating
Expenses | Operating
Expenses
(before
expense
waiver) | Net
Investment
Income
(Loss) | Net
Investment
Income
(Loss)
(before
expense
waiver) | Portfolio
Turnover
Rate | Net
Assets,
End of
Period
(in thousands) |
| R Class | | | | | | | | | | | | | | |
| 2021 | $7.51 | 0.04 | 2.11 | 2.15 | (0.02) | (0.47) | (0.49) | $9.17 | 29.58% | 1.17% | 1.66% | 0.45% | (0.04)% | 44% | $18,729 | |
| 2020 | $7.96 | 0.04 | 0.59 | 0.63 | (0.09) | (0.99) | (1.08) | $7.51 | 8.16% | 1.34% | 1.66% | 0.56% | 0.24% | 109% | $16,353 | |
| 2019 | $8.61 | 0.06 | 0.12 | 0.18 | (0.06) | (0.77) | (0.83) | $7.96 | 3.51% | 1.61% | 1.66% | 0.77% | 0.72% | 78% | $17,858 | |
2018(3) | $9.06 | 0.03 | 0.28 | 0.31 | (0.07) | (0.69) | (0.76) | $8.61 | 3.72% | 1.61%(4) | 1.66%(4) | 0.60%(4) | 0.55%(4) | 58% | $19,634 | |
| 2017 | $7.82 | 0.06 | 1.37 | 1.43 | (0.07) | (0.12) | (0.19) | $9.06 | 18.64% | 1.61% | 1.66% | 0.69% | 0.64% | 80% | $22,514 | |
| 2016 | $8.20 | 0.06 | 0.17 | 0.23 | (0.05) | (0.56) | (0.61) | $7.82 | 3.18% | 1.61% | 1.66% | 0.73% | 0.68% | 82% | $24,678 | |
| R5 Class | | | | | | | | | | | | | | |
| 2021 | $7.40 | 0.10 | 2.07 | 2.17 | (0.08) | (0.47) | (0.55) | $9.02 | 30.24% | 0.47% | 0.96% | 1.15% | 0.66% | 44% | $15 | |
| 2020 | $7.86 | 0.09 | 0.59 | 0.68 | (0.15) | (0.99) | (1.14) | $7.40 | 9.11% | 0.64% | 0.96% | 1.26% | 0.94% | 109% | $10 | |
| 2019 | $8.53 | 0.11 | 0.10 | 0.21 | (0.11) | (0.77) | (0.88) | $7.86 | 4.08% | 0.91% | 0.96% | 1.47% | 1.42% | 78% | $8 | |
2018(3) | $9.00 | 0.07 | 0.28 | 0.35 | (0.13) | (0.69) | (0.82) | $8.53 | 4.24% | 0.91%(4) | 0.96%(4) | 1.30%(4) | 1.25%(4) | 58% | $6 | |
2017(6) | $8.05 | 0.08 | 0.87 | 0.95 | — | — | — | $9.00 | 11.80% | 0.91%(4) | 0.96%(4) | 1.46%(4) | 1.41%(4) | 80%(7) | $6 | |
| | | | | | | | | | | | | | | | | | | | | | | | | | | | | | | | | | | | | | | | | | | | | | | |
| For a Share Outstanding Throughout the Years Ended July 31 (except as noted) |
| Per-Share Data | | | | | | | | | Ratios and Supplemental Data | |
| | Income From Investment Operations: | Distributions From: | | | Ratio to Average Net Assets of: | | |
| Net Asset
Value,
Beginning
of Period | Net Investment Income (Loss)(1) | Net Realized and Unrealized Gain (Loss) | Total From
Investment
Operations | Net
Investment
Income | Net
Realized
Gains | Total
Distributions | Net Asset
Value,
End
of Period | Total Return(2) | Operating
Expenses | Operating
Expenses
(before
expense
waiver) | Net
Investment
Income
(Loss) | Net
Investment
Income
(Loss)
(before
expense
waiver) | Portfolio
Turnover
Rate | Net
Assets,
End of
Period
(in thousands) |
| R6 Class | | | | | | | | | | | | | | |
| 2021 | $7.38 | 0.11 | 2.06 | 2.17 | (0.09) | (0.47) | (0.56) | $8.99 | 30.57% | 0.32% | 0.81% | 1.30% | 0.81% | 44% | $268,579 | |
| 2020 | $7.84 | 0.10 | 0.59 | 0.69 | (0.16) | (0.99) | (1.15) | $7.38 | 9.18% | 0.49% | 0.81% | 1.41% | 1.09% | 109% | $213,077 | |
| 2019 | $8.51 | 0.13 | 0.10 | 0.23 | (0.13) | (0.77) | (0.90) | $7.84 | 4.27% | 0.76% | 0.81% | 1.62% | 1.57% | 78% | $200,468 | |
2018(3) | $8.99 | 0.09 | 0.27 | 0.36 | (0.15) | (0.69) | (0.84) | $8.51 | 4.36% | 0.76%(4) | 0.81%(4) | 1.45%(4) | 1.40%(4) | 58% | $200,589 | |
| 2017 | $7.76 | 0.13 | 1.36 | 1.49 | (0.14) | (0.12) | (0.26) | $8.99 | 19.70% | 0.76% | 0.81% | 1.54% | 1.49% | 80% | $90,339 | |
| 2016 | $8.15 | 0.12 | 0.16 | 0.28 | (0.11) | (0.56) | (0.67) | $7.76 | 4.02% | 0.76% | 0.81% | 1.58% | 1.53% | 82% | $51,430 | |
| | | | | | | | | | | | | | |
| Notes to Financial Highlights | | |
(1)Computed using average shares outstanding throughout the period.
(2)Total returns are calculated based on the net asset value of the last business day and do not reflect applicable sales charges, if any. Total returns for periods less than one year are not annualized.
(3)December 1, 2017 through July 31, 2018. The fund's fiscal year end was changed from November 30 to July 31, resulting in an eight-month annual reporting period. For the years before July 31, 2018, the fund's fiscal year end was November 30.
(4)Annualized.
(5)Per-share amount was less than $0.005.
(6)April 10, 2017 (commencement of sale) through November 30, 2017.
(7)Portfolio turnover is calculated at the fund level. Percentage indicated was calculated for the year ended November 30, 2017.
See Notes to Financial Statements.
| | |
| Report of Independent Registered Public Accounting Firm |
To the Shareholders and the Board of Directors of American Century Strategic Asset Allocations, Inc.:
Opinion on the Financial Statements and Financial Highlights
We have audited the accompanying statement of assets and liabilities, including the schedule of investments, of Strategic Allocation: Aggressive Fund (the “Fund”), one of the funds constituting the American Century Strategic Asset Allocations, Inc., as of July 31, 2021, the related statement of operations for the year then ended, the statements of changes in net assets for each of the two years in the period then ended, the financial highlights for each of the three years in the period then ended, the period December 1, 2017 through July 31, 2018 and for the years ended November 30, 2017 and 2016, and the related notes. In our opinion, the financial statements and financial highlights present fairly, in all material respects, the financial position of Strategic Allocation: Aggressive Fund of the American Century Strategic Asset Allocations, Inc. as of July 31, 2021, and the results of its operations for the year then ended, the changes in its net assets for each of the two years in the period then ended, and the financial highlights for each of the three years in the period then ended, the period December 1, 2017 through July 31, 2018 and for the years ended November 30, 2017 and 2016, in conformity with accounting principles generally accepted in the United States of America.
Basis for Opinion
These financial statements and financial highlights are the responsibility of the Fund's management. Our responsibility is to express an opinion on the Fund’s financial statements and financial highlights based on our audits. We are a public accounting firm registered with the Public Company Accounting Oversight Board (United States) (PCAOB) and are required to be independent with respect to the Fund in accordance with the U.S. federal securities laws and the applicable rules and regulations of the Securities and Exchange Commission and the PCAOB.
We conducted our audits in accordance with the standards of the PCAOB. Those standards require that we plan and perform the audit to obtain reasonable assurance about whether the financial statements and financial highlights are free of material misstatement, whether due to error or fraud. The Fund is not required to have, nor were we engaged to perform, an audit of its internal control over financial reporting. As part of our audits we are required to obtain an understanding of internal control over financial reporting but not for the purpose of expressing an opinion on the effectiveness of the Fund’s internal control over financial reporting. Accordingly, we express no such opinion.
Our audits included performing procedures to assess the risks of material misstatement of the financial statements and financial highlights, whether due to error or fraud, and performing procedures that respond to those risks. Such procedures included examining, on a test basis, evidence regarding the amounts and disclosures in the financial statements and financial highlights. Our audits also included evaluating the accounting principles used and significant estimates made by management, as well as evaluating the overall presentation of the financial statements and financial highlights. Our procedures included confirmation of securities owned as of July 31, 2021, by correspondence with the custodian and brokers; when replies were not received from brokers, we performed other auditing procedures. We believe that our audits provide a reasonable basis for our opinion.
DELOITTE & TOUCHE LLP
Kansas City, Missouri
September 15, 2021
We have served as the auditor of one or more American Century investment companies since 1997.
The Board of Directors
The individuals listed below serve as directors of the funds. Each director will continue to serve in this capacity until death, retirement, resignation or removal from office. The board has adopted a mandatory retirement age for directors who are not “interested persons,” as that term is defined in the Investment Company Act (independent directors). Independent directors shall retire by December 31 of the year in which they reach their 75th birthday.
Mr. Thomas is an “interested person” because he currently serves as President and Chief Executive Officer of American Century Companies, Inc. (ACC), the parent company of American Century Investment Management, Inc. (ACIM or the advisor). The other directors (more than three-fourths of the total number) are independent. They are not employees, directors or officers of, and have no financial interest in, ACC or any of its wholly owned, direct or indirect, subsidiaries, including ACIM, American Century Investment Services, Inc. (ACIS) and American Century Services, LLC (ACS), and they do not have any other affiliations, positions or relationships that would cause them to be considered “interested persons” under the Investment Company Act. The directors serve in this capacity for seven (in the case of Jonathan S. Thomas, 16; and Stephen E. Yates, 8) registered investment companies in the American Century Investments family of funds.
The following table presents additional information about the directors. The mailing address for each director is 4500 Main Street, Kansas City, Missouri 64111.
| | | | | | | | | | | | | | | | | |
Name
(Year of Birth) | Position(s) Held with Funds | Length of Time Served | Principal Occupation(s) During Past 5 Years | Number of American Century Portfolios Overseen by Director | Other Directorships Held During Past 5 Years |
| Independent Directors | | |
| Thomas W. Bunn (1953) | Director | Since 2017 | Retired | 72 | SquareTwo Financial; Barings (formerly Babson Capital Funds Trust) (2013 to 2016) |
Chris H. Cheesman
(1962)
| Director | Since 2019
| Retired. Senior Vice President & Chief Audit Executive, AllianceBernstein (1999 to 2018) | 72 | None |
Barry Fink
(1955) | Director | Since 2012 (independent since 2016) | Retired | 72 | None |
Rajesh K. Gupta
(1960)
| Director | Since 2019
| Partner Emeritus, SeaCrest Investment Management and SeaCrest Wealth Management (2019 to Present); Chief Executive Officer and Chief Investment Officer, SeaCrest Investment Management (2006 to 2019); Chief Executive Officer and Chief Investment Officer, SeaCrest Wealth Management (2008 to 2019) | 72 | None |
| | | | | | | | | | | | | | | | | |
Name
(Year of Birth) | Position(s) Held with Funds | Length of Time Served | Principal Occupation(s) During Past 5 Years | Number of American Century Portfolios Overseen by Director | Other Directorships Held During Past 5 Years |
| Independent Directors | | |
Lynn Jenkins
(1963)
| Director | Since 2019
| Consultant, LJ Strategies (2019 to present); United States Representative, U.S. House of Representatives (2009 to 2018) | 72 | MGP Ingredients, Inc. (2019 to 2021) |
Jan M. Lewis
(1957) | Director | Since 2011 | Retired | 72 | None |
John R. Whitten
(1946) | Director | Since 2008 | Retired | 72 | Onto Innovation Inc. (2019 to 2020); Rudolph Technologies, Inc. (2006 to 2019) |
Stephen E. Yates
(1948) | Director and Chairman of the Board | Since 2012 (Chairman since 2018) | Retired | 103 | None |
| Interested Director | |
Jonathan S. Thomas
(1963) | Director | Since 2007 | President and Chief Executive Officer, ACC (2007 to present). Also serves as Chief Executive Officer, ACS; Director, ACC and other ACC subsidiaries | 141 | None |
The Statement of Additional Information has additional information about the fund's directors and is available without charge, upon request, by calling 1-800-345-2021.
Officers
The following table presents certain information about the executive officers of the funds. Each officer serves as an officer for each of the 16 (in the case of Robert J. Leach, 15) investment companies in the American Century family of funds. No officer is compensated for his or her service as an officer of the funds. The listed officers are interested persons of the funds and are appointed or re-appointed on an annual basis. The mailing address for each officer listed below is 4500 Main Street, Kansas City, Missouri 64111.
| | | | | | | | |
Name
(Year of Birth) | Offices with the Funds | Principal Occupation(s) During the Past Five Years |
Patrick Bannigan
(1965) | President since 2019 | Executive Vice President and Director, ACC (2012 to present); Chief Financial Officer, Chief Accounting Officer and Treasurer, ACC (2015 to present). Also serves as President, ACS; Vice President, ACIM; Chief Financial Officer, Chief Accounting Officer and/or Director, ACIM, ACS and other ACC subsidiaries |
R. Wes Campbell
(1974) | Chief Financial Officer and Treasurer since 2018 | Vice President, ACS, (2020 to present); Investment Operations and Investment Accounting, ACS (2000 to present) |
Amy D. Shelton
(1964) | Chief Compliance Officer and Vice President since 2014 | Chief Compliance Officer, American Century funds, (2014 to present); Chief Compliance Officer, ACIM (2014 to present); Chief Compliance Officer, ACIS (2009 to present). Also serves as Vice President, ACIS |
Charles A. Etherington
(1957) | General Counsel since 2007 and Senior Vice President since 2006 | Attorney, ACC (1994 to present); Vice President, ACC (2005 to present); General Counsel, ACC (2007 to present). Also serves as General Counsel, ACIM, ACS, ACIS and other ACC subsidiaries; and Senior Vice President, ACIM and ACS |
C. Jean Wade
(1964) | Vice President since 2012 | Senior Vice President, ACS (2017 to present); Vice President, ACS (2000 to 2017) |
Robert J. Leach
(1966) | Vice President since 2006 | Vice President, ACS (2000 to present) |
David H. Reinmiller
(1963) | Vice President since 2000 | Attorney, ACC (1994 to present). Also serves as Vice President, ACIM and ACS |
Ward D. Stauffer
(1960) | Secretary since 2005 | Attorney, ACC (2003 to present) |
| | |
| Approval of Management Agreement |
At a meeting held on June 30, 2021, the Fund’s Board of Directors (the "Board") unanimously approved the renewal of the management agreement pursuant to which American Century Investment Management, Inc. (the “Advisor”) acts as the investment advisor for the Fund. Under Section 15(c) of the Investment Company Act, contracts for investment advisory services are required to be reviewed, evaluated, and approved by a majority of a fund’s directors (the “Directors”), including a majority of the independent Directors, each year.
Prior to its consideration of the renewal of the management agreement, the Directors requested and reviewed extensive data and information compiled by the Advisor and certain independent providers of evaluation data concerning the Fund and the services provided to the Fund by the Advisor. This review was in addition to the oversight and evaluation undertaken by the Board and its committees on a continual basis and the information received was supplemental to the extensive information that the Board and its committees receive and consider throughout the year.
In connection with its consideration of the renewal of the management agreement, the Board’s review and evaluation of the services provided by the Advisor and its affiliates included, but was not limited to, the following:
•the nature, extent, and quality of investment management, shareholder services, and other services provided and to be provided to the Fund including without limitation portfolio management and trading services, shareholder and intermediary services, compliance and legal services, fund accounting and financial reporting, and fund share distribution;
•the wide range of other programs and services provided and to be provided to the Fund and its shareholders on a routine and non-routine basis;
•the Fund’s investment performance, including data comparing the Fund's performance to appropriate benchmarks and/or a peer group of other mutual funds with similar investment objectives and strategies;
•the cost of owning the Fund compared to the cost of owning similar funds;
•the compliance policies, procedures, and regulatory experience of the Advisor and the Fund's service providers;
•the Advisor’s strategic plans, COVID-19 pandemic response, vendor management practices, and social justice initiatives;
•the Advisor’s business continuity plans and cyber security practices;
•financial data showing the cost of services provided to the Fund, the profitability of the Fund to the Advisor, and the overall profitability of the Advisor;
•possible economies of scale associated with the Advisor’s management of the Fund and other accounts;
•services provided and charges to the Advisor's other investment management clients;
•acquired fund fees and expenses;
•payments and practices in connection with financial intermediaries holding shares of the Fund and the services provided by intermediaries in connection therewith; and
•possible collateral benefits to the Advisor from the management of the Fund.
The Board held two meetings to consider the renewal. The independent Directors also met in private session three times to review and discuss the information provided in response to their request. The independent Directors held active discussions with the Advisor regarding the renewal of the management agreement, requesting supplemental information, and reviewing information provided by the Advisor in response thereto. The independent Directors had the benefit of the advice of their independent counsel throughout the process.
Factors Considered
The Directors considered all of the information provided by the Advisor, the independent data providers, and independent counsel in connection with the approval. They determined that the information was sufficient for them to evaluate the management agreement for the Fund. In connection with their review, the Directors did not identify any single factor as being all-important or controlling, and each Director may have attributed different levels of importance to different factors. In deciding to renew the management agreement, the Board based its decision on a number of factors, including without limitation the following:
Nature, Extent and Quality of Services — Generally. Under the management agreement, the Advisor is responsible for providing or arranging for all services necessary for the operation of the Fund. The Board noted that the Advisor provides or arranges at its own expense a wide variety of services which include the following:
•constructing and designing the Fund
•portfolio research and security selection
•initial capitalization/funding
•securities trading
•Fund administration
•custody of Fund assets
•daily valuation of the Fund’s portfolio
•liquidity monitoring and management
•risk management, including cyber security
•shareholder servicing and transfer agency, including shareholder confirmations, recordkeeping, and communications
•legal services (except the independent Directors’ counsel)
•regulatory and portfolio compliance
•financial reporting
•marketing and distribution (except amounts paid by the Fund under Rule 12b-1 plans)
The Board noted that many of these services have expanded over time in terms of both quantity and complexity in response to shareholder demands, competition in the industry, changing distribution channels, and the changing regulatory environment.
Investment Management Services. The nature of the investment management services provided to the Fund is quite complex and allows Fund shareholders access to professional money management, instant diversification of their investments within an asset class, the opportunity to easily diversify among asset classes by investing in or exchanging among various American Century Investments funds, and liquidity. In evaluating investment performance, the Board expects the Advisor to manage the Fund in accordance with its investment objectives and approved strategies. Further, the Directors recognize that the Advisor has an obligation to monitor trading activities, and in particular to seek the best execution of fund trades, and to evaluate the use of and payment for research. In providing these services, the Advisor utilizes teams of investment professionals (portfolio managers, analysts, research assistants, and securities traders) who require extensive information technology, research, training, compliance, and other systems to conduct their business. The Board, directly and through its Fund Performance Review Committee, provides oversight of the investment performance process. It regularly reviews investment performance information for the Fund, together with comparative information for appropriate benchmarks and/or peer groups of similarly-managed funds, over different time horizons. The Directors also review investment performance information during the management agreement renewal process. If performance concerns are identified, the Fund receives special reviews until performance improves, during which the Board discusses with the Advisor the reasons for such results (e.g., market conditions, security selection) and any efforts being undertaken to improve performance. The Fund’s performance was above its benchmark for the one-, three-, five-, and ten-year periods reviewed by the Board. The Board found the investment management services provided by the Advisor to the Fund to be satisfactory and consistent with the management agreement.
Shareholder and Other Services. Under the management agreement, the Advisor provides the Fund with a comprehensive package of transfer agency, shareholder, and other services. The Board, directly and through its various committees, regularly reviews reports and evaluations of such services at its regular meetings. These reports include, but are not limited to, information regarding the operational efficiency and accuracy of the shareholder and transfer agency services provided, staffing levels, shareholder satisfaction, technology support (including cyber security), new products and services offered to Fund shareholders, securities trading activities, portfolio valuation services, auditing services, and legal and operational compliance activities. The Board found the services provided by the Advisor to the Fund under the management agreement to be competitive and of high quality.
Costs of Services and Profitability. The Advisor provides detailed information concerning its cost of providing various services to the Fund, its profitability in managing the Fund (pre- and post-distribution), its overall profitability, and its financial condition. The Directors have reviewed with the Advisor the methodology used to prepare this financial information. This information is considered in evaluating the Advisor’s financial condition, its ability to continue to provide services under the management agreement, and the reasonableness of the current management fee. The Board concluded that the Advisor’s profits were reasonable in light of the services provided to the Fund.
Ethics. The Board generally considers the Advisor’s commitment to providing quality services to shareholders and to conducting its business ethically. They noted that the Advisor’s practices generally meet or exceed industry best practices.
Economies of Scale. The Board also reviewed information provided by the Advisor regarding the possible existence of economies of scale in connection with the management of the Fund. The Board concluded that economies of scale are difficult to measure and predict with precision, especially on a fund-by-fund basis. The Board concluded that the Advisor is sharing economies of scale, to the extent they exist, through its competitive fee structure, offering competitive fees from fund inception, and through reinvestment in its business, infrastructure, investment capabilities and initiatives to provide shareholders additional content and services.
Comparison to Other Funds’ Fees. The management agreement provides that the Fund pays the Advisor a single, all-inclusive (or unified) management fee for providing all services necessary for the management and operation of the Fund, other than brokerage expenses, expenses attributable to short sales, taxes, interest, extraordinary expenses, fees and expenses of the Fund’s independent Directors (including their independent legal counsel), and expenses incurred in connection with the provision of shareholder services and distribution services under a plan adopted pursuant to Rule 12b-1 under the Investment Company Act. Under the unified fee structure, the Advisor is responsible for providing all investment advisory, custody, audit, administrative, compliance, recordkeeping, marketing and shareholder services, or arranging and supervising third parties to provide such services. By contrast, most other funds are charged a variety of fees, including an investment advisory fee, a transfer agency fee, an administrative fee, distribution charges, and other expenses. Other than their investment advisory fees and any applicable Rule 12b-1 distribution fees, all other components of the total fees charged by these other funds may be increased without shareholder approval. The Board believes the unified fee structure is a benefit to Fund shareholders because it clearly discloses to shareholders the cost of owning Fund shares, and, since the unified fee cannot be increased without a vote of Fund shareholders, it shifts to the Advisor the risk of increased costs of operating the Fund and provides a direct incentive to minimize administrative inefficiencies. Part of the Board’s analysis of fee levels involves reviewing certain evaluative data compiled by an independent provider comparing the Fund’s unified fee to the total expense ratios of its peers. The unified fee charged to shareholders of the Fund was above the median of the total expense ratios of the Fund’s peer expense universe. In addition, the Board reviewed the Fund’s position relative to the narrower set of its expense group peers. The Board and the Advisor agreed to a temporary reduction of the Fund's fee schedule that should have the effect of lowering the Fund's total expense ratio by approximately 0.04% (e.g., the Investor Class total expense ratio will be reduced from 0.83% to 0.79%), for at least one year, beginning August 1, 2021. The Board concluded that the management fee paid by the Fund to the Advisor under the management agreement is reasonable in light of the services provided to the Fund.
Comparison to Fees and Services Provided to Other Clients of the Advisor. The Board also requested and received information from the Advisor concerning the nature of the services, fees, costs, and profitability of its advisory services to advisory clients other than the Fund. They observed that these varying types of client accounts require different services and involve different regulatory and entrepreneurial risks than the management of the Fund. The Board analyzed this information and concluded that the fees charged and services provided to the Fund were reasonable by comparison.
Payments to Intermediaries. The Directors also requested and received a description of payments made to intermediaries by the Fund and the Advisor and services provided in response thereto. These payments include various payments made by the Fund or the Advisor to different types of intermediaries and recordkeepers for distribution and service activities provided for the Fund. The Directors reviewed such information and received representations from the Advisor that all such payments by the Fund were made pursuant to the Fund's Rule 12b-1 Plan and that all such payments by the Advisor were made from the Advisor’s resources and reasonable profits. The Board found such payments to be reasonable in scope and purpose.
Collateral or “Fall-Out” Benefits Derived by the Advisor. The Board considered the possible existence of collateral benefits the Advisor may receive as a result of its relationship with the Fund. They concluded that the Advisor’s primary business is managing funds and it generally does not use fund or shareholder information to generate profits in other lines of business, and therefore does not derive any significant collateral benefits from them. To the extent there are potential collateral benefits, the Board has been advised and has taken this into consideration in its review of the management contract with the Fund. The Board noted that additional assets from other clients may offer the Advisor some benefit from increased leverage with service providers and counterparties. Additionally, the Advisor may receive proprietary research from broker-dealers that execute fund portfolio transactions, which the Board concluded is likely to benefit other clients of the Advisor, as well as Fund shareholders. The Board also determined that the Advisor is able to provide investment management services to certain clients other than the Fund, at least in part, due to its existing infrastructure built to serve the fund complex. The Board concluded that appropriate allocation methodologies had been employed to assign resources and the cost of those resources to these other clients.
Existing Relationship. The Board also considered whether there was any reason for not continuing the existing arrangement with the Advisor. In this regard, the Board was mindful of the potential disruptions of the Fund’s operations and various risks, uncertainties, and other effects that could occur as a result of a decision not to continue such relationship. In particular, the Board recognized that most shareholders have invested in the Fund on the strength of the Advisor’s industry standing and reputation and in the expectation that the Advisor will have a continuing role in providing advisory services to the Fund.
Conclusion of the Directors. As a result of this process, the Board, including all of the independent Directors, taking into account all of the factors discussed above and the information provided by the Advisor and others in connection with its review and throughout the year, determined that the management fee is fair and reasonable in light of the services provided and that the investment management agreement between the Fund and the Advisor should be renewed.
| | |
| Liquidity Risk Management Program |
The Fund has adopted a liquidity risk management program (the “program”). The Fund’s Board of Directors (the "Board") has designated American Century Investment Management, Inc. (“ACIM”) as the administrator of the program. Personnel of ACIM or its affiliates conduct the day-to-day operation of the program pursuant to policies and procedures administered by those members of the ACIM’s Investment Oversight Committee who are members of the ACIM’s Investment Management and Global Analytics departments.
Under the program, ACIM manages the Fund’s liquidity risk, which is the risk that the Fund could not meet shareholder redemption requests without significant dilution of remaining shareholders’ interests in the Fund. This risk is managed by monitoring the degree of liquidity of the Fund’s investments, limiting the amount of the Fund’s illiquid investments, and utilizing various risk management tools and facilities available to the Fund for meeting shareholder redemptions, among other means. ACIM’s process of determining the degree of liquidity of the Fund’s investments is supported by one or more third-party liquidity assessment vendors.
The Board reviewed a report prepared by ACIM regarding the operation and effectiveness of the program for the period January 1, 2020 through December 31, 2020. No significant liquidity events impacting the Fund were noted in the report. In addition, ACIM provided its assessment that the program had been effective in managing the Fund’s liquidity risk.
Retirement Account Information
As required by law, distributions you receive from certain retirement accounts are subject to federal income tax withholding, unless you elect not to have withholding apply*. Tax will be withheld on the total amount withdrawn even though you may be receiving amounts that are not subject to withholding, such as nondeductible contributions. In such case, excess amounts of withholding could occur. You may adjust your withholding election so that a greater or lesser amount will be withheld.
If you don’t want us to withhold on this amount, you must notify us to not withhold the federal income tax. You may notify us in writing or in certain situations by telephone or through other electronic means. For systematic withdrawals, your withholding election will remain in effect until revoked or changed by filing a new election. You have the right to revoke your election at any time and change your withholding percentage for future distributions.
Remember, even if you elect not to have income tax withheld, you are liable for paying income tax on the taxable portion of your withdrawal. If you elect not to have income tax withheld or you don’t have enough income tax withheld, you may be responsible for payment of estimated tax. You may incur penalties under the estimated tax rules if your withholding and estimated tax payments are not sufficient. You can reduce or defer the income tax on a distribution by directly or indirectly rolling such distribution over to another IRA or eligible plan. You should consult your tax advisor for additional information.
State tax will be withheld if, at the time of your distribution, your address is within one of the mandatory withholding states and you have federal income tax withheld (or as otherwise required by state law). State taxes will be withheld from your distribution in accordance with the respective state rules.
*Some 403(b), 457 and qualified retirement plan distributions may be subject to 20% mandatory withholding, as they are subject to special tax and withholding rules. Your plan administrator or plan sponsor is required to provide you with a special tax notice explaining those rules at the time you request a distribution. If applicable, federal and/or state taxes may be withheld from your distribution amount.
Proxy Voting Policies
A description of the policies that the fund's investment advisor uses in exercising the voting rights associated with the securities purchased and/or held by the fund is available without charge, upon request, by calling 1-800-345-2021. It is also available on American Century Investments’ website at americancentury.com/proxy and on the Securities and Exchange Commission’s website at sec.gov. Information regarding how the investment advisor voted proxies relating to portfolio securities during the most recent 12-month period ended June 30 is available on americancentury.com/proxy. It is also available at sec.gov.
Quarterly Portfolio Disclosure
The fund files its complete schedule of portfolio holdings with the Securities and Exchange
Commission (SEC) for the first and third quarters of each fiscal year as an exhibit to its reports on
Form N-PORT. These portfolio holdings are available on the fund's website at
americancentury.com and, upon request, by calling 1-800-345-2021. The fund’s Form N-PORT
reports are available on the SEC’s website at sec.gov.
Other Tax Information
The following information is provided pursuant to provisions of the Internal Revenue Code.
The fund hereby designates up to the maximum amount allowable as qualified dividend income for
the fiscal year ended July 31, 2021.
For corporate taxpayers, the fund hereby designates $1,868,032, or up to the maximum amount
allowable, of ordinary income distributions paid during the fiscal year ended July 31, 2021 as
qualified for the corporate dividends received deduction.
The fund hereby designates $32,363,916, or up to the maximum amount allowable, as long-term
capital gain distributions (20% rate gain distributions) for the fiscal year ended July 31, 2021.
The fund hereby designates $10,962,863 as qualified short-term capital gain distributions for purposes of Internal Revenue Code Section 871 for the fiscal year ended July 31, 2021.
| | | | | | | | |
| |
| | |
| Contact Us | americancentury.com | |
| Automated Information Line | 1-800-345-8765 | |
| Investor Services Representative | 1-800-345-2021
or 816-531-5575 | |
| Investors Using Advisors | 1-800-378-9878 | |
| Business, Not-For-Profit, Employer-Sponsored Retirement Plans | 1-800-345-3533 | |
| Banks and Trust Companies, Broker-Dealers, Financial Professionals, Insurance Companies | 1-800-345-6488 | |
| Telecommunications Relay Service for the Deaf | 711 | |
| | |
| American Century Strategic Asset Allocations, Inc. | |
| | |
Investment Advisor: American Century Investment Management, Inc. Kansas City, Missouri | |
| | |
| This report and the statements it contains are submitted for the general information of our shareholders. The report is not authorized for distribution to prospective investors unless preceded or accompanied by an effective prospectus. | |
| | |
©2021 American Century Proprietary Holdings, Inc. All rights reserved.
CL-ANN-91037 2109 | |

| | | | | |
| |
| Annual Report |
| |
| July 31, 2021 |
| |
| Strategic Allocation: Conservative Fund |
| Investor Class (TWSCX) |
| I Class (ACCIX) |
| A Class (ACCAX) |
| C Class (AACCX) |
| R Class (AACRX) |
| R5 Class (AACGX) |
| R6 Class (AACDX) |
| | | | | |
| President’s Letter | |
| Performance | |
| Portfolio Commentary | |
| Fund Characteristics | |
| Shareholder Fee Example | |
| Schedule of Investments | |
| Statement of Assets and Liabilities | |
| Statement of Operations | |
| Statement of Changes in Net Assets | |
| Notes to Financial Statements | |
| Financial Highlights | |
| Report of Independent Registered Public Accounting Firm | |
| Management | |
| Approval of Management Agreement | |
| Liquidity Risk Management Program | |
| |
| Additional Information | |
| |
Any opinions expressed in this report reflect those of the author as of the date of the report, and do not necessarily represent the opinions of American Century Investments® or any other person in the American Century Investments organization. Any such opinions are subject to change at any time based upon market or other conditions and American Century Investments disclaims any responsibility to update such opinions. These opinions may not be relied upon as investment advice and, because investment decisions made by American Century Investments funds are based on numerous factors, may not be relied upon as an indication of trading intent on behalf of any American Century Investments fund. Security examples are used for representational purposes only and are not intended as recommendations to purchase or sell securities. Performance information for comparative indices and securities is provided to American Century Investments by third party vendors. To the best of American Century Investments’ knowledge, such information is accurate at the time of printing.
Jonathan Thomas
Dear Investor:
Thank you for reviewing this annual report for the period ended July 31, 2021. Annual reports help convey important information about fund returns, including market factors that affected performance. For additional investment insights, please visit americancentury.com.
Stocks Delivered Strong Gains
Global equities and other risk-on assets rallied for the 12-month period, benefiting from ongoing central bank and federal government support. These programs helped sustain investor confidence and bolster the economic landscape, despite ongoing challenges from COVID-19 and the inconsistent lifting of virus-related restrictions.
In general, data on U.S. manufacturing, employment, housing and corporate earnings remained upbeat during the period. Additionally, expanding COVID-19 vaccine availability and two federal coronavirus aid packages also helped promote investor optimism. Outside the U.S., economies recovered but at a slower pace. Virus outbreaks and slower vaccine rollouts led to lingering lockdowns in some regions.
Against this backdrop, inflation rose, but central banks remained supportive. In the U.S., where annual inflation soared to a 13-year high, the Federal Reserve (Fed) insisted temporary supply chain disruptions and other transient factors were at play. The Fed left interest rates unchanged but hinted it may start hiking rates in 2023, sooner than its previous timetable of 2024.
Despite ongoing pandemic-related challenges, including the emergence of the delta variant of COVID-19, risk assets remained in favor, and global stocks delivered stellar 12-month returns. The U.S. generally outperformed other developed markets, as the S&P 500 Index returned more than 36%. Value stocks generally outperformed growth stocks, while small caps sharply outpaced large caps. The broad U.S. bond market declined modestly, but global bonds delivered a slight gain.
Several Influences Shaping Market Dynamics
The return to pre-pandemic life is progressing, albeit somewhat cautiously due to the spread of the delta variant. As the economy and markets respond to this fluid backdrop, investors will face opportunities and ongoing challenges. Economic growth, inflation, the virus’s trajectory, supply chain normalization and fiscal and monetary policy likely will sway market dynamics.
We appreciate your confidence in us during these extraordinary times. Our firm has a long history of helping clients weather unpredictable markets, and we’re confident we will continue to meet today’s challenges.
Sincerely,
Jonathan Thomas
President and Chief Executive Officer
American Century Investments
| | | | | | | | | | | | | | | | | | | | | |
| Total Returns as of July 31, 2021 |
| | | | | Average Annual Returns | |
| | Ticker Symbol | | 1 year | 5 years | 10 years | Since Inception | Inception Date |
| Investor Class | TWSCX | | 18.09% | 8.22% | 7.01% | — | 2/15/96 |
| S&P 500 Index | — | | 36.45% | 17.34% | 15.33% | — | — |
| Bloomberg Barclays U.S. Aggregate Bond Index | — | | -0.70% | 3.12% | 3.34% | — | — |
| Bloomberg Barclays U.S. 1-3 Month Treasury Bill Index | — | | 0.06% | 1.10% | 0.58% | — | — |
| I Class | ACCIX | | 18.51% | 8.47% | 7.24% | — | 8/1/00 |
| A Class | ACCAX | | | | | | 10/2/96 |
| No sales charge | | | 17.79% | 7.99% | 6.75% | — | |
| With sales charge | | | 11.11% | 6.72% | 6.12% | — | |
| C Class | AACCX | | 16.90% | 7.17% | 5.94% | — | 9/30/04 |
| | | | | | | |
| | | | | | | |
| R Class | AACRX | | 17.59% | 7.72% | 6.48% | — | 3/31/05 |
| R5 Class | AACGX | | 18.48% | — | — | 9.24% | 4/10/17 |
| R6 Class | AACDX | | 18.48% | 8.63% | — | 7.32% | 7/26/13 |
Average annual returns since inception are presented when ten years of performance history is not available.
Fund returns would have been lower if a portion of the fees had not been waived.
C Class shares will automatically convert to A Class shares after being held for approximately eight years. C Class average annual returns do not reflect this conversion.
Sales charges include initial sales charges and contingent deferred sales charges (CDSCs), as applicable. A Class shares have a 5.75% maximum initial sales charge and may be subject to a maximum CDSC of 1.00%. C Class shares redeemed within 12 months of purchase are subject to a maximum CDSC of 1.00%. The SEC requires that mutual funds provide performance information net of maximum sales charges in all cases where charges could be applied.
Data presented reflect past performance. Past performance is no guarantee of future results. Current performance may be higher or lower than the performance shown. Total returns for periods less than one year are not annualized. Investment return and principal value will fluctuate, and redemption value may be more or less than original cost. Data assumes reinvestment of dividends and capital gains, and none of the charts reflect the deduction of taxes that a shareholder would pay on fund distributions or the redemption of fund shares. To obtain performance data current to the most recent month end, please call 1-800-345-2021 or visit americancentury.com. For additional information about the fund, please consult the prospectus.
| | |
| Growth of $10,000 Over 10 Years |
| $10,000 investment made July 31, 2011 |
| Performance for other share classes will vary due to differences in fee structure. |
| | | | | |
| Value on July 31, 2021 |
| Investor Class — $19,701 |
|
| S&P 500 Index — $41,689 |
|
| Bloomberg Barclays U.S. Aggregate Bond Index — $13,897 |
|
| Bloomberg Barclays U.S. 1-3 Month Treasury Bill Index — $10,600 |
|
Ending value of Investor Class would have been lower if a portion of the fees had not been waived.
| | | | | | | | | | | | | | | | | | | | |
Total Annual Fund Operating Expenses | | |
| Investor Class | I Class | A Class | C Class | R Class | R5 Class | R6 Class |
| 1.11% | 0.91% | 1.36% | 2.11% | 1.61% | 0.91% | 0.76% |
The total annual fund operating expenses shown is as stated in the fund’s prospectus current as of the date of this report. The prospectus may vary from the expense ratio shown elsewhere in this report because it is based on a different time period, includes acquired fund fees and expenses, and, if applicable, does not include fee waivers or expense reimbursements.
Data presented reflect past performance. Past performance is no guarantee of future results. Current performance may be higher or lower than the performance shown. Total returns for periods less than one year are not annualized. Investment return and principal value will fluctuate, and redemption value may be more or less than original cost. Data assumes reinvestment of dividends and capital gains, and none of the charts reflect the deduction of taxes that a shareholder would pay on fund distributions or the redemption of fund shares. To obtain performance data current to the most recent month end, please call 1-800-345-2021 or visit americancentury.com. For additional information about the fund, please consult the prospectus.
Portfolio Managers: Rich Weiss, Scott Wilson, Radu Gabudean, Vidya Rajappa and Brian Garbe
Performance Summary
Strategic Allocation: Conservative returned 18.09%* for the fiscal period ended July 31, 2021. Because of the fund’s strategic exposure to a variety of asset classes, a review of the financial markets helps provide context around performance for the reporting period.
Global financial markets performance was colored by a shift in investor sentiment in late 2020, when investors began to anticipate the rollout of COVID-19 vaccines. Prior to the approval, stock and bond markets had been volatile as the outlook for growth varied with pandemic news. Nevertheless, stimulative fiscal and monetary policies supported the economy and financial markets throughout. The change in sentiment was reflected in equity market performance—gains were initially led by growth-oriented stocks, but then shifted to more economically sensitive value stocks. It was a similar story in fixed-income markets, where risk aversion initially kept yields on government bonds near historic lows. But with the prospect of vaccine distribution and the end of the pandemic, investors generally shifted out of government bonds and into higher-yielding, more procyclical sectors to take advantage of an anticipated economic recovery. Later, however, inflation concerns began to play into investor decisions and contributed to market volatility.
In that environment, broad global equity indices finished the period at or near record highs. In the U.S., stocks generally posted very strong returns. Mid-cap companies led the way, followed by small caps and large caps, while value outperformed growth across all market capitalizations, according to the Russell family of indices. Emerging markets stocks also performed well but lagged the U.S. and developed non-U.S. markets. For the period, the S&P 500 Index gained 36.45%, while the MSCI EAFE Index rose 30.31% and the MSCI Emerging Markets (Net) Index increased 20.64%.
In fixed-income markets, government bonds benefited from concerns about the pandemic early in the period, as investors sought out high-quality, perceived safe-haven investments. In the U.S., unprecedented fiscal and monetary stimulus, and a new tolerance for higher inflation by the Federal Reserve, led to a rise in inflation expectations. As a result, yields on government bonds rose, while inflation-protected and corporate bonds performed well. Later in the period, concerns about a resurgence of COVID-19 and questions about the economic recovery caused government bond yields to decline somewhat. It was a similar story outside the U.S., where yields generally followed the same falling-rising-falling pattern, and ultimately ended the period higher than where they began. Add it all up, and the Bloomberg Barclays Global Aggregate Bond Index ex-USD (Unhedged) returned 1.66% and the Bloomberg Barclays Global Aggregate Bond Index (USD, Hedged) returned 0.23%. By comparison, the Bloomberg Barclays U.S. Aggregate Bond, U.S. High-Yield 2% Issuer Capped Bond and U.S. Treasury Inflation-Protected Securities (TIPS) Indices returned -0.70%, 10.62% and 6.90%, respectively.
Strategic Allocation: Conservative’s neutral asset mix throughout the period was 45% stocks, 49% bonds and 6% cash-equivalent investments. However, the portfolio’s actual asset weightings varied based on short-term tactical adjustments and fluctuating securities prices.
Tactical Positioning
In an effort to add value and improve the fund’s ability to achieve its objective, we make modest adjustments to the asset allocation. As for regional allocations, because of the speed and success of vaccine rollouts, the U.S. was at the forefront of the economic and earnings recovery. As a result, we maintained our overweight to U.S. stocks relative to non-U.S. markets throughout the period.
*All fund returns referenced in this commentary are for Investor Class shares. Fund returns would have been lower if a portion of the fees had not been waived. Performance for other share classes will vary due to differences in fee structure; when Investor Class performance exceeds that of the fund’s benchmark, other share classes may not. See page 3 for returns for all share classes.
Similarly, the continued economic recovery, rising consumer sentiment and indications of higher interest rates all favored value-oriented sectors like financials, materials and industrials over technology and health care. In that environment, we eliminated our long-standing growth overweight and moved to a value overweight during the period. The strong U.S. economic recovery and positive sentiment also pointed us toward a bias in favor of small-cap stocks relative to large.
In fixed income, the rapid economic rebound, higher interest rates and concerns about inflation weighed on government bond markets but favored TIPS and corporate bonds. These conditions benefited our fixed-income allocation, which generally underweighted government bonds in favor of TIPS and higher-yielding sectors such as corporates and select asset-backed securities. Our other tactical allocation decisions also produced positive effects, as U.S. equities outperformed non-U.S. equities, value beat growth and small beat large.
Equity Allocation Performed Well
The equity allocation of Strategic Allocation: Conservative performed well as all strategies produced positive returns. Gains were strong in large-cap and value-oriented holdings. In the U.S., large-cap value, large-cap core and mid-cap value were significant contributors. While overweight allocations to large-cap value were beneficial, security selections in this category limited gains. Returns were also strongly positive among small-cap value and small-cap growth positions. Mid-cap equity returns were also positive, though stock selection effects were mixed.
Outside the U.S., large-cap shares and global real estate were significant contributors, while growth-oriented and small-cap holdings made more modest contributions. In global real estate, security selection and our decision to overweight this allocation added to performance. Security selection was generally positive across the international equity segment and was particularly strong in the international small-cap value allocation. Stock selection was also a significant contributor in large caps, especially in large-cap core and growth allocations. In contrast, decisions to underweight large-cap non-U.S. equities detracted somewhat from returns.
Security Selection in Fixed Income Added to Performance
In a period when stocks surged to record highs and interest rates rose, the global bond allocation made only a modest, positive contribution to performance. Certain decisions particularly benefited fixed-income returns. For example, worries about resurgent inflation meant that it was beneficial to overweight TIPS. At the same time, expectations of an improving economy also contributed to strong returns in the high-yield market, where we were overweight. The fund’s bond holdings benefited notably from strong security selection.
Outlook
The global economic recovery is underway and corporate profits have rebounded sharply, but risks remain. Volatility could spike if investors’ assumptions about inflation, interest rates and corporate earnings disappoint. In addition, the resurgent virus and challenges in terms of vaccine distribution and virus mutation mean we are not out of the woods yet with respect to a sustained global economic recovery. And while the U.S. is leading the recovery in developed markets as easing coronavirus restrictions unleash pent-up consumer demand, emerging markets are improving more gradually as vaccination rates climb. Therefore, we remain neutral in our stock allocations relative to bonds and cash, preferring to stick to our long-term strategic diversification targets.
Within equities, economically sensitive value stocks look appealing relative to growth stocks. We believe the economic recovery that’s driving the rotation from growth to value still has plenty of room to run in the U.S. We also favor small-cap stocks based on several favorable conditions, including stronger U.S. growth relative to non-U.S. economies, low interest rates, tight corporate bond spreads, rising commodity prices and relatively attractive valuations.
In fixed-income markets, our outlook for emerging markets sovereign debt and U.S. securitized bonds is positive. We’re more selective around U.S. credit, U.S. government debt and European debt.
| | | | | |
| JULY 31, 2021 |
Types of Investments in Portfolio | % of net assets |
| Affiliated Funds | 30.2% |
| U.S. Treasury Securities | 19.4% |
| Common Stocks | 19.0% |
| Corporate Bonds | 8.1% |
| Sovereign Governments and Agencies | 7.7% |
| Commercial Paper | 2.3% |
| Collateralized Loan Obligations | 2.1% |
| Municipal Securities | 2.1% |
| Collateralized Mortgage Obligations | 1.0% |
| Preferred Stocks | 0.7% |
| Asset-Backed Securities | 0.6% |
| Certificates of Deposit | 0.5% |
| U.S. Government Agency Mortgage-Backed Securities | 0.5% |
| Exchange-Traded Funds | —* |
| Temporary Cash Investments | 5.4% |
| Temporary Cash Investments - Securities Lending Collateral | 0.1% |
| Other Assets and Liabilities | 0.3% |
*Category is less than 0.05% of total net assets.
Fund shareholders may incur two types of costs: (1) transaction costs, including sales charges (loads) on purchase payments and redemption/exchange fees; and (2) ongoing costs, including management fees; distribution and service (12b-1) fees; and other fund expenses. This example is intended to help you understand your ongoing costs (in dollars) of investing in your fund and to compare these costs with the ongoing cost of investing in other mutual funds.
The example is based on an investment of $1,000 made at the beginning of the period and held for the entire period from February 1, 2021 to July 31, 2021.
Actual Expenses
The table provides information about actual account values and actual expenses for each class. You may use the information, together with the amount you invested, to estimate the expenses that you paid over the period. First, identify the share class you own. Then simply divide your account value by $1,000 (for example, an $8,600 account value divided by $1,000 = 8.6), then multiply the result by the number under the heading “Expenses Paid During Period” to estimate the expenses you paid on your account during this period.
If you hold Investor Class shares of any American Century Investments fund, or I Class shares of the American Century Diversified Bond Fund, in an American Century Investments account (i.e., not through a financial intermediary or employer-sponsored retirement plan account), American Century Investments may charge you a $25.00 annual account maintenance fee if the value of those shares is less than $10,000. We will redeem shares automatically in one of your accounts to pay the $25.00 fee. In determining your total eligible investment amount, we will include your investments in all personal accounts (including American Century Investments brokerage accounts) registered under your Social Security number. Personal accounts include individual accounts, joint accounts, UGMA/UTMA accounts, personal trusts, Coverdell Education Savings Accounts and IRAs (including traditional, Roth, Rollover, SEP-, SARSEP- and SIMPLE-IRAs), and certain other retirement accounts. If you have only business, business retirement, employer-sponsored or American Century Investments brokerage accounts, you are currently not subject to this fee. If you are subject to the account maintenance fee, your account value could be reduced by the fee amount.
Hypothetical Example for Comparison Purposes
The table also provides information about hypothetical account values and hypothetical expenses based on the actual expense ratio of each class of your fund and an assumed rate of return of 5% per year before expenses, which is not the actual return of a fund’s share class. The hypothetical account values and expenses may not be used to estimate the actual ending account balance or expenses you paid for the period. You may use this information to compare the ongoing costs of investing in your fund and other funds. To do so, compare this 5% hypothetical example with the 5% hypothetical examples that appear in the shareholder reports of the other funds.
Please note that the expenses shown in the table are meant to highlight your ongoing costs only and do not reflect any transactional costs, such as sales charges (loads) or redemption/exchange fees. Therefore, the table is useful in comparing ongoing costs only, and will not help you determine the relative total costs of owning different funds. In addition, if these transactional costs were included, your costs would have been higher.
| | | | | | | | | | | | | | |
| | Beginning
Account Value
2/1/21 | Ending
Account Value
7/31/21 | Expenses Paid During Period(1) 2/1/21 - 7/31/21 | Annualized Expense Ratio(1) |
Actual |
| Investor Class | $1,000 | $1,080.50 | $3.97 | 0.77% |
| I Class | $1,000 | $1,083.30 | $2.94 | 0.57% |
| A Class | $1,000 | $1,081.00 | $5.26 | 1.02% |
| C Class | $1,000 | $1,075.20 | $9.11 | 1.77% |
| R Class | $1,000 | $1,078.50 | $6.54 | 1.27% |
| R5 Class | $1,000 | $1,083.10 | $2.94 | 0.57% |
| R6 Class | $1,000 | $1,084.10 | $2.17 | 0.42% |
| Hypothetical |
| Investor Class | $1,000 | $1,020.98 | $3.86 | 0.77% |
| I Class | $1,000 | $1,021.97 | $2.86 | 0.57% |
| A Class | $1,000 | $1,019.74 | $5.11 | 1.02% |
| C Class | $1,000 | $1,016.02 | $8.85 | 1.77% |
| R Class | $1,000 | $1,018.50 | $6.36 | 1.27% |
| R5 Class | $1,000 | $1,021.97 | $2.86 | 0.57% |
| R6 Class | $1,000 | $1,022.71 | $2.11 | 0.42% |
(1)Expenses are equal to the class's annualized expense ratio listed in the table above, multiplied by the average account value over the period, multiplied by 181, the number of days in the most recent fiscal half-year, divided by 365, to reflect the one-half year period. Annualized expense ratio reflects actual expenses, including any applicable fee waivers or expense reimbursements and excluding any acquired fund fees and expenses.
JULY 31, 2021
| | | | | | | | | | | |
| | Shares/Principal Amount | Value |
AFFILIATED FUNDS(1) — 30.2% | | | |
| American Century Diversified Corporate Bond ETF | | 389,060 | | $ | 20,574,271 | |
| American Century Focused Dynamic Growth ETF | | 56,357 | | 4,660,160 | |
| American Century Focused Large Cap Value ETF | | 218,758 | | 13,404,681 | |
| American Century Quality Diversified International ETF | | 191,236 | | 9,959,131 | |
| American Century STOXX U.S. Quality Growth ETF | | 237,983 | | 17,376,686 | |
| American Century STOXX U.S. Quality Value ETF | | 576,226 | | 29,240,127 | |
| Avantis International Equity ETF | | 173,519 | | 11,047,955 | |
| Avantis International Small Cap Value ETF | | 36,537 | | 2,386,597 | |
| Avantis U.S. Equity ETF | | 284,284 | | 21,278,657 | |
| Avantis U.S. Small Cap Value ETF | | 87,620 | | 6,430,432 | |
TOTAL AFFILIATED FUNDS (Cost $102,099,087) | | | 136,358,697 | |
| U.S. TREASURY SECURITIES — 19.4% | | | |
U.S. Treasury Bills, 0.05%, 8/3/21(2) | | $ | 560,000 | | 560,000 | |
U.S. Treasury Bills, 0.05%, 9/2/21(2) | | 210,000 | | 209,993 | |
U.S. Treasury Bills, 0.05%, 9/9/21(2) | | 280,000 | | 279,988 | |
U.S. Treasury Bills, 0.04%, 9/30/21(2) | | 500,000 | | 499,965 | |
| U.S. Treasury Bonds, 4.50%, 5/15/38 | | 1,000,000 | | 1,433,477 | |
| U.S. Treasury Bonds, 2.25%, 5/15/41 | | 1,250,000 | | 1,343,066 | |
| U.S. Treasury Bonds, 3.00%, 5/15/42 | | 430,000 | | 518,939 | |
U.S. Treasury Bonds, 2.50%, 2/15/45(3) | | 1,700,000 | | 1,902,539 | |
| U.S. Treasury Bonds, 3.00%, 5/15/45 | | 600,000 | | 731,039 | |
| U.S. Treasury Bonds, 3.00%, 11/15/45 | | 850,000 | | 1,038,727 | |
U.S. Treasury Cash Management Bills, 0.04%, 9/16/21(2) | | 640,000 | | 639,970 | |
| U.S. Treasury Inflation Indexed Bonds, 2.375%, 1/15/25 | | 2,214,237 | | 2,590,236 | |
| U.S. Treasury Inflation Indexed Bonds, 2.375%, 1/15/27 | | 400,581 | | 499,486 | |
| U.S. Treasury Inflation Indexed Bonds, 0.75%, 2/15/42 | | 595,845 | | 750,041 | |
| U.S. Treasury Inflation Indexed Bonds, 0.625%, 2/15/43 | | 585,610 | | 723,790 | |
| U.S. Treasury Inflation Indexed Bonds, 0.75%, 2/15/45 | | 571,755 | | 730,725 | |
| U.S. Treasury Inflation Indexed Bonds, 0.875%, 2/15/47 | | 557,755 | | 745,703 | |
| U.S. Treasury Inflation Indexed Bonds, 0.125%, 2/15/51 | | 723,996 | | 833,239 | |
| U.S. Treasury Inflation Indexed Notes, 0.125%, 7/15/22 | | 2,868,828 | | 2,964,872 | |
| U.S. Treasury Inflation Indexed Notes, 0.125%, 1/15/23 | | 3,266,452 | | 3,411,903 | |
| U.S. Treasury Inflation Indexed Notes, 0.375%, 7/15/23 | | 3,586,979 | | 3,821,097 | |
| U.S. Treasury Inflation Indexed Notes, 0.625%, 1/15/24 | | 1,500,265 | | 1,621,771 | |
| U.S. Treasury Inflation Indexed Notes, 0.50%, 4/15/24 | | 4,003,763 | | 4,336,583 | |
| U.S. Treasury Inflation Indexed Notes, 0.125%, 7/15/24 | | 9,922,938 | | 10,739,940 | |
| U.S. Treasury Inflation Indexed Notes, 0.125%, 10/15/24 | | 2,256,511 | | 2,448,784 | |
| U.S. Treasury Inflation Indexed Notes, 0.25%, 1/15/25 | | 4,547,520 | | 4,963,231 | |
| U.S. Treasury Inflation Indexed Notes, 0.125%, 4/15/25 | | 4,222,085 | | 4,604,947 | |
| U.S. Treasury Inflation Indexed Notes, 0.625%, 1/15/26 | | 6,346,256 | | 7,148,584 | |
| U.S. Treasury Inflation Indexed Notes, 0.125%, 4/15/26 | | 3,799,123 | | 4,193,710 | |
| U.S. Treasury Inflation Indexed Notes, 0.125%, 7/15/26 | | 1,235,718 | | 1,376,726 | |
| U.S. Treasury Inflation Indexed Notes, 0.375%, 1/15/27 | | 222,948 | | 251,845 | |
| U.S. Treasury Inflation Indexed Notes, 0.50%, 1/15/28 | | 3,820,810 | | 4,388,290 | |
| U.S. Treasury Inflation Indexed Notes, 0.875%, 1/15/29 | | 2,666,075 | | 3,169,565 | |
| U.S. Treasury Inflation Indexed Notes, 0.125%, 1/15/30 | | 6,279,660 | | 7,100,803 | |
| | | | | | | | | | | |
| | Shares/Principal Amount | Value |
| U.S. Treasury Inflation Indexed Notes, 0.125%, 1/15/31 | | $ | 4,137,680 | | $ | 4,687,717 | |
| U.S. Treasury Notes, 0.375%, 3/31/22 | | 200,000 | | 200,397 | |
U.S. Treasury Notes, 2.25%, 8/15/27(3) | | 300,000 | | 324,703 | |
TOTAL U.S. TREASURY SECURITIES (Cost $80,789,033) | | | 87,786,391 | |
| COMMON STOCKS — 19.0% | | | |
| Aerospace and Defense — 0.3% | | | |
Babcock International Group plc(4) | | 22,846 | | 81,198 | |
| BAE Systems plc | | 53,530 | | 429,179 | |
CAE, Inc.(4) | | 757 | | 23,099 | |
| General Dynamics Corp. | | 1,790 | | 350,894 | |
| Lockheed Martin Corp. | | 557 | | 207,020 | |
Mercury Systems, Inc.(4) | | 966 | | 63,756 | |
| Safran SA | | 972 | | 127,210 | |
| Spirit AeroSystems Holdings, Inc., Class A | | 965 | | 41,698 | |
| | | 1,324,054 | |
| Air Freight and Logistics — 0.1% | | | |
| Expeditors International of Washington, Inc. | | 723 | | 92,725 | |
| United Parcel Service, Inc., Class B | | 1,122 | | 214,706 | |
| | | 307,431 | |
| Airlines — 0.1% | | | |
Ryanair Holdings plc, ADR(4) | | 734 | | 80,035 | |
Southwest Airlines Co.(4) | | 7,527 | | 380,264 | |
| | | 460,299 | |
| Auto Components — 0.3% | | | |
Aptiv plc(4) | | 2,798 | | 466,846 | |
| BorgWarner, Inc. | | 5,680 | | 278,207 | |
| Bridgestone Corp. | | 2,700 | | 118,948 | |
| Hyundai Mobis Co. Ltd. | | 544 | | 126,390 | |
| Linamar Corp. | | 819 | | 48,460 | |
| Minth Group Ltd. | | 2,000 | | 8,458 | |
| Sumitomo Rubber Industries Ltd. | | 4,900 | | 65,950 | |
| Valeo SA | | 2,901 | | 83,885 | |
| | | 1,197,144 | |
| Automobiles — 0.2% | | | |
| Bayerische Motoren Werke AG | | 1,529 | | 152,030 | |
| Daimler AG | | 3,646 | | 325,367 | |
| Honda Motor Co. Ltd., ADR | | 7,617 | | 244,506 | |
Nissan Motor Co. Ltd.(4) | | 29,200 | | 169,472 | |
Tesla, Inc.(4) | | 168 | | 115,450 | |
| | | 1,006,825 | |
| Banks — 0.9% | | | |
AIB Group plc(4) | | 10,349 | | 25,418 | |
Banco Bilbao Vizcaya Argentaria SA(4) | | 22,478 | | 143,892 | |
| Banco Bradesco SA | | 9,386 | | 37,485 | |
| Banco do Brasil SA | | 10,700 | | 64,858 | |
| Bank Central Asia Tbk PT | | 22,000 | | 45,416 | |
| Bank of America Corp. | | 7,557 | | 289,887 | |
| Barclays plc | | 117,442 | | 284,102 | |
| BNP Paribas SA | | 3,346 | | 204,036 | |
| BPER Banca | | 10,502 | | 20,474 | |
| CaixaBank SA | | 38,691 | | 114,909 | |
| | | | | | | | | | | |
| | Shares/Principal Amount | Value |
| Canadian Western Bank | | 882 | | $ | 24,044 | |
| Commerce Bancshares, Inc. | | 634 | | 44,843 | |
Commerzbank AG(4) | | 7,535 | | 48,525 | |
| Eastern Bankshares, Inc. | | 1,374 | | 25,075 | |
| First Hawaiian, Inc. | | 4,957 | | 136,466 | |
| HDFC Bank Ltd., ADR | | 1,588 | | 112,065 | |
| HSBC Holdings plc | | 22,800 | | 125,847 | |
| JPMorgan Chase & Co. | | 2,511 | | 381,120 | |
Jyske Bank A/S(4) | | 406 | | 19,701 | |
| M&T Bank Corp. | | 1,790 | | 239,591 | |
| Mitsubishi UFJ Financial Group, Inc. | | 39,700 | | 209,722 | |
| Mizuho Financial Group, Inc. | | 10,590 | | 151,327 | |
| Prosperity Bancshares, Inc. | | 2,262 | | 154,246 | |
| Regions Financial Corp. | | 11,962 | | 230,268 | |
Silvergate Capital Corp., Class A(4) | | 422 | | 43,382 | |
| Societe Generale SA | | 3,155 | | 92,396 | |
| Standard Chartered plc (London) | | 7,624 | | 45,704 | |
| Sumitomo Mitsui Financial Group, Inc. | | 4,000 | | 134,836 | |
Triumph Bancorp, Inc.(4) | | 808 | | 61,941 | |
| Truist Financial Corp. | | 6,440 | | 350,529 | |
| UniCredit SpA | | 4,772 | | 57,080 | |
Virgin Money UK plc(4) | | 4,891 | | 13,518 | |
| Westamerica Bancorporation | | 2,526 | | 140,319 | |
| | | 4,073,022 | |
| Beverages — 0.1% | | | |
Boston Beer Co., Inc. (The), Class A(4) | | 118 | | 83,780 | |
| MGP Ingredients, Inc. | | 534 | | 31,853 | |
| PepsiCo, Inc. | | 2,006 | | 314,842 | |
| Royal Unibrew A/S | | 185 | | 25,070 | |
| | | 455,545 | |
| Biotechnology — 0.3% | | | |
| AbbVie, Inc. | | 694 | | 80,712 | |
Acceleron Pharma, Inc.(4) | | 305 | | 38,143 | |
ADC Therapeutics SA(4)(5) | | 1,092 | | 22,976 | |
Alnylam Pharmaceuticals, Inc.(4) | | 714 | | 127,763 | |
| Amgen, Inc. | | 645 | | 155,793 | |
Arcutis Biotherapeutics, Inc.(4) | | 1,082 | | 25,243 | |
Arena Pharmaceuticals, Inc.(4) | | 363 | | 22,455 | |
Argenx SE, ADR(4) | | 280 | | 85,240 | |
Biohaven Pharmaceutical Holding Co. Ltd.(4) | | 529 | | 66,659 | |
Blueprint Medicines Corp.(4) | | 438 | | 38,487 | |
Bridgebio Pharma, Inc.(4) | | 744 | | 39,767 | |
Centessa Pharmaceuticals plc, ADR(4) | | 1,068 | | 22,044 | |
Cytokinetics, Inc.(4) | | 969 | | 28,760 | |
Deciphera Pharmaceuticals, Inc.(4) | | 849 | | 25,886 | |
Erasca, Inc.(4) | | 852 | | 17,892 | |
Fate Therapeutics, Inc.(4) | | 371 | | 30,719 | |
FibroGen, Inc.(4) | | 776 | | 10,088 | |
Flexion Therapeutics, Inc.(4) | | 2,028 | | 12,026 | |
Global Blood Therapeutics, Inc.(4) | | 973 | | 26,592 | |
Halozyme Therapeutics, Inc.(4) | | 1,208 | | 49,927 | |
Heron Therapeutics, Inc.(4) | | 911 | | 11,260 | |
| | | | | | | | | | | |
| | Shares/Principal Amount | Value |
Horizon Therapeutics plc(4) | | 1,455 | | $ | 145,529 | |
Immunovant, Inc.(4) | | 730 | | 7,636 | |
Insmed, Inc.(4) | | 1,553 | | 38,204 | |
Intellia Therapeutics, Inc.(4) | | 198 | | 28,086 | |
Invitae Corp.(4)(5) | | 671 | | 18,781 | |
Iovance Biotherapeutics, Inc.(4) | | 352 | | 7,839 | |
KalVista Pharmaceuticals, Inc.(4) | | 772 | | 15,548 | |
Karuna Therapeutics, Inc.(4) | | 365 | | 41,690 | |
Kinnate Biopharma, Inc.(4)(5) | | 509 | | 10,984 | |
Kymera Therapeutics, Inc.(4) | | 428 | | 25,757 | |
Natera, Inc.(4) | | 1,403 | | 160,672 | |
Relay Therapeutics, Inc.(4) | | 575 | | 18,653 | |
Sigilon Therapeutics, Inc.(4) | | 1,040 | | 5,242 | |
Turning Point Therapeutics, Inc.(4) | | 719 | | 45,887 | |
Vertex Pharmaceuticals, Inc.(4) | | 338 | | 68,134 | |
| | | 1,577,074 | |
| Building Products — 0.2% | | | |
| Johnson Controls International plc | | 5,041 | | 360,028 | |
| Masco Corp. | | 2,382 | | 142,229 | |
Masonite International Corp.(4) | | 560 | | 63,370 | |
| Sanwa Holdings Corp. | | 1,100 | | 13,386 | |
| Trane Technologies plc | | 1,123 | | 228,654 | |
Trex Co., Inc.(4) | | 496 | | 48,162 | |
| | | 855,829 | |
| Capital Markets — 0.9% | | | |
| Ameriprise Financial, Inc. | | 1,715 | | 441,715 | |
| Bank of New York Mellon Corp. (The) | | 11,932 | | 612,470 | |
| BlackRock, Inc. | | 236 | | 204,652 | |
| Credit Suisse Group AG | | 17,615 | | 176,842 | |
flatexDEGIRO AG(4) | | 147 | | 17,764 | |
| GCM Grosvenor, Inc., Class A | | 2,506 | | 24,960 | |
| Intercontinental Exchange, Inc. | | 857 | | 102,694 | |
| Intermediate Capital Group plc | | 1,372 | | 41,346 | |
| LPL Financial Holdings, Inc. | | 1,534 | | 216,355 | |
| MarketAxess Holdings, Inc. | | 210 | | 99,786 | |
| Morgan Stanley | | 3,860 | | 370,483 | |
| MSCI, Inc. | | 346 | | 206,202 | |
| Northern Trust Corp. | | 4,748 | | 535,812 | |
Open Lending Corp., Class A(4) | | 2,237 | | 85,006 | |
| Partners Group Holding AG | | 100 | | 170,836 | |
| S&P Global, Inc. | | 579 | | 248,229 | |
| State Street Corp. | | 1,725 | | 150,316 | |
| T. Rowe Price Group, Inc. | | 1,223 | | 249,688 | |
| | | 3,955,156 | |
| Chemicals — 0.3% | | | |
| Air Liquide SA | | 590 | | 102,606 | |
| Air Products and Chemicals, Inc. | | 342 | | 99,532 | |
| Albemarle Corp. | | 382 | | 78,707 | |
Axalta Coating Systems Ltd.(4) | | 6,834 | | 205,703 | |
| Corbion NV | | 110 | | 6,022 | |
Diversey Holdings Ltd.(4) | | 2,951 | | 49,223 | |
| | | | | | | | | | | |
| | Shares/Principal Amount | Value |
| Ecolab, Inc. | | 456 | | $ | 100,699 | |
| Element Solutions, Inc. | | 6,587 | | 154,070 | |
| Koninklijke DSM NV | | 517 | | 104,218 | |
| Linde plc | | 890 | | 273,577 | |
OCI NV(4) | | 550 | | 13,342 | |
| Sherwin-Williams Co. (The) | | 450 | | 130,964 | |
| Zeon Corp. | | 1,000 | | 13,663 | |
| | | 1,332,326 | |
| Commercial Services and Supplies — 0.1% | | | |
| Brink's Co. (The) | | 1,068 | | 82,193 | |
Clean Harbors, Inc.(4) | | 817 | | 77,615 | |
Driven Brands Holdings, Inc.(4) | | 2,845 | | 90,528 | |
Elis SA(4) | | 1,361 | | 24,407 | |
| Loomis AB | | 787 | | 26,388 | |
| Republic Services, Inc. | | 2,612 | | 309,156 | |
| | | 610,287 | |
| Communications Equipment — 0.3% | | | |
Arista Networks, Inc.(4) | | 744 | | 283,010 | |
| Cisco Systems, Inc. | | 4,483 | | 248,224 | |
F5 Networks, Inc.(4) | | 2,664 | | 550,142 | |
| Juniper Networks, Inc. | | 5,826 | | 163,944 | |
| Telefonaktiebolaget LM Ericsson, B Shares | | 9,853 | | 113,646 | |
| | | 1,358,966 | |
Construction and Engineering† | | | |
| Arcadis NV | | 564 | | 24,977 | |
| Hazama Ando Corp. | | 3,800 | | 28,909 | |
| | | 53,886 | |
| Construction Materials — 0.1% | | | |
| Buzzi Unicem SpA | | 494 | | 13,058 | |
Cemex SAB de CV, ADR(4) | | 20,222 | | 164,405 | |
| Eagle Materials, Inc. | | 367 | | 51,864 | |
Summit Materials, Inc., Class A(4) | | 851 | | 28,594 | |
| | | 257,921 | |
Consumer Finance† | | | |
| American Express Co. | | 1,021 | | 174,111 | |
goeasy Ltd.(5) | | 205 | | 28,098 | |
| | | 202,209 | |
| Containers and Packaging — 0.3% | | | |
| Amcor plc | | 10,692 | | 123,599 | |
| Avery Dennison Corp. | | 1,060 | | 223,321 | |
| Ball Corp. | | 2,544 | | 205,759 | |
| Intertape Polymer Group, Inc. | | 1,588 | | 35,347 | |
| Packaging Corp. of America | | 1,173 | | 165,979 | |
SIG Combibloc Group AG(4) | | 933 | | 27,529 | |
| Sonoco Products Co. | | 6,948 | | 443,213 | |
| | | 1,224,747 | |
Distributors† | | | |
| D'ieteren Group | | 251 | | 40,230 | |
Diversified Consumer Services† | | | |
Chegg, Inc.(4) | | 752 | | 66,650 | |
| IDP Education Ltd. | | 985 | | 20,410 | |
| | | 87,060 | |
| | | | | | | | | | | |
| | Shares/Principal Amount | Value |
Diversified Financial Services† | | | |
| Zenkoku Hosho Co. Ltd. | | 500 | | $ | 22,685 | |
| Diversified Telecommunication Services — 0.1% | | | |
BT Group plc(4) | | 19,797 | | 47,686 | |
| Cellnex Telecom SA | | 3,390 | | 221,084 | |
| Verizon Communications, Inc. | | 1,624 | | 90,587 | |
| | | 359,357 | |
| Electric Utilities — 0.4% | | | |
| Edison International | | 7,230 | | 394,035 | |
| Evergy, Inc. | | 2,150 | | 140,223 | |
| Eversource Energy | | 1,741 | | 150,196 | |
| Iberdrola SA | | 8,384 | | 100,902 | |
| NextEra Energy, Inc. | | 4,850 | | 377,815 | |
| Pinnacle West Capital Corp. | | 4,761 | | 397,782 | |
| Xcel Energy, Inc. | | 927 | | 63,268 | |
| | | 1,624,221 | |
| Electrical Equipment — 0.5% | | | |
| AMETEK, Inc. | | 1,397 | | 194,253 | |
| Eaton Corp. plc | | 998 | | 157,734 | |
| Emerson Electric Co. | | 4,884 | | 492,747 | |
Generac Holdings, Inc.(4) | | 253 | | 106,098 | |
| Hubbell, Inc. | | 1,442 | | 289,063 | |
| Nexans SA | | 300 | | 28,714 | |
| nVent Electric plc | | 17,795 | | 562,500 | |
Plug Power, Inc.(4) | | 1,118 | | 30,499 | |
| Rockwell Automation, Inc. | | 600 | | 184,452 | |
| Schneider Electric SE | | 1,177 | | 197,134 | |
Sensata Technologies Holding plc(4) | | 1,037 | | 60,789 | |
| Ushio, Inc. | | 900 | | 16,127 | |
| | | 2,320,110 | |
| Electronic Equipment, Instruments and Components — 0.3% | | |
| CDW Corp. | | 895 | | 164,098 | |
| Cognex Corp. | | 3,688 | | 333,432 | |
| Comet Holding AG | | 67 | | 21,939 | |
Fabrinet(4) | | 355 | | 33,555 | |
| Hexagon AB, B Shares | | 9,121 | | 150,985 | |
| Jabil, Inc. | | 890 | | 52,991 | |
| Keyence Corp. | | 200 | | 111,401 | |
Keysight Technologies, Inc.(4) | | 2,580 | | 424,539 | |
| National Instruments Corp. | | 893 | | 39,390 | |
nLight, Inc.(4) | | 1,963 | | 68,096 | |
Sesa SpA(4) | | 145 | | 25,816 | |
| TE Connectivity Ltd. | | 929 | | 137,000 | |
| | | 1,563,242 | |
| Energy Equipment and Services — 0.1% | | | |
| Baker Hughes Co. | | 9,306 | | 197,659 | |
| Schlumberger NV | | 4,019 | | 115,868 | |
| | | 313,527 | |
| Entertainment — 0.2% | | | |
| Activision Blizzard, Inc. | | 994 | | 83,118 | |
Live Nation Entertainment, Inc.(4) | | 975 | | 76,918 | |
| | | | | | | | | | | |
| | Shares/Principal Amount | Value |
ROBLOX Corp., Class A(4) | | 422 | | $ | 32,486 | |
Roku, Inc.(4) | | 490 | | 209,872 | |
Sea Ltd., ADR(4) | | 376 | | 103,836 | |
Walt Disney Co. (The)(4) | | 2,104 | | 370,346 | |
Zynga, Inc., Class A(4) | | 12,083 | | 122,038 | |
| | | 998,614 | |
| Equity Real Estate Investment Trusts (REITs) — 1.8% | | | |
| American Campus Communities, Inc. | | 1,540 | | 77,477 | |
| Brixmor Property Group, Inc. | | 4,218 | | 97,098 | |
Capital & Counties Properties plc(4) | | 27,002 | | 64,038 | |
| Charter Hall Group | | 8,791 | | 105,051 | |
| Comforia Residential REIT, Inc. | | 18 | | 57,519 | |
| Community Healthcare Trust, Inc. | | 714 | | 35,579 | |
| CoreSite Realty Corp. | | 516 | | 71,316 | |
| Crown Castle International Corp. | | 284 | | 54,838 | |
| Empire State Realty Trust, Inc., Class A | | 3,511 | | 40,131 | |
| Equinix, Inc. | | 678 | | 556,238 | |
| Equity Residential | | 2,458 | | 206,792 | |
| Essential Properties Realty Trust, Inc. | | 1,670 | | 49,766 | |
| Essex Property Trust, Inc. | | 1,122 | | 368,128 | |
| Extra Space Storage, Inc. | | 1,164 | | 202,699 | |
| Fibra Uno Administracion SA de CV | | 73,205 | | 79,654 | |
| Global Medical REIT, Inc. | | 2,467 | | 38,387 | |
| Goodman Group | | 14,121 | | 234,863 | |
| Healthcare Trust of America, Inc., Class A | | 8,752 | | 250,220 | |
| Healthpeak Properties, Inc. | | 9,206 | | 340,346 | |
| Ingenia Communities Group | | 14,134 | | 60,329 | |
| Innovative Industrial Properties, Inc. | | 886 | | 190,481 | |
| Invincible Investment Corp. | | 134 | | 52,644 | |
| Invitation Homes, Inc. | | 7,831 | | 318,565 | |
| Iron Mountain, Inc. | | 2,166 | | 94,784 | |
| Japan Hotel REIT Investment Corp. | | 28 | | 17,075 | |
| Kilroy Realty Corp. | | 1,252 | | 86,726 | |
| Kimco Realty Corp. | | 6,294 | | 134,251 | |
Klepierre SA(4) | | 3,173 | | 76,824 | |
| LaSalle Logiport REIT | | 41 | | 75,096 | |
| Life Storage, Inc. | | 1,468 | | 172,284 | |
| Link REIT | | 11,600 | | 110,854 | |
| Mapletree Commercial Trust | | 40,900 | | 65,116 | |
| Mapletree Logistics Trust | | 34,300 | | 53,404 | |
| MGM Growth Properties LLC, Class A | | 8,104 | | 306,331 | |
| Mitsubishi Estate Logistics REIT Investment Corp. | | 12 | | 55,324 | |
| NETSTREIT Corp. | | 1,997 | | 51,822 | |
| Orix JREIT, Inc. | | 31 | | 59,151 | |
| Prologis, Inc. | | 8,068 | | 1,033,027 | |
| Realty Income Corp. | | 2,343 | | 164,689 | |
| Rexford Industrial Realty, Inc. | | 2,148 | | 132,145 | |
Ryman Hospitality Properties, Inc.(4) | | 766 | | 58,752 | |
| SBA Communications Corp. | | 260 | | 88,657 | |
| Segro plc | | 7,769 | | 131,329 | |
Shaftesbury plc(5) | | 7,835 | | 64,224 | |
| Simon Property Group, Inc. | | 1,624 | | 205,469 | |
| | | | | | | | | | | |
| | Shares/Principal Amount | Value |
| SL Green Realty Corp. | | 846 | | $ | 62,993 | |
| SOSiLA Logistics REIT, Inc. | | 54 | | 84,744 | |
| Sun Communities, Inc. | | 1,169 | | 229,253 | |
| Tritax Big Box REIT plc | | 9,665 | | 28,276 | |
| UDR, Inc. | | 5,366 | | 295,076 | |
| Urban Edge Properties | | 4,265 | | 81,035 | |
| Ventas, Inc. | | 1,808 | | 108,082 | |
| VICI Properties, Inc. | | 3,415 | | 106,514 | |
| Welltower, Inc. | | 2,870 | | 249,288 | |
| Weyerhaeuser Co. | | 2,121 | | 71,541 | |
| Workspace Group plc | | 6,647 | | 79,617 | |
Xenia Hotels & Resorts, Inc.(4) | | 4,713 | | 83,326 | |
| | | 8,269,238 | |
| Food and Staples Retailing — 0.2% | | | |
| Costco Wholesale Corp. | | 282 | | 121,181 | |
| Koninklijke Ahold Delhaize NV | | 14,724 | | 457,693 | |
MARR SpA(4) | | 836 | | 19,402 | |
| Matsumotokiyoshi Holdings Co. Ltd. | | 600 | | 26,659 | |
| Sysco Corp. | | 4,468 | | 331,526 | |
Zur Rose Group AG(4) | | 269 | | 100,024 | |
| | | 1,056,485 | |
| Food Products — 0.3% | | | |
| Bakkafrost P/F | | 423 | | 35,948 | |
Beyond Meat, Inc.(4) | | 55 | | 6,748 | |
| Conagra Brands, Inc. | | 12,986 | | 434,901 | |
| General Mills, Inc. | | 2,524 | | 148,563 | |
| Glanbia plc | | 1,504 | | 25,819 | |
| J.M. Smucker Co. (The) | | 1,541 | | 202,041 | |
| Kellogg Co. | | 2,448 | | 155,105 | |
| Mondelez International, Inc., Class A | | 2,654 | | 167,892 | |
| Orkla ASA | | 18,739 | | 170,195 | |
Vital Farms, Inc.(4) | | 740 | | 12,883 | |
Whole Earth Brands, Inc.(4) | | 3,230 | | 41,538 | |
| | | 1,401,633 | |
| Gas Utilities — 0.1% | | | |
| Atmos Energy Corp. | | 1,988 | | 195,997 | |
| Nippon Gas Co. Ltd. | | 1,800 | | 28,431 | |
| Spire, Inc. | | 2,608 | | 185,038 | |
| | | 409,466 | |
| Health Care Equipment and Supplies — 0.7% | | | |
Align Technology, Inc.(4) | | 206 | | 143,335 | |
| Arjo AB, B Shares | | 927 | | 11,710 | |
| Baxter International, Inc. | | 1,727 | | 133,583 | |
| Becton Dickinson and Co. | | 1,058 | | 270,584 | |
DexCom, Inc.(4) | | 389 | | 200,533 | |
Eargo, Inc.(4)(5) | | 1,058 | | 38,088 | |
Edwards Lifesciences Corp.(4) | | 1,931 | | 216,793 | |
| Elekta AB, B Shares | | 825 | | 12,041 | |
Envista Holdings Corp.(4) | | 2,755 | | 118,685 | |
IDEXX Laboratories, Inc.(4) | | 384 | | 260,556 | |
Inmode Ltd.(4) | | 286 | | 32,510 | |
| | | | | | | | | | | |
| | Shares/Principal Amount | Value |
| Koninklijke Philips NV | | 3,618 | | $ | 166,573 | |
| Medtronic plc | | 1,392 | | 182,784 | |
NeuroPace, Inc.(4) | | 1,500 | | 31,950 | |
| Olympus Corp. | | 4,200 | | 86,433 | |
Ortho Clinical Diagnostics Holdings plc(4) | | 2,901 | | 65,185 | |
OrthoPediatrics Corp.(4) | | 488 | | 30,666 | |
| ResMed, Inc. | | 181 | | 49,196 | |
Silk Road Medical, Inc.(4) | | 966 | | 48,474 | |
Tandem Diabetes Care, Inc.(4) | | 809 | | 87,914 | |
| Teleflex, Inc. | | 335 | | 133,139 | |
| Zimmer Biomet Holdings, Inc. | | 4,720 | | 771,342 | |
| | | 3,092,074 | |
| Health Care Providers and Services — 0.9% | | | |
| Alfresa Holdings Corp. | | 6,300 | | 95,948 | |
Amedisys, Inc.(4) | | 506 | | 131,874 | |
| Amvis Holdings, Inc. | | 200 | | 11,038 | |
ATI Physical Therapy, Inc.(4)(5) | | 4,361 | | 14,871 | |
Cano Health, Inc.(4) | | 2,089 | | 22,457 | |
| Cardinal Health, Inc. | | 6,718 | | 398,915 | |
Centene Corp.(4) | | 2,643 | | 181,336 | |
| Chartwell Retirement Residences | | 6,144 | | 64,562 | |
| Cigna Corp. | | 1,051 | | 241,194 | |
Covetrus, Inc.(4) | | 298 | | 7,587 | |
| CVS Health Corp. | | 2,279 | | 187,698 | |
| Encompass Health Corp. | | 2,656 | | 221,112 | |
| Ensign Group, Inc. (The) | | 481 | | 40,919 | |
HealthEquity, Inc.(4) | | 1,114 | | 82,414 | |
Henry Schein, Inc.(4) | | 4,905 | | 393,136 | |
| Humana, Inc. | | 229 | | 97,522 | |
| McKesson Corp. | | 1,475 | | 300,649 | |
Option Care Health, Inc.(4) | | 2,614 | | 54,162 | |
| Quest Diagnostics, Inc. | | 3,400 | | 482,120 | |
R1 RCM, Inc.(4) | | 5,983 | | 128,096 | |
RadNet, Inc.(4) | | 1,644 | | 60,400 | |
| UnitedHealth Group, Inc. | | 694 | | 286,081 | |
| Universal Health Services, Inc., Class B | | 2,877 | | 461,500 | |
| | | 3,965,591 | |
| Health Care Technology — 0.2% | | | |
| Cerner Corp. | | 5,969 | | 479,848 | |
Health Catalyst, Inc.(4) | | 1,355 | | 78,671 | |
OptimizeRx Corp.(4) | | 596 | | 32,941 | |
Veeva Systems, Inc., Class A(4) | | 723 | | 240,549 | |
| | | 832,009 | |
| Hotels, Restaurants and Leisure — 0.4% | | | |
Autogrill SpA(4)(5) | | 3,146 | | 22,073 | |
Basic-Fit NV(4)(5) | | 449 | | 20,753 | |
Booking Holdings, Inc.(4) | | 61 | | 132,874 | |
Brinker International, Inc.(4) | | 695 | | 37,766 | |
Chipotle Mexican Grill, Inc.(4) | | 167 | | 311,194 | |
| Churchill Downs, Inc. | | 317 | | 58,899 | |
Corporate Travel Management Ltd.(4) | | 1,004 | | 16,028 | |
| | | | | | | | | | | |
| | Shares/Principal Amount | Value |
| Cracker Barrel Old Country Store, Inc. | | 554 | | $ | 75,444 | |
Expedia Group, Inc.(4) | | 1,004 | | 161,513 | |
| Food & Life Cos. Ltd. | | 800 | | 32,596 | |
Greggs plc(4) | | 833 | | 31,919 | |
Hilton Worldwide Holdings, Inc.(4) | | 1,031 | | 135,525 | |
Las Vegas Sands Corp.(4) | | 2,557 | | 108,289 | |
Planet Fitness, Inc., Class A(4) | | 627 | | 47,169 | |
SeaWorld Entertainment, Inc.(4) | | 539 | | 25,554 | |
Sodexo SA(4) | | 2,731 | | 232,696 | |
| Travel + Leisure Co. | | 186 | | 9,635 | |
Whitbread plc(4) | | 2,599 | | 109,849 | |
| Wingstop, Inc. | | 337 | | 57,731 | |
| Wyndham Hotels & Resorts, Inc. | | 942 | | 67,880 | |
| | | 1,695,387 | |
| Household Durables — 0.1% | | | |
| Haseko Corp. | | 4,400 | | 59,542 | |
| Man Wah Holdings Ltd. | | 6,000 | | 12,039 | |
| Open House Co. Ltd. | | 2,900 | | 146,623 | |
Sonos, Inc.(4) | | 1,786 | | 59,617 | |
| Taylor Wimpey plc | | 59,595 | | 136,250 | |
| Token Corp. | | 300 | | 27,083 | |
| | | 441,154 | |
| Household Products — 0.1% | | | |
| Colgate-Palmolive Co. | | 1,165 | | 92,618 | |
| Kimberly-Clark Corp. | | 1,649 | | 223,802 | |
| Procter & Gamble Co. (The) | | 1,679 | | 238,804 | |
| Reynolds Consumer Products, Inc. | | 709 | | 20,171 | |
| | | 575,395 | |
| Industrial Conglomerates — 0.1% | | |
| Honeywell International, Inc. | | 1,225 | | 286,393 | |
| Lifco AB, B Shares | | 965 | | 28,303 | |
| | | 314,696 | |
| Insurance — 0.6% | | | |
| Aegon NV | | 17,657 | | 75,176 | |
| Aflac, Inc. | | 8,550 | | 470,250 | |
| AIA Group Ltd. | | 7,600 | | 90,940 | |
| Allstate Corp. (The) | | 1,639 | | 213,152 | |
| Arthur J. Gallagher & Co. | | 675 | | 94,034 | |
| Chubb Ltd. | | 3,109 | | 524,613 | |
| Goosehead Insurance, Inc., Class A | | 334 | | 40,143 | |
| Hartford Financial Services Group, Inc. (The) | | 1,866 | | 118,715 | |
| Kinsale Capital Group, Inc. | | 325 | | 58,060 | |
| Marsh & McLennan Cos., Inc. | | 685 | | 100,846 | |
Palomar Holdings, Inc.(4) | | 508 | | 41,366 | |
| Prudential Financial, Inc. | | 901 | | 90,352 | |
| Reinsurance Group of America, Inc. | | 3,392 | | 373,731 | |
Ryan Specialty Group Holdings, Inc., Class A(4) | | 1,143 | | 33,718 | |
SelectQuote, Inc.(4) | | 3,887 | | 69,189 | |
| Storebrand ASA | | 2,293 | | 19,688 | |
| Travelers Cos., Inc. (The) | | 832 | | 123,901 | |
| | | 2,537,874 | |
| | | | | | | | | | | |
| | Shares/Principal Amount | Value |
| Interactive Media and Services — 0.5% | | | |
Alphabet, Inc., Class A(4) | | 394 | | $ | 1,061,645 | |
Baidu, Inc., Class A(4) | | 7,150 | | 146,504 | |
| carsales.com Ltd. | | 1,114 | | 17,963 | |
Eventbrite, Inc., Class A(4) | | 2,099 | | 37,299 | |
Facebook, Inc., Class A(4) | | 885 | | 315,326 | |
fuboTV, Inc.(4)(5) | | 1,076 | | 28,019 | |
Match Group, Inc.(4) | | 1,234 | | 196,539 | |
Pinterest, Inc., Class A(4) | | 2,329 | | 137,178 | |
QuinStreet, Inc.(4) | | 4,061 | | 74,479 | |
| Tencent Holdings Ltd. | | 3,100 | | 186,955 | |
| | | 2,201,907 | |
| Internet and Direct Marketing Retail — 0.3% | | | |
Alibaba Group Holding Ltd.(4) | | 5,800 | | 141,652 | |
Amazon.com, Inc.(4) | | 258 | | 858,518 | |
| ASKUL Corp. | | 800 | | 12,076 | |
ASOS plc(4) | | 1,519 | | 80,320 | |
BHG Group AB(4) | | 376 | | 5,799 | |
Chewy, Inc., Class A(4)(5) | | 1,221 | | 102,198 | |
Etsy, Inc.(4) | | 690 | | 126,622 | |
Revolve Group, Inc.(4) | | 585 | | 40,722 | |
| | | 1,367,907 | |
| IT Services — 0.7% | | | |
| Accenture plc, Class A | | 808 | | 256,685 | |
Adyen NV(4) | | 68 | | 184,283 | |
| Alten SA | | 171 | | 27,183 | |
| Amdocs Ltd. | | 1,761 | | 135,791 | |
| Atos SE | | 1,228 | | 58,726 | |
| Capgemini SE | | 931 | | 201,238 | |
Capita plc(4) | | 48,489 | | 23,755 | |
DigitalOcean Holdings, Inc.(4) | | 830 | | 42,745 | |
| Edenred | | 1,800 | | 104,573 | |
Endava plc, ADR(4) | | 249 | | 32,026 | |
EPAM Systems, Inc.(4) | | 301 | | 168,500 | |
Euronet Worldwide, Inc.(4) | | 839 | | 119,826 | |
GDS Holdings Ltd., Class A(4) | | 1,800 | | 13,346 | |
I3 Verticals, Inc., Class A(4) | | 2,041 | | 65,149 | |
Indra Sistemas SA(4) | | 5,940 | | 62,183 | |
| Mastercard, Inc., Class A | | 776 | | 299,489 | |
| MAXIMUS, Inc. | | 944 | | 84,016 | |
Nuvei Corp.(4) | | 284 | | 23,288 | |
Okta, Inc.(4) | | 746 | | 184,851 | |
PayPal Holdings, Inc.(4) | | 1,222 | | 336,698 | |
Perficient, Inc.(4) | | 641 | | 60,440 | |
Repay Holdings Corp.(4) | | 1,334 | | 33,230 | |
Square, Inc., Class A(4) | | 503 | | 124,372 | |
Twilio, Inc., Class A(4) | | 388 | | 144,953 | |
| Visa, Inc., Class A | | 1,295 | | 319,075 | |
| | | 3,106,421 | |
| Leisure Products — 0.1% | | | |
Accell Group NV(4) | | 369 | | 18,274 | |
| BRP, Inc. | | 297 | | 24,884 | |
| | | | | | | | | | | |
| | Shares/Principal Amount | Value |
| Brunswick Corp. | | 651 | | $ | 67,964 | |
Callaway Golf Co.(4) | | 1,882 | | 59,622 | |
Hayward Holdings, Inc.(4) | | 2,971 | | 71,571 | |
Peloton Interactive, Inc., Class A(4) | | 497 | | 58,671 | |
| Polaris, Inc. | | 1,110 | | 145,488 | |
| | | 446,474 | |
| Life Sciences Tools and Services — 0.3% | | | |
10X Genomics, Inc., Class A(4) | | 547 | | 100,227 | |
| Agilent Technologies, Inc. | | 1,560 | | 239,039 | |
Akoya Biosciences, Inc.(4)(5) | | 857 | | 14,860 | |
| Bio-Techne Corp. | | 322 | | 155,281 | |
ICON plc(4) | | 317 | | 77,116 | |
| Lonza Group AG | | 203 | | 158,061 | |
Mettler-Toledo International, Inc.(4) | | 155 | | 228,425 | |
NeoGenomics, Inc.(4) | | 1,236 | | 56,980 | |
Repligen Corp.(4) | | 427 | | 104,914 | |
| Thermo Fisher Scientific, Inc. | | 397 | | 214,384 | |
Wuxi Biologics Cayman, Inc.(4) | | 8,000 | | 122,194 | |
| | | 1,471,481 | |
| Machinery — 0.5% | | | |
| ANDRITZ AG | | 486 | | 26,757 | |
| Astec Industries, Inc. | | 606 | | 37,154 | |
| Crane Co. | | 1,629 | | 158,388 | |
| Cummins, Inc. | | 1,232 | | 285,947 | |
Evoqua Water Technologies Corp.(4) | | 1,740 | | 57,437 | |
| FANUC Corp. | | 400 | | 89,587 | |
| Graco, Inc. | | 1,285 | | 100,333 | |
IHI Corp.(4) | | 1,200 | | 27,756 | |
| IMI plc | | 3,331 | | 81,493 | |
| Japan Steel Works Ltd. (The) | | 600 | | 14,760 | |
Kornit Digital Ltd.(4) | | 213 | | 28,150 | |
| Metso Outotec Oyj | | 3,107 | | 35,277 | |
| Oshkosh Corp. | | 1,792 | | 214,234 | |
| PACCAR, Inc. | | 2,041 | | 169,383 | |
| Parker-Hannifin Corp. | | 1,414 | | 441,210 | |
| Rexnord Corp. | | 2,107 | | 118,687 | |
| Techtronic Industries Co. Ltd. | | 8,000 | | 142,658 | |
| Timken Co. (The) | | 669 | | 53,185 | |
| Trelleborg AB, B Shares | | 573 | | 14,164 | |
| Tsubaki Nakashima Co. Ltd. | | 1,500 | | 22,612 | |
| | | 2,119,172 | |
| Media — 0.2% | | | |
Atresmedia Corp. de Medios de Comunicacion SA(4) | | 5,878 | | 24,301 | |
| Comcast Corp., Class A | | 2,312 | | 136,015 | |
Criteo SA, ADR(4) | | 328 | | 12,723 | |
| Fox Corp., Class B | | 9,814 | | 326,217 | |
| Future plc | | 762 | | 36,505 | |
Nordic Entertainment Group AB, B Shares(4) | | 397 | | 21,200 | |
| ProSiebenSat.1 Media SE | | 626 | | 11,893 | |
| Publicis Groupe SA | | 2,835 | | 178,975 | |
Storytel AB(4) | | 234 | | 6,059 | |
| WPP plc | | 17,145 | | 221,737 | |
| | | 975,625 | |
| | | | | | | | | | | |
| | Shares/Principal Amount | Value |
| Metals and Mining — 0.1% | | | |
| Alamos Gold, Inc. (New York), Class A | | 1,604 | | $ | 13,025 | |
| APERAM SA | | 458 | | 28,703 | |
| Mineral Resources Ltd. | | 444 | | 20,544 | |
| MMC Norilsk Nickel PJSC | | 528 | | 182,495 | |
| Nickel Mines Ltd. | | 6,408 | | 5,170 | |
| OZ Minerals Ltd. | | 937 | | 15,886 | |
| Teck Resources Ltd., Class B | | 4,531 | | 103,488 | |
| | | 369,311 | |
| Multi-Utilities — 0.1% | | | |
| NorthWestern Corp. | | 5,765 | | 357,372 | |
| Multiline Retail — 0.1% | | | |
Dollar Tree, Inc.(4) | | 3,333 | | 332,600 | |
| Isetan Mitsukoshi Holdings Ltd. | | 3,400 | | 23,023 | |
| Magazine Luiza SA | | 20,534 | | 81,217 | |
Marks & Spencer Group plc(4) | | 8,260 | | 15,550 | |
| Target Corp. | | 469 | | 122,433 | |
| | | 574,823 | |
| Oil, Gas and Consumable Fuels — 0.4% | | | |
| Cimarex Energy Co. | | 1,549 | | 100,995 | |
| ConocoPhillips | | 10,949 | | 613,801 | |
| Devon Energy Corp. | | 7,123 | | 184,058 | |
| Eni SpA | | 6,262 | | 74,052 | |
| Matador Resources Co. | | 1,604 | | 49,563 | |
| Neste Oyj | | 2,007 | | 123,372 | |
| Pioneer Natural Resources Co. | | 1,059 | | 153,947 | |
| Surgutneftegas PJSC, Preference Shares | | 318,153 | | 166,076 | |
| TotalEnergies SE | | 4,358 | | 190,038 | |
Whitecap Resources, Inc.(5) | | 15,912 | | 72,826 | |
| | | 1,728,728 | |
| Paper and Forest Products — 0.1% | | | |
| Mondi plc | | 13,270 | | 367,894 | |
Personal Products† | | | |
| Estee Lauder Cos., Inc. (The), Class A | | 321 | | 107,160 | |
| Shiseido Co. Ltd. | | 1,600 | | 106,937 | |
| | | 214,097 | |
| Pharmaceuticals — 0.5% | | | |
ALK-Abello A/S(4) | | 62 | | 30,567 | |
Arvinas, Inc.(4) | | 336 | | 33,970 | |
| AstraZeneca plc | | 629 | | 72,278 | |
| AstraZeneca plc, ADR | | 4,513 | | 258,324 | |
Axsome Therapeutics, Inc.(4) | | 375 | | 18,221 | |
| Bristol-Myers Squibb Co. | | 3,165 | | 214,809 | |
| Dermapharm Holding SE | | 249 | | 19,918 | |
Edgewise Therapeutics, Inc.(4)(5) | | 853 | | 14,936 | |
| GlaxoSmithKline plc | | 18,362 | | 362,536 | |
Harmony Biosciences Holdings, Inc.(4) | | 540 | | 14,126 | |
| Laboratorios Farmaceuticos Rovi SA | | 224 | | 15,812 | |
| Merck & Co., Inc. | | 2,556 | | 196,480 | |
| Novartis AG | | 1,418 | | 131,134 | |
| Novo Nordisk A/S, B Shares | | 2,736 | | 253,275 | |
Reata Pharmaceuticals, Inc., Class A(4) | | 185 | | 23,182 | |
| | | | | | | | | | | |
| | Shares/Principal Amount | Value |
| Sanofi | | 1,106 | | $ | 113,999 | |
| Sanofi, ADR | | 3,652 | | 188,297 | |
| Takeda Pharmaceutical Co. Ltd. | | 5,500 | | 183,076 | |
| Zoetis, Inc. | | 972 | | 197,025 | |
| | | 2,341,965 | |
| Professional Services — 0.2% | | | |
ASGN, Inc.(4) | | 418 | | 42,272 | |
| Bureau Veritas SA | | 2,985 | | 98,576 | |
CoStar Group, Inc.(4) | | 1,260 | | 111,951 | |
| DKSH Holding AG | | 259 | | 21,895 | |
| en Japan, Inc. | | 500 | | 17,460 | |
First Advantage Corp.(4) | | 2,722 | | 53,379 | |
| IHS Markit Ltd. | | 585 | | 68,351 | |
| IR Japan Holdings Ltd. | | 100 | | 12,375 | |
| Jacobs Engineering Group, Inc. | | 1,221 | | 165,140 | |
| Outsourcing, Inc. | | 700 | | 13,399 | |
| Recruit Holdings Co. Ltd. | | 3,400 | | 176,224 | |
| Teleperformance | | 317 | | 133,710 | |
| TransUnion | | 683 | | 82,001 | |
| Verisk Analytics, Inc. | | 477 | | 90,601 | |
| | | 1,087,334 | |
| Real Estate Management and Development — 0.1% | | | |
| Altus Group Ltd. | | 644 | | 30,311 | |
| CapitaLand Ltd. | | 17,200 | | 51,101 | |
Colliers International Group, Inc.(5) | | 238 | | 30,604 | |
| Colliers International Group, Inc. (Toronto) | | 245 | | 31,436 | |
CTP NV(4) | | 3,029 | | 61,057 | |
ESR Cayman Ltd.(4) | | 12,600 | | 44,287 | |
Fastighets AB Balder, B Shares(4) | | 304 | | 20,978 | |
| FirstService Corp. | | 104 | | 19,371 | |
| Newmark Group, Inc., Class A | | 1,967 | | 25,335 | |
| Relo Group, Inc. | | 500 | | 11,034 | |
Samhallsbyggnadsbolaget i Norden AB(5) | | 7,052 | | 35,330 | |
| Savills plc | | 1,097 | | 17,520 | |
| Tokyu Fudosan Holdings Corp. | | 13,400 | | 75,648 | |
| Tricon Residential, Inc. | | 11,135 | | 133,431 | |
| VGP NV | | 172 | | 35,410 | |
| | | 622,853 | |
| Road and Rail — 0.1% | | | |
| Heartland Express, Inc. | | 9,757 | | 166,162 | |
Nagoya Railroad Co. Ltd.(4) | | 600 | | 10,104 | |
| Norfolk Southern Corp. | | 553 | | 142,580 | |
| TFI International, Inc. | | 252 | | 28,209 | |
| Union Pacific Corp. | | 521 | | 113,974 | |
| | | 461,029 | |
| Semiconductors and Semiconductor Equipment — 0.6% | | | |
Advanced Micro Devices, Inc.(4) | | 1,116 | | 118,508 | |
Allegro MicroSystems, Inc.(4) | | 797 | | 21,846 | |
| Applied Materials, Inc. | | 1,317 | | 184,288 | |
| ASM International NV | | 35 | | 12,422 | |
| ASML Holding NV | | 356 | | 272,121 | |
| | | | | | | | | | | |
| | Shares/Principal Amount | Value |
| BE Semiconductor Industries NV | | 327 | | $ | 28,697 | |
Enphase Energy, Inc.(4) | | 1,095 | | 207,612 | |
Ichor Holdings Ltd.(4) | | 636 | | 32,798 | |
| Infineon Technologies AG | | 3,209 | | 122,629 | |
MACOM Technology Solutions Holdings, Inc.(4) | | 1,182 | | 72,953 | |
| Marvell Technology, Inc. | | 3,096 | | 187,339 | |
Nova Ltd.(4) | | 334 | | 32,665 | |
| NVIDIA Corp. | | 2,132 | | 415,719 | |
Onto Innovation, Inc.(4) | | 939 | | 65,805 | |
| Optorun Co. Ltd. | | 300 | | 6,045 | |
| Power Integrations, Inc. | | 294 | | 28,515 | |
Semtech Corp.(4) | | 1,135 | | 70,268 | |
| Skyworks Solutions, Inc. | | 1,106 | | 204,068 | |
SOITEC(4) | | 107 | | 25,653 | |
| Taiwan Semiconductor Manufacturing Co. Ltd. | | 10,000 | | 208,995 | |
| Teradyne, Inc. | | 881 | | 111,887 | |
| Texas Instruments, Inc. | | 1,185 | | 225,885 | |
| | | 2,656,718 | |
| Software — 1.2% | | | |
Adobe, Inc.(4) | | 360 | | 223,787 | |
Atlassian Corp. plc, Class A(4) | | 655 | | 212,954 | |
Autodesk, Inc.(4) | | 645 | | 207,129 | |
Cadence Design Systems, Inc.(4) | | 2,301 | | 339,743 | |
| CDK Global, Inc. | | 3,348 | | 160,671 | |
Cloudflare, Inc., Class A(4) | | 672 | | 79,719 | |
Coupa Software, Inc.(4) | | 319 | | 69,223 | |
| Dassault Systemes SE | | 2,235 | | 123,287 | |
Descartes Systems Group, Inc. (The)(4) | | 343 | | 24,878 | |
DocuSign, Inc.(4) | | 1,109 | | 330,526 | |
Everbridge, Inc.(4) | | 223 | | 31,492 | |
Five9, Inc.(4) | | 337 | | 67,835 | |
HubSpot, Inc.(4) | | 490 | | 292,050 | |
Lightspeed POS, Inc.(4) | | 350 | | 29,970 | |
| m-up Holdings, Inc. | | 400 | | 12,042 | |
Manhattan Associates, Inc.(4) | | 2,281 | | 364,116 | |
| Microsoft Corp. | | 6,054 | | 1,724,845 | |
Model N, Inc.(4) | | 1,374 | | 44,476 | |
nCino, Inc.(4) | | 759 | | 48,250 | |
| Open Text Corp. | | 3,987 | | 206,965 | |
Palo Alto Networks, Inc.(4) | | 760 | | 303,278 | |
Paycor HCM, Inc.(4) | | 1,110 | | 30,525 | |
Paylocity Holding Corp.(4) | | 339 | | 70,329 | |
RingCentral, Inc., Class A(4) | | 468 | | 125,082 | |
SailPoint Technologies Holdings, Inc.(4) | | 1,391 | | 69,536 | |
salesforce.com, Inc.(4) | | 538 | | 130,158 | |
Sprinklr, Inc., Class A(4) | | 1,699 | | 32,859 | |
Sprout Social, Inc., Class A(4) | | 1,235 | | 109,717 | |
Workday, Inc., Class A(4) | | 189 | | 44,302 | |
| | | 5,509,744 | |
| Specialty Retail — 0.5% | | | |
| Advance Auto Parts, Inc. | | 2,233 | | 473,530 | |
| | | | | | | | | | | |
| | Shares/Principal Amount | Value |
American Eagle Outfitters, Inc.(5) | | 2,186 | | $ | 75,351 | |
Arko Corp.(4) | | 3,898 | | 32,353 | |
Burlington Stores, Inc.(4) | | 693 | | 232,016 | |
Carvana Co.(4) | | 369 | | 124,560 | |
Five Below, Inc.(4) | | 516 | | 100,321 | |
Floor & Decor Holdings, Inc., Class A(4) | | 1,175 | | 143,362 | |
| Home Depot, Inc. (The) | | 1,514 | | 496,880 | |
Leslie's, Inc.(4) | | 3,088 | | 75,193 | |
| Lithia Motors, Inc. | | 96 | | 36,213 | |
Musti Group Oyj(4) | | 668 | | 27,573 | |
National Vision Holdings, Inc.(4) | | 1,133 | | 61,159 | |
| Nextage Co. Ltd. | | 1,300 | | 26,738 | |
| Pets at Home Group plc | | 4,270 | | 27,741 | |
| TJX Cos., Inc. (The) | | 2,176 | | 149,730 | |
| Tractor Supply Co. | | 347 | | 62,783 | |
Watches of Switzerland Group plc(4) | | 2,342 | | 32,756 | |
WH Smith plc(4) | | 517 | | 11,660 | |
| | | 2,189,919 | |
| Technology Hardware, Storage and Peripherals — 0.3% | | | |
| Apple, Inc. | | 5,938 | | 866,117 | |
| HP, Inc. | | 9,654 | | 278,711 | |
| | | 1,144,828 | |
| Textiles, Apparel and Luxury Goods — 0.3% | | | |
| ANTA Sports Products Ltd. | | 7,000 | | 152,399 | |
| Asics Corp. | | 1,000 | | 22,085 | |
Capri Holdings Ltd.(4) | | 857 | | 48,258 | |
Crocs, Inc.(4) | | 702 | | 95,339 | |
Dr. Martens plc(4) | | 2,982 | | 17,970 | |
lululemon athletica, Inc.(4) | | 543 | | 217,292 | |
| LVMH Moet Hennessy Louis Vuitton SE | | 209 | | 167,339 | |
| NIKE, Inc., Class B | | 1,837 | | 307,716 | |
| Pandora A/S | | 273 | | 35,314 | |
| Puma SE | | 1,111 | | 136,286 | |
| VF Corp. | | 1,218 | | 97,684 | |
| | | 1,297,682 | |
Thrifts and Mortgage Finance† | | | |
| Capitol Federal Financial, Inc. | | 6,540 | | 72,529 | |
NMI Holdings, Inc., Class A(4) | | 1,151 | | 25,345 | |
| | | 97,874 | |
| Trading Companies and Distributors — 0.2% | | | |
| AddTech AB, B Shares | | 788 | | 16,396 | |
| Ashtead Group plc | | 1,704 | | 127,509 | |
Beacon Roofing Supply, Inc.(4) | | 1,378 | | 73,695 | |
| Diploma plc | | 733 | | 30,111 | |
| Electrocomponents plc | | 2,240 | | 31,646 | |
| Finning International, Inc. | | 2,525 | | 65,291 | |
| Grafton Group plc | | 2,327 | | 41,515 | |
| Howden Joinery Group plc | | 2,875 | | 35,827 | |
| MSC Industrial Direct Co., Inc., Class A | | 4,043 | | 360,514 | |
NOW, Inc.(4) | | 1,904 | | 18,793 | |
Seven Group Holdings Ltd.(5) | | 791 | | 13,566 | |
| W.W. Grainger, Inc. | | 308 | | 136,931 | |
| | | | | | | | | | | |
| | Shares/Principal Amount | Value |
| Yamazen Corp. | | 2,100 | | $ | 19,818 | |
| | | 971,612 | |
TOTAL COMMON STOCKS (Cost $56,684,952) | | | 85,855,539 | |
| CORPORATE BONDS — 8.1% | |
|
|
| Aerospace and Defense — 0.1% | | | |
| Boeing Co. (The), 5.81%, 5/1/50 | | $ | 100,000 | | 136,631 | |
| Howmet Aerospace, Inc., 5.125%, 10/1/24 | | 50,000 | | 55,109 | |
TransDigm, Inc., 4.625%, 1/15/29(6) | | 390,000 | | 389,528 | |
| | | 581,268 | |
| Airlines — 0.1% | | | |
American Airlines, Inc. / AAdvantage Loyalty IP Ltd., 5.50%, 4/20/26(6) | | 432,000 | | 452,520 | |
| United Airlines Holdings, Inc., 5.00%, 2/1/24 | | 45,000 | | 46,730 | |
| | | 499,250 | |
| Automobiles — 0.2% | | | |
| BMW Finance NV, MTN, 1.00%, 2/15/22 | EUR | 40,000 | | 47,826 | |
| BMW Finance NV, MTN, 0.875%, 4/3/25 | EUR | 50,000 | | 61,858 | |
| Ford Motor Credit Co. LLC, 3.625%, 6/17/31 | | $ | 460,000 | | 477,303 | |
| General Motors Co., 5.15%, 4/1/38 | | 290,000 | | 356,625 | |
| | | 943,612 | |
| Banks — 1.1% | | | |
| Akbank T.A.S., 5.00%, 10/24/22 | | 50,000 | | 51,438 | |
Avi Funding Co. Ltd., 3.80%, 9/16/25(6) | | 102,000 | | 112,691 | |
| Banco Santander SA, MTN, 2.50%, 3/18/25 | EUR | 200,000 | | 257,658 | |
| Bank of America Corp., MTN, 2.30%, 7/25/25 | GBP | 100,000 | | 146,874 | |
| Bank of America Corp., MTN, VRN, 2.68%, 6/19/41 | | $ | 465,000 | | 459,748 | |
| Barclays plc, MTN, VRN, 2.00%, 2/7/28 | EUR | 200,000 | | 243,203 | |
| CaixaBank SA, MTN, VRN, 2.75%, 7/14/28 | EUR | 100,000 | | 123,960 | |
| CaixaBank SA, MTN, VRN, 2.25%, 4/17/30 | EUR | 100,000 | | 125,002 | |
| Citigroup, Inc., VRN, 3.52%, 10/27/28 | | $ | 315,000 | | 347,391 | |
| Co-Operative Bank plc (The), 4.75%, 11/11/21 (Secured) | GBP | 200,000 | | 280,951 | |
| Commerzbank AG, MTN, 4.00%, 3/23/26 | EUR | 220,000 | | 296,283 | |
| Credit Agricole SA, MTN, 7.375%, 12/18/23 | GBP | 100,000 | | 159,849 | |
| European Financial Stability Facility, MTN, 2.125%, 2/19/24 | EUR | 351,000 | | 445,196 | |
| European Financial Stability Facility, MTN, 0.40%, 5/31/26 | EUR | 400,000 | | 494,996 | |
| European Financial Stability Facility, MTN, 2.35%, 7/29/44 | EUR | 62,000 | | 105,616 | |
| HSBC Bank plc, MTN, VRN, 5.375%, 11/4/30 | GBP | 90,000 | | 146,318 | |
| ING Groep NV, MTN, 2.125%, 1/10/26 | EUR | 300,000 | | 390,870 | |
Intercorp Financial Services, Inc., 4.125%, 10/19/27(6) | | $ | 125,000 | | 126,324 | |
| Kreditanstalt fuer Wiederaufbau, 4.625%, 1/4/23 | EUR | 250,000 | | 318,949 | |
| Lloyds Bank plc, MTN, 7.625%, 4/22/25 | GBP | 80,000 | | 137,556 | |
| Wells Fargo & Co., VRN, 3.07%, 4/30/41 | | $ | 430,000 | | 451,572 | |
| | | 5,222,445 | |
| Beverages — 0.1% | | | |
| Anheuser-Busch Cos. LLC / Anheuser-Busch InBev Worldwide, Inc., 4.90%, 2/1/46 | | 180,000 | | 231,198 | |
| Biotechnology — 0.2% | | | |
| AbbVie, Inc., 4.55%, 3/15/35 | | 80,000 | | 98,316 | |
| AbbVie, Inc., 4.40%, 11/6/42 | | 385,000 | | 475,226 | |
| | | | | | | | | | | |
| | Shares/Principal Amount | Value |
| Gilead Sciences, Inc., 3.65%, 3/1/26 | | $ | 230,000 | | $ | 255,128 | |
| | | 828,670 | |
| Capital Markets — 0.2% | | | |
| Criteria Caixa SA, MTN, 1.50%, 5/10/23 | EUR | 100,000 | | 122,111 | |
| Goldman Sachs Group, Inc. (The), 5.50%, 10/12/21 | GBP | 50,000 | | 70,137 | |
| Goldman Sachs Group, Inc. (The), VRN, 1.43%, 3/9/27 | | $ | 155,000 | | 155,835 | |
LPL Holdings, Inc., 4.375%, 5/15/31(6) | | 533,000 | | 547,005 | |
MDGH - GMTN B.V., 3.25%, 4/28/22(6) | | 41,000 | | 41,898 | |
| | | 936,986 | |
| Chemicals — 0.1% | | | |
| Dow Chemical Co. (The), 3.60%, 11/15/50 | | 220,000 | | 245,485 | |
Equate Petrochemical BV, 4.25%, 11/3/26(6) | | 34,000 | | 37,843 | |
| | | 283,328 | |
| Commercial Services and Supplies — 0.1% | | | |
Sodexo, Inc., 2.72%, 4/16/31(6) | | 370,000 | | 383,864 | |
| Waste Management, Inc., 2.50%, 11/15/50 | | 160,000 | | 154,517 | |
| | | 538,381 | |
| Consumer Finance — 0.1% | | | |
| Navient Corp., 4.875%, 3/15/28 | | 525,000 | | 530,263 | |
| Containers and Packaging — 0.1% | | | |
Ardagh Metal Packaging Finance USA LLC / Ardagh Metal Packaging Finance plc, 4.00%, 9/1/29(6) | | 322,000 | | 323,207 | |
Mauser Packaging Solutions Holding Co., 5.50%, 4/15/24(6) | | 10,000 | | 10,075 | |
Sealed Air Corp., 5.125%, 12/1/24(6) | | 25,000 | | 27,203 | |
| | | 360,485 | |
Diversified Consumer Services† | | | |
| Duke University, 3.30%, 10/1/46 | | 60,000 | | 68,071 | |
| Diversified Financial Services — 1.0% | | | |
| Fiore Capital LLC, VRDN, 0.12%, 8/6/21 (LOC: Wells Fargo Bank N.A.) | | 1,500,000 | | 1,500,000 | |
Gulf Gate Apartments LLC, VRN, 0.09%, (Acquired 9/29/03 - 11/10/03, Cost $3,000,000), 9/1/28(7) | | 3,000,000 | | 3,000,000 | |
| | | 4,500,000 | |
| Diversified Telecommunication Services — 0.3% | | | |
Altice France SA, 7.375%, 5/1/26(6) | | 35,000 | | 36,444 | |
| AT&T, Inc., 2.60%, 12/17/29 | EUR | 100,000 | | 138,981 | |
AT&T, Inc., 3.55%, 9/15/55(6) | | $ | 207,000 | | 214,316 | |
| Deutsche Telekom International Finance BV, MTN, 1.25%, 10/6/23 | GBP | 50,000 | | 70,552 | |
| Deutsche Telekom International Finance BV, MTN, 0.875%, 1/30/24 | EUR | 40,000 | | 48,859 | |
| Hughes Satellite Systems Corp., 5.25%, 8/1/26 | | $ | 25,000 | | 27,988 | |
Level 3 Financing, Inc., 4.625%, 9/15/27(6) | | 232,000 | | 241,312 | |
| Lumen Technologies, Inc., 5.80%, 3/15/22 | | 5,000 | | 5,137 | |
Ooredoo International Finance Ltd., 3.75%, 6/22/26(6) | | 61,000 | | 67,565 | |
Turk Telekomunikasyon AS, 4.875%, 6/19/24(6) | | 80,000 | | 83,871 | |
| Verizon Communications, Inc., 1.75%, 1/20/31 | | 180,000 | | 174,985 | |
| Verizon Communications, Inc., 2.99%, 10/30/56 | | 255,000 | | 248,487 | |
| | | 1,358,497 | |
| Electric Utilities — 0.3% | | | |
| Duke Energy Carolinas LLC, 3.20%, 8/15/49 | | 190,000 | | 206,671 | |
| | | | | | | | | | | |
| | Shares/Principal Amount | Value |
| Duke Energy Florida LLC, 3.85%, 11/15/42 | | $ | 80,000 | | $ | 95,469 | |
| Duke Energy Progress LLC, 4.15%, 12/1/44 | | 9,000 | | 11,127 | |
| Exelon Corp., 4.45%, 4/15/46 | | 90,000 | | 112,188 | |
Greenko Investment Co., 4.875%, 8/16/23(6) | | 41,000 | | 41,485 | |
Israel Electric Corp. Ltd., 6.875%, 6/21/23(6) | | 41,000 | | 45,671 | |
| MidAmerican Energy Co., 4.40%, 10/15/44 | | 40,000 | | 50,703 | |
NextEra Energy Operating Partners LP, 4.50%, 9/15/27(6) | | 50,000 | | 54,045 | |
| Northern States Power Co., 3.20%, 4/1/52 | | 120,000 | | 133,898 | |
| PacifiCorp, 2.90%, 6/15/52 | | 130,000 | | 132,929 | |
| Perusahaan Perseroan (Persero) PT Perusahaan Listrik Negara, MTN, 3.00%, 6/30/30 | | 375,000 | | 376,320 | |
| Southern Co. Gas Capital Corp., 3.95%, 10/1/46 | | 30,000 | | 34,451 | |
| Virginia Electric and Power Co., 2.45%, 12/15/50 | | 110,000 | | 104,104 | |
| | | 1,399,061 | |
| Equity Real Estate Investment Trusts (REITs) — 0.3% | | | |
| EPR Properties, 4.95%, 4/15/28 | | 506,000 | | 547,930 | |
IIP Operating Partnership LP, 5.50%, 5/25/26(6) | | 230,000 | | 240,683 | |
Iron Mountain, Inc., 4.875%, 9/15/29(6) | | 495,000 | | 519,240 | |
| MGM Growth Properties Operating Partnership LP / MGP Finance Co-Issuer, Inc., 5.625%, 5/1/24 | | 20,000 | | 21,673 | |
| | | 1,329,526 | |
Food and Staples Retailing† | | | |
| Kroger Co. (The), 3.875%, 10/15/46 | | 110,000 | | 124,023 | |
| Tesco plc, MTN, 5.00%, 3/24/23 | GBP | 50,000 | | 74,374 | |
| | | 198,397 | |
| Food Products — 0.1% | | | |
Lamb Weston Holdings, Inc., 4.625%, 11/1/24(6) | | $ | 70,000 | | 71,922 | |
MHP SE, 7.75%, 5/10/24(6) | | 51,000 | | 55,180 | |
Post Holdings, Inc., 4.625%, 4/15/30(6) | | 280,000 | | 285,627 | |
| | | 412,729 | |
Gas Utilities† | | | |
| Perusahaan Gas Negara Tbk PT, 5.125%, 5/16/24 | | 82,000 | | 90,622 | |
| Health Care Providers and Services — 0.4% | | | |
CHS / Community Health Systems, Inc., 8.00%, 12/15/27(6) | | 14,000 | | 15,517 | |
CHS / Community Health Systems, Inc., 6.875%, 4/1/28(6) | | 35,000 | | 34,648 | |
| CVS Health Corp., 4.30%, 3/25/28 | | 74,000 | | 85,752 | |
| CVS Health Corp., 4.78%, 3/25/38 | | 310,000 | | 389,754 | |
DaVita, Inc., 4.625%, 6/1/30(6) | | 370,000 | | 382,950 | |
| Kaiser Foundation Hospitals, 3.00%, 6/1/51 | | 130,000 | | 138,004 | |
Team Health Holdings, Inc., 6.375%, 2/1/25(6) | | 10,000 | | 9,288 | |
| Tenet Healthcare Corp., 6.75%, 6/15/23 | | 40,000 | | 43,450 | |
Tenet Healthcare Corp., 6.125%, 10/1/28(6) | | 310,000 | | 330,551 | |
Universal Health Services, Inc., 2.65%, 10/15/30(6) | | 420,000 | | 427,999 | |
| | | 1,857,913 | |
| Hotels, Restaurants and Leisure — 0.2% | | | |
1011778 BC ULC / New Red Finance, Inc., 4.375%, 1/15/28(6) | | 168,000 | | 170,738 | |
Caesars Resort Collection LLC / CRC Finco, Inc., 5.25%, 10/15/25(6) | | 405,000 | | 408,811 | |
Golden Nugget, Inc., 6.75%, 10/15/24(6) | | 30,000 | | 30,113 | |
| MGM Resorts International, 6.00%, 3/15/23 | | 30,000 | | 31,738 | |
| MGM Resorts International, 4.625%, 9/1/26 | | 8,000 | | 8,350 | |
| | | | | | | | | | | |
| | Shares/Principal Amount | Value |
Penn National Gaming, Inc., 5.625%, 1/15/27(6) | | $ | 35,000 | | $ | 36,313 | |
Penn National Gaming, Inc., 4.125%, 7/1/29(6) | | 54,000 | | 53,309 | |
Wynn Las Vegas LLC / Wynn Las Vegas Capital Corp., 5.50%, 3/1/25(6) | | 55,000 | | 58,231 | |
| | | 797,603 | |
| Household Durables — 0.1% | | | |
| KB Home, 4.80%, 11/15/29 | | 355,000 | | 387,838 | |
| Meritage Homes Corp., 5.125%, 6/6/27 | | 40,000 | | 45,100 | |
| | | 432,938 | |
| Industrial Conglomerates — 0.1% | | | |
| General Electric Co., 4.35%, 5/1/50 | | 230,000 | | 283,945 | |
| Insurance — 0.1% | | | |
| American International Group, Inc., 6.25%, 5/1/36 | | 250,000 | | 354,725 | |
| AXA SA, MTN, VRN, 3.375%, 7/6/47 | EUR | 200,000 | | 274,619 | |
| | | 629,344 | |
Interactive Media and Services† | | | |
Tencent Holdings Ltd., 3.80%, 2/11/25(6) | | $ | 61,000 | | 66,373 | |
| Internet and Direct Marketing Retail — 0.1% | | | |
| Alibaba Group Holding Ltd., 2.80%, 6/6/23 | | 140,000 | | 145,281 | |
Prosus NV, 3.68%, 1/21/30(6) | | 375,000 | | 395,535 | |
| | | 540,816 | |
IT Services† | | | |
| International Business Machines Corp., 1.75%, 3/7/28 | EUR | 100,000 | | 131,941 | |
| Life Sciences Tools and Services — 0.1% | | | |
| Agilent Technologies, Inc., 2.30%, 3/12/31 | | $ | 400,000 | | 408,871 | |
| Media — 0.5% | | | |
CCO Holdings LLC / CCO Holdings Capital Corp., 5.00%, 2/1/28(6) | | 100,000 | | 104,975 | |
CCO Holdings LLC / CCO Holdings Capital Corp., 4.25%, 2/1/31(6) | | 380,000 | | 392,547 | |
| Charter Communications Operating LLC / Charter Communications Operating Capital, 6.48%, 10/23/45 | | 20,000 | | 28,204 | |
| Charter Communications Operating LLC / Charter Communications Operating Capital, 5.125%, 7/1/49 | | 160,000 | | 194,600 | |
| CSC Holdings LLC, 5.25%, 6/1/24 | | 230,000 | | 248,802 | |
| DISH DBS Corp., 7.75%, 7/1/26 | | 200,000 | | 228,500 | |
Gray Television, Inc., 5.875%, 7/15/26(6) | | 40,000 | | 41,350 | |
| Lamar Media Corp., 3.75%, 2/15/28 | | 255,000 | | 259,666 | |
| TEGNA, Inc., 4.625%, 3/15/28 | | 412,000 | | 425,034 | |
| ViacomCBS, Inc., 4.375%, 3/15/43 | | 120,000 | | 142,220 | |
| WPP Finance 2013, MTN, 3.00%, 11/20/23 | EUR | 100,000 | | 127,575 | |
| | | 2,193,473 | |
| Metals and Mining — 0.3% | | | |
Alcoa Nederland Holding BV, 4.125%, 3/31/29(6) | | $ | 200,000 | | 210,906 | |
Cleveland-Cliffs, Inc., 4.625%, 3/1/29(6) | | 330,000 | | 350,660 | |
| First Quantum Minerals Ltd., 7.25%, 4/1/23 | | 50,000 | | 51,000 | |
First Quantum Minerals Ltd., 6.50%, 3/1/24(6) | | 110,000 | | 112,307 | |
Minera Mexico SA de CV, 4.50%, 1/26/50(6) | | 375,000 | | 421,526 | |
| Teck Resources Ltd., 6.25%, 7/15/41 | | 180,000 | | 243,023 | |
| | | 1,389,422 | |
| Mortgage Real Estate Investment Trusts (REITs) — 0.1% | | | |
Ladder Capital Finance Holdings LLLP / Ladder Capital Finance Corp., 4.75%, 6/15/29(6) | | 450,000 | | 448,875 | |
| | | | | | | | | | | |
| | Shares/Principal Amount | Value |
| Multi-Utilities — 0.1% | | | |
| Dominion Energy, Inc., 4.90%, 8/1/41 | | $ | 70,000 | | $ | 91,813 | |
| NiSource, Inc., 5.65%, 2/1/45 | | 140,000 | | 197,032 | |
| | | 288,845 | |
| Oil, Gas and Consumable Fuels — 0.5% | | | |
Antero Resources Corp., 7.625%, 2/1/29(6) | | 153,000 | | 167,917 | |
| BP Capital Markets America, Inc., 3.06%, 6/17/41 | | 130,000 | | 134,224 | |
| Crestwood Midstream Partners LP / Crestwood Midstream Finance Corp., 5.75%, 4/1/25 | | 25,000 | | 25,624 | |
| Enterprise Products Operating LLC, 4.85%, 3/15/44 | | 220,000 | | 276,080 | |
Galaxy Pipeline Assets Bidco Ltd., 2.94%, 9/30/40(6) | | 375,000 | | 378,494 | |
Gazprom PJSC Via Gaz Capital SA, 6.51%, 3/7/22(6) | | 56,000 | | 57,922 | |
Gazprom PJSC Via Gaz Capital SA, 7.29%, 8/16/37(6) | | 56,000 | | 78,322 | |
| Kinder Morgan Energy Partners LP, 6.50%, 9/1/39 | | 130,000 | | 185,227 | |
MEG Energy Corp., 6.50%, 1/15/25(6) | | 17,000 | | 17,588 | |
MEG Energy Corp., 5.875%, 2/1/29(6) | | 160,000 | | 165,618 | |
| Petroleos Mexicanos, 6.50%, 3/13/27 | | 55,000 | | 58,314 | |
| Saudi Arabian Oil Co., MTN, 4.25%, 4/16/39 | | 375,000 | | 425,583 | |
| SM Energy Co., 5.00%, 1/15/24 | | 25,000 | | 24,920 | |
| Southwestern Energy Co., 6.45%, 1/23/25 | | 35,000 | | 38,367 | |
| Suncor Energy, Inc., 3.75%, 3/4/51 | | 80,000 | | 88,925 | |
| | | 2,123,125 | |
| Pharmaceuticals — 0.2% | | | |
| Astrazeneca Finance LLC, 1.75%, 5/28/28 | | 400,000 | | 407,373 | |
Bausch Health Cos., Inc., 6.125%, 4/15/25(6) | | 78,000 | | 79,706 | |
Viatris, Inc., 4.00%, 6/22/50(6) | | 250,000 | | 271,427 | |
| | | 758,506 | |
| Real Estate Management and Development — 0.1% | | | |
Howard Hughes Corp. (The), 4.375%, 2/1/31(6) | | 292,000 | | 291,623 | |
Road and Rail† | | | |
| Burlington Northern Santa Fe LLC, 4.45%, 3/15/43 | | 16,000 | | 20,625 | |
| Burlington Northern Santa Fe LLC, 4.15%, 4/1/45 | | 100,000 | | 123,582 | |
| | | 144,207 | |
| Software — 0.1% | | | |
| Oracle Corp., 3.60%, 4/1/40 | | 355,000 | | 380,730 | |
| Specialty Retail — 0.1% | | | |
| Home Depot, Inc. (The), 2.375%, 3/15/51 | | 340,000 | | 322,690 | |
Rent-A-Center, Inc., 6.375%, 2/15/29(6) | | 110,000 | | 118,488 | |
| | | 441,178 | |
| Technology Hardware, Storage and Peripherals — 0.2% | | | |
NCR Corp., 5.125%, 4/15/29(6) | | 245,000 | | 255,356 | |
| Seagate HDD Cayman, 4.875%, 6/1/27 | | 220,000 | | 245,850 | |
| Western Digital Corp., 4.75%, 2/15/26 | | 390,000 | | 433,388 | |
| | | 934,594 | |
| Thrifts and Mortgage Finance — 0.1% | | | |
United Wholesale Mortgage LLC, 5.50%, 4/15/29(6) | | 265,000 | | 263,397 | |
| Transportation Infrastructure — 0.2% | | | |
| Adani Ports & Special Economic Zone Ltd., 4.00%, 7/30/27 | | 375,000 | | 391,527 | |
| DP World Crescent Ltd., MTN, 4.85%, 9/26/28 | | 375,000 | | 430,209 | |
| | | 821,736 | |
| | | | | | | | | | | |
| | Shares/Principal Amount | Value |
| Wireless Telecommunication Services — 0.1% | | | |
C&W Senior Financing DAC, 6.875%, 9/15/27(6) | | $ | 97,000 | | $ | 103,038 | |
Millicom International Cellular SA, 5.125%, 1/15/28(6) | | 91,800 | | 95,791 | |
| Sprint Corp., 7.875%, 9/15/23 | | 35,000 | | 39,643 | |
| Sprint Corp., 7.125%, 6/15/24 | | 70,000 | | 80,570 | |
| T-Mobile USA, Inc., 4.75%, 2/1/28 | | 285,000 | | 303,326 | |
T-Mobile USA, Inc., 3.50%, 4/15/31(6) | | 85,000 | | 89,269 | |
| T-Mobile USA, Inc., 3.50%, 4/15/31 | | 20,000 | | 21,004 | |
| | | 732,641 | |
TOTAL CORPORATE BONDS (Cost $35,376,017) | | | 36,674,885 | |
| SOVEREIGN GOVERNMENTS AND AGENCIES — 7.7% | |
|
|
| Australia — 0.3% | | | |
| Australia Government Bond, 2.75%, 4/21/24 | AUD | 1,012,000 | | 797,465 | |
| Australia Government Bond, 3.00%, 3/21/47 | AUD | 505,000 | | 444,194 | |
| New South Wales Treasury Corp., 3.00%, 3/20/28 | AUD | 285,000 | | 235,365 | |
| | | 1,477,024 | |
| Austria — 0.1% | | | |
Republic of Austria Government Bond, 3.40%, 11/22/22(6) | EUR | 126,000 | | 157,544 | |
Republic of Austria Government Bond, 0.75%, 10/20/26(6) | EUR | 140,000 | | 178,250 | |
Republic of Austria Government Bond, 4.15%, 3/15/37(6) | EUR | 101,000 | | 196,293 | |
| | | 532,087 | |
Belgium† | | | |
Kingdom of Belgium Government Bond, 4.25%, 3/28/41(6) | EUR | 47,000 | | 96,522 | |
| Canada — 0.6% | | | |
| Canadian Government Bond, 0.25%, 3/1/26 | CAD | 1,150,000 | | 898,587 | |
| Province of British Columbia Canada, 3.25%, 12/18/21 | CAD | 302,000 | | 244,859 | |
| Province of British Columbia Canada, 2.85%, 6/18/25 | CAD | 684,000 | | 588,650 | |
| Province of Quebec Canada, 3.00%, 9/1/23 | CAD | 460,000 | | 387,659 | |
| Province of Quebec Canada, 5.75%, 12/1/36 | CAD | 325,000 | | 380,683 | |
| Province of Quebec Canada, 5.00%, 12/1/41 | CAD | 33,000 | | 37,638 | |
| Province of Quebec Canada, 3.50%, 12/1/48 | CAD | 102,000 | | 97,833 | |
| | | 2,635,909 | |
| China — 1.9% | | | |
| China Government Bond, 2.64%, 8/13/22 | CNY | 18,500,000 | | 2,869,814 | |
| China Government Bond, 2.88%, 11/5/23 | CNY | 25,000,000 | | 3,907,051 | |
| China Government Bond, 3.25%, 6/6/26 | CNY | 550,000 | | 87,333 | |
| China Government Bond, 3.29%, 5/23/29 | CNY | 400,000 | | 63,487 | |
| China Government Bond, 3.39%, 3/16/50 | CNY | 10,340,000 | | 1,566,961 | |
| | | 8,494,646 | |
Colombia† | | | |
| Colombia Government International Bond, 7.375%, 9/18/37 | | $ | 100,000 | | 129,920 | |
Czech Republic† | | | |
| Czech Republic Government Bond, 4.70%, 9/12/22 | CZK | 2,100,000 | | 102,222 | |
Denmark† | | | |
| Denmark Government Bond, 0.50%, 11/15/27 | DKK | 517,000 | | 87,347 | |
| Denmark Government Bond, 4.50%, 11/15/39 | DKK | 260,000 | | 75,161 | |
| | | 162,508 | |
| Finland — 0.5% | | | |
Finland Government Bond, 4.00%, 7/4/25(6) | EUR | 173,000 | | 244,059 | |
Finland Government Bond, 0.125%, 4/15/36(6) | EUR | 1,750,000 | | 2,099,607 | |
| | | 2,343,666 | |
| | | | | | | | | | | |
| | Shares/Principal Amount | Value |
| France — 0.6% | | | |
| French Republic Government Bond OAT, 2.50%, 5/25/30 | EUR | 1,170,000 | | $ | 1,731,770 | |
French Republic Government Bond OAT, 0.00%, 11/25/31(8) | EUR | 850,000 | | 1,018,872 | |
| | | 2,750,642 | |
| Indonesia — 0.1% | | | |
| Indonesia Treasury Bond, 8.375%, 9/15/26 | IDR | 3,000,000,000 | | 235,542 | |
| Ireland — 0.1% | | | |
| Ireland Government Bond, 3.40%, 3/18/24 | EUR | 196,000 | | 257,458 | |
| Italy — 0.4% | | | |
| Italy Buoni Poliennali Del Tesoro, 1.50%, 6/1/25 | EUR | 263,000 | | 332,060 | |
| Italy Buoni Poliennali Del Tesoro, 2.00%, 12/1/25 | EUR | 971,000 | | 1,257,743 | |
| | | 1,589,803 | |
| Japan — 2.1% | | | |
| Japan Government Ten Year Bond, 0.80%, 6/20/23 | JPY | 31,500,000 | | 292,077 | |
| Japan Government Thirty Year Bond, 2.40%, 3/20/37 | JPY | 161,750,000 | | 1,961,434 | |
| Japan Government Thirty Year Bond, 2.00%, 9/20/41 | JPY | 154,250,000 | | 1,838,495 | |
| Japan Government Thirty Year Bond, 1.40%, 12/20/45 | JPY | 11,400,000 | | 125,188 | |
| Japan Government Twenty Year Bond, 2.10%, 12/20/26 | JPY | 313,550,000 | | 3,202,747 | |
| Japanese Government CPI Linked Bond, 0.10%, 3/10/29 | JPY | 226,981,848 | | 2,127,987 | |
| | | 9,547,928 | |
Malaysia† | | | |
| Malaysia Government Bond, 3.96%, 9/15/25 | MYR | 785,000 | | 196,242 | |
| Mexico — 0.2% | | | |
| Mexican Bonos, 6.50%, 6/9/22 | MXN | 7,800,000 | | 395,269 | |
| Mexico Government International Bond, 4.15%, 3/28/27 | | $ | 400,000 | | 455,746 | |
| | | 851,015 | |
| Netherlands — 0.2% | | | |
Netherlands Government Bond, 0.00%, 1/15/22(6)(8) | EUR | 95,000 | | 113,030 | |
Netherlands Government Bond, 0.50%, 7/15/26(6) | EUR | 401,000 | | 504,811 | |
Netherlands Government Bond, 2.75%, 1/15/47(6) | EUR | 63,000 | | 126,894 | |
| | | 744,735 | |
| Norway — 0.1% | | | |
Norway Government Bond, 2.00%, 5/24/23(6) | NOK | 360,000 | | 41,812 | |
Norway Government Bond, 1.75%, 2/17/27(6) | NOK | 1,510,000 | | 177,739 | |
| | | 219,551 | |
Poland† | | | |
| Republic of Poland Government Bond, 4.00%, 10/25/23 | PLN | 650,000 | | 182,334 | |
Russia† | | | |
| Russian Federal Bond - OFZ, 7.05%, 1/19/28 | RUB | 4,500,000 | | 62,662 | |
Singapore† | | | |
| Singapore Government Bond, 3.125%, 9/1/22 | SGD | 288,000 | | 218,886 | |
| Spain — 0.1% | | | |
Spain Government Bond, 4.40%, 10/31/23(6) | EUR | 5,000 | | 6,598 | |
Spain Government Bond, 1.60%, 4/30/25(6) | EUR | 164,000 | | 209,909 | |
Spain Government Bond, 5.15%, 10/31/28(6) | EUR | 16,000 | | 26,253 | |
Spain Government Bond, 5.15%, 10/31/44(6) | EUR | 30,000 | | 66,791 | |
| | | 309,551 | |
| Switzerland — 0.1% | | | |
| Swiss Confederation Government Bond, 1.25%, 5/28/26 | CHF | 253,000 | | 305,895 | |
| Swiss Confederation Government Bond, 2.50%, 3/8/36 | CHF | 89,000 | | 137,619 | |
| | | 443,514 | |
| | | | | | | | | | | |
| | Shares/Principal Amount | Value |
| Thailand — 0.1% | | | |
| Thailand Government Bond, 3.625%, 6/16/23 | THB | 3,450,000 | | $ | 111,035 | |
| Thailand Government Bond, 3.85%, 12/12/25 | THB | 9,350,000 | | 322,124 | |
| | | 433,159 | |
| United Kingdom — 0.2% | | | |
| United Kingdom Gilt, 0.125%, 1/30/26 | GBP | 600,000 | | 828,636 | |
TOTAL SOVEREIGN GOVERNMENTS AND AGENCIES (Cost $32,668,768) | | | 34,846,162 | |
COMMERCIAL PAPER(2) — 2.3% | |
|
|
First Abu Dhabi Bank PJSC, 0.12%, 8/27/21(6) | | $ | 445,000 | | 444,971 | |
Nordea Bank Abp, 0.19%, 6/24/22(6) | | 2,050,000 | | 2,050,055 | |
Ridgefield Funding Co. LLC, 0.19%, 11/2/21(6) | | 1,080,000 | | 1,079,724 | |
| Royal Bank of Canada (New York), VRN, 0.14%, (3-month LIBOR plus 0.01%), 1/27/22 | | 775,000 | | 775,053 | |
Societe Generale SA, 0.19%, 10/21/21(6) | | 2,360,000 | | 2,359,510 | |
Toronto-Dominion Bank (The), 0.23%, 4/11/22(6) | | 3,410,000 | | 3,406,425 | |
Washington Morgan Capital Co. LLC, Series A, 0.25%, 11/19/21 (LOC: Goldman Sachs & Co.)(6) | | 280,000 | | 280,077 | |
TOTAL COMMERCIAL PAPER (Cost $10,392,924) | | | 10,395,815 | |
| COLLATERALIZED LOAN OBLIGATIONS — 2.1% | |
|
|
Ares LVI CLO Ltd., Series 2020-56A, Class C, VRN, 2.53%, (3-month LIBOR plus 2.40%), 10/25/31(6) | | 425,000 | | 426,376 | |
Ares XXXIV CLO Ltd., Series 2015-2A, Class BR2, VRN, 1.73%, (3-month LIBOR plus 1.60%), 4/17/33(6) | | 550,000 | | 549,294 | |
Bean Creek CLO Ltd., Series 2015-1A, Class BR, VRN, 1.58%, (3-month LIBOR plus 1.45%), 4/20/31(6) | | 400,000 | | 398,956 | |
CBAM Ltd., Series 2018-5A, Class B1, VRN, 1.53%, (3-month LIBOR plus 1.40%), 4/17/31(6) | | 450,000 | | 447,259 | |
Dryden Senior Loan Fund, Series 2017-50A, Class A1R, VRN, 1.13%, (3-month LIBOR plus 1.00%), 7/15/30(6) | | 325,000 | | 325,428 | |
Dryden Senior Loan Fund, Series 2021-87A, Class D, VRN, 3.07%, (3-month LIBOR plus 2.95%), 5/20/34(6) | | 300,000 | | 301,508 | |
Elmwood CLO IV Ltd., Series 2020-1A, Class C, VRN, 2.18%, (3-month LIBOR plus 2.05%), 4/15/33(6) | | 300,000 | | 301,207 | |
Elmwood CLO IV Ltd., Series 2020-1A, Class D, VRN, 3.28%, (3-month LIBOR plus 3.15%), 4/15/33(6) | | 150,000 | | 150,942 | |
Elmwood CLO V Ltd., Series 2020-2A, Class C, VRN, 2.875%, (3-month LIBOR plus 2.75%), 7/24/31(6) | | 500,000 | | 501,818 | |
Elmwood CLO V Ltd., Series 2020-2A, Class CR, VRN, 2.12%, (3-month LIBOR plus 2.00%), 10/20/34(6)(9) | | 350,000 | | 350,004 | |
Elmwood CLO VII Ltd., Series 2020-4A, Class C, VRN, 2.38%, (3-month LIBOR plus 2.25%), 1/17/34(6) | | 275,000 | | 277,213 | |
Flatiron CLO Ltd., Series 2020-1A, Class C, VRN, 2.61%, (3-month LIBOR plus 2.45%), 11/20/33(6) | | 350,000 | | 354,698 | |
Goldentree Loan Opportunities X Ltd., Series 2015-10A, Class AR, VRN, 1.25%, (3-month LIBOR plus 1.12%), 7/20/31(6) | | 250,000 | | 250,408 | |
Kayne CLO Ltd., Series 2020-9A, Class C, VRN, 2.73%, (3-month LIBOR plus 2.60%), 1/15/34(6) | | 350,000 | | 355,938 | |
KKR CLO Ltd., Series 2022A, Class B, VRN, 1.73%, (3-month LIBOR plus 1.60%), 7/20/31(6) | | 450,000 | | 450,011 | |
Logan CLO I Ltd., Series 2021-1A, Class C, VRN, 2.05%, (3-month LIBOR plus 1.90%), 7/20/34(6) | | 325,000 | | 324,487 | |
Magnetite VIII Ltd., Series 2014-8A, Class BR2, VRN, 1.63%, (3-month LIBOR plus 1.50%), 4/15/31(6) | | 400,000 | | 398,775 | |
Magnetite XIV-R Ltd., Series 2015-14RA, Class B, VRN, 1.73%, (3-month LIBOR plus 1.60%), 10/18/31(6) | | 375,000 | | 374,602 | |
| | | | | | | | | | | |
| | Shares/Principal Amount | Value |
Magnetite XXV Ltd., Series 2020-25A, Class C, VRN, 2.23%, (3-month LIBOR plus 2.10%), 1/25/32(6) | | $ | 350,000 | | $ | 351,372 | |
Neuberger Berman Loan Advisers CLO Ltd., Series 2018-30A, Class DR, VRN, 2.98%, (3-month LIBOR plus 2.85%), 1/20/31(6) | | 175,000 | | 175,614 | |
Neuberger Berman Loan Advisers CLO Ltd., Series 2019-34A, Class C1, VRN, 2.73%, (3-month LIBOR plus 2.60%), 1/20/33(6) | | 275,000 | | 276,861 | |
Octagon Ltd., Series 2021-1A, Class D, VRN, 3.18%, (3-month LIBOR plus 3.05%), 7/15/34(6) | | 325,000 | | 327,513 | |
OHA Credit Funding Ltd., Series 2020-7A, Class B, VRN, 1.83%, (3-month LIBOR plus 1.70%), 10/19/32(6) | | 350,000 | | 350,644 | |
OHA Credit Partners VII Ltd., Series 2012-7A, Class D1R3, VRN, 3.06%, (3-month LIBOR plus 2.90%), 2/20/34(6) | | 275,000 | | 276,261 | |
Point Au Roche Park CLO Ltd., Series 2021-1A, Class D, VRN, 2.98%, (3-month LIBOR plus 2.80%), 7/20/34(6) | | 200,000 | | 201,032 | |
Reese Park CLO Ltd., Series 2020-1A, Class C1, VRN, 2.58%, (3-month LIBOR plus 2.45%), 10/15/32(6) | | 325,000 | | 326,148 | |
Rockford Tower CLO Ltd., Series 2020-1A, Class C, VRN, 2.48%, (3-month LIBOR plus 2.35%), 1/20/32(6) | | 325,000 | | 326,457 | |
Symphony CLO XXII Ltd., Series 2020-22A, Class B, VRN, 1.83%, (3-month LIBOR plus 1.70%), 4/18/33(6) | | 500,000 | | 502,132 | |
TOTAL COLLATERALIZED LOAN OBLIGATIONS (Cost $9,600,271) | | | 9,652,958 | |
| MUNICIPAL SECURITIES — 2.1% | |
|
|
| Alaska Housing Finance Corp. Rev., VRDN, 0.04%, 8/2/21 (SBBPA: FHLB) | | 100,000 | | 100,000 | |
| Alaska Housing Finance Corp. Rev., VRDN, 0.09%, 8/6/21 | | 100,000 | | 100,000 | |
| Bay Area Toll Authority Rev., 6.92%, 4/1/40 | | 105,000 | | 161,094 | |
| California Infrastructure & Economic Development Bank Rev., (Morningstar Enterprises LLC), VRDN, 0.07%, 8/6/21 (LOC: Wells Fargo Bank N.A.) | | 100,000 | | 100,000 | |
| Metropolitan Transportation Authority Rev., 6.81%, 11/15/40 | | 30,000 | | 44,138 | |
| Michigan Finance Authority Rev., 4.00%, 8/20/21 (LOC: JPMorgan Chase Bank N.A.) | | 2,500,000 | | 2,504,915 | |
| Mississippi Business Finance Corp. Rev., (Chevron USA, Inc.), VRDN, 0.02%, 8/2/21 (GA: Chevron Corp.) | | 150,000 | | 150,000 | |
| New Jersey Turnpike Authority Rev., 7.41%, 1/1/40 | | 100,000 | | 167,754 | |
| New Jersey Turnpike Authority Rev., 7.10%, 1/1/41 | | 9,000 | | 14,730 | |
| New York City GO, 6.27%, 12/1/37 | | 40,000 | | 59,790 | |
| Ohio Water Development Authority Water Pollution Control Loan Fund Rev., 4.88%, 12/1/34 | | 110,000 | | 133,102 | |
| Port Authority of New York & New Jersey Rev., 4.93%, 10/1/51 | | 50,000 | | 71,532 | |
| Regents of the University of California Medical Center Pooled Rev., 3.26%, 5/15/60 | | 125,000 | | 138,473 | |
| Rutgers The State University of New Jersey Rev., 5.67%, 5/1/40 | | 150,000 | | 209,107 | |
| Sacramento Municipal Utility District Rev., 6.16%, 5/15/36 | | 180,000 | | 255,870 | |
| San Francisco Public Utilities Commission Water Rev., 6.00%, 11/1/40 | | 75,000 | | 106,133 | |
| Santa Clara Valley Transportation Authority Rev., 5.88%, 4/1/32 | | 105,000 | | 133,227 | |
| State of California GO, 4.60%, 4/1/38 | | 40,000 | | 47,030 | |
| State of California GO, 7.55%, 4/1/39 | | 30,000 | | 52,121 | |
| State of California GO, 7.30%, 10/1/39 | | 30,000 | | 48,770 | |
| State of California GO, 7.60%, 11/1/40 | | 65,000 | | 115,770 | |
| State of Maryland GO, 2.65%, 3/15/22 | | 200,000 | | 203,079 | |
| | | | | | | | | | | |
| | Shares/Principal Amount | Value |
| State of New York Mortgage Agency Rev., VRDN, 0.04%, 8/2/21 (SBBPA: Barclays Bank plc) | | $ | 155,000 | | $ | 155,000 | |
| State of Texas Rev., 4.00%, 8/26/21 | | 2,880,000 | | 2,887,637 | |
| State of Washington GO, 5.14%, 8/1/40 | | 5,000 | | 7,105 | |
| Tempe Industrial Development Authority Rev., (ASUF Brickyard LLC), VRDN, 0.13%, 8/6/21 (LOC: Bank of America N.A.) | | 120,000 | | 120,000 | |
| Tennis for Charity, Inc. Rev., VRDN, 0.06%, 8/6/21 (LOC: JPMorgan Chase Bank N.A.) | | 1,325,000 | | 1,325,000 | |
TOTAL MUNICIPAL SECURITIES (Cost $8,936,266) | | | 9,411,377 | |
| COLLATERALIZED MORTGAGE OBLIGATIONS — 1.0% | | | |
| Private Sponsor Collateralized Mortgage Obligations — 0.2% |
| Citigroup Mortgage Loan Trust, Inc., Series 2004-UST1, Class A5, VRN, 2.01%, 8/25/34 | | 86,156 | | 88,233 | |
| JP Morgan Mortgage Trust, Series 2013-1, Class 2A2 SEQ, VRN, 2.50%, 3/25/43(6) | | 22,713 | | 22,995 | |
JP Morgan Mortgage Trust, Series 2014-5, Class A1, VRN, 2.89%, 10/25/29(6) | | 84,368 | | 86,891 | |
Radnor RE Ltd., Series 2021-1, Class M1B, VRN, 1.75%, (SOFR plus 1.70%), 12/27/33(6) | | 600,000 | | 601,263 | |
Sofi Mortgage Trust, Series 2016-1A, Class 1A4 SEQ, VRN, 3.00%, 11/25/46(6) | | 20,645 | | 21,083 | |
| | | 820,465 | |
| U.S. Government Agency Collateralized Mortgage Obligations — 0.8% |
| FHLMC, Series 2014-HQ2, Class M3, VRN, 3.84%, (1-month LIBOR plus 3.75%), 9/25/24 | | 575,507 | | 586,161 | |
FHLMC, Series 2016-DNA3, Class M3, VRN, 5.09%,
(1-month LIBOR plus 5.00%), 12/25/28 | | 452,258 | | 471,534 | |
FHLMC, Series 2016-HQA3, Class M2, VRN, 1.44%,
(1-month LIBOR plus 1.35%), 3/25/29 | | 1,891 | | 1,891 | |
FHLMC, Series 2016-HQA4, Class M3, VRN, 3.99%,
(1-month LIBOR plus 3.90%), 4/25/29 | | 1,055,767 | | 1,090,641 | |
| FHLMC, Series 5123, Class HI, IO, 5.00%, 1/25/42 | | 530,212 | | 93,610 | |
| FNMA, Series 2014-C02, Class 2M2, VRN, 2.69%, (1-month LIBOR plus 2.60%), 5/25/24 | | 247,511 | | 250,107 | |
| FNMA, Series 2015-C04, Class 1M2, VRN, 5.79%, (1-month LIBOR plus 5.70%), 4/25/28 | | 180,932 | | 191,695 | |
| FNMA, Series 2016-C03, Class 2M2, VRN, 5.99%, (1-month LIBOR plus 5.90%), 10/25/28 | | 111,561 | | 117,789 | |
| FNMA, Series 2017-C03, Class 1M2, VRN, 3.09%, (1-month LIBOR plus 3.00%), 10/25/29 | | 119,948 | | 123,333 | |
| FNMA, Series 2018-C04, Class 2M2, VRN, 2.64%, (1-month LIBOR plus 2.55%), 12/25/30 | | 612,578 | | 620,972 | |
| | | 3,547,733 | |
TOTAL COLLATERALIZED MORTGAGE OBLIGATIONS (Cost $4,141,016) | | | 4,368,198 | |
| PREFERRED STOCKS — 0.7% | |
|
|
| Automobiles — 0.1% | | | |
| Volkswagen International Finance NV, 3.875% | | 300,000 | | 401,682 | |
| Diversified Telecommunication Services — 0.1% | | | |
| Telefonica Europe BV, 3.00% | | 300,000 | | 368,331 | |
| Telefonica Europe BV, 5.875% | | 100,000 | | 132,889 | |
| | | 501,220 | |
| Electric Utilities — 0.1% | | | |
| Electricite de France SA, 3.375% | | 200,000 | | 252,374 | |
| Enel SpA, 2.25% | | 300,000 | | 376,184 | |
| | | 628,558 | |
| | | | | | | | | | | |
| | Shares/Principal Amount | Value |
| Insurance — 0.2% | | | |
| Allianz SE, 2.625% | | 200,000 | | $ | 243,774 | |
| Allianz SE, 3.375% | | 200,000 | | 259,066 | |
| Credit Agricole Assurances SA, 4.25% | | 100,000 | | 131,970 | |
| Intesa Sanpaolo Vita SpA, 4.75% | | 200,000 | | 261,969 | |
| | | 896,779 | |
| Oil, Gas and Consumable Fuels — 0.1% | | | |
| Eni SpA, 3.375% | | 300,000 | | 384,879 | |
| Trading Companies and Distributors — 0.1% | | | |
Aircastle Ltd., 5.25%(6) | | 365,000 | | 369,563 | |
TOTAL PREFERRED STOCKS (Cost $3,146,735) | | | 3,182,681 | |
| ASSET-BACKED SECURITIES — 0.6% | |
|
|
BRE Grand Islander Timeshare Issuer LLC, Series 2017-1A, Class A SEQ, 2.94%, 5/25/29(6) | | $ | 83,115 | | 85,226 | |
FirstKey Homes Trust, Series 2020-SFR1, Class C, 1.94%, 9/17/25(6) | | 400,000 | | 403,938 | |
FirstKey Homes Trust, Series 2020-SFR2, Class E, 2.67%, 10/19/37(6) | | 1,300,000 | | 1,332,103 | |
Sierra Timeshare Receivables Funding LLC, Series 2018-2A, Class B, 3.65%, 6/20/35(6) | | 209,108 | | 215,275 | |
VSE VOI Mortgage LLC, Series 2016-A, Class A SEQ, 2.54%, 7/20/33(6) | | 162,517 | | 162,648 | |
VSE VOI Mortgage LLC, Series 2018-A, Class B, 3.72%, 2/20/36(6) | | 225,207 | | 236,000 | |
TOTAL ASSET-BACKED SECURITIES (Cost $2,377,349) | | | 2,435,190 | |
| CERTIFICATES OF DEPOSIT — 0.5% | |
|
|
| Banks — 0.5% | | | |
| Natixis NY, 0.29%, 8/10/21 | | 190,000 | | 190,013 | |
| Skandinaviska Enskilda Banken AB, 0.18%, 10/4/21 | | 2,200,000 | | 2,200,407 | |
TOTAL CERTIFICATES OF DEPOSIT (Cost $2,390,007) | | | 2,390,420 | |
| U.S. GOVERNMENT AGENCY MORTGAGE-BACKED SECURITIES — 0.5% | |
| Adjustable-Rate U.S. Government Agency Mortgage-Backed Securities — 0.1% | |
| FHLMC, VRN, 2.25%, (12-month LIBOR plus 1.87%), 7/1/36 | | 5,082 | | 5,387 | |
| FHLMC, VRN, 2.34%, (1-year H15T1Y plus 2.14%), 10/1/36 | | 17,115 | | 18,319 | |
| FHLMC, VRN, 2.42%, (1-year H15T1Y plus 2.26%), 4/1/37 | | 47,887 | | 51,038 | |
| FHLMC, VRN, 2.30%, (12-month LIBOR plus 1.77%), 9/1/40 | | 10,814 | | 11,259 | |
| FHLMC, VRN, 2.15%, (12-month LIBOR plus 1.88%), 5/1/41 | | 7,943 | | 8,288 | |
| FHLMC, VRN, 2.45%, (12-month LIBOR plus 1.86%), 7/1/41 | | 27,788 | | 29,548 | |
| FHLMC, VRN, 2.02%, (12-month LIBOR plus 1.64%), 2/1/43 | | 8,329 | | 8,548 | |
| FHLMC, VRN, 1.87%, (12-month LIBOR plus 1.62%), 6/1/43 | | 124 | | 124 | |
| FHLMC, VRN, 1.90%, (12-month LIBOR plus 1.65%), 6/1/43 | | 4,208 | | 4,222 | |
| FNMA, VRN, 1.82%, (6-month LIBOR plus 1.57%), 6/1/35 | | 23,621 | | 24,640 | |
| FNMA, VRN, 1.82%, (6-month LIBOR plus 1.57%), 6/1/35 | | 30,174 | | 31,469 | |
| FNMA, VRN, 1.79%, (6-month LIBOR plus 1.54%), 9/1/35 | | 4,816 | | 5,019 | |
| FNMA, VRN, 2.36%, (1-year H15T1Y plus 2.16%), 3/1/38 | | 34,420 | | 36,701 | |
| FNMA, VRN, 2.07%, (12-month LIBOR plus 1.69%), 1/1/40 | | 5,912 | | 6,154 | |
| FNMA, VRN, 2.29%, (12-month LIBOR plus 1.86%), 3/1/40 | | 7,918 | | 8,415 | |
| FNMA, VRN, 2.32%, (12-month LIBOR plus 1.77%), 10/1/40 | | 15,713 | | 16,611 | |
| | | 265,742 | |
| Fixed-Rate U.S. Government Agency Mortgage-Backed Securities — 0.4% | |
| FHLMC, 8.00%, 7/1/30 | | 985 | | 1,185 | |
| | | | | | | | | | | |
| | Shares/Principal Amount | Value |
| FHLMC, 6.50%, 5/1/31 | | $ | 6,315 | | $ | 7,109 | |
| FHLMC, 5.50%, 12/1/33 | | 40,169 | | 45,796 | |
| FHLMC, 5.50%, 1/1/38 | | 54,938 | | 63,961 | |
| FHLMC, 6.00%, 2/1/38 | | 72,413 | | 86,146 | |
| FHLMC, 6.00%, 11/1/38 | | 51,313 | | 59,763 | |
| FNMA, 7.00%, 6/1/26 | | 121 | | 133 | |
| FNMA, 6.50%, 6/1/29 | | 7,193 | | 8,090 | |
| FNMA, 7.00%, 7/1/29 | | 307 | | 308 | |
| FNMA, 7.00%, 3/1/30 | | 2,217 | | 2,436 | |
| FNMA, 7.50%, 9/1/30 | | 1,588 | | 1,842 | |
| FNMA, 6.50%, 9/1/31 | | 12,142 | | 13,662 | |
| FNMA, 7.00%, 9/1/31 | | 3,467 | | 3,658 | |
| FNMA, 6.50%, 1/1/32 | | 2,209 | | 2,487 | |
| FNMA, 5.50%, 6/1/33 | | 34,512 | | 39,870 | |
| FNMA, 5.50%, 8/1/33 | | 196,390 | | 227,174 | |
| FNMA, 5.50%, 9/1/33 | | 41,231 | | 47,327 | |
| FNMA, 5.50%, 1/1/34 | | 98,119 | | 113,353 | |
| FNMA, 3.50%, 3/1/34 | | 72,765 | | 78,370 | |
| FNMA, 5.50%, 4/1/36 | | 21,901 | | 25,429 | |
| FNMA, 5.50%, 12/1/36 | | 44,531 | | 51,708 | |
| FNMA, 5.50%, 1/1/37 | | 153,376 | | 178,102 | |
| FNMA, 6.50%, 8/1/37 | | 24,450 | | 28,122 | |
| FNMA, 6.50%, 8/1/47 | | 7,564 | | 8,217 | |
| FNMA, 6.50%, 9/1/47 | | 18,102 | | 19,608 | |
| FNMA, 6.50%, 9/1/47 | | 871 | | 945 | |
| FNMA, 6.50%, 9/1/47 | | 9,572 | | 10,366 | |
| GNMA, 7.00%, 1/15/24 | | 230 | | 240 | |
| GNMA, 8.00%, 7/15/24 | | 2,020 | | 2,062 | |
| GNMA, 8.00%, 9/15/24 | | 657 | | 660 | |
| GNMA, 9.00%, 4/20/25 | | 320 | | 349 | |
| GNMA, 7.00%, 9/15/25 | | 2,824 | | 2,835 | |
| GNMA, 7.50%, 10/15/25 | | 2,313 | | 2,347 | |
| GNMA, 7.50%, 2/15/26 | | 4,638 | | 5,035 | |
| GNMA, 8.25%, 7/15/26 | | 14,302 | | 14,528 | |
| GNMA, 7.00%, 12/15/27 | | 9,925 | | 9,965 | |
| GNMA, 6.50%, 2/15/28 | | 1,511 | | 1,689 | |
| GNMA, 6.50%, 3/15/28 | | 6,376 | | 7,129 | |
| GNMA, 6.50%, 4/15/28 | | 321 | | 359 | |
| GNMA, 6.00%, 10/15/28 | | 9,416 | | 10,582 | |
| GNMA, 7.00%, 5/15/31 | | 3,352 | | 3,940 | |
| GNMA, 5.50%, 11/15/32 | | 19,192 | | 22,125 | |
| GNMA, 6.50%, 10/15/38 | | 289,046 | | 347,384 | |
| GNMA, 4.50%, 5/20/41 | | 171,882 | | 191,284 | |
| GNMA, 4.50%, 6/15/41 | | 104,895 | | 120,295 | |
| GNMA, 3.50%, 6/20/42 | | 148,181 | | 159,621 | |
| GNMA, 3.50%, 4/20/45 | | 36,461 | | 38,897 | |
| GNMA, 2.50%, 2/20/47 | | 26,861 | | 28,038 | |
| | | 2,094,531 | |
TOTAL U.S. GOVERNMENT AGENCY MORTGAGE-BACKED SECURITIES (Cost $2,134,007) | 2,360,273 | |
EXCHANGE-TRADED FUNDS† | |
|
|
| iShares MSCI EAFE Value ETF | | 1,657 | | 85,534 | |
| | | | | | | | | | | |
| | Shares/Principal Amount | Value |
| iShares Russell 2000 Growth ETF | | 195 | | $ | 58,510 | |
TOTAL EXCHANGE-TRADED FUNDS (Cost $147,267) | | | 144,044 | |
| TEMPORARY CASH INVESTMENTS — 5.4% | | | |
State Street Institutional U.S. Government Money Market Fund, Premier Class (Cost $24,706,263) | | 24,706,263 | 24,706,263 | |
TEMPORARY CASH INVESTMENTS - SECURITIES LENDING COLLATERAL(10) — 0.1% |
State Street Navigator Securities Lending Government Money Market Portfolio (Cost $300,750) | | 300,750 | 300,750 | |
TOTAL INVESTMENT SECURITIES — 99.7% (Cost $375,890,712) | | | 450,869,643 | |
| OTHER ASSETS AND LIABILITIES — 0.3% | | | 1,180,609 | |
| TOTAL NET ASSETS — 100.0% | | | $ | 452,050,252 | |
FORWARD FOREIGN CURRENCY EXCHANGE CONTRACTS
| | | | | | | | | | | | | | | | | | | | |
| Currency Purchased | Currency Sold | Counterparty | Settlement Date | Unrealized Appreciation
(Depreciation) |
| AUD | 728,066 | | USD | 544,892 | | Bank of America N.A. | 9/15/21 | $ | (10,492) | |
| USD | 858,146 | | AUD | 1,109,762 | | Bank of America N.A. | 9/15/21 | 43,582 | |
| USD | 570,055 | | AUD | 759,851 | | Bank of America N.A. | 9/15/21 | 12,326 | |
| BRL | 3,944,137 | | USD | 770,565 | | Goldman Sachs & Co. | 9/15/21 | (17,613) | |
| USD | 402,119 | | BRL | 2,046,185 | | Goldman Sachs & Co. | 9/15/21 | 11,494 | |
| CAD | 5,844 | | USD | 4,640 | | Morgan Stanley | 9/29/21 | 45 | |
| CAD | 11,804 | | USD | 9,239 | | Morgan Stanley | 9/29/21 | 222 | |
| USD | 1,175,060 | | CAD | 1,420,883 | | Bank of America N.A. | 9/15/21 | 36,190 | |
| USD | 317,554 | | CAD | 386,317 | | Bank of America N.A. | 9/15/21 | 7,912 | |
| USD | 103 | | CAD | 127 | | Morgan Stanley | 9/29/21 | 1 | |
| USD | 215,670 | | CAD | 267,229 | | Morgan Stanley | 9/29/21 | 1,477 | |
| USD | 5,059 | | CAD | 6,357 | | Morgan Stanley | 9/29/21 | (36) | |
| USD | 5,985 | | CAD | 7,518 | | Morgan Stanley | 9/29/21 | (41) | |
| USD | 751,596 | | CHF | 672,235 | | Morgan Stanley | 9/15/21 | 8,678 | |
| CLP | 14,600,850 | | USD | 20,252 | | Goldman Sachs & Co. | 9/15/21 | (1,036) | |
| USD | 5,670,685 | | CNY | 36,488,020 | | Goldman Sachs & Co. | 9/15/21 | 46,154 | |
| COP | 1,145,252,190 | | USD | 317,768 | | Goldman Sachs & Co. | 9/15/21 | (23,126) | |
| USD | 265,847 | | COP | 998,214,005 | | Goldman Sachs & Co. | 9/15/21 | 9,033 | |
| USD | 60,204 | | CZK | 1,254,908 | | UBS AG | 9/15/21 | 1,867 | |
| USD | 14,926 | | DKK | 90,938 | | UBS AG | 9/15/21 | 413 | |
| EUR | 209,794 | | USD | 249,437 | | JPMorgan Chase Bank N.A. | 8/18/21 | (497) | |
| EUR | 6,748 | | USD | 7,958 | | Credit Suisse AG | 9/30/21 | 56 | |
| EUR | 4,781 | | USD | 5,657 | | Credit Suisse AG | 9/30/21 | 21 | |
| EUR | 4,478 | | USD | 5,325 | | Credit Suisse AG | 9/30/21 | (6) | |
| USD | 6,115,367 | | EUR | 5,169,547 | | JPMorgan Chase Bank N.A. | 8/18/21 | (18,780) | |
| USD | 654,782 | | EUR | 548,969 | | Credit Suisse AG | 9/30/21 | 2,820 | |
| USD | 203,490 | | EUR | 170,606 | | Credit Suisse AG | 9/30/21 | 876 | |
| USD | 6,621 | | EUR | 5,538 | | Credit Suisse AG | 9/30/21 | 45 | |
| USD | 15,866 | | EUR | 13,281 | | Credit Suisse AG | 9/30/21 | 93 | |
| USD | 19,376 | | EUR | 16,344 | | Credit Suisse AG | 9/30/21 | (34) | |
| USD | 5,675 | | EUR | 4,781 | | Credit Suisse AG | 9/30/21 | (3) | |
| USD | 5,917 | | EUR | 4,993 | | Credit Suisse AG | 9/30/21 | (13) | |
| USD | 7,768 | | EUR | 6,597 | | Credit Suisse AG | 9/30/21 | (66) | |
| USD | 26,363 | | EUR | 22,387 | | Credit Suisse AG | 9/30/21 | (224) | |
| USD | 7,739 | | EUR | 6,566 | | Credit Suisse AG | 9/30/21 | (59) | |
| USD | 6,439 | | EUR | 5,447 | | Credit Suisse AG | 9/30/21 | (30) | |
| USD | 7,021 | | EUR | 5,901 | | Credit Suisse AG | 9/30/21 | 13 | |
| USD | 17,789 | | EUR | 15,044 | | Goldman Sachs & Co. | 9/30/21 | (77) | |
| GBP | 867,471 | | USD | 1,225,216 | | Bank of America N.A. | 9/15/21 | (19,304) | |
| GBP | 82,803 | | USD | 113,923 | | Bank of America N.A. | 9/15/21 | 1,185 | |
| GBP | 89,023 | | USD | 124,379 | | Bank of America N.A. | 9/15/21 | (624) | |
| GBP | 12,641 | | USD | 17,610 | | JPMorgan Chase Bank N.A. | 9/30/21 | (36) | |
| GBP | 13,731 | | USD | 18,940 | | JPMorgan Chase Bank N.A. | 9/30/21 | 149 | |
| USD | 19,798 | | GBP | 14,241 | | Goldman Sachs & Co. | 9/30/21 | (1) | |
| USD | 642,775 | | GBP | 461,784 | | JPMorgan Chase Bank N.A. | 9/30/21 | 801 | |
| HKD | 5,184 | | USD | 667 | | Bank of America N.A. | 9/30/21 | — | |
| HKD | 13,851 | | USD | 1,780 | | Bank of America N.A. | 9/30/21 | 3 | |
| HKD | 19,278 | | USD | 2,478 | | Bank of America N.A. | 9/30/21 | 3 | |
| USD | 823 | | HKD | 6,395 | | Bank of America N.A. | 9/30/21 | — | |
| USD | 795 | | HKD | 6,179 | | Bank of America N.A. | 9/30/21 | — | |
| | | | | | | | | | | | | | | | | | | | |
| Currency Purchased | Currency Sold | Counterparty | Settlement Date | Unrealized Appreciation
(Depreciation) |
| USD | 1,662 | | HKD | 12,915 | | Bank of America N.A. | 9/30/21 | $ | (1) | |
| USD | 1,772 | | HKD | 13,770 | | Bank of America N.A. | 9/30/21 | — | |
| USD | 10,015 | | HKD | 77,787 | | Bank of America N.A. | 9/30/21 | 4 | |
| USD | 354 | | HKD | 2,754 | | Bank of America N.A. | 9/30/21 | — | |
| USD | 2,542 | | HKD | 19,764 | | Bank of America N.A. | 9/30/21 | (2) | |
| HUF | 10,604,698 | | USD | 37,228 | | UBS AG | 9/15/21 | (2,189) | |
| IDR | 7,234,439,890 | | USD | 501,556 | | Goldman Sachs & Co. | 9/15/21 | (2,820) | |
| ILS | 187,276 | | USD | 57,757 | | UBS AG | 9/17/21 | 197 | |
| USD | 507,996 | | INR | 37,498,769 | | Goldman Sachs & Co. | 9/15/21 | 6,226 | |
| JPY | 825,660 | | USD | 7,419 | | Bank of America N.A. | 9/30/21 | 111 | |
| JPY | 280,800 | | USD | 2,562 | | Bank of America N.A. | 9/30/21 | (1) | |
| JPY | 300,960 | | USD | 2,733 | | Bank of America N.A. | 9/30/21 | 11 | |
| JPY | 1,031,311 | | USD | 9,366 | | Bank of America N.A. | 9/30/21 | 39 | |
| JPY | 856,125 | | USD | 7,828 | | Bank of America N.A. | 9/30/21 | (21) | |
| JPY | 246,240 | | USD | 2,236 | | Bank of America N.A. | 9/30/21 | 10 | |
| JPY | 1,015,113 | | USD | 9,235 | | Bank of America N.A. | 9/30/21 | 23 | |
| USD | 3,349,186 | | JPY | 368,830,462 | | Bank of America N.A. | 8/18/21 | (13,194) | |
| USD | 225,750 | | JPY | 24,967,460 | | Bank of America N.A. | 9/30/21 | (1,941) | |
| USD | 106,286 | | JPY | 11,754,990 | | Bank of America N.A. | 9/30/21 | (914) | |
| USD | 3,701 | | JPY | 410,040 | | Bank of America N.A. | 9/30/21 | (38) | |
| USD | 3,864 | | JPY | 426,870 | | Bank of America N.A. | 9/30/21 | (29) | |
| USD | 97,344 | | JPY | 10,704,126 | | Bank of America N.A. | 9/30/21 | (273) | |
| USD | 7,900 | | JPY | 867,245 | | Bank of America N.A. | 9/30/21 | (9) | |
| KRW | 491,522,722 | | USD | 440,365 | | Goldman Sachs & Co. | 9/15/21 | (14,366) | |
| KZT | 87,842,751 | | USD | 202,566 | | Goldman Sachs & Co. | 9/15/21 | 2,021 | |
| USD | 297,277 | | MXN | 5,933,418 | | Morgan Stanley | 9/15/21 | 923 | |
| MYR | 2,549,378 | | USD | 618,406 | | Goldman Sachs & Co. | 9/15/21 | (17,711) | |
| NOK | 31,975 | | USD | 3,754 | | UBS AG | 9/30/21 | (134) | |
| NOK | 87,578 | | USD | 9,917 | | UBS AG | 9/30/21 | (3) | |
| USD | 205,819 | | NOK | 1,703,128 | | UBS AG | 9/15/21 | 13,021 | |
| USD | 4,383 | | NOK | 38,324 | | UBS AG | 9/30/21 | 45 | |
| USD | 1,638 | | NOK | 14,660 | | UBS AG | 9/30/21 | (22) | |
| USD | 159,769 | | NOK | 1,371,403 | | UBS AG | 9/30/21 | 4,523 | |
| NZD | 368,417 | | USD | 257,604 | | Bank of America N.A. | 9/15/21 | (972) | |
| USD | 195,956 | | NZD | 273,148 | | Bank of America N.A. | 9/15/21 | 5,687 | |
| PEN | 81,154 | | USD | 20,977 | | Goldman Sachs & Co. | 9/15/21 | (996) | |
| USD | 659,991 | | PHP | 31,723,794 | | Goldman Sachs & Co. | 9/15/21 | 26,547 | |
| USD | 121,888 | | PLN | 447,595 | | UBS AG | 9/15/21 | 5,688 | |
| USD | 66,787 | | RUB | 4,895,219 | | Goldman Sachs & Co. | 9/15/21 | 257 | |
| SEK | 1,471,761 | | USD | 178,363 | | UBS AG | 9/15/21 | (7,337) | |
| SEK | 4,834,448 | | USD | 556,940 | | UBS AG | 9/15/21 | 4,847 | |
| USD | 132,804 | | SGD | 176,011 | | Bank of America N.A. | 9/15/21 | 2,910 | |
| USD | 918,239 | | THB | 28,691,309 | | Goldman Sachs & Co. | 9/15/21 | 45,501 | |
| | | | | | $ | 148,979 | |
| | | | | | | | | | | | | | |
| FUTURES CONTRACTS PURCHASED |
| Reference Entity | Contracts | Expiration Date | Notional
Amount | Unrealized
Appreciation
(Depreciation)^ |
| Euro-Bobl 5-Year Bonds | 15 | | September 2021 | $ | 2,408,561 | | $ | 22,928 | |
| Korean Treasury 10-Year Bonds | 7 | | September 2021 | 780,482 | | 13,863 | |
| U.K. Gilt 10-Year Bonds | 14 | | September 2021 | 2,525,715 | | 51,741 | |
| U.S. Treasury 2-Year Notes | 56 | | September 2021 | 12,356,750 | | (4,484) | |
| U.S. Treasury 5-Year Notes | 85 | | September 2021 | 10,577,852 | | 46,950 | |
| U.S. Treasury Ultra Bonds | 12 | | September 2021 | 2,394,375 | | 44,227 | |
| | | $ | 31,043,735 | | $ | 175,225 | |
^Amount represents value and unrealized appreciation (depreciation).
| | | | | | | | | | | | | | |
| FUTURES CONTRACTS SOLD |
| Reference Entity | Contracts | Expiration Date | Notional Amount | Unrealized Appreciation (Depreciation)^ |
| U.S. Treasury 10-Year Notes | 13 | | September 2021 | $ | 1,747,890 | | $ | (3,108) | |
| U.S. Treasury Long Bonds | 9 | | September 2021 | 1,482,469 | (72,299) | |
| | | $ | 3,230,359 | | $ | (75,407) | |
^Amount represents value and unrealized appreciation (depreciation).
| | | | | | | | | | | | | | | | | |
| NOTES TO SCHEDULE OF INVESTMENTS |
| ADR | - | American Depositary Receipt | MTN | - | Medium Term Note |
| AUD | - | Australian Dollar | MXN | - | Mexican Peso |
| BRL | - | Brazilian Real | MYR | - | Malaysian Ringgit |
| CAD | - | Canadian Dollar | NOK | - | Norwegian Krone |
| CHF | - | Swiss Franc | NZD | - | New Zealand Dollar |
| CLP | - | Chilean Peso | PEN | - | Peruvian Sol |
| CNY | - | Chinese Yuan | PHP | - | Philippine Peso |
| COP | - | Colombian Peso | PLN | - | Polish Zloty |
| CPI | - | Consumer Price Index | RUB | - | Russian Ruble |
| CZK | - | Czech Koruna | SBBPA | - | Standby Bond Purchase Agreement |
| DKK | - | Danish Krone | SEK | - | Swedish Krona |
| EUR | - | Euro | SEQ | - | Sequential Payer |
| FHLB | - | Federal Home Loan Bank | SGD | - | Singapore Dollar |
| FHLMC | - | Federal Home Loan Mortgage Corporation | SOFR | - | Secured Overnight Financing Rate |
| FNMA | - | Federal National Mortgage Association | THB | - | Thai Baht |
| GA | - | Guaranty Agreement | USD | - | United States Dollar |
| GBP | - | British Pound | VRDN | - | Variable Rate Demand Note. The instrument may be payable upon demand and adjusts periodically based upon the terms set forth in the security's offering documents. The rate shown is effective at the period end and the reference rate and spread, if any, is indicated. The date of the demand feature is disclosed. |
| GNMA | - | Government National Mortgage Association | | |
| GO | - | General Obligation | | |
| H15T1Y | - | Constant Maturity U.S. Treasury Note Yield Curve Rate Index | | |
| HKD | - | Hong Kong Dollar | | |
| HUF | - | Hungarian Forint | VRN | - | Variable Rate Note. The rate adjusts periodically based upon the terms set forth in the security’s offering documents. The rate shown is effective at the period end and the reference rate and spread, if any, is indicated. The security's effective maturity date may be shorter than the final maturity date shown. |
| IDR | - | Indonesian Rupiah | | |
| ILS | - | Israeli Shekel | | |
| INR | - | Indian Rupee | | |
| IO | - | Interest Only | | |
| JPY | - | Japanese Yen | | |
| KRW | - | South Korean Won | | | |
| KZT | - | Kazakhstani Tenge | | | |
| LIBOR | - | London Interbank Offered Rate | | | |
| LOC | - | Letter of Credit | | | |
†Category is less than 0.05% of total net assets.
(1)Investments are funds within the American Century Investments family of funds and are considered affiliated funds.
(2)The rate indicated is the yield to maturity at purchase for non-interest bearing securities. For interest bearing securities, the stated coupon rate is shown.
(3)Security, or a portion thereof, has been pledged at the custodian bank or with a broker for collateral requirements on forward foreign currency exchange contracts and/or futures contracts. At the period end, the aggregate value of securities pledged was $292,755.
(4)Non-income producing.
(5)Security, or a portion thereof, is on loan. At the period end, the aggregate value of securities on loan was $583,338. The amount of securities on loan indicated may not correspond with the securities on loan identified because securities with pending sales are in the process of recall from the brokers.
(6)Security was purchased pursuant to Rule 144A or Section 4(2) under the Securities Act of 1933 and may be sold in transactions exempt from registration, normally to qualified institutional investors. The aggregate value of these securities at the period end was $38,403,814, which represented 8.5% of total net assets.
(7)Restricted security that may not be offered for public sale without being registered with the Securities and Exchange Commission and/or may be subject to resale, redemption or transferability restrictions. The aggregate value of these securities at the period end was $3,000,000, which represented 0.7% of total net assets.
(8)Security is a zero-coupon bond.
(9)When-issued security. The issue price and yield are fixed on the date of the commitment, but payment and delivery are scheduled for a future date.
(10)Investment of cash collateral from securities on loan. At the period end, the aggregate value of the collateral held by the fund was $610,667, which includes securities collateral of $309,917.
See Notes to Financial Statements.
| | |
| Statement of Assets and Liabilities |
| | | | | |
| JULY 31, 2021 |
| Assets |
| Investment securities - unaffiliated, at value (cost of $273,490,875) — including $583,338 of securities on loan | $ | 314,210,196 | |
| Investment securities - affiliated, at value (cost of $102,099,087) | 136,358,697 | |
Investment made with cash collateral received for securities on loan, at value
(cost of $300,750) | 300,750 | |
| Total investment securities, at value (cost of $375,890,712) | 450,869,643 | |
| Cash | 95,029 | |
| Foreign currency holdings, at value (cost of $4,350) | 3,749 | |
| Foreign deposits with broker for futures contracts, at value (cost of $101,349) | 102,532 | |
| Receivable for investments sold | 775,966 | |
| Receivable for capital shares sold | 155,447 | |
| Receivable for variation margin on futures contracts | 19,331 | |
| Unrealized appreciation on forward foreign currency exchange contracts | 304,050 | |
| Interest and dividends receivable | 1,190,677 | |
| Securities lending receivable | 435 |
| 453,516,859 | |
| |
| Liabilities |
| Payable for collateral received for securities on loan | 300,750 | |
| Payable for investments purchased | 612,552 | |
| Payable for capital shares redeemed | 110,979 | |
| Unrealized depreciation on forward foreign currency exchange contracts | 155,071 | |
| Accrued management fees | 250,771 | |
| Distribution and service fees payable | 34,802 | |
| Accrued foreign taxes | 1,682 | |
| 1,466,607 | |
| |
| Net Assets | $ | 452,050,252 | |
| |
| Net Assets Consist of: |
| Capital (par value and paid-in surplus) | $ | 356,039,990 | |
| Distributable earnings | 96,010,262 | |
| $ | 452,050,252 | |
| | | | | | | | | | | |
| | Net Assets | Shares Outstanding | Net Asset Value Per Share |
| Investor Class, $0.01 Par Value | $167,284,982 | 26,166,669 | $6.39 |
| I Class, $0.01 Par Value | $38,058,177 | 5,950,333 | $6.40 |
| A Class, $0.01 Par Value | $92,011,313 | 14,407,914 | $6.39* |
| C Class, $0.01 Par Value | $11,901,688 | 1,906,134 | $6.24 |
| R Class, $0.01 Par Value | $11,768,143 | 1,848,135 | $6.37 |
| R5 Class, $0.01 Par Value | $38,543,187 | 6,017,047 | $6.41 |
| R6 Class, $0.01 Par Value | $92,482,762 | 14,457,907 | $6.40 |
*Maximum offering price $6.78 (net asset value divided by 0.9425).
See Notes to Financial Statements.
| | | | | |
| YEAR ENDED JULY 31, 2021 |
| Investment Income (Loss) |
| Income: | |
| Interest | $ | 5,601,973 | |
| Income distributions from affiliated funds | 1,986,880 | |
| Dividends (net of foreign taxes withheld of $44,844) | 1,397,560 | |
| Securities lending, net | 5,793 | |
| 8,992,206 | |
| |
| Expenses: | |
| Management fees | 3,771,410 | |
| Distribution and service fees: | |
| A Class | 215,823 | |
| C Class | 137,818 | |
| R Class | 59,761 | |
| Directors' fees and expenses | 11,594 | |
| Other expenses | 7,928 | |
| 4,204,334 | |
Fees waived(1) | (1,014,243) | |
| 3,190,091 | |
| |
| Net investment income (loss) | 5,802,115 | |
| |
| Realized and Unrealized Gain (Loss) |
| Net realized gain (loss) on: | |
| Investment transactions (including $10,399,061 from affiliated funds) | 26,474,927 | |
| Forward foreign currency exchange contract transactions | (418,281) | |
| Futures contract transactions | 24,781 | |
| Swap agreement transactions | 48,562 | |
| Foreign currency translation transactions | 5,507 | |
| Capital gain distributions received from affiliated funds | 87,266 | |
| 26,222,762 | |
| |
| Change in net unrealized appreciation (depreciation) on: | |
| Investments (including $25,938,895 from affiliated funds and (increase) decrease in accrued foreign taxes of $(784)) | 36,918,388 | |
| Forward foreign currency exchange contracts | 270,464 | |
| Futures contracts | 93,558 | |
| Translation of assets and liabilities in foreign currencies | (4,264) | |
| 37,278,146 | |
| |
| Net realized and unrealized gain (loss) | 63,500,908 | |
| |
| Net Increase (Decrease) in Net Assets Resulting from Operations | $ | 69,303,023 | |
(1)Amount consists of $379,943, $78,442, $208,730, $33,383, $28,898, $87,476 and $197,371 for Investor Class, I Class, A Class, C Class, R Class, R5 Class and R6 Class, respectively.
See Notes to Financial Statements.
| | |
| Statement of Changes in Net Assets |
| | | | | | | | |
| YEARS ENDED JULY 31, 2021 AND JULY 31, 2020 |
| Increase (Decrease) in Net Assets | July 31, 2021 | July 31, 2020 |
| Operations |
| Net investment income (loss) | $ | 5,802,115 | | $ | 4,198,207 | |
| Net realized gain (loss) | 26,222,762 | | 32,620,321 | |
| Change in net unrealized appreciation (depreciation) | 37,278,146 | | (7,309,756) | |
| Net increase (decrease) in net assets resulting from operations | 69,303,023 | | 29,508,772 | |
| | |
| Distributions to Shareholders |
| From earnings: | | |
| Investor Class | (6,695,769) | | (12,238,428) | |
| I Class | (1,438,166) | | (2,275,562) | |
| A Class | (3,455,974) | | (5,976,445) | |
| C Class | (541,627) | | (1,162,797) | |
| R Class | (459,461) | | (745,441) | |
| R5 Class | (1,614,113) | | (2,974,364) | |
| R6 Class | (3,762,974) | | (5,935,807) | |
| Decrease in net assets from distributions | (17,968,084) | | (31,308,844) | |
| | |
| Capital Share Transactions |
Net increase (decrease) in net assets from
capital share transactions (Note 5) | 15,524,665 | | (25,464,995) | |
| | |
| Net increase (decrease) in net assets | 66,859,604 | | (27,265,067) | |
| | |
| Net Assets |
| Beginning of period | 385,190,648 | | 412,455,715 | |
| End of period | $ | 452,050,252 | | $ | 385,190,648 | |
See Notes to Financial Statements.
| | |
| Notes to Financial Statements |
JULY 31, 2021
1. Organization
American Century Strategic Asset Allocations, Inc. (the corporation) is registered under the Investment Company Act of 1940, as amended (the 1940 Act), as an open-end management investment company and is organized as a Maryland corporation. Strategic Allocation: Conservative Fund (the fund) is one fund in a series issued by the corporation. The fund may invest in varying combinations of other affiliated investment companies such as mutual funds and exchange-traded funds advised by American Century Investments (affiliated funds). The fund will assume the risks associated with the affiliated funds. The fund is an asset allocation fund and its investment objective is to seek the highest level of total return consistent with its asset mix.
The fund offers the Investor Class, I Class, A Class, C Class, R Class, R5 Class and R6 Class. The A Class may incur an initial sales charge. The A Class and C Class may be subject to a contingent deferred sales charge.
2. Significant Accounting Policies
The following is a summary of significant accounting policies consistently followed by the fund in preparation of its financial statements. The fund is an investment company and follows accounting and reporting guidance in accordance with accounting principles generally accepted in the United States of America. This may require management to make certain estimates and assumptions at the date of the financial statements. Actual results could differ from these estimates. Management evaluated the impact of events or transactions occurring through the date the financial statements were issued that would merit recognition or disclosure.
Investment Valuations — The fund determines the fair value of its investments and computes its net asset value (NAV) per share at the close of regular trading (usually 4 p.m. Eastern time) on the New York Stock Exchange (NYSE) on each day the NYSE is open. The Board of Directors has adopted valuation policies and procedures to guide the investment advisor in the fund’s investment valuation process and to provide methodologies for the oversight of the fund’s pricing function.
Equity securities that are listed or traded on a domestic securities exchange are valued at the last reported sales price or at the official closing price as provided by the exchange. Equity securities traded on foreign securities exchanges are generally valued at the closing price of such securities on the exchange where primarily traded or at the close of the NYSE, if that is earlier. If no last sales price is reported, or if local convention or regulation so provides, the mean of the latest bid and asked prices may be used. Securities traded over-the-counter are valued at the mean of the latest bid and asked prices, the last sales price, or the official closing price. Equity securities initially expressed in local currencies are translated into U.S. dollars at the mean of the appropriate currency exchange rate at the close of the NYSE as provided by an independent pricing service.
Fixed income securities are valued at the evaluated mean as provided by independent pricing services or at the mean of the most recent bid and asked prices as provided by investment dealers. Corporate bonds, U.S. Treasury and Government Agency securities, convertible bonds, municipal securities, and sovereign governments and agencies are valued using market models that consider trade data, quotations from dealers and active market makers, relevant yield curve and spread data, creditworthiness, trade data or market information on comparable securities, and other relevant security specific information. Mortgage-related and asset-backed securities are valued based on models that consider trade data, prepayment and default projections, benchmark yield and spread data and estimated cash flows of each tranche of the issuer. Collateralized loan obligations are valued based on discounted cash flow models that consider trade and economic data, prepayment assumptions and default projections. Commercial paper and certificates of deposits are valued using a curve-based approach that considers money market rates for specific instruments, programs, currencies and maturity points from a variety of active market makers. Fixed income securities initially expressed in local currencies are translated into U.S. dollars at the mean of the appropriate currency exchange rate at the close of the NYSE as provided by an independent pricing service.
Hybrid securities are valued at the evaluated mean as provided by independent pricing services or at the mean of the most recent bid and asked prices as provided by investment dealers. Preferred stocks and convertible preferred stocks with perpetual maturities are valued using market models that consider trade data, quotations from dealers and active market makers, relevant yield curve and spread data, creditworthiness, trade data or market information on comparable securities, and other relevant security specific information.
Open-end management investment companies are valued at the reported NAV per share. Exchange-traded futures contracts are valued at the settlement price as provided by the appropriate exchange. Swap agreements are valued at an evaluated mean as provided by independent pricing services or independent brokers. Forward foreign currency exchange contracts are valued at the mean of the appropriate forward exchange rate at the close of the NYSE as provided by an independent pricing service. Investments initially expressed in local currencies are translated into U.S. dollars at the mean of the appropriate currency exchange rate at the close of the NYSE as provided by an independent pricing service.
If the fund determines that the market price for an investment is not readily available or the valuation methods mentioned above do not reflect an investment’s fair value, such investment is valued as determined in good faith by the Board of Directors or its delegate, in accordance with policies and procedures adopted by the Board of Directors. In its determination of fair value, the fund may review several factors including, but not limited to, market information regarding the specific investment or comparable investments and correlation with other investment types, futures indices or general market indicators. Circumstances that may cause the fund to use these procedures to value an investment include, but are not limited to: an investment has been declared in default or is distressed; trading in a security has been suspended during the trading day or a security is not actively trading on its principal exchange; prices received from a regular pricing source are deemed unreliable; or there is a foreign market holiday and no trading occurred.
The fund monitors for significant events occurring after the close of an investment’s primary exchange but before the fund’s NAV per share is determined. Significant events may include, but are not limited to: corporate announcements and transactions; governmental action and political unrest that could impact a specific investment or an investment sector; or armed conflicts, natural disasters and similar events that could affect investments in a specific country or region. The fund also monitors for significant fluctuations between domestic and foreign markets, as evidenced by the U.S. market or such other indicators that the Board of Directors, or its delegate, deems appropriate. The fund may apply a model-derived factor to the closing price of equity securities traded on foreign securities exchanges. The factor is based on observable market data as provided by an independent pricing service.
Security Transactions — Security transactions are accounted for as of the trade date. Net realized gains and losses are determined on the identified cost basis, which is also used for federal income tax purposes. Certain countries impose taxes on realized gains on the sale of securities registered in their country. The fund records the foreign tax expense, if any, on an accrual basis. The foreign tax expense on realized gains and unrealized appreciation reduces the net realized gain (loss) on investment transactions and net unrealized appreciation (depreciation) on investments, respectively.
Investment Income — Dividend income less foreign taxes withheld, if any, is recorded as of the ex-dividend date. Distributions received on securities that represent a return of capital or long-term capital gain are recorded as a reduction of cost of investments and/or as a realized gain. The fund may estimate the components of distributions received that may be considered nontaxable distributions or long-term capital gain distributions for income tax purposes. Income and capital gain distributions, if any, from the affiliated funds are recorded as of the ex-dividend date. Interest income is recorded on the accrual basis and includes paydown gain (loss) and accretion of discounts and amortization of premiums. Inflation adjustments related to inflation-linked debt securities are reflected as interest income. Securities lending income is net of fees and rebates earned by the lending agent for its services.
Segregated Assets — In accordance with the 1940 Act, the fund segregates assets on its books and records to cover certain types of investment securities and other financial instruments. American Century Investment Management, Inc. (ACIM) (the investment advisor) monitors, on a daily basis, the securities segregated to ensure the fund designates a sufficient amount of liquid assets, marked-to-market daily. The fund may also receive assets or be required to pledge assets at the custodian bank or with a broker for collateral requirements.
Foreign Currency Translations — All assets and liabilities initially expressed in foreign currencies are translated into U.S. dollars at prevailing exchange rates at period end. The fund may enter into spot foreign currency exchange contracts to facilitate transactions denominated in a foreign currency. Purchases and sales
of investment securities, dividend and interest income, spot foreign currency exchange contracts, and expenses are translated at the rates of exchange prevailing on the respective dates of such transactions. Net realized and unrealized foreign currency exchange gains or losses related to investment securities are a component of net realized gain (loss) on investment transactions and change in net unrealized appreciation (depreciation) on investments, respectively.
Income Tax Status — It is the fund’s policy to distribute substantially all net investment income and net realized gains to shareholders and to otherwise qualify as a regulated investment company under provisions of the Internal Revenue Code. Accordingly, no provision has been made for income taxes. The fund files U.S. federal, state, local and non-U.S. tax returns as applicable. The fund's tax returns are subject to examination by the relevant taxing authority until expiration of the applicable statute of limitations, which is generally three years from the date of filing but can be longer in certain jurisdictions. At this time, management believes there are no uncertain tax positions which, based on their technical merit, would not be sustained upon examination and for which it is reasonably possible that the total amounts of unrecognized tax benefits will significantly change in the next twelve months.
Multiple Class — All shares of the fund represent an equal pro rata interest in the net assets of the class to which such shares belong, and have identical voting, dividend, liquidation and other rights and the same terms and conditions, except for class specific expenses and exclusive rights to vote on matters affecting only individual classes. Income, non-class specific expenses, and realized and unrealized capital gains and losses of the fund are allocated to each class of shares based on their relative net assets.
Distributions to Shareholders — Distributions from net investment income, if any, are generally declared and paid quarterly. Distributions from net realized gains, if any, are generally declared and paid annually.
Indemnifications — Under the corporation’s organizational documents, its officers and directors are indemnified against certain liabilities arising out of the performance of their duties to the fund. In addition, in the normal course of business, the fund enters into contracts that provide general indemnifications. The maximum exposure under these arrangements is unknown as this would involve future claims that may be made against a fund. The risk of material loss from such claims is considered by management to be remote.
Securities Lending — Securities are lent to qualified financial institutions and brokers. State Street Bank & Trust Co. serves as securities lending agent to the fund pursuant to a Securities Lending Agreement. The lending of securities exposes the fund to risks such as: the borrowers may fail to return the loaned securities, the borrowers may not be able to provide additional collateral, the fund may experience delays in recovery of the loaned securities or delays in access to collateral, or the fund may experience losses related to the investment collateral. To minimize certain risks, loan counterparties pledge collateral in the form of cash and/or securities. The lending agent has agreed to indemnify the fund in the case of default of any securities borrowed. Cash collateral received is invested in the State Street Navigator Securities Lending Government Money Market Portfolio, a money market mutual fund registered under the 1940 Act. The loans may also be secured by U.S. government securities in an amount at least equal to the market value of the securities loaned, plus accrued interest and dividends, determined on a daily basis and adjusted accordingly. By lending securities, the fund seeks to increase its net investment income through the receipt of interest and fees. Such income is reflected separately within the Statement of Operations. The value of loaned securities and related collateral outstanding at period end, if any, are shown on a gross basis within the Schedule of Investments and Statement of Assets and Liabilities.
The following table reflects a breakdown of transactions accounted for as secured borrowings, the gross obligation by the type of collateral pledged, and the remaining contractual maturity of those transactions as of July 31, 2021.
| | | | | | | | | | | | | | | | | |
| Remaining Contractual Maturity of Agreements |
| Overnight and
Continuous | <30 days | Between
30 & 90 days | >90 days | Total |
Securities Lending Transactions(1) | | | | |
| Common Stocks | $ | 300,750 | | — | | — | | — | | $ | 300,750 | |
| Gross amount of recognized liabilities for securities lending transactions | $ | 300,750 | |
(1)Amount represents the payable for cash collateral received for securities on loan. This will generally be in the Overnight and Continuous column as the securities are typically callable on demand.
3. Fees and Transactions with Related Parties
Certain officers and directors of the corporation are also officers and/or directors of American Century Companies, Inc. (ACC). The corporation’s investment advisor, ACIM, the corporation's distributor, American Century Investment Services, Inc. (ACIS), and the corporation’s transfer agent, American Century Services, LLC, are wholly owned, directly or indirectly, by ACC. ACIM serves as the investment advisor for the affiliated funds.
Management Fees — The corporation has entered into a management agreement with ACIM, under which ACIM provides the fund with investment advisory and management services in exchange for a single, unified management fee (the fee) per class. The agreement provides that ACIM will pay all expenses of managing and operating the fund, except brokerage expenses, taxes, interest, fees and expenses of the independent directors (including legal counsel fees), extraordinary expenses, and expenses incurred in connection with the provision of shareholder services and distribution services under a plan adopted pursuant to Rule 12b-1 under the 1940 Act. The fee is computed and accrued daily based on each class's daily net assets and paid monthly in arrears. The difference in the fee among the classes is a result of their separate arrangements for non-Rule 12b-1 shareholder services. It is not the result of any difference in advisory or custodial fees or other expenses related to the management of the fund’s assets, which do not vary by class. The rate of the fee is determined by applying a fee rate calculation formula. This formula takes into account the fund’s assets as well as certain assets, if any, of other clients of the investment advisor outside the American Century Investments family of funds (such as subadvised funds and separate accounts) that use very similar investment teams and strategies (strategy assets). The investment advisor will waive the portion of the fund’s management fee equal to the expenses attributable to the management fees of the American Century Investments funds in which the fund invests. The amount of this waiver will fluctuate depending on the fund’s daily allocation to other American Century Investments funds. This waiver is expected to remain in effect permanently and it cannot be terminated without the approval of the Board of Directors. During the period ended July 31, 2021, the investment advisor agreed to waive an additional 0.15% of the fund's management fee. Effective August 1, 2021, the investment advisor agreed to increase the amount of the additional waiver from 0.15% to 0.18% of the fund's management fee. The investment advisor expects this waiver to continue until July 31, 2022 and cannot terminate it prior to such date without the approval of the Board of Directors.
The management fee schedule range and the effective annual management fee before and after waiver for each class for the period ended July 31, 2021 are as follows:
| | | | | | | | | | | |
| | Effective Annual Management Fee |
| Management Fee Schedule Range | Before Waiver | After Waiver |
| Investor Class | 0.80% to 1.00% | 1.00% | 0.76% |
| I Class | 0.60% to 0.80% | 0.80% | 0.56% |
| A Class | 0.80% to 1.00% | 1.00% | 0.76% |
| C Class | 0.80% to 1.00% | 1.00% | 0.76% |
| R Class | 0.80% to 1.00% | 1.00% | 0.76% |
| R5 Class | 0.60% to 0.80% | 0.80% | 0.56% |
| R6 Class | 0.45% to 0.65% | 0.65% | 0.41% |
Distribution and Service Fees — The Board of Directors has adopted a separate Master Distribution and Individual Shareholder Services Plan for each of the A Class, C Class and R Class (collectively the plans), pursuant to Rule 12b-1 of the 1940 Act. The plans provide that the A Class will pay ACIS an annual distribution and service fee of 0.25%. The plans provide that the C Class will pay ACIS an annual distribution and service fee of 1.00%, of which 0.25% is paid for individual shareholder services and 0.75% is paid for distribution services. The plans provide that the R Class will pay ACIS an annual distribution and service fee of 0.50%. The fees are computed and accrued daily based on each class’s daily net assets and paid monthly in arrears. The fees are used to pay financial intermediaries for distribution and individual shareholder services. Fees incurred under the plans during the period ended July 31, 2021 are detailed in the Statement of Operations.
Directors' Fees and Expenses — The Board of Directors is responsible for overseeing the investment advisor’s management and operations of the fund. The directors receive detailed information about the fund and its investment advisor regularly throughout the year, and meet at least quarterly with management of the investment advisor to review reports about fund operations. The fund’s officers do not receive compensation from the fund.
Interfund Transactions — The fund may enter into security transactions with other American Century Investments funds and other client accounts of the investment advisor, in accordance with the 1940 Act rules and procedures adopted by the Board of Directors. The rules and procedures require, among other things, that these transactions be effected at the independent current market price of the security. During the period, the interfund purchases and sales were $200,842 and $2,632,920, respectively. The effect of interfund transactions on the Statement of Operations was $64,259 in net realized gain (loss) on investment transactions.
4. Investment Transactions
Purchases of investment securities, excluding short-term investments, for the period ended July 31, 2021 totaled $228,699,387, of which $108,445,114 represented U.S. Treasury and Government Agency obligations.
Sales of investment securities, excluding short-term investments, for the period ended July 31, 2021 totaled $257,608,395, of which $115,782,573 represented U.S. Treasury and Government Agency obligations.
5. Capital Share Transactions
Transactions in shares of the fund were as follows:
| | | | | | | | | | | | | | |
| Year ended
July 31, 2021 | Year ended
July 31, 2020 |
| Shares | Amount | Shares | Amount |
| Investor Class/Shares Authorized | 500,000,000 | | | 500,000,000 | | |
| Sold | 4,004,568 | | $ | 24,144,889 | | 3,089,007 | | $ | 16,345,089 | |
| Issued in reinvestment of distributions | 1,081,604 | | 6,467,181 | | 2,191,241 | | 12,014,731 | |
| Redeemed | (4,468,193) | | (27,002,114) | | (8,234,700) | | (45,168,135) | |
| 617,979 | | 3,609,956 | | (2,954,452) | | (16,808,315) | |
| I Class/Shares Authorized | 120,000,000 | |
| 120,000,000 | | |
| Sold | 1,905,056 | | 11,566,663 | | 1,341,385 | | 7,258,248 | |
| Issued in reinvestment of distributions | 240,061 | | 1,437,511 | | 414,673 | | 2,274,358 | |
| Redeemed | (1,143,757) | | (6,862,440) | | (1,961,383) | | (10,657,011) | |
| 1,001,360 | | 6,141,734 | | (205,325) | | (1,124,405) | |
| A Class/Shares Authorized | 270,000,000 | |
| 270,000,000 | | |
| Sold | 3,091,189 | | 18,624,543 | | 2,678,884 | | 14,641,649 | |
| Issued in reinvestment of distributions | 568,940 | | 3,397,027 | | 1,057,771 | | 5,797,946 | |
| Redeemed | (3,075,861) | | (18,625,515) | | (5,237,372) | | (28,714,839) | |
| 584,268 | | 3,396,055 | | (1,500,717) | | (8,275,244) | |
| C Class/Shares Authorized | 70,000,000 | |
| 70,000,000 | | |
| Sold | 400,624 | | 2,346,781 | | 303,952 | | 1,624,649 | |
| Issued in reinvestment of distributions | 92,490 | | 540,053 | | 211,603 | | 1,137,600 | |
| Redeemed | (1,271,056) | | (7,510,076) | | (1,009,983) | | (5,445,064) | |
| (777,942) | | (4,623,242) | | (494,428) | | (2,682,815) | |
| R Class/Shares Authorized | 50,000,000 | |
| 50,000,000 | | |
| Sold | 390,576 | | 2,359,899 | | 451,192 | | 2,448,869 | |
| Issued in reinvestment of distributions | 76,980 | | 458,694 | | 135,298 | | 738,680 | |
| Redeemed | (534,155) | | (3,272,842) | | (496,484) | | (2,704,247) | |
| (66,599) | | (454,249) | | 90,006 | | 483,302 | |
| R5 Class/Shares Authorized | 150,000,000 | |
| 50,000,000 | | |
| Sold | 480,848 | | 2,913,012 | | 395,433 | | 2,145,115 | |
| Issued in reinvestment of distributions | 269,380 | | 1,614,113 | | 541,377 | | 2,974,364 | |
| Redeemed | (819,442) | | (4,902,813) | | (1,338,552) | | (7,124,856) | |
| (69,214) | | (375,688) | | (401,742) | | (2,005,377) | |
| R6 Class/Shares Authorized | 235,000,000 | |
| 90,000,000 | | |
| Sold | 3,111,443 | | 19,058,432 | | 2,517,849 | | 13,510,237 | |
| Issued in reinvestment of distributions | 628,858 | | 3,762,974 | | 1,082,241 | | 5,935,807 | |
| Redeemed | (2,484,704) | | (14,991,307) | | (2,704,571) | | (14,498,185) | |
| 1,255,597 | | 7,830,099 | | 895,519 | | 4,947,859 | |
| Net increase (decrease) | 2,545,449 | | $ | 15,524,665 | | (4,571,139) | | $ | (25,464,995) | |
6. Fair Value Measurements
The fund’s investments valuation process is based on several considerations and may use multiple inputs to determine the fair value of the investments held by the fund. In conformity with accounting principles generally accepted in the United States of America, the inputs used to determine a valuation are classified into three broad levels.
•Level 1 valuation inputs consist of unadjusted quoted prices in an active market for identical investments.
•Level 2 valuation inputs consist of direct or indirect observable market data (including quoted prices for comparable investments, evaluations of subsequent market events, interest rates, prepayment speeds, credit risk, etc.). These inputs also consist of quoted prices for identical investments initially expressed in local currencies that are adjusted through translation into U.S. dollars.
•Level 3 valuation inputs consist of unobservable data (including a fund’s own assumptions).
The level classification is based on the lowest level input that is significant to the fair valuation measurement. The valuation inputs are not necessarily an indication of the risks associated with investing in these securities or other financial instruments.
The following is a summary of the level classifications as of period end. The Schedule of Investments provides additional information on the fund’s portfolio holdings.
| | | | | | | | | | | |
| Level 1 | Level 2 | Level 3 |
| Assets | | | |
| Investment Securities | | | |
| Affiliated Funds | $ | 136,358,697 | | — | | — | |
| U.S. Treasury Securities | — | | $ | 87,786,391 | | — | |
| Common Stocks | 68,246,929 | | 17,608,610 | | — | |
| Corporate Bonds | — | | 36,674,885 | | — | |
| Sovereign Governments and Agencies | — | | 34,846,162 | | — | |
| Commercial Paper | — | | 10,395,815 | | — | |
| Collateralized Loan Obligations | — | | 9,652,958 | | — | |
| Municipal Securities | — | | 9,411,377 | | — | |
| Collateralized Mortgage Obligations | — | | 4,368,198 | | — | |
| Preferred Stocks | — | | 3,182,681 | | — | |
| Asset-Backed Securities | — | | 2,435,190 | | — | |
| Certificates of Deposit | — | | 2,390,420 | | — | |
| U.S. Government Agency Mortgage-Backed Securities | — | | 2,360,273 | | — | |
| Exchange-Traded Funds | 144,044 | | — | | — | |
| Temporary Cash Investments | 24,706,263 | | — | | — | |
| Temporary Cash Investments - Securities Lending Collateral | 300,750 | | — | | — | |
| $ | 229,756,683 | | $ | 221,112,960 | | — | |
| Other Financial Instruments | | | |
| Futures Contracts | $ | 91,177 | | $ | 88,532 | | — | |
| Forward Foreign Currency Exchange Contracts | — | | 304,050 | | — | |
| $ | 91,177 | | $ | 392,582 | | — | |
| | | |
| Liabilities | | | |
| Other Financial Instruments | | | |
| Futures Contracts | $ | 79,891 | | — | | — | |
| Forward Foreign Currency Exchange Contracts | — | | $ | 155,071 | | — | |
| $ | 79,891 | | $ | 155,071 | | — | |
7. Derivative Instruments
Credit Risk — The fund is subject to credit risk in the normal course of pursuing its investment objectives. The value of a bond generally declines as the credit quality of its issuer declines. Credit default swap agreements enable a fund to buy/sell protection against a credit event of a specific issuer or index. A fund may attempt to enhance returns by selling protection or attempt to mitigate credit risk by buying protection. The buyer/seller of credit protection against a security or basket of securities may pay/receive an up-front or periodic payment to compensate for/against potential default events. Changes in value, including the periodic amounts of interest to be paid or received on swap agreements, are recorded as unrealized appreciation (depreciation) on swap agreements. Upon entering into a centrally cleared swap, a fund is required to deposit cash or securities (initial margin) with a financial intermediary in an amount equal to a certain percentage of the notional amount. Subsequent payments (variation margin) are made or received daily, in cash, by a fund. The variation margin is equal to the daily change in the value and is a component of unrealized gains and losses. Realized gain or loss is recorded upon receipt or payment of a periodic settlement or termination of swap agreements. Net realized and unrealized gains or losses occurring during the holding period of swap agreements are a component of net realized gain (loss) on swap agreement transactions and change in net unrealized appreciation (depreciation) on swap agreements, respectively. The risks of entering into swap agreements include the possible lack of liquidity, failure of the counterparty to meet its obligations, and that there may be unfavorable changes in the underlying investments or instruments. The fund's average notional amount held during the period was $7,660,000.
Foreign Currency Risk — The fund is subject to foreign currency exchange rate risk in the normal course of pursuing its investment objectives. The value of foreign investments held by a fund may be significantly affected by changes in foreign currency exchange rates. The dollar value of a foreign security generally decreases when the value of the dollar rises against the foreign currency in which the security is denominated and tends to increase when the value of the dollar declines against such foreign currency. A fund may enter into forward foreign currency exchange contracts to reduce a fund's exposure to foreign currency exchange rate fluctuations or to gain exposure to the fluctuations in the value of foreign currencies. The net U.S. dollar value of foreign currency underlying all contractual commitments held by a fund and the resulting unrealized appreciation or depreciation are determined daily. Realized gain or loss is recorded upon settlement of the contract. Net realized and unrealized gains or losses occurring during the holding period of forward foreign currency exchange contracts are a component of net realized gain (loss) on forward foreign currency exchange contract transactions and change in net unrealized appreciation (depreciation) on forward foreign currency exchange contracts, respectively. A fund bears the risk of an unfavorable change in the foreign currency exchange rate underlying the forward contract. Additionally, losses, up to the fair value, may arise if the counterparties do not perform under the contract terms. The fund's average U.S. dollar exposure to foreign currency risk derivative instruments held during the period was $30,835,480.
Interest Rate Risk — The fund is subject to interest rate risk in the normal course of pursuing its investment objectives. The value of bonds generally declines as interest rates rise. A fund may enter into futures contracts based on a bond index or a specific underlying security. A fund may purchase futures contracts to gain exposure to increases in market value or sell futures contracts to protect against a decline in market value. Upon entering into a futures contract, a fund will segregate cash, cash equivalents or other appropriate liquid securities on its records in amounts sufficient to meet requirements. Subsequent payments (variation margin) are made or received daily, in cash, by a fund. The variation margin is equal to the daily change in the contract value and is recorded as unrealized gains and losses. A fund recognizes a realized gain or loss when the futures contract is closed or expires. Net realized and unrealized gains or losses occurring during the holding period of futures contracts are a component of net realized gain (loss) on futures contract transactions and change in net unrealized appreciation (depreciation) on futures contracts, respectively. One of the risks of entering into futures contracts is the possibility that the change in value of the contract may not correlate with the changes in value of the underlying securities. The fund's average notional exposure to interest rate risk derivative instruments held during the period was $14,768,997 futures contracts purchased and $8,545,930 futures contracts sold.
| | | | | | | | | | | | | | |
| Value of Derivative Instruments as of July 31, 2021 |
| Asset Derivatives | Liability Derivatives |
Type of Risk Exposure | Location on Statement of Assets and Liabilities | Value | Location on Statement of Assets and Liabilities | Value |
| Foreign Currency Risk | Unrealized appreciation on forward foreign currency exchange contracts | $ | 304,050 | | Unrealized depreciation on forward foreign currency exchange contracts | $ | 155,071 | |
| Interest Rate Risk | Receivable for variation margin on futures contracts* | 19,331 | | Payable for variation margin on futures contracts* | — | |
| | $ | 323,381 | | | $ | 155,071 | |
*Included in the unrealized appreciation (depreciation) on futures contracts, as reported in the Schedule of Investments.
| | | | | | | | | | | | | | |
| Effect of Derivative Instruments on the Statement of Operations for the Year Ended July 31, 2021 |
| Net Realized Gain (Loss) | Change in Net Unrealized
Appreciation (Depreciation) |
Type of Risk Exposure | Location on Statement of Operations | Value | Location on Statement of Operations | Value |
| Credit Risk | Net realized gain (loss) on swap agreement transactions | $ | 48,562 | | Change in net unrealized appreciation (depreciation) on swap agreements | — | |
| Foreign Currency Risk | Net realized gain (loss) on forward foreign currency exchange contract transactions | (418,281) | | Change in net unrealized appreciation (depreciation) on forward foreign currency exchange contracts | $ | 270,464 | |
| Interest Rate Risk | Net realized gain (loss) on futures contract transactions | 24,781 | | Change in net unrealized appreciation (depreciation) on futures contracts | 93,558 | |
| | $ | (344,938) | | | $ | 364,022 | |
8. Risk Factors
The value of the fund’s shares will go up and down, sometimes rapidly or unpredictably, based on the performance of the securities owned by the fund and other factors generally affecting the securities market. Market risks, including political, regulatory, economic and social developments, can affect the value of the fund’s investments. Natural disasters, public health emergencies, terrorism and other unforeseeable events may lead to increased market volatility and may have adverse long-term effects on world economies and markets generally.
The fund may invest in instruments that have variable or floating coupon rates based on the London Interbank Offered Rate (LIBOR). LIBOR is a benchmark interest rate intended to be representative of the rate at which certain major international banks lend to one another over short-terms. However, LIBOR is expected to be phased out and the transition process may lead to increased volatility or illiquidity in markets for instruments that rely on LIBOR. This could result in a change to the value of such instruments.
There are certain risks involved in investing in foreign securities. These risks include those resulting from political events (such as civil unrest, national elections and imposition of exchange controls), social and economic events (such as labor strikes and rising inflation), and natural disasters. Securities of foreign issuers may be less liquid and more volatile. Investing in emerging markets or a significant portion of assets in one country or region may accentuate these risks.
9. Federal Tax Information
The tax character of distributions paid during the years ended July 31, 2021 and July 31, 2020 were as follows:
| | | | | | | | |
| 2021 | 2020 |
| Distributions Paid From | | |
| Ordinary income | $ | 8,616,574 | | $ | 7,688,591 | |
| Long-term capital gains | $ | 9,351,510 | | $ | 23,620,253 | |
The book-basis character of distributions made during the year from net investment income or net realized gains may differ from their ultimate characterization for federal income tax purposes. These differences reflect the differing character of certain income items and net realized gains and losses for financial statement and tax purposes, and may result in reclassification among certain capital accounts on the financial statements.
As of period end, the federal tax cost of investments and the components of distributable earnings on a tax-basis were as follows:
| | | | | |
| Federal tax cost of investments | $ | 377,644,361 | |
| Gross tax appreciation of investments | $ | 74,573,754 | |
| Gross tax depreciation of investments | (1,348,472) | |
| Net tax appreciation (depreciation) of investments | 73,225,282 | |
| Net tax appreciation (depreciation) on derivatives and translation of assets and liabilities in foreign currencies | 122,636 | |
| Net tax appreciation (depreciation) | $ | 73,347,918 | |
| Other book-to-tax adjustments | $ | (475,942) | |
| Undistributed ordinary income | $ | 8,151,844 | |
| Accumulated long-term gains | $ | 14,986,442 | |
The difference between book-basis and tax-basis unrealized appreciation (depreciation) is attributable primarily to the tax deferral of losses on wash sales. Other book-to-tax adjustments are attributable primarily to the tax deferral of losses on straddle positions.
10. Investments in Affiliated Funds
The fund does not invest in an affiliated fund for the purpose of exercising management or control; however, investments by the fund within its investment strategy may represent a significant portion of an affiliated fund's net assets.
11. Affiliated Fund Transactions
A summary of transactions for each affiliated fund for the period ended July 31, 2021 follows (amounts in thousands):
| | | | | | | | | | | | | | | | | | | | | | | | | | |
Affiliated Fund(1) | Beginning Value | Purchase
Cost | Sales
Cost | Change in Net Unrealized Appreciation (Depreciation) | Ending
Value | Ending
Shares | Net Realized
Gain (Loss) | Distributions
Received(2) |
| American Century Diversified Corporate Bond ETF | $ | 20,618 | | — | | — | | $ | (44) | | $ | 20,574 | | 389 | | — | | $ | 639 | |
| American Century Focused Dynamic Growth ETF | 12,808 | | — | | $ | 8,103 | | (45) | | 4,660 | | 56 | | $ | 3,213 | | 1 | |
| American Century Focused Large Cap Value ETF | 4,959 | | $ | 6,526 | | — | | 1,920 | | 13,405 | | 219 | | — | | 139 | |
| American Century Quality Diversified International ETF | 8,792 | | 239 | | 1,107 | | 2,035 | | 9,959 | | 191 | | 211 | | 207 | |
| American Century STOXX U.S. Quality Growth ETF | 25,050 | | — | | 10,123 | | 2,450 | | 17,377 | | 238 | | 4,866 | | 49 | |
| American Century STOXX U.S. Quality Value ETF | 19,320 | | 2,572 | | 118 | | 7,466 | | 29,240 | | 576 | | 3 | | 433 | |
| Avantis International Equity ETF | 9,480 | | 254 | | 1,535 | | 2,849 | | 11,048 | | 174 | | 223 | | 224 | |
| Avantis International Small Cap Value ETF | 1,977 | | 41 | | 409 | | 778 | | 2,387 | | 37 | | 97 | | 51 | |
| Avantis U.S. Equity ETF | 19,222 | | 123 | | 4,316 | | 6,250 | | 21,279 | | 284 | | 1,534 | | 262 | |
| Avantis U.S. Small Cap Value ETF | 3,775 | | 1,526 | | 1,151 | | 2,280 | | 6,430 | | 88 | | 252 | | 69 | |
| $ | 126,001 | | $ | 11,281 | | $ | 26,862 | | $ | 25,939 | | $ | 136,359 | | 2,252 | | $ | 10,399 | | $ | 2,074 | |
(1)Investments are funds within the American Century Investments family of funds and are considered affiliated funds. Additional information and attributes of each affiliated fund are available at americancentury.com or avantisinvestors.com.
(2)Distributions received includes distributions from net investment income and from capital gains, if any.
| | | | | | | | | | | | | | | | | | | | | | | | | | | | | | | | | | | | | | | | | | | | | | | |
| For a Share Outstanding Throughout the Years Ended July 31 (except as noted) | | | | | |
| Per-Share Data | | Ratios and Supplemental Data |
| | | Income From Investment Operations: | Distributions From: | | | Ratio to Average Net Assets of: | | |
| | Net Asset Value, Beginning
of Period | Net
Investment Income
(Loss)(1) | Net
Realized and Unrealized Gain (Loss) | Total From Investment Operations | Net Investment Income | Net Realized Gains | Total Distributions | Net Asset Value,
End of
Period | Total Return(2) | Operating Expenses | Operating Expenses (before expense waiver) | Net Investment Income (Loss) | Net Investment Income (Loss) (before expense waiver) | Portfolio Turnover
Rate | Net Assets, End of Period (in thousands) |
| Investor Class | | | | | | | | | | | | | |
| 2021 | $5.65 | 0.08 | 0.92 | 1.00 | (0.07) | (0.19) | (0.26) | $6.39 | 18.09% | 0.76% | 1.00% | 1.38% | 1.14% | 57% | $167,285 | |
| 2020 | $5.67 | 0.06 | 0.37 | 0.43 | (0.07) | (0.38) | (0.45) | $5.65 | 7.89% | 0.85% | 1.01% | 1.09% | 0.93% | 87% | $144,395 | |
| 2019 | $5.83 | 0.09 | 0.14 | 0.23 | (0.10) | (0.29) | (0.39) | $5.67 | 4.55% | 1.00% | 1.01% | 1.58% | 1.57% | 65% | $161,655 | |
2018(3) | $6.06 | 0.06 | 0.05 | 0.11 | (0.06) | (0.28) | (0.34) | $5.83 | 2.01% | 1.00%(4) | 1.00%(4) | 1.51%(4) | 1.51%(4) | 53% | $179,992 | |
| 2017 | $5.62 | 0.07 | 0.54 | 0.61 | (0.08) | (0.09) | (0.17) | $6.06 | 11.02% | 1.01% | 1.01% | 1.28% | 1.28% | 78% | $246,975 | |
| 2016 | $5.83 | 0.07 | 0.09 | 0.16 | (0.05) | (0.32) | (0.37) | $5.62 | 2.96% | 1.00% | 1.00% | 1.21% | 1.21% | 87% | $245,726 | |
| I Class | | | | | | | | | | | | | |
| 2021 | $5.65 | 0.10 | 0.93 | 1.03 | (0.09) | (0.19) | (0.28) | $6.40 | 18.51% | 0.56% | 0.80% | 1.58% | 1.34% | 57% | $38,058 | |
| 2020 | $5.67 | 0.07 | 0.37 | 0.44 | (0.08) | (0.38) | (0.46) | $5.65 | 8.11% | 0.65% | 0.81% | 1.29% | 1.13% | 87% | $27,985 | |
| 2019 | $5.84 | 0.10 | 0.13 | 0.23 | (0.11) | (0.29) | (0.40) | $5.67 | 4.57% | 0.80% | 0.81% | 1.78% | 1.77% | 65% | $29,248 | |
2018(3) | $6.06 | 0.07 | 0.06 | 0.13 | (0.07) | (0.28) | (0.35) | $5.84 | 2.33% | 0.80%(4) | 0.80%(4) | 1.71%(4) | 1.71%(4) | 53% | $44,101 | |
| 2017 | $5.63 | 0.09 | 0.52 | 0.61 | (0.09) | (0.09) | (0.18) | $6.06 | 11.05% | 0.81% | 0.81% | 1.48% | 1.48% | 78% | $46,536 | |
| 2016 | $5.84 | 0.08 | 0.10 | 0.18 | (0.07) | (0.32) | (0.39) | $5.63 | 3.27% | 0.80% | 0.80% | 1.41% | 1.41% | 87% | $76,532 | |
| | | | | | | | | | | | | | | | | | | | | | | | | | | | | | | | | | | | | | | | | | | | | | | |
| For a Share Outstanding Throughout the Years Ended July 31 (except as noted) | | | | | |
| Per-Share Data | | Ratios and Supplemental Data |
| | | Income From Investment Operations: | Distributions From: | | | Ratio to Average Net Assets of: | | |
| | Net Asset Value, Beginning
of Period | Net
Investment Income
(Loss)(1) | Net
Realized and Unrealized Gain (Loss) | Total From Investment Operations | Net Investment Income | Net Realized Gains | Total Distributions | Net Asset Value,
End of
Period | Total Return(2) | Operating Expenses | Operating Expenses (before expense waiver) | Net Investment Income (Loss) | Net Investment Income (Loss) (before expense waiver) | Portfolio Turnover
Rate | Net Assets, End of Period (in thousands) |
| A Class | | | | | | | | | | | | | |
| 2021 | $5.65 | 0.07 | 0.92 | 0.99 | (0.06) | (0.19) | (0.25) | $6.39 | 17.79% | 1.01% | 1.25% | 1.13% | 0.89% | 57% | $92,011 | |
| 2020 | $5.67 | 0.05 | 0.36 | 0.41 | (0.05) | (0.38) | (0.43) | $5.65 | 7.62% | 1.10% | 1.26% | 0.84% | 0.68% | 87% | $78,047 | |
| 2019 | $5.83 | 0.07 | 0.14 | 0.21 | (0.08) | (0.29) | (0.37) | $5.67 | 4.29% | 1.25% | 1.26% | 1.33% | 1.32% | 65% | $86,822 | |
2018(3) | $6.05 | 0.05 | 0.06 | 0.11 | (0.05) | (0.28) | (0.33) | $5.83 | 1.99% | 1.25%(4) | 1.25%(4) | 1.26%(4) | 1.26%(4) | 53% | $113,865 | |
| 2017 | $5.62 | 0.06 | 0.52 | 0.58 | (0.06) | (0.09) | (0.15) | $6.05 | 10.56% | 1.26% | 1.26% | 1.03% | 1.03% | 78% | $117,230 | |
| 2016 | $5.81 | 0.05 | 0.11 | 0.16 | (0.03) | (0.32) | (0.35) | $5.62 | 2.94% | 1.25% | 1.25% | 0.96% | 0.96% | 87% | $137,168 | |
| C Class | | | | | | | | | | | | |
| 2021 | $5.53 | 0.02 | 0.90 | 0.92 | (0.02) | (0.19) | (0.21) | $6.24 | 16.90% | 1.76% | 2.00% | 0.38% | 0.14% | 57% | $11,902 | |
| 2020 | $5.57 | 0.01 | 0.35 | 0.36 | (0.02) | (0.38) | (0.40) | $5.53 | 6.78% | 1.85% | 2.01% | 0.09% | (0.07)% | 87% | $14,851 | |
| 2019 | $5.74 | 0.03 | 0.14 | 0.17 | (0.05) | (0.29) | (0.34) | $5.57 | 3.43% | 2.00% | 2.01% | 0.58% | 0.57% | 65% | $17,705 | |
2018(3) | $5.96 | 0.02 | 0.07 | 0.09 | (0.03) | (0.28) | (0.31) | $5.74 | 1.58% | 2.00%(4) | 2.00%(4) | 0.51%(4) | 0.51%(4) | 53% | $26,867 | |
| 2017 | $5.54 | 0.02 | 0.51 | 0.53 | (0.02) | (0.09) | (0.11) | $5.96 | 9.77% | 2.01% | 2.01% | 0.28% | 0.28% | 78% | $32,110 | |
| 2016 | $5.75 | 0.01 | 0.10 | 0.11 | — | (0.32) | (0.32) | $5.54 | 2.06% | 2.00% | 2.00% | 0.21% | 0.21% | 87% | $37,188 | |
| | | | | | | | | | | | | | | | | | | | | | | | | | | | | | | | | | | | | | | | | | | | | | | |
| For a Share Outstanding Throughout the Years Ended July 31 (except as noted) | | | | | |
| Per-Share Data | | Ratios and Supplemental Data |
| | | Income From Investment Operations: | Distributions From: | | | Ratio to Average Net Assets of: | | |
| | Net Asset Value, Beginning
of Period | Net
Investment Income
(Loss)(1) | Net
Realized and Unrealized Gain (Loss) | Total From Investment Operations | Net Investment Income | Net Realized Gains | Total Distributions | Net Asset Value,
End of
Period | Total Return(2) | Operating Expenses | Operating Expenses (before expense waiver) | Net Investment Income (Loss) | Net Investment Income (Loss) (before expense waiver) | Portfolio Turnover
Rate | Net Assets, End of Period (in thousands) |
| R Class | | | | | | | | | | | | | |
| 2021 | $5.63 | 0.05 | 0.93 | 0.98 | (0.05) | (0.19) | (0.24) | $6.37 | 17.59% | 1.26% | 1.50% | 0.88% | 0.64% | 57% | $11,768 | |
| 2020 | $5.65 | 0.03 | 0.37 | 0.40 | (0.04) | (0.38) | (0.42) | $5.63 | 7.37% | 1.35% | 1.51% | 0.59% | 0.43% | 87% | $10,783 | |
| 2019 | $5.82 | 0.06 | 0.13 | 0.19 | (0.07) | (0.29) | (0.36) | $5.65 | 3.86% | 1.50% | 1.51% | 1.08% | 1.07% | 65% | $10,314 | |
2018(3) | $6.04 | 0.04 | 0.06 | 0.10 | (0.04) | (0.28) | (0.32) | $5.82 | 1.83% | 1.50%(4) | 1.50%(4) | 1.01%(4) | 1.01%(4) | 53% | $10,960 | |
| 2017 | $5.61 | 0.05 | 0.52 | 0.57 | (0.05) | (0.09) | (0.14) | $6.04 | 10.31% | 1.51% | 1.51% | 0.78% | 0.78% | 78% | $15,004 | |
| 2016 | $5.80 | 0.04 | 0.10 | 0.14 | (0.01) | (0.32) | (0.33) | $5.61 | 2.59% | 1.50% | 1.50% | 0.71% | 0.71% | 87% | $15,398 | |
| R5 Class | | | | | | | | | | | | | |
| 2021 | $5.66 | 0.10 | 0.93 | 1.03 | (0.09) | (0.19) | (0.28) | $6.41 | 18.48% | 0.56% | 0.80% | 1.58% | 1.34% | 57% | $38,543 | |
| 2020 | $5.68 | 0.07 | 0.37 | 0.44 | (0.08) | (0.38) | (0.46) | $5.66 | 8.10% | 0.65% | 0.81% | 1.29% | 1.13% | 87% | $34,465 | |
| 2019 | $5.85 | 0.10 | 0.13 | 0.23 | (0.11) | (0.29) | (0.40) | $5.68 | 4.75% | 0.80% | 0.81% | 1.78% | 1.77% | 65% | $36,866 | |
2018(3) | $6.07 | 0.08 | 0.05 | 0.13 | (0.07) | (0.28) | (0.35) | $5.85 | 2.15% | 0.80%(4) | 0.80%(4) | 1.71%(4) | 1.71%(4) | 53% | $34,766 | |
2017(5) | $5.73 | 0.06 | 0.33 | 0.39 | (0.05) | — | (0.05) | $6.07 | 6.80% | 0.81%(4) | 0.81%(4) | 1.60%(4) | 1.60%(4) | 78%(6) | $5 | |
| | | | | | | | | | | | | | | | | | | | | | | | | | | | | | | | | | | | | | | | | | | | | | | |
| For a Share Outstanding Throughout the Years Ended July 31 (except as noted) | | | | | |
| Per-Share Data | | Ratios and Supplemental Data |
| | | Income From Investment Operations: | Distributions From: | | | Ratio to Average Net Assets of: | | |
| | Net Asset Value, Beginning
of Period | Net
Investment Income
(Loss)(1) | Net
Realized and Unrealized Gain (Loss) | Total From Investment Operations | Net Investment Income | Net Realized Gains | Total Distributions | Net Asset Value,
End of
Period | Total Return(2) | Operating Expenses | Operating Expenses (before expense waiver) | Net Investment Income (Loss) | Net Investment Income (Loss) (before expense waiver) | Portfolio Turnover
Rate | Net Assets, End of Period (in thousands) |
| R6 Class | | | | | | | | | | | | | |
| 2021 | $5.66 | 0.10 | 0.93 | 1.03 | (0.10) | (0.19) | (0.29) | $6.40 | 18.48% | 0.41% | 0.65% | 1.73% | 1.49% | 57% | $92,483 | |
| 2020 | $5.68 | 0.08 | 0.37 | 0.45 | (0.09) | (0.38) | (0.47) | $5.66 | 8.28% | 0.50% | 0.66% | 1.44% | 1.28% | 87% | $74,665 | |
| 2019 | $5.84 | 0.11 | 0.14 | 0.25 | (0.12) | (0.29) | (0.41) | $5.68 | 4.91% | 0.65% | 0.66% | 1.93% | 1.92% | 65% | $69,846 | |
2018(3) | $6.06 | 0.07 | 0.07 | 0.14 | (0.08) | (0.28) | (0.36) | $5.84 | 2.44% | 0.65%(4) | 0.65%(4) | 1.86%(4) | 1.86%(4) | 53% | $76,077 | |
| 2017 | $5.63 | 0.10 | 0.52 | 0.62 | (0.10) | (0.09) | (0.19) | $6.06 | 11.21% | 0.66% | 0.66% | 1.63% | 1.63% | 78% | $63,151 | |
| 2016 | $5.84 | 0.09 | 0.10 | 0.19 | (0.08) | (0.32) | (0.40) | $5.63 | 3.50% | 0.65% | 0.65% | 1.56% | 1.56% | 87% | $20,398 | |
| | | | | |
| Notes to Financial Highlights |
(1)Computed using average shares outstanding throughout the period.
(2)Total returns are calculated based on the net asset value of the last business day and do not reflect applicable sales charges, if any. Total returns for periods less than one year are not annualized.
(3)December 1, 2017 through July 31, 2018. The fund's fiscal year end was changed from November 30 to July 31, resulting in an eight-month annual reporting period. For the years before July 31, 2018, the fund's fiscal year end was November 30.
(4)Annualized.
(5)April 10, 2017 (commencement of sale) through November 30, 2017.
(6)Portfolio turnover is calculated at the fund level. Percentage indicated was calculated for the year ended November 30, 2017.
See Notes to Financial Statements.
| | |
| Report of Independent Registered Public Accounting Firm |
To the Shareholders and the Board of Directors of American Century Strategic Asset Allocations, Inc.:
Opinion on the Financial Statements and Financial Highlights
We have audited the accompanying statement of assets and liabilities, including the schedule of investments, of Strategic Allocation: Conservative Fund (the “Fund”), one of the funds constituting the American Century Strategic Asset Allocations, Inc., as of July 31, 2021, the related statement of operations for the year then ended, the statements of changes in net assets for each of the two years in the period then ended, the financial highlights for each of the three years in the period then ended, the period December 1, 2017 through July 31, 2018 and for the years ended November 30, 2017 and 2016, and the related notes. In our opinion, the financial statements and financial highlights present fairly, in all material respects, the financial position of Strategic Allocation: Conservative Fund of the American Century Strategic Asset Allocations, Inc. as of July 31, 2021, and the results of its operations for the year then ended, the changes in its net assets for each of the two years in the period then ended, and the financial highlights for each of the three years in the period then ended, the period December 1, 2017 through July 31, 2018 and for the years ended November 30, 2017 and 2016, in conformity with accounting principles generally accepted in the United States of America.
Basis for Opinion
These financial statements and financial highlights are the responsibility of the Fund's management. Our responsibility is to express an opinion on the Fund’s financial statements and financial highlights based on our audits. We are a public accounting firm registered with the Public Company Accounting Oversight Board (United States) (PCAOB) and are required to be independent with respect to the Fund in accordance with the U.S. federal securities laws and the applicable rules and regulations of the Securities and Exchange Commission and the PCAOB.
We conducted our audits in accordance with the standards of the PCAOB. Those standards require that we plan and perform the audit to obtain reasonable assurance about whether the financial statements and financial highlights are free of material misstatement, whether due to error or fraud. The Fund is not required to have, nor were we engaged to perform, an audit of its internal control over financial reporting. As part of our audits we are required to obtain an understanding of internal control over financial reporting but not for the purpose of expressing an opinion on the effectiveness of the Fund’s internal control over financial reporting. Accordingly, we express no such opinion.
Our audits included performing procedures to assess the risks of material misstatement of the financial statements and financial highlights, whether due to error or fraud, and performing procedures that respond to those risks. Such procedures included examining, on a test basis, evidence regarding the amounts and disclosures in the financial statements and financial highlights. Our audits also included evaluating the accounting principles used and significant estimates made by management, as well as evaluating the overall presentation of the financial statements and financial highlights. Our procedures included confirmation of securities owned as of July 31, 2021, by correspondence with the custodian and brokers; when replies were not received from brokers, we performed other auditing procedures. We believe that our audits provide a reasonable basis for our opinion.
DELOITTE & TOUCHE LLP
Kansas City, Missouri
September 15, 2021
We have served as the auditor of one or more American Century investment companies since 1997.
The Board of Directors
The individuals listed below serve as directors of the funds. Each director will continue to serve in this capacity until death, retirement, resignation or removal from office. The board has adopted a mandatory retirement age for directors who are not “interested persons,” as that term is defined in the Investment Company Act (independent directors). Independent directors shall retire by December 31 of the year in which they reach their 75th birthday.
Mr. Thomas is an “interested person” because he currently serves as President and Chief Executive Officer of American Century Companies, Inc. (ACC), the parent company of American Century Investment Management, Inc. (ACIM or the advisor). The other directors (more than three-fourths of the total number) are independent. They are not employees, directors or officers of, and have no financial interest in, ACC or any of its wholly owned, direct or indirect, subsidiaries, including ACIM, American Century Investment Services, Inc. (ACIS) and American Century Services, LLC (ACS), and they do not have any other affiliations, positions or relationships that would cause them to be considered “interested persons” under the Investment Company Act. The directors serve in this capacity for seven (in the case of Jonathan S. Thomas, 16; and Stephen E. Yates, 8) registered investment companies in the American Century Investments family of funds.
The following table presents additional information about the directors. The mailing address for each director is 4500 Main Street, Kansas City, Missouri 64111.
| | | | | | | | | | | | | | | | | |
Name
(Year of Birth) | Position(s) Held with Funds | Length of Time Served | Principal Occupation(s) During Past 5 Years | Number of American Century Portfolios Overseen by Director | Other Directorships Held During Past 5 Years |
| Independent Directors | | |
| Thomas W. Bunn (1953) | Director | Since 2017 | Retired | 72 | SquareTwo Financial; Barings (formerly Babson Capital Funds Trust) (2013 to 2016) |
Chris H. Cheesman
(1962)
| Director | Since 2019
| Retired. Senior Vice President & Chief Audit Executive, AllianceBernstein (1999 to 2018) | 72 | None |
Barry Fink
(1955) | Director | Since 2012 (independent since 2016) | Retired | 72 | None |
Rajesh K. Gupta
(1960)
| Director | Since 2019
| Partner Emeritus, SeaCrest Investment Management and SeaCrest Wealth Management (2019 to Present); Chief Executive Officer and Chief Investment Officer, SeaCrest Investment Management (2006 to 2019); Chief Executive Officer and Chief Investment Officer, SeaCrest Wealth Management (2008 to 2019) | 72 | None |
| | | | | | | | | | | | | | | | | |
Name
(Year of Birth) | Position(s) Held with Funds | Length of Time Served | Principal Occupation(s) During Past 5 Years | Number of American Century Portfolios Overseen by Director | Other Directorships Held During Past 5 Years |
| Independent Directors | | |
Lynn Jenkins
(1963)
| Director | Since 2019
| Consultant, LJ Strategies (2019 to present); United States Representative, U.S. House of Representatives (2009 to 2018) | 72 | MGP Ingredients, Inc. (2019 to 2021) |
Jan M. Lewis
(1957) | Director | Since 2011 | Retired | 72 | None |
John R. Whitten
(1946) | Director | Since 2008 | Retired | 72 | Onto Innovation Inc. (2019 to 2020); Rudolph Technologies, Inc. (2006 to 2019) |
Stephen E. Yates
(1948) | Director and Chairman of the Board | Since 2012 (Chairman since 2018) | Retired | 103 | None |
| Interested Director | |
Jonathan S. Thomas
(1963) | Director | Since 2007 | President and Chief Executive Officer, ACC (2007 to present). Also serves as Chief Executive Officer, ACS; Director, ACC and other ACC subsidiaries | 141 | None |
The Statement of Additional Information has additional information about the fund's directors and is available without charge, upon request, by calling 1-800-345-2021.
Officers
The following table presents certain information about the executive officers of the funds. Each officer serves as an officer for each of the 16 (in the case of Robert J. Leach, 15) investment companies in the American Century family of funds. No officer is compensated for his or her service as an officer of the funds. The listed officers are interested persons of the funds and are appointed or re-appointed on an annual basis. The mailing address for each officer listed below is 4500 Main Street, Kansas City, Missouri 64111.
| | | | | | | | |
Name
(Year of Birth) | Offices with the Funds | Principal Occupation(s) During the Past Five Years |
Patrick Bannigan
(1965) | President since 2019 | Executive Vice President and Director, ACC (2012 to present); Chief Financial Officer, Chief Accounting Officer and Treasurer, ACC (2015 to present). Also serves as President, ACS; Vice President, ACIM; Chief Financial Officer, Chief Accounting Officer and/or Director, ACIM, ACS and other ACC subsidiaries |
R. Wes Campbell
(1974) | Chief Financial Officer and Treasurer since 2018 | Vice President, ACS, (2020 to present); Investment Operations and Investment Accounting, ACS (2000 to present) |
Amy D. Shelton
(1964) | Chief Compliance Officer and Vice President since 2014 | Chief Compliance Officer, American Century funds, (2014 to present); Chief Compliance Officer, ACIM (2014 to present); Chief Compliance Officer, ACIS (2009 to present). Also serves as Vice President, ACIS |
Charles A. Etherington
(1957) | General Counsel since 2007 and Senior Vice President since 2006 | Attorney, ACC (1994 to present); Vice President, ACC (2005 to present); General Counsel, ACC (2007 to present). Also serves as General Counsel, ACIM, ACS, ACIS and other ACC subsidiaries; and Senior Vice President, ACIM and ACS |
C. Jean Wade
(1964) | Vice President since 2012 | Senior Vice President, ACS (2017 to present); Vice President, ACS (2000 to 2017) |
Robert J. Leach
(1966) | Vice President since 2006 | Vice President, ACS (2000 to present) |
David H. Reinmiller
(1963) | Vice President since 2000 | Attorney, ACC (1994 to present). Also serves as Vice President, ACIM and ACS |
Ward D. Stauffer
(1960) | Secretary since 2005 | Attorney, ACC (2003 to present) |
| | |
| Approval of Management Agreement |
At a meeting held on June 30, 2021, the Fund’s Board of Directors (the "Board") unanimously approved the renewal of the management agreement pursuant to which American Century Investment Management, Inc. (the “Advisor”) acts as the investment advisor for the Fund. Under Section 15(c) of the Investment Company Act, contracts for investment advisory services are required to be reviewed, evaluated, and approved by a majority of a fund’s directors (the “Directors”), including a majority of the independent Directors, each year.
Prior to its consideration of the renewal of the management agreement, the Directors requested and reviewed extensive data and information compiled by the Advisor and certain independent providers of evaluation data concerning the Fund and the services provided to the Fund by the Advisor. This review was in addition to the oversight and evaluation undertaken by the Board and its committees on a continual basis and the information received was supplemental to the extensive information that the Board and its committees receive and consider throughout the year.
In connection with its consideration of the renewal of the management agreement, the Board’s review and evaluation of the services provided by the Advisor and its affiliates included, but was not limited to, the following:
•the nature, extent, and quality of investment management, shareholder services, and other services provided and to be provided to the Fund including without limitation portfolio management and trading services, shareholder and intermediary services, compliance and legal services, fund accounting and financial reporting, and fund share distribution;
•the wide range of other programs and services provided and to be provided to the Fund and its shareholders on a routine and non-routine basis;
•the Fund’s investment performance, including data comparing the Fund's performance to appropriate benchmarks and/or a peer group of other mutual funds with similar investment objectives and strategies;
•the cost of owning the Fund compared to the cost of owning similar funds;
•the compliance policies, procedures, and regulatory experience of the Advisor and the Fund's service providers;
•the Advisor’s strategic plans, COVID-19 pandemic response, vendor management practices, and social justice initiatives;
•the Advisor’s business continuity plans and cyber security practices;
•financial data showing the cost of services provided to the Fund, the profitability of the Fund to the Advisor, and the overall profitability of the Advisor;
•possible economies of scale associated with the Advisor’s management of the Fund and other accounts;
•services provided and charges to the Advisor's other investment management clients;
•acquired fund fees and expenses;
•payments and practices in connection with financial intermediaries holding shares of the Fund and the services provided by intermediaries in connection therewith; and
•possible collateral benefits to the Advisor from the management of the Fund.
The Board held two meetings to consider the renewal. The independent Directors also met in private session three times to review and discuss the information provided in response to their request. The independent Directors held active discussions with the Advisor regarding the renewal of the management agreement, requesting supplemental information, and reviewing information provided by the Advisor in response thereto. The independent Directors had the benefit of the advice of their independent counsel throughout the process.
Factors Considered
The Directors considered all of the information provided by the Advisor, the independent data providers, and independent counsel in connection with the approval. They determined that the information was sufficient for them to evaluate the management agreement for the Fund. In connection with their review, the Directors did not identify any single factor as being all-important or controlling, and each Director may have attributed different levels of importance to different factors. In deciding to renew the management agreement, the Board based its decision on a number of factors, including without limitation the following:
Nature, Extent and Quality of Services — Generally. Under the management agreement, the Advisor is responsible for providing or arranging for all services necessary for the operation of the Fund. The Board noted that the Advisor provides or arranges at its own expense a wide variety of services which include the following:
•constructing and designing the Fund
•portfolio research and security selection
•initial capitalization/funding
•securities trading
•Fund administration
•custody of Fund assets
•daily valuation of the Fund’s portfolio
•liquidity monitoring and management
•risk management, including cyber security
•shareholder servicing and transfer agency, including shareholder confirmations, recordkeeping, and communications
•legal services (except the independent Directors’ counsel)
•regulatory and portfolio compliance
•financial reporting
•marketing and distribution (except amounts paid by the Fund under Rule 12b-1 plans)
The Board noted that many of these services have expanded over time in terms of both quantity and complexity in response to shareholder demands, competition in the industry, changing distribution channels, and the changing regulatory environment.
Investment Management Services. The nature of the investment management services provided to the Fund is quite complex and allows Fund shareholders access to professional money management, instant diversification of their investments within an asset class, the opportunity to easily diversify among asset classes by investing in or exchanging among various American Century Investments funds, and liquidity. In evaluating investment performance, the Board expects the Advisor to manage the Fund in accordance with its investment objectives and approved strategies. Further, the Directors recognize that the Advisor has an obligation to monitor trading activities, and in particular to seek the best execution of fund trades, and to evaluate the use of and payment for research. In providing these services, the Advisor utilizes teams of investment professionals (portfolio managers, analysts, research assistants, and securities traders) who require extensive information technology, research, training, compliance, and other systems to conduct their business. The Board, directly and through its Fund Performance Review Committee, provides oversight of the investment performance process. It regularly reviews investment performance information for the Fund, together with comparative information for appropriate benchmarks and/or peer groups of similarly-managed funds, over different time horizons. The Directors also review investment performance information during the management agreement renewal process. If performance concerns are identified, the Fund receives special reviews until performance improves, during which the Board discusses with the Advisor the reasons for such results (e.g., market conditions, security selection) and any efforts being undertaken to improve performance. The Fund’s performance was above its benchmark for the one-, three-, five-, and ten-year periods reviewed by the Board. The Board found the investment management services provided by the Advisor to the Fund to be satisfactory and consistent with the management agreement.
Shareholder and Other Services. Under the management agreement, the Advisor provides the Fund with a comprehensive package of transfer agency, shareholder, and other services. The Board, directly and through its various committees, regularly reviews reports and evaluations of such services at its regular meetings. These reports include, but are not limited to, information regarding the operational efficiency and accuracy of the shareholder and transfer agency services provided, staffing levels, shareholder satisfaction, technology support (including cyber security), new products and services offered to Fund shareholders, securities trading activities, portfolio valuation services, auditing services, and legal and operational compliance activities. The Board found the services provided by the Advisor to the Fund under the management agreement to be competitive and of high quality.
Costs of Services and Profitability. The Advisor provides detailed information concerning its cost of providing various services to the Fund, its profitability in managing the Fund (pre- and post-distribution), its overall profitability, and its financial condition. The Directors have reviewed with the Advisor the methodology used to prepare this financial information. This information is considered in evaluating the Advisor’s financial condition, its ability to continue to provide services under the management agreement, and the reasonableness of the current management fee. The Board concluded that the Advisor’s profits were reasonable in light of the services provided to the Fund.
Ethics. The Board generally considers the Advisor’s commitment to providing quality services to shareholders and to conducting its business ethically. They noted that the Advisor’s practices generally meet or exceed industry best practices.
Economies of Scale. The Board also reviewed information provided by the Advisor regarding the possible existence of economies of scale in connection with the management of the Fund. The Board concluded that economies of scale are difficult to measure and predict with precision, especially on a fund-by-fund basis. The Board concluded that the Advisor is sharing economies of scale, to the extent they exist, through its competitive fee structure, offering competitive fees from fund inception, and through reinvestment in its business, infrastructure, investment capabilities and initiatives to provide shareholders additional content and services.
Comparison to Other Funds’ Fees. The management agreement provides that the Fund pays the Advisor a single, all-inclusive (or unified) management fee for providing all services necessary for the management and operation of the Fund, other than brokerage expenses, expenses attributable to short sales, taxes, interest, extraordinary expenses, fees and expenses of the Fund’s independent Directors (including their independent legal counsel), and expenses incurred in connection with the provision of shareholder services and distribution services under a plan adopted pursuant to Rule 12b-1 under the Investment Company Act. Under the unified fee structure, the Advisor is responsible for providing all investment advisory, custody, audit, administrative, compliance, recordkeeping, marketing and shareholder services, or arranging and supervising third parties to provide such services. By contrast, most other funds are charged a variety of fees, including an investment advisory fee, a transfer agency fee, an administrative fee, distribution charges, and other expenses. Other than their investment advisory fees and any applicable Rule 12b-1 distribution fees, all other components of the total fees charged by these other funds may be increased without shareholder approval. The Board believes the unified fee structure is a benefit to Fund shareholders because it clearly discloses to shareholders the cost of owning Fund shares, and, since the unified fee cannot be increased without a vote of Fund shareholders, it shifts to the Advisor the risk of increased costs of operating the Fund and provides a direct incentive to minimize administrative inefficiencies. Part of the Board’s analysis of fee levels involves reviewing certain evaluative data compiled by an independent provider comparing the Fund’s unified fee to the total expense ratios of its peers. The unified fee charged to shareholders of the Fund was above the median of the total expense ratios of the Fund’s peer expense universe. In addition, the Board reviewed the Fund’s position relative to the narrower set of its expense group peers. The Board and the Advisor agreed to a temporary reduction of the Fund's fee schedule that should have the effect of lowering the Fund's total expense ratio by approximately 0.03% (e.g., the Investor Class total expense ratio will be reduced from 0.86% to 0.83%), for at least one year, beginning August 1, 2021. The Board concluded that the management fee paid by the Fund to the Advisor under the management agreement is reasonable in light of the services provided to the Fund.
Comparison to Fees and Services Provided to Other Clients of the Advisor. The Board also requested and received information from the Advisor concerning the nature of the services, fees, costs, and profitability of its advisory services to advisory clients other than the Fund. They observed that these varying types of client accounts require different services and involve different regulatory and entrepreneurial risks than the management of the Fund. The Board analyzed this information and concluded that the fees charged and services provided to the Fund were reasonable by comparison.
Payments to Intermediaries. The Directors also requested and received a description of payments made to intermediaries by the Fund and the Advisor and services provided in response thereto. These payments include various payments made by the Fund or the Advisor to different types of intermediaries and recordkeepers for distribution and service activities provided for the Fund. The Directors reviewed such information and received representations from the Advisor that all such payments by the Fund were made pursuant to the Fund's Rule 12b-1 Plan and that all such payments by the Advisor were made from the Advisor’s resources and reasonable profits. The Board found such payments to be reasonable in scope and purpose.
Collateral or “Fall-Out” Benefits Derived by the Advisor. The Board considered the possible existence of collateral benefits the Advisor may receive as a result of its relationship with the Fund. They concluded that the Advisor’s primary business is managing funds and it generally does not use fund or shareholder information to generate profits in other lines of business, and therefore does not derive any significant collateral benefits from them. To the extent there are potential collateral benefits, the Board has been advised and has taken this into consideration in its review of the management contract with the Fund. The Board noted that additional assets from other clients may offer the Advisor some benefit from increased leverage with service providers and counterparties. Additionally, the Advisor may receive proprietary research from broker-dealers that execute fund portfolio transactions, which the Board concluded is likely to benefit other clients of the Advisor, as well as Fund shareholders. The Board also determined that the Advisor is able to provide investment management services to certain clients other than the Fund, at least in part, due to its existing infrastructure built to serve the fund complex. The Board concluded that appropriate allocation methodologies had been employed to assign resources and the cost of those resources to these other clients.
Existing Relationship. The Board also considered whether there was any reason for not continuing the existing arrangement with the Advisor. In this regard, the Board was mindful of the potential disruptions of the Fund’s operations and various risks, uncertainties, and other effects that could occur as a result of a decision not to continue such relationship. In particular, the Board recognized that most shareholders have invested in the Fund on the strength of the Advisor’s industry standing and reputation and in the expectation that the Advisor will have a continuing role in providing advisory services to the Fund.
Conclusion of the Directors. As a result of this process, the Board, including all of the independent Directors, taking into account all of the factors discussed above and the information provided by the Advisor and others in connection with its review and throughout the year, determined that the management fee is fair and reasonable in light of the services provided and that the investment management agreement between the Fund and the Advisor should be renewed.
| | |
| Liquidity Risk Management Program |
The Fund has adopted a liquidity risk management program (the “program”). The Fund’s Board of Directors (the "Board") has designated American Century Investment Management, Inc. (“ACIM”) as the administrator of the program. Personnel of ACIM or its affiliates conduct the day-to-day operation of the program pursuant to policies and procedures administered by those members of the ACIM’s Investment Oversight Committee who are members of the ACIM’s Investment Management and Global Analytics departments.
Under the program, ACIM manages the Fund’s liquidity risk, which is the risk that the Fund could not meet shareholder redemption requests without significant dilution of remaining shareholders’ interests in the Fund. This risk is managed by monitoring the degree of liquidity of the Fund’s investments, limiting the amount of the Fund’s illiquid investments, and utilizing various risk management tools and facilities available to the Fund for meeting shareholder redemptions, among other means. ACIM’s process of determining the degree of liquidity of the Fund’s investments is supported by one or more third-party liquidity assessment vendors.
The Board reviewed a report prepared by ACIM regarding the operation and effectiveness of the program for the period January 1, 2020 through December 31, 2020. No significant liquidity events impacting the Fund were noted in the report. In addition, ACIM provided its assessment that the program had been effective in managing the Fund’s liquidity risk.
Retirement Account Information
As required by law, distributions you receive from certain retirement accounts are subject to federal income tax withholding, unless you elect not to have withholding apply*. Tax will be withheld on the total amount withdrawn even though you may be receiving amounts that are not subject to withholding, such as nondeductible contributions. In such case, excess amounts of withholding could occur. You may adjust your withholding election so that a greater or lesser amount will be withheld.
If you don’t want us to withhold on this amount, you must notify us to not withhold the federal income tax. You may notify us in writing or in certain situations by telephone or through other electronic means. For systematic withdrawals, your withholding election will remain in effect until revoked or changed by filing a new election. You have the right to revoke your election at any time and change your withholding percentage for future distributions.
Remember, even if you elect not to have income tax withheld, you are liable for paying income tax on the taxable portion of your withdrawal. If you elect not to have income tax withheld or you don’t have enough income tax withheld, you may be responsible for payment of estimated tax. You may incur penalties under the estimated tax rules if your withholding and estimated tax payments are not sufficient. You can reduce or defer the income tax on a distribution by directly or indirectly rolling such distribution over to another IRA or eligible plan. You should consult your tax advisor for additional information.
State tax will be withheld if, at the time of your distribution, your address is within one of the mandatory withholding states and you have federal income tax withheld (or as otherwise required by state law). State taxes will be withheld from your distribution in accordance with the respective state rules.
*Some 403(b), 457 and qualified retirement plan distributions may be subject to 20% mandatory withholding, as they are subject to special tax and withholding rules. Your plan administrator or plan sponsor is required to provide you with a special tax notice explaining those rules at the time you request a distribution. If applicable, federal and/or state taxes may be withheld from your distribution amount.
Proxy Voting Policies
A description of the policies that the fund's investment advisor uses in exercising the voting rights associated with the securities purchased and/or held by the fund is available without charge, upon request, by calling 1-800-345-2021. It is also available on American Century Investments’ website at americancentury.com/proxy and on the Securities and Exchange Commission’s website at sec.gov. Information regarding how the investment advisor voted proxies relating to portfolio securities during the most recent 12-month period ended June 30 is available on americancentury.com/proxy. It is also available at sec.gov.
Quarterly Portfolio Disclosure
The fund files its complete schedule of portfolio holdings with the Securities and Exchange
Commission (SEC) for the first and third quarters of each fiscal year as an exhibit to its reports on
Form N-PORT. These portfolio holdings are available on the fund's website at
americancentury.com and, upon request, by calling 1-800-345-2021. The fund’s Form N-PORT
reports are available on the SEC’s website at sec.gov.
Other Tax Information
The following information is provided pursuant to provisions of the Internal Revenue Code.
The fund hereby designates up to the maximum amount allowable as qualified dividend income for
the fiscal year ended July 31, 2021.
For corporate taxpayers, the fund hereby designates $716,316, or up to the maximum amount
allowable, of ordinary income distributions paid during the fiscal year ended July 31, 2021 as
qualified for the corporate dividends received deduction.
The fund hereby designates $9,351,510, or up to the maximum amount allowable, as long-term
capital gain distributions (20% rate gain distributions) for the fiscal year ended July 31, 2021.
The fund hereby designates $3,490,593 as qualified short-term capital gain distributions for
purposes of Internal Revenue Code Section 871 for the fiscal year ended July 31, 2021.
| | | | | | | | |
| |
| | |
| Contact Us | americancentury.com | |
| Automated Information Line | 1-800-345-8765 | |
| Investor Services Representative | 1-800-345-2021
or 816-531-5575 | |
| Investors Using Advisors | 1-800-378-9878 | |
| Business, Not-For-Profit, Employer-Sponsored Retirement Plans | 1-800-345-3533 | |
| Banks and Trust Companies, Broker-Dealers, Financial Professionals, Insurance Companies | 1-800-345-6488 | |
| Telecommunications Relay Service for the Deaf | 711 | |
| | |
| American Century Strategic Asset Allocations, Inc. | |
| | |
Investment Advisor: American Century Investment Management, Inc. Kansas City, Missouri | |
| | |
| This report and the statements it contains are submitted for the general information of our shareholders. The report is not authorized for distribution to prospective investors unless preceded or accompanied by an effective prospectus. | |
| | |
©2021 American Century Proprietary Holdings, Inc. All rights reserved.
CL-ANN-91039 2109 | |
| | | | | |
| |
| Annual Report |
| |
| July 31, 2021 |
| |
| Strategic Allocation: Moderate Fund |
| Investor Class (TWSMX) |
| I Class (ASAMX) |
| A Class (ACOAX) |
| C Class (ASTCX) |
| R Class (ASMRX) |
| R5 Class (ASMUX) |
| R6 Class (ASMDX) |
| | | | | |
| President’s Letter | |
| Performance | |
| Portfolio Commentary | |
| Fund Characteristics | |
| Shareholder Fee Example | |
| Schedule of Investments | |
| Statement of Assets and Liabilities | |
| Statement of Operations | |
| Statement of Changes in Net Assets | |
| Notes to Financial Statements | |
| Financial Highlights | |
| Report of Independent Registered Public Accounting Firm | |
| Management | |
| Approval of Management Agreement | |
| Liquidity Risk Management Program | |
| |
| Additional Information | |
Any opinions expressed in this report reflect those of the author as of the date of the report, and do not necessarily represent the opinions of American Century Investments® or any other person in the American Century Investments organization. Any such opinions are subject to change at any time based upon market or other conditions and American Century Investments disclaims any responsibility to update such opinions. These opinions may not be relied upon as investment advice and, because investment decisions made by American Century Investments funds are based on numerous factors, may not be relied upon as an indication of trading intent on behalf of any American Century Investments fund. Security examples are used for representational purposes only and are not intended as recommendations to purchase or sell securities. Performance information for comparative indices and securities is provided to American Century Investments by third party vendors. To the best of American Century Investments’ knowledge, such information is accurate at the time of printing.
Jonathan Thomas
Dear Investor:
Thank you for reviewing this annual report for the period ended July 31, 2021. Annual reports help convey important information about fund returns, including market factors that affected performance. For additional investment insights, please visit americancentury.com.
Stocks Delivered Strong Gains
Global equities and other risk-on assets rallied for the 12-month period, benefiting from ongoing central bank and federal government support. These programs helped sustain investor confidence and bolster the economic landscape, despite ongoing challenges from COVID-19 and the inconsistent lifting of virus-related restrictions.
In general, data on U.S. manufacturing, employment, housing and corporate earnings remained upbeat during the period. Additionally, expanding COVID-19 vaccine availability and two federal coronavirus aid packages also helped promote investor optimism. Outside the U.S., economies recovered but at a slower pace. Virus outbreaks and slower vaccine rollouts led to lingering lockdowns in some regions.
Against this backdrop, inflation rose, but central banks remained supportive. In the U.S., where annual inflation soared to a 13-year high, the Federal Reserve (Fed) insisted temporary supply chain disruptions and other transient factors were at play. The Fed left interest rates unchanged but hinted it may start hiking rates in 2023, sooner than its previous timetable of 2024.
Despite ongoing pandemic-related challenges, including the emergence of the delta variant of COVID-19, risk assets remained in favor, and global stocks delivered stellar 12-month returns. The U.S. generally outperformed other developed markets, as the S&P 500 Index returned more than 36%. Value stocks generally outperformed growth stocks, while small caps sharply outpaced large caps. The broad U.S. bond market declined modestly, but global bonds delivered a slight gain.
Several Influences Shaping Market Dynamics
The return to pre-pandemic life is progressing, albeit somewhat cautiously due to the spread of the delta variant. As the economy and markets respond to this fluid backdrop, investors will face opportunities and ongoing challenges. Economic growth, inflation, the virus’s trajectory, supply chain normalization and fiscal and monetary policy likely will sway market dynamics.
We appreciate your confidence in us during these extraordinary times. Our firm has a long history of helping clients weather unpredictable markets, and we’re confident we will continue to meet today’s challenges.
Sincerely,
Jonathan Thomas
President and Chief Executive Officer
American Century Investments
| | | | | | | | | | | | | | | | | | | | |
| Total Returns as of July 31, 2021 |
| | | | Average Annual Returns | |
| | Ticker
Symbol | 1 year | 5 years | 10 years | Since
Inception | Inception Date |
| Investor Class | TWSMX | 24.69% | 10.79% | 8.84% | — | 2/15/96 |
| S&P 500 Index | — | 36.45% | 17.34% | 15.33% | — | — |
| Bloomberg Barclays U.S. Aggregate Bond Index | — | -0.70% | 3.12% | 3.34% | — | — |
| Bloomberg Barclays U.S. 1-3 Month Treasury Bill Index | — | 0.06% | 1.10% | 0.58% | — | — |
| I Class | ASAMX | 24.93% | 11.04% | 9.05% | — | 8/1/00 |
| A Class | ACOAX | | | | | 10/2/96 |
| No sales charge | | 24.48% | 10.52% | 8.57% | — | |
| With sales charge | | 17.31% | 9.22% | 7.93% | — | |
| C Class | ASTCX | 23.55% | 9.71% | 7.74% | — | 10/2/01 |
| | | | | | |
| | | | | | |
| R Class | ASMRX | 24.23% | 10.26% | 8.29% | — | 8/29/03 |
| R5 Class | ASMUX | 25.10% | — | — | 11.60% | 4/10/17 |
| R6 Class | ASMDX | 25.17% | 11.19% | — | 9.18% | 7/26/13 |
Average annual returns since inception are presented when ten years of performance history is not available.
Fund returns would have been lower if a portion of the fees had not been waived.
C Class shares will automatically convert to A Class shares after being held for approximately eight years. C Class average annual returns do not reflect this conversion.
Sales charges include initial sales charges and contingent deferred sales charges (CDSCs), as applicable. A Class shares have a 5.75% maximum initial sales charge and may be subject to a maximum CDSC of 1.00%. C Class shares redeemed within 12 months of purchase are subject to a maximum CDSC of 1.00%. The SEC requires that mutual funds provide performance information net of maximum sales charges in all cases where charges could be applied.
Data presented reflect past performance. Past performance is no guarantee of future results. Current performance may be higher or lower than the performance shown. Total returns for periods less than one year are not annualized. Investment return and principal value will fluctuate, and redemption value may be more or less than original cost. Data assumes reinvestment of dividends and capital gains, and none of the charts reflect the deduction of taxes that a shareholder would pay on fund distributions or the redemption of fund shares. To obtain performance data current to the most recent month end, please call 1-800-345-2021 or visit americancentury.com. For additional information about the fund, please consult the prospectus.
| | |
| Growth of $10,000 Over 10 Years |
| $10,000 investment made July 31, 2011 |
| Performance for other share classes will vary due to differences in fee structure. |
| | | | | |
| Value on July 31, 2021 |
| Investor Class — $23,335 |
|
| S&P 500 Index — $41,689 |
|
| Bloomberg Barclays U.S. Aggregate Bond Index — $13,897 |
|
| Bloomberg Barclays U.S. 1-3 Month Treasury Bill Index — $10,600 |
|
Ending value of Investor Class would have been lower if a portion of the fees had not been waived.
| | | | | | | | | | | | | | | | | | | | |
Total Annual Fund Operating Expenses | | |
| Investor Class | I Class | A Class | C Class | R Class | R5 Class | R6 Class |
| 1.24% | 1.04% | 1.49% | 2.24% | 1.74% | 1.04% | 0.89% |
The total annual fund operating expenses shown is as stated in the fund’s prospectus current as of the date of this report. The prospectus may vary from the expense ratio shown elsewhere in this report because it is based on a different time period, includes acquired fund fees and expenses, and, if applicable, does not include fee waivers or expense reimbursements.
Data presented reflect past performance. Past performance is no guarantee of future results. Current performance may be higher or lower than the performance shown. Total returns for periods less than one year are not annualized. Investment return and principal value will fluctuate, and redemption value may be more or less than original cost. Data assumes reinvestment of dividends and capital gains, and none of the charts reflect the deduction of taxes that a shareholder would pay on fund distributions or the redemption of fund shares. To obtain performance data current to the most recent month end, please call 1-800-345-2021 or visit americancentury.com. For additional information about the fund, please consult the prospectus.
Portfolio Managers: Rich Weiss, Scott Wilson, Radu Gabudean, Vidya Rajappa and Brian Garbe
Performance Summary
Strategic Allocation: Moderate returned 24.69%* for the fiscal period ended July 31, 2021. Because of the fund’s strategic exposure to a variety of asset classes, a review of the financial markets helps provide context around performance for the reporting period.
Global financial markets performance was colored by a shift in investor sentiment in late 2020, when investors began to anticipate the rollout of COVID-19 vaccines. Prior to the approval, stock and bond markets had been volatile as the outlook for growth varied with pandemic news. Nevertheless, stimulative fiscal and monetary policies supported the economy and financial markets throughout. The change in sentiment was reflected in equity market performance—gains were initially led by growth-oriented stocks, but then shifted to more economically sensitive value stocks. It was a similar story in fixed-income markets, where risk aversion initially kept yields on government bonds near historic lows. But with the prospect of vaccine distribution and the end of the pandemic, investors generally shifted out of government bonds and into higher-yielding, more procyclical sectors to take advantage of an anticipated economic recovery. Later, however, inflation concerns began to play into investor decisions and contributed to market volatility.
In that environment, broad global equity indices finished the period at or near record highs. In the U.S., stocks generally posted very strong returns. Mid-cap companies led the way, followed by small caps and large caps, while value outperformed growth across all market capitalizations, according to the Russell family of indices. Emerging markets stocks also performed well but lagged the U.S. and developed non-U.S. markets. For the period, the S&P 500 Index gained 36.45%, while the MSCI EAFE Index rose 30.31% and the MSCI Emerging Markets (Net) Index increased 20.64%.
In fixed-income markets, government bonds benefited from concerns about the pandemic early in the period, as investors sought out high-quality, perceived safe-haven investments. In the U.S., unprecedented fiscal and monetary stimulus, and a new tolerance for higher inflation by the Federal Reserve, led to a rise in inflation expectations. As a result, yields on government bonds rose, while inflation-protected and corporate bonds performed well. Later in the period, concerns about a resurgence of COVID-19 and questions about the economic recovery caused government bond yields to decline somewhat. It was a similar story outside the U.S., where yields generally followed the same falling-rising-falling pattern, and ultimately ended the period higher than where they began. Add it all up, and the Bloomberg Barclays Global Aggregate Bond Index ex-USD (Unhedged) returned 1.66% and the Bloomberg Barclays Global Aggregate Bond Index (USD, Hedged) returned 0.23%. By comparison, the Bloomberg Barclays U.S. Aggregate Bond, U.S. High-Yield 2% Issuer Capped Bond and U.S. Treasury Inflation-Protected Securities (TIPS) Indices returned -0.70%, 10.62% and 6.90%, respectively.
Strategic Allocation: Moderate’s neutral asset mix throughout the period was 64% stocks, 32% bonds and 4% cash-equivalent investments. However, the portfolio’s actual asset weightings varied based on short-term tactical adjustments and fluctuating securities prices.
Tactical Positioning
In an effort to add value and improve the fund’s ability to achieve its objective, we make modest adjustments to the asset allocation. As for regional allocations, because of the speed and success of vaccine rollouts, the U.S. was at the forefront of the economic and earnings recovery. As a result, we maintained our overweight to U.S. stocks relative to non-U.S. markets throughout the period.
*All fund returns referenced in this commentary are for Investor Class shares. Fund returns would have been lower if a portion of the fees had not been waived. Performance for other share classes will vary due to differences in fee structure; when Investor Class performance exceeds that of the fund’s benchmark, other share classes may not. See page 3 for returns for all share classes.
Similarly, the continued economic recovery, rising consumer sentiment and indications of higher interest rates all favored value-oriented sectors like financials, materials and industrials over technology and health care. In that environment, we eliminated our long-standing growth overweight and moved to a value overweight during the period. The strong U.S. economic recovery and positive sentiment also pointed us toward a bias in favor of small-cap stocks relative to large.
In fixed income, the rapid economic rebound, higher interest rates and concerns about inflation weighed on government bond markets but favored TIPS and corporate bonds. These conditions benefited our fixed-income allocation, which generally underweighted government bonds in favor of TIPS and higher-yielding sectors such as corporates and select asset-backed securities. Our other tactical allocation decisions also produced positive effects, as U.S. equities outperformed non-U.S. equities, value beat growth and small beat large.
Equity Allocation Performs Well
The equity allocation of Strategic Allocation: Moderate performed well as all strategies produced positive returns. Gains were strong in large-cap and value-oriented holdings. In the U.S., large-cap value, large-cap core and mid-cap value were significant contributors. While overweight allocations to large-cap value were beneficial, security selections in this category detracted. Returns were also strongly positive among small-cap value and small-cap growth positions. Mid-cap equity returns were also positive, though stock selection effects were mixed.
Outside the U.S., large-cap shares and global real estate were significant contributors, while growth-oriented and small-cap holdings made more modest contributions. In global real estate, security selection and our decision to overweight this allocation added to performance. Security selection was generally positive across the international equity segment and was particularly strong in the international small-cap value allocation. Stock selection was also a significant contributor in large caps, especially in large-cap core and growth allocations. In contrast, decisions to underweight large-cap non-U.S. equities detracted somewhat from returns.
Security Selection in Fixed Income Added to Performance
In a period when stocks surged to record highs and interest rates rose, the global bond allocation made only a modest, positive contribution to performance. Certain decisions particularly benefited fixed-income returns. For example, worries about resurgent inflation meant that it was beneficial to overweight TIPS. At the same time, expectations of an improving economy also contributed to strong returns in the high-yield market, where we were overweight. The fund’s bond holdings benefited notably from strong security selection.
Outlook
The global economic recovery is underway and corporate profits have rebounded sharply, but risks remain. Volatility could spike if investors’ assumptions about inflation, interest rates and corporate earnings disappoint. In addition, the resurgent virus and challenges in terms of vaccine distribution and virus mutation mean we are not out of the woods yet with respect to a sustained global economic recovery. And while the U.S. is leading the recovery in developed markets as easing coronavirus restrictions unleash pent-up consumer demand, emerging markets are improving more gradually as vaccination rates climb. Therefore, we remain neutral in our stock allocations relative to bonds and cash, preferring to stick to our long-term strategic diversification targets.
Within equities, economically sensitive value stocks look appealing relative to growth stocks. We believe the economic recovery that’s driving the rotation from growth to value still has plenty of room to run in the U.S. We also favor small-cap stocks based on several favorable conditions, including stronger U.S. growth relative to non-U.S. economies, low interest rates, tight corporate bond spreads, rising commodity prices and relatively attractive valuations.
In fixed-income markets, our outlook for emerging markets sovereign debt and U.S. securitized bonds is positive. We’re more selective around U.S. credit, U.S. government debt and European debt.
| | | | | |
| JULY 31, 2021 |
Types of Investments in Portfolio | % of net assets |
| Affiliated Funds | 40.2% |
| Common Stocks | 26.6% |
| U.S. Treasury Securities | 10.0% |
| Corporate Bonds | 5.5% |
| Sovereign Governments and Agencies | 4.4% |
| Commercial Paper | 2.1% |
| Municipal Securities | 1.6% |
| Collateralized Loan Obligations | 1.4% |
| Collateralized Mortgage Obligations | 0.7% |
| U.S. Government Agency Mortgage-Backed Securities | 0.4% |
| Asset-Backed Securities | 0.4% |
| Preferred Stocks | 0.4% |
| Certificates of Deposit | 0.2% |
| Exchange-Traded Funds | —* |
| Temporary Cash Investments | 5.9% |
| Temporary Cash Investments - Securities Lending Collateral | 0.1% |
| Other Assets and Liabilities | 0.1% |
*Category is less than 0.05% of total net assets.
Fund shareholders may incur two types of costs: (1) transaction costs, including sales charges (loads) on purchase payments and redemption/exchange fees; and (2) ongoing costs, including management fees; distribution and service (12b-1) fees; and other fund expenses. This example is intended to help you understand your ongoing costs (in dollars) of investing in your fund and to compare these costs with the ongoing cost of investing in other mutual funds.
The example is based on an investment of $1,000 made at the beginning of the period and held for the entire period from February 1, 2021 to July 31, 2021.
Actual Expenses
The table provides information about actual account values and actual expenses for each class. You may use the information, together with the amount you invested, to estimate the expenses that you paid over the period. First, identify the share class you own. Then simply divide your account value by $1,000 (for example, an $8,600 account value divided by $1,000 = 8.6), then multiply the result by the number under the heading “Expenses Paid During Period” to estimate the expenses you paid on your account during this period.
If you hold Investor Class shares of any American Century Investments fund, or I Class shares of the American Century Diversified Bond Fund, in an American Century Investments account (i.e., not through a financial intermediary or employer-sponsored retirement plan account), American Century Investments may charge you a $25.00 annual account maintenance fee if the value of those shares is less than $10,000. We will redeem shares automatically in one of your accounts to pay the $25.00 fee. In determining your total eligible investment amount, we will include your investments in all personal accounts (including American Century Investments brokerage accounts) registered under your Social Security number. Personal accounts include individual accounts, joint accounts, UGMA/UTMA accounts, personal trusts, Coverdell Education Savings Accounts and IRAs (including traditional, Roth, Rollover, SEP-, SARSEP- and SIMPLE-IRAs), and certain other retirement accounts. If you have only business, business retirement, employer-sponsored or American Century Investments brokerage accounts, you are currently not subject to this fee. If you are subject to the account maintenance fee, your account value could be reduced by the fee amount.
Hypothetical Example for Comparison Purposes
The table also provides information about hypothetical account values and hypothetical expenses based on the actual expense ratio of each class of your fund and an assumed rate of return of 5% per year before expenses, which is not the actual return of a fund’s share class. The hypothetical account values and expenses may not be used to estimate the actual ending account balance or expenses you paid for the period. You may use this information to compare the ongoing costs of investing in your fund and other funds. To do so, compare this 5% hypothetical example with the 5% hypothetical examples that appear in the shareholder reports of the other funds.
Please note that the expenses shown in the table are meant to highlight your ongoing costs only and do not reflect any transactional costs, such as sales charges (loads) or redemption/exchange fees. Therefore, the table is useful in comparing ongoing costs only, and will not help you determine the relative total costs of owning different funds. In addition, if these transactional costs were included, your costs would have been higher.
| | | | | | | | | | | | | | |
| Beginning
Account Value
2/1/21 | Ending
Account Value
7/31/21 | Expenses Paid During Period(1) 2/1/21 - 7/31/21 | Annualized Expense Ratio(1) |
Actual |
| Investor Class | $1,000 | $1,103.60 | $3.81 | 0.73% |
| I Class | $1,000 | $1,104.70 | $2.77 | 0.53% |
| A Class | $1,000 | $1,102.70 | $5.11 | 0.98% |
| C Class | $1,000 | $1,097.70 | $9.00 | 1.73% |
| R Class | $1,000 | $1,100.90 | $6.41 | 1.23% |
| R5 Class | $1,000 | $1,104.50 | $2.77 | 0.53% |
| R6 Class | $1,000 | $1,105.60 | $1.98 | 0.38% |
| Hypothetical |
| Investor Class | $1,000 | $1,021.18 | $3.66 | 0.73% |
| I Class | $1,000 | $1,022.17 | $2.66 | 0.53% |
| A Class | $1,000 | $1,019.94 | $4.91 | 0.98% |
| C Class | $1,000 | $1,016.22 | $8.65 | 1.73% |
| R Class | $1,000 | $1,018.70 | $6.16 | 1.23% |
| R5 Class | $1,000 | $1,022.17 | $2.66 | 0.53% |
| R6 Class | $1,000 | $1,022.91 | $1.91 | 0.38% |
(1)Expenses are equal to the class's annualized expense ratio listed in the table above, multiplied by the average account value over the period, multiplied by 181, the number of days in the most recent fiscal half-year, divided by 365, to reflect the one-half year period. Annualized expense ratio reflects actual expenses, including any applicable fee waivers or expense reimbursements and excluding any acquired fund fees and expenses.
JULY 31, 2021
| | | | | | | | | | | |
| | Shares/Principal Amount | Value |
AFFILIATED FUNDS(1) — 40.2% |
|
|
|
| American Century Diversified Corporate Bond ETF | | 541,178 | | $ | 28,618,575 | |
| American Century Focused Dynamic Growth ETF | | 329,973 | | 27,285,467 | |
| American Century Focused Large Cap Value ETF | | 712,144 | | 43,637,549 | |
| American Century Quality Diversified International ETF | | 585,117 | | 30,471,548 | |
| American Century STOXX U.S. Quality Growth ETF | | 648,603 | | 47,358,721 | |
| American Century STOXX U.S. Quality Value ETF | | 1,241,353 | | 62,991,465 | |
| Avantis Emerging Markets Equity ETF | | 313,544 | | 20,679,795 | |
| Avantis International Equity ETF | | 481,741 | | 30,672,449 | |
| Avantis International Small Cap Value ETF | | 156,188 | | 10,202,200 | |
| Avantis U.S. Equity ETF | | 837,500 | | 62,686,875 | |
| Avantis U.S. Small Cap Value ETF | | 266,115 | | 19,530,180 | |
TOTAL AFFILIATED FUNDS (Cost $282,593,174) |
| | 384,134,824 | |
| COMMON STOCKS — 26.6% |
|
|
|
| Aerospace and Defense — 0.4% | | | |
Babcock International Group plc(2) | | 64,573 | | 229,501 | |
| BAE Systems plc | | 132,754 | | 1,064,361 | |
CAE, Inc.(2) | | 3,274 | | 99,905 | |
| General Dynamics Corp. | | 4,133 | | 810,192 | |
| Lockheed Martin Corp. | | 1,631 | | 606,194 | |
Mercury Systems, Inc.(2) | | 2,989 | | 197,274 | |
| Safran SA | | 3,123 | | 408,720 | |
| Spirit AeroSystems Holdings, Inc., Class A | | 2,938 | | 126,951 | |
| | | 3,543,098 | |
| Air Freight and Logistics — 0.1% | | | |
| Expeditors International of Washington, Inc. | | 2,365 | | 303,311 | |
| United Parcel Service, Inc., Class B | | 3,284 | | 628,426 | |
| | | 931,737 | |
| Airlines — 0.1% | | | |
Ryanair Holdings plc, ADR(2) | | 2,430 | | 264,967 | |
Southwest Airlines Co.(2) | | 17,302 | | 874,097 | |
| | | 1,139,064 | |
| Auto Components — 0.4% | | | |
Aptiv plc(2) | | 9,420 | | 1,571,727 | |
| BorgWarner, Inc. | | 13,114 | | 642,324 | |
| Bridgestone Corp. | | 6,400 | | 281,951 | |
| Hyundai Mobis Co. Ltd. | | 1,538 | | 357,331 | |
| Linamar Corp. | | 2,292 | | 135,617 | |
| Minth Group Ltd. | | 10,000 | | 42,290 | |
| Sumitomo Rubber Industries Ltd. | | 13,900 | | 187,082 | |
| Valeo SA | | 9,622 | | 278,228 | |
| | | 3,496,550 | |
| Automobiles — 0.3% | | | |
| Bayerische Motoren Werke AG | | 4,322 | | 429,742 | |
| Daimler AG | | 10,887 | | 971,549 | |
| Honda Motor Co. Ltd., ADR | | 17,588 | | 564,575 | |
| | | | | | | | | | | |
| | Shares/Principal Amount | Value |
Nissan Motor Co. Ltd.(2) | | 82,400 | | $ | 478,236 | |
Tesla, Inc.(2) | | 498 | | 342,226 | |
| | | 2,786,328 | |
| Banks — 1.2% | | | |
AIB Group plc(2) | | 45,675 | | 112,180 | |
Banco Bilbao Vizcaya Argentaria SA(2) | | 63,533 | | 406,705 | |
| Banco Bradesco SA | | 26,149 | | 104,430 | |
| Banco do Brasil SA | | 30,300 | | 183,665 | |
| Bank Central Asia Tbk PT | | 73,000 | | 150,698 | |
| Bank of America Corp. | | 22,250 | | 853,510 | |
| Barclays plc | | 331,247 | | 801,313 | |
| BNP Paribas SA | | 9,424 | | 574,667 | |
| BPER Banca | | 44,985 | | 87,699 | |
| CaixaBank SA | | 126,561 | | 375,875 | |
| Canadian Western Bank | | 3,849 | | 104,925 | |
| Commerce Bancshares, Inc. | | 1,463 | | 103,478 | |
Commerzbank AG(2) | | 21,357 | | 137,538 | |
| Eastern Bankshares, Inc. | | 3,251 | | 59,331 | |
| First Hawaiian, Inc. | | 11,446 | | 315,108 | |
| HDFC Bank Ltd., ADR | | 5,285 | | 372,962 | |
| HSBC Holdings plc | | 74,800 | | 412,865 | |
| JPMorgan Chase & Co. | | 7,185 | | 1,090,539 | |
Jyske Bank A/S(2) | | 1,769 | | 85,838 | |
| M&T Bank Corp. | | 4,134 | | 553,336 | |
| Mitsubishi UFJ Financial Group, Inc. | | 111,700 | | 590,075 | |
| Mizuho Financial Group, Inc. | | 30,000 | | 428,688 | |
| Prosperity Bancshares, Inc. | | 5,222 | | 356,088 | |
| Regions Financial Corp. | | 35,233 | | 678,235 | |
Silvergate Capital Corp., Class A(2) | | 1,308 | | 134,462 | |
| Societe Generale SA | | 8,918 | | 261,170 | |
| Standard Chartered plc (London) | | 21,305 | | 127,719 | |
| Sumitomo Mitsui Financial Group, Inc. | | 11,100 | | 374,171 | |
Triumph Bancorp, Inc.(2) | | 2,442 | | 187,204 | |
| Truist Financial Corp. | | 14,869 | | 809,320 | |
| UniCredit SpA | | 13,368 | | 159,900 | |
Virgin Money UK plc(2) | | 21,028 | | 58,120 | |
| Westamerica Bancorporation | | 5,852 | | 325,079 | |
| | | 11,376,893 | |
| Beverages — 0.2% | | | |
Boston Beer Co., Inc. (The), Class A(2) | | 494 | | 350,740 | |
| MGP Ingredients, Inc. | | 1,549 | | 92,398 | |
| PepsiCo, Inc. | | 5,808 | | 911,566 | |
| Royal Unibrew A/S | | 804 | | 108,953 | |
| | | 1,463,657 | |
| Biotechnology — 0.5% | | | |
| AbbVie, Inc. | | 2,062 | | 239,811 | |
Acceleron Pharma, Inc.(2) | | 938 | | 117,306 | |
ADC Therapeutics SA(2)(3) | | 3,343 | | 70,337 | |
Alnylam Pharmaceuticals, Inc.(2) | | 2,636 | | 471,686 | |
| Amgen, Inc. | | 1,895 | | 457,718 | |
Arcutis Biotherapeutics, Inc.(2) | | 3,340 | | 77,922 | |
| | | | | | | | | | | |
| | Shares/Principal Amount | Value |
Arena Pharmaceuticals, Inc.(2) | | 1,118 | | $ | 69,159 | |
Argenx SE, ADR(2) | | 1,091 | | 332,133 | |
Biohaven Pharmaceutical Holding Co. Ltd.(2) | | 1,624 | | 204,640 | |
Blueprint Medicines Corp.(2) | | 1,358 | | 119,327 | |
Bridgebio Pharma, Inc.(2) | | 2,281 | | 121,919 | |
Centessa Pharmaceuticals plc, ADR(2) | | 3,304 | | 68,195 | |
Cytokinetics, Inc.(2) | | 2,932 | | 87,022 | |
Deciphera Pharmaceuticals, Inc.(2) | | 2,630 | | 80,189 | |
Erasca, Inc.(2) | | 2,592 | | 54,432 | |
Fate Therapeutics, Inc.(2) | | 1,148 | | 95,054 | |
FibroGen, Inc.(2) | | 2,440 | | 31,720 | |
Flexion Therapeutics, Inc.(2) | | 6,348 | | 37,644 | |
Global Blood Therapeutics, Inc.(2) | | 3,007 | | 82,181 | |
Halozyme Therapeutics, Inc.(2) | | 3,715 | | 153,541 | |
Heron Therapeutics, Inc.(2) | | 2,915 | | 36,029 | |
Horizon Therapeutics plc(2) | | 5,400 | | 540,108 | |
Immunovant, Inc.(2) | | 2,380 | | 24,895 | |
Insmed, Inc.(2) | | 4,745 | | 116,727 | |
Intellia Therapeutics, Inc.(2) | | 615 | | 87,238 | |
Invitae Corp.(2)(3) | | 2,055 | | 57,519 | |
Iovance Biotherapeutics, Inc.(2) | | 1,144 | | 25,477 | |
KalVista Pharmaceuticals, Inc.(2) | | 2,440 | | 49,142 | |
Karuna Therapeutics, Inc.(2) | | 1,126 | | 128,612 | |
Kinnate Biopharma, Inc.(2)(3) | | 1,564 | | 33,751 | |
Kymera Therapeutics, Inc.(2) | | 1,326 | | 79,799 | |
Natera, Inc.(2) | | 5,019 | | 574,776 | |
Relay Therapeutics, Inc.(2) | | 1,765 | | 57,257 | |
Sigilon Therapeutics, Inc.(2) | | 3,130 | | 15,775 | |
Turning Point Therapeutics, Inc.(2) | | 2,741 | | 174,931 | |
Vertex Pharmaceuticals, Inc.(2) | | 982 | | 197,951 | |
| | | 5,171,923 | |
| Building Products — 0.3% | | | |
| Johnson Controls International plc | | 14,067 | | 1,004,665 | |
| Masco Corp. | | 6,609 | | 394,623 | |
Masonite International Corp.(2) | | 1,730 | | 195,767 | |
| Sanwa Holdings Corp. | | 5,100 | | 62,064 | |
| Trane Technologies plc | | 4,360 | | 887,739 | |
Trex Co., Inc.(2) | | 1,536 | | 149,146 | |
| | | 2,694,004 | |
| Capital Markets — 1.2% | | | |
| Ameriprise Financial, Inc. | | 4,291 | | 1,105,190 | |
| Bank of New York Mellon Corp. (The) | | 27,551 | | 1,414,193 | |
| BlackRock, Inc. | | 692 | | 600,082 | |
| Credit Suisse Group AG | | 49,788 | | 499,836 | |
flatexDEGIRO AG(2) | | 622 | | 75,163 | |
| GCM Grosvenor, Inc., Class A | | 7,706 | | 76,752 | |
| Intercontinental Exchange, Inc. | | 2,512 | | 301,013 | |
| Intermediate Capital Group plc | | 5,971 | | 179,939 | |
| LPL Financial Holdings, Inc. | | 5,970 | | 842,009 | |
| MarketAxess Holdings, Inc. | | 824 | | 391,540 | |
| Morgan Stanley | | 11,372 | | 1,091,484 | |
| | | | | | | | | | | |
| | Shares/Principal Amount | Value |
| MSCI, Inc. | | 1,389 | | $ | 827,788 | |
| Northern Trust Corp. | | 10,962 | | 1,237,062 | |
Open Lending Corp., Class A(2) | | 6,912 | | 262,656 | |
| Partners Group Holding AG | | 329 | | 562,052 | |
| S&P Global, Inc. | | 1,701 | | 729,253 | |
| State Street Corp. | | 3,983 | | 347,078 | |
| T. Rowe Price Group, Inc. | | 2,823 | | 576,344 | |
| | | 11,119,434 | |
| Chemicals — 0.4% | | | |
| Air Liquide SA | | 1,931 | | 335,817 | |
| Air Products and Chemicals, Inc. | | 1,015 | | 295,396 | |
| Albemarle Corp. | | 1,484 | | 305,763 | |
Axalta Coating Systems Ltd.(2) | | 15,704 | | 472,690 | |
| Corbion NV | | 466 | | 25,511 | |
Diversey Holdings Ltd.(2) | | 9,117 | | 152,072 | |
| Ecolab, Inc. | | 1,339 | | 295,691 | |
| Element Solutions, Inc. | | 23,713 | | 554,647 | |
| Koninklijke DSM NV | | 1,715 | | 345,712 | |
| Linde plc | | 2,505 | | 770,012 | |
OCI NV(2) | | 2,330 | | 56,523 | |
| Sherwin-Williams Co. (The) | | 1,322 | | 384,742 | |
| Zeon Corp. | | 4,200 | | 57,386 | |
| | | 4,051,962 | |
| Commercial Services and Supplies — 0.2% | | | |
| Brink's Co. (The) | | 3,298 | | 253,814 | |
Clean Harbors, Inc.(2) | | 2,528 | | 240,160 | |
Driven Brands Holdings, Inc.(2) | | 8,795 | | 279,857 | |
Elis SA(2) | | 5,962 | | 106,915 | |
| Loomis AB | | 3,510 | | 117,690 | |
| Republic Services, Inc. | | 6,032 | | 713,948 | |
| | | 1,712,384 | |
| Communications Equipment — 0.4% | | | |
Arista Networks, Inc.(2) | | 2,873 | | 1,092,861 | |
| Cisco Systems, Inc. | | 12,719 | | 704,251 | |
F5 Networks, Inc.(2) | | 7,816 | | 1,614,082 | |
| Juniper Networks, Inc. | | 13,784 | | 387,882 | |
| Telefonaktiebolaget LM Ericsson, B Shares | | 31,215 | | 360,039 | |
| | | 4,159,115 | |
Construction and Engineering† | | | |
| Arcadis NV | | 2,432 | | 107,702 | |
| Hazama Ando Corp. | | 10,500 | | 79,880 | |
| | | 187,582 | |
| Construction Materials — 0.1% | | | |
| Buzzi Unicem SpA | | 2,124 | | 56,144 | |
Cemex SAB de CV, ADR(2) | | 66,125 | | 537,596 | |
| Eagle Materials, Inc. | | 1,115 | | 157,572 | |
Summit Materials, Inc., Class A(2) | | 2,635 | | 88,536 | |
| | | 839,848 | |
| Consumer Finance — 0.1% | | | |
| American Express Co. | | 2,950 | | 503,064 | |
goeasy Ltd.(3) | | 891 | | 122,123 | |
| | | 625,187 | |
| | | | | | | | | | | |
| | Shares/Principal Amount | Value |
| Containers and Packaging — 0.4% | | | |
| Amcor plc | | 25,295 | | $ | 292,410 | |
| Avery Dennison Corp. | | 4,110 | | 865,895 | |
| Ball Corp. | | 8,665 | | 700,825 | |
| Intertape Polymer Group, Inc. | | 4,888 | | 108,801 | |
| Packaging Corp. of America | | 2,777 | | 392,946 | |
SIG Combibloc Group AG(2) | | 4,052 | | 119,557 | |
| Sonoco Products Co. | | 16,043 | | 1,023,383 | |
| | | 3,503,817 | |
Distributors† | | | |
| D'ieteren Group | | 1,091 | | 174,864 | |
Diversified Consumer Services† | | | |
Chegg, Inc.(2) | | 2,296 | | 203,494 | |
| IDP Education Ltd. | | 4,295 | | 88,998 | |
| | | 292,492 | |
Diversified Financial Services† | | | |
| Zenkoku Hosho Co. Ltd. | | 2,200 | | 99,816 | |
| Diversified Telecommunication Services — 0.1% | | | |
BT Group plc(2) | | 55,464 | | 133,598 | |
| Cellnex Telecom SA | | 10,715 | | 698,796 | |
| Verizon Communications, Inc. | | 4,813 | | 268,469 | |
| | | 1,100,863 | |
| Electric Utilities — 0.4% | | | |
| Edison International | | 16,612 | | 905,354 | |
| Evergy, Inc. | | 5,054 | | 329,622 | |
| Eversource Energy | | 4,119 | | 355,346 | |
| Iberdrola SA | | 27,880 | | 335,538 | |
| NextEra Energy, Inc. | | 14,217 | | 1,107,504 | |
| Pinnacle West Capital Corp. | | 10,941 | | 914,121 | |
| Xcel Energy, Inc. | | 2,190 | | 149,467 | |
| | | 4,096,952 | |
| Electrical Equipment — 0.7% | | | |
| AMETEK, Inc. | | 5,266 | | 732,237 | |
| Eaton Corp. plc | | 2,955 | | 467,038 | |
| Emerson Electric Co. | | 11,278 | | 1,137,837 | |
Generac Holdings, Inc.(2) | | 983 | | 412,231 | |
| Hubbell, Inc. | | 3,329 | | 667,331 | |
| Nexans SA | | 1,316 | | 125,959 | |
| nVent Electric plc | | 46,767 | | 1,478,305 | |
Plug Power, Inc.(2) | | 4,307 | | 117,495 | |
| Rockwell Automation, Inc. | | 2,094 | | 643,738 | |
| Schneider Electric SE | | 3,874 | | 648,850 | |
Sensata Technologies Holding plc(2) | | 3,191 | | 187,056 | |
| Ushio, Inc. | | 4,000 | | 71,676 | |
| | | 6,689,753 | |
| Electronic Equipment, Instruments and Components — 0.5% |
| CDW Corp. | | 2,657 | | 487,161 | |
| Cognex Corp. | | 13,085 | | 1,183,015 | |
| Comet Holding AG | | 287 | | 93,976 | |
Fabrinet(2) | | 1,078 | | 101,893 | |
| Hexagon AB, B Shares | | 30,254 | | 500,813 | |
| | | | | | | | | | | |
| | Shares/Principal Amount | Value |
| Jabil, Inc. | | 2,751 | | $ | 163,794 | |
| Keyence Corp. | | 800 | | 445,602 | |
Keysight Technologies, Inc.(2) | | 9,065 | | 1,491,646 | |
| National Instruments Corp. | | 2,715 | | 119,759 | |
nLight, Inc.(2) | | 5,974 | | 207,238 | |
Sesa SpA(2) | | 632 | | 112,523 | |
| TE Connectivity Ltd. | | 2,120 | | 312,636 | |
| | | 5,220,056 | |
| Energy Equipment and Services — 0.1% | | | |
| Baker Hughes Co. | | 21,486 | | 456,363 | |
| Schlumberger NV | | 11,935 | | 344,086 | |
| | | 800,449 | |
| Entertainment — 0.4% | | | |
| Activision Blizzard, Inc. | | 2,918 | | 244,003 | |
Live Nation Entertainment, Inc.(2) | | 3,789 | | 298,914 | |
ROBLOX Corp., Class A(2) | | 1,584 | | 121,936 | |
Roku, Inc.(2) | | 1,999 | | 856,192 | |
Sea Ltd., ADR(2) | | 1,246 | | 344,095 | |
Walt Disney Co. (The)(2) | | 6,158 | | 1,083,931 | |
Zynga, Inc., Class A(2) | | 47,155 | | 476,266 | |
| | | 3,425,337 | |
| Equity Real Estate Investment Trusts (REITs) — 2.5% | | | |
| American Campus Communities, Inc. | | 4,509 | | 226,848 | |
| Brixmor Property Group, Inc. | | 12,380 | | 284,988 | |
Capital & Counties Properties plc(2) | | 79,077 | | 187,540 | |
| Charter Hall Group | | 25,744 | | 307,637 | |
| Comforia Residential REIT, Inc. | | 52 | | 166,167 | |
| Community Healthcare Trust, Inc. | | 2,092 | | 104,244 | |
| CoreSite Realty Corp. | | 1,511 | | 208,835 | |
| Crown Castle International Corp. | | 831 | | 160,458 | |
| Empire State Realty Trust, Inc., Class A | | 10,108 | | 115,534 | |
| Equinix, Inc. | | 1,844 | | 1,512,836 | |
| Equity Residential | | 7,199 | | 605,652 | |
| Essential Properties Realty Trust, Inc. | | 4,793 | | 142,831 | |
| Essex Property Trust, Inc. | | 2,830 | | 928,523 | |
| Extra Space Storage, Inc. | | 3,432 | | 597,649 | |
| Fibra Uno Administracion SA de CV | | 206,417 | | 224,602 | |
| Global Medical REIT, Inc. | | 7,379 | | 114,817 | |
| Goodman Group | | 41,353 | | 687,790 | |
| Healthcare Trust of America, Inc., Class A | | 20,210 | | 577,804 | |
| Healthpeak Properties, Inc. | | 21,726 | | 803,210 | |
| Ingenia Communities Group | | 41,392 | | 176,676 | |
| Innovative Industrial Properties, Inc. | | 2,621 | | 563,489 | |
| Invincible Investment Corp. | | 393 | | 154,397 | |
| Invitation Homes, Inc. | | 22,937 | | 933,077 | |
| Iron Mountain, Inc. | | 6,334 | | 277,176 | |
| Japan Hotel REIT Investment Corp. | | 121 | | 73,787 | |
| Kilroy Realty Corp. | | 3,667 | | 254,013 | |
| Kimco Realty Corp. | | 18,474 | | 394,050 | |
Klepierre SA(2) | | 9,293 | | 225,002 | |
| LaSalle Logiport REIT | | 121 | | 221,624 | |
| | | | | | | | | | | |
| | Shares/Principal Amount | Value |
| Life Storage, Inc. | | 4,299 | | $ | 504,531 | |
| Link REIT | | 33,900 | | 323,960 | |
| Mapletree Commercial Trust | | 119,800 | | 190,730 | |
| Mapletree Logistics Trust | | 100,500 | | 156,475 | |
| MGM Growth Properties LLC, Class A | | 19,253 | | 727,763 | |
| Mitsubishi Estate Logistics REIT Investment Corp. | | 34 | | 156,750 | |
| NETSTREIT Corp. | | 5,845 | | 151,678 | |
| Orix JREIT, Inc. | | 89 | | 169,819 | |
| Prologis, Inc. | | 23,431 | | 3,000,105 | |
| Realty Income Corp. | | 6,861 | | 482,260 | |
| Rexford Industrial Realty, Inc. | | 6,293 | | 387,145 | |
Ryman Hospitality Properties, Inc.(2) | | 2,371 | | 181,856 | |
| SBA Communications Corp. | | 762 | | 259,834 | |
| Segro plc | | 22,751 | | 384,588 | |
Shaftesbury plc(3) | | 22,947 | | 188,099 | |
| Simon Property Group, Inc. | | 4,779 | | 604,639 | |
| SL Green Realty Corp. | | 2,505 | | 186,522 | |
| SOSiLA Logistics REIT, Inc. | | 160 | | 251,093 | |
| Sun Communities, Inc. | | 3,423 | | 671,285 | |
| Tritax Big Box REIT plc | | 41,962 | | 122,762 | |
| UDR, Inc. | | 15,715 | | 864,168 | |
| Urban Edge Properties | | 12,392 | | 235,448 | |
| Ventas, Inc. | | 5,296 | | 316,595 | |
| VICI Properties, Inc. | | 9,999 | | 311,869 | |
| Welltower, Inc. | | 8,403 | | 729,885 | |
| Weyerhaeuser Co. | | 4,898 | | 165,210 | |
| Workspace Group plc | | 19,466 | | 233,162 | |
Xenia Hotels & Resorts, Inc.(2) | | 13,801 | | 244,002 | |
| | | 23,433,489 | |
| Food and Staples Retailing — 0.3% | | | |
| Costco Wholesale Corp. | | 788 | | 338,619 | |
| Koninklijke Ahold Delhaize NV | | 34,667 | | 1,077,618 | |
MARR SpA(2) | | 3,702 | | 85,917 | |
| Matsumotokiyoshi Holdings Co. Ltd. | | 2,400 | | 106,637 | |
| Sysco Corp. | | 11,868 | | 880,606 | |
Zur Rose Group AG(2) | | 924 | | 343,578 | |
| | | 2,832,975 | |
| Food Products — 0.4% | | | |
| Bakkafrost P/F | | 1,808 | | 153,648 | |
Beyond Meat, Inc.(2) | | 158 | | 19,387 | |
| Conagra Brands, Inc. | | 29,984 | | 1,004,164 | |
| General Mills, Inc. | | 5,828 | | 343,036 | |
| Glanbia plc | | 6,416 | | 110,144 | |
| J.M. Smucker Co. (The) | | 3,557 | | 466,358 | |
| Kellogg Co. | | 5,791 | | 366,918 | |
| Mondelez International, Inc., Class A | | 7,458 | | 471,793 | |
| Orkla ASA | | 43,267 | | 392,968 | |
Vital Farms, Inc.(2) | | 2,184 | | 38,024 | |
Whole Earth Brands, Inc.(2) | | 9,887 | | 127,147 | |
| | | 3,493,587 | |
| Gas Utilities — 0.1% | | | |
| Atmos Energy Corp. | | 4,580 | | 451,542 | |
| | | | | | | | | | | |
| | Shares/Principal Amount | Value |
| Nippon Gas Co. Ltd. | | 8,100 | | $ | 127,940 | |
| Spire, Inc. | | 5,994 | | 425,274 | |
| | | 1,004,756 | |
| Health Care Equipment and Supplies — 0.9% | | | |
Align Technology, Inc.(2) | | 800 | | 556,640 | |
| Arjo AB, B Shares | | 4,033 | | 50,944 | |
| Baxter International, Inc. | | 3,988 | | 308,472 | |
| Becton Dickinson and Co. | | 2,514 | | 642,956 | |
DexCom, Inc.(2) | | 1,513 | | 779,967 | |
Eargo, Inc.(2) | | 3,199 | | 115,164 | |
Edwards Lifesciences Corp.(2) | | 5,674 | | 637,020 | |
| Elekta AB, B Shares | | 3,589 | | 52,383 | |
Envista Holdings Corp.(2) | | 6,518 | | 280,795 | |
IDEXX Laboratories, Inc.(2) | | 1,476 | | 1,001,510 | |
Inmode Ltd.(2) | | 1,207 | | 137,200 | |
| Koninklijke Philips NV | | 8,353 | | 384,572 | |
| Medtronic plc | | 4,084 | | 536,270 | |
NeuroPace, Inc.(2) | | 4,545 | | 96,809 | |
| Olympus Corp. | | 13,900 | | 286,053 | |
Ortho Clinical Diagnostics Holdings plc(2) | | 8,986 | | 201,915 | |
OrthoPediatrics Corp.(2) | | 1,508 | | 94,763 | |
| ResMed, Inc. | | 511 | | 138,890 | |
Silk Road Medical, Inc.(2) | | 2,958 | | 148,432 | |
Tandem Diabetes Care, Inc.(2) | | 2,467 | | 268,089 | |
| Teleflex, Inc. | | 1,245 | | 494,800 | |
| Zimmer Biomet Holdings, Inc. | | 10,898 | | 1,780,951 | |
| | | 8,994,595 | |
| Health Care Providers and Services — 1.1% | | | |
| Alfresa Holdings Corp. | | 17,600 | | 268,046 | |
Amedisys, Inc.(2) | | 1,968 | | 512,900 | |
| Amvis Holdings, Inc. | | 800 | | 44,151 | |
ATI Physical Therapy, Inc.(2)(3) | | 13,212 | | 45,053 | |
Cano Health, Inc.(2) | | 6,538 | | 70,284 | |
| Cardinal Health, Inc. | | 15,510 | | 920,984 | |
Centene Corp.(2) | | 6,184 | | 424,284 | |
| Chartwell Retirement Residences | | 17,992 | | 189,063 | |
| Cigna Corp. | | 3,123 | | 716,697 | |
Covetrus, Inc.(2) | | 905 | | 23,041 | |
| CVS Health Corp. | | 6,801 | | 560,130 | |
| Encompass Health Corp. | | 9,809 | | 816,599 | |
| Ensign Group, Inc. (The) | | 1,487 | | 126,499 | |
HealthEquity, Inc.(2) | | 3,421 | | 253,086 | |
Henry Schein, Inc.(2) | | 11,306 | | 906,176 | |
| Humana, Inc. | | 660 | | 281,068 | |
| McKesson Corp. | | 3,405 | | 694,041 | |
Option Care Health, Inc.(2) | | 8,013 | | 166,029 | |
| Quest Diagnostics, Inc. | | 7,850 | | 1,113,130 | |
R1 RCM, Inc.(2) | | 20,512 | | 439,162 | |
RadNet, Inc.(2) | | 5,090 | | 187,007 | |
| UnitedHealth Group, Inc. | | 2,040 | | 840,929 | |
| Universal Health Services, Inc., Class B | | 6,642 | | 1,065,443 | |
| | | 10,663,802 | |
| | | | | | | | | | | |
| | Shares/Principal Amount | Value |
| Health Care Technology — 0.3% | | | |
| Cerner Corp. | | 13,721 | | $ | 1,103,031 | |
Health Catalyst, Inc.(2) | | 4,182 | | 242,807 | |
OptimizeRx Corp.(2) | | 1,817 | | 100,426 | |
Veeva Systems, Inc., Class A(2) | | 2,788 | | 927,595 | |
| | | 2,373,859 | |
| Hotels, Restaurants and Leisure — 0.6% | | | |
Autogrill SpA(2)(3) | | 13,296 | | 93,286 | |
Basic-Fit NV(2)(3) | | 1,920 | | 88,745 | |
Booking Holdings, Inc.(2) | | 180 | | 392,087 | |
Brinker International, Inc.(2) | | 2,118 | | 115,092 | |
Chipotle Mexican Grill, Inc.(2) | | 585 | | 1,090,112 | |
| Churchill Downs, Inc. | | 987 | | 183,385 | |
Corporate Travel Management Ltd.(2) | | 4,287 | | 68,438 | |
| Cracker Barrel Old Country Store, Inc. | | 1,280 | | 174,310 | |
Expedia Group, Inc.(2) | | 3,012 | | 484,540 | |
| Food & Life Cos. Ltd. | | 3,300 | | 134,457 | |
Greggs plc(2) | | 3,627 | | 138,979 | |
Hilton Worldwide Holdings, Inc.(2) | | 4,008 | | 526,852 | |
Las Vegas Sands Corp.(2) | | 9,824 | | 416,046 | |
Planet Fitness, Inc., Class A(2) | | 1,943 | | 146,172 | |
SeaWorld Entertainment, Inc.(2) | | 1,638 | | 77,658 | |
Sodexo SA(2) | | 6,307 | | 537,391 | |
| Travel + Leisure Co. | | 542 | | 28,076 | |
Whitbread plc(2) | | 8,672 | | 366,529 | |
| Wingstop, Inc. | | 1,014 | | 173,708 | |
| Wyndham Hotels & Resorts, Inc. | | 2,919 | | 210,343 | |
| | | 5,446,206 | |
| Household Durables — 0.1% | | | |
| Haseko Corp. | | 12,300 | | 166,447 | |
| Man Wah Holdings Ltd. | | 26,400 | | 52,972 | |
| Open House Co. Ltd. | | 10,000 | | 505,597 | |
Sonos, Inc.(2) | | 5,478 | | 182,856 | |
| Taylor Wimpey plc | | 170,242 | | 389,219 | |
| Token Corp. | | 1,000 | | 90,275 | |
| | | 1,387,366 | |
| Household Products — 0.2% | | | |
| Colgate-Palmolive Co. | | 3,700 | | 294,150 | |
| Kimberly-Clark Corp. | | 3,789 | | 514,243 | |
| Procter & Gamble Co. (The) | | 4,921 | | 699,914 | |
| Reynolds Consumer Products, Inc. | | 2,200 | | 62,590 | |
| | | 1,570,897 | |
| Industrial Conglomerates — 0.1% | | | |
| Honeywell International, Inc. | | 3,591 | | 839,540 | |
| Lifco AB, B Shares | | 4,080 | | 119,666 | |
| | | 959,206 | |
| Insurance — 0.7% | | | |
| Aegon NV | | 49,967 | | 212,739 | |
| Aflac, Inc. | | 20,997 | | 1,154,835 | |
| AIA Group Ltd. | | 25,200 | | 301,537 | |
| Allstate Corp. (The) | | 3,785 | | 492,239 | |
| | | | | | | | | | | |
| | Shares/Principal Amount | Value |
| Arthur J. Gallagher & Co. | | 1,598 | | $ | 222,617 | |
| Chubb Ltd. | | 7,178 | | 1,211,216 | |
| Goosehead Insurance, Inc., Class A | | 1,014 | | 121,873 | |
| Hartford Financial Services Group, Inc. (The) | | 4,393 | | 279,483 | |
| Kinsale Capital Group, Inc. | | 1,004 | | 179,360 | |
| Marsh & McLennan Cos., Inc. | | 2,018 | | 297,090 | |
Palomar Holdings, Inc.(2) | | 1,542 | | 125,565 | |
| Prudential Financial, Inc. | | 2,661 | | 266,845 | |
| Reinsurance Group of America, Inc. | | 7,831 | | 862,820 | |
Ryan Specialty Group Holdings, Inc., Class A(2) | | 3,472 | | 102,424 | |
SelectQuote, Inc.(2) | | 14,810 | | 263,618 | |
| Storebrand ASA | | 10,060 | | 86,375 | |
| Travelers Cos., Inc. (The) | | 2,471 | | 367,981 | |
| | | 6,548,617 | |
| Interactive Media and Services — 0.7% | | | |
Alphabet, Inc., Class A(2) | | 1,153 | | 3,106,793 | |
Baidu, Inc., Class A(2) | | 20,200 | | 413,898 | |
| carsales.com Ltd. | | 4,849 | | 78,190 | |
Eventbrite, Inc., Class A(2) | | 6,491 | | 115,345 | |
Facebook, Inc., Class A(2) | | 2,604 | | 927,805 | |
fuboTV, Inc.(2)(3) | | 3,346 | | 87,130 | |
Match Group, Inc.(2) | | 4,646 | | 739,969 | |
Pinterest, Inc., Class A(2) | | 8,750 | | 515,375 | |
QuinStreet, Inc.(2) | | 12,600 | | 231,084 | |
| Tencent Holdings Ltd. | | 8,600 | | 518,650 | |
| | | 6,734,239 | |
| Internet and Direct Marketing Retail — 0.4% | | | |
Alibaba Group Holding Ltd.(2) | | 16,400 | | 400,533 | |
Amazon.com, Inc.(2) | | 748 | | 2,489,037 | |
| ASKUL Corp. | | 3,400 | | 51,323 | |
ASOS plc(2) | | 5,092 | | 269,249 | |
BHG Group AB(2) | | 1,623 | | 25,034 | |
Chewy, Inc., Class A(2)(3) | | 4,614 | | 386,192 | |
Etsy, Inc.(2) | | 2,660 | | 488,137 | |
Revolve Group, Inc.(2) | | 1,808 | | 125,855 | |
| | | 4,235,360 | |
| IT Services — 1.0% | | | |
| Accenture plc, Class A | | 2,369 | | 752,584 | |
Adyen NV(2) | | 225 | | 609,761 | |
| Alten SA | | 747 | | 118,747 | |
| Amdocs Ltd. | | 4,166 | | 321,240 | |
| Atos SE | | 3,470 | | 165,945 | |
| Capgemini SE | | 3,106 | | 671,370 | |
Capita plc(2) | | 135,509 | | 66,386 | |
DigitalOcean Holdings, Inc.(2) | | 2,570 | | 132,355 | |
| Edenred | | 6,061 | | 352,120 | |
Endava plc, ADR(2) | | 1,065 | | 136,980 | |
EPAM Systems, Inc.(2) | | 1,168 | | 653,846 | |
Euronet Worldwide, Inc.(2) | | 1,954 | | 279,070 | |
GDS Holdings Ltd., Class A(2) | | 8,200 | | 60,799 | |
I3 Verticals, Inc., Class A(2) | | 6,312 | | 201,479 | |
| | | | | | | | | | | |
| | Shares/Principal Amount | Value |
Indra Sistemas SA(2) | | 16,788 | | $ | 175,745 | |
| Mastercard, Inc., Class A | | 2,277 | | 878,785 | |
| MAXIMUS, Inc. | | 2,926 | | 260,414 | |
Nuvei Corp.(2) | | 1,258 | | 103,156 | |
Okta, Inc.(2) | | 2,803 | | 694,555 | |
PayPal Holdings, Inc.(2) | | 3,583 | | 987,224 | |
Perficient, Inc.(2) | | 1,950 | | 183,866 | |
Repay Holdings Corp.(2) | | 4,127 | | 102,804 | |
Square, Inc., Class A(2) | | 1,941 | | 479,932 | |
Twilio, Inc., Class A(2) | | 1,505 | | 562,253 | |
| Visa, Inc., Class A | | 3,753 | | 924,702 | |
| | | 9,876,118 | |
| Leisure Products — 0.1% | | | |
Accell Group NV(2) | | 1,598 | | 79,137 | |
| BRP, Inc. | | 1,322 | | 110,764 | |
| Brunswick Corp. | | 2,028 | | 211,723 | |
Callaway Golf Co.(2) | | 5,788 | | 183,364 | |
Hayward Holdings, Inc.(2) | | 9,211 | | 221,893 | |
Peloton Interactive, Inc., Class A(2) | | 1,942 | | 229,253 | |
| Polaris, Inc. | | 2,563 | | 335,932 | |
| | | 1,372,066 | |
| Life Sciences Tools and Services — 0.5% | | | |
10X Genomics, Inc., Class A(2) | | 2,121 | | 388,631 | |
| Agilent Technologies, Inc. | | 4,587 | | 702,866 | |
Akoya Biosciences, Inc.(2)(3) | | 2,743 | | 47,564 | |
| Bio-Techne Corp. | | 1,235 | | 595,566 | |
ICON plc(2) | | 1,051 | | 255,677 | |
| Lonza Group AG | | 672 | | 523,236 | |
Mettler-Toledo International, Inc.(2) | | 599 | | 882,752 | |
NeoGenomics, Inc.(2) | | 3,768 | | 173,705 | |
Repligen Corp.(2) | | 1,649 | | 405,159 | |
| Thermo Fisher Scientific, Inc. | | 1,161 | | 626,952 | |
Wuxi Biologics Cayman, Inc.(2) | | 27,000 | | 412,405 | |
| | | 5,014,513 | |
| Machinery — 0.7% | | | |
| ANDRITZ AG | | 2,113 | | 116,331 | |
| Astec Industries, Inc. | | 1,875 | | 114,956 | |
| Crane Co. | | 3,762 | | 365,779 | |
| Cummins, Inc. | | 3,292 | | 764,073 | |
Evoqua Water Technologies Corp.(2) | | 5,434 | | 179,376 | |
| FANUC Corp. | | 1,200 | | 268,761 | |
| Graco, Inc. | | 5,119 | | 399,692 | |
IHI Corp.(2) | | 5,200 | | 120,276 | |
| IMI plc | | 7,691 | | 188,159 | |
| Japan Steel Works Ltd. (The) | | 2,600 | | 63,960 | |
Kornit Digital Ltd.(2) | | 939 | | 124,098 | |
| Metso Outotec Oyj | | 13,684 | | 155,370 | |
| Oshkosh Corp. | | 4,138 | | 494,698 | |
| PACCAR, Inc. | | 4,712 | | 391,049 | |
| Parker-Hannifin Corp. | | 4,840 | | 1,510,225 | |
| Rexnord Corp. | | 8,179 | | 460,723 | |
| | | | | | | | | | | |
| | Shares/Principal Amount | Value |
| Techtronic Industries Co. Ltd. | | 28,000 | | $ | 499,304 | |
| Timken Co. (The) | | 2,086 | | 165,837 | |
| Trelleborg AB, B Shares | | 2,473 | | 61,132 | |
| Tsubaki Nakashima Co. Ltd. | | 6,500 | | 97,985 | |
| | | 6,541,784 | |
| Media — 0.3% | | | |
Atresmedia Corp. de Medios de Comunicacion SA(2) | | 16,427 | | 67,913 | |
| Comcast Corp., Class A | | 6,767 | | 398,103 | |
Criteo SA, ADR(2) | | 1,422 | | 55,159 | |
| Fox Corp., Class B | | 22,660 | | 753,218 | |
| Future plc | | 3,328 | | 159,431 | |
Nordic Entertainment Group AB, B Shares(2) | | 1,707 | | 91,155 | |
| ProSiebenSat.1 Media SE | | 2,729 | | 51,848 | |
| Publicis Groupe SA | | 8,014 | | 505,929 | |
Storytel AB(2)(3) | | 954 | | 24,703 | |
| WPP plc | | 48,274 | | 624,329 | |
| | | 2,731,788 | |
| Metals and Mining — 0.1% | | | |
| Alamos Gold, Inc. (New York), Class A | | 6,819 | | 55,370 | |
| APERAM SA | | 1,994 | | 124,966 | |
| Mineral Resources Ltd. | | 1,932 | | 89,392 | |
| MMC Norilsk Nickel PJSC | | 1,487 | | 513,960 | |
| Nickel Mines Ltd. | | 28,086 | | 22,662 | |
| OZ Minerals Ltd. | | 4,073 | | 69,053 | |
| Teck Resources Ltd., Class B | | 12,797 | | 292,283 | |
| | | 1,167,686 | |
| Multi-Utilities — 0.1% | | | |
| NorthWestern Corp. | | 13,249 | | 821,306 | |
| Multiline Retail — 0.2% | | | |
Dollar Tree, Inc.(2) | | 7,629 | | 761,298 | |
| Isetan Mitsukoshi Holdings Ltd. | | 15,200 | | 102,927 | |
| Magazine Luiza SA | | 67,121 | | 265,481 | |
Marks & Spencer Group plc(2) | | 35,077 | | 66,033 | |
| Target Corp. | | 1,384 | | 361,293 | |
| | | 1,557,032 | |
| Oil, Gas and Consumable Fuels — 0.5% | | | |
| Cimarex Energy Co. | | 3,607 | | 235,176 | |
| ConocoPhillips | | 27,693 | | 1,552,470 | |
| Devon Energy Corp. | | 16,448 | | 425,016 | |
| Eni SpA | | 17,652 | | 208,746 | |
| Matador Resources Co. | | 4,958 | | 153,202 | |
| Neste Oyj | | 6,608 | | 406,199 | |
| Pioneer Natural Resources Co. | | 2,445 | | 355,430 | |
| Surgutneftegas PJSC, Preference Shares | | 895,962 | | 467,692 | |
| TotalEnergies SE | | 12,286 | | 535,752 | |
Whitecap Resources, Inc.(3) | | 56,251 | | 257,449 | |
| | | 4,597,132 | |
| Paper and Forest Products — 0.1% | | | |
| Mondi plc | | 30,910 | | 856,941 | |
| Personal Products — 0.1% | | | |
| Estee Lauder Cos., Inc. (The), Class A | | 941 | | 314,134 | |
| | | | | | | | | | | |
| | Shares/Principal Amount | Value |
| Shiseido Co. Ltd. | | 6,400 | | $ | 427,748 | |
| | | 741,882 | |
| Pharmaceuticals — 0.7% | | | |
ALK-Abello A/S(2) | | 265 | | 130,647 | |
Arvinas, Inc.(2) | | 1,039 | | 105,043 | |
| AstraZeneca plc | | 2,086 | | 239,702 | |
| AstraZeneca plc, ADR | | 12,724 | | 728,322 | |
Axsome Therapeutics, Inc.(2) | | 1,160 | | 56,364 | |
| Bristol-Myers Squibb Co. | | 9,522 | | 646,258 | |
| Dermapharm Holding SE | | 1,118 | | 89,433 | |
Edgewise Therapeutics, Inc.(2)(3) | | 2,573 | | 45,053 | |
| GlaxoSmithKline plc | | 51,768 | | 1,022,099 | |
Harmony Biosciences Holdings, Inc.(2) | | 1,637 | | 42,824 | |
| Laboratorios Farmaceuticos Rovi SA | | 962 | | 67,907 | |
| Merck & Co., Inc. | | 7,514 | | 577,601 | |
| Novartis AG | | 4,008 | | 370,653 | |
| Novo Nordisk A/S, B Shares | | 8,788 | | 813,516 | |
Reata Pharmaceuticals, Inc., Class A(2) | | 580 | | 72,680 | |
| Sanofi | | 3,532 | | 364,055 | |
| Sanofi, ADR | | 9,479 | | 488,737 | |
| Takeda Pharmaceutical Co. Ltd. | | 15,300 | | 509,284 | |
| Zoetis, Inc. | | 2,845 | | 576,681 | |
| | | 6,946,859 | |
| Professional Services — 0.4% | | | |
ASGN, Inc.(2) | | 1,281 | | 129,548 | |
| Bureau Veritas SA | | 9,905 | | 327,100 | |
CoStar Group, Inc.(2) | | 4,840 | | 430,034 | |
| DKSH Holding AG | | 1,164 | | 98,401 | |
| en Japan, Inc. | | 2,300 | | 80,317 | |
First Advantage Corp.(2) | | 8,418 | | 165,077 | |
| IHS Markit Ltd. | | 1,723 | | 201,315 | |
| IR Japan Holdings Ltd. | | 500 | | 61,873 | |
| Jacobs Engineering Group, Inc. | | 4,741 | | 641,220 | |
| Outsourcing, Inc. | | 3,200 | | 61,251 | |
| Recruit Holdings Co. Ltd. | | 11,200 | | 580,503 | |
| Teleperformance | | 1,057 | | 445,839 | |
| TransUnion | | 2,630 | | 315,758 | |
| Verisk Analytics, Inc. | | 2,062 | | 391,656 | |
| | | 3,929,892 | |
| Real Estate Management and Development — 0.2% | | | |
Altus Group Ltd.(3) | | 1,990 | | 93,662 | |
| CapitaLand Ltd. | | 50,500 | | 150,034 | |
| Colliers International Group, Inc. | | 741 | | 95,285 | |
| Colliers International Group, Inc. (Toronto) | | 1,065 | | 136,651 | |
CTP NV(2) | | 8,857 | | 178,534 | |
ESR Cayman Ltd.(2) | | 37,000 | | 130,048 | |
Fastighets AB Balder, B Shares(2) | | 1,276 | | 88,055 | |
| FirstService Corp. | | 440 | | 81,955 | |
| Newmark Group, Inc., Class A | | 6,096 | | 78,517 | |
| Relo Group, Inc. | | 2,300 | | 50,758 | |
Samhallsbyggnadsbolaget i Norden AB(3) | | 20,200 | | 101,200 | |
| | | | | | | | | | | |
| | Shares/Principal Amount | Value |
| Savills plc | | 4,784 | | $ | 76,407 | |
| Tokyu Fudosan Holdings Corp. | | 39,300 | | 221,862 | |
| Tricon Residential, Inc. | | 35,819 | | 429,219 | |
| VGP NV | | 511 | | 105,201 | |
| | | 2,017,388 | |
| Road and Rail — 0.1% | | | |
| Heartland Express, Inc. | | 22,610 | | 385,048 | |
Nagoya Railroad Co. Ltd.(2) | | 2,300 | | 38,731 | |
| Norfolk Southern Corp. | | 1,622 | | 418,200 | |
| TFI International, Inc. | | 1,096 | | 122,690 | |
| Union Pacific Corp. | | 1,530 | | 334,703 | |
| | | 1,299,372 | |
| Semiconductors and Semiconductor Equipment — 0.9% | | | |
Advanced Micro Devices, Inc.(2) | | 3,275 | | 347,772 | |
Allegro MicroSystems, Inc.(2) | | 2,431 | | 66,634 | |
| Applied Materials, Inc. | | 3,897 | | 545,307 | |
| ASM International NV | | 150 | | 53,237 | |
| ASML Holding NV | | 1,046 | | 799,545 | |
| BE Semiconductor Industries NV | | 1,426 | | 125,144 | |
Enphase Energy, Inc.(2) | | 4,129 | | 782,858 | |
Ichor Holdings Ltd.(2) | | 1,968 | | 101,490 | |
| Infineon Technologies AG | | 10,642 | | 406,675 | |
MACOM Technology Solutions Holdings, Inc.(2) | | 3,642 | | 224,784 | |
| Marvell Technology, Inc. | | 11,897 | | 719,887 | |
Nova Ltd.(2) | | 1,459 | | 142,690 | |
| NVIDIA Corp. | | 6,240 | | 1,216,738 | |
Onto Innovation, Inc.(2) | | 2,883 | | 202,041 | |
| Optorun Co. Ltd. | | 600 | | 12,091 | |
| Power Integrations, Inc. | | 913 | | 88,552 | |
Semtech Corp.(2) | | 3,552 | | 219,904 | |
| Skyworks Solutions, Inc. | | 4,395 | | 810,921 | |
SOITEC(2) | | 481 | | 115,319 | |
| Taiwan Semiconductor Manufacturing Co. Ltd. | | 33,000 | | 689,683 | |
| Teradyne, Inc. | | 3,425 | | 434,975 | |
| Texas Instruments, Inc. | | 3,554 | | 677,464 | |
| | | 8,783,711 | |
| Software — 1.9% | | | |
Adobe, Inc.(2) | | 1,059 | | 658,306 | |
Atlassian Corp. plc, Class A(2) | | 2,542 | | 826,455 | |
Autodesk, Inc.(2) | | 2,501 | | 803,146 | |
Cadence Design Systems, Inc.(2) | | 9,048 | | 1,335,937 | |
| CDK Global, Inc. | | 7,730 | | 370,963 | |
Cloudflare, Inc., Class A(2) | | 2,611 | | 309,743 | |
Coupa Software, Inc.(2) | | 1,248 | | 270,816 | |
| Dassault Systemes SE | | 7,670 | | 423,094 | |
Descartes Systems Group, Inc. (The)(2) | | 1,493 | | 108,289 | |
DocuSign, Inc.(2) | | 4,315 | | 1,286,043 | |
Everbridge, Inc.(2) | | 702 | | 99,136 | |
Five9, Inc.(2) | | 1,043 | | 209,945 | |
HubSpot, Inc.(2) | | 1,900 | | 1,132,438 | |
Lightspeed POS, Inc.(2) | | 1,107 | | 94,791 | |
| | | | | | | | | | | |
| | Shares/Principal Amount | Value |
| m-up Holdings, Inc. | | 1,600 | | $ | 48,167 | |
Manhattan Associates, Inc.(2) | | 8,332 | | 1,330,037 | |
| Microsoft Corp. | | 17,684 | | 5,038,348 | |
Model N, Inc.(2) | | 4,292 | | 138,932 | |
nCino, Inc.(2) | | 2,371 | | 150,724 | |
| Open Text Corp. | | 9,437 | | 489,875 | |
Palo Alto Networks, Inc.(2) | | 2,968 | | 1,184,380 | |
Paycor HCM, Inc.(2) | | 3,371 | | 92,703 | |
Paylocity Holding Corp.(2) | | 1,040 | | 215,758 | |
RingCentral, Inc., Class A(2) | | 1,806 | | 482,690 | |
SailPoint Technologies Holdings, Inc.(2) | | 4,229 | | 211,408 | |
salesforce.com, Inc.(2) | | 1,567 | | 379,104 | |
Sprinklr, Inc., Class A(2) | | 5,130 | | 99,214 | |
Sprout Social, Inc., Class A(2) | | 3,782 | | 335,993 | |
Workday, Inc., Class A(2) | | 554 | | 129,858 | |
| | | 18,256,293 | |
| Specialty Retail — 0.7% | | | |
| Advance Auto Parts, Inc. | | 5,155 | | 1,093,169 | |
American Eagle Outfitters, Inc.(3) | | 6,750 | | 232,673 | |
Arko Corp.(2) | | 12,145 | | 100,804 | |
Burlington Stores, Inc.(2) | | 2,766 | | 926,057 | |
Carvana Co.(2) | | 1,439 | | 485,749 | |
Five Below, Inc.(2) | | 2,016 | | 391,951 | |
Floor & Decor Holdings, Inc., Class A(2) | | 4,545 | | 554,536 | |
| Home Depot, Inc. (The) | | 4,434 | | 1,455,195 | |
Leslie's, Inc.(2) | | 9,464 | | 230,448 | |
| Lithia Motors, Inc. | | 297 | | 112,034 | |
Musti Group Oyj(2) | | 2,831 | | 116,854 | |
National Vision Holdings, Inc.(2) | | 3,497 | | 188,768 | |
| Nextage Co. Ltd. | | 5,900 | | 121,348 | |
| Pets at Home Group plc | | 18,470 | | 119,996 | |
| TJX Cos., Inc. (The) | | 6,053 | | 416,507 | |
| Tractor Supply Co. | | 1,040 | | 188,167 | |
Watches of Switzerland Group plc(2) | | 9,951 | | 139,176 | |
WH Smith plc(2) | | 2,227 | | 50,227 | |
| | | 6,923,659 | |
| Technology Hardware, Storage and Peripherals — 0.3% | | | |
| Apple, Inc. | | 17,279 | | 2,520,315 | |
| HP, Inc. | | 22,290 | | 643,512 | |
| | | 3,163,827 | |
| Textiles, Apparel and Luxury Goods — 0.5% | | | |
| ANTA Sports Products Ltd. | | 21,000 | | 457,198 | |
| Asics Corp. | | 4,300 | | 94,964 | |
Capri Holdings Ltd.(2) | | 2,638 | | 148,546 | |
Crocs, Inc.(2) | | 2,156 | | 292,806 | |
Dr. Martens plc(2) | | 12,900 | | 77,737 | |
lululemon athletica, Inc.(2) | | 2,120 | | 848,361 | |
| LVMH Moet Hennessy Louis Vuitton SE | | 688 | | 550,859 | |
| NIKE, Inc., Class B | | 5,388 | | 902,544 | |
| Pandora A/S | | 1,189 | | 153,806 | |
| Puma SE | | 3,671 | | 450,319 | |
| | | | | | | | | | | |
| | Shares/Principal Amount | Value |
| VF Corp. | | 3,612 | | $ | 289,682 | |
| | | 4,266,822 | |
Thrifts and Mortgage Finance† | | | |
| Capitol Federal Financial, Inc. | | 15,472 | | 171,584 | |
NMI Holdings, Inc., Class A(2) | | 3,580 | | 78,832 | |
| | | 250,416 | |
| Trading Companies and Distributors — 0.3% | | | |
| AddTech AB, B Shares | | 3,339 | | 69,476 | |
| Ashtead Group plc | | 5,680 | | 425,031 | |
Beacon Roofing Supply, Inc.(2) | | 3,337 | | 178,463 | |
| Diploma plc | | 3,214 | | 132,029 | |
| Electrocomponents plc | | 9,878 | | 139,554 | |
| Finning International, Inc. | | 7,840 | | 202,724 | |
| Grafton Group plc | | 10,129 | | 180,707 | |
| Howden Joinery Group plc | | 12,511 | | 155,907 | |
| MSC Industrial Direct Co., Inc., Class A | | 9,278 | | 827,319 | |
NOW, Inc.(2) | | 5,782 | | 57,068 | |
Seven Group Holdings Ltd.(3) | | 3,474 | | 59,582 | |
| W.W. Grainger, Inc. | | 1,264 | | 561,949 | |
| Yamazen Corp. | | 5,900 | | 55,679 | |
| | | 3,045,488 | |
TOTAL COMMON STOCKS (Cost $166,707,431) |
| | 254,544,094 | |
| U.S. TREASURY SECURITIES — 10.0% |
|
|
|
U.S. Treasury Bills, 0.05%, 9/2/21(4) | | $ | 300,000 | | 299,990 | |
U.S. Treasury Bills, 0.04%, 9/30/21(4) | | 500,000 | | 499,965 | |
U.S. Treasury Bonds, 3.125%, 8/15/44(5) | | 200,000 | | 247,703 | |
U.S. Treasury Bonds, 2.50%, 2/15/45(5) | | 1,060,000 | | 1,186,289 | |
U.S. Treasury Bonds, 3.00%, 5/15/45(5) | | 560,000 | | 682,303 | |
| U.S. Treasury Bonds, 3.00%, 11/15/45 | | 100,000 | | 122,203 | |
U.S. Treasury Cash Management Bills, 0.04%, 9/16/21(4) | | 1,070,000 | | 1,069,950 | |
| U.S. Treasury Inflation Indexed Bonds, 2.375%, 1/15/25 | | 1,071,405 | | 1,253,340 | |
| U.S. Treasury Inflation Indexed Bonds, 2.375%, 1/15/27 | | 333,818 | | 416,238 | |
| U.S. Treasury Inflation Indexed Bonds, 2.50%, 1/15/29 | | 1,423,517 | | 1,878,707 | |
| U.S. Treasury Inflation Indexed Bonds, 3.375%, 4/15/32 | | 151,705 | | 230,078 | |
| U.S. Treasury Inflation Indexed Bonds, 2.125%, 2/15/40 | | 747,504 | | 1,147,367 | |
| U.S. Treasury Inflation Indexed Bonds, 2.125%, 2/15/41 | | 1,008,288 | | 1,565,907 | |
| U.S. Treasury Inflation Indexed Bonds, 0.625%, 2/15/43 | | 1,136,083 | | 1,404,152 | |
| U.S. Treasury Inflation Indexed Bonds, 1.375%, 2/15/44 | | 3,061,810 | | 4,363,599 | |
| U.S. Treasury Inflation Indexed Bonds, 0.75%, 2/15/45 | | 2,698,684 | | 3,449,020 | |
| U.S. Treasury Inflation Indexed Bonds, 0.875%, 2/15/47 | | 613,531 | | 820,273 | |
| U.S. Treasury Inflation Indexed Bonds, 0.125%, 2/15/51 | | 1,034,280 | | 1,190,341 | |
| U.S. Treasury Inflation Indexed Notes, 0.125%, 7/15/22 | | 1,932,068 | | 1,996,751 | |
| U.S. Treasury Inflation Indexed Notes, 0.625%, 1/15/24 | | 5,770,250 | | 6,237,580 | |
| U.S. Treasury Inflation Indexed Notes, 0.50%, 4/15/24 | | 5,765,418 | | 6,244,679 | |
| U.S. Treasury Inflation Indexed Notes, 0.125%, 10/15/24 | | 2,991,189 | | 3,246,062 | |
| U.S. Treasury Inflation Indexed Notes, 0.25%, 1/15/25 | | 4,547,520 | | 4,963,231 | |
| U.S. Treasury Inflation Indexed Notes, 0.125%, 4/15/25 | | 3,752,964 | | 4,093,286 | |
| U.S. Treasury Inflation Indexed Notes, 0.625%, 1/15/26 | | 3,966,410 | | 4,467,865 | |
| U.S. Treasury Inflation Indexed Notes, 0.125%, 4/15/26 | | 5,441,987 | | 6,007,207 | |
| U.S. Treasury Inflation Indexed Notes, 0.125%, 7/15/26 | | 6,459,435 | | 7,196,525 | |
| | | | | | | | | | | |
| | Shares/Principal Amount | Value |
| U.S. Treasury Inflation Indexed Notes, 0.50%, 1/15/28 | | $ | 2,019,571 | | $ | 2,319,525 | |
| U.S. Treasury Inflation Indexed Notes, 0.875%, 1/15/29 | | 2,026,217 | | 2,408,869 | |
| U.S. Treasury Inflation Indexed Notes, 0.125%, 1/15/31 | | 5,896,194 | | 6,679,997 | |
| U.S. Treasury Notes, 1.875%, 3/31/22 | | 200,000 | | 202,382 | |
| U.S. Treasury Notes, 0.25%, 5/31/25 | | 9,900,000 | | 9,800,613 | |
| U.S. Treasury Notes, 0.50%, 4/30/27 | | 6,500,000 | | 6,384,980 | |
U.S. Treasury Notes, 2.25%, 8/15/27(5) | | 400,000 | | 432,938 | |
| U.S. Treasury Notes, 0.625%, 5/15/30 | | 1,100,000 | | 1,050,070 | |
TOTAL U.S. TREASURY SECURITIES (Cost $87,070,554) |
| | 95,559,985 | |
| CORPORATE BONDS — 5.5% |
|
|
|
| Aerospace and Defense — 0.1% | | | |
| Boeing Co. (The), 5.81%, 5/1/50 | | 130,000 | | 177,620 | |
Bombardier, Inc., 6.00%, 10/15/22(6) | | 18,000 | | 18,092 | |
| Howmet Aerospace, Inc., 5.125%, 10/1/24 | | 115,000 | | 126,752 | |
| TransDigm, Inc., 6.375%, 6/15/26 | | 50,000 | | 51,750 | |
TransDigm, Inc., 4.625%, 1/15/29(6) | | 540,000 | | 539,346 | |
| | | 913,560 | |
| Airlines — 0.1% | | | |
American Airlines, Inc. / AAdvantage Loyalty IP Ltd., 5.50%, 4/20/26(6) | | 594,000 | | 622,215 | |
| United Airlines Holdings, Inc., 5.00%, 2/1/24 | | 85,000 | | 88,267 | |
| | | 710,482 | |
Auto Components† | | | |
ZF North America Capital, Inc., 4.75%, 4/29/25(6) | | 105,000 | | 114,132 | |
| Automobiles — 0.1% | | | |
| BMW Finance NV, MTN, 1.00%, 2/15/22 | EUR | 10,000 | | 11,956 | |
| BMW Finance NV, MTN, 0.875%, 4/3/25 | EUR | 50,000 | | 61,858 | |
| Ford Motor Credit Co. LLC, 3.625%, 6/17/31 | | $ | 670,000 | | 695,202 | |
| General Motors Co., 5.15%, 4/1/38 | | 410,000 | | 504,195 | |
| | | 1,273,211 | |
| Banks — 0.8% | | | |
| Akbank T.A.S., 5.00%, 10/24/22 | | 130,000 | | 133,738 | |
Avi Funding Co. Ltd., 3.80%, 9/16/25(6) | | 255,000 | | 281,727 | |
| Banco Santander SA, MTN, 2.50%, 3/18/25 | EUR | 200,000 | | 257,658 | |
| Bank of America Corp., MTN, VRN, 2.68%, 6/19/41 | | $ | 665,000 | | 657,490 | |
| Barclays Bank plc, MTN, 6.625%, 3/30/22 | EUR | 50,000 | | 61,912 | |
| Barclays plc, MTN, VRN, 1.375%, 1/24/26 | EUR | 100,000 | | 124,078 | |
| Barclays plc, MTN, VRN, 2.00%, 2/7/28 | EUR | 100,000 | | 121,601 | |
| CaixaBank SA, MTN, VRN, 2.75%, 7/14/28 | EUR | 200,000 | | 247,919 | |
| CaixaBank SA, MTN, VRN, 2.25%, 4/17/30 | EUR | 400,000 | | 500,009 | |
| Citigroup, Inc., VRN, 3.52%, 10/27/28 | | $ | 490,000 | | 540,386 | |
| Co-Operative Bank plc (The), 4.75%, 11/11/21 (Secured) | GBP | 200,000 | | 280,951 | |
| Commerzbank AG, MTN, 4.00%, 3/23/26 | EUR | 250,000 | | 336,685 | |
| Credit Agricole SA, MTN, 7.375%, 12/18/23 | GBP | 100,000 | | 159,849 | |
| European Financial Stability Facility, MTN, 2.125%, 2/19/24 | EUR | 399,000 | | 506,077 | |
| European Financial Stability Facility, MTN, 0.40%, 5/31/26 | EUR | 400,000 | | 494,996 | |
| European Financial Stability Facility, MTN, 2.35%, 7/29/44 | EUR | 60,000 | | 102,209 | |
| | | | | | | | | | | |
| | Shares/Principal Amount | Value |
| HSBC Bank plc, MTN, VRN, 5.375%, 11/4/30 | GBP | 50,000 | | $ | 81,288 | |
| ING Groep NV, MTN, 2.125%, 1/10/26 | EUR | 400,000 | | 521,160 | |
Intercorp Financial Services, Inc., 4.125%, 10/19/27(6) | | $ | 305,000 | | 308,230 | |
| Intesa Sanpaolo SpA, MTN, 6.625%, 9/13/23 | EUR | 220,000 | | 294,482 | |
| Kreditanstalt fuer Wiederaufbau, 4.625%, 1/4/23 | EUR | 300,000 | | 382,739 | |
| Lloyds Bank plc, MTN, 7.625%, 4/22/25 | GBP | 120,000 | | 206,335 | |
| Wells Fargo & Co., VRN, 3.07%, 4/30/41 | | $ | 605,000 | | 635,351 | |
| | | 7,236,870 | |
Beverages† | | | |
| Anheuser-Busch Cos. LLC / Anheuser-Busch InBev Worldwide, Inc., 4.90%, 2/1/46 | | 370,000 | | 475,241 | |
| Biotechnology — 0.1% | | | |
| AbbVie, Inc., 4.55%, 3/15/35 | | 110,000 | | 135,185 | |
| AbbVie, Inc., 4.40%, 11/6/42 | | 605,000 | | 746,784 | |
| Gilead Sciences, Inc., 3.65%, 3/1/26 | | 390,000 | | 432,607 | |
| | | 1,314,576 | |
| Capital Markets — 0.2% | | | |
| Criteria Caixa SA, MTN, 1.50%, 5/10/23 | EUR | 100,000 | | 122,111 | |
| Goldman Sachs Group, Inc. (The), 5.50%, 10/12/21 | GBP | 150,000 | | 210,412 | |
| Goldman Sachs Group, Inc. (The), VRN, 1.43%, 3/9/27 | | $ | 225,000 | | 226,212 | |
LPL Holdings, Inc., 4.375%, 5/15/31(6) | | 766,000 | | 786,127 | |
MDGH - GMTN B.V., 3.25%, 4/28/22(6) | | 102,000 | | 104,235 | |
| | | 1,449,097 | |
| Chemicals — 0.1% | | | |
| Dow Chemical Co. (The), 3.60%, 11/15/50 | | 310,000 | | 345,911 | |
Equate Petrochemical BV, 4.25%, 11/3/26(6) | | 82,000 | | 91,268 | |
| Olin Corp., 5.125%, 9/15/27 | | 60,000 | | 62,552 | |
| | | 499,731 | |
| Commercial Services and Supplies — 0.1% | | | |
Sodexo, Inc., 2.72%, 4/16/31(6) | | 530,000 | | 549,859 | |
| Waste Management, Inc., 2.50%, 11/15/50 | | 220,000 | | 212,461 | |
| | | 762,320 | |
| Consumer Finance — 0.1% | | | |
| Navient Corp., 4.875%, 3/15/28 | | 760,000 | | 767,619 | |
| Containers and Packaging — 0.1% | | | |
Ardagh Metal Packaging Finance USA LLC / Ardagh Metal Packaging Finance plc, 4.00%, 9/1/29(6) | | 396,000 | | 397,485 | |
| Ball Corp., 5.25%, 7/1/25 | | 35,000 | | 39,518 | |
Mauser Packaging Solutions Holding Co., 5.50%, 4/15/24(6) | | 30,000 | | 30,225 | |
Owens-Brockway Glass Container, Inc., 5.875%, 8/15/23(6) | | 20,000 | | 21,491 | |
Sealed Air Corp., 5.125%, 12/1/24(6) | | 80,000 | | 87,049 | |
| | | 575,768 | |
Diversified Consumer Services† | | | |
| Duke University, 3.30%, 10/1/46 | | 220,000 | | 249,593 | |
| Diversified Financial Services — 0.3% | | | |
| Fiore Capital LLC, VRDN, 0.12%, 8/6/21 (LOC: Wells Fargo Bank N.A.) | | 2,500,000 | | 2,500,000 | |
| Diversified Telecommunication Services — 0.3% | | | |
Altice France SA, 7.375%, 5/1/26(6) | | 175,000 | | 182,219 | |
| | | | | | | | | | | |
| | Shares/Principal Amount | Value |
| AT&T, Inc., 2.60%, 12/17/29 | EUR | 120,000 | | $ | 166,778 | |
AT&T, Inc., 3.55%, 9/15/55(6) | | $ | 316,000 | | 327,169 | |
| Deutsche Telekom International Finance BV, MTN, 1.25%, 10/6/23 | GBP | 150,000 | | 211,657 | |
| Deutsche Telekom International Finance BV, MTN, 0.875%, 1/30/24 | EUR | 40,000 | | 48,858 | |
| Hughes Satellite Systems Corp., 5.25%, 8/1/26 | | $ | 100,000 | | 111,950 | |
Level 3 Financing, Inc., 4.625%, 9/15/27(6) | | 331,000 | | 344,286 | |
| Lumen Technologies, Inc., 5.80%, 3/15/22 | | 20,000 | | 20,548 | |
Ooredoo International Finance Ltd., 3.75%, 6/22/26(6) | | 153,000 | | 169,466 | |
Turk Telekomunikasyon AS, 4.875%, 6/19/24(6) | | 205,000 | | 214,920 | |
| Verizon Communications, Inc., 1.75%, 1/20/31 | | 255,000 | | 247,896 | |
| Verizon Communications, Inc., 2.99%, 10/30/56 | | 365,000 | | 355,677 | |
| | | 2,401,424 | |
| Electric Utilities — 0.2% | | | |
| Duke Energy Carolinas LLC, 3.20%, 8/15/49 | | 270,000 | | 293,691 | |
| Duke Energy Florida LLC, 3.85%, 11/15/42 | | 130,000 | | 155,137 | |
| Duke Energy Progress LLC, 4.15%, 12/1/44 | | 59,000 | | 72,943 | |
| Exelon Corp., 4.45%, 4/15/46 | | 190,000 | | 236,842 | |
Greenko Investment Co., 4.875%, 8/16/23(6) | | 102,000 | | 103,206 | |
Israel Electric Corp. Ltd., 6.875%, 6/21/23(6) | | 102,000 | | 113,619 | |
| MidAmerican Energy Co., 4.40%, 10/15/44 | | 80,000 | | 101,407 | |
NextEra Energy Operating Partners LP, 4.50%, 9/15/27(6) | | 40,000 | | 43,236 | |
| Northern States Power Co., 3.20%, 4/1/52 | | 160,000 | | 178,531 | |
| NRG Energy, Inc., 7.25%, 5/15/26 | | 50,000 | | 52,074 | |
| PacifiCorp, 2.90%, 6/15/52 | | 180,000 | | 184,055 | |
| Perusahaan Perseroan (Persero) PT Perusahaan Listrik Negara, MTN, 3.00%, 6/30/30 | | 500,000 | | 501,760 | |
| Southern Co. Gas Capital Corp., 3.95%, 10/1/46 | | 50,000 | | 57,419 | |
| Virginia Electric and Power Co., 2.45%, 12/15/50 | | 140,000 | | 132,495 | |
| | | 2,226,415 | |
| Equity Real Estate Investment Trusts (REITs) — 0.2% | | | |
| EPR Properties, 4.95%, 4/15/28 | | 734,000 | | 794,823 | |
IIP Operating Partnership LP, 5.50%, 5/25/26(6) | | 330,000 | | 345,327 | |
Iron Mountain, Inc., 4.875%, 9/15/29(6) | | 675,000 | | 708,055 | |
| MGM Growth Properties Operating Partnership LP / MGP Finance Co-Issuer, Inc., 5.625%, 5/1/24 | | 90,000 | | 97,530 | |
| | | 1,945,735 | |
Food and Staples Retailing† | | | |
| Kroger Co. (The), 3.875%, 10/15/46 | | 170,000 | | 191,671 | |
| Tesco plc, MTN, 5.00%, 3/24/23 | GBP | 50,000 | | 74,375 | |
| | | 266,046 | |
| Food Products — 0.1% | | | |
Lamb Weston Holdings, Inc., 4.625%, 11/1/24(6) | | $ | 130,000 | | 133,569 | |
MHP SE, 7.75%, 5/10/24(6) | | 128,000 | | 138,491 | |
Post Holdings, Inc., 4.625%, 4/15/30(6) | | 355,000 | | 362,134 | |
| | | 634,194 | |
Gas Utilities† | | | |
| Perusahaan Gas Negara Tbk PT, 5.125%, 5/16/24 | | 204,000 | | 225,450 | |
| Health Care Providers and Services — 0.3% | | | |
CHS / Community Health Systems, Inc., 8.00%, 12/15/27(6) | | 17,000 | | 18,842 | |
| | | | | | | | | | | |
| | Shares/Principal Amount | Value |
CHS / Community Health Systems, Inc., 6.875%, 4/1/28(6) | | $ | 42,000 | | $ | 41,578 | |
| CVS Health Corp., 4.30%, 3/25/28 | | 141,000 | | 163,392 | |
| CVS Health Corp., 4.78%, 3/25/38 | | 475,000 | | 597,204 | |
DaVita, Inc., 4.625%, 6/1/30(6) | | 510,000 | | 527,850 | |
| Kaiser Foundation Hospitals, 3.00%, 6/1/51 | | 180,000 | | 191,083 | |
Team Health Holdings, Inc., 6.375%, 2/1/25(6) | | 40,000 | | 37,151 | |
| Tenet Healthcare Corp., 6.75%, 6/15/23 | | 40,000 | | 43,450 | |
Tenet Healthcare Corp., 6.125%, 10/1/28(6) | | 405,000 | | 431,849 | |
Universal Health Services, Inc., 2.65%, 10/15/30(6) | | 605,000 | | 616,522 | |
| | | 2,668,921 | |
| Hotels, Restaurants and Leisure — 0.2% | | | |
1011778 BC ULC / New Red Finance, Inc., 4.375%, 1/15/28(6) | | 232,000 | | 235,782 | |
Caesars Resort Collection LLC / CRC Finco, Inc., 5.25%, 10/15/25(6) | | 555,000 | | 560,223 | |
Golden Nugget, Inc., 6.75%, 10/15/24(6) | | 120,000 | | 120,450 | |
| MGM Resorts International, 6.00%, 3/15/23 | | 130,000 | | 137,529 | |
Penn National Gaming, Inc., 5.625%, 1/15/27(6) | | 150,000 | | 155,625 | |
Penn National Gaming, Inc., 4.125%, 7/1/29(6) | | 77,000 | | 76,015 | |
Wynn Las Vegas LLC / Wynn Las Vegas Capital Corp., 5.50%, 3/1/25(6) | | 150,000 | | 158,812 | |
| | | 1,444,436 | |
| Household Durables — 0.1% | | | |
| KB Home, 4.80%, 11/15/29 | | 477,000 | | 521,122 | |
| Meritage Homes Corp., 5.125%, 6/6/27 | | 160,000 | | 180,402 | |
| | | 701,524 | |
Industrial Conglomerates† | | | |
| General Electric Co., 4.35%, 5/1/50 | | 310,000 | | 382,708 | |
| Insurance — 0.1% | | | |
| American International Group, Inc., 6.25%, 5/1/36 | | 365,000 | | 517,898 | |
| AXA SA, MTN, VRN, 3.375%, 7/6/47 | EUR | 200,000 | | 274,619 | |
| | | 792,517 | |
Interactive Media and Services† | | | |
Tencent Holdings Ltd., 3.80%, 2/11/25(6) | | $ | 153,000 | | 166,478 | |
| Internet and Direct Marketing Retail — 0.1% | | | |
| Alibaba Group Holding Ltd., 2.80%, 6/6/23 | | 330,000 | | 342,448 | |
Meituan, 3.05%, 10/28/30(6) | | 500,000 | | 468,451 | |
Prosus NV, 3.68%, 1/21/30(6) | | 500,000 | | 527,380 | |
| | | 1,338,279 | |
IT Services† | | | |
| CDW LLC / CDW Finance Corp., 5.50%, 12/1/24 | | 90,000 | | 99,370 | |
| Life Sciences Tools and Services — 0.1% | | | |
| Agilent Technologies, Inc., 2.30%, 3/12/31 | | 570,000 | | 582,641 | |
| Media — 0.3% | | | |
CCO Holdings LLC / CCO Holdings Capital Corp., 5.00%, 2/1/28(6) | | 145,000 | | 152,214 | |
CCO Holdings LLC / CCO Holdings Capital Corp., 4.25%, 2/1/31(6) | | 520,000 | | 537,171 | |
| | | | | | | | | | | |
| | Shares/Principal Amount | Value |
| Charter Communications Operating LLC / Charter Communications Operating Capital, 6.48%, 10/23/45 | | $ | 40,000 | | $ | 56,407 | |
| Charter Communications Operating LLC / Charter Communications Operating Capital, 5.125%, 7/1/49 | | 230,000 | | 279,737 | |
| CSC Holdings LLC, 5.875%, 9/15/22 | | 100,000 | | 104,733 | |
| CSC Holdings LLC, 5.25%, 6/1/24 | | 335,000 | | 362,386 | |
| DISH DBS Corp., 7.75%, 7/1/26 | | 310,000 | | 354,175 | |
Gray Television, Inc., 5.875%, 7/15/26(6) | | 75,000 | | 77,531 | |
| Lamar Media Corp., 3.75%, 2/15/28 | | 340,000 | | 346,222 | |
| TEGNA, Inc., 4.625%, 3/15/28 | | 580,000 | | 598,348 | |
| ViacomCBS, Inc., 4.375%, 3/15/43 | | 165,000 | | 195,552 | |
| WPP Finance 2013, MTN, 3.00%, 11/20/23 | EUR | 100,000 | | 127,575 | |
| | | 3,192,051 | |
| Metals and Mining — 0.3% | | | |
Alcoa Nederland Holding BV, 4.125%, 3/31/29(6) | | $ | 400,000 | | 421,812 | |
Cleveland-Cliffs, Inc., 4.625%, 3/1/29(6) | | 452,000 | | 480,297 | |
| First Quantum Minerals Ltd., 7.25%, 4/1/23 | | 150,000 | | 153,000 | |
First Quantum Minerals Ltd., 6.50%, 3/1/24(6) | | 250,000 | | 255,244 | |
| Freeport-McMoRan, Inc., 5.40%, 11/14/34 | | 180,000 | | 229,086 | |
Minera Mexico SA de CV, 4.50%, 1/26/50(6) | | 500,000 | | 562,035 | |
| Teck Resources Ltd., 6.25%, 7/15/41 | | 230,000 | | 310,530 | |
| | | 2,412,004 | |
| Mortgage Real Estate Investment Trusts (REITs) — 0.1% | | | |
Ladder Capital Finance Holdings LLLP / Ladder Capital Finance Corp., 4.75%, 6/15/29(6) | | 620,000 | | 618,450 | |
Multi-Utilities† | | | |
| Dominion Energy, Inc., 4.90%, 8/1/41 | | 70,000 | | 91,813 | |
| NiSource, Inc., 5.65%, 2/1/45 | | 200,000 | | 281,475 | |
| | | 373,288 | |
| Oil, Gas and Consumable Fuels — 0.4% | | | |
Antero Resources Corp., 7.625%, 2/1/29(6) | | 220,000 | | 241,449 | |
| BP Capital Markets America, Inc., 3.06%, 6/17/41 | | 180,000 | | 185,848 | |
| Crestwood Midstream Partners LP / Crestwood Midstream Finance Corp., 5.75%, 4/1/25 | | 70,000 | | 71,747 | |
| Enterprise Products Operating LLC, 4.85%, 3/15/44 | | 360,000 | | 451,768 | |
Galaxy Pipeline Assets Bidco Ltd., 2.94%, 9/30/40(6) | | 500,000 | | 504,659 | |
Gazprom PJSC Via Gaz Capital SA, 6.51%, 3/7/22(6) | | 140,000 | | 144,805 | |
Gazprom PJSC Via Gaz Capital SA, 7.29%, 8/16/37(6) | | 140,000 | | 195,806 | |
| Kinder Morgan Energy Partners LP, 6.50%, 9/1/39 | | 180,000 | | 256,468 | |
MEG Energy Corp., 6.50%, 1/15/25(6) | | 46,000 | | 47,592 | |
MEG Energy Corp., 5.875%, 2/1/29(6) | | 220,000 | | 227,724 | |
| NuStar Logistics LP, 4.75%, 2/1/22 | | 40,000 | | 40,269 | |
| Petroleos Mexicanos, 3.50%, 1/30/23 | | 110,000 | | 112,129 | |
| Petroleos Mexicanos, 6.50%, 3/13/27 | | 140,000 | | 148,435 | |
| Petroleos Mexicanos, 5.50%, 6/27/44 | | 230,000 | | 189,239 | |
| Saudi Arabian Oil Co., MTN, 4.25%, 4/16/39 | | 500,000 | | 567,445 | |
| SM Energy Co., 5.00%, 1/15/24 | | 80,000 | | 79,745 | |
| Southwestern Energy Co., 6.45%, 1/23/25 | | 100,000 | | 109,621 | |
| | | | | | | | | | | |
| | Shares/Principal Amount | Value |
| Suncor Energy, Inc., 3.75%, 3/4/51 | | $ | 100,000 | | $ | 111,156 | |
| | | 3,685,905 | |
Personal Products† | | | |
| Avon Products, Inc., 6.50%, 3/15/23 | | 45,000 | | 47,981 | |
| Pharmaceuticals — 0.1% | | | |
| Astrazeneca Finance LLC, 1.75%, 5/28/28 | | 560,000 | | 570,321 | |
Bausch Health Cos., Inc., 6.125%, 4/15/25(6) | | 180,000 | | 183,938 | |
Viatris, Inc., 4.00%, 6/22/50(6) | | 375,000 | | 407,141 | |
| | | 1,161,400 | |
Real Estate Management and Development† | | | |
Howard Hughes Corp. (The), 4.375%, 2/1/31(6) | | 402,000 | | 401,481 | |
Road and Rail† | | | |
| Burlington Northern Santa Fe LLC, 4.45%, 3/15/43 | | 160,000 | | 206,248 | |
| Burlington Northern Santa Fe LLC, 4.15%, 4/1/45 | | 70,000 | | 86,508 | |
| | | 292,756 | |
| Software — 0.1% | | | |
| Oracle Corp., 3.60%, 4/1/40 | | 510,000 | | 546,964 | |
| Specialty Retail — 0.1% | | | |
| Home Depot, Inc. (The), 2.375%, 3/15/51 | | 470,000 | | 446,072 | |
Rent-A-Center, Inc., 6.375%, 2/15/29(6) | | 160,000 | | 172,345 | |
| | | 618,417 | |
| Technology Hardware, Storage and Peripherals — 0.1% | | | |
NCR Corp., 5.125%, 4/15/29(6) | | 335,000 | | 349,160 | |
| Seagate HDD Cayman, 4.875%, 6/1/27 | | 315,000 | | 352,013 | |
| Western Digital Corp., 4.75%, 2/15/26 | | 536,000 | | 595,630 | |
| | | 1,296,803 | |
Textiles, Apparel and Luxury Goods† | | | |
Hanesbrands, Inc., 4.625%, 5/15/24(6) | | 115,000 | | 121,959 | |
Thrifts and Mortgage Finance† | | | |
United Wholesale Mortgage LLC, 5.50%, 4/15/29(6) | | 360,000 | | 357,822 | |
| Transportation Infrastructure — 0.1% | | | |
| Adani Ports & Special Economic Zone Ltd., 4.00%, 7/30/27 | | 500,000 | | 522,036 | |
| DP World Crescent Ltd., MTN, 4.85%, 9/26/28 | | 500,000 | | 573,612 | |
| | | 1,095,648 | |
| Wireless Telecommunication Services — 0.1% | | | |
C&W Senior Financing DAC, 6.875%, 9/15/27(6) | | 228,000 | | 242,193 | |
Millicom International Cellular SA, 5.125%, 1/15/28(6) | | 229,500 | | 239,477 | |
| Sprint Corp., 7.875%, 9/15/23 | | 75,000 | | 84,949 | |
| Sprint Corp., 7.125%, 6/15/24 | | 205,000 | | 235,955 | |
| T-Mobile USA, Inc., 4.75%, 2/1/28 | | 409,000 | | 435,299 | |
| T-Mobile USA, Inc., 3.50%, 4/15/31 | | 27,000 | | 28,356 | |
T-Mobile USA, Inc., 3.50%, 4/15/31(6) | | 125,000 | | 131,278 | |
| | | 1,397,507 | |
TOTAL CORPORATE BONDS (Cost $50,147,619) |
| | 52,338,774 | |
| SOVEREIGN GOVERNMENTS AND AGENCIES — 4.4% |
|
|
|
| Australia — 0.2% | | | |
| Australia Government Bond, 2.75%, 4/21/24 | AUD | 1,219,000 | | 960,583 | |
| | | | | | | | | | | |
| | Shares/Principal Amount | Value |
| Australia Government Bond, 3.00%, 3/21/47 | AUD | 270,000 | | $ | 237,490 | |
| New South Wales Treasury Corp., 3.00%, 3/20/28 | AUD | 395,000 | | 326,208 | |
| | | 1,524,281 | |
| Austria — 0.1% | | | |
Republic of Austria Government Bond, 3.40%, 11/22/22(6) | EUR | 172,000 | | 215,060 | |
Republic of Austria Government Bond, 0.75%, 10/20/26(6) | EUR | 185,000 | | 235,545 | |
Republic of Austria Government Bond, 4.15%, 3/15/37(6) | EUR | 121,000 | | 235,162 | |
| | | 685,767 | |
Belgium† | | | |
Kingdom of Belgium Government Bond, 4.25%, 3/28/41(6) | EUR | 74,000 | | 151,971 | |
| Canada — 0.4% | | | |
| Canadian Government Bond, 0.25%, 3/1/26 | CAD | 1,500,000 | | 1,172,070 | |
| Province of British Columbia Canada, 3.25%, 12/18/21 | CAD | 594,000 | | 481,611 | |
| Province of British Columbia Canada, 2.85%, 6/18/25 | CAD | 809,000 | | 696,224 | |
| Province of Quebec Canada, 3.00%, 9/1/23 | CAD | 465,000 | | 391,873 | |
| Province of Quebec Canada, 5.75%, 12/1/36 | CAD | 445,000 | | 521,243 | |
| Province of Quebec Canada, 5.00%, 12/1/41 | CAD | 30,000 | | 34,216 | |
| Province of Quebec Canada, 3.50%, 12/1/48 | CAD | 110,000 | | 105,506 | |
| | | 3,402,743 | |
Chile† | | | |
| Chile Government International Bond, 3.25%, 9/14/21 | | $ | 230,000 | | 230,127 | |
| China — 1.0% | | | |
| China Government Bond, 2.88%, 11/5/23 | CNY | 34,000,000 | | 5,313,589 | |
| China Government Bond, 3.25%, 6/6/26 | CNY | 750,000 | | 119,091 | |
| China Government Bond, 3.29%, 5/23/29 | CNY | 550,000 | | 87,294 | |
| China Government Bond, 2.68%, 5/21/30 | CNY | 24,800,000 | | 3,758,996 | |
| | | 9,278,970 | |
Czech Republic† | | | |
| Czech Republic Government Bond, 4.70%, 9/12/22 | CZK | 2,470,000 | | 120,232 | |
Denmark† | | | |
| Denmark Government Bond, 0.50%, 11/15/27 | DKK | 600,000 | | 101,369 | |
| Denmark Government Bond, 4.50%, 11/15/39 | DKK | 340,000 | | 98,288 | |
| | | 199,657 | |
| Finland — 0.3% | | | |
Finland Government Bond, 4.00%, 7/4/25(6) | EUR | 219,000 | | 308,954 | |
Finland Government Bond, 0.125%, 4/15/36(6) | EUR | 2,250,000 | | 2,699,494 | |
| | | 3,008,448 | |
| France — 0.2% | | | |
French Republic Government Bond OAT, 0.00%, 11/25/31(7) | EUR | 1,400,000 | | 1,678,142 | |
| Indonesia — 0.1% | | | |
| Indonesia Treasury Bond, 8.375%, 9/15/26 | IDR | 6,000,000,000 | | 471,085 | |
Ireland† | | | |
| Ireland Government Bond, 3.40%, 3/18/24 | EUR | 283,000 | | 371,737 | |
| Italy — 0.2% | | | |
| Italy Buoni Poliennali Del Tesoro, 1.50%, 6/1/25 | EUR | 180,000 | | 227,265 | |
| Italy Buoni Poliennali Del Tesoro, 2.00%, 12/1/25 | EUR | 1,338,000 | | 1,733,120 | |
| | | 1,960,385 | |
| Japan — 1.2% | | | |
| Japan Government Ten Year Bond, 0.80%, 6/20/23 | JPY | 26,250,000 | | 243,397 | |
| | | | | | | | | | | |
| | Shares/Principal Amount | Value |
| Japan Government Thirty Year Bond, 2.40%, 3/20/37 | JPY | 173,800,000 | | $ | 2,107,556 | |
| Japan Government Thirty Year Bond, 2.00%, 9/20/41 | JPY | 154,250,000 | | 1,838,495 | |
| Japan Government Twenty Year Bond, 2.10%, 12/20/26 | JPY | 402,800,000 | | 4,114,389 | |
| Japanese Government CPI Linked Bond, 0.10%, 3/10/29 | JPY | 312,902,097 | | 2,933,502 | |
| | | 11,237,339 | |
Malaysia† | | | |
| Malaysia Government Bond, 3.96%, 9/15/25 | MYR | 990,000 | | 247,490 | |
| Mexico — 0.1% | | | |
| Mexican Bonos, 6.50%, 6/9/22 | MXN | 9,190,000 | | 465,708 | |
| Mexico Government International Bond, 4.15%, 3/28/27 | | $ | 700,000 | | 797,556 | |
| | | 1,263,264 | |
| Namibia — 0.1% | | | |
| Namibia International Bond, 5.25%, 10/29/25 | | $ | 400,000 | | 428,920 | |
| Netherlands — 0.1% | | | |
Netherlands Government Bond, 0.00%, 1/15/22(6)(7) | EUR | 152,000 | | 180,848 | |
Netherlands Government Bond, 0.50%, 7/15/26(6) | EUR | 506,000 | | 636,993 | |
Netherlands Government Bond, 2.75%, 1/15/47(6) | EUR | 82,000 | | 165,164 | |
| | | 983,005 | |
Norway† | | | |
Norway Government Bond, 2.00%, 5/24/23(6) | NOK | 405,000 | | 47,038 | |
Norway Government Bond, 1.75%, 2/17/27(6) | NOK | 1,880,000 | | 221,292 | |
| | | 268,330 | |
Peru† | | | |
| Peruvian Government International Bond, 5.625%, 11/18/50 | | $ | 160,000 | | 217,211 | |
Philippines† | | | |
| Philippine Government International Bond, 6.375%, 10/23/34 | | $ | 100,000 | | 141,361 | |
Poland† | | | |
| Republic of Poland Government Bond, 4.00%, 10/25/23 | PLN | 775,000 | | 217,398 | |
Russia† | | | |
| Russian Federal Bond - OFZ, 7.05%, 1/19/28 | RUB | 5,500,000 | | 76,587 | |
Singapore† | | | |
| Singapore Government Bond, 3.125%, 9/1/22 | SGD | 377,000 | | 286,528 | |
Spain† | | | |
Spain Government Bond, 4.40%, 10/31/23(6) | EUR | 100,000 | | 131,966 | |
Spain Government Bond, 1.60%, 4/30/25(6) | EUR | 132,000 | | 168,951 | |
Spain Government Bond, 5.15%, 10/31/28(6) | EUR | 47,000 | | 77,117 | |
Spain Government Bond, 5.15%, 10/31/44(6) | EUR | 9,000 | | 20,037 | |
| | | 398,071 | |
| Switzerland — 0.1% | | | |
| Swiss Confederation Government Bond, 1.25%, 5/28/26 | CHF | 410,000 | | 495,720 | |
| Swiss Confederation Government Bond, 2.50%, 3/8/36 | CHF | 71,000 | | 109,786 | |
| | | 605,506 | |
| Thailand — 0.1% | | | |
| Thailand Government Bond, 3.625%, 6/16/23 | THB | 4,150,000 | | 133,564 | |
| Thailand Government Bond, 3.85%, 12/12/25 | THB | 11,550,000 | | 397,918 | |
| | | 531,482 | |
| Turkey — 0.1% | | | |
| Turkey Government International Bond, 6.875%, 3/17/36 | | $ | 400,000 | | 409,101 | |
| United Kingdom — 0.1% | | | |
| United Kingdom Gilt, 0.125%, 1/30/26 | GBP | 800,000 | | 1,104,848 | |
| | | | | | | | | | | |
| | Shares/Principal Amount | Value |
Uruguay† | | | |
| Uruguay Government International Bond, 4.125%, 11/20/45 | | $ | 80,000 | | $ | 94,546 | |
TOTAL SOVEREIGN GOVERNMENTS AND AGENCIES (Cost $39,037,220) |
| | 41,594,532 | |
COMMERCIAL PAPER(4) — 2.1% |
|
|
|
First Abu Dhabi Bank PJSC, 0.12%, 8/27/21(6) | | 900,000 | | 899,941 | |
Nordea Bank Abp, 0.19%, 6/24/22(6) | | 3,900,000 | | 3,900,105 | |
Ridgefield Funding Co. LLC, 0.19%, 11/2/21(6) | | 3,050,000 | | 3,049,219 | |
| Royal Bank of Canada, 0.18%, 5/16/22 | | 3,000,000 | | 2,995,143 | |
Societe Generale SA, 0.19%, 10/21/21(6) | | 3,020,000 | | 3,019,373 | |
Toronto-Dominion Bank (The), 0.23%, 4/11/22(6) | | 6,610,000 | | 6,603,071 | |
TOTAL COMMERCIAL PAPER (Cost $20,462,168) |
| | 20,466,852 | |
| MUNICIPAL SECURITIES — 1.6% |
|
|
|
| Bay Area Toll Authority Rev., 6.92%, 4/1/40 | | 130,000 | | 199,449 | |
| California Infrastructure & Economic Development Bank Rev., (Morningstar Enterprises LLC), VRDN, 0.07%, 8/6/21 (LOC: Wells Fargo Bank N.A.) | | 220,000 | | 220,000 | |
| Kansas City Rev., VRDN, 0.11%, 8/6/21 (LOC: JPMorgan Chase & Co.) | | 210,000 | | 210,000 | |
| Metropolitan Transportation Authority Rev., 6.69%, 11/15/40 | | 30,000 | | 43,754 | |
| Metropolitan Transportation Authority Rev., 6.81%, 11/15/40 | | 15,000 | | 22,069 | |
| Michigan Finance Authority Rev., 4.00%, 8/20/21 (LOC: JPMorgan Chase Bank N.A.) | | 3,700,000 | | 3,707,275 | |
| Mississippi Business Finance Corp. Rev., (Chevron USA, Inc.), VRDN, 0.02%, 8/2/21 (GA: Chevron Corp.) | | 250,000 | | 250,000 | |
| New Jersey Turnpike Authority Rev., 7.10%, 1/1/41 | | 140,000 | | 229,130 | |
| New York City GO, 6.27%, 12/1/37 | | 40,000 | | 59,790 | |
| Ohio Water Development Authority Water Pollution Control Loan Fund Rev., 4.88%, 12/1/34 | | 200,000 | | 242,003 | |
| Orange County Housing Finance Authority Rev., (Marbella Pointe Development Group LLLP), VRDN, 0.06%, 8/6/21 (LOC: JPMorgan Chase Bank N.A.) | | 3,000,000 | | 3,000,000 | |
| Regents of the University of California Medical Center Pooled Rev., 3.26%, 5/15/60 | | 175,000 | | 193,862 | |
| Rutgers The State University of New Jersey Rev., 5.67%, 5/1/40 | | 130,000 | | 181,226 | |
| Sacramento Municipal Utility District Rev., 6.16%, 5/15/36 | | 170,000 | | 241,655 | |
| San Francisco Public Utilities Commission Water Rev., 6.00%, 11/1/40 | | 135,000 | | 191,039 | |
| State of California GO, 4.60%, 4/1/38 | | 100,000 | | 117,575 | |
| State of California GO, 7.55%, 4/1/39 | | 60,000 | | 104,243 | |
| State of California GO, 7.30%, 10/1/39 | | 90,000 | | 146,309 | |
| State of Maryland GO, 2.65%, 3/15/22 | | 100,000 | | 101,540 | |
| State of Ohio Rev., VRDN, 0.01%, 8/6/21 | | 350,000 | | 350,000 | |
| State of Texas Rev., 4.00%, 8/26/21 | | 3,980,000 | | 3,990,554 | |
| Tempe Industrial Development Authority Rev., (ASUF Brickyard LLC), VRDN, 0.13%, 8/6/21 (LOC: Bank of America N.A.) | | 175,000 | | 175,000 | |
| Tennis for Charity, Inc. Rev., VRDN, 0.06%, 8/6/21 (LOC: JPMorgan Chase Bank N.A.) | | 860,000 | | 860,000 | |
TOTAL MUNICIPAL SECURITIES (Cost $14,320,301) |
| | 14,836,473 | |
| | | | | | | | | | | |
| | Shares/Principal Amount | Value |
| COLLATERALIZED LOAN OBLIGATIONS — 1.4% |
|
|
|
Ares LVI CLO Ltd., Series 2020-56A, Class C, VRN, 2.53%, (3-month LIBOR plus 2.40%), 10/25/31(6) | | $ | 625,000 | | $ | 627,023 | |
Ares XXXIV CLO Ltd., Series 2015-2A, Class BR2, VRN, 1.73%, (3-month LIBOR plus 1.60%), 4/17/33(6) | | 725,000 | | 724,070 | |
Bean Creek CLO Ltd., Series 2015-1A, Class BR, VRN, 1.58%, (3-month LIBOR plus 1.45%), 4/20/31(6) | | 550,000 | | 548,564 | |
CBAM Ltd., Series 2018-5A, Class B1, VRN, 1.53%, (3-month LIBOR plus 1.40%), 4/17/31(6) | | 625,000 | | 621,194 | |
Dryden Senior Loan Fund, Series 2017-50A, Class A1R, VRN, 1.13%, (3-month LIBOR plus 1.00%), 7/15/30(6) | | 450,000 | | 450,592 | |
Dryden Senior Loan Fund, Series 2021-87A, Class D, VRN, 3.07%, (3-month LIBOR plus 2.95%), 5/20/34(6) | | 425,000 | | 427,136 | |
Elmwood CLO IV Ltd., Series 2020-1A, Class C, VRN, 2.18%, (3-month LIBOR plus 2.05%), 4/15/33(6) | | 400,000 | | 401,610 | |
Elmwood CLO IV Ltd., Series 2020-1A, Class D, VRN, 3.28%, (3-month LIBOR plus 3.15%), 4/15/33(6) | | 200,000 | | 201,256 | |
Elmwood CLO V Ltd., Series 2020-2A, Class C, VRN, 2.875%, (3-month LIBOR plus 2.75%), 7/24/31(6) | | 725,000 | | 727,637 | |
Elmwood CLO V Ltd., Series 2020-2A, Class CR, VRN, 2.12%, (3-month LIBOR plus 2.00%), 10/20/34(6)(8) | | 475,000 | | 475,006 | |
Elmwood CLO VII Ltd., Series 2020-4A, Class C, VRN, 2.38%, (3-month LIBOR plus 2.25%), 1/17/34(6) | | 350,000 | | 352,817 | |
Flatiron CLO Ltd., Series 2020-1A, Class C, VRN, 2.61%, (3-month LIBOR plus 2.45%), 11/20/33(6) | | 500,000 | | 506,711 | |
Goldentree Loan Opportunities X Ltd., Series 2015-10A, Class AR, VRN, 1.25%, (3-month LIBOR plus 1.12%), 7/20/31(6) | | 350,000 | | 350,572 | |
Kayne CLO Ltd., Series 2020-9A, Class C, VRN, 2.73%, (3-month LIBOR plus 2.60%), 1/15/34(6) | | 500,000 | | 508,483 | |
KKR CLO Ltd., Series 2022A, Class B, VRN, 1.73%, (3-month LIBOR plus 1.60%), 7/20/31(6) | | 500,000 | | 500,012 | |
Logan CLO I Ltd., Series 2021-1A, Class C, VRN, 2.05%, (3-month LIBOR plus 1.90%), 7/20/34(6) | | 425,000 | | 424,329 | |
Magnetite VIII Ltd., Series 2014-8A, Class BR2, VRN, 1.63%, (3-month LIBOR plus 1.50%), 4/15/31(6) | | 600,000 | | 598,162 | |
Magnetite XIV-R Ltd., Series 2015-14RA, Class B, VRN, 1.73%, (3-month LIBOR plus 1.60%), 10/18/31(6) | | 525,000 | | 524,442 | |
Magnetite XXV Ltd., Series 2020-25A, Class C, VRN, 2.23%, (3-month LIBOR plus 2.10%), 1/25/32(6) | | 450,000 | | 451,764 | |
Neuberger Berman Loan Advisers CLO Ltd., Series 2018-30A, Class DR, VRN, 2.98%, (3-month LIBOR plus 2.85%), 1/20/31(6) | | 250,000 | | 250,877 | |
Neuberger Berman Loan Advisers CLO Ltd., Series 2019-34A, Class C1, VRN, 2.73%, (3-month LIBOR plus 2.60%), 1/20/33(6) | | 375,000 | | 377,537 | |
Octagon Ltd., Series 2021-1A, Class D, VRN, 3.18%, (3-month LIBOR plus 3.05%), 7/15/34(6) | | 450,000 | | 453,480 | |
OHA Credit Funding Ltd., Series 2020-7A, Class B, VRN, 1.83%, (3-month LIBOR plus 1.70%), 10/19/32(6) | | 500,000 | | 500,920 | |
OHA Credit Partners VII Ltd., Series 2012-7A, Class D1R3, VRN, 3.06%, (3-month LIBOR plus 2.90%), 2/20/34(6) | | 375,000 | | 376,720 | |
Point Au Roche Park CLO Ltd., Series 2021-1A, Class D, VRN, 2.98%, (3-month LIBOR plus 2.80%), 7/20/34(6) | | 275,000 | | 276,418 | |
| | | | | | | | | | | |
| | Shares/Principal Amount | Value |
Reese Park CLO Ltd., Series 2020-1A, Class C1, VRN, 2.58%, (3-month LIBOR plus 2.45%), 10/15/32(6) | | $ | 475,000 | | $ | 476,678 | |
Rockford Tower CLO Ltd., Series 2020-1A, Class C, VRN, 2.48%, (3-month LIBOR plus 2.35%), 1/20/32(6) | | 400,000 | | 401,793 | |
Symphony CLO XXII Ltd., Series 2020-22A, Class B, VRN, 1.83%, (3-month LIBOR plus 1.70%), 4/18/33(6) | | 1,000,000 | | 1,004,264 | |
TOTAL COLLATERALIZED LOAN OBLIGATIONS (Cost $13,465,168) |
| | 13,540,067 | |
| COLLATERALIZED MORTGAGE OBLIGATIONS — 0.7% |
|
|
|
| Private Sponsor Collateralized Mortgage Obligations — 0.2% |
| ABN Amro Mortgage Corp., Series 2003-4, Class A4, 5.50%, 3/25/33 | | 8,704 | | 8,922 | |
| Adjustable Rate Mortgage Trust, Series 2004-4, Class 4A1, VRN, 2.63%, 3/25/35 | | 35,118 | | 35,714 | |
| Banc of America Mortgage Trust, Series 2004-E, Class 2A6 SEQ, VRN, 2.83%, 6/25/34 | | 73,053 | | 74,697 | |
| Citigroup Mortgage Loan Trust, Inc., Series 2004-UST1, Class A5, VRN, 2.01%, 8/25/34 | | 70,716 | | 72,421 | |
| First Horizon Alternative Mortgage Securities Trust, Series 2004-AA4, Class A1, VRN, 2.37%, 10/25/34 | | 64,446 | | 66,708 | |
| GSR Mortgage Loan Trust, Series 2004-7, Class 3A1, VRN, 2.34%, 6/25/34 | | 26,638 | | 26,686 | |
| GSR Mortgage Loan Trust, Series 2004-AR5, Class 3A3, VRN, 2.60%, 5/25/34 | | 50,353 | | 49,482 | |
| GSR Mortgage Loan Trust, Series 2005-AR1, Class 3A1, VRN, 2.89%, 1/25/35 | | 71,675 | | 73,134 | |
JP Morgan Mortgage Trust, Series 2013-1, Class 2A2 SEQ, VRN, 2.50%, 3/25/43(6) | | 4,543 | | 4,599 | |
| MASTR Adjustable Rate Mortgages Trust, Series 2004-13, Class 3A7, VRN, 2.79%, 11/21/34 | | 208,542 | | 210,779 | |
| Merrill Lynch Mortgage Investors Trust, Series 2005-3, Class 2A, VRN, 2.19%, 11/25/35 | | 41,551 | | 41,521 | |
| Merrill Lynch Mortgage Investors Trust, Series 2005-A2, Class A1, VRN, 2.82%, 2/25/35 | | 58,654 | | 59,241 | |
| Merrill Lynch Mortgage Investors Trust, Series 2005-A2, Class A2, VRN, 2.82%, 2/25/35 | | 18,329 | | 18,565 | |
Radnor RE Ltd., Series 2021-1, Class M1B, VRN, 1.75%, (SOFR plus 1.70%), 12/27/33(6) | | 850,000 | | 851,789 | |
Sofi Mortgage Trust, Series 2016-1A, Class 1A4 SEQ, VRN, 3.00%, 11/25/46(6) | | 46,451 | | 47,438 | |
| Structured Adjustable Rate Mortgage Loan Trust, Series 2004-8, Class 2A1, VRN, 2.45%, 7/25/34 | | 41,422 | | 42,560 | |
| WaMu Mortgage Pass-Through Certificates, Series 2003-S11, Class 3A5, 5.95%, 11/25/33 | | 39,620 | | 41,361 | |
| Wells Fargo Mortgage-Backed Securities Trust, Series 2007-13, Class A1, 6.00%, 9/25/37 | | 836 | | 852 | |
| | | 1,726,469 | |
| U.S. Government Agency Collateralized Mortgage Obligations — 0.5% |
| FHLMC, Series 2014-HQ2, Class M3, VRN, 3.84%, (1-month LIBOR plus 3.75%), 9/25/24 | | 789,649 | | 804,268 | |
FHLMC, Series 2016-DNA3, Class M3, VRN, 5.09%,
(1-month LIBOR plus 5.00%), 12/25/28 | | 623,804 | | 650,392 | |
FHLMC, Series 2016-HQA3, Class M2, VRN, 1.44%,
(1-month LIBOR plus 1.35%), 3/25/29 | | 3,782 | | 3,781 | |
FHLMC, Series 2016-HQA4, Class M3, VRN, 3.99%,
(1-month LIBOR plus 3.90%), 4/25/29 | | 1,448,048 | | 1,495,879 | |
| FHLMC, Series 5123, Class HI, IO, 5.00%, 1/25/42 | | 895,655 | | 158,130 | |
| | | | | | | | | | | |
| | Shares/Principal Amount | Value |
| FNMA, Series 2014-C02, Class 2M2, VRN, 2.69%, (1-month LIBOR plus 2.60%), 5/25/24 | | $ | 410,962 | | $ | 415,273 | |
| FNMA, Series 2015-C04, Class 1M2, VRN, 5.79%, (1-month LIBOR plus 5.70%), 4/25/28 | | 248,781 | | 263,581 | |
| FNMA, Series 2016-C03, Class 2M2, VRN, 5.99%, (1-month LIBOR plus 5.90%), 10/25/28 | | 156,186 | | 164,904 | |
| FNMA, Series 2017-C03, Class 1M2, VRN, 3.09%, (1-month LIBOR plus 3.00%), 10/25/29 | | 115,505 | | 118,765 | |
| FNMA, Series 2018-C04, Class 2M2, VRN, 2.64%, (1-month LIBOR plus 2.55%), 12/25/30 | | 864,816 | | 876,666 | |
| | | 4,951,639 | |
TOTAL COLLATERALIZED MORTGAGE OBLIGATIONS (Cost $6,358,608) |
| | 6,678,108 | |
| U.S. GOVERNMENT AGENCY MORTGAGE-BACKED SECURITIES — 0.4% |
| Adjustable-Rate U.S. Government Agency Mortgage-Backed Securities — 0.1% |
| FHLMC, VRN, 2.25%, (12-month LIBOR plus 1.87%), 7/1/36 | | 23,717 | | 25,139 | |
| FHLMC, VRN, 2.34%, (1-year H15T1Y plus 2.14%), 10/1/36 | | 72,129 | | 77,202 | |
| FHLMC, VRN, 2.42%, (1-year H15T1Y plus 2.26%), 4/1/37 | | 76,376 | | 81,402 | |
| FHLMC, VRN, 2.30%, (12-month LIBOR plus 1.77%), 9/1/40 | | 18,424 | | 19,182 | |
| FHLMC, VRN, 2.15%, (12-month LIBOR plus 1.88%), 5/1/41 | | 15,318 | | 15,985 | |
| FHLMC, VRN, 2.45%, (12-month LIBOR plus 1.86%), 7/1/41 | | 47,486 | | 50,494 | |
| FHLMC, VRN, 2.02%, (12-month LIBOR plus 1.64%), 2/1/43 | | 14,543 | | 14,924 | |
| FHLMC, VRN, 1.87%, (12-month LIBOR plus 1.62%), 6/1/43 | | 213 | | 214 | |
| FHLMC, VRN, 1.90%, (12-month LIBOR plus 1.65%), 6/1/43 | | 8,253 | | 8,281 | |
| FNMA, VRN, 1.82%, (6-month LIBOR plus 1.57%), 6/1/35 | | 42,947 | | 44,799 | |
| FNMA, VRN, 1.82%, (6-month LIBOR plus 1.57%), 6/1/35 | | 58,006 | | 60,496 | |
| FNMA, VRN, 1.79%, (6-month LIBOR plus 1.54%), 9/1/35 | | 12,135 | | 12,648 | |
| FNMA, VRN, 2.36%, (1-year H15T1Y plus 2.16%), 3/1/38 | | 65,711 | | 70,066 | |
| FNMA, VRN, 2.07%, (12-month LIBOR plus 1.69%), 1/1/40 | | 10,134 | | 10,551 | |
| FNMA, VRN, 2.29%, (12-month LIBOR plus 1.86%), 3/1/40 | | 13,574 | | 14,425 | |
| FNMA, VRN, 2.32%, (12-month LIBOR plus 1.77%), 10/1/40 | | 25,141 | | 26,577 | |
| | | 532,385 | |
| Fixed-Rate U.S. Government Agency Mortgage-Backed Securities — 0.3% |
| FHLMC, 8.00%, 6/1/26 | | 2,626 | | 2,672 | |
| FHLMC, 8.00%, 6/1/26 | | 120 | | 131 | |
| FHLMC, 7.00%, 8/1/29 | | 565 | | 624 | |
| FHLMC, 8.00%, 7/1/30 | | 3,264 | | 3,926 | |
| FHLMC, 5.50%, 12/1/33 | | 73,035 | | 83,266 | |
| FHLMC, 6.50%, 5/1/34 | | 4,702 | | 5,604 | |
| FHLMC, 5.50%, 6/1/35 | | 2,129 | | 2,378 | |
| FHLMC, 5.50%, 10/1/35 | | 8,472 | | 9,572 | |
| FHLMC, 5.50%, 10/1/35 | | 5,419 | | 6,064 | |
| FHLMC, 6.50%, 3/1/36 | | 402 | | 453 | |
| FHLMC, 6.50%, 3/1/36 | | 1,270 | | 1,429 | |
| FHLMC, 5.50%, 1/1/38 | | 43,700 | | 50,878 | |
| FHLMC, 6.00%, 2/1/38 | | 27,826 | | 33,103 | |
| FHLMC, 6.00%, 11/1/38 | | 117,711 | | 137,096 | |
| FNMA, 7.00%, 5/1/26 | | 664 | | 682 | |
| FNMA, 7.00%, 6/1/26 | | 483 | | 532 | |
| | | | | | | | | | | |
| | Shares/Principal Amount | Value |
| FNMA, 6.50%, 4/1/29 | | $ | 4,178 | | $ | 4,703 | |
| FNMA, 6.50%, 6/1/29 | | 7,193 | | 8,090 | |
| FNMA, 6.50%, 6/1/29 | | 3,284 | | 3,696 | |
| FNMA, 7.00%, 7/1/29 | | 614 | | 616 | |
| FNMA, 6.50%, 8/1/29 | | 4,878 | | 5,568 | |
| FNMA, 7.00%, 3/1/30 | | 3,326 | | 3,654 | |
| FNMA, 7.50%, 9/1/30 | | 2,647 | | 3,070 | |
| FNMA, 6.50%, 9/1/31 | | 20,157 | | 22,680 | |
| FNMA, 7.00%, 9/1/31 | | 10,400 | | 10,975 | |
| FNMA, 6.50%, 1/1/32 | | 3,682 | | 4,145 | |
| FNMA, 5.50%, 6/1/33 | | 25,884 | | 29,902 | |
| FNMA, 5.50%, 8/1/33 | | 210,418 | | 243,401 | |
| FNMA, 5.50%, 1/1/34 | | 111,455 | | 128,759 | |
| FNMA, 3.50%, 3/1/34 | | 123,297 | | 132,794 | |
| FNMA, 5.50%, 9/1/34 | | 7,245 | | 8,409 | |
| FNMA, 5.50%, 10/1/34 | | 7,488 | | 8,647 | |
| FNMA, 6.00%, 10/1/34 | | 17,997 | | 20,224 | |
| FNMA, 5.50%, 3/1/35 | | 593 | | 662 | |
| FNMA, 5.50%, 3/1/35 | | 998 | | 1,114 | |
| FNMA, 5.50%, 3/1/35 | | 1,629 | | 1,819 | |
| FNMA, 5.50%, 3/1/35 | | 8,936 | | 10,372 | |
| FNMA, 5.50%, 3/1/35 | | 5,726 | | 6,475 | |
| FNMA, 6.00%, 5/1/35 | | 3,160 | | 3,667 | |
| FNMA, 6.00%, 6/1/35 | | 3,824 | | 4,300 | |
| FNMA, 6.00%, 6/1/35 | | 878 | | 991 | |
| FNMA, 6.00%, 6/1/35 | | 326 | | 371 | |
| FNMA, 5.50%, 7/1/35 | | 6,195 | | 7,074 | |
| FNMA, 6.00%, 7/1/35 | | 17,161 | | 20,392 | |
| FNMA, 6.00%, 7/1/35 | | 2,730 | | 3,067 | |
| FNMA, 6.00%, 7/1/35 | | 6,522 | | 7,348 | |
| FNMA, 5.50%, 8/1/35 | | 3,965 | | 4,528 | |
| FNMA, 5.50%, 9/1/35 | | 4,220 | | 4,712 | |
| FNMA, 5.50%, 9/1/35 | | 338 | | 393 | |
| FNMA, 5.50%, 9/1/35 | | 225 | | 261 | |
| FNMA, 5.50%, 9/1/35 | | 6,371 | | 7,391 | |
| FNMA, 5.50%, 9/1/35 | | 25,204 | | 29,241 | |
| FNMA, 5.50%, 10/1/35 | | 70,153 | | 81,387 | |
| FNMA, 6.00%, 10/1/35 | | 15,847 | | 18,172 | |
| FNMA, 5.50%, 11/1/35 | | 37,369 | | 43,358 | |
| FNMA, 6.00%, 11/1/35 | | 2,479 | | 2,784 | |
| FNMA, 6.50%, 11/1/35 | | 2,337 | | 2,686 | |
| FNMA, 6.50%, 12/1/35 | | 4,383 | | 4,935 | |
| FNMA, 6.00%, 8/1/36 | | 3,025 | | 3,590 | |
| FNMA, 5.50%, 1/1/37 | | 204,501 | | 237,469 | |
| FNMA, 6.00%, 5/1/37 | | 3,742 | | 4,436 | |
| FNMA, 6.00%, 7/1/37 | | 1,014 | | 1,198 | |
| | | | | | | | | | | |
| | Shares/Principal Amount | Value |
| FNMA, 6.50%, 8/1/37 | | $ | 1,595 | | $ | 1,834 | |
| FNMA, 6.50%, 8/1/37 | | 375,682 | | 406,558 | |
| FNMA, 6.50%, 8/1/47 | | 14,175 | | 15,399 | |
| FNMA, 6.50%, 9/1/47 | | 33,924 | | 36,746 | |
| FNMA, 6.50%, 9/1/47 | | 1,632 | | 1,771 | |
| FNMA, 6.50%, 9/1/47 | | 17,939 | | 19,426 | |
| GNMA, 9.00%, 4/20/25 | | 320 | | 349 | |
| GNMA, 7.50%, 10/15/25 | | 1,261 | | 1,280 | |
| GNMA, 6.00%, 4/15/26 | | 366 | | 410 | |
| GNMA, 7.50%, 6/15/26 | | 1,227 | | 1,251 | |
| GNMA, 7.00%, 12/15/27 | | 7,090 | | 7,118 | |
| GNMA, 7.50%, 12/15/27 | | 2,527 | | 2,622 | |
| GNMA, 6.00%, 5/15/28 | | 4,472 | | 5,012 | |
| GNMA, 6.50%, 5/15/28 | | 3,992 | | 4,463 | |
| GNMA, 7.00%, 5/15/31 | | 11,062 | | 13,002 | |
| GNMA, 5.50%, 11/15/32 | | 28,788 | | 33,187 | |
| GNMA, 6.50%, 10/15/38 | | 535,966 | | 644,139 | |
| GNMA, 4.50%, 5/20/41 | | 448,387 | | 499,002 | |
| GNMA, 4.50%, 6/15/41 | | 194,563 | | 223,128 | |
| GNMA, 3.50%, 4/20/45 | | 74,579 | | 79,561 | |
| GNMA, 2.50%, 2/20/47 | | 53,722 | | 56,077 | |
| | | 3,544,271 | |
TOTAL U.S. GOVERNMENT AGENCY MORTGAGE-BACKED SECURITIES (Cost $3,692,927) | 4,076,656 | |
| ASSET-BACKED SECURITIES — 0.4% |
|
|
|
BRE Grand Islander Timeshare Issuer LLC, Series 2017-1A, Class A SEQ, 2.94%, 5/25/29(6) | | 145,451 | | 149,145 | |
FirstKey Homes Trust, Series 2020-SFR1, Class C, 1.94%, 9/17/25(6) | | 600,000 | | 605,908 | |
FirstKey Homes Trust, Series 2020-SFR2, Class E, 2.67%, 10/19/37(6) | | 1,800,000 | | 1,844,450 | |
MAPS Trust, Series 2021-1A, Class A SEQ, 2.52%, 6/15/46(6) | | 471,960 | | 479,621 | |
Sierra Timeshare Receivables Funding LLC, Series 2018-2A, Class B, 3.65%, 6/20/35(6) | | 313,662 | | 322,913 | |
| UAL Pass-Through Trust, Series 2007-1, Class A, 6.64%, 1/2/24 | | 37,567 | | 38,867 | |
VSE VOI Mortgage LLC, Series 2016-A, Class A SEQ, 2.54%, 7/20/33(6) | | 202,350 | | 202,513 | |
VSE VOI Mortgage LLC, Series 2018-A, Class B, 3.72%, 2/20/36(6) | | 355,135 | | 372,153 | |
TOTAL ASSET-BACKED SECURITIES (Cost $3,924,931) |
| | 4,015,570 | |
| PREFERRED STOCKS — 0.4% |
|
|
|
| Automobiles — 0.1% | | | |
| Volkswagen International Finance NV, 3.875% | | 500,000 | | 669,471 | |
| Diversified Telecommunication Services — 0.1% | | | |
| Telefonica Europe BV, 3.00% | | 400,000 | | 491,108 | |
| Telefonica Europe BV, 5.875% | | 100,000 | | 132,889 | |
| | | 623,997 | |
| | | | | | | | | | | |
| | Shares/Principal Amount | Value |
Electric Utilities† | | | |
| Electricite de France SA, 3.375% | | 200,000 | | $ | 252,375 | |
| Enel SpA, 2.25% | | 200,000 | | 250,789 | |
| | | 503,164 | |
| Insurance — 0.1% | | | |
| Allianz SE, 3.375% | | 100,000 | | 129,533 | |
| Allianz SE, MTN, 4.75% | | 200,000 | | 261,846 | |
| AXA SA, MTN, 6.69% | | 50,000 | | 85,097 | |
| Credit Agricole Assurances SA, 4.25% | | 200,000 | | 263,940 | |
| Intesa Sanpaolo Vita SpA, 4.75% | | 100,000 | | 130,984 | |
| | | 871,400 | |
| Oil, Gas and Consumable Fuels — 0.1% | | | |
| Eni SpA, 3.375% | | 500,000 | | 641,464 | |
Trading Companies and Distributors† | | | |
Aircastle Ltd., 5.25%(6) | | 520,000 | | 526,500 | |
TOTAL PREFERRED STOCKS (Cost $3,754,872) |
| | 3,835,996 | |
| CERTIFICATES OF DEPOSIT — 0.2% |
|
|
|
| Banks — 0.2% | | | |
Skandinaviska Enskilda Banken AB, 0.18%, 10/4/21 (Cost $1,700,000) | | $ | 1,700,000 | | 1,700,315 | |
EXCHANGE-TRADED FUNDS† |
|
|
|
iShares MSCI EAFE Value ETF (Cost $247,471) |
| 4,744 | | 244,885 | |
| TEMPORARY CASH INVESTMENTS — 5.9% |
|
|
|
State Street Institutional U.S. Government Money Market Fund, Premier Class (Cost $57,038,183) |
| 57,038,183 | | 57,038,183 | |
TEMPORARY CASH INVESTMENTS - SECURITIES LENDING COLLATERAL(9) — 0.1% |
State Street Navigator Securities Lending Government Money Market Portfolio (Cost $624,184) |
| 624,184 | | 624,184 | |
TOTAL INVESTMENT SECURITIES — 99.9% (Cost $751,144,811) |
|
| 955,229,498 | |
| OTHER ASSETS AND LIABILITIES — 0.1% |
|
| 1,076,694 | |
| TOTAL NET ASSETS — 100.0% |
|
| $ | 956,306,192 | |
FORWARD FOREIGN CURRENCY EXCHANGE CONTRACTS
| | | | | | | | | | | | | | | | | | | | |
| Currency Purchased | Currency Sold | Counterparty | Settlement Date | Unrealized Appreciation
(Depreciation) |
| AUD | 1,005,052 | | USD | 752,191 | | Bank of America N.A. | 9/15/21 | $ | (14,484) | |
| USD | 1,099,598 | | AUD | 1,422,010 | | Bank of America N.A. | 9/15/21 | 55,844 | |
| USD | 758,621 | | AUD | 1,011,198 | | Bank of America N.A. | 9/15/21 | 16,403 | |
| BRL | 5,339,370 | | USD | 1,043,151 | | Goldman Sachs & Co. | 9/15/21 | (23,844) | |
| USD | 531,566 | | BRL | 2,704,876 | | Goldman Sachs & Co. | 9/15/21 | 15,195 | |
| CAD | 18,129 | | USD | 14,392 | | Morgan Stanley | 9/29/21 | 139 | |
| CAD | 36,563 | | USD | 28,618 | | Morgan Stanley | 9/29/21 | 689 | |
| USD | 2,156,436 | | CAD | 2,607,563 | | Bank of America N.A. | 9/15/21 | 66,414 | |
| USD | 432,157 | | CAD | 525,736 | | Bank of America N.A. | 9/15/21 | 10,767 | |
| USD | 361 | | CAD | 444 | | Morgan Stanley | 9/29/21 | 4 | |
| USD | 668,936 | | CAD | 828,855 | | Morgan Stanley | 9/29/21 | 4,580 | |
| USD | 15,735 | | CAD | 19,772 | | Morgan Stanley | 9/29/21 | (113) | |
| USD | 18,647 | | CAD | 23,424 | | Morgan Stanley | 9/29/21 | (128) | |
| USD | 1,147,797 | | CHF | 1,026,601 | | Morgan Stanley | 9/15/21 | 13,252 | |
| CLP | 10,963,621 | | USD | 15,207 | | Goldman Sachs & Co. | 9/15/21 | (778) | |
| USD | 7,117,374 | | CNY | 45,796,745 | | Goldman Sachs & Co. | 9/15/21 | 57,928 | |
| COP | 1,476,794,027 | | USD | 409,760 | | Goldman Sachs & Co. | 9/15/21 | (29,820) | |
| USD | 363,786 | | COP | 1,365,961,954 | | Goldman Sachs & Co. | 9/15/21 | 12,361 | |
| USD | 92,461 | | CZK | 1,927,275 | | UBS AG | 9/15/21 | 2,867 | |
| USD | 68,507 | | DKK | 417,393 | | UBS AG | 9/15/21 | 1,897 | |
| EUR | 115,984 | | USD | 137,901 | | JPMorgan Chase Bank N.A. | 8/18/21 | (275) | |
| EUR | 32,019 | | USD | 38,072 | | Credit Suisse AG | 9/30/21 | (46) | |
| EUR | 13,159 | | USD | 15,646 | | Credit Suisse AG | 9/30/21 | (19) | |
| EUR | 19,827 | | USD | 23,381 | | Credit Suisse AG | 9/30/21 | 165 | |
| EUR | 14,048 | | USD | 16,621 | | Credit Suisse AG | 9/30/21 | 63 | |
| USD | 11,176,921 | | EUR | 9,448,266 | | JPMorgan Chase Bank N.A. | 8/18/21 | (34,323) | |
| USD | 1,534,776 | | EUR | 1,286,754 | | Credit Suisse AG | 9/30/21 | 6,610 | |
| USD | 597,895 | | EUR | 501,275 | | Credit Suisse AG | 9/30/21 | 2,575 | |
| USD | 19,454 | | EUR | 16,271 | | Credit Suisse AG | 9/30/21 | 131 | |
| USD | 46,205 | | EUR | 38,952 | | Credit Suisse AG | 9/30/21 | (55) | |
| USD | 53,043 | | EUR | 44,742 | | Credit Suisse AG | 9/30/21 | (94) | |
| USD | 16,675 | | EUR | 14,048 | | Credit Suisse AG | 9/30/21 | (8) | |
| USD | 17,385 | | EUR | 14,670 | | Credit Suisse AG | 9/30/21 | (38) | |
| USD | 22,825 | | EUR | 19,382 | | Credit Suisse AG | 9/30/21 | (194) | |
| USD | 46,868 | | EUR | 39,766 | | Credit Suisse AG | 9/30/21 | (358) | |
| USD | 22,739 | | EUR | 19,293 | | Credit Suisse AG | 9/30/21 | (174) | |
| USD | 18,918 | | EUR | 16,004 | | Credit Suisse AG | 9/30/21 | (88) | |
| USD | 20,630 | | EUR | 17,337 | | Credit Suisse AG | 9/30/21 | 39 | |
| USD | 49,062 | | EUR | 41,535 | | Goldman Sachs & Co. | 9/30/21 | (265) | |
| GBP | 490,427 | | USD | 692,679 | | Bank of America N.A. | 9/15/21 | (10,913) | |
| GBP | 135,950 | | USD | 189,944 | | Bank of America N.A. | 9/15/21 | (953) | |
| GBP | 30,890 | | USD | 43,032 | | JPMorgan Chase Bank N.A. | 9/30/21 | (89) | |
| GBP | 31,057 | | USD | 43,112 | | JPMorgan Chase Bank N.A. | 9/30/21 | 64 | |
| GBP | 41,742 | | USD | 56,848 | | JPMorgan Chase Bank N.A. | 9/30/21 | 1,181 | |
| USD | 43,546 | | GBP | 31,325 | | Goldman Sachs & Co. | 9/30/21 | (2) | |
| USD | 1,517,832 | | GBP | 1,090,443 | | JPMorgan Chase Bank N.A. | 9/30/21 | 1,891 | |
| USD | 33,381 | | GBP | 24,235 | | JPMorgan Chase Bank N.A. | 9/30/21 | (311) | |
| HKD | 23,616 | | USD | 3,037 | | Bank of America N.A. | 9/30/21 | 2 | |
| HKD | 63,099 | | USD | 8,109 | | Bank of America N.A. | 9/30/21 | 11 | |
| HKD | 87,822 | | USD | 11,287 | | Bank of America N.A. | 9/30/21 | 16 | |
| | | | | | | | | | | | | | | | | | | | |
| Currency Purchased | Currency Sold | Counterparty | Settlement Date | Unrealized Appreciation
(Depreciation) |
| USD | 4,116 | | HKD | 31,973 | | Bank of America N.A. | 9/30/21 | $ | 1 | |
| USD | 4,784 | | HKD | 37,179 | | Bank of America N.A. | 9/30/21 | (1) | |
| USD | 9,958 | | HKD | 77,405 | | Bank of America N.A. | 9/30/21 | (4) | |
| USD | 9,768 | | HKD | 75,906 | | Bank of America N.A. | 9/30/21 | (1) | |
| USD | 40,007 | | HKD | 310,743 | | Bank of America N.A. | 9/30/21 | 15 | |
| USD | 1,615 | | HKD | 12,546 | | Bank of America N.A. | 9/30/21 | — | |
| USD | 11,580 | | HKD | 90,036 | | Bank of America N.A. | 9/30/21 | (7) | |
| HUF | 7,769,107 | | USD | 27,274 | | UBS AG | 9/15/21 | (1,604) | |
| IDR | 6,431,147,442 | | USD | 445,864 | | Goldman Sachs & Co. | 9/15/21 | (2,507) | |
| ILS | 137,716 | | USD | 42,473 | | UBS AG | 9/17/21 | 145 | |
| USD | 684,916 | | INR | 50,558,458 | | Goldman Sachs & Co. | 9/15/21 | 8,394 | |
| JPY | 1,463,040 | | USD | 13,347 | | Bank of America N.A. | 9/30/21 | (4) | |
| JPY | 2,564,016 | | USD | 23,325 | | Bank of America N.A. | 9/30/21 | 58 | |
| JPY | 2,419,344 | | USD | 21,972 | | Bank of America N.A. | 9/30/21 | 92 | |
| JPY | 1,203,840 | | USD | 10,933 | | Bank of America N.A. | 9/30/21 | 46 | |
| JPY | 1,982,040 | | USD | 18,123 | | Bank of America N.A. | 9/30/21 | (48) | |
| JPY | 984,960 | | USD | 8,944 | | Bank of America N.A. | 9/30/21 | 39 | |
| USD | 6,252,131 | | JPY | 688,518,464 | | Bank of America N.A. | 8/18/21 | (24,630) | |
| USD | 534,850 | | JPY | 59,153,381 | | Bank of America N.A. | 9/30/21 | (4,600) | |
| USD | 400,135 | | JPY | 44,254,080 | | Bank of America N.A. | 9/30/21 | (3,441) | |
| USD | 13,933 | | JPY | 1,543,680 | | Bank of America N.A. | 9/30/21 | (145) | |
| USD | 14,548 | | JPY | 1,607,040 | | Bank of America N.A. | 9/30/21 | (108) | |
| USD | 219,494 | | JPY | 24,136,023 | | Bank of America N.A. | 9/30/21 | (615) | |
| USD | 18,382 | | JPY | 2,017,849 | | Bank of America N.A. | 9/30/21 | (20) | |
| KRW | 360,542,123 | | USD | 323,017 | | Goldman Sachs & Co. | 9/15/21 | (10,538) | |
| KZT | 119,784,230 | | USD | 276,223 | | Goldman Sachs & Co. | 9/15/21 | 2,755 | |
| USD | 397,410 | | MXN | 7,931,978 | | Morgan Stanley | 9/15/21 | 1,234 | |
| MYR | 3,291,516 | | USD | 798,427 | | Goldman Sachs & Co. | 9/15/21 | (22,867) | |
| NOK | 75,011 | | USD | 8,806 | | UBS AG | 9/30/21 | (314) | |
| NOK | 249,251 | | USD | 28,224 | | UBS AG | 9/30/21 | (8) | |
| USD | 269,061 | | NOK | 2,226,452 | | UBS AG | 9/15/21 | 17,022 | |
| USD | 377,985 | | NOK | 3,244,482 | | UBS AG | 9/30/21 | 10,702 | |
| USD | 10,366 | | NOK | 90,738 | | UBS AG | 9/30/21 | 94 | |
| USD | 202 | | NOK | 1,810 | | UBS AG | 9/30/21 | (3) | |
| NZD | 509,315 | | USD | 356,123 | | Bank of America N.A. | 9/15/21 | (1,344) | |
| USD | 313,853 | | NZD | 437,487 | | Bank of America N.A. | 9/15/21 | 9,109 | |
| PEN | 59,108 | | USD | 15,279 | | Goldman Sachs & Co. | 9/15/21 | (725) | |
| USD | 931,249 | | PHP | 44,762,362 | | Goldman Sachs & Co. | 9/15/21 | 37,457 | |
| USD | 179,411 | | PLN | 658,828 | | UBS AG | 9/15/21 | 8,373 | |
| USD | 81,629 | | RUB | 5,983,047 | | Goldman Sachs & Co. | 9/15/21 | 314 | |
| SEK | 1,083,510 | | USD | 131,311 | | UBS AG | 9/15/21 | (5,401) | |
| SEK | 6,612,090 | | USD | 761,729 | | UBS AG | 9/15/21 | 6,629 | |
| USD | 215,453 | | SGD | 285,549 | | Bank of America N.A. | 9/15/21 | 4,720 | |
| USD | 1,262,446 | | THB | 39,446,379 | | Goldman Sachs & Co. | 9/15/21 | 62,558 | |
| | | | | | $ | 244,538 | |
| | | | | | | | | | | | | | |
| FUTURES CONTRACTS PURCHASED |
| Reference Entity | Contracts | Expiration Date | Notional
Amount | Unrealized Appreciation (Depreciation)^ |
| Euro-Bobl 5-Year Bonds | 15 | September 2021 | $ | 2,408,561 | | $ | 22,928 | |
| Korean Treasury 10-Year Bonds | 10 | September 2021 | 1,114,975 | | 19,804 | |
| U.K. Gilt 10-Year Bonds | 17 | September 2021 | 3,066,940 | | 62,829 | |
| U.S. Treasury 2-Year Notes | 132 | September 2021 | 29,126,625 | | (10,569) | |
| U.S. Treasury 5-Year Notes | 173 | September 2021 | 21,529,039 | | 98,437 | |
| U.S. Treasury Ultra Bonds | 29 | September 2021 | 5,786,406 | | 106,881 | |
| | | $ | 63,032,546 | | $ | 300,310 | |
^Amount represents value and unrealized appreciation (depreciation).
| | | | | | | | | | | | | | |
| FUTURES CONTRACTS SOLD |
| Reference Entity | Contracts | Expiration Date | Notional
Amount | Unrealized Appreciation (Depreciation)^ |
| U.S. Treasury 10-Year Notes | 18 | September 2021 | $ | 2,420,156 | | $ | (4,304) | |
| U.S. Treasury Long Bonds | 13 | September 2021 | 2,141,344 | | (104,431) | |
| | | $ | 4,561,500 | | $ | (108,735) | |
^Amount represents value and unrealized appreciation (depreciation).
| | | | | | | | | | | | | | | | | | | | | | | |
| CENTRALLY CLEARED CREDIT DEFAULT SWAP AGREEMENTS |
| Reference Entity | Type‡ | Fixed Rate Received (Paid) Quarterly | Termination Date | Notional
Amount | Premiums Paid (Received) | Unrealized Appreciation
(Depreciation) | Value^ |
| Markit CDX North America High Yield Index Series 35 | Sell | 5.00% | 12/20/25 | $ | 3,652,000 | | $ | 291,175 | | $ | 66,854 | | $ | 358,029 | |
‡The maximum potential amount the fund could be required to deliver as a seller of credit protection if a credit event occurs as defined under the terms of the agreement is the notional amount. The maximum potential amount may be partially offset by any recovery values of the reference entities and upfront payments received upon entering into the agreement.
^The value for credit default swap agreements serves as an indicator of the current status of the payment/performance risk and represent the likelihood of an expected liability or profit at the period end. Increasing values in absolute terms when compared to the notional amount of the credit default swap agreement represent a deterioration of the referenced entity's credit soundness and an increased likelihood or risk of a credit event occurring as defined in the agreement.
| | | | | | | | | | | | | | | | | |
| NOTES TO SCHEDULE OF INVESTMENTS |
| ADR | - | American Depositary Receipt | LOC | - | Letter of Credit |
| AUD | - | Australian Dollar | MTN | - | Medium Term Note |
| BRL | - | Brazilian Real | MXN | - | Mexican Peso |
| CAD | - | Canadian Dollar | MYR | - | Malaysian Ringgit |
| CDX | - | Credit Derivatives Indexes | NOK | - | Norwegian Krone |
| CHF | - | Swiss Franc | NZD | - | New Zealand Dollar |
| CLP | - | Chilean Peso | PEN | - | Peruvian Sol |
| CNY | - | Chinese Yuan | PHP | - | Philippine Peso |
| COP | - | Colombian Peso | PLN | - | Polish Zloty |
| CPI | - | Consumer Price Index | RUB | - | Russian Ruble |
| CZK | - | Czech Koruna | SEK | - | Swedish Krona |
| DKK | - | Danish Krone | SEQ | - | Sequential Payer |
| EUR | - | Euro | SGD | - | Singapore Dollar |
| FHLMC | - | Federal Home Loan Mortgage Corporation | SOFR | - | Secured Overnight Financing Rate |
| FNMA | - | Federal National Mortgage Association | THB | - | Thai Baht |
| GA | - | Guaranty Agreement | USD | - | United States Dollar |
| GBP | - | British Pound | VRDN | - | Variable Rate Demand Note. The instrument may be payable upon demand and adjusts periodically based upon the terms set forth in the security's offering documents. The rate shown is effective at the period end and the reference rate and spread, if any, is indicated. The date of the demand feature is disclosed. |
| GNMA | - | Government National Mortgage Association | | |
| GO | - | General Obligation | | |
| H15T1Y | - | Constant Maturity U.S. Treasury Note Yield Curve Rate Index | | |
| HKD | - | Hong Kong Dollar | | |
| HUF | - | Hungarian Forint | | |
| IDR | - | Indonesian Rupiah | VRN | - | Variable Rate Note. The rate adjusts periodically based upon the terms set forth in the security’s offering documents. The rate shown is effective at the period end and the reference rate and spread, if any, is indicated. The security's effective maturity date may be shorter than the final maturity date shown. |
| ILS | - | Israeli Shekel | | |
| INR | - | Indian Rupee | | |
| IO | - | Interest Only | | |
| JPY | - | Japanese Yen | | |
| KRW | - | South Korean Won | | |
| KZT | - | Kazakhstani Tenge | | |
| LIBOR | - | London Interbank Offered Rate | | | |
†Category is less than 0.05% of total net assets.
(1)Investments are funds within the American Century Investments family of funds and are considered affiliated funds.
(2)Non-income producing.
(3)Security, or a portion thereof, is on loan. At the period end, the aggregate value of securities on loan was $1,822,974. The amount of securities on loan indicated may not correspond with the securities on loan identified because securities with pending sales are in the process of recall from the brokers.
(4)The rate indicated is the yield to maturity at purchase for non-interest bearing securities. For interest bearing securities, the stated coupon rate is shown.
(5)Security, or a portion thereof, has been pledged at the custodian bank or with a broker for collateral requirements on forward foreign currency exchange contracts, futures contracts and/or swap agreements. At the period end, the aggregate value of securities pledged was $720,851.
(6)Security was purchased pursuant to Rule 144A or Section 4(2) under the Securities Act of 1933 and may be sold in transactions exempt from registration, normally to qualified institutional investors. The aggregate value of these securities at the period end was $60,268,166, which represented 6.3% of total net assets.
(7)Security is a zero-coupon bond.
(8)When-issued security. The issue price and yield are fixed on the date of the commitment, but payment and delivery are scheduled for a future date.
(9)Investment of cash collateral from securities on loan. At the period end, the aggregate value of the collateral held by the fund was $1,917,775, which includes securities collateral of $1,293,591.
See Notes to Financial Statements.
| | |
| Statement of Assets and Liabilities |
| | | | | |
| JULY 31, 2021 | |
| Assets | |
| Investment securities - unaffiliated, at value (cost of $467,927,453) — including $1,822,974 of securities on loan | $ | 570,470,490 | |
| Investment securities - affiliated, at value (cost of $282,593,174) | 384,134,824 | |
Investment made with cash collateral received for securities on loan, at value
(cost of $624,184) | 624,184 | |
| Total investment securities, at value (cost of $751,144,811) | 955,229,498 | |
| Cash | 163,701 | |
| Foreign currency holdings, at value (cost of $8,644) | 7,949 | |
| Foreign deposits with broker for futures contracts, at value (cost of $136,601) | 138,489 | |
| Receivable for investments sold | 1,236,437 | |
| Receivable for capital shares sold | 157,905 | |
| Receivable for variation margin on futures contracts | 45,947 | |
| Unrealized appreciation on forward foreign currency exchange contracts | 440,845 | |
| Interest and dividends receivable | 1,846,384 | |
| Securities lending receivable | 1,458 | |
| Other assets | 19,091 | |
| 959,287,704 | |
| |
| Liabilities | |
| Payable for collateral received for securities on loan | 624,184 | |
| Payable for investments purchased | 1,228,464 | |
| Payable for capital shares redeemed | 271,131 | |
| Payable for variation margin on swap agreements | 11,082 | |
| Unrealized depreciation on forward foreign currency exchange contracts | 196,307 | |
| Accrued management fees | 533,999 | |
| Distribution and service fees payable | 112,980 | |
| Accrued foreign taxes | 3,365 | |
| 2,981,512 | |
| |
| Net Assets | $ | 956,306,192 | |
| |
| Net Assets Consist of: | |
| Capital (par value and paid-in surplus) | $ | 690,100,242 | |
| Distributable earnings | 266,205,950 | |
| $ | 956,306,192 | |
| | | | | | | | | | | |
| | Net Assets | Shares Outstanding | Net Asset Value Per Share |
| Investor Class, $0.01 Par Value | $332,602,107 | 44,960,190 | $7.40 |
| I Class, $0.01 Par Value | $71,639,196 | 9,679,471 | $7.40 |
| A Class, $0.01 Par Value | $342,834,545 | 46,530,067 | $7.37* |
| C Class, $0.01 Par Value | $28,682,528 | 3,987,490 | $7.19 |
| R Class, $0.01 Par Value | $38,353,218 | 5,249,605 | $7.31 |
| R5 Class, $0.01 Par Value | $7,768,159 | 1,048,804 | $7.41 |
| R6 Class, $0.01 Par Value | $134,426,439 | 18,194,425 | $7.39 |
*Maximum offering price $7.82 (net asset value divided by 0.9425).
See Notes to Financial Statements.
| | | | | |
| YEAR ENDED JULY 31, 2021 |
| Investment Income (Loss) | |
| Income: | |
| Interest (net of foreign taxes withheld of $4,604) | $ | 6,696,010 | |
| Income distributions from affiliated funds | 5,317,321 | |
| Dividends (net of foreign taxes withheld of $126,753) | 3,799,127 | |
| Securities lending, net | 17,375 | |
| 15,829,833 | |
| |
| Expenses: | |
| Management fees | 9,378,225 | |
| Distribution and service fees: | |
| A Class | 792,166 | |
| C Class | 347,327 | |
| R Class | 193,198 | |
| Directors' fees and expenses | 25,179 | |
| Other expenses | 29,064 | |
| 10,765,159 | |
Fees waived(1) | (3,398,453) | |
| 7,366,706 | |
| |
| Net investment income (loss) | 8,463,127 | |
| |
| Realized and Unrealized Gain (Loss) | |
| Net realized gain (loss) on: | |
| Investment transactions (including $30,068,746 from affiliated funds and net of foreign tax expenses paid (refunded) of $(72)) | 78,893,574 | |
| Forward foreign currency exchange contract transactions | (938,558) | |
| Futures contract transactions | 19,668 | |
| Swap agreement transactions | 131,787 | |
| Foreign currency translation transactions | 9,252 | |
| Capital gain distributions received from affiliated funds | 121,385 | |
| 78,237,108 | |
| |
| Change in net unrealized appreciation (depreciation) on: | |
| Investments (including $81,865,484 from affiliated funds and (increase) decrease in accrued foreign taxes of $(1,568)) | 110,984,763 | |
| Forward foreign currency exchange contracts | 593,932 | |
| Futures contracts | 182,626 | |
| Swap agreements | 66,854 | |
| Translation of assets and liabilities in foreign currencies | (5,837) | |
| 111,822,338 | |
| |
| Net realized and unrealized gain (loss) | 190,059,446 | |
| |
| Net Increase (Decrease) in Net Assets Resulting from Operations | $ | 198,522,573 | |
(1)Amount consists of $1,179,106, $250,810, $1,187,428, $130,336, $144,844, $26,982 and $478,947 for Investor Class, I Class, A Class, C Class, R Class, R5 Class and R6 Class, respectively.
See Notes to Financial Statements.
| | |
| Statement of Changes in Net Assets |
| | | | | | | | |
| YEARS ENDED JULY 31, 2021 AND JULY 31, 2020 |
| Increase (Decrease) in Net Assets | July 31, 2021 | July 31, 2020 |
| Operations | | |
| Net investment income (loss) | $ | 8,463,127 | | $ | 8,585,850 | |
| Net realized gain (loss) | 78,237,108 | | 105,148,279 | |
| Change in net unrealized appreciation (depreciation) | 111,822,338 | | (46,558,316) | |
| Net increase (decrease) in net assets resulting from operations | 198,522,573 | | 67,175,813 | |
| | |
| Distributions to Shareholders | | |
| From earnings: | | |
| Investor Class | (16,064,506) | | (37,790,354) | |
| I Class | (3,522,656) | | (8,557,597) | |
| A Class | (15,023,804) | | (37,234,066) | |
| C Class | (1,773,159) | | (5,380,827) | |
| R Class | (1,822,110) | | (4,681,843) | |
| R5 Class | (388,300) | | (983,349) | |
| R6 Class | (7,105,756) | | (13,652,619) | |
| Decrease in net assets from distributions | (45,700,291) | | (108,280,655) | |
| | |
| Capital Share Transactions | | |
| Net increase (decrease) in net assets from capital share transactions (Note 5) | (49,353,471) | | 8,003,059 | |
| | |
| Net increase (decrease) in net assets | 103,468,811 | | (33,101,783) | |
| | |
| Net Assets | | |
| Beginning of period | 852,837,381 | | 885,939,164 | |
| End of period | $ | 956,306,192 | | $ | 852,837,381 | |
| | |
| | |
See Notes to Financial Statements.
| | |
| Notes to Financial Statements |
JULY 31, 2021
1. Organization
American Century Strategic Asset Allocations, Inc. (the corporation) is registered under the Investment Company Act of 1940, as amended (the 1940 Act), as an open-end management investment company and is organized as a Maryland corporation. Strategic Allocation: Moderate Fund (the fund) is one fund in a series issued by the corporation. The fund may invest in varying combinations of other affiliated investment companies such as mutual funds and exchange-traded funds advised by American Century Investments (affiliated funds). The fund will assume the risks associated with the affiliated funds. The fund is an asset allocation fund and its investment objective is to seek the highest level of total return consistent with its asset mix.
The fund offers the Investor Class, I Class, A Class, C Class, R Class, R5 Class and R6 Class. The A Class may incur an initial sales charge. The A Class and C Class may be subject to a contingent deferred sales charge.
2. Significant Accounting Policies
The following is a summary of significant accounting policies consistently followed by the fund in preparation of its financial statements. The fund is an investment company and follows accounting and reporting guidance in accordance with accounting principles generally accepted in the United States of America. This may require management to make certain estimates and assumptions at the date of the financial statements. Actual results could differ from these estimates. Management evaluated the impact of events or transactions occurring through the date the financial statements were issued that would merit recognition or disclosure.
Investment Valuations — The fund determines the fair value of its investments and computes its net asset value (NAV) per share at the close of regular trading (usually 4 p.m. Eastern time) on the New York Stock Exchange (NYSE) on each day the NYSE is open. The Board of Directors has adopted valuation policies and procedures to guide the investment advisor in the fund’s investment valuation process and to provide methodologies for the oversight of the fund’s pricing function.
Equity securities that are listed or traded on a domestic securities exchange are valued at the last reported sales price or at the official closing price as provided by the exchange. Equity securities traded on foreign securities exchanges are generally valued at the closing price of such securities on the exchange where primarily traded or at the close of the NYSE, if that is earlier. If no last sales price is reported, or if local convention or regulation so provides, the mean of the latest bid and asked prices may be used. Securities traded over-the-counter are valued at the mean of the latest bid and asked prices, the last sales price, or the official closing price. Equity securities initially expressed in local currencies are translated into U.S. dollars at the mean of the appropriate currency exchange rate at the close of the NYSE as provided by an independent pricing service.
Fixed income securities are valued at the evaluated mean as provided by independent pricing services or at the mean of the most recent bid and asked prices as provided by investment dealers. Corporate bonds, U.S. Treasury and Government Agency securities, convertible bonds, municipal securities, and sovereign governments and agencies are valued using market models that consider trade data, quotations from dealers and active market makers, relevant yield curve and spread data, creditworthiness, trade data or market information on comparable securities, and other relevant security specific information. Mortgage-related and asset-backed securities are valued based on models that consider trade data, prepayment and default projections, benchmark yield and spread data and estimated cash flows of each tranche of the issuer. Collateralized loan obligations are valued based on discounted cash flow models that consider trade and economic data, prepayment assumptions and default projections. Commercial paper and certificates of deposit are valued using a curve-based approach that considers money market rates for specific instruments, programs, currencies and maturity points from a variety of active market makers. Fixed income securities initially expressed in local currencies are translated into U.S. dollars at the mean of the appropriate currency exchange rate at the close of the NYSE as provided by an independent pricing service.
Hybrid securities are valued at the evaluated mean as provided by independent pricing services or at the mean of the most recent bid and asked prices as provided by investment dealers. Preferred stocks and convertible preferred stocks with perpetual maturities are valued using market models that consider trade data, quotations from dealers and active market makers, relevant yield curve and spread data, creditworthiness, trade data or market information on comparable securities, and other relevant security specific information.
Open-end management investment companies are valued at the reported NAV per share. Exchange-traded futures contracts are valued at the settlement price as provided by the appropriate exchange. Swap agreements are valued at an evaluated mean as provided by independent pricing services or independent brokers. Forward foreign currency exchange contracts are valued at the mean of the appropriate forward exchange rate at the close of the NYSE as provided by an independent pricing service. Investments initially expressed in local currencies are translated into U.S. dollars at the mean of the appropriate currency exchange rate at the close of the NYSE as provided by an independent pricing service.
If the fund determines that the market price for an investment is not readily available or the valuation methods mentioned above do not reflect an investment’s fair value, such investment is valued as determined in good faith by the Board of Directors or its delegate, in accordance with policies and procedures adopted by the Board of Directors. In its determination of fair value, the fund may review several factors including, but not limited to, market information regarding the specific investment or comparable investments and correlation with other investment types, futures indices or general market indicators. Circumstances that may cause the fund to use these procedures to value an investment include, but are not limited to: an investment has been declared in default or is distressed; trading in a security has been suspended during the trading day or a security is not actively trading on its principal exchange; prices received from a regular pricing source are deemed unreliable; or there is a foreign market holiday and no trading occurred.
The fund monitors for significant events occurring after the close of an investment’s primary exchange but before the fund’s NAV per share is determined. Significant events may include, but are not limited to: corporate announcements and transactions; governmental action and political unrest that could impact a specific investment or an investment sector; or armed conflicts, natural disasters and similar events that could affect investments in a specific country or region. The fund also monitors for significant fluctuations between domestic and foreign markets, as evidenced by the U.S. market or such other indicators that the Board of Directors, or its delegate, deems appropriate. The fund may apply a model-derived factor to the closing price of equity securities traded on foreign securities exchanges. The factor is based on observable market data as provided by an independent pricing service.
Security Transactions — Security transactions are accounted for as of the trade date. Net realized gains and losses are determined on the identified cost basis, which is also used for federal income tax purposes. Certain countries impose taxes on realized gains on the sale of securities registered in their country. The fund records the foreign tax expense, if any, on an accrual basis. The foreign tax expense on realized gains and unrealized appreciation reduces the net realized gain (loss) on investment transactions and net unrealized appreciation (depreciation) on investments, respectively.
Investment Income — Dividend income less foreign taxes withheld, if any, is recorded as of the ex-dividend date. Distributions received on securities that represent a return of capital or long-term capital gain are recorded as a reduction of cost of investments and/or as a realized gain. The fund may estimate the components of distributions received that may be considered nontaxable distributions or long-term capital gain distributions for income tax purposes. Income and capital gain distributions, if any, from the affiliated funds are recorded as of the ex-dividend date. Interest income less foreign taxes withheld, if any, is recorded on the accrual basis and includes paydown gain (loss) and accretion of discounts and amortization of premiums. Inflation adjustments related to inflation-linked debt securities are reflected as interest income. Securities lending income is net of fees and rebates earned by the lending agent for its services.
Segregated Assets — In accordance with the 1940 Act, the fund segregates assets on its books and records to cover certain types of investment securities and other financial instruments. American Century Investment Management, Inc. (ACIM) (the investment advisor) monitors, on a daily basis, the securities segregated to ensure the fund designates a sufficient amount of liquid assets, marked-to-market daily. The fund may also receive assets or be required to pledge assets at the custodian bank or with a broker for collateral requirements.
Foreign Currency Translations — All assets and liabilities initially expressed in foreign currencies are translated into U.S. dollars at prevailing exchange rates at period end. The fund may enter into spot foreign currency exchange contracts to facilitate transactions denominated in a foreign currency. Purchases and sales of investment securities, dividend and interest income, spot foreign currency exchange contracts, and expenses are translated at the rates of exchange prevailing on the respective dates of such transactions. Net realized and unrealized foreign currency exchange gains or losses related to investment securities are a component of net realized gain (loss) on investment transactions and change in net unrealized appreciation (depreciation) on investments, respectively.
Income Tax Status — It is the fund’s policy to distribute substantially all net investment income and net realized gains to shareholders and to otherwise qualify as a regulated investment company under provisions of the Internal Revenue Code. Accordingly, no provision has been made for income taxes. The fund files U.S. federal, state, local and non-U.S. tax returns as applicable. The fund's tax returns are subject to examination by the relevant taxing authority until expiration of the applicable statute of limitations, which is generally three years from the date of filing but can be longer in certain jurisdictions. At this time, management believes there are no uncertain tax positions which, based on their technical merit, would not be sustained upon examination and for which it is reasonably possible that the total amounts of unrecognized tax benefits will significantly change in the next twelve months.
Multiple Class — All shares of the fund represent an equal pro rata interest in the net assets of the class to which such shares belong, and have identical voting, dividend, liquidation and other rights and the same terms and conditions, except for class specific expenses and exclusive rights to vote on matters affecting only individual classes. Income, non-class specific expenses, and realized and unrealized capital gains and losses of the fund are allocated to each class of shares based on their relative net assets.
Distributions to Shareholders — Distributions from net investment income, if any, are generally declared and paid quarterly. Distributions from net realized gains, if any, are generally declared and paid annually.
Indemnifications — Under the corporation’s organizational documents, its officers and directors are indemnified against certain liabilities arising out of the performance of their duties to the fund. In addition, in the normal course of business, the fund enters into contracts that provide general indemnifications. The maximum exposure under these arrangements is unknown as this would involve future claims that may be made against a fund. The risk of material loss from such claims is considered by management to be remote.
Securities Lending — Securities are lent to qualified financial institutions and brokers. State Street Bank & Trust Co. serves as securities lending agent to the fund pursuant to a Securities Lending Agreement. The lending of securities exposes the fund to risks such as: the borrowers may fail to return the loaned securities, the borrowers may not be able to provide additional collateral, the fund may experience delays in recovery of the loaned securities or delays in access to collateral, or the fund may experience losses related to the investment collateral. To minimize certain risks, loan counterparties pledge collateral in the form of cash and/or securities. The lending agent has agreed to indemnify the fund in the case of default of any securities borrowed. Cash collateral received is invested in the State Street Navigator Securities Lending Government Money Market Portfolio, a money market mutual fund registered under the 1940 Act. The loans may also be secured by U.S. government securities in an amount at least equal to the market value of the securities loaned, plus accrued interest and dividends, determined on a daily basis and adjusted accordingly. By lending securities, the fund seeks to increase its net investment income through the receipt of interest and fees. Such income is reflected separately within the Statement of Operations. The value of loaned securities and related collateral outstanding at period end, if any, are shown on a gross basis within the Schedule of Investments and Statement of Assets and Liabilities.
The following table reflects a breakdown of transactions accounted for as secured borrowings, the gross obligation by the type of collateral pledged, and the remaining contractual maturity of those transactions as of July 31, 2021.
| | | | | | | | | | | | | | | | | |
| Remaining Contractual Maturity of Agreements |
| Overnight and
Continuous | <30 days | Between 30 & 90 days | >90 days | Total |
Securities Lending Transactions(1) | | | | |
| Common Stocks | $ | 624,184 | | — | | — | | — | | $ | 624,184 | |
| Gross amount of recognized liabilities for securities lending transactions | $ | 624,184 | |
(1)Amount represents the payable for cash collateral received for securities on loan. This will generally be in the Overnight and Continuous column as the securities are typically callable on demand.
3. Fees and Transactions with Related Parties
Certain officers and directors of the corporation are also officers and/or directors of American Century Companies, Inc. (ACC). The corporation’s investment advisor, ACIM, the corporation's distributor, American Century Investment Services, Inc. (ACIS), and the corporation’s transfer agent, American Century Services, LLC, are wholly owned, directly or indirectly, by ACC. ACIM serves as the investment advisor for the affiliated funds.
Management Fees —The corporation has entered into a management agreement with ACIM, under which ACIM provides the fund with investment advisory and management services in exchange for a single, unified management fee (the fee) per class. The agreement provides that ACIM will pay all expenses of managing and operating the fund, except brokerage expenses, taxes, interest, fees and expenses of the independent directors (including legal counsel fees), extraordinary expenses, and expenses incurred in connection with the provision of shareholder services and distribution services under a plan adopted pursuant to Rule 12b-1 under the 1940 Act. The fee is computed and accrued daily based on each class’s daily net assets and paid monthly in arrears. The difference in the fee among the classes is a result of their separate arrangements for non-Rule 12b-1 shareholder services. It is not the result of any difference in advisory or custodial fees or other expenses related to the management of the fund’s assets, which do not vary by class. The rate of the fee is determined by applying a fee rate calculation formula. This formula takes into account the fund’s assets as well as certain assets, if any, of other clients of the investment advisor outside the American Century Investments family of funds (such as subadvised funds and separate accounts) that use very similar investment teams and strategies (strategy assets). The investment advisor will waive the portion of the fund’s management fee equal to the expenses attributable to the management fees of the American Century Investments funds in which the fund invests. The amount of this waiver will fluctuate depending on the fund’s daily allocation to other American Century Investments funds. This waiver is expected to remain in effect permanently and it cannot be terminated without the approval of the Board of Directors. During the period ended July 31, 2021, the investment advisor agreed to waive an additional 0.25% of the fund's management fee. Effective August 1, 2021, the investment advisor agreed to increase the amount of the additional waiver from 0.25% to 0.28% of the fund's management fee. The investment advisor expects this waiver to continue until July 31, 2022 and cannot terminate it prior to such date without the approval of the Board of Directors.
The management fee schedule range and the effective annual management fee before and after waiver for each class for the period ended July 31, 2021 are as follows:
| | | | | | | | | | | |
| | Effective Annual Management Fee |
| Management Fee Schedule Range | Before Waiver | After Waiver |
| Investor Class | 0.90% to 1.10% | 1.10% | 0.72% |
| I Class | 0.70% to 0.90% | 0.90% | 0.52% |
| A Class | 0.90% to 1.10% | 1.10% | 0.72% |
| C Class | 0.90% to 1.10% | 1.10% | 0.72% |
| R Class | 0.90% to 1.10% | 1.10% | 0.72% |
| R5 Class | 0.70% to 0.90% | 0.90% | 0.52% |
| R6 Class | 0.55% to 0.75% | 0.75% | 0.37% |
Distribution and Service Fees — The Board of Directors has adopted a separate Master Distribution and Individual Shareholder Services Plan for each of the A Class, C Class and R Class (collectively the plans), pursuant to Rule 12b-1 of the 1940 Act. The plans provide that the A Class will pay ACIS an annual distribution and service fee of 0.25%. The plans provide that the C Class will pay ACIS an annual distribution and service fee of 1.00%, of which 0.25% is paid for individual shareholder services and 0.75% is paid for distribution services. The plans provide that the R Class will pay ACIS an annual distribution and service fee of 0.50%. The fees are computed and accrued daily based on each class’s daily net assets and paid monthly in arrears. The fees are used to pay financial intermediaries for distribution and individual shareholder services. Fees incurred under the plans during the period ended July 31, 2021 are detailed in the Statement of Operations.
Directors' Fees and Expenses — The Board of Directors is responsible for overseeing the investment advisor’s management and operations of the fund. The directors receive detailed information about the fund and its investment advisor regularly throughout the year, and meet at least quarterly with management of the investment advisor to review reports about fund operations. The fund’s officers do not receive compensation from the fund.
Interfund Transactions — The fund may enter into security transactions with other American Century Investments funds and other client accounts of the investment advisor, in accordance with the 1940 Act rules and procedures adopted by the Board of Directors. The rules and procedures require, among other things, that these transactions be effected at the independent current market price of the security. During the period, the interfund purchases and sales were $294,732 and $3,377,816, respectively. The effect of interfund transactions on the Statement of Operations was $109,635 in net realized gain (loss) on investment transactions.
4. Investment Transactions
Purchases of investment securities, excluding short-term investments, for the period ended July 31, 2021 totaled $419,091,752, of which $155,704,938 represented U.S. Treasury and Government Agency obligations.
Sales of investment securities, excluding short-term investments, for the period ended July 31, 2021 totaled $563,224,886, of which $179,897,818 represented U.S. Treasury and Government Agency obligations.
5. Capital Share Transactions
Transactions in shares of the fund were as follows:
| | | | | | | | | | | | | | |
| Year ended
July 31, 2021 | Year ended
July 31, 2020 |
| Shares | Amount | Shares | Amount |
| Investor Class/Shares Authorized | 790,000,000 | | | 790,000,000 | | |
| Sold | 4,099,547 | | $ | 28,587,905 | | 5,636,640 | | $ | 32,291,094 | |
| Issued in reinvestment of distributions | 2,335,225 | | 15,641,289 | | 6,082,375 | | 37,158,054 | |
| Redeemed | (9,175,667) | | (62,598,014) | | (11,891,155) | | (73,244,645) | |
| (2,740,895) | | (18,368,820) | | (172,140) | | (3,795,497) | |
| I Class/Shares Authorized | 380,000,000 | | | 380,000,000 | | |
| Sold | 1,397,614 | | 9,624,673 | | 922,860 | | 5,660,828 | |
| Issued in reinvestment of distributions | 523,495 | | 3,516,603 | | 1,399,890 | | 8,556,549 | |
| Redeemed | (2,293,806) | | (15,588,905) | | (3,861,678) | | (24,282,702) | |
| (372,697) | | (2,447,629) | | (1,538,928) | | (10,065,325) | |
| A Class/Shares Authorized | 670,000,000 | | | 670,000,000 | | |
| Sold | 5,905,766 | | 40,402,029 | | 5,025,835 | | 30,520,692 | |
| Issued in reinvestment of distributions | 2,195,878 | | 14,650,103 | | 5,898,171 | | 35,902,097 | |
| Redeemed | (7,941,893) | | (54,075,671) | | (11,068,511) | | (67,526,965) | |
| 159,751 | | 976,461 | | (144,505) | | (1,104,176) | |
| C Class/Shares Authorized | 160,000,000 | | | 160,000,000 | | |
| Sold | 471,554 | | 3,147,225 | | 499,274 | | 2,952,893 | |
| Issued in reinvestment of distributions | 270,676 | | 1,768,799 | | 885,810 | | 5,306,449 | |
| Redeemed | (3,238,938) | | (21,637,082) | | (2,422,943) | | (14,652,563) | |
| (2,496,708) | | (16,721,058) | | (1,037,859) | | (6,393,221) | |
| R Class/Shares Authorized | 90,000,000 | | | 90,000,000 | | |
| Sold | 597,422 | | 4,045,578 | | 836,738 | | 5,120,562 | |
| Issued in reinvestment of distributions | 275,380 | | 1,821,434 | | 771,046 | | 4,660,507 | |
| Redeemed | (1,423,460) | | (9,788,870) | | (1,815,246) | | (11,015,570) | |
| (550,658) | | (3,921,858) | | (207,462) | | (1,234,501) | |
| R5 Class/Shares Authorized | 50,000,000 | | | 50,000,000 | | |
| Sold | 98,060 | | 678,487 | | 141,601 | | 848,522 | |
| Issued in reinvestment of distributions | 57,800 | | 388,300 | | 160,726 | | 983,349 | |
| Redeemed | (220,043) | | (1,476,149) | | (284,046) | | (1,648,151) | |
| (64,183) | | (409,362) | | 18,281 | | 183,720 | |
| R6 Class/Shares Authorized | 295,000,000 | | | 150,000,000 | | |
| Sold | 2,925,930 | | 20,290,100 | | 5,780,320 | | 35,627,500 | |
| Issued in reinvestment of distributions | 1,060,303 | | 7,105,756 | | 2,238,672 | | 13,652,619 | |
| Redeemed | (5,222,882) | | (35,857,061) | | (3,165,729) | | (18,868,060) | |
| (1,236,649) | | (8,461,205) | | 4,853,263 | | 30,412,059 | |
| Net increase (decrease) | (7,302,039) | | $ | (49,353,471) | | 1,770,650 | | $ | 8,003,059 | |
6. Fair Value Measurements
The fund’s investments valuation process is based on several considerations and may use multiple inputs to determine the fair value of the investments held by the fund. In conformity with accounting principles generally accepted in the United States of America, the inputs used to determine a valuation are classified into three broad levels.
•Level 1 valuation inputs consist of unadjusted quoted prices in an active market for identical investments.
•Level 2 valuation inputs consist of direct or indirect observable market data (including quoted prices for comparable investments, evaluations of subsequent market events, interest rates, prepayment speeds, credit risk, etc.). These inputs also consist of quoted prices for identical investments initially expressed in local currencies that are adjusted through translation into U.S. dollars.
•Level 3 valuation inputs consist of unobservable data (including a fund’s own assumptions).
The level classification is based on the lowest level input that is significant to the fair valuation measurement. The valuation inputs are not necessarily an indication of the risks associated with investing in these securities or other financial instruments.
The following is a summary of the level classifications as of period end. The Schedule of Investments provides additional information on the fund’s portfolio holdings.
| | | | | | | | | | | |
| Level 1 | Level 2 | Level 3 |
| Assets | | | |
| Investment Securities | | | |
| Affiliated Funds | $ | 384,134,824 | | — | | — | |
| Common Stocks | 199,163,292 | | $ | 55,380,802 | | — | |
| U.S. Treasury Securities | — | | 95,559,985 | | — | |
| Corporate Bonds | — | | 52,338,774 | | — | |
| Sovereign Governments and Agencies | — | | 41,594,532 | | — | |
| Commercial Paper | — | | 20,466,852 | | — | |
| Municipal Securities | — | | 14,836,473 | | — | |
| Collateralized Loan Obligations | — | | 13,540,067 | | — | |
| Collateralized Mortgage Obligations | — | | 6,678,108 | | — | |
| U.S. Government Agency Mortgage-Backed Securities | — | | 4,076,656 | | — | |
| Asset-Backed Securities | — | | 4,015,570 | | — | |
| Preferred Stocks | — | | 3,835,996 | | — | |
| Certificates of Deposit | — | | 1,700,315 | | — | |
| Exchange-Traded Funds | 244,885 | | — | | — | |
| Temporary Cash Investments | 57,038,183 | | — | | — | |
| Temporary Cash Investments - Securities Lending Collateral | 624,184 | | — | | — | |
| $ | 641,205,368 | | $ | 314,024,130 | | — | |
| Other Financial Instruments | | | |
| Futures Contracts | $ | 205,318 | | $ | 105,561 | | — | |
| Swap Agreements | — | | 358,029 | | — | |
| Forward Foreign Currency Exchange Contracts | — | | 440,845 | | — | |
| $ | 205,318 | | $ | 904,435 | | — | |
| | | |
| Liabilities | | | |
| Other Financial Instruments | | | |
| Futures Contracts | $ | 119,304 | | — | | — | |
| Forward Foreign Currency Exchange Contracts | — | | $ | 196,307 | | — | |
| $ | 119,304 | | $ | 196,307 | | — | |
7. Derivative Instruments
Credit Risk — The fund is subject to credit risk in the normal course of pursuing its investment objectives. The value of a bond generally declines as the credit quality of its issuer declines. Credit default swap agreements enable a fund to buy/sell protection against a credit event of a specific issuer or index. A fund may attempt to enhance returns by selling protection or attempt to mitigate credit risk by buying protection. The buyer/seller of credit protection against a security or basket of securities may pay/receive an up-front or periodic payment to compensate for/against potential default events. Changes in value, including the periodic amounts of interest to be paid or received on swap agreements, are recorded as unrealized appreciation (depreciation) on swap agreements. Upon entering into a centrally cleared swap, a fund is required to deposit cash or securities (initial margin) with a financial intermediary in an amount equal to a certain percentage of the notional amount. Subsequent payments (variation margin) are made or received daily, in cash, by a fund. The variation margin is equal to the daily change in the value and is a component of unrealized gains and losses. Realized gain or loss is recorded upon receipt or payment of a periodic settlement or termination of swap agreements. Net realized and unrealized gains or losses occurring during the holding period of swap agreements are a component of net realized gain (loss) on swap agreement transactions and change in net unrealized appreciation (depreciation) on swap agreements, respectively. The risks of entering into swap agreements include the possible lack of liquidity, failure of the counterparty to meet its obligations, and that there may be unfavorable changes in the underlying investments or instruments. The fund's average notional amount held during the period was $8,527,000.
Foreign Currency Risk — The fund is subject to foreign currency exchange rate risk in the normal course of pursuing its investment objectives. The value of foreign investments held by a fund may be significantly affected by changes in foreign currency exchange rates. The dollar value of a foreign security generally decreases when the value of the dollar rises against the foreign currency in which the security is denominated and tends to increase when the value of the dollar declines against such foreign currency. A fund may enter into forward foreign currency exchange contracts to reduce a fund's exposure to foreign currency exchange rate fluctuations or to gain exposure to the fluctuations in the value of foreign currencies. The net U.S. dollar value of foreign currency underlying all contractual commitments held by a fund and the resulting unrealized appreciation or depreciation are determined daily. Realized gain or loss is recorded upon settlement of the contract. Net realized and unrealized gains or losses occurring during the holding period of forward foreign currency exchange contracts are a component of net realized gain (loss) on forward foreign currency exchange contract transactions and change in net unrealized appreciation (depreciation) on forward foreign currency exchange contracts, respectively. A fund bears the risk of an unfavorable change in the foreign currency exchange rate underlying the forward contract. Additionally, losses, up to the fair value, may arise if the counterparties do not perform under the contract terms. The fund's average U.S. dollar exposure to foreign currency risk derivative instruments held during the period was $48,285,996.
Interest Rate Risk — The fund is subject to interest rate risk in the normal course of pursuing its investment objectives. The value of bonds generally declines as interest rates rise. A fund may enter into futures contracts based on a bond index or a specific underlying security. A fund may purchase futures contracts to gain exposure to increases in market value or sell futures contracts to protect against a decline in market value. Upon entering into a futures contract, a fund will segregate cash, cash equivalents or other appropriate liquid securities on its records in amounts sufficient to meet requirements. Subsequent payments (variation margin) are made or received daily, in cash, by a fund. The variation margin is equal to the daily change in the contract value and is recorded as unrealized gains and losses. A fund recognizes a realized gain or loss when the futures contract is closed or expires. Net realized and unrealized gains or losses occurring during the holding period of futures contracts are a component of net realized gain (loss) on futures contract transactions and change in net unrealized appreciation (depreciation) on futures contracts, respectively. One of the risks of entering into futures contracts is the possibility that the change in value of the contract may not correlate with the changes in value of the underlying securities. The fund's average notional exposure to interest rate risk derivative instruments held during the period was $25,119,252 futures contracts purchased and $11,772,294 futures contracts sold.
Value of Derivative Instruments as of July 31, 2021
| | | | | | | | | | | | | | |
| Asset Derivatives | Liability Derivatives |
| Type of Risk Exposure | Location on Statement of Assets and Liabilities | Value | Location on Statement of Assets and Liabilities | Value |
| Credit Risk | Receivable for variation margin on swap agreements* | — | | Payable for variation margin on swap agreements* | $ | 11,082 | |
| Foreign Currency Risk | Unrealized appreciation on forward foreign currency exchange contracts | $ | 440,845 | | Unrealized depreciation on forward foreign currency exchange contracts | 196,307 | |
| Interest Rate Risk | Receivable for variation margin on futures contracts* | 45,947 | Payable for variation margin on futures contracts* | — | |
| | $ | 486,792 | | | $ | 207,389 | |
*Included in the unrealized appreciation (depreciation) on futures contracts or centrally cleared swap agreements, as applicable, as reported in the Schedule of Investments.
Effect of Derivative Instruments on the Statement of Operations for the Year Ended July 31, 2021
| | | | | | | | | | | | | | |
| Net Realized Gain (Loss) | Change in Net Unrealized
Appreciation (Depreciation) |
| Type of Risk Exposure | Location on Statement of Operations | Value | Location on Statement of Operations | Value |
| Credit Risk | Net realized gain (loss) on swap agreement transactions | $ | 131,787 | | Change in net unrealized appreciation (depreciation) on swap agreements | $ | 66,854 | |
| Foreign Currency Risk | Net realized gain (loss) on forward foreign currency exchange contract transactions | (938,558) | | Change in net unrealized appreciation (depreciation) on forward foreign currency exchange contracts | 593,932 | |
| Interest Rate Risk | Net realized gain (loss) on futures contract transactions | 19,668 | | Change in net unrealized appreciation (depreciation) on futures contracts | 182,626 | |
| | $ | (787,103) | | | $ | 843,412 | |
8. Risk Factors
The value of the fund’s shares will go up and down, sometimes rapidly or unpredictably, based on the performance of the securities owned by the fund and other factors generally affecting the securities market. Market risks, including political, regulatory, economic and social developments, can affect the value of the fund’s investments. Natural disasters, public health emergencies, terrorism and other unforeseeable events may lead to increased market volatility and may have adverse long-term effects on world economies and markets generally.
The fund may invest in instruments that have variable or floating coupon rates based on the London Interbank Offered Rate (LIBOR). LIBOR is a benchmark interest rate intended to be representative of the rate at which certain major international banks lend to one another over short-terms. However, LIBOR is expected to be phased out and the transition process may lead to increased volatility or illiquidity in markets for instruments that rely on LIBOR. This could result in a change to the value of such instruments.
There are certain risks involved in investing in foreign securities. These risks include those resulting from political events (such as civil unrest, national elections and imposition of exchange controls), social and economic events (such as labor strikes and rising inflation), and natural disasters. Securities of foreign issuers may be less liquid and more volatile. Investing in emerging markets or a significant portion of assets in one country or region may accentuate these risks.
9. Federal Tax Information
The tax character of distributions paid during the years ended July 31, 2021 and July 31, 2020 were as follows:
| | | | | | | | |
| 2021 | 2020 |
| Distributions Paid From | | |
| Ordinary income | $ | 18,914,522 | | $ | 17,799,600 | |
| Long-term capital gains | $ | 26,785,769 | | $ | 90,481,055 | |
The book-basis character of distributions made during the year from net investment income or net realized gains may differ from their ultimate characterization for federal income tax purposes. These differences reflect the differing character of certain income items and net realized gains and losses for financial statement and tax purposes, and may result in reclassification among certain capital accounts on the financial statements.
As of period end, the federal tax cost of investments and the components of distributable earnings on a tax-basis were as follows:
| | | | | |
| Federal tax cost of investments | $ | 755,636,973 | |
| Gross tax appreciation of investments | $ | 207,689,640 | |
| Gross tax depreciation of investments | (8,097,115) | |
| Net tax appreciation (depreciation) of investments | 199,592,525 | |
| Net tax appreciation (depreciation) on derivatives and translation of assets and liabilities in foreign currencies | 209,302 | |
| Net tax appreciation (depreciation) | $ | 199,801,827 | |
| Other book-to-tax adjustments | $ | (524,208) | |
| Undistributed ordinary income | $ | 19,155,549 | |
| Accumulated long-term gains | $ | 47,772,782 | |
The difference between book-basis and tax-basis unrealized appreciation (depreciation) is attributable primarily to the tax deferral of losses on wash sales. Other book-to-tax adjustments are attributable primarily to the tax deferral of losses on straddle positions.
10. Investments in Affiliated Funds
The fund does not invest in an affiliated fund for the purpose of exercising management or control; however, investments by the fund within its investment strategy may represent a significant portion of an affiliated fund's net assets. As of period end, the fund owned 25% of the total outstanding shares of American Century STOXX U.S. Quality Value ETF.
11. Affiliated Fund Transactions
A summary of transactions for each affiliated fund for the period ended July 31, 2021 follows (amounts in thousands):
| | | | | | | | | | | | | | | | | | | | | | | | | | |
Affiliated Fund(1) | Beginning
Value | Purchase
Cost | Sales Cost | Change in Net
Unrealized
Appreciation
(Depreciation) | Ending
Value | Ending
Shares | Net Realized
Gain (Loss) | Distributions
Received(2) |
| American Century Diversified Corporate Bond ETF | $ | 28,680 | | — | | — | | $ | (61) | | $ | 28,619 | | 541 | | — | | $ | 889 | |
| American Century Focused Dynamic Growth ETF | 42,360 | | — | | $ | 19,263 | | 4,188 | | 27,285 | | 330 | | $ | 7,410 | | 4 | |
| American Century Focused Large Cap Value ETF | 23,269 | | $ | 13,082 | | — | | 7,287 | | 43,638 | | 712 | | — | | 524 | |
| American Century Quality Diversified International ETF | 28,262 | | 1,454 | | 5,218 | | 5,974 | | 30,472 | | 585 | | 838 | | 628 | |
| American Century STOXX U.S. Quality Growth ETF | 58,991 | | — | | 20,160 | | 8,528 | | 47,359 | | 649 | | 9,332 | | 122 | |
| American Century STOXX U.S. Quality Value ETF | 39,459 | | 8,448 | | — | | 15,084 | | 62,991 | | 1,241 | | — | | 888 | |
| Avantis Emerging Markets Equity ETF | 35,487 | | 1,993 | | 21,049 | | 4,249 | | 20,680 | | 314 | | 5,717 | | 558 | |
| Avantis International Equity ETF | 27,401 | | 1,583 | | 6,127 | | 7,815 | | 30,672 | | 482 | | 482 | | 610 | |
| Avantis International Small Cap Value ETF | 8,434 | | 187 | | 1,749 | | 3,330 | | 10,202 | | 156 | | 407 | | 219 | |
| Avantis U.S. Equity ETF | 56,954 | | 947 | | 13,601 | | 18,387 | | 62,687 | | 838 | | 4,748 | | 779 | |
| Avantis U.S. Small Cap Value ETF | 12,181 | | 5,443 | | 5,178 | | 7,084 | | 19,530 | | 266 | | 1,135 | | 218 | |
| $ | 361,478 | | $ | 33,137 | | $ | 92,345 | | $ | 81,865 | | $ | 384,135 | | 6,114 | | $ | 30,069 | | $ | 5,439 | |
(1)Investments are funds within the American Century Investments family of funds and are considered affiliated funds. Additional information and attributes of each affiliated fund are available at americancentury.com or avantisinvestors.com.
(2)Distributions received includes distributions from net investment income and from capital gains, if any.
| | | | | | | | | | | | | | | | | | | | | | | | | | | | | | | | | | | | | | | | | | | | | | | |
| For a Share Outstanding Throughout the Years Ended July 31 (except as noted) | | | | | | | |
| Per-Share Data | | | | Ratios and Supplemental Data | | |
| | | Income From Investment Operations: | Distributions From: | | | Ratio to Average Net Assets of: | | |
| | Net Asset Value, Beginning
of Period | Net Investment Income (Loss)(1) | Net
Realized and Unrealized Gain (Loss) | Total From Investment Operations | Net
Investment Income | Net
Realized
Gains | Total Distributions | Net Asset Value,
End of Period | Total Return(2) | Operating Expenses | Operating Expenses
(before expense waiver) | Net
Investment Income
(Loss) | Net
Investment Income
(Loss) (before expense waiver) | Portfolio Turnover
Rate | Net Assets,
End of Period (in thousands) |
| Investor Class | | | | | | | | | | | | | |
| 2021 | $6.25 | 0.07 | 1.43 | 1.50 | (0.07) | (0.28) | (0.35) | $7.40 | 24.69% | 0.73% | 1.11% | 1.01% | 0.63% | 48% | $332,602 | |
| 2020 | $6.57 | 0.07 | 0.46 | 0.53 | (0.08) | (0.77) | (0.85) | $6.25 | 8.42% | 0.84% | 1.11% | 1.13% | 0.86% | 99% | $297,963 | |
| 2019 | $7.02 | 0.09 | 0.13 | 0.22 | (0.10) | (0.57) | (0.67) | $6.57 | 4.36% | 1.06% | 1.11% | 1.42% | 1.37% | 68% | $314,567 | |
2018(3) | $7.51 | 0.06 | 0.16 | 0.22 | (0.06) | (0.65) | (0.71) | $7.02 | 3.22% | 1.09%(4) | 1.09%(4) | 1.25%(4) | 1.25%(4) | 55% | $444,259 | |
| 2017 | $6.67 | 0.08 | 0.93 | 1.01 | (0.09) | (0.08) | (0.17) | $7.51 | 15.42% | 1.08% | 1.08% | 1.20% | 1.20% | 81% | $523,241 | |
| 2016 | $6.97 | 0.08 | 0.14 | 0.22 | (0.07) | (0.45) | (0.52) | $6.67 | 3.49% | 1.07% | 1.07% | 1.22% | 1.22% | 82% | $574,968 | |
| I Class | | | | | | | | | | | | | |
| 2021 | $6.25 | 0.08 | 1.44 | 1.52 | (0.09) | (0.28) | (0.37) | $7.40 | 24.93% | 0.53% | 0.91% | 1.21% | 0.83% | 48% | $71,639 | |
| 2020 | $6.57 | 0.08 | 0.46 | 0.54 | (0.09) | (0.77) | (0.86) | $6.25 | 8.64% | 0.64% | 0.91% | 1.33% | 1.06% | 99% | $62,820 | |
| 2019 | $7.02 | 0.11 | 0.13 | 0.24 | (0.12) | (0.57) | (0.69) | $6.57 | 4.55% | 0.86% | 0.91% | 1.62% | 1.57% | 68% | $76,202 | |
2018(3) | $7.52 | 0.07 | 0.15 | 0.22 | (0.07) | (0.65) | (0.72) | $7.02 | 3.23% | 0.89%(4) | 0.89%(4) | 1.45%(4) | 1.45%(4) | 55% | $125,345 | |
| 2017 | $6.68 | 0.10 | 0.92 | 1.02 | (0.10) | (0.08) | (0.18) | $7.52 | 15.64% | 0.88% | 0.88% | 1.40% | 1.40% | 81% | $135,618 | |
| 2016 | $6.97 | 0.09 | 0.15 | 0.24 | (0.08) | (0.45) | (0.53) | $6.68 | 3.86% | 0.87% | 0.87% | 1.42% | 1.42% | 82% | $213,502 | |
| | | | | | | | | | | | | | | | | | | | | | | | | | | | | | | | | | | | | | | | | | | | | | | |
| For a Share Outstanding Throughout the Years Ended July 31 (except as noted) | | | | | | | |
| Per-Share Data | | | | Ratios and Supplemental Data | | |
| | | Income From Investment Operations: | Distributions From: | | | Ratio to Average Net Assets of: | | |
| | Net Asset Value, Beginning
of Period | Net Investment Income (Loss)(1) | Net
Realized and Unrealized Gain (Loss) | Total From Investment Operations | Net
Investment Income | Net
Realized
Gains | Total Distributions | Net Asset Value,
End of Period | Total Return(2) | Operating Expenses | Operating Expenses
(before expense waiver) | Net
Investment Income
(Loss) | Net
Investment Income
(Loss) (before expense waiver) | Portfolio Turnover
Rate | Net Assets,
End of Period (in thousands) |
| A Class |
| 2021 | $6.22 | 0.05 | 1.44 | 1.49 | (0.06) | (0.28) | (0.34) | $7.37 | 24.48% | 0.98% | 1.36% | 0.76% | 0.38% | 48% | $342,835 | |
| 2020 | $6.55 | 0.05 | 0.46 | 0.51 | (0.07) | (0.77) | (0.84) | $6.22 | 8.04% | 1.09% | 1.36% | 0.88% | 0.61% | 99% | $288,517 | |
| 2019 | $7.00 | 0.08 | 0.13 | 0.21 | (0.09) | (0.57) | (0.66) | $6.55 | 4.11% | 1.31% | 1.36% | 1.17% | 1.12% | 68% | $304,644 | |
2018(3) | $7.49 | 0.05 | 0.16 | 0.21 | (0.05) | (0.65) | (0.70) | $7.00 | 3.04% | 1.34%(4) | 1.34%(4) | 1.00%(4) | 1.00%(4) | 55% | $347,290 | |
| 2017 | $6.66 | 0.07 | 0.91 | 0.98 | (0.07) | (0.08) | (0.15) | $7.49 | 15.01% | 1.33% | 1.33% | 0.95% | 0.95% | 81% | $398,519 | |
| 2016 | $6.95 | 0.06 | 0.15 | 0.21 | (0.05) | (0.45) | (0.50) | $6.66 | 3.38% | 1.32% | 1.32% | 0.97% | 0.97% | 82% | $456,392 | |
| C Class | | | | | | | | | | | | | |
| 2021 | $6.10 | —(5) | 1.39 | 1.39 | (0.02) | (0.28) | (0.30) | $7.19 | 23.55% | 1.73% | 2.11% | 0.01% | (0.37)% | 48% | $28,683 | |
| 2020 | $6.45 | 0.01 | 0.45 | 0.46 | (0.04) | (0.77) | (0.81) | $6.10 | 7.18% | 1.84% | 2.11% | 0.13% | (0.14)% | 99% | $39,523 | |
| 2019 | $6.91 | 0.03 | 0.12 | 0.15 | (0.04) | (0.57) | (0.61) | $6.45 | 3.30% | 2.06% | 2.11% | 0.42% | 0.37% | 68% | $48,515 | |
2018(3) | $7.42 | 0.01 | 0.16 | 0.17 | (0.03) | (0.65) | (0.68) | $6.91 | 2.46% | 2.09%(4) | 2.09%(4) | 0.25%(4) | 0.25%(4) | 55% | $80,205 | |
| 2017 | $6.60 | 0.01 | 0.92 | 0.93 | (0.03) | (0.08) | (0.11) | $7.42 | 14.29% | 2.08% | 2.08% | 0.20% | 0.20% | 81% | $97,269 | |
| 2016 | $6.91 | 0.01 | 0.15 | 0.16 | (0.02) | (0.45) | (0.47) | $6.60 | 2.55% | 2.07% | 2.07% | 0.22% | 0.22% | 82% | $106,604 | |
| | | | | | | | | | | | | | | | | | | | | | | | | | | | | | | | | | | | | | | | | | | | | | | |
| For a Share Outstanding Throughout the Years Ended July 31 (except as noted) | | | | | | | |
| Per-Share Data | | | | Ratios and Supplemental Data | | |
| | | Income From Investment Operations: | Distributions From: | | | Ratio to Average Net Assets of: | | |
| | Net Asset Value, Beginning
of Period | Net Investment Income (Loss)(1) | Net
Realized and Unrealized Gain (Loss) | Total From Investment Operations | Net
Investment Income | Net
Realized
Gains | Total Distributions | Net Asset Value,
End of Period | Total Return(2) | Operating Expenses | Operating Expenses
(before expense waiver) | Net
Investment Income
(Loss) | Net
Investment Income
(Loss) (before expense waiver) | Portfolio Turnover
Rate | Net Assets,
End of Period (in thousands) |
| R Class | | | | | | | | | | | | | |
| 2021 | $6.17 | 0.03 | 1.43 | 1.46 | (0.04) | (0.28) | (0.32) | $7.31 | 24.23% | 1.23% | 1.61% | 0.51% | 0.13% | 48% | $38,353 | |
| 2020 | $6.51 | 0.04 | 0.45 | 0.49 | (0.06) | (0.77) | (0.83) | $6.17 | 7.77% | 1.34% | 1.61% | 0.63% | 0.36% | 99% | $35,807 | |
| 2019 | $6.96 | 0.06 | 0.13 | 0.19 | (0.07) | (0.57) | (0.64) | $6.51 | 3.88% | 1.56% | 1.61% | 0.92% | 0.87% | 68% | $39,114 | |
2018(3) | $7.46 | 0.03 | 0.16 | 0.19 | (0.04) | (0.65) | (0.69) | $6.96 | 2.74% | 1.59%(4) | 1.59%(4) | 0.75%(4) | 0.75%(4) | 55% | $43,590 | |
| 2017 | $6.63 | 0.05 | 0.92 | 0.97 | (0.06) | (0.08) | (0.14) | $7.46 | 14.83% | 1.58% | 1.58% | 0.70% | 0.70% | 81% | $50,395 | |
| 2016 | $6.93 | 0.05 | 0.13 | 0.18 | (0.03) | (0.45) | (0.48) | $6.63 | 2.98% | 1.57% | 1.57% | 0.72% | 0.72% | 82% | $53,902 | |
| R5 Class | | | | | | | | | | | | | |
| 2021 | $6.25 | 0.08 | 1.45 | 1.53 | (0.09) | (0.28) | (0.37) | $7.41 | 25.10% | 0.53% | 0.91% | 1.21% | 0.83% | 48% | $7,768 | |
| 2020 | $6.58 | 0.08 | 0.45 | 0.53 | (0.09) | (0.77) | (0.86) | $6.25 | 8.46% | 0.64% | 0.91% | 1.33% | 1.06% | 99% | $6,960 | |
| 2019 | $7.03 | 0.11 | 0.13 | 0.24 | (0.12) | (0.57) | (0.69) | $6.58 | 4.56% | 0.86% | 0.91% | 1.62% | 1.57% | 68% | $7,200 | |
2018(3) | $7.52 | 0.08 | 0.15 | 0.23 | (0.07) | (0.65) | (0.72) | $7.03 | 3.38% | 0.89%(4) | 0.89%(4) | 1.45%(4) | 1.45%(4) | 55% | $6,885 | |
2017(6) | $6.93 | 0.07 | 0.58 | 0.65 | (0.06) | — | (0.06) | $7.52 | 9.43% | 0.88%(4) | 0.88%(4) | 1.46%(4) | 1.46%(4) | 81%(7) | $5 | |
| | | | | | | | | | | | | | | | | | | | | | | | | | | | | | | | | | | | | | | | | | | | | | | |
| For a Share Outstanding Throughout the Years Ended July 31 (except as noted) | | | | | | | |
| Per-Share Data | | | | Ratios and Supplemental Data | | |
| | | Income From Investment Operations: | Distributions From: | | | Ratio to Average Net Assets of: | | |
| | Net Asset Value, Beginning
of Period | Net Investment Income (Loss)(1) | Net
Realized and Unrealized Gain (Loss) | Total From Investment Operations | Net
Investment Income | Net
Realized
Gains | Total Distributions | Net Asset Value,
End of Period | Total Return(2) | Operating Expenses | Operating Expenses
(before expense waiver) | Net
Investment Income
(Loss) | Net
Investment Income
(Loss) (before expense waiver) | Portfolio Turnover
Rate | Net Assets,
End of Period (in thousands) |
| R6 Class | | | | | | | | | | | | |
| 2021 | $6.24 | 0.09 | 1.44 | 1.53 | (0.10) | (0.28) | (0.38) | $7.39 | 25.17% | 0.38% | 0.76% | 1.36% | 0.98% | 48% | $134,426 | |
| 2020 | $6.56 | 0.09 | 0.46 | 0.55 | (0.10) | (0.77) | (0.87) | $6.24 | 8.82% | 0.49% | 0.76% | 1.48% | 1.21% | 99% | $121,246 | |
| 2019 | $7.01 | 0.12 | 0.13 | 0.25 | (0.13) | (0.57) | (0.70) | $6.56 | 4.72% | 0.71% | 0.76% | 1.77% | 1.72% | 68% | $95,697 | |
2018(3) | $7.51 | 0.08 | 0.15 | 0.23 | (0.08) | (0.65) | (0.73) | $7.01 | 3.35% | 0.74%(4) | 0.74%(4) | 1.60%(4) | 1.60%(4) | 55% | $111,937 | |
| 2017 | $6.67 | 0.11 | 0.93 | 1.04 | (0.12) | (0.08) | (0.20) | $7.51 | 15.83% | 0.73% | 0.73% | 1.55% | 1.55% | 81% | $85,623 | |
| 2016 | $6.97 | 0.10 | 0.14 | 0.24 | (0.09) | (0.45) | (0.54) | $6.67 | 3.86% | 0.72% | 0.72% | 1.57% | 1.57% | 82% | $71,340 | |
| | |
| Notes to Financial Highlights |
(1)Computed using average shares outstanding throughout the period.
(2)Total returns are calculated based on the net asset value of the last business day and do not reflect applicable sales charges, if any. Total returns for periods less than one year are not annualized.
(3)December 1, 2017 through July 31, 2018. The fund's fiscal year end was changed from November 30 to July 31, resulting in an eight-month annual reporting period. For the years before July 31, 2018, the fund's fiscal year end was November 30.
(4)Annualized.
(5)Per-share amount was less than $0.005.
(6)April 10, 2017 (commencement of sale) through November 30, 2017.
(7)Portfolio turnover is calculated at the fund level. Percentage indicated was calculated for the year ended November 30, 2017.
See Notes to Financial Statements.
| | |
| Report of Independent Registered Public Accounting Firm |
To the Shareholders and the Board of Directors of American Century Strategic Asset Allocations, Inc.:
Opinion on the Financial Statements and Financial Highlights
We have audited the accompanying statement of assets and liabilities, including the schedule of investments, of Strategic Allocation: Moderate Fund (the “Fund”), one of the funds constituting the American Century Strategic Asset Allocations, Inc., as of July 31, 2021, the related statement of operations for the year then ended, the statements of changes in net assets for each of the two years in the period then ended, the financial highlights for each of the three years in the period then ended, the period December 1, 2017 through July 31, 2018 and for the years ended November 30, 2017 and 2016, and the related notes. In our opinion, the financial statements and financial highlights present fairly, in all material respects, the financial position of Strategic Allocation: Moderate Fund of the American Century Strategic Asset Allocations, Inc. as of July 31, 2021, and the results of its operations for the year then ended, the changes in its net assets for each of the two years in the period then ended, and the financial highlights for each of the three years in the period then ended, the period December 1, 2017 through July 31, 2018 and for the years ended November 30, 2017 and 2016, in conformity with accounting principles generally accepted in the United States of America.
Basis for Opinion
These financial statements and financial highlights are the responsibility of the Fund's management. Our responsibility is to express an opinion on the Fund’s financial statements and financial highlights based on our audits. We are a public accounting firm registered with the Public Company Accounting Oversight Board (United States) (PCAOB) and are required to be independent with respect to the Fund in accordance with the U.S. federal securities laws and the applicable rules and regulations of the Securities and Exchange Commission and the PCAOB.
We conducted our audits in accordance with the standards of the PCAOB. Those standards require that we plan and perform the audit to obtain reasonable assurance about whether the financial statements and financial highlights are free of material misstatement, whether due to error or fraud. The Fund is not required to have, nor were we engaged to perform, an audit of its internal control over financial reporting. As part of our audits we are required to obtain an understanding of internal control over financial reporting but not for the purpose of expressing an opinion on the effectiveness of the Fund’s internal control over financial reporting. Accordingly, we express no such opinion.
Our audits included performing procedures to assess the risks of material misstatement of the financial statements and financial highlights, whether due to error or fraud, and performing procedures that respond to those risks. Such procedures included examining, on a test basis, evidence regarding the amounts and disclosures in the financial statements and financial highlights. Our audits also included evaluating the accounting principles used and significant estimates made by management, as well as evaluating the overall presentation of the financial statements and financial highlights. Our procedures included confirmation of securities owned as of July 31, 2021, by correspondence with the custodian and brokers; when replies were not received from brokers, we performed other auditing procedures. We believe that our audits provide a reasonable basis for our opinion.
DELOITTE & TOUCHE LLP
Kansas City, Missouri
September 15, 2021
We have served as the auditor of one or more American Century investment companies since 1997.
The Board of Directors
The individuals listed below serve as directors of the funds. Each director will continue to serve in this capacity until death, retirement, resignation or removal from office. The board has adopted a mandatory retirement age for directors who are not “interested persons,” as that term is defined in the Investment Company Act (independent directors). Independent directors shall retire by December 31 of the year in which they reach their 75th birthday.
Mr. Thomas is an “interested person” because he currently serves as President and Chief Executive Officer of American Century Companies, Inc. (ACC), the parent company of American Century Investment Management, Inc. (ACIM or the advisor). The other directors (more than three-fourths of the total number) are independent. They are not employees, directors or officers of, and have no financial interest in, ACC or any of its wholly owned, direct or indirect, subsidiaries, including ACIM, American Century Investment Services, Inc. (ACIS) and American Century Services, LLC (ACS), and they do not have any other affiliations, positions or relationships that would cause them to be considered “interested persons” under the Investment Company Act. The directors serve in this capacity for seven (in the case of Jonathan S. Thomas, 16; and Stephen E. Yates, 8) registered investment companies in the American Century Investments family of funds.
The following table presents additional information about the directors. The mailing address for each director is 4500 Main Street, Kansas City, Missouri 64111.
| | | | | | | | | | | | | | | | | |
Name
(Year of Birth) | Position(s) Held with Funds | Length of Time Served | Principal Occupation(s) During Past 5 Years | Number of American Century Portfolios Overseen by Director | Other Directorships Held During Past 5 Years |
| Independent Directors | | |
| Thomas W. Bunn (1953) | Director | Since 2017 | Retired | 72 | SquareTwo Financial; Barings (formerly Babson Capital Funds Trust) (2013 to 2016) |
Chris H. Cheesman
(1962)
| Director | Since 2019
| Retired. Senior Vice President & Chief Audit Executive, AllianceBernstein (1999 to 2018) | 72 | None |
Barry Fink
(1955) | Director | Since 2012 (independent since 2016) | Retired | 72 | None |
Rajesh K. Gupta
(1960)
| Director | Since 2019
| Partner Emeritus, SeaCrest Investment Management and SeaCrest Wealth Management (2019 to Present); Chief Executive Officer and Chief Investment Officer, SeaCrest Investment Management (2006 to 2019); Chief Executive Officer and Chief Investment Officer, SeaCrest Wealth Management (2008 to 2019) | 72 | None |
| | | | | | | | | | | | | | | | | |
Name
(Year of Birth) | Position(s) Held with Funds | Length of Time Served | Principal Occupation(s) During Past 5 Years | Number of American Century Portfolios Overseen by Director | Other Directorships Held During Past 5 Years |
| Independent Directors | | |
Lynn Jenkins
(1963)
| Director | Since 2019
| Consultant, LJ Strategies (2019 to present); United States Representative, U.S. House of Representatives (2009 to 2018) | 72 | MGP Ingredients, Inc. (2019 to 2021) |
Jan M. Lewis
(1957) | Director | Since 2011 | Retired | 72 | None |
John R. Whitten
(1946) | Director | Since 2008 | Retired | 72 | Onto Innovation Inc. (2019 to 2020); Rudolph Technologies, Inc. (2006 to 2019) |
Stephen E. Yates
(1948) | Director and Chairman of the Board | Since 2012 (Chairman since 2018) | Retired | 103 | None |
| Interested Director | |
Jonathan S. Thomas
(1963) | Director | Since 2007 | President and Chief Executive Officer, ACC (2007 to present). Also serves as Chief Executive Officer, ACS; Director, ACC and other ACC subsidiaries | 141 | None |
The Statement of Additional Information has additional information about the fund's directors and is available without charge, upon request, by calling 1-800-345-2021.
Officers
The following table presents certain information about the executive officers of the funds. Each officer serves as an officer for each of the 16 (in the case of Robert J. Leach, 15) investment companies in the American Century family of funds. No officer is compensated for his or her service as an officer of the funds. The listed officers are interested persons of the funds and are appointed or re-appointed on an annual basis. The mailing address for each officer listed below is 4500 Main Street, Kansas City, Missouri 64111.
| | | | | | | | |
Name
(Year of Birth) | Offices with the Funds | Principal Occupation(s) During the Past Five Years |
Patrick Bannigan
(1965) | President since 2019 | Executive Vice President and Director, ACC (2012 to present); Chief Financial Officer, Chief Accounting Officer and Treasurer, ACC (2015 to present). Also serves as President, ACS; Vice President, ACIM; Chief Financial Officer, Chief Accounting Officer and/or Director, ACIM, ACS and other ACC subsidiaries |
R. Wes Campbell
(1974) | Chief Financial Officer and Treasurer since 2018 | Vice President, ACS, (2020 to present); Investment Operations and Investment Accounting, ACS (2000 to present) |
Amy D. Shelton
(1964) | Chief Compliance Officer and Vice President since 2014 | Chief Compliance Officer, American Century funds, (2014 to present); Chief Compliance Officer, ACIM (2014 to present); Chief Compliance Officer, ACIS (2009 to present). Also serves as Vice President, ACIS |
Charles A. Etherington
(1957) | General Counsel since 2007 and Senior Vice President since 2006 | Attorney, ACC (1994 to present); Vice President, ACC (2005 to present); General Counsel, ACC (2007 to present). Also serves as General Counsel, ACIM, ACS, ACIS and other ACC subsidiaries; and Senior Vice President, ACIM and ACS |
C. Jean Wade
(1964) | Vice President since 2012 | Senior Vice President, ACS (2017 to present); Vice President, ACS (2000 to 2017) |
Robert J. Leach
(1966) | Vice President since 2006 | Vice President, ACS (2000 to present) |
David H. Reinmiller
(1963) | Vice President since 2000 | Attorney, ACC (1994 to present). Also serves as Vice President, ACIM and ACS |
Ward D. Stauffer
(1960) | Secretary since 2005 | Attorney, ACC (2003 to present) |
| | |
| Approval of Management Agreement |
At a meeting held on June 30, 2021, the Fund’s Board of Directors (the "Board") unanimously approved the renewal of the management agreement pursuant to which American Century Investment Management, Inc. (the “Advisor”) acts as the investment advisor for the Fund. Under Section 15(c) of the Investment Company Act, contracts for investment advisory services are required to be reviewed, evaluated, and approved by a majority of a fund’s directors (the “Directors”), including a majority of the independent Directors, each year.
Prior to its consideration of the renewal of the management agreement, the Directors requested and reviewed extensive data and information compiled by the Advisor and certain independent providers of evaluation data concerning the Fund and the services provided to the Fund by the Advisor. This review was in addition to the oversight and evaluation undertaken by the Board and its committees on a continual basis and the information received was supplemental to the extensive information that the Board and its committees receive and consider throughout the year.
In connection with its consideration of the renewal of the management agreement, the Board’s review and evaluation of the services provided by the Advisor and its affiliates included, but was not limited to, the following:
•the nature, extent, and quality of investment management, shareholder services, and other services provided and to be provided to the Fund including without limitation portfolio management and trading services, shareholder and intermediary services, compliance and legal services, fund accounting and financial reporting, and fund share distribution;
•the wide range of other programs and services provided and to be provided to the Fund and its shareholders on a routine and non-routine basis;
•the Fund’s investment performance, including data comparing the Fund's performance to appropriate benchmarks and/or a peer group of other mutual funds with similar investment objectives and strategies;
•the cost of owning the Fund compared to the cost of owning similar funds;
•the compliance policies, procedures, and regulatory experience of the Advisor and the Fund's service providers;
•the Advisor’s strategic plans, COVID-19 pandemic response, vendor management practices, and social justice initiatives;
•the Advisor’s business continuity plans and cyber security practices;
•financial data showing the cost of services provided to the Fund, the profitability of the Fund to the Advisor, and the overall profitability of the Advisor;
•possible economies of scale associated with the Advisor’s management of the Fund and other accounts;
•services provided and charges to the Advisor's other investment management clients;
•acquired fund fees and expenses;
•payments and practices in connection with financial intermediaries holding shares of the Fund and the services provided by intermediaries in connection therewith; and
•possible collateral benefits to the Advisor from the management of the Fund.
The Board held two meetings to consider the renewal. The independent Directors also met in private session three times to review and discuss the information provided in response to their request. The independent Directors held active discussions with the Advisor regarding the renewal of the management agreement, requesting supplemental information, and reviewing information provided by the Advisor in response thereto. The independent Directors had the benefit of the advice of their independent counsel throughout the process.
Factors Considered
The Directors considered all of the information provided by the Advisor, the independent data providers, and independent counsel in connection with the approval. They determined that the information was sufficient for them to evaluate the management agreement for the Fund. In connection with their review, the Directors did not identify any single factor as being all-important or controlling, and each Director may have attributed different levels of importance to different factors. In deciding to renew the management agreement, the Board based its decision on a number of factors, including without limitation the following:
Nature, Extent and Quality of Services — Generally. Under the management agreement, the Advisor is responsible for providing or arranging for all services necessary for the operation of the Fund. The Board noted that the Advisor provides or arranges at its own expense a wide variety of services which include the following:
•constructing and designing the Fund
•portfolio research and security selection
•initial capitalization/funding
•securities trading
•Fund administration
•custody of Fund assets
•daily valuation of the Fund’s portfolio
•liquidity monitoring and management
•risk management, including cyber security
•shareholder servicing and transfer agency, including shareholder confirmations, recordkeeping, and communications
•legal services (except the independent Directors’ counsel)
•regulatory and portfolio compliance
•financial reporting
•marketing and distribution (except amounts paid by the Fund under Rule 12b-1 plans)
The Board noted that many of these services have expanded over time in terms of both quantity and complexity in response to shareholder demands, competition in the industry, changing distribution channels, and the changing regulatory environment.
Investment Management Services. The nature of the investment management services provided to the Fund is quite complex and allows Fund shareholders access to professional money management, instant diversification of their investments within an asset class, the opportunity to easily diversify among asset classes by investing in or exchanging among various American Century Investments funds, and liquidity. In evaluating investment performance, the Board expects the Advisor to manage the Fund in accordance with its investment objectives and approved strategies. Further, the Directors recognize that the Advisor has an obligation to monitor trading activities, and in particular to seek the best execution of fund trades, and to evaluate the use of and payment for research. In providing these services, the Advisor utilizes teams of investment professionals (portfolio managers, analysts, research assistants, and securities traders) who require extensive information technology, research, training, compliance, and other systems to conduct their business. The Board, directly and through its Fund Performance Review Committee, provides oversight of the investment performance process. It regularly reviews investment performance information for the Fund, together with comparative information for appropriate benchmarks and/or peer groups of similarly-managed funds, over different time horizons. The Directors also review investment performance information during the management agreement renewal process. If performance concerns are identified, the Fund receives special reviews until performance improves, during which the Board discusses with the Advisor the reasons for such results (e.g., market conditions, security selection) and any efforts being undertaken to improve performance. The Fund’s performance was above its benchmark for the one-, three-, five-, and ten-year periods reviewed by the Board. The Board found the investment management services provided by the Advisor to the Fund to be satisfactory and consistent with the management agreement.
Shareholder and Other Services. Under the management agreement, the Advisor provides the Fund with a comprehensive package of transfer agency, shareholder, and other services. The Board, directly and through its various committees, regularly reviews reports and evaluations of such services at its regular meetings. These reports include, but are not limited to, information regarding the operational efficiency and accuracy of the shareholder and transfer agency services provided, staffing levels, shareholder satisfaction, technology support (including cyber security), new products and services offered to Fund shareholders, securities trading activities, portfolio valuation services, auditing services, and legal and operational compliance activities. The Board found the services provided by the Advisor to the Fund under the management agreement to be competitive and of high quality.
Costs of Services and Profitability. The Advisor provides detailed information concerning its cost of providing various services to the Fund, its profitability in managing the Fund (pre- and post-distribution), its overall profitability, and its financial condition. The Directors have reviewed with the Advisor the methodology used to prepare this financial information. This information is considered in evaluating the Advisor’s financial condition, its ability to continue to provide services under the management agreement, and the reasonableness of the current management fee. The Board concluded that the Advisor’s profits were reasonable in light of the services provided to the Fund.
Ethics. The Board generally considers the Advisor’s commitment to providing quality services to shareholders and to conducting its business ethically. They noted that the Advisor’s practices generally meet or exceed industry best practices.
Economies of Scale. The Board also reviewed information provided by the Advisor regarding the possible existence of economies of scale in connection with the management of the Fund. The Board concluded that economies of scale are difficult to measure and predict with precision, especially on a fund-by-fund basis. The Board concluded that the Advisor is sharing economies of scale, to the extent they exist, through its competitive fee structure, offering competitive fees from fund inception, and through reinvestment in its business, infrastructure, investment capabilities and initiatives to provide shareholders additional content and services.
Comparison to Other Funds’ Fees. The management agreement provides that the Fund pays the Advisor a single, all-inclusive (or unified) management fee for providing all services necessary for the management and operation of the Fund, other than brokerage expenses, expenses attributable to short sales, taxes, interest, extraordinary expenses, fees and expenses of the Fund’s independent Directors (including their independent legal counsel), and expenses incurred in connection with the provision of shareholder services and distribution services under a plan adopted pursuant to Rule 12b-1 under the Investment Company Act. Under the unified fee structure, the Advisor is responsible for providing all investment advisory, custody, audit, administrative, compliance, recordkeeping, marketing and shareholder services, or arranging and supervising third parties to provide such services. By contrast, most other funds are charged a variety of fees, including an investment advisory fee, a transfer agency fee, an administrative fee, distribution charges, and other expenses. Other than their investment advisory fees and any applicable Rule 12b-1 distribution fees, all other components of the total fees charged by these other funds may be increased without shareholder approval. The Board believes the unified fee structure is a benefit to Fund shareholders because it clearly discloses to shareholders the cost of owning Fund shares, and, since the unified fee cannot be increased without a vote of Fund shareholders, it shifts to the Advisor the risk of increased costs of operating the Fund and provides a direct incentive to minimize administrative inefficiencies. Part of the Board’s analysis of fee levels involves reviewing certain evaluative data compiled by an independent provider comparing the Fund’s unified fee to the total expense ratios of its peers. The unified fee charged to shareholders of the Fund was above the median of the total expense ratios of the Fund’s peer expense universe. In addition, the Board reviewed the Fund’s position relative to the narrower set of its expense group peers. The Board and the Advisor agreed to a temporary reduction of the Fund's fee schedule that should have the effect of lowering the Fund's total expense ratio by approximately 0.03% (e.g., the Investor Class total expense ratio will be reduced from 0.86% to 0.83%), for at least one year, beginning August 1, 2021. The Board concluded that the management fee paid by the Fund to the Advisor under the management agreement is reasonable in light of the services provided to the Fund.
Comparison to Fees and Services Provided to Other Clients of the Advisor. The Board also requested and received information from the Advisor concerning the nature of the services, fees, costs, and profitability of its advisory services to advisory clients other than the Fund. They observed that these varying types of client accounts require different services and involve different regulatory and entrepreneurial risks than the management of the Fund. The Board analyzed this information and concluded that the fees charged and services provided to the Fund were reasonable by comparison.
Payments to Intermediaries. The Directors also requested and received a description of payments made to intermediaries by the Fund and the Advisor and services provided in response thereto. These payments include various payments made by the Fund or the Advisor to different types of intermediaries and recordkeepers for distribution and service activities provided for the Fund. The Directors reviewed such information and received representations from the Advisor that all such payments by the Fund were made pursuant to the Fund's Rule 12b-1 Plan and that all such payments by the Advisor were made from the Advisor’s resources and reasonable profits. The Board found such payments to be reasonable in scope and purpose.
Collateral or “Fall-Out” Benefits Derived by the Advisor. The Board considered the possible existence of collateral benefits the Advisor may receive as a result of its relationship with the Fund. They concluded that the Advisor’s primary business is managing funds and it generally does not use fund or shareholder information to generate profits in other lines of business, and therefore does not derive any significant collateral benefits from them. To the extent there are potential collateral benefits, the Board has been advised and has taken this into consideration in its review of the management contract with the Fund. The Board noted that additional assets from other clients may offer the Advisor some benefit from increased leverage with service providers and counterparties. Additionally, the Advisor may receive proprietary research from broker-dealers that execute fund portfolio transactions, which the Board concluded is likely to benefit other clients of the Advisor, as well as Fund shareholders. The Board also determined that the Advisor is able to provide investment management services to certain clients other than the Fund, at least in part, due to its existing infrastructure built to serve the fund complex. The Board concluded that appropriate allocation methodologies had been employed to assign resources and the cost of those resources to these other clients.
Existing Relationship. The Board also considered whether there was any reason for not continuing the existing arrangement with the Advisor. In this regard, the Board was mindful of the potential disruptions of the Fund’s operations and various risks, uncertainties, and other effects that could occur as a result of a decision not to continue such relationship. In particular, the Board recognized that most shareholders have invested in the Fund on the strength of the Advisor’s industry standing and reputation and in the expectation that the Advisor will have a continuing role in providing advisory services to the Fund.
Conclusion of the Directors. As a result of this process, the Board, including all of the independent Directors, taking into account all of the factors discussed above and the information provided by the Advisor and others in connection with its review and throughout the year, determined that the management fee is fair and reasonable in light of the services provided and that the investment management agreement between the Fund and the Advisor should be renewed.
| | |
| Liquidity Risk Management Program |
The Fund has adopted a liquidity risk management program (the “program”). The Fund’s Board of Directors (the "Board") has designated American Century Investment Management, Inc. (“ACIM”) as the administrator of the program. Personnel of ACIM or its affiliates conduct the day-to-day operation of the program pursuant to policies and procedures administered by those members of the ACIM’s Investment Oversight Committee who are members of the ACIM’s Investment Management and Global Analytics departments.
Under the program, ACIM manages the Fund’s liquidity risk, which is the risk that the Fund could not meet shareholder redemption requests without significant dilution of remaining shareholders’ interests in the Fund. This risk is managed by monitoring the degree of liquidity of the Fund’s investments, limiting the amount of the Fund’s illiquid investments, and utilizing various risk management tools and facilities available to the Fund for meeting shareholder redemptions, among other means. ACIM’s process of determining the degree of liquidity of the Fund’s investments is supported by one or more third-party liquidity assessment vendors.
The Board reviewed a report prepared by ACIM regarding the operation and effectiveness of the program for the period January 1, 2020 through December 31, 2020. No significant liquidity events impacting the Fund were noted in the report. In addition, ACIM provided its assessment that the program had been effective in managing the Fund’s liquidity risk.
Retirement Account Information
As required by law, distributions you receive from certain retirement accounts are subject to federal income tax withholding, unless you elect not to have withholding apply*. Tax will be withheld on the total amount withdrawn even though you may be receiving amounts that are not subject to withholding, such as nondeductible contributions. In such case, excess amounts of withholding could occur. You may adjust your withholding election so that a greater or lesser amount will be withheld.
If you don’t want us to withhold on this amount, you must notify us to not withhold the federal income tax. You may notify us in writing or in certain situations by telephone or through other electronic means. For systematic withdrawals, your withholding election will remain in effect until revoked or changed by filing a new election. You have the right to revoke your election at any time and change your withholding percentage for future distributions.
Remember, even if you elect not to have income tax withheld, you are liable for paying income tax on the taxable portion of your withdrawal. If you elect not to have income tax withheld or you don’t have enough income tax withheld, you may be responsible for payment of estimated tax. You may incur penalties under the estimated tax rules if your withholding and estimated tax payments are not sufficient. You can reduce or defer the income tax on a distribution by directly or indirectly rolling such distribution over to another IRA or eligible plan. You should consult your tax advisor for additional information.
State tax will be withheld if, at the time of your distribution, your address is within one of the mandatory withholding states and you have federal income tax withheld (or as otherwise required by state law). State taxes will be withheld from your distribution in accordance with the respective state rules.
*Some 403(b), 457 and qualified retirement plan distributions may be subject to 20% mandatory withholding, as they are subject to special tax and withholding rules. Your plan administrator or plan sponsor is required to provide you with a special tax notice explaining those rules at the time you request a distribution. If applicable, federal and/or state taxes may be withheld from your distribution amount.
Proxy Voting Policies
A description of the policies that the fund's investment advisor uses in exercising the voting rights associated with the securities purchased and/or held by the fund is available without charge, upon request, by calling 1-800-345-2021. It is also available on American Century Investments’ website at americancentury.com/proxy and on the Securities and Exchange Commission’s website at sec.gov. Information regarding how the investment advisor voted proxies relating to portfolio securities during the most recent 12-month period ended June 30 is available on americancentury.com/proxy. It is also available at sec.gov.
Quarterly Portfolio Disclosure
The fund files its complete schedule of portfolio holdings with the Securities and Exchange
Commission (SEC) for the first and third quarters of each fiscal year as an exhibit to its reports on
Form N-PORT. These portfolio holdings are available on the fund's website at
americancentury.com and, upon request, by calling 1-800-345-2021. The fund’s Form N-PORT
reports are available on the SEC’s website at sec.gov.
Other Tax Information
The following information is provided pursuant to provisions of the Internal Revenue Code.
The fund hereby designates up to the maximum amount allowable as qualified dividend income for
the fiscal year ended July 31, 2021.
For corporate taxpayers, the fund hereby designates $1,905,764, or up to the maximum amount
allowable, of ordinary income distributions paid during the fiscal year ended July 31, 2021 as
qualified for the corporate dividends received deduction.
The fund hereby designates $26,785,769, or up to the maximum amount allowable, as long-term
capital gain distributions (20% rate gain distributions) for the fiscal year ended July 31, 2021.
The fund hereby designates $10,005,428 as qualified short-term capital gain distributions for
purposes of Internal Revenue Code Section 871 for the fiscal year ended July 31, 2021.
| | | | | | | | |
| |
| | |
| Contact Us | americancentury.com | |
| Automated Information Line | 1-800-345-8765 | |
| Investor Services Representative | 1-800-345-2021
or 816-531-5575 | |
| Investors Using Advisors | 1-800-378-9878 | |
| Business, Not-For-Profit, Employer-Sponsored Retirement Plans | 1-800-345-3533 | |
| Banks and Trust Companies, Broker-Dealers, Financial Professionals, Insurance Companies | 1-800-345-6488 | |
| Telecommunications Relay Service for the Deaf | 711 | |
| | |
| American Century Strategic Asset Allocations, Inc. | |
| | |
Investment Advisor: American Century Investment Management, Inc. Kansas City, Missouri | |
| | |
| This report and the statements it contains are submitted for the general information of our shareholders. The report is not authorized for distribution to prospective investors unless preceded or accompanied by an effective prospectus. | |
| | |
©2021 American Century Proprietary Holdings, Inc. All rights reserved.
CL-ANN-91038 2109 | |
(b) None.
ITEM 2. CODE OF ETHICS.
(a) The registrant has adopted a Code of Ethics for Senior Financial Officers that applies to the registrant’s principal executive officer, principal financial officer, principal accounting officer, and persons performing similar functions.
(b) No response required.
(c) None.
(d) None.
(e) Not applicable.
(f) The registrant’s Code of Ethics for Senior Financial Officers was filed as Exhibit 12 (a)(1) to American Century Asset Allocation Portfolios, Inc.’s Annual Certified Shareholder Report on Form N-CSR, File No. 811-21591, on September 29, 2005, and is incorporated herein by reference.
ITEM 3. AUDIT COMMITTEE FINANCIAL EXPERT.
(a)(1) The registrant’s board has determined that the registrant has at least one audit committee financial expert serving on its audit committee.
(a)(2) John R. Whitten, Chris H. Cheesman, Lynn M. Jenkins and Barry Fink are the registrant’s designated audit committee financial experts. They are “independent” as defined in Item 3 of Form N-CSR.
(a)(3) Not applicable.
(b) No response required.
(c) No response required.
(d) No response required.
ITEM 4. PRINCIPAL ACCOUNTANT FEES AND SERVICES.
(a) Audit Fees.
The aggregate fees billed for each of the last two fiscal years for professional services rendered by the principal accountant for the audit of the registrant’s annual financial statements or services that are normally provided by the accountant in connection with statutory and regulatory filings or engagements for those fiscal years were as follows:
FY 2020: $125,320
FY 2021: $98,720
(b) Audit-Related Fees.
The aggregate fees billed in each of the last two fiscal years for assurance and related services by the principal accountant that are reasonably related to the performance of the audit of the registrant’s financial statements and are not reported under paragraph (a) of this Item were as follows:
For services rendered to the registrant:
FY 2020: $0
FY 2021: $0
Fees required to be approved pursuant to paragraph (c)(7)(ii) of Rule 2-01 of Regulation S-X (relating to certain engagements for non-audit services with the registrant’s investment adviser and its affiliates):
FY 2020: $0
FY 2021: $0
(c) Tax Fees.
The aggregate fees billed in each of the last two fiscal years for professional services rendered by the principal accountant for tax compliance, tax advice, and tax planning were as follows:
For services rendered to the registrant:
FY 2020: $0
FY 2021: $0
Fees required to be approved pursuant to paragraph (c)(7)(ii) of Rule 2-01 of Regulation S-X (relating to certain engagements for non-audit services with the registrant’s investment adviser and its affiliates):
FY 2020: $0
(d) All Other Fees.
The aggregate fees billed in each of the last two fiscal years for products and services provided by the principal accountant, other than the services reported in paragraphs (a) through (c) of this Item were as follows:
For services rendered to the registrant:
FY 2020: $0
FY 2021: $0
Fees required to be approved pursuant to paragraph (c)(7)(ii) of Rule 2-01 of Regulation S-X (relating to certain engagements for non-audit services with the registrant’s investment adviser and its affiliates):
FY 2020: $0
FY 2021: $0
(e)(1) In accordance with paragraph (c)(7)(i)(A) of Rule 2-01 of Regulation S-X, before the accountant is engaged by the registrant to render audit or non-audit services, the engagement is approved by the registrant’s audit committee. Pursuant to paragraph (c)(7)(ii) of Rule 2-01 of Regulation S-X, the registrant’s audit committee also pre-approves its accountant’s engagements for non-audit services with the registrant’s investment adviser, its parent company, and any
entity controlled by, or under common control with the investment adviser that provides ongoing services to the registrant, if the engagement relates directly to the operations and financial reporting of the registrant.
(e)(2) All services described in each of paragraphs (b) through (d) of this Item were pre-approved before the engagement by the registrant’s audit committee pursuant to paragraph (c)(7)(i)(A) of Rule 2-01 of Regulation S-X. Consequently, none of such services were required to be approved by the audit committee pursuant to paragraph (c)(7)(i)(C).
(f) The percentage of hours expended on the principal accountant’s engagement to audit the registrant’s financial statements for the most recent fiscal year that were attributed to work performed by persons other than the principal accountant’s full-time, permanent employees was less than 50%.
(g) The aggregate non-audit fees billed by the registrant’s accountant for services rendered to the registrant, and rendered to the registrant’s investment adviser (not including any sub-adviser whose role is primarily portfolio management and is subcontracted with or overseen by another investment adviser), and any entity controlling, controlled by, or under common control with the adviser that provides ongoing services to the registrant for each of the last two fiscal years of the registrant were as follows:
FY 2020: $0
FY 2021: $546,515
(h) The registrant’s investment adviser and accountant have notified the registrant’s audit committee of all non-audit services that were rendered by the registrant’s accountant to the registrant’s investment adviser, its parent company, and any entity controlled by, or under common control with the investment adviser that provides services to the registrant, which services were not required to be pre-approved pursuant to paragraph (c)(7)(ii) of Rule 2-01 of Regulation S-X. The notification provided to the registrant’s audit committee included sufficient details regarding such services to allow the registrant’s audit committee to consider the continuing independence of its principal accountant.
ITEM 5. AUDIT COMMITTEE OF LISTED REGISTRANTS.
Not applicable.
ITEM 6. INVESTMENTS.
(a) The schedule of investments is included as part of the report to stockholders filed under Item 1 of this Form.
(b) Not applicable.
ITEM 7. DISCLOSURE OF PROXY VOTING POLICIES AND PROCEDURES FOR CLOSED-END MANAGEMENT INVESTMENT COMPANIES.
Not applicable.
ITEM 8. PORTFOLIO MANAGERS OF CLOSED-END MANAGEMENT INVESTMENT COMPANIES.
Not applicable.
ITEM 9. PURCHASES OF EQUITY SECURITIES BY CLOSED-END MANAGEMENT INVESTMENT COMPANY AND AFFILIATED PURCHASERS.
Not applicable.
ITEM 10. SUBMISSION OF MATTERS TO A VOTE OF SECURITY HOLDERS.
During the reporting period, there were no material changes to the procedures by which shareholders may recommend nominees to the registrant’s board.
ITEM 11. CONTROLS AND PROCEDURES.
(a) The registrant's principal executive officer and principal financial officer have concluded that the registrant's disclosure controls and procedures (as defined in Rule 30a-3(c) under the Investment Company Act of 1940) are effective based on their evaluation of these controls and procedures as of a date within 90 days of the filing date of this report.
(b) There were no changes in the registrant's internal control over financial reporting (as defined in Rule 30a-3(d) under the Investment Company Act of 1940) that occurred during the period covered by this report that have materially affected, or are reasonably likely to materially affect, the registrant's internal control over financial reporting.
ITEM 12. DISCLOSURE OF SECURITIES LENDING ACTIVITIES FOR CLOSED-END MANAGEMENT INVESTMENT COMPANIES.
Not applicable.
ITEM 13. EXHIBITS.
(a)(1) Registrant’s Code of Ethics for Senior Financial Officers, which is the subject of the disclosure required by Item 2 of Form N-CSR, was filed as Exhibit 12(a)(1) to American Century Asset Allocation Portfolios, Inc.’s Certified Shareholder Report on Form N-CSR, File No. 811-21591, on September 29, 2005.
(a)(3) Not applicable.
(a)(4) Not applicable.
SIGNATURES
Pursuant to the requirements of the Securities Exchange Act of 1934 and the Investment Company Act of 1940, the registrant has duly caused this report to be signed on its behalf by the undersigned, thereunto duly authorized.
| | | | | | | | | | | | | | |
| Registrant: | American Century Strategic Asset Allocations, Inc. | |
| | | |
| By: | /s/ Patrick Bannigan | |
| Name: | Patrick Bannigan | |
| Title: | President | |
| | | |
| Date: | September 23, 2021 | |
Pursuant to the requirements of the Securities Exchange Act of 1934 and the Investment Company Act of 1940, this report has been signed below by the following persons on behalf of the registrant and in the capacities and on the dates indicated.
| | | | | | | | | | | |
| By: | /s/ Patrick Bannigan |
| Name: Patrick Bannigan | |
| Title: President | |
| (principal executive officer) |
| | |
| Date: | September 23, 2021 | |
| | | | | | | | | | | |
| By: | /s/ R. Wes Campbell |
| Name: R. Wes Campbell | |
| Title: Treasurer and | |
| Chief Financial Officer |
| (principal financial officer) | |
| | |
| Date: | September 23, 2021 | |