UNITED STATES
SECURITIES AND EXCHANGE COMMISSION
Washington, D.C. 20549
FORM N-CSR
CERTIFIED SHAREHOLDER REPORT OF REGISTERED
MANAGEMENT INVESTMENT COMPANIES
| | | | | | | | | | | | | | | | | | | | |
| Investment Company Act file number | 811-08532 |
| |
| AMERICAN CENTURY STRATEGIC ASSET ALLOCATIONS, INC. |
| (Exact name of registrant as specified in charter) |
| |
| 4500 MAIN STREET, KANSAS CITY, MISSOURI | 64111 |
| (Address of principal executive offices) | (Zip Code) |
| |
JOHN PAK
4500 MAIN STREET, KANSAS CITY, MISSOURI 64111 |
| (Name and address of agent for service) |
| |
| Registrant’s telephone number, including area code: | 816-531-5575 |
| |
| Date of fiscal year end: | 07-31 |
| |
| Date of reporting period: | 07-31-2024 |
ITEM 1. REPORTS TO STOCKHOLDERS.
(a) Provided under separate cover.
ANNUAL SHAREHOLDER REPORT
Strategic Allocation: Aggressive Fund 
| | | | | |
Investor Class (TWSAX) | July 31, 2024 |
This annual shareholder report contains important information about Strategic Allocation: Aggressive Fund for the period of August 1, 2023 to July 31, 2024. You can find additional information about the fund at americancentury.com/docs. You can also request this information by contacting us at 1-800-345-2021.
| | | | | | | | |
What were the fund costs for the last year? (based on a hypothetical $10,000 investment) |
|
| Costs of a $10,000 investment | Costs paid as a percentage of a $10,000 investment |
| Investor Class | $66 | 0.62% |
|
| | | | | |
| What were the key factors that affected the fund’s performance? |
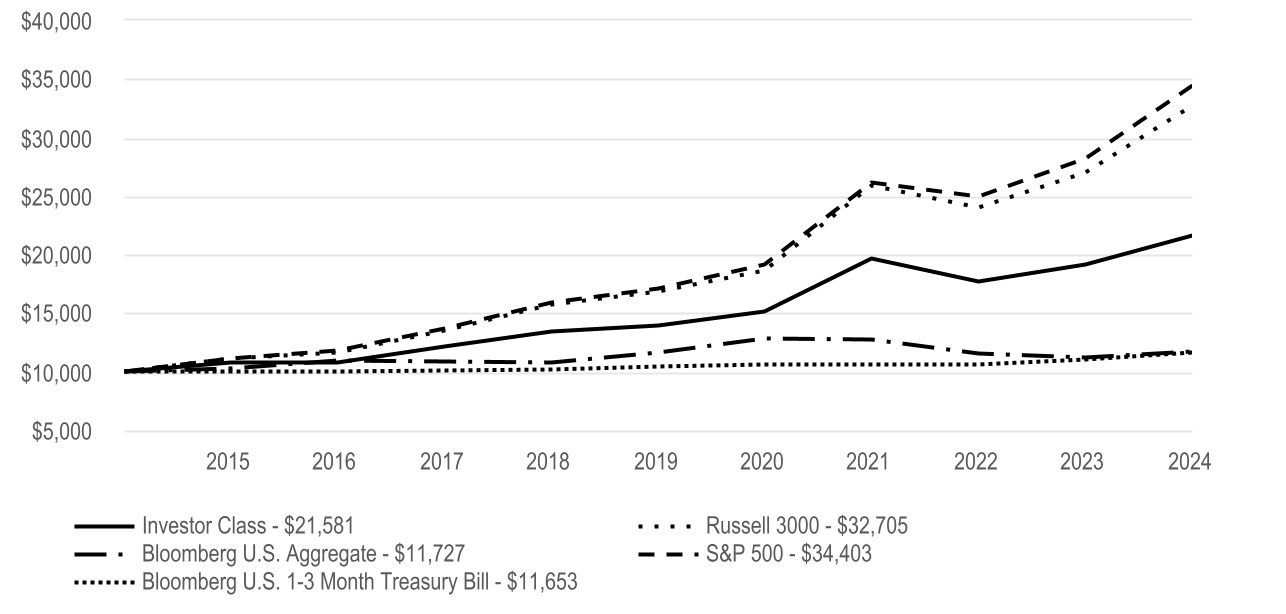
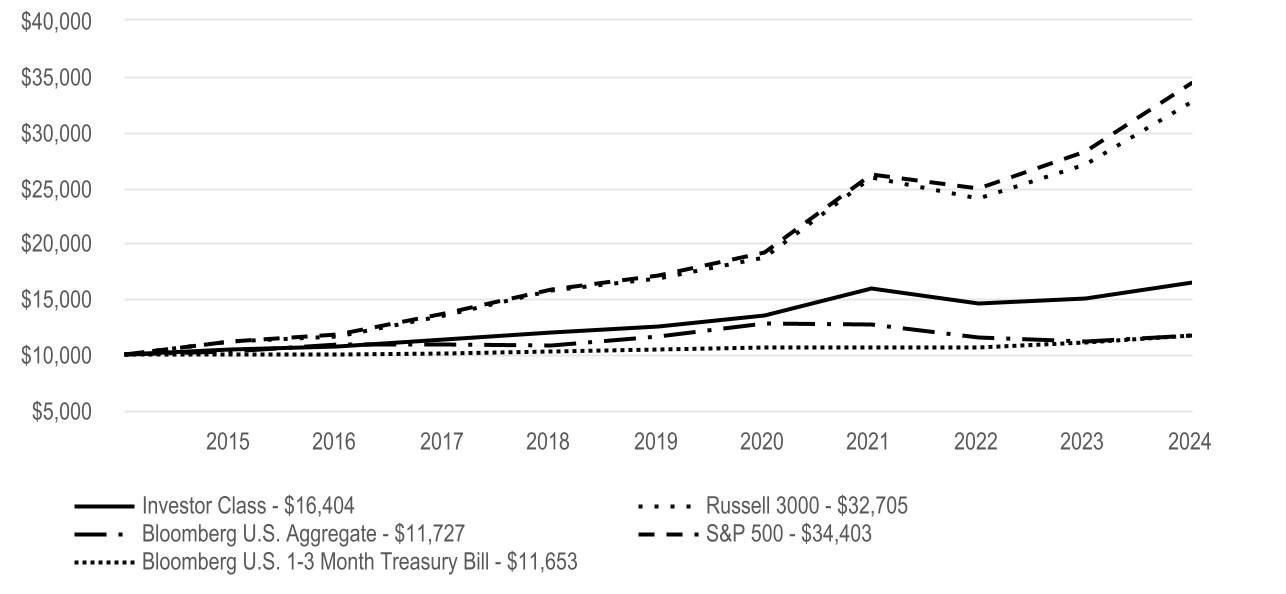
Strategic Allocation: Aggressive Fund Investor Class returned 12.93% for the reporting period ended July 31, 2024. |
| The fund is an asset allocation fund. That is, it diversifies its assets among various classes of investments such as equity securities, bonds and money market instruments. The fund seeks the highest level of total return consistent with its asset mix. See the Fund Holdings for the portfolio's asset weights. Below, we discuss the factors that affected these asset classes. |
| • | Investments in domestic equity holdings contributed meaningfully to performance. U.S. stocks did very well from late 2023 through mid-2024 as a much-anticipated recession failed to arrive. Investors favored stocks benefiting from heavy investment in artificial intelligence-related chips and technologies. Stocks gave back some gains in July, however, amid worries about slowing economic conditions. |
| • | The portfolio's non-U.S. equity holdings also rose but by a smaller amount than U.S. large-cap stocks. Signs of slowing economic growth led the European Central Bank to lower short-term interest rates for the first time in almost five years in June 2024. Emerging markets equities generally fared better as Taiwanese and South Korean companies benefited from strength in technology stocks. |
| • | The portfolio's domestic fixed-income holdings contributed to performance. Bond yields were volatile amid changing perceptions of the economy and inflation. The benchmark 10-year Treasury yield started and ended the period at around 4% but went as high as 5% and as low as 3.8%. Reflecting the rally in stocks and strength in corporate earnings, corporate bonds did very well. |
| |
| | |
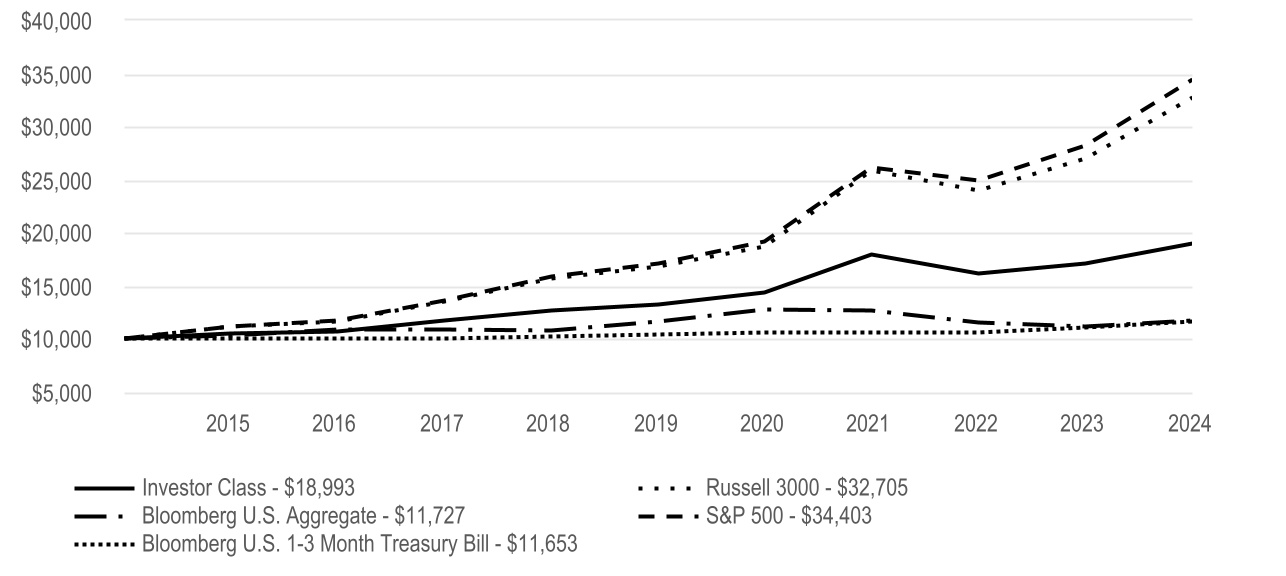
Cumulative Performance (based on an initial $10,000 investment) |
| July 31, 2014, through July 31, 2024 |
|
| | | | | | | | | | | | | | |
Average Annual Total Returns | |
| 1 Year | 5 Year | 10 Year | | | |
| Investor Class | 12.93% | 9.18% | 8.00% | | | |
| | | | | | |
| | | | | | |
| Russell 3000 | 21.07% | 14.23% | 12.58% | | | |
| Bloomberg U.S. Aggregate | 5.10% | 0.19% | 1.61% | | | |
| | | | | | |
| S&P 500 | 22.15% | 15.00% | 13.15% | | | |
| Bloomberg U.S. 1-3 Month Treasury Bill | 5.51% | 2.22% | 1.54% | | | |
| | | | | | |
| | | | | | |
| | | | | | |
| | | | | | | | | | | | | | | | | |
|
|
|
|
|
|
|
| The investment advisor selected a different index for comparison purposes. The advisor believes the Russell 3000 is more reflective of the fund's strategy as compared to the S&P 500. |
|
|
|
| | | | | |
| | |
|
The opinions expressed are those of American Century Investments and are no guarantee of the future performance of any American Century Investments fund. This information is for educational purposes only and is not intended as investment advice. Data reflects past performance, assumes reinvestment of dividends and capital gains and is no guarantee of future results. Current performance may be higher or lower than data shown. Investment return and principal value will fluctuate and redemption value may be more or less than original cost, and none of the charts reflect the deduction of taxes that a shareholder would pay on fund distributions or the redemption of fund shares. Total returns for periods less than one year are not annualized. Visit americancentury.com for more recent performance information.
|
| | | | | |
Fund Statistics | |
| Net Assets | $662,512,290 |
| Management Fees (dollars paid during the reporting period) | $3,185,115 |
| Portfolio Turnover Rate | 29 | % |
| Total Number of Portfolio Holdings | 814 |
| |
| |
| | | | | | | | | | | | | | | | | | | | | | | | | | | | | | |
| Types of Investments in Portfolio (as a % of net assets) | | | | | | | | | | | | | | | | |
| Affiliated Funds | 52.6% | | | | | | | | | | | | | | | | | | | | | | | | |
| Common Stocks | 30.9% | | | | | | | | | | | | | | | | | | | | | | | | |
| U.S. Treasury Securities | 8.6% | | | | | | | | | | | | | | | | | | | | | | | | |
| Corporate Bonds | 1.3% | | | | | | | | | | | | | | | | | | | | | | | | |
| Sovereign Governments and Agencies | 1.2% | | | | | | | | | | | | | | | | | | | | | | | | |
| Collateralized Loan Obligations | 0.2% | | | | | | | | | | | | | | | | | | | | | | | | |
| Preferred Stocks | 0.2% | | | | | | | | | | | | | | | | | | | | | | | | |
| Asset-Backed Securities | 0.1% | | | | | | | | | | | | | | | | | | | | | | | | |
| Municipal Securities | 0.0% | | | | | | | | | | | | | | | | | | | | | | | | |
| Collateralized Mortgage Obligations | 0.0% | | | | | | | | | | | | | | | | | | | | | | | | |
| U.S. Government Agency Mortgage-Backed Securities | 0.0% | | | | | | | | | | | | | | | | | | | | | | | | |
| Exchange-Traded Funds | 0.0% | | | | | | | | | | | | | | | | | | | | | | | | |
| Short-Term Investments | 7.3% | | | | | | | | | | | | | | | | | | | | | | | | |
| Other Assets and Liabilities | (2.4)% | | | | | | | | | | | | | | | | | | | | | | | | |
| | | | | | | | | | | | | | | | | | | | | | | | | | |
| | | | | | | | | | | | | | | | | | | | | | | | | | |
| | |
| For additional information about the fund, including its Prospectus, Statement of Additional Information, financial statements, holdings and proxy voting information, scan the QR code or visit americancentury.com/docs. |

| | |
| American Century Investment Services, Inc., Distributor |
| ©2024 American Century Proprietary Holdings, Inc. All rights reserved. |
A-25085705
ANNUAL SHAREHOLDER REPORT
Strategic Allocation: Aggressive Fund | | | | | |
I Class (AAAIX) | July 31, 2024 |
This annual shareholder report contains important information about Strategic Allocation: Aggressive Fund for the period of August 1, 2023 to July 31, 2024. You can find additional information about the fund at americancentury.com/docs. You can also request this information by contacting us at 1-800-345-2021.
| | | | | | | | |
What were the fund costs for the last year? (based on a hypothetical $10,000 investment) |
|
| Costs of a $10,000 investment | Costs paid as a percentage of a $10,000 investment |
| I Class | $45 | 0.42% |
|
| | | | | |
| What were the key factors that affected the fund’s performance? |
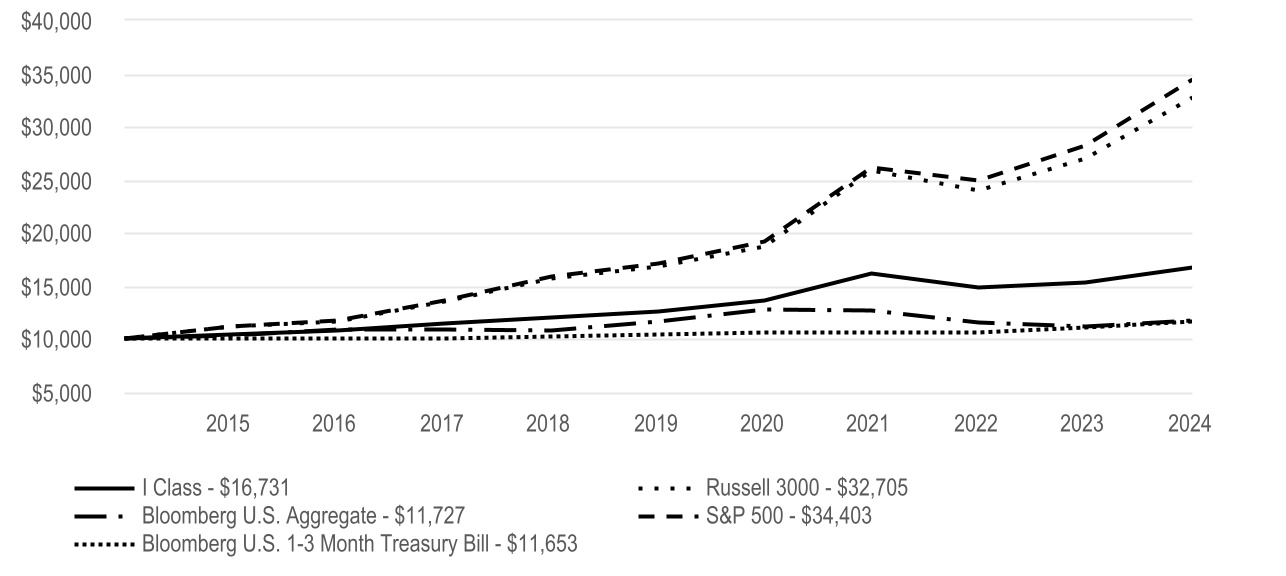
Strategic Allocation: Aggressive Fund I Class returned 13.16% for the reporting period ended July 31, 2024. |
| The fund is an asset allocation fund. That is, it diversifies its assets among various classes of investments such as equity securities, bonds and money market instruments. The fund seeks the highest level of total return consistent with its asset mix. See the Fund Holdings for the portfolio's asset weights. Below, we discuss the factors that affected these asset classes. |
| • | Investments in domestic equity holdings contributed meaningfully to performance. U.S. stocks did very well from late 2023 through mid-2024 as a much-anticipated recession failed to arrive. Investors favored stocks benefiting from heavy investment in artificial intelligence-related chips and technologies. Stocks gave back some gains in July, however, amid worries about slowing economic conditions. |
| • | The portfolio's non-U.S. equity holdings also rose but by a smaller amount than U.S. large-cap stocks. Signs of slowing economic growth led the European Central Bank to lower short-term interest rates for the first time in almost five years in June 2024. Emerging markets equities generally fared better as Taiwanese and South Korean companies benefited from strength in technology stocks. |
| • | The portfolio's domestic fixed-income holdings contributed to performance. Bond yields were volatile amid changing perceptions of the economy and inflation. The benchmark 10-year Treasury yield started and ended the period at around 4% but went as high as 5% and as low as 3.8%. Reflecting the rally in stocks and strength in corporate earnings, corporate bonds did very well. |
| |
| | |
Cumulative Performance (based on an initial $10,000 investment) |
| July 31, 2014, through July 31, 2024 |
|
| | | | | | | | | | | | | | |
Average Annual Total Returns | |
| 1 Year | 5 Year | 10 Year | | | |
| I Class | 13.16% | 9.38% | 8.20% | | | |
| | | | | | |
| | | | | | |
| Russell 3000 | 21.07% | 14.23% | 12.58% | | | |
| Bloomberg U.S. Aggregate | 5.10% | 0.19% | 1.61% | | | |
| | | | | | |
| S&P 500 | 22.15% | 15.00% | 13.15% | | | |
| Bloomberg U.S. 1-3 Month Treasury Bill | 5.51% | 2.22% | 1.54% | | | |
| | | | | | |
| | | | | | |
| | | | | | |
| | | | | | | | | | | | | | | | | |
| | | | | |
|
|
|
|
|
|
|
| The investment advisor selected a different index for comparison purposes. The advisor believes the Russell 3000 is more reflective of the fund's strategy as compared to the S&P 500. |
|
|
|
| | |
|
The opinions expressed are those of American Century Investments and are no guarantee of the future performance of any American Century Investments fund. This information is for educational purposes only and is not intended as investment advice. Data reflects past performance, assumes reinvestment of dividends and capital gains and is no guarantee of future results. Current performance may be higher or lower than data shown. Investment return and principal value will fluctuate and redemption value may be more or less than original cost, and none of the charts reflect the deduction of taxes that a shareholder would pay on fund distributions or the redemption of fund shares. Total returns for periods less than one year are not annualized. Visit americancentury.com for more recent performance information.
|
| | | | | |
Fund Statistics | |
| Net Assets | $662,512,290 |
| Management Fees (dollars paid during the reporting period) | $3,185,115 |
| Portfolio Turnover Rate | 29 | % |
| Total Number of Portfolio Holdings | 814 |
| |
| |
| | | | | | | | | | | | | | | | | | | | | | | | | | | | | | |
| Types of Investments in Portfolio (as a % of net assets) | | | | | | | | | | | | | | | | |
| Affiliated Funds | 52.6% | | | | | | | | | | | | | | | | | | | | | | | | |
| Common Stocks | 30.9% | | | | | | | | | | | | | | | | | | | | | | | | |
| U.S. Treasury Securities | 8.6% | | | | | | | | | | | | | | | | | | | | | | | | |
| Corporate Bonds | 1.3% | | | | | | | | | | | | | | | | | | | | | | | | |
| Sovereign Governments and Agencies | 1.2% | | | | | | | | | | | | | | | | | | | | | | | | |
| Collateralized Loan Obligations | 0.2% | | | | | | | | | | | | | | | | | | | | | | | | |
| Preferred Stocks | 0.2% | | | | | | | | | | | | | | | | | | | | | | | | |
| Asset-Backed Securities | 0.1% | | | | | | | | | | | | | | | | | | | | | | | | |
| Municipal Securities | 0.0% | | | | | | | | | | | | | | | | | | | | | | | | |
| Collateralized Mortgage Obligations | 0.0% | | | | | | | | | | | | | | | | | | | | | | | | |
| U.S. Government Agency Mortgage-Backed Securities | 0.0% | | | | | | | | | | | | | | | | | | | | | | | | |
| Exchange-Traded Funds | 0.0% | | | | | | | | | | | | | | | | | | | | | | | | |
| Short-Term Investments | 7.3% | | | | | | | | | | | | | | | | | | | | | | | | |
| Other Assets and Liabilities | (2.4)% | | | | | | | | | | | | | | | | | | | | | | | | |
| | | | | | | | | | | | | | | | | | | | | | | | | | |
| | | | | | | | | | | | | | | | | | | | | | | | | | |
| | |
| For additional information about the fund, including its Prospectus, Statement of Additional Information, financial statements, holdings and proxy voting information, scan the QR code or visit americancentury.com/docs. |
| | |
| American Century Investment Services, Inc., Distributor |
| ©2024 American Century Proprietary Holdings, Inc. All rights reserved. |
A-25085853
ANNUAL SHAREHOLDER REPORT
Strategic Allocation: Aggressive Fund | | | | | |
A Class (ACVAX) | July 31, 2024 |
This annual shareholder report contains important information about Strategic Allocation: Aggressive Fund for the period of August 1, 2023 to July 31, 2024. You can find additional information about the fund at americancentury.com/docs. You can also request this information by contacting us at 1-800-345-2021.
| | | | | | | | |
What were the fund costs for the last year? (based on a hypothetical $10,000 investment) |
|
| Costs of a $10,000 investment | Costs paid as a percentage of a $10,000 investment |
| A Class | $92 | 0.87% |
|
| | | | | |
| What were the key factors that affected the fund’s performance? |
Strategic Allocation: Aggressive Fund A Class returned 12.63% for the reporting period ended July 31, 2024. |
| The fund is an asset allocation fund. That is, it diversifies its assets among various classes of investments such as equity securities, bonds and money market instruments. The fund seeks the highest level of total return consistent with its asset mix. See the Fund Holdings for the portfolio's asset weights. Below, we discuss the factors that affected these asset classes. |
| • | Investments in domestic equity holdings contributed meaningfully to performance. U.S. stocks did very well from late 2023 through mid-2024 as a much-anticipated recession failed to arrive. Investors favored stocks benefiting from heavy investment in artificial intelligence-related chips and technologies. Stocks gave back some gains in July, however, amid worries about slowing economic conditions. |
| • | The portfolio's non-U.S. equity holdings also rose but by a smaller amount than U.S. large-cap stocks. Signs of slowing economic growth led the European Central Bank to lower short-term interest rates for the first time in almost five years in June 2024. Emerging markets equities generally fared better as Taiwanese and South Korean companies benefited from strength in technology stocks. |
| • | The portfolio's domestic fixed-income holdings contributed to performance. Bond yields were volatile amid changing perceptions of the economy and inflation. The benchmark 10-year Treasury yield started and ended the period at around 4% but went as high as 5% and as low as 3.8%. Reflecting the rally in stocks and strength in corporate earnings, corporate bonds did very well. |
| |
| | |
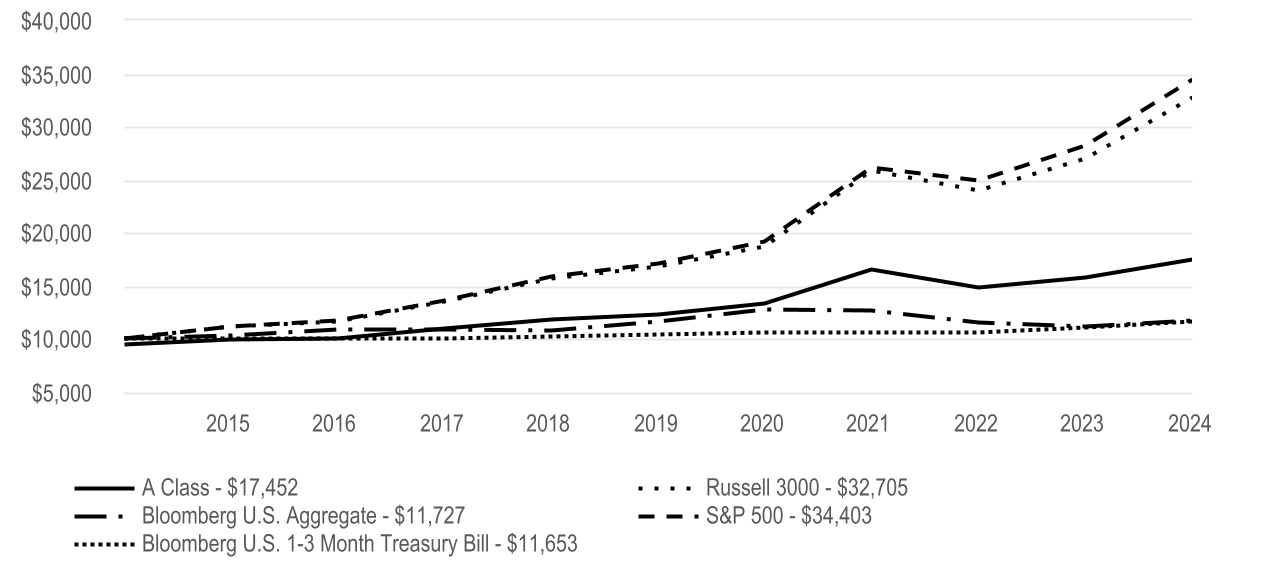
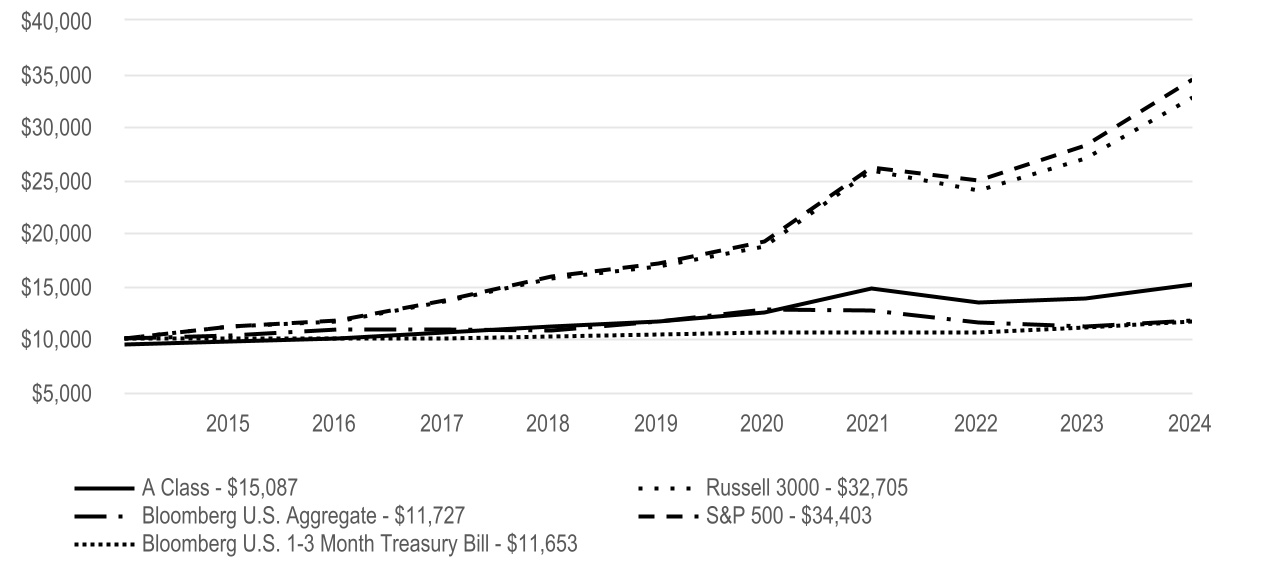
Cumulative Performance (based on an initial $10,000 investment) |
| July 31, 2014, through July 31, 2024 |
| The initial investment is adjusted to reflect the maximum initial sales charge. |
| | | | | | | | | | | | | | |
Average Annual Total Returns | |
| 1 Year | 5 Year | 10 Year | | | |
| A Class | 12.63% | 8.91% | 7.72% | | | |
| A Class - with sales charge | 6.15% | 7.63% | 7.09% | | | |
| | | | | | |
| Russell 3000 | 21.07% | 14.23% | 12.58% | | | |
| Bloomberg U.S. Aggregate | 5.10% | 0.19% | 1.61% | | | |
| | | | | | |
| S&P 500 | 22.15% | 15.00% | 13.15% | | | |
| Bloomberg U.S. 1-3 Month Treasury Bill | 5.51% | 2.22% | 1.54% | | | |
| | | | | | |
| | | | | | |
| | | | | | |
| | | | | | | | | | | | | | | | | |
|
| A Class shares have a 5.75% maximum initial sales charge and may be subject to a maximum contingent deferred sales charge of 1.00%. |
|
|
|
|
|
| The investment advisor selected a different index for comparison purposes. The advisor believes the Russell 3000 is more reflective of the fund's strategy as compared to the S&P 500. |
|
|
|
| | |
|
The opinions expressed are those of American Century Investments and are no guarantee of the future performance of any American Century Investments fund. This information is for educational purposes only and is not intended as investment advice. Data reflects past performance, assumes reinvestment of dividends and capital gains and is no guarantee of future results. Current performance may be higher or lower than data shown. Investment return and principal value will fluctuate and redemption value may be more or less than original cost, and none of the charts reflect the deduction of taxes that a shareholder would pay on fund distributions or the redemption of fund shares. Total returns for periods less than one year are not annualized. Visit americancentury.com for more recent performance information.
|
| | | | | |
Fund Statistics | |
| Net Assets | $662,512,290 |
| Management Fees (dollars paid during the reporting period) | $3,185,115 |
| Portfolio Turnover Rate | 29 | % |
| Total Number of Portfolio Holdings | 814 |
| |
| |
| | | | | | | | | | | | | | | | | | | | | | | | | | | | | | |
| Types of Investments in Portfolio (as a % of net assets) | | | | | | | | | | | | | | | | |
| Affiliated Funds | 52.6% | | | | | | | | | | | | | | | | | | | | | | | | |
| Common Stocks | 30.9% | | | | | | | | | | | | | | | | | | | | | | | | |
| U.S. Treasury Securities | 8.6% | | | | | | | | | | | | | | | | | | | | | | | | |
| Corporate Bonds | 1.3% | | | | | | | | | | | | | | | | | | | | | | | | |
| Sovereign Governments and Agencies | 1.2% | | | | | | | | | | | | | | | | | | | | | | | | |
| Collateralized Loan Obligations | 0.2% | | | | | | | | | | | | | | | | | | | | | | | | |
| Preferred Stocks | 0.2% | | | | | | | | | | | | | | | | | | | | | | | | |
| Asset-Backed Securities | 0.1% | | | | | | | | | | | | | | | | | | | | | | | | |
| Municipal Securities | 0.0% | | | | | | | | | | | | | | | | | | | | | | | | |
| Collateralized Mortgage Obligations | 0.0% | | | | | | | | | | | | | | | | | | | | | | | | |
| U.S. Government Agency Mortgage-Backed Securities | 0.0% | | | | | | | | | | | | | | | | | | | | | | | | |
| Exchange-Traded Funds | 0.0% | | | | | | | | | | | | | | | | | | | | | | | | |
| Short-Term Investments | 7.3% | | | | | | | | | | | | | | | | | | | | | | | | |
| Other Assets and Liabilities | (2.4)% | | | | | | | | | | | | | | | | | | | | | | | | |
| | | | | | | | | | | | | | | | | | | | | | | | | | |
| | | | | | | | | | | | | | | | | | | | | | | | | | |
| | |
| For additional information about the fund, including its Prospectus, Statement of Additional Information, financial statements, holdings and proxy voting information, scan the QR code or visit americancentury.com/docs. |
| | |
| American Century Investment Services, Inc., Distributor |
| ©2024 American Century Proprietary Holdings, Inc. All rights reserved. |
A-25085887
ANNUAL SHAREHOLDER REPORT
Strategic Allocation: Aggressive Fund | | | | | |
C Class (ASTAX) | July 31, 2024 |
This annual shareholder report contains important information about Strategic Allocation: Aggressive Fund for the period of August 1, 2023 to July 31, 2024. You can find additional information about the fund at americancentury.com/docs. You can also request this information by contacting us at 1-800-345-2021.
| | | | | | | | |
What were the fund costs for the last year? (based on a hypothetical $10,000 investment) |
|
| Costs of a $10,000 investment | Costs paid as a percentage of a $10,000 investment |
| C Class | $172 | 1.62% |
|
| | | | | |
| What were the key factors that affected the fund’s performance? |
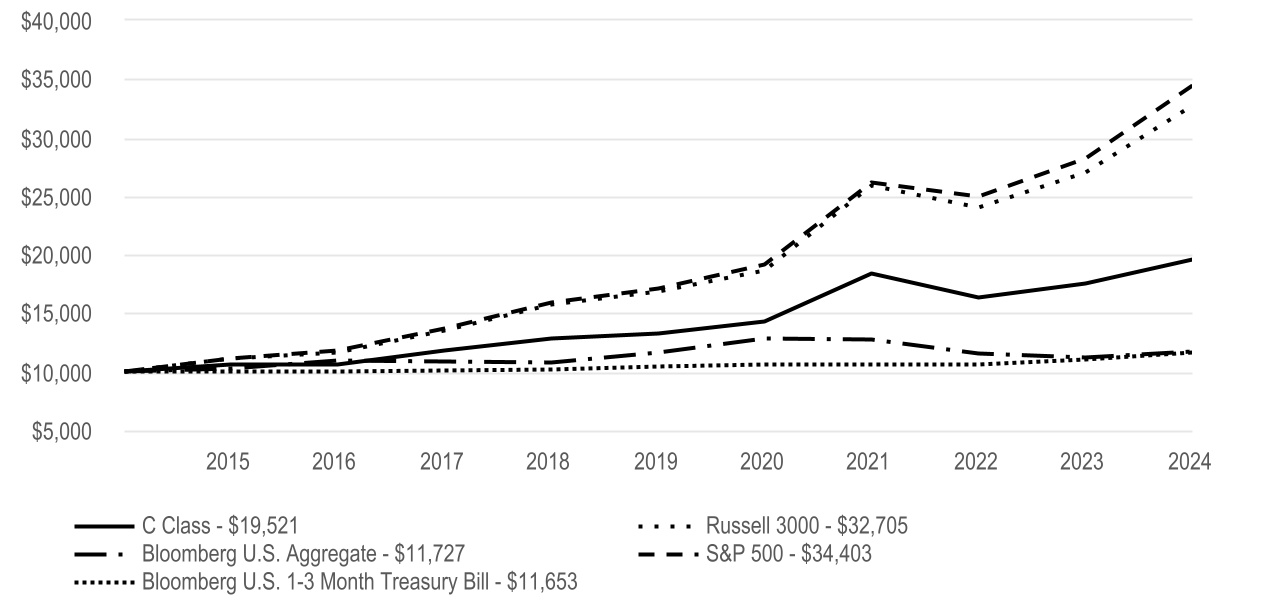
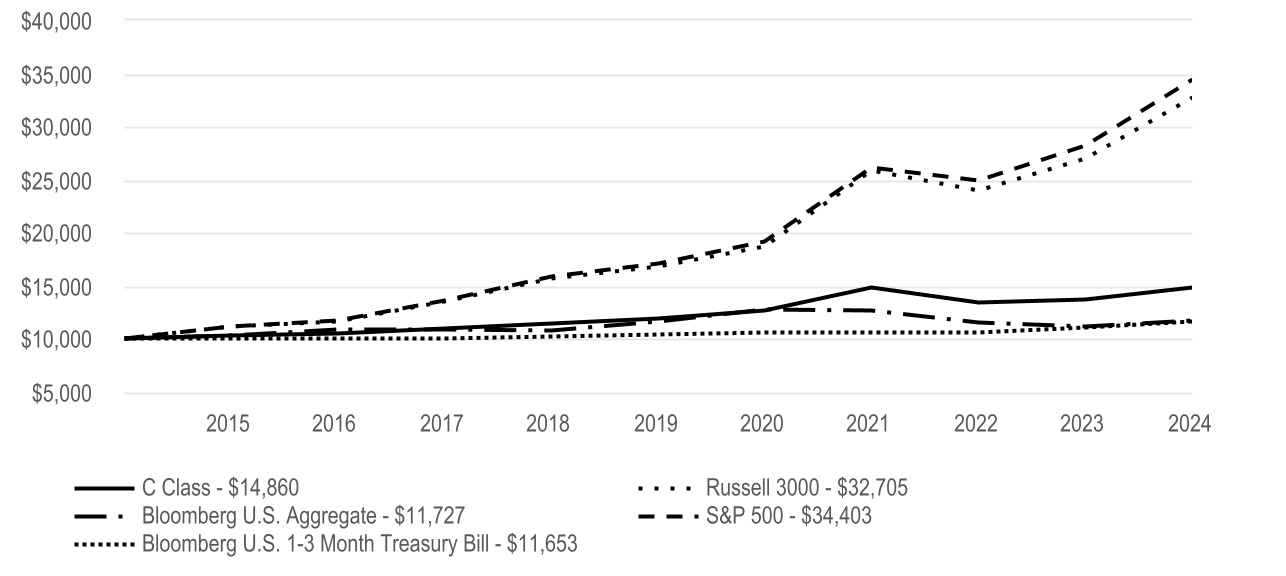
Strategic Allocation: Aggressive Fund C Class returned 11.73% for the reporting period ended July 31, 2024. |
| The fund is an asset allocation fund. That is, it diversifies its assets among various classes of investments such as equity securities, bonds and money market instruments. The fund seeks the highest level of total return consistent with its asset mix. See the Fund Holdings for the portfolio's asset weights. Below, we discuss the factors that affected these asset classes. |
| • | Investments in domestic equity holdings contributed meaningfully to performance. U.S. stocks did very well from late 2023 through mid-2024 as a much-anticipated recession failed to arrive. Investors favored stocks benefiting from heavy investment in artificial intelligence-related chips and technologies. Stocks gave back some gains in July, however, amid worries about slowing economic conditions. |
| • | The portfolio's non-U.S. equity holdings also rose but by a smaller amount than U.S. large-cap stocks. Signs of slowing economic growth led the European Central Bank to lower short-term interest rates for the first time in almost five years in June 2024. Emerging markets equities generally fared better as Taiwanese and South Korean companies benefited from strength in technology stocks. |
| • | The portfolio's domestic fixed-income holdings contributed to performance. Bond yields were volatile amid changing perceptions of the economy and inflation. The benchmark 10-year Treasury yield started and ended the period at around 4% but went as high as 5% and as low as 3.8%. Reflecting the rally in stocks and strength in corporate earnings, corporate bonds did very well. |
| |
| | |
Cumulative Performance (based on an initial $10,000 investment) |
| July 31, 2014, through July 31, 2024 |
|
| | | | | | | | | | | | | | |
Average Annual Total Returns | |
| 1 Year | 5 Year | 10 Year | | | |
| C Class | 11.73% | 8.10% | 6.92% | | | |
| | | | | | |
| | | | | | |
| Russell 3000 | 21.07% | 14.23% | 12.58% | | | |
| Bloomberg U.S. Aggregate | 5.10% | 0.19% | 1.61% | | | |
| | | | | | |
| S&P 500 | 22.15% | 15.00% | 13.15% | | | |
| Bloomberg U.S. 1-3 Month Treasury Bill | 5.51% | 2.22% | 1.54% | | | |
| | | | | | |
| | | | | | |
| | | | | | |
| | | | | | | | | | | | | | | | | |
|
|
|
|
|
| C Class shares will automatically convert to A Class shares after being held for approximately eight years. C Class average annual returns do not reflect this conversion. |
|
| The investment advisor selected a different index for comparison purposes. The advisor believes the Russell 3000 is more reflective of the fund's strategy as compared to the S&P 500. |
|
|
|
| | |
|
The opinions expressed are those of American Century Investments and are no guarantee of the future performance of any American Century Investments fund. This information is for educational purposes only and is not intended as investment advice. Data reflects past performance, assumes reinvestment of dividends and capital gains and is no guarantee of future results. Current performance may be higher or lower than data shown. Investment return and principal value will fluctuate and redemption value may be more or less than original cost, and none of the charts reflect the deduction of taxes that a shareholder would pay on fund distributions or the redemption of fund shares. Total returns for periods less than one year are not annualized. Visit americancentury.com for more recent performance information.
|
| | | | | |
Fund Statistics | |
| Net Assets | $662,512,290 |
| Management Fees (dollars paid during the reporting period) | $3,185,115 |
| Portfolio Turnover Rate | 29 | % |
| Total Number of Portfolio Holdings | 814 |
| |
| |
| | | | | | | | | | | | | | | | | | | | | | | | | | | | | | |
| Types of Investments in Portfolio (as a % of net assets) | | | | | | | | | | | | | | | | |
| Affiliated Funds | 52.6% | | | | | | | | | | | | | | | | | | | | | | | | |
| Common Stocks | 30.9% | | | | | | | | | | | | | | | | | | | | | | | | |
| U.S. Treasury Securities | 8.6% | | | | | | | | | | | | | | | | | | | | | | | | |
| Corporate Bonds | 1.3% | | | | | | | | | | | | | | | | | | | | | | | | |
| Sovereign Governments and Agencies | 1.2% | | | | | | | | | | | | | | | | | | | | | | | | |
| Collateralized Loan Obligations | 0.2% | | | | | | | | | | | | | | | | | | | | | | | | |
| Preferred Stocks | 0.2% | | | | | | | | | | | | | | | | | | | | | | | | |
| Asset-Backed Securities | 0.1% | | | | | | | | | | | | | | | | | | | | | | | | |
| Municipal Securities | 0.0% | | | | | | | | | | | | | | | | | | | | | | | | |
| Collateralized Mortgage Obligations | 0.0% | | | | | | | | | | | | | | | | | | | | | | | | |
| U.S. Government Agency Mortgage-Backed Securities | 0.0% | | | | | | | | | | | | | | | | | | | | | | | | |
| Exchange-Traded Funds | 0.0% | | | | | | | | | | | | | | | | | | | | | | | | |
| Short-Term Investments | 7.3% | | | | | | | | | | | | | | | | | | | | | | | | |
| Other Assets and Liabilities | (2.4)% | | | | | | | | | | | | | | | | | | | | | | | | |
| | | | | | | | | | | | | | | | | | | | | | | | | | |
| | | | | | | | | | | | | | | | | | | | | | | | | | |
| | |
| For additional information about the fund, including its Prospectus, Statement of Additional Information, financial statements, holdings and proxy voting information, scan the QR code or visit americancentury.com/docs. |
| | |
| American Century Investment Services, Inc., Distributor |
| ©2024 American Century Proprietary Holdings, Inc. All rights reserved. |
A-25085838
ANNUAL SHAREHOLDER REPORT
Strategic Allocation: Aggressive Fund | | | | | |
R Class (AAARX) | July 31, 2024 |
This annual shareholder report contains important information about Strategic Allocation: Aggressive Fund for the period of August 1, 2023 to July 31, 2024. You can find additional information about the fund at americancentury.com/docs. You can also request this information by contacting us at 1-800-345-2021.
| | | | | | | | |
What were the fund costs for the last year? (based on a hypothetical $10,000 investment) |
|
| Costs of a $10,000 investment | Costs paid as a percentage of a $10,000 investment |
| R Class | $119 | 1.12% |
|
| | | | | |
| What were the key factors that affected the fund’s performance? |
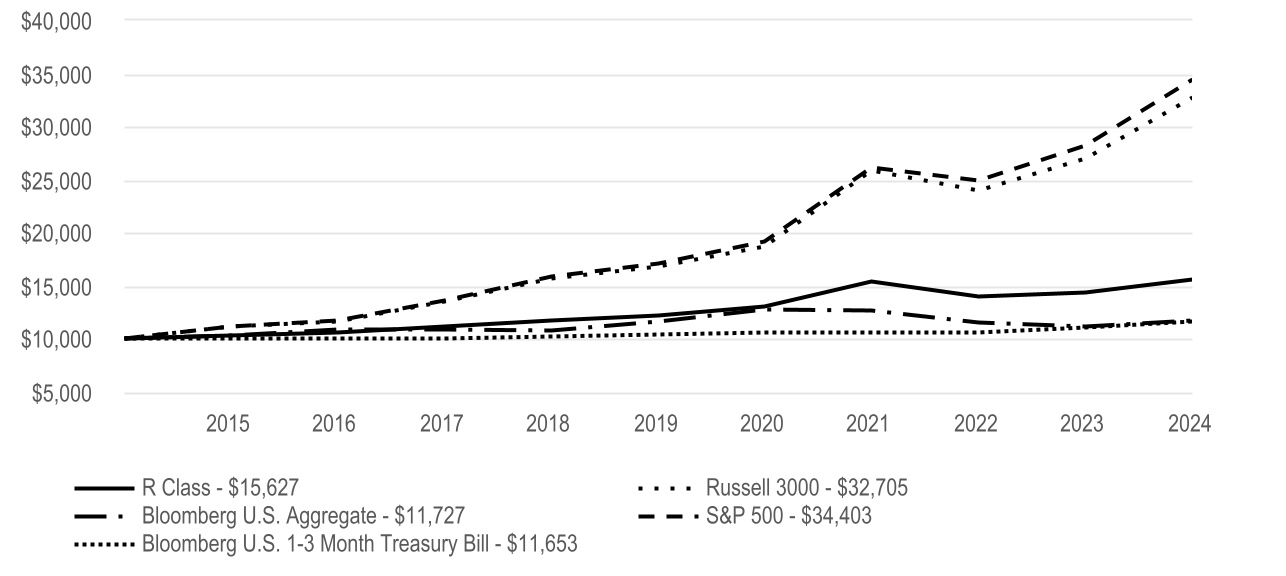
Strategic Allocation: Aggressive Fund R Class returned 12.38% for the reporting period ended July 31, 2024. |
| The fund is an asset allocation fund. That is, it diversifies its assets among various classes of investments such as equity securities, bonds and money market instruments. The fund seeks the highest level of total return consistent with its asset mix. See the Fund Holdings for the portfolio's asset weights. Below, we discuss the factors that affected these asset classes. |
| • | Investments in domestic equity holdings contributed meaningfully to performance. U.S. stocks did very well from late 2023 through mid-2024 as a much-anticipated recession failed to arrive. Investors favored stocks benefiting from heavy investment in artificial intelligence-related chips and technologies. Stocks gave back some gains in July, however, amid worries about slowing economic conditions. |
| • | The portfolio's non-U.S. equity holdings also rose but by a smaller amount than U.S. large-cap stocks. Signs of slowing economic growth led the European Central Bank to lower short-term interest rates for the first time in almost five years in June 2024. Emerging markets equities generally fared better as Taiwanese and South Korean companies benefited from strength in technology stocks. |
| • | The portfolio's domestic fixed-income holdings contributed to performance. Bond yields were volatile amid changing perceptions of the economy and inflation. The benchmark 10-year Treasury yield started and ended the period at around 4% but went as high as 5% and as low as 3.8%. Reflecting the rally in stocks and strength in corporate earnings, corporate bonds did very well. |
| |
| | |
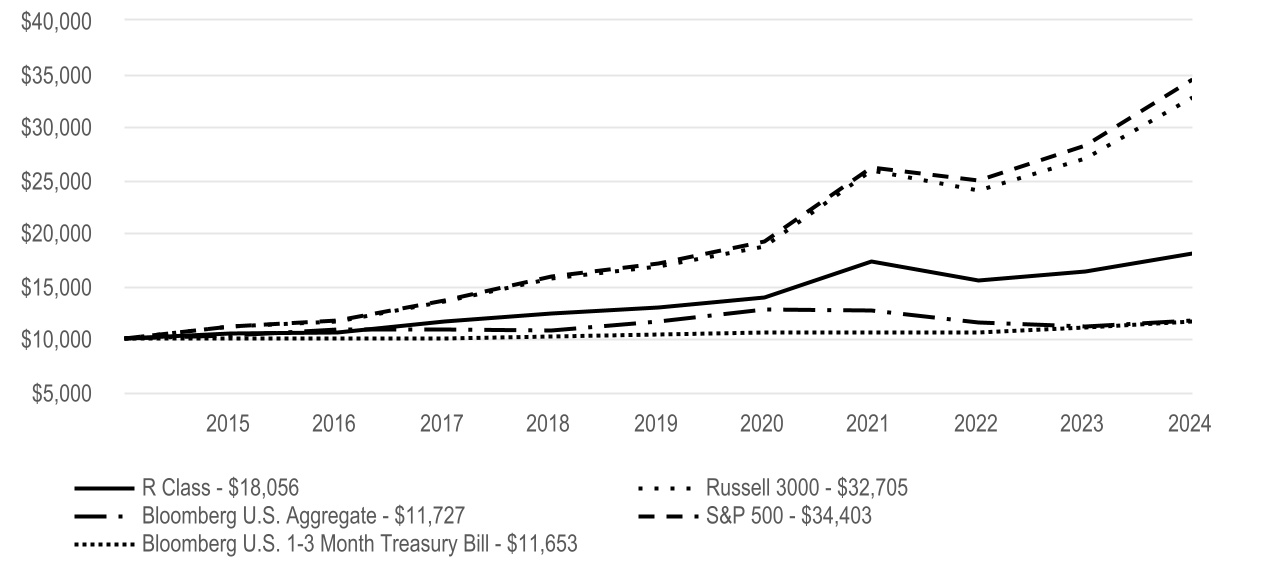
Cumulative Performance (based on an initial $10,000 investment) |
| July 31, 2014, through July 31, 2024 |
|
| | | | | | | | | | | | | | |
Average Annual Total Returns | |
| 1 Year | 5 Year | 10 Year | | | |
| R Class | 12.38% | 8.62% | 7.45% | | | |
| | | | | | |
| | | | | | |
| Russell 3000 | 21.07% | 14.23% | 12.58% | | | |
| Bloomberg U.S. Aggregate | 5.10% | 0.19% | 1.61% | | | |
| | | | | | |
| S&P 500 | 22.15% | 15.00% | 13.15% | | | |
| Bloomberg U.S. 1-3 Month Treasury Bill | 5.51% | 2.22% | 1.54% | | | |
| | | | | | |
| | | | | | |
| | | | | | |
| | | | | | | | | | | | | | | | | |
| | | | | |
|
|
|
|
|
|
|
| The investment advisor selected a different index for comparison purposes. The advisor believes the Russell 3000 is more reflective of the fund's strategy as compared to the S&P 500. |
|
|
|
| | |
|
The opinions expressed are those of American Century Investments and are no guarantee of the future performance of any American Century Investments fund. This information is for educational purposes only and is not intended as investment advice. Data reflects past performance, assumes reinvestment of dividends and capital gains and is no guarantee of future results. Current performance may be higher or lower than data shown. Investment return and principal value will fluctuate and redemption value may be more or less than original cost, and none of the charts reflect the deduction of taxes that a shareholder would pay on fund distributions or the redemption of fund shares. Total returns for periods less than one year are not annualized. Visit americancentury.com for more recent performance information.
|
| | | | | |
Fund Statistics | |
| Net Assets | $662,512,290 |
| Management Fees (dollars paid during the reporting period) | $3,185,115 |
| Portfolio Turnover Rate | 29 | % |
| Total Number of Portfolio Holdings | 814 |
| |
| |
| | | | | | | | | | | | | | | | | | | | | | | | | | | | | | |
| Types of Investments in Portfolio (as a % of net assets) | | | | | | | | | | | | | | | | |
| Affiliated Funds | 52.6% | | | | | | | | | | | | | | | | | | | | | | | | |
| Common Stocks | 30.9% | | | | | | | | | | | | | | | | | | | | | | | | |
| U.S. Treasury Securities | 8.6% | | | | | | | | | | | | | | | | | | | | | | | | |
| Corporate Bonds | 1.3% | | | | | | | | | | | | | | | | | | | | | | | | |
| Sovereign Governments and Agencies | 1.2% | | | | | | | | | | | | | | | | | | | | | | | | |
| Collateralized Loan Obligations | 0.2% | | | | | | | | | | | | | | | | | | | | | | | | |
| Preferred Stocks | 0.2% | | | | | | | | | | | | | | | | | | | | | | | | |
| Asset-Backed Securities | 0.1% | | | | | | | | | | | | | | | | | | | | | | | | |
| Municipal Securities | 0.0% | | | | | | | | | | | | | | | | | | | | | | | | |
| Collateralized Mortgage Obligations | 0.0% | | | | | | | | | | | | | | | | | | | | | | | | |
| U.S. Government Agency Mortgage-Backed Securities | 0.0% | | | | | | | | | | | | | | | | | | | | | | | | |
| Exchange-Traded Funds | 0.0% | | | | | | | | | | | | | | | | | | | | | | | | |
| Short-Term Investments | 7.3% | | | | | | | | | | | | | | | | | | | | | | | | |
| Other Assets and Liabilities | (2.4)% | | | | | | | | | | | | | | | | | | | | | | | | |
| | | | | | | | | | | | | | | | | | | | | | | | | | |
| | | | | | | | | | | | | | | | | | | | | | | | | | |
| | |
| For additional information about the fund, including its Prospectus, Statement of Additional Information, financial statements, holdings and proxy voting information, scan the QR code or visit americancentury.com/docs. |
| | |
| American Century Investment Services, Inc., Distributor |
| ©2024 American Century Proprietary Holdings, Inc. All rights reserved. |
A-25085713
ANNUAL SHAREHOLDER REPORT
Strategic Allocation: Aggressive Fund | | | | | |
R5 Class (ASAUX) | July 31, 2024 |
This annual shareholder report contains important information about Strategic Allocation: Aggressive Fund for the period of August 1, 2023 to July 31, 2024. You can find additional information about the fund at americancentury.com/docs. You can also request this information by contacting us at 1-800-345-2021.
| | | | | | | | |
What were the fund costs for the last year? (based on a hypothetical $10,000 investment) |
|
| Costs of a $10,000 investment | Costs paid as a percentage of a $10,000 investment |
| R5 Class | $45 | 0.42% |
|
| | | | | |
| What were the key factors that affected the fund’s performance? |
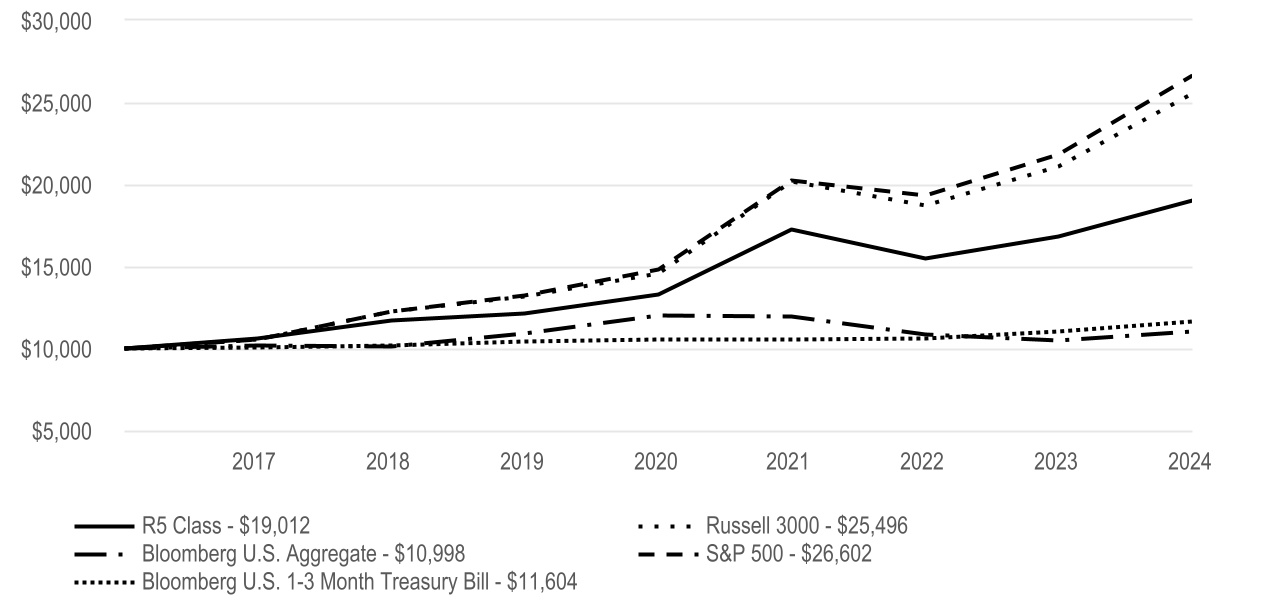
Strategic Allocation: Aggressive Fund R5 Class returned 13.14% for the reporting period ended July 31, 2024. |
| The fund is an asset allocation fund. That is, it diversifies its assets among various classes of investments such as equity securities, bonds and money market instruments. The fund seeks the highest level of total return consistent with its asset mix. See the Fund Holdings for the portfolio's asset weights. Below, we discuss the factors that affected these asset classes. |
| • | Investments in domestic equity holdings contributed meaningfully to performance. U.S. stocks did very well from late 2023 through mid-2024 as a much-anticipated recession failed to arrive. Investors favored stocks benefiting from heavy investment in artificial intelligence-related chips and technologies. Stocks gave back some gains in July, however, amid worries about slowing economic conditions. |
| • | The portfolio's non-U.S. equity holdings also rose but by a smaller amount than U.S. large-cap stocks. Signs of slowing economic growth led the European Central Bank to lower short-term interest rates for the first time in almost five years in June 2024. Emerging markets equities generally fared better as Taiwanese and South Korean companies benefited from strength in technology stocks. |
| • | The portfolio's domestic fixed-income holdings contributed to performance. Bond yields were volatile amid changing perceptions of the economy and inflation. The benchmark 10-year Treasury yield started and ended the period at around 4% but went as high as 5% and as low as 3.8%. Reflecting the rally in stocks and strength in corporate earnings, corporate bonds did very well. |
| |
| | |
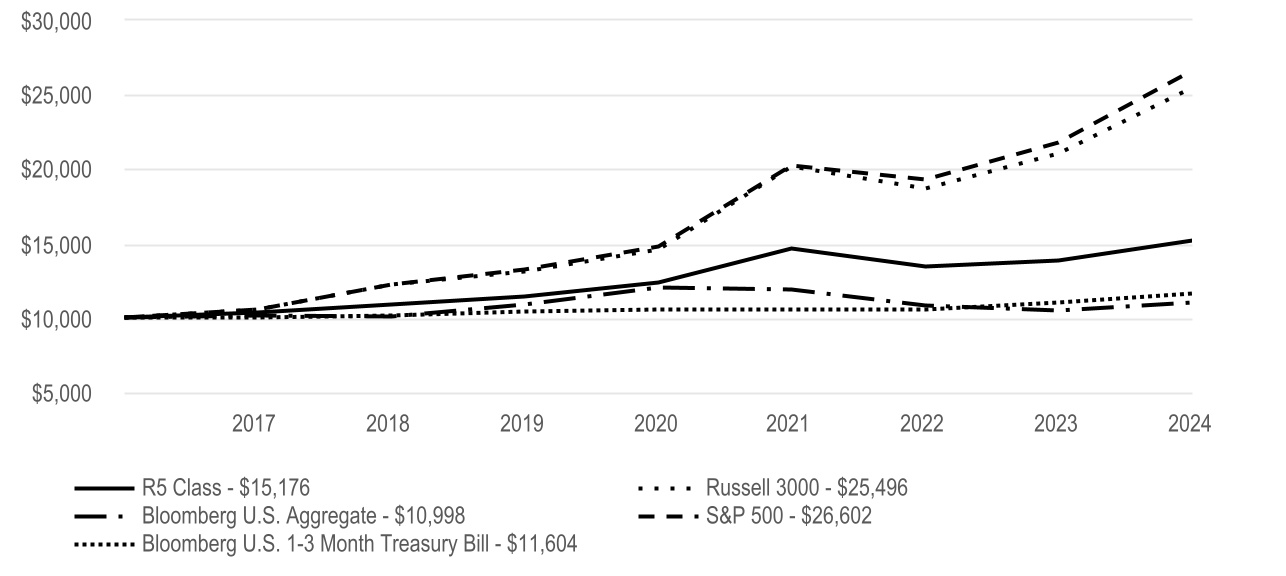
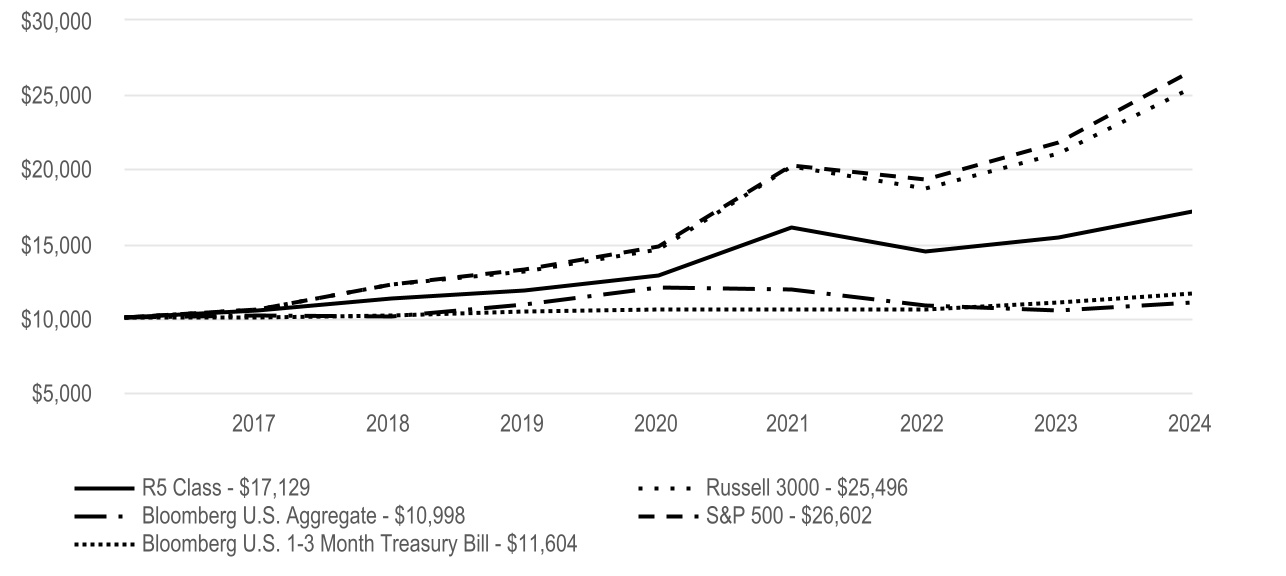
Cumulative Performance (based on an initial $10,000 investment) |
| April 10, 2017, through July 31, 2024 |
|
| | | | | | | | | | | | | | | | |
Average Annual Total Returns | |
| 1 Year | 5 Year | | Since Inception | Inception Date | |
| R5 Class | 13.14% | 9.41% | | 9.18% | 4/10/17 | |
| | | | | | |
| | | | | | |
| Russell 3000 | 21.07% | 14.23% | | 13.65% | — | |
| Bloomberg U.S. Aggregate | 5.10% | 0.19% | | 1.31% | — | |
| | | | | | |
| S&P 500 | 22.15% | 15.00% | | 14.32% | — | |
| Bloomberg U.S. 1-3 Month Treasury Bill | 5.51% | 2.22% | | 2.06% | — | |
| | | | | | |
| | | | | | |
| | | | | | |
| | | | | | | | | | | | | | | | | |
| | | | | |
|
|
|
|
|
|
|
| The investment advisor selected a different index for comparison purposes. The advisor believes the Russell 3000 is more reflective of the fund's strategy as compared to the S&P 500. |
|
|
|
| | |
|
The opinions expressed are those of American Century Investments and are no guarantee of the future performance of any American Century Investments fund. This information is for educational purposes only and is not intended as investment advice. Data reflects past performance, assumes reinvestment of dividends and capital gains and is no guarantee of future results. Current performance may be higher or lower than data shown. Investment return and principal value will fluctuate and redemption value may be more or less than original cost, and none of the charts reflect the deduction of taxes that a shareholder would pay on fund distributions or the redemption of fund shares. Total returns for periods less than one year are not annualized. Visit americancentury.com for more recent performance information.
|
| | | | | |
Fund Statistics | |
| Net Assets | $662,512,290 |
| Management Fees (dollars paid during the reporting period) | $3,185,115 |
| Portfolio Turnover Rate | 29 | % |
| Total Number of Portfolio Holdings | 814 |
| |
| |
| | | | | | | | | | | | | | | | | | | | | | | | | | | | | | |
| Types of Investments in Portfolio (as a % of net assets) | | | | | | | | | | | | | | | | |
| Affiliated Funds | 52.6% | | | | | | | | | | | | | | | | | | | | | | | | |
| Common Stocks | 30.9% | | | | | | | | | | | | | | | | | | | | | | | | |
| U.S. Treasury Securities | 8.6% | | | | | | | | | | | | | | | | | | | | | | | | |
| Corporate Bonds | 1.3% | | | | | | | | | | | | | | | | | | | | | | | | |
| Sovereign Governments and Agencies | 1.2% | | | | | | | | | | | | | | | | | | | | | | | | |
| Collateralized Loan Obligations | 0.2% | | | | | | | | | | | | | | | | | | | | | | | | |
| Preferred Stocks | 0.2% | | | | | | | | | | | | | | | | | | | | | | | | |
| Asset-Backed Securities | 0.1% | | | | | | | | | | | | | | | | | | | | | | | | |
| Municipal Securities | 0.0% | | | | | | | | | | | | | | | | | | | | | | | | |
| Collateralized Mortgage Obligations | 0.0% | | | | | | | | | | | | | | | | | | | | | | | | |
| U.S. Government Agency Mortgage-Backed Securities | 0.0% | | | | | | | | | | | | | | | | | | | | | | | | |
| Exchange-Traded Funds | 0.0% | | | | | | | | | | | | | | | | | | | | | | | | |
| Short-Term Investments | 7.3% | | | | | | | | | | | | | | | | | | | | | | | | |
| Other Assets and Liabilities | (2.4)% | | | | | | | | | | | | | | | | | | | | | | | | |
| | | | | | | | | | | | | | | | | | | | | | | | | | |
| | | | | | | | | | | | | | | | | | | | | | | | | | |
| | |
| For additional information about the fund, including its Prospectus, Statement of Additional Information, financial statements, holdings and proxy voting information, scan the QR code or visit americancentury.com/docs. |
| | |
| American Century Investment Services, Inc., Distributor |
| ©2024 American Century Proprietary Holdings, Inc. All rights reserved. |
A-25085499
ANNUAL SHAREHOLDER REPORT
Strategic Allocation: Aggressive Fund | | | | | |
R6 Class (AAAUX) | July 31, 2024 |
This annual shareholder report contains important information about Strategic Allocation: Aggressive Fund for the period of August 1, 2023 to July 31, 2024. You can find additional information about the fund at americancentury.com/docs. You can also request this information by contacting us at 1-800-345-2021.
| | | | | | | | |
What were the fund costs for the last year? (based on a hypothetical $10,000 investment) |
|
| Costs of a $10,000 investment | Costs paid as a percentage of a $10,000 investment |
| R6 Class | $29 | 0.27% |
|
| | | | | |
| What were the key factors that affected the fund’s performance? |
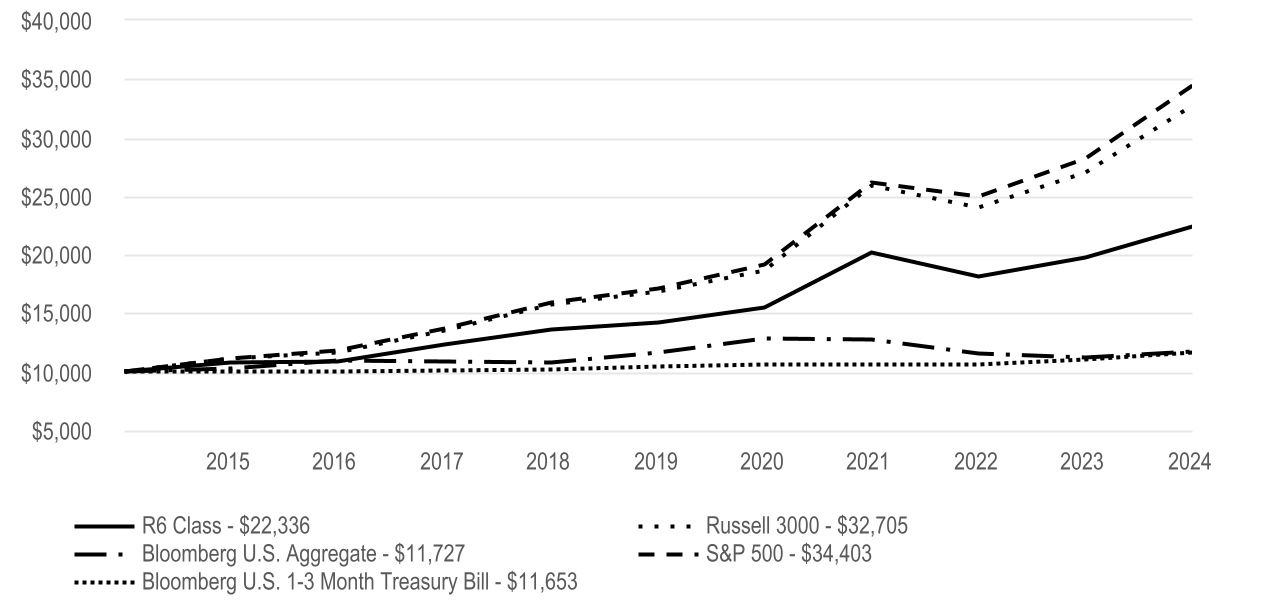
Strategic Allocation: Aggressive Fund R6 Class returned 13.23% for the reporting period ended July 31, 2024. |
| The fund is an asset allocation fund. That is, it diversifies its assets among various classes of investments such as equity securities, bonds and money market instruments. The fund seeks the highest level of total return consistent with its asset mix. See the Fund Holdings for the portfolio's asset weights. Below, we discuss the factors that affected these asset classes. |
| • | Investments in domestic equity holdings contributed meaningfully to performance. U.S. stocks did very well from late 2023 through mid-2024 as a much-anticipated recession failed to arrive. Investors favored stocks benefiting from heavy investment in artificial intelligence-related chips and technologies. Stocks gave back some gains in July, however, amid worries about slowing economic conditions. |
| • | The portfolio's non-U.S. equity holdings also rose but by a smaller amount than U.S. large-cap stocks. Signs of slowing economic growth led the European Central Bank to lower short-term interest rates for the first time in almost five years in June 2024. Emerging markets equities generally fared better as Taiwanese and South Korean companies benefited from strength in technology stocks. |
| • | The portfolio's domestic fixed-income holdings contributed to performance. Bond yields were volatile amid changing perceptions of the economy and inflation. The benchmark 10-year Treasury yield started and ended the period at around 4% but went as high as 5% and as low as 3.8%. Reflecting the rally in stocks and strength in corporate earnings, corporate bonds did very well. |
| |
| | |
Cumulative Performance (based on an initial $10,000 investment) |
| July 31, 2014, through July 31, 2024 |
|
| | | | | | | | | | | | | | |
Average Annual Total Returns | |
| 1 Year | 5 Year | 10 Year | | | |
| R6 Class | 13.23% | 9.56% | 8.37% | | | |
| | | | | | |
| | | | | | |
| Russell 3000 | 21.07% | 14.23% | 12.58% | | | |
| Bloomberg U.S. Aggregate | 5.10% | 0.19% | 1.61% | | | |
| | | | | | |
| S&P 500 | 22.15% | 15.00% | 13.15% | | | |
| Bloomberg U.S. 1-3 Month Treasury Bill | 5.51% | 2.22% | 1.54% | | | |
| | | | | | |
| | | | | | |
| | | | | | |
| | | | | | | | | | | | | | | | | |
| | | | | |
|
|
|
|
|
|
|
| The investment advisor selected a different index for comparison purposes. The advisor believes the Russell 3000 is more reflective of the fund's strategy as compared to the S&P 500. |
|
|
|
| | |
|
The opinions expressed are those of American Century Investments and are no guarantee of the future performance of any American Century Investments fund. This information is for educational purposes only and is not intended as investment advice. Data reflects past performance, assumes reinvestment of dividends and capital gains and is no guarantee of future results. Current performance may be higher or lower than data shown. Investment return and principal value will fluctuate and redemption value may be more or less than original cost, and none of the charts reflect the deduction of taxes that a shareholder would pay on fund distributions or the redemption of fund shares. Total returns for periods less than one year are not annualized. Visit americancentury.com for more recent performance information.
|
| | | | | |
Fund Statistics | |
| Net Assets | $662,512,290 |
| Management Fees (dollars paid during the reporting period) | $3,185,115 |
| Portfolio Turnover Rate | 29 | % |
| Total Number of Portfolio Holdings | 814 |
| |
| |
| | | | | | | | | | | | | | | | | | | | | | | | | | | | | | |
| Types of Investments in Portfolio (as a % of net assets) | | | | | | | | | | | | | | | | |
| Affiliated Funds | 52.6% | | | | | | | | | | | | | | | | | | | | | | | | |
| Common Stocks | 30.9% | | | | | | | | | | | | | | | | | | | | | | | | |
| U.S. Treasury Securities | 8.6% | | | | | | | | | | | | | | | | | | | | | | | | |
| Corporate Bonds | 1.3% | | | | | | | | | | | | | | | | | | | | | | | | |
| Sovereign Governments and Agencies | 1.2% | | | | | | | | | | | | | | | | | | | | | | | | |
| Collateralized Loan Obligations | 0.2% | | | | | | | | | | | | | | | | | | | | | | | | |
| Preferred Stocks | 0.2% | | | | | | | | | | | | | | | | | | | | | | | | |
| Asset-Backed Securities | 0.1% | | | | | | | | | | | | | | | | | | | | | | | | |
| Municipal Securities | 0.0% | | | | | | | | | | | | | | | | | | | | | | | | |
| Collateralized Mortgage Obligations | 0.0% | | | | | | | | | | | | | | | | | | | | | | | | |
| U.S. Government Agency Mortgage-Backed Securities | 0.0% | | | | | | | | | | | | | | | | | | | | | | | | |
| Exchange-Traded Funds | 0.0% | | | | | | | | | | | | | | | | | | | | | | | | |
| Short-Term Investments | 7.3% | | | | | | | | | | | | | | | | | | | | | | | | |
| Other Assets and Liabilities | (2.4)% | | | | | | | | | | | | | | | | | | | | | | | | |
| | | | | | | | | | | | | | | | | | | | | | | | | | |
| | | | | | | | | | | | | | | | | | | | | | | | | | |
| | |
| For additional information about the fund, including its Prospectus, Statement of Additional Information, financial statements, holdings and proxy voting information, scan the QR code or visit americancentury.com/docs. |
| | |
| American Century Investment Services, Inc., Distributor |
| ©2024 American Century Proprietary Holdings, Inc. All rights reserved. |
A-25085622
ANNUAL SHAREHOLDER REPORT
Strategic Allocation: Conservative Fund | | | | | |
Investor Class (TWSCX) | July 31, 2024 |
This annual shareholder report contains important information about Strategic Allocation: Conservative Fund for the period of August 1, 2023 to July 31, 2024. You can find additional information about the fund at americancentury.com/docs. You can also request this information by contacting us at 1-800-345-2021.
| | | | | | | | |
What were the fund costs for the last year? (based on a hypothetical $10,000 investment) |
|
| Costs of a $10,000 investment | Costs paid as a percentage of a $10,000 investment |
| Investor Class | $75 | 0.72% |
|
| | | | | |
| What were the key factors that affected the fund’s performance? |
Strategic Allocation: Conservative Fund Investor Class returned 9.37% for the reporting period ended July 31, 2024. |
| The fund is an asset allocation fund. That is, it diversifies its assets among various classes of investments such as equity securities, bonds and money market instruments. The fund seeks the highest level of total return consistent with its asset mix. See the Fund Holdings for the portfolio's asset weights. Below, we discuss the factors that affected these asset classes. |
| • | Investments in domestic equity holdings contributed meaningfully to performance. U.S. stocks did very well from late 2023 through mid-2024 as a much-anticipated recession failed to arrive. Investors favored stocks benefiting from heavy investment in artificial intelligence-related chips and technologies. Stocks gave back some gains in July, however, amid worries about slowing economic conditions. |
| • | The portfolio's non-U.S. equity holdings rose by a smaller amount than U.S. large-cap stocks. The performance disparity can be explained by differences in actual and expected earnings growth—earnings by companies outside the U.S. fell at a faster rate in 2023 and are expected to recover more slowly in 2024 and 2025 than are those of U.S. companies, according to data provider FactSet. |
| • | The portfolio's domestic fixed-income holdings contributed to performance. Bond yields were volatile amid changing perceptions of the economy and inflation. The benchmark 10-year Treasury yield started and ended the period at around 4% but went as high as 5% and as low as 3.8%. Reflecting the rally in stocks and strength in corporate earnings, corporate bonds did very well. |
| • | Non-U.S. fixed-income holdings produced positive results. Bond prices generally rose and yields fell as manufacturing activity in several developed economies slowed, while inflation concerns eased. That allowed the European Central Bank to cut interest rates. The Bank of Japan, however, raised rates to support its currency and fight imported inflation despite signs of economic weakness. |
| | |
Cumulative Performance (based on an initial $10,000 investment) |
| July 31, 2014, through July 31, 2024 |
|
| | | | | | | | | | | | | | |
Average Annual Total Returns | |
| 1 Year | 5 Year | 10 Year | | | |
| Investor Class | 9.37% | 5.63% | 5.07% | | | |
| | | | | | |
| | | | | | |
| Russell 3000 | 21.07% | 14.23% | 12.58% | | | |
| Bloomberg U.S. Aggregate | 5.10% | 0.19% | 1.61% | | | |
| | | | | | |
| S&P 500 | 22.15% | 15.00% | 13.15% | | | |
| Bloomberg U.S. 1-3 Month Treasury Bill | 5.51% | 2.22% | 1.54% | | | |
| | | | | | |
| | | | | | |
| | | | | | |
| | | | | | | | | | | | | | | | | |
| | | | | |
|
|
|
|
|
|
|
| The investment advisor selected a different index for comparison purposes. The advisor believes the Russell 3000 is more reflective of the fund's strategy as compared to the S&P 500. |
|
|
|
| | |
|
The opinions expressed are those of American Century Investments and are no guarantee of the future performance of any American Century Investments fund. This information is for educational purposes only and is not intended as investment advice. Data reflects past performance, assumes reinvestment of dividends and capital gains and is no guarantee of future results. Current performance may be higher or lower than data shown. Investment return and principal value will fluctuate and redemption value may be more or less than original cost, and none of the charts reflect the deduction of taxes that a shareholder would pay on fund distributions or the redemption of fund shares. Total returns for periods less than one year are not annualized. Visit americancentury.com for more recent performance information.
|
| | | | | |
Fund Statistics | |
| Net Assets | $323,616,822 |
| Management Fees (dollars paid during the reporting period) | $1,906,662 |
| Portfolio Turnover Rate | 30 | % |
| Total Number of Portfolio Holdings | 831 |
| |
| |
| | | | | | | | | | | | | | | | | | | | | | | | | | | | | | |
| Types of Investments in Portfolio (as a % of net assets) | | | | | | | | | | | | | | | | |
| Affiliated Funds | 37.3% | | | | | | | | | | | | | | | | | | | | | | | | |
| U.S. Treasury Securities | 23.8% | | | | | | | | | | | | | | | | | | | | | | | | |
| Common Stocks | 18.3% | | | | | | | | | | | | | | | | | | | | | | | | |
| Sovereign Governments and Agencies | 5.2% | | | | | | | | | | | | | | | | | | | | | | | | |
| Corporate Bonds | 2.9% | | | | | | | | | | | | | | | | | | | | | | | | |
| Collateralized Loan Obligations | 1.1% | | | | | | | | | | | | | | | | | | | | | | | | |
| Preferred Stocks | 0.4% | | | | | | | | | | | | | | | | | | | | | | | | |
| Asset-Backed Securities | 0.4% | | | | | | | | | | | | | | | | | | | | | | | | |
| Municipal Securities | 0.3% | | | | | | | | | | | | | | | | | | | | | | | | |
| Collateralized Mortgage Obligations | 0.2% | | | | | | | | | | | | | | | | | | | | | | | | |
| Exchange-Traded Funds | 0.2% | | | | | | | | | | | | | | | | | | | | | | | | |
| U.S. Government Agency Mortgage-Backed Securities | 0.1% | | | | | | | | | | | | | | | | | | | | | | | | |
| Short-Term Investments | 9.8% | | | | | | | | | | | | | | | | | | | | | | | | |
| Other Assets and Liabilities | 0.0% | | | | | | | | | | | | | | | | | | | | | | | | |
| | | | | | | | | | | | | | | | | | | | | | | | | | |
| | | | | | | | | | | | | | | | | | | | | | | | | | |
| | |
| For additional information about the fund, including its Prospectus, Statement of Additional Information, financial statements, holdings and proxy voting information, scan the QR code or visit americancentury.com/docs. |
| | |
| American Century Investment Services, Inc., Distributor |
| ©2024 American Century Proprietary Holdings, Inc. All rights reserved. |
A-25085101
ANNUAL SHAREHOLDER REPORT
Strategic Allocation: Conservative Fund | | | | | |
I Class (ACCIX) | July 31, 2024 |
This annual shareholder report contains important information about Strategic Allocation: Conservative Fund for the period of August 1, 2023 to July 31, 2024. You can find additional information about the fund at americancentury.com/docs. You can also request this information by contacting us at 1-800-345-2021.
| | | | | | | | |
What were the fund costs for the last year? (based on a hypothetical $10,000 investment) |
|
| Costs of a $10,000 investment | Costs paid as a percentage of a $10,000 investment |
| I Class | $54 | 0.52% |
|
| | | | | |
| What were the key factors that affected the fund’s performance? |
Strategic Allocation: Conservative Fund I Class returned 9.59% for the reporting period ended July 31, 2024. |
| The fund is an asset allocation fund. That is, it diversifies its assets among various classes of investments such as equity securities, bonds and money market instruments. The fund seeks the highest level of total return consistent with its asset mix. See the Fund Holdings for the portfolio's asset weights. Below, we discuss the factors that affected these asset classes. |
| • | Investments in domestic equity holdings contributed meaningfully to performance. U.S. stocks did very well from late 2023 through mid-2024 as a much-anticipated recession failed to arrive. Investors favored stocks benefiting from heavy investment in artificial intelligence-related chips and technologies. Stocks gave back some gains in July, however, amid worries about slowing economic conditions. |
| • | The portfolio's non-U.S. equity holdings rose by a smaller amount than U.S. large-cap stocks. The performance disparity can be explained by differences in actual and expected earnings growth—earnings by companies outside the U.S. fell at a faster rate in 2023 and are expected to recover more slowly in 2024 and 2025 than are those of U.S. companies, according to data provider FactSet. |
| • | The portfolio's domestic fixed-income holdings contributed to performance. Bond yields were volatile amid changing perceptions of the economy and inflation. The benchmark 10-year Treasury yield started and ended the period at around 4% but went as high as 5% and as low as 3.8%. Reflecting the rally in stocks and strength in corporate earnings, corporate bonds did very well. |
| • | Non-U.S. fixed-income holdings produced positive results. Bond prices generally rose and yields fell as manufacturing activity in several developed economies slowed, while inflation concerns eased. That allowed the European Central Bank to cut interest rates. The Bank of Japan, however, raised rates to support its currency and fight imported inflation despite signs of economic weakness. |
| | |
Cumulative Performance (based on an initial $10,000 investment) |
| July 31, 2014, through July 31, 2024 |
|
| | | | | | | | | | | | | | |
Average Annual Total Returns | |
| 1 Year | 5 Year | 10 Year | | | |
| I Class | 9.59% | 5.85% | 5.28% | | | |
| | | | | | |
| | | | | | |
| Russell 3000 | 21.07% | 14.23% | 12.58% | | | |
| Bloomberg U.S. Aggregate | 5.10% | 0.19% | 1.61% | | | |
| | | | | | |
| S&P 500 | 22.15% | 15.00% | 13.15% | | | |
| Bloomberg U.S. 1-3 Month Treasury Bill | 5.51% | 2.22% | 1.54% | | | |
| | | | | | |
| | | | | | |
| | | | | | |
| | | | | | | | | | | | | | | | | |
| | | | | |
|
|
|
|
|
|
|
| The investment advisor selected a different index for comparison purposes. The advisor believes the Russell 3000 is more reflective of the fund's strategy as compared to the S&P 500. |
|
|
|
| | |
|
The opinions expressed are those of American Century Investments and are no guarantee of the future performance of any American Century Investments fund. This information is for educational purposes only and is not intended as investment advice. Data reflects past performance, assumes reinvestment of dividends and capital gains and is no guarantee of future results. Current performance may be higher or lower than data shown. Investment return and principal value will fluctuate and redemption value may be more or less than original cost, and none of the charts reflect the deduction of taxes that a shareholder would pay on fund distributions or the redemption of fund shares. Total returns for periods less than one year are not annualized. Visit americancentury.com for more recent performance information.
|
| | | | | |
Fund Statistics | |
| Net Assets | $323,616,822 |
| Management Fees (dollars paid during the reporting period) | $1,906,662 |
| Portfolio Turnover Rate | 30 | % |
| Total Number of Portfolio Holdings | 831 |
| |
| |
| | | | | | | | | | | | | | | | | | | | | | | | | | | | | | |
| Types of Investments in Portfolio (as a % of net assets) | | | | | | | | | | | | | | | | |
| Affiliated Funds | 37.3% | | | | | | | | | | | | | | | | | | | | | | | | |
| U.S. Treasury Securities | 23.8% | | | | | | | | | | | | | | | | | | | | | | | | |
| Common Stocks | 18.3% | | | | | | | | | | | | | | | | | | | | | | | | |
| Sovereign Governments and Agencies | 5.2% | | | | | | | | | | | | | | | | | | | | | | | | |
| Corporate Bonds | 2.9% | | | | | | | | | | | | | | | | | | | | | | | | |
| Collateralized Loan Obligations | 1.1% | | | | | | | | | | | | | | | | | | | | | | | | |
| Preferred Stocks | 0.4% | | | | | | | | | | | | | | | | | | | | | | | | |
| Asset-Backed Securities | 0.4% | | | | | | | | | | | | | | | | | | | | | | | | |
| Municipal Securities | 0.3% | | | | | | | | | | | | | | | | | | | | | | | | |
| Collateralized Mortgage Obligations | 0.2% | | | | | | | | | | | | | | | | | | | | | | | | |
| Exchange-Traded Funds | 0.2% | | | | | | | | | | | | | | | | | | | | | | | | |
| U.S. Government Agency Mortgage-Backed Securities | 0.1% | | | | | | | | | | | | | | | | | | | | | | | | |
| Short-Term Investments | 9.8% | | | | | | | | | | | | | | | | | | | | | | | | |
| Other Assets and Liabilities | 0.0% | | | | | | | | | | | | | | | | | | | | | | | | |
| | | | | | | | | | | | | | | | | | | | | | | | | | |
| | | | | | | | | | | | | | | | | | | | | | | | | | |
| | |
| For additional information about the fund, including its Prospectus, Statement of Additional Information, financial statements, holdings and proxy voting information, scan the QR code or visit americancentury.com/docs. |
| | |
| American Century Investment Services, Inc., Distributor |
| ©2024 American Century Proprietary Holdings, Inc. All rights reserved. |
A-25085879
ANNUAL SHAREHOLDER REPORT
Strategic Allocation: Conservative Fund | | | | | |
A Class (ACCAX) | July 31, 2024 |
This annual shareholder report contains important information about Strategic Allocation: Conservative Fund for the period of August 1, 2023 to July 31, 2024. You can find additional information about the fund at americancentury.com/docs. You can also request this information by contacting us at 1-800-345-2021.
| | | | | | | | |
What were the fund costs for the last year? (based on a hypothetical $10,000 investment) |
|
| Costs of a $10,000 investment | Costs paid as a percentage of a $10,000 investment |
| A Class | $101 | 0.97% |
|
| | | | | |
| What were the key factors that affected the fund’s performance? |
Strategic Allocation: Conservative Fund A Class returned 9.12% for the reporting period ended July 31, 2024. |
| The fund is an asset allocation fund. That is, it diversifies its assets among various classes of investments such as equity securities, bonds and money market instruments. The fund seeks the highest level of total return consistent with its asset mix. See the Fund Holdings for the portfolio's asset weights. Below, we discuss the factors that affected these asset classes. |
| • | Investments in domestic equity holdings contributed meaningfully to performance. U.S. stocks did very well from late 2023 through mid-2024 as a much-anticipated recession failed to arrive. Investors favored stocks benefiting from heavy investment in artificial intelligence-related chips and technologies. Stocks gave back some gains in July, however, amid worries about slowing economic conditions. |
| • | The portfolio's non-U.S. equity holdings rose by a smaller amount than U.S. large-cap stocks. The performance disparity can be explained by differences in actual and expected earnings growth—earnings by companies outside the U.S. fell at a faster rate in 2023 and are expected to recover more slowly in 2024 and 2025 than are those of U.S. companies, according to data provider FactSet. |
| • | The portfolio's domestic fixed-income holdings contributed to performance. Bond yields were volatile amid changing perceptions of the economy and inflation. The benchmark 10-year Treasury yield started and ended the period at around 4% but went as high as 5% and as low as 3.8%. Reflecting the rally in stocks and strength in corporate earnings, corporate bonds did very well. |
| • | Non-U.S. fixed-income holdings produced positive results. Bond prices generally rose and yields fell as manufacturing activity in several developed economies slowed, while inflation concerns eased. That allowed the European Central Bank to cut interest rates. The Bank of Japan, however, raised rates to support its currency and fight imported inflation despite signs of economic weakness. |
| | |
Cumulative Performance (based on an initial $10,000 investment) |
| July 31, 2014, through July 31, 2024 |
| The initial investment is adjusted to reflect the maximum initial sales charge. |
| | | | | | | | | | | | | | |
Average Annual Total Returns | |
| 1 Year | 5 Year | 10 Year | | | |
| A Class | 9.12% | 5.34% | 4.82% | | | |
| A Class - with sales charge | 2.84% | 4.10% | 4.20% | | | |
| | | | | | |
| Russell 3000 | 21.07% | 14.23% | 12.58% | | | |
| Bloomberg U.S. Aggregate | 5.10% | 0.19% | 1.61% | | | |
| | | | | | |
| S&P 500 | 22.15% | 15.00% | 13.15% | | | |
| Bloomberg U.S. 1-3 Month Treasury Bill | 5.51% | 2.22% | 1.54% | | | |
| | | | | | |
| | | | | | |
| | | | | | |
| | | | | | | | | | | | | | | | | |
|
| A Class shares have a 5.75% maximum initial sales charge and may be subject to a maximum contingent deferred sales charge of 1.00%. |
|
|
|
|
|
| The investment advisor selected a different index for comparison purposes. The advisor believes the Russell 3000 is more reflective of the fund's strategy as compared to the S&P 500. |
|
|
|
| | |
|
The opinions expressed are those of American Century Investments and are no guarantee of the future performance of any American Century Investments fund. This information is for educational purposes only and is not intended as investment advice. Data reflects past performance, assumes reinvestment of dividends and capital gains and is no guarantee of future results. Current performance may be higher or lower than data shown. Investment return and principal value will fluctuate and redemption value may be more or less than original cost, and none of the charts reflect the deduction of taxes that a shareholder would pay on fund distributions or the redemption of fund shares. Total returns for periods less than one year are not annualized. Visit americancentury.com for more recent performance information.
|
| | | | | |
Fund Statistics | |
| Net Assets | $323,616,822 |
| Management Fees (dollars paid during the reporting period) | $1,906,662 |
| Portfolio Turnover Rate | 30 | % |
| Total Number of Portfolio Holdings | 831 |
| |
| |
| | | | | | | | | | | | | | | | | | | | | | | | | | | | | | |
| Types of Investments in Portfolio (as a % of net assets) | | | | | | | | | | | | | | | | |
| Affiliated Funds | 37.3% | | | | | | | | | | | | | | | | | | | | | | | | |
| U.S. Treasury Securities | 23.8% | | | | | | | | | | | | | | | | | | | | | | | | |
| Common Stocks | 18.3% | | | | | | | | | | | | | | | | | | | | | | | | |
| Sovereign Governments and Agencies | 5.2% | | | | | | | | | | | | | | | | | | | | | | | | |
| Corporate Bonds | 2.9% | | | | | | | | | | | | | | | | | | | | | | | | |
| Collateralized Loan Obligations | 1.1% | | | | | | | | | | | | | | | | | | | | | | | | |
| Preferred Stocks | 0.4% | | | | | | | | | | | | | | | | | | | | | | | | |
| Asset-Backed Securities | 0.4% | | | | | | | | | | | | | | | | | | | | | | | | |
| Municipal Securities | 0.3% | | | | | | | | | | | | | | | | | | | | | | | | |
| Collateralized Mortgage Obligations | 0.2% | | | | | | | | | | | | | | | | | | | | | | | | |
| Exchange-Traded Funds | 0.2% | | | | | | | | | | | | | | | | | | | | | | | | |
| U.S. Government Agency Mortgage-Backed Securities | 0.1% | | | | | | | | | | | | | | | | | | | | | | | | |
| Short-Term Investments | 9.8% | | | | | | | | | | | | | | | | | | | | | | | | |
| Other Assets and Liabilities | 0.0% | | | | | | | | | | | | | | | | | | | | | | | | |
| | | | | | | | | | | | | | | | | | | | | | | | | | |
| | | | | | | | | | | | | | | | | | | | | | | | | | |
| | |
| For additional information about the fund, including its Prospectus, Statement of Additional Information, financial statements, holdings and proxy voting information, scan the QR code or visit americancentury.com/docs. |
| | |
| American Century Investment Services, Inc., Distributor |
| ©2024 American Century Proprietary Holdings, Inc. All rights reserved. |
A-25085309
ANNUAL SHAREHOLDER REPORT
Strategic Allocation: Conservative Fund | | | | | |
C Class (AACCX) | July 31, 2024 |
This annual shareholder report contains important information about Strategic Allocation: Conservative Fund for the period of August 1, 2023 to July 31, 2024. You can find additional information about the fund at americancentury.com/docs. You can also request this information by contacting us at 1-800-345-2021.
| | | | | | | | |
What were the fund costs for the last year? (based on a hypothetical $10,000 investment) |
|
| Costs of a $10,000 investment | Costs paid as a percentage of a $10,000 investment |
| C Class | $179 | 1.72% |
|
| | | | | |
| What were the key factors that affected the fund’s performance? |
Strategic Allocation: Conservative Fund C Class returned 8.37% for the reporting period ended July 31, 2024. |
| The fund is an asset allocation fund. That is, it diversifies its assets among various classes of investments such as equity securities, bonds and money market instruments. The fund seeks the highest level of total return consistent with its asset mix. See the Fund Holdings for the portfolio's asset weights. Below, we discuss the factors that affected these asset classes. |
| • | Investments in domestic equity holdings contributed meaningfully to performance. U.S. stocks did very well from late 2023 through mid-2024 as a much-anticipated recession failed to arrive. Investors favored stocks benefiting from heavy investment in artificial intelligence-related chips and technologies. Stocks gave back some gains in July, however, amid worries about slowing economic conditions. |
| • | The portfolio's non-U.S. equity holdings rose by a smaller amount than U.S. large-cap stocks. The performance disparity can be explained by differences in actual and expected earnings growth—earnings by companies outside the U.S. fell at a faster rate in 2023 and are expected to recover more slowly in 2024 and 2025 than are those of U.S. companies, according to data provider FactSet. |
| • | The portfolio's domestic fixed-income holdings contributed to performance. Bond yields were volatile amid changing perceptions of the economy and inflation. The benchmark 10-year Treasury yield started and ended the period at around 4% but went as high as 5% and as low as 3.8%. Reflecting the rally in stocks and strength in corporate earnings, corporate bonds did very well. |
| • | Non-U.S. fixed-income holdings produced positive results. Bond prices generally rose and yields fell as manufacturing activity in several developed economies slowed, while inflation concerns eased. That allowed the European Central Bank to cut interest rates. The Bank of Japan, however, raised rates to support its currency and fight imported inflation despite signs of economic weakness. |
| | |
Cumulative Performance (based on an initial $10,000 investment) |
| July 31, 2014, through July 31, 2024 |
|
| | | | | | | | | | | | | | |
Average Annual Total Returns | |
| 1 Year | 5 Year | 10 Year | | | |
| C Class | 8.37% | 4.58% | 4.04% | | | |
| | | | | | |
| | | | | | |
| Russell 3000 | 21.07% | 14.23% | 12.58% | | | |
| Bloomberg U.S. Aggregate | 5.10% | 0.19% | 1.61% | | | |
| | | | | | |
| S&P 500 | 22.15% | 15.00% | 13.15% | | | |
| Bloomberg U.S. 1-3 Month Treasury Bill | 5.51% | 2.22% | 1.54% | | | |
| | | | | | |
| | | | | | |
| | | | | | |
| | | | | | | | | | | | | | | | | |
|
|
|
|
|
| C Class shares will automatically convert to A Class shares after being held for approximately eight years. C Class average annual returns do not reflect this conversion. |
|
| The investment advisor selected a different index for comparison purposes. The advisor believes the Russell 3000 is more reflective of the fund's strategy as compared to the S&P 500. |
|
|
|
| | |
|
The opinions expressed are those of American Century Investments and are no guarantee of the future performance of any American Century Investments fund. This information is for educational purposes only and is not intended as investment advice. Data reflects past performance, assumes reinvestment of dividends and capital gains and is no guarantee of future results. Current performance may be higher or lower than data shown. Investment return and principal value will fluctuate and redemption value may be more or less than original cost, and none of the charts reflect the deduction of taxes that a shareholder would pay on fund distributions or the redemption of fund shares. Total returns for periods less than one year are not annualized. Visit americancentury.com for more recent performance information.
|
| | | | | |
Fund Statistics | |
| Net Assets | $323,616,822 |
| Management Fees (dollars paid during the reporting period) | $1,906,662 |
| Portfolio Turnover Rate | 30 | % |
| Total Number of Portfolio Holdings | 831 |
| |
| |
| | | | | | | | | | | | | | | | | | | | | | | | | | | | | | |
| Types of Investments in Portfolio (as a % of net assets) | | | | | | | | | | | | | | | | |
| Affiliated Funds | 37.3% | | | | | | | | | | | | | | | | | | | | | | | | |
| U.S. Treasury Securities | 23.8% | | | | | | | | | | | | | | | | | | | | | | | | |
| Common Stocks | 18.3% | | | | | | | | | | | | | | | | | | | | | | | | |
| Sovereign Governments and Agencies | 5.2% | | | | | | | | | | | | | | | | | | | | | | | | |
| Corporate Bonds | 2.9% | | | | | | | | | | | | | | | | | | | | | | | | |
| Collateralized Loan Obligations | 1.1% | | | | | | | | | | | | | | | | | | | | | | | | |
| Preferred Stocks | 0.4% | | | | | | | | | | | | | | | | | | | | | | | | |
| Asset-Backed Securities | 0.4% | | | | | | | | | | | | | | | | | | | | | | | | |
| Municipal Securities | 0.3% | | | | | | | | | | | | | | | | | | | | | | | | |
| Collateralized Mortgage Obligations | 0.2% | | | | | | | | | | | | | | | | | | | | | | | | |
| Exchange-Traded Funds | 0.2% | | | | | | | | | | | | | | | | | | | | | | | | |
| U.S. Government Agency Mortgage-Backed Securities | 0.1% | | | | | | | | | | | | | | | | | | | | | | | | |
| Short-Term Investments | 9.8% | | | | | | | | | | | | | | | | | | | | | | | | |
| Other Assets and Liabilities | 0.0% | | | | | | | | | | | | | | | | | | | | | | | | |
| | | | | | | | | | | | | | | | | | | | | | | | | | |
| | | | | | | | | | | | | | | | | | | | | | | | | | |
| | |
| For additional information about the fund, including its Prospectus, Statement of Additional Information, financial statements, holdings and proxy voting information, scan the QR code or visit americancentury.com/docs. |
| | |
| American Century Investment Services, Inc., Distributor |
| ©2024 American Century Proprietary Holdings, Inc. All rights reserved. |
A-25085739
ANNUAL SHAREHOLDER REPORT
Strategic Allocation: Conservative Fund | | | | | |
R Class (AACRX) | July 31, 2024 |
This annual shareholder report contains important information about Strategic Allocation: Conservative Fund for the period of August 1, 2023 to July 31, 2024. You can find additional information about the fund at americancentury.com/docs. You can also request this information by contacting us at 1-800-345-2021.
| | | | | | | | |
What were the fund costs for the last year? (based on a hypothetical $10,000 investment) |
|
| Costs of a $10,000 investment | Costs paid as a percentage of a $10,000 investment |
| R Class | $127 | 1.22% |
|
| | | | | |
| What were the key factors that affected the fund’s performance? |
Strategic Allocation: Conservative Fund R Class returned 8.86% for the reporting period ended July 31, 2024. |
| The fund is an asset allocation fund. That is, it diversifies its assets among various classes of investments such as equity securities, bonds and money market instruments. The fund seeks the highest level of total return consistent with its asset mix. See the Fund Holdings for the portfolio's asset weights. Below, we discuss the factors that affected these asset classes. |
| • | Investments in domestic equity holdings contributed meaningfully to performance. U.S. stocks did very well from late 2023 through mid-2024 as a much-anticipated recession failed to arrive. Investors favored stocks benefiting from heavy investment in artificial intelligence-related chips and technologies. Stocks gave back some gains in July, however, amid worries about slowing economic conditions. |
| • | The portfolio's non-U.S. equity holdings rose by a smaller amount than U.S. large-cap stocks. The performance disparity can be explained by differences in actual and expected earnings growth—earnings by companies outside the U.S. fell at a faster rate in 2023 and are expected to recover more slowly in 2024 and 2025 than are those of U.S. companies, according to data provider FactSet. |
| • | The portfolio's domestic fixed-income holdings contributed to performance. Bond yields were volatile amid changing perceptions of the economy and inflation. The benchmark 10-year Treasury yield started and ended the period at around 4% but went as high as 5% and as low as 3.8%. Reflecting the rally in stocks and strength in corporate earnings, corporate bonds did very well. |
| • | Non-U.S. fixed-income holdings produced positive results. Bond prices generally rose and yields fell as manufacturing activity in several developed economies slowed, while inflation concerns eased. That allowed the European Central Bank to cut interest rates. The Bank of Japan, however, raised rates to support its currency and fight imported inflation despite signs of economic weakness. |
| | |
Cumulative Performance (based on an initial $10,000 investment) |
| July 31, 2014, through July 31, 2024 |
|
| | | | | | | | | | | | | | |
Average Annual Total Returns | |
| 1 Year | 5 Year | 10 Year | | | |
| R Class | 8.86% | 5.13% | 4.57% | | | |
| | | | | | |
| | | | | | |
| Russell 3000 | 21.07% | 14.23% | 12.58% | | | |
| Bloomberg U.S. Aggregate | 5.10% | 0.19% | 1.61% | | | |
| | | | | | |
| S&P 500 | 22.15% | 15.00% | 13.15% | | | |
| Bloomberg U.S. 1-3 Month Treasury Bill | 5.51% | 2.22% | 1.54% | | | |
| | | | | | |
| | | | | | |
| | | | | | |
| | | | | | | | | | | | | | | | | |
| | | | | |
|
|
|
|
|
|
|
| The investment advisor selected a different index for comparison purposes. The advisor believes the Russell 3000 is more reflective of the fund's strategy as compared to the S&P 500. |
|
|
|
| | |
|
The opinions expressed are those of American Century Investments and are no guarantee of the future performance of any American Century Investments fund. This information is for educational purposes only and is not intended as investment advice. Data reflects past performance, assumes reinvestment of dividends and capital gains and is no guarantee of future results. Current performance may be higher or lower than data shown. Investment return and principal value will fluctuate and redemption value may be more or less than original cost, and none of the charts reflect the deduction of taxes that a shareholder would pay on fund distributions or the redemption of fund shares. Total returns for periods less than one year are not annualized. Visit americancentury.com for more recent performance information.
|
| | | | | |
Fund Statistics | |
| Net Assets | $323,616,822 |
| Management Fees (dollars paid during the reporting period) | $1,906,662 |
| Portfolio Turnover Rate | 30 | % |
| Total Number of Portfolio Holdings | 831 |
| |
| |
| | | | | | | | | | | | | | | | | | | | | | | | | | | | | | |
| Types of Investments in Portfolio (as a % of net assets) | | | | | | | | | | | | | | | | |
| Affiliated Funds | 37.3% | | | | | | | | | | | | | | | | | | | | | | | | |
| U.S. Treasury Securities | 23.8% | | | | | | | | | | | | | | | | | | | | | | | | |
| Common Stocks | 18.3% | | | | | | | | | | | | | | | | | | | | | | | | |
| Sovereign Governments and Agencies | 5.2% | | | | | | | | | | | | | | | | | | | | | | | | |
| Corporate Bonds | 2.9% | | | | | | | | | | | | | | | | | | | | | | | | |
| Collateralized Loan Obligations | 1.1% | | | | | | | | | | | | | | | | | | | | | | | | |
| Preferred Stocks | 0.4% | | | | | | | | | | | | | | | | | | | | | | | | |
| Asset-Backed Securities | 0.4% | | | | | | | | | | | | | | | | | | | | | | | | |
| Municipal Securities | 0.3% | | | | | | | | | | | | | | | | | | | | | | | | |
| Collateralized Mortgage Obligations | 0.2% | | | | | | | | | | | | | | | | | | | | | | | | |
| Exchange-Traded Funds | 0.2% | | | | | | | | | | | | | | | | | | | | | | | | |
| U.S. Government Agency Mortgage-Backed Securities | 0.1% | | | | | | | | | | | | | | | | | | | | | | | | |
| Short-Term Investments | 9.8% | | | | | | | | | | | | | | | | | | | | | | | | |
| Other Assets and Liabilities | 0.0% | | | | | | | | | | | | | | | | | | | | | | | | |
| | | | | | | | | | | | | | | | | | | | | | | | | | |
| | | | | | | | | | | | | | | | | | | | | | | | | | |
| | |
| For additional information about the fund, including its Prospectus, Statement of Additional Information, financial statements, holdings and proxy voting information, scan the QR code or visit americancentury.com/docs. |
| | |
| American Century Investment Services, Inc., Distributor |
| ©2024 American Century Proprietary Holdings, Inc. All rights reserved. |
A-25085721
ANNUAL SHAREHOLDER REPORT
Strategic Allocation: Conservative Fund | | | | | |
R5 Class (AACGX) | July 31, 2024 |
This annual shareholder report contains important information about Strategic Allocation: Conservative Fund for the period of August 1, 2023 to July 31, 2024. You can find additional information about the fund at americancentury.com/docs. You can also request this information by contacting us at 1-800-345-2021.
| | | | | | | | |
What were the fund costs for the last year? (based on a hypothetical $10,000 investment) |
|
| Costs of a $10,000 investment | Costs paid as a percentage of a $10,000 investment |
| R5 Class | $54 | 0.52% |
|
| | | | | |
| What were the key factors that affected the fund’s performance? |
Strategic Allocation: Conservative Fund R5 Class returned 9.57% for the reporting period ended July 31, 2024. |
| The fund is an asset allocation fund. That is, it diversifies its assets among various classes of investments such as equity securities, bonds and money market instruments. The fund seeks the highest level of total return consistent with its asset mix. See the Fund Holdings for the portfolio's asset weights. Below, we discuss the factors that affected these asset classes. |
| • | Investments in domestic equity holdings contributed meaningfully to performance. U.S. stocks did very well from late 2023 through mid-2024 as a much-anticipated recession failed to arrive. Investors favored stocks benefiting from heavy investment in artificial intelligence-related chips and technologies. Stocks gave back some gains in July, however, amid worries about slowing economic conditions. |
| • | The portfolio's non-U.S. equity holdings rose by a smaller amount than U.S. large-cap stocks. The performance disparity can be explained by differences in actual and expected earnings growth—earnings by companies outside the U.S. fell at a faster rate in 2023 and are expected to recover more slowly in 2024 and 2025 than are those of U.S. companies, according to data provider FactSet. |
| • | The portfolio's domestic fixed-income holdings contributed to performance. Bond yields were volatile amid changing perceptions of the economy and inflation. The benchmark 10-year Treasury yield started and ended the period at around 4% but went as high as 5% and as low as 3.8%. Reflecting the rally in stocks and strength in corporate earnings, corporate bonds did very well. |
| • | Non-U.S. fixed-income holdings produced positive results. Bond prices generally rose and yields fell as manufacturing activity in several developed economies slowed, while inflation concerns eased. That allowed the European Central Bank to cut interest rates. The Bank of Japan, however, raised rates to support its currency and fight imported inflation despite signs of economic weakness. |
| | |
Cumulative Performance (based on an initial $10,000 investment) |
| April 10, 2017, through July 31, 2024 |
|
| | | | | | | | | | | | | | | | |
Average Annual Total Returns | |
| 1 Year | 5 Year | | Since Inception | Inception Date | |
| R5 Class | 9.57% | 5.84% | | 5.87% | 4/10/17 | |
| | | | | | |
| | | | | | |
| Russell 3000 | 21.07% | 14.23% | | 13.65% | — | |
| Bloomberg U.S. Aggregate | 5.10% | 0.19% | | 1.31% | — | |
| | | | | | |
| S&P 500 | 22.15% | 15.00% | | 14.32% | — | |
| Bloomberg U.S. 1-3 Month Treasury Bill | 5.51% | 2.22% | | 2.06% | — | |
| | | | | | |
| | | | | | |
| | | | | | |
| | | | | | | | | | | | | | | | | |
| | | | | |
|
|
|
|
|
|
|
| The investment advisor selected a different index for comparison purposes. The advisor believes the Russell 3000 is more reflective of the fund's strategy as compared to the S&P 500. |
|
|
|
| | |
|
The opinions expressed are those of American Century Investments and are no guarantee of the future performance of any American Century Investments fund. This information is for educational purposes only and is not intended as investment advice. Data reflects past performance, assumes reinvestment of dividends and capital gains and is no guarantee of future results. Current performance may be higher or lower than data shown. Investment return and principal value will fluctuate and redemption value may be more or less than original cost, and none of the charts reflect the deduction of taxes that a shareholder would pay on fund distributions or the redemption of fund shares. Total returns for periods less than one year are not annualized. Visit americancentury.com for more recent performance information.
|
| | | | | |
Fund Statistics | |
| Net Assets | $323,616,822 |
| Management Fees (dollars paid during the reporting period) | $1,906,662 |
| Portfolio Turnover Rate | 30 | % |
| Total Number of Portfolio Holdings | 831 |
| |
| |
| | | | | | | | | | | | | | | | | | | | | | | | | | | | | | |
| Types of Investments in Portfolio (as a % of net assets) | | | | | | | | | | | | | | | | |
| Affiliated Funds | 37.3% | | | | | | | | | | | | | | | | | | | | | | | | |
| U.S. Treasury Securities | 23.8% | | | | | | | | | | | | | | | | | | | | | | | | |
| Common Stocks | 18.3% | | | | | | | | | | | | | | | | | | | | | | | | |
| Sovereign Governments and Agencies | 5.2% | | | | | | | | | | | | | | | | | | | | | | | | |
| Corporate Bonds | 2.9% | | | | | | | | | | | | | | | | | | | | | | | | |
| Collateralized Loan Obligations | 1.1% | | | | | | | | | | | | | | | | | | | | | | | | |
| Preferred Stocks | 0.4% | | | | | | | | | | | | | | | | | | | | | | | | |
| Asset-Backed Securities | 0.4% | | | | | | | | | | | | | | | | | | | | | | | | |
| Municipal Securities | 0.3% | | | | | | | | | | | | | | | | | | | | | | | | |
| Collateralized Mortgage Obligations | 0.2% | | | | | | | | | | | | | | | | | | | | | | | | |
| Exchange-Traded Funds | 0.2% | | | | | | | | | | | | | | | | | | | | | | | | |
| U.S. Government Agency Mortgage-Backed Securities | 0.1% | | | | | | | | | | | | | | | | | | | | | | | | |
| Short-Term Investments | 9.8% | | | | | | | | | | | | | | | | | | | | | | | | |
| Other Assets and Liabilities | 0.0% | | | | | | | | | | | | | | | | | | | | | | | | |
| | | | | | | | | | | | | | | | | | | | | | | | | | |
| | | | | | | | | | | | | | | | | | | | | | | | | | |
| | |
| For additional information about the fund, including its Prospectus, Statement of Additional Information, financial statements, holdings and proxy voting information, scan the QR code or visit americancentury.com/docs. |
| | |
| American Century Investment Services, Inc., Distributor |
| ©2024 American Century Proprietary Holdings, Inc. All rights reserved. |
A-25085523
ANNUAL SHAREHOLDER REPORT
Strategic Allocation: Conservative Fund | | | | | |
R6 Class (AACDX) | July 31, 2024 |
This annual shareholder report contains important information about Strategic Allocation: Conservative Fund for the period of August 1, 2023 to July 31, 2024. You can find additional information about the fund at americancentury.com/docs. You can also request this information by contacting us at 1-800-345-2021.
| | | | | | | | |
What were the fund costs for the last year? (based on a hypothetical $10,000 investment) |
|
| Costs of a $10,000 investment | Costs paid as a percentage of a $10,000 investment |
| R6 Class | $39 | 0.37% |
|
| | | | | |
| What were the key factors that affected the fund’s performance? |
Strategic Allocation: Conservative Fund R6 Class returned 9.76% for the reporting period ended July 31, 2024. |
| The fund is an asset allocation fund. That is, it diversifies its assets among various classes of investments such as equity securities, bonds and money market instruments. The fund seeks the highest level of total return consistent with its asset mix. See the Fund Holdings for the portfolio's asset weights. Below, we discuss the factors that affected these asset classes. |
| • | Investments in domestic equity holdings contributed meaningfully to performance. U.S. stocks did very well from late 2023 through mid-2024 as a much-anticipated recession failed to arrive. Investors favored stocks benefiting from heavy investment in artificial intelligence-related chips and technologies. Stocks gave back some gains in July, however, amid worries about slowing economic conditions. |
| • | The portfolio's non-U.S. equity holdings rose by a smaller amount than U.S. large-cap stocks. The performance disparity can be explained by differences in actual and expected earnings growth—earnings by companies outside the U.S. fell at a faster rate in 2023 and are expected to recover more slowly in 2024 and 2025 than are those of U.S. companies, according to data provider FactSet. |
| • | The portfolio's domestic fixed-income holdings contributed to performance. Bond yields were volatile amid changing perceptions of the economy and inflation. The benchmark 10-year Treasury yield started and ended the period at around 4% but went as high as 5% and as low as 3.8%. Reflecting the rally in stocks and strength in corporate earnings, corporate bonds did very well. |
| • | Non-U.S. fixed-income holdings produced positive results. Bond prices generally rose and yields fell as manufacturing activity in several developed economies slowed, while inflation concerns eased. That allowed the European Central Bank to cut interest rates. The Bank of Japan, however, raised rates to support its currency and fight imported inflation despite signs of economic weakness. |
| | |
Cumulative Performance (based on an initial $10,000 investment) |
| July 31, 2014, through July 31, 2024 |
|
| | | | | | | | | | | | | | |
Average Annual Total Returns | |
| 1 Year | 5 Year | 10 Year | | | |
| R6 Class | 9.76% | 5.97% | 5.44% | | | |
| | | | | | |
| | | | | | |
| Russell 3000 | 21.07% | 14.23% | 12.58% | | | |
| Bloomberg U.S. Aggregate | 5.10% | 0.19% | 1.61% | | | |
| | | | | | |
| S&P 500 | 22.15% | 15.00% | 13.15% | | | |
| Bloomberg U.S. 1-3 Month Treasury Bill | 5.51% | 2.22% | 1.54% | | | |
| | | | | | |
| | | | | | |
| | | | | | |
| | | | | | | | | | | | | | | | | |
| | | | | |
|
|
|
|
|
|
|
| The investment advisor selected a different index for comparison purposes. The advisor believes the Russell 3000 is more reflective of the fund's strategy as compared to the S&P 500. |
|
|
|
| | |
|
The opinions expressed are those of American Century Investments and are no guarantee of the future performance of any American Century Investments fund. This information is for educational purposes only and is not intended as investment advice. Data reflects past performance, assumes reinvestment of dividends and capital gains and is no guarantee of future results. Current performance may be higher or lower than data shown. Investment return and principal value will fluctuate and redemption value may be more or less than original cost, and none of the charts reflect the deduction of taxes that a shareholder would pay on fund distributions or the redemption of fund shares. Total returns for periods less than one year are not annualized. Visit americancentury.com for more recent performance information.
|
| | | | | |
Fund Statistics | |
| Net Assets | $323,616,822 |
| Management Fees (dollars paid during the reporting period) | $1,906,662 |
| Portfolio Turnover Rate | 30 | % |
| Total Number of Portfolio Holdings | 831 |
| |
| |
| | | | | | | | | | | | | | | | | | | | | | | | | | | | | | |
| Types of Investments in Portfolio (as a % of net assets) | | | | | | | | | | | | | | | | |
| Affiliated Funds | 37.3% | | | | | | | | | | | | | | | | | | | | | | | | |
| U.S. Treasury Securities | 23.8% | | | | | | | | | | | | | | | | | | | | | | | | |
| Common Stocks | 18.3% | | | | | | | | | | | | | | | | | | | | | | | | |
| Sovereign Governments and Agencies | 5.2% | | | | | | | | | | | | | | | | | | | | | | | | |
| Corporate Bonds | 2.9% | | | | | | | | | | | | | | | | | | | | | | | | |
| Collateralized Loan Obligations | 1.1% | | | | | | | | | | | | | | | | | | | | | | | | |
| Preferred Stocks | 0.4% | | | | | | | | | | | | | | | | | | | | | | | | |
| Asset-Backed Securities | 0.4% | | | | | | | | | | | | | | | | | | | | | | | | |
| Municipal Securities | 0.3% | | | | | | | | | | | | | | | | | | | | | | | | |
| Collateralized Mortgage Obligations | 0.2% | | | | | | | | | | | | | | | | | | | | | | | | |
| Exchange-Traded Funds | 0.2% | | | | | | | | | | | | | | | | | | | | | | | | |
| U.S. Government Agency Mortgage-Backed Securities | 0.1% | | | | | | | | | | | | | | | | | | | | | | | | |
| Short-Term Investments | 9.8% | | | | | | | | | | | | | | | | | | | | | | | | |
| Other Assets and Liabilities | 0.0% | | | | | | | | | | | | | | | | | | | | | | | | |
| | | | | | | | | | | | | | | | | | | | | | | | | | |
| | | | | | | | | | | | | | | | | | | | | | | | | | |
| | |
| For additional information about the fund, including its Prospectus, Statement of Additional Information, financial statements, holdings and proxy voting information, scan the QR code or visit americancentury.com/docs. |
| | |
| American Century Investment Services, Inc., Distributor |
| ©2024 American Century Proprietary Holdings, Inc. All rights reserved. |
A-25085648
ANNUAL SHAREHOLDER REPORT
Strategic Allocation: Moderate Fund | | | | | |
Investor Class (TWSMX) | July 31, 2024 |
This annual shareholder report contains important information about Strategic Allocation: Moderate Fund for the period of August 1, 2023 to July 31, 2024. You can find additional information about the fund at americancentury.com/docs. You can also request this information by contacting us at 1-800-345-2021.
| | | | | | | | |
What were the fund costs for the last year? (based on a hypothetical $10,000 investment) |
|
| Costs of a $10,000 investment | Costs paid as a percentage of a $10,000 investment |
| Investor Class | $73 | 0.69% |
|
| | | | | |
| What were the key factors that affected the fund’s performance? |
Strategic Allocation: Moderate Fund Investor Class returned 11.30% for the reporting period ended July 31, 2024. |
| The fund is an asset allocation fund. That is, it diversifies its assets among various classes of investments such as equity securities, bonds and money market instruments. The fund seeks the highest level of total return consistent with its asset mix. See the Fund Holdings for the portfolio's asset weights. Below, we discuss the factors that affected these asset classes. |
| • | Investments in domestic equity holdings contributed meaningfully to performance. U.S. stocks did very well from late 2023 through mid-2024 as a much-anticipated recession failed to arrive. Investors favored stocks benefiting from heavy investment in artificial intelligence-related chips and technologies. Stocks gave back some gains in July, however, amid worries about slowing economic conditions. |
| • | The portfolio's non-U.S. equity holdings also rose but by a smaller amount than U.S. large-cap stocks. Signs of slowing economic growth led the European Central Bank to lower short-term interest rates for the first time in almost five years in June 2024. Emerging markets equities generally fared better as Taiwanese and South Korean companies benefited from strength in technology stocks. |
| • | The portfolio's domestic fixed-income holdings contributed to performance. Bond yields were volatile amid changing perceptions of the economy and inflation. The benchmark 10-year Treasury yield started and ended the period at around 4% but went as high as 5% and as low as 3.8%. Reflecting the rally in stocks and strength in corporate earnings, corporate bonds did very well. |
| • | Non-U.S. fixed-income holdings produced positive results. Bond prices generally rose and yields fell as manufacturing activity in several developed economies slowed, while inflation concerns eased. That allowed the European Central Bank to cut interest rates. The Bank of Japan, however, raised rates to support its currency and fight imported inflation despite signs of economic weakness. |
| | |
Cumulative Performance (based on an initial $10,000 investment) |
| July 31, 2014, through July 31, 2024 |
|
| | | | | | | | | | | | | | |
Average Annual Total Returns | |
| 1 Year | 5 Year | 10 Year | | | |
| Investor Class | 11.30% | 7.48% | 6.63% | | | |
| | | | | | |
| | | | | | |
| Russell 3000 | 21.07% | 14.23% | 12.58% | | | |
| Bloomberg U.S. Aggregate | 5.10% | 0.19% | 1.61% | | | |
| | | | | | |
| S&P 500 | 22.15% | 15.00% | 13.15% | | | |
| Bloomberg U.S. 1-3 Month Treasury Bill | 5.51% | 2.22% | 1.54% | | | |
| | | | | | |
| | | | | | |
| | | | | | |
| | | | | | | | | | | | | | | | | |
| | | | | |
|
|
|
|
|
|
|
| The investment advisor selected a different index for comparison purposes. The advisor believes the Russell 3000 is more reflective of the fund's strategy as compared to the S&P 500. |
|
|
|
| | |
|
The opinions expressed are those of American Century Investments and are no guarantee of the future performance of any American Century Investments fund. This information is for educational purposes only and is not intended as investment advice. Data reflects past performance, assumes reinvestment of dividends and capital gains and is no guarantee of future results. Current performance may be higher or lower than data shown. Investment return and principal value will fluctuate and redemption value may be more or less than original cost, and none of the charts reflect the deduction of taxes that a shareholder would pay on fund distributions or the redemption of fund shares. Total returns for periods less than one year are not annualized. Visit americancentury.com for more recent performance information.
|
| | | | | |
Fund Statistics | |
| Net Assets | $754,098,529 |
| Management Fees (dollars paid during the reporting period) | $4,378,042 |
| Portfolio Turnover Rate | 28 | % |
| Total Number of Portfolio Holdings | 838 |
| |
| |
| | | | | | | | | | | | | | | | | | | | | | | | | | | | | | |
| Types of Investments in Portfolio (as a % of net assets) | | | | | | | | | | | | | | | | |
| Affiliated Funds | 46.0% | | | | | | | | | | | | | | | | | | | | | | | | |
| Common Stocks | 25.7% | | | | | | | | | | | | | | | | | | | | | | | | |
| U.S. Treasury Securities | 14.0% | | | | | | | | | | | | | | | | | | | | | | | | |
| Sovereign Governments and Agencies | 2.9% | | | | | | | | | | | | | | | | | | | | | | | | |
| Corporate Bonds | 1.7% | | | | | | | | | | | | | | | | | | | | | | | | |
| Collateralized Loan Obligations | 1.0% | | | | | | | | | | | | | | | | | | | | | | | | |
| Asset-Backed Securities | 0.2% | | | | | | | | | | | | | | | | | | | | | | | | |
| Collateralized Mortgage Obligations | 0.2% | | | | | | | | | | | | | | | | | | | | | | | | |
| Preferred Stocks | 0.2% | | | | | | | | | | | | | | | | | | | | | | | | |
| U.S. Government Agency Mortgage-Backed Securities | 0.1% | | | | | | | | | | | | | | | | | | | | | | | | |
| Municipal Securities | 0.1% | | | | | | | | | | | | | | | | | | | | | | | | |
| Exchange-Traded Funds | 0.0% | | | | | | | | | | | | | | | | | | | | | | | | |
| Short-Term Investments | 8.9% | | | | | | | | | | | | | | | | | | | | | | | | |
| Other Assets and Liabilities | (1.0)% | | | | | | | | | | | | | | | | | | | | | | | | |
| | | | | | | | | | | | | | | | | | | | | | | | | | |
| | | | | | | | | | | | | | | | | | | | | | | | | | |
| | |
| For additional information about the fund, including its Prospectus, Statement of Additional Information, financial statements, holdings and proxy voting information, scan the QR code or visit americancentury.com/docs. |
| | |
| American Century Investment Services, Inc., Distributor |
| ©2024 American Century Proprietary Holdings, Inc. All rights reserved. |
A-25085408
ANNUAL SHAREHOLDER REPORT
Strategic Allocation: Moderate Fund | | | | | |
I Class (ASAMX) | July 31, 2024 |
This annual shareholder report contains important information about Strategic Allocation: Moderate Fund for the period of August 1, 2023 to July 31, 2024. You can find additional information about the fund at americancentury.com/docs. You can also request this information by contacting us at 1-800-345-2021.
| | | | | | | | |
What were the fund costs for the last year? (based on a hypothetical $10,000 investment) |
|
| Costs of a $10,000 investment | Costs paid as a percentage of a $10,000 investment |
| I Class | $52 | 0.49% |
|
| | | | | |
| What were the key factors that affected the fund’s performance? |
Strategic Allocation: Moderate Fund I Class returned 11.50% for the reporting period ended July 31, 2024. |
| The fund is an asset allocation fund. That is, it diversifies its assets among various classes of investments such as equity securities, bonds and money market instruments. The fund seeks the highest level of total return consistent with its asset mix. See the Fund Holdings for the portfolio's asset weights. Below, we discuss the factors that affected these asset classes. |
| • | Investments in domestic equity holdings contributed meaningfully to performance. U.S. stocks did very well from late 2023 through mid-2024 as a much-anticipated recession failed to arrive. Investors favored stocks benefiting from heavy investment in artificial intelligence-related chips and technologies. Stocks gave back some gains in July, however, amid worries about slowing economic conditions. |
| • | The portfolio's non-U.S. equity holdings also rose but by a smaller amount than U.S. large-cap stocks. Signs of slowing economic growth led the European Central Bank to lower short-term interest rates for the first time in almost five years in June 2024. Emerging markets equities generally fared better as Taiwanese and South Korean companies benefited from strength in technology stocks. |
| • | The portfolio's domestic fixed-income holdings contributed to performance. Bond yields were volatile amid changing perceptions of the economy and inflation. The benchmark 10-year Treasury yield started and ended the period at around 4% but went as high as 5% and as low as 3.8%. Reflecting the rally in stocks and strength in corporate earnings, corporate bonds did very well. |
| • | Non-U.S. fixed-income holdings produced positive results. Bond prices generally rose and yields fell as manufacturing activity in several developed economies slowed, while inflation concerns eased. That allowed the European Central Bank to cut interest rates. The Bank of Japan, however, raised rates to support its currency and fight imported inflation despite signs of economic weakness. |
| | |
Cumulative Performance (based on an initial $10,000 investment) |
| July 31, 2014, through July 31, 2024 |
|
| | | | | | | | | | | | | | |
Average Annual Total Returns | |
| 1 Year | 5 Year | 10 Year | | | |
| I Class | 11.50% | 7.73% | 6.85% | | | |
| | | | | | |
| | | | | | |
| Russell 3000 | 21.07% | 14.23% | 12.58% | | | |
| Bloomberg U.S. Aggregate | 5.10% | 0.19% | 1.61% | | | |
| | | | | | |
| S&P 500 | 22.15% | 15.00% | 13.15% | | | |
| Bloomberg U.S. 1-3 Month Treasury Bill | 5.51% | 2.22% | 1.54% | | | |
| | | | | | |
| | | | | | |
| | | | | | |
| | | | | | | | | | | | | | | | | |
| | | | | |
|
|
|
|
|
|
|
| The investment advisor selected a different index for comparison purposes. The advisor believes the Russell 3000 is more reflective of the fund's strategy as compared to the S&P 500. |
|
|
|
| | |
|
The opinions expressed are those of American Century Investments and are no guarantee of the future performance of any American Century Investments fund. This information is for educational purposes only and is not intended as investment advice. Data reflects past performance, assumes reinvestment of dividends and capital gains and is no guarantee of future results. Current performance may be higher or lower than data shown. Investment return and principal value will fluctuate and redemption value may be more or less than original cost, and none of the charts reflect the deduction of taxes that a shareholder would pay on fund distributions or the redemption of fund shares. Total returns for periods less than one year are not annualized. Visit americancentury.com for more recent performance information.
|
| | | | | |
Fund Statistics | |
| Net Assets | $754,098,529 |
| Management Fees (dollars paid during the reporting period) | $4,378,042 |
| Portfolio Turnover Rate | 28 | % |
| Total Number of Portfolio Holdings | 838 |
| |
| |
| | | | | | | | | | | | | | | | | | | | | | | | | | | | | | |
| Types of Investments in Portfolio (as a % of net assets) | | | | | | | | | | | | | | | | |
| Affiliated Funds | 46.0% | | | | | | | | | | | | | | | | | | | | | | | | |
| Common Stocks | 25.7% | | | | | | | | | | | | | | | | | | | | | | | | |
| U.S. Treasury Securities | 14.0% | | | | | | | | | | | | | | | | | | | | | | | | |
| Sovereign Governments and Agencies | 2.9% | | | | | | | | | | | | | | | | | | | | | | | | |
| Corporate Bonds | 1.7% | | | | | | | | | | | | | | | | | | | | | | | | |
| Collateralized Loan Obligations | 1.0% | | | | | | | | | | | | | | | | | | | | | | | | |
| Asset-Backed Securities | 0.2% | | | | | | | | | | | | | | | | | | | | | | | | |
| Collateralized Mortgage Obligations | 0.2% | | | | | | | | | | | | | | | | | | | | | | | | |
| Preferred Stocks | 0.2% | | | | | | | | | | | | | | | | | | | | | | | | |
| U.S. Government Agency Mortgage-Backed Securities | 0.1% | | | | | | | | | | | | | | | | | | | | | | | | |
| Municipal Securities | 0.1% | | | | | | | | | | | | | | | | | | | | | | | | |
| Exchange-Traded Funds | 0.0% | | | | | | | | | | | | | | | | | | | | | | | | |
| Short-Term Investments | 8.9% | | | | | | | | | | | | | | | | | | | | | | | | |
| Other Assets and Liabilities | (1.0)% | | | | | | | | | | | | | | | | | | | | | | | | |
| | | | | | | | | | | | | | | | | | | | | | | | | | |
| | | | | | | | | | | | | | | | | | | | | | | | | | |
| | |
| For additional information about the fund, including its Prospectus, Statement of Additional Information, financial statements, holdings and proxy voting information, scan the QR code or visit americancentury.com/docs. |
| | |
| American Century Investment Services, Inc., Distributor |
| ©2024 American Century Proprietary Holdings, Inc. All rights reserved. |
A-25085861
ANNUAL SHAREHOLDER REPORT
Strategic Allocation: Moderate Fund | | | | | |
A Class (ACOAX) | July 31, 2024 |
This annual shareholder report contains important information about Strategic Allocation: Moderate Fund for the period of August 1, 2023 to July 31, 2024. You can find additional information about the fund at americancentury.com/docs. You can also request this information by contacting us at 1-800-345-2021.
| | | | | | | | |
What were the fund costs for the last year? (based on a hypothetical $10,000 investment) |
|
| Costs of a $10,000 investment | Costs paid as a percentage of a $10,000 investment |
| A Class | $99 | 0.94% |
|
| | | | | |
| What were the key factors that affected the fund’s performance? |
Strategic Allocation: Moderate Fund A Class returned 10.89% for the reporting period ended July 31, 2024. |
| The fund is an asset allocation fund. That is, it diversifies its assets among various classes of investments such as equity securities, bonds and money market instruments. The fund seeks the highest level of total return consistent with its asset mix. See the Fund Holdings for the portfolio's asset weights. Below, we discuss the factors that affected these asset classes. |
| • | Investments in domestic equity holdings contributed meaningfully to performance. U.S. stocks did very well from late 2023 through mid-2024 as a much-anticipated recession failed to arrive. Investors favored stocks benefiting from heavy investment in artificial intelligence-related chips and technologies. Stocks gave back some gains in July, however, amid worries about slowing economic conditions. |
| • | The portfolio's non-U.S. equity holdings also rose but by a smaller amount than U.S. large-cap stocks. Signs of slowing economic growth led the European Central Bank to lower short-term interest rates for the first time in almost five years in June 2024. Emerging markets equities generally fared better as Taiwanese and South Korean companies benefited from strength in technology stocks. |
| • | The portfolio's domestic fixed-income holdings contributed to performance. Bond yields were volatile amid changing perceptions of the economy and inflation. The benchmark 10-year Treasury yield started and ended the period at around 4% but went as high as 5% and as low as 3.8%. Reflecting the rally in stocks and strength in corporate earnings, corporate bonds did very well. |
| • | Non-U.S. fixed-income holdings produced positive results. Bond prices generally rose and yields fell as manufacturing activity in several developed economies slowed, while inflation concerns eased. That allowed the European Central Bank to cut interest rates. The Bank of Japan, however, raised rates to support its currency and fight imported inflation despite signs of economic weakness. |
| | |
Cumulative Performance (based on an initial $10,000 investment) |
| July 31, 2014, through July 31, 2024 |
| The initial investment is adjusted to reflect the maximum initial sales charge. |
| | | | | | | | | | | | | | |
Average Annual Total Returns | |
| 1 Year | 5 Year | 10 Year | | | |
| A Class | 10.89% | 7.21% | 6.35% | | | |
| A Class - with sales charge | 4.51% | 5.95% | 5.73% | | | |
| | | | | | |
| Russell 3000 | 21.07% | 14.23% | 12.58% | | | |
| Bloomberg U.S. Aggregate | 5.10% | 0.19% | 1.61% | | | |
| | | | | | |
| S&P 500 | 22.15% | 15.00% | 13.15% | | | |
| Bloomberg U.S. 1-3 Month Treasury Bill | 5.51% | 2.22% | 1.54% | | | |
| | | | | | |
| | | | | | |
| | | | | | |
| | | | | | | | | | | | | | | | | |
|
| A Class shares have a 5.75% maximum initial sales charge and may be subject to a maximum contingent deferred sales charge of 1.00%. |
|
|
|
|
|
| The investment advisor selected a different index for comparison purposes. The advisor believes the Russell 3000 is more reflective of the fund's strategy as compared to the S&P 500. |
|
|
|
| | |
|
The opinions expressed are those of American Century Investments and are no guarantee of the future performance of any American Century Investments fund. This information is for educational purposes only and is not intended as investment advice. Data reflects past performance, assumes reinvestment of dividends and capital gains and is no guarantee of future results. Current performance may be higher or lower than data shown. Investment return and principal value will fluctuate and redemption value may be more or less than original cost, and none of the charts reflect the deduction of taxes that a shareholder would pay on fund distributions or the redemption of fund shares. Total returns for periods less than one year are not annualized. Visit americancentury.com for more recent performance information.
|
| | | | | |
Fund Statistics | |
| Net Assets | $754,098,529 |
| Management Fees (dollars paid during the reporting period) | $4,378,042 |
| Portfolio Turnover Rate | 28 | % |
| Total Number of Portfolio Holdings | 838 |
| |
| |
| | | | | | | | | | | | | | | | | | | | | | | | | | | | | | |
| Types of Investments in Portfolio (as a % of net assets) | | | | | | | | | | | | | | | | |
| Affiliated Funds | 46.0% | | | | | | | | | | | | | | | | | | | | | | | | |
| Common Stocks | 25.7% | | | | | | | | | | | | | | | | | | | | | | | | |
| U.S. Treasury Securities | 14.0% | | | | | | | | | | | | | | | | | | | | | | | | |
| Sovereign Governments and Agencies | 2.9% | | | | | | | | | | | | | | | | | | | | | | | | |
| Corporate Bonds | 1.7% | | | | | | | | | | | | | | | | | | | | | | | | |
| Collateralized Loan Obligations | 1.0% | | | | | | | | | | | | | | | | | | | | | | | | |
| Asset-Backed Securities | 0.2% | | | | | | | | | | | | | | | | | | | | | | | | |
| Collateralized Mortgage Obligations | 0.2% | | | | | | | | | | | | | | | | | | | | | | | | |
| Preferred Stocks | 0.2% | | | | | | | | | | | | | | | | | | | | | | | | |
| U.S. Government Agency Mortgage-Backed Securities | 0.1% | | | | | | | | | | | | | | | | | | | | | | | | |
| Municipal Securities | 0.1% | | | | | | | | | | | | | | | | | | | | | | | | |
| Exchange-Traded Funds | 0.0% | | | | | | | | | | | | | | | | | | | | | | | | |
| Short-Term Investments | 8.9% | | | | | | | | | | | | | | | | | | | | | | | | |
| Other Assets and Liabilities | (1.0)% | | | | | | | | | | | | | | | | | | | | | | | | |
| | | | | | | | | | | | | | | | | | | | | | | | | | |
| | | | | | | | | | | | | | | | | | | | | | | | | | |
| | |
| For additional information about the fund, including its Prospectus, Statement of Additional Information, financial statements, holdings and proxy voting information, scan the QR code or visit americancentury.com/docs. |
| | |
| American Century Investment Services, Inc., Distributor |
| ©2024 American Century Proprietary Holdings, Inc. All rights reserved. |
A-25085606
ANNUAL SHAREHOLDER REPORT
Strategic Allocation: Moderate Fund | | | | | |
C Class (ASTCX) | July 31, 2024 |
This annual shareholder report contains important information about Strategic Allocation: Moderate Fund for the period of August 1, 2023 to July 31, 2024. You can find additional information about the fund at americancentury.com/docs. You can also request this information by contacting us at 1-800-345-2021.
| | | | | | | | |
What were the fund costs for the last year? (based on a hypothetical $10,000 investment) |
|
| Costs of a $10,000 investment | Costs paid as a percentage of a $10,000 investment |
| C Class | $178 | 1.69% |
|
| | | | | |
| What were the key factors that affected the fund’s performance? |
Strategic Allocation: Moderate Fund C Class returned 10.09% for the reporting period ended July 31, 2024. |
| The fund is an asset allocation fund. That is, it diversifies its assets among various classes of investments such as equity securities, bonds and money market instruments. The fund seeks the highest level of total return consistent with its asset mix. See the Fund Holdings for the portfolio's asset weights. Below, we discuss the factors that affected these asset classes. |
| • | Investments in domestic equity holdings contributed meaningfully to performance. U.S. stocks did very well from late 2023 through mid-2024 as a much-anticipated recession failed to arrive. Investors favored stocks benefiting from heavy investment in artificial intelligence-related chips and technologies. Stocks gave back some gains in July, however, amid worries about slowing economic conditions. |
| • | The portfolio's non-U.S. equity holdings also rose but by a smaller amount than U.S. large-cap stocks. Signs of slowing economic growth led the European Central Bank to lower short-term interest rates for the first time in almost five years in June 2024. Emerging markets equities generally fared better as Taiwanese and South Korean companies benefited from strength in technology stocks. |
| • | The portfolio's domestic fixed-income holdings contributed to performance. Bond yields were volatile amid changing perceptions of the economy and inflation. The benchmark 10-year Treasury yield started and ended the period at around 4% but went as high as 5% and as low as 3.8%. Reflecting the rally in stocks and strength in corporate earnings, corporate bonds did very well. |
| • | Non-U.S. fixed-income holdings produced positive results. Bond prices generally rose and yields fell as manufacturing activity in several developed economies slowed, while inflation concerns eased. That allowed the European Central Bank to cut interest rates. The Bank of Japan, however, raised rates to support its currency and fight imported inflation despite signs of economic weakness. |
| | |
Cumulative Performance (based on an initial $10,000 investment) |
| July 31, 2014, through July 31, 2024 |
|
| | | | | | | | | | | | | | |
Average Annual Total Returns | |
| 1 Year | 5 Year | 10 Year | | | |
| C Class | 10.09% | 6.43% | 5.57% | | | |
| | | | | | |
| | | | | | |
| Russell 3000 | 21.07% | 14.23% | 12.58% | | | |
| Bloomberg U.S. Aggregate | 5.10% | 0.19% | 1.61% | | | |
| | | | | | |
| S&P 500 | 22.15% | 15.00% | 13.15% | | | |
| Bloomberg U.S. 1-3 Month Treasury Bill | 5.51% | 2.22% | 1.54% | | | |
| | | | | | |
| | | | | | |
| | | | | | |
| | | | | | | | | | | | | | | | | |
|
|
|
|
|
| C Class shares will automatically convert to A Class shares after being held for approximately eight years. C Class average annual returns do not reflect this conversion. |
|
| The investment advisor selected a different index for comparison purposes. The advisor believes the Russell 3000 is more reflective of the fund's strategy as compared to the S&P 500. |
|
|
|
| | |
|
The opinions expressed are those of American Century Investments and are no guarantee of the future performance of any American Century Investments fund. This information is for educational purposes only and is not intended as investment advice. Data reflects past performance, assumes reinvestment of dividends and capital gains and is no guarantee of future results. Current performance may be higher or lower than data shown. Investment return and principal value will fluctuate and redemption value may be more or less than original cost, and none of the charts reflect the deduction of taxes that a shareholder would pay on fund distributions or the redemption of fund shares. Total returns for periods less than one year are not annualized. Visit americancentury.com for more recent performance information.
|
| | | | | |
Fund Statistics | |
| Net Assets | $754,098,529 |
| Management Fees (dollars paid during the reporting period) | $4,378,042 |
| Portfolio Turnover Rate | 28 | % |
| Total Number of Portfolio Holdings | 838 |
| |
| |
| | | | | | | | | | | | | | | | | | | | | | | | | | | | | | |
| Types of Investments in Portfolio (as a % of net assets) | | | | | | | | | | | | | | | | |
| Affiliated Funds | 46.0% | | | | | | | | | | | | | | | | | | | | | | | | |
| Common Stocks | 25.7% | | | | | | | | | | | | | | | | | | | | | | | | |
| U.S. Treasury Securities | 14.0% | | | | | | | | | | | | | | | | | | | | | | | | |
| Sovereign Governments and Agencies | 2.9% | | | | | | | | | | | | | | | | | | | | | | | | |
| Corporate Bonds | 1.7% | | | | | | | | | | | | | | | | | | | | | | | | |
| Collateralized Loan Obligations | 1.0% | | | | | | | | | | | | | | | | | | | | | | | | |
| Asset-Backed Securities | 0.2% | | | | | | | | | | | | | | | | | | | | | | | | |
| Collateralized Mortgage Obligations | 0.2% | | | | | | | | | | | | | | | | | | | | | | | | |
| Preferred Stocks | 0.2% | | | | | | | | | | | | | | | | | | | | | | | | |
| U.S. Government Agency Mortgage-Backed Securities | 0.1% | | | | | | | | | | | | | | | | | | | | | | | | |
| Municipal Securities | 0.1% | | | | | | | | | | | | | | | | | | | | | | | | |
| Exchange-Traded Funds | 0.0% | | | | | | | | | | | | | | | | | | | | | | | | |
| Short-Term Investments | 8.9% | | | | | | | | | | | | | | | | | | | | | | | | |
| Other Assets and Liabilities | (1.0)% | | | | | | | | | | | | | | | | | | | | | | | | |
| | | | | | | | | | | | | | | | | | | | | | | | | | |
| | | | | | | | | | | | | | | | | | | | | | | | | | |
| | | | | | | | | | | | | | | | | | | | | | | | | | |
| | |
| For additional information about the fund, including its Prospectus, Statement of Additional Information, financial statements, holdings and proxy voting information, scan the QR code or visit americancentury.com/docs. |
| | |
| American Century Investment Services, Inc., Distributor |
| ©2024 American Century Proprietary Holdings, Inc. All rights reserved. |
A-25085846
ANNUAL SHAREHOLDER REPORT
Strategic Allocation: Moderate Fund | | | | | |
R Class (ASMRX) | July 31, 2024 |
This annual shareholder report contains important information about Strategic Allocation: Moderate Fund for the period of August 1, 2023 to July 31, 2024. You can find additional information about the fund at americancentury.com/docs. You can also request this information by contacting us at 1-800-345-2021.
| | | | | | | | |
What were the fund costs for the last year? (based on a hypothetical $10,000 investment) |
|
| Costs of a $10,000 investment | Costs paid as a percentage of a $10,000 investment |
| R Class | $125 | 1.19% |
|
| | | | | |
| What were the key factors that affected the fund’s performance? |
Strategic Allocation: Moderate Fund R Class returned 10.55% for the reporting period ended July 31, 2024. |
| The fund is an asset allocation fund. That is, it diversifies its assets among various classes of investments such as equity securities, bonds and money market instruments. The fund seeks the highest level of total return consistent with its asset mix. See the Fund Holdings for the portfolio's asset weights. Below, we discuss the factors that affected these asset classes. |
| • | Investments in domestic equity holdings contributed meaningfully to performance. U.S. stocks did very well from late 2023 through mid-2024 as a much-anticipated recession failed to arrive. Investors favored stocks benefiting from heavy investment in artificial intelligence-related chips and technologies. Stocks gave back some gains in July, however, amid worries about slowing economic conditions. |
| • | The portfolio's non-U.S. equity holdings also rose but by a smaller amount than U.S. large-cap stocks. Signs of slowing economic growth led the European Central Bank to lower short-term interest rates for the first time in almost five years in June 2024. Emerging markets equities generally fared better as Taiwanese and South Korean companies benefited from strength in technology stocks. |
| • | The portfolio's domestic fixed-income holdings contributed to performance. Bond yields were volatile amid changing perceptions of the economy and inflation. The benchmark 10-year Treasury yield started and ended the period at around 4% but went as high as 5% and as low as 3.8%. Reflecting the rally in stocks and strength in corporate earnings, corporate bonds did very well. |
| • | Non-U.S. fixed-income holdings produced positive results. Bond prices generally rose and yields fell as manufacturing activity in several developed economies slowed, while inflation concerns eased. That allowed the European Central Bank to cut interest rates. The Bank of Japan, however, raised rates to support its currency and fight imported inflation despite signs of economic weakness. |
| | |
Cumulative Performance (based on an initial $10,000 investment) |
| July 31, 2014, through July 31, 2024 |
|
| | | | | | | | | | | | | | |
Average Annual Total Returns | |
| 1 Year | 5 Year | 10 Year | | | |
| R Class | 10.55% | 6.94% | 6.09% | | | |
| | | | | | |
| | | | | | |
| Russell 3000 | 21.07% | 14.23% | 12.58% | | | |
| Bloomberg U.S. Aggregate | 5.10% | 0.19% | 1.61% | | | |
| | | | | | |
| S&P 500 | 22.15% | 15.00% | 13.15% | | | |
| Bloomberg U.S. 1-3 Month Treasury Bill | 5.51% | 2.22% | 1.54% | | | |
| | | | | | |
| | | | | | |
| | | | | | |
| | | | | | | | | | | | | | | | | |
| | | | | |
|
|
|
|
|
|
|
| The investment advisor selected a different index for comparison purposes. The advisor believes the Russell 3000 is more reflective of the fund's strategy as compared to the S&P 500. |
|
|
|
| | |
|
The opinions expressed are those of American Century Investments and are no guarantee of the future performance of any American Century Investments fund. This information is for educational purposes only and is not intended as investment advice. Data reflects past performance, assumes reinvestment of dividends and capital gains and is no guarantee of future results. Current performance may be higher or lower than data shown. Investment return and principal value will fluctuate and redemption value may be more or less than original cost, and none of the charts reflect the deduction of taxes that a shareholder would pay on fund distributions or the redemption of fund shares. Total returns for periods less than one year are not annualized. Visit americancentury.com for more recent performance information.
|
| | | | | |
Fund Statistics | |
| Net Assets | $754,098,529 |
| Management Fees (dollars paid during the reporting period) | $4,378,042 |
| Portfolio Turnover Rate | 28 | % |
| Total Number of Portfolio Holdings | 838 |
| |
| |
| | | | | | | | | | | | | | | | | | | | | | | | | | | | | | |
| Types of Investments in Portfolio (as a % of net assets) | | | | | | | | | | | | | | | | |
| Affiliated Funds | 46.0% | | | | | | | | | | | | | | | | | | | | | | | | |
| Common Stocks | 25.7% | | | | | | | | | | | | | | | | | | | | | | | | |
| U.S. Treasury Securities | 14.0% | | | | | | | | | | | | | | | | | | | | | | | | |
| Sovereign Governments and Agencies | 2.9% | | | | | | | | | | | | | | | | | | | | | | | | |
| Corporate Bonds | 1.7% | | | | | | | | | | | | | | | | | | | | | | | | |
| Collateralized Loan Obligations | 1.0% | | | | | | | | | | | | | | | | | | | | | | | | |
| Asset-Backed Securities | 0.2% | | | | | | | | | | | | | | | | | | | | | | | | |
| Collateralized Mortgage Obligations | 0.2% | | | | | | | | | | | | | | | | | | | | | | | | |
| Preferred Stocks | 0.2% | | | | | | | | | | | | | | | | | | | | | | | | |
| U.S. Government Agency Mortgage-Backed Securities | 0.1% | | | | | | | | | | | | | | | | | | | | | | | | |
| Municipal Securities | 0.1% | | | | | | | | | | | | | | | | | | | | | | | | |
| Exchange-Traded Funds | 0.0% | | | | | | | | | | | | | | | | | | | | | | | | |
| Short-Term Investments | 8.9% | | | | | | | | | | | | | | | | | | | | | | | | |
| Other Assets and Liabilities | (1.0)% | | | | | | | | | | | | | | | | | | | | | | | | |
| | | | | | | | | | | | | | | | | | | | | | | | | | |
| | | | | | | | | | | | | | | | | | | | | | | | | | |
| | |
| For additional information about the fund, including its Prospectus, Statement of Additional Information, financial statements, holdings and proxy voting information, scan the QR code or visit americancentury.com/docs. |
| | |
| American Century Investment Services, Inc., Distributor |
| ©2024 American Century Proprietary Holdings, Inc. All rights reserved. |
A-25085820
ANNUAL SHAREHOLDER REPORT
Strategic Allocation: Moderate Fund | | | | | |
R5 Class (ASMUX) | July 31, 2024 |
This annual shareholder report contains important information about Strategic Allocation: Moderate Fund for the period of August 1, 2023 to July 31, 2024. You can find additional information about the fund at americancentury.com/docs. You can also request this information by contacting us at 1-800-345-2021.
| | | | | | | | |
What were the fund costs for the last year? (based on a hypothetical $10,000 investment) |
|
| Costs of a $10,000 investment | Costs paid as a percentage of a $10,000 investment |
| R5 Class | $52 | 0.49% |
|
| | | | | |
| What were the key factors that affected the fund’s performance? |
Strategic Allocation: Moderate Fund R5 Class returned 11.50% for the reporting period ended July 31, 2024. |
| The fund is an asset allocation fund. That is, it diversifies its assets among various classes of investments such as equity securities, bonds and money market instruments. The fund seeks the highest level of total return consistent with its asset mix. See the Fund Holdings for the portfolio's asset weights. Below, we discuss the factors that affected these asset classes. |
| • | Investments in domestic equity holdings contributed meaningfully to performance. U.S. stocks did very well from late 2023 through mid-2024 as a much-anticipated recession failed to arrive. Investors favored stocks benefiting from heavy investment in artificial intelligence-related chips and technologies. Stocks gave back some gains in July, however, amid worries about slowing economic conditions. |
| • | The portfolio's non-U.S. equity holdings also rose but by a smaller amount than U.S. large-cap stocks. Signs of slowing economic growth led the European Central Bank to lower short-term interest rates for the first time in almost five years in June 2024. Emerging markets equities generally fared better as Taiwanese and South Korean companies benefited from strength in technology stocks. |
| • | The portfolio's domestic fixed-income holdings contributed to performance. Bond yields were volatile amid changing perceptions of the economy and inflation. The benchmark 10-year Treasury yield started and ended the period at around 4% but went as high as 5% and as low as 3.8%. Reflecting the rally in stocks and strength in corporate earnings, corporate bonds did very well. |
| • | Non-U.S. fixed-income holdings produced positive results. Bond prices generally rose and yields fell as manufacturing activity in several developed economies slowed, while inflation concerns eased. That allowed the European Central Bank to cut interest rates. The Bank of Japan, however, raised rates to support its currency and fight imported inflation despite signs of economic weakness. |
| | |
Cumulative Performance (based on an initial $10,000 investment) |
| April 10, 2017, through July 31, 2024 |
|
| | | | | | | | | | | | | | | | |
Average Annual Total Returns | |
| 1 Year | 5 Year | | Since Inception | Inception Date | |
| R5 Class | 11.50% | 7.69% | | 7.64% | 4/10/17 | |
| | | | | | |
| | | | | | |
| Russell 3000 | 21.07% | 14.23% | | 13.65% | — | |
| Bloomberg U.S. Aggregate | 5.10% | 0.19% | | 1.31% | — | |
| | | | | | |
| S&P 500 | 22.15% | 15.00% | | 14.32% | — | |
| Bloomberg U.S. 1-3 Month Treasury Bill | 5.51% | 2.22% | | 2.06% | — | |
| | | | | | |
| | | | | | |
| | | | | | |
| | | | | | | | | | | | | | | | | |
| | | | | |
|
|
|
|
|
|
|
| The investment advisor selected a different index for comparison purposes. The advisor believes the Russell 3000 is more reflective of the fund's strategy as compared to the S&P 500. |
|
|
|
| | |
|
The opinions expressed are those of American Century Investments and are no guarantee of the future performance of any American Century Investments fund. This information is for educational purposes only and is not intended as investment advice. Data reflects past performance, assumes reinvestment of dividends and capital gains and is no guarantee of future results. Current performance may be higher or lower than data shown. Investment return and principal value will fluctuate and redemption value may be more or less than original cost, and none of the charts reflect the deduction of taxes that a shareholder would pay on fund distributions or the redemption of fund shares. Total returns for periods less than one year are not annualized. Visit americancentury.com for more recent performance information.
|
| | | | | |
Fund Statistics | |
| Net Assets | $754,098,529 |
| Management Fees (dollars paid during the reporting period) | $4,378,042 |
| Portfolio Turnover Rate | 28 | % |
| Total Number of Portfolio Holdings | 838 |
| |
| |
| | | | | | | | | | | | | | | | | | | | | | | | | | | | | | |
| Types of Investments in Portfolio (as a % of net assets) | | | | | | | | | | | | | | | | |
| Affiliated Funds | 46.0% | | | | | | | | | | | | | | | | | | | | | | | | |
| Common Stocks | 25.7% | | | | | | | | | | | | | | | | | | | | | | | | |
| U.S. Treasury Securities | 14.0% | | | | | | | | | | | | | | | | | | | | | | | | |
| Sovereign Governments and Agencies | 2.9% | | | | | | | | | | | | | | | | | | | | | | | | |
| Corporate Bonds | 1.7% | | | | | | | | | | | | | | | | | | | | | | | | |
| Collateralized Loan Obligations | 1.0% | | | | | | | | | | | | | | | | | | | | | | | | |
| Asset-Backed Securities | 0.2% | | | | | | | | | | | | | | | | | | | | | | | | |
| Collateralized Mortgage Obligations | 0.2% | | | | | | | | | | | | | | | | | | | | | | | | |
| Preferred Stocks | 0.2% | | | | | | | | | | | | | | | | | | | | | | | | |
| U.S. Government Agency Mortgage-Backed Securities | 0.1% | | | | | | | | | | | | | | | | | | | | | | | | |
| Municipal Securities | 0.1% | | | | | | | | | | | | | | | | | | | | | | | | |
| Exchange-Traded Funds | 0.0% | | | | | | | | | | | | | | | | | | | | | | | | |
| Short-Term Investments | 8.9% | | | | | | | | | | | | | | | | | | | | | | | | |
| Other Assets and Liabilities | (1.0)% | | | | | | | | | | | | | | | | | | | | | | | | |
| | | | | | | | | | | | | | | | | | | | | | | | | | |
| | | | | | | | | | | | | | | | | | | | | | | | | | |
| | |
| For additional information about the fund, including its Prospectus, Statement of Additional Information, financial statements, holdings and proxy voting information, scan the QR code or visit americancentury.com/docs. |
| | |
| American Century Investment Services, Inc., Distributor |
| ©2024 American Century Proprietary Holdings, Inc. All rights reserved. |
A-25085515
ANNUAL SHAREHOLDER REPORT
Strategic Allocation: Moderate Fund | | | | | |
R6 Class (ASMDX) | July 31, 2024 |
This annual shareholder report contains important information about Strategic Allocation: Moderate Fund for the period of August 1, 2023 to July 31, 2024. You can find additional information about the fund at americancentury.com/docs. You can also request this information by contacting us at 1-800-345-2021.
| | | | | | | | |
What were the fund costs for the last year? (based on a hypothetical $10,000 investment) |
|
| Costs of a $10,000 investment | Costs paid as a percentage of a $10,000 investment |
| R6 Class | $36 | 0.34% |
|
| | | | | |
| What were the key factors that affected the fund’s performance? |
Strategic Allocation: Moderate Fund R6 Class returned 11.52% for the reporting period ended July 31, 2024. |
| The fund is an asset allocation fund. That is, it diversifies its assets among various classes of investments such as equity securities, bonds and money market instruments. The fund seeks the highest level of total return consistent with its asset mix. See the Fund Holdings for the portfolio's asset weights. Below, we discuss the factors that affected these asset classes. |
| • | Investments in domestic equity holdings contributed meaningfully to performance. U.S. stocks did very well from late 2023 through mid-2024 as a much-anticipated recession failed to arrive. Investors favored stocks benefiting from heavy investment in artificial intelligence-related chips and technologies. Stocks gave back some gains in July, however, amid worries about slowing economic conditions. |
| • | The portfolio's non-U.S. equity holdings also rose but by a smaller amount than U.S. large-cap stocks. Signs of slowing economic growth led the European Central Bank to lower short-term interest rates for the first time in almost five years in June 2024. Emerging markets equities generally fared better as Taiwanese and South Korean companies benefited from strength in technology stocks. |
| • | The portfolio's domestic fixed-income holdings contributed to performance. Bond yields were volatile amid changing perceptions of the economy and inflation. The benchmark 10-year Treasury yield started and ended the period at around 4% but went as high as 5% and as low as 3.8%. Reflecting the rally in stocks and strength in corporate earnings, corporate bonds did very well. |
| • | Non-U.S. fixed-income holdings produced positive results. Bond prices generally rose and yields fell as manufacturing activity in several developed economies slowed, while inflation concerns eased. That allowed the European Central Bank to cut interest rates. The Bank of Japan, however, raised rates to support its currency and fight imported inflation despite signs of economic weakness. |
| | |
Cumulative Performance (based on an initial $10,000 investment) |
| July 31, 2014, through July 31, 2024 |
|
| | | | | | | | | | | | | | |
Average Annual Total Returns | |
| 1 Year | 5 Year | 10 Year | | | |
| R6 Class | 11.52% | 7.87% | 6.99% | | | |
| | | | | | |
| | | | | | |
| Russell 3000 | 21.07% | 14.23% | 12.58% | | | |
| Bloomberg U.S. Aggregate | 5.10% | 0.19% | 1.61% | | | |
| | | | | | |
| S&P 500 | 22.15% | 15.00% | 13.15% | | | |
| Bloomberg U.S. 1-3 Month Treasury Bill | 5.51% | 2.22% | 1.54% | | | |
| | | | | | |
| | | | | | |
| | | | | | |
| | | | | | | | | | | | | | | | | |
| | | | | |
|
|
|
|
|
|
|
| The investment advisor selected a different index for comparison purposes. The advisor believes the Russell 3000 is more reflective of the fund's strategy as compared to the S&P 500. |
|
|
|
| | |
|
The opinions expressed are those of American Century Investments and are no guarantee of the future performance of any American Century Investments fund. This information is for educational purposes only and is not intended as investment advice. Data reflects past performance, assumes reinvestment of dividends and capital gains and is no guarantee of future results. Current performance may be higher or lower than data shown. Investment return and principal value will fluctuate and redemption value may be more or less than original cost, and none of the charts reflect the deduction of taxes that a shareholder would pay on fund distributions or the redemption of fund shares. Total returns for periods less than one year are not annualized. Visit americancentury.com for more recent performance information.
|
| | | | | |
Fund Statistics | |
| Net Assets | $754,098,529 |
| Management Fees (dollars paid during the reporting period) | $4,378,042 |
| Portfolio Turnover Rate | 28 | % |
| Total Number of Portfolio Holdings | 838 |
| |
| |
| | | | | | | | | | | | | | | | | | | | | | | | | | | | | | |
| Types of Investments in Portfolio (as a % of net assets) | | | | | | | | | | | | | | | | |
| Affiliated Funds | 46.0% | | | | | | | | | | | | | | | | | | | | | | | | |
| Common Stocks | 25.7% | | | | | | | | | | | | | | | | | | | | | | | | |
| U.S. Treasury Securities | 14.0% | | | | | | | | | | | | | | | | | | | | | | | | |
| Sovereign Governments and Agencies | 2.9% | | | | | | | | | | | | | | | | | | | | | | | | |
| Corporate Bonds | 1.7% | | | | | | | | | | | | | | | | | | | | | | | | |
| Collateralized Loan Obligations | 1.0% | | | | | | | | | | | | | | | | | | | | | | | | |
| Asset-Backed Securities | 0.2% | | | | | | | | | | | | | | | | | | | | | | | | |
| Collateralized Mortgage Obligations | 0.2% | | | | | | | | | | | | | | | | | | | | | | | | |
| Preferred Stocks | 0.2% | | | | | | | | | | | | | | | | | | | | | | | | |
| U.S. Government Agency Mortgage-Backed Securities | 0.1% | | | | | | | | | | | | | | | | | | | | | | | | |
| Municipal Securities | 0.1% | | | | | | | | | | | | | | | | | | | | | | | | |
| Exchange-Traded Funds | 0.0% | | | | | | | | | | | | | | | | | | | | | | | | |
| Short-Term Investments | 8.9% | | | | | | | | | | | | | | | | | | | | | | | | |
| Other Assets and Liabilities | (1.0)% | | | | | | | | | | | | | | | | | | | | | | | | |
| | | | | | | | | | | | | | | | | | | | | | | | | | |
| | | | | | | | | | | | | | | | | | | | | | | | | | |
| | |
| For additional information about the fund, including its Prospectus, Statement of Additional Information, financial statements, holdings and proxy voting information, scan the QR code or visit americancentury.com/docs. |
| | |
| American Century Investment Services, Inc., Distributor |
| ©2024 American Century Proprietary Holdings, Inc. All rights reserved. |
A-25085630
ITEM 2. CODE OF ETHICS.
(a) The registrant has adopted a Code of Ethics for Senior Financial Officers that applies to the registrant’s principal executive officer, principal financial officer, principal accounting officer, and persons performing similar functions.
(b) No response required.
(c) None.
(d) None.
(e) Not applicable.
(f) The registrant’s Code of Ethics for Senior Financial Officers was filed as Exhibit 12 (a)(1) to American Century Asset Allocation Portfolios, Inc.’s Annual Certified Shareholder Report on Form N-CSR, File No. 811-21591, on September 29, 2005, and is incorporated herein by reference.
ITEM 3. AUDIT COMMITTEE FINANCIAL EXPERT.
(a)(1) The registrant’s board has determined that the registrant has at least one audit committee financial expert serving on its audit committee.
(a)(2) Chris H. Cheesman, Lynn M. Jenkins, Barry Fink and Gary Meltzer are the registrant’s designated audit committee financial experts. They are “independent” as defined in Item 3 of Form N-CSR.
(a)(3) Not applicable.
(b) No response required.
(c) No response required.
(d) No response required.
ITEM 4. PRINCIPAL ACCOUNTANT FEES AND SERVICES.
(a) Audit Fees.
The aggregate fees billed for each of the last two fiscal years for professional services rendered by the principal
accountant for the audit of the registrant’s annual financial statements or services that are normally provided by the accountant in connection with statutory and regulatory filings or engagements for those fiscal years were as follows:
| | | | | |
| FY 2023: | $72,960 |
| FY 2024: | $72,960 |
(b) Audit-Related Fees.
The aggregate fees billed in each of the last two fiscal years for assurance and related services by the principal accountant that are reasonably related to the performance of the audit of the registrant’s financial statements and are not reported under paragraph (a) of this Item were as follows:
For services rendered to the registrant:
Fees required to be approved pursuant to paragraph (c)(7)(ii) of Rule 2-01 of Regulation S-X (relating to certain engagements for non-audit services with the registrant’s investment adviser and its affiliates):
(c) Tax Fees.
The aggregate fees billed in each of the last two fiscal years for professional services rendered by the principal accountant for tax compliance, tax advice, and tax planning were as follows:
For services rendered to the registrant:
Fees required to be approved pursuant to paragraph (c)(7)(ii) of Rule 2-01 of Regulation S-X (relating to certain engagements for non-audit services with the registrant’s investment adviser and its affiliates):
(d) All Other Fees.
The aggregate fees billed in each of the last two fiscal years for products and services provided by the principal accountant, other than the services reported in paragraphs (a) through (c) of this Item were as follows:
For services rendered to the registrant:
Fees required to be approved pursuant to paragraph (c)(7)(ii) of Rule 2-01 of Regulation S-X (relating to certain engagements for non-audit services with the registrant’s investment adviser and its affiliates):
(e)(1) In accordance with paragraph (c)(7)(i)(A) of Rule 2-01 of Regulation S-X, before the accountant is engaged by the registrant to render audit or non-audit services, the engagement is approved by the registrant’s audit committee. Pursuant to paragraph (c)(7)(ii) of Rule 2-01 of Regulation S-X, the registrant’s audit committee also pre-approves its accountant’s engagements for non-audit services with the registrant’s investment adviser, its parent company, and any entity controlled by, or under common control with the investment adviser that provides ongoing services to the registrant, if the engagement relates directly to the operations and financial reporting of the registrant.
(e)(2) All services described in each of paragraphs (b) through (d) of this Item were pre-approved before the engagement by the registrant’s audit committee pursuant to paragraph (c)(7)(i)(A) of Rule 2-01 of Regulation S-X. Consequently, none of such services were required to be approved by the audit committee pursuant to paragraph (c)(7)(i)(C).
(f) The percentage of hours expended on the principal accountant’s engagement to audit the registrant’s financial statements for the most recent fiscal year that were attributed to work performed by persons other than the principal accountant’s full-time, permanent employees was less than 50%.
(g) The aggregate non-audit fees billed by the registrant’s accountant for services rendered to the registrant, and rendered to the registrant’s investment adviser (not including any sub-adviser whose role is primarily portfolio management and is subcontracted with or overseen by another investment adviser), and any entity controlling, controlled by, or under common control with the adviser that provides ongoing services to the registrant for each of the last two fiscal years of the registrant were as follows:
| | | | | |
| FY 2023: | $243,325 |
| FY 2024: | $198,325 |
(h) The registrant’s investment adviser and accountant have notified the registrant’s audit committee of all non-audit services that were rendered by the registrant’s accountant to the registrant’s investment adviser, its parent company, and any entity controlled by, or under common control with the investment adviser that provides services to the registrant, which services were not required to be pre-approved pursuant to paragraph (c)(7)(ii) of Rule 2-01 of Regulation S-X. The notification provided to the registrant’s audit committee included sufficient details regarding such services to allow the registrant’s audit committee to consider the continuing independence of its principal accountant.
| | | | | |
| (i) | Not applicable. |
| |
| (j) | Not applicable. |
ITEM 5. AUDIT COMMITTEE OF LISTED REGISTRANTS.
Not applicable.
ITEM 6. INVESTMENTS.
(a) The schedule of investments is included as part of the report to stockholders filed under Item 7 of this Form.
(b) Not applicable.
ITEM 7. FINANCIAL STATEMENTS AND FINANCIAL HIGHLIGHTS FOR OPEN-END MANAGEMENT INVESTMENT COMPANIES.
(a)
| | | | | |
| |
| Annual Financial Statement and Other Information |
| |
| July 31, 2024 |
| |
| Strategic Allocation: Aggressive Fund |
| Investor Class (TWSAX) |
| I Class (AAAIX) |
| A Class (ACVAX) |
| C Class (ASTAX) |
| R Class (AAARX) |
| R5 Class (ASAUX) |
| R6 Class (AAAUX) |
| | | | | |
| Schedule of Investments | |
| Statement of Assets and Liabilities | |
| Statement of Operations | |
| Statement of Changes in Net Assets | |
| Notes to Financial Statements | |
| Financial Highlights | |
| Report of Independent Registered Public Accounting Firm | |
| Approval of Management Agreement | |
| |
| Other Tax Information | |
JULY 31, 2024
| | | | | | | | | | | |
| | Shares/Principal
Amount | Value |
AFFILIATED FUNDS(1) — 52.6% | | | |
| American Century Diversified Corporate Bond ETF | | 288,278 | | $ | 13,564,575 | |
| American Century Emerging Markets Bond ETF | | 133,102 | | 5,184,682 | |
American Century Focused Dynamic Growth ETF(2) | | 457,680 | | 40,112,814 | |
| American Century Focused Large Cap Value ETF | | 584,326 | | 38,904,834 | |
| American Century Multisector Income ETF | | 526,514 | | 23,082,374 | |
| American Century Quality Diversified International ETF | | 603,127 | | 30,052,853 | |
| American Century Short Duration Strategic Income ETF | | 70,956 | | 3,646,784 | |
American Century U.S. Quality Growth ETF(3) | | 415,443 | | 35,678,245 | |
| American Century U.S. Quality Value ETF | | 625,378 | | 36,874,976 | |
Avantis Emerging Markets Equity ETF(3) | | 599,000 | | 36,646,820 | |
Avantis International Equity ETF(3) | | 302,133 | | 19,478,515 | |
Avantis International Small Cap Value ETF(3) | | 132,595 | | 9,013,808 | |
| Avantis U.S. Equity ETF | | 444,768 | | 41,243,337 | |
Avantis U.S. Small Cap Value ETF(3) | | 146,911 | | 14,647,027 | |
TOTAL AFFILIATED FUNDS (Cost $250,523,615) | | | 348,131,644 | |
| COMMON STOCKS — 30.9% | | | |
| Aerospace and Defense — 0.3% | | | |
AAR Corp.(2) | | 1,834 | | 118,476 | |
Bombardier, Inc., Class B(2) | | 335 | | 22,609 | |
CAE, Inc.(2) | | 6,560 | | 119,355 | |
| Curtiss-Wright Corp. | | 2,374 | | 699,618 | |
| HEICO Corp. | | 1,984 | | 478,819 | |
| Hexcel Corp. | | 2,196 | | 145,397 | |
| Huntington Ingalls Industries, Inc. | | 1,637 | | 458,327 | |
| Lockheed Martin Corp. | | 273 | | 147,944 | |
| Melrose Industries PLC | | 4,910 | | 37,180 | |
| Saab AB, Class B | | 3,584 | | 82,758 | |
| | | 2,310,483 | |
| Air Freight and Logistics — 0.1% | | | |
Cargojet, Inc.(3) | | 755 | | 71,325 | |
| FedEx Corp. | | 610 | | 184,372 | |
GXO Logistics, Inc.(2) | | 3,555 | | 199,009 | |
InPost SA(2) | | 5,158 | | 89,365 | |
| United Parcel Service, Inc., Class B | | 1,456 | | 189,819 | |
| | | 733,890 | |
| Automobile Components — 0.2% | | | |
Aptiv PLC(2) | | 5,852 | | 406,070 | |
| BorgWarner, Inc. | | 7,568 | | 267,226 | |
| Continental AG | | 4,558 | | 279,423 | |
| Hyundai Mobis Co. Ltd. | | 2,001 | | 323,742 | |
| Linamar Corp. | | 4,541 | | 226,516 | |
| Nifco, Inc. | | 1,000 | | 25,355 | |
| Toyo Tire Corp. | | 2,900 | | 47,316 | |
| | | 1,575,648 | |
| Automobiles — 0.2% | | | |
| Bayerische Motoren Werke AG | | 3,517 | | 326,199 | |
| Ferrari NV | | 898 | | 369,592 | |
| Mercedes-Benz Group AG | | 5,287 | | 349,494 | |
Tesla, Inc.(2) | | 1,578 | | 366,206 | |
| | | | | | | | | | | |
| | Shares/Principal
Amount | Value |
Volvo Car AB, Class B(2) | | 54,943 | | $ | 155,892 | |
| Winnebago Industries, Inc. | | 980 | | 61,270 | |
| | | 1,628,653 | |
| Banks — 1.1% | | | |
Bancorp, Inc.(2) | | 1,286 | | 66,666 | |
| Bank Central Asia Tbk. PT | | 785,700 | | 497,514 | |
| Bank of America Corp. | | 9,703 | | 391,128 | |
| Bankinter SA | | 10,819 | | 92,410 | |
| Barclays PLC | | 305,620 | | 913,897 | |
| BNP Paribas SA | | 1,801 | | 123,393 | |
| BPER Banca SpA | | 25,211 | | 147,510 | |
| Commerce Bancshares, Inc. | | 6,945 | | 449,411 | |
| First Hawaiian, Inc. | | 9,663 | | 241,962 | |
| Fukuoka Financial Group, Inc. | | 4,300 | | 120,610 | |
| Hana Financial Group, Inc. | | 1,654 | | 78,363 | |
| ING Groep NV, Series N | | 20,870 | | 378,810 | |
| JPMorgan Chase & Co. | | 3,389 | | 721,179 | |
| Mebuki Financial Group, Inc. | | 29,100 | | 121,127 | |
NU Holdings Ltd., Class A(2) | | 80,200 | | 972,826 | |
| PNC Financial Services Group, Inc. | | 1,563 | | 283,059 | |
| Regions Financial Corp. | | 15,280 | | 341,814 | |
Triumph Financial, Inc.(2) | | 1,157 | | 104,975 | |
| Truist Financial Corp. | | 15,544 | | 694,662 | |
| U.S. Bancorp | | 8,372 | | 375,735 | |
| Westamerica Bancorporation | | 4,749 | | 256,256 | |
| | | 7,373,307 | |
| Beverages — 0.3% | | | |
| Ambev SA | | 116,500 | | 237,896 | |
Celsius Holdings, Inc.(2) | | 3,118 | | 146,016 | |
| Coca-Cola Bottlers Japan Holdings, Inc. | | 3,900 | | 58,131 | |
| Davide Campari-Milano NV | | 45,489 | | 410,241 | |
Heineken NV(3) | | 3,873 | | 343,693 | |
| MGP Ingredients, Inc. | | 818 | | 66,708 | |
| PepsiCo, Inc. | | 2,741 | | 473,288 | |
Pernod Ricard SA(3) | | 2,442 | | 326,757 | |
Royal Unibrew AS(2) | | 972 | | 76,315 | |
| | | 2,139,045 | |
| Biotechnology — 0.8% | | | |
| AbbVie, Inc. | | 3,030 | | 561,520 | |
ADMA Biologics, Inc.(2) | | 9,859 | | 121,069 | |
Alkermes PLC(2) | | 2,897 | | 79,146 | |
Alnylam Pharmaceuticals, Inc.(2) | | 2,055 | | 487,980 | |
| Amgen, Inc. | | 650 | | 216,105 | |
Amicus Therapeutics, Inc.(2) | | 27,468 | | 283,195 | |
Arcutis Biotherapeutics, Inc.(2) | | 3,851 | | 38,780 | |
Argenx SE, ADR(2) | | 554 | | 285,792 | |
Biohaven Ltd.(2) | | 1,615 | | 63,518 | |
BioMarin Pharmaceutical, Inc.(2) | | 4,197 | | 353,933 | |
Blueprint Medicines Corp.(2) | | 1,117 | | 120,971 | |
Bridgebio Pharma, Inc.(2) | | 2,888 | | 74,944 | |
Celldex Therapeutics, Inc.(2) | | 1,301 | | 49,581 | |
Centessa Pharmaceuticals PLC, ADR(2)(3) | | 2,615 | | 27,536 | |
Crinetics Pharmaceuticals, Inc.(2) | | 1,219 | | 64,753 | |
| CSL Ltd. | | 1,915 | | 388,674 | |
| | | | | | | | | | | |
| | Shares/Principal
Amount | Value |
Cytokinetics, Inc.(2) | | 1,023 | | $ | 60,367 | |
Halozyme Therapeutics, Inc.(2) | | 2,252 | | 124,446 | |
Insmed, Inc.(2) | | 2,331 | | 169,580 | |
Keros Therapeutics, Inc.(2) | | 941 | | 47,201 | |
Madrigal Pharmaceuticals, Inc.(2)(3) | | 352 | | 100,200 | |
Mineralys Therapeutics, Inc.(2) | | 2,273 | | 28,162 | |
Natera, Inc.(2) | | 6,982 | | 714,887 | |
REVOLUTION Medicines, Inc.(2) | | 1,757 | | 80,189 | |
Telix Pharmaceuticals Ltd.(2)(3) | | 6,303 | | 79,128 | |
Twist Bioscience Corp.(2) | | 1,144 | | 63,847 | |
Vaxcyte, Inc.(2) | | 1,589 | | 125,356 | |
Vera Therapeutics, Inc.(2) | | 1,232 | | 45,079 | |
Vertex Pharmaceuticals, Inc.(2) | | 364 | | 180,442 | |
Viking Therapeutics, Inc.(2) | | 835 | | 47,595 | |
| | | 5,083,976 | |
| Broadline Retail — 0.4% | | | |
| Alibaba Group Holding Ltd. | | 26,500 | | 260,766 | |
Amazon.com, Inc.(2) | | 7,659 | | 1,432,080 | |
Ollie's Bargain Outlet Holdings, Inc.(2) | | 1,760 | | 171,846 | |
| Pan Pacific International Holdings Corp. | | 16,200 | | 422,645 | |
| Ryohin Keikaku Co. Ltd. | | 5,400 | | 101,832 | |
| | | 2,389,169 | |
| Building Products — 0.4% | | | |
AZEK Co., Inc.(2) | | 4,824 | | 216,549 | |
| Cie de Saint-Gobain SA | | 1,994 | | 171,057 | |
| Fortune Brands Innovations, Inc. | | 2,198 | | 177,620 | |
Hayward Holdings, Inc.(2) | | 12,174 | | 180,053 | |
JELD-WEN Holding, Inc.(2) | | 8,178 | | 136,491 | |
| Johnson Controls International PLC | | 9,502 | | 679,773 | |
| Lennox International, Inc. | | 1,417 | | 826,820 | |
| Munters Group AB | | 3,573 | | 77,355 | |
| Reliance Worldwide Corp. Ltd. | | 32,878 | | 110,826 | |
| | | 2,576,544 | |
| Capital Markets — 1.5% | | | |
| AllianceBernstein Holding LP | | 5,077 | | 179,167 | |
| Ameriprise Financial, Inc. | | 575 | | 247,290 | |
| ARES Management Corp., Class A | | 6,616 | | 1,013,571 | |
| Bank of New York Mellon Corp. | | 15,131 | | 984,574 | |
| BlackRock, Inc. | | 358 | | 313,787 | |
| Bolsa Mexicana de Valores SAB de CV | | 35,130 | | 54,681 | |
Coinbase Global, Inc., Class A(2) | | 3,097 | | 694,843 | |
Donnelley Financial Solutions, Inc.(2) | | 2,679 | | 180,779 | |
| GQG Partners, Inc. | | 45,825 | | 89,444 | |
| Hamilton Lane, Inc., Class A | | 1,149 | | 165,881 | |
| Integral Corp. | | 1,900 | | 51,766 | |
| Intercontinental Exchange, Inc. | | 1,259 | | 190,814 | |
| Intermediate Capital Group PLC | | 3,760 | | 106,133 | |
| London Stock Exchange Group PLC | | 4,931 | | 600,229 | |
| LPL Financial Holdings, Inc. | | 3,136 | | 694,687 | |
| Man Group PLC | | 26,261 | | 82,677 | |
| Morgan Stanley | | 5,250 | | 541,853 | |
| MSCI, Inc. | | 1,923 | | 1,039,881 | |
| Northern Trust Corp. | | 10,020 | | 888,273 | |
| S&P Global, Inc. | | 927 | | 449,345 | |
| | | | | | | | | | | |
| | Shares/Principal
Amount | Value |
| Swissquote Group Holding SA | | 289 | | $ | 92,176 | |
| T Rowe Price Group, Inc. | | 4,820 | | 550,492 | |
| TPG, Inc. | | 8,709 | | 444,072 | |
| | | 9,656,415 | |
| Chemicals — 0.6% | | | |
| Air Liquide SA | | 3,110 | | 567,446 | |
| Akzo Nobel NV | | 6,018 | | 372,106 | |
| Arkema SA | | 2,517 | | 227,141 | |
Aspen Aerogels, Inc.(2) | | 2,207 | | 45,045 | |
| Avient Corp. | | 9,628 | | 435,571 | |
| DSM-Firmenich AG | | 4,175 | | 533,018 | |
| Ecolab, Inc. | | 1,175 | | 271,061 | |
| Element Solutions, Inc. | | 29,130 | | 785,054 | |
| Linde PLC | | 1,002 | | 454,407 | |
| Shin-Etsu Chemical Co. Ltd. | | 9,600 | | 426,534 | |
| Tokyo Ohka Kogyo Co. Ltd. | | 2,800 | | 72,071 | |
| | | 4,189,454 | |
| Commercial Services and Supplies — 0.3% | | | |
Casella Waste Systems, Inc., Class A(2) | | 1,669 | | 172,842 | |
Clean Harbors, Inc.(2) | | 701 | | 167,350 | |
| Daiei Kankyo Co. Ltd. | | 5,000 | | 95,634 | |
| Element Fleet Management Corp. | | 928 | | 17,751 | |
| Elis SA | | 6,093 | | 140,903 | |
| Republic Services, Inc. | | 6,011 | | 1,168,057 | |
| SPIE SA | | 3,374 | | 130,421 | |
Stericycle, Inc.(2) | | 1,854 | | 108,552 | |
| UniFirst Corp. | | 536 | | 104,273 | |
| | | 2,105,783 | |
| Communications Equipment — 0.3% | | | |
Arista Networks, Inc.(2) | | 1,289 | | 446,703 | |
| Cisco Systems, Inc. | | 6,249 | | 302,764 | |
F5, Inc.(2) | | 2,900 | | 590,556 | |
| Juniper Networks, Inc. | | 9,272 | | 349,462 | |
| Motorola Solutions, Inc. | | 422 | | 168,344 | |
| | | 1,857,829 | |
| Construction and Engineering — 0.2% | | | |
| AtkinsRealis Group, Inc. | | 2,436 | | 104,946 | |
Construction Partners, Inc., Class A(2) | | 2,059 | | 133,114 | |
| Eiffage SA | | 4,000 | | 398,087 | |
Fugro NV(3) | | 5,055 | | 135,009 | |
| Kinden Corp. | | 4,900 | | 103,380 | |
| Ventia Services Group Pty. Ltd. | | 33,822 | | 97,375 | |
| Vinci SA | | 4,569 | | 521,405 | |
| | | 1,493,316 | |
| Construction Materials — 0.2% | | | |
| CRH PLC | | 7,485 | | 641,464 | |
James Hardie Industries PLC(2) | | 9,157 | | 328,953 | |
Summit Materials, Inc., Class A(2) | | 3,524 | | 147,233 | |
| Taiheiyo Cement Corp. | | 4,100 | | 111,983 | |
| | | 1,229,633 | |
| Consumer Finance — 0.1% | | | |
| American Express Co. | | 1,095 | | 277,079 | |
| FirstCash Holdings, Inc. | | 1,252 | | 139,723 | |
| | | 416,802 | |
| | | | | | | | | | | |
| | Shares/Principal
Amount | Value |
| Consumer Staples Distribution & Retail — 0.5% | | | |
| BGF retail Co. Ltd. | | 1,258 | | $ | 95,018 | |
| Casey's General Stores, Inc. | | 574 | | 222,620 | |
| Costco Wholesale Corp. | | 384 | | 315,648 | |
Dollar Tree, Inc.(2) | | 5,100 | | 532,134 | |
Grocery Outlet Holding Corp.(2) | | 2,862 | | 55,981 | |
| Koninklijke Ahold Delhaize NV | | 27,570 | | 888,173 | |
| Marks & Spencer Group PLC | | 27,585 | | 116,507 | |
| PriceSmart, Inc. | | 1,512 | | 138,091 | |
Redcare Pharmacy NV(2) | | 696 | | 104,193 | |
| Sysco Corp. | | 4,388 | | 336,340 | |
| Target Corp. | | 2,229 | | 335,264 | |
| | | 3,139,969 | |
| Containers and Packaging — 0.4% | | | |
| Amcor PLC | | 12,883 | | 135,658 | |
| AptarGroup, Inc. | | 477 | | 70,109 | |
| Avery Dennison Corp. | | 1,050 | | 227,671 | |
| Ball Corp. | | 3,153 | | 201,256 | |
| Graphic Packaging Holding Co. | | 17,476 | | 526,028 | |
| Packaging Corp. of America | | 2,500 | | 499,675 | |
| Smurfit WestRock PLC | | 6,032 | | 270,475 | |
| Sonoco Products Co. | | 4,435 | | 239,135 | |
| Verallia SA | | 16,081 | | 473,029 | |
| | | 2,643,036 | |
| Distributors — 0.2% | | | |
| D'ieteren Group | | 205 | | 47,113 | |
| LKQ Corp. | | 4,571 | | 189,697 | |
| Pool Corp. | | 2,734 | | 1,022,625 | |
| | | 1,259,435 | |
| Diversified Consumer Services — 0.2% | | | |
Bright Horizons Family Solutions, Inc.(2) | | 3,749 | | 450,817 | |
Duolingo, Inc.(2) | | 3,089 | | 531,123 | |
European Wax Center, Inc., Class A(2) | | 6,557 | | 61,570 | |
Stride, Inc.(2) | | 2,402 | | 182,504 | |
| | | 1,226,014 | |
| Diversified REITs — 0.1% | | | |
| British Land Co. PLC | | 21,992 | | 116,564 | |
| Essential Properties Realty Trust, Inc. | | 15,111 | | 447,135 | |
| Merlin Properties Socimi SA | | 18,466 | | 210,879 | |
| Mirvac Group | | 90,907 | | 127,998 | |
| | | 902,576 | |
| Diversified Telecommunication Services — 0.2% | | | |
| BCE, Inc. | | 10,093 | | 340,442 | |
| Cellnex Telecom SA | | 916 | | 31,947 | |
| LG Uplus Corp. | | 15,071 | | 110,230 | |
| Orange SA | | 43,137 | | 478,703 | |
U-Next Holdings Co. Ltd.(3) | | 2,700 | | 92,985 | |
| Verizon Communications, Inc. | | 10,414 | | 421,975 | |
| | | 1,476,282 | |
| Electric Utilities — 0.6% | | | |
| Duke Energy Corp. | | 5,739 | | 627,100 | |
| Edison International | | 9,457 | | 756,655 | |
| Evergy, Inc. | | 9,671 | | 560,918 | |
| Eversource Energy | | 8,779 | | 569,845 | |
| | | | | | | | | | | |
| | Shares/Principal
Amount | Value |
| Iberdrola SA | | 15,458 | | $ | 204,172 | |
| NextEra Energy, Inc. | | 8,584 | | 655,732 | |
| Pinnacle West Capital Corp. | | 2,401 | | 205,502 | |
| Xcel Energy, Inc. | | 7,333 | | 427,367 | |
| | | 4,007,291 | |
| Electrical Equipment — 0.6% | | | |
| AMETEK, Inc. | | 2,194 | | 380,615 | |
| Atkore, Inc. | | 1,013 | | 136,755 | |
| Eaton Corp. PLC | | 1,225 | | 373,368 | |
| Emerson Electric Co. | | 6,180 | | 723,740 | |
| Furukawa Electric Co. Ltd. | | 2,100 | | 57,449 | |
| Hubbell, Inc. | | 703 | | 278,142 | |
| Regal Rexnord Corp. | | 2,903 | | 466,454 | |
| Schneider Electric SE | | 2,748 | | 662,365 | |
| Signify NV | | 10,313 | | 255,292 | |
| Vertiv Holdings Co., Class A | | 6,122 | | 481,801 | |
| | | 3,815,981 | |
| Electronic Equipment, Instruments and Components — 0.3% | | | |
| CDW Corp. | | 4,054 | | 884,218 | |
Celestica, Inc. (Toronto)(2) | | 871 | | 45,681 | |
| Cognex Corp. | | 1,454 | | 72,148 | |
| Horiba Ltd. | | 700 | | 55,402 | |
| Keyence Corp. | | 1,000 | | 437,260 | |
| Littelfuse, Inc. | | 586 | | 156,526 | |
Mirion Technologies, Inc., Class A(2) | | 9,282 | | 97,832 | |
| TE Connectivity Ltd. | | 2,567 | | 396,165 | |
| Yokogawa Electric Corp. | | 1,700 | | 43,031 | |
| | | 2,188,263 | |
| Energy Equipment and Services — 0.3% | | | |
| Baker Hughes Co. | | 16,248 | | 629,123 | |
Expro Group Holdings NV(2) | | 12,455 | | 289,205 | |
| Schlumberger NV | | 9,597 | | 463,439 | |
Seadrill Ltd.(2) | | 1,130 | | 62,161 | |
| Subsea 7 SA | | 6,263 | | 120,469 | |
| TechnipFMC PLC | | 2,346 | | 69,207 | |
Transocean Ltd.(2) | | 19,200 | | 111,168 | |
| | | 1,744,772 | |
| Entertainment — 0.2% | | | |
| CTS Eventim AG & Co. KGaA | | 740 | | 65,182 | |
| Electronic Arts, Inc. | | 1,224 | | 184,750 | |
Liberty Media Corp.-Liberty Formula One, Class C(2) | | 772 | | 62,432 | |
Spotify Technology SA(2) | | 1,466 | | 504,216 | |
Take-Two Interactive Software, Inc.(2) | | 3,375 | | 508,039 | |
| Universal Music Group NV | | 6,073 | | 144,686 | |
| Walt Disney Co. | | 1,632 | | 152,902 | |
| | | 1,622,207 | |
| Financial Services — 0.5% | | | |
Adyen NV(2) | | 273 | | 333,944 | |
AvidXchange Holdings, Inc.(2) | | 13,832 | | 123,658 | |
Block, Inc.(2) | | 1,248 | | 77,226 | |
Corpay, Inc.(2) | | 2,719 | | 793,458 | |
| Edenred SE | | 13,946 | | 580,694 | |
| Mastercard, Inc., Class A | | 728 | | 337,581 | |
Shift4 Payments, Inc., Class A(2)(3) | | 1,380 | | 94,930 | |
| | | | | | | | | | | |
| | Shares/Principal
Amount | Value |
| Visa, Inc., Class A | | 2,489 | | $ | 661,253 | |
Worldline SA(2) | | 6,667 | | 75,650 | |
| | | 3,078,394 | |
| Food Products — 0.4% | | | |
| AAK AB | | 3,247 | | 93,439 | |
| Conagra Brands, Inc. | | 33,458 | | 1,014,447 | |
| General Mills, Inc. | | 8,610 | | 578,075 | |
| Glanbia PLC | | 5,518 | | 110,355 | |
| Mondelez International, Inc., Class A | | 3,665 | | 250,503 | |
| Morinaga & Co. Ltd. | | 2,400 | | 46,061 | |
| Nomad Foods Ltd. | | 6,473 | | 123,699 | |
| Toyo Suisan Kaisha Ltd. | | 1,300 | | 87,290 | |
| Yamazaki Baking Co. Ltd. | | 2,400 | | 59,341 | |
| | | 2,363,210 | |
| Gas Utilities — 0.1% | | | |
| Nippon Gas Co. Ltd. | | 4,600 | | 71,704 | |
| ONE Gas, Inc. | | 5,558 | | 387,004 | |
| Spire, Inc. | | 6,735 | | 448,484 | |
| | | 907,192 | |
| Ground Transportation — 0.5% | | | |
| Canadian Pacific Kansas City Ltd. | | 5,822 | | 488,227 | |
| CSX Corp. | | 3,938 | | 138,224 | |
| Knight-Swift Transportation Holdings, Inc. | | 2,863 | | 155,833 | |
| Kyushu Railway Co. | | 1,000 | | 26,692 | |
| Norfolk Southern Corp. | | 4,851 | | 1,210,616 | |
Saia, Inc.(2) | | 147 | | 61,424 | |
| Schneider National, Inc., Class B | | 4,002 | | 107,694 | |
Uber Technologies, Inc.(2) | | 3,360 | | 216,619 | |
| Union Pacific Corp. | | 1,453 | | 358,499 | |
XPO, Inc.(2) | | 5,863 | | 673,600 | |
| | | 3,437,428 | |
| Health Care Equipment and Supplies — 1.0% | | | |
Alphatec Holdings, Inc.(2) | | 10,362 | | 104,656 | |
| Becton Dickinson & Co. | | 1,890 | | 455,603 | |
| ConvaTec Group PLC | | 9,920 | | 29,889 | |
| DENTSPLY SIRONA, Inc. | | 8,881 | | 241,030 | |
Dexcom, Inc.(2) | | 9,412 | | 638,322 | |
Envista Holdings Corp.(2) | | 13,515 | | 230,701 | |
| GE HealthCare Technologies, Inc. | | 7,191 | | 608,574 | |
Hologic, Inc.(2) | | 5,269 | | 430,003 | |
IDEXX Laboratories, Inc.(2) | | 1,381 | | 657,522 | |
Inari Medical, Inc.(2) | | 3,054 | | 142,194 | |
Insulet Corp.(2) | | 2,319 | | 450,698 | |
Integer Holdings Corp.(2) | | 1,097 | | 130,280 | |
Intuitive Surgical, Inc.(2) | | 592 | | 263,209 | |
Lantheus Holdings, Inc.(2) | | 1,262 | | 132,296 | |
SI-BONE, Inc.(2) | | 6,344 | | 96,429 | |
| Terumo Corp. | | 27,800 | | 498,408 | |
| Ypsomed Holding AG | | 227 | | 104,320 | |
| Zimmer Biomet Holdings, Inc. | | 12,309 | | 1,370,607 | |
| | | 6,584,741 | |
| Health Care Providers and Services — 1.1% | | | |
Acadia Healthcare Co., Inc.(2) | | 1,280 | | 83,008 | |
AMN Healthcare Services, Inc.(2) | | 1,041 | | 70,392 | |
| | | | | | | | | | | |
| | Shares/Principal
Amount | Value |
| Amvis Holdings, Inc. | | 1,300 | | $ | 22,633 | |
| Cardinal Health, Inc. | | 6,296 | | 634,826 | |
| Cencora, Inc. | | 3,453 | | 821,400 | |
Centene Corp.(2) | | 4,490 | | 345,371 | |
| Chartwell Retirement Residences | | 29,122 | | 288,974 | |
| Cigna Group | | 1,114 | | 388,418 | |
| Encompass Health Corp. | | 1,362 | | 126,584 | |
HealthEquity, Inc.(2) | | 1,656 | | 129,963 | |
Henry Schein, Inc.(2) | | 12,894 | | 927,594 | |
| Labcorp Holdings, Inc. | | 2,244 | | 483,447 | |
NeoGenomics, Inc.(2) | | 8,150 | | 144,500 | |
Option Care Health, Inc.(2) | | 3,425 | | 101,688 | |
| Quest Diagnostics, Inc. | | 5,886 | | 837,578 | |
R1 RCM, Inc.(2) | | 9,612 | | 123,803 | |
RadNet, Inc.(2) | | 1,301 | | 77,735 | |
| UnitedHealth Group, Inc. | | 1,445 | | 832,551 | |
| Universal Health Services, Inc., Class B | | 2,986 | | 638,287 | |
| | | 7,078,752 | |
| Health Care REITs — 0.3% | | | |
| Aedifica SA | | 908 | | 57,715 | |
| CareTrust REIT, Inc. | | 6,392 | | 172,328 | |
| Healthpeak Properties, Inc. | | 28,961 | | 631,929 | |
| Ventas, Inc. | | 6,850 | | 372,914 | |
| Welltower, Inc. | | 8,034 | | 893,783 | |
| | | 2,128,669 | |
| Health Care Technology — 0.1% | | | |
Evolent Health, Inc., Class A(2) | | 3,387 | | 78,985 | |
GoodRx Holdings, Inc., Class A(2) | | 8,962 | | 81,106 | |
| Pro Medicus Ltd. | | 651 | | 61,421 | |
Veeva Systems, Inc., Class A(2) | | 2,033 | | 390,194 | |
Waystar Holding Corp.(2) | | 3,018 | | 69,414 | |
| | | 681,120 | |
| Hotel & Resort REITs — 0.1% | | | |
| Invincible Investment Corp. | | 611 | | 276,752 | |
| Japan Hotel REIT Investment Corp. | | 169 | | 86,329 | |
| Ryman Hospitality Properties, Inc. | | 2,140 | | 215,091 | |
| | | 578,172 | |
| Hotels, Restaurants and Leisure — 0.7% | | | |
Airbnb, Inc., Class A(2) | | 4,559 | | 636,254 | |
Chipotle Mexican Grill, Inc.(2) | | 13,002 | | 706,269 | |
| Darden Restaurants, Inc. | | 1,805 | | 264,053 | |
DoorDash, Inc., Class A(2) | | 3,914 | | 433,358 | |
| Greggs PLC | | 2,044 | | 82,315 | |
| H World Group Ltd., ADR | | 6,421 | | 192,630 | |
| Hilton Worldwide Holdings, Inc. | | 6,792 | | 1,458,039 | |
| Kyoritsu Maintenance Co. Ltd. | | 1,300 | | 25,238 | |
MakeMyTrip Ltd.(2) | | 4,610 | | 431,450 | |
Melia Hotels International SA(3) | | 2,380 | | 18,223 | |
Planet Fitness, Inc., Class A(2) | | 1,263 | | 93,083 | |
| Wingstop, Inc. | | 194 | | 72,533 | |
| | | 4,413,445 | |
| Household Durables — 0.2% | | | |
| Barratt Developments PLC | | 27,890 | | 188,729 | |
| Bellway PLC | | 2,925 | | 107,400 | |
| | | | | | | | | | | |
| | Shares/Principal
Amount | Value |
Breville Group Ltd.(3) | | 2,778 | | $ | 53,380 | |
Mohawk Industries, Inc.(2) | | 1,704 | | 274,463 | |
Sonos, Inc.(2) | | 7,439 | | 100,426 | |
| Taylor Wimpey PLC | | 211,736 | | 434,096 | |
TopBuild Corp.(2) | | 174 | | 83,266 | |
| | | 1,241,760 | |
| Household Products — 0.5% | | | |
| Church & Dwight Co., Inc. | | 9,634 | | 944,228 | |
| Colgate-Palmolive Co. | | 1,299 | | 128,848 | |
| Henkel AG & Co. KGaA, Preference Shares | | 3,825 | | 327,197 | |
| Kimberly-Clark Corp. | | 4,731 | | 638,922 | |
| Procter & Gamble Co. | | 2,055 | | 330,362 | |
| Reckitt Benckiser Group PLC | | 12,832 | | 690,280 | |
| | | 3,059,837 | |
| Independent Power and Renewable Electricity Producers — 0.1% | | | |
Talen Energy Corp.(2) | | 936 | | 116,672 | |
| Vistra Corp. | | 7,948 | | 629,641 | |
| | | 746,313 | |
| Industrial Conglomerates — 0.1% | | | |
| Hitachi Ltd. | | 17,800 | | 384,598 | |
| Honeywell International, Inc. | | 1,365 | | 279,484 | |
| LG Corp. | | 3,109 | | 198,268 | |
| | | 862,350 | |
| Industrial REITs — 0.5% | | | |
| Americold Realty Trust, Inc. | | 8,086 | | 241,691 | |
| CapitaLand Ascendas REIT | | 55,500 | | 113,306 | |
| EastGroup Properties, Inc. | | 1,199 | | 224,201 | |
| Goodman Group | | 20,890 | | 482,268 | |
| Mapletree Industrial Trust | | 30,700 | | 53,268 | |
| Prologis, Inc. | | 14,042 | | 1,769,994 | |
| Segro PLC | | 19,670 | | 231,528 | |
| Terreno Realty Corp. | | 1,132 | | 77,440 | |
| Tritax Big Box REIT PLC | | 22,971 | | 48,827 | |
| Warehouses De Pauw CVA | | 1,559 | | 42,232 | |
| | | 3,284,755 | |
| Insurance — 0.8% | | | |
| Aflac, Inc. | | 2,065 | | 196,960 | |
| Allstate Corp. | | 4,635 | | 793,141 | |
Goosehead Insurance, Inc., Class A(2) | | 1,182 | | 106,723 | |
| Hanover Insurance Group, Inc. | | 2,955 | | 406,283 | |
| Kinsale Capital Group, Inc. | | 352 | | 160,889 | |
| Marsh & McLennan Cos., Inc. | | 1,189 | | 264,636 | |
| MetLife, Inc. | | 2,810 | | 215,949 | |
| NN Group NV | | 9,575 | | 480,513 | |
Palomar Holdings, Inc.(2) | | 764 | | 70,296 | |
| Progressive Corp. | | 1,260 | | 269,791 | |
| Prudential Financial, Inc. | | 1,731 | | 216,929 | |
| Prudential PLC | | 35,984 | | 324,734 | |
| Reinsurance Group of America, Inc. | | 1,154 | | 260,146 | |
| Ryan Specialty Holdings, Inc., Class A | | 7,972 | | 490,995 | |
Skyward Specialty Insurance Group, Inc.(2) | | 2,462 | | 97,421 | |
| Tokio Marine Holdings, Inc. | | 8,100 | | 317,788 | |
| Willis Towers Watson PLC | | 3,151 | | 889,464 | |
| | | 5,562,658 | |
| | | | | | | | | | | |
| | Shares/Principal
Amount | Value |
| Interactive Media and Services — 0.6% | | | |
| Alphabet, Inc., Class A | | 10,236 | | $ | 1,755,883 | |
| Autohome, Inc., ADR | | 6,525 | | 162,734 | |
| CAR Group Ltd. | | 3,169 | | 72,477 | |
| Hemnet Group AB | | 1,795 | | 66,507 | |
| Meta Platforms, Inc., Class A | | 1,881 | | 893,155 | |
QuinStreet, Inc.(2) | | 6,397 | | 119,624 | |
| Scout24 SE | | 958 | | 75,737 | |
| Tencent Holdings Ltd. | | 17,600 | | 812,178 | |
| | | 3,958,295 | |
| IT Services — 0.8% | | | |
| Accenture PLC, Class A | | 1,540 | | 509,155 | |
| Amdocs Ltd. | | 6,756 | | 590,947 | |
| BIPROGY, Inc. | | 1,800 | | 58,983 | |
Cloudflare, Inc., Class A(2) | | 7,981 | | 618,528 | |
| Cognizant Technology Solutions Corp., Class A | | 4,517 | | 341,847 | |
GDS Holdings Ltd., ADR(2) | | 2,366 | | 26,570 | |
GDS Holdings Ltd., Class A(2)(3) | | 33,600 | | 46,820 | |
Globant SA(2) | | 402 | | 78,273 | |
Indra Sistemas SA(3) | | 5,958 | | 119,481 | |
| International Business Machines Corp. | | 1,541 | | 296,088 | |
Megaport Ltd.(2) | | 2,339 | | 16,933 | |
MongoDB, Inc.(2) | | 2,815 | | 710,393 | |
| NEC Corp. | | 5,300 | | 458,740 | |
NEXTDC Ltd.(2) | | 72,906 | | 802,858 | |
| NTT Data Group Corp. | | 25,200 | | 392,475 | |
| | | 5,068,091 | |
| Leisure Products — 0.1% | | | |
BRP, Inc.(3) | | 4,387 | | 317,844 | |
| Brunswick Corp. | | 635 | | 51,721 | |
| Thule Group AB | | 2,282 | | 63,091 | |
YETI Holdings, Inc.(2) | | 2,393 | | 98,951 | |
| | | 531,607 | |
| Life Sciences Tools and Services — 0.6% | | | |
| Agilent Technologies, Inc. | | 4,582 | | 647,895 | |
Avantor, Inc.(2) | | 11,102 | | 296,979 | |
| Bio-Techne Corp. | | 3,185 | | 259,864 | |
| Danaher Corp. | | 1,976 | | 547,510 | |
ICON PLC(2) | | 1,882 | | 618,124 | |
IQVIA Holdings, Inc.(2) | | 1,422 | | 350,139 | |
| Lonza Group AG | | 672 | | 447,491 | |
Mettler-Toledo International, Inc.(2) | | 204 | | 310,290 | |
| Thermo Fisher Scientific, Inc. | | 606 | | 371,684 | |
| | | 3,849,976 | |
| Machinery — 0.6% | | | |
| Aalberts NV | | 773 | | 29,558 | |
| Amada Co. Ltd. | | 4,800 | | 56,371 | |
| CNH Industrial NV | | 25,264 | | 269,062 | |
| Crane Co. | | 1,595 | | 255,870 | |
| Cummins, Inc. | | 1,978 | | 577,180 | |
| Deere & Co. | | 422 | | 156,976 | |
| Dover Corp. | | 621 | | 114,425 | |
| Fluidra SA | | 2,836 | | 63,182 | |
| Hoshizaki Corp. | | 1,500 | | 47,241 | |
| | | | | | | | | | | |
| | Shares/Principal
Amount | Value |
| KION Group AG | | 1,044 | | $ | 41,290 | |
| Konecranes OYJ | | 1,689 | | 117,982 | |
| Organo Corp. | | 1,600 | | 72,568 | |
| Oshkosh Corp. | | 4,660 | | 506,309 | |
| Parker-Hannifin Corp. | | 518 | | 290,681 | |
RBC Bearings, Inc.(2) | | 635 | | 184,683 | |
| Techtronic Industries Co. Ltd. | | 25,000 | | 320,167 | |
| Timken Co. | | 2,786 | | 242,243 | |
| Trelleborg AB, B Shares | | 1,265 | | 47,011 | |
| Weir Group PLC | | 4,077 | | 106,429 | |
| Xylem, Inc. | | 4,233 | | 565,106 | |
| | | 4,064,334 | |
| Media — 0.4% | | | |
| 4imprint Group PLC | | 644 | | 50,286 | |
| CyberAgent, Inc. | | 11,700 | | 75,646 | |
| Fox Corp., Class B | | 6,842 | | 242,412 | |
| Interpublic Group of Cos., Inc. | | 18,985 | | 610,747 | |
| Omnicom Group, Inc. | | 1,262 | | 123,727 | |
| Stroeer SE & Co. KGaA | | 1,270 | | 85,865 | |
Trade Desk, Inc., Class A(2) | | 10,308 | | 926,483 | |
| WPP PLC | | 37,481 | | 361,545 | |
| | | 2,476,711 | |
| Metals and Mining — 0.1% | | | |
| Alamos Gold, Inc., Class A | | 5,650 | | 96,291 | |
ATI, Inc.(2) | | 1,108 | | 75,023 | |
Capstone Copper Corp.(2) | | 14,638 | | 98,389 | |
| Carpenter Technology Corp. | | 1,075 | | 156,810 | |
ERO Copper Corp.(2) | | 3,277 | | 64,085 | |
GMK Norilskiy Nickel PAO(4) | | 244,600 | | 3 | |
Sandfire Resources Ltd.(2) | | 16,174 | | 92,380 | |
| | | 582,981 | |
| Multi-Utilities — 0.3% | | | |
| CMS Energy Corp. | | 5,196 | | 336,701 | |
| Northwestern Energy Group, Inc. | | 14,397 | | 774,126 | |
| WEC Energy Group, Inc. | | 6,831 | | 587,876 | |
| | | 1,698,703 | |
| Office REITs — 0.0% | | | |
| BXP, Inc. | | 3,597 | | 256,502 | |
| Oil, Gas and Consumable Fuels — 0.7% | | | |
| Cheniere Energy, Inc. | | 2,072 | | 378,430 | |
| ConocoPhillips | | 4,454 | | 495,285 | |
| Coterra Energy, Inc. | | 11,945 | | 308,181 | |
| Enterprise Products Partners LP | | 30,936 | | 892,813 | |
| EOG Resources, Inc. | | 3,573 | | 453,056 | |
| EQT Corp. | | 9,793 | | 337,956 | |
| Gaztransport Et Technigaz SA | | 155 | | 22,839 | |
Kosmos Energy Ltd.(2) | | 39,806 | | 220,127 | |
| Occidental Petroleum Corp. | | 7,970 | | 484,735 | |
Paladin Energy Ltd.(2) | | 9,236 | | 69,286 | |
| Permian Resources Corp. | | 23,143 | | 355,014 | |
| Targa Resources Corp. | | 3,595 | | 486,332 | |
| | | 4,504,054 | |
| Paper and Forest Products — 0.0% | | | |
| Louisiana-Pacific Corp. | | 795 | | 78,037 | |
| | | | | | | | | | | |
| | Shares/Principal
Amount | Value |
Stella-Jones, Inc.(3) | | 1,827 | | $ | 122,921 | |
| | | 200,958 | |
| Passenger Airlines — 0.1% | | | |
| Southwest Airlines Co. | | 19,107 | | 514,743 | |
| Personal Care Products — 0.3% | | | |
BellRing Brands, Inc.(2) | | 1,446 | | 74,151 | |
elf Beauty, Inc.(2) | | 2,038 | | 351,718 | |
| Haleon PLC | | 88,533 | | 397,106 | |
| Inter Parfums, Inc. | | 816 | | 114,795 | |
| Kenvue, Inc. | | 28,012 | | 517,942 | |
| Kose Corp. | | 900 | | 60,144 | |
| Unilever PLC | | 6,555 | | 402,835 | |
| | | 1,918,691 | |
| Pharmaceuticals — 0.9% | | | |
ALK-Abello AS(2) | | 4,994 | | 112,564 | |
| AstraZeneca PLC, ADR | | 1,177 | | 93,160 | |
| Bristol-Myers Squibb Co. | | 1,779 | | 84,609 | |
Edgewise Therapeutics, Inc.(2) | | 2,495 | | 42,490 | |
| Eli Lilly & Co. | | 480 | | 386,050 | |
Galderma Group AG(2) | | 4,133 | | 325,128 | |
| GSK PLC | | 33,669 | | 653,811 | |
| Hikma Pharmaceuticals PLC | | 7,368 | | 180,146 | |
Intra-Cellular Therapies, Inc.(2) | | 759 | | 59,748 | |
| Laboratorios Farmaceuticos Rovi SA | | 707 | | 68,023 | |
Longboard Pharmaceuticals, Inc.(2) | | 1,569 | | 52,154 | |
| Merck & Co., Inc. | | 3,275 | | 370,501 | |
| Novo Nordisk AS, Class B | | 10,514 | | 1,393,030 | |
| Roche Holding AG | | 2,304 | | 745,942 | |
| Sanofi SA | | 824 | | 84,948 | |
| Sanofi SA, ADR | | 10,736 | | 556,232 | |
| Santen Pharmaceutical Co. Ltd. | | 9,800 | | 117,612 | |
Verona Pharma PLC, ADR(2)(3) | | 2,769 | | 62,745 | |
| Virbac SACA | | 111 | | 42,255 | |
| Zoetis, Inc. | | 1,781 | | 320,651 | |
| | | 5,751,799 | |
| Professional Services — 0.6% | | | |
| Adecco Group AG | | 15,474 | | 526,709 | |
| ALS Ltd. | | 6,231 | | 63,084 | |
| BayCurrent Consulting, Inc. | | 2,100 | | 64,648 | |
| Equifax, Inc. | | 2,078 | | 580,531 | |
FTI Consulting, Inc.(2) | | 447 | | 97,432 | |
| Jacobs Solutions, Inc. | | 4,234 | | 619,646 | |
| RELX PLC | | 13,745 | | 648,729 | |
| Teleperformance SE | | 4,735 | | 609,562 | |
| Verisk Analytics, Inc. | | 2,533 | | 663,013 | |
| | | 3,873,354 | |
| Real Estate Management and Development — 0.2% | | | |
Colliers International Group, Inc.(3) | | 467 | | 62,891 | |
| CTP NV | | 4,331 | | 75,879 | |
| DLF Ltd. | | 6,864 | | 73,077 | |
| FirstService Corp. | | 474 | | 82,742 | |
| FirstService Corp. (Toronto) | | 897 | | 156,401 | |
Godrej Properties Ltd.(2) | | 1,813 | | 69,891 | |
| Grainger PLC | | 22,003 | | 68,343 | |
| | | | | | | | | | | |
| | Shares/Principal
Amount | Value |
| Macrotech Developers Ltd. | | 4,313 | | $ | 67,540 | |
| Mitsubishi Estate Co. Ltd. | | 8,200 | | 139,760 | |
| Mitsui Fudosan Co. Ltd. | | 18,600 | | 192,693 | |
| Phoenix Mills Ltd. | | 2,067 | | 88,953 | |
| PSP Swiss Property AG | | 679 | | 90,736 | |
Redfin Corp.(2)(3) | | 5,188 | | 42,230 | |
| Tokyo Tatemono Co. Ltd. | | 6,600 | | 115,134 | |
| Tokyu Fudosan Holdings Corp. | | 16,900 | | 122,023 | |
| Vonovia SE | | 2,469 | | 75,700 | |
| | | 1,523,993 | |
| Residential REITs — 0.3% | | | |
| American Homes 4 Rent, Class A | | 5,209 | | 187,993 | |
| AvalonBay Communities, Inc. | | 2,312 | | 473,775 | |
| Boardwalk Real Estate Investment Trust | | 1,528 | | 86,324 | |
| Camden Property Trust | | 1,308 | | 144,861 | |
| Equity Residential | | 6,919 | | 481,770 | |
| Essex Property Trust, Inc. | | 1,579 | | 439,530 | |
| Invitation Homes, Inc. | | 7,363 | | 259,693 | |
| UNITE Group PLC | | 5,484 | | 67,219 | |
| | | 2,141,165 | |
| Retail REITs — 0.4% | | | |
| Agree Realty Corp. | | 3,826 | | 263,879 | |
| Charter Hall Retail REIT | | 29,448 | | 67,378 | |
| Kite Realty Group Trust | | 13,945 | | 343,884 | |
| Link REIT | | 8,700 | | 36,705 | |
| Phillips Edison & Co., Inc. | | 2,289 | | 80,344 | |
| Realty Income Corp. | | 12,750 | | 732,232 | |
| Regency Centers Corp. | | 6,358 | | 428,148 | |
| Scentre Group | | 118,386 | | 269,971 | |
| Simon Property Group, Inc. | | 2,107 | | 323,298 | |
| Unibail-Rodamco-Westfield | | 1,886 | | 141,037 | |
| Urban Edge Properties | | 11,746 | | 238,444 | |
| | | 2,925,320 | |
| Semiconductors and Semiconductor Equipment — 1.7% | | | |
Advanced Micro Devices, Inc.(2) | | 3,362 | | 485,742 | |
| Analog Devices, Inc. | | 1,898 | | 439,159 | |
| Applied Materials, Inc. | | 1,832 | | 388,750 | |
| ASML Holding NV | | 984 | | 916,273 | |
| Broadcom, Inc. | | 2,498 | | 401,379 | |
| Camtek Ltd. | | 532 | | 55,860 | |
Credo Technology Group Holding Ltd.(2) | | 4,263 | | 118,298 | |
Enphase Energy, Inc.(2) | | 4,347 | | 500,383 | |
FormFactor, Inc.(2) | | 1,289 | | 69,039 | |
Impinj, Inc.(2) | | 679 | | 108,158 | |
| Infineon Technologies AG | | 7,005 | | 243,341 | |
MACOM Technology Solutions Holdings, Inc.(2) | | 1,319 | | 133,113 | |
| Marvell Technology, Inc. | | 3,201 | | 214,403 | |
| Micronics Japan Co. Ltd. | | 1,000 | | 39,736 | |
| MKS Instruments, Inc. | | 536 | | 67,482 | |
| Monolithic Power Systems, Inc. | | 1,060 | | 914,875 | |
Nova Ltd.(2) | | 429 | | 88,576 | |
| NVIDIA Corp. | | 23,373 | | 2,735,108 | |
ON Semiconductor Corp.(2) | | 3,067 | | 239,993 | |
Onto Innovation, Inc.(2) | | 637 | | 121,858 | |
| | | | | | | | | | | |
| | Shares/Principal
Amount | Value |
Rambus, Inc.(2) | | 2,606 | | $ | 134,053 | |
Silicon Laboratories, Inc.(2) | | 982 | | 117,968 | |
| Socionext, Inc. | | 1,700 | | 34,329 | |
| SUMCO Corp. | | 37,800 | | 621,447 | |
| Taiwan Semiconductor Manufacturing Co. Ltd. | | 42,000 | | 1,225,194 | |
| Teradyne, Inc. | | 7,032 | | 922,317 | |
| | | 11,336,834 | |
| Software — 1.8% | | | |
Adobe, Inc.(2) | | 206 | | 113,640 | |
Agilysys, Inc.(2) | | 594 | | 66,581 | |
| Bytes Technology Group PLC | | 6,697 | | 43,632 | |
Cadence Design Systems, Inc.(2) | | 2,783 | | 744,898 | |
Crowdstrike Holdings, Inc., Class A(2) | | 436 | | 101,135 | |
CyberArk Software Ltd.(2) | | 714 | | 183,055 | |
Datadog, Inc., Class A(2) | | 7,615 | | 886,691 | |
Descartes Systems Group, Inc.(2) | | 946 | | 96,214 | |
Dynatrace, Inc.(2) | | 1,276 | | 56,042 | |
Five9, Inc.(2) | | 1,615 | | 71,948 | |
Guidewire Software, Inc.(2) | | 4,279 | | 642,149 | |
HubSpot, Inc.(2) | | 1,256 | | 624,270 | |
JFrog Ltd.(2) | | 2,458 | | 94,780 | |
Klaviyo, Inc., Class A(2)(3) | | 1,540 | | 40,348 | |
Manhattan Associates, Inc.(2) | | 3,084 | | 787,592 | |
| Microsoft Corp. | | 7,979 | | 3,338,015 | |
Money Forward, Inc.(2) | | 1,500 | | 50,124 | |
nCino, Inc.(2) | | 2,900 | | 95,004 | |
Palantir Technologies, Inc., Class A(2) | | 34,657 | | 931,927 | |
Procore Technologies, Inc.(2) | | 6,805 | | 483,359 | |
Q2 Holdings, Inc.(2) | | 2,734 | | 184,463 | |
| Salesforce, Inc. | | 856 | | 221,533 | |
| SAP SE | | 3,544 | | 749,273 | |
ServiceNow, Inc.(2) | | 137 | | 111,571 | |
SPS Commerce, Inc.(2) | | 537 | | 115,680 | |
Tenable Holdings, Inc.(2) | | 3,420 | | 157,046 | |
Workday, Inc., Class A(2) | | 955 | | 216,900 | |
Zscaler, Inc.(2) | | 3,745 | | 671,666 | |
| | | 11,879,536 | |
| Specialized REITs — 0.8% | | | |
| American Tower Corp. | | 413 | | 91,025 | |
| CubeSmart | | 4,893 | | 232,809 | |
| Digital Core REIT Management Pte. Ltd. | | 151,000 | | 86,142 | |
| Digital Realty Trust, Inc. | | 5,946 | | 888,868 | |
| Equinix, Inc. | | 1,223 | | 966,464 | |
| Extra Space Storage, Inc. | | 2,746 | | 438,317 | |
| Iron Mountain, Inc. | | 5,974 | | 612,693 | |
| Lamar Advertising Co., Class A | | 583 | | 69,878 | |
| Public Storage | | 2,632 | | 778,861 | |
| SBA Communications Corp. | | 2,002 | | 439,519 | |
| VICI Properties, Inc. | | 21,380 | | 668,339 | |
| | | 5,272,915 | |
| Specialty Retail — 0.5% | | | |
Arhaus, Inc.(3) | | 6,843 | | 103,945 | |
Boot Barn Holdings, Inc.(2) | | 1,185 | | 158,174 | |
Burlington Stores, Inc.(2) | | 3,413 | | 888,472 | |
| | | | | | | | | | | |
| | Shares/Principal
Amount | Value |
CarMax, Inc.(2) | | 1,595 | | $ | 134,682 | |
| Home Depot, Inc. | | 1,770 | | 651,643 | |
| Kingfisher PLC | | 115,765 | | 411,560 | |
| Sanrio Co. Ltd. | | 4,100 | | 87,048 | |
| TJX Cos., Inc. | | 3,910 | | 441,908 | |
| Tractor Supply Co. | | 802 | | 211,183 | |
| | | 3,088,615 | |
| Technology Hardware, Storage and Peripherals — 0.6% | | | |
| Apple, Inc. | | 12,468 | | 2,768,893 | |
| HP, Inc. | | 14,961 | | 539,943 | |
Super Micro Computer, Inc.(2) | | 816 | | 572,546 | |
| | | 3,881,382 | |
| Textiles, Apparel and Luxury Goods — 0.2% | | | |
| Asics Corp. | | 6,800 | | 110,978 | |
Crocs, Inc.(2) | | 621 | | 83,444 | |
Deckers Outdoor Corp.(2) | | 130 | | 119,942 | |
| Levi Strauss & Co., Class A | | 2,429 | | 44,524 | |
| LVMH Moet Hennessy Louis Vuitton SE | | 277 | | 195,385 | |
On Holding AG, Class A(2) | | 20,267 | | 839,459 | |
| | | 1,393,732 | |
| Tobacco — 0.2% | | | |
| British American Tobacco PLC | | 25,425 | | 902,105 | |
| KT&G Corp. | | 6,975 | | 475,499 | |
| | | 1,377,604 | |
| Trading Companies and Distributors — 0.5% | | | |
| AddTech AB, B Shares | | 1,208 | | 38,981 | |
| Applied Industrial Technologies, Inc. | | 910 | | 198,553 | |
Beacon Roofing Supply, Inc.(2) | | 4,964 | | 510,299 | |
Beijer Ref AB(3) | | 4,150 | | 65,900 | |
| Bunzl PLC | | 13,122 | | 549,803 | |
Core & Main, Inc., Class A(2) | | 8,187 | | 437,759 | |
| Diploma PLC | | 2,183 | | 124,814 | |
| Ferguson PLC | | 880 | | 195,932 | |
| FTAI Aviation Ltd. | | 470 | | 52,382 | |
| H&E Equipment Services, Inc. | | 2,328 | | 121,754 | |
| Howden Joinery Group PLC | | 7,438 | | 89,927 | |
| MSC Industrial Direct Co., Inc., Class A | | 6,390 | | 568,390 | |
| Rexel SA | | 11,331 | | 287,886 | |
| Seven Group Holdings Ltd. | | 3,837 | | 98,446 | |
SiteOne Landscape Supply, Inc.(2) | | 1,333 | | 195,524 | |
| | | 3,536,350 | |
| Transportation Infrastructure — 0.0% | | | |
| Flughafen Zurich AG | | 434 | | 100,442 | |
| SATS Ltd. | | 11,400 | | 28,025 | |
| | | 128,467 | |
TOTAL COMMON STOCKS (Cost $152,722,694) | | | 204,531,281 | |
| U.S. TREASURY SECURITIES — 8.6% | | | |
| U.S. Treasury Bonds, 2.00%, 11/15/41 | | $ | 3,150,000 | | 2,240,991 | |
| U.S. Treasury Bonds, 2.375%, 2/15/42 | | 5,000,000 | | 3,768,262 | |
| U.S. Treasury Bonds, 3.00%, 5/15/42 | | 250,000 | | 207,266 | |
| U.S. Treasury Bonds, 3.75%, 11/15/43 | | 40,000 | | 36,425 | |
| U.S. Treasury Bonds, 4.75%, 11/15/43 | | 40,000 | | 41,787 | |
| U.S. Treasury Bonds, 3.125%, 8/15/44 | | 350,000 | | 288,641 | |
| | | | | | | | | | | |
| | Shares/Principal
Amount | Value |
| U.S. Treasury Bonds, 3.00%, 5/15/45 | | $ | 100,000 | | $ | 80,355 | |
| U.S. Treasury Bonds, 3.00%, 11/15/45 | | 50,000 | | 40,010 | |
| U.S. Treasury Inflation-Indexed Bonds, 2.375%, 1/15/27 | | 311,476 | | 313,109 | |
| U.S. Treasury Inflation-Indexed Bonds, 2.125%, 2/15/40 | | 523,109 | | 531,983 | |
| U.S. Treasury Inflation-Indexed Bonds, 0.75%, 2/15/42 | | 917,354 | | 738,714 | |
| U.S. Treasury Inflation-Indexed Bonds, 0.625%, 2/15/43 | | 423,476 | | 328,361 | |
| U.S. Treasury Inflation-Indexed Bonds, 1.375%, 2/15/44 | | 1,549,729 | | 1,370,018 | |
| U.S. Treasury Inflation-Indexed Bonds, 0.75%, 2/15/45 | | 3,160,940 | | 2,447,559 | |
| U.S. Treasury Inflation-Indexed Bonds, 0.875%, 2/15/47 | | 520,428 | | 403,758 | |
| U.S. Treasury Inflation-Indexed Bonds, 0.125%, 2/15/51 | | 663,482 | | 400,009 | |
| U.S. Treasury Inflation-Indexed Bonds, 0.125%, 2/15/52 | | 1,128,220 | | 669,543 | |
| U.S. Treasury Inflation-Indexed Notes, 0.125%, 4/15/25 | | 6,079,500 | | 5,913,650 | |
| U.S. Treasury Inflation-Indexed Notes, 0.125%, 4/15/26 | | 2,993,975 | | 2,870,918 | |
| U.S. Treasury Inflation-Indexed Notes, 0.875%, 1/15/29 | | 435,341 | | 418,686 | |
| U.S. Treasury Inflation-Indexed Notes, 0.125%, 1/15/32 | | 940,382 | | 831,708 | |
| U.S. Treasury Notes, 1.875%, 8/31/24 | | 4,000,000 | | 3,988,936 | |
| U.S. Treasury Notes, 4.625%, 2/28/26 | | 6,220,000 | | 6,236,765 | |
| U.S. Treasury Notes, 2.75%, 7/31/27 | | 311,000 | | 299,532 | |
| U.S. Treasury Notes, 2.25%, 8/15/27 | | 200,000 | | 189,699 | |
| U.S. Treasury Notes, 3.875%, 11/30/27 | | 3,895,000 | | 3,876,742 | |
| U.S. Treasury Notes, 4.375%, 8/31/28 | | 3,830,000 | | 3,887,824 | |
U.S. Treasury Notes, 1.50%, 11/30/28(5) | | 6,900,000 | | 6,229,676 | |
| U.S. Treasury Notes, 3.50%, 4/30/30 | | 3,550,000 | | 3,467,490 | |
| U.S. Treasury Notes, 4.375%, 11/30/30 | | 1,870,000 | | 1,912,988 | |
| U.S. Treasury Notes, 4.375%, 5/15/34 | | 2,550,000 | | 2,615,543 | |
| U.S. Treasury Notes, VRN, 5.34%, (3-month USBMMY plus 0.13%), 7/31/25 | | 400,000 | | 399,969 | |
TOTAL U.S. TREASURY SECURITIES (Cost $60,960,783) | | | 57,046,917 | |
| CORPORATE BONDS — 1.3% | | | |
| Aerospace and Defense — 0.0% | | | |
| TransDigm, Inc., 4.625%, 1/15/29 | | 190,000 | | 179,862 | |
| Automobile Components — 0.0% | | | |
ZF North America Capital, Inc., 4.75%, 4/29/25(6) | | 110,000 | | 108,835 | |
| Automobiles — 0.2% | | | |
| American Honda Finance Corp., 0.75%, 8/9/24 | | 750,000 | | 749,183 | |
| Ford Motor Credit Co. LLC, 3.625%, 6/17/31 | | 370,000 | | 324,216 | |
| | | 1,073,399 | |
| Banks — 0.3% | | | |
Avi Funding Co. Ltd., 3.80%, 9/16/25(6) | | 143,000 | | 141,031 | |
| Banco Santander SA, 2.50%, 3/18/25 | EUR | 100,000 | | 107,352 | |
| Bank of America Corp., 2.30%, 7/25/25 | GBP | 100,000 | | 125,189 | |
| CaixaBank SA, VRN, 2.25%, 4/17/30 | EUR | 100,000 | | 106,320 | |
| Commerzbank AG, 4.00%, 3/23/26 | EUR | 150,000 | | 162,982 | |
European Union, 0.00%, 7/4/31(7) | EUR | 1,450,000 | | 1,306,849 | |
| ING Groep NV, 2.125%, 1/10/26 | EUR | 200,000 | | 213,146 | |
| Lloyds Bank PLC, 7.625%, 4/22/25 | GBP | 20,000 | | 26,104 | |
| | | 2,188,973 | |
| Chemicals — 0.0% | | | |
MEGlobal BV, 4.25%, 11/3/26(6) | | $ | 46,000 | | 44,842 | |
| Olin Corp., 5.125%, 9/15/27 | | 70,000 | | 68,399 | |
| | | 113,241 | |
| Commercial Services and Supplies — 0.0% | | | |
Clean Harbors, Inc., 6.375%, 2/1/31(6) | | 190,000 | | 192,334 | |
| | | | | | | | | | | |
| | Shares/Principal
Amount | Value |
| Containers and Packaging — 0.0% | | | |
Sealed Air Corp., 5.125%, 12/1/24(6) | | $ | 105,000 | | $ | 105,244 | |
| Diversified Telecommunication Services — 0.1% | | | |
| AT&T, Inc., 4.90%, 8/15/37 | | 59,000 | | 56,574 | |
| Sprint Capital Corp., 6.875%, 11/15/28 | | 258,000 | | 276,816 | |
| | | 333,390 | |
| Electric Utilities — 0.0% | | | |
| Duke Energy Progress LLC, 4.15%, 12/1/44 | | 40,000 | | 33,209 | |
| MidAmerican Energy Co., 5.85%, 9/15/54 | | 45,000 | | 47,444 | |
| | | 80,653 | |
| Financial Services — 0.0% | | | |
| Allen C Stonecipher Life Insurance Trust, VRDN, 5.45%, 8/7/24 (LOC: FHLB) | | 5,000 | | 5,000 | |
| Ground Transportation — 0.0% | | | |
| Burlington Northern Santa Fe LLC, 4.45%, 3/15/43 | | 12,000 | | 10,825 | |
| Burlington Northern Santa Fe LLC, 5.50%, 3/15/55 | | 60,000 | | 61,657 | |
| | | 72,482 | |
| Health Care Providers and Services — 0.1% | | | |
DaVita, Inc., 4.625%, 6/1/30(6) | | 270,000 | | 247,482 | |
| Kaiser Foundation Hospitals, 3.00%, 6/1/51 | | 70,000 | | 48,627 | |
| | | 296,109 | |
| Hotels, Restaurants and Leisure — 0.2% | | | |
Caesars Entertainment, Inc., 4.625%, 10/15/29(6) | | 110,000 | | 102,266 | |
Caesars Entertainment, Inc., 7.00%, 2/15/30(6) | | 142,000 | | 146,573 | |
| MGM Resorts International, 4.625%, 9/1/26 | | 39,000 | | 38,267 | |
Station Casinos LLC, 4.625%, 12/1/31(6) | | 530,000 | | 483,321 | |
Wynn Las Vegas LLC/Wynn Las Vegas Capital Corp., 5.25%, 5/15/27(6) | | 200,000 | | 196,119 | |
| | | 966,546 | |
| Household Durables — 0.1% | | | |
| KB Home, 4.80%, 11/15/29 | | 253,000 | | 243,526 | |
| Meritage Homes Corp., 5.125%, 6/6/27 | | 190,000 | | 190,197 | |
Tempur Sealy International, Inc., 3.875%, 10/15/31(6) | | 136,000 | | 117,201 | |
| | | 550,924 | |
| Leisure Products — 0.0% | | | |
| Mattel, Inc., 5.45%, 11/1/41 | | 200,000 | | 184,048 | |
| Media — 0.0% | | | |
| Charter Communications Operating LLC/Charter Communications Operating Capital, 6.38%, 10/23/35 | | 155,000 | | 155,475 | |
| Metals and Mining — 0.1% | | | |
| ATI, Inc., 4.875%, 10/1/29 | | 240,000 | | 229,098 | |
Cleveland-Cliffs, Inc., 6.75%, 4/15/30(6) | | 230,000 | | 231,851 | |
| Freeport-McMoRan, Inc., 5.40%, 11/14/34 | | 215,000 | | 214,777 | |
| | | 675,726 | |
| Multi-Utilities — 0.0% | | | |
| Dominion Energy, Inc., 4.90%, 8/1/41 | | 30,000 | | 27,240 | |
| Oil, Gas and Consumable Fuels — 0.1% | | | |
Antero Resources Corp., 7.625%, 2/1/29(6) | | 65,000 | | 67,189 | |
| Energy Transfer LP, 5.75%, 4/1/25 | | 90,000 | | 90,009 | |
MEG Energy Corp., 5.875%, 2/1/29(6) | | 70,000 | | 69,171 | |
| Southwestern Energy Co., 5.70%, 1/23/25 | | 21,000 | | 20,930 | |
| | | 247,299 | |
| Passenger Airlines — 0.0% | | | |
American Airlines, Inc./AAdvantage Loyalty IP Ltd., 5.50%, 4/20/26(6) | | 95,128 | | 94,574 | |
| Personal Care Products — 0.0% | | | |
Edgewell Personal Care Co., 4.125%, 4/1/29(6) | | 180,000 | | 167,639 | |
| | | | | | | | | | | |
| | Shares/Principal
Amount | Value |
| Specialty Retail — 0.0% | | | |
Murphy Oil USA, Inc., 3.75%, 2/15/31(6) | | $ | 210,000 | | $ | 186,648 | |
| Technology Hardware, Storage and Peripherals — 0.1% | | | |
| Apple, Inc., 2.75%, 1/13/25 | | 500,000 | | 494,734 | |
TOTAL CORPORATE BONDS (Cost $8,812,733) | | | 8,500,375 | |
| SOVEREIGN GOVERNMENTS AND AGENCIES — 1.2% | | | |
| Australia — 0.0% | | | |
| Australia Government Bonds, 3.00%, 3/21/47 | AUD | 120,000 | | 61,346 | |
| New South Wales Treasury Corp., 3.00%, 3/20/28 | AUD | 110,000 | | 69,435 | |
| | | 130,781 | |
| Austria — 0.0% | | | |
Republic of Austria Government Bonds, 0.75%, 10/20/26(6) | EUR | 41,000 | | 42,642 | |
Republic of Austria Government Bonds, 4.15%, 3/15/37(6) | EUR | 29,000 | | 35,329 | |
| | | 77,971 | |
| Belgium — 0.0% | | | |
Kingdom of Belgium Government Bonds, 4.25%, 3/28/41(6) | EUR | 27,000 | | 33,090 | |
| Canada — 0.3% | | | |
| Canada Government Bonds, 0.25%, 3/1/26 | CAD | 850,000 | | 584,451 | |
| Canada Government Bonds, 3.50%, 3/1/28 | CAD | 1,785,000 | | 1,308,487 | |
| Province of British Columbia, 2.85%, 6/18/25 | CAD | 201,000 | | 144,064 | |
| Province of Quebec, 5.75%, 12/1/36 | CAD | 108,000 | | 91,100 | |
| Province of Quebec, 3.50%, 12/1/48 | CAD | 20,000 | | 12,847 | |
| | | 2,140,949 | |
| Chile — 0.0% | | | |
| Chile Government International Bonds, 5.33%, 1/5/54 | | $ | 60,000 | | 57,843 | |
| China — 0.0% | | | |
| China Government Bonds, 3.25%, 6/6/26 | CNY | 400,000 | | 57,149 | |
| China Government Bonds, 3.29%, 5/23/29 | CNY | 300,000 | | 44,445 | |
| | | 101,594 | |
| Denmark — 0.0% | | | |
| Denmark Government Bonds, 0.50%, 11/15/27 | DKK | 245,000 | | 33,638 | |
| Denmark Government Bonds, 4.50%, 11/15/39 | DKK | 62,000 | | 11,286 | |
| | | 44,924 | |
| Finland — 0.1% | | | |
Finland Government Bonds, 4.00%, 7/4/25(6) | EUR | 58,000 | | 63,305 | |
Finland Government Bonds, 0.125%, 4/15/36(6) | EUR | 350,000 | | 275,513 | |
| | | 338,818 | |
| France — 0.2% | | | |
French Republic Government Bonds OAT, 0.00%, 11/25/31(6)(7) | EUR | 1,050,000 | | 929,590 | |
| Germany — 0.2% | | | |
| Bundesrepublik Deutschland Bundesanleihe, 2.30%, 2/15/33 | EUR | 1,320,000 | | 1,437,260 | |
Bundesrepublik Deutschland Bundesanleihe, 0.00%, 8/15/52(7) | EUR | 40,000 | | 21,809 | |
| | | 1,459,069 | |
| Italy — 0.1% | | | |
| Italy Buoni Poliennali Del Tesoro, 1.50%, 6/1/25 | EUR | 35,000 | | 37,346 | |
| Italy Buoni Poliennali Del Tesoro, 2.00%, 12/1/25 | EUR | 223,000 | | 238,223 | |
| | | 275,569 | |
| Japan — 0.1% | | | |
| Japan Government Thirty Year Bonds, 1.40%, 3/20/53 | JPY | 58,700,000 | | 328,620 | |
| Japan Government Thirty Year Bonds, 1.20%, 6/20/53 | JPY | 35,000,000 | | 185,649 | |
| Japan Government Thirty Year Bonds, 1.80%, 9/20/53 | JPY | 26,500,000 | | 162,919 | |
| | | 677,188 | |
| Malaysia — 0.0% | | | |
| Malaysia Government Bonds, 3.96%, 9/15/25 | MYR | 250,000 | | 54,862 | |
| | | | | | | | | | | |
| | Shares/Principal
Amount | Value |
| Mexico — 0.0% | | | |
| Mexico Government International Bonds, 4.15%, 3/28/27 | | $ | 200,000 | | $ | 196,284 | |
| Netherlands — 0.0% | | | |
Netherlands Government Bonds, 2.75%, 1/15/47(6) | EUR | 27,000 | | 29,460 | |
| Norway — 0.0% | | | |
Norway Government Bonds, 1.75%, 2/17/27(6) | NOK | 510,000 | | 44,830 | |
| Thailand — 0.0% | | | |
| Thailand Government Bonds, 3.85%, 12/12/25 | THB | 3,200,000 | | 91,622 | |
| United Kingdom — 0.2% | | | |
| U.K. Gilts, 0.125%, 1/30/26 | GBP | 1,100,000 | | 1,339,988 | |
TOTAL SOVEREIGN GOVERNMENTS AND AGENCIES (Cost $9,099,754) | | | 8,024,432 | |
| COLLATERALIZED LOAN OBLIGATIONS — 0.2% | | | |
ARES Loan Funding III Ltd., Series 2022-ALF3A, Class A1R, VRN, 6.51%, (3-month SOFR plus 1.27%), 7/25/36(6)(8) | | $ | 250,000 | | 250,000 | |
Cerberus Loan Funding XXXI LP, Series 2021-1A, Class A, VRN, 7.06%, (3-month SOFR plus 1.76%), 4/15/32(6) | | 48,444 | | 48,712 | |
Cook Park CLO Ltd., Series 2018-1A, Class C, VRN, 7.30%, (3-month SOFR plus 2.01%), 4/17/30(6) | | 250,000 | | 250,576 | |
KKR CLO 18 Ltd., Series 2018, Class CR, VRN, 7.64%, (3-month SOFR plus 2.36%), 7/18/30(6) | | 175,000 | | 175,285 | |
Magnetite XXV Ltd., Series 2020-25A, Class C, VRN, 7.65%, (3-month SOFR plus 2.36%), 1/25/32(6) | | 300,000 | | 300,803 | |
Marathon CLO Ltd., Series 2021-17A, Class B1, VRN, 8.22%, (3-month SOFR plus 2.94%), 1/20/35(6) | | 200,000 | | 200,518 | |
TOTAL COLLATERALIZED LOAN OBLIGATIONS (Cost $1,222,342) | | | 1,225,894 | |
| PREFERRED STOCKS — 0.2% | | | |
| Automobiles — 0.1% | | | |
| Volkswagen International Finance NV, 3.875% | | 300,000 | | 304,438 | |
| Electric Utilities — 0.0% | | | |
| Enel SpA, 2.25% | | 100,000 | | 102,973 | |
| Insurance — 0.1% | | | |
| Allianz SE, 2.625% | | 200,000 | | 175,261 | |
| Generali, 4.60% | | 100,000 | | 108,574 | |
| Intesa Sanpaolo Vita SpA, 4.75% | | 100,000 | | 108,366 | |
| | | 392,201 | |
| Oil, Gas and Consumable Fuels — 0.0% | | | |
| Eni SpA, 3.375% | | 200,000 | | 204,559 | |
TOTAL PREFERRED STOCKS (Cost $1,283,969) | | | 1,004,171 | |
| ASSET-BACKED SECURITIES — 0.1% | | | |
Blackbird Capital II Aircraft Lease Ltd., Series 2021-1A, Class A, SEQ, 2.44%, 7/15/46(6) | | $ | 181,223 | | 162,610 | |
FirstKey Homes Trust, Series 2020-SFR1, Class C, 1.94%, 8/17/37(6) | | 300,000 | | 287,687 | |
Lunar Aircraft Ltd., Series 2020-1A, Class A, SEQ, 3.38%, 2/15/45(6) | | 257,139 | | 247,713 | |
MAPS Trust, Series 2021-1A, Class A, SEQ, 2.52%, 6/15/46(6) | | 176,264 | | 160,265 | |
VSE VOI Mortgage LLC, Series 2018-A, Class B, 3.72%, 2/20/36(6) | | 48,498 | | 48,267 | |
TOTAL ASSET-BACKED SECURITIES (Cost $966,273) | | | 906,542 | |
| MUNICIPAL SECURITIES — 0.0% | | | |
| New Jersey Turnpike Authority Rev., 7.10%, 1/1/41 | | 30,000 | | 34,959 | |
| New York City GO, 6.27%, 12/1/37 | | 5,000 | | 5,459 | |
| Port Authority of New York & New Jersey Rev., 4.93%, 10/1/51 | | 35,000 | | 34,249 | |
| Regents of the University of California Medical Center Pooled Rev., 3.26%, 5/15/60 | | 100,000 | | 69,692 | |
| State of California GO, 4.60%, 4/1/38 | | 30,000 | | 29,164 | |
| State of California GO, 7.60%, 11/1/40 | | 40,000 | | 49,694 | |
| Texas Natural Gas Securitization Finance Corp. Rev., SEQ, 5.17%, 4/1/41 | | 30,000 | | 30,791 | |
TOTAL MUNICIPAL SECURITIES (Cost $288,432) | | | 254,008 | |
| | | | | | | | | | | |
| | Shares/Principal
Amount | Value |
| COLLATERALIZED MORTGAGE OBLIGATIONS — 0.0% | | | |
| Private Sponsor Collateralized Mortgage Obligations — 0.0% | | | |
| ABN AMRO Mortgage Corp., Series 2003-4, Class A4, 5.50%, 3/25/33 | | $ | 1,483 | | $ | 1,453 | |
SoFi Mortgage Trust, Series 2016-1A, Class 1A4, SEQ, VRN, 3.00%, 11/25/46(6) | | 8,137 | | 7,161 | |
| | | 8,614 | |
| U.S. Government Agency Collateralized Mortgage Obligations — 0.0% | | | |
FNMA, Series 2024-R01, Class 1M1, VRN, 6.40%, (30-day average SOFR plus 1.05%), 1/25/44(6) | | 218,219 | | 218,575 | |
TOTAL COLLATERALIZED MORTGAGE OBLIGATIONS (Cost $227,734) | | | 227,189 | |
| U.S. GOVERNMENT AGENCY MORTGAGE-BACKED SECURITIES — 0.0% | | | |
| Fixed-Rate U.S. Government Agency Mortgage-Backed Securities — 0.0% | | | |
| GNMA, 7.50%, 10/15/25 | | 30 | | 30 | |
| GNMA, 6.00%, 3/15/26 | | 714 | | 720 | |
| GNMA, 7.00%, 12/15/27 | | 1,219 | | 1,223 | |
| GNMA, 7.00%, 5/15/31 | | 2,916 | | 3,019 | |
| GNMA, 6.50%, 10/15/38 | | 115,592 | | 122,876 | |
| GNMA, 4.50%, 6/15/41 | | 91,888 | | 90,824 | |
TOTAL U.S. GOVERNMENT AGENCY MORTGAGE-BACKED SECURITIES (Cost $218,688) | | | 218,692 | |
| EXCHANGE-TRADED FUNDS — 0.0% | | | |
iShares MSCI EAFE Small-Cap ETF (Cost $4,471) | | 76 | | 4,924 | |
| SHORT-TERM INVESTMENTS — 7.3% | | | |
| Certificates of Deposit — 0.5% | | | |
Wells Fargo Bank NA, 5.40%, 3/11/25(6) | | $ | 3,500,000 | | 3,508,116 | |
Commercial Paper(9) — 1.8% | | | |
Banco Santander SA, 5.58%, 1/7/25(6) | | 1,000,000 | | 977,000 | |
Ionic Funding LLC, 5.69%, 9/5/24(6) | | 1,000,000 | | 994,607 | |
Ionic Funding LLC, 5.71%, 9/17/24(6) | | 2,500,000 | | 2,482,037 | |
JP Morgan Securities LLC, VRN, 5.71%, (SOFR plus 0.37%), 1/27/25(6) | | 2,000,000 | | 2,001,268 | |
Mainbeach Funding LLC, 5.50%, 8/1/24(6) | | 1,820,000 | | 1,819,729 | |
Overwatch Alpha Funding LLC, 5.49%, 8/1/24(6) | | 725,000 | | 725,000 | |
Regatta Funding Co. LLC, 5.56%, 8/21/24(6) | | 1,250,000 | | 1,246,075 | |
UBS AG, VRN, 5.62%, (SOFR plus 0.25%), 8/19/24(6) | | 750,000 | | 750,076 | |
Washington Morgan Capital Co. LLC, 5.60%, 11/22/24 (LOC: Goldman Sachs & Co.)(6) | | 1,100,000 | | 1,081,699 | |
| | | 12,077,491 | |
| Money Market Funds — 4.6% | | | |
| State Street Institutional U.S. Government Money Market Fund, Premier Class | | 13,911,027 | | 13,911,027 | |
State Street Navigator Securities Lending Government Money Market Portfolio(10) | | 16,370,705 | | 16,370,705 | |
| | | 30,281,732 | |
Treasury Bills(9) — 0.4% | | | |
| U.S. Treasury Bills, 5.44%, 8/20/24 | | $ | 1,750,000 | | 1,745,126 | |
| U.S. Treasury Bills, 5.44%, 8/27/24 | | 500,000 | | 498,094 | |
| U.S. Treasury Bills, 5.19%, 6/12/25 | | 500,000 | | 479,956 | |
| | | 2,723,176 | |
TOTAL SHORT-TERM INVESTMENTS (Cost $48,578,235) | | | 48,590,515 | |
TOTAL INVESTMENT SECURITIES — 102.4% (Cost $534,909,723) | | | 678,666,584 | |
| OTHER ASSETS AND LIABILITIES — (2.4)% | | | (16,154,294) | |
| TOTAL NET ASSETS — 100.0% | | | $ | 662,512,290 | |
FORWARD FOREIGN CURRENCY EXCHANGE CONTRACTS
| | | | | | | | | | | | | | | | | | | | |
| Currency Purchased | Currency Sold | Counterparty | Settlement
Date | Unrealized
Appreciation
(Depreciation) |
| USD | 129,335 | | AUD | 195,489 | | Citibank N.A. | 9/18/24 | $ | 1,342 | |
| BRL | 2,549,821 | | USD | 470,664 | | JPMorgan Chase Bank N.A. | 9/18/24 | (22,050) | |
| CAD | 4,859 | | USD | 3,553 | | Bank of America N.A. | 9/27/24 | (28) | |
| CAD | 17,330 | | USD | 12,733 | | Bank of America N.A. | 9/27/24 | (160) | |
| CAD | 18,716 | | USD | 13,752 | | Bank of America N.A. | 9/27/24 | (173) | |
| CAD | 6,310 | | USD | 4,641 | | Bank of America N.A. | 9/27/24 | (64) | |
| CAD | 9,650 | | USD | 7,067 | | Bank of America N.A. | 9/27/24 | (66) | |
| CAD | 9,301 | | USD | 6,816 | | Bank of America N.A. | 9/27/24 | (69) | |
| CAD | 6,511 | | USD | 4,757 | | Bank of America N.A. | 9/27/24 | (34) | |
| CAD | 4,650 | | USD | 3,394 | | Bank of America N.A. | 9/27/24 | (20) | |
| CAD | 6,517 | | USD | 4,747 | | Bank of America N.A. | 9/27/24 | (19) | |
| CAD | 10,266 | | USD | 7,449 | | Bank of America N.A. | 9/27/24 | (2) | |
| CAD | 4,655 | | USD | 3,377 | | Bank of America N.A. | 9/27/24 | 1 | |
| CAD | 10,187 | | USD | 7,381 | | Bank of America N.A. | 9/27/24 | 9 | |
| CAD | 3,882 | | USD | 2,807 | | Bank of America N.A. | 9/27/24 | 9 | |
| CAD | 12,624 | | USD | 9,162 | | Bank of America N.A. | 9/27/24 | (3) | |
| USD | 2,135,445 | | CAD | 2,932,820 | | Citibank N.A. | 9/18/24 | 8,271 | |
| USD | 56,249 | | CAD | 76,632 | | Bank of America N.A. | 9/27/24 | 653 | |
| USD | 351,842 | | CAD | 479,337 | | Bank of America N.A. | 9/27/24 | 4,082 | |
| USD | 282,491 | | CAD | 384,856 | | Bank of America N.A. | 9/27/24 | 3,278 | |
| USD | 1,870 | | CAD | 2,549 | | Bank of America N.A. | 9/27/24 | 21 | |
| USD | 8,455 | | CAD | 11,562 | | Bank of America N.A. | 9/27/24 | 67 | |
| USD | 2,507 | | CAD | 3,425 | | Bank of America N.A. | 9/27/24 | 21 | |
| USD | 36,108 | | CAD | 49,316 | | Bank of America N.A. | 9/27/24 | 329 | |
| USD | 18,407 | | CAD | 25,141 | | Bank of America N.A. | 9/27/24 | 168 | |
| USD | 13,049 | | CAD | 17,889 | | Bank of America N.A. | 9/27/24 | 70 | |
| USD | 11,632 | | CAD | 15,948 | | Bank of America N.A. | 9/27/24 | 62 | |
| USD | 5,780 | | CAD | 7,889 | | Bank of America N.A. | 9/27/24 | 57 | |
| USD | 15,822 | | CAD | 21,533 | | Bank of America N.A. | 9/27/24 | 199 | |
| USD | 20,827 | | CAD | 28,295 | | Bank of America N.A. | 9/27/24 | 298 | |
| USD | 17,649 | | CAD | 24,016 | | Bank of America N.A. | 9/27/24 | 225 | |
| USD | 22,451 | | CAD | 30,553 | | Bank of America N.A. | 9/27/24 | 285 | |
| USD | 12,299 | | CAD | 16,736 | | Bank of America N.A. | 9/27/24 | 157 | |
| USD | 12,614 | | CAD | 17,149 | | Bank of America N.A. | 9/27/24 | 173 | |
| USD | 25,348 | | CAD | 34,491 | | Bank of America N.A. | 9/27/24 | 324 | |
| USD | 10,526 | | CAD | 14,327 | | Bank of America N.A. | 9/27/24 | 132 | |
| USD | 7,249 | | CAD | 9,866 | | Bank of America N.A. | 9/27/24 | 91 | |
| USD | 9,703 | | CAD | 13,249 | | Bank of America N.A. | 9/27/24 | 91 | |
| USD | 18,021 | | CAD | 24,607 | | Bank of America N.A. | 9/27/24 | 169 | |
| USD | 13,036 | | CAD | 17,806 | | Bank of America N.A. | 9/27/24 | 118 | |
| USD | 10,468 | | CAD | 14,327 | | Bank of America N.A. | 9/27/24 | 74 | |
| USD | 7,161 | | CAD | 9,873 | | Bank of America N.A. | 9/27/24 | (1) | |
| USD | 1,820 | | CAD | 2,513 | | Bank of America N.A. | 9/27/24 | (3) | |
| USD | 7,834 | | CAD | 10,818 | | Bank of America N.A. | 9/27/24 | (15) | |
| USD | 15,530 | | CAD | 21,479 | | Bank of America N.A. | 9/27/24 | (53) | |
| CLP | 80,639,740 | | USD | 87,237 | | Bank of America N.A. | 9/23/24 | (1,651) | |
| CNY | 2,597,720 | | USD | 365,110 | | Bank of America N.A. | 9/18/24 | (343) | |
| COP | 885,715,002 | | USD | 220,928 | | Morgan Stanley | 9/18/24 | (3,723) | |
| CZK | 7,063,848 | | USD | 306,830 | | JPMorgan Chase Bank N.A. | 9/18/24 | (5,638) | |
| EUR | 95,447 | | USD | 103,205 | | Morgan Stanley | 9/18/24 | 319 | |
| EUR | 190,268 | | USD | 204,472 | | Morgan Stanley | 9/18/24 | 1,897 | |
| EUR | 20,757 | | USD | 22,721 | | Bank of America N.A. | 9/27/24 | (198) | |
| EUR | 70,728 | | USD | 76,158 | | Bank of America N.A. | 9/27/24 | 588 | |
| | | | | | | | | | | | | | | | | | | | |
| Currency Purchased | Currency Sold | Counterparty | Settlement
Date | Unrealized
Appreciation
(Depreciation) |
| EUR | 15,310 | | USD | 16,667 | | JPMorgan Chase Bank N.A. | 9/27/24 | $ | (54) | |
| EUR | 5,508 | | USD | 6,016 | | UBS AG | 9/27/24 | (39) | |
| EUR | 7,615 | | USD | 8,295 | | UBS AG | 9/27/24 | (33) | |
| USD | 6,417,071 | | EUR | 5,950,239 | | JPMorgan Chase Bank N.A. | 9/18/24 | (36,712) | |
| USD | 44,178 | | EUR | 40,945 | | Bank of America N.A. | 9/27/24 | (250) | |
| USD | 660,717 | | EUR | 612,356 | | Bank of America N.A. | 9/27/24 | (3,741) | |
| USD | 76,975 | | EUR | 70,320 | | Bank of America N.A. | 9/27/24 | 671 | |
| USD | 44,158 | | EUR | 40,945 | | Citibank N.A. | 9/27/24 | (270) | |
| USD | 660,416 | | EUR | 612,356 | | Citibank N.A. | 9/27/24 | (4,042) | |
| USD | 44,204 | | EUR | 40,945 | | Morgan Stanley | 9/27/24 | (224) | |
| USD | 661,111 | | EUR | 612,356 | | Morgan Stanley | 9/27/24 | (3,348) | |
| USD | 73,448 | | EUR | 67,728 | | Morgan Stanley | 9/27/24 | (43) | |
| USD | 3,391 | | EUR | 3,127 | | Morgan Stanley | 9/27/24 | (2) | |
| USD | 44,178 | | EUR | 40,945 | | UBS AG | 9/27/24 | (250) | |
| USD | 5,470 | | EUR | 5,032 | | UBS AG | 9/27/24 | 10 | |
| USD | 660,714 | | EUR | 612,356 | | UBS AG | 9/27/24 | (3,744) | |
| USD | 1,460,866 | | GBP | 1,147,993 | | Citibank N.A. | 9/18/24 | (15,559) | |
| USD | 442,631 | | GBP | 348,572 | | Goldman Sachs & Co. | 9/27/24 | (5,694) | |
| USD | 14,171 | | GBP | 11,066 | | Goldman Sachs & Co. | 9/27/24 | (61) | |
| USD | 11,670 | | GBP | 8,991 | | Goldman Sachs & Co. | 9/27/24 | 106 | |
| USD | 43,906 | | GBP | 33,980 | | Goldman Sachs & Co. | 9/27/24 | 201 | |
| USD | 41,573 | | GBP | 32,150 | | Goldman Sachs & Co. | 9/27/24 | 223 | |
| USD | 25,010 | | GBP | 19,400 | | Goldman Sachs & Co. | 9/27/24 | 59 | |
| USD | 40,591 | | GBP | 31,576 | | Goldman Sachs & Co. | 9/27/24 | (21) | |
| HUF | 53,446,138 | | USD | 144,809 | | Bank of America N.A. | 9/18/24 | 1,774 | |
| IDR | 7,949,240,080 | | USD | 486,415 | | Bank of America N.A. | 9/18/24 | 2,326 | |
| USD | 660,454 | | JPY | 102,372,763 | | Citibank N.A. | 9/18/24 | (27,682) | |
| MXN | 8,176,923 | | USD | 437,870 | | JPMorgan Chase Bank N.A. | 9/18/24 | (2,164) | |
| MYR | 2,046,018 | | USD | 435,045 | | Goldman Sachs & Co. | 9/18/24 | 12,622 | |
| USD | 45,435 | | NOK | 486,758 | | Citibank N.A. | 9/18/24 | 772 | |
| PEN | 421,150 | | USD | 111,399 | | Goldman Sachs & Co. | 9/18/24 | 1,246 | |
| PLN | 1,557,789 | | USD | 384,532 | | Morgan Stanley | 9/18/24 | 8,270 | |
| RON | 922,842 | | USD | 198,634 | | Goldman Sachs & Co. | 9/18/24 | 2,002 | |
| THB | 13,244,008 | | USD | 362,227 | | Citibank N.A. | 9/18/24 | 10,717 | |
| TRY | 2,390,443 | | USD | 66,857 | | Goldman Sachs & Co. | 9/18/24 | 1,625 | |
| ZAR | 7,745,236 | | USD | 412,326 | | Bank of America N.A. | 9/18/24 | 11,394 | |
| | | | | | $ | (60,648) | |
| | | | | | | | | | | | | | |
| FUTURES CONTRACTS PURCHASED |
| Reference Entity | Contracts | Expiration Date | Notional
Amount | Unrealized Appreciation
(Depreciation)^ |
| U.K. Gilt 10-Year Bonds | 3 | September 2024 | $ | 382,657 | | $ | 8,442 | |
| U.S. Treasury 5-Year Notes | 180 | September 2024 | 19,420,313 | | 391,657 | |
| U.S. Treasury 10-Year Notes | 4 | September 2024 | 447,250 | | 12,818 | |
| U.S. Treasury 10-Year Ultra Notes | 58 | September 2024 | 6,703,531 | | 216,558 | |
| | | | $ | 26,953,751 | | $ | 629,475 | |
^Amount represents value and unrealized appreciation (depreciation).
| | | | | | | | | | | | | | | | | | | | | | | |
| CENTRALLY CLEARED CREDIT DEFAULT SWAP AGREEMENTS |
Reference
Entity | Type‡ | Fixed Rate
Received
(Paid)
Quarterly | Termination
Date | Notional
Amount | Premiums
Paid
(Received) | Unrealized
Appreciation
(Depreciation) | Value^ |
| Markit CDX North America High Yield Index Series 38 | Sell | 5.00% | 6/20/27 | $ | 4,171,000 | | $ | (36,337) | | $ | 328,350 | | $ | 292,013 | |
| Markit CDX North America High Yield Index Series 41 | Sell | 5.00% | 12/20/28 | $ | 2,772,000 | | 9,168 | | 195,601 | | 204,769 | |
| Markit CDX North America High Yield Index Series 42 | Sell | 5.00% | 6/20/29 | $ | 3,300,000 | | 181,467 | | 62,088 | | 243,555 | |
| Markit iTraxx Europe Crossover Index Series 41 | Sell | 5.00% | 6/20/29 | EUR | 830,000 | | 62,382 | | 19,214 | | 81,596 | |
| | | | | $ | 216,680 | | $ | 605,253 | | $ | 821,933 | |
‡The maximum potential amount the fund could be required to deliver as a seller of credit protection if a credit event occurs as defined under the terms of the agreement is the notional amount. The maximum potential amount may be partially offset by any recovery values of the reference entities and upfront payments received upon entering into the agreement.
^The value for credit default swap agreements serves as an indicator of the current status of the payment/performance risk and represent the likelihood of an expected liability or profit at the period end. Increasing values in absolute terms when compared to the notional amount of the credit default swap agreement represent a deterioration of the referenced entity's credit soundness and an increased likelihood or risk of a credit event occurring as defined in the agreement.
| | | | | | | | |
| NOTES TO SCHEDULE OF INVESTMENTS |
| ADR | – | American Depositary Receipt |
| AUD | – | Australian Dollar |
| BRL | – | Brazilian Real |
| CAD | – | Canadian Dollar |
| CDX | – | Credit Derivatives Indexes |
| CLP | – | Chilean Peso |
| CNY | – | Chinese Yuan |
| COP | – | Colombian Peso |
| CVA | – | Certificaten Van Aandelen |
| CZK | – | Czech Koruna |
| DKK | – | Danish Krone |
| EUR | – | Euro |
| FHLB | – | Federal Home Loan Bank |
| FNMA | – | Federal National Mortgage Association |
| GBP | – | British Pound |
| GNMA | – | Government National Mortgage Association |
| GO | – | General Obligation |
| HUF | – | Hungarian Forint |
| IDR | – | Indonesian Rupiah |
| JPY | – | Japanese Yen |
| LOC | – | Letter of Credit |
| MXN | – | Mexican Peso |
| MYR | – | Malaysian Ringgit |
| NOK | – | Norwegian Krone |
| PEN | – | Peruvian Sol |
| PLN | – | Polish Zloty |
| RON | – | Romanian New Leu |
| SEQ | – | Sequential Payer |
| SOFR | – | Secured Overnight Financing Rate |
| THB | – | Thai Baht |
| TRY | – | Turkish Lira |
| USBMMY | – | U.S. Treasury Bill Money Market Yield |
| USD | – | United States Dollar |
| VRDN | – | Variable Rate Demand Note. The instrument may be payable upon demand and adjusts periodically based upon the terms set forth in the security's offering documents. The rate shown is effective at the period end and the reference rate and spread, if any, is indicated. The date of the demand feature is disclosed. |
| VRN | – | Variable Rate Note. The rate adjusts periodically based upon the terms set forth in the security’s offering documents. The rate shown is effective at the period end and the reference rate and spread, if any, is indicated. The security's effective maturity date may be shorter than the final maturity date shown. |
| ZAR | – | South African Rand |
(1)Investments are funds within the American Century Investments family of funds and are considered affiliated funds.
(2)Non-income producing.
(3)Security, or a portion thereof, is on loan. At the period end, the aggregate value of securities on loan was $17,299,272. The amount of securities on loan indicated may not correspond with the securities on loan identified because securities with pending sales are in the process of recall from the brokers.
(4)Security may be subject to resale, redemption or transferability restrictions.
(5)Security, or a portion thereof, has been pledged at the custodian bank or with a broker for collateral requirements on forward foreign currency exchange contracts, futures contracts and/or swap agreements. At the period end, the aggregate value of securities pledged was $1,431,923.
(6)Security was purchased pursuant to Rule 144A or Section 4(2) under the Securities Act of 1933 and may be sold in transactions exempt from registration, normally to qualified institutional investors. The aggregate value of these securities at the period end was $22,099,858, which represented 3.3% of total net assets.
(7)Security is a zero-coupon bond. Zero-coupon securities may be issued at a substantial discount from their value at maturity.
(8)When-issued security. The issue price and yield are fixed on the date of the commitment, but payment and delivery are scheduled for a future date.
(9)The rate indicated is the yield to maturity at purchase for non-interest bearing securities. For interest bearing securities, the stated coupon rate is shown.
(10)Investment of cash collateral from securities on loan. At the period end, the aggregate value of the collateral held by the fund was $17,710,950, which includes securities collateral of $1,340,245.
See Notes to Financial Statements.
| | |
| Statement of Assets and Liabilities |
| | | | | |
| JULY 31, 2024 |
| Assets |
| Investment securities - affiliated, at value (cost of $250,523,615) — including $15,401,767 of securities on loan | $ | 348,131,644 | |
| Investment securities - unaffiliated, at value (cost of $268,015,403) — including $1,897,505 of securities on loan | 314,164,235 | |
| Investment made with cash collateral received for securities on loan, at value (cost of $16,370,705) | 16,370,705 | |
| Total investment securities, at value (cost of $534,909,723) | 678,666,584 | |
| Cash | 296,632 | |
| Foreign currency holdings, at value (cost of $46,786) | 3,776 | |
| Receivable for investments sold | 687,899 | |
| Receivable for capital shares sold | 620,965 | |
| Receivable for variation margin on futures contracts | 48,113 | |
| Receivable for variation margin on swap agreements | 30,389 | |
| Unrealized appreciation on forward foreign currency exchange contracts | 77,598 | |
| Interest and dividends receivable | 991,448 | |
| Securities lending receivable | 11,467 | |
| Other assets | 24,525 | |
| 681,459,396 | |
| |
| Liabilities |
| Payable for collateral received for securities on loan | 16,370,705 | |
| Payable for investments purchased | 992,648 | |
| Payable for capital shares redeemed | 1,120,563 | |
| Unrealized depreciation on forward foreign currency exchange contracts | 138,246 | |
| Accrued management fees | 275,791 | |
| Distribution and service fees payable | 49,153 | |
| 18,947,106 | |
| |
| Net Assets | $ | 662,512,290 | |
| |
| Net Assets Consist of: |
| Capital (par value and paid-in surplus) | $ | 487,734,182 | |
| Distributable earnings (loss) | 174,778,108 | |
| $ | 662,512,290 | |
| | | | | | | | | | | |
| Net Assets | Shares Outstanding | Net Asset Value Per Share* |
| Investor Class, $0.01 Par Value | $250,280,725 | 30,718,135 | $8.15 |
| I Class, $0.01 Par Value | $32,893,765 | 4,079,274 | $8.06 |
| A Class, $0.01 Par Value | $150,329,829 | 18,226,884 | $8.25 |
| C Class, $0.01 Par Value | $13,504,165 | 1,706,745 | $7.91 |
| R Class, $0.01 Par Value | $14,413,027 | 1,750,904 | $8.23 |
| R5 Class, $0.01 Par Value | $12,734 | 1,578 | $8.07 |
| R6 Class, $0.01 Par Value | $201,078,045 | 25,032,341 | $8.03 |
*Maximum offering price per share was equal to the net asset value per share for all share classes, except A Class, for which the maximum offering price per share was $8.75 (net asset value divided by 0.9425). A contingent deferred sales charge may be imposed on redemptions of A Class and C Class.
See Notes to Financial Statements.
| | | | | |
| YEAR ENDED JULY 31, 2024 |
| Investment Income (Loss) | |
| Income: | |
| Income distributions from affiliated funds | $ | 7,882,962 | |
| Interest (net of foreign taxes withheld of $423) | 4,641,371 | |
| Dividends (net of foreign taxes withheld of $130,675) | 3,481,771 | |
| Securities lending, net | 102,219 | |
| 16,108,323 | |
| |
| Expenses: | |
| Management fees | 6,664,913 | |
| Distribution and service fees: | |
| A Class | 362,400 | |
| C Class | 135,545 | |
| R Class | 69,593 | |
| Directors' fees and expenses | 20,966 | |
| Other expenses | 65,009 | |
| 7,318,426 | |
Fees waived(1) | (3,479,798) | |
| 3,838,628 | |
| |
| Net investment income (loss) | 12,269,695 | |
| |
| Realized and Unrealized Gain (Loss) |
| Net realized gain (loss) on: | |
| Investment transactions (including $14,055,407 from affiliated funds) | 29,311,012 | |
| Forward foreign currency exchange contract transactions | 380,750 | |
| Futures contract transactions | (1,475,859) | |
| Swap agreement transactions | 607,443 | |
| Foreign currency translation transactions | 6,477 | |
| 28,829,823 | |
| |
| Change in net unrealized appreciation (depreciation) on: | |
| Investments (including $30,418,946 from affiliated funds) | 36,506,874 | |
| Forward foreign currency exchange contracts | 94,734 | |
| Futures contracts | 1,039,760 | |
| Swap agreements | 120,972 | |
| Translation of assets and liabilities in foreign currencies | 805 | |
| 37,763,145 | |
| |
| Net realized and unrealized gain (loss) | 66,592,968 | |
| |
| Net Increase (Decrease) in Net Assets Resulting from Operations | $ | 78,862,663 | |
(1)Amount consists of $1,296,893, $248,024, $783,208, $73,236, $75,198, $113 and $1,003,126 for Investor Class, I Class, A Class, C Class, R Class, R5 Class and R6 Class, respectively.
See Notes to Financial Statements.
| | |
| Statement of Changes in Net Assets |
| | | | | | | | |
| YEARS ENDED JULY 31, 2024 AND JULY 31, 2023 |
| Increase (Decrease) in Net Assets | July 31, 2024 | July 31, 2023 |
| Operations |
| Net investment income (loss) | $ | 12,269,695 | | $ | 11,857,945 | |
| Net realized gain (loss) | 28,829,823 | | 4,134,050 | |
| Change in net unrealized appreciation (depreciation) | 37,763,145 | | 35,317,667 | |
| Net increase (decrease) in net assets resulting from operations | 78,862,663 | | 51,309,662 | |
| | |
| Distributions to Shareholders |
| From earnings: | | |
| Investor Class | (5,694,464) | | (12,410,905) | |
| I Class | (1,435,120) | | (3,151,906) | |
| A Class | (3,064,551) | | (6,768,419) | |
| C Class | (193,914) | | (662,133) | |
| R Class | (251,898) | | (609,476) | |
| R5 Class | (653) | | (882) | |
| R6 Class | (5,004,998) | | (8,730,240) | |
| Decrease in net assets from distributions | (15,645,598) | | (32,333,961) | |
| | |
| Capital Share Transactions |
| Net increase (decrease) in net assets from capital share transactions (Note 5) | (67,260,838) | | (2,804,141) | |
| | |
| Net increase (decrease) in net assets | (4,043,773) | | 16,171,560 | |
| | |
| Net Assets |
| Beginning of period | 666,556,063 | | 650,384,503 | |
| End of period | $ | 662,512,290 | | $ | 666,556,063 | |
See Notes to Financial Statements.
| | |
| Notes to Financial Statements |
JULY 31, 2024
1. Organization
American Century Strategic Asset Allocations, Inc. (the corporation) is registered under the Investment Company Act of 1940, as amended (the 1940 Act), as an open-end management investment company and is organized as a Maryland corporation. Strategic Allocation: Aggressive Fund (the fund) is one fund in a series issued by the corporation. The fund may invest in varying combinations of other affiliated investment companies such as mutual funds and exchange-traded funds advised by American Century Investments (affiliated funds). The fund will assume the risks associated with the affiliated funds. The fund is an asset allocation fund and its investment objective is to seek the highest level of total return consistent with its asset mix.
The fund offers the Investor Class, I Class, A Class, C Class, R Class, R5 Class and R6 Class. The A Class may incur an initial sales charge. The A Class and C Class may be subject to a contingent deferred sales charge.
2. Significant Accounting Policies
The following is a summary of significant accounting policies consistently followed by the fund in preparation of its financial statements. The fund is an investment company and follows accounting and reporting guidance in accordance with accounting principles generally accepted in the United States of America. This may require management to make certain estimates and assumptions at the date of the financial statements. Actual results could differ from these estimates. Management evaluated the impact of events or transactions occurring through the date the financial statements were issued that would merit recognition or disclosure.
Investment Valuations — The fund determines the fair value of its investments and computes its net asset value (NAV) per share at the close of regular trading (usually 4 p.m. Eastern time) on the New York Stock Exchange (NYSE) on each day the NYSE is open. The value of investments of the fund is determined by American Century Investment Management, Inc. (ACIM) (the investment advisor), as the valuation designee, pursuant to its valuation policies and procedures. The Board of Directors oversees the valuation designee and reviews its valuation policies and procedures at least annually.
Equity securities that are listed or traded on a domestic securities exchange are valued at the last reported sales price or at the official closing price as provided by the exchange. Equity securities traded on foreign securities exchanges are generally valued at the closing price of such securities on the exchange where primarily traded or at the close of the NYSE, if that is earlier. If no last sales price is reported, or if local convention or regulation so provides, the mean of the latest bid and asked prices may be used. Securities traded over-the-counter are valued at the mean of the latest bid and asked prices, the last sales price, or the official closing price.
Fixed income securities are valued at the evaluated mean as provided by independent pricing services or at the mean of the most recent bid and asked prices as provided by investment dealers. Corporate bonds, U.S. Treasury and Government Agency securities, municipal securities, and sovereign governments and agencies are valued using market models that consider trade data, quotations from dealers and active market makers, relevant yield curve and spread data, creditworthiness, trade data or market information on comparable securities, and other relevant security specific information. Mortgage-related and asset-backed securities are valued based on models that consider trade data, prepayment and default projections, benchmark yield and spread data and estimated cash flows of each tranche of the issuer. Collateralized loan obligations are valued based on discounted cash flow models that consider trade and economic data, prepayment assumptions and default projections. Commercial paper and certificates of deposit are valued using a curve-based approach that considers money market rates for specific instruments, programs, currencies and maturity points from a variety of active market makers.
Hybrid securities are valued at the evaluated mean as provided by independent pricing services or at the mean of the most recent bid and asked prices as provided by investment dealers. Preferred stocks and convertible preferred stocks with perpetual maturities are valued using market models that consider trade data, quotations from dealers and active market makers, relevant yield curve and spread data, creditworthiness, trade data or market information on comparable securities, and other relevant security specific information.
Open-end management investment companies are valued at the reported NAV per share. Exchange-traded futures contracts are valued at the settlement price as provided by the appropriate exchange. Swap agreements are valued at an evaluated mean as provided by independent pricing services or independent brokers. Forward foreign currency exchange contracts are valued at the mean of the appropriate forward exchange rate at the close of the NYSE as provided by an independent pricing service.
If the valuation designee determines that the market price for a portfolio security is not readily available or is believed by the valuation designee to be unreliable, such security is valued at fair value as determined in good faith by the valuation designee, in accordance with its policies and procedures. Circumstances that may cause the fund to determine that market quotations are not available or reliable include, but are not limited to: when there is a significant event subsequent to the market quotation; trading in a security has been halted during the trading day; or trading in a security is insufficient or did not take place due to a closure or holiday.
The valuation designee monitors for significant events occurring after the close of an investment’s primary exchange but before the fund’s NAV per share is determined. Significant events may include, but are not limited to: corporate announcements and transactions; regulatory news, governmental action and political unrest that could impact a specific investment or an investment sector; or armed conflicts, natural disasters and similar events that could affect investments in a specific country or region. The valuation designee also monitors for significant fluctuations between domestic and foreign markets, as evidenced by the U.S. market or such other indicators that it deems appropriate. The valuation designee may apply a model-derived factor to the closing price of equity securities traded on foreign securities exchanges. The factor is based on observable market data as provided by an independent pricing service.
Foreign Currency Translations — All assets and liabilities, including investment securities and other financial instruments, initially expressed in foreign currencies are translated into U.S. dollars each day at the mean of the appropriate currency exchange rate at the close of the NYSE as provided by an independent pricing service. The fund may enter into spot foreign currency exchange contracts to facilitate transactions denominated in a foreign currency. Purchases and sales of investment securities, dividend and interest income, spot foreign currency exchange contracts, and expenses are translated at the rates of exchange prevailing on the respective dates of such transactions. Net realized and unrealized foreign currency exchange gains or losses related to investment securities are a component of net realized gain (loss) on investment transactions and change in net unrealized appreciation (depreciation) on investments, respectively.
Security Transactions — Security transactions are accounted for as of the trade date. Net realized gains and losses are determined on the identified cost basis, which is also used for federal income tax purposes.
Investment Income — Interest income less foreign taxes withheld, if any, is recorded on the accrual basis and includes paydown gain (loss) and accretion of discounts and amortization of premiums. Inflation adjustments related to inflation-linked debt securities are reflected as interest income. Dividend income less foreign taxes withheld, if any, is recorded as of the ex-dividend date. Distributions received on securities that represent a return of capital or long-term capital gain are recorded as a reduction of cost of investments and/or as a realized gain. The fund may estimate the components of distributions received that may be considered nontaxable distributions or long-term capital gain distributions for income tax purposes. Income and capital gain distributions, if any, from the affiliated funds are recorded as of the ex-dividend date. Securities lending income is net of fees and rebates earned by the lending agent for its services.
Income Tax Status — It is the fund's policy to distribute substantially all net investment income and net realized gains to shareholders and to otherwise qualify as a regulated investment company under provisions of the Internal Revenue Code. Accordingly, no provision has been made for income taxes. The fund files U.S. federal, state, local and non-U.S. tax returns as applicable. The fund's tax returns are subject to examination by the relevant taxing authority until expiration of the applicable statute of limitations, which is generally three years from the date of filing but can be longer in certain jurisdictions. At this time, management believes there are no uncertain tax positions which, based on their technical merit, would not be sustained upon examination and for which it is reasonably possible that the total amounts of unrecognized tax benefits will significantly change in the next twelve months.
Multiple Class — All shares of the fund represent an equal pro rata interest in the net assets of the class to which such shares belong, and have identical voting, dividend, liquidation and other rights and the same terms and conditions, except for class specific expenses and exclusive rights to vote on matters affecting only individual classes. Income, non-class specific expenses, and realized and unrealized capital gains and losses of the fund are allocated to each class of shares based on their relative net assets.
Distributions to Shareholders — Distributions from net investment income and net realized gains, if any, are generally declared and paid annually. The fund may elect to treat a portion of its payment to a redeeming shareholder, which represents the pro rata share of undistributed net investment income and net realized gains, as a distribution for federal income tax purposes (tax equalization).
Indemnifications — Under the corporation’s organizational documents, its officers and directors are indemnified against certain liabilities arising out of the performance of their duties to the fund. In addition, in the normal course of business, the fund enters into contracts that provide general indemnifications. The maximum exposure under these arrangements is unknown as this would involve future claims that may be made against a fund. The risk of material loss from such claims is considered by management to be remote.
Securities Lending — Securities are lent to qualified financial institutions and brokers. State Street Bank & Trust Co. serves as securities lending agent to the fund pursuant to a Securities Lending Agreement. The lending of securities exposes the fund to risks such as: the borrowers may fail to return the loaned securities, the borrowers may not be able to provide additional collateral, the fund may experience delays in recovery of the loaned securities or delays in access to collateral, or the fund may experience losses related to the investment collateral. To minimize certain risks, loan counterparties pledge collateral in the form of cash and/or securities. The lending agent has agreed to indemnify the fund in the case of default of any securities borrowed. Cash collateral received is invested in the State Street Navigator Securities Lending Government Money Market Portfolio, a money market mutual fund registered under the 1940 Act. The loans may also be secured by U.S. government securities in an amount at least equal to the market value of the securities loaned, plus accrued interest and dividends, determined on a daily basis and adjusted accordingly. By lending securities, the fund seeks to increase its net investment income through the receipt of interest and fees. Such income is reflected separately within the Statement of Operations. The value of loaned securities and related collateral outstanding at period end, if any, are shown on a gross basis within the Schedule of Investments and Statement of Assets and Liabilities.
The following table reflects a breakdown of transactions accounted for as secured borrowings, the gross obligation by the type of collateral pledged, and the remaining contractual maturity of those transactions as of July 31, 2024.
| | | | | | | | | | | | | | | | | |
| Remaining Contractual Maturity of Agreements |
| Overnight and Continuous | <30 days | Between 30 & 90 days | >90 days | Total |
Securities Lending Transactions(1) | | | | |
| Affiliated Funds | $ | 2,766,791 | | — | | — | | — | | $ | 2,766,791 | |
| Common Stocks | 13,603,914 | | — | | — | | — | | 13,603,914 | |
| Total Borrowings | $ | 16,370,705 | | — | | — | | — | | $ | 16,370,705 | |
| Gross amount of recognized liabilities for securities lending transactions | $ | 16,370,705 | |
(1)Amount represents the payable for cash collateral received for securities on loan. This will generally be in the Overnight and Continuous column as the securities are typically callable on demand.
3. Fees and Transactions with Related Parties
Certain officers and directors of the corporation are also officers and/or directors of American Century Companies, Inc. (ACC). The corporation's investment advisor, ACIM, the corporation's distributor, American Century Investment Services, Inc. (ACIS), and the corporation's transfer agent, American Century Services, LLC, are wholly owned, directly or indirectly, by ACC. ACIM serves as the investment advisor for the affiliated funds.
Management Fees — The corporation has entered into a management agreement with ACIM, under which ACIM provides the fund with investment advisory and management services in exchange for a single, unified management fee (the fee) per class. The agreement provides that ACIM will pay all expenses of managing and operating the fund, except brokerage expenses, taxes, interest, fees and expenses of the independent directors (including legal counsel fees), extraordinary expenses, and expenses incurred in connection with the provision of shareholder services and distribution services under a plan adopted pursuant to Rule 12b-1 under the 1940 Act. The fee is computed and accrued daily based on each class's daily net assets and paid monthly in arrears. The difference in the fee among the classes is a result of their separate arrangements for non-Rule 12b-1 shareholder services. It is not the result of any difference in advisory or custodial fees or other expenses related to the management of the fund's assets, which do not vary by class. The rate of the fee is determined by applying a fee rate calculation formula. This formula takes into account the fund's assets as well as certain assets, if any, of other clients of the investment advisor outside the American Century Investments family of funds (such as subadvised funds and separate accounts), as well as exchange-traded funds managed by the investment advisor, that use very similar investment teams and strategies (strategy assets). The investment advisor will waive the portion of the fund's management fee equal to the expenses attributable to the management fees of the funds advised by American Century Investments in which the fund invests. The amount of this waiver will fluctuate depending on the fund's daily allocation to such funds. This waiver is expected to remain in effect permanently and it cannot be terminated without the approval of the Board of Directors. During the period ended July 31, 2024, the investment advisor agreed to waive an additional 0.37% of the fund's management fee. The investment advisor expects this waiver to continue until July 31, 2025 and cannot terminate it prior to such date without the approval of the Board of Directors.
The management fee schedule range and the effective annual management fee before and after waiver for each class for the period ended July 31, 2024 are as follows:
| | | | | | | | | | | |
| Management Fee Schedule Range | Effective Annual Management Fee |
| Before Waiver | After Waiver |
| Investor Class | 0.90% to 1.15% | 1.15% | 0.61% |
| I Class | 0.70% to 0.95% | 0.95% | 0.41% |
| A Class | 0.90% to 1.15% | 1.15% | 0.61% |
| C Class | 0.90% to 1.15% | 1.15% | 0.61% |
| R Class | 0.90% to 1.15% | 1.15% | 0.61% |
| R5 Class | 0.70% to 0.95% | 0.95% | 0.41% |
| R6 Class | 0.55% to 0.80% | 0.80% | 0.26% |
Distribution and Service Fees — The Board of Directors has adopted a separate Master Distribution and Individual Shareholder Services Plan for each of the A Class, C Class and R Class (collectively the plans), pursuant to Rule 12b-1 of the 1940 Act. The plans provide that the A Class will pay ACIS an annual distribution and service fee of 0.25%. The plans provide that the C Class will pay ACIS an annual distribution and service fee of 1.00%, of which 0.25% is paid for individual shareholder services and 0.75% is paid for distribution services. The plans provide that the R Class will pay ACIS an annual distribution and service fee of 0.50%. The fees are computed and accrued daily based on each class’s daily net assets and paid monthly in arrears. The fees are used to pay financial intermediaries for distribution and individual shareholder services. Fees incurred under the plans during the period ended July 31, 2024 are detailed in the Statement of Operations.
Directors' Fees and Expenses — The Board of Directors is responsible for overseeing the investment advisor’s management and operations of the fund. The directors receive detailed information about the fund and its investment advisor regularly throughout the year, and meet at least quarterly with management of the investment advisor to review reports about fund operations. The fund's officers do not receive compensation from the fund.
Other Expenses — A fund’s other expenses may include interest charges, clearing exchange fees, proxy solicitation expenses, fees associated with the recovery of foreign tax reclaims and other miscellaneous expenses.
Interfund Transactions — The fund may enter into security transactions with other American Century Investments funds and other client accounts of the investment advisor, in accordance with the 1940 Act rules and procedures adopted by the Board of Directors. The rules and procedures require, among other things, that these transactions be effected at the independent current market price of the security. During the period, the interfund purchases and sales were $98,062 and $25,299, respectively. The effect of interfund transactions on the Statement of Operations was $(1,162) in net realized gain (loss) on investment transactions.
4. Investment Transactions
Purchases of investment securities, excluding short-term investments, for the period ended July 31, 2024 totaled $174,924,166, of which $21,611,168 represented U.S. Treasury and Government Agency obligations.
Sales of investment securities, excluding short-term investments, for the period ended July 31, 2024 totaled $250,082,079, of which $11,462,882 represented U.S. Treasury and Government Agency obligations.
5. Capital Share Transactions
Transactions in shares of the fund were as follows:
| | | | | | | | | | | | | | |
| Year ended July 31, 2024 | Year ended
July 31, 2023 |
| Shares | Amount | Shares | Amount |
| Investor Class/Shares Authorized | 550,000,000 | | | 550,000,000 | | |
| Sold | 1,998,297 | | $ | 15,048,008 | | 2,428,535 | | $ | 16,937,715 | |
| Issued in reinvestment of distributions | 757,363 | | 5,604,485 | | 1,868,069 | | 12,235,850 | |
| Redeemed | (5,880,647) | | (43,821,326) | | (5,310,361) | | (36,939,188) | |
| (3,124,987) | | (23,168,833) | | (1,013,757) | | (7,765,623) | |
| I Class/Shares Authorized | 150,000,000 | | | 150,000,000 | | |
| Sold | 511,844 | | 3,792,337 | | 890,062 | | 6,151,499 | |
| Issued in reinvestment of distributions | 195,325 | | 1,427,827 | | 482,518 | | 3,126,719 | |
| Redeemed | (4,431,143) | | (33,472,555) | | (2,115,212) | | (14,623,733) | |
| (3,723,974) | | (28,252,391) | | (742,632) | | (5,345,515) | |
| A Class/Shares Authorized | 325,000,000 | | | 325,000,000 | | |
| Sold | 1,760,537 | | 12,994,816 | | 1,648,361 | | 11,605,277 | |
| Issued in reinvestment of distributions | 399,673 | | 2,997,550 | | 995,087 | | 6,607,375 | |
| Redeemed | (3,538,542) | | (26,871,299) | | (2,844,897) | | (20,088,593) | |
| (1,378,332) | | (10,878,933) | | (201,449) | | (1,875,941) | |
| C Class/Shares Authorized | 90,000,000 | | | 90,000,000 | | |
| Sold | 270,232 | | 1,973,647 | | 287,801 | | 1,947,506 | |
| Issued in reinvestment of distributions | 26,793 | | 193,715 | | 103,458 | | 662,133 | |
| Redeemed | (649,897) | | (4,709,502) | | (710,965) | | (4,829,256) | |
| (352,872) | | (2,542,140) | | (319,706) | | (2,219,617) | |
| R Class/Shares Authorized | 50,000,000 | | | 50,000,000 | | |
| Sold | 258,075 | | 1,958,824 | | 256,468 | | 1,793,006 | |
| Issued in reinvestment of distributions | 33,342 | | 250,061 | | 91,189 | | 605,479 | |
| Redeemed | (456,216) | | (3,418,011) | | (567,761) | | (3,940,466) | |
| (164,799) | | (1,209,126) | | (220,104) | | (1,541,981) | |
| R5 Class/Shares Authorized | 50,000,000 | | | 50,000,000 | | |
| Sold | 445 | | 3,176 | | 725 | | 4,984 | |
| Issued in reinvestment of distributions | 89 | | 653 | | 136 | | 882 | |
| Redeemed | (1,996) | | (15,242) | | — | | — | |
| (1,462) | | (11,413) | | 861 | | 5,866 | |
| R6 Class/Shares Authorized | 455,000,000 | | | 455,000,000 | | |
| Sold | 4,548,197 | | 33,446,543 | | 4,725,934 | | 32,382,323 | |
| Issued in reinvestment of distributions | 687,500 | | 5,004,998 | | 1,353,526 | | 8,730,240 | |
| Redeemed | (5,430,890) | | (39,649,543) | | (3,675,171) | | (25,173,893) | |
| (195,193) | | (1,198,002) | | 2,404,289 | | 15,938,670 | |
| Net increase (decrease) | (8,941,619) | | $ | (67,260,838) | | (92,498) | | $ | (2,804,141) | |
6. Fair Value Measurements
The fund's investments valuation process is based on several considerations and may use multiple inputs to determine the fair value of the investments held by the fund. In conformity with accounting principles generally accepted in the United States of America, the inputs used to determine a valuation are classified into three broad levels.
•Level 1 valuation inputs consist of unadjusted quoted prices in an active market for identical investments.
•Level 2 valuation inputs consist of direct or indirect observable market data (including quoted prices for comparable investments, evaluations of subsequent market events, interest rates, prepayment speeds, credit risk, etc.). These inputs also consist of quoted prices for identical investments initially expressed in local currencies that are adjusted through translation into U.S. dollars.
•Level 3 valuation inputs consist of unobservable data (including a fund’s own assumptions).
The level classification is based on the lowest level input that is significant to the fair valuation measurement. The valuation inputs are not necessarily an indication of the risks associated with investing in these securities or other financial instruments.
The following is a summary of the level classifications as of period end. The Schedule of Investments provides additional information on the fund's portfolio holdings.
| | | | | | | | | | | |
| Level 1 | Level 2 | Level 3 |
| Assets | | | |
| Investment Securities | | | |
| Affiliated Funds | $ | 348,131,644 | | — | | — | |
| Common Stocks | 155,709,651 | | $ | 48,821,630 | | — | |
| U.S. Treasury Securities | — | | 57,046,917 | | — | |
| Corporate Bonds | — | | 8,500,375 | | — | |
| Sovereign Governments and Agencies | — | | 8,024,432 | | — | |
| Collateralized Loan Obligations | — | | 1,225,894 | | — | |
| Preferred Stocks | — | | 1,004,171 | | — | |
| Asset-Backed Securities | — | | 906,542 | | — | |
| Municipal Securities | — | | 254,008 | | — | |
| Collateralized Mortgage Obligations | — | | 227,189 | | — | |
| U.S. Government Agency Mortgage-Backed Securities | — | | 218,692 | | — | |
| Exchange-Traded Funds | 4,924 | | — | | — | |
| Short-Term Investments | 30,281,732 | | 18,308,783 | | — | |
| $ | 534,127,951 | | $ | 144,538,633 | | — | |
| Other Financial Instruments | | | |
| Futures Contracts | $ | 621,033 | | $ | 8,442 | | — | |
| Swap Agreements | — | | 821,933 | | — | |
| Forward Foreign Currency Exchange Contracts | — | | 77,598 | | — | |
| $ | 621,033 | | $ | 907,973 | | — | |
| | | |
| Liabilities | | | |
| Other Financial Instruments | | | |
| Forward Foreign Currency Exchange Contracts | — | | $ | 138,246 | | — | |
7. Derivative Instruments
Credit Risk — The fund is subject to credit risk in the normal course of pursuing its investment objectives. The value of a bond generally declines as the credit quality of its issuer declines. Credit default swap agreements enable a fund to buy/sell protection against a credit event of a specific issuer or index. A fund may attempt to enhance returns by selling protection or attempt to mitigate credit risk by buying protection. The buyer/seller of credit protection against a security or basket of securities may pay/receive an up-front or periodic payment to compensate for/against potential default events. Changes in value, including the periodic amounts of interest to be paid or received on swap agreements, are recorded as unrealized appreciation (depreciation) on swap agreements. Upon entering into a centrally cleared swap, a fund is required to deposit cash or securities (initial margin) with a financial intermediary in an amount equal to a certain percentage of the notional amount. A fund may incur charges or earn income on cash deposit balances, which are reflected in interest expenses or interest income, respectively. Subsequent payments (variation margin) are made or received daily, in cash, by a fund. The variation margin is equal to the daily change in the value and is a component of unrealized gains and losses. Realized gain or loss is recorded upon receipt or payment of a periodic settlement or termination of swap agreements. Net realized and unrealized gains or losses occurring during the holding period of swap agreements are a component of net realized gain (loss) on swap agreement transactions and change in net unrealized appreciation (depreciation) on swap agreements, respectively. The risks of entering into swap agreements include the possible lack of liquidity, failure of the counterparty to meet its obligations, and that there may be unfavorable changes in the underlying investments or instruments. The fund's average notional amount held during the period was $9,434,994.
Foreign Currency Risk — The fund is subject to foreign currency exchange rate risk in the normal course of pursuing its investment objectives. The value of foreign investments held by a fund may be significantly affected by changes in foreign currency exchange rates. The dollar value of a foreign security generally decreases when the value of the dollar rises against the foreign currency in which the security is denominated and tends to increase when the value of the dollar declines against such foreign currency. A fund may enter into forward foreign currency exchange contracts to reduce a fund's exposure to foreign currency exchange rate fluctuations or to gain exposure to the fluctuations in the value of foreign currencies. A fund will segregate cash, cash equivalents or other appropriate liquid securities on its records in amounts sufficient to meet requirements. The net U.S. dollar value of foreign currency underlying all contractual commitments held by a fund and the resulting unrealized appreciation or depreciation are determined daily. Realized gain or loss is recorded upon settlement of the contract. Net realized and unrealized gains or losses occurring during the holding period of forward foreign currency exchange contracts are a component of net realized gain (loss) on forward foreign currency exchange contract transactions and change in net unrealized appreciation (depreciation) on forward foreign currency exchange contracts, respectively. A fund bears the risk of an unfavorable change in the foreign currency exchange rate underlying the forward contract. Additionally, losses, up to the fair value, may arise if the counterparties do not perform under the contract terms. The fund's average U.S. dollar exposure to foreign currency risk derivative instruments held during the period was $24,826,550.
Interest Rate Risk — The fund is subject to interest rate risk in the normal course of pursuing its investment objectives. The value of bonds generally declines as interest rates rise. A fund may enter into futures contracts based on a bond index or a specific underlying security. A fund may purchase futures contracts to gain exposure to increases in market value or sell futures contracts to protect against a decline in market value. Upon entering into a futures contract, a fund will segregate cash, cash equivalents or other appropriate liquid securities on its records in amounts sufficient to meet requirements. A fund may incur charges or earn income on cash deposit balances, which are reflected in interest expenses or interest income, respectively. Subsequent payments (variation margin) are made or received daily, in cash, by a fund. The variation margin is equal to the daily change in the contract value and is recorded as unrealized gains and losses. A fund recognizes a realized gain or loss when the futures contract is closed or expires. Net realized and unrealized gains or losses occurring during the holding period of futures contracts are a component of net realized gain (loss) on futures contract transactions and change in net unrealized appreciation (depreciation) on futures contracts, respectively. One of the risks of entering into futures contracts is the possibility that the change in value of the contract may not correlate with the changes in value of the underlying securities. The fund's average notional exposure to interest rate risk derivative instruments held during the period was $31,891,148 futures contracts purchased.
Value of Derivative Instruments as of July 31, 2024
| | | | | | | | | | | | | | |
| Asset Derivatives | Liability Derivatives |
| Type of Risk Exposure | Location on Statement of Assets and Liabilities | Value | Location on Statement of Assets and Liabilities | Value |
| Credit Risk | Receivable for variation margin on swap agreements* | $ | 30,389 | | Payable for variation margin on swap agreements* | — | |
| Foreign Currency Risk | Unrealized appreciation on forward foreign currency exchange contracts | 77,598 | | Unrealized depreciation on forward foreign currency exchange contracts | $ | 138,246 | |
| Interest Rate Risk | Receivable for variation margin on futures contracts* | 48,113 | | Payable for variation margin on futures contracts* | — | |
| | $ | 156,100 | | | $ | 138,246 | |
*Included in the unrealized appreciation (depreciation) on futures contracts or centrally cleared swap agreements, as applicable, as reported in the Schedule of Investments.
Effect of Derivative Instruments on the Statement of Operations for the Year Ended July 31, 2024
| | | | | | | | | | | | | | |
| Net Realized Gain (Loss) | Change in Net Unrealized Appreciation (Depreciation) |
| Type of Risk Exposure | Location on Statement of Operations | Value | Location on Statement of Operations | Value |
| Credit Risk | Net realized gain (loss) on swap agreement transactions | $ | 607,443 | | Change in net unrealized appreciation (depreciation) on swap agreements | $ | 120,972 | |
| Foreign Currency Risk | Net realized gain (loss) on forward foreign currency exchange contract transactions | 380,750 | | Change in net unrealized appreciation (depreciation) on forward foreign currency exchange contracts | 94,734 | |
| Interest Rate Risk | Net realized gain (loss) on futures contract transactions | (1,475,859) | | Change in net unrealized appreciation (depreciation) on futures contracts | 1,039,760 | |
| | $ | (487,666) | | | $ | 1,255,466 | |
8. Risk Factors
The value of the fund’s shares will go up and down, sometimes rapidly or unpredictably, based on the performance of the securities owned by the fund and other factors generally affecting the securities market. Market risks, including political, regulatory, economic and social developments, can affect the value of the fund’s investments. Natural disasters, public health emergencies, war, terrorism and other unforeseeable events may lead to increased market volatility and may have adverse long-term effects on world economies and markets generally.
There are certain risks involved in investing in foreign securities. These risks include those resulting from political events (such as civil unrest, national elections and imposition of exchange controls), social and economic events (such as labor strikes and rising inflation), and natural disasters. Securities of foreign issuers may be less liquid and more volatile. Investing in emerging markets or a significant portion of assets in one country or region may accentuate these risks.
9. Federal Tax Information
The tax character of distributions paid during the years ended July 31, 2024 and July 31, 2023 were as follows:
| | | | | | | | |
| 2024 | 2023 |
| Distributions Paid From | | |
| Ordinary income | $ | 12,151,279 | | $ | 10,161,407 | |
| Long-term capital gains | $ | 3,494,319 | | $ | 22,172,554 | |
The book-basis character of distributions made during the year from net investment income or net realized gains may differ from their ultimate characterization for federal income tax purposes. These differences reflect the differing character of certain income items and net realized gains and losses for financial statement and tax purposes, and may result in reclassification among certain capital accounts on the financial statements.
As of period end, the federal tax cost of investments and the components of distributable earnings on a tax-basis were as follows:
| | | | | |
| Federal tax cost of investments | $ | 537,896,072 | |
| Gross tax appreciation of investments | $ | 157,640,797 | |
| Gross tax depreciation of investments | (16,870,285) | |
| Net tax appreciation (depreciation) of investments | 140,770,512 | |
| Net tax appreciation (depreciation) on derivatives and translation of assets and liabilities in foreign currencies | 509,551 | |
| Net tax appreciation (depreciation) | $ | 141,280,063 | |
| Other book-to-tax adjustments | $ | (19,676) | |
| Undistributed ordinary income | $ | 8,172,972 | |
| Accumulated long-term gains | $ | 25,344,749 | |
The difference between book-basis and tax-basis unrealized appreciation (depreciation) is attributable primarily to the tax deferral of losses on wash sales. Other book-to-tax adjustments are attributable primarily to the tax deferral of losses on straddle positions.
10. Investments in Affiliated Funds
The fund does not invest in an affiliated fund for the purpose of exercising management or control; however, investments by the fund within its investment strategy may represent a significant portion of an affiliated fund's net assets.
11. Affiliated Fund Transactions
A summary of transactions for each affiliated fund for the period ended July 31, 2024 follows (amounts in thousands):
| | | | | | | | | | | | | | | | | | | | | | | | | | |
Affiliated Fund(1) | Beginning Value | Purchase
Cost | Sales
Cost | Change in Net Unrealized Appreciation (Depreciation) | Ending
Value | Ending
Shares | Net Realized
Gain (Loss) | Distributions Received(2) |
| American Century Diversified Corporate Bond ETF | $ | 13,163 | | — | | — | | $ | 402 | | $ | 13,565 | | 288 | | — | | $ | 647 | |
| American Century Emerging Markets Bond ETF | 5,058 | | — | | — | | 127 | | 5,185 | | 133 | | — | | 308 | |
American Century Focused Dynamic Growth ETF(3) | 38,371 | | $ | 142 | | $ | 5,734 | | 7,334 | | 40,113 | | 458 | | $ | 2,106 | | — | |
| American Century Focused Large Cap Value ETF | 40,047 | | 744 | | 4,580 | | 2,694 | | 38,905 | | 584 | | 872 | | 840 | |
| American Century Multisector Income ETF | 22,734 | | — | | 265 | | 613 | | 23,082 | | 527 | | (49) | | 1,268 | |
| American Century Quality Diversified International ETF | 32,948 | | 984 | | 6,152 | | 2,273 | | 30,053 | | 603 | | 206 | | 991 | |
| American Century Short Duration Strategic Income ETF | 3,589 | | — | | — | | 58 | | 3,647 | | 71 | | — | | 200 | |
American Century U.S. Quality Growth ETF(4) | 37,393 | | 888 | | 6,758 | | 4,155 | | 35,678 | | 415 | | 3,013 | | 128 | |
| American Century U.S. Quality Value ETF | 41,188 | | 1,254 | | 9,576 | | 4,009 | | 36,875 | | 625 | | 1,523 | | 596 | |
Avantis Emerging Markets Equity ETF(4) | 28,697 | | 10,230 | | 4,975 | | 2,695 | | 36,647 | | 599 | | 321 | | 1,058 | |
Avantis International Equity ETF(4) | 31,049 | | 346 | | 11,799 | | (118) | | 19,478 | | 302 | | 2,073 | | 774 | |
Avantis International Small Cap Value ETF(4) | 8,793 | | 277 | | 873 | | 817 | | 9,014 | | 133 | | 106 | | 271 | |
| Avantis U.S. Equity ETF | 44,350 | | 185 | | 6,342 | | 3,050 | | 41,243 | | 445 | | 3,838 | | 584 | |
Avantis U.S. Small Cap Value ETF(4) | 10,163 | | 2,740 | | 566 | | 2,310 | | 14,647 | | 147 | | 46 | | 218 | |
| $ | 357,543 | | $ | 17,790 | | $ | 57,620 | | $ | 30,419 | | $ | 348,132 | | 5,330 | | $ | 14,055 | | $ | 7,883 | |
(1)Investments are funds within the American Century Investments family of funds and are considered affiliated funds. Additional information and attributes of each affiliated fund are available at americancentury.com or avantisinvestors.com.
(2)Distributions received includes distributions from net investment income and from capital gains, if any.
(3)Non-income producing.
(4)Security, or a portion thereof, is on loan.
| | | | | | | | | | | | | | | | | | | | | | | | | | | | | | | | | | | | | | | | | | | | | | | |
| For a Share Outstanding Throughout the Years Ended July 31 (except as noted) |
| Per-Share Data | | | | | | | | | Ratios and Supplemental Data | |
| | Income From Investment Operations*: | Distributions From: | | | Ratio to Average Net Assets of†: | | |
| Net Asset
Value,
Beginning
of Period | Net Investment Income (Loss)(1) | Net
Realized
and
Unrealized
Gain (Loss) | Total From
Investment
Operations | Net
Investment
Income | Net
Realized
Gains | Total
Distributions | Net
Asset
Value,
End
of Period | Total Return(2) | Operating
Expenses | Operating
Expenses
(before
expense
waiver) | Net
Investment
Income
(Loss) | Net
Investment
Income
(Loss)
(before
expense
waiver) | Portfolio
Turnover
Rate | Net
Assets,
End of
Period
(in thousands) |
| Investor Class |
| 2024 | $7.39 | 0.14 | 0.80 | 0.94 | (0.14) | (0.04) | (0.18) | $8.15 | 12.93% | 0.62% | 1.16% | 1.88% | 1.34% | 29% | $250,281 | |
| 2023 | $7.20 | 0.13 | 0.42 | 0.55 | (0.11) | (0.25) | (0.36) | $7.39 | 8.35% | 0.63% | 1.17% | 1.85% | 1.31% | 28% | $249,998 | |
| 2022 | $9.09 | 0.13 | (0.93) | (0.80) | (0.14) | (0.95) | (1.09) | $7.20 | (10.38)% | 0.63% | 1.17% | 1.61% | 1.07% | 36% | $250,891 | |
| 2021 | $7.45 | 0.08 | 2.09 | 2.17 | (0.06) | (0.47) | (0.53) | $9.09 | 30.04% | 0.67% | 1.16% | 0.95% | 0.46% | 44% | $316,039 | |
| 2020 | $7.91 | 0.08 | 0.58 | 0.66 | (0.13) | (0.99) | (1.12) | $7.45 | 8.82% | 0.84% | 1.16% | 1.06% | 0.74% | 109% | $262,987 | |
| I Class |
| 2024 | $7.31 | 0.15 | 0.79 | 0.94 | (0.15) | (0.04) | (0.19) | $8.06 | 13.16% | 0.42% | 0.96% | 2.08% | 1.54% | 29% | $32,894 | |
| 2023 | $7.13 | 0.14 | 0.42 | 0.56 | (0.13) | (0.25) | (0.38) | $7.31 | 8.51% | 0.43% | 0.97% | 2.05% | 1.51% | 28% | $57,065 | |
| 2022 | $9.02 | 0.15 | (0.93) | (0.78) | (0.16) | (0.95) | (1.11) | $7.13 | (10.28)% | 0.43% | 0.97% | 1.81% | 1.27% | 36% | $60,934 | |
| 2021 | $7.40 | 0.10 | 2.07 | 2.17 | (0.08) | (0.47) | (0.55) | $9.02 | 30.42% | 0.47% | 0.96% | 1.15% | 0.66% | 44% | $55,466 | |
| 2020 | $7.86 | 0.09 | 0.59 | 0.68 | (0.15) | (0.99) | (1.14) | $7.40 | 8.97% | 0.64% | 0.96% | 1.26% | 0.94% | 109% | $46,105 | |
| A Class |
| 2024 | $7.48 | 0.12 | 0.81 | 0.93 | (0.12) | (0.04) | (0.16) | $8.25 | 12.63% | 0.87% | 1.41% | 1.63% | 1.09% | 29% | $150,330 | |
| 2023 | $7.28 | 0.11 | 0.44 | 0.55 | (0.10) | (0.25) | (0.35) | $7.48 | 8.12% | 0.88% | 1.42% | 1.60% | 1.06% | 28% | $146,576 | |
| 2022 | $9.18 | 0.11 | (0.94) | (0.83) | (0.12) | (0.95) | (1.07) | $7.28 | (10.64)% | 0.88% | 1.42% | 1.36% | 0.82% | 36% | $144,188 | |
| 2021 | $7.52 | 0.06 | 2.11 | 2.17 | (0.04) | (0.47) | (0.51) | $9.18 | 29.69% | 0.92% | 1.41% | 0.70% | 0.21% | 44% | $177,147 | |
| 2020 | $7.97 | 0.06 | 0.59 | 0.65 | (0.11) | (0.99) | (1.10) | $7.52 | 8.58% | 1.09% | 1.41% | 0.81% | 0.49% | 109% | $147,856 | |
| C Class |
| 2024 | $7.18 | 0.06 | 0.77 | 0.83 | (0.06) | (0.04) | (0.10) | $7.91 | 11.73% | 1.62% | 2.16% | 0.88% | 0.34% | 29% | $13,504 | |
| 2023 | $7.00 | 0.06 | 0.41 | 0.47 | (0.04) | (0.25) | (0.29) | $7.18 | 7.29% | 1.63% | 2.17% | 0.85% | 0.31% | 28% | $14,782 | |
| 2022 | $8.86 | 0.05 | (0.91) | (0.86) | (0.05) | (0.95) | (1.00) | $7.00 | (11.30)% | 1.63% | 2.17% | 0.61% | 0.07% | 36% | $16,652 | |
| 2021 | $7.29 | (0.01) | 2.05 | 2.04 | — | (0.47) | (0.47) | $8.86 | 28.76% | 1.67% | 2.16% | (0.05)% | (0.54)% | 44% | $23,338 | |
| 2020 | $7.75 | —(3) | 0.58 | 0.58 | (0.05) | (0.99) | (1.04) | $7.29 | 7.80% | 1.84% | 2.16% | 0.06% | (0.26)% | 109% | $29,423 | |
| R Class |
| 2024 | $7.46 | 0.11 | 0.80 | 0.91 | (0.10) | (0.04) | (0.14) | $8.23 | 12.38% | 1.12% | 1.66% | 1.38% | 0.84% | 29% | $14,413 | |
| 2023 | $7.27 | 0.09 | 0.43 | 0.52 | (0.08) | (0.25) | (0.33) | $7.46 | 7.71% | 1.13% | 1.67% | 1.35% | 0.81% | 28% | $14,296 | |
| 2022 | $9.17 | 0.09 | (0.95) | (0.86) | (0.09) | (0.95) | (1.04) | $7.27 | (10.88)% | 1.13% | 1.67% | 1.11% | 0.57% | 36% | $15,518 | |
| 2021 | $7.51 | 0.04 | 2.11 | 2.15 | (0.02) | (0.47) | (0.49) | $9.17 | 29.58% | 1.17% | 1.66% | 0.45% | (0.04)% | 44% | $18,729 | |
| 2020 | $7.96 | 0.04 | 0.59 | 0.63 | (0.09) | (0.99) | (1.08) | $7.51 | 8.16% | 1.34% | 1.66% | 0.56% | 0.24% | 109% | $16,353 | |
| | | | | | | | | | | | | | | | | | | | | | | | | | | | | | | | | | | | | | | | | | | | | | | |
| For a Share Outstanding Throughout the Years Ended July 31 (except as noted) |
| Per-Share Data | | | | | | | | | Ratios and Supplemental Data | |
| | Income From Investment Operations*: | Distributions From: | | | Ratio to Average Net Assets of†: | | |
| Net Asset
Value,
Beginning
of Period | Net Investment Income (Loss)(1) | Net
Realized
and
Unrealized
Gain (Loss) | Total From
Investment
Operations | Net
Investment
Income | Net
Realized
Gains | Total
Distributions | Net
Asset
Value,
End
of Period | Total Return(2) | Operating
Expenses | Operating
Expenses
(before
expense
waiver) | Net
Investment
Income
(Loss) | Net
Investment
Income
(Loss)
(before
expense
waiver) | Portfolio
Turnover
Rate | Net
Assets,
End of
Period
(in thousands) |
| R5 Class |
| 2024 | $7.32 | 0.15 | 0.79 | 0.94 | (0.15) | (0.04) | (0.19) | $8.07 | 13.14% | 0.42% | 0.96% | 2.08% | 1.54% | 29% | $13 | |
| 2023 | $7.13 | 0.15 | 0.42 | 0.57 | (0.13) | (0.25) | (0.38) | $7.32 | 8.66% | 0.43% | 0.97% | 2.05% | 1.51% | 28% | $22 | |
| 2022 | $9.02 | 0.15 | (0.93) | (0.78) | (0.16) | (0.95) | (1.11) | $7.13 | (10.28)% | 0.43% | 0.97% | 1.81% | 1.27% | 36% | $16 | |
| 2021 | $7.40 | 0.10 | 2.07 | 2.17 | (0.08) | (0.47) | (0.55) | $9.02 | 30.24% | 0.47% | 0.96% | 1.15% | 0.66% | 44% | $15 | |
| 2020 | $7.86 | 0.09 | 0.59 | 0.68 | (0.15) | (0.99) | (1.14) | $7.40 | 9.11% | 0.64% | 0.96% | 1.26% | 0.94% | 109% | $10 | |
| R6 Class |
| 2024 | $7.29 | 0.17 | 0.77 | 0.94 | (0.16) | (0.04) | (0.20) | $8.03 | 13.23% | 0.27% | 0.81% | 2.23% | 1.69% | 29% | $201,078 | |
| 2023 | $7.11 | 0.15 | 0.42 | 0.57 | (0.14) | (0.25) | (0.39) | $7.29 | 8.71% | 0.28% | 0.82% | 2.20% | 1.66% | 28% | $183,818 | |
| 2022 | $8.99 | 0.16 | (0.92) | (0.76) | (0.17) | (0.95) | (1.12) | $7.11 | (10.05)% | 0.28% | 0.82% | 1.96% | 1.42% | 36% | $162,186 | |
| 2021 | $7.38 | 0.11 | 2.06 | 2.17 | (0.09) | (0.47) | (0.56) | $8.99 | 30.57% | 0.32% | 0.81% | 1.30% | 0.81% | 44% | $268,579 | |
| 2020 | $7.84 | 0.10 | 0.59 | 0.69 | (0.16) | (0.99) | (1.15) | $7.38 | 9.18% | 0.49% | 0.81% | 1.41% | 1.09% | 109% | $213,077 | |
| | |
| Notes to Financial Highlights |
(1)Computed using average shares outstanding throughout the period.
(2)Total returns are calculated based on the net asset value of the last business day and do not reflect applicable sales charges, if any. Total returns for periods less than one year are not annualized.
(3)Per-share amount was less than $0.005.
*The amount shown for a share outstanding throughout the period may not correlate with the Statement(s) of Operations or precisely reflect the class expense differentials due to the timing of transactions in shares of a fund in relation to income earned and/or fluctuations in the fair value of a fund's investments.
†Ratios for periods less than one year are annualized. Zero balances may reflect amounts less than 0.005%.
See Notes to Financial Statements.
| | |
| Report of Independent Registered Public Accounting Firm |
To the shareholders of the Strategic Allocation: Aggressive Fund and the Board of Directors of American Century Strategic Asset Allocations, Inc.:
Opinion on the Financial Statements and Financial Highlights
We have audited the accompanying statement of assets and liabilities, including the schedule of investments, of Strategic Allocation: Aggressive Fund (the “Fund”), one of the funds constituting the American Century Strategic Asset Allocations, Inc., as of July 31, 2024, the related statement of operations for the year then ended, the statements of changes in net assets for each of the two years in the period then ended, the financial highlights for each of the five years in the period then ended, and the related notes. In our opinion, the financial statements and financial highlights present fairly, in all material respects, the financial position of the Fund as of July 31, 2024, and the results of its operations for the year then ended, the changes in its net assets for each of the two years in the period then ended, and the financial highlights for each of the five years in the period then ended, in conformity with accounting principles generally accepted in the United States of America.
Basis for Opinion
These financial statements and financial highlights are the responsibility of the Fund's management. Our responsibility is to express an opinion on the Fund’s financial statements and financial highlights based on our audits. We are a public accounting firm registered with the Public Company Accounting Oversight Board (United States) (PCAOB) and are required to be independent with respect to the Fund in accordance with the U.S. federal securities laws and the applicable rules and regulations of the Securities and Exchange Commission and the PCAOB.
We conducted our audits in accordance with the standards of the PCAOB. Those standards require that we plan and perform the audit to obtain reasonable assurance about whether the financial statements and financial highlights are free of material misstatement, whether due to error or fraud. The Fund is not required to have, nor were we engaged to perform, an audit of its internal control over financial reporting. As part of our audits, we are required to obtain an understanding of internal control over financial reporting but not for the purpose of expressing an opinion on the effectiveness of the Fund’s internal control over financial reporting. Accordingly, we express no such opinion.
Our audits included performing procedures to assess the risks of material misstatement of the financial statements and financial highlights, whether due to error or fraud, and performing procedures that respond to those risks. Such procedures included examining, on a test basis, evidence regarding the amounts and disclosures in the financial statements and financial highlights. Our audits also included evaluating the accounting principles used and significant estimates made by management, as well as evaluating the overall presentation of the financial statements and financial highlights. Our procedures included confirmation of securities owned as of July 31, 2024, by correspondence with the custodian and brokers; when replies were not received from brokers, we performed other auditing procedures. We believe that our audits provide a reasonable basis for our opinion.
/s/ Deloitte & Touche LLP
Kansas City, Missouri
September 17, 2024
We have served as the auditor of one or more American Century investment companies since 1997.
| | |
| Approval of Management Agreement |
At a meeting held on June 27, 2024, the Fund’s Board of Directors (the “Board”) unanimously approved the renewal of the management agreement pursuant to which American Century Investment Management, Inc. (the “Advisor”) acts as the investment advisor for the Fund. Under the Investment Company Act of 1940 (the “Investment Company Act”), contracts for investment advisory services are required to be reviewed, evaluated, and approved by a majority of a fund’s Directors, including a majority of the independent Directors.
Prior to its consideration of the renewal of the management agreement, the Directors requested and reviewed data and information compiled by the Advisor and certain independent consultants and data providers concerning the Fund. This review was in addition to the oversight and evaluation undertaken by the Board and its committees on a continual basis and the information received was supplemental to the information that the Board and its committees receive and consider over time.
In connection with its consideration of the renewal of the management agreement, the Board’s review and evaluation of the services provided by the Advisor and its affiliates included, but was not limited to
•the nature, extent, and quality of investment management, shareholder services, distribution services, and other services provided to the Fund;
•the wide range of programs and services the Advisor and other service providers provide to the Fund and its shareholders on a routine and non-routine basis;
•the Fund’s investment performance compared to appropriate benchmarks and/or peer groups of other mutual funds with similar investment objectives and strategies;
•the cost of owning the Fund compared to the cost of owning similarly-managed funds;
•the Advisor’s compliance policies, procedures, and regulatory experience and those of certain other service providers;
•the Advisor’s strategic plans, generally, and with respect to the Advisor’s response to investment management industry challenges;
•the Advisor’s business continuity plans, vendor management practices, and information security practices;
•the cost of services provided to the Fund, the profitability of the Fund to the Advisor, and the Advisor’s financial results of operation;
•possible economies of scale associated with the Advisor’s management of the Fund;
•any collateral benefits derived by the Advisor from the management of the Fund;
•fees and expenses associated with any investment by the Fund in other funds;
•payments to intermediaries by the Fund and the Advisor and services provided by intermediaries in connection therewith; and
•services provided and charges to the Advisor’s other investment management clients.
The Board held two meetings to consider the renewal. The independent Directors also met in private session multiple times to review and discuss the information provided in response to their request. The independent Directors held active discussions with the Advisor regarding the renewal of the management agreement, requesting supplemental information, and reviewing information provided by the Advisor in response thereto. The independent Directors had the benefit of the advice of their independent counsel throughout the process.
Factors Considered
The Directors considered all of the information provided by the Advisor, the independent consultant and data providers, and the independent Directors’ independent counsel in connection with the approval. They determined that the information was sufficient for them to evaluate the management agreement for the Fund. In connection with their review, the Directors did not identify any single factor as being all-important or controlling, and each Director may have attributed different levels of importance to different factors. In deciding to renew the management agreement, the Board based its decision on a number of factors, including without limitation the following:
Nature, Extent and Quality of Services — Generally. Under the management agreement, the Advisor is responsible for providing or arranging for all services necessary for the operation of the Fund. The Board noted that the Advisor provides or arranges at its own expense a wide variety of services which include, without limitation, the following:
•constructing and designing the Fund
•portfolio research and security selection
•initial capitalization/funding
•securities trading
•Fund administration
•custody of Fund assets
•daily valuation of the Fund’s portfolio
•liquidity monitoring and management
•risk management, including information security
•shareholder servicing and transfer agency, including shareholder confirmations, recordkeeping, and communications
•legal services (except the independent Directors’ counsel)
•regulatory and portfolio compliance
•financial reporting
•marketing and distribution (except amounts paid by the Fund under Rule 12b-1 plans)
The Board noted that many of these services have expanded over time in terms of both quantity and complexity in response to shareholder demands, competition in the industry, changing distribution channels, and the changing regulatory environment.
Investment Management Services. The nature of the investment management services provided to the Fund is quite complex and allows Fund shareholders access to professional money management, instant diversification of their investments, the opportunity to easily diversify among asset classes by investing in or exchanging among various American Century Investments funds, and liquidity. In evaluating investment performance, the Board expects the Advisor to manage the Fund in accordance with its investment objectives and principal investment strategies. Further, the Directors recognize that the Advisor has an obligation to monitor trading activities, and in particular to seek the best execution of fund trades, and to evaluate the use of and payment for research. In providing these services, the Advisor utilizes teams of investment professionals who require extensive information technology, research, training, compliance, and other systems to conduct their business. The Board, directly and through its Fund Performance Review Committee, provides oversight of the investment performance process. It regularly reviews investment performance information for the Fund, together with comparative information for appropriate benchmarks and/or peer groups of similarly-managed funds, over different time horizons. The Directors also review investment performance information from both the Advisor and an independent third party during the management agreement renewal process. If performance concerns are identified, the Board discusses with the Advisor the reasons for such results and any actions being taken to improve performance and may conduct special reviews until performance improves. The Fund’s performance was above its benchmark for the three-, five-, and ten-year periods and below its benchmark for the one-year period reviewed by the Board. In relation to industry peers, the Fund was above the median of its peer performance universe as identified by a third-party service provider for the five- and ten-year periods and below the median for the one- and three-year periods. The Board found the investment management services provided by the Advisor to the Fund to be satisfactory and consistent with the management agreement.
Shareholder and Other Services. Under the management agreement, the Advisor provides the Fund with a comprehensive package of transfer agency, shareholder, and other services. The Board, directly and through its various committees, regularly reviews reports and evaluations of such services at its regular meetings. These reports include, but are not limited to, information regarding the operational efficiency and accuracy of the shareholder and transfer agency services provided, staffing levels, shareholder satisfaction, technology support (including information security), new products and services offered to Fund shareholders, securities trading activities, portfolio valuation services, auditing services, and legal and operational compliance activities. The Board found the services provided by the Advisor to the Fund under the management agreement to be competitive and of high quality.
Costs of Services and Profitability. The Advisor provides detailed information concerning its cost of providing various services to the Fund, its profitability in managing the Fund (pre- and post-distribution), and its financial results of operation. The Directors have reviewed with the Advisor the methodology used to prepare this financial information and arranged for an independent consultant to confirm the reasonableness of the allocation methodology used. This information is considered in evaluating the Advisor’s financial condition, its ability to continue to provide services under the management agreement, and the reasonableness of the terms of the current management agreement. The Board concluded that the Advisor’s profits were reasonable in light of the services provided to the Fund.
Ethics. The Board generally considers the Advisor’s commitment to providing quality services to shareholders and to conducting its business ethically. They noted that the Advisor’s practices generally meet or exceed industry best practices.
Economies of Scale. The Board also reviewed information provided by the Advisor regarding the possible existence of economies of scale in connection with the management of the Fund. The Board concluded that economies of scale are difficult to measure and predict with precision, especially on a fund-by-fund basis. The Board concluded that the Advisor is sharing economies of scale, to the extent they exist, through its fee structure, and through reinvestment in its business, infrastructure, investment capabilities and initiatives to provide shareholders enhanced and expanded content and services.
Comparison to Other Funds’ Fees. The management agreement provides that the Fund pays the Advisor a single, all-inclusive (or unified) management fee for providing all services necessary for the management and operation of the Fund, other than brokerage and other transaction fees and expenses relating to acquisition and disposition of portfolio securities, acquired fund fees and expenses, taxes, interest, extraordinary expenses, fund litigation expenses, fees and expenses of the Fund’s independent Directors (including their independent legal counsel), and expenses incurred in connection with the provision of shareholder services and distribution services under a plan adopted pursuant to Investment Company Act Rule 12b-1. Under the unified fee structure, the Advisor is responsible for providing all investment advisory, custody, audit, administrative, compliance, recordkeeping, marketing and shareholder services, or arranging and supervising third parties to provide such services. By contrast, most other funds are charged a variety of fees, including an investment advisory fee, a transfer agency fee, an administrative fee, distribution charges, and other expenses. Other than their investment advisory fees and any applicable Rule 12b-1 distribution fees, all other components of the total fees charged by these other funds may be increased without shareholder approval. The Board believes the unified fee structure is a benefit to Fund shareholders because it clearly discloses to shareholders the cost of owning Fund shares, and,
since the unified fee cannot be increased without a vote of Fund shareholders, it shifts to the Advisor the risk of increased costs of operating the Fund and provides a direct incentive to minimize administrative inefficiencies. Part of the Board’s analysis of fee levels involves reviewing certain evaluative data compiled by an independent provider comparing the Fund’s unified fee to the total expense ratios of its peers. The unified fee charged to shareholders of the Fund was below the median of the total expense ratios of the Fund’s peer expense universe. In addition, the Board reviewed the Fund’s position relative to the narrower set of its expense group peers. The Board and the Advisor agreed to continue the temporary reduction of the Fund’s annual unified management fee such that the Investor Class management fee not exceed 0.79% for at least one year beginning August 1, 2024. The Board concluded that the management fee paid by the Fund to the Advisor under the management agreement is reasonable in light of the services provided to the Fund.
Comparison to Fees and Services Provided to Other Clients of the Advisor. The Board also requested and received information from the Advisor concerning the nature of the services, fees, costs, and profitability of its advisory services to advisory clients other than the Fund. They observed that these varying types of client accounts require different services and involve different regulatory and entrepreneurial risks than the management of the Fund. The Board analyzed this information and concluded that the fees charged and services provided to the Fund were reasonable by comparison.
Payments to Intermediaries. The Directors also requested and received a description of payments made to intermediaries by the Fund and the Advisor and services provided in response thereto. These payments include various payments made by the Fund or the Advisor to different types of intermediaries and recordkeepers for distribution and service activities provided for the Fund. The Directors reviewed such information and received representations from the Advisor that all such payments by the Fund were made pursuant to the Fund’s Rule 12b-1 Plan and that all such payments by the Advisor were made from the Advisor’s resources and reasonable profits.
Collateral or “Fall-Out” Benefits Derived by the Advisor. The Board considered the possible existence of collateral benefits the Advisor may receive as a result of its relationship with the Fund. They concluded that the Advisor’s primary business is managing funds and it generally does not use fund or shareholder information to generate profits in other lines of business, and therefore does not derive any significant collateral benefits from them. To the extent there are potential collateral benefits, the Board has been advised and has taken this into consideration in its review of the management contract with the Fund. The Board noted that additional assets from other clients may offer the Advisor some benefit from increased leverage with prospective clients, service providers, and counterparties. Additionally, the Advisor may receive proprietary research from broker-dealers that execute fund portfolio transactions, which the Board concluded is likely to benefit other clients of the Advisor, as well as Fund shareholders. The Board also determined that the Advisor is able to provide investment management services to certain clients other than the Fund, at least in part, due to its existing infrastructure built to serve the fund complex. The Board concluded that appropriate allocation methodologies had been employed to assign resources and the cost of those resources to these other clients.
Existing Relationship. The Board also considered whether there was any reason for not continuing the existing arrangement with the Advisor. In this regard, the Board was mindful of the potential disruptions of the Fund’s operations and various risks, uncertainties, and other effects that could occur as a result of a decision not to continue such relationship. In particular, the Board recognized that most shareholders have invested in the Fund on the strength of the Advisor’s industry standing and reputation and in the expectation that the Advisor will have a continuing role in providing advisory services to the Fund.
Conclusion of the Directors. As a result of this process, the Board, including all of the independent Directors, taking into account all of the factors discussed above and the information provided by the Advisor and others in connection with its review and received over time, determined that the terms of the management agreement are fair and reasonable and that the management fee charged to the Fund is reasonable in light of the services provided and that the management agreement between the Fund and the Advisor should be renewed for an additional one-year period.
Other Tax Information
The following information is provided pursuant to provisions of the Internal Revenue Code.
The fund hereby designates up to the maximum amount allowable as qualified dividend income for the fiscal year ended July 31, 2024.
For corporate taxpayers, the fund hereby designates $3,928,471, or up to the maximum amount allowable, of ordinary income distributions paid during the fiscal year ended July 31, 2024 as qualified for the corporate dividends received deduction.
The fund hereby designates $4,417,748, or up to the maximum amount allowable, as long-term capital gain distributions (20% rate gain distributions) for the fiscal year ended July 31, 2024.
The fund hereby designates $83,718 as qualified short-term capital gain distributions for purposes of Internal Revenue Code Section 871 for the fiscal year ended July 31, 2024.
For the fiscal year ended July 31, 2024, the fund intends to pass through to shareholders foreign source income of $2,623,480 and foreign taxes paid of $132,734, or up to the maximum amount allowable, as a foreign tax credit. Foreign source income and foreign tax expense per outstanding share on July 31, 2024 are $0.0322 and $0.0016, respectively.
The fund utilized earnings and profits of $1,460,259 distributed to shareholders on redemption of shares as part of the dividends paid deduction (tax equalization).
| | | | | | | | |
| Contact Us | americancentury.com | |
| Automated Information Line | 1-800-345-8765 | |
| Investor Services Representative | 1-800-345-2021
or 816-531-5575 | |
| Banks and Trust Companies, Broker-Dealers, Financial Professionals, Insurance Companies | 1-800-345-6488 | |
| | |
| This report and the statements it contains are submitted for the general information of our shareholders. The report is not authorized for distribution to prospective investors unless preceded or accompanied by an effective prospectus. | |
| | |
©2024 American Century Proprietary Holdings, Inc. All rights reserved.
CL-ANN-91037 2409 | |
| | | | | |
| |
| Annual Financial Statement and Other Information |
| |
| July 31, 2024 |
| |
| Strategic Allocation: Conservative Fund |
| Investor Class (TWSCX) |
| I Class (ACCIX) |
| A Class (ACCAX) |
| C Class (AACCX) |
| R Class (AACRX) |
| R5 Class (AACGX) |
| R6 Class (AACDX) |
| | | | | |
| Schedule of Investments | |
| Statement of Assets and Liabilities | |
| Statement of Operations | |
| Statement of Changes in Net Assets | |
| Notes to Financial Statements | |
| Financial Highlights | |
| Report of Independent Registered Public Accounting Firm | |
| Approval of Management Agreement | |
| |
| Other Tax Information | |
JULY 31, 2024
| | | | | | | | | | | |
| | Shares/Principal
Amount | Value |
AFFILIATED FUNDS(1) — 37.3% | | | |
| American Century Diversified Corporate Bond ETF | | 389,060 | | $ | 18,306,751 | |
| American Century Emerging Markets Bond ETF | | 155,611 | | 6,061,469 | |
American Century Focused Dynamic Growth ETF(2) | | 68,202 | | 5,977,483 | |
| American Century Focused Large Cap Value ETF | | 86,584 | | 5,764,823 | |
| American Century Multisector Income ETF | | 377,777 | | 16,561,744 | |
| American Century Quality Diversified International ETF | | 178,243 | | 8,881,564 | |
| American Century Short Duration Strategic Income ETF | | 31,790 | | 1,633,847 | |
| American Century U.S. Quality Growth ETF | | 181,099 | | 15,552,782 | |
| American Century U.S. Quality Value ETF | | 312,433 | | 18,422,393 | |
| Avantis International Equity ETF | | 64,673 | | 4,169,468 | |
| Avantis International Small Cap Value ETF | | 24,835 | | 1,688,283 | |
| Avantis U.S. Equity ETF | | 153,113 | | 14,198,169 | |
| Avantis U.S. Small Cap Value ETF | | 33,572 | | 3,347,128 | |
TOTAL AFFILIATED FUNDS (Cost $95,280,898) | | | 120,565,904 | |
| U.S. TREASURY SECURITIES — 23.8% | | | |
| U.S. Treasury Bonds, 4.50%, 5/15/38 | | $ | 1,000,000 | | 1,039,062 | |
| U.S. Treasury Bonds, 2.25%, 5/15/41 | | 1,250,000 | | 936,938 | |
| U.S. Treasury Bonds, 2.00%, 11/15/41 | | 1,350,000 | | 960,425 | |
| U.S. Treasury Bonds, 2.375%, 2/15/42 | | 7,000,000 | | 5,275,566 | |
| U.S. Treasury Bonds, 3.00%, 5/15/42 | | 430,000 | | 356,497 | |
| U.S. Treasury Bonds, 4.75%, 11/15/43 | | 50,000 | | 52,234 | |
| U.S. Treasury Bonds, 2.50%, 2/15/45 | | 1,700,000 | | 1,254,713 | |
| U.S. Treasury Bonds, 3.00%, 5/15/45 | | 600,000 | | 482,133 | |
| U.S. Treasury Bonds, 3.00%, 11/15/45 | | 850,000 | | 680,166 | |
| U.S. Treasury Bonds, 1.875%, 2/15/51 | | 1,000,000 | | 604,180 | |
| U.S. Treasury Inflation-Indexed Bonds, 2.375%, 1/15/25 | | 83,309 | | 82,392 | |
| U.S. Treasury Inflation-Indexed Bonds, 2.375%, 1/15/27 | | 467,214 | | 469,663 | |
| U.S. Treasury Inflation-Indexed Bonds, 0.75%, 2/15/42 | | 694,965 | | 559,632 | |
| U.S. Treasury Inflation-Indexed Bonds, 0.625%, 2/15/43 | | 683,025 | | 529,614 | |
| U.S. Treasury Inflation-Indexed Bonds, 0.75%, 2/15/45 | | 3,667,758 | | 2,839,994 | |
| U.S. Treasury Inflation-Indexed Bonds, 0.875%, 2/15/47 | | 650,535 | | 504,698 | |
| U.S. Treasury Inflation-Indexed Bonds, 0.125%, 2/15/51 | | 844,431 | | 509,102 | |
| U.S. Treasury Inflation-Indexed Notes, 0.375%, 7/15/25 | | 4,635,330 | | 4,523,987 | |
| U.S. Treasury Inflation-Indexed Notes, 0.125%, 4/15/26 | | 3,592,770 | | 3,445,101 | |
| U.S. Treasury Inflation-Indexed Notes, 0.375%, 1/15/27 | | 260,034 | | 249,044 | |
| U.S. Treasury Inflation-Indexed Notes, 0.125%, 4/15/27 | | 3,637,385 | | 3,449,218 | |
| U.S. Treasury Inflation-Indexed Notes, 0.50%, 1/15/28 | | 4,456,410 | | 4,248,839 | |
| U.S. Treasury Inflation-Indexed Notes, 0.875%, 1/15/29 | | 3,109,575 | | 2,990,617 | |
| U.S. Treasury Inflation-Indexed Notes, 0.125%, 1/15/30 | | 7,324,260 | | 6,709,775 | |
| U.S. Treasury Inflation-Indexed Notes, 0.125%, 1/15/32 | | 2,305,635 | | 2,039,189 | |
| U.S. Treasury Notes, 4.625%, 2/28/26 | | 15,600,000 | | 15,642,047 | |
| U.S. Treasury Notes, 2.25%, 8/15/27 | | 300,000 | | 284,549 | |
| U.S. Treasury Notes, 3.50%, 4/30/30 | | 1,100,000 | | 1,074,434 | |
| U.S. Treasury Notes, 0.625%, 5/15/30 | | 1,250,000 | | 1,036,621 | |
| U.S. Treasury Notes, 4.375%, 11/30/30 | | 9,340,000 | | 9,554,711 | |
U.S. Treasury Notes, 1.875%, 2/15/32(3) | | 4,200,000 | | 3,623,977 | |
| U.S. Treasury Notes, VRN, 5.34%, (3-month USBMMY plus 0.13%), 7/31/25 | | 1,000,000 | | 999,922 | |
TOTAL U.S. TREASURY SECURITIES (Cost $84,191,276) | | | 77,009,040 | |
| | | | | | | | | | | |
| | Shares/Principal
Amount | Value |
| COMMON STOCKS — 18.3% | | | |
| Aerospace and Defense — 0.2% | | | |
AAR Corp.(2) | | 415 | | $ | 26,809 | |
Bombardier, Inc., Class B(2) | | 63 | | 4,252 | |
CAE, Inc.(2) | | 1,476 | | 26,855 | |
| Curtiss-Wright Corp. | | 546 | | 160,906 | |
| HEICO Corp. | | 458 | | 110,533 | |
| Hexcel Corp. | | 494 | | 32,708 | |
| Huntington Ingalls Industries, Inc. | | 463 | | 129,631 | |
| Lockheed Martin Corp. | | 90 | | 48,773 | |
| Melrose Industries PLC | | 869 | | 6,580 | |
| Saab AB, Class B | | 659 | | 15,217 | |
| | | 562,264 | |
| Air Freight and Logistics — 0.1% | | | |
Cargojet, Inc.(4) | | 178 | | 16,816 | |
| FedEx Corp. | | 210 | | 63,472 | |
GXO Logistics, Inc.(2) | | 799 | | 44,728 | |
InPost SA(2) | | 942 | | 16,321 | |
| United Parcel Service, Inc., Class B | | 496 | | 64,663 | |
| | | 206,000 | |
| Automobile Components — 0.1% | | | |
Aptiv PLC(2) | | 1,808 | | 125,457 | |
| BorgWarner, Inc. | | 2,131 | | 75,246 | |
| Continental AG | | 1,442 | | 88,400 | |
| Hyundai Mobis Co. Ltd. | | 633 | | 102,413 | |
| Linamar Corp. | | 1,425 | | 71,082 | |
| Nifco, Inc. | | 200 | | 5,071 | |
| Toyo Tire Corp. | | 600 | | 9,790 | |
| | | | 477,459 | |
| Automobiles — 0.2% | | | |
| Bayerische Motoren Werke AG | | 1,118 | | 103,693 | |
| Ferrari NV | | 263 | | 108,244 | |
| Mercedes-Benz Group AG | | 1,678 | | 110,923 | |
Tesla, Inc.(2) | | 517 | | 119,980 | |
Volvo Car AB, Class B(2) | | 17,241 | | 48,919 | |
| Winnebago Industries, Inc. | | 230 | | 14,380 | |
| | | 506,139 | |
| Banks — 0.7% | | | |
Bancorp, Inc.(2) | | 294 | | 15,241 | |
| Bank Central Asia Tbk. PT | | 267,500 | | 169,384 | |
| Bank of America Corp. | | 3,154 | | 127,138 | |
| Bankinter SA | | 2,019 | | 17,245 | |
| Barclays PLC | | 91,875 | | 274,734 | |
| BNP Paribas SA | | 570 | | 39,053 | |
| BPER Banca SpA | | 4,794 | | 28,050 | |
| Commerce Bancshares, Inc. | | 1,963 | | 127,026 | |
| First Hawaiian, Inc. | | 2,796 | | 70,012 | |
| Fukuoka Financial Group, Inc. | | 800 | | 22,439 | |
| Hana Financial Group, Inc. | | 523 | | 24,779 | |
| ING Groep NV, Series N | | 6,594 | | 119,687 | |
| JPMorgan Chase & Co. | | 1,094 | | 232,803 | |
| Mebuki Financial Group, Inc. | | 5,400 | | 22,477 | |
NU Holdings Ltd., Class A(2) | | 19,969 | | 242,224 | |
| PNC Financial Services Group, Inc. | | 442 | | 80,046 | |
| | | | | | | | | | | |
| | Shares/Principal
Amount | Value |
| Regions Financial Corp. | | 5,029 | | $ | 112,499 | |
Triumph Financial, Inc.(2) | | 263 | | 23,862 | |
| Truist Financial Corp. | | 4,420 | | 197,530 | |
| U.S. Bancorp | | 2,381 | | 106,859 | |
| Westamerica Bancorporation | | 1,372 | | 74,033 | |
| | | 2,127,121 | |
| Beverages — 0.2% | | | |
| Ambev SA | | 37,000 | | 75,555 | |
Celsius Holdings, Inc.(2) | | 737 | | 34,514 | |
| Coca-Cola Bottlers Japan Holdings, Inc. | | 700 | | 10,434 | |
| Davide Campari-Milano NV | | 12,944 | | 116,735 | |
| Heineken NV | | 1,079 | | 95,751 | |
| MGP Ingredients, Inc. | | 188 | | 15,331 | |
| PepsiCo, Inc. | | 886 | | 152,986 | |
Pernod Ricard SA(4) | | 690 | | 92,327 | |
Royal Unibrew AS(2) | | 182 | | 14,289 | |
| | | 607,922 | |
| Biotechnology — 0.4% | | | |
| AbbVie, Inc. | | 981 | | 181,799 | |
ADMA Biologics, Inc.(2) | | 2,238 | | 27,483 | |
Alkermes PLC(2) | | 658 | | 17,977 | |
Alnylam Pharmaceuticals, Inc.(2) | | 495 | | 117,543 | |
| Amgen, Inc. | | 213 | | 70,816 | |
Amicus Therapeutics, Inc.(2) | | 6,176 | | 63,675 | |
Arcutis Biotherapeutics, Inc.(2) | | 932 | | 9,385 | |
Argenx SE, ADR(2) | | 134 | | 69,127 | |
Biohaven Ltd.(2) | | 368 | | 14,473 | |
BioMarin Pharmaceutical, Inc.(2) | | 930 | | 78,427 | |
Blueprint Medicines Corp.(2) | | 250 | | 27,075 | |
Bridgebio Pharma, Inc.(2) | | 649 | | 16,842 | |
Celldex Therapeutics, Inc.(2) | | 297 | | 11,319 | |
Centessa Pharmaceuticals PLC, ADR(2) | | 719 | | 7,571 | |
Crinetics Pharmaceuticals, Inc.(2) | | 281 | | 14,927 | |
| CSL Ltd. | | 504 | | 102,293 | |
Cytokinetics, Inc.(2) | | 234 | | 13,808 | |
Halozyme Therapeutics, Inc.(2) | | 507 | | 28,017 | |
Insmed, Inc.(2) | | 523 | | 38,048 | |
Keros Therapeutics, Inc.(2) | | 216 | | 10,835 | |
Madrigal Pharmaceuticals, Inc.(2)(4) | | 77 | | 21,919 | |
Mineralys Therapeutics, Inc.(2) | | 598 | | 7,409 | |
Natera, Inc.(2) | | 1,655 | | 169,455 | |
REVOLUTION Medicines, Inc.(2) | | 396 | | 18,073 | |
Telix Pharmaceuticals Ltd.(2)(4) | | 1,176 | | 14,763 | |
Twist Bioscience Corp.(2) | | 259 | | 14,455 | |
Vaxcyte, Inc.(2) | | 359 | | 28,321 | |
Vera Therapeutics, Inc.(2) | | 286 | | 10,465 | |
Vertex Pharmaceuticals, Inc.(2) | | 117 | | 57,999 | |
Viking Therapeutics, Inc.(2) | | 193 | | 11,001 | |
| | | | 1,275,300 | |
| Broadline Retail — 0.2% | | | |
| Alibaba Group Holding Ltd. | | 8,400 | | 82,658 | |
Amazon.com, Inc.(2) | | 2,456 | | 459,223 | |
Ollie's Bargain Outlet Holdings, Inc.(2) | | 402 | | 39,251 | |
| Pan Pacific International Holdings Corp. | | 4,700 | | 122,619 | |
| | | | | | | | | | | |
| | Shares/Principal
Amount | Value |
| Ryohin Keikaku Co. Ltd. | | 1,000 | | $ | 18,858 | |
| | | 722,609 | |
| Building Products — 0.2% | | | |
AZEK Co., Inc.(2) | | 1,087 | | 48,795 | |
| Cie de Saint-Gobain SA | | 564 | | 48,383 | |
| Fortune Brands Innovations, Inc. | | 494 | | 39,920 | |
Hayward Holdings, Inc.(2) | | 2,779 | | 41,101 | |
JELD-WEN Holding, Inc.(2) | | 1,854 | | 30,943 | |
| Johnson Controls International PLC | | 2,935 | | 209,970 | |
| Lennox International, Inc. | | 335 | | 195,473 | |
| Munters Group AB | | 668 | | 14,462 | |
| Reliance Worldwide Corp. Ltd. | | 6,131 | | 20,667 | |
| | | 649,714 | |
| Capital Markets — 0.8% | | | |
| AllianceBernstein Holding LP | | 1,442 | | 50,888 | |
| Ameriprise Financial, Inc. | | 181 | | 77,843 | |
| ARES Management Corp., Class A | | 1,527 | | 233,936 | |
| Bank of New York Mellon Corp. | | 4,278 | | 278,369 | |
| BlackRock, Inc. | | 113 | | 99,044 | |
| Bolsa Mexicana de Valores SAB de CV | | 11,145 | | 17,348 | |
Coinbase Global, Inc., Class A(2) | | 720 | | 161,539 | |
Donnelley Financial Solutions, Inc.(2) | | 610 | | 41,163 | |
| GQG Partners, Inc. | | 8,551 | | 16,690 | |
| Hamilton Lane, Inc., Class A | | 258 | | 37,247 | |
| Integral Corp. | | 300 | | 8,174 | |
| Intercontinental Exchange, Inc. | | 401 | | 60,776 | |
| Intermediate Capital Group PLC | | 706 | | 19,928 | |
| London Stock Exchange Group PLC | | 1,690 | | 205,716 | |
| LPL Financial Holdings, Inc. | | 759 | | 168,134 | |
| Man Group PLC | | 4,839 | | 15,235 | |
| Morgan Stanley | | 1,672 | | 172,567 | |
| MSCI, Inc. | | 447 | | 241,720 | |
| Northern Trust Corp. | | 2,804 | | 248,575 | |
| S&P Global, Inc. | | 300 | | 145,419 | |
| Swissquote Group Holding SA | | 53 | | 16,904 | |
| T Rowe Price Group, Inc. | | 1,372 | | 156,696 | |
| TPG, Inc. | | 2,131 | | 108,660 | |
| | | 2,582,571 | |
| Chemicals — 0.4% | | | |
| Air Liquide SA | | 887 | | 161,841 | |
| Akzo Nobel NV | | 1,728 | | 106,846 | |
| Arkema SA | | 796 | | 71,833 | |
Aspen Aerogels, Inc.(2) | | 508 | | 10,368 | |
| Avient Corp. | | 2,273 | | 102,831 | |
| DSM-Firmenich AG | | 1,187 | | 151,543 | |
| Ecolab, Inc. | | 390 | | 89,969 | |
| Element Solutions, Inc. | | 6,711 | | 180,861 | |
| Linde PLC | | 324 | | 146,934 | |
| Shin-Etsu Chemical Co. Ltd. | | 2,600 | | 115,520 | |
| Tokyo Ohka Kogyo Co. Ltd. | | 500 | | 12,870 | |
| | | 1,151,416 | |
| Commercial Services and Supplies — 0.1% | | | |
Casella Waste Systems, Inc., Class A(2) | | 375 | | 38,835 | |
Clean Harbors, Inc.(2) | | 157 | | 37,481 | |
| | | | | | | | | | | |
| | Shares/Principal
Amount | Value |
| Daiei Kankyo Co. Ltd. | | 900 | | $ | 17,214 | |
| Element Fleet Management Corp. | | 174 | | 3,328 | |
| Elis SA | | 1,138 | | 26,317 | |
| Republic Services, Inc. | | 1,452 | | 282,153 | |
| SPIE SA | | 631 | | 24,391 | |
Stericycle, Inc.(2) | | 423 | | 24,767 | |
| UniFirst Corp. | | 121 | | 23,539 | |
| | | 478,025 | |
| Communications Equipment — 0.2% | | | |
Arista Networks, Inc.(2) | | 318 | | 110,203 | |
| Cisco Systems, Inc. | | 2,004 | | 97,094 | |
F5, Inc.(2) | | 825 | | 168,003 | |
| Juniper Networks, Inc. | | 2,618 | | 98,672 | |
| Motorola Solutions, Inc. | | 144 | | 57,445 | |
| | | 531,417 | |
| Construction and Engineering — 0.1% | | | |
| AtkinsRealis Group, Inc. | | 455 | | 19,602 | |
Construction Partners, Inc., Class A(2) | | 466 | | 30,127 | |
| Eiffage SA | | 1,269 | | 126,293 | |
Fugro NV(4) | | 960 | | 25,639 | |
| Kinden Corp. | | 900 | | 18,988 | |
| Ventia Services Group Pty. Ltd. | | 6,252 | | 18,000 | |
| Vinci SA | | 1,278 | | 145,843 | |
| | | 384,492 | |
| Construction Materials — 0.1% | | | |
| CRH PLC | | 2,197 | | 188,283 | |
James Hardie Industries PLC(2) | | 2,600 | | 93,401 | |
Summit Materials, Inc., Class A(2) | | 810 | | 33,842 | |
| Taiheiyo Cement Corp. | | 800 | | 21,851 | |
| | | 337,377 | |
| Consumer Finance — 0.0% | | | |
| American Express Co. | | 353 | | 89,323 | |
| FirstCash Holdings, Inc. | | 283 | | 31,583 | |
| | | 120,906 | |
| Consumer Staples Distribution & Retail — 0.3% | | | |
| BGF retail Co. Ltd. | | 398 | | 30,062 | |
| Casey's General Stores, Inc. | | 145 | | 56,237 | |
| Costco Wholesale Corp. | | 125 | | 102,750 | |
Dollar Tree, Inc.(2) | | 1,465 | | 152,858 | |
Grocery Outlet Holding Corp.(2) | | 659 | | 12,890 | |
| Koninklijke Ahold Delhaize NV | | 7,660 | | 246,768 | |
| Marks & Spencer Group PLC | | 5,180 | | 21,878 | |
| PriceSmart, Inc. | | 343 | | 31,326 | |
Redcare Pharmacy NV(2) | | 131 | | 19,611 | |
| Sysco Corp. | | 1,415 | | 108,460 | |
| Target Corp. | | 725 | | 109,047 | |
| | | 891,887 | |
| Containers and Packaging — 0.2% | | | |
| Amcor PLC | | 3,570 | | 37,592 | |
| AptarGroup, Inc. | | 108 | | 15,874 | |
| Avery Dennison Corp. | | 244 | | 52,907 | |
| Ball Corp. | | 1,035 | | 66,064 | |
| Graphic Packaging Holding Co. | | 4,683 | | 140,958 | |
| Packaging Corp. of America | | 705 | | 140,908 | |
| | | | | | | | | | | |
| | Shares/Principal
Amount | Value |
| Smurfit WestRock PLC | | 1,909 | | $ | 85,600 | |
| Sonoco Products Co. | | 1,239 | | 66,807 | |
| Verallia SA | | 5,090 | | 149,724 | |
| | | 756,434 | |
| Distributors — 0.1% | | | |
| D'ieteren Group | | 38 | | 8,733 | |
| LKQ Corp. | | 1,475 | | 61,212 | |
| Pool Corp. | | 646 | | 241,630 | |
| | | 311,575 | |
| Diversified Consumer Services — 0.1% | | | |
Bright Horizons Family Solutions, Inc.(2) | | 886 | | 106,542 | |
Duolingo, Inc.(2) | | 725 | | 124,657 | |
European Wax Center, Inc., Class A(2) | | 1,506 | | 14,141 | |
Stride, Inc.(2) | | 540 | | 41,029 | |
| | | 286,369 | |
| Diversified REITs — 0.1% | | | |
| British Land Co. PLC | | 10,687 | | 56,645 | |
| Essential Properties Realty Trust, Inc. | | 7,392 | | 218,729 | |
| Merlin Properties Socimi SA | | 9,057 | | 103,430 | |
| Mirvac Group | | 44,495 | | 62,649 | |
| | | 441,453 | |
| Diversified Telecommunication Services — 0.1% | | | |
BCE, Inc.(4) | | 2,908 | | 98,088 | |
| Cellnex Telecom SA | | 443 | | 15,450 | |
| LG Uplus Corp. | | 4,769 | | 34,881 | |
| Orange SA | | 13,649 | | 151,467 | |
U-Next Holdings Co. Ltd.(4) | | 500 | | 17,219 | |
| Verizon Communications, Inc. | | 3,395 | | 137,566 | |
| | | 454,671 | |
| Electric Utilities — 0.4% | | | |
| Duke Energy Corp. | | 1,622 | | 177,236 | |
| Edison International | | 2,689 | | 215,147 | |
| Evergy, Inc. | | 2,781 | | 161,298 | |
| Eversource Energy | | 2,441 | | 158,445 | |
| Iberdrola SA | | 4,392 | | 58,010 | |
| NextEra Energy, Inc. | | 2,758 | | 210,684 | |
| Pinnacle West Capital Corp. | | 679 | | 58,116 | |
| Xcel Energy, Inc. | | 2,073 | | 120,814 | |
| | | 1,159,750 | |
| Electrical Equipment — 0.3% | | | |
| AMETEK, Inc. | | 539 | | 93,506 | |
| Atkore, Inc. | | 283 | | 38,205 | |
| Eaton Corp. PLC | | 402 | | 122,526 | |
| Emerson Electric Co. | | 1,723 | | 201,780 | |
| Furukawa Electric Co. Ltd. | | 400 | | 10,943 | |
| Hubbell, Inc. | | 156 | | 61,721 | |
| Regal Rexnord Corp. | | 684 | | 109,905 | |
| Schneider Electric SE | | 784 | | 188,971 | |
| Signify NV | | 3,236 | | 80,105 | |
| Vertiv Holdings Co., Class A | | 1,441 | | 113,407 | |
| | | 1,021,069 | |
| Electronic Equipment, Instruments and Components — 0.1% | | | |
| CDW Corp. | | 1,029 | | 224,435 | |
Celestica, Inc. (Toronto)(2) | | 160 | | 8,391 | |
| | | | | | | | | | | |
| | Shares/Principal
Amount | Value |
| Cognex Corp. | | 327 | | $ | 16,226 | |
| Horiba Ltd. | | 100 | | 7,915 | |
| Keyence Corp. | | 100 | | 43,726 | |
| Littelfuse, Inc. | | 132 | | 35,259 | |
Mirion Technologies, Inc., Class A(2) | | 2,110 | | 22,239 | |
| TE Connectivity Ltd. | | 713 | | 110,037 | |
| Yokogawa Electric Corp. | | 300 | | 7,594 | |
| | | 475,822 | |
| Energy Equipment and Services — 0.1% | | | |
| Baker Hughes Co. | | 4,529 | | 175,363 | |
Expro Group Holdings NV(2) | | 2,800 | | 65,016 | |
| Schlumberger NV | | 3,074 | | 148,443 | |
Seadrill Ltd.(2) | | 199 | | 10,947 | |
| Subsea 7 SA | | 1,174 | | 22,582 | |
| TechnipFMC PLC | | 471 | | 13,894 | |
Transocean Ltd.(2) | | 4,287 | | 24,822 | |
| | | 461,067 | |
| Entertainment — 0.1% | | | |
| CTS Eventim AG & Co. KGaA | | 138 | | 12,156 | |
| Electronic Arts, Inc. | | 342 | | 51,621 | |
Liberty Media Corp.-Liberty Formula One, Class C(2) | | 255 | | 20,622 | |
Spotify Technology SA(2) | | 348 | | 119,691 | |
Take-Two Interactive Software, Inc.(2) | | 770 | | 115,908 | |
| Universal Music Group NV | | 1,728 | | 41,169 | |
| Walt Disney Co. | | 525 | | 49,187 | |
| | | 410,354 | |
| Financial Services — 0.3% | | | |
Adyen NV(2) | | 77 | | 94,189 | |
AvidXchange Holdings, Inc.(2) | | 3,135 | | 28,027 | |
Block, Inc.(2) | | 410 | | 25,371 | |
Corpay, Inc.(2) | | 653 | | 190,558 | |
| Edenred SE | | 3,960 | | 164,889 | |
| Mastercard, Inc., Class A | | 249 | | 115,464 | |
Shift4 Payments, Inc., Class A(2)(4) | | 310 | | 21,325 | |
| Visa, Inc., Class A | | 803 | | 213,333 | |
Worldline SA(2) | | 2,109 | | 23,931 | |
| | | 877,087 | |
| Food Products — 0.2% | | | |
| AAK AB | | 606 | | 17,439 | |
| Conagra Brands, Inc. | | 9,261 | | 280,793 | |
| General Mills, Inc. | | 2,406 | | 161,539 | |
| Glanbia PLC | | 1,029 | | 20,579 | |
| Mondelez International, Inc., Class A | | 1,196 | | 81,747 | |
| Morinaga & Co. Ltd. | | 500 | | 9,596 | |
| Nomad Foods Ltd. | | 2,075 | | 39,653 | |
| Toyo Suisan Kaisha Ltd. | | 300 | | 20,144 | |
| Yamazaki Baking Co. Ltd. | | 400 | | 9,890 | |
| | | 641,380 | |
| Gas Utilities — 0.1% | | | |
| Nippon Gas Co. Ltd. | | 800 | | 12,470 | |
| ONE Gas, Inc. | | 1,569 | | 109,250 | |
| Spire, Inc. | | 1,878 | | 125,056 | |
| | | 246,776 | |
| Ground Transportation — 0.3% | | | |
| Canadian Pacific Kansas City Ltd. | | 1,653 | | 138,619 | |
| | | | | | | | | | | |
| | Shares/Principal
Amount | Value |
| CSX Corp. | | 1,120 | | $ | 39,312 | |
| Knight-Swift Transportation Holdings, Inc. | | 647 | | 35,216 | |
| Kyushu Railway Co. | | 200 | | 5,338 | |
| Norfolk Southern Corp. | | 1,308 | | 326,425 | |
Saia, Inc.(2) | | 48 | | 20,057 | |
| Schneider National, Inc., Class B | | 898 | | 24,165 | |
Uber Technologies, Inc.(2) | | 1,162 | | 74,914 | |
| Union Pacific Corp. | | 477 | | 117,690 | |
XPO, Inc.(2) | | 1,339 | | 153,838 | |
| | | 935,574 | |
| Health Care Equipment and Supplies — 0.5% | | | |
Alphatec Holdings, Inc.(2) | | 2,332 | | 23,553 | |
| Becton Dickinson & Co. | | 543 | | 130,896 | |
| ConvaTec Group PLC | | 1,863 | | 5,613 | |
| DENTSPLY SIRONA, Inc. | | 2,525 | | 68,528 | |
Dexcom, Inc.(2) | | 2,358 | | 159,920 | |
Envista Holdings Corp.(2) | | 3,900 | | 66,573 | |
| GE HealthCare Technologies, Inc. | | 1,792 | | 151,657 | |
Hologic, Inc.(2) | | 1,490 | | 121,599 | |
IDEXX Laboratories, Inc.(2) | | 340 | | 161,881 | |
Inari Medical, Inc.(2) | | 690 | | 32,126 | |
Insulet Corp.(2) | | 560 | | 108,836 | |
Integer Holdings Corp.(2) | | 247 | | 29,334 | |
Intuitive Surgical, Inc.(2) | | 191 | | 84,920 | |
Lantheus Holdings, Inc.(2) | | 282 | | 29,562 | |
SI-BONE, Inc.(2) | | 1,453 | | 22,086 | |
| Terumo Corp. | | 7,900 | | 141,634 | |
| Ypsomed Holding AG | | 41 | | 18,842 | |
| Zimmer Biomet Holdings, Inc. | | 3,422 | | 381,040 | |
| | | 1,738,600 | |
| Health Care Providers and Services — 0.6% | | | |
Acadia Healthcare Co., Inc.(2) | | 293 | | 19,001 | |
AMN Healthcare Services, Inc.(2) | | 240 | | 16,229 | |
| Amvis Holdings, Inc. | | 200 | | 3,482 | |
| Cardinal Health, Inc. | | 1,780 | | 179,477 | |
| Cencora, Inc. | | 817 | | 194,348 | |
Centene Corp.(2) | | 1,269 | | 97,612 | |
| Chartwell Retirement Residences | | 14,291 | | 141,808 | |
| Cigna Group | | 361 | | 125,870 | |
| Encompass Health Corp. | | 311 | | 28,904 | |
HealthEquity, Inc.(2) | | 370 | | 29,038 | |
Henry Schein, Inc.(2) | | 3,584 | | 257,833 | |
| Labcorp Holdings, Inc. | | 627 | | 135,081 | |
NeoGenomics, Inc.(2) | | 1,882 | | 33,368 | |
Option Care Health, Inc.(2) | | 778 | | 23,099 | |
| Quest Diagnostics, Inc. | | 1,637 | | 232,945 | |
R1 RCM, Inc.(2) | | 2,221 | | 28,606 | |
RadNet, Inc.(2) | | 293 | | 17,507 | |
| UnitedHealth Group, Inc. | | 464 | | 267,338 | |
| Universal Health Services, Inc., Class B | | 832 | | 177,848 | |
| | | 2,009,394 | |
| Health Care REITs — 0.3% | | | |
| Aedifica SA | | 170 | | 10,806 | |
| CareTrust REIT, Inc. | | 3,130 | | 84,385 | |
| | | | | | | | | | | |
| | Shares/Principal
Amount | Value |
| Healthpeak Properties, Inc. | | 8,165 | | $ | 178,160 | |
| Ventas, Inc. | | 3,355 | | 182,646 | |
| Welltower, Inc. | | 3,929 | | 437,101 | |
| | | 893,098 | |
| Health Care Technology — 0.0% | | | |
Evolent Health, Inc., Class A(2) | | 795 | | 18,539 | |
GoodRx Holdings, Inc., Class A(2) | | 2,015 | | 18,236 | |
Pro Medicus Ltd.(4) | | 119 | | 11,228 | |
Veeva Systems, Inc., Class A(2) | | 473 | | 90,783 | |
Waystar Holding Corp.(2) | | 679 | | 15,617 | |
| | | 154,403 | |
| Hotel & Resort REITs — 0.1% | | | |
| Invincible Investment Corp. | | 209 | | 94,666 | |
| Japan Hotel REIT Investment Corp. | | 83 | | 42,398 | |
| Ryman Hospitality Properties, Inc. | | 788 | | 79,202 | |
| | | 216,266 | |
| Hotels, Restaurants and Leisure — 0.4% | | | |
Airbnb, Inc., Class A(2) | | 1,150 | | 160,494 | |
Chipotle Mexican Grill, Inc.(2) | | 3,423 | | 185,937 | |
| Darden Restaurants, Inc. | | 510 | | 74,608 | |
DoorDash, Inc., Class A(2) | | 898 | | 99,427 | |
| Greggs PLC | | 383 | | 15,424 | |
| H World Group Ltd., ADR | | 1,823 | | 54,690 | |
| Hilton Worldwide Holdings, Inc. | | 1,706 | | 366,227 | |
| Kyoritsu Maintenance Co. Ltd. | | 200 | | 3,883 | |
MakeMyTrip Ltd.(2) | | 1,406 | | 131,588 | |
Melia Hotels International SA(4) | | 436 | | 3,338 | |
Planet Fitness, Inc., Class A(2) | | 282 | | 20,783 | |
| Wingstop, Inc. | | 44 | | 16,451 | |
| | | 1,132,850 | |
| Household Durables — 0.1% | | | |
| Barratt Developments PLC | | 8,752 | | 59,224 | |
| Bellway PLC | | 547 | | 20,085 | |
Breville Group Ltd.(4) | | 507 | | 9,742 | |
Mohawk Industries, Inc.(2) | | 485 | | 78,119 | |
Sonos, Inc.(2) | | 1,692 | | 22,842 | |
| Taylor Wimpey PLC | | 75,418 | | 154,620 | |
TopBuild Corp.(2) | | 39 | | 18,663 | |
| | | 363,295 | |
| Household Products — 0.3% | | | |
| Church & Dwight Co., Inc. | | 2,261 | | 221,601 | |
| Colgate-Palmolive Co. | | 386 | | 38,287 | |
| Henkel AG & Co. KGaA, Preference Shares | | 1,070 | | 91,530 | |
| Kimberly-Clark Corp. | | 1,355 | | 182,993 | |
| Procter & Gamble Co. | | 666 | | 107,066 | |
| Reckitt Benckiser Group PLC | | 3,938 | | 211,839 | |
| | | 853,316 | |
| Independent Power and Renewable Electricity Producers — 0.1% | | | |
Talen Energy Corp.(2) | | 211 | | 26,301 | |
| Vistra Corp. | | 1,877 | | 148,696 | |
| | | 174,997 | |
| Industrial Conglomerates — 0.1% | | | |
| Hitachi Ltd. | | 5,000 | | 108,033 | |
| Honeywell International, Inc. | | 443 | | 90,704 | |
| | | | | | | | | | | |
| | Shares/Principal
Amount | Value |
| LG Corp. | | 976 | | $ | 62,242 | |
| | | 260,979 | |
| Industrial REITs — 0.5% | | | |
| Americold Realty Trust, Inc. | | 3,956 | | 118,245 | |
| CapitaLand Ascendas REIT | | 27,100 | | 55,326 | |
| EastGroup Properties, Inc. | | 587 | | 109,763 | |
| Goodman Group | | 10,225 | | 236,055 | |
| Mapletree Industrial Trust | | 14,900 | | 25,853 | |
| Prologis, Inc. | | 6,045 | | 761,972 | |
| Segro PLC | | 9,628 | | 113,327 | |
| Terreno Realty Corp. | | 251 | | 17,171 | |
| Tritax Big Box REIT PLC | | 4,448 | | 9,455 | |
| Warehouses De Pauw CVA | | 298 | | 8,073 | |
| | | 1,455,240 | |
| Insurance — 0.5% | | | |
| Aflac, Inc. | | 584 | | 55,702 | |
| Allstate Corp. | | 1,310 | | 224,167 | |
Goosehead Insurance, Inc., Class A(2) | | 265 | | 23,927 | |
| Hanover Insurance Group, Inc. | | 844 | | 116,041 | |
| Kinsale Capital Group, Inc. | | 82 | | 37,480 | |
| Marsh & McLennan Cos., Inc. | | 373 | | 83,019 | |
| MetLife, Inc. | | 896 | | 68,858 | |
| NN Group NV | | 3,028 | | 151,958 | |
Palomar Holdings, Inc.(2) | | 172 | | 15,826 | |
| Progressive Corp. | | 420 | | 89,930 | |
| Prudential Financial, Inc. | | 576 | | 72,184 | |
| Prudential PLC | | 11,386 | | 102,752 | |
| Reinsurance Group of America, Inc. | | 326 | | 73,490 | |
| Ryan Specialty Holdings, Inc., Class A | | 1,862 | | 114,681 | |
Skyward Specialty Insurance Group, Inc.(2) | | 564 | | 22,317 | |
| Tokio Marine Holdings, Inc. | | 2,300 | | 90,236 | |
| Willis Towers Watson PLC | | 897 | | 253,205 | |
| | | 1,595,773 | |
| Interactive Media and Services — 0.4% | | | |
| Alphabet, Inc., Class A | | 3,314 | | 568,484 | |
| Autohome, Inc., ADR | | 2,047 | | 51,052 | |
| CAR Group Ltd. | | 590 | | 13,494 | |
| Hemnet Group AB | | 339 | | 12,560 | |
| Meta Platforms, Inc., Class A | | 625 | | 296,769 | |
QuinStreet, Inc.(2) | | 1,470 | | 27,489 | |
| Scout24 SE | | 178 | | 14,072 | |
| Tencent Holdings Ltd. | | 5,400 | | 249,191 | |
| | | 1,233,111 | |
| IT Services — 0.4% | | | |
| Accenture PLC, Class A | | 493 | | 162,996 | |
| Amdocs Ltd. | | 1,875 | | 164,006 | |
| BIPROGY, Inc. | | 400 | | 13,107 | |
Cloudflare, Inc., Class A(2) | | 1,837 | | 142,368 | |
| Cognizant Technology Solutions Corp., Class A | | 1,255 | | 94,978 | |
GDS Holdings Ltd., ADR(2) | | 1,158 | | 13,004 | |
GDS Holdings Ltd., Class A(2)(4) | | 16,400 | | 22,853 | |
Globant SA(2) | | 90 | | 17,524 | |
Indra Sistemas SA(4) | | 1,114 | | 22,340 | |
| International Business Machines Corp. | | 500 | | 96,070 | |
| | | | | | | | | | | |
| | Shares/Principal
Amount | Value |
Megaport Ltd.(2) | | 451 | | $ | 3,265 | |
MongoDB, Inc.(2) | | 653 | | 164,791 | |
| NEC Corp. | | 1,400 | | 121,177 | |
NEXTDC Ltd.(2)(4) | | 20,476 | | 225,486 | |
| NTT Data Group Corp. | | 7,100 | | 110,578 | |
| | | 1,374,543 | |
| Leisure Products — 0.0% | | | |
BRP, Inc.(4) | | 1,085 | | 78,610 | |
| Brunswick Corp. | | 148 | | 12,055 | |
| Thule Group AB | | 425 | | 11,750 | |
YETI Holdings, Inc.(2) | | 786 | | 32,501 | |
| | | 134,916 | |
| Life Sciences Tools and Services — 0.3% | | | |
| Agilent Technologies, Inc. | | 1,371 | | 193,859 | |
Avantor, Inc.(2) | | 2,813 | | 75,248 | |
| Bio-Techne Corp. | | 804 | | 65,598 | |
| Danaher Corp. | | 635 | | 175,946 | |
ICON PLC(2) | | 571 | | 187,539 | |
IQVIA Holdings, Inc.(2) | | 314 | | 77,316 | |
| Lonza Group AG | | 191 | | 127,189 | |
Mettler-Toledo International, Inc.(2) | | 44 | | 66,925 | |
| Thermo Fisher Scientific, Inc. | | 193 | | 118,375 | |
| | | 1,087,995 | |
| Machinery — 0.3% | | | |
| Aalberts NV | | 147 | | 5,621 | |
| Amada Co. Ltd. | | 900 | | 10,570 | |
| CNH Industrial NV | | 7,994 | | 85,136 | |
| Crane Co. | | 405 | | 64,970 | |
| Cummins, Inc. | | 612 | | 178,582 | |
| Deere & Co. | | 142 | | 52,821 | |
| Dover Corp. | | 173 | | 31,877 | |
| Fluidra SA | | 531 | | 11,830 | |
| Hoshizaki Corp. | | 300 | | 9,448 | |
| KION Group AG | | 194 | | 7,673 | |
| Konecranes OYJ | | 309 | | 21,585 | |
| Organo Corp. | | 300 | | 13,606 | |
| Oshkosh Corp. | | 1,296 | | 140,810 | |
| Parker-Hannifin Corp. | | 169 | | 94,836 | |
RBC Bearings, Inc.(2) | | 143 | | 41,590 | |
| Techtronic Industries Co. Ltd. | | 7,000 | | 89,647 | |
| Timken Co. | | 779 | | 67,734 | |
| Trelleborg AB, B Shares | | 234 | | 8,696 | |
| Weir Group PLC | | 752 | | 19,631 | |
| Xylem, Inc. | | 1,161 | | 154,993 | |
| | | 1,111,656 | |
| Media — 0.2% | | | |
| 4imprint Group PLC | | 122 | | 9,526 | |
| CyberAgent, Inc. | | 2,200 | | 14,224 | |
| Fox Corp., Class B | | 1,875 | | 66,431 | |
| Interpublic Group of Cos., Inc. | | 5,255 | | 169,054 | |
| Omnicom Group, Inc. | | 356 | | 34,902 | |
| Stroeer SE & Co. KGaA | | 237 | | 16,024 | |
Trade Desk, Inc., Class A(2) | | 2,401 | | 215,802 | |
| WPP PLC | | 11,886 | | 114,653 | |
| | | 640,616 | |
| | | | | | | | | | | |
| | Shares/Principal
Amount | Value |
| Metals and Mining — 0.0% | | | |
| Alamos Gold, Inc., Class A | | 1,060 | | $ | 18,065 | |
ATI, Inc.(2) | | 251 | | 16,995 | |
Capstone Copper Corp.(2) | | 2,748 | | 18,471 | |
| Carpenter Technology Corp. | | 243 | | 35,446 | |
ERO Copper Corp.(2) | | 1,037 | | 20,280 | |
GMK Norilskiy Nickel PAO(5) | | 94,900 | | 1 | |
Sandfire Resources Ltd.(2) | | 3,025 | | 17,278 | |
| | | 126,536 | |
| Multi-Utilities — 0.2% | | | |
| CMS Energy Corp. | | 1,444 | | 93,571 | |
| Northwestern Energy Group, Inc. | | 4,172 | | 224,328 | |
| WEC Energy Group, Inc. | | 1,911 | | 164,461 | |
| | | 482,360 | |
| Office REITs — 0.0% | | | |
| BXP, Inc. | | 1,768 | | 126,076 | |
| Oil, Gas and Consumable Fuels — 0.4% | | | |
| Cheniere Energy, Inc. | | 468 | | 85,475 | |
| ConocoPhillips | | 1,421 | | 158,015 | |
| Coterra Energy, Inc. | | 3,409 | | 87,952 | |
| Enterprise Products Partners LP | | 8,798 | | 253,910 | |
| EOG Resources, Inc. | | 1,161 | | 147,215 | |
| EQT Corp. | | 2,735 | | 94,385 | |
| Gaztransport Et Technigaz SA | | 29 | | 4,273 | |
Kosmos Energy Ltd.(2) | | 8,934 | | 49,405 | |
| Occidental Petroleum Corp. | | 2,284 | | 138,913 | |
Paladin Energy Ltd.(2) | | 1,732 | | 12,993 | |
| Permian Resources Corp. | | 5,453 | | 83,649 | |
| Targa Resources Corp. | | 867 | | 117,288 | |
| | | 1,233,473 | |
| Paper and Forest Products — 0.0% | | | |
| Louisiana-Pacific Corp. | | 182 | | 17,865 | |
Stella-Jones, Inc.(4) | | 392 | | 26,374 | |
| | | 44,239 | |
| Passenger Airlines — 0.0% | | | |
| Southwest Airlines Co. | | 5,330 | | 143,590 | |
| Personal Care Products — 0.2% | | | |
BellRing Brands, Inc.(2) | | 326 | | 16,717 | |
elf Beauty, Inc.(2) | | 478 | | 82,493 | |
| Haleon PLC | | 26,782 | | 120,128 | |
| Inter Parfums, Inc. | | 183 | | 25,745 | |
| Kenvue, Inc. | | 7,919 | | 146,423 | |
| Kose Corp. | | 200 | | 13,365 | |
| Unilever PLC | | 1,863 | | 114,490 | |
| | | 519,361 | |
| Pharmaceuticals — 0.5% | | | |
ALK-Abello AS(2) | | 944 | | 21,278 | |
| AstraZeneca PLC, ADR | | 372 | | 29,444 | |
| Bristol-Myers Squibb Co. | | 606 | | 28,821 | |
Edgewise Therapeutics, Inc.(2) | | 568 | | 9,673 | |
| Eli Lilly & Co. | | 157 | | 126,270 | |
Galderma Group AG(2) | | 1,178 | | 92,669 | |
| GSK PLC | | 10,678 | | 207,354 | |
| Hikma Pharmaceuticals PLC | | 2,331 | | 56,993 | |
| | | | | | | | | | | |
| | Shares/Principal
Amount | Value |
Intra-Cellular Therapies, Inc.(2) | | 172 | | $ | 13,540 | |
| Laboratorios Farmaceuticos Rovi SA | | 132 | | 12,700 | |
Longboard Pharmaceuticals, Inc.(2) | | 369 | | 12,266 | |
| Merck & Co., Inc. | | 1,060 | | 119,918 | |
| Novo Nordisk AS, Class B | | 3,265 | | 432,589 | |
| Roche Holding AG | | 731 | | 236,668 | |
| Sanofi SA | | 1,162 | | 119,793 | |
| Sanofi SA, ADR | | 1,602 | | 83,000 | |
| Santen Pharmaceutical Co. Ltd. | | 1,800 | | 21,602 | |
Verona Pharma PLC, ADR(2)(4) | | 641 | | 14,525 | |
| Virbac SACA | | 22 | | 8,375 | |
| Zoetis, Inc. | | 585 | | 105,323 | |
| | | 1,752,801 | |
| Professional Services — 0.3% | | | |
| Adecco Group AG | | 4,896 | | 166,652 | |
| ALS Ltd. | | 1,162 | | 11,764 | |
| BayCurrent Consulting, Inc. | | 400 | | 12,314 | |
| Equifax, Inc. | | 496 | | 138,567 | |
FTI Consulting, Inc.(2) | | 102 | | 22,233 | |
| Jacobs Solutions, Inc. | | 1,028 | | 150,448 | |
| RELX PLC | | 4,197 | | 198,088 | |
| Teleperformance SE | | 1,499 | | 192,974 | |
| Verisk Analytics, Inc. | | 584 | | 152,862 | |
| | | | 1,045,902 | |
| Real Estate Management and Development — 0.2% | | | |
Colliers International Group, Inc.(4) | | 107 | | 14,409 | |
| CTP NV | | 2,123 | | 37,195 | |
| DLF Ltd. | | 3,386 | | 36,049 | |
| FirstService Corp. | | 88 | | 15,361 | |
| FirstService Corp. (Toronto) | | 205 | | 35,744 | |
Godrej Properties Ltd.(2) | | 887 | | 34,194 | |
| Grainger PLC | | 10,803 | | 33,555 | |
| Macrotech Developers Ltd. | | 2,133 | | 33,402 | |
| Mitsubishi Estate Co. Ltd. | | 4,000 | | 68,176 | |
| Mitsui Fudosan Co. Ltd. | | 9,100 | | 94,275 | |
| Phoenix Mills Ltd. | | 1,012 | | 43,551 | |
| PSP Swiss Property AG | | 124 | | 16,570 | |
Redfin Corp.(2)(4) | | 1,241 | | 10,102 | |
| Tokyo Tatemono Co. Ltd. | | 1,300 | | 22,678 | |
| Tokyu Fudosan Holdings Corp. | | 8,300 | | 59,928 | |
| Vonovia SE | | 1,245 | | 38,172 | |
| | | 593,361 | |
| Residential REITs — 0.3% | | | |
| American Homes 4 Rent, Class A | | 2,552 | | 92,101 | |
| AvalonBay Communities, Inc. | | 1,132 | | 231,969 | |
| Boardwalk Real Estate Investment Trust | | 757 | | 42,767 | |
| Camden Property Trust | | 640 | | 70,880 | |
| Equity Residential | | 1,968 | | 137,032 | |
| Essex Property Trust, Inc. | | 627 | | 174,532 | |
| Invitation Homes, Inc. | | 3,610 | | 127,325 | |
| UNITE Group PLC | | 1,081 | | 13,250 | |
| | | 889,856 | |
| Retail REITs — 0.4% | | | |
| Agree Realty Corp. | | 1,873 | | 129,181 | |
| | | | | | | | | | | |
| | Shares/Principal
Amount | Value |
| Charter Hall Retail REIT | | 5,513 | | $ | 12,614 | |
| Kite Realty Group Trust | | 6,853 | | 168,995 | |
| Link REIT | | 4,220 | | 17,804 | |
| Phillips Edison & Co., Inc. | | 1,120 | | 39,312 | |
| Realty Income Corp. | | 3,537 | | 203,130 | |
| Regency Centers Corp. | | 1,762 | | 118,653 | |
| Scentre Group | | 57,945 | | 132,139 | |
| Simon Property Group, Inc. | | 1,031 | | 158,197 | |
| Unibail-Rodamco-Westfield | | 923 | | 69,023 | |
| Urban Edge Properties | | 5,749 | | 116,705 | |
| | | 1,165,753 | |
| Semiconductors and Semiconductor Equipment — 1.0% | | | |
Advanced Micro Devices, Inc.(2) | | 1,076 | | 155,460 | |
| Analog Devices, Inc. | | 614 | | 142,067 | |
| Applied Materials, Inc. | | 594 | | 126,047 | |
| ASML Holding NV | | 288 | | 268,177 | |
| Broadcom, Inc. | | 814 | | 130,794 | |
| Camtek Ltd. | | 99 | | 10,395 | |
Credo Technology Group Holding Ltd.(2) | | 963 | | 26,723 | |
Enphase Energy, Inc.(2) | | 977 | | 112,462 | |
FormFactor, Inc.(2) | | 287 | | 15,372 | |
Impinj, Inc.(2) | | 153 | | 24,371 | |
| Infineon Technologies AG | | 2,003 | | 69,580 | |
MACOM Technology Solutions Holdings, Inc.(2) | | 300 | | 30,276 | |
| Marvell Technology, Inc. | | 790 | | 52,914 | |
| Micronics Japan Co. Ltd. | | 200 | | 7,947 | |
| MKS Instruments, Inc. | | 120 | | 15,108 | |
| Monolithic Power Systems, Inc. | | 251 | | 216,636 | |
Nova Ltd.(2) | | 82 | | 16,931 | |
| NVIDIA Corp. | | 7,600 | | 889,352 | |
ON Semiconductor Corp.(2) | | 857 | | 67,060 | |
Onto Innovation, Inc.(2) | | 143 | | 27,356 | |
Rambus, Inc.(2) | | 595 | | 30,607 | |
Silicon Laboratories, Inc.(2) | | 220 | | 26,429 | |
| Socionext, Inc. | | 300 | | 6,058 | |
| SUMCO Corp. | | 12,000 | | 197,285 | |
| Taiwan Semiconductor Manufacturing Co. Ltd. | | 10,000 | | 291,713 | |
| Teradyne, Inc. | | 1,625 | | 213,135 | |
| | | | 3,170,255 | |
| Software — 1.0% | | | |
Adobe, Inc.(2) | | 64 | | 35,306 | |
Agilysys, Inc.(2) | | 134 | | 15,020 | |
| Bytes Technology Group PLC | | 1,258 | | 8,196 | |
Cadence Design Systems, Inc.(2) | | 805 | | 215,466 | |
Crowdstrike Holdings, Inc., Class A(2) | | 148 | | 34,330 | |
CyberArk Software Ltd.(2) | | 147 | | 37,688 | |
Datadog, Inc., Class A(2) | | 1,839 | | 214,133 | |
Descartes Systems Group, Inc.(2) | | 177 | | 18,002 | |
Dynatrace, Inc.(2) | | 415 | | 18,227 | |
Five9, Inc.(2) | | 365 | | 16,261 | |
Guidewire Software, Inc.(2) | | 996 | | 149,470 | |
HubSpot, Inc.(2) | | 288 | | 143,145 | |
JFrog Ltd.(2) | | 561 | | 21,632 | |
Klaviyo, Inc., Class A(2)(4) | | 361 | | 9,458 | |
| | | | | | | | | | | |
| | Shares/Principal
Amount | Value |
Manhattan Associates, Inc.(2) | | 738 | | $ | 188,471 | |
| Microsoft Corp. | | 2,582 | | 1,080,180 | |
Money Forward, Inc.(2) | | 300 | | 10,025 | |
nCino, Inc.(2) | | 661 | | 21,654 | |
Palantir Technologies, Inc., Class A(2) | | 8,245 | | 221,708 | |
Procore Technologies, Inc.(2) | | 1,643 | | 116,702 | |
Q2 Holdings, Inc.(2) | | 621 | | 41,899 | |
| Salesforce, Inc. | | 273 | | 70,652 | |
| SAP SE | | 1,009 | | 213,323 | |
ServiceNow, Inc.(2) | | 47 | | 38,276 | |
SPS Commerce, Inc.(2) | | 122 | | 26,281 | |
Tenable Holdings, Inc.(2) | | 769 | | 35,313 | |
Workday, Inc., Class A(2) | | 312 | | 70,861 | |
Zscaler, Inc.(2) | | 866 | | 155,317 | |
| | | 3,226,996 | |
| Specialized REITs — 0.7% | | | |
| American Tower Corp. | | 202 | | 44,521 | |
| CubeSmart | | 2,394 | | 113,907 | |
| Digital Core REIT Management Pte. Ltd. | | 73,900 | | 42,158 | |
| Digital Realty Trust, Inc. | | 2,910 | | 435,016 | |
| Equinix, Inc. | | 547 | | 432,261 | |
| Extra Space Storage, Inc. | | 1,344 | | 214,529 | |
| Iron Mountain, Inc. | | 2,924 | | 299,886 | |
| Lamar Advertising Co., Class A | | 284 | | 34,040 | |
| Public Storage | | 964 | | 285,267 | |
| SBA Communications Corp. | | 472 | | 103,623 | |
| VICI Properties, Inc. | | 8,578 | | 268,148 | |
| | | 2,273,356 | |
| Specialty Retail — 0.3% | | | |
Arhaus, Inc.(4) | | 1,549 | | 23,529 | |
Boot Barn Holdings, Inc.(2) | | 268 | | 35,773 | |
Burlington Stores, Inc.(2) | | 806 | | 209,818 | |
CarMax, Inc.(2) | | 521 | | 43,993 | |
| Home Depot, Inc. | | 571 | | 210,219 | |
| Kingfisher PLC | | 36,704 | | 130,488 | |
| Sanrio Co. Ltd. | | 700 | | 14,862 | |
| TJX Cos., Inc. | | 1,265 | | 142,970 | |
| Tractor Supply Co. | | 262 | | 68,990 | |
| | | 880,642 | |
| Technology Hardware, Storage and Peripherals — 0.4% | | | |
| Apple, Inc. | | 4,032 | | 895,426 | |
| HP, Inc. | | 4,157 | | 150,026 | |
Super Micro Computer, Inc.(2) | | 198 | | 138,927 | |
| | | 1,184,379 | |
| Textiles, Apparel and Luxury Goods — 0.1% | | | |
| Asics Corp. | | 1,200 | | 19,584 | |
Crocs, Inc.(2) | | 138 | | 18,543 | |
Deckers Outdoor Corp.(2) | | 43 | | 39,673 | |
| Levi Strauss & Co., Class A | | 567 | | 10,393 | |
| LVMH Moet Hennessy Louis Vuitton SE | | 79 | | 55,724 | |
On Holding AG, Class A(2) | | 5,290 | | 219,112 | |
| | | 363,029 | |
| Tobacco — 0.1% | | | |
| British American Tobacco PLC | | 8,045 | | 285,445 | |
| | | | | | | | | | | |
| | Shares/Principal
Amount | Value |
| KT&G Corp. | | 2,208 | | $ | 150,523 | |
| | | 435,968 | |
| Trading Companies and Distributors — 0.3% | | | |
| AddTech AB, B Shares | | 228 | | 7,357 | |
| Applied Industrial Technologies, Inc. | | 204 | | 44,511 | |
Beacon Roofing Supply, Inc.(2) | | 1,387 | | 142,584 | |
Beijer Ref AB(4) | | 778 | | 12,355 | |
| Bunzl PLC | | 3,646 | | 152,765 | |
Core & Main, Inc., Class A(2) | | 1,925 | | 102,930 | |
| Diploma PLC | | 395 | | 22,584 | |
| Ferguson PLC | | 300 | | 66,795 | |
| FTAI Aviation Ltd. | | 109 | | 12,148 | |
| H&E Equipment Services, Inc. | | 523 | | 27,353 | |
| Howden Joinery Group PLC | | 1,393 | | 16,842 | |
| MSC Industrial Direct Co., Inc., Class A | | 1,774 | | 157,797 | |
| Rexel SA | | 3,586 | | 91,109 | |
| Seven Group Holdings Ltd. | | 693 | | 17,780 | |
SiteOne Landscape Supply, Inc.(2) | | 299 | | 43,857 | |
| | | 918,767 | |
| Transportation Infrastructure — 0.0% | | | |
| Flughafen Zurich AG | | 81 | | 18,746 | |
| SATS Ltd. | | 2,100 | | 5,163 | |
| | | 23,909 | |
TOTAL COMMON STOCKS (Cost $43,174,650) | | | 59,123,657 | |
| SOVEREIGN GOVERNMENTS AND AGENCIES — 5.2% | | | |
| Australia — 0.1% | | | |
| Australia Government Bonds, 3.00%, 3/21/47 | AUD | 505,000 | | 258,163 | |
| New South Wales Treasury Corp., 3.00%, 3/20/28 | AUD | 285,000 | | 179,901 | |
| | | 438,064 | |
| Austria — 0.1% | | | |
Republic of Austria Government Bonds, 0.75%, 10/20/26(6) | EUR | 140,000 | | 145,608 | |
Republic of Austria Government Bonds, 4.15%, 3/15/37(6) | EUR | 101,000 | | 123,041 | |
| | | 268,649 | |
| Belgium — 0.0% | | | |
Kingdom of Belgium Government Bonds, 4.25%, 3/28/41(6) | EUR | 47,000 | | 57,601 | |
| Canada — 1.1% | | | |
| Canada Government Bonds, 0.25%, 3/1/26 | CAD | 1,150,000 | | 790,727 | |
| Canada Government Bonds, 3.50%, 3/1/28 | CAD | 2,428,000 | | 1,779,836 | |
| Province of British Columbia, 2.85%, 6/18/25 | CAD | 684,000 | | 490,247 | |
| Province of Quebec, 5.75%, 12/1/36 | CAD | 325,000 | | 274,145 | |
| Province of Quebec, 5.00%, 12/1/41 | CAD | 33,000 | | 26,154 | |
| Province of Quebec, 3.50%, 12/1/48 | CAD | 102,000 | | 65,519 | |
| | | 3,426,628 | |
| China — 0.5% | | | |
| China Government Bonds, 3.39%, 3/16/50 | CNY | 10,340,000 | | 1,697,418 | |
| Denmark — 0.0% | | | |
| Denmark Government Bonds, 0.50%, 11/15/27 | DKK | 517,000 | | 70,983 | |
| Denmark Government Bonds, 4.50%, 11/15/39 | DKK | 260,000 | | 47,329 | |
| | | 118,312 | |
| Finland — 0.5% | | | |
Finland Government Bonds, 4.00%, 7/4/25(6) | EUR | 173,000 | | 188,822 | |
Finland Government Bonds, 0.125%, 4/15/36(6) | EUR | 1,750,000 | | 1,377,568 | |
| | | 1,566,390 | |
| | | | | | | | | | | |
| | Shares/Principal
Amount | Value |
| France — 0.6% | | | |
French Republic Government Bonds OAT, 2.50%, 5/25/30(6) | EUR | 1,170,000 | | $ | 1,253,370 | |
French Republic Government Bonds OAT, 0.00%, 11/25/31(6)(7) | EUR | 850,000 | | 752,525 | |
| | | 2,005,895 | |
| Germany — 0.6% | | | |
| Bundesrepublik Deutschland Bundesanleihe, 2.30%, 2/15/33 | EUR | 1,800,000 | | 1,959,900 | |
Bundesrepublik Deutschland Bundesanleihe, 0.00%, 8/15/52(7) | EUR | 60,000 | | 32,713 | |
| | | 1,992,613 | |
| Italy — 0.4% | | | |
| Italy Buoni Poliennali Del Tesoro, 1.50%, 6/1/25 | EUR | 263,000 | | 280,628 | |
| Italy Buoni Poliennali Del Tesoro, 2.00%, 12/1/25 | EUR | 971,000 | | 1,037,286 | |
| | | 1,317,914 | |
| Japan — 0.6% | | | |
| Japan Government Thirty Year Bonds, 1.40%, 12/20/45 | JPY | 11,400,000 | | 69,261 | |
| Japan Government Thirty Year Bonds, 1.40%, 3/20/53 | JPY | 242,800,000 | | 1,359,266 | |
| Japan Government Thirty Year Bonds, 1.20%, 6/20/53 | JPY | 47,500,000 | | 251,953 | |
| Japan Government Thirty Year Bonds, 1.80%, 9/20/53 | JPY | 35,600,000 | | 218,864 | |
| | | 1,899,344 | |
| Malaysia — 0.1% | | | |
| Malaysia Government Bonds, 3.96%, 9/15/25 | MYR | 785,000 | | 172,266 | |
| Mexico — 0.1% | | | |
| Mexico Government International Bonds, 4.15%, 3/28/27 | | $ | 400,000 | | 392,569 | |
| Netherlands — 0.0% | | | |
Netherlands Government Bonds, 2.75%, 1/15/47(6) | EUR | 63,000 | | 68,740 | |
| Norway — 0.1% | | | |
Norway Government Bonds, 1.75%, 2/17/27(6) | NOK | 1,510,000 | | 132,732 | |
| Spain — 0.1% | | | |
Spain Government Bonds, 1.60%, 4/30/25(6) | EUR | 164,000 | | 175,378 | |
Spain Government Bonds, 5.15%, 10/31/28(6) | EUR | 16,000 | | 19,036 | |
Spain Government Bonds, 5.15%, 10/31/44(6) | EUR | 30,000 | | 39,974 | |
| | | 234,388 | |
| Thailand — 0.1% | | | |
| Thailand Government Bonds, 3.85%, 12/12/25 | THB | 9,350,000 | | 267,708 | |
| United Kingdom — 0.2% | | | |
| U.K. Gilts, 0.125%, 1/30/26 | GBP | 600,000 | | 730,903 | |
TOTAL SOVEREIGN GOVERNMENTS AND AGENCIES (Cost $18,999,065) | | | 16,788,134 | |
| CORPORATE BONDS — 2.9% | | | |
| Automobiles — 0.3% | | | |
| American Honda Finance Corp., 0.75%, 8/9/24 | | $ | 750,000 | | 749,183 | |
| BMW Finance NV, 0.875%, 4/3/25 | EUR | 50,000 | | 53,162 | |
| | | 802,345 | |
| Banks — 0.6% | | | |
Avi Funding Co. Ltd., 3.80%, 9/16/25(6) | | $ | 102,000 | | 100,595 | |
| Banco Santander SA, 2.50%, 3/18/25 | EUR | 200,000 | | 214,703 | |
| Bank of America Corp., 2.30%, 7/25/25 | GBP | 100,000 | | 125,189 | |
| Bank of America Corp., VRN, 5.47%, 1/23/35 | | $ | 120,000 | | 122,749 | |
| CaixaBank SA, VRN, 2.25%, 4/17/30 | EUR | 100,000 | | 106,320 | |
| Citigroup, Inc., VRN, 6.27%, 11/17/33 | | $ | 20,000 | | 21,431 | |
| Citigroup, Inc., VRN, 5.83%, 2/13/35 | | 20,000 | | 20,280 | |
| Commerzbank AG, 4.00%, 3/23/26 | EUR | 220,000 | | 239,041 | |
European Union, 0.00%, 7/4/31(7) | EUR | 400,000 | | 360,510 | |
| HSBC Bank PLC, VRN, 5.375%, 11/4/30 | GBP | 90,000 | | 114,552 | |
| ING Groep NV, 2.125%, 1/10/26 | EUR | 300,000 | | 319,720 | |
| | | | | | | | | | | |
| | Shares/Principal
Amount | Value |
| JPMorgan Chase & Co., VRN, 4.01%, 4/23/29 | | $ | 3,000 | | $ | 2,918 | |
| Lloyds Bank PLC, 7.625%, 4/22/25 | GBP | 80,000 | | 104,416 | |
| Wells Fargo & Co., VRN, 5.39%, 4/24/34 | | $ | 40,000 | | 40,482 | |
| | | 1,892,906 | |
| Beverages — 0.1% | | | |
| Anheuser-Busch Cos. LLC/Anheuser-Busch InBev Worldwide, Inc., 4.70%, 2/1/36 | | 180,000 | | 175,955 | |
| Chemicals — 0.0% | | | |
MEGlobal BV, 4.25%, 11/3/26(6) | | 34,000 | | 33,144 | |
| Commercial Services and Supplies — 0.0% | | | |
| Waste Connections, Inc., 2.95%, 1/15/52 | | 112,000 | | 74,230 | |
| Containers and Packaging — 0.0% | | | |
Sealed Air Corp., 5.125%, 12/1/24(6) | | 25,000 | | 25,058 | |
| Diversified Consumer Services — 0.0% | | | |
| Duke University, 3.30%, 10/1/46 | | 60,000 | | 45,548 | |
| Diversified Telecommunication Services — 0.1% | | | |
| AT&T, Inc., 2.60%, 12/17/29 | EUR | 100,000 | | 105,046 | |
| AT&T, Inc., 4.90%, 8/15/37 | | $ | 85,000 | | 81,504 | |
| Sprint Capital Corp., 6.875%, 11/15/28 | | 89,000 | | 95,491 | |
| | | 282,041 | |
| Electric Utilities — 0.2% | | | |
| Duke Energy Carolinas LLC, 3.20%, 8/15/49 | | 190,000 | | 132,267 | |
| Duke Energy Progress LLC, 4.15%, 12/1/44 | | 89,000 | | 73,890 | |
Indianapolis Power & Light Co., 5.70%, 4/1/54(6) | | 67,000 | | 67,752 | |
| MidAmerican Energy Co., 5.85%, 9/15/54 | | 30,000 | | 31,629 | |
| Northern States Power Co., 3.20%, 4/1/52 | | 120,000 | | 83,226 | |
| Northern States Power Co., 5.10%, 5/15/53 | | 80,000 | | 75,961 | |
| | | 464,725 | |
| Financial Services — 0.9% | | | |
Gulf Gate Apartments LLC, VRN, 5.46%, (Acquired 9/29/03 - 11/10/03, Cost $3,000,000), 9/1/28(8) | | 3,000,000 | | 3,000,000 | |
| Ground Transportation — 0.0% | | | |
| Burlington Northern Santa Fe LLC, 4.45%, 3/15/43 | | 16,000 | | 14,434 | |
| Burlington Northern Santa Fe LLC, 5.50%, 3/15/55 | | 75,000 | | 77,071 | |
| | | 91,505 | |
| Health Care Providers and Services — 0.1% | | | |
DaVita, Inc., 4.625%, 6/1/30(6) | | 370,000 | | 339,142 | |
| Kaiser Foundation Hospitals, 3.00%, 6/1/51 | | 130,000 | | 90,307 | |
| | | 429,449 | |
| Hotels, Restaurants and Leisure — 0.0% | | | |
| MGM Resorts International, 4.625%, 9/1/26 | | 8,000 | | 7,849 | |
| Household Durables — 0.0% | | | |
| Meritage Homes Corp., 5.125%, 6/6/27 | | 40,000 | | 40,042 | |
| Industrial Conglomerates — 0.1% | | | |
| Honeywell International, Inc., 5.25%, 3/1/54 | | 140,000 | | 138,961 | |
| Insurance — 0.1% | | | |
| AXA SA, VRN, 3.375%, 7/6/47 | EUR | 200,000 | | 214,706 | |
| Metals and Mining — 0.0% | | | |
Minera Mexico SA de CV, 4.50%, 1/26/50(6) | | $ | 158,000 | | 124,040 | |
| Multi-Utilities — 0.0% | | | |
| Dominion Energy, Inc., 4.90%, 8/1/41 | | 70,000 | | 63,561 | |
| Oil, Gas and Consumable Fuels — 0.1% | | | |
Antero Resources Corp., 7.625%, 2/1/29(6) | | 75,000 | | 77,526 | |
| BP Capital Markets America, Inc., 3.06%, 6/17/41 | | 130,000 | | 97,862 | |
| Energy Transfer LP, 5.75%, 4/1/25 | | 25,000 | | 25,003 | |
MEG Energy Corp., 5.875%, 2/1/29(6) | | 100,000 | | 98,816 | |
| | | | | | | | | | | |
| | Shares/Principal
Amount | Value |
| Southwestern Energy Co., 5.70%, 1/23/25 | | $ | 5,000 | | $ | 4,983 | |
| | | 304,190 | |
| Passenger Airlines — 0.0% | | | |
American Airlines, Inc./AAdvantage Loyalty IP Ltd., 5.50%, 4/20/26(6) | | 132,237 | | 131,467 | |
| Software — 0.0% | | | |
| Oracle Corp., 3.60%, 4/1/40 | | 95,000 | | 75,228 | |
| Technology Hardware, Storage and Peripherals — 0.3% | | | |
| Apple, Inc., 2.75%, 1/13/25 | | 1,000,000 | | 989,468 | |
TOTAL CORPORATE BONDS (Cost $9,916,120) | | | 9,406,418 | |
| COLLATERALIZED LOAN OBLIGATIONS — 1.1% | | | |
ARES Loan Funding III Ltd., Series 2022-ALF3A, Class A1R, VRN, 6.52%, (3-month SOFR plus 1.27%), 7/25/36(6)(9) | | 600,000 | | 600,000 | |
ARES XLVII CLO Ltd., Series 2018-47A, Class C, VRN, 7.31%, (3-month SOFR plus 2.01%), 4/15/30(6) | | 250,000 | | 250,434 | |
Carlyle Global Market Strategies CLO Ltd., Series 2012-4A, Class CR3, VRN, 8.14%, (3-month SOFR plus 2.86%), 4/22/32(6) | | 750,000 | | 752,307 | |
Cerberus Loan Funding XXXI LP, Series 2021-1A, Class A, VRN, 7.06%, (3-month SOFR plus 1.76%), 4/15/32(6) | | 70,803 | | 71,195 | |
Cook Park CLO Ltd., Series 2018-1A, Class C, VRN, 7.30%, (3-month SOFR plus 2.01%), 4/17/30(6) | | 750,000 | | 751,730 | |
Eaton Vance CLO Ltd., Series 2015-1A, Class CR, VRN, 7.44%, (3-month SOFR plus 2.16%), 1/20/30(6) | | 250,000 | | 250,585 | |
KKR CLO 18 Ltd., Series 2018, Class CR, VRN, 7.64%, (3-month SOFR plus 2.36%), 7/18/30(6) | | 250,000 | | 250,407 | |
Magnetite XXV Ltd., Series 2020-25A, Class C, VRN, 7.65%, (3-month SOFR plus 2.36%), 1/25/32(6) | | 350,000 | | 350,936 | |
Marathon CLO Ltd., Series 2021-17A, Class B1, VRN, 8.22%, (3-month SOFR plus 2.94%), 1/20/35(6) | | 325,000 | | 325,841 | |
TOTAL COLLATERALIZED LOAN OBLIGATIONS (Cost $3,587,318) | | | 3,603,435 | |
| PREFERRED STOCKS — 0.4% | | | |
| Automobiles — 0.1% | | | |
| Volkswagen International Finance NV, 3.875% | | 300,000 | | 304,438 | |
| Insurance — 0.2% | | | |
| Allianz SE, 2.625% | | 200,000 | | 175,261 | |
| Allianz SE, 3.375% | | 200,000 | | 216,238 | |
| Intesa Sanpaolo Vita SpA, 4.75% | | 200,000 | | 216,731 | |
| | | 608,230 | |
| Oil, Gas and Consumable Fuels — 0.1% | | | |
| Eni SpA, 3.375% | | 300,000 | | 306,838 | |
TOTAL PREFERRED STOCKS (Cost $1,580,512) | | | 1,219,506 | |
| ASSET-BACKED SECURITIES — 0.4% | | | |
Blackbird Capital II Aircraft Lease Ltd., Series 2021-1A, Class A, SEQ, 2.44%, 7/15/46(6) | | $ | 235,589 | | 211,393 | |
FirstKey Homes Trust, Series 2020-SFR1, Class C, 1.94%, 8/17/37(6) | | 400,000 | | 383,583 | |
Lunar Aircraft Ltd., Series 2020-1A, Class A, SEQ, 3.38%, 2/15/45(6) | | 342,851 | | 330,285 | |
MAPS Trust, Series 2021-1A, Class A, SEQ, 2.52%, 6/15/46(6) | | 246,770 | | 224,371 | |
VSE VOI Mortgage LLC, Series 2018-A, Class B, 3.72%, 2/20/36(6) | | 63,047 | | 62,746 | |
TOTAL ASSET-BACKED SECURITIES (Cost $1,292,537) | | | 1,212,378 | |
| MUNICIPAL SECURITIES — 0.3% | | | |
| New Jersey Turnpike Authority Rev., 7.10%, 1/1/41 | | 9,000 | | 10,487 | |
| New York City GO, 6.27%, 12/1/37 | | 40,000 | | 43,668 | |
| North Dakota Housing Finance Agency Rev., VRDN, 5.37%, 8/7/24 (SBBPA: Royal Bank of Canada) | | 750,000 | | 750,000 | |
| Port Authority of New York & New Jersey Rev., 4.93%, 10/1/51 | | 50,000 | | 48,928 | |
| Regents of the University of California Medical Center Pooled Rev., 3.26%, 5/15/60 | | 125,000 | | 87,115 | |
| State of California GO, 4.60%, 4/1/38 | | 40,000 | | 38,886 | |
| State of California GO, 7.60%, 11/1/40 | | 65,000 | | 80,753 | |
| Texas Natural Gas Securitization Finance Corp. Rev., SEQ, 5.17%, 4/1/41 | | 30,000 | | 30,791 | |
TOTAL MUNICIPAL SECURITIES (Cost $1,127,575) | | | 1,090,628 | |
| | | | | | | | | | | |
| | Shares/Principal
Amount | Value |
| COLLATERALIZED MORTGAGE OBLIGATIONS — 0.2% | | | |
| Private Sponsor Collateralized Mortgage Obligations — 0.1% | | | |
COLT Mortgage Loan Trust, Series 2021-3, Class M1, VRN, 2.30%, 9/27/66(6) | | $ | 700,000 | | $ | 470,055 | |
JP Morgan Mortgage Trust, Series 2014-5, Class A1, VRN, 2.72%, 10/25/29(6) | | 28,344 | | 27,249 | |
SoFi Mortgage Trust, Series 2016-1A, Class 1A4, SEQ, VRN, 3.00%, 11/25/46(6) | | 10,849 | | 9,548 | |
| | | 506,852 | |
| U.S. Government Agency Collateralized Mortgage Obligations — 0.1% | | | |
FNMA, Series 2024-R01, Class 1M1, VRN, 6.40%, (30-day average SOFR plus 1.05%), 1/25/44(6) | | 261,862 | | 262,290 | |
TOTAL COLLATERALIZED MORTGAGE OBLIGATIONS (Cost $1,001,135) | | | 769,142 | |
| EXCHANGE-TRADED FUNDS — 0.2% | | | |
| iShares Core S&P 500 ETF | | 1,194 | | 660,664 | |
| iShares MSCI EAFE Small-Cap ETF | | 14 | | 907 | |
TOTAL EXCHANGE-TRADED FUNDS (Cost $636,257) | | | 661,571 | |
| U.S. GOVERNMENT AGENCY MORTGAGE-BACKED SECURITIES — 0.1% | | | |
| Fixed-Rate U.S. Government Agency Mortgage-Backed Securities — 0.1% | | | |
| FHLMC, 6.00%, 2/1/38 | | $ | 42,653 | | 44,153 | |
| GNMA, 8.00%, 9/15/24 | | 8 | | 8 | |
| GNMA, 9.00%, 4/20/25 | | 22 | | 22 | |
| GNMA, 7.50%, 10/15/25 | | 111 | | 111 | |
| GNMA, 7.50%, 2/15/26 | | 1,630 | | 1,632 | |
| GNMA, 8.25%, 7/15/26 | | 4,368 | | 4,374 | |
| GNMA, 7.00%, 12/15/27 | | 5,689 | | 5,708 | |
| GNMA, 6.50%, 3/15/28 | | 3,746 | | 3,777 | |
| GNMA, 6.00%, 10/15/28 | | 3,362 | | 3,432 | |
| GNMA, 7.00%, 5/15/31 | | 1,666 | | 1,725 | |
| GNMA, 6.50%, 10/15/38 | | 191,676 | | 203,755 | |
| GNMA, 4.50%, 6/15/41 | | 63,300 | | 62,568 | |
| GNMA, 3.50%, 6/20/42 | | 90,824 | | 85,432 | |
TOTAL U.S. GOVERNMENT AGENCY MORTGAGE-BACKED SECURITIES (Cost $423,022) | | | 416,697 | |
| SHORT-TERM INVESTMENTS — 9.8% | | | |
| Certificates of Deposit — 0.9% | | | |
Wells Fargo Bank NA, 5.40%, 3/11/25(6) | | 3,000,000 | | 3,006,957 | |
Commercial Paper(10) — 3.9% | | | |
Banco Santander SA, 5.58%, 1/7/25(6) | | 1,000,000 | | 977,000 | |
Ionic Funding LLC, 5.69%, 9/5/24(6) | | 1,000,000 | | 994,607 | |
Ionic Funding LLC, 5.71%, 9/17/24(6) | | 2,750,000 | | 2,730,240 | |
JP Morgan Securities LLC, VRN, 5.71%, (SOFR plus 0.37%), 1/27/25(6) | | 2,500,000 | | 2,501,585 | |
Mainbeach Funding LLC, 5.50%, 8/1/24(6) | | 1,900,000 | | 1,899,717 | |
Overwatch Alpha Funding LLC, 5.49%, 8/1/24(6) | | 710,000 | | 710,000 | |
Regatta Funding Co. LLC, 5.56%, 8/21/24(6) | | 1,250,000 | | 1,246,075 | |
UBS AG, VRN, 5.62%, (SOFR plus 0.25%), 8/19/24(6) | | 750,000 | | 750,077 | |
Washington Morgan Capital Co. LLC, 5.60%, 11/22/24 (LOC: Goldman Sachs & Co.)(6) | | 1,000,000 | | 983,363 | |
| | | 12,792,664 | |
| Money Market Funds — 3.9% | | | |
| State Street Institutional U.S. Government Money Market Fund, Premier Class | | 12,346,770 | | 12,346,770 | |
State Street Navigator Securities Lending Government Money Market Portfolio(11) | | 153,026 | | 153,026 | |
| | | 12,499,796 | |
Treasury Bills(10) — 1.1% | | | |
| U.S. Treasury Bills, 5.44%, 8/20/24 | | $ | 1,500,000 | | 1,495,822 | |
| U.S. Treasury Bills, 5.44%, 8/27/24 | | 1,000,000 | | 996,188 | |
| | | | | | | | | | | |
| | Shares/Principal
Amount | Value |
| U.S. Treasury Bills, 5.19%, 6/12/25 | | $ | 1,000,000 | | $ | 959,912 | |
| | | 3,451,922 | |
TOTAL SHORT-TERM INVESTMENTS (Cost $31,738,622) | | | 31,751,339 | |
TOTAL INVESTMENT SECURITIES — 100.0% (Cost $292,948,987) | | | 323,617,849 | |
| OTHER ASSETS AND LIABILITIES — 0.0% | | | (1,027) | |
| TOTAL NET ASSETS — 100.0% | | | $ | 323,616,822 | |
FORWARD FOREIGN CURRENCY EXCHANGE CONTRACTS
| | | | | | | | | | | | | | | | | | | | |
| Currency Purchased | Currency Sold | Counterparty | Settlement
Date | Unrealized Appreciation (Depreciation) |
| USD | 434,556 | AUD | 656,830 | Citibank N.A. | 9/18/24 | $ | 4,509 | |
| BRL | 1,653,927 | USD | 305,294 | JPMorgan Chase Bank N.A. | 9/18/24 | (14,302) | |
| CAD | 1,349 | USD | 986 | Bank of America N.A. | 9/27/24 | (8) | |
| CAD | 4,404 | USD | 3,236 | Bank of America N.A. | 9/27/24 | (41) | |
| CAD | 5,591 | USD | 4,108 | Bank of America N.A. | 9/27/24 | (52) | |
| CAD | 2,652 | USD | 1,952 | Bank of America N.A. | 9/27/24 | (28) | |
| CAD | 1,485 | USD | 1,092 | Bank of America N.A. | 9/27/24 | (15) | |
| CAD | 2,271 | USD | 1,663 | Bank of America N.A. | 9/27/24 | (16) | |
| CAD | 262 | USD | 192 | Bank of America N.A. | 9/27/24 | (2) | |
| CAD | 2,189 | USD | 1,604 | Bank of America N.A. | 9/27/24 | (16) | |
| CAD | 1,532 | USD | 1,119 | Bank of America N.A. | 9/27/24 | (8) | |
| CAD | 183 | USD | 134 | Bank of America N.A. | 9/27/24 | (1) | |
| CAD | 1,961 | USD | 1,431 | Bank of America N.A. | 9/27/24 | (8) | |
| CAD | 1,094 | USD | 799 | Bank of America N.A. | 9/27/24 | (5) | |
| CAD | 131 | USD | 96 | Bank of America N.A. | 9/27/24 | (1) | |
| CAD | 4,640 | USD | 3,381 | Bank of America N.A. | 9/27/24 | (14) | |
| CAD | 1,534 | USD | 1,117 | Bank of America N.A. | 9/27/24 | (4) | |
| CAD | 2,539 | USD | 1,842 | Bank of America N.A. | 9/27/24 | — | |
| CAD | 1,095 | USD | 795 | Bank of America N.A. | 9/27/24 | — | |
| CAD | 2,519 | USD | 1,826 | Bank of America N.A. | 9/27/24 | 2 | |
| CAD | 625 | USD | 452 | Bank of America N.A. | 9/27/24 | 1 | |
| CAD | 3,033 | USD | 2,193 | Bank of America N.A. | 9/27/24 | 7 | |
| CAD | 993 | USD | 718 | Bank of America N.A. | 9/27/24 | 2 | |
| CAD | 6,042 | USD | 4,370 | Bank of America N.A. | 9/27/24 | 14 | |
| USD | 3,416,477 | CAD | 4,692,189 | Citibank N.A. | 9/18/24 | 13,233 | |
| USD | 91,132 | CAD | 124,155 | Bank of America N.A. | 9/27/24 | 1,057 | |
| USD | 15,615 | CAD | 21,273 | Bank of America N.A. | 9/27/24 | 181 | |
| USD | 85,286 | CAD | 116,191 | Bank of America N.A. | 9/27/24 | 990 | |
| USD | 519 | CAD | 708 | Bank of America N.A. | 9/27/24 | 6 | |
| USD | 696 | CAD | 951 | Bank of America N.A. | 9/27/24 | 6 | |
| USD | 4,897 | CAD | 6,688 | Bank of America N.A. | 9/27/24 | 45 | |
| USD | 2,435 | CAD | 3,338 | Bank of America N.A. | 9/27/24 | 13 | |
| USD | 3,292 | CAD | 4,514 | Bank of America N.A. | 9/27/24 | 18 | |
| USD | 7,003 | CAD | 9,531 | Bank of America N.A. | 9/27/24 | 88 | |
| USD | 2,679 | CAD | 3,645 | Bank of America N.A. | 9/27/24 | 34 | |
| USD | 9,049 | CAD | 12,315 | Bank of America N.A. | 9/27/24 | 115 | |
| USD | 5,193 | CAD | 7,066 | Bank of America N.A. | 9/27/24 | 66 | |
| USD | 975 | CAD | 1,325 | Bank of America N.A. | 9/27/24 | 13 | |
| USD | 16,874 | CAD | 22,961 | Bank of America N.A. | 9/27/24 | 216 | |
| USD | 2,338 | CAD | 3,183 | Bank of America N.A. | 9/27/24 | 29 | |
| USD | 2,583 | CAD | 3,516 | Bank of America N.A. | 9/27/24 | 32 | |
| USD | 2,395 | CAD | 3,270 | Bank of America N.A. | 9/27/24 | 22 | |
| | | | | | | | | | | | | | | | | | | | |
| Currency Purchased | Currency Sold | Counterparty | Settlement
Date | Unrealized Appreciation (Depreciation) |
| USD | 8,519 | CAD | 11,633 | Bank of America N.A. | 9/27/24 | $ | 80 | |
| USD | 2,080 | CAD | 2,842 | Bank of America N.A. | 9/27/24 | 19 | |
| USD | 1,748 | CAD | 2,410 | Bank of America N.A. | 9/27/24 | — | |
| USD | 1,937 | CAD | 2,676 | Bank of America N.A. | 9/27/24 | (4) | |
| USD | 3,841 | CAD | 5,312 | Bank of America N.A. | 9/27/24 | (13) | |
| USD | 1,443,256 | CNY | 10,262,705 | JPMorgan Chase Bank N.A. | 9/18/24 | 2,183 | |
| COP | 576,422,518 | USD | 143,780 | Morgan Stanley | 9/18/24 | (2,423) | |
| CZK | 4,583,916 | USD | 199,110 | JPMorgan Chase Bank N.A. | 9/18/24 | (3,658) | |
| EUR | 382,741 | USD | 413,850 | Morgan Stanley | 9/18/24 | 1,280 | |
| EUR | 54,909 | USD | 58,985 | Morgan Stanley | 9/18/24 | 571 | |
| EUR | 380,536 | USD | 408,945 | Morgan Stanley | 9/18/24 | 3,795 | |
| EUR | 6,746 | USD | 7,384 | Bank of America N.A. | 9/27/24 | (64) | |
| EUR | 23,937 | USD | 25,774 | Bank of America N.A. | 9/27/24 | 199 | |
| EUR | 29,855 | USD | 32,599 | Bank of America N.A. | 9/27/24 | (204) | |
| EUR | 3,675 | USD | 4,000 | JPMorgan Chase Bank N.A. | 9/27/24 | (13) | |
| EUR | 1,790 | USD | 1,955 | UBS AG | 9/27/24 | (13) | |
| EUR | 2,553 | USD | 2,781 | UBS AG | 9/27/24 | (11) | |
| EUR | 19,658 | USD | 21,310 | UBS AG | 9/27/24 | 21 | |
| USD | 11,202,118 | EUR | 10,387,181 | JPMorgan Chase Bank N.A. | 9/18/24 | (64,088) | |
| USD | 14,358 | EUR | 13,307 | Bank of America N.A. | 9/27/24 | (81) | |
| USD | 207,750 | EUR | 192,543 | Bank of America N.A. | 9/27/24 | (1,176) | |
| USD | 14,351 | EUR | 13,307 | Citibank N.A. | 9/27/24 | (88) | |
| USD | 207,655 | EUR | 192,543 | Citibank N.A. | 9/27/24 | (1,271) | |
| USD | 14,366 | EUR | 13,307 | Morgan Stanley | 9/27/24 | (73) | |
| USD | 207,873 | EUR | 192,543 | Morgan Stanley | 9/27/24 | (1,053) | |
| USD | 1,137 | EUR | 1,048 | Morgan Stanley | 9/27/24 | (1) | |
| USD | 14,358 | EUR | 13,307 | UBS AG | 9/27/24 | (81) | |
| USD | 1,778 | EUR | 1,635 | UBS AG | 9/27/24 | 3 | |
| USD | 207,749 | EUR | 192,543 | UBS AG | 9/27/24 | (1,177) | |
| GBP | 2,870 | USD | 3,710 | Goldman Sachs & Co. | 9/27/24 | (19) | |
| GBP | 3,377 | USD | 4,364 | Goldman Sachs & Co. | 9/27/24 | (20) | |
| USD | 1,189,763 | GBP | 934,952 | Citibank N.A. | 9/18/24 | (12,671) | |
| USD | 138,459 | GBP | 109,036 | Goldman Sachs & Co. | 9/27/24 | (1,781) | |
| USD | 4,433 | GBP | 3,461 | Goldman Sachs & Co. | 9/27/24 | (19) | |
| USD | 11,706 | GBP | 9,060 | Goldman Sachs & Co. | 9/27/24 | 54 | |
| USD | 12,045 | GBP | 9,315 | Goldman Sachs & Co. | 9/27/24 | 65 | |
| USD | 13,533 | GBP | 10,528 | Goldman Sachs & Co. | 9/27/24 | (7) | |
| HUF | 34,706,146 | USD | 94,034 | Bank of America N.A. | 9/18/24 | 1,152 | |
| IDR | 5,172,338,602 | USD | 316,496 | Bank of America N.A. | 9/18/24 | 1,513 | |
| USD | 1,850,451 | JPY | 286,826,696 | Citibank N.A. | 9/18/24 | (77,559) | |
| MXN | 5,252,536 | USD | 281,270 | JPMorgan Chase Bank N.A. | 9/18/24 | (1,390) | |
| MYR | 694,977 | USD | 147,773 | Goldman Sachs & Co. | 9/18/24 | 4,287 | |
| USD | 134,529 | NOK | 1,441,231 | Citibank N.A. | 9/18/24 | 2,287 | |
| PLN | 1,010,043 | USD | 249,324 | Morgan Stanley | 9/18/24 | 5,362 | |
| RON | 598,453 | USD | 128,812 | Goldman Sachs & Co. | 9/18/24 | 1,298 | |
| TRY | 1,550,928 | USD | 43,377 | Goldman Sachs & Co. | 9/18/24 | 1,055 | |
| ZAR | 5,025,135 | USD | 267,519 | Bank of America N.A. | 9/18/24 | 7,392 | |
| | | | | | $ | (130,164) | |
| | | | | | | | | | | | | | |
| FUTURES CONTRACTS PURCHASED |
| Reference Entity | Contracts | Expiration Date | Notional
Amount | Unrealized
Appreciation
(Depreciation)^ |
| Euro-Bobl 5-Year Bonds | 21 | September 2024 | $ | 2,670,679 | | $ | 36,103 | |
| U.K. Gilt 10-Year Bonds | 20 | September 2024 | 2,551,046 | | 56,277 | |
| U.S. Treasury 5-Year Notes | 131 | September 2024 | 14,133,672 | | 285,040 | |
| U.S. Treasury 10-Year Notes | 2 | September 2024 | 223,625 | | 6,409 | |
| U.S. Treasury 10-Year Ultra Notes | 14 | September 2024 | 1,618,094 | | 52,273 | |
| | | $ | 21,197,116 | | $ | 436,102 | |
^Amount represents value and unrealized appreciation (depreciation).
| | | | | | | | | | | | | | | | | | | | | | | |
| CENTRALLY CLEARED CREDIT DEFAULT SWAP AGREEMENTS |
| Reference Entity | Type‡ | Fixed Rate
Received
(Paid)
Quarterly | Termination
Date | Notional
Amount | Premiums
Paid
(Received) | Unrealized
Appreciation
(Depreciation) | Value^ |
| Markit CDX North America High Yield Index Series 37 | Buy | (5.00)% | 12/20/26 | $ | 2,816,880 | | $ | (63,419) | | $ | (146,309) | | $ | (209,728) | |
| Markit CDX North America High Yield Index Series 42 | Sell | 5.00% | 6/20/29 | $ | 360,000 | | 19,320 | | 7,262 | | 26,582 | |
| Markit iTraxx Europe Crossover Index Series 41 | Sell | 5.00% | 6/20/29 | EUR | 340,000 | | 25,827 | | 7,598 | | 33,425 | |
| | | | | $ | (18,272) | | $ | (131,449) | | $ | (149,721) | |
‡The maximum potential amount the fund could be required to deliver as a seller of credit protection if a credit event occurs as defined under the terms of the agreement is the notional amount. The maximum potential amount may be partially offset by any recovery values of the reference entities and upfront payments received upon entering into the agreement.
^The value for credit default swap agreements serves as an indicator of the current status of the payment/performance risk and represent the likelihood of an expected liability or profit at the period end. Increasing values in absolute terms when compared to the notional amount of the credit default swap agreement represent a deterioration of the referenced entity's credit soundness and an increased likelihood or risk of a credit event occurring as defined in the agreement.
| | | | | | | | |
| NOTES TO SCHEDULE OF INVESTMENTS |
| ADR | – | American Depositary Receipt |
| AUD | – | Australian Dollar |
| BRL | – | Brazilian Real |
| CAD | – | Canadian Dollar |
| CDX | – | Credit Derivatives Indexes |
| CNY | – | Chinese Yuan |
| COP | – | Colombian Peso |
| CVA | – | Certificaten Van Aandelen |
| CZK | – | Czech Koruna |
| DKK | – | Danish Krone |
| EUR | – | Euro |
| FHLMC | – | Federal Home Loan Mortgage Corp. |
| FNMA | – | Federal National Mortgage Association |
| GBP | – | British Pound |
| GNMA | – | Government National Mortgage Association |
| GO | – | General Obligation |
| HUF | – | Hungarian Forint |
| IDR | – | Indonesian Rupiah |
| JPY | – | Japanese Yen |
| LOC | – | Letter of Credit |
| MXN | – | Mexican Peso |
| MYR | – | Malaysian Ringgit |
| NOK | – | Norwegian Krone |
| PLN | – | Polish Zloty |
| RON | – | Romanian New Leu |
| SBBPA | – | Standby Bond Purchase Agreement |
| SEQ | – | Sequential Payer |
| | | | | | | | |
| SOFR | – | Secured Overnight Financing Rate |
| THB | – | Thai Baht |
| TRY | – | Turkish Lira |
| USBMMY | – | U.S. Treasury Bill Money Market Yield |
| USD | – | United States Dollar |
| VRDN | – | Variable Rate Demand Note. The instrument may be payable upon demand and adjusts periodically based upon the terms set forth in the security's offering documents. The rate shown is effective at the period end and the reference rate and spread, if any, is indicated. The date of the demand feature is disclosed. |
| VRN | – | Variable Rate Note. The rate adjusts periodically based upon the terms set forth in the security’s offering documents. The rate shown is effective at the period end and the reference rate and spread, if any, is indicated. The security's effective maturity date may be shorter than the final maturity date shown. |
| ZAR | – | South African Rand |
(1)Investments are funds within the American Century Investments family of funds and are considered affiliated funds.
(2)Non-income producing.
(3)Security, or a portion thereof, has been pledged at the custodian bank or with a broker for collateral requirements on forward foreign currency exchange contracts, futures contracts and/or swap agreements. At the period end, the aggregate value of securities pledged was $698,047.
(4)Security, or a portion thereof, is on loan. At the period end, the aggregate value of securities on loan was $496,269. The amount of securities on loan indicated may not correspond with the securities on loan identified because securities with pending sales are in the process of recall from the brokers.
(5)Security may be subject to resale, redemption or transferability restrictions.
(6)Security was purchased pursuant to Rule 144A or Section 4(2) under the Securities Act of 1933 and may be sold in transactions exempt from registration, normally to qualified institutional investors. The aggregate value of these securities at the period end was $26,716,511, which represented 8.3% of total net assets.
(7)Security is a zero-coupon bond. Zero-coupon securities may be issued at a substantial discount from their value at maturity.
(8)Restricted security that may not be offered for public sale without being registered with the Securities and Exchange Commission and/or may be subject to resale, redemption or transferability restrictions. The aggregate value of these securities at the period end was $3,000,000, which represented 0.9% of total net assets.
(9)When-issued security. The issue price and yield are fixed on the date of the commitment, but payment and delivery are scheduled for a future date.
(10)The rate indicated is the yield to maturity at purchase for non-interest bearing securities. For interest bearing securities, the stated coupon rate is shown.
(11)Investment of cash collateral from securities on loan. At the period end, the aggregate value of the collateral held by the fund was $517,721, which includes securities collateral of $364,695.
See Notes to Financial Statements.
| | |
| Statement of Assets and Liabilities |
| | | | | |
| JULY 31, 2024 |
| Assets | |
| Investment securities - unaffiliated, at value (cost of $197,515,063) — including $496,269 of securities on loan | $ | 202,898,919 | |
| Investment securities - affiliated, at value (cost of $95,280,898) | 120,565,904 | |
| Investment made with cash collateral received for securities on loan, at value (cost of $153,026) | 153,026 | |
| Total investment securities, at value (cost of $292,948,987) | 323,617,849 | |
| Cash | 351,613 | |
| Foreign currency holdings, at value (cost of $17,220) | 4,630 | |
| Receivable for investments sold | 192,784 | |
| Receivable for capital shares sold | 210,846 | |
| Receivable for variation margin on futures contracts | 39,600 | |
| Unrealized appreciation on forward foreign currency exchange contracts | 53,315 | |
| Interest and dividends receivable | 1,029,432 | |
| Securities lending receivable | 700 | |
| 325,500,769 | |
| |
| Liabilities | |
| Payable for collateral received for securities on loan | 153,026 | |
| Payable for investments purchased | 813,491 | |
| Payable for capital shares redeemed | 544,244 | |
| Payable for variation margin on swap agreements | 3,452 | |
| Unrealized depreciation on forward foreign currency exchange contracts | 183,479 | |
| Accrued management fees | 161,780 | |
| Distribution and service fees payable | 24,475 | |
| 1,883,947 | |
| |
| Net Assets | $ | 323,616,822 | |
| |
| Net Assets Consist of: | |
| Capital (par value and paid-in surplus) | $ | 283,989,366 | |
| Distributable earnings (loss) | 39,627,456 | |
| $ | 323,616,822 | |
| | | | | | | | | | | |
| Net Assets | Shares Outstanding | Net Asset Value Per Share* |
| Investor Class, $0.01 Par Value | $116,902,472 | 20,759,525 | $5.63 |
| I Class, $0.01 Par Value | $22,875,659 | 4,060,836 | $5.63 |
| A Class, $0.01 Par Value | $73,419,307 | 13,053,267 | $5.62 |
| C Class, $0.01 Par Value | $5,171,855 | 943,570 | $5.48 |
| R Class, $0.01 Par Value | $9,713,830 | 1,732,672 | $5.61 |
| R5 Class, $0.01 Par Value | $7,590 | 1,345 | $5.64 |
| R6 Class, $0.01 Par Value | $95,526,109 | 16,953,707 | $5.63 |
*Maximum offering price per share was equal to the net asset value per share for all share classes, except A Class, for which the maximum offering price per share was $5.96 (net asset value divided by 0.9425). A contingent deferred sales charge may be imposed on redemptions of A Class and C Class.
See Notes to Financial Statements.
| | | | | |
| YEAR ENDED JULY 31, 2024 | |
| Investment Income (Loss) | |
| Income: | |
| Interest | $ | 5,679,127 | |
| Income distributions from affiliated funds | 3,506,157 | |
| Dividends (net of foreign taxes withheld of $44,302) | 1,146,181 | |
| Securities lending, net | 18,981 | |
| 10,350,446 | |
| |
| Expenses: | |
| Management fees | 2,850,204 | |
| Distribution and service fees: | |
| A Class | 182,487 | |
| C Class | 53,909 | |
| R Class | 44,664 | |
| Directors' fees and expenses | 10,514 | |
| Other expenses | 30,739 | |
| 3,172,517 | |
Fees waived(1) | (943,542) | |
| 2,228,975 | |
| |
| Net investment income (loss) | 8,121,471 | |
| |
| Realized and Unrealized Gain (Loss) | |
| Net realized gain (loss) on: | |
| Investment transactions (including $5,167,196 from affiliated funds) | 9,398,399 | |
| Forward foreign currency exchange contract transactions | 271,030 | |
| Futures contract transactions | (996,559) | |
| Swap agreement transactions | (148,459) | |
| Foreign currency translation transactions | 6,715 | |
| 8,531,126 | |
| |
| Change in net unrealized appreciation (depreciation) on: | |
| Investments (including $7,978,513 from affiliated funds) | 11,265,247 | |
| Forward foreign currency exchange contracts | 74,649 | |
| Futures contracts | 742,153 | |
| Swap agreements | 65,898 | |
| Translation of assets and liabilities in foreign currencies | (2,266) | |
| 12,145,681 | |
| |
| Net realized and unrealized gain (loss) | 20,676,807 | |
| |
| Net Increase (Decrease) in Net Assets Resulting from Operations | $ | 28,798,278 | |
(1)Amount consists of $346,579, $68,517, $213,686, $15,780, $26,149, $25 and $272,806 for Investor Class, I Class, A Class, C Class, R Class, R5 Class and R6 Class, respectively.
See Notes to Financial Statements.
| | |
| Statement of Changes in Net Assets |
| | | | | | | | |
| YEARS ENDED JULY 31, 2024 AND JULY 31, 2023 |
| Increase (Decrease) in Net Assets | July 31, 2024 | July 31, 2023 |
| Operations | | |
| Net investment income (loss) | $ | 8,121,471 | | $ | 8,100,941 | |
| Net realized gain (loss) | 8,531,126 | | 2,015,119 | |
| Change in net unrealized appreciation (depreciation) | 12,145,681 | | (758,537) | |
| Net increase (decrease) in net assets resulting from operations | 28,798,278 | | 9,357,523 | |
| | |
| Distributions to Shareholders | | |
| From earnings: | | |
| Investor Class | (2,572,031) | | (5,716,063) | |
| I Class | (552,227) | | (1,455,675) | |
| A Class | (1,400,519) | | (3,202,169) | |
| C Class | (67,873) | | (258,850) | |
| R Class | (155,178) | | (362,746) | |
| R5 Class | (208) | | (393) | |
| R6 Class | (2,348,990) | | (4,263,604) | |
| Decrease in net assets from distributions | (7,097,026) | | (15,259,500) | |
| | |
| Capital Share Transactions | | |
| Net increase (decrease) in net assets from capital share transactions (Note 5) | (32,589,475) | | (17,433,674) | |
| | |
| Net increase (decrease) in net assets | (10,888,223) | | (23,335,651) | |
| | |
| Net Assets | | |
| Beginning of period | 334,505,045 | | 357,840,696 | |
| End of period | $ | 323,616,822 | | $ | 334,505,045 | |
See Notes to Financial Statements.
| | |
| Notes to Financial Statements |
JULY 31, 2024
1. Organization
American Century Strategic Asset Allocations, Inc. (the corporation) is registered under the Investment Company Act of 1940, as amended (the 1940 Act), as an open-end management investment company and is organized as a Maryland corporation. Strategic Allocation: Conservative Fund (the fund) is one fund in a series issued by the corporation. The fund may invest in varying combinations of other affiliated investment companies such as mutual funds and exchange-traded funds advised by American Century Investments (affiliated funds). The fund will assume the risks associated with the affiliated funds. The fund is an asset allocation fund and its investment objective is to seek the highest level of total return consistent with its asset mix.
The fund offers the Investor Class, I Class, A Class, C Class, R Class, R5 Class and R6 Class. The A Class may incur an initial sales charge. The A Class and C Class may be subject to a contingent deferred sales charge.
2. Significant Accounting Policies
The following is a summary of significant accounting policies consistently followed by the fund in preparation of its financial statements. The fund is an investment company and follows accounting and reporting guidance in accordance with accounting principles generally accepted in the United States of America. This may require management to make certain estimates and assumptions at the date of the financial statements. Actual results could differ from these estimates. Management evaluated the impact of events or transactions occurring through the date the financial statements were issued that would merit recognition or disclosure.
Investment Valuations — The fund determines the fair value of its investments and computes its net asset value (NAV) per share at the close of regular trading (usually 4 p.m. Eastern time) on the New York Stock Exchange (NYSE) on each day the NYSE is open. The value of investments of the fund is determined by American Century Investment Management, Inc. (ACIM) (the investment advisor), as the valuation designee, pursuant to its valuation policies and procedures. The Board of Directors oversees the valuation designee and reviews its valuation policies and procedures at least annually.
Equity securities that are listed or traded on a domestic securities exchange are valued at the last reported sales price or at the official closing price as provided by the exchange. Equity securities traded on foreign securities exchanges are generally valued at the closing price of such securities on the exchange where primarily traded or at the close of the NYSE, if that is earlier. If no last sales price is reported, or if local convention or regulation so provides, the mean of the latest bid and asked prices may be used. Securities traded over-the-counter are valued at the mean of the latest bid and asked prices, the last sales price, or the official closing price.
Fixed income securities are valued at the evaluated mean as provided by independent pricing services or at the mean of the most recent bid and asked prices as provided by investment dealers. Corporate bonds, U.S. Treasury and Government Agency securities, municipal securities, and sovereign governments and agencies are valued using market models that consider trade data, quotations from dealers and active market makers, relevant yield curve and spread data, creditworthiness, trade data or market information on comparable securities, and other relevant security specific information. Mortgage-related and asset-backed securities are valued based on models that consider trade data, prepayment and default projections, benchmark yield and spread data and estimated cash flows of each tranche of the issuer. Collateralized loan obligations are valued based on discounted cash flow models that consider trade and economic data, prepayment assumptions and default projections. Commercial paper and certificates of deposit are valued using a curve-based approach that considers money market rates for specific instruments, programs, currencies and maturity points from a variety of active market makers.
Hybrid securities are valued at the evaluated mean as provided by independent pricing services or at the mean of the most recent bid and asked prices as provided by investment dealers. Preferred stocks and convertible preferred stocks with perpetual maturities are valued using market models that consider trade data, quotations from dealers and active market makers, relevant yield curve and spread data, creditworthiness, trade data or market information on comparable securities, and other relevant security specific information.
Open-end management investment companies are valued at the reported NAV per share. Exchange-traded futures contracts are valued at the settlement price as provided by the appropriate exchange. Swap agreements are valued at an evaluated mean as provided by independent pricing services or independent brokers. Forward foreign currency exchange contracts are valued at the mean of the appropriate forward exchange rate at the close of the NYSE as provided by an independent pricing service.
If the valuation designee determines that the market price for a portfolio security is not readily available or is believed by the valuation designee to be unreliable, such security is valued at fair value as determined in good faith by the valuation designee, in accordance with its policies and procedures. Circumstances that may cause the fund to determine that market quotations are not available or reliable include, but are not limited to: when there is a significant event subsequent to the market quotation; trading in a security has been halted during the trading day; or trading in a security is insufficient or did not take place due to a closure or holiday.
The valuation designee monitors for significant events occurring after the close of an investment’s primary exchange but before the fund’s NAV per share is determined. Significant events may include, but are not limited to: corporate announcements and transactions; regulatory news, governmental action and political unrest that could impact a specific investment or an investment sector; or armed conflicts, natural disasters and similar events that could affect investments in a specific country or region. The valuation designee also monitors for significant fluctuations between domestic and foreign markets, as evidenced by the U.S. market or such other indicators that it deems appropriate. The valuation designee may apply a model-derived factor to the closing price of equity securities traded on foreign securities exchanges. The factor is based on observable market data as provided by an independent pricing service.
Foreign Currency Translations — All assets and liabilities, including investment securities and other financial instruments, initially expressed in foreign currencies are translated into U.S. dollars each day at the mean of the appropriate currency exchange rate at the close of the NYSE as provided by an independent pricing service. The fund may enter into spot foreign currency exchange contracts to facilitate transactions denominated in a foreign currency. Purchases and sales of investment securities, dividend and interest income, spot foreign currency exchange contracts, and expenses are translated at the rates of exchange prevailing on the respective dates of such transactions. Net realized and unrealized foreign currency exchange gains or losses related to investment securities are a component of net realized gain (loss) on investment transactions and change in net unrealized appreciation (depreciation) on investments, respectively.
Security Transactions — Security transactions are accounted for as of the trade date. Net realized gains and losses are determined on the identified cost basis, which is also used for federal income tax purposes.
Investment Income — Interest income is recorded on the accrual basis and includes paydown gain (loss) and accretion of discounts and amortization of premiums. Inflation adjustments related to inflation-linked debt securities are reflected as interest income. Dividend income less foreign taxes withheld, if any, is recorded as of the ex-dividend date. Distributions received on securities that represent a return of capital or long-term capital gain are recorded as a reduction of cost of investments and/or as a realized gain. The fund may estimate the components of distributions received that may be considered nontaxable distributions or long-term capital gain distributions for income tax purposes. Income and capital gain distributions, if any, from the affiliated funds are recorded as of the ex-dividend date. Securities lending income is net of fees and rebates earned by the lending agent for its services.
Income Tax Status — It is the fund's policy to distribute substantially all net investment income and net realized gains to shareholders and to otherwise qualify as a regulated investment company under provisions of the Internal Revenue Code. Accordingly, no provision has been made for income taxes. The fund files U.S. federal, state, local and non-U.S. tax returns as applicable. The fund's tax returns are subject to examination by the relevant taxing authority until expiration of the applicable statute of limitations, which is generally three years from the date of filing but can be longer in certain jurisdictions. At this time, management believes there are no uncertain tax positions which, based on their technical merit, would not be sustained upon examination and for which it is reasonably possible that the total amounts of unrecognized tax benefits will significantly change in the next twelve months.
Multiple Class — All shares of the fund represent an equal pro rata interest in the net assets of the class to which such shares belong, and have identical voting, dividend, liquidation and other rights and the same terms and conditions, except for class specific expenses and exclusive rights to vote on matters affecting only individual classes. Income, non-class specific expenses, and realized and unrealized capital gains and losses of the fund are allocated to each class of shares based on their relative net assets.
Distributions to Shareholders — Distributions from net investment income, if any, are generally declared and paid quarterly. Distributions from net realized gains, if any, are generally declared and paid annually. The fund may elect to treat a portion of its payment to a redeeming shareholder, which represents the pro rata share of undistributed net investment income and net realized gains, as a distribution for federal income tax purposes (tax equalization).
Indemnifications — Under the corporation’s organizational documents, its officers and directors are indemnified against certain liabilities arising out of the performance of their duties to the fund. In addition, in the normal course of business, the fund enters into contracts that provide general indemnifications. The maximum exposure under these arrangements is unknown as this would involve future claims that may be made against a fund. The risk of material loss from such claims is considered by management to be remote.
Securities Lending — Securities are lent to qualified financial institutions and brokers. State Street Bank & Trust Co. serves as securities lending agent to the fund pursuant to a Securities Lending Agreement. The lending of securities exposes the fund to risks such as: the borrowers may fail to return the loaned securities, the borrowers may not be able to provide additional collateral, the fund may experience delays in recovery of the loaned securities or delays in access to collateral, or the fund may experience losses related to the investment collateral. To minimize certain risks, loan counterparties pledge collateral in the form of cash and/or securities. The lending agent has agreed to indemnify the fund in the case of default of any securities borrowed. Cash collateral received is invested in the State Street Navigator Securities Lending Government Money Market Portfolio, a money market mutual fund registered under the 1940 Act. The loans may also be secured by U.S. government securities in an amount at least equal to the market value of the securities loaned, plus accrued interest and dividends, determined on a daily basis and adjusted accordingly. By lending securities, the fund seeks to increase its net investment income through the receipt of interest and fees. Such income is reflected separately within the Statement of Operations. The value of loaned securities and related collateral outstanding at period end, if any, are shown on a gross basis within the Schedule of Investments and Statement of Assets and Liabilities.
The following table reflects a breakdown of transactions accounted for as secured borrowings, the gross obligation by the type of collateral pledged, and the remaining contractual maturity of those transactions as of July 31, 2024.
| | | | | | | | | | | | | | | | | |
| Remaining Contractual Maturity of Agreements |
| Overnight and Continuous | <30 days | Between 30 & 90 days | >90 days | Total |
Securities Lending Transactions(1) | | | | |
| Common Stocks | $ | 153,026 | | — | | — | | — | | $ | 153,026 | |
| Gross amount of recognized liabilities for securities lending transactions | $ | 153,026 | |
(1)Amount represents the payable for cash collateral received for securities on loan. This will generally be in the Overnight and Continuous column as the securities are typically callable on demand.
3. Fees and Transactions with Related Parties
Certain officers and directors of the corporation are also officers and/or directors of American Century Companies, Inc. (ACC). The corporation's investment advisor, ACIM, the corporation's distributor, American Century Investment Services, Inc. (ACIS), and the corporation's transfer agent, American Century Services, LLC, are wholly owned, directly or indirectly, by ACC. ACIM serves as the investment advisor for the affiliated funds.
Management Fees — The corporation has entered into a management agreement with ACIM, under which ACIM provides the fund with investment advisory and management services in exchange for a single, unified management fee (the fee) per class. The agreement provides that ACIM will pay all expenses of managing and operating the fund, except brokerage expenses, taxes, interest, fees and expenses of the independent directors (including legal counsel fees), extraordinary expenses, and expenses incurred in connection with the provision of shareholder services and distribution services under a plan adopted pursuant to Rule 12b-1 under the 1940 Act. The fee is computed and accrued daily based on each class's daily net assets and paid monthly in arrears. The difference in the fee among the classes is a result of their separate arrangements for non-Rule 12b-1 shareholder services. It is not the result of any difference in advisory or custodial fees or other expenses related to the management of the fund's assets, which do not vary by class. The rate of the fee is determined by applying a fee rate calculation formula. This formula takes into account the fund's assets as well as certain assets, if any, of other clients of the investment advisor outside the American Century Investments family of funds (such as subadvised funds and separate accounts), as well as exchange-traded funds managed by the investment advisor, that use very similar investment teams and strategies (strategy assets). The investment advisor will waive the portion of the fund's management fee equal to the expenses attributable to the management fees of the funds advised by American Century Investments in which the fund invests. The amount of this waiver will fluctuate depending on the fund's daily allocation to such funds. This waiver is expected to remain in effect permanently and it cannot be terminated without the approval of the Board of Directors. During the period ended July 31, 2024, the investment advisor agreed to waive an additional 0.18% of the fund's management fee. The investment advisor expects this waiver to continue until July 31, 2025 and cannot terminate it prior to such date without the approval of the Board of Directors.
The management fee schedule range and the effective annual management fee before and after waiver for each class for the period ended July 31, 2024 are as follows:
| | | | | | | | | | | |
| Management Fee Schedule Range | Effective Annual Management Fee |
| Before Waiver | After Waiver |
| Investor Class | 0.80% to 1.00% | 1.00% | 0.71% |
| I Class | 0.60% to 0.80% | 0.80% | 0.51% |
| A Class | 0.80% to 1.00% | 1.00% | 0.71% |
| C Class | 0.80% to 1.00% | 1.00% | 0.71% |
| R Class | 0.80% to 1.00% | 1.00% | 0.71% |
| R5 Class | 0.60% to 0.80% | 0.80% | 0.51% |
| R6 Class | 0.45% to 0.65% | 0.65% | 0.36% |
Distribution and Service Fees — The Board of Directors has adopted a separate Master Distribution and Individual Shareholder Services Plan for each of the A Class, C Class and R Class (collectively the plans), pursuant to Rule 12b-1 of the 1940 Act. The plans provide that the A Class will pay ACIS an annual distribution and service fee of 0.25%. The plans provide that the C Class will pay ACIS an annual distribution and service fee of 1.00%, of which 0.25% is paid for individual shareholder services and 0.75% is paid for distribution services. The plans provide that the R Class will pay ACIS an annual distribution and service fee of 0.50%. The fees are computed and accrued daily based on each class’s daily net assets and paid monthly in arrears. The fees are used to pay financial intermediaries for distribution and individual shareholder services. Fees incurred under the plans during the period ended July 31, 2024 are detailed in the Statement of Operations.
Directors' Fees and Expenses — The Board of Directors is responsible for overseeing the investment advisor’s management and operations of the fund. The directors receive detailed information about the fund and its investment advisor regularly throughout the year, and meet at least quarterly with management of the investment advisor to review reports about fund operations. The fund's officers do not receive compensation from the fund.
Other Expenses — A fund’s other expenses may include interest charges, clearing exchange fees, proxy solicitation expenses, fees associated with the recovery of foreign tax reclaims and other miscellaneous expenses.
Interfund Transactions — The fund may enter into security transactions with other American Century Investments funds and other client accounts of the investment advisor, in accordance with the 1940 Act rules and procedures adopted by the Board of Directors. The rules and procedures require, among other things, that these transactions be effected at the independent current market price of the security. During the period, the interfund purchases and sales were $38,147 and $15,520, respectively. The effect of interfund transactions on the Statement of Operations was $(820) in net realized gain (loss) on investment transactions.
4. Investment Transactions
Purchases of investment securities, excluding short-term investments, for the period ended July 31, 2024 totaled $86,477,870, of which $29,846,773 represented U.S. Treasury and Government Agency obligations.
Sales of investment securities, excluding short-term investments, for the period ended July 31, 2024 totaled $117,493,958, of which $22,380,100 represented U.S. Treasury and Government Agency obligations.
5. Capital Share Transactions
Transactions in shares of the fund were as follows:
| | | | | | | | | | | | | | |
| Year ended
July 31, 2024 | Year ended
July 31, 2023 |
| Shares | Amount | Shares | Amount |
| Investor Class/Shares Authorized | 500,000,000 | | | 500,000,000 | | |
| Sold | 892,378 | | $ | 4,739,938 | | 1,717,775 | | $ | 8,837,762 | |
| Issued in reinvestment of distributions | 467,961 | | 2,490,715 | | 1,113,592 | | 5,555,974 | |
| Redeemed | (4,565,609) | | (24,253,101) | | (4,484,897) | | (23,139,430) | |
| (3,205,270) | | (17,022,448) | | (1,653,530) | | (8,745,694) | |
| I Class/Shares Authorized | 120,000,000 | | | 120,000,000 | | |
| Sold | 1,109,924 | | 5,874,997 | | 1,555,334 | | 7,987,749 | |
| Issued in reinvestment of distributions | 103,710 | | 552,174 | | 292,194 | | 1,455,549 | |
| Redeemed | (1,730,234) | | (9,247,970) | | (3,914,636) | | (20,018,848) | |
| (516,600) | | (2,820,799) | | (2,067,108) | | (10,575,550) | |
| A Class/Shares Authorized | 270,000,000 | | | 270,000,000 | | |
| Sold | 1,686,051 | | 8,841,087 | | 1,760,326 | | 9,042,293 | |
| Issued in reinvestment of distributions | 260,101 | | 1,383,801 | | 634,282 | | 3,162,664 | |
| Redeemed | (3,097,932) | | (16,419,025) | | (3,004,919) | | (15,402,772) | |
| (1,151,780) | | (6,194,137) | | (610,311) | | (3,197,815) | |
| C Class/Shares Authorized | 70,000,000 | | | 70,000,000 | | |
| Sold | 224,588 | | 1,160,820 | | 155,969 | | 776,994 | |
| Issued in reinvestment of distributions | 13,047 | | 67,625 | | 53,044 | | 257,746 | |
| Redeemed | (488,428) | | (2,503,771) | | (665,450) | | (3,325,822) | |
| (250,793) | | (1,275,326) | | (456,437) | | (2,291,082) | |
| R Class/Shares Authorized | 50,000,000 | | | 50,000,000 | | |
| Sold | 677,356 | | 3,680,824 | | 304,838 | | 1,560,941 | |
| Issued in reinvestment of distributions | 29,129 | | 154,891 | | 72,879 | | 361,984 | |
| Redeemed | (631,885) | | (3,410,792) | | (644,993) | | (3,311,002) | |
| 74,600 | | 424,923 | | (267,276) | | (1,388,077) | |
| R5 Class/Shares Authorized | 150,000,000 | | | 150,000,000 | | |
| Sold | 53 | | 276 | | 139 | | 729 | |
| Issued in reinvestment of distributions | 39 | | 208 | | 79 | | 393 | |
| Redeemed | (457) | | (2,534) | | — | | (2) | |
| (365) | | (2,050) | | 218 | | 1,120 | |
| R6 Class/Shares Authorized | 235,000,000 | | | 235,000,000 | | |
| Sold | 3,846,752 | | 20,385,164 | | 3,362,374 | | 17,320,754 | |
| Issued in reinvestment of distributions | 440,923 | | 2,348,865 | | 853,673 | | 4,263,321 | |
| Redeemed | (5,382,080) | | (28,433,667) | | (2,485,887) | | (12,820,651) | |
| (1,094,405) | | (5,699,638) | | 1,730,160 | | 8,763,424 | |
| Net increase (decrease) | (6,144,613) | | $ | (32,589,475) | | (3,324,284) | | $ | (17,433,674) | |
6. Fair Value Measurements
The fund's investments valuation process is based on several considerations and may use multiple inputs to determine the fair value of the investments held by the fund. In conformity with accounting principles generally accepted in the United States of America, the inputs used to determine a valuation are classified into three broad levels.
•Level 1 valuation inputs consist of unadjusted quoted prices in an active market for identical investments.
•Level 2 valuation inputs consist of direct or indirect observable market data (including quoted prices for comparable investments, evaluations of subsequent market events, interest rates, prepayment speeds, credit risk, etc.). These inputs also consist of quoted prices for identical investments initially expressed in local currencies that are adjusted through translation into U.S. dollars.
•Level 3 valuation inputs consist of unobservable data (including a fund’s own assumptions).
The level classification is based on the lowest level input that is significant to the fair valuation measurement. The valuation inputs are not necessarily an indication of the risks associated with investing in these securities or other financial instruments.
The following is a summary of the level classifications as of period end. The Schedule of Investments provides additional information on the fund's portfolio holdings.
| | | | | | | | | | | |
| Level 1 | Level 2 | Level 3 |
| Assets | | | |
| Investment Securities | | | |
| Affiliated Funds | $ | 120,565,904 | | — | | — | |
| U.S. Treasury Securities | — | | $ | 77,009,040 | | — | |
| Common Stocks | 44,850,587 | | 14,273,070 | | — | |
| Sovereign Governments and Agencies | — | | 16,788,134 | | — | |
| Corporate Bonds | — | | 9,406,418 | | — | |
| Collateralized Loan Obligations | — | | 3,603,435 | | — | |
| Preferred Stocks | — | | 1,219,506 | | — | |
| Asset-Backed Securities | — | | 1,212,378 | | — | |
| Municipal Securities | — | | 1,090,628 | | — | |
| Collateralized Mortgage Obligations | — | | 769,142 | | — | |
| Exchange-Traded Funds | 661,571 | | — | | — | |
| U.S. Government Agency Mortgage-Backed Securities | — | | 416,697 | | — | |
| Short-Term Investments | 12,499,796 | | 19,251,543 | | — | |
| $ | 178,577,858 | | $ | 145,039,991 | | — | |
| Other Financial Instruments | | | |
| Futures Contracts | $ | 343,722 | | $ | 92,380 | | — | |
| Swap Agreements | — | | 60,007 | | — | |
| Forward Foreign Currency Exchange Contracts | — | | 53,315 | | — | |
| $ | 343,722 | | $ | 205,702 | | — | |
| | | |
| Liabilities | | | |
| Other Financial Instruments | | | |
| Swap Agreements | — | | $ | 209,728 | | — | |
| Forward Foreign Currency Exchange Contracts | — | | 183,479 | | — | |
| — | | $ | 393,207 | | — | |
7. Derivative Instruments
Credit Risk — The fund is subject to credit risk in the normal course of pursuing its investment objectives. The value of a bond generally declines as the credit quality of its issuer declines. Credit default swap agreements enable a fund to buy/sell protection against a credit event of a specific issuer or index. A fund may attempt to enhance returns by selling protection or attempt to mitigate credit risk by buying protection. The buyer/seller of credit protection against a security or basket of securities may pay/receive an up-front or periodic payment to compensate for/against potential default events. Changes in value, including the periodic amounts of interest to be paid or received on swap agreements, are recorded as unrealized appreciation (depreciation) on swap agreements. Upon entering into a centrally cleared swap, a fund is required to deposit cash or securities (initial margin) with a financial intermediary in an amount equal to a certain percentage of the notional amount. A fund may incur charges or earn income on cash deposit balances, which are reflected in interest expenses or interest income, respectively. Subsequent payments (variation margin) are made or received daily, in cash, by a fund. The variation margin is equal to the daily change in the value and is a component of unrealized gains and losses. Realized gain or loss is recorded upon receipt or payment of a periodic settlement or termination of swap agreements. Net realized and unrealized gains or losses occurring during the holding period of swap agreements are a component of net realized gain (loss) on swap agreement transactions and change in net unrealized appreciation (depreciation) on swap agreements, respectively. The risks of entering into swap agreements include the possible lack of liquidity, failure of the counterparty to meet its obligations, and that there may be unfavorable changes in the underlying investments or instruments. The fund's average notional amount held during the period was $3,799,761.
Foreign Currency Risk — The fund is subject to foreign currency exchange rate risk in the normal course of pursuing its investment objectives. The value of foreign investments held by a fund may be significantly affected by changes in foreign currency exchange rates. The dollar value of a foreign security generally decreases when the value of the dollar rises against the foreign currency in which the security is denominated and tends to increase when the value of the dollar declines against such foreign currency. A fund may enter into forward foreign currency exchange contracts to reduce a fund's exposure to foreign currency exchange rate fluctuations or to gain exposure to the fluctuations in the value of foreign currencies. A fund will segregate cash, cash equivalents or other appropriate liquid securities on its records in amounts sufficient to meet requirements. The net U.S. dollar value of foreign currency underlying all contractual commitments held by a fund and the resulting unrealized appreciation or depreciation are determined daily. Realized gain or loss is recorded upon settlement of the contract. Net realized and unrealized gains or losses occurring during the holding period of forward foreign currency exchange contracts are a component of net realized gain (loss) on forward foreign currency exchange contract transactions and change in net unrealized appreciation (depreciation) on forward foreign currency exchange contracts, respectively. A fund bears the risk of an unfavorable change in the foreign currency exchange rate underlying the forward contract. Additionally, losses, up to the fair value, may arise if the counterparties do not perform under the contract terms. The fund's average U.S. dollar exposure to foreign currency risk derivative instruments held during the period was $22,616,724.
Interest Rate Risk — The fund is subject to interest rate risk in the normal course of pursuing its investment objectives. The value of bonds generally declines as interest rates rise. A fund may enter into futures contracts based on a bond index or a specific underlying security. A fund may purchase futures contracts to gain exposure to increases in market value or sell futures contracts to protect against a decline in market value. Upon entering into a futures contract, a fund will segregate cash, cash equivalents or other appropriate liquid securities on its records in amounts sufficient to meet requirements. A fund may incur charges or earn income on cash deposit balances, which are reflected in interest expenses or interest income, respectively. Subsequent payments (variation margin) are made or received daily, in cash, by a fund. The variation margin is equal to the daily change in the contract value and is recorded as unrealized gains and losses. A fund recognizes a realized gain or loss when the futures contract is closed or expires. Net realized and unrealized gains or losses occurring during the holding period of futures contracts are a component of net realized gain (loss) on futures contract transactions and change in net unrealized appreciation (depreciation) on futures contracts, respectively. One of the risks of entering into futures contracts is the possibility that the change in value of the contract may not correlate with the changes in value of the underlying securities. The fund's average notional exposure to interest rate risk derivative instruments held during the period was $30,333,708 futures contracts purchased.
Value of Derivative Instruments as of July 31, 2024
| | | | | | | | | | | | | | |
| Asset Derivatives | Liability Derivatives |
| Type of Risk Exposure | Location on Statement of Assets and Liabilities | Value | Location on Statement of Assets and Liabilities | Value |
| Credit Risk | Receivable for variation margin on swap agreements* | — | | Payable for variation margin on swap agreements* | $ | 3,452 | |
| Foreign Currency Risk | Unrealized appreciation on forward foreign currency exchange contracts | $ | 53,315 | | Unrealized depreciation on forward foreign currency exchange contracts | 183,479 | |
| Interest Rate Risk | Receivable for variation margin on futures contracts* | 39,600 | | Payable for variation margin on futures contracts* | — | |
| | $ | 92,915 | | | $ | 186,931 | |
*Included in the unrealized appreciation (depreciation) on futures contracts or centrally cleared swap agreements, as applicable, as reported in the Schedule of Investments.
Effect of Derivative Instruments on the Statement of Operations for the Year Ended July 31, 2024
| | | | | | | | | | | | | | |
| Net Realized Gain (Loss) | Change in Net Unrealized Appreciation (Depreciation) |
| Type of Risk Exposure | Location on Statement of Operations | Value | Location on Statement of Operations | Value |
| Credit Risk | Net realized gain (loss) on swap agreement transactions | $ | (148,459) | | Change in net unrealized appreciation (depreciation) on swap agreements | $ | 65,898 | |
| Foreign Currency Risk | Net realized gain (loss) on forward foreign currency exchange contract transactions | 271,030 | | Change in net unrealized appreciation (depreciation) on forward foreign currency exchange contracts | 74,649 | |
| Interest Rate Risk | Net realized gain (loss) on futures contract transactions | (996,559) | | Change in net unrealized appreciation (depreciation) on futures contracts | 742,153 | |
| | $ | (873,988) | | | $ | 882,700 | |
8. Risk Factors
The value of the fund’s shares will go up and down, sometimes rapidly or unpredictably, based on the performance of the securities owned by the fund and other factors generally affecting the securities market. Market risks, including political, regulatory, economic and social developments, can affect the value of the fund’s investments. Natural disasters, public health emergencies, war, terrorism and other unforeseeable events may lead to increased market volatility and may have adverse long-term effects on world economies and markets generally.
There are certain risks involved in investing in foreign securities. These risks include those resulting from political events (such as civil unrest, national elections and imposition of exchange controls), social and economic events (such as labor strikes and rising inflation), and natural disasters. Securities of foreign issuers may be less liquid and more volatile. Investing in emerging markets or a significant portion of assets in one country or region may accentuate these risks.
9. Federal Tax Information
The tax character of distributions paid during the years ended July 31, 2024 and July 31, 2023 were as follows:
| | | | | | | | |
| 2024 | 2023 |
| Distributions Paid From | | |
| Ordinary income | $ | 6,876,315 | | $ | 7,078,534 | |
| Long-term capital gains | $ | 220,711 | | $ | 8,180,966 | |
The book-basis character of distributions made during the year from net investment income or net realized gains may differ from their ultimate characterization for federal income tax purposes. These differences reflect the differing character of certain income items and net realized gains and losses for financial statement and tax purposes, and may result in reclassification among certain capital accounts on the financial statements.
As of period end, the federal tax cost of investments and the components of distributable earnings on a tax-basis were as follows:
| | | | | |
| Federal tax cost of investments | $ | 293,910,138 | |
| Gross tax appreciation of investments | $ | 46,951,049 | |
| Gross tax depreciation of investments | (17,243,338) | |
| Net tax appreciation (depreciation) of investments | 29,707,711 | |
| Net tax appreciation (depreciation) on derivatives and translation of assets and liabilities in foreign currencies | (126,585) | |
| Net tax appreciation (depreciation) | $ | 29,581,126 | |
| Other book-to-tax adjustments | $ | (16,573) | |
| Undistributed ordinary income | $ | 2,221,617 | |
| Accumulated long-term gains | $ | 7,841,286 | |
The difference between book-basis and tax-basis unrealized appreciation (depreciation) is attributable primarily to the tax deferral of losses on wash sales. Other book-to-tax adjustments are attributable primarily to the tax deferral of losses on straddle positions.
10. Investments in Affiliated Funds
The fund does not invest in an affiliated fund for the purpose of exercising management or control; however, investments by the fund within its investment strategy may represent a significant portion of an affiliated fund's net assets.
11. Affiliated Fund Transactions
A summary of transactions for each affiliated fund for the period ended July 31, 2024 follows (amounts in thousands):
| | | | | | | | | | | | | | | | | | | | | | | | | | |
Affiliated Fund(1) | Beginning
Value | Purchase
Cost | Sales Cost | Change in Net
Unrealized
Appreciation
(Depreciation) | Ending
Value | Ending
Shares | Net Realized
Gain (Loss) | Distributions
Received(2) |
| American Century Diversified Corporate Bond ETF | $ | 17,764 | | — | | — | | $ | 543 | | $ | 18,307 | | 389 | | — | | $ | 873 | |
| American Century Emerging Markets Bond ETF | 5,913 | | — | | — | | 148 | | 6,061 | | 156 | | — | | 360 | |
American Century Focused Dynamic Growth ETF(3) | 4,230 | | $ | 1,552 | | $ | 1,134 | | 1,329 | | 5,977 | | 68 | | $ | 158 | | — | |
| American Century Focused Large Cap Value ETF | 6,233 | | 118 | | 959 | | 373 | | 5,765 | | 87 | | 174 | | 126 | |
| American Century Multisector Income ETF | 15,038 | | 1,066 | | — | | 458 | | 16,562 | | 378 | | — | | 893 | |
| American Century Quality Diversified International ETF | 9,579 | | 296 | | 1,537 | | 544 | | 8,882 | | 178 | | 232 | | 297 | |
| American Century Short Duration Strategic Income ETF | 1,608 | | — | | — | | 26 | | 1,634 | | 32 | | — | | 90 | |
| American Century U.S. Quality Growth ETF | 14,211 | | 2,264 | | 3,032 | | 2,110 | | 15,553 | | 181 | | 715 | | 51 | |
| American Century U.S. Quality Value ETF | 18,706 | | 2,067 | | 3,930 | | 1,579 | | 18,422 | | 312 | | 1,020 | | 277 | |
| Avantis International Equity ETF | 10,414 | | 123 | | 5,765 | | (603) | | 4,169 | | 65 | | 1,313 | | 237 | |
| Avantis International Small Cap Value ETF | 1,865 | | 49 | | 345 | | 120 | | 1,689 | | 25 | | 57 | | 53 | |
| Avantis U.S. Equity ETF | 14,651 | | 1,482 | | 2,832 | | 897 | | 14,198 | | 153 | | 1,387 | | 194 | |
| Avantis U.S. Small Cap Value ETF | 2,758 | | 781 | | 647 | | 455 | | 3,347 | | 34 | | 111 | | 55 | |
| $ | 122,970 | | $ | 9,798 | | $ | 20,181 | | $ | 7,979 | | $ | 120,566 | | 2,058 | | $ | 5,167 | | $ | 3,506 | |
(1)Investments are funds within the American Century Investments family of funds and are considered affiliated funds. Additional information and attributes of each affiliated fund are available at americancentury.com or avantisinvestors.com.
(2)Distributions received includes distributions from net investment income and from capital gains, if any.
(3)Non-income producing.
| | | | | | | | | | | | | | | | | | | | | | | | | | | | | | | | | | | | | | | | | | | | | | | |
| For a Share Outstanding Throughout the Years Ended July 31 (except as noted) | | | | | |
| Per-Share Data | | Ratios and Supplemental Data |
| | Income From Investment Operations*: | Distributions From: | | | Ratio to Average Net Assets of†: | | |
| Net Asset Value, Beginning of Period | Net Investment Income (Loss)(1) | Net Realized and Unrealized Gain (Loss) | Total From Investment Operations | Net
Investment
Income | Net
Realized
Gains | Total
Distributions | Net Asset Value, End of Period | Total Return(2) | Operating
Expenses | Operating
Expenses
(before
expense
waiver) | Net
Investment
Income
(Loss) | Net Investment Income (Loss) (before expense
waiver) | Portfolio
Turnover
Rate | Net Assets, End of
Period (in
thousands) |
| Investor Class | | | | | | | | | | | | | |
| 2024 | $5.26 | 0.13 | 0.35 | 0.48 | (0.11) | —(3) | (0.11) | $5.63 | 9.37% | 0.72% | 1.01% | 2.49% | 2.20% | 30% | $116,902 | |
| 2023 | $5.35 | 0.12 | 0.03 | 0.15 | (0.11) | (0.13) | (0.24) | $5.26 | 3.04% | 0.72% | 1.01% | 2.39% | 2.10% | 21% | $126,027 | |
| 2022 | $6.39 | 0.12 | (0.61) | (0.49) | (0.12) | (0.43) | (0.55) | $5.35 | (8.39)% | 0.72% | 1.01% | 2.00% | 1.71% | 40% | $136,990 | |
| 2021 | $5.65 | 0.08 | 0.92 | 1.00 | (0.07) | (0.19) | (0.26) | $6.39 | 18.09% | 0.76% | 1.00% | 1.38% | 1.14% | 57% | $167,285 | |
| 2020 | $5.67 | 0.06 | 0.37 | 0.43 | (0.07) | (0.38) | (0.45) | $5.65 | 7.89% | 0.85% | 1.01% | 1.09% | 0.93% | 87% | $144,395 | |
| I Class | | | | | | | | | | | | | |
| 2024 | $5.26 | 0.14 | 0.35 | 0.49 | (0.12) | —(3) | (0.12) | $5.63 | 9.59% | 0.52% | 0.81% | 2.69% | 2.40% | 30% | $22,876 | |
| 2023 | $5.35 | 0.13 | 0.03 | 0.16 | (0.12) | (0.13) | (0.25) | $5.26 | 3.24% | 0.52% | 0.81% | 2.59% | 2.30% | 21% | $24,080 | |
| 2022 | $6.40 | 0.13 | (0.62) | (0.49) | (0.13) | (0.43) | (0.56) | $5.35 | (8.35)% | 0.52% | 0.81% | 2.20% | 1.91% | 40% | $35,548 | |
| 2021 | $5.65 | 0.10 | 0.93 | 1.03 | (0.09) | (0.19) | (0.28) | $6.40 | 18.51% | 0.56% | 0.80% | 1.58% | 1.34% | 57% | $38,058 | |
| 2020 | $5.67 | 0.07 | 0.37 | 0.44 | (0.08) | (0.38) | (0.46) | $5.65 | 8.11% | 0.65% | 0.81% | 1.29% | 1.13% | 87% | $27,985 | |
| A Class | | | | | | | | | | | | | |
| 2024 | $5.25 | 0.12 | 0.35 | 0.47 | (0.10) | —(3) | (0.10) | $5.62 | 9.12% | 0.97% | 1.26% | 2.24% | 1.95% | 30% | $73,419 | |
| 2023 | $5.34 | 0.11 | 0.03 | 0.14 | (0.10) | (0.13) | (0.23) | $5.25 | 2.77% | 0.97% | 1.26% | 2.14% | 1.85% | 21% | $74,616 | |
| 2022 | $6.39 | 0.10 | (0.62) | (0.52) | (0.10) | (0.43) | (0.53) | $5.34 | (8.78)% | 0.97% | 1.26% | 1.75% | 1.46% | 40% | $79,128 | |
| 2021 | $5.65 | 0.07 | 0.92 | 0.99 | (0.06) | (0.19) | (0.25) | $6.39 | 17.79% | 1.01% | 1.25% | 1.13% | 0.89% | 57% | $92,011 | |
| 2020 | $5.67 | 0.05 | 0.36 | 0.41 | (0.05) | (0.38) | (0.43) | $5.65 | 7.62% | 1.10% | 1.26% | 0.84% | 0.68% | 87% | $78,047 | |
| C Class | | | | | | | | | | | | |
| 2024 | $5.12 | 0.08 | 0.34 | 0.42 | (0.06) | —(3) | (0.06) | $5.48 | 8.37% | 1.72% | 2.01% | 1.49% | 1.20% | 30% | $5,172 | |
| 2023 | $5.21 | 0.07 | 0.03 | 0.10 | (0.06) | (0.13) | (0.19) | $5.12 | 2.05% | 1.72% | 2.01% | 1.39% | 1.10% | 21% | $6,118 | |
| 2022 | $6.24 | 0.06 | (0.60) | (0.54) | (0.06) | (0.43) | (0.49) | $5.21 | (9.37)% | 1.72% | 2.01% | 1.00% | 0.71% | 40% | $8,606 | |
| 2021 | $5.53 | 0.02 | 0.90 | 0.92 | (0.02) | (0.19) | (0.21) | $6.24 | 16.90% | 1.76% | 2.00% | 0.38% | 0.14% | 57% | $11,902 | |
| 2020 | $5.57 | 0.01 | 0.35 | 0.36 | (0.02) | (0.38) | (0.40) | $5.53 | 6.78% | 1.85% | 2.01% | 0.09% | (0.07)% | 87% | $14,851 | |
| R Class | | | | | | | | | | | | | |
| 2024 | $5.24 | 0.11 | 0.35 | 0.46 | (0.09) | —(3) | (0.09) | $5.61 | 8.86% | 1.22% | 1.51% | 1.99% | 1.70% | 30% | $9,714 | |
| 2023 | $5.32 | 0.10 | 0.03 | 0.13 | (0.08) | (0.13) | (0.21) | $5.24 | 2.72% | 1.22% | 1.51% | 1.89% | 1.60% | 21% | $8,681 | |
| 2022 | $6.37 | 0.09 | (0.62) | (0.53) | (0.09) | (0.43) | (0.52) | $5.32 | (9.04)% | 1.22% | 1.51% | 1.50% | 1.21% | 40% | $10,251 | |
| 2021 | $5.63 | 0.05 | 0.93 | 0.98 | (0.05) | (0.19) | (0.24) | $6.37 | 17.59% | 1.26% | 1.50% | 0.88% | 0.64% | 57% | $11,768 | |
| 2020 | $5.65 | 0.03 | 0.37 | 0.40 | (0.04) | (0.38) | (0.42) | $5.63 | 7.37% | 1.35% | 1.51% | 0.59% | 0.43% | 87% | $10,783 | |
| | | | | | | | | | | | | | | | | | | | | | | | | | | | | | | | | | | | | | | | | | | | | | | |
| For a Share Outstanding Throughout the Years Ended July 31 (except as noted) | | | | | |
| Per-Share Data | | Ratios and Supplemental Data |
| | Income From Investment Operations*: | Distributions From: | | | Ratio to Average Net Assets of†: | | |
| Net Asset Value, Beginning of Period | Net Investment Income (Loss)(1) | Net Realized and Unrealized Gain (Loss) | Total From Investment Operations | Net
Investment
Income | Net
Realized
Gains | Total
Distributions | Net Asset Value, End of Period | Total Return(2) | Operating
Expenses | Operating
Expenses
(before
expense
waiver) | Net
Investment
Income
(Loss) | Net Investment Income (Loss) (before expense
waiver) | Portfolio
Turnover
Rate | Net Assets, End of
Period (in
thousands) |
| R5 Class | | | | | | | | | | | | | |
| 2024 | $5.27 | 0.14 | 0.35 | 0.49 | (0.12) | —(3) | (0.12) | $5.64 | 9.57% | 0.52% | 0.81% | 2.69% | 2.40% | 30% | $8 | |
| 2023 | $5.36 | 0.13 | 0.03 | 0.16 | (0.12) | (0.13) | (0.25) | $5.27 | 3.23% | 0.52% | 0.81% | 2.59% | 2.30% | 21% | $9 | |
| 2022 | $6.41 | 0.10 | (0.59) | (0.49) | (0.13) | (0.43) | (0.56) | $5.36 | (8.34)% | 0.52% | 0.81% | 2.20% | 1.91% | 40% | $8 | |
| 2021 | $5.66 | 0.10 | 0.93 | 1.03 | (0.09) | (0.19) | (0.28) | $6.41 | 18.48% | 0.56% | 0.80% | 1.58% | 1.34% | 57% | $38,543 | |
| 2020 | $5.68 | 0.07 | 0.37 | 0.44 | (0.08) | (0.38) | (0.46) | $5.66 | 8.10% | 0.65% | 0.81% | 1.29% | 1.13% | 87% | $34,465 | |
| R6 Class | | | | | | | | | | | | | |
| 2024 | $5.26 | 0.15 | 0.35 | 0.50 | (0.13) | —(3) | (0.13) | $5.63 | 9.76% | 0.37% | 0.66% | 2.84% | 2.55% | 30% | $95,526 | |
| 2023 | $5.35 | 0.14 | 0.03 | 0.17 | (0.13) | (0.13) | (0.26) | $5.26 | 3.40% | 0.37% | 0.66% | 2.74% | 2.45% | 21% | $94,974 | |
| 2022 | $6.40 | 0.14 | (0.62) | (0.48) | (0.14) | (0.43) | (0.57) | $5.35 | (8.21)% | 0.37% | 0.66% | 2.35% | 2.06% | 40% | $87,310 | |
| 2021 | $5.66 | 0.10 | 0.93 | 1.03 | (0.10) | (0.19) | (0.29) | $6.40 | 18.48% | 0.41% | 0.65% | 1.73% | 1.49% | 57% | $92,483 | |
| 2020 | $5.68 | 0.08 | 0.37 | 0.45 | (0.09) | (0.38) | (0.47) | $5.66 | 8.28% | 0.50% | 0.66% | 1.44% | 1.28% | 87% | $74,665 | |
| | | | | |
| Notes to Financial Highlights |
(1)Computed using average shares outstanding throughout the period.
(2)Total returns are calculated based on the net asset value of the last business day and do not reflect applicable sales charges, if any. Total returns for periods less than one year are not annualized.
(3)Per-share amount was less than $0.005.
*The amount shown for a share outstanding throughout the period may not correlate with the Statement(s) of Operations or precisely reflect the class expense differentials due to the timing of transactions in shares of a fund in relation to income earned and/or fluctuations in the fair value of a fund's investments.
†Ratios for periods less than one year are annualized. Zero balances may reflect amounts less than 0.005%.
See Notes to Financial Statements.
| | |
| Report of Independent Registered Public Accounting Firm |
To the shareholders of the Strategic Allocation: Conservative Fund and the Board of Directors of American Century Strategic Asset Allocations, Inc.:
Opinion on the Financial Statements and Financial Highlights
We have audited the accompanying statement of assets and liabilities, including the schedule of investments, of Strategic Allocation: Conservative Fund (the “Fund”), one of the funds constituting the American Century Strategic Asset Allocations, Inc., as of July 31, 2024, the related statement of operations for the year then ended, the statements of changes in net assets for each of the two years in the period then ended, the financial highlights for each of the five years in the period then ended, and the related notes. In our opinion, the financial statements and financial highlights present fairly, in all material respects, the financial position of the Fund as of July 31, 2024, and the results of its operations for the year then ended, the changes in its net assets for each of the two years in the period then ended, and the financial highlights for each of the five years in the period then ended, in conformity with accounting principles generally accepted in the United States of America.
Basis for Opinion
These financial statements and financial highlights are the responsibility of the Fund's management. Our responsibility is to express an opinion on the Fund’s financial statements and financial highlights based on our audits. We are a public accounting firm registered with the Public Company Accounting Oversight Board (United States) (PCAOB) and are required to be independent with respect to the Fund in accordance with the U.S. federal securities laws and the applicable rules and regulations of the Securities and Exchange Commission and the PCAOB.
We conducted our audits in accordance with the standards of the PCAOB. Those standards require that we plan and perform the audit to obtain reasonable assurance about whether the financial statements and financial highlights are free of material misstatement, whether due to error or fraud. The Fund is not required to have, nor were we engaged to perform, an audit of its internal control over financial reporting. As part of our audits, we are required to obtain an understanding of internal control over financial reporting but not for the purpose of expressing an opinion on the effectiveness of the Fund’s internal control over financial reporting. Accordingly, we express no such opinion.
Our audits included performing procedures to assess the risks of material misstatement of the financial statements and financial highlights, whether due to error or fraud, and performing procedures that respond to those risks. Such procedures included examining, on a test basis, evidence regarding the amounts and disclosures in the financial statements and financial highlights. Our audits also included evaluating the accounting principles used and significant estimates made by management, as well as evaluating the overall presentation of the financial statements and financial highlights. Our procedures included confirmation of securities owned as of July 31, 2024, by correspondence with the custodian and brokers; when replies were not received from brokers, we performed other auditing procedures. We believe that our audits provide a reasonable basis for our opinion.
/s/ Deloitte & Touche LLP
Kansas City, Missouri
September 17, 2024
We have served as the auditor of one or more American Century investment companies since 1997.
| | |
| Approval of Management Agreement |
At a meeting held on June 27, 2024, the Fund’s Board of Directors (the “Board”) unanimously approved the renewal of the management agreement pursuant to which American Century Investment Management, Inc. (the “Advisor”) acts as the investment advisor for the Fund. Under the Investment Company Act of 1940 (the “Investment Company Act”), contracts for investment advisory services are required to be reviewed, evaluated, and approved by a majority of a fund’s Directors, including a majority of the independent Directors.
Prior to its consideration of the renewal of the management agreement, the Directors requested and reviewed data and information compiled by the Advisor and certain independent consultants and data providers concerning the Fund. This review was in addition to the oversight and evaluation undertaken by the Board and its committees on a continual basis and the information received was supplemental to the information that the Board and its committees receive and consider over time.
In connection with its consideration of the renewal of the management agreement, the Board’s review and evaluation of the services provided by the Advisor and its affiliates included, but was not limited to
•the nature, extent, and quality of investment management, shareholder services, distribution services, and other services provided to the Fund;
•the wide range of programs and services the Advisor and other service providers provide to the Fund and its shareholders on a routine and non-routine basis;
•the Fund’s investment performance compared to appropriate benchmarks and/or peer groups of other mutual funds with similar investment objectives and strategies;
•the cost of owning the Fund compared to the cost of owning similarly-managed funds;
•the Advisor’s compliance policies, procedures, and regulatory experience and those of certain other service providers;
•the Advisor’s strategic plans, generally, and with respect to the Advisor’s response to investment management industry challenges;
•the Advisor’s business continuity plans, vendor management practices, and information security practices;
•the cost of services provided to the Fund, the profitability of the Fund to the Advisor, and the Advisor’s financial results of operation;
•possible economies of scale associated with the Advisor’s management of the Fund;
•any collateral benefits derived by the Advisor from the management of the Fund;
•fees and expenses associated with any investment by the Fund in other funds;
•payments to intermediaries by the Fund and the Advisor and services provided by intermediaries in connection therewith; and
•services provided and charges to the Advisor’s other investment management clients.
The Board held two meetings to consider the renewal. The independent Directors also met in private session multiple times to review and discuss the information provided in response to their request. The independent Directors held active discussions with the Advisor regarding the renewal of the management agreement, requesting supplemental information, and reviewing information provided by the Advisor in response thereto. The independent Directors had the benefit of the advice of their independent counsel throughout the process.
Factors Considered
The Directors considered all of the information provided by the Advisor, the independent consultant and data providers, and the independent Directors’ independent counsel in connection with the approval. They determined that the information was sufficient for them to evaluate the management agreement for the Fund. In connection with their review, the Directors did not identify any single factor as being all-important or controlling, and each Director may have attributed different levels of importance to different factors. In deciding to renew the management agreement, the Board based its decision on a number of factors, including without limitation the following:
Nature, Extent and Quality of Services — Generally. Under the management agreement, the Advisor is responsible for providing or arranging for all services necessary for the operation of the Fund. The Board noted that the Advisor provides or arranges at its own expense a wide variety of services which include, without limitation, the following:
•constructing and designing the Fund
•portfolio research and security selection
•initial capitalization/funding
•securities trading
•Fund administration
•custody of Fund assets
•daily valuation of the Fund’s portfolio
•liquidity monitoring and management
•risk management, including information security
•shareholder servicing and transfer agency, including shareholder confirmations, recordkeeping, and communications
•legal services (except the independent Directors’ counsel)
•regulatory and portfolio compliance
•financial reporting
•marketing and distribution (except amounts paid by the Fund under Rule 12b-1 plans)
The Board noted that many of these services have expanded over time in terms of both quantity and complexity in response to shareholder demands, competition in the industry, changing distribution channels, and the changing regulatory environment.
Investment Management Services. The nature of the investment management services provided to the Fund is quite complex and allows Fund shareholders access to professional money management, instant diversification of their investments, the opportunity to easily diversify among asset classes by investing in or exchanging among various American Century Investments funds, and liquidity. In evaluating investment performance, the Board expects the Advisor to manage the Fund in accordance with its investment objectives and principal investment strategies. Further, the Directors recognize that the Advisor has an obligation to monitor trading activities, and in particular to seek the best execution of fund trades, and to evaluate the use of and payment for research. In providing these services, the Advisor utilizes teams of investment professionals who require extensive information technology, research, training, compliance, and other systems to conduct their business. The Board, directly and through its Fund Performance Review Committee, provides oversight of the investment performance process. It regularly reviews investment performance information for the Fund, together with comparative information for appropriate benchmarks and/or peer groups of similarly-managed funds, over different time horizons. The Directors also review investment performance information from both the Advisor and an independent third party during the management agreement renewal process. If performance concerns are identified, the Board discusses with the Advisor the reasons for such results and any actions being taken to improve performance and may conduct special reviews until performance improves. The Fund’s performance was above its benchmark for the three-, five-, and ten-year periods and below its benchmark for the one-year period reviewed by the Board. In relation to industry peers, the Fund was below the median of its peer performance universe as identified by a third-party service provider for the one-, three-, five- and ten-year periods. The Board found the investment management services provided by the Advisor to the Fund to be satisfactory and consistent with the management agreement.
Shareholder and Other Services. Under the management agreement, the Advisor provides the Fund with a comprehensive package of transfer agency, shareholder, and other services. The Board, directly and through its various committees, regularly reviews reports and evaluations of such services at its regular meetings. These reports include, but are not limited to, information regarding the operational efficiency and accuracy of the shareholder and transfer agency services provided, staffing levels, shareholder satisfaction, technology support (including information security), new products and services offered to Fund shareholders, securities trading activities, portfolio valuation services, auditing services, and legal and operational compliance activities. The Board found the services provided by the Advisor to the Fund under the management agreement to be competitive and of high quality.
Costs of Services and Profitability. The Advisor provides detailed information concerning its cost of providing various services to the Fund, its profitability in managing the Fund (pre- and post-distribution), and its financial results of operation. The Directors have reviewed with the Advisor the methodology used to prepare this financial information and arranged for an independent consultant to confirm the reasonableness of the allocation methodology used. This information is considered in evaluating the Advisor’s financial condition, its ability to continue to provide services under the management agreement, and the reasonableness of the terms of the current management agreement. The Board concluded that the Advisor’s profits were reasonable in light of the services provided to the Fund.
Ethics. The Board generally considers the Advisor’s commitment to providing quality services to shareholders and to conducting its business ethically. They noted that the Advisor’s practices generally meet or exceed industry best practices.
Economies of Scale. The Board also reviewed information provided by the Advisor regarding the possible existence of economies of scale in connection with the management of the Fund. The Board concluded that economies of scale are difficult to measure and predict with precision, especially on a fund-by-fund basis. The Board concluded that the Advisor is sharing economies of scale, to the extent they exist, through its fee structure, and through reinvestment in its business, infrastructure, investment capabilities and initiatives to provide shareholders enhanced and expanded content and services. The Board also noted that economies of scale are shared with the Fund and its shareholders through management fee breakpoints that serve to reduce the effective management fee as the assets of the Fund grow.
Comparison to Other Funds’ Fees. The management agreement provides that the Fund pays the Advisor a single, all-inclusive (or unified) management fee for providing all services necessary for the management and operation of the Fund, other than brokerage and other transaction fees and expenses relating to acquisition and disposition of portfolio securities, acquired fund fees and expenses, taxes, interest, extraordinary expenses, fund litigation expenses, fees and expenses of the Fund’s independent Directors (including their independent legal counsel), and expenses incurred in connection with the provision of shareholder services and distribution services under a plan adopted pursuant to Investment Company Act Rule 12b-1. Under the unified fee structure, the Advisor is responsible for providing all investment advisory, custody, audit, administrative, compliance, recordkeeping, marketing and shareholder services, or arranging and supervising third parties to provide such services. By contrast, most other funds are charged a variety of fees, including an investment advisory fee, a transfer agency fee, an administrative fee, distribution charges, and other expenses. Other than their investment advisory fees and any applicable Rule 12b-1 distribution fees, all other components of the total fees charged by these other funds may be increased without shareholder approval. The Board believes the unified fee structure is a benefit to Fund shareholders because it clearly discloses to shareholders the cost of owning Fund shares, and,
since the unified fee cannot be increased without a vote of Fund shareholders, it shifts to the Advisor the risk of increased costs of operating the Fund and provides a direct incentive to minimize administrative inefficiencies. Part of the Board’s analysis of fee levels involves reviewing certain evaluative data compiled by an independent provider comparing the Fund’s unified fee to the total expense ratios of its peers. The unified fee charged to shareholders of the Fund was below the median of the total expense ratios of the Fund’s peer expense universe. In addition, the Board reviewed the Fund’s position relative to the narrower set of its expense group peers. The Board and the Advisor agreed to continue the temporary reduction of the Fund’s annual unified management fee such that the Investor Class management fee not exceed 0.83% for at least one year beginning August 1, 2024. The Board concluded that the management fee paid by the Fund to the Advisor under the management agreement is reasonable in light of the services provided to the Fund.
Comparison to Fees and Services Provided to Other Clients of the Advisor. The Board also requested and received information from the Advisor concerning the nature of the services, fees, costs, and profitability of its advisory services to advisory clients other than the Fund. They observed that these varying types of client accounts require different services and involve different regulatory and entrepreneurial risks than the management of the Fund. The Board analyzed this information and concluded that the fees charged and services provided to the Fund were reasonable by comparison.
Payments to Intermediaries. The Directors also requested and received a description of payments made to intermediaries by the Fund and the Advisor and services provided in response thereto. These payments include various payments made by the Fund or the Advisor to different types of intermediaries and recordkeepers for distribution and service activities provided for the Fund. The Directors reviewed such information and received representations from the Advisor that all such payments by the Fund were made pursuant to the Fund’s Rule 12b-1 Plan and that all such payments by the Advisor were made from the Advisor’s resources and reasonable profits.
Collateral or “Fall-Out” Benefits Derived by the Advisor. The Board considered the possible existence of collateral benefits the Advisor may receive as a result of its relationship with the Fund. They concluded that the Advisor’s primary business is managing funds and it generally does not use fund or shareholder information to generate profits in other lines of business, and therefore does not derive any significant collateral benefits from them. To the extent there are potential collateral benefits, the Board has been advised and has taken this into consideration in its review of the management contract with the Fund. The Board noted that additional assets from other clients may offer the Advisor some benefit from increased leverage with prospective clients, service providers, and counterparties. Additionally, the Advisor may receive proprietary research from broker-dealers that execute fund portfolio transactions, which the Board concluded is likely to benefit other clients of the Advisor, as well as Fund shareholders. The Board also determined that the Advisor is able to provide investment management services to certain clients other than the Fund, at least in part, due to its existing infrastructure built to serve the fund complex. The Board concluded that appropriate allocation methodologies had been employed to assign resources and the cost of those resources to these other clients, and these other client assets are included with the assets of the Fund to determine breakpoints in the management fee schedule.
Existing Relationship. The Board also considered whether there was any reason for not continuing the existing arrangement with the Advisor. In this regard, the Board was mindful of the potential disruptions of the Fund’s operations and various risks, uncertainties, and other effects that could occur as a result of a decision not to continue such relationship. In particular, the Board recognized that most shareholders have invested in the Fund on the strength of the Advisor’s industry standing and reputation and in the expectation that the Advisor will have a continuing role in providing advisory services to the Fund.
Conclusion of the Directors. As a result of this process, the Board, including all of the independent Directors, taking into account all of the factors discussed above and the information provided by the Advisor and others in connection with its review and received over time, determined that the terms of the management agreement are fair and reasonable and that the management fee charged to the Fund is reasonable in light of the services provided and that the management agreement between the Fund and the Advisor should be renewed for an additional one-year period.
Other Tax Information
The following information is provided pursuant to provisions of the Internal Revenue Code.
The fund hereby designates up to the maximum amount allowable as qualified dividend income for the fiscal year ended July 31, 2024.
For corporate taxpayers, the fund hereby designates $518,380, or up to the maximum amount allowable, of ordinary income distributions paid during the fiscal year ended July 31, 2024 as qualified for the corporate dividends received deduction.
The fund hereby designates $456,159, or up to the maximum amount allowable, as long-term capital gain distributions (20% rate gain distributions) for the fiscal year ended July 31, 2024.
The fund hereby designates $35,082 as qualified short-term capital gain distributions for purposes of Internal Revenue Code Section 871 for the fiscal year ended July 31, 2024.
The fund utilized earnings and profits of $501,802 distributed to shareholders on redemption of shares as part of the dividends paid deduction (tax equalization).
| | | | | | | | |
| Contact Us | americancentury.com | |
| Automated Information Line | 1-800-345-8765 | |
| Investor Services Representative | 1-800-345-2021
or 816-531-5575 | |
| Banks and Trust Companies, Broker-Dealers, Financial Professionals, Insurance Companies | 1-800-345-6488 | |
| | |
| This report and the statements it contains are submitted for the general information of our shareholders. The report is not authorized for distribution to prospective investors unless preceded or accompanied by an effective prospectus. | |
| | |
©2024 American Century Proprietary Holdings, Inc. All rights reserved.
CL-ANN-91039 2409 | |
| | | | | |
| |
| Annual Financial Statement and Other Information |
| |
| July 31, 2024 |
| |
| Strategic Allocation: Moderate Fund |
| Investor Class (TWSMX) |
| I Class (ASAMX) |
| A Class (ACOAX) |
| C Class (ASTCX) |
| R Class (ASMRX) |
| R5 Class (ASMUX) |
| R6 Class (ASMDX) |
| | | | | |
| Schedule of Investments | |
| Statement of Assets and Liabilities | |
| Statement of Operations | |
| Statement of Changes in Net Assets | |
| Notes to Financial Statements | |
| Financial Highlights | |
| Report of Independent Registered Public Accounting Firm | |
| Approval of Management Agreement | |
| |
| Other Tax Information | |
JULY 31, 2024
| | | | | | | | | | | |
| | Shares/Principal
Amount | Value |
AFFILIATED FUNDS(1) — 46.0% | | | |
| American Century Diversified Corporate Bond ETF | | 541,178 | | $ | 25,464,481 | |
| American Century Emerging Markets Bond ETF | | 231,939 | | 9,034,650 | |
American Century Focused Dynamic Growth ETF(2) | | 296,788 | | 26,011,628 | |
| American Century Focused Large Cap Value ETF | | 378,827 | | 25,222,567 | |
| American Century Multisector Income ETF | | 812,544 | | 35,621,929 | |
| American Century Quality Diversified International ETF | | 571,776 | | 28,490,683 | |
| American Century Short Duration Strategic Income ETF | | 89,869 | | 4,618,817 | |
American Century U.S. Quality Growth ETF(3) | | 460,593 | | 39,555,727 | |
| American Century U.S. Quality Value ETF | | 671,842 | | 39,614,693 | |
| Avantis Emerging Markets Equity ETF | | 496,985 | | 30,405,542 | |
Avantis International Equity ETF(3) | | 260,904 | | 16,820,481 | |
| Avantis International Small Cap Value ETF | | 121,479 | | 8,258,143 | |
Avantis U.S. Equity ETF(3) | | 483,606 | | 44,844,785 | |
Avantis U.S. Small Cap Value ETF(3) | | 125,753 | | 12,537,574 | |
TOTAL AFFILIATED FUNDS (Cost $259,067,710) | | | 346,501,700 | |
| COMMON STOCKS — 25.7% | | | |
| Aerospace and Defense — 0.3% | | | |
AAR Corp.(2) | | 1,581 | | 102,133 | |
Bombardier, Inc., Class B(2) | | 306 | | 20,652 | |
CAE, Inc.(2) | | 5,611 | | 102,088 | |
| Curtiss-Wright Corp. | | 2,095 | | 617,397 | |
| HEICO Corp. | | 1,683 | | 406,175 | |
| Hexcel Corp. | | 1,886 | | 124,872 | |
| Huntington Ingalls Industries, Inc. | | 1,394 | | 390,292 | |
| Lockheed Martin Corp. | | 299 | | 162,034 | |
| Melrose Industries PLC | | 4,505 | | 34,113 | |
| Saab AB, Class B | | 3,244 | | 74,907 | |
| | | 2,034,663 | |
| Air Freight and Logistics — 0.1% | | | |
Cargojet, Inc.(3) | | 670 | | 63,295 | |
| FedEx Corp. | | 671 | | 202,810 | |
GXO Logistics, Inc.(2) | | 3,049 | | 170,683 | |
InPost SA(2) | | 4,751 | | 82,313 | |
| United Parcel Service, Inc., Class B | | 1,583 | | 206,376 | |
| | | 725,477 | |
| Automobile Components — 0.2% | | | |
Aptiv PLC(2) | | 5,616 | | 389,694 | |
| BorgWarner, Inc. | | 6,426 | | 226,902 | |
| Continental AG | | 4,594 | | 281,630 | |
| Hyundai Mobis Co. Ltd. | | 2,017 | | 326,331 | |
| Linamar Corp. | | 4,538 | | 226,366 | |
| Nifco, Inc. | | 900 | | 22,820 | |
| Toyo Tire Corp. | | 2,600 | | 42,421 | |
| | | 1,516,164 | |
| Automobiles — 0.2% | | | |
| Bayerische Motoren Werke AG | | 3,554 | | 329,630 | |
| Ferrari NV | | 887 | | 365,065 | |
| Mercedes-Benz Group AG | | 5,333 | | 352,535 | |
Tesla, Inc.(2) | | 1,721 | | 399,393 | |
| | | | | | | | | | | |
| | Shares/Principal
Amount | Value |
Volvo Car AB, Class B(2) | | 55,477 | | $ | 157,407 | |
| Winnebago Industries, Inc. | | 818 | | 51,141 | |
| | | 1,655,171 | |
| Banks — 0.9% | | | |
Bancorp, Inc.(2) | | 1,095 | | 56,765 | |
| Bank Central Asia Tbk. PT | | 786,600 | | 498,083 | |
| Bank of America Corp. | | 10,447 | | 421,119 | |
| Bankinter SA | | 9,866 | | 84,270 | |
| Barclays PLC | | 301,059 | | 900,259 | |
| BNP Paribas SA | | 1,815 | | 124,352 | |
| BPER Banca SpA | | 23,251 | | 136,042 | |
| Commerce Bancshares, Inc. | | 5,917 | | 382,889 | |
| First Hawaiian, Inc. | | 8,268 | | 207,031 | |
| Fukuoka Financial Group, Inc. | | 4,000 | | 112,195 | |
| Hana Financial Group, Inc. | | 1,667 | | 78,979 | |
| ING Groep NV, Series N | | 21,044 | | 381,969 | |
| JPMorgan Chase & Co. | | 3,664 | | 779,699 | |
| Mebuki Financial Group, Inc. | | 26,700 | | 111,138 | |
NU Holdings Ltd., Class A(2) | | 71,814 | | 871,104 | |
| PNC Financial Services Group, Inc. | | 1,332 | | 241,225 | |
| Regions Financial Corp. | | 16,705 | | 373,691 | |
Triumph Financial, Inc.(2) | | 993 | | 90,095 | |
| Truist Financial Corp. | | 13,301 | | 594,422 | |
| U.S. Bancorp | | 7,164 | | 321,520 | |
| Westamerica Bancorporation | | 4,064 | | 219,293 | |
| | | 6,986,140 | |
| Beverages — 0.3% | | | |
| Ambev SA | | 117,600 | | 240,142 | |
Celsius Holdings, Inc.(2) | | 2,717 | | 127,237 | |
| Coca-Cola Bottlers Japan Holdings, Inc. | | 3,500 | | 52,169 | |
| Davide Campari-Milano NV | | 43,486 | | 392,177 | |
Heineken NV(3) | | 3,304 | | 293,200 | |
| MGP Ingredients, Inc. | | 680 | | 55,454 | |
| PepsiCo, Inc. | | 2,964 | | 511,794 | |
Pernod Ricard SA(3) | | 2,080 | | 278,319 | |
Royal Unibrew AS(2) | | 887 | | 69,641 | |
| | | 2,020,133 | |
| Biotechnology — 0.6% | | | |
| AbbVie, Inc. | | 3,295 | | 610,629 | |
ADMA Biologics, Inc.(2) | | 8,565 | | 105,178 | |
Alkermes PLC(2) | | 2,496 | | 68,191 | |
Alnylam Pharmaceuticals, Inc.(2) | | 1,844 | | 437,876 | |
| Amgen, Inc. | | 710 | | 236,054 | |
Amicus Therapeutics, Inc.(2) | | 24,668 | | 254,327 | |
Arcutis Biotherapeutics, Inc.(2) | | 3,376 | | 33,996 | |
Argenx SE, ADR(2) | | 482 | | 248,649 | |
Biohaven Ltd.(2) | | 1,368 | | 53,804 | |
BioMarin Pharmaceutical, Inc.(2) | | 3,688 | | 311,009 | |
Blueprint Medicines Corp.(2) | | 960 | | 103,968 | |
Bridgebio Pharma, Inc.(2) | | 2,475 | | 64,226 | |
Celldex Therapeutics, Inc.(2) | | 1,122 | | 42,760 | |
Centessa Pharmaceuticals PLC, ADR(2)(3) | | 3,114 | | 32,790 | |
Crinetics Pharmaceuticals, Inc.(2) | | 1,048 | | 55,670 | |
| CSL Ltd. | | 1,707 | | 346,458 | |
| | | | | | | | | | | |
| | Shares/Principal
Amount | Value |
Cytokinetics, Inc.(2) | | 870 | | $ | 51,339 | |
Halozyme Therapeutics, Inc.(2) | | 1,929 | | 106,597 | |
Insmed, Inc.(2) | | 2,003 | | 145,718 | |
Keros Therapeutics, Inc.(2) | | 802 | | 40,228 | |
Madrigal Pharmaceuticals, Inc.(2)(3) | | 302 | | 85,967 | |
Mineralys Therapeutics, Inc.(2) | | 2,201 | | 27,270 | |
Natera, Inc.(2) | | 6,051 | | 619,562 | |
REVOLUTION Medicines, Inc.(2) | | 1,509 | | 68,871 | |
Telix Pharmaceuticals Ltd.(2)(3) | | 5,749 | | 72,173 | |
Twist Bioscience Corp.(2) | | 985 | | 54,973 | |
Vaxcyte, Inc.(2) | | 1,372 | | 108,237 | |
Vera Therapeutics, Inc.(2) | | 1,058 | | 38,712 | |
Vertex Pharmaceuticals, Inc.(2) | | 397 | | 196,801 | |
Viking Therapeutics, Inc.(2) | | 712 | | 40,584 | |
| | | 4,662,617 | |
| Broadline Retail — 0.3% | | | |
| Alibaba Group Holding Ltd. | | 26,700 | | 262,734 | |
Amazon.com, Inc.(2) | | 8,325 | | 1,556,609 | |
Ollie's Bargain Outlet Holdings, Inc.(2) | | 1,508 | | 147,241 | |
| Pan Pacific International Holdings Corp. | | 16,000 | | 417,427 | |
| Ryohin Keikaku Co. Ltd. | | 4,800 | | 90,517 | |
| | | 2,474,528 | |
| Building Products — 0.3% | | | |
AZEK Co., Inc.(2) | | 4,128 | | 185,306 | |
| Cie de Saint-Gobain SA | | 1,699 | | 145,750 | |
| Fortune Brands Innovations, Inc. | | 1,885 | | 152,327 | |
Hayward Holdings, Inc.(2) | | 10,448 | | 154,526 | |
JELD-WEN Holding, Inc.(2) | | 7,000 | | 116,830 | |
| Johnson Controls International PLC | | 9,429 | | 674,550 | |
| Lennox International, Inc. | | 1,234 | | 720,039 | |
| Munters Group AB | | 3,266 | | 70,709 | |
| Reliance Worldwide Corp. Ltd. | | 30,023 | | 101,202 | |
| | | 2,321,239 | |
| Capital Markets — 1.2% | | | |
| AllianceBernstein Holding LP | | 4,429 | | 156,299 | |
| Ameriprise Financial, Inc. | | 614 | | 264,063 | |
| ARES Management Corp., Class A | | 5,761 | | 882,585 | |
| Bank of New York Mellon Corp. | | 12,892 | | 838,882 | |
| BlackRock, Inc. | | 386 | | 338,329 | |
| Bolsa Mexicana de Valores SAB de CV | | 35,862 | | 55,821 | |
Coinbase Global, Inc., Class A(2) | | 2,674 | | 599,939 | |
Donnelley Financial Solutions, Inc.(2) | | 2,294 | | 154,799 | |
| GQG Partners, Inc. | | 41,794 | | 81,576 | |
| Hamilton Lane, Inc., Class A | | 985 | | 142,204 | |
| Integral Corp. | | 1,700 | | 46,317 | |
| Intercontinental Exchange, Inc. | | 1,418 | | 214,912 | |
| Intermediate Capital Group PLC | | 3,443 | | 97,185 | |
| London Stock Exchange Group PLC | | 4,936 | | 600,838 | |
| LPL Financial Holdings, Inc. | | 2,727 | | 604,085 | |
| Man Group PLC | | 23,670 | | 74,520 | |
| Morgan Stanley | | 5,601 | | 578,079 | |
| MSCI, Inc. | | 1,675 | | 905,773 | |
| Northern Trust Corp. | | 8,453 | | 749,359 | |
| S&P Global, Inc. | | 993 | | 481,337 | |
| | | | | | | | | | | |
| | Shares/Principal
Amount | Value |
| Swissquote Group Holding SA | | 251 | | $ | 80,056 | |
| T Rowe Price Group, Inc. | | 4,138 | | 472,601 | |
| TPG, Inc. | | 7,371 | | 375,847 | |
| | | 8,795,406 | |
| Chemicals — 0.5% | | | |
| Air Liquide SA | | 3,000 | | 547,375 | |
| Akzo Nobel NV | | 5,209 | | 322,084 | |
| Arkema SA | | 2,536 | | 228,856 | |
Aspen Aerogels, Inc.(2) | | 1,895 | | 38,677 | |
| Avient Corp. | | 8,602 | | 389,154 | |
| DSM-Firmenich AG | | 3,988 | | 509,144 | |
| Ecolab, Inc. | | 1,289 | | 297,359 | |
| Element Solutions, Inc. | | 25,190 | | 678,871 | |
| Linde PLC | | 1,089 | | 493,862 | |
| Shin-Etsu Chemical Co. Ltd. | | 9,500 | | 422,091 | |
| Tokyo Ohka Kogyo Co. Ltd. | | 2,600 | | 66,924 | |
| | | 3,994,397 | |
| Commercial Services and Supplies — 0.2% | | | |
Casella Waste Systems, Inc., Class A(2) | | 1,433 | | 148,402 | |
Clean Harbors, Inc.(2) | | 591 | | 141,089 | |
| Daiei Kankyo Co. Ltd. | | 4,600 | | 87,983 | |
| Element Fleet Management Corp. | | 846 | | 16,183 | |
| Elis SA | | 5,539 | | 128,091 | |
| Republic Services, Inc. | | 5,190 | | 1,008,521 | |
| SPIE SA | | 3,022 | | 116,815 | |
Stericycle, Inc.(2) | | 1,619 | | 94,793 | |
| UniFirst Corp. | | 458 | | 89,099 | |
| | | 1,830,976 | |
| Communications Equipment — 0.2% | | | |
Arista Networks, Inc.(2) | | 1,122 | | 388,829 | |
| Cisco Systems, Inc. | | 6,796 | | 329,266 | |
F5, Inc.(2) | | 2,482 | | 505,435 | |
| Juniper Networks, Inc. | | 7,893 | | 297,487 | |
| Motorola Solutions, Inc. | | 459 | | 183,104 | |
| | | 1,704,121 | |
| Construction and Engineering — 0.2% | | | |
| AtkinsRealis Group, Inc. | | 2,254 | | 97,105 | |
Construction Partners, Inc., Class A(2) | | 1,753 | | 113,331 | |
| Eiffage SA | | 4,033 | | 401,371 | |
Fugro NV(3) | | 4,643 | | 124,005 | |
| Kinden Corp. | | 4,500 | | 94,941 | |
| Ventia Services Group Pty. Ltd. | | 30,856 | | 88,836 | |
| Vinci SA | | 3,855 | | 439,925 | |
| | | 1,359,514 | |
| Construction Materials — 0.2% | | | |
| CRH PLC | | 6,951 | | 595,700 | |
James Hardie Industries PLC(2) | | 8,749 | | 314,296 | |
Summit Materials, Inc., Class A(2) | | 3,027 | | 126,468 | |
| Taiheiyo Cement Corp. | | 3,900 | | 106,521 | |
| | | 1,142,985 | |
| Consumer Finance — 0.1% | | | |
| American Express Co. | | 1,156 | | 292,514 | |
| FirstCash Holdings, Inc. | | 1,072 | | 119,635 | |
| | | 412,149 | |
| | | | | | | | | | | |
| | Shares/Principal
Amount | Value |
| Consumer Staples Distribution & Retail — 0.4% | | | |
| BGF retail Co. Ltd. | | 1,269 | | $ | 95,849 | |
| Casey's General Stores, Inc. | | 512 | | 198,574 | |
| Costco Wholesale Corp. | | 429 | | 352,638 | |
Dollar Tree, Inc.(2) | | 4,417 | | 460,870 | |
Grocery Outlet Holding Corp.(2) | | 2,455 | | 48,020 | |
| Koninklijke Ahold Delhaize NV | | 23,095 | | 744,010 | |
| Marks & Spencer Group PLC | | 25,367 | | 107,139 | |
| PriceSmart, Inc. | | 1,296 | | 118,364 | |
Redcare Pharmacy NV(2) | | 636 | | 95,211 | |
| Sysco Corp. | | 4,726 | | 362,248 | |
| Target Corp. | | 2,398 | | 360,683 | |
| | | 2,943,606 | |
| Containers and Packaging — 0.3% | | | |
| Amcor PLC | | 11,090 | | 116,778 | |
| AptarGroup, Inc. | | 407 | | 59,821 | |
| Avery Dennison Corp. | | 914 | | 198,183 | |
| Ball Corp. | | 3,445 | | 219,894 | |
| Graphic Packaging Holding Co. | | 14,913 | | 448,881 | |
| Packaging Corp. of America | | 2,125 | | 424,724 | |
| Smurfit WestRock PLC | | 6,081 | | 272,672 | |
| Sonoco Products Co. | | 3,782 | | 203,925 | |
| Verallia SA | | 16,209 | | 476,794 | |
| | | 2,421,672 | |
| Distributors — 0.1% | | | |
| D'ieteren Group | | 188 | | 43,206 | |
| LKQ Corp. | | 4,900 | | 203,350 | |
| Pool Corp. | | 2,383 | | 891,337 | |
| | | 1,137,893 | |
| Diversified Consumer Services — 0.1% | | | |
Bright Horizons Family Solutions, Inc.(2) | | 3,267 | | 392,857 | |
Duolingo, Inc.(2) | | 2,687 | | 462,003 | |
European Wax Center, Inc., Class A(2) | | 5,665 | | 53,194 | |
Stride, Inc.(2) | | 2,055 | | 156,139 | |
| | | 1,064,193 | |
| Diversified REITs — 0.1% | | | |
| British Land Co. PLC | | 24,761 | | 131,241 | |
| Essential Properties Realty Trust, Inc. | | 16,952 | | 501,610 | |
| Merlin Properties Socimi SA | | 20,730 | | 236,734 | |
| Mirvac Group | | 102,066 | | 143,709 | |
| | | 1,013,294 | |
| Diversified Telecommunication Services — 0.2% | | | |
| BCE, Inc. | | 8,766 | | 295,681 | |
| Cellnex Telecom SA | | 1,032 | | 35,993 | |
| LG Uplus Corp. | | 15,186 | | 111,071 | |
| Orange SA | | 43,464 | | 482,332 | |
U-Next Holdings Co. Ltd.(3) | | 2,300 | | 79,209 | |
| Verizon Communications, Inc. | | 11,239 | | 455,404 | |
| | | 1,459,690 | |
| Electric Utilities — 0.5% | | | |
| Duke Energy Corp. | | 4,889 | | 534,221 | |
| Edison International | | 8,093 | | 647,521 | |
| Evergy, Inc. | | 8,383 | | 486,214 | |
| Eversource Energy | | 7,361 | | 477,803 | |
| | | | | | | | | | | |
| | Shares/Principal
Amount | Value |
| Iberdrola SA | | 14,767 | | $ | 195,045 | |
| NextEra Energy, Inc. | | 9,365 | | 715,392 | |
| Pinnacle West Capital Corp. | | 2,046 | | 175,117 | |
| Xcel Energy, Inc. | | 6,248 | | 364,134 | |
| | | 3,595,447 | |
| Electrical Equipment — 0.5% | | | |
| AMETEK, Inc. | | 1,909 | | 331,173 | |
| Atkore, Inc. | | 870 | | 117,450 | |
| Eaton Corp. PLC | | 1,338 | | 407,809 | |
| Emerson Electric Co. | | 5,194 | | 608,269 | |
| Furukawa Electric Co. Ltd. | | 1,900 | | 51,978 | |
| Hubbell, Inc. | | 593 | | 234,621 | |
| Regal Rexnord Corp. | | 2,611 | | 419,536 | |
| Schneider Electric SE | | 2,647 | | 638,020 | |
| Signify NV | | 10,307 | | 255,143 | |
| Vertiv Holdings Co., Class A | | 5,334 | | 419,786 | |
| | | 3,483,785 | |
| Electronic Equipment, Instruments and Components — 0.2% | | | |
| CDW Corp. | | 3,759 | | 819,876 | |
Celestica, Inc. (Toronto)(2) | | 786 | | 41,223 | |
| Cognex Corp. | | 1,248 | | 61,926 | |
| Horiba Ltd. | | 600 | | 47,487 | |
| Keyence Corp. | | 700 | | 306,082 | |
| Littelfuse, Inc. | | 502 | | 134,089 | |
Mirion Technologies, Inc., Class A(2) | | 8,080 | | 85,163 | |
| TE Connectivity Ltd. | | 2,151 | | 331,964 | |
| Yokogawa Electric Corp. | | 1,500 | | 37,968 | |
| | | 1,865,778 | |
| Energy Equipment and Services — 0.2% | | | |
| Baker Hughes Co. | | 13,656 | | 528,760 | |
Expro Group Holdings NV(2) | | 10,704 | | 248,547 | |
| Schlumberger NV | | 10,480 | | 506,079 | |
Seadrill Ltd.(2) | | 1,031 | | 56,715 | |
| Subsea 7 SA | | 5,727 | | 110,159 | |
| TechnipFMC PLC | | 2,150 | | 63,425 | |
Transocean Ltd.(2) | | 16,446 | | 95,223 | |
| | | 1,608,908 | |
| Entertainment — 0.2% | | | |
| CTS Eventim AG & Co. KGaA | | 676 | | 59,545 | |
| Electronic Arts, Inc. | | 1,033 | | 155,921 | |
Liberty Media Corp.-Liberty Formula One, Class C(2) | | 866 | | 70,033 | |
Spotify Technology SA(2) | | 1,277 | | 439,211 | |
Take-Two Interactive Software, Inc.(2) | | 2,849 | | 428,860 | |
| Universal Music Group NV | | 5,806 | | 138,325 | |
| Walt Disney Co. | | 1,769 | | 165,738 | |
| | | 1,457,633 | |
| Financial Services — 0.4% | | | |
Adyen NV(2) | | 264 | | 322,935 | |
AvidXchange Holdings, Inc.(2) | | 11,845 | | 105,894 | |
Block, Inc.(2) | | 1,316 | | 81,434 | |
Corpay, Inc.(2) | | 2,354 | | 686,944 | |
| Edenred SE | | 12,754 | | 531,061 | |
| Mastercard, Inc., Class A | | 793 | | 367,722 | |
Shift4 Payments, Inc., Class A(2)(3) | | 1,186 | | 81,585 | |
| | | | | | | | | | | |
| | Shares/Principal
Amount | Value |
| Visa, Inc., Class A | | 2,697 | | $ | 716,512 | |
Worldline SA(2) | | 6,717 | | 76,217 | |
| | | 2,970,304 | |
| Food Products — 0.3% | | | |
| AAK AB | | 2,961 | | 85,209 | |
| Conagra Brands, Inc. | | 27,922 | | 846,595 | |
| General Mills, Inc. | | 7,255 | | 487,101 | |
| Glanbia PLC | | 5,037 | | 100,735 | |
| Mondelez International, Inc., Class A | | 4,017 | | 274,562 | |
| Morinaga & Co. Ltd. | | 2,200 | | 42,223 | |
| Nomad Foods Ltd. | | 6,536 | | 124,903 | |
| Toyo Suisan Kaisha Ltd. | | 1,200 | | 80,575 | |
| Yamazaki Baking Co. Ltd. | | 2,100 | | 51,923 | |
| | | 2,093,826 | |
| Gas Utilities — 0.1% | | | |
| Nippon Gas Co. Ltd. | | 4,100 | | 63,910 | |
| ONE Gas, Inc. | | 4,730 | | 329,350 | |
| Spire, Inc. | | 5,661 | | 376,966 | |
| | | 770,226 | |
| Ground Transportation — 0.4% | | | |
| Canadian Pacific Kansas City Ltd. | | 5,563 | | 466,508 | |
| CSX Corp. | | 3,370 | | 118,287 | |
| Knight-Swift Transportation Holdings, Inc. | | 2,463 | | 134,061 | |
| Kyushu Railway Co. | | 900 | | 24,023 | |
| Norfolk Southern Corp. | | 4,178 | | 1,042,662 | |
Saia, Inc.(2) | | 160 | | 66,856 | |
| Schneider National, Inc., Class B | | 3,407 | | 91,682 | |
Uber Technologies, Inc.(2) | | 3,712 | | 239,313 | |
| Union Pacific Corp. | | 1,559 | | 384,652 | |
XPO, Inc.(2) | | 5,101 | | 586,054 | |
| | | 3,154,098 | |
| Health Care Equipment and Supplies — 0.8% | | | |
Alphatec Holdings, Inc.(2) | | 8,828 | | 89,163 | |
| Becton Dickinson & Co. | | 1,633 | | 393,651 | |
| ConvaTec Group PLC | | 9,165 | | 27,614 | |
| DENTSPLY SIRONA, Inc. | | 7,599 | | 206,237 | |
Dexcom, Inc.(2) | | 8,509 | | 577,080 | |
Envista Holdings Corp.(2) | | 11,758 | | 200,709 | |
| GE HealthCare Technologies, Inc. | | 6,228 | | 527,076 | |
Hologic, Inc.(2) | | 4,489 | | 366,347 | |
IDEXX Laboratories, Inc.(2) | | 1,255 | | 597,530 | |
Inari Medical, Inc.(2) | | 2,609 | | 121,475 | |
Insulet Corp.(2) | | 2,019 | | 392,393 | |
Integer Holdings Corp.(2) | | 942 | | 111,872 | |
Intuitive Surgical, Inc.(2) | | 631 | | 280,549 | |
Lantheus Holdings, Inc.(2) | | 1,078 | | 113,007 | |
SI-BONE, Inc.(2) | | 5,415 | | 82,308 | |
| Terumo Corp. | | 28,000 | | 501,994 | |
| Ypsomed Holding AG | | 205 | | 94,210 | |
| Zimmer Biomet Holdings, Inc. | | 10,316 | | 1,148,686 | |
| | | 5,831,901 | |
| Health Care Providers and Services — 0.8% | | | |
Acadia Healthcare Co., Inc.(2) | | 1,113 | | 72,178 | |
AMN Healthcare Services, Inc.(2) | | 894 | | 60,452 | |
| | | | | | | | | | | |
| | Shares/Principal
Amount | Value |
| Amvis Holdings, Inc. | | 1,100 | | $ | 19,151 | |
| Cardinal Health, Inc. | | 5,364 | | 540,852 | |
| Cencora, Inc. | | 2,975 | | 707,693 | |
Centene Corp.(2) | | 3,825 | | 294,219 | |
| Chartwell Retirement Residences | | 32,834 | | 325,807 | |
| Cigna Group | | 1,212 | | 422,588 | |
| Encompass Health Corp. | | 1,171 | | 108,833 | |
HealthEquity, Inc.(2) | | 1,422 | | 111,599 | |
Henry Schein, Inc.(2) | | 10,807 | | 777,456 | |
| Labcorp Holdings, Inc. | | 1,891 | | 407,397 | |
NeoGenomics, Inc.(2) | | 7,000 | | 124,110 | |
Option Care Health, Inc.(2) | | 3,001 | | 89,100 | |
| Quest Diagnostics, Inc. | | 4,935 | | 702,250 | |
R1 RCM, Inc.(2) | | 8,309 | | 107,020 | |
RadNet, Inc.(2) | | 1,125 | | 67,219 | |
| UnitedHealth Group, Inc. | | 1,578 | | 909,180 | |
| Universal Health Services, Inc., Class B | | 2,510 | | 536,538 | |
| | | 6,383,642 | |
| Health Care REITs — 0.3% | | | |
| Aedifica SA | | 831 | | 52,821 | |
| CareTrust REIT, Inc. | | 7,195 | | 193,977 | |
| Healthpeak Properties, Inc. | | 24,616 | | 537,121 | |
| Ventas, Inc. | | 7,716 | | 420,059 | |
| Welltower, Inc. | | 9,021 | | 1,003,586 | |
| | | 2,207,564 | |
| Health Care Technology — 0.1% | | | |
Evolent Health, Inc., Class A(2) | | 2,946 | | 68,701 | |
GoodRx Holdings, Inc., Class A(2) | | 7,691 | | 69,603 | |
| Pro Medicus Ltd. | | 594 | | 56,043 | |
Veeva Systems, Inc., Class A(2) | | 1,817 | | 348,737 | |
Waystar Holding Corp.(2) | | 2,590 | | 59,570 | |
| | | 602,654 | |
| Hotel & Resort REITs — 0.1% | | | |
| Invincible Investment Corp. | | 624 | | 282,641 | |
| Japan Hotel REIT Investment Corp. | | 189 | | 96,545 | |
| Ryman Hospitality Properties, Inc. | | 2,141 | | 215,192 | |
| | | 594,378 | |
| Hotels, Restaurants and Leisure — 0.5% | | | |
Airbnb, Inc., Class A(2) | | 4,047 | | 564,799 | |
Chipotle Mexican Grill, Inc.(2) | | 11,808 | | 641,411 | |
| Darden Restaurants, Inc. | | 1,538 | | 224,994 | |
DoorDash, Inc., Class A(2) | | 3,313 | | 366,815 | |
| Greggs PLC | | 1,866 | | 75,147 | |
| H World Group Ltd., ADR | | 6,133 | | 183,990 | |
| Hilton Worldwide Holdings, Inc. | | 5,946 | | 1,276,428 | |
| Kyoritsu Maintenance Co. Ltd. | | 1,200 | | 23,297 | |
MakeMyTrip Ltd.(2) | | 4,558 | | 426,583 | |
Melia Hotels International SA(3) | | 2,165 | | 16,577 | |
Planet Fitness, Inc., Class A(2) | | 1,074 | | 79,154 | |
| Wingstop, Inc. | | 167 | | 62,438 | |
| | | 3,941,633 | |
| Household Durables — 0.2% | | | |
| Barratt Developments PLC | | 28,161 | | 190,562 | |
| Bellway PLC | | 2,666 | | 97,890 | |
| | | | | | | | | | | |
| | Shares/Principal
Amount | Value |
Breville Group Ltd.(3) | | 2,531 | | $ | 48,634 | |
Mohawk Industries, Inc.(2) | | 1,459 | | 235,001 | |
Sonos, Inc.(2) | | 6,411 | | 86,549 | |
| Taylor Wimpey PLC | | 219,075 | | 449,142 | |
TopBuild Corp.(2) | | 148 | | 70,824 | |
| | | 1,178,602 | |
| Household Products — 0.4% | | | |
| Church & Dwight Co., Inc. | | 8,410 | | 824,264 | |
| Colgate-Palmolive Co. | | 1,377 | | 136,585 | |
| Henkel AG & Co. KGaA, Preference Shares | | 3,226 | | 275,958 | |
| Kimberly-Clark Corp. | | 4,077 | | 550,599 | |
| Procter & Gamble Co. | | 2,211 | | 355,440 | |
| Reckitt Benckiser Group PLC | | 12,366 | | 665,212 | |
| | | 2,808,058 | |
| Independent Power and Renewable Electricity Producers — 0.1% | | | |
Talen Energy Corp.(2) | | 804 | | 100,219 | |
| Vistra Corp. | | 6,925 | | 548,598 | |
| | | 648,817 | |
| Industrial Conglomerates — 0.1% | | | |
| Hitachi Ltd. | | 17,000 | | 367,313 | |
| Honeywell International, Inc. | | 1,485 | | 304,054 | |
| LG Corp. | | 3,139 | | 200,181 | |
| | | 871,548 | |
| Industrial REITs — 0.5% | | | |
| Americold Realty Trust, Inc. | | 9,078 | | 271,341 | |
| CapitaLand Ascendas REIT | | 62,300 | | 127,189 | |
| EastGroup Properties, Inc. | | 1,346 | | 251,689 | |
| Goodman Group | | 23,455 | | 541,484 | |
| Mapletree Industrial Trust | | 34,000 | | 58,994 | |
| Prologis, Inc. | | 15,581 | | 1,963,985 | |
| Segro PLC | | 22,083 | | 259,930 | |
| Terreno Realty Corp. | | 949 | | 64,921 | |
| Tritax Big Box REIT PLC | | 20,909 | | 44,444 | |
| Warehouses De Pauw CVA | | 1,425 | | 38,602 | |
| | | 3,622,579 | |
| Insurance — 0.7% | | | |
| Aflac, Inc. | | 1,760 | | 167,869 | |
| Allstate Corp. | | 3,949 | | 675,753 | |
Goosehead Insurance, Inc., Class A(2) | | 1,004 | | 90,651 | |
| Hanover Insurance Group, Inc. | | 2,545 | | 349,912 | |
| Kinsale Capital Group, Inc. | | 301 | | 137,578 | |
| Marsh & McLennan Cos., Inc. | | 1,270 | | 282,664 | |
| MetLife, Inc. | | 3,133 | | 240,771 | |
| NN Group NV | | 9,634 | | 483,474 | |
Palomar Holdings, Inc.(2) | | 665 | | 61,187 | |
| Progressive Corp. | | 1,379 | | 295,272 | |
| Prudential Financial, Inc. | | 1,939 | | 242,995 | |
| Prudential PLC | | 36,257 | | 327,197 | |
| Reinsurance Group of America, Inc. | | 984 | | 221,823 | |
| Ryan Specialty Holdings, Inc., Class A | | 6,773 | | 417,149 | |
Skyward Specialty Insurance Group, Inc.(2) | | 2,127 | | 84,165 | |
| Tokio Marine Holdings, Inc. | | 7,700 | | 302,095 | |
| Willis Towers Watson PLC | | 2,703 | | 763,003 | |
| | | 5,143,558 | |
| | | | | | | | | | | |
| | Shares/Principal
Amount | Value |
| Interactive Media and Services — 0.6% | | | |
| Alphabet, Inc., Class A | | 11,104 | | $ | 1,904,780 | |
| Autohome, Inc., ADR | | 6,588 | | 164,305 | |
| CAR Group Ltd. | | 2,875 | | 65,753 | |
| Hemnet Group AB | | 1,645 | | 60,949 | |
| Meta Platforms, Inc., Class A | | 2,082 | | 988,596 | |
QuinStreet, Inc.(2) | | 5,501 | | 102,869 | |
| Scout24 SE | | 840 | | 66,408 | |
| Tencent Holdings Ltd. | | 17,900 | | 826,022 | |
| | | 4,179,682 | |
| IT Services — 0.6% | | | |
| Accenture PLC, Class A | | 1,682 | | 556,103 | |
| Amdocs Ltd. | | 5,652 | | 494,380 | |
| BIPROGY, Inc. | | 1,600 | | 52,430 | |
Cloudflare, Inc., Class A(2) | | 6,944 | | 538,160 | |
| Cognizant Technology Solutions Corp., Class A | | 3,784 | | 286,373 | |
GDS Holdings Ltd., ADR(2) | | 2,657 | | 29,838 | |
GDS Holdings Ltd., Class A(2)(3) | | 37,700 | | 52,533 | |
Globant SA(2) | | 343 | | 66,786 | |
Indra Sistemas SA(3) | | 5,442 | | 109,133 | |
| International Business Machines Corp. | | 1,676 | | 322,027 | |
Megaport Ltd.(2) | | 2,122 | | 15,362 | |
MongoDB, Inc.(2) | | 2,450 | | 618,282 | |
| NEC Corp. | | 5,100 | | 441,429 | |
NEXTDC Ltd.(2) | | 73,381 | | 808,088 | |
| NTT Data Group Corp. | | 24,200 | | 376,901 | |
| | | 4,767,825 | |
| Leisure Products — 0.1% | | | |
BRP, Inc.(3) | | 3,919 | | 283,937 | |
| Brunswick Corp. | | 532 | | 43,331 | |
| Thule Group AB | | 2,080 | | 57,506 | |
YETI Holdings, Inc.(2) | | 2,613 | | 108,048 | |
| | | 492,822 | |
| Life Sciences Tools and Services — 0.5% | | | |
| Agilent Technologies, Inc. | | 4,677 | | 661,328 | |
Avantor, Inc.(2) | | 9,549 | | 255,436 | |
| Bio-Techne Corp. | | 2,799 | | 228,370 | |
| Danaher Corp. | | 2,107 | | 583,808 | |
ICON PLC(2) | | 1,859 | | 610,570 | |
IQVIA Holdings, Inc.(2) | | 1,249 | | 307,541 | |
| Lonza Group AG | | 648 | | 431,509 | |
Mettler-Toledo International, Inc.(2) | | 183 | | 278,349 | |
| Thermo Fisher Scientific, Inc. | | 657 | | 402,964 | |
| | | 3,759,875 | |
| Machinery — 0.5% | | | |
| Aalberts NV | | 701 | | 26,805 | |
| Amada Co. Ltd. | | 4,400 | | 51,673 | |
| CNH Industrial NV | | 25,456 | | 271,106 | |
| Crane Co. | | 1,426 | | 228,759 | |
| Cummins, Inc. | | 1,931 | | 563,466 | |
| Deere & Co. | | 474 | | 176,318 | |
| Dover Corp. | | 530 | | 97,658 | |
| Fluidra SA | | 2,590 | | 57,702 | |
| Hoshizaki Corp. | | 1,300 | | 40,942 | |
| | | | | | | | | | | |
| | Shares/Principal
Amount | Value |
| KION Group AG | | 956 | | $ | 37,810 | |
| Konecranes OYJ | | 1,497 | | 104,570 | |
| Organo Corp. | | 1,500 | | 68,033 | |
| Oshkosh Corp. | | 3,907 | | 424,495 | |
| Parker-Hannifin Corp. | | 563 | | 315,933 | |
RBC Bearings, Inc.(2) | | 547 | | 159,089 | |
| Techtronic Industries Co. Ltd. | | 24,000 | | 307,361 | |
| Timken Co. | | 2,348 | | 204,159 | |
| Trelleborg AB, B Shares | | 1,160 | | 43,109 | |
| Weir Group PLC | | 3,760 | | 98,154 | |
| Xylem, Inc. | | 4,147 | | 553,624 | |
| | | 3,830,766 | |
| Media — 0.3% | | | |
| 4imprint Group PLC | | 596 | | 46,538 | |
| CyberAgent, Inc. | | 10,700 | | 69,180 | |
| Fox Corp., Class B | | 5,653 | | 200,286 | |
| Interpublic Group of Cos., Inc. | | 15,845 | | 509,734 | |
| Omnicom Group, Inc. | | 1,074 | | 105,295 | |
| Stroeer SE & Co. KGaA | | 1,158 | | 78,293 | |
Trade Desk, Inc., Class A(2) | | 9,004 | | 809,280 | |
| WPP PLC | | 37,787 | | 364,496 | |
| | | 2,183,102 | |
| Metals and Mining — 0.1% | | | |
| Alamos Gold, Inc., Class A | | 5,185 | | 88,367 | |
ATI, Inc.(2) | | 951 | | 64,392 | |
Capstone Copper Corp.(2) | | 13,269 | | 89,187 | |
| Carpenter Technology Corp. | | 922 | | 134,492 | |
ERO Copper Corp.(2) | | 3,302 | | 64,574 | |
GMK Norilskiy Nickel PAO(4) | | 265,800 | | 3 | |
Sandfire Resources Ltd.(2) | | 14,737 | | 84,172 | |
| | | 525,187 | |
| Multi-Utilities — 0.2% | | | |
| CMS Energy Corp. | | 4,353 | | 282,074 | |
| Northwestern Energy Group, Inc. | | 12,554 | | 675,029 | |
| WEC Energy Group, Inc. | | 5,763 | | 495,964 | |
| | | 1,453,067 | |
| Office REITs — 0.0% | | | |
| BXP, Inc. | | 4,045 | | 288,449 | |
| Oil, Gas and Consumable Fuels — 0.5% | | | |
| Cheniere Energy, Inc. | | 1,845 | | 336,971 | |
| ConocoPhillips | | 4,788 | | 532,426 | |
| Coterra Energy, Inc. | | 10,278 | | 265,172 | |
| Enterprise Products Partners LP | | 26,473 | | 764,011 | |
| EOG Resources, Inc. | | 3,843 | | 487,292 | |
| EQT Corp. | | 8,245 | | 284,535 | |
| Gaztransport Et Technigaz SA | | 141 | | 20,776 | |
Kosmos Energy Ltd.(2) | | 33,984 | | 187,932 | |
| Occidental Petroleum Corp. | | 6,887 | | 418,867 | |
Paladin Energy Ltd.(2) | | 8,436 | | 63,284 | |
| Permian Resources Corp. | | 20,164 | | 309,316 | |
| Targa Resources Corp. | | 3,059 | | 413,821 | |
| | | 4,084,403 | |
| Paper and Forest Products — 0.0% | | | |
| Louisiana-Pacific Corp. | | 682 | | 66,945 | |
| | | | | | | | | | | |
| | Shares/Principal
Amount | Value |
Stella-Jones, Inc.(3) | | 1,622 | | $ | 109,128 | |
| | | 176,073 | |
| Passenger Airlines — 0.1% | | | |
| Southwest Airlines Co. | | 16,069 | | 432,899 | |
| Personal Care Products — 0.2% | | | |
BellRing Brands, Inc.(2) | | 1,235 | | 63,331 | |
elf Beauty, Inc.(2) | | 1,771 | | 305,639 | |
| Haleon PLC | | 88,620 | | 397,496 | |
| Inter Parfums, Inc. | | 694 | | 97,632 | |
| Kenvue, Inc. | | 23,866 | | 441,282 | |
| Kose Corp. | | 800 | | 53,461 | |
| Unilever PLC | | 6,259 | | 384,645 | |
| | | 1,743,486 | |
| Pharmaceuticals — 0.8% | | | |
ALK-Abello AS(2) | | 4,531 | | 102,128 | |
| AstraZeneca PLC, ADR | | 1,186 | | 93,872 | |
| Bristol-Myers Squibb Co. | | 1,935 | | 92,029 | |
Edgewise Therapeutics, Inc.(2) | | 2,124 | | 36,172 | |
| Eli Lilly & Co. | | 524 | | 421,437 | |
Galderma Group AG(2) | | 1,995 | | 156,939 | |
| GSK PLC | | 33,948 | | 659,229 | |
| Hikma Pharmaceuticals PLC | | 7,424 | | 181,516 | |
Intra-Cellular Therapies, Inc.(2) | | 645 | | 50,774 | |
| Laboratorios Farmaceuticos Rovi SA | | 644 | | 61,962 | |
Longboard Pharmaceuticals, Inc.(2) | | 1,342 | | 44,608 | |
| Merck & Co., Inc. | | 3,561 | | 402,856 | |
| Novo Nordisk AS, Class B | | 10,712 | | 1,419,264 | |
| Roche Holding AG | | 2,323 | | 752,093 | |
| Sanofi SA | | 4,209 | | 433,916 | |
| Sanofi SA, ADR | | 4,120 | | 213,457 | |
| Santen Pharmaceutical Co. Ltd. | | 8,900 | | 106,811 | |
Verona Pharma PLC, ADR(2)(3) | | 2,332 | | 52,843 | |
| Virbac SACA | | 101 | | 38,448 | |
| Zoetis, Inc. | | 1,945 | | 350,178 | |
| | | 5,670,532 | |
| Professional Services — 0.5% | | | |
| Adecco Group AG | | 15,592 | | 530,725 | |
| ALS Ltd. | | 5,681 | | 57,516 | |
| BayCurrent Consulting, Inc. | | 1,900 | | 58,491 | |
| Equifax, Inc. | | 1,850 | | 516,834 | |
FTI Consulting, Inc.(2) | | 391 | | 85,226 | |
| Jacobs Solutions, Inc. | | 3,658 | | 535,348 | |
| RELX PLC | | 13,508 | | 637,544 | |
| Teleperformance SE | | 4,773 | | 614,454 | |
| Verisk Analytics, Inc. | | 2,188 | | 572,709 | |
| | | 3,608,847 | |
| Real Estate Management and Development — 0.2% | | | |
Colliers International Group, Inc.(3) | | 397 | | 53,464 | |
| CTP NV | | 4,904 | | 85,918 | |
| DLF Ltd. | | 7,739 | | 82,393 | |
| FirstService Corp. | | 434 | | 75,759 | |
| FirstService Corp. (Toronto) | | 765 | | 133,385 | |
Godrej Properties Ltd.(2) | | 2,035 | | 78,449 | |
| Grainger PLC | | 24,392 | | 75,764 | |
| | | | | | | | | | | |
| | Shares/Principal
Amount | Value |
| Macrotech Developers Ltd. | | 4,922 | | $ | 77,076 | |
| Mitsubishi Estate Co. Ltd. | | 9,200 | | 156,804 | |
| Mitsui Fudosan Co. Ltd. | | 20,800 | | 215,485 | |
| Phoenix Mills Ltd. | | 2,321 | | 99,884 | |
| PSP Swiss Property AG | | 626 | | 83,653 | |
Redfin Corp.(2)(3) | | 4,461 | | 36,313 | |
| Tokyo Tatemono Co. Ltd. | | 6,300 | | 109,901 | |
| Tokyu Fudosan Holdings Corp. | | 19,000 | | 137,185 | |
| Vonovia SE | | 2,793 | | 85,634 | |
| | | 1,587,067 | |
| Residential REITs — 0.3% | | | |
| American Homes 4 Rent, Class A | | 5,870 | | 211,848 | |
| AvalonBay Communities, Inc. | | 2,596 | | 531,972 | |
| Boardwalk Real Estate Investment Trust | | 1,712 | | 96,720 | |
| Camden Property Trust | | 1,468 | | 162,581 | |
| Equity Residential | | 5,921 | | 412,279 | |
| Essex Property Trust, Inc. | | 1,583 | | 440,644 | |
| Invitation Homes, Inc. | | 8,247 | | 290,872 | |
| UNITE Group PLC | | 5,075 | | 62,206 | |
| | | 2,209,122 | |
| Retail REITs — 0.4% | | | |
| Agree Realty Corp. | | 4,295 | | 296,226 | |
| Charter Hall Retail REIT | | 27,033 | | 61,852 | |
| Kite Realty Group Trust | | 15,720 | | 387,655 | |
| Link REIT | | 9,720 | | 41,009 | |
| Phillips Edison & Co., Inc. | | 2,570 | | 90,207 | |
| Realty Income Corp. | | 10,663 | | 612,376 | |
| Regency Centers Corp. | | 5,312 | | 357,710 | |
| Scentre Group | | 132,918 | | 303,110 | |
| Simon Property Group, Inc. | | 2,366 | | 363,039 | |
| Unibail-Rodamco-Westfield | | 2,104 | | 157,340 | |
| Urban Edge Properties | | 13,188 | | 267,716 | |
| | | 2,938,240 | |
| Semiconductors and Semiconductor Equipment — 1.5% | | | |
Advanced Micro Devices, Inc.(2) | | 3,619 | | 522,873 | |
| Analog Devices, Inc. | | 2,053 | | 475,023 | |
| Applied Materials, Inc. | | 1,967 | | 417,397 | |
| ASML Holding NV | | 962 | | 895,787 | |
| Broadcom, Inc. | | 2,720 | | 437,050 | |
| Camtek Ltd. | | 483 | | 50,715 | |
Credo Technology Group Holding Ltd.(2) | | 3,663 | | 101,648 | |
Enphase Energy, Inc.(2) | | 3,782 | | 435,346 | |
FormFactor, Inc.(2) | | 1,099 | | 58,862 | |
Impinj, Inc.(2) | | 581 | | 92,547 | |
| Infineon Technologies AG | | 6,753 | | 234,587 | |
MACOM Technology Solutions Holdings, Inc.(2) | | 1,136 | | 114,645 | |
| Marvell Technology, Inc. | | 2,785 | | 186,539 | |
| Micronics Japan Co. Ltd. | | 900 | | 35,763 | |
| MKS Instruments, Inc. | | 457 | | 57,536 | |
| Monolithic Power Systems, Inc. | | 939 | | 810,441 | |
Nova Ltd.(2) | | 412 | | 85,066 | |
| NVIDIA Corp. | | 25,433 | | 2,976,170 | |
ON Semiconductor Corp.(2) | | 2,584 | | 202,198 | |
Onto Innovation, Inc.(2) | | 547 | | 104,641 | |
| | | | | | | | | | | |
| | Shares/Principal
Amount | Value |
Rambus, Inc.(2) | | 2,251 | | $ | 115,791 | |
Silicon Laboratories, Inc.(2) | | 843 | | 101,270 | |
| Socionext, Inc. | | 1,600 | | 32,310 | |
| SUMCO Corp. | | 38,100 | | 626,379 | |
| Taiwan Semiconductor Manufacturing Co. Ltd. | | 40,000 | | 1,166,852 | |
| Teradyne, Inc. | | 6,125 | | 803,355 | |
| | | 11,140,791 | |
| Software — 1.5% | | | |
Adobe, Inc.(2) | | 215 | | 118,605 | |
Agilysys, Inc.(2) | | 510 | | 57,166 | |
| Bytes Technology Group PLC | | 6,135 | | 39,971 | |
Cadence Design Systems, Inc.(2) | | 2,691 | | 720,273 | |
Crowdstrike Holdings, Inc., Class A(2) | | 474 | | 109,949 | |
CyberArk Software Ltd.(2) | | 632 | | 162,032 | |
Datadog, Inc., Class A(2) | | 6,633 | | 772,346 | |
Descartes Systems Group, Inc.(2) | | 865 | | 87,975 | |
Dynatrace, Inc.(2) | | 1,393 | | 61,180 | |
Five9, Inc.(2) | | 1,401 | | 62,414 | |
Guidewire Software, Inc.(2) | | 3,713 | | 557,210 | |
HubSpot, Inc.(2) | | 1,093 | | 543,254 | |
JFrog Ltd.(2) | | 2,163 | | 83,405 | |
Klaviyo, Inc., Class A(2)(3) | | 1,303 | | 34,139 | |
Manhattan Associates, Inc.(2) | | 2,679 | | 684,163 | |
| Microsoft Corp. | | 8,676 | | 3,629,605 | |
Money Forward, Inc.(2) | | 1,300 | | 43,441 | |
nCino, Inc.(2) | | 2,522 | | 82,621 | |
Palantir Technologies, Inc., Class A(2) | | 30,176 | | 811,433 | |
Procore Technologies, Inc.(2) | | 5,927 | | 420,995 | |
Q2 Holdings, Inc.(2) | | 2,335 | | 157,542 | |
| Salesforce, Inc. | | 931 | | 240,943 | |
| SAP SE | | 3,413 | | 721,577 | |
ServiceNow, Inc.(2) | | 162 | | 131,931 | |
SPS Commerce, Inc.(2) | | 469 | | 101,032 | |
Tenable Holdings, Inc.(2) | | 2,913 | | 133,765 | |
Workday, Inc., Class A(2) | | 1,039 | | 235,978 | |
Zscaler, Inc.(2) | | 3,259 | | 584,502 | |
| | | 11,389,447 | |
| Specialized REITs — 0.7% | | | |
| American Tower Corp. | | 464 | | 102,266 | |
| CubeSmart | | 5,496 | | 261,500 | |
| Digital Core REIT Management Pte. Ltd. | | 169,500 | | 96,696 | |
| Digital Realty Trust, Inc. | | 6,676 | | 997,995 | |
| Equinix, Inc. | | 1,366 | | 1,079,468 | |
| Extra Space Storage, Inc. | | 3,084 | | 492,268 | |
| Iron Mountain, Inc. | | 6,711 | | 688,280 | |
| Lamar Advertising Co., Class A | | 646 | | 77,430 | |
| Public Storage | | 2,521 | | 746,014 | |
| SBA Communications Corp. | | 1,775 | | 389,684 | |
| VICI Properties, Inc. | | 21,675 | | 677,560 | |
| | | 5,609,161 | |
| Specialty Retail — 0.4% | | | |
Arhaus, Inc.(3) | | 5,906 | | 89,712 | |
Boot Barn Holdings, Inc.(2) | | 1,012 | | 135,082 | |
Burlington Stores, Inc.(2) | | 2,974 | | 774,192 | |
| | | | | | | | | | | |
| | Shares/Principal
Amount | Value |
CarMax, Inc.(2) | | 1,685 | | $ | 142,281 | |
| Home Depot, Inc. | | 1,912 | | 703,922 | |
| Kingfisher PLC | | 116,693 | | 414,859 | |
| Sanrio Co. Ltd. | | 3,800 | | 80,679 | |
| TJX Cos., Inc. | | 4,301 | | 486,099 | |
| Tractor Supply Co. | | 897 | | 236,198 | |
| | | 3,063,024 | |
| Technology Hardware, Storage and Peripherals — 0.5% | | | |
| Apple, Inc. | | 13,558 | | 3,010,961 | |
| HP, Inc. | | 12,534 | | 452,352 | |
Super Micro Computer, Inc.(2) | | 707 | | 496,066 | |
| | | 3,959,379 | |
| Textiles, Apparel and Luxury Goods — 0.2% | | | |
| Asics Corp. | | 6,400 | | 104,450 | |
Crocs, Inc.(2) | | 527 | | 70,813 | |
Deckers Outdoor Corp.(2) | | 142 | | 131,014 | |
| Levi Strauss & Co., Class A | | 2,083 | | 38,181 | |
| LVMH Moet Hennessy Louis Vuitton SE | | 265 | | 186,921 | |
On Holding AG, Class A(2) | | 18,769 | | 777,412 | |
| | | 1,308,791 | |
| Tobacco — 0.2% | | | |
| British American Tobacco PLC | | 25,617 | | 908,918 | |
| KT&G Corp. | | 7,031 | | 479,316 | |
| | | 1,388,234 | |
| Trading Companies and Distributors — 0.4% | | | |
| AddTech AB, B Shares | | 1,102 | | 35,560 | |
| Applied Industrial Technologies, Inc. | | 777 | | 169,534 | |
Beacon Roofing Supply, Inc.(2) | | 4,182 | | 429,910 | |
Beijer Ref AB(3) | | 3,761 | | 59,723 | |
| Bunzl PLC | | 10,991 | | 460,516 | |
Core & Main, Inc., Class A(2) | | 7,355 | | 393,272 | |
| Diploma PLC | | 1,928 | | 110,234 | |
| Ferguson PLC | | 957 | | 213,076 | |
| FTAI Aviation Ltd. | | 413 | | 46,029 | |
| H&E Equipment Services, Inc. | | 1,996 | | 104,391 | |
| Howden Joinery Group PLC | | 6,748 | | 81,584 | |
| MSC Industrial Direct Co., Inc., Class A | | 5,350 | | 475,882 | |
| Rexel SA | | 11,421 | | 290,172 | |
| Seven Group Holdings Ltd. | | 3,490 | | 89,543 | |
SiteOne Landscape Supply, Inc.(2) | | 1,142 | | 167,508 | |
| | | 3,126,934 | |
| Transportation Infrastructure — 0.0% | | | |
| Flughafen Zurich AG | | 398 | | 92,111 | |
| SATS Ltd. | | 10,400 | | 25,566 | |
| | | 117,677 | |
TOTAL COMMON STOCKS (Cost $141,446,569) | | | 193,545,849 | |
| U.S. TREASURY SECURITIES — 14.0% | | | |
| U.S. Treasury Bonds, 2.00%, 11/15/41 | | $ | 3,500,000 | | 2,489,990 | |
| U.S. Treasury Bonds, 2.375%, 2/15/42 | | 11,500,000 | | 8,667,002 | |
| U.S. Treasury Bonds, 4.75%, 11/15/43 | | 120,000 | | 125,362 | |
| U.S. Treasury Bonds, 3.125%, 8/15/44 | | 200,000 | | 164,937 | |
| U.S. Treasury Bonds, 2.50%, 2/15/45 | | 1,060,000 | | 782,350 | |
| U.S. Treasury Bonds, 3.00%, 5/15/45 | | 560,000 | | 449,991 | |
| U.S. Treasury Bonds, 3.00%, 11/15/45 | | 100,000 | | 80,020 | |
| | | | | | | | | | | |
| | Shares/Principal
Amount | Value |
| U.S. Treasury Inflation-Indexed Bonds, 2.375%, 1/15/27 | | $ | 389,345 | | $ | 391,386 | |
| U.S. Treasury Inflation-Indexed Bonds, 2.50%, 1/15/29 | | 1,660,312 | | 1,710,700 | |
| U.S. Treasury Inflation-Indexed Bonds, 3.375%, 4/15/32 | | 176,940 | | 196,901 | |
| U.S. Treasury Inflation-Indexed Bonds, 2.125%, 2/15/40 | | 871,848 | | 886,639 | |
| U.S. Treasury Inflation-Indexed Bonds, 2.125%, 2/15/41 | | 1,176,011 | | 1,199,006 | |
| U.S. Treasury Inflation-Indexed Bonds, 0.625%, 2/15/43 | | 1,325,069 | | 1,027,452 | |
| U.S. Treasury Inflation-Indexed Bonds, 1.375%, 2/15/44 | | 3,571,114 | | 3,156,997 | |
| U.S. Treasury Inflation-Indexed Bonds, 0.75%, 2/15/45 | | 6,081,809 | | 4,709,227 | |
| U.S. Treasury Inflation-Indexed Bonds, 0.875%, 2/15/47 | | 715,589 | | 555,168 | |
| U.S. Treasury Inflation-Indexed Bonds, 0.125%, 2/15/51 | | 1,206,330 | | 727,289 | |
| U.S. Treasury Inflation-Indexed Notes, 0.375%, 7/15/25 | | 8,608,470 | | 8,401,690 | |
| U.S. Treasury Inflation-Indexed Notes, 0.125%, 4/15/26 | | 5,389,155 | | 5,167,652 | |
| U.S. Treasury Inflation-Indexed Notes, 0.125%, 4/15/27 | | 4,966,643 | | 4,709,712 | |
| U.S. Treasury Inflation-Indexed Notes, 0.50%, 1/15/28 | | 2,355,531 | | 2,245,815 | |
| U.S. Treasury Inflation-Indexed Notes, 0.875%, 1/15/29 | | 2,363,277 | | 2,272,869 | |
| U.S. Treasury Inflation-Indexed Notes, 0.125%, 1/15/32 | | 3,098,728 | | 2,740,629 | |
| U.S. Treasury Notes, 0.25%, 5/31/25 | | 9,900,000 | | 9,530,451 | |
| U.S. Treasury Notes, 4.625%, 2/28/26 | | 7,080,000 | | 7,099,083 | |
| U.S. Treasury Notes, 0.50%, 4/30/27 | | 6,000,000 | | 5,445,234 | |
| U.S. Treasury Notes, 2.75%, 7/31/27 | | 3,505,000 | | 3,375,753 | |
| U.S. Treasury Notes, 2.25%, 8/15/27 | | 400,000 | | 379,398 | |
| U.S. Treasury Notes, 4.375%, 8/31/28 | | 6,170,000 | | 6,263,153 | |
| U.S. Treasury Notes, 2.625%, 7/31/29 | | 3,000,000 | | 2,822,461 | |
| U.S. Treasury Notes, 3.50%, 4/30/30 | | 2,350,000 | | 2,295,381 | |
| U.S. Treasury Notes, 0.625%, 5/15/30 | | 1,100,000 | | 912,227 | |
| U.S. Treasury Notes, 4.375%, 11/30/30 | | 1,390,000 | | 1,421,954 | |
U.S. Treasury Notes, 1.875%, 2/15/32(5) | | 5,800,000 | | 5,004,539 | |
| U.S. Treasury Notes, 4.375%, 5/15/34 | | 4,667,000 | | 4,786,956 | |
| U.S. Treasury Notes, VRN, 5.41%, (3-month USBMMY plus 0.20%), 1/31/25 | | 2,000,000 | | 2,000,645 | |
| U.S. Treasury Notes, VRN, 5.34%, (3-month USBMMY plus 0.13%), 7/31/25 | | 1,500,000 | | 1,499,883 | |
TOTAL U.S. TREASURY SECURITIES (Cost $114,239,447) | | | 105,695,902 | |
| SOVEREIGN GOVERNMENTS AND AGENCIES — 2.9% | | | |
| Australia — 0.1% | | | |
| Australia Government Bonds, 3.00%, 3/21/47 | AUD | 270,000 | | 138,028 | |
| New South Wales Treasury Corp., 3.00%, 3/20/28 | AUD | 395,000 | | 249,336 | |
| | | 387,364 | |
| Austria — 0.1% | | | |
Republic of Austria Government Bonds, 0.75%, 10/20/26(6) | EUR | 185,000 | | 192,411 | |
Republic of Austria Government Bonds, 4.15%, 3/15/37(6) | EUR | 121,000 | | 147,405 | |
| | | 339,816 | |
| Belgium — 0.0% | | | |
Kingdom of Belgium Government Bonds, 4.25%, 3/28/41(6) | EUR | 74,000 | | 90,691 | |
| Canada — 0.6% | | | |
| Canada Government Bonds, 0.25%, 3/1/26 | CAD | 1,500,000 | | 1,031,384 | |
| Canada Government Bonds, 3.50%, 3/1/28 | CAD | 3,387,000 | | 2,482,827 | |
| Province of British Columbia, 2.85%, 6/18/25 | CAD | 809,000 | | 579,838 | |
| Province of Quebec, 5.75%, 12/1/36 | CAD | 445,000 | | 375,368 | |
| Province of Quebec, 5.00%, 12/1/41 | CAD | 30,000 | | 23,776 | |
| Province of Quebec, 3.50%, 12/1/48 | CAD | 110,000 | | 70,658 | |
| | | 4,563,851 | |
| Chile — 0.0% | | | |
| Chile Government International Bonds, 5.33%, 1/5/54 | | $ | 160,000 | | 154,247 | |
| China — 0.5% | | | |
| China Government Bonds, 2.68%, 5/21/30 | CNY | 24,800,000 | | 3,567,625 | |
| | | | | | | | | | | |
| | Shares/Principal
Amount | Value |
| Denmark — 0.0% | | | |
| Denmark Government Bonds, 0.50%, 11/15/27 | DKK | 600,000 | | $ | 82,379 | |
| Denmark Government Bonds, 4.50%, 11/15/39 | DKK | 340,000 | | 61,892 | |
| | | 144,271 | |
| Finland — 0.3% | | | |
Finland Government Bonds, 4.00%, 7/4/25(6) | EUR | 219,000 | | 239,030 | |
Finland Government Bonds, 0.125%, 4/15/36(6) | EUR | 2,250,000 | | 1,771,158 | |
| | | 2,010,188 | |
| France — 0.2% | | | |
French Republic Government Bonds OAT, 0.00%, 11/25/31(6)(7) | EUR | 1,400,000 | | 1,239,453 | |
French Republic Government Bonds OAT, 1.25%, 5/25/38(6) | EUR | 379,000 | | 321,578 | |
| | | 1,561,031 | |
| Germany — 0.4% | | | |
| Bundesrepublik Deutschland Bundesanleihe, 2.30%, 2/15/33 | EUR | 2,400,000 | | 2,613,201 | |
Bundesrepublik Deutschland Bundesanleihe, 0.00%, 8/15/52(7) | EUR | 400,000 | | 218,085 | |
| | | 2,831,286 | |
| Italy — 0.2% | | | |
| Italy Buoni Poliennali Del Tesoro, 1.50%, 6/1/25 | EUR | 180,000 | | 192,064 | |
| Italy Buoni Poliennali Del Tesoro, 2.00%, 12/1/25 | EUR | 1,338,000 | | 1,429,340 | |
| | | 1,621,404 | |
| Japan — 0.3% | | | |
| Japan Government Thirty Year Bonds, 1.40%, 3/20/53 | JPY | 224,000,000 | | 1,254,018 | |
| Japan Government Thirty Year Bonds, 1.20%, 6/20/53 | JPY | 66,500,000 | | 352,734 | |
| Japan Government Thirty Year Bonds, 1.80%, 9/20/53 | JPY | 51,300,000 | | 315,386 | |
| | | 1,922,138 | |
| Malaysia — 0.0% | | | |
| Malaysia Government Bonds, 3.96%, 9/15/25 | MYR | 990,000 | | 217,252 | |
| Mexico — 0.1% | | | |
| Mexico Government International Bonds, 4.15%, 3/28/27 | | $ | 700,000 | | 686,996 | |
| Netherlands — 0.0% | | | |
Netherlands Government Bonds, 2.75%, 1/15/47(6) | EUR | 82,000 | | 89,471 | |
| Norway — 0.0% | | | |
Norway Government Bonds, 1.75%, 2/17/27(6) | NOK | 1,880,000 | | 165,256 | |
| Spain — 0.0% | | | |
Spain Government Bonds, 1.60%, 4/30/25(6) | EUR | 132,000 | | 141,158 | |
Spain Government Bonds, 5.15%, 10/31/28(6) | EUR | 47,000 | | 55,919 | |
Spain Government Bonds, 5.15%, 10/31/44(6) | EUR | 9,000 | | 11,992 | |
| | | 209,069 | |
| Thailand — 0.0% | | | |
| Thailand Government Bonds, 3.85%, 12/12/25 | THB | 11,550,000 | | 330,698 | |
| United Kingdom — 0.1% | | | |
| U.K. Gilts, 0.125%, 1/30/26 | GBP | 800,000 | | 974,537 | |
TOTAL SOVEREIGN GOVERNMENTS AND AGENCIES (Cost $24,578,824) | | | 21,867,191 | |
| CORPORATE BONDS — 1.7% | | | |
| Automobile Components — 0.0% | | | |
ZF North America Capital, Inc., 4.75%, 4/29/25(6) | | $ | 105,000 | | 103,888 | |
| Automobiles — 0.3% | | | |
| American Honda Finance Corp., 0.75%, 8/9/24 | | 1,500,000 | | 1,498,366 | |
| BMW Finance NV, 0.875%, 4/3/25 | EUR | 50,000 | | 53,162 | |
| Ford Motor Credit Co. LLC, 3.625%, 6/17/31 | | $ | 670,000 | | 587,095 | |
| | | 2,138,623 | |
| Banks — 0.5% | | | |
Avi Funding Co. Ltd., 3.80%, 9/16/25(6) | | 255,000 | | 251,489 | |
| Banco Santander SA, 2.50%, 3/18/25 | EUR | 200,000 | | 214,703 | |
| | | | | | | | | | | |
| | Shares/Principal
Amount | Value |
| Bank of America Corp., VRN, 5.47%, 1/23/35 | | $ | 170,000 | | $ | 173,895 | |
| Barclays PLC, VRN, 1.375%, 1/24/26 | EUR | 100,000 | | 106,988 | |
| CaixaBank SA, VRN, 2.25%, 4/17/30 | EUR | 400,000 | | 425,278 | |
| Citigroup, Inc., VRN, 6.27%, 11/17/33 | | $ | 30,000 | | 32,146 | |
| Citigroup, Inc., VRN, 5.83%, 2/13/35 | | 30,000 | | 30,420 | |
| Commerzbank AG, 4.00%, 3/23/26 | EUR | 250,000 | | 271,637 | |
European Union, 0.00%, 7/4/31(7) | EUR | 1,650,000 | | 1,487,104 | |
| HSBC Bank PLC, VRN, 5.375%, 11/4/30 | GBP | 50,000 | | 63,640 | |
| ING Groep NV, 2.125%, 1/10/26 | EUR | 400,000 | | 426,293 | |
| JPMorgan Chase & Co., VRN, 4.01%, 4/23/29 | | $ | 6,000 | | 5,837 | |
| Lloyds Bank PLC, 7.625%, 4/22/25 | GBP | 120,000 | | 156,623 | |
| Wells Fargo & Co., VRN, 5.39%, 4/24/34 | | $ | 60,000 | | 60,722 | |
| | | 3,706,775 | |
| Beverages — 0.1% | | | |
| Anheuser-Busch Cos. LLC/Anheuser-Busch InBev Worldwide, Inc., 4.70%, 2/1/36 | | 370,000 | | 361,685 | |
| Chemicals — 0.0% | | | |
MEGlobal BV, 4.25%, 11/3/26(6) | | 82,000 | | 79,936 | |
| Olin Corp., 5.125%, 9/15/27 | | 60,000 | | 58,627 | |
| | | 138,563 | |
| Commercial Services and Supplies — 0.0% | | | |
| Waste Connections, Inc., 2.95%, 1/15/52 | | 154,000 | | 102,066 | |
| Containers and Packaging — 0.0% | | | |
Sealed Air Corp., 5.125%, 12/1/24(6) | | 80,000 | | 80,186 | |
| Diversified Consumer Services — 0.0% | | | |
| Duke University, 3.30%, 10/1/46 | | 220,000 | | 167,010 | |
| Diversified Telecommunication Services — 0.1% | | | |
| AT&T, Inc., 2.60%, 12/17/29 | EUR | 120,000 | | 126,054 | |
| AT&T, Inc., 4.90%, 8/15/37 | | $ | 116,000 | | 111,230 | |
| Sprint Capital Corp., 6.875%, 11/15/28 | | 352,000 | | 377,672 | |
| | | 614,956 | |
| Electric Utilities — 0.1% | | | |
| Duke Energy Carolinas LLC, 3.20%, 8/15/49 | | 270,000 | | 187,958 | |
| Duke Energy Progress LLC, 4.15%, 12/1/44 | | 59,000 | | 48,983 | |
| MidAmerican Energy Co., 5.85%, 9/15/54 | | 55,000 | | 57,988 | |
| Northern States Power Co., 3.20%, 4/1/52 | | 160,000 | | 110,968 | |
| Northern States Power Co., 5.10%, 5/15/53 | | 110,000 | | 104,446 | |
| | | 510,343 | |
| Ground Transportation — 0.0% | | | |
| Burlington Northern Santa Fe LLC, 4.45%, 3/15/43 | | 160,000 | | 144,337 | |
| Burlington Northern Santa Fe LLC, 5.50%, 3/15/55 | | 50,000 | | 51,381 | |
| | | 195,718 | |
| Health Care Providers and Services — 0.1% | | | |
DaVita, Inc., 4.625%, 6/1/30(6) | | 510,000 | | 467,466 | |
| Kaiser Foundation Hospitals, 3.00%, 6/1/51 | | 180,000 | | 125,041 | |
| | | 592,507 | |
| Hotels, Restaurants and Leisure — 0.1% | | | |
Caesars Entertainment, Inc., 4.625%, 10/15/29(6) | | 200,000 | | 185,938 | |
Wynn Las Vegas LLC/Wynn Las Vegas Capital Corp., 5.25%, 5/15/27(6) | | 150,000 | | 147,090 | |
| | | 333,028 | |
| Household Durables — 0.1% | | | |
| KB Home, 4.80%, 11/15/29 | | 477,000 | | 459,137 | |
| Meritage Homes Corp., 5.125%, 6/6/27 | | 160,000 | | 160,167 | |
Tempur Sealy International, Inc., 3.875%, 10/15/31(6) | | 238,000 | | 205,101 | |
| | | 824,405 | |
| | | | | | | | | | | |
| | Shares/Principal
Amount | Value |
| Insurance — 0.0% | | | |
| AXA SA, VRN, 3.375%, 7/6/47 | EUR | 200,000 | | $ | 214,706 | |
| Media — 0.0% | | | |
| Charter Communications Operating LLC/Charter Communications Operating Capital, 6.38%, 10/23/35 | | $ | 240,000 | | 240,735 | |
| Metals and Mining — 0.0% | | | |
| Freeport-McMoRan, Inc., 5.40%, 11/14/34 | | 180,000 | | 179,813 | |
| Multi-Utilities — 0.0% | | | |
| Dominion Energy, Inc., 4.90%, 8/1/41 | | 70,000 | | 63,561 | |
| Oil, Gas and Consumable Fuels — 0.1% | | | |
Antero Resources Corp., 7.625%, 2/1/29(6) | | 108,000 | | 111,637 | |
| BP Capital Markets America, Inc., 3.06%, 6/17/41 | | 180,000 | | 135,501 | |
| Energy Transfer LP, 5.75%, 4/1/25 | | 70,000 | | 70,007 | |
MEG Energy Corp., 5.875%, 2/1/29(6) | | 130,000 | | 128,461 | |
| Southwestern Energy Co., 5.70%, 1/23/25 | | 14,000 | | 13,953 | |
| | | 459,559 | |
| Passenger Airlines — 0.0% | | | |
American Airlines, Inc./AAdvantage Loyalty IP Ltd., 5.50%, 4/20/26(6) | | 183,391 | | 182,323 | |
| Software — 0.0% | | | |
| Oracle Corp., 3.60%, 4/1/40 | | 130,000 | | 102,944 | |
| Technology Hardware, Storage and Peripherals — 0.2% | | | |
| Apple, Inc., 2.75%, 1/13/25 | | 1,750,000 | | 1,731,569 | |
TOTAL CORPORATE BONDS (Cost $13,912,957) | | | 13,044,963 | |
| COLLATERALIZED LOAN OBLIGATIONS — 1.0% | | | |
ARES Loan Funding III Ltd., Series 2022-ALF3A, Class A1R, VRN, 6.51%, (3-month SOFR plus 1.27%), 7/25/36(6)(8) | | 1,200,000 | | 1,200,000 | |
ARES XLVII CLO Ltd., Series 2018-47A, Class C, VRN, 7.31%, (3-month SOFR plus 2.01%), 4/15/30(6) | | 350,000 | | 350,608 | |
Carlyle Global Market Strategies CLO Ltd., Series 2012-4A, Class CR3, VRN, 8.14%, (3-month SOFR plus 2.86%), 4/22/32(6) | | 1,450,000 | | 1,454,460 | |
Cerberus Loan Funding XXXI LP, Series 2021-1A, Class A, VRN, 7.06%, (3-month SOFR plus 1.76%), 4/15/32(6) | | 96,888 | | 97,424 | |
Cook Park CLO Ltd., Series 2018-1A, Class C, VRN, 7.30%, (3-month SOFR plus 2.01%), 4/17/30(6) | | 3,000,000 | | 3,006,918 | |
Eaton Vance CLO Ltd., Series 2015-1A, Class CR, VRN, 7.44%, (3-month SOFR plus 2.16%), 1/20/30(6) | | 512,500 | | 513,700 | |
KKR CLO 18 Ltd., Series 2018, Class CR, VRN, 7.64%, (3-month SOFR plus 2.36%), 7/18/30(6) | | 200,000 | | 200,326 | |
Magnetite XXV Ltd., Series 2020-25A, Class C, VRN, 7.65%, (3-month SOFR plus 2.36%), 1/25/32(6) | | 450,000 | | 451,204 | |
Marathon CLO Ltd., Series 2021-17A, Class B1, VRN, 8.22%, (3-month SOFR plus 2.94%), 1/20/35(6) | | 425,000 | | 426,100 | |
TOTAL COLLATERALIZED LOAN OBLIGATIONS (Cost $7,682,535) | | | 7,700,740 | |
| ASSET-BACKED SECURITIES — 0.2% | | | |
Blackbird Capital II Aircraft Lease Ltd., Series 2021-1A, Class A, SEQ, 2.44%, 7/15/46(6) | | 308,078 | | 276,437 | |
FirstKey Homes Trust, Series 2020-SFR1, Class C, 1.94%, 8/17/37(6) | | 600,000 | | 575,374 | |
Lunar Aircraft Ltd., Series 2020-1A, Class A, SEQ, 3.38%, 2/15/45(6) | | 459,733 | | 442,882 | |
MAPS Trust, Series 2021-1A, Class A, SEQ, 2.52%, 6/15/46(6) | | 352,529 | | 320,530 | |
VSE VOI Mortgage LLC, Series 2018-A, Class B, 3.72%, 2/20/36(6) | | 99,420 | | 98,946 | |
TOTAL ASSET-BACKED SECURITIES (Cost $1,823,823) | | | 1,714,169 | |
| COLLATERALIZED MORTGAGE OBLIGATIONS — 0.2% | | | |
| Private Sponsor Collateralized Mortgage Obligations — 0.2% | | | |
| ABN AMRO Mortgage Corp., Series 2003-4, Class A4, 5.50%, 3/25/33 | | 3,707 | | 3,633 | |
COLT Mortgage Loan Trust, Series 2021-3, Class M1, VRN, 2.30%, 9/27/66(6) | | 1,800,000 | | 1,208,713 | |
SoFi Mortgage Trust, Series 2016-1A, Class 1A4, SEQ, VRN, 3.00%, 11/25/46(6) | | 24,411 | | 21,482 | |
| | | 1,233,828 | |
| U.S. Government Agency Collateralized Mortgage Obligations — 0.0% | | | |
FNMA, Series 2024-R01, Class 1M1, VRN, 6.40%, (30-day average SOFR plus 1.05%), 1/25/44(6) | | 436,438 | | 437,151 | |
TOTAL COLLATERALIZED MORTGAGE OBLIGATIONS (Cost $2,264,055) | | | 1,670,979 | |
| | | | | | | | | | | |
| | Shares/Principal
Amount | Value |
| PREFERRED STOCKS — 0.2% | | | |
| Automobiles — 0.1% | | | |
| Volkswagen International Finance NV, 3.875% | | 500,000 | | $ | 507,397 | |
| Electric Utilities — 0.0% | | | |
| Enel SpA, 2.25% | | 200,000 | | 205,946 | |
| Insurance — 0.0% | | | |
| Allianz SE, 3.375% | | 100,000 | | 108,119 | |
| AXA SA, 6.69% | | 50,000 | | 65,571 | |
| Intesa Sanpaolo Vita SpA, 4.75% | | 100,000 | | 108,365 | |
| | | 282,055 | |
| Oil, Gas and Consumable Fuels — 0.1% | | | |
| Eni SpA, 3.375% | | 500,000 | | 511,397 | |
TOTAL PREFERRED STOCKS (Cost $1,925,370) | | | 1,506,795 | |
| U.S. GOVERNMENT AGENCY MORTGAGE-BACKED SECURITIES — 0.1% | | | |
| Fixed-Rate U.S. Government Agency Mortgage-Backed Securities — 0.1% | | | |
| FHLMC, 6.00%, 2/1/38 | | $ | 16,390 | | 16,966 | |
| GNMA, 9.00%, 4/20/25 | | 22 | | 22 | |
| GNMA, 7.50%, 10/15/25 | | 60 | | 60 | |
| GNMA, 7.50%, 6/15/26 | | 138 | | 138 | |
| GNMA, 7.00%, 12/15/27 | | 4,064 | | 4,078 | |
| GNMA, 7.50%, 12/15/27 | | 456 | | 457 | |
| GNMA, 6.00%, 5/15/28 | | 2,723 | | 2,749 | |
| GNMA, 6.50%, 5/15/28 | | 2,419 | | 2,442 | |
| GNMA, 7.00%, 5/15/31 | | 5,498 | | 5,693 | |
| GNMA, 6.50%, 10/15/38 | | 355,417 | | 377,814 | |
| GNMA, 4.50%, 6/15/41 | | 117,412 | | 116,054 | |
TOTAL U.S. GOVERNMENT AGENCY MORTGAGE-BACKED SECURITIES (Cost $517,530) | | | 526,473 | |
| MUNICIPAL SECURITIES — 0.1% | | | |
| New Jersey Turnpike Authority Rev., 7.10%, 1/1/41 | | 140,000 | | 163,141 | |
| New York City GO, 6.27%, 12/1/37 | | 40,000 | | 43,668 | |
| Regents of the University of California Medical Center Pooled Rev., 3.26%, 5/15/60 | | 175,000 | | 121,962 | |
| State of California GO, 4.60%, 4/1/38 | | 100,000 | | 97,214 | |
| Texas Natural Gas Securitization Finance Corp. Rev., SEQ, 5.17%, 4/1/41 | | 45,000 | | 46,186 | |
TOTAL MUNICIPAL SECURITIES (Cost $513,314) | | | 472,171 | |
| EXCHANGE-TRADED FUNDS — 0.0% | | | |
| iShares Core S&P 500 ETF | | 49 | | 27,113 | |
| iShares MSCI EAFE Small-Cap ETF | | 59 | | 3,822 | |
TOTAL EXCHANGE-TRADED FUNDS (Cost $28,198) | | | 30,935 | |
| SHORT-TERM INVESTMENTS — 8.9% | | | |
| Certificates of Deposit — 0.8% | | | |
Canadian Imperial Bank of Commerce, VRN, 5.58%, (SOFR plus 0.25%), 2/11/25(6) | | $ | 1,000,000 | | 1,000,000 | |
Wells Fargo Bank NA, 5.40%, 3/11/25(6) | | 5,000,000 | | 5,011,594 | |
| | | 6,011,594 | |
Commercial Paper(9) — 3.5% | | | |
Banco Santander SA, 5.58%, 1/7/25(6) | | 3,000,000 | | 2,931,000 | |
Ionic Funding LLC, 5.69%, 9/5/24(6) | | 3,000,000 | | 2,983,821 | |
Ionic Funding LLC, 5.71%, 9/17/24(6) | | 4,500,000 | | 4,467,666 | |
JP Morgan Securities LLC, VRN, 5.71%, (SOFR plus 0.37%), 1/27/25(6) | | 3,000,000 | | 3,001,902 | |
Mainbeach Funding LLC, 5.50%, 8/1/24(6) | | 3,515,000 | | 3,514,476 | |
Overwatch Alpha Funding LLC, 5.49%, 8/1/24(6) | | 3,375,000 | | 3,375,000 | |
Regatta Funding Co. LLC, 5.56%, 8/21/24(6) | | 2,500,000 | | 2,492,150 | |
| | | | | | | | | | | |
| | Shares/Principal
Amount | Value |
UBS AG, VRN, 5.62%, (SOFR plus 0.25%), 8/19/24(6) | | $ | 1,000,000 | | $ | 1,000,102 | |
Washington Morgan Capital Co. LLC, 5.60%, 11/22/24 (LOC: Goldman Sachs & Co.)(6) | | 2,900,000 | | 2,851,753 | |
| | | 26,617,870 | |
| Money Market Funds — 3.9% | | | |
| State Street Institutional U.S. Government Money Market Fund, Premier Class | | 21,714,094 | | 21,714,094 | |
State Street Navigator Securities Lending Government Money Market Portfolio(10) | | 8,054,414 | | 8,054,414 | |
| | | 29,768,508 | |
Treasury Bills(9) — 0.7% | | | |
| U.S. Treasury Bills, 5.44%, 8/20/24 | | $ | 2,500,000 | | 2,493,036 | |
| U.S. Treasury Bills, 5.07%, 3/20/25 | | 1,000,000 | | 970,040 | |
| U.S. Treasury Bills, 5.19%, 6/12/25 | | 1,750,000 | | 1,679,846 | |
| | | 5,142,922 | |
TOTAL SHORT-TERM INVESTMENTS (Cost $67,518,428) | | | 67,540,894 | |
TOTAL INVESTMENT SECURITIES — 101.0% (Cost $635,518,760) | | | 761,818,761 | |
| OTHER ASSETS AND LIABILITIES — (1.0)% | | | (7,720,232) | |
| TOTAL NET ASSETS — 100.0% | | | $ | 754,098,529 | |
FORWARD FOREIGN CURRENCY EXCHANGE CONTRACTS
| | | | | | | | | | | | | | | | | | | | |
| Currency Purchased | Currency Sold | Counterparty | Settlement
Date | Unrealized
Appreciation
(Depreciation) |
| USD | 382,605 | | AUD | 578,306 | | Citibank N.A. | 9/18/24 | $ | 3,970 | |
| BRL | 3,863,362 | | USD | 713,126 | | JPMorgan Chase Bank N.A. | 9/18/24 | (33,409) | |
| CAD | 4,342 | | USD | 3,175 | | Bank of America N.A. | 9/27/24 | (25) | |
| CAD | 15,511 | | USD | 11,397 | | Bank of America N.A. | 9/27/24 | (143) | |
| CAD | 16,414 | | USD | 12,060 | | Bank of America N.A. | 9/27/24 | (152) | |
| CAD | 5,534 | | USD | 4,070 | | Bank of America N.A. | 9/27/24 | (56) | |
| CAD | 8,463 | | USD | 6,198 | | Bank of America N.A. | 9/27/24 | (58) | |
| CAD | 8,157 | | USD | 5,978 | | Bank of America N.A. | 9/27/24 | (60) | |
| CAD | 5,710 | | USD | 4,172 | | Bank of America N.A. | 9/27/24 | (30) | |
| CAD | 4,078 | | USD | 2,976 | | Bank of America N.A. | 9/27/24 | (17) | |
| CAD | 5,716 | | USD | 4,163 | | Bank of America N.A. | 9/27/24 | (17) | |
| CAD | 9,171 | | USD | 6,655 | | Bank of America N.A. | 9/27/24 | (1) | |
| CAD | 4,083 | | USD | 2,961 | | Bank of America N.A. | 9/27/24 | 1 | |
| CAD | 9,100 | | USD | 6,594 | | Bank of America N.A. | 9/27/24 | 8 | |
| CAD | 3,432 | | USD | 2,482 | | Bank of America N.A. | 9/27/24 | 8 | |
| CAD | 11,047 | | USD | 8,017 | | Bank of America N.A. | 9/27/24 | (3) | |
| USD | 4,550,913 | | CAD | 6,250,223 | | Citibank N.A. | 9/18/24 | 17,627 | |
| USD | 50,256 | | CAD | 68,467 | | Bank of America N.A. | 9/27/24 | 583 | |
| USD | 252,851 | | CAD | 344,475 | | Bank of America N.A. | 9/27/24 | 2,934 | |
| USD | 303,262 | | CAD | 413,153 | | Bank of America N.A. | 9/27/24 | 3,519 | |
| USD | 1,671 | | CAD | 2,278 | | Bank of America N.A. | 9/27/24 | 19 | |
| USD | 7,519 | | CAD | 10,281 | | Bank of America N.A. | 9/27/24 | 60 | |
| USD | 2,240 | | CAD | 3,060 | | Bank of America N.A. | 9/27/24 | 19 | |
| USD | 15,867 | | CAD | 21,671 | | Bank of America N.A. | 9/27/24 | 144 | |
| USD | 22,889 | | CAD | 31,262 | | Bank of America N.A. | 9/27/24 | 208 | |
| USD | 9,927 | | CAD | 13,610 | | Bank of America N.A. | 9/27/24 | 53 | |
| USD | 17,048 | | CAD | 23,372 | | Bank of America N.A. | 9/27/24 | 92 | |
| USD | 5,780 | | CAD | 7,889 | | Bank of America N.A. | 9/27/24 | 57 | |
| USD | 13,872 | | CAD | 18,880 | | Bank of America N.A. | 9/27/24 | 175 | |
| USD | 10,413 | | CAD | 14,146 | | Bank of America N.A. | 9/27/24 | 149 | |
| USD | 13,245 | | CAD | 18,024 | | Bank of America N.A. | 9/27/24 | 169 | |
| USD | 22,660 | | CAD | 30,837 | | Bank of America N.A. | 9/27/24 | 288 | |
| | | | | | | | | | | | | | | | | | | | |
| Currency Purchased | Currency Sold | Counterparty | Settlement
Date | Unrealized
Appreciation
(Depreciation) |
| USD | 14,677 | | CAD | 19,972 | | Bank of America N.A. | 9/27/24 | $ | 187 | |
| USD | 18,429 | | CAD | 25,054 | | Bank of America N.A. | 9/27/24 | 252 | |
| USD | 22,753 | | CAD | 30,960 | | Bank of America N.A. | 9/27/24 | 291 | |
| USD | 6,488 | | CAD | 8,831 | | Bank of America N.A. | 9/27/24 | 81 | |
| USD | 7,480 | | CAD | 10,181 | | Bank of America N.A. | 9/27/24 | 94 | |
| USD | 8,299 | | CAD | 11,333 | | Bank of America N.A. | 9/27/24 | 78 | |
| USD | 18,794 | | CAD | 25,662 | | Bank of America N.A. | 9/27/24 | 176 | |
| USD | 11,611 | | CAD | 15,860 | | Bank of America N.A. | 9/27/24 | 105 | |
| USD | 9,370 | | CAD | 12,824 | | Bank of America N.A. | 9/27/24 | 66 | |
| USD | 6,187 | | CAD | 8,529 | | Bank of America N.A. | 9/27/24 | (1) | |
| USD | 6,998 | | CAD | 9,664 | | Bank of America N.A. | 9/27/24 | (13) | |
| USD | 1,361 | | CAD | 1,880 | | Bank of America N.A. | 9/27/24 | (3) | |
| USD | 13,873 | | CAD | 19,187 | | Bank of America N.A. | 9/27/24 | (47) | |
| CLP | 122,272,129 | | USD | 132,275 | | Bank of America N.A. | 9/23/24 | (2,504) | |
| USD | 2,933,904 | | CNY | 20,862,405 | | JPMorgan Chase Bank N.A. | 9/18/24 | 4,438 | |
| COP | 1,343,400,162 | | USD | 335,091 | | Morgan Stanley | 9/18/24 | (5,647) | |
| CZK | 10,704,519 | | USD | 464,969 | | JPMorgan Chase Bank N.A. | 9/18/24 | (8,543) | |
| EUR | 482,960 | | USD | 522,215 | | Morgan Stanley | 9/18/24 | 1,616 | |
| EUR | 380,536 | | USD | 408,945 | | Morgan Stanley | 9/18/24 | 3,795 | |
| EUR | 53,138 | | USD | 57,082 | | Morgan Stanley | 9/18/24 | 552 | |
| EUR | 22,210 | | USD | 24,312 | | Bank of America N.A. | 9/27/24 | (212) | |
| EUR | 63,485 | | USD | 68,359 | | Bank of America N.A. | 9/27/24 | 528 | |
| EUR | 50,318 | | USD | 54,943 | | Bank of America N.A. | 9/27/24 | (344) | |
| EUR | 15,167 | | USD | 16,511 | | JPMorgan Chase Bank N.A. | 9/27/24 | (54) | |
| EUR | 5,894 | | USD | 6,437 | | UBS AG | 9/27/24 | (42) | |
| EUR | 8,220 | | USD | 8,955 | | UBS AG | 9/27/24 | (36) | |
| EUR | 52,978 | | USD | 57,429 | | UBS AG | 9/27/24 | 56 | |
| USD | 14,529,745 | | EUR | 13,472,728 | | JPMorgan Chase Bank N.A. | 9/18/24 | (83,125) | |
| USD | 47,271 | | EUR | 43,811 | | Bank of America N.A. | 9/27/24 | (268) | |
| USD | 592,612 | | EUR | 549,236 | | Bank of America N.A. | 9/27/24 | (3,356) | |
| USD | 59,224 | | EUR | 54,104 | | Bank of America N.A. | 9/27/24 | 516 | |
| USD | 47,249 | | EUR | 43,811 | | Citibank N.A. | 9/27/24 | (289) | |
| USD | 592,342 | | EUR | 549,236 | | Citibank N.A. | 9/27/24 | (3,625) | |
| USD | 47,299 | | EUR | 43,811 | | Morgan Stanley | 9/27/24 | (239) | |
| USD | 592,965 | | EUR | 549,236 | | Morgan Stanley | 9/27/24 | (3,003) | |
| USD | 3,660 | | EUR | 3,375 | | Morgan Stanley | 9/27/24 | (2) | |
| USD | 58,559 | | EUR | 53,999 | | Morgan Stanley | 9/27/24 | (34) | |
| USD | 47,270 | | EUR | 43,811 | | UBS AG | 9/27/24 | (268) | |
| USD | 5,853 | | EUR | 5,384 | | UBS AG | 9/27/24 | 11 | |
| USD | 592,609 | | EUR | 549,236 | | UBS AG | 9/27/24 | (3,358) | |
| GBP | 12,237 | | USD | 15,812 | | Goldman Sachs & Co. | 9/27/24 | (74) | |
| USD | 1,363,914 | | GBP | 1,071,806 | | Citibank N.A. | 9/18/24 | (14,526) | |
| USD | 396,151 | | GBP | 311,969 | | Goldman Sachs & Co. | 9/27/24 | (5,096) | |
| USD | 12,683 | | GBP | 9,904 | | Goldman Sachs & Co. | 9/27/24 | (55) | |
| USD | 10,444 | | GBP | 8,047 | | Goldman Sachs & Co. | 9/27/24 | 95 | |
| USD | 35,066 | | GBP | 27,139 | | Goldman Sachs & Co. | 9/27/24 | 161 | |
| USD | 35,885 | | GBP | 27,751 | | Goldman Sachs & Co. | 9/27/24 | 192 | |
| USD | 25,073 | | GBP | 19,449 | | Goldman Sachs & Co. | 9/27/24 | 59 | |
| USD | 28,717 | | GBP | 22,339 | | Goldman Sachs & Co. | 9/27/24 | (15) | |
| HUF | 81,009,383 | | USD | 219,490 | | Bank of America N.A. | 9/18/24 | 2,688 | |
| IDR | 12,056,184,774 | | USD | 737,720 | | Bank of America N.A. | 9/18/24 | 3,528 | |
| USD | 1,871,976 | | JPY | 290,163,184 | | Citibank N.A. | 9/18/24 | (78,462) | |
| MXN | 12,351,641 | | USD | 661,423 | | JPMorgan Chase Bank N.A. | 9/18/24 | (3,269) | |
| MYR | 2,479,488 | | USD | 527,214 | | Goldman Sachs & Co. | 9/18/24 | 15,296 | |
| | | | | | | | | | | | | | | | | | | | |
| Currency Purchased | Currency Sold | Counterparty | Settlement
Date | Unrealized
Appreciation
(Depreciation) |
| USD | 167,506 | | NOK | 1,794,525 | | Citibank N.A. | 9/18/24 | $ | 2,848 | |
| PEN | 638,294 | | USD | 168,837 | | Goldman Sachs & Co. | 9/18/24 | 1,888 | |
| PLN | 2,360,040 | | USD | 582,564 | | Morgan Stanley | 9/18/24 | 12,528 | |
| RON | 1,398,173 | | USD | 300,945 | | Goldman Sachs & Co. | 9/18/24 | 3,033 | |
| THB | 13,090,959 | | USD | 358,041 | | Citibank N.A. | 9/18/24 | 10,594 | |
| TRY | 3,622,249 | | USD | 101,309 | | Goldman Sachs & Co. | 9/18/24 | 2,463 | |
| ZAR | 11,736,389 | | USD | 624,800 | | Bank of America N.A. | 9/18/24 | 17,265 | |
| | | | | | $ | (134,918) | |
| | | | | | | | | | | | | | |
| FUTURES CONTRACTS PURCHASED |
| Reference Entity | Contracts | Expiration Date | Notional
Amount | Unrealized
Appreciation
(Depreciation)^ |
| Euro-Bobl 5-Year Bonds | 13 | September 2024 | $ | 1,653,277 | | $ | 22,350 | |
| U.K. Gilt 10-Year Bonds | 27 | September 2024 | 3,443,912 | | 75,975 | |
| U.S. Treasury 5-Year Notes | 234 | September 2024 | 25,246,406 | | 509,155 | |
| U.S. Treasury 10-Year Notes | 22 | September 2024 | 2,459,875 | | 45,368 | |
| U.S. Treasury 10-Year Ultra Notes | 37 | September 2024 | 4,276,391 | | 138,149 | |
| | | $ | 37,079,861 | | $ | 790,997 | |
^Amount represents value and unrealized appreciation (depreciation).
| | | | | | | | | | | | | | | | | | | | | | | |
| CENTRALLY CLEARED CREDIT DEFAULT SWAP AGREEMENTS |
| Reference Entity | Type‡ | Fixed
Rate
Received
(Paid)
Quarterly | Termination
Date | Notional
Amount | Premiums
Paid
(Received) | Unrealized
Appreciation
(Depreciation) | Value^ |
| Markit CDX North America High Yield Index Series 37 | Buy | (5.00)% | 12/20/26 | $ | 5,496,020 | | $ | (123,885) | | $ | (285,316) | | $ | (409,201) | |
| Markit CDX North America High Yield Index Series 42 | Sell | 5.00% | 6/20/29 | $ | 1,080,000 | | 57,011 | | 22,735 | | 79,746 | |
| Markit iTraxx Europe Crossover Index Series 41 | Sell | 5.00% | 6/20/29 | EUR | 1,000,000 | | 75,066 | | 23,243 | | 98,309 | |
| | | | | $ | 8,192 | | $ | (239,338) | | $ | (231,146) | |
‡The maximum potential amount the fund could be required to deliver as a seller of credit protection if a credit event occurs as defined under the terms of the agreement is the notional amount. The maximum potential amount may be partially offset by any recovery values of the reference entities and upfront payments received upon entering into the agreement.
^The value for credit default swap agreements serves as an indicator of the current status of the payment/performance risk and represent the likelihood of an expected liability or profit at the period end. Increasing values in absolute terms when compared to the notional amount of the credit default swap agreement represent a deterioration of the referenced entity's credit soundness and an increased likelihood or risk of a credit event occurring as defined in the agreement.
| | | | | | | | |
| NOTES TO SCHEDULE OF INVESTMENTS |
| ADR | – | American Depositary Receipt |
| AUD | – | Australian Dollar |
| BRL | – | Brazilian Real |
| CAD | – | Canadian Dollar |
| CDX | – | Credit Derivatives Indexes |
| CLP | – | Chilean Peso |
| CNY | – | Chinese Yuan |
| COP | – | Colombian Peso |
| CVA | – | Certificaten Van Aandelen |
| CZK | – | Czech Koruna |
| DKK | – | Danish Krone |
| EUR | – | Euro |
| FHLMC | – | Federal Home Loan Mortgage Corp. |
| FNMA | – | Federal National Mortgage Association |
| GBP | – | British Pound |
| GNMA | – | Government National Mortgage Association |
| GO | – | General Obligation |
| HUF | – | Hungarian Forint |
| IDR | – | Indonesian Rupiah |
| JPY | – | Japanese Yen |
| LOC | – | Letter of Credit |
| MXN | – | Mexican Peso |
| MYR | – | Malaysian Ringgit |
| NOK | – | Norwegian Krone |
| PEN | – | Peruvian Sol |
| PLN | – | Polish Zloty |
| RON | – | Romanian New Leu |
| SEQ | – | Sequential Payer |
| SOFR | – | Secured Overnight Financing Rate |
| THB | – | Thai Baht |
| TRY | – | Turkish Lira |
| USBMMY | – | U.S. Treasury Bill Money Market Yield |
| USD | – | United States Dollar |
| VRN | – | Variable Rate Note. The rate adjusts periodically based upon the terms set forth in the security’s offering documents. The rate shown is effective at the period end and the reference rate and spread, if any, is indicated. The security's effective maturity date may be shorter than the final maturity date shown. |
| ZAR | – | South African Rand |
(1)Investments are funds within the American Century Investments family of funds and are considered affiliated funds.
(2)Non-income producing.
(3)Security, or a portion thereof, is on loan. At the period end, the aggregate value of securities on loan was $8,986,409. The amount of securities on loan indicated may not correspond with the securities on loan identified because securities with pending sales are in the process of recall from the brokers.
(4)Security may be subject to resale, redemption or transferability restrictions.
(5)Security, or a portion thereof, has been pledged at the custodian bank or with a broker for collateral requirements on forward foreign currency exchange contracts, futures contracts and/or swap agreements. At the period end, the aggregate value of securities pledged was $1,197,639.
(6)Security was purchased pursuant to Rule 144A or Section 4(2) under the Securities Act of 1933 and may be sold in transactions exempt from registration, normally to qualified institutional investors. The aggregate value of these securities at the period end was $50,120,756, which represented 6.6% of total net assets.
(7)Security is a zero-coupon bond. Zero-coupon securities may be issued at a substantial discount from their value at maturity.
(8)When-issued security. The issue price and yield are fixed on the date of the commitment, but payment and delivery are scheduled for a future date.
(9)The rate indicated is the yield to maturity at purchase for non-interest bearing securities. For interest bearing securities, the stated coupon rate is shown.
(10)Investment of cash collateral from securities on loan. At the period end, the aggregate value of the collateral held by the fund was $9,217,113, which includes securities collateral of $1,162,699.
See Notes to Financial Statements.
| | |
| Statement of Assets and Liabilities |
| | | | | |
| JULY 31, 2024 | |
| Assets | |
| Investment securities - unaffiliated, at value (cost of $368,396,636) — including $1,460,184 of securities on loan | $ | 407,262,647 | |
| Investment securities - affiliated, at value (cost of $259,067,710) — including $7,526,225 of securities on loan | 346,501,700 | |
| Investment made with cash collateral received for securities on loan, at value (cost of $8,054,414) | 8,054,414 | |
| Total investment securities, at value (cost of $635,518,760) | 761,818,761 | |
| Cash | 611,728 | |
| Foreign currency holdings, at value (cost of $50,312) | 7,421 | |
| Receivable for investments sold | 684,382 | |
| Receivable for capital shares sold | 276,624 | |
| Receivable for variation margin on futures contracts | 70,025 | |
| Unrealized appreciation on forward foreign currency exchange contracts | 115,563 | |
| Interest and dividends receivable | 1,406,972 | |
| Securities lending receivable | 3,483 | |
| Other assets | 16,943 | |
| 765,011,902 | |
| |
| Liabilities | |
| Payable for collateral received for securities on loan | 8,054,414 | |
| Payable for investments purchased | 1,885,567 | |
| Payable for capital shares redeemed | 264,943 | |
| Payable for variation margin on swap agreements | 4,761 | |
| Unrealized depreciation on forward foreign currency exchange contracts | 250,481 | |
| Accrued management fees | 375,887 | |
| Distribution and service fees payable | 77,320 | |
| 10,913,373 | |
| |
| Net Assets | $ | 754,098,529 | |
| |
| Net Assets Consist of: | |
| Capital (par value and paid-in surplus) | $ | 605,322,461 | |
| Distributable earnings (loss) | 148,776,068 | |
| $ | 754,098,529 | |
| | | | | | | | | | | |
| Net Assets | Shares Outstanding | Net Asset Value Per Share* |
| Investor Class, $0.01 Par Value | $236,662,617 | 36,179,318 | $6.54 |
| I Class, $0.01 Par Value | $76,384,968 | 11,668,661 | $6.55 |
| A Class, $0.01 Par Value | $263,505,549 | 40,470,361 | $6.51 |
| C Class, $0.01 Par Value | $12,208,106 | 1,934,982 | $6.31 |
| R Class, $0.01 Par Value | $27,203,801 | 4,221,426 | $6.44 |
| R5 Class, $0.01 Par Value | $8,566 | 1,308 | $6.55 |
| R6 Class, $0.01 Par Value | $138,124,922 | 21,148,558 | $6.53 |
*Maximum offering price per share was equal to the net asset value per share for all share classes, except A Class, for which the maximum offering price per share was $6.91 (net asset value divided by 0.9425). A contingent deferred sales charge may be imposed on redemptions of A Class and C Class.
See Notes to Financial Statements.
| | | | | |
| YEAR ENDED JULY 31, 2024 |
| Investment Income (Loss) | |
| Income: | |
| Interest | $ | 8,924,037 | |
| Income distributions from affiliated funds | 8,887,479 | |
| Dividends (net of foreign taxes withheld of $127,793) | 3,394,999 | |
| Securities lending, net | 107,305 | |
| 21,313,820 | |
| |
| Expenses: | |
| Management fees | 7,492,226 | |
| Distribution and service fees: | |
| A Class | 641,815 | |
| C Class | 134,193 | |
| R Class | 127,527 | |
| Directors' fees and expenses | 23,926 | |
| Other expenses | 65,418 | |
| 8,485,105 | |
Fees waived(1) | (3,114,184) | |
| 5,370,921 | |
| |
| Net investment income (loss) | 15,942,899 | |
| |
| Realized and Unrealized Gain (Loss) | |
| Net realized gain (loss) on: | |
| Investment transactions (including $11,216,511 from affiliated funds) | 25,078,037 | |
| Forward foreign currency exchange contract transactions | 488,591 | |
| Futures contract transactions | (2,064,767) | |
| Swap agreement transactions | (132,952) | |
| Foreign currency translation transactions | (9,991) | |
| 23,358,918 | |
| |
| Change in net unrealized appreciation (depreciation) on: | |
| Investments (including $29,571,720 from affiliated funds) | 37,087,485 | |
| Forward foreign currency exchange contracts | 151,474 | |
| Futures contracts | 1,462,922 | |
| Swap agreements | 54,931 | |
| Translation of assets and liabilities in foreign currencies | (4,506) | |
| 38,752,306 | |
| |
| Net realized and unrealized gain (loss) | 62,111,224 | |
| |
| Net Increase (Decrease) in Net Assets Resulting from Operations | $ | 78,054,123 | |
(1)Amount consists of $1,016,660, $289,454, $1,087,404, $56,843, $108,030, $2,154 and $553,639 for Investor Class, I Class, A Class, C Class, R Class, R5 Class and R6 Class, respectively.
See Notes to Financial Statements.
| | |
| Statement of Changes in Net Assets |
| | | | | | | | |
| YEARS ENDED JULY 31, 2024 AND JULY 31, 2023 |
| Increase (Decrease) in Net Assets | July 31, 2024 | July 31, 2023 |
| Operations | | |
| Net investment income (loss) | $ | 15,942,899 | | $ | 14,943,278 | |
| Net realized gain (loss) | 23,358,918 | | 2,404,303 | |
| Change in net unrealized appreciation (depreciation) | 38,752,306 | | 24,210,396 | |
| Net increase (decrease) in net assets resulting from operations | 78,054,123 | | 41,557,977 | |
| | |
| Distributions to Shareholders | | |
| From earnings: | | |
| Investor Class | (4,640,706) | | (14,175,527) | |
| I Class | (1,462,818) | | (3,345,838) | |
| A Class | (4,302,501) | | (14,170,892) | |
| C Class | (136,756) | | (840,397) | |
| R Class | (367,434) | | (1,357,828) | |
| R5 Class | (12,336) | | (33,107) | |
| R6 Class | (2,972,781) | | (6,786,397) | |
| Decrease in net assets from distributions | (13,895,332) | | (40,709,986) | |
| | |
| Capital Share Transactions | | |
| Net increase (decrease) in net assets from capital share transactions (Note 5) | (64,164,875) | | (9,133,582) | |
| | |
| Net increase (decrease) in net assets | (6,084) | | (8,285,591) | |
| | |
| Net Assets | | |
| Beginning of period | 754,104,613 | | 762,390,204 | |
| End of period | $ | 754,098,529 | | $ | 754,104,613 | |
See Notes to Financial Statements.
| | |
| Notes to Financial Statements |
JULY 31, 2024
1. Organization
American Century Strategic Asset Allocations, Inc. (the corporation) is registered under the Investment Company Act of 1940, as amended (the 1940 Act), as an open-end management investment company and is organized as a Maryland corporation. Strategic Allocation: Moderate Fund (the fund) is one fund in a series issued by the corporation. The fund may invest in varying combinations of other affiliated investment companies such as mutual funds and exchange-traded funds advised by American Century Investments (affiliated funds). The fund will assume the risks associated with the affiliated funds. The fund is an asset allocation fund and its investment objective is to seek the highest level of total return consistent with its asset mix.
The fund offers the Investor Class, I Class, A Class, C Class, R Class, R5 Class and R6 Class. The A Class may incur an initial sales charge. The A Class and C Class may be subject to a contingent deferred sales charge.
2. Significant Accounting Policies
The following is a summary of significant accounting policies consistently followed by the fund in preparation of its financial statements. The fund is an investment company and follows accounting and reporting guidance in accordance with accounting principles generally accepted in the United States of America. This may require management to make certain estimates and assumptions at the date of the financial statements. Actual results could differ from these estimates. Management evaluated the impact of events or transactions occurring through the date the financial statements were issued that would merit recognition or disclosure.
Investment Valuations — The fund determines the fair value of its investments and computes its net asset value (NAV) per share at the close of regular trading (usually 4 p.m. Eastern time) on the New York Stock Exchange (NYSE) on each day the NYSE is open. The value of investments of the fund is determined by American Century Investment Management, Inc. (ACIM) (the investment advisor), as the valuation designee, pursuant to its valuation policies and procedures. The Board of Directors oversees the valuation designee and reviews its valuation policies and procedures at least annually.
Equity securities that are listed or traded on a domestic securities exchange are valued at the last reported sales price or at the official closing price as provided by the exchange. Equity securities traded on foreign securities exchanges are generally valued at the closing price of such securities on the exchange where primarily traded or at the close of the NYSE, if that is earlier. If no last sales price is reported, or if local convention or regulation so provides, the mean of the latest bid and asked prices may be used. Securities traded over-the-counter are valued at the mean of the latest bid and asked prices, the last sales price, or the official closing price.
Fixed income securities are valued at the evaluated mean as provided by independent pricing services or at the mean of the most recent bid and asked prices as provided by investment dealers. Corporate bonds, U.S. Treasury and Government Agency securities, municipal securities, and sovereign governments and agencies are valued using market models that consider trade data, quotations from dealers and active market makers, relevant yield curve and spread data, creditworthiness, trade data or market information on comparable securities, and other relevant security specific information. Mortgage-related and asset-backed securities are valued based on models that consider trade data, prepayment and default projections, benchmark yield and spread data and estimated cash flows of each tranche of the issuer. Collateralized loan obligations are valued based on discounted cash flow models that consider trade and economic data, prepayment assumptions and default projections. Commercial paper and certificates of deposit are valued using a curve-based approach that considers money market rates for specific instruments, programs, currencies and maturity points from a variety of active market makers.
Hybrid securities are valued at the evaluated mean as provided by independent pricing services or at the mean of the most recent bid and asked prices as provided by investment dealers. Preferred stocks and convertible preferred stocks with perpetual maturities are valued using market models that consider trade data, quotations from dealers and active market makers, relevant yield curve and spread data, creditworthiness, trade data or market information on comparable securities, and other relevant security specific information.
Open-end management investment companies are valued at the reported NAV per share. Exchange-traded futures contracts are valued at the settlement price as provided by the appropriate exchange. Swap agreements are valued at an evaluated mean as provided by independent pricing services or independent brokers. Forward foreign currency exchange contracts are valued at the mean of the appropriate forward exchange rate at the close of the NYSE as provided by an independent pricing service.
If the valuation designee determines that the market price for a portfolio security is not readily available or is believed by the valuation designee to be unreliable, such security is valued at fair value as determined in good faith by the valuation designee, in accordance with its policies and procedures. Circumstances that may cause the fund to determine that market quotations are not available or reliable include, but are not limited to: when there is a significant event subsequent to the market quotation; trading in a security has been halted during the trading day; or trading in a security is insufficient or did not take place due to a closure or holiday.
The valuation designee monitors for significant events occurring after the close of an investment’s primary exchange but before the fund’s NAV per share is determined. Significant events may include, but are not limited to: corporate announcements and transactions; regulatory news, governmental action and political unrest that could impact a specific investment or an investment sector; or armed conflicts, natural disasters and similar events that could affect investments in a specific country or region. The valuation designee also monitors for significant fluctuations between domestic and foreign markets, as evidenced by the U.S. market or such other indicators that it deems appropriate. The valuation designee may apply a model-derived factor to the closing price of equity securities traded on foreign securities exchanges. The factor is based on observable market data as provided by an independent pricing service.
Foreign Currency Translations — All assets and liabilities, including investment securities and other financial instruments, initially expressed in foreign currencies are translated into U.S. dollars each day at the mean of the appropriate currency exchange rate at the close of the NYSE as provided by an independent pricing service. The fund may enter into spot foreign currency exchange contracts to facilitate transactions denominated in a foreign currency. Purchases and sales of investment securities, dividend and interest income, spot foreign currency exchange contracts, and expenses are translated at the rates of exchange prevailing on the respective dates of such transactions. Net realized and unrealized foreign currency exchange gains or losses related to investment securities are a component of net realized gain (loss) on investment transactions and change in net unrealized appreciation (depreciation) on investments, respectively.
Security Transactions — Security transactions are accounted for as of the trade date. Net realized gains and losses are determined on the identified cost basis, which is also used for federal income tax purposes.
Investment Income — Interest income is recorded on the accrual basis and includes paydown gain (loss) and accretion of discounts and amortization of premiums. Inflation adjustments related to inflation-linked debt securities are reflected as interest income. Dividend income less foreign taxes withheld, if any, is recorded as of the ex-dividend date. Distributions received on securities that represent a return of capital or long-term capital gain are recorded as a reduction of cost of investments and/or as a realized gain. The fund may estimate the components of distributions received that may be considered nontaxable distributions or long-term capital gain distributions for income tax purposes. Income and capital gain distributions, if any, from the affiliated funds are recorded as of the ex-dividend date. Securities lending income is net of fees and rebates earned by the lending agent for its services.
Income Tax Status — It is the fund's policy to distribute substantially all net investment income and net realized gains to shareholders and to otherwise qualify as a regulated investment company under provisions of the Internal Revenue Code. Accordingly, no provision has been made for income taxes. The fund files U.S. federal, state, local and non-U.S. tax returns as applicable. The fund's tax returns are subject to examination by the relevant taxing authority until expiration of the applicable statute of limitations, which is generally three years from the date of filing but can be longer in certain jurisdictions. At this time, management believes there are no uncertain tax positions which, based on their technical merit, would not be sustained upon examination and for which it is reasonably possible that the total amounts of unrecognized tax benefits will significantly change in the next twelve months.
Multiple Class — All shares of the fund represent an equal pro rata interest in the net assets of the class to which such shares belong, and have identical voting, dividend, liquidation and other rights and the same terms and conditions, except for class specific expenses and exclusive rights to vote on matters affecting only individual classes. Income, non-class specific expenses, and realized and unrealized capital gains and losses of the fund are allocated to each class of shares based on their relative net assets.
Distributions to Shareholders — Distributions from net investment income, if any, are generally declared and paid quarterly. Distributions from net realized gains, if any, are generally declared and paid annually. The fund may elect to treat a portion of its payment to a redeeming shareholder, which represents the pro rata share of undistributed net investment income and net realized gains, as a distribution for federal income tax purposes (tax equalization).
Indemnifications — Under the corporation’s organizational documents, its officers and directors are indemnified against certain liabilities arising out of the performance of their duties to the fund. In addition, in the normal course of business, the fund enters into contracts that provide general indemnifications. The maximum exposure under these arrangements is unknown as this would involve future claims that may be made against a fund. The risk of material loss from such claims is considered by management to be remote.
Securities Lending — Securities are lent to qualified financial institutions and brokers. State Street Bank & Trust Co. serves as securities lending agent to the fund pursuant to a Securities Lending Agreement. The lending of securities exposes the fund to risks such as: the borrowers may fail to return the loaned securities, the borrowers may not be able to provide additional collateral, the fund may experience delays in recovery of the loaned securities or delays in access to collateral, or the fund may experience losses related to the investment collateral. To minimize certain risks, loan counterparties pledge collateral in the form of cash and/or securities. The lending agent has agreed to indemnify the fund in the case of default of any securities borrowed. Cash collateral received is invested in the State Street Navigator Securities Lending Government Money Market Portfolio, a money market mutual fund registered under the 1940 Act. The loans may also be secured by U.S. government securities in an amount at least equal to the market value of the securities loaned, plus accrued interest and dividends, determined on a daily basis and adjusted accordingly. By lending securities, the fund seeks to increase its net investment income through the receipt of interest and fees. Such income is reflected separately within the Statement of Operations. The value of loaned securities and related collateral outstanding at period end, if any, are shown on a gross basis within the Schedule of Investments and Statement of Assets and Liabilities.
The following table reflects a breakdown of transactions accounted for as secured borrowings, the gross obligation by the type of collateral pledged, and the remaining contractual maturity of those transactions as of July 31, 2024.
| | | | | | | | | | | | | | | | | |
| Remaining Contractual Maturity of Agreements |
| Overnight and
Continuous | <30 days | Between 30 & 90 days | >90 days | Total |
Securities Lending Transactions(1) | | | | |
| Affiliated Funds | $ | 1,160,508 | | — | | — | | — | | $ | 1,160,508 | |
| Common Stocks | 6,893,906 | | — | | — | | — | | 6,893,906 | |
| Total Borrowings | $ | 8,054,414 | | — | | — | | — | | $ | 8,054,414 | |
| Gross amount of recognized liabilities for securities lending transactions | $ | 8,054,414 | |
(1)Amount represents the payable for cash collateral received for securities on loan. This will generally be in the Overnight and Continuous column as the securities are typically callable on demand.
3. Fees and Transactions with Related Parties
Certain officers and directors of the corporation are also officers and/or directors of American Century Companies, Inc. (ACC). The corporation's investment advisor, ACIM, the corporation's distributor, American Century Investment Services, Inc. (ACIS), and the corporation's transfer agent, American Century Services, LLC, are wholly owned, directly or indirectly, by ACC. ACIM serves as the investment advisor for the affiliated funds.
Management Fees — The corporation has entered into a management agreement with ACIM, under which ACIM provides the fund with investment advisory and management services in exchange for a single, unified management fee (the fee) per class. The agreement provides that ACIM will pay all expenses of managing and operating the fund, except brokerage expenses, taxes, interest, fees and expenses of the independent directors (including legal counsel fees), extraordinary expenses, and expenses incurred in connection with the provision of shareholder services and distribution services under a plan adopted pursuant to Rule 12b-1 under the 1940 Act. The fee is computed and accrued daily based on each class's daily net assets and paid monthly in arrears. The difference in the fee among the classes is a result of their separate arrangements for non-Rule 12b-1 shareholder services. It is not the result of any difference in advisory or custodial fees or other expenses related to the management of the fund's assets, which do not vary by class. The rate of the fee is determined by applying a fee rate calculation formula. This formula takes into account the fund's assets as well as certain assets, if any, of other clients of the investment advisor outside the American Century Investments family of funds (such as subadvised funds and separate accounts), as well as exchange-traded funds managed by the investment advisor, that use very similar investment teams and strategies (strategy assets). The investment advisor will waive the portion of the fund's management fee equal to the expenses attributable to the management fees of the funds advised by American Century Investments in which the fund invests. The amount of this waiver will fluctuate depending on the fund's daily allocation to such funds. This waiver is expected to remain in effect permanently and it cannot be terminated without the approval of the Board of Directors. During the period ended July 31, 2024, the investment advisor agreed to waive an additional 0.27% of the fund's management fee. The investment advisor expects this waiver to continue until July 31, 2025 and cannot terminate it prior to such date without the approval of the Board of Directors.
The management fee schedule range and the effective annual management fee before and after waiver for each class for the period ended July 31, 2024 are as follows:
| | | | | | | | | | | |
| Management Fee Schedule Range | Effective Annual Management Fee |
| Before Waiver | After Waiver |
| Investor Class | 0.90% to 1.10% | 1.10% | 0.68% |
| I Class | 0.70% to 0.90% | 0.90% | 0.48% |
| A Class | 0.90% to 1.10% | 1.10% | 0.68% |
| C Class | 0.90% to 1.10% | 1.10% | 0.68% |
| R Class | 0.90% to 1.10% | 1.10% | 0.68% |
| R5 Class | 0.70% to 0.90% | 0.90% | 0.48% |
| R6 Class | 0.55% to 0.75% | 0.75% | 0.33% |
Distribution and Service Fees — The Board of Directors has adopted a separate Master Distribution and Individual Shareholder Services Plan for each of the A Class, C Class and R Class (collectively the plans), pursuant to Rule 12b-1 of the 1940 Act. The plans provide that the A Class will pay ACIS an annual distribution and service fee of 0.25%. The plans provide that the C Class will pay ACIS an annual distribution and service fee of 1.00%, of which 0.25% is paid for individual shareholder services and 0.75% is paid for distribution services. The plans provide that the R Class will pay ACIS an annual distribution and service fee of 0.50%. The fees are computed and accrued daily based on each class’s daily net assets and paid monthly in arrears. The fees are used to pay financial intermediaries for distribution and individual shareholder services. Fees incurred under the plans during the period ended July 31, 2024 are detailed in the Statement of Operations.
Directors' Fees and Expenses — The Board of Directors is responsible for overseeing the investment advisor’s management and operations of the fund. The directors receive detailed information about the fund and its investment advisor regularly throughout the year, and meet at least quarterly with management of the investment advisor to review reports about fund operations. The fund's officers do not receive compensation from the fund.
Other Expenses — A fund’s other expenses may include interest charges, clearing exchange fees, proxy solicitation expenses, fees associated with the recovery of foreign tax reclaims and other miscellaneous expenses.
Interfund Transactions — The fund may enter into security transactions with other American Century Investments funds and other client accounts of the investment advisor, in accordance with the 1940 Act rules and procedures adopted by the Board of Directors. The rules and procedures require, among other things, that these transactions be effected at the independent current market price of the security. During the period, the interfund purchases and sales were $79,729 and $31,545, respectively. The effect of interfund transactions on the Statement of Operations was $(1,665) in net realized gain (loss) on investment transactions.
4. Investment Transactions
Purchases of investment securities, excluding short-term investments, for the period ended July 31, 2024 totaled $188,531,749, of which $31,515,670 represented U.S. Treasury and Government Agency obligations.
Sales of investment securities, excluding short-term investments, for the period ended July 31, 2024 totaled $261,442,613, of which $7,988,830 represented U.S. Treasury and Government Agency obligations.
5. Capital Share Transactions
Transactions in shares of the fund were as follows:
| | | | | | | | | | | | | | |
| Year ended
July 31, 2024 | Year ended
July 31, 2023 |
| Shares | Amount | Shares | Amount |
| Investor Class/Shares Authorized | 790,000,000 | | | 790,000,000 | | |
| Sold | 2,134,083 | | $ | 12,932,030 | | 3,856,387 | | $ | 22,397,941 | |
| Issued in reinvestment of distributions | 746,805 | | 4,550,129 | | 2,516,767 | | 13,912,787 | |
| Redeemed | (9,477,638) | | (57,731,315) | | (7,338,775) | | (42,538,192) | |
| (6,596,750) | | (40,249,156) | | (965,621) | | (6,227,464) | |
| I Class/Shares Authorized | 380,000,000 | | | 380,000,000 | | |
| Sold | 5,860,046 | | 34,750,637 | | 1,945,793 | | 11,573,001 | |
| Issued in reinvestment of distributions | 238,952 | | 1,460,252 | | 603,820 | | 3,338,603 | |
| Redeemed | (3,748,753) | | (23,075,265) | | (2,677,123) | | (15,393,397) | |
| 2,350,245 | | 13,135,624 | | (127,510) | | (481,793) | |
| A Class/Shares Authorized | 670,000,000 | | | 670,000,000 | | |
| Sold | 3,434,687 | | 20,558,536 | | 3,895,038 | | 22,398,568 | |
| Issued in reinvestment of distributions | 690,131 | | 4,188,401 | | 2,506,968 | | 13,802,068 | |
| Redeemed | (8,508,318) | | (50,787,481) | | (8,478,982) | | (48,851,789) | |
| (4,383,500) | | (26,040,544) | | (2,076,976) | | (12,651,153) | |
| C Class/Shares Authorized | 160,000,000 | | | 160,000,000 | | |
| Sold | 185,795 | | 1,094,748 | | 289,288 | | 1,611,880 | |
| Issued in reinvestment of distributions | 23,191 | | 136,594 | | 157,565 | | 840,351 | |
| Redeemed | (854,493) | | (5,043,585) | | (1,093,994) | | (6,093,459) | |
| (645,507) | | (3,812,243) | | (647,141) | | (3,641,228) | |
| R Class/Shares Authorized | 90,000,000 | | | 90,000,000 | | |
| Sold | 467,093 | | 2,808,659 | | 447,519 | | 2,543,474 | |
| Issued in reinvestment of distributions | 61,131 | | 367,423 | | 249,074 | | 1,357,800 | |
| Redeemed | (692,351) | | (4,111,706) | | (1,397,652) | | (7,879,383) | |
| (164,127) | | (935,624) | | (701,059) | | (3,978,109) | |
| R5 Class/Shares Authorized | 50,000,000 | | | 50,000,000 | | |
| Sold | 18,000 | | 105,149 | | 32,546 | | 189,579 | |
| Issued in reinvestment of distributions | 2,051 | | 12,336 | | 5,968 | | 33,107 | |
| Redeemed | (133,354) | | (854,516) | | (2,171) | | (12,503) | |
| (113,303) | | (737,031) | | 36,343 | | 210,183 | |
| R6 Class/Shares Authorized | 295,000,000 | | | 295,000,000 | | |
| Sold | 5,690,859 | | 34,338,619 | | 5,288,799 | | 30,336,216 | |
| Issued in reinvestment of distributions | 488,106 | | 2,972,781 | | 1,227,701 | | 6,786,397 | |
| Redeemed | (7,177,803) | | (42,837,301) | | (3,383,846) | | (19,486,631) | |
| (998,838) | | (5,525,901) | | 3,132,654 | | 17,635,982 | |
| Net increase (decrease) | (10,551,780) | | $ | (64,164,875) | | (1,349,310) | | $ | (9,133,582) | |
6. Fair Value Measurements
The fund's investments valuation process is based on several considerations and may use multiple inputs to determine the fair value of the investments held by the fund. In conformity with accounting principles generally accepted in the United States of America, the inputs used to determine a valuation are classified into three broad levels.
•Level 1 valuation inputs consist of unadjusted quoted prices in an active market for identical investments.
•Level 2 valuation inputs consist of direct or indirect observable market data (including quoted prices for comparable investments, evaluations of subsequent market events, interest rates, prepayment speeds, credit risk, etc.). These inputs also consist of quoted prices for identical investments initially expressed in local currencies that are adjusted through translation into U.S. dollars.
•Level 3 valuation inputs consist of unobservable data (including a fund’s own assumptions).
The level classification is based on the lowest level input that is significant to the fair valuation measurement. The valuation inputs are not necessarily an indication of the risks associated with investing in these securities or other financial instruments.
The following is a summary of the level classifications as of period end. The Schedule of Investments provides additional information on the fund's portfolio holdings.
| | | | | | | | | | | |
| Level 1 | Level 2 | Level 3 |
| Assets | | | |
| Investment Securities | | | |
| Affiliated Funds | $ | 346,501,700 | | — | | — | |
| Common Stocks | 146,046,878 | | $ | 47,498,971 | | — | |
| U.S. Treasury Securities | — | | 105,695,902 | | — | |
| Sovereign Governments and Agencies | — | | 21,867,191 | | — | |
| Corporate Bonds | — | | 13,044,963 | | — | |
| Collateralized Loan Obligations | — | | 7,700,740 | | — | |
| Asset-Backed Securities | — | | 1,714,169 | | — | |
| Collateralized Mortgage Obligations | — | | 1,670,979 | | — | |
| Preferred Stocks | — | | 1,506,795 | | — | |
| U.S. Government Agency Mortgage-Backed Securities | — | | 526,473 | | — | |
| Municipal Securities | — | | 472,171 | | — | |
| Exchange-Traded Funds | 30,935 | | — | | — | |
| Short-Term Investments | 29,768,508 | | 37,772,386 | | — | |
| $ | 522,348,021 | | $ | 239,470,740 | | — | |
| Other Financial Instruments | | | |
| Futures Contracts | $ | 692,672 | | $ | 98,325 | | — | |
| Swap Agreements | — | | 178,055 | | — | |
| Forward Foreign Currency Exchange Contracts | — | | 115,563 | | — | |
| $ | 692,672 | | $ | 391,943 | | — | |
| | | |
| Liabilities | | | |
| Other Financial Instruments | | | |
| Swap Agreements | — | | $ | 409,201 | | — | |
| Forward Foreign Currency Exchange Contracts | — | | 250,481 | | — | |
| — | | $ | 659,682 | | — | |
7. Derivative Instruments
Credit Risk — The fund is subject to credit risk in the normal course of pursuing its investment objectives. The value of a bond generally declines as the credit quality of its issuer declines. Credit default swap agreements enable a fund to buy/sell protection against a credit event of a specific issuer or index. A fund may attempt to enhance returns by selling protection or attempt to mitigate credit risk by buying protection. The buyer/seller of credit protection against a security or basket of securities may pay/receive an up-front or periodic payment to compensate for/against potential default events. Changes in value, including the periodic amounts of interest to be paid or received on swap agreements, are recorded as unrealized appreciation (depreciation) on swap agreements. Upon entering into a centrally cleared swap, a fund is required to deposit cash or securities (initial margin) with a financial intermediary in an amount equal to a certain percentage of the notional amount. A fund may incur charges or earn income on cash deposit balances, which are reflected in interest expenses or interest income, respectively. Subsequent payments (variation margin) are made or received daily, in cash, by a fund. The variation margin is equal to the daily change in the value and is a component of unrealized gains and losses. Realized gain or loss is recorded upon receipt or payment of a periodic settlement or termination of swap agreements. Net realized and unrealized gains or losses occurring during the holding period of swap agreements are a component of net realized gain (loss) on swap agreement transactions and change in net unrealized appreciation (depreciation) on swap agreements, respectively. The risks of entering into swap agreements include the possible lack of liquidity, failure of the counterparty to meet its obligations, and that there may be unfavorable changes in the underlying investments or instruments. The fund's average notional amount held during the period was $8,327,015.
Foreign Currency Risk — The fund is subject to foreign currency exchange rate risk in the normal course of pursuing its investment objectives. The value of foreign investments held by a fund may be significantly affected by changes in foreign currency exchange rates. The dollar value of a foreign security generally decreases when the value of the dollar rises against the foreign currency in which the security is denominated and tends to increase when the value of the dollar declines against such foreign currency. A fund may enter into forward foreign currency exchange contracts to reduce a fund's exposure to foreign currency exchange rate fluctuations or to gain exposure to the fluctuations in the value of foreign currencies. A fund will segregate cash, cash equivalents or other appropriate liquid securities on its records in amounts sufficient to meet requirements. The net U.S. dollar value of foreign currency underlying all contractual commitments held by a fund and the resulting unrealized appreciation or depreciation are determined daily. Realized gain or loss is recorded upon settlement of the contract. Net realized and unrealized gains or losses occurring during the holding period of forward foreign currency exchange contracts are a component of net realized gain (loss) on forward foreign currency exchange contract transactions and change in net unrealized appreciation (depreciation) on forward foreign currency exchange contracts, respectively. A fund bears the risk of an unfavorable change in the foreign currency exchange rate underlying the forward contract. Additionally, losses, up to the fair value, may arise if the counterparties do not perform under the contract terms. The fund's average U.S. dollar exposure to foreign currency risk derivative instruments held during the period was $30,740,520.
Interest Rate Risk — The fund is subject to interest rate risk in the normal course of pursuing its investment objectives. The value of bonds generally declines as interest rates rise. A fund may enter into futures contracts based on a bond index or a specific underlying security. A fund may purchase futures contracts to gain exposure to increases in market value or sell futures contracts to protect against a decline in market value. Upon entering into a futures contract, a fund will segregate cash, cash equivalents or other appropriate liquid securities on its records in amounts sufficient to meet requirements. A fund may incur charges or earn income on cash deposit balances, which are reflected in interest expenses or interest income, respectively. Subsequent payments (variation margin) are made or received daily, in cash, by a fund. The variation margin is equal to the daily change in the contract value and is recorded as unrealized gains and losses. A fund recognizes a realized gain or loss when the futures contract is closed or expires. Net realized and unrealized gains or losses occurring during the holding period of futures contracts are a component of net realized gain (loss) on futures contract transactions and change in net unrealized appreciation (depreciation) on futures contracts, respectively. One of the risks of entering into futures contracts is the possibility that the change in value of the contract may not correlate with the changes in value of the underlying securities. The fund's average notional exposure to interest rate risk derivative instruments held during the period was $51,288,260 futures contracts purchased.
Value of Derivative Instruments as of July 31, 2024
| | | | | | | | | | | | | | |
| Asset Derivatives | Liability Derivatives |
| Type of Risk Exposure | Location on Statement of Assets and Liabilities | Value | Location on Statement of Assets and Liabilities | Value |
| Credit Risk | Receivable for variation margin on swap agreements* | — | | Payable for variation margin on swap agreements* | $ | 4,761 | |
| Foreign Currency Risk | Unrealized appreciation on forward foreign currency exchange contracts | $ | 115,563 | | Unrealized depreciation on forward foreign currency exchange contracts | 250,481 | |
| Interest Rate Risk | Receivable for variation margin on futures contracts* | 70,025 | | Payable for variation margin on futures contracts* | — | |
| | $ | 185,588 | | | $ | 255,242 | |
*Included in the unrealized appreciation (depreciation) on futures contracts or centrally cleared swap agreements, as applicable, as reported in the Schedule of Investments.
Effect of Derivative Instruments on the Statement of Operations for the Year Ended July 31, 2024
| | | | | | | | | | | | | | |
| Net Realized Gain (Loss) | Change in Net Unrealized
Appreciation (Depreciation) |
| Type of Risk Exposure | Location on Statement of Operations | Value | Location on Statement of Operations | Value |
| Credit Risk | Net realized gain (loss) on swap agreement transactions | $ | (132,952) | | Change in net unrealized appreciation (depreciation) on swap agreements | $ | 54,931 | |
| Foreign Currency Risk | Net realized gain (loss) on forward foreign currency exchange contract transactions | 488,591 | | Change in net unrealized appreciation (depreciation) on forward foreign currency exchange contracts | 151,474 | |
| Interest Rate Risk | Net realized gain (loss) on futures contract transactions | (2,064,767) | Change in net unrealized appreciation (depreciation) on futures contracts | 1,462,922 | |
| | $ | (1,709,128) | | | $ | 1,669,327 | |
8. Risk Factors
The value of the fund’s shares will go up and down, sometimes rapidly or unpredictably, based on the performance of the securities owned by the fund and other factors generally affecting the securities market. Market risks, including political, regulatory, economic and social developments, can affect the value of the fund’s investments. Natural disasters, public health emergencies, war, terrorism and other unforeseeable events may lead to increased market volatility and may have adverse long-term effects on world economies and markets generally.
There are certain risks involved in investing in foreign securities. These risks include those resulting from political events (such as civil unrest, national elections and imposition of exchange controls), social and economic events (such as labor strikes and rising inflation), and natural disasters. Securities of foreign issuers may be less liquid and more volatile. Investing in emerging markets or a significant portion of assets in one country or region may accentuate these risks.
9. Federal Tax Information
The tax character of distributions paid during the years ended July 31, 2024 and July 31, 2023 were as follows:
| | | | | | | | |
| 2024 | 2023 |
| Distributions Paid From | | |
| Ordinary income | $ | 13,895,193 | | $ | 13,175,425 | |
| Long-term capital gains | $ | 139 | | $ | 27,534,561 | |
The book-basis character of distributions made during the year from net investment income or net realized gains may differ from their ultimate characterization for federal income tax purposes. These differences reflect the differing character of certain income items and net realized gains and losses for financial statement and tax purposes, and may result in reclassification among certain capital accounts on the financial statements.
As of period end, the federal tax cost of investments and the components of distributable earnings on a tax-basis were as follows:
| | | | | |
| Federal tax cost of investments | $ | 638,520,967 | |
| Gross tax appreciation of investments | $ | 151,375,216 | |
| Gross tax depreciation of investments | (28,077,422) | |
| Net tax appreciation (depreciation) of investments | 123,297,794 | |
| Net tax appreciation (depreciation) on derivatives and translation of assets and liabilities in foreign currencies | (243,742) | |
| Net tax appreciation (depreciation) | $ | 123,054,052 | |
| Other book-to-tax adjustments | $ | (27,222) | |
| Undistributed ordinary income | $ | 4,999,915 | |
| Accumulated long-term gains | $ | 20,749,323 | |
The difference between book-basis and tax-basis unrealized appreciation (depreciation) is attributable primarily to the tax deferral of losses on wash sales. Other book-to-tax adjustments are attributable primarily to the tax deferral of losses on straddle positions.
10. Investments in Affiliated Funds
The fund does not invest in an affiliated fund for the purpose of exercising management or control; however, investments by the fund within its investment strategy may represent a significant portion of an affiliated fund's net assets. As of period end, the fund owned 29% of the total outstanding shares of American Century Emerging Markets Bond ETF.
11. Affiliated Fund Transactions
A summary of transactions for each affiliated fund for the period ended July 31, 2024 follows (amounts in thousands):
| | | | | | | | | | | | | | | | | | | | | | | | | | |
Affiliated Fund(1) | Beginning
Value | Purchase
Cost | Sales Cost | Change in Net
Unrealized
Appreciation
(Depreciation) | Ending
Value | Ending
Shares | Net Realized
Gain (Loss) | Distributions
Received(2) |
| American Century Diversified Corporate Bond ETF | $ | 24,710 | | — | | — | | $ | 754 | | $ | 25,464 | | 541 | | — | | $ | 1,215 | |
| American Century Emerging Markets Bond ETF | 8,814 | | — | | — | | 221 | | 9,035 | | 232 | | — | | 536 | |
American Century Focused Dynamic Growth ETF(3) | 22,640 | | $ | 2,278 | | $ | 3,930 | | 5,023 | | 26,011 | | 297 | | $ | 1,301 | | — | |
| American Century Focused Large Cap Value ETF | 25,831 | | 495 | | 2,889 | | 1,785 | | 25,222 | | 379 | | 493 | | 547 | |
| American Century Multisector Income ETF | 35,616 | | — | | 1,032 | | 1,038 | | 35,622 | | 813 | | (192) | | 1,964 | |
| American Century Quality Diversified International ETF | 31,831 | | 924 | | 6,968 | | 2,704 | | 28,491 | | 572 | | (365) | | 942 | |
| American Century Short Duration Strategic Income ETF | 4,546 | | — | | — | | 73 | | 4,619 | | 90 | | — | | 253 | |
American Century U.S. Quality Growth ETF(4) | 35,799 | | 6,041 | | 7,991 | | 5,707 | | 39,556 | | 461 | | 1,822 | | 131 | |
| American Century U.S. Quality Value ETF | 44,414 | | 3,086 | | 11,662 | | 3,777 | | 39,615 | | 672 | | 1,916 | | 619 | |
| Avantis Emerging Markets Equity ETF | 22,722 | | 8,951 | | 3,665 | | 2,398 | | 30,406 | | 497 | | 181 | | 881 | |
Avantis International Equity ETF(4) | 31,676 | | 339 | | 14,822 | | (373) | | 16,820 | | 261 | | 2,327 | | 731 | |
| Avantis International Small Cap Value ETF | 8,141 | | 235 | | 855 | | 737 | | 8,258 | | 121 | | 89 | | 249 | |
Avantis U.S. Equity ETF(4) | 46,890 | | 665 | | 6,500 | | 3,790 | | 44,845 | | 484 | | 3,594 | | 627 | |
Avantis U.S. Small Cap Value ETF(4) | 9,895 | | 1,414 | | 709 | | 1,938 | | 12,538 | | 126 | | 51 | | 192 | |
| $ | 353,525 | | $ | 24,428 | | $ | 61,023 | | $ | 29,572 | | $ | 346,502 | | 5,546 | | $ | 11,217 | | $ | 8,887 | |
(1)Investments are funds within the American Century Investments family of funds and are considered affiliated funds. Additional information and attributes of each affiliated fund are available at americancentury.com or avantisinvestors.com.
(2)Distributions received includes distributions from net investment income and from capital gains, if any.
(3)Non-income producing.
(4)Security, or a portion thereof, is on loan.
| | | | | | | | | | | | | | | | | | | | | | | | | | | | | | | | | | | | | | | | | | | | | | | |
| For a Share Outstanding Throughout the Years Ended July 31 (except as noted) |
| Per-Share Data | | | | Ratios and Supplemental Data | | |
| | Income From Investment Operations*: | Distributions From: | | | Ratio to Average Net Assets of†: | | |
| Net Asset Value, Beginning
of Period | Net Investment Income (Loss)(1) | Net
Realized and Unrealized Gain (Loss) | Total From Investment Operations | Net
Investment Income | Net
Realized
Gains | Total Distributions | Net
Asset Value,
End of Period | Total Return(2) | Operating Expenses | Operating Expenses
(before expense waiver) | Net
Investment Income
(Loss) | Net Investment Income (Loss) (before expense waiver) | Portfolio Turnover
Rate | Net
Assets,
End of Period (in thousands) |
| Investor Class | | | | | | | | | | | | | |
| 2024 | $5.99 | 0.13 | 0.54 | 0.67 | (0.12) | — | (0.12) | $6.54 | 11.30% | 0.69% | 1.11% | 2.21% | 1.79% | 28% | $236,663 | |
| 2023 | $6.00 | 0.12 | 0.20 | 0.32 | (0.11) | (0.22) | (0.33) | $5.99 | 5.89% | 0.69% | 1.11% | 2.10% | 1.68% | 25% | $256,440 | |
| 2022 | $7.40 | 0.10 | (0.76) | (0.66) | (0.11) | (0.63) | (0.74) | $6.00 | (9.97)% | 0.70% | 1.12% | 1.55% | 1.13% | 39% | $262,310 | |
| 2021 | $6.25 | 0.07 | 1.43 | 1.50 | (0.07) | (0.28) | (0.35) | $7.40 | 24.69% | 0.73% | 1.11% | 1.01% | 0.63% | 48% | $332,602 | |
| 2020 | $6.57 | 0.07 | 0.46 | 0.53 | (0.08) | (0.77) | (0.85) | $6.25 | 8.42% | 0.84% | 1.11% | 1.13% | 0.86% | 99% | $297,963 | |
| I Class | | | | | | | | | | | | | |
| 2024 | $6.00 | 0.15 | 0.53 | 0.68 | (0.13) | — | (0.13) | $6.55 | 11.50% | 0.49% | 0.91% | 2.41% | 1.99% | 28% | $76,385 | |
| 2023 | $6.00 | 0.13 | 0.21 | 0.34 | (0.12) | (0.22) | (0.34) | $6.00 | 6.28% | 0.49% | 0.91% | 2.30% | 1.88% | 25% | $55,900 | |
| 2022 | $7.40 | 0.12 | (0.77) | (0.65) | (0.12) | (0.63) | (0.75) | $6.00 | (9.80)% | 0.50% | 0.92% | 1.75% | 1.33% | 39% | $56,679 | |
| 2021 | $6.25 | 0.08 | 1.44 | 1.52 | (0.09) | (0.28) | (0.37) | $7.40 | 24.93% | 0.53% | 0.91% | 1.21% | 0.83% | 48% | $71,639 | |
| 2020 | $6.57 | 0.08 | 0.46 | 0.54 | (0.09) | (0.77) | (0.86) | $6.25 | 8.64% | 0.64% | 0.91% | 1.33% | 1.06% | 99% | $62,820 | |
| A Class |
| 2024 | $5.97 | 0.12 | 0.52 | 0.64 | (0.10) | — | (0.10) | $6.51 | 10.89% | 0.94% | 1.36% | 1.96% | 1.54% | 28% | $263,506 | |
| 2023 | $5.97 | 0.11 | 0.20 | 0.31 | (0.09) | (0.22) | (0.31) | $5.97 | 5.82% | 0.94% | 1.36% | 1.85% | 1.43% | 25% | $267,677 | |
| 2022 | $7.37 | 0.09 | (0.77) | (0.68) | (0.09) | (0.63) | (0.72) | $5.97 | (10.26)% | 0.95% | 1.37% | 1.30% | 0.88% | 39% | $280,223 | |
| 2021 | $6.22 | 0.05 | 1.44 | 1.49 | (0.06) | (0.28) | (0.34) | $7.37 | 24.48% | 0.98% | 1.36% | 0.76% | 0.38% | 48% | $342,835 | |
| 2020 | $6.55 | 0.05 | 0.46 | 0.51 | (0.07) | (0.77) | (0.84) | $6.22 | 8.04% | 1.09% | 1.36% | 0.88% | 0.61% | 99% | $288,517 | |
| C Class | | | | | | | | | | | | | |
| 2024 | $5.79 | 0.07 | 0.51 | 0.58 | (0.06) | — | (0.06) | $6.31 | 10.09% | 1.69% | 2.11% | 1.21% | 0.79% | 28% | $12,208 | |
| 2023 | $5.81 | 0.06 | 0.21 | 0.27 | (0.07) | (0.22) | (0.29) | $5.79 | 5.12% | 1.69% | 2.11% | 1.10% | 0.68% | 25% | $14,930 | |
| 2022 | $7.19 | 0.03 | (0.73) | (0.70) | (0.05) | (0.63) | (0.68) | $5.81 | (10.90)% | 1.70% | 2.12% | 0.55% | 0.13% | 39% | $18,764 | |
| 2021 | $6.10 | —(3) | 1.39 | 1.39 | (0.02) | (0.28) | (0.30) | $7.19 | 23.55% | 1.73% | 2.11% | 0.01% | (0.37)% | 48% | $28,683 | |
| 2020 | $6.45 | 0.01 | 0.45 | 0.46 | (0.04) | (0.77) | (0.81) | $6.10 | 7.18% | 1.84% | 2.11% | 0.13% | (0.14)% | 99% | $39,523 | |
| R Class | | | | | | | | | | | | | |
| 2024 | $5.91 | 0.10 | 0.52 | 0.62 | (0.09) | — | (0.09) | $6.44 | 10.55% | 1.19% | 1.61% | 1.71% | 1.29% | 28% | $27,204 | |
| 2023 | $5.91 | 0.09 | 0.21 | 0.30 | (0.08) | (0.22) | (0.30) | $5.91 | 5.65% | 1.19% | 1.61% | 1.60% | 1.18% | 25% | $25,907 | |
| 2022 | $7.31 | 0.07 | (0.76) | (0.69) | (0.08) | (0.63) | (0.71) | $5.91 | (10.56)% | 1.20% | 1.62% | 1.05% | 0.63% | 39% | $30,086 | |
| 2021 | $6.17 | 0.03 | 1.43 | 1.46 | (0.04) | (0.28) | (0.32) | $7.31 | 24.23% | 1.23% | 1.61% | 0.51% | 0.13% | 48% | $38,353 | |
| 2020 | $6.51 | 0.04 | 0.45 | 0.49 | (0.06) | (0.77) | (0.83) | $6.17 | 7.77% | 1.34% | 1.61% | 0.63% | 0.36% | 99% | $35,807 | |
| | | | | | | | | | | | | | | | | | | | | | | | | | | | | | | | | | | | | | | | | | | | | | | |
| For a Share Outstanding Throughout the Years Ended July 31 (except as noted) |
| Per-Share Data | | | | Ratios and Supplemental Data | | |
| | Income From Investment Operations*: | Distributions From: | | | Ratio to Average Net Assets of†: | | |
| Net Asset Value, Beginning
of Period | Net Investment Income (Loss)(1) | Net
Realized and Unrealized Gain (Loss) | Total From Investment Operations | Net
Investment Income | Net
Realized
Gains | Total Distributions | Net
Asset Value,
End of Period | Total Return(2) | Operating Expenses | Operating Expenses
(before expense waiver) | Net
Investment Income
(Loss) | Net Investment Income (Loss) (before expense waiver) | Portfolio Turnover
Rate | Net
Assets,
End of Period (in thousands) |
| R5 Class | | | | | | | | | | | | | |
| 2024 | $6.00 | 0.14 | 0.54 | 0.68 | (0.13) | — | (0.13) | $6.55 | 11.50% | 0.49% | 0.91% | 2.41% | 1.99% | 28% | $9 | |
| 2023 | $6.00 | 0.14 | 0.20 | 0.34 | (0.12) | (0.22) | (0.34) | $6.00 | 6.27% | 0.49% | 0.91% | 2.30% | 1.88% | 25% | $688 | |
| 2022 | $7.41 | 0.09 | (0.75) | (0.66) | (0.12) | (0.63) | (0.75) | $6.00 | (9.92)% | 0.50% | 0.92% | 1.75% | 1.33% | 39% | $470 | |
| 2021 | $6.25 | 0.08 | 1.45 | 1.53 | (0.09) | (0.28) | (0.37) | $7.41 | 25.10% | 0.53% | 0.91% | 1.21% | 0.83% | 48% | $7,768 | |
| 2020 | $6.58 | 0.08 | 0.45 | 0.53 | (0.09) | (0.77) | (0.86) | $6.25 | 8.46% | 0.64% | 0.91% | 1.33% | 1.06% | 99% | $6,960 | |
| R6 Class | | | | | | | | | | | | | |
| 2024 | $5.99 | 0.16 | 0.52 | 0.68 | (0.14) | — | (0.14) | $6.53 | 11.52% | 0.34% | 0.76% | 2.56% | 2.14% | 28% | $138,125 | |
| 2023 | $5.99 | 0.14 | 0.21 | 0.35 | (0.13) | (0.22) | (0.35) | $5.99 | 6.45% | 0.34% | 0.76% | 2.45% | 2.03% | 25% | $132,562 | |
| 2022 | $7.39 | 0.13 | (0.77) | (0.64) | (0.13) | (0.63) | (0.76) | $5.99 | (9.67)% | 0.35% | 0.77% | 1.90% | 1.48% | 39% | $113,859 | |
| 2021 | $6.24 | 0.09 | 1.44 | 1.53 | (0.10) | (0.28) | (0.38) | $7.39 | 25.17% | 0.38% | 0.76% | 1.36% | 0.98% | 48% | $134,426 | |
| 2020 | $6.56 | 0.09 | 0.46 | 0.55 | (0.10) | (0.77) | (0.87) | $6.24 | 8.82% | 0.49% | 0.76% | 1.48% | 1.21% | 99% | $121,246 | |
| | |
| Notes to Financial Highlights |
(1)Computed using average shares outstanding throughout the period.
(2)Total returns are calculated based on the net asset value of the last business day and do not reflect applicable sales charges, if any. Total returns for periods less than one year are not annualized.
(3)Per-share amount was less than $0.005.
*The amount shown for a share outstanding throughout the period may not correlate with the Statement(s) of Operations or precisely reflect the class expense differentials due to the timing of transactions in shares of a fund in relation to income earned and/or fluctuations in the fair value of a fund's investments.
†Ratios for periods less than one year are annualized. Zero balances may reflect amounts less than 0.005%.
See Notes to Financial Statements.
| | |
| Report of Independent Registered Public Accounting Firm |
To the shareholders of the Strategic Allocation: Moderate Fund and the Board of Directors of American Century Strategic Asset Allocations, Inc.:
Opinion on the Financial Statements and Financial Highlights
We have audited the accompanying statement of assets and liabilities, including the schedule of investments, of Strategic Allocation: Moderate Fund (the “Fund”), one of the funds constituting the American Century Strategic Asset Allocations, Inc., as of July 31, 2024, the related statement of operations for the year then ended, the statements of changes in net assets for each of the two years in the period then ended, the financial highlights for each of the five years in the period then ended, and the related notes. In our opinion, the financial statements and financial highlights present fairly, in all material respects, the financial position of the Fund as of July 31, 2024, and the results of its operations for the year then ended, the changes in its net assets for each of the two years in the period then ended, and the financial highlights for each of the five years in the period then ended, in conformity with accounting principles generally accepted in the United States of America.
Basis for Opinion
These financial statements and financial highlights are the responsibility of the Fund's management. Our responsibility is to express an opinion on the Fund’s financial statements and financial highlights based on our audits. We are a public accounting firm registered with the Public Company Accounting Oversight Board (United States) (PCAOB) and are required to be independent with respect to the Fund in accordance with the U.S. federal securities laws and the applicable rules and regulations of the Securities and Exchange Commission and the PCAOB.
We conducted our audits in accordance with the standards of the PCAOB. Those standards require that we plan and perform the audit to obtain reasonable assurance about whether the financial statements and financial highlights are free of material misstatement, whether due to error or fraud. The Fund is not required to have, nor were we engaged to perform, an audit of its internal control over financial reporting. As part of our audits, we are required to obtain an understanding of internal control over financial reporting but not for the purpose of expressing an opinion on the effectiveness of the Fund’s internal control over financial reporting. Accordingly, we express no such opinion.
Our audits included performing procedures to assess the risks of material misstatement of the financial statements and financial highlights, whether due to error or fraud, and performing procedures that respond to those risks. Such procedures included examining, on a test basis, evidence regarding the amounts and disclosures in the financial statements and financial highlights. Our audits also included evaluating the accounting principles used and significant estimates made by management, as well as evaluating the overall presentation of the financial statements and financial highlights. Our procedures included confirmation of securities owned as of July 31, 2024, by correspondence with the custodian and brokers; when replies were not received from brokers, we performed other auditing procedures. We believe that our audits provide a reasonable basis for our opinion.
/s/ Deloitte & Touche LLP
Kansas City, Missouri
September 17, 2024
We have served as the auditor of one or more American Century investment companies since 1997.
| | |
| Approval of Management Agreement |
At a meeting held on June 27, 2024, the Fund’s Board of Directors (the “Board”) unanimously approved the renewal of the management agreement pursuant to which American Century Investment Management, Inc. (the “Advisor”) acts as the investment advisor for the Fund. Under the Investment Company Act of 1940 (the “Investment Company Act”), contracts for investment advisory services are required to be reviewed, evaluated, and approved by a majority of a fund’s Directors, including a majority of the independent Directors.
Prior to its consideration of the renewal of the management agreement, the Directors requested and reviewed data and information compiled by the Advisor and certain independent consultants and data providers concerning the Fund. This review was in addition to the oversight and evaluation undertaken by the Board and its committees on a continual basis and the information received was supplemental to the information that the Board and its committees receive and consider over time.
In connection with its consideration of the renewal of the management agreement, the Board’s review and evaluation of the services provided by the Advisor and its affiliates included, but was not limited to
•the nature, extent, and quality of investment management, shareholder services, distribution services, and other services provided to the Fund;
•the wide range of programs and services the Advisor and other service providers provide to the Fund and its shareholders on a routine and non-routine basis;
•the Fund’s investment performance compared to appropriate benchmarks and/or peer groups of other mutual funds with similar investment objectives and strategies;
•the cost of owning the Fund compared to the cost of owning similarly-managed funds;
•the Advisor’s compliance policies, procedures, and regulatory experience and those of certain other service providers;
•the Advisor’s strategic plans, generally, and with respect to the Advisor’s response to investment management industry challenges;
•the Advisor’s business continuity plans, vendor management practices, and information security practices;
•the cost of services provided to the Fund, the profitability of the Fund to the Advisor, and the Advisor’s financial results of operation;
•possible economies of scale associated with the Advisor’s management of the Fund;
•any collateral benefits derived by the Advisor from the management of the Fund;
•fees and expenses associated with any investment by the Fund in other funds;
•payments to intermediaries by the Fund and the Advisor and services provided by intermediaries in connection therewith; and
•services provided and charges to the Advisor’s other investment management clients.
The Board held two meetings to consider the renewal. The independent Directors also met in private session multiple times to review and discuss the information provided in response to their request. The independent Directors held active discussions with the Advisor regarding the renewal of the management agreement, requesting supplemental information, and reviewing information provided by the Advisor in response thereto. The independent Directors had the benefit of the advice of their independent counsel throughout the process.
Factors Considered
The Directors considered all of the information provided by the Advisor, the independent consultant and data providers, and the independent Directors’ independent counsel in connection with the approval. They determined that the information was sufficient for them to evaluate the management agreement for the Fund. In connection with their review, the Directors did not identify any single factor as being all-important or controlling, and each Director may have attributed different levels of importance to different factors. In deciding to renew the management agreement, the Board based its decision on a number of factors, including without limitation the following:
Nature, Extent and Quality of Services — Generally. Under the management agreement, the Advisor is responsible for providing or arranging for all services necessary for the operation of the Fund. The Board noted that the Advisor provides or arranges at its own expense a wide variety of services which include, without limitation, the following:
•constructing and designing the Fund
•portfolio research and security selection
•initial capitalization/funding
•securities trading
•Fund administration
•custody of Fund assets
•daily valuation of the Fund’s portfolio
•liquidity monitoring and management
•risk management, including information security
•shareholder servicing and transfer agency, including shareholder confirmations, recordkeeping, and communications
•legal services (except the independent Directors’ counsel)
•regulatory and portfolio compliance
•financial reporting
•marketing and distribution (except amounts paid by the Fund under Rule 12b-1 plans)
The Board noted that many of these services have expanded over time in terms of both quantity and complexity in response to shareholder demands, competition in the industry, changing distribution channels, and the changing regulatory environment.
Investment Management Services. The nature of the investment management services provided to the Fund is quite complex and allows Fund shareholders access to professional money management, instant diversification of their investments, the opportunity to easily diversify among asset classes by investing in or exchanging among various American Century Investments funds, and liquidity. In evaluating investment performance, the Board expects the Advisor to manage the Fund in accordance with its investment objectives and principal investment strategies. Further, the Directors recognize that the Advisor has an obligation to monitor trading activities, and in particular to seek the best execution of fund trades, and to evaluate the use of and payment for research. In providing these services, the Advisor utilizes teams of investment professionals who require extensive information technology, research, training, compliance, and other systems to conduct their business. The Board, directly and through its Fund Performance Review Committee, provides oversight of the investment performance process. It regularly reviews investment performance information for the Fund, together with comparative information for appropriate benchmarks and/or peer groups of similarly-managed funds, over different time horizons. The Directors also review investment performance information from both the Advisor and an independent third party during the management agreement renewal process. If performance concerns are identified, the Board discusses with the Advisor the reasons for such results and any actions being taken to improve performance and may conduct special reviews until performance improves. The Fund’s performance was above its benchmark for the three-, five-, and ten-year periods and below its benchmark for the one-year period reviewed by the Board. In relation to industry peers, the Fund was above the median of its peer performance universe as identified by a third-party service provider for the one-, three-, five- and ten-year periods. The Board found the investment management services provided by the Advisor to the Fund to be satisfactory and consistent with the management agreement.
Shareholder and Other Services. Under the management agreement, the Advisor provides the Fund with a comprehensive package of transfer agency, shareholder, and other services. The Board, directly and through its various committees, regularly reviews reports and evaluations of such services at its regular meetings. These reports include, but are not limited to, information regarding the operational efficiency and accuracy of the shareholder and transfer agency services provided, staffing levels, shareholder satisfaction, technology support (including information security), new products and services offered to Fund shareholders, securities trading activities, portfolio valuation services, auditing services, and legal and operational compliance activities. The Board found the services provided by the Advisor to the Fund under the management agreement to be competitive and of high quality.
Costs of Services and Profitability. The Advisor provides detailed information concerning its cost of providing various services to the Fund, its profitability in managing the Fund (pre- and post-distribution), and its financial results of operation. The Directors have reviewed with the Advisor the methodology used to prepare this financial information and arranged for an independent consultant to confirm the reasonableness of the allocation methodology used. This information is considered in evaluating the Advisor’s financial condition, its ability to continue to provide services under the management agreement, and the reasonableness of the terms of the current management agreement. The Board concluded that the Advisor’s profits were reasonable in light of the services provided to the Fund.
Ethics. The Board generally considers the Advisor’s commitment to providing quality services to shareholders and to conducting its business ethically. They noted that the Advisor’s practices generally meet or exceed industry best practices.
Economies of Scale. The Board also reviewed information provided by the Advisor regarding the possible existence of economies of scale in connection with the management of the Fund. The Board concluded that economies of scale are difficult to measure and predict with precision, especially on a fund-by-fund basis. The Board concluded that the Advisor is sharing economies of scale, to the extent they exist, through its fee structure, and through reinvestment in its business, infrastructure, investment capabilities and initiatives to provide shareholders enhanced and expanded content and services.
Comparison to Other Funds’ Fees. The management agreement provides that the Fund pays the Advisor a single, all-inclusive (or unified) management fee for providing all services necessary for the management and operation of the Fund, other than brokerage and other transaction fees and expenses relating to acquisition and disposition of portfolio securities, acquired fund fees and expenses, taxes, interest, extraordinary expenses, fund litigation expenses, fees and expenses of the Fund’s independent Directors (including their independent legal counsel), and expenses incurred in connection with the provision of shareholder services and distribution services under a plan adopted pursuant to Investment Company Act Rule 12b-1. Under the unified fee structure, the Advisor is responsible for providing all investment advisory, custody, audit, administrative, compliance, recordkeeping, marketing and shareholder services, or arranging and supervising third parties to provide such services. By contrast, most other funds are charged a variety of fees, including an investment advisory fee, a transfer agency fee, an administrative fee, distribution charges, and other expenses. Other than their investment advisory fees and any applicable Rule 12b-1 distribution fees, all other components of the total fees charged by these other funds may be increased without shareholder approval. The Board believes the unified fee structure is a benefit to Fund shareholders because it clearly discloses to shareholders the cost of owning Fund shares, and, since the unified fee cannot be increased without a vote of Fund shareholders, it shifts to the Advisor the risk of increased costs of operating the
Fund and provides a direct incentive to minimize administrative inefficiencies. Part of the Board’s analysis of fee levels involves reviewing certain evaluative data compiled by an independent provider comparing the Fund’s unified fee to the total expense ratios of its peers. The unified fee charged to shareholders of the Fund was below the median of the total expense ratios of the Fund’s peer expense universe. In addition, the Board reviewed the Fund’s position relative to the narrower set of its expense group peers. The Board and the Advisor agreed to continue the temporary reduction of the Fund’s annual unified management fee such that the Investor Class management fee not exceed 0.83% for at least one year beginning August 1, 2024. The Board concluded that the management fee paid by the Fund to the Advisor under the management agreement is reasonable in light of the services provided to the Fund.
Comparison to Fees and Services Provided to Other Clients of the Advisor. The Board also requested and received information from the Advisor concerning the nature of the services, fees, costs, and profitability of its advisory services to advisory clients other than the Fund. They observed that these varying types of client accounts require different services and involve different regulatory and entrepreneurial risks than the management of the Fund. The Board analyzed this information and concluded that the fees charged and services provided to the Fund were reasonable by comparison.
Payments to Intermediaries. The Directors also requested and received a description of payments made to intermediaries by the Fund and the Advisor and services provided in response thereto. These payments include various payments made by the Fund or the Advisor to different types of intermediaries and recordkeepers for distribution and service activities provided for the Fund. The Directors reviewed such information and received representations from the Advisor that all such payments by the Fund were made pursuant to the Fund’s Rule 12b-1 Plan and that all such payments by the Advisor were made from the Advisor’s resources and reasonable profits.
Collateral or “Fall-Out” Benefits Derived by the Advisor. The Board considered the possible existence of collateral benefits the Advisor may receive as a result of its relationship with the Fund. They concluded that the Advisor’s primary business is managing funds and it generally does not use fund or shareholder information to generate profits in other lines of business, and therefore does not derive any significant collateral benefits from them. To the extent there are potential collateral benefits, the Board has been advised and has taken this into consideration in its review of the management contract with the Fund. The Board noted that additional assets from other clients may offer the Advisor some benefit from increased leverage with prospective clients, service providers, and counterparties. Additionally, the Advisor may receive proprietary research from broker-dealers that execute fund portfolio transactions, which the Board concluded is likely to benefit other clients of the Advisor, as well as Fund shareholders. The Board also determined that the Advisor is able to provide investment management services to certain clients other than the Fund, at least in part, due to its existing infrastructure built to serve the fund complex. The Board concluded that appropriate allocation methodologies had been employed to assign resources and the cost of those resources to these other clients.
Existing Relationship. The Board also considered whether there was any reason for not continuing the existing arrangement with the Advisor. In this regard, the Board was mindful of the potential disruptions of the Fund’s operations and various risks, uncertainties, and other effects that could occur as a result of a decision not to continue such relationship. In particular, the Board recognized that most shareholders have invested in the Fund on the strength of the Advisor’s industry standing and reputation and in the expectation that the Advisor will have a continuing role in providing advisory services to the Fund.
Conclusion of the Directors. As a result of this process, the Board, including all of the independent Directors, taking into account all of the factors discussed above and the information provided by the Advisor and others in connection with its review and received over time, determined that the terms of the management agreement are fair and reasonable and that the management fee charged to the Fund is reasonable in light of the services provided and that the management agreement between the Fund and the Advisor should be renewed for an additional one-year period.
Other Tax Information
The following information is provided pursuant to provisions of the Internal Revenue Code.
The fund hereby designates up to the maximum amount allowable as qualified dividend income for the fiscal year ended July 31, 2024.
For corporate taxpayers, the fund hereby designates $1,565,167, or up to the maximum amount allowable, of ordinary income distributions paid during the fiscal year ended July 31, 2024 as qualified for the corporate dividends received deduction.
The fund hereby designates $537,568, or up to the maximum amount allowable, as long-term capital gain distributions (20% rate gain distributions) for the fiscal year ended July 31, 2024.
The fund hereby designates $65,652 as qualified short-term capital gain distributions for purposes of Internal Revenue Code Section 871 for the fiscal year ended July 31, 2024.
The fund utilized earnings and profits of $1,011,403 distributed to shareholders on redemption of shares as part of the dividends paid deduction (tax equalization).
| | | | | | | | |
| Contact Us | americancentury.com | |
| Automated Information Line | 1-800-345-8765 | |
| Investor Services Representative | 1-800-345-2021
or 816-531-5575 | |
| Banks and Trust Companies, Broker-Dealers, Financial Professionals, Insurance Companies | 1-800-345-6488 | |
| | |
| This report and the statements it contains are submitted for the general information of our shareholders. The report is not authorized for distribution to prospective investors unless preceded or accompanied by an effective prospectus. | |
| | |
©2024 American Century Proprietary Holdings, Inc. All rights reserved.
CL-ANN-91038 2409 | |
(b) The information required by Item 13 of Form N-1A is included as part of the financial statements filed under Item 7(a) of this Form.
ITEM 8. CHANGES IN AND DISAGREEMENTS WITH ACCOUNTANTS FOR OPEN-END MANAGEMENT INVESTMENT COMPANIES.
None.
ITEM 9. PROXY DISCLOSURES FOR OPEN-END MANAGEMENT INVESTMENT COMPANIES.
None.
ITEM 10. REMUNERATION PAID TO DIRECTORS, OFFICERS, AND OTHERS OF OPEN-END MANAGEMENT INVESTMENT COMPANIES.
The remuneration paid to directors, officers and others is included as part of the report to stockholders filed under Item 7 of this Form.
ITEM 11. STATEMENT REGARDING BASIS FOR APPROVAL OF INVESTMENT ADVISORY CONTRACT.
| | |
|
| A statement regarding the basis for the board of directors’ approval of the investment advisory contract is included as part of the reports to stockholders filed under Item 7 of this Form. |
|
ITEM 12. DISCLOSURE OF PROXY VOTING POLICIES AND PROCEDURES FOR CLOSED-END MANAGEMENT INVESTMENT COMPANIES.
Not applicable.
ITEM 13. PORTFOLIO MANAGERS OF CLOSED-END MANAGEMENT INVESTMENT COMPANIES.
Not applicable.
ITEM 14. PURCHASES OF EQUITY SECURITIES BY CLOSED-END MANAGEMENT INVESTMENT COMPANY AND AFFILIATED PURCHASERS.
Not applicable.
ITEM 15. SUBMISSION OF MATTERS TO A VOTE OF SECURITY HOLDERS.
During the reporting period, there were no material changes to the procedures by which shareholders may recommend nominees to the registrant’s board.
ITEM 16. CONTROLS AND PROCEDURES.
(a) The registrant's principal executive officer and principal financial officer have concluded that the registrant's disclosure controls and procedures (as defined in Rule 30a-3(c) under the Investment Company Act of 1940) are effective based on their evaluation of these controls and procedures as of a date within 90 days of the filing date of this report.
(b) There were no changes in the registrant's internal control over financial reporting (as defined in Rule 30a-3(d) under the Investment Company Act of 1940) that occurred during the period covered by this report that have materially affected, or are reasonably likely to materially affect, the registrant's internal control over financial reporting.
ITEM 17. DISCLOSURE OF SECURITIES LENDING ACTIVITIES FOR CLOSED-END MANAGEMENT INVESTMENT COMPANIES.
Not applicable.
ITEM 18. RECOVERY OF ERRONEOUSLY AWARDED COMPENSATION.
(a) Not applicable.
(b) Not applicable.
ITEM 19. EXHIBITS.
(a)(1) Registrant’s Code of Ethics for Senior Financial Officers, which is the subject of the disclosure required by Item 2 of Form N-CSR, was filed as Exhibit 12(a)(1) to American Century Asset Allocation Portfolios, Inc.’s Certified Shareholder Report on Form N-CSR, File No. 811-21591, on September 29, 2005.
(a)(2) Not applicable.
(a)(4) Not applicable.
(a)(5) Not applicable.
SIGNATURES
Pursuant to the requirements of the Securities Exchange Act of 1934 and the Investment Company Act of 1940, the registrant has duly caused this report to be signed on its behalf by the undersigned, thereunto duly authorized.
| | | | | | | | | | | |
| Registrant: | American Century Strategic Asset Allocations, Inc. |
| | | |
| By: | /s/ Patrick Bannigan |
| Name: | Patrick Bannigan |
| Title: | President |
| | |
| Date: | September 26, 2024 |
Pursuant to the requirements of the Securities Exchange Act of 1934 and the Investment Company Act of 1940, this report has been signed below by the following persons on behalf of the registrant and in the capacities and on the dates indicated.
| | | | | | | | | | | |
| By: | /s/ Patrick Bannigan |
| Name: | Patrick Bannigan | |
| Title: | President | |
| | (principal executive officer) | |
| | |
| Date: | September 26, 2024 | |
| | | | | | | | | | | |
| By: | /s/ R. Wes Campbell |
| Name: | R. Wes Campbell | |
| Title: | Treasurer and | |
| | Chief Financial Officer | |
| | (principal financial officer) |
| | |
| Date: | September 26, 2024 | |